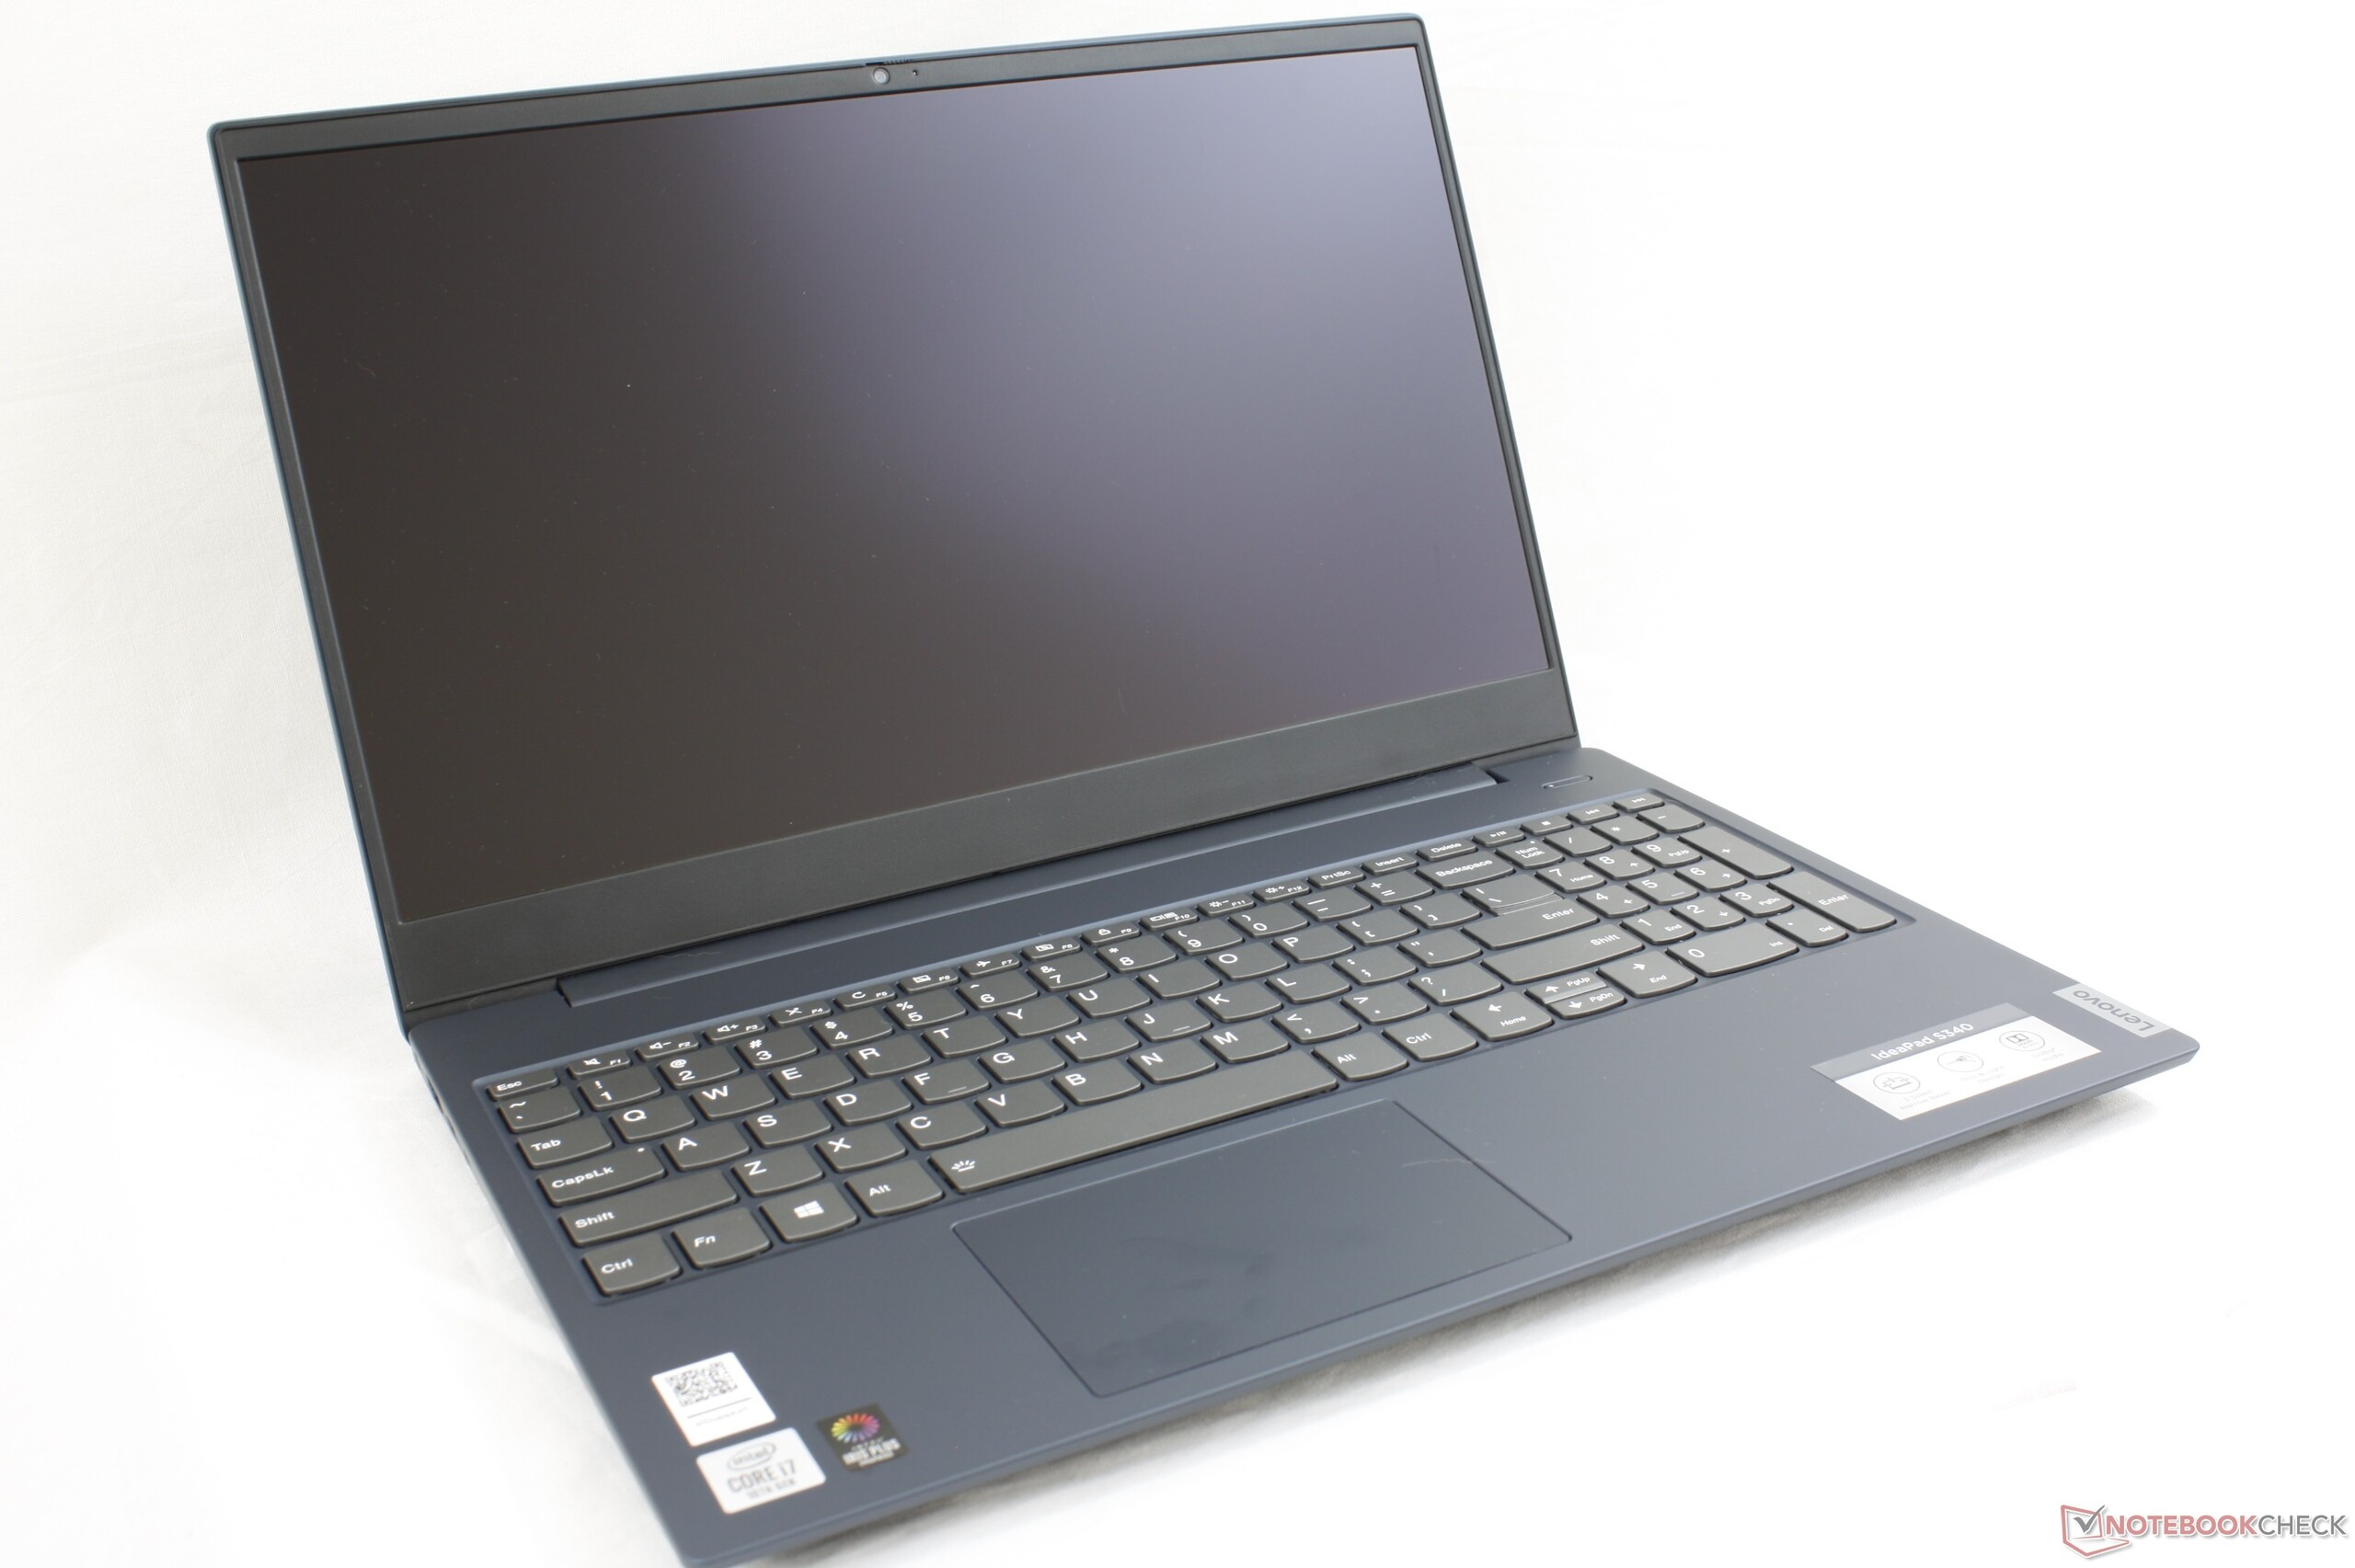
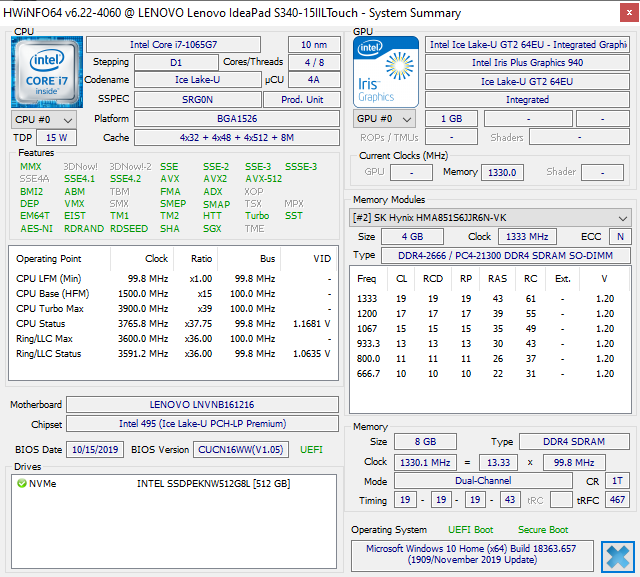
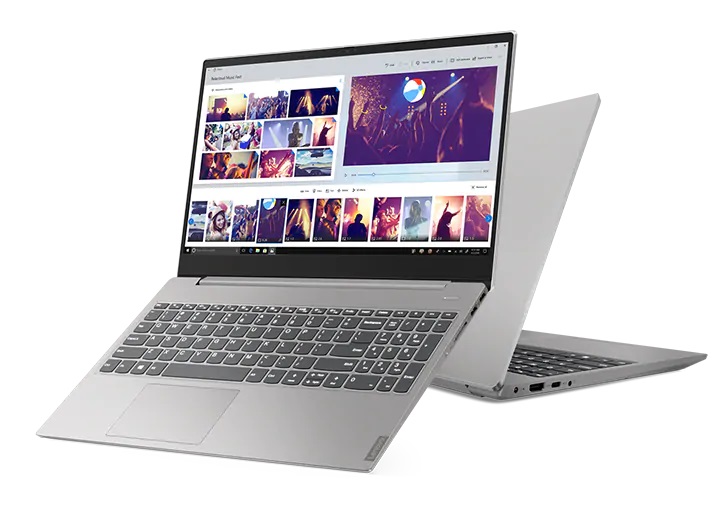
Test du Lenovo IdeaPad S340-15 (i7-1065G7, Iris Plus G7, FHD, 60 Hz) : i7 Ice Lake à petit prix et bridé
Note | Date | Modèle | Poids | Épaisseur | Taille | Résolution | Prix |
|---|---|---|---|---|---|---|---|
| 79.4 % v7 (old) | 03/20 | Lenovo Ideapad S340-15IIL i7-1065G7, Iris Plus Graphics G7 (Ice Lake 64 EU) | 1.8 kg | 17.9 mm | 15.60" | 1920x1080 | |
| 86.3 % v7 (old) | 09/19 | Dell XPS 15 7590 i5 iGPU FHD i5-9300H, UHD Graphics 630 | 1.9 kg | 17 mm | 15.60" | 1920x1080 | |
| 83 % v6 (old) | 04/19 | HP Pavilion 15-cs2019ng i5-8265U, GeForce MX250 | 1.9 kg | 18 mm | 15.60" | 1920x1080 | |
| 80.7 % v6 (old) | 05/18 | Asus VivoBook 15 X542UF-DM143T i5-8250U, GeForce MX130 | 2.3 kg | 23 mm | 15.60" | 1920x1080 | |
| 84.1 % v6 (old) | 06/19 | Lenovo Yoga 530-14ARR-81H9000VGE R7 2700U, Vega 10 | 1.7 kg | 17.6 mm | 14.00" | 1920x1080 |
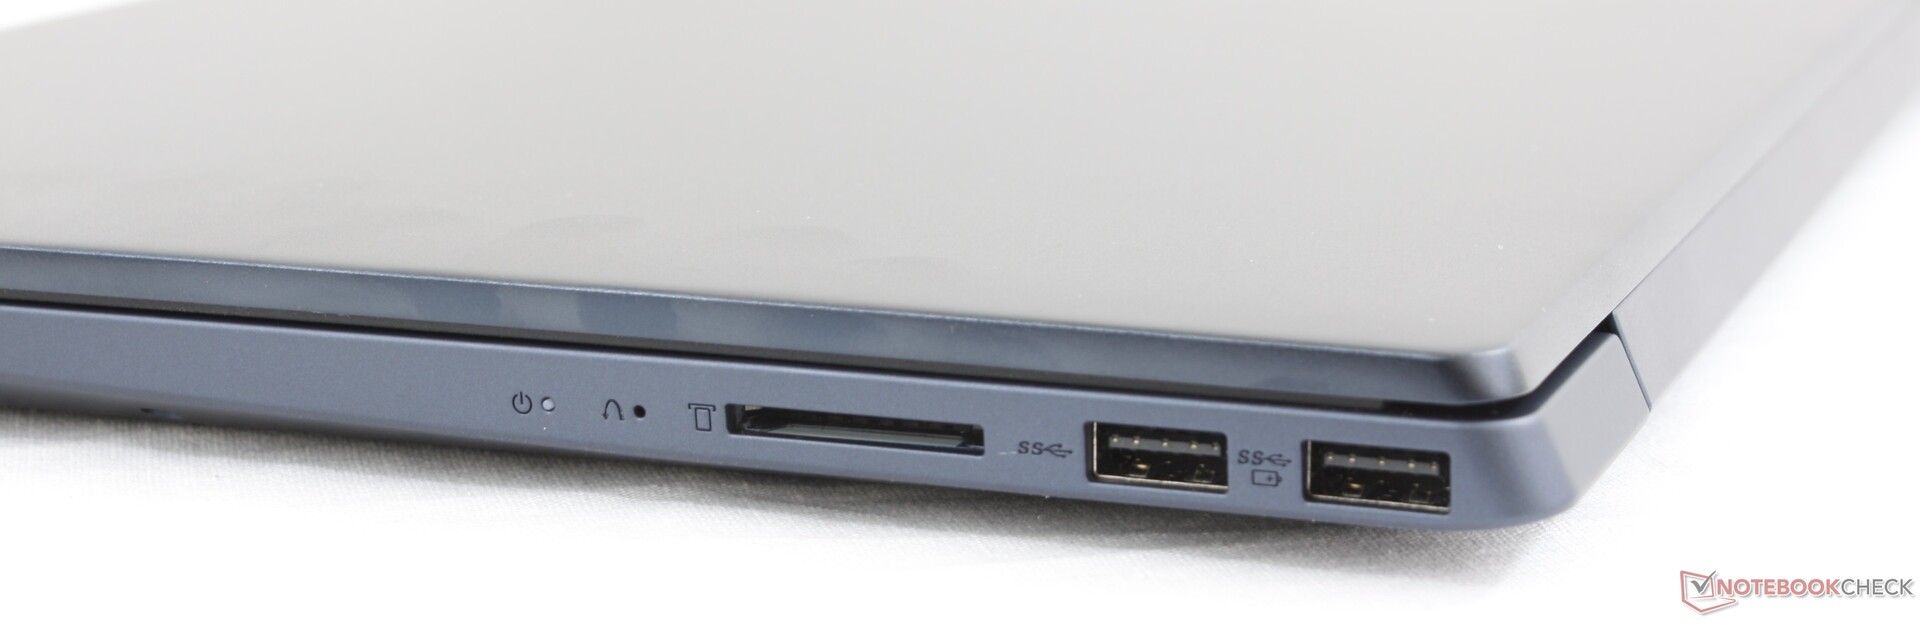
| SD Card Reader | |
| average JPG Copy Test (av. of 3 runs) | |
| Dell XPS 15 7590 i5 iGPU FHD (Toshiba Exceria Pro SDXC 64 GB UHS-II) | |
| Lenovo Ideapad S540-15IML (Toshiba Exceria Pro SDXC 64 GB UHS-II) | |
| Lenovo Ideapad S340-15IIL (Toshiba Exceria Pro SDXC 64 GB UHS-II) | |
| Dell Inspiron 15 5000 5585 (Toshiba Exceria Pro SDXC 64 GB UHS-II) | |
| maximum AS SSD Seq Read Test (1GB) | |
| Dell XPS 15 7590 i5 iGPU FHD (Toshiba Exceria Pro SDXC 64 GB UHS-II) | |
| Lenovo Ideapad S340-15IIL (Toshiba Exceria Pro SDXC 64 GB UHS-II) | |
| Lenovo Ideapad S540-15IML (Toshiba Exceria Pro SDXC 64 GB UHS-II) | |
| Dell Inspiron 15 5000 5585 (Toshiba Exceria Pro SDXC 64 GB UHS-II) | |
| Networking | |
| iperf3 transmit AX12 | |
| Lenovo ThinkPad T490 20RY0002US | |
| Lenovo Yoga C740-14IML | |
| Lenovo Ideapad S340-15IIL | |
| Alienware m17 R2 P41E | |
| iperf3 receive AX12 | |
| Lenovo ThinkPad T490 20RY0002US | |
| Lenovo Ideapad S340-15IIL | |
| Lenovo Yoga C740-14IML | |
| Alienware m17 R2 P41E | |

| |||||||||||||||||||||||||
Homogénéité de la luminosité: 87 %
Valeur mesurée au centre, sur batterie: 320.8 cd/m²
Contraste: 1188:1 (Valeurs des noirs: 0.27 cd/m²)
ΔE ColorChecker Calman: 7.68 | ∀{0.5-29.43 Ø4.71}
calibrated: 4.65
ΔE Greyscale Calman: 7.3 | ∀{0.09-98 Ø4.96}
58.3% sRGB (Argyll 1.6.3 3D)
37.8% AdobeRGB 1998 (Argyll 1.6.3 3D)
41.77% AdobeRGB 1998 (Argyll 3D)
58.8% sRGB (Argyll 3D)
40.43% Display P3 (Argyll 3D)
Gamma: 2.12
CCT: 6213 K
| Lenovo Ideapad S340-15IIL BOE CQ NV156FHM-T03, IPS, 15.6", 1920x1080 | Dell XPS 15 7590 i5 iGPU FHD LQ156M1, IPS, 15.6", 1920x1080 | Dell Inspiron 15 5000 5585 LG Philips 156WFC, IPS, 15.6", 1920x1080 | Lenovo Ideapad S540-15IML BOEhydis NV156FHM-N61 (BOE06FB), IPS, 15.6", 1920x1080 | HP Pavilion 15-cs2019ng BOE080D, IPS, 15.6", 1920x1080 | Asus VivoBook 15 X542UF-DM143T BOE CQ NT156FHM-N41, TN LED, 15.6", 1920x1080 | |
|---|---|---|---|---|---|---|
| Display | 65% | -7% | 54% | 57% | -6% | |
| Display P3 Coverage (%) | 40.43 | 66.5 64% | 37.31 -8% | 66.8 65% | 67.2 66% | 37.47 -7% |
| sRGB Coverage (%) | 58.8 | 98 67% | 56.2 -4% | 86.5 47% | 88.1 50% | 56.4 -4% |
| AdobeRGB 1998 Coverage (%) | 41.77 | 68.4 64% | 38.55 -8% | 63.2 51% | 64.4 54% | 38.71 -7% |
| Response Times | -3% | 31% | -3% | 13% | 29% | |
| Response Time Grey 50% / Grey 80% * (ms) | 46.4 ? | 52.8 ? -14% | 28.4 ? 39% | 49.6 ? -7% | 43 ? 7% | 41 ? 12% |
| Response Time Black / White * (ms) | 35.2 ? | 32 ? 9% | 27.2 ? 23% | 34.8 ? 1% | 29 ? 18% | 19 ? 46% |
| PWM Frequency (Hz) | 1020 ? | 202 ? | 208 ? | 7000 ? | ||
| Screen | 49% | 2% | 25% | 24% | 0% | |
| Brightness middle (cd/m²) | 320.8 | 588 83% | 253.6 -21% | 299 -7% | 320 0% | 230 -28% |
| Brightness (cd/m²) | 309 | 555 80% | 227 -27% | 278 -10% | 293 -5% | 221 -28% |
| Brightness Distribution (%) | 87 | 89 2% | 84 -3% | 87 0% | 86 -1% | 91 5% |
| Black Level * (cd/m²) | 0.27 | 0.4 -48% | 0.27 -0% | 0.25 7% | 0.26 4% | 0.45 -67% |
| Contrast (:1) | 1188 | 1470 24% | 939 -21% | 1196 1% | 1231 4% | 511 -57% |
| Colorchecker dE 2000 * | 7.68 | 2.5 67% | 6.05 21% | 4.32 44% | 4.5 41% | 3.6 53% |
| Colorchecker dE 2000 max. * | 21.97 | 6.3 71% | 14.03 36% | 9.3 58% | 8.81 60% | 5.59 75% |
| Colorchecker dE 2000 calibrated * | 4.65 | 0.6 87% | 4.97 -7% | 2.58 45% | ||
| Greyscale dE 2000 * | 7.3 | 4.5 38% | 3.2 56% | 4.21 42% | 4.71 35% | 3.13 57% |
| Gamma | 2.12 104% | 2.2 100% | 2 110% | 2.39 92% | 2.45 90% | 2.45 90% |
| CCT | 6213 105% | 6836 95% | 6820 95% | 6799 96% | 7085 92% | 7244 90% |
| Color Space (Percent of AdobeRGB 1998) (%) | 37.8 | 63.2 67% | 35.5 -6% | 57 51% | 58 53% | 36 -5% |
| Color Space (Percent of sRGB) (%) | 58.3 | 98 68% | 55.6 -5% | 86 48% | 88 51% | 56 -4% |
| Moyenne finale (programmes/paramètres) | 37% /
46% | 9% /
4% | 25% /
27% | 31% /
29% | 8% /
3% |
* ... Moindre est la valeur, meilleures sont les performances
Temps de réponse de l'écran
| ↔ Temps de réponse noir à blanc | ||
|---|---|---|
| 35.2 ms ... hausse ↗ et chute ↘ combinées | ↗ 20.4 ms hausse | 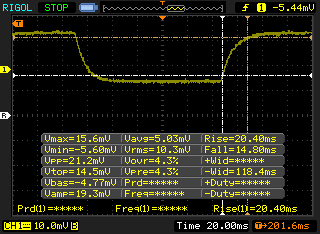 |
| ↘ 14.8 ms chute | ||
| L'écran souffre de latences très élevées, à éviter pour le jeu. En comparaison, tous les appareils testés affichent entre 0.1 (minimum) et 240 (maximum) ms. » 93 % des appareils testés affichent de meilleures performances. Cela signifie que les latences relevées sont moins bonnes que la moyenne (19.8 ms) de tous les appareils testés. | ||
| ↔ Temps de réponse gris 50% à gris 80% | ||
| 46.4 ms ... hausse ↗ et chute ↘ combinées | ↗ 26 ms hausse | 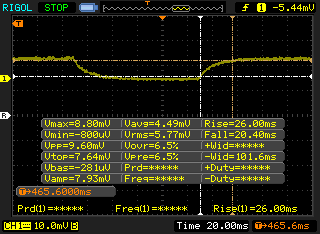 |
| ↘ 20.4 ms chute | ||
| L'écran souffre de latences très élevées, à éviter pour le jeu. En comparaison, tous les appareils testés affichent entre 0.165 (minimum) et 636 (maximum) ms. » 80 % des appareils testés affichent de meilleures performances. Cela signifie que les latences relevées sont moins bonnes que la moyenne (30.9 ms) de tous les appareils testés. | ||
Scintillement / MLI (Modulation de largeur d'impulsion)
| Scintillement / MLI (Modulation de largeur d'impulsion) non décelé |  | ||
En comparaison, 52 % des appareils testés n'emploient pas MDI pour assombrir leur écran. Nous avons relevé une moyenne à 7744 (minimum : 5 - maximum : 343500) Hz dans le cas où une MDI était active. | |||
| wPrime 2.10 - 1024m | |
| Moyenne Intel Core i7-1065G7 (233 - 354, n=3) | |
| Microsoft Surface Laptop 3 13 Core i5-1035G7 | |
* ... Moindre est la valeur, meilleures sont les performances
| PCMark 8 | |
| Home Score Accelerated v2 | |
| Dell XPS 15 7590 i5 iGPU FHD | |
| Asus VivoBook 15 X512FL-EJ205T | |
| Lenovo Ideapad S340-15IIL | |
| Moyenne Intel Core i7-1065G7, Intel Iris Plus Graphics G7 (Ice Lake 64 EU) (3305 - 4275, n=17) | |
| Dell Inspiron 15 5000 5585 | |
| HP Pavilion 15-cw1212ng | |
| Work Score Accelerated v2 | |
| Lenovo Ideapad S340-15IIL | |
| Dell XPS 15 7590 i5 iGPU FHD | |
| Asus VivoBook 15 X512FL-EJ205T | |
| HP Pavilion 15-cw1212ng | |
| Dell Inspiron 15 5000 5585 | |
| Moyenne Intel Core i7-1065G7, Intel Iris Plus Graphics G7 (Ice Lake 64 EU) (2460 - 5291, n=17) | |
| PCMark 8 Home Score Accelerated v2 | 3791 points | |
| PCMark 8 Work Score Accelerated v2 | 5291 points | |
| PCMark 10 Score | 4679 points | |
Aide | ||
| Lenovo Ideapad S340-15IIL Intel SSD 660p SSDPEKNW512G8 | Dell XPS 15 7590 i5 iGPU FHD Toshiba XG6 KXG60ZNV512G | Dell Inspiron 15 5000 5585 WDC PC SN520 SDAPNUW-512G | Asus VivoBook 15 X512FL-EJ205T Kingston RBUSNS8154P3512GJ | Lenovo Ideapad S540-15IML Samsung SSD PM981a MZVLB512HBJQ | |
|---|---|---|---|---|---|
| AS SSD | 71% | 9% | -31% | 128% | |
| Seq Read (MB/s) | 1447 | 2357 63% | 398.9 -72% | 1348 -7% | 2642 83% |
| Seq Write (MB/s) | 926 | 1235 33% | 884 -5% | 685 -26% | 2433 163% |
| 4K Read (MB/s) | 40.06 | 43.29 8% | 34.54 -14% | 29.15 -27% | 58 45% |
| 4K Write (MB/s) | 97.9 | 99.7 2% | 82.1 -16% | 90.3 -8% | 145.3 48% |
| 4K-64 Read (MB/s) | 323.7 | 1020 215% | 647 100% | 650 101% | 1431 342% |
| 4K-64 Write (MB/s) | 791 | 1502 90% | 985 25% | 514 -35% | 1753 122% |
| Access Time Read * (ms) | 0.06 | 0.07 -17% | 0.072 -20% | 0.31 -417% | 0.072 -20% |
| Access Time Write * (ms) | 0.144 | 0.039 73% | 0.047 67% | 0.044 69% | 0.027 81% |
| Score Read (Points) | 508 | 1299 156% | 721 42% | 814 60% | 1753 245% |
| Score Write (Points) | 982 | 1726 76% | 1155 18% | 673 -31% | 2142 118% |
| Score Total (Points) | 1738 | 3640 109% | 2279 31% | 1876 8% | 4790 176% |
| Copy ISO MB/s (MB/s) | 943 | 2145 127% | 862 -9% | 763 -19% | |
| Copy Program MB/s (MB/s) | 612 | 565 -8% | 457 -25% | 350.3 -43% | |
| Copy Game MB/s (MB/s) | 826 | 1320 60% | 902 9% | 310 -62% | |
| CrystalDiskMark 5.2 / 6 | 35% | -24% | -34% | 44% | |
| Write 4K (MB/s) | 130.8 | 93.6 -28% | 105.9 -19% | 63.6 -51% | 170.7 31% |
| Read 4K (MB/s) | 54.8 | 41.87 -24% | 36.56 -33% | 28.58 -48% | 49.51 -10% |
| Write Seq (MB/s) | 978 | 1698 74% | 1165 19% | 688 -30% | 1156 18% |
| Read Seq (MB/s) | 1627 | 1978 22% | 423.2 -74% | 1032 -37% | 1136 -30% |
| Write 4K Q32T1 (MB/s) | 450.1 | 383.1 -15% | 332.1 -26% | 266.7 -41% | 420.5 -7% |
| Read 4K Q32T1 (MB/s) | 345.9 | 326.9 -5% | 229.3 -34% | 321.5 -7% | 527 52% |
| Write Seq Q32T1 (MB/s) | 982 | 2778 183% | 1460 49% | 606 -38% | 2984 204% |
| Read Seq Q32T1 (MB/s) | 1842 | 3119 69% | 472.5 -74% | 1508 -18% | 3550 93% |
| Write 4K Q8T8 (MB/s) | 410.8 | ||||
| Read 4K Q8T8 (MB/s) | 331.4 | ||||
| Moyenne finale (programmes/paramètres) | 53% /
57% | -8% /
-3% | -33% /
-32% | 86% /
92% |
* ... Moindre est la valeur, meilleures sont les performances

| 3DMark 11 Performance | 3762 points | |
| 3DMark Ice Storm Standard Score | 65852 points | |
| 3DMark Cloud Gate Standard Score | 9962 points | |
| 3DMark Fire Strike Score | 2171 points | |
| 3DMark Time Spy Score | 701 points | |
Aide | ||
| The Witcher 3 - 1024x768 Low Graphics & Postprocessing | |
| Huawei MateBook 13 i7 | |
| MSI Modern 15 A10RB | |
| Dell Inspiron 15 5000 5585 | |
| Microsoft Surface Laptop 3 13 Core i5-1035G7 | |
| Moyenne Intel Iris Plus Graphics G7 (Ice Lake 64 EU) (28.2 - 58, n=20) | |
| Lenovo Ideapad S340-15IIL | |
| Bas | Moyen | Élevé | Ultra | |
|---|---|---|---|---|
| BioShock Infinite (2013) | 81.9 | 48.9 | 39.9 | 13.5 |
| The Witcher 3 (2015) | 29.9 | 20.8 | 10.9 | 5.9 |
| Rocket League (2017) | 45.5 | 30 | 21.1 | |
| Shadow of the Tomb Raider (2018) | 19 |
| Lenovo Ideapad S340-15IIL Iris Plus Graphics G7 (Ice Lake 64 EU), i7-1065G7, Intel SSD 660p SSDPEKNW512G8 | Dell XPS 15 7590 i5 iGPU FHD UHD Graphics 630, i5-9300H, Toshiba XG6 KXG60ZNV512G | Dell Inspiron 15 5000 5585 Vega 10, R7 3700U, WDC PC SN520 SDAPNUW-512G | Lenovo Ideapad S540-15IML GeForce MX250, i5-10210U, Samsung SSD PM981a MZVLB512HBJQ | HP Pavilion 15-cs2019ng GeForce MX250, i5-8265U, Toshiba KBG30ZMV256G | Asus VivoBook 15 X542UF-DM143T GeForce MX130, i5-8250U, Micron 1100 MTFDDAV256TBN | |
|---|---|---|---|---|---|---|
| Noise | -4% | -3% | -18% | -17% | -11% | |
| arrêt / environnement * (dB) | 28.5 | 29.3 -3% | 28.3 1% | 30 -5% | 30.5 -7% | 30 -5% |
| Idle Minimum * (dB) | 28.5 | 29.3 -3% | 28.3 1% | 30 -5% | 31.5 -11% | 30.9 -8% |
| Idle Average * (dB) | 28.5 | 29.3 -3% | 28.3 1% | 32 -12% | 31.5 -11% | 30.9 -8% |
| Idle Maximum * (dB) | 28.5 | 29.8 -5% | 28.3 1% | 37 -30% | 31.5 -11% | 30.9 -8% |
| Load Average * (dB) | 30.3 | 32.4 -7% | 31.4 -4% | 41 -35% | 42.5 -40% | 39 -29% |
| Load Maximum * (dB) | 35.5 | 37.2 -5% | 41.4 -17% | 42 -18% | 42.5 -20% | 38 -7% |
| Witcher 3 ultra * (dB) | 41.4 | 39 |
* ... Moindre est la valeur, meilleures sont les performances
Degré de la nuisance sonore
| Au repos |
| 28.5 / 28.5 / 28.5 dB(A) |
| Fortement sollicité |
| 30.3 / 35.5 dB(A) |
 | ||
30 dB silencieux 40 dB(A) audible 50 dB(A) bruyant |
||
min: | ||
(+) La température maximale du côté supérieur est de 35 °C / 95 F, par rapport à la moyenne de 36.8 °C / 98 F, allant de 21 à 71 °C pour la classe Multimedia.
(±) Le fond chauffe jusqu'à un maximum de 44 °C / 111 F, contre une moyenne de 39.1 °C / 102 F
(+) En utilisation inactive, la température moyenne du côté supérieur est de 24.3 °C / 76 F, par rapport à la moyenne du dispositif de 31.3 °C / 88 F.
(+) Les repose-poignets et le pavé tactile sont plus froids que la température de la peau avec un maximum de 25 °C / 77 F et sont donc froids au toucher.
(+) La température moyenne de la zone de l'appui-paume de dispositifs similaires était de 28.7 °C / 83.7 F (+3.7 °C / #6.7 F).
Lenovo Ideapad S340-15IIL analyse audio
(+) | les haut-parleurs peuvent jouer relativement fort (83.4# dB)
Basses 100 - 315 Hz
(-) | presque aucune basse - en moyenne 21.2% plus bas que la médiane
(±) | la linéarité des basses est moyenne (11.4% delta à la fréquence précédente)
Médiums 400 - 2000 Hz
(+) | médiane équilibrée - seulement 4.8% de la médiane
(±) | la linéarité des médiums est moyenne (7% delta à la fréquence précédente)
Aiguës 2 - 16 kHz
(+) | des sommets équilibrés - à seulement 2.5% de la médiane
(+) | les aigus sont linéaires (4% delta à la fréquence précédente)
Globalement 100 - 16 000 Hz
(±) | la linéarité du son global est moyenne (22% de différence avec la médiane)
Par rapport à la même classe
» 78% de tous les appareils testés de cette catégorie étaient meilleurs, 4% similaires, 17% pires
» Le meilleur avait un delta de 5%, la moyenne était de 17%, le pire était de 45%.
Par rapport à tous les appareils testés
» 64% de tous les appareils testés étaient meilleurs, 6% similaires, 30% pires
» Le meilleur avait un delta de 4%, la moyenne était de 23%, le pire était de 134%.
Apple MacBook 12 (Early 2016) 1.1 GHz analyse audio
(+) | les haut-parleurs peuvent jouer relativement fort (83.6# dB)
Basses 100 - 315 Hz
(±) | basse réduite - en moyenne 11.3% inférieure à la médiane
(±) | la linéarité des basses est moyenne (14.2% delta à la fréquence précédente)
Médiums 400 - 2000 Hz
(+) | médiane équilibrée - seulement 2.4% de la médiane
(+) | les médiums sont linéaires (5.5% delta à la fréquence précédente)
Aiguës 2 - 16 kHz
(+) | des sommets équilibrés - à seulement 2% de la médiane
(+) | les aigus sont linéaires (4.5% delta à la fréquence précédente)
Globalement 100 - 16 000 Hz
(+) | le son global est linéaire (10.2% différence à la médiane)
Par rapport à la même classe
» 7% de tous les appareils testés de cette catégorie étaient meilleurs, 2% similaires, 90% pires
» Le meilleur avait un delta de 5%, la moyenne était de 18%, le pire était de 53%.
Par rapport à tous les appareils testés
» 5% de tous les appareils testés étaient meilleurs, 1% similaires, 94% pires
» Le meilleur avait un delta de 4%, la moyenne était de 23%, le pire était de 134%.
| Éteint/en veille | |
| Au repos | |
| Fortement sollicité |
|
Légende:
min: | |
| Lenovo Ideapad S340-15IIL i7-1065G7, Iris Plus Graphics G7 (Ice Lake 64 EU), Intel SSD 660p SSDPEKNW512G8, IPS, 1920x1080, 15.6" | Dell XPS 15 7590 i5 iGPU FHD i5-9300H, UHD Graphics 630, Toshiba XG6 KXG60ZNV512G, IPS, 1920x1080, 15.6" | Dell Inspiron 15 5000 5585 R7 3700U, Vega 10, WDC PC SN520 SDAPNUW-512G, IPS, 1920x1080, 15.6" | Lenovo Ideapad S540-15IML i5-10210U, GeForce MX250, Samsung SSD PM981a MZVLB512HBJQ, IPS, 1920x1080, 15.6" | HP Pavilion 15-cs2019ng i5-8265U, GeForce MX250, Toshiba KBG30ZMV256G, IPS, 1920x1080, 15.6" | Asus VivoBook 15 X542UF-DM143T i5-8250U, GeForce MX130, Micron 1100 MTFDDAV256TBN, TN LED, 1920x1080, 15.6" | |
|---|---|---|---|---|---|---|
| Power Consumption | -38% | 5% | -27% | -19% | -15% | |
| Idle Minimum * (Watt) | 3.8 | 3.79 -0% | 4.2 -11% | 5 -32% | 4.9 -29% | 4.75 -25% |
| Idle Average * (Watt) | 6.9 | 6.9 -0% | 6.8 1% | 7 -1% | 7.9 -14% | 6.9 -0% |
| Idle Maximum * (Watt) | 7.7 | 9.2 -19% | 7 9% | 10 -30% | 10.1 -31% | 7 9% |
| Load Average * (Watt) | 43.3 | 62 -43% | 36.5 16% | 64 -48% | 60 -39% | 53 -22% |
| Witcher 3 ultra * (Watt) | 40.4 | 37.9 6% | 44 -9% | |||
| Load Maximum * (Watt) | 47.5 | 108 -127% | 44 7% | 67 -41% | 38 20% | 65.3 -37% |
* ... Moindre est la valeur, meilleures sont les performances
| Lenovo Ideapad S340-15IIL i7-1065G7, Iris Plus Graphics G7 (Ice Lake 64 EU), 36 Wh | Dell XPS 15 7590 i5 iGPU FHD i5-9300H, UHD Graphics 630, 97 Wh | Dell Inspiron 15 5000 5585 R7 3700U, Vega 10, 42 Wh | Lenovo Ideapad S540-15IML i5-10210U, GeForce MX250, 70 Wh | HP Pavilion 15-cs2019ng i5-8265U, GeForce MX250, 41 Wh | Asus VivoBook 15 X542UF-DM143T i5-8250U, GeForce MX130, 38 Wh | |
|---|---|---|---|---|---|---|
| Autonomie de la batterie | 142% | 44% | 137% | 5% | 58% | |
| Reader / Idle (h) | 10 | 14.3 43% | 30.2 202% | 8 -20% | ||
| WiFi v1.3 (h) | 4.3 | 14.1 228% | 7 63% | 12.1 181% | 5 16% | 6.8 58% |
| Load (h) | 1.1 | 1.7 55% | 1.4 27% | 1.4 27% | 1.3 18% |
Points positifs
Points négatifs
Il y a quelques semaines, nous avons affirmé que le Lenovo IdeaPad S340-15 était l’un des PC portables les moins chers avec un processeur de 10e et dernière génération d’Intel Core i7-1065G7. C’est le même processeur que sur les alternatives plus chères comme le Dell XPS 13 2-en-1 ou le Razer Blade Stealth, qui peuvent coûter le double du prix de notre Lenovo. Si cela semble réussi sur le papier, la réalité est que l’IdeaPad S340-15 possède des performances inférieures à la moyenne, et en particulier aux modèles cités précédemment, surtout dans les jeux ou dans les tâches exigeantes. Si vous voulez le meilleur de ce que peut proposer Ice Lake, il va falloir regarder au-delà de la série IdeaPad.
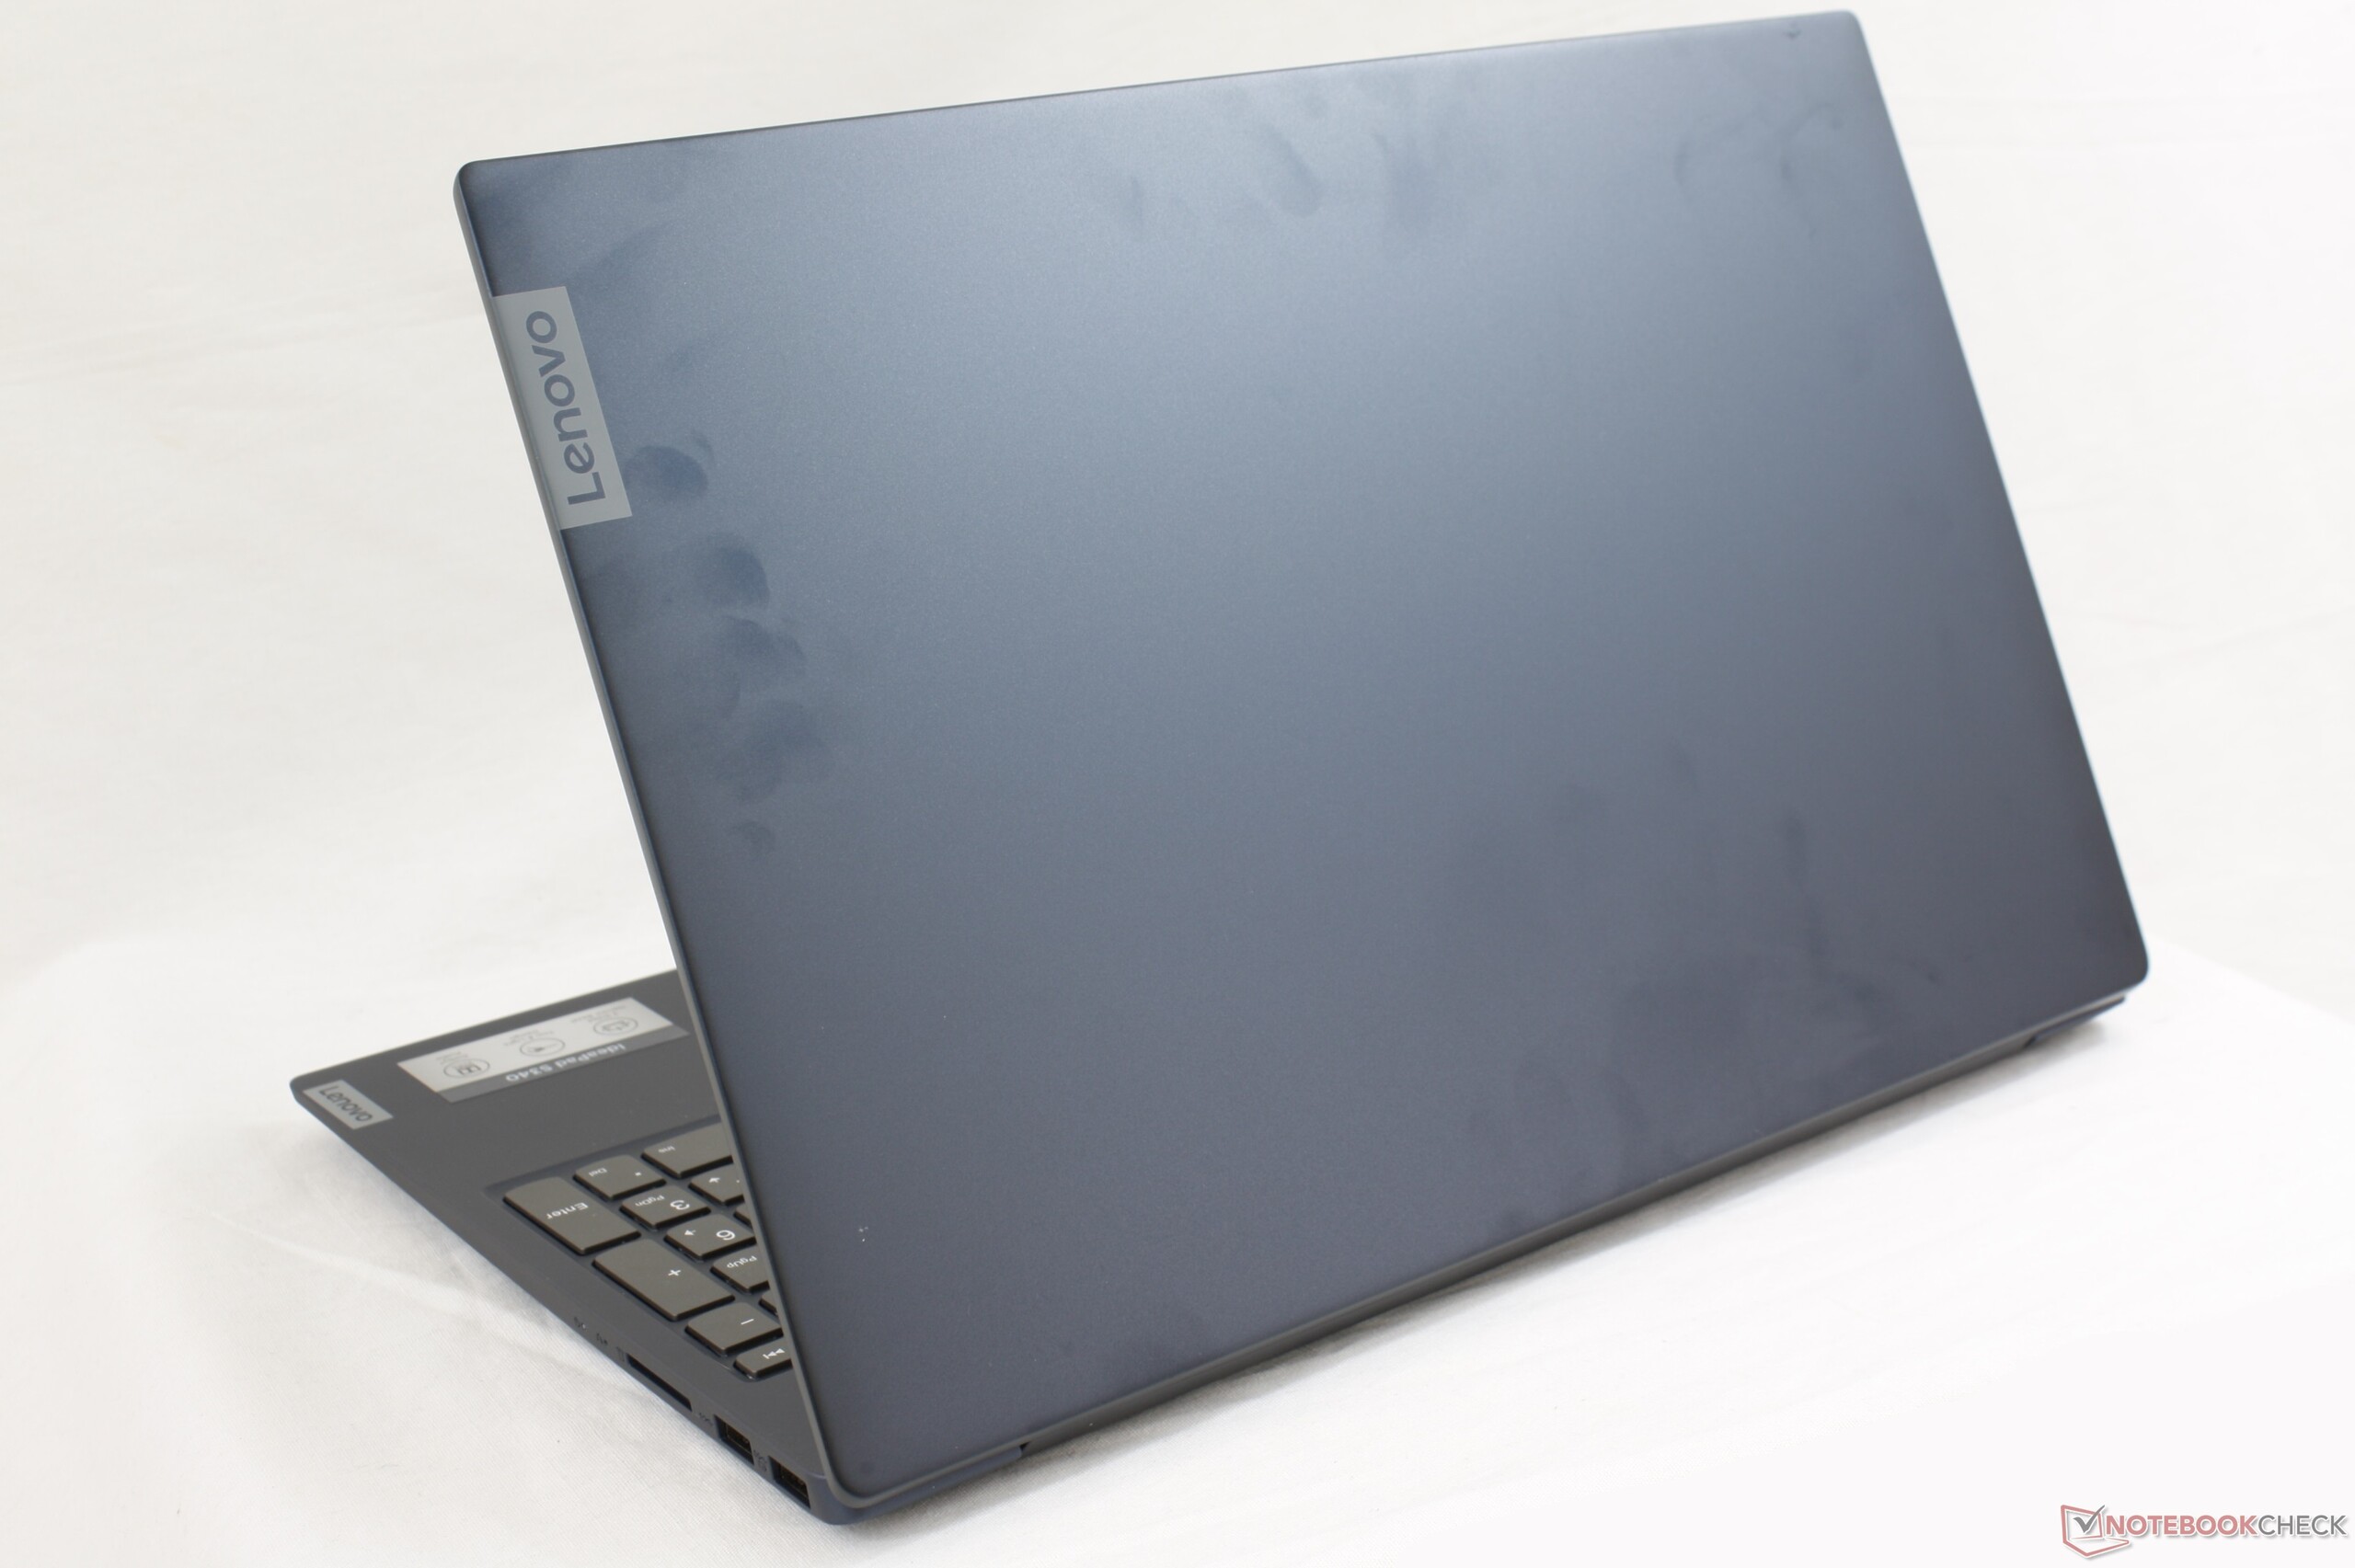
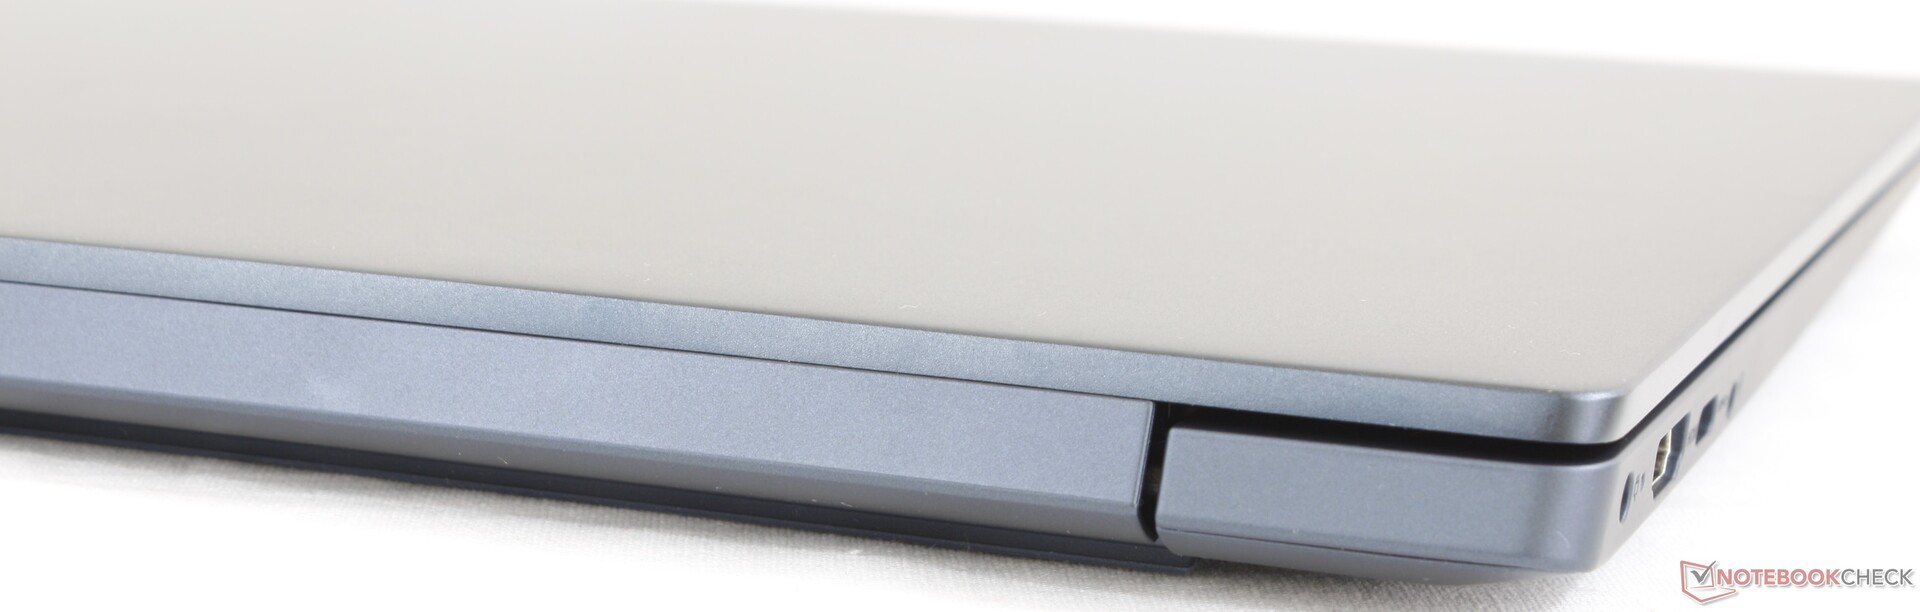
Le portable en lui-même est cependant plus moderne et plus réussi visuellement que les séries Dell Inspiron, Asus VivoBook ou HP Pavilion concurrentes. L’écran tactile matte et les deux emplacements de stockage accessibles sont de belles surprises, ces fonctionnalités étant peu communes sur les portables à petit prix. Cela mis à part, tout le reste est moyen, voire médiocre. La couverture colorimétrique réduite, la mollesse des touches et l’autonomie médiocre sont habituelles dans ce niveau de prix. Nous recommandons d’opter pour le Core i5 moins cher ou pour les versions Core i7 Whiskey Lake U, la version Ice Lake ayant très peu d’avantages pour l’IdeaPad S340.
Le Lenovo IdeaPad S340-15 est adapté à un usage multimédia à la maison et à des déplacements occasionnels grâce à son poids réduit. Mais ne vous attendez pas à de bonnes performances du Core i7 lors de sollicitations plus élevées comme le jeu.
L’intégralité de cette critique est disponible en anglais en suivant ce lien.
Lenovo Ideapad S340-15IIL
- 03/14/2020 v7 (old)
Allen Ngo
Price comparison
