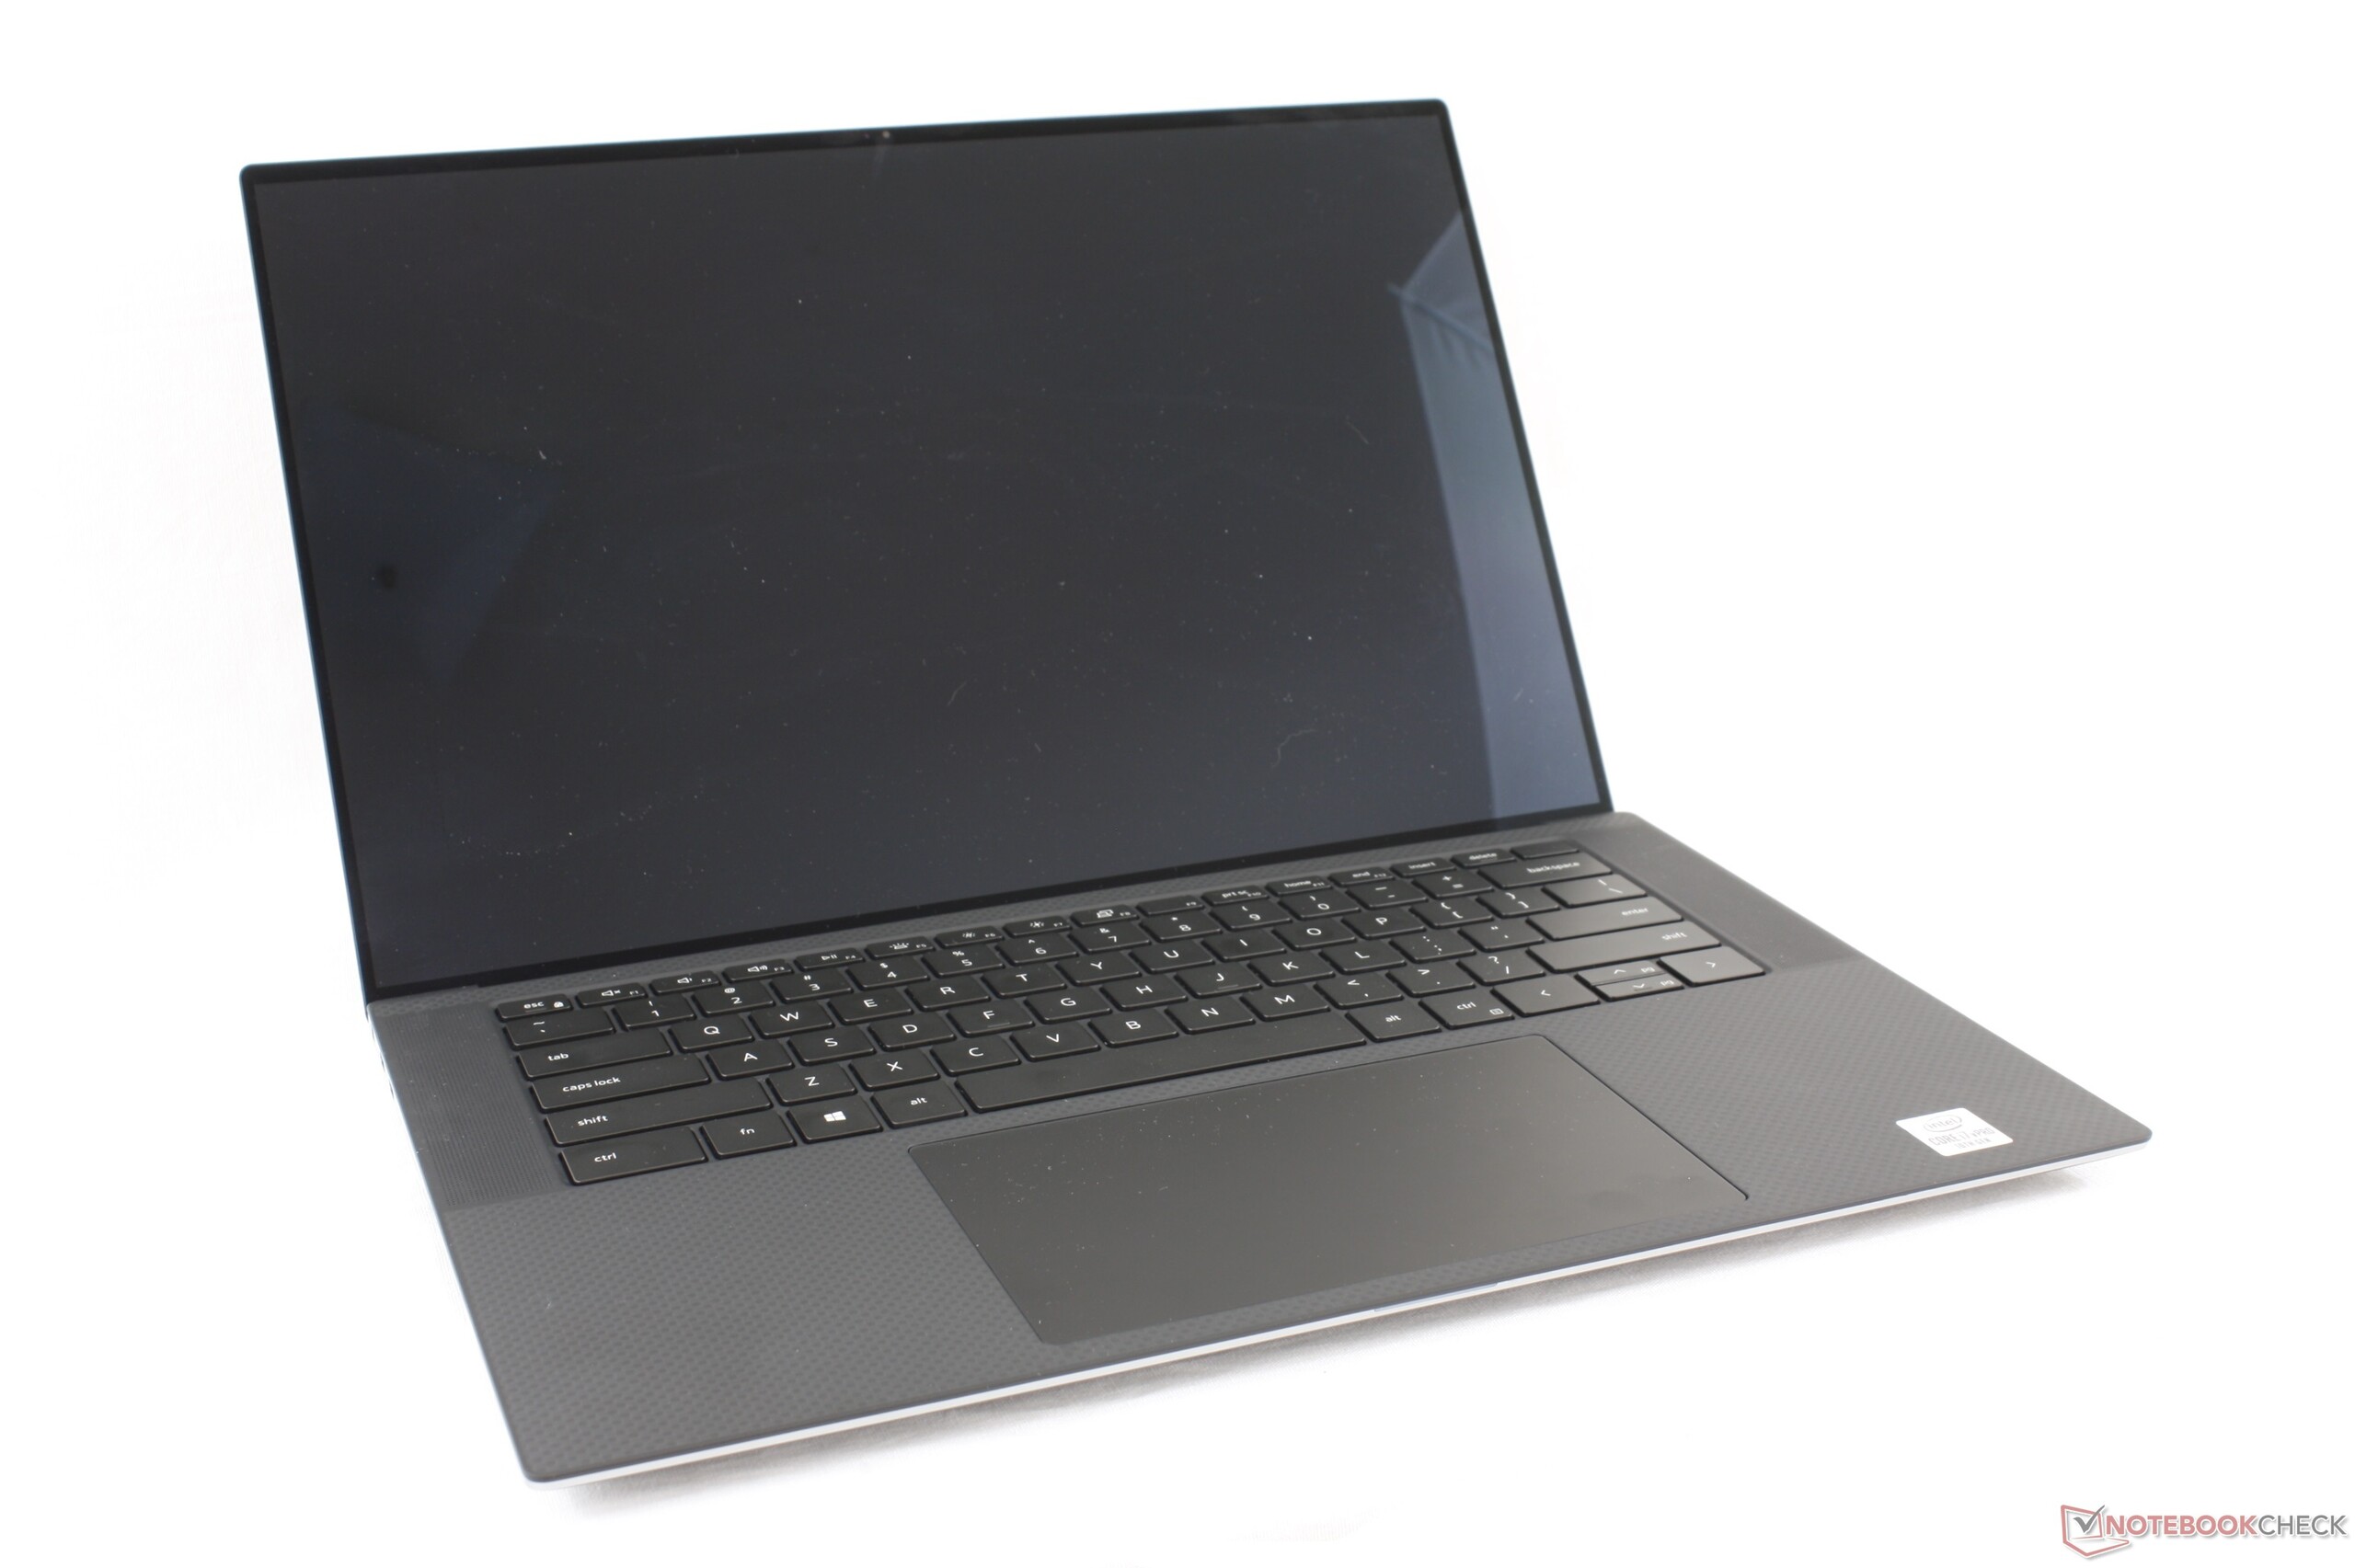
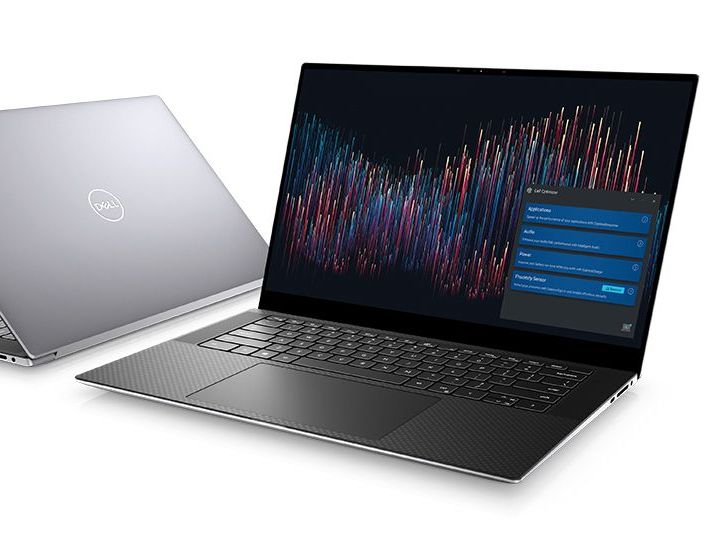
Test du Dell Precision 5550 (i7-10875H, T2000 Max-Q, UHD+) : la station de travail XPS 15 pour les pros
Note | Date | Modèle | Poids | Épaisseur | Taille | Résolution | Prix |
|---|---|---|---|---|---|---|---|
| 86.3 % v7 (old) | 09/20 | Dell Precision 5550 P91F i7-10875H, Quadro T2000 Max-Q | 2 kg | 18 mm | 15.60" | 3840x2400 | |
| 86.9 % v7 (old) | 11/19 | Dell Precision 5540 i9-9980HK, Quadro T2000 Max-Q | 2 kg | 17 mm | 15.60" | 3840x2160 | |
| 87 % v7 (old) | 09/20 | Razer Blade 15 Studio Edition 2020 i7-10875H, Quadro RTX 5000 Max-Q | 2.2 kg | 13.98 mm | 15.60" | 3840x2160 | |
| 82.1 % v7 (old) | 07/20 | Acer ConceptD 3 Pro CN315-71P-73W1 i7-9750H, Quadro T1000 (Laptop) | 2.4 kg | 23.4 mm | 15.60" | 1920x1080 | |
| 89.8 % v7 (old) | 11/19 | Lenovo ThinkPad P53-20QN000YGE i7-9850H, Quadro RTX 5000 Max-Q | 2.7 kg | 29.4 mm | 15.60" | 1920x1080 | |
| 76 % v7 (old) | 10/19 | MSI WP65 i7-9750H, Quadro P620 | 1.9 kg | 21.7 mm | 15.60" | 1920x1080 |
| SD Card Reader - average JPG Copy Test (av. of 3 runs) | |
| Dell Precision 5550 P91F (Toshiba Exceria Pro SDXC 64 GB UHS-II) | |
| Lenovo ThinkPad P53-20QN000YGE (Toshiba Exceria Pro SDXC 64 GB UHS-II) | |
| Dell Precision 5540 (Toshiba Exceria Pro SDXC 64 GB UHS-II) | |
| Razer Blade 15 Studio Edition (Toshiba Exceria Pro SDXC 64 GB UHS-II) | |


| |||||||||||||||||||||||||
Homogénéité de la luminosité: 85 %
Valeur mesurée au centre, sur batterie: 469.8 cd/m²
Contraste: 1119:1 (Valeurs des noirs: 0.42 cd/m²)
ΔE ColorChecker Calman: 5.16 | ∀{0.5-29.43 Ø4.72}
calibrated: 3.75
ΔE Greyscale Calman: 5.5 | ∀{0.09-98 Ø4.97}
100% sRGB (Argyll 1.6.3 3D)
89.2% AdobeRGB 1998 (Argyll 1.6.3 3D)
99.9% AdobeRGB 1998 (Argyll 3D)
100% sRGB (Argyll 3D)
89.9% Display P3 (Argyll 3D)
Gamma: 2
CCT: 6198 K
| Dell Precision 5550 P91F Sharp LQ156R1, IPS, 15.6", 3840x2400 | Dell Precision 5540 SDCA029, OLED, 15.6", 3840x2160 | Razer Blade 15 Studio Edition 2020 Samsung SDCA029, OLED, 15.6", 3840x2160 | Acer ConceptD 3 Pro CN315-71P-73W1 Chi Mei N156HCE-EN2, IPS, 15.6", 1920x1080 | Lenovo ThinkPad P53-20QN000YGE N156HCE-GN1, IPS, 15.6", 1920x1080 | MSI WP65 AU Optronics B156HAN02.1, IPS, 15.6", 1920x1080 | |
|---|---|---|---|---|---|---|
| Display | 3% | 3% | -1% | -24% | -52% | |
| Display P3 Coverage (%) | 89.9 | 99.9 11% | 99.9 11% | 97.9 9% | 63.2 -30% | 39.46 -56% |
| sRGB Coverage (%) | 100 | 100 0% | 100 0% | 99.9 0% | 92.9 -7% | 58.8 -41% |
| AdobeRGB 1998 Coverage (%) | 99.9 | 97.3 -3% | 97.3 -3% | 87.2 -13% | 64.3 -36% | 40.69 -59% |
| Response Times | 93% | 90% | 32% | 22% | 19% | |
| Response Time Grey 50% / Grey 80% * (ms) | 46 ? | 2.8 ? 94% | 4 ? 91% | 33 ? 28% | 38.4 ? 17% | 37.6 ? 18% |
| Response Time Black / White * (ms) | 34 ? | 3.2 ? 91% | 4 ? 88% | 22 ? 35% | 25.2 ? 26% | 27.6 ? 19% |
| PWM Frequency (Hz) | 240.9 ? | 26040 ? | ||||
| Screen | 14% | 171% | 14% | 20% | -25% | |
| Brightness middle (cd/m²) | 469.8 | 427 -9% | 380 -19% | 343 -27% | 510 9% | 267.4 -43% |
| Brightness (cd/m²) | 464 | 411 -11% | 388 -16% | 309 -33% | 468 1% | 259 -44% |
| Brightness Distribution (%) | 85 | 89 5% | 93 9% | 85 0% | 89 5% | 86 1% |
| Black Level * (cd/m²) | 0.42 | 0.018 96% | 0.22 48% | 0.36 14% | 0.37 12% | |
| Contrast (:1) | 1119 | 21111 1787% | 1559 39% | 1417 27% | 723 -35% | |
| Colorchecker dE 2000 * | 5.16 | 3.2 38% | 5.47 -6% | 3.73 28% | 2.3 55% | 4.21 18% |
| Colorchecker dE 2000 max. * | 9.33 | 8.4 10% | 8.19 12% | 6.51 30% | 5.5 41% | 21.1 -126% |
| Colorchecker dE 2000 calibrated * | 3.75 | 2.8 25% | 3.04 19% | 1.43 62% | 1.2 68% | 4.27 -14% |
| Greyscale dE 2000 * | 5.5 | 1.8 67% | 5.3 4% | 4.24 23% | 3.2 42% | 2.3 58% |
| Gamma | 2 110% | 2.15 102% | 2.15 102% | 2.2 100% | 2.34 94% | 2.2 100% |
| CCT | 6198 105% | 6176 105% | 6128 106% | 6329 103% | 7036 92% | 6578 99% |
| Color Space (Percent of AdobeRGB 1998) (%) | 89.2 | 86.8 -3% | 86 -4% | 78 -13% | 59.4 -33% | 37.2 -58% |
| Color Space (Percent of sRGB) (%) | 100 | 100 0% | 100 0% | 100 0% | 93.1 -7% | 58.5 -41% |
| Moyenne finale (programmes/paramètres) | 37% /
23% | 88% /
129% | 15% /
14% | 6% /
12% | -19% /
-24% |
* ... Moindre est la valeur, meilleures sont les performances
Temps de réponse de l'écran
| ↔ Temps de réponse noir à blanc | ||
|---|---|---|
| 34 ms ... hausse ↗ et chute ↘ combinées | ↗ 17.6 ms hausse | 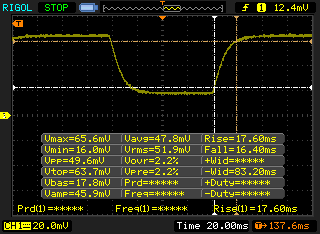 |
| ↘ 16.4 ms chute | ||
| L'écran souffre de latences très élevées, à éviter pour le jeu. En comparaison, tous les appareils testés affichent entre 0.1 (minimum) et 240 (maximum) ms. » 91 % des appareils testés affichent de meilleures performances. Cela signifie que les latences relevées sont moins bonnes que la moyenne (19.8 ms) de tous les appareils testés. | ||
| ↔ Temps de réponse gris 50% à gris 80% | ||
| 46 ms ... hausse ↗ et chute ↘ combinées | ↗ 24 ms hausse | 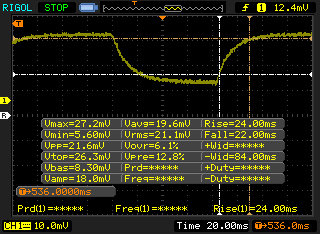 |
| ↘ 22 ms chute | ||
| L'écran souffre de latences très élevées, à éviter pour le jeu. En comparaison, tous les appareils testés affichent entre 0.165 (minimum) et 636 (maximum) ms. » 79 % des appareils testés affichent de meilleures performances. Cela signifie que les latences relevées sont moins bonnes que la moyenne (31 ms) de tous les appareils testés. | ||
Scintillement / MLI (Modulation de largeur d'impulsion)
| Scintillement / MLI (Modulation de largeur d'impulsion) non décelé | 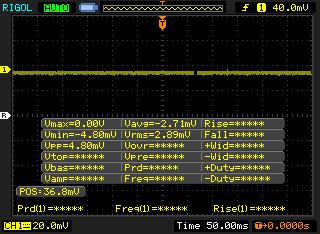 | ||
En comparaison, 52 % des appareils testés n'emploient pas MDI pour assombrir leur écran. Nous avons relevé une moyenne à 7769 (minimum : 5 - maximum : 343500) Hz dans le cas où une MDI était active. | |||
Cinebench R15: CPU Multi 64Bit | CPU Single 64Bit
Blender: v2.79 BMW27 CPU
7-Zip 18.03: 7z b 4 -mmt1 | 7z b 4
Geekbench 5.5: Single-Core | Multi-Core
HWBOT x265 Benchmark v2.2: 4k Preset
LibreOffice : 20 Documents To PDF
R Benchmark 2.5: Overall mean
| Cinebench R20 / CPU (Multi Core) | |
| Eluktronics RP-15 | |
| Asus ROG Zephyrus Duo 15 GX550LXS | |
| Moyenne Intel Core i7-10875H (1986 - 4176, n=32) | |
| Dell Precision 5550 P91F | |
| Apple MacBook Pro 15 2019 i9 Vega 16 | |
| MSI GS66 Stealth 10SE-045 | |
| Razer Blade 15 Studio Edition 2020 | |
| Schenker Work 15 | |
| Dell XPS 15 9500 Core i5 | |
| Razer Blade 15 Studio Edition | |
| Cinebench R20 / CPU (Single Core) | |
| Asus ROG Zephyrus Duo 15 GX550LXS | |
| Dell Precision 5550 P91F | |
| Eluktronics RP-15 | |
| Moyenne Intel Core i7-10875H (430 - 524, n=32) | |
| Razer Blade 15 Studio Edition 2020 | |
| Apple MacBook Pro 15 2019 i9 Vega 16 | |
| MSI GS66 Stealth 10SE-045 | |
| Dell XPS 15 9500 Core i5 | |
| Razer Blade 15 Studio Edition | |
| Schenker Work 15 | |
| Cinebench R15 / CPU Multi 64Bit | |
| Eluktronics RP-15 | |
| Asus ROG Zephyrus Duo 15 GX550LXS | |
| Moyenne Intel Core i7-10875H (1003 - 1833, n=38) | |
| Dell Precision 5550 P91F | |
| Dell Precision 5540 | |
| Apple MacBook Pro 15 2019 i9 Vega 16 | |
| Lenovo ThinkPad P53-20QN000YGE | |
| MSI GS66 Stealth 10SE-045 | |
| Razer Blade 15 Studio Edition 2020 | |
| Razer Blade 15 Studio Edition | |
| Schenker Work 15 | |
| Dell XPS 15 9500 Core i5 | |
| Cinebench R15 / CPU Single 64Bit | |
| Asus ROG Zephyrus Duo 15 GX550LXS | |
| Moyenne Intel Core i7-10875H (190 - 220, n=37) | |
| Dell Precision 5550 P91F | |
| Lenovo ThinkPad P53-20QN000YGE | |
| Dell Precision 5540 | |
| Razer Blade 15 Studio Edition 2020 | |
| Eluktronics RP-15 | |
| MSI GS66 Stealth 10SE-045 | |
| Dell XPS 15 9500 Core i5 | |
| Apple MacBook Pro 15 2019 i9 Vega 16 | |
| Razer Blade 15 Studio Edition | |
| Schenker Work 15 | |
| Blender / v2.79 BMW27 CPU | |
| Dell XPS 15 9500 Core i5 | |
| Schenker Work 15 | |
| Schenker Work 15 | |
| Lenovo ThinkPad P53-20QN000YGE | |
| MSI GS66 Stealth 10SE-045 | |
| Razer Blade 15 Studio Edition 2020 | |
| Apple MacBook Pro 15 2019 i9 Vega 16 | |
| Dell Precision 5550 P91F | |
| Dell Precision 5540 | |
| Moyenne Intel Core i7-10875H (259 - 535, n=30) | |
| Asus ROG Zephyrus Duo 15 GX550LXS | |
| Eluktronics RP-15 | |
| 7-Zip 18.03 / 7z b 4 -mmt1 | |
| Dell Precision 5550 P91F | |
| Asus ROG Zephyrus Duo 15 GX550LXS | |
| Moyenne Intel Core i7-10875H (5071 - 5780, n=31) | |
| Razer Blade 15 Studio Edition 2020 | |
| Dell Precision 5540 | |
| Lenovo ThinkPad P53-20QN000YGE | |
| Dell XPS 15 9500 Core i5 | |
| MSI GS66 Stealth 10SE-045 | |
| Eluktronics RP-15 | |
| Schenker Work 15 | |
| Schenker Work 15 | |
| 7-Zip 18.03 / 7z b 4 | |
| Eluktronics RP-15 | |
| Asus ROG Zephyrus Duo 15 GX550LXS | |
| Moyenne Intel Core i7-10875H (29844 - 49562, n=31) | |
| Dell Precision 5550 P91F | |
| Dell Precision 5540 | |
| Razer Blade 15 Studio Edition 2020 | |
| MSI GS66 Stealth 10SE-045 | |
| Lenovo ThinkPad P53-20QN000YGE | |
| Schenker Work 15 | |
| Schenker Work 15 | |
| Dell XPS 15 9500 Core i5 | |
| Geekbench 5.5 / Single-Core | |
| Asus ROG Zephyrus Duo 15 GX550LXS | |
| Dell Precision 5550 P91F | |
| Moyenne Intel Core i7-10875H (1233 - 1371, n=29) | |
| Razer Blade 15 Studio Edition 2020 | |
| Eluktronics RP-15 | |
| MSI GS66 Stealth 10SE-045 | |
| Dell XPS 15 9500 Core i5 | |
| Geekbench 5.5 / Multi-Core | |
| Eluktronics RP-15 | |
| Asus ROG Zephyrus Duo 15 GX550LXS | |
| Dell Precision 5550 P91F | |
| Moyenne Intel Core i7-10875H (5715 - 8620, n=29) | |
| Razer Blade 15 Studio Edition 2020 | |
| MSI GS66 Stealth 10SE-045 | |
| Dell XPS 15 9500 Core i5 | |
| HWBOT x265 Benchmark v2.2 / 4k Preset | |
| Eluktronics RP-15 | |
| Asus ROG Zephyrus Duo 15 GX550LXS | |
| Moyenne Intel Core i7-10875H (7.27 - 14.1, n=27) | |
| Dell Precision 5540 | |
| Dell Precision 5550 P91F | |
| Razer Blade 15 Studio Edition 2020 | |
| MSI GS66 Stealth 10SE-045 | |
| Lenovo ThinkPad P53-20QN000YGE | |
| Schenker Work 15 | |
| Schenker Work 15 | |
| Dell XPS 15 9500 Core i5 | |
| LibreOffice / 20 Documents To PDF | |
| Dell XPS 15 9500 Core i5 | |
| Eluktronics RP-15 | |
| MSI GS66 Stealth 10SE-045 | |
| Asus ROG Zephyrus Duo 15 GX550LXS | |
| Moyenne Intel Core i7-10875H (30.2 - 84.3, n=30) | |
| Razer Blade 15 Studio Edition 2020 | |
| Dell Precision 5550 P91F | |
| R Benchmark 2.5 / Overall mean | |
| Dell XPS 15 9500 Core i5 | |
| MSI GS66 Stealth 10SE-045 | |
| Dell Precision 5550 P91F | |
| Razer Blade 15 Studio Edition 2020 | |
| Asus ROG Zephyrus Duo 15 GX550LXS | |
| Moyenne Intel Core i7-10875H (0.546 - 0.662, n=29) | |
| Eluktronics RP-15 | |
* ... Moindre est la valeur, meilleures sont les performances
| PCMark 8 | |
| Home Score Accelerated v2 | |
| MSI WP65 | |
| Acer ConceptD 3 Pro CN315-71P-73W1 | |
| Dell Precision 5550 P91F | |
| Dell Precision 5540 | |
| Razer Blade 15 Studio Edition 2020 | |
| Work Score Accelerated v2 | |
| Acer ConceptD 3 Pro CN315-71P-73W1 | |
| MSI WP65 | |
| Razer Blade 15 Studio Edition 2020 | |
| Dell Precision 5540 | |
| Dell Precision 5550 P91F | |
| PCMark 8 Home Score Accelerated v2 | 3729 points | |
| PCMark 8 Work Score Accelerated v2 | 4515 points | |
| PCMark 10 Score | 5442 points | |
Aide | ||
| DPC Latencies / LatencyMon - interrupt to process latency (max), Web, Youtube, Prime95 | |
| Dell XPS 15 9500 Core i7 4K UHD | |
| Asus ROG Zephyrus Duo 15 GX550LXS | |
| Dell XPS 15 9500 Core i5 | |
| Acer ConceptD 3 Pro CN315-71P-73W1 | |
| Razer Blade 15 Studio Edition 2020 | |
| Eluktronics RP-15 | |
| Dell Precision 5550 P91F | |
* ... Moindre est la valeur, meilleures sont les performances
| Dell Precision 5550 P91F SK Hynix PC601A NVMe 1TB | Dell Precision 5540 SK hynix PC400 512 GB | Razer Blade 15 Studio Edition 2020 Samsung PM981a MZVLB1T0HBLR | Acer ConceptD 3 Pro CN315-71P-73W1 WDC PC SN720 SDAPNTW-512G | MSI WP65 Samsung SSD PM981 MZVLB512HAJQ | |
|---|---|---|---|---|---|
| AS SSD | -14% | 10% | 4% | 8% | |
| Seq Read (MB/s) | 2039 | 1743 -15% | 1982 -3% | 2973 46% | 1097 -46% |
| Seq Write (MB/s) | 1376 | 930 -32% | 2252 64% | 2429 77% | 1838 34% |
| 4K Read (MB/s) | 44.11 | 39.1 -11% | 47.13 7% | 24.7 -44% | 52.9 20% |
| 4K Write (MB/s) | 113.3 | 92.1 -19% | 88.2 -22% | 115.3 2% | 108.4 -4% |
| 4K-64 Read (MB/s) | 1094 | 956 -13% | 1481 35% | 1243 14% | 1509 38% |
| 4K-64 Write (MB/s) | 1630 | 863 -47% | 1842 13% | 835 -49% | 1695 4% |
| Access Time Read * (ms) | 0.059 | 0.074 -25% | 0.087 -47% | 0.067 -14% | |
| Access Time Write * (ms) | 0.99 | 0.053 95% | 0.04 96% | 0.034 97% | 0.103 90% |
| Score Read (Points) | 1342 | 1170 -13% | 1726 29% | 1565 17% | 1671 25% |
| Score Write (Points) | 1881 | 1048 -44% | 2155 15% | 1193 -37% | 1988 6% |
| Score Total (Points) | 3883 | 2781 -28% | 4781 23% | 3525 -9% | 4558 17% |
| Copy ISO MB/s (MB/s) | 2489 | 1982 -20% | 2136 -14% | 1800 -28% | |
| Copy Program MB/s (MB/s) | 682 | 501 -27% | 489.6 -28% | 569 -17% | |
| Copy Game MB/s (MB/s) | 1515 | 1140 -25% | 1163 -23% | 1409 -7% | |
| CrystalDiskMark 5.2 / 6 | -18% | 14% | -3% | 5% | |
| Write 4K (MB/s) | 122.6 | 98 -20% | 132.9 8% | 113.2 -8% | 126.9 4% |
| Read 4K (MB/s) | 42.4 | 41.25 -3% | 46.73 10% | 31.1 -27% | 44.91 6% |
| Write Seq (MB/s) | 2167 | 1295 -40% | 2214 2% | 2540 17% | 1944 -10% |
| Read Seq (MB/s) | 1747 | 1441 -18% | 2018 16% | 2005 15% | 1449 -17% |
| Write 4K Q32T1 (MB/s) | 388.8 | 429.2 10% | 478.9 23% | 331.4 -15% | 531 37% |
| Read 4K Q32T1 (MB/s) | 367.3 | 400.1 9% | 540 47% | 368.3 0% | 579 58% |
| Write Seq Q32T1 (MB/s) | 2629 | 1366 -48% | 2975 13% | 2535 -4% | 1970 -25% |
| Read Seq Q32T1 (MB/s) | 3460 | 2201 -36% | 3195 -8% | 3427 -1% | 2990 -14% |
| Moyenne finale (programmes/paramètres) | -16% /
-16% | 12% /
11% | 1% /
1% | 7% /
7% |
* ... Moindre est la valeur, meilleures sont les performances

Disk Throttling: DiskSpd Read Loop, Queue Depth 8
| 3DMark 11 Performance | 12119 points | |
| 3DMark Cloud Gate Standard Score | 21582 points | |
| 3DMark Fire Strike Score | 7767 points | |
| 3DMark Time Spy Score | 3348 points | |
Aide | ||
| Bas | Moyen | Élevé | Ultra | QHD | 4K | |
|---|---|---|---|---|---|---|
| The Witcher 3 (2015) | 181 | 107.6 | 62.5 | 33.4 | ||
| Dota 2 Reborn (2015) | 153 | 140 | 130 | 118 | 47.9 | |
| Final Fantasy XV Benchmark (2018) | 91 | 48.5 | 36.8 | 25.7 | 13.7 | |
| X-Plane 11.11 (2018) | 91.9 | 76 | 64.8 | 47.2 | ||
| Shadow of the Tomb Raider (2018) | 101 | 56 | 48 | 42 | ||
| Assassin´s Creed Odyssey (2018) | 71 | 53 | 45 | 25 | ||
| Apex Legends (2019) | 144 | 86.4 | 72.7 | 64.9 | ||
| Far Cry New Dawn (2019) | 83 | 58 | 55 | 50 | ||
| Metro Exodus (2019) | 91.5 | 41.74 | 31.2 | 24.6 | ||
| Dirt Rally 2.0 (2019) | 271 | 86.1 | 69.9 | 40.3 | ||
| Total War: Three Kingdoms (2019) | 148.4 | 60.3 | 36.3 | 24.4 | ||
| Control (2019) | 120.2 | 40.4 | 28.3 | |||
| Borderlands 3 (2019) | 123.4 | 56 | 35.8 | 27.3 | ||
| GRID 2019 (2019) | 179 | 94.7 | 77.7 | 51 | ||
| Star Wars Jedi Fallen Order (2019) | 64.2 | 53.1 | 47 | |||
| Hunt Showdown (2020) | 141.3 | 50.3 | 44.5 | |||
| Doom Eternal (2020) | 147.4 | 85.5 | 58.1 | |||
| Gears Tactics (2020) | 263.3 | 77.5 | 47.6 | 35.1 | ||
| F1 2020 (2020) | 182 | 96 | 78 | 55 |
| Dell Precision 5550 P91F Quadro T2000 Max-Q, i7-10875H, SK Hynix PC601A NVMe 1TB | Dell Precision 5540 Quadro T2000 Max-Q, i9-9980HK, SK hynix PC400 512 GB | Razer Blade 15 Studio Edition 2020 Quadro RTX 5000 Max-Q, i7-10875H, Samsung PM981a MZVLB1T0HBLR | Acer ConceptD 3 Pro CN315-71P-73W1 Quadro T1000 (Laptop), i7-9750H, WDC PC SN720 SDAPNTW-512G | Lenovo ThinkPad P53-20QN000YGE Quadro RTX 5000 Max-Q, i7-9850H, Samsung PM981a MZVLB1T0HBLR | MSI WP65 Quadro P620, i7-9750H, Samsung SSD PM981 MZVLB512HAJQ | |
|---|---|---|---|---|---|---|
| Noise | 2% | -11% | -7% | 3% | -15% | |
| arrêt / environnement * (dB) | 26.2 | 28.6 -9% | 30.1 -15% | 31.2 -19% | 28.3 -8% | 28.7 -10% |
| Idle Minimum * (dB) | 26.2 | 28.6 -9% | 30.1 -15% | 31.2 -19% | 28.3 -8% | 33.4 -27% |
| Idle Average * (dB) | 26.2 | 28.6 -9% | 30.1 -15% | 31.2 -19% | 28.3 -8% | 33.5 -28% |
| Idle Maximum * (dB) | 26.2 | 28.6 -9% | 30.1 -15% | 31.5 -20% | 28.3 -8% | 33.5 -28% |
| Load Average * (dB) | 39.2 | 33.3 15% | 42.3 -8% | 38.4 2% | 29.8 24% | 37 6% |
| Witcher 3 ultra * (dB) | 39 | 34.7 11% | 48.2 -24% | 36.9 5% | 38.3 2% | 38.7 1% |
| Load Maximum * (dB) | 50.6 | 38 25% | 42.1 17% | 41.2 19% | 38.3 24% | 59.5 -18% |
* ... Moindre est la valeur, meilleures sont les performances
Degré de la nuisance sonore
| Au repos |
| 26.2 / 26.2 / 26.2 dB(A) |
| Fortement sollicité |
| 39.2 / 50.6 dB(A) |
 | ||
30 dB silencieux 40 dB(A) audible 50 dB(A) bruyant |
||
min: | ||
(-) La température maximale du côté supérieur est de 47 °C / 117 F, par rapport à la moyenne de 38.2 °C / 101 F, allant de 22.2 à 69.8 °C pour la classe Workstation.
(±) Le fond chauffe jusqu'à un maximum de 44 °C / 111 F, contre une moyenne de 41.1 °C / 106 F
(+) En utilisation inactive, la température moyenne du côté supérieur est de 27.1 °C / 81 F, par rapport à la moyenne du dispositif de 32 °C / 90 F.
(±) En jouant à The Witcher 3, la température moyenne du côté supérieur est de 35.4 °C / 96 F, alors que la moyenne de l'appareil est de 32 °C / 90 F.
(+) Les repose-poignets et le pavé tactile atteignent la température maximale de la peau (32.2 °C / 90 F) et ne sont donc pas chauds.
(-) La température moyenne de la zone de l'appui-paume de dispositifs similaires était de 27.8 °C / 82 F (-4.4 °C / #-8 F).
Dell Precision 5550 P91F analyse audio
(+) | les haut-parleurs peuvent jouer relativement fort (85# dB)
Basses 100 - 315 Hz
(±) | basse réduite - en moyenne 5.7% inférieure à la médiane
(±) | la linéarité des basses est moyenne (7.7% delta à la fréquence précédente)
Médiums 400 - 2000 Hz
(+) | médiane équilibrée - seulement 2.9% de la médiane
(+) | les médiums sont linéaires (4.2% delta à la fréquence précédente)
Aiguës 2 - 16 kHz
(+) | des sommets équilibrés - à seulement 2.3% de la médiane
(+) | les aigus sont linéaires (2.6% delta à la fréquence précédente)
Globalement 100 - 16 000 Hz
(+) | le son global est linéaire (6.7% différence à la médiane)
Par rapport à la même classe
» 0% de tous les appareils testés de cette catégorie étaient meilleurs, 1% similaires, 99% pires
» Le meilleur avait un delta de 7%, la moyenne était de 17%, le pire était de 35%.
Par rapport à tous les appareils testés
» 1% de tous les appareils testés étaient meilleurs, 0% similaires, 99% pires
» Le meilleur avait un delta de 4%, la moyenne était de 24%, le pire était de 134%.
Apple MacBook 12 (Early 2016) 1.1 GHz analyse audio
(+) | les haut-parleurs peuvent jouer relativement fort (83.6# dB)
Basses 100 - 315 Hz
(±) | basse réduite - en moyenne 11.3% inférieure à la médiane
(±) | la linéarité des basses est moyenne (14.2% delta à la fréquence précédente)
Médiums 400 - 2000 Hz
(+) | médiane équilibrée - seulement 2.4% de la médiane
(+) | les médiums sont linéaires (5.5% delta à la fréquence précédente)
Aiguës 2 - 16 kHz
(+) | des sommets équilibrés - à seulement 2% de la médiane
(+) | les aigus sont linéaires (4.5% delta à la fréquence précédente)
Globalement 100 - 16 000 Hz
(+) | le son global est linéaire (10.2% différence à la médiane)
Par rapport à la même classe
» 7% de tous les appareils testés de cette catégorie étaient meilleurs, 2% similaires, 91% pires
» Le meilleur avait un delta de 5%, la moyenne était de 18%, le pire était de 53%.
Par rapport à tous les appareils testés
» 5% de tous les appareils testés étaient meilleurs, 1% similaires, 94% pires
» Le meilleur avait un delta de 4%, la moyenne était de 24%, le pire était de 134%.
| Éteint/en veille | |
| Au repos | |
| Fortement sollicité |
|
Légende:
min: | |
| Dell Precision 5550 P91F i7-10875H, Quadro T2000 Max-Q, SK Hynix PC601A NVMe 1TB, IPS, 3840x2400, 15.6" | Dell Precision 5540 i9-9980HK, Quadro T2000 Max-Q, SK hynix PC400 512 GB, OLED, 3840x2160, 15.6" | Razer Blade 15 Studio Edition 2020 i7-10875H, Quadro RTX 5000 Max-Q, Samsung PM981a MZVLB1T0HBLR, OLED, 3840x2160, 15.6" | Acer ConceptD 3 Pro CN315-71P-73W1 i7-9750H, Quadro T1000 (Laptop), WDC PC SN720 SDAPNTW-512G, IPS, 1920x1080, 15.6" | Lenovo ThinkPad P53-20QN000YGE i7-9850H, Quadro RTX 5000 Max-Q, Samsung PM981a MZVLB1T0HBLR, IPS, 1920x1080, 15.6" | MSI WP65 i7-9750H, Quadro P620, Samsung SSD PM981 MZVLB512HAJQ, IPS, 1920x1080, 15.6" | |
|---|---|---|---|---|---|---|
| Power Consumption | -2% | -59% | 31% | -27% | -4% | |
| Idle Minimum * (Watt) | 5.6 | 7.4 -32% | 13.4 -139% | 2.9 48% | 7.9 -41% | 5.6 -0% |
| Idle Average * (Watt) | 11.2 | 12.1 -8% | 18 -61% | 5.5 51% | 11.8 -5% | 8.6 23% |
| Idle Maximum * (Watt) | 18.4 | 12.7 31% | 26.1 -42% | 10.6 42% | 14.9 19% | 30.7 -67% |
| Load Average * (Watt) | 114 | 98 14% | 115 -1% | 86 25% | 96 16% | 78 32% |
| Witcher 3 ultra * (Watt) | 76.7 | 89.9 -17% | 145 -89% | 83 -8% | 149 -94% | 63.5 17% |
| Load Maximum * (Watt) | 134.2 | 135.1 -1% | 165 -23% | 100.7 25% | 207.8 -55% | 170.2 -27% |
* ... Moindre est la valeur, meilleures sont les performances
| Dell Precision 5550 P91F i7-10875H, Quadro T2000 Max-Q, 86 Wh | Dell Precision 5540 i9-9980HK, Quadro T2000 Max-Q, 97 Wh | Razer Blade 15 Studio Edition 2020 i7-10875H, Quadro RTX 5000 Max-Q, 80 Wh | Acer ConceptD 3 Pro CN315-71P-73W1 i7-9750H, Quadro T1000 (Laptop), 58.7 Wh | Lenovo ThinkPad P53-20QN000YGE i7-9850H, Quadro RTX 5000 Max-Q, 90 Wh | MSI WP65 i7-9750H, Quadro P620, 51 Wh | |
|---|---|---|---|---|---|---|
| Autonomie de la batterie | -9% | -18% | -10% | 33% | -48% | |
| Reader / Idle (h) | 22.6 | 15 -34% | 8.8 -61% | 10.1 -55% | ||
| WiFi v1.3 (h) | 9 | 7.7 -14% | 5.7 -37% | 8.1 -10% | 11.1 23% | 6 -33% |
| Load (h) | 1.4 | 1.7 21% | 2 43% | 2 43% | 0.6 -57% |
Points positifs
Points négatifs
Comma la plupart des autres PC portable Studio fin et léger, le Precision 5550 devrait séduire grâce à sa portabilité, son élégance et son impressionnant écran tactile brillant, plus que par ses performances brutes et son choix de ports. Cela ne signifie pas que c'est une machine lente, mais il faudra quand même sacrifier les options graphiques les plus puissantes pour avoir ce look d'ultrabook.
Si vous ne vous déplacez pas trop ou si l'espace ne vous manque pas, alors le Precision 7550 plus grand aura plus de puissant que le Precision 5550. Celui-ci est plus conçu pour les nomades et les utilisations hybrides station de travail - ultrabook que pour les sédentaires voulant des performances extrêmes plusieurs heures d'affilées.
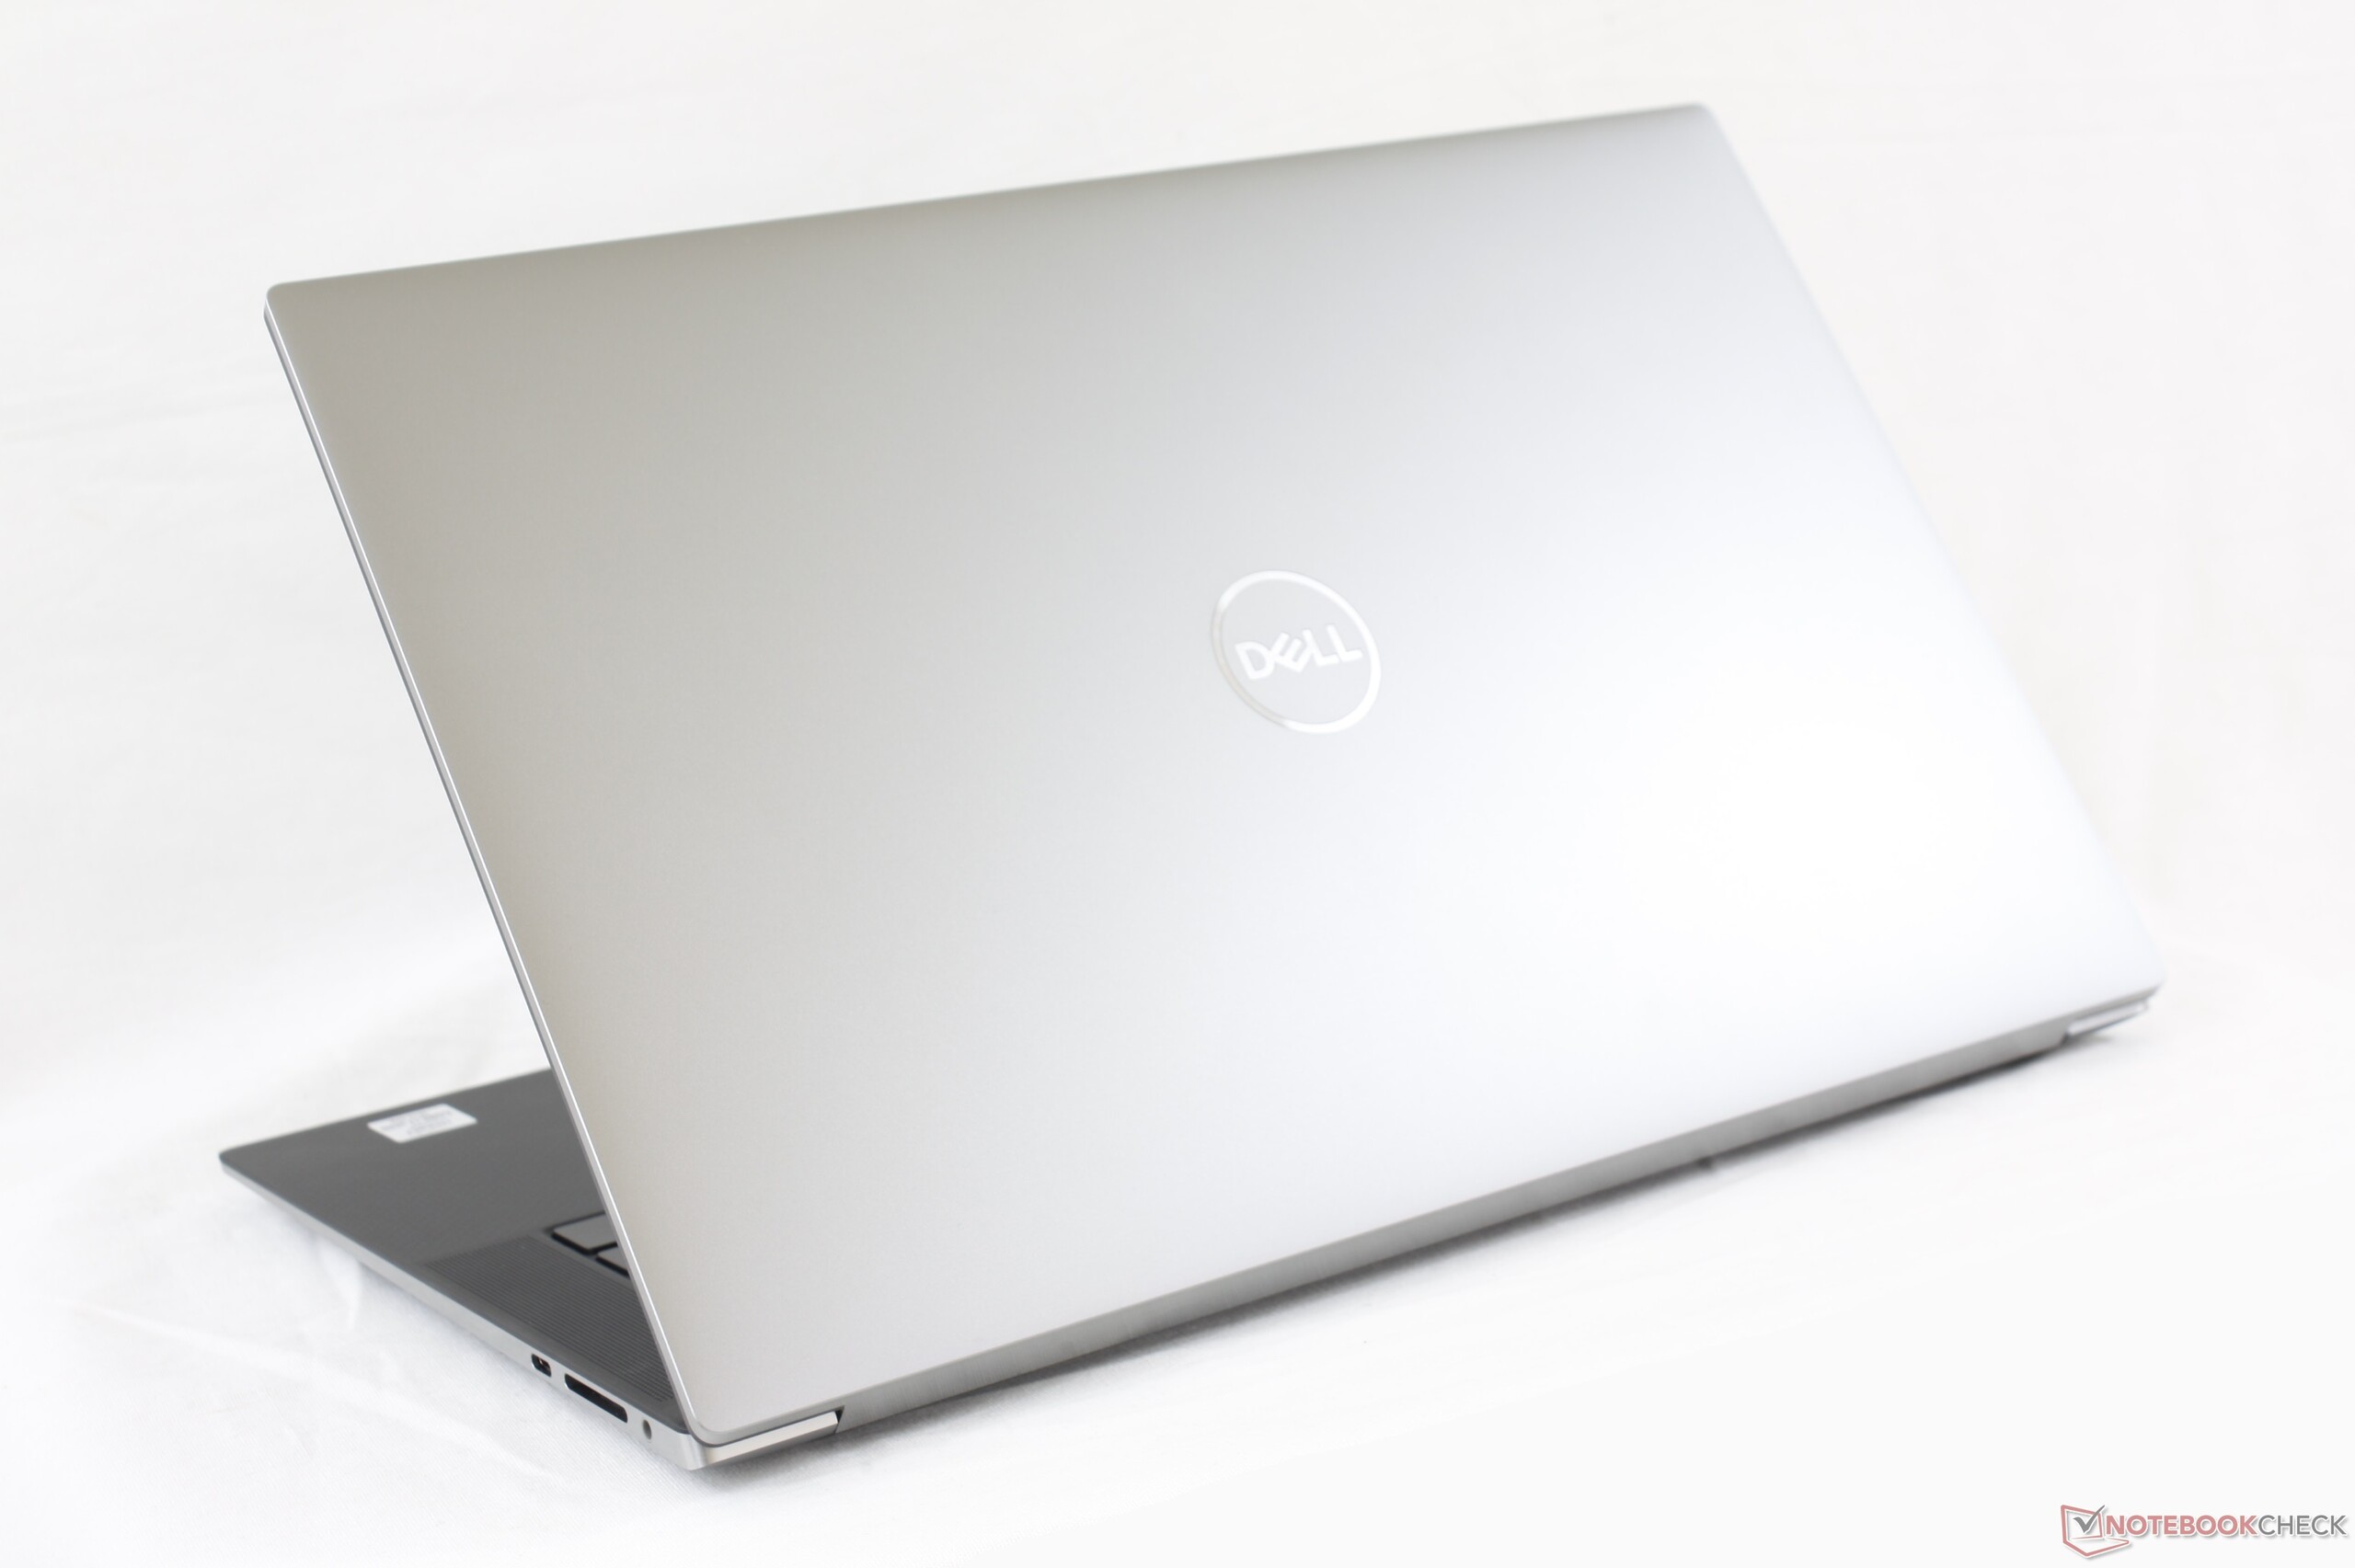
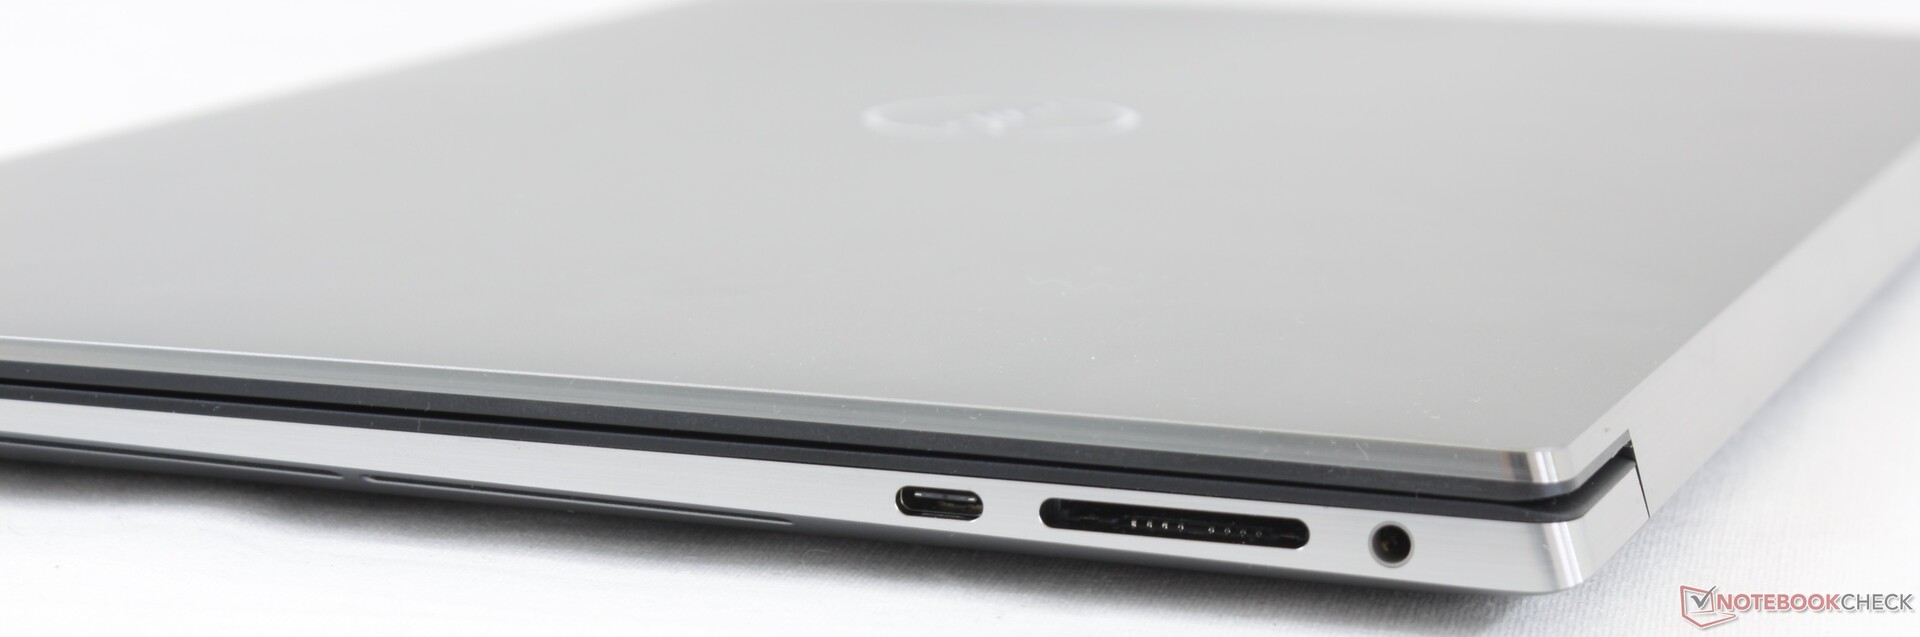
Plus petit, plus fin et léger que la plupart des stations de travail du marché : le Dell Precision 5550 sacrifie les options graphiques les plus puissantes et la variété des ports pour être une machine nomade.
L’intégralité de cette critique est disponible en anglais en suivant ce lien.
Dell Precision 5550 P91F
- 08/05/2020 v7 (old)
Allen Ngo
Price comparison
