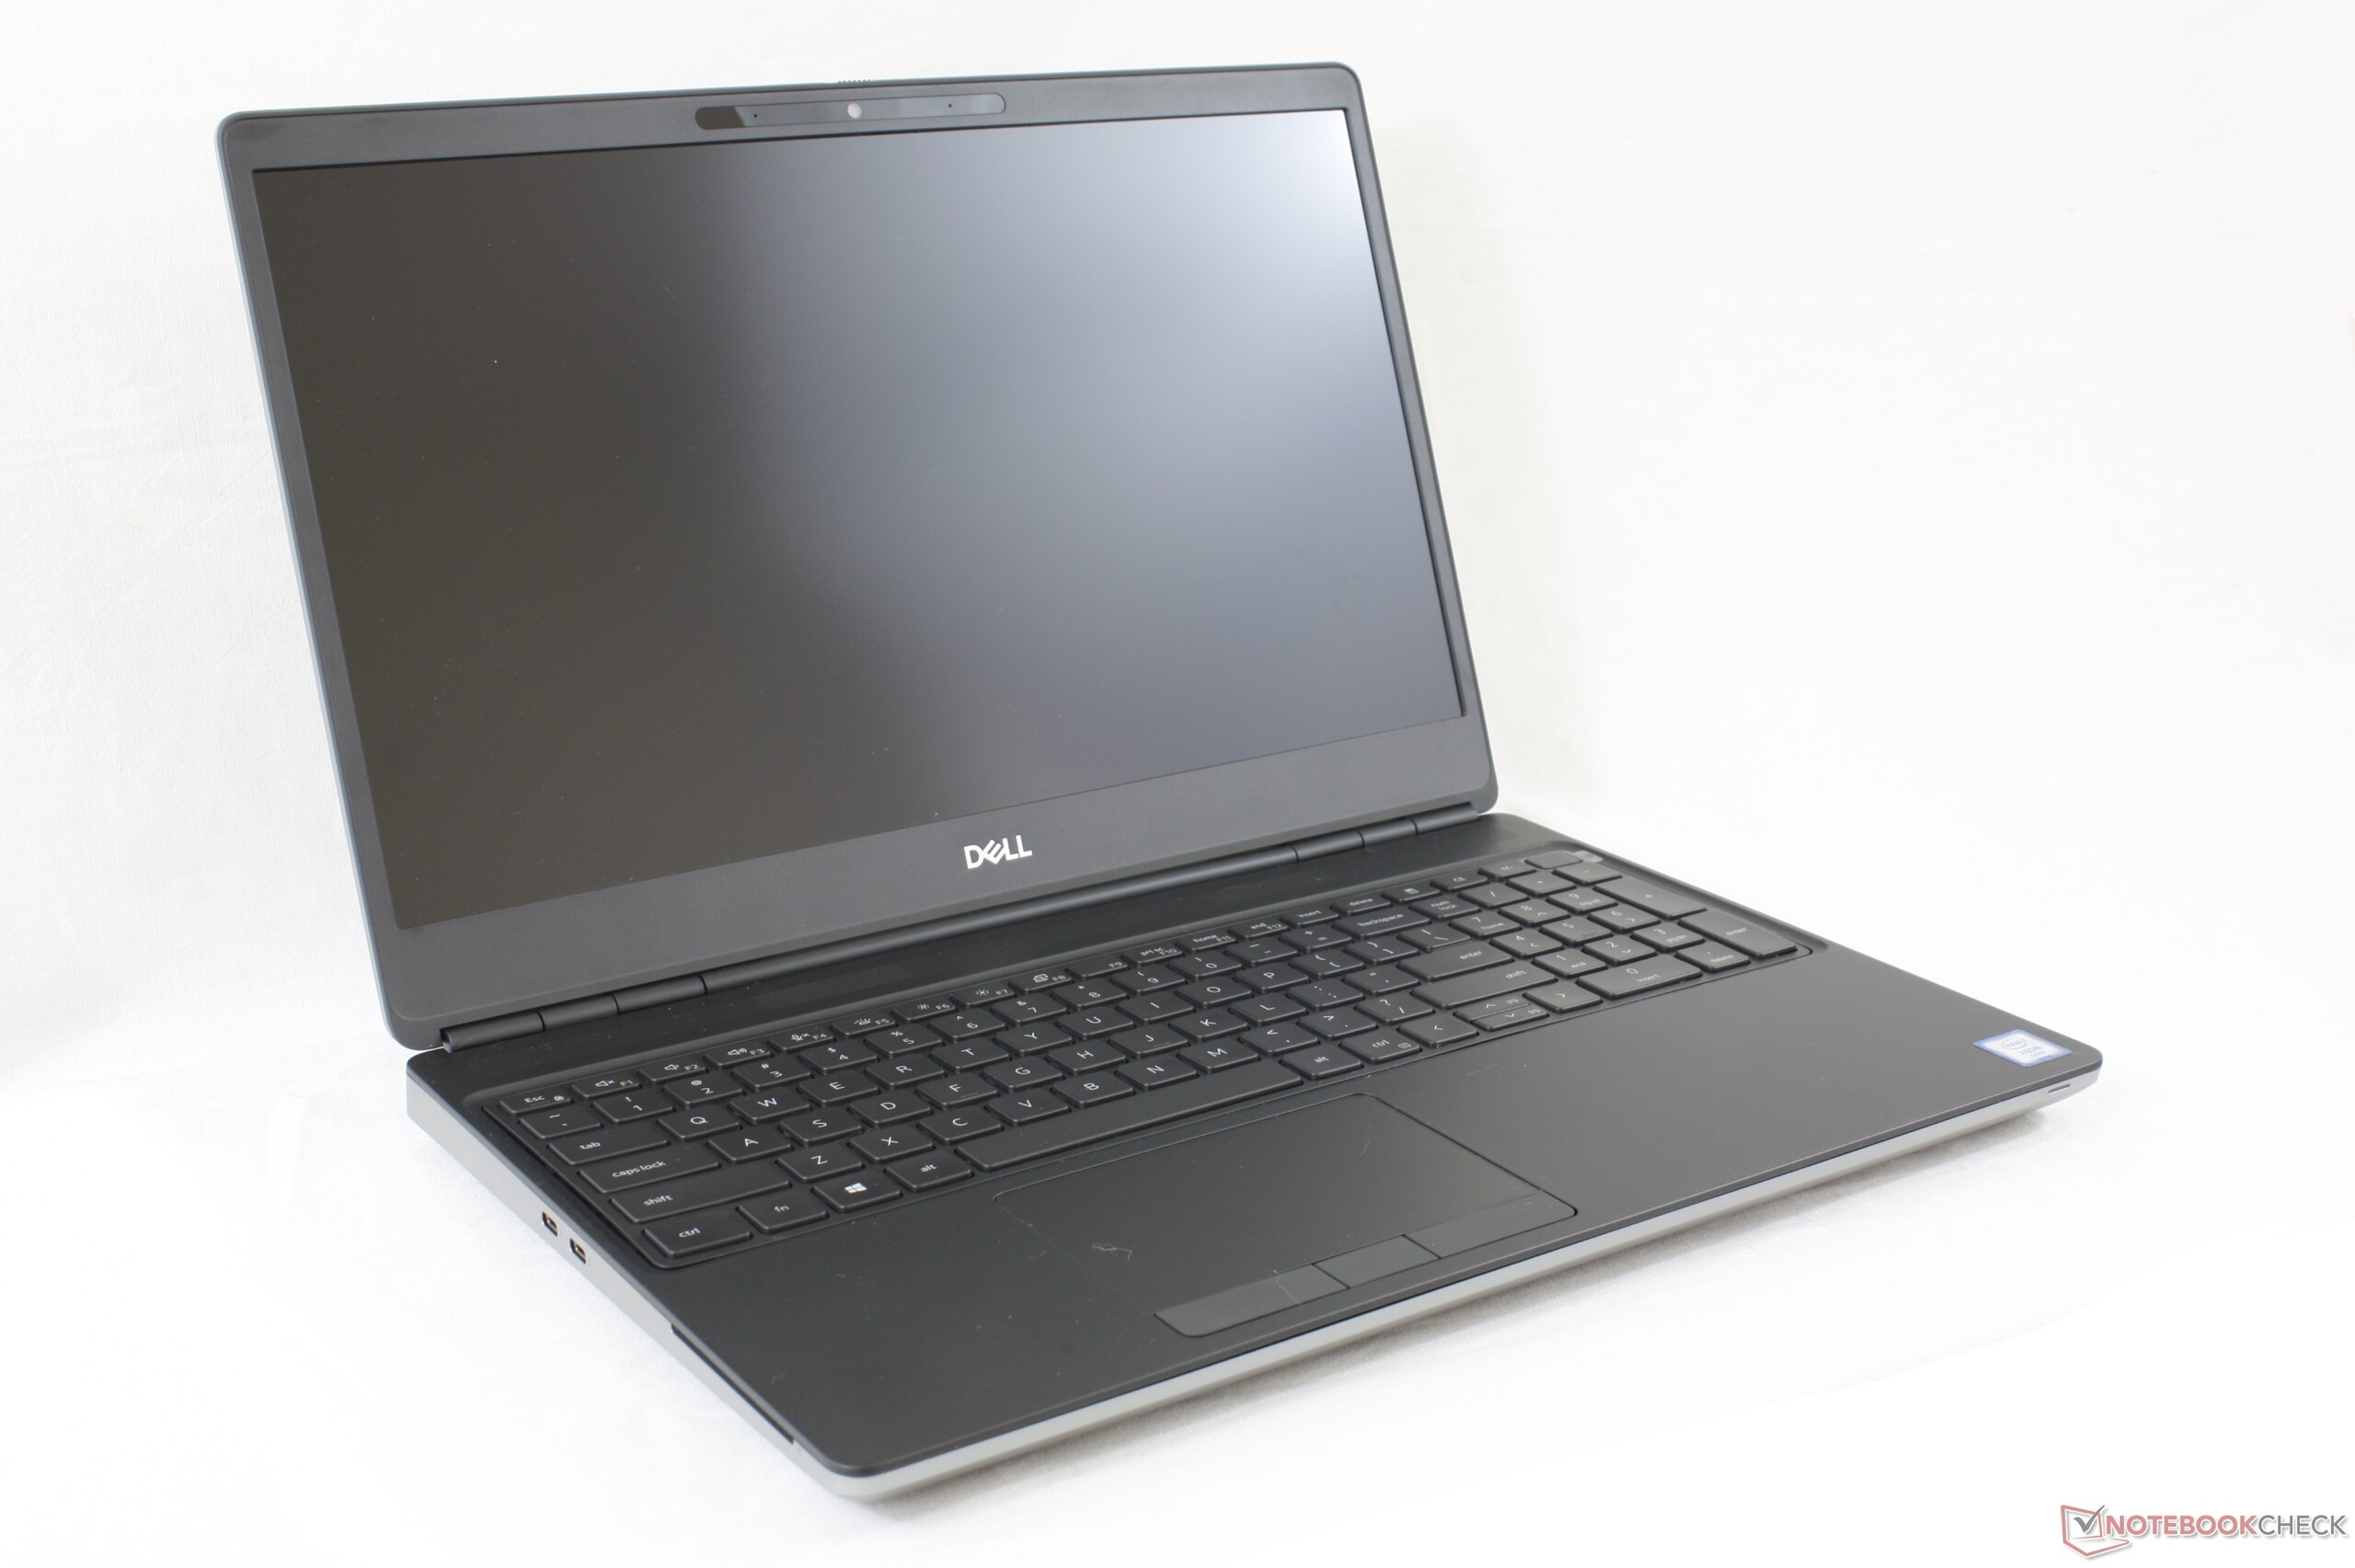
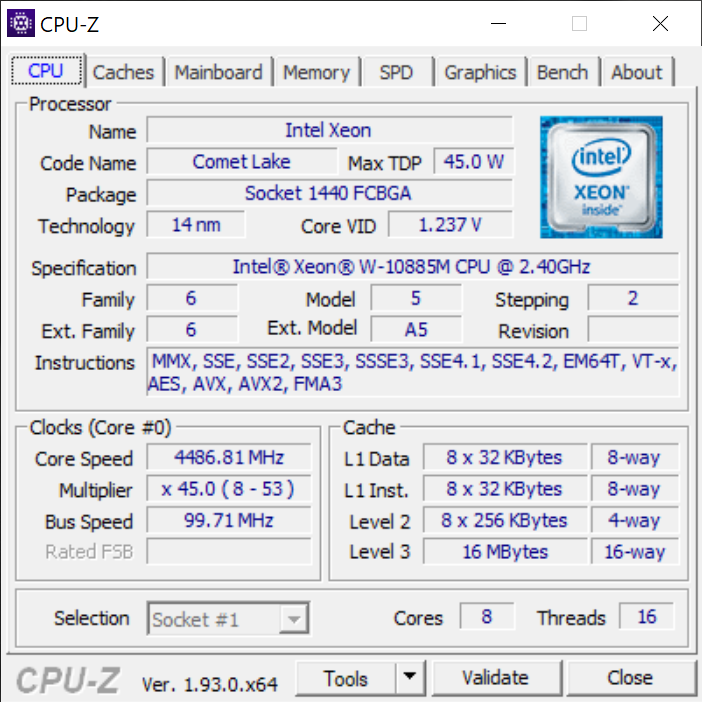
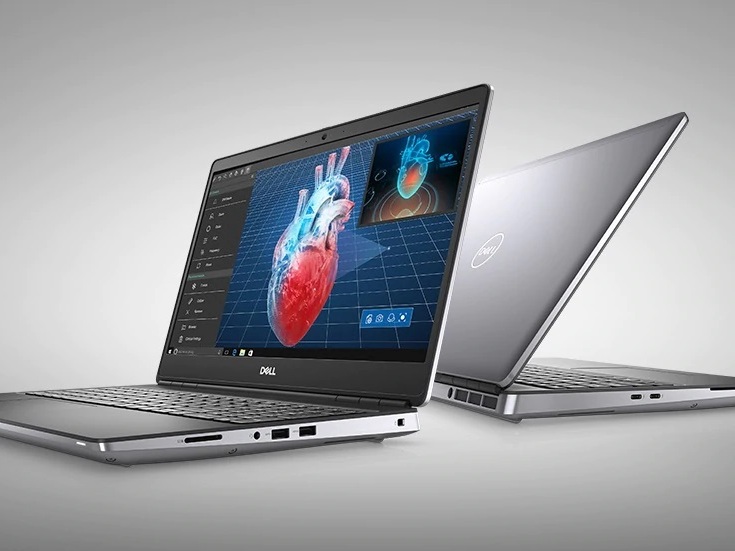
Test du Dell Precision 7550 (Xeon W-10885M, RTX 5000 Max-Q, 4K UHD) : station de travail à l'antithèse du Precision 5550
Note | Date | Modèle | Poids | Épaisseur | Taille | Résolution | Prix |
|---|---|---|---|---|---|---|---|
| 87.8 % v7 (old) | 09/20 | Dell Precision 7550 W-10885M, Quadro RTX 5000 Max-Q | 2.8 kg | 27.36 mm | 15.60" | 3840x2160 | |
v (old) | Dell Precision 7540 i9-9980HK, Quadro RTX 3000 (Laptop) | 2.8 kg | 25 mm | 15.60" | 3840x2160 | ||
| 86.3 % v7 (old) | 09/20 | Dell Precision 5550 P91F i7-10875H, Quadro T2000 Max-Q | 2 kg | 18 mm | 15.60" | 3840x2400 | |
| 82.1 % v7 (old) | 07/20 | Acer ConceptD 3 Pro CN315-71P-73W1 i7-9750H, Quadro T1000 (Laptop) | 2.4 kg | 23.4 mm | 15.60" | 1920x1080 | |
| 89.8 % v7 (old) | 11/19 | Lenovo ThinkPad P53-20QN000YGE i7-9850H, Quadro RTX 5000 Max-Q | 2.7 kg | 29.4 mm | 15.60" | 1920x1080 | |
| 84.4 % v7 (old) | 11/18 | HP ZBook Studio G5-4QH10EA i7-8750H, Quadro P1000 | 2.1 kg | 18.9 mm | 15.60" | 3840x2160 |
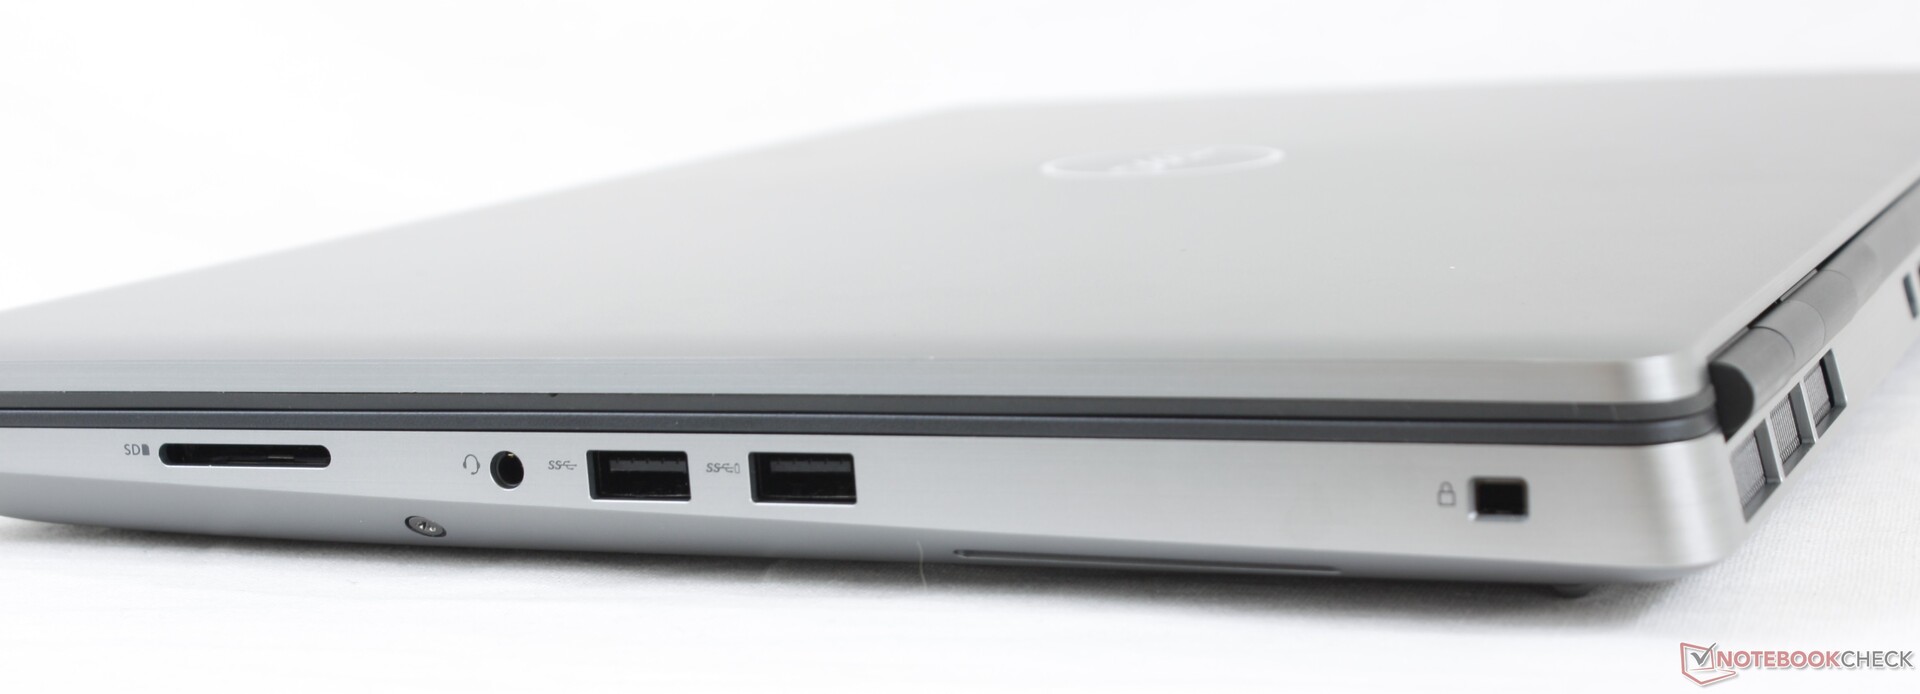
| SD Card Reader | |
| average JPG Copy Test (av. of 3 runs) | |
| Dell Precision 5550 P91F (Toshiba Exceria Pro SDXC 64 GB UHS-II) | |
| Dell Precision 7540 (Toshiba Exceria Pro SDXC 64 GB UHS-II) | |
| Dell Precision 7550 (Toshiba Exceria Pro SDXC 64 GB UHS-II) | |
| Lenovo ThinkPad P53-20QN000YGE (Toshiba Exceria Pro SDXC 64 GB UHS-II) | |
| HP ZBook Studio G5-4QH10EA (Toshiba Exceria Pro SDXC 64 GB UHS-II) | |
| maximum AS SSD Seq Read Test (1GB) | |
| HP ZBook Studio G5-4QH10EA (Toshiba Exceria Pro SDXC 64 GB UHS-II) | |
| Lenovo ThinkPad P53-20QN000YGE (Toshiba Exceria Pro SDXC 64 GB UHS-II) | |
| Dell Precision 5550 P91F (Toshiba Exceria Pro SDXC 64 GB UHS-II) | |
| Dell Precision 7550 (Toshiba Exceria Pro SDXC 64 GB UHS-II) | |
| Dell Precision 7540 (Toshiba Exceria Pro SDXC 64 GB UHS-II) | |
| Networking | |
| iperf3 transmit AX12 | |
| Dell Precision 7540 | |
| Dell Precision 5550 P91F | |
| Dell Precision 7550 | |
| Acer ConceptD 9 Pro | |
| Acer ConceptD 3 Pro CN315-71P-73W1 | |
| iperf3 receive AX12 | |
| Dell Precision 7540 | |
| Dell Precision 5550 P91F | |
| Dell Precision 7550 | |
| Acer ConceptD 9 Pro | |
| Acer ConceptD 3 Pro CN315-71P-73W1 | |


| |||||||||||||||||||||||||
Homogénéité de la luminosité: 90 %
Valeur mesurée au centre, sur batterie: 473.5 cd/m²
Contraste: 861:1 (Valeurs des noirs: 0.55 cd/m²)
ΔE ColorChecker Calman: 4.8 | ∀{0.5-29.43 Ø4.73}
calibrated: 3.08
ΔE Greyscale Calman: 5.6 | ∀{0.09-98 Ø4.97}
99.7% sRGB (Argyll 1.6.3 3D)
86.4% AdobeRGB 1998 (Argyll 1.6.3 3D)
96.8% AdobeRGB 1998 (Argyll 3D)
99.6% sRGB (Argyll 3D)
82.1% Display P3 (Argyll 3D)
Gamma: 2.34
CCT: 7549 K
| Dell Precision 7550 AU Optronics B156ZAN, IPS, 15.6", 3840x2160 | Dell Precision 7540 AUO41EB, , 15.6", 3840x2160 | Dell Precision 5550 P91F Sharp LQ156R1, IPS, 15.6", 3840x2400 | Acer ConceptD 3 Pro CN315-71P-73W1 Chi Mei N156HCE-EN2, IPS, 15.6", 1920x1080 | Lenovo ThinkPad P53-20QN000YGE N156HCE-GN1, IPS, 15.6", 1920x1080 | HP ZBook Studio G5-4QH10EA AUO30EB, IPS LED, 15.6", 3840x2160 | |
|---|---|---|---|---|---|---|
| Display | 3% | 4% | 3% | -21% | -16% | |
| Display P3 Coverage (%) | 82.1 | 87.1 6% | 89.9 10% | 97.9 19% | 63.2 -23% | 68.2 -17% |
| sRGB Coverage (%) | 99.6 | 100 0% | 100 0% | 99.9 0% | 92.9 -7% | 96.2 -3% |
| AdobeRGB 1998 Coverage (%) | 96.8 | 99.8 3% | 99.9 3% | 87.2 -10% | 64.3 -34% | 68.8 -29% |
| Response Times | -7% | 5% | 36% | 26% | -8% | |
| Response Time Grey 50% / Grey 80% * (ms) | 51.2 ? | 61.6 ? -20% | 46 ? 10% | 33 ? 36% | 38.4 ? 25% | 60.8 ? -19% |
| Response Time Black / White * (ms) | 34 ? | 32 ? 6% | 34 ? -0% | 22 ? 35% | 25.2 ? 26% | 32.8 ? 4% |
| PWM Frequency (Hz) | 26040 ? | |||||
| Screen | 23% | 1% | 17% | 24% | 12% | |
| Brightness middle (cd/m²) | 473.5 | 491 4% | 469.8 -1% | 343 -28% | 510 8% | 417 -12% |
| Brightness (cd/m²) | 461 | 477 3% | 464 1% | 309 -33% | 468 2% | 412 -11% |
| Brightness Distribution (%) | 90 | 92 2% | 85 -6% | 85 -6% | 89 -1% | 85 -6% |
| Black Level * (cd/m²) | 0.55 | 0.37 33% | 0.42 24% | 0.22 60% | 0.36 35% | 0.29 47% |
| Contrast (:1) | 861 | 1327 54% | 1119 30% | 1559 81% | 1417 65% | 1438 67% |
| Colorchecker dE 2000 * | 4.8 | 2.9 40% | 5.16 -8% | 3.73 22% | 2.3 52% | 4.4 8% |
| Colorchecker dE 2000 max. * | 8.73 | 5.8 34% | 9.33 -7% | 6.51 25% | 5.5 37% | 6.7 23% |
| Colorchecker dE 2000 calibrated * | 3.08 | 1.2 61% | 3.75 -22% | 1.43 54% | 1.2 61% | 1.9 38% |
| Greyscale dE 2000 * | 5.6 | 4.4 21% | 5.5 2% | 4.24 24% | 3.2 43% | 5 11% |
| Gamma | 2.34 94% | 2.03 108% | 2 110% | 2.2 100% | 2.34 94% | 2.28 96% |
| CCT | 7549 86% | 6655 98% | 6198 105% | 6329 103% | 7036 92% | 7575 86% |
| Color Space (Percent of AdobeRGB 1998) (%) | 86.4 | 88.2 2% | 89.2 3% | 78 -10% | 59.4 -31% | 62.3 -28% |
| Color Space (Percent of sRGB) (%) | 99.7 | 99.9 0% | 100 0% | 100 0% | 93.1 -7% | 96 -4% |
| Moyenne finale (programmes/paramètres) | 6% /
16% | 3% /
2% | 19% /
17% | 10% /
16% | -4% /
4% |
* ... Moindre est la valeur, meilleures sont les performances
Temps de réponse de l'écran
| ↔ Temps de réponse noir à blanc | ||
|---|---|---|
| 34 ms ... hausse ↗ et chute ↘ combinées | ↗ 20 ms hausse | 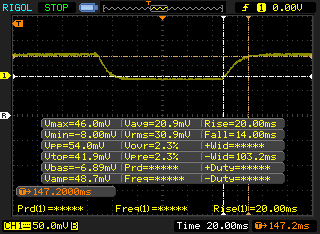 |
| ↘ 14 ms chute | ||
| L'écran souffre de latences très élevées, à éviter pour le jeu. En comparaison, tous les appareils testés affichent entre 0.1 (minimum) et 240 (maximum) ms. » 91 % des appareils testés affichent de meilleures performances. Cela signifie que les latences relevées sont moins bonnes que la moyenne (19.9 ms) de tous les appareils testés. | ||
| ↔ Temps de réponse gris 50% à gris 80% | ||
| 51.2 ms ... hausse ↗ et chute ↘ combinées | ↗ 24.4 ms hausse | 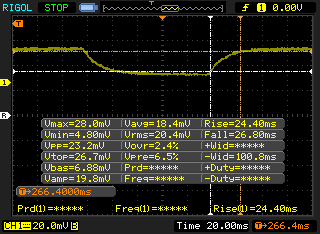 |
| ↘ 26.8 ms chute | ||
| L'écran souffre de latences très élevées, à éviter pour le jeu. En comparaison, tous les appareils testés affichent entre 0.165 (minimum) et 636 (maximum) ms. » 88 % des appareils testés affichent de meilleures performances. Cela signifie que les latences relevées sont moins bonnes que la moyenne (31.1 ms) de tous les appareils testés. | ||
Scintillement / MLI (Modulation de largeur d'impulsion)
| Scintillement / MLI (Modulation de largeur d'impulsion) non décelé | 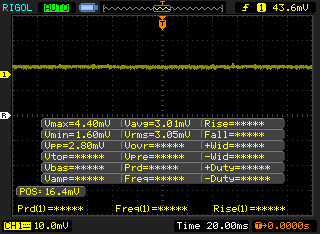 | ||
En comparaison, 52 % des appareils testés n'emploient pas MDI pour assombrir leur écran. Nous avons relevé une moyenne à 7798 (minimum : 5 - maximum : 343500) Hz dans le cas où une MDI était active. | |||

Cinebench R15: CPU Multi 64Bit | CPU Single 64Bit
Blender: v2.79 BMW27 CPU
7-Zip 18.03: 7z b 4 -mmt1 | 7z b 4
Geekbench 5.5: Single-Core | Multi-Core
HWBOT x265 Benchmark v2.2: 4k Preset
LibreOffice : 20 Documents To PDF
R Benchmark 2.5: Overall mean
| Blender / v2.79 BMW27 CPU | |
| Acer ConceptD 3 Pro CN315-71P-73W1 | |
| Dell Precision 5550 P91F | |
| Alienware m15 R3 P87F | |
| Dell Precision 7550 | |
| Asus ROG Strix Scar 15 G532LWS | |
| Intel Core i9-10900K | |
| AMD Radeon RX Vega 64 | |
| 7-Zip 18.03 / 7z b 4 -mmt1 | |
| Intel Core i9-10900K | |
| AMD Radeon RX Vega 64 | |
| Asus ROG Strix Scar 15 G532LWS | |
| Dell Precision 7550 | |
| Dell Precision 5550 P91F | |
| Acer ConceptD 3 Pro CN315-71P-73W1 | |
| Alienware m15 R3 P87F | |
| 7-Zip 18.03 / 7z b 4 | |
| AMD Radeon RX Vega 64 | |
| Intel Core i9-10900K | |
| Dell Precision 7550 | |
| Asus ROG Strix Scar 15 G532LWS | |
| Dell Precision 5550 P91F | |
| Alienware m15 R3 P87F | |
| Acer ConceptD 3 Pro CN315-71P-73W1 | |
| Geekbench 5.5 / Single-Core | |
| Intel Core i9-10900K | |
| Asus ROG Strix Scar 15 G532LWS | |
| Dell Precision 7550 | |
| Dell Precision 5550 P91F | |
| Alienware m15 R3 P87F | |
| AMD Radeon RX Vega 64 | |
| Acer ConceptD 3 Pro CN315-71P-73W1 | |
| Geekbench 5.5 / Multi-Core | |
| Intel Core i9-10900K | |
| AMD Radeon RX Vega 64 | |
| Asus ROG Strix Scar 15 G532LWS | |
| Dell Precision 5550 P91F | |
| Dell Precision 7550 | |
| Alienware m15 R3 P87F | |
| Acer ConceptD 3 Pro CN315-71P-73W1 | |
* ... Moindre est la valeur, meilleures sont les performances
| PCMark 10 | |
| Score | |
| Dell Precision 7540 | |
| Dell Precision 7550 | |
| Lenovo ThinkPad P53-20QN000YGE | |
| Dell Precision 5550 P91F | |
| Acer ConceptD 3 Pro CN315-71P-73W1 | |
| HP ZBook Studio G5-4QH10EA | |
| Essentials | |
| Dell Precision 5550 P91F | |
| Dell Precision 7550 | |
| Lenovo ThinkPad P53-20QN000YGE | |
| Dell Precision 7540 | |
| Acer ConceptD 3 Pro CN315-71P-73W1 | |
| HP ZBook Studio G5-4QH10EA | |
| Productivity | |
| Dell Precision 7540 | |
| Dell Precision 7550 | |
| Dell Precision 5550 P91F | |
| Lenovo ThinkPad P53-20QN000YGE | |
| Acer ConceptD 3 Pro CN315-71P-73W1 | |
| HP ZBook Studio G5-4QH10EA | |
| Digital Content Creation | |
| Dell Precision 7540 | |
| Dell Precision 7550 | |
| Lenovo ThinkPad P53-20QN000YGE | |
| Dell Precision 5550 P91F | |
| HP ZBook Studio G5-4QH10EA | |
| Acer ConceptD 3 Pro CN315-71P-73W1 | |
| PCMark 8 | |
| Home Score Accelerated v2 | |
| Dell Precision 7540 | |
| Acer ConceptD 3 Pro CN315-71P-73W1 | |
| Dell Precision 7550 | |
| Dell Precision 5550 P91F | |
| HP ZBook Studio G5-4QH10EA | |
| Work Score Accelerated v2 | |
| Acer ConceptD 3 Pro CN315-71P-73W1 | |
| Dell Precision 7550 | |
| Dell Precision 7540 | |
| Dell Precision 5550 P91F | |
| HP ZBook Studio G5-4QH10EA | |
| PCMark 8 Home Score Accelerated v2 | 3781 points | |
| PCMark 8 Work Score Accelerated v2 | 4726 points | |
| PCMark 10 Score | 5904 points | |
Aide | ||
| DPC Latencies / LatencyMon - interrupt to process latency (max), Web, Youtube, Prime95 | |
| Dell Precision 7550 | |
| Asus ROG Strix Scar 15 G532LWS | |
| Alienware m15 R3 P87F | |
| MSI GE66 Raider 10SFS | |
| Acer ConceptD 3 Pro CN315-71P-73W1 | |
| Acer ConceptD 9 Pro | |
| Razer Blade 15 Studio Edition 2020 | |
| Dell Precision 5550 P91F | |
* ... Moindre est la valeur, meilleures sont les performances
| Dell Precision 7550 SK Hynix PC601A NVMe 1TB | Dell Precision 5550 P91F SK Hynix PC601A NVMe 1TB | Acer ConceptD 3 Pro CN315-71P-73W1 WDC PC SN720 SDAPNTW-512G | Lenovo ThinkPad P53-20QN000YGE Samsung PM981a MZVLB1T0HBLR | HP ZBook Studio G5-4QH10EA Samsung SSD PM981 MZVLB512HAJQ | |
|---|---|---|---|---|---|
| AS SSD | -52% | 8% | 51% | 13% | |
| Seq Read (MB/s) | 2028 | 2039 1% | 2973 47% | 2655 31% | 2379 17% |
| Seq Write (MB/s) | 1193 | 1376 15% | 2429 104% | 2454 106% | 1780 49% |
| 4K Read (MB/s) | 42.31 | 44.11 4% | 24.7 -42% | 59.1 40% | 51 21% |
| 4K Write (MB/s) | 105.5 | 113.3 7% | 115.3 9% | 138.1 31% | 109.5 4% |
| 4K-64 Read (MB/s) | 1128 | 1094 -3% | 1243 10% | 2009 78% | 1184 5% |
| 4K-64 Write (MB/s) | 1537 | 1630 6% | 835 -46% | 1907 24% | 1725 12% |
| Access Time Read * (ms) | 0.069 | 0.059 14% | 0.054 22% | 0.057 17% | |
| Access Time Write * (ms) | 0.106 | 0.99 -834% | 0.034 68% | 0.028 74% | 0.034 68% |
| Score Read (Points) | 1373 | 1342 -2% | 1565 14% | 2333 70% | 1472 7% |
| Score Write (Points) | 1762 | 1881 7% | 1193 -32% | 2291 30% | 2013 14% |
| Score Total (Points) | 3801 | 3883 2% | 3525 -7% | 5810 53% | 4217 11% |
| Copy ISO MB/s (MB/s) | 1768 | 2489 41% | 2136 21% | 1989 13% | |
| Copy Program MB/s (MB/s) | 627 | 682 9% | 489.6 -22% | 457 -27% | |
| Copy Game MB/s (MB/s) | 1477 | 1515 3% | 1163 -21% | 1121 -24% | |
| CrystalDiskMark 5.2 / 6 | -1% | -4% | 9% | -20% | |
| Write 4K (MB/s) | 121 | 122.6 1% | 113.2 -6% | 147 21% | 102.7 -15% |
| Read 4K (MB/s) | 42.16 | 42.4 1% | 31.1 -26% | 48.3 15% | 38.32 -9% |
| Write Seq (MB/s) | 2150 | 2167 1% | 2540 18% | 1402 -35% | 1417 -34% |
| Read Seq (MB/s) | 1755 | 1747 0% | 2005 14% | 1503 -14% | 1289 -27% |
| Write 4K Q32T1 (MB/s) | 395.3 | 388.8 -2% | 331.4 -16% | 475.2 20% | 278.9 -29% |
| Read 4K Q32T1 (MB/s) | 381.8 | 367.3 -4% | 368.3 -4% | 581 52% | 348.8 -9% |
| Write Seq Q32T1 (MB/s) | 2730 | 2629 -4% | 2535 -7% | 2936 8% | 1895 -31% |
| Read Seq Q32T1 (MB/s) | 3468 | 3460 0% | 3427 -1% | 3539 2% | 3352 -3% |
| Write 4K Q8T8 (MB/s) | 1575 | ||||
| Read 4K Q8T8 (MB/s) | 1607 | ||||
| Moyenne finale (programmes/paramètres) | -27% /
-34% | 2% /
4% | 30% /
33% | -4% /
1% |
* ... Moindre est la valeur, meilleures sont les performances

Disk Throttling: DiskSpd Read Loop, Queue Depth 8
| 3DMark 06 Standard Score | 42280 points | |
| 3DMark 11 Performance | 21922 points | |
| 3DMark Cloud Gate Standard Score | 34476 points | |
| 3DMark Fire Strike Score | 16641 points | |
| 3DMark Time Spy Score | 7579 points | |
Aide | ||
| Bas | Moyen | Élevé | Ultra | QHD | 4K | |
|---|---|---|---|---|---|---|
| The Witcher 3 (2015) | 299 | 249.4 | 139.1 | 77.3 | 52.5 | |
| Dota 2 Reborn (2015) | 156 | 142 | 117 | 111 | 98.7 | |
| Final Fantasy XV Benchmark (2018) | 154 | 99.7 | 77.3 | 56 | 32.8 | |
| X-Plane 11.11 (2018) | 118 | 102 | 85.7 | 48.8 |
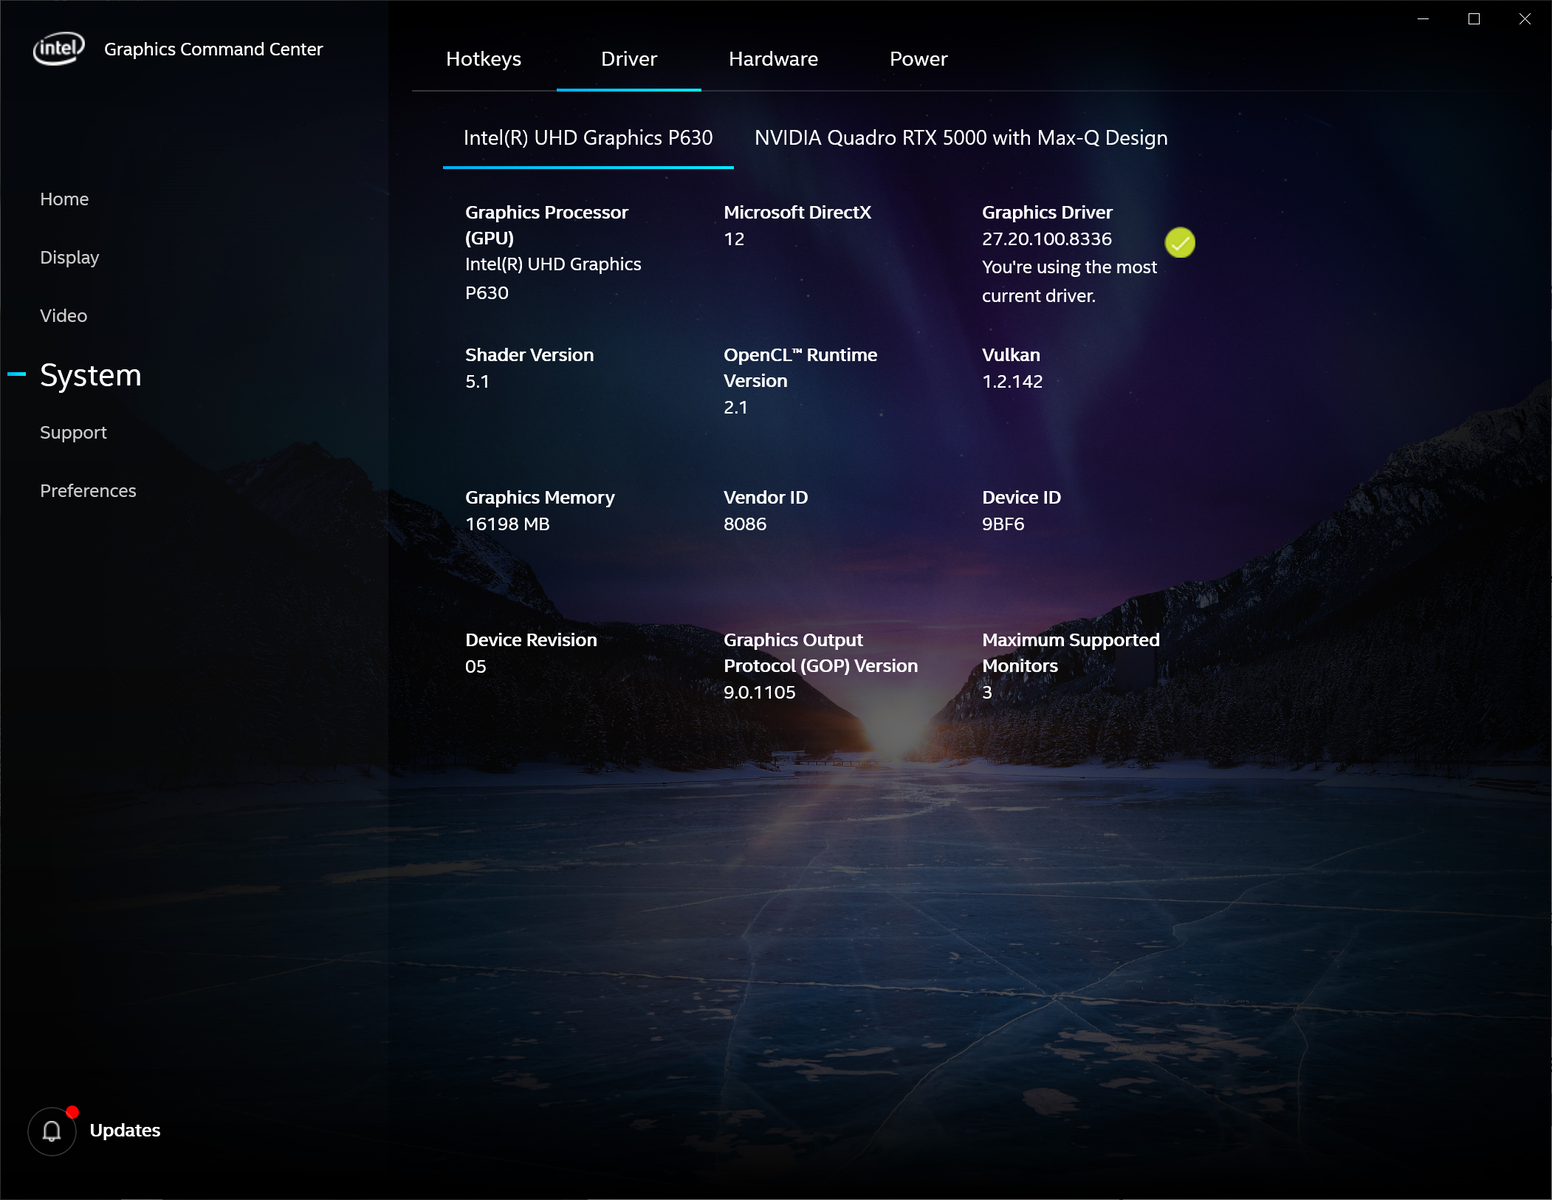
| Dell Precision 7550 Quadro RTX 5000 Max-Q, W-10885M, SK Hynix PC601A NVMe 1TB | Dell Precision 7540 Quadro RTX 3000 (Laptop), i9-9980HK, SK hynix PC400 512 GB | Dell Precision 5550 P91F Quadro T2000 Max-Q, i7-10875H, SK Hynix PC601A NVMe 1TB | Acer ConceptD 3 Pro CN315-71P-73W1 Quadro T1000 (Laptop), i7-9750H, WDC PC SN720 SDAPNTW-512G | Lenovo ThinkPad P53-20QN000YGE Quadro RTX 5000 Max-Q, i7-9850H, Samsung PM981a MZVLB1T0HBLR | HP ZBook Studio G5-4QH10EA Quadro P1000, i7-8750H, Samsung SSD PM981 MZVLB512HAJQ | |
|---|---|---|---|---|---|---|
| Noise | 3% | 6% | -1% | 8% | 4% | |
| arrêt / environnement * (dB) | 25.8 | 28.7 -11% | 26.2 -2% | 31.2 -21% | 28.3 -10% | 28.6 -11% |
| Idle Minimum * (dB) | 25.8 | 28.8 -12% | 26.2 -2% | 31.2 -21% | 28.3 -10% | 28.6 -11% |
| Idle Average * (dB) | 25.8 | 28.7 -11% | 26.2 -2% | 31.2 -21% | 28.3 -10% | 28.6 -11% |
| Idle Maximum * (dB) | 25.9 | 29.1 -12% | 26.2 -1% | 31.5 -22% | 28.3 -9% | 30 -16% |
| Load Average * (dB) | 51.2 | 37.1 28% | 39.2 23% | 38.4 25% | 29.8 42% | 38.1 26% |
| Witcher 3 ultra * (dB) | 51.9 | 41.2 21% | 39 25% | 36.9 29% | 38.3 26% | 35 33% |
| Load Maximum * (dB) | 51.9 | 41.2 21% | 50.6 3% | 41.2 21% | 38.3 26% | 42.5 18% |
* ... Moindre est la valeur, meilleures sont les performances
Degré de la nuisance sonore
| Au repos |
| 25.8 / 25.8 / 25.9 dB(A) |
| Fortement sollicité |
| 51.2 / 51.9 dB(A) |
 | ||
30 dB silencieux 40 dB(A) audible 50 dB(A) bruyant |
||
min: | ||
(-) La température maximale du côté supérieur est de 49 °C / 120 F, par rapport à la moyenne de 38.2 °C / 101 F, allant de 22.2 à 69.8 °C pour la classe Workstation.
(-) Le fond chauffe jusqu'à un maximum de 51 °C / 124 F, contre une moyenne de 41.1 °C / 106 F
(+) En utilisation inactive, la température moyenne du côté supérieur est de 26.7 °C / 80 F, par rapport à la moyenne du dispositif de 32 °C / 90 F.
(±) En jouant à The Witcher 3, la température moyenne du côté supérieur est de 37.8 °C / 100 F, alors que la moyenne de l'appareil est de 32 °C / 90 F.
(+) Les repose-poignets et le pavé tactile sont plus froids que la température de la peau avec un maximum de 31 °C / 87.8 F et sont donc froids au toucher.
(-) La température moyenne de la zone de l'appui-paume de dispositifs similaires était de 27.8 °C / 82 F (-3.2 °C / #-5.8 F).
Dell Precision 7550 analyse audio
(+) | les haut-parleurs peuvent jouer relativement fort (83.6# dB)
Basses 100 - 315 Hz
(±) | basse réduite - en moyenne 11.5% inférieure à la médiane
(±) | la linéarité des basses est moyenne (11.6% delta à la fréquence précédente)
Médiums 400 - 2000 Hz
(±) | médiane supérieure - en moyenne 5.7% supérieure à la médiane
(+) | les médiums sont linéaires (4.5% delta à la fréquence précédente)
Aiguës 2 - 16 kHz
(+) | des sommets équilibrés - à seulement 3.2% de la médiane
(+) | les aigus sont linéaires (5.4% delta à la fréquence précédente)
Globalement 100 - 16 000 Hz
(+) | le son global est linéaire (12.6% différence à la médiane)
Par rapport à la même classe
» 21% de tous les appareils testés de cette catégorie étaient meilleurs, 4% similaires, 75% pires
» Le meilleur avait un delta de 7%, la moyenne était de 17%, le pire était de 35%.
Par rapport à tous les appareils testés
» 11% de tous les appareils testés étaient meilleurs, 2% similaires, 86% pires
» Le meilleur avait un delta de 4%, la moyenne était de 24%, le pire était de 134%.
Apple MacBook 12 (Early 2016) 1.1 GHz analyse audio
(+) | les haut-parleurs peuvent jouer relativement fort (83.6# dB)
Basses 100 - 315 Hz
(±) | basse réduite - en moyenne 11.3% inférieure à la médiane
(±) | la linéarité des basses est moyenne (14.2% delta à la fréquence précédente)
Médiums 400 - 2000 Hz
(+) | médiane équilibrée - seulement 2.4% de la médiane
(+) | les médiums sont linéaires (5.5% delta à la fréquence précédente)
Aiguës 2 - 16 kHz
(+) | des sommets équilibrés - à seulement 2% de la médiane
(+) | les aigus sont linéaires (4.5% delta à la fréquence précédente)
Globalement 100 - 16 000 Hz
(+) | le son global est linéaire (10.2% différence à la médiane)
Par rapport à la même classe
» 7% de tous les appareils testés de cette catégorie étaient meilleurs, 2% similaires, 91% pires
» Le meilleur avait un delta de 5%, la moyenne était de 18%, le pire était de 53%.
Par rapport à tous les appareils testés
» 5% de tous les appareils testés étaient meilleurs, 1% similaires, 94% pires
» Le meilleur avait un delta de 4%, la moyenne était de 24%, le pire était de 134%.
| Éteint/en veille | |
| Au repos | |
| Fortement sollicité |
|
Légende:
min: | |
| Dell Precision 7550 W-10885M, Quadro RTX 5000 Max-Q, SK Hynix PC601A NVMe 1TB, IPS, 3840x2160, 15.6" | Dell Precision 7540 i9-9980HK, Quadro RTX 3000 (Laptop), SK hynix PC400 512 GB, , 3840x2160, 15.6" | Dell Precision 5550 P91F i7-10875H, Quadro T2000 Max-Q, SK Hynix PC601A NVMe 1TB, IPS, 3840x2400, 15.6" | Acer ConceptD 3 Pro CN315-71P-73W1 i7-9750H, Quadro T1000 (Laptop), WDC PC SN720 SDAPNTW-512G, IPS, 1920x1080, 15.6" | Lenovo ThinkPad P53-20QN000YGE i7-9850H, Quadro RTX 5000 Max-Q, Samsung PM981a MZVLB1T0HBLR, IPS, 1920x1080, 15.6" | HP ZBook Studio G5-4QH10EA i7-8750H, Quadro P1000, Samsung SSD PM981 MZVLB512HAJQ, IPS LED, 3840x2160, 15.6" | Acer ConceptD 9 Pro i9-9980HK, Quadro RTX 5000 (Laptop), WDC PC SN720 SDAQNTW-1T00, IPS, 3840x2160, 17.3" | |
|---|---|---|---|---|---|---|---|
| Power Consumption | 11% | 31% | 53% | 17% | 38% | -42% | |
| Idle Minimum * (Watt) | 8.2 | 8.4 -2% | 5.6 32% | 2.9 65% | 7.9 4% | 6.8 17% | 18.8 -129% |
| Idle Average * (Watt) | 16.8 | 15.4 8% | 11.2 33% | 5.5 67% | 11.8 30% | 11.3 33% | 25 -49% |
| Idle Maximum * (Watt) | 24.4 | 17.4 29% | 18.4 25% | 10.6 57% | 14.9 39% | 14.3 41% | 30 -23% |
| Load Average * (Watt) | 131 | 126 4% | 114 13% | 86 34% | 96 27% | 78 40% | 116 11% |
| Witcher 3 ultra * (Watt) | 156.6 | 143 9% | 76.7 51% | 83 47% | 149 5% | 64 59% | 221 -41% |
| Load Maximum * (Watt) | 201.8 | 170 16% | 134.2 33% | 100.7 50% | 207.8 -3% | 126 38% | 241 -19% |
* ... Moindre est la valeur, meilleures sont les performances
| Dell Precision 7550 W-10885M, Quadro RTX 5000 Max-Q, 95 Wh | Dell Precision 7540 i9-9980HK, Quadro RTX 3000 (Laptop), Wh | Dell Precision 5550 P91F i7-10875H, Quadro T2000 Max-Q, 86 Wh | Acer ConceptD 3 Pro CN315-71P-73W1 i7-9750H, Quadro T1000 (Laptop), 58.7 Wh | Lenovo ThinkPad P53-20QN000YGE i7-9850H, Quadro RTX 5000 Max-Q, 90 Wh | HP ZBook Studio G5-4QH10EA i7-8750H, Quadro P1000, 97 Wh | |
|---|---|---|---|---|---|---|
| Autonomie de la batterie | -19% | 48% | -9% | 63% | 62% | |
| Reader / Idle (h) | 11.1 | 22.6 104% | 17.3 56% | |||
| WiFi v1.3 (h) | 8.9 | 7.2 -19% | 9 1% | 8.1 -9% | 11.1 25% | 9.7 9% |
| Load (h) | 1 | 1.4 40% | 2 100% | 2.2 120% |
Points positifs
Points négatifs
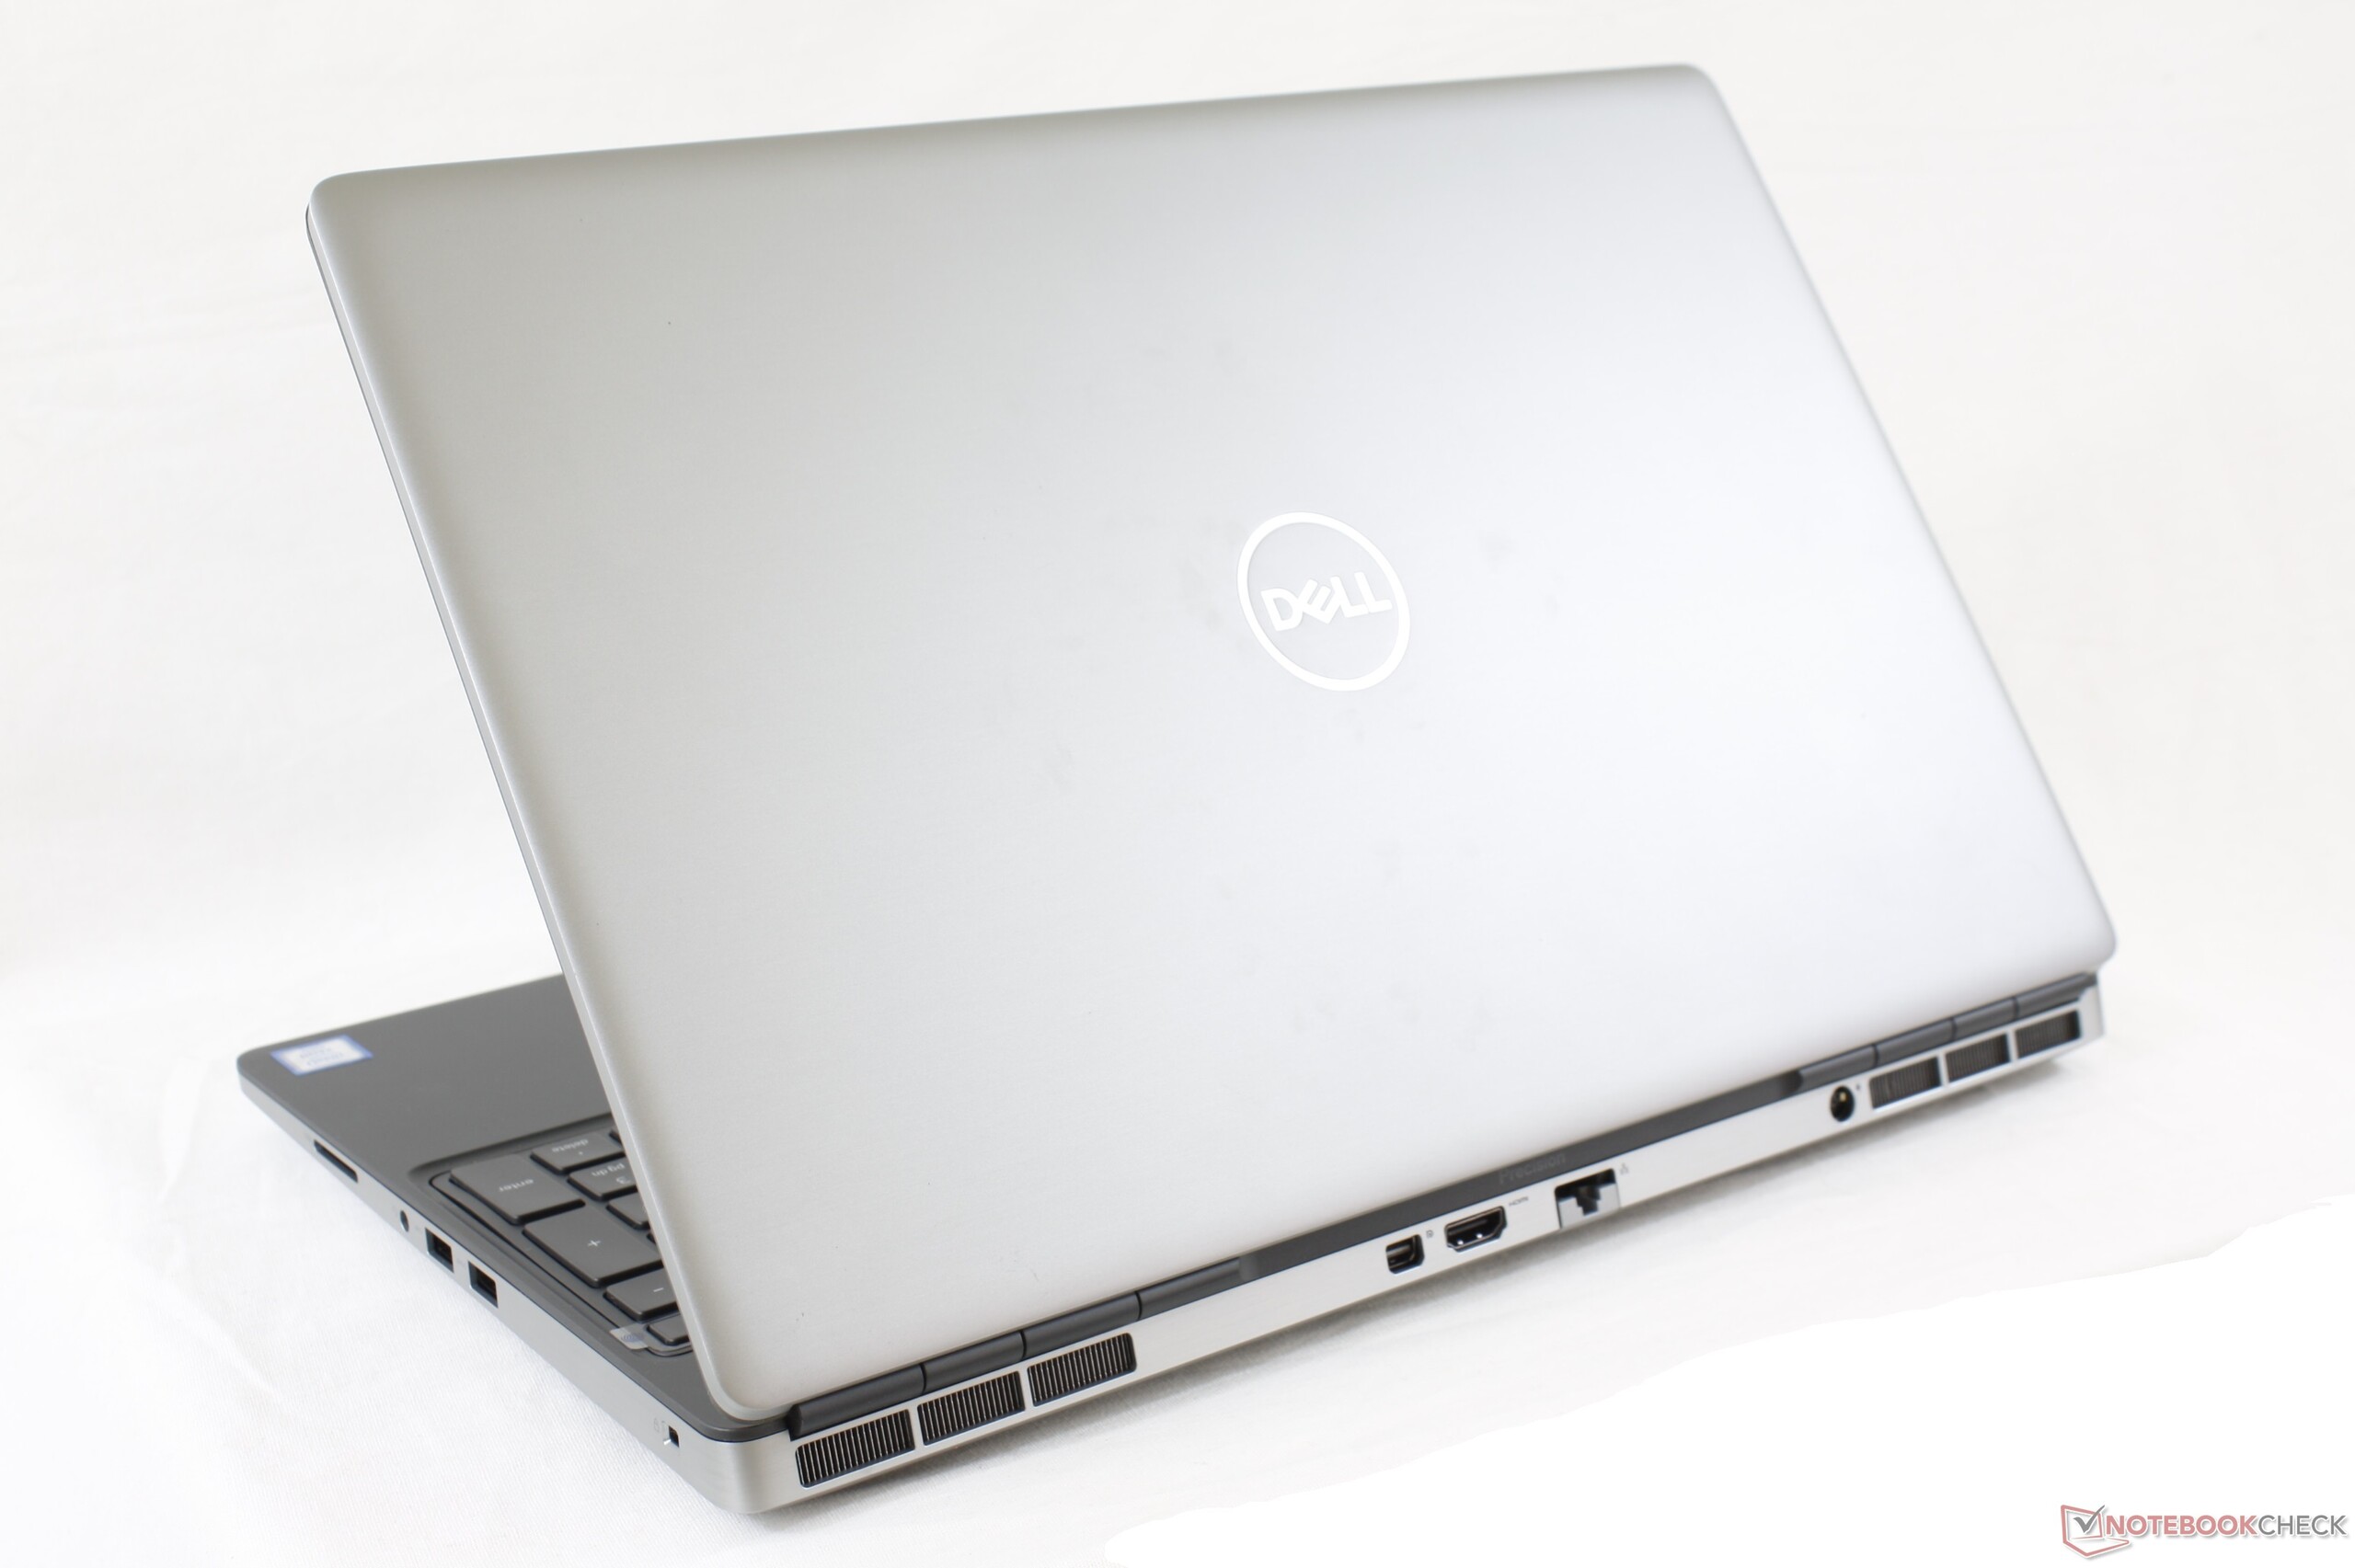
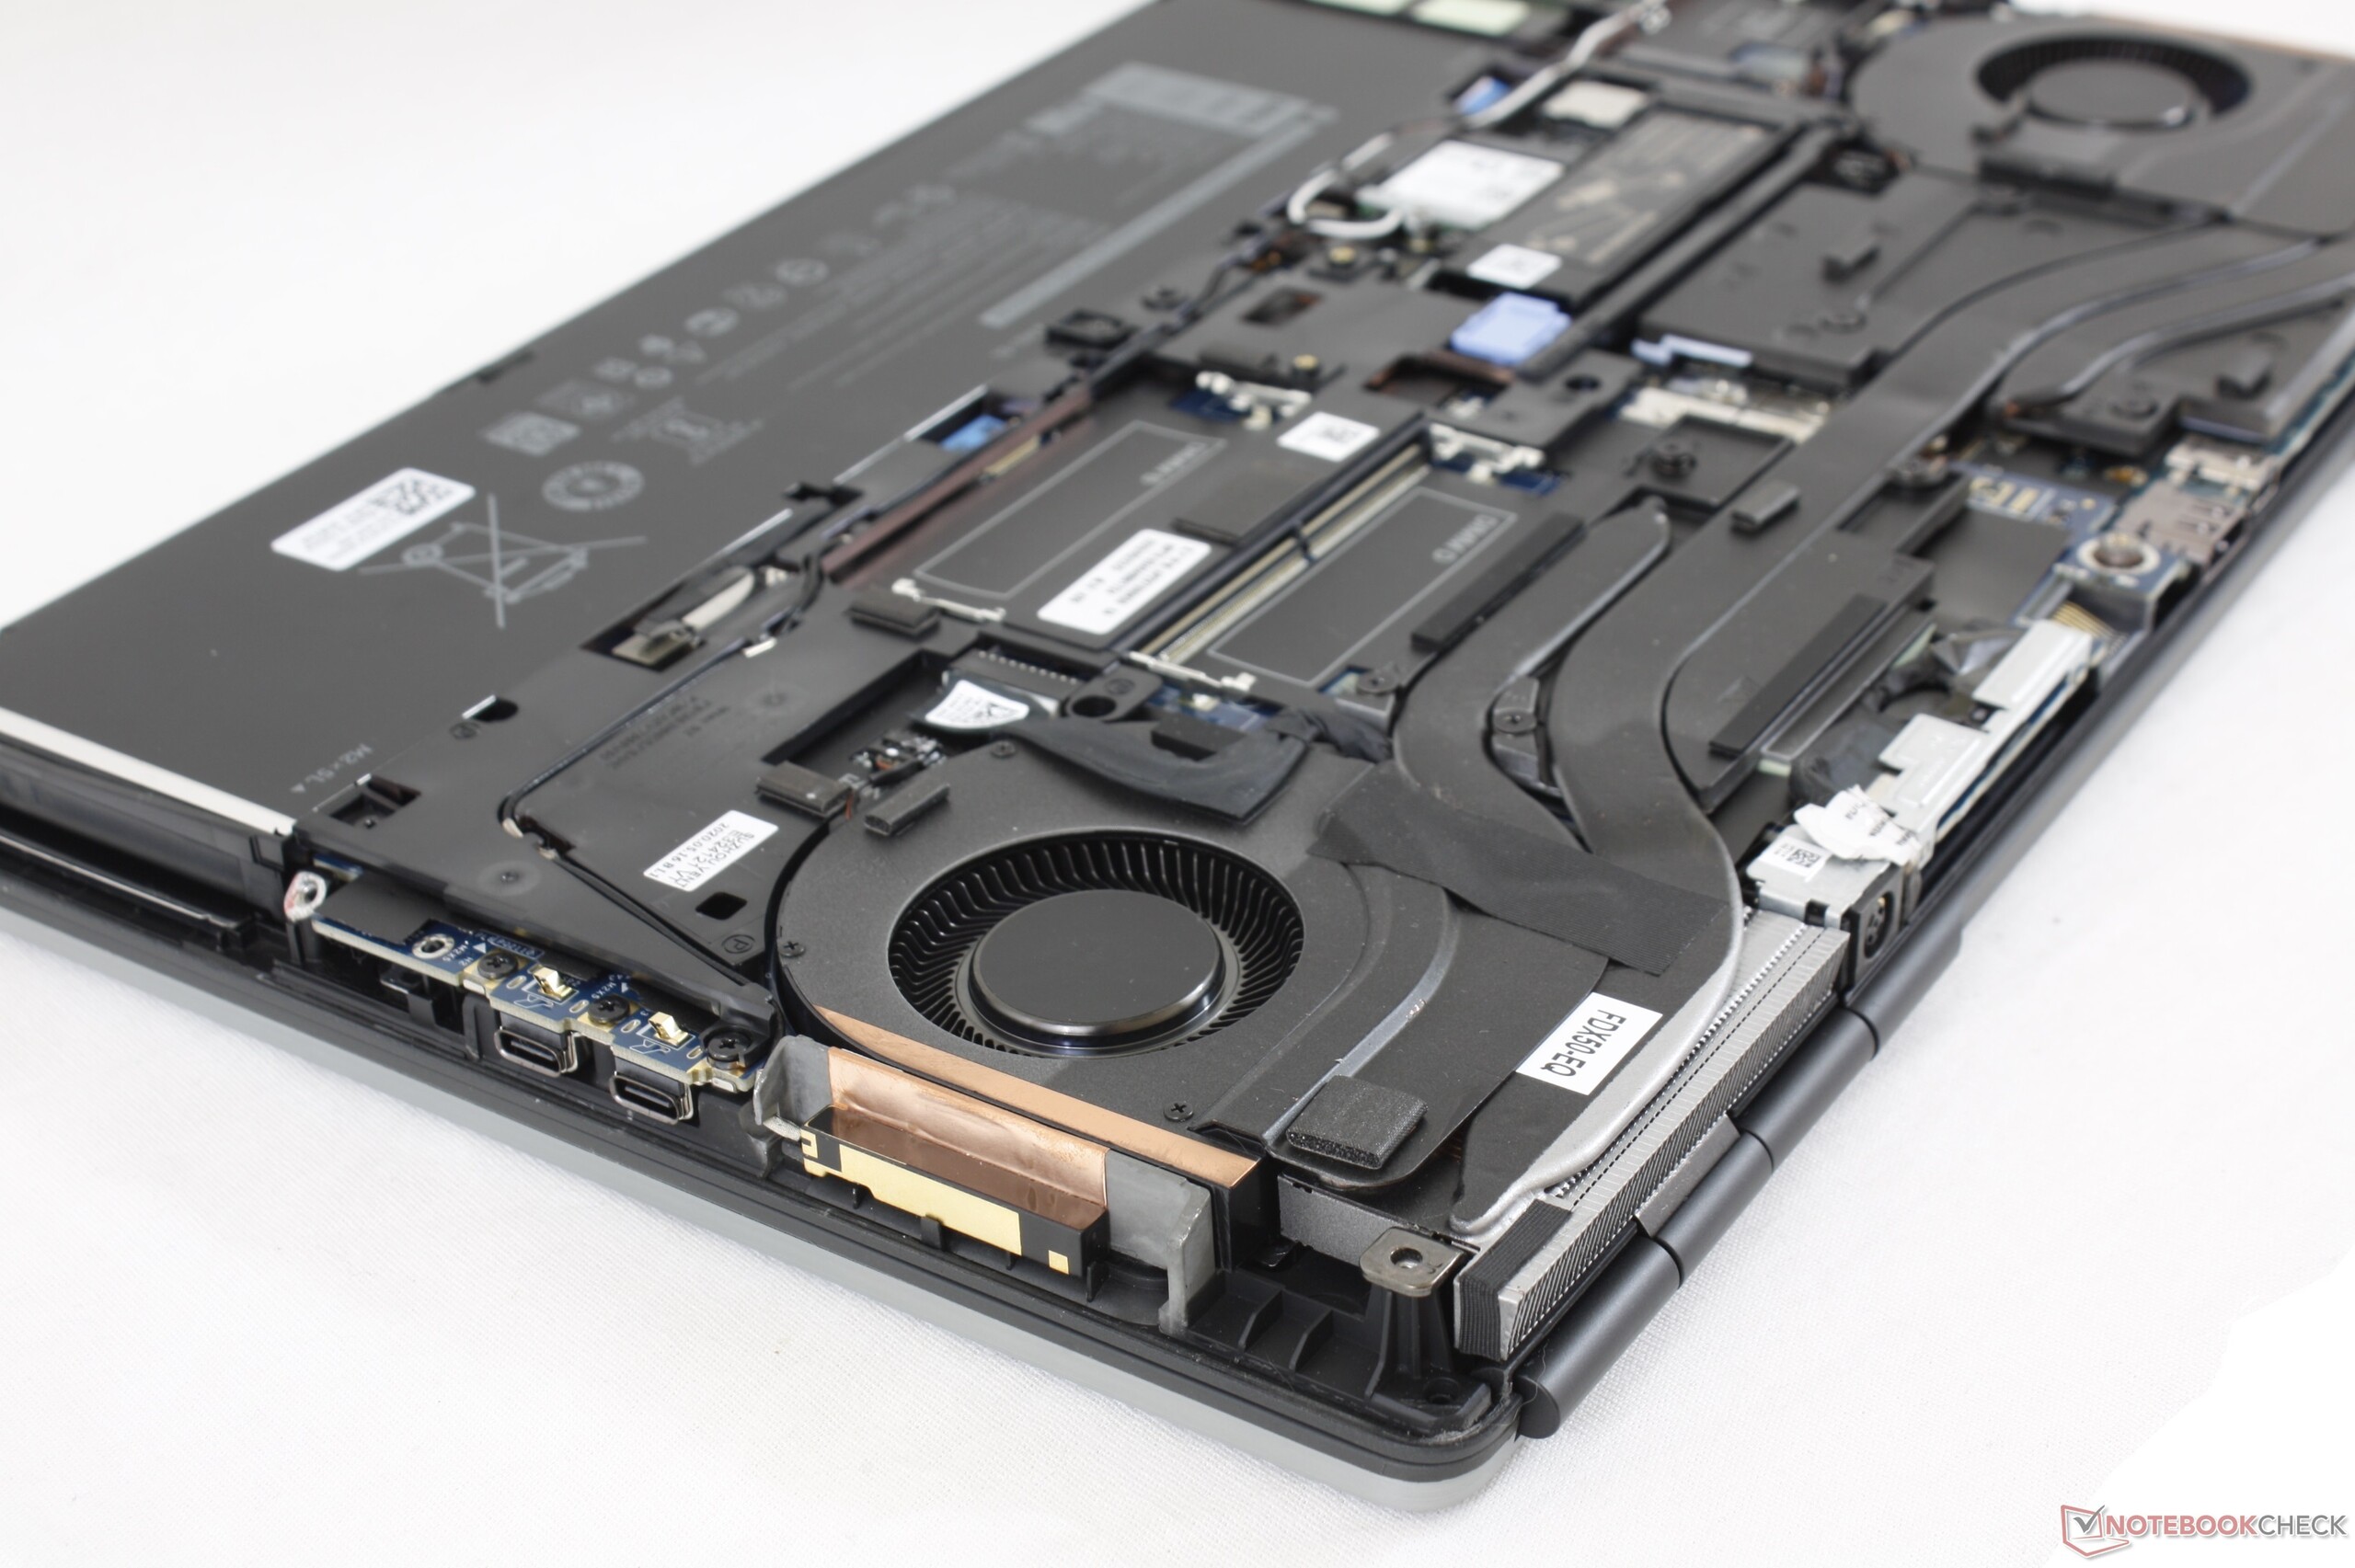
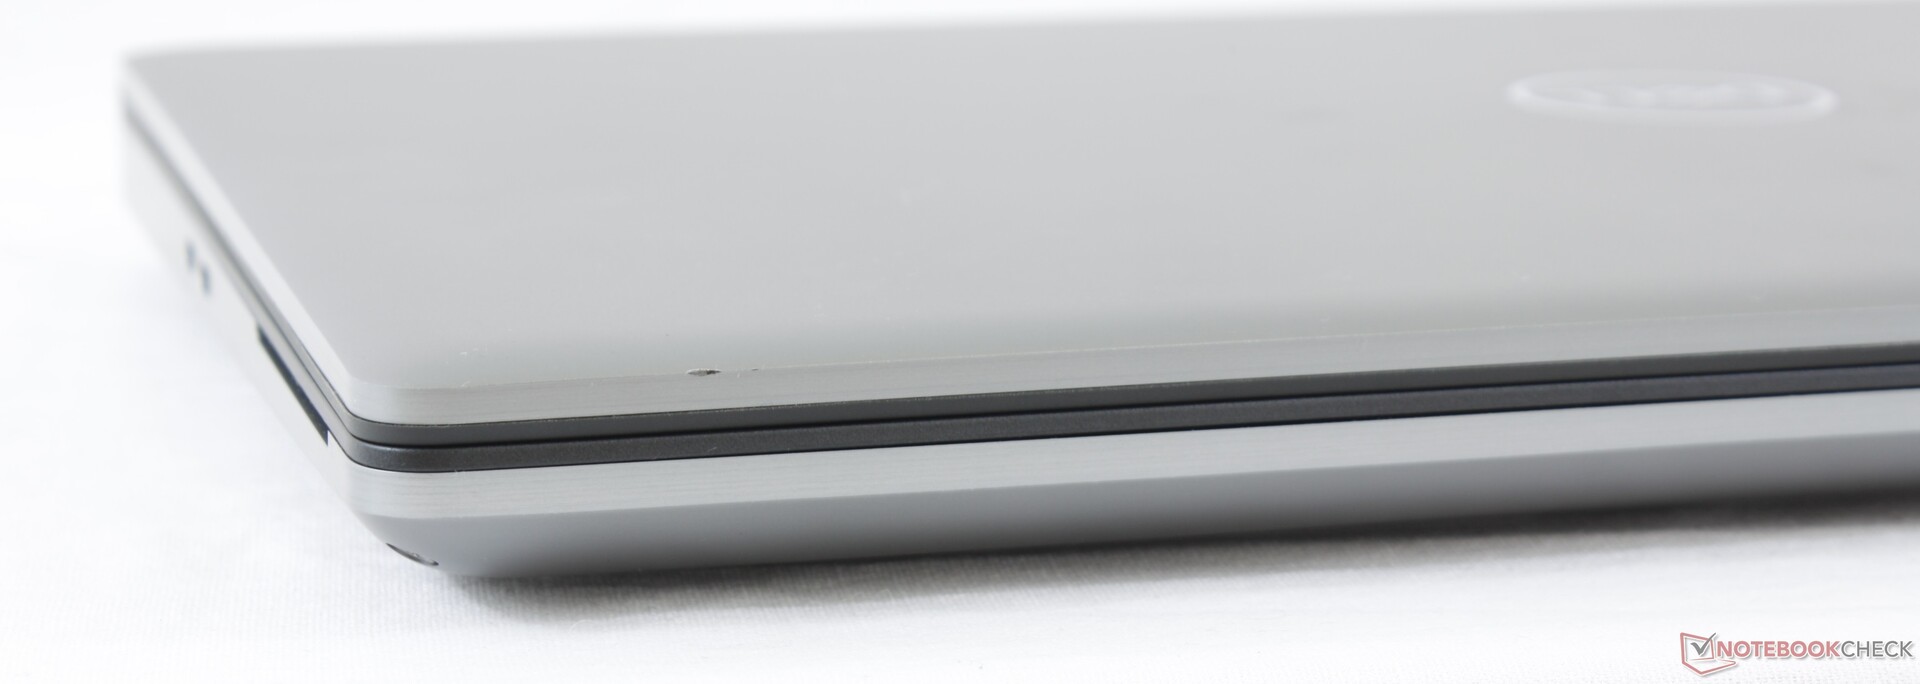
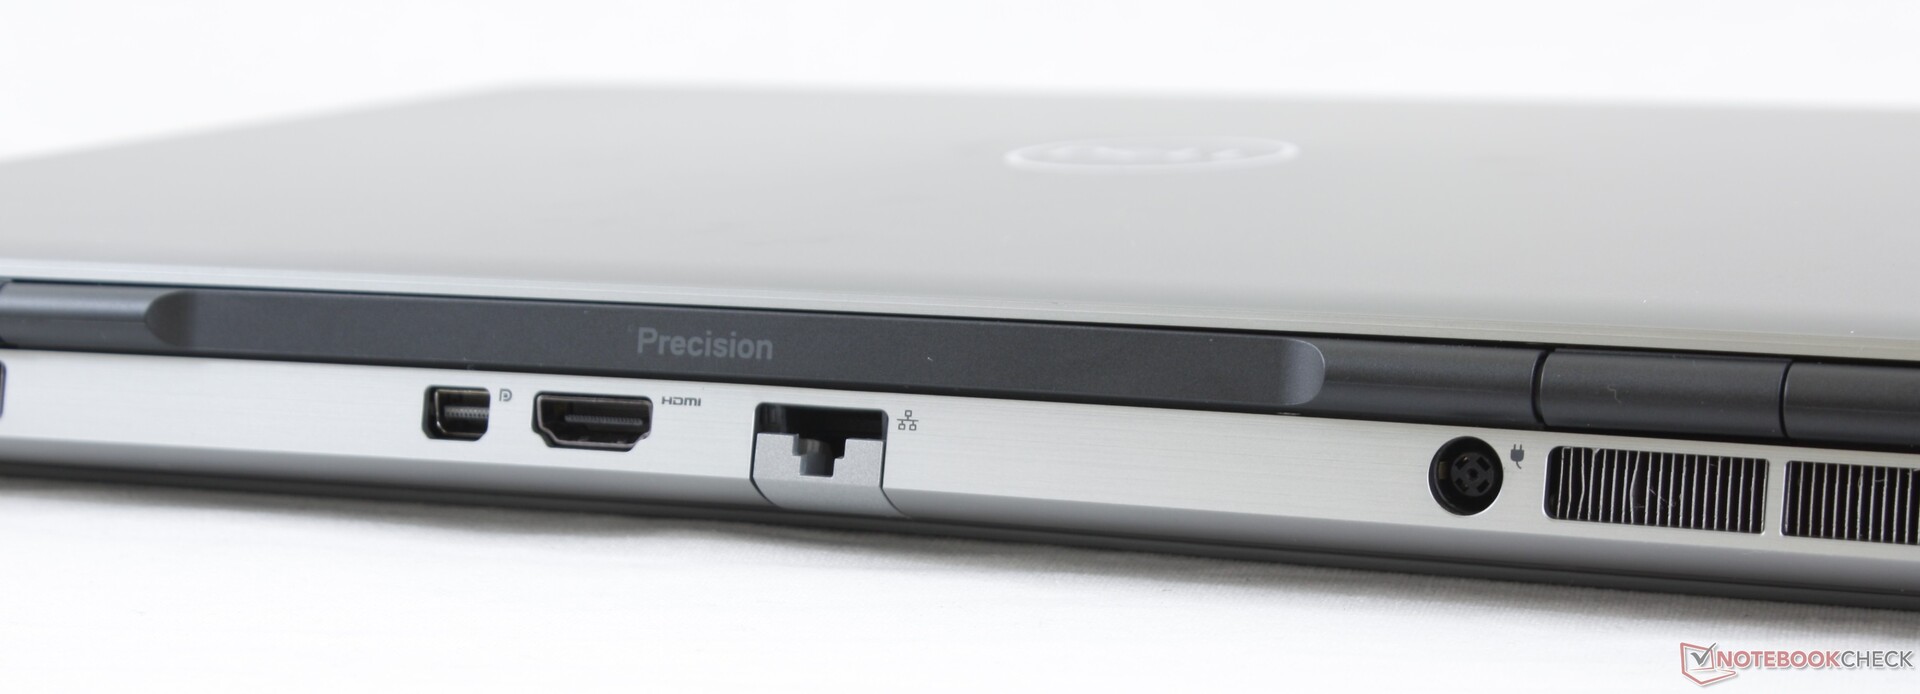
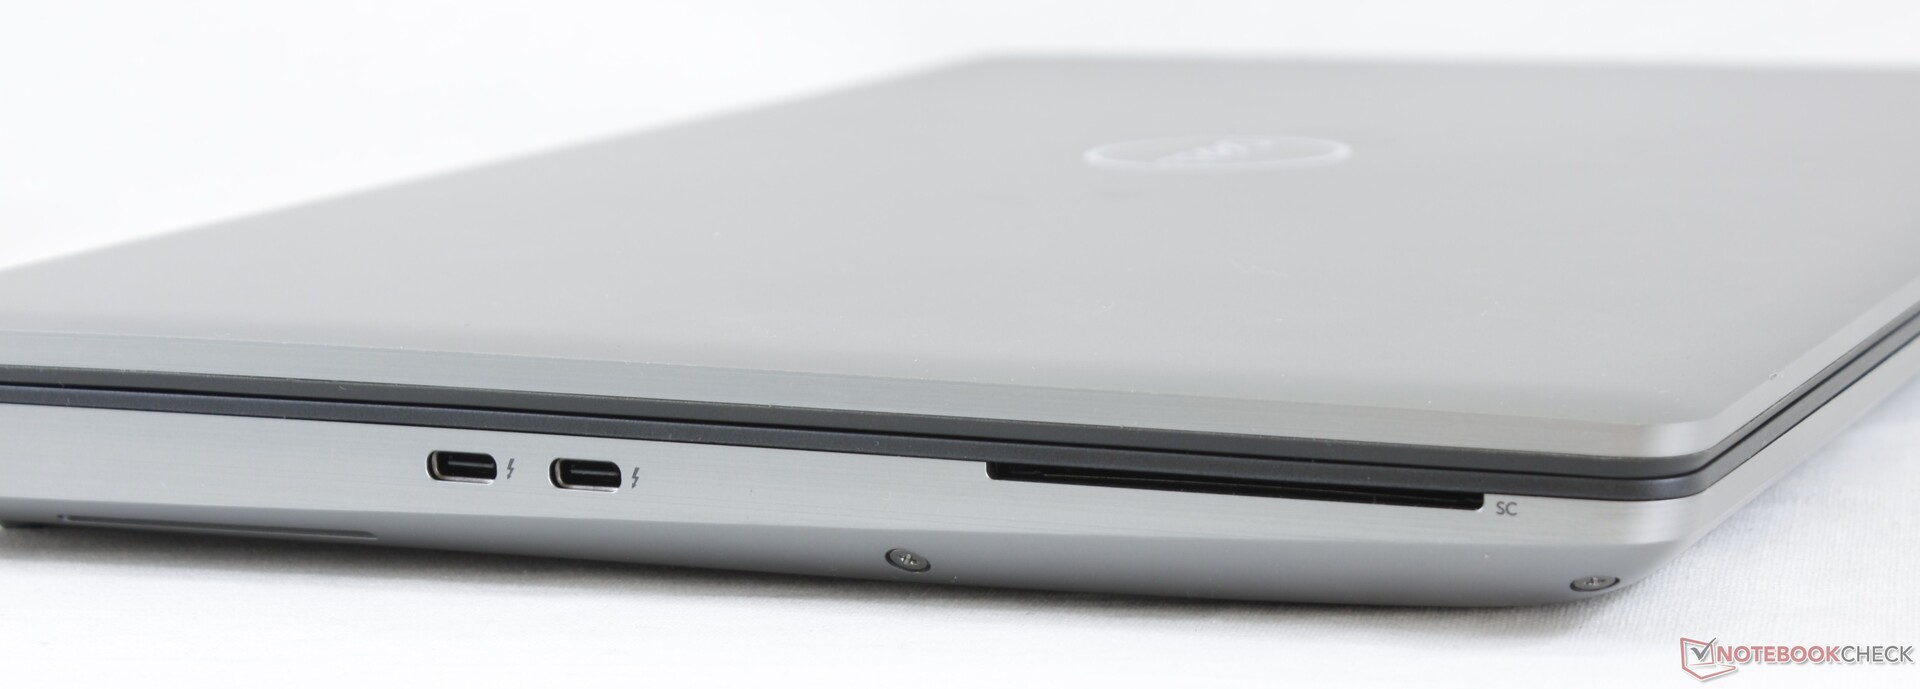
A la différence de nombreuses stations de travail, le Precision 7550 n'a pas honte d'être gros et encombrant, afin d'intégrer plus de fonctionnalités et de composants que les utilisateurs ciblés recherchent dans ce type de machine. On ne trouvera pas de fonctionnalités utiles telles que le WAN, un lecteur de carte à puce, un 4e emplacement SODIMM, des boutons de souris dédiés, un pavé numérique grand format, ou un troisième emplacement de stockage M.2, sur les stations ultrafines telles que le Precision 5550, le MSI WS66, le Razer Blade 15 Studio, ou l'Asus StudioBook Pro 15. Pour certains, ces extras valent bien le gain de taille...
Le principal défaut de la machine est qu'elle utilise des GPU Quadro Max-Q, et non des variantes plus puissantes non Max-Q, malgré la taille et le poids du châssis. Les machines concurrentes comme l'Acer ConceptD 9 Pro démontrent que la Quadro RTX 5000 peut fournir au moins 30 % de performances supplémentaires que la Quadro RTX 5000 Max-Q. Nous soupçonnons qu'il n'y a pas de Quadro RTX 5000 non Max-Q parce que l'adaptateur secteur de 180 W n'y suffirait pas. De ce fait, les performances graphiques sont à peu près les mêmes que celles des MSI WS66, Razer Blade 15 Studio ou Asus StudioBook, alors qu'il sont largement plus compacts que notre Precision 7550.
Le Precision 7550 et une station de travail séduisante pour ceux qui valorisent ses fonctionnalités et son évolutivité. Si ce n'est pas le cas, l'on aura le même niveau de performances avec des stations de travail Nvidia Studio, bien plus légères et compactes.
L’intégralité de cette critique est disponible en anglais en suivant ce lien.
Dell Precision 7550
- 08/28/2020 v7 (old)
Allen Ngo
Price comparison
