Test du MSI WP65 9TH (i7-9750H, Quadro P620, FHD) : pour les professionnels au petit budget
Note | Date | Modèle | Poids | Épaisseur | Taille | Résolution | Prix |
|---|---|---|---|---|---|---|---|
| 76 % v7 (old) | 10/19 | MSI WP65 i7-9750H, Quadro P620 | 1.9 kg | 21.7 mm | 15.60" | 1920x1080 | |
| 80.8 % v7 (old) | 10/19 | HP ZBook 15u G6 6TP54EA i7-8565U, Radeon Pro WX 3200 | 1.6 kg | 19 mm | 15.60" | 3840x2160 | |
| 87.8 % v7 (old) | 08/19 | Lenovo ThinkPad P1 2019-20QT000RGE i7-9850H, Quadro T1000 (Laptop) | 1.7 kg | 18.4 mm | 15.60" | 1920x1080 | |
| 86.9 % v7 (old) | 11/18 | Dell Precision 7530 i9-8950HK, Quadro P3200 | 2.6 kg | 29.95 mm | 15.60" | 3840x2160 | |
| 83.2 % v6 (old) | 06/18 | Lenovo ThinkPad P52s-20LB000HGE i5-8550U, Quadro P500 | 2.2 kg | 20.2 mm | 15.60" | 1920x1080 |
| |||||||||||||||||||||||||
Homogénéité de la luminosité: 86 %
Valeur mesurée au centre, sur batterie: 267.4 cd/m²
Contraste: 723:1 (Valeurs des noirs: 0.37 cd/m²)
ΔE ColorChecker Calman: 4.21 | ∀{0.5-29.43 Ø4.73}
calibrated: 4.27
ΔE Greyscale Calman: 2.3 | ∀{0.09-98 Ø4.97}
58.5% sRGB (Argyll 1.6.3 3D)
37.2% AdobeRGB 1998 (Argyll 1.6.3 3D)
40.69% AdobeRGB 1998 (Argyll 3D)
58.8% sRGB (Argyll 3D)
39.46% Display P3 (Argyll 3D)
Gamma: 2.2
CCT: 6578 K
| MSI WP65 AU Optronics B156HAN02.1, IPS, 15.6", 1920x1080 | HP ZBook 15u G6 6TP54EA AU Optronics AUO30EB, IPS, 15.6", 3840x2160 | Lenovo ThinkPad P1 2019-20QT000RGE N156HCE-GN1, IPS LED, 15.6", 1920x1080 | Dell Precision 7530 Sharp LQ156D1, IPS, 15.6", 3840x2160 | Lenovo ThinkPad P52s-20LB000HGE NV156FHM-N47, IPS LED, 15.6", 1920x1080 | MSI WS63VR 7RL-023US SAMSUNG LƒFL156FL02-101 , IPS, 15.6", 3840x2160 | |
|---|---|---|---|---|---|---|
| Display | 70% | 57% | 105% | 6% | 20% | |
| Display P3 Coverage (%) | 39.46 | 69.2 75% | 62.4 58% | 82.5 109% | 41.83 6% | 47.43 20% |
| sRGB Coverage (%) | 58.8 | 97.1 65% | 91.5 56% | 99.4 69% | 62.1 6% | 71.4 21% |
| AdobeRGB 1998 Coverage (%) | 40.69 | 69.7 71% | 63.4 56% | 96.2 136% | 43.22 6% | 49 20% |
| Response Times | -45% | 29% | 5% | -33% | -1% | |
| Response Time Grey 50% / Grey 80% * (ms) | 37.6 ? | 68.8 ? -83% | 34.4 ? 9% | 35.2 ? 6% | 47.2 ? -26% | 36.8 ? 2% |
| Response Time Black / White * (ms) | 27.6 ? | 29.6 -7% | 14 ? 49% | 26.4 ? 4% | 38.4 ? -39% | 28.4 ? -3% |
| PWM Frequency (Hz) | 26040 ? | 198.4 ? | 21550 ? | 1351 ? | ||
| Screen | 42% | 39% | 24% | 20% | -5% | |
| Brightness middle (cd/m²) | 267.4 | 451 69% | 542 103% | 292.8 9% | 291 9% | 259.4 -3% |
| Brightness (cd/m²) | 259 | 434 68% | 528 104% | 295 14% | 284 10% | 247 -5% |
| Brightness Distribution (%) | 86 | 89 3% | 84 -2% | 85 -1% | 91 6% | 85 -1% |
| Black Level * (cd/m²) | 0.37 | 0.25 32% | 0.41 -11% | 0.36 3% | 0.11 70% | 0.43 -16% |
| Contrast (:1) | 723 | 1804 150% | 1322 83% | 813 12% | 2645 266% | 603 -17% |
| Colorchecker dE 2000 * | 4.21 | 4.4 -5% | 3.5 17% | 3.48 17% | 6.7 -59% | 5.5 -31% |
| Colorchecker dE 2000 max. * | 21.1 | 6.7 68% | 7.8 63% | 6.81 68% | 20.2 4% | 12.7 40% |
| Colorchecker dE 2000 calibrated * | 4.27 | 1.8 58% | 1.3 70% | 3.13 27% | 4.5 -5% | |
| Greyscale dE 2000 * | 2.3 | 5 -117% | 4.8 -109% | 4.1 -78% | 4.5 -96% | 3.6 -57% |
| Gamma | 2.2 100% | 2.31 95% | 2.33 94% | 2.2 100% | 2.28 96% | 2.24 98% |
| CCT | 6578 99% | 7717 84% | 7690 85% | 6740 96% | 7503 87% | 7163 91% |
| Color Space (Percent of AdobeRGB 1998) (%) | 37.2 | 63 69% | 58.8 58% | 84.4 127% | 39.6 6% | 45 21% |
| Color Space (Percent of sRGB) (%) | 58.5 | 97 66% | 91.1 56% | 99.6 70% | 61.7 5% | 71 21% |
| Moyenne finale (programmes/paramètres) | 22% /
36% | 42% /
41% | 45% /
37% | -2% /
11% | 5% /
1% |
* ... Moindre est la valeur, meilleures sont les performances
Temps de réponse de l'écran
| ↔ Temps de réponse noir à blanc | ||
|---|---|---|
| 27.6 ms ... hausse ↗ et chute ↘ combinées | ↗ 15.2 ms hausse | 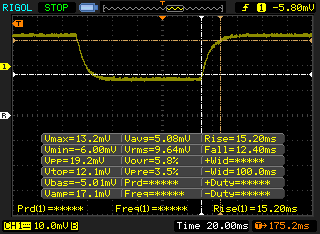 |
| ↘ 12.4 ms chute | ||
| L'écran souffre de latences relativement élevées, insuffisant pour le jeu. En comparaison, tous les appareils testés affichent entre 0.1 (minimum) et 240 (maximum) ms. » 70 % des appareils testés affichent de meilleures performances. Cela signifie que les latences relevées sont moins bonnes que la moyenne (19.9 ms) de tous les appareils testés. | ||
| ↔ Temps de réponse gris 50% à gris 80% | ||
| 37.6 ms ... hausse ↗ et chute ↘ combinées | ↗ 20.4 ms hausse | 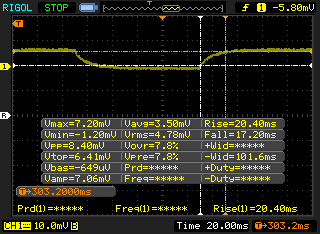 |
| ↘ 17.2 ms chute | ||
| L'écran souffre de latences très élevées, à éviter pour le jeu. En comparaison, tous les appareils testés affichent entre 0.165 (minimum) et 636 (maximum) ms. » 54 % des appareils testés affichent de meilleures performances. Cela signifie que les latences relevées sont moins bonnes que la moyenne (31.1 ms) de tous les appareils testés. | ||
Scintillement / MLI (Modulation de largeur d'impulsion)
| Scintillement / MLI (Modulation de largeur d'impulsion) non décelé | 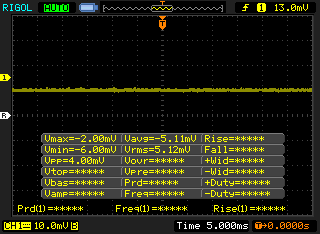 | ||
En comparaison, 52 % des appareils testés n'emploient pas MDI pour assombrir leur écran. Nous avons relevé une moyenne à 7801 (minimum : 5 - maximum : 343500) Hz dans le cas où une MDI était active. | |||
| PCMark 8 Home Score Accelerated v2 | 4165 points | |
| PCMark 8 Work Score Accelerated v2 | 5213 points | |
| PCMark 10 Score | 5025 points | |
Aide | ||
| MSI WP65 Samsung SSD PM981 MZVLB512HAJQ | HP ZBook 15u G6 6TP54EA Samsung SSD PM981 MZVLB512HAJQ | Lenovo ThinkPad P1 2019-20QT000RGE WDC PC SN720 SDAQNTW-512G | Dell Precision 7530 Samsung PM961 NVMe MZVLW512HMJP | Lenovo ThinkPad P52s-20LB000HGE Samsung PM961 MZVLW256HEHP | MSI WS63VR 7RL-023US Toshiba NVMe THNSN5512GPU7 | |
|---|---|---|---|---|---|---|
| AS SSD | 15% | 20% | 3% | -8% | -26% | |
| Seq Read (MB/s) | 1097 | 2083 90% | 2980 172% | 1807 65% | 1463 33% | 2133 94% |
| Seq Write (MB/s) | 1838 | 1715 -7% | 2094 14% | 1540 -16% | 1164 -37% | 1287 -30% |
| 4K Read (MB/s) | 52.9 | 55.3 5% | 45.05 -15% | 34.27 -35% | 44.98 -15% | 40.2 -24% |
| 4K Write (MB/s) | 108.4 | 137.6 27% | 155.4 43% | 103 -5% | 140 29% | 114.6 6% |
| 4K-64 Read (MB/s) | 1509 | 1211 -20% | 1291 -14% | 1304 -14% | 1312 -13% | 710 -53% |
| 4K-64 Write (MB/s) | 1695 | 1446 -15% | 1506 -11% | 1221 -28% | 612 -64% | 314 -81% |
| Access Time Read * (ms) | 0.067 | 0.039 42% | 0.064 4% | 0.055 18% | 0.065 3% | 0.128 -91% |
| Access Time Write * (ms) | 0.103 | 0.026 75% | 0.024 77% | 0.037 64% | 0.026 75% | 0.033 68% |
| Score Read (Points) | 1671 | 1474 -12% | 1634 -2% | 1519 -9% | 1504 -10% | 962 -42% |
| Score Write (Points) | 1988 | 1755 -12% | 1871 -6% | 1478 -26% | 868 -56% | 557 -72% |
| Score Total (Points) | 4558 | 3976 -13% | 4300 -6% | 3761 -17% | 3131 -31% | 1979 -57% |
| Copy ISO MB/s (MB/s) | 1800 | 2015 12% | 3015 68% | |||
| Copy Program MB/s (MB/s) | 569 | 597 5% | 519 -9% | |||
| Copy Game MB/s (MB/s) | 1409 | 1449 3% | 1172 -17% |
* ... Moindre est la valeur, meilleures sont les performances

| 3DMark 06 Standard Score | 34862 points | |
| 3DMark Vantage P Result | 25105 points | |
| 3DMark 11 Performance | 6492 points | |
| 3DMark Ice Storm Standard Score | 100811 points | |
| 3DMark Cloud Gate Standard Score | 22501 points | |
| 3DMark Fire Strike Score | 4493 points | |
| 3DMark Time Spy Score | 1572 points | |
Aide | ||
| Bas | Moyen | Élevé | Ultra | |
|---|---|---|---|---|
| Guild Wars 2 (2012) | 149.9 | 73.1 | 28.4 | |
| StarCraft II: Heart of the Swarm (2013) | 542 | 258.9 | 156.8 | 82.4 |
| BioShock Infinite (2013) | 301.7 | 160.9 | 140 | 52.8 |
| The Witcher 3 (2015) | 101 | 57.7 | 33 | 18.1 |
| Rise of the Tomb Raider (2016) | 101.9 | 62.9 | 33.7 | 26.4 |
| Ashes of the Singularity (2016) | 50.6 | 29.2 | 25.4 | |
| Doom (2016) | 96.7 | 76.3 | 44.1 | |
| Overwatch (2016) | 261.8 | 169 | 77 | |
| Prey (2017) | 144.7 | 74.8 | 56.7 | |
| Rocket League (2017) | 248.9 | 153.5 | 96.5 | |
| Middle-earth: Shadow of War (2017) | 96 | 37 | 27 | 20 |
| Destiny 2 (2017) | 100.5 | 48.6 | 37.6 | 30.1 |
| Fortnite (2018) | 183.6 | 113.2 | 41.9 | 29.3 |
| Final Fantasy XV Benchmark (2018) | 51.9 | 25.6 | 18.3 | |
| F1 2018 (2018) | 106 | 55 | 42 | 25 |
| Shadow of the Tomb Raider (2018) | 70 | 16 | 14 | 12 |
| Apex Legends (2019) | 88.4 | 35.2 | 29.1 | 26 |
| Metro Exodus (2019) | 46.6 | 21.4 | 15.5 | 12.9 |
| F1 2019 (2019) | 102 | 46 | 39 | 26 |
| Borderlands 3 (2019) | 75.8 | 29.7 | 19.3 | 14.5 |
| FIFA 20 (2019) | 166 | 117.8 | 112 | 92.4 |
| MSI WP65 Quadro P620, i7-9750H, Samsung SSD PM981 MZVLB512HAJQ | HP ZBook 15u G6 6TP54EA Radeon Pro WX 3200, i7-8565U, Samsung SSD PM981 MZVLB512HAJQ | Lenovo ThinkPad P1 2019-20QT000RGE Quadro T1000 (Laptop), i7-9850H, WDC PC SN720 SDAQNTW-512G | Dell Precision 7530 Quadro P3200, i9-8950HK, Samsung PM961 NVMe MZVLW512HMJP | Lenovo ThinkPad P52s-20LB000HGE Quadro P500, i5-8550U, Samsung PM961 MZVLW256HEHP | MSI WS63VR 7RL-023US Quadro P4000 Max-Q, i7-7700HQ, Toshiba NVMe THNSN5512GPU7 | |
|---|---|---|---|---|---|---|
| Noise | 13% | 14% | 5% | 14% | 3% | |
| arrêt / environnement * (dB) | 28.7 | 29.7 -3% | 28.8 -0% | 28.3 1% | 29 -1% | 28 2% |
| Idle Minimum * (dB) | 33.4 | 29.7 11% | 28.8 14% | 28.3 15% | 29 13% | 33.2 1% |
| Idle Average * (dB) | 33.5 | 29.7 11% | 28.8 14% | 28.3 16% | 29 13% | 33.2 1% |
| Idle Maximum * (dB) | 33.5 | 30.3 10% | 28.8 14% | 30.5 9% | 31.2 7% | 33.2 1% |
| Load Average * (dB) | 37 | 32.6 12% | 36.1 2% | 34.5 7% | 32.5 12% | 41.4 -12% |
| Witcher 3 ultra * (dB) | 38.7 | 34.2 12% | 49.5 -28% | 32.5 16% | 38.4 1% | |
| Load Maximum * (dB) | 59.5 | 36.1 39% | 36.7 38% | 49.5 17% | 37.5 37% | 43.5 27% |
* ... Moindre est la valeur, meilleures sont les performances
Degré de la nuisance sonore
| Au repos |
| 33.4 / 33.5 / 33.5 dB(A) |
| Fortement sollicité |
| 37 / 59.5 dB(A) |
 | ||
30 dB silencieux 40 dB(A) audible 50 dB(A) bruyant |
||
min: | ||
(±) La température maximale du côté supérieur est de 42.8 °C / 109 F, par rapport à la moyenne de 38.2 °C / 101 F, allant de 22.2 à 69.8 °C pour la classe Workstation.
(-) Le fond chauffe jusqu'à un maximum de 47.4 °C / 117 F, contre une moyenne de 41.1 °C / 106 F
(+) En utilisation inactive, la température moyenne du côté supérieur est de 28 °C / 82 F, par rapport à la moyenne du dispositif de 32 °C / 90 F.
(+) En jouant à The Witcher 3, la température moyenne du côté supérieur est de 29.2 °C / 85 F, alors que la moyenne de l'appareil est de 32 °C / 90 F.
(+) Les repose-poignets et le pavé tactile sont plus froids que la température de la peau avec un maximum de 27.4 °C / 81.3 F et sont donc froids au toucher.
(±) La température moyenne de la zone de l'appui-paume de dispositifs similaires était de 27.8 °C / 82 F (+0.4 °C / #0.7 F).
MSI WP65 analyse audio
(±) | le niveau sonore du haut-parleur est moyen mais bon (77.1# dB)
Basses 100 - 315 Hz
(-) | presque aucune basse - en moyenne 16.5% plus bas que la médiane
(±) | la linéarité des basses est moyenne (14.1% delta à la fréquence précédente)
Médiums 400 - 2000 Hz
(±) | médiane supérieure - en moyenne 5.4% supérieure à la médiane
(±) | la linéarité des médiums est moyenne (12.1% delta à la fréquence précédente)
Aiguës 2 - 16 kHz
(+) | des sommets équilibrés - à seulement 1.8% de la médiane
(±) | la linéarité des aigus est moyenne (8.7% delta à la fréquence précédente)
Globalement 100 - 16 000 Hz
(±) | la linéarité du son global est moyenne (26% de différence avec la médiane)
Par rapport à la même classe
» 87% de tous les appareils testés de cette catégorie étaient meilleurs, 6% similaires, 6% pires
» Le meilleur avait un delta de 7%, la moyenne était de 17%, le pire était de 35%.
Par rapport à tous les appareils testés
» 80% de tous les appareils testés étaient meilleurs, 4% similaires, 16% pires
» Le meilleur avait un delta de 4%, la moyenne était de 24%, le pire était de 134%.
Apple MacBook 12 (Early 2016) 1.1 GHz analyse audio
(+) | les haut-parleurs peuvent jouer relativement fort (83.6# dB)
Basses 100 - 315 Hz
(±) | basse réduite - en moyenne 11.3% inférieure à la médiane
(±) | la linéarité des basses est moyenne (14.2% delta à la fréquence précédente)
Médiums 400 - 2000 Hz
(+) | médiane équilibrée - seulement 2.4% de la médiane
(+) | les médiums sont linéaires (5.5% delta à la fréquence précédente)
Aiguës 2 - 16 kHz
(+) | des sommets équilibrés - à seulement 2% de la médiane
(+) | les aigus sont linéaires (4.5% delta à la fréquence précédente)
Globalement 100 - 16 000 Hz
(+) | le son global est linéaire (10.2% différence à la médiane)
Par rapport à la même classe
» 7% de tous les appareils testés de cette catégorie étaient meilleurs, 2% similaires, 91% pires
» Le meilleur avait un delta de 5%, la moyenne était de 18%, le pire était de 53%.
Par rapport à tous les appareils testés
» 5% de tous les appareils testés étaient meilleurs, 1% similaires, 94% pires
» Le meilleur avait un delta de 4%, la moyenne était de 24%, le pire était de 134%.
| Éteint/en veille | |
| Au repos | |
| Fortement sollicité |
|
Légende:
min: | |
| MSI WP65 i7-9750H, Quadro P620, Samsung SSD PM981 MZVLB512HAJQ, IPS, 1920x1080, 15.6" | HP ZBook 15u G6 6TP54EA i7-8565U, Radeon Pro WX 3200, Samsung SSD PM981 MZVLB512HAJQ, IPS, 3840x2160, 15.6" | Dell Precision 7530 i9-8950HK, Quadro P3200, Samsung PM961 NVMe MZVLW512HMJP, IPS, 3840x2160, 15.6" | Lenovo ThinkPad P52s-20LB000HGE i5-8550U, Quadro P500, Samsung PM961 MZVLW256HEHP, IPS LED, 1920x1080, 15.6" | MSI WS63VR 7RL-023US i7-7700HQ, Quadro P4000 Max-Q, Toshiba NVMe THNSN5512GPU7, IPS, 3840x2160, 15.6" | Lenovo ThinkPad P1 2019-20QT000RGE i7-9850H, Quadro T1000 (Laptop), WDC PC SN720 SDAQNTW-512G, IPS LED, 1920x1080, 15.6" | Lenovo ThinkPad P52 20MAS03N00 i7-8750H, Quadro P1000, Samsung SSD PM981 MZVLB512HAJQ, IPS LED, 1920x1080, 15.6" | |
|---|---|---|---|---|---|---|---|
| Power Consumption | 25% | -77% | 39% | -38% | -38% | 17% | |
| Idle Minimum * (Watt) | 5.6 | 5.5 2% | 15.7 -180% | 4.1 27% | 13.3 -138% | 13.7 -145% | 4.02 28% |
| Idle Average * (Watt) | 8.6 | 9.8 -14% | 20.3 -136% | 7.7 10% | 17.2 -100% | 17.5 -103% | 7.2 16% |
| Idle Maximum * (Watt) | 30.7 | 12 61% | 25.7 16% | 10.7 65% | 17.9 42% | 20.9 32% | 11.46 63% |
| Load Average * (Watt) | 78 | 59 24% | 118.9 -52% | 52 33% | 83.7 -7% | 77.2 1% | 76.3 2% |
| Witcher 3 ultra * (Watt) | 63.5 | 51 20% | 131.2 -107% | 38.8 39% | 101.9 -60% | 74 -17% | |
| Load Maximum * (Watt) | 170.2 | 70 59% | 174 -2% | 65 62% | 114.3 33% | 123.7 27% | 154 10% |
* ... Moindre est la valeur, meilleures sont les performances
| MSI WP65 i7-9750H, Quadro P620, 51 Wh | HP ZBook 15u G6 6TP54EA i7-8565U, Radeon Pro WX 3200, 56 Wh | Lenovo ThinkPad P1 2019-20QT000RGE i7-9850H, Quadro T1000 (Laptop), 80 Wh | Dell Precision 7530 i9-8950HK, Quadro P3200, 97 Wh | Lenovo ThinkPad P52s-20LB000HGE i5-8550U, Quadro P500, 104 Wh | MSI WS63VR 7RL-023US i7-7700HQ, Quadro P4000 Max-Q, 48 Wh | |
|---|---|---|---|---|---|---|
| Autonomie de la batterie | 107% | 83% | 36% | 325% | -21% | |
| Reader / Idle (h) | 10.1 | 12.4 23% | 6.4 -37% | 39.3 289% | 3.9 -61% | |
| WiFi v1.3 (h) | 6 | 6.9 15% | 8.9 48% | 4.6 -23% | 16.2 170% | 2.9 -52% |
| Load (h) | 0.6 | 2.3 283% | 1.3 117% | 1.6 167% | 3.7 517% | 0.9 50% |
Points positifs
Points négatifs
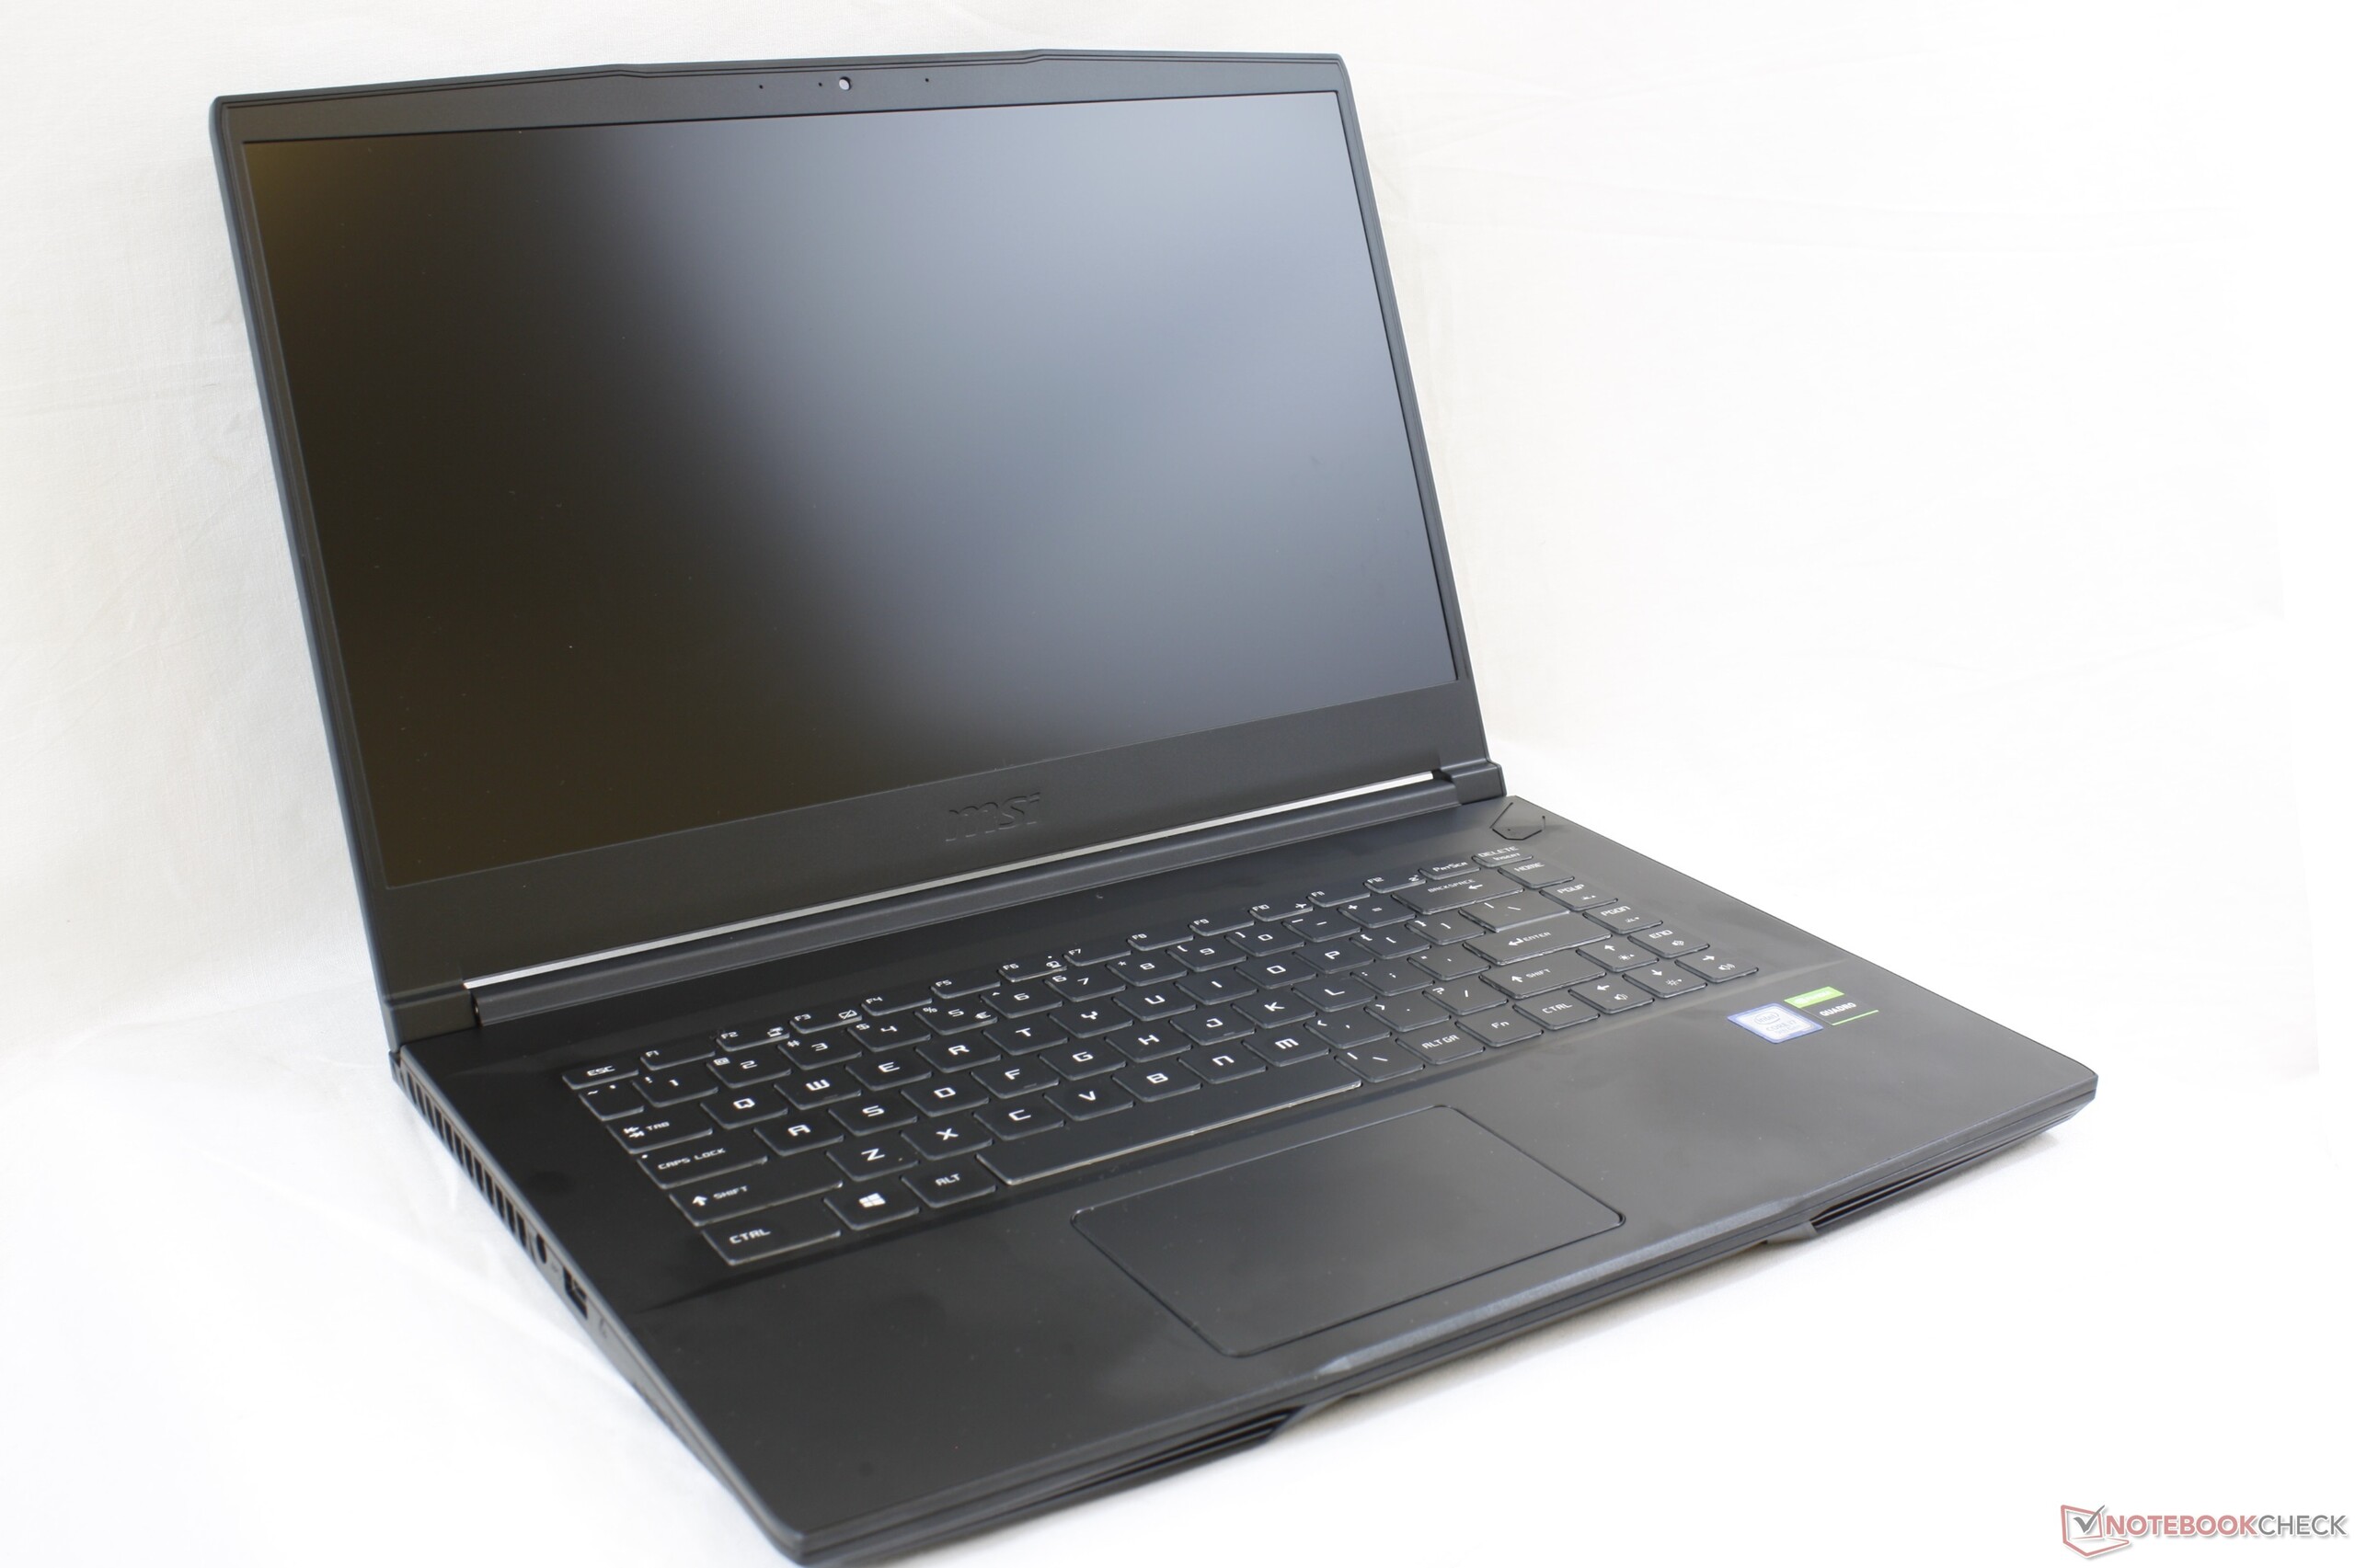
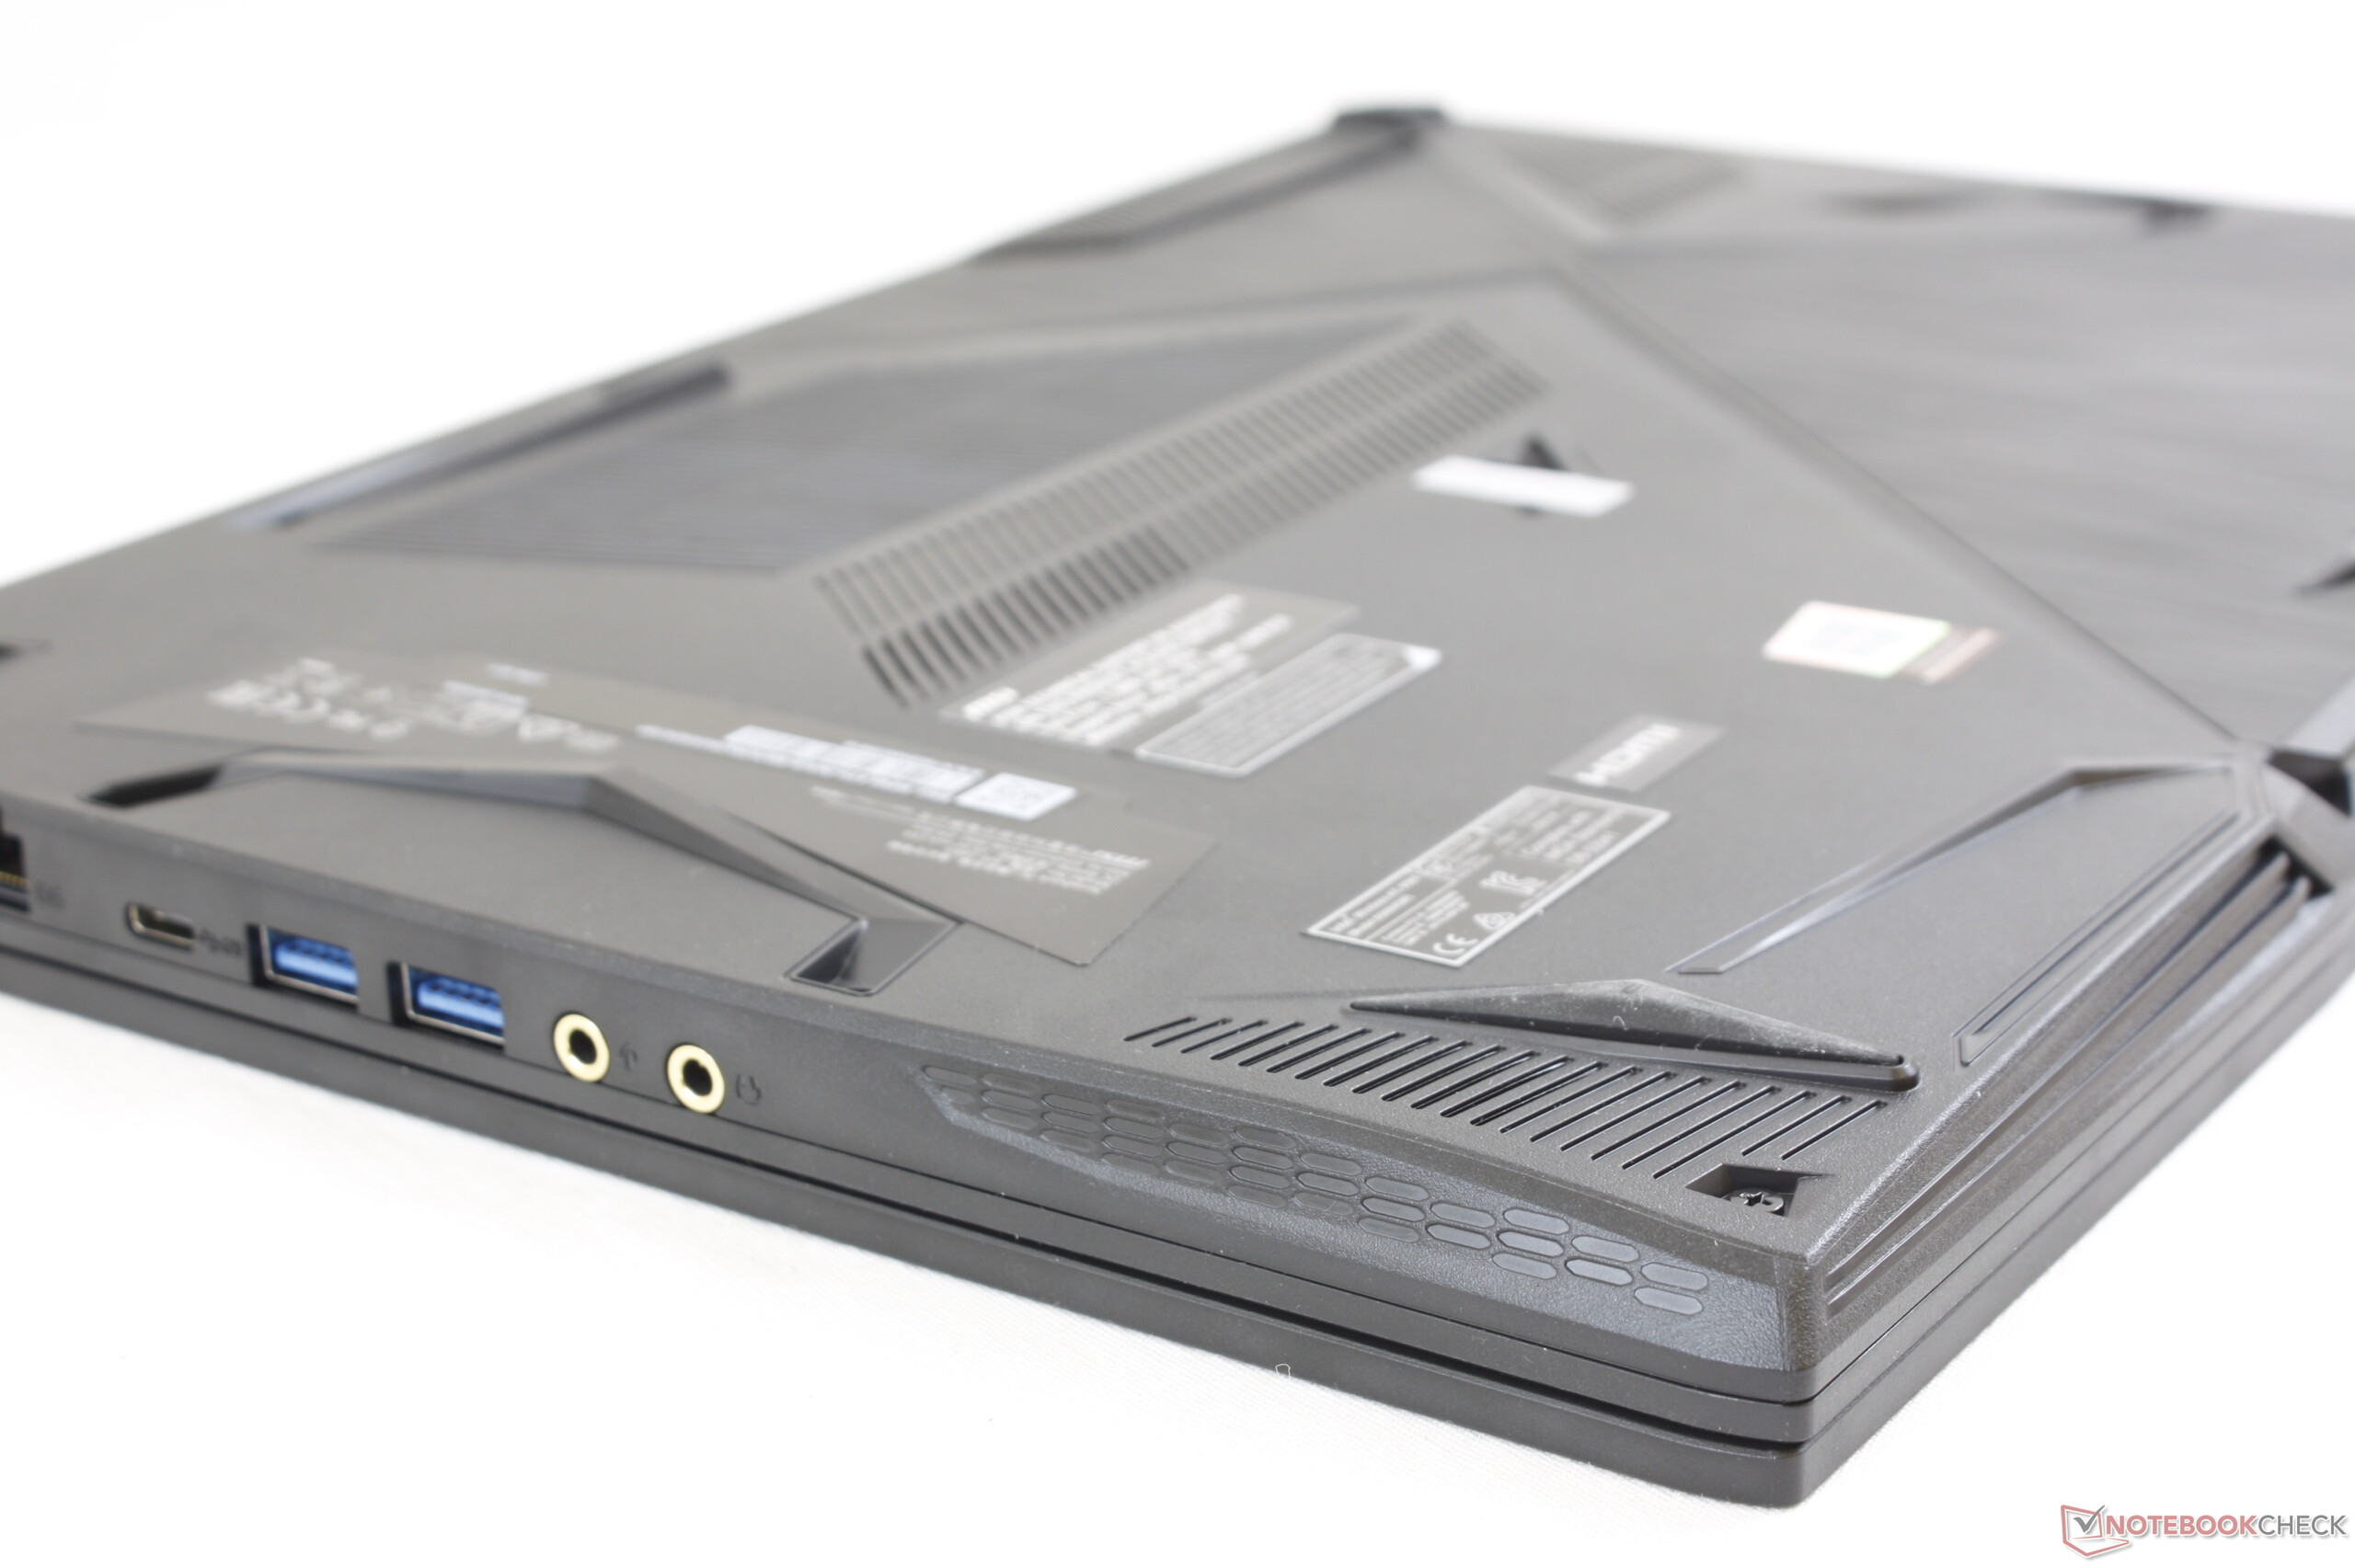
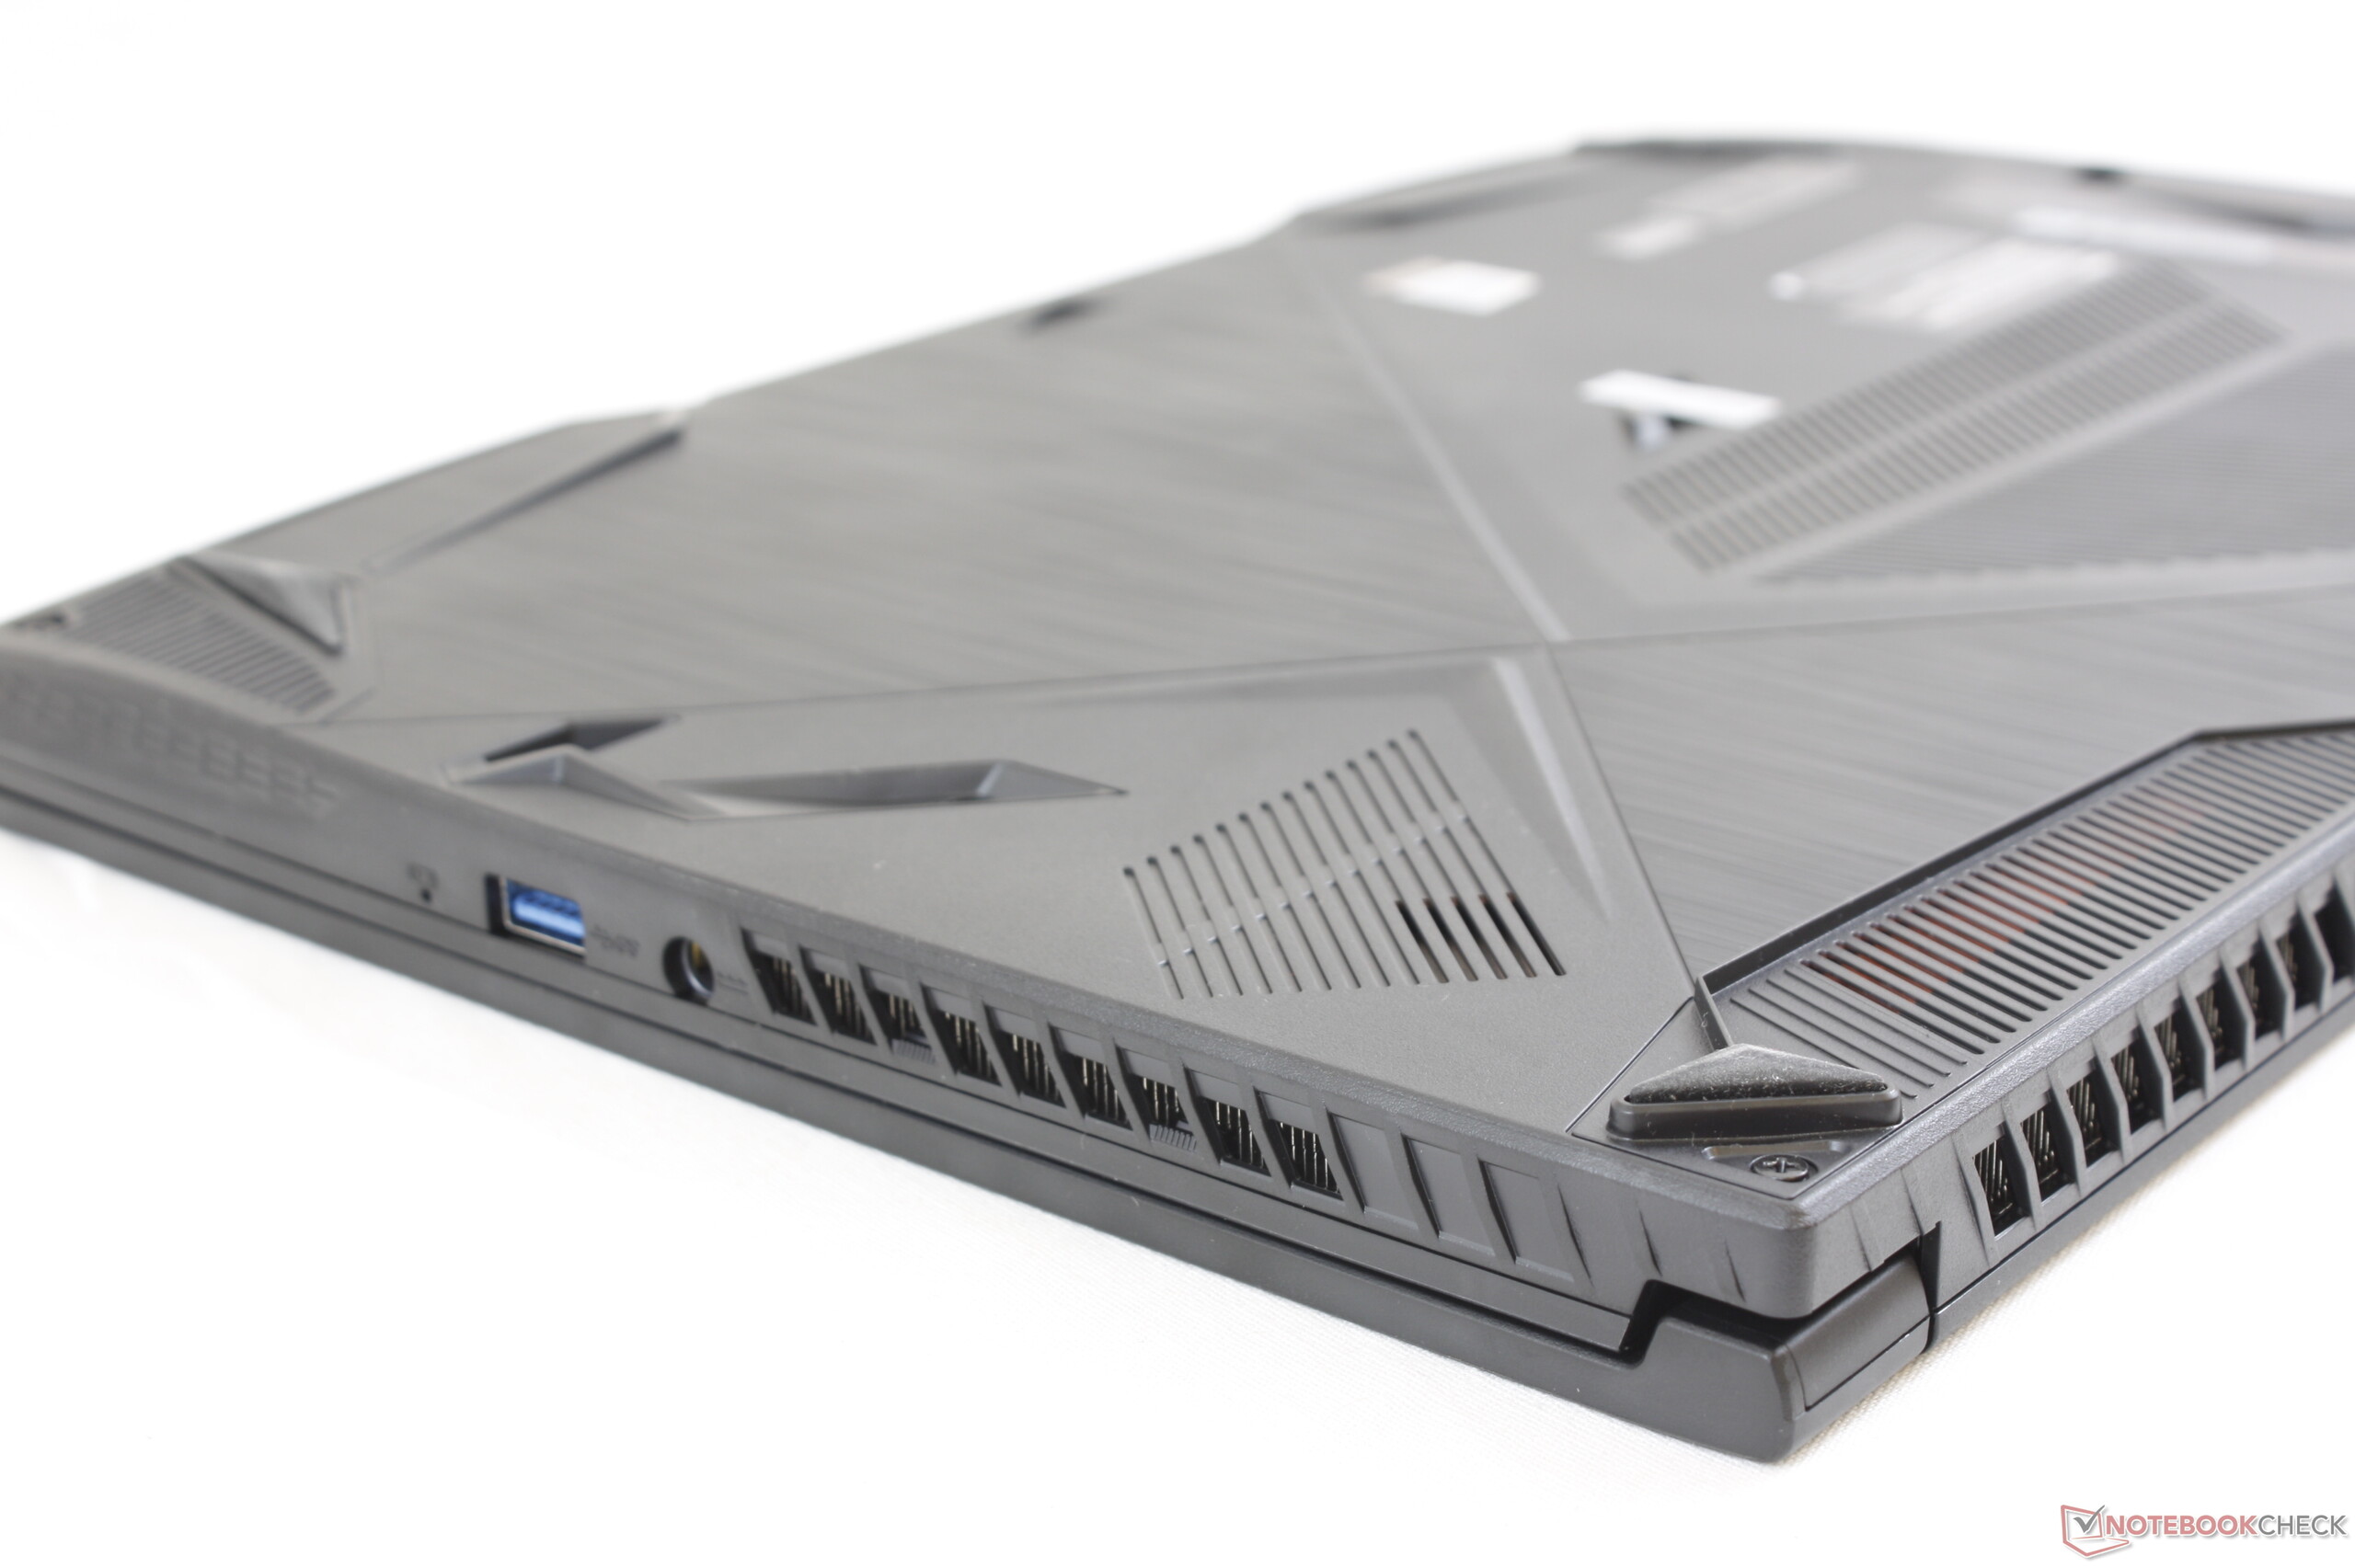
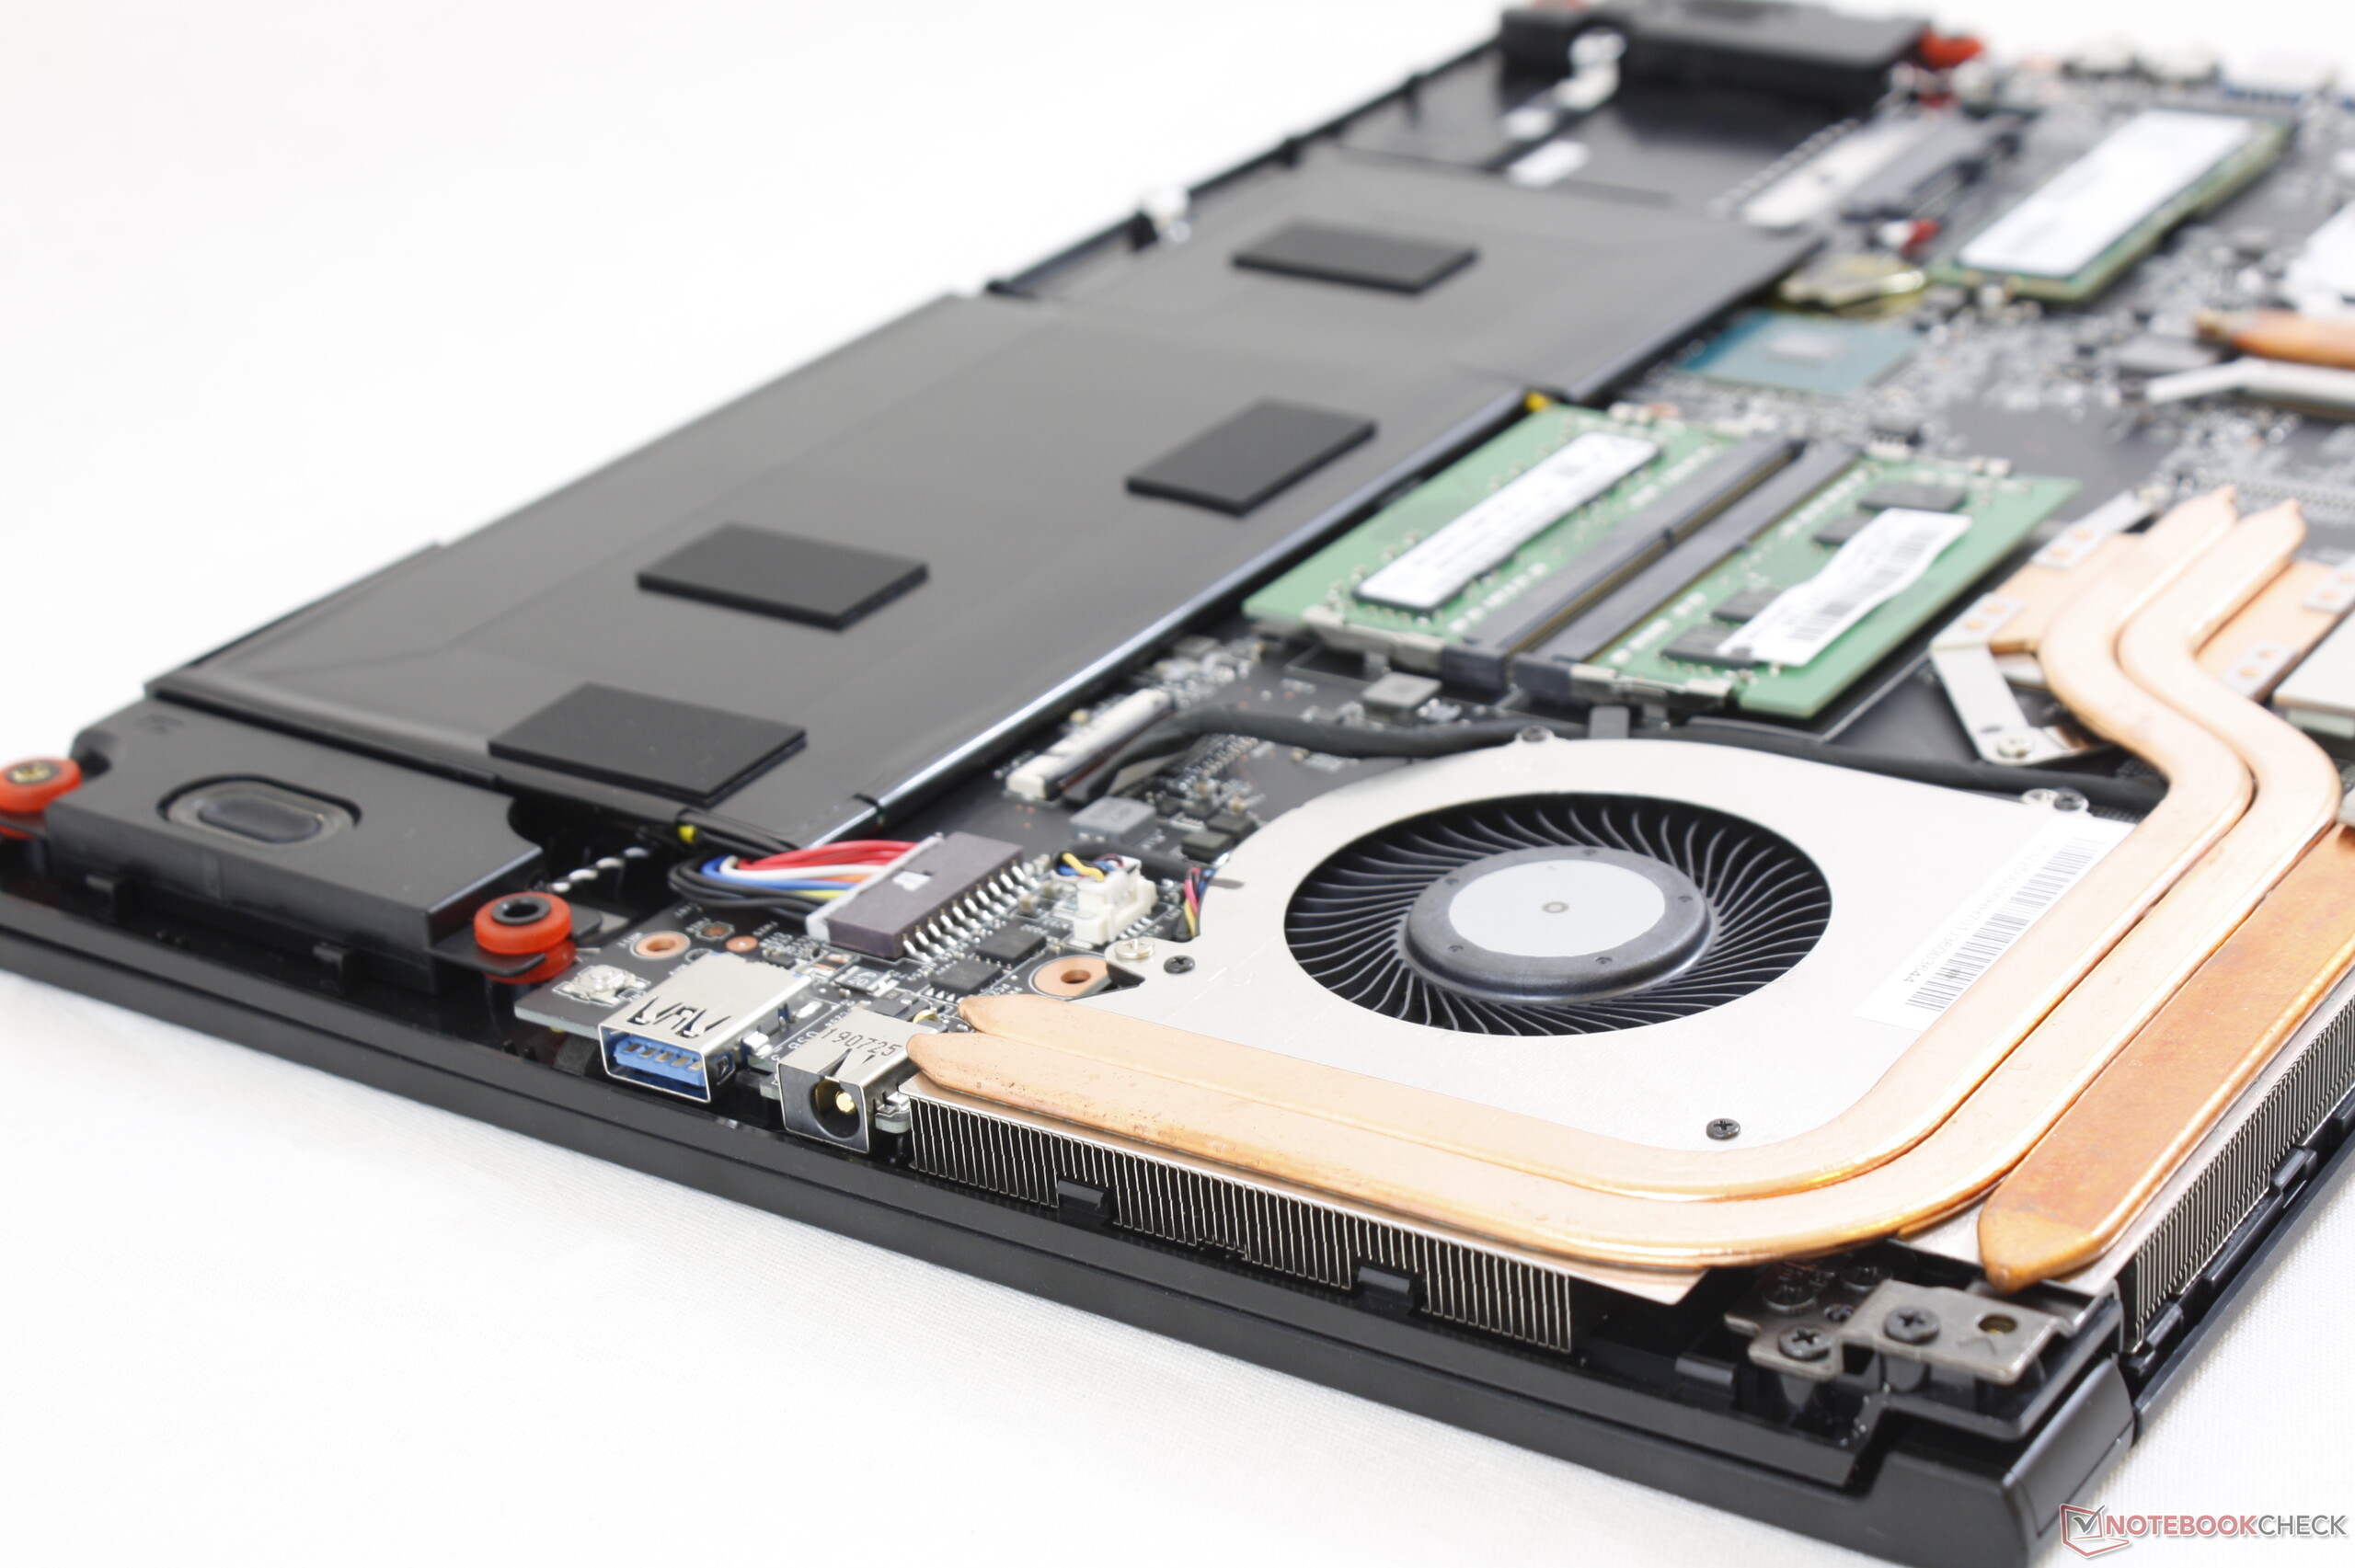
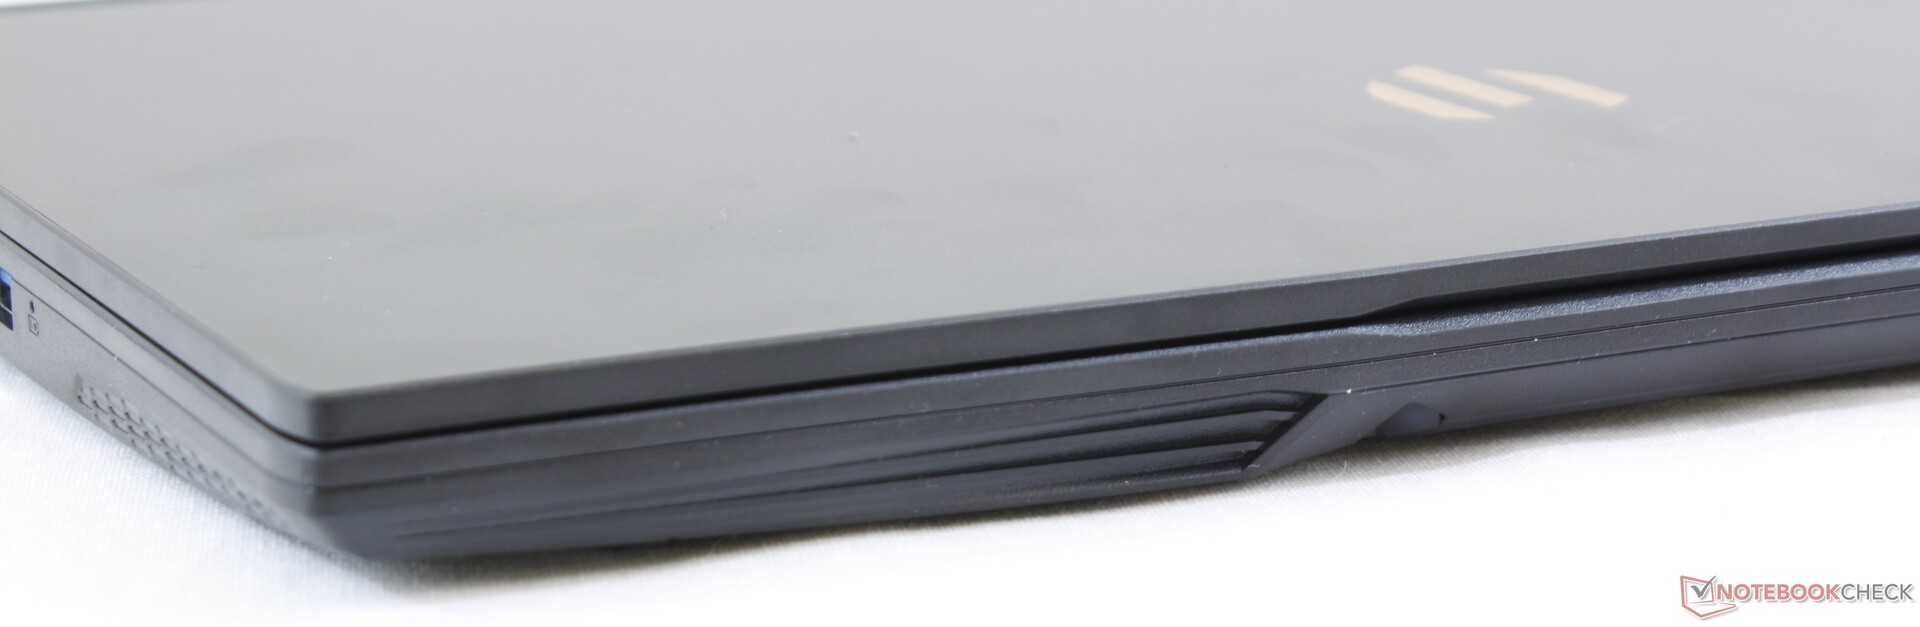
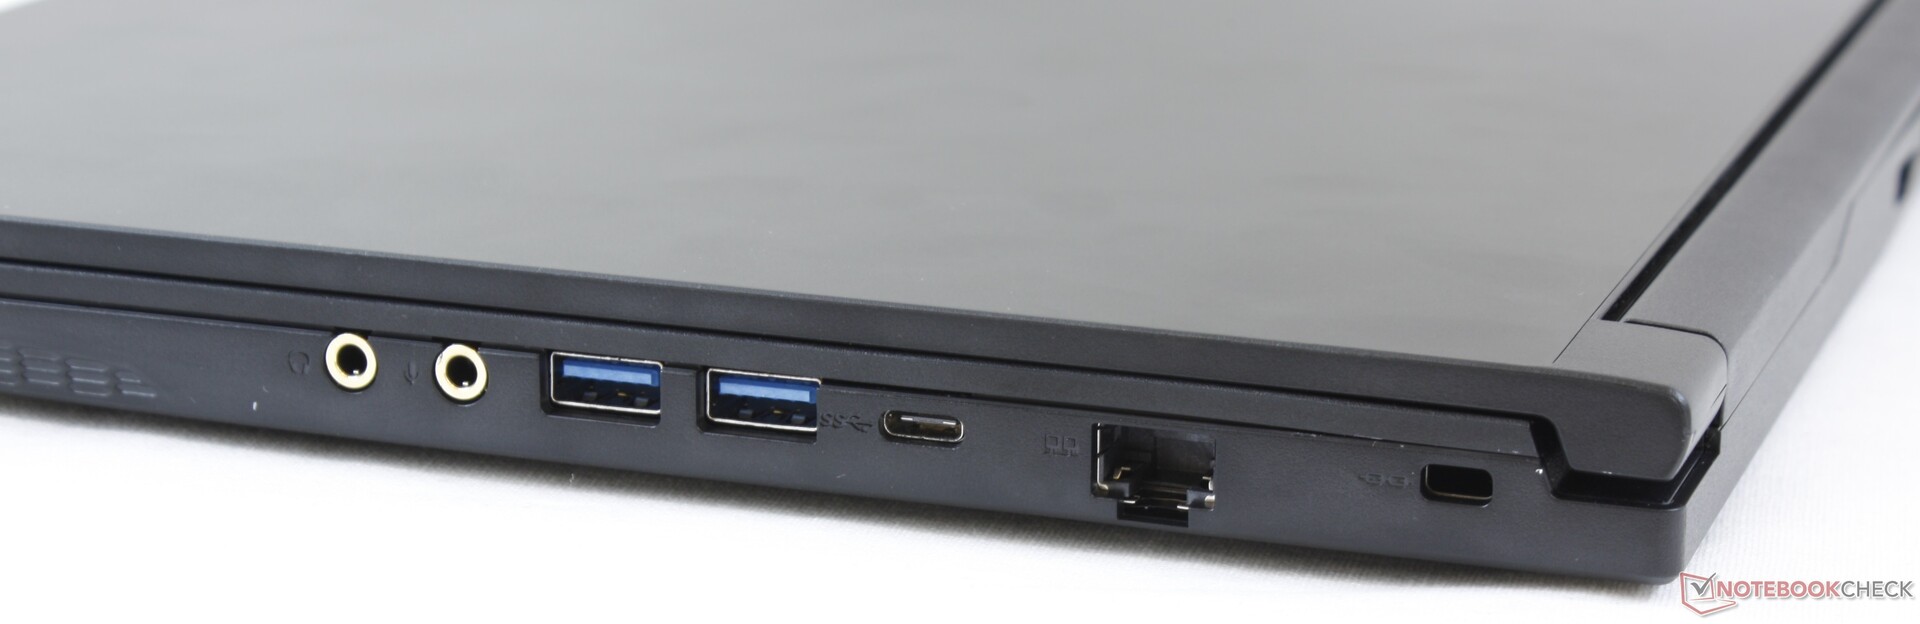
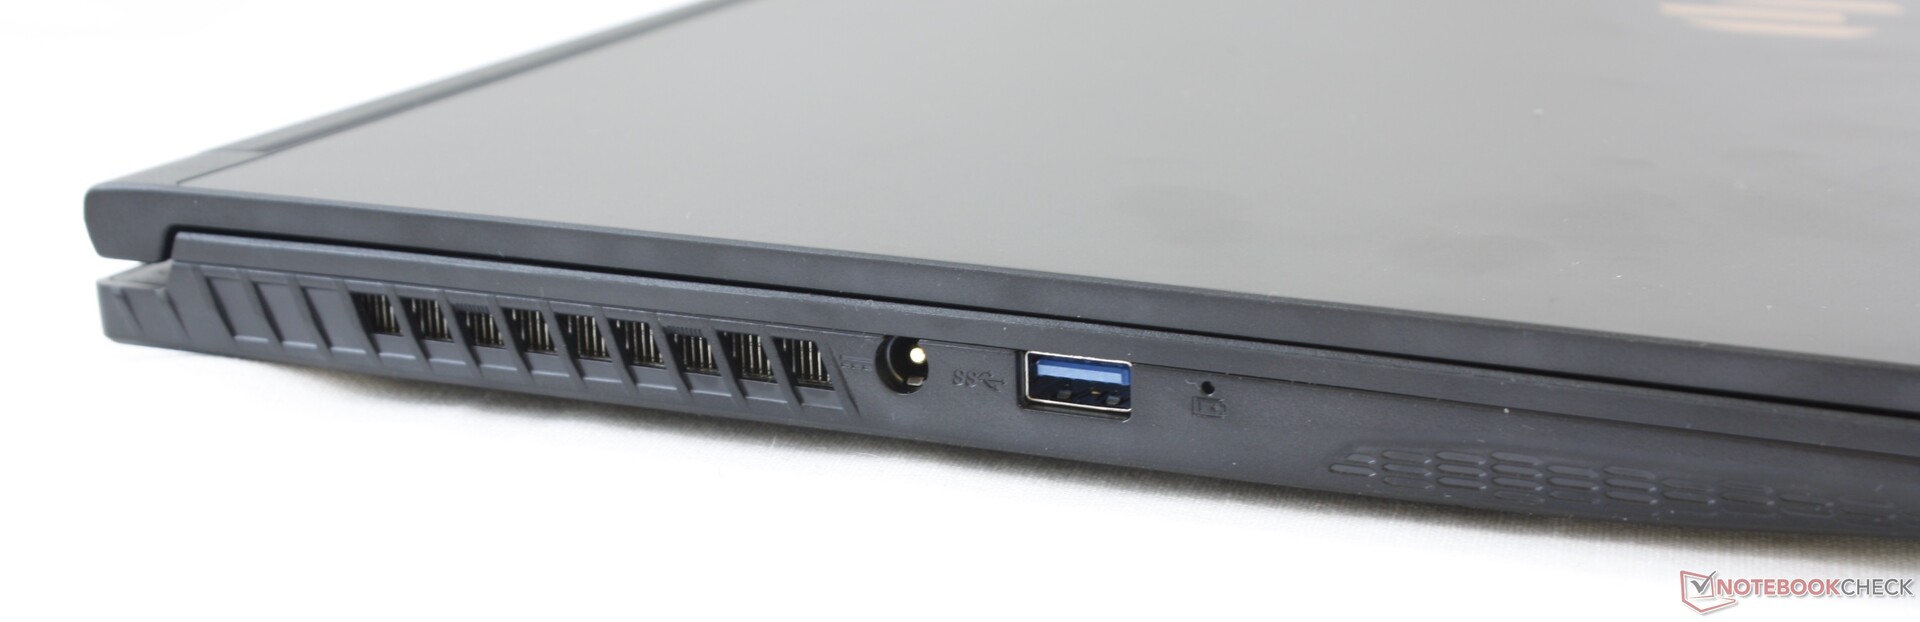
MSI est avant tout connu pour ses portables de jeu, et c’est sans surprise que la station de travail WP65 ressemble à un portable de série G. Elle est même équipée de plusieurs prises jack audio plaqué-or pour micro et écouteurs, ce qui est une originalité pour une station de travail. D’un point de vue professionnel, c’est à double tranchant : le WP65 est plus séduisant et visuellement réussi que les ternes Dell Precision 3000 ou HP ZBook 15v, mais ces avantages extérieurs se font au prix des composants.
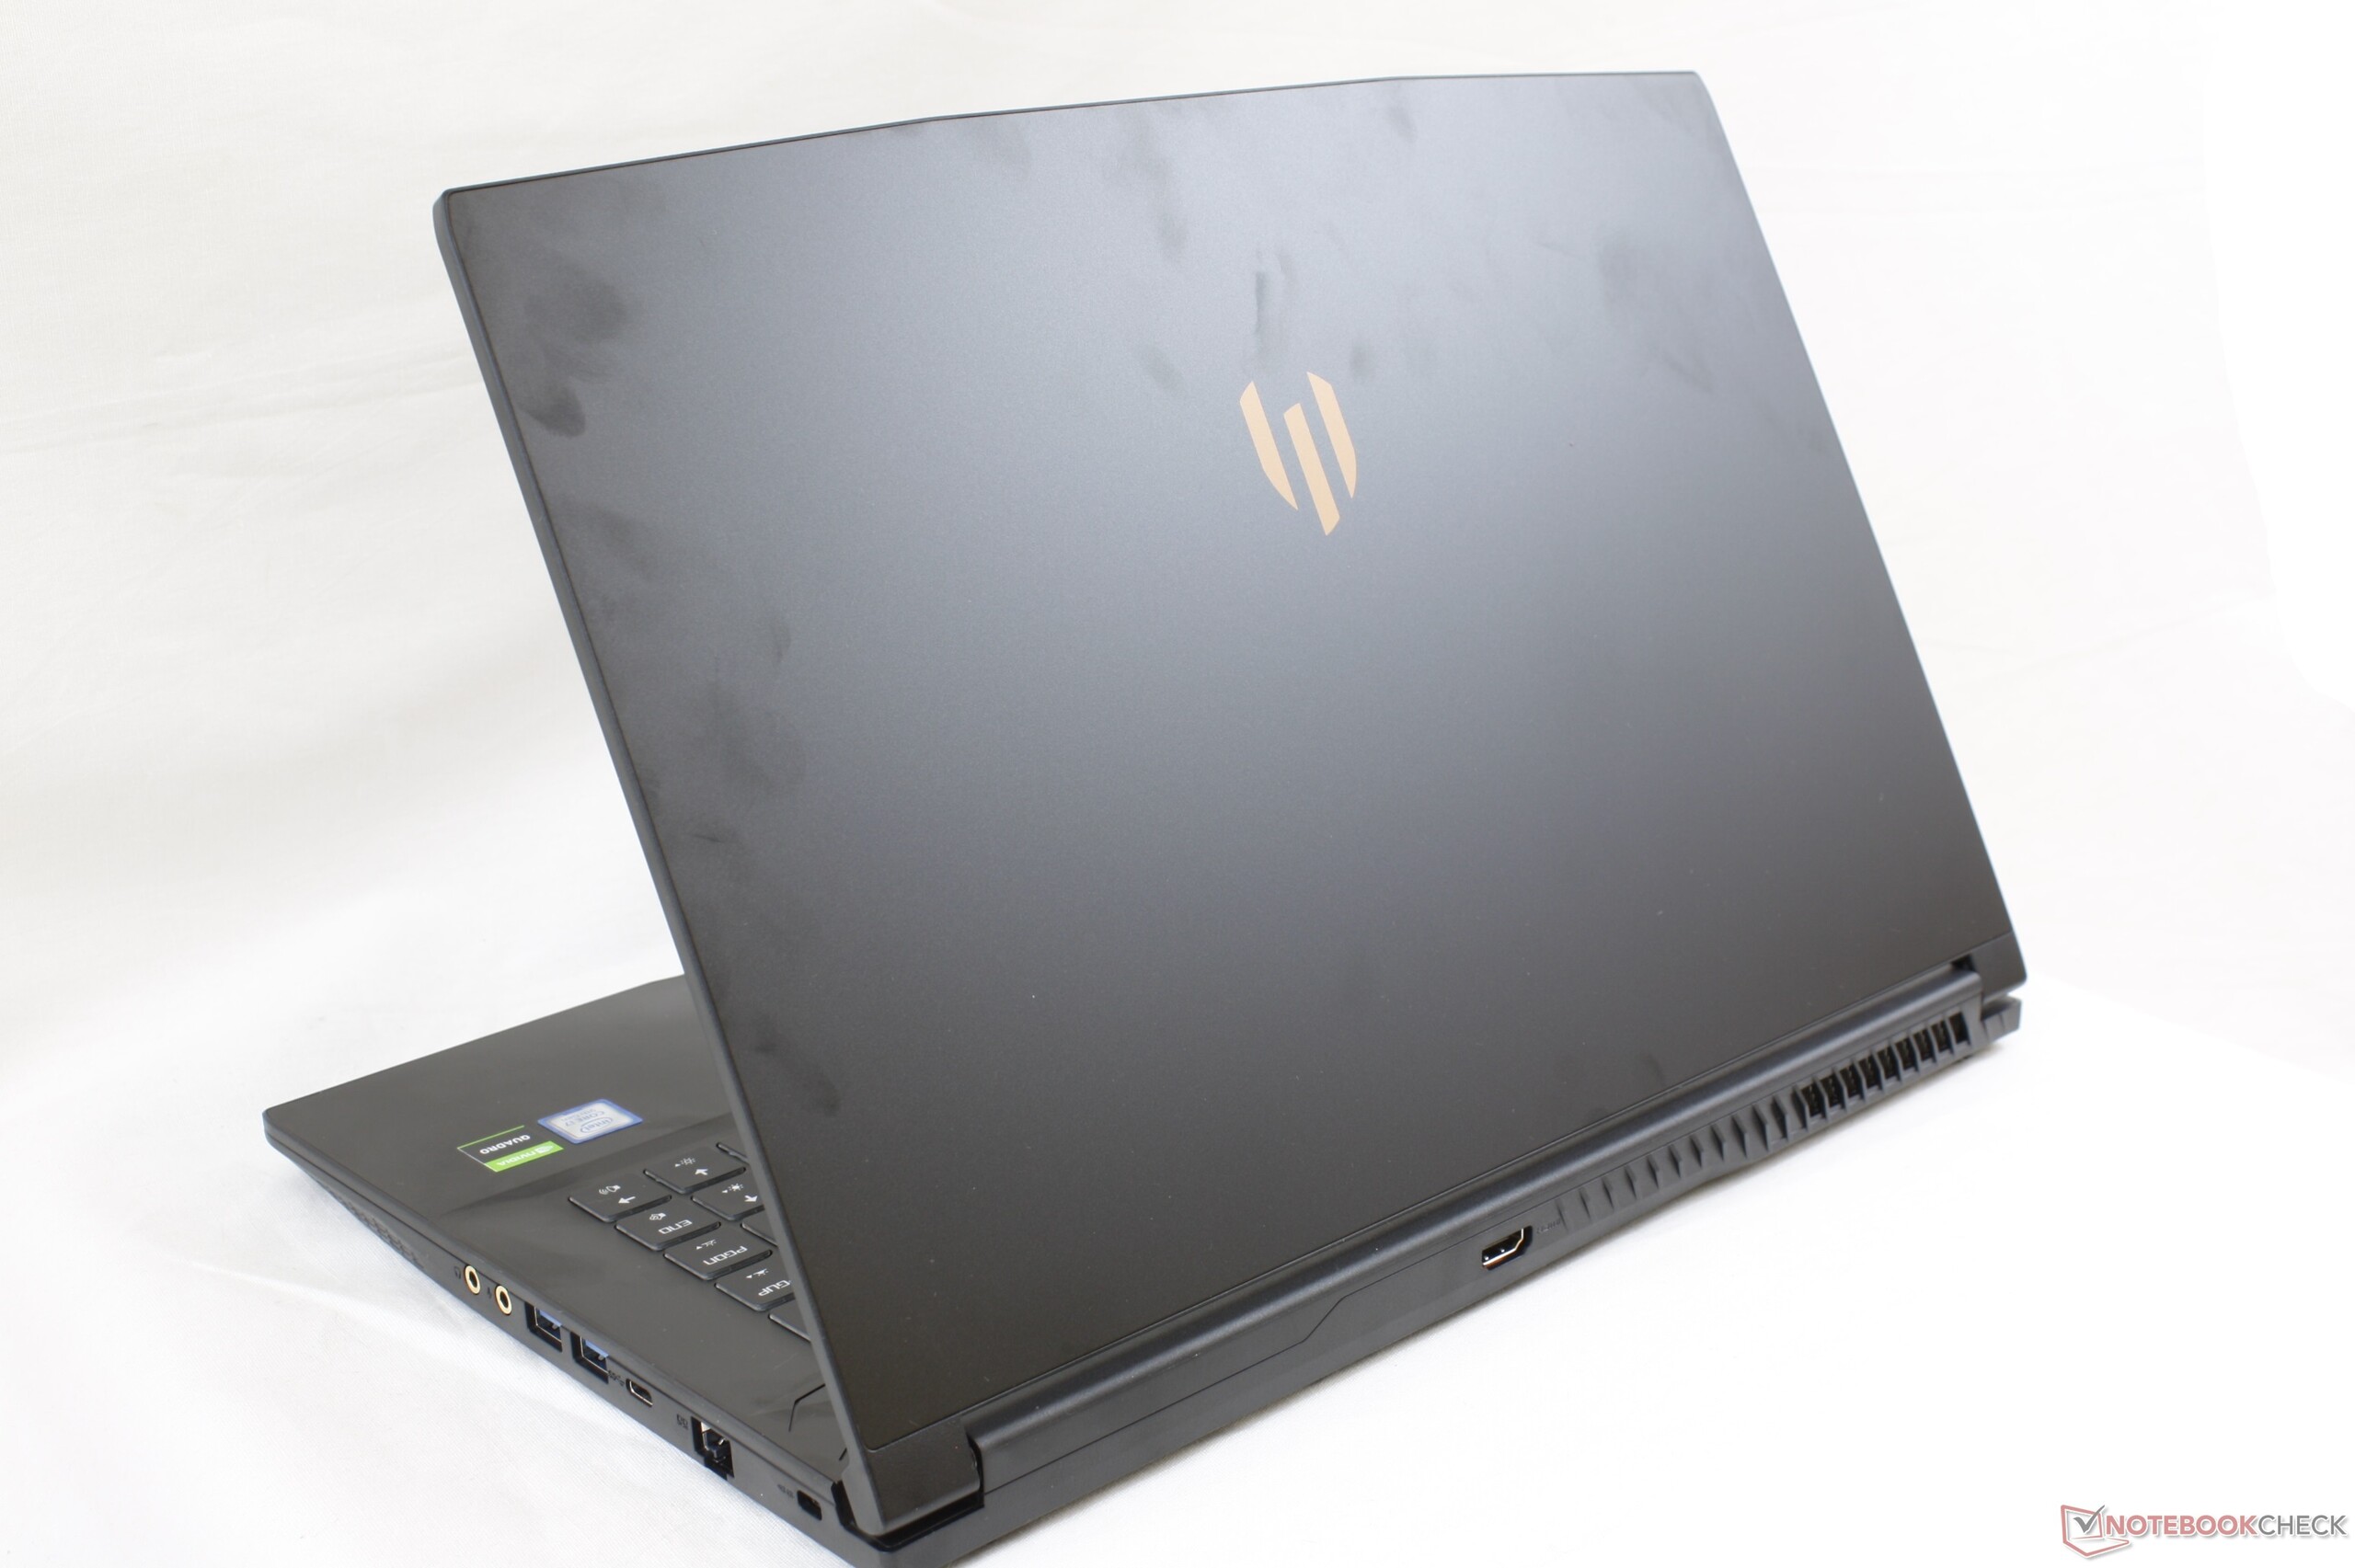
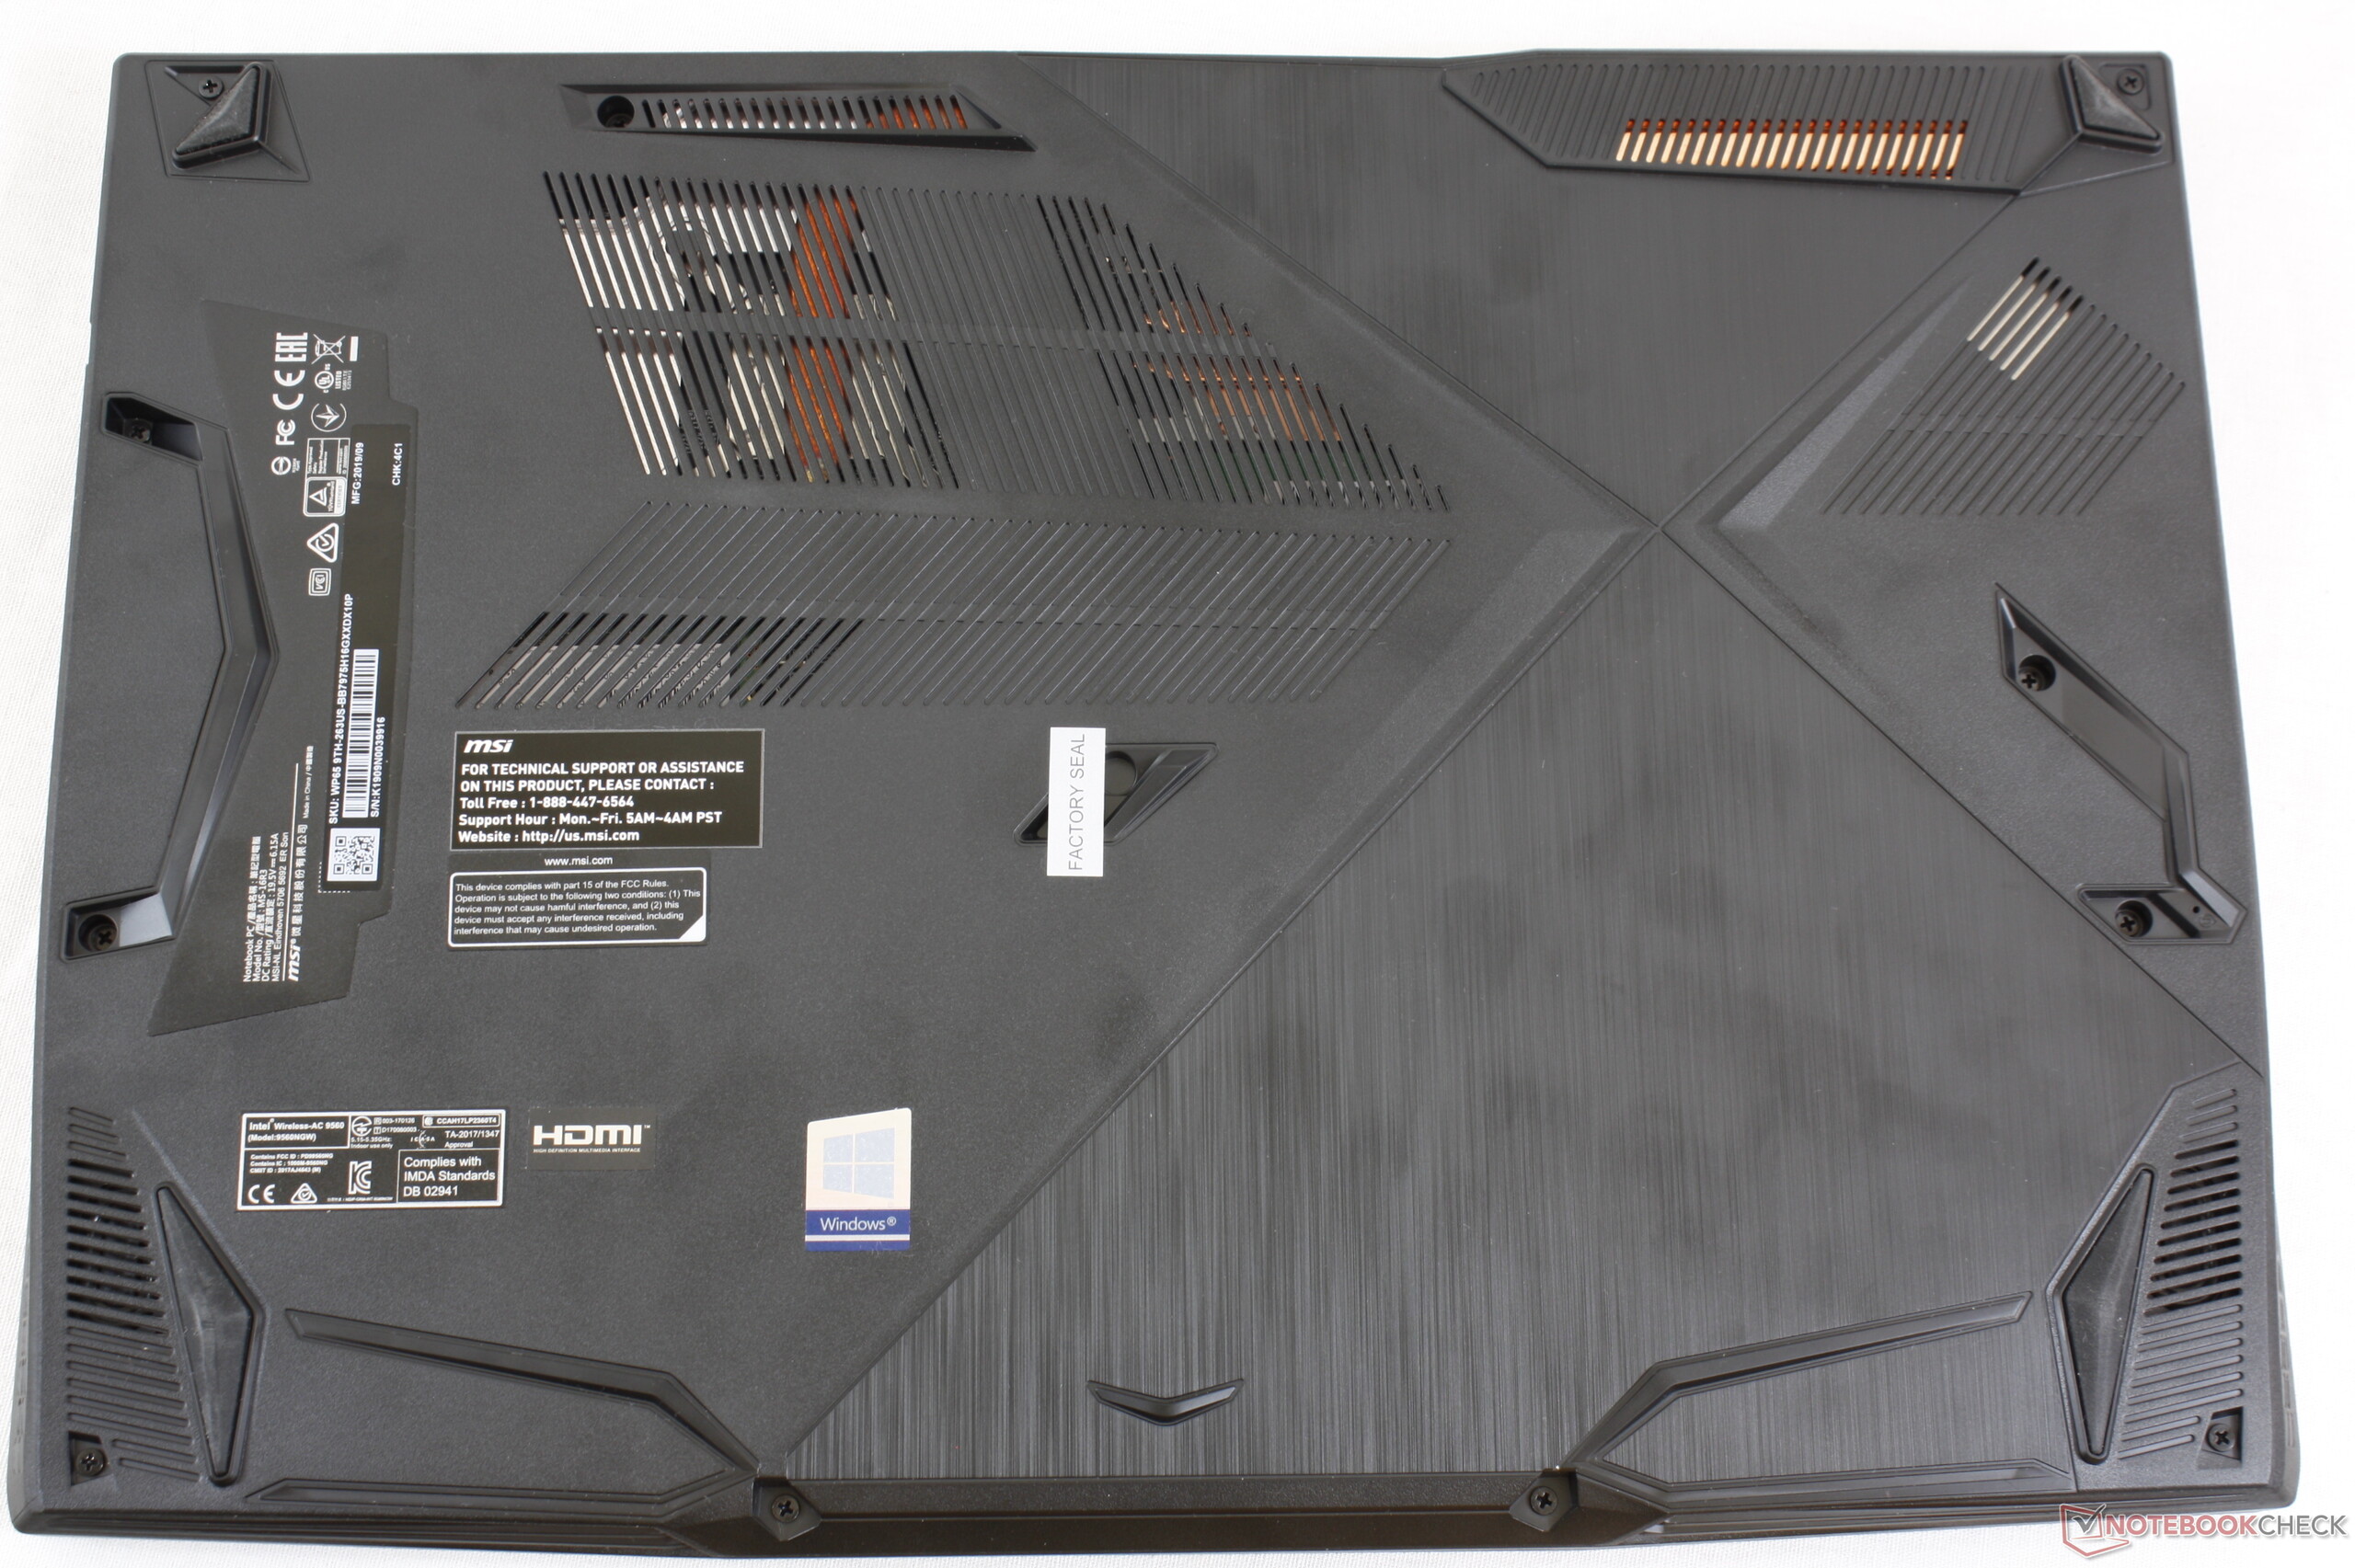
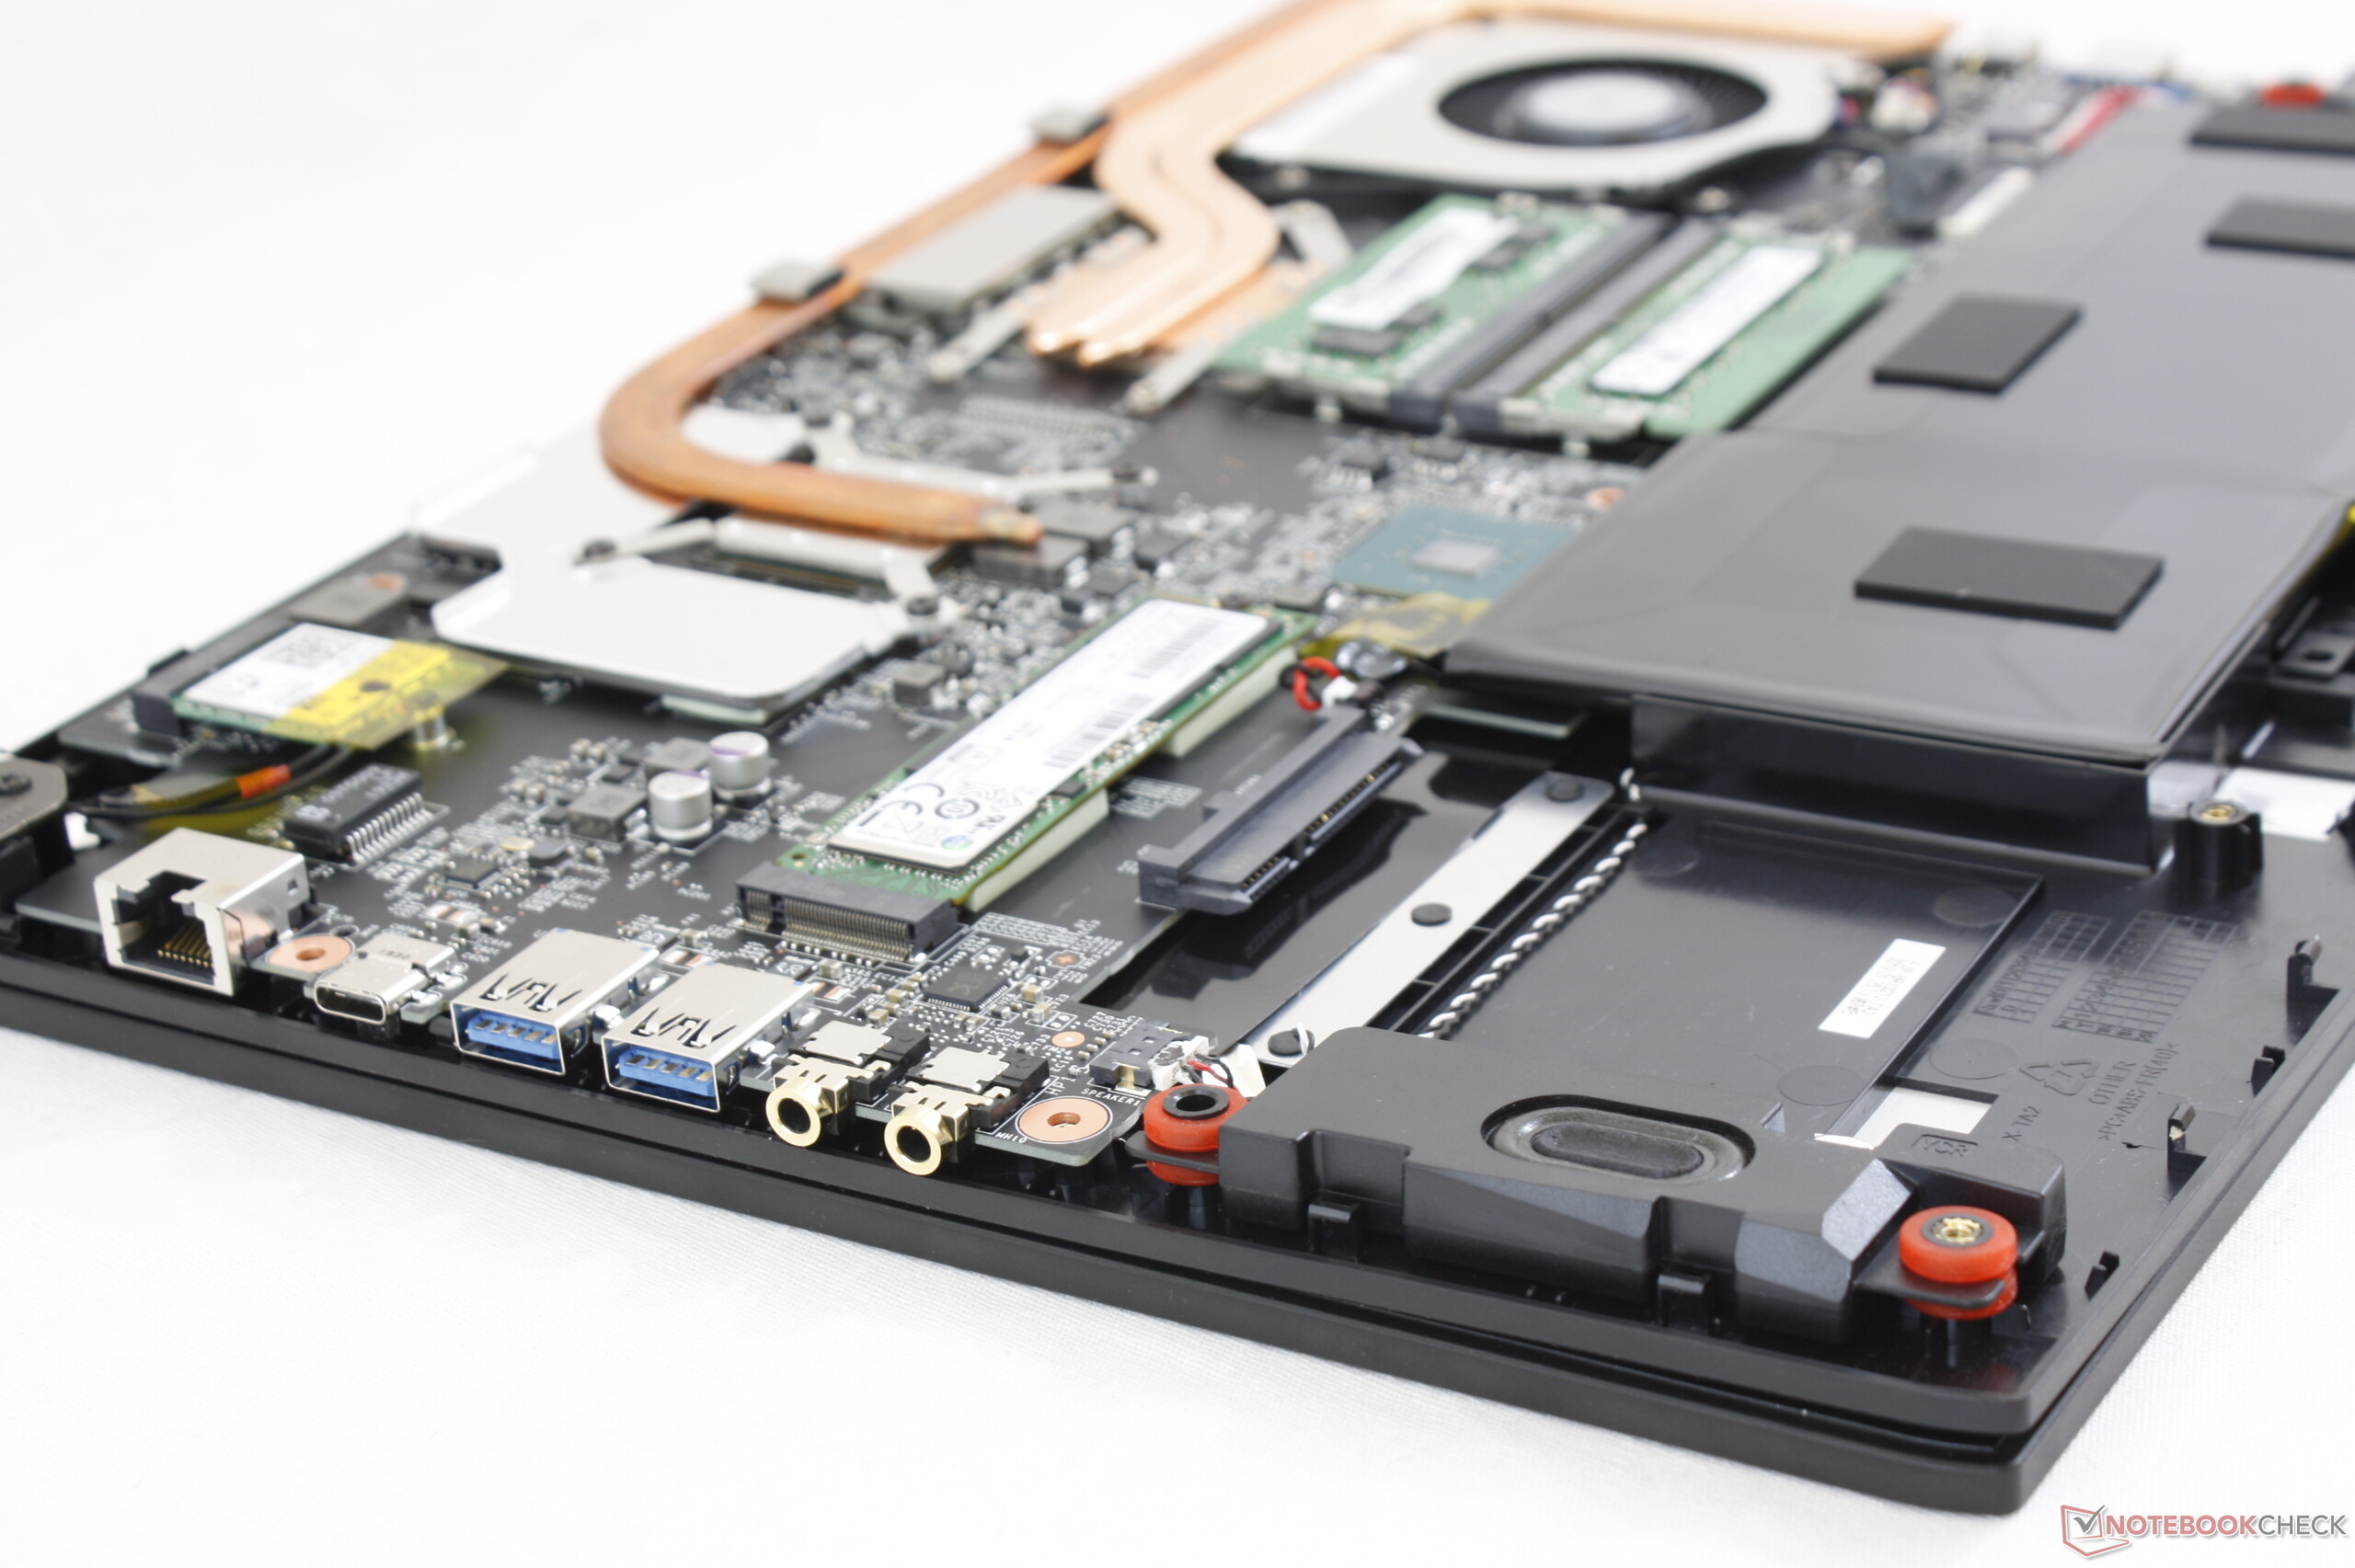
En creusant un peu, on découvre une longue liste de défauts. Des fonctionnalités classiques de stations de travail, comme la présence de processeurs Xeon, de mémoire ECC, d’écrans couvrant le sRVB à 100 %, de lecteur de carte SD, de pavé numérique ou de lecteur de carte à puce ou d’empreintes digitales sont tout simplement absentes du XP65. De plus, le châssis et ses charnières sont plus flexibles que sur les ThinkPad P ou Precision 3541 moins chers, donnant une première impression moins bonne. Le clickpad et le sceau de garantie décourageant la maintenance par l’utilisateur semblent dérivés de portables grand public plutôt que professionnels. Il faudra passer aux séries MSI WS plus haut de gammes ou WT plus puissante pour avoir les options classiques d’une station d’accueil.
Les stations de travail à petit prix classiques priorisent les options et les fonctionnalités sur l’apparence. Le MSI XP65 s’attarde un peu trop sur l’apparence, et n’en fait pas assez sur les fonctionnalités pour fournir une bonne expérience utilisateur. Plus de versions et de fonctionnalités dédiées aux professionnels pourraient l’aider à sortir du lot, face à des rivaux tels HP, Lenovo ou Dell.
L’intégralité de cette critique est disponible en anglais en suivant ce lien.
MSI WP65
- 10/15/2019 v7 (old)
Allen Ngo
Price comparison
