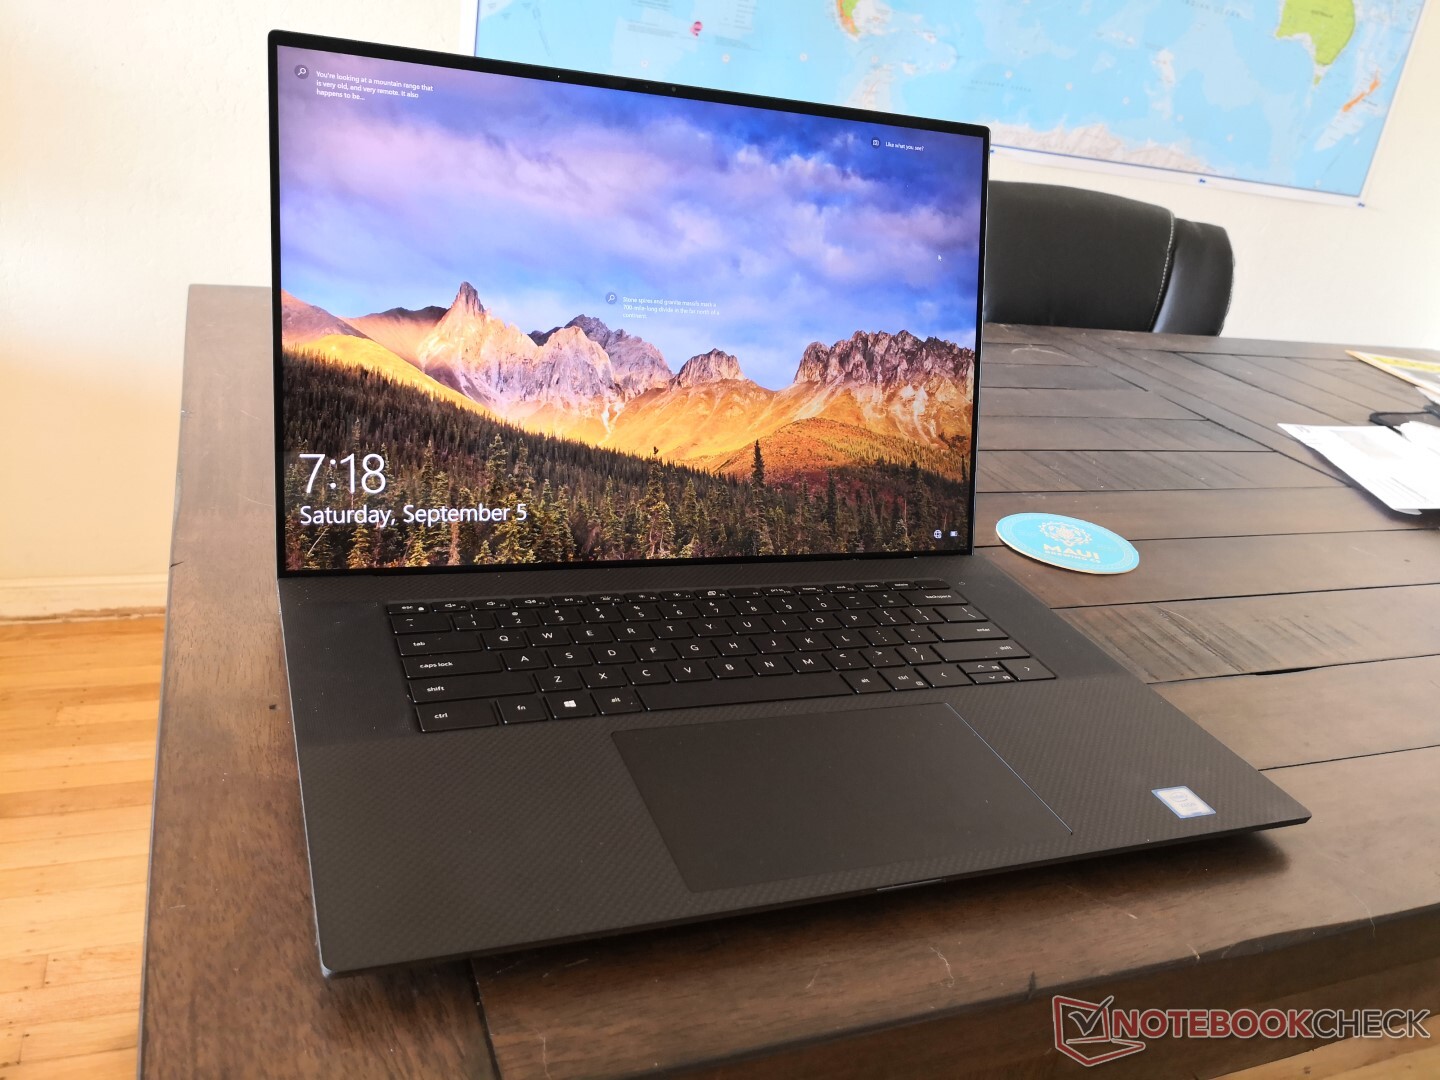
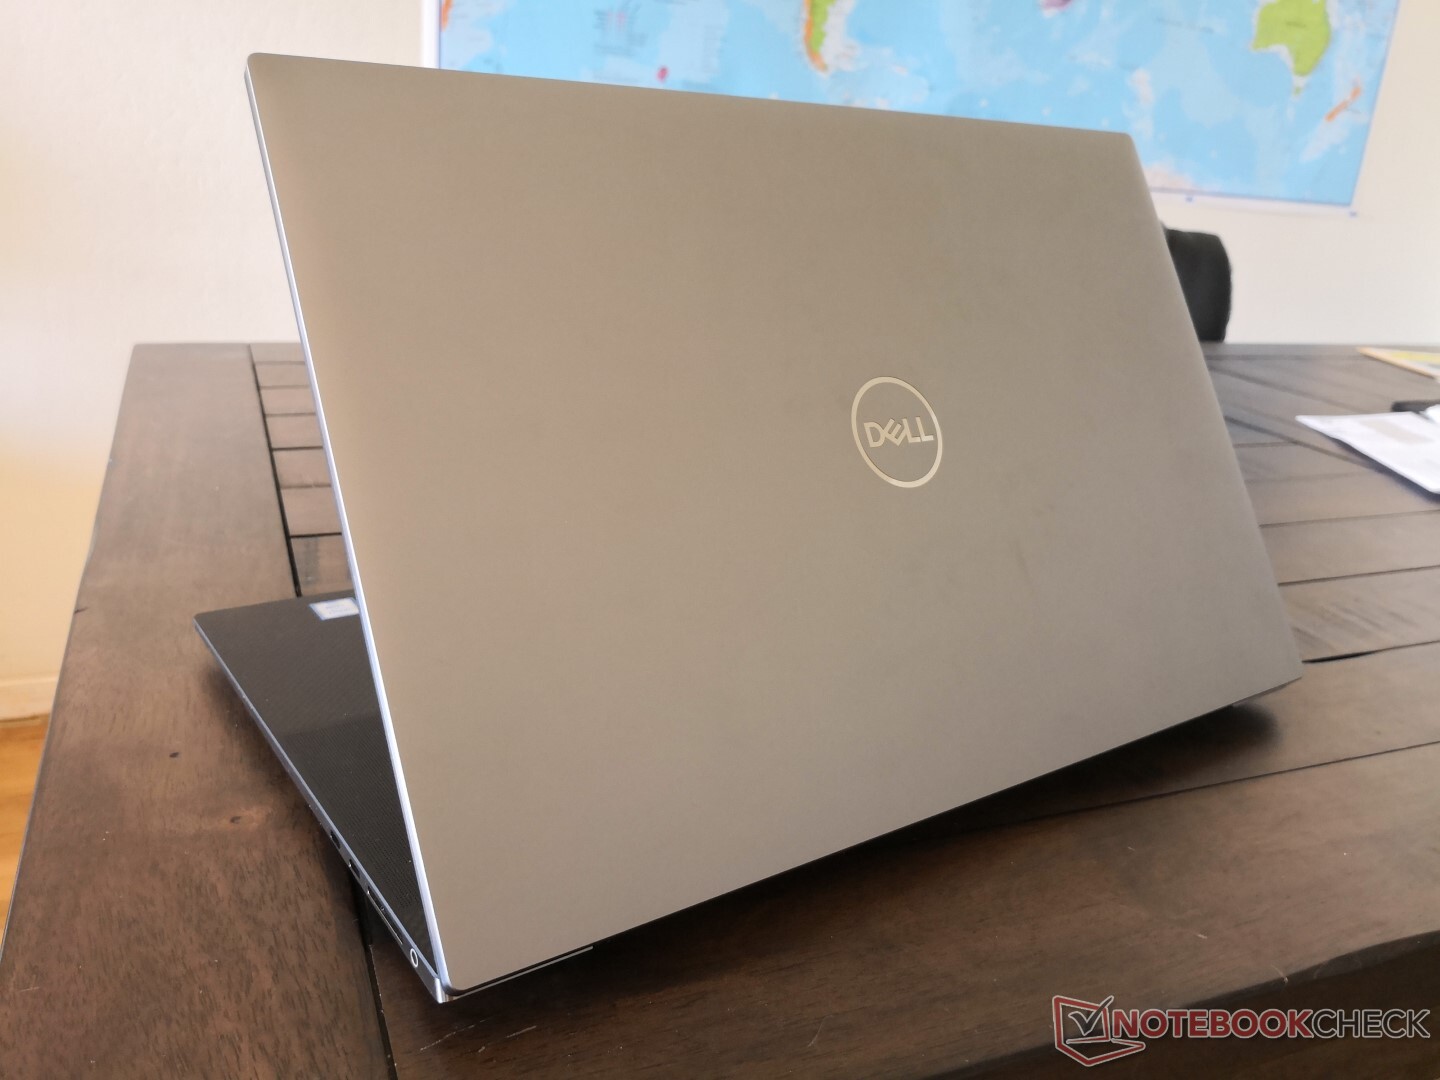
Test du Dell Precision 5750 (Xeon W-10885M, Quadro RTX 3000 Max-Q, 4K UHD+) : le XPS 17 du professionnel
Note | Date | Modèle | Poids | Épaisseur | Taille | Résolution | Prix |
|---|---|---|---|---|---|---|---|
| 87 % v7 (old) | 09/20 | Dell Precision 5000 5750 P92F W-10885M, Quadro RTX 3000 Max-Q | 2.5 kg | 19.5 mm | 17.00" | 3840x2400 | |
| 86.4 % v7 (old) | 06/20 | Asus ProArt StudioBook Pro 17 W700G3T i7-9750H, Quadro RTX 3000 Max-Q | 2.5 kg | 18.4 mm | 17.00" | 1920x1200 | |
| 83.8 % v7 (old) | 06/19 | MSI WS75 9TL-636 i7-9750H, Quadro RTX 4000 (Laptop) | 2.3 kg | 18.95 mm | 17.30" | 1920x1080 | |
| 85.7 % v7 (old) | 05/19 | Dell Precision 7730 i7-8850H, Quadro P3200 | 3.3 kg | 30 mm | 17.30" | 1920x1080 | |
| 86.6 % v7 (old) | 12/19 | Lenovo ThinkPad P73-20QR002DGE i7-9850H, Quadro RTX 3000 (Laptop) | 3.5 kg | 31 mm | 17.30" | 1920x1080 | |
| 84.8 % v7 (old) | 11/19 | MSI WE75 9TK i7-9750H, Quadro RTX 3000 (Laptop) | 2.6 kg | 27.5 mm | 17.30" | 1920x1080 |
| SD Card Reader | |
| average JPG Copy Test (av. of 3 runs) | |
| Dell Precision 7730 (Toshiba Exceria Pro SDXC 64 GB UHS-II) | |
| Lenovo ThinkPad P73-20QR002DGE (Toshiba Exceria Pro SDXC 64 GB UHS-II) | |
| Asus ProArt StudioBook Pro 17 W700G3T (Toshiba Exceria Pro SDXC 64 GB UHS-II) | |
| MSI WS75 9TL-636 (Toshiba Exceria Pro M501 64 GB UHS-II) | |
| Dell Precision 5000 5750 P92F (Toshiba Exceria Pro SDXC 64 GB UHS-II) | |
| MSI WE75 9TK (Toshiba Exceria Pro SDXC 64 GB UHS-II) | |
| maximum AS SSD Seq Read Test (1GB) | |
| Asus ProArt StudioBook Pro 17 W700G3T (Toshiba Exceria Pro SDXC 64 GB UHS-II) | |
| Dell Precision 7730 (Toshiba Exceria Pro SDXC 64 GB UHS-II) | |
| MSI WS75 9TL-636 (Toshiba Exceria Pro M501 64 GB UHS-II) | |
| Lenovo ThinkPad P73-20QR002DGE (Toshiba Exceria Pro SDXC 64 GB UHS-II) | |
| Dell Precision 5000 5750 P92F (Toshiba Exceria Pro SDXC 64 GB UHS-II) | |
| MSI WE75 9TK (Toshiba Exceria Pro SDXC 64 GB UHS-II) | |


| |||||||||||||||||||||||||
Homogénéité de la luminosité: 90 %
Valeur mesurée au centre, sur batterie: 483.8 cd/m²
Contraste: 1308:1 (Valeurs des noirs: 0.37 cd/m²)
ΔE ColorChecker Calman: 4.27 | ∀{0.5-29.43 Ø4.72}
calibrated: 4.01
ΔE Greyscale Calman: 3.5 | ∀{0.09-98 Ø4.97}
99.9% sRGB (Argyll 1.6.3 3D)
86.7% AdobeRGB 1998 (Argyll 1.6.3 3D)
97.7% AdobeRGB 1998 (Argyll 3D)
99.7% sRGB (Argyll 3D)
83.6% Display P3 (Argyll 3D)
Gamma: 2.43
CCT: 1741 K
| Dell Precision 5000 5750 P92F Sharp LQ170R1, IPS, 17", 3840x2400 | Asus ProArt StudioBook Pro 17 W700G3T 170PUW1-A00, IPS, 17", 1920x1200 | MSI WS75 9TL-636 B173HAN04.2, IPS, 17.3", 1920x1080 | Dell Precision 7730 B173HAN01.3, IPS LED, 17.3", 1920x1080 | Lenovo ThinkPad P73-20QR002DGE N173HCE-E31, IPS LED, 17.3", 1920x1080 | MSI WE75 9TK AU Optronics B173HAN04.2, IPS, 17.3", 1920x1080 | |
|---|---|---|---|---|---|---|
| Display | 1% | -22% | -20% | -19% | -23% | |
| Display P3 Coverage (%) | 83.6 | 96.2 15% | 64.5 -23% | 65 -22% | 67.5 -19% | 63.2 -24% |
| sRGB Coverage (%) | 99.7 | 99.8 0% | 91.1 -9% | 93.4 -6% | 94.2 -6% | 89.9 -10% |
| AdobeRGB 1998 Coverage (%) | 97.7 | 84.7 -13% | 65.8 -33% | 66.3 -32% | 67.8 -31% | 64.3 -34% |
| Response Times | 7% | 11% | -7% | 11% | 17% | |
| Response Time Grey 50% / Grey 80% * (ms) | 41.2 ? | 41.2 ? -0% | 39.2 ? 5% | 48.8 ? -18% | 40 ? 3% | 30.8 ? 25% |
| Response Time Black / White * (ms) | 34 ? | 29.6 ? 13% | 28.4 ? 16% | 32.8 ? 4% | 28 ? 18% | 31.2 ? 8% |
| PWM Frequency (Hz) | 25000 ? | |||||
| Screen | 17% | -3% | 12% | -12% | 0% | |
| Brightness middle (cd/m²) | 483.8 | 323 -33% | 300 -38% | 322 -33% | 333 -31% | 287.3 -41% |
| Brightness (cd/m²) | 457 | 308 -33% | 288 -37% | 316 -31% | 310 -32% | 280 -39% |
| Brightness Distribution (%) | 90 | 88 -2% | 86 -4% | 84 -7% | 83 -8% | 89 -1% |
| Black Level * (cd/m²) | 0.37 | 0.36 3% | 0.25 32% | 0.24 35% | 0.39 -5% | 0.26 30% |
| Contrast (:1) | 1308 | 897 -31% | 1200 -8% | 1342 3% | 854 -35% | 1105 -16% |
| Colorchecker dE 2000 * | 4.27 | 1.1 74% | 3.9 9% | 2.2 48% | 4.4 -3% | 2.98 30% |
| Colorchecker dE 2000 max. * | 8.78 | 3.3 62% | 6 32% | 4.6 48% | 7.5 15% | 5.08 42% |
| Colorchecker dE 2000 calibrated * | 4.01 | 0.8 80% | 2.3 43% | 1.9 53% | 2 50% | 3.06 24% |
| Greyscale dE 2000 * | 3.5 | 0.8 77% | 4.3 -23% | 1.6 54% | 5.1 -46% | 3 14% |
| Gamma | 2.43 91% | 2.23 99% | 2.2 100% | 2.19 100% | 2.39 92% | 2.28 96% |
| CCT | 1741 373% | 6479 100% | 7391 88% | 6621 98% | 7061 92% | 6993 93% |
| Color Space (Percent of AdobeRGB 1998) (%) | 86.7 | 75.7 -13% | 59.2 -32% | 60.4 -30% | 61.1 -30% | 58.1 -33% |
| Color Space (Percent of sRGB) (%) | 99.9 | 99.8 0% | 91 -9% | 93.3 -7% | 94 -6% | 89.5 -10% |
| Moyenne finale (programmes/paramètres) | 8% /
12% | -5% /
-5% | -5% /
4% | -7% /
-10% | -2% /
-2% |
* ... Moindre est la valeur, meilleures sont les performances
Temps de réponse de l'écran
| ↔ Temps de réponse noir à blanc | ||
|---|---|---|
| 34 ms ... hausse ↗ et chute ↘ combinées | ↗ 20 ms hausse | 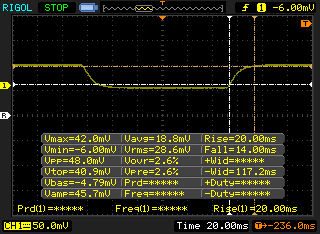 |
| ↘ 14 ms chute | ||
| L'écran souffre de latences très élevées, à éviter pour le jeu. En comparaison, tous les appareils testés affichent entre 0.1 (minimum) et 240 (maximum) ms. » 91 % des appareils testés affichent de meilleures performances. Cela signifie que les latences relevées sont moins bonnes que la moyenne (19.8 ms) de tous les appareils testés. | ||
| ↔ Temps de réponse gris 50% à gris 80% | ||
| 41.2 ms ... hausse ↗ et chute ↘ combinées | ↗ 18.4 ms hausse | 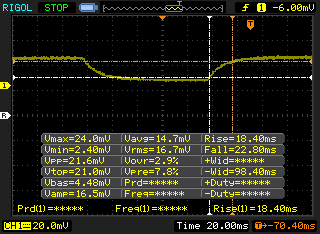 |
| ↘ 22.8 ms chute | ||
| L'écran souffre de latences très élevées, à éviter pour le jeu. En comparaison, tous les appareils testés affichent entre 0.165 (minimum) et 636 (maximum) ms. » 66 % des appareils testés affichent de meilleures performances. Cela signifie que les latences relevées sont moins bonnes que la moyenne (31 ms) de tous les appareils testés. | ||
Scintillement / MLI (Modulation de largeur d'impulsion)
| Scintillement / MLI (Modulation de largeur d'impulsion) non décelé |  | ||
En comparaison, 52 % des appareils testés n'emploient pas MDI pour assombrir leur écran. Nous avons relevé une moyenne à 7769 (minimum : 5 - maximum : 343500) Hz dans le cas où une MDI était active. | |||
Cinebench R15: CPU Multi 64Bit | CPU Single 64Bit
Blender: v2.79 BMW27 CPU
7-Zip 18.03: 7z b 4 -mmt1 | 7z b 4
Geekbench 5.5: Single-Core | Multi-Core
HWBOT x265 Benchmark v2.2: 4k Preset
LibreOffice : 20 Documents To PDF
R Benchmark 2.5: Overall mean
| HWBOT x265 Benchmark v2.2 / 4k Preset | |
| Corsair One i160 | |
| Dell Precision 5000 5750 P92F | |
| Eluktronics RP-17 | |
| MSI WS66 10TMT-207US | |
| Moyenne Intel Xeon W-10885M (8.89 - 13.6, n=3) | |
| Dell Precision 5550 P91F | |
| MSI GS66 Stealth 10SE-045 | |
| Dell Precision 7730 | |
| Lenovo ThinkPad P73-20QR002DGE | |
| Acer ConceptD 3 Pro CN315-71P-73W1 | |
| Dell XPS 15 9500 Core i5 | |
| LibreOffice / 20 Documents To PDF | |
| Dell XPS 15 9500 Core i5 | |
| MSI GS66 Stealth 10SE-045 | |
| Eluktronics RP-17 | |
| Acer ConceptD 9 Pro | |
| Acer ConceptD 3 Pro CN315-71P-73W1 | |
| Moyenne Intel Xeon W-10885M (44.4 - 58.1, n=3) | |
| Dell Precision 5000 5750 P92F | |
| MSI WS66 10TMT-207US | |
| Dell Precision 5550 P91F | |
| R Benchmark 2.5 / Overall mean | |
| Acer ConceptD 3 Pro CN315-71P-73W1 | |
| Dell XPS 15 9500 Core i5 | |
| MSI GS66 Stealth 10SE-045 | |
| Dell Precision 5550 P91F | |
| Eluktronics RP-17 | |
| MSI WS66 10TMT-207US | |
| Dell Precision 5000 5750 P92F | |
| Moyenne Intel Xeon W-10885M (0.551 - 0.57, n=3) | |
* ... Moindre est la valeur, meilleures sont les performances
| PCMark 8 Home Score Accelerated v2 | 3819 points | |
| PCMark 8 Work Score Accelerated v2 | 4718 points | |
| PCMark 10 Score | 5484 points | |
Aide | ||
| DPC Latencies / LatencyMon - interrupt to process latency (max), Web, Youtube, Prime95 | |
| Dell Precision 7550 | |
| MSI WS66 10TMT-207US | |
| Eluktronics RP-17 | |
| Acer ConceptD 3 Pro CN315-71P-73W1 | |
| Acer ConceptD 9 Pro | |
| Razer Blade 15 Studio Edition 2020 | |
| Dell Precision 5000 5750 P92F | |
| Dell Precision 5550 P91F | |
* ... Moindre est la valeur, meilleures sont les performances
| Dell Precision 5000 5750 P92F Toshiba Kioxia XG6 KXG60PNV1T02 | Asus ProArt StudioBook Pro 17 W700G3T Samsung SSD PM981 MZVLB1T0HALR | MSI WS75 9TL-636 Samsung SSD PM981 MZVLB1T0HALR | Dell Precision 7730 Samsung SSD PM981 MZVLB512HAJQ | Lenovo ThinkPad P73-20QR002DGE Intel SSD Pro 7600p SSDPEKKF512G8L | MSI WE75 9TK Samsung SSD PM981 MZVLB512HAJQ | |
|---|---|---|---|---|---|---|
| AS SSD | 44% | 23% | 15% | 3% | 7% | |
| Seq Read (MB/s) | 2025 | 2958 46% | 870 -57% | 2697 33% | 2693 33% | 1308 -35% |
| Seq Write (MB/s) | 1438 | 2350 63% | 2247 56% | 1789 24% | 1542 7% | 1871 30% |
| 4K Read (MB/s) | 38.77 | 56.6 46% | 53.4 38% | 50.5 30% | 62.6 61% | 48.35 25% |
| 4K Write (MB/s) | 96.9 | 106.1 9% | 123.2 27% | 105.9 9% | 149.5 54% | 106.6 10% |
| 4K-64 Read (MB/s) | 1105 | 1836 66% | 1673 51% | 1139 3% | 871 -21% | 1510 37% |
| 4K-64 Write (MB/s) | 1435 | 1789 25% | 1826 27% | 1714 19% | 1006 -30% | 1715 20% |
| Access Time Read * (ms) | 0.08 | 0.061 24% | 0.05 37% | 0.061 24% | 0.058 27% | 0.103 -29% |
| Access Time Write * (ms) | 0.116 | 0.036 69% | 0.033 72% | 0.037 68% | 0.067 42% | 0.106 9% |
| Score Read (Points) | 1347 | 2189 63% | 1813 35% | 1460 8% | 1203 -11% | 1689 25% |
| Score Write (Points) | 1676 | 2130 27% | 2173 30% | 1999 19% | 1309 -22% | 2008 20% |
| Score Total (Points) | 3686 | 5411 47% | 4989 35% | 4168 13% | 3088 -16% | 4594 25% |
| Copy ISO MB/s (MB/s) | 2609 | 3154 21% | 3259 25% | 1716 -34% | 2343 -10% | |
| Copy Program MB/s (MB/s) | 740 | 533 -28% | 435.6 -41% | 542 -27% | 526 -29% | |
| Copy Game MB/s (MB/s) | 1624 | 1349 -17% | 1273 -22% | 1375 -15% | 1506 -7% | |
| CrystalDiskMark 5.2 / 6 | 19% | -1% | -7% | 16% | 19% | |
| Write 4K (MB/s) | 103.5 | 147.6 43% | 103.5 0% | 103.2 0% | 154.3 49% | 135.4 31% |
| Read 4K (MB/s) | 44.56 | 47.57 7% | 41.88 -6% | 41.39 -7% | 66.4 49% | 56.6 27% |
| Write Seq (MB/s) | 1934 | 2222 15% | 1931 0% | 1880 -3% | 1561 -19% | 1972 2% |
| Read Seq (MB/s) | 1937 | 2543 31% | 1286 -34% | 2350 21% | 2460 27% | 2101 8% |
| Write 4K Q32T1 (MB/s) | 372.9 | 459.2 23% | 414.3 11% | 282.3 -24% | 438 17% | 527 41% |
| Read 4K Q32T1 (MB/s) | 358.9 | 515 43% | 470.2 31% | 314.3 -12% | 568 58% | 578 61% |
| Write Seq Q32T1 (MB/s) | 2894 | 2167 -25% | 2393 -17% | 1881 -35% | 1581 -45% | 1985 -31% |
| Read Seq Q32T1 (MB/s) | 3082 | 3430 11% | 3425 11% | 3216 4% | 2724 -12% | 3358 9% |
| Write 4K Q8T8 (MB/s) | 1484 | 1000 | ||||
| Read 4K Q8T8 (MB/s) | 1536 | 928 | ||||
| Moyenne finale (programmes/paramètres) | 32% /
33% | 11% /
15% | 4% /
7% | 10% /
8% | 13% /
11% |
* ... Moindre est la valeur, meilleures sont les performances

Disk Throttling: DiskSpd Read Loop, Queue Depth 8
| 3DMark 11 Performance | 18981 points | |
| 3DMark Cloud Gate Standard Score | 34264 points | |
| 3DMark Fire Strike Score | 13342 points | |
| 3DMark Time Spy Score | 5737 points | |
Aide | ||
| Bas | Moyen | Élevé | Ultra | QHD | 4K | |
|---|---|---|---|---|---|---|
| The Witcher 3 (2015) | 304.7 | 189.4 | 107.4 | 57.2 | 36.5 | |
| Dota 2 Reborn (2015) | 145 | 133 | 126 | 120 | 77.6 | |
| Final Fantasy XV Benchmark (2018) | 149 | 79.1 | 59.5 | 43.8 | 25.9 | |
| X-Plane 11.11 (2018) | 117 | 106 | 85.8 | 67.6 |
| Dell Precision 5000 5750 P92F Quadro RTX 3000 Max-Q, W-10885M, Toshiba Kioxia XG6 KXG60PNV1T02 | Asus ProArt StudioBook Pro 17 W700G3T Quadro RTX 3000 Max-Q, i7-9750H, Samsung SSD PM981 MZVLB1T0HALR | MSI WS75 9TL-636 Quadro RTX 4000 (Laptop), i7-9750H, Samsung SSD PM981 MZVLB1T0HALR | Dell Precision 7730 Quadro P3200, i7-8850H, Samsung SSD PM981 MZVLB512HAJQ | Lenovo ThinkPad P73-20QR002DGE Quadro RTX 3000 (Laptop), i7-9850H, Intel SSD Pro 7600p SSDPEKKF512G8L | MSI WE75 9TK Quadro RTX 3000 (Laptop), i7-9750H, Samsung SSD PM981 MZVLB512HAJQ | |
|---|---|---|---|---|---|---|
| Noise | 11% | 2% | 6% | 12% | 1% | |
| arrêt / environnement * (dB) | 27.5 | 29.4 -7% | 29.4 -7% | 29.7 -8% | 29.3 -7% | 28.5 -4% |
| Idle Minimum * (dB) | 27.5 | 29.4 -7% | 29.4 -7% | 29.7 -8% | 29.3 -7% | 29 -5% |
| Idle Average * (dB) | 27.5 | 29.9 -9% | 30.1 -9% | 29.7 -8% | 29.3 -7% | 29 -5% |
| Idle Maximum * (dB) | 27.5 | 29.9 -9% | 30.9 -12% | 29.7 -8% | 29.3 -7% | 31.5 -15% |
| Load Average * (dB) | 44.8 | 31.6 29% | 40.7 9% | 31.4 30% | 30.2 33% | 32 29% |
| Witcher 3 ultra * (dB) | 52.5 | 31.6 40% | 41.9 20% | 37.9 28% | 30.7 42% | 44.7 15% |
| Load Maximum * (dB) | 52.5 | 31.6 40% | 42.7 19% | 44.2 16% | 33.1 37% | 56.5 -8% |
* ... Moindre est la valeur, meilleures sont les performances
Degré de la nuisance sonore
| Au repos |
| 27.5 / 27.5 / 27.5 dB(A) |
| Fortement sollicité |
| 44.8 / 52.5 dB(A) |
 | ||
30 dB silencieux 40 dB(A) audible 50 dB(A) bruyant |
||
min: | ||
(-) La température maximale du côté supérieur est de 55.6 °C / 132 F, par rapport à la moyenne de 38.2 °C / 101 F, allant de 22.2 à 69.8 °C pour la classe Workstation.
(±) Le fond chauffe jusqu'à un maximum de 42 °C / 108 F, contre une moyenne de 41.1 °C / 106 F
(+) En utilisation inactive, la température moyenne du côté supérieur est de 25.2 °C / 77 F, par rapport à la moyenne du dispositif de 32 °C / 90 F.
(±) En jouant à The Witcher 3, la température moyenne du côté supérieur est de 36 °C / 97 F, alors que la moyenne de l'appareil est de 32 °C / 90 F.
(+) Les repose-poignets et le pavé tactile atteignent la température maximale de la peau (33.6 °C / 92.5 F) et ne sont donc pas chauds.
(-) La température moyenne de la zone de l'appui-paume de dispositifs similaires était de 27.8 °C / 82 F (-5.8 °C / #-10.5 F).
Dell Precision 5000 5750 P92F analyse audio
(+) | les haut-parleurs peuvent jouer relativement fort (85.6# dB)
Basses 100 - 315 Hz
(±) | basse réduite - en moyenne 7.4% inférieure à la médiane
(±) | la linéarité des basses est moyenne (8.7% delta à la fréquence précédente)
Médiums 400 - 2000 Hz
(+) | médiane équilibrée - seulement 3.6% de la médiane
(+) | les médiums sont linéaires (3.8% delta à la fréquence précédente)
Aiguës 2 - 16 kHz
(±) | sommets plus élevés - en moyenne 5.3% plus élevés que la médiane
(+) | les aigus sont linéaires (5.6% delta à la fréquence précédente)
Globalement 100 - 16 000 Hz
(+) | le son global est linéaire (10.5% différence à la médiane)
Par rapport à la même classe
» 7% de tous les appareils testés de cette catégorie étaient meilleurs, 6% similaires, 87% pires
» Le meilleur avait un delta de 7%, la moyenne était de 17%, le pire était de 35%.
Par rapport à tous les appareils testés
» 5% de tous les appareils testés étaient meilleurs, 1% similaires, 93% pires
» Le meilleur avait un delta de 4%, la moyenne était de 24%, le pire était de 134%.
Apple MacBook 12 (Early 2016) 1.1 GHz analyse audio
(+) | les haut-parleurs peuvent jouer relativement fort (83.6# dB)
Basses 100 - 315 Hz
(±) | basse réduite - en moyenne 11.3% inférieure à la médiane
(±) | la linéarité des basses est moyenne (14.2% delta à la fréquence précédente)
Médiums 400 - 2000 Hz
(+) | médiane équilibrée - seulement 2.4% de la médiane
(+) | les médiums sont linéaires (5.5% delta à la fréquence précédente)
Aiguës 2 - 16 kHz
(+) | des sommets équilibrés - à seulement 2% de la médiane
(+) | les aigus sont linéaires (4.5% delta à la fréquence précédente)
Globalement 100 - 16 000 Hz
(+) | le son global est linéaire (10.2% différence à la médiane)
Par rapport à la même classe
» 7% de tous les appareils testés de cette catégorie étaient meilleurs, 2% similaires, 91% pires
» Le meilleur avait un delta de 5%, la moyenne était de 18%, le pire était de 53%.
Par rapport à tous les appareils testés
» 5% de tous les appareils testés étaient meilleurs, 1% similaires, 94% pires
» Le meilleur avait un delta de 4%, la moyenne était de 24%, le pire était de 134%.
| Éteint/en veille | |
| Au repos | |
| Fortement sollicité |
|
Légende:
min: | |
| Dell Precision 5000 5750 P92F W-10885M, Quadro RTX 3000 Max-Q, Toshiba Kioxia XG6 KXG60PNV1T02, IPS, 3840x2400, 17" | Asus ProArt StudioBook Pro 17 W700G3T i7-9750H, Quadro RTX 3000 Max-Q, Samsung SSD PM981 MZVLB1T0HALR, IPS, 1920x1200, 17" | MSI WS75 9TL-636 i7-9750H, Quadro RTX 4000 (Laptop), Samsung SSD PM981 MZVLB1T0HALR, IPS, 1920x1080, 17.3" | Dell Precision 7730 i7-8850H, Quadro P3200, Samsung SSD PM981 MZVLB512HAJQ, IPS LED, 1920x1080, 17.3" | Lenovo ThinkPad P73-20QR002DGE i7-9850H, Quadro RTX 3000 (Laptop), Intel SSD Pro 7600p SSDPEKKF512G8L, IPS LED, 1920x1080, 17.3" | MSI WE75 9TK i7-9750H, Quadro RTX 3000 (Laptop), Samsung SSD PM981 MZVLB512HAJQ, IPS, 1920x1080, 17.3" | |
|---|---|---|---|---|---|---|
| Power Consumption | -17% | -47% | -25% | -13% | -30% | |
| Idle Minimum * (Watt) | 6.3 | 11.3 -79% | 16.4 -160% | 10.1 -60% | 8.9 -41% | 12.1 -92% |
| Idle Average * (Watt) | 14.2 | 16 -13% | 21.6 -52% | 18 -27% | 12.8 10% | 18.4 -30% |
| Idle Maximum * (Watt) | 17.3 | 16.8 3% | 22.9 -32% | 19.7 -14% | 16.4 5% | 18.8 -9% |
| Load Average * (Watt) | 121.2 | 93.6 23% | 88 27% | 89.6 26% | 108.4 11% | 95.1 22% |
| Witcher 3 ultra * (Watt) | 115.4 | 106 8% | 137 -19% | 134 -16% | 153 -33% | 135.5 -17% |
| Load Maximum * (Watt) | 130.7 | 186.6 -43% | 193 -48% | 204 -56% | 166 -27% | 203.7 -56% |
* ... Moindre est la valeur, meilleures sont les performances
| Dell Precision 5000 5750 P92F W-10885M, Quadro RTX 3000 Max-Q, 97 Wh | Asus ProArt StudioBook Pro 17 W700G3T i7-9750H, Quadro RTX 3000 Max-Q, 57 Wh | MSI WS75 9TL-636 i7-9750H, Quadro RTX 4000 (Laptop), 82 Wh | Dell Precision 7730 i7-8850H, Quadro P3200, 92 Wh | Lenovo ThinkPad P73-20QR002DGE i7-9850H, Quadro RTX 3000 (Laptop), 99 Wh | MSI WE75 9TK i7-9750H, Quadro RTX 3000 (Laptop), 65 Wh | |
|---|---|---|---|---|---|---|
| Autonomie de la batterie | -35% | -38% | -41% | -17% | -50% | |
| Reader / Idle (h) | 18.2 | 12.6 -31% | 11 -40% | |||
| WiFi v1.3 (h) | 10.9 | 5.9 -46% | 6.6 -39% | 5.6 -49% | 11.1 2% | 4.9 -55% |
| Load (h) | 2.2 | 1.7 -23% | 1.2 -45% | 1.5 -32% | 1.4 -36% | 1 -55% |
Points positifs
Points négatifs
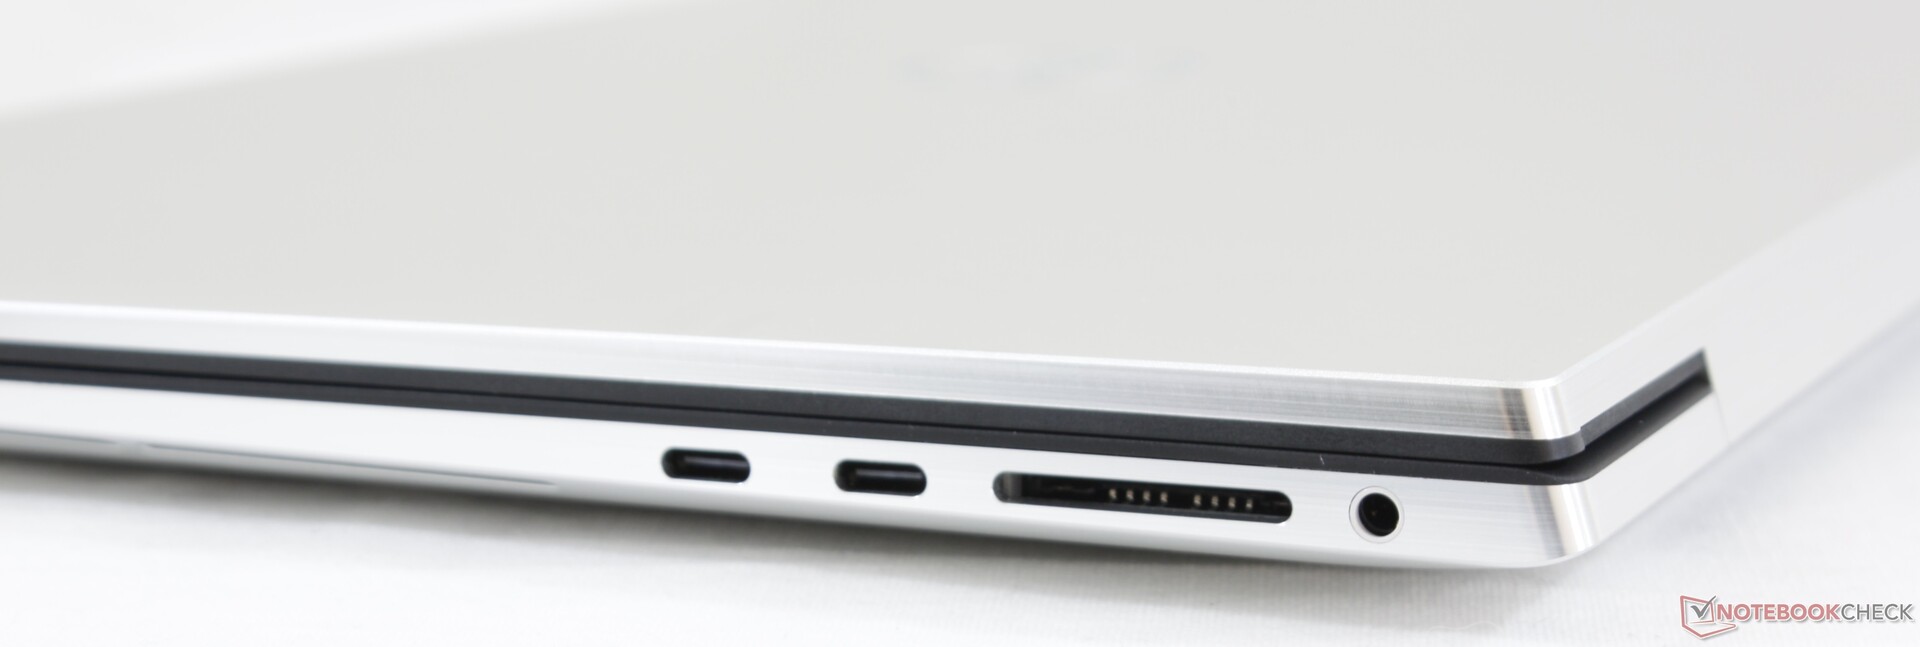
Le Precision 5750 est pour ceux qui n'ont pas besoin des fonctionnalités du Precision 7750 plus encombrant et qui sont prêts à les abandonner au profit d'un appareil plus fin, plus élégant et plus portable. Les nomades qui n'ont pas peur d'un appareil sans fioritures mi-ultrabook, mi-station de travail seront satisfaits de ce Precision. Il est conseillé d'avoir des moniteurs et stations d'accueil Thunderbolt 3 pour tirer au mieux parti du système.
Mis à part les sacrifices matériels, il faut avoir conscience de quelques autres défauts. D'abord, la garantie n'est que de 12 mois contre 36 pour le Precision 7750 plus gros, comme si Dell considérait cette machine comme inférieure. Ensuite, la chauffe du CPU est plutôt élevée, et le temps de charge est élevé avec de fortes sollicitations. Cela est dû à l'adaptateur secteur de 130 W, qui favorise la portabilité plutôt que la puissance. Dell a conçu l'appareil pour des sollicitations courtes, tandis que les Precision 7550 / 7570 feront mieux avec les sollicitations soutenues. Enfin, l'absence de cache de webcam est étrange dans un châssis nouveau.
Le Precision 5750 intègre intentionnellement peu de fonctionnalités, au profit d'une conception plus légère. Ceux qui veulent une station de travail de 17 pouces pour nomade pourront choisir le Precision 5750.
L’intégralité de cette critique est disponible en anglais en suivant ce lien.
Dell Precision 5000 5750 P92F
- 09/07/2020 v7 (old)
Allen Ngo
Price comparison
