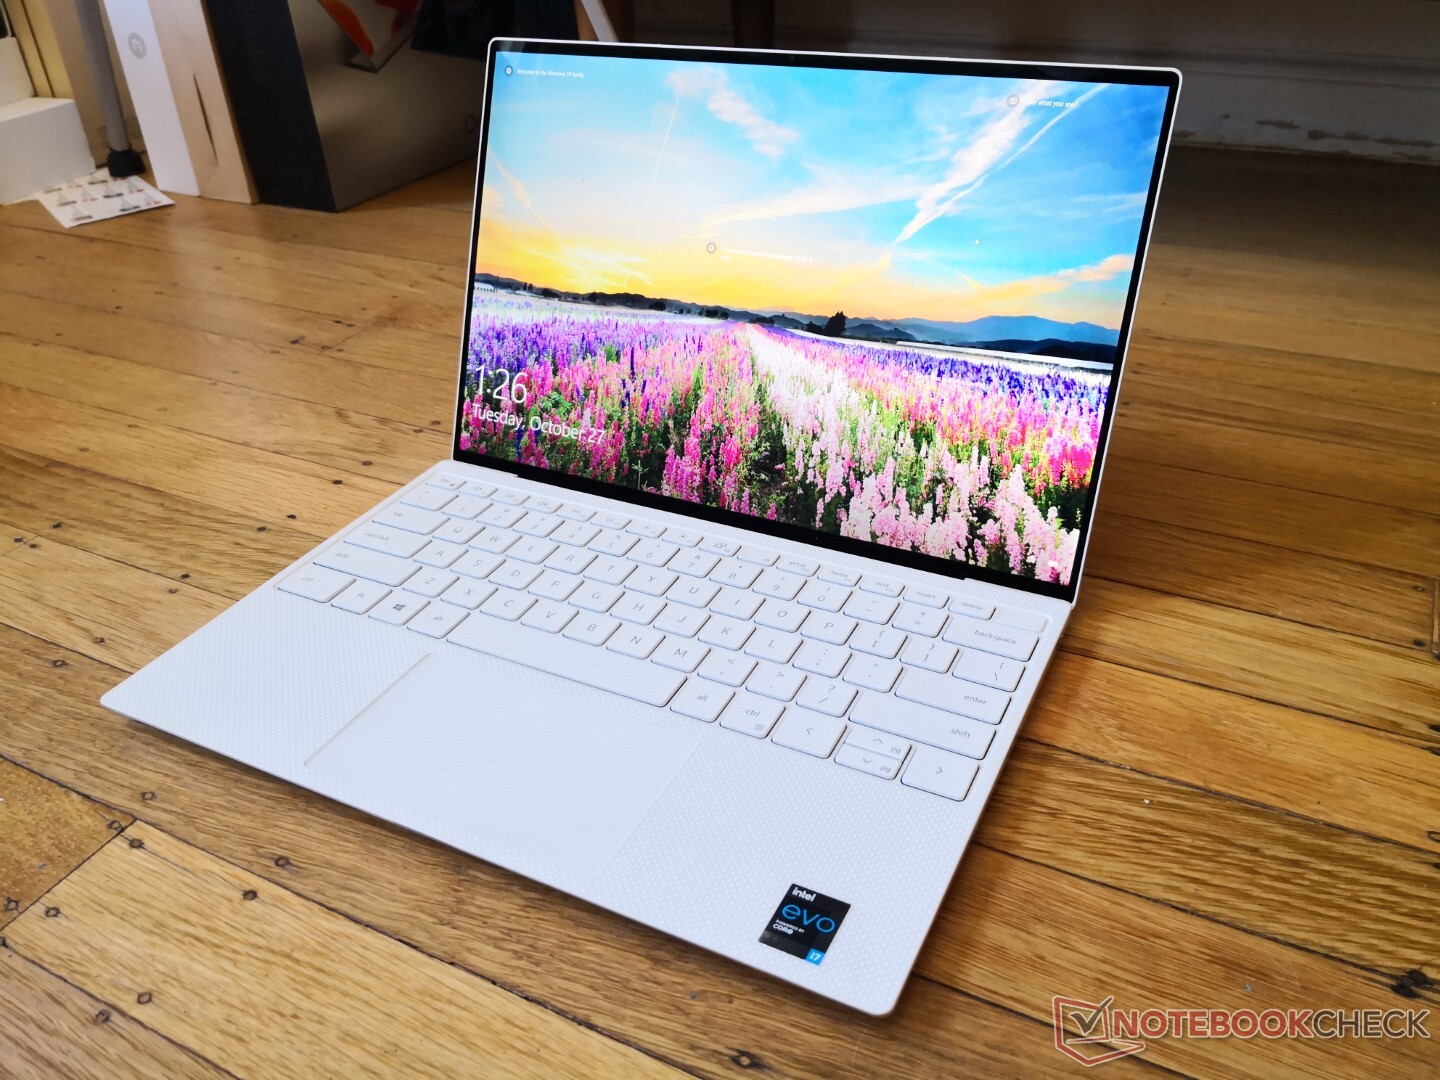
Test du Dell XPS 13 9310 (i7-1165G7, FHD+) : le processeur Tiger Lake de 11e génération fait la différence
Note | Date | Modèle | Poids | Épaisseur | Taille | Résolution | Prix |
|---|---|---|---|---|---|---|---|
| 88.1 % v7 (old) | 11/20 | Dell XPS 13 9310 Core i7 FHD i7-1165G7, Iris Xe G7 96EUs | 1.3 kg | 14.8 mm | 13.40" | 1920x1200 | |
| 88.9 % v7 (old) | 04/20 | Dell XPS 13 9300 Core i7-1065G7 i7-1065G7, Iris Plus Graphics G7 (Ice Lake 64 EU) | 1.2 kg | 14.8 mm | 13.40" | 1920x1200 | |
| 92.1 % v7 (old) | 07/20 | Apple MacBook Pro 13 2020 2GHz i5 10th-Gen i5-1038NG7, Iris Plus Graphics G7 (Ice Lake 64 EU) | 1.4 kg | 15.6 mm | 13.30" | 2560x1600 | |
| 87.4 % v7 (old) | 07/20 | Huawei MateBook X Pro 2020 i7 i7-10510U, GeForce MX250 | 1.3 kg | 14.6 mm | 13.90" | 3000x2000 | |
| 85.3 % v7 (old) | 09/20 | Lenovo Yoga Slim 7-14ARE R7 4800U, Vega 8 | 1.4 kg | 14.9 mm | 14.00" | 1920x1080 | |
| 88.4 % v7 (old) | 01/20 | HP Spectre x360 13-aw0013dx i7-1065G7, Iris Plus Graphics G7 (Ice Lake 64 EU) | 1.2 kg | 16.9 mm | 13.30" | 1920x1080 |
| SD Card Reader | |
| average JPG Copy Test (av. of 3 runs) | |
| Dell XPS 13 9310 Core i7 FHD (Toshiba Exceria Pro M501 64 GB UHS-II) | |
| HP Spectre x360 13-aw0013dx (Toshiba Exceria Pro M501 microSDXC 64GB) | |
| Dell XPS 13 9300 Core i7-1065G7 (Toshiba Exceria Pro M501 64 GB UHS-II) | |
| Lenovo Yoga Slim 7-14ARE (Toshiba Exceria Pro M501 64 GB UHS-II) | |
| maximum AS SSD Seq Read Test (1GB) | |
| Dell XPS 13 9310 Core i7 FHD (Toshiba Exceria Pro M501 64 GB UHS-II) | |
| Dell XPS 13 9300 Core i7-1065G7 (Toshiba Exceria Pro M501 64 GB UHS-II) | |
| HP Spectre x360 13-aw0013dx (Toshiba Exceria Pro M501 microSDXC 64GB) | |
| Lenovo Yoga Slim 7-14ARE (Toshiba Exceria Pro M501 64 GB UHS-II) | |


| |||||||||||||||||||||||||
Homogénéité de la luminosité: 92 %
Valeur mesurée au centre, sur batterie: 543.3 cd/m²
Contraste: 1430:1 (Valeurs des noirs: 0.38 cd/m²)
ΔE ColorChecker Calman: 3.02 | ∀{0.5-29.43 Ø4.72}
calibrated: 1.23
ΔE Greyscale Calman: 5 | ∀{0.09-98 Ø4.97}
99.6% sRGB (Argyll 1.6.3 3D)
66.8% AdobeRGB 1998 (Argyll 1.6.3 3D)
72.9% AdobeRGB 1998 (Argyll 3D)
99.1% sRGB (Argyll 3D)
70.9% Display P3 (Argyll 3D)
Gamma: 2.02
CCT: 6550 K
| Dell XPS 13 9310 Core i7 FHD Sharp LQ134N1, IPS, 13.4", 1920x1200 | Dell XPS 13 9300 Core i7-1065G7 Sharp LQ134N1, IPS, 13.4", 1920x1200 | Apple MacBook Pro 13 2020 2GHz i5 10th-Gen APPA03D, IPS, 13.3", 2560x1600 | Huawei MateBook X Pro 2020 i7 JDI LPM139M422A, LTPS, 13.9", 3000x2000 | Lenovo Yoga Slim 7-14ARE AU Optronics B140HAN06.8, IPS, 14", 1920x1080 | HP Spectre x360 13-aw0013dx AU Optronics AUO5E2D, IPS, 13.3", 1920x1080 | |
|---|---|---|---|---|---|---|
| Display | -5% | 20% | -4% | 0% | -1% | |
| Display P3 Coverage (%) | 70.9 | 66.3 -6% | 98.8 39% | 66.6 -6% | 71.7 1% | 69.6 -2% |
| sRGB Coverage (%) | 99.1 | 97.3 -2% | 99.9 1% | 99.4 0% | 99.3 0% | 98.9 0% |
| AdobeRGB 1998 Coverage (%) | 72.9 | 68.5 -6% | 86.4 19% | 68.6 -6% | 72.9 0% | 71.5 -2% |
| Response Times | 2% | 7% | 6% | 12% | -14% | |
| Response Time Grey 50% / Grey 80% * (ms) | 52 ? | 50 ? 4% | 46 ? 12% | 49.6 ? 5% | 45.6 ? 12% | 60.8 ? -17% |
| Response Time Black / White * (ms) | 33.2 ? | 33.2 ? -0% | 32.4 ? 2% | 30.8 ? 7% | 29.6 ? 11% | 36.8 ? -11% |
| PWM Frequency (Hz) | 2475 ? | 2500 ? | 113600 ? | 29070 ? | ||
| Screen | 1% | 19% | 23% | -9% | -11% | |
| Brightness middle (cd/m²) | 543.3 | 607.6 12% | 512 -6% | 557 3% | 399.6 -26% | 447.4 -18% |
| Brightness (cd/m²) | 524 | 595 14% | 491 -6% | 532 2% | 385 -27% | 420 -20% |
| Brightness Distribution (%) | 92 | 96 4% | 91 -1% | 87 -5% | 89 -3% | 85 -8% |
| Black Level * (cd/m²) | 0.38 | 0.4 -5% | 0.32 16% | 0.33 13% | 0.37 3% | 0.31 18% |
| Contrast (:1) | 1430 | 1519 6% | 1600 12% | 1688 18% | 1080 -24% | 1443 1% |
| Colorchecker dE 2000 * | 3.02 | 3.23 -7% | 1.7 44% | 1.4 54% | 3.2 -6% | 4.23 -40% |
| Colorchecker dE 2000 max. * | 7.61 | 8.67 -14% | 3.4 55% | 2.5 67% | 6.44 15% | 9.34 -23% |
| Colorchecker dE 2000 calibrated * | 1.23 | 1.01 18% | 1 19% | 0.7 43% | 1.73 -41% | 1.32 -7% |
| Greyscale dE 2000 * | 5 | 5.5 -10% | 1.9 62% | 2 60% | 4.7 6% | 6.1 -22% |
| Gamma | 2.02 109% | 2.12 104% | 2.19 100% | 2.14 103% | 2.21 100% | 2.11 104% |
| CCT | 6550 99% | 6413 101% | 6817 95% | 6689 97% | 7184 90% | 6136 106% |
| Color Space (Percent of AdobeRGB 1998) (%) | 66.8 | 63 -6% | 77.4 16% | 62.5 -6% | 66.3 -1% | 64.8 -3% |
| Color Space (Percent of sRGB) (%) | 99.6 | 97.5 -2% | 99.9 0% | 99.5 0% | 99.5 0% | 98.9 -1% |
| Moyenne finale (programmes/paramètres) | -1% /
0% | 15% /
18% | 8% /
16% | 1% /
-5% | -9% /
-10% |
* ... Moindre est la valeur, meilleures sont les performances
Temps de réponse de l'écran
| ↔ Temps de réponse noir à blanc | ||
|---|---|---|
| 33.2 ms ... hausse ↗ et chute ↘ combinées | ↗ 19.2 ms hausse | 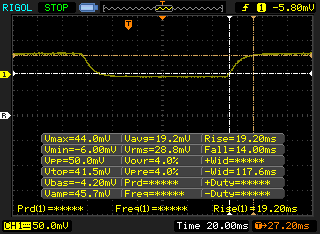 |
| ↘ 14 ms chute | ||
| L'écran souffre de latences très élevées, à éviter pour le jeu. En comparaison, tous les appareils testés affichent entre 0.1 (minimum) et 240 (maximum) ms. » 90 % des appareils testés affichent de meilleures performances. Cela signifie que les latences relevées sont moins bonnes que la moyenne (19.8 ms) de tous les appareils testés. | ||
| ↔ Temps de réponse gris 50% à gris 80% | ||
| 52 ms ... hausse ↗ et chute ↘ combinées | ↗ 27.6 ms hausse | 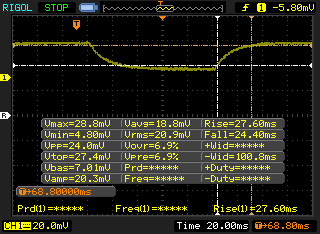 |
| ↘ 24.4 ms chute | ||
| L'écran souffre de latences très élevées, à éviter pour le jeu. En comparaison, tous les appareils testés affichent entre 0.165 (minimum) et 636 (maximum) ms. » 88 % des appareils testés affichent de meilleures performances. Cela signifie que les latences relevées sont moins bonnes que la moyenne (31 ms) de tous les appareils testés. | ||
Scintillement / MLI (Modulation de largeur d'impulsion)
| Scintillement / MLI (Modulation de largeur d'impulsion) décelé | 2475 Hz | ≤ 20 Niveau de luminosité | 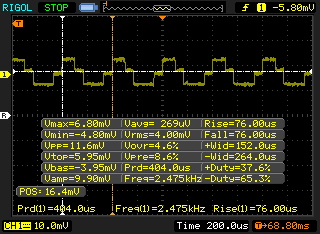 |
Le rétroéclairage de l'écran scintille à la fréquence de 2475 Hz (certainement du fait de l'utilisation d'une MDI - Modulation de largeur d'impulsion) à un niveau de luminosité inférieur ou égal à 20 % . Aucun scintillement ne devrait être perceptible au-dessus de cette valeur. La fréquence de rafraîchissement de 2475 Hz est élevée, la grande majorité des utilisateurs ne devrait pas percevoir de scintillements et être sujette à une fatigue oculaire accrue. En comparaison, 52 % des appareils testés n'emploient pas MDI pour assombrir leur écran. Nous avons relevé une moyenne à 7778 (minimum : 5 - maximum : 343500) Hz dans le cas où une MDI était active. | |||
Cinebench R15: CPU Multi 64Bit | CPU Single 64Bit
Blender: v2.79 BMW27 CPU
7-Zip 18.03: 7z b 4 -mmt1 | 7z b 4
Geekbench 5.5: Single-Core | Multi-Core
HWBOT x265 Benchmark v2.2: 4k Preset
LibreOffice : 20 Documents To PDF
R Benchmark 2.5: Overall mean
Cinebench R15: CPU Multi 64Bit | CPU Single 64Bit
Blender: v2.79 BMW27 CPU
7-Zip 18.03: 7z b 4 -mmt1 | 7z b 4
Geekbench 5.5: Single-Core | Multi-Core
HWBOT x265 Benchmark v2.2: 4k Preset
LibreOffice : 20 Documents To PDF
R Benchmark 2.5: Overall mean
* ... Moindre est la valeur, meilleures sont les performances
| PCMark 8 Home Score Accelerated v2 | 4407 points | |
| PCMark 8 Work Score Accelerated v2 | 3073 points | |
| PCMark 10 Score | 4914 points | |
Aide | ||
| DPC Latencies / LatencyMon - interrupt to process latency (max), Web, Youtube, Prime95 | |
| Dell XPS 13 9300 Core i7-1065G7 | |
| Lenovo Yoga Slim 7-14ARE | |
| Dell XPS 13 9310 Core i7 FHD | |
* ... Moindre est la valeur, meilleures sont les performances
| Dell XPS 13 9310 Core i7 FHD Micron 2300 512GB MTFDHBA512TDV | Dell XPS 13 9300 Core i7-1065G7 Intel SSDPEMKF512G8 NVMe SSD | Apple MacBook Pro 13 2020 2GHz i5 10th-Gen Apple SSD SM0512F | Huawei MateBook X Pro 2020 i7 Samsung PM981a MZVLB1T0HBLR | HP Spectre x360 13-aw0013dx Intel Optane Memory H10 with Solid State Storage 32GB + 512GB HBRPEKNX0202A(L/H) | |
|---|---|---|---|---|---|
| AS SSD | -16% | -49% | 48% | -30% | |
| Seq Read (MB/s) | 2091 | 1956 -6% | 1300 -38% | 2737 31% | 1039 -50% |
| Seq Write (MB/s) | 1396 | 1227 -12% | 1518 9% | 2530 81% | 310.1 -78% |
| 4K Read (MB/s) | 49.29 | 63 28% | 14.09 -71% | 54 10% | 76 54% |
| 4K Write (MB/s) | 104.2 | 156.6 50% | 24.25 -77% | 152.5 46% | 118 13% |
| 4K-64 Read (MB/s) | 827 | 475.6 -42% | 725 -12% | 2011 143% | 371.8 -55% |
| 4K-64 Write (MB/s) | 1636 | 539 -67% | 169.6 -90% | 1260 -23% | 469.5 -71% |
| Access Time Read * (ms) | 0.066 | 0.042 36% | 0.172 -161% | 0.066 -0% | 0.067 -2% |
| Access Time Write * (ms) | 0.365 | 0.105 71% | 0.155 58% | 0.024 93% | 0.138 62% |
| Score Read (Points) | 1086 | 734 -32% | 869 -20% | 2339 115% | 552 -49% |
| Score Write (Points) | 1880 | 818 -56% | 346 -82% | 1666 -11% | 618 -67% |
| Score Total (Points) | 3499 | 1915 -45% | 1667 -52% | 5191 48% | 1448 -59% |
| Copy ISO MB/s (MB/s) | 1544 | 1022 -34% | 764 -51% | ||
| Copy Program MB/s (MB/s) | 613 | 302.8 -51% | 465.8 -24% | ||
| Copy Game MB/s (MB/s) | 1451 | 491.4 -66% | 764 -47% | ||
| CrystalDiskMark 5.2 / 6 | 15% | -31% | 14% | -7% | |
| Write 4K (MB/s) | 97.5 | 186.8 92% | 28.16 -71% | 165.6 70% | 112.6 15% |
| Read 4K (MB/s) | 50.9 | 71.4 40% | 17.5 -66% | 50.2 -1% | 131 157% |
| Write Seq (MB/s) | 1811 | 1203 -34% | 1195 -34% | 1905 5% | 458.9 -75% |
| Read Seq (MB/s) | 1836 | 2600 42% | 1470 -20% | 1669 -9% | 1355 -26% |
| Write 4K Q32T1 (MB/s) | 521 | 514 -1% | 205 -61% | 474.6 -9% | 341.3 -34% |
| Read 4K Q32T1 (MB/s) | 357.5 | 570 59% | 692 94% | 508 42% | 320.6 -10% |
| Write Seq Q32T1 (MB/s) | 2879 | 786 -73% | 1475 -49% | 3007 4% | 1219 -58% |
| Read Seq Q32T1 (MB/s) | 3204 | 2947 -8% | 1920 -40% | 3556 11% | 2462 -23% |
| Moyenne finale (programmes/paramètres) | -1% /
-5% | -40% /
-41% | 31% /
34% | -19% /
-22% |
* ... Moindre est la valeur, meilleures sont les performances

Disk Throttling: DiskSpd Read Loop, Queue Depth 8
| 3DMark 11 Performance | 6554 points | |
| 3DMark Cloud Gate Standard Score | 14167 points | |
| 3DMark Fire Strike Score | 3656 points | |
| 3DMark Time Spy Score | 1333 points | |
Aide | ||
| Bas | Moyen | Élevé | Ultra | |
|---|---|---|---|---|
| GTA V (2015) | 84.3 | 76.8 | 24.7 | 10.5 |
| The Witcher 3 (2015) | 97.7 | 58.4 | 32.7 | 14.3 |
| Dota 2 Reborn (2015) | 77.5 | 54.3 | 40.5 | 42.5 |
| Final Fantasy XV Benchmark (2018) | 33.7 | 19.6 | 15.4 | |
| X-Plane 11.11 (2018) | 48 | 37.3 | 32.5 | |
| Strange Brigade (2018) | 94.4 | 38.5 | 30.4 | 24 |
| Dell XPS 13 9310 Core i7 FHD Iris Xe G7 96EUs, i7-1165G7, Micron 2300 512GB MTFDHBA512TDV | Dell XPS 13 9300 Core i7-1065G7 Iris Plus Graphics G7 (Ice Lake 64 EU), i7-1065G7, Intel SSDPEMKF512G8 NVMe SSD | Apple MacBook Pro 13 2020 2GHz i5 10th-Gen Iris Plus Graphics G7 (Ice Lake 64 EU), i5-1038NG7, Apple SSD SM0512F | Huawei MateBook X Pro 2020 i7 GeForce MX250, i7-10510U, Samsung PM981a MZVLB1T0HBLR | Lenovo Yoga Slim 7-14ARE Vega 8, R7 4800U, Samsung SSD PM981a MZVLB512HBJQ | |
|---|---|---|---|---|---|
| Noise | -11% | -15% | -16% | -4% | |
| arrêt / environnement * (dB) | 25.7 | 28.3 -10% | 29.6 -15% | 29.6 -15% | 26.3 -2% |
| Idle Minimum * (dB) | 25.7 | 28.3 -10% | 29.6 -15% | 29.6 -15% | 26.5 -3% |
| Idle Average * (dB) | 25.7 | 28.3 -10% | 29.6 -15% | 29.6 -15% | 26.5 -3% |
| Idle Maximum * (dB) | 25.9 | 28.3 -9% | 29.6 -14% | 30.3 -17% | 26.5 -2% |
| Load Average * (dB) | 26.2 | 32.5 -24% | 34.4 -31% | 38 -45% | 31.8 -21% |
| Witcher 3 ultra * (dB) | 36.5 | 39.3 -8% | 36.1 1% | 38 -4% | 35.9 2% |
| Load Maximum * (dB) | 36.6 | 39.3 -7% | 42.1 -15% | 38 -4% | 35.9 2% |
* ... Moindre est la valeur, meilleures sont les performances
Degré de la nuisance sonore
| Au repos |
| 25.7 / 25.7 / 25.9 dB(A) |
| Fortement sollicité |
| 26.2 / 36.6 dB(A) |
 | ||
30 dB silencieux 40 dB(A) audible 50 dB(A) bruyant |
||
min: | ||
(-) La température maximale du côté supérieur est de 46.2 °C / 115 F, par rapport à la moyenne de 35.9 °C / 97 F, allant de 21.4 à 59 °C pour la classe Subnotebook.
(-) Le fond chauffe jusqu'à un maximum de 46 °C / 115 F, contre une moyenne de 39.2 °C / 103 F
(+) En utilisation inactive, la température moyenne du côté supérieur est de 20.7 °C / 69 F, par rapport à la moyenne du dispositif de 30.8 °C / 87 F.
(±) En jouant à The Witcher 3, la température moyenne du côté supérieur est de 34.2 °C / 94 F, alors que la moyenne de l'appareil est de 30.8 °C / 87 F.
(+) Les repose-poignets et le pavé tactile atteignent la température maximale de la peau (32 °C / 89.6 F) et ne sont donc pas chauds.
(-) La température moyenne de la zone de l'appui-paume de dispositifs similaires était de 28.2 °C / 82.8 F (-3.8 °C / #-6.8 F).
Dell XPS 13 9310 Core i7 FHD analyse audio
(+) | les haut-parleurs peuvent jouer relativement fort (84.6# dB)
Basses 100 - 315 Hz
(-) | presque aucune basse - en moyenne 16.1% plus bas que la médiane
(±) | la linéarité des basses est moyenne (13.1% delta à la fréquence précédente)
Médiums 400 - 2000 Hz
(+) | médiane équilibrée - seulement 2.6% de la médiane
(+) | les médiums sont linéaires (4.6% delta à la fréquence précédente)
Aiguës 2 - 16 kHz
(+) | des sommets équilibrés - à seulement 1.3% de la médiane
(+) | les aigus sont linéaires (4% delta à la fréquence précédente)
Globalement 100 - 16 000 Hz
(+) | le son global est linéaire (10.7% différence à la médiane)
Par rapport à la même classe
» 9% de tous les appareils testés de cette catégorie étaient meilleurs, 3% similaires, 88% pires
» Le meilleur avait un delta de 5%, la moyenne était de 18%, le pire était de 53%.
Par rapport à tous les appareils testés
» 6% de tous les appareils testés étaient meilleurs, 2% similaires, 93% pires
» Le meilleur avait un delta de 4%, la moyenne était de 24%, le pire était de 134%.
Apple MacBook 12 (Early 2016) 1.1 GHz analyse audio
(+) | les haut-parleurs peuvent jouer relativement fort (83.6# dB)
Basses 100 - 315 Hz
(±) | basse réduite - en moyenne 11.3% inférieure à la médiane
(±) | la linéarité des basses est moyenne (14.2% delta à la fréquence précédente)
Médiums 400 - 2000 Hz
(+) | médiane équilibrée - seulement 2.4% de la médiane
(+) | les médiums sont linéaires (5.5% delta à la fréquence précédente)
Aiguës 2 - 16 kHz
(+) | des sommets équilibrés - à seulement 2% de la médiane
(+) | les aigus sont linéaires (4.5% delta à la fréquence précédente)
Globalement 100 - 16 000 Hz
(+) | le son global est linéaire (10.2% différence à la médiane)
Par rapport à la même classe
» 7% de tous les appareils testés de cette catégorie étaient meilleurs, 2% similaires, 91% pires
» Le meilleur avait un delta de 5%, la moyenne était de 18%, le pire était de 53%.
Par rapport à tous les appareils testés
» 5% de tous les appareils testés étaient meilleurs, 1% similaires, 94% pires
» Le meilleur avait un delta de 4%, la moyenne était de 24%, le pire était de 134%.
| Éteint/en veille | |
| Au repos | |
| Fortement sollicité |
|
Légende:
min: | |
| Dell XPS 13 9310 Core i7 FHD i7-1165G7, Iris Xe G7 96EUs, Micron 2300 512GB MTFDHBA512TDV, IPS, 1920x1200, 13.4" | Dell XPS 13 9300 Core i7-1065G7 i7-1065G7, Iris Plus Graphics G7 (Ice Lake 64 EU), Intel SSDPEMKF512G8 NVMe SSD, IPS, 1920x1200, 13.4" | Apple MacBook Pro 13 2020 2GHz i5 10th-Gen i5-1038NG7, Iris Plus Graphics G7 (Ice Lake 64 EU), Apple SSD SM0512F, IPS, 2560x1600, 13.3" | Huawei MateBook X Pro 2020 i7 i7-10510U, GeForce MX250, Samsung PM981a MZVLB1T0HBLR, LTPS, 3000x2000, 13.9" | Lenovo Yoga Slim 7-14ARE R7 4800U, Vega 8, Samsung SSD PM981a MZVLB512HBJQ, IPS, 1920x1080, 14" | HP Spectre x360 13-aw0013dx i7-1065G7, Iris Plus Graphics G7 (Ice Lake 64 EU), Intel Optane Memory H10 with Solid State Storage 32GB + 512GB HBRPEKNX0202A(L/H), IPS, 1920x1080, 13.3" | |
|---|---|---|---|---|---|---|
| Power Consumption | -6% | -36% | -41% | -19% | 1% | |
| Idle Minimum * (Watt) | 3.9 | 4.2 -8% | 3.8 3% | 4.3 -10% | 4 -3% | 3.9 -0% |
| Idle Average * (Watt) | 5.9 | 6.9 -17% | 8.6 -46% | 8.5 -44% | 6.3 -7% | 6.3 -7% |
| Idle Maximum * (Watt) | 6.3 | 7.5 -19% | 10.3 -63% | 12 -90% | 7.7 -22% | 6.8 -8% |
| Load Average * (Watt) | 39.7 | 33.3 16% | 52.1 -31% | 54.8 -38% | 48.3 -22% | 32.6 18% |
| Witcher 3 ultra * (Watt) | 34.8 | 37.1 -7% | 48.2 -39% | 47.1 -35% | 49 -41% | 25.6 26% |
| Load Maximum * (Watt) | 47.5 | 48.4 -2% | 65.2 -37% | 61.5 -29% | 57.6 -21% | 59 -24% |
* ... Moindre est la valeur, meilleures sont les performances
| Dell XPS 13 9310 Core i7 FHD i7-1165G7, Iris Xe G7 96EUs, 52 Wh | Dell XPS 13 9300 Core i7-1065G7 i7-1065G7, Iris Plus Graphics G7 (Ice Lake 64 EU), 52 Wh | Apple MacBook Pro 13 2020 2GHz i5 10th-Gen i5-1038NG7, Iris Plus Graphics G7 (Ice Lake 64 EU), 58 Wh | Huawei MateBook X Pro 2020 i7 i7-10510U, GeForce MX250, 57.4 Wh | Lenovo Yoga Slim 7-14ARE R7 4800U, Vega 8, 61 Wh | HP Spectre x360 13-aw0013dx i7-1065G7, Iris Plus Graphics G7 (Ice Lake 64 EU), 60 Wh | |
|---|---|---|---|---|---|---|
| Autonomie de la batterie | 15% | 10% | -15% | -25% | -1% | |
| Reader / Idle (h) | 30 | 27.1 -10% | 37.1 24% | |||
| WiFi v1.3 (h) | 11 | 12.7 15% | 12.1 10% | 10.4 -5% | 10.3 -6% | 9.9 -10% |
| Load (h) | 3.2 | 2.4 -25% | 1.3 -59% | 2.7 -16% |
Points positifs
Points négatifs
Ceux qui ont déjà un PC portable Ice Lake n'ont pas beaucoup de raisons de passer à Tiger Lake. Les performances globales ne sont pas spécialement meilleures qu'avec le XPS 9300, qui n'a pas un an. Les performances graphiques sont la principale exception, l'Iris Xe intégrée étant bien plus puissante que l'Iris Plus G7, sans demander plus d'énergie ni être plus bruyante ou chaude. Cela est particulièrement intéressant pour les monteurs vidéo ou graphique, qui savent qu'ils peuvent utiliser la carte graphique pour exploiter au mieux le XPS 13 9310 et son nouveau processeur.
Pour les autres, le XPS 13 9300 moins cher sera plus que suffisant, d'autant que le gain de performances entre le Core i7 de 10e génération et le Core i7 de 11e génération est marginal. Le plus gros avantage de Tiger Lake, qui est son nouveau GPU intégré, n'est en rien utile aux joueurs si ce n'est qu'occasionnellement, le taux d'image ayant tendance à être moins stable et même parfois moins élevé qu'avec la gamme éprouvée GeForce MX150 / MX250. Et les temps de réponse moyens et l'absence d'adaptive sync de l'écran viennent confirmer cela. Ce serait bien que cela progresse dans les générations futures, tout comme le fait d'intégrer un cache de webcam. Une possibilité logicielle pour désactiver l'adaptation dynamique de la fréquence serait également bien.
Impossible de choisir entre le XPS 13 9300 ou le 9310 ? Pour la rédaction, le streaming vidéo et le jeu occasionnel, le XPS 13 9300 paraîtra tout aussi puissant que le 9310. Pour les usages gourmands en ressources graphiques hormis le jeu, la puissance de la carte graphique et son rapport performances / prix élevé devraient s'avérer utiles.
L’intégralité de cette critique est disponible en anglais en suivant ce lien.
Dell XPS 13 9310 Core i7 FHD
- 10/28/2020 v7 (old)
Allen Ngo
Price comparison
