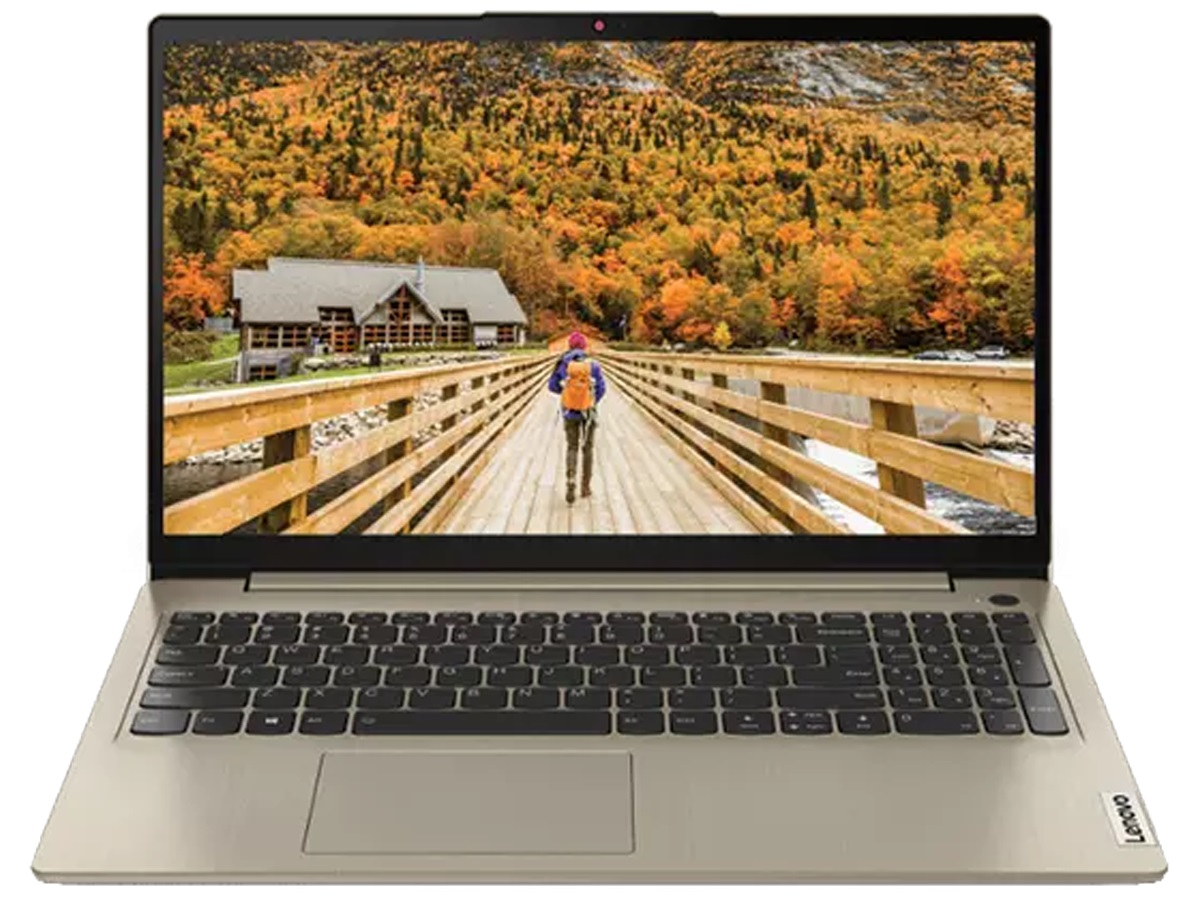
Test du Lenovo IdeaPad 3 15ALC6 : le Ryzen 3 surpasse le Core i3
La famille IdeaPad 3 regroupe des modèles d'ordinateurs portables bas de gamme qui se situent sous les familles déjà bon marché IdeaPad 5 et IdeaPad 7. Si vous disposez d'un budget très serré, le faible prix de départ d'un IdeaPad 3 peut sembler attrayant.
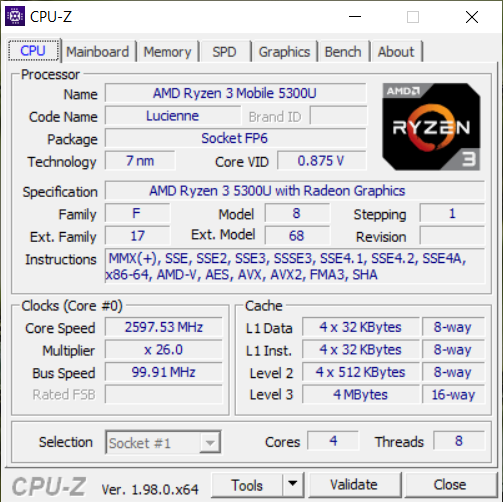
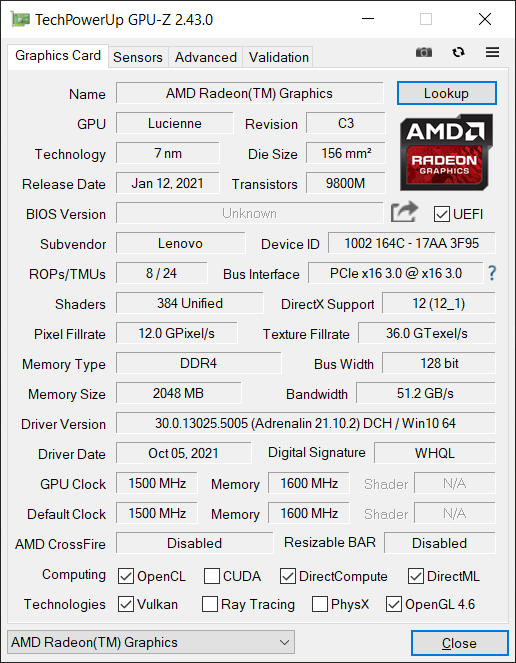
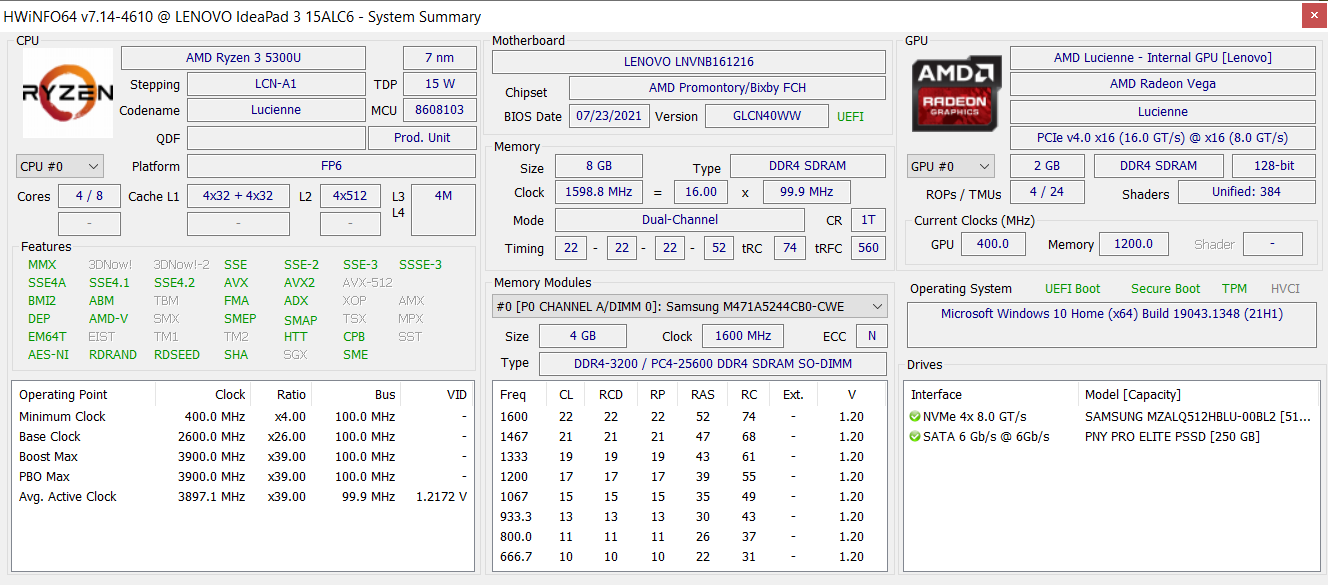
Notre unité de test est équipée du processeur quadricœur Ryzen 3 5300U Zen 2, de 8 Go de RAM, d'un écran IPS 1080p et d'un SSD PCIe3 NVMe de 512 Go pour un prix de détail d'environ 539 USD, voire moins en promotion. Des SKU plus haut de gamme peuvent être disponibles avec le Ryzen 5 5500U ou le Ryzen 7 5700U et avec plus de RAM ou de stockage. Parmi les concurrents de l'IdeaPad 3, on trouve d'autres ordinateurs portables grand public bon marché comme le HP Pavilion 15, Asus VivoBook F series, Dell Inspiron series, ou le Acer Aspire 3 series Test de l'Acer Aspire 5 A515 : un regard sur un PC portable Tiger Lake .
Plus de commentaires sur Lenovo :
Potential Competitors in Comparison
Note | Date | Modèle | Poids | Épaisseur | Taille | Résolution | Prix |
|---|---|---|---|---|---|---|---|
| 80.4 % v7 (old) | 12/21 | Lenovo IdeaPad 3 15ALC6 R3 5300U, Vega 6 | 1.7 kg | 19.9 mm | 15.60" | 1920x1080 | |
| 83 % v7 (old) | 08/20 | Lenovo IdeaPad 5 15IIL05 i5-1035G1, GeForce MX350 | 1.7 kg | 17.9 mm | 15.60" | 1920x1080 | |
| 81.4 % v7 (old) | 02/20 | Lenovo Ideapad S540-15IML i5-10210U, GeForce MX250 | 1.9 kg | 17 mm | 15.60" | 1920x1080 | |
| 80.5 % v7 (old) | 10/21 | Dell Inspiron 15 3501 i7-1165G7, Iris Xe G7 96EUs | 2 kg | 19.9 mm | 15.60" | 1920x1080 | |
| 81.2 % v7 (old) | 06/21 | HP Pavilion 15-eg i7-1165G7, GeForce MX450 | 1.7 kg | 17.9 mm | 15.60" | 1920x1080 | |
| 80.5 % v7 (old) | 11/21 | Asus VivoBook 15 KM513UA-L503TS R5 5500U, Vega 7 | 1.8 kg | 18.6 mm | 15.60" | 1920x1080 |
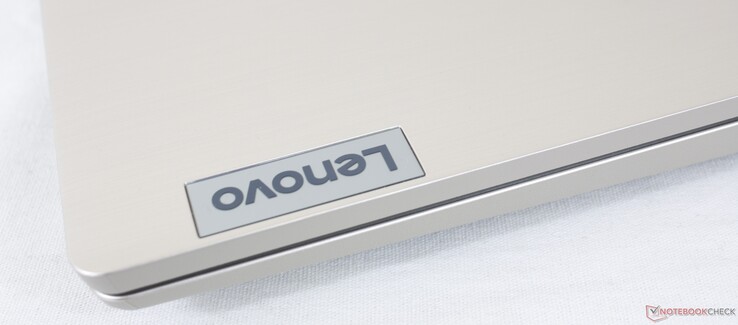
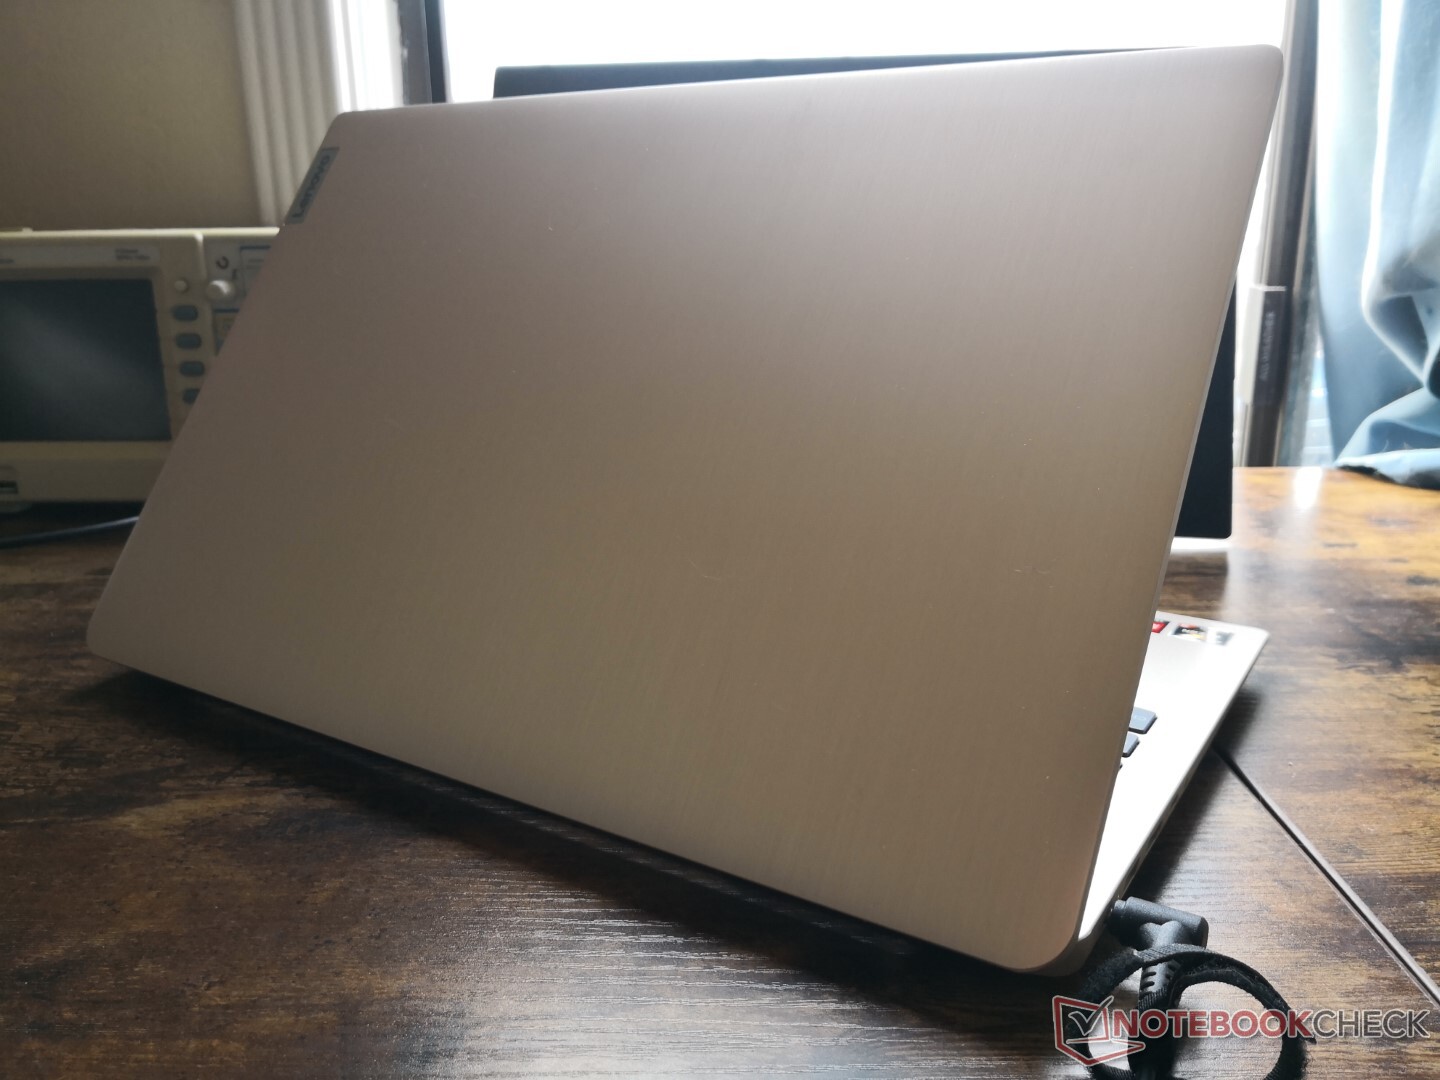
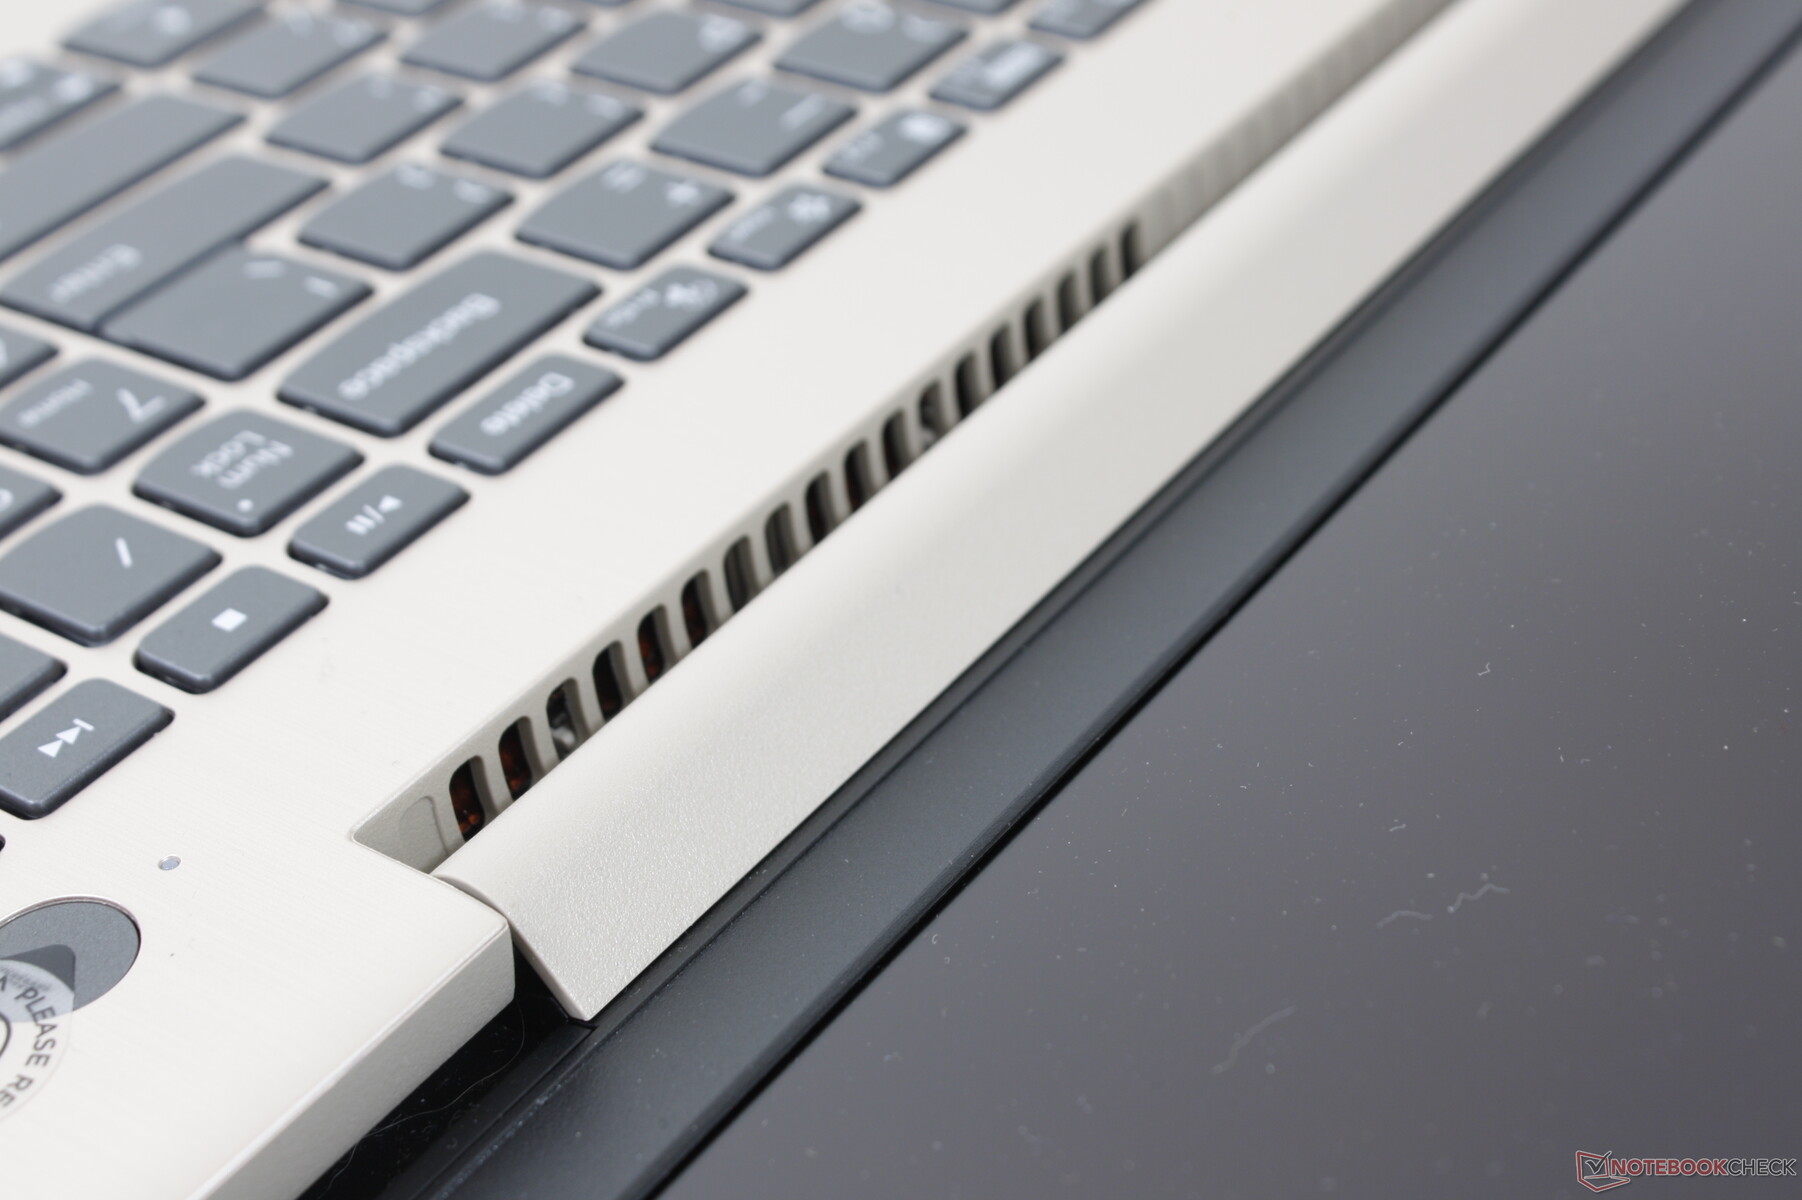
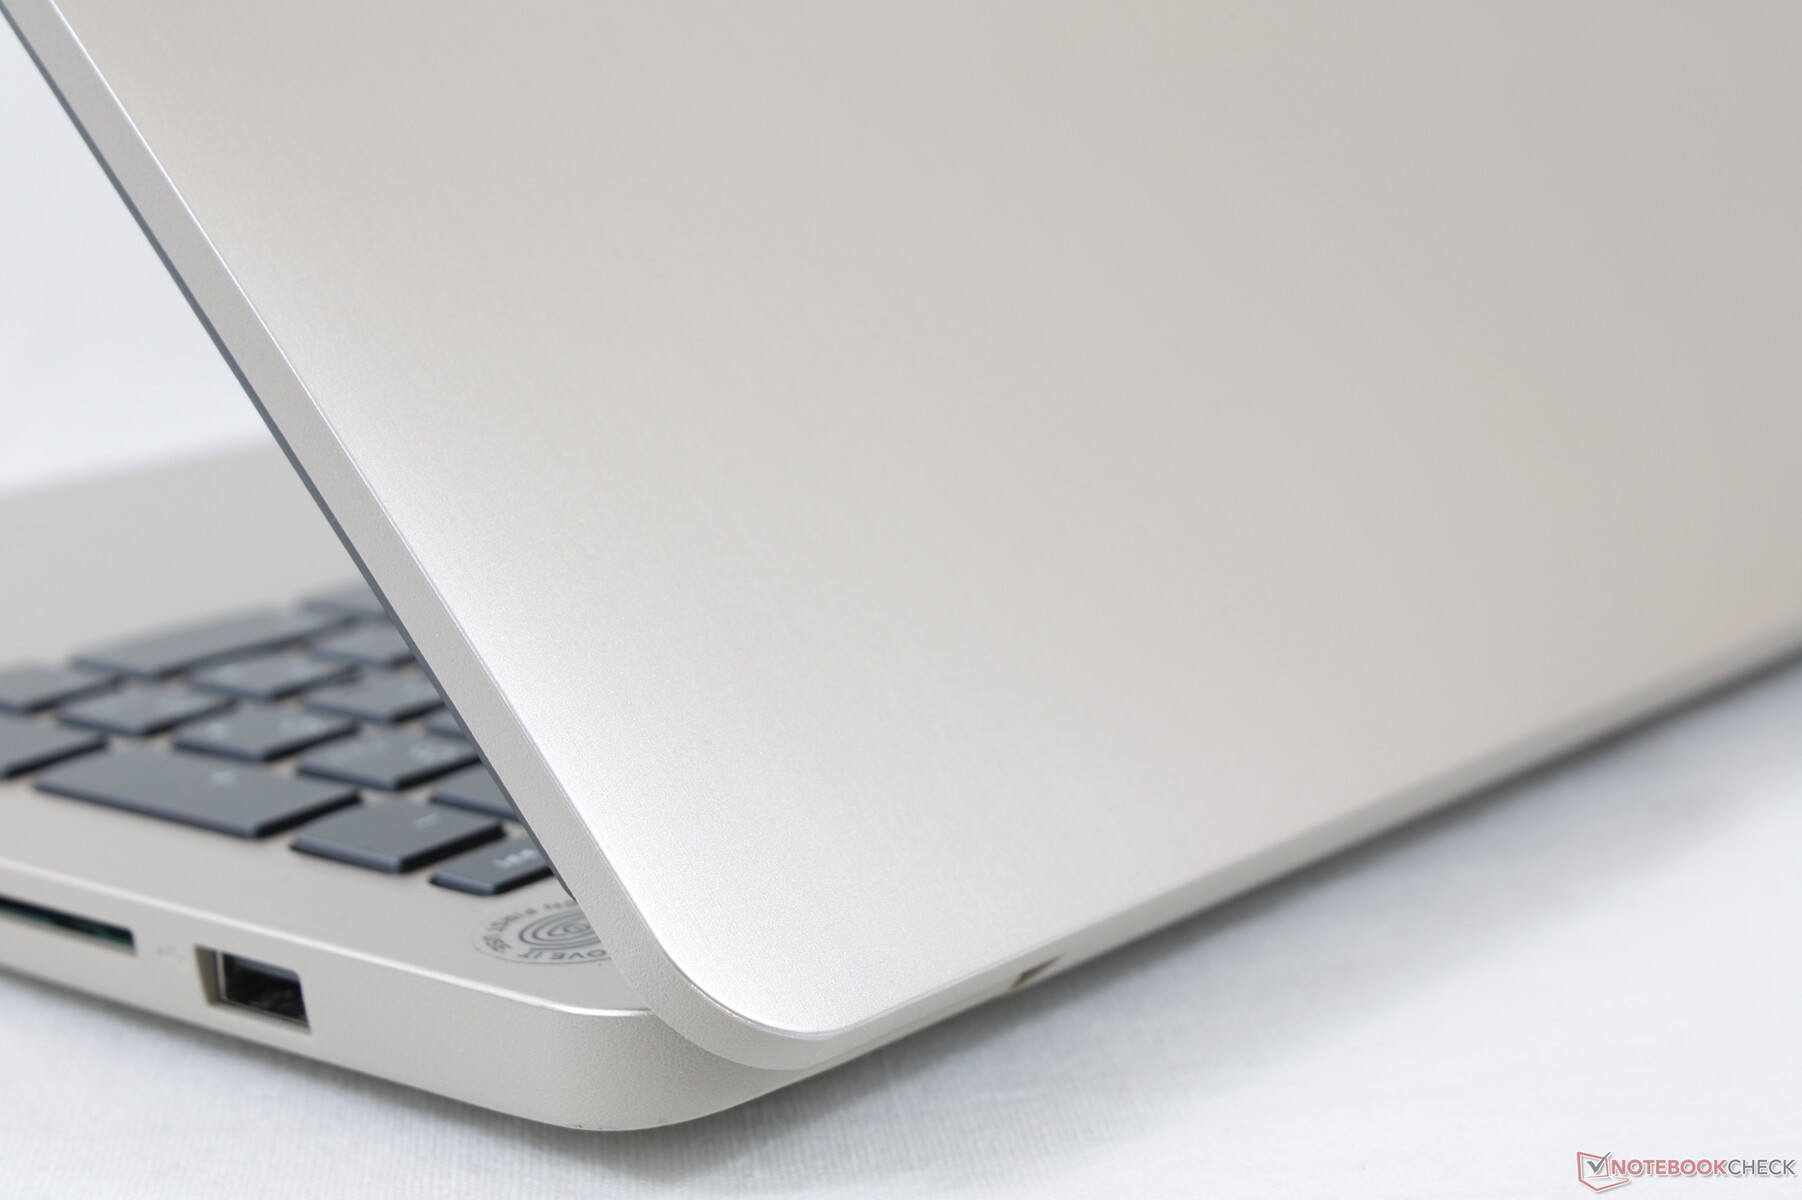
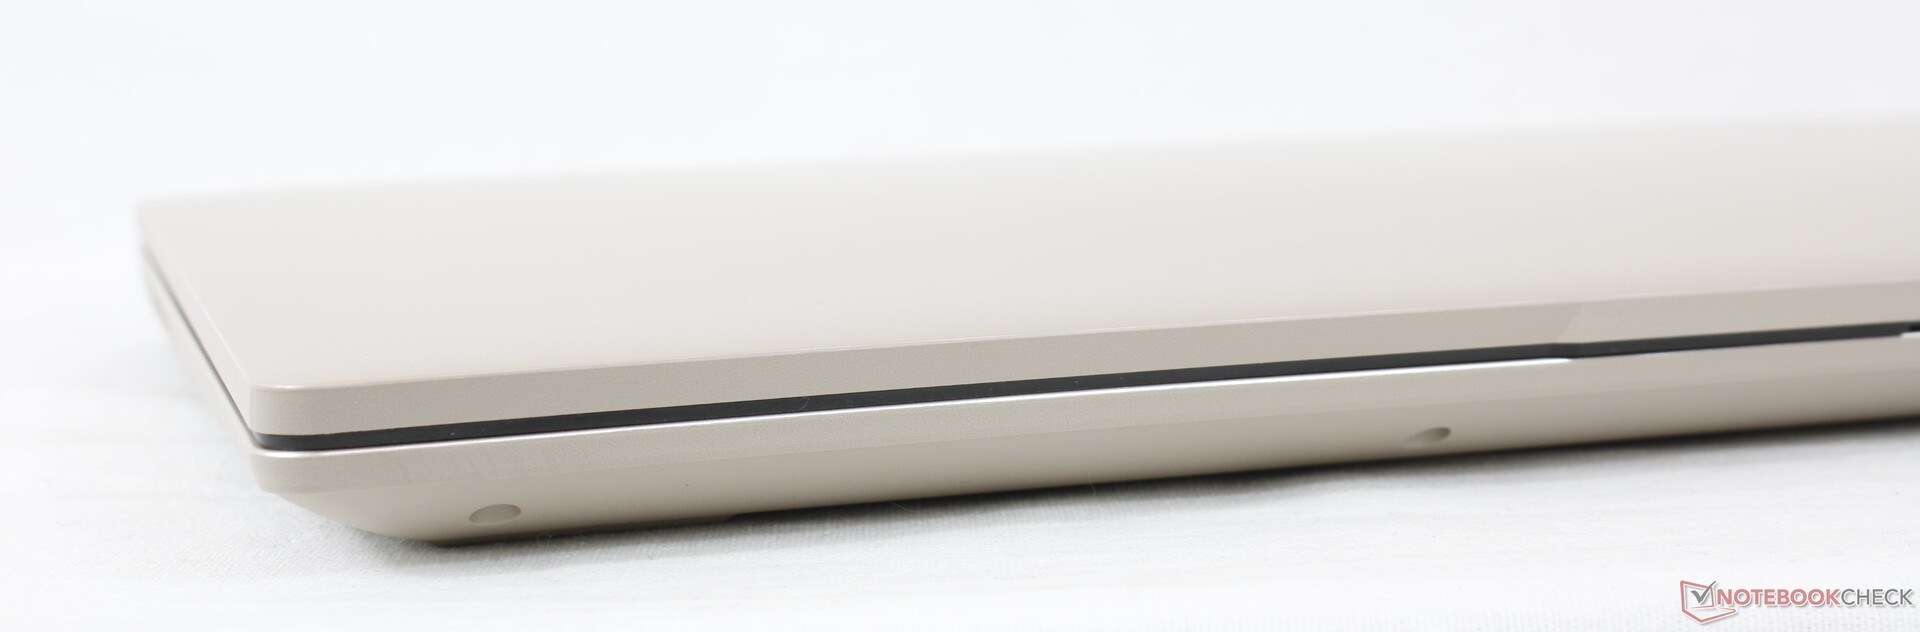
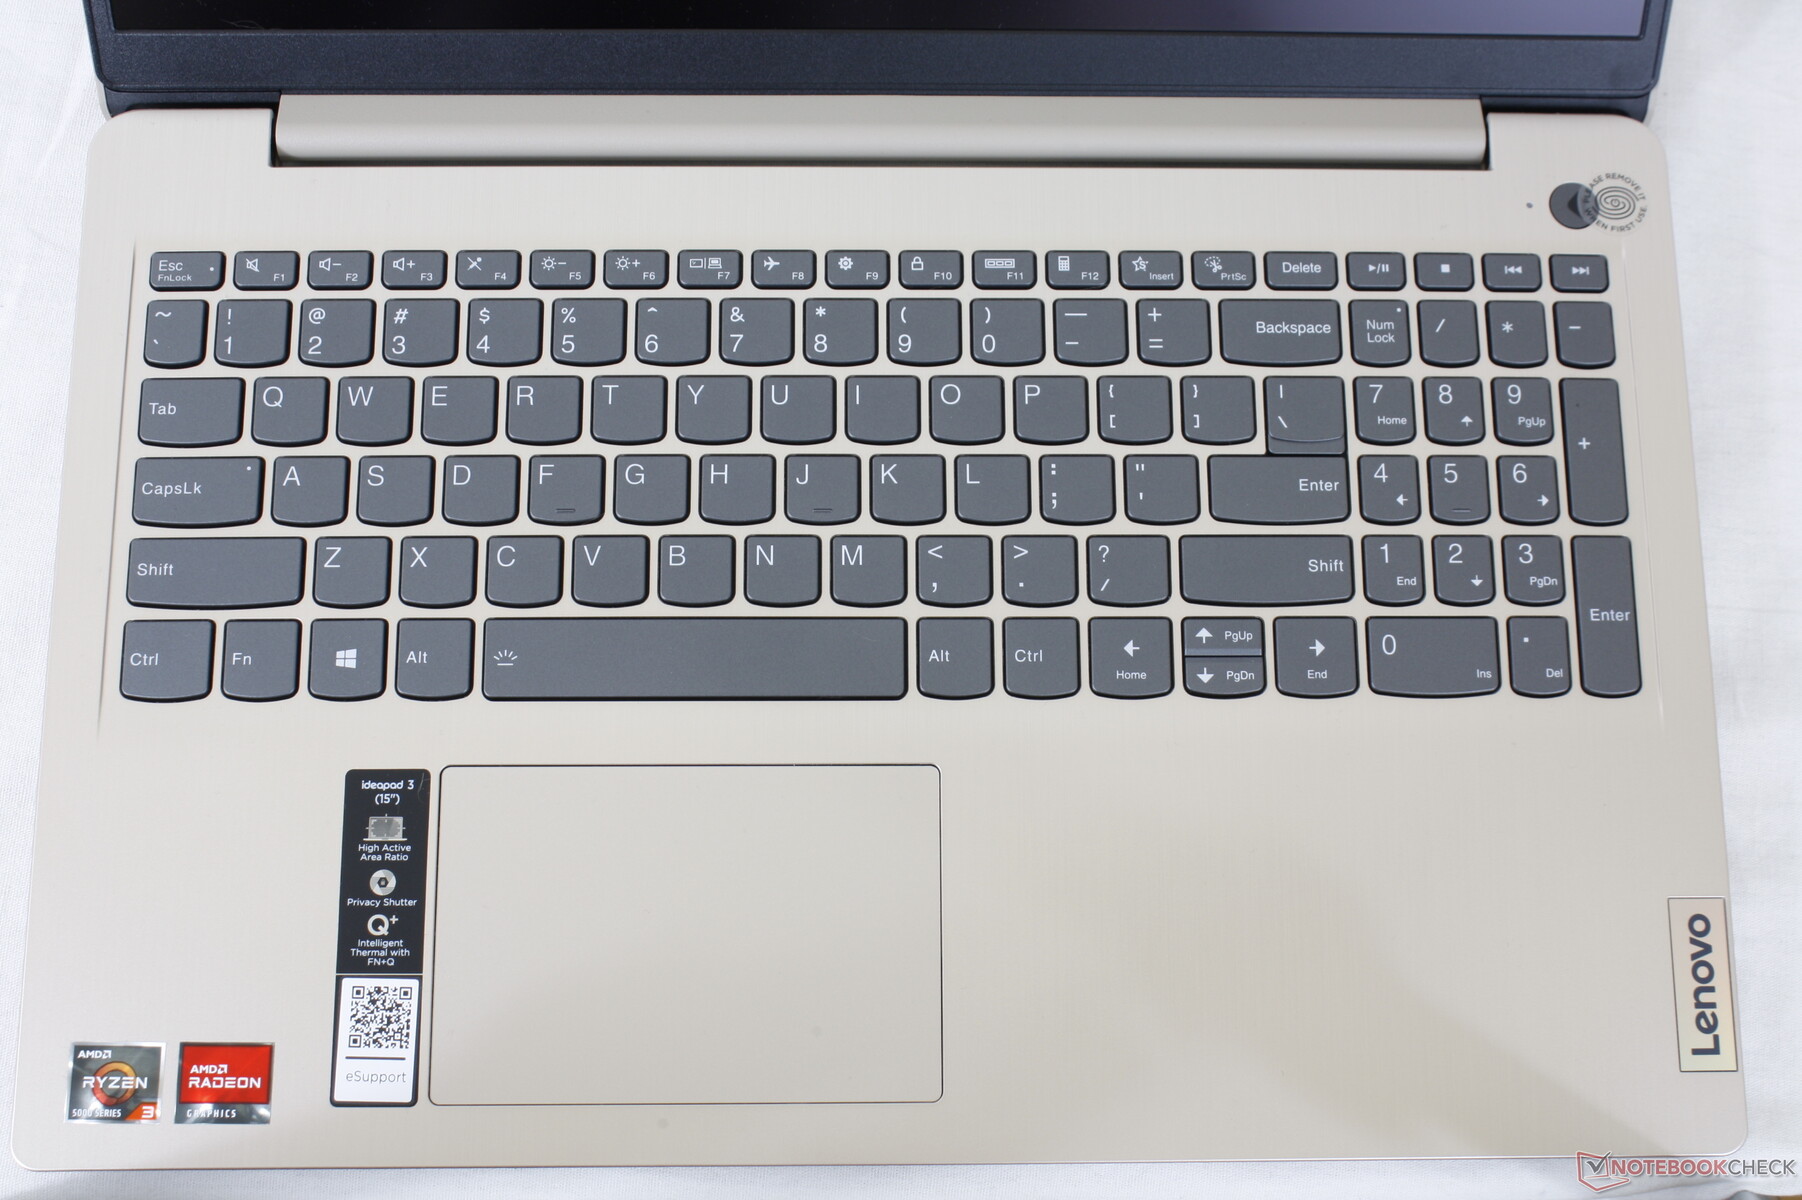
Boîtier - Apparence bon marché
Le clavier et le couvercle extérieur sont en aluminium brossé pour une meilleure esthétique. Cependant, le châssis présente à la fois des flexions et des craquements légers mais audibles. La rigidité globale est légèrement inférieure à celle des modèles concurrents HP Pavilion 15 ou Asus VivoBook 15.
La taille et les dimensions du châssis sont presque identiques à celles du Pavilion 15 et du VivoBook 15, ce qui signifie que les utilisateurs ne bénéficieront d'aucun avantage en termes de poids ou de déplacement en choisissant le Lenovo. Le Inspiron 3501 est nettement plus grand et plus lourd que les trois autres.
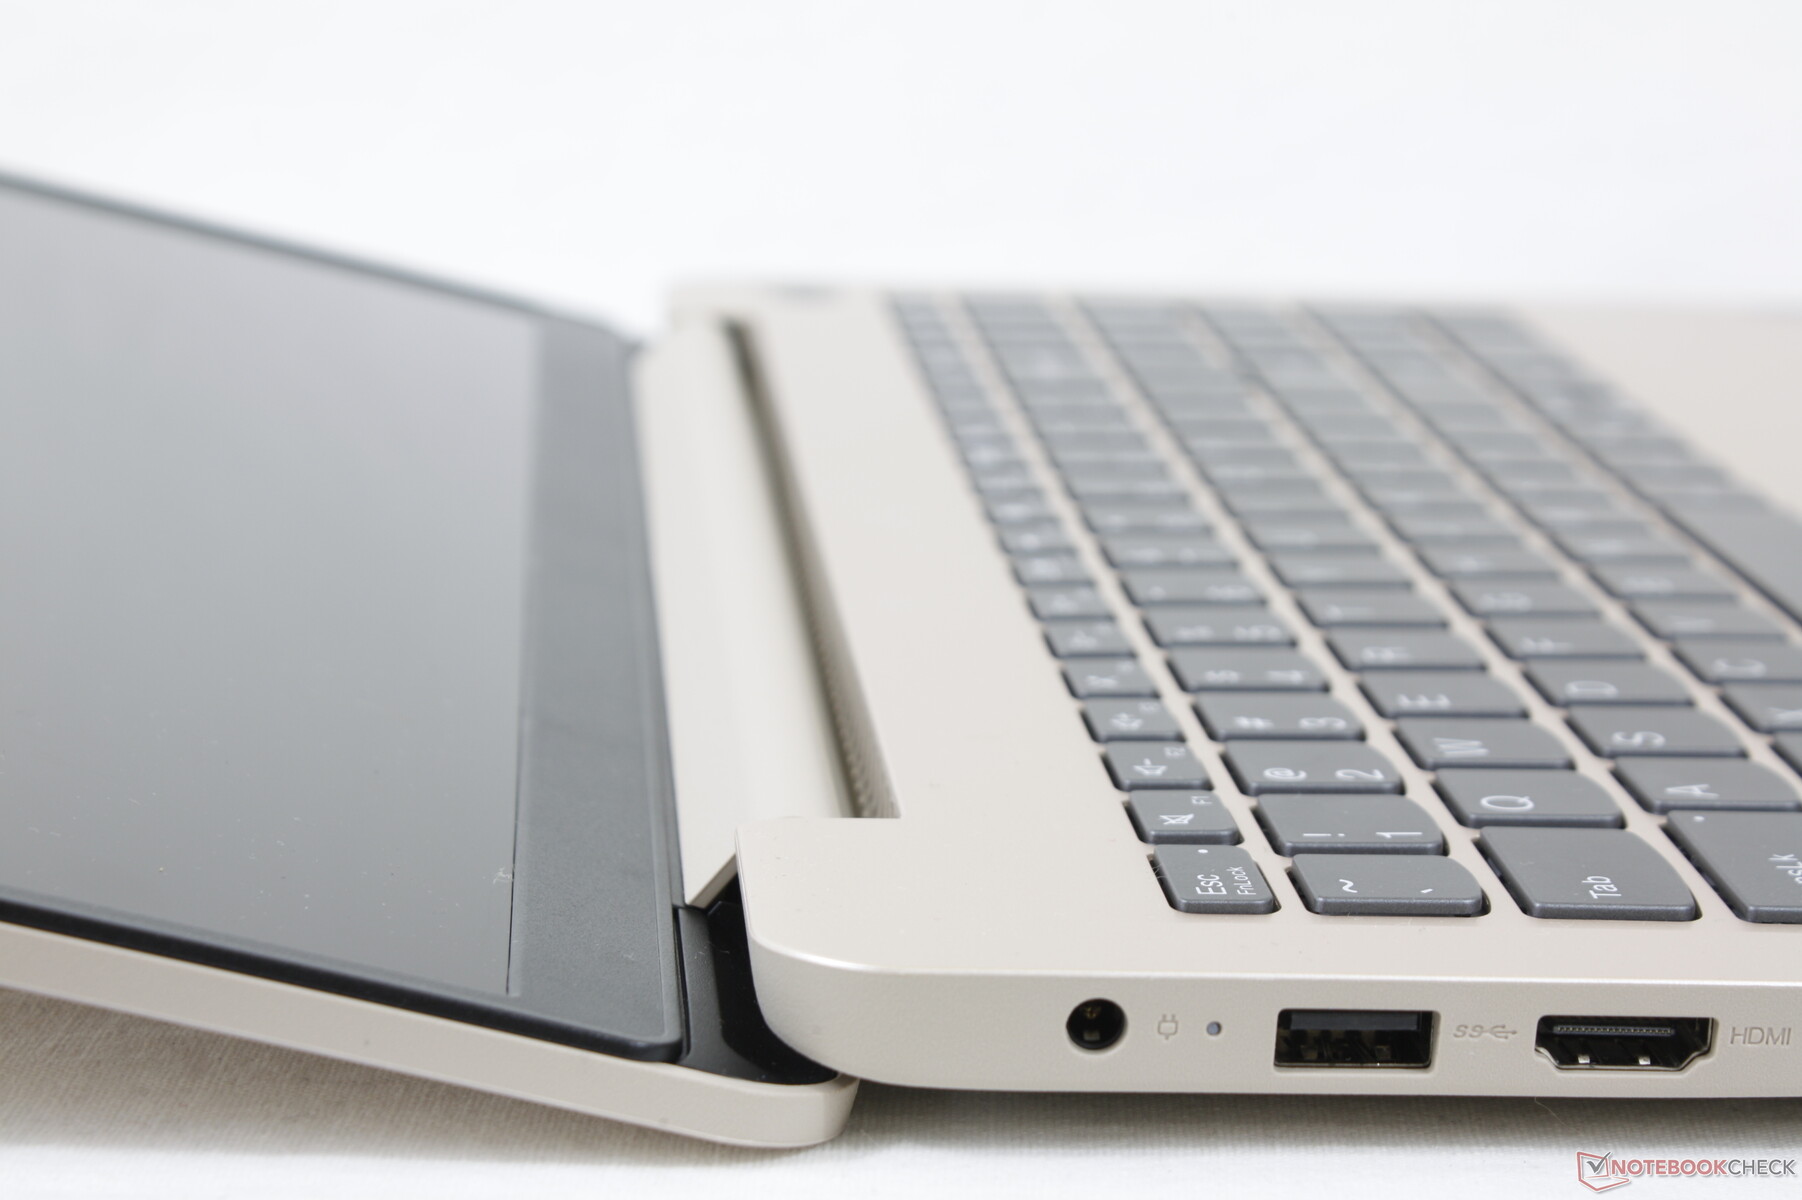
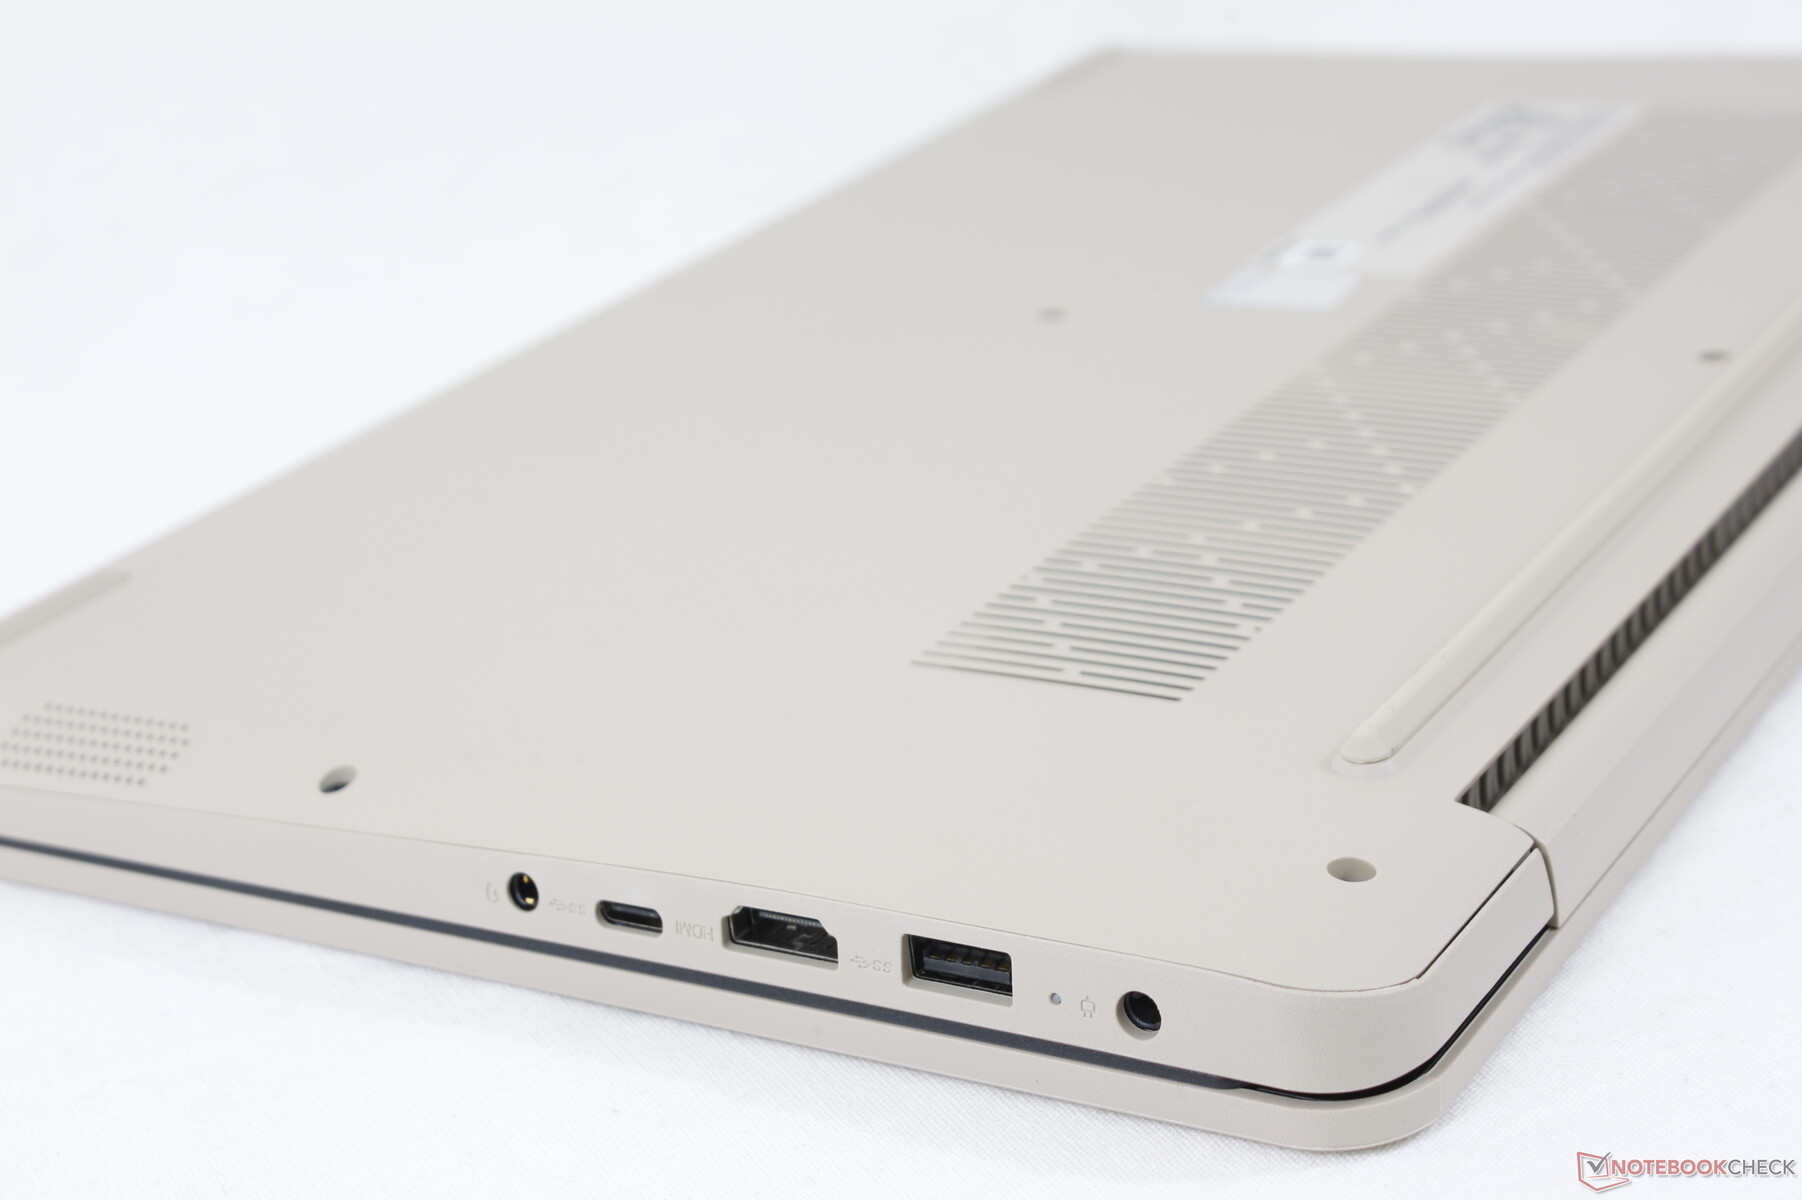
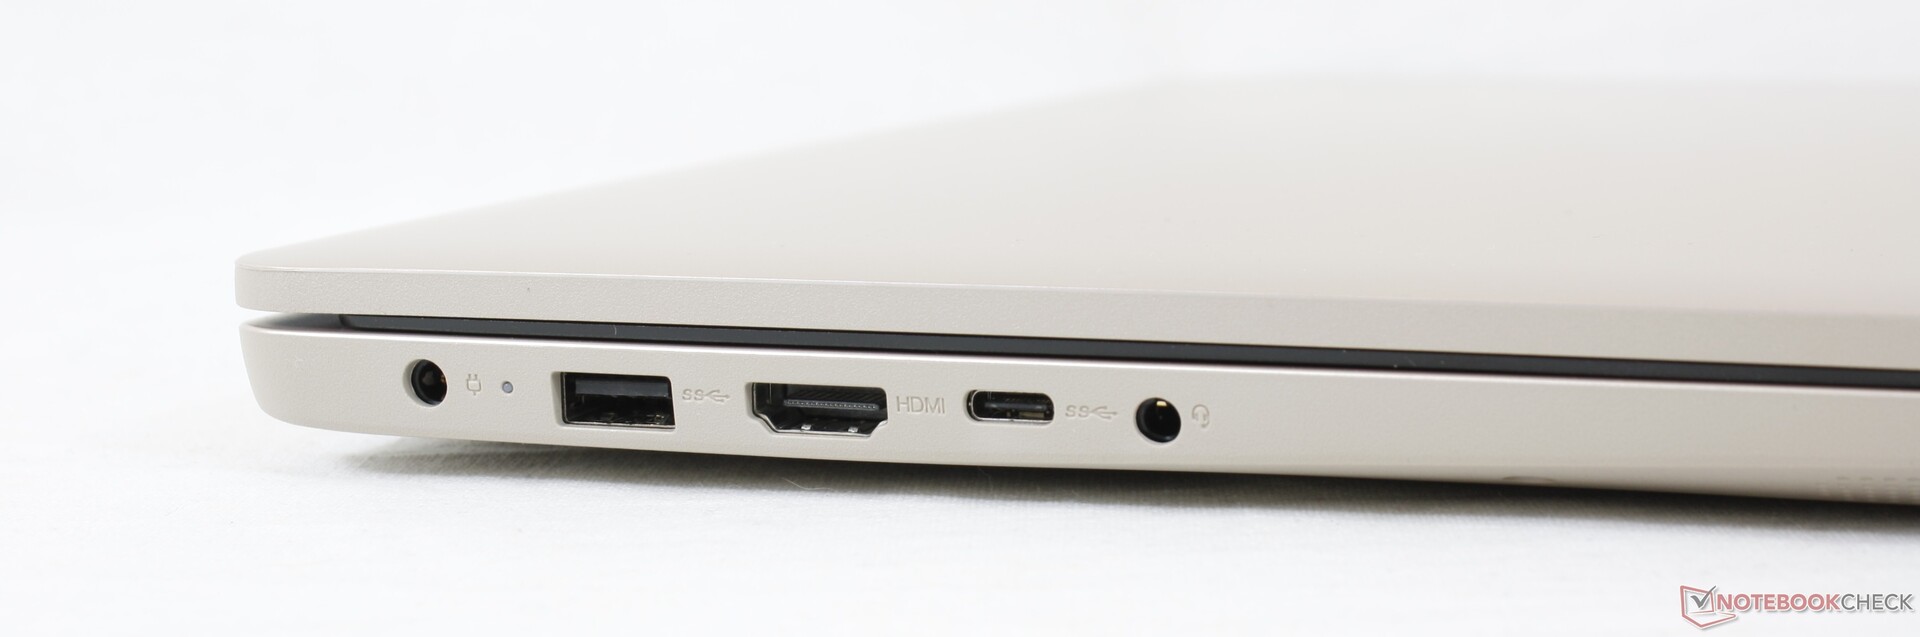
Connectivité - Port USB-C neutralisé
Les options de port et le positionnement sont tous deux différents de ce que vous trouverez sur d'autres ordinateurs portables IdeaPad comme le IdeaPad S340, IdeaPad 3 14,IdeaPad S540ou l'IdeaPad 5 15. La chose la plus importante à garder à l'esprit est peut-être que l'unique port USB-C ne prend pas en charge Power Delivery ou DisplayPort, contrairement aux ports USB-C de la plupart des ordinateurs portables Intel. La sortie vidéo doit se faire via HDMI à la place.
Il convient de mentionner que nous avons rencontré des problèmes d'alimentation lorsque nous avons tenté de connecter notre SSD externe PNY Pro Elite au port USB-C. Nous ne savons pas si ce problème est spécifique à notre appareil ou s'il est plus répandu. Nous ne savons pas si cela est spécifique à notre appareil ou si c'est un problème plus répandu.
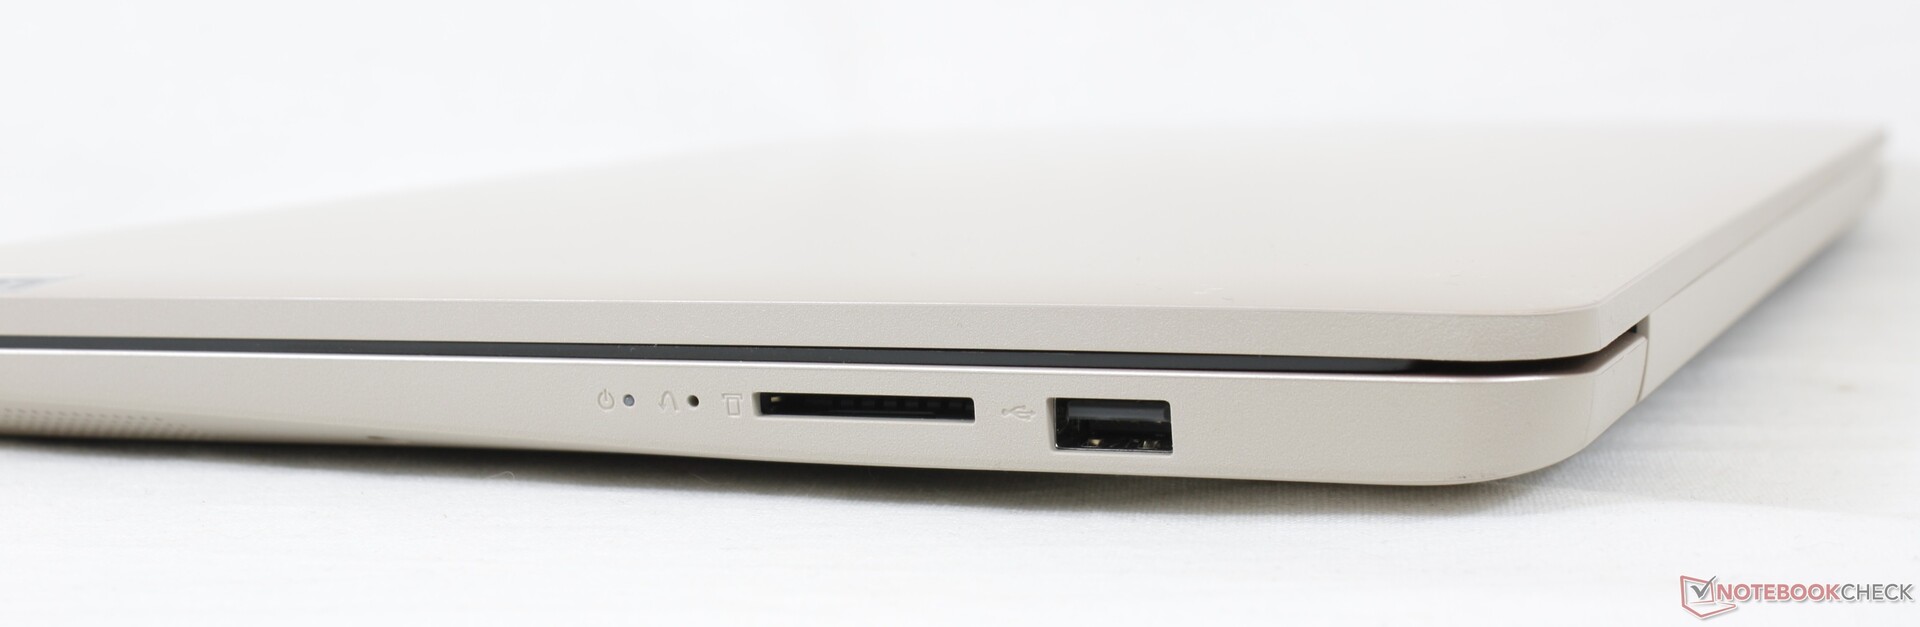
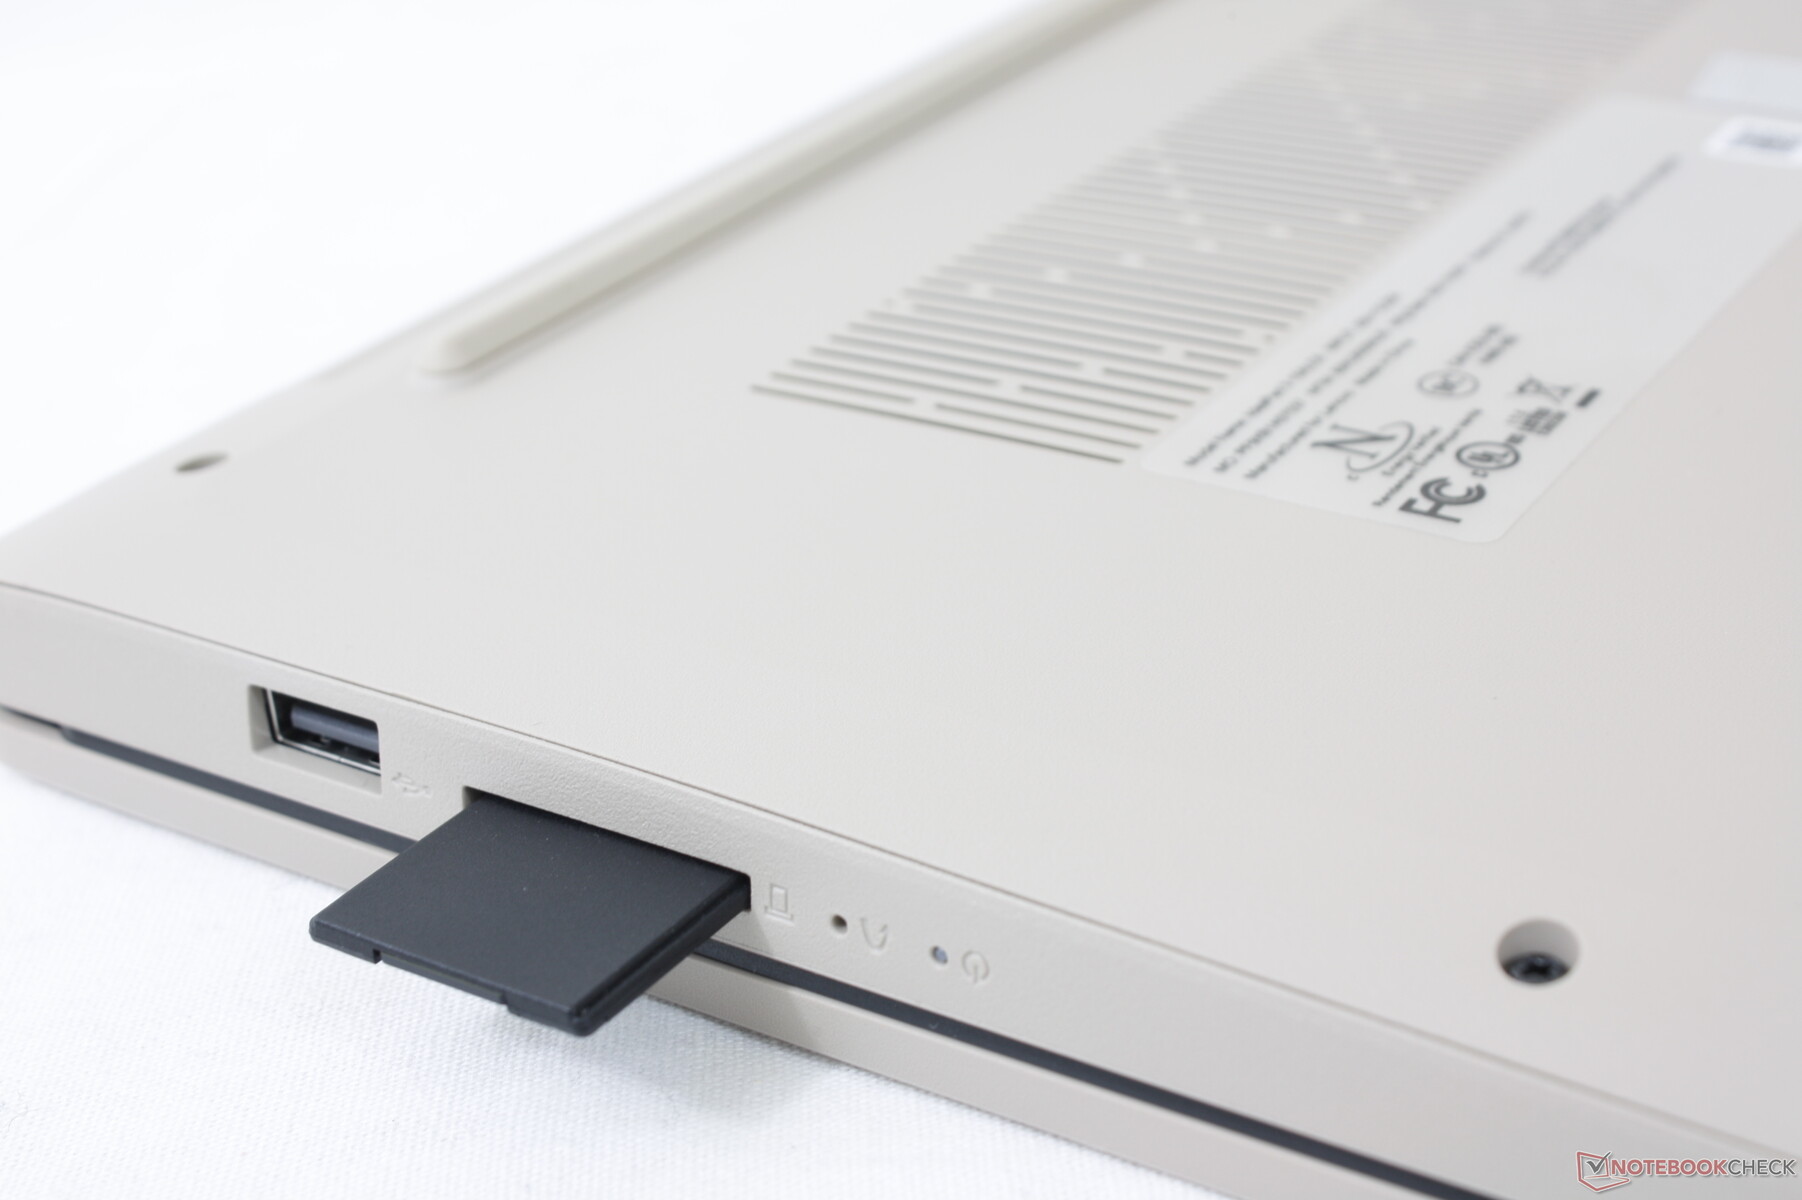
Lecteur de carte SD
Le lecteur de carte SD intégré est lent. Le transfert de 1 Go d'images depuis notre carte de test UHS-II vers le bureau prend environ 36 secondes, contre environ la moitié sur le Pavilion 15. Le lecteur de cartes n'est pas non plus doté d'un ressort, de sorte que les cartes entièrement insérées dépassent toujours, ce qui rend leur manipulation potentiellement dangereuse.
| SD Card Reader | |
| average JPG Copy Test (av. of 3 runs) | |
| Lenovo Ideapad S540-15IML (Toshiba Exceria Pro SDXC 64 GB UHS-II) | |
| HP Pavilion 15-eg (AV PRO microSD 128 GB V60) | |
| Asus VivoBook 15 KM513UA-L503TS (AV PRO microSD 128 GB V60) | |
| Lenovo IdeaPad 3 15ALC6 (AV PRO microSD 128 GB V60) | |
| Lenovo IdeaPad 5 15IIL05 (Toshiba Exceria Pro SDXC 64 GB UHS-II) | |
| Dell Inspiron 15 3501 (AV Pro SD 128 GB V60) | |
| maximum AS SSD Seq Read Test (1GB) | |
| Lenovo Ideapad S540-15IML (Toshiba Exceria Pro SDXC 64 GB UHS-II) | |
| HP Pavilion 15-eg (AV PRO microSD 128 GB V60) | |
| Lenovo IdeaPad 3 15ALC6 (AV PRO microSD 128 GB V60) | |
| Asus VivoBook 15 KM513UA-L503TS (AV PRO microSD 128 GB V60) | |
| Lenovo IdeaPad 5 15IIL05 (Toshiba Exceria Pro SDXC 64 GB UHS-II) | |
| Dell Inspiron 15 3501 (AV Pro SD microSD 128 GB V60) | |
Communication
Notre configuration utilise le Wi-Fi 5 au lieu du Wi-Fi 6, probablement pour économiser sur les coûts. Les taux de transfert sont stables lorsqu'ils sont couplés à notre routeur de test Netgear RAX200.
Webcam
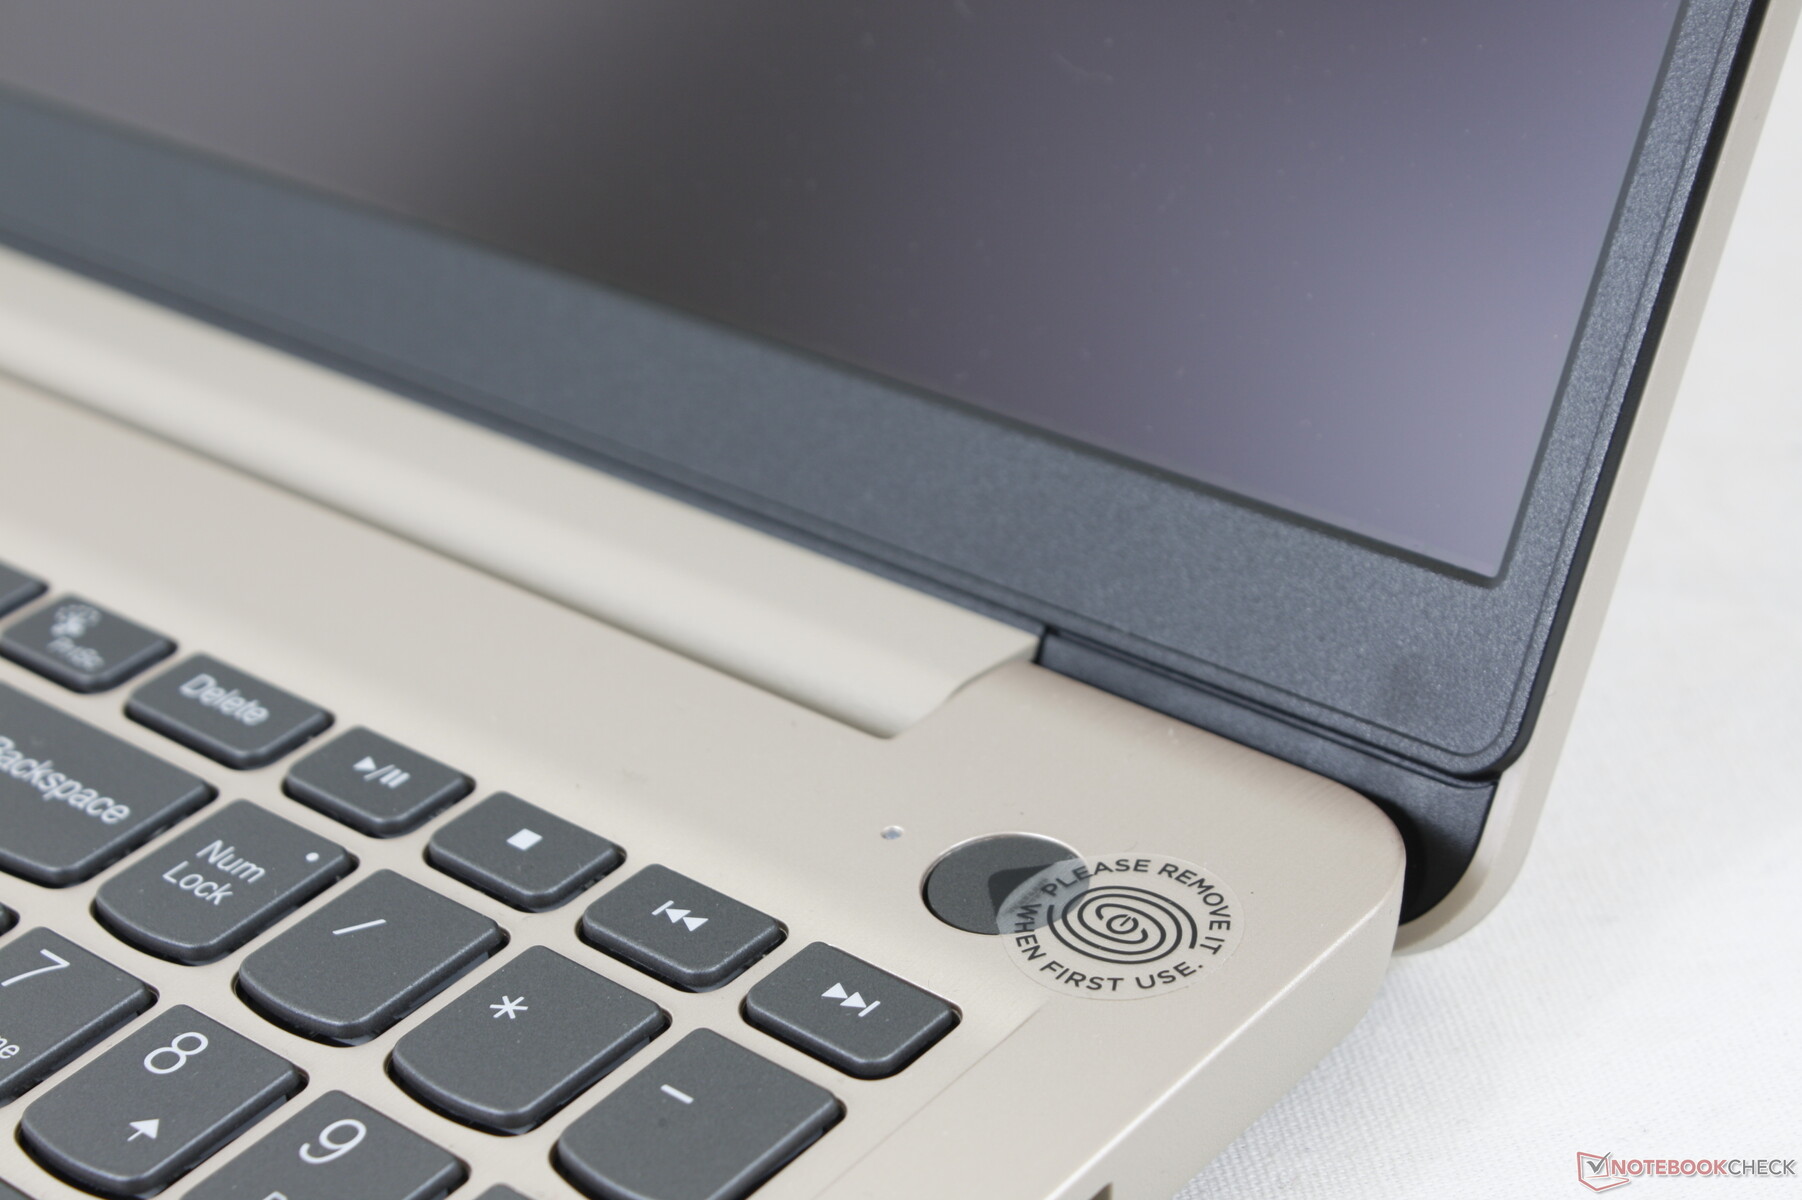
La qualité de la webcam est médiocre avec seulement 1 MP. En outre, il n'y a pas de capteur IR pour la prise en charge de Windows Hello. Un obturateur manuel de confidentialité est fourni en standard.


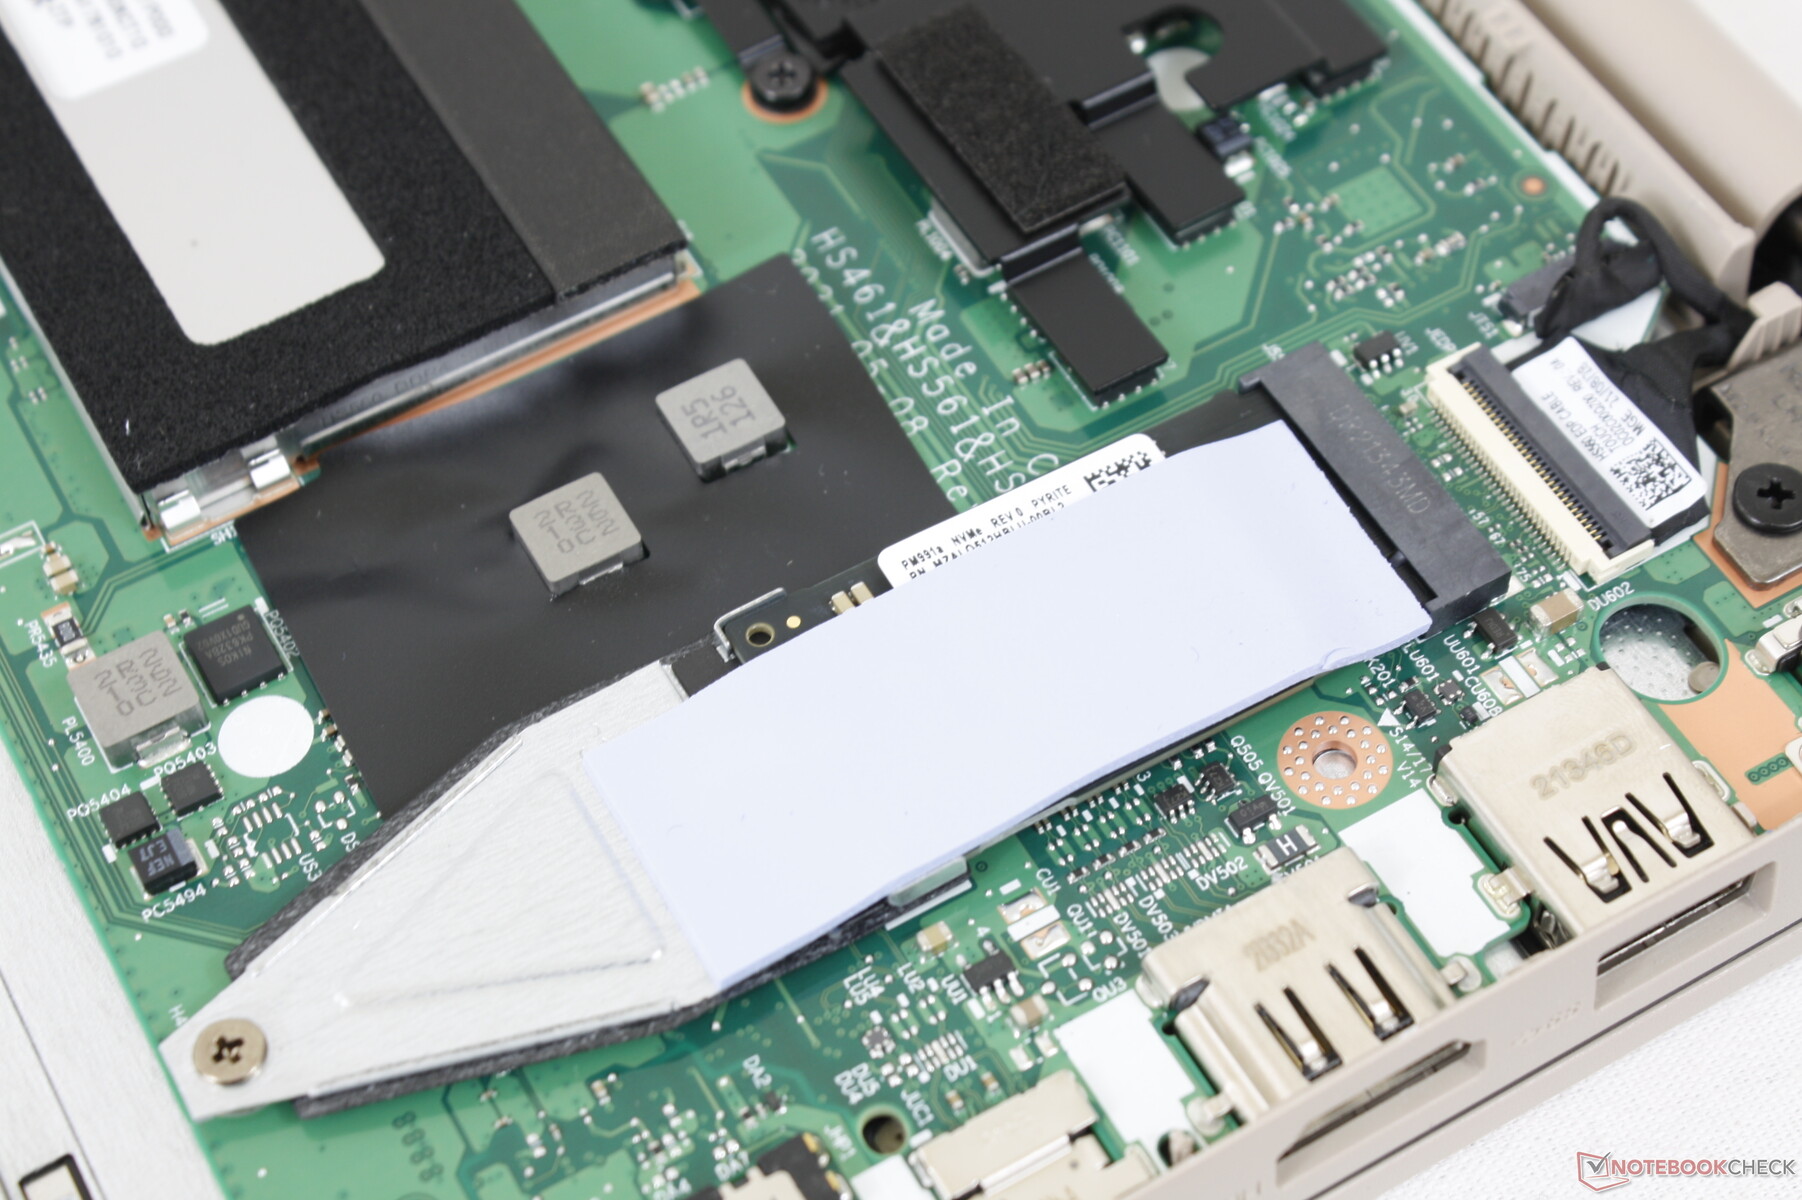
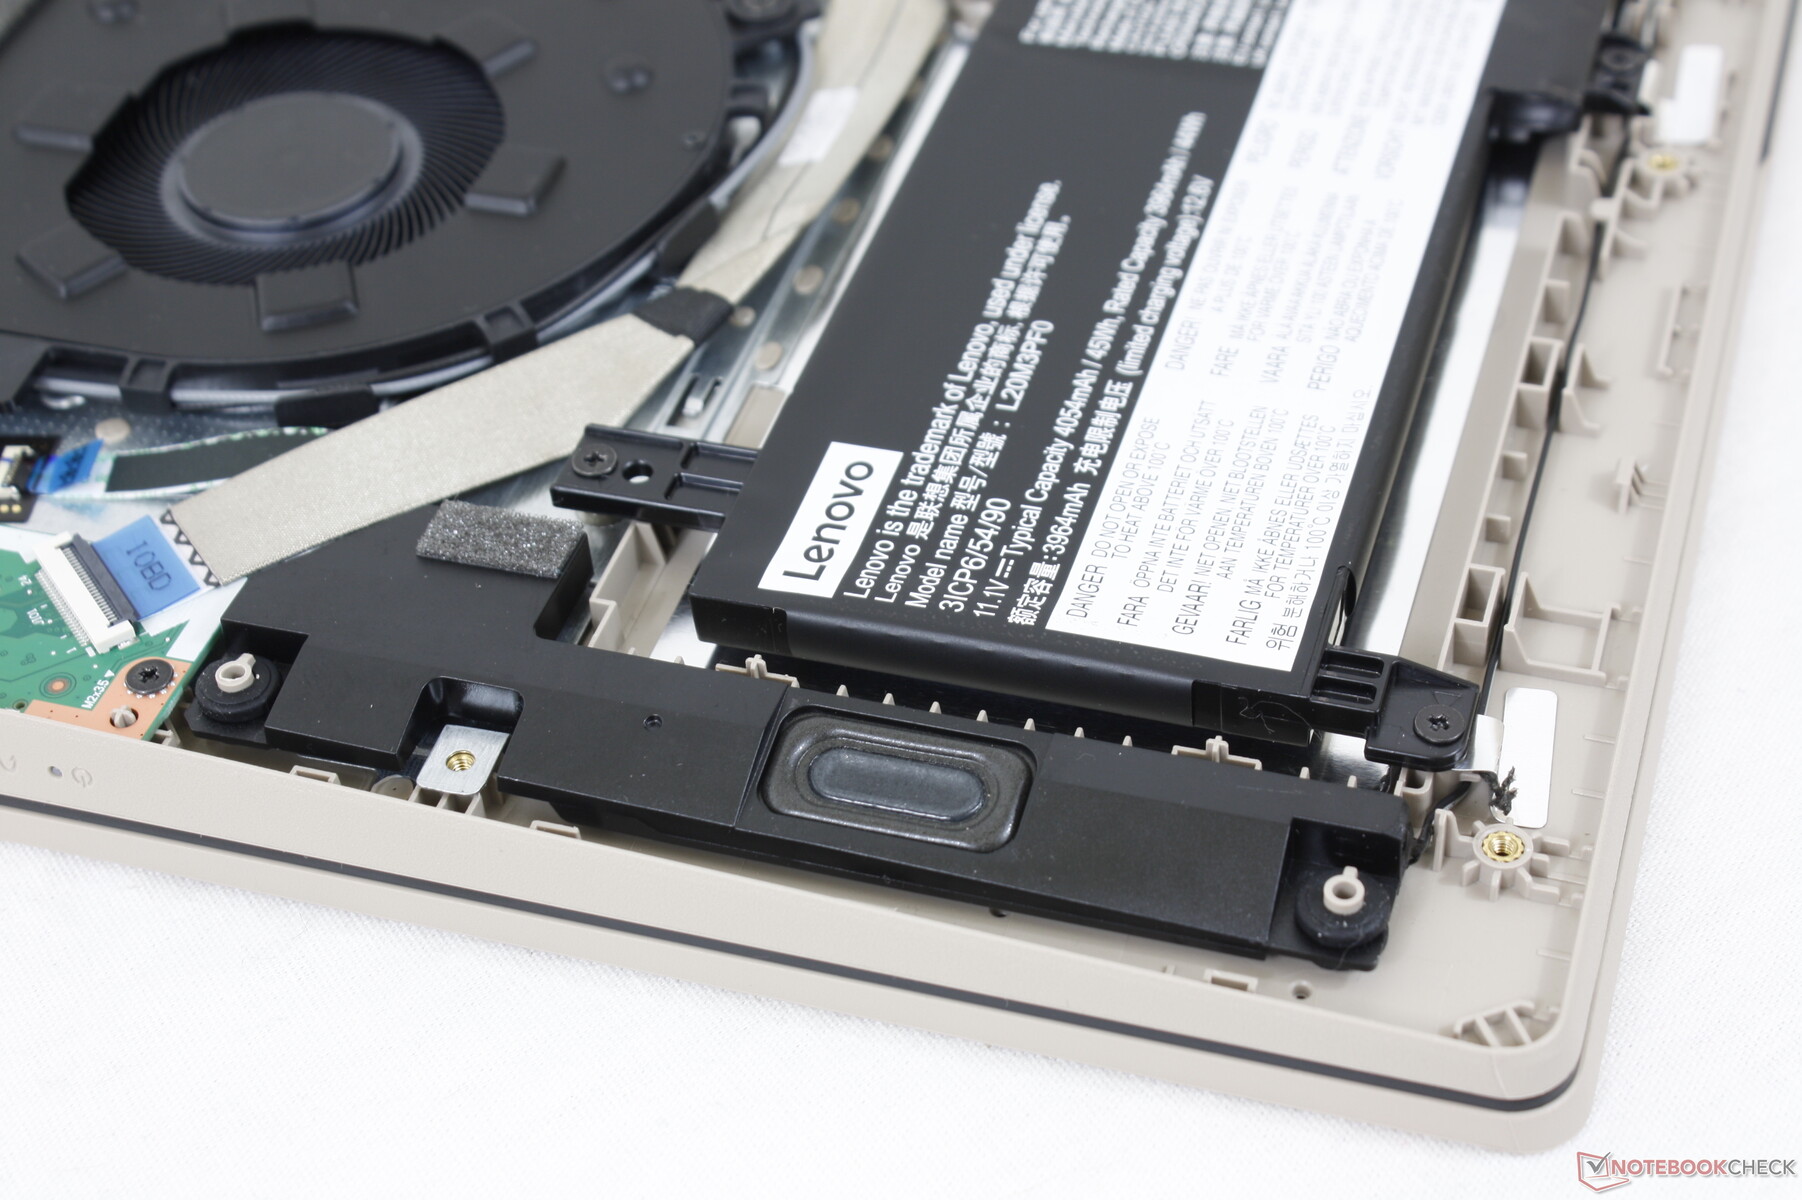
Entretien - Facile à ouvrir
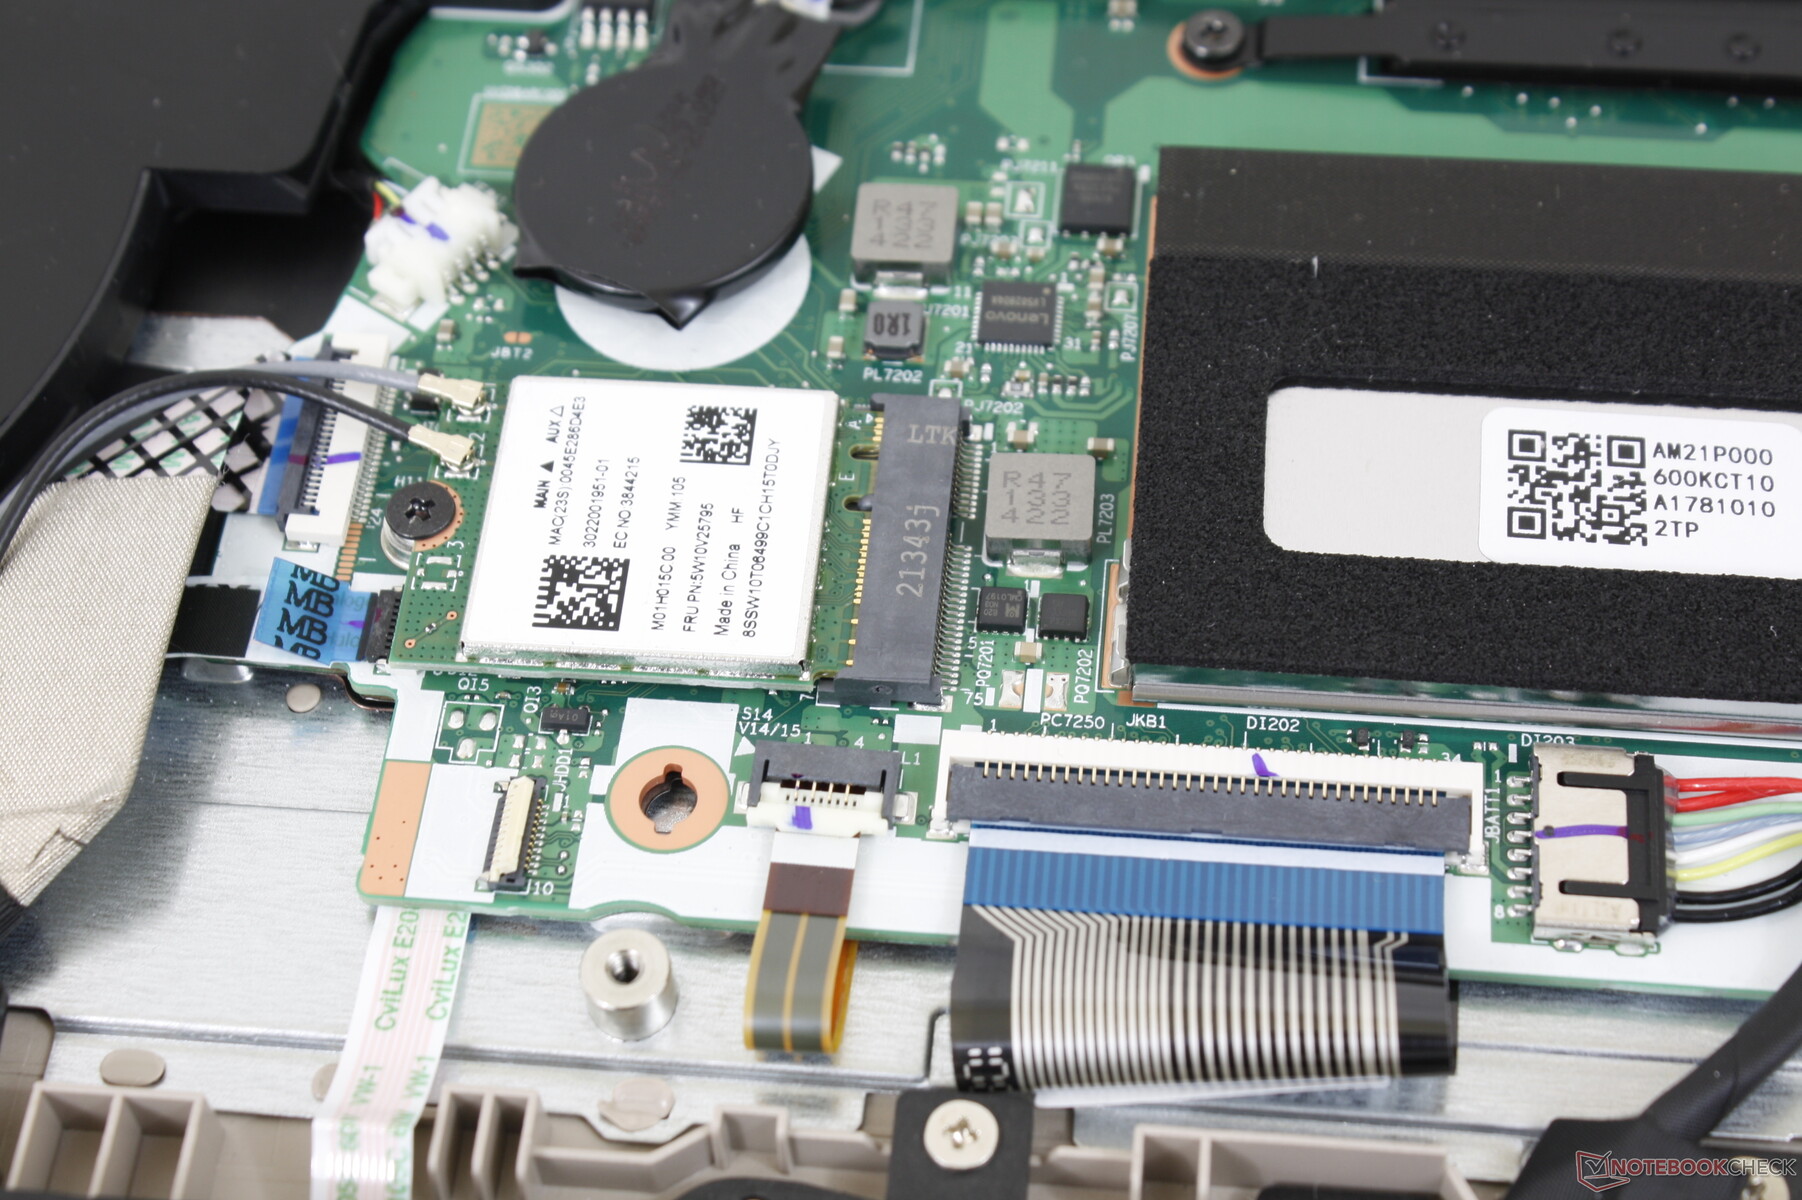
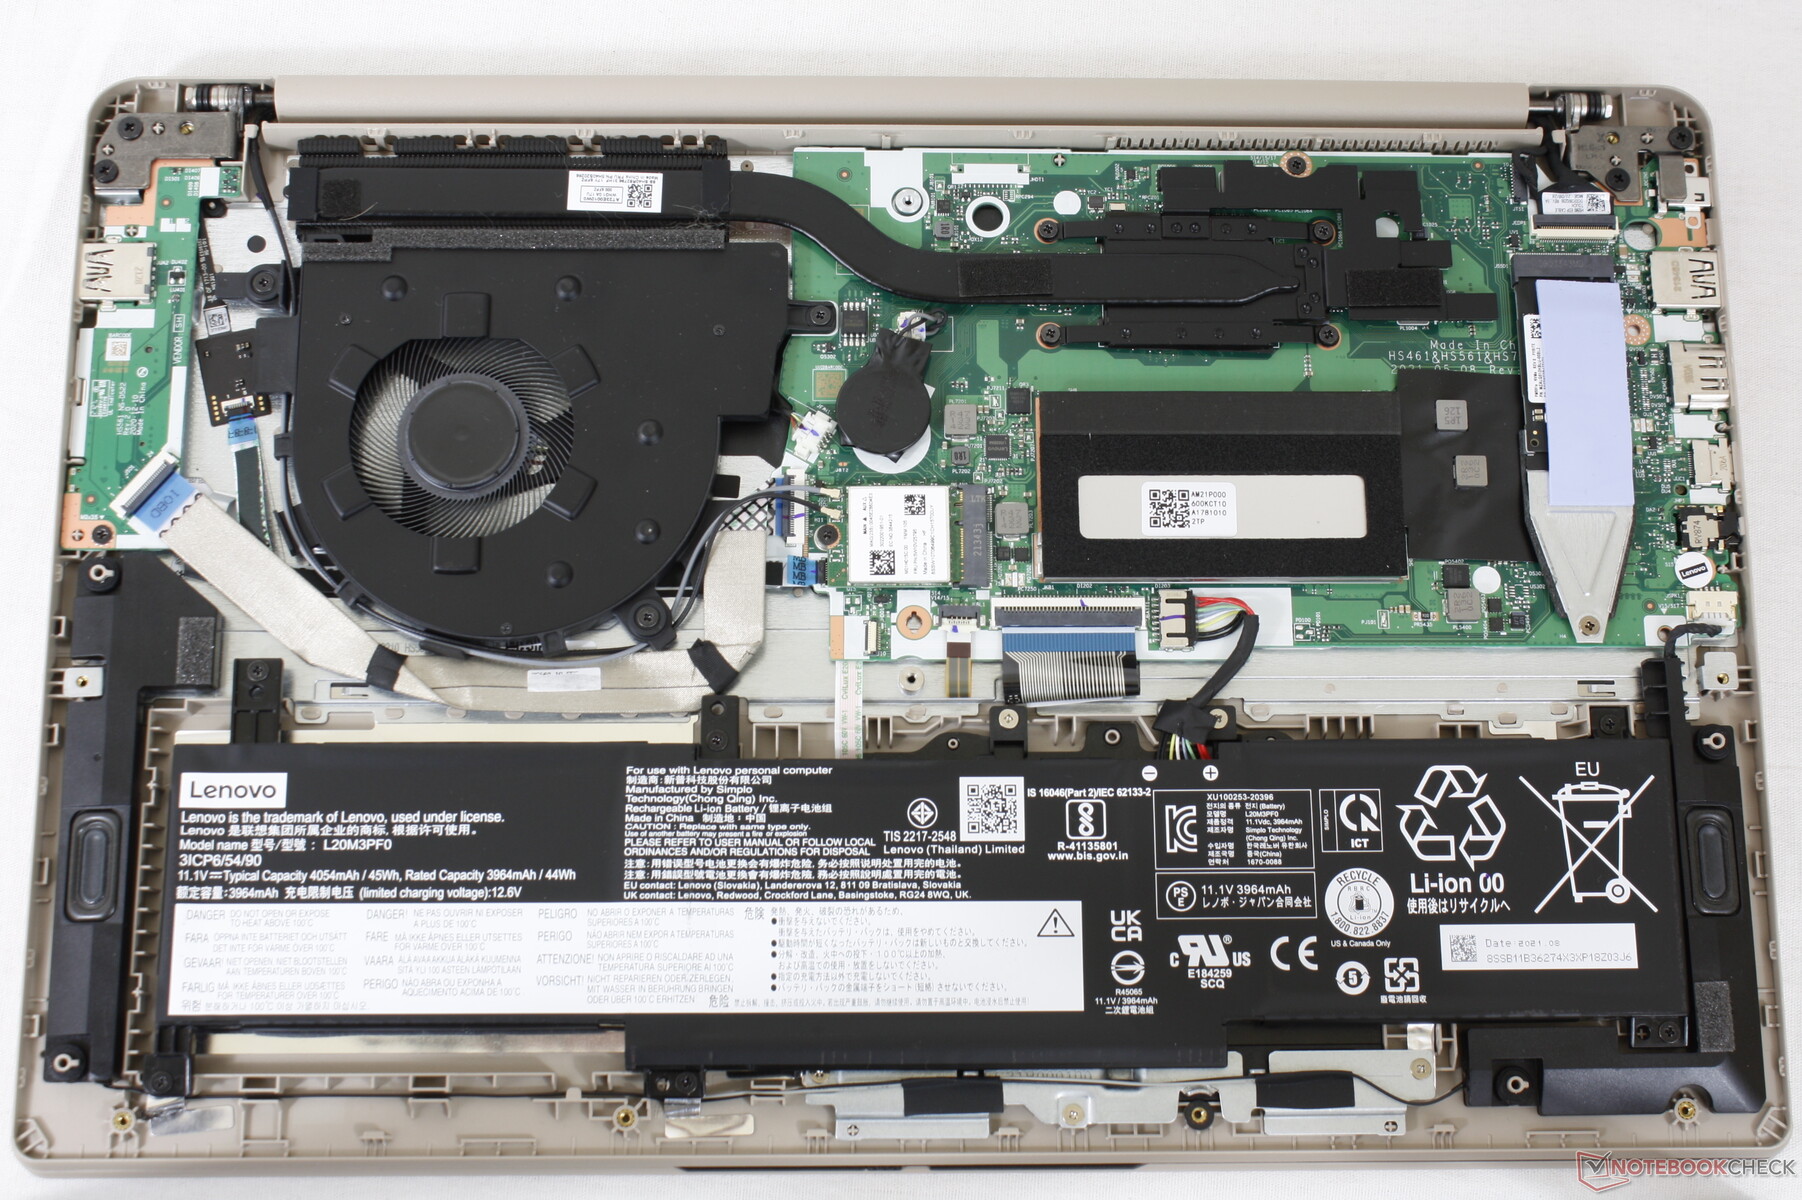
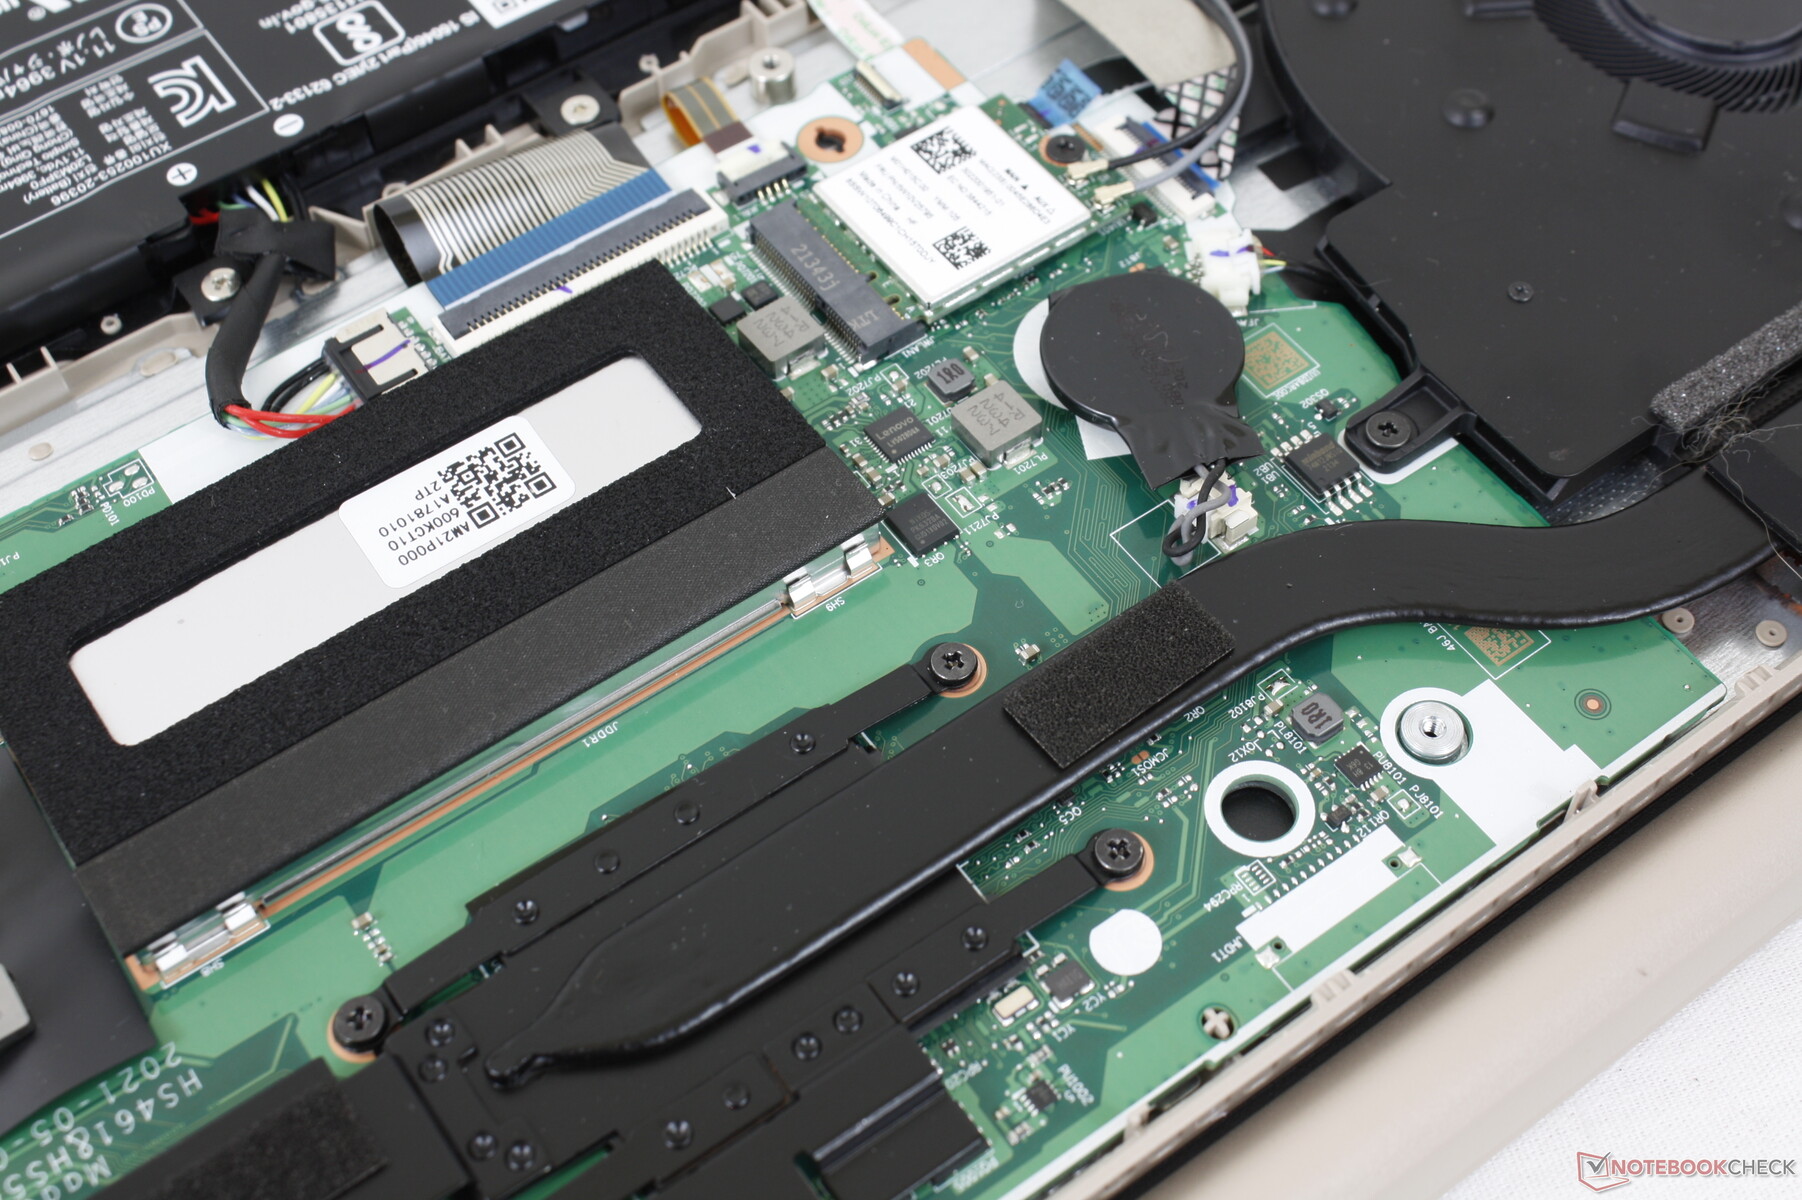
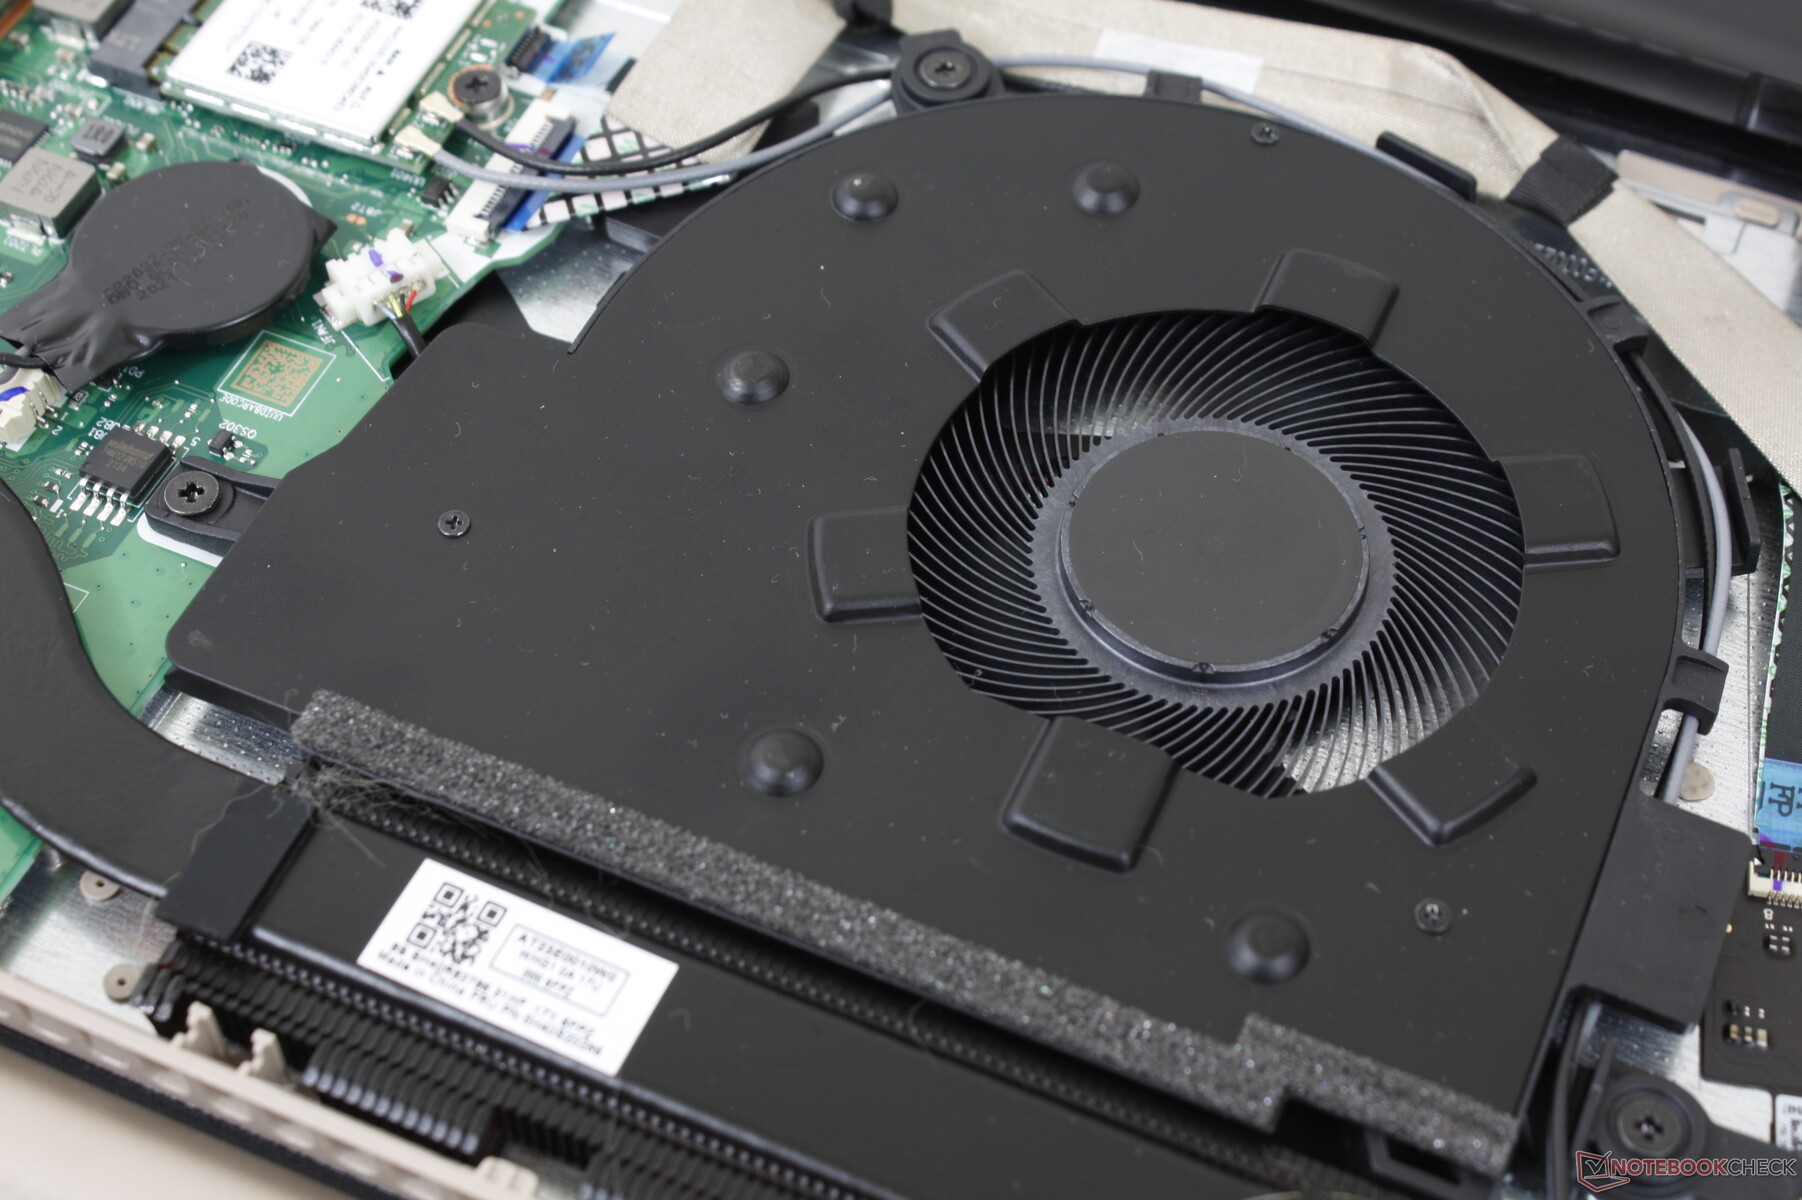
Le panneau inférieur peut être facilement retiré à l'aide d'un simple tournevis Philips, alors que de nombreux autres ordinateurs portables économiques sont généralement plus difficiles à entretenir. Les utilisateurs verront un seul emplacement M.2 PCIe3 x4 2280 pour le stockage, un emplacement WLAN et un emplacement SODIMM pour compléter les 4 Go de RAM soudés.
Accessoires et garantie
Il n'y a pas d'autres éléments dans la boîte, à part l'adaptateur secteur et les documents. La garantie limitée habituelle d'un an du fabricant s'applique
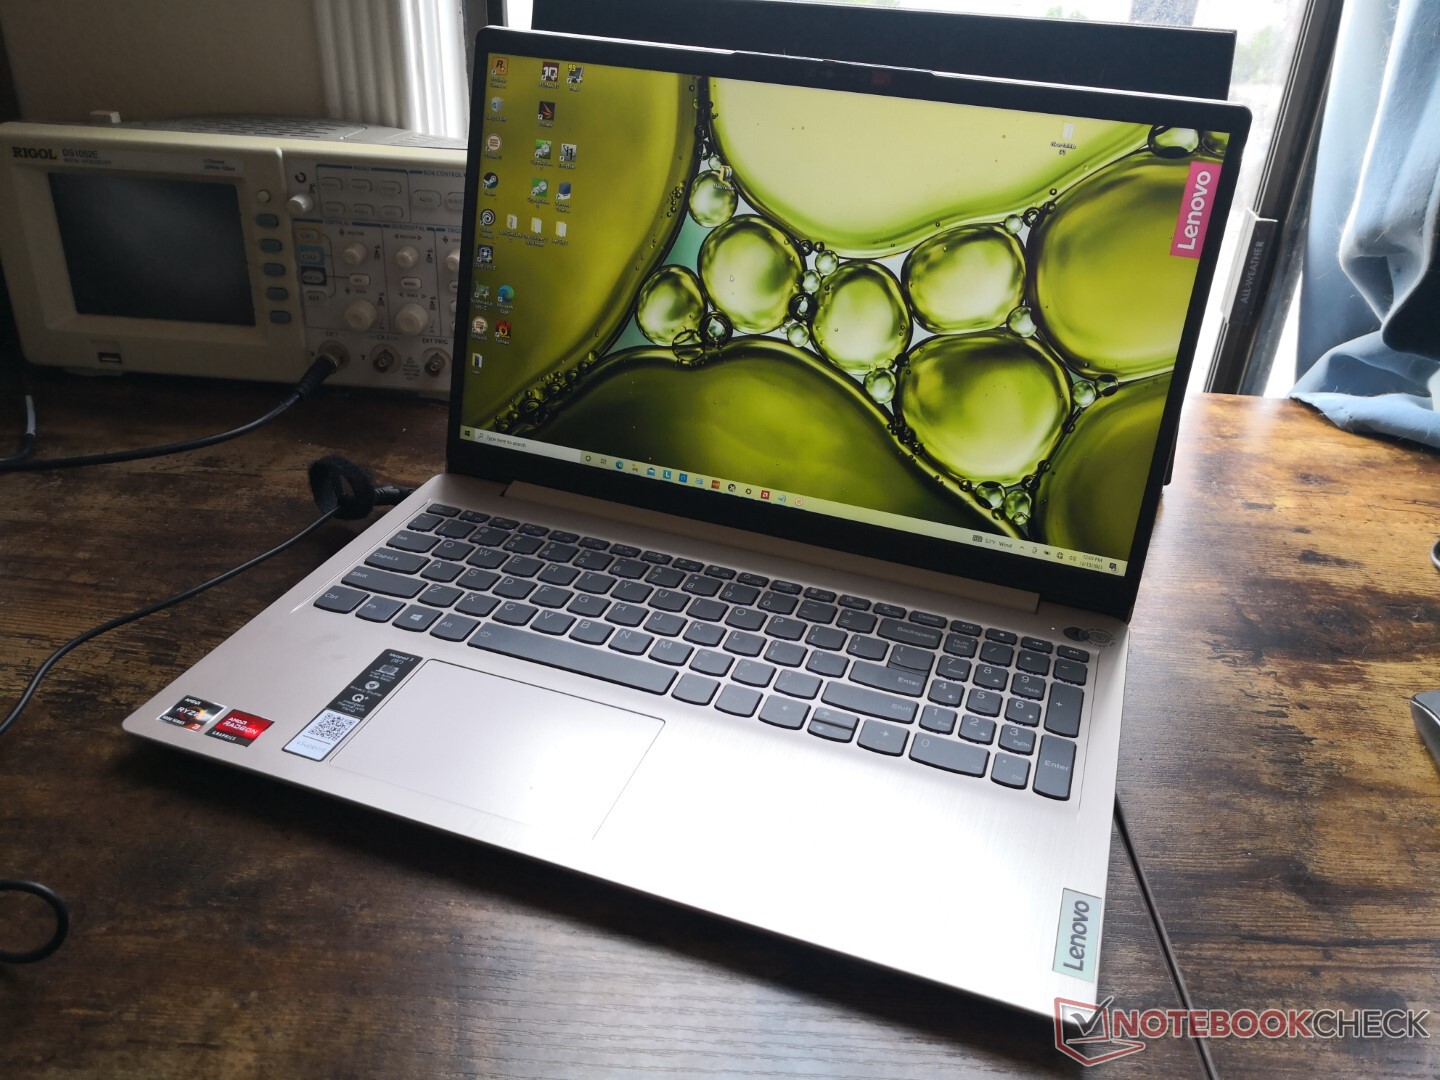
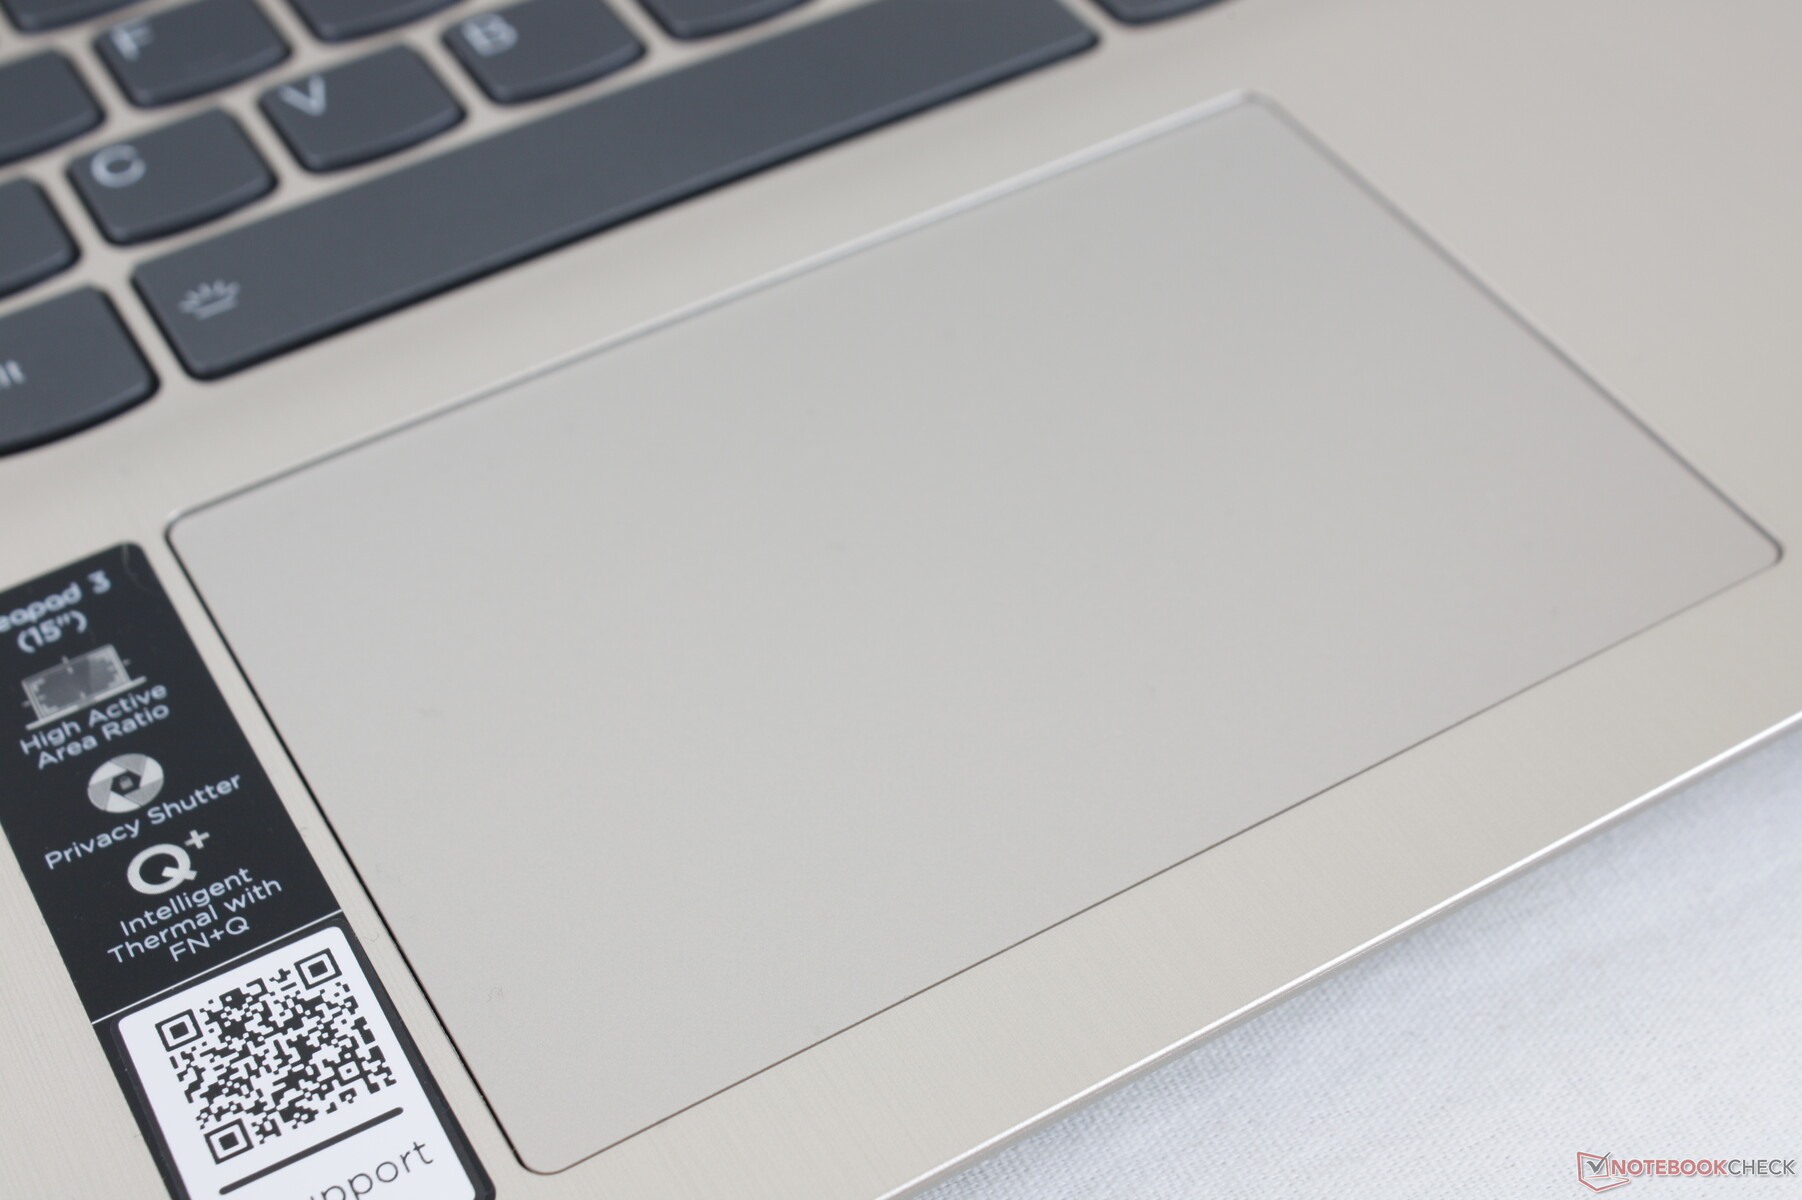
Périphériques d'entrée - Pavé tactile spongieux
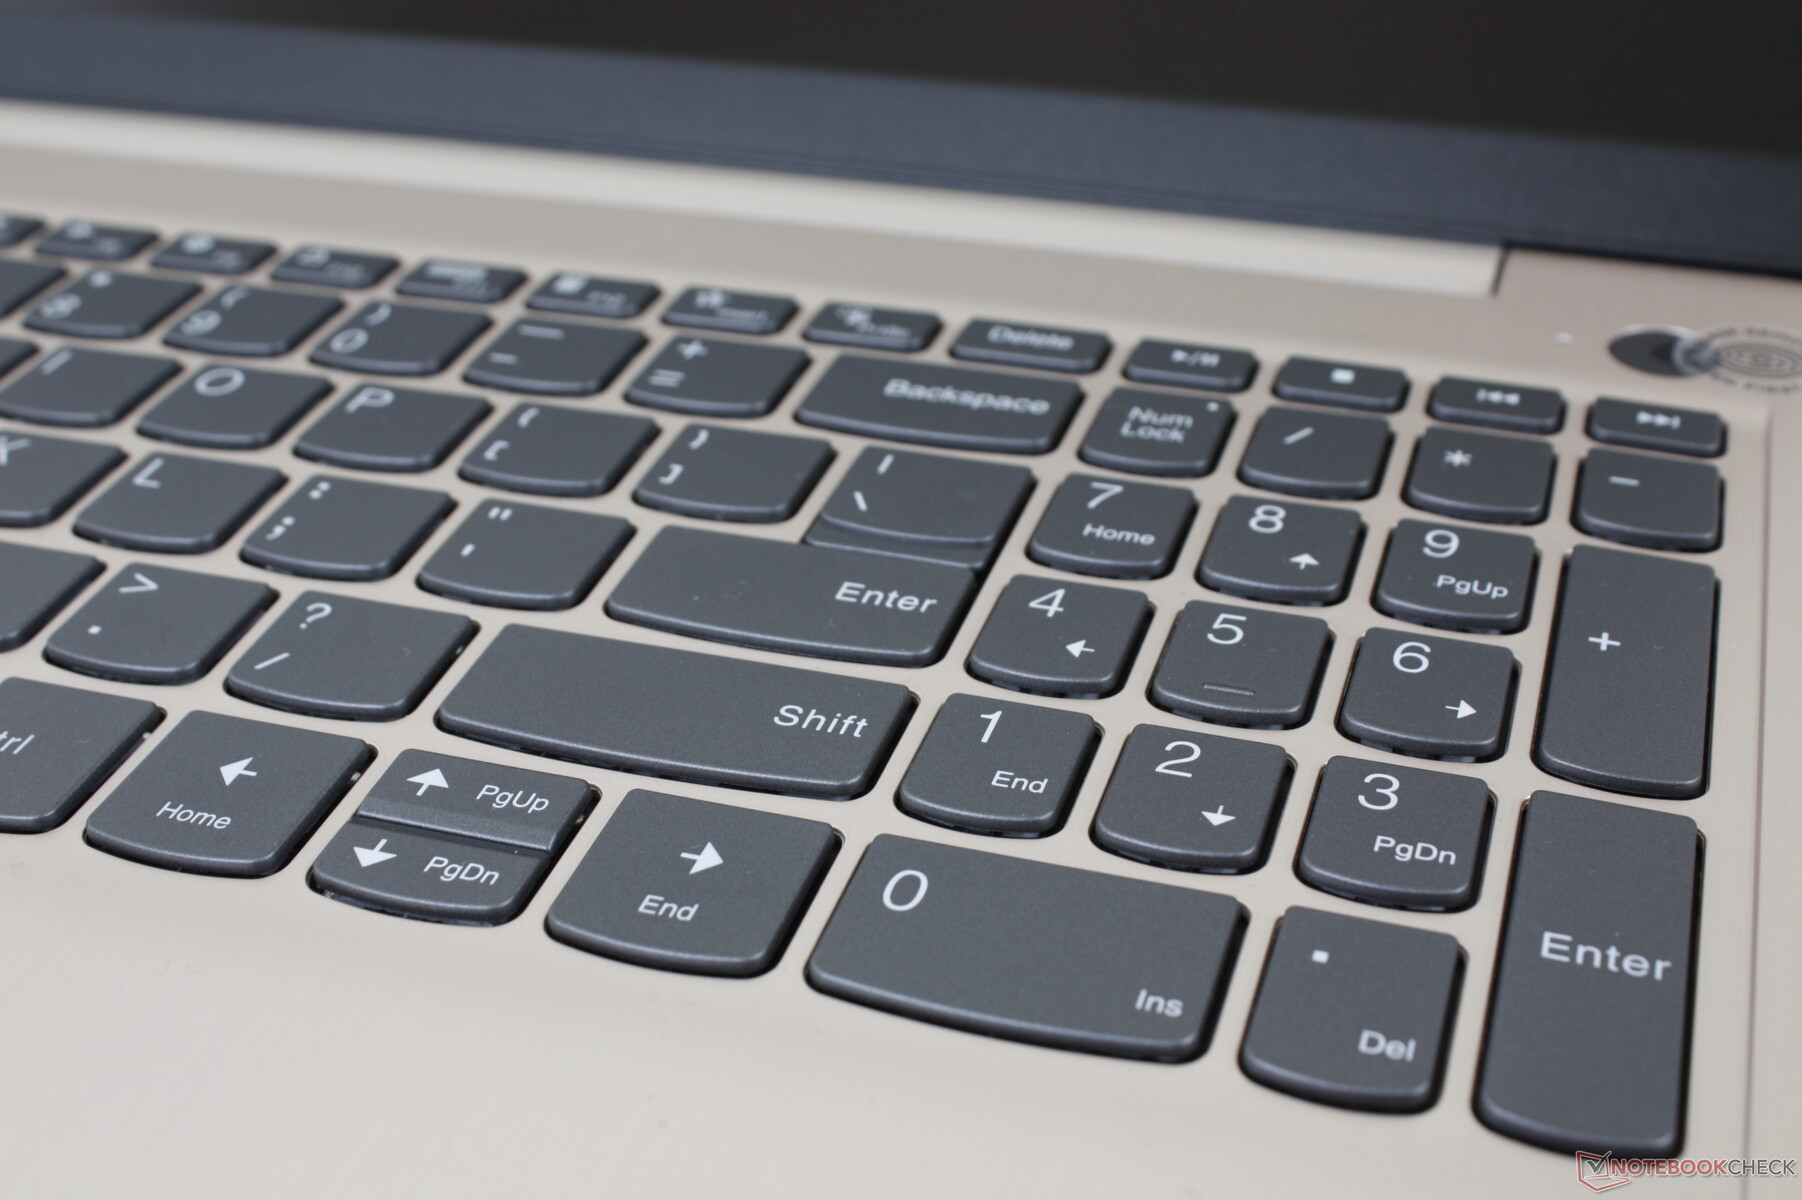
Clavier
Les touches rétroéclairées ont une course courte et un retour d'information relativement faible lorsqu'on appuie dessus, surtout si on les compare aux touches d'un ordinateur portable ThinkPad ou HP Spectre plus coûteux. Le claquement des touches est plus silencieux que prévu en raison de la faible rétroaction.
Pavé tactile
Le pavé tactile est légèrement plus petit que celui de l'IdeaPad 5 Pro 14 pouces IdeaPad 5 Pro 14 (10 x 7 cm contre 10,5 x 7 cm). Le glissement est fluide à des vitesses moyennes ou élevées, tandis que le doigt a tendance à coller à des vitesses plus lentes pour un clic plus précis. Malheureusement, les clics sur le pavé tactile sont peu profonds et spongieux, avec un retour d'information insatisfaisant.

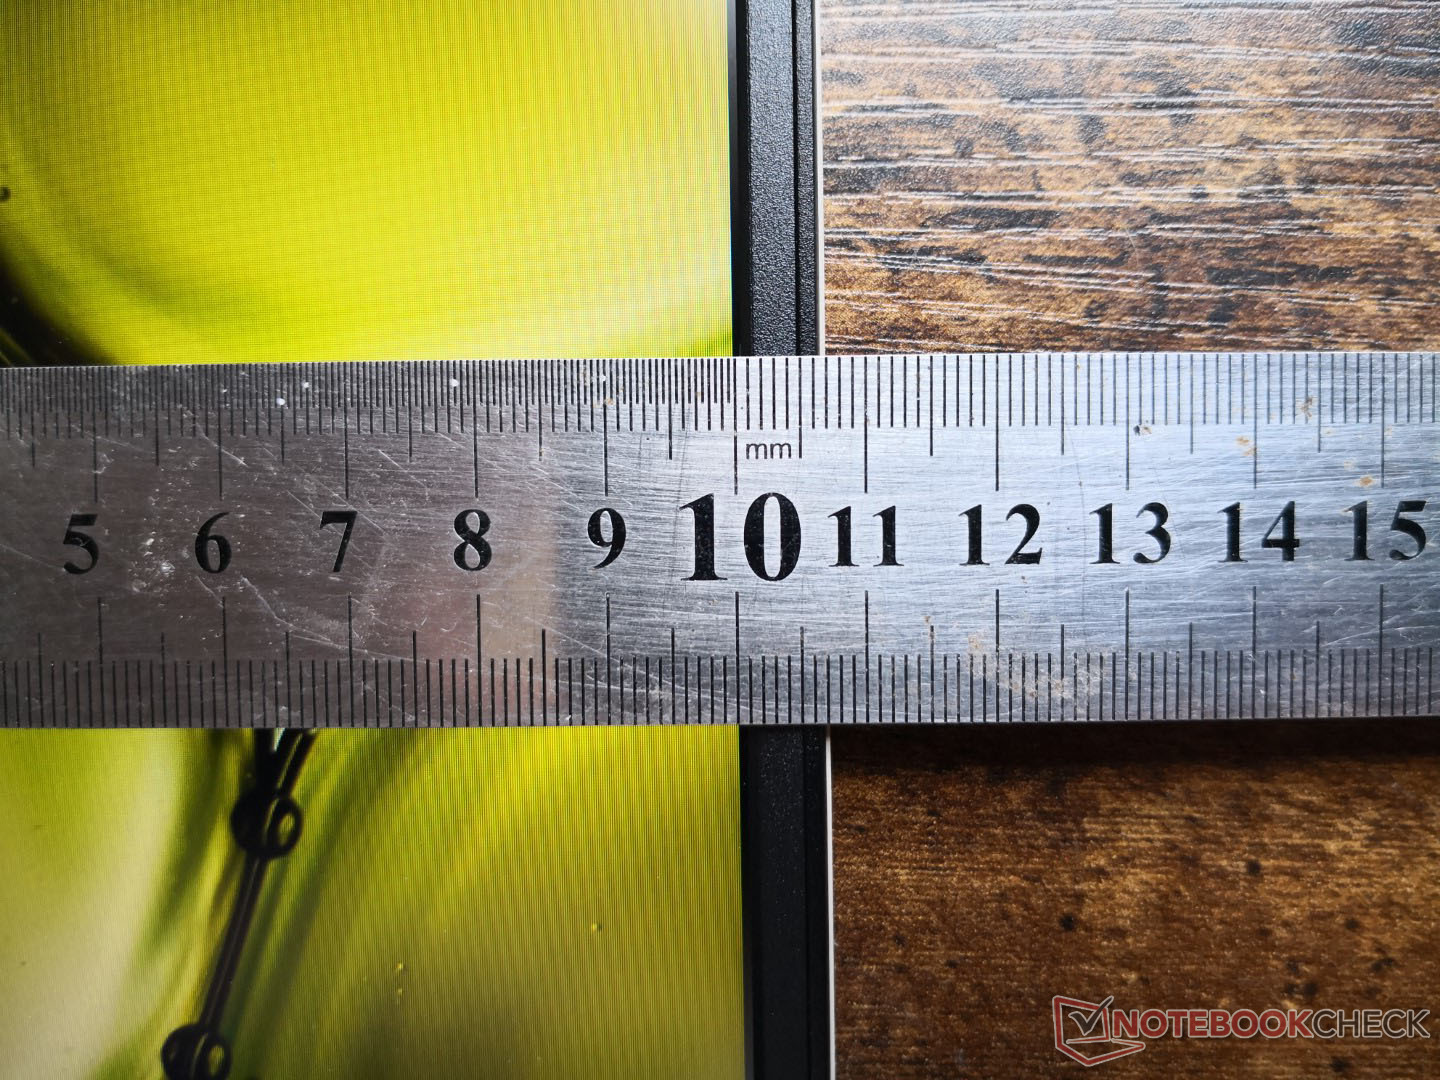
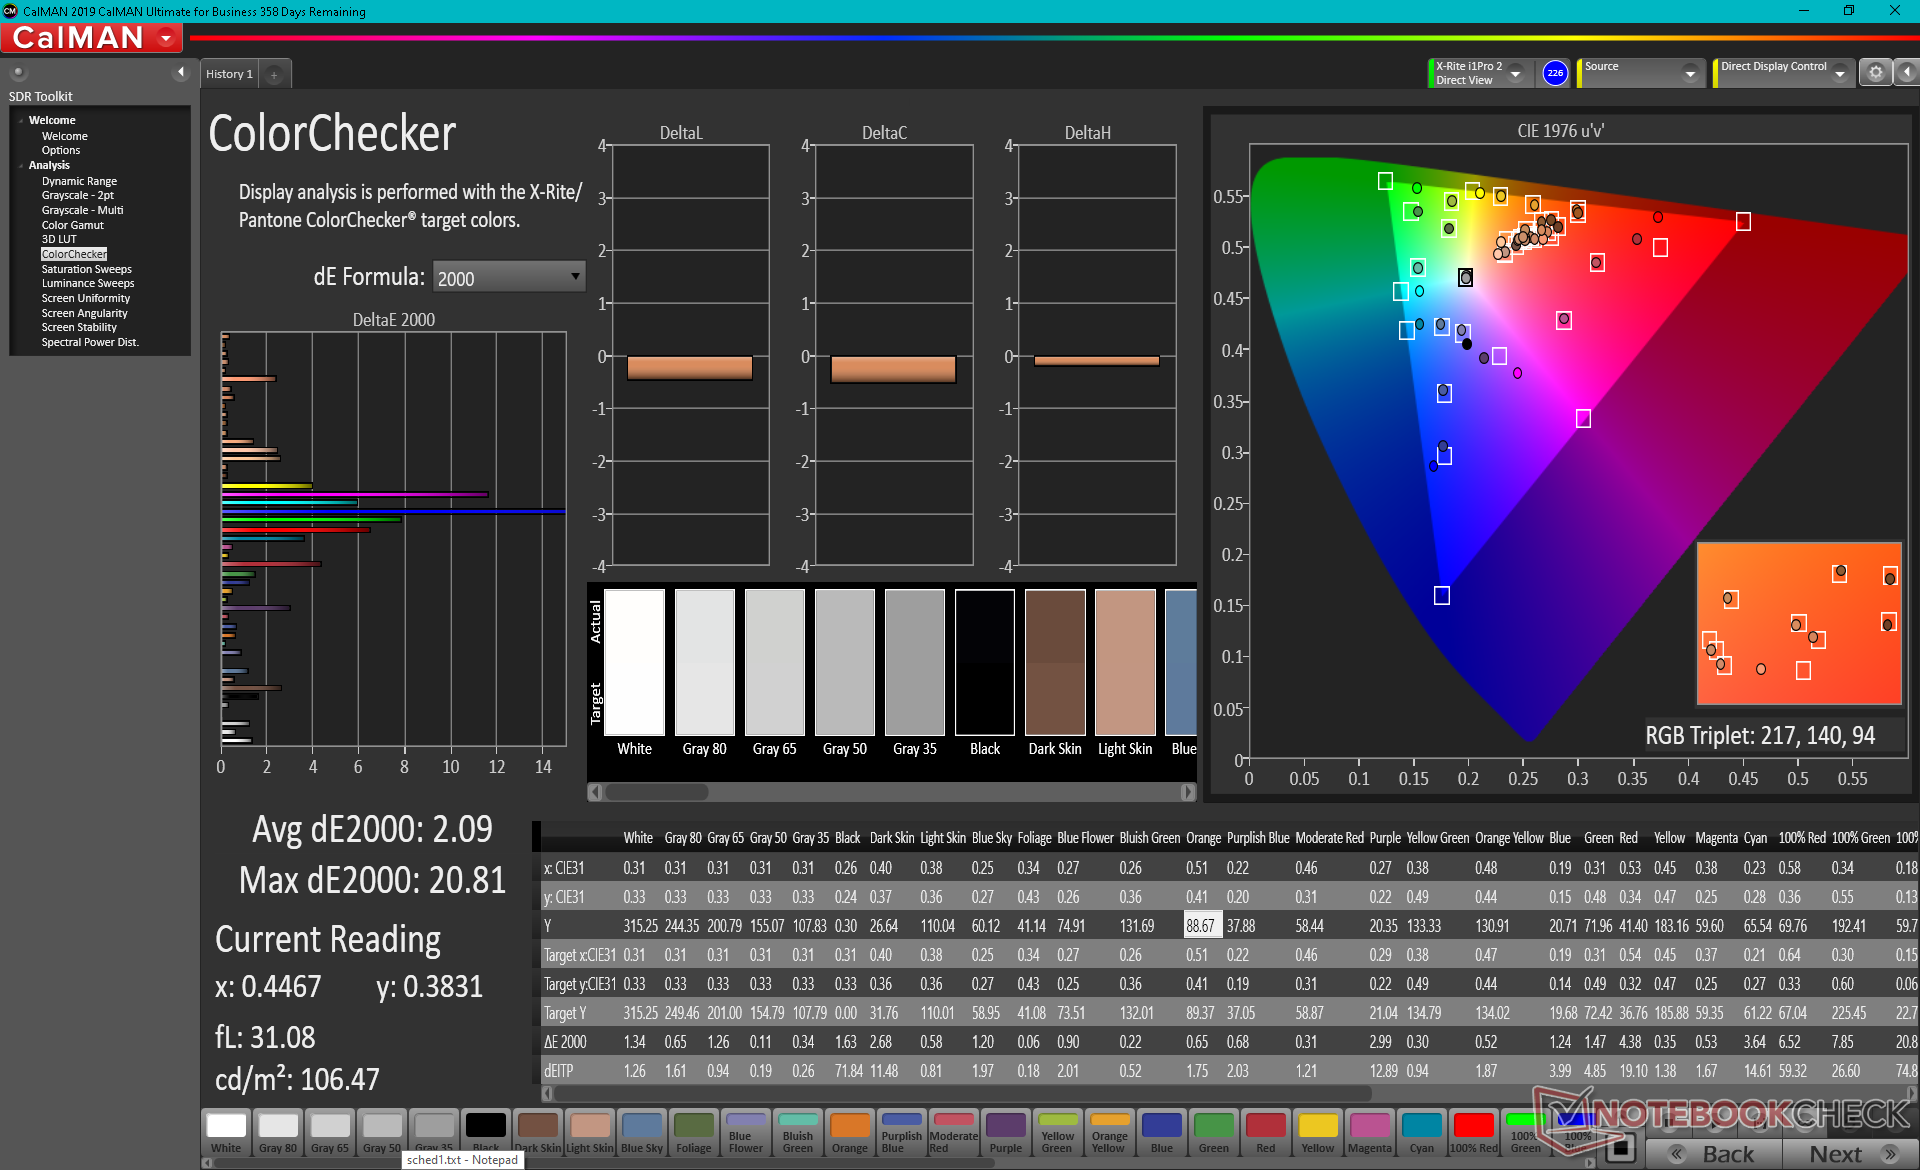
Affichage - Support FreeSync et écran tactile
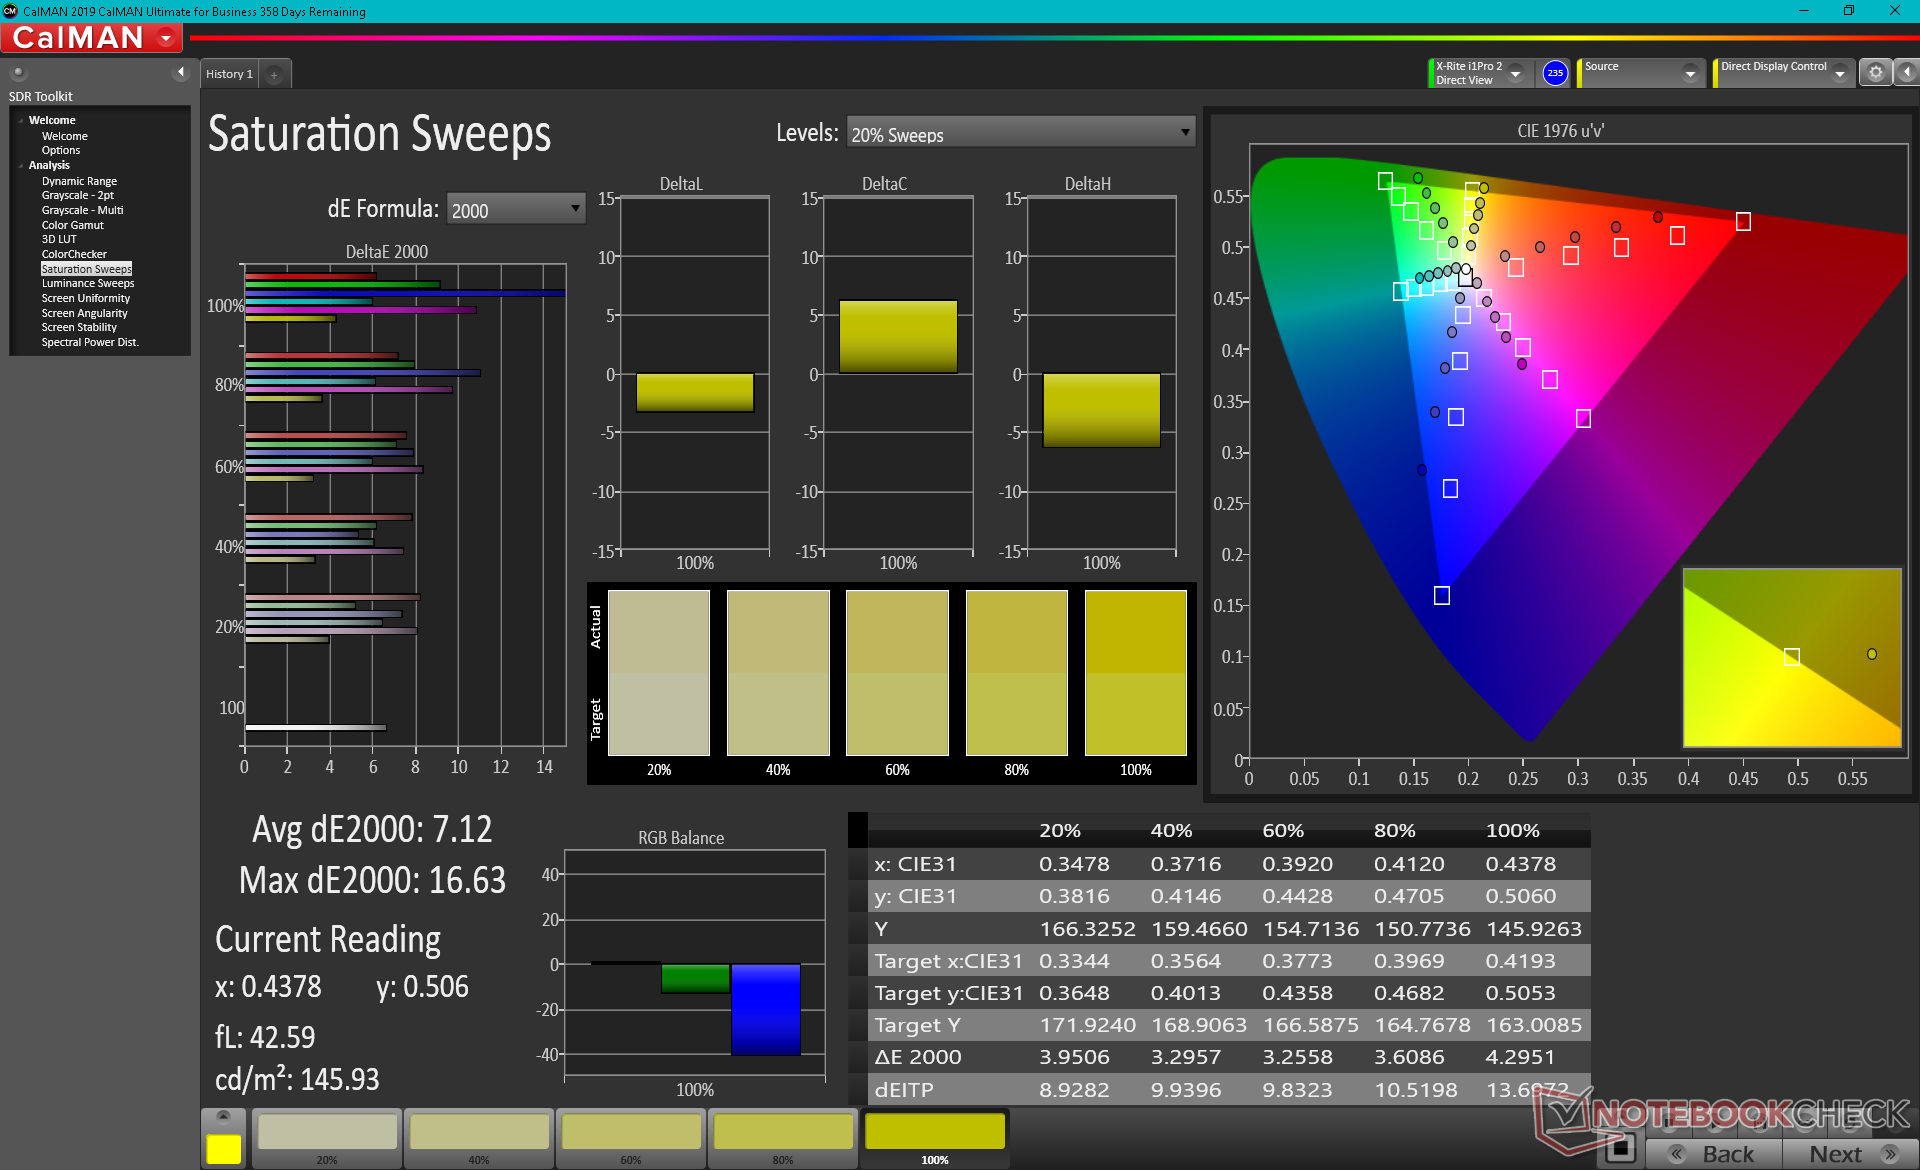
La dalle IPS BOE CQ NV156FHM-T07 ne se trouve sur aucun autre ordinateur portable de notre base de données. Bien que son taux de contraste élevé de 1400:1 et ses temps de réponse noir-blanc raisonnables méritent des éloges, ses couleurs sont au mieux médiocres et loin d'être aussi vibrantes que les écrans d'un modèle Yoga.
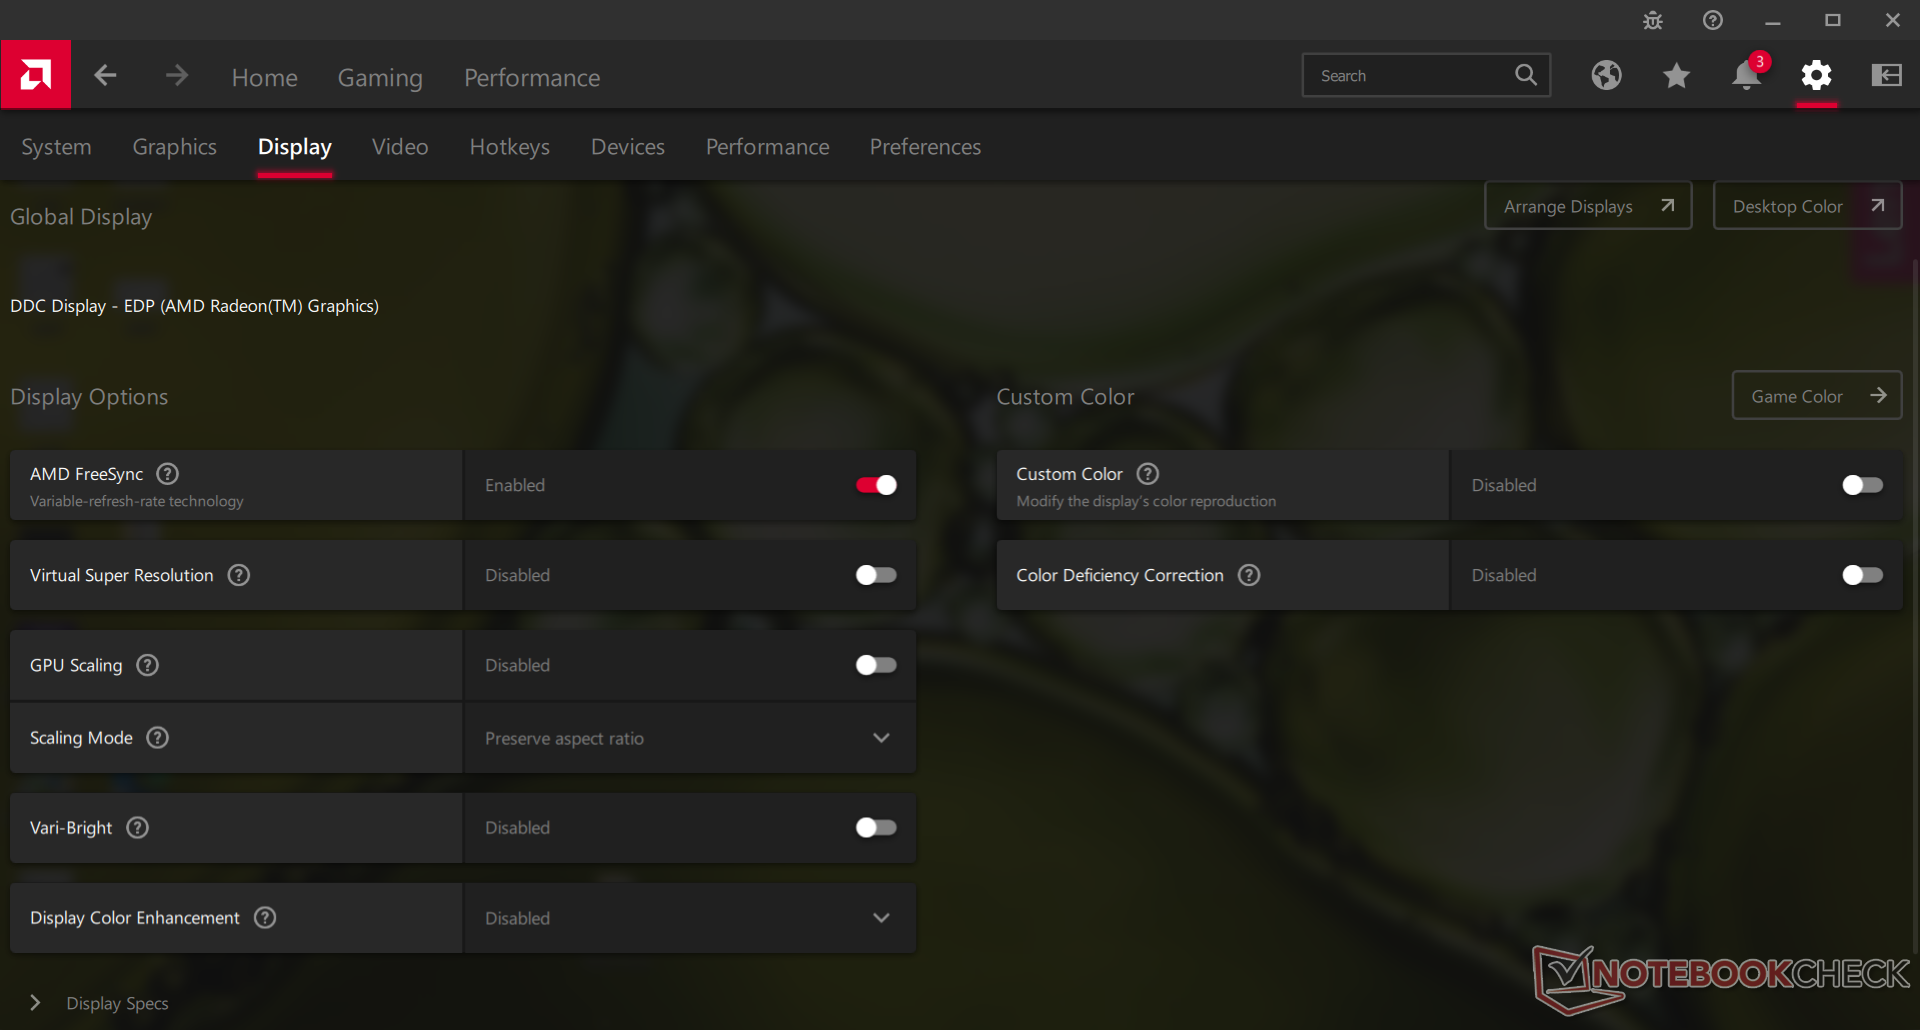
L'aspect le plus remarquable de l'écran est peut-être qu'il s'agit également d'un écran tactile avec prise en charge de FreeSync, ce qui est presque inédit pour un ordinateur portable à moins de 500 $. De telles caractéristiques ne séduiront probablement qu'un très petit sous-ensemble du public cible.


| |||||||||||||||||||||||||
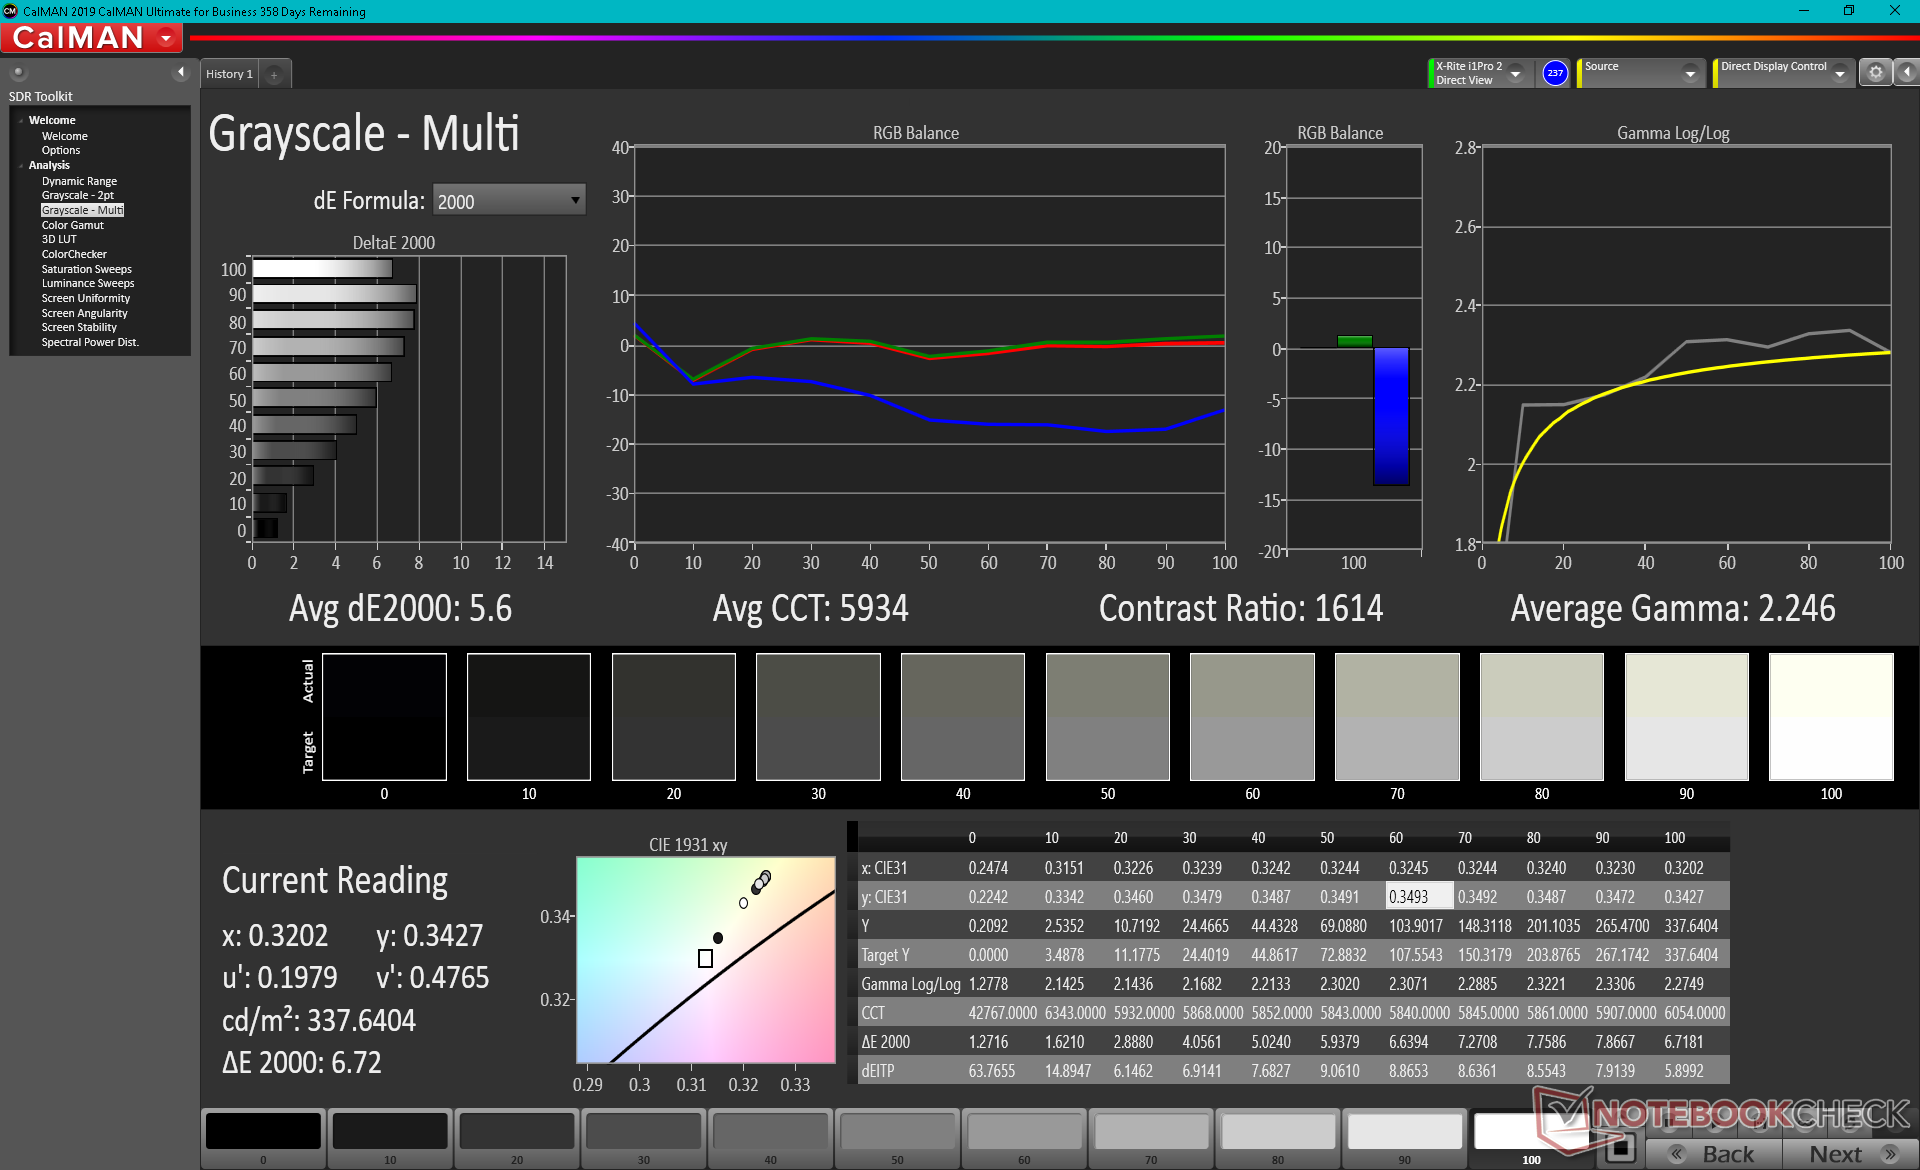
Homogénéité de la luminosité: 84 %
Valeur mesurée au centre, sur batterie: 336.4 cd/m²
Contraste: 1402:1 (Valeurs des noirs: 0.24 cd/m²)
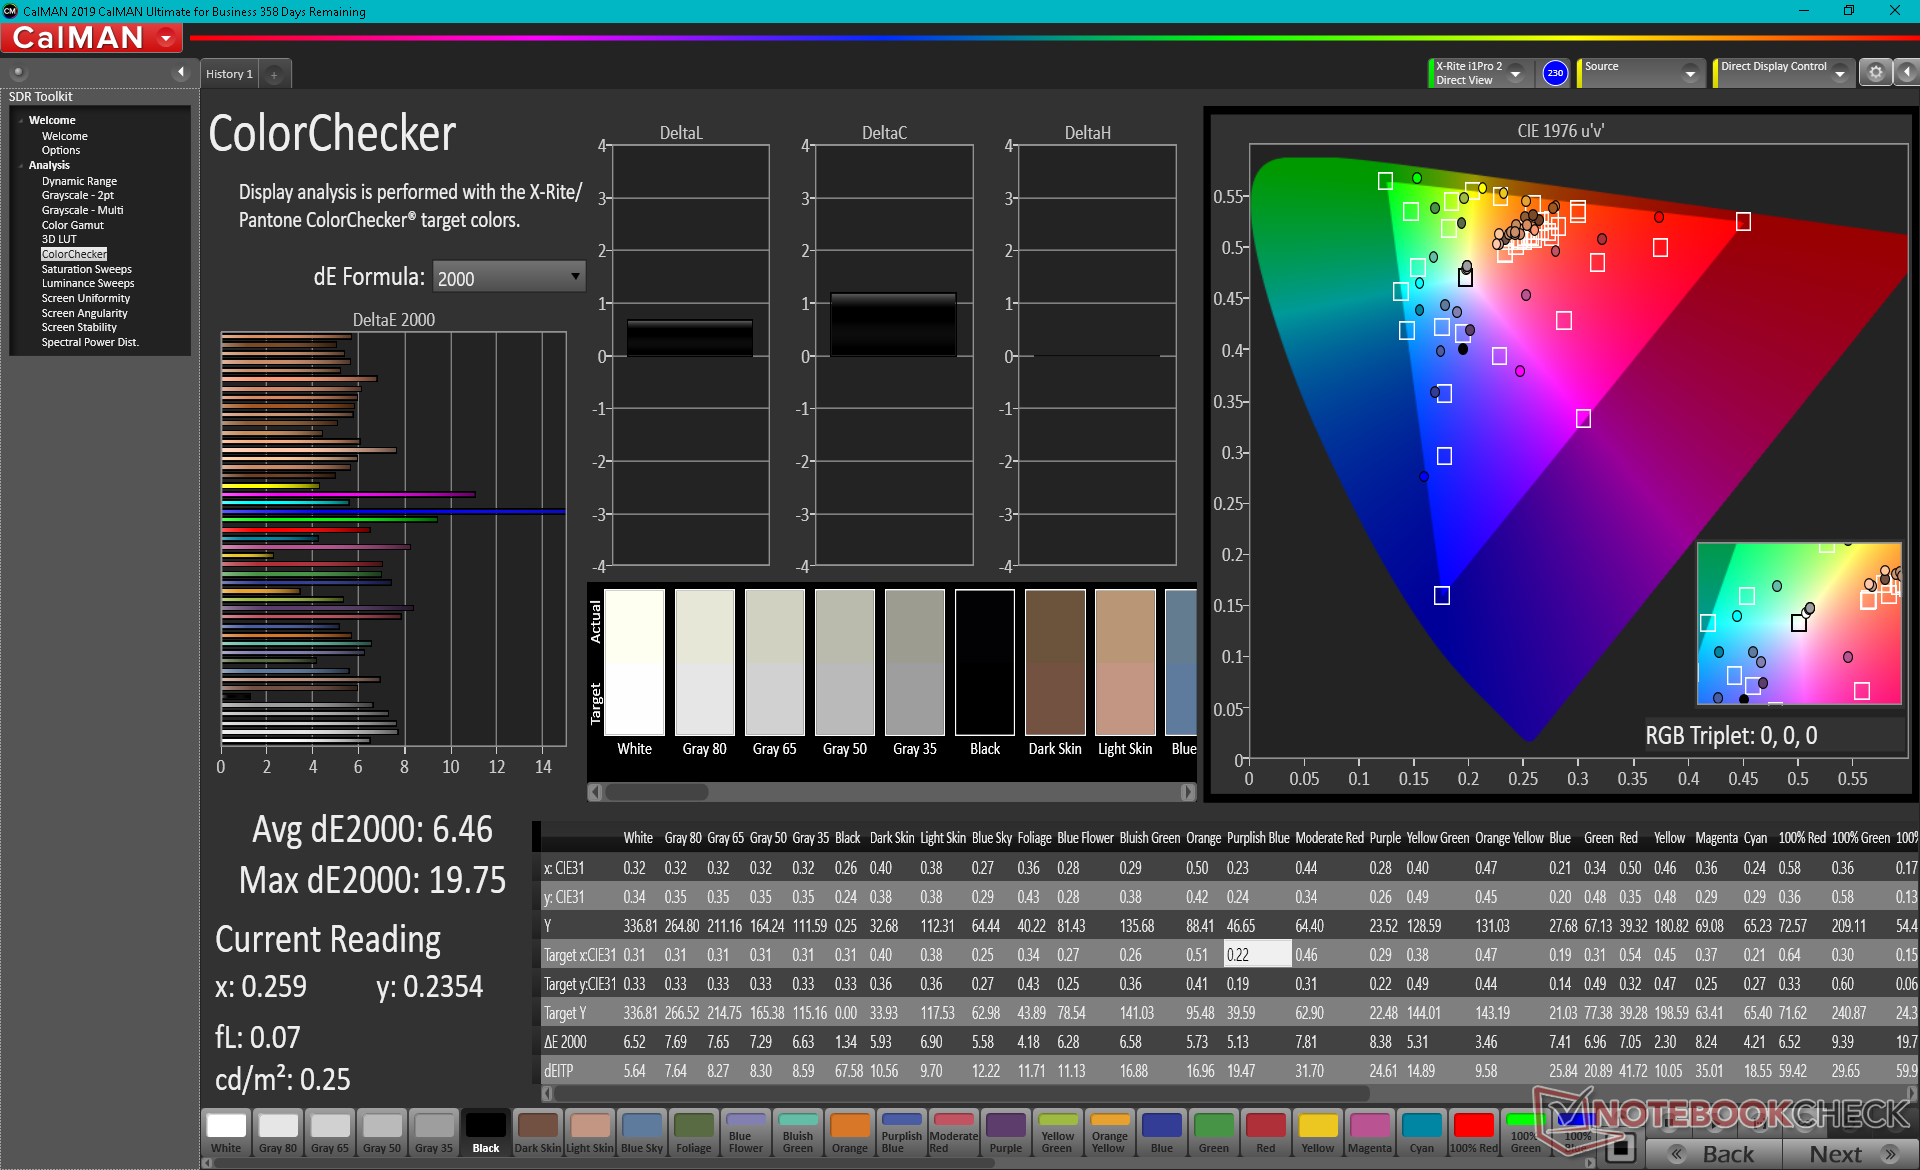
ΔE ColorChecker Calman: 6.46 | ∀{0.5-29.43 Ø4.71}
calibrated: 2.09
ΔE Greyscale Calman: 5.6 | ∀{0.09-98 Ø4.96}
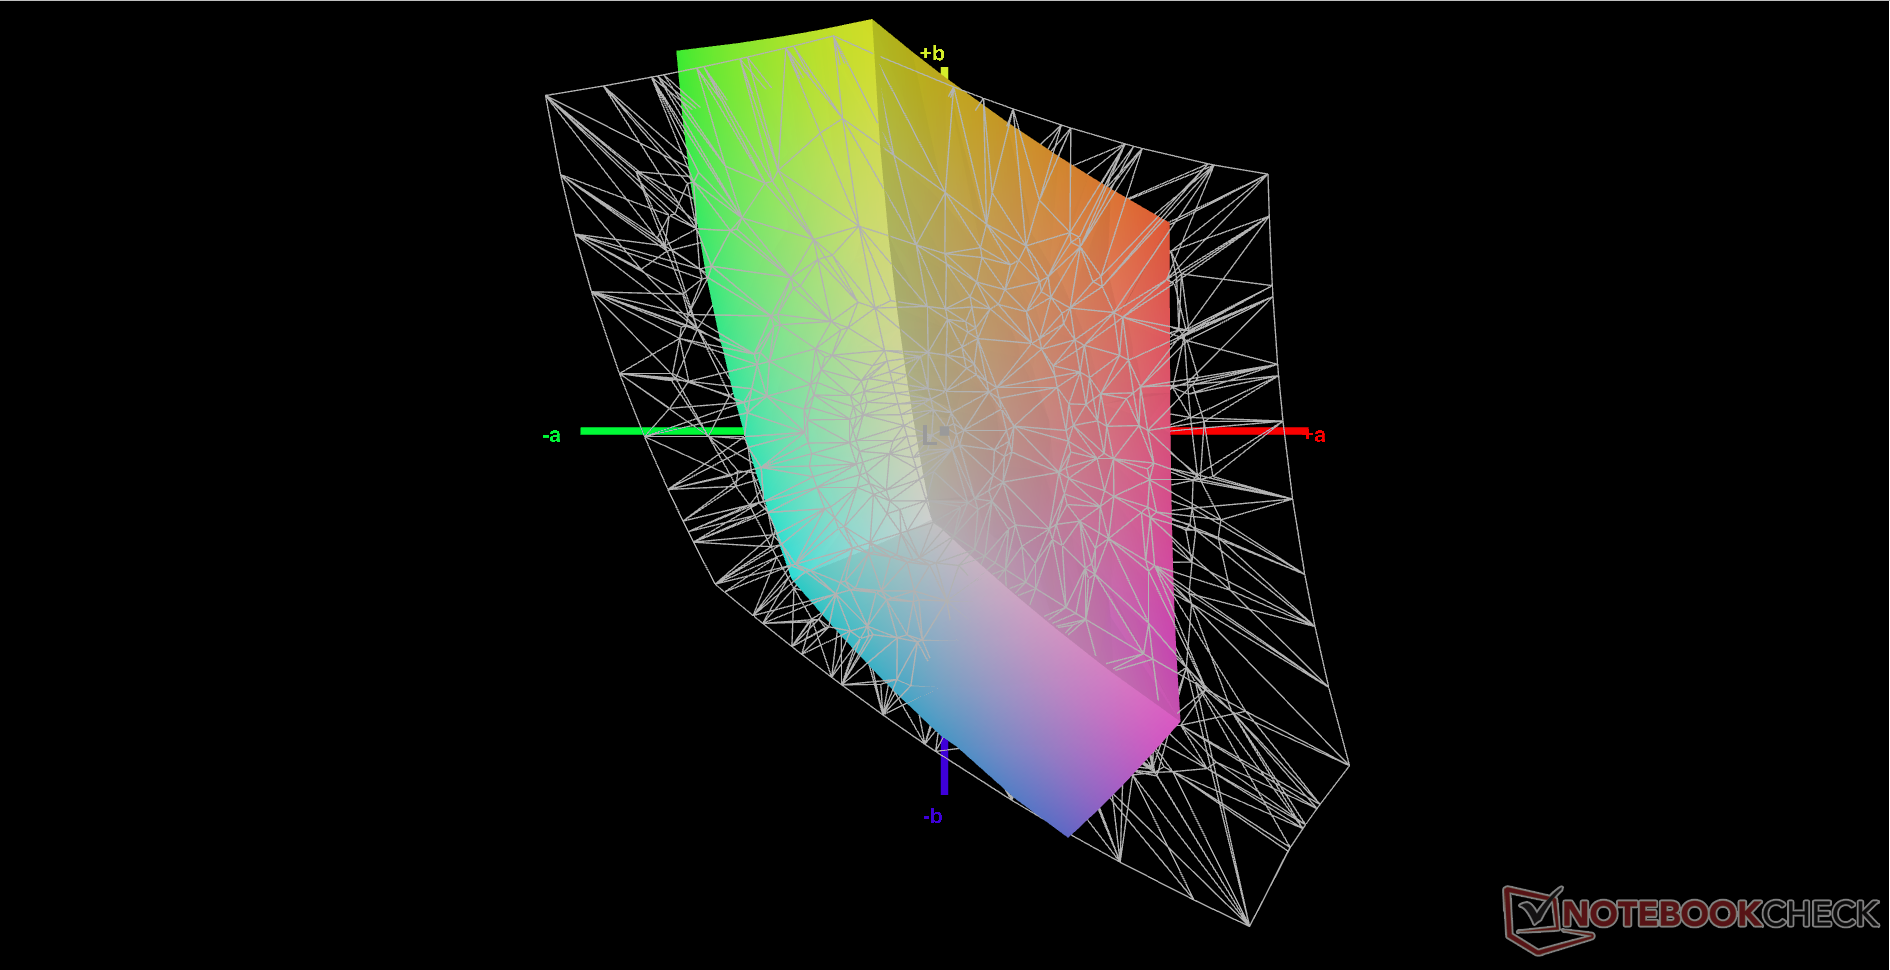
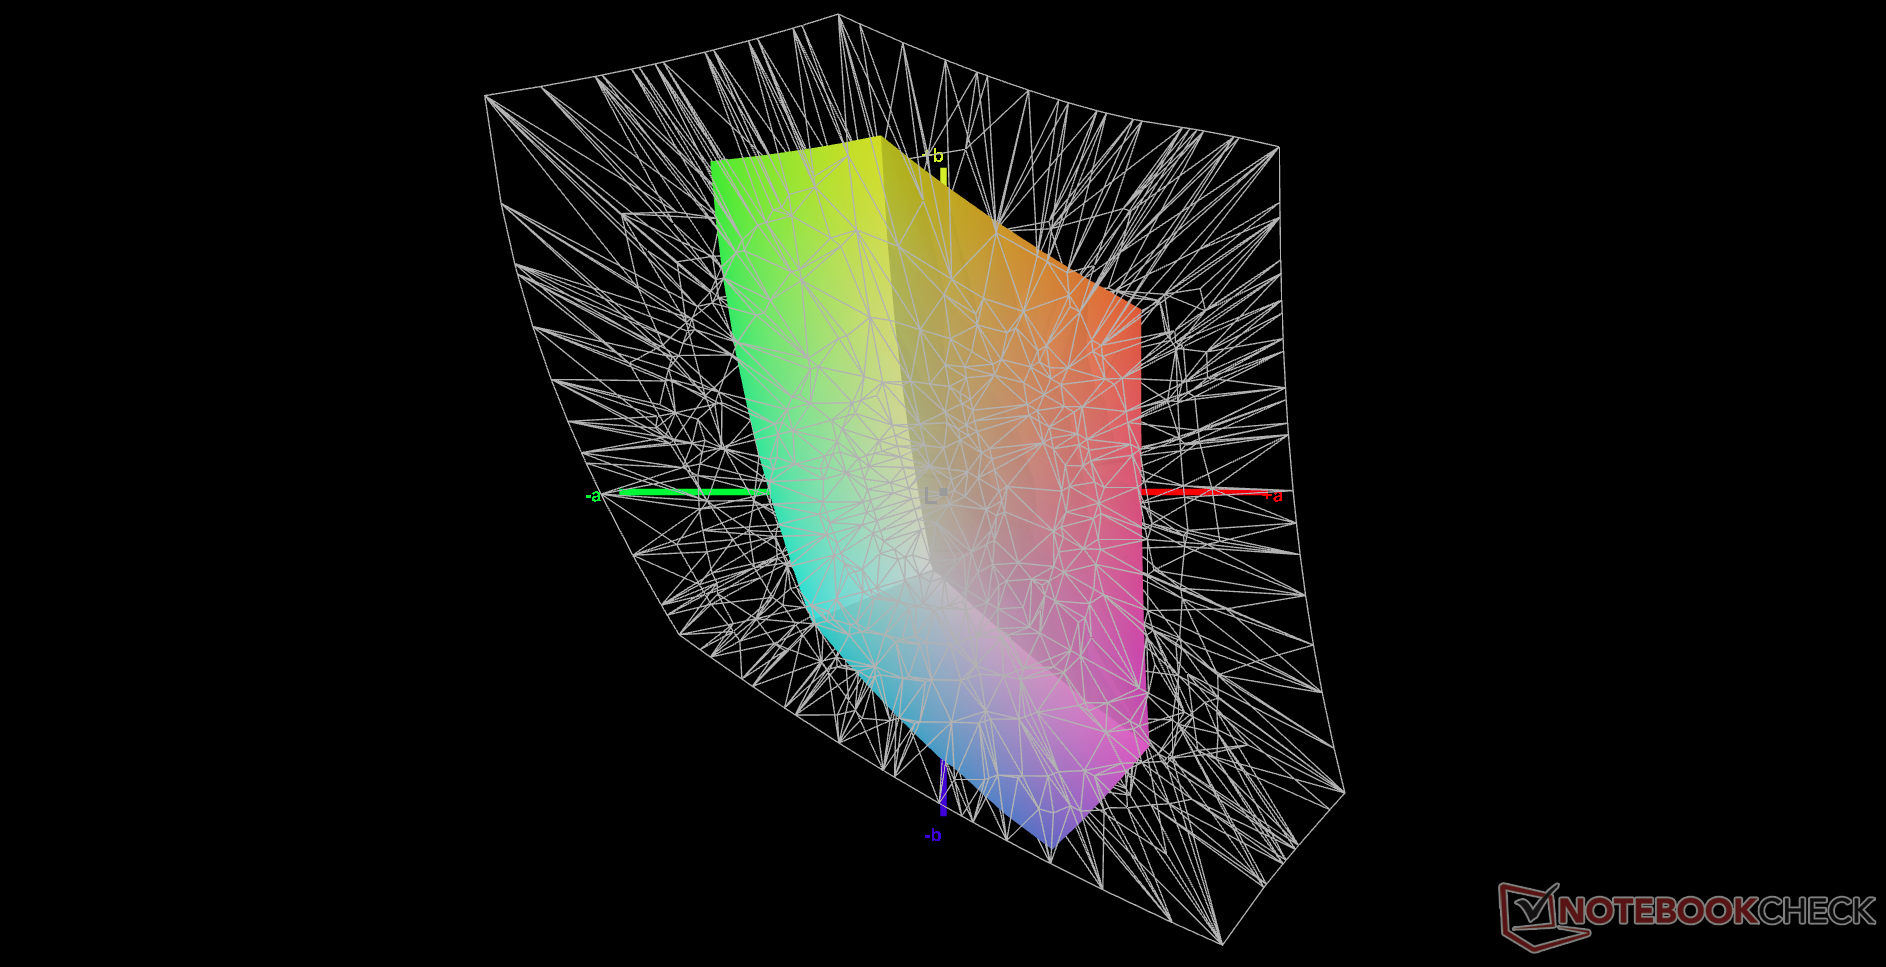
41.2% AdobeRGB 1998 (Argyll 3D)
57.7% sRGB (Argyll 3D)
40% Display P3 (Argyll 3D)
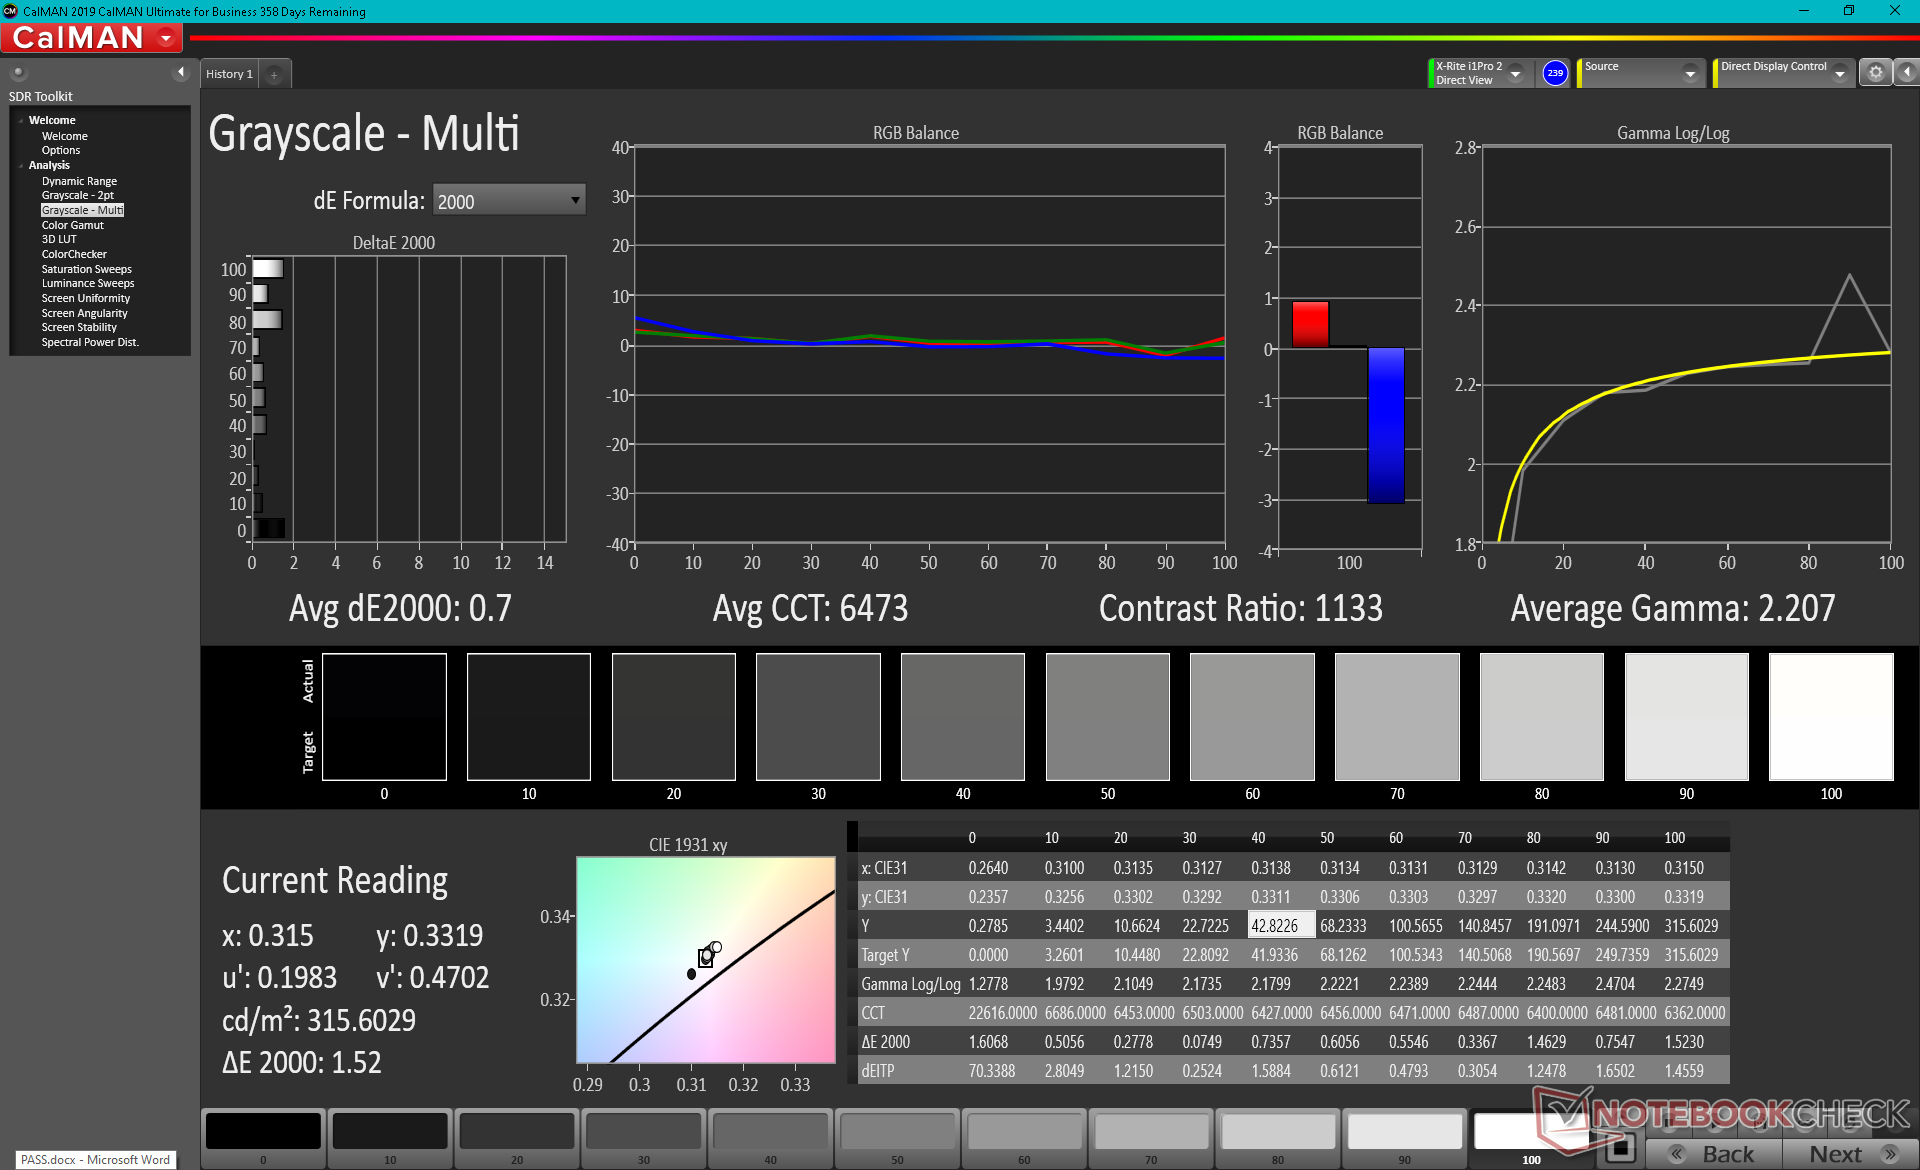
Gamma: 2.25
CCT: 5934 K
| Lenovo IdeaPad 3 15ALC6 BOE CQ NV156FHM-T07, IPS, 1920x1080, 15.6" | Lenovo IdeaPad 5 15IIL05 AU Optronics B156HAN02.1, IPS, 1920x1080, 15.6" | Lenovo Ideapad S540-15IML BOEhydis NV156FHM-N61 (BOE06FB), IPS, 1920x1080, 15.6" | Dell Inspiron 15 3501 BOE NV15N3D (Dell P/N: N39X1), IPS, 1920x1080, 15.6" | HP Pavilion 15-eg Chi Mei CMN1523, IPS, 1920x1080, 15.6" | Asus VivoBook 15 KM513UA-L503TS Samsung ATNA56YX03-0, OLED, 1920x1080, 15.6" | |
|---|---|---|---|---|---|---|
| Display | -5% | 57% | 0% | 9% | 119% | |
| Display P3 Coverage (%) | 40 | 37.63 -6% | 66.8 67% | 39.4 -1% | 42.9 7% | 99.9 150% |
| sRGB Coverage (%) | 57.7 | 56.5 -2% | 86.5 50% | 58.7 2% | 64 11% | 100 73% |
| AdobeRGB 1998 Coverage (%) | 41.2 | 38.88 -6% | 63.2 53% | 40.7 -1% | 44.4 8% | 96.7 135% |
| Response Times | -32% | -62% | -43% | 13% | 94% | |
| Response Time Grey 50% / Grey 80% * (ms) | 24.8 ? | 42 ? -69% | 49.6 ? -100% | 43 ? -73% | 22.8 ? 8% | 0.89 ? 96% |
| Response Time Black / White * (ms) | 28.4 ? | 27 ? 5% | 34.8 ? -23% | 32 ? -13% | 23.6 ? 17% | 2.31 ? 92% |
| PWM Frequency (Hz) | 202 ? | 1000 ? | 26320 ? | 60 ? | ||
| Screen | -15% | 5% | 21% | -7% | 33% | |
| Brightness middle (cd/m²) | 336.4 | 340 1% | 299 -11% | 271 -19% | 294.3 -13% | 401 19% |
| Brightness (cd/m²) | 318 | 325 2% | 278 -13% | 263 -17% | 251 -21% | 403 27% |
| Brightness Distribution (%) | 84 | 88 5% | 87 4% | 92 10% | 76 -10% | 98 17% |
| Black Level * (cd/m²) | 0.24 | 0.27 -13% | 0.25 -4% | 0.15 37% | 0.26 -8% | |
| Contrast (:1) | 1402 | 1259 -10% | 1196 -15% | 1807 29% | 1132 -19% | |
| Colorchecker dE 2000 * | 6.46 | 6.62 -2% | 4.32 33% | 4.83 25% | 4.08 37% | 3.24 50% |
| Colorchecker dE 2000 max. * | 19.75 | 21.05 -7% | 9.3 53% | 7 65% | 19.49 1% | 6.42 67% |
| Colorchecker dE 2000 calibrated * | 2.09 | 4.71 -125% | 2.58 -23% | 3.7 -77% | 2.13 -2% | |
| Greyscale dE 2000 * | 5.6 | 4.61 18% | 4.21 25% | 3.36 40% | 3 46% | 2.7 52% |
| Gamma | 2.25 98% | 2.74 80% | 2.39 92% | 2.56 86% | 2.21 100% | 2.14 103% |
| CCT | 5934 110% | 6262 104% | 6799 96% | 6764 96% | 6616 98% | 6374 102% |
| Color Space (Percent of AdobeRGB 1998) (%) | 36 | 57 | ||||
| Color Space (Percent of sRGB) (%) | 56 | 86 | ||||
| Moyenne finale (programmes/paramètres) | -17% /
-15% | 0% /
7% | -7% /
6% | 5% /
-1% | 82% /
65% |
* ... Moindre est la valeur, meilleures sont les performances
L'espace colorimétrique est réduit à seulement 58 % de sRGB, contre 90 % ou plus sur les ultrabooks de milieu de gamme ou plus chers
L'écran n'est pas bien calibré, comme c'est le cas sur la plupart des ordinateurs portables économiques. La température des couleurs, par exemple, est trop chaude. En calibrant nous-mêmes l'écran avec un colorimètre X-Rite, nous pourrions améliorer considérablement les valeurs DeltaE moyennes, comme le montrent nos résultats ci-dessous. Néanmoins, les couleurs sont toujours imprécises à des niveaux de saturation élevés en raison de l'espace colorimétrique limité mentionné ci-dessus, le bleu étant le plus grand contrevenant
Temps de réponse de l'écran
| ↔ Temps de réponse noir à blanc | ||
|---|---|---|
| 28.4 ms ... hausse ↗ et chute ↘ combinées | ↗ 17.2 ms hausse | 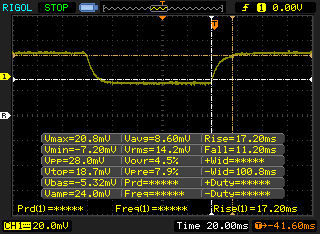 |
| ↘ 11.2 ms chute | ||
| L'écran souffre de latences relativement élevées, insuffisant pour le jeu. En comparaison, tous les appareils testés affichent entre 0.1 (minimum) et 240 (maximum) ms. » 75 % des appareils testés affichent de meilleures performances. Cela signifie que les latences relevées sont moins bonnes que la moyenne (19.8 ms) de tous les appareils testés. | ||
| ↔ Temps de réponse gris 50% à gris 80% | ||
| 24.8 ms ... hausse ↗ et chute ↘ combinées | ↗ 10.8 ms hausse | 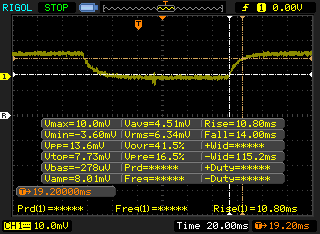 |
| ↘ 14 ms chute | ||
| L'écran montre de bons temps de réponse, mais insuffisant pour du jeu compétitif. En comparaison, tous les appareils testés affichent entre 0.165 (minimum) et 636 (maximum) ms. » 35 % des appareils testés affichent de meilleures performances. Cela signifie que les latences relevées sont meilleures que la moyenne (31 ms) de tous les appareils testés. | ||
Scintillement / MLI (Modulation de largeur d'impulsion)
| Scintillement / MLI (Modulation de largeur d'impulsion) non décelé | 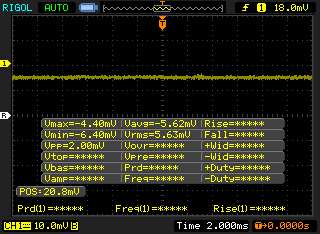 | ||
En comparaison, 52 % des appareils testés n'emploient pas MDI pour assombrir leur écran. Nous avons relevé une moyenne à 7754 (minimum : 5 - maximum : 343500) Hz dans le cas où une MDI était active. | |||
La visibilité en extérieur est décente à l'ombre grâce à l'écran 300 nit raisonnablement lumineux. Veillez simplement à désactiver la fonction Vari-Bright d'AMD, qui est activée par défaut dans le logiciel d'AMD, sinon la luminosité maximale sera automatiquement réduite en cas de fonctionnement sur batterie

Performance
Conditions d'essai
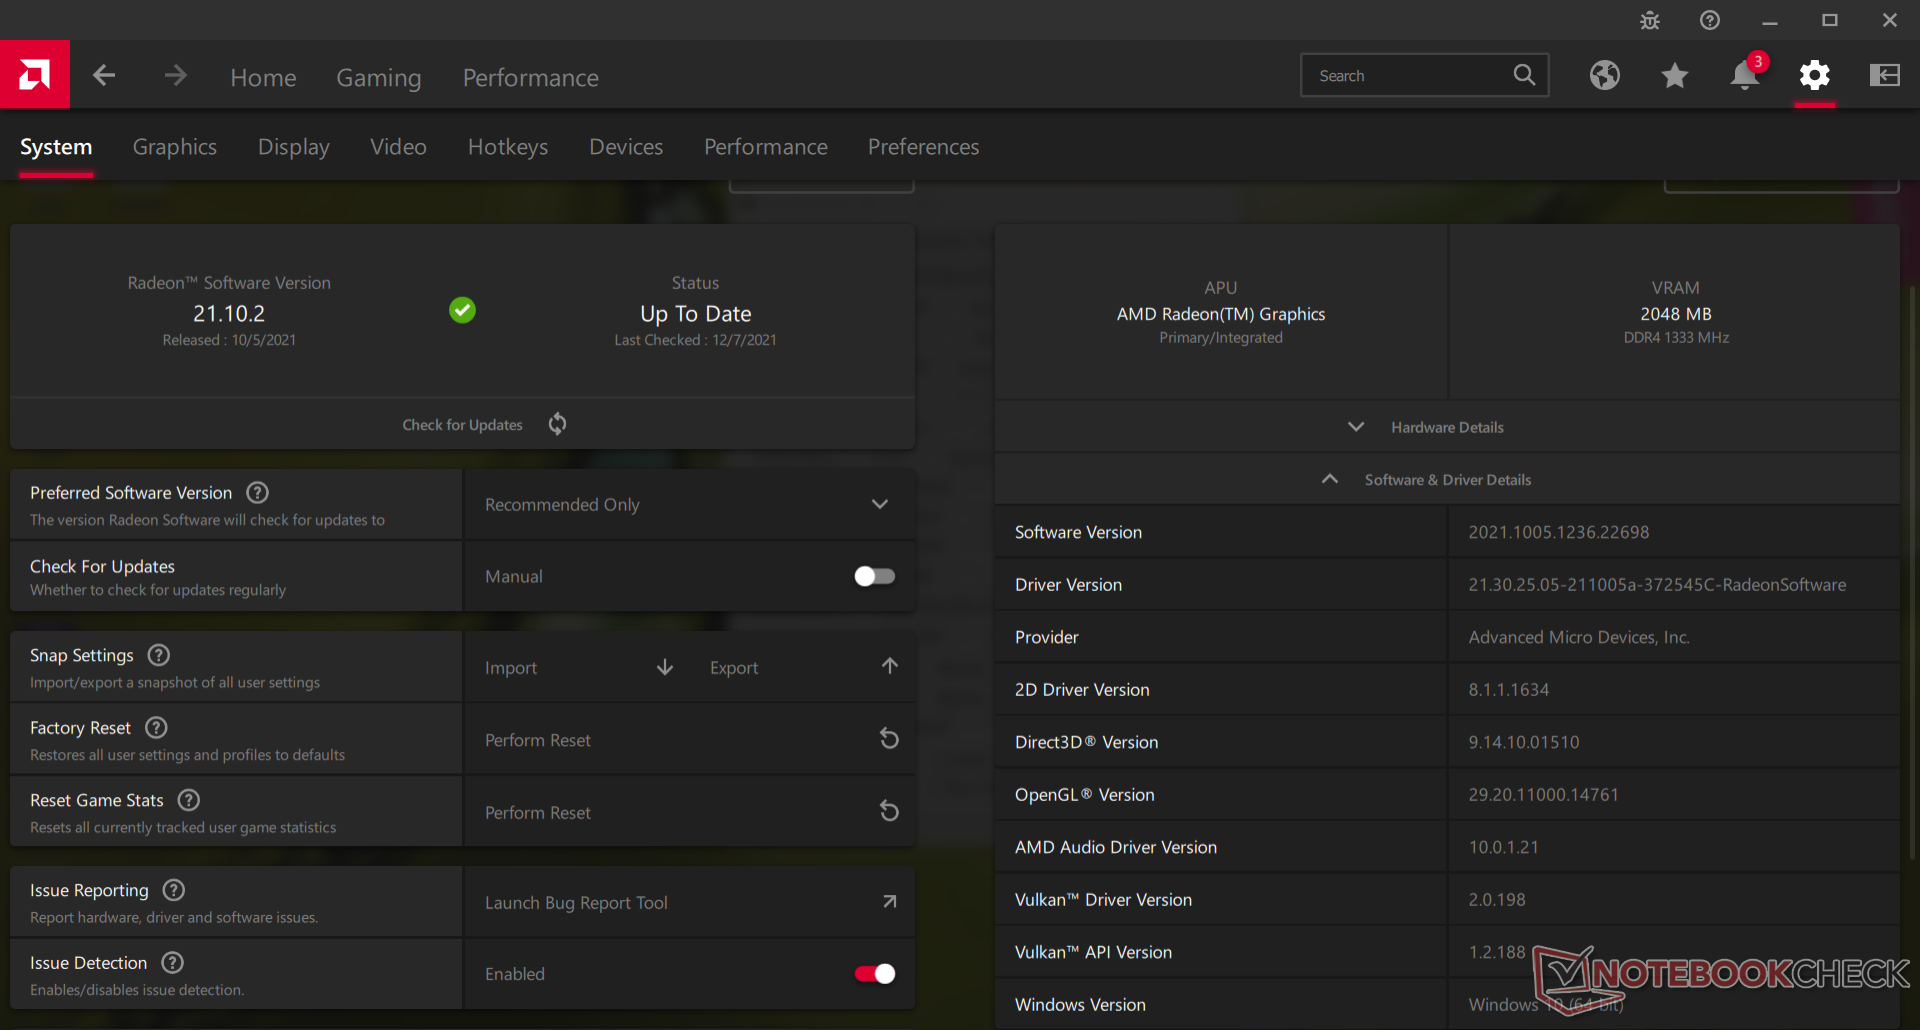
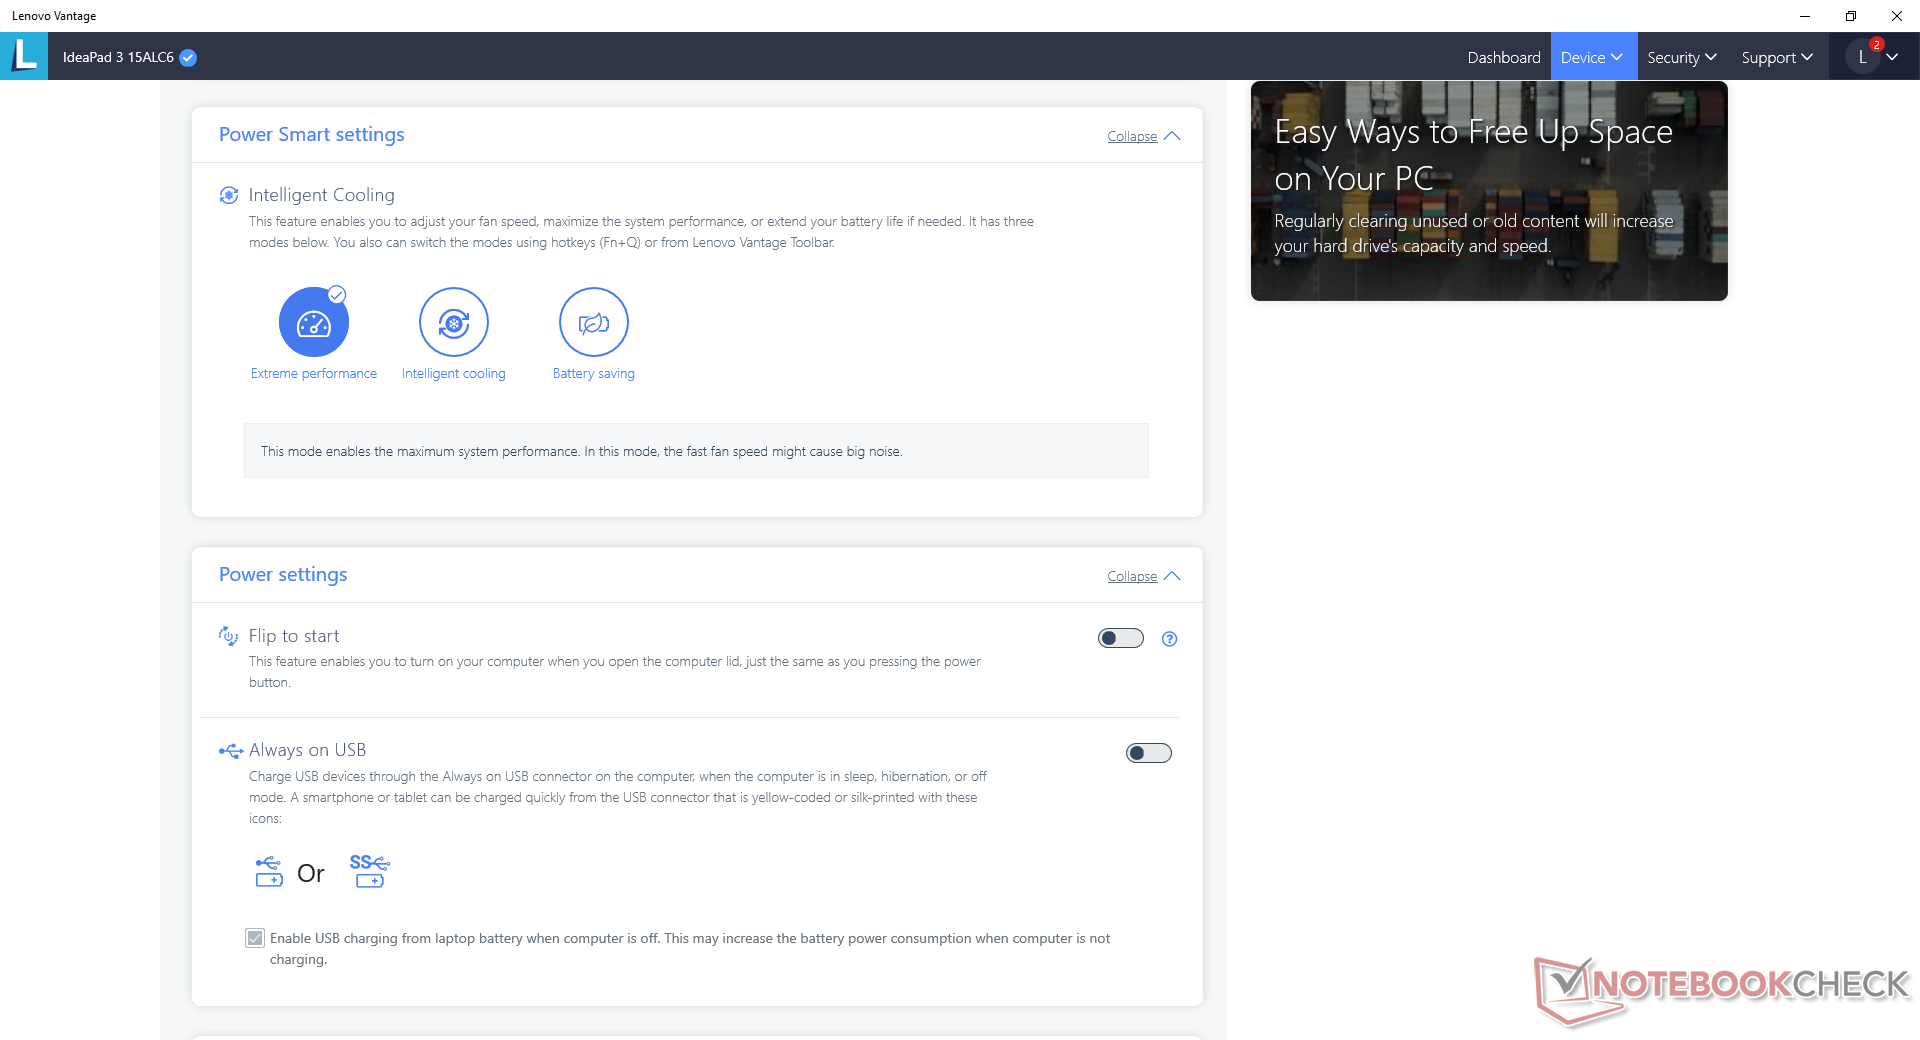
Notre appareil a été réglé en mode Performance extrême via le logiciel préinstallé Lenovo Vantage pour obtenir les meilleurs résultats possibles aux tests de référence. Nous recommandons aux utilisateurs de se familiariser avec Vantage et le logiciel AMD Radeon, car de nombreuses fonctions et mises à jour clés du système sont activées ici.
Processeur - Rapide pour un Ryzen 3
Les performances brutes du CPU sont excellentes si l'on considère que le Ryzen 3 se positionne comme une alternative au Core i3. Son avantage le plus frappant réside dans ses performances multithread qui peuvent être jusqu'à 70 à 80 % plus rapides que celles du concurrent Core i3-1115G4 puisque le Ryzen 3 5300U possède deux fois plus de cœurs physiques. Les performances brutes en multi-thread sont en fait comparables à celles duCore i7-1165G7 tandis que les performances en mode single-thread ne sont inférieures que de 25 % environ.
La durabilité des performances est excellente, sans problème majeur d'étranglement lors de l'exécution de CineBench R15 xT en boucle continue.
Cinebench R15 Multi Loop
Cinebench R23: Multi Core | Single Core
Cinebench R20: CPU (Multi Core) | CPU (Single Core)
Cinebench R15: CPU Multi 64Bit | CPU Single 64Bit
Blender: v2.79 BMW27 CPU
7-Zip 18.03: 7z b 4 | 7z b 4 -mmt1
Geekbench 5.5: Multi-Core | Single-Core
HWBOT x265 Benchmark v2.2: 4k Preset
LibreOffice : 20 Documents To PDF
R Benchmark 2.5: Overall mean
| CPU Performance rating | |
| Asus VivoBook S15 D533UA | |
| MSI Prestige 15 A10SC -10! | |
| Asus VivoBook 15 KM513UA-L503TS | |
| HP Pavilion 15-eg -2! | |
| HP Pavilion x360 15-er0155ng | |
| Lenovo IdeaPad 3 15ALC6 | |
| Lenovo IdeaPad 5 15IIL05 -2! | |
| Moyenne AMD Ryzen 3 5300U | |
| Lenovo Ideapad S540-15IML -10! | |
| Lenovo ThinkPad L15 G2-20X4S0KU00 | |
| Teclast TBOLT F15 Pro | |
| HP 255 G7 159P1EA | |
| Beelink U59 -2! | |
| Cinebench R23 / Multi Core | |
| Asus VivoBook S15 D533UA | |
| Asus VivoBook 15 KM513UA-L503TS | |
| Asus VivoBook 15 KM513UA-L503TS | |
| Lenovo IdeaPad 3 15ALC6 | |
| Moyenne AMD Ryzen 3 5300U (4772 - 5522, n=3) | |
| HP Pavilion 15-eg | |
| HP Pavilion x360 15-er0155ng | |
| Lenovo ThinkPad L15 G2-20X4S0KU00 | |
| Beelink U59 | |
| Teclast TBOLT F15 Pro | |
| HP 255 G7 159P1EA | |
| Cinebench R23 / Single Core | |
| HP Pavilion 15-eg | |
| HP Pavilion x360 15-er0155ng | |
| Lenovo ThinkPad L15 G2-20X4S0KU00 | |
| Asus VivoBook S15 D533UA | |
| Asus VivoBook 15 KM513UA-L503TS | |
| Asus VivoBook 15 KM513UA-L503TS | |
| Lenovo IdeaPad 3 15ALC6 | |
| Moyenne AMD Ryzen 3 5300U (1102 - 1129, n=3) | |
| Teclast TBOLT F15 Pro | |
| HP 255 G7 159P1EA | |
| Beelink U59 | |
| Cinebench R20 / CPU (Multi Core) | |
| Asus VivoBook S15 D533UA | |
| Asus VivoBook 15 KM513UA-L503TS | |
| Asus VivoBook 15 KM513UA-L503TS | |
| MSI Prestige 15 A10SC | |
| Lenovo IdeaPad 3 15ALC6 | |
| Moyenne AMD Ryzen 3 5300U (1883 - 2138, n=4) | |
| HP Pavilion 15-eg | |
| Lenovo IdeaPad 5 15IIL05 | |
| HP Pavilion x360 15-er0155ng | |
| Lenovo Ideapad S540-15IML | |
| Lenovo ThinkPad L15 G2-20X4S0KU00 | |
| Beelink U59 | |
| Teclast TBOLT F15 Pro | |
| HP 255 G7 159P1EA | |
| Cinebench R20 / CPU (Single Core) | |
| HP Pavilion 15-eg | |
| HP Pavilion x360 15-er0155ng | |
| Lenovo ThinkPad L15 G2-20X4S0KU00 | |
| Asus VivoBook S15 D533UA | |
| MSI Prestige 15 A10SC | |
| Asus VivoBook 15 KM513UA-L503TS | |
| Asus VivoBook 15 KM513UA-L503TS | |
| Lenovo IdeaPad 3 15ALC6 | |
| Moyenne AMD Ryzen 3 5300U (431 - 441, n=4) | |
| Lenovo IdeaPad 5 15IIL05 | |
| Lenovo Ideapad S540-15IML | |
| Teclast TBOLT F15 Pro | |
| HP 255 G7 159P1EA | |
| Beelink U59 | |
| Cinebench R15 / CPU Multi 64Bit | |
| Asus VivoBook S15 D533UA | |
| Asus VivoBook 15 KM513UA-L503TS | |
| Asus VivoBook 15 KM513UA-L503TS | |
| MSI Prestige 15 A10SC | |
| Lenovo IdeaPad 3 15ALC6 | |
| Moyenne AMD Ryzen 3 5300U (832 - 915, n=3) | |
| Lenovo IdeaPad 5 15IIL05 | |
| HP Pavilion 15-eg | |
| HP Pavilion x360 15-er0155ng | |
| Lenovo Ideapad S540-15IML | |
| Lenovo ThinkPad L15 G2-20X4S0KU00 | |
| Beelink U59 | |
| HP 255 G7 159P1EA | |
| Teclast TBOLT F15 Pro | |
| Cinebench R15 / CPU Single 64Bit | |
| HP Pavilion 15-eg | |
| HP Pavilion x360 15-er0155ng | |
| Lenovo ThinkPad L15 G2-20X4S0KU00 | |
| MSI Prestige 15 A10SC | |
| Asus VivoBook S15 D533UA | |
| Asus VivoBook 15 KM513UA-L503TS | |
| Asus VivoBook 15 KM513UA-L503TS | |
| Lenovo Ideapad S540-15IML | |
| Lenovo IdeaPad 5 15IIL05 | |
| Lenovo IdeaPad 3 15ALC6 | |
| Moyenne AMD Ryzen 3 5300U (166 - 170, n=3) | |
| Teclast TBOLT F15 Pro | |
| HP 255 G7 159P1EA | |
| Beelink U59 | |
| Blender / v2.79 BMW27 CPU | |
| Beelink U59 | |
| HP 255 G7 159P1EA | |
| Teclast TBOLT F15 Pro | |
| Lenovo ThinkPad L15 G2-20X4S0KU00 | |
| HP Pavilion x360 15-er0155ng | |
| Lenovo IdeaPad 5 15IIL05 | |
| HP Pavilion 15-eg | |
| Moyenne AMD Ryzen 3 5300U (524 - 617, n=3) | |
| Lenovo IdeaPad 3 15ALC6 | |
| Asus VivoBook 15 KM513UA-L503TS | |
| Asus VivoBook 15 KM513UA-L503TS | |
| Asus VivoBook S15 D533UA | |
| 7-Zip 18.03 / 7z b 4 | |
| Asus VivoBook S15 D533UA | |
| Asus VivoBook 15 KM513UA-L503TS | |
| Asus VivoBook 15 KM513UA-L503TS | |
| Lenovo IdeaPad 3 15ALC6 | |
| HP Pavilion 15-eg | |
| HP Pavilion x360 15-er0155ng | |
| Moyenne AMD Ryzen 3 5300U (19170 - 24366, n=3) | |
| Lenovo IdeaPad 5 15IIL05 | |
| Lenovo ThinkPad L15 G2-20X4S0KU00 | |
| Beelink U59 | |
| Teclast TBOLT F15 Pro | |
| HP 255 G7 159P1EA | |
| 7-Zip 18.03 / 7z b 4 -mmt1 | |
| HP Pavilion 15-eg | |
| HP Pavilion x360 15-er0155ng | |
| Asus VivoBook S15 D533UA | |
| Lenovo ThinkPad L15 G2-20X4S0KU00 | |
| Asus VivoBook 15 KM513UA-L503TS | |
| Asus VivoBook 15 KM513UA-L503TS | |
| Lenovo IdeaPad 5 15IIL05 | |
| Lenovo IdeaPad 3 15ALC6 | |
| Moyenne AMD Ryzen 3 5300U (3755 - 4198, n=3) | |
| Teclast TBOLT F15 Pro | |
| HP 255 G7 159P1EA | |
| Beelink U59 | |
| Geekbench 5.5 / Multi-Core | |
| Asus VivoBook S15 D533UA | |
| Asus VivoBook 15 KM513UA-L503TS | |
| Asus VivoBook 15 KM513UA-L503TS | |
| HP Pavilion x360 15-er0155ng | |
| Lenovo IdeaPad 3 15ALC6 | |
| Lenovo IdeaPad 5 15IIL05 | |
| Moyenne AMD Ryzen 3 5300U (3730 - 4191, n=3) | |
| Teclast TBOLT F15 Pro | |
| Lenovo ThinkPad L15 G2-20X4S0KU00 | |
| HP 255 G7 159P1EA | |
| Geekbench 5.5 / Single-Core | |
| HP Pavilion x360 15-er0155ng | |
| Lenovo ThinkPad L15 G2-20X4S0KU00 | |
| Lenovo IdeaPad 5 15IIL05 | |
| Asus VivoBook S15 D533UA | |
| Teclast TBOLT F15 Pro | |
| Asus VivoBook 15 KM513UA-L503TS | |
| Asus VivoBook 15 KM513UA-L503TS | |
| Lenovo IdeaPad 3 15ALC6 | |
| Moyenne AMD Ryzen 3 5300U (1040 - 1080, n=3) | |
| HP 255 G7 159P1EA | |
| HWBOT x265 Benchmark v2.2 / 4k Preset | |
| Asus VivoBook S15 D533UA | |
| Asus VivoBook 15 KM513UA-L503TS | |
| Asus VivoBook 15 KM513UA-L503TS | |
| Lenovo IdeaPad 3 15ALC6 | |
| HP Pavilion 15-eg | |
| Lenovo IdeaPad 5 15IIL05 | |
| Moyenne AMD Ryzen 3 5300U (5.87 - 6.74, n=3) | |
| HP Pavilion x360 15-er0155ng | |
| Lenovo ThinkPad L15 G2-20X4S0KU00 | |
| Teclast TBOLT F15 Pro | |
| Beelink U59 | |
| HP 255 G7 159P1EA | |
| LibreOffice / 20 Documents To PDF | |
| Beelink U59 | |
| HP 255 G7 159P1EA | |
| Teclast TBOLT F15 Pro | |
| Moyenne AMD Ryzen 3 5300U (63.4 - 77.1, n=3) | |
| Lenovo IdeaPad 3 15ALC6 | |
| Asus VivoBook 15 KM513UA-L503TS | |
| Asus VivoBook S15 D533UA | |
| Lenovo IdeaPad 5 15IIL05 | |
| Lenovo ThinkPad L15 G2-20X4S0KU00 | |
| HP Pavilion x360 15-er0155ng | |
| HP Pavilion 15-eg | |
| R Benchmark 2.5 / Overall mean | |
| Beelink U59 | |
| HP 255 G7 159P1EA | |
| Teclast TBOLT F15 Pro | |
| Lenovo IdeaPad 5 15IIL05 | |
| Lenovo ThinkPad L15 G2-20X4S0KU00 | |
| Moyenne AMD Ryzen 3 5300U (0.654 - 0.664, n=3) | |
| Lenovo IdeaPad 3 15ALC6 | |
| Asus VivoBook 15 KM513UA-L503TS | |
| Asus VivoBook 15 KM513UA-L503TS | |
| HP Pavilion x360 15-er0155ng | |
| Asus VivoBook S15 D533UA | |
| HP Pavilion 15-eg | |
Cinebench R23: Multi Core | Single Core
Cinebench R20: CPU (Multi Core) | CPU (Single Core)
Cinebench R15: CPU Multi 64Bit | CPU Single 64Bit
Blender: v2.79 BMW27 CPU
7-Zip 18.03: 7z b 4 | 7z b 4 -mmt1
Geekbench 5.5: Multi-Core | Single-Core
HWBOT x265 Benchmark v2.2: 4k Preset
LibreOffice : 20 Documents To PDF
R Benchmark 2.5: Overall mean
* ... Moindre est la valeur, meilleures sont les performances
AIDA64: FP32 Ray-Trace | FPU Julia | CPU SHA3 | CPU Queen | FPU SinJulia | FPU Mandel | CPU AES | CPU ZLib | FP64 Ray-Trace | CPU PhotoWorxx
| Performance rating | |
| Asus VivoBook 15 KM513UA-L503TS | |
| HP Pavilion 15-eg | |
| Lenovo IdeaPad 3 15ALC6 | |
| Lenovo IdeaPad 5 15IIL05 | |
| Dell Inspiron 15 3501 | |
| Moyenne AMD Ryzen 3 5300U | |
| AIDA64 / FP32 Ray-Trace | |
| Asus VivoBook 15 KM513UA-L503TS | |
| Lenovo IdeaPad 3 15ALC6 | |
| Lenovo IdeaPad 5 15IIL05 | |
| HP Pavilion 15-eg | |
| Dell Inspiron 15 3501 | |
| Moyenne AMD Ryzen 3 5300U (3612 - 7053, n=3) | |
| AIDA64 / FPU Julia | |
| Asus VivoBook 15 KM513UA-L503TS | |
| Lenovo IdeaPad 3 15ALC6 | |
| Moyenne AMD Ryzen 3 5300U (33606 - 37829, n=3) | |
| Lenovo IdeaPad 5 15IIL05 | |
| HP Pavilion 15-eg | |
| Dell Inspiron 15 3501 | |
| AIDA64 / CPU SHA3 | |
| Lenovo IdeaPad 5 15IIL05 | |
| HP Pavilion 15-eg | |
| Dell Inspiron 15 3501 | |
| Asus VivoBook 15 KM513UA-L503TS | |
| Lenovo IdeaPad 3 15ALC6 | |
| Moyenne AMD Ryzen 3 5300U (1244 - 1248, n=2) | |
| AIDA64 / CPU Queen | |
| Asus VivoBook 15 KM513UA-L503TS | |
| Lenovo IdeaPad 3 15ALC6 | |
| Moyenne AMD Ryzen 3 5300U (51280 - 51454, n=3) | |
| HP Pavilion 15-eg | |
| Dell Inspiron 15 3501 | |
| Lenovo IdeaPad 5 15IIL05 | |
| AIDA64 / FPU SinJulia | |
| Asus VivoBook 15 KM513UA-L503TS | |
| Lenovo IdeaPad 3 15ALC6 | |
| Moyenne AMD Ryzen 3 5300U (6686 - 6703, n=3) | |
| HP Pavilion 15-eg | |
| Dell Inspiron 15 3501 | |
| Lenovo IdeaPad 5 15IIL05 | |
| AIDA64 / FPU Mandel | |
| Asus VivoBook 15 KM513UA-L503TS | |
| Lenovo IdeaPad 3 15ALC6 | |
| Moyenne AMD Ryzen 3 5300U (17564 - 20109, n=3) | |
| HP Pavilion 15-eg | |
| Lenovo IdeaPad 5 15IIL05 | |
| Dell Inspiron 15 3501 | |
| AIDA64 / CPU AES | |
| HP Pavilion 15-eg | |
| Dell Inspiron 15 3501 | |
| Lenovo IdeaPad 5 15IIL05 | |
| Asus VivoBook 15 KM513UA-L503TS | |
| Lenovo IdeaPad 3 15ALC6 | |
| Moyenne AMD Ryzen 3 5300U (19307 - 34964, n=3) | |
| AIDA64 / CPU ZLib | |
| Asus VivoBook 15 KM513UA-L503TS | |
| Lenovo IdeaPad 3 15ALC6 | |
| Moyenne AMD Ryzen 3 5300U (374 - 396, n=3) | |
| Dell Inspiron 15 3501 | |
| Lenovo IdeaPad 5 15IIL05 | |
| HP Pavilion 15-eg | |
| AIDA64 / FP64 Ray-Trace | |
| Asus VivoBook 15 KM513UA-L503TS | |
| Lenovo IdeaPad 3 15ALC6 | |
| Moyenne AMD Ryzen 3 5300U (3199 - 3768, n=3) | |
| Lenovo IdeaPad 5 15IIL05 | |
| Dell Inspiron 15 3501 | |
| HP Pavilion 15-eg | |
| AIDA64 / CPU PhotoWorxx | |
| HP Pavilion 15-eg | |
| Lenovo IdeaPad 5 15IIL05 | |
| Lenovo IdeaPad 3 15ALC6 | |
| Dell Inspiron 15 3501 | |
| Moyenne AMD Ryzen 3 5300U (16799 - 17037, n=3) | |
| Asus VivoBook 15 KM513UA-L503TS | |
Performance du système
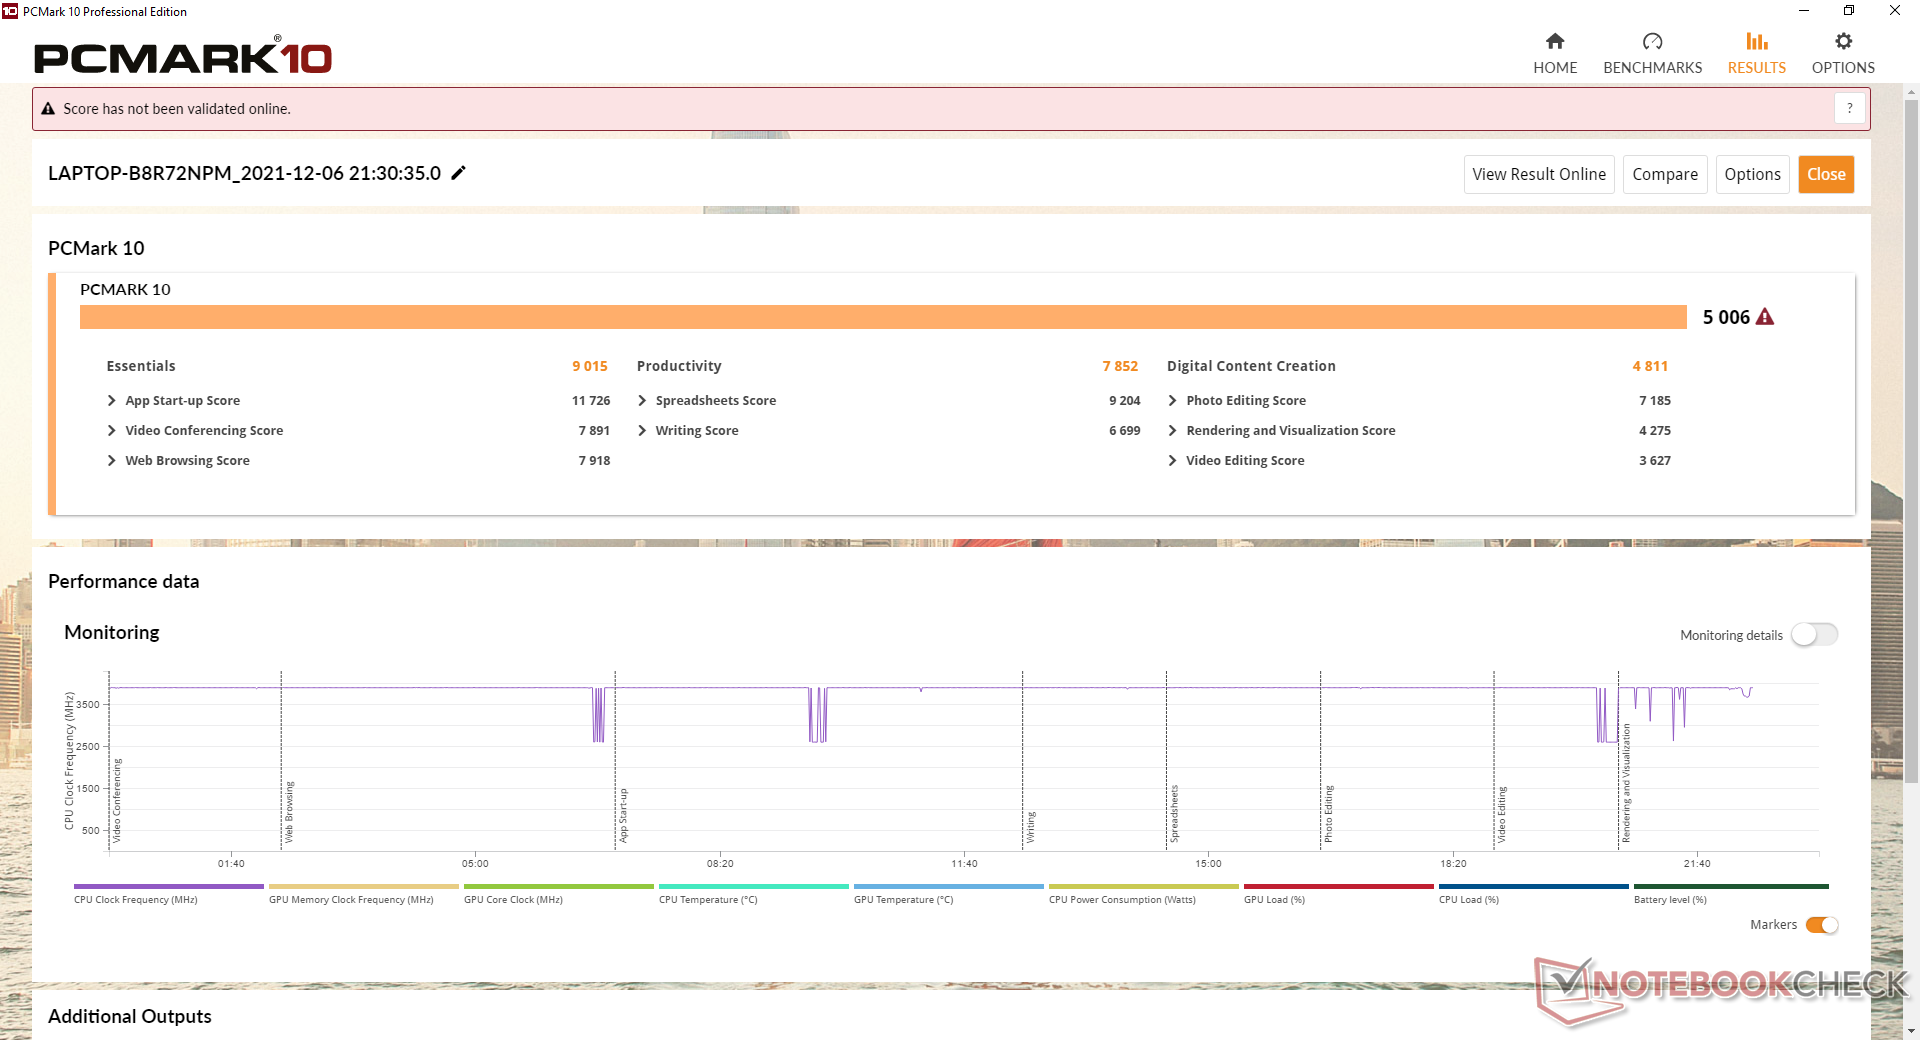
Les résultats de PCMark sont comparables à ceux des ordinateurs portables équipés du Core i7-1165G7 d'Intel, plus onéreux, comme le Dell Inspiron 15 3501. L'expérience de l'interface utilisateur est tout aussi fluide et douce, bien qu'elle ne fonctionne "que" sur un processeur Ryzen 3 économique.
| PCMark 10 / Score | |
| HP Pavilion 15-eg | |
| Asus VivoBook 15 KM513UA-L503TS | |
| Lenovo IdeaPad 3 15ALC6 | |
| Dell Inspiron 15 3501 | |
| Moyenne AMD Ryzen 3 5300U, AMD Radeon RX Vega 6 (Ryzen 4000/5000) (4299 - 5006, n=3) | |
| Lenovo Ideapad S540-15IML | |
| Lenovo IdeaPad 5 15IIL05 | |
| PCMark 10 / Essentials | |
| HP Pavilion 15-eg | |
| Dell Inspiron 15 3501 | |
| Lenovo Ideapad S540-15IML | |
| Asus VivoBook 15 KM513UA-L503TS | |
| Lenovo IdeaPad 3 15ALC6 | |
| Moyenne AMD Ryzen 3 5300U, AMD Radeon RX Vega 6 (Ryzen 4000/5000) (7833 - 9015, n=3) | |
| Lenovo IdeaPad 5 15IIL05 | |
| PCMark 10 / Productivity | |
| HP Pavilion 15-eg | |
| Lenovo IdeaPad 3 15ALC6 | |
| Asus VivoBook 15 KM513UA-L503TS | |
| Lenovo Ideapad S540-15IML | |
| Moyenne AMD Ryzen 3 5300U, AMD Radeon RX Vega 6 (Ryzen 4000/5000) (6596 - 7852, n=3) | |
| Lenovo IdeaPad 5 15IIL05 | |
| Dell Inspiron 15 3501 | |
| PCMark 10 / Digital Content Creation | |
| HP Pavilion 15-eg | |
| Asus VivoBook 15 KM513UA-L503TS | |
| Dell Inspiron 15 3501 | |
| Lenovo IdeaPad 3 15ALC6 | |
| Moyenne AMD Ryzen 3 5300U, AMD Radeon RX Vega 6 (Ryzen 4000/5000) (4136 - 4811, n=3) | |
| Lenovo IdeaPad 5 15IIL05 | |
| Lenovo Ideapad S540-15IML | |
| PCMark 10 Score | 5006 points | |
Aide | ||
| AIDA64 / Memory Copy | |
| HP Pavilion 15-eg | |
| Asus VivoBook 15 KM513UA-L503TS | |
| Lenovo IdeaPad 5 15IIL05 | |
| Moyenne AMD Ryzen 3 5300U (30710 - 36092, n=3) | |
| Lenovo IdeaPad 3 15ALC6 | |
| Dell Inspiron 15 3501 | |
| AIDA64 / Memory Read | |
| HP Pavilion 15-eg | |
| Asus VivoBook 15 KM513UA-L503TS | |
| Lenovo IdeaPad 5 15IIL05 | |
| Dell Inspiron 15 3501 | |
| Lenovo IdeaPad 3 15ALC6 | |
| Moyenne AMD Ryzen 3 5300U (34493 - 35443, n=3) | |
| AIDA64 / Memory Write | |
| HP Pavilion 15-eg | |
| Lenovo IdeaPad 5 15IIL05 | |
| Moyenne AMD Ryzen 3 5300U (38052 - 40554, n=3) | |
| Asus VivoBook 15 KM513UA-L503TS | |
| Lenovo IdeaPad 3 15ALC6 | |
| Dell Inspiron 15 3501 | |
| AIDA64 / Memory Latency | |
| Moyenne AMD Ryzen 3 5300U (97.1 - 113.5, n=3) | |
| Lenovo IdeaPad 3 15ALC6 | |
| Asus VivoBook 15 KM513UA-L503TS | |
| Dell Inspiron 15 3501 | |
| Lenovo IdeaPad 5 15IIL05 | |
| HP Pavilion 15-eg | |
* ... Moindre est la valeur, meilleures sont les performances
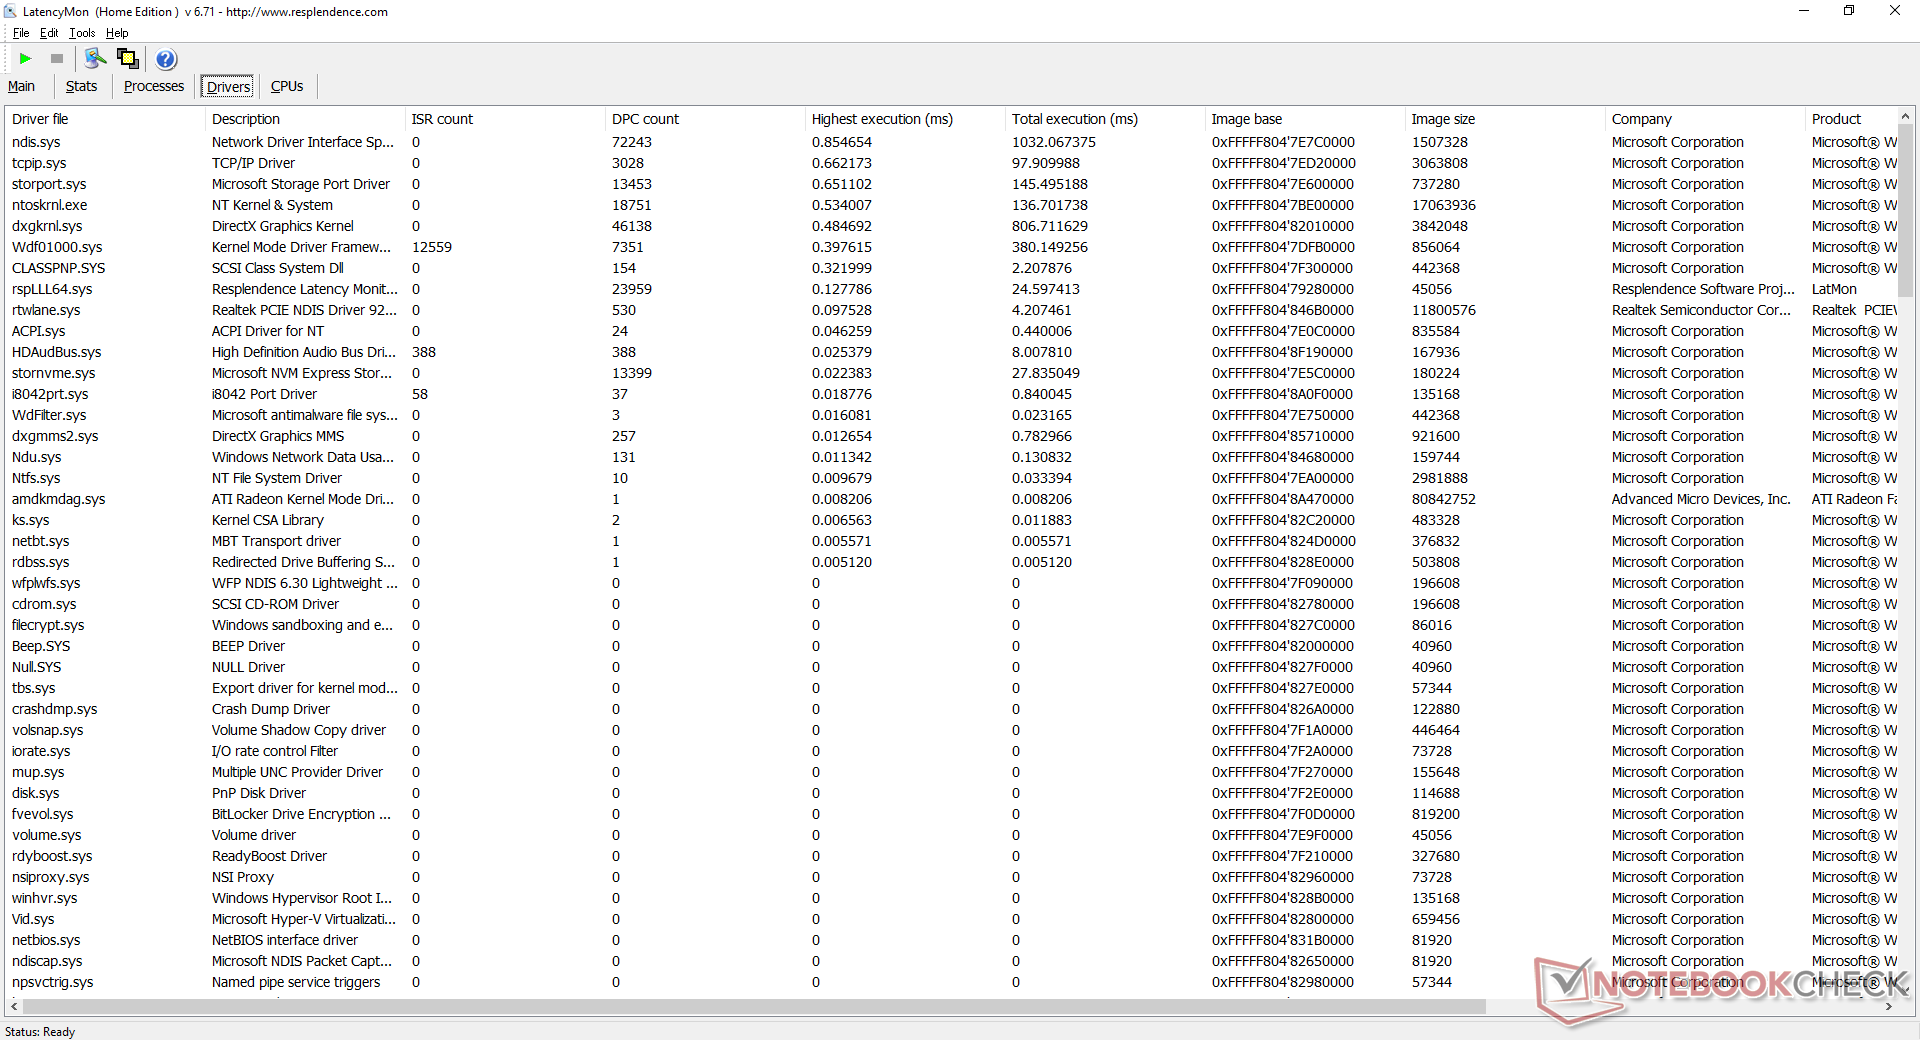
Latence DPC
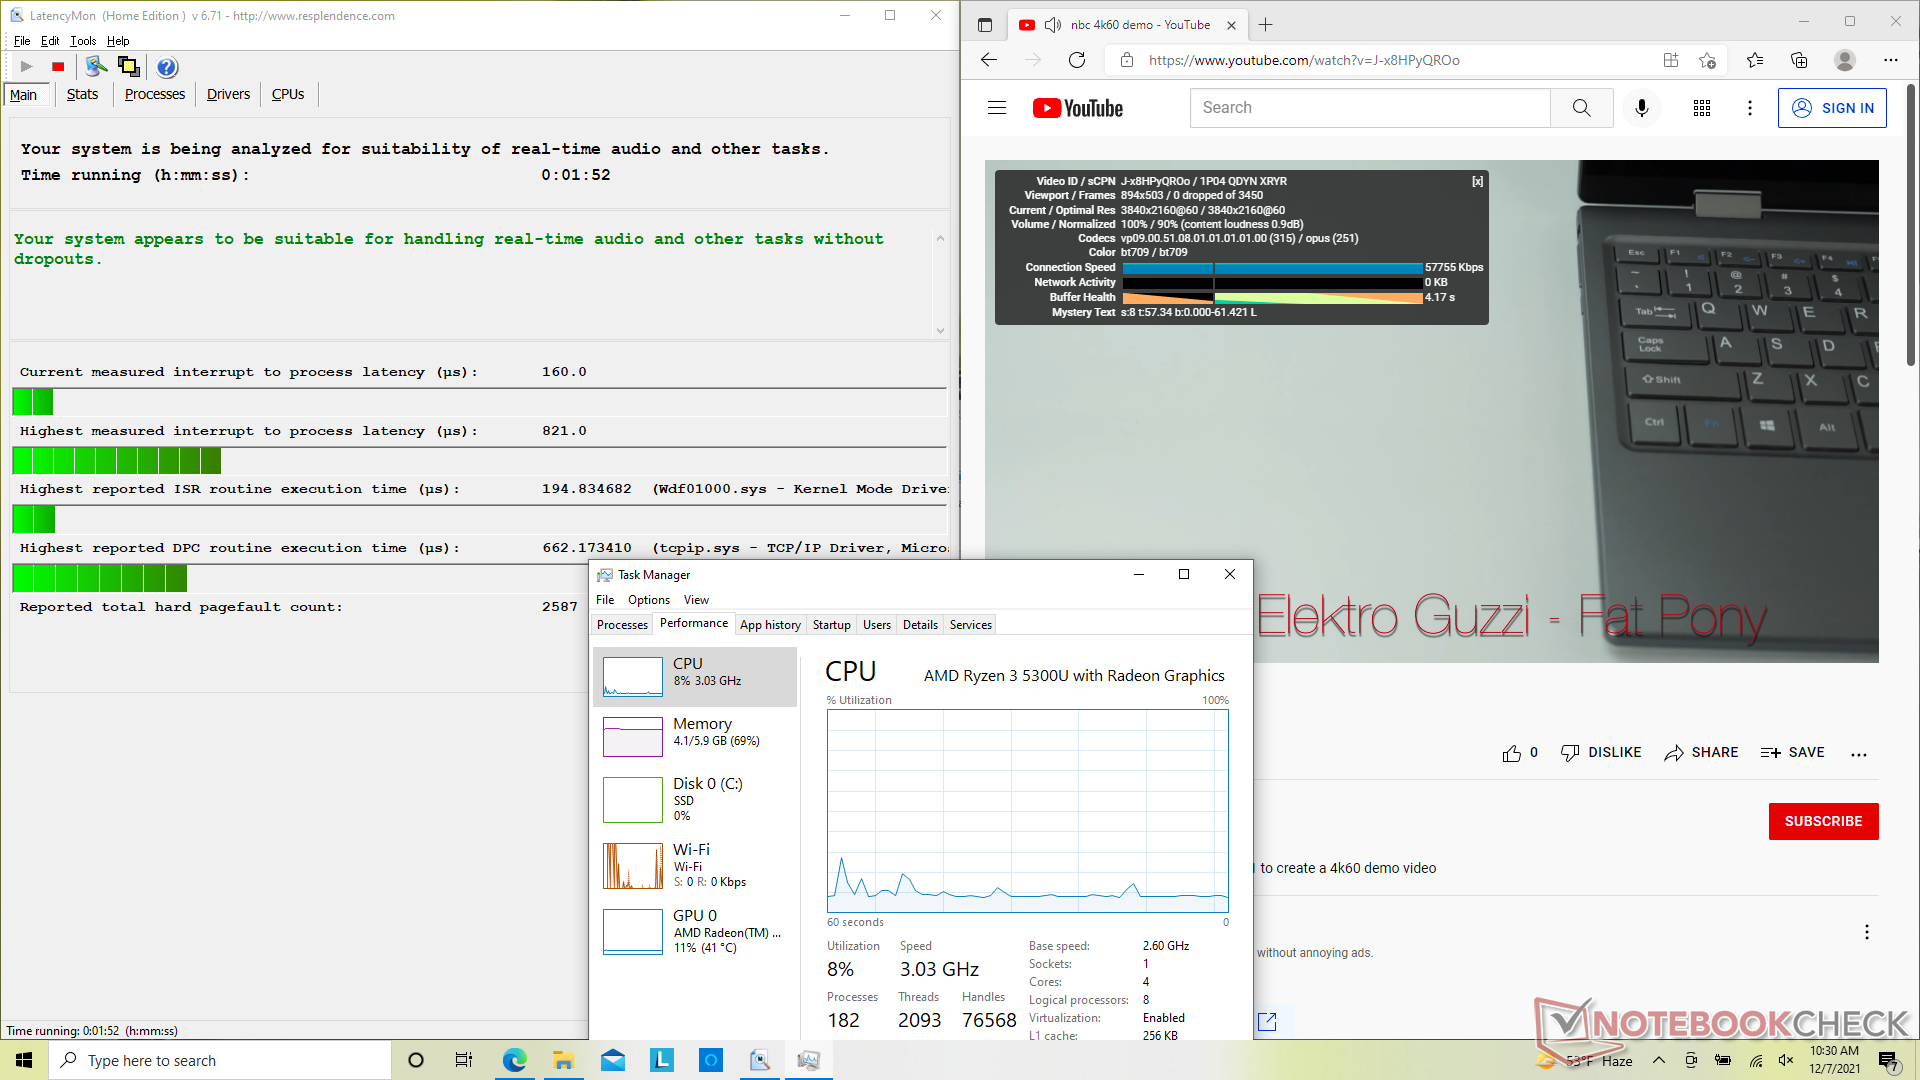
LatencyMon ne montre aucun problème de latence lors de l'ouverture de plusieurs onglets de navigateur sur notre page d'accueil. La lecture de vidéos 4K à 60 FPS est parfaite avec une utilisation minimale du CPU et du GPU et aucune perte d'images.
| DPC Latencies / LatencyMon - interrupt to process latency (max), Web, Youtube, Prime95 | |
| HP Pavilion 15-eg | |
| Asus VivoBook 15 KM513UA-L503TS | |
| Dell Inspiron 15 3501 | |
| Lenovo IdeaPad 3 15ALC6 | |
| Lenovo IdeaPad 5 15IIL05 | |
* ... Moindre est la valeur, meilleures sont les performances
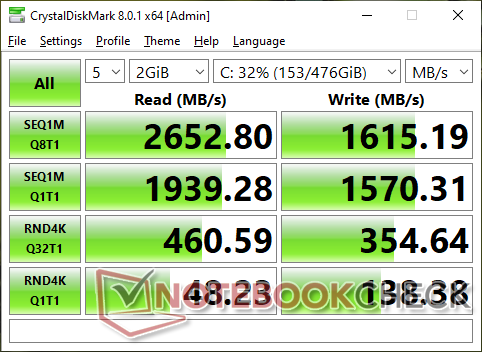
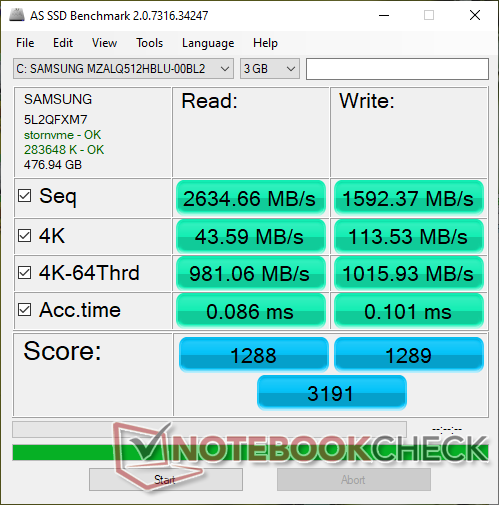
Périphériques de stockage - Un seul emplacement M.2 2280 PCIe3 x4
Le 512 GB Samsung PM991a est un SSD NVMe PCIe3 x4 de milieu de gamme avec des taux de lecture et d'écriture séquentiels théoriques de 3100 Mo/s et 1800 Mo/s, respectivement, selon les spécifications officielles de Samsung. Cependant, le disque de notre Lenovo est un peu plus lent, avec des taux de lecture et d'écriture dans le monde réel approchant seulement 2700 Mo/s et 1600 Mo/s, respectivement. Les performances semblent ralentir si elles sont sollicitées pendant de longues périodes, comme le montre notre test DiskSpd Read Loop ci-dessous, probablement pour des raisons thermiques.

| Drive Performance rating - Percent | |
| Lenovo Ideapad S540-15IML -8! | |
| Dell Inspiron 15 3501 | |
| Lenovo IdeaPad 3 15ALC6 | |
| HP Pavilion 15-eg | |
| Lenovo IdeaPad 5 15IIL05 | |
| Asus VivoBook 15 KM513UA-L503TS | |
* ... Moindre est la valeur, meilleures sont les performances
Disk Throttling: DiskSpd Read Loop, Queue Depth 8
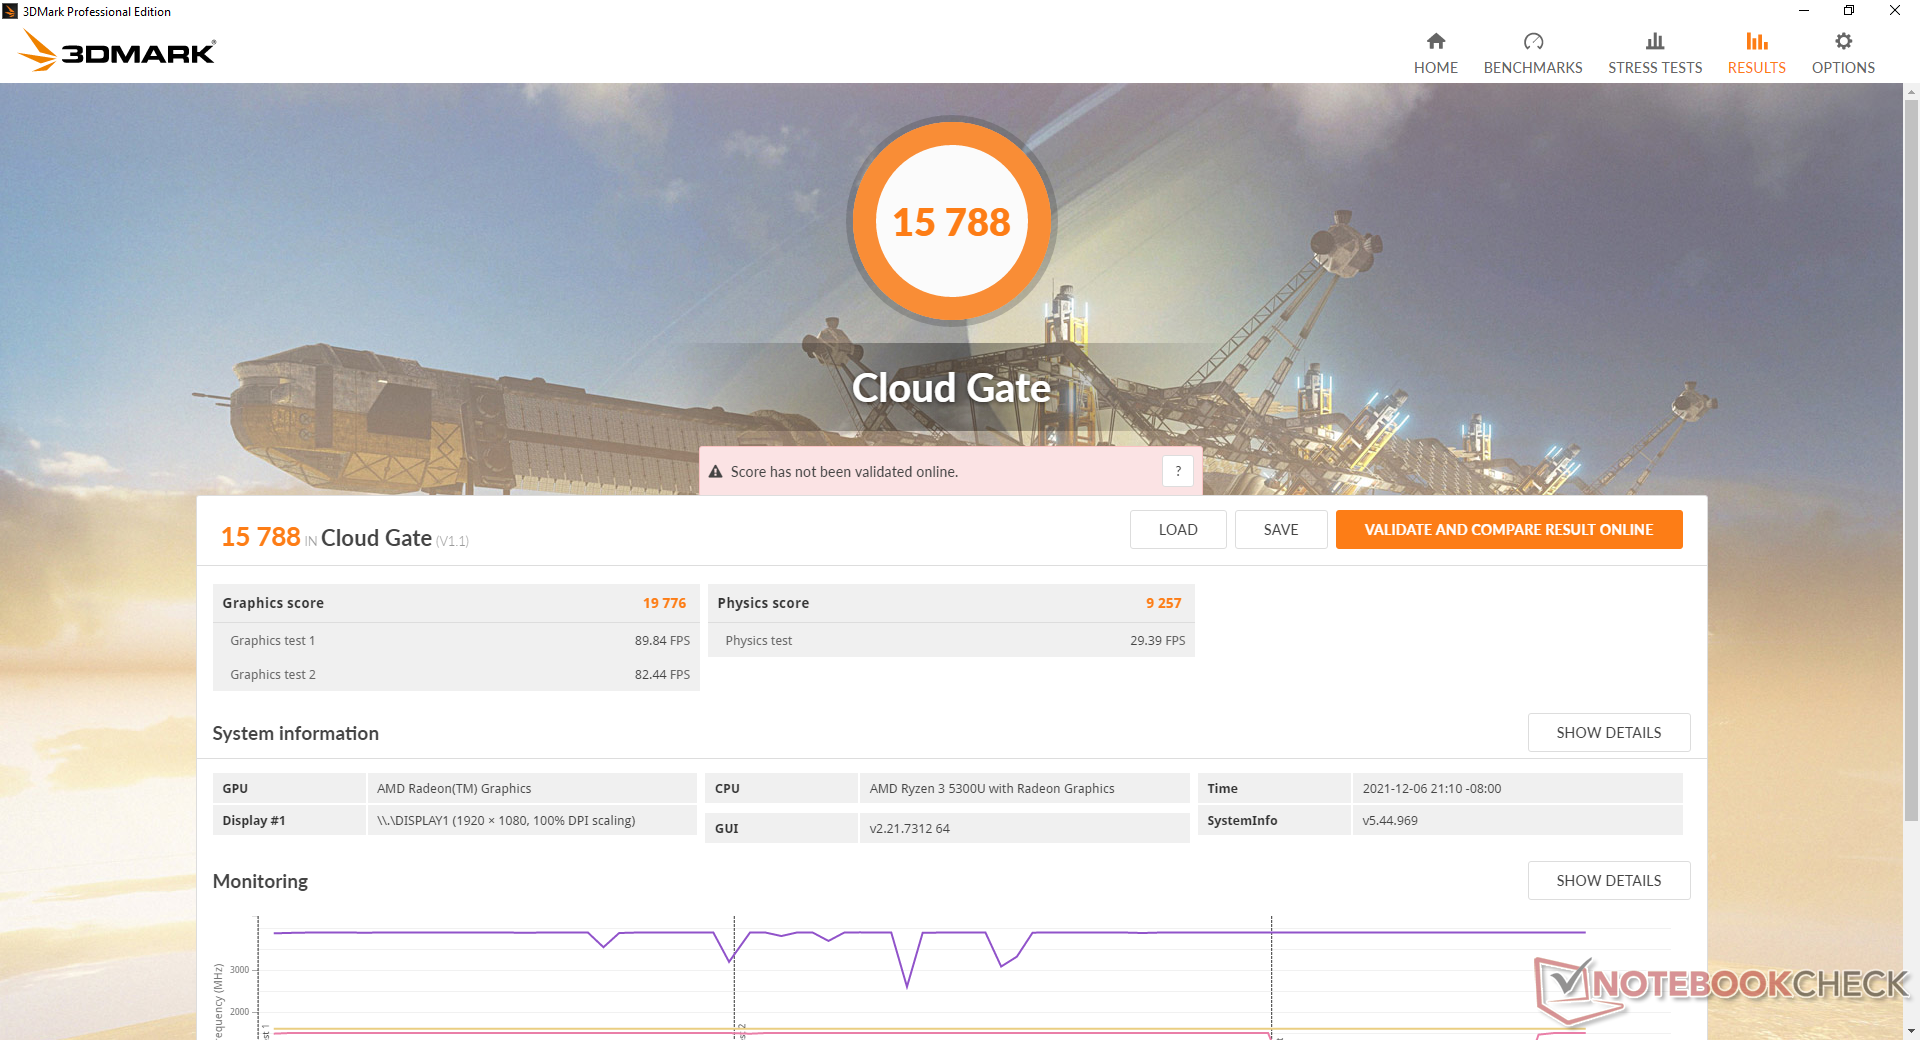
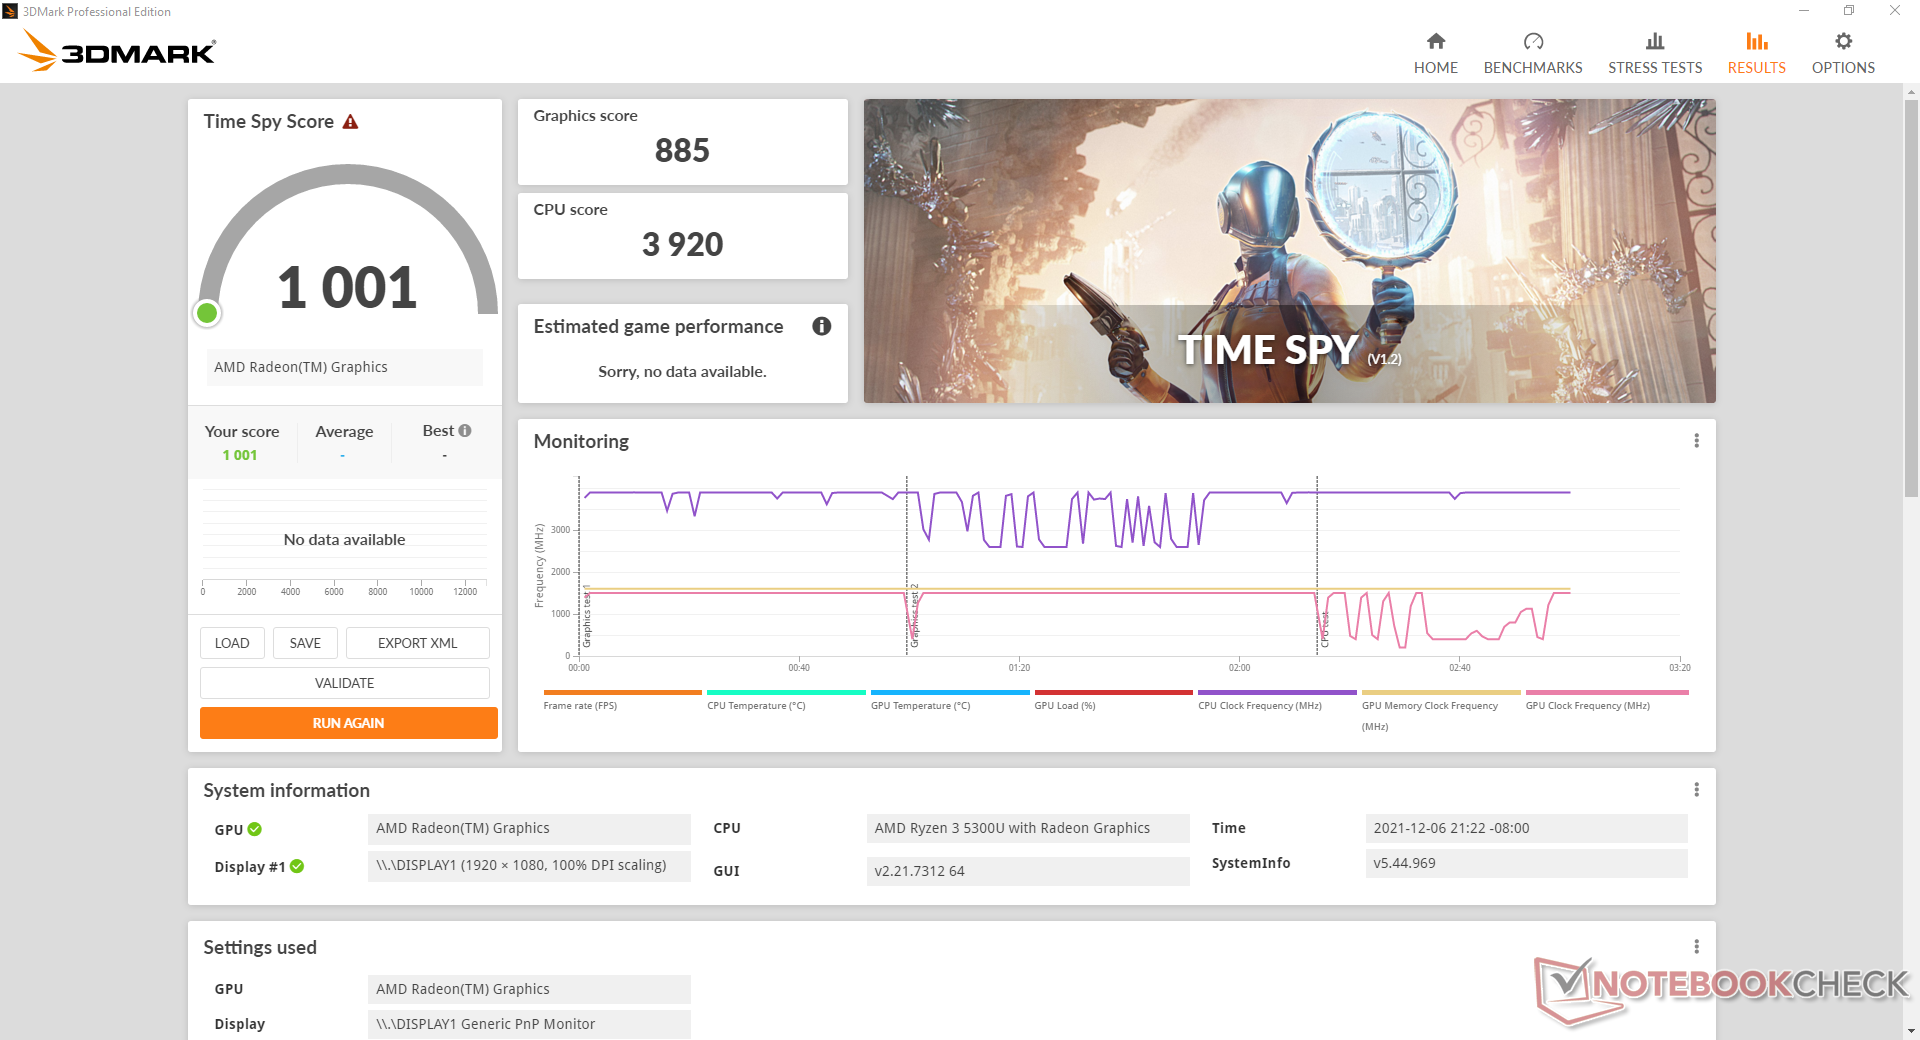
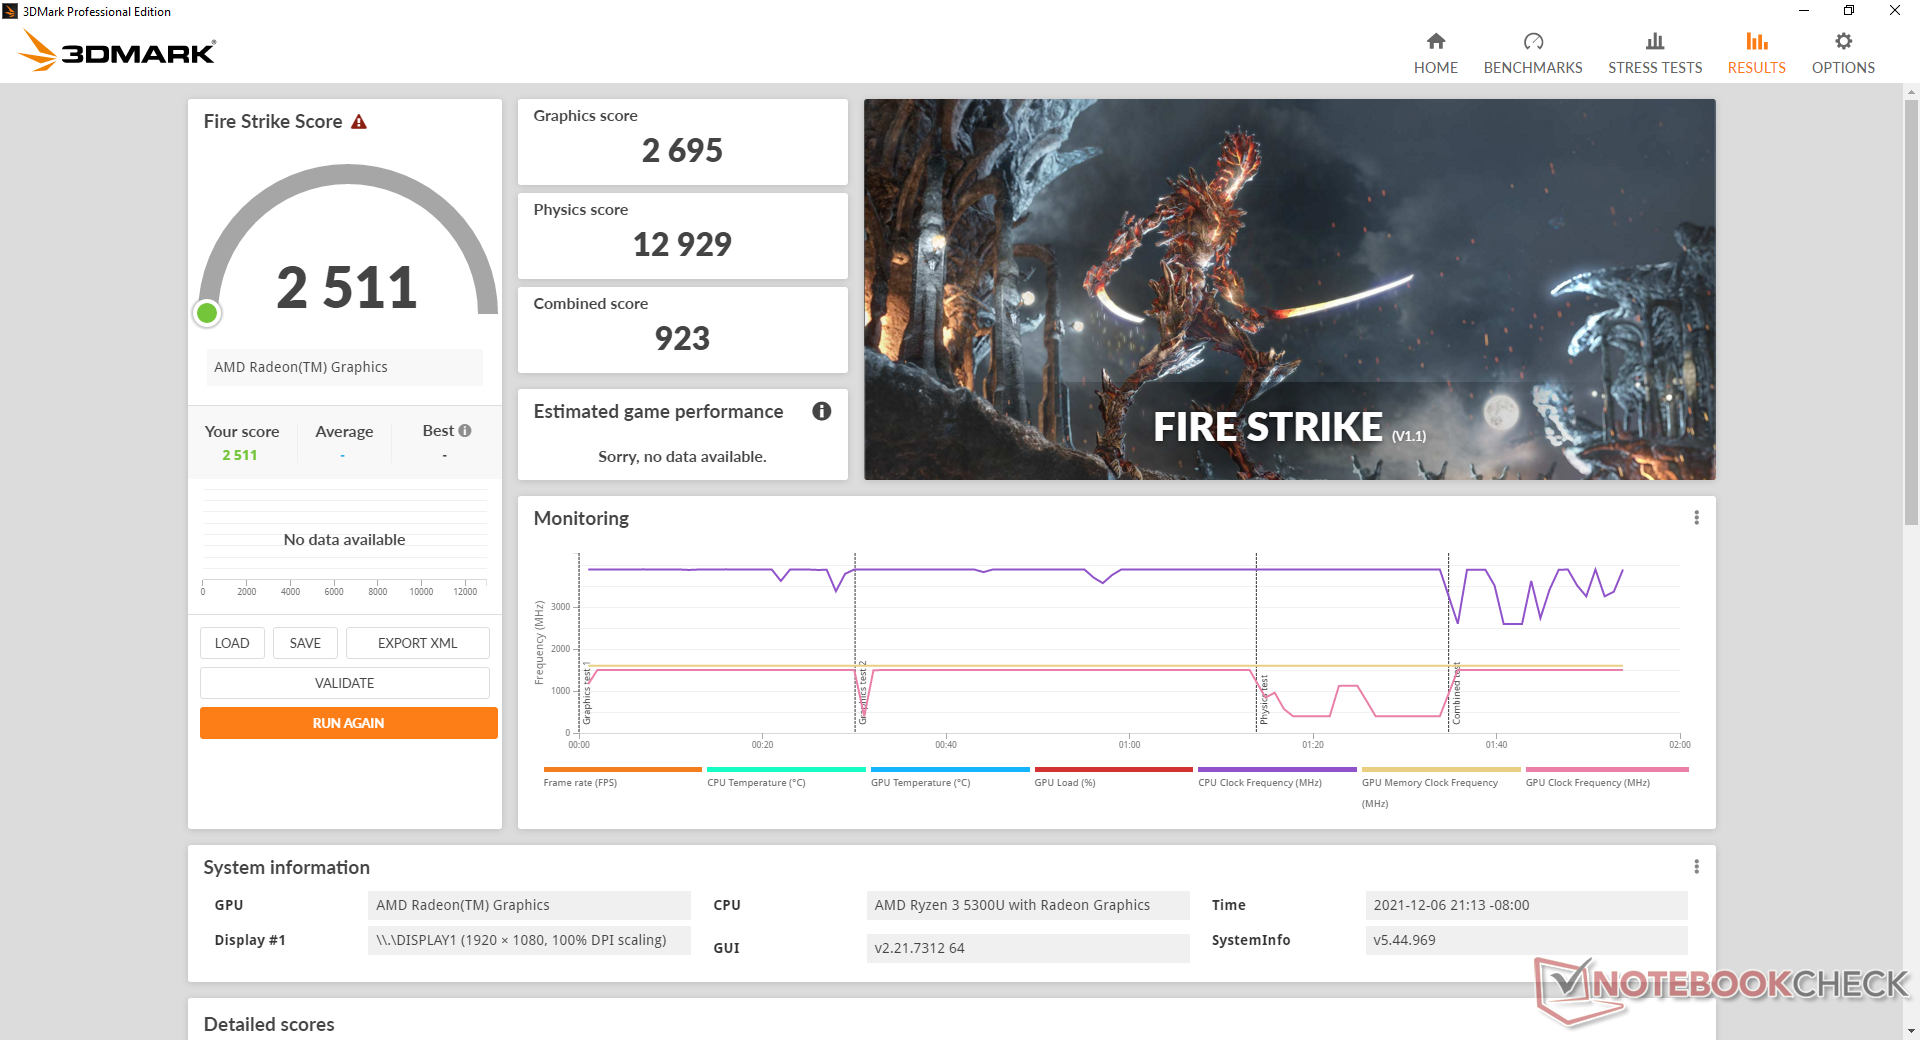
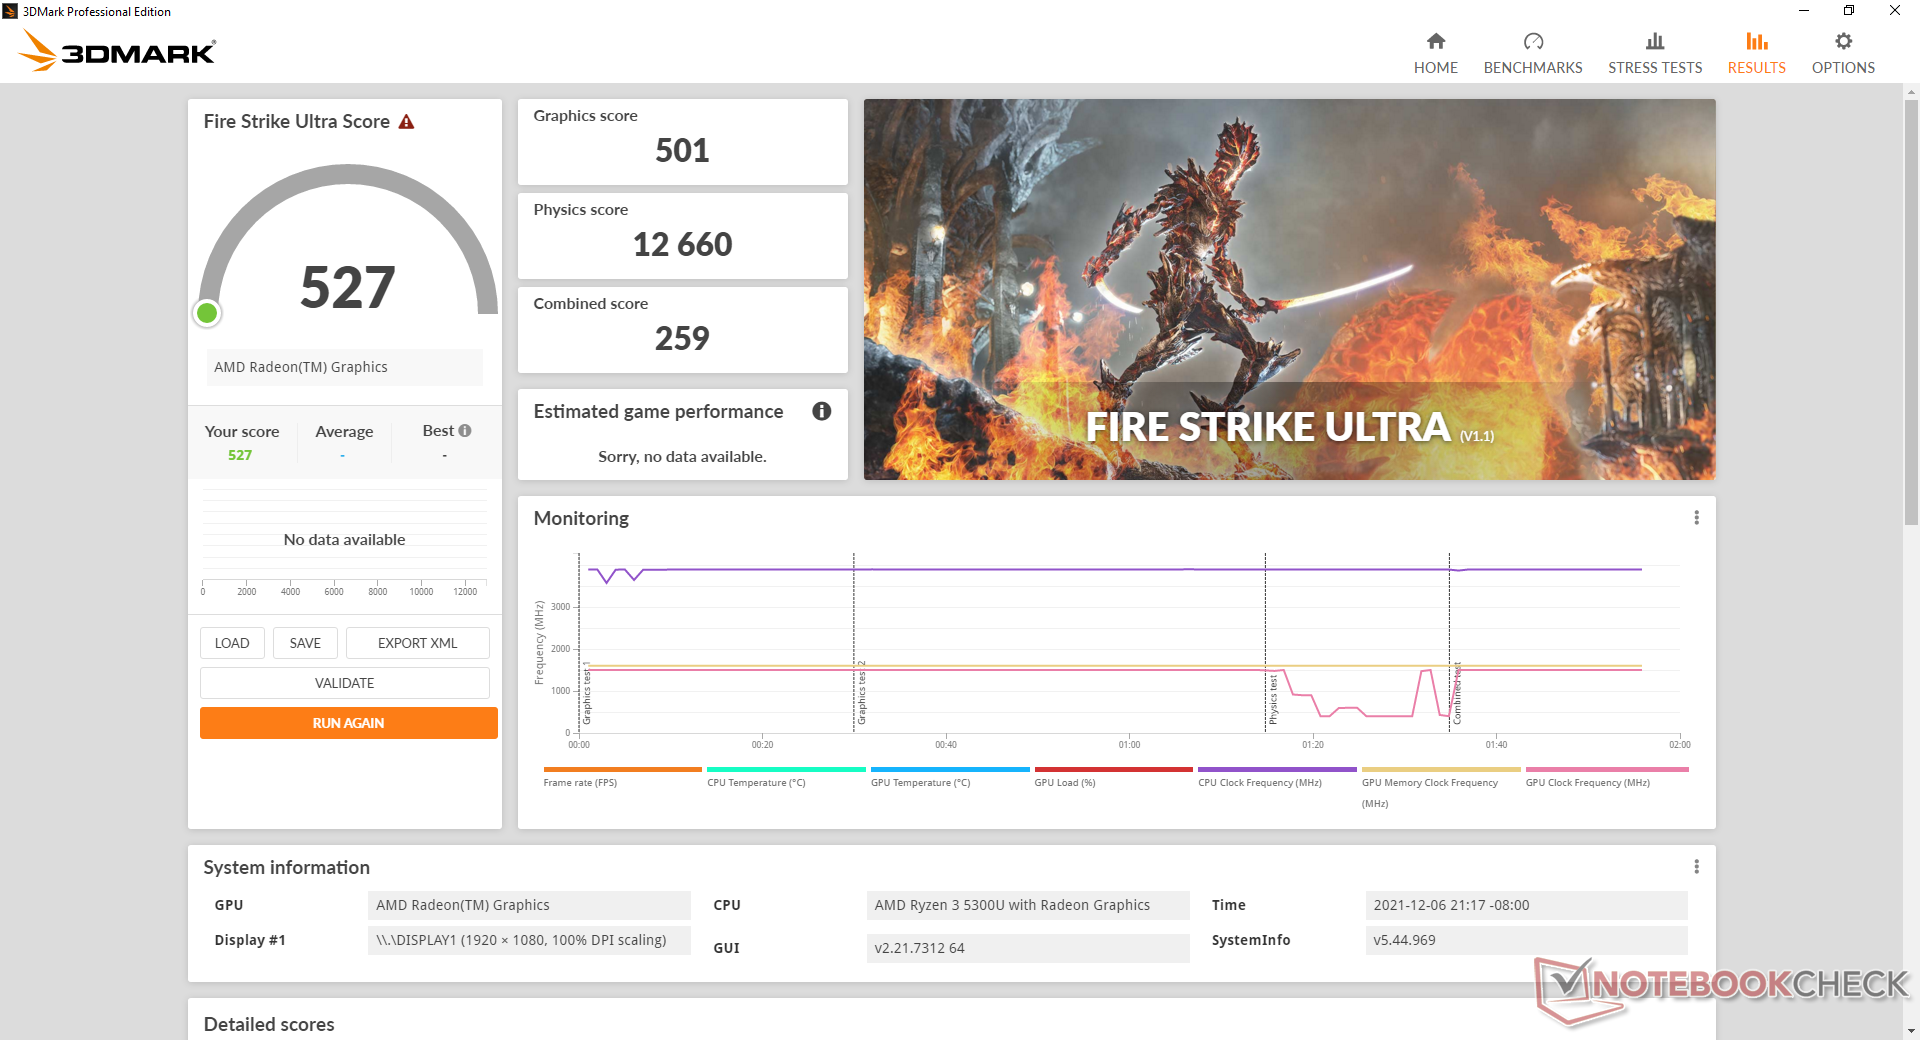
Performances du GPU - Bien meilleures que UHD Graphics 620
Les performances graphiques brutes sont 30 à 50 % plus rapides que celles de l'Iris Xe G4 48 EU Iris Xe G4 48 EU que l'on trouve sur de nombreux processeurs Intel Core i3 de 11e génération, ou environ 2 fois plus rapide que l'Iris Xe G4 48 EU courante UHD Graphics 620. Bien que l'augmentation de la vitesse soit notable, elle n'est toujours pas suffisante pour faire tourner la plupart des jeux à des résolutions supérieures à 720p. La mise à niveau vers le SKU Ryzen 7 5700U avec son plus puissantRadeon RX Vega 8 plus puissant, les performances augmenteront d'environ 30 % par rapport à notreRadeon RX Vega 6.
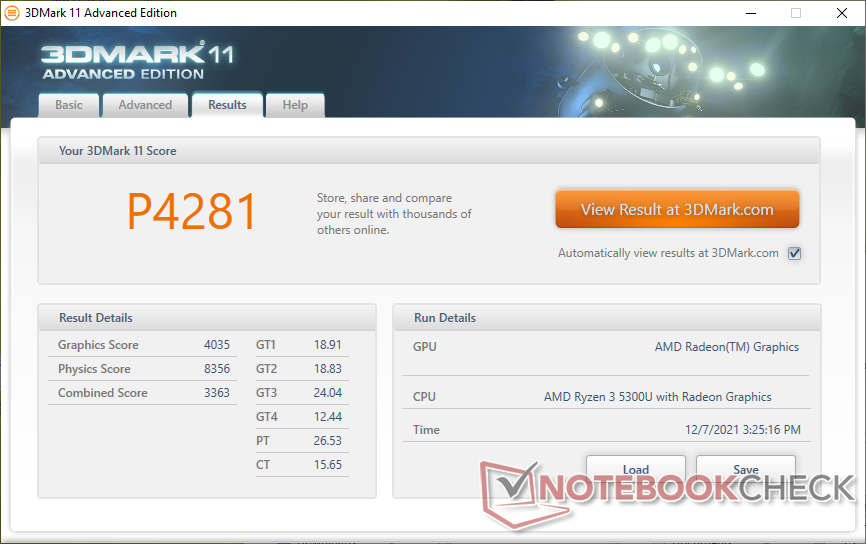
| 3DMark 11 Performance | 4281 points | |
| 3DMark Cloud Gate Standard Score | 15788 points | |
| 3DMark Fire Strike Score | 2511 points | |
| 3DMark Time Spy Score | 1001 points | |
Aide | ||
| Final Fantasy XV Benchmark | |
| 1280x720 Lite Quality | |
| HP Pavilion 15-eg | |
| Asus VivoBook S15 D533UA | |
| Dell Inspiron 15 3501 | |
| Asus VivoBook 15 KM513UA-L503TS | |
| HP Pavilion x360 15-er0155ng | |
| Lenovo IdeaPad 3 15ALC6 | |
| Moyenne AMD Radeon RX Vega 6 (Ryzen 4000/5000) (15.6 - 32.2, n=9) | |
| Lenovo ThinkPad L15 G2-20X4S0KU00 | |
| Teclast TBOLT F15 Pro | |
| Beelink U59 | |
| 1920x1080 Standard Quality | |
| HP Pavilion 15-eg | |
| Dell Inspiron 15 3501 | |
| HP Pavilion x360 15-er0155ng | |
| Asus VivoBook S15 D533UA | |
| Asus VivoBook 15 KM513UA-L503TS | |
| Lenovo IdeaPad 3 15ALC6 | |
| Moyenne AMD Radeon RX Vega 6 (Ryzen 4000/5000) (10.6 - 16.1, n=8) | |
| Teclast TBOLT F15 Pro | |
| 1920x1080 High Quality | |
| HP Pavilion 15-eg | |
| HP Pavilion x360 15-er0155ng | |
| Dell Inspiron 15 3501 | |
| Asus VivoBook S15 D533UA | |
| Asus VivoBook 15 KM513UA-L503TS | |
| Lenovo IdeaPad 3 15ALC6 | |
| Moyenne AMD Radeon RX Vega 6 (Ryzen 4000/5000) (4.82 - 11.5, n=6) | |
| Teclast TBOLT F15 Pro | |
Witcher 3 FPS Chart
| Bas | Moyen | Élevé | Ultra | |
|---|---|---|---|---|
| GTA V (2015) | 81.7 | 72.5 | 20.6 | 9.41 |
| The Witcher 3 (2015) | 52.2 | 33 | 17 | 10.2 |
| Dota 2 Reborn (2015) | 95.5 | 74 | 42.4 | 40 |
| Final Fantasy XV Benchmark (2018) | 28.6 | 14.2 | 9.99 | |
| X-Plane 11.11 (2018) | 36.7 | 28 | 25.5 | |
| Far Cry 5 (2018) | 39 | 18 | 16 | 15 |
| Strange Brigade (2018) | 67.3 | 26.3 | 21.7 | 18.5 |
Émissions
Bruit du système - silencieux dans la plupart des conditions
Le système est plus silencieux que prévu. L'exécution de la première scène de benchmark dans 3DMark 06, par exemple, fait plafonner le ventilateur à 32 dB(A) seulement, contre 40 dB(A) sur l'IdeaPad 5 ou l'IdeaPad 6 alimenté par GeForceHP Pavilion 15. En revanche, si l'on sollicite davantage le processeur pendant de longues périodes, le bruit du ventilateur augmente régulièrement pour atteindre 44 dB(A), ce qui correspond davantage à ce que nous avons observé sur d'autres ordinateurs portables multimédias bon marché. En bref, il faut plus de temps à notre IdeaPad 3 pour atteindre les mêmes niveaux de bruit maximum du ventilateur que beaucoup de ses pairs.
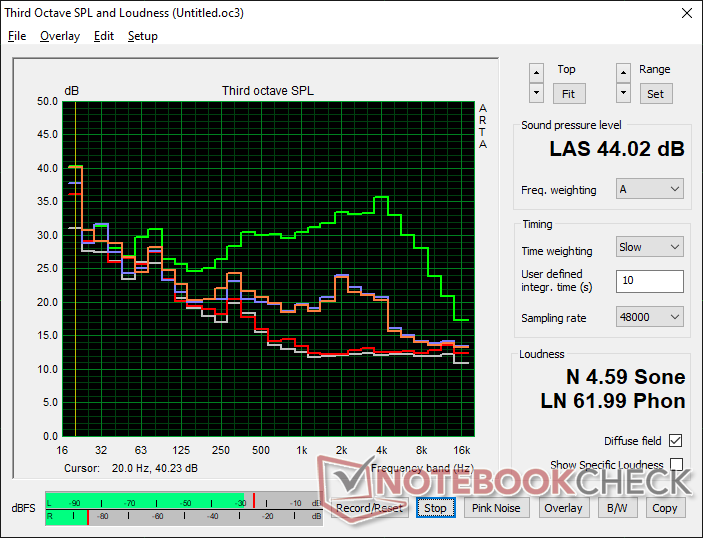
Degré de la nuisance sonore
| Au repos |
| 25.8 / 25.8 / 25.8 dB(A) |
| Fortement sollicité |
| 32.3 / 44 dB(A) |
 | ||
30 dB silencieux 40 dB(A) audible 50 dB(A) bruyant |
||
min: | ||
| Lenovo IdeaPad 3 15ALC6 Vega 6, R3 5300U, Samsung PM991a MZALQ512HBLU | Lenovo IdeaPad 5 15IIL05 GeForce MX350, i5-1035G1, SK hynix BC511 HFM512GDHTNI-87A0B | Lenovo Ideapad S540-15IML GeForce MX250, i5-10210U, Samsung SSD PM981a MZVLB512HBJQ | Dell Inspiron 15 3501 Iris Xe G7 96EUs, i7-1165G7, Samsung PM991a MZ9LQ512HBLU-00BD1 | HP Pavilion 15-eg GeForce MX450, i7-1165G7, Samsung PM991 MZVLQ1T0HALB | Asus VivoBook 15 KM513UA-L503TS Vega 7, R5 5500U, WDC PC SN530 SDBPMPZ-265G | |
|---|---|---|---|---|---|---|
| Noise | -21% | -21% | 0% | -5% | -12% | |
| arrêt / environnement * (dB) | 25.2 | 30.7 -22% | 30 -19% | 26 -3% | 25.4 -1% | 28.28 -12% |
| Idle Minimum * (dB) | 25.8 | 30.7 -19% | 30 -16% | 26 -1% | 25.6 1% | 28.28 -10% |
| Idle Average * (dB) | 25.8 | 30.7 -19% | 32 -24% | 26 -1% | 25.6 1% | 28.28 -10% |
| Idle Maximum * (dB) | 25.8 | 30.7 -19% | 37 -43% | 26 -1% | 25.6 1% | 28.28 -10% |
| Load Average * (dB) | 32.3 | 43.4 -34% | 41 -27% | 35.9 -11% | 39.2 -21% | 35.76 -11% |
| Witcher 3 ultra * (dB) | 32 | 43.2 -35% | 39 -22% | 39.1 -22% | 42.79 -34% | |
| Load Maximum * (dB) | 44 | 43.7 1% | 42 5% | 35.8 19% | 41.5 6% | 42.67 3% |
* ... Moindre est la valeur, meilleures sont les performances
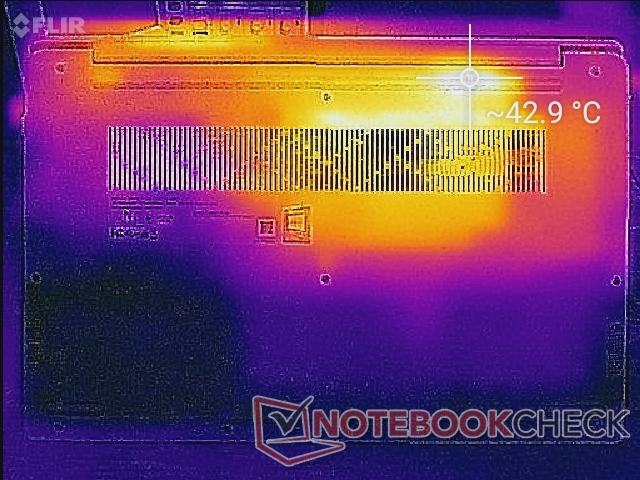
Température
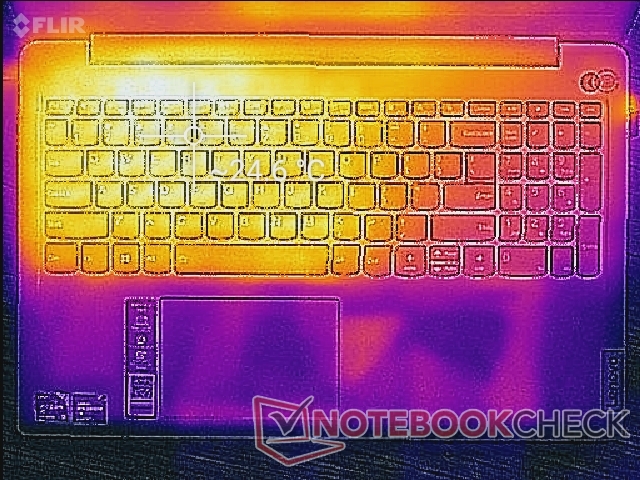
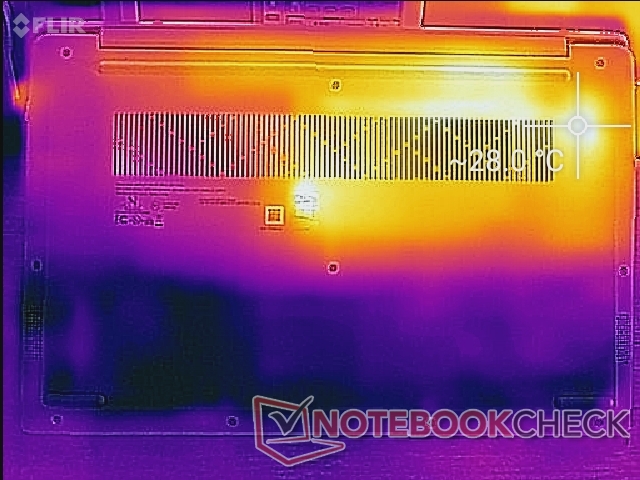
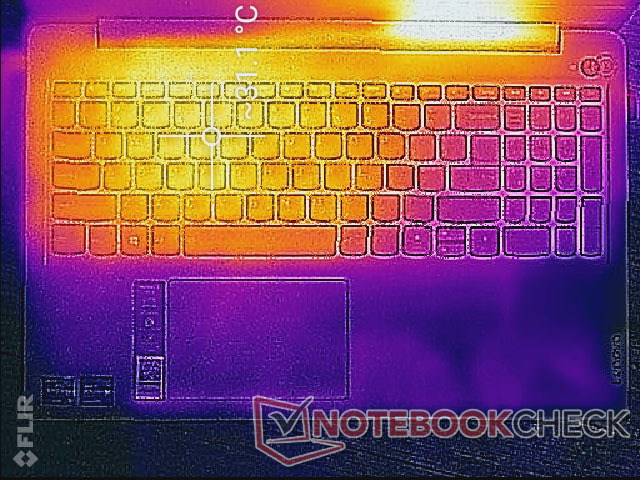
Les températures de surface ne sont jamais trop élevées, quelle que soit la charge, en particulier sur le clavier. Les points chauds lors des jeux dépassent à peine les 30°C comme le montrent nos cartes de température ci-dessous, contre 40°C pour l'Asus VivoBook 15 KM513UA.Asus VivoBook 15 KM513UA. La partie inférieure de notre Lenovo peut atteindre 43 C, mais il s'agit heureusement d'un petit point vers l'arrière du système que les utilisateurs ne toucheront probablement pas.
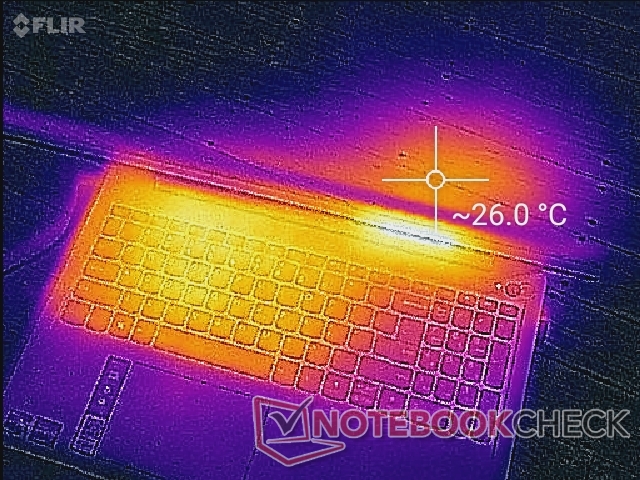
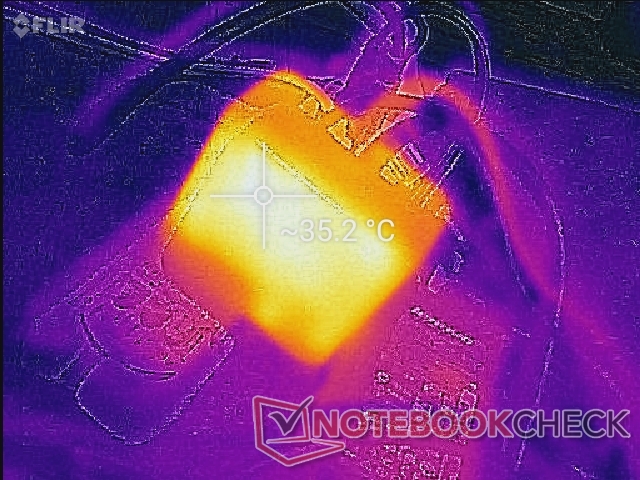
(+) La température maximale du côté supérieur est de 31.2 °C / 88 F, par rapport à la moyenne de 36.8 °C / 98 F, allant de 21 à 71 °C pour la classe Multimedia.
(±) Le fond chauffe jusqu'à un maximum de 43 °C / 109 F, contre une moyenne de 39.1 °C / 102 F
(+) En utilisation inactive, la température moyenne du côté supérieur est de 22.8 °C / 73 F, par rapport à la moyenne du dispositif de 31.3 °C / 88 F.
(+) Les repose-poignets et le pavé tactile sont plus froids que la température de la peau avec un maximum de 21 °C / 69.8 F et sont donc froids au toucher.
(+) La température moyenne de la zone de l'appui-paume de dispositifs similaires était de 28.7 °C / 83.7 F (+7.7 °C / #13.9 F).
| Lenovo IdeaPad 3 15ALC6 AMD Ryzen 3 5300U, AMD Radeon RX Vega 6 (Ryzen 4000/5000) | Lenovo IdeaPad 5 15IIL05 Intel Core i5-1035G1, NVIDIA GeForce MX350 | Lenovo Ideapad S540-15IML Intel Core i5-10210U, NVIDIA GeForce MX250 | Dell Inspiron 15 3501 Intel Core i7-1165G7, Intel Iris Xe Graphics G7 96EUs | HP Pavilion 15-eg Intel Core i7-1165G7, NVIDIA GeForce MX450 | Asus VivoBook 15 KM513UA-L503TS AMD Ryzen 5 5500U, AMD Radeon RX Vega 7 | |
|---|---|---|---|---|---|---|
| Heat | -21% | -8% | -15% | -19% | -22% | |
| Maximum Upper Side * (°C) | 31.2 | 43.1 -38% | 42 -35% | 45.6 -46% | 44 -41% | 43.8 -40% |
| Maximum Bottom * (°C) | 43 | 50.9 -18% | 45 -5% | 41 5% | 53.4 -24% | 42.2 2% |
| Idle Upper Side * (°C) | 24.8 | 29 -17% | 25 -1% | 28.2 -14% | 27.4 -10% | 33.4 -35% |
| Idle Bottom * (°C) | 28.2 | 31 -10% | 26 8% | 29.1 -3% | 28.8 -2% | 32.6 -16% |
* ... Moindre est la valeur, meilleures sont les performances
Test de stress
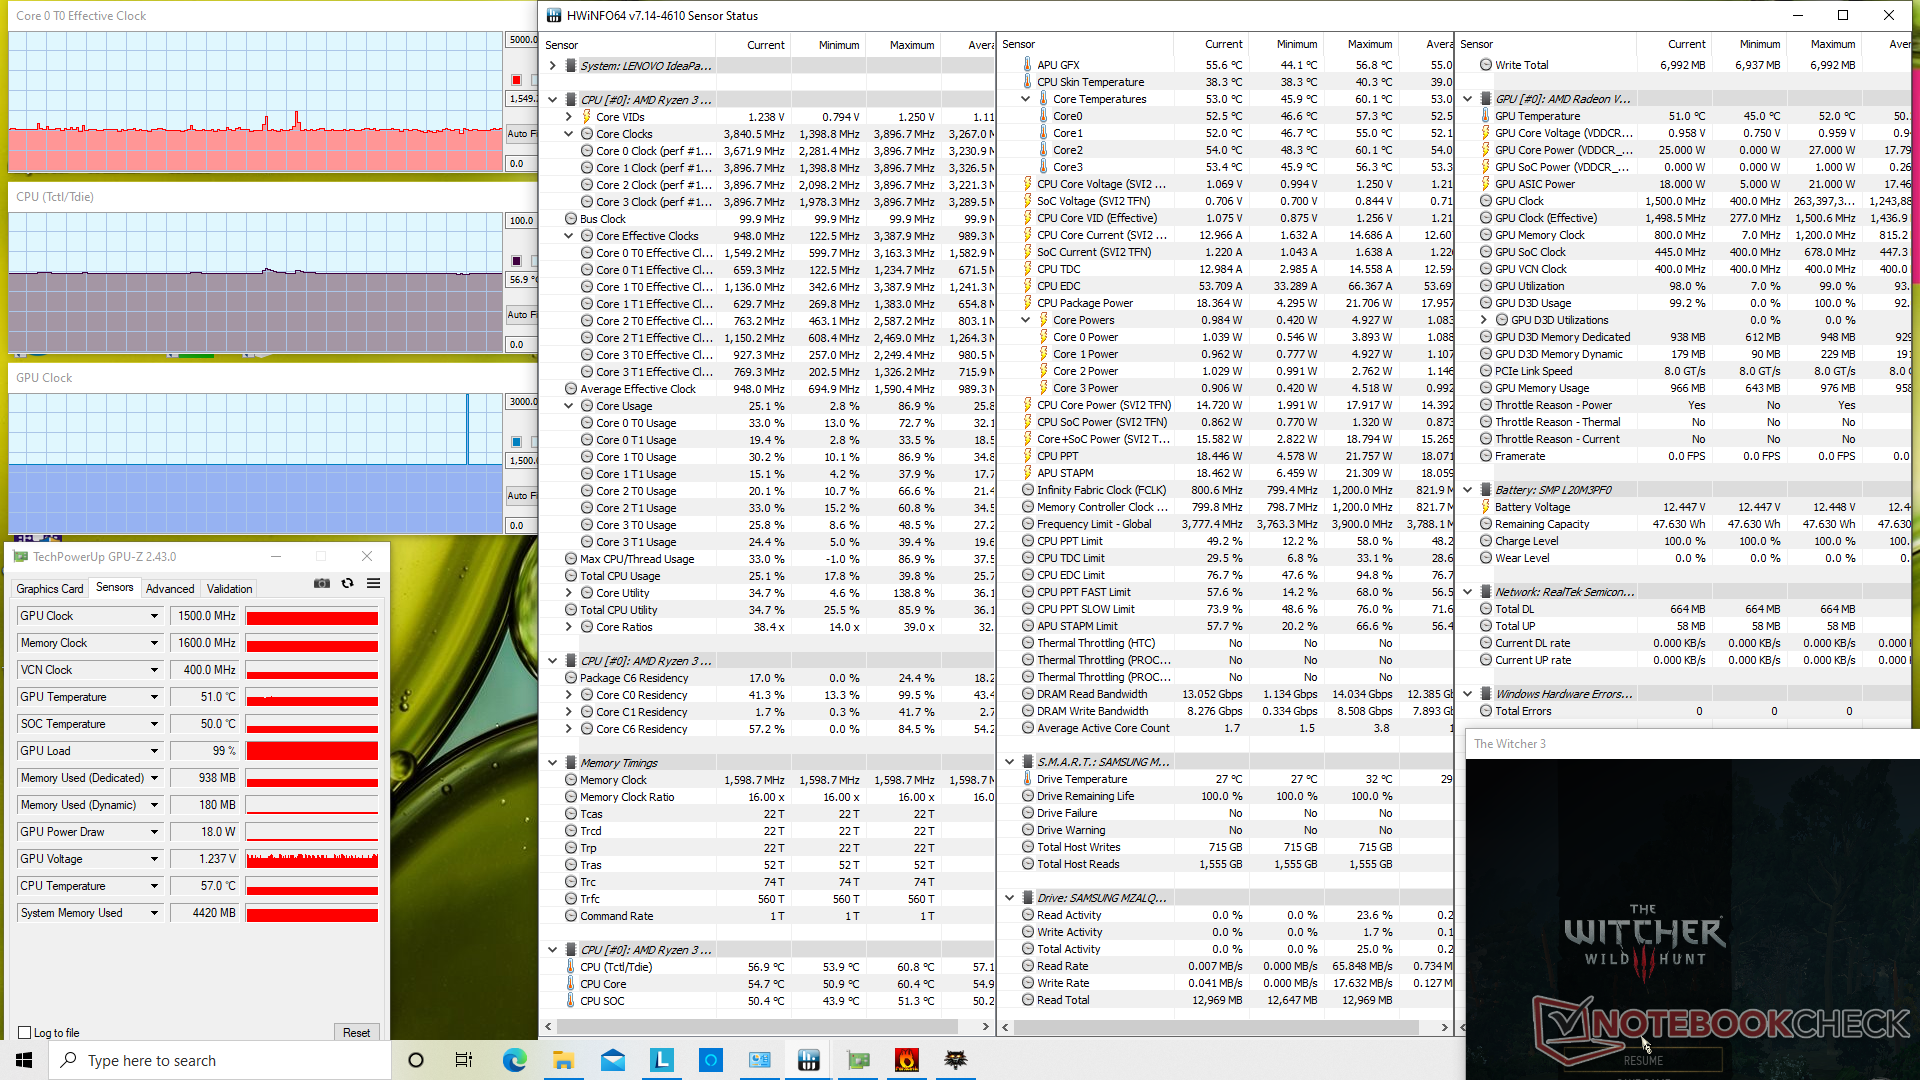
Lors de l'exécution de Prime95 pour solliciter le processeur, les fréquences d'horloge ont augmenté à 3,9 GHz et à une puissance maximale de 29 W avant d'atteindre une température centrale de 80 C environ 30 secondes plus tard. Ensuite, les fréquences d'horloge et la puissance du boîtier diminuent légèrement à 3,7 GHz et 24 W, respectivement, afin de maintenir une température centrale plus fraîche de 72 C.
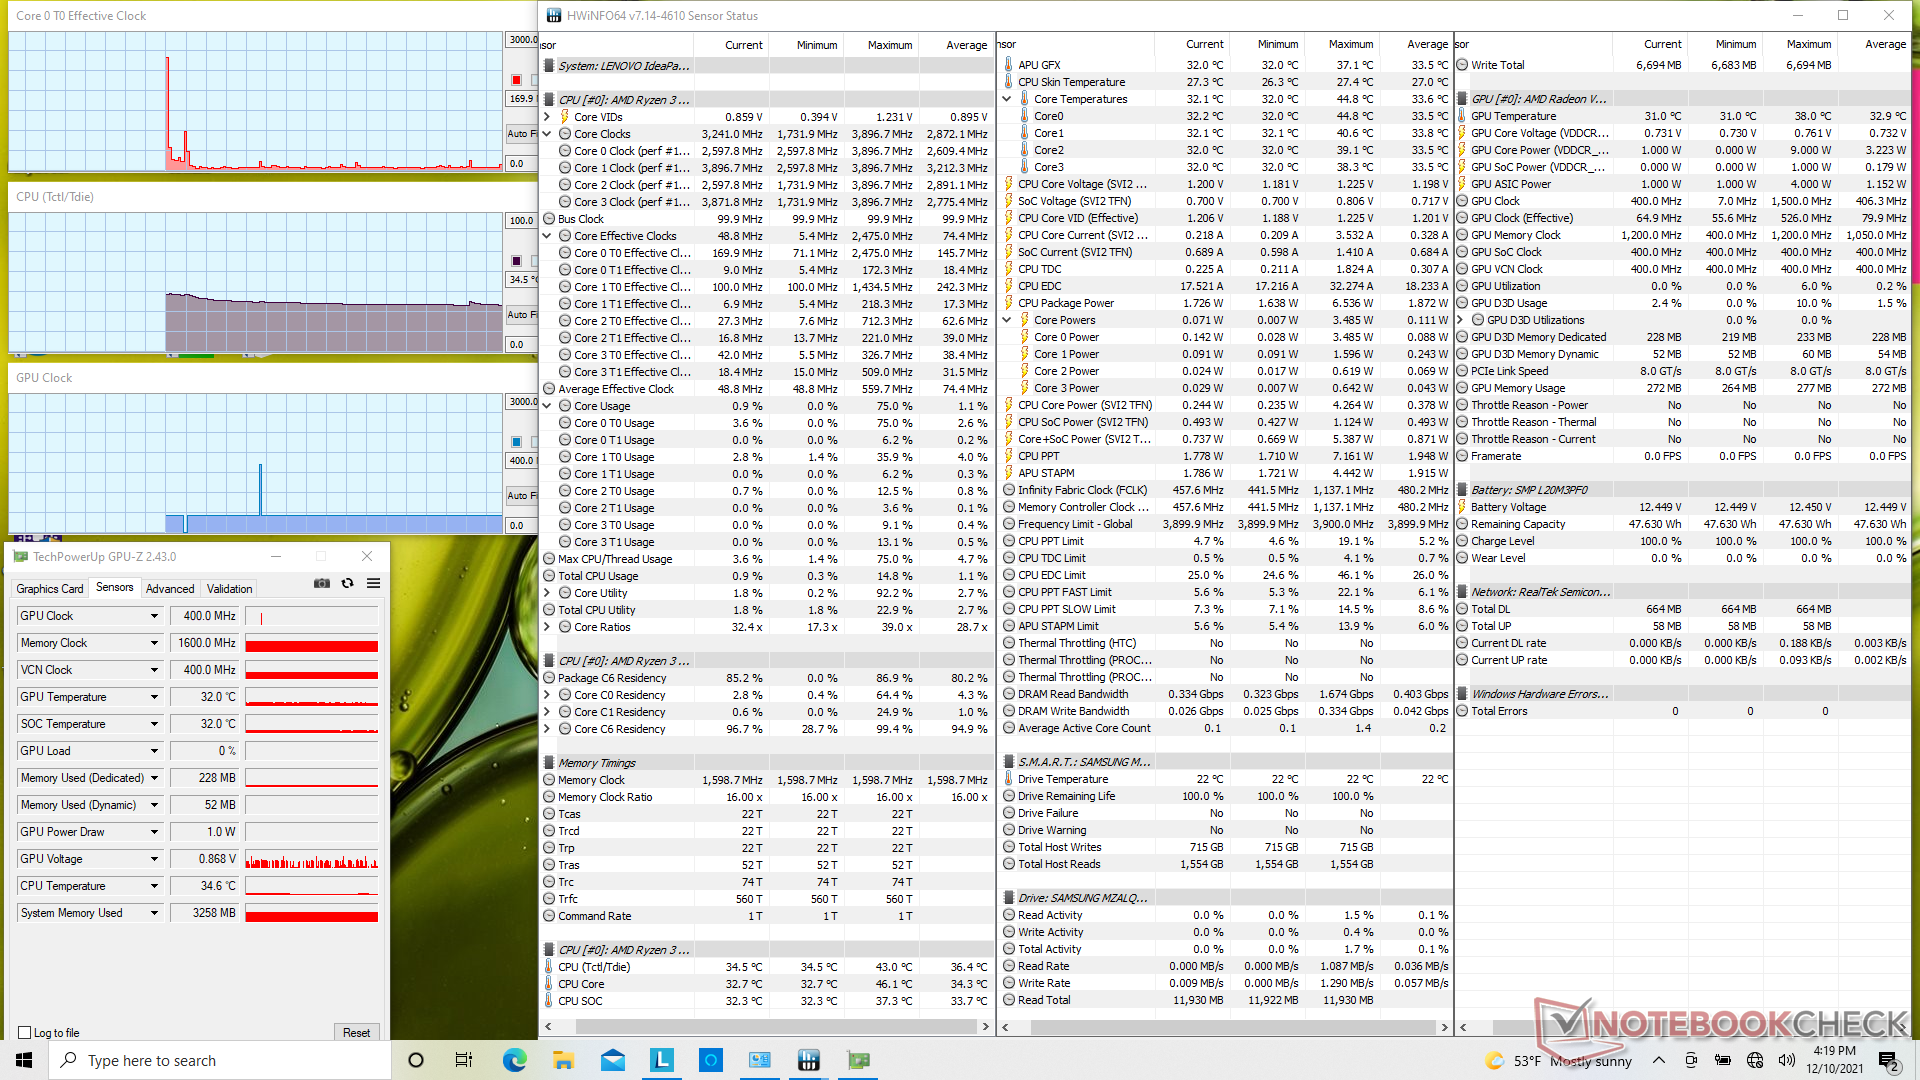
Lors de l'exécution de Witcher 3le GPU intégré se stabilise à 1500 MHz comme annoncé. La température du cœur se stabiliserait également à seulement 57°C, contre 74°C sur l'IdeaPad 5 Pro 14, plus rapide et plus fin.
Le fonctionnement sur batterie a un impact sur les performances. Une exécution de 3DMark 11 sur batterie donne des scores de physique et de graphisme de 7818 et 3818 points, respectivement, contre 8356 et 4035 points sur le secteur.
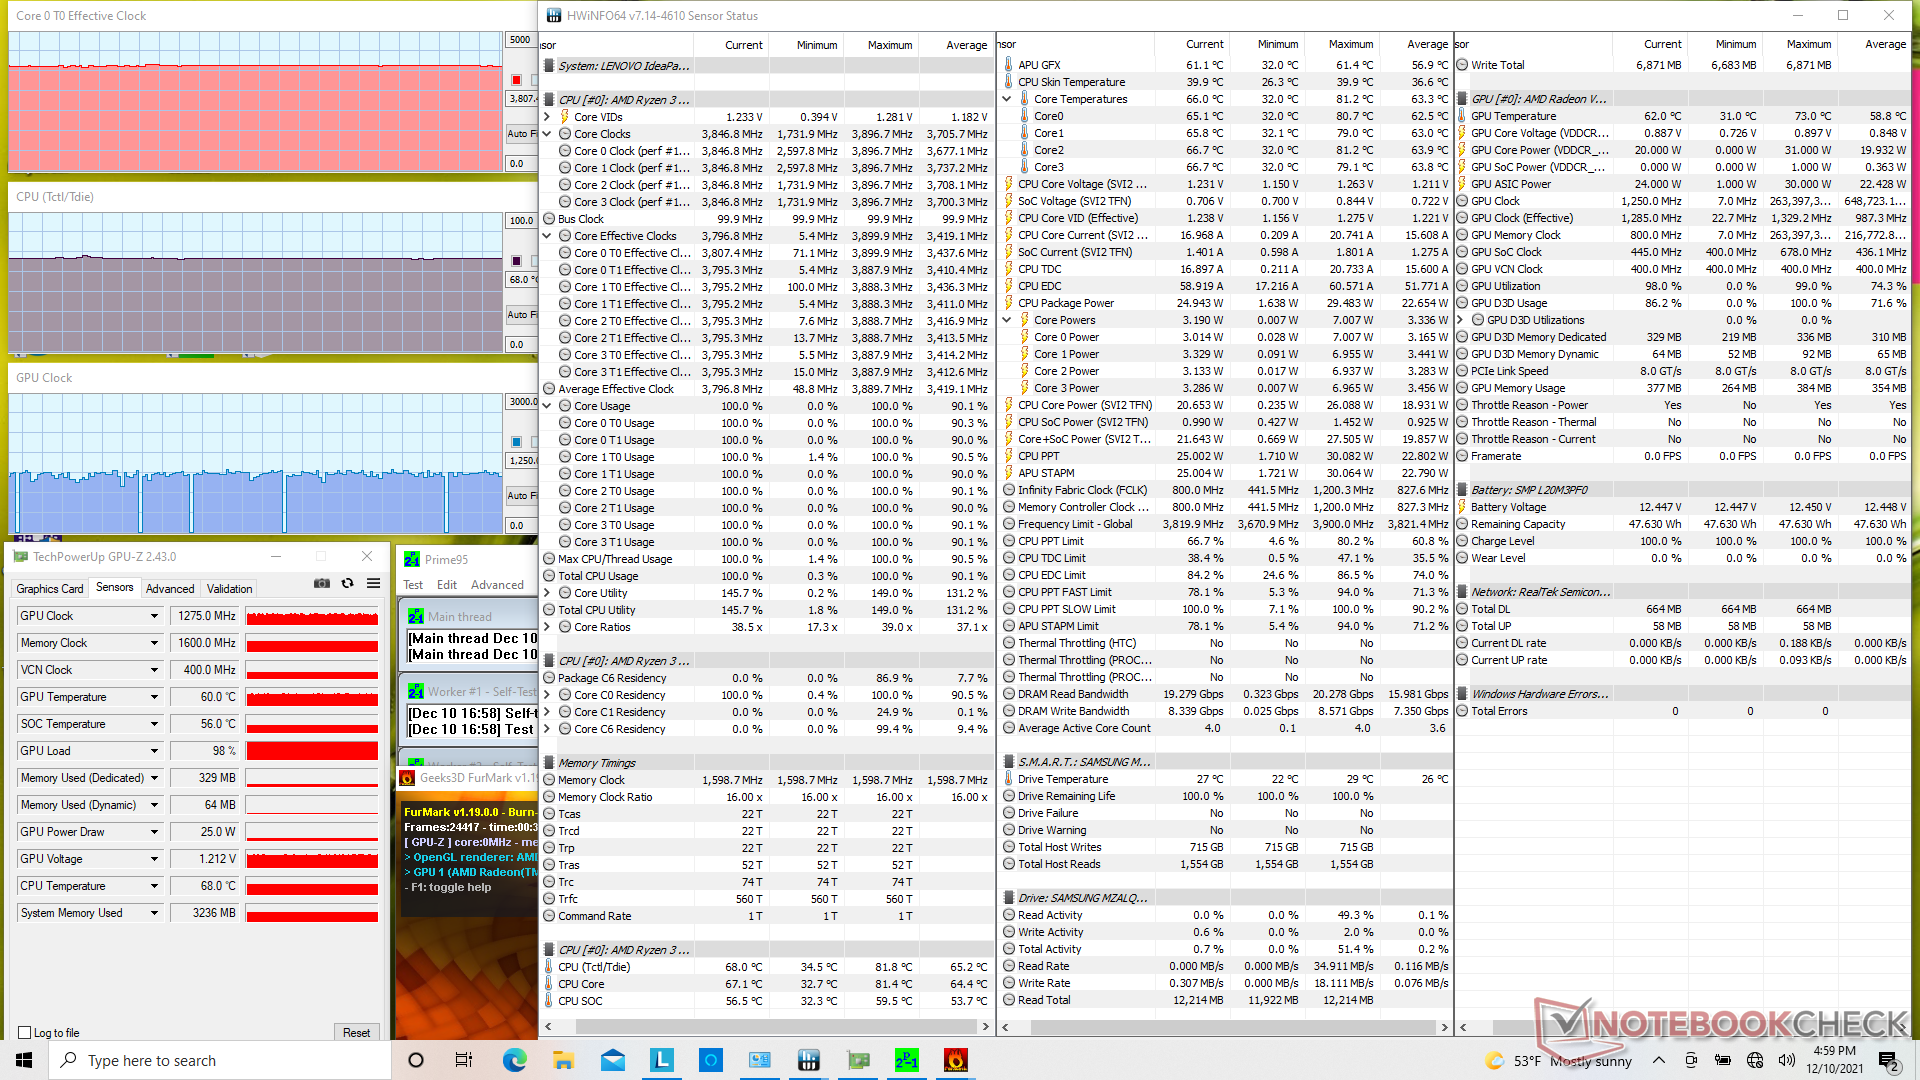
| Fréquence CPU(GHz) | Fréquence GPU(MHz) | Températuremoyennedu CPU (°C) | |
| Système au repos | - | - | 35 |
| Prime95 Stress | 3.8 | -- | 74 |
| Prime95+ FurMark Stress | 3.8 | 1250 | 68 |
| Witcher 3 Stress | 1.6 | 1500 | 57 |
Haut-parleurs
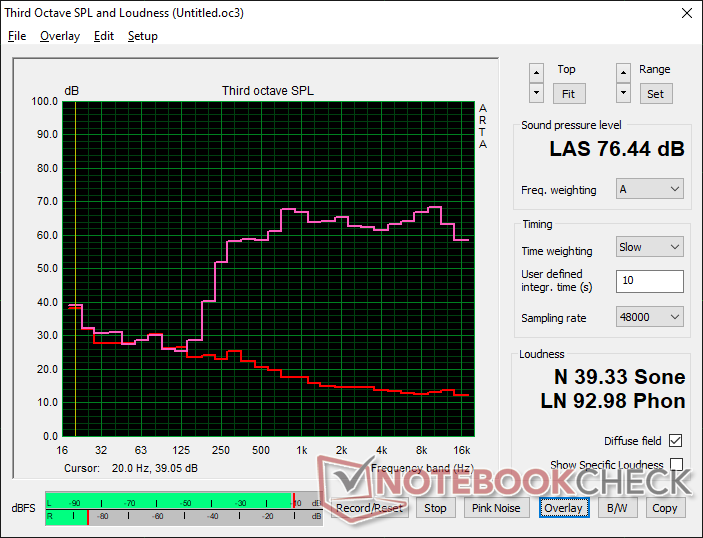
Lenovo IdeaPad 3 15ALC6 analyse audio
(±) | le niveau sonore du haut-parleur est moyen mais bon (76.4# dB)
Basses 100 - 315 Hz
(-) | presque aucune basse - en moyenne 24% plus bas que la médiane
(±) | la linéarité des basses est moyenne (13.4% delta à la fréquence précédente)
Médiums 400 - 2000 Hz
(+) | médiane équilibrée - seulement 3.1% de la médiane
(+) | les médiums sont linéaires (4.2% delta à la fréquence précédente)
Aiguës 2 - 16 kHz
(+) | des sommets équilibrés - à seulement 2.1% de la médiane
(+) | les aigus sont linéaires (3.4% delta à la fréquence précédente)
Globalement 100 - 16 000 Hz
(±) | la linéarité du son global est moyenne (19.3% de différence avec la médiane)
Par rapport à la même classe
» 62% de tous les appareils testés de cette catégorie étaient meilleurs, 8% similaires, 30% pires
» Le meilleur avait un delta de 5%, la moyenne était de 17%, le pire était de 45%.
Par rapport à tous les appareils testés
» 47% de tous les appareils testés étaient meilleurs, 8% similaires, 46% pires
» Le meilleur avait un delta de 4%, la moyenne était de 23%, le pire était de 134%.
Apple MacBook 12 (Early 2016) 1.1 GHz analyse audio
(+) | les haut-parleurs peuvent jouer relativement fort (83.6# dB)
Basses 100 - 315 Hz
(±) | basse réduite - en moyenne 11.3% inférieure à la médiane
(±) | la linéarité des basses est moyenne (14.2% delta à la fréquence précédente)
Médiums 400 - 2000 Hz
(+) | médiane équilibrée - seulement 2.4% de la médiane
(+) | les médiums sont linéaires (5.5% delta à la fréquence précédente)
Aiguës 2 - 16 kHz
(+) | des sommets équilibrés - à seulement 2% de la médiane
(+) | les aigus sont linéaires (4.5% delta à la fréquence précédente)
Globalement 100 - 16 000 Hz
(+) | le son global est linéaire (10.2% différence à la médiane)
Par rapport à la même classe
» 7% de tous les appareils testés de cette catégorie étaient meilleurs, 2% similaires, 90% pires
» Le meilleur avait un delta de 5%, la moyenne était de 18%, le pire était de 53%.
Par rapport à tous les appareils testés
» 5% de tous les appareils testés étaient meilleurs, 1% similaires, 94% pires
» Le meilleur avait un delta de 4%, la moyenne était de 23%, le pire était de 134%.
Gestion de l'énergie
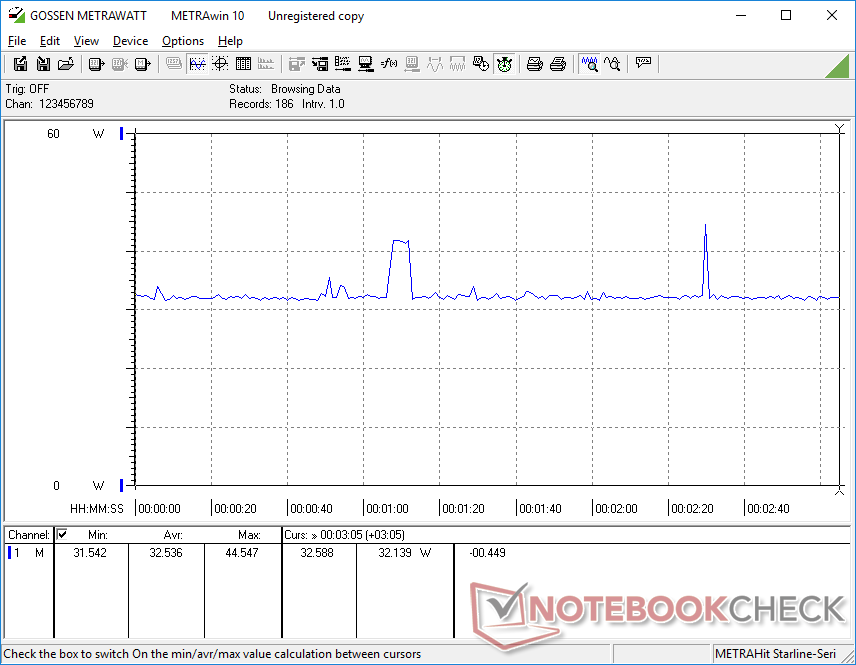
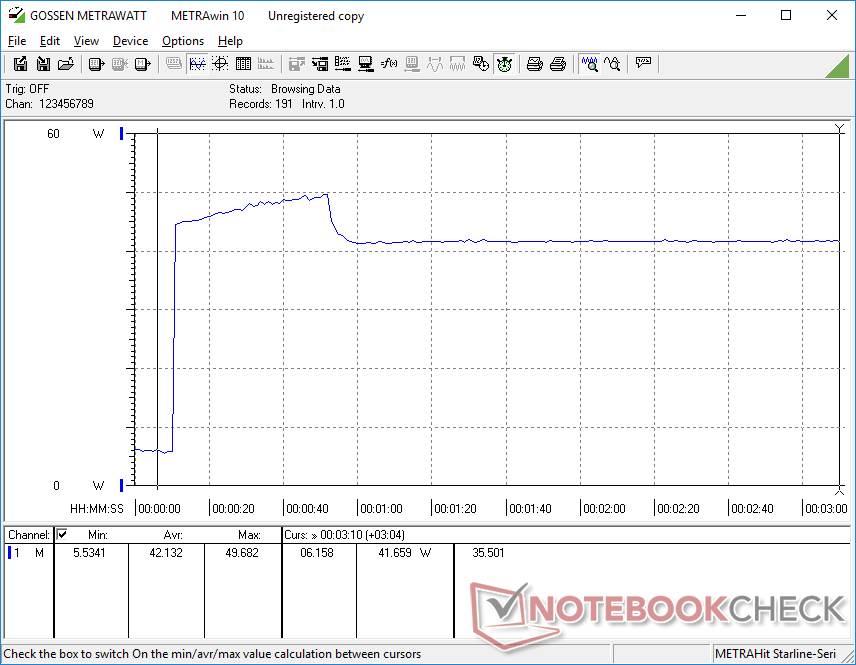
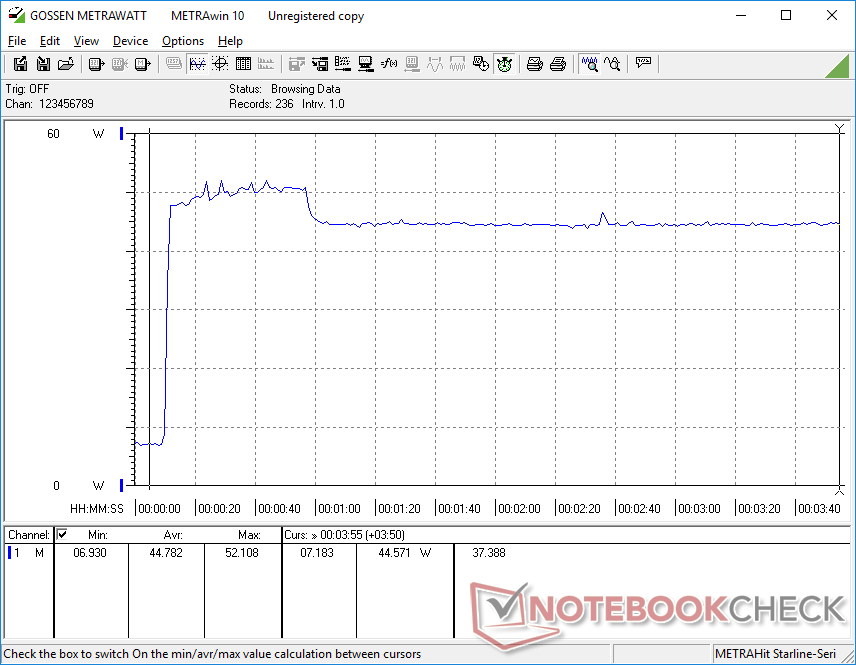
Consommation d'énergie - Performance élevée du CPU par watt
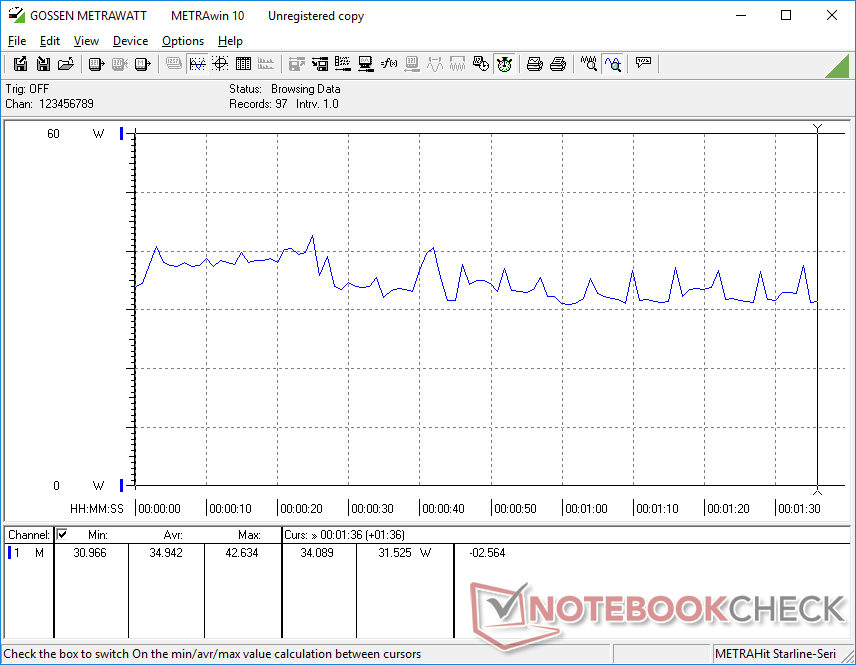
Le système est plus exigeant que le système à base de Core i3 Lenovo ThinkPad L15 G2 lors de l'exécution de charges moyennes ou élevées. L'exécution de 3DMark 06, par exemple, consommerait presque 37 % d'énergie en plus sur notre IdeaPad. Les avantages en termes de performances de notre CPU Ryzen 3 par rapport à l'alternative Core i3 peuvent valoir l'augmentation de la consommation d'énergie pour de nombreux utilisateurs. Les différences de consommation d'énergie lors de l'exécution de charges plus faibles comme la navigation sur le Web ou le streaming vidéo sont minimes.
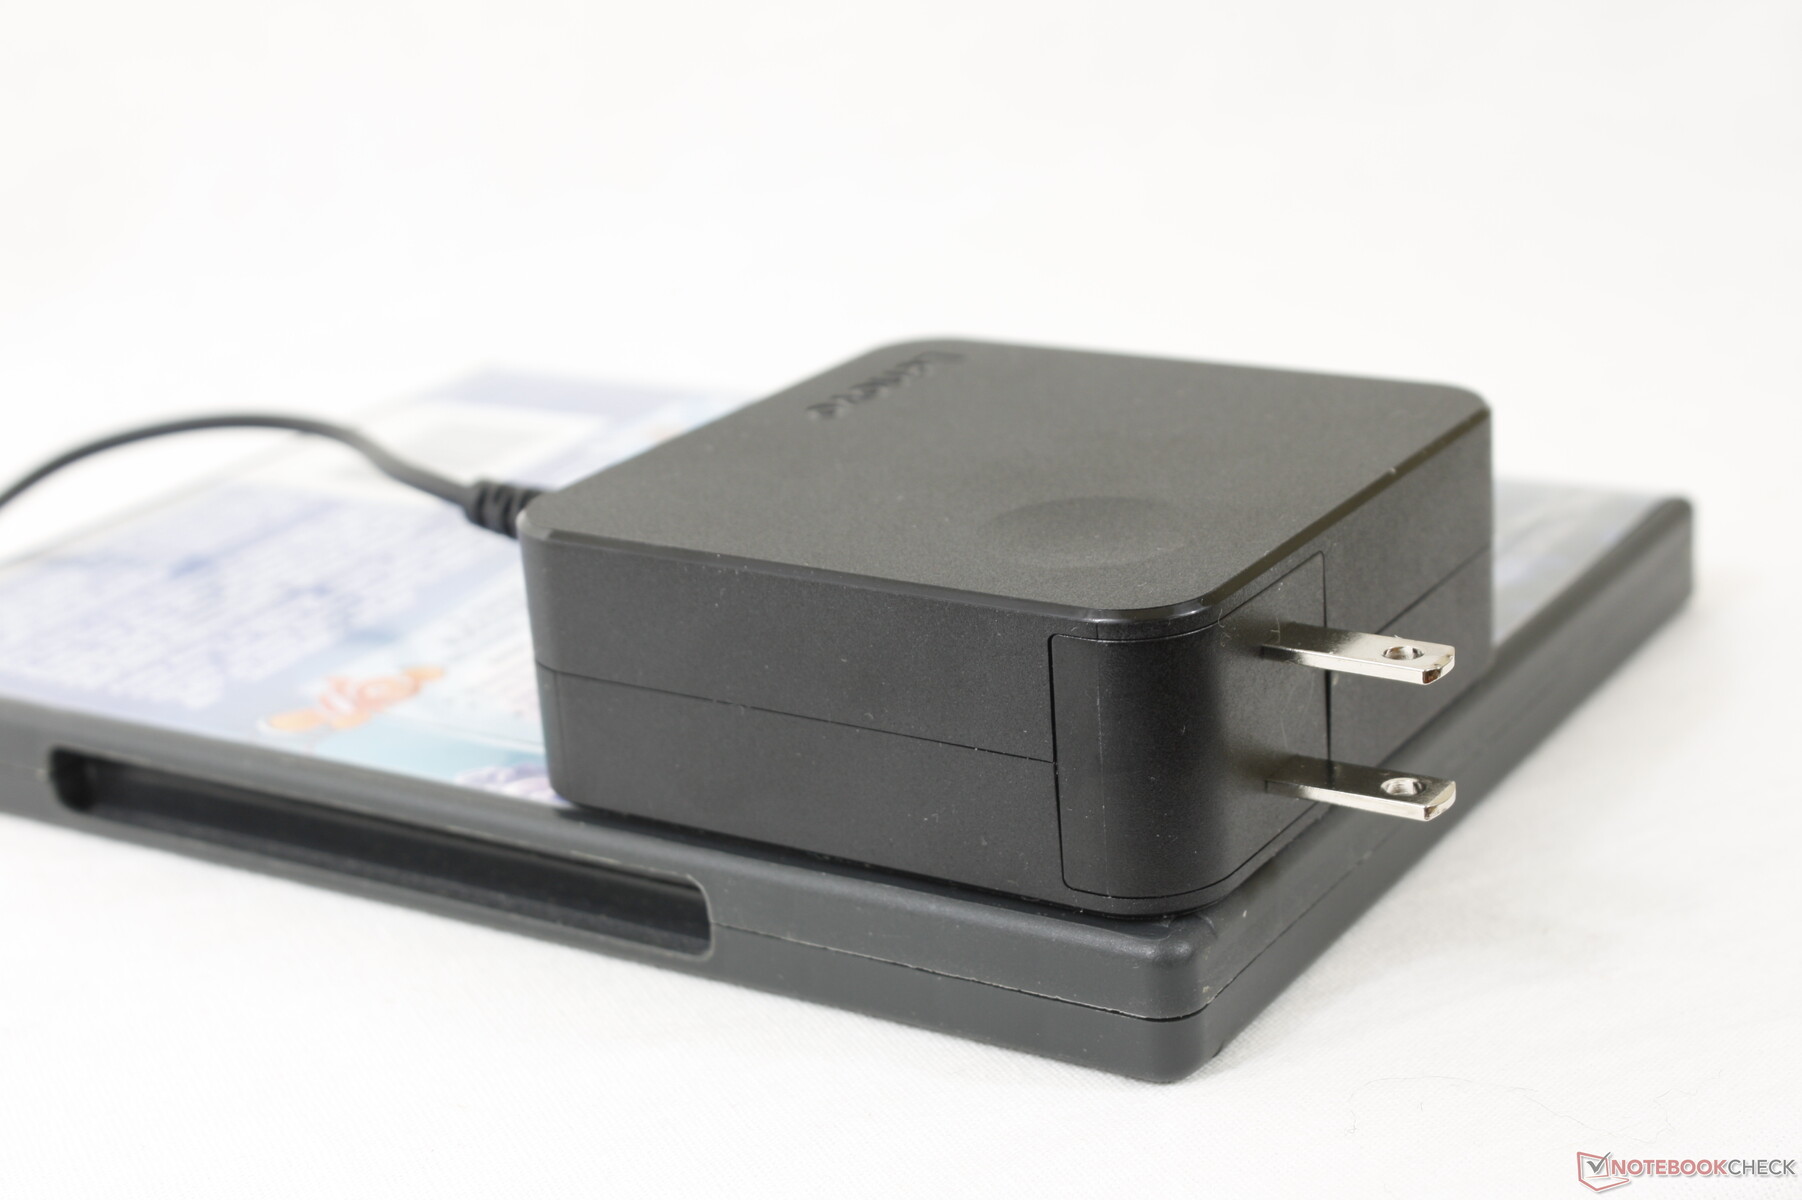
Nous avons pu enregistrer une consommation maximale temporaire de 52 W sur le petit adaptateur secteur de 65 W (~7,5 x 7,5 x 2,8 cm). Les broches de l'adaptateur ne sont malheureusement pas rétractables, ce qui peut être un inconvénient en voyage.
| Éteint/en veille | |
| Au repos | |
| Fortement sollicité |
|
Légende:
min: | |
| Lenovo IdeaPad 3 15ALC6 R3 5300U, Vega 6, Samsung PM991a MZALQ512HBLU, IPS, 1920x1080, 15.6" | Lenovo IdeaPad 5 15IIL05 i5-1035G1, GeForce MX350, SK hynix BC511 HFM512GDHTNI-87A0B, IPS, 1920x1080, 15.6" | Lenovo Ideapad S540-15IML i5-10210U, GeForce MX250, Samsung SSD PM981a MZVLB512HBJQ, IPS, 1920x1080, 15.6" | Dell Inspiron 15 3501 i7-1165G7, Iris Xe G7 96EUs, Samsung PM991a MZ9LQ512HBLU-00BD1, IPS, 1920x1080, 15.6" | Asus VivoBook 15 KM513UA-L503TS R5 5500U, Vega 7, WDC PC SN530 SDBPMPZ-265G, OLED, 1920x1080, 15.6" | Lenovo ThinkPad L15 G2-20X4S0KU00 i3-1115G4, UHD Graphics Xe G4 48EUs, Samsung SSD PM981a MZVLB256HBHQ, IPS, 1920x1080, 15.6" | |
|---|---|---|---|---|---|---|
| Power Consumption | -50% | -33% | 1% | -10% | -3% | |
| Idle Minimum * (Watt) | 5.6 | 4.9 12% | 5 11% | 3.6 36% | 4.96 11% | 4.08 27% |
| Idle Average * (Watt) | 6 | 9.1 -52% | 7 -17% | 6.4 -7% | 7.38 -23% | 8 -33% |
| Idle Maximum * (Watt) | 7 | 11.6 -66% | 10 -43% | 7.9 -13% | 7.79 -11% | 8.89 -27% |
| Load Average * (Watt) | 34.9 | 65 -86% | 64 -83% | 39 -12% | 41.77 -20% | 25.64 27% |
| Witcher 3 ultra * (Watt) | 32.5 | 59 -82% | 44 -35% | 37.6 -16% | 38.2 -18% | 31.7 2% |
| Load Maximum * (Watt) | 52.1 | 65.3 -25% | 67 -29% | 41.8 20% | 50.95 2% | 60.31 -16% |
* ... Moindre est la valeur, meilleures sont les performances
Power Consumption Witcher 3 / Stresstest
Power Consumption external Monitor
Autonomie de la batterie - Faible capacité, longue durée d'utilisation
La capacité de la batterie est faible (45 Wh), ce qui est normal pour un système économique. Néanmoins, les durées d'exécution sont encore excellentes avec près de 10,5 heures de WLAN dans le monde réel pour être comparable à l'IdeaPad 5 plus cher.
Le chargement de la batterie vide à pleine capacité prend un peu moins de 2,5 heures, contre 1,5 heure pour la plupart des autres Ultrabooks. Malheureusement, le système ne peut pas être rechargé via l'USB-C.
| Lenovo IdeaPad 3 15ALC6 R3 5300U, Vega 6, 45 Wh | Lenovo IdeaPad 5 15IIL05 i5-1035G1, GeForce MX350, 70 Wh | Lenovo Ideapad S540-15IML i5-10210U, GeForce MX250, 70 Wh | Dell Inspiron 15 3501 i7-1165G7, Iris Xe G7 96EUs, 42 Wh | HP Pavilion 15-eg i7-1165G7, GeForce MX450, 41 Wh | Asus VivoBook 15 KM513UA-L503TS R5 5500U, Vega 7, 42 Wh | |
|---|---|---|---|---|---|---|
| Autonomie de la batterie | 23% | 17% | -35% | -29% | -41% | |
| Reader / Idle (h) | 20.1 | 23.2 15% | 30.2 50% | 15 -25% | 11.8 -41% | |
| WiFi v1.3 (h) | 10.5 | 11.4 9% | 12.1 15% | 6.8 -35% | 6.6 -37% | 6.4 -39% |
| Load (h) | 1.6 | 2.3 44% | 1.4 -13% | 1.2 -25% | 0.9 -44% | |
| H.264 (h) | 16.1 |
Points positifs
Points négatifs
Verdict : le Core i3 en a pour son argent
L'IdeaPad 3 15ALC6 possède trois caractéristiques fortes qui font défaut à de nombreux autres modèles de sa gamme de prix : une facilité d'entretien, un écran tactile lumineux compatible FreeSync et un CPU étonnamment rapide. Ces attributs contribuent à la longévité du système, car les propriétaires peuvent facilement ajouter de l'espace de stockage ou de la mémoire vive et être sûrs que le Ryzen 3 5300U ne sera pas dépassé trop tôt. L'autonomie de la batterie et le bruit du ventilateur sont respectivement longs et silencieux, en partie grâce à l'efficacité du processeur.
Le rapide processeur Ryzen 3 5300U propulse un ordinateur portable économique autrement terne avec une qualité de construction, des couleurs et une esthétique médiocres.
Il y a toujours des économies de bouts de chandelle associées aux ordinateurs portables économiques et l'IdeaPad 3 ne fait pas exception. Dans ce cas, le système souffre de touches relativement molles, d'un pavé tactile spongieux, d'une conception de châssis faible et d'une reproduction des couleurs superficielle. Ce dernier point en particulier est commun à presque tous les ordinateurs portables à bas prix et nous ne pouvons donc pas accuser le Lenovo pour ses couleurs médiocres, mais le châssis pourrait certainement être retravaillé pour le rendre plus solide et plus durable.
Prix et disponibilité
Lenovo IdeaPad 3 15ALC6
- 12/14/2021 v7 (old)
Allen Ngo
Price comparison

