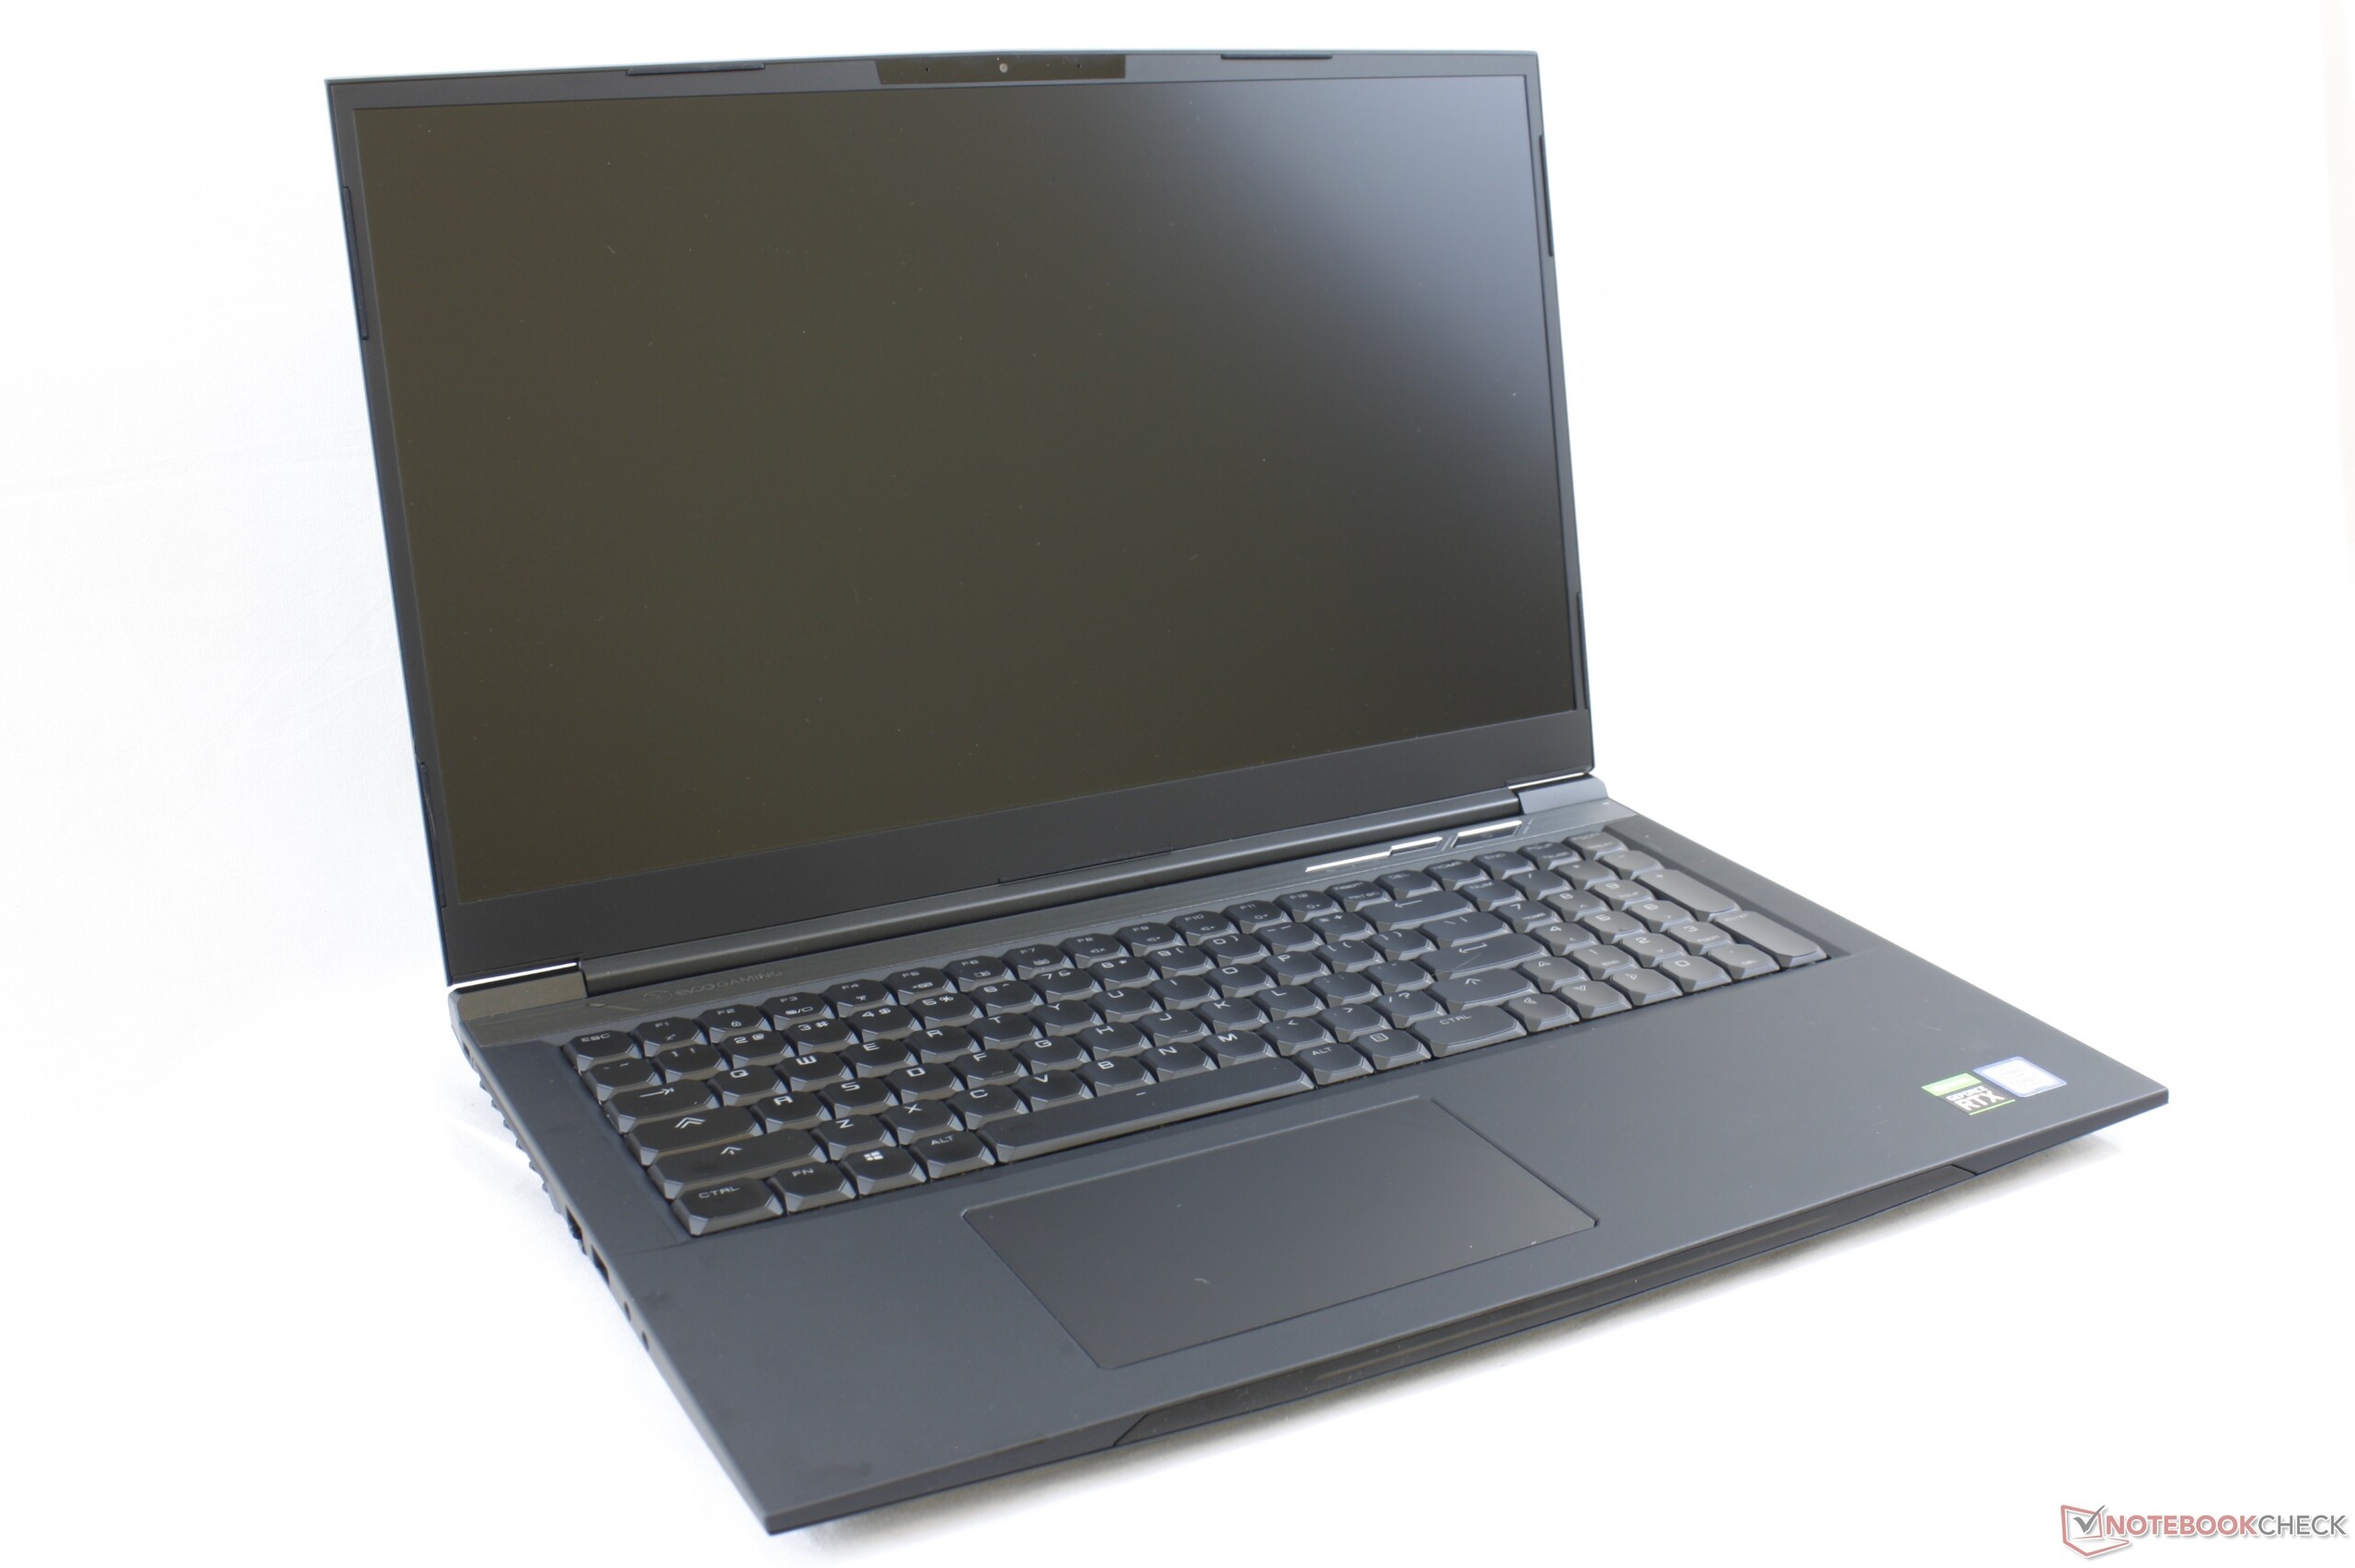
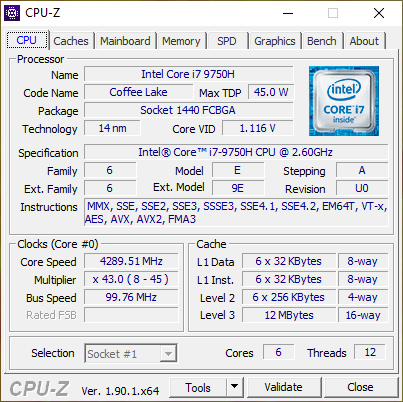
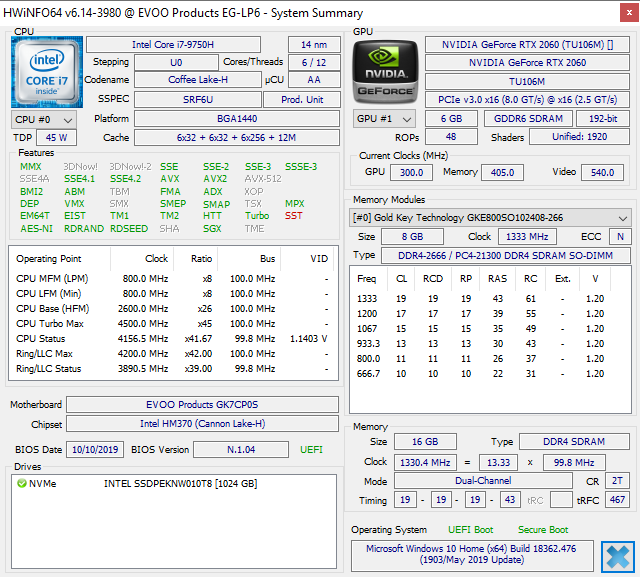
Test du Walmart EVOO Gaming 17 (i9-9750H, RTX 2060, FHD) : portable chinois avec étiquette Walmart
Note | Date | Modèle | Poids | Épaisseur | Taille | Résolution | Prix |
|---|---|---|---|---|---|---|---|
| 84.5 % v7 (old) | 12/19 | Walmart EVOO Gaming 17 i7-9750H, GeForce RTX 2060 Mobile | 2.5 kg | 27.5 mm | 17.30" | 1920x1080 | |
| 83.3 % v7 (old) | 04/19 | Schenker XMG Neo 17 i7-8750H, GeForce RTX 2070 Mobile | 2.5 kg | 27.5 mm | 17.30" | 1920x1080 | |
| 87.4 % v6 (old) | 05/19 | Alienware m17 P37E i9-8950HK, GeForce RTX 2080 Max-Q | 2.6 kg | 23 mm | 17.30" | 3840x2160 | |
| 83.2 % v7 (old) | 10/19 | Lenovo Legion Y740-17IRH i7-9750H, GeForce RTX 2060 Mobile | 3 kg | 23 mm | 17.30" | 1920x1080 | |
| 89.4 % v6 (old) | 08/19 | Razer Blade Pro 17 RTX 2060 i7-9750H, GeForce RTX 2060 Mobile | 2.8 kg | 19.9 mm | 17.30" | 1920x1080 |
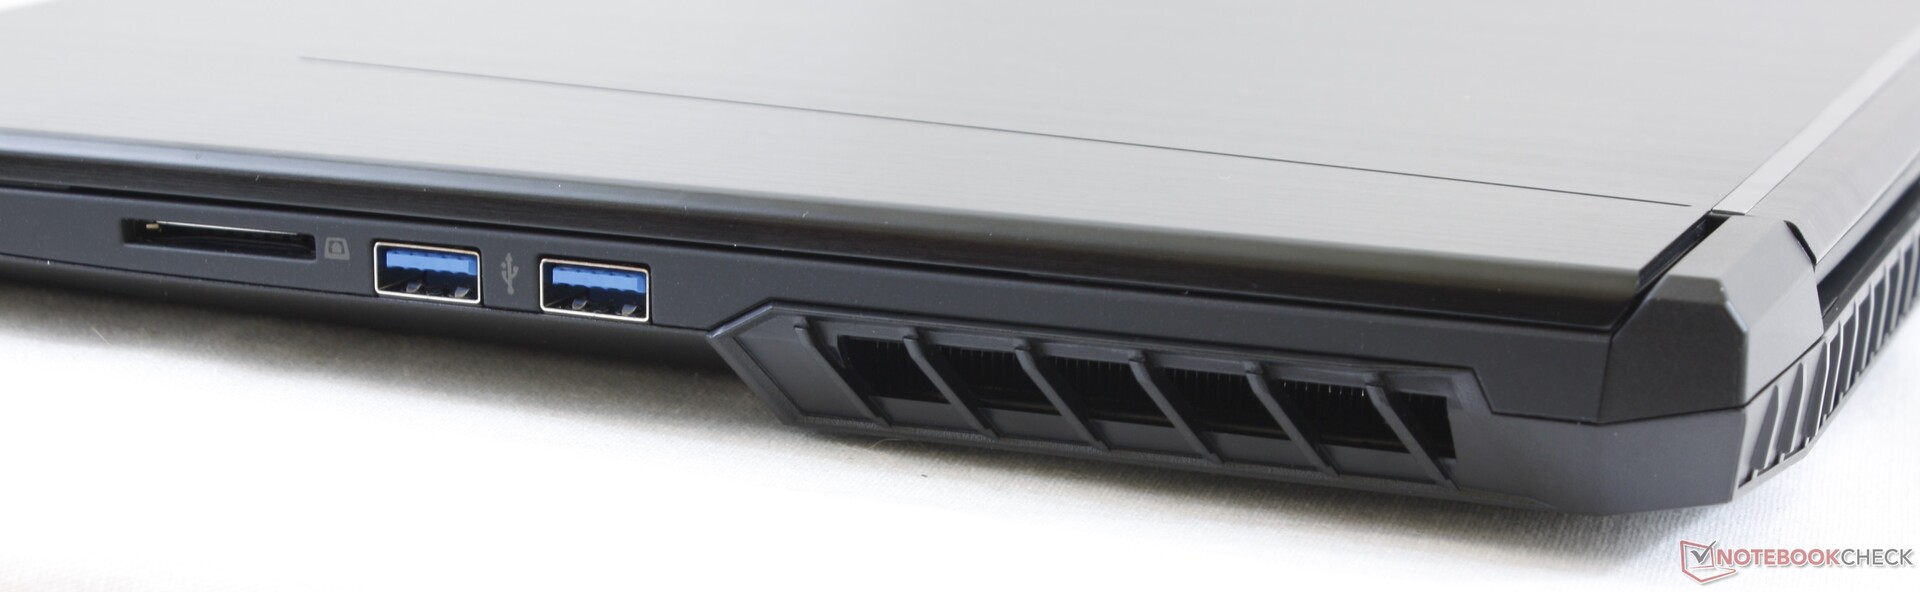
| SD Card Reader | |
| average JPG Copy Test (av. of 3 runs) | |
| Dell XPS 15 7590 9980HK GTX 1650 (Toshiba Exceria Pro SDXC 64 GB UHS-II) | |
| Samsung Notebook 9 NP930QAA (Toshiba Exceria Pro M501 microSDXC 64GB) | |
| Schenker XMG Neo 17 (Toshiba Exceria Pro SDXC 64 GB UHS-II) | |
| Walmart EVOO Gaming 17 (Toshiba Exceria Pro SDXC 64 GB UHS-II) | |
| MSI GL62M 7RD-077 (Toshiba Exceria Pro SDXC 64 GB UHS-II) | |
| maximum AS SSD Seq Read Test (1GB) | |
| Dell XPS 15 7590 9980HK GTX 1650 (Toshiba Exceria Pro SDXC 64 GB UHS-II) | |
| Samsung Notebook 9 NP930QAA (Toshiba Exceria Pro M501 microSDXC 64GB) | |
| Schenker XMG Neo 17 (Toshiba Exceria Pro SDXC 64 GB UHS-II) | |
| Walmart EVOO Gaming 17 (Toshiba Exceria Pro SDXC 64 GB UHS-II) | |
| MSI GL62M 7RD-077 (Toshiba Exceria Pro SDXC 64 GB UHS-II) | |
| Networking | |
| iperf3 transmit AX12 | |
| Lenovo Legion Y740-17IRH | |
| Schenker XMG Neo 17 | |
| Alienware m17 P37E | |
| Razer Blade Pro 17 RTX 2060 | |
| iperf3 receive AX12 | |
| Razer Blade Pro 17 RTX 2060 | |
| Lenovo Legion Y740-17IRH | |
| Alienware m17 P37E | |
| Schenker XMG Neo 17 | |
| |||||||||||||||||||||||||
Homogénéité de la luminosité: 92 %
Valeur mesurée au centre, sur batterie: 314.2 cd/m²
Contraste: 1208:1 (Valeurs des noirs: 0.26 cd/m²)
ΔE ColorChecker Calman: 3.15 | ∀{0.5-29.43 Ø4.72}
calibrated: 2.74
ΔE Greyscale Calman: 2.6 | ∀{0.09-98 Ø4.97}
91.8% sRGB (Argyll 1.6.3 3D)
59.6% AdobeRGB 1998 (Argyll 1.6.3 3D)
66.7% AdobeRGB 1998 (Argyll 3D)
92.2% sRGB (Argyll 3D)
65.5% Display P3 (Argyll 3D)
Gamma: 2.31
CCT: 6928 K
| Walmart EVOO Gaming 17 BOE HF N173FHM-N44, IPS, 17.3", 1920x1080 | Schenker XMG Neo 17 BOEhydis NV173FHM-N44 (BOE07B6), IPS, 17.3", 1920x1080 | Alienware m17 P37E AU Optronics B173ZAN01.0, IPS, 17.3", 3840x2160 | Lenovo Legion Y740-17IRH LG Philips LP173WFG-SPD2 (LGD05E0), IPS, 17.3", 1920x1080 | Razer Blade Pro 17 RTX 2060 AU Optronics B173HAN04.0, IPS, 17.3", 1920x1080 | MSI GS75 Stealth 9SG Chi Mei N173HCE-G33 (CMN175C), IPS, 17.3", 1920x1080 | |
|---|---|---|---|---|---|---|
| Display | 0% | 30% | 1% | -5% | -2% | |
| Display P3 Coverage (%) | 65.5 | 65.2 0% | 86.4 32% | 64.8 -1% | 61.1 -7% | 62.6 -4% |
| sRGB Coverage (%) | 92.2 | 92.2 0% | 99.9 8% | 96 4% | 89.4 -3% | 93.5 1% |
| AdobeRGB 1998 Coverage (%) | 66.7 | 66.5 0% | 99.1 49% | 65.8 -1% | 62.5 -6% | 64.7 -3% |
| Response Times | -1% | -111% | 15% | 46% | 41% | |
| Response Time Grey 50% / Grey 80% * (ms) | 17.6 ? | 18.8 ? -7% | 35.6 ? -102% | 14.8 ? 16% | 6.8 ? 61% | 7.2 ? 59% |
| Response Time Black / White * (ms) | 12.8 ? | 12 ? 6% | 28 ? -119% | 11.2 ? 13% | 8.8 ? 31% | 10 ? 22% |
| PWM Frequency (Hz) | 980 ? | 971 ? | 25510 ? | |||
| Screen | 3% | -32% | -8% | 3% | 19% | |
| Brightness middle (cd/m²) | 314.2 | 304 -3% | 357.9 14% | 282 -10% | 300.4 -4% | 366 16% |
| Brightness (cd/m²) | 307 | 289 -6% | 347 13% | 261 -15% | 289 -6% | 343 12% |
| Brightness Distribution (%) | 92 | 90 -2% | 94 2% | 87 -5% | 93 1% | 91 -1% |
| Black Level * (cd/m²) | 0.26 | 0.26 -0% | 0.33 -27% | 0.27 -4% | 0.32 -23% | 0.29 -12% |
| Contrast (:1) | 1208 | 1169 -3% | 1085 -10% | 1044 -14% | 939 -22% | 1262 4% |
| Colorchecker dE 2000 * | 3.15 | 2.65 16% | 6.57 -109% | 3.18 -1% | 2.32 26% | 1.51 52% |
| Colorchecker dE 2000 max. * | 5.4 | 6.11 -13% | 9.86 -83% | 8.39 -55% | 3.81 29% | 3.22 40% |
| Colorchecker dE 2000 calibrated * | 2.74 | 1.5 45% | 6.74 -146% | 0.95 65% | 2.95 -8% | 0.71 74% |
| Greyscale dE 2000 * | 2.6 | 2.75 -6% | 4.3 -65% | 4.1 -58% | 1.5 42% | 1.93 26% |
| Gamma | 2.31 95% | 2.46 89% | 2.6 85% | 2.55 86% | 2.3 96% | 2.38 92% |
| CCT | 6928 94% | 6763 96% | 6403 102% | 7260 90% | 6764 96% | 6881 94% |
| Color Space (Percent of AdobeRGB 1998) (%) | 59.6 | 60 1% | 88.4 48% | 61 2% | 57.4 -4% | 60 1% |
| Color Space (Percent of sRGB) (%) | 91.8 | 92 0% | 100 9% | 96 5% | 89 -3% | 94 2% |
| Moyenne finale (programmes/paramètres) | 1% /
2% | -38% /
-30% | 3% /
-4% | 15% /
7% | 19% /
18% |
* ... Moindre est la valeur, meilleures sont les performances
Temps de réponse de l'écran
| ↔ Temps de réponse noir à blanc | ||
|---|---|---|
| 12.8 ms ... hausse ↗ et chute ↘ combinées | ↗ 7.6 ms hausse | 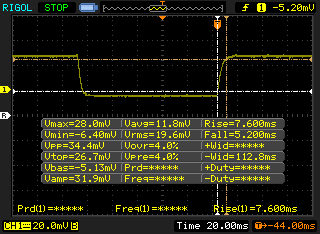 |
| ↘ 5.2 ms chute | ||
| L'écran montre de bons temps de réponse, mais insuffisant pour du jeu compétitif. En comparaison, tous les appareils testés affichent entre 0.1 (minimum) et 240 (maximum) ms. » 33 % des appareils testés affichent de meilleures performances. Cela signifie que les latences relevées sont meilleures que la moyenne (19.8 ms) de tous les appareils testés. | ||
| ↔ Temps de réponse gris 50% à gris 80% | ||
| 17.6 ms ... hausse ↗ et chute ↘ combinées | ↗ 8.4 ms hausse | 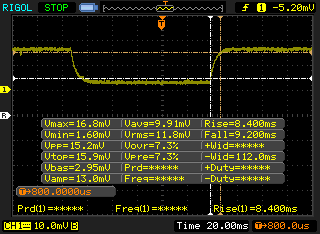 |
| ↘ 9.2 ms chute | ||
| L'écran montre de bons temps de réponse, mais insuffisant pour du jeu compétitif. En comparaison, tous les appareils testés affichent entre 0.165 (minimum) et 636 (maximum) ms. » 31 % des appareils testés affichent de meilleures performances. Cela signifie que les latences relevées sont meilleures que la moyenne (31 ms) de tous les appareils testés. | ||
Scintillement / MLI (Modulation de largeur d'impulsion)
| Scintillement / MLI (Modulation de largeur d'impulsion) décelé | 980 Hz | ≤ 99 Niveau de luminosité | 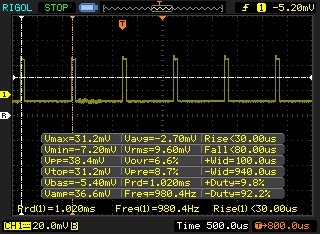 |
Le rétroéclairage de l'écran scintille à la fréquence de 980 Hz (certainement du fait de l'utilisation d'une MDI - Modulation de largeur d'impulsion) à un niveau de luminosité inférieur ou égal à 99 % . Aucun scintillement ne devrait être perceptible au-dessus de cette valeur. La fréquence de rafraîchissement de 980 Hz est élevée, la grande majorité des utilisateurs ne devrait pas percevoir de scintillements et être sujette à une fatigue oculaire accrue. En comparaison, 52 % des appareils testés n'emploient pas MDI pour assombrir leur écran. Nous avons relevé une moyenne à 7781 (minimum : 5 - maximum : 343500) Hz dans le cas où une MDI était active. | |||
| PCMark 8 Home Score Accelerated v2 | 4445 points | |
| PCMark 8 Work Score Accelerated v2 | 5746 points | |
| PCMark 10 Score | 5797 points | |
Aide | ||
| Walmart EVOO Gaming 17 Intel SSD 660p 1TB SSDPEKNW010T8 | Schenker XMG Neo 17 Samsung SSD 970 EVO Plus 1TB | Alienware m17 P37E SK Hynix PC401 512GB M.2 (HFS512GD9TNG) | Lenovo Legion Y740-17IRH WDC PC SN520 SDAPMUW-128G | Razer Blade Pro 17 RTX 2060 Samsung SSD PM981 MZVLB512HAJQ | MSI GS75 Stealth 9SG 2x Samsung SSD PM981 MZVLB1T0HALR (RAID 0) | |
|---|---|---|---|---|---|---|
| AS SSD | 98% | -1% | -51% | 47% | 55% | |
| Seq Read (MB/s) | 1038 | 2359 127% | 1835 77% | 1339 29% | 1810 74% | 2855 175% |
| Seq Write (MB/s) | 1604 | 2469 54% | 1121 -30% | 688 -57% | 1797 12% | 2687 68% |
| 4K Read (MB/s) | 42.9 | 53.5 25% | 23.98 -44% | 23.23 -46% | 48.43 13% | 30.31 -29% |
| 4K Write (MB/s) | 107.4 | 117.6 9% | 100 -7% | 98.8 -8% | 106 -1% | 96.3 -10% |
| 4K-64 Read (MB/s) | 583 | 1579 171% | 687 18% | 300.9 -48% | 1156 98% | 1460 150% |
| 4K-64 Write (MB/s) | 725 | 2048 182% | 776 7% | 204.6 -72% | 1748 141% | 1224 69% |
| Access Time Read * (ms) | 0.045 | 0.048 -7% | 0.047 -4% | 0.184 -309% | 0.057 -27% | 0.054 -20% |
| Access Time Write * (ms) | 0.127 | 0.03 76% | 0.053 58% | 0.037 71% | 0.035 72% | 0.038 70% |
| Score Read (Points) | 730 | 1869 156% | 895 23% | 458 -37% | 1385 90% | 1776 143% |
| Score Write (Points) | 992 | 2413 143% | 988 0% | 372 -62% | 2033 105% | 1589 60% |
| Score Total (Points) | 2137 | 5248 146% | 2306 8% | 1038 -51% | 4135 93% | 4259 99% |
| Copy ISO MB/s (MB/s) | 1612 | 773 -52% | 988 -39% | 1984 23% | 2226 38% | |
| Copy Program MB/s (MB/s) | 564 | 493 -13% | 327.2 -42% | 588 4% | 426.4 -24% | |
| Copy Game MB/s (MB/s) | 1328 | 647 -51% | 758 -43% | 835 -37% | 1152 -13% |
* ... Moindre est la valeur, meilleures sont les performances

| 3DMark 11 Performance | 19567 points | |
| 3DMark Cloud Gate Standard Score | 38260 points | |
| 3DMark Fire Strike Score | 16083 points | |
| 3DMark Time Spy Score | 6911 points | |
Aide | ||
| Bas | Moyen | Élevé | Ultra | |
|---|---|---|---|---|
| BioShock Infinite (2013) | 322.5 | 285 | 265 | 156 |
| The Witcher 3 (2015) | 295.3 | 215.4 | 131 | 68.9 |
| Shadow of the Tomb Raider (2018) | 133 | 100 | 94 | 83 |
| Walmart EVOO Gaming 17 GeForce RTX 2060 Mobile, i7-9750H, Intel SSD 660p 1TB SSDPEKNW010T8 | Schenker XMG Neo 17 XNE17M19 GeForce RTX 2060 Mobile, i7-9750H, Samsung SSD 970 EVO Plus 500GB | Alienware m17 P37E GeForce RTX 2080 Max-Q, i9-8950HK, SK Hynix PC401 512GB M.2 (HFS512GD9TNG) | Lenovo Legion Y740-17IRH GeForce RTX 2060 Mobile, i7-9750H, WDC PC SN520 SDAPMUW-128G | Razer Blade Pro 17 RTX 2060 GeForce RTX 2060 Mobile, i7-9750H, Samsung SSD PM981 MZVLB512HAJQ | MSI GS75 Stealth 9SG GeForce RTX 2080 Max-Q, i7-9750H, 2x Samsung SSD PM981 MZVLB1T0HALR (RAID 0) | |
|---|---|---|---|---|---|---|
| Noise | -11% | -10% | -15% | -5% | -15% | |
| arrêt / environnement * (dB) | 28.7 | 31 -8% | 28.2 2% | 30 -5% | 28.2 2% | 30 -5% |
| Idle Minimum * (dB) | 28.7 | 31 -8% | 28.2 2% | 33 -15% | 28.2 2% | 31 -8% |
| Idle Average * (dB) | 28.7 | 33 -15% | 28.2 2% | 34 -18% | 28.2 2% | 32 -11% |
| Idle Maximum * (dB) | 29.5 | 35 -19% | 31 -5% | 35 -19% | 28.2 4% | 38 -29% |
| Load Average * (dB) | 31.4 | 43 -37% | 50.8 -62% | 48 -53% | 43 -37% | 47 -50% |
| Witcher 3 ultra * (dB) | 44.5 | 45 -1% | 50.8 -14% | 46 -3% | 48.4 -9% | 48 -8% |
| Load Maximum * (dB) | 54 | 47 13% | 50.8 6% | 49 9% | 53.4 1% | 49 9% |
* ... Moindre est la valeur, meilleures sont les performances
Degré de la nuisance sonore
| Au repos |
| 28.7 / 28.7 / 29.5 dB(A) |
| Fortement sollicité |
| 31.4 / 54 dB(A) |
 | ||
30 dB silencieux 40 dB(A) audible 50 dB(A) bruyant |
||
min: | ||
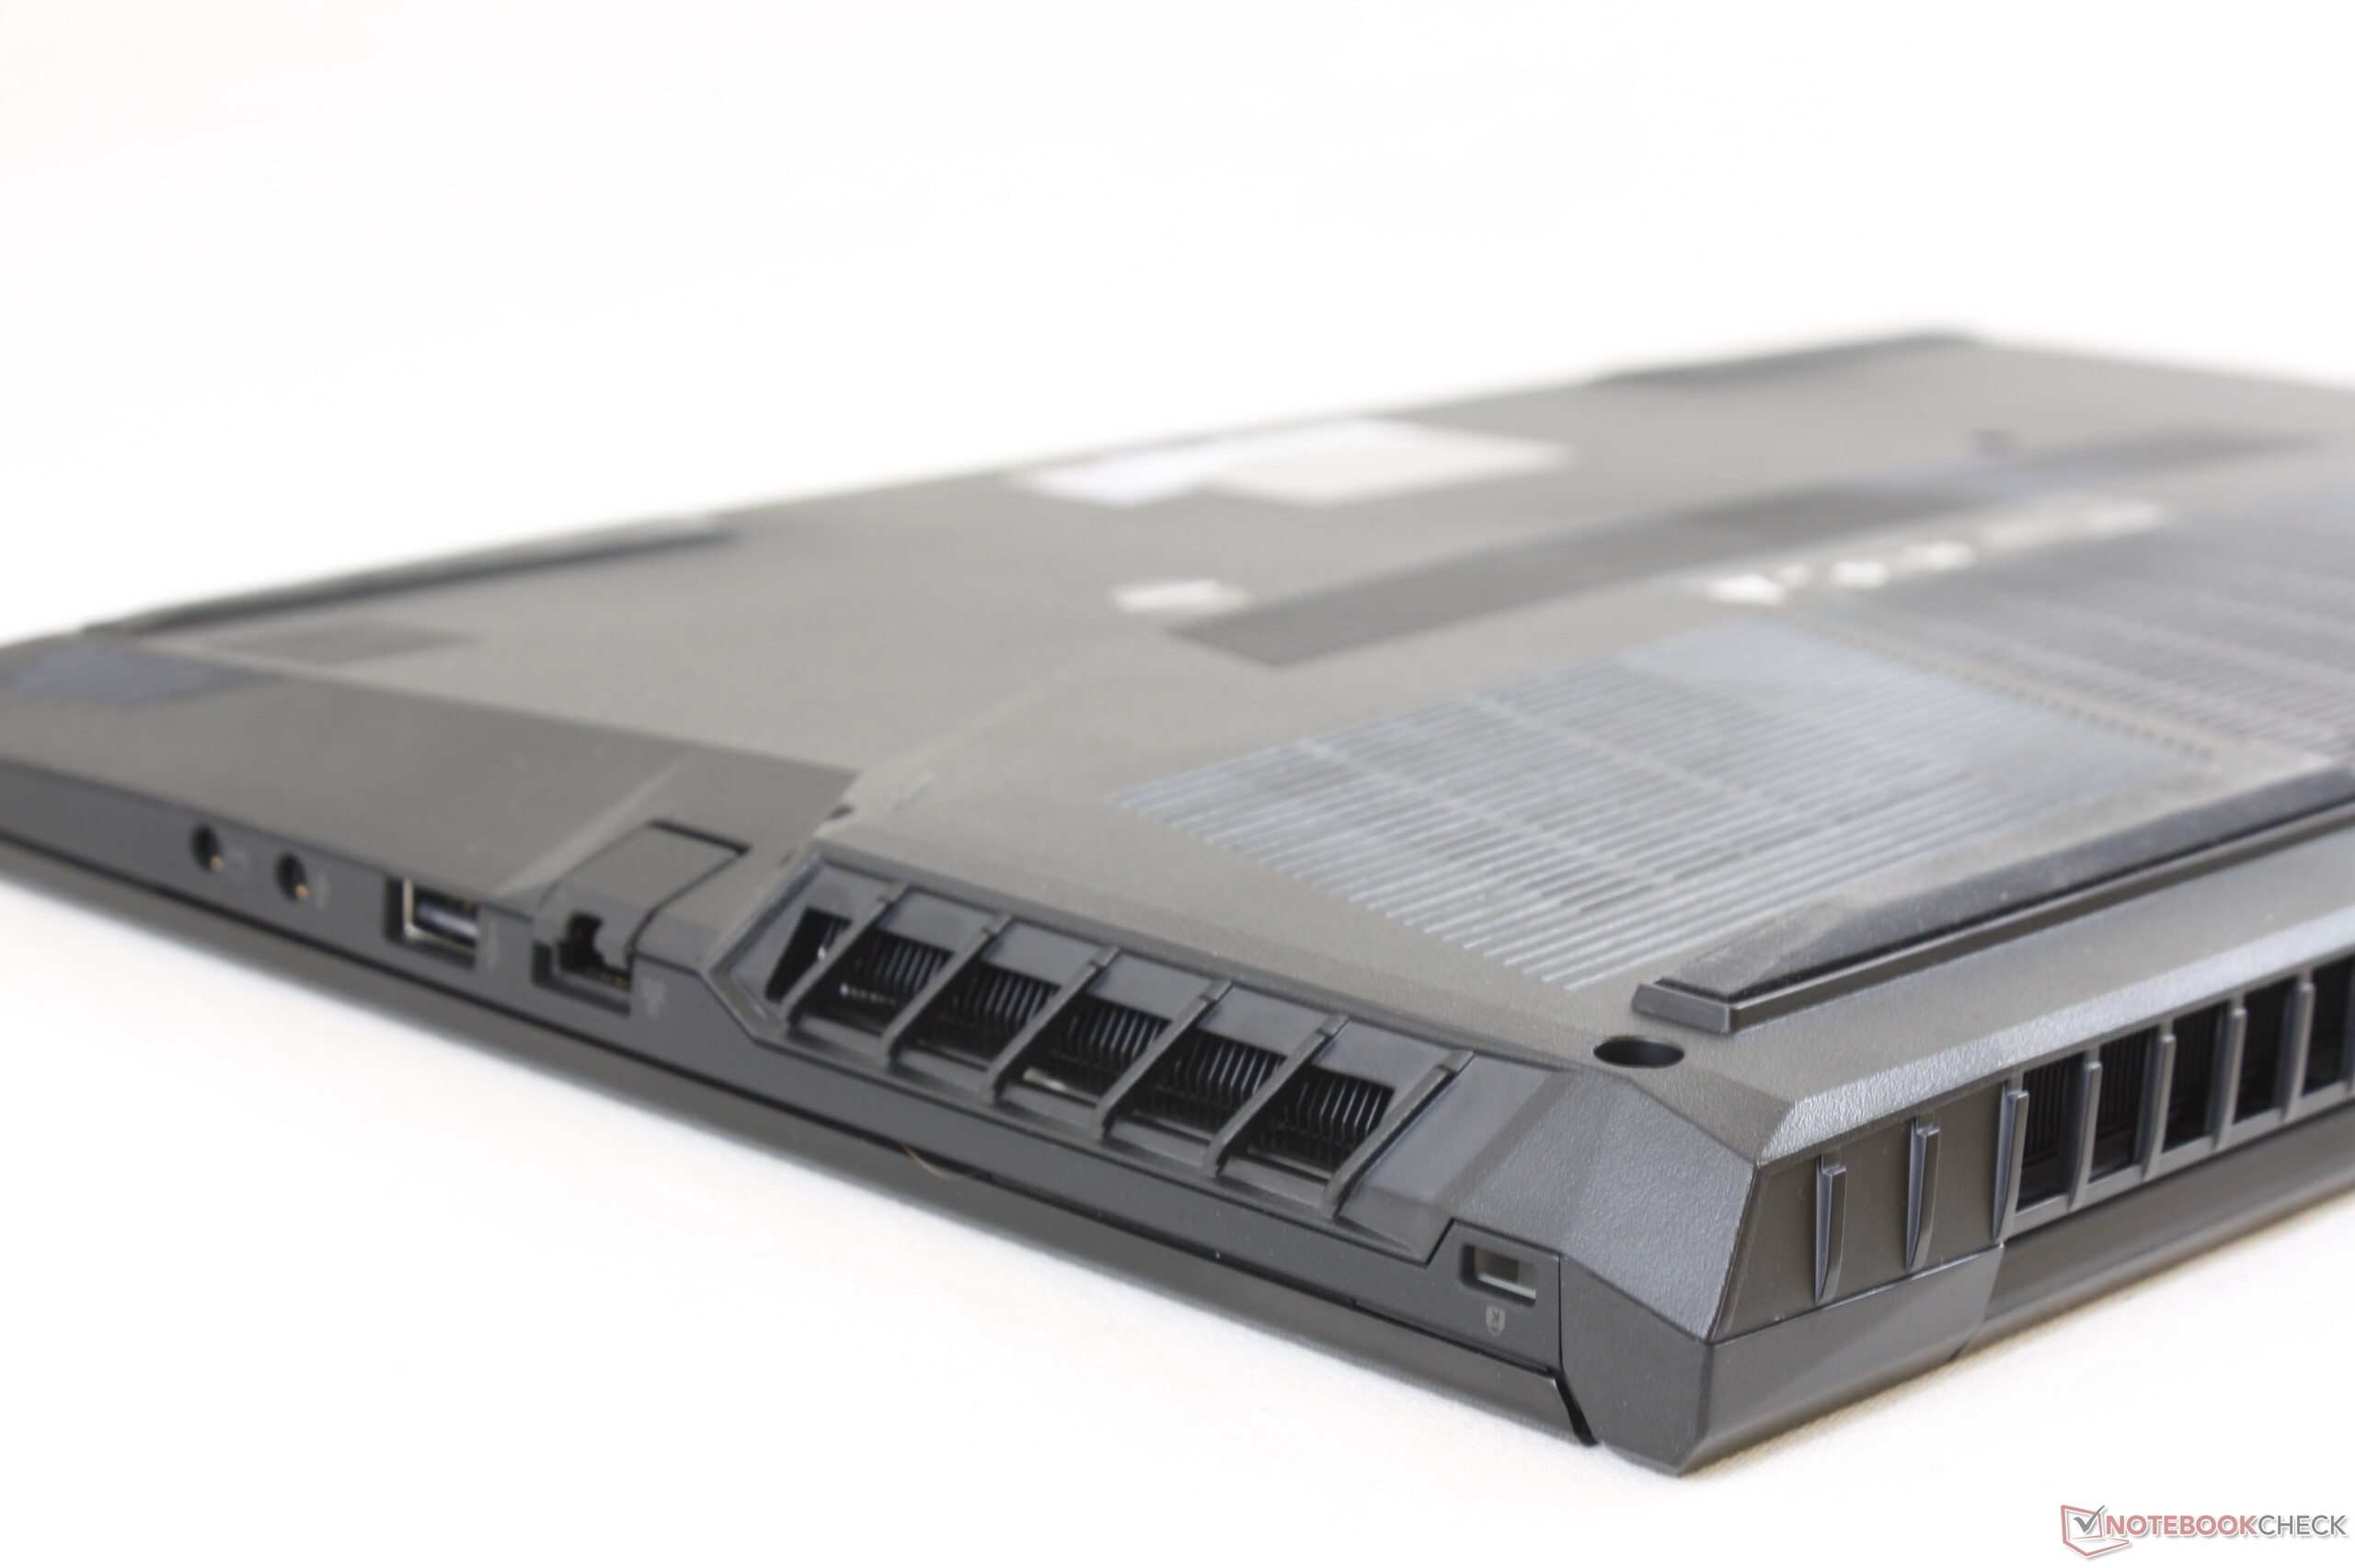
(±) La température maximale du côté supérieur est de 45 °C / 113 F, par rapport à la moyenne de 40.4 °C / 105 F, allant de 21.2 à 68.8 °C pour la classe Gaming.
(-) Le fond chauffe jusqu'à un maximum de 56.8 °C / 134 F, contre une moyenne de 43.2 °C / 110 F
(+) En utilisation inactive, la température moyenne du côté supérieur est de 21.1 °C / 70 F, par rapport à la moyenne du dispositif de 33.9 °C / 93 F.
(+) En jouant à The Witcher 3, la température moyenne du côté supérieur est de 30.4 °C / 87 F, alors que la moyenne de l'appareil est de 33.9 °C / 93 F.
(+) Les repose-poignets et le pavé tactile sont plus froids que la température de la peau avec un maximum de 26.2 °C / 79.2 F et sont donc froids au toucher.
(+) La température moyenne de la zone de l'appui-paume de dispositifs similaires était de 28.8 °C / 83.8 F (+2.6 °C / #4.6 F).
| Éteint/en veille | |
| Au repos | |
| Fortement sollicité |
|
Légende:
min: | |
| Walmart EVOO Gaming 17 i7-9750H, GeForce RTX 2060 Mobile, Intel SSD 660p 1TB SSDPEKNW010T8, IPS, 1920x1080, 17.3" | Schenker XMG Neo 17 XNE17M19 i7-9750H, GeForce RTX 2060 Mobile, Samsung SSD 970 EVO Plus 500GB, IPS, 1920x1080, 17.3" | Alienware m17 P37E i9-8950HK, GeForce RTX 2080 Max-Q, SK Hynix PC401 512GB M.2 (HFS512GD9TNG), IPS, 3840x2160, 17.3" | Lenovo Legion Y740-17IRH i7-9750H, GeForce RTX 2060 Mobile, WDC PC SN520 SDAPMUW-128G, IPS, 1920x1080, 17.3" | Razer Blade Pro 17 RTX 2060 i7-9750H, GeForce RTX 2060 Mobile, Samsung SSD PM981 MZVLB512HAJQ, IPS, 1920x1080, 17.3" | MSI GS75 Stealth 9SG i7-9750H, GeForce RTX 2080 Max-Q, 2x Samsung SSD PM981 MZVLB1T0HALR (RAID 0), IPS, 1920x1080, 17.3" | |
|---|---|---|---|---|---|---|
| Power Consumption | 15% | -35% | -7% | -9% | 2% | |
| Idle Minimum * (Watt) | 11.4 | 11 4% | 21.2 -86% | 20 -75% | 16 -40% | 13 -14% |
| Idle Average * (Watt) | 16.3 | 14 14% | 29.6 -82% | 21 -29% | 21.7 -33% | 17 -4% |
| Idle Maximum * (Watt) | 31.8 | 20 37% | 34 -7% | 26 18% | 26.1 18% | 25 21% |
| Load Average * (Watt) | 92.9 | 100 -8% | 130.9 -41% | 97 -4% | 105.6 -14% | 96 -3% |
| Witcher 3 ultra * (Watt) | 171.5 | 151 12% | 177.5 -3% | 139 19% | 161.8 6% | 156 9% |
| Load Maximum * (Watt) | 243.3 | 174 28% | 219.7 10% | 168 31% | 225.3 7% | 239 2% |
* ... Moindre est la valeur, meilleures sont les performances
| Walmart EVOO Gaming 17 i7-9750H, GeForce RTX 2060 Mobile, 46 Wh | Schenker XMG Neo 17 i7-8750H, GeForce RTX 2070 Mobile, 46.74 Wh | Alienware m17 P37E i9-8950HK, GeForce RTX 2080 Max-Q, 90 Wh | Lenovo Legion Y740-17IRH i7-9750H, GeForce RTX 2060 Mobile, 76 Wh | Razer Blade Pro 17 RTX 2060 i7-9750H, GeForce RTX 2060 Mobile, 70 Wh | MSI GS75 Stealth 9SG i7-9750H, GeForce RTX 2080 Max-Q, 80.25 Wh | |
|---|---|---|---|---|---|---|
| Autonomie de la batterie | -12% | 17% | 2% | 7% | 43% | |
| WiFi v1.3 (h) | 4.2 | 3.7 -12% | 4.9 17% | 4.3 2% | 4.5 7% | 6 43% |
| Reader / Idle (h) | 5.3 | 9.1 | 6.9 | 7.7 | ||
| Load (h) | 0.9 | 0.8 | 1.1 | 1.2 |
Points positifs
Points négatifs
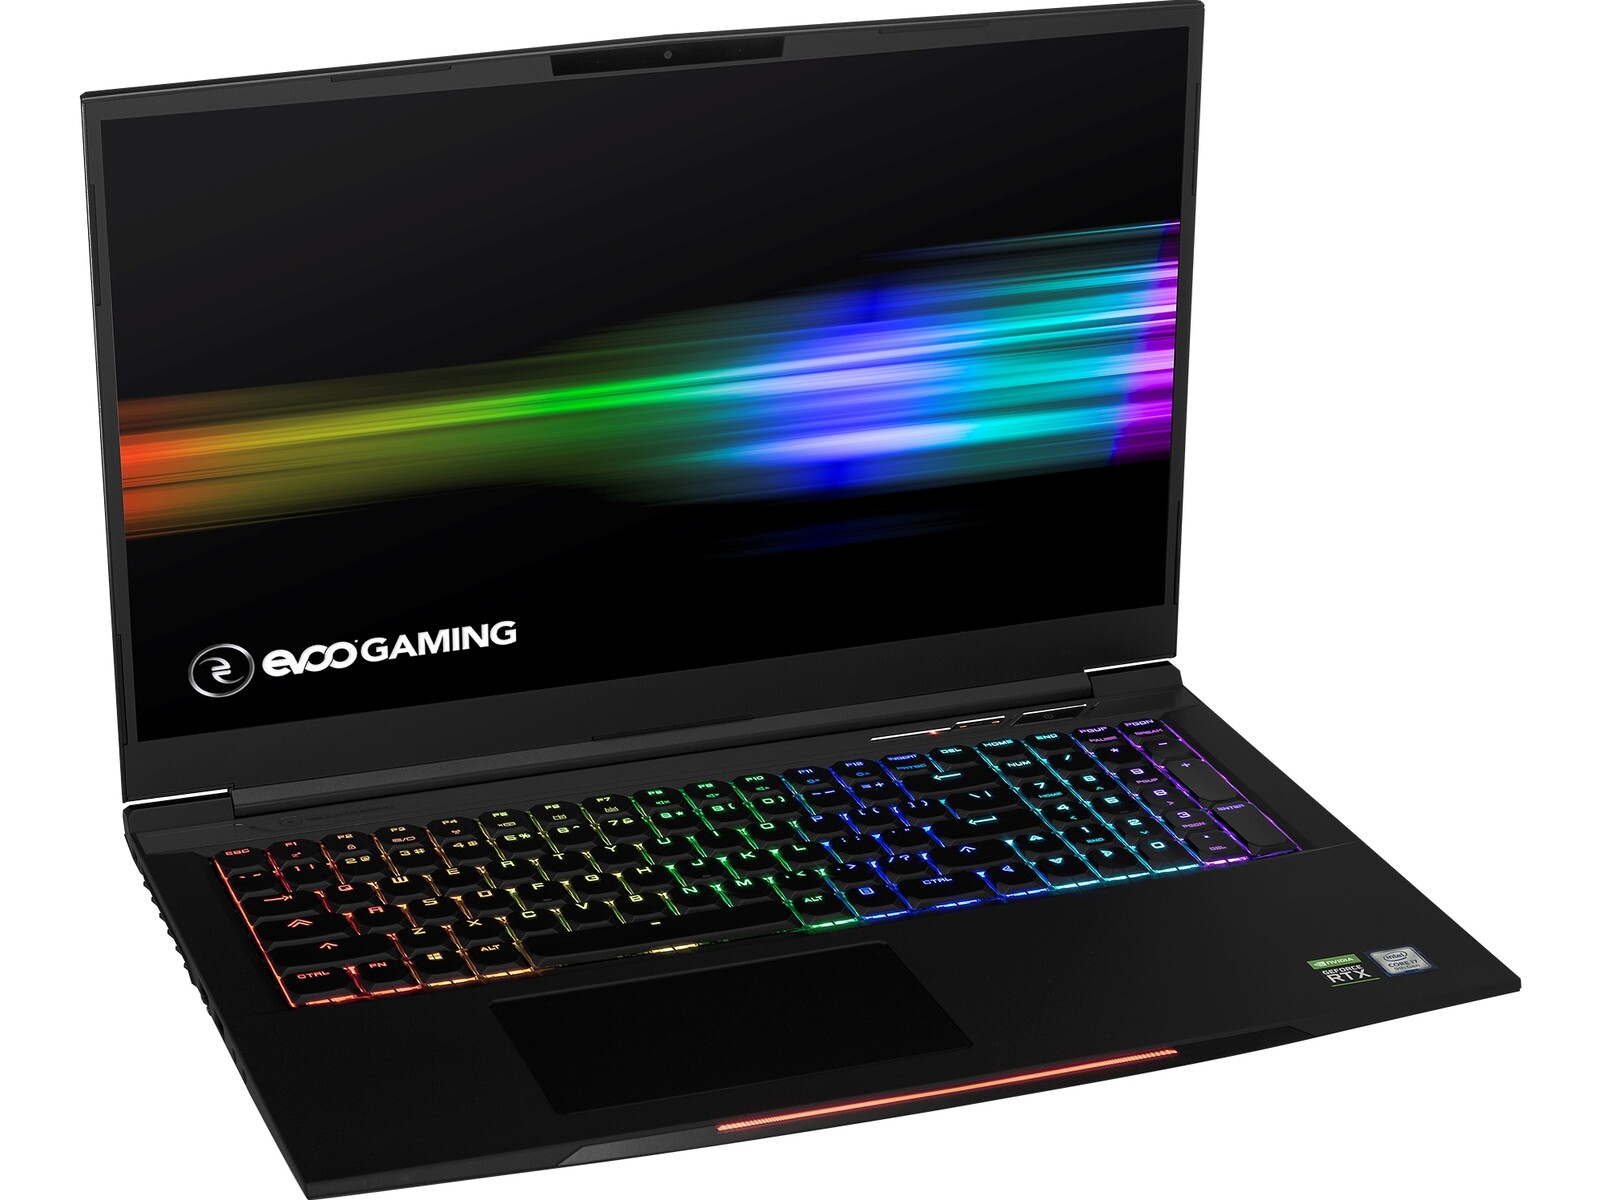
Acheter un Walmart EVOO plutôt qu’une machine telle que les MSI GS75, Razer Blade Pro 17, Lenovo Legion Y740, ou Asus Zephyrus S GX701, ne signifie pas nécessairement qu’il faut sacrifier la qualité pour avoir un prix moins élevé. Gardez à l’esprit que Walmart ne conçoit ni ne fabrique ses portables, mais qu’il s’agit en fait de machines chinoises rebaptisées. Des revendeurs de portables de jeu haut de gammes tel Maingear, Elukronics et autres utilisent la même tactique, avec les mêmes châssis chinois.
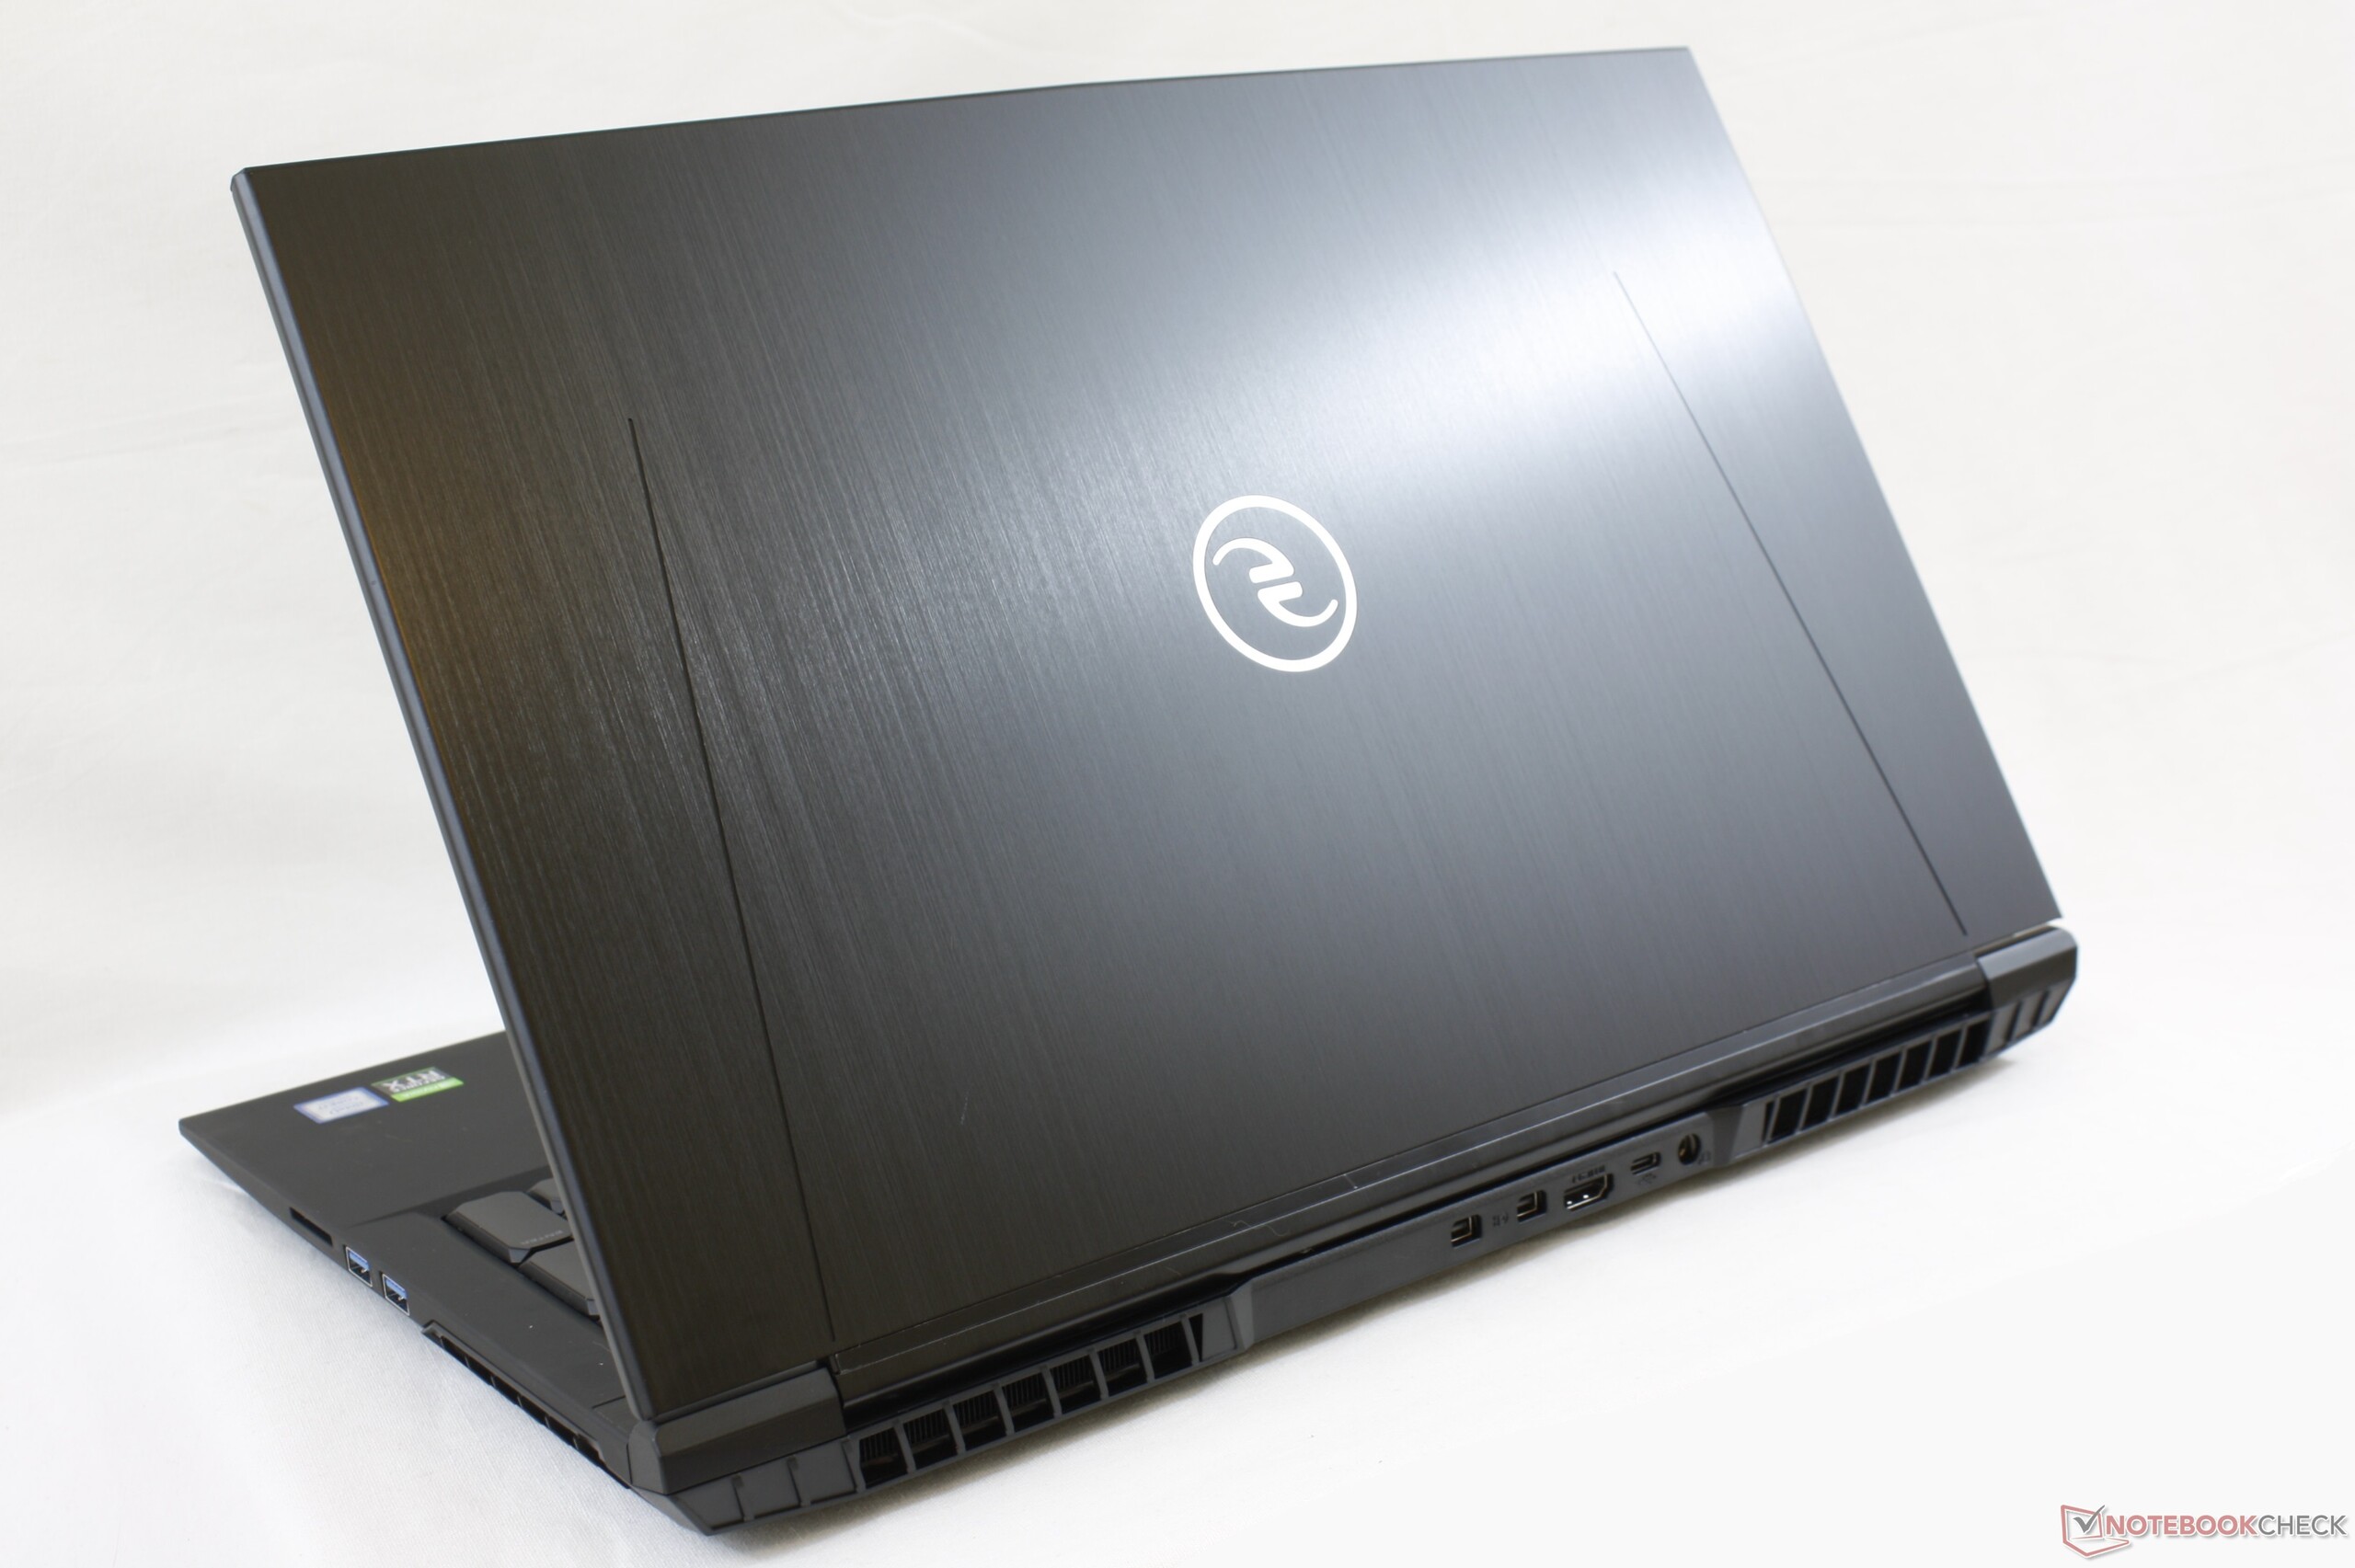
Cela dit, nous avons été impressionnés par les performances CPU et GPU supérieures à la moyenne du Walmart EVOO. Le châssis et l’écran sont de meilleure qualité que ceux du Lenovo mentionné. Le clavier mécanique bruyant n’est en revanche pas pour tout le monde, surtout pour les salles de classe ou les bibliothèques. La batterie est petite pour un portable de 17,3 pouces, et c’est dommage que le simple remplacement de RAM ou de stockage nécessite de briser un sceau de garantie. Nous recommandons également de vérifier les problèmes audio, les haut-parleurs de notre machine ne fonctionnant pas.
Le Walmart EVOO Gaming 17 tourne bien si vous ne l’utilisez que pour le jeu. Sa faible autonomie et ses touches bruyantes le rendent peu pratique pour les nomades et pour les étudiants, qui pourraient préférer un portable de jeu plus polyvalent.
L’intégralité de cette critique est disponible en anglais en suivant ce lien.
Walmart EVOO Gaming 17
- 05/14/2020 v7 (old)
Allen Ngo
Price comparison
