Test du Microsoft Surface Laptop 3 15 (Ryzen 5 3580U, Vega 9, FHD+) : peut mieux faire
Note | Date | Modèle | Poids | Épaisseur | Taille | Résolution | Prix |
|---|---|---|---|---|---|---|---|
| 82.9 % v7 (old) | 10/19 | Microsoft Surface Laptop 3 15 Ryzen 5 3580U R5 3580U, Vega 9 | 1.5 kg | 14.7 mm | 15.00" | 2496x1664 | |
| 86.3 % v7 (old) | 09/19 | Dell XPS 15 7590 i5 iGPU FHD i5-9300H, UHD Graphics 630 | 1.9 kg | 17 mm | 15.60" | 1920x1080 | |
| 87.9 % v7 (old) | 11/18 | Apple MacBook Pro 15 2018 (2.6 GHz, 560X) i7-8850H, Radeon Pro 560X | 1.8 kg | 15.5 mm | 15.40" | 2880x1800 | |
| 83.9 % v7 (old) | 03/19 | HP Spectre x360 15-df0126ng i7-8750H, GeForce GTX 1050 Ti Max-Q | 2.2 kg | 19.3 mm | 15.60" | 3840x2160 | |
| 90 % v6 (old) | 01/19 | Lenovo ThinkPad X1 Carbon 2018-20KGS5DU00 i5-8550U, UHD Graphics 620 | 1.1 kg | 15.95 mm | 14.00" | 2560x1440 |


| |||||||||||||||||||||||||
Homogénéité de la luminosité: 86 %
Valeur mesurée au centre, sur batterie: 403.4 cd/m²
Contraste: 1042:1 (Valeurs des noirs: 0.4 cd/m²)
ΔE ColorChecker Calman: 2.75 | ∀{0.5-29.43 Ø4.72}
calibrated: 0.71
ΔE Greyscale Calman: 1.8 | ∀{0.09-98 Ø4.97}
99.4% sRGB (Argyll 1.6.3 3D)
63.4% AdobeRGB 1998 (Argyll 1.6.3 3D)
63.7% AdobeRGB 1998 (Argyll 3D)
99.3% sRGB (Argyll 3D)
66.9% Display P3 (Argyll 3D)
Gamma: 2.09
CCT: 6646 K
| Microsoft Surface Laptop 3 15 Ryzen 5 3580U Sharp LQ150P1JX51, IPS, 15", 2496x1664 | Microsoft Surface Laptop 2-LQN-00004 VVX14T092N00, IPS, 13.5", 2256x1504 | Microsoft Surface Laptop i5 ID: MEI96A2, Name: Panasonic VVX14T092N00, IPS, 13.5", 2256x1504 | Dell XPS 15 7590 i5 iGPU FHD LQ156M1, IPS, 15.6", 1920x1080 | HP Spectre x360 15-df0126ng AU Optronics AUO30EB, IPS, 15.6", 3840x2160 | Apple MacBook Pro 15 2018 (2.6 GHz, 560X) APPA040, IPS, 15.4", 2880x1800 | |
|---|---|---|---|---|---|---|
| Display | 2% | 2% | 2% | 1% | 28% | |
| Display P3 Coverage (%) | 66.9 | 68 2% | 67.8 1% | 66.5 -1% | 68.1 2% | 98.7 48% |
| sRGB Coverage (%) | 99.3 | 94.7 -5% | 94.3 -5% | 98 -1% | 94.2 -5% | 99.9 1% |
| AdobeRGB 1998 Coverage (%) | 63.7 | 69.2 9% | 69.5 9% | 68.4 7% | 68.4 7% | 86.6 36% |
| Response Times | -37% | -5% | 1% | -3% | 12% | |
| Response Time Grey 50% / Grey 80% * (ms) | 47.2 ? | 69.2 ? -47% | 50.8 ? -8% | 52.8 ? -12% | 57 ? -21% | 43.2 ? 8% |
| Response Time Black / White * (ms) | 36.8 ? | 46.4 ? -26% | 37.2 ? -1% | 32 ? 13% | 31 ? 16% | 31.2 ? 15% |
| PWM Frequency (Hz) | 21370 ? | 1020 ? | 117000 ? | |||
| Screen | -15% | 11% | 1% | -39% | 29% | |
| Brightness middle (cd/m²) | 416.9 | 392 -6% | 384.2 -8% | 588 41% | 330 -21% | 520 25% |
| Brightness (cd/m²) | 389 | 390 0% | 378 -3% | 555 43% | 310 -20% | 492 26% |
| Brightness Distribution (%) | 86 | 89 3% | 90 5% | 89 3% | 87 1% | 88 2% |
| Black Level * (cd/m²) | 0.4 | 0.24 40% | 0.36 10% | 0.4 -0% | 0.37 7% | 0.39 2% |
| Contrast (:1) | 1042 | 1633 57% | 1067 2% | 1470 41% | 892 -14% | 1333 28% |
| Colorchecker dE 2000 * | 2.75 | 3.2 -16% | 1.8 35% | 2.5 9% | 4.03 -47% | 1.2 56% |
| Colorchecker dE 2000 max. * | 6.64 | 6.3 5% | 4.2 37% | 6.3 5% | 6.74 -2% | 2.3 65% |
| Colorchecker dE 2000 calibrated * | 0.71 | 1.4 -97% | 0.6 15% | 1.96 -176% | ||
| Greyscale dE 2000 * | 1.8 | 4.5 -150% | 1.2 33% | 4.5 -150% | 4.49 -149% | 1.3 28% |
| Gamma | 2.09 105% | 2.2 100% | 2.21 100% | 2.2 100% | 2.57 86% | 2.18 101% |
| CCT | 6646 98% | 7556 86% | 6708 97% | 6836 95% | 6744 96% | 6738 96% |
| Color Space (Percent of AdobeRGB 1998) (%) | 63.4 | 63.9 1% | 63.7 0% | 63.2 0% | 61 -4% | |
| Color Space (Percent of sRGB) (%) | 99.4 | 95 -4% | 94.2 -5% | 98 -1% | 94 -5% | |
| Moyenne finale (programmes/paramètres) | -17% /
-15% | 3% /
7% | 1% /
1% | -14% /
-27% | 23% /
26% |
* ... Moindre est la valeur, meilleures sont les performances
Temps de réponse de l'écran
| ↔ Temps de réponse noir à blanc | ||
|---|---|---|
| 36.8 ms ... hausse ↗ et chute ↘ combinées | ↗ 20.4 ms hausse | 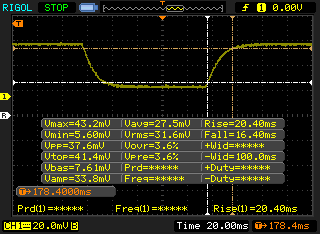 |
| ↘ 16.4 ms chute | ||
| L'écran souffre de latences très élevées, à éviter pour le jeu. En comparaison, tous les appareils testés affichent entre 0.1 (minimum) et 240 (maximum) ms. » 95 % des appareils testés affichent de meilleures performances. Cela signifie que les latences relevées sont moins bonnes que la moyenne (19.8 ms) de tous les appareils testés. | ||
| ↔ Temps de réponse gris 50% à gris 80% | ||
| 47.2 ms ... hausse ↗ et chute ↘ combinées | ↗ 23.2 ms hausse | 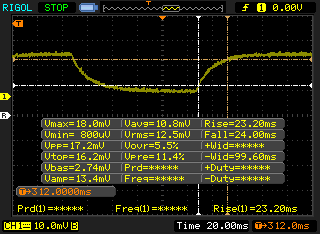 |
| ↘ 24 ms chute | ||
| L'écran souffre de latences très élevées, à éviter pour le jeu. En comparaison, tous les appareils testés affichent entre 0.165 (minimum) et 636 (maximum) ms. » 82 % des appareils testés affichent de meilleures performances. Cela signifie que les latences relevées sont moins bonnes que la moyenne (31 ms) de tous les appareils testés. | ||
Scintillement / MLI (Modulation de largeur d'impulsion)
| Scintillement / MLI (Modulation de largeur d'impulsion) décelé | 21370 Hz | ≤ 51 Niveau de luminosité | 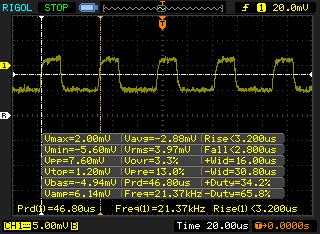 |
Le rétroéclairage de l'écran scintille à la fréquence de 21370 Hz (certainement du fait de l'utilisation d'une MDI - Modulation de largeur d'impulsion) à un niveau de luminosité inférieur ou égal à 51 % . Aucun scintillement ne devrait être perceptible au-dessus de cette valeur. La fréquence de rafraîchissement de 21370 Hz est élevée, la grande majorité des utilisateurs ne devrait pas percevoir de scintillements et être sujette à une fatigue oculaire accrue. En comparaison, 52 % des appareils testés n'emploient pas MDI pour assombrir leur écran. Nous avons relevé une moyenne à 7763 (minimum : 5 - maximum : 343500) Hz dans le cas où une MDI était active. | |||
| PCMark 8 Home Score Accelerated v2 | 3348 points | |
| PCMark 8 Work Score Accelerated v2 | 4246 points | |
| PCMark 10 Score | 4056 points | |
Aide | ||
| Microsoft Surface Laptop 3 15 Ryzen 5 3580U SK hynix BC501 HFM256GDGTNG | Microsoft Surface Laptop 2-LQN-00004 SK Hynix BC501 NVMe 256 GB | Microsoft Surface Laptop i5 Toshiba THNSN0128GTYA | Dell XPS 15 7590 i5 iGPU FHD Toshiba XG6 KXG60ZNV512G | Apple MacBook Pro 15 2018 (2.6 GHz, 560X) Apple SSD AP0512 | HP Spectre x360 15-df0126ng Toshiba XG5-P KXG50PNV2T04 | |
|---|---|---|---|---|---|---|
| AS SSD | 10% | -89% | 133% | 2% | 55% | |
| Seq Read (MB/s) | 1122 | 826 -26% | 561 -50% | 2357 110% | 2239 100% | 2018 80% |
| Seq Write (MB/s) | 514 | 555 8% | 117.2 -77% | 1235 140% | 1644 220% | 773 50% |
| 4K Read (MB/s) | 34.98 | 33.39 -5% | 20.15 -42% | 43.29 24% | 9.46 -73% | 24.62 -30% |
| 4K Write (MB/s) | 96.8 | 95.3 -2% | 39.07 -60% | 99.7 3% | 18.78 -81% | 92.8 -4% |
| 4K-64 Read (MB/s) | 492 | 447 -9% | 80.4 -84% | 1020 107% | 965 96% | 845 72% |
| 4K-64 Write (MB/s) | 339.9 | 370.4 9% | 35.48 -90% | 1502 342% | 163.5 -52% | 957 182% |
| Access Time Read * (ms) | 0.056 | 0.048 14% | 0.128 -129% | 0.07 -25% | 0.225 -302% | 0.147 -163% |
| Access Time Write * (ms) | 0.11 | 0.048 56% | 0.369 -235% | 0.039 65% | 0.057 48% | |
| Score Read (Points) | 639 | 563 -12% | 157 -75% | 1299 103% | 1199 88% | 1071 68% |
| Score Write (Points) | 488 | 521 7% | 86 -82% | 1726 254% | 347 -29% | 1127 131% |
| Score Total (Points) | 1434 | 1369 -5% | 309 -78% | 3640 154% | 2119 48% | 2684 87% |
| Copy ISO MB/s (MB/s) | 828 | 755 -9% | 87.1 -89% | 2145 159% | 1652 100% | |
| Copy Program MB/s (MB/s) | 200.5 | 325.1 62% | 62.7 -69% | 565 182% | 328.5 64% | |
| Copy Game MB/s (MB/s) | 387.4 | 577 49% | 80.5 -79% | 1320 241% | 700 81% |
* ... Moindre est la valeur, meilleures sont les performances

| 3DMark 06 Standard Score | 13365 points | |
| 3DMark Vantage P Result | 12628 points | |
| 3DMark 11 Performance | 4424 points | |
| 3DMark Ice Storm Standard Score | 77533 points | |
| 3DMark Cloud Gate Standard Score | 13582 points | |
| 3DMark Fire Strike Score | 2524 points | |
| 3DMark Time Spy Score | 974 points | |
Aide | ||
| Fortnite | |
| 1280x720 Low Preset | |
| Apple MacBook Pro 15 2018 (2.6 GHz, 560X) | |
| Asus ROG Zephyrus G15 GA502DU | |
| Razer Blade Stealth i7-1065G7 Iris Plus | |
| Honor Magicbook | |
| Microsoft Surface Laptop 3 15 Ryzen 5 3580U | |
| 1920x1080 Medium Preset | |
| MSI PS63 Modern 8SC | |
| Asus ROG Zephyrus G15 GA502DU | |
| Apple MacBook Pro 15 2018 (2.6 GHz, 560X) | |
| Razer Blade Stealth i7-1065G7 Iris Plus | |
| Honor Magicbook | |
| Microsoft Surface Laptop 3 15 Ryzen 5 3580U | |
| Bas | Moyen | Élevé | Ultra | |
|---|---|---|---|---|
| BioShock Infinite (2013) | 117.9 | 20.5 | ||
| The Witcher 3 (2015) | 41.9 | 13.3 | 8.1 | |
| Overwatch (2016) | 92.3 | 36.3 | 19.3 | |
| Rocket League (2017) | 100.7 | 46.2 | 30.4 | |
| Fortnite (2018) | 48 | 22.3 | 15.7 | 9.1 |
| Shadow of the Tomb Raider (2018) | 29 | 8 | ||
| Apex Legends (2019) | 60.7 | 20.9 | 18 | 14.5 |
| F1 2019 (2019) | 51 | 21 | 18 | 12 |
| Borderlands 3 (2019) | 28.3 | 13.5 | 7.8 |
| Microsoft Surface Laptop 3 15 Ryzen 5 3580U Vega 9, R5 3580U, SK hynix BC501 HFM256GDGTNG | Microsoft Surface Laptop 2-LQN-00004 UHD Graphics 620, i5-8250U, SK Hynix BC501 NVMe 256 GB | Microsoft Surface Laptop i5 HD Graphics 620, i5-7200U, Toshiba THNSN0128GTYA | Dell XPS 15 7590 i5 iGPU FHD UHD Graphics 630, i5-9300H, Toshiba XG6 KXG60ZNV512G | Apple MacBook Pro 15 2018 (2.6 GHz, 560X) Radeon Pro 560X, i7-8850H, Apple SSD AP0512 | HP Spectre x360 15-df0126ng GeForce GTX 1050 Ti Max-Q, i7-8750H, Toshiba XG5-P KXG50PNV2T04 | |
|---|---|---|---|---|---|---|
| Noise | 2% | -1% | -4% | -14% | -14% | |
| arrêt / environnement * (dB) | 28 | 28.7 -2% | 28.2 -1% | 29.3 -5% | 29.6 -6% | 30.4 -9% |
| Idle Minimum * (dB) | 28 | 28.7 -2% | 28.2 -1% | 29.3 -5% | 30.1 -8% | 30.4 -9% |
| Idle Average * (dB) | 28 | 28.7 -2% | 28.2 -1% | 29.3 -5% | 30.1 -8% | 30.4 -9% |
| Idle Maximum * (dB) | 28 | 28.7 -2% | 29 -4% | 29.8 -6% | 30.1 -8% | 31.6 -13% |
| Load Average * (dB) | 29.2 | 30 -3% | 30.3 -4% | 32.4 -11% | 46.8 -60% | 43.2 -48% |
| Witcher 3 ultra * (dB) | 39 | 36 8% | ||||
| Load Maximum * (dB) | 41.4 | 32.9 21% | 39.3 5% | 37.2 10% | 46.8 -13% | 38.3 7% |
* ... Moindre est la valeur, meilleures sont les performances
Degré de la nuisance sonore
| Au repos |
| 28 / 28 / 28 dB(A) |
| Fortement sollicité |
| 29.2 / 41.4 dB(A) |
 | ||
30 dB silencieux 40 dB(A) audible 50 dB(A) bruyant |
||
min: | ||
(±) La température maximale du côté supérieur est de 43.6 °C / 110 F, par rapport à la moyenne de 34.3 °C / 94 F, allant de 21.2 à 62.5 °C pour la classe Office.
(-) Le fond chauffe jusqu'à un maximum de 49.4 °C / 121 F, contre une moyenne de 36.8 °C / 98 F
(+) En utilisation inactive, la température moyenne du côté supérieur est de 26.6 °C / 80 F, par rapport à la moyenne du dispositif de 29.5 °C / 85 F.
(±) En jouant à The Witcher 3, la température moyenne du côté supérieur est de 37.6 °C / 100 F, alors que la moyenne de l'appareil est de 29.5 °C / 85 F.
(+) Les repose-poignets et le pavé tactile atteignent la température maximale de la peau (35.8 °C / 96.4 F) et ne sont donc pas chauds.
(-) La température moyenne de la zone de l'appui-paume de dispositifs similaires était de 27.5 °C / 81.5 F (-8.3 °C / #-14.9 F).
Microsoft Surface Laptop 3 15 Ryzen 5 3580U analyse audio
(±) | le niveau sonore du haut-parleur est moyen mais bon (79.9# dB)
Basses 100 - 315 Hz
(+) | bonne basse - seulement 4.8% loin de la médiane
(±) | la linéarité des basses est moyenne (8.2% delta à la fréquence précédente)
Médiums 400 - 2000 Hz
(+) | médiane équilibrée - seulement 4% de la médiane
(±) | la linéarité des médiums est moyenne (8.5% delta à la fréquence précédente)
Aiguës 2 - 16 kHz
(+) | des sommets équilibrés - à seulement 3.5% de la médiane
(±) | la linéarité des aigus est moyenne (9.1% delta à la fréquence précédente)
Globalement 100 - 16 000 Hz
(+) | le son global est linéaire (14.7% différence à la médiane)
Par rapport à la même classe
» 13% de tous les appareils testés de cette catégorie étaient meilleurs, 4% similaires, 84% pires
» Le meilleur avait un delta de 7%, la moyenne était de 21%, le pire était de 53%.
Par rapport à tous les appareils testés
» 19% de tous les appareils testés étaient meilleurs, 4% similaires, 77% pires
» Le meilleur avait un delta de 4%, la moyenne était de 23%, le pire était de 134%.
Apple MacBook 12 (Early 2016) 1.1 GHz analyse audio
(+) | les haut-parleurs peuvent jouer relativement fort (83.6# dB)
Basses 100 - 315 Hz
(±) | basse réduite - en moyenne 11.3% inférieure à la médiane
(±) | la linéarité des basses est moyenne (14.2% delta à la fréquence précédente)
Médiums 400 - 2000 Hz
(+) | médiane équilibrée - seulement 2.4% de la médiane
(+) | les médiums sont linéaires (5.5% delta à la fréquence précédente)
Aiguës 2 - 16 kHz
(+) | des sommets équilibrés - à seulement 2% de la médiane
(+) | les aigus sont linéaires (4.5% delta à la fréquence précédente)
Globalement 100 - 16 000 Hz
(+) | le son global est linéaire (10.2% différence à la médiane)
Par rapport à la même classe
» 7% de tous les appareils testés de cette catégorie étaient meilleurs, 2% similaires, 91% pires
» Le meilleur avait un delta de 5%, la moyenne était de 18%, le pire était de 53%.
Par rapport à tous les appareils testés
» 5% de tous les appareils testés étaient meilleurs, 1% similaires, 94% pires
» Le meilleur avait un delta de 4%, la moyenne était de 23%, le pire était de 134%.
| Éteint/en veille | |
| Au repos | |
| Fortement sollicité |
|
Légende:
min: | |
| Microsoft Surface Laptop 3 15 Ryzen 5 3580U R5 3580U, Vega 9, SK hynix BC501 HFM256GDGTNG, IPS, 2496x1664, 15" | Microsoft Surface Laptop 2-LQN-00004 i5-8250U, UHD Graphics 620, SK Hynix BC501 NVMe 256 GB, IPS, 2256x1504, 13.5" | Dell XPS 15 7590 i5 iGPU FHD i5-9300H, UHD Graphics 630, Toshiba XG6 KXG60ZNV512G, IPS, 1920x1080, 15.6" | Asus VivoBook S15 S530UN-BQ097T i5-8550U, GeForce MX150, SanDisk SD9SN8W256G1027, IPS LED, 1920x1080, 15.6" | Dell Inspiron 15 5000 5585 R7 3700U, Vega 10, WDC PC SN520 SDAPNUW-512G, IPS, 1920x1080, 15.6" | HP EliteBook 755 G5 3UN79EA R7 2700U, Vega 10, Toshiba XG5 KXG50ZNV512G, IPS, 1920x1080, 15.6" | |
|---|---|---|---|---|---|---|
| Power Consumption | 7% | -36% | -8% | 5% | -32% | |
| Idle Minimum * (Watt) | 3.3 | 3 9% | 3.79 -15% | 3.1 6% | 4.2 -27% | 5 -52% |
| Idle Average * (Watt) | 7.1 | 6.8 4% | 6.9 3% | 6.3 11% | 6.8 4% | 10.6 -49% |
| Idle Maximum * (Watt) | 7.2 | 8.76 -22% | 9.2 -28% | 8.6 -19% | 7 3% | 12.9 -79% |
| Load Average * (Watt) | 44.8 | 35.1 22% | 62 -38% | 56.4 -26% | 36.5 19% | 40.6 9% |
| Witcher 3 ultra * (Watt) | 45.1 | 45 -0% | 37.9 16% | |||
| Load Maximum * (Watt) | 53 | 42.6 20% | 108 -104% | 62.7 -18% | 44 17% | 46.6 12% |
* ... Moindre est la valeur, meilleures sont les performances
| Microsoft Surface Laptop 3 15 Ryzen 5 3580U R5 3580U, Vega 9, 45 Wh | Microsoft Surface Laptop 2-LQN-00004 i5-8250U, UHD Graphics 620, 45 Wh | Microsoft Surface Laptop i5 i5-7200U, HD Graphics 620, 45 Wh | Dell XPS 15 7590 i5 iGPU FHD i5-9300H, UHD Graphics 630, 97 Wh | Apple MacBook Pro 15 2018 (2.6 GHz, 560X) i7-8850H, Radeon Pro 560X, 83 Wh | HP Spectre x360 15-df0126ng i7-8750H, GeForce GTX 1050 Ti Max-Q, 84 Wh | |
|---|---|---|---|---|---|---|
| Autonomie de la batterie | 2% | 18% | 28% | 12% | 11% | |
| Reader / Idle (h) | 18.7 | 20.8 11% | 22.5 20% | 18.8 1% | ||
| WiFi v1.3 (h) | 9.1 | 9.1 0% | 10 10% | 14.1 55% | 10.2 12% | 8.8 -3% |
| Load (h) | 1.7 | 1.6 -6% | 2.1 24% | 1.7 0% | 2.3 35% | |
| Witcher 3 ultra (h) | 1.5 |
Points positifs
Points négatifs
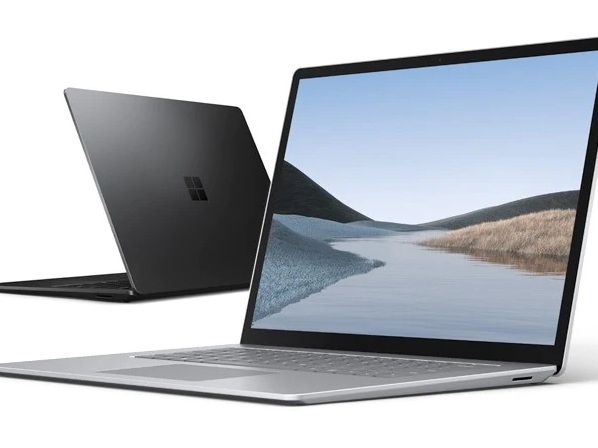
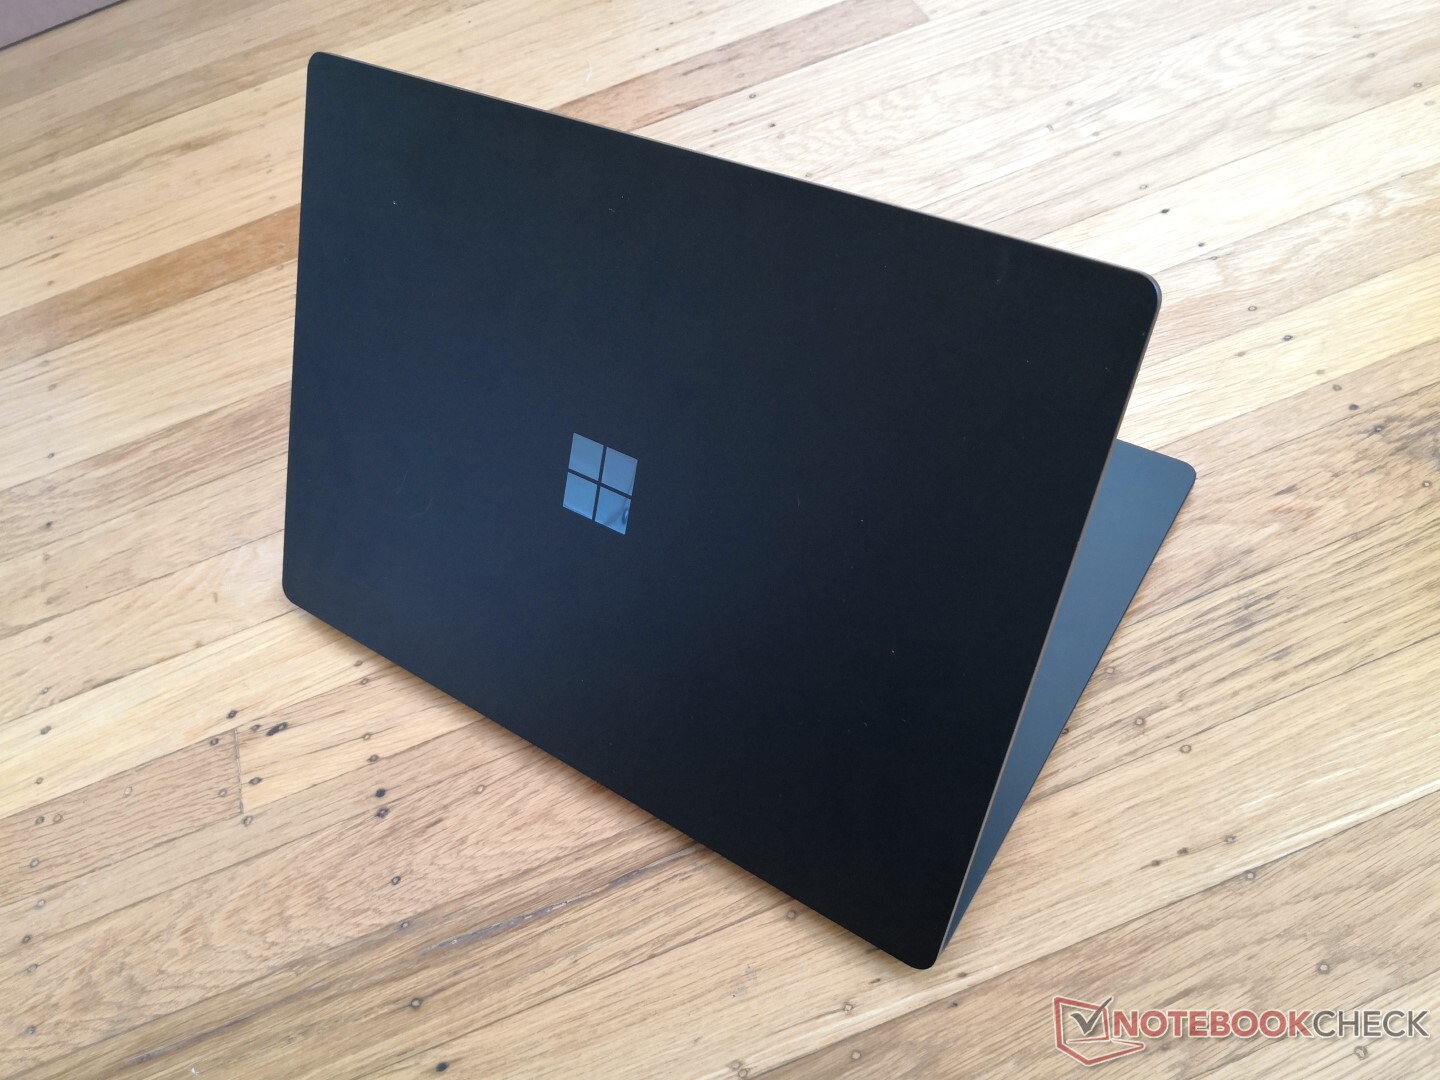
Le Surface Laptop 3 15 possède quelques points forts. Le fait que le Ryzen 5 3580U peu cher puisse se rapprocher du Core i7-1065G7 plus cher en termes de puissance brute est un succès pour AMD. Des facteurs comme l’autonomie et le niveau sonore n’ont pas vraiment changé par rapport au Surface Laptop 2, ce qui signifie que le Surface Laptop 3 AMD propose de meilleures performances sans que cela n’ait de répercussions négatives. Gardez à l’esprit que nous n’avons pas nous-mêmes testé le Surface Laptop 3 15 Core i7 – il devra nous impressionner puisqu’il est vendu 500 € plus cher que la version AMD Ryzen 5 !
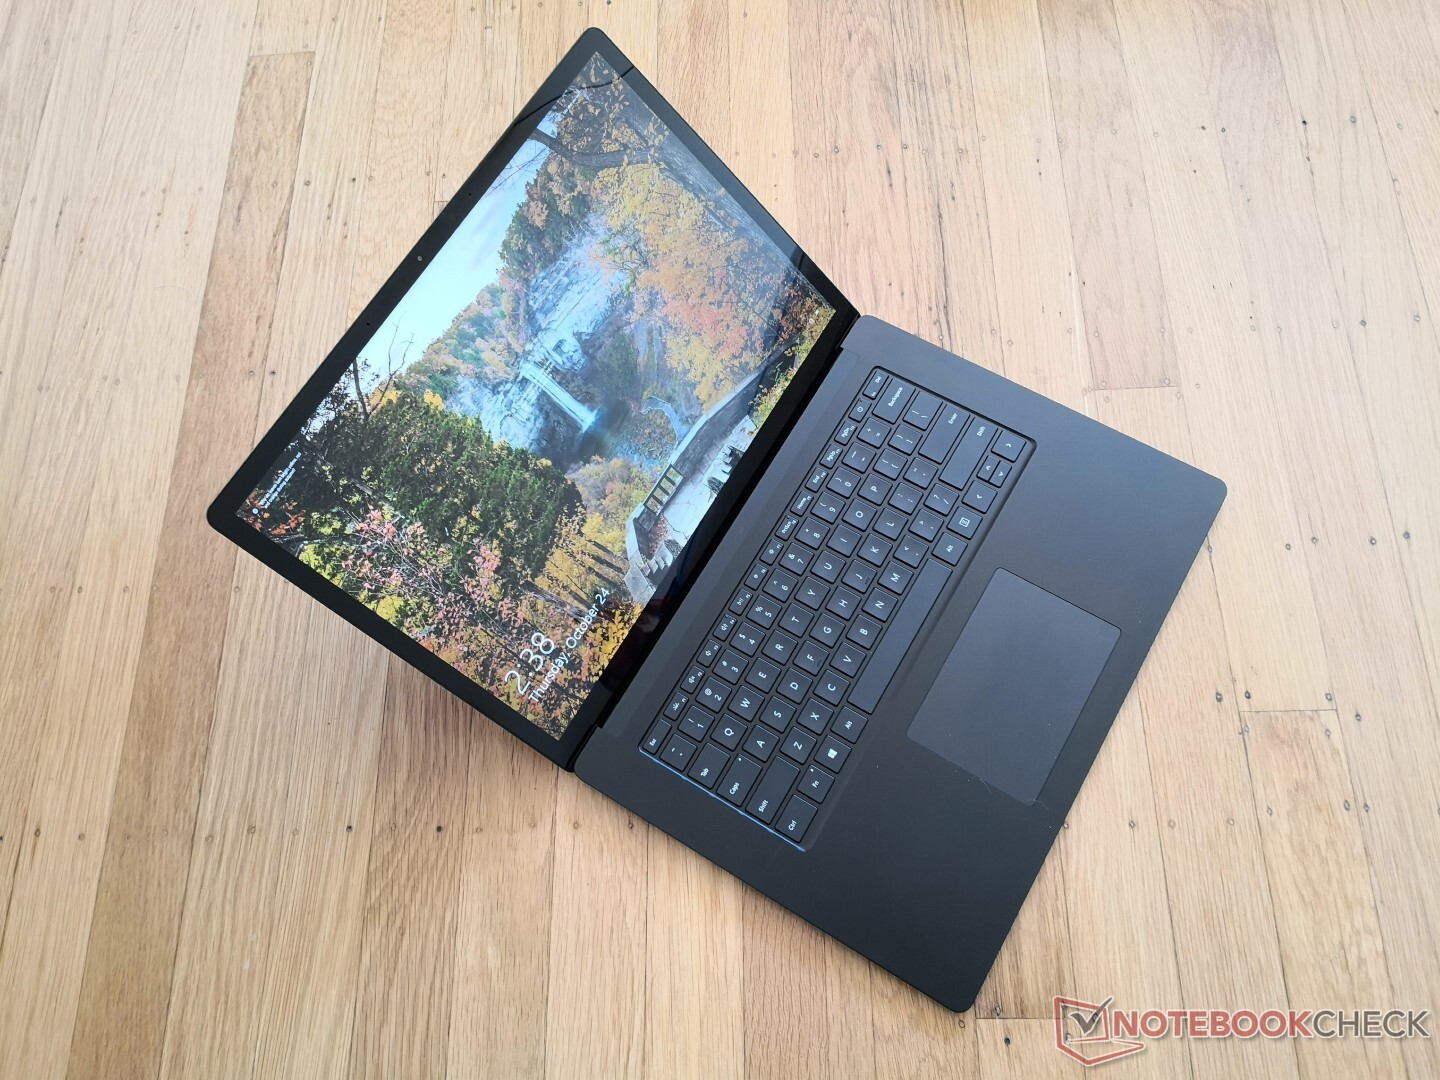
L’écran tactile 3:2 est un autre point notable. La dalle est nette et plutôt lumineuse, et couvre le sRVB à 100 %. Malheureusement, Microsoft ne propose pas de calibrage d’usine comme le font le Gigabyte Aero 15 ou le Razer Blade, si bien qu’un calibrage par l’utilisateur final est nécessaire pour tirer pleinement parti de l’écran.
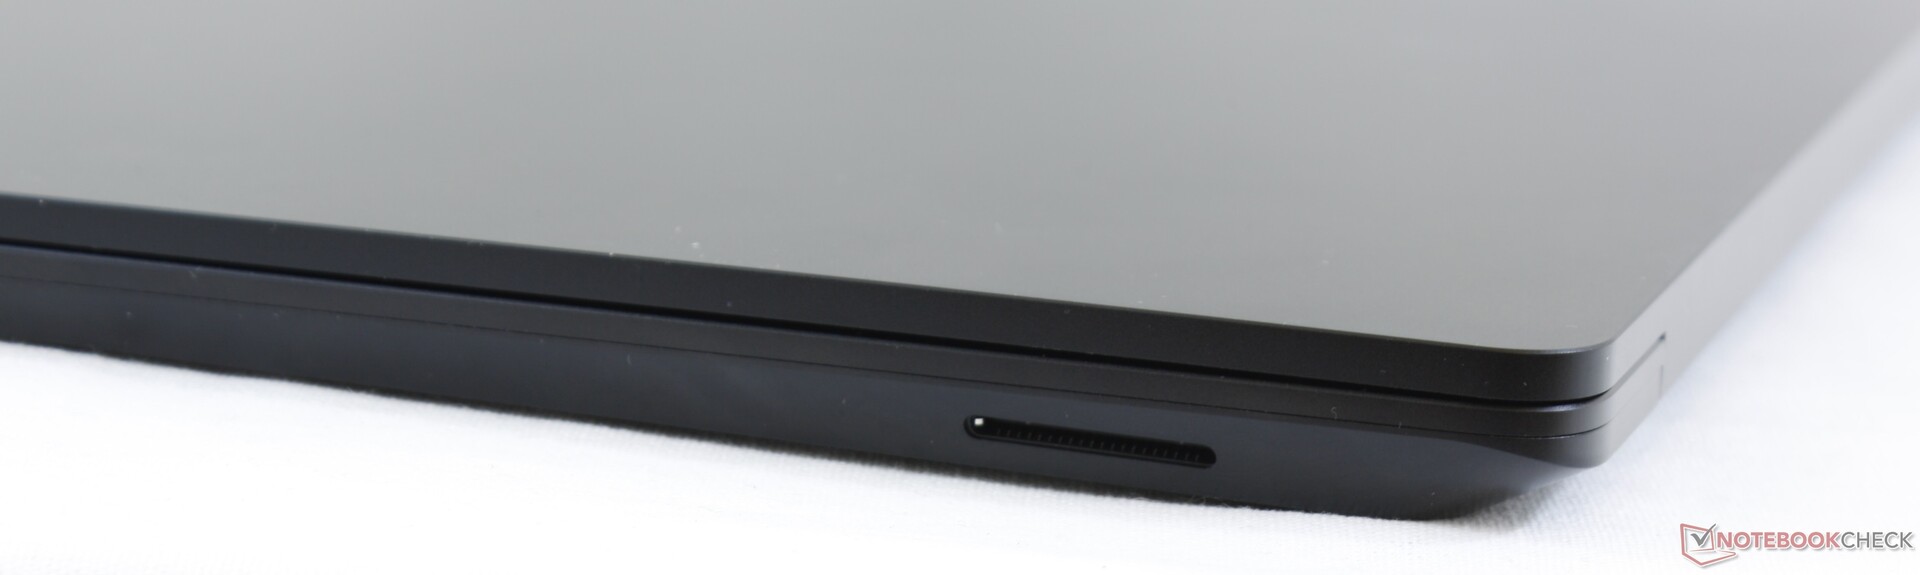
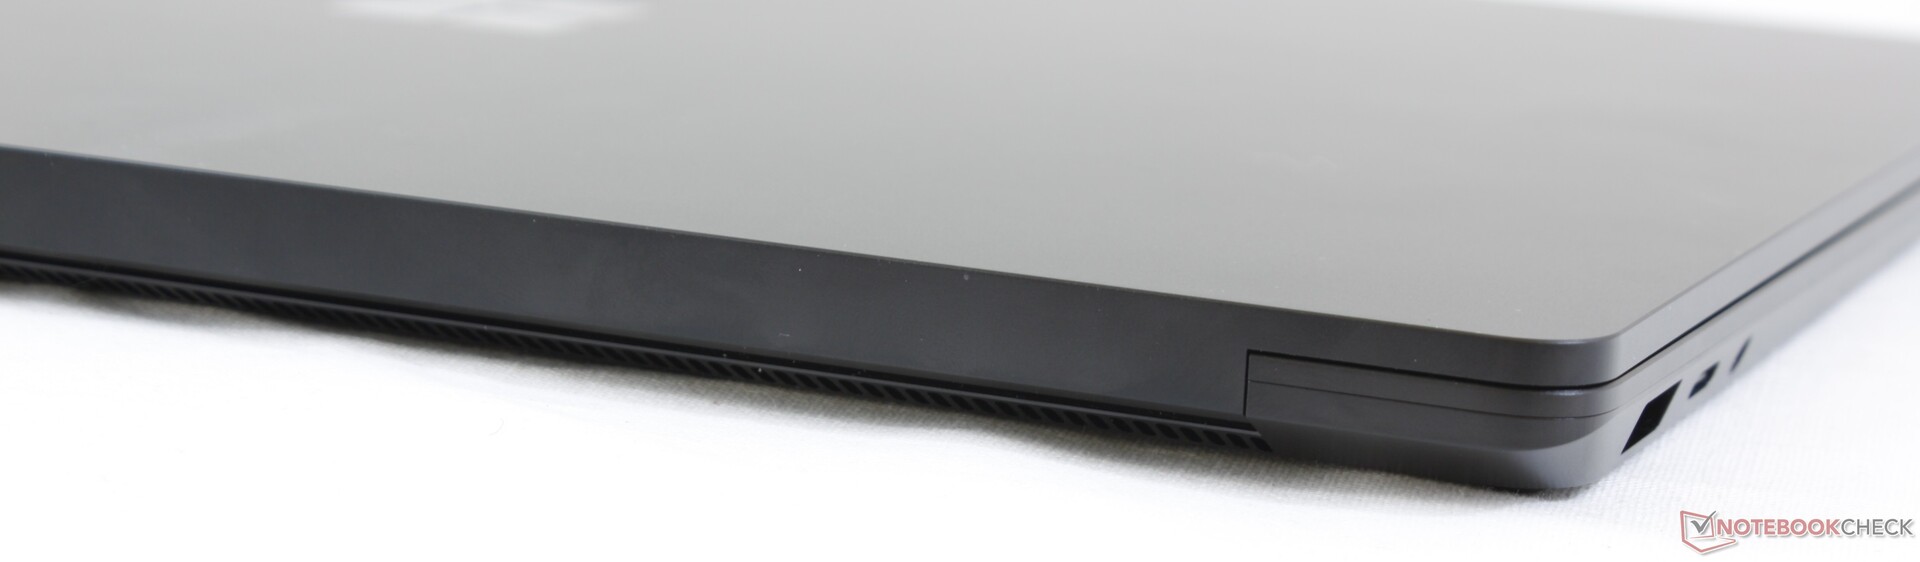
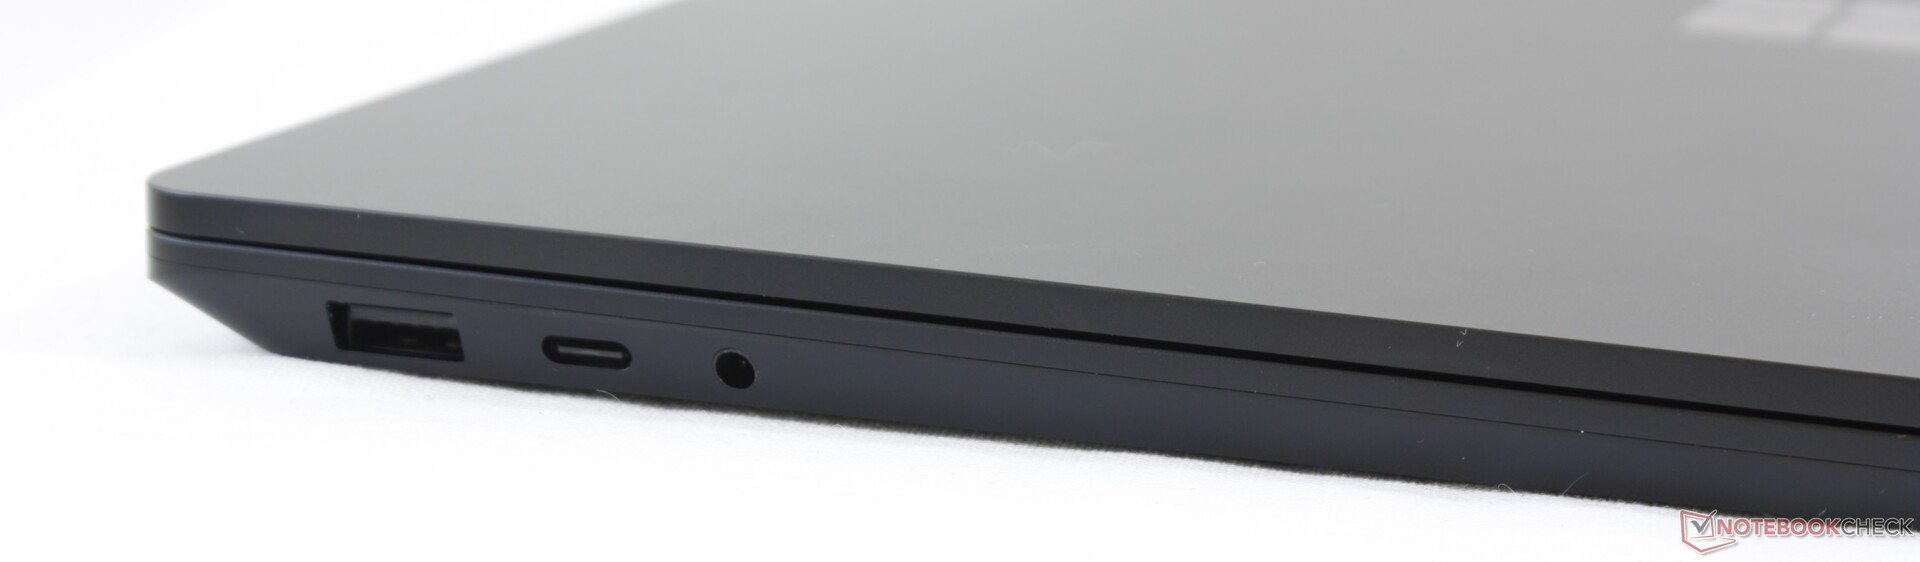
Presque tout le reste est plutôt moyen, voire décevant vu le niveau de prix du Surface Laptop 3. Ce Surface Laptop plus grand était la dernière chance pour Microsoft de corriger les problèmes de connectivité réduite du Surface Laptop de 13,5 pouces, mais rien n’a vraiment évolué. Le mini DisplayPort a disparu, poussant les utilisateurs à investir dans le Surface Dock, à 200 €. Le port USB C n’est pas compatible Thunderbolt 3 ni PowerDelivery, si bien qu’il faudra trimbaler partout l’adaptateur propriétaire. À l’inverse, on peut utiliser un chargeur USB C universel avec les Dell XPS 13, XPS 15, le Huawei MateBook X Pro, le HP Spectre x360 13, les smartphones ou les tablettes, sans avoir besoin d’un dock spécial pour connecter un écran externe.
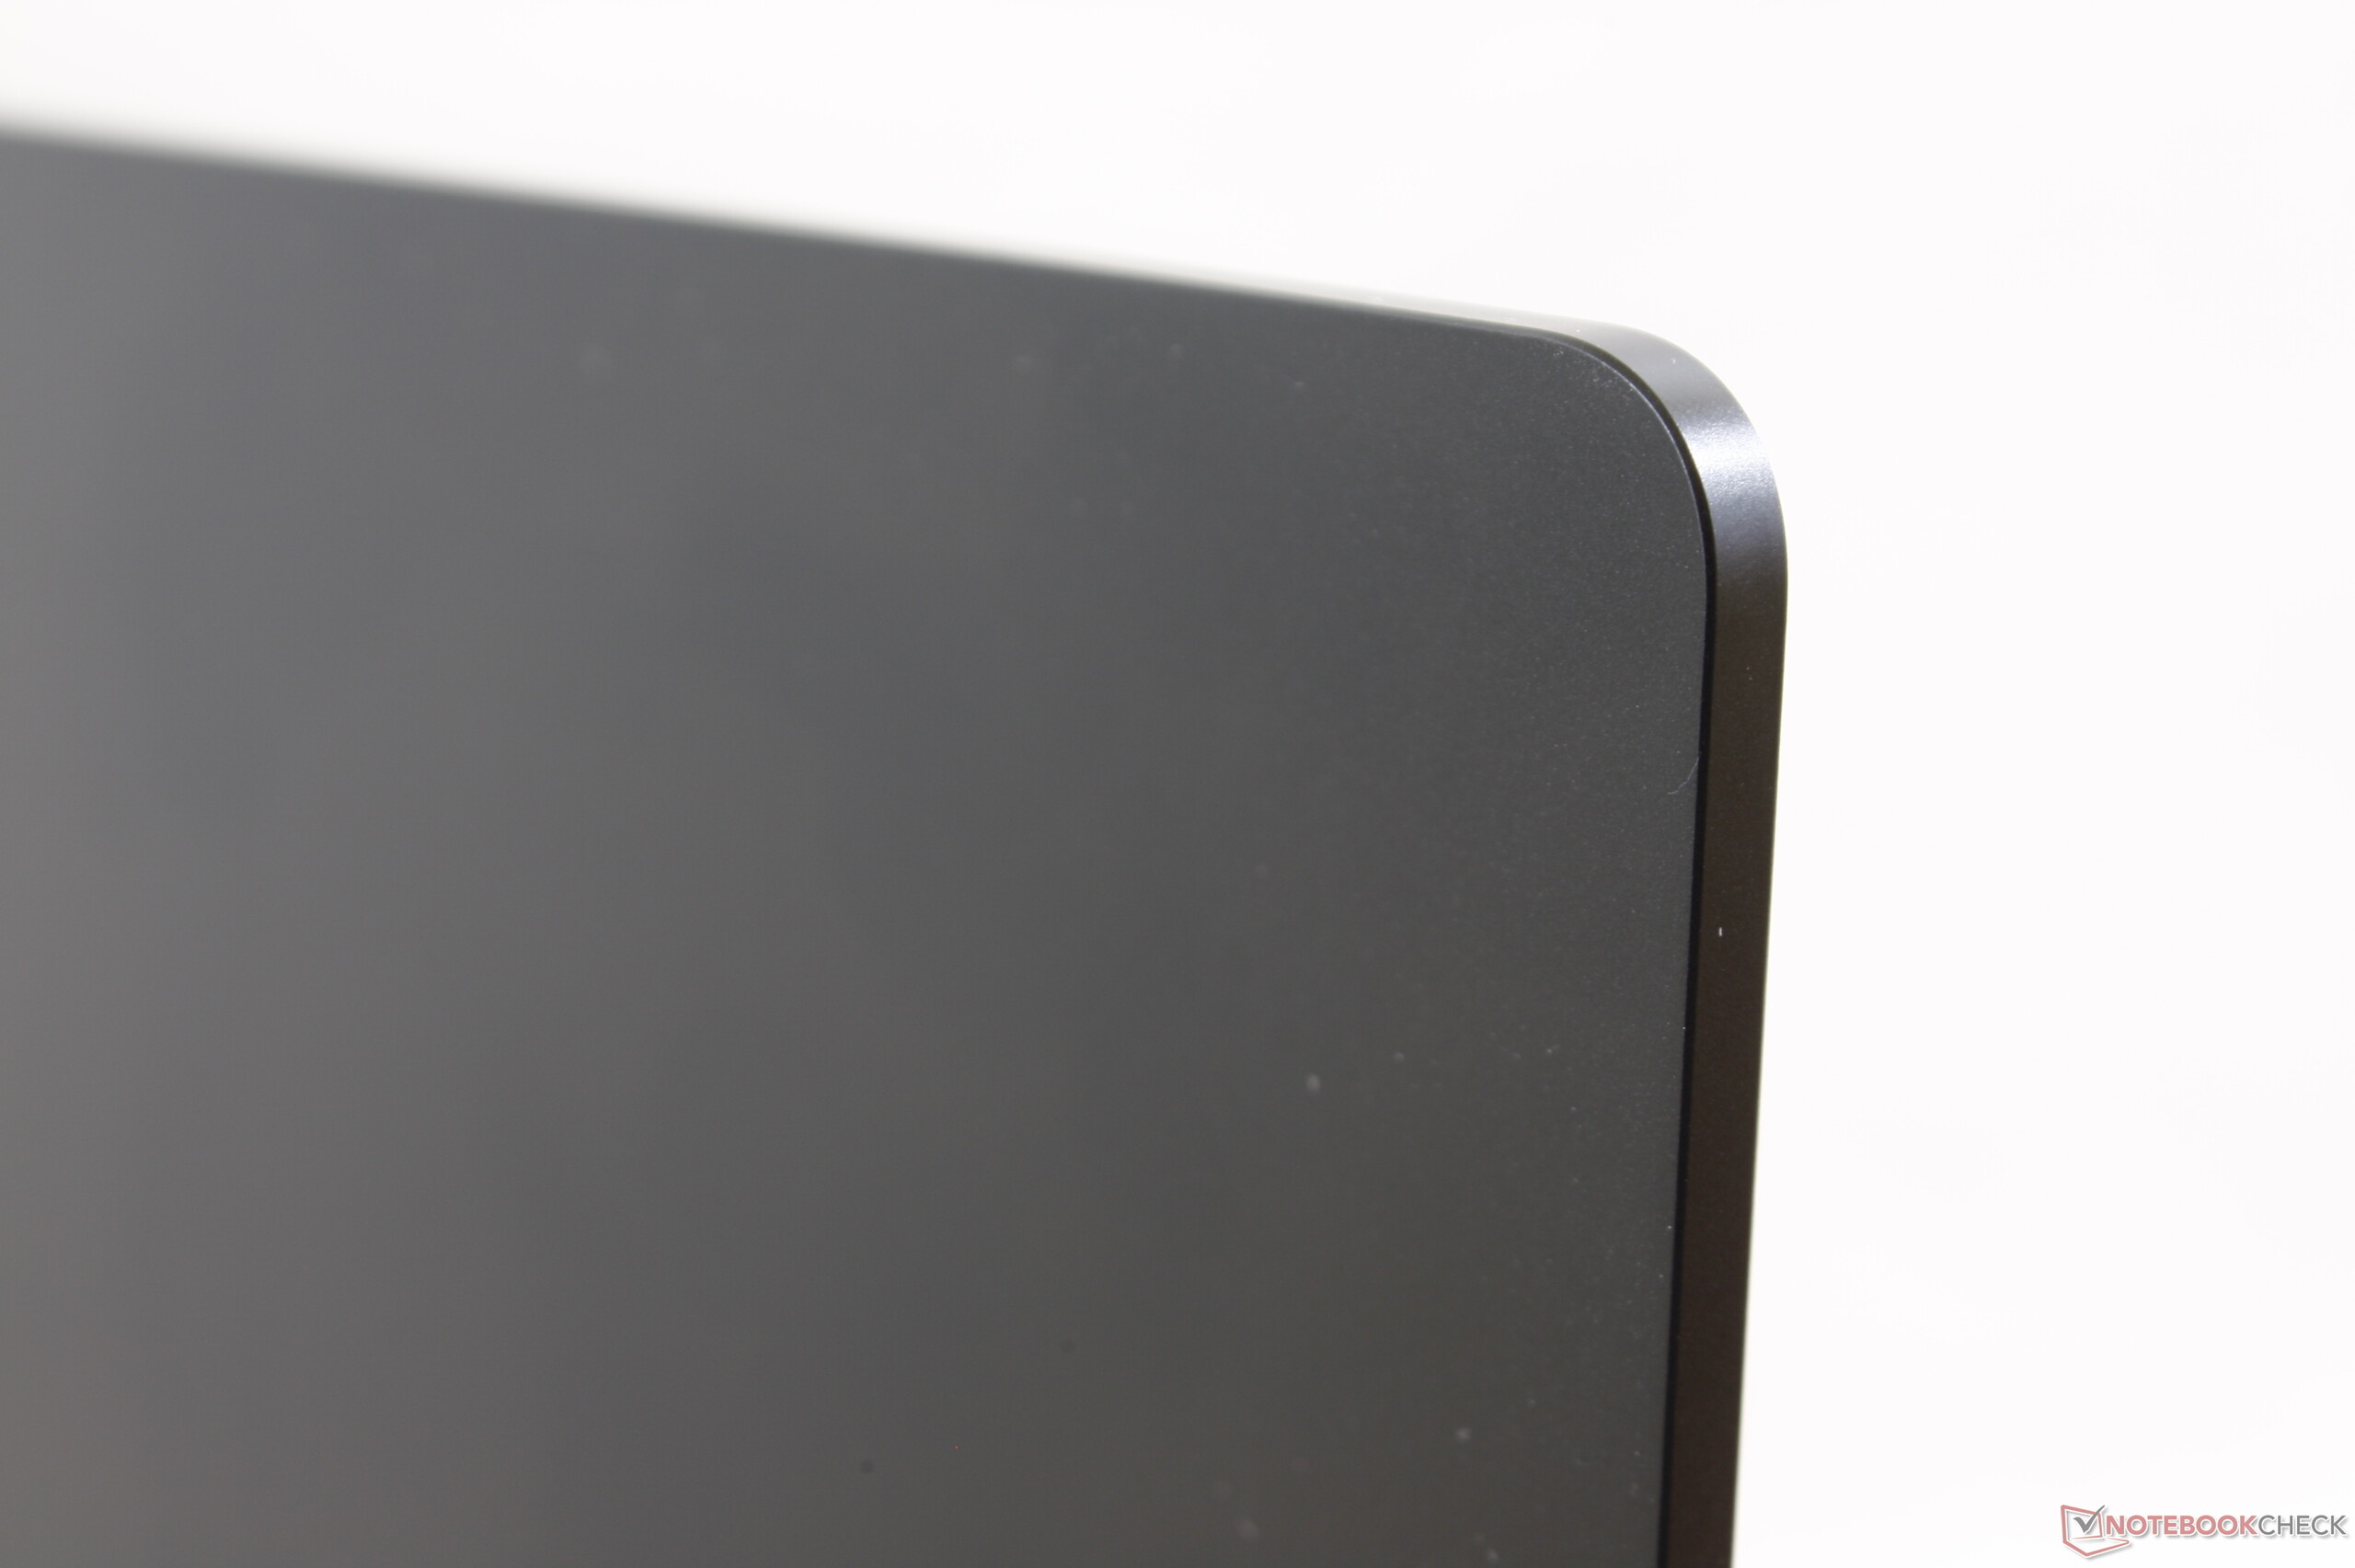
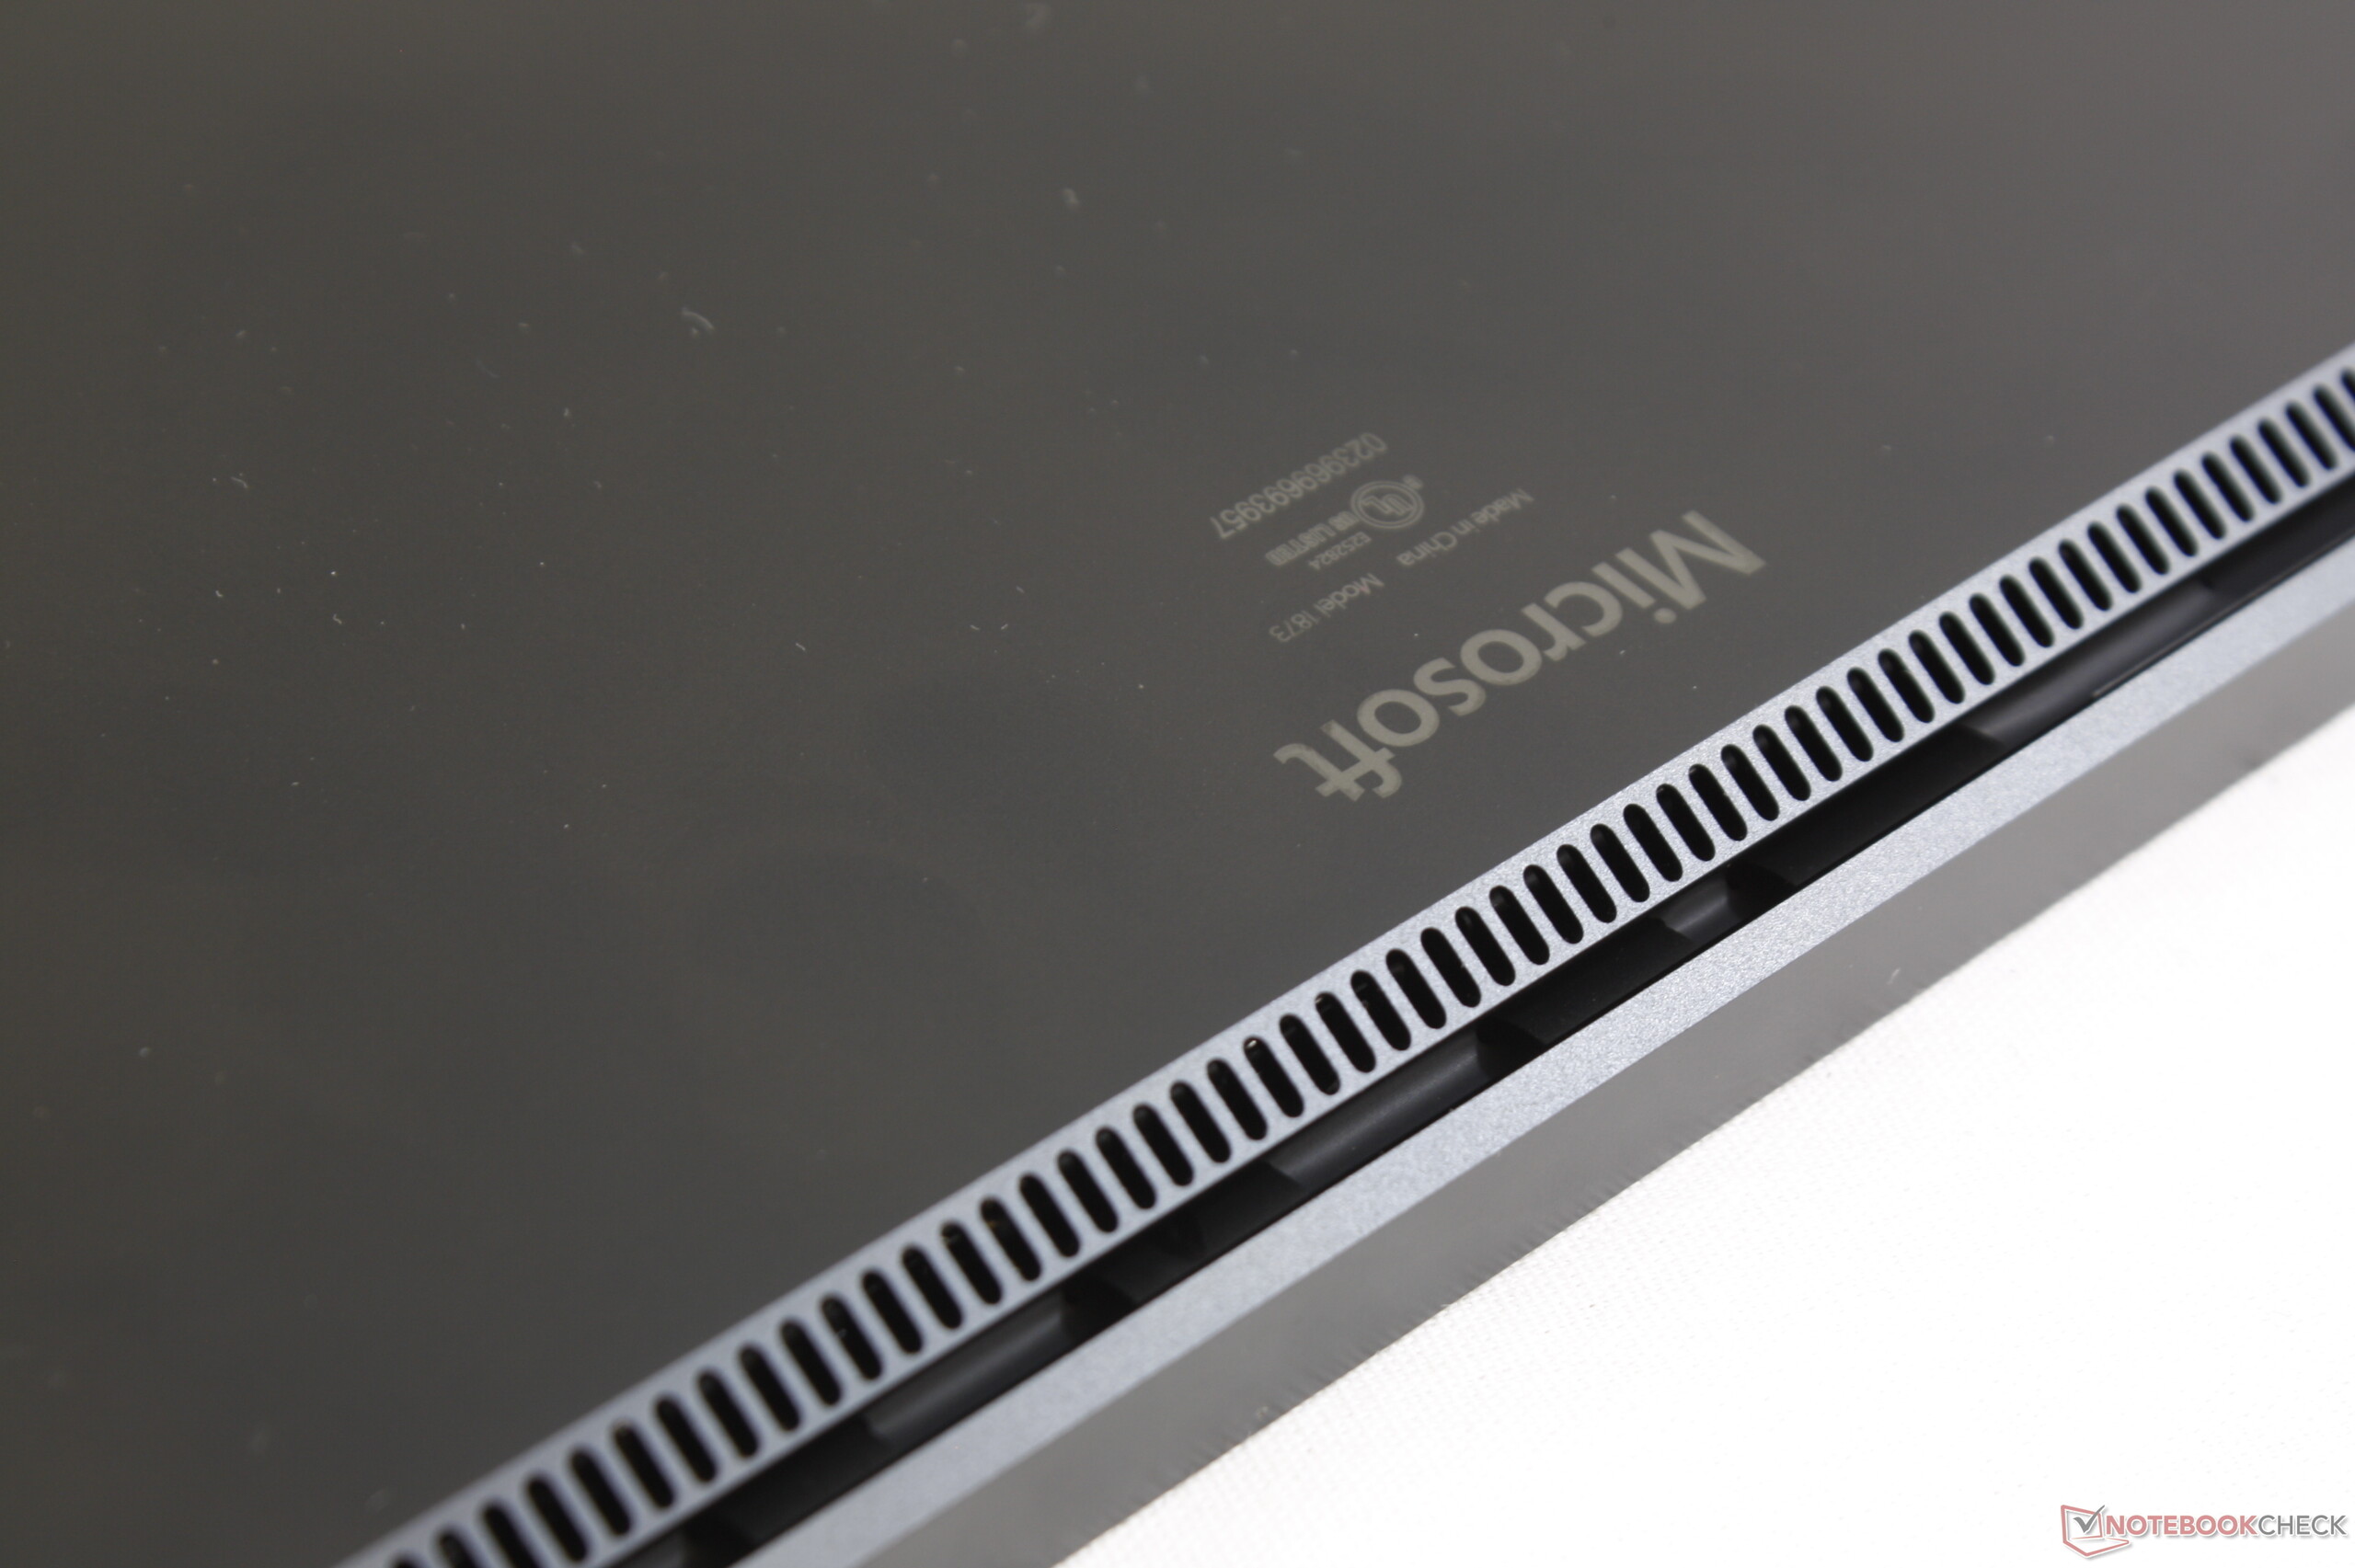
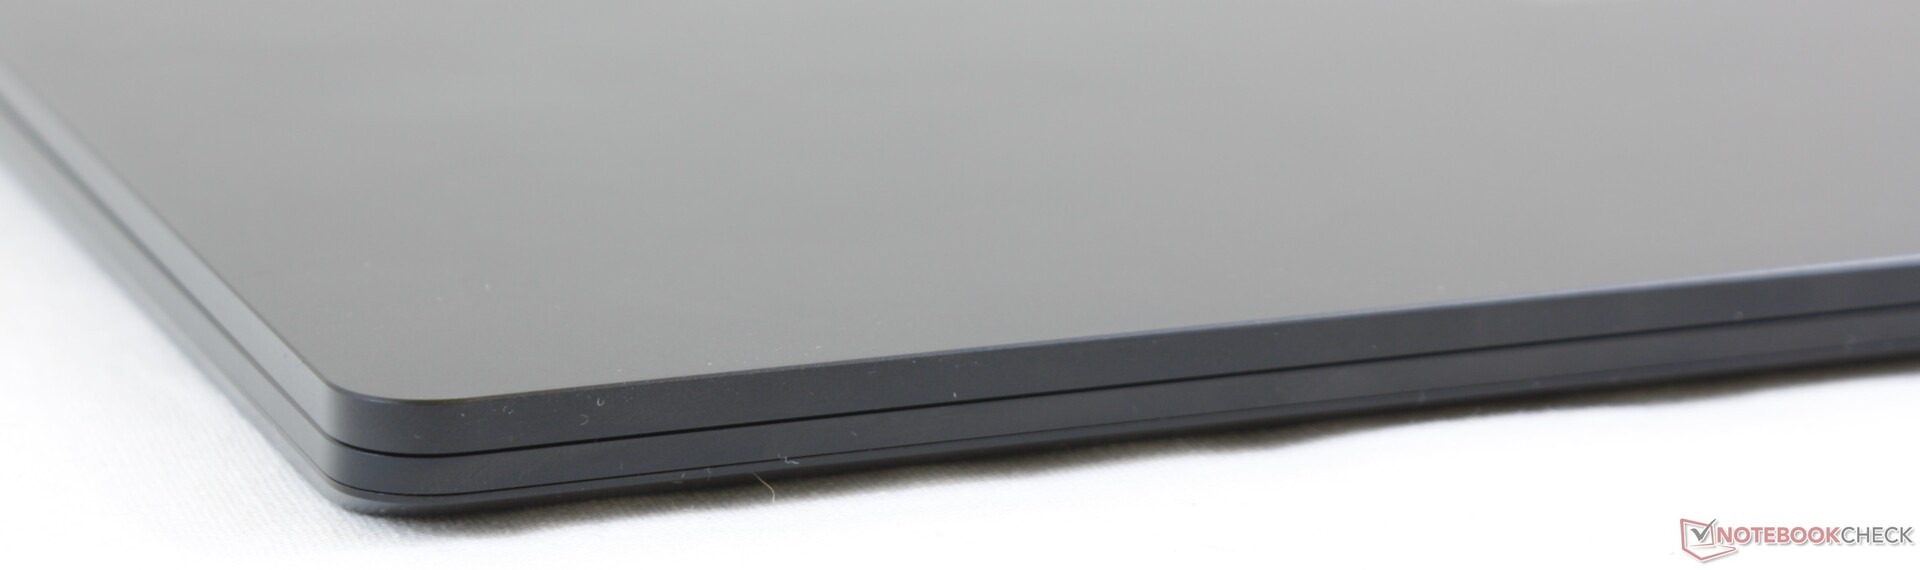
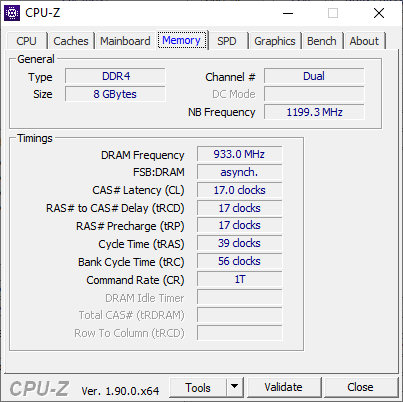
Les bordures d’écran épaisses, la RAM monocanal, le SSD NVMe lent, les temps de réponse du noir au blanc en retrait, et l’absence de Wifi 6, de lecteur d’empreintes digitales et de cache de webcam contribuent à donner l’impression que le portable sans fioritures est daté, malgré son excellent écran et ses excellentes performances. Le Surface Laptop 3 15 peut néanmoins plaire à ceux qui recherchent un format 3:2 ultraléger, et qui ne seront pas gênés par la connectique limitée – mais on peut faire mieux pour 1 500 €.
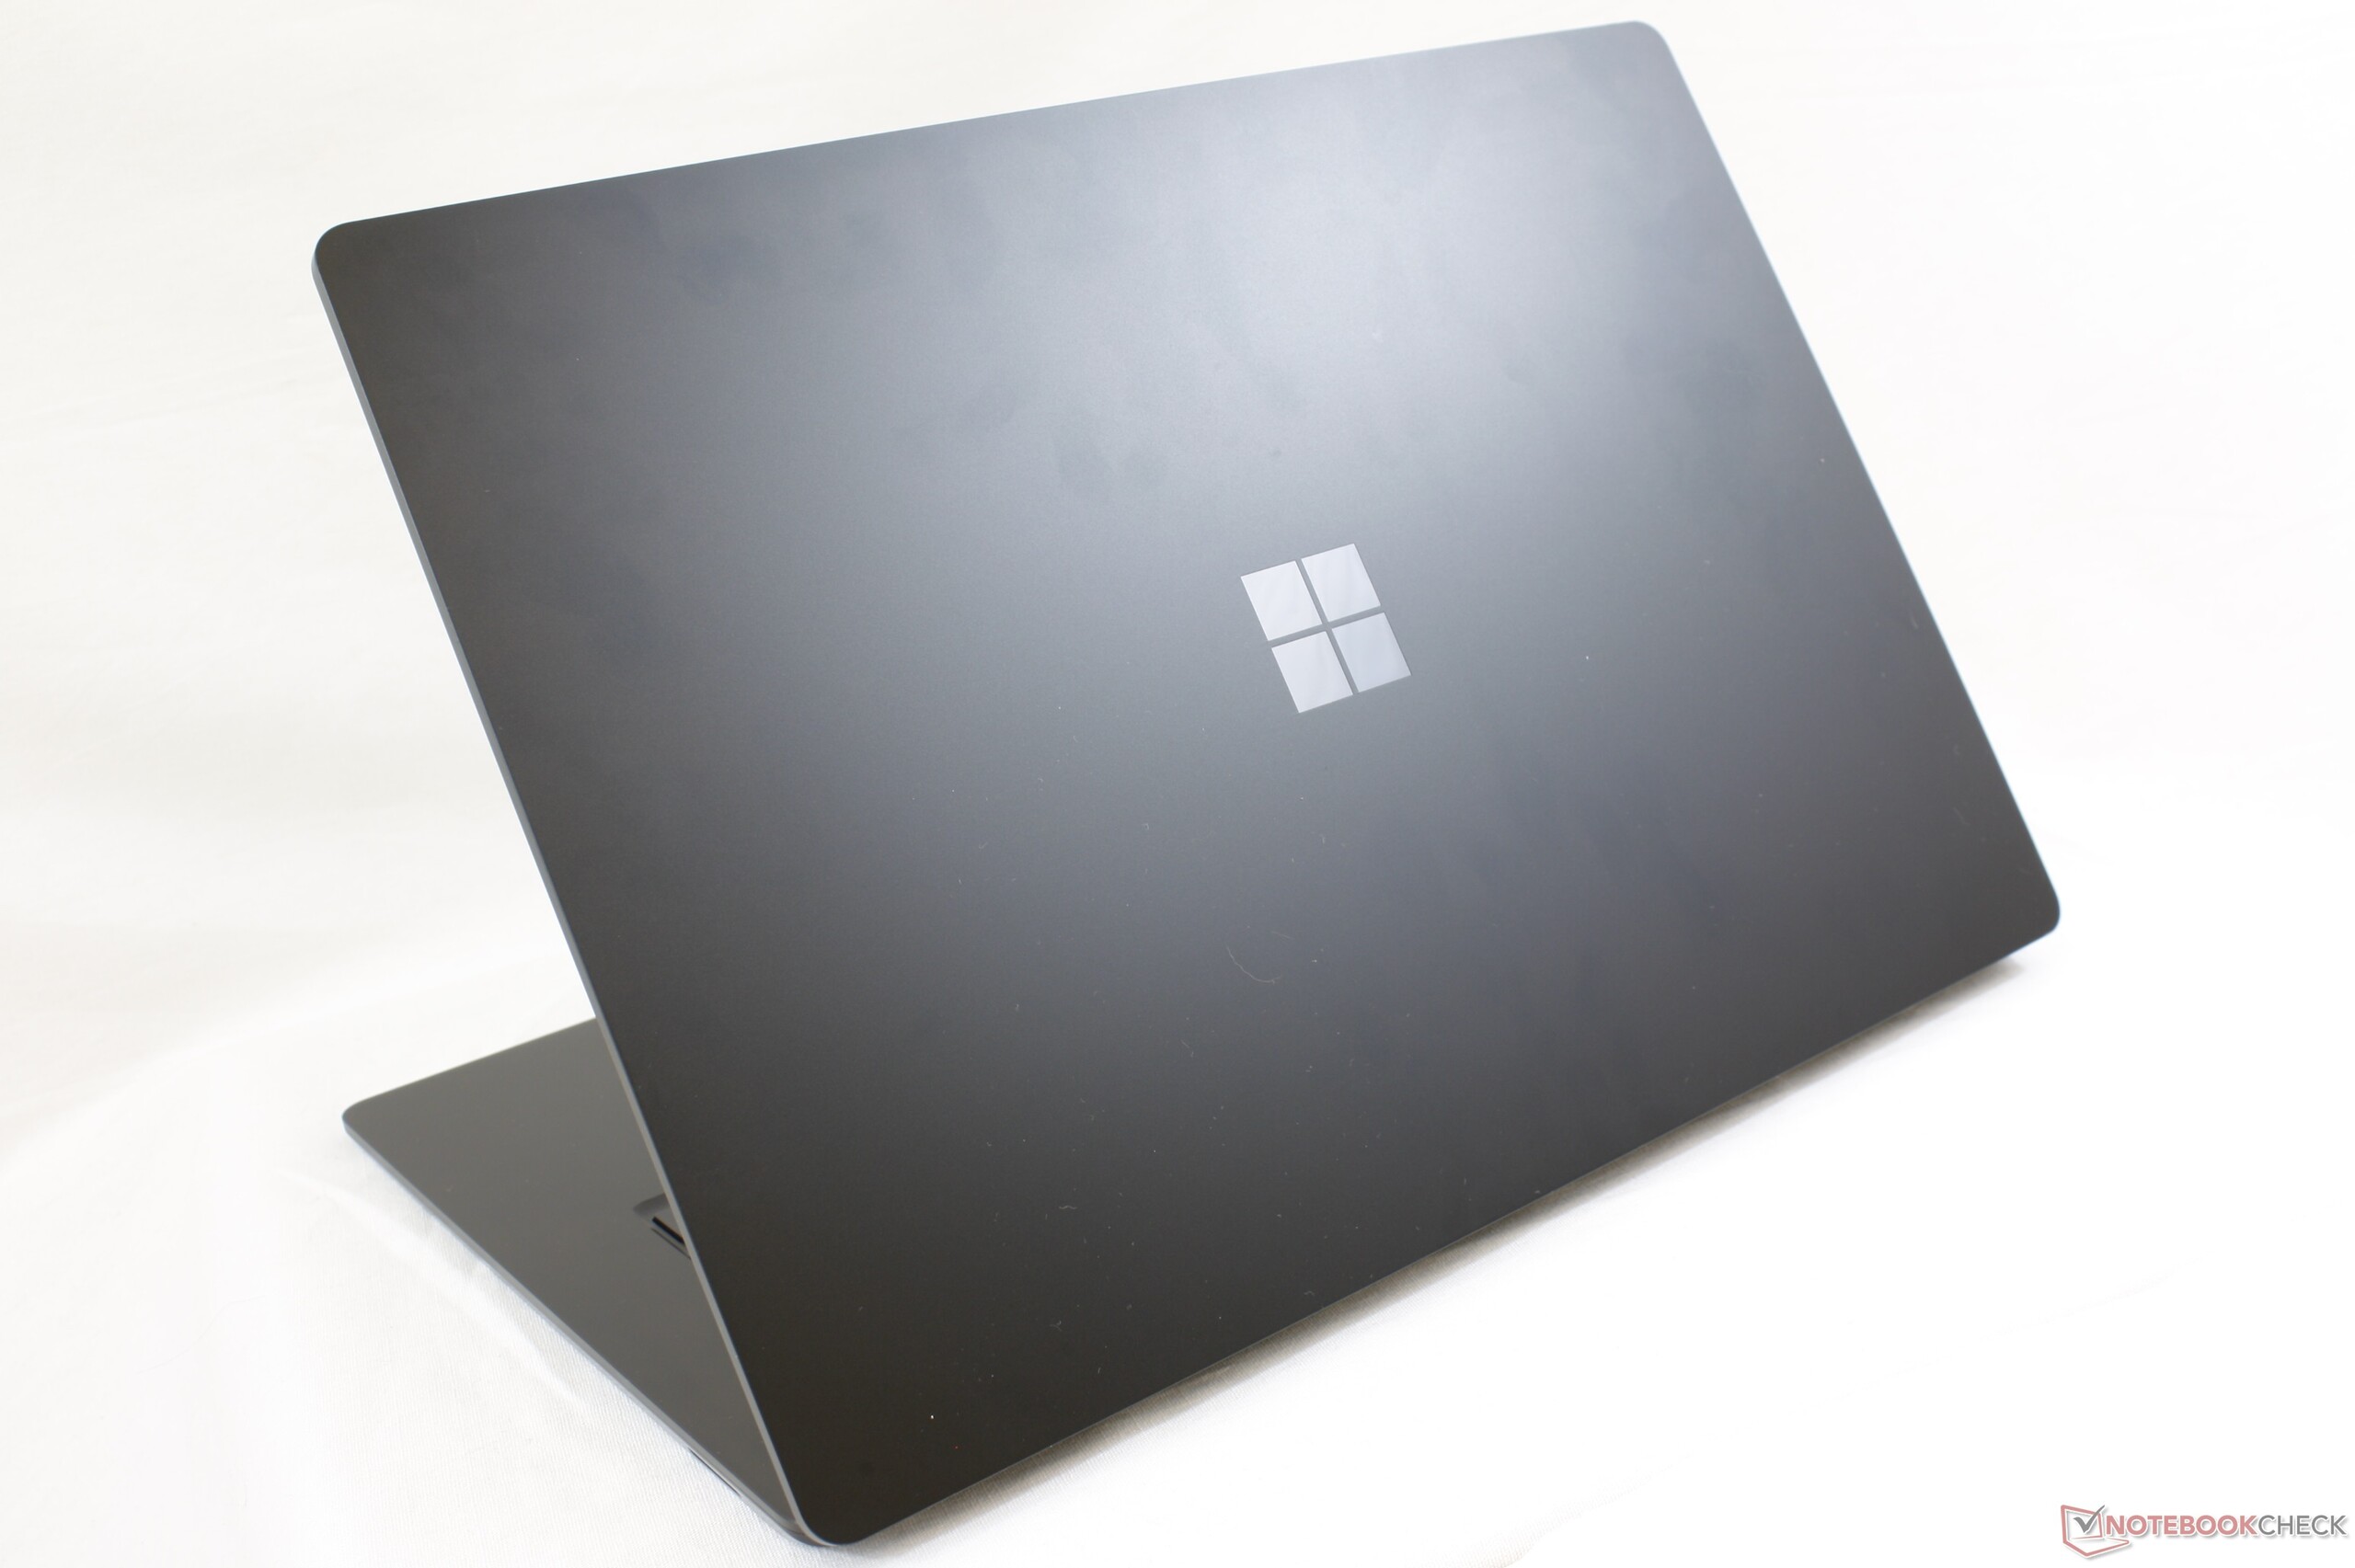
Il est élégant et performant, même avec la version AMD la moins puissante, mais l’absence de fonctionnalités et de ports sera vite un problème. Les ultrabooks haut de gammes classiques font mieux à ce niveau de prix en ce qui concerne les performances et la connectivité.
L’intégralité de cette critique est disponible en anglais en suivant ce lien.
Microsoft Surface Laptop 3 15 Ryzen 5 3580U
- 10/27/2019 v7 (old)
Allen Ngo
Price comparison
