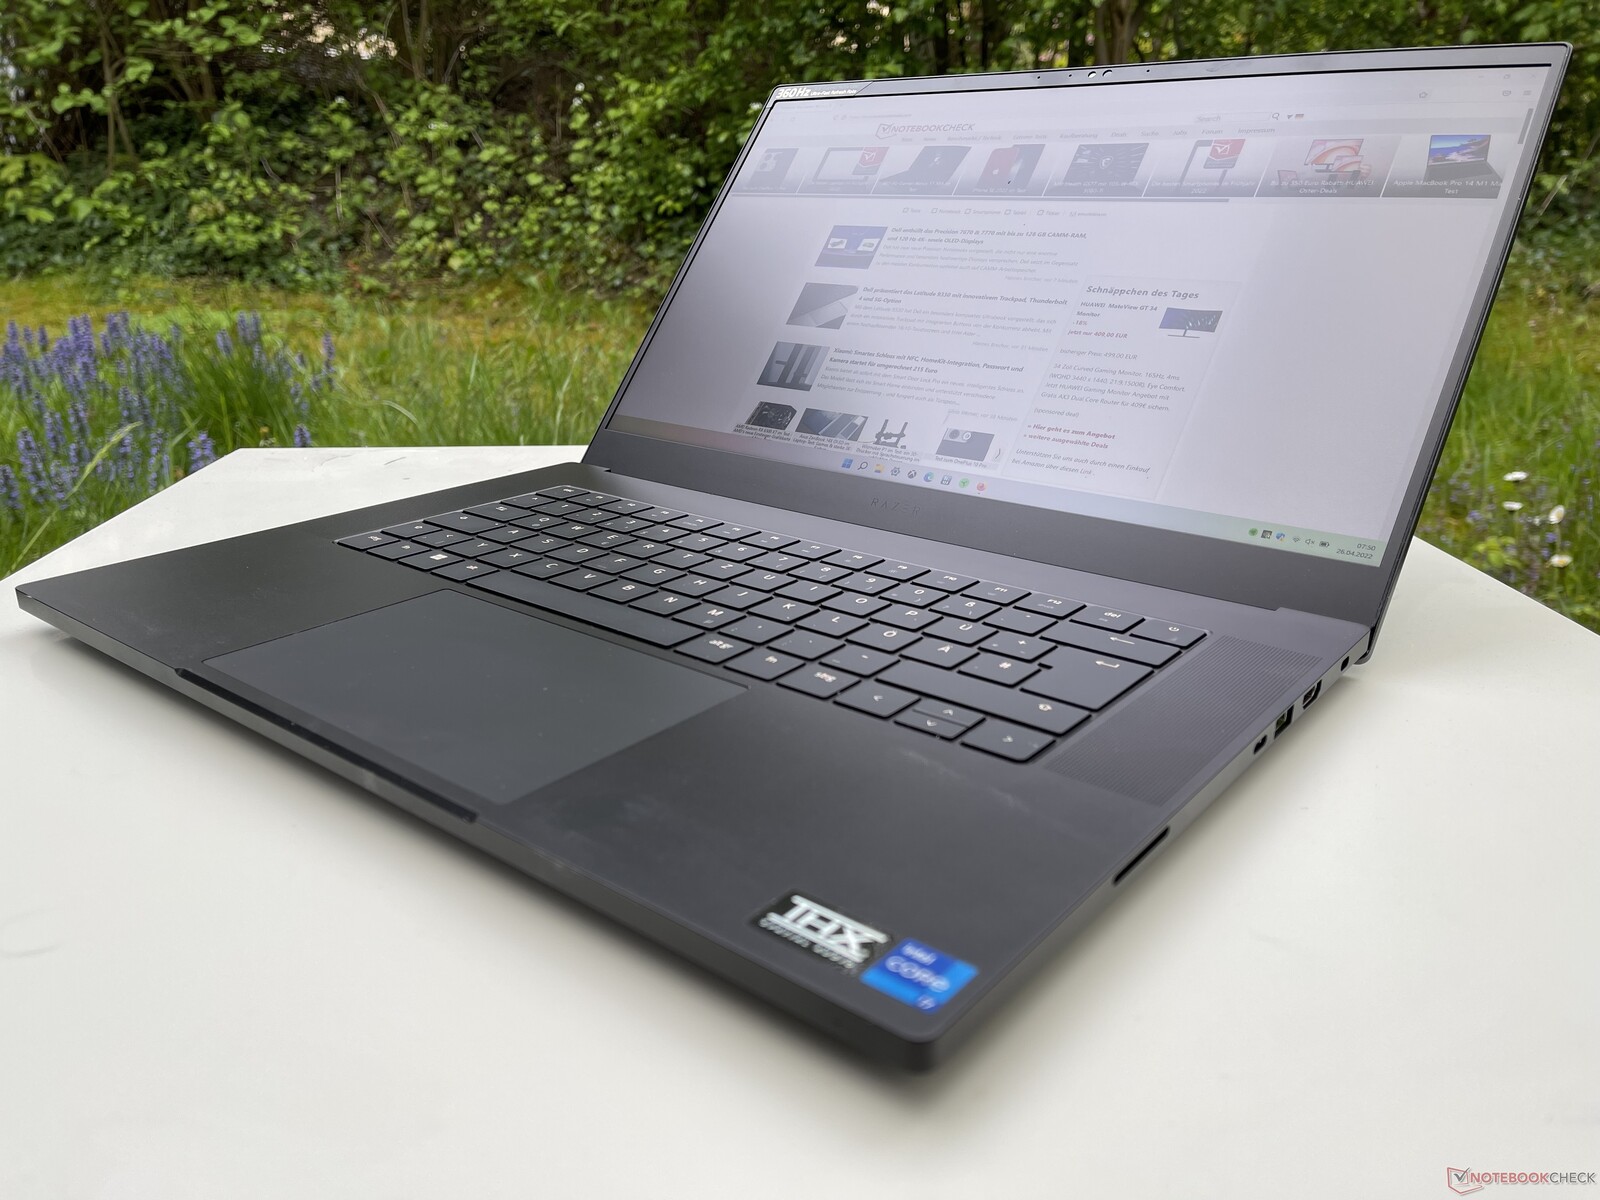
Test du Razer Blade 15 modèle Avancé 2022 : PC portable de jeu compact avec écran rapide
Équipé des dernières puces Intel et Nvidia, le modèle de printemps Razer Blade 15 2022 promet des améliorations itératives pour la populaire gamme d'ordinateurs portables de jeu de 15 pouces. La principale différence entre le modèle examiné ici et le blade 15 2022 précédemment examiné la principale différence entre le modèle examiné ici et le Blade 15 2022 précédemment examiné est la dalle 1080p 360 Hz, les lecteurs peuvent donc s'en tenir à cette revue pour les détails sur les spécifications physiques largement identiques. Les concurrents directs du Blade 15 sont d'autres ordinateurs portables de jeu de 15,6 pouces très performants, tels que le Schenker XMG Neo 15 E22le Asus ROG Strix Scar 15le MSI Stealth GS66 12UGS et le MSI Vector GP66 12UGS.
Autres commentaires sur Razer :
Comparaison avec les concurrents potentiels
Note | Date | Modèle | Poids | Épaisseur | Taille | Résolution | Prix |
|---|---|---|---|---|---|---|---|
| 88.3 % v7 (old) | 05/22 | Razer Blade 15 Advanced Model Early 2022 i7-12800H, GeForce RTX 3080 Ti Laptop GPU | 2.1 kg | 16.99 mm | 15.60" | 1920x1080 | |
| 89.1 % v7 (old) | 03/22 | Razer Blade 15 2022 i7-12800H, GeForce RTX 3080 Ti Laptop GPU | 2.1 kg | 16.99 mm | 15.60" | 2560x1440 | |
v (old) | 03/22 | Schenker XMG Neo 15 E22 (Early 2022, RTX 3080 Ti) i7-12700H, GeForce RTX 3080 Ti Laptop GPU | 2.2 kg | 26.6 mm | 15.60" | 2560x1440 | |
| 86.3 % v7 (old) | 07/21 | Asus ROG Strix Scar 15 G533QS R9 5900HX, GeForce RTX 3080 Laptop GPU | 2.3 kg | 27.2 mm | 15.60" | 2560x1440 | |
| 84.5 % v7 (old) | 02/22 | MSI Stealth GS66 12UGS i7-12700H, GeForce RTX 3070 Ti Laptop GPU | 2.2 kg | 19.8 mm | 15.60" | 2560x1440 | |
| 86.9 % v7 (old) | 03/22 | MSI Vector GP66 12UGS i9-12900H, GeForce RTX 3070 Ti Laptop GPU | 2.3 kg | 23.4 mm | 15.60" | 1920x1080 |
Mallette - Compacte et adaptée aux voyages
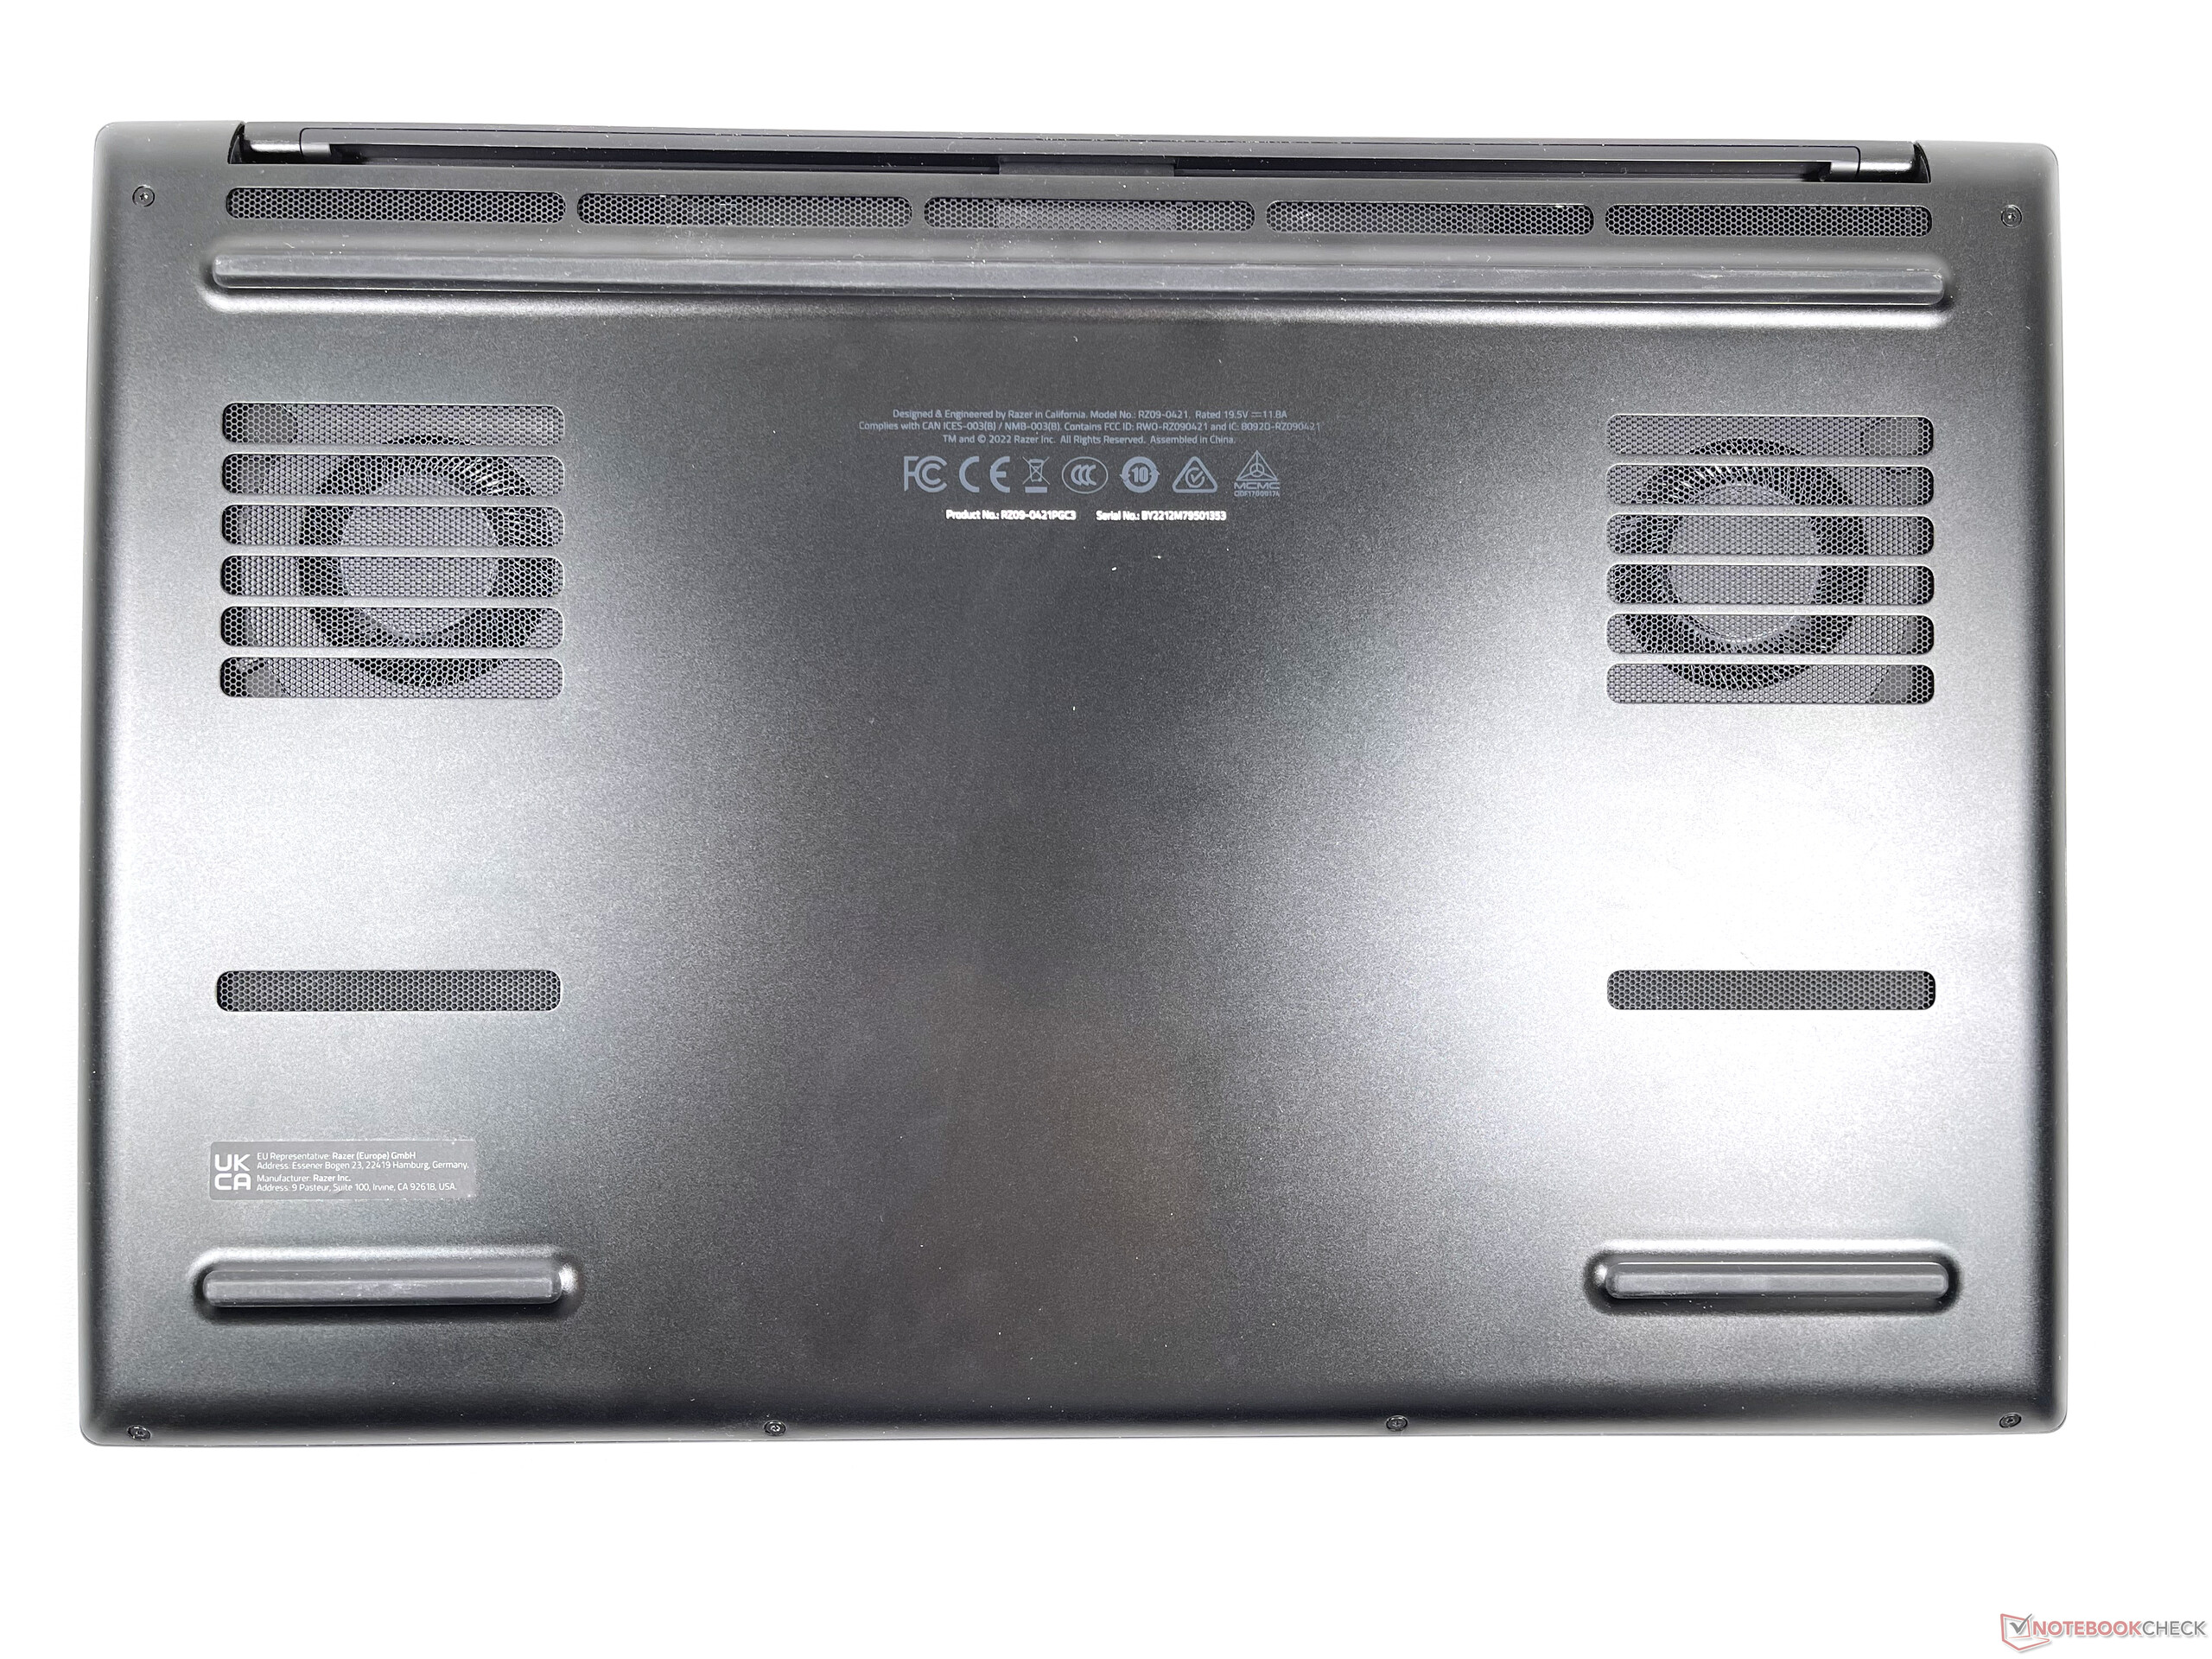
Pour le boîtier, nous retrouvons la construction métallique lisse et familière avec laquelle la série Blade s'est fait connaître à l'origine. La stabilité, la qualité de fabrication et la résistance à la torsion restent donc excellentes. Le revers de la médaille est la forte sensibilité aux empreintes digitales
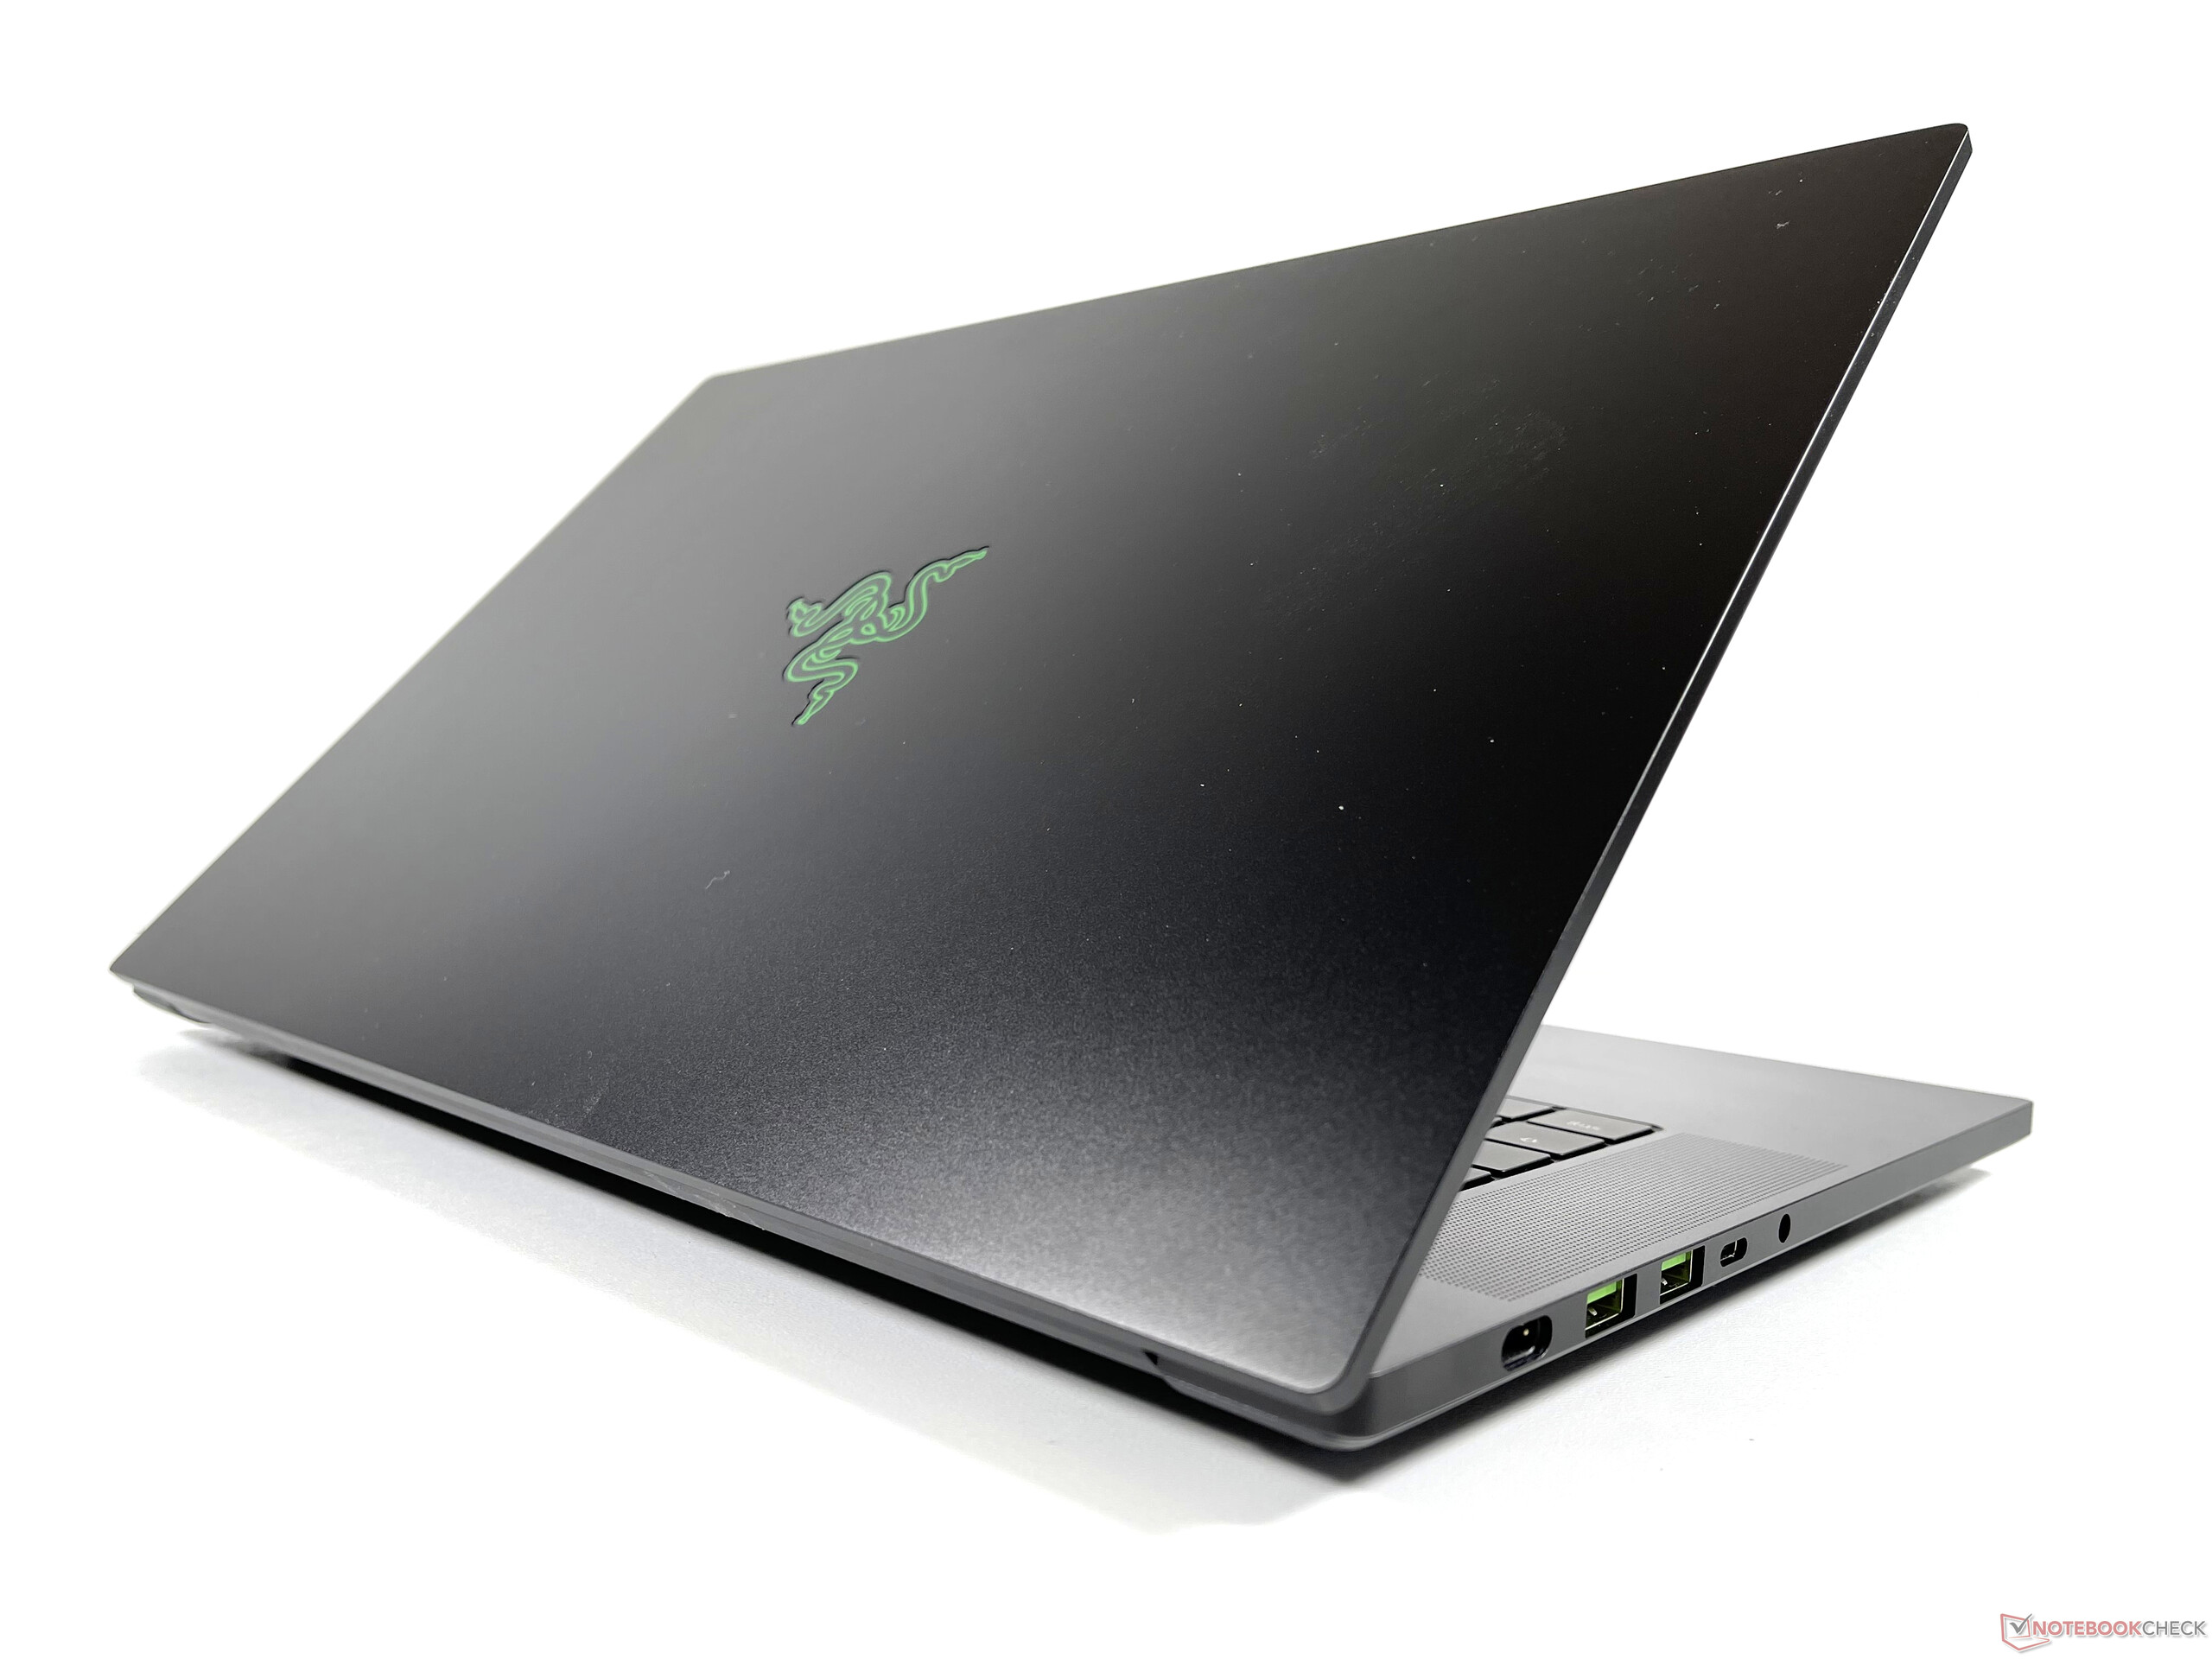
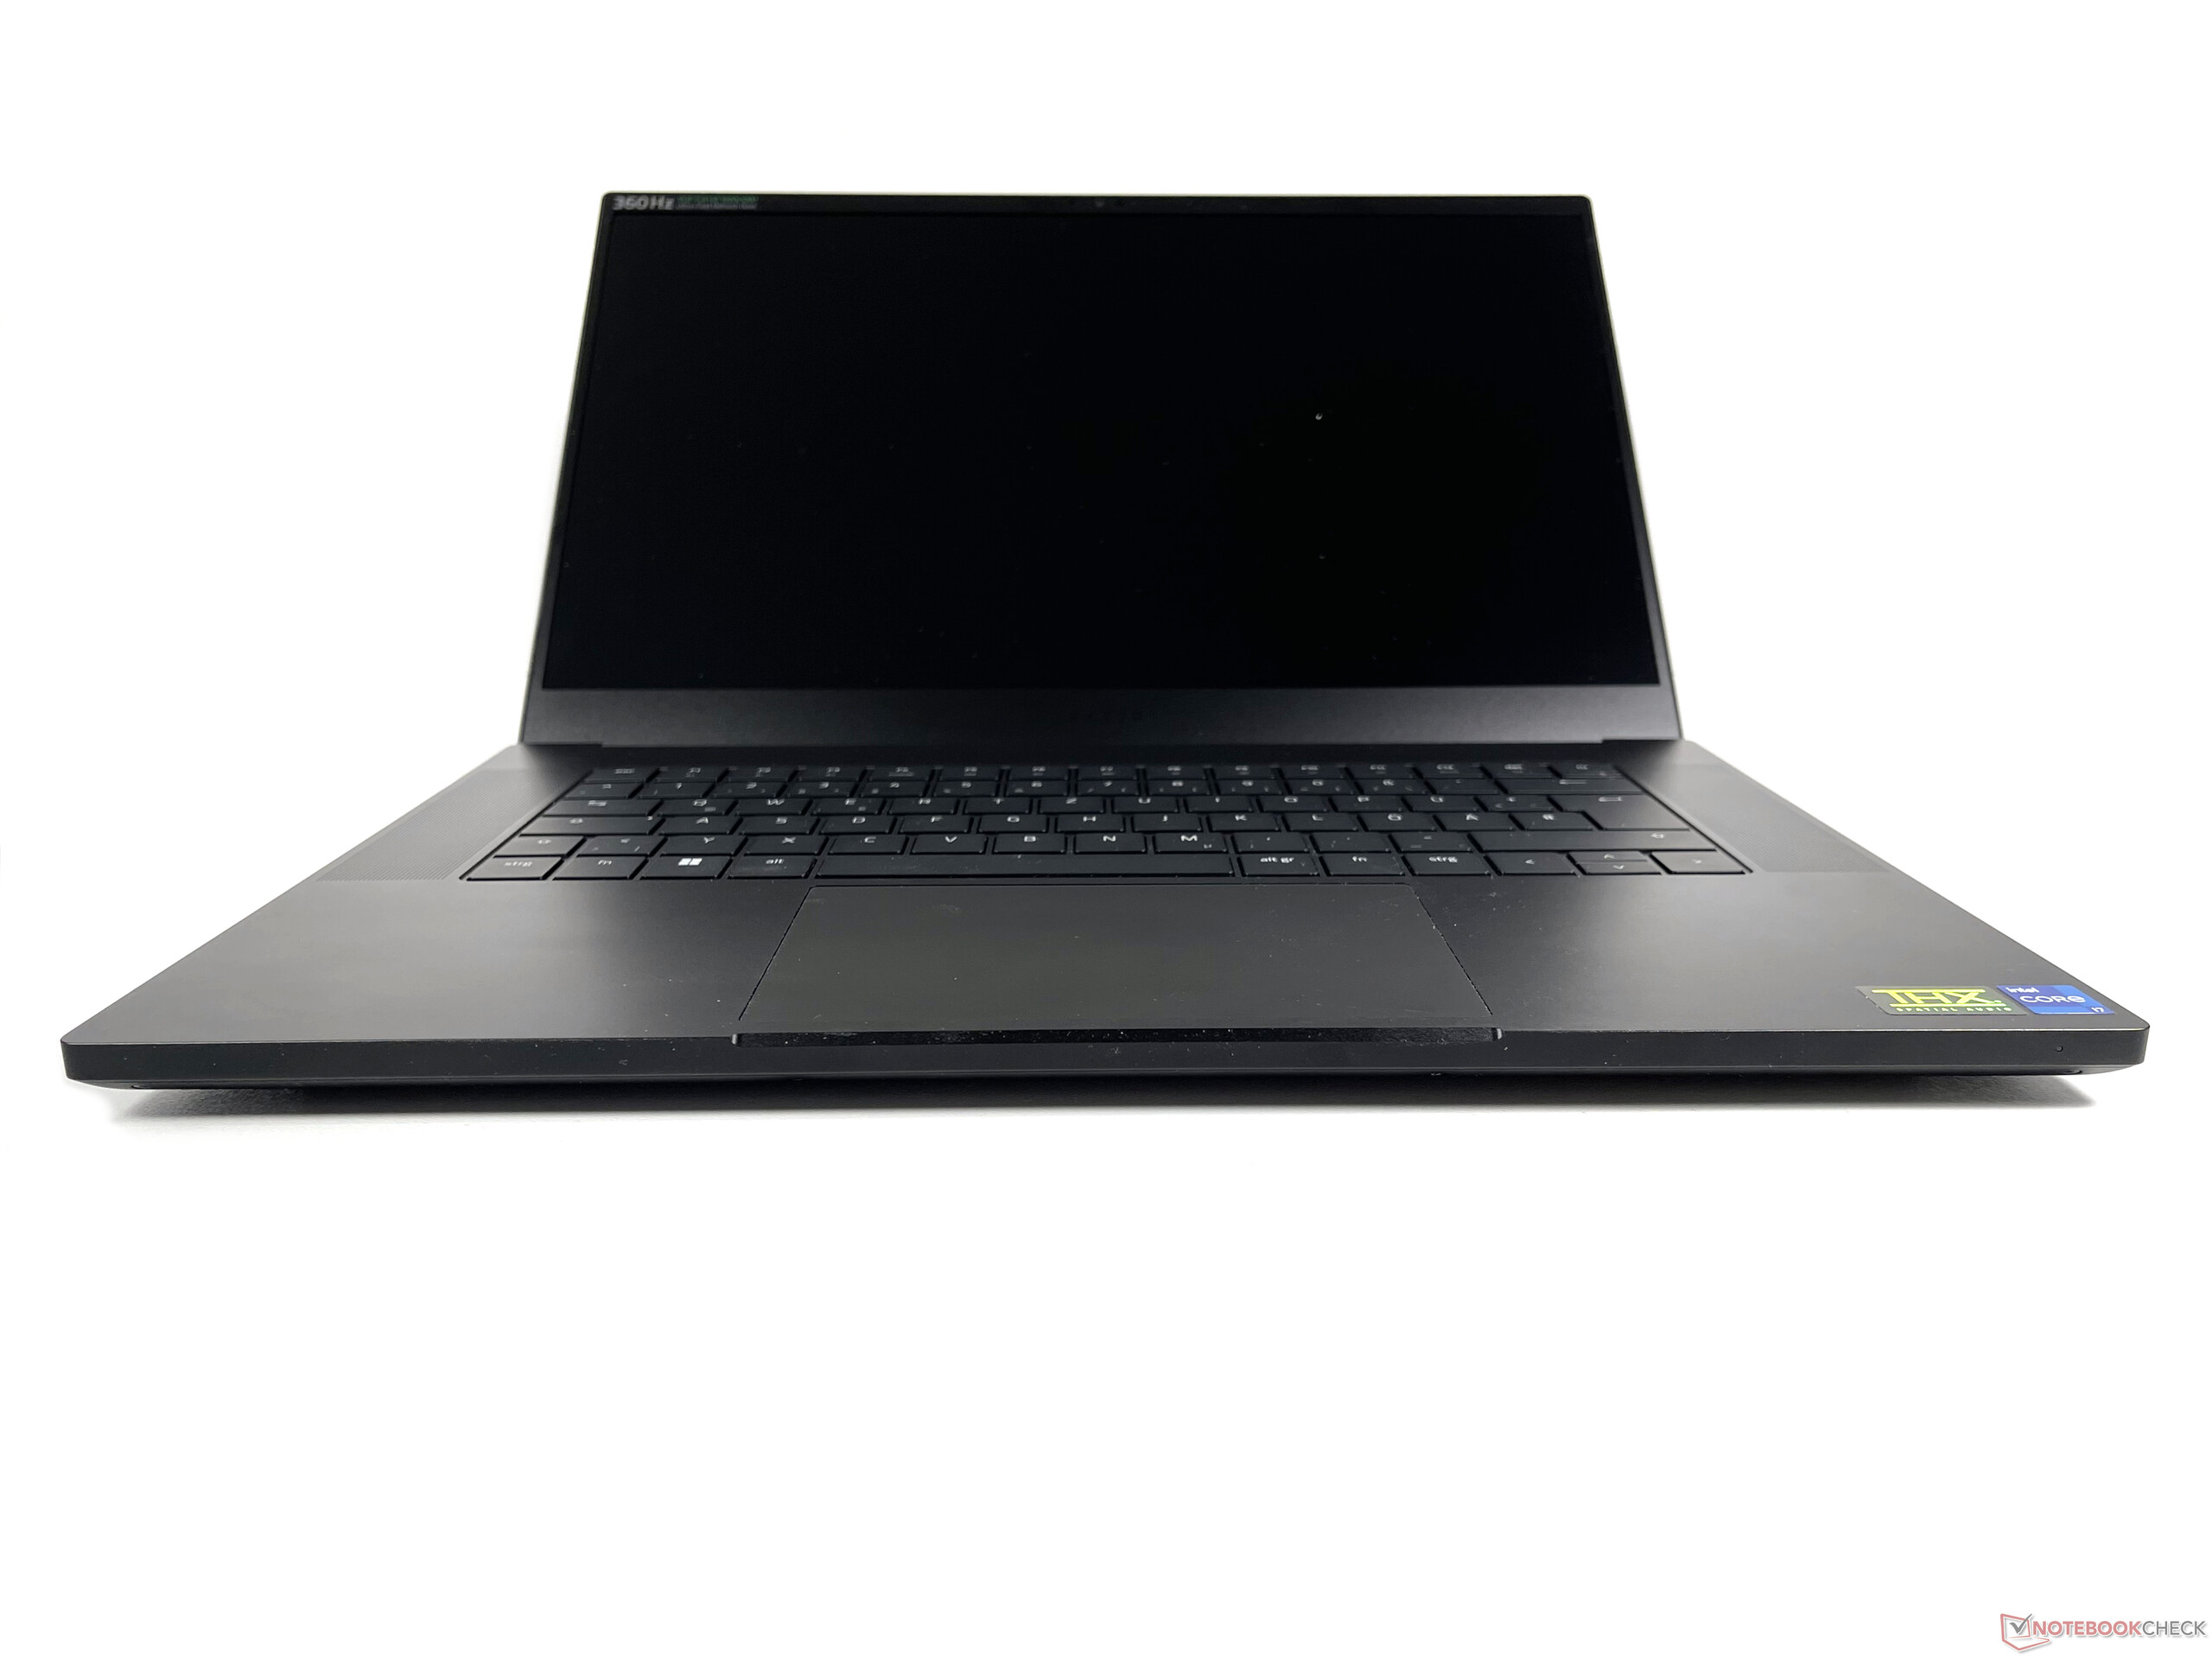
Le Razer Blade 15 est un ordinateur portable très compact de 15,6 pouces, à la fois plus petit et plus fin que la plupart de ses concurrents. En particulier, le ROG Strix Scar 15 et le XMG Neo 15 E22 sont nettement plus épais et environ 100-200 g plus lourds que notre appareil de 2,1 kg.
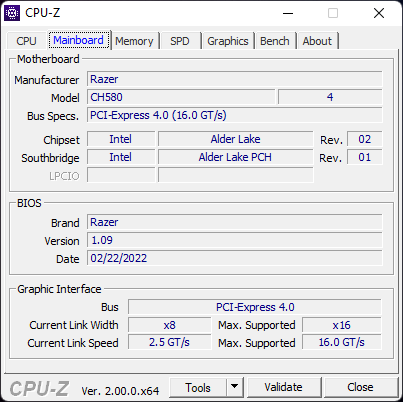
Matériel - Blade 15 avec connectivité moderne
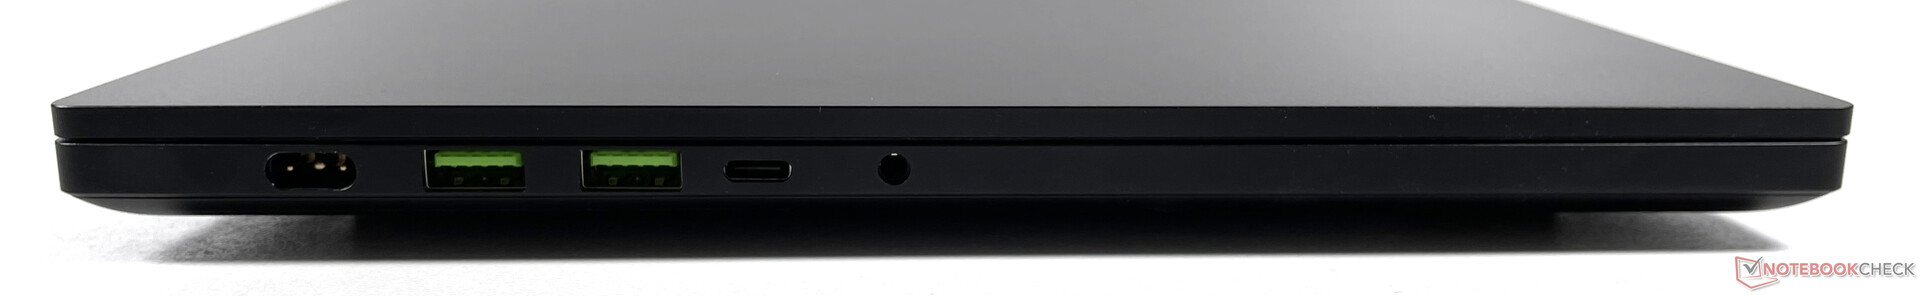
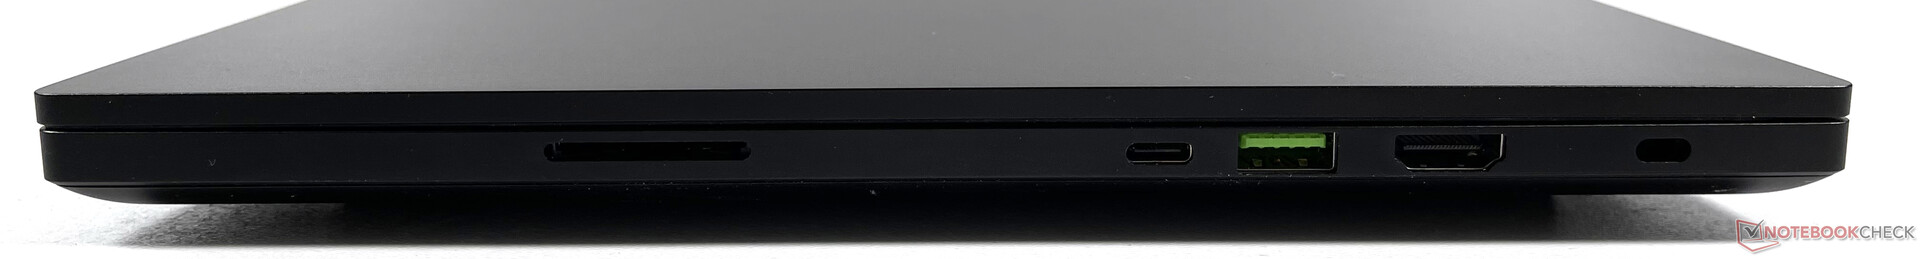
Il n'y a pas de grandes surprises en termes de connectivité. Il convient de mentionner le lecteur de carte SD à part entière et le port HDMI, qui prend en charge la version 2.1. Contrairement à de nombreux concurrents tels que le XMG Neo 15 E22il n'y a pas de port LAN dédié. Mais cela peut être corrigé par un dock Thunderbolt si nécessaire.
Lecteur de carte SD
Les performances du lecteur de cartes SD sont d'un niveau élevé. Lors du test de lecture séquentielle AS-SSD avec notre carte microSD AV PRO 128GB V60, une erreur s'est produite sur notre appareil de test
| SD Card Reader - average JPG Copy Test (av. of 3 runs) | |
| Razer Blade 15 2022 (Toshiba Exceria Pro SDXC 64 GB UHS-II) | |
| Razer Blade 15 Advanced Model Early 2022 (AV PRO microSD 128 GB V60) | |
| Moyenne de la classe Gaming (20.9 - 210, n=54, 2 dernières années) | |
| Schenker XMG Neo 15 E22 (Early 2022, RTX 3080 Ti) | |
Communication
Le module intégré Killer Wi-Fi 6E 1690i a offert des taux de transfert très rapides lorsqu'il était connecté à notre routeur de test Asus GT-AXE11000. Le support Bluetooth 5.2 est également fourni
| Networking | |
| iperf3 transmit AXE11000 | |
| Razer Blade 15 Advanced Model Early 2022 | |
| Moyenne de la classe Gaming (560 - 1862, n=93, 2 dernières années) | |
| iperf3 receive AXE11000 | |
| Razer Blade 15 Advanced Model Early 2022 | |
| MSI Stealth GS66 12UGS | |
| Moyenne de la classe Gaming (680 - 1745, n=93, 2 dernières années) | |
Webcam


Maintenance
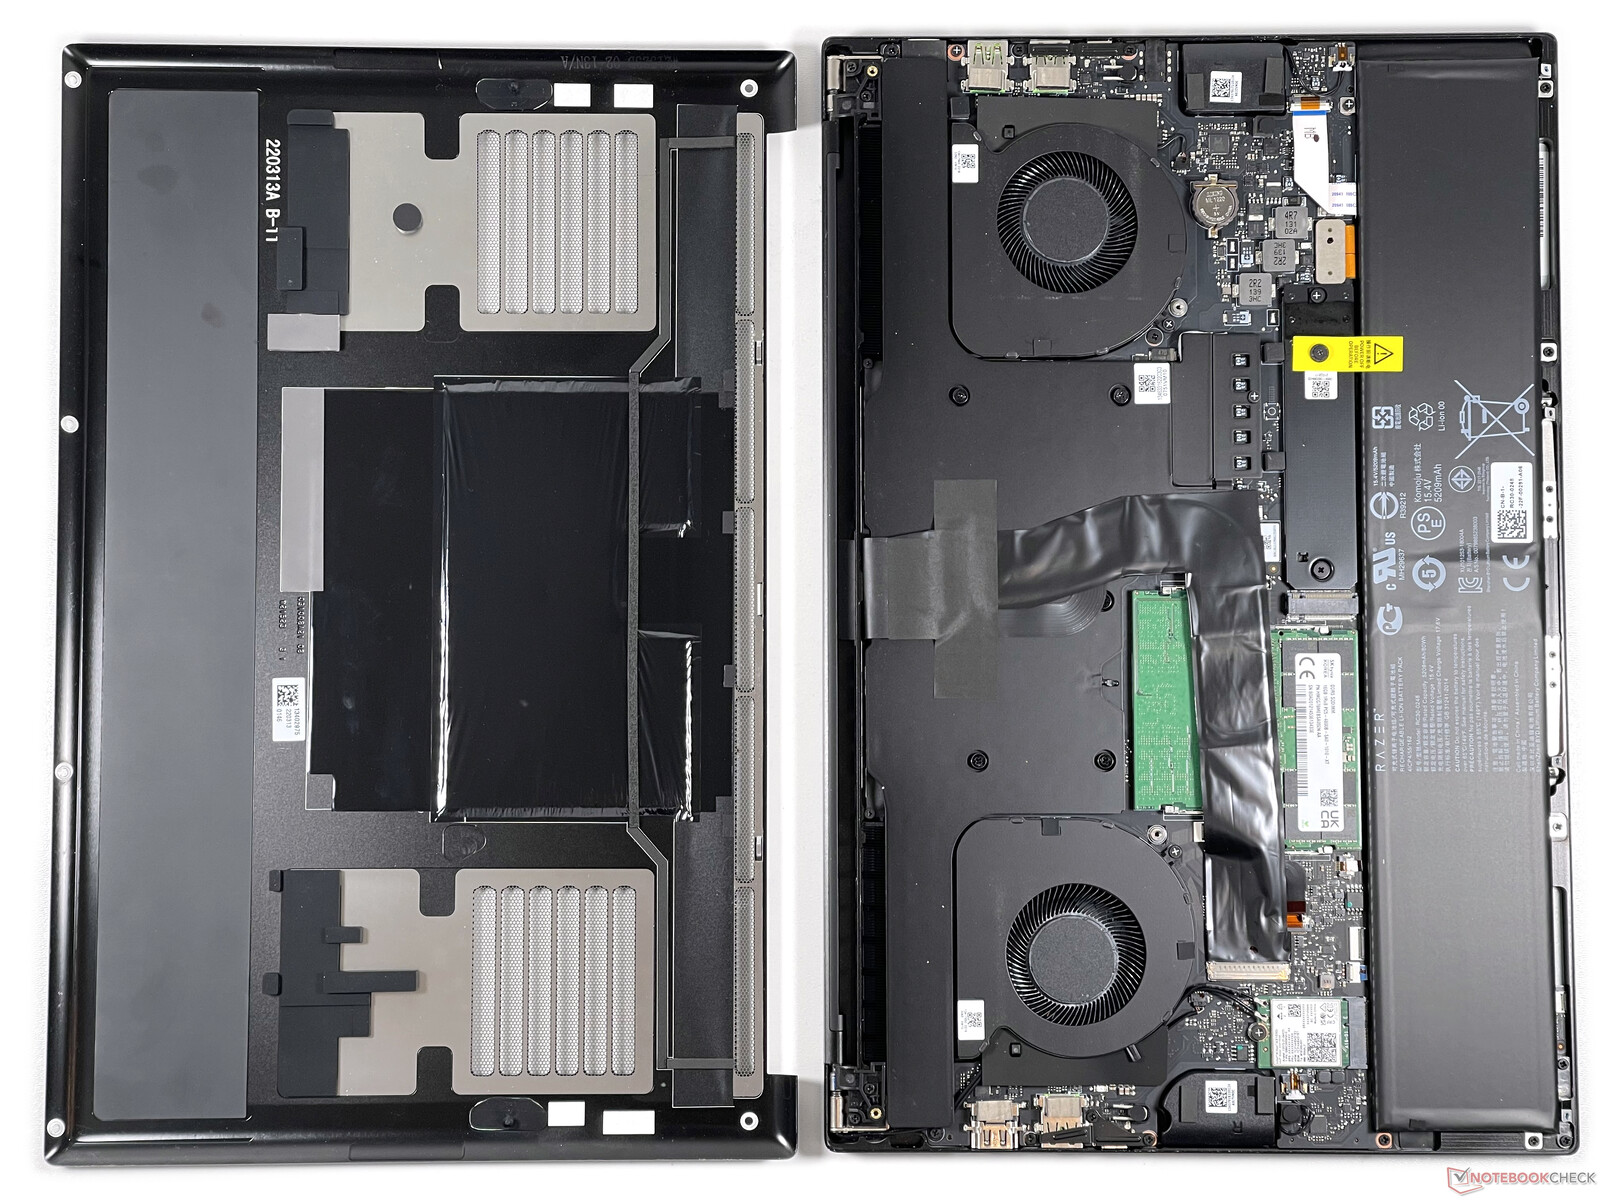
Après avoir retiré six vis Torx (T5), on a accès aux deux modules de RAM, à la batterie, au module WLAN et (après avoir retiré un couvercle supplémentaire) au SSD M.2
Dispositifs d'entrée - Grand pavé tactile et clavier bien rangé
Clavier
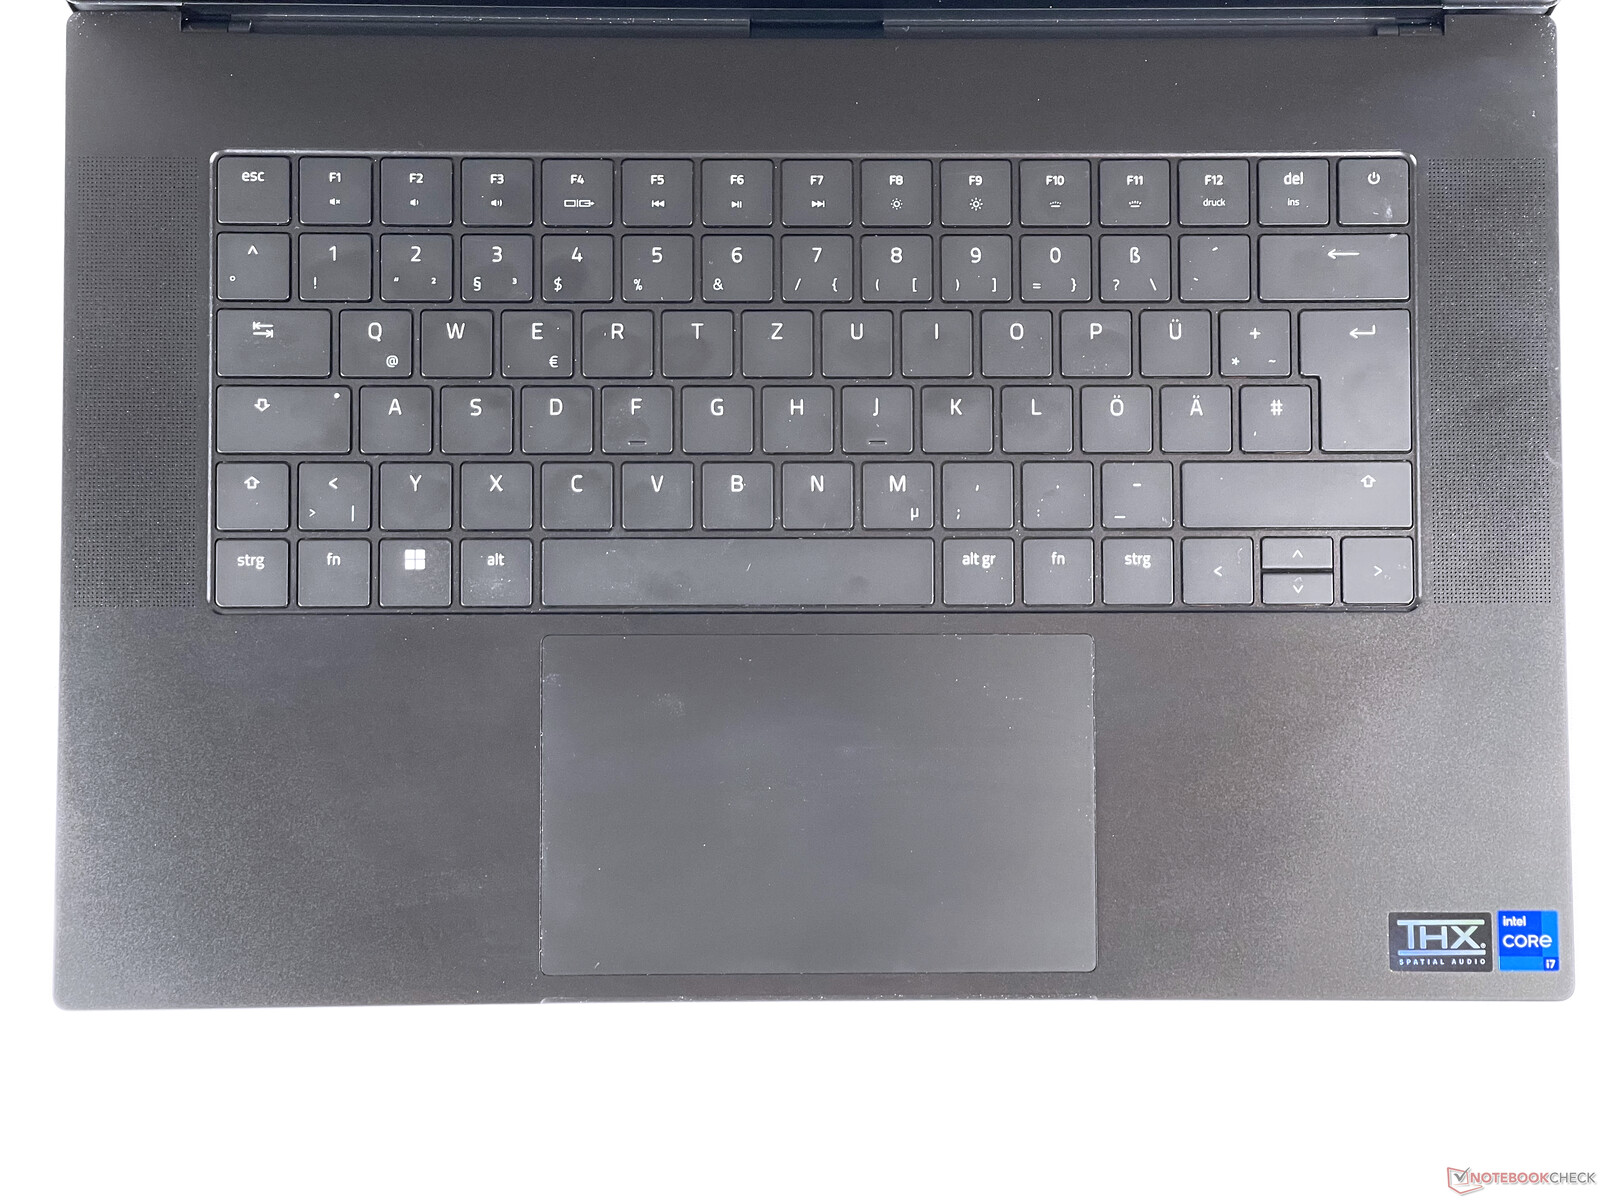
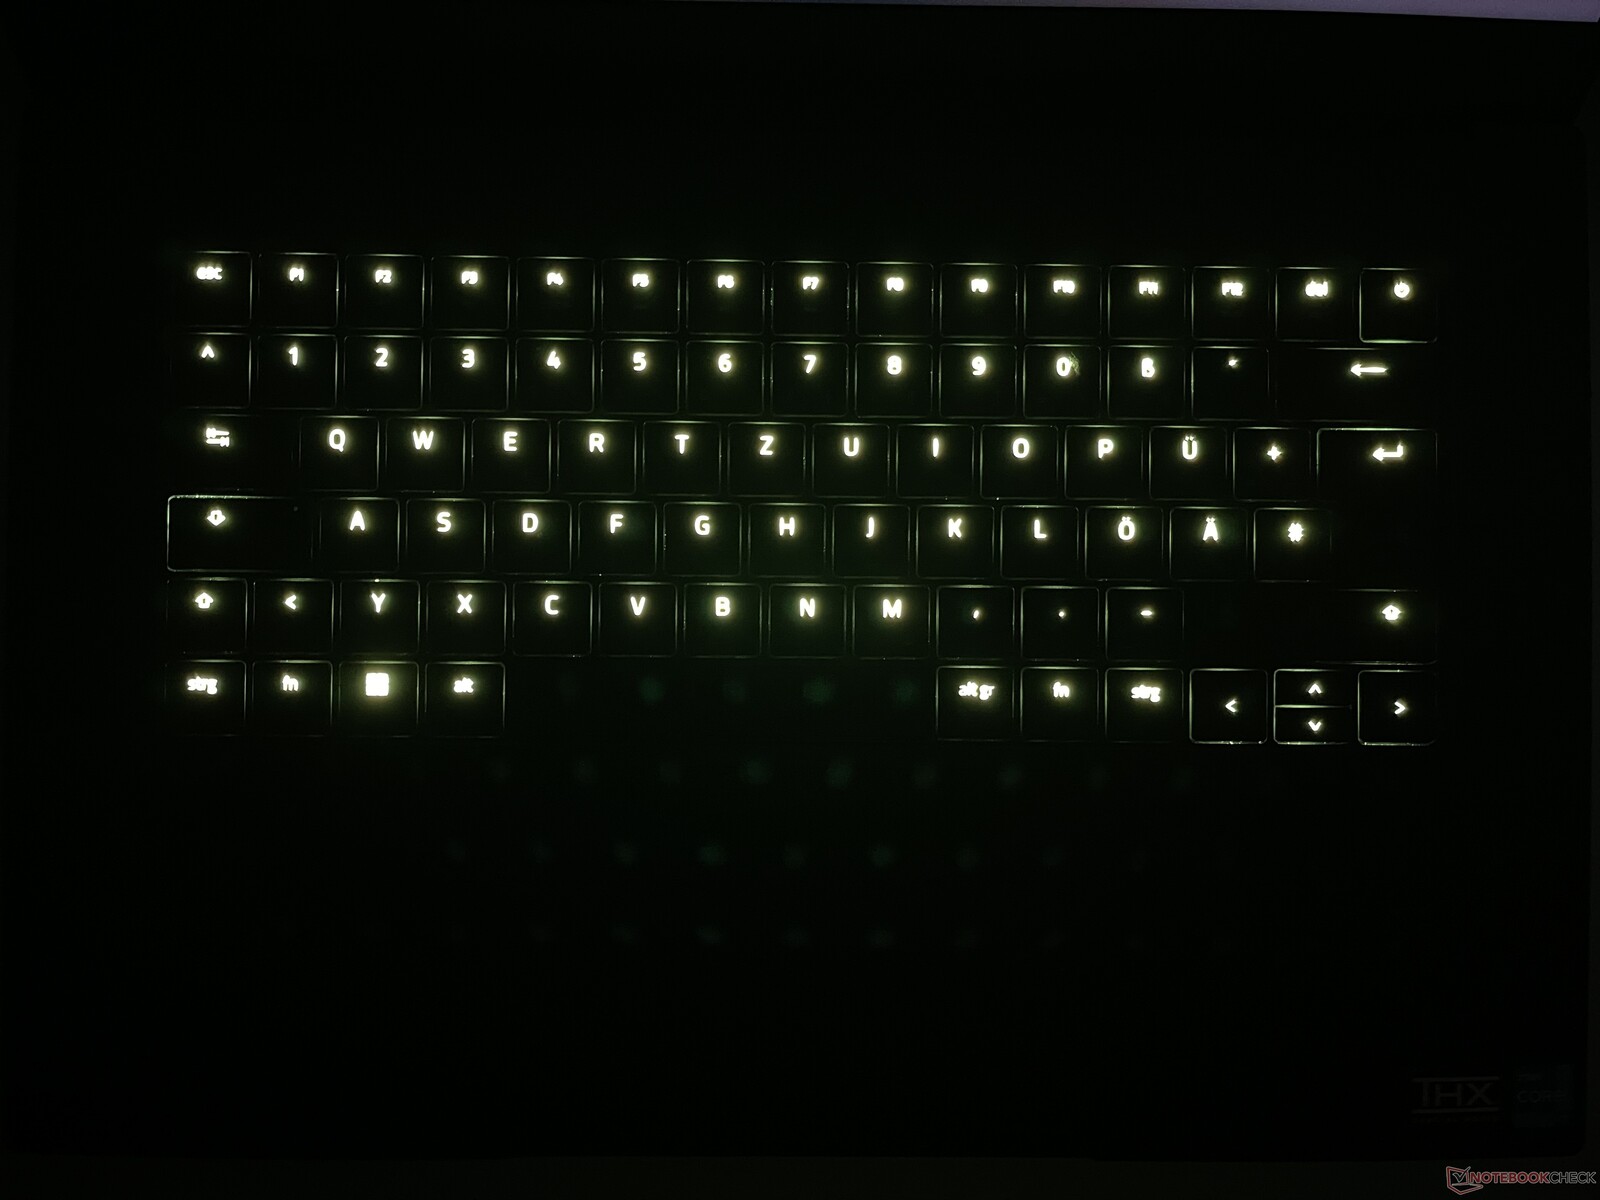
Le clavier dispose d'un éclairage de touche RVB avec 16 niveaux de luminosité (y compris "off") et des touches flèche vers le haut et flèche vers le bas à mi-hauteur, ce qui permet à Razer de placer l'ensemble du clavier dans une zone rectangulaire centrée entre les ouvertures des haut-parleurs. Les touches offrent une course plate et des sons de frappe silencieux et étouffés. La résistance des touches est modérée et le centre du clavier cède à peine lors de la frappe.
Pavé tactile
Le pavé tactile comprend une surface d'environ 13x8 cm et permet un excellent glissement des doigts. Les clics sont caractérisés par une course de touche courte et un retour haptique clair
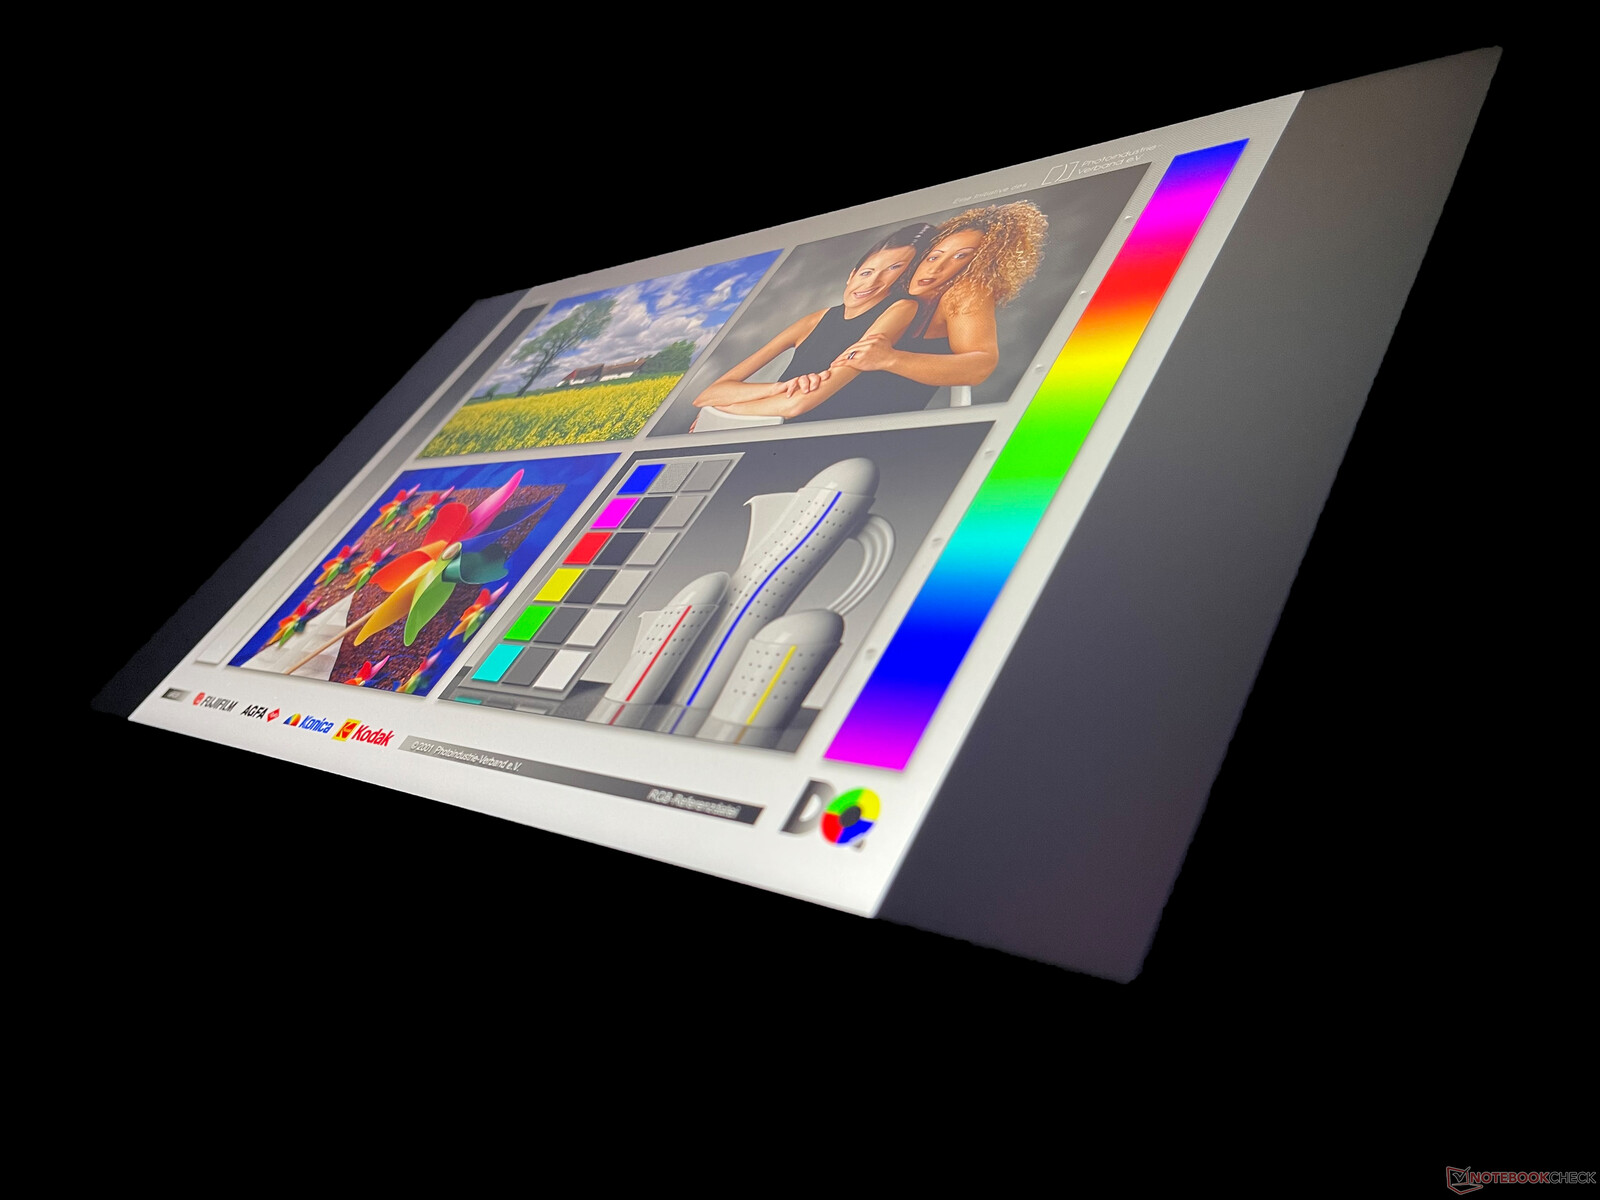
Affichage - Panneau rapide avec un spectre de couleurs limité
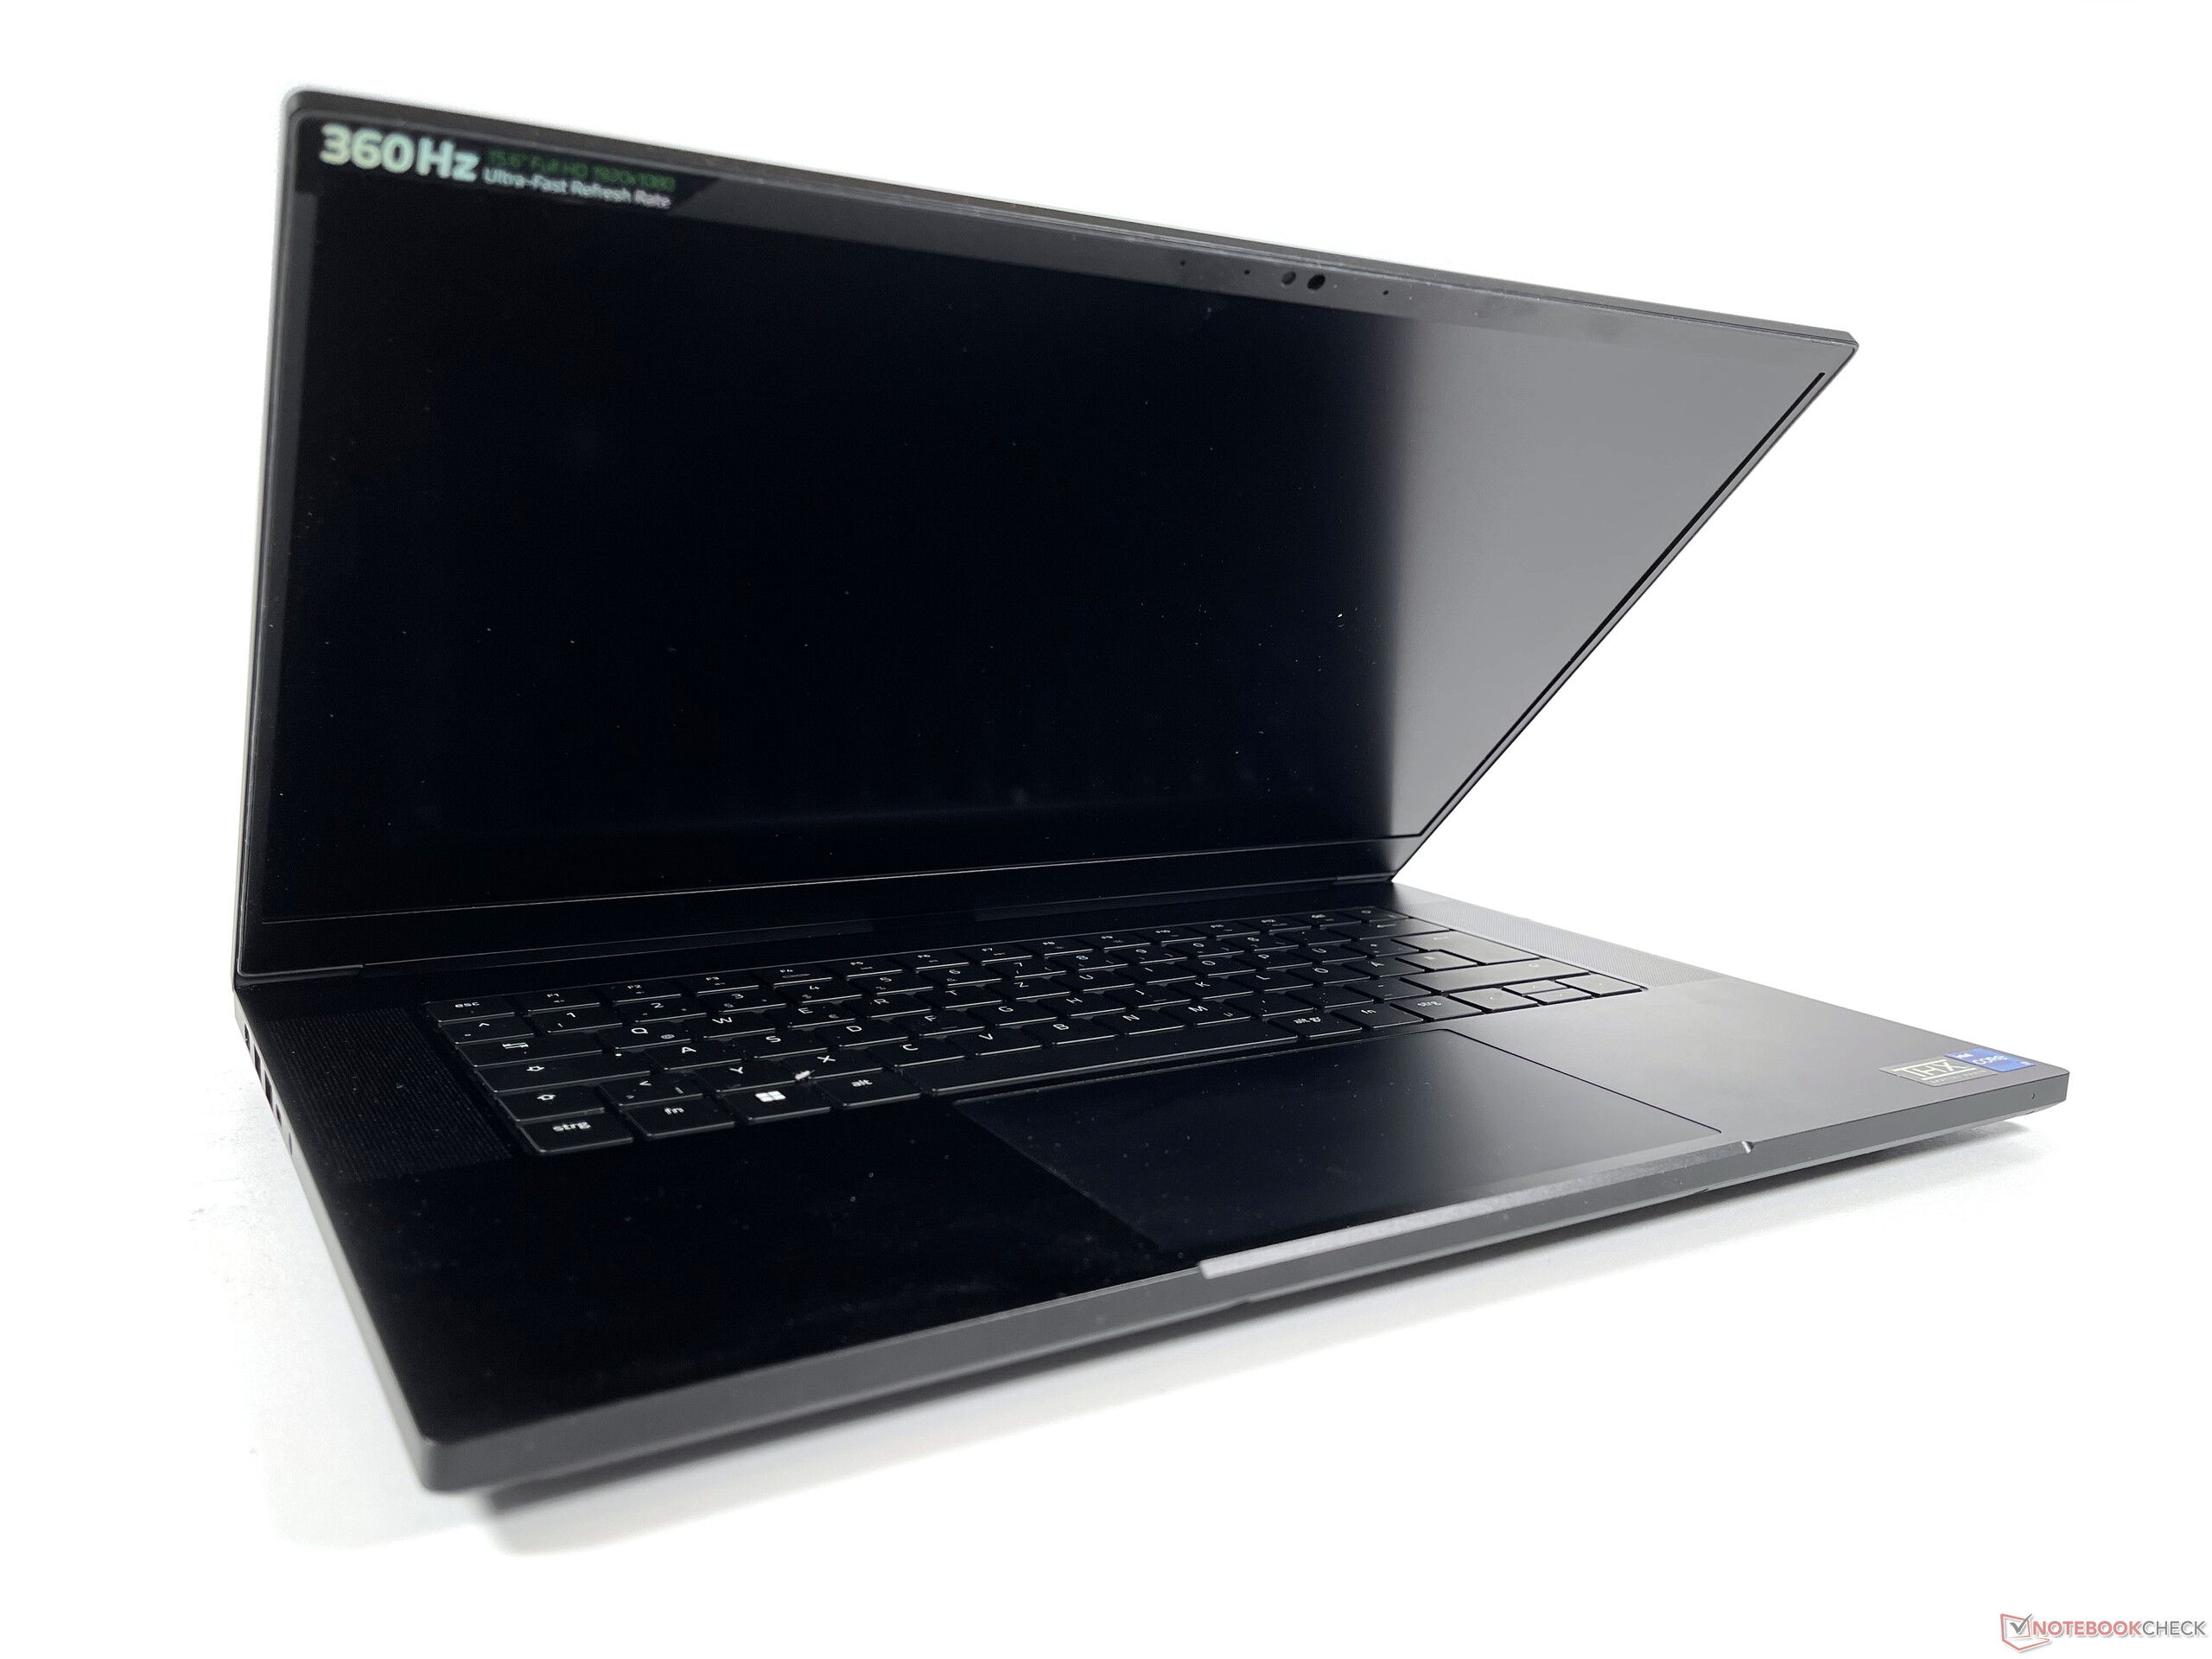
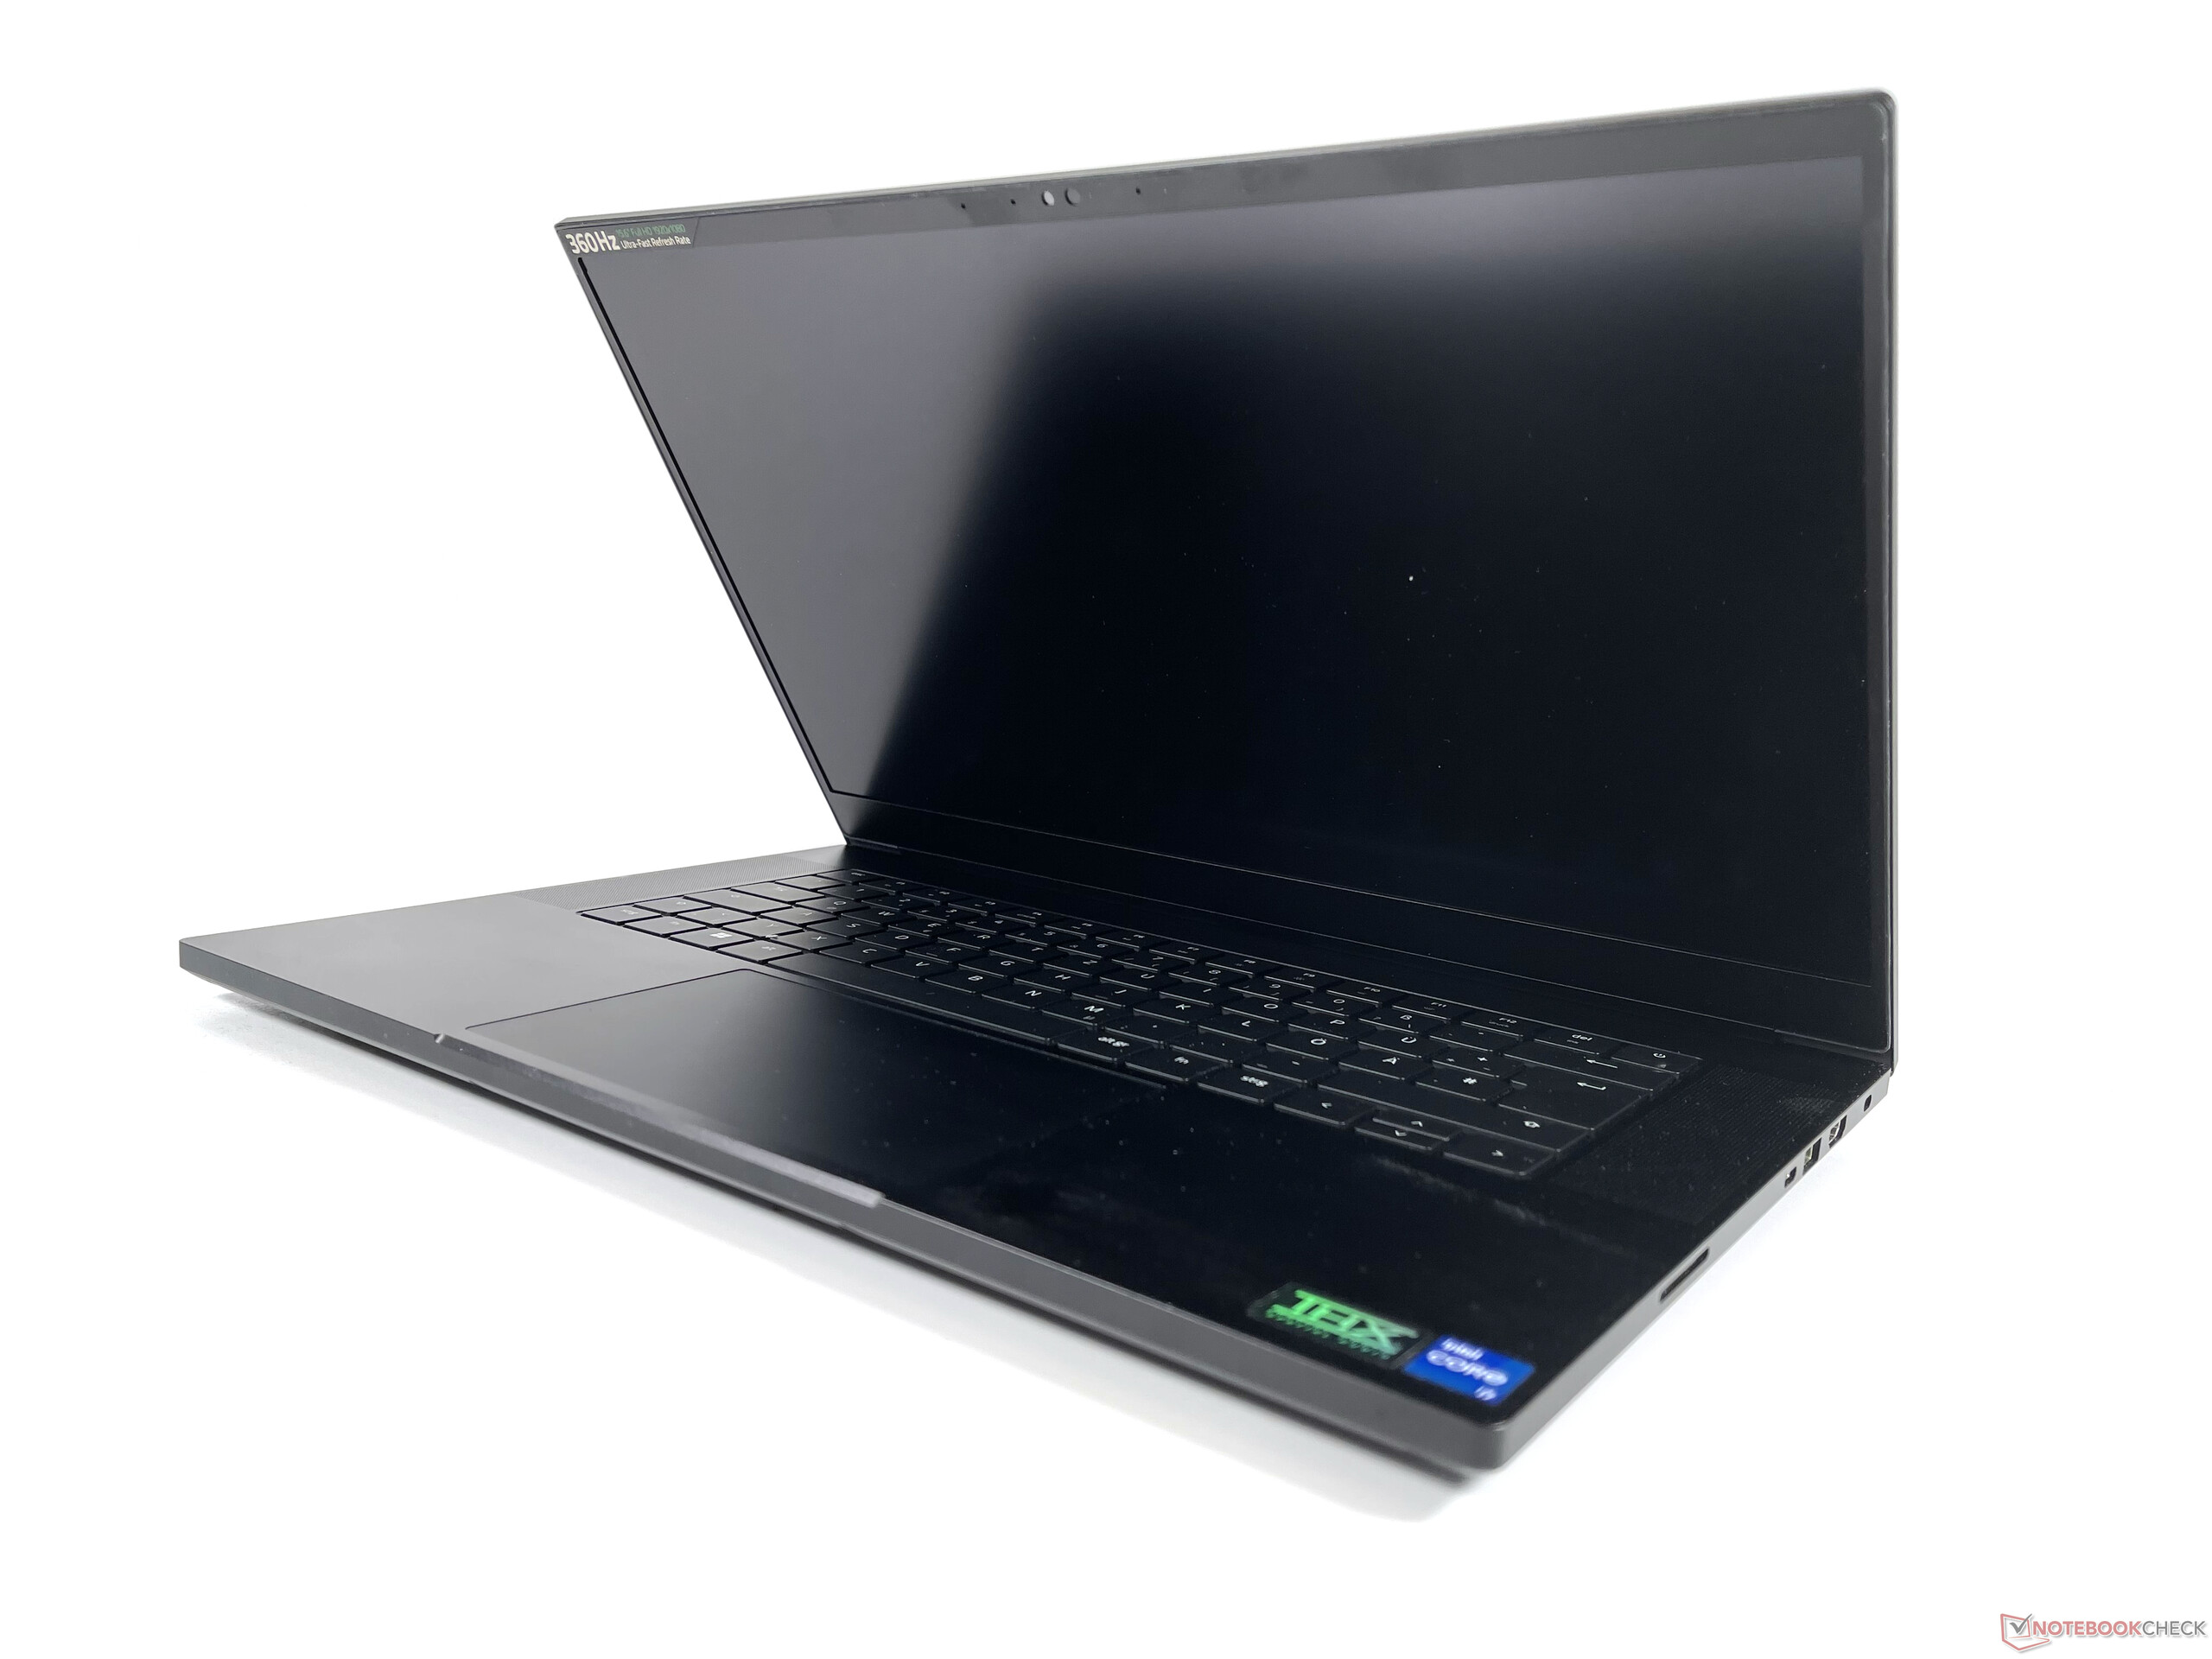
Notre appareil de référence est équipé d'une dalle IPS Full HD mate offrant une résolution native de 1920x1080 pixels et un taux de rafraîchissement de 360 Hz. Un écran QHD 240 Hz et un écran 4K 144 Hz sont également disponibles, chacun d'eux devant couvrir l'espace colorimétrique DCI-P3. Le modèle QHD prend également en charge Nvidia G-Sync et Advanced Optimus.
La luminosité de 315 cd/m² en moyenne est plus que suffisante pour la plupart des scénarios d'application et, associée à une valeur de noir décente de 0,24, elle se traduit par un contraste supérieur à la moyenne de 1 375:1 en comparaison avec la classe. Les temps de réponse gris-gris sont particulièrement courts et nous n'avons pas pu détecter de PWM.
| |||||||||||||||||||||||||
Homogénéité de la luminosité: 89 %
Valeur mesurée au centre, sur batterie: 330 cd/m²
Contraste: 1375:1 (Valeurs des noirs: 0.24 cd/m²)
ΔE ColorChecker Calman: 1.47 | ∀{0.5-29.43 Ø4.72}
calibrated: 0.63
ΔE Greyscale Calman: 1.8 | ∀{0.09-98 Ø4.97}
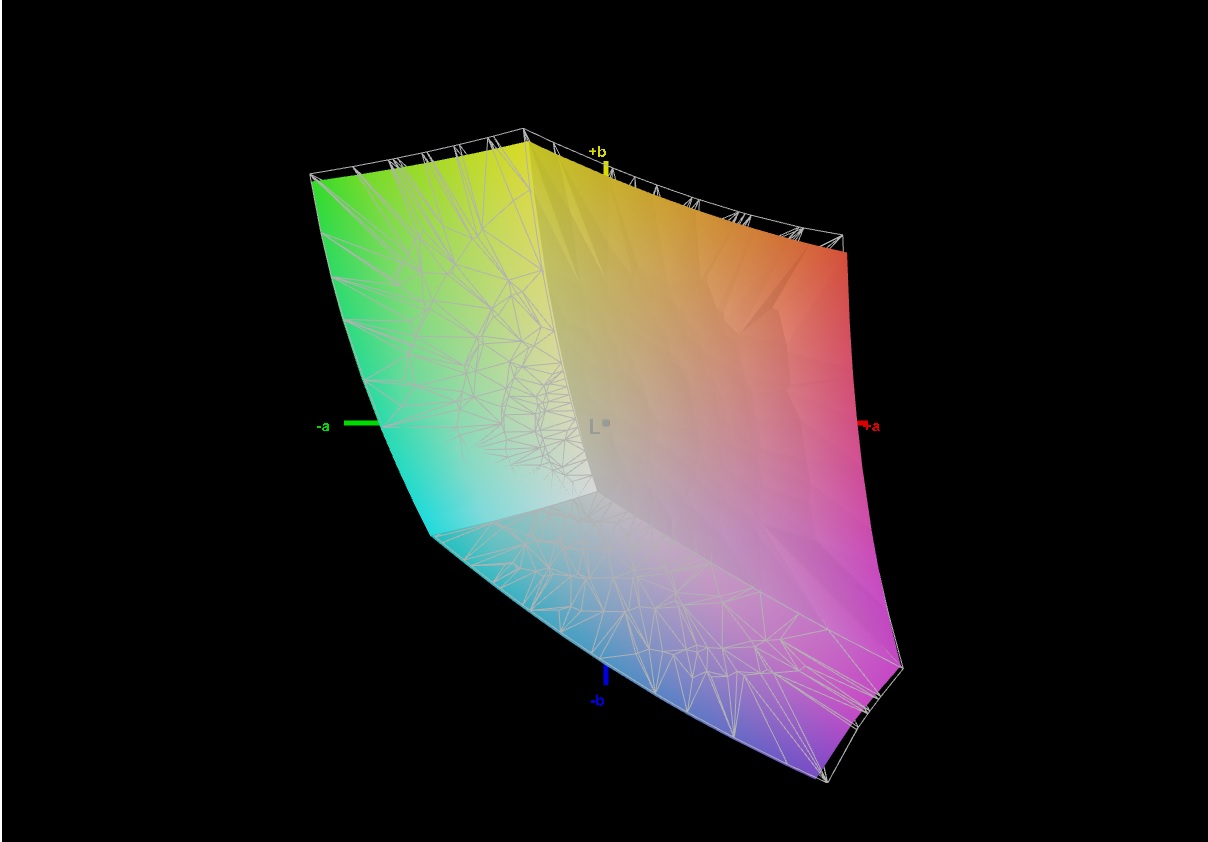
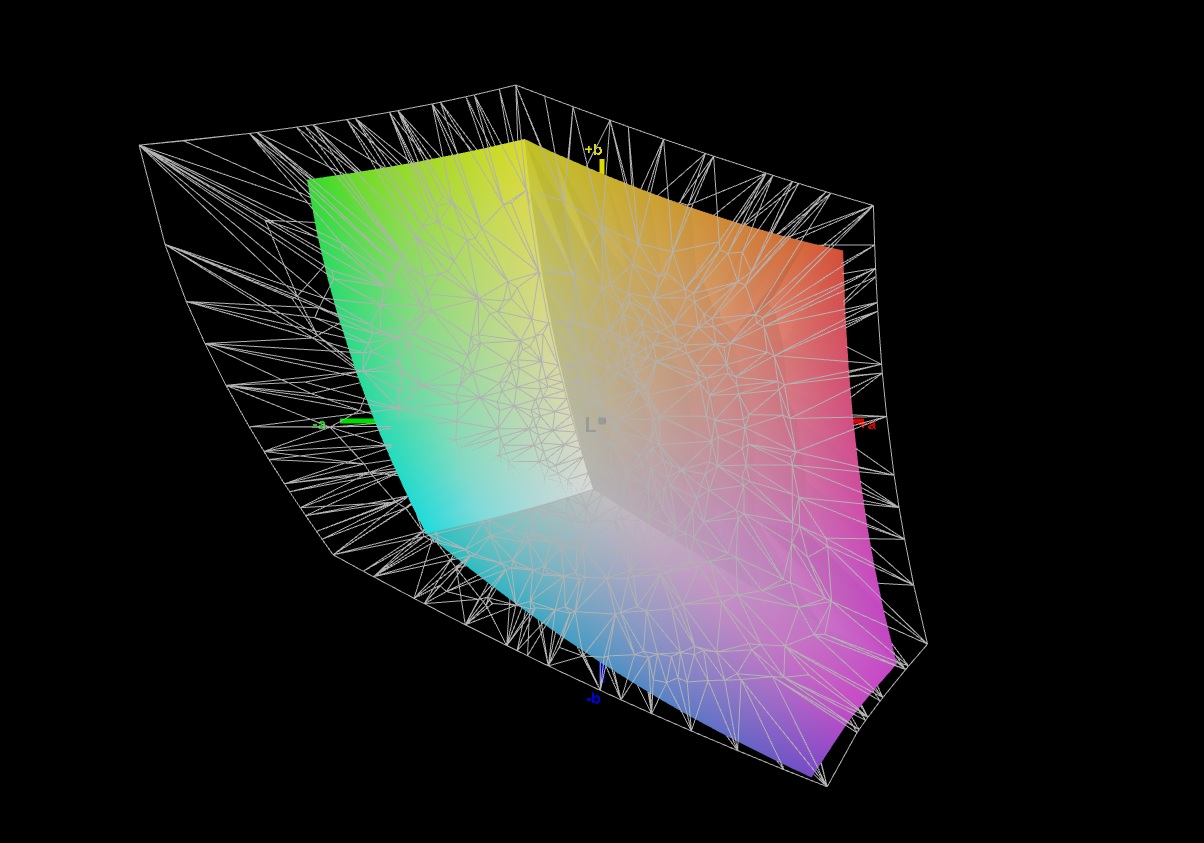
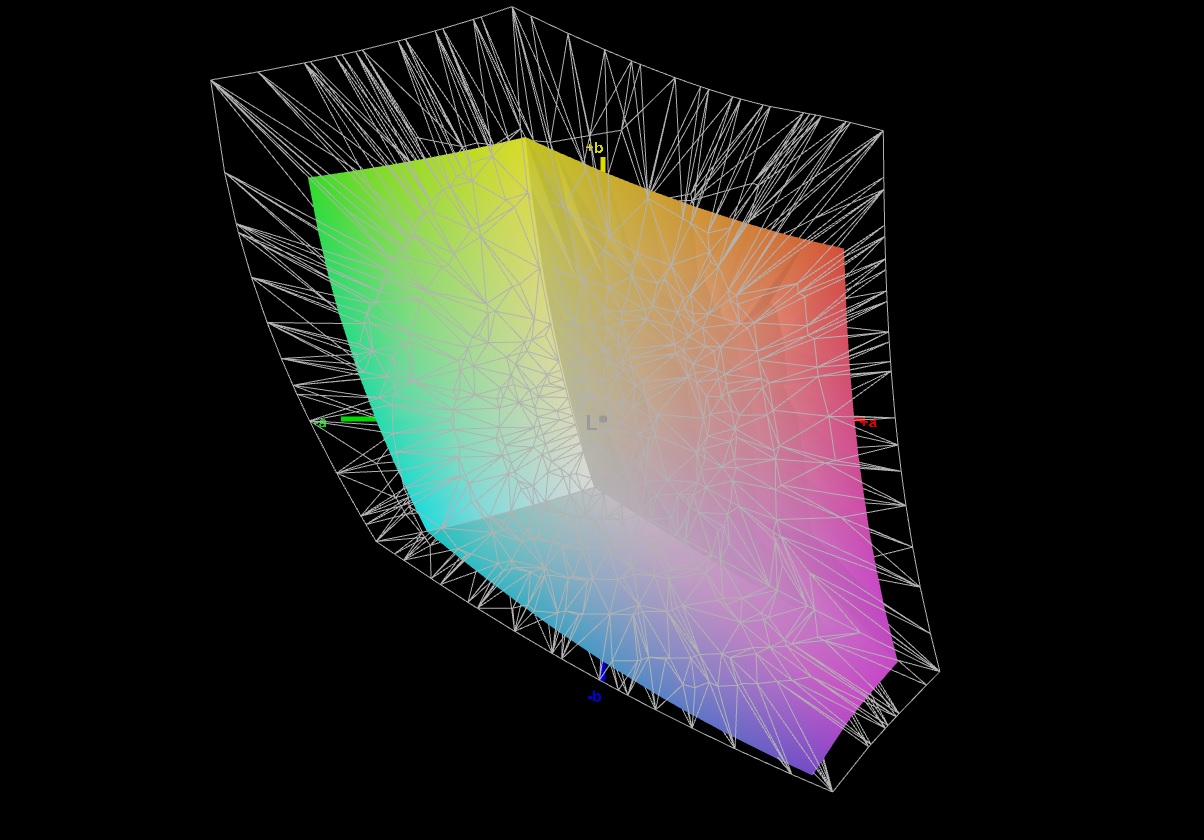
67.4% AdobeRGB 1998 (Argyll 3D)
85.1% sRGB (Argyll 3D)
65.3% Display P3 (Argyll 3D)
Gamma: 2.282
CCT: 6499 K
| Razer Blade 15 Advanced Model Early 2022 TL156VDXP02-0, IPS, 1920x1080, 15.6" | Razer Blade 15 2022 Sharp LQ156T1JW03, IPS, 2560x1440, 15.6" | Schenker XMG Neo 15 E22 (Early 2022, RTX 3080 Ti) BOE0A67 (BOE CQ NE156QHM-NZ1), IPS, 2560x1440, 15.6" | Asus ROG Strix Scar 15 G533QS BOE CQ NE156QHM-NY1, IPS, 2560x1440, 15.6" | MSI Stealth GS66 12UGS Sharp LQ156T1JW04 (SHP153C), IPS-Level, 2560x1440, 15.6" | MSI Vector GP66 12UGS BOE NE156FHM-NZ3, IPS, 1920x1080, 15.6" | |
|---|---|---|---|---|---|---|
| Display | 33% | 31% | 31% | 10% | ||
| Display P3 Coverage (%) | 65.3 | 99.1 52% | 97.6 49% | 96.4 48% | 70.1 7% | |
| sRGB Coverage (%) | 85.1 | 99.9 17% | 99.9 17% | 99.7 17% | 99.5 17% | |
| AdobeRGB 1998 Coverage (%) | 67.4 | 86.8 29% | 85.3 27% | 85.6 27% | 72.1 7% | |
| Response Times | -123% | -119% | -122% | -10% | -13% | |
| Response Time Grey 50% / Grey 80% * (ms) | 4.3 ? | 14.4 ? -235% | 14.4 ? -235% | 14 ? -226% | 6 ? -40% | 5.8 ? -35% |
| Response Time Black / White * (ms) | 10.5 ? | 11.6 ? -10% | 10.8 ? -3% | 12.4 ? -18% | 8.4 ? 20% | 9.6 ? 9% |
| PWM Frequency (Hz) | ||||||
| Screen | -54% | -38% | -77% | -87% | -45% | |
| Brightness middle (cd/m²) | 330 | 286 -13% | 295 -11% | 304.3 -8% | 272 -18% | 353.1 7% |
| Brightness (cd/m²) | 315 | 271 -14% | 277 -12% | 286 -9% | 253 -20% | 325 3% |
| Brightness Distribution (%) | 89 | 89 0% | 62 -30% | 76 -15% | 87 -2% | 85 -4% |
| Black Level * (cd/m²) | 0.24 | 0.25 -4% | 0.28 -17% | 0.33 -38% | 0.25 -4% | 0.38 -58% |
| Contrast (:1) | 1375 | 1144 -17% | 1054 -23% | 922 -33% | 1088 -21% | 929 -32% |
| Colorchecker dE 2000 * | 1.47 | 2.74 -86% | 2.36 -61% | 2.76 -88% | 3.73 -154% | 2.24 -52% |
| Colorchecker dE 2000 max. * | 2.73 | 5.21 -91% | 4.24 -55% | 5.57 -104% | 9.43 -245% | 5 -83% |
| Colorchecker dE 2000 calibrated * | 0.63 | 2.52 -300% | 2.38 -278% | 0.98 -56% | 1.02 -62% | |
| Greyscale dE 2000 * | 1.8 | 1.1 39% | 3.43 -91% | 4 -122% | 6.5 -261% | 4 -122% |
| Gamma | 2.282 96% | 2.2 100% | 2.44 90% | 2.14 103% | 2.172 101% | 2.24 98% |
| CCT | 6499 100% | 6408 101% | 6266 104% | 6844 95% | 6485 100% | 6864 95% |
| Moyenne finale (programmes/paramètres) | -48% /
-45% | -79% /
-54% | -56% /
-60% | -22% /
-51% | -16% /
-28% |
* ... Moindre est la valeur, meilleures sont les performances
Dans notre configuration, le Razer Blade 15 ne couvre que 85 % de l'espace couleur sRGB. Compte tenu de la revendication du fabricant de "jusqu'à 100%", nous nous attendions à plus ici.

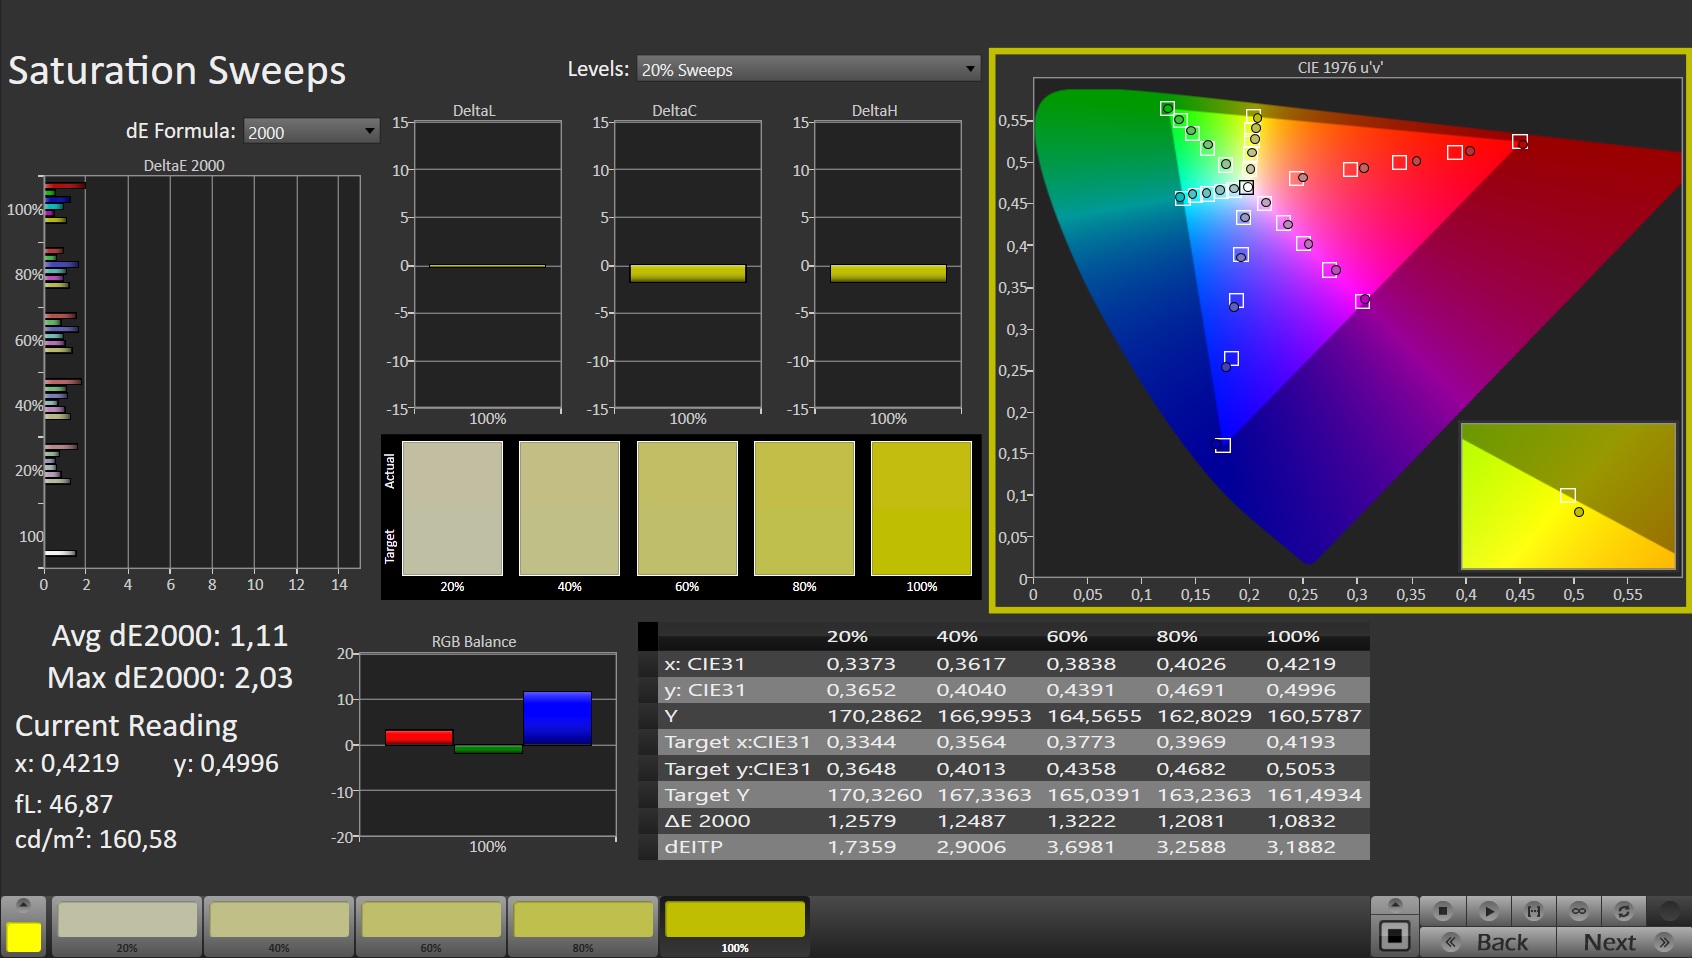
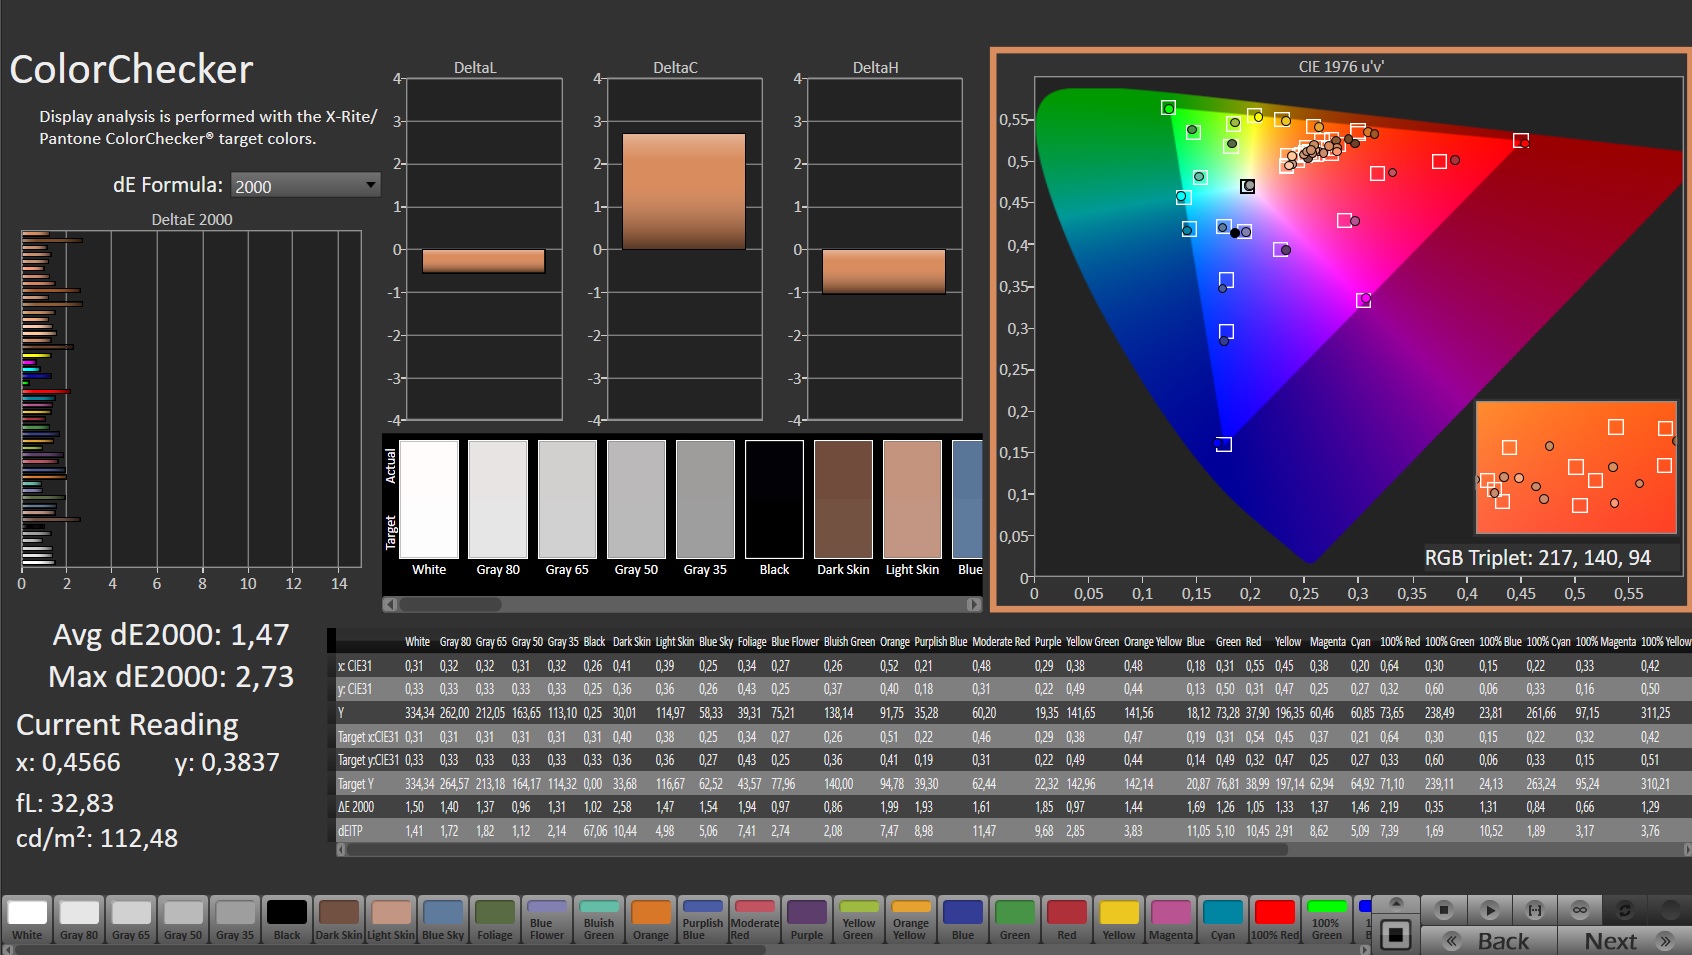
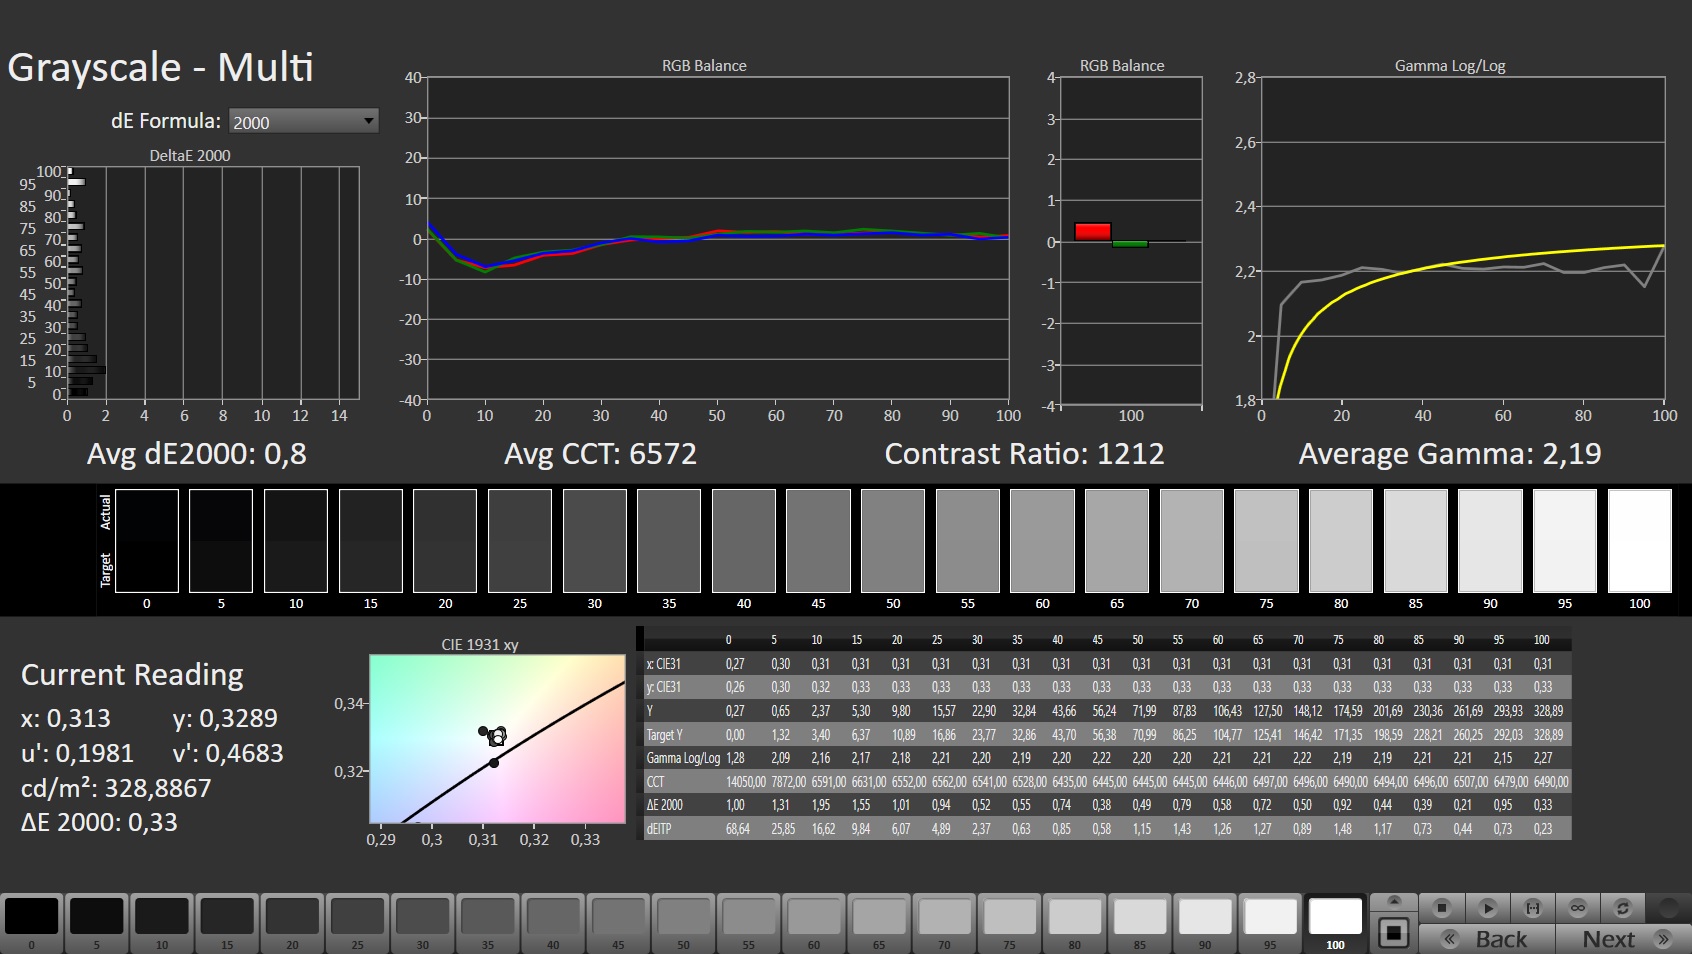
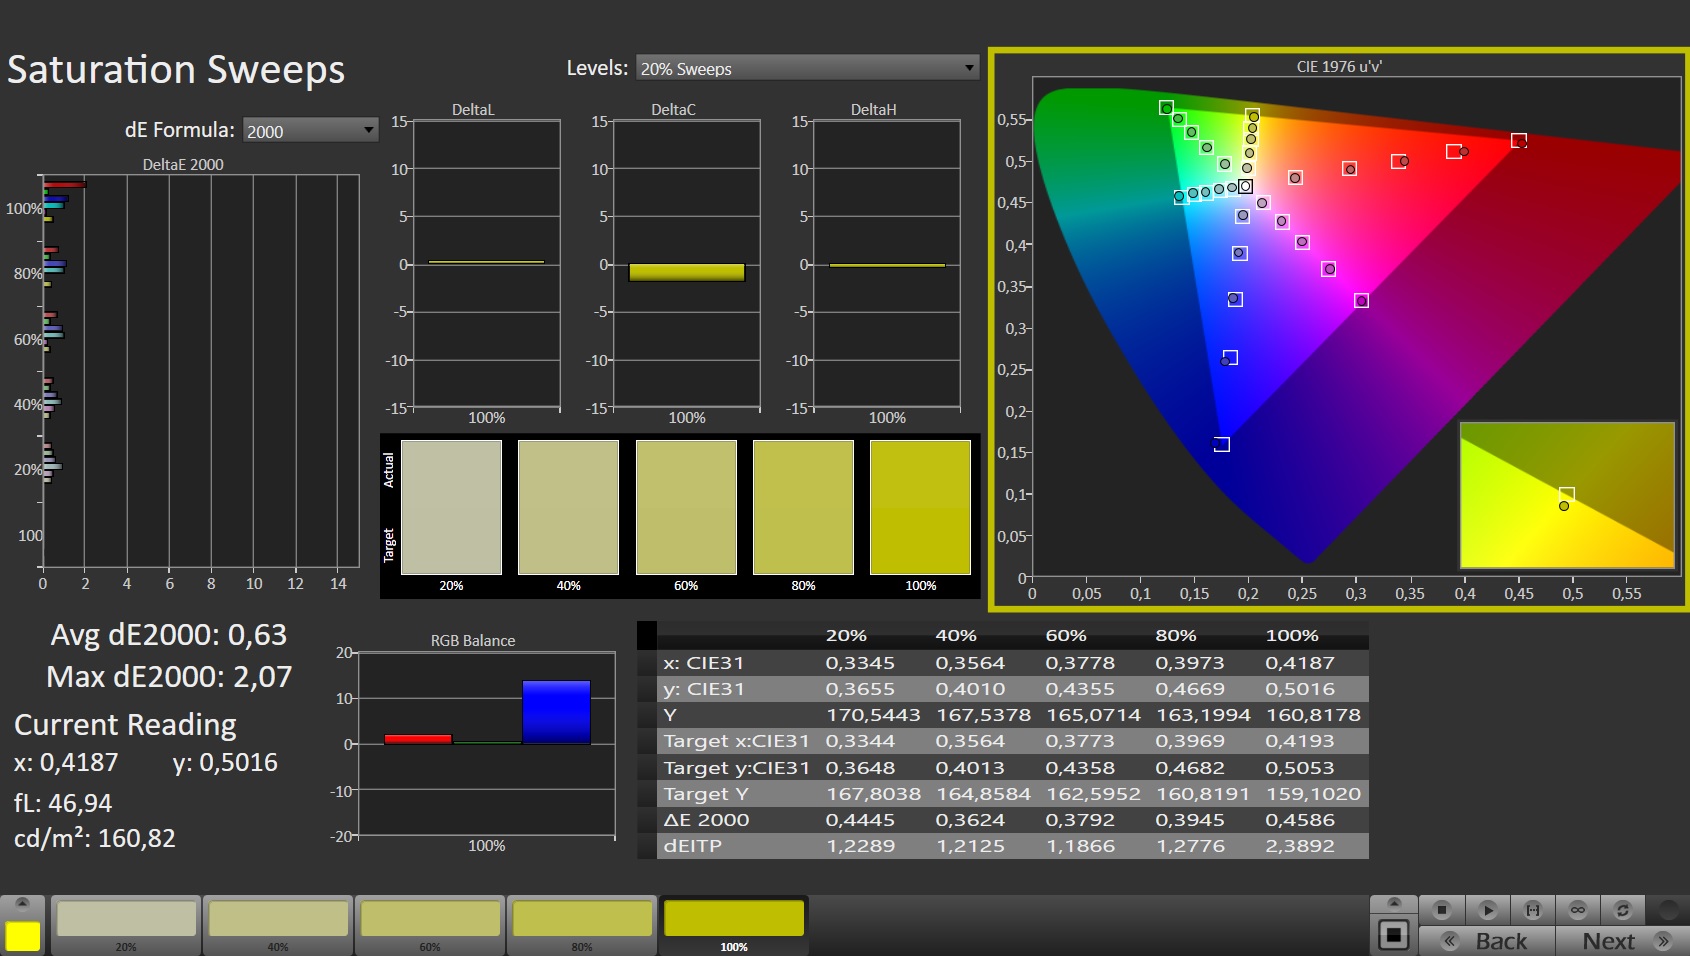
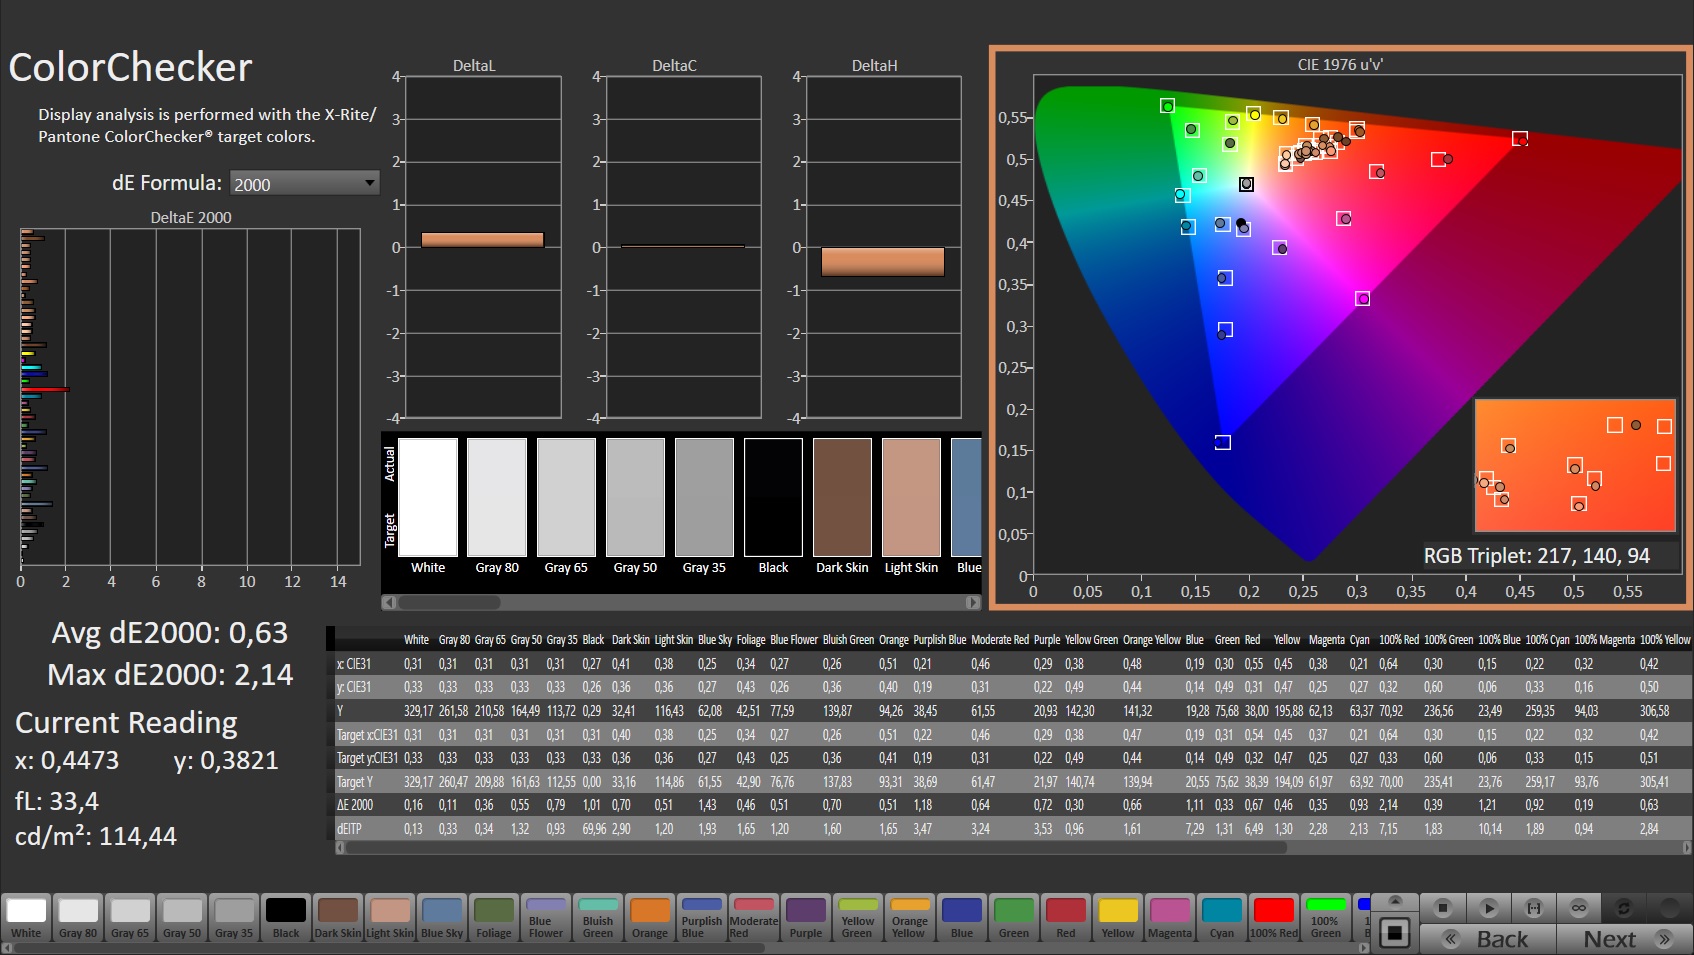
À la livraison, les écarts de l'espace couleur DeltaE des niveaux de gris et des couleurs sont déjà dans la fourchette idéale (moins de 3) et peuvent être améliorés à un solide 0,63 et 0,8 respectivement par un calibrage ultérieur
Temps de réponse de l'écran
| ↔ Temps de réponse noir à blanc | ||
|---|---|---|
| 10.5 ms ... hausse ↗ et chute ↘ combinées | ↗ 5.7 ms hausse | 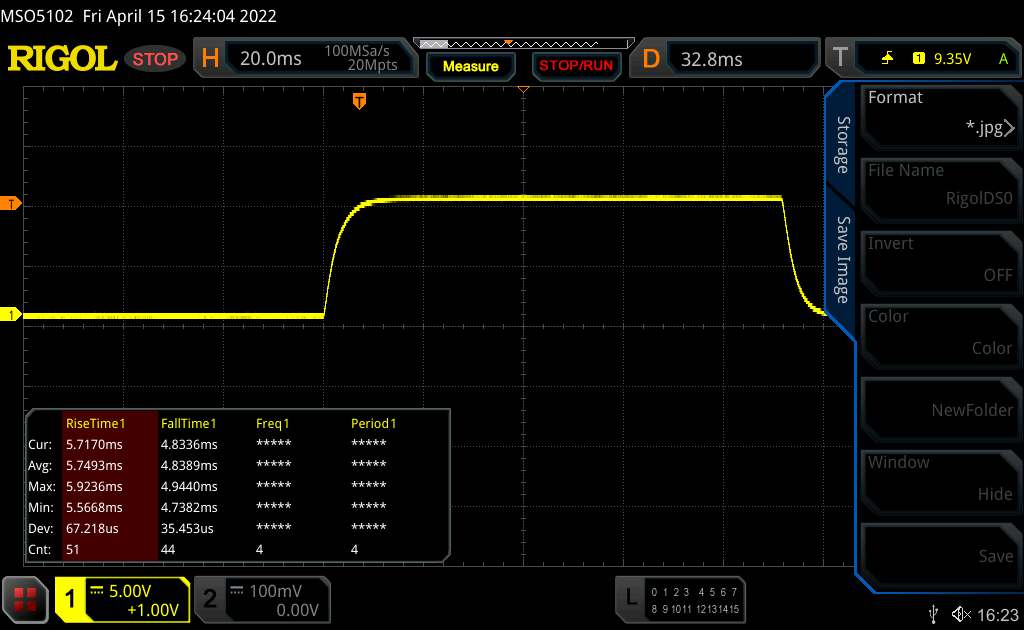 |
| ↘ 4.8 ms chute | ||
| L'écran montre de bons temps de réponse, mais insuffisant pour du jeu compétitif. En comparaison, tous les appareils testés affichent entre 0.1 (minimum) et 240 (maximum) ms. » 29 % des appareils testés affichent de meilleures performances. Cela signifie que les latences relevées sont meilleures que la moyenne (19.8 ms) de tous les appareils testés. | ||
| ↔ Temps de réponse gris 50% à gris 80% | ||
| 4.3 ms ... hausse ↗ et chute ↘ combinées | ↗ 2.4 ms hausse | 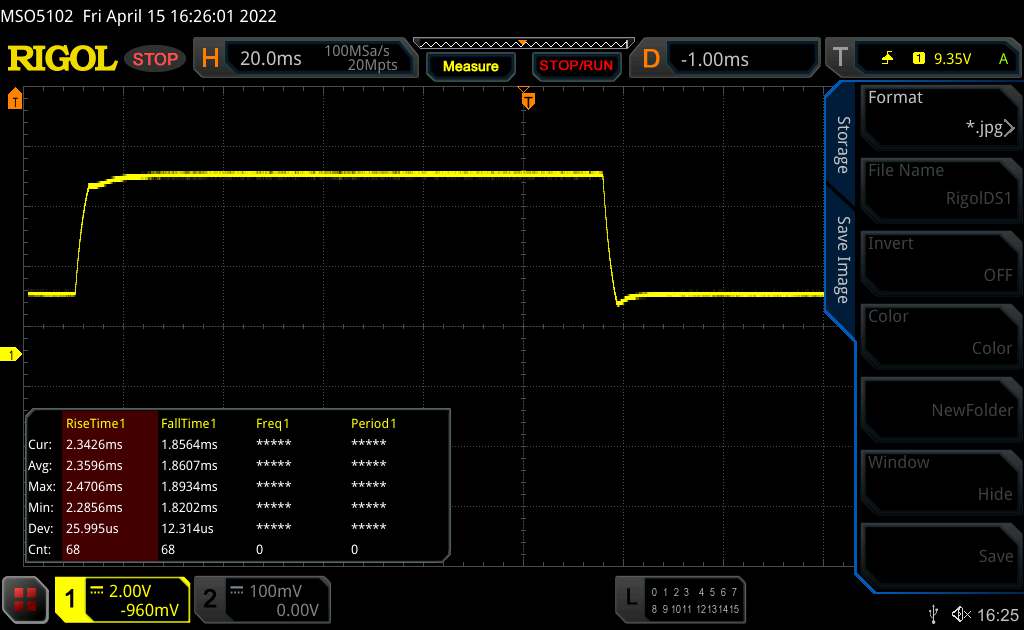 |
| ↘ 1.9 ms chute | ||
| L'écran montre de très faibles temps de réponse, parfait pour le jeu. En comparaison, tous les appareils testés affichent entre 0.165 (minimum) et 636 (maximum) ms. » 16 % des appareils testés affichent de meilleures performances. Cela signifie que les latences relevées sont meilleures que la moyenne (31 ms) de tous les appareils testés. | ||
Scintillement / MLI (Modulation de largeur d'impulsion)
| Scintillement / MLI (Modulation de largeur d'impulsion) non décelé | 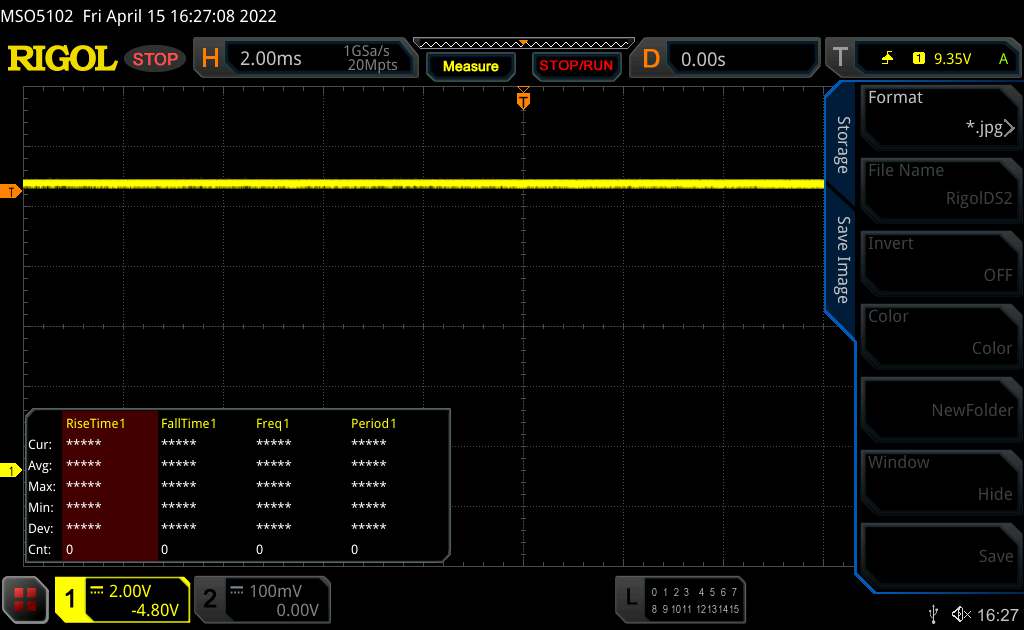 | ||
En comparaison, 52 % des appareils testés n'emploient pas MDI pour assombrir leur écran. Nous avons relevé une moyenne à 7765 (minimum : 5 - maximum : 343500) Hz dans le cas où une MDI était active. | |||
Grâce à une luminosité de plus de 300 cd/m², l'écran est également équipé pour une utilisation en extérieur, à condition de rester à l'ombre
Les angles de vision sont superbes. Même sous des angles prononcés, les couleurs et les contrastes de l'écran IPS sont à peine déformés
Performances - Ordinateur portable de jeu Razer avec matériel de pointe
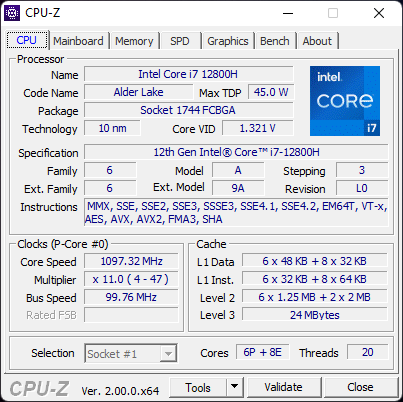
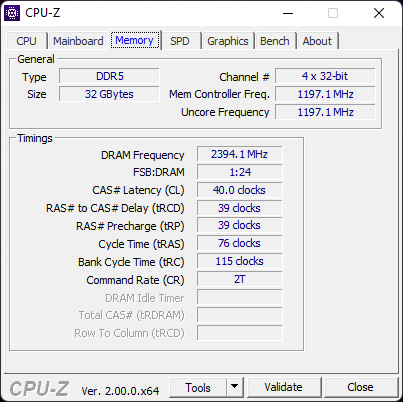
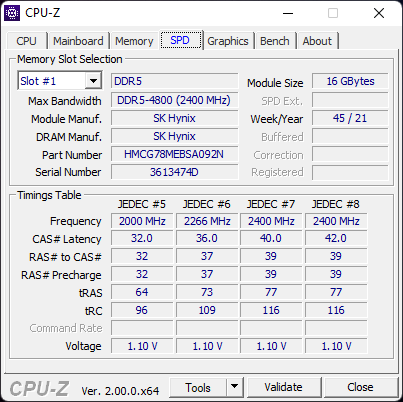
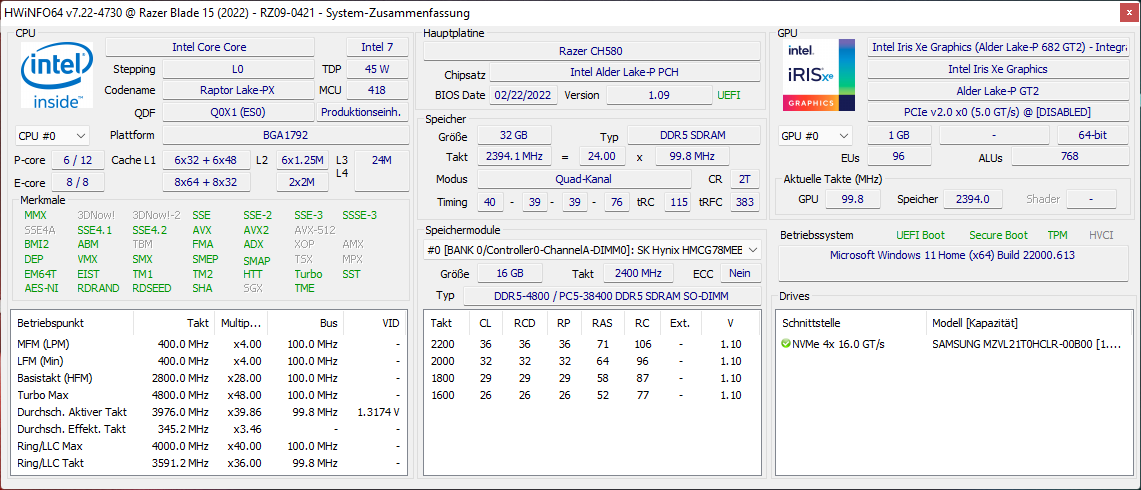
Notre Razer Blade 15 est équipé d'un Intel Core i7-12800H et d'une Nvidia GeForce RTX 3080 Ti. On trouve également 32 Go de RAM DDR5 en mode quadri-canal et un SSD PCIe 4.0 de 1 To. En combinaison avec l'écran 4K, l'ordinateur portable est également disponible avec le Core i9-12900H.
Conditions d'essai
Afin d'obtenir de nouvelles informations pendant les tests, nous avons effectué toutes les mesures avec le profil Synapse "Balanced". Cela fait travailler le GPU avec un TGP maximum d'environ 95 W et limite également le CPU. Vous pouvez trouver les scores maximaux réalisables dans notre autre test.
Processeur
Le site Intel Core i7-12800H est un tout nouveau processeur Intel de 12e génération qui prend en charge la mémoire vive DDR5. La fonctionnalité DDR5 permet aux deux modules de RAM de fonctionner en mode quadri-canal.
Le Razer Blade 15 est moins capable de suivre ses concurrents en termes de performances du processeur en mode "équilibré" que sans limitations de performances. Même le Core i7-12700H du XMG Neo 15 E22 bat notre appareil dans les deux scénarios du test multi-boucles Cinebench R15. Le fait que certains benchmarks à un seul fil soient meilleurs est probablement dû au fait que les limites de température sont atteintes avant les limites du TDP. Le turbo boost ne reste actif que pendant une courte période.
Le test multithread Cinebench R15 donne le même résultat en mode batterie avec le profil que nous avons sélectionné.
Cinebench R15 Multi Sustained Load
* ... Moindre est la valeur, meilleures sont les performances
AIDA64: FP32 Ray-Trace | FPU Julia | CPU SHA3 | CPU Queen | FPU SinJulia | FPU Mandel | CPU AES | CPU ZLib | FP64 Ray-Trace | CPU PhotoWorxx
| Performance rating | |
| Moyenne de la classe Gaming | |
| Asus ROG Strix Scar 15 G533QS | |
| MSI Stealth GS66 12UGS | |
| Schenker XMG Neo 15 E22 (Early 2022, RTX 3080 Ti) | |
| MSI Vector GP66 12UGS | |
| Moyenne Intel Core i7-12800H | |
| Razer Blade 15 2022 | |
| Razer Blade 15 Advanced Model Early 2022 | |
| AIDA64 / FP32 Ray-Trace | |
| Moyenne de la classe Gaming (10227 - 85542, n=107, 2 dernières années) | |
| Asus ROG Strix Scar 15 G533QS | |
| Schenker XMG Neo 15 E22 (Early 2022, RTX 3080 Ti) | |
| MSI Stealth GS66 12UGS | |
| Moyenne Intel Core i7-12800H (5839 - 15206, n=5) | |
| MSI Vector GP66 12UGS | |
| Razer Blade 15 2022 | |
| Razer Blade 15 Advanced Model Early 2022 | |
| AIDA64 / FPU Julia | |
| Moyenne de la classe Gaming (51376 - 238426, n=107, 2 dernières années) | |
| Asus ROG Strix Scar 15 G533QS | |
| Moyenne Intel Core i7-12800H (27801 - 80002, n=5) | |
| Schenker XMG Neo 15 E22 (Early 2022, RTX 3080 Ti) | |
| MSI Stealth GS66 12UGS | |
| MSI Vector GP66 12UGS | |
| Razer Blade 15 2022 | |
| Razer Blade 15 Advanced Model Early 2022 | |
| AIDA64 / CPU SHA3 | |
| Moyenne de la classe Gaming (2180 - 9817, n=107, 2 dernières années) | |
| Asus ROG Strix Scar 15 G533QS | |
| Schenker XMG Neo 15 E22 (Early 2022, RTX 3080 Ti) | |
| MSI Stealth GS66 12UGS | |
| MSI Vector GP66 12UGS | |
| Moyenne Intel Core i7-12800H (2013 - 3684, n=5) | |
| Razer Blade 15 2022 | |
| Razer Blade 15 Advanced Model Early 2022 | |
| AIDA64 / CPU Queen | |
| Moyenne de la classe Gaming (49785 - 173351, n=95, 2 dernières années) | |
| MSI Vector GP66 12UGS | |
| Asus ROG Strix Scar 15 G533QS | |
| MSI Stealth GS66 12UGS | |
| Schenker XMG Neo 15 E22 (Early 2022, RTX 3080 Ti) | |
| Moyenne Intel Core i7-12800H (85965 - 108084, n=5) | |
| Razer Blade 15 2022 | |
| Razer Blade 15 Advanced Model Early 2022 | |
| AIDA64 / FPU SinJulia | |
| Moyenne de la classe Gaming (4424 - 33636, n=107, 2 dernières années) | |
| Asus ROG Strix Scar 15 G533QS | |
| Schenker XMG Neo 15 E22 (Early 2022, RTX 3080 Ti) | |
| MSI Stealth GS66 12UGS | |
| MSI Vector GP66 12UGS | |
| Razer Blade 15 2022 | |
| Moyenne Intel Core i7-12800H (7027 - 9658, n=5) | |
| Razer Blade 15 Advanced Model Early 2022 | |
| AIDA64 / FPU Mandel | |
| Moyenne de la classe Gaming (25115 - 128721, n=107, 2 dernières années) | |
| Asus ROG Strix Scar 15 G533QS | |
| Schenker XMG Neo 15 E22 (Early 2022, RTX 3080 Ti) | |
| MSI Stealth GS66 12UGS | |
| Moyenne Intel Core i7-12800H (15765 - 38179, n=5) | |
| MSI Vector GP66 12UGS | |
| Razer Blade 15 2022 | |
| Razer Blade 15 Advanced Model Early 2022 | |
| AIDA64 / CPU AES | |
| Asus ROG Strix Scar 15 G533QS | |
| Moyenne de la classe Gaming (39258 - 247074, n=107, 2 dernières années) | |
| MSI Stealth GS66 12UGS | |
| MSI Vector GP66 12UGS | |
| Schenker XMG Neo 15 E22 (Early 2022, RTX 3080 Ti) | |
| Razer Blade 15 Advanced Model Early 2022 | |
| Moyenne Intel Core i7-12800H (55371 - 73928, n=5) | |
| Razer Blade 15 2022 | |
| AIDA64 / CPU ZLib | |
| Moyenne de la classe Gaming (574 - 2531, n=107, 2 dernières années) | |
| Schenker XMG Neo 15 E22 (Early 2022, RTX 3080 Ti) | |
| MSI Vector GP66 12UGS | |
| MSI Stealth GS66 12UGS | |
| Razer Blade 15 2022 | |
| Moyenne Intel Core i7-12800H (701 - 1047, n=5) | |
| Asus ROG Strix Scar 15 G533QS | |
| Razer Blade 15 Advanced Model Early 2022 | |
| AIDA64 / FP64 Ray-Trace | |
| Moyenne de la classe Gaming (5509 - 45446, n=107, 2 dernières années) | |
| Asus ROG Strix Scar 15 G533QS | |
| Schenker XMG Neo 15 E22 (Early 2022, RTX 3080 Ti) | |
| MSI Stealth GS66 12UGS | |
| Moyenne Intel Core i7-12800H (3257 - 8559, n=5) | |
| MSI Vector GP66 12UGS | |
| Razer Blade 15 2022 | |
| Razer Blade 15 Advanced Model Early 2022 | |
| AIDA64 / CPU PhotoWorxx | |
| Moyenne de la classe Gaming (12271 - 89891, n=107, 2 dernières années) | |
| Razer Blade 15 2022 | |
| Schenker XMG Neo 15 E22 (Early 2022, RTX 3080 Ti) | |
| MSI Stealth GS66 12UGS | |
| Razer Blade 15 Advanced Model Early 2022 | |
| Moyenne Intel Core i7-12800H (31329 - 40992, n=5) | |
| MSI Vector GP66 12UGS | |
| Asus ROG Strix Scar 15 G533QS | |
Performance du système
Les performances du système sont solides, selon les tests PCMark 10. Dans l'utilisation quotidienne, la vitesse de fonctionnement est fluide et il n'y a pas de retards notables, c'est pourquoi vous pouvez utiliser le mode "Balanced" sans souci.
CrossMark: Overall | Productivity | Creativity | Responsiveness
| PCMark 10 / Score | |
| Moyenne de la classe Gaming (5828 - 11574, n=95, 2 dernières années) | |
| MSI Vector GP66 12UGS | |
| Razer Blade 15 2022 | |
| Moyenne Intel Core i7-12800H, NVIDIA GeForce RTX 3080 Ti Laptop GPU (7313 - 7744, n=3) | |
| MSI Stealth GS66 12UGS | |
| Razer Blade 15 Advanced Model Early 2022 | |
| Schenker XMG Neo 15 E22 (Early 2022, RTX 3080 Ti) | |
| Asus ROG Strix Scar 15 G533QS | |
| PCMark 10 / Essentials | |
| MSI Vector GP66 12UGS | |
| MSI Stealth GS66 12UGS | |
| Razer Blade 15 2022 | |
| Moyenne Intel Core i7-12800H, NVIDIA GeForce RTX 3080 Ti Laptop GPU (10597 - 10814, n=3) | |
| Moyenne de la classe Gaming (8810 - 12600, n=99, 2 dernières années) | |
| Razer Blade 15 Advanced Model Early 2022 | |
| Asus ROG Strix Scar 15 G533QS | |
| Schenker XMG Neo 15 E22 (Early 2022, RTX 3080 Ti) | |
| PCMark 10 / Productivity | |
| Moyenne de la classe Gaming (6845 - 21327, n=97, 2 dernières années) | |
| MSI Vector GP66 12UGS | |
| Asus ROG Strix Scar 15 G533QS | |
| Razer Blade 15 Advanced Model Early 2022 | |
| Razer Blade 15 2022 | |
| Moyenne Intel Core i7-12800H, NVIDIA GeForce RTX 3080 Ti Laptop GPU (9470 - 9675, n=3) | |
| MSI Stealth GS66 12UGS | |
| Schenker XMG Neo 15 E22 (Early 2022, RTX 3080 Ti) | |
| PCMark 10 / Digital Content Creation | |
| Moyenne de la classe Gaming (7602 - 19657, n=97, 2 dernières années) | |
| MSI Vector GP66 12UGS | |
| Razer Blade 15 2022 | |
| Moyenne Intel Core i7-12800H, NVIDIA GeForce RTX 3080 Ti Laptop GPU (10351 - 12306, n=3) | |
| MSI Stealth GS66 12UGS | |
| Schenker XMG Neo 15 E22 (Early 2022, RTX 3080 Ti) | |
| Razer Blade 15 Advanced Model Early 2022 | |
| Asus ROG Strix Scar 15 G533QS | |
| CrossMark / Overall | |
| Moyenne de la classe Gaming (1366 - 2409, n=96, 2 dernières années) | |
| Razer Blade 15 Advanced Model Early 2022 | |
| Moyenne Intel Core i7-12800H, NVIDIA GeForce RTX 3080 Ti Laptop GPU (n=1) | |
| CrossMark / Productivity | |
| Moyenne de la classe Gaming (1386 - 2254, n=96, 2 dernières années) | |
| Razer Blade 15 Advanced Model Early 2022 | |
| Moyenne Intel Core i7-12800H, NVIDIA GeForce RTX 3080 Ti Laptop GPU (n=1) | |
| CrossMark / Creativity | |
| Moyenne de la classe Gaming (1343 - 2729, n=96, 2 dernières années) | |
| Razer Blade 15 Advanced Model Early 2022 | |
| Moyenne Intel Core i7-12800H, NVIDIA GeForce RTX 3080 Ti Laptop GPU (n=1) | |
| CrossMark / Responsiveness | |
| Moyenne de la classe Gaming (1226 - 2334, n=96, 2 dernières années) | |
| Razer Blade 15 Advanced Model Early 2022 | |
| Moyenne Intel Core i7-12800H, NVIDIA GeForce RTX 3080 Ti Laptop GPU (n=1) | |
| PCMark 8 Home Score Accelerated v2 | 6657 points | |
| PCMark 8 Work Score Accelerated v2 | 7009 points | |
| PCMark 10 Score | 7313 points | |
Aide | ||
| AIDA64 / Memory Copy | |
| Moyenne de la classe Gaming (21750 - 129946, n=107, 2 dernières années) | |
| Schenker XMG Neo 15 E22 (Early 2022, RTX 3080 Ti) | |
| Razer Blade 15 2022 | |
| MSI Stealth GS66 12UGS | |
| Razer Blade 15 Advanced Model Early 2022 | |
| Moyenne Intel Core i7-12800H (48643 - 62522, n=5) | |
| MSI Vector GP66 12UGS | |
| Asus ROG Strix Scar 15 G533QS | |
| AIDA64 / Memory Read | |
| Moyenne de la classe Gaming (22956 - 118858, n=107, 2 dernières années) | |
| Schenker XMG Neo 15 E22 (Early 2022, RTX 3080 Ti) | |
| Razer Blade 15 2022 | |
| MSI Stealth GS66 12UGS | |
| Razer Blade 15 Advanced Model Early 2022 | |
| Moyenne Intel Core i7-12800H (56629 - 66199, n=5) | |
| MSI Vector GP66 12UGS | |
| Asus ROG Strix Scar 15 G533QS | |
| AIDA64 / Memory Write | |
| Moyenne de la classe Gaming (22297 - 135096, n=107, 2 dernières années) | |
| MSI Stealth GS66 12UGS | |
| Razer Blade 15 2022 | |
| Razer Blade 15 Advanced Model Early 2022 | |
| Schenker XMG Neo 15 E22 (Early 2022, RTX 3080 Ti) | |
| Moyenne Intel Core i7-12800H (50923 - 66074, n=5) | |
| MSI Vector GP66 12UGS | |
| Asus ROG Strix Scar 15 G533QS | |
| AIDA64 / Memory Latency | |
| Moyenne de la classe Gaming (75.3 - 259, n=107, 2 dernières années) | |
| Razer Blade 15 Advanced Model Early 2022 | |
| MSI Stealth GS66 12UGS | |
| MSI Vector GP66 12UGS | |
| Asus ROG Strix Scar 15 G533QS | |
| Moyenne Intel Core i7-12800H (89.3 - 95.2, n=5) | |
| Schenker XMG Neo 15 E22 (Early 2022, RTX 3080 Ti) | |
| Razer Blade 15 2022 | |
* ... Moindre est la valeur, meilleures sont les performances
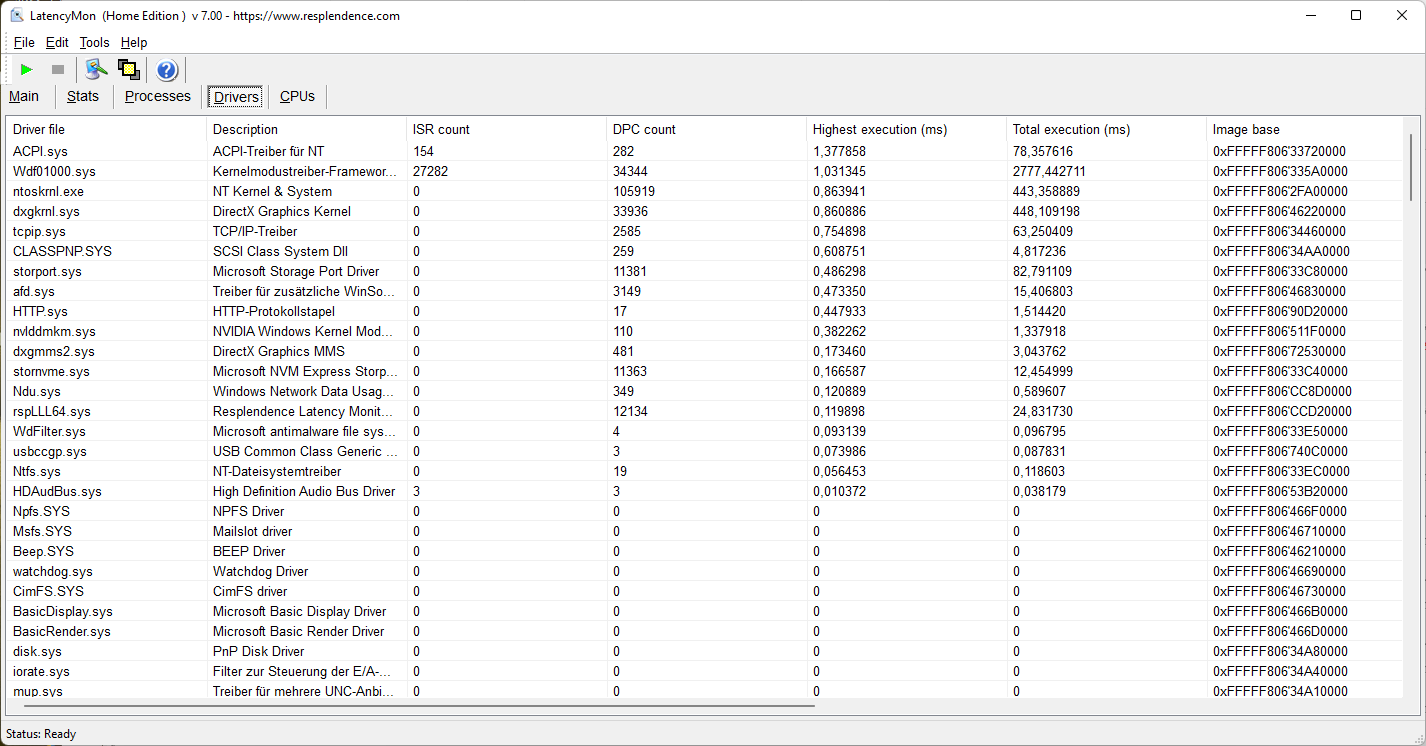
Latences DPC
Selon LatencyMon, les latences DPC peuvent être trop élevées pour l'édition audio et vidéo en temps réel dans la configuration que nous avons testée
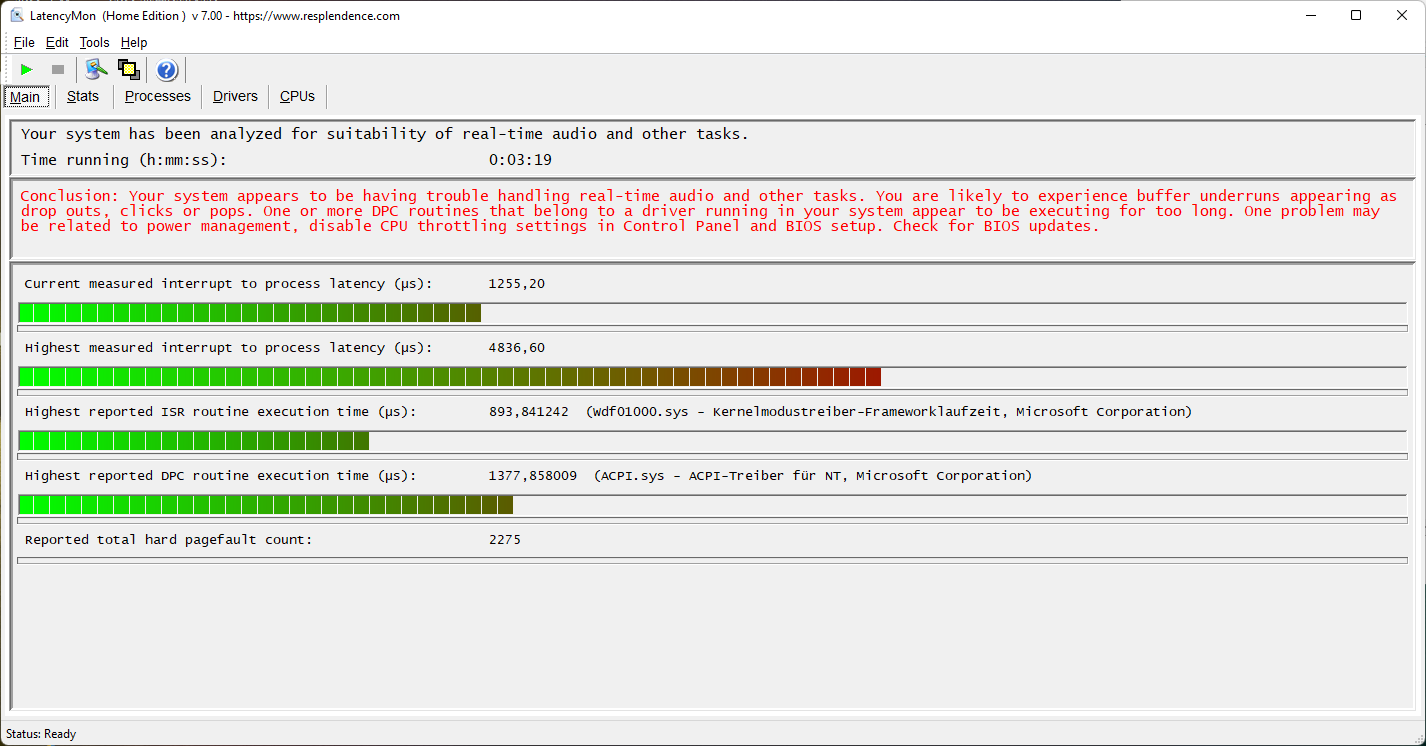
| DPC Latencies / LatencyMon - interrupt to process latency (max), Web, Youtube, Prime95 | |
| Razer Blade 15 Advanced Model Early 2022 | |
| MSI Vector GP66 12UGS | |
| MSI Stealth GS66 12UGS | |
| Asus ROG Strix Scar 15 G533QS | |
| Razer Blade 15 2022 | |
| Schenker XMG Neo 15 E22 (Early 2022, RTX 3080 Ti) | |
* ... Moindre est la valeur, meilleures sont les performances
Périphériques de stockage
Un disque dur Samsung PM9A1 M.2 de 1 To avec PCIe 4.0 est installé dans notre appareil de test, ce qui se traduit par des taux de transfert de données très élevés. Depuis que le SSD PCIe 4.0 "CA6-8D1024" de SSSTC a été installé dans notre premier appareil de test Blade 15, les taux de transfert de données sont très élevés premier appareil Blade 15les modèles de disques et les taux de transfert peuvent différer.

* ... Moindre est la valeur, meilleures sont les performances
Sustained Read Performance: DiskSpd Read Loop, Queue Depth 8
GPU
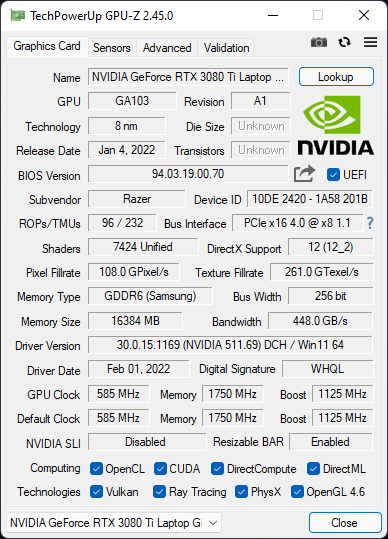
Le mobile Nvidia GeForce RTX 3080 Ti avec 16 Go de VRAM appartient à la génération Ampere Refresh. D'après les benchmarks 3DMark, l'utilisation du mode "Balanced" entraîne un déficit de performance d'environ 10 à 20 %. De petites baisses peuvent être observées dans la progression de la fréquence d'images de The Witcher 3, mais cela n'a eu qu'un impact minimal sur l'expérience de jeu.
Les performances sont limitées en mode batterie. Une exécution sur Fire Strike a donné des scores de physique et de graphisme de 12 888 et 10 344 respectivement en mode batterie, contre 21866 et 25240 en mode secteur.
| 3DMark 11 Performance | 25091 points | |
| 3DMark Ice Storm Standard Score | 158195 points | |
| 3DMark Cloud Gate Standard Score | 43351 points | |
| 3DMark Fire Strike Score | 21106 points | |
| 3DMark Time Spy Score | 9596 points | |
Aide | ||
Performances en matière de jeux
Les benchmarks de Gming sont naturellement plus faibles en mode performances équilibrées. Néanmoins, les fréquences d'images absolues sont encore suffisamment élevées pour une expérience de jeu fluide, de sorte que vous n'avez pas nécessairement besoin d'utiliser le Blade 15 en mode hautes performances.
Witcher 3 FPS Diagram
| Bas | Moyen | Élevé | Ultra | |
|---|---|---|---|---|
| GTA V (2015) | 178.7 | 170.7 | 153.4 | 92.4 |
| The Witcher 3 (2015) | 316 | 200 | 155.5 | 89.3 |
| Dota 2 Reborn (2015) | 59.9 | 59.9 | 59.9 | 59.9 |
| Final Fantasy XV Benchmark (2018) | 148.3 | 119.4 | 90.4 | |
| X-Plane 11.11 (2018) | 124.3 | 109.5 | 93.4 | |
| Strange Brigade (2018) | 361 | 212 | 167.6 | 149.8 |
Émissions - Boîtier conducteur de chaleur
Bruit
Les ventilateurs sont lents et laissent les composants chauffer un peu avant de se mettre en marche. En particulier, le niveau sonore moyen sous charge est sensiblement plus faible en mode équilibré. Le niveau sonore de notre première Blade 15 (mode : performance maximale) se situait dans la fourchette habituelle. Aucun gémissement de la bobine n'a été détecté dans notre appareil.
Degré de la nuisance sonore
| Au repos |
| 26 / 27 / 29 dB(A) |
| Fortement sollicité |
| 37 / 45 dB(A) |
 | ||
30 dB silencieux 40 dB(A) audible 50 dB(A) bruyant |
||
min: | ||
| Razer Blade 15 Advanced Model Early 2022 i7-12800H, GeForce RTX 3080 Ti Laptop GPU | Razer Blade 15 2022 i7-12800H, GeForce RTX 3080 Ti Laptop GPU | Schenker XMG Neo 15 E22 (Early 2022, RTX 3080 Ti) i7-12700H, GeForce RTX 3080 Ti Laptop GPU | Asus ROG Strix Scar 15 G533QS R9 5900HX, GeForce RTX 3080 Laptop GPU | MSI Stealth GS66 12UGS i7-12700H, GeForce RTX 3070 Ti Laptop GPU | MSI Vector GP66 12UGS i9-12900H, GeForce RTX 3070 Ti Laptop GPU | |
|---|---|---|---|---|---|---|
| Noise | -5% | -2% | -8% | -12% | -2% | |
| arrêt / environnement * (dB) | 26 | 25.4 2% | 24 8% | 25.5 2% | 24 8% | 22.9 12% |
| Idle Minimum * (dB) | 26 | 26.2 -1% | 24 8% | 25.5 2% | 31 -19% | 23.4 10% |
| Idle Average * (dB) | 27 | 26.2 3% | 24 11% | 25.5 6% | 32 -19% | 23.4 13% |
| Idle Maximum * (dB) | 29 | 28.4 2% | 27.76 4% | 37.1 -28% | 35 -21% | 27.4 6% |
| Load Average * (dB) | 37 | 44.7 -21% | 38.81 -5% | 39.2 -6% | 48 -30% | 36 3% |
| Witcher 3 ultra * (dB) | 44 | 44.7 -2% | 54.2 -23% | 50.5 -15% | 43 2% | 58.2 -32% |
| Load Maximum * (dB) | 45 | 51.9 -15% | 54.18 -20% | 51.8 -15% | 48 -7% | 58 -29% |
* ... Moindre est la valeur, meilleures sont les performances
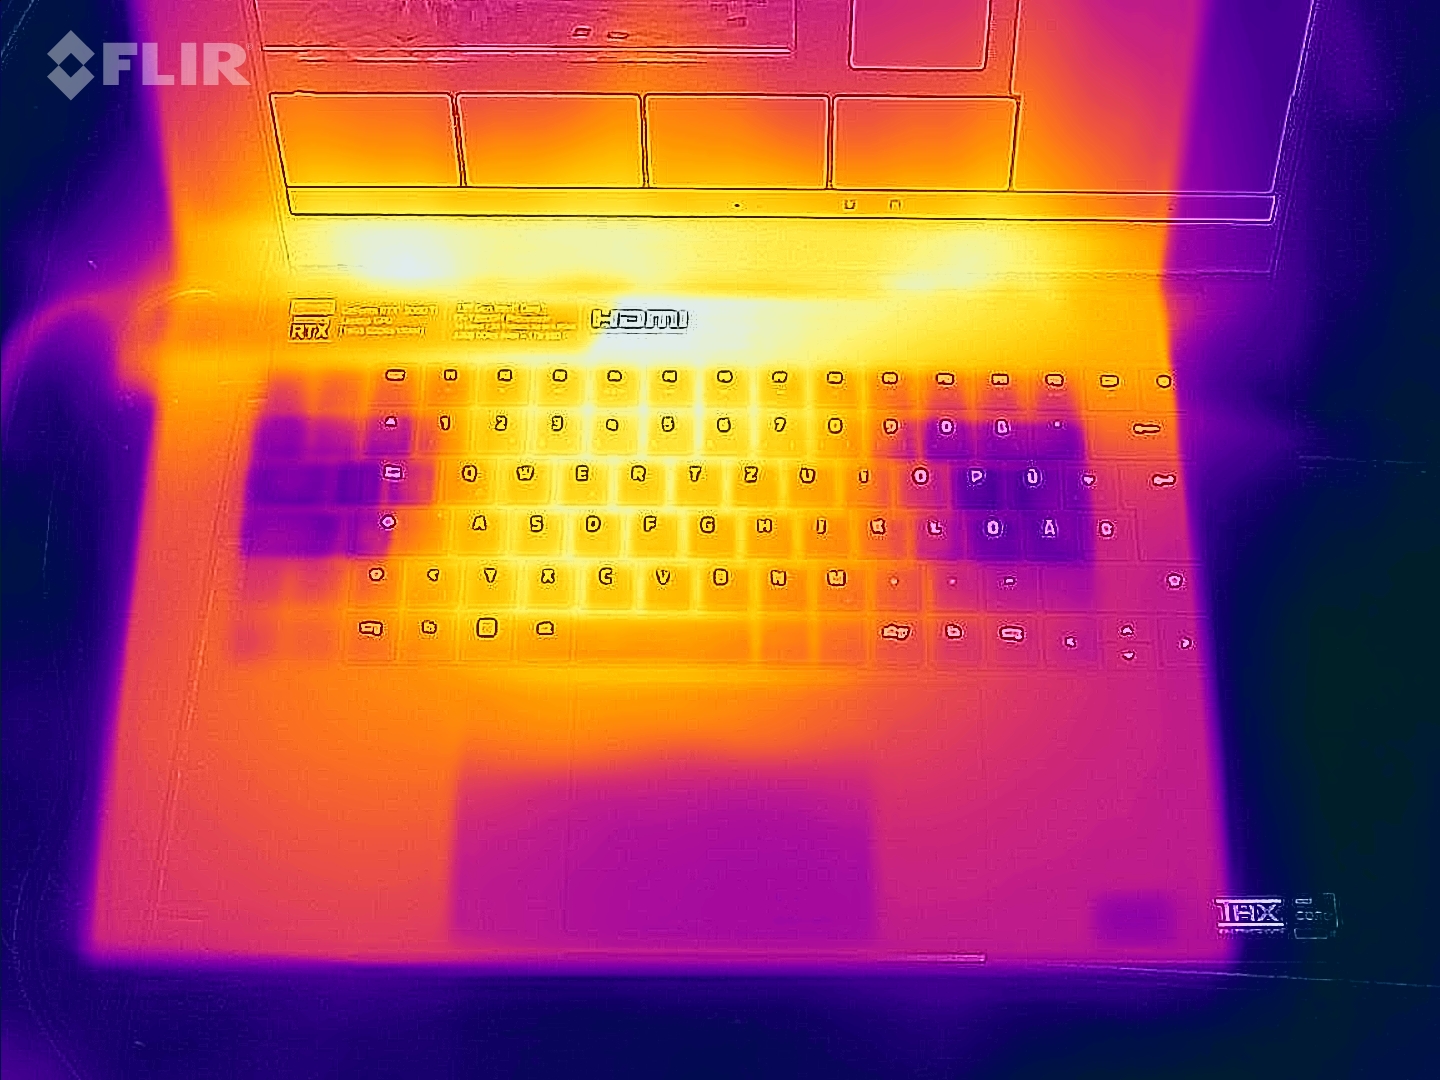
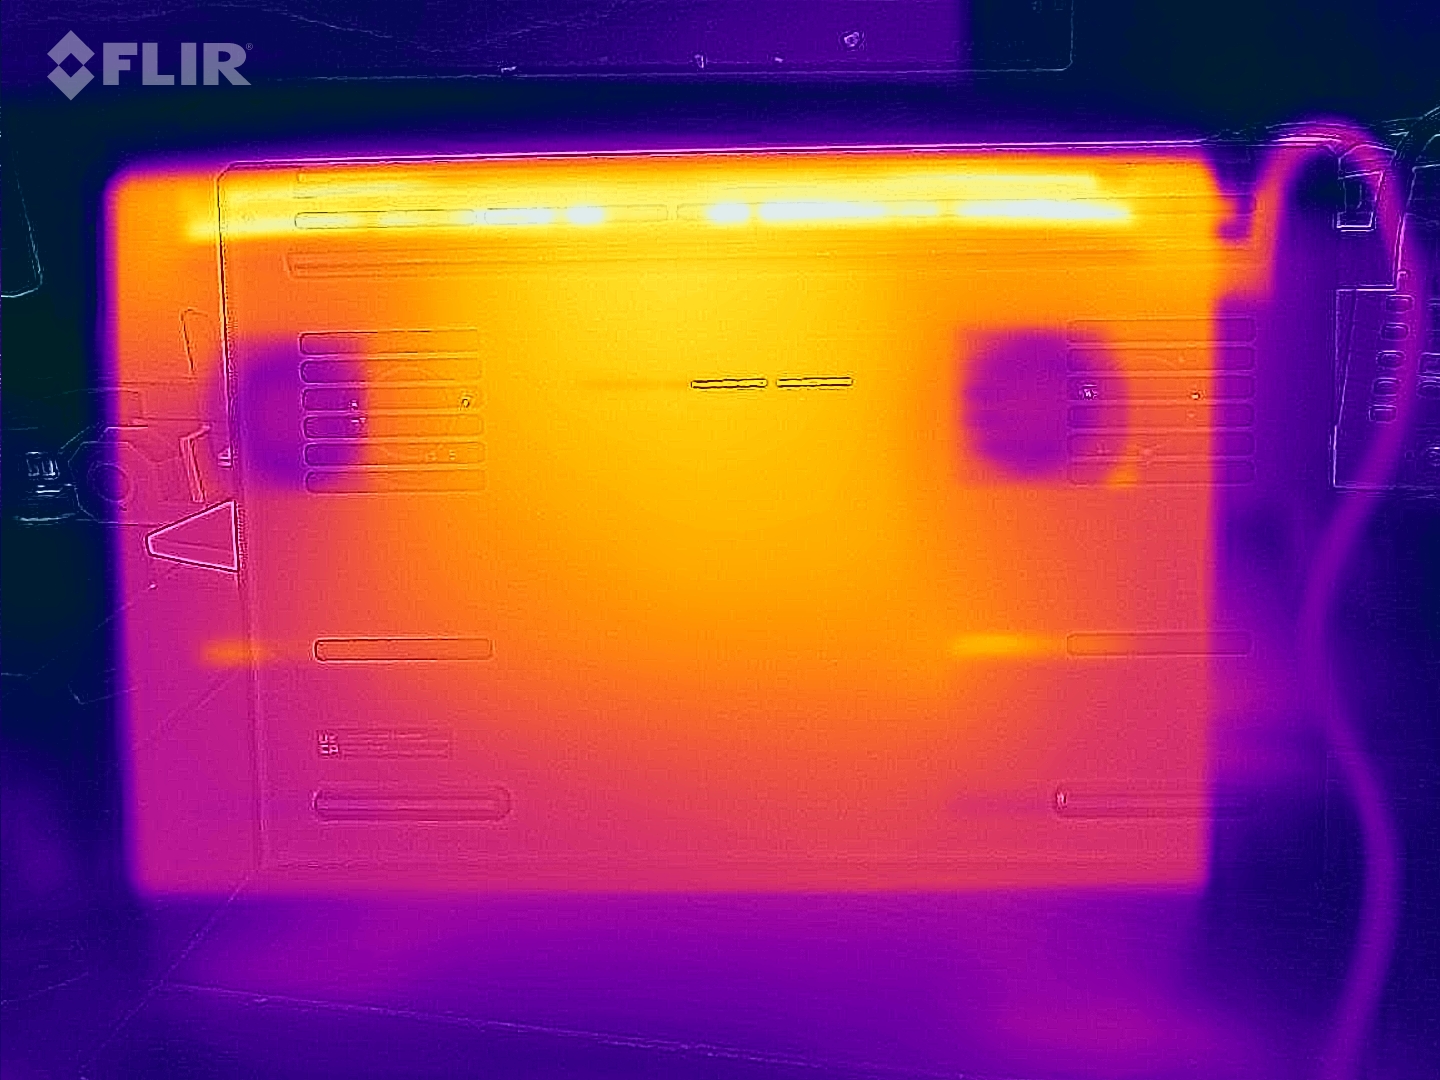
Température
En raison de la construction métallique et des composants puissants, le boîtier devient relativement chaud sous une charge modérée. L'ordinateur portable chauffe aussi fortement via les surfaces de contrôle lorsqu'on joue à The Witcher 3, par exemple.
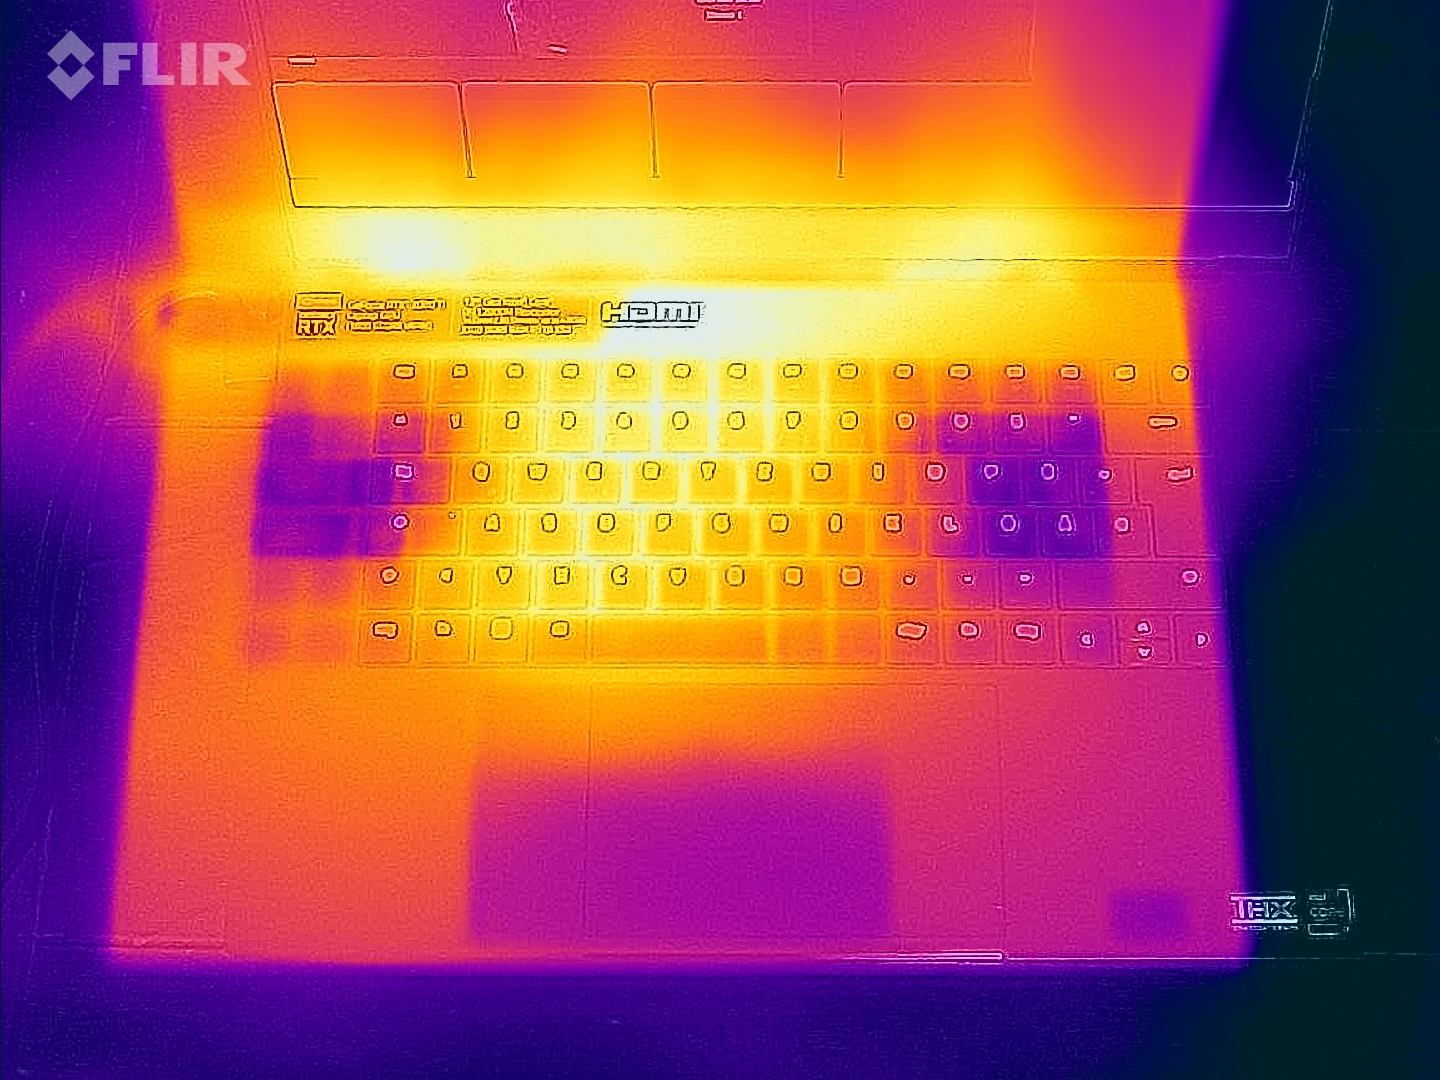
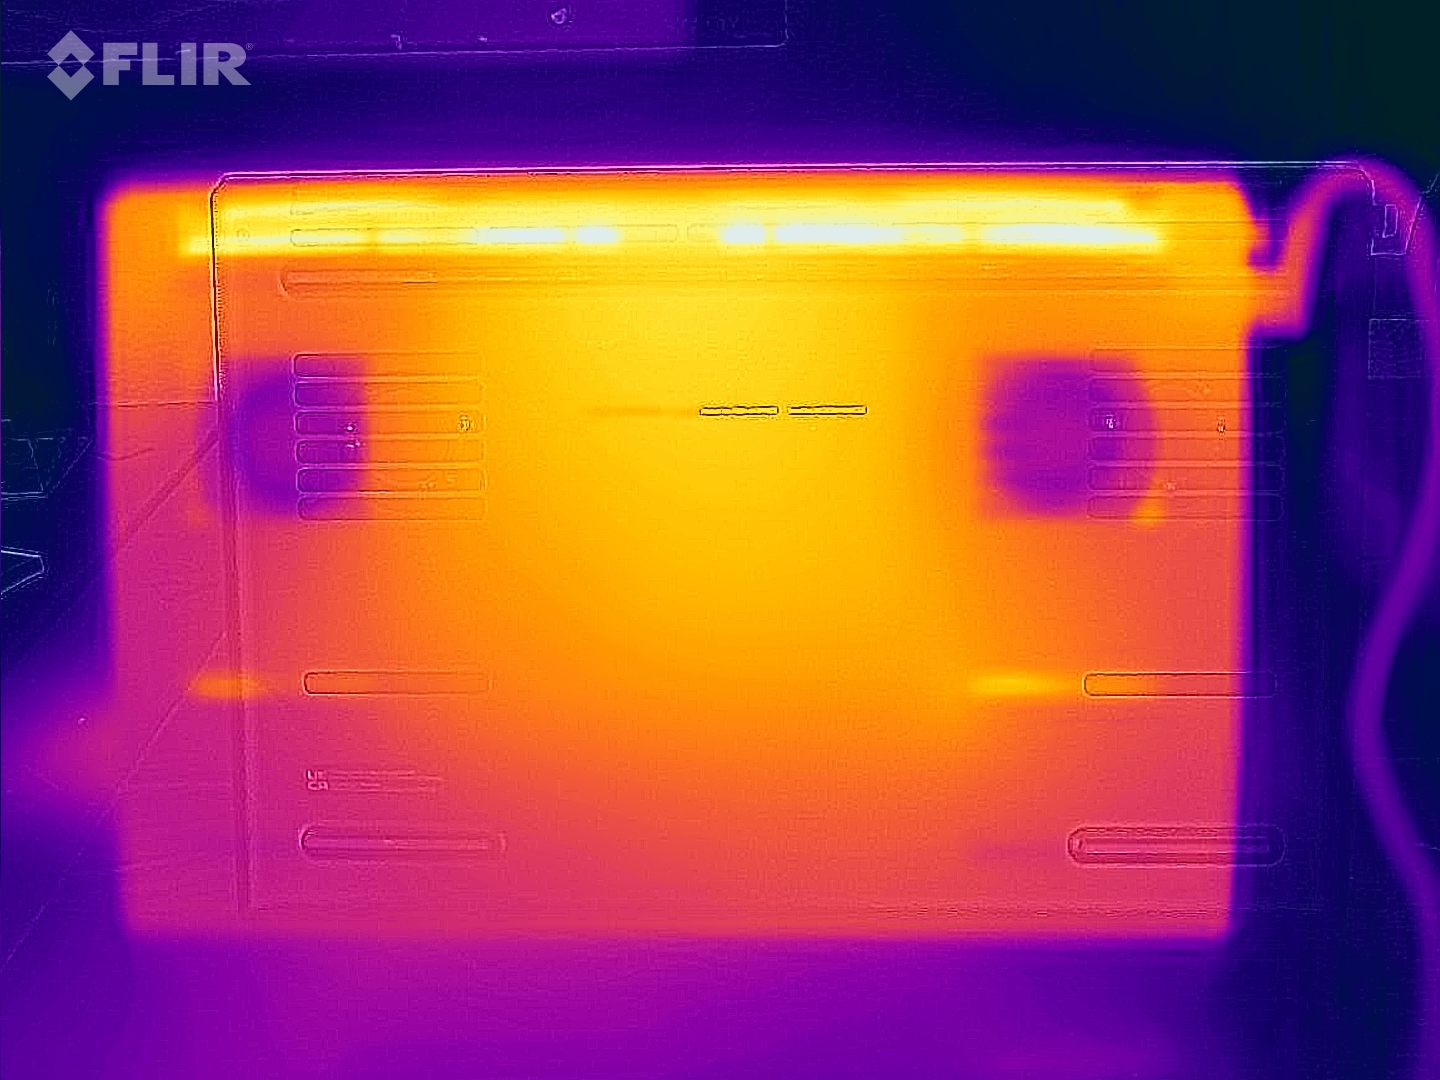
(-) La température maximale du côté supérieur est de 53 °C / 127 F, par rapport à la moyenne de 40.4 °C / 105 F, allant de 21.2 à 68.8 °C pour la classe Gaming.
(-) Le fond chauffe jusqu'à un maximum de 53 °C / 127 F, contre une moyenne de 43.2 °C / 110 F
(±) En utilisation inactive, la température moyenne du côté supérieur est de 33.2 °C / 92 F, par rapport à la moyenne du dispositif de 33.9 °C / 93 F.
(-) En jouant à The Witcher 3, la température moyenne du côté supérieur est de 45.2 °C / 113 F, alors que la moyenne de l'appareil est de 33.9 °C / 93 F.
(-) Les repose-poignets et le pavé tactile peuvent devenir très chauds au toucher, avec un maximum de 43 °C / 109.4# F.
(-) La température moyenne de la zone de l'appui-paume de dispositifs similaires était de 28.8 °C / 83.8 F (-14.2 °C / #-25.6 F).
| Razer Blade 15 Advanced Model Early 2022 Intel Core i7-12800H, NVIDIA GeForce RTX 3080 Ti Laptop GPU | Razer Blade 15 2022 Intel Core i7-12800H, NVIDIA GeForce RTX 3080 Ti Laptop GPU | Schenker XMG Neo 15 E22 (Early 2022, RTX 3080 Ti) Intel Core i7-12700H, NVIDIA GeForce RTX 3080 Ti Laptop GPU | Asus ROG Strix Scar 15 G533QS AMD Ryzen 9 5900HX, NVIDIA GeForce RTX 3080 Laptop GPU | MSI Stealth GS66 12UGS Intel Core i7-12700H, NVIDIA GeForce RTX 3070 Ti Laptop GPU | MSI Vector GP66 12UGS Intel Core i9-12900H, NVIDIA GeForce RTX 3070 Ti Laptop GPU | |
|---|---|---|---|---|---|---|
| Heat | 3% | -3% | 8% | 11% | 12% | |
| Maximum Upper Side * (°C) | 53 | 50 6% | 52 2% | 43.4 18% | 54 -2% | 40.2 24% |
| Maximum Bottom * (°C) | 53 | 47 11% | 68 -28% | 48.2 9% | 59 -11% | 43.8 17% |
| Idle Upper Side * (°C) | 36 | 37.4 -4% | 32 11% | 35.2 2% | 26 28% | 34.8 3% |
| Idle Bottom * (°C) | 38 | 38.4 -1% | 36 5% | 37 3% | 27 29% | 37 3% |
* ... Moindre est la valeur, meilleures sont les performances
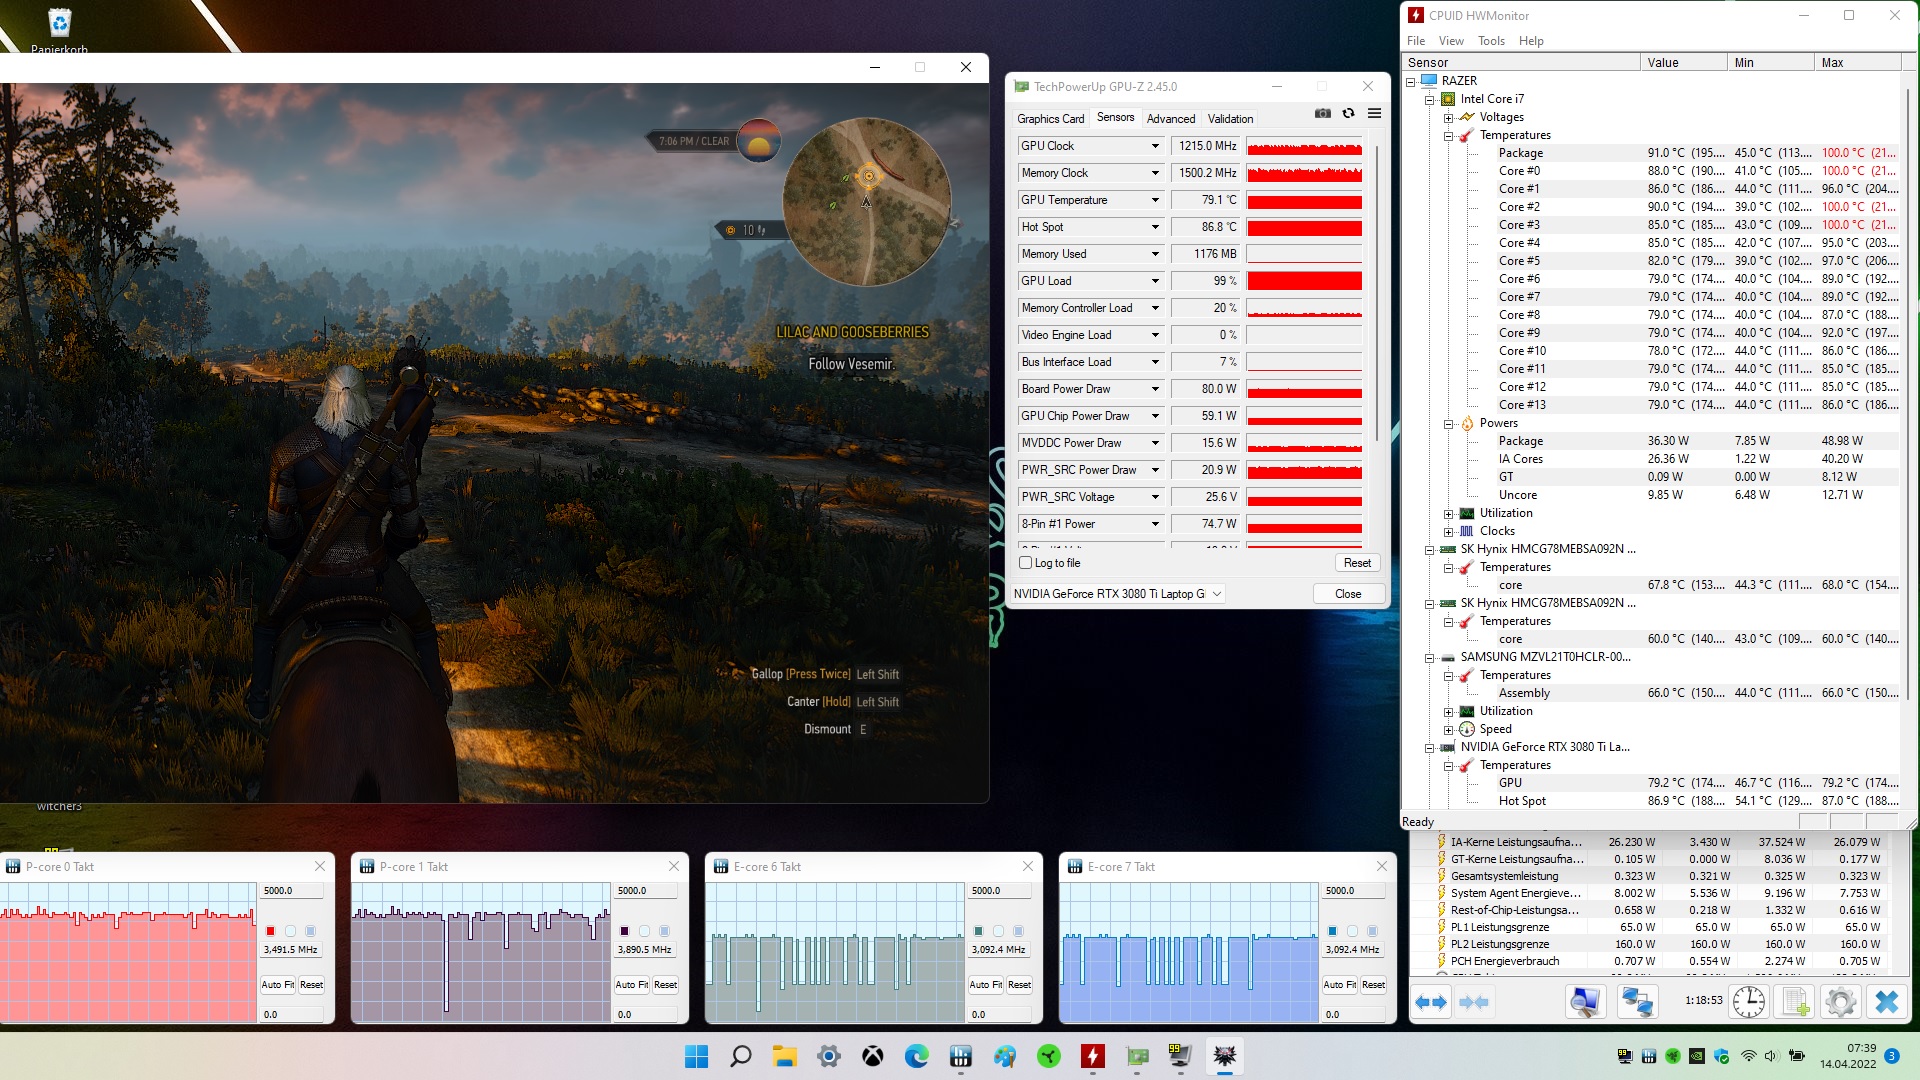
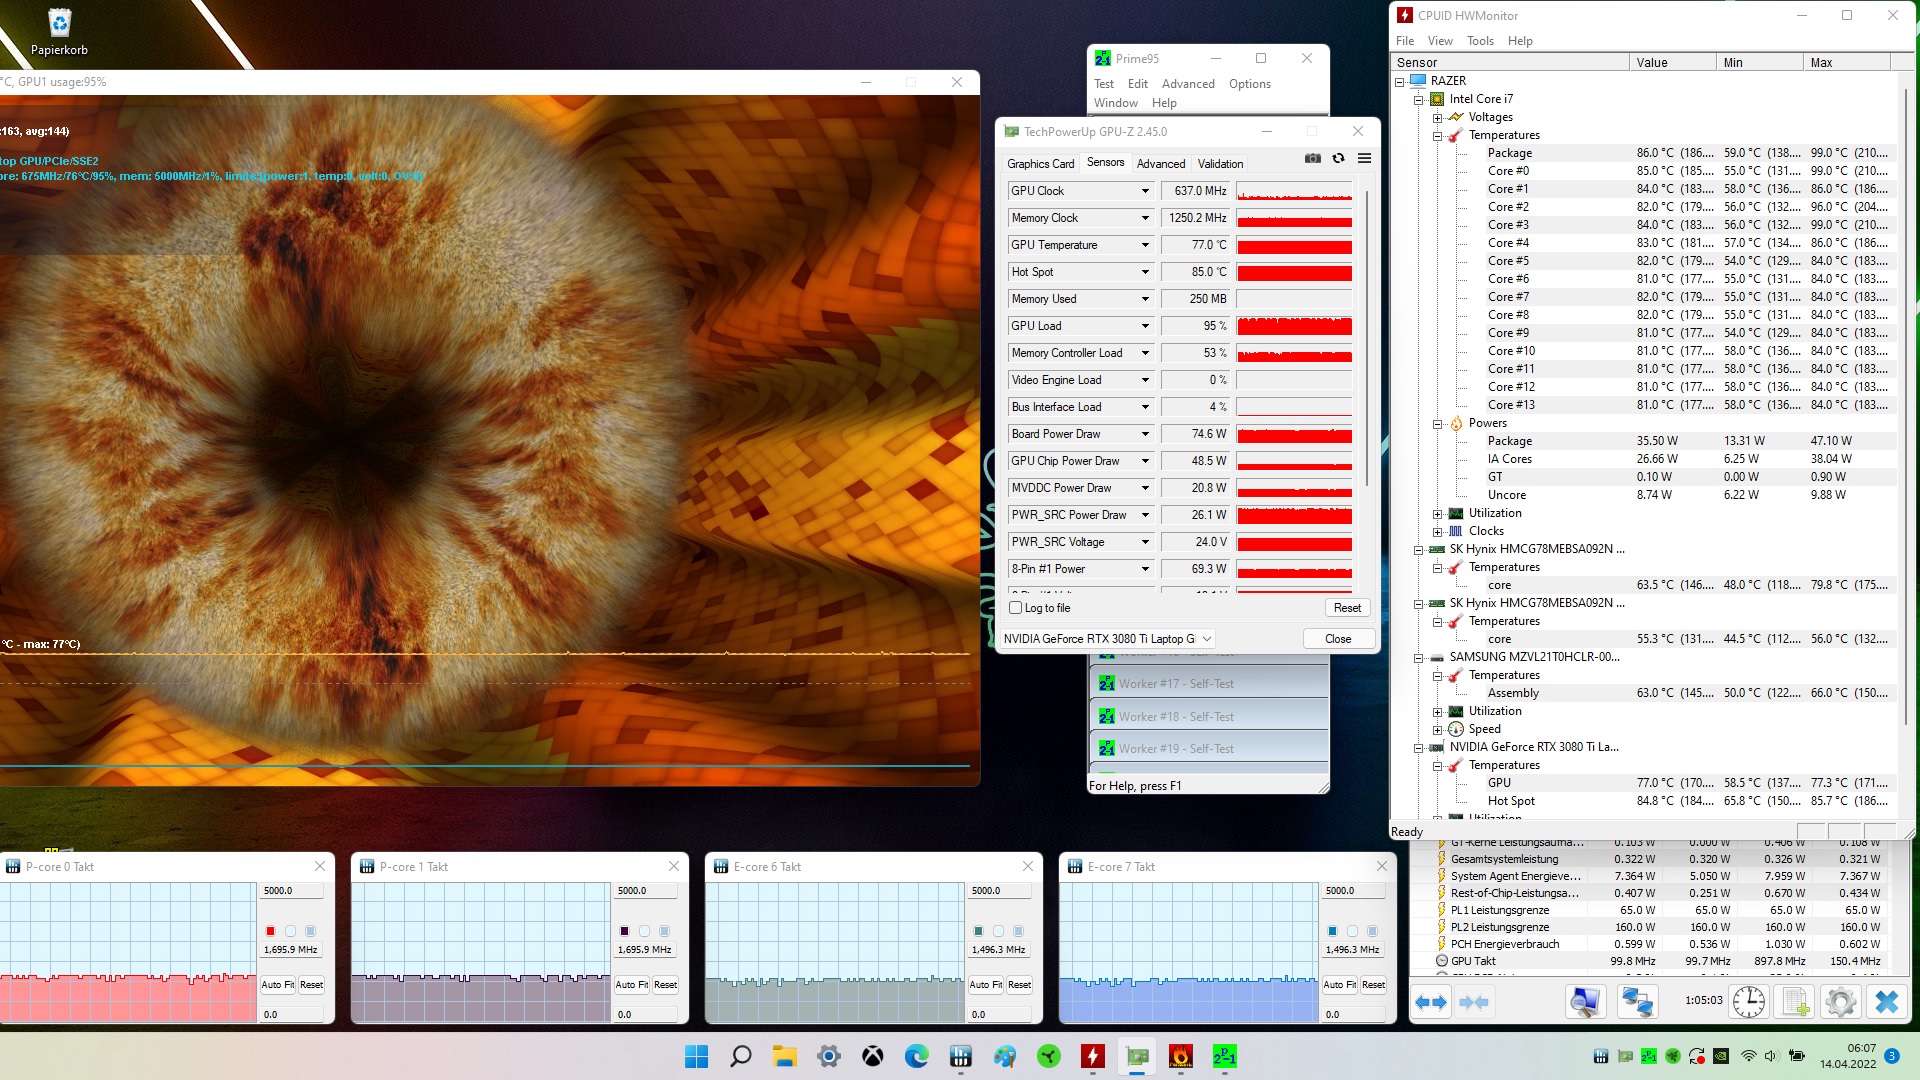
Test de stress
Dans notre test de stress, nous avons chargé le système simultanément avec Prime95 et FurMark. Le CPU a commencé le test avec des vitesses d'horloge des cœurs P et E d'environ 2 et 1,9 GHz, respectivement, et s'est stabilisé à 1,7 et 1,5 GHz, respectivement, et à environ 85°C sur de longues périodes. Le GPU a démarré à environ 1 100 MHz et s'est finalement stabilisé à 640 MHz et à une température du cœur de 77°C
Haut-parleurs
Les haut-parleurs ne sont pas accordés de manière uniforme. Le diagramme de bruit rose montre la chute de fréquence nettement plus plate du MacBook Pro 16, qui est l'un des meilleurs ordinateurs portables dans cette discipline. Les périphériques audio externes peuvent être connectés via Bluetooth, USB ou le port 3,5 mm
Razer Blade 15 Advanced Model Early 2022 analyse audio
(+) | les haut-parleurs peuvent jouer relativement fort (92# dB)
Basses 100 - 315 Hz
(-) | presque aucune basse - en moyenne 21.8% plus bas que la médiane
(±) | la linéarité des basses est moyenne (9.2% delta à la fréquence précédente)
Médiums 400 - 2000 Hz
(+) | médiane équilibrée - seulement 4.1% de la médiane
(+) | les médiums sont linéaires (3.4% delta à la fréquence précédente)
Aiguës 2 - 16 kHz
(+) | des sommets équilibrés - à seulement 3.3% de la médiane
(+) | les aigus sont linéaires (6.8% delta à la fréquence précédente)
Globalement 100 - 16 000 Hz
(±) | la linéarité du son global est moyenne (15% de différence avec la médiane)
Par rapport à la même classe
» 32% de tous les appareils testés de cette catégorie étaient meilleurs, 6% similaires, 62% pires
» Le meilleur avait un delta de 6%, la moyenne était de 18%, le pire était de 132%.
Par rapport à tous les appareils testés
» 21% de tous les appareils testés étaient meilleurs, 4% similaires, 75% pires
» Le meilleur avait un delta de 4%, la moyenne était de 24%, le pire était de 134%.
Apple MacBook Pro 16 2021 M1 Pro analyse audio
(+) | les haut-parleurs peuvent jouer relativement fort (84.7# dB)
Basses 100 - 315 Hz
(+) | bonne basse - seulement 3.8% loin de la médiane
(+) | les basses sont linéaires (5.2% delta à la fréquence précédente)
Médiums 400 - 2000 Hz
(+) | médiane équilibrée - seulement 1.3% de la médiane
(+) | les médiums sont linéaires (2.1% delta à la fréquence précédente)
Aiguës 2 - 16 kHz
(+) | des sommets équilibrés - à seulement 1.9% de la médiane
(+) | les aigus sont linéaires (2.7% delta à la fréquence précédente)
Globalement 100 - 16 000 Hz
(+) | le son global est linéaire (4.6% différence à la médiane)
Par rapport à la même classe
» 0% de tous les appareils testés de cette catégorie étaient meilleurs, 0% similaires, 100% pires
» Le meilleur avait un delta de 5%, la moyenne était de 17%, le pire était de 45%.
Par rapport à tous les appareils testés
» 0% de tous les appareils testés étaient meilleurs, 0% similaires, 100% pires
» Le meilleur avait un delta de 4%, la moyenne était de 24%, le pire était de 134%.
Gestion de l'énergie - Aucun enregistrement de durée d'exécution
Consommation d'énergie
Les valeurs de consommation en veille de 19 W en moyenne sont nettement inférieures à celles du Razer Blade 15 (36.4 W). Cela est probablement dû au profil de performance plus économique et à la résolution d'affichage inférieure. Dans le Witcher 3la consommation globale est inférieure d'environ 13 %.
La consommation maximale du bloc d'alimentation de 230 W pendant l'exécution simultanée de Prime95 et FurMark était de 179 W. Le bloc d'alimentation de 230 W est suffisamment dimensionné.
| Éteint/en veille | |
| Au repos | |
| Fortement sollicité |
|
Légende:
min: | |
| Razer Blade 15 Advanced Model Early 2022 i7-12800H, GeForce RTX 3080 Ti Laptop GPU | Razer Blade 15 2022 i7-12800H, GeForce RTX 3080 Ti Laptop GPU | Schenker XMG Neo 15 E22 (Early 2022, RTX 3080 Ti) i7-12700H, GeForce RTX 3080 Ti Laptop GPU | Asus ROG Strix Scar 15 G533QS R9 5900HX, GeForce RTX 3080 Laptop GPU | MSI Stealth GS66 12UGS i7-12700H, GeForce RTX 3070 Ti Laptop GPU | MSI Vector GP66 12UGS i9-12900H, GeForce RTX 3070 Ti Laptop GPU | Moyenne de la classe Gaming | |
|---|---|---|---|---|---|---|---|
| Power Consumption | -48% | -14% | -2% | 5% | -34% | -4% | |
| Idle Minimum * (Watt) | 17 | 33.2 -95% | 14 18% | 11.2 34% | 11 35% | 17.5 -3% | 13.2 ? 22% |
| Idle Average * (Watt) | 19 | 36.4 -92% | 18 5% | 16.4 14% | 16 16% | 20.1 -6% | 18.9 ? 1% |
| Idle Maximum * (Watt) | 25 | 37.6 -50% | 19 24% | 29.4 -18% | 23 8% | 47.3 -89% | 24.5 ? 2% |
| Load Average * (Watt) | 108 | 116.7 -8% | 115 -6% | 106.2 2% | 110 -2% | 107.3 1% | 108.8 ? -1% |
| Witcher 3 ultra * (Watt) | 150 | 172 -15% | 228 -52% | 189 -26% | 151 -1% | 225 -50% | |
| Load Maximum * (Watt) | 179 | 228.6 -28% | 307 -72% | 213.6 -19% | 230 -28% | 277.7 -55% | 254 ? -42% |
* ... Moindre est la valeur, meilleures sont les performances
Power Consumption Witcher 3 / Stress test
{
Autonomie de la batterie
Dans notre test WLAN en conditions réelles, le Blade 15 atteint une autonomie de 4:53 h. Presque aucun concurrent n'arrive à suivre les 7:20 h du Asus ROG Strix Scar 15tandis que le MSI Vector GP66 offre également une plus longue autonomie malgré une batterie plus petite (65 Wh contre 80 Wh).
| Razer Blade 15 Advanced Model Early 2022 i7-12800H, GeForce RTX 3080 Ti Laptop GPU, 80 Wh | Razer Blade 15 2022 i7-12800H, GeForce RTX 3080 Ti Laptop GPU, 80 Wh | Schenker XMG Neo 15 E22 (Early 2022, RTX 3080 Ti) i7-12700H, GeForce RTX 3080 Ti Laptop GPU, 93 Wh | Asus ROG Strix Scar 15 G533QS R9 5900HX, GeForce RTX 3080 Laptop GPU, 90 Wh | MSI Stealth GS66 12UGS i7-12700H, GeForce RTX 3070 Ti Laptop GPU, 99.9 Wh | MSI Vector GP66 12UGS i9-12900H, GeForce RTX 3070 Ti Laptop GPU, 65 Wh | Moyenne de la classe Gaming | |
|---|---|---|---|---|---|---|---|
| Autonomie de la batterie | 0% | 48% | 19% | -5% | -12% | 16% | |
| Reader / Idle (h) | 8.1 | 11.1 37% | 7.8 -4% | 7.9 -2% | 8.71 ? 8% | ||
| H.264 (h) | 5.9 | 6.9 17% | 8.28 ? 40% | ||||
| WiFi v1.3 (h) | 4.9 | 4.9 0% | 6.7 37% | 7.3 49% | 5.4 10% | 5.7 16% | 6.96 ? 42% |
| Load (h) | 2 | 3.8 90% | 1.4 -30% | 1.6 -20% | 1 -50% | 1.47 ? -26% |
Points positifs
Points négatifs
Verdict
Le Blade 15 est un ordinateur portable très compact et de bonne facture. La connectivité est tout aussi moderne que les nouvelles puces d'Intel et de Nvidia et est bien complétée par un lecteur de carte SD rapide. L'écran offre une représentation visuelle incroyablement fluide et une luminosité maximale décente, mais contrairement au modèle QHD, l'Advanced Optimus fait défaut et la couverture de l'espace colorimétrique pourrait être un peu meilleure. Compte tenu du groupe cible, ce dernier point est toutefois acceptable
Les benchmarks en mode "Balanced" donnent une image intéressante. Dans la pratique, les performances sont souvent plus que suffisantes et le niveau de bruit est nettement plus faible. Cependant, les surfaces du boîtier chauffent encore très fortement.
Si vous recherchez un ordinateur portable de jeu élégant et compact avec un écran exceptionnellement rapide, ne cherchez pas plus loin. Cependant, les utilisateurs sensibles à la température doivent se méfier ici
Un autre point de critique concerne les haut-parleurs : De nombreux ordinateurs portables moins chers offrent un meilleur son
Le ROG Strix Scar 15 d'Asus est une alternative moins compacte, basée sur AMD, au Razer Blade 15, avec une autonomie de batterie beaucoup plus longue. Pour les utilisateurs qui sont souvent en déplacement et qui ont besoin de beaucoup de performances, le Razer Blade 15 peut encore être le bon choix.
Prix et disponibilité
Notre configuration du Razer Blade 15 est actuellement disponible sur B&H Photo Video pour 3 699,99 $ US ou sur le site officiel de Razer ( ) pour le même prix.
Razer Blade 15 Advanced Model Early 2022
- 05/04/2022 v7 (old)
Marius Schell
Price comparison

