Test du Trigkey S3 : mini PC aux performances d'un Core i3 pour le prix d'un Celeron ou d'un Atom
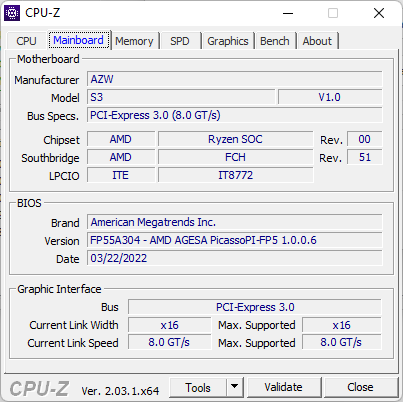
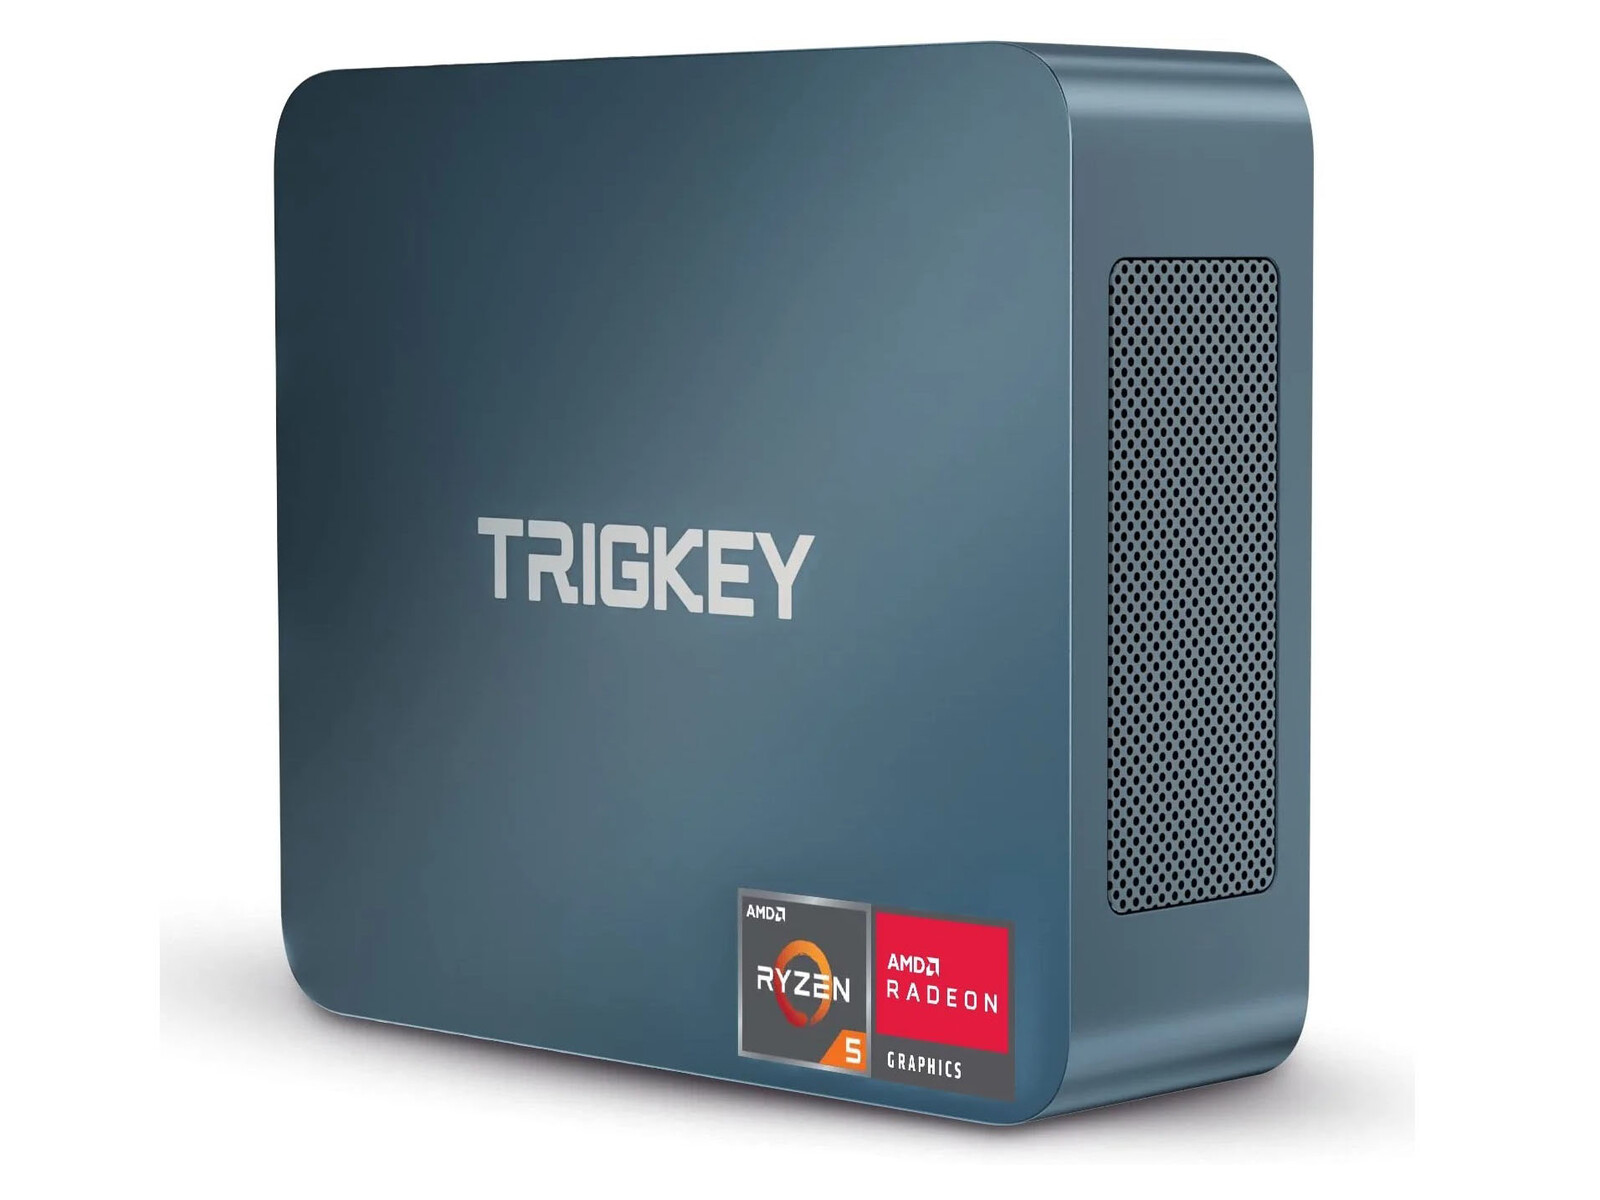
Trigkey est spécialisé dans les mini-PC bon marché fonctionnant avec des processeurs plus anciens afin de maintenir des prix bas. Le S3 est l'un de ces modèles fonctionnant avec le processeur vieux de trois ans Ryzen 5 3550H et se vend à environ 280 dollars américains
Les concurrents dans ce domaine comprennent d'autres mini-PC bon marché comme le BMax B5 Pro, Beelink U59ou le Chuwi LarkBox.
Comparaison avec les concurrents potentiels
Note | Date | Modèle | Poids | Épaisseur | Taille | Résolution | Prix |
|---|---|---|---|---|---|---|---|
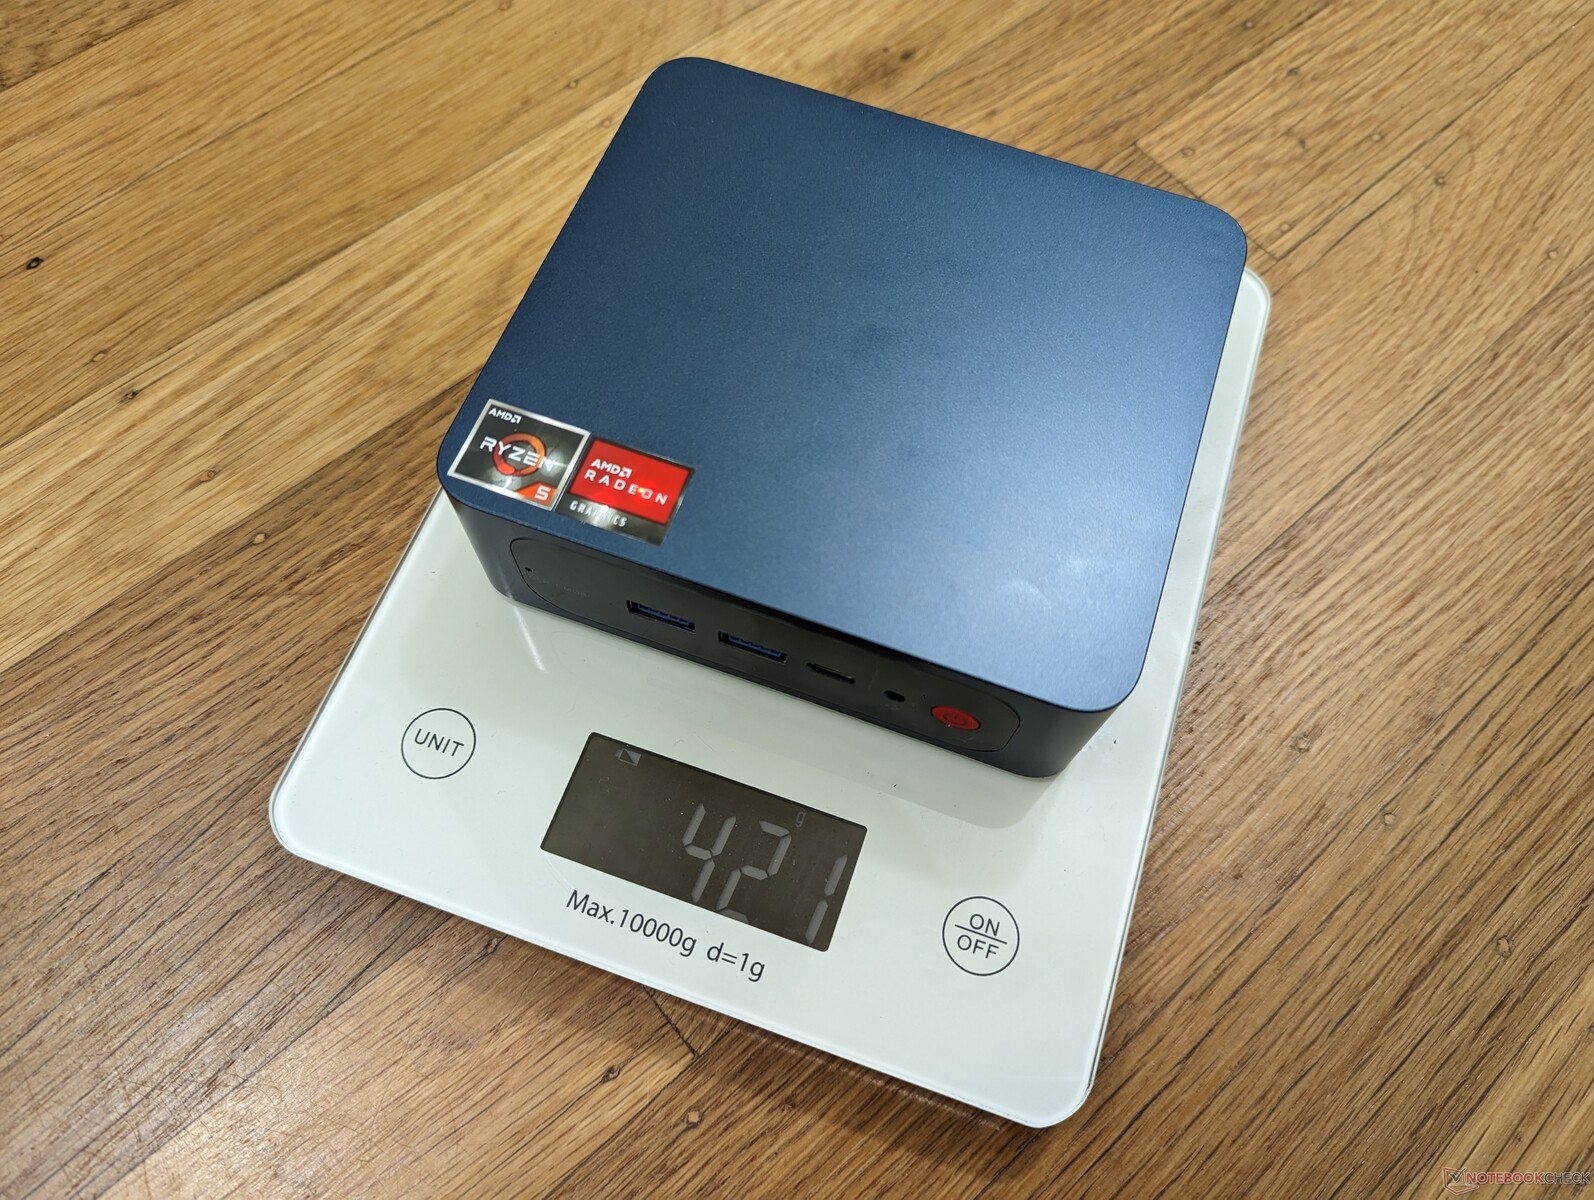
v (old) | 01/23 | Trigkey S3 R5 3550H, Vega 8 | 419 g | 40.7 mm | x | ||
v (old) | 11/22 | Intel NUC Pro Chassis_i7_1265U i7-1265U, Iris Xe G7 96EUs | 35 mm | x | |||
v (old) | 04/21 | Intel NUC11TNKi5 i5-1135G7, Iris Xe G7 80EUs | 504 g | 37 mm | x | ||
v (old) | 12/22 | Beelink SEi12 Core i5-1235U i5-1235U, Iris Xe G7 80EUs | 465 g | 42 mm | x | ||
v (old) | 09/22 | Beelink SEi11 Pro i5-11320H, Iris Xe G7 96EUs | 440 g | 40 mm | x | ||
v (old) | 10/22 | Beelink SER Pro Ryzen 5 5600H R5 5600H, Vega 7 | 498 g | 42 mm | x |
Cas
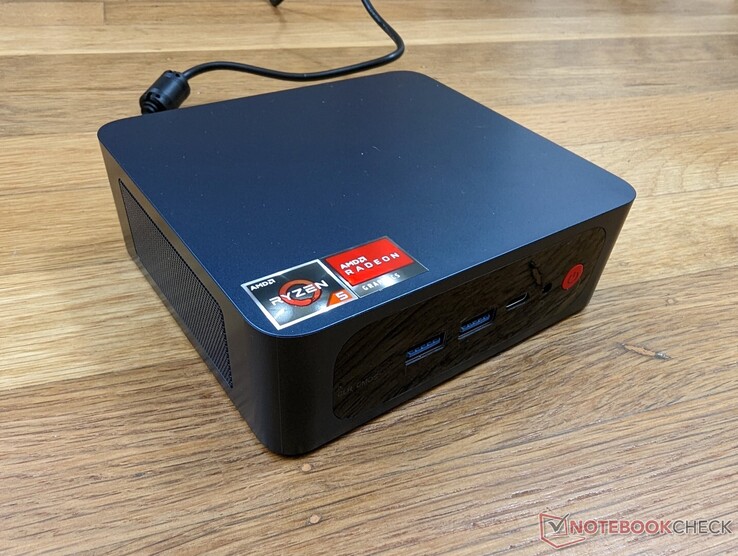
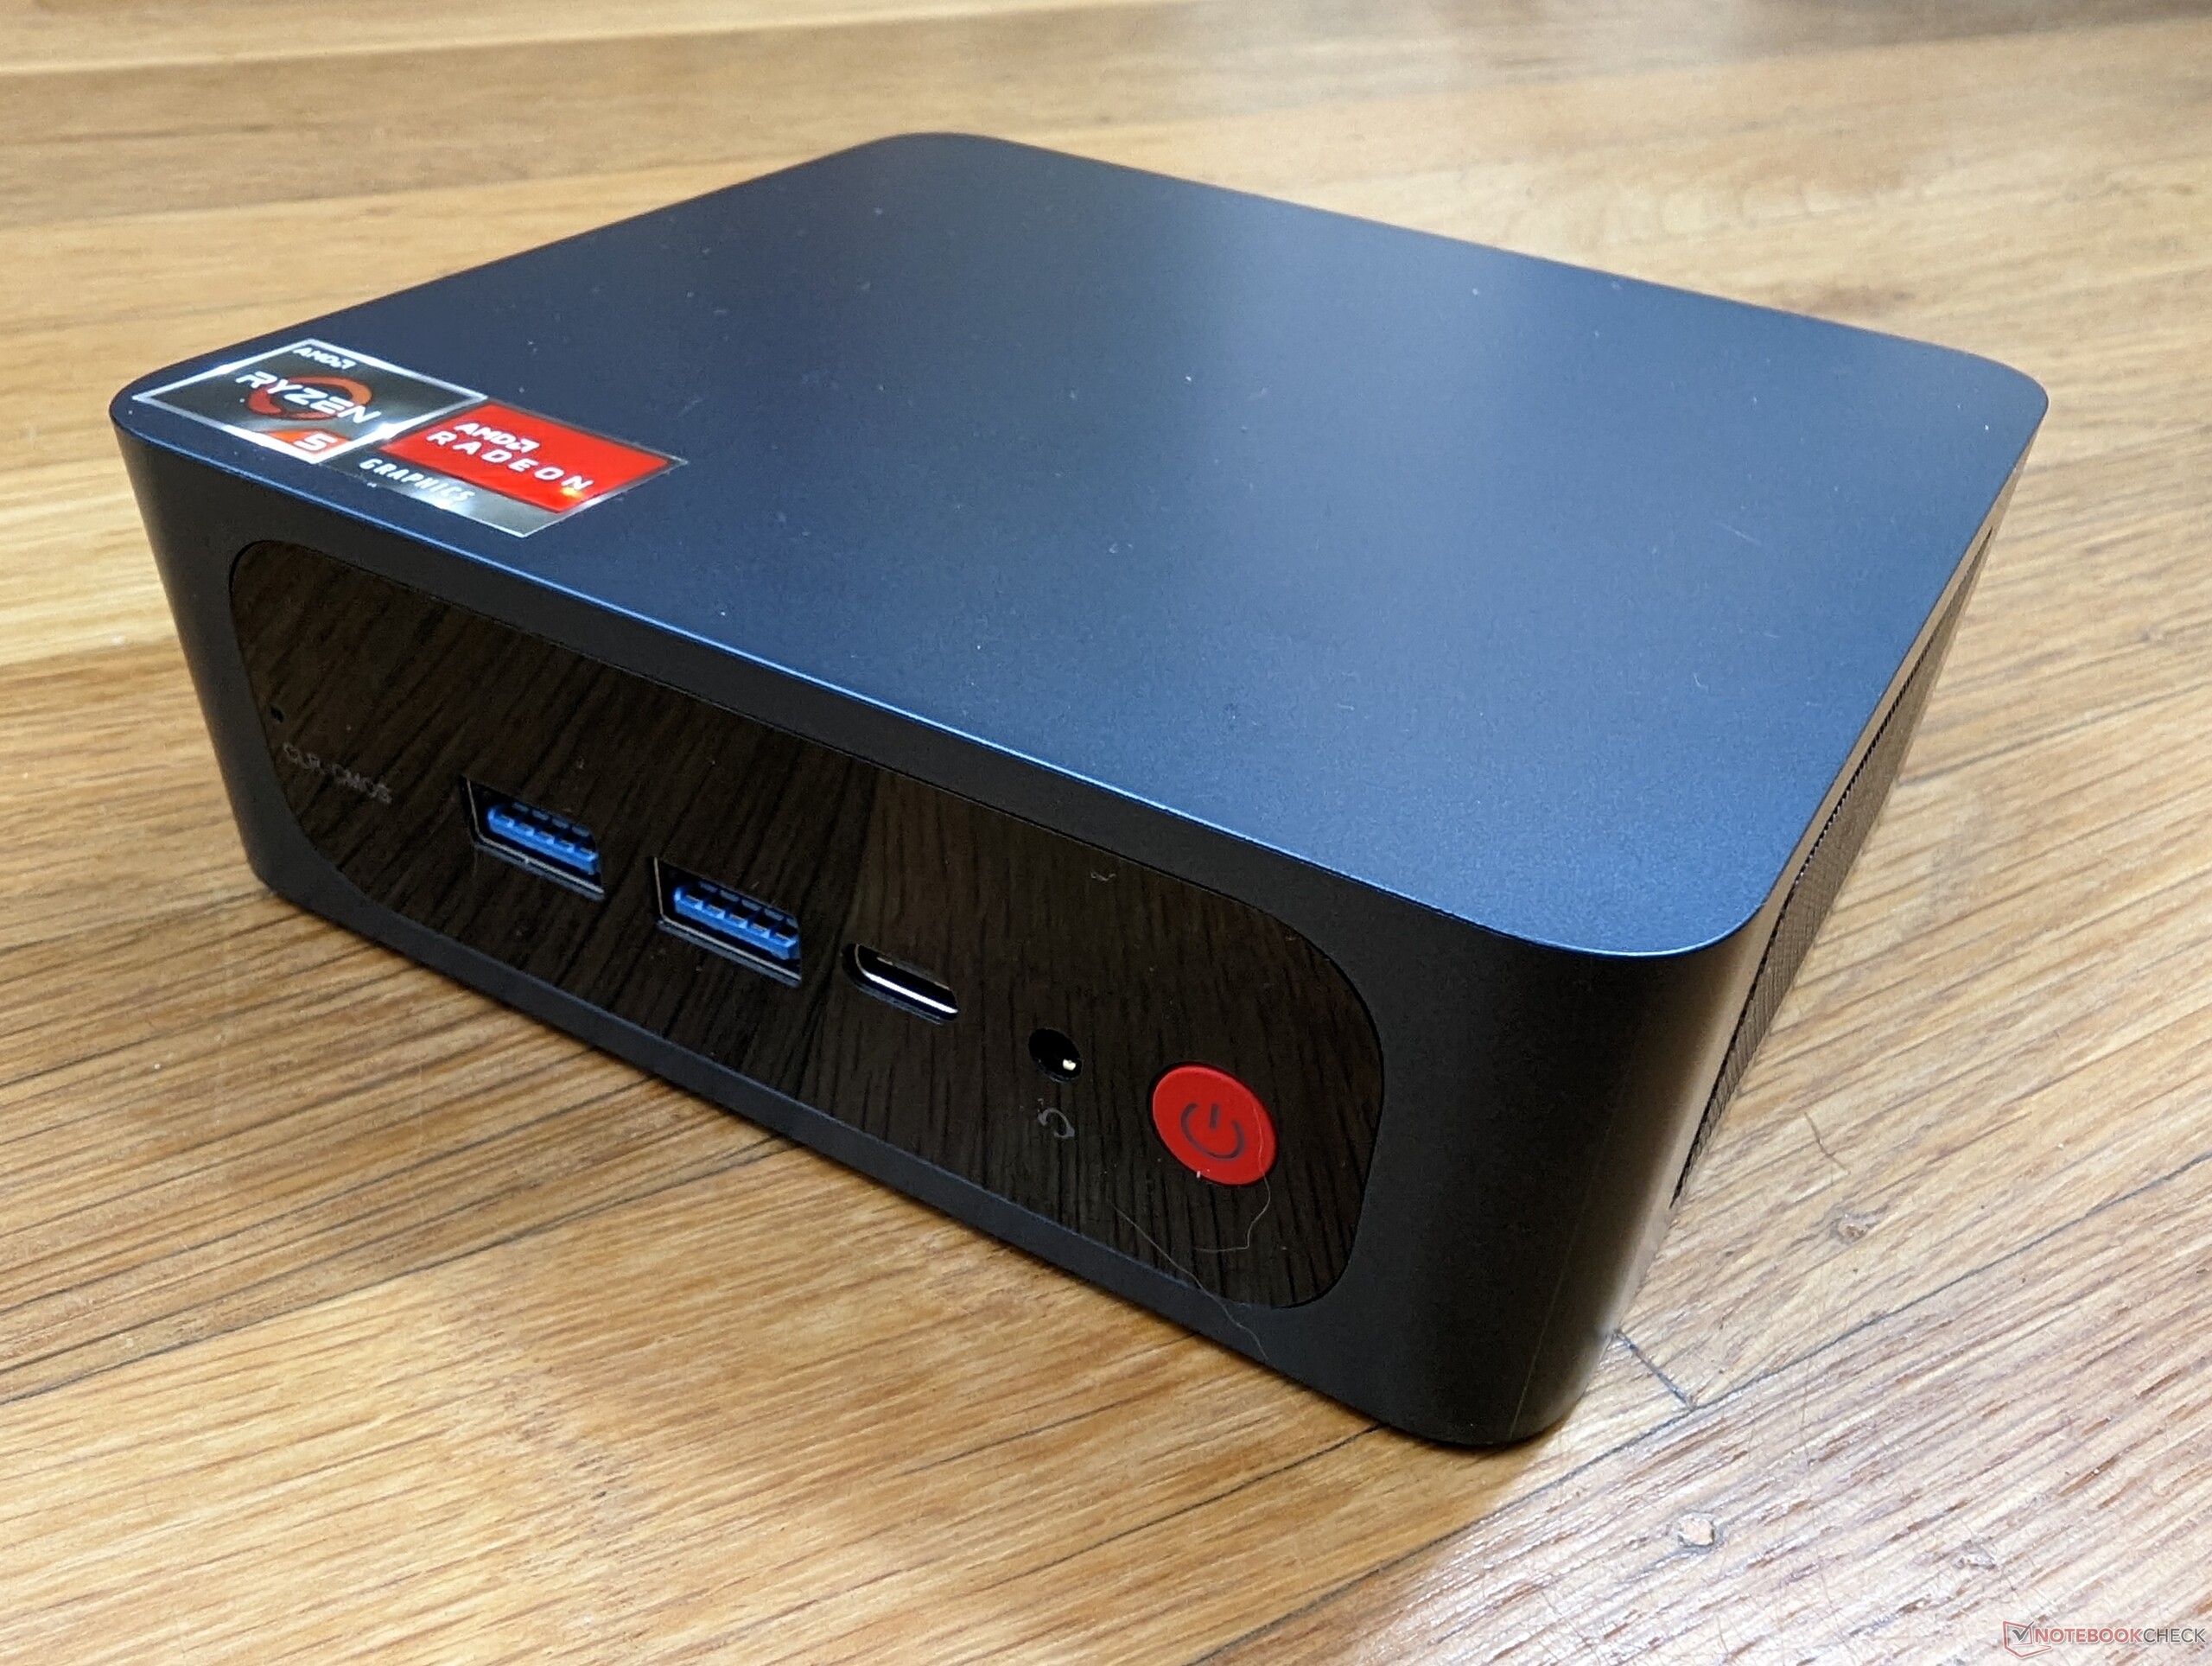
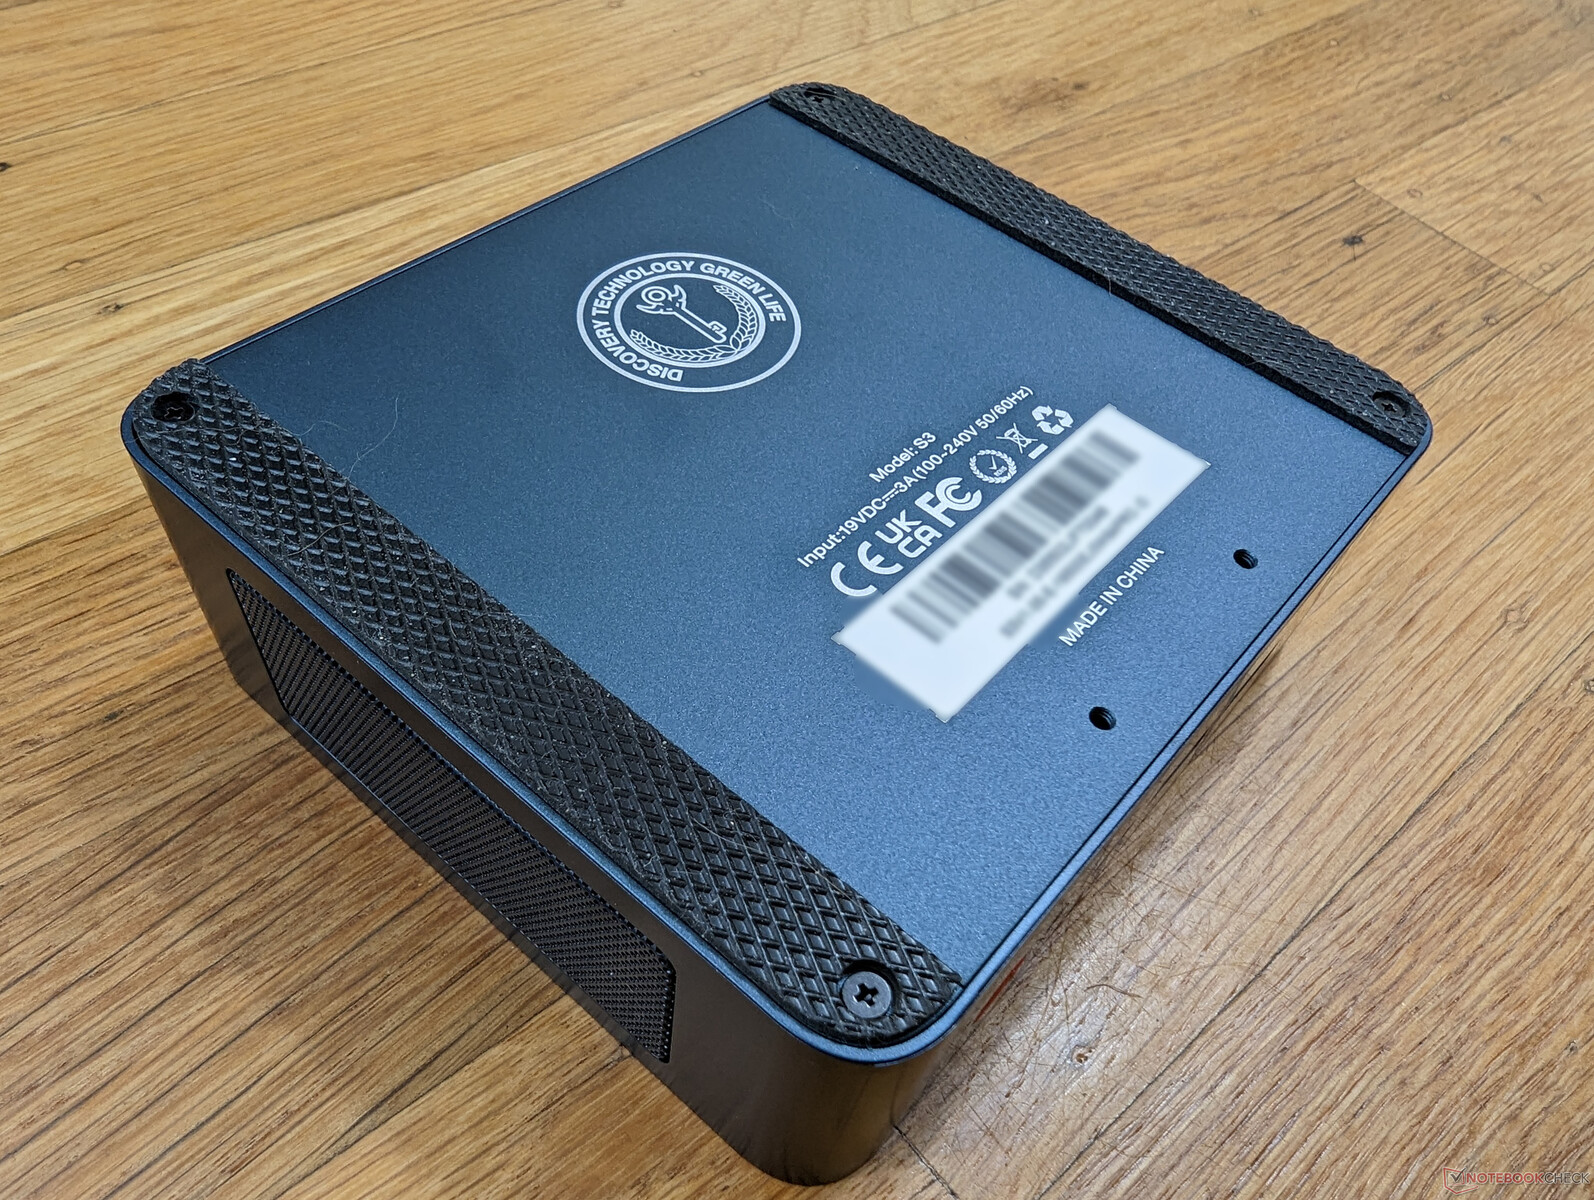
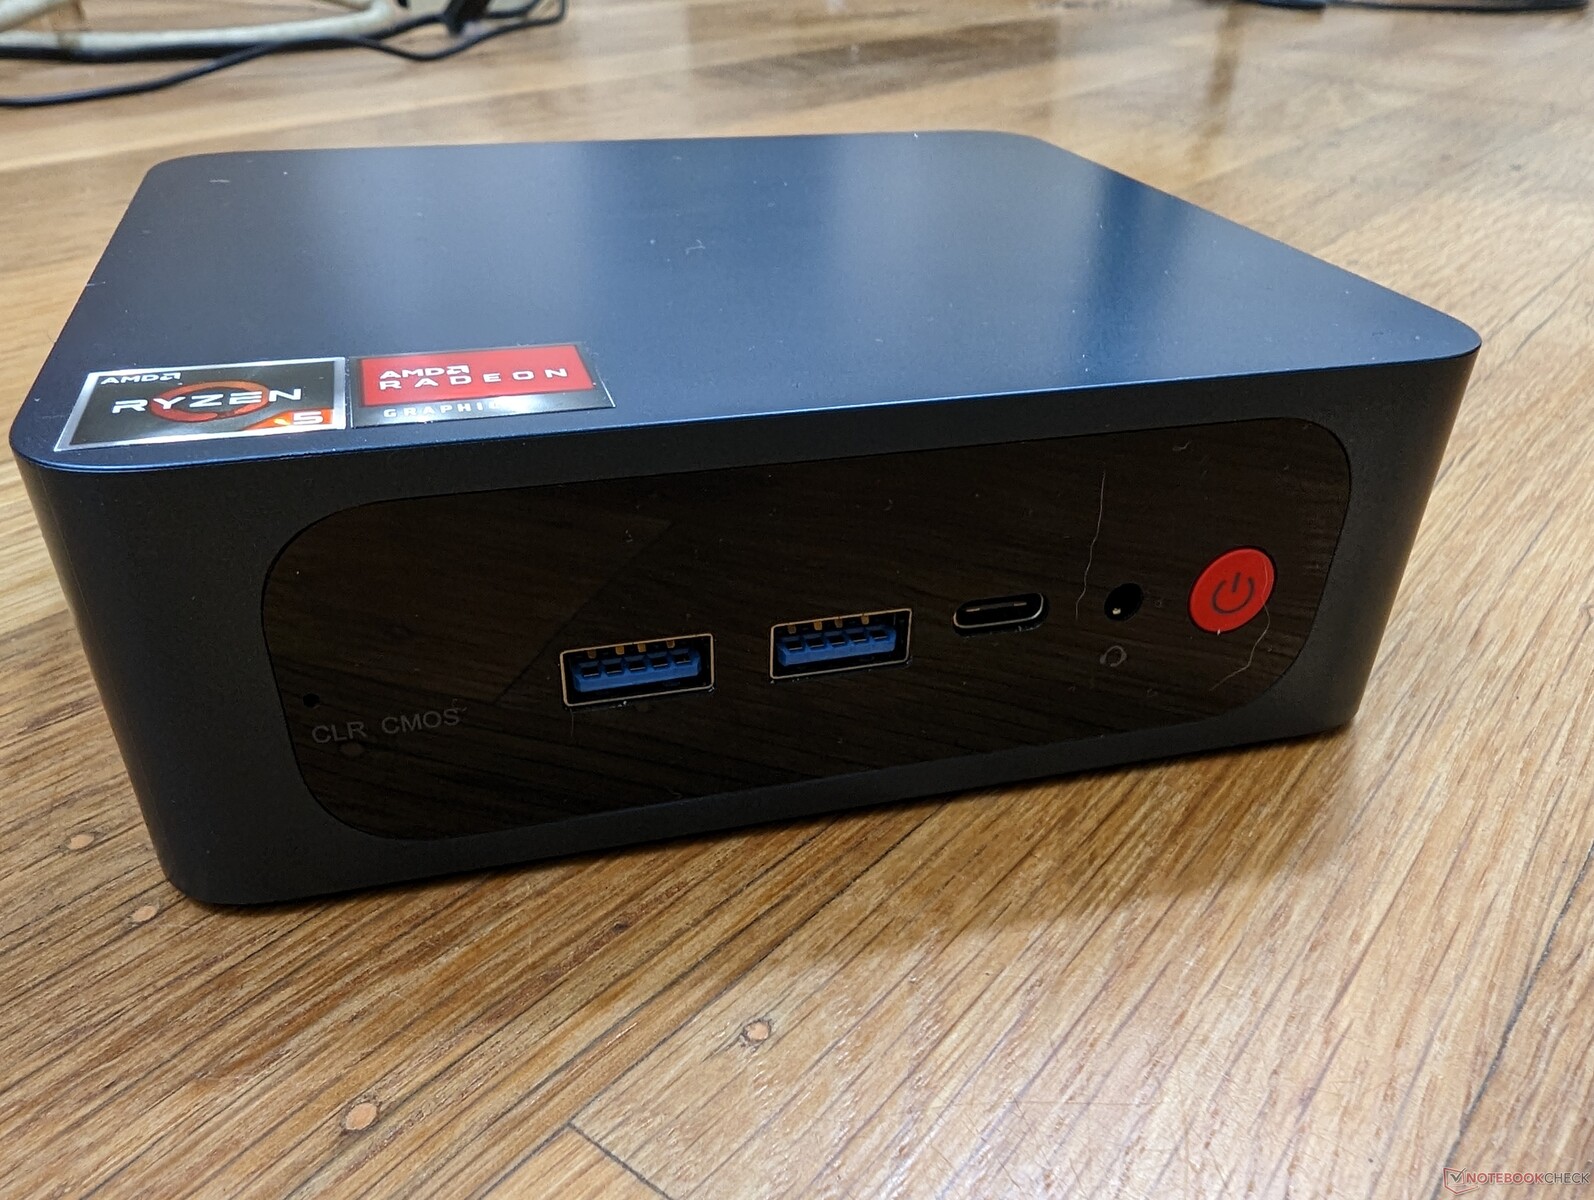
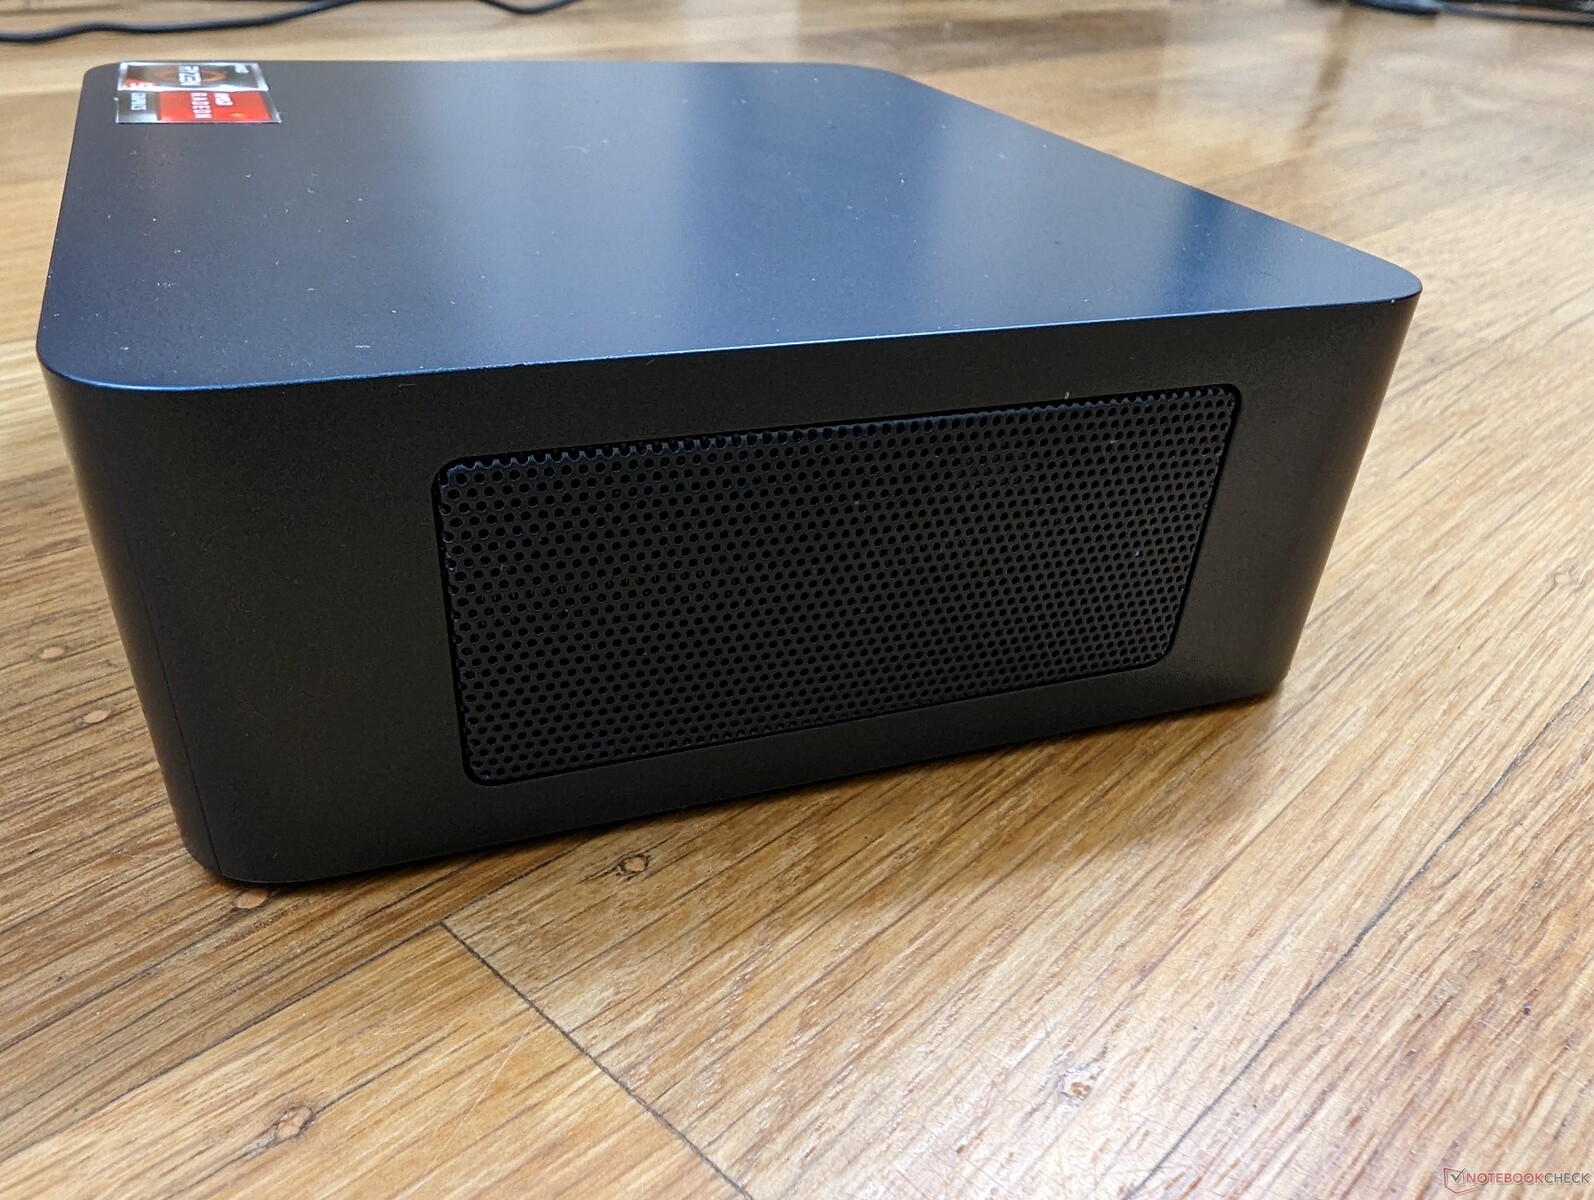
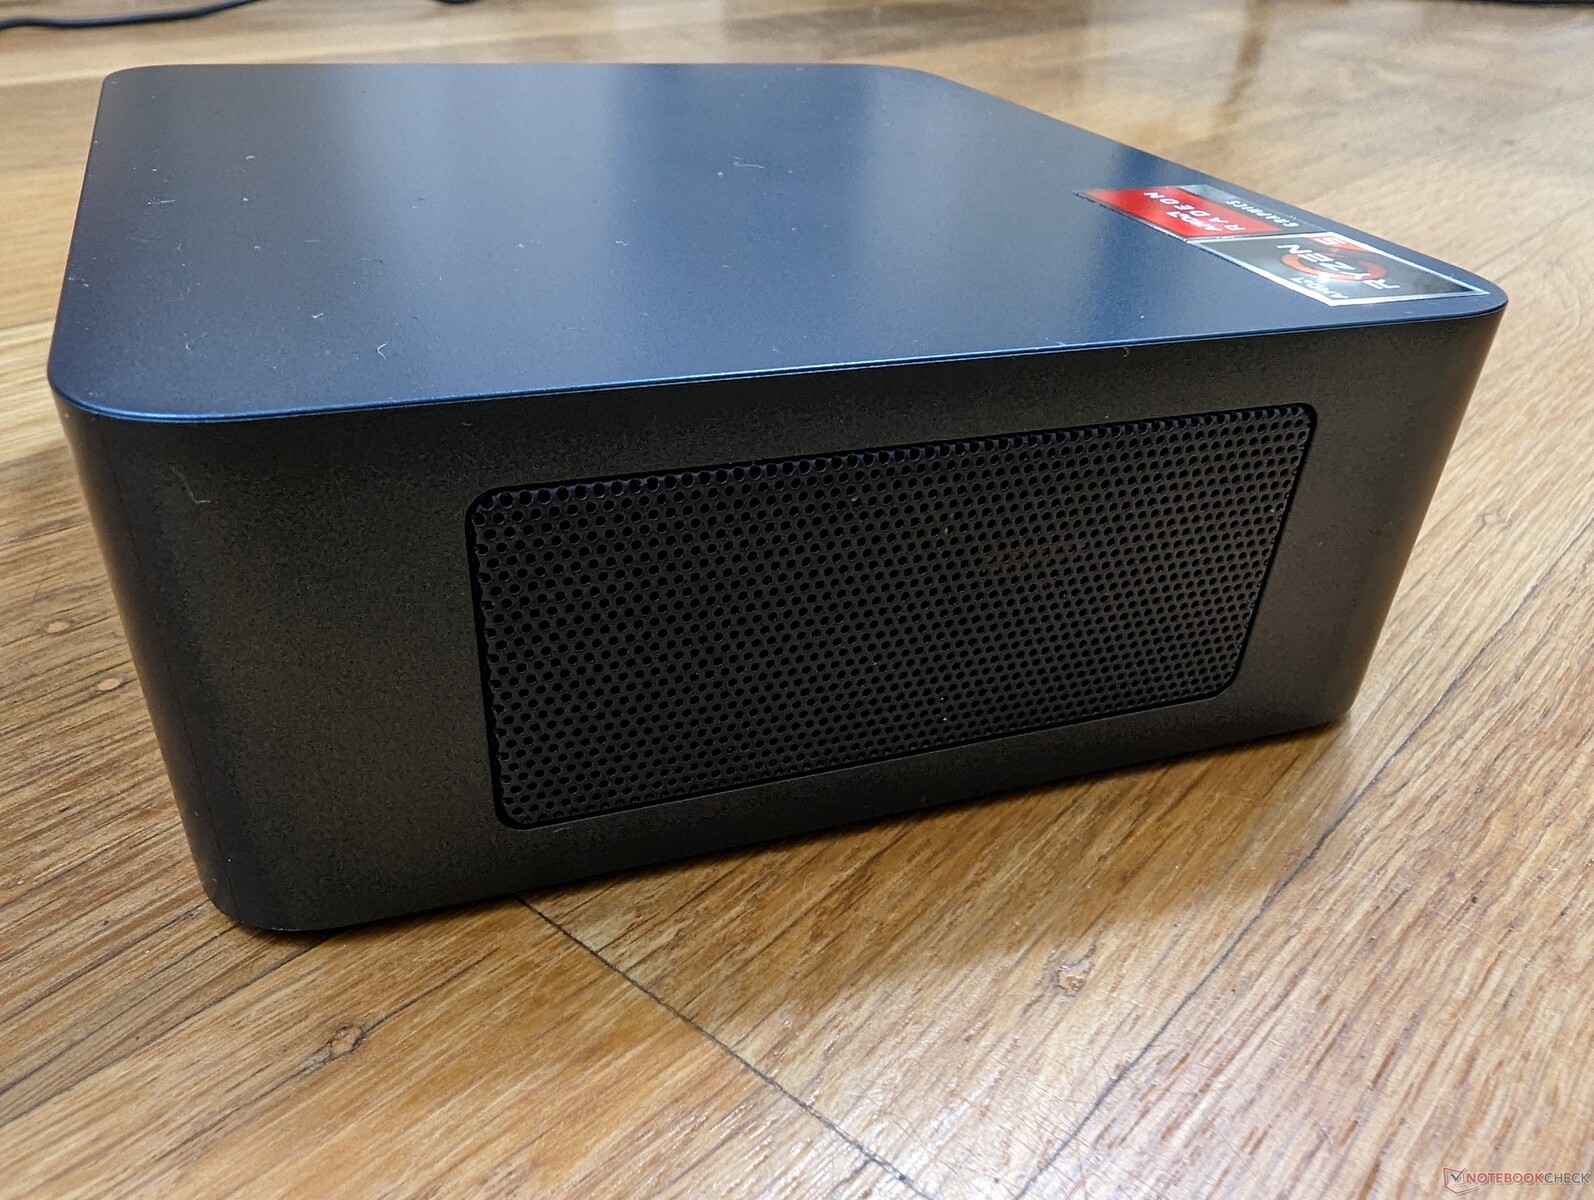
Le châssis en plastique a une forme similaire à celle du Beelink SEi8 mais avec plusieurs différences superficielles. Le dessus, par exemple, est maintenant tout mat et affleure les bords des côtés pour un look plus propre. Les options de port et l'entretien sont par ailleurs presque identiques.
Connectivité
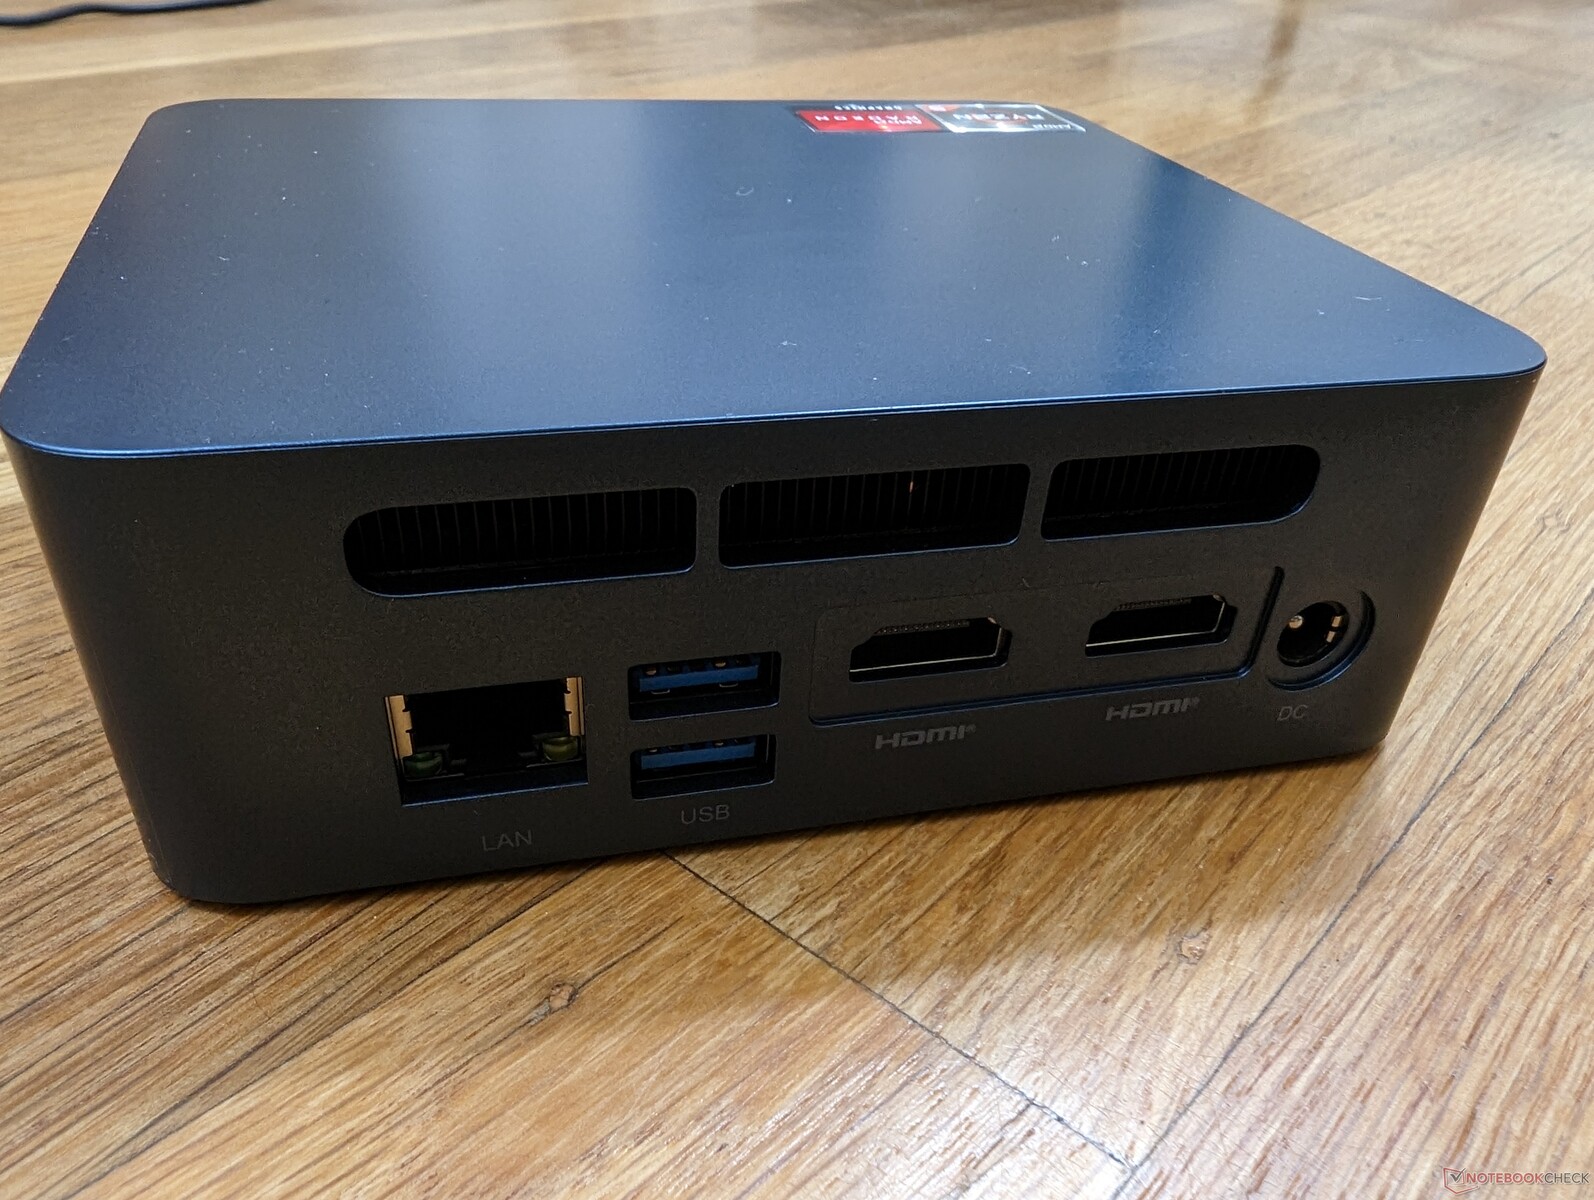
Les options de port sont nombreuses, mais l'unique port USB-C semble être réservé aux données ou à la recharge de périphériques externes. Notre moniteur externe USB-C n'a pas pu fonctionner avec la Trigkey.
Communication
Le système est livré avec l'ancien module 1x1 Intel Dual Band Wireless-AC 3165 pour des taux de transfert qui ne représentent qu'une fraction de ce dont sont capables les modules modernes Wi-Fi 6 et 6E. Néanmoins, les performances sont stables et suffisantes pour le streaming et la navigation en 1080p.
| Networking | |
| iperf3 transmit AX12 | |
| Intel NUC11TNKi5 | |
| iperf3 receive AX12 | |
| Intel NUC11TNKi5 | |
| iperf3 receive AXE11000 6GHz | |
| Intel NUC Pro Chassis_i7_1265U | |
| Beelink SER Pro Ryzen 5 5600H | |
| Beelink SEi11 Pro | |
| iperf3 receive AXE11000 | |
| Beelink SEi12 Core i5-1235U | |
| Trigkey S3 | |
| iperf3 transmit AXE11000 | |
| Beelink SEi12 Core i5-1235U | |
| Trigkey S3 | |
| iperf3 transmit AXE11000 6GHz | |
| Intel NUC Pro Chassis_i7_1265U | |
| Beelink SER Pro Ryzen 5 5600H | |
| Beelink SEi11 Pro | |
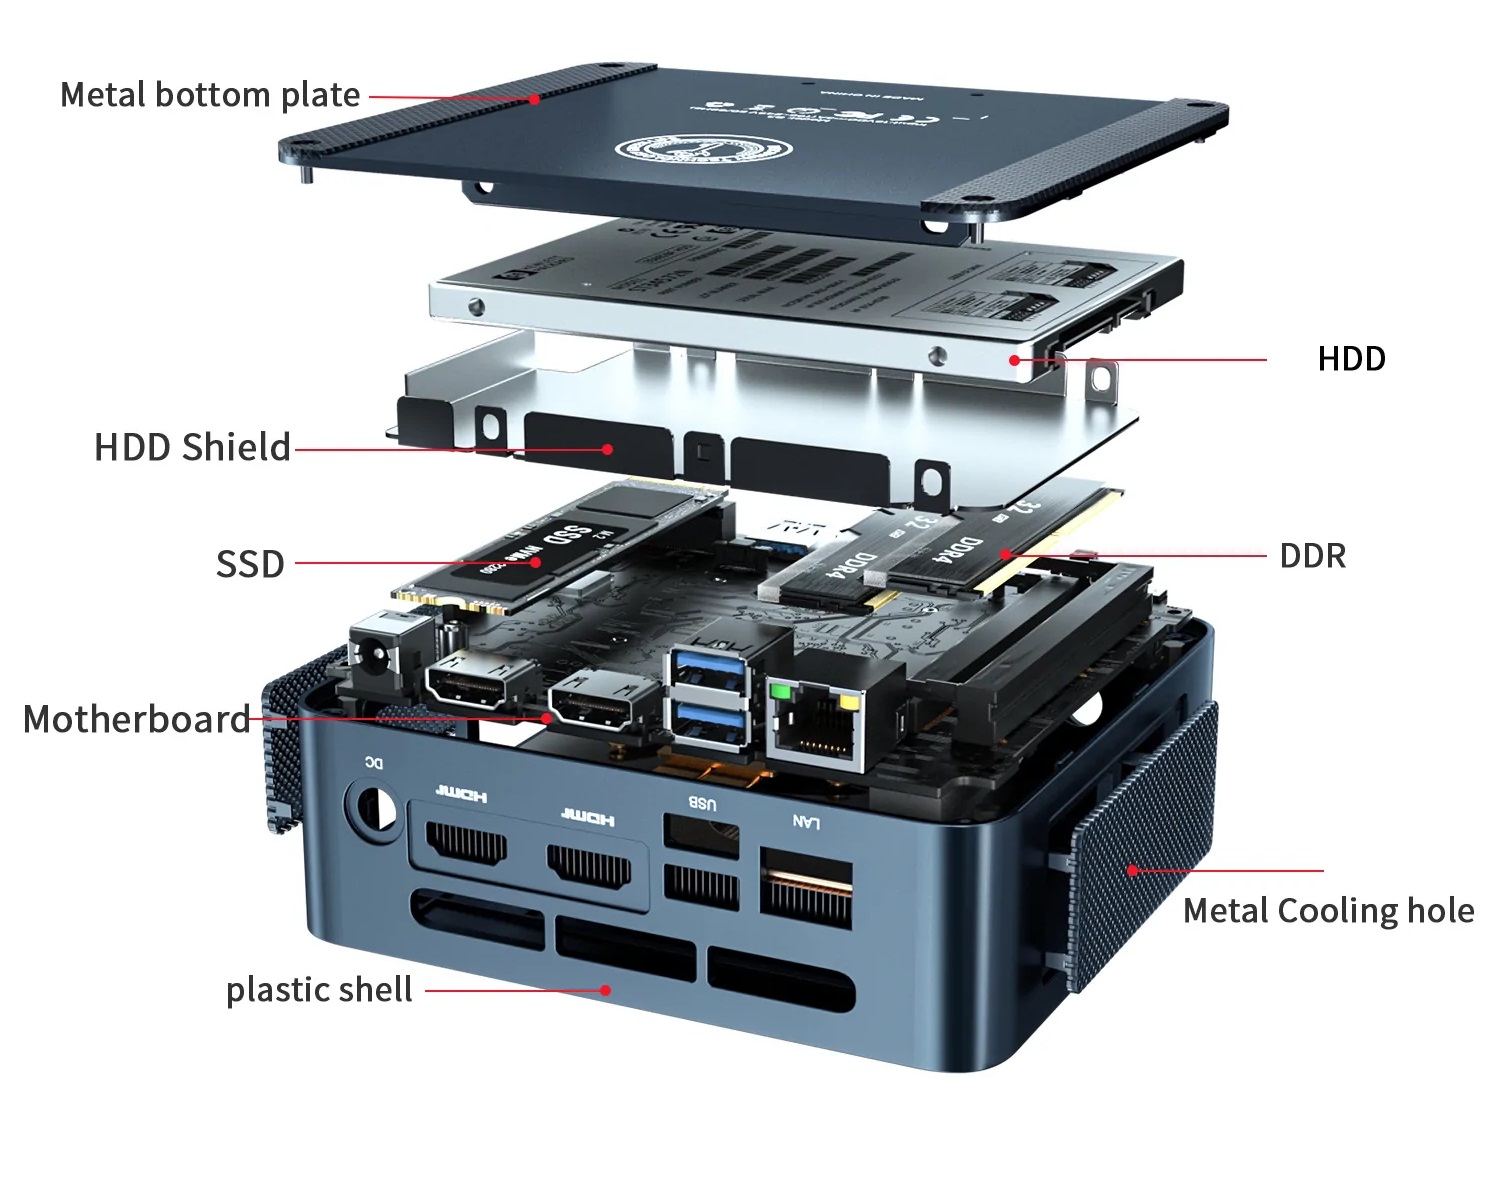
Maintenance
Le panneau inférieur est censé se détacher facilement, mais les vis sont molles et peuvent se détacher plus facilement que sur la plupart des autres mini-PC. Cela s'est malheureusement produit sur notre appareil et nous recommandons donc aux propriétaires d'être très prudents lors de l'entretien de l'appareil. En comparaison, le NUC d'Intel a des vis à oreilles pour un entretien plus rapide et sans outils.
Accessoires et garantie
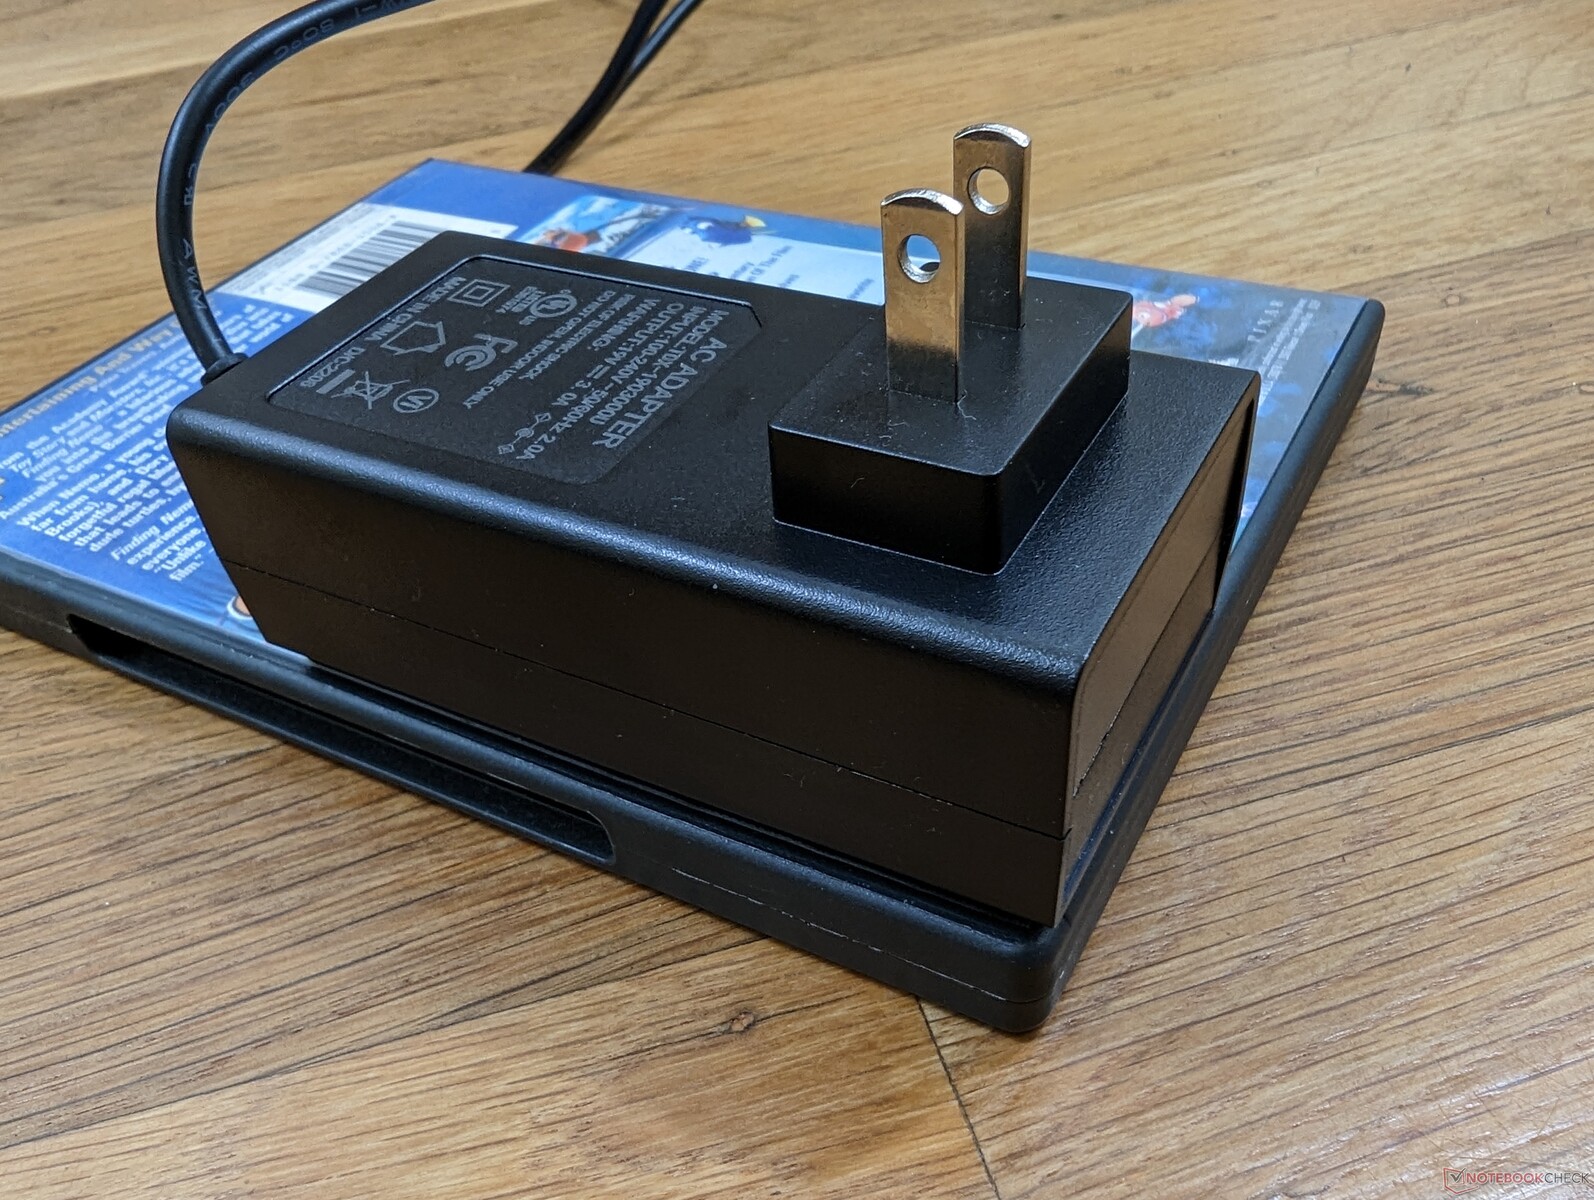
La boîte de détail comprend un support mural, un adaptateur secteur, un manuel d'utilisation et deux câbles HDMI. La garantie limitée habituelle d'un an du fabricant s'applique.
Performance
Conditions d'essai
Nous avons réglé Windows en mode Performance avant d'exécuter les benchmarks ci-dessous. Le système n'est pas livré avec des applications préinstallées de type "centre de contrôle" permettant de régler les profils d'alimentation.
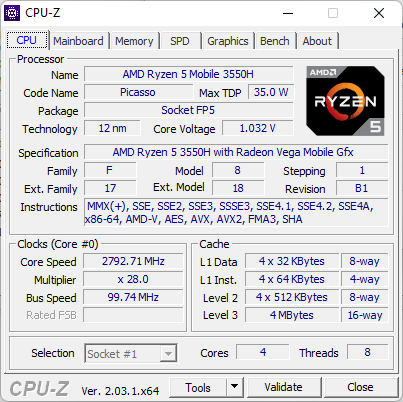
Processeur
Les performances globales du processeur sont bien plus lentes que celles des processeurs Intel Core i5 ou i7 de la série U de 11e ou 12e génération, mais elles restent nettement supérieures à celles des solutions Celeron ou Atom actuellement sur le marché. Ainsi, le Ryzen 5 3550H dans notre Trigkey est plus comparable à un PC basé sur un Intel Core i3 ou le beaucoup plus ancien Core i5-8260U. Il est dommage que le constructeur n'ait pas opté pour le Ryzen 7 4800U à la place, car le processeur Zen 2 est une mise à niveau massive par rapport à la série H du Zen+.
Cinebench R15 Multi Loop
Cinebench R20: CPU (Multi Core) | CPU (Single Core)
Cinebench R23: Multi Core | Single Core
Cinebench R15: CPU Multi 64Bit | CPU Single 64Bit
Blender: v2.79 BMW27 CPU
7-Zip 18.03: 7z b 4 | 7z b 4 -mmt1
Geekbench 5.5: Multi-Core | Single-Core
HWBOT x265 Benchmark v2.2: 4k Preset
LibreOffice : 20 Documents To PDF
R Benchmark 2.5: Overall mean
| CPU Performance rating | |
| Beelink GTR6 | |
| Intel NUC 12 Pro Kit NUC12WSKi7 | |
| Intel NUC Pro Chassis_i7_1265U | |
| Beelink SEi12 Core i5-1235U | |
| Beelink SER Pro Ryzen 5 5600H | |
| Beelink SEi11 Pro | |
| Intel NUC Pro Chassis_i7_1185G7 | |
| Prime Computer PrimeBook Circular-i7-1165G7 | |
| Minipc Union NiPoGi CK10 - 10810U | |
| Beelink SER3 -2! | |
| Moyenne AMD Ryzen 5 3550H | |
| Trigkey S3 | |
| MSI Cubi 5 10M -8! | |
| Beelink SEi8 | |
| BMAX B5 Pro G7H8 | |
| Beelink U59 N5105 | |
| Geekom MiniAir 11 Special Edition | |
| Chuwi LapBook Plus -6! | |
| Chuwi Hi10 Air -12! | |
| Cinebench R20 / CPU (Multi Core) | |
| Beelink GTR6 | |
| Intel NUC 12 Pro Kit NUC12WSKi7 | |
| Intel NUC Pro Chassis_i7_1265U | |
| Beelink SEi12 Core i5-1235U | |
| Beelink SER Pro Ryzen 5 5600H | |
| Beelink SEi11 Pro | |
| Prime Computer PrimeBook Circular-i7-1165G7 | |
| Intel NUC Pro Chassis_i7_1185G7 | |
| Moyenne AMD Ryzen 5 3550H (1421 - 1728, n=8) | |
| Beelink SER3 | |
| Minipc Union NiPoGi CK10 - 10810U | |
| BMAX B5 Pro G7H8 | |
| Trigkey S3 | |
| Geekom MiniAir 11 Special Edition | |
| Beelink U59 N5105 | |
| Beelink SEi8 | |
| MSI Cubi 5 10M | |
| Chuwi LapBook Plus | |
| Cinebench R20 / CPU (Single Core) | |
| Intel NUC 12 Pro Kit NUC12WSKi7 | |
| Intel NUC Pro Chassis_i7_1265U | |
| Beelink GTR6 | |
| Beelink SEi12 Core i5-1235U | |
| Prime Computer PrimeBook Circular-i7-1165G7 | |
| Beelink SEi11 Pro | |
| Intel NUC Pro Chassis_i7_1185G7 | |
| Beelink SER Pro Ryzen 5 5600H | |
| Minipc Union NiPoGi CK10 - 10810U | |
| MSI Cubi 5 10M | |
| BMAX B5 Pro G7H8 | |
| Beelink SER3 | |
| Trigkey S3 | |
| Moyenne AMD Ryzen 5 3550H (331 - 370, n=8) | |
| Beelink SEi8 | |
| Beelink U59 N5105 | |
| Geekom MiniAir 11 Special Edition | |
| Chuwi LapBook Plus | |
| Cinebench R23 / Multi Core | |
| Beelink GTR6 | |
| Intel NUC 12 Pro Kit NUC12WSKi7 | |
| Intel NUC Pro Chassis_i7_1265U | |
| Beelink SEi12 Core i5-1235U | |
| Beelink SER Pro Ryzen 5 5600H | |
| Beelink SEi11 Pro | |
| Prime Computer PrimeBook Circular-i7-1165G7 | |
| Intel NUC Pro Chassis_i7_1185G7 | |
| Moyenne AMD Ryzen 5 3550H (3646 - 4213, n=2) | |
| Beelink SER3 | |
| Minipc Union NiPoGi CK10 - 10810U | |
| Trigkey S3 | |
| BMAX B5 Pro G7H8 | |
| Beelink U59 N5105 | |
| Geekom MiniAir 11 Special Edition | |
| Beelink SEi8 | |
| MSI Cubi 5 10M | |
| Cinebench R23 / Single Core | |
| Intel NUC 12 Pro Kit NUC12WSKi7 | |
| Intel NUC Pro Chassis_i7_1265U | |
| Beelink SEi12 Core i5-1235U | |
| Beelink GTR6 | |
| Prime Computer PrimeBook Circular-i7-1165G7 | |
| Beelink SEi11 Pro | |
| Intel NUC Pro Chassis_i7_1185G7 | |
| Beelink SER Pro Ryzen 5 5600H | |
| Minipc Union NiPoGi CK10 - 10810U | |
| MSI Cubi 5 10M | |
| Beelink SER3 | |
| Trigkey S3 | |
| Beelink SEi8 | |
| Moyenne AMD Ryzen 5 3550H (850 - 922, n=2) | |
| BMAX B5 Pro G7H8 | |
| Beelink U59 N5105 | |
| Geekom MiniAir 11 Special Edition | |
| Geekbench 5.5 / Multi-Core | |
| Intel NUC 12 Pro Kit NUC12WSKi7 | |
| Beelink GTR6 | |
| Intel NUC Pro Chassis_i7_1265U | |
| Beelink SEi12 Core i5-1235U | |
| Beelink SER Pro Ryzen 5 5600H | |
| Intel NUC Pro Chassis_i7_1185G7 | |
| Beelink SEi11 Pro | |
| Prime Computer PrimeBook Circular-i7-1165G7 | |
| Minipc Union NiPoGi CK10 - 10810U | |
| Moyenne AMD Ryzen 5 3550H (3162 - 3486, n=5) | |
| Trigkey S3 | |
| Beelink U59 N5105 | |
| Geekom MiniAir 11 Special Edition | |
| Beelink SEi8 | |
| BMAX B5 Pro G7H8 | |
| Geekbench 5.5 / Single-Core | |
| Intel NUC 12 Pro Kit NUC12WSKi7 | |
| Intel NUC Pro Chassis_i7_1265U | |
| Beelink GTR6 | |
| Beelink SEi12 Core i5-1235U | |
| Prime Computer PrimeBook Circular-i7-1165G7 | |
| Beelink SEi11 Pro | |
| Intel NUC Pro Chassis_i7_1185G7 | |
| Beelink SER Pro Ryzen 5 5600H | |
| Minipc Union NiPoGi CK10 - 10810U | |
| Trigkey S3 | |
| Moyenne AMD Ryzen 5 3550H (880 - 907, n=5) | |
| Beelink SEi8 | |
| Geekom MiniAir 11 Special Edition | |
| Beelink U59 N5105 | |
| BMAX B5 Pro G7H8 | |
| HWBOT x265 Benchmark v2.2 / 4k Preset | |
| Beelink GTR6 | |
| Intel NUC 12 Pro Kit NUC12WSKi7 | |
| Beelink SER Pro Ryzen 5 5600H | |
| Intel NUC Pro Chassis_i7_1265U | |
| Beelink SEi12 Core i5-1235U | |
| Beelink SEi11 Pro | |
| Intel NUC Pro Chassis_i7_1185G7 | |
| Minipc Union NiPoGi CK10 - 10810U | |
| Prime Computer PrimeBook Circular-i7-1165G7 | |
| Beelink SER3 | |
| Moyenne AMD Ryzen 5 3550H (3.7 - 4.43, n=5) | |
| Trigkey S3 | |
| Beelink SEi8 | |
| Geekom MiniAir 11 Special Edition | |
| Beelink U59 N5105 | |
| BMAX B5 Pro G7H8 | |
| Chuwi LapBook Plus | |
| LibreOffice / 20 Documents To PDF | |
| BMAX B5 Pro G7H8 | |
| Geekom MiniAir 11 Special Edition | |
| Beelink U59 N5105 | |
| Trigkey S3 | |
| Beelink SER3 | |
| Moyenne AMD Ryzen 5 3550H (73.3 - 92.7, n=4) | |
| Beelink SEi8 | |
| Minipc Union NiPoGi CK10 - 10810U | |
| Beelink SER Pro Ryzen 5 5600H | |
| Prime Computer PrimeBook Circular-i7-1165G7 | |
| Beelink SEi11 Pro | |
| Intel NUC Pro Chassis_i7_1265U | |
| Beelink SEi12 Core i5-1235U | |
| Intel NUC Pro Chassis_i7_1185G7 | |
| Beelink GTR6 | |
| Intel NUC 12 Pro Kit NUC12WSKi7 | |
| R Benchmark 2.5 / Overall mean | |
| BMAX B5 Pro G7H8 | |
| Geekom MiniAir 11 Special Edition | |
| Beelink U59 N5105 | |
| Beelink SEi8 | |
| Moyenne AMD Ryzen 5 3550H (0.732 - 0.752, n=4) | |
| Trigkey S3 | |
| Beelink SER3 | |
| Minipc Union NiPoGi CK10 - 10810U | |
| Prime Computer PrimeBook Circular-i7-1165G7 | |
| Intel NUC Pro Chassis_i7_1185G7 | |
| Beelink SEi11 Pro | |
| Beelink SER Pro Ryzen 5 5600H | |
| Beelink SEi12 Core i5-1235U | |
| Intel NUC Pro Chassis_i7_1265U | |
| Intel NUC 12 Pro Kit NUC12WSKi7 | |
| Beelink GTR6 | |
Cinebench R20: CPU (Multi Core) | CPU (Single Core)
Cinebench R23: Multi Core | Single Core
Cinebench R15: CPU Multi 64Bit | CPU Single 64Bit
Blender: v2.79 BMW27 CPU
7-Zip 18.03: 7z b 4 | 7z b 4 -mmt1
Geekbench 5.5: Multi-Core | Single-Core
HWBOT x265 Benchmark v2.2: 4k Preset
LibreOffice : 20 Documents To PDF
R Benchmark 2.5: Overall mean
* ... Moindre est la valeur, meilleures sont les performances
* ... Moindre est la valeur, meilleures sont les performances
AIDA64: FP32 Ray-Trace | FPU Julia | CPU SHA3 | CPU Queen | FPU SinJulia | FPU Mandel | CPU AES | CPU ZLib | FP64 Ray-Trace | CPU PhotoWorxx
| Performance rating | |
| Beelink SER Pro Ryzen 5 5600H | |
| Intel NUC Pro Chassis_i7_1265U | |
| Beelink SEi12 Core i5-1235U | |
| Beelink SEi11 Pro | |
| Intel NUC11TNKi5 | |
| Moyenne AMD Ryzen 5 3550H | |
| Trigkey S3 | |
| AIDA64 / FP32 Ray-Trace | |
| Beelink SER Pro Ryzen 5 5600H | |
| Beelink SEi11 Pro | |
| Intel NUC Pro Chassis_i7_1265U | |
| Beelink SEi12 Core i5-1235U | |
| Intel NUC11TNKi5 | |
| Moyenne AMD Ryzen 5 3550H (2996 - 3607, n=5) | |
| Trigkey S3 | |
| AIDA64 / FPU Julia | |
| Beelink SER Pro Ryzen 5 5600H | |
| Intel NUC Pro Chassis_i7_1265U | |
| Beelink SEi12 Core i5-1235U | |
| Beelink SEi11 Pro | |
| Intel NUC11TNKi5 | |
| Moyenne AMD Ryzen 5 3550H (16278 - 18781, n=5) | |
| Trigkey S3 | |
| AIDA64 / CPU SHA3 | |
| Beelink SER Pro Ryzen 5 5600H | |
| Beelink SEi11 Pro | |
| Intel NUC Pro Chassis_i7_1265U | |
| Beelink SEi12 Core i5-1235U | |
| Intel NUC11TNKi5 | |
| Moyenne AMD Ryzen 5 3550H (847 - 983, n=4) | |
| Trigkey S3 | |
| AIDA64 / CPU Queen | |
| Beelink SER Pro Ryzen 5 5600H | |
| Intel NUC Pro Chassis_i7_1265U | |
| Beelink SEi12 Core i5-1235U | |
| Beelink SEi11 Pro | |
| Intel NUC11TNKi5 | |
| Moyenne AMD Ryzen 5 3550H (42017 - 48622, n=5) | |
| Trigkey S3 | |
| AIDA64 / FPU SinJulia | |
| Beelink SER Pro Ryzen 5 5600H | |
| Moyenne AMD Ryzen 5 3550H (5386 - 6316, n=5) | |
| Trigkey S3 | |
| Intel NUC Pro Chassis_i7_1265U | |
| Beelink SEi11 Pro | |
| Beelink SEi12 Core i5-1235U | |
| Intel NUC11TNKi5 | |
| AIDA64 / FPU Mandel | |
| Beelink SER Pro Ryzen 5 5600H | |
| Intel NUC Pro Chassis_i7_1265U | |
| Beelink SEi11 Pro | |
| Intel NUC11TNKi5 | |
| Beelink SEi12 Core i5-1235U | |
| Moyenne AMD Ryzen 5 3550H (8460 - 9767, n=5) | |
| Trigkey S3 | |
| AIDA64 / CPU AES | |
| Beelink SER Pro Ryzen 5 5600H | |
| Beelink SEi11 Pro | |
| Beelink SEi12 Core i5-1235U | |
| Intel NUC11TNKi5 | |
| Intel NUC Pro Chassis_i7_1265U | |
| Moyenne AMD Ryzen 5 3550H (27486 - 32316, n=5) | |
| Trigkey S3 | |
| AIDA64 / CPU ZLib | |
| Beelink SEi12 Core i5-1235U | |
| Intel NUC Pro Chassis_i7_1265U | |
| Beelink SER Pro Ryzen 5 5600H | |
| Intel NUC11TNKi5 | |
| Beelink SEi11 Pro | |
| Moyenne AMD Ryzen 5 3550H (299 - 352, n=5) | |
| Trigkey S3 | |
| AIDA64 / FP64 Ray-Trace | |
| Beelink SER Pro Ryzen 5 5600H | |
| Intel NUC Pro Chassis_i7_1265U | |
| Beelink SEi11 Pro | |
| Intel NUC11TNKi5 | |
| Beelink SEi12 Core i5-1235U | |
| Moyenne AMD Ryzen 5 3550H (1584 - 1914, n=5) | |
| Trigkey S3 | |
| AIDA64 / CPU PhotoWorxx | |
| Intel NUC Pro Chassis_i7_1265U | |
| Beelink SEi12 Core i5-1235U | |
| Beelink SEi11 Pro | |
| Beelink SER Pro Ryzen 5 5600H | |
| Intel NUC11TNKi5 | |
| Trigkey S3 | |
| Moyenne AMD Ryzen 5 3550H (14325 - 17838, n=5) | |
Performance du système
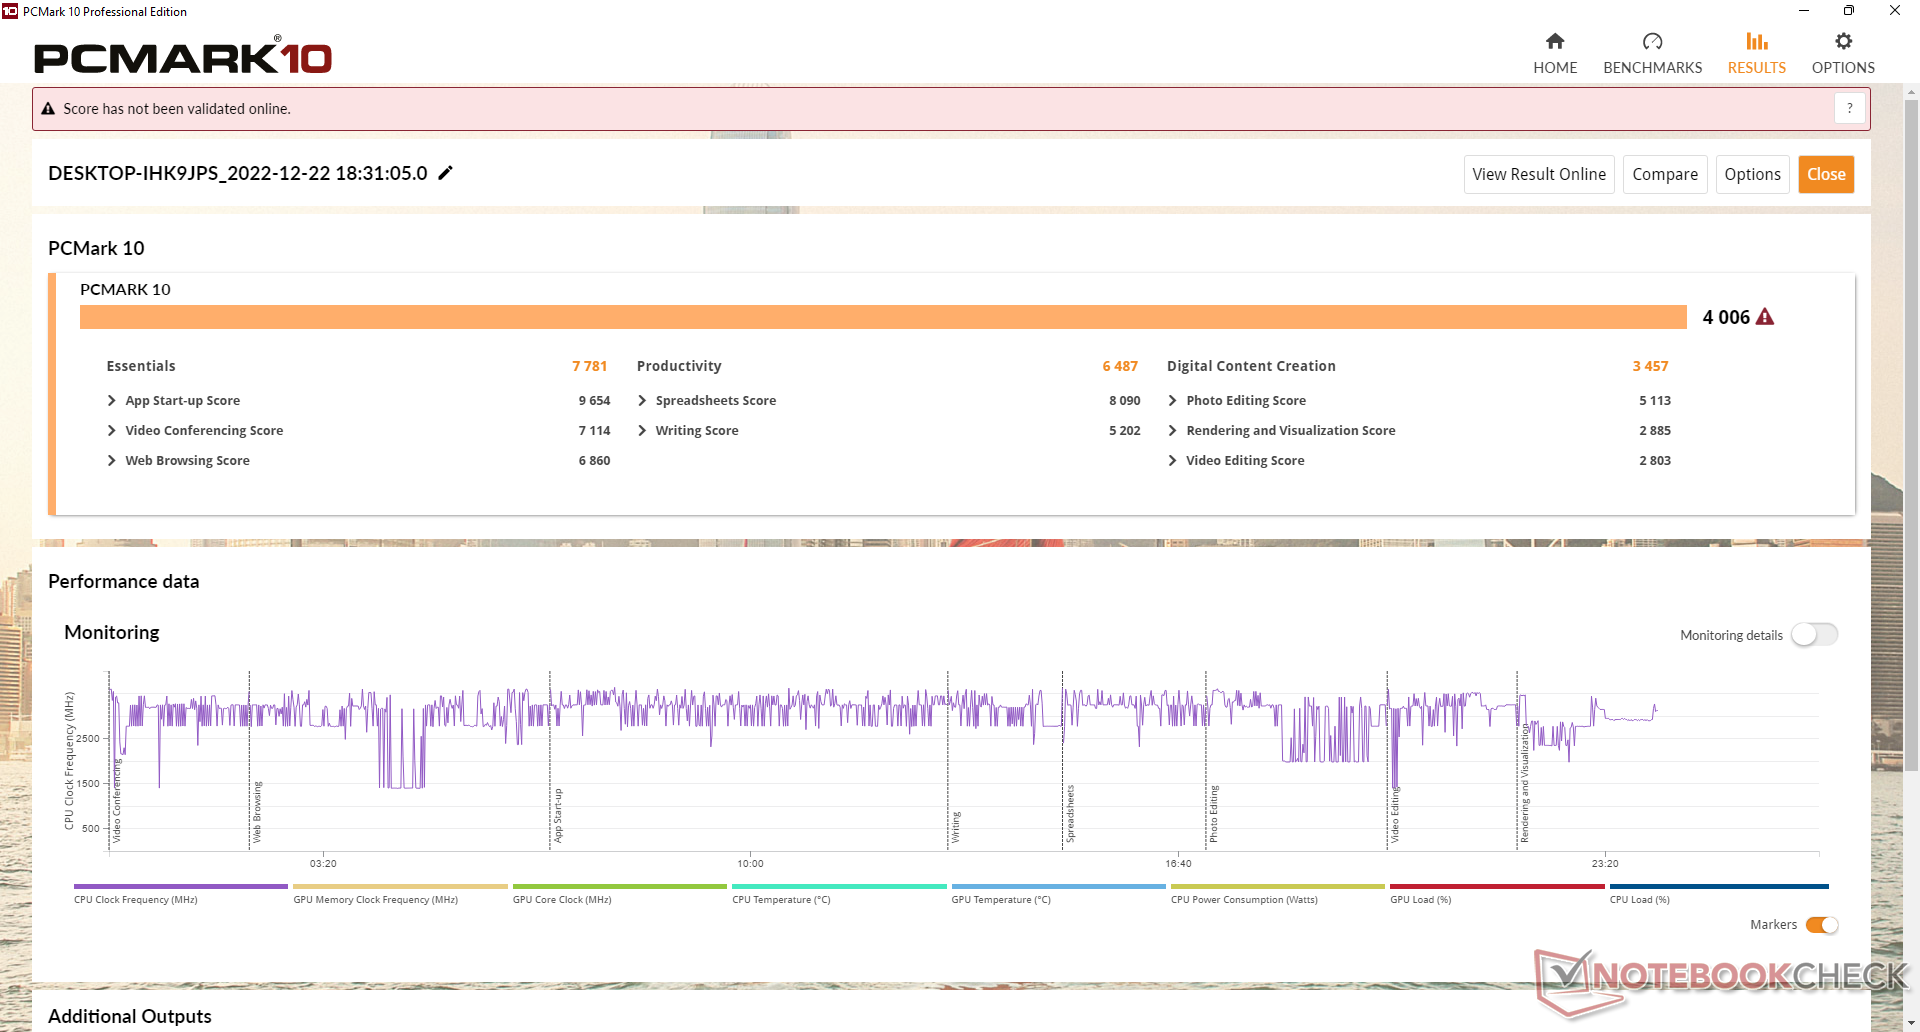
Comme prévu, les résultats de PCMark se situent entre les mini PC plus lents équipés de CPU Celeron ou Atom et les mini PC plus rapides équipés de CPU Intel plus modernes de 11e ou 12e génération.
CrossMark: Overall | Productivity | Creativity | Responsiveness
| PCMark 10 / Score | |
| Beelink SER Pro Ryzen 5 5600H | |
| Beelink SEi12 Core i5-1235U | |
| Intel NUC Pro Chassis_i7_1265U | |
| Beelink SEi11 Pro | |
| Intel NUC11TNKi5 | |
| Moyenne AMD Ryzen 5 3550H, AMD Radeon RX Vega 8 (Ryzen 2000/3000) (4006 - 4307, n=4) | |
| Trigkey S3 | |
| Beelink U59 N5105 | |
| Chuwi LapBook Plus | |
| PCMark 10 / Essentials | |
| Beelink SEi12 Core i5-1235U | |
| Beelink SER Pro Ryzen 5 5600H | |
| Beelink SEi11 Pro | |
| Intel NUC Pro Chassis_i7_1265U | |
| Intel NUC11TNKi5 | |
| Moyenne AMD Ryzen 5 3550H, AMD Radeon RX Vega 8 (Ryzen 2000/3000) (7781 - 8579, n=4) | |
| Trigkey S3 | |
| Beelink U59 N5105 | |
| Chuwi LapBook Plus | |
| PCMark 10 / Productivity | |
| Beelink SER Pro Ryzen 5 5600H | |
| Beelink SEi12 Core i5-1235U | |
| Intel NUC Pro Chassis_i7_1265U | |
| Beelink SEi11 Pro | |
| Trigkey S3 | |
| Moyenne AMD Ryzen 5 3550H, AMD Radeon RX Vega 8 (Ryzen 2000/3000) (5995 - 6487, n=4) | |
| Intel NUC11TNKi5 | |
| Beelink U59 N5105 | |
| Chuwi LapBook Plus | |
| PCMark 10 / Digital Content Creation | |
| Intel NUC Pro Chassis_i7_1265U | |
| Beelink SER Pro Ryzen 5 5600H | |
| Beelink SEi12 Core i5-1235U | |
| Beelink SEi11 Pro | |
| Intel NUC11TNKi5 | |
| Moyenne AMD Ryzen 5 3550H, AMD Radeon RX Vega 8 (Ryzen 2000/3000) (3457 - 3947, n=4) | |
| Trigkey S3 | |
| Beelink U59 N5105 | |
| Chuwi LapBook Plus | |
| CrossMark / Overall | |
| Beelink SEi12 Core i5-1235U | |
| Intel NUC Pro Chassis_i7_1265U | |
| Beelink SEi11 Pro | |
| Beelink SER Pro Ryzen 5 5600H | |
| Trigkey S3 | |
| Moyenne AMD Ryzen 5 3550H, AMD Radeon RX Vega 8 (Ryzen 2000/3000) (n=1) | |
| Beelink U59 N5105 | |
| CrossMark / Productivity | |
| Beelink SEi12 Core i5-1235U | |
| Intel NUC Pro Chassis_i7_1265U | |
| Beelink SEi11 Pro | |
| Beelink SER Pro Ryzen 5 5600H | |
| Trigkey S3 | |
| Moyenne AMD Ryzen 5 3550H, AMD Radeon RX Vega 8 (Ryzen 2000/3000) (n=1) | |
| Beelink U59 N5105 | |
| CrossMark / Creativity | |
| Intel NUC Pro Chassis_i7_1265U | |
| Beelink SEi12 Core i5-1235U | |
| Beelink SER Pro Ryzen 5 5600H | |
| Beelink SEi11 Pro | |
| Trigkey S3 | |
| Moyenne AMD Ryzen 5 3550H, AMD Radeon RX Vega 8 (Ryzen 2000/3000) (n=1) | |
| Beelink U59 N5105 | |
| CrossMark / Responsiveness | |
| Beelink SEi12 Core i5-1235U | |
| Beelink SEi11 Pro | |
| Intel NUC Pro Chassis_i7_1265U | |
| Beelink SER Pro Ryzen 5 5600H | |
| Trigkey S3 | |
| Moyenne AMD Ryzen 5 3550H, AMD Radeon RX Vega 8 (Ryzen 2000/3000) (n=1) | |
| Beelink U59 N5105 | |
| PCMark 10 Score | 4006 points | |
Aide | ||
| AIDA64 / Memory Copy | |
| Intel NUC Pro Chassis_i7_1265U | |
| Beelink SEi12 Core i5-1235U | |
| Beelink SER Pro Ryzen 5 5600H | |
| Beelink SEi11 Pro | |
| Trigkey S3 | |
| Moyenne AMD Ryzen 5 3550H (28887 - 32188, n=5) | |
| Intel NUC11TNKi5 | |
| AIDA64 / Memory Read | |
| Intel NUC Pro Chassis_i7_1265U | |
| Beelink SER Pro Ryzen 5 5600H | |
| Beelink SEi12 Core i5-1235U | |
| Beelink SEi11 Pro | |
| Trigkey S3 | |
| Moyenne AMD Ryzen 5 3550H (31862 - 35172, n=5) | |
| Intel NUC11TNKi5 | |
| AIDA64 / Memory Write | |
| Intel NUC Pro Chassis_i7_1265U | |
| Beelink SEi11 Pro | |
| Beelink SEi12 Core i5-1235U | |
| Beelink SER Pro Ryzen 5 5600H | |
| Trigkey S3 | |
| Moyenne AMD Ryzen 5 3550H (32493 - 35847, n=5) | |
| Intel NUC11TNKi5 | |
| AIDA64 / Memory Latency | |
| Moyenne AMD Ryzen 5 3550H (95 - 120, n=5) | |
| Intel NUC Pro Chassis_i7_1265U | |
| Trigkey S3 | |
| Beelink SEi12 Core i5-1235U | |
| Intel NUC11TNKi5 | |
| Beelink SEi11 Pro | |
| Beelink SER Pro Ryzen 5 5600H | |
* ... Moindre est la valeur, meilleures sont les performances
Latence DPC
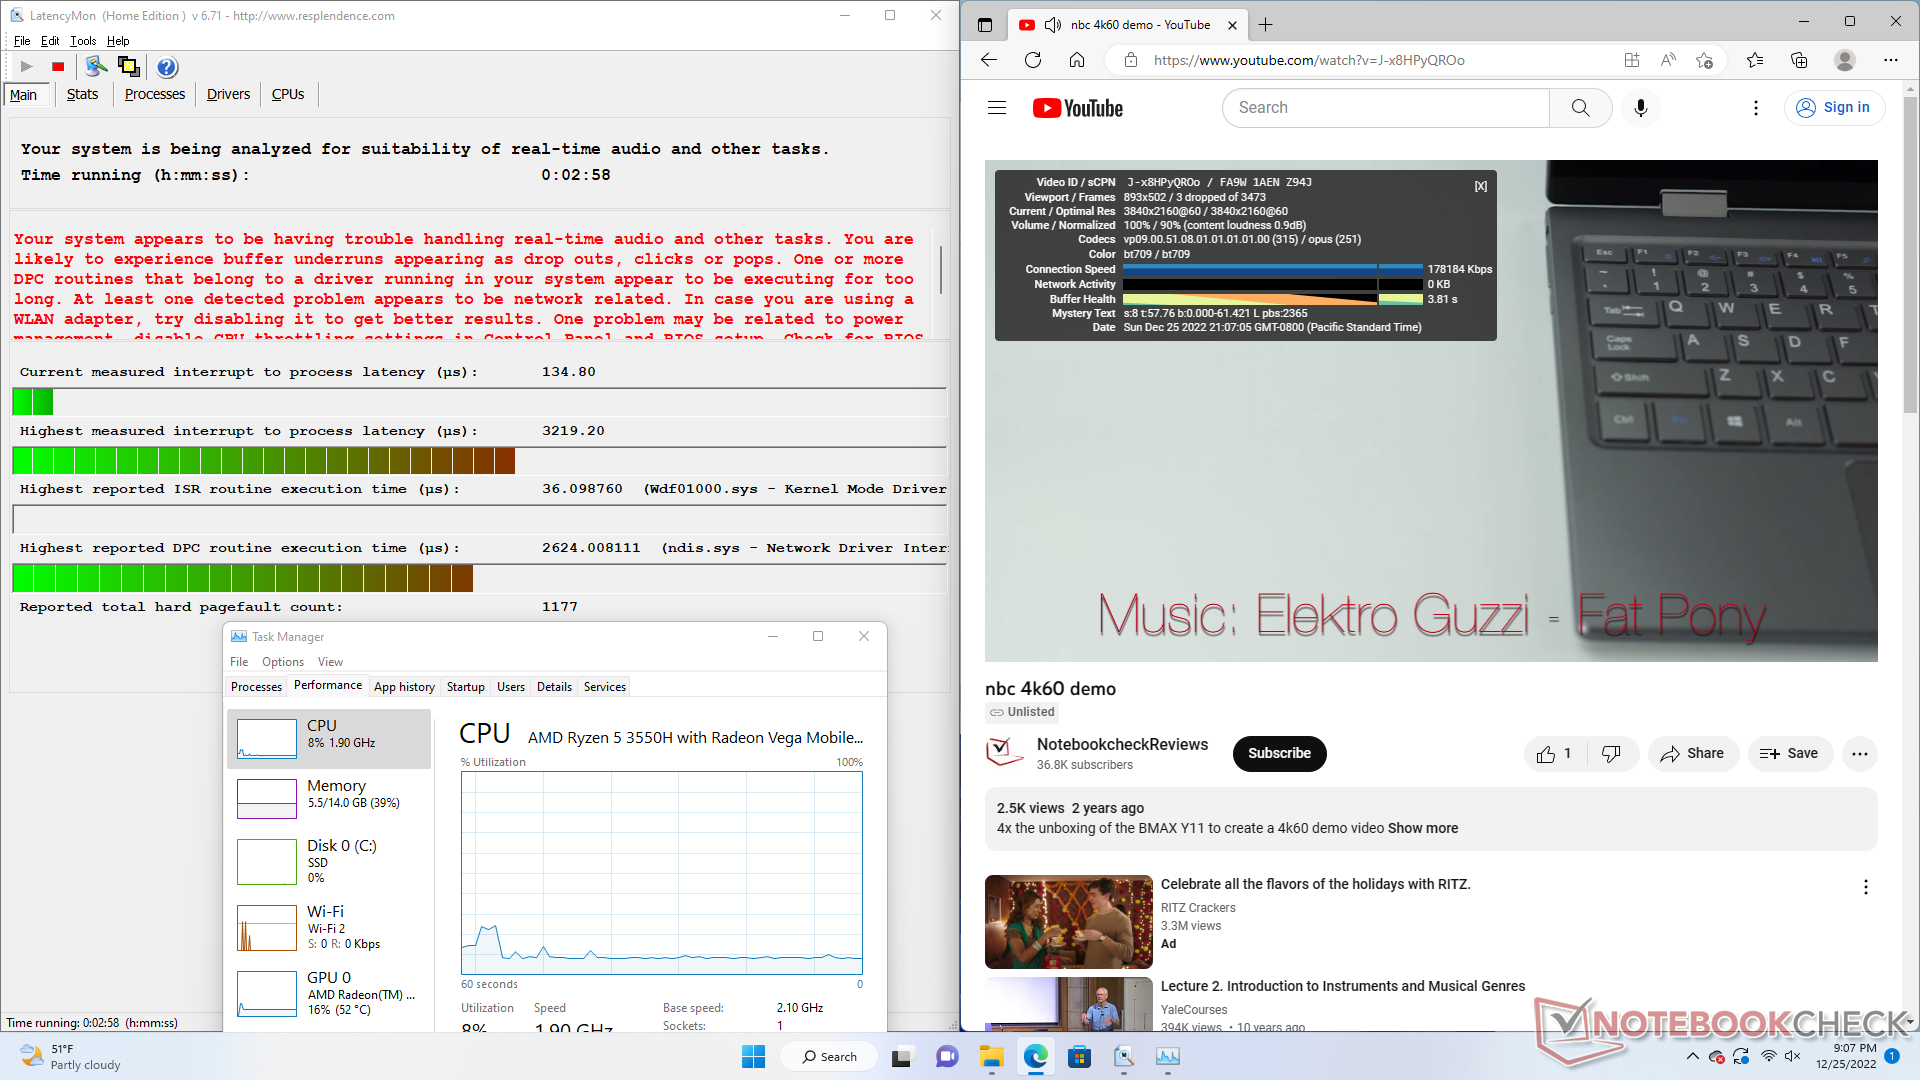
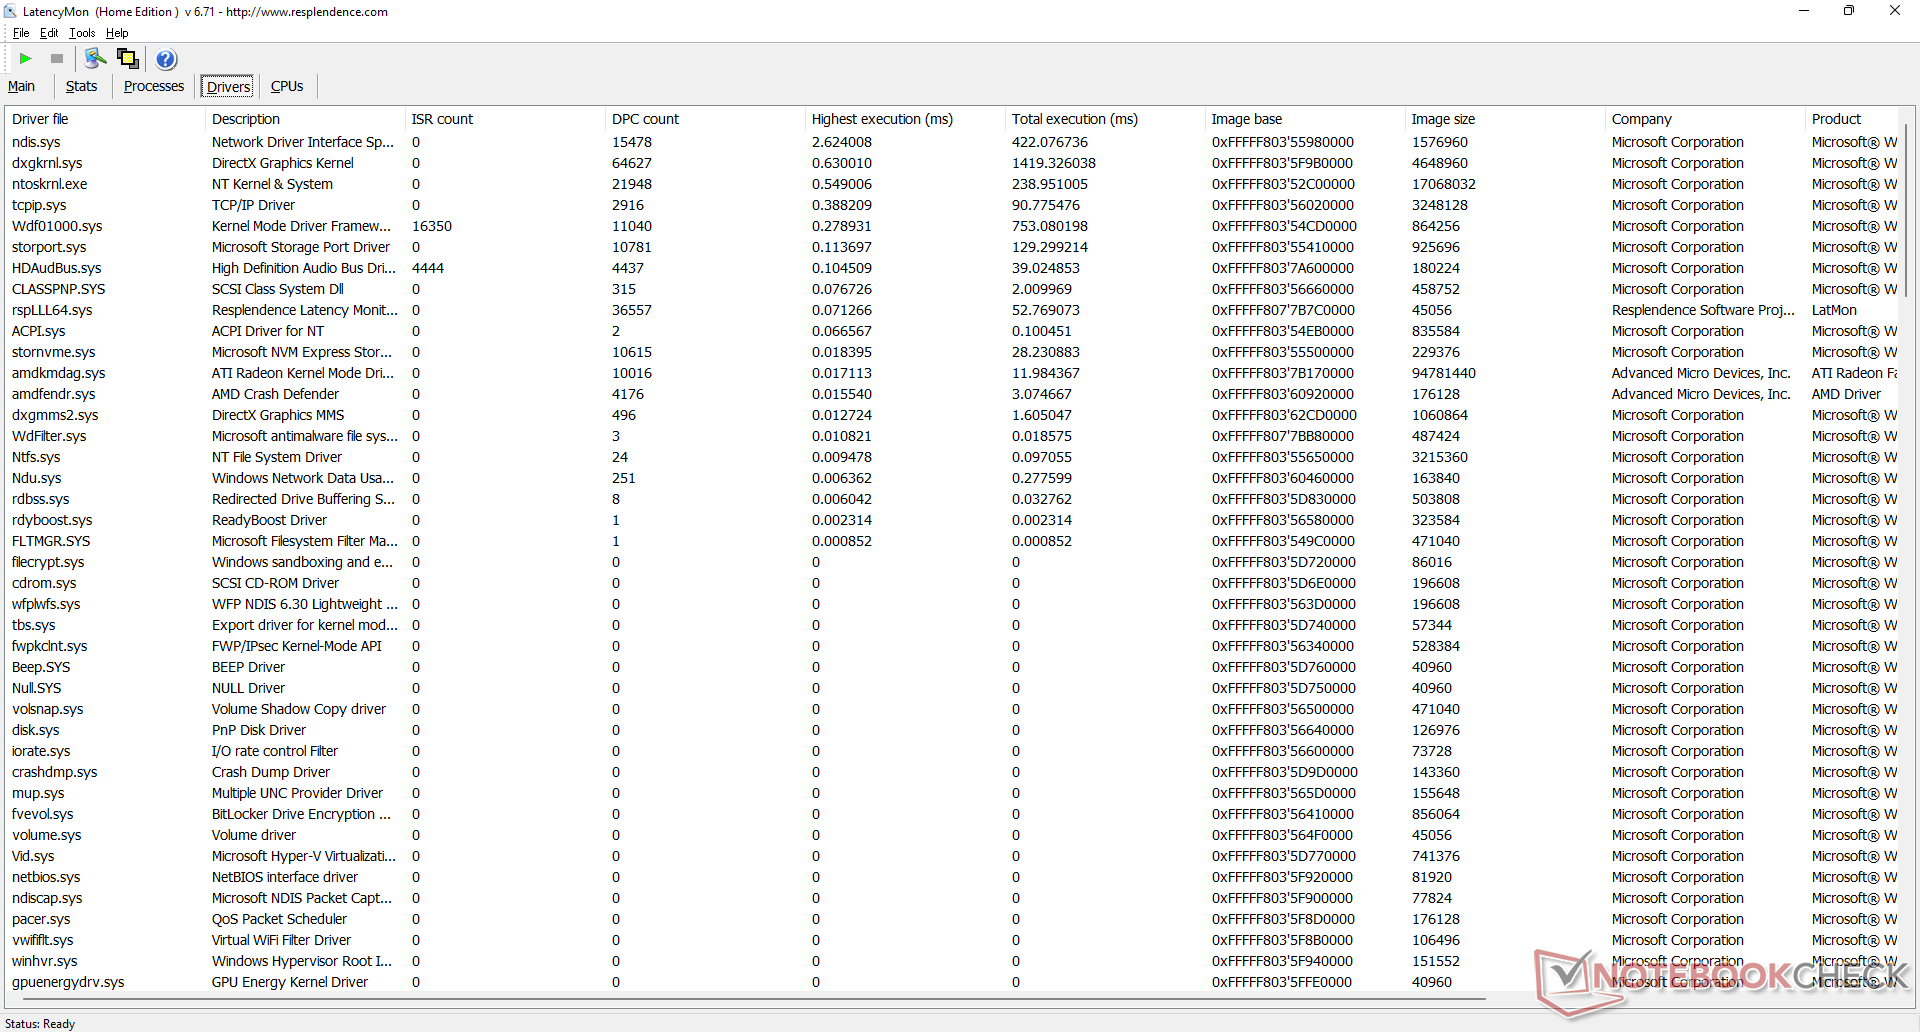
LatencyMon révèle des problèmes de CPD lors de l'ouverture de plusieurs onglets de navigateur sur notre page d'accueil. la lecture de vidéos 4K à 60 FPS est généralement fluide, avec seulement 3 images perdues pendant notre vidéo de test d'une minute.
| DPC Latencies / LatencyMon - interrupt to process latency (max), Web, Youtube, Prime95 | |
| Trigkey S3 | |
| Intel NUC Pro Chassis_i7_1265U | |
| Beelink SEi12 Core i5-1235U | |
| Beelink SER Pro Ryzen 5 5600H | |
| Intel NUC11TNKi5 | |
| Beelink SEi11 Pro | |
* ... Moindre est la valeur, meilleures sont les performances
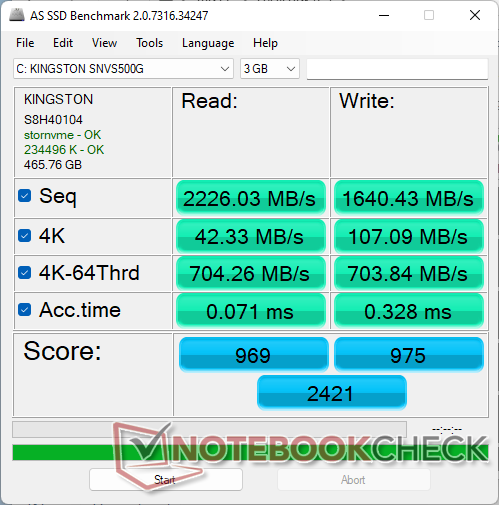
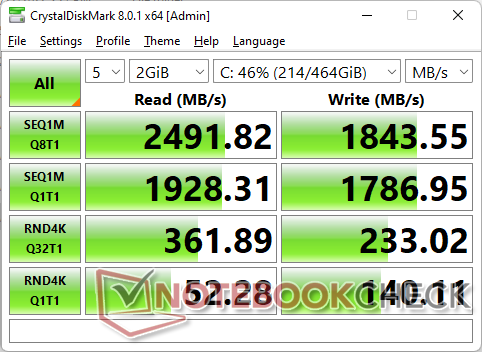
Périphériques de stockage
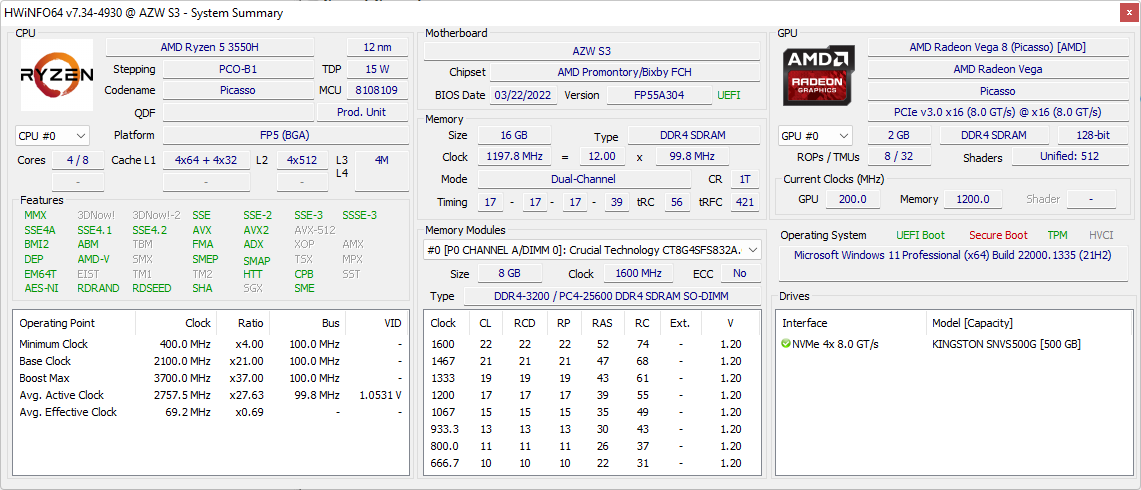
Le Trigkey utilise le mêmeKingston NV1 SNVS/500GCN M.2 2280 NVMe SSD que l'on trouve sur de nombreux mini PC Beelink tels que le SEi11 Pro ou SER Pro. Il s'agit d'un disque PCIe3 x4 économique dont le taux de transfert maximal soutenu est d'environ 2500 Mo/s. Les utilisateurs peuvent installer un SSD M.2 et un disque SATA III de 2,5 pouces s'ils peuvent ouvrir le panneau inférieur.

| Drive Performance rating - Percent | |
| Beelink SEi12 Core i5-1235U | |
| Intel NUC Pro Chassis_i7_1265U | |
| Beelink SEi11 Pro | |
| Beelink SER Pro Ryzen 5 5600H -11! | |
| Trigkey S3 | |
| Intel NUC11TNKi5 | |
* ... Moindre est la valeur, meilleures sont les performances
Disk Throttling: DiskSpd Read Loop, Queue Depth 8
Performances du GPU
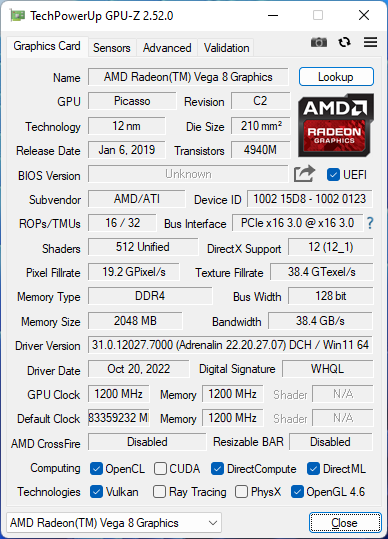
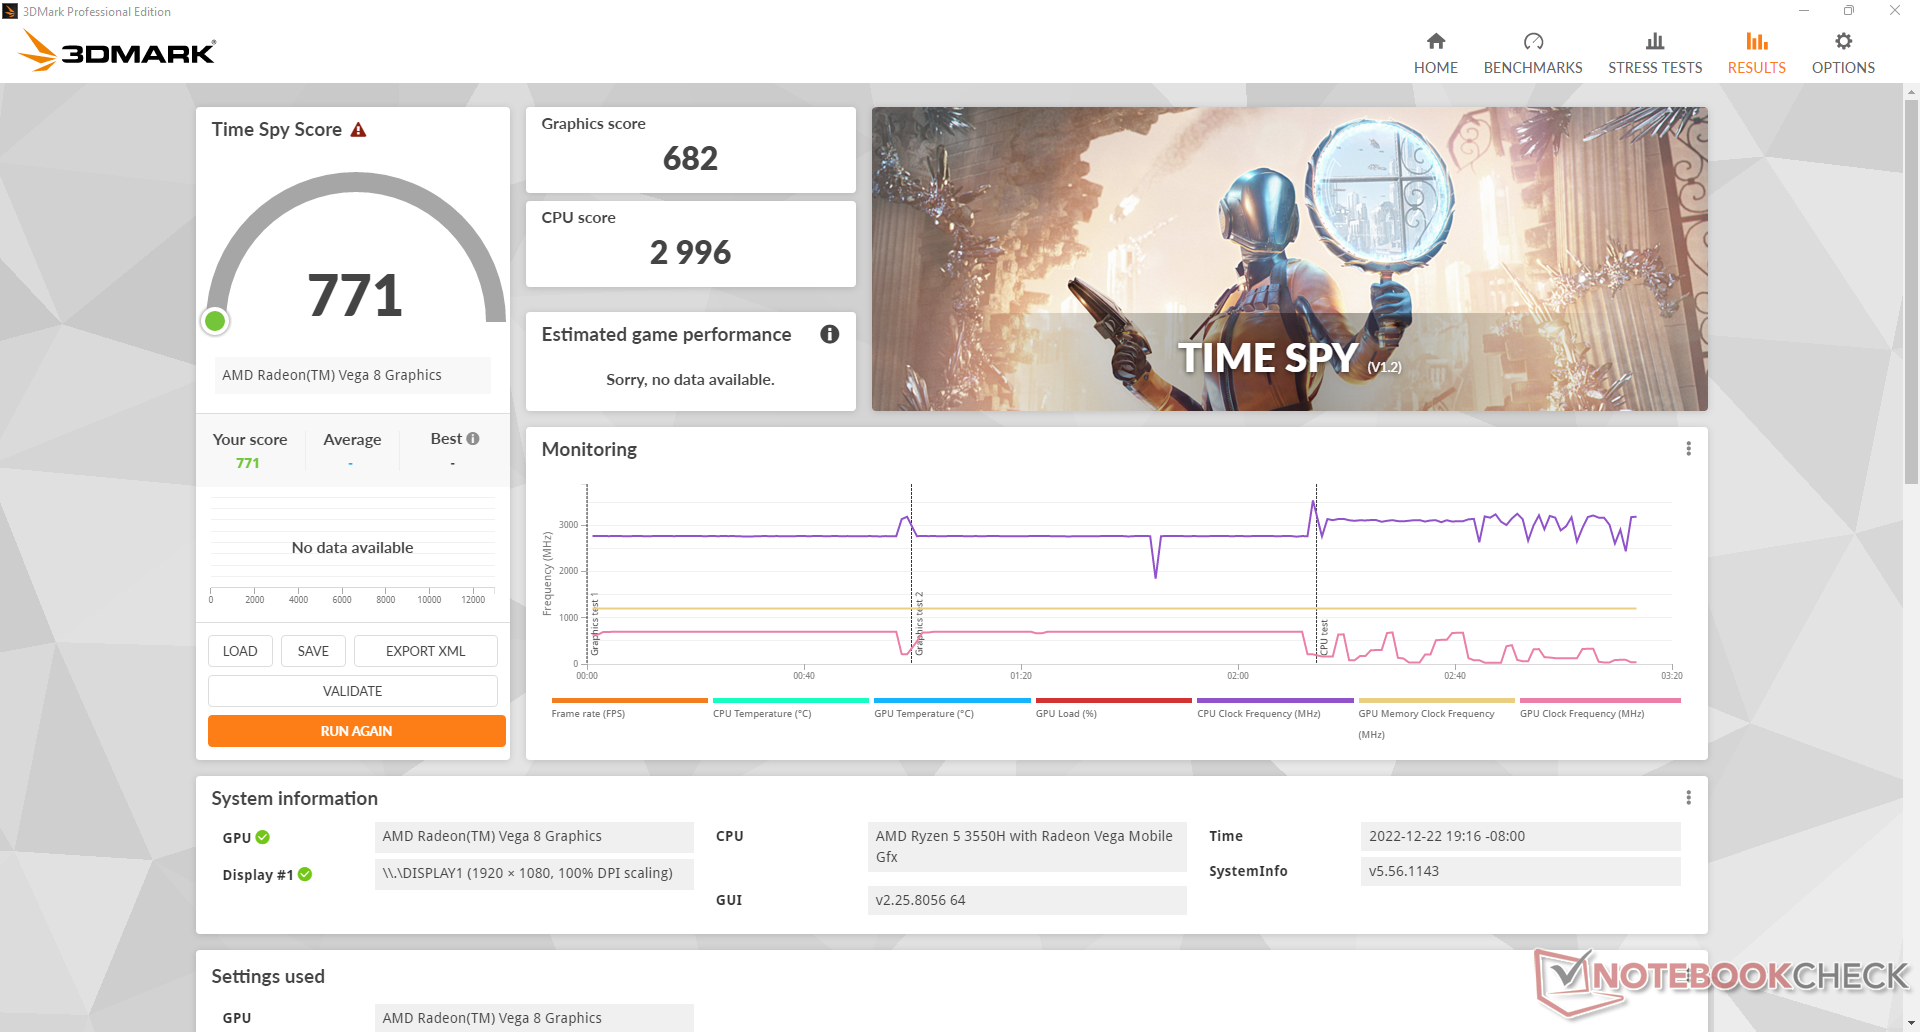
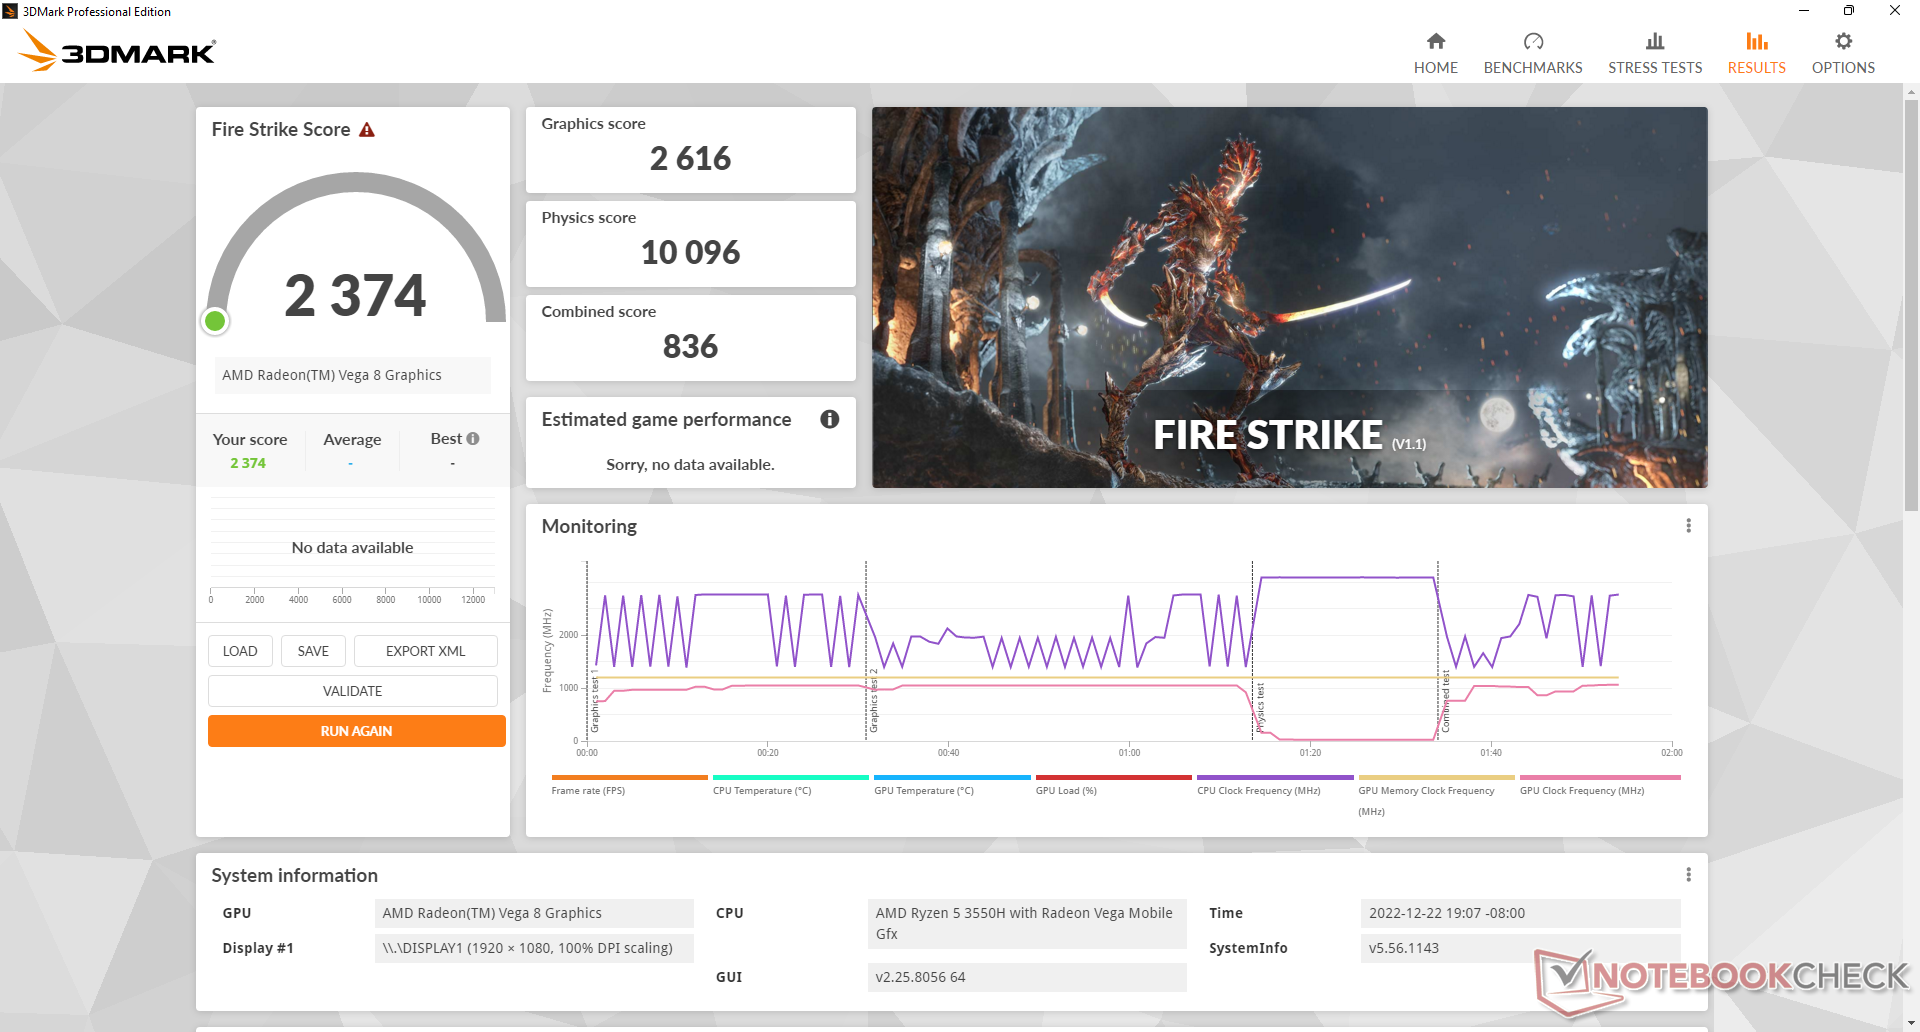
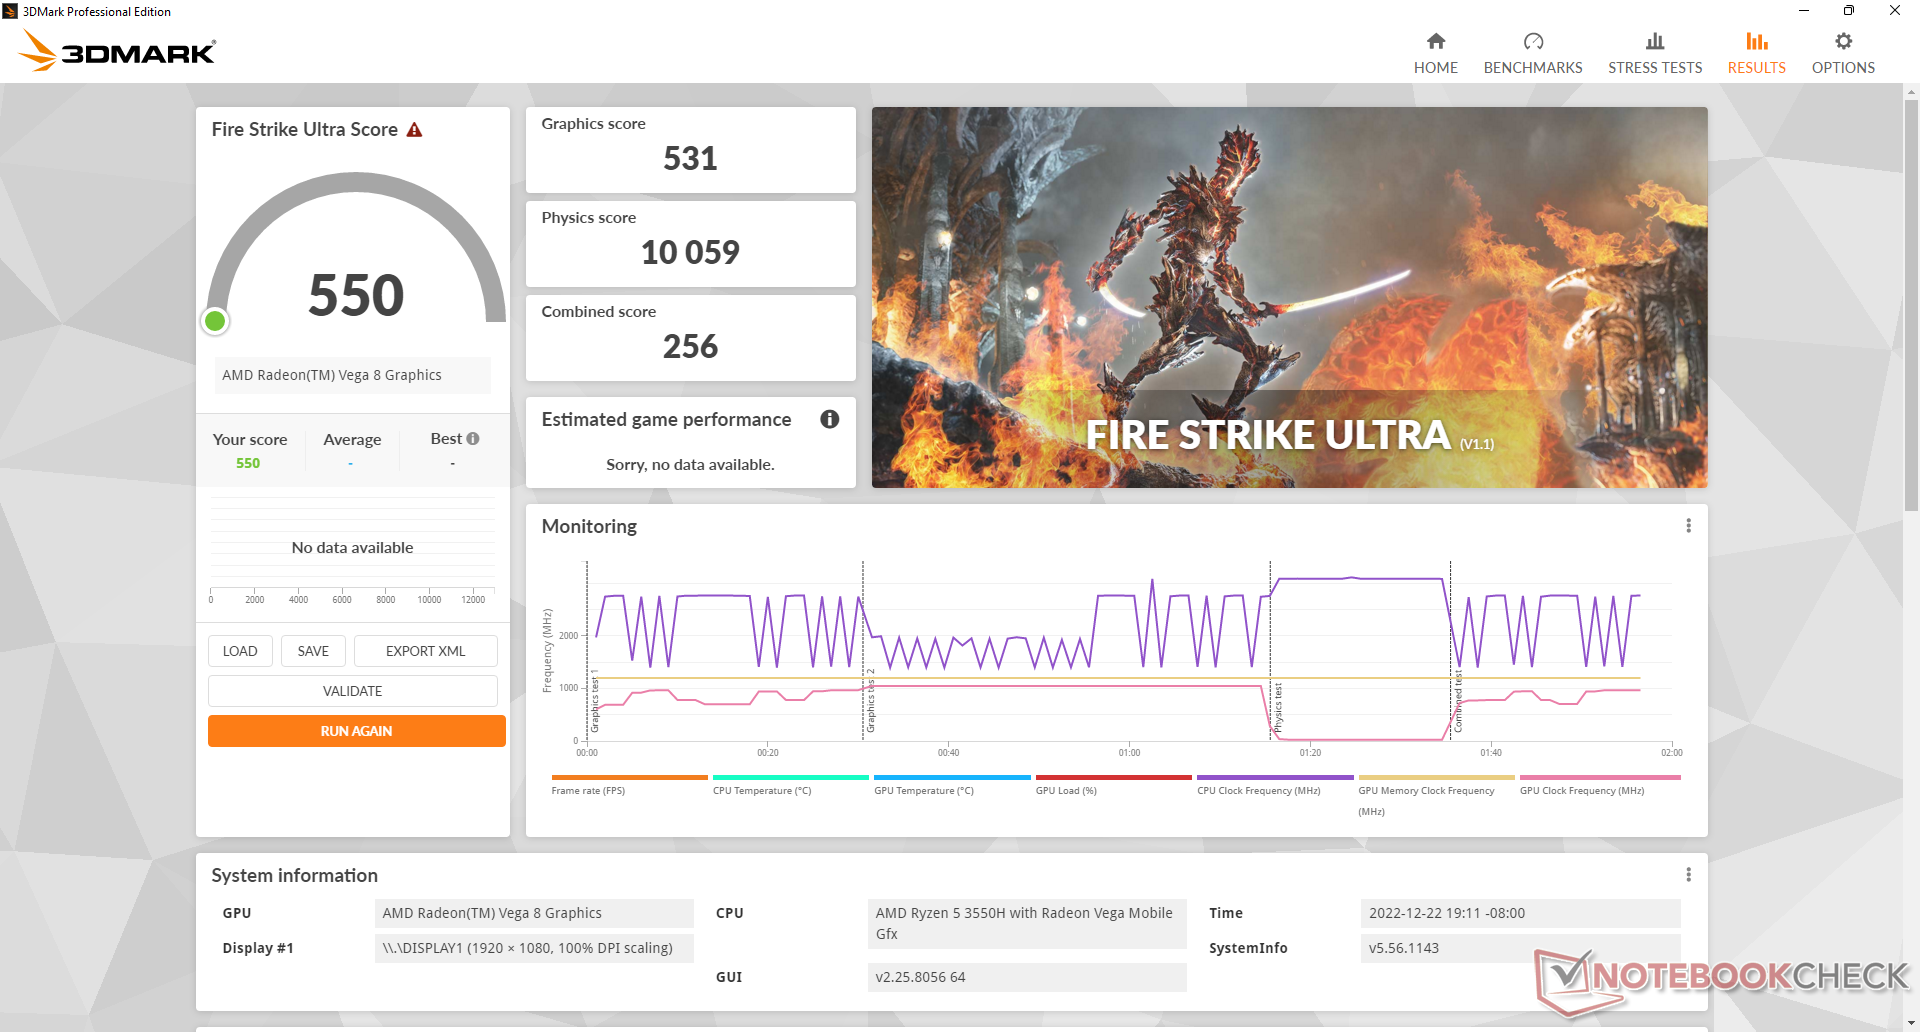
Les performances graphiques brutes sont environ 2 fois supérieures à celles de la UHD Graphics 620 que l'on trouve généralement sur les processeurs Intel de 10e génération ou plus anciens. Ce n'est pas suffisant pour alimenter la plupart des jeux, mais chaque détail compte lors de la diffusion en continu ou sur des écrans à haute résolution.
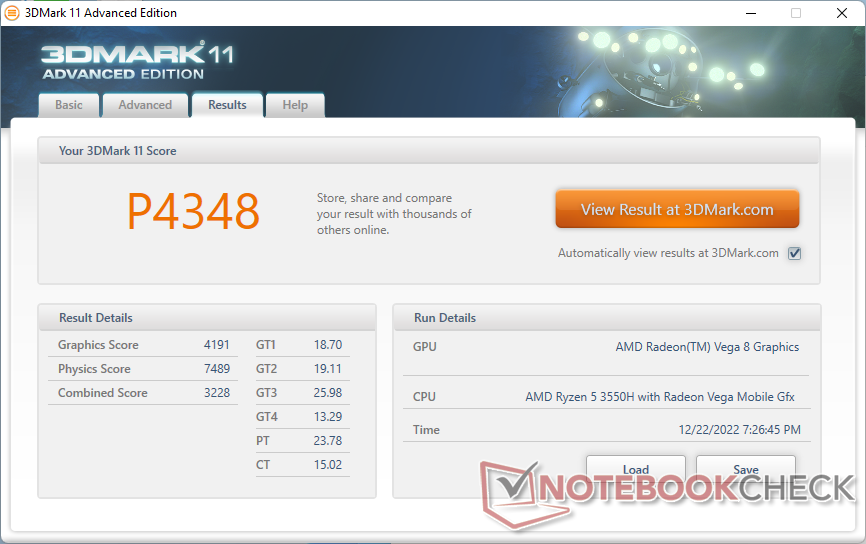
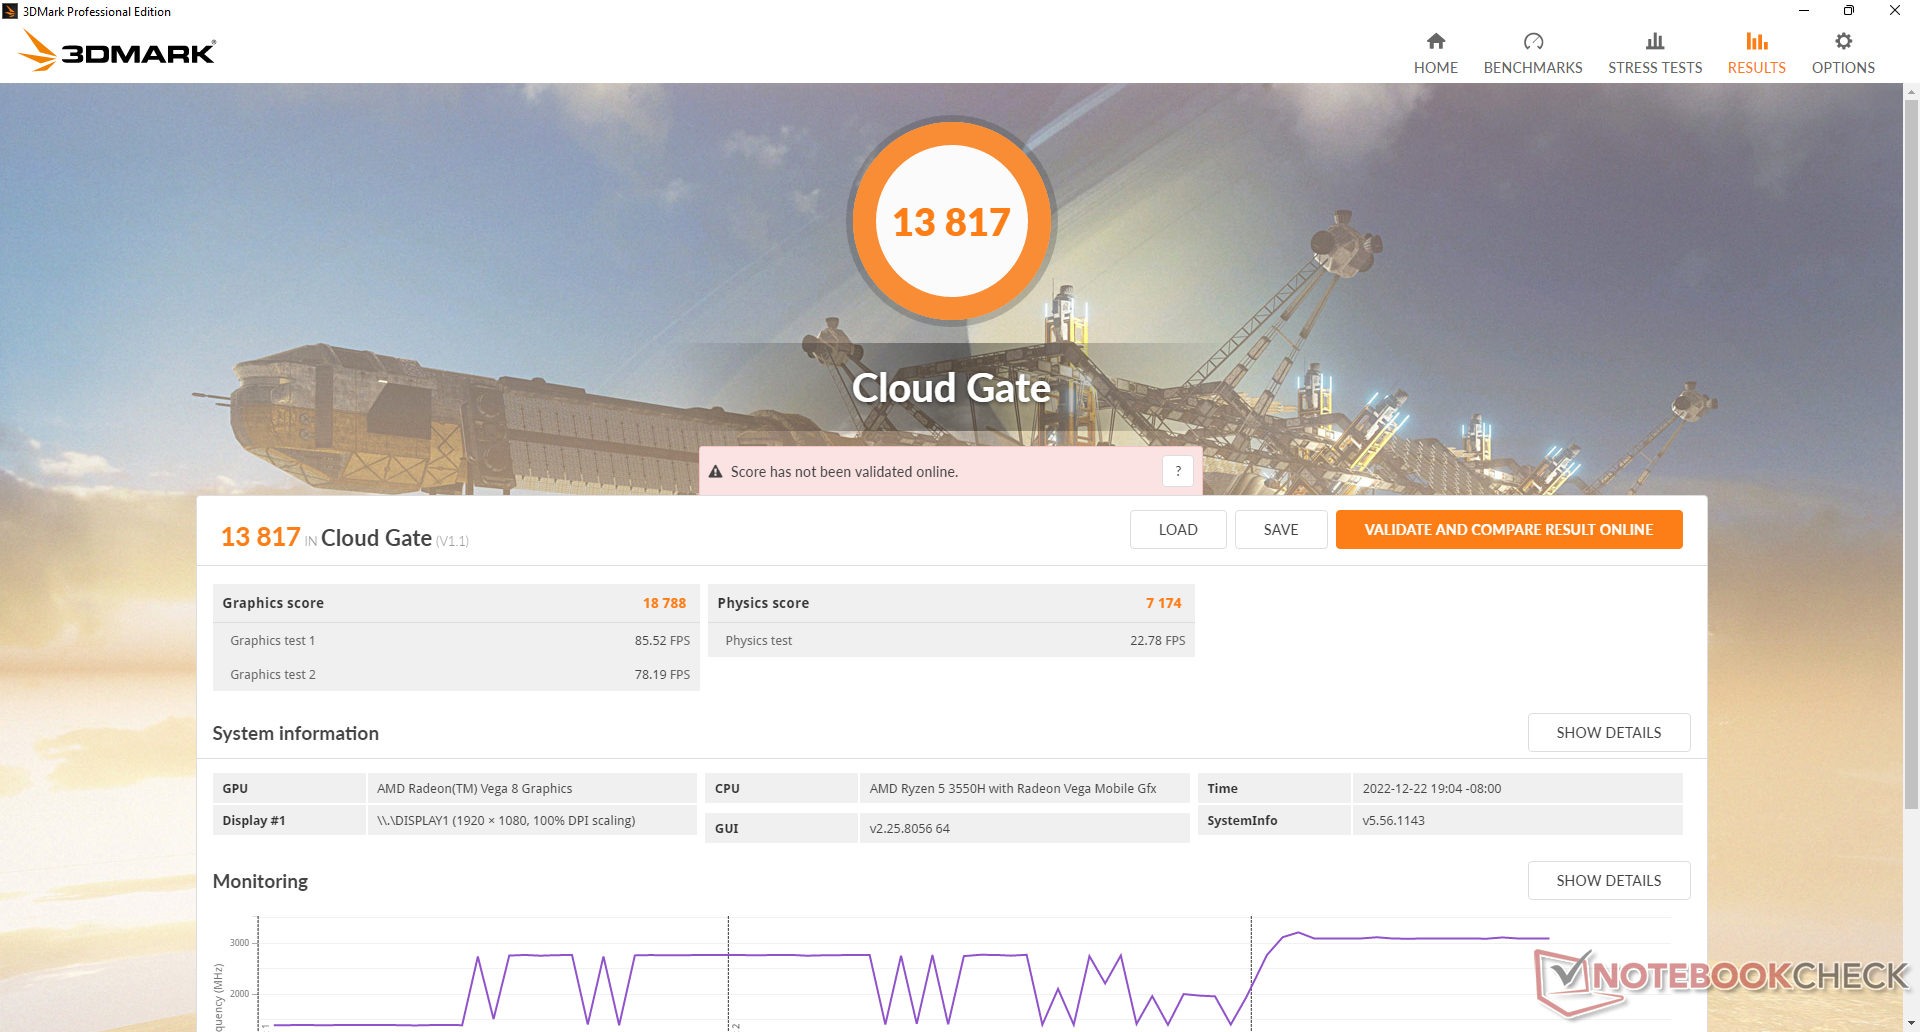
| 3DMark 11 Performance | 4348 points | |
| 3DMark Cloud Gate Standard Score | 13817 points | |
| 3DMark Fire Strike Score | 2374 points | |
| 3DMark Time Spy Score | 771 points | |
Aide | ||
La marche au ralenti Witcher 3 montre que les fréquences d'images chutent périodiquement jusqu'à 30 FPS pendant de courtes périodes avant de se rétablir. Ce comportement suggère une mauvaise optimisation ou l'interruption d'une activité d'arrière-plan qui pourrait potentiellement conduire à des images perdues lors de la diffusion d'autres contenus.
Witcher 3 FPS Chart
| Bas | Moyen | Élevé | Ultra | |
|---|---|---|---|---|
| GTA V (2015) | 81.2 | 72.3 | 21.8 | 10.3 |
| The Witcher 3 (2015) | 50.7 | 33.8 | 18.3 | 10.1 |
| Dota 2 Reborn (2015) | 73 | 64.4 | 40.7 | 37.8 |
| Final Fantasy XV Benchmark (2018) | 27.2 | 13.8 | 9.68 | |
| X-Plane 11.11 (2018) | 11.5 | 10.5 | 9.58 | |
| Strange Brigade (2018) | 65.5 | 21.8 | 17.5 | 14.6 |
| Cyberpunk 2077 1.6 (2022) | 10.8 | 8.6 | 6.3 | 5 |
Émissions
Bruit du système
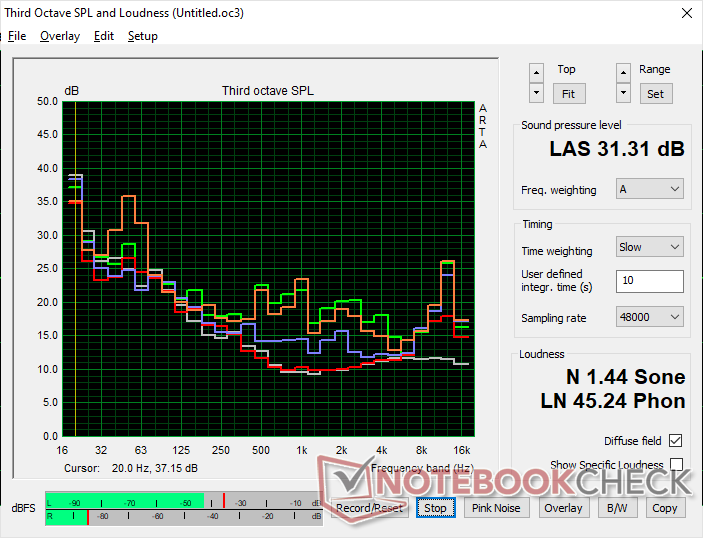
Le bruit du ventilateur est étonnamment silencieux pour être un point fort du S3. Nous n'avons pu atteindre qu'un maximum d'un peu plus de 31 dB(A) lors de l'exécution de charges exigeantes, contre 40 dB(A) ou plus sur des mini PC plus rapides comme le Beelink SEi12 ou le Beelink SER Pro.
Degré de la nuisance sonore
| Au repos |
| 24.5 / 24.5 / 24.5 dB(A) |
| Fortement sollicité |
| 27.1 / 31.3 dB(A) |
 | ||
30 dB silencieux 40 dB(A) audible 50 dB(A) bruyant |
||
min: | ||
| Trigkey S3 Vega 8, R5 3550H, Kingston NV1 SNVS/500GCN | Intel NUC Pro Chassis_i7_1265U Iris Xe G7 96EUs, i7-1265U, WDC PC SN720 SDAQNTW-512G | Intel NUC11TNKi5 Iris Xe G7 80EUs, i5-1135G7, Transcend M.2 SSD 430S TS512GMTS430S | Beelink SEi12 Core i5-1235U Iris Xe G7 80EUs, i5-1235U, Kingston NV1 SNVS/500GCN | Beelink SEi11 Pro Iris Xe G7 96EUs, i5-11320H, Kingston NV1 SNVS/500GCN | Beelink SER Pro Ryzen 5 5600H Vega 7, R5 5600H, Kingston NV1 SNVS/500GCN | |
|---|---|---|---|---|---|---|
| Noise | -36% | -36% | -13% | -9% | -10% | |
| arrêt / environnement * (dB) | 23.2 | 30.5 -31% | 24.8 -7% | 23.3 -0% | 22.8 2% | 22.8 2% |
| Idle Minimum * (dB) | 24.5 | 31.4 -28% | 35.6 -45% | 27.8 -13% | 24.7 -1% | 26.1 -7% |
| Idle Average * (dB) | 24.5 | 31.4 -28% | 35.6 -45% | 27.8 -13% | 24.7 -1% | 26.1 -7% |
| Idle Maximum * (dB) | 24.5 | 31.4 -28% | 35.6 -45% | 27.8 -13% | 25.3 -3% | 28.7 -17% |
| Load Average * (dB) | 27.1 | 43.8 -62% | 36.2 -34% | 32 -18% | 33.2 -23% | 32.3 -19% |
| Witcher 3 ultra * (dB) | 30.6 | 38 -24% | 34.1 -11% | 34.5 -13% | 32.8 -7% | |
| Load Maximum * (dB) | 31.3 | 44 -41% | 47.6 -52% | 39.2 -25% | 37.8 -21% | 36.4 -16% |
* ... Moindre est la valeur, meilleures sont les performances
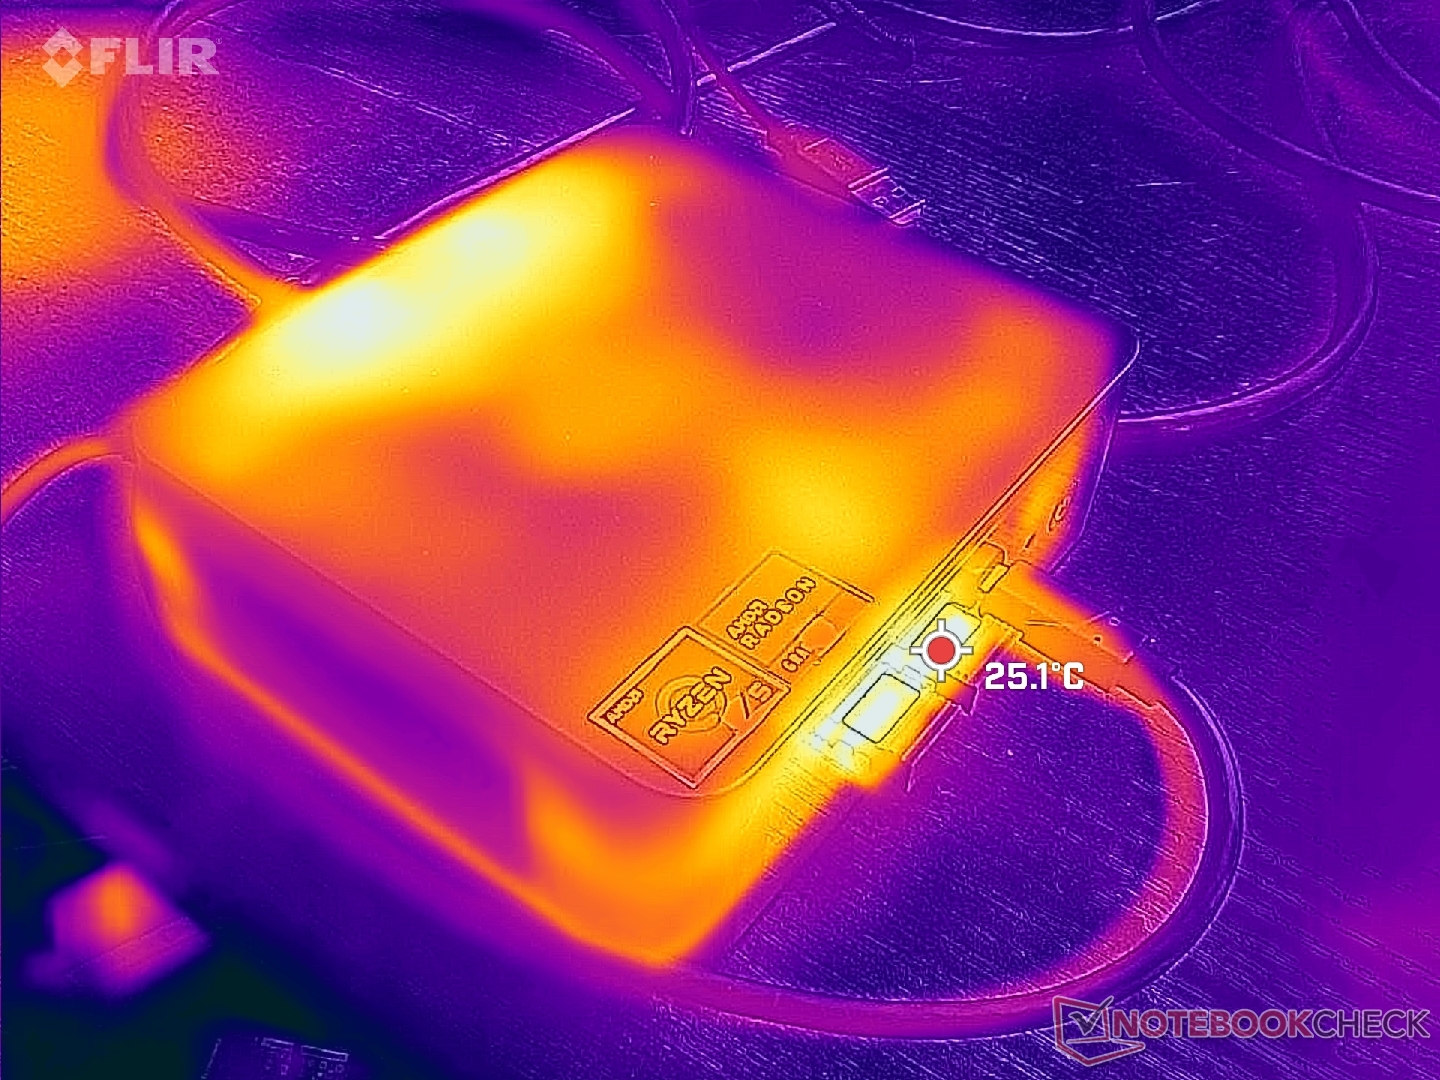
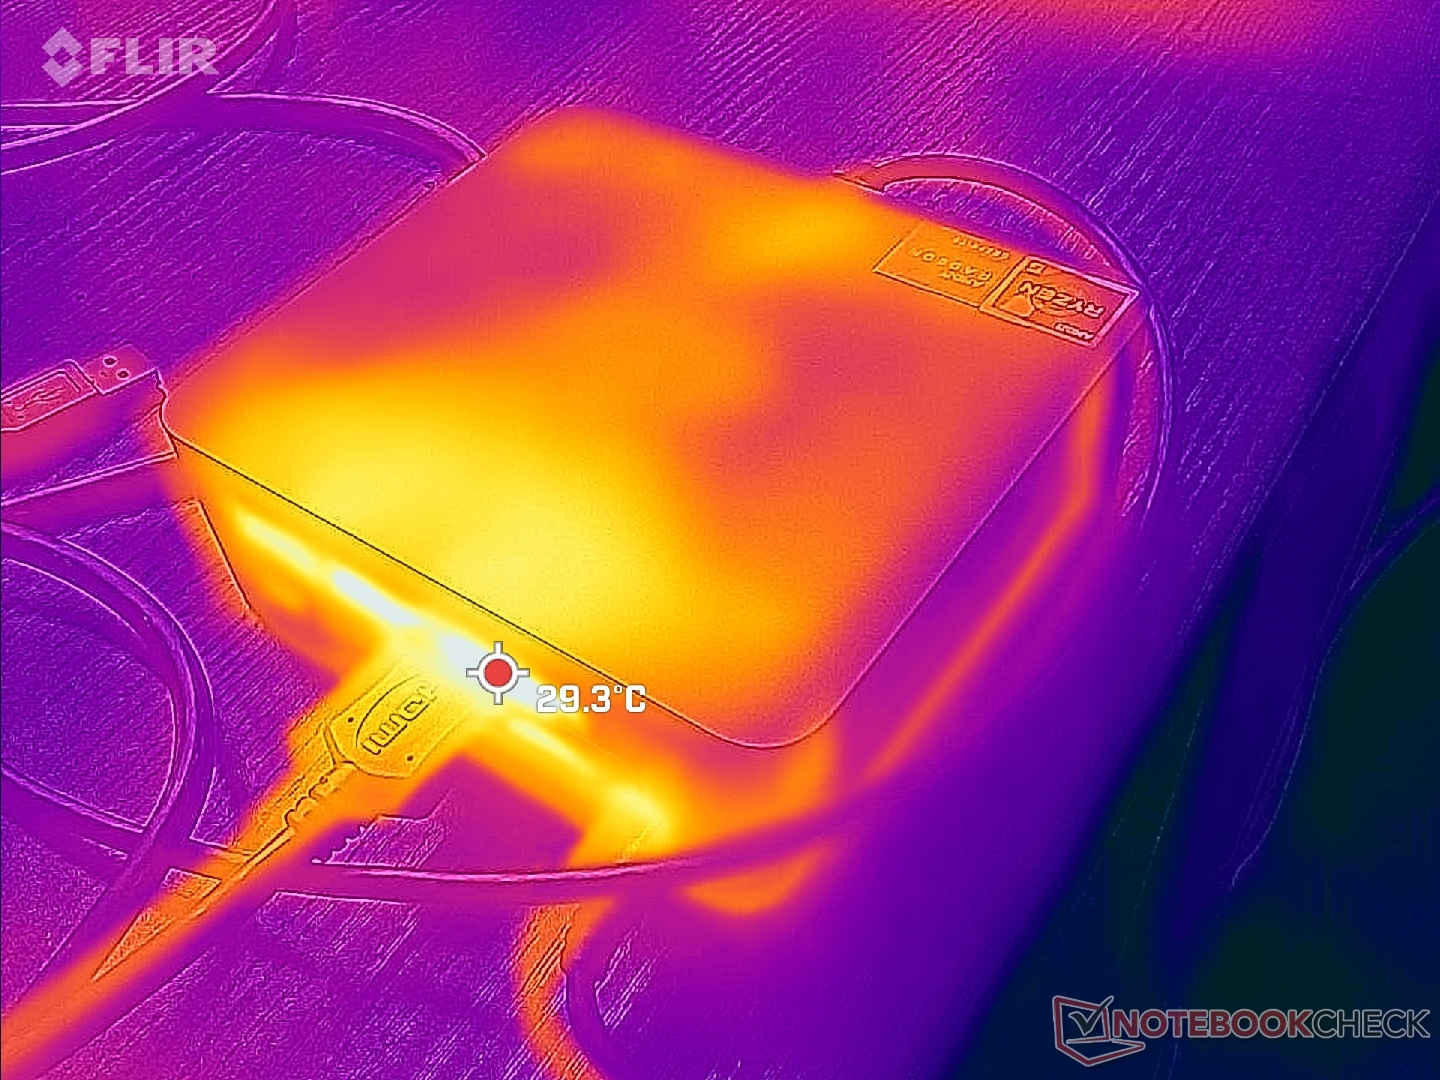
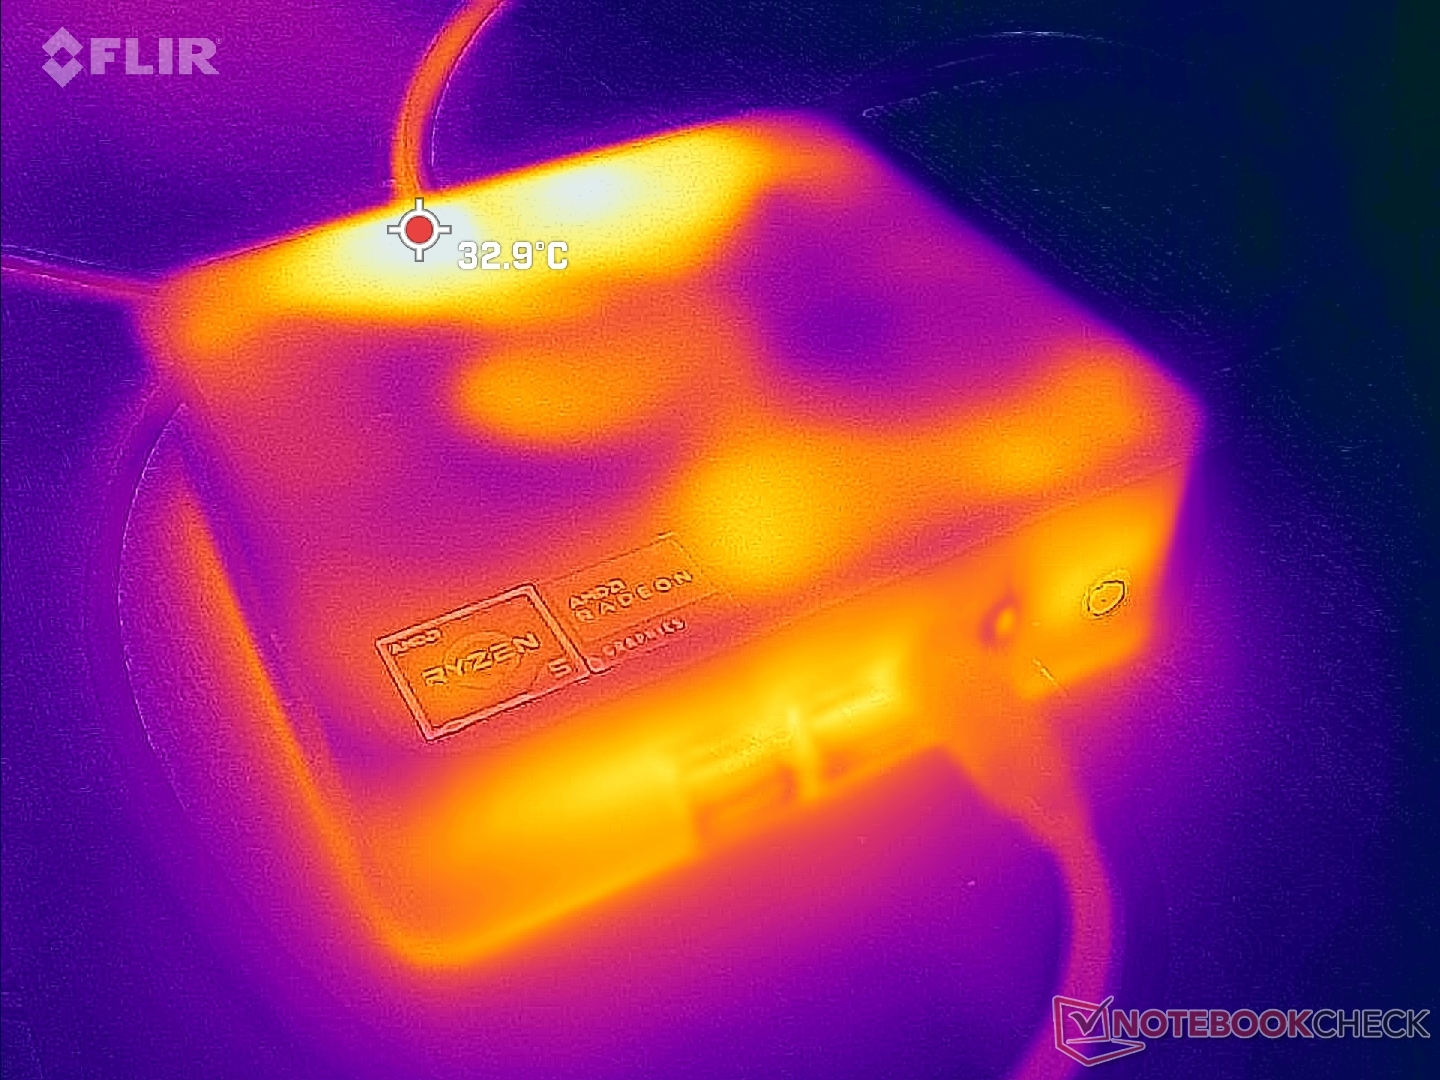
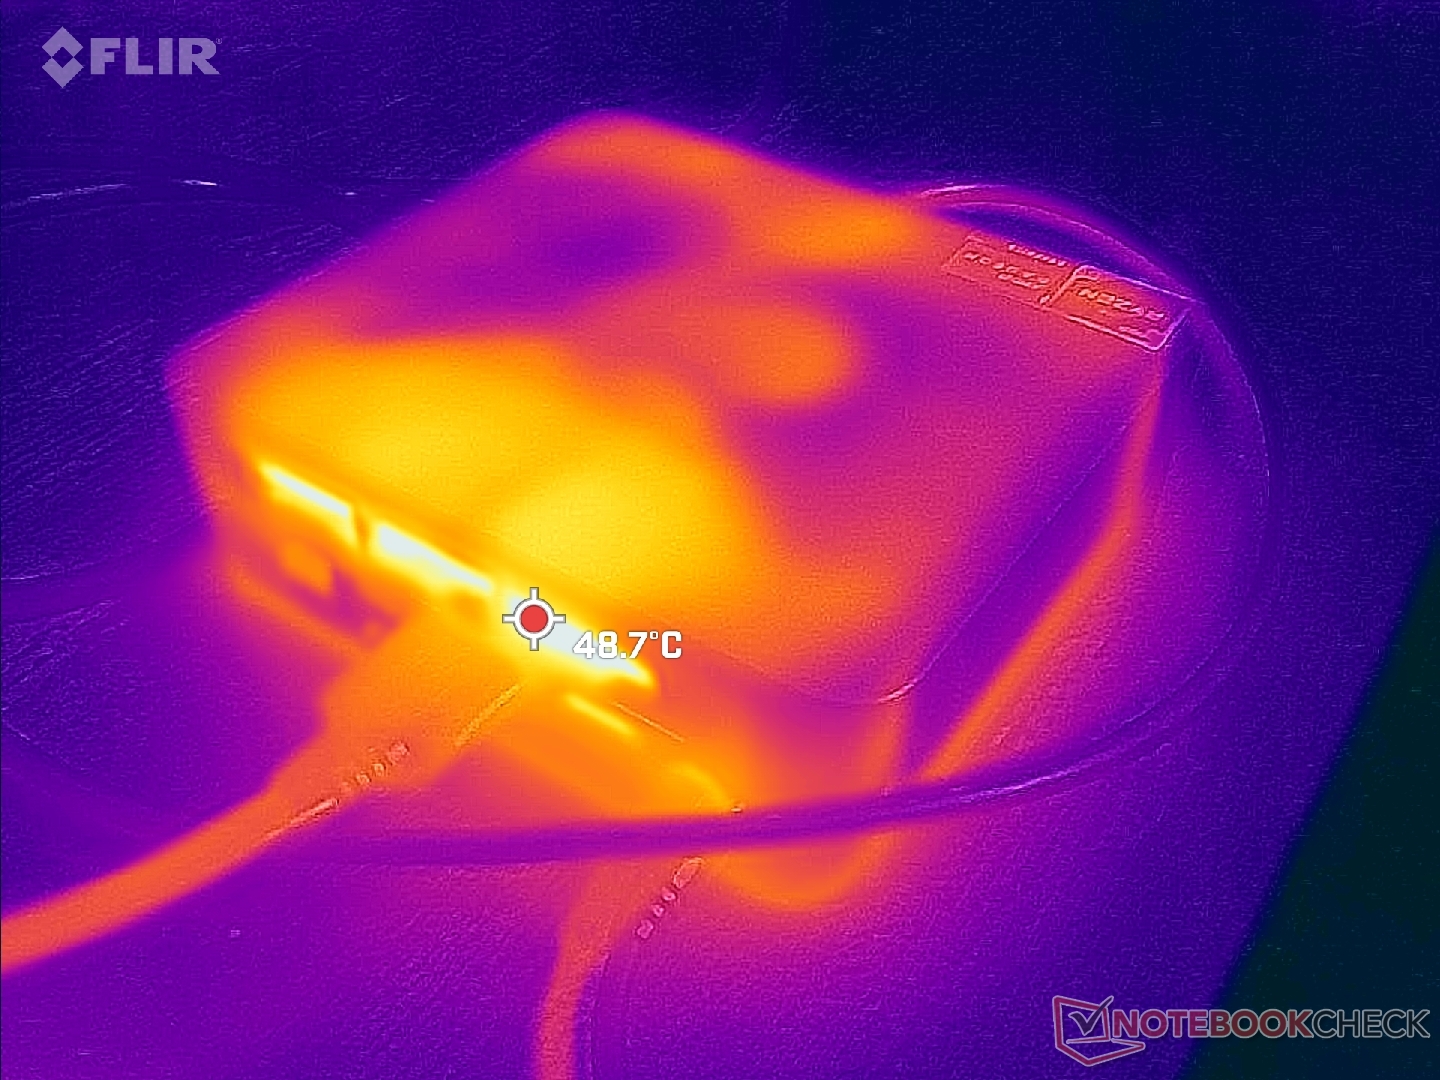
Température
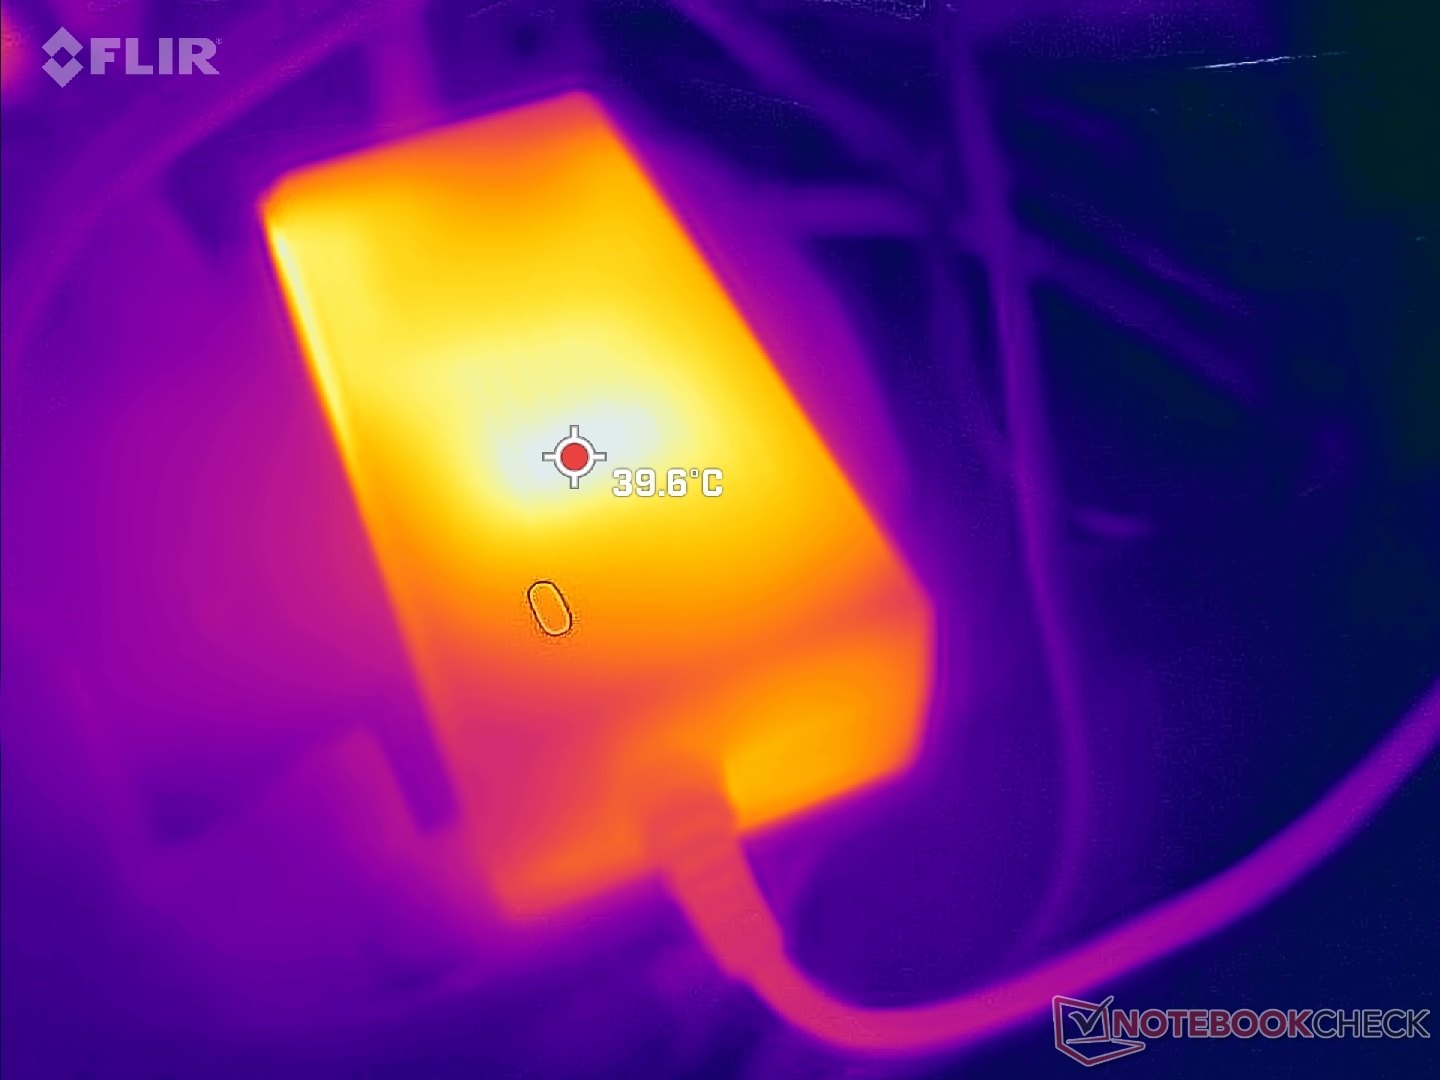
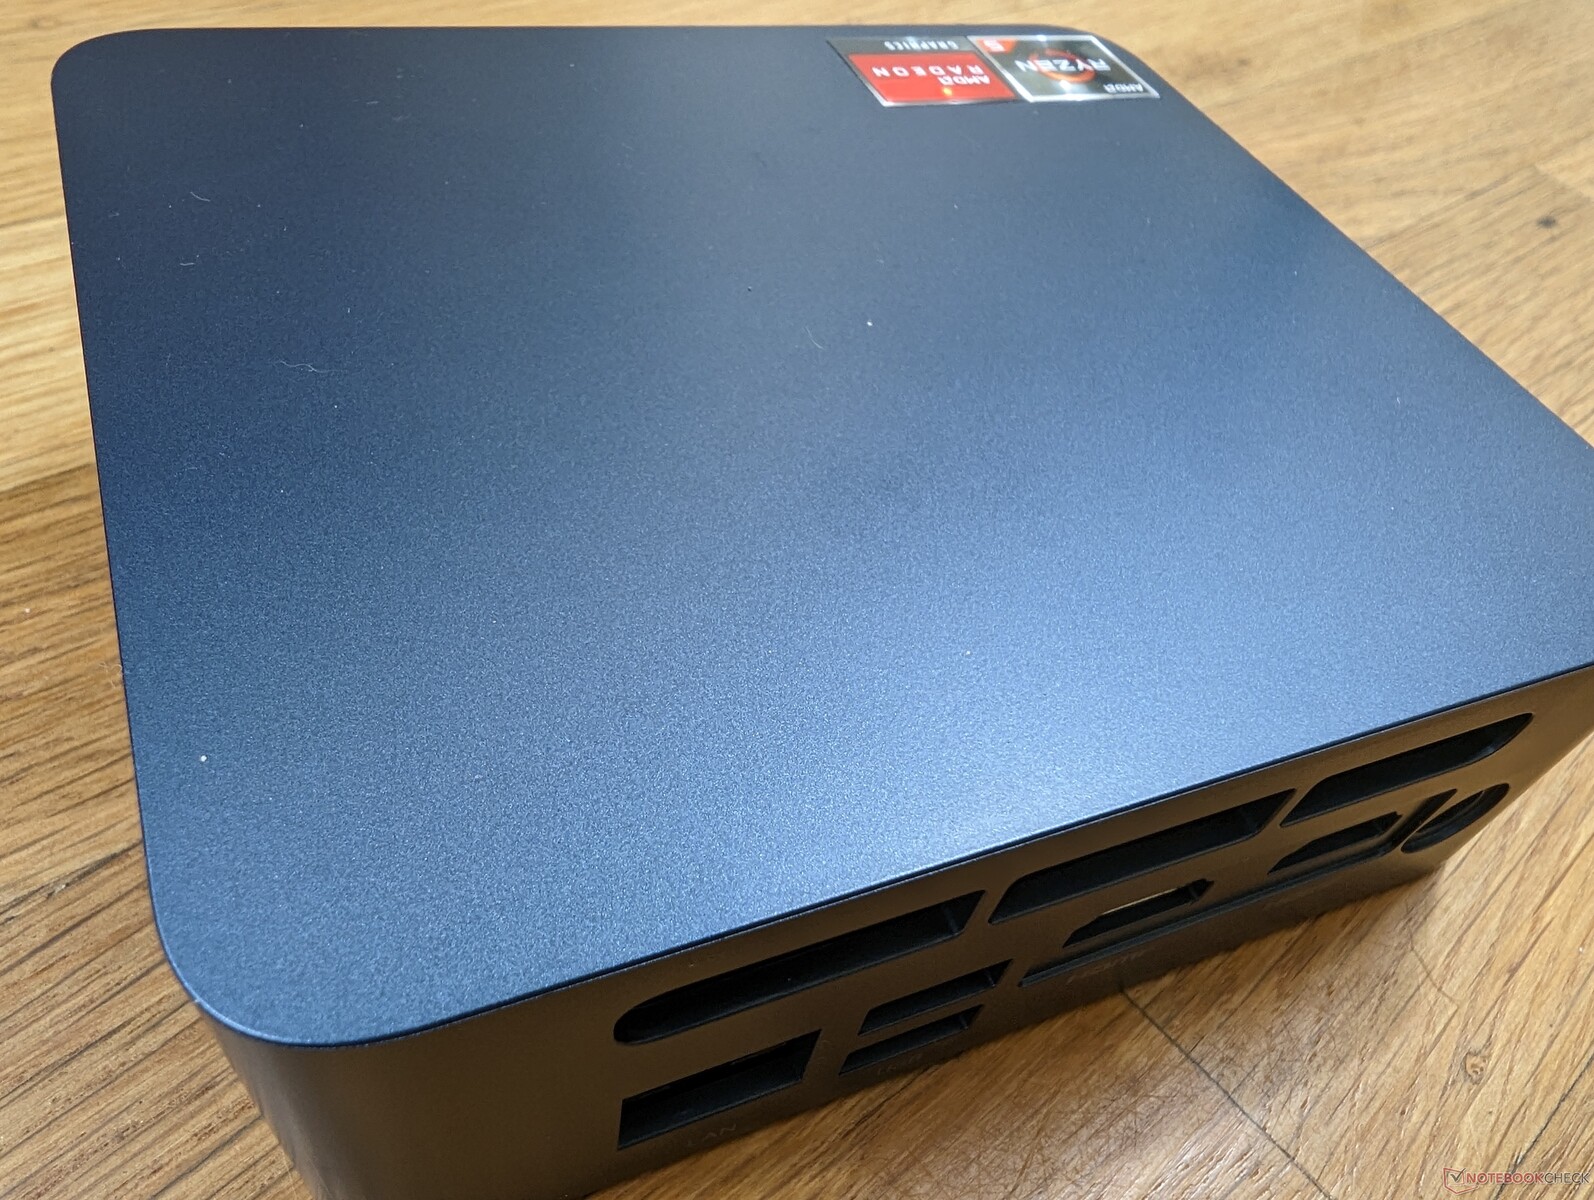
Les températures de surface sont les plus chaudes vers l'arrière où l'air chaud s'échappe. L'air frais entre par les côtés et non par le haut, contrairement au Beelink SEi12, ce qui signifie qu'il est possible de placer des objets comme du papier sur le dessus du mini-PC sans gêner le flux d'air.
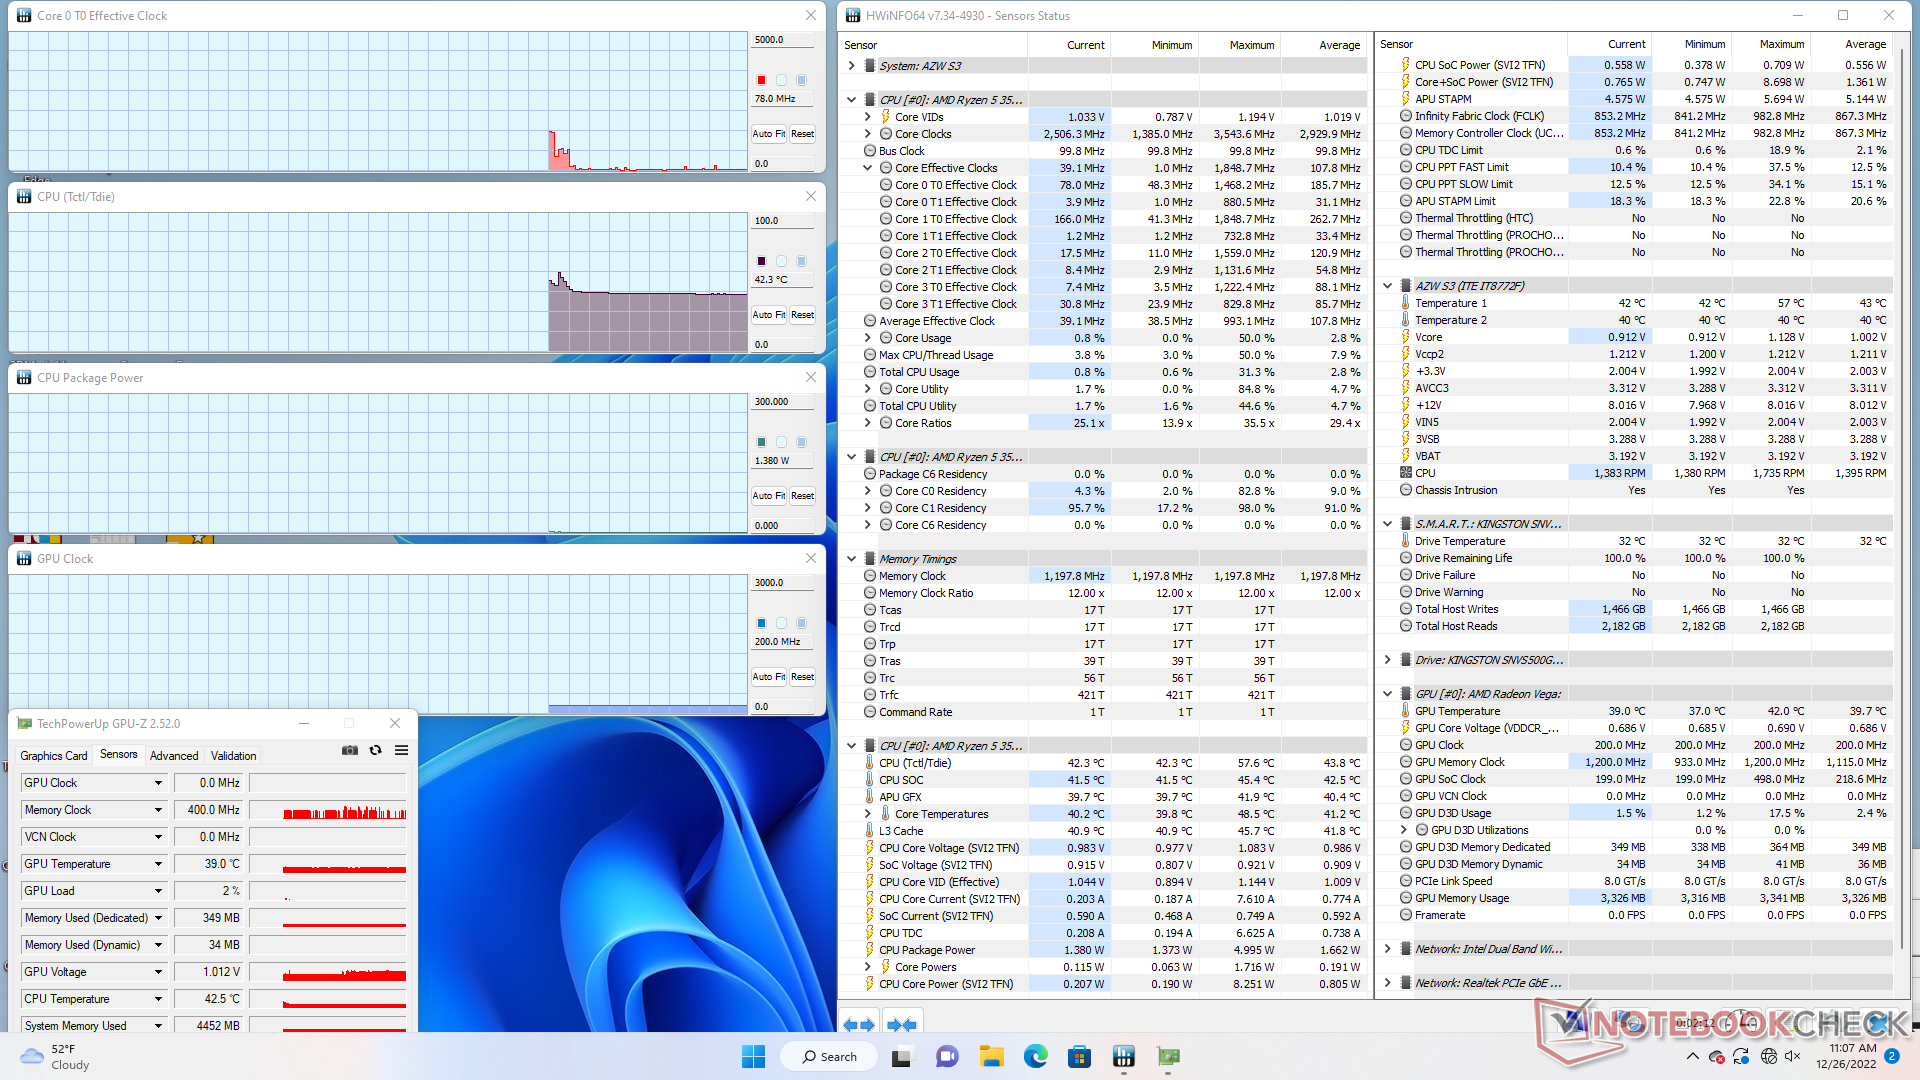
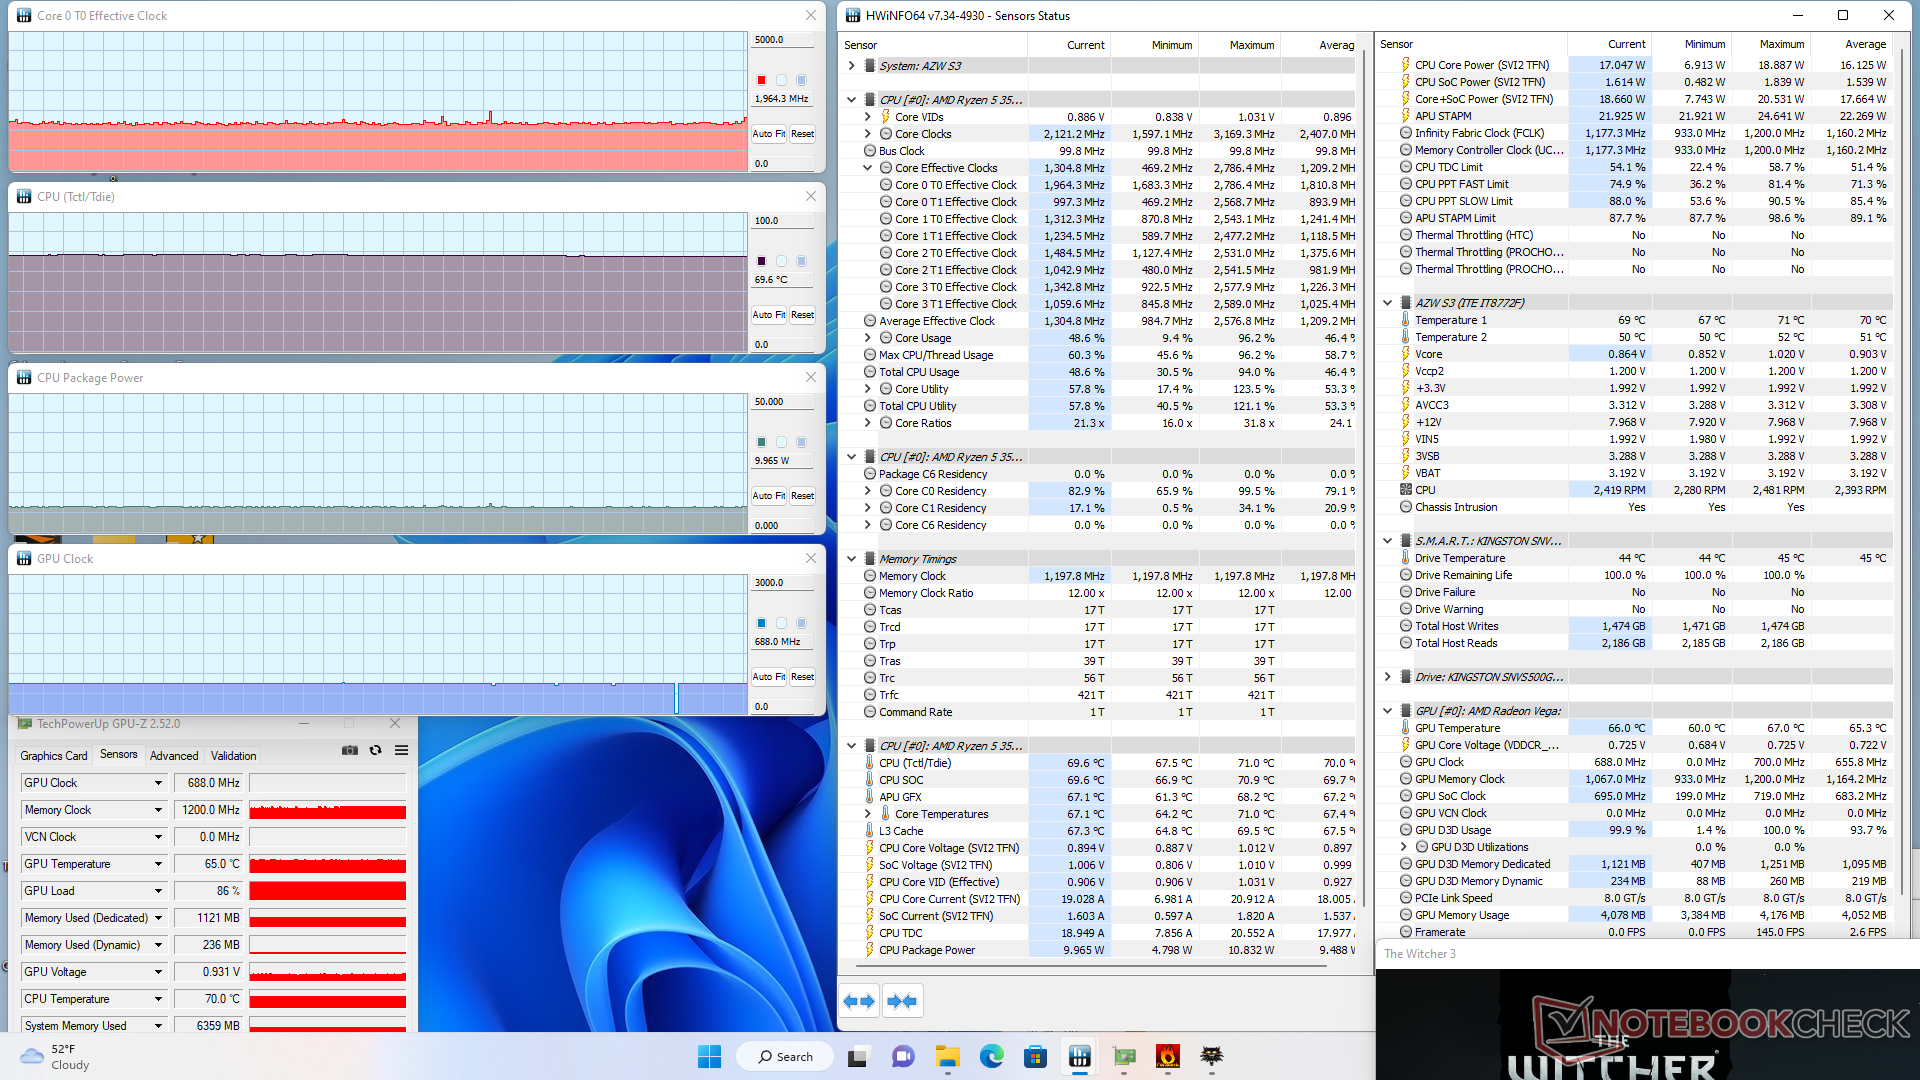
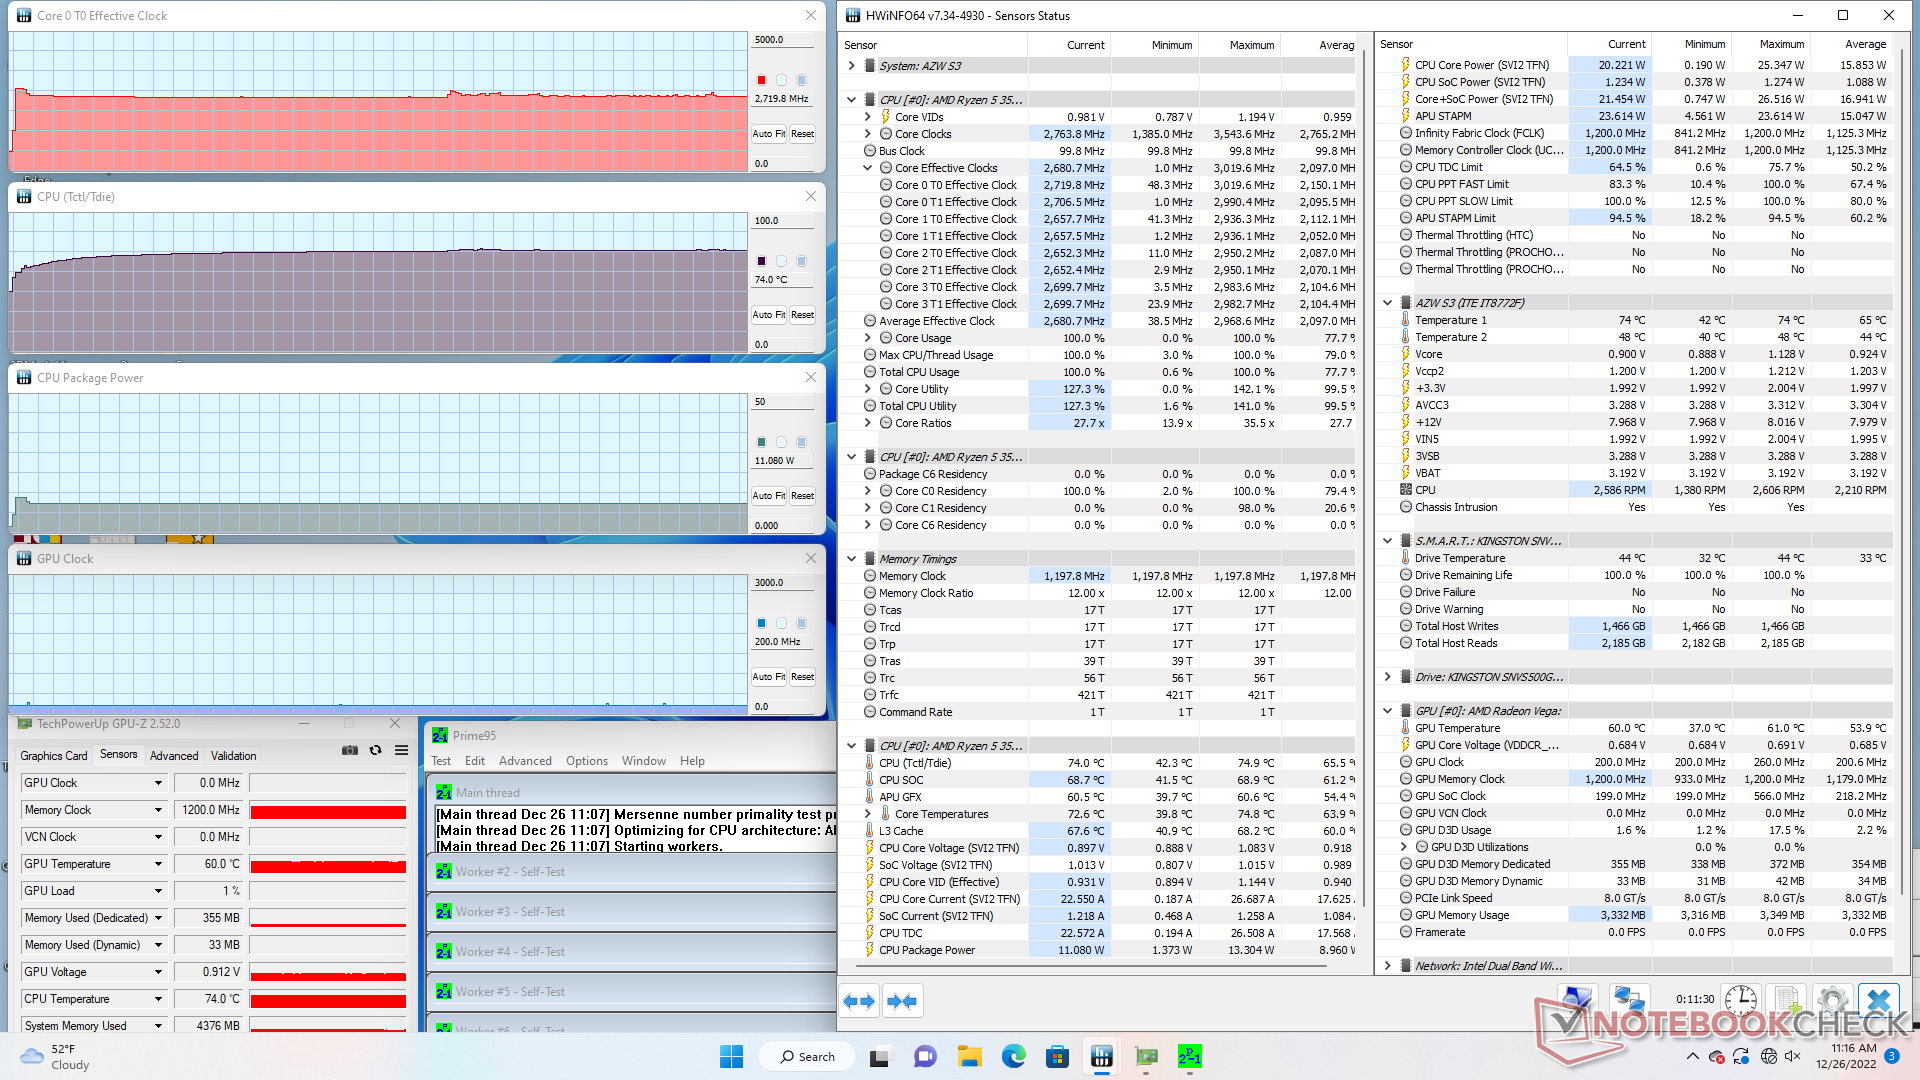
Test de stress
Lors de l'exécution de Prime95 pour solliciter le CPU, les fréquences d'horloge du CPU et la consommation d'énergie de la carte ont augmenté jusqu'à 3 GHz et 13 W, respectivement, avant de retomber quelques secondes plus tard et de se stabiliser à 2,7 GHz, 11 W et 74 C. La température du cœur s'est stabilisée à 70 C lors de l'exécution de Prime95, ce qui est comparable à la température de la carte Witcher 3 ce qui est comparable au Beelink SEi12 dans des conditions de test similaires, mais toujours plus chaude que sur leIntel NUC11TNKi5 Pro.
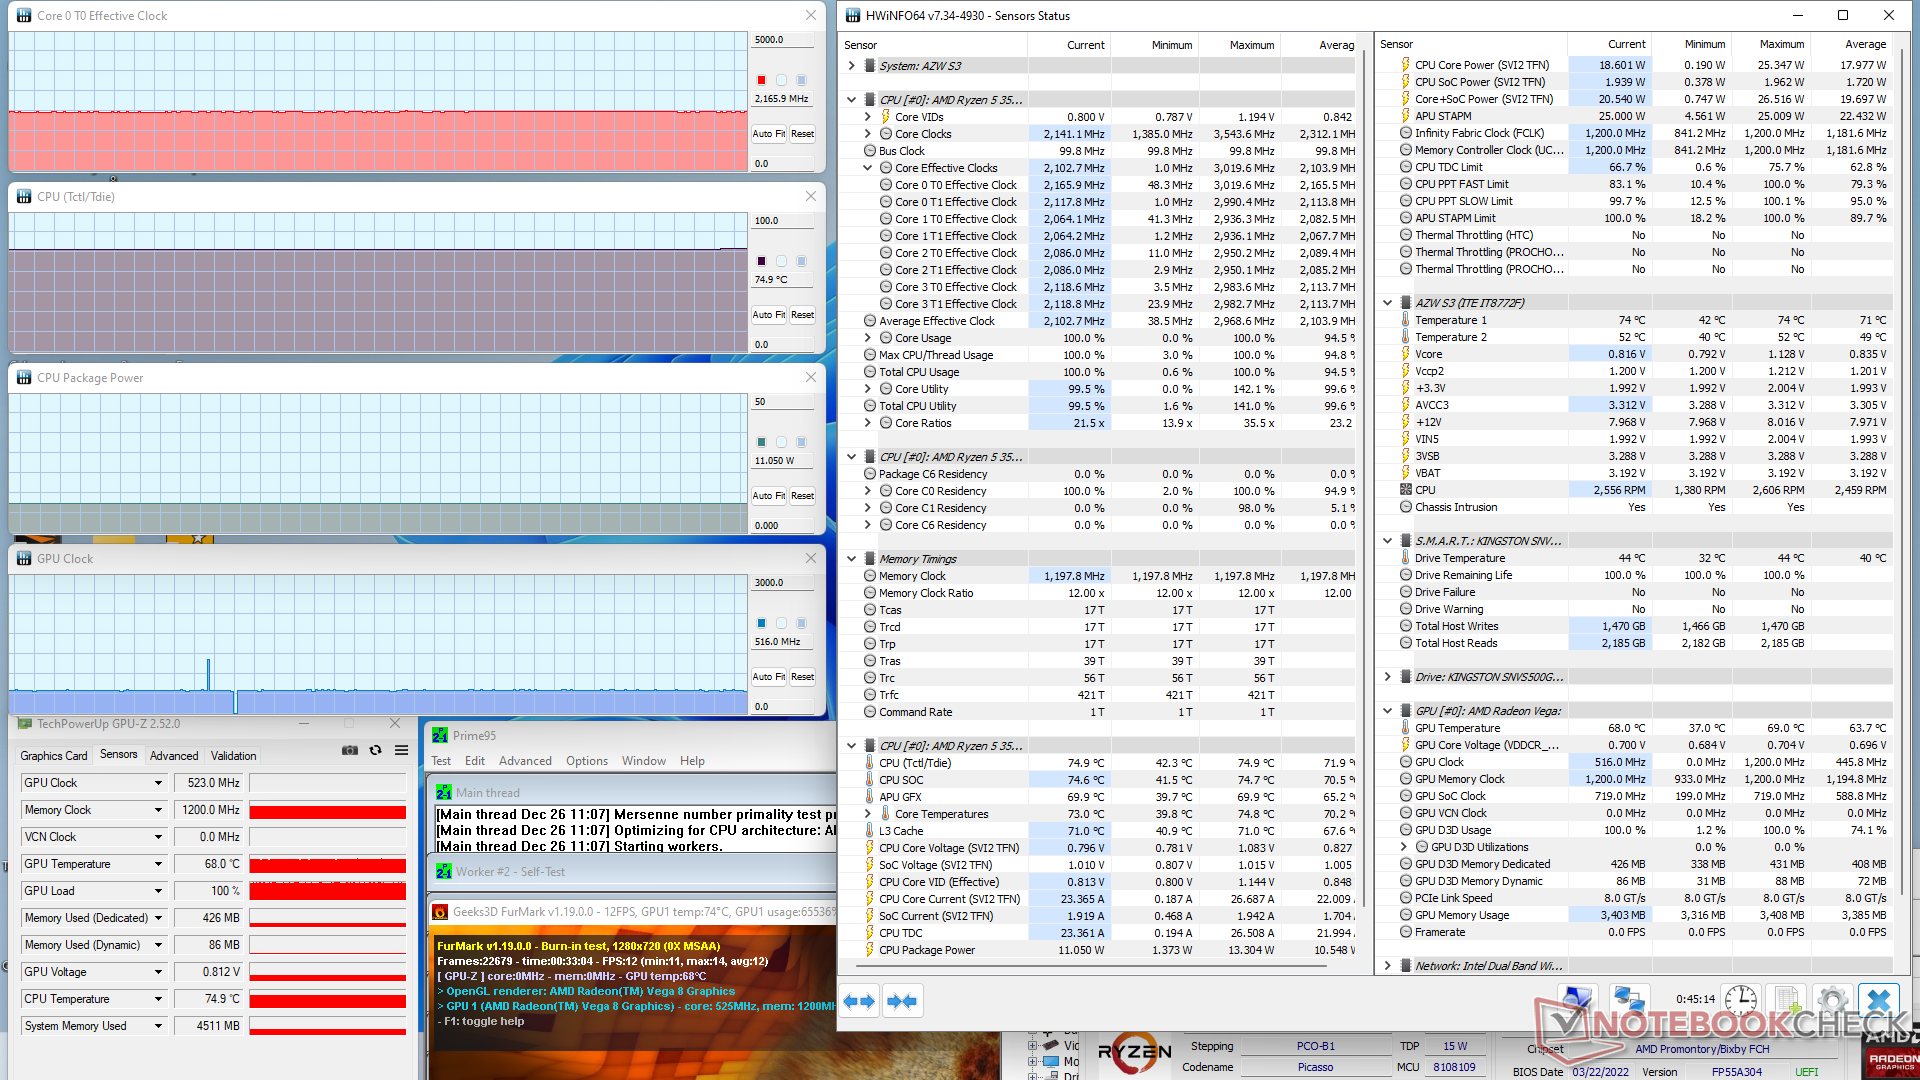
| Fréquence du CPU (GHz) | Fréquence du GPU (MHz) | Température moyenne du CPU (°C) | |
| Système au repos | -- | -- | 42 |
| Prime95 Stress | 2.7 | -- | 74 |
| Prime95 + FurMark Stress | 2.2 | 523 | 75 |
| Witcher 3 Stress | 2.0 | 688 | 70 |
Gestion de l'énergie
Consommation d'énergie
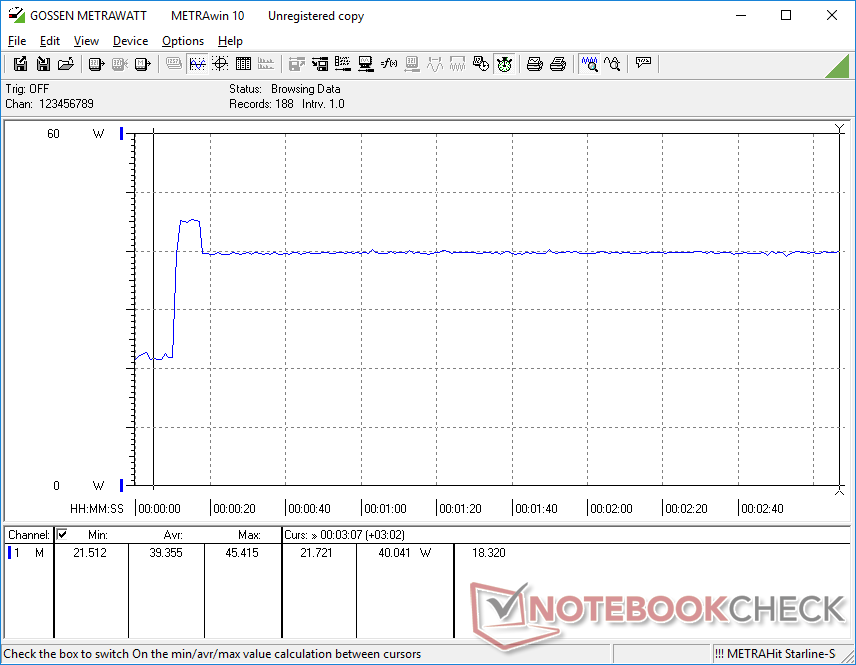
La consommation d'énergie au ralenti est relativement élevée, jusqu'à 22 W, alors qu'elle est deux fois moins élevée que celle des mini-PC équipés de la série U, comme le NUC11 d'Intel ou le SEi12 de Beelink, ce qui n'est pas surprenant étant donné que le S3 est équipé d'un processeur de la série H plus ancien. La situation est inversée lors de l'exécution de charges plus élevées comme les jeux, malgré les performances graphiques plus faibles du Radeon Vega 8 intégré. La faible performance globale par watt n'est pas surprenante étant donné que la série Zen+ a quelques années.
| Éteint/en veille | |
| Au repos | |
| Fortement sollicité |
|
Légende:
min: | |
| Trigkey S3 R5 3550H, Vega 8, Kingston NV1 SNVS/500GCN, , x, | GMK NucBox 2 i5-8259U, Iris Plus Graphics 655, Netac S930E8/256GPN, , x, | Intel NUC11TNKi5 i5-1135G7, Iris Xe G7 80EUs, Transcend M.2 SSD 430S TS512GMTS430S, , x, | Beelink SEi12 Core i5-1235U i5-1235U, Iris Xe G7 80EUs, Kingston NV1 SNVS/500GCN, , x, | Beelink SEi11 Pro i5-11320H, Iris Xe G7 96EUs, Kingston NV1 SNVS/500GCN, , x, | Beelink SER Pro Ryzen 5 5600H R5 5600H, Vega 7, Kingston NV1 SNVS/500GCN, , x, | |
|---|---|---|---|---|---|---|
| Power Consumption | 32% | 2% | -35% | 3% | 21% | |
| Idle Minimum * (Watt) | 11.3 | 6.1 46% | 11.5 -2% | 15.8 -40% | 9.8 13% | 5.4 52% |
| Idle Average * (Watt) | 21.8 | 6.8 69% | 12.4 43% | 16.8 23% | 10.3 53% | 8.2 62% |
| Idle Maximum * (Watt) | 22.2 | 7.3 67% | 12.9 42% | 17 23% | 10.5 53% | 8.3 63% |
| Load Average * (Watt) | 39.7 | 46.3 -17% | 40.7 -3% | 54.4 -37% | 54.2 -37% | 49.3 -24% |
| Witcher 3 ultra * (Watt) | 37.5 | 43.9 -17% | 50.7 -35% | 53.1 -42% | 46.1 -23% | |
| Load Maximum * (Watt) | 48.9 | 50.7 -4% | 73.5 -50% | 119.1 -144% | 59 -21% | 50.2 -3% |
* ... Moindre est la valeur, meilleures sont les performances
Power Consumption Witcher 3 / Stresstest
Power Consumption external Monitor
Points positifs
Points négatifs
Verdict - Plus rapide que les alternatives Celeron ou Atom
Lorsque l'on cherche des mini-PC dans la gamme des moins de 300 USD, il est courant de se contenter des processeurs suivants Intel Celeron ou Atom car ces processeurs sont plus lents et moins chers que les options Core habituelles. Les processeurs rapides ne sont pas vraiment nécessaires pour la plupart des HTPC de base, mais les processeurs Celeron et Atom sont connus pour être trop lents pour des efforts multi-tâches même minimes. C'est là que le Trigkey S3 entre en jeu, car son CPU Ryzen 5 3550H peut fournir cette performance supplémentaire sans avoir à augmenter les prix.
Le Trigkey S3 offre des performances similaires à celles du Core i3 pour le prix d'un mini PC Atom ou Celeron.
Le principal inconvénient est que le Ryzen 5 3550H est un processeur plus ancien et qu'il nécessite donc un peu plus d'énergie pour fonctionner dans de nombreuses situations que les dernières options de la série U. Même ainsi, le bruit du ventilateur n'est heureusement pas plus élevé que celui des autres processeurs. Même ainsi, le bruit du ventilateur n'est heureusement pas plus fort malgré la consommation d'énergie plus élevée.
Prix et disponibilité
Le Trigkey S3 est maintenant disponible sur Amazon au prix de 280 USD.
Price comparison

