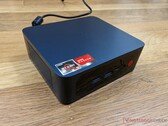
Test du Trigkey S3 : mini PC aux performances d'un Core i3 pour le prix d'un Celeron ou d'un Atom
AMD Ryzen 5 3550H | AMD Radeon RX Vega 8 (Ryzen 2000/3000) | 419 g

L'AMD Ryzen 5 3550H est un SoC mobile annoncé en janvier 2019. Il combine quatre curs Zen+ (8 threads) cadencés entre 2,1 et 3,7 Ghz, avec une puce graphique Radeon RX Vega 8 avec 8 unités de calcul (512 shaders) cadencée à 1 200 MHz. Par rapport au Ryzen 5 3500U similaire, le 3550H possède une enveloppe thermique plus élevée de 20 W, ce qui lui permet d'avoir de meilleures performances en cas de sollicitations continues. Le contrôleur mémoire double canal inclus prend en charge la mémoire DDR4-2400. Les fonctionnalités des APU Picasso étant les mêmes que celles des Raven Ridge précédents, nous renvoyons à notre article sur le lancement de Raven Ridge.
Les SoC Picasso utilisent la microarchitecture Zen+ avec quelques améliorations qui peuvent conduire à une hausse de 3 % des performances par horloge. De plus, le procédé de fabrication en 12 nm permet une fréquence plus élevée avec une même consommation.
AMD affirme que les APU Picasso sont d'environ 8 % plus performants que leurs prédécesseurs. Avec l'enveloppe thermique de 35 W, le 3550H devrait faire un processeur du milieu de gamme efficace pour les portables, et même les portables de jeu. Les performances devraient se situer entre celles du Ryzen 5 2500U et celles du Ryzen 7 2700U.
| Nom de code | Picasso-U (Zen+) | ||||||||||||||||||||||||
| Gamme | AMD Picasso (Ryzen 3000 APU) | ||||||||||||||||||||||||
Gamme: Picasso (Ryzen 3000 APU) Picasso-U (Zen+)
| |||||||||||||||||||||||||
| Fréquence | 2100 - 3700 MHz | ||||||||||||||||||||||||
| Cache de Niveau 1 (L1) | 384 KB | ||||||||||||||||||||||||
| Cache de Niveau 2 (L2) | 2 MB | ||||||||||||||||||||||||
| Cache de Niveau 3 (L3) | 4 MB | ||||||||||||||||||||||||
| Nombres de cœurs/threads simultanés supportés | 4 / 8 | ||||||||||||||||||||||||
| Consommation énergétique maximale (TDP) | 35 Watt(s) | ||||||||||||||||||||||||
| Nombre de transistors | 4500 Million(s) | ||||||||||||||||||||||||
| Lithographie (procédé de fabrication) | 12 nm | ||||||||||||||||||||||||
| Température maximale | 105 °C | ||||||||||||||||||||||||
| Socket | FP5 | ||||||||||||||||||||||||
| Fonctionnalités | DDR4-2400 RAM, PCIe 3, MMX (+), SSE, SSE2, SSE3, SSSE3, SSE4.1, SSE4.2, SSE4A, AES, AVX, AVX2, FMA3, SHA | ||||||||||||||||||||||||
| Carte graphique | AMD Radeon RX Vega 8 (Ryzen 2000/3000) ( - 1200 MHz) | ||||||||||||||||||||||||
| 64 Bit | Prend en charge les instructions 64 Bit | ||||||||||||||||||||||||
| Architecture | x86 | ||||||||||||||||||||||||
| Date de présentation | 01/06/2019 | ||||||||||||||||||||||||
| Lien redirigeant vers une page externe du produit | www.amd.com | ||||||||||||||||||||||||


Asus TUF FX505DY: AMD Radeon RX 560X (Laptop), 15.60", 2.2 kg
Critique » Critique complète du PC portable de jeu Asus TUF FX505DY (Ryzen 5 3550H, Radeon RX 560X, FHD)
Acer Nitro 5 AN515-43-R6BW: NVIDIA GeForce GTX 1650 Mobile, 15.60", 2.3 kg
Autres tests » Acer Nitro 5 AN515-43-R6BW
MSI Alpha 15 A3DC-250XES: AMD Radeon RX 5300M, 15.60"
Autres tests » MSI Alpha 15 A3DC-250XES
Acer Aspire 7 A715-41G-R8MJ: NVIDIA GeForce GTX 1650 Mobile, 15.60", 2.2 kg
Autres tests » Acer Aspire 7 A715-41G-R8MJ
Acer Aspire 7 A715-41G-R5LR: NVIDIA GeForce GTX 1650 Mobile, 15.60", 2.4 kg
Autres tests » Acer Aspire 7 A715-41G-R5LR
Lenovo IdeaPad S540-13API: AMD Radeon RX Vega 8 (Ryzen 2000/3000), 13.30", 1.3 kg
Autres tests » Lenovo IdeaPad S540-13API
Honor MagicBook Pro HLY-19R: AMD Radeon RX Vega 8 (Ryzen 2000/3000), 16.10", 1.7 kg
Autres tests » Honor MagicBook Pro HLY-19R
Asus TUF FX505DT-BQ051: NVIDIA GeForce GTX 1650 Mobile, 15.60", 2.2 kg
Autres tests » Asus TUF FX505DT-BQ051
HP Pavilion Gaming 15-ec0005ns: NVIDIA GeForce GTX 1050 Mobile, 15.60", 2.3 kg
Autres tests » HP Pavilion Gaming 15-ec0005ns
Acer Nitro 5 AN515-43-R84P: NVIDIA GeForce GTX 1650 Mobile, 15.60"
Autres tests » Acer Nitro 5 AN515-43-R84P
HP Pavilion Gaming 15-ec0006ns: NVIDIA GeForce GTX 1050 Mobile, 15.60", 2.3 kg
Autres tests » HP Pavilion Gaming 15-ec0006ns
HP Pavilion Gaming 15-ec0009ns: NVIDIA GeForce GTX 1050 Mobile, 15.60", 2 kg
Autres tests » HP Pavilion Gaming 15-ec0009ns
Acer Aspire Nitro 5 AN515-43-R4N0: AMD Radeon RX 560X (Laptop), 15.60", 2.3 kg
Autres tests » Acer Aspire Nitro 5 AN515-43-R4N0
Acer Nitro 5 AN515-43-R1BL: AMD Radeon RX 560X (Laptop), 15.60", 2.7 kg
Autres tests » Acer Nitro 5 AN515-43-R1BL
Asus TUF FX505DY-BQ024: AMD Radeon RX 560X (Laptop), 15.60", 2.2 kg
Autres tests » Asus TUF FX505DY-BQ024
HP Pavilion Gaming 15-ec0010nr: NVIDIA GeForce GTX 1050 Mobile, 15.60", 2.3 kg
Autres tests » HP Pavilion Gaming 15-ec0010nr
Asus TUF FX505DD-BQ114: NVIDIA GeForce GTX 1050 Max-Q, 15.60", 2.2 kg
Autres tests » Asus TUF FX505DD-BQ114
Asus TUF FX705DY-AU017T: AMD Radeon RX 560X (Laptop), 17.30", 2.7 kg
Autres tests » Asus TUF FX705DY-AU017T
Asus TUF FX505DY-AL007T: AMD Radeon RX 560X (Laptop), 15.60", 2.2 kg
Autres tests » Asus TUF FX505DY-AL007T
Asus TUF FX705DY-AU072 : AMD Radeon RX 560X (Laptop), 17.30", 2.7 kg
Autres tests » Asus TUF FX705DY-AU072
Asus TUF FX505DY-AL016T: AMD Radeon RX 560X (Laptop), 15.60", 2.2 kg
Autres tests » Asus TUF FX505DY-AL016T
Asus TUF FX505DY: AMD Radeon RX 560X (Laptop), 15.60", 2.2 kg
Autres tests » Asus TUF FX505DY
» Comparaison des processeurs pour ordinateur portable
Comparaison de tout les processeurs mobiles
» Processeurs mobiles - liste des benchmarks
Liste des benchmarks de l'intégralité des processeurs pour portables
Top 10
» Le Top 10 des PC portables multimédia
» Le Top 10 des PC portables de jeu
» Le Top 10 des PC portables de jeu légers
» Le Top 10 des ordinateurs portables bureautiques
» Le Top 10 des PC portables bureautiques premium/professionnels
» Le Top 10 des Stations de travail mobiles
» Le Top 10 des Ultraportables
» Le Top 10 des Ultrabooks
» Le Top 10 des Convertibles
» Le Top 10 des Tablettes
» Le Top 10 des Tablettes Windows
» Le Top 10 des Smartphones
» Le Top 10 des PC Portables á moins de 300 euros
» Le Top 10 des PC Portables á moins de 500 euros
» Le Top 25 des meilleurs écrans d'ordinateurs