
Verdict : Un pas en avant, deux pas en arrière
L'ancien ThinkPad P16 était plus grand et plus lourd que ses concurrents. Le nouveau modèle, le Lenovo ThinkPad P16 Gen 3, semble toutefois être une surcorrection : Il est beaucoup plus mobile, mais fait des sacrifices en termes de performances, avec notamment le TGP de 105 W du GPU et le chargeur de 180 W. Ce n'est pas quelque chose que nous attendons de la part de ce ThinkPad. Ce n'est pas quelque chose que nous attendons de cette ligne de produits dont l'objectif principal est la performance.
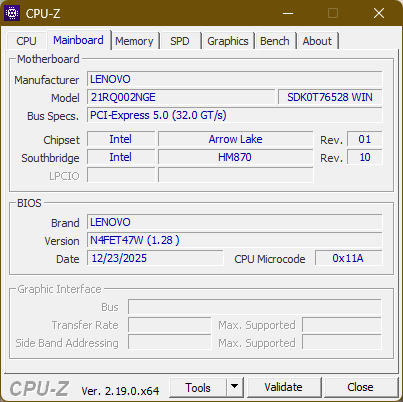
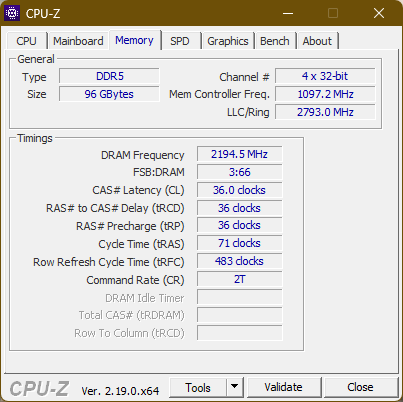
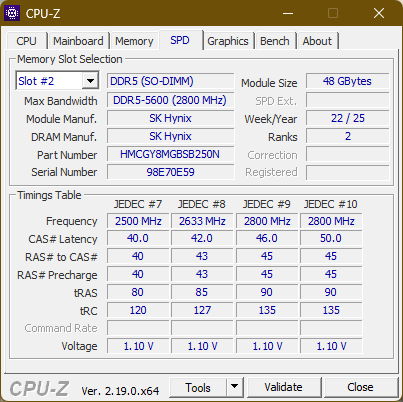
Les performances globales restent élevées et le ThinkPad P16 G3 possède de nombreuses qualités qui en font un bon outil de travail. L'extensibilité est particulièrement remarquable, puisqu'il est possible d'ajouter jusqu'à 192 Go de RAM et trois disques durs de 2280 Go à cet ordinateur portable. Pour la CAO ou l'utilisation locale de l'IA, c'est un excellent ordinateur portable.
Prix et disponibilité
Sur le site Lenovo.com, le Lenovo ThinkPad P16 Gen 3 est proposé à partir de 3 500 dollars.
Table des matières
Lenovo appelle ses stations de travail mobiles la série ThinkPad P, P signifiant puissance ou performance. Notre modèle d'essai, le Lenovo ThinkPad P16 Gen 3, est le plus représentatif de cette série. Il privilégie les performances par rapport à d'autres aspects, comme la mobilité. Il s'agit de l'ordinateur portable ThinkPad le plus lourd, le plus épais, mais aussi le plus puissant de la gamme, avec le plus grand nombre d'options de configuration et de possibilités d'évolution. Si vous achetez un P16 Gen 3, c'est que vous avez besoin de cette puissance et que vous avez beaucoup d'argent. Qu'il s'agisse de CAO ou d'IA locale, ou même d'un serveur portable, le ThinkPad P16 est le modèle qui est censé le supporter.
Spécifications : Core Ultra 9 & RTX Pro 3000 Blackwell
Boîtier : Un nouveau départ pour le ThinkPad P16
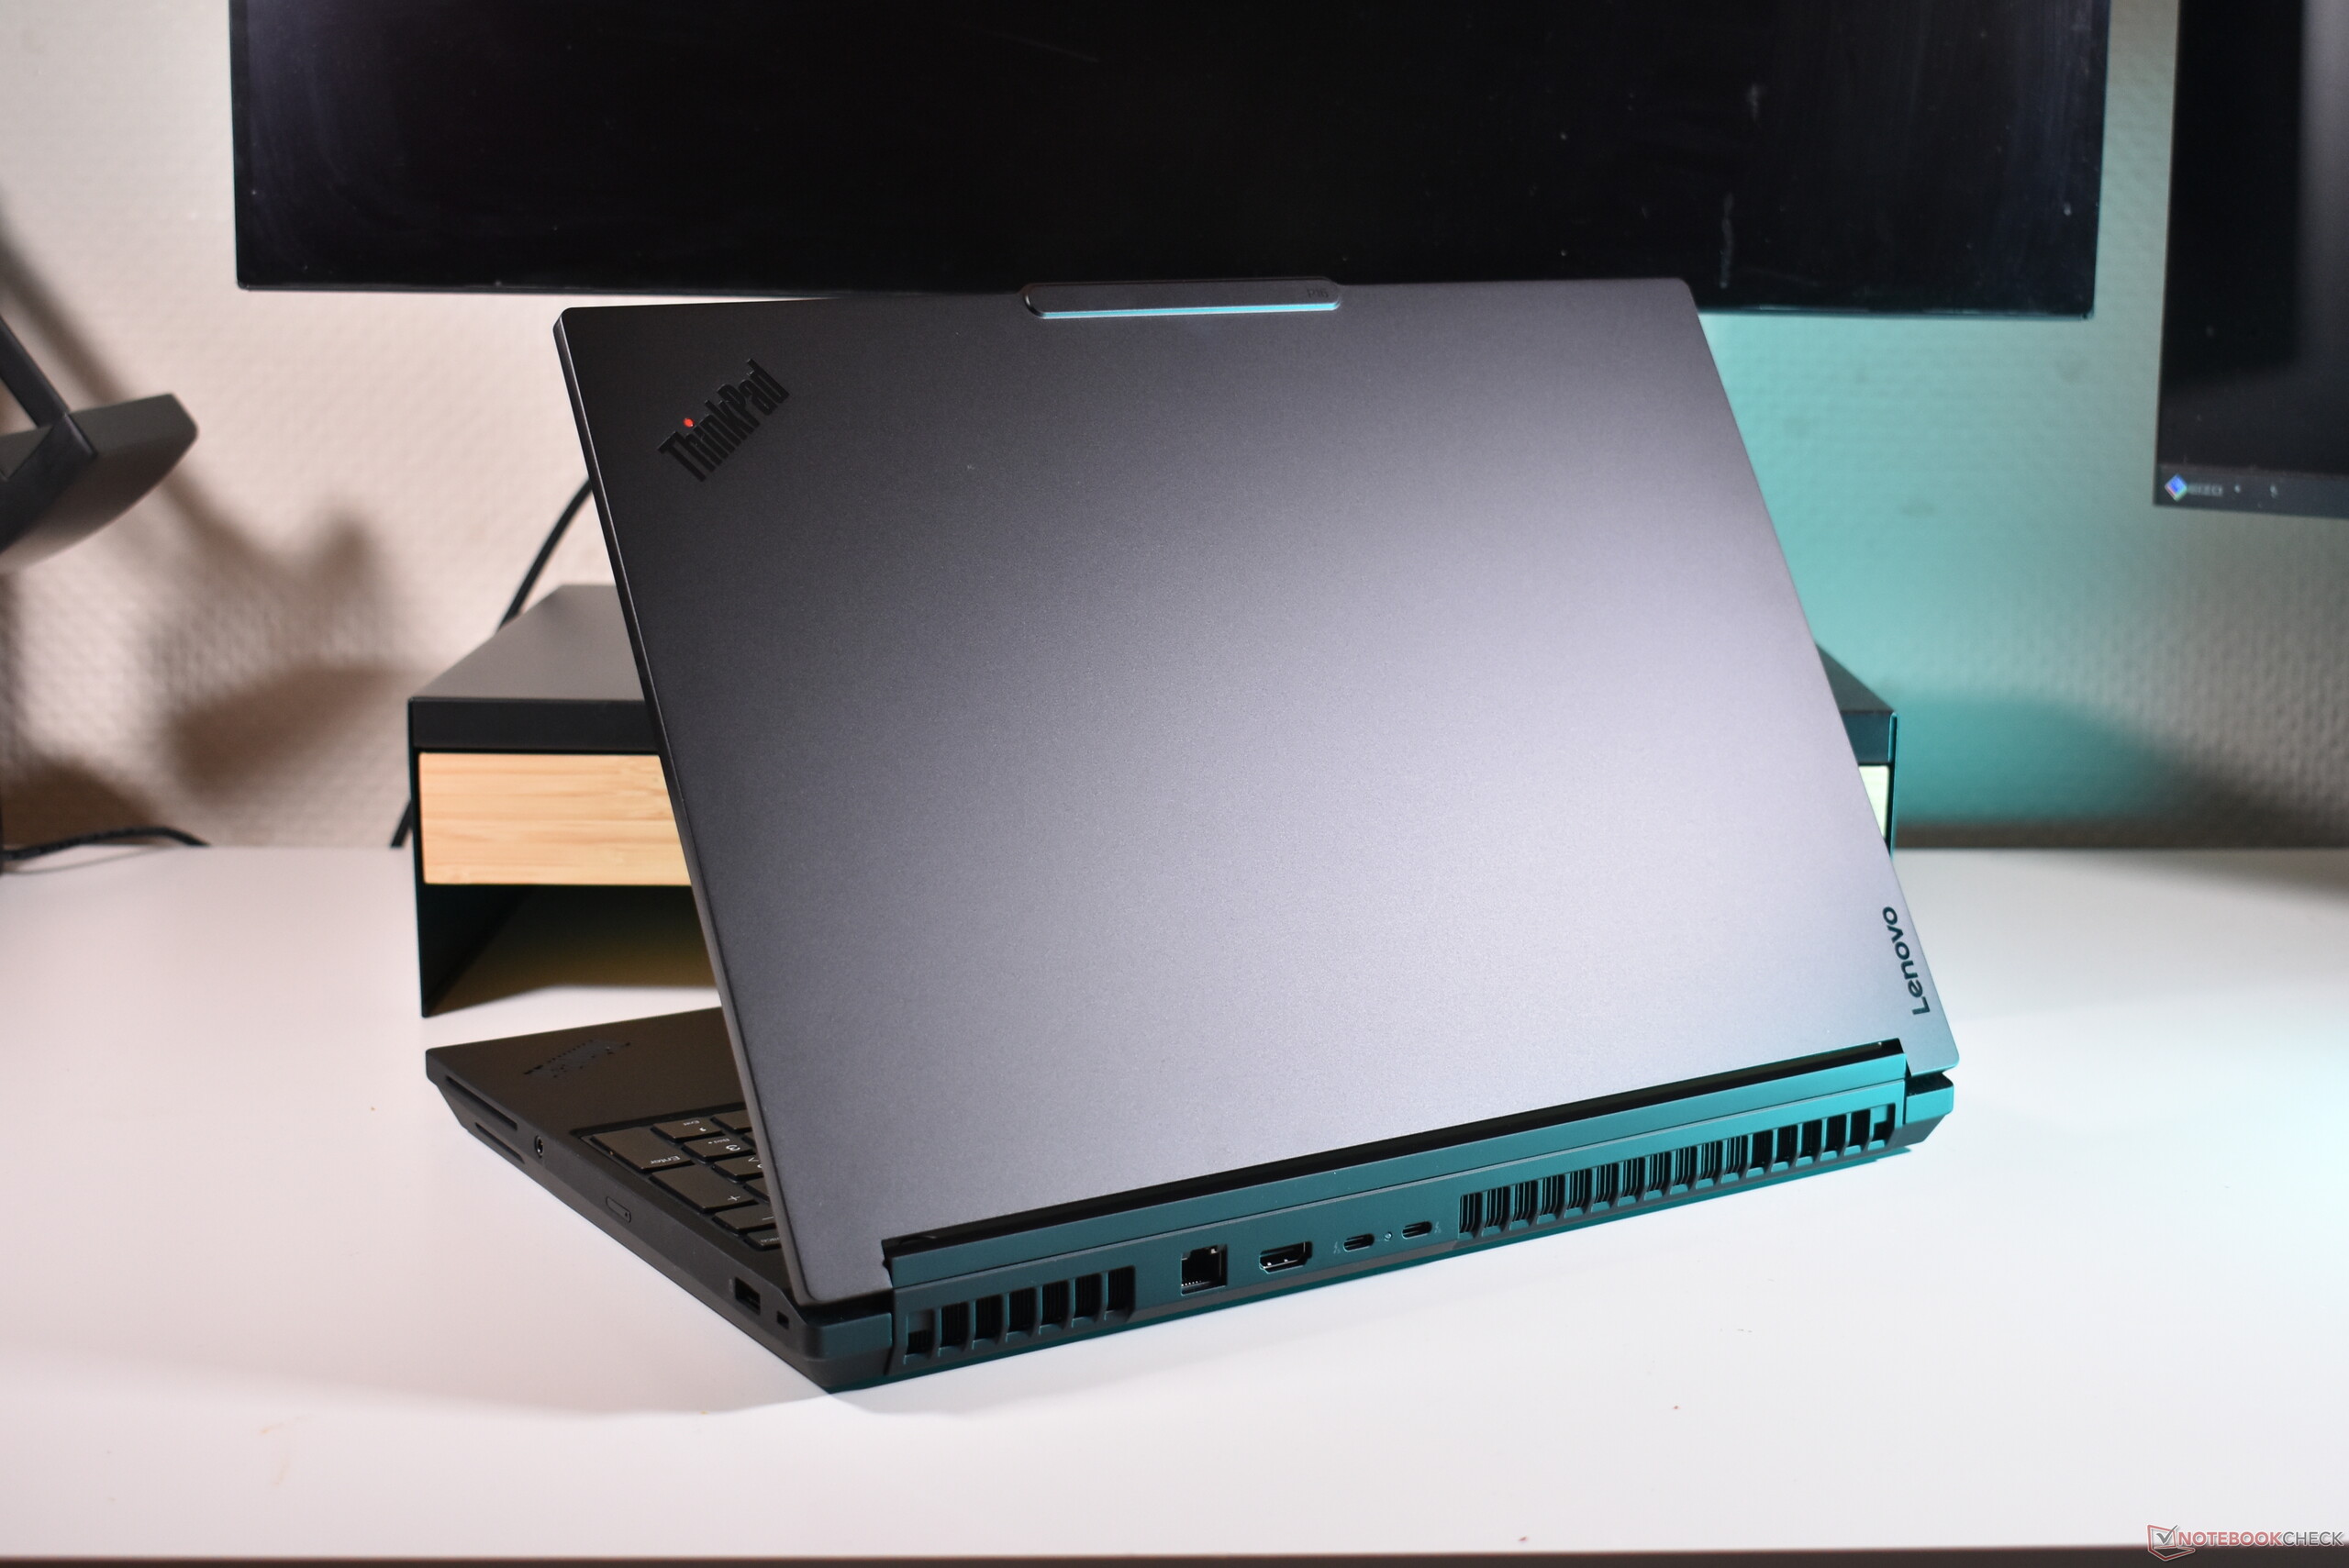
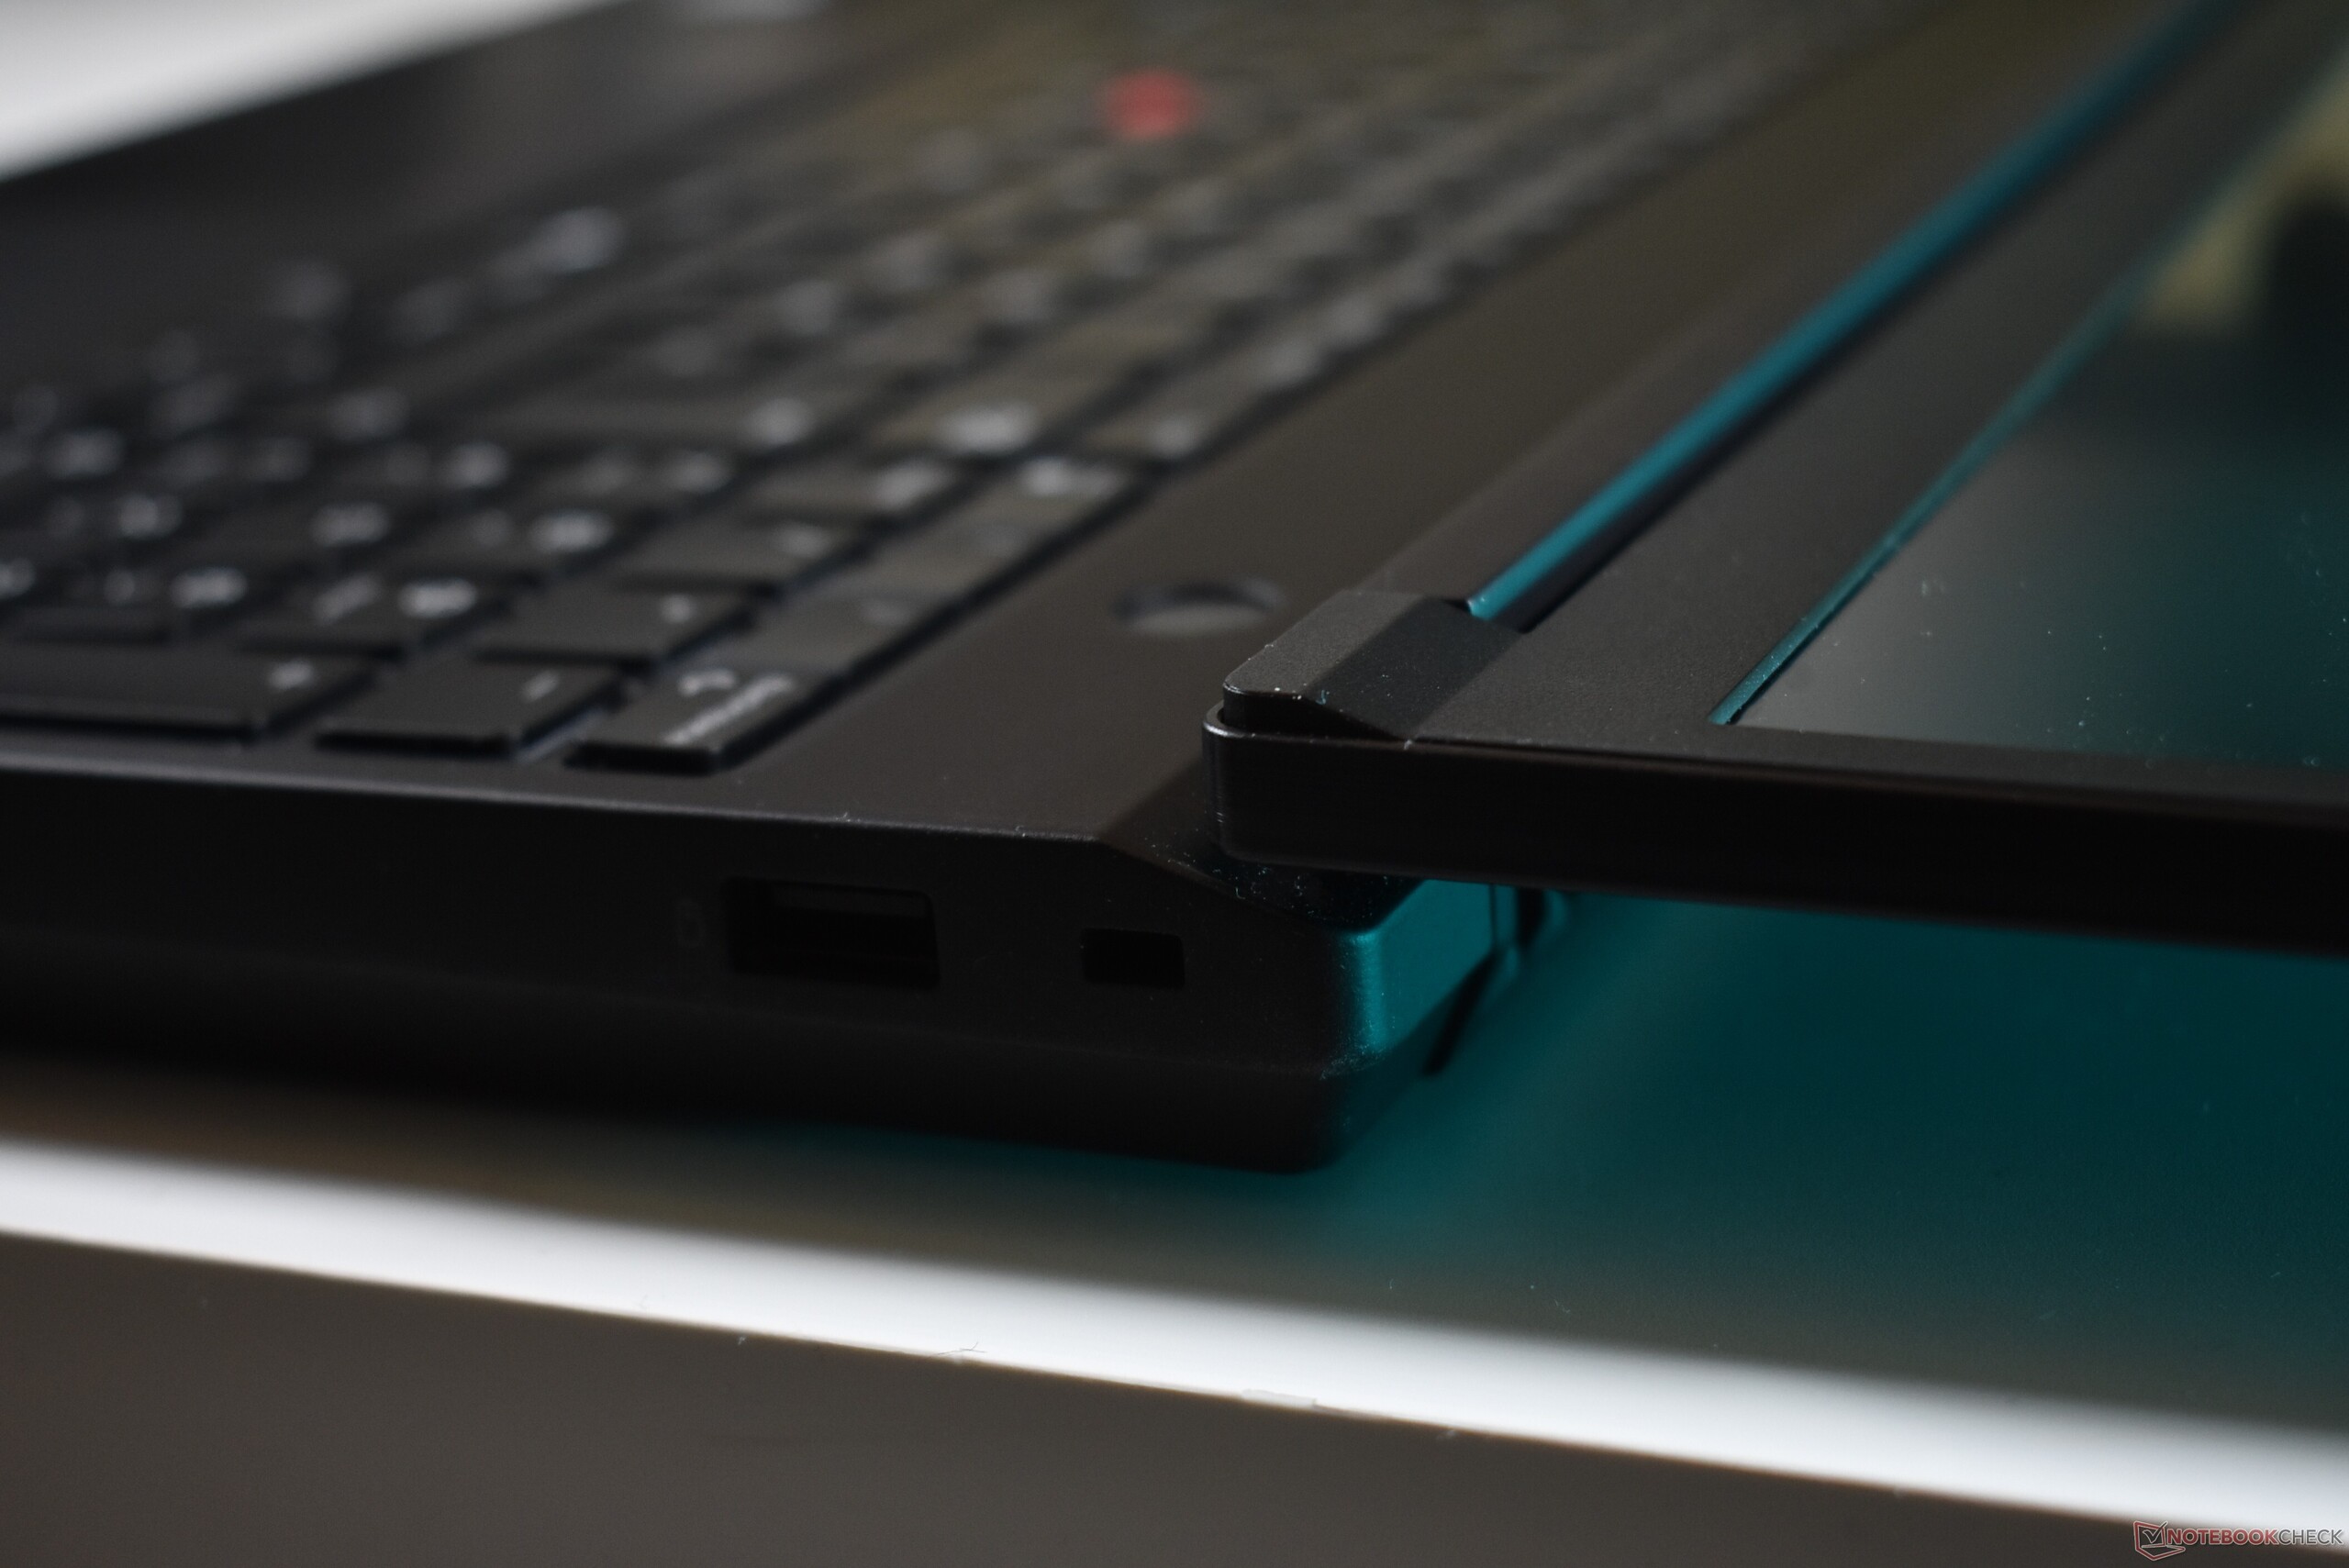
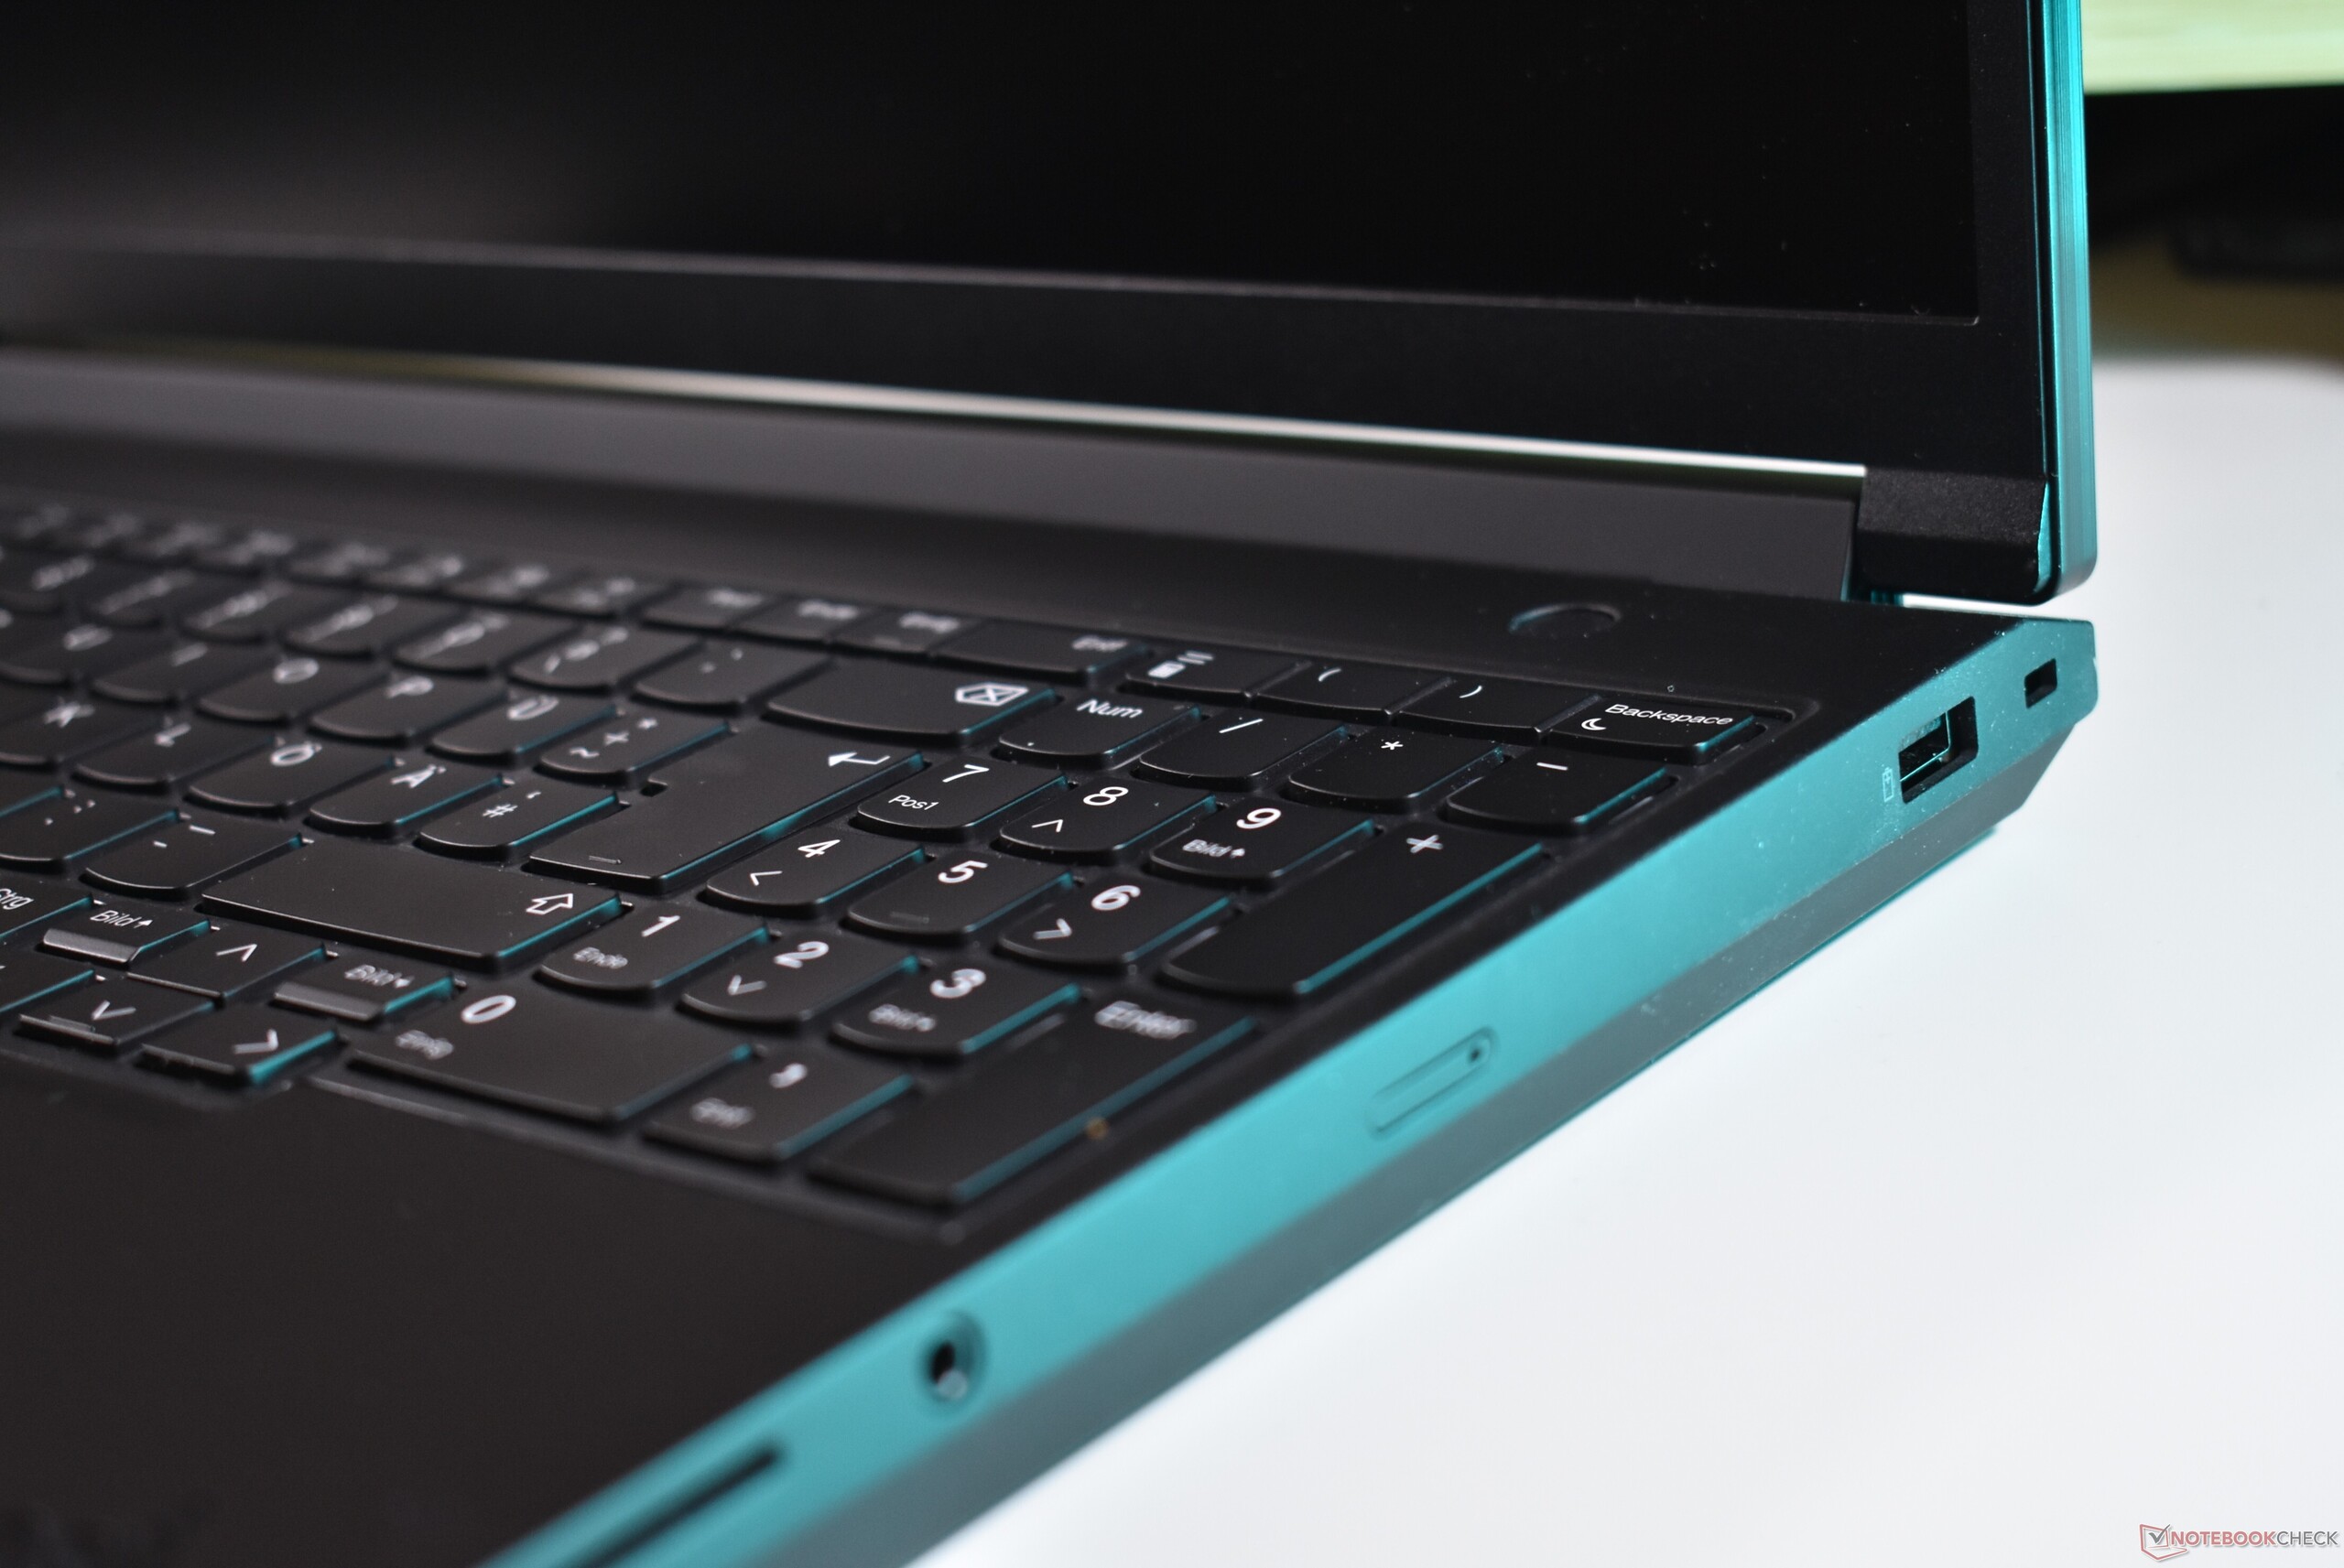
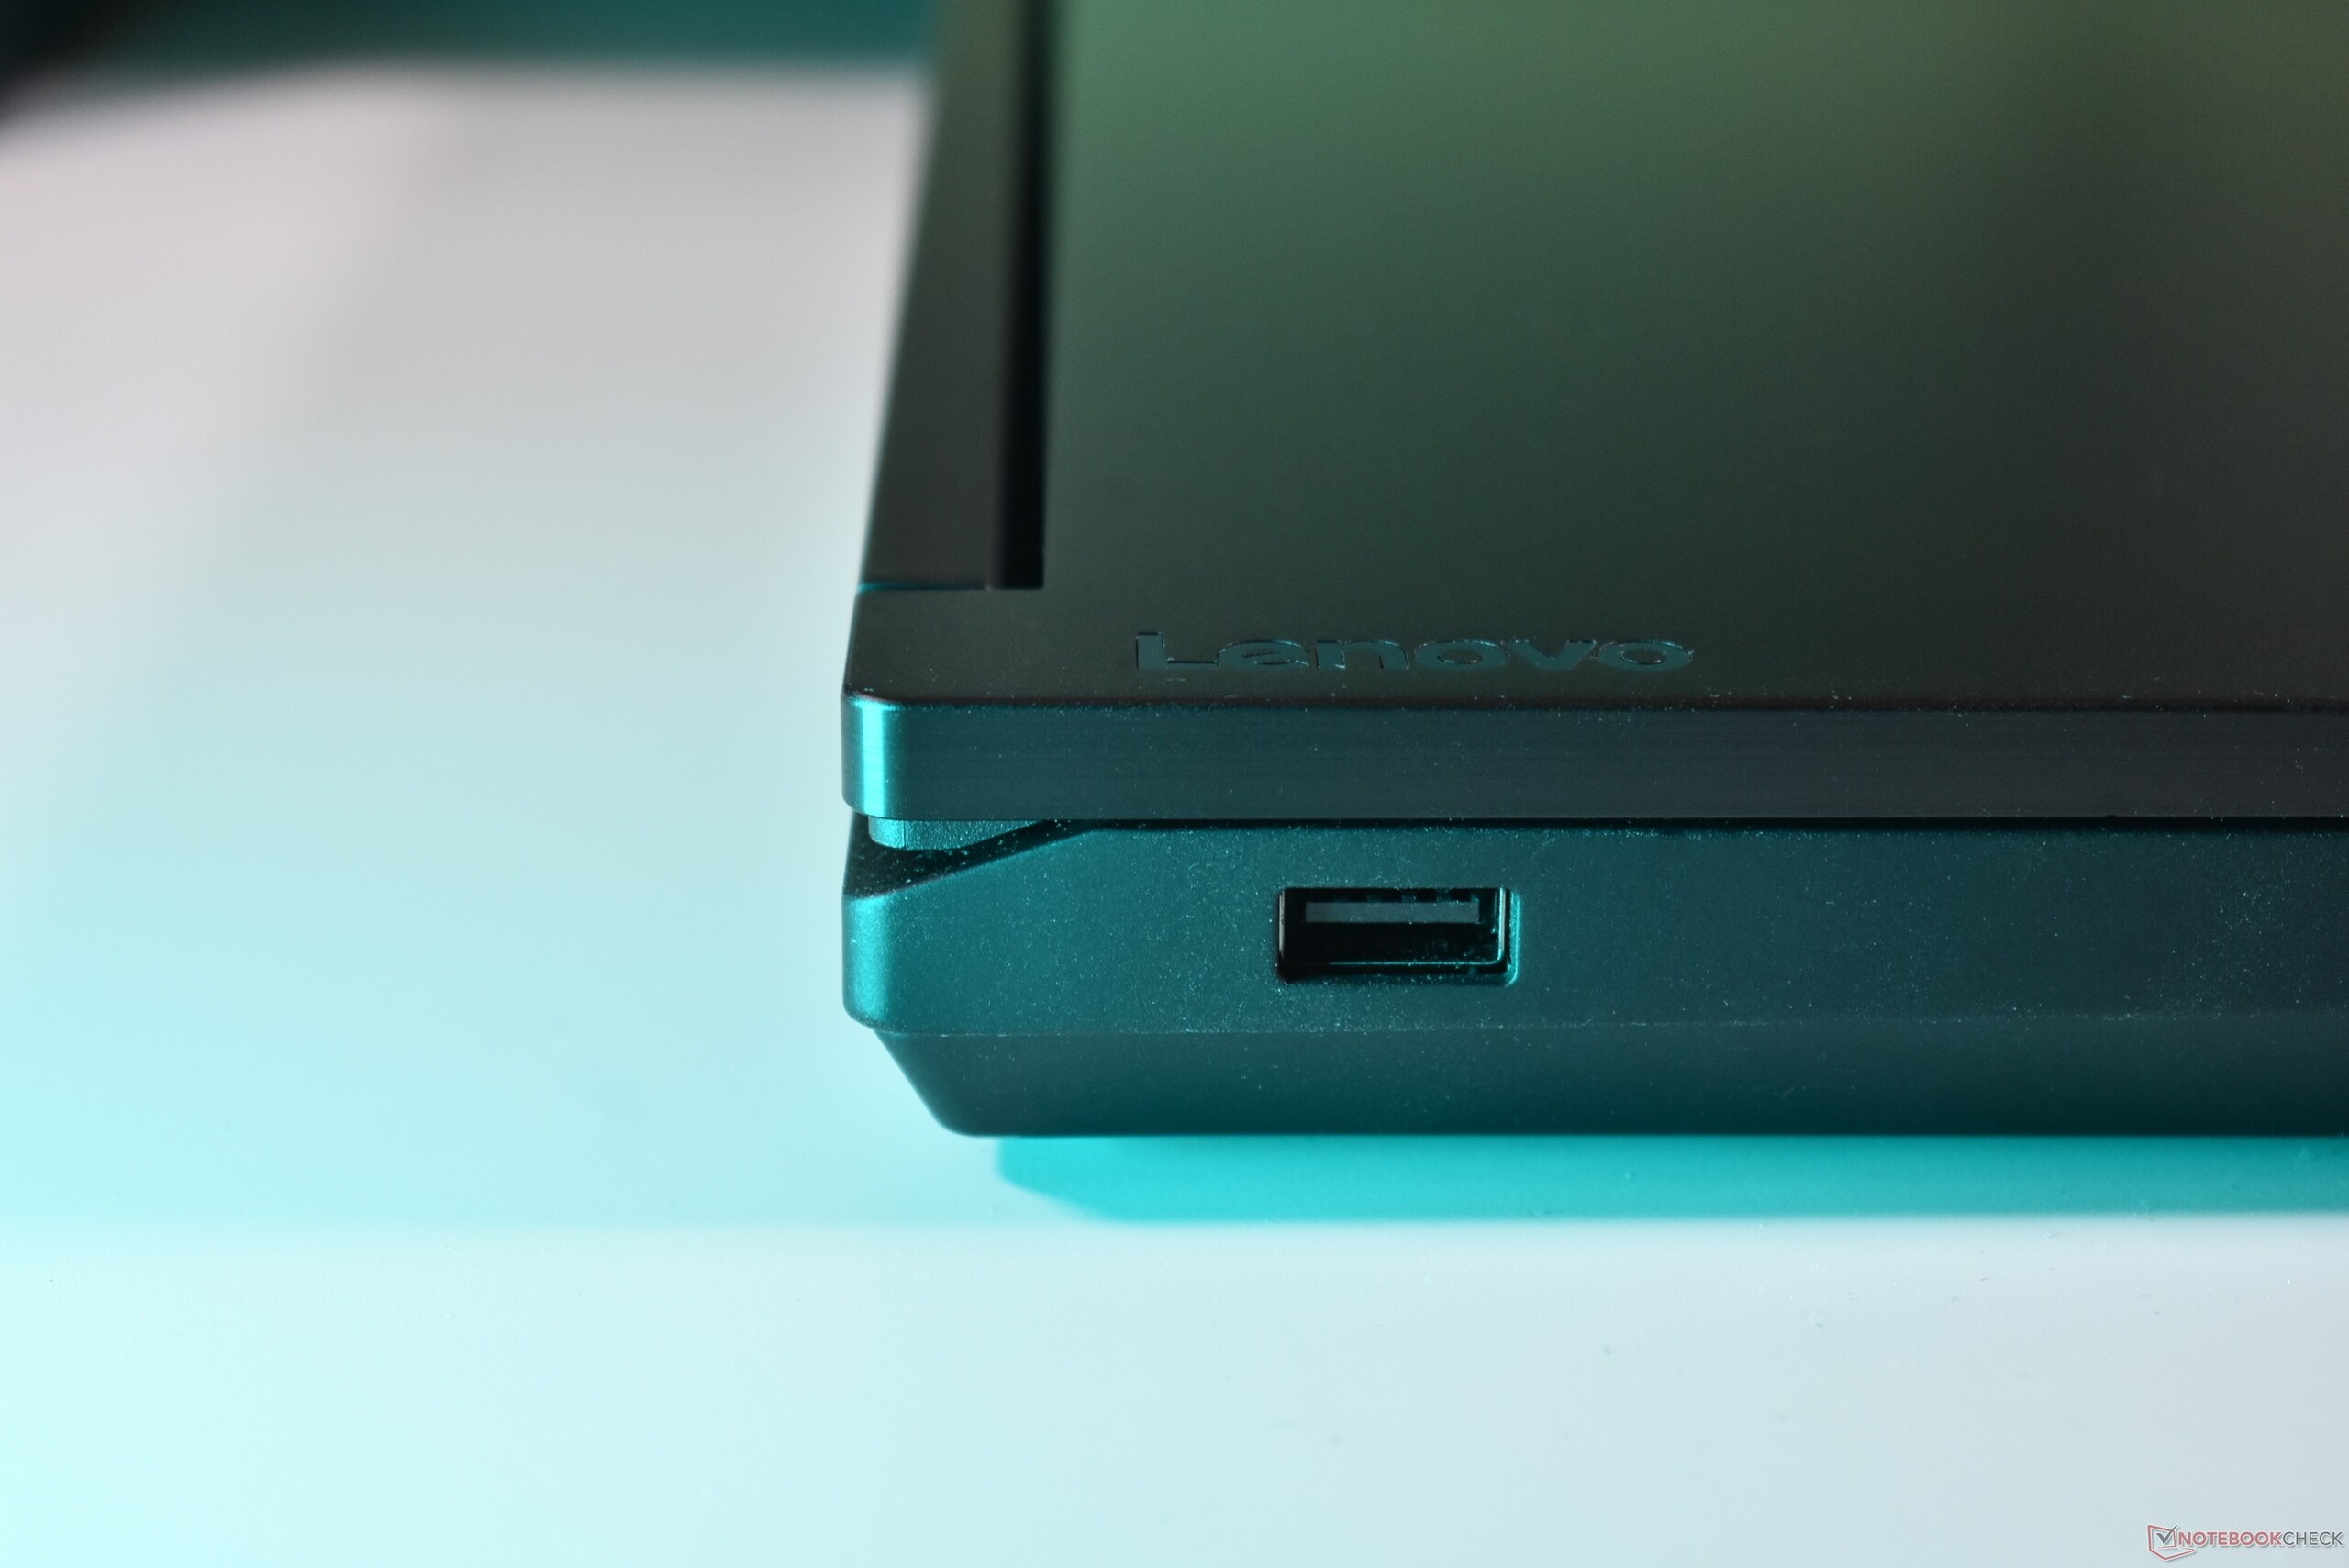
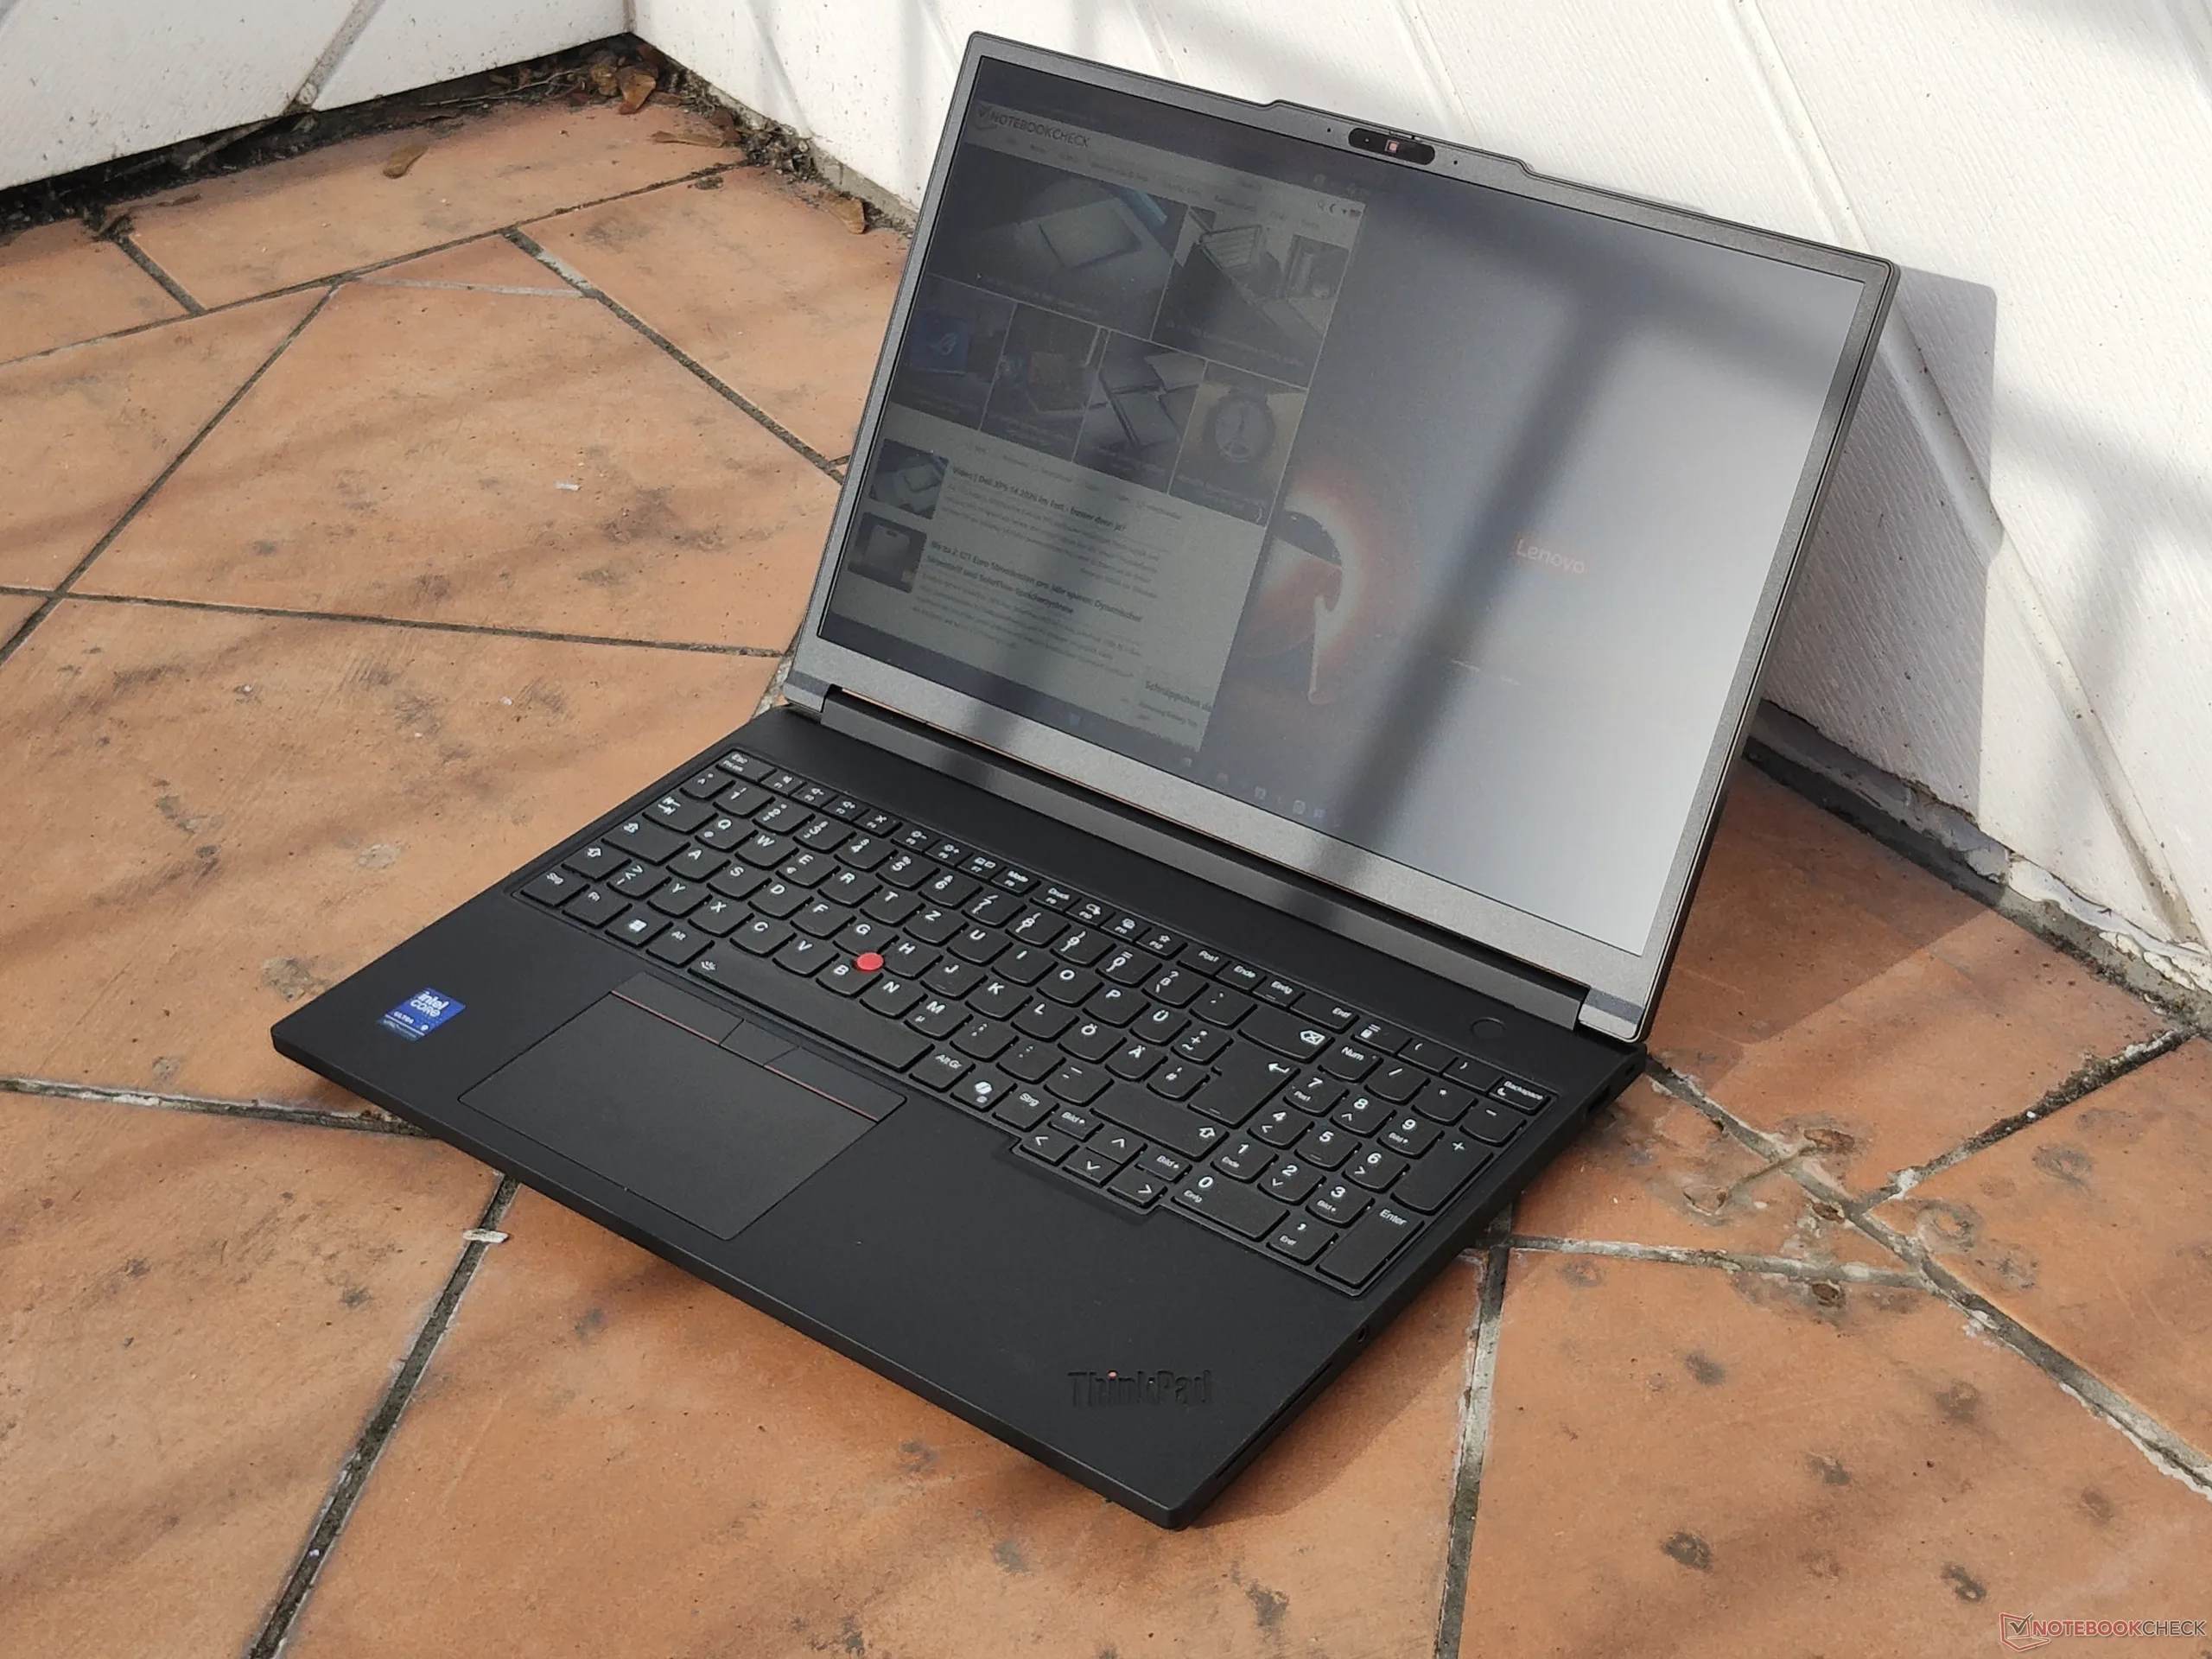
Avec le ThinkPad P16 Gen 1 et le ThinkPad P16 Gen 2lenovo a pris une nouvelle direction audacieuse avec ses stations de travail : Gris au lieu de noir, arrondi au lieu d'encombrant. Le nouveau Lenovo ThinkPad P16 Gen 3 n'a plus rien à voir avec cela : il est noir et rectangulaire, comme un ThinkPad classique. Mais il ne s'agit pas d'un rejet complet de l'ancien design du P16 : Lenovo conserve le capot supérieur en aluminium, mais désormais en noir anodisé. La moitié inférieure du châssis en métal est recouverte du revêtement noir typique des ThinkPad, lisse et légèrement caoutchouté. La nouveauté de cette année est la charnière plus large en une seule pièce, où Lenovo place les antennes Wi-Fi. L'écran oscille à peine et s'ouvre à 180 degrés. Il est possible de l'ouvrir d'une seule main.
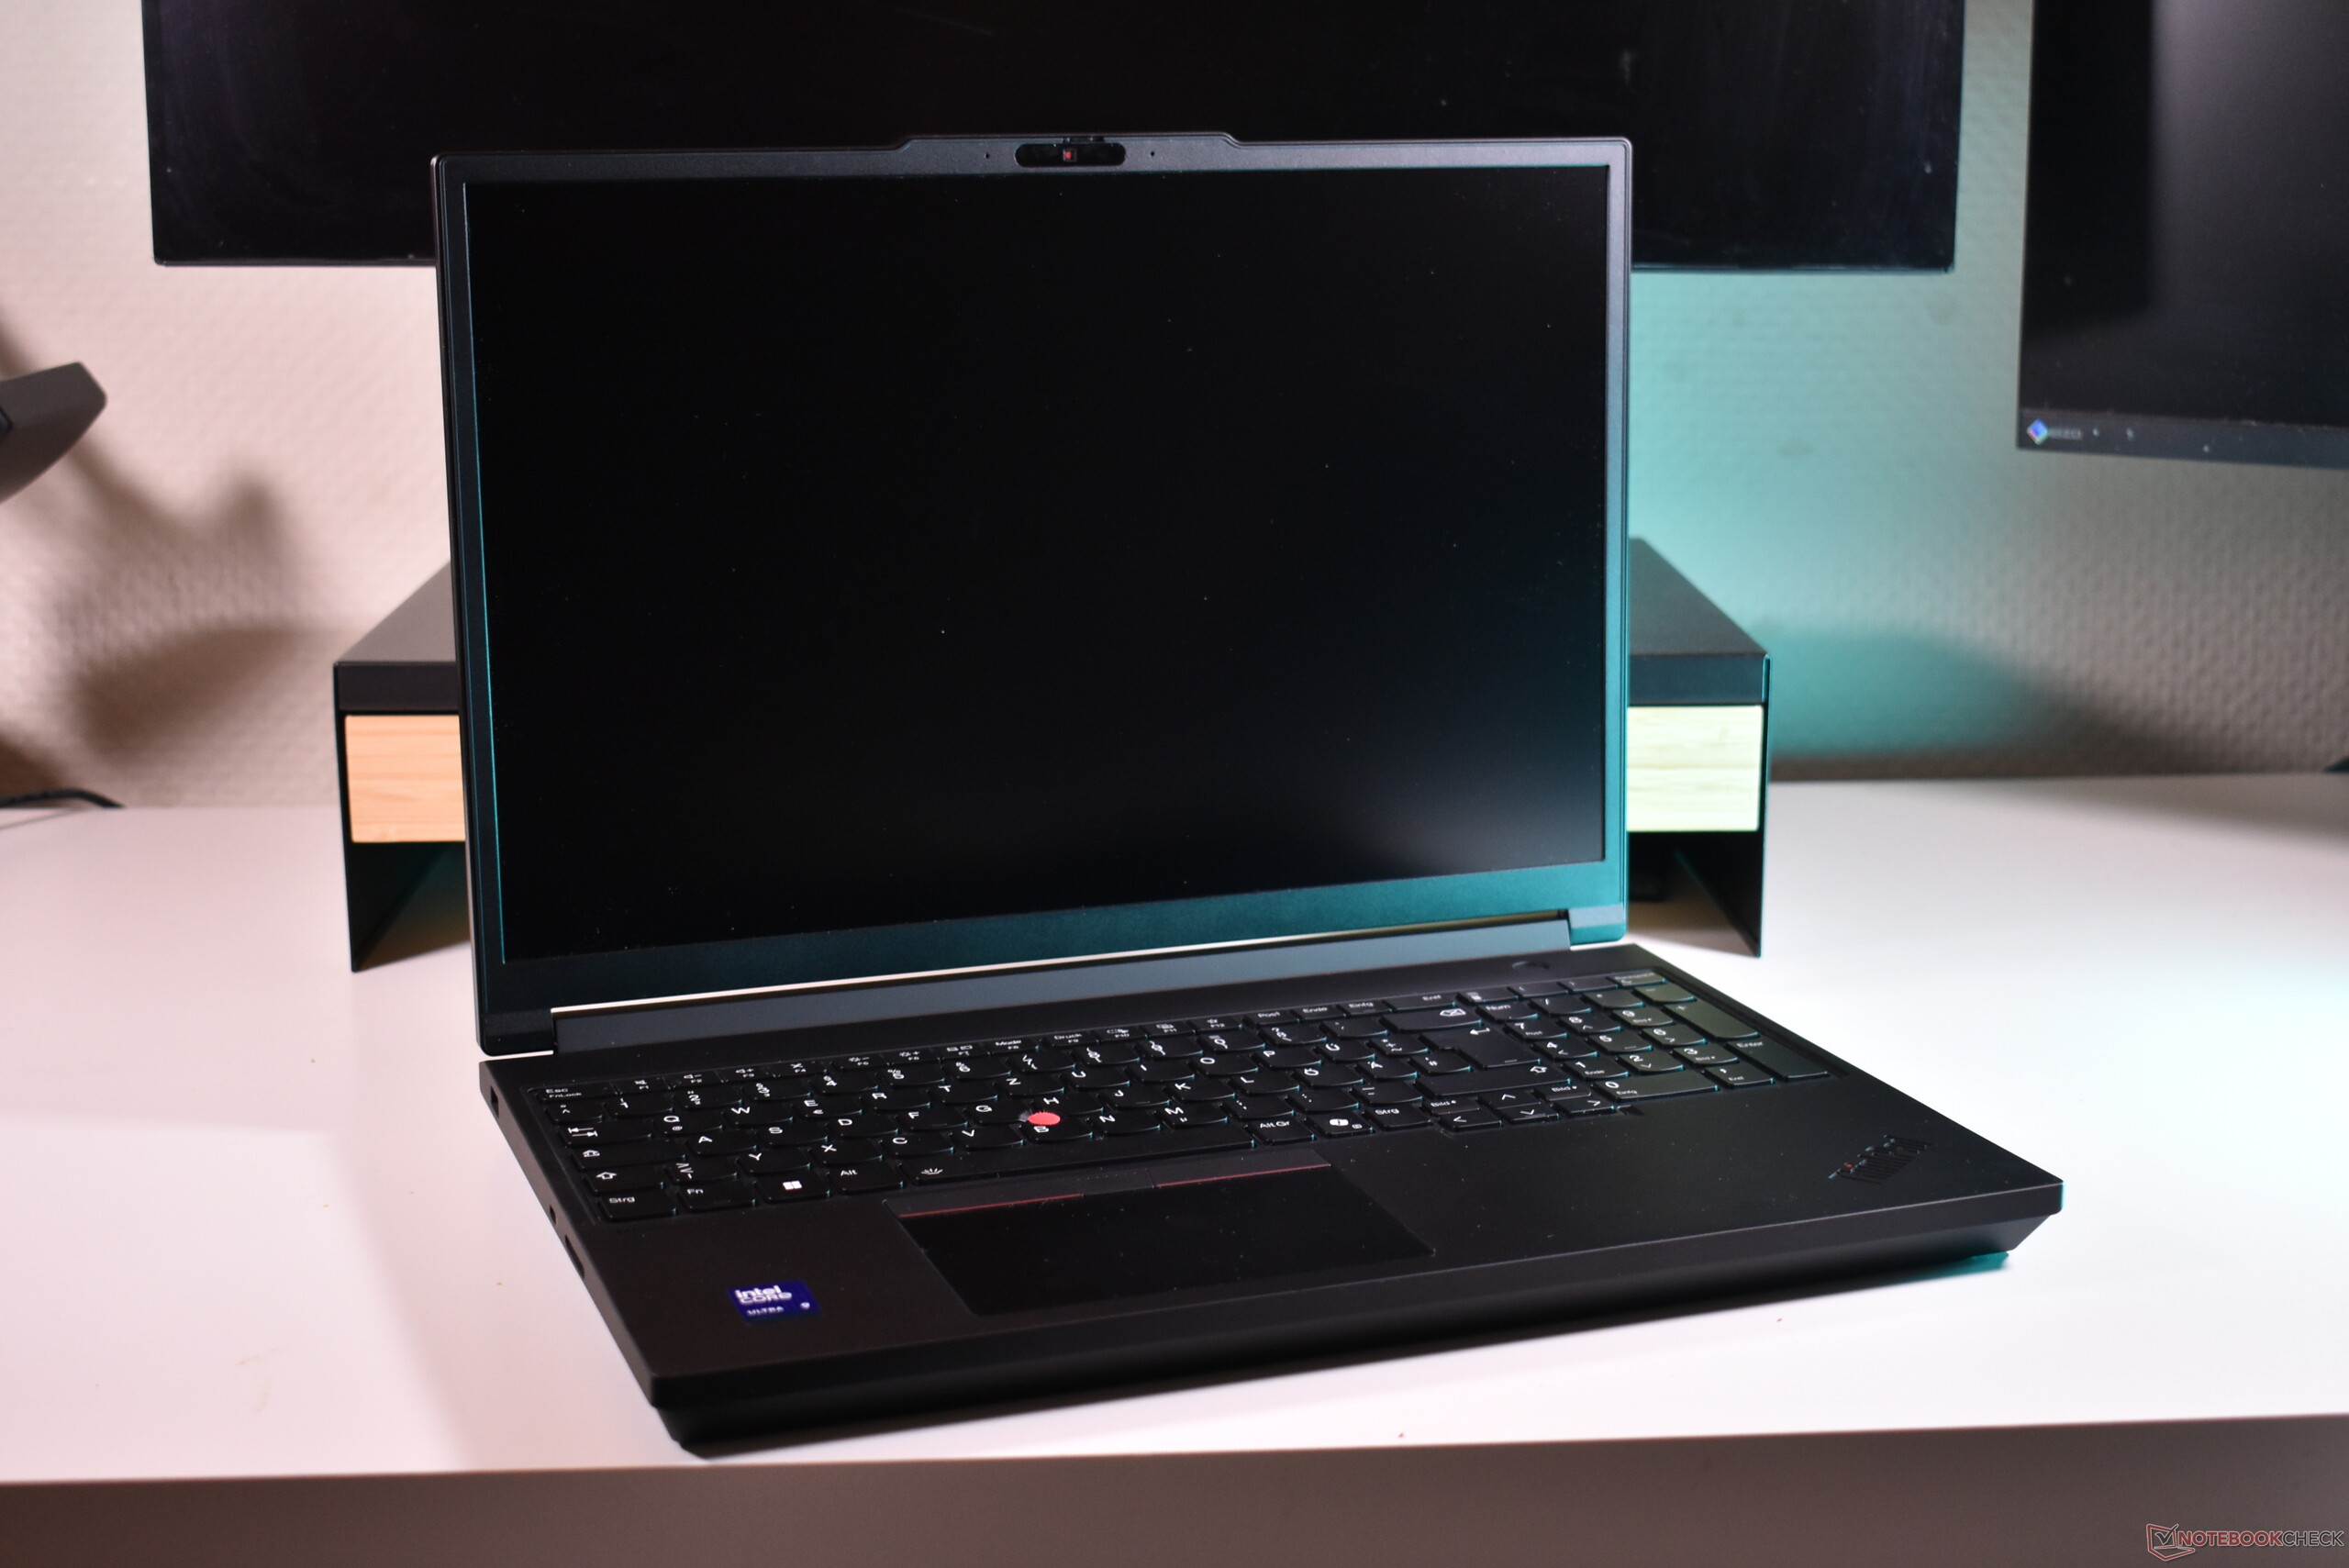
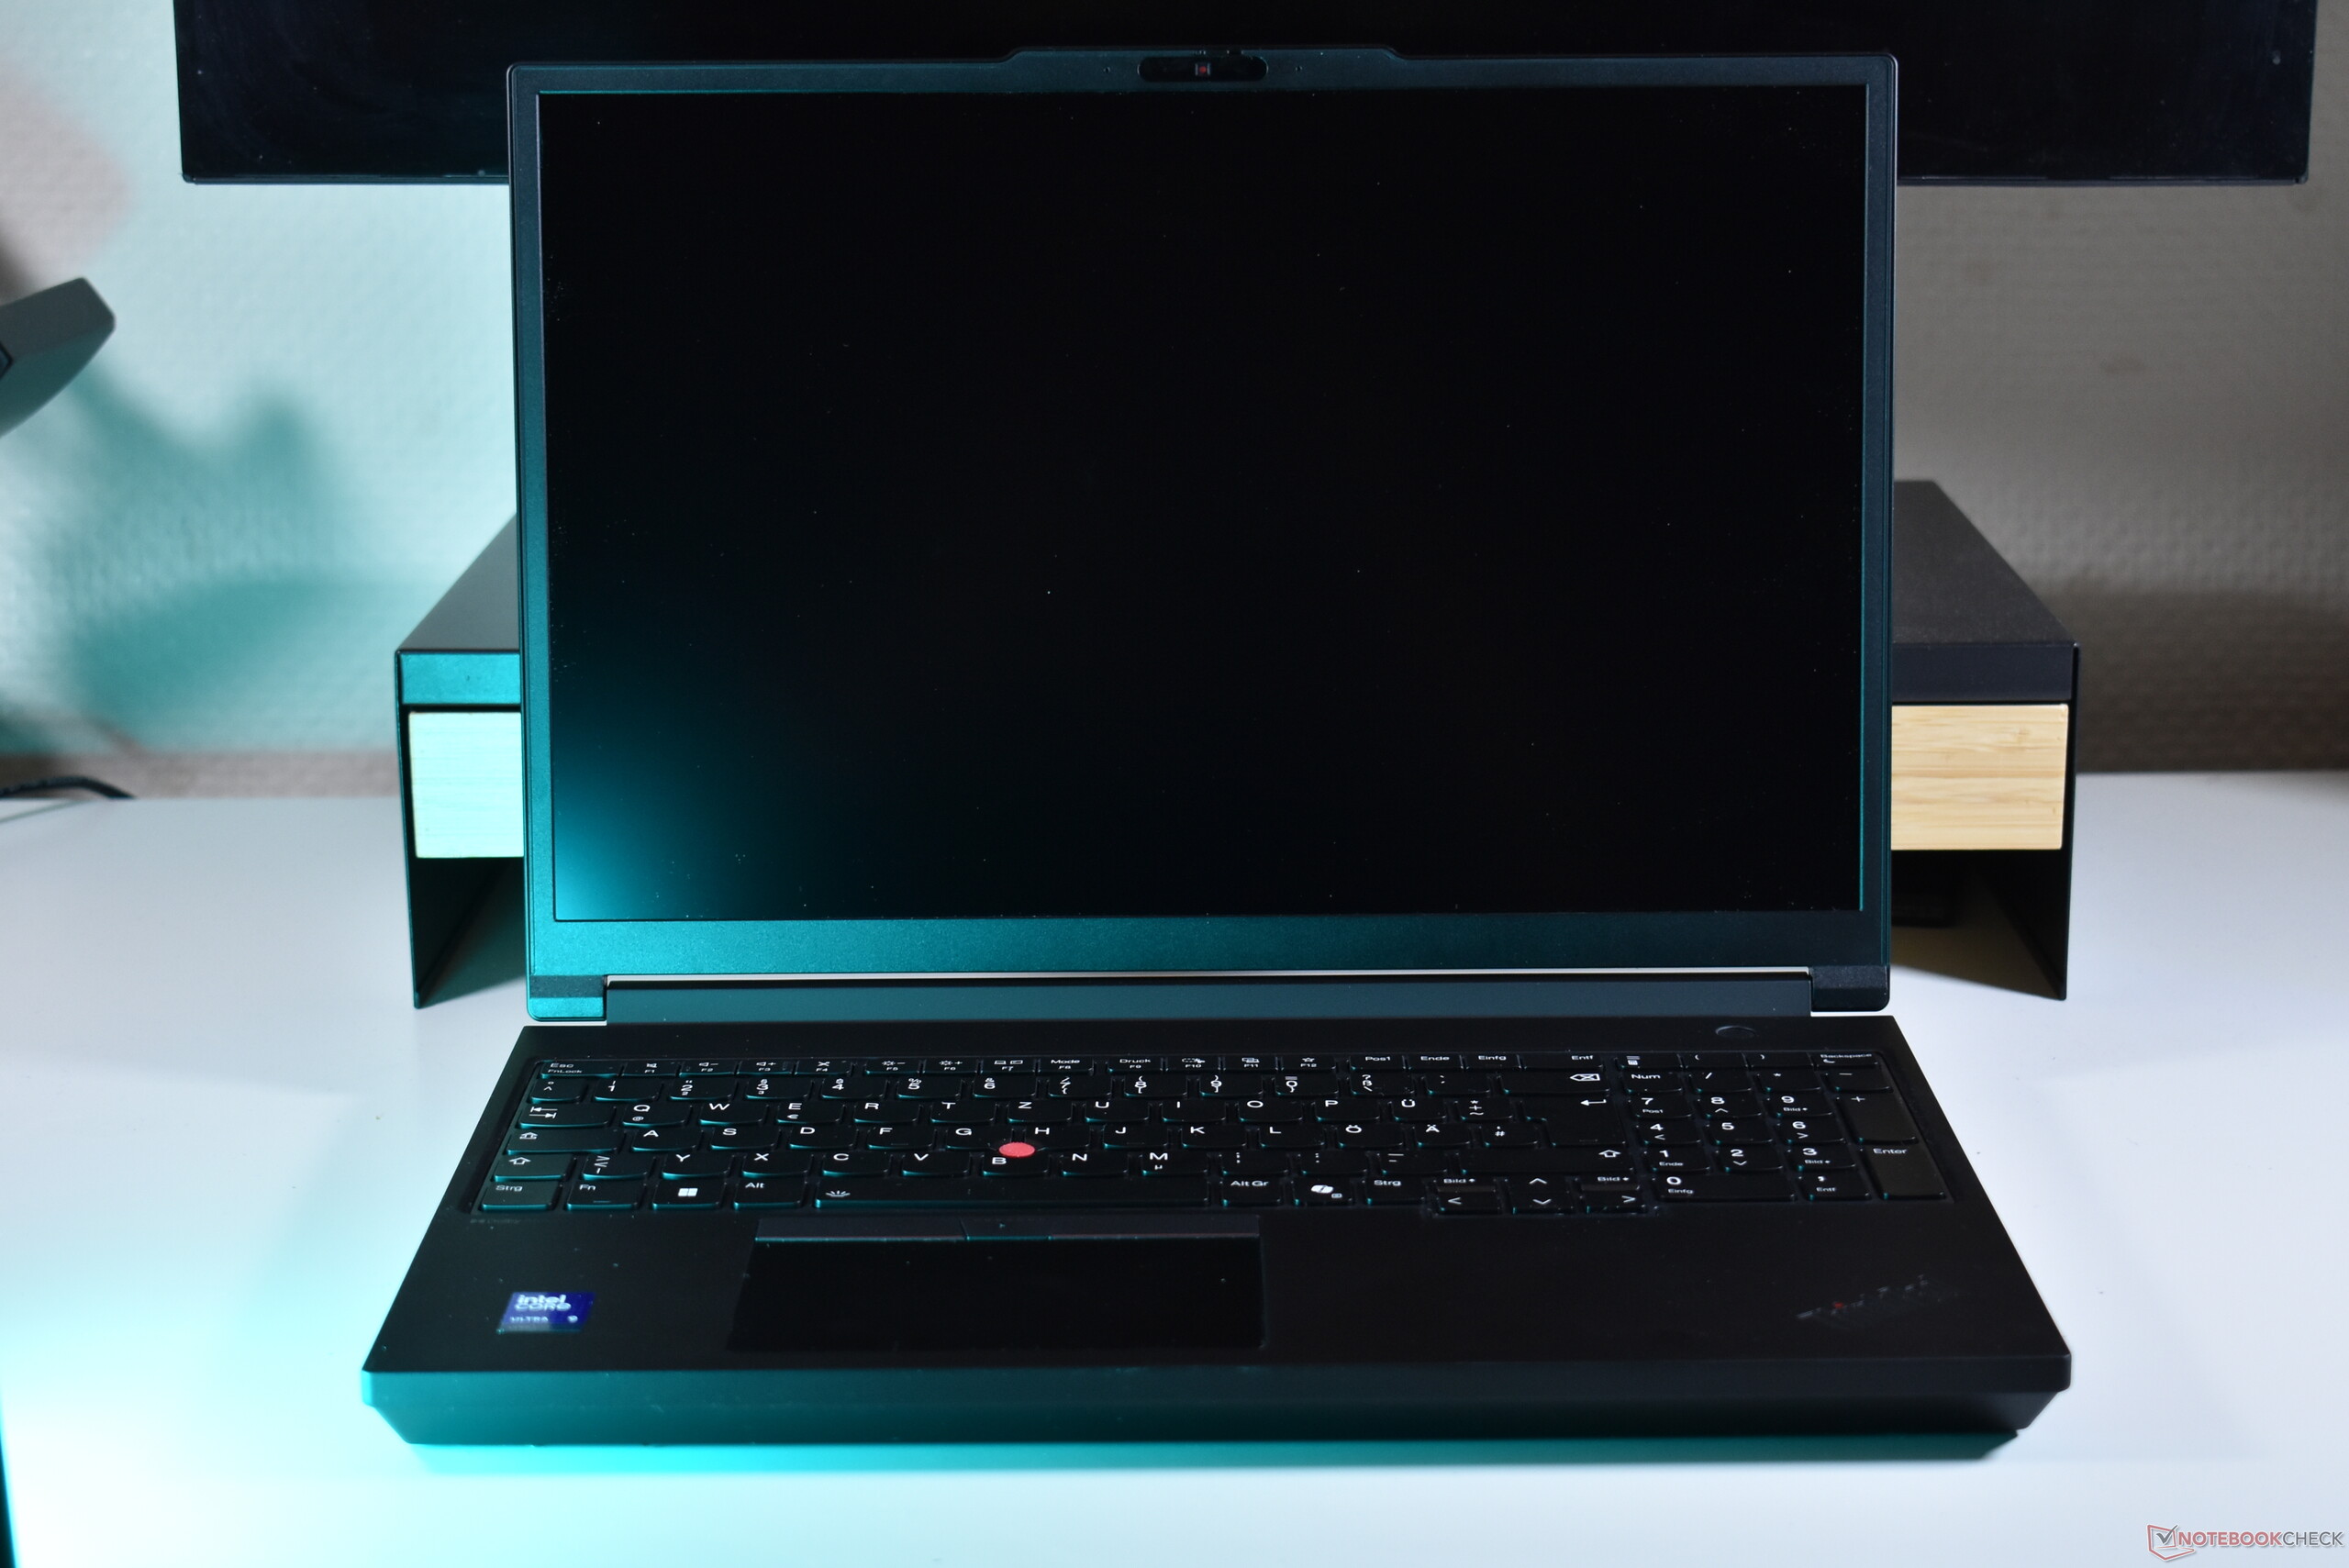
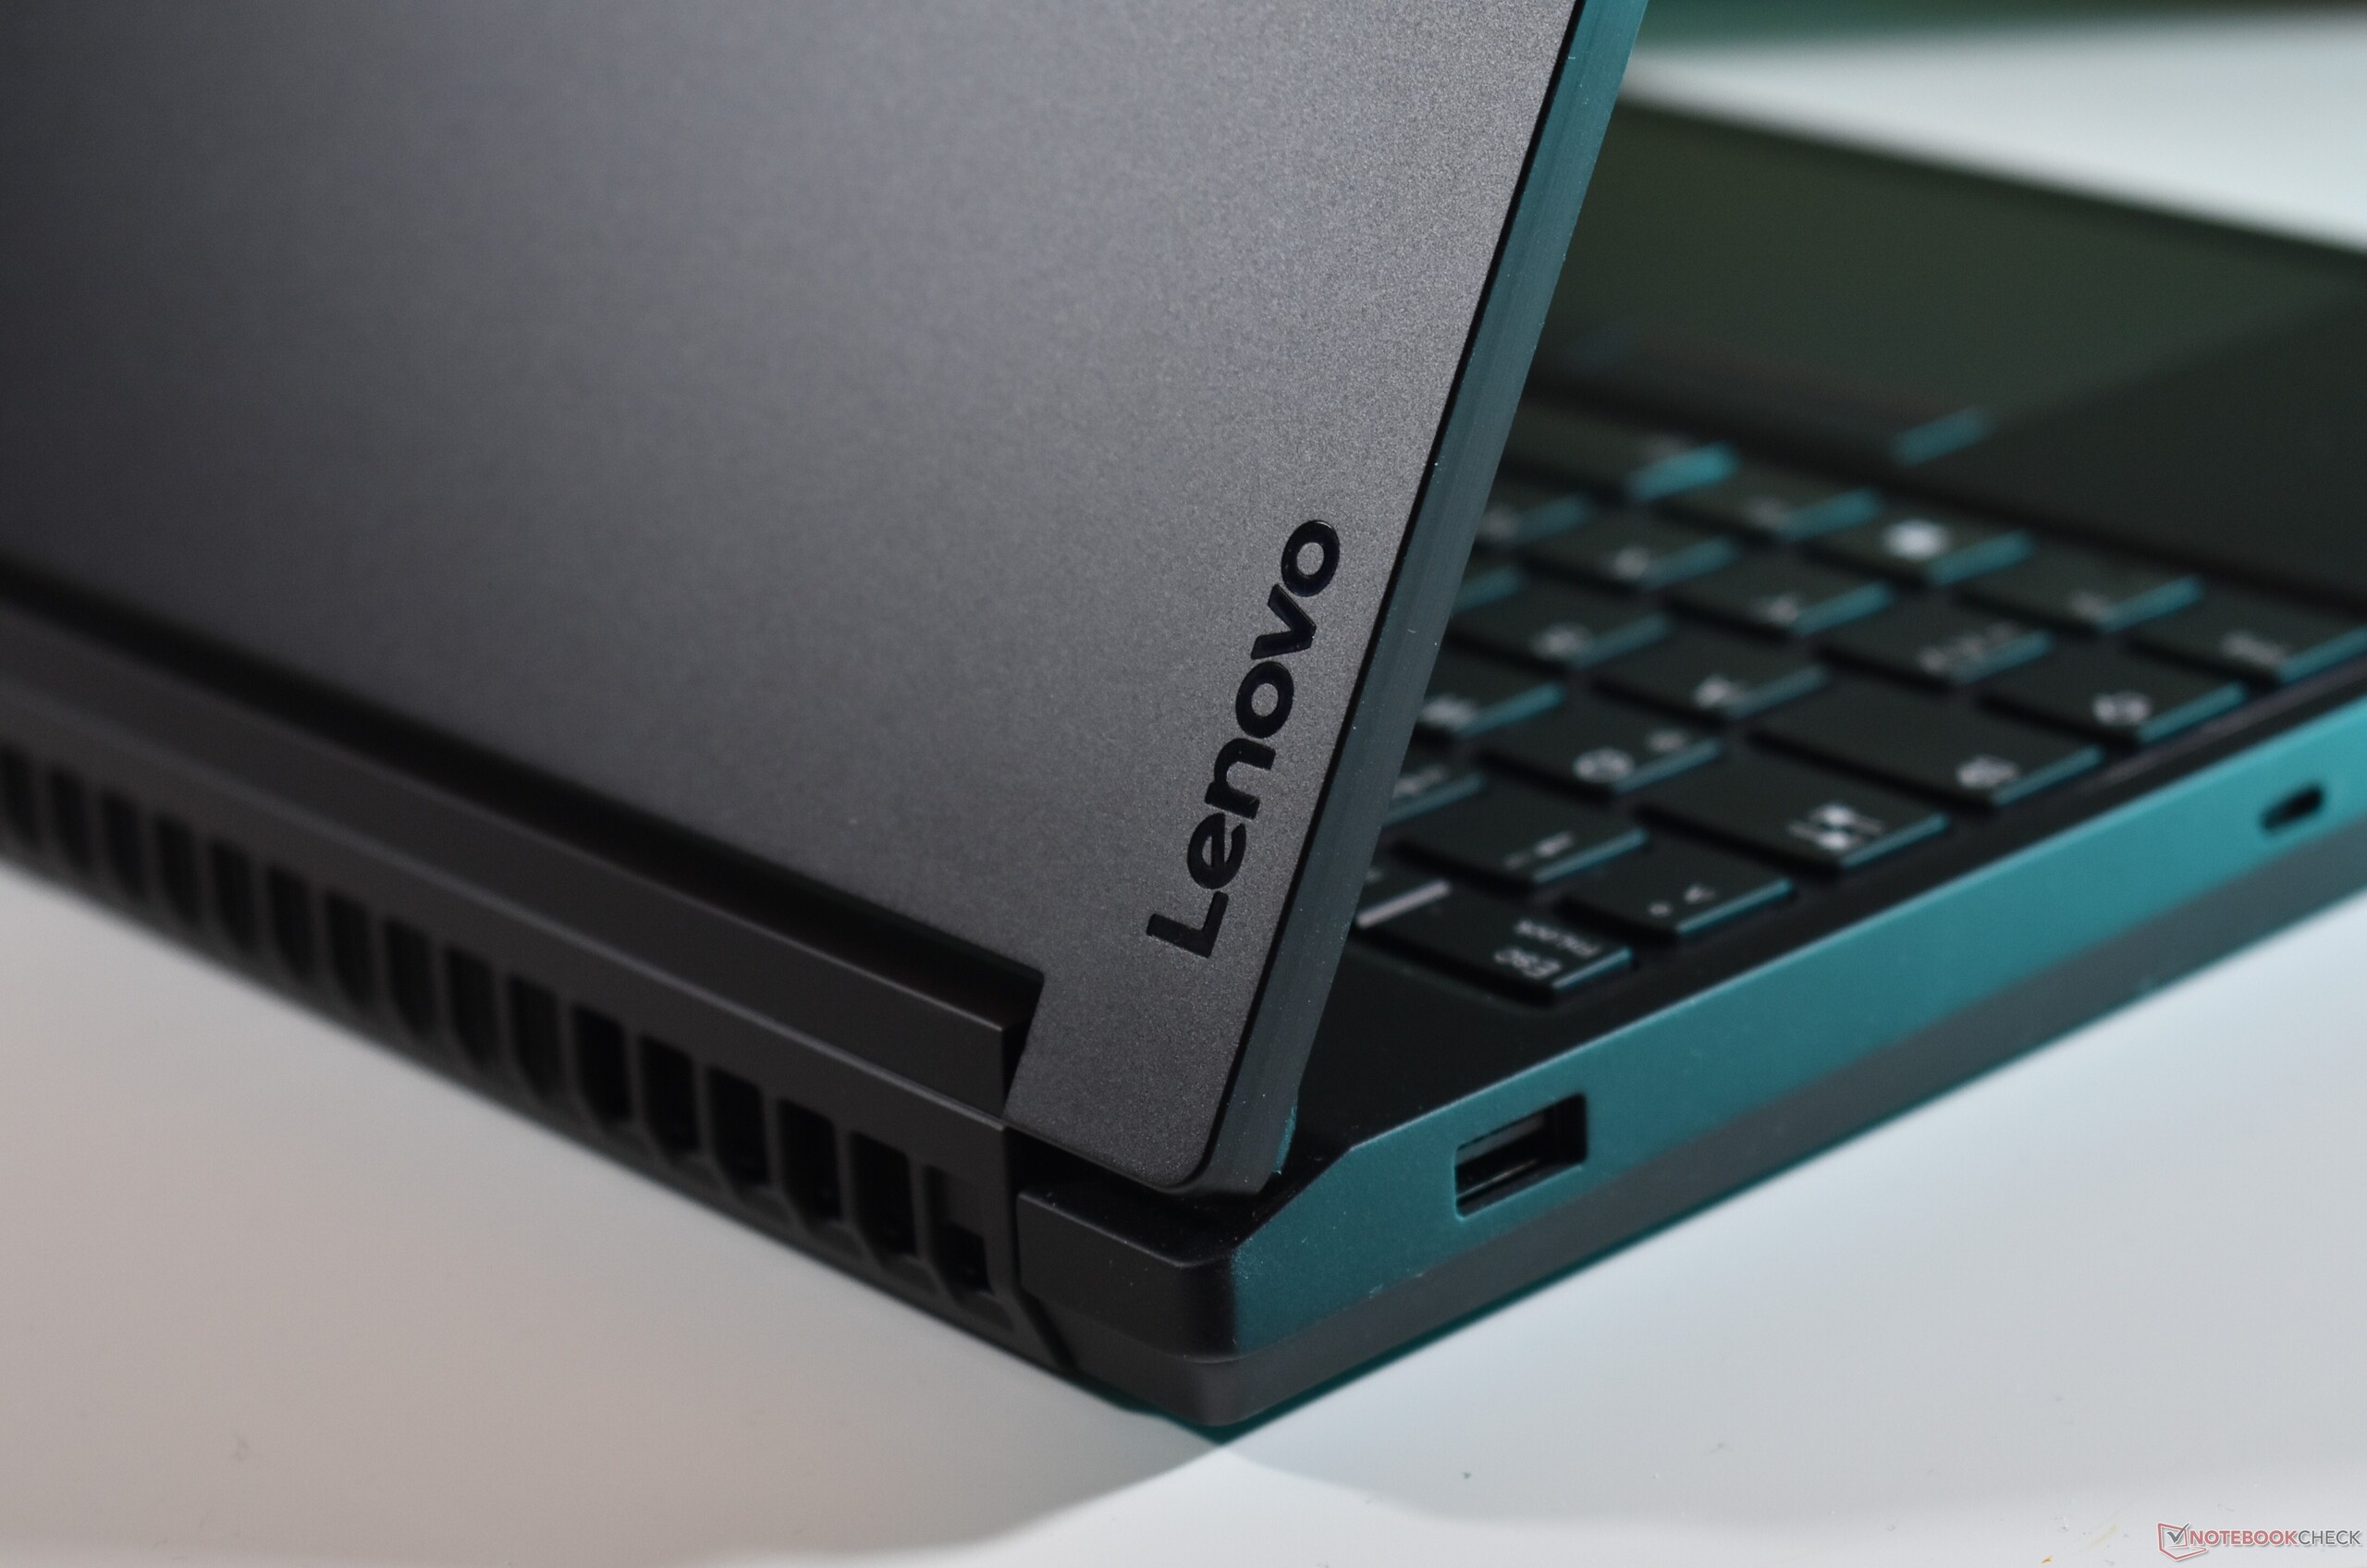

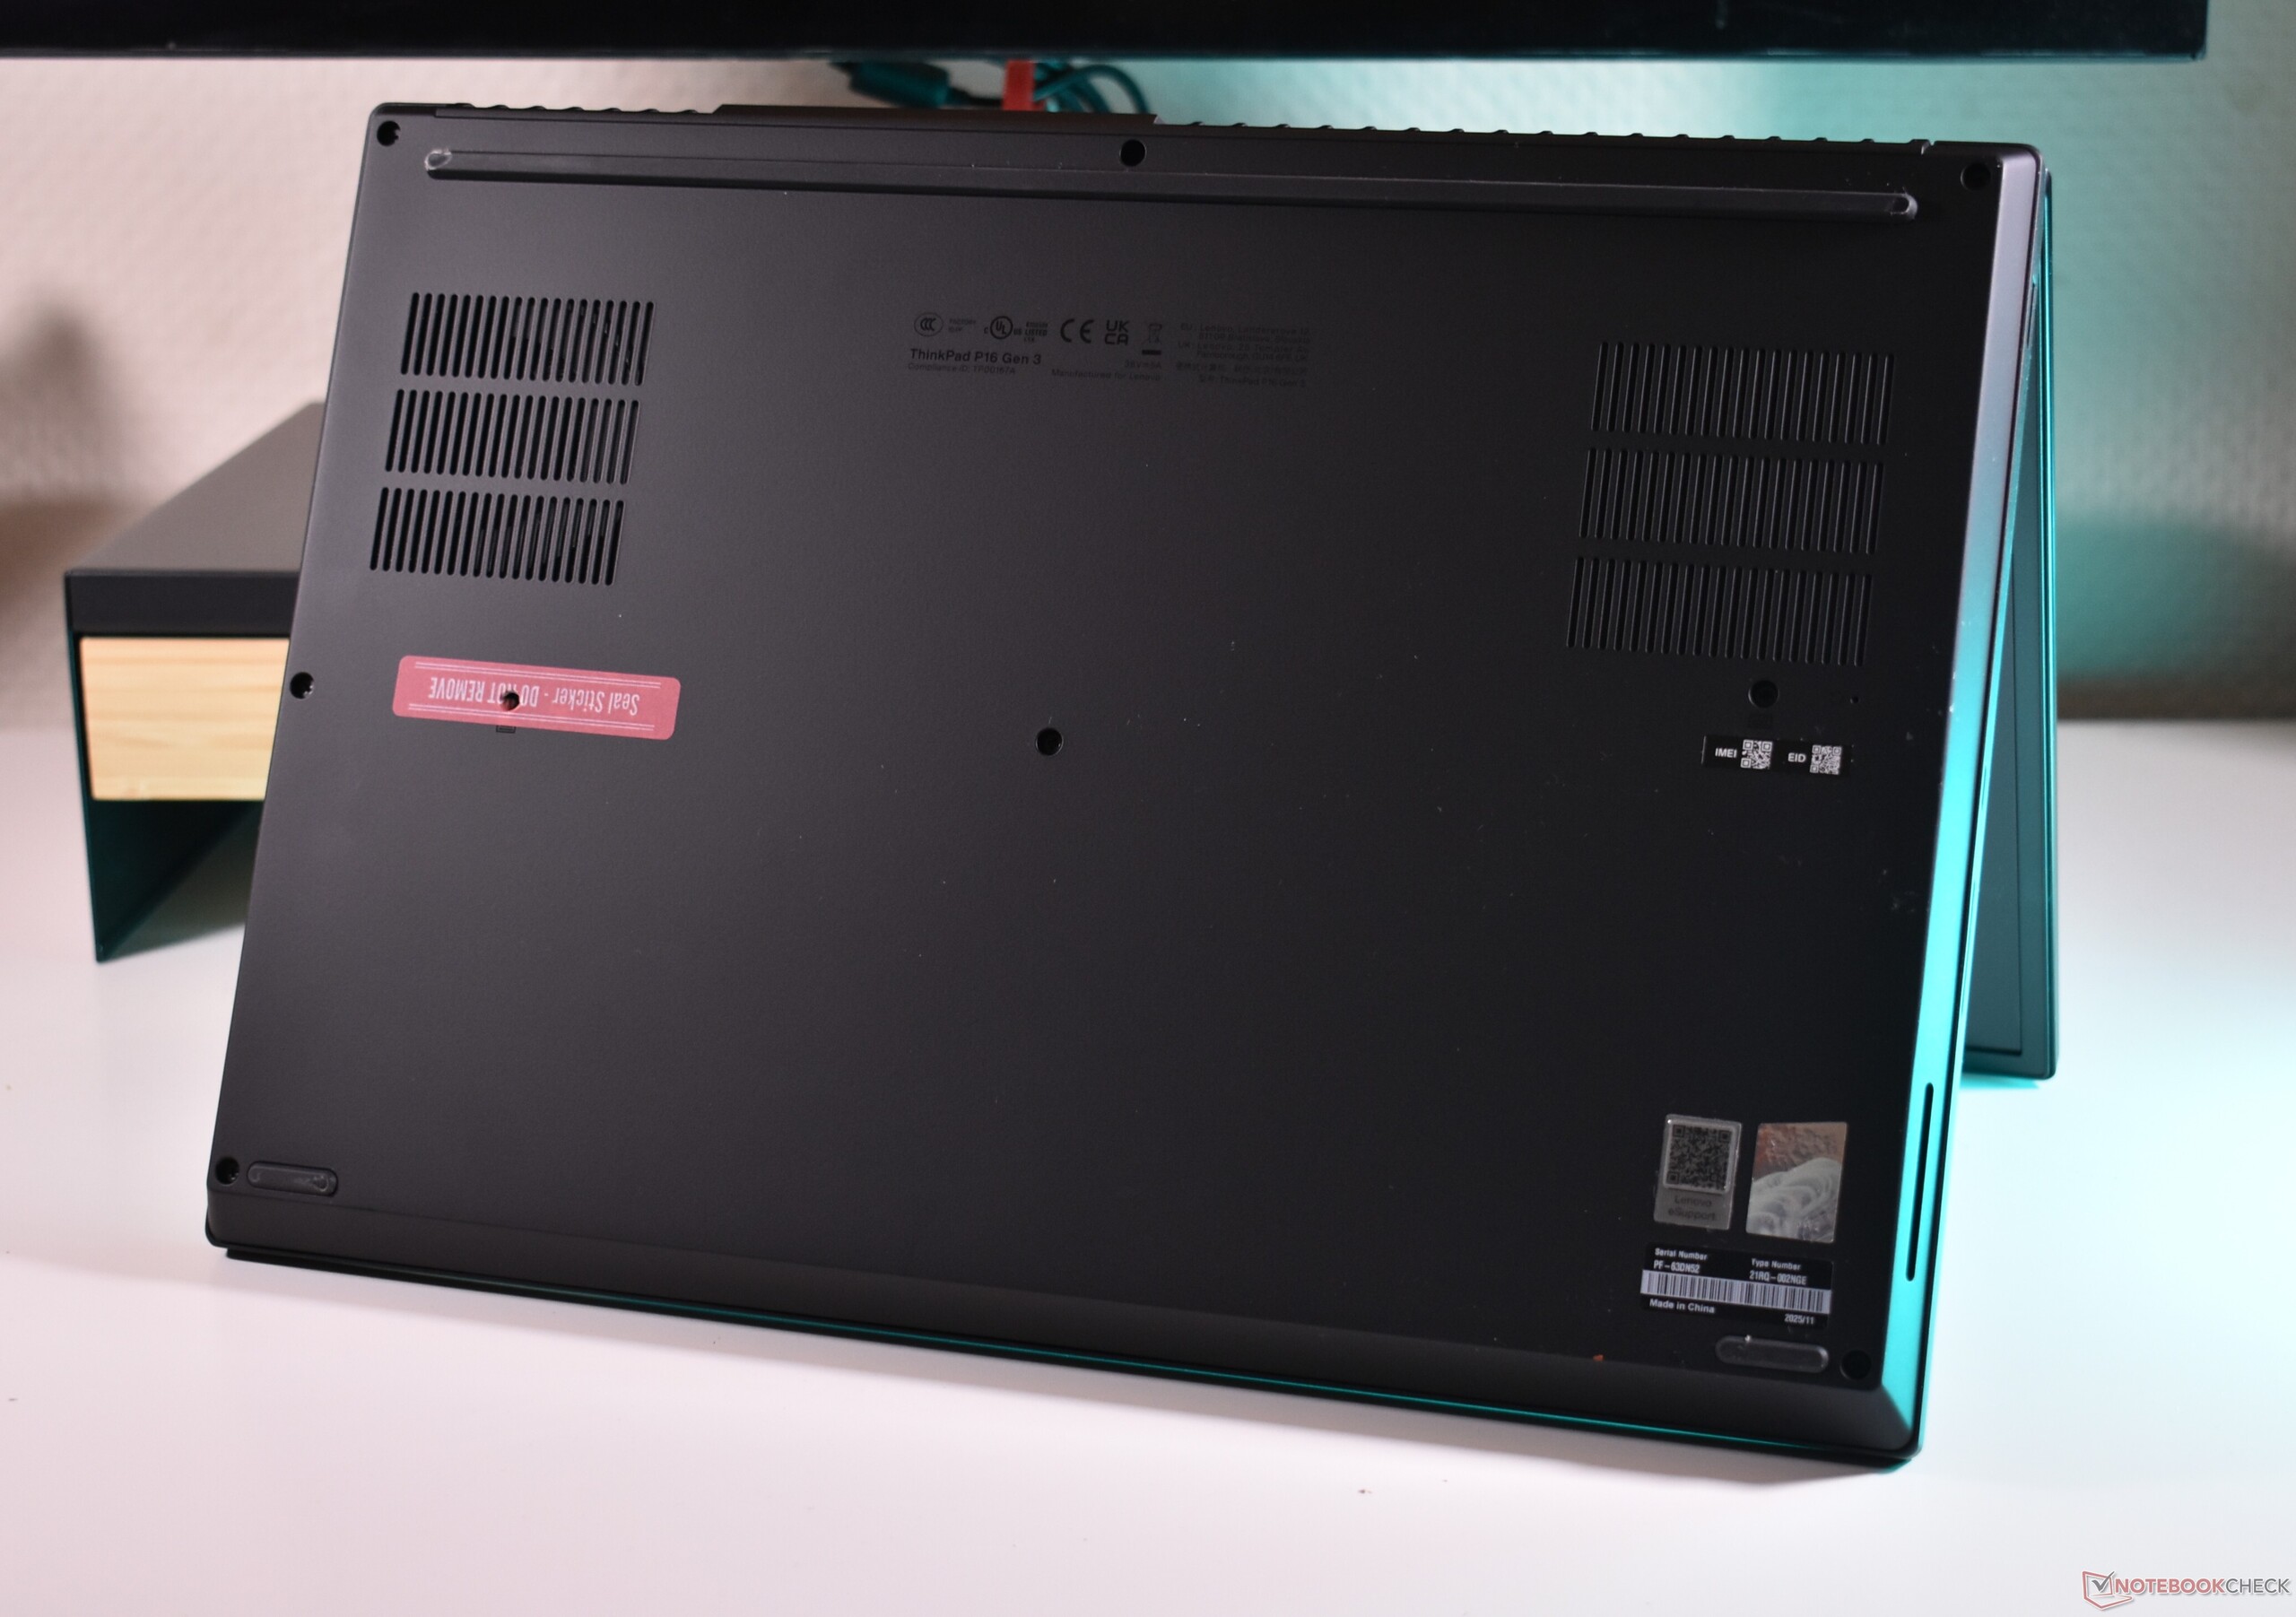
Le nouveau P16 est nettement plus léger et compact que l'ancienne version. Il reste lourd et imposant, mais il n'est plus le plus gros et le plus lourd des ordinateurs portables de 16 pouces pour stations de travail. Il est clair que l'optimisation de la mobilité était l'une des priorités de Lenovo.
Connectivité
Les principales nouveautés sont les ports Thunderbolt 5 à l'arrière. En outre, le troisième port USB-C prend désormais en charge Thunderbolt 4. Lenovo a également choisi de ramener le RJ45-Ethernet, qui prend en charge des vitesses de 2,5 GBit. Le ThinkPad P16 se recharge désormais via USB-C.


Lecteur de carte SD
| SD Card Reader | |
| average JPG Copy Test (av. of 3 runs) | |
| Lenovo ThinkPad T16g Gen 3 RTX 5080 (ADATA SD8.0 Express 512 GB) | |
| Lenovo ThinkPad T16g Gen 3 RTX 5080 (Angelbird AV Pro V60) | |
| Moyenne de la classe Workstation (49.6 - 681, n=14, 2 dernières années) | |
| HP ZBook Fury 16 G11 (Toshiba Exceria Pro SDXC 64 GB UHS-II) | |
| Lenovo ThinkPad P1 Gen 8 (Toshiba Exceria Pro SDXC 64 GB UHS-II) | |
| Lenovo ThinkPad P16 Gen 3 (AV Pro V60) | |
| Dell Pro Max 16 Plus (Toshiba Exceria Pro SDXC 64 GB UHS-II) | |
| Lenovo ThinkPad P16 G2 21FA000FGE | |
| maximum AS SSD Seq Read Test (1GB) | |
| Lenovo ThinkPad T16g Gen 3 RTX 5080 (ADATA SD8.0 Express 512 GB) | |
| Lenovo ThinkPad T16g Gen 3 RTX 5080 (Angelbird AV Pro V60) | |
| Moyenne de la classe Workstation (87.6 - 1455, n=14, 2 dernières années) | |
| Lenovo ThinkPad P16 Gen 3 (AV Pro V60) | |
| HP ZBook Fury 16 G11 (Toshiba Exceria Pro SDXC 64 GB UHS-II) | |
| Dell Pro Max 16 Plus (Toshiba Exceria Pro SDXC 64 GB UHS-II) | |
| Lenovo ThinkPad P1 Gen 8 (Toshiba Exceria Pro SDXC 64 GB UHS-II) | |
| Lenovo ThinkPad P16 G2 21FA000FGE | |
Communication


Maintenance


Périphériques d'entrée
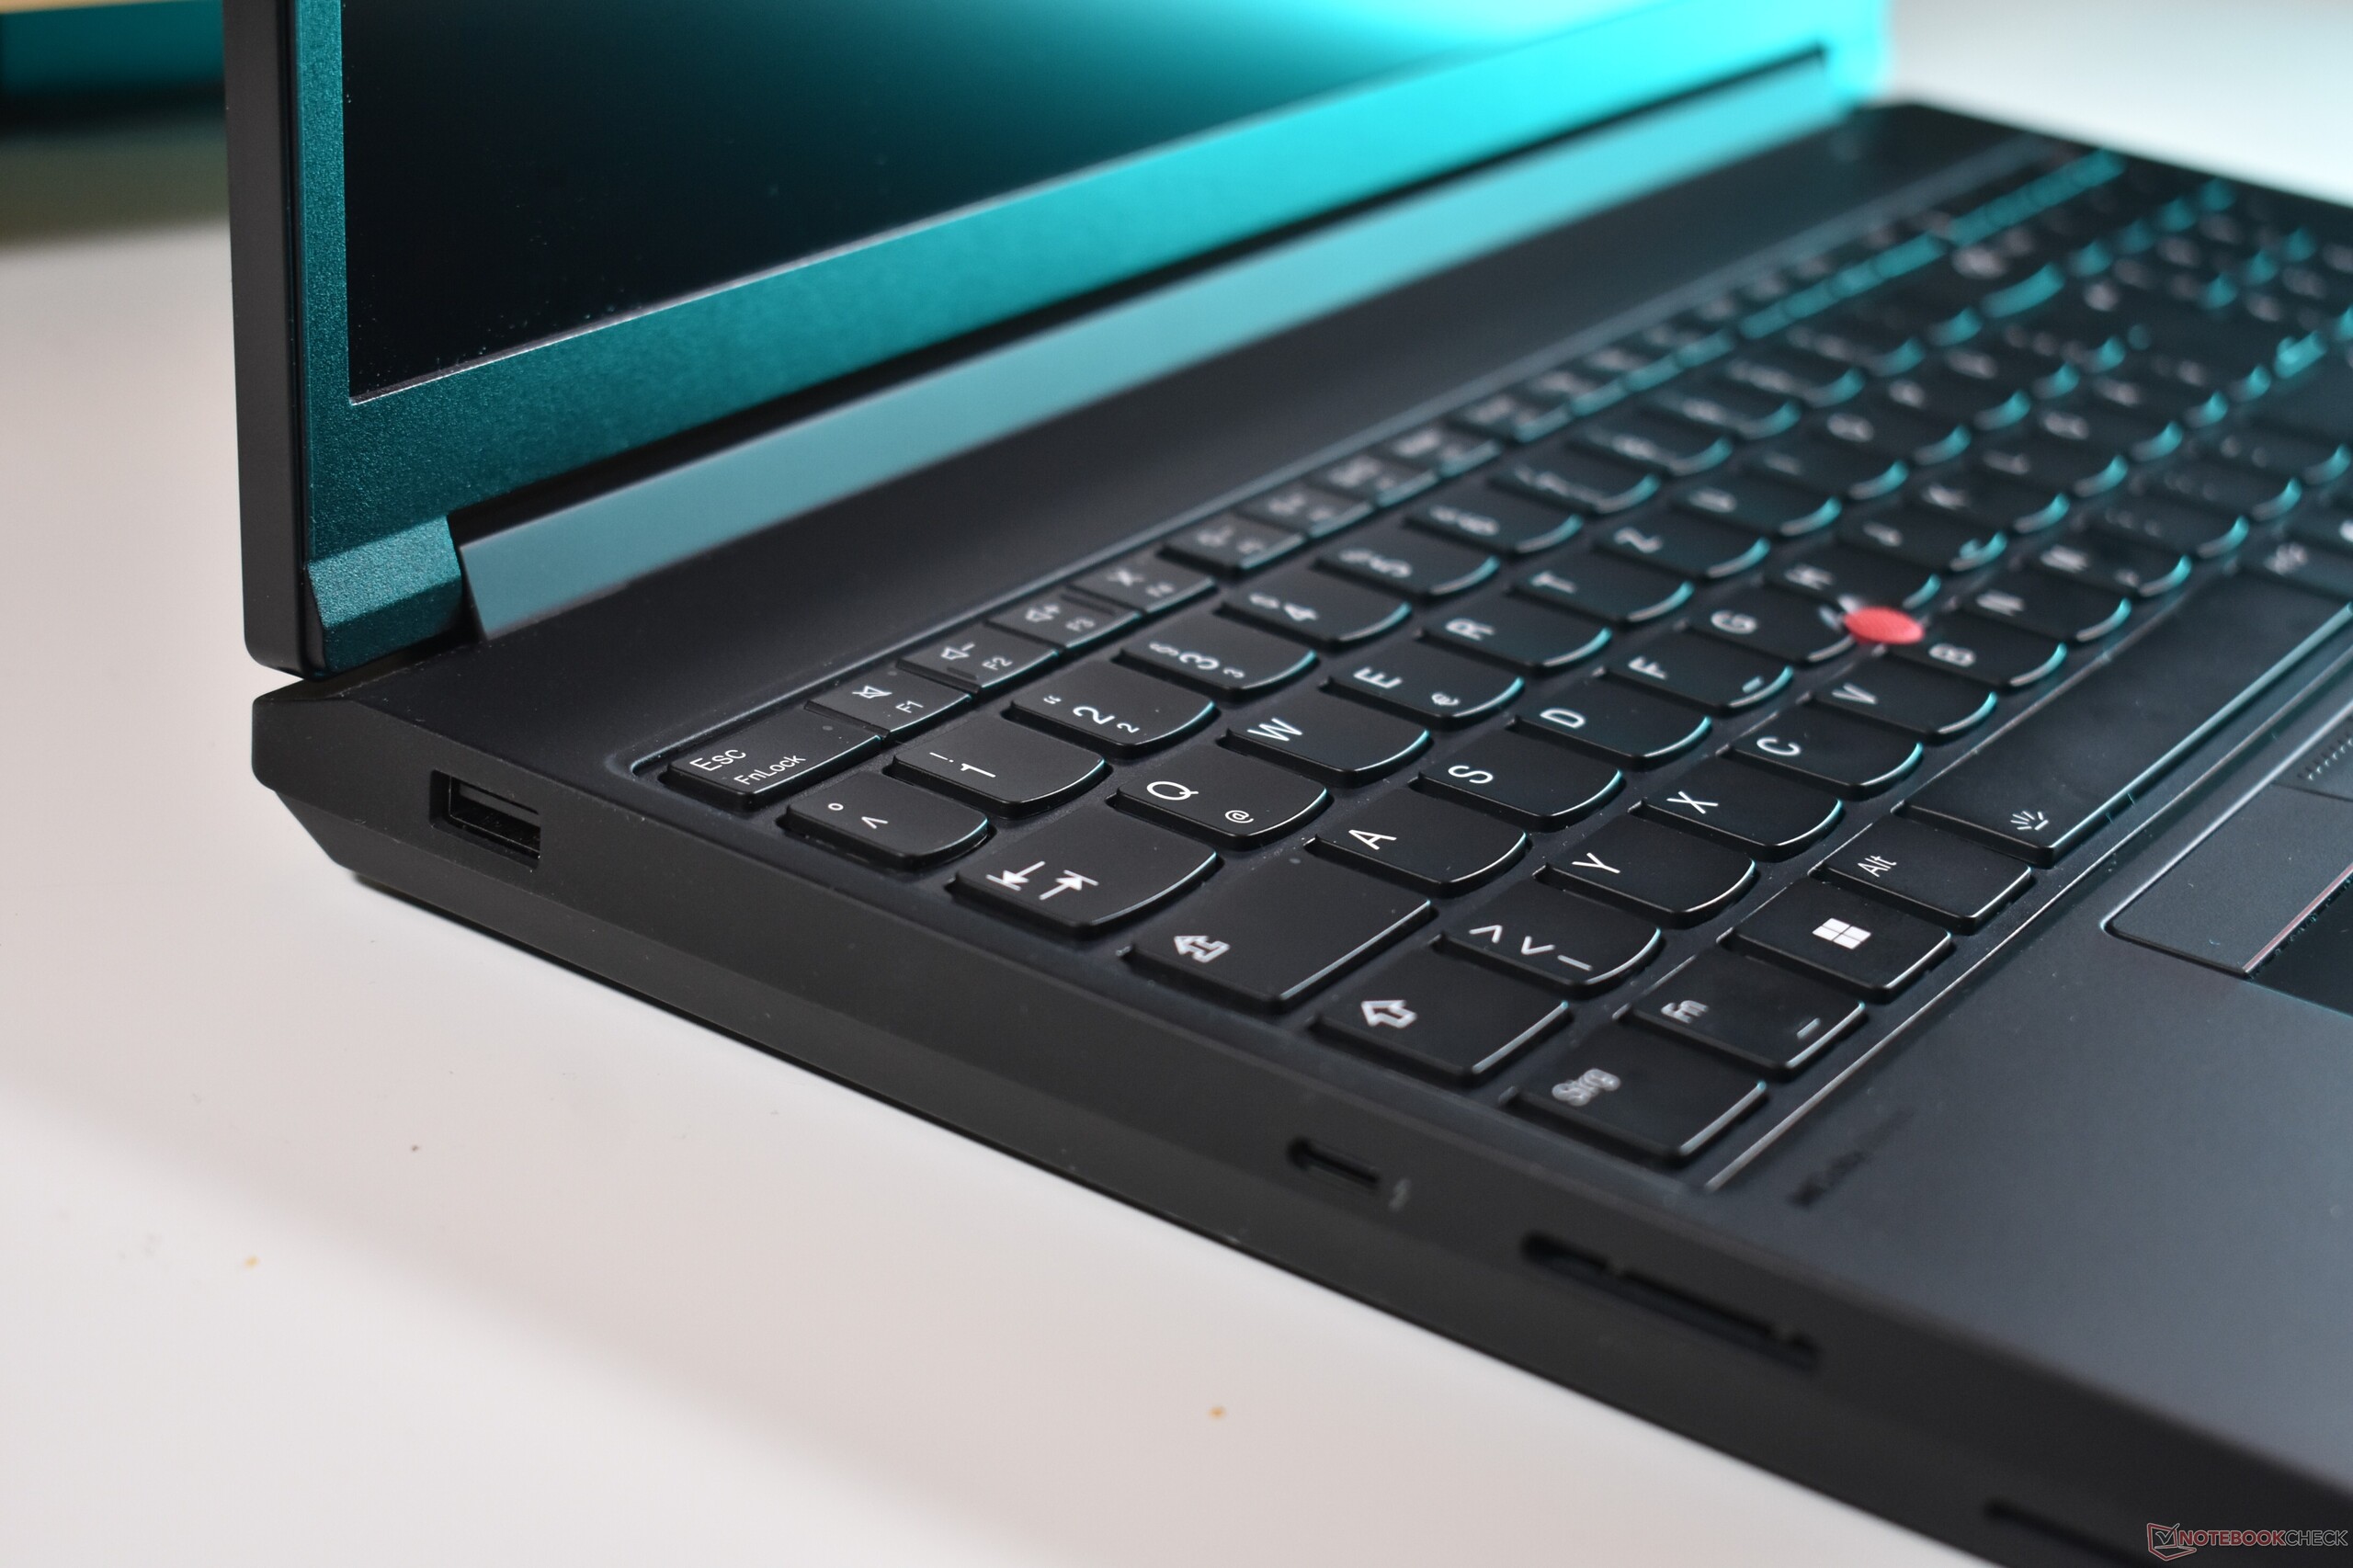
Clavier
Si le reste de l'ordinateur portable change, le clavier rétroéclairé wite-LED à deux niveaux reste le même qu'auparavant. Les touches arrondies et légèrement concaves offrent un contact doux mais défini avec une bonne distance de déplacement de 1,5 mm. La disposition est spacieuse et le pavé numérique dédié est idéal pour la saisie de chiffres. Dans l'ensemble, l'utilisation du clavier est un plaisir et il figure parmi les meilleurs de la gamme ThinkPad actuelle.

Pavé tactile
Hormis la couleur qui passe de l'argent au noir, le pavé tactile reste identique à celui du modèle précédent ThinkPad P16 G2. La surface en mylar du pavé tactile mécanique de type dive-board mesure 11,5 x 6,5 cm, son clic est bien amorti et, bien qu'il ne soit pas aussi agréable au toucher que le verre, sa surface est lisse, ce qui le rend très utilisable. Le TrackPoint du ThinkPad, avec ses trois boutons dédiés, est tout aussi bon, voire meilleur.


Affichage
Les acheteurs du Lenovo ThinkPad P16 Gen 3 ont le choix entre trois options d'écran :
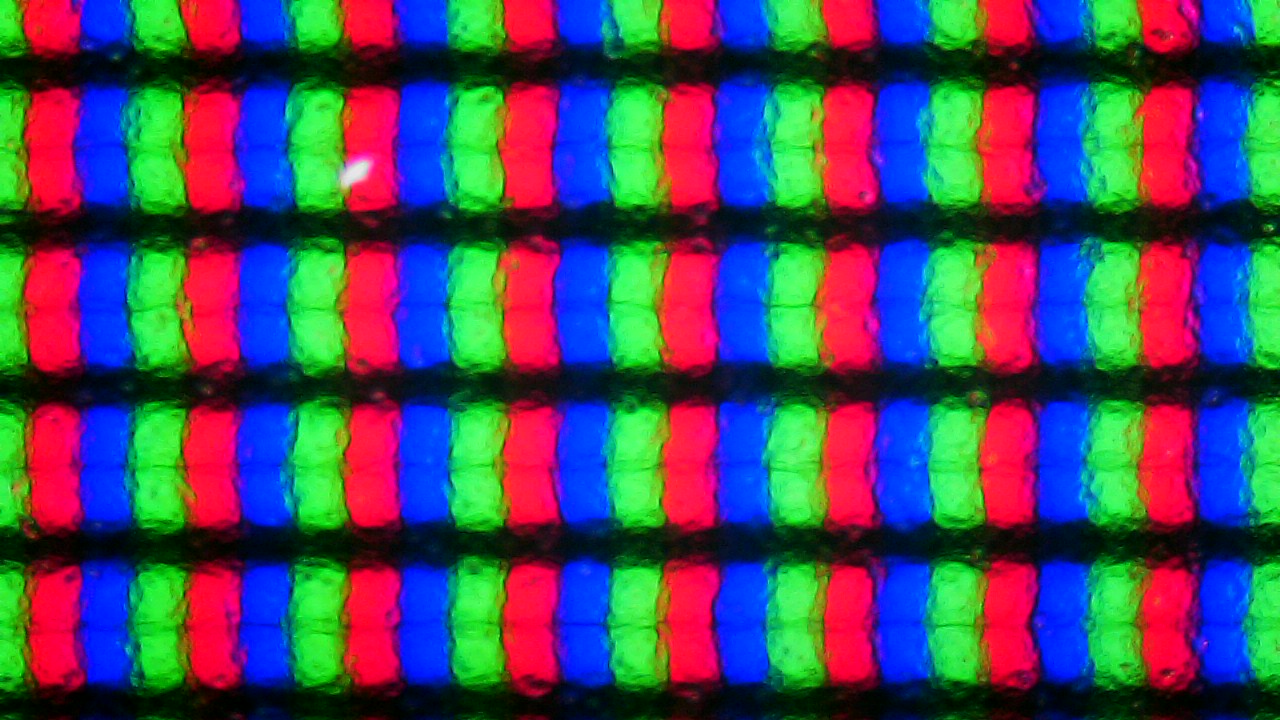
- WUXGA (1 920 x 1 200), IPS, 500 cd/m², 100 % sRGB, mat, 60 Hz
- 3.2K (3 200 x 2 000), Tandem OLED, 600 cd/m² (SDR) / 1500 cd/m² peak (HDR), 100 % DCI P3, semi-brillant, 40 - 120 Hz VRR, Dolby Vision
- 4K-WQUXGA (3 840 x 2 400), IPS, 800 cd/m², 100 % DCI P3, mat, Dolby Vision, 60 Hz
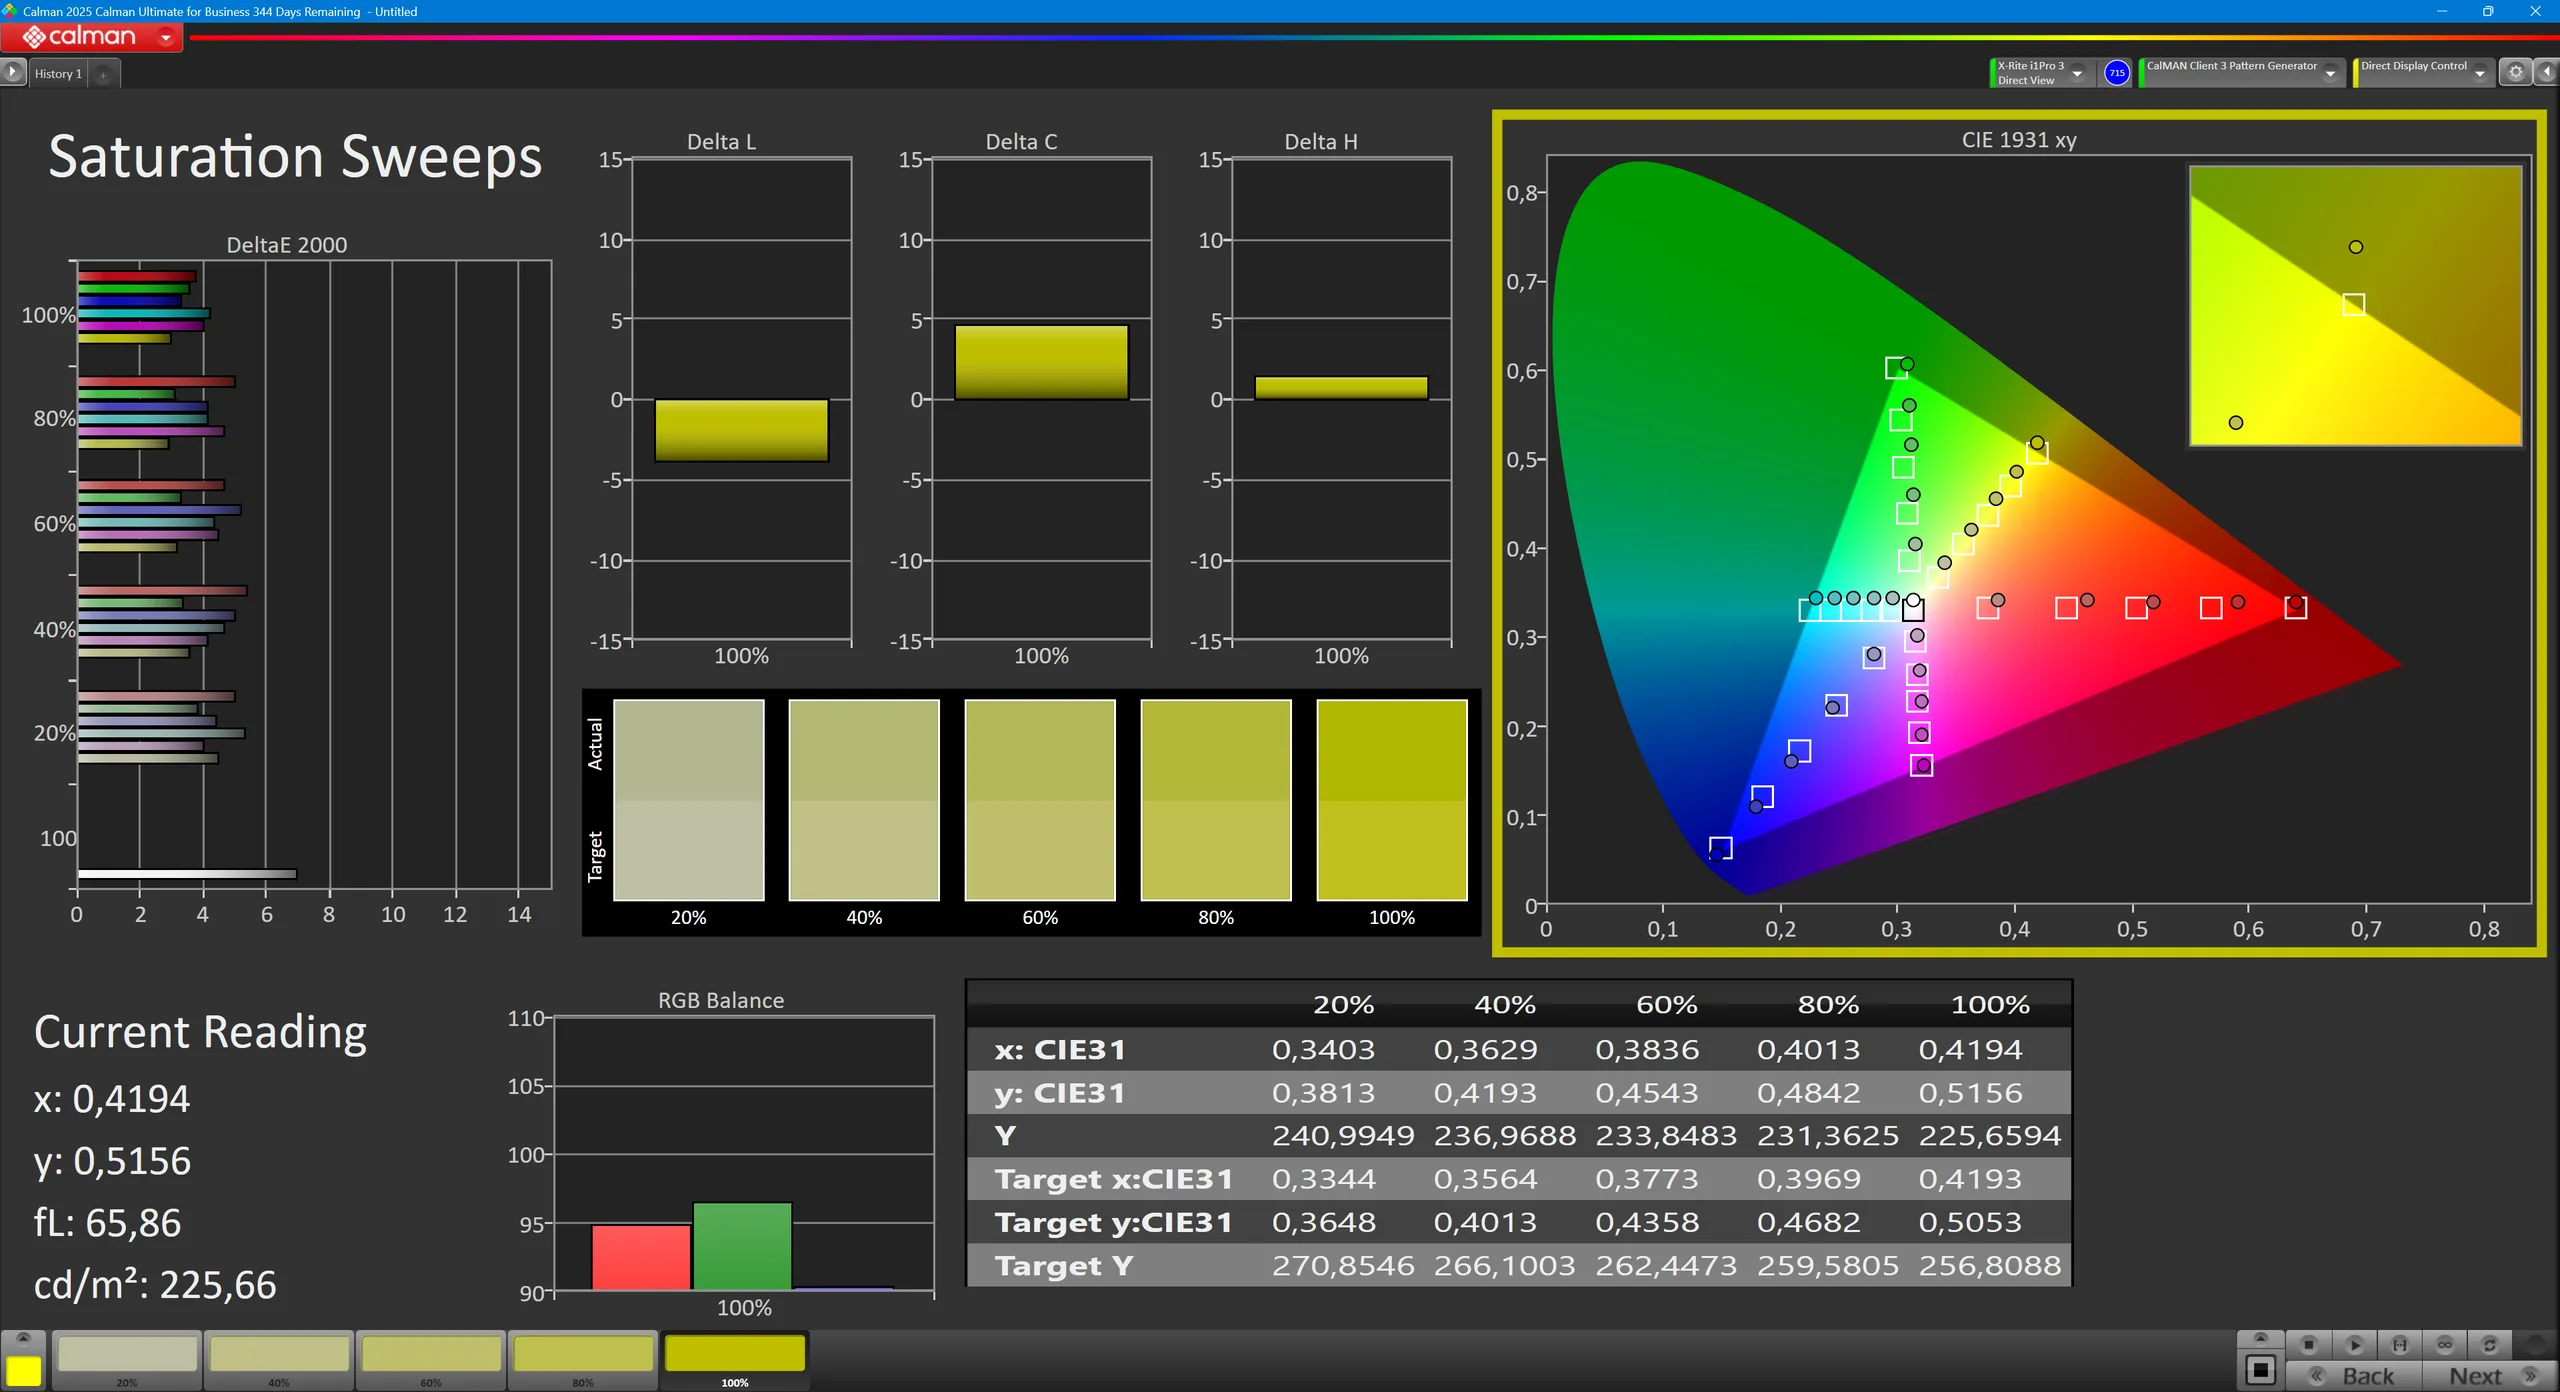
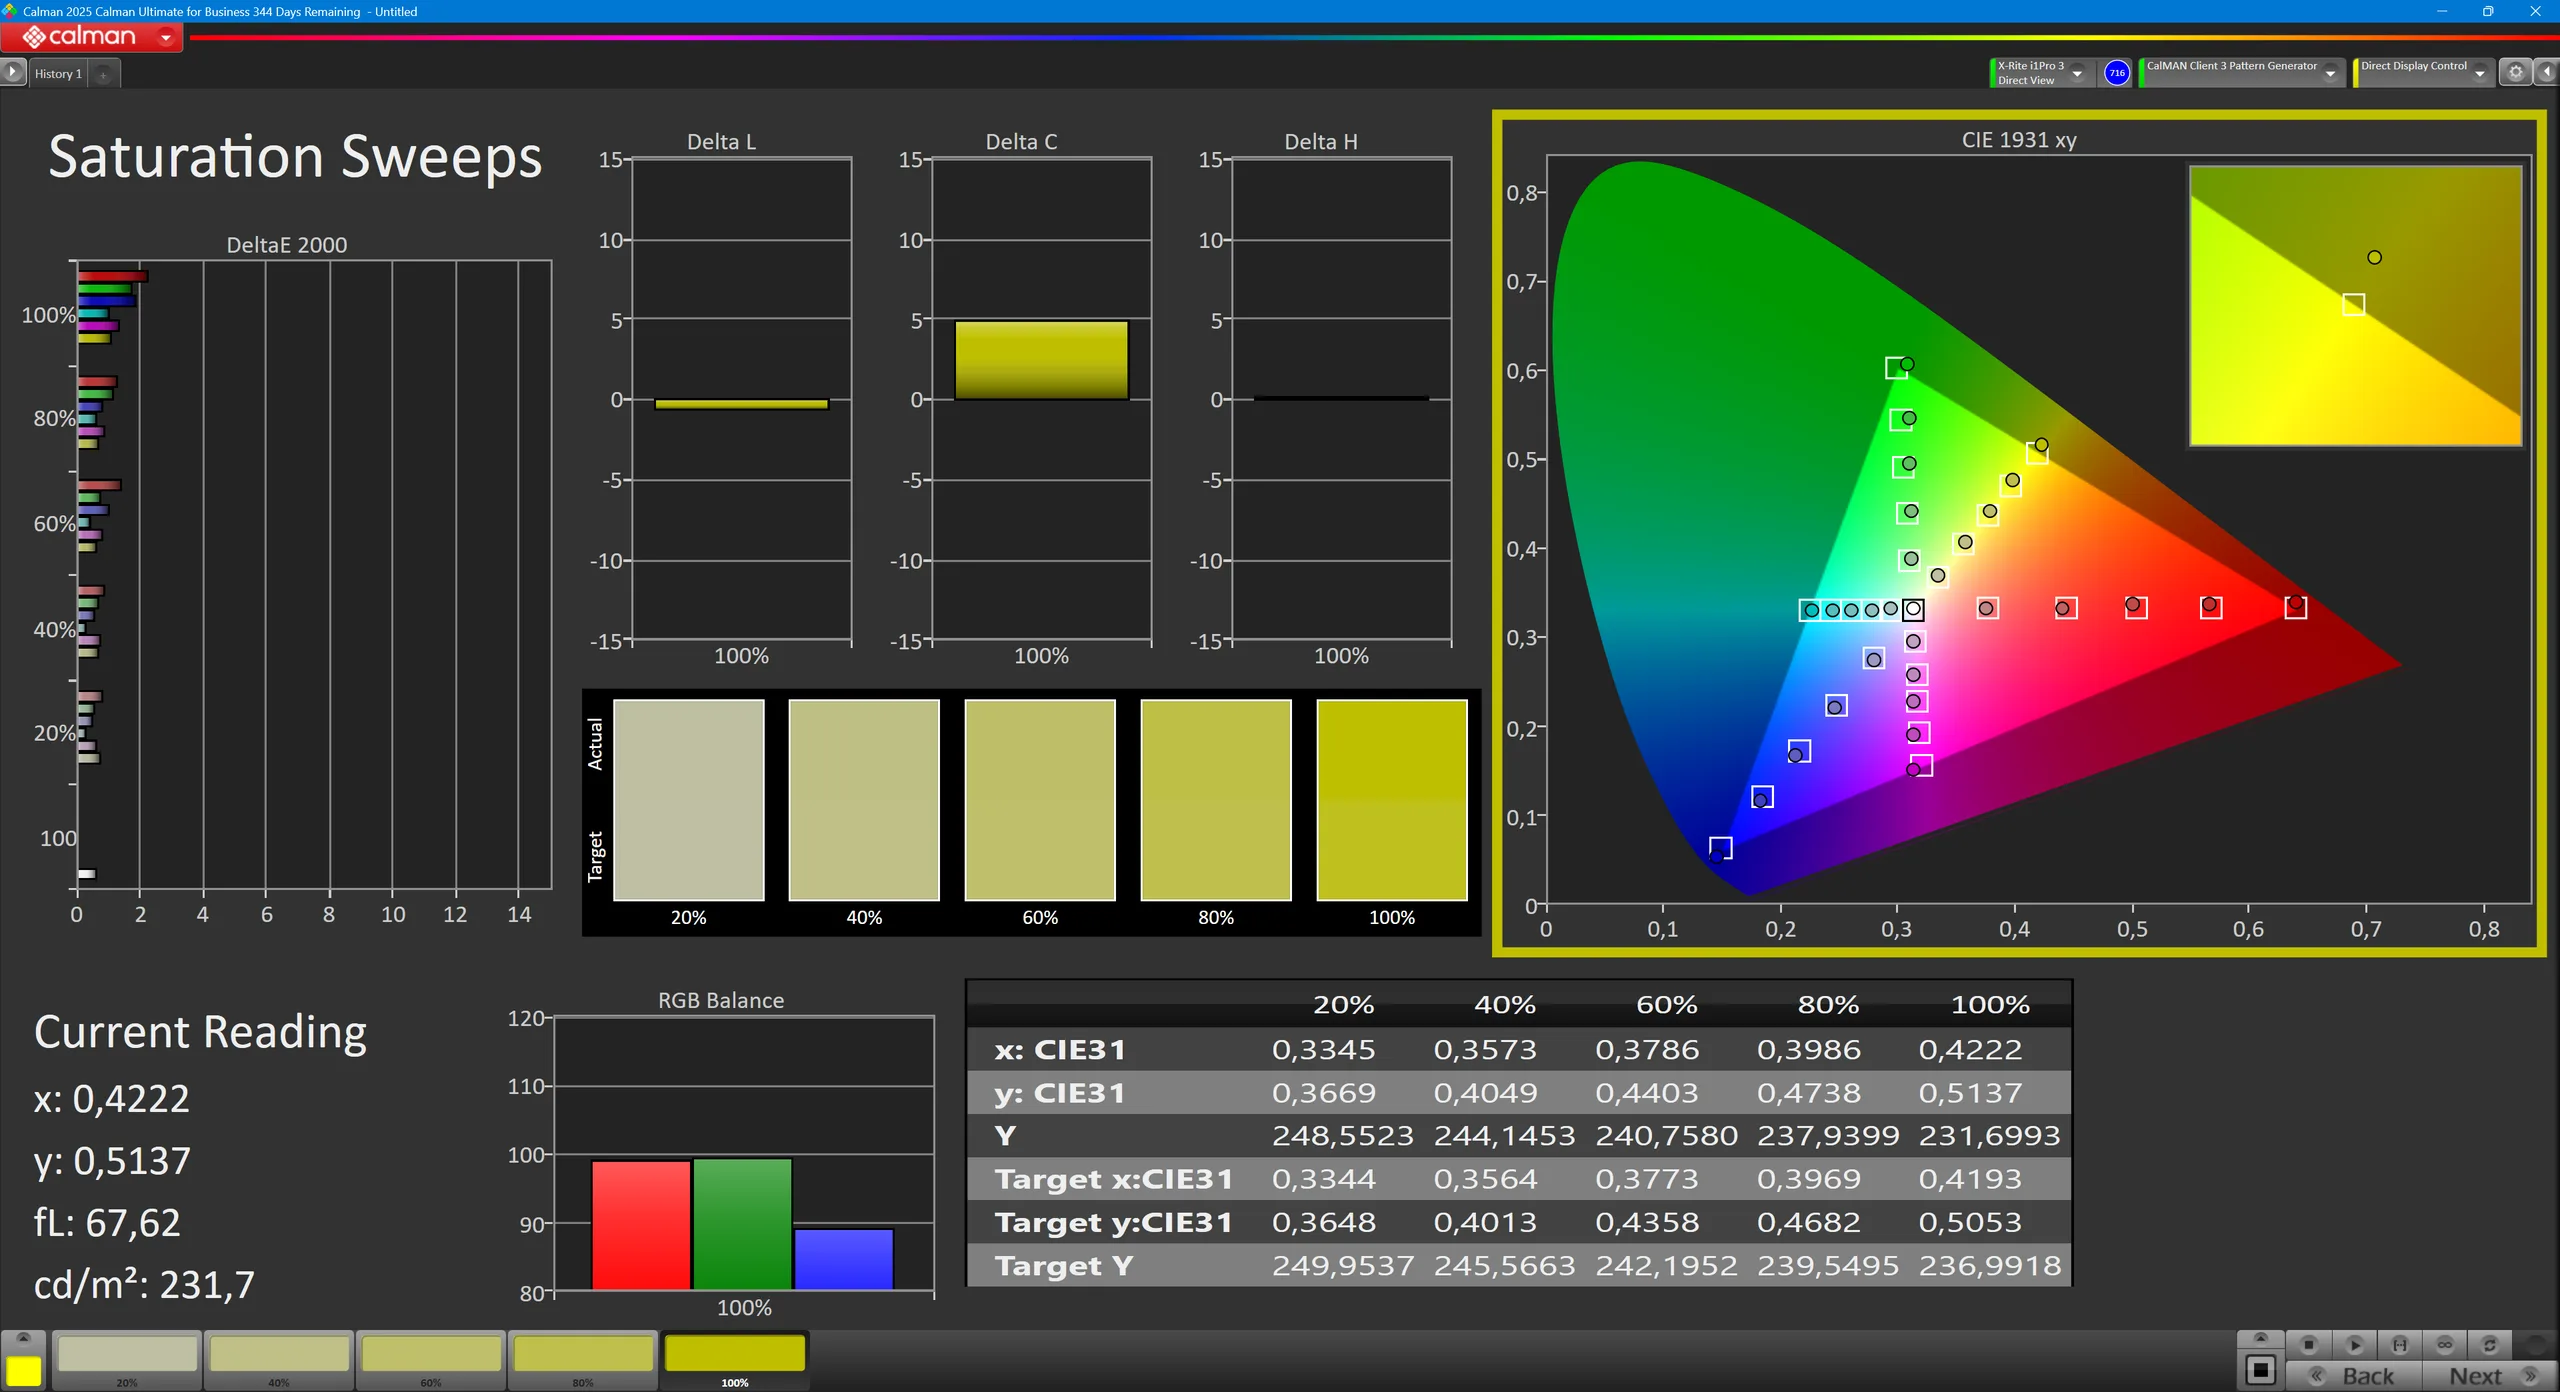
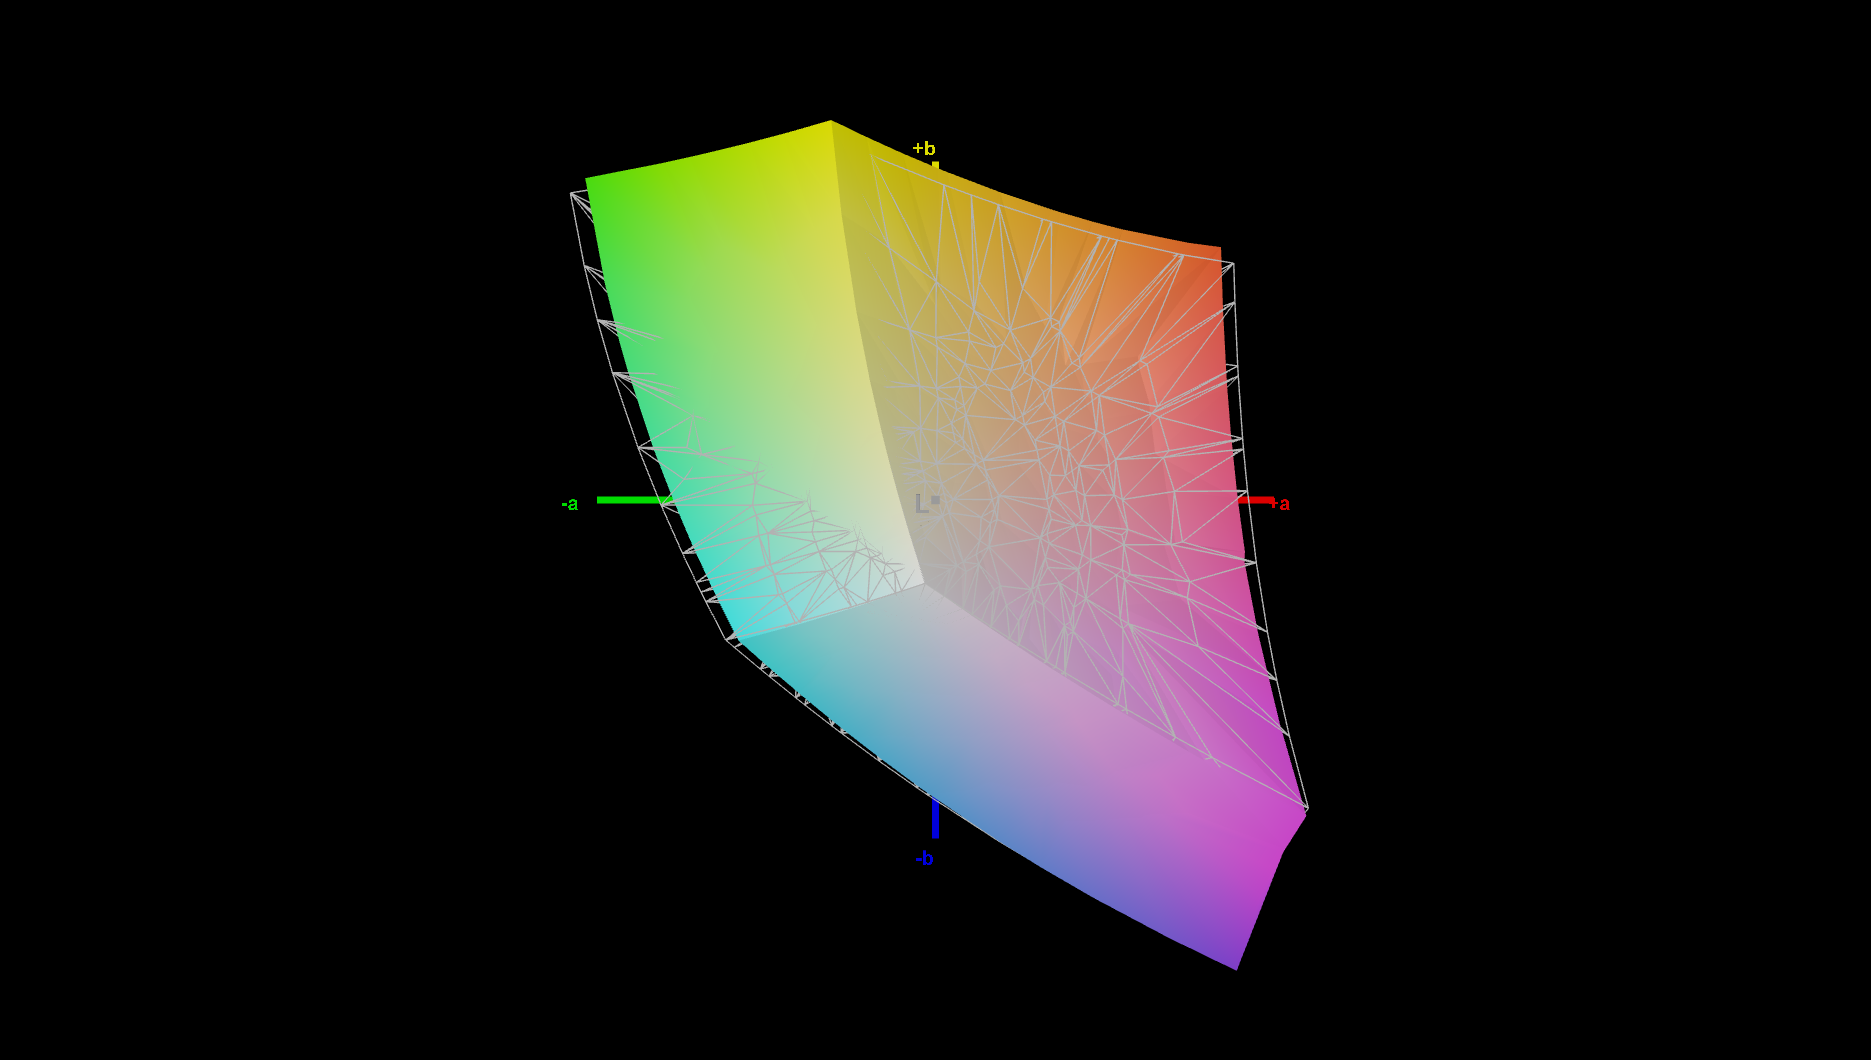
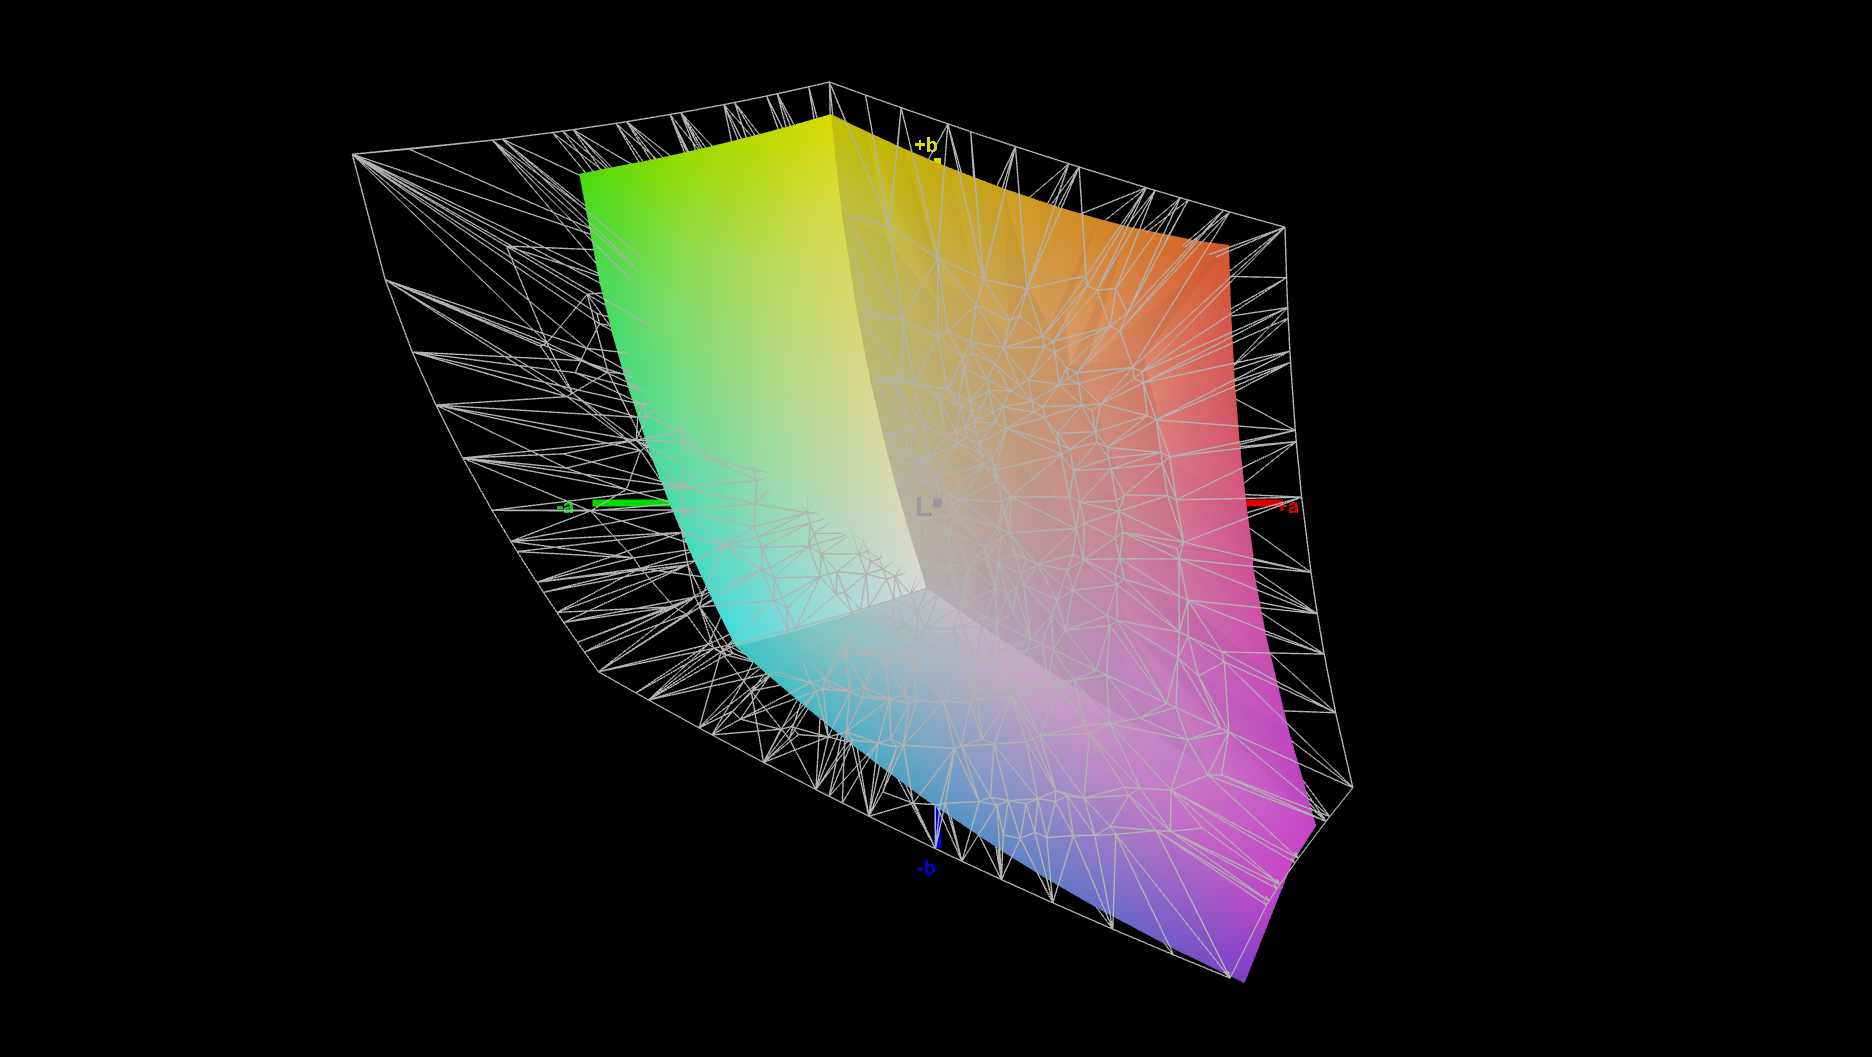
L'option d'écran de base de notre échantillon d'évaluation convient au travail de bureau et à d'autres tâches pour lesquelles une large gamme de couleurs n'est pas nécessaire. Pour une utilisation multimédia, il n'est pas le meilleur, notamment en raison du taux de rafraîchissement lent de 60 Hz. Au moins, il n'y a pas de PWM. Nous aurions aimé que la résolution soit plus élevée, car le WUXGA n'est pas très bon pour une station de travail de 16 pouces aussi chère.
| |||||||||||||||||||||||||
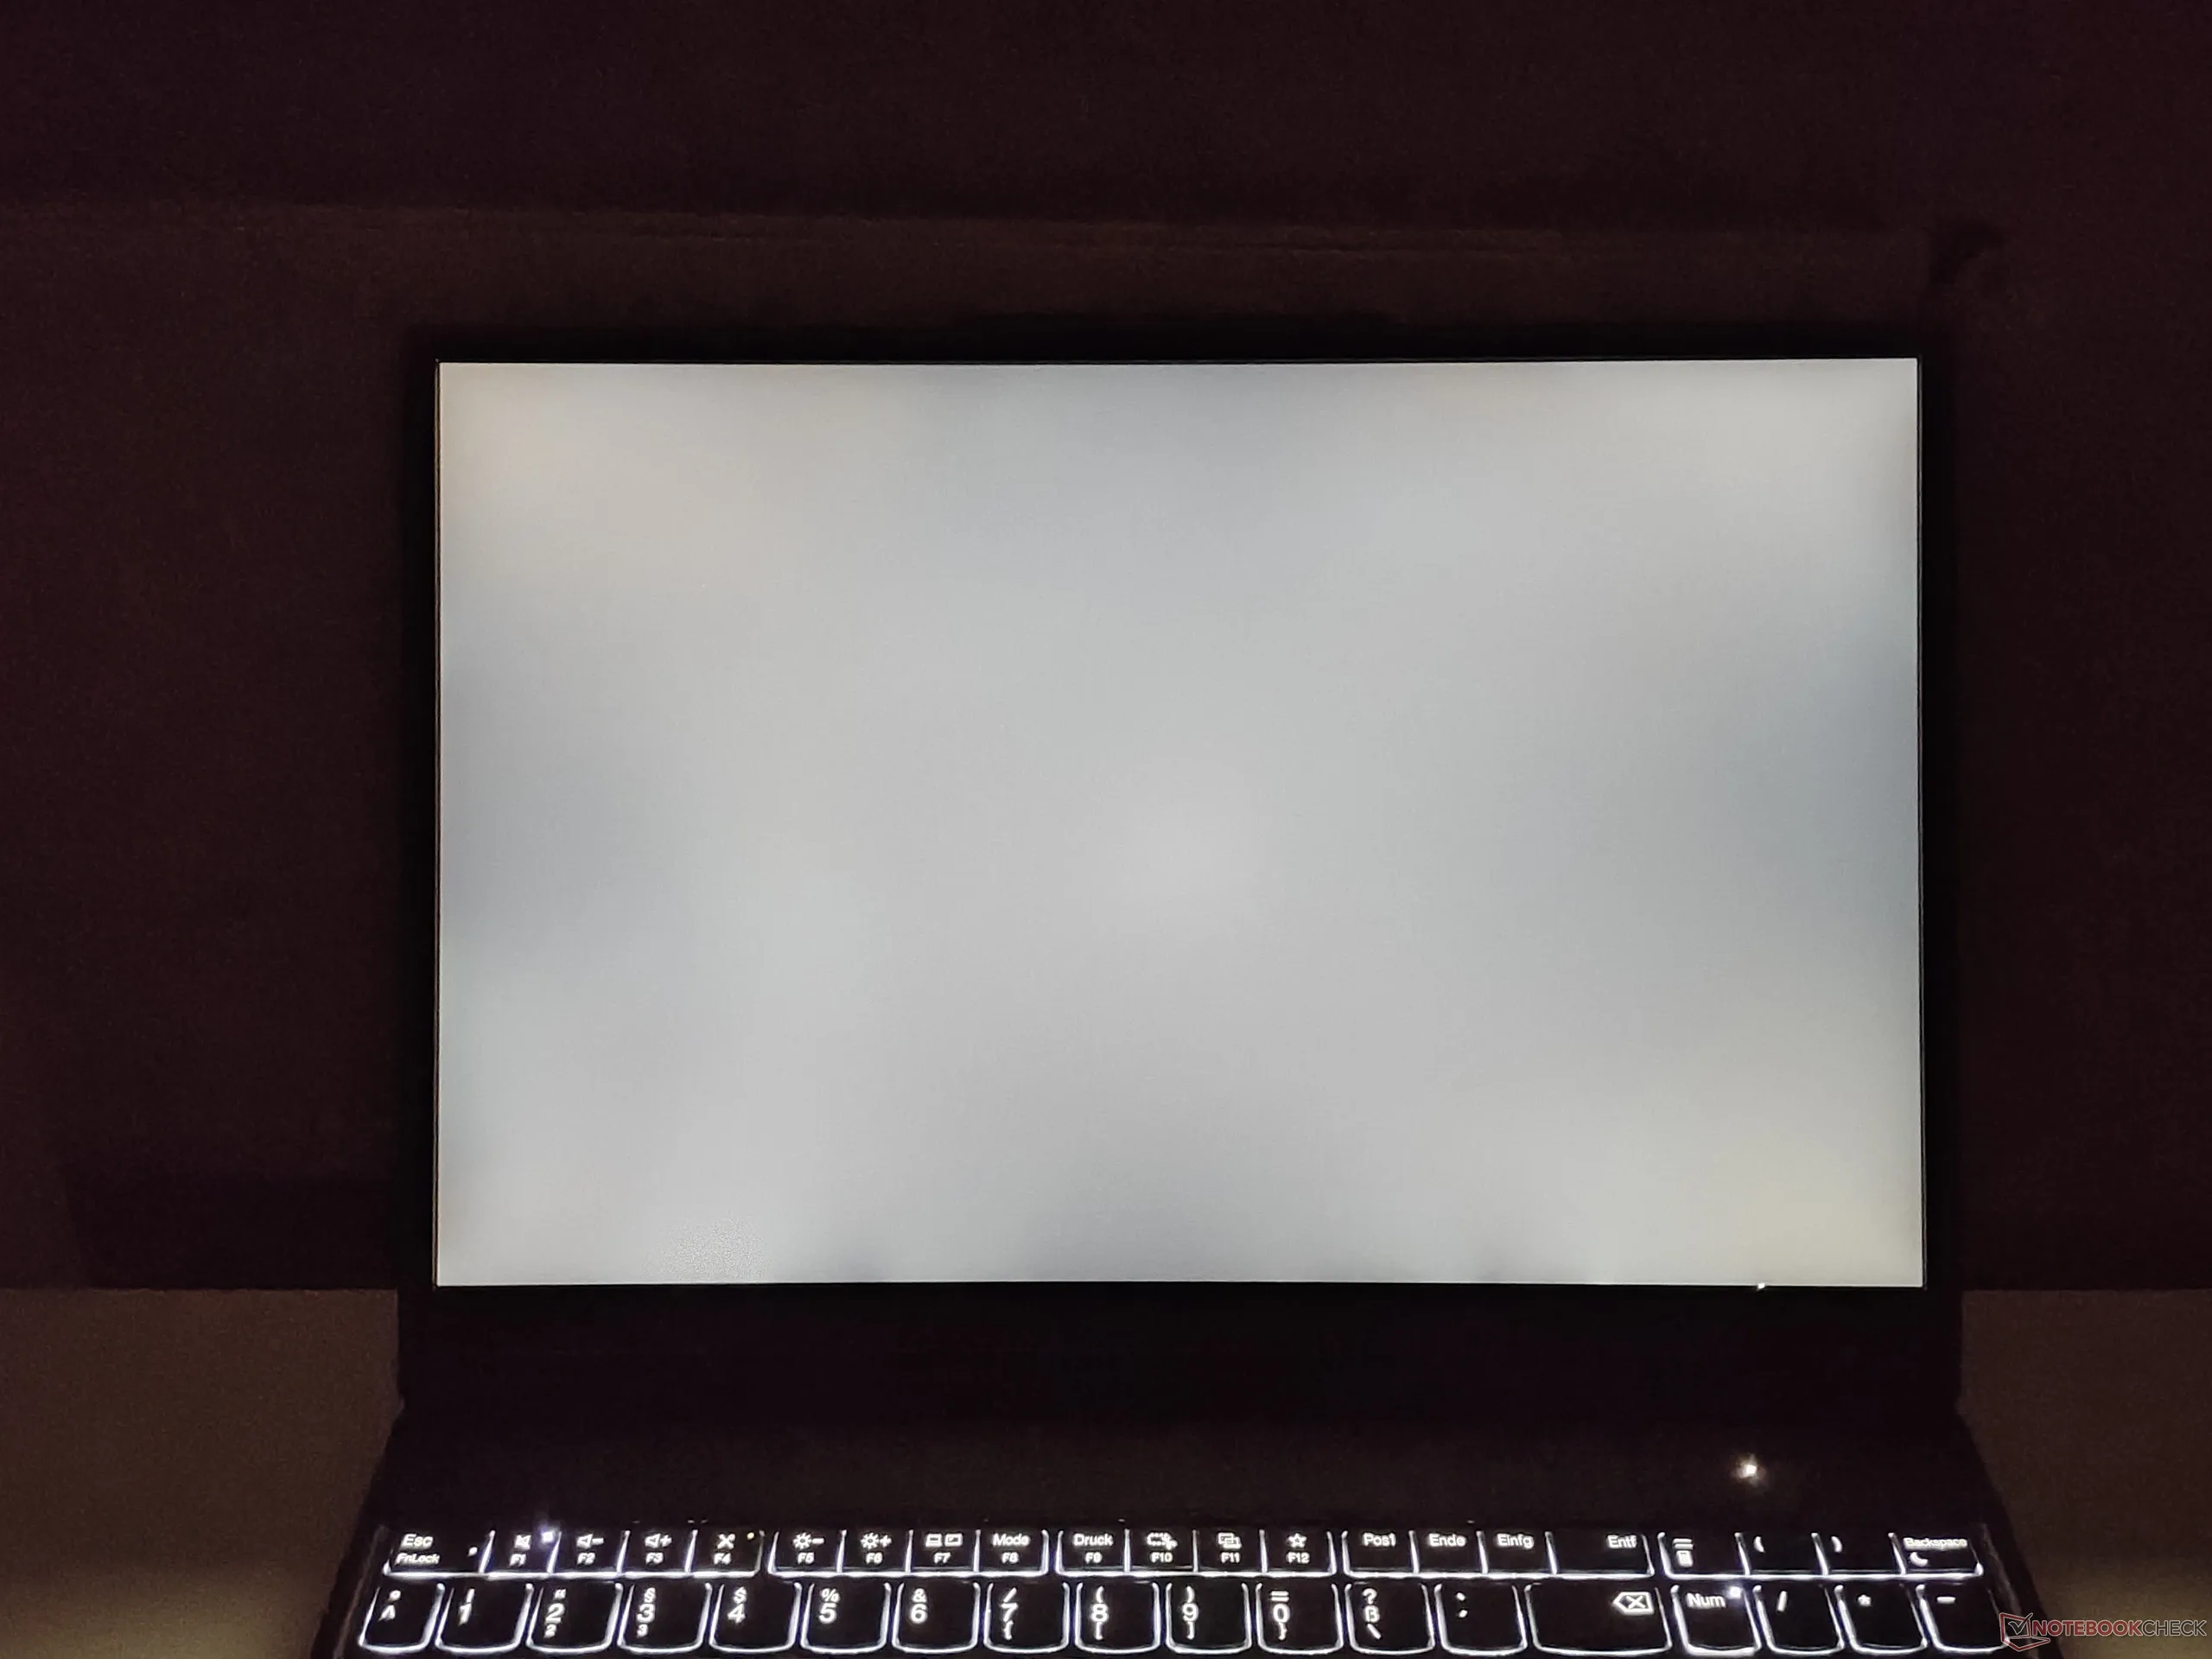
Homogénéité de la luminosité: 88 %
Valeur mesurée au centre, sur batterie: 532 cd/m²
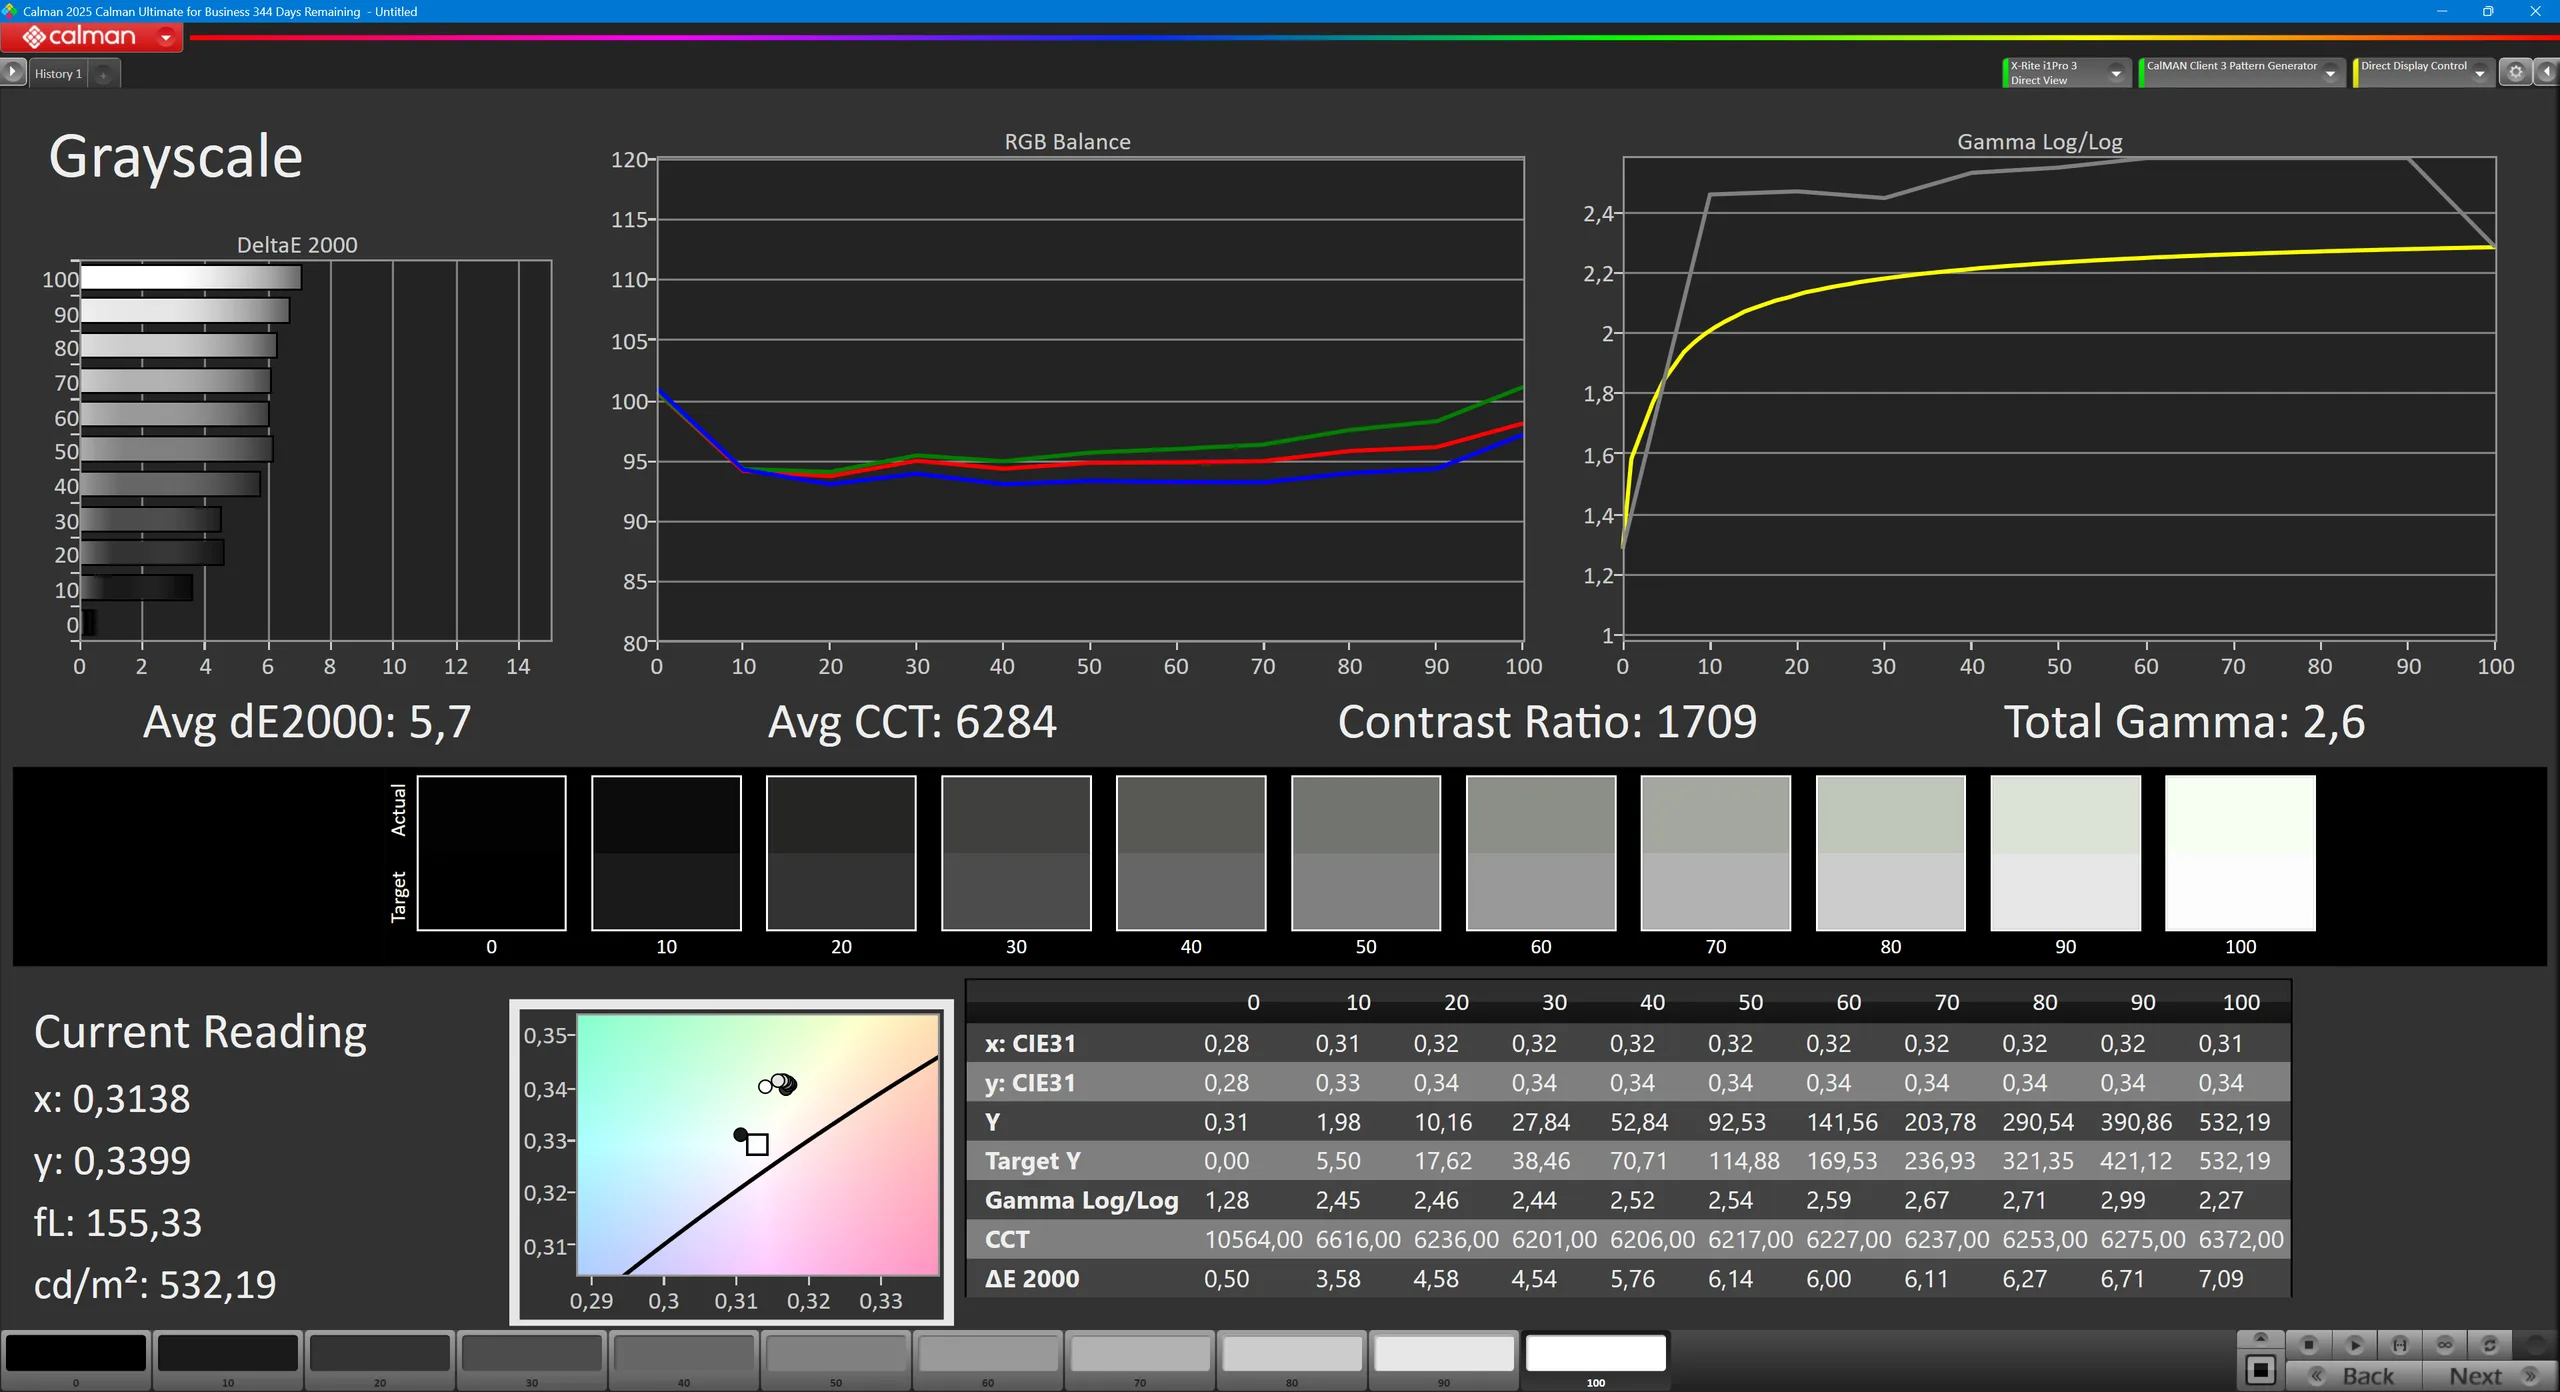
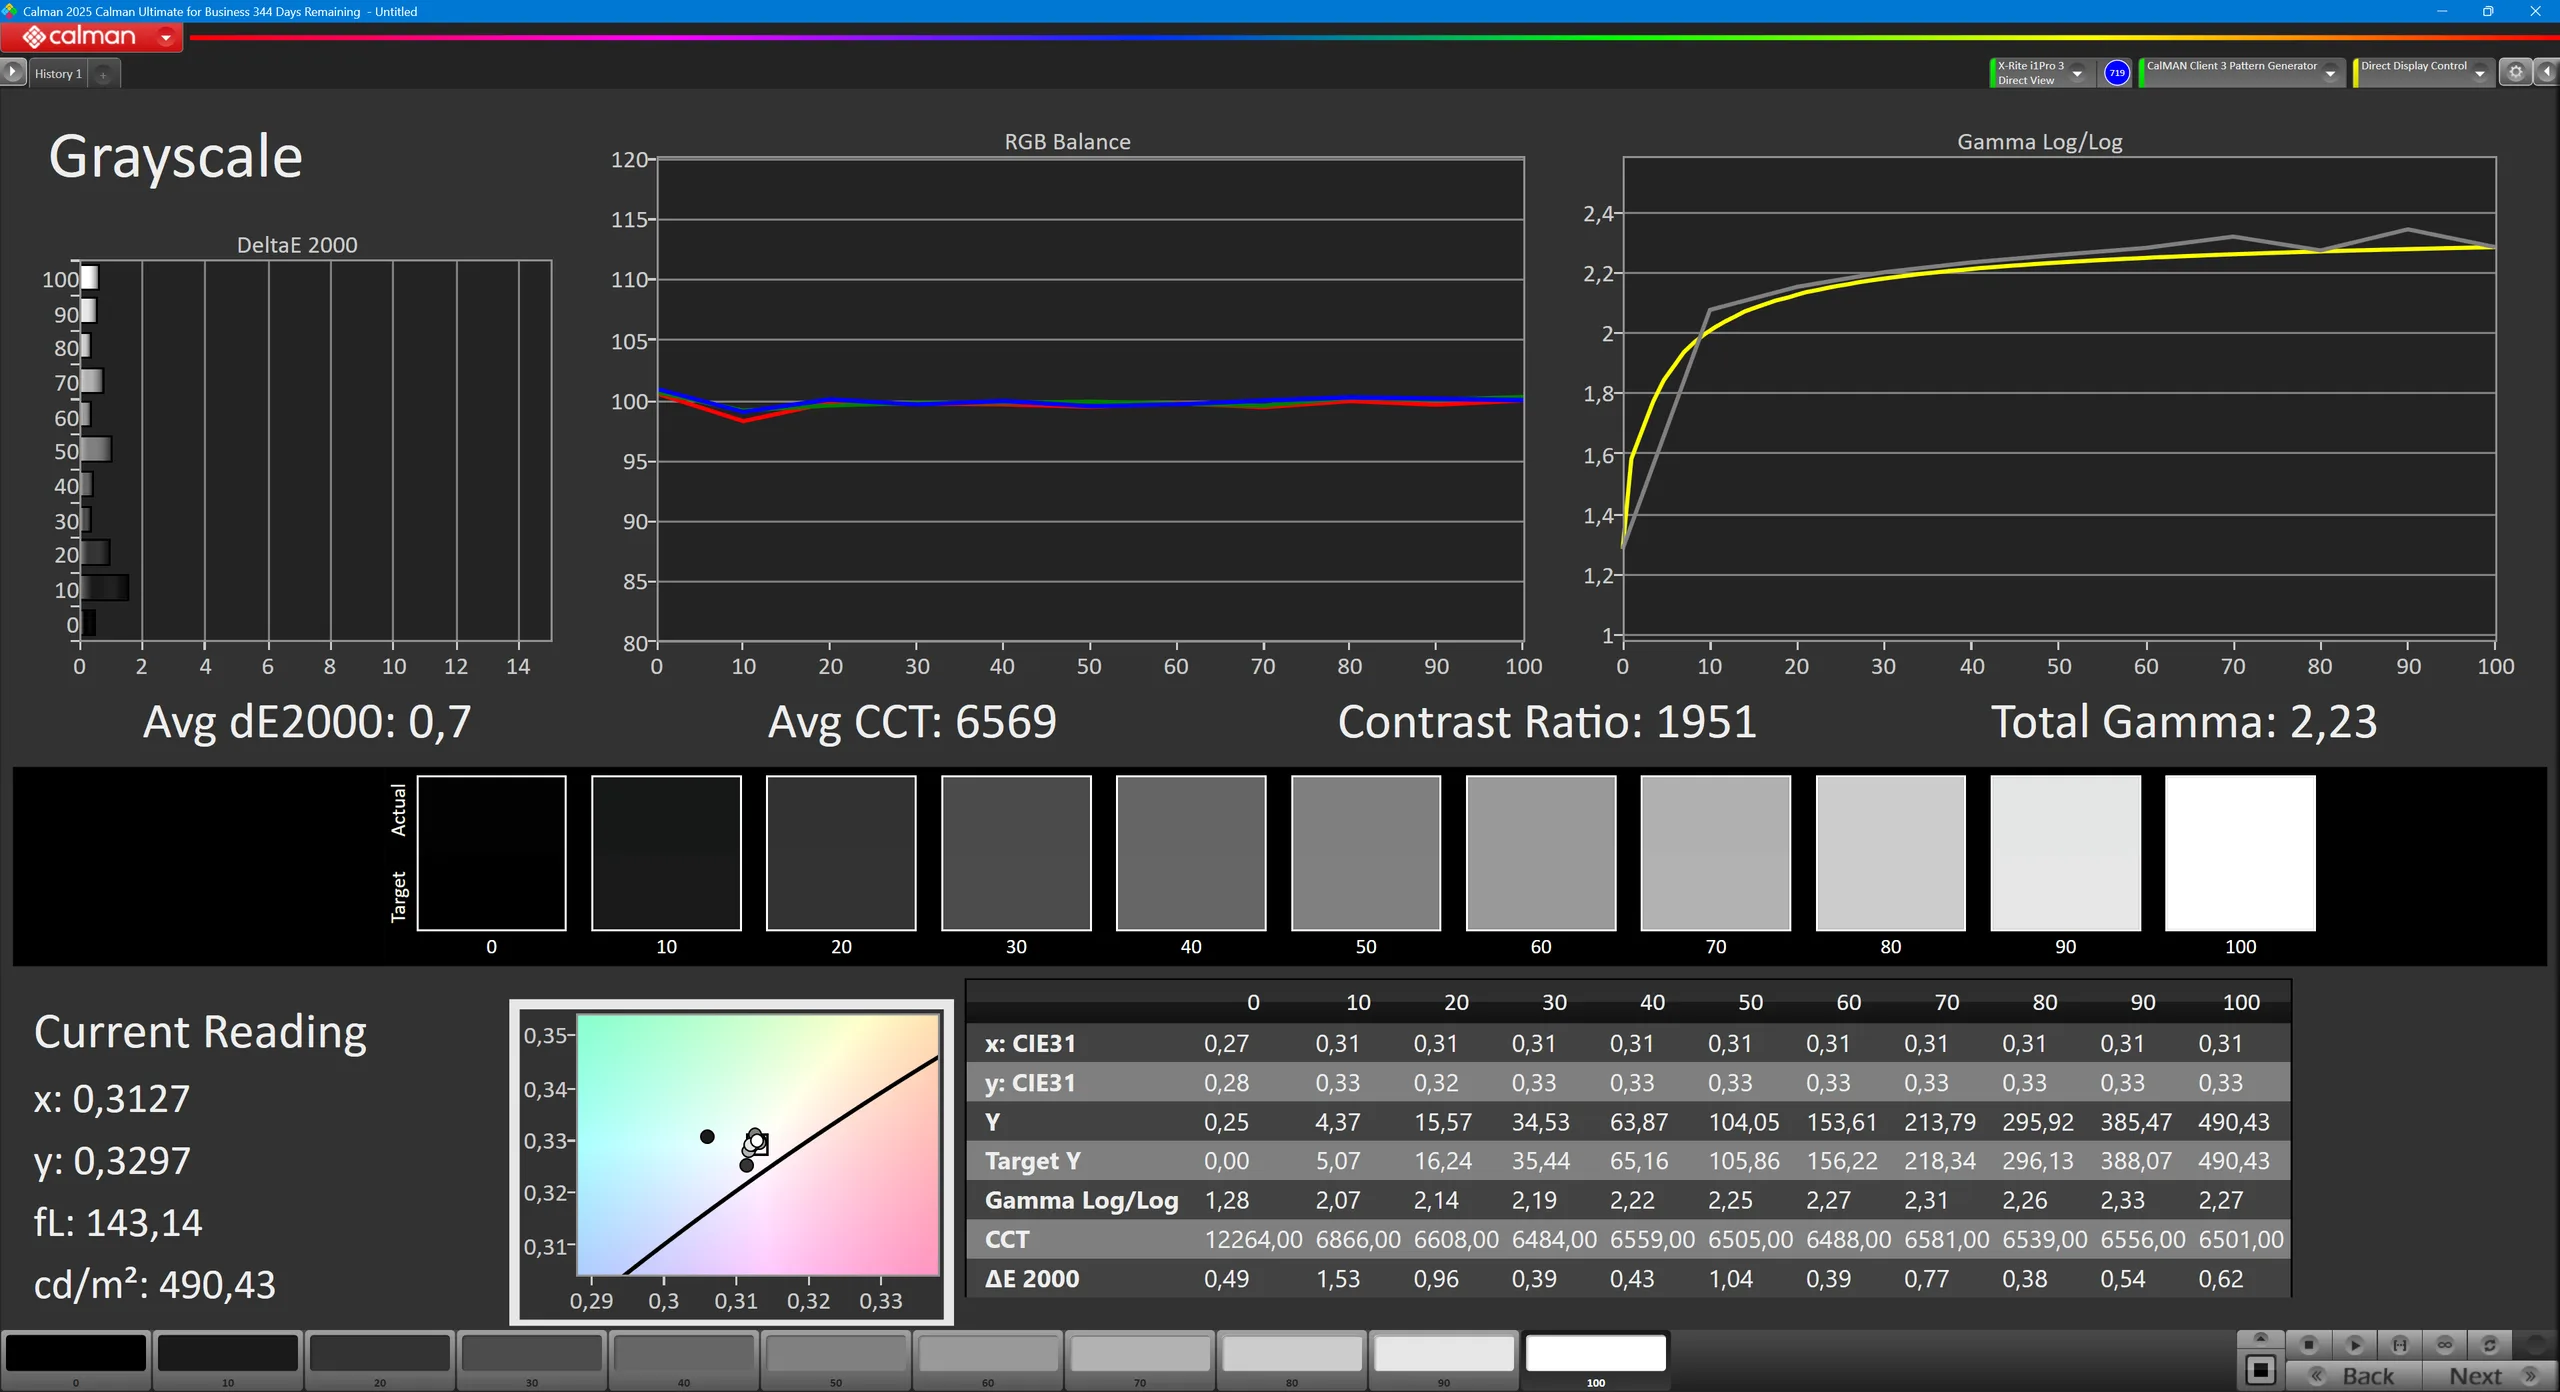
Contraste: 1716:1 (Valeurs des noirs: 0.31 cd/m²)
ΔE ColorChecker Calman: 4.4 | ∀{0.5-29.43 Ø4.74}
calibrated: 1.1
ΔE Greyscale Calman: 5.7 | ∀{0.09-98 Ø4.99}
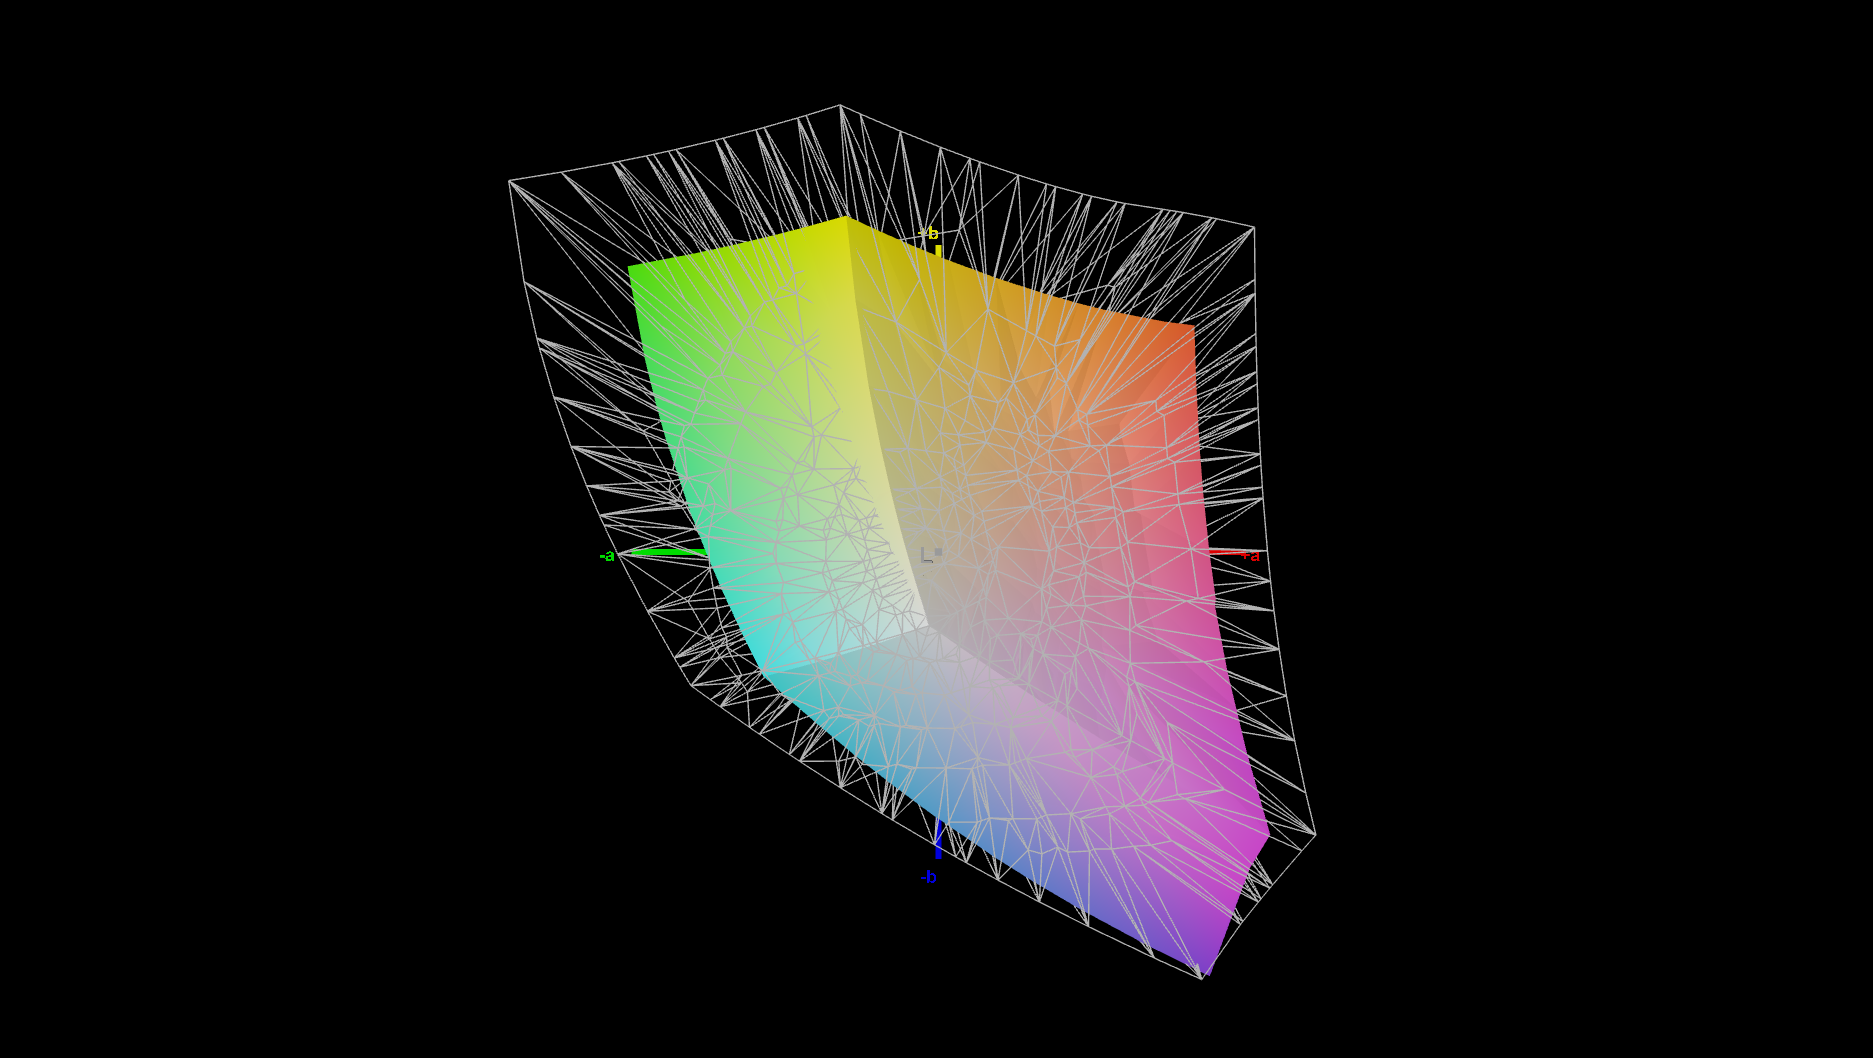
66.6% AdobeRGB 1998 (Argyll 3D)
95.2% sRGB (Argyll 3D)
64.9% Display P3 (Argyll 3D)
Gamma: 2.6
CCT: 6284 K
| Lenovo ThinkPad P16 Gen 3 N160JCA-GT1, IPS LED, 1920x1200, 16", 60 Hz | Lenovo ThinkPad P16 G2 21FA000FGE MNG007DA1-9, IPS LED, 2560x1600, 16", 165 Hz | Dell Pro Max 16 Plus Samsung 160HC01, OLED, 3840x2400, 16", 120 Hz | HP ZBook Fury 16 G11 AUO87A8, IPS, 3840x2400, 16", 120 Hz | Lenovo ThinkPad T16g Gen 3 RTX 5080 ATNA60KA02-0, OLED, 3200x2000, 16", 120 Hz | Lenovo ThinkPad P1 Gen 8 Samsung ATNA60KA02-0, Tandem OLED, 3200x2000, 16", 120 Hz | |
|---|---|---|---|---|---|---|
| Display | 8% | 29% | 29% | 30% | 34% | |
| Display P3 Coverage (%) | 64.9 | 71 9% | 97.3 50% | 98.4 52% | 98.8 52% | 98.8 52% |
| sRGB Coverage (%) | 95.2 | 99.2 4% | 100 5% | 99.9 5% | 100 5% | 100 5% |
| AdobeRGB 1998 Coverage (%) | 66.6 | 73.2 10% | 88.8 33% | 86 29% | 88.9 33% | 97.5 46% |
| Response Times | 52% | 97% | 59% | 97% | 97% | |
| Response Time Grey 50% / Grey 80% * (ms) | 29.8 ? | 12.8 ? 57% | 0.63 ? 98% | 11.4 ? 62% | 1.51 ? 95% | 0.57 ? 98% |
| Response Time Black / White * (ms) | 18.7 ? | 10.1 ? 46% | 0.89 ? 95% | 8.4 ? 55% | 0.44 ? 98% | 0.73 ? 96% |
| PWM Frequency (Hz) | 479.9 ? | 1200 ? | 1199 | |||
| PWM Amplitude * (%) | 28 | 22 | 18 | |||
| Screen | -5% | 29% | -1% | 43% | 37% | |
| Brightness middle (cd/m²) | 532 | 510 -4% | 530.9 0% | 457.6 -14% | 585 10% | 561.8 6% |
| Brightness (cd/m²) | 497 | 517 4% | 540 9% | 466 -6% | 590 19% | 566 14% |
| Brightness Distribution (%) | 88 | 89 1% | 95 8% | 83 -6% | 98 11% | 99 13% |
| Black Level * (cd/m²) | 0.31 | 0.37 -19% | 0.43 -39% | |||
| Contrast (:1) | 1716 | 1378 -20% | 1064 -38% | |||
| Colorchecker dE 2000 * | 4.4 | 2.6 41% | 2.42 45% | 2.78 37% | 0.9 80% | 1.29 71% |
| Colorchecker dE 2000 max. * | 6.9 | 5.2 25% | 5.76 17% | 5.53 20% | 2.7 61% | 2.96 57% |
| Colorchecker dE 2000 calibrated * | 1.1 | 2.3 -109% | 0.7 36% | 1.37 -25% | 0.81 26% | |
| Greyscale dE 2000 * | 5.7 | 3.6 37% | 0.8 86% | 2 65% | 1.4 75% | 1.4 75% |
| Gamma | 2.6 85% | 2.26 97% | 2.23 99% | 2.28 96% | 2.18 101% | 2.23 99% |
| CCT | 6284 103% | 5969 109% | 6488 100% | 6806 96% | 6442 101% | 6319 103% |
| Moyenne finale (programmes/paramètres) | 18% /
6% | 52% /
40% | 29% /
14% | 57% /
49% | 56% /
47% |
* ... Moindre est la valeur, meilleures sont les performances


Temps de réponse de l'écran
| ↔ Temps de réponse noir à blanc | ||
|---|---|---|
| 18.7 ms ... hausse ↗ et chute ↘ combinées | ↗ 10.4 ms hausse | 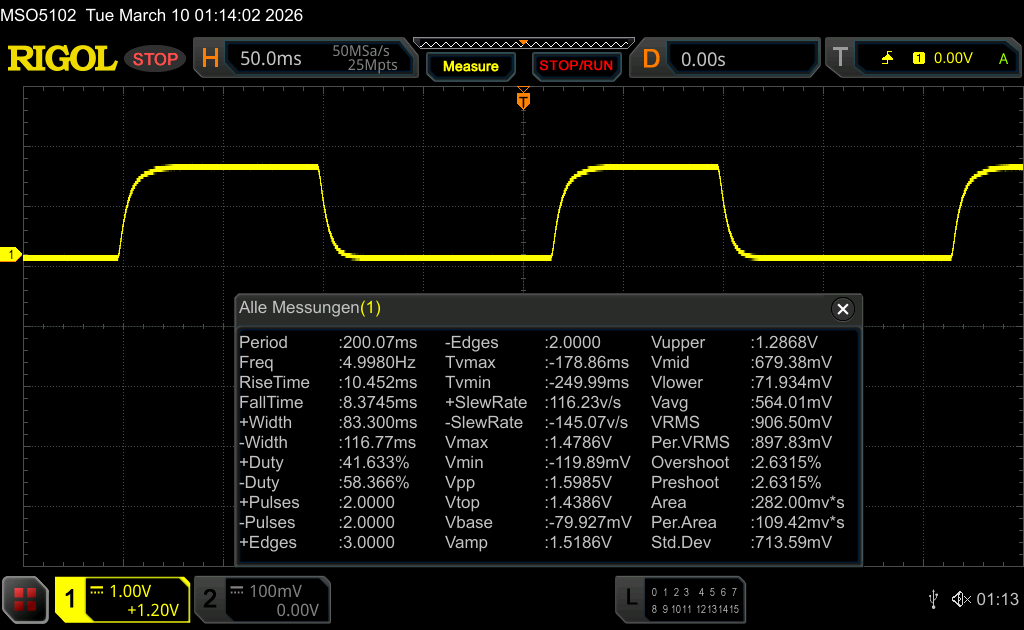 |
| ↘ 8.3 ms chute | ||
| L'écran montre de bons temps de réponse, mais insuffisant pour du jeu compétitif. En comparaison, tous les appareils testés affichent entre 0.1 (minimum) et 240 (maximum) ms. » 41 % des appareils testés affichent de meilleures performances. Cela signifie que les latences relevées sont similaires à la moyenne (20 ms) de tous les appareils testés. | ||
| ↔ Temps de réponse gris 50% à gris 80% | ||
| 29.8 ms ... hausse ↗ et chute ↘ combinées | ↗ 13.7 ms hausse | 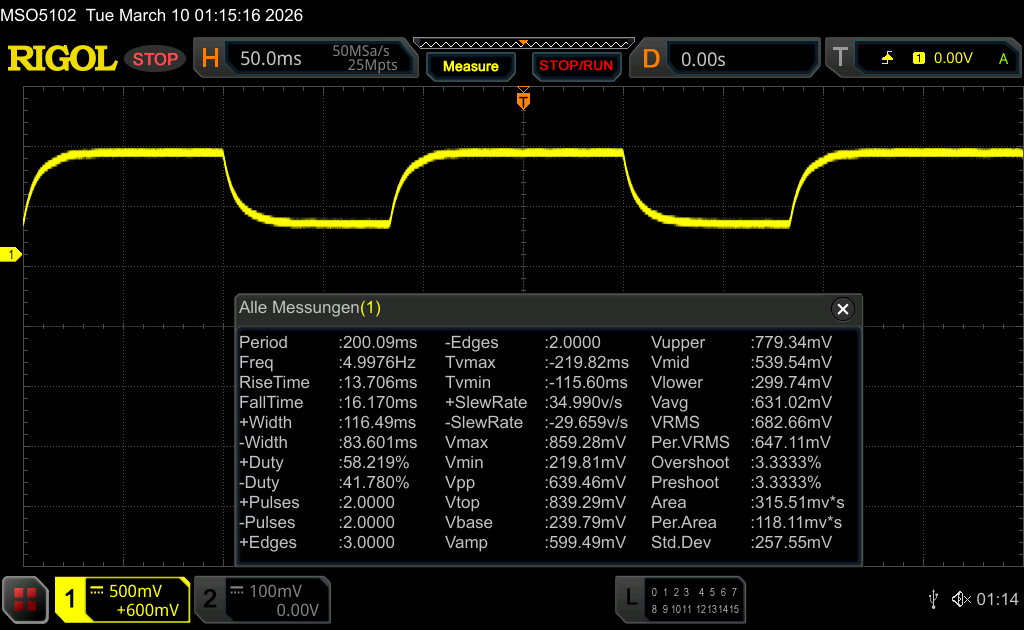 |
| ↘ 16.1 ms chute | ||
| L'écran souffre de latences relativement élevées, insuffisant pour le jeu. En comparaison, tous les appareils testés affichent entre 0.165 (minimum) et 636 (maximum) ms. » 40 % des appareils testés affichent de meilleures performances. Cela signifie que les latences relevées sont similaires à la moyenne (31.2 ms) de tous les appareils testés. | ||
Scintillement / MLI (Modulation de largeur d'impulsion)
| Scintillement / MLI (Modulation de largeur d'impulsion) non décelé |  | ||
En comparaison, 52 % des appareils testés n'emploient pas MDI pour assombrir leur écran. Nous avons relevé une moyenne à 7901 (minimum : 5 - maximum : 343500) Hz dans le cas où une MDI était active. | |||


Performance
Conditions d'essai
- Meilleure autonomie de la batterie : PL1 45 W / PL2 160 W
- Équilibrée : PL1 100 W / PL2 160 W
- Meilleure performance : PL1 110 W /PL2 160 W
Tous nos benchmarks ont été réalisés en mode "Best Performance".
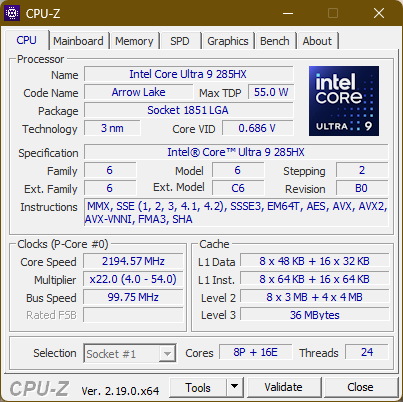
Processeur
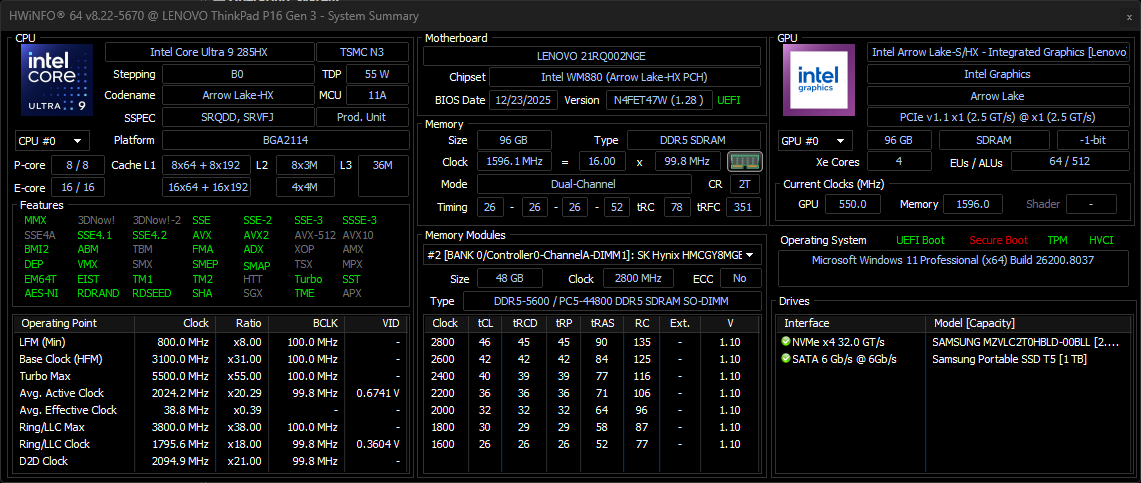
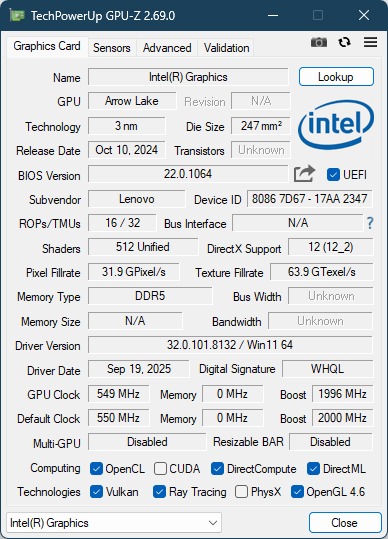
L'Intel Core Ultra 285HX Intel Core Ultra 285HX est un puissant processeur "Arrow Lake", basé sur la plus récente série de CPU pour ordinateurs de bureau d'Intel. Avec un total de 24 cœurs, dont huit peuvent atteindre jusqu'à 5,5 GHz, il s'agit de l'un des CPU Intel les plus rapides pour les ordinateurs portables. Vous pouvez effectuer d'autres comparaisons avec d'autres processeurs en consultant notre liste de CPU.
En moyenne, le ThinkPad P16 Gen 3 est 43 % plus rapide que le ThinkPad P16 Gen 2 en ce qui concerne les performances du processeur. Malgré cette grande avancée, les performances du processeur sont légèrement inférieures à la moyenne pour cette puce.
Lorsque l'ordinateur portable fonctionne sur batterie, les performances sont réduites de 26 %, à 27728 points dans le test Cinebench R23 Multicore.
Cinebench R15 Multi Loop
Cinebench R23: Multi Core | Single Core
Cinebench R20: CPU (Multi Core) | CPU (Single Core)
Cinebench R15: CPU Multi 64Bit | CPU Single 64Bit
Blender: v2.79 BMW27 CPU
7-Zip 18.03: 7z b 4 | 7z b 4 -mmt1
Geekbench 6.6: Multi-Core | Single-Core
Geekbench 5.5: Multi-Core | Single-Core
HWBOT x265 Benchmark v2.2: 4k Preset
LibreOffice : 20 Documents To PDF
R Benchmark 2.5: Overall mean
| CPU Performance rating | |
| Moyenne Intel Core Ultra 9 285HX | |
| Lenovo ThinkPad T16g Gen 3 RTX 5080 | |
| Dell Pro Max 16 Plus | |
| Lenovo ThinkPad P16 Gen 3 | |
| HP ZBook Fury 16 G11 | |
| Moyenne de la classe Workstation | |
| Lenovo ThinkPad P1 Gen 8 | |
| Lenovo ThinkPad P16 G2 21FA000FGE -2! | |
| Cinebench R23 / Multi Core | |
| Lenovo ThinkPad T16g Gen 3 RTX 5080 | |
| Moyenne Intel Core Ultra 9 285HX (34955 - 40117, n=6) | |
| Dell Pro Max 16 Plus | |
| Lenovo ThinkPad P16 Gen 3 | |
| HP ZBook Fury 16 G11 | |
| Moyenne de la classe Workstation (14055 - 38520, n=26, 2 dernières années) | |
| Lenovo ThinkPad P1 Gen 8 | |
| Lenovo ThinkPad P16 G2 21FA000FGE | |
| Cinebench R23 / Single Core | |
| Lenovo ThinkPad P16 Gen 3 | |
| Lenovo ThinkPad T16g Gen 3 RTX 5080 | |
| Moyenne Intel Core Ultra 9 285HX (2057 - 2303, n=6) | |
| HP ZBook Fury 16 G11 | |
| Dell Pro Max 16 Plus | |
| Lenovo ThinkPad P1 Gen 8 | |
| Moyenne de la classe Workstation (1712 - 2228, n=26, 2 dernières années) | |
| Lenovo ThinkPad P16 G2 21FA000FGE | |
| Cinebench R20 / CPU (Multi Core) | |
| Lenovo ThinkPad T16g Gen 3 RTX 5080 | |
| Moyenne Intel Core Ultra 9 285HX (13152 - 15751, n=6) | |
| Dell Pro Max 16 Plus | |
| Lenovo ThinkPad P16 Gen 3 | |
| HP ZBook Fury 16 G11 | |
| Moyenne de la classe Workstation (5471 - 15043, n=26, 2 dernières années) | |
| Lenovo ThinkPad P1 Gen 8 | |
| Lenovo ThinkPad P16 G2 21FA000FGE | |
| Cinebench R20 / CPU (Single Core) | |
| Lenovo ThinkPad P16 Gen 3 | |
| Lenovo ThinkPad T16g Gen 3 RTX 5080 | |
| Moyenne Intel Core Ultra 9 285HX (799 - 884, n=6) | |
| HP ZBook Fury 16 G11 | |
| Dell Pro Max 16 Plus | |
| Moyenne de la classe Workstation (671 - 857, n=26, 2 dernières années) | |
| Lenovo ThinkPad P1 Gen 8 | |
| Lenovo ThinkPad P16 G2 21FA000FGE | |
| Cinebench R15 / CPU Multi 64Bit | |
| Lenovo ThinkPad T16g Gen 3 RTX 5080 | |
| Moyenne Intel Core Ultra 9 285HX (5427 - 6232, n=6) | |
| Lenovo ThinkPad P16 Gen 3 | |
| Dell Pro Max 16 Plus | |
| HP ZBook Fury 16 G11 | |
| Moyenne de la classe Workstation (2489 - 5810, n=26, 2 dernières années) | |
| Lenovo ThinkPad P1 Gen 8 | |
| Lenovo ThinkPad P16 G2 21FA000FGE | |
| Cinebench R15 / CPU Single 64Bit | |
| Lenovo ThinkPad T16g Gen 3 RTX 5080 | |
| Moyenne Intel Core Ultra 9 285HX (307 - 340, n=6) | |
| Lenovo ThinkPad P16 Gen 3 | |
| Dell Pro Max 16 Plus | |
| Lenovo ThinkPad P1 Gen 8 | |
| HP ZBook Fury 16 G11 | |
| Moyenne de la classe Workstation (191.4 - 328, n=26, 2 dernières années) | |
| Lenovo ThinkPad P16 G2 21FA000FGE | |
| Blender / v2.79 BMW27 CPU | |
| Lenovo ThinkPad P1 Gen 8 | |
| Lenovo ThinkPad P16 G2 21FA000FGE | |
| Moyenne de la classe Workstation (91 - 261, n=26, 2 dernières années) | |
| HP ZBook Fury 16 G11 | |
| Lenovo ThinkPad P16 Gen 3 | |
| Dell Pro Max 16 Plus | |
| Lenovo ThinkPad T16g Gen 3 RTX 5080 | |
| Moyenne Intel Core Ultra 9 285HX (83 - 103, n=6) | |
| 7-Zip 18.03 / 7z b 4 | |
| Moyenne Intel Core Ultra 9 285HX (99260 - 128778, n=6) | |
| Dell Pro Max 16 Plus | |
| Lenovo ThinkPad T16g Gen 3 RTX 5080 | |
| HP ZBook Fury 16 G11 | |
| Lenovo ThinkPad P16 Gen 3 | |
| Moyenne de la classe Workstation (54741 - 116969, n=26, 2 dernières années) | |
| Lenovo ThinkPad P16 G2 21FA000FGE | |
| Lenovo ThinkPad P1 Gen 8 | |
| 7-Zip 18.03 / 7z b 4 -mmt1 | |
| HP ZBook Fury 16 G11 | |
| Lenovo ThinkPad T16g Gen 3 RTX 5080 | |
| Moyenne Intel Core Ultra 9 285HX (6422 - 6822, n=6) | |
| Dell Pro Max 16 Plus | |
| Lenovo ThinkPad P16 Gen 3 | |
| Lenovo ThinkPad P16 G2 21FA000FGE | |
| Moyenne de la classe Workstation (4981 - 6960, n=26, 2 dernières années) | |
| Lenovo ThinkPad P1 Gen 8 | |
| Geekbench 6.6 / Multi-Core | |
| Dell Pro Max 16 Plus | |
| Moyenne Intel Core Ultra 9 285HX (18212 - 22104, n=6) | |
| Lenovo ThinkPad T16g Gen 3 RTX 5080 | |
| Lenovo ThinkPad P16 Gen 3 | |
| Lenovo ThinkPad P1 Gen 8 | |
| Moyenne de la classe Workstation (12196 - 20887, n=26, 2 dernières années) | |
| HP ZBook Fury 16 G11 | |
| Geekbench 6.6 / Single-Core | |
| Lenovo ThinkPad T16g Gen 3 RTX 5080 | |
| Moyenne Intel Core Ultra 9 285HX (2907 - 3088, n=6) | |
| Lenovo ThinkPad P16 Gen 3 | |
| HP ZBook Fury 16 G11 | |
| Dell Pro Max 16 Plus | |
| Lenovo ThinkPad P1 Gen 8 | |
| Moyenne de la classe Workstation (2389 - 3065, n=26, 2 dernières années) | |
| Geekbench 5.5 / Multi-Core | |
| Dell Pro Max 16 Plus | |
| Moyenne Intel Core Ultra 9 285HX (18992 - 27010, n=6) | |
| Lenovo ThinkPad T16g Gen 3 RTX 5080 | |
| Lenovo ThinkPad P16 Gen 3 | |
| HP ZBook Fury 16 G11 | |
| Moyenne de la classe Workstation (11542 - 25554, n=26, 2 dernières années) | |
| Lenovo ThinkPad P1 Gen 8 | |
| Lenovo ThinkPad P16 G2 21FA000FGE | |
| Geekbench 5.5 / Single-Core | |
| Lenovo ThinkPad T16g Gen 3 RTX 5080 | |
| Moyenne Intel Core Ultra 9 285HX (2121 - 2232, n=6) | |
| Lenovo ThinkPad P16 Gen 3 | |
| Dell Pro Max 16 Plus | |
| HP ZBook Fury 16 G11 | |
| Moyenne de la classe Workstation (1781 - 2183, n=26, 2 dernières années) | |
| Lenovo ThinkPad P1 Gen 8 | |
| Lenovo ThinkPad P16 G2 21FA000FGE | |
| HWBOT x265 Benchmark v2.2 / 4k Preset | |
| Moyenne Intel Core Ultra 9 285HX (35.3 - 44.3, n=6) | |
| Lenovo ThinkPad T16g Gen 3 RTX 5080 | |
| Dell Pro Max 16 Plus | |
| Lenovo ThinkPad P16 Gen 3 | |
| HP ZBook Fury 16 G11 | |
| Lenovo ThinkPad P1 Gen 8 | |
| Moyenne de la classe Workstation (14.4 - 40.5, n=26, 2 dernières années) | |
| Lenovo ThinkPad P16 G2 21FA000FGE | |
| LibreOffice / 20 Documents To PDF | |
| Lenovo ThinkPad P16 G2 21FA000FGE | |
| HP ZBook Fury 16 G11 | |
| Moyenne de la classe Workstation (37.1 - 74.7, n=26, 2 dernières années) | |
| Lenovo ThinkPad T16g Gen 3 RTX 5080 | |
| Moyenne Intel Core Ultra 9 285HX (38 - 49.1, n=6) | |
| Dell Pro Max 16 Plus | |
| Lenovo ThinkPad P16 Gen 3 | |
| Lenovo ThinkPad P1 Gen 8 | |
| R Benchmark 2.5 / Overall mean | |
| Lenovo ThinkPad P16 G2 21FA000FGE | |
| Moyenne de la classe Workstation (0.3825 - 0.603, n=26, 2 dernières années) | |
| Lenovo ThinkPad P1 Gen 8 | |
| Dell Pro Max 16 Plus | |
| Moyenne Intel Core Ultra 9 285HX (0.4012 - 0.4444, n=6) | |
| Lenovo ThinkPad P16 Gen 3 | |
| Lenovo ThinkPad T16g Gen 3 RTX 5080 | |
| HP ZBook Fury 16 G11 | |
* ... Moindre est la valeur, meilleures sont les performances
AIDA64: FP32 Ray-Trace | FPU Julia | CPU SHA3 | CPU Queen | FPU SinJulia | FPU Mandel | CPU AES | CPU ZLib | FP64 Ray-Trace | CPU PhotoWorxx
| Performance rating | |
| Moyenne Intel Core Ultra 9 285HX | |
| Lenovo ThinkPad T16g Gen 3 RTX 5080 | |
| Dell Pro Max 16 Plus | |
| Lenovo ThinkPad P16 Gen 3 | |
| Moyenne de la classe Workstation | |
| HP ZBook Fury 16 G11 | |
| Lenovo ThinkPad P1 Gen 8 | |
| Lenovo ThinkPad P16 G2 21FA000FGE | |
| AIDA64 / FP32 Ray-Trace | |
| Lenovo ThinkPad T16g Gen 3 RTX 5080 (v6.92.6600) | |
| Moyenne Intel Core Ultra 9 285HX (29076 - 42341, n=6) | |
| Dell Pro Max 16 Plus (v6.92.6600) | |
| Lenovo ThinkPad P16 Gen 3 (v6.92.6600) | |
| Moyenne de la classe Workstation (10658 - 61611, n=26, 2 dernières années) | |
| Lenovo ThinkPad P1 Gen 8 (v6.92.6600) | |
| HP ZBook Fury 16 G11 (v6.92.6600) | |
| Lenovo ThinkPad P16 G2 21FA000FGE (v6.75.6100) | |
| AIDA64 / FPU Julia | |
| Moyenne Intel Core Ultra 9 285HX (161276 - 210885, n=6) | |
| Lenovo ThinkPad T16g Gen 3 RTX 5080 (v6.92.6600) | |
| Lenovo ThinkPad P16 Gen 3 (v6.92.6600) | |
| Dell Pro Max 16 Plus (v6.92.6600) | |
| Moyenne de la classe Workstation (56664 - 186971, n=26, 2 dernières années) | |
| Lenovo ThinkPad P1 Gen 8 (v6.92.6600) | |
| HP ZBook Fury 16 G11 (v6.92.6600) | |
| Lenovo ThinkPad P16 G2 21FA000FGE (v6.75.6100) | |
| AIDA64 / CPU SHA3 | |
| Lenovo ThinkPad T16g Gen 3 RTX 5080 (v6.92.6600) | |
| Moyenne Intel Core Ultra 9 285HX (7757 - 9815, n=6) | |
| Lenovo ThinkPad P16 Gen 3 (v6.92.6600) | |
| Dell Pro Max 16 Plus (v6.92.6600) | |
| Moyenne de la classe Workstation (2608 - 8975, n=26, 2 dernières années) | |
| Lenovo ThinkPad P1 Gen 8 (v6.92.6600) | |
| HP ZBook Fury 16 G11 (v6.92.6600) | |
| Lenovo ThinkPad P16 G2 21FA000FGE (v6.75.6100) | |
| AIDA64 / CPU Queen | |
| Lenovo ThinkPad T16g Gen 3 RTX 5080 (v6.92.6600) | |
| HP ZBook Fury 16 G11 (v6.92.6600) | |
| Lenovo ThinkPad P16 Gen 3 (v6.92.6600) | |
| Moyenne Intel Core Ultra 9 285HX (134345 - 141681, n=6) | |
| Dell Pro Max 16 Plus (v6.92.6600) | |
| Lenovo ThinkPad P16 G2 21FA000FGE (v6.75.6100) | |
| Moyenne de la classe Workstation (60778 - 144411, n=26, 2 dernières années) | |
| Lenovo ThinkPad P1 Gen 8 (v6.92.6600) | |
| AIDA64 / FPU SinJulia | |
| Lenovo ThinkPad T16g Gen 3 RTX 5080 (v6.92.6600) | |
| HP ZBook Fury 16 G11 (v6.92.6600) | |
| Moyenne Intel Core Ultra 9 285HX (12559 - 14431, n=6) | |
| Moyenne de la classe Workstation (8165 - 29343, n=26, 2 dernières années) | |
| Dell Pro Max 16 Plus (v6.92.6600) | |
| Lenovo ThinkPad P16 Gen 3 (v6.92.6600) | |
| Lenovo ThinkPad P16 G2 21FA000FGE (v6.75.6100) | |
| Lenovo ThinkPad P1 Gen 8 (v6.92.6600) | |
| AIDA64 / FPU Mandel | |
| Lenovo ThinkPad T16g Gen 3 RTX 5080 (v6.92.6600) | |
| Moyenne Intel Core Ultra 9 285HX (84053 - 108922, n=6) | |
| Lenovo ThinkPad P16 Gen 3 (v6.92.6600) | |
| Dell Pro Max 16 Plus (v6.92.6600) | |
| Moyenne de la classe Workstation (27301 - 98153, n=26, 2 dernières années) | |
| Lenovo ThinkPad P1 Gen 8 (v6.92.6600) | |
| HP ZBook Fury 16 G11 (v6.92.6600) | |
| Lenovo ThinkPad P16 G2 21FA000FGE (v6.75.6100) | |
| AIDA64 / CPU AES | |
| Lenovo ThinkPad T16g Gen 3 RTX 5080 (v6.92.6600) | |
| Moyenne Intel Core Ultra 9 285HX (119553 - 134195, n=6) | |
| Lenovo ThinkPad P16 Gen 3 (v6.92.6600) | |
| Dell Pro Max 16 Plus (v6.92.6600) | |
| Moyenne de la classe Workstation (56077 - 187841, n=26, 2 dernières années) | |
| HP ZBook Fury 16 G11 (v6.92.6600) | |
| Lenovo ThinkPad P16 G2 21FA000FGE (v6.75.6100) | |
| Lenovo ThinkPad P1 Gen 8 (v6.92.6600) | |
| AIDA64 / CPU ZLib | |
| Lenovo ThinkPad T16g Gen 3 RTX 5080 (v6.92.6600) | |
| Moyenne Intel Core Ultra 9 285HX (1886 - 2267, n=6) | |
| Lenovo ThinkPad P16 Gen 3 (v6.92.6600) | |
| Dell Pro Max 16 Plus (v6.92.6600) | |
| Moyenne de la classe Workstation (742 - 2148, n=26, 2 dernières années) | |
| HP ZBook Fury 16 G11 (v6.92.6600) | |
| Lenovo ThinkPad P1 Gen 8 (v6.92.6600) | |
| Lenovo ThinkPad P16 G2 21FA000FGE (v6.75.6100) | |
| AIDA64 / FP64 Ray-Trace | |
| Lenovo ThinkPad T16g Gen 3 RTX 5080 (v6.92.6600) | |
| Moyenne Intel Core Ultra 9 285HX (15059 - 22312, n=6) | |
| Dell Pro Max 16 Plus (v6.92.6600) | |
| Lenovo ThinkPad P16 Gen 3 (v6.92.6600) | |
| Moyenne de la classe Workstation (5580 - 32891, n=26, 2 dernières années) | |
| Lenovo ThinkPad P1 Gen 8 (v6.92.6600) | |
| HP ZBook Fury 16 G11 (v6.92.6600) | |
| Lenovo ThinkPad P16 G2 21FA000FGE (v6.75.6100) | |
| AIDA64 / CPU PhotoWorxx | |
| Dell Pro Max 16 Plus (v6.92.6600) | |
| Lenovo ThinkPad P1 Gen 8 (v6.92.6600) | |
| Moyenne de la classe Workstation (37151 - 93684, n=26, 2 dernières années) | |
| Moyenne Intel Core Ultra 9 285HX (39232 - 62611, n=6) | |
| Lenovo ThinkPad T16g Gen 3 RTX 5080 (v6.92.6600) | |
| Lenovo ThinkPad P16 Gen 3 (v6.92.6600) | |
| HP ZBook Fury 16 G11 (v6.92.6600) | |
| Lenovo ThinkPad P16 G2 21FA000FGE (v6.75.6100) | |
Performance du système
PCMark 10: Score | Essentials | Productivity | Digital Content Creation
CrossMark: Overall | Productivity | Creativity | Responsiveness
WebXPRT 3: Overall
WebXPRT 4: Overall
Mozilla Kraken 1.1: Total
| Performance rating | |
| Lenovo ThinkPad T16g Gen 3 RTX 5080 | |
| Lenovo ThinkPad P16 Gen 3 | |
| Moyenne Intel Core Ultra 9 285HX, NVIDIA RTX PRO 3000 Blackwell Generation Laptop | |
| Dell Pro Max 16 Plus -4! | |
| Lenovo ThinkPad P1 Gen 8 | |
| HP ZBook Fury 16 G11 | |
| Moyenne de la classe Workstation | |
| Lenovo ThinkPad P16 G2 21FA000FGE -1! | |
| PCMark 10 / Score | |
| Lenovo ThinkPad T16g Gen 3 RTX 5080 | |
| Lenovo ThinkPad P16 Gen 3 | |
| Moyenne Intel Core Ultra 9 285HX, NVIDIA RTX PRO 3000 Blackwell Generation Laptop (n=1) | |
| Lenovo ThinkPad P1 Gen 8 | |
| Moyenne de la classe Workstation (6436 - 10409, n=22, 2 dernières années) | |
| HP ZBook Fury 16 G11 | |
| Lenovo ThinkPad P16 G2 21FA000FGE | |
| PCMark 10 / Essentials | |
| Lenovo ThinkPad P16 G2 21FA000FGE | |
| Lenovo ThinkPad P1 Gen 8 | |
| Moyenne de la classe Workstation (9622 - 11157, n=22, 2 dernières années) | |
| Lenovo ThinkPad P16 Gen 3 | |
| Moyenne Intel Core Ultra 9 285HX, NVIDIA RTX PRO 3000 Blackwell Generation Laptop (n=1) | |
| Lenovo ThinkPad T16g Gen 3 RTX 5080 | |
| HP ZBook Fury 16 G11 | |
| PCMark 10 / Productivity | |
| Lenovo ThinkPad T16g Gen 3 RTX 5080 | |
| Lenovo ThinkPad P16 Gen 3 | |
| Moyenne Intel Core Ultra 9 285HX, NVIDIA RTX PRO 3000 Blackwell Generation Laptop (n=1) | |
| Lenovo ThinkPad P1 Gen 8 | |
| Moyenne de la classe Workstation (8789 - 20616, n=22, 2 dernières années) | |
| HP ZBook Fury 16 G11 | |
| Lenovo ThinkPad P16 G2 21FA000FGE | |
| PCMark 10 / Digital Content Creation | |
| Lenovo ThinkPad T16g Gen 3 RTX 5080 | |
| Lenovo ThinkPad P16 Gen 3 | |
| Moyenne Intel Core Ultra 9 285HX, NVIDIA RTX PRO 3000 Blackwell Generation Laptop (n=1) | |
| HP ZBook Fury 16 G11 | |
| Lenovo ThinkPad P1 Gen 8 | |
| Moyenne de la classe Workstation (7744 - 15631, n=22, 2 dernières années) | |
| Lenovo ThinkPad P16 G2 21FA000FGE | |
| CrossMark / Overall | |
| Lenovo ThinkPad T16g Gen 3 RTX 5080 | |
| Dell Pro Max 16 Plus | |
| Lenovo ThinkPad P16 Gen 3 | |
| Moyenne Intel Core Ultra 9 285HX, NVIDIA RTX PRO 3000 Blackwell Generation Laptop (n=1) | |
| HP ZBook Fury 16 G11 | |
| Lenovo ThinkPad P1 Gen 8 | |
| Moyenne de la classe Workstation (1307 - 2267, n=25, 2 dernières années) | |
| Lenovo ThinkPad P16 G2 21FA000FGE | |
| CrossMark / Productivity | |
| Lenovo ThinkPad T16g Gen 3 RTX 5080 | |
| Lenovo ThinkPad P16 Gen 3 | |
| Moyenne Intel Core Ultra 9 285HX, NVIDIA RTX PRO 3000 Blackwell Generation Laptop (n=1) | |
| Dell Pro Max 16 Plus | |
| HP ZBook Fury 16 G11 | |
| Lenovo ThinkPad P1 Gen 8 | |
| Moyenne de la classe Workstation (1130 - 2122, n=25, 2 dernières années) | |
| Lenovo ThinkPad P16 G2 21FA000FGE | |
| CrossMark / Creativity | |
| Dell Pro Max 16 Plus | |
| Lenovo ThinkPad T16g Gen 3 RTX 5080 | |
| Lenovo ThinkPad P16 Gen 3 | |
| Moyenne Intel Core Ultra 9 285HX, NVIDIA RTX PRO 3000 Blackwell Generation Laptop (n=1) | |
| HP ZBook Fury 16 G11 | |
| Lenovo ThinkPad P1 Gen 8 | |
| Moyenne de la classe Workstation (1657 - 2725, n=25, 2 dernières années) | |
| Lenovo ThinkPad P16 G2 21FA000FGE | |
| CrossMark / Responsiveness | |
| Lenovo ThinkPad T16g Gen 3 RTX 5080 | |
| Lenovo ThinkPad P16 Gen 3 | |
| Moyenne Intel Core Ultra 9 285HX, NVIDIA RTX PRO 3000 Blackwell Generation Laptop (n=1) | |
| Dell Pro Max 16 Plus | |
| HP ZBook Fury 16 G11 | |
| Lenovo ThinkPad P1 Gen 8 | |
| Moyenne de la classe Workstation (993 - 2096, n=25, 2 dernières années) | |
| Lenovo ThinkPad P16 G2 21FA000FGE | |
| WebXPRT 3 / Overall | |
| Lenovo ThinkPad T16g Gen 3 RTX 5080 | |
| Lenovo ThinkPad P16 Gen 3 | |
| Moyenne Intel Core Ultra 9 285HX, NVIDIA RTX PRO 3000 Blackwell Generation Laptop (n=1) | |
| Lenovo ThinkPad P1 Gen 8 | |
| Dell Pro Max 16 Plus | |
| Lenovo ThinkPad P16 G2 21FA000FGE | |
| HP ZBook Fury 16 G11 | |
| Moyenne de la classe Workstation (260 - 360, n=26, 2 dernières années) | |
| WebXPRT 4 / Overall | |
| Lenovo ThinkPad P16 Gen 3 | |
| Moyenne Intel Core Ultra 9 285HX, NVIDIA RTX PRO 3000 Blackwell Generation Laptop (n=1) | |
| Lenovo ThinkPad T16g Gen 3 RTX 5080 | |
| Dell Pro Max 16 Plus | |
| HP ZBook Fury 16 G11 | |
| Lenovo ThinkPad P1 Gen 8 | |
| Moyenne de la classe Workstation (189.2 - 326, n=26, 2 dernières années) | |
| Mozilla Kraken 1.1 / Total | |
| Lenovo ThinkPad P16 G2 21FA000FGE | |
| Moyenne de la classe Workstation (411 - 538, n=26, 2 dernières années) | |
| Lenovo ThinkPad P1 Gen 8 | |
| HP ZBook Fury 16 G11 | |
| Dell Pro Max 16 Plus | |
| Lenovo ThinkPad T16g Gen 3 RTX 5080 | |
| Lenovo ThinkPad P16 Gen 3 | |
| Moyenne Intel Core Ultra 9 285HX, NVIDIA RTX PRO 3000 Blackwell Generation Laptop (n=1) | |
* ... Moindre est la valeur, meilleures sont les performances
| PCMark 10 Score | 10149 points | |
Aide | ||
| AIDA64 / Memory Copy | |
| Lenovo ThinkPad P1 Gen 8 | |
| Dell Pro Max 16 Plus | |
| Moyenne de la classe Workstation (56003 - 164795, n=26, 2 dernières années) | |
| Moyenne Intel Core Ultra 9 285HX (63431 - 93933, n=6) | |
| Lenovo ThinkPad T16g Gen 3 RTX 5080 | |
| Lenovo ThinkPad P16 Gen 3 | |
| HP ZBook Fury 16 G11 | |
| Lenovo ThinkPad P16 G2 21FA000FGE | |
| AIDA64 / Memory Read | |
| Dell Pro Max 16 Plus | |
| Moyenne Intel Core Ultra 9 285HX (67084 - 97565, n=6) | |
| Moyenne de la classe Workstation (55795 - 121563, n=26, 2 dernières années) | |
| Lenovo ThinkPad P1 Gen 8 | |
| Lenovo ThinkPad P16 Gen 3 | |
| Lenovo ThinkPad T16g Gen 3 RTX 5080 | |
| HP ZBook Fury 16 G11 | |
| Lenovo ThinkPad P16 G2 21FA000FGE | |
| AIDA64 / Memory Write | |
| Dell Pro Max 16 Plus | |
| Moyenne de la classe Workstation (55663 - 214520, n=26, 2 dernières années) | |
| Moyenne Intel Core Ultra 9 285HX (64112 - 89691, n=6) | |
| Lenovo ThinkPad P16 Gen 3 | |
| Lenovo ThinkPad T16g Gen 3 RTX 5080 | |
| Lenovo ThinkPad P1 Gen 8 | |
| Lenovo ThinkPad P16 G2 21FA000FGE | |
| HP ZBook Fury 16 G11 | |
| AIDA64 / Memory Latency | |
| Lenovo ThinkPad P16 Gen 3 | |
| Lenovo ThinkPad T16g Gen 3 RTX 5080 | |
| Lenovo ThinkPad P1 Gen 8 | |
| Moyenne Intel Core Ultra 9 285HX (104.8 - 151.7, n=6) | |
| Moyenne de la classe Workstation (84.5 - 165.2, n=26, 2 dernières années) | |
| Dell Pro Max 16 Plus | |
| Lenovo ThinkPad P16 G2 21FA000FGE | |
| HP ZBook Fury 16 G11 | |
* ... Moindre est la valeur, meilleures sont les performances
Latence DPC
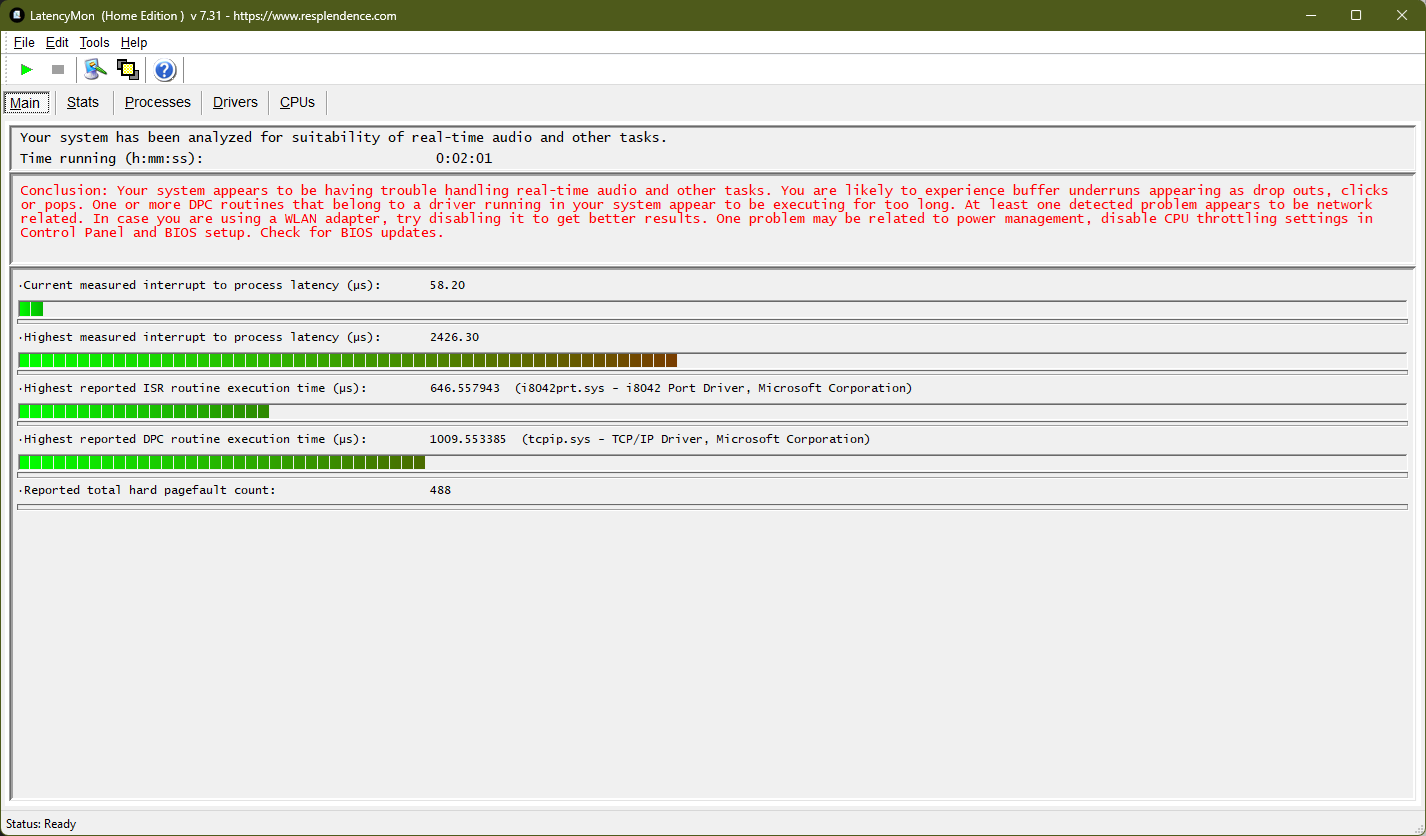
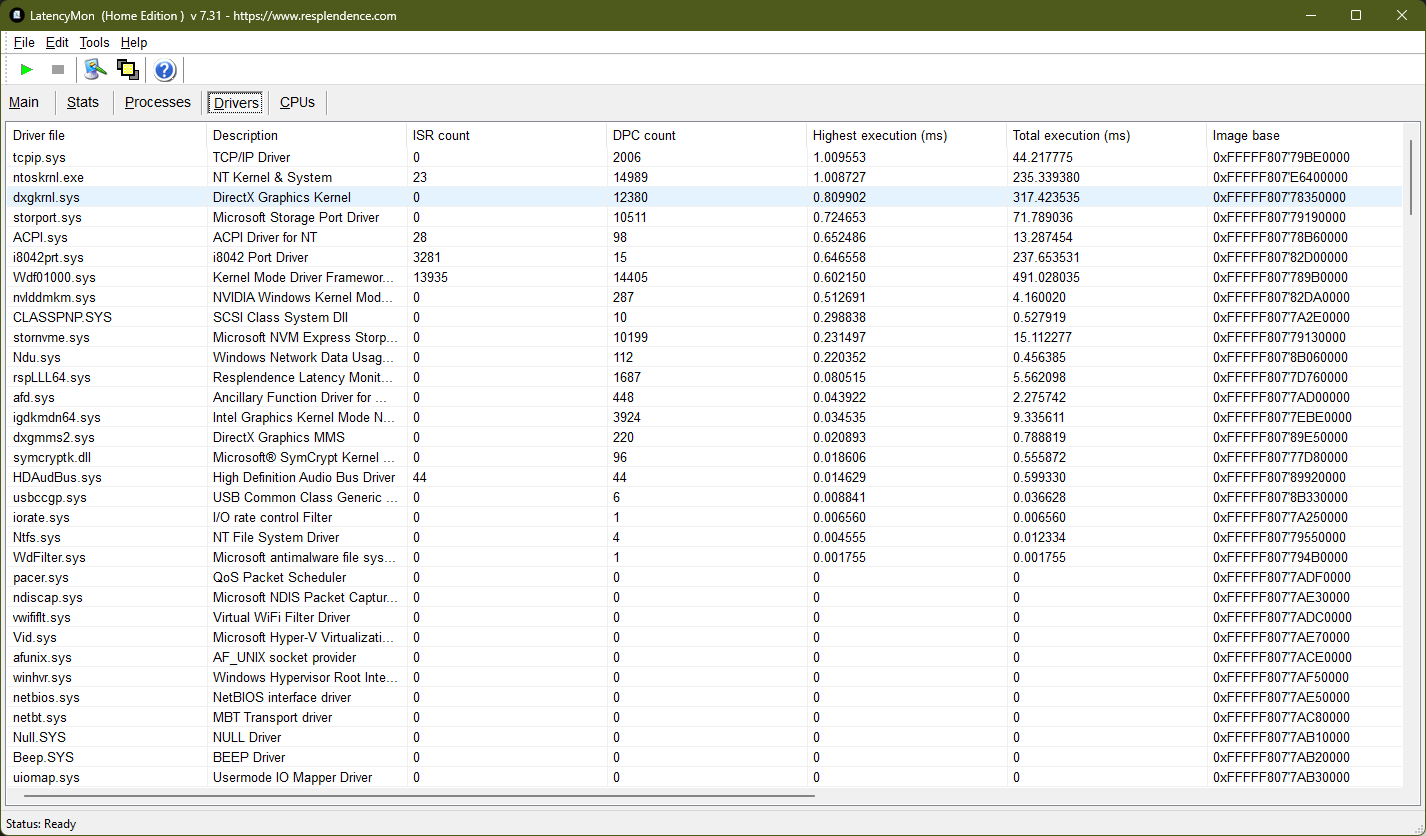
| DPC Latencies / LatencyMon - interrupt to process latency (max), Web, Youtube, Prime95 | |
| HP ZBook Fury 16 G11 | |
| Lenovo ThinkPad P1 Gen 8 | |
| Dell Pro Max 16 Plus | |
| Lenovo ThinkPad P16 Gen 3 | |
| Lenovo ThinkPad T16g Gen 3 RTX 5080 | |
| Lenovo ThinkPad P16 G2 21FA000FGE | |
* ... Moindre est la valeur, meilleures sont les performances
Dispositifs de stockage
Lenovo utilise un SSD PCIe 5.0 rapide fabriqué par Samsung, le PM9E1, d'une capacité de 2 To. Le SSD M.2 2280 se comporte bien dans nos benchmarks, surpassant la plupart des autres stations de travail. Cependant, les performances sont un peu ralenties en cas de charge.
Le ThinkPad dispose de deux baies M.2 2280 NVMe 4.0 supplémentaires sous le clavier, ce qui permet d'étendre considérablement le stockage.

* ... Moindre est la valeur, meilleures sont les performances
Throttoir de disque : Boucle de lecture DiskSpd, profondeur de la file d'attente 8
Performance du GPU
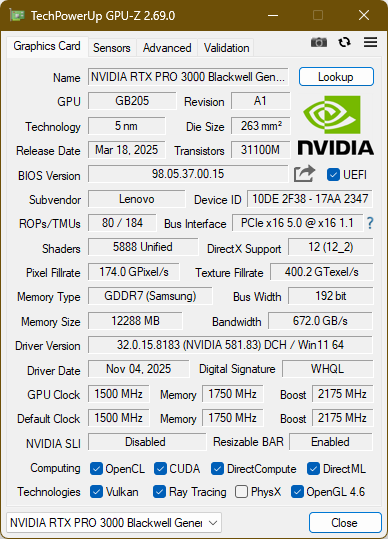
Lenovo utilise la Nvidia RTX Pro 3000 Blackwellun GPU professionnel certifié ISV de Nvidia. Cette carte graphique est comparable à la Nvidia GeForce RTX 5070 Ti. Dans le ThinkPad P16 Gen 3, Lenovo la limite à 105 W, ce qui est loin des 175 W de la TGP RTX 5000 Pro du ThinkPad P16 Gen 3 Dell Pro Max 16 Plus. Les performances s'en ressentent, avec un retard d'environ 24 % par rapport à la concurrence, tant dans les tests professionnels (SPECviewperf) que dans les tests grand public (3DMark).
Globalement, les performances du GPU sont réduites lorsque le P16 Gen 3 fonctionne sur batterie, avec seulement 37978 points au test 3DMark 11 GPU, soit une réduction de 23%.
| 3DMark 06 Standard Score | 63693 points | |
| 3DMark Vantage P Result | 116321 points | |
| 3DMark 11 Performance | 39176 points | |
| 3DMark Cloud Gate Standard Score | 65135 points | |
| 3DMark Fire Strike Score | 31208 points | |
| 3DMark Time Spy Score | 14579 points | |
Aide | ||
* ... Moindre est la valeur, meilleures sont les performances
Performances des jeux
| Cyberpunk 2077 - 1920x1080 Ultra Preset (FSR off) | |
| Dell Pro Max 16 Plus | |
| Lenovo ThinkPad T16g Gen 3 RTX 5080 | |
| Lenovo ThinkPad P16 Gen 3 | |
| HP ZBook Fury 16 G11 | |
| Lenovo ThinkPad P1 Gen 8 | |
| Moyenne de la classe Workstation (19.6 - 152.4, n=26, 2 dernières années) | |
| Baldur's Gate 3 - 1920x1080 Ultra Preset AA:T | |
| Dell Pro Max 16 Plus | |
| Lenovo ThinkPad T16g Gen 3 RTX 5080 | |
| Lenovo ThinkPad P16 Gen 3 | |
| HP ZBook Fury 16 G11 | |
| Lenovo ThinkPad P1 Gen 8 | |
| Moyenne de la classe Workstation (23.7 - 205, n=27, 2 dernières années) | |
Cyberpunk 2077 ultra FPS Chart
| Bas | Moyen | Élevé | Ultra | QHD | 4K DLSS | 4K FSR | 4K | |
|---|---|---|---|---|---|---|---|---|
| GTA V (2015) | 183.5 | 182.6 | 176.4 | 131.7 | 116.7 | |||
| Dota 2 Reborn (2015) | 204 | 181.7 | 167.3 | 157 | 128.7 | |||
| Final Fantasy XV Benchmark (2018) | 204 | 164 | 132 | 111 | 63.8 | |||
| X-Plane 11.11 (2018) | 136.1 | 118.7 | 92.1 | 73.5 | ||||
| Strange Brigade (2018) | 524 | 380 | 321 | 290 | 204 | 108.7 | ||
| Baldur's Gate 3 (2023) | 172.4 | 147.8 | 128.9 | 126.8 | 91.9 | 75.8 | 75.4 | 49.4 |
| Cyberpunk 2077 (2023) | 138.7 | 137 | 112.7 | 102.5 | 70.7 | 37.7 | 30.8 | |
| Kingdom Come Deliverance 2 (2025) | 166.7 | 131.2 | 106.4 | 80.2 | 56.3 | 44.8 | 30 | |
| Civilization 7 (2025) | 287 | 183.6 | 163.2 | 116.9 | 88.7 | 62.4 | ||
| Assassin's Creed Shadows (2025) | 79 | 74 | 62 | 47 | 39 | 37 | 26 | |
| The Elder Scrolls IV Oblivion Remastered (2025) | 87.8 | 81.6 | 76.4 | 35.3 | 23.6 | 21.6 | 24.3 | 13.3 |
| Doom: The Dark Ages (2025) | 98.2 | 80.3 | 73.4 | 69.7 | 46.9 | 35.1 | 24.9 | |
| F1 25 (2025) | 189.1 | 176.5 | 165.8 | 33.8 | 20.1 | 17.7 | 9.25 | |
| Borderlands 4 (2025) | 71.5 | 59 | 46.6 | 32.5 | 22 | 64.6 | 11.5 | |
| The Outer Worlds 2 (2025) | 101.1 | 97.1 | 83.4 | 50.3 | 32.6 | 27.2 | 17 | |
| ARC Raiders (2025) | 167.6 | 137 | 121.7 | 84.4 | 57.5 | 55.7 | 31.3 | |
| Anno 117: Pax Romana (2025) | 129 | 103.8 | 78 | 41.5 | 29 | 26 | 15.9 |
Émissions
Bruit du système
Les deux ventilateurs de l'ordinateur portable ThinkPad sont généralement silencieux en utilisation bureautique, mais peuvent devenir très bruyants en charge - plus de 50 dB(a) sont très audibles, même à partir de pièces différentes.
Nous n'avons pas pu détecter de bruit de bobine pour le ThinkPad P16 Gen 3.
Degré de la nuisance sonore
| Au repos |
| 23.6 / 27.2 / 27.2 dB(A) |
| Fortement sollicité |
| 42.7 / 53.9 dB(A) |
 | ||
30 dB silencieux 40 dB(A) audible 50 dB(A) bruyant |
||
min: | ||
| Lenovo ThinkPad P16 Gen 3 Ultra 9 285HX, RTX PRO 3000 Blackwell Generation Laptop | Lenovo ThinkPad P16 G2 21FA000FGE i7-13700HX, RTX 2000 Ada Generation Laptop | Dell Pro Max 16 Plus Ultra 9 285HX, RTX PRO 5000 Blackwell Generation Laptop | HP ZBook Fury 16 G11 i9-14900HX, RTX 3500 Ada Generation Laptop | Lenovo ThinkPad T16g Gen 3 RTX 5080 Ultra 9 275HX, GeForce RTX 5080 Laptop | Lenovo ThinkPad P1 Gen 8 Ultra 7 255H, RTX PRO 2000 Blackwell Generation Laptop | |
|---|---|---|---|---|---|---|
| Noise | 1% | -6% | 5% | -1% | 14% | |
| arrêt / environnement * (dB) | 23.6 | 23.5 -0% | 23.2 2% | 23.2 2% | 24.7 -5% | 23.1 2% |
| Idle Minimum * (dB) | 23.6 | 23.5 -0% | 26.7 -13% | 23.2 2% | 24.7 -5% | 23.1 2% |
| Idle Average * (dB) | 27.2 | 29.2 -7% | 30.5 -12% | 23.2 15% | 28.9 -6% | 23.1 15% |
| Idle Maximum * (dB) | 27.2 | 29.5 -8% | 34 -25% | 29.5 -8% | 28.9 -6% | 23.1 15% |
| Load Average * (dB) | 42.7 | 32.7 23% | 39.8 7% | 43 -1% | 30.4 29% | 27.3 36% |
| Cyberpunk 2077 ultra * (dB) | 53.9 | 54.3 -1% | 48.2 11% | 57.7 -7% | ||
| Load Maximum * (dB) | 53.9 | 56.6 -5% | 54.3 -1% | 48.2 11% | 57.7 -7% | 47.9 11% |
| Witcher 3 ultra * (dB) | 50.6 |
* ... Moindre est la valeur, meilleures sont les performances
Température
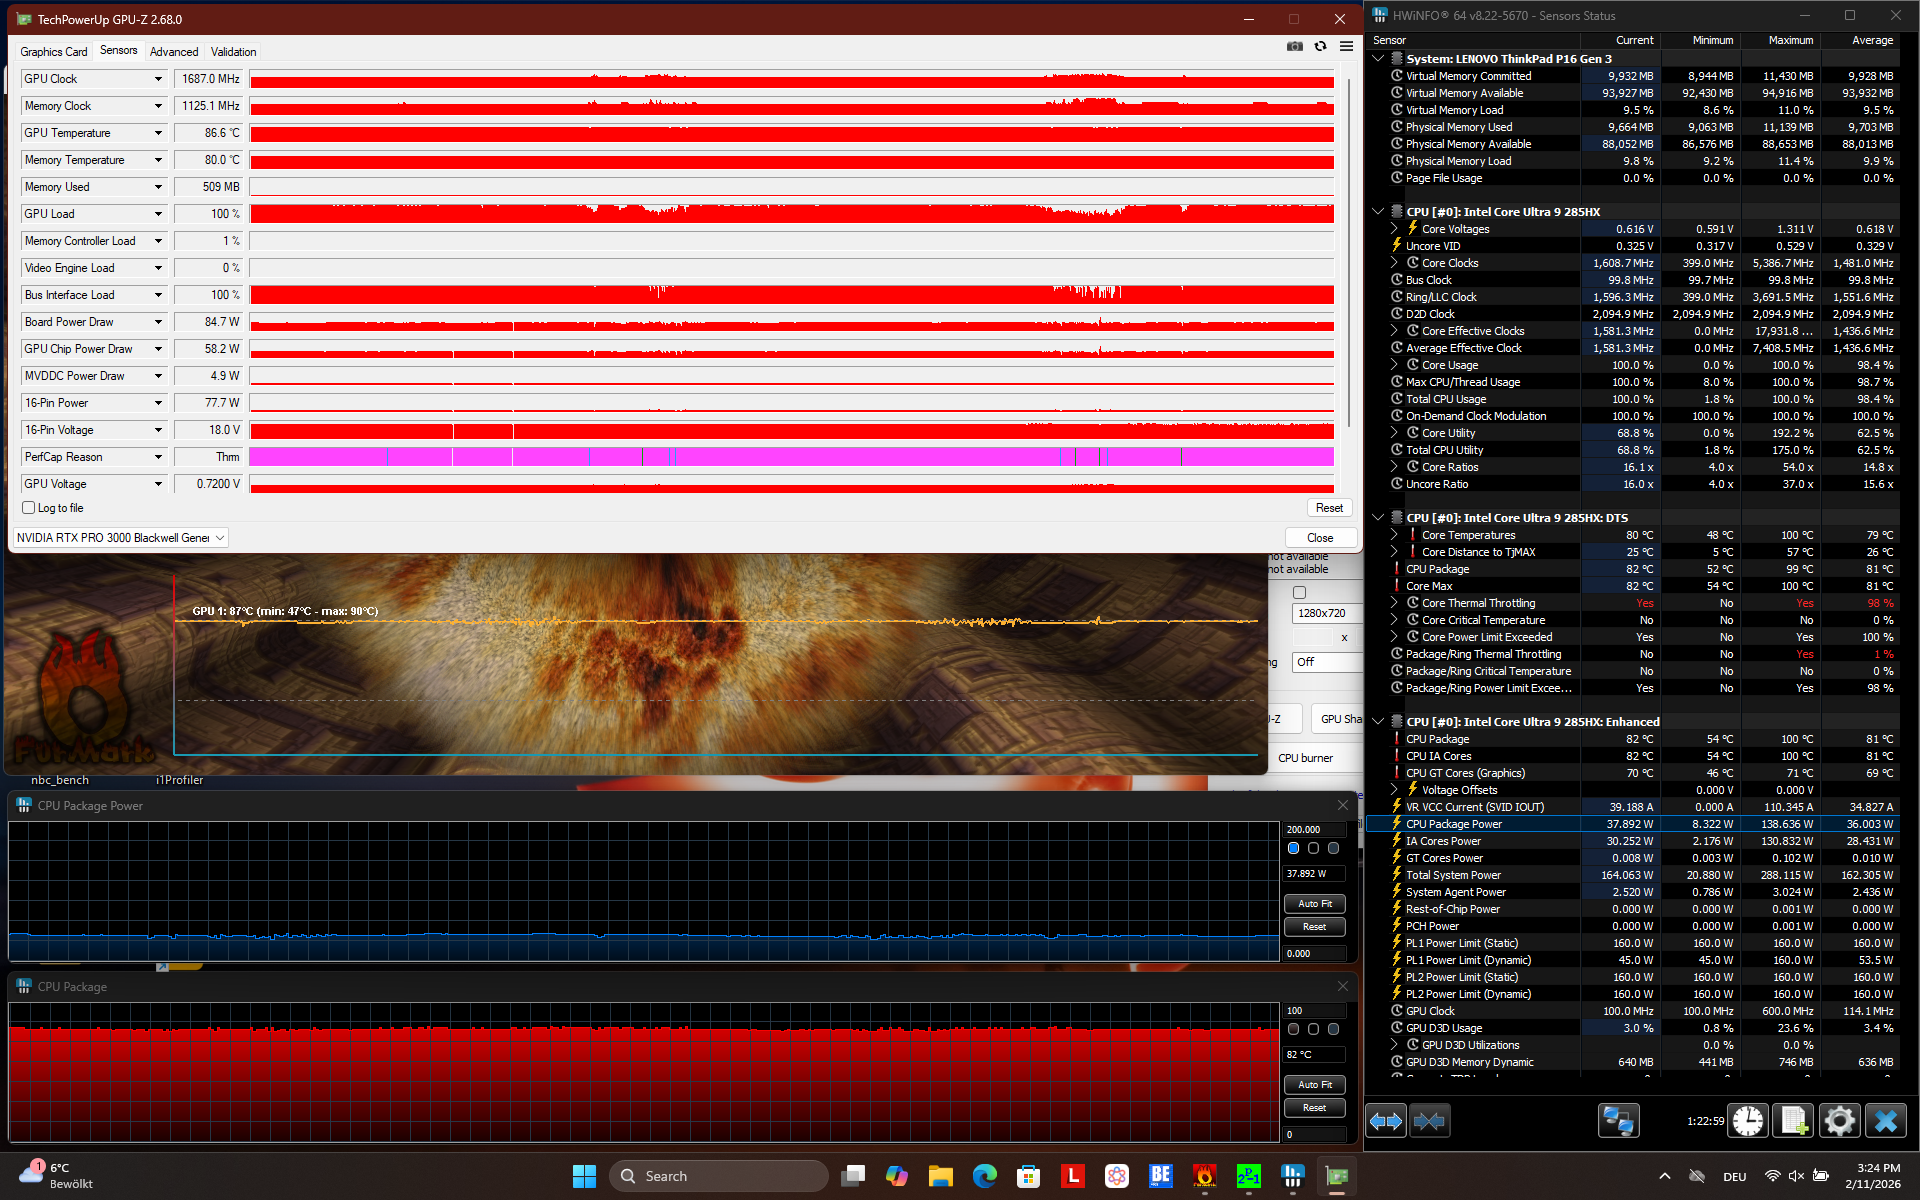
Le ThinkPad P16 Gen 3 étant plus compact que son prédécesseur, nous ne sommes pas surpris qu'il chauffe un peu plus. La température maximale globale est de 50,8 degrés Celsius ou 123 F, le repose-poignets devenant également un peu chaud au toucher.
Ni le GPU ni le CPU ne peuvent maintenir leur consommation maximale sous une charge combinée. Le CPU est limité à 37 W et le GPU à 85 W.
(-) La température maximale du côté supérieur est de 50.8 °C / 123 F, par rapport à la moyenne de 38.2 °C / 101 F, allant de 22.2 à 69.8 °C pour la classe Workstation.
(-) Le fond chauffe jusqu'à un maximum de 48 °C / 118 F, contre une moyenne de 41.1 °C / 106 F
(+) En utilisation inactive, la température moyenne du côté supérieur est de 26.9 °C / 80 F, par rapport à la moyenne du dispositif de 32 °C / 90 F.
(±) 3: The average temperature for the upper side is 35 °C / 95 F, compared to the average of 32 °C / 90 F for the class Workstation.
(+) Les repose-poignets et le pavé tactile atteignent la température maximale de la peau (32.4 °C / 90.3 F) et ne sont donc pas chauds.
(-) La température moyenne de la zone de l'appui-paume de dispositifs similaires était de 27.8 °C / 82 F (-4.6 °C / #-8.3 F).
| Lenovo ThinkPad P16 Gen 3 Ultra 9 285HX, RTX PRO 3000 Blackwell Generation Laptop | Lenovo ThinkPad P16 G2 21FA000FGE i7-13700HX, RTX 2000 Ada Generation Laptop | Dell Pro Max 16 Plus Ultra 9 285HX, RTX PRO 5000 Blackwell Generation Laptop | HP ZBook Fury 16 G11 i9-14900HX, RTX 3500 Ada Generation Laptop | Lenovo ThinkPad T16g Gen 3 RTX 5080 Ultra 9 275HX, GeForce RTX 5080 Laptop | Lenovo ThinkPad P1 Gen 8 Ultra 7 255H, RTX PRO 2000 Blackwell Generation Laptop | |
|---|---|---|---|---|---|---|
| Heat | 10% | -1% | -10% | 6% | 6% | |
| Maximum Upper Side * (°C) | 50.8 | 47.2 7% | 40.4 20% | 42.2 17% | 43.9 14% | 45 11% |
| Maximum Bottom * (°C) | 48 | 39.5 18% | 45.6 5% | 48 -0% | 45.4 5% | 33 31% |
| Idle Upper Side * (°C) | 30.1 | 28.1 7% | 32.8 -9% | 37 -23% | 27.7 8% | 30.6 -2% |
| Idle Bottom * (°C) | 27.5 | 25.3 8% | 33 -20% | 36.8 -34% | 28.6 -4% | 31.6 -15% |
* ... Moindre est la valeur, meilleures sont les performances
Intervenants
Malgré leur taille minuscule, les haut-parleurs du P16 G3, situés sur le côté de l'appareil, fonctionnent bien - ils sont puissants et délivrent même des basses, ce qui les rend adaptés à l'écoute de la musique.
Lenovo ThinkPad P16 Gen 3 analyse audio
(+) | les haut-parleurs peuvent jouer relativement fort (83.5# dB)
Basses 100 - 315 Hz
(±) | basse réduite - en moyenne 9.9% inférieure à la médiane
(±) | la linéarité des basses est moyenne (13% delta à la fréquence précédente)
Médiums 400 - 2000 Hz
(+) | médiane équilibrée - seulement 4% de la médiane
(+) | les médiums sont linéaires (4% delta à la fréquence précédente)
Aiguës 2 - 16 kHz
(+) | des sommets équilibrés - à seulement 2.2% de la médiane
(+) | les aigus sont linéaires (4.8% delta à la fréquence précédente)
Globalement 100 - 16 000 Hz
(+) | le son global est linéaire (10% différence à la médiane)
Par rapport à la même classe
» 6% de tous les appareils testés de cette catégorie étaient meilleurs, 3% similaires, 91% pires
» Le meilleur avait un delta de 7%, la moyenne était de 17%, le pire était de 35%.
Par rapport à tous les appareils testés
» 4% de tous les appareils testés étaient meilleurs, 1% similaires, 94% pires
» Le meilleur avait un delta de 4%, la moyenne était de 24%, le pire était de 134%.
Lenovo ThinkPad P1 Gen 8 analyse audio
(+) | les haut-parleurs peuvent jouer relativement fort (87.5# dB)
Basses 100 - 315 Hz
(±) | basse réduite - en moyenne 9.8% inférieure à la médiane
(±) | la linéarité des basses est moyenne (11.2% delta à la fréquence précédente)
Médiums 400 - 2000 Hz
(+) | médiane équilibrée - seulement 2.9% de la médiane
(+) | les médiums sont linéaires (2.8% delta à la fréquence précédente)
Aiguës 2 - 16 kHz
(+) | des sommets équilibrés - à seulement 3% de la médiane
(+) | les aigus sont linéaires (4.7% delta à la fréquence précédente)
Globalement 100 - 16 000 Hz
(+) | le son global est linéaire (8.3% différence à la médiane)
Par rapport à la même classe
» 1% de tous les appareils testés de cette catégorie étaient meilleurs, 1% similaires, 97% pires
» Le meilleur avait un delta de 7%, la moyenne était de 17%, le pire était de 35%.
Par rapport à tous les appareils testés
» 2% de tous les appareils testés étaient meilleurs, 1% similaires, 97% pires
» Le meilleur avait un delta de 4%, la moyenne était de 24%, le pire était de 134%.
Gestion de l'énergie
Consommation électrique
La consommation d'énergie est inférieure à celle du ThinkPad P16 précédent. La consommation d'énergie en charge dépasse 180 W, ce qui indique que l'appareil peut vider sa batterie, même lorsqu'il est connecté à un chargeur.
| Éteint/en veille | |
| Au repos | |
| Fortement sollicité |
|
Légende:
min: | |
| Lenovo ThinkPad P16 Gen 3 Ultra 9 285HX, RTX PRO 3000 Blackwell Generation Laptop, Samsung PM9E1 MZVLC2T0HBLD, IPS LED, 1920x1200, 16" | Lenovo ThinkPad P16 G2 21FA000FGE i7-13700HX, RTX 2000 Ada Generation Laptop, SK hynix PC801 HFS001TEJ9X162N, IPS LED, 2560x1600, 16" | Dell Pro Max 16 Plus Ultra 9 285HX, RTX PRO 5000 Blackwell Generation Laptop, SK hynix PCB01 HFS001TFM9X186N, OLED, 3840x2400, 16" | HP ZBook Fury 16 G11 i9-14900HX, RTX 3500 Ada Generation Laptop, SK hynix PC801 HFS001TEJ9X101N, IPS, 3840x2400, 16" | Lenovo ThinkPad T16g Gen 3 RTX 5080 Ultra 9 275HX, GeForce RTX 5080 Laptop, Samsung PM9E1 MZVLC2T0HBLD, OLED, 3200x2000, 16" | Lenovo ThinkPad P1 Gen 8 Ultra 7 255H, RTX PRO 2000 Blackwell Generation Laptop, Samsung PM9E1 1 TB MZVLC1T0HFLU, Tandem OLED, 3200x2000, 16" | Moyenne NVIDIA RTX PRO 3000 Blackwell Generation Laptop | Moyenne de la classe Workstation | |
|---|---|---|---|---|---|---|---|---|
| Power Consumption | -7% | -135% | -15% | -12% | -10% | 0% | -2% | |
| Idle Minimum * (Watt) | 7.8 | 9.3 -19% | 35.1 -350% | 8.6 -10% | 9.9 -27% | 15.4 -97% | 7.8 ? -0% | 8.9 ? -14% |
| Idle Average * (Watt) | 12.6 | 14.1 -12% | 39.2 -211% | 14.8 -17% | 17.1 -36% | 16.5 -31% | 12.6 ? -0% | 13.7 ? -9% |
| Idle Maximum * (Watt) | 16.5 | 15.5 6% | 56 -239% | 15.7 5% | 17.7 -7% | 23.1 -40% | 16.5 ? -0% | 18 ? -9% |
| Load Average * (Watt) | 118.7 | 133.6 -13% | 130.2 -10% | 129.4 -9% | 125.6 -6% | 86.6 27% | 118.7 ? -0% | 95.2 ? 20% |
| Cyberpunk 2077 ultra external monitor * (Watt) | 161.3 | 213 -32% | 192.6 -19% | 166.8 -3% | 121.8 24% | |||
| Cyberpunk 2077 ultra * (Watt) | 159.6 | 229 -43% | 199.4 -25% | 160.5 -1% | 123.1 23% | |||
| Load Maximum * (Watt) | 181.4 | 179.6 1% | 285.2 -57% | 236.1 -30% | 182.8 -1% | 143.6 21% | 181.4 ? -0% | 175.2 ? 3% |
| Witcher 3 ultra * (Watt) | 144.9 |
* ... Moindre est la valeur, meilleures sont les performances
Consommation électrique Cyberpunk / Stress Test
Consommation électrique du moniteur externe
Autonomie de la batterie
Avec une grande batterie de 99 Wh et un écran WUXGA économe en énergie, le ThinkPad P16 Gen 3 s'en sort bien dans nos tests de batterie : 11.6 heures dans le test de navigation Wi-Fi (150 cd/m²) sont supérieures à toutes les autres stations de travail de la comparaison.
| Lenovo ThinkPad P16 Gen 3 Ultra 9 285HX, RTX PRO 3000 Blackwell Generation Laptop, 99 Wh | Lenovo ThinkPad P16 G2 21FA000FGE i7-13700HX, RTX 2000 Ada Generation Laptop, 94 Wh | Dell Pro Max 16 Plus Ultra 9 285HX, RTX PRO 5000 Blackwell Generation Laptop, 96 Wh | HP ZBook Fury 16 G11 i9-14900HX, RTX 3500 Ada Generation Laptop, 95 Wh | Lenovo ThinkPad T16g Gen 3 RTX 5080 Ultra 9 275HX, GeForce RTX 5080 Laptop, 99.9 Wh | Lenovo ThinkPad P1 Gen 8 Ultra 7 255H, RTX PRO 2000 Blackwell Generation Laptop, 90 Wh | Moyenne de la classe Workstation | |
|---|---|---|---|---|---|---|---|
| Autonomie de la batterie | -26% | -69% | -42% | -19% | -53% | -24% | |
| WiFi v1.3 (h) | 11.6 | 8.6 -26% | 3.6 -69% | 6.7 -42% | 9.4 -19% | 5.5 -53% | 8.55 ? -26% |
| Load (h) | 1.8 | 1.429 ? -21% |
Notebookcheck Rating
Le ThinkPad P16 Gen 3 est une station de travail mobile puissante et hautement extensible, dotée d'une excellente qualité de fabrication, de périphériques d'entrée, d'options de port et d'un écran mat et lumineux, ainsi que d'une bonne autonomie de batterie. Curieusement, ce sont les performances qui constituent le plus gros inconvénient, car elles pourraient être encore meilleures.
Lenovo ThinkPad P16 Gen 3
- 04/22/2026 v8
Benjamin Herzig
 Total Sustainability Score:
 Comparaison avec des concurrents potentiels
Image | Modèle | Prix | Poids | Épaisseur | Écran |
|---|---|---|---|---|---|
1. 89%  | Lenovo ThinkPad P16 Gen 3 Intel Core Ultra 9 285HX ⎘ NVIDIA RTX PRO 3000 Blackwell Generation Laptop ⎘ 96 Go Mémoire, 2048 Go SSD | Amazon: Prix de liste: 4000 Euro | 2.7 kg | 30 mm | 16.00" 1920x1200 142 PPI IPS LED |
2. 90.2% v7 (old)  | Lenovo ThinkPad P16 G2 21FA000FGE Intel Core i7-13700HX ⎘ NVIDIA RTX 2000 Ada Generation Laptop ⎘ 32 Go Mémoire, 1024 Go SSD | Prix de liste: 2750 Euro | 3 kg | 30.23 mm | 16.00" 2560x1600 189 PPI IPS LED |
3. 88.4% 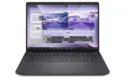 | Dell Pro Max 16 Plus Intel Core Ultra 9 285HX ⎘ NVIDIA RTX PRO 5000 Blackwell Generation Laptop ⎘ 128 Go Mémoire, SSD | Prix de liste: 5000 USD | 2.8 kg | 30.9 mm | 16.00" 3840x2400 283 PPI OLED |
4. 85.9%  | HP ZBook Fury 16 G11 Intel Core i9-14900HX ⎘ NVIDIA RTX 3500 Ada Generation Laptop ⎘ 64 Go Mémoire, 1024 Go SSD | Amazon: Prix de liste: 3300 USD | 2.6 kg | 28.5 mm | 16.00" 3840x2400 283 PPI IPS |
5. 87.3%  | Lenovo ThinkPad T16g Gen 3 RTX 5080 Intel Core Ultra 9 275HX ⎘ NVIDIA GeForce RTX 5080 Laptop ⎘ 64 Go Mémoire, 2048 Go SSD | Amazon: 1. $2,499.00 Lenovo ThinkPad P16 Gen 3 (1... 2. $2,499.00 Lenovo ThinkPad P16 Gen 3 La... 3. $2,999.00 Lenovo ThinkPad P16 Gen 3 Mo... Prix de liste: 4800€ | 2.6 kg | 29.8 mm | 16.00" 3200x2000 236 PPI OLED |
6. 91.6%  | Lenovo ThinkPad P1 Gen 8 Intel Core Ultra 7 255H ⎘ NVIDIA RTX PRO 2000 Blackwell Generation Laptop ⎘ 32 Go Mémoire, 1024 Go SSD | Prix de liste: 2000 USD | 1.9 kg | 20.6 mm | 16.00" 3200x2000 236 PPI Tandem OLED |
Transparency
La sélection des appareils à examiner est effectuée par notre équipe éditoriale. L'échantillon de test a été prêté à l'auteur par le fabricant ou le détaillant pour les besoins de cet examen. Le prêteur n'a pas eu d'influence sur cette évaluation et le fabricant n'a pas reçu de copie de cette évaluation avant sa publication. Il n'y avait aucune obligation de publier cet article. En tant que média indépendant, Notebookcheck n'est pas soumis à l'autorité des fabricants, des détaillants ou des éditeurs.
Voici comment Notebookcheck teste
Chaque année, Notebookcheck examine de manière indépendante des centaines d'ordinateurs portables et de smartphones en utilisant des procédures standardisées afin de garantir que tous les résultats sont comparables. Nous avons continuellement développé nos méthodes de test depuis environ 20 ans et avons établi des normes industrielles dans le processus. Dans nos laboratoires de test, des équipements de mesure de haute qualité sont utilisés par des techniciens et des rédacteurs expérimentés. Ces tests impliquent un processus de validation en plusieurs étapes. Notre système d'évaluation complexe repose sur des centaines de mesures et de points de référence bien fondés, ce qui garantit l'objectivité.
