Verdict - La configuration la plus raisonnable pour la plupart des utilisateurs
Le Core Ultra 7 355 perd une grande partie de ce qui fait la spécificité de la série H Panther Lake. En particulier, les performances et les performances par watt sont plus proches de Lunar Lake-V, voire pires, si l'on prend en compte les performances graphiques intégrées. Alors que le produit phare Core Ultra X7 358H est un énorme pas en avant pour la série, le Core Ultra 7 355 de milieu de gamme peut ressembler à un rebranding du Core Ultra 7 255U à bien des égards. Le système ne fonctionne pas sensiblement plus froid ou plus longtemps que l'option Core Ultra X7 plus rapide, malgré les différences de performances.
Bien entendu, les utilisateurs qui n'ont pas besoin des avantages du Core Ultra X7 en termes de performances préféreront peut-être la configuration Core Ultra 7 355, moins onéreuse, car elle présente toutes les améliorations physiques par rapport au modèle 2025 ou aux modèles précédents, qui suscitent la controverse. Même la dalle IPS 1200p de base est meilleure que la plupart des autres d'un même type en termes de qualité d'image. Les utilisateurs qui ne sont pas convaincus par le GPU Arc B390 trouveront que le Core Ultra 7 355 est tout aussi bon pour la navigation, le traitement de texte et le multimédia en général. En revanche, les créateurs de contenu et les joueurs occasionnels auront tout intérêt à se tourner vers le Core Ultra X7, plus haut de gamme.
Points positifs
Points négatifs
Prix et disponibilité
Dell commercialise désormais la configuration XPS 14 de la série Core Ultra 7 U, telle qu'elle a été présentée, à partir de 1700 dollars.
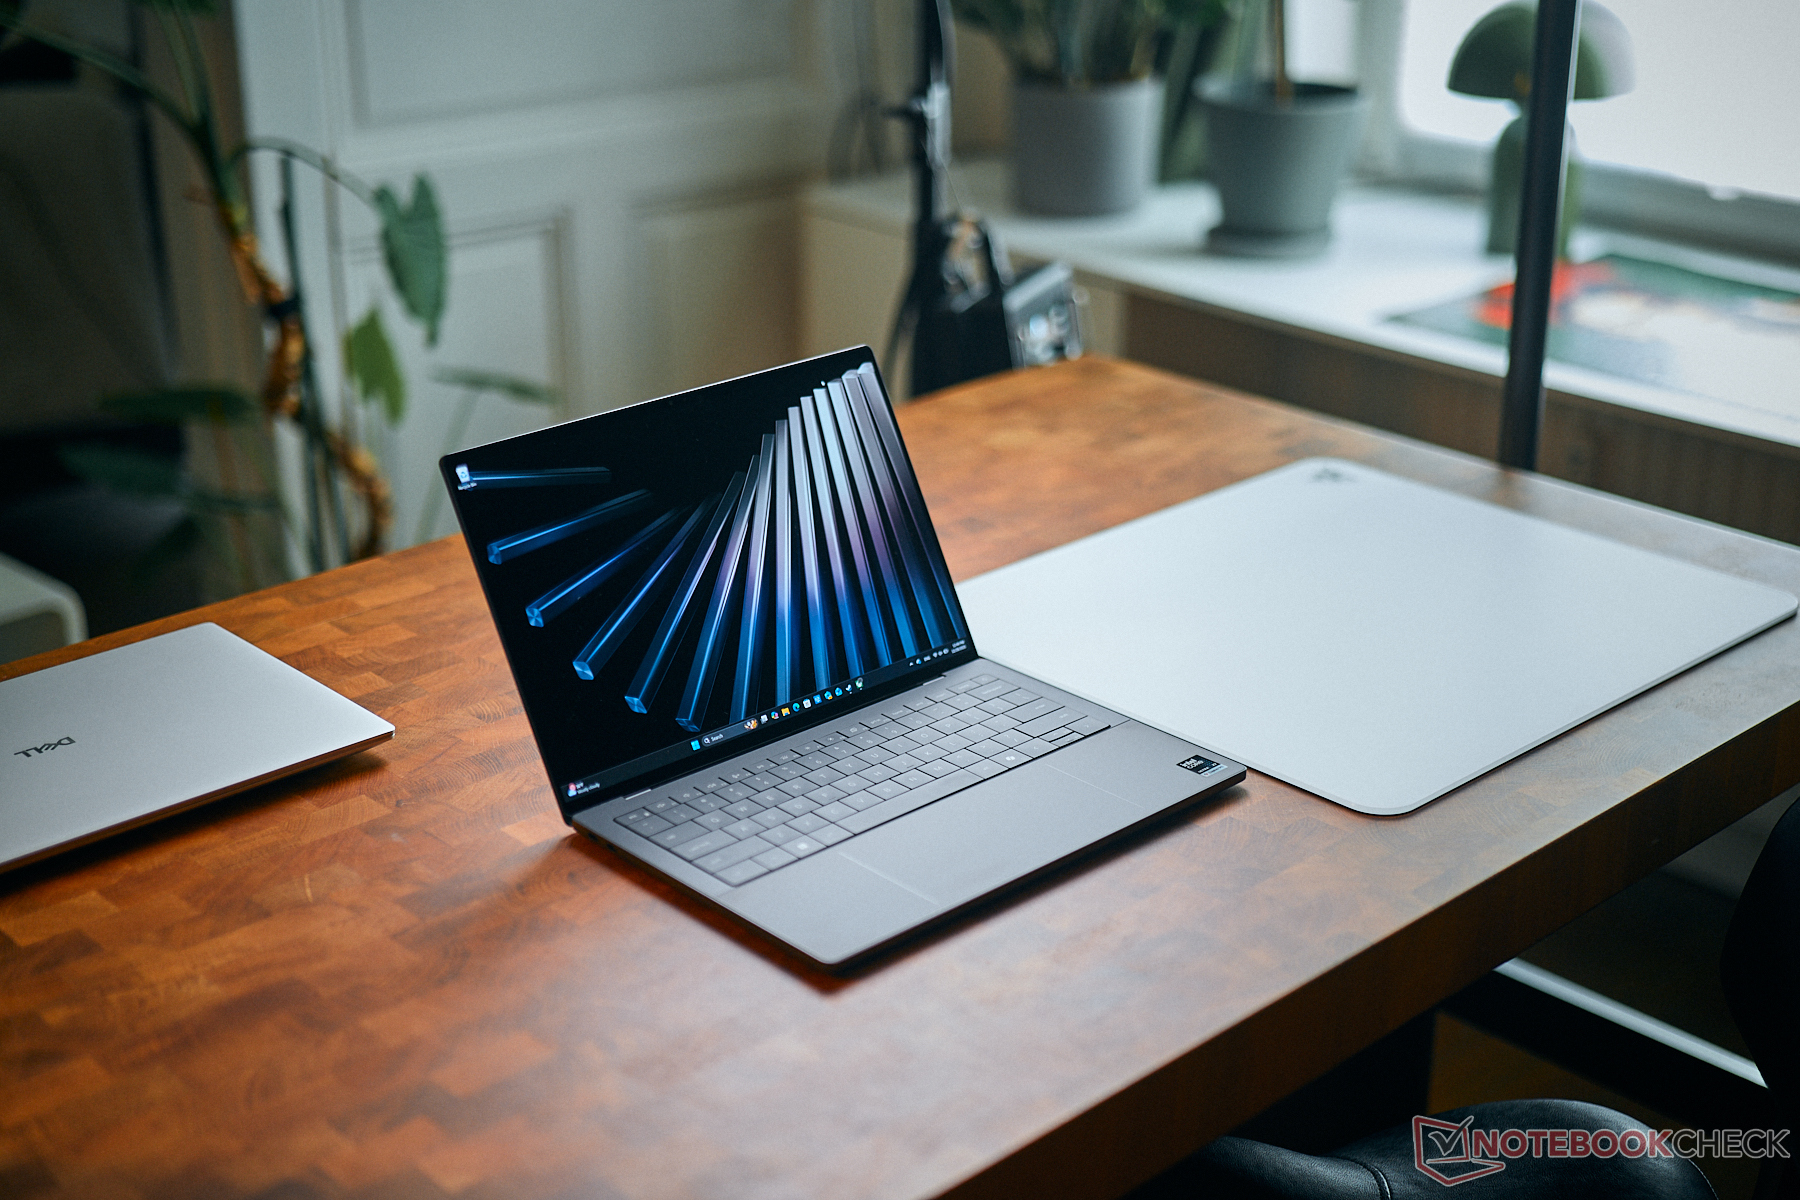
Nous avons récemment testé le Core Ultra X7 OLED XPS 14 et lui avons donné de bonnes notes en ce qui concerne toutes les améliorations apportées à la fois aux performances et au design. Néanmoins, la majorité des utilisateurs pourraient être plus intéressés par les SKUs abordables avec le Core Ultra 7 et l'écran IPS pour près de 500 USD de moins. Cet article compare les deux configurations afin de déterminer le déficit de performances auquel les utilisateurs peuvent s'attendre avant d'acheter.
Comme les Core Ultra 7 et Core Ultra X7 sont visuellement identiques, nous vous recommandons de lire notre revue du XPS 14 OLED pour en savoir plus sur les caractéristiques physiques du XPS 14 pour en savoir plus sur les caractéristiques physiques du modèle.
Plus d'avis Dell :
Spécifications
Cas
La configuration IPS non tactile est légèrement plus fine que la configuration OLED tactile (14,6 mm contre 15,2 mm). Pour le reste, les impressions sont les mêmes : la construction est nettement plus solide que celle du modèle précédent, mais le processus d'entretien est un peu plus complexe.
Connectivité


Communication
Webcam


Maintenance

Durabilité
Dell continue d'utiliser de plus en plus de matériaux recyclés pour fabriquer ses modèles phares, y compris le dernier XPS 14, comme nous l'avons indiqué dans notre premier article.
Affichage
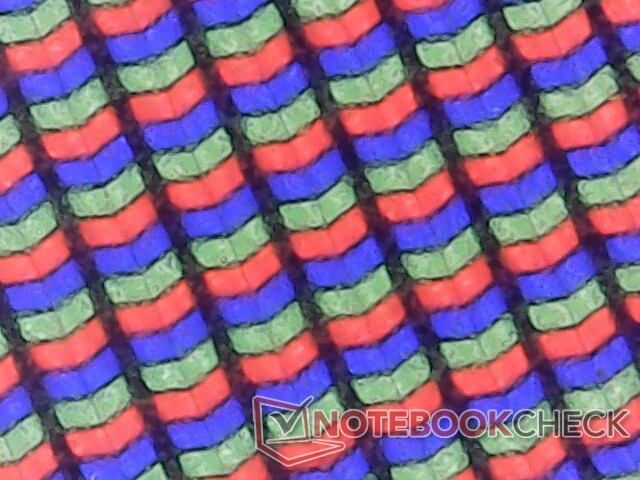
Deux options d'affichage sont disponibles :
- 1920 x 1200, non tactile, mat, 500 nits, 100% sRGB, IPS, 1 - 120 Hz
- 2880 x 1800, écran tactile, brillant, 500 nits, 100% DCI-P3, OLED, 20 - 120 Hz
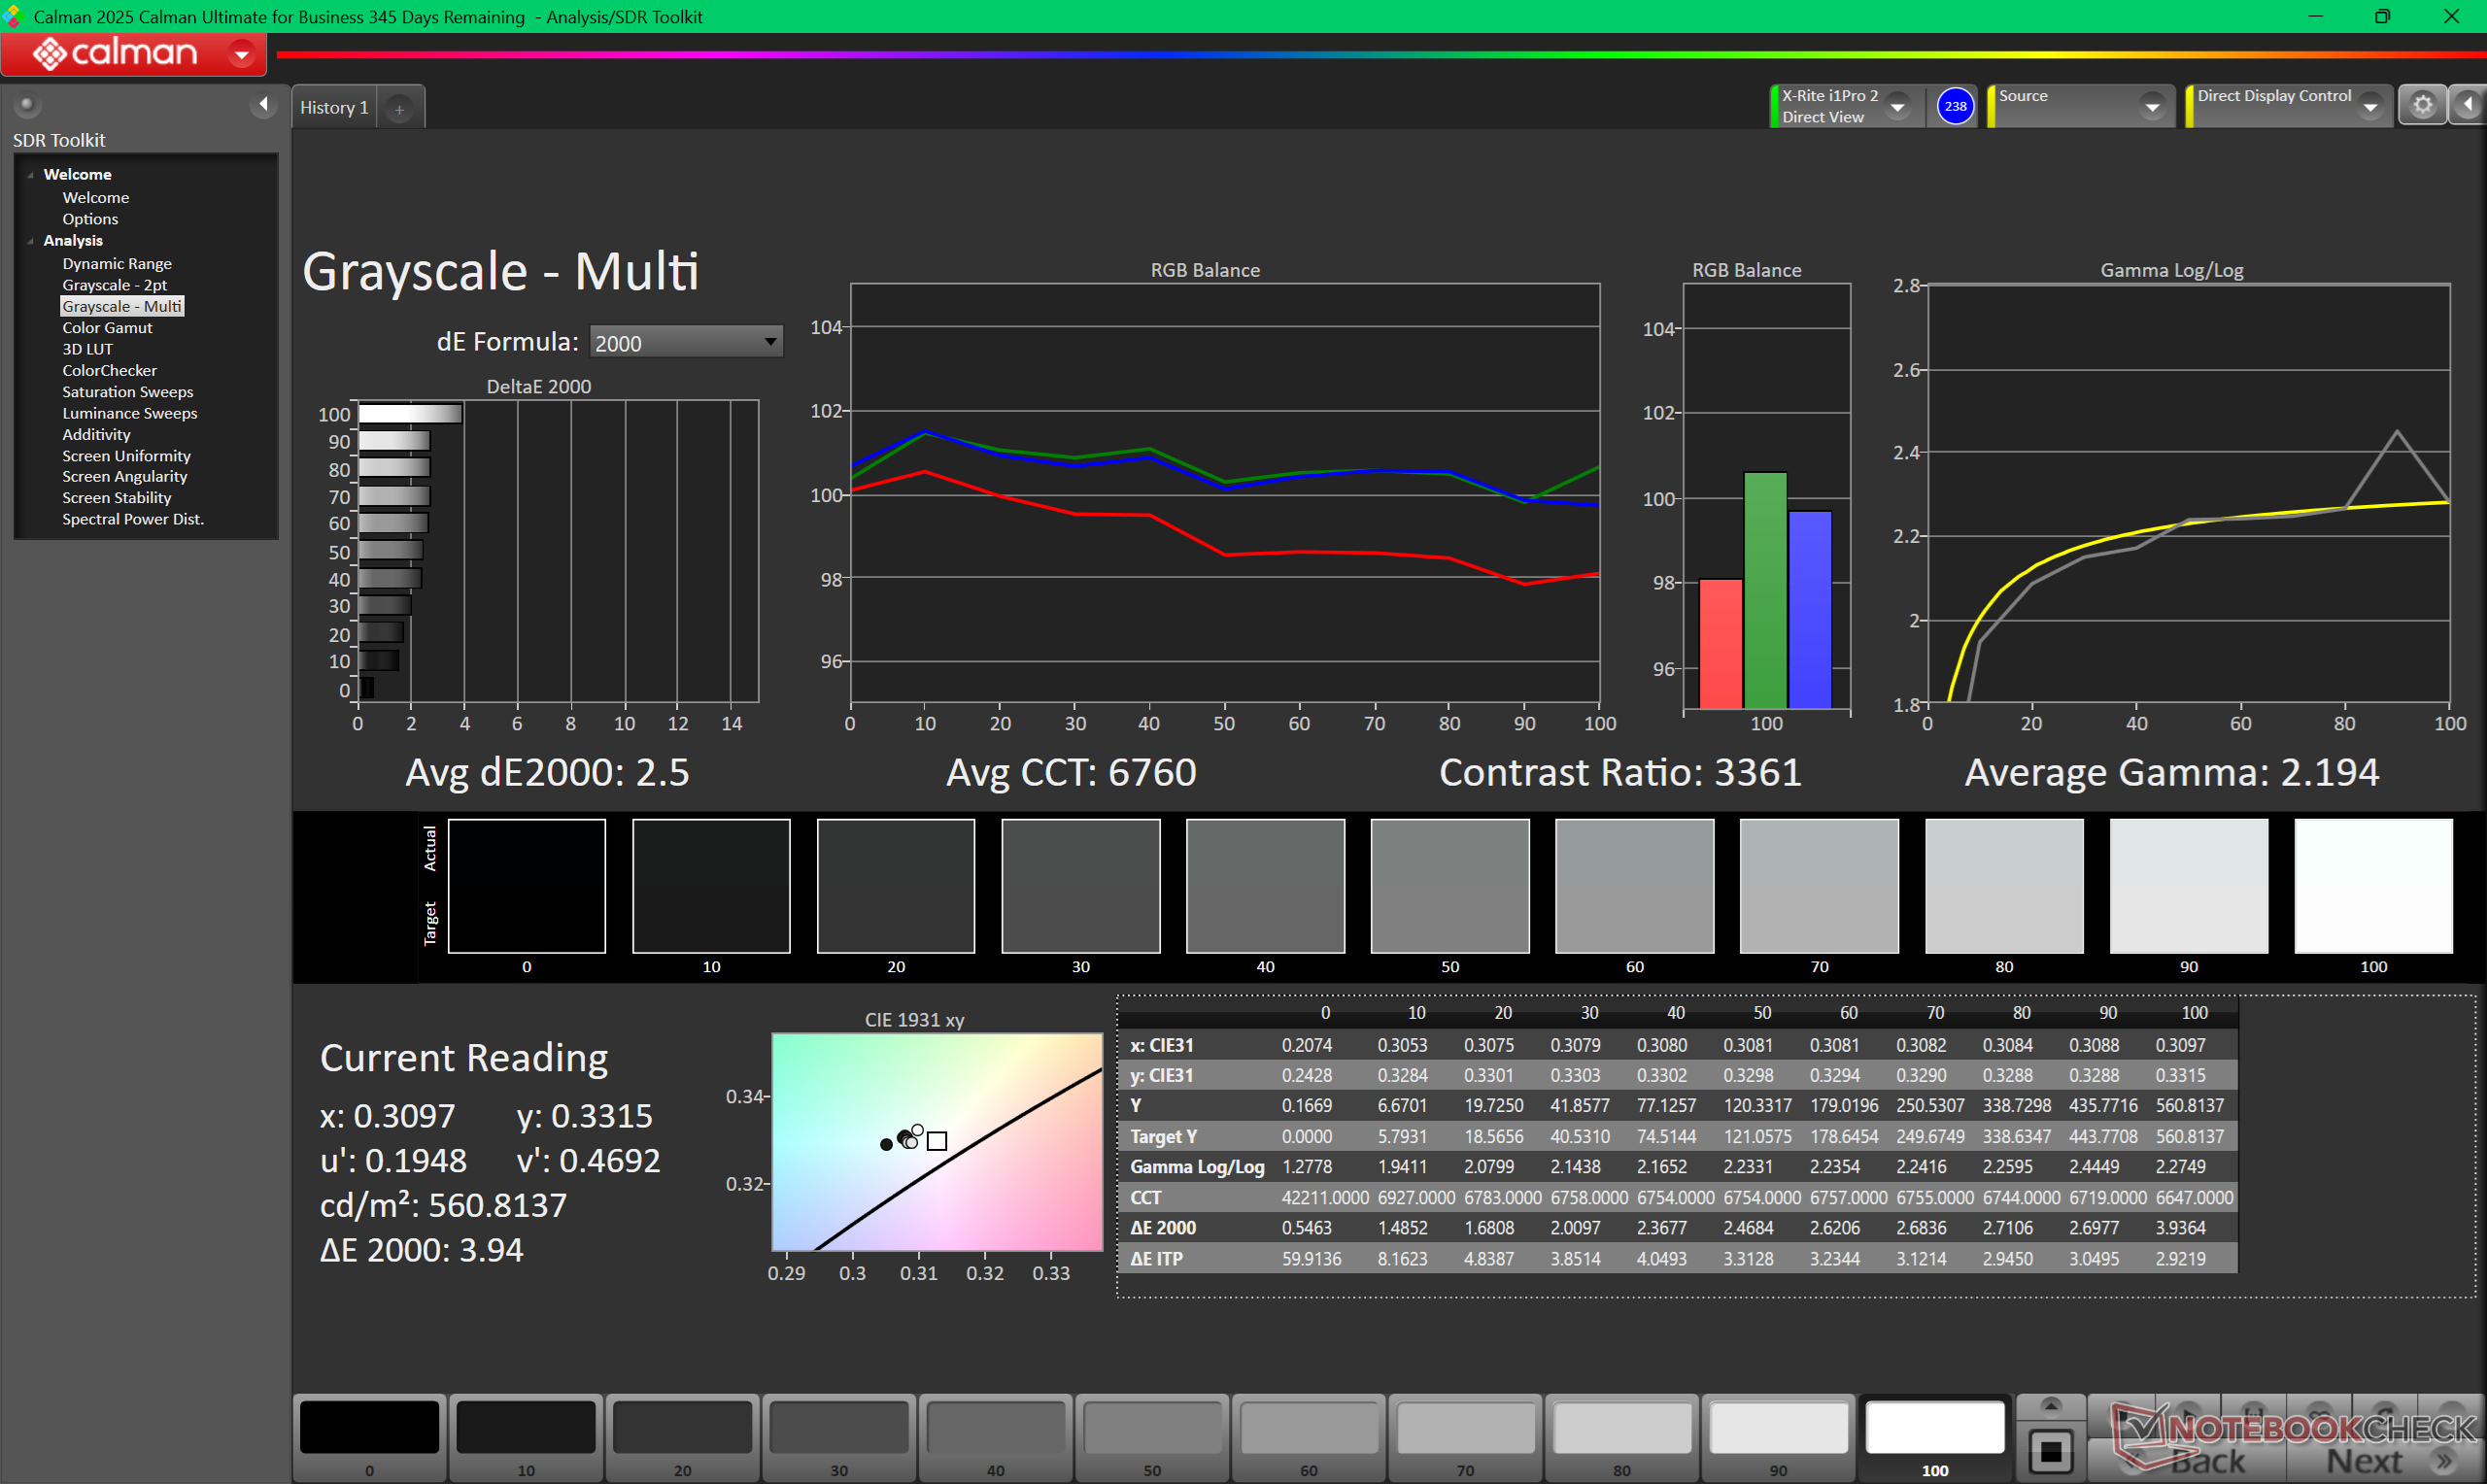
Comparée à la dalle OLED, la dalle IPS, moins chère, peut être légèrement plus lumineuse au centre, mais aussi légèrement plus faible sur les bords et dans les coins en raison d'une moins bonne uniformité. Le rapport de contraste est toujours très bon, surtout pour un écran IPS, à plus de 2000:1, et Windows VRR est supporté jusqu'à 1 Hz au ralenti, contre 20 Hz ou plus sur la plupart des autres ordinateurs portables. Notez que cette fonctionnalité est désactivée par défaut et doit être activée manuellement.
Les deux inconvénients les plus notables de la dalle IPS sont ses temps de réponse noir-blanc beaucoup plus lents et l'absence de couverture DCI-P3. Par conséquent, les images fantômes peuvent être très visibles, en particulier dans les jeux, et le HDR n'est pas officiellement pris en charge.


| |||||||||||||||||||||||||
Homogénéité de la luminosité: 85 %
Valeur mesurée au centre, sur batterie: 561.2 cd/m²
Contraste: 2551:1 (Valeurs des noirs: 0.22 cd/m²)
ΔE ColorChecker Calman: 2.09 | ∀{0.5-29.43 Ø4.73}
calibrated: 1.09
ΔE Greyscale Calman: 2.5 | ∀{0.09-98 Ø4.98}
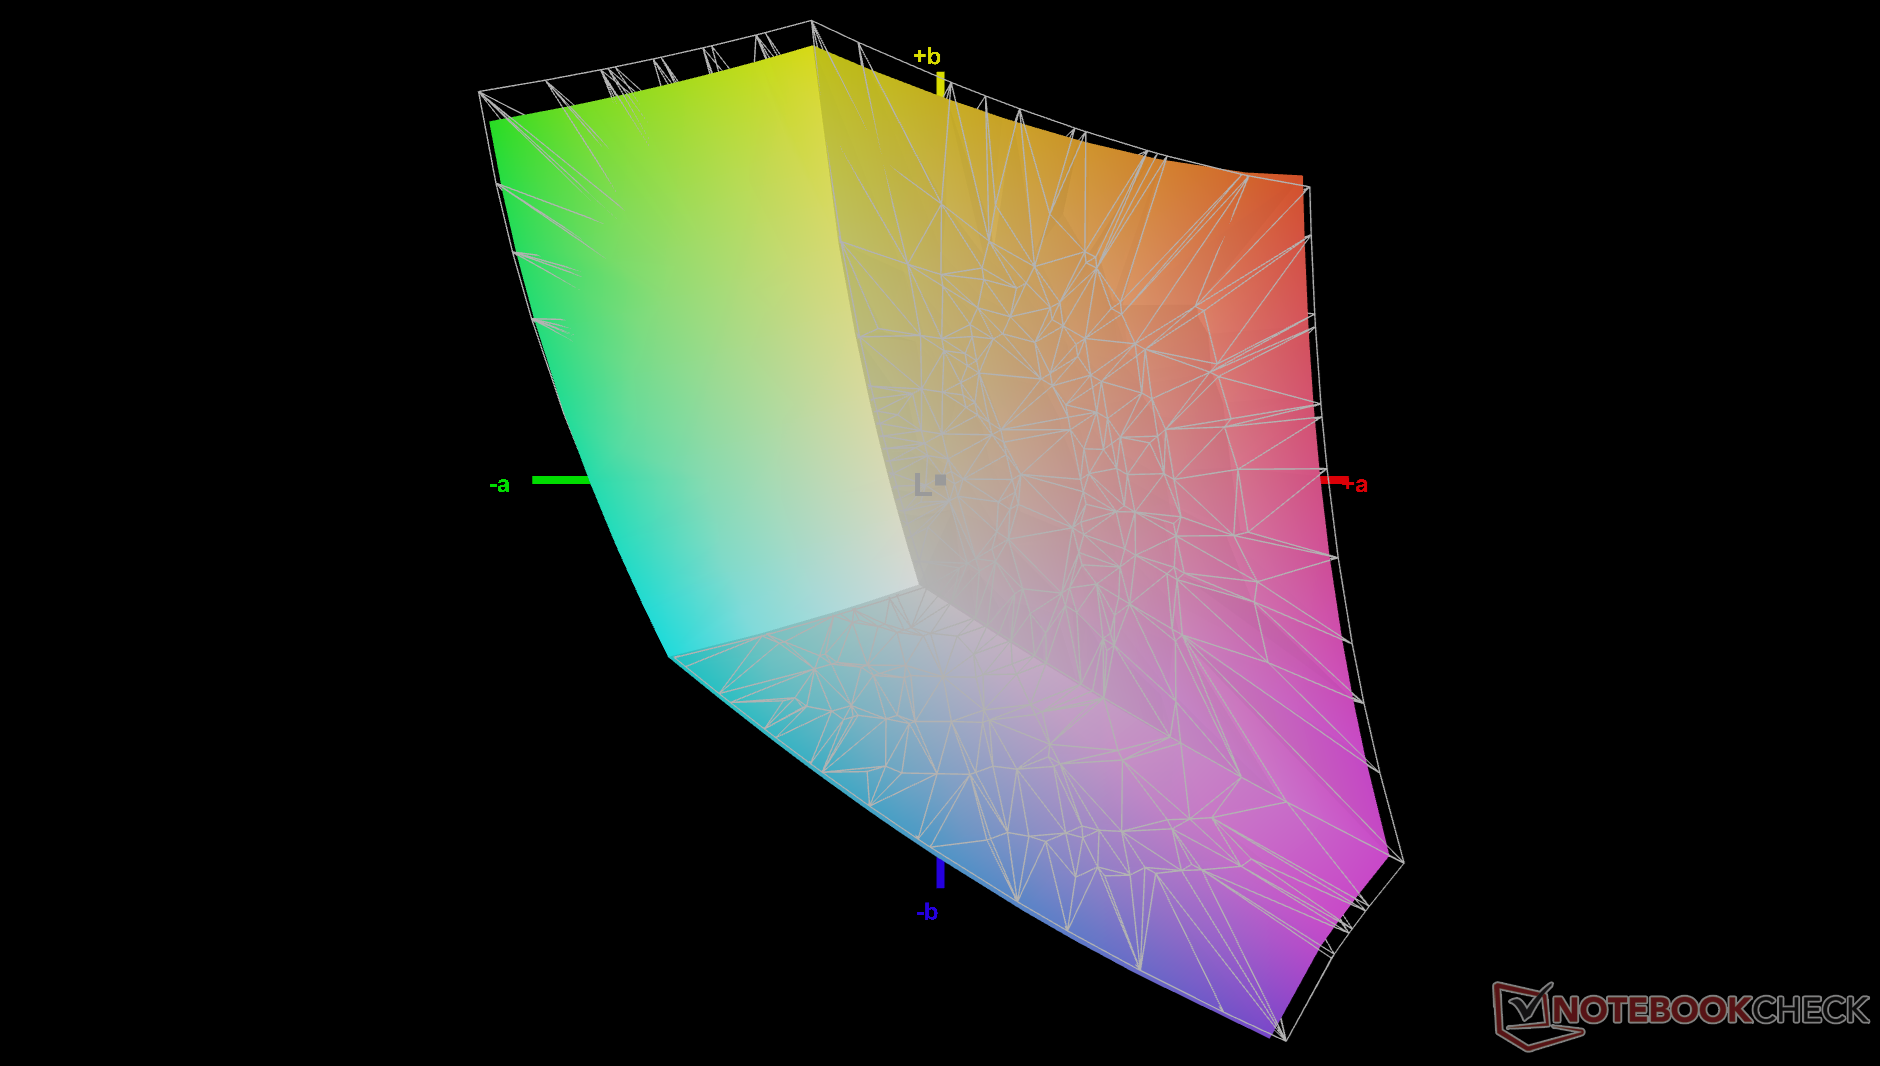
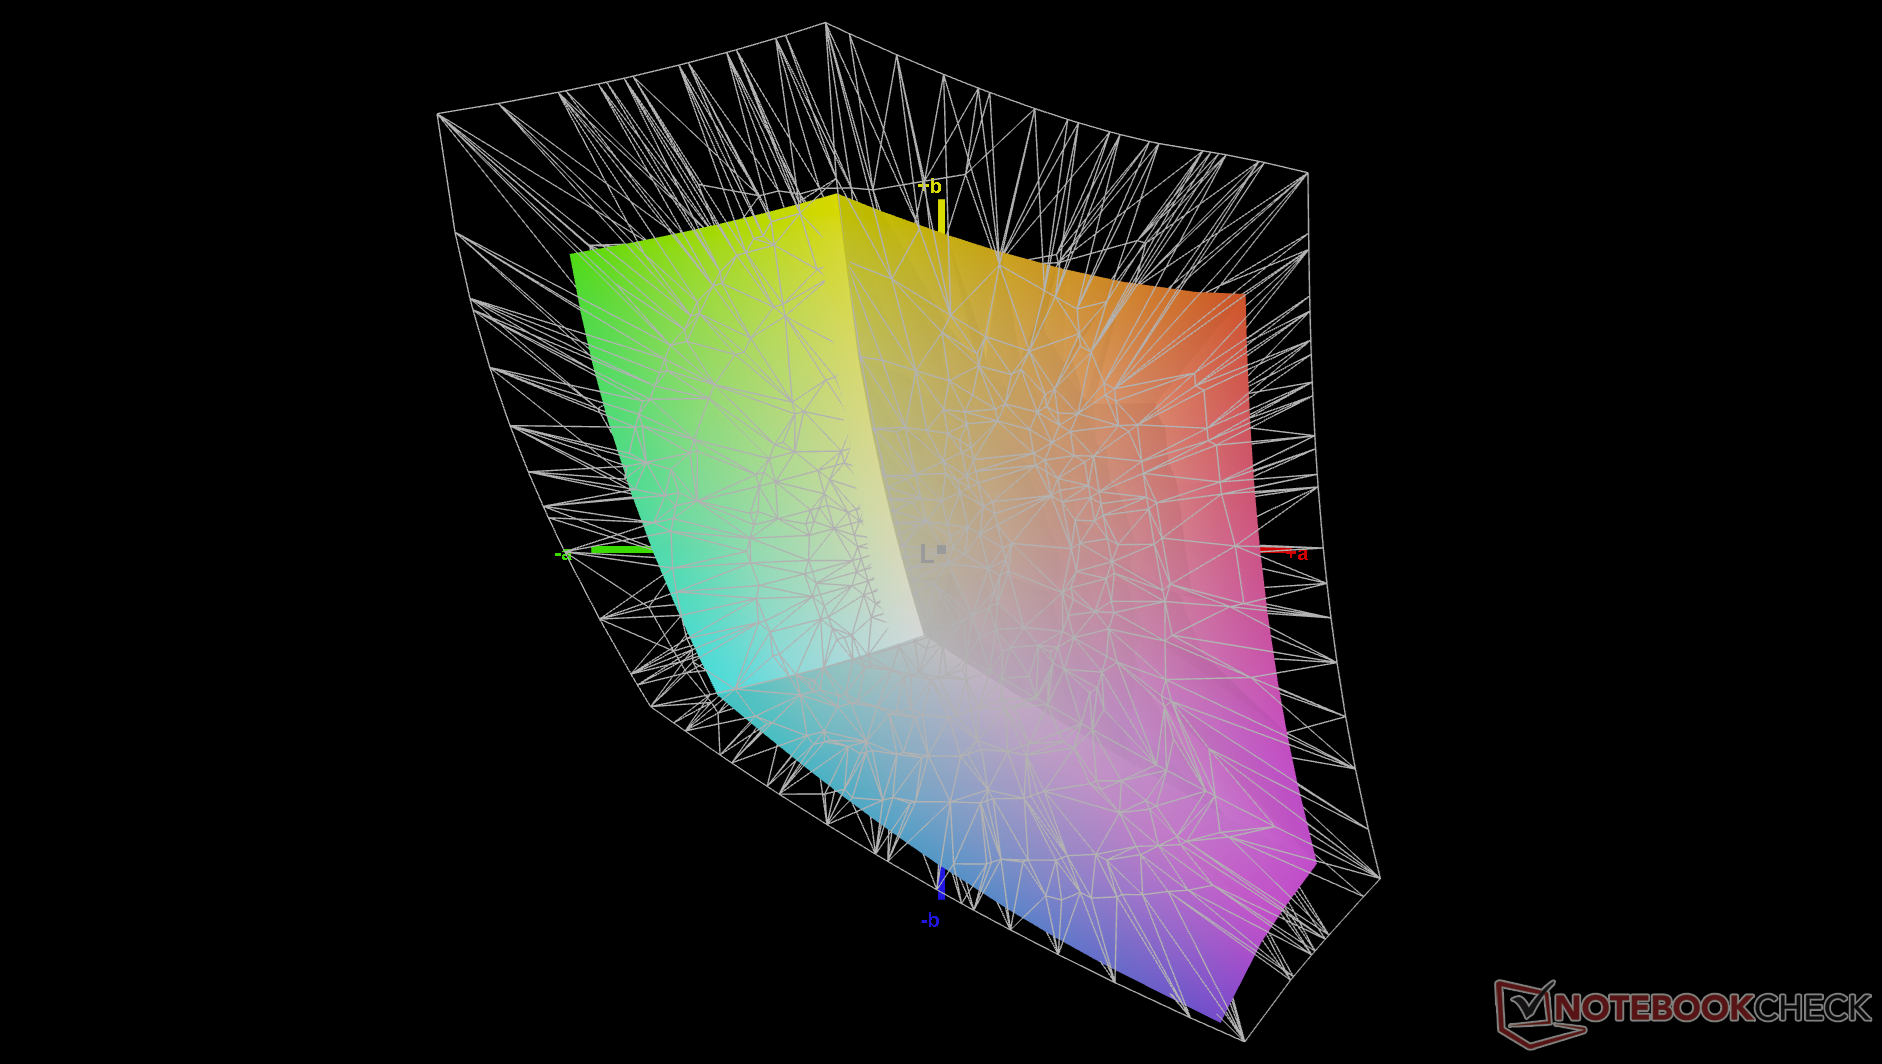
66.2% AdobeRGB 1998 (Argyll 3D)
95.3% sRGB (Argyll 3D)
64% Display P3 (Argyll 3D)
Gamma: 2.19
CCT: 6760 K
| Dell XPS 14 Core Ultra 7 355 LG Philips 140WUX, IPS, 1920x1200, 14", 120 Hz | Dell XPS 14 Core Ultra X7 358H LG Philips 140WT2, OLED, 2880x1800, 14", 120 Hz | Asus ExpertBook PM3406 MNE007QS3-6, IPS, 1920x1200, 14", 60 Hz | Lenovo ThinkPad T14 Gen 6 21QG001VGE MNE007JA1-3, IPS LED, 1920x1200, 14", 60 Hz | HP OmniBook Ultra Flip 14 Samsung SDC41AA, OLED, 2880x1800, 14", 120 Hz | Samsung Galaxy Book5 Pro 14 940XHA ATNA40CU07-0, OLED, 2880x1800, 14", 120 Hz | |
|---|---|---|---|---|---|---|
| Display | 36% | -39% | 5% | 36% | 35% | |
| Display P3 Coverage (%) | 64 | 99.7 56% | 39.3 -39% | 67.7 6% | 99.8 56% | 99.9 56% |
| sRGB Coverage (%) | 95.3 | 100 5% | 58.1 -39% | 98.3 3% | 100 5% | 100 5% |
| AdobeRGB 1998 Coverage (%) | 66.2 | 98.2 48% | 40.6 -39% | 69.9 6% | 96.7 46% | 95.7 45% |
| Response Times | 98% | 54% | 28% | 98% | 99% | |
| Response Time Grey 50% / Grey 80% * (ms) | 57.7 ? | 0.75 ? 99% | 27.6 ? 52% | 40.2 ? 30% | 0.86 ? 99% | 0.83 ? 99% |
| Response Time Black / White * (ms) | 38.8 ? | 1.03 ? 97% | 17 ? 56% | 29.1 ? 25% | 1.01 ? 97% | 0.69 ? 98% |
| PWM Frequency (Hz) | 240.62 ? | 469 ? | 240 ? | |||
| PWM Amplitude * (%) | 29 | 33.3 | 66 | |||
| Screen | 11% | -102% | 5% | 19% | -7% | |
| Brightness middle (cd/m²) | 561.2 | 393.8 -30% | 320 -43% | 554 -1% | 363.9 -35% | 400 -29% |
| Brightness (cd/m²) | 505 | 389 -23% | 310 -39% | 516 2% | 366 -28% | 402 -20% |
| Brightness Distribution (%) | 85 | 96 13% | 93 9% | 91 7% | 99 16% | 99 16% |
| Black Level * (cd/m²) | 0.22 | 0.26 -18% | 0.24 -9% | |||
| Contrast (:1) | 2551 | 1231 -52% | 2308 -10% | |||
| Colorchecker dE 2000 * | 2.09 | 1.27 39% | 5.1 -144% | 1.5 28% | 0.84 60% | 2.1 -0% |
| Colorchecker dE 2000 max. * | 4.37 | 3.35 23% | 18.1 -314% | 3.4 22% | 2.72 38% | 3.3 24% |
| Colorchecker dE 2000 calibrated * | 1.09 | 0.71 35% | 4.9 -350% | 0.9 17% | 0.82 25% | 1.6 -47% |
| Greyscale dE 2000 * | 2.5 | 2 20% | 1.7 32% | 2.7 -8% | 1.1 56% | 2.3 8% |
| Gamma | 2.19 100% | 2.19 100% | 2.21 100% | 2.25 98% | 2.18 101% | 2.26 97% |
| CCT | 6760 96% | 6379 102% | 6398 102% | 6882 94% | 6330 103% | 6795 96% |
| Moyenne finale (programmes/paramètres) | 48% /
32% | -29% /
-66% | 13% /
8% | 51% /
36% | 42% /
21% |
* ... Moindre est la valeur, meilleures sont les performances
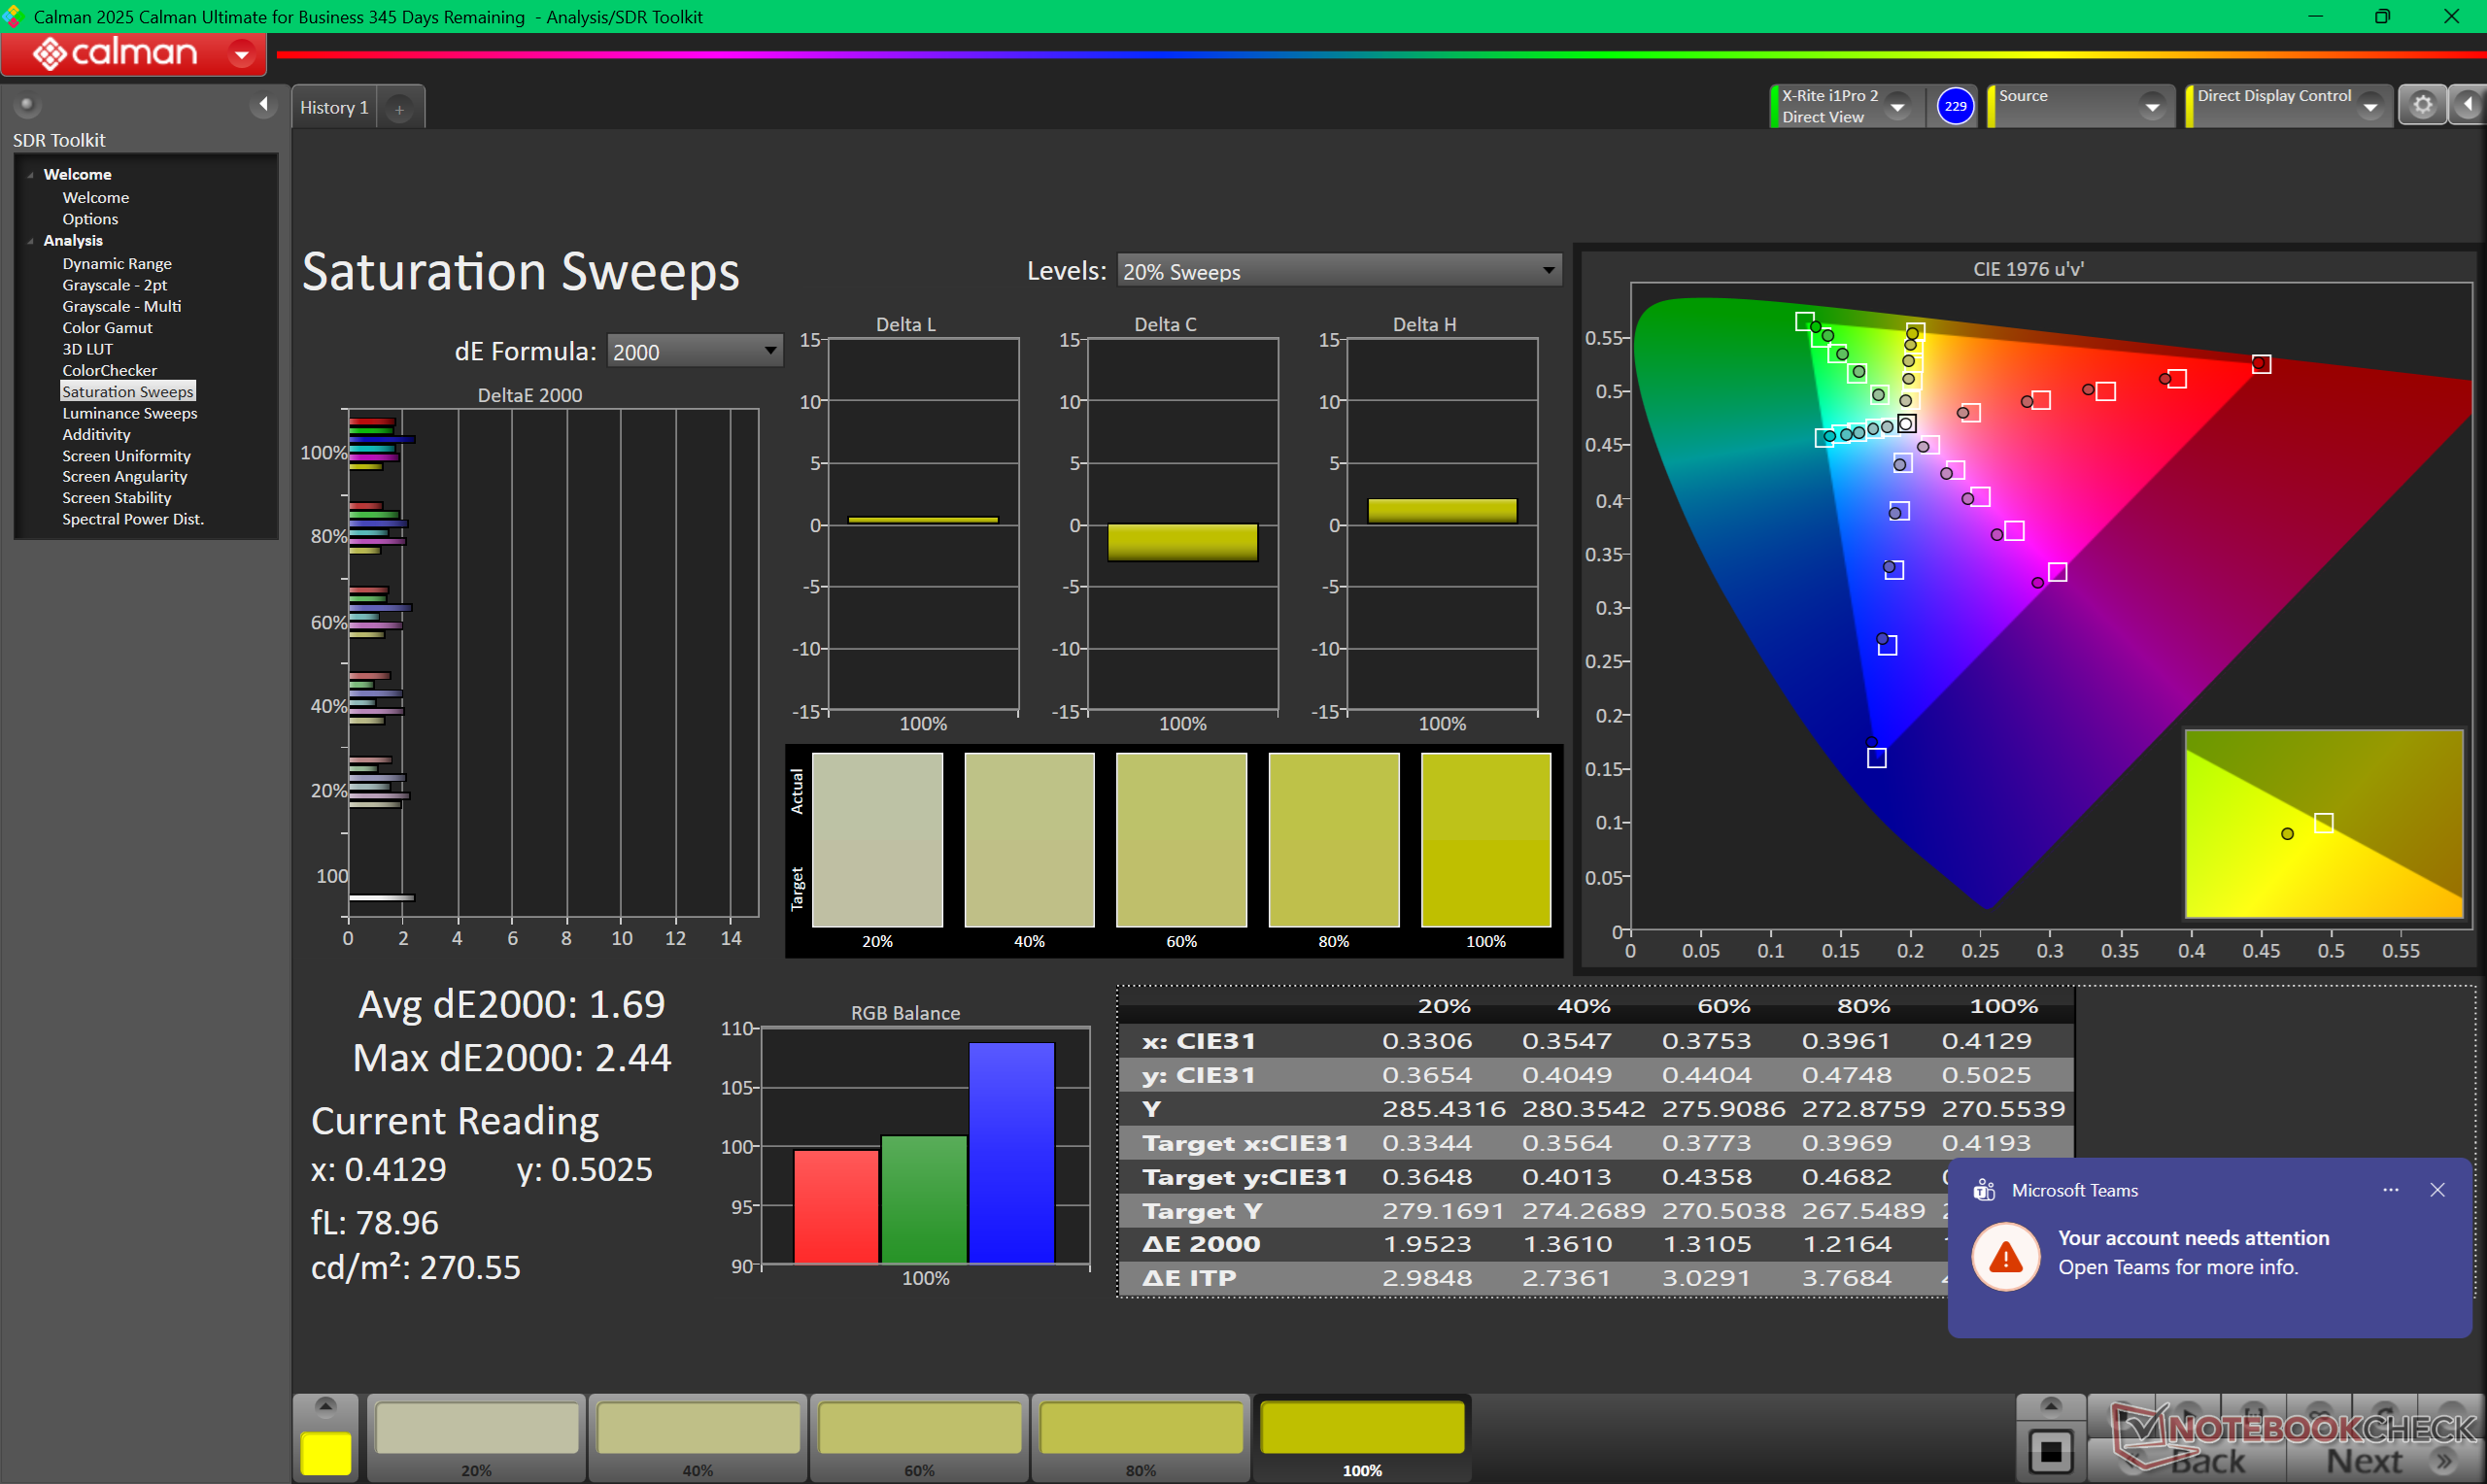
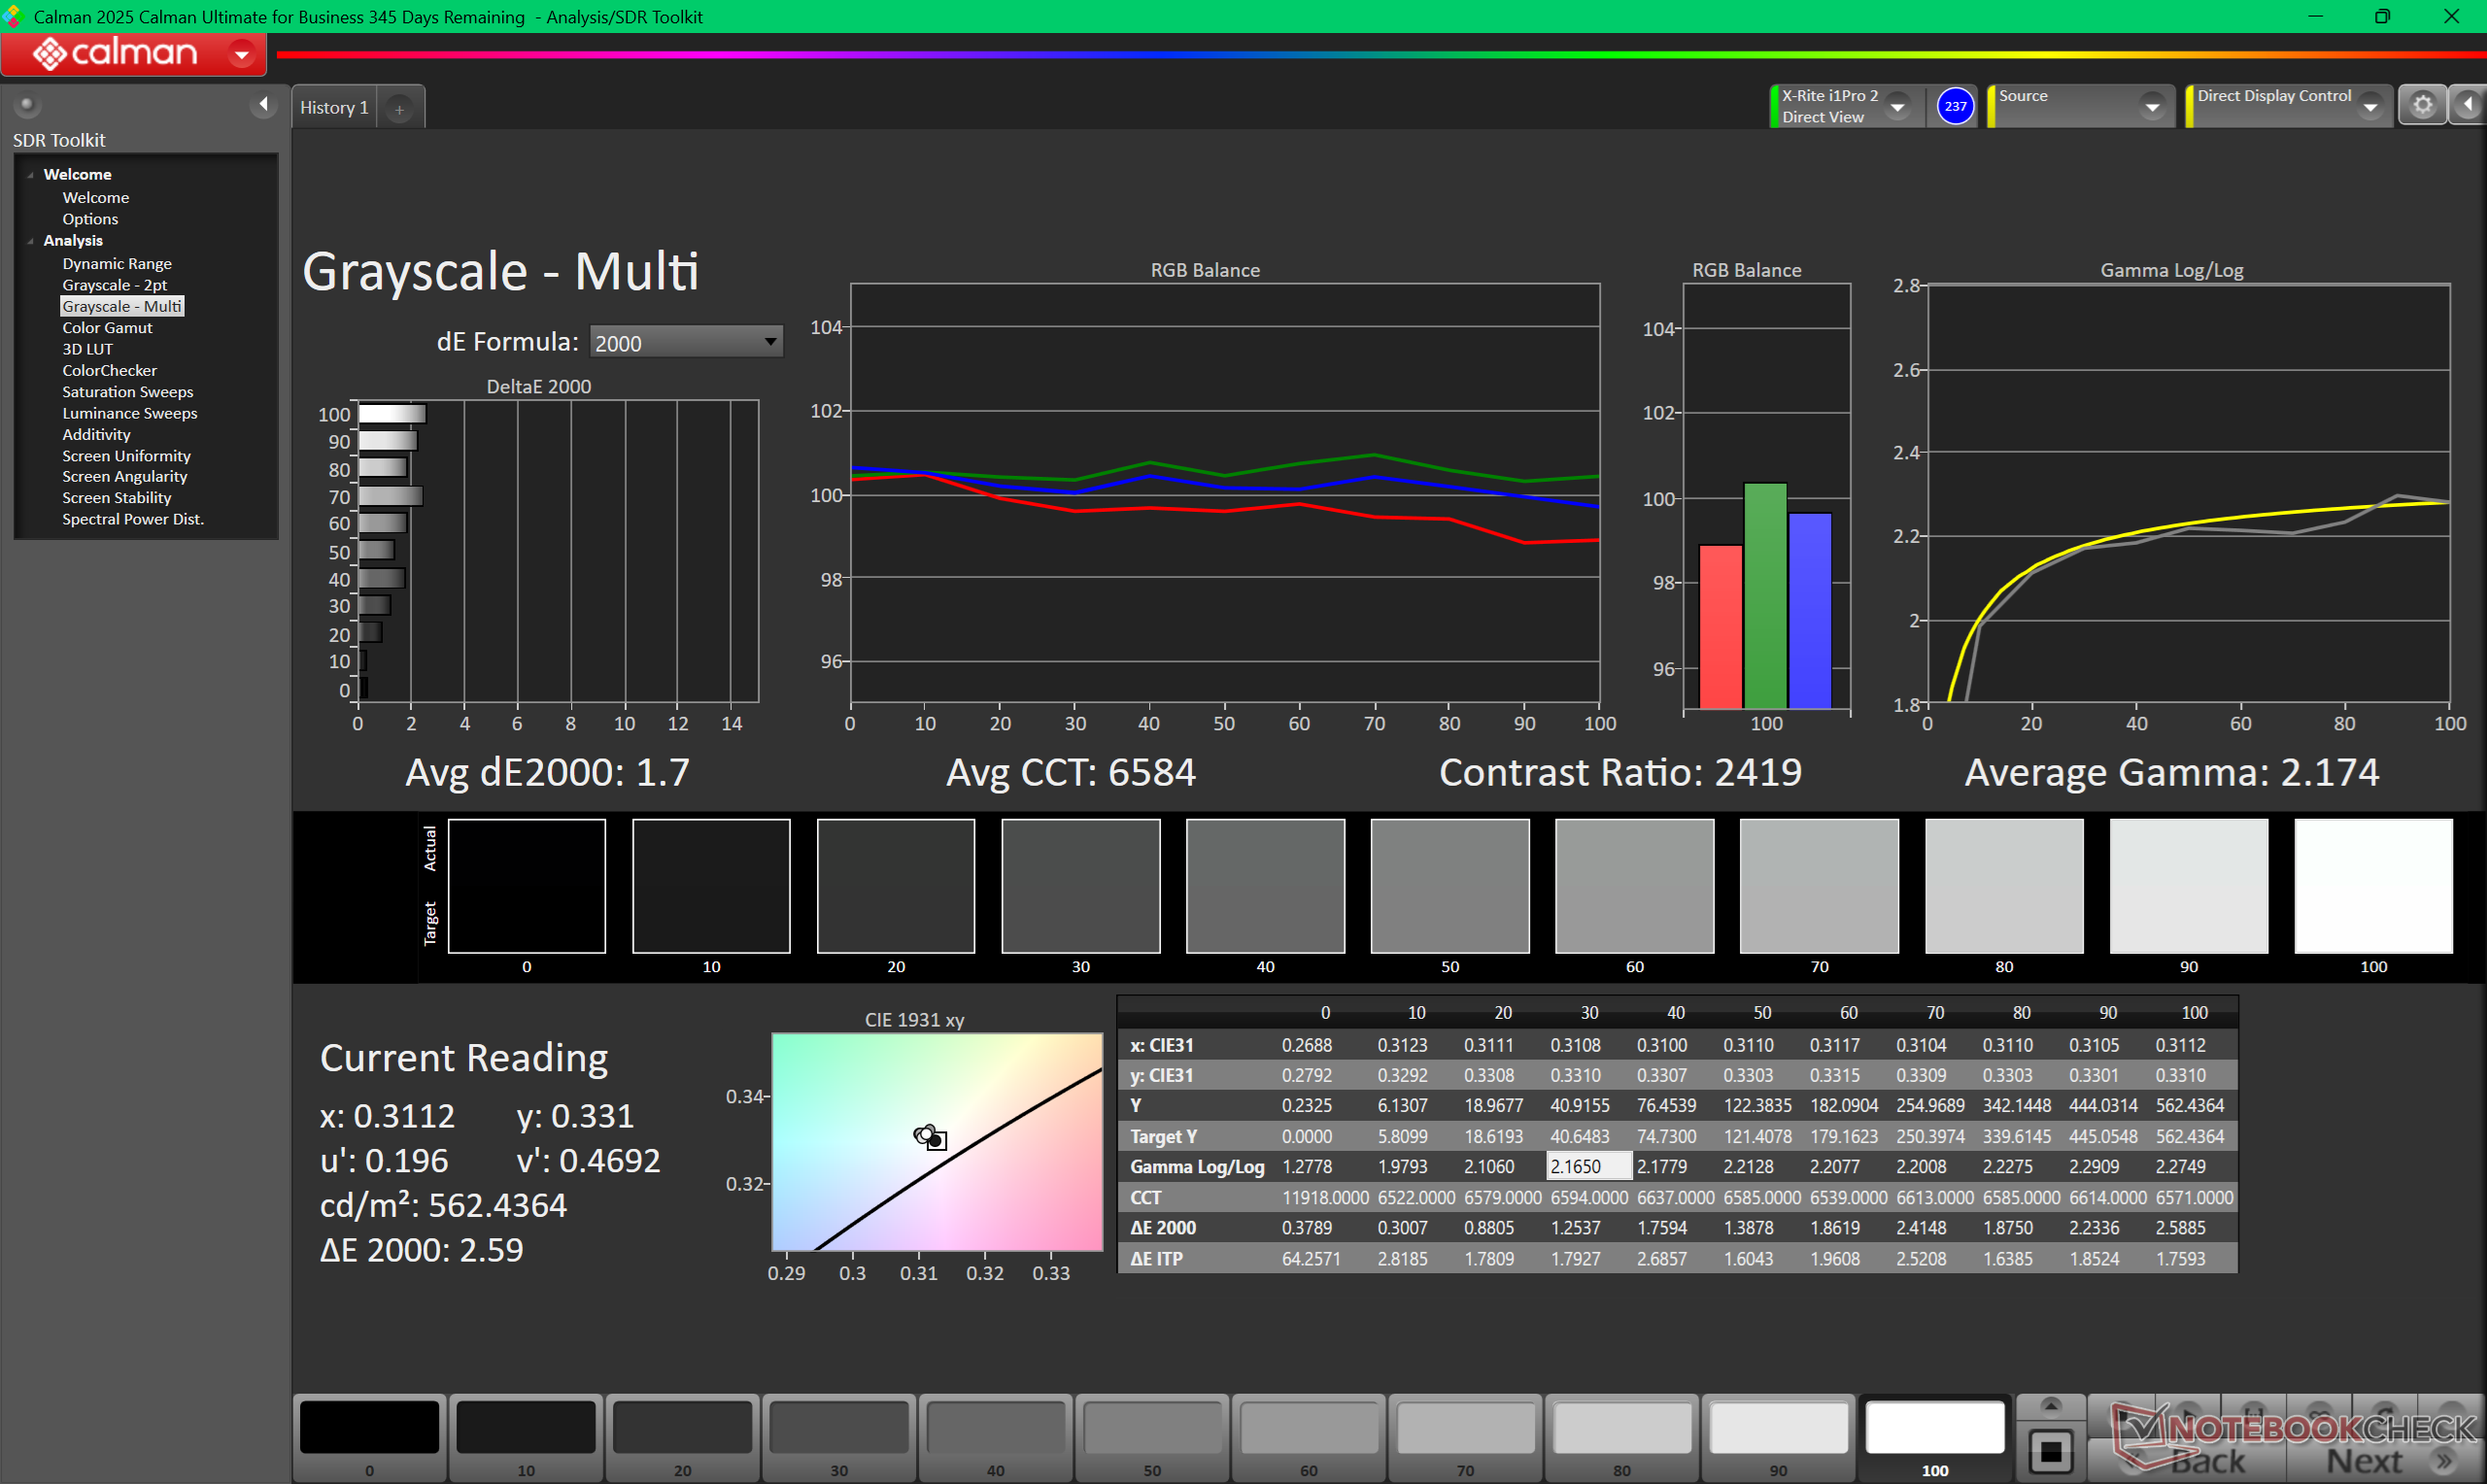
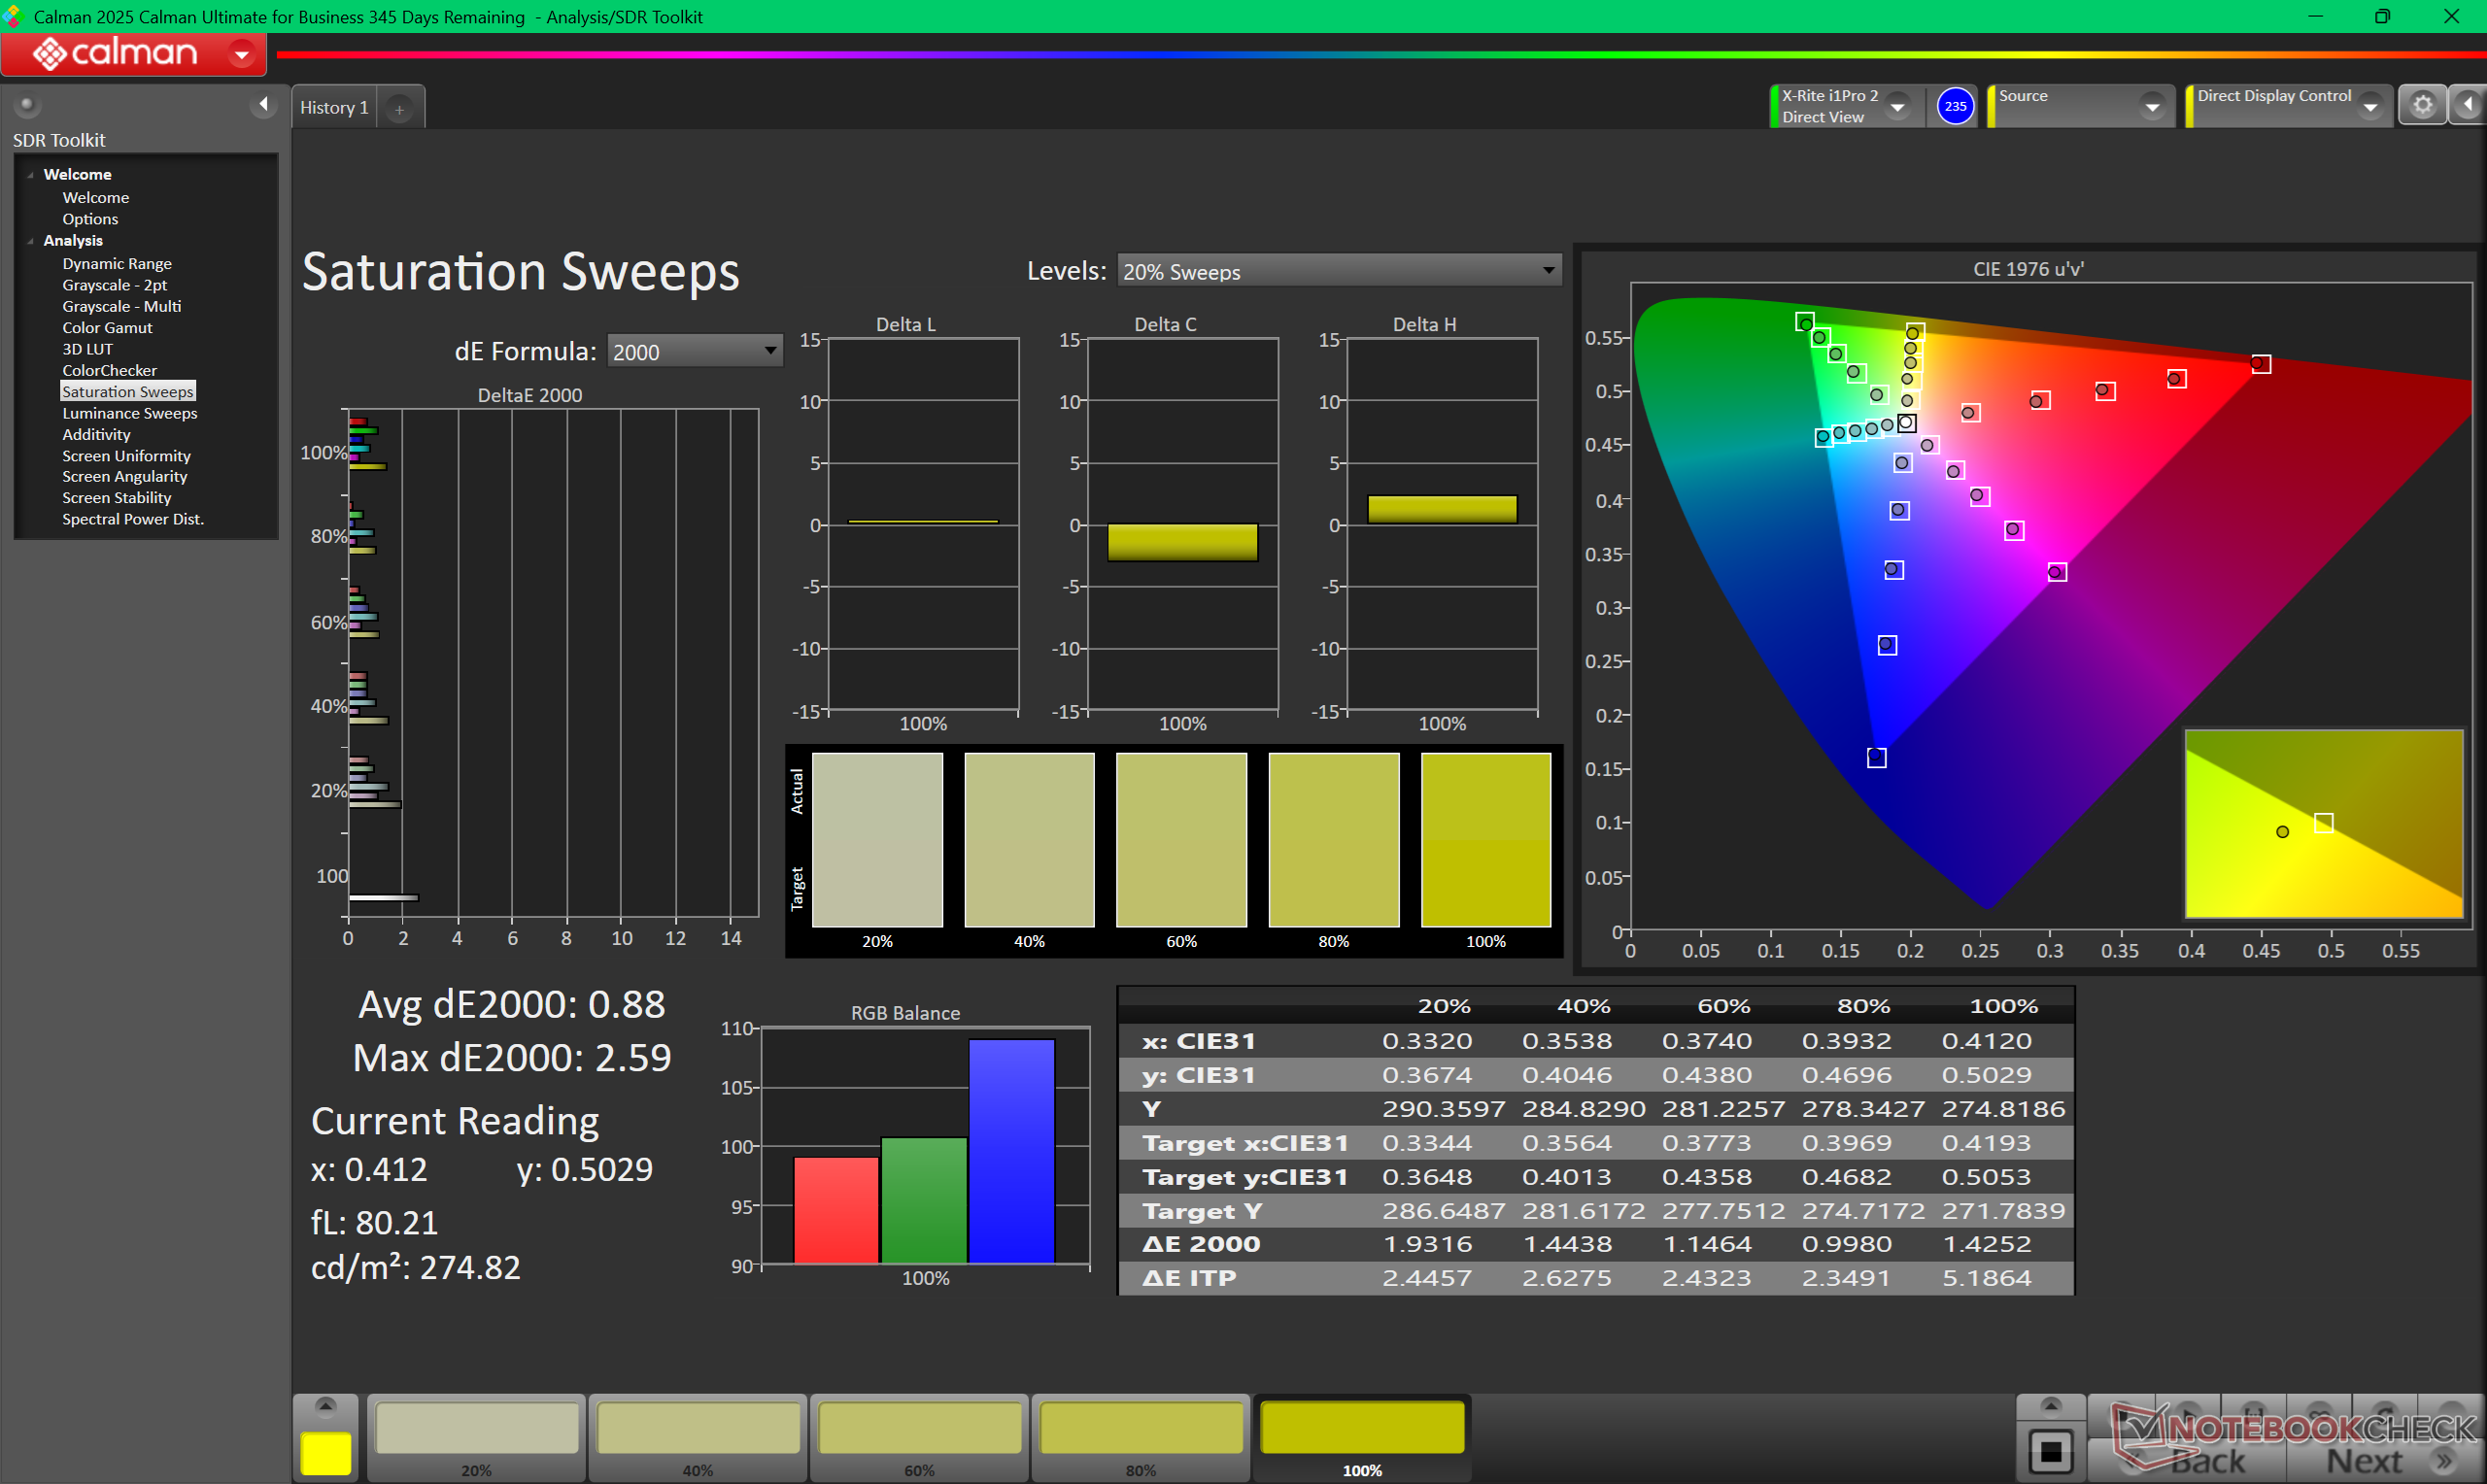
Bien que l'écran soit calibré de manière satisfaisante dès sa sortie de l'emballage, il peut encore être légèrement amélioré. En calibrant nous-mêmes l'écran à l'aide d'un colorimètre X-Rite, les valeurs moyennes de l'échelle de gris et du deltaE des couleurs passeraient respectivement de 2,5 et 2,09 à 1,7 et 1,09, tout en rapprochant la température des couleurs de l'objectif de 6500K.


Temps de réponse de l'écran
| ↔ Temps de réponse noir à blanc | ||
|---|---|---|
| 38.8 ms ... hausse ↗ et chute ↘ combinées | ↗ 17 ms hausse | 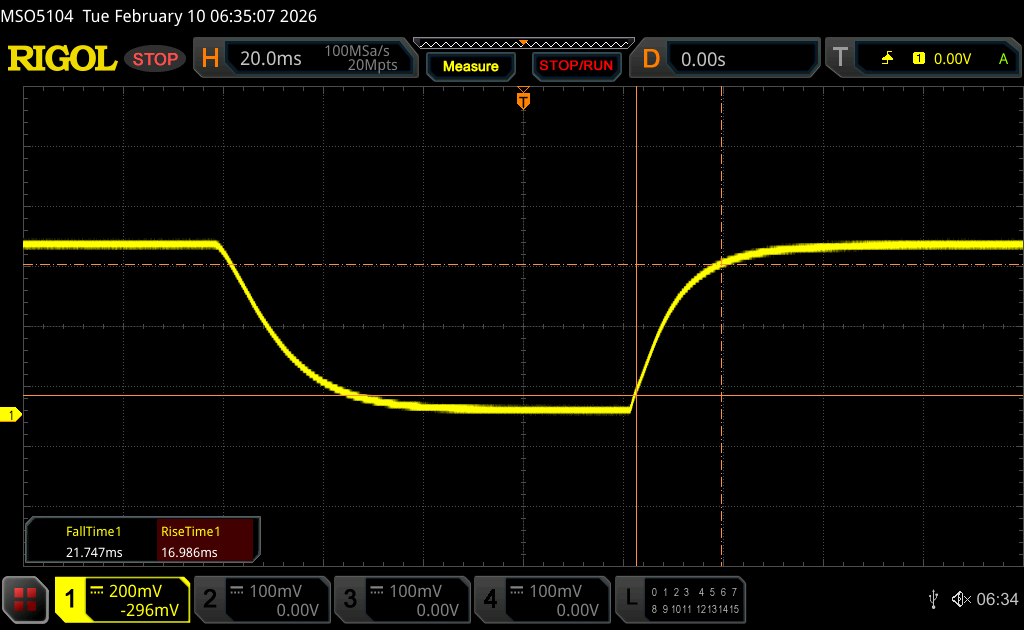 |
| ↘ 21.8 ms chute | ||
| L'écran souffre de latences très élevées, à éviter pour le jeu. En comparaison, tous les appareils testés affichent entre 0.1 (minimum) et 240 (maximum) ms. » 96 % des appareils testés affichent de meilleures performances. Cela signifie que les latences relevées sont moins bonnes que la moyenne (19.9 ms) de tous les appareils testés. | ||
| ↔ Temps de réponse gris 50% à gris 80% | ||
| 57.7 ms ... hausse ↗ et chute ↘ combinées | ↗ 26.4 ms hausse | 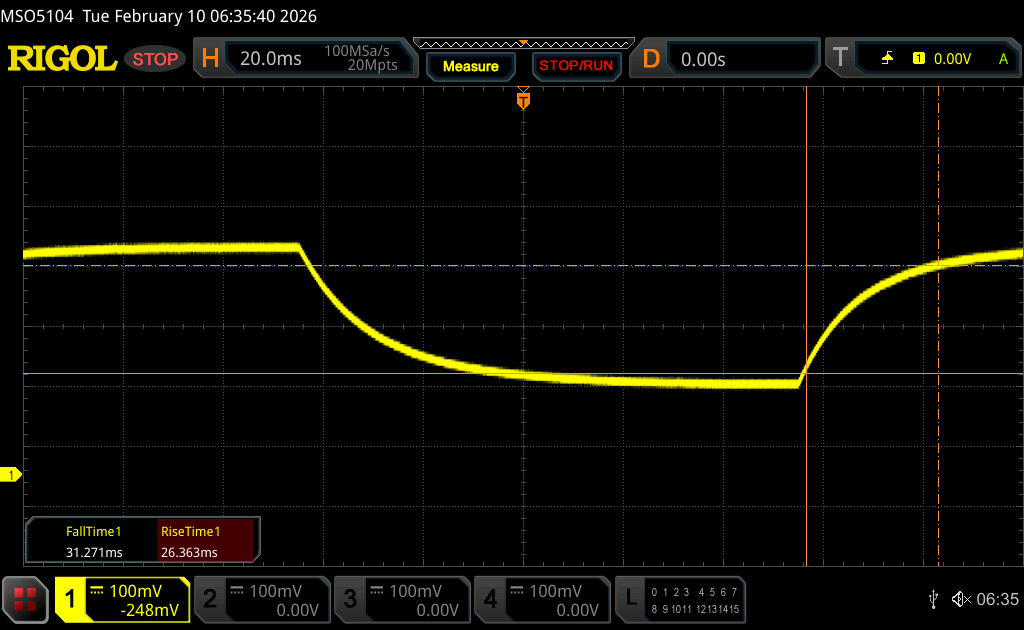 |
| ↘ 31.3 ms chute | ||
| L'écran souffre de latences très élevées, à éviter pour le jeu. En comparaison, tous les appareils testés affichent entre 0.165 (minimum) et 636 (maximum) ms. » 94 % des appareils testés affichent de meilleures performances. Cela signifie que les latences relevées sont moins bonnes que la moyenne (31.1 ms) de tous les appareils testés. | ||
Scintillement / MLI (Modulation de largeur d'impulsion)
| Scintillement / MLI (Modulation de largeur d'impulsion) non décelé | 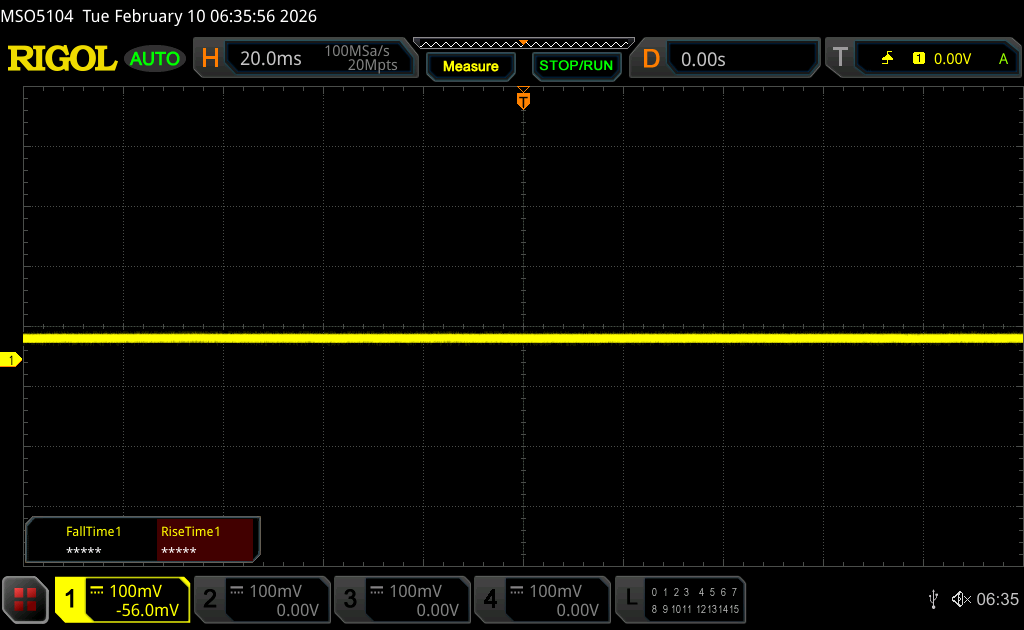 | ||
En comparaison, 52 % des appareils testés n'emploient pas MDI pour assombrir leur écran. Nous avons relevé une moyenne à 7841 (minimum : 5 - maximum : 343500) Hz dans le cas où une MDI était active. | |||


Performance
Conditions d'essai
Nous avons réglé Windows et Dell Optimizer sur le mode Performance avant d'effectuer les tests ci-dessous.
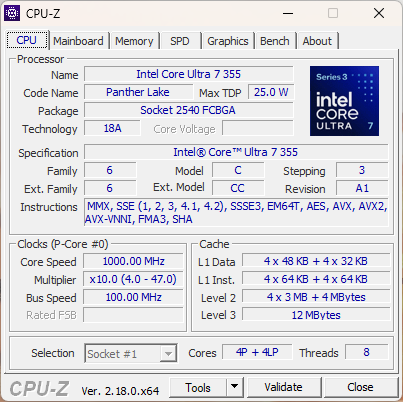
Processeur
Performance multithread brute de notre Core Ultra 7 355 est environ 40 % plus lente que celle du Core Ultra X7 358H La configuration du XPS 14 est presque identique à celle des ordinateurs portables fonctionnant avec l'ancien Core Ultra 7 255U d'Arrow Lake Core Ultra 7 255U ou Lunar Lake-V Core Ultra 7 258V pour des gains minimes d'une année sur l'autre. Le potentiel Turbo Boost est également beaucoup plus limité que pour la configuration Core Ultra X7, comme le montre notre graphique en boucle CineBench R15 xT ci-dessous.
Cinebench R15 Multi Loop
Cinebench R23: Multi Core | Single Core
Cinebench R20: CPU (Multi Core) | CPU (Single Core)
Cinebench R15: CPU Multi 64Bit | CPU Single 64Bit
Blender: v2.79 BMW27 CPU
7-Zip 18.03: 7z b 4 | 7z b 4 -mmt1
Geekbench 6.6: Multi-Core | Single-Core
Geekbench 5.5: Multi-Core | Single-Core
HWBOT x265 Benchmark v2.2: 4k Preset
LibreOffice : 20 Documents To PDF
R Benchmark 2.5: Overall mean
* ... Moindre est la valeur, meilleures sont les performances
AIDA64: FP32 Ray-Trace | FPU Julia | CPU SHA3 | CPU Queen | FPU SinJulia | FPU Mandel | CPU AES | CPU ZLib | FP64 Ray-Trace | CPU PhotoWorxx | CPU CheckMate
| Performance rating | |
| Asus ExpertBook PM3406 -1! | |
| Dell XPS 14 Core Ultra X7 358H | |
| HP OmniBook Ultra Flip 14 -1! | |
| Lenovo ThinkPad T14 Gen 6 21QG001VGE -1! | |
| Dell XPS 14 Core Ultra 7 355 | |
| Moyenne Intel Core Ultra 7 355 | |
| Samsung Galaxy Book5 Pro 14 940XHA -1! | |
| AIDA64 / FP32 Ray-Trace | |
| Asus ExpertBook PM3406 (v6.92.6600) | |
| Dell XPS 14 Core Ultra X7 358H (v8.20.8100) | |
| HP OmniBook Ultra Flip 14 (v6.92.6600) | |
| Lenovo ThinkPad T14 Gen 6 21QG001VGE (v6.92.6600) | |
| Moyenne Intel Core Ultra 7 355 (12228 - 12305, n=2) | |
| Dell XPS 14 Core Ultra 7 355 (v8.20.8100) | |
| Samsung Galaxy Book5 Pro 14 940XHA (v6.92.6600) | |
| AIDA64 / FPU Julia | |
| Asus ExpertBook PM3406 (v6.92.6600) | |
| Dell XPS 14 Core Ultra X7 358H (v8.20.8100) | |
| Dell XPS 14 Core Ultra 7 355 (v8.20.8100) | |
| Moyenne Intel Core Ultra 7 355 (60741 - 63504, n=2) | |
| Lenovo ThinkPad T14 Gen 6 21QG001VGE (v6.92.6600) | |
| HP OmniBook Ultra Flip 14 (v6.92.6600) | |
| Samsung Galaxy Book5 Pro 14 940XHA (v6.92.6600) | |
| AIDA64 / CPU SHA3 | |
| Dell XPS 14 Core Ultra X7 358H (v8.20.8100) | |
| Asus ExpertBook PM3406 (v6.92.6600) | |
| HP OmniBook Ultra Flip 14 (v6.92.6600) | |
| Moyenne Intel Core Ultra 7 355 (2763 - 2841, n=2) | |
| Dell XPS 14 Core Ultra 7 355 (v8.20.8100) | |
| Lenovo ThinkPad T14 Gen 6 21QG001VGE (v6.92.6600) | |
| Samsung Galaxy Book5 Pro 14 940XHA (v6.92.6600) | |
| AIDA64 / CPU Queen | |
| Asus ExpertBook PM3406 (v6.92.6600) | |
| Dell XPS 14 Core Ultra X7 358H (v6.92.6600) | |
| HP OmniBook Ultra Flip 14 (v6.92.6600) | |
| Lenovo ThinkPad T14 Gen 6 21QG001VGE (v6.92.6600) | |
| Samsung Galaxy Book5 Pro 14 940XHA (v6.92.6600) | |
| Dell XPS 14 Core Ultra 7 355 (v6.92.6600) | |
| Moyenne Intel Core Ultra 7 355 (n=1) | |
| AIDA64 / FPU SinJulia | |
| Asus ExpertBook PM3406 (v6.92.6600) | |
| Dell XPS 14 Core Ultra X7 358H (v8.20.8100) | |
| Moyenne Intel Core Ultra 7 355 (4597 - 4600, n=2) | |
| Dell XPS 14 Core Ultra 7 355 (v8.20.8100) | |
| HP OmniBook Ultra Flip 14 (v6.92.6600) | |
| Lenovo ThinkPad T14 Gen 6 21QG001VGE (v6.92.6600) | |
| Samsung Galaxy Book5 Pro 14 940XHA (v6.92.6600) | |
| AIDA64 / FPU Mandel | |
| Asus ExpertBook PM3406 (v6.92.6600) | |
| Dell XPS 14 Core Ultra X7 358H (v8.20.8100) | |
| Dell XPS 14 Core Ultra 7 355 (v8.20.8100) | |
| Moyenne Intel Core Ultra 7 355 (32404 - 34150, n=2) | |
| Lenovo ThinkPad T14 Gen 6 21QG001VGE (v6.92.6600) | |
| HP OmniBook Ultra Flip 14 (v6.92.6600) | |
| Samsung Galaxy Book5 Pro 14 940XHA (v6.92.6600) | |
| AIDA64 / CPU AES | |
| Asus ExpertBook PM3406 (v6.92.6600) | |
| Dell XPS 14 Core Ultra X7 358H (v8.20.8100) | |
| HP OmniBook Ultra Flip 14 (v6.92.6600) | |
| Lenovo ThinkPad T14 Gen 6 21QG001VGE (v6.92.6600) | |
| Moyenne Intel Core Ultra 7 355 (39050 - 39424, n=2) | |
| Dell XPS 14 Core Ultra 7 355 (v8.20.8100) | |
| Samsung Galaxy Book5 Pro 14 940XHA (v6.92.6600) | |
| AIDA64 / CPU ZLib | |
| Dell XPS 14 Core Ultra X7 358H (v8.20.8100) | |
| Asus ExpertBook PM3406 (v6.92.6600) | |
| Moyenne Intel Core Ultra 7 355 (635 - 646, n=2) | |
| Dell XPS 14 Core Ultra 7 355 (v8.20.8100) | |
| HP OmniBook Ultra Flip 14 (v6.92.6600) | |
| Lenovo ThinkPad T14 Gen 6 21QG001VGE (v6.92.6600) | |
| Samsung Galaxy Book5 Pro 14 940XHA (v6.92.6600) | |
| AIDA64 / FP64 Ray-Trace | |
| Asus ExpertBook PM3406 (v6.92.6600) | |
| Dell XPS 14 Core Ultra X7 358H (v8.20.8100) | |
| Lenovo ThinkPad T14 Gen 6 21QG001VGE (v6.92.6600) | |
| HP OmniBook Ultra Flip 14 (v6.92.6600) | |
| Dell XPS 14 Core Ultra 7 355 (v8.20.8100) | |
| Moyenne Intel Core Ultra 7 355 (6147 - 6594, n=2) | |
| Samsung Galaxy Book5 Pro 14 940XHA (v6.92.6600) | |
| AIDA64 / CPU PhotoWorxx | |
| Dell XPS 14 Core Ultra X7 358H (v8.20.8100) | |
| Moyenne Intel Core Ultra 7 355 (57998 - 60240, n=2) | |
| Dell XPS 14 Core Ultra 7 355 (v8.20.8100) | |
| Lenovo ThinkPad T14 Gen 6 21QG001VGE (v6.92.6600) | |
| HP OmniBook Ultra Flip 14 (v6.92.6600) | |
| Samsung Galaxy Book5 Pro 14 940XHA (v6.92.6600) | |
| Asus ExpertBook PM3406 (v6.92.6600) | |
| AIDA64 / CPU CheckMate | |
| Dell XPS 14 Core Ultra X7 358H (v8.20.8100) | |
| Moyenne Intel Core Ultra 7 355 (2790 - 2802, n=2) | |
| Dell XPS 14 Core Ultra 7 355 (v8.20.8100) | |
Performance du système
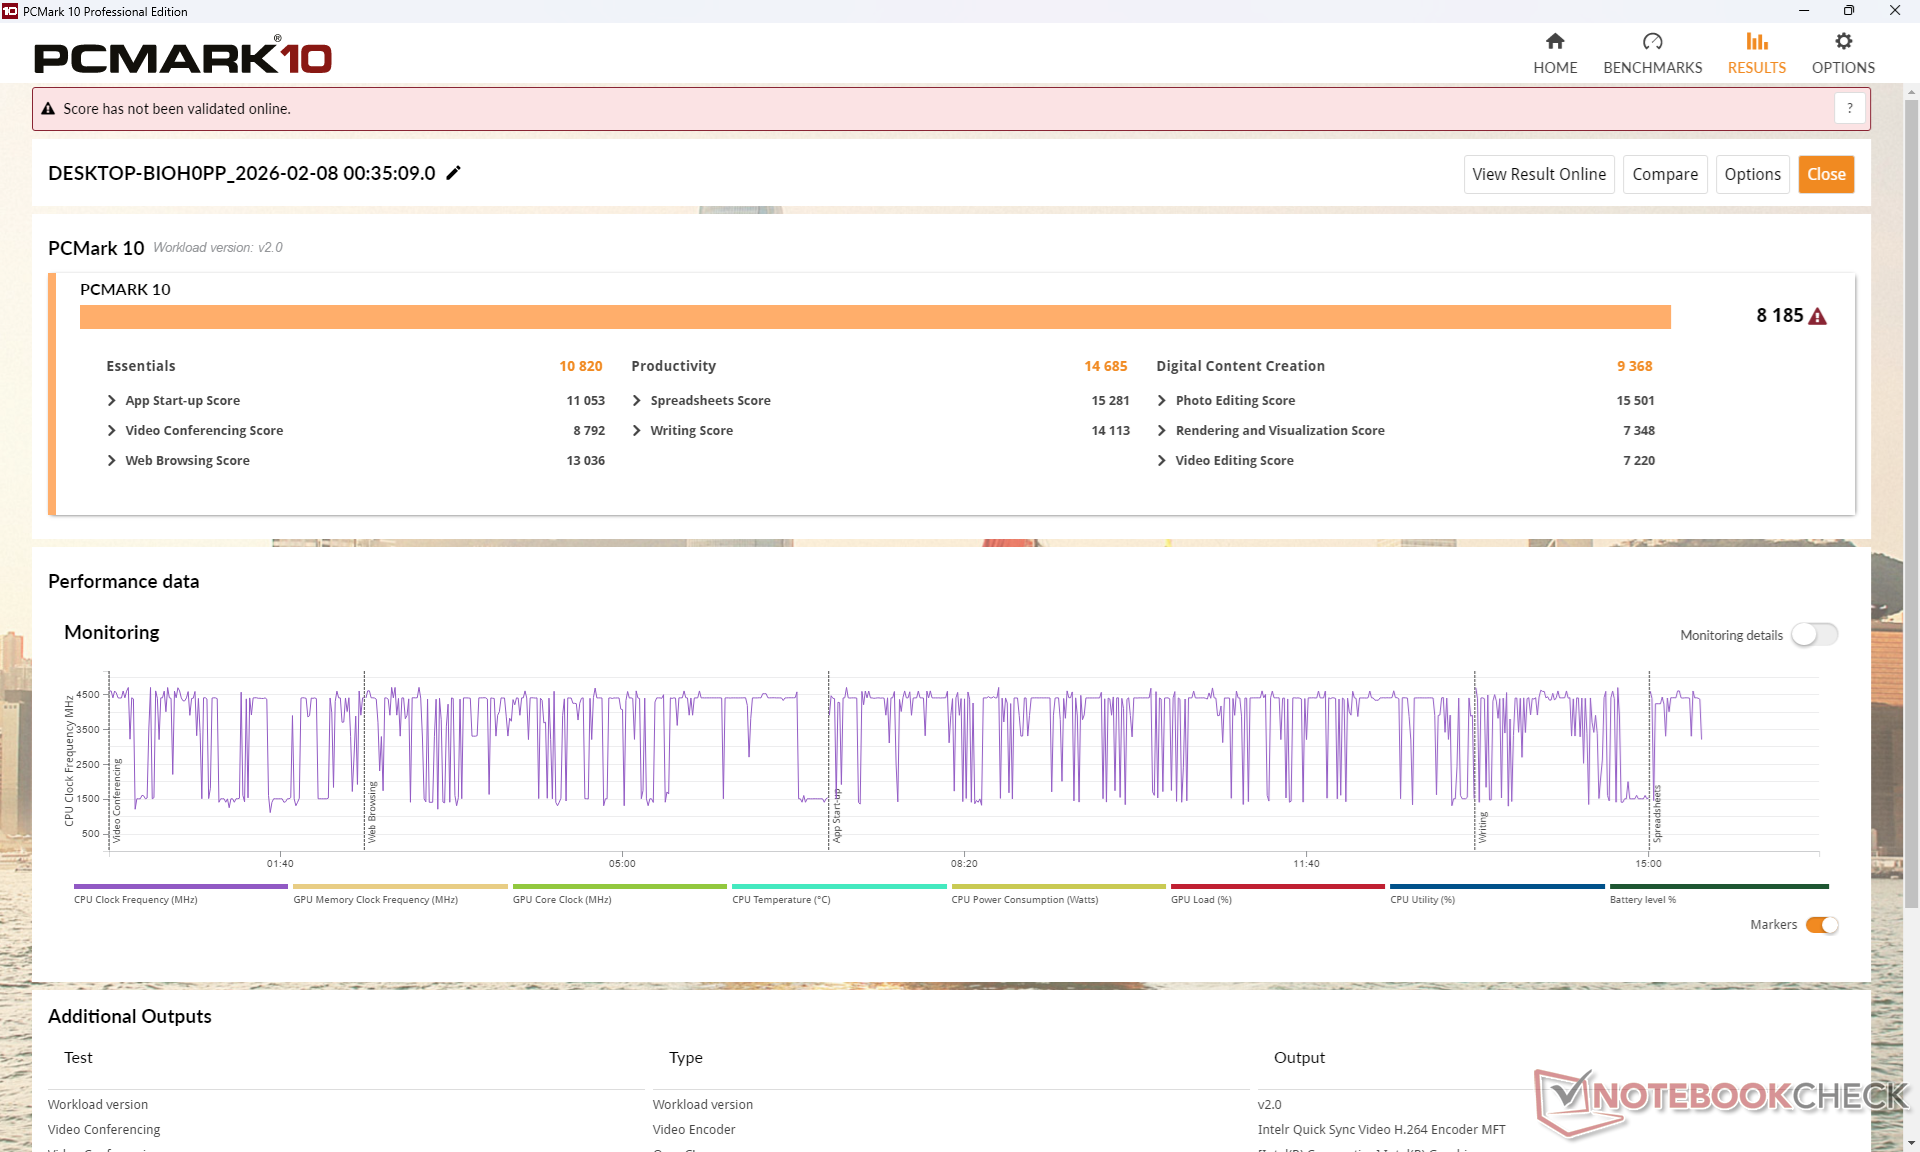
PCMark 10: Score | Essentials | Productivity | Digital Content Creation
CrossMark: Overall | Productivity | Creativity | Responsiveness
WebXPRT 3: Overall
WebXPRT 4: Overall
Mozilla Kraken 1.1: Total
Geekbench AI: Single Precision GPU 1.7 | Half Precision GPU 1.7 | Quantized GPU 1.7
| PCMark 10 / Score | |
| Dell XPS 14 Core Ultra X7 358H | |
| Asus ExpertBook PM3406 | |
| Dell XPS 14 Core Ultra 7 355 | |
| Lenovo ThinkPad T14 Gen 6 21QG001VGE | |
| Samsung Galaxy Book5 Pro 14 940XHA | |
| HP OmniBook Ultra Flip 14 | |
| PCMark 10 / Essentials | |
| Dell XPS 14 Core Ultra X7 358H | |
| Asus ExpertBook PM3406 | |
| Dell XPS 14 Core Ultra 7 355 | |
| Lenovo ThinkPad T14 Gen 6 21QG001VGE | |
| Samsung Galaxy Book5 Pro 14 940XHA | |
| HP OmniBook Ultra Flip 14 | |
| CrossMark / Overall | |
| Dell XPS 14 Core Ultra X7 358H | |
| Lenovo ThinkPad T14 Gen 6 21QG001VGE | |
| Dell XPS 14 Core Ultra 7 355 | |
| HP OmniBook Ultra Flip 14 | |
| Samsung Galaxy Book5 Pro 14 940XHA | |
| Asus ExpertBook PM3406 | |
| CrossMark / Creativity | |
| Dell XPS 14 Core Ultra X7 358H | |
| Lenovo ThinkPad T14 Gen 6 21QG001VGE | |
| HP OmniBook Ultra Flip 14 | |
| Dell XPS 14 Core Ultra 7 355 | |
| Samsung Galaxy Book5 Pro 14 940XHA | |
| Asus ExpertBook PM3406 | |
| WebXPRT 3 / Overall | |
| Dell XPS 14 Core Ultra X7 358H | |
| Dell XPS 14 Core Ultra 7 355 | |
| Lenovo ThinkPad T14 Gen 6 21QG001VGE | |
| Samsung Galaxy Book5 Pro 14 940XHA | |
| HP OmniBook Ultra Flip 14 | |
| Asus ExpertBook PM3406 | |
| WebXPRT 4 / Overall | |
| Dell XPS 14 Core Ultra X7 358H | |
| Dell XPS 14 Core Ultra 7 355 | |
| Lenovo ThinkPad T14 Gen 6 21QG001VGE | |
| HP OmniBook Ultra Flip 14 | |
| Samsung Galaxy Book5 Pro 14 940XHA | |
| Asus ExpertBook PM3406 | |
| Geekbench AI / Single Precision GPU 1.7 | |
| Dell XPS 14 Core Ultra X7 358H | |
| Samsung Galaxy Book5 Pro 14 940XHA | |
| Dell XPS 14 Core Ultra 7 355 | |
| Geekbench AI / Half Precision GPU 1.7 | |
| Dell XPS 14 Core Ultra X7 358H | |
| Samsung Galaxy Book5 Pro 14 940XHA | |
| Dell XPS 14 Core Ultra 7 355 | |
| Geekbench AI / Quantized GPU 1.7 | |
| Dell XPS 14 Core Ultra X7 358H | |
| Samsung Galaxy Book5 Pro 14 940XHA | |
| Dell XPS 14 Core Ultra 7 355 | |
* ... Moindre est la valeur, meilleures sont les performances
| PCMark 10 Score | 8185 points | |
Aide | ||
| AIDA64 / Memory Copy | |
| Dell XPS 14 Core Ultra X7 358H | |
| Lenovo ThinkPad T14 Gen 6 21QG001VGE | |
| HP OmniBook Ultra Flip 14 | |
| Moyenne Intel Core Ultra 7 355 (97301 - 105135, n=2) | |
| Samsung Galaxy Book5 Pro 14 940XHA | |
| Dell XPS 14 Core Ultra 7 355 | |
| Asus ExpertBook PM3406 | |
| AIDA64 / Memory Read | |
| Dell XPS 14 Core Ultra X7 358H | |
| Lenovo ThinkPad T14 Gen 6 21QG001VGE | |
| HP OmniBook Ultra Flip 14 | |
| Samsung Galaxy Book5 Pro 14 940XHA | |
| Moyenne Intel Core Ultra 7 355 (79551 - 85021, n=2) | |
| Dell XPS 14 Core Ultra 7 355 | |
| Asus ExpertBook PM3406 | |
| AIDA64 / Memory Write | |
| Dell XPS 14 Core Ultra X7 358H | |
| Lenovo ThinkPad T14 Gen 6 21QG001VGE | |
| HP OmniBook Ultra Flip 14 | |
| Samsung Galaxy Book5 Pro 14 940XHA | |
| Moyenne Intel Core Ultra 7 355 (103056 - 108621, n=2) | |
| Dell XPS 14 Core Ultra 7 355 | |
| Asus ExpertBook PM3406 | |
| AIDA64 / Memory Latency | |
| Dell XPS 14 Core Ultra 7 355 | |
| Moyenne Intel Core Ultra 7 355 (99.7 - 105.8, n=2) | |
| Lenovo ThinkPad T14 Gen 6 21QG001VGE | |
| HP OmniBook Ultra Flip 14 | |
| Samsung Galaxy Book5 Pro 14 940XHA | |
| Dell XPS 14 Core Ultra X7 358H | |
| Asus ExpertBook PM3406 | |
* ... Moindre est la valeur, meilleures sont les performances
Latence DPC
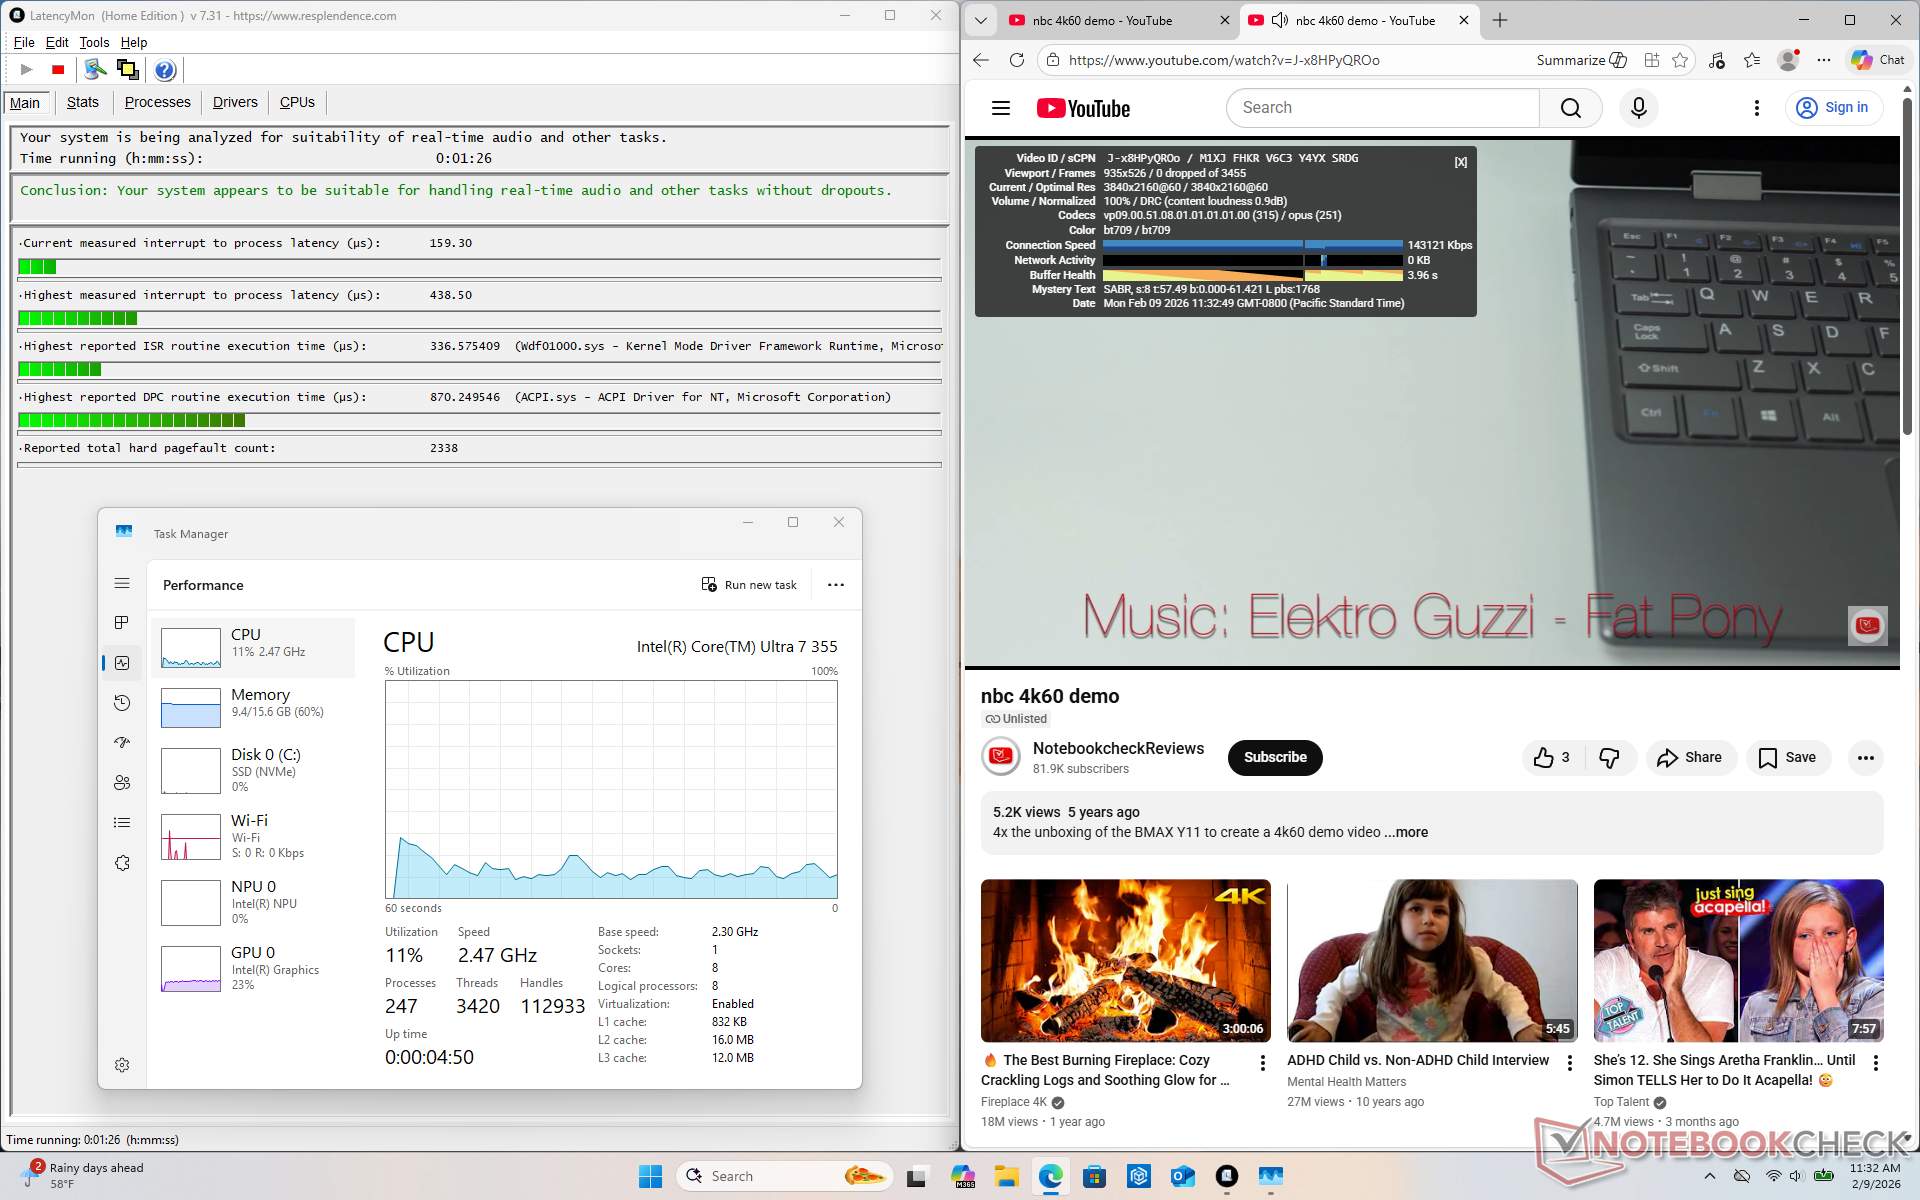
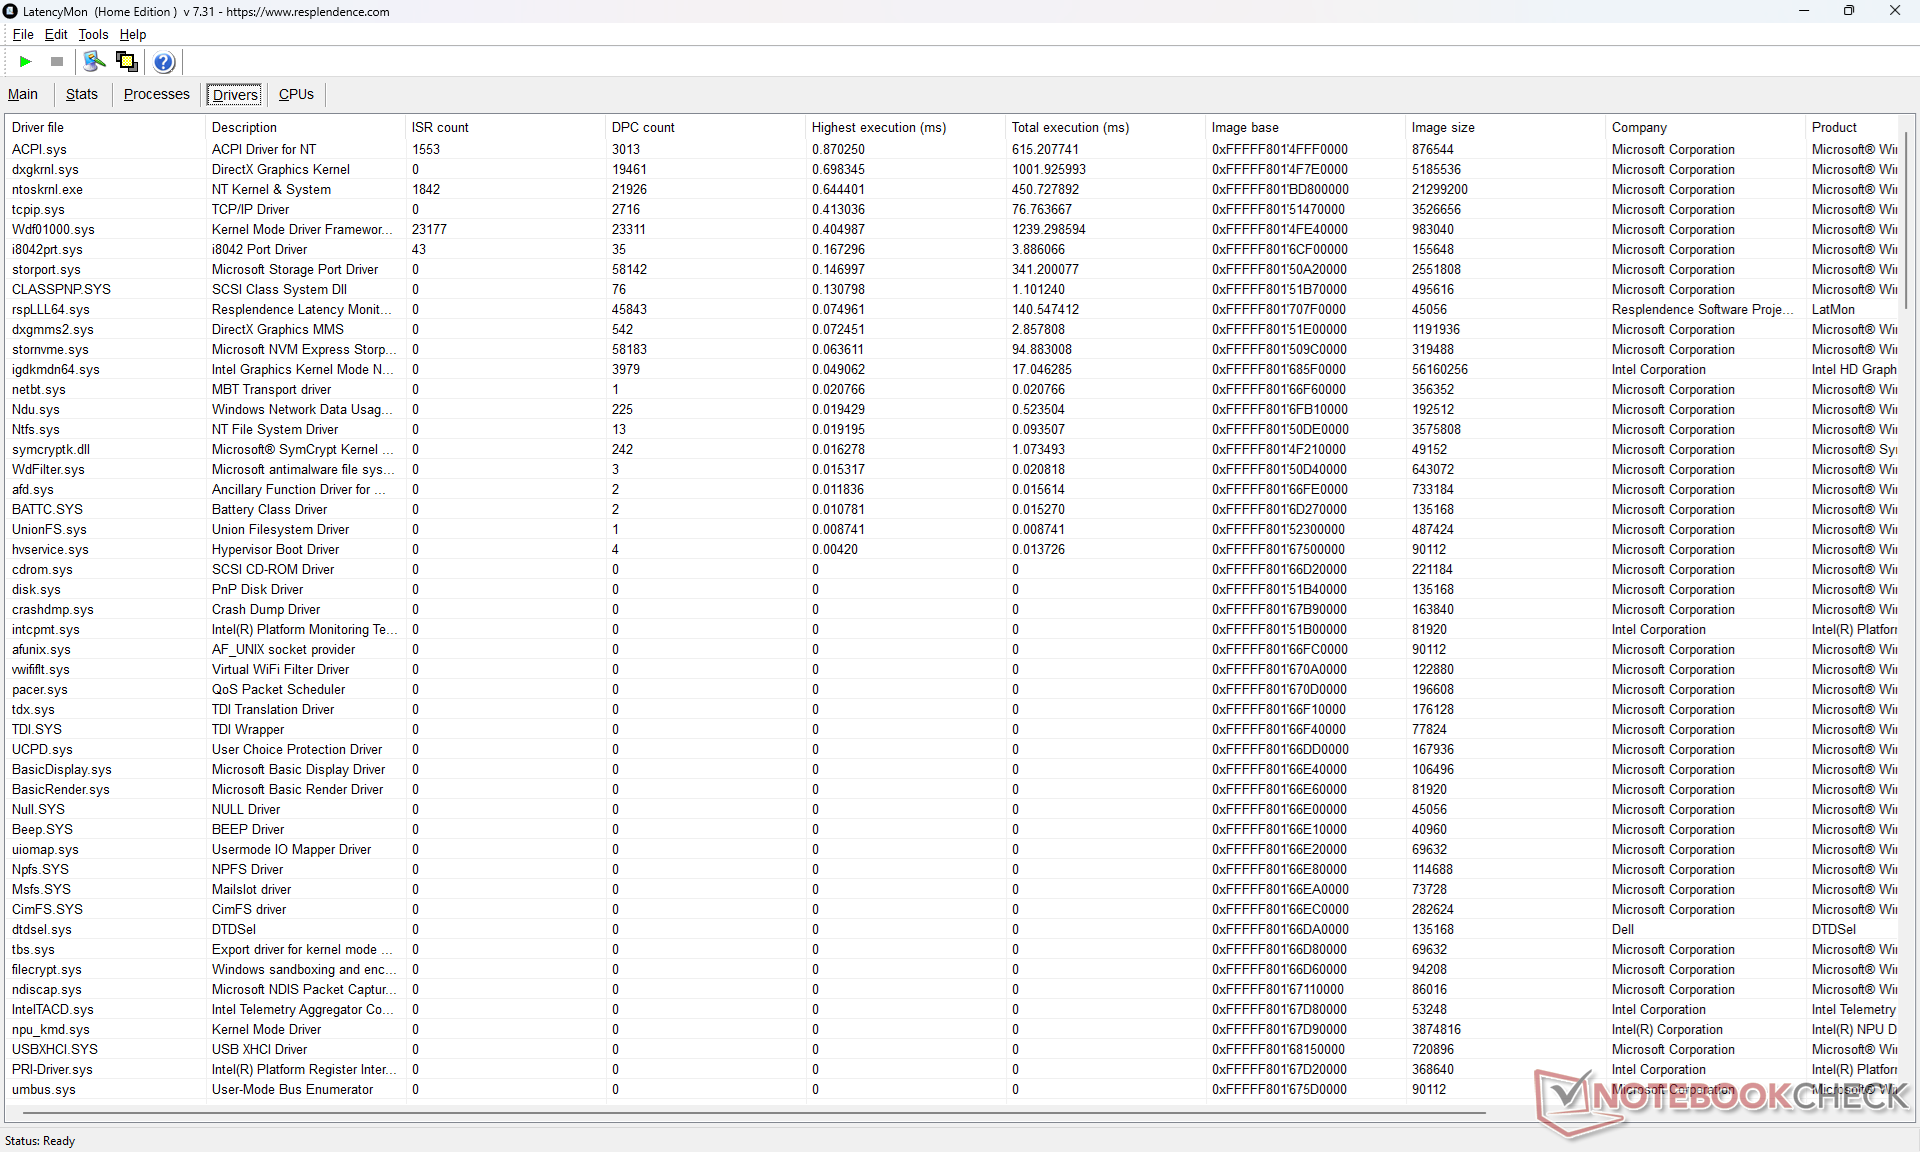
| DPC Latencies / LatencyMon - interrupt to process latency (max), Web, Youtube, Prime95 | |
| Asus ExpertBook PM3406 | |
| Samsung Galaxy Book5 Pro 14 940XHA | |
| Lenovo ThinkPad T14 Gen 6 21QG001VGE | |
| Dell XPS 14 Core Ultra X7 358H | |
| Dell XPS 14 Core Ultra 7 355 | |
* ... Moindre est la valeur, meilleures sont les performances
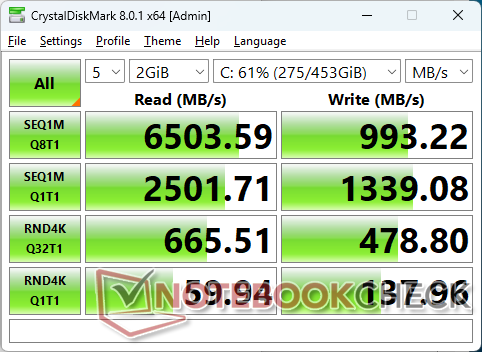
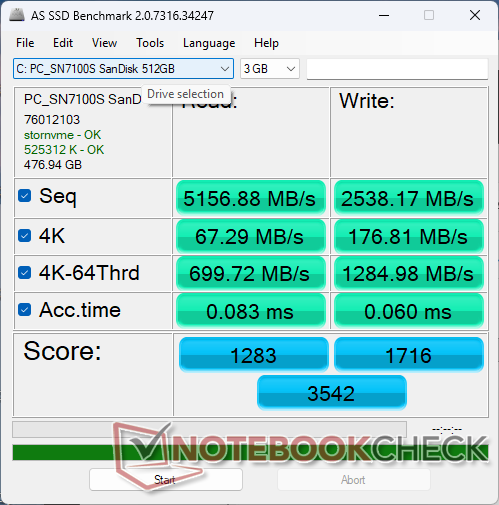
Dispositifs de stockage
Notre appareil est livré avec un SanDisk SN7100S PCIe4 x4 NVMe SSD au lieu du Samsung PM9C1b sur la configuration Core Ultra X7 XPS 14. Les performances sont par ailleurs assez proches, et aucun comportement d'étranglement notable n'a été observé.

* ... Moindre est la valeur, meilleures sont les performances
Throttoir de disque : Boucle de lecture DiskSpd, profondeur de la file d'attente 8
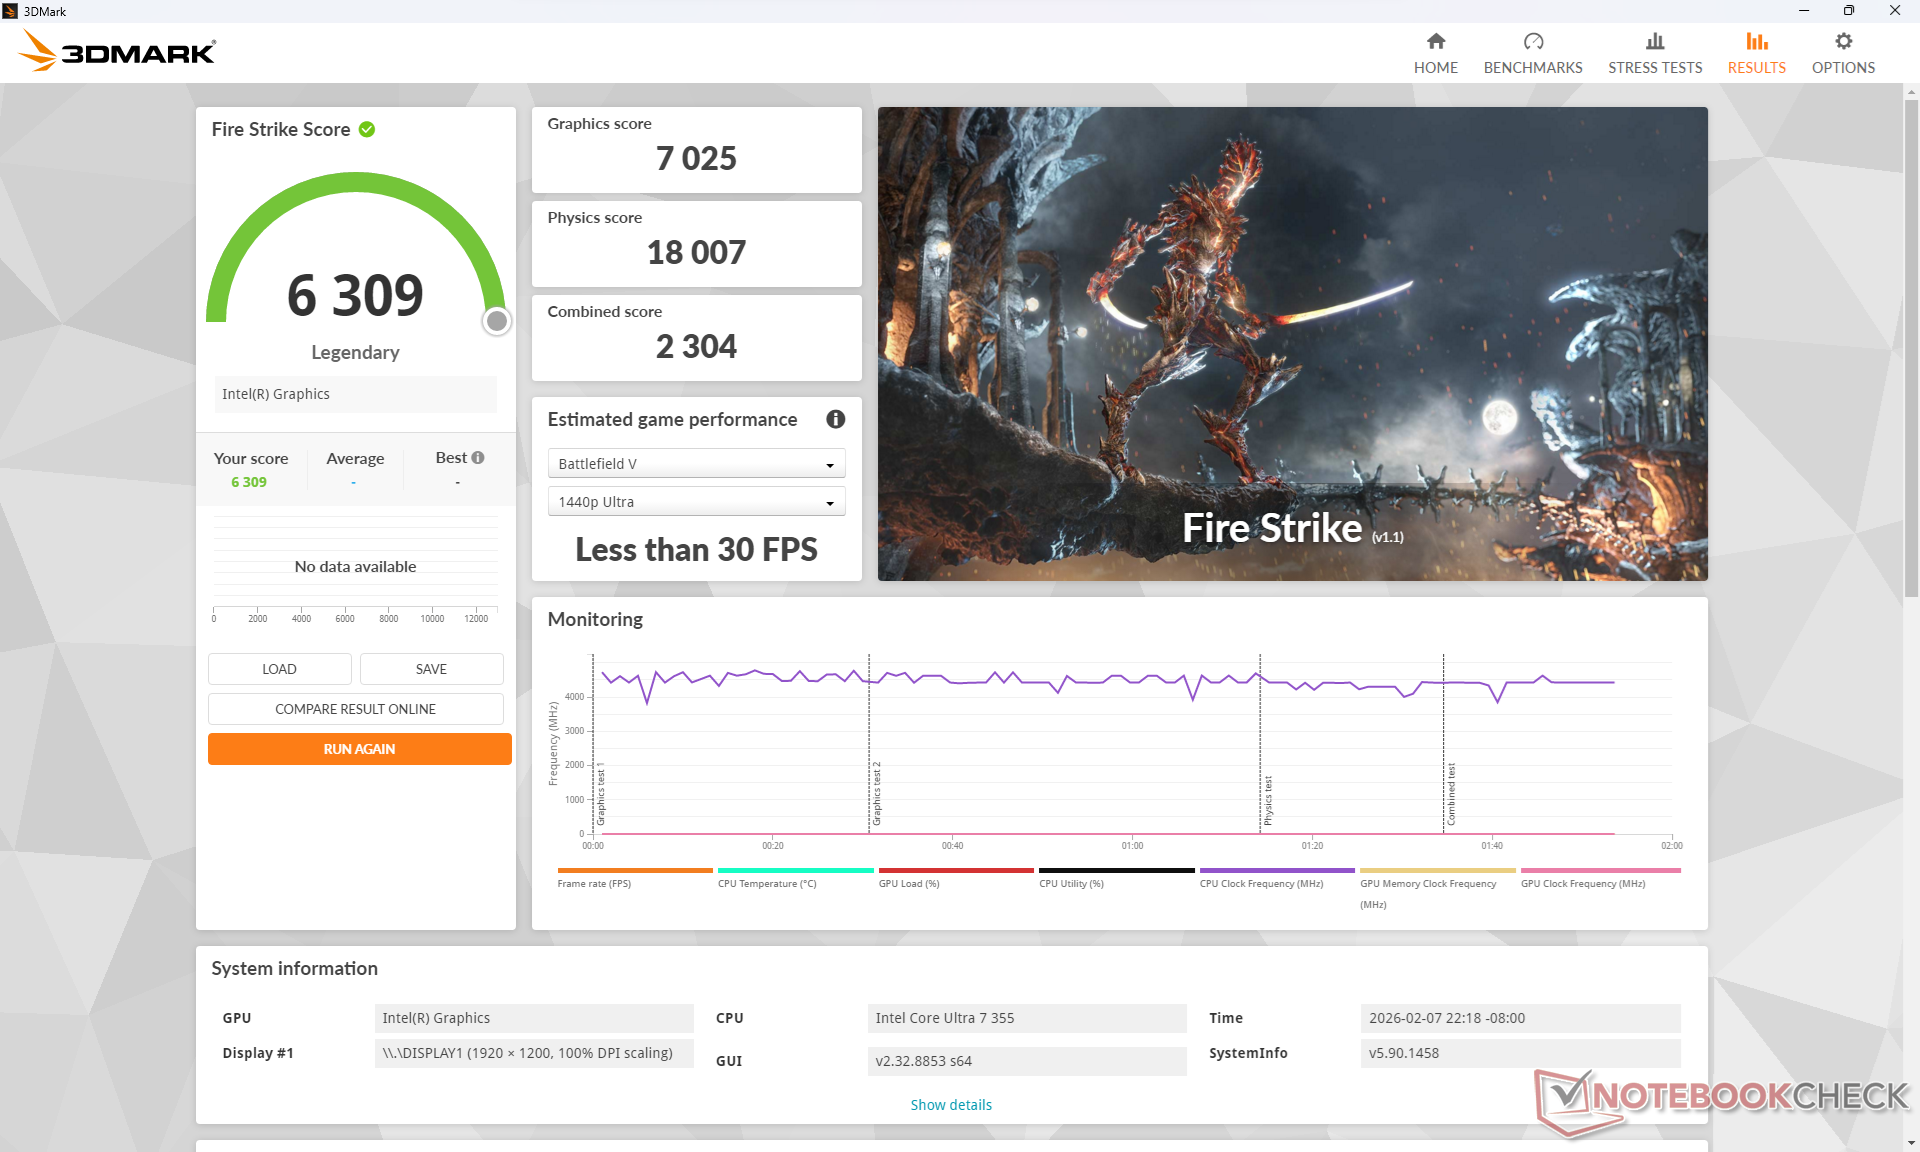
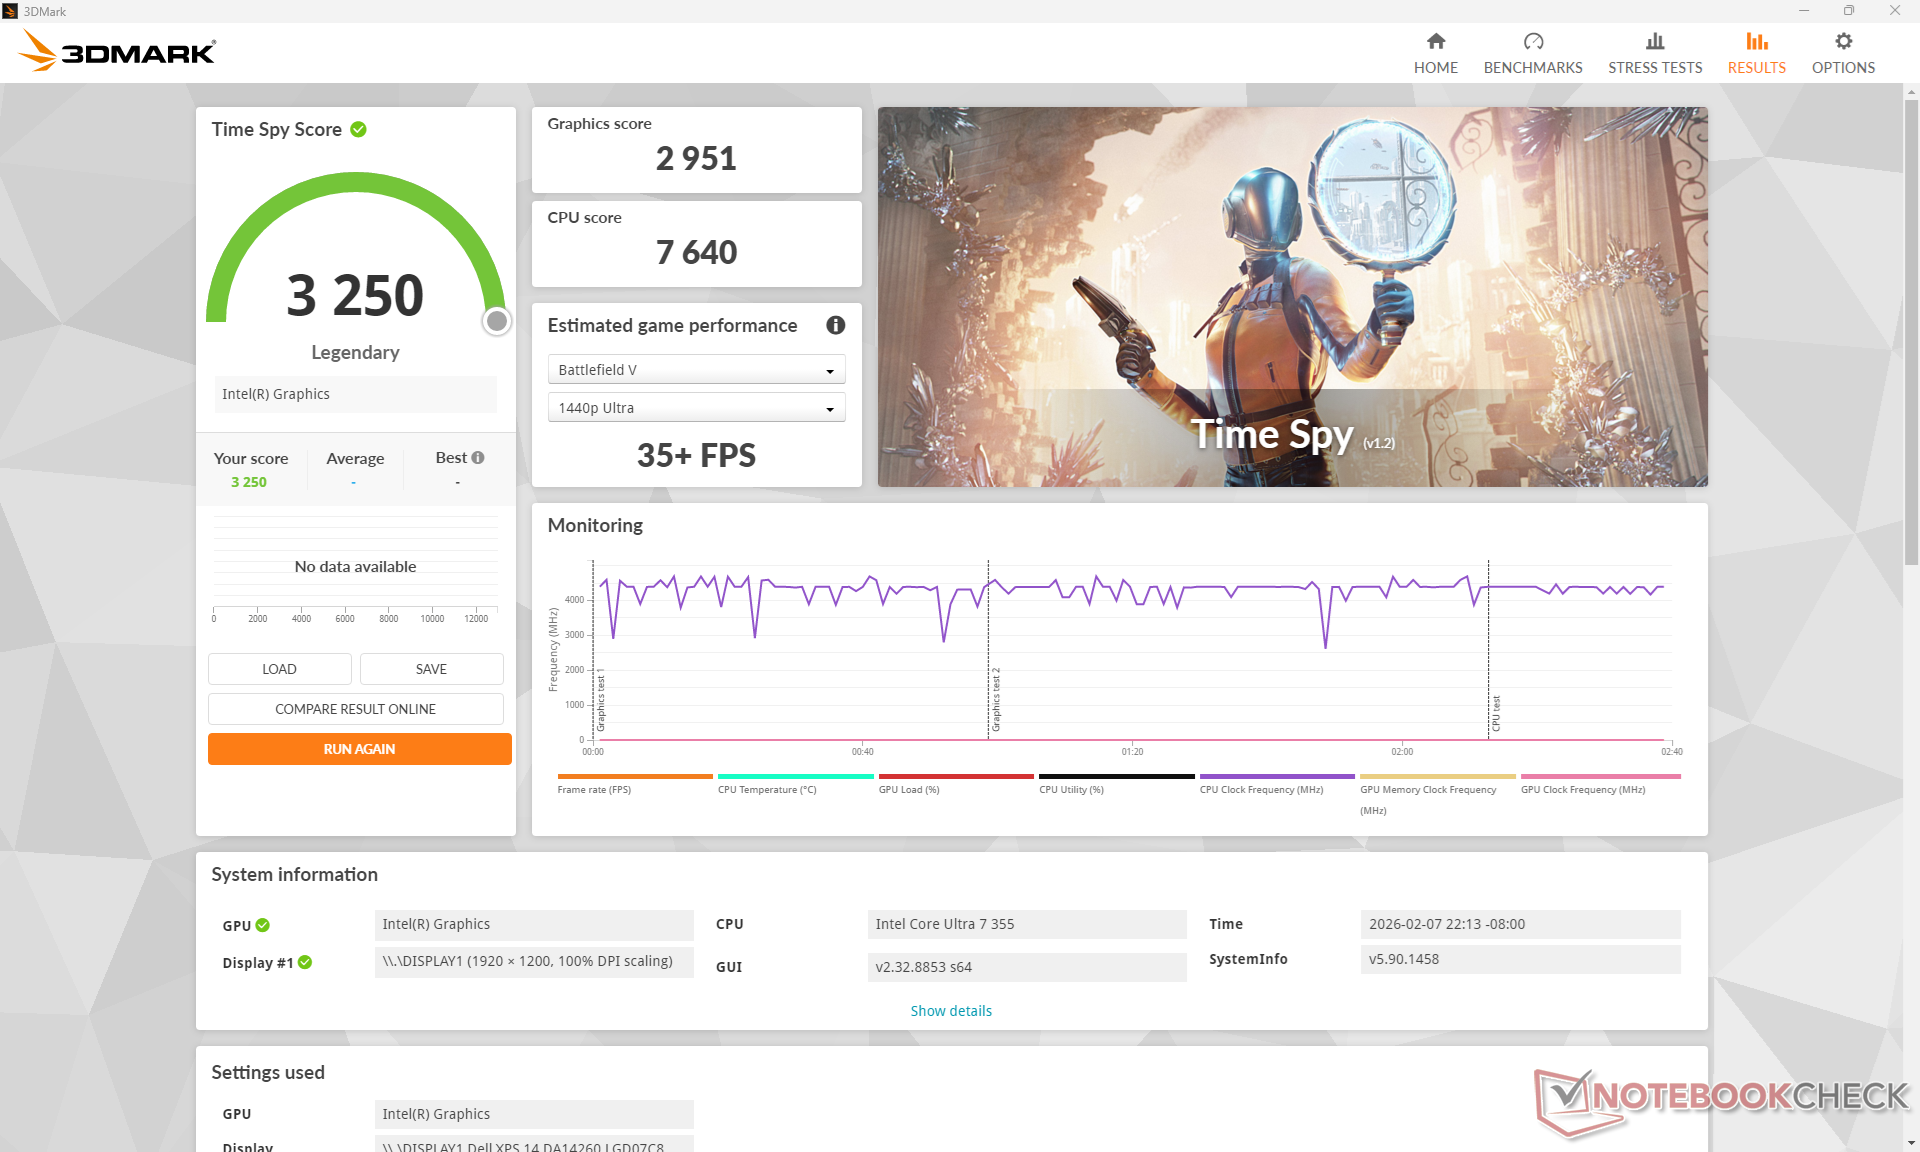
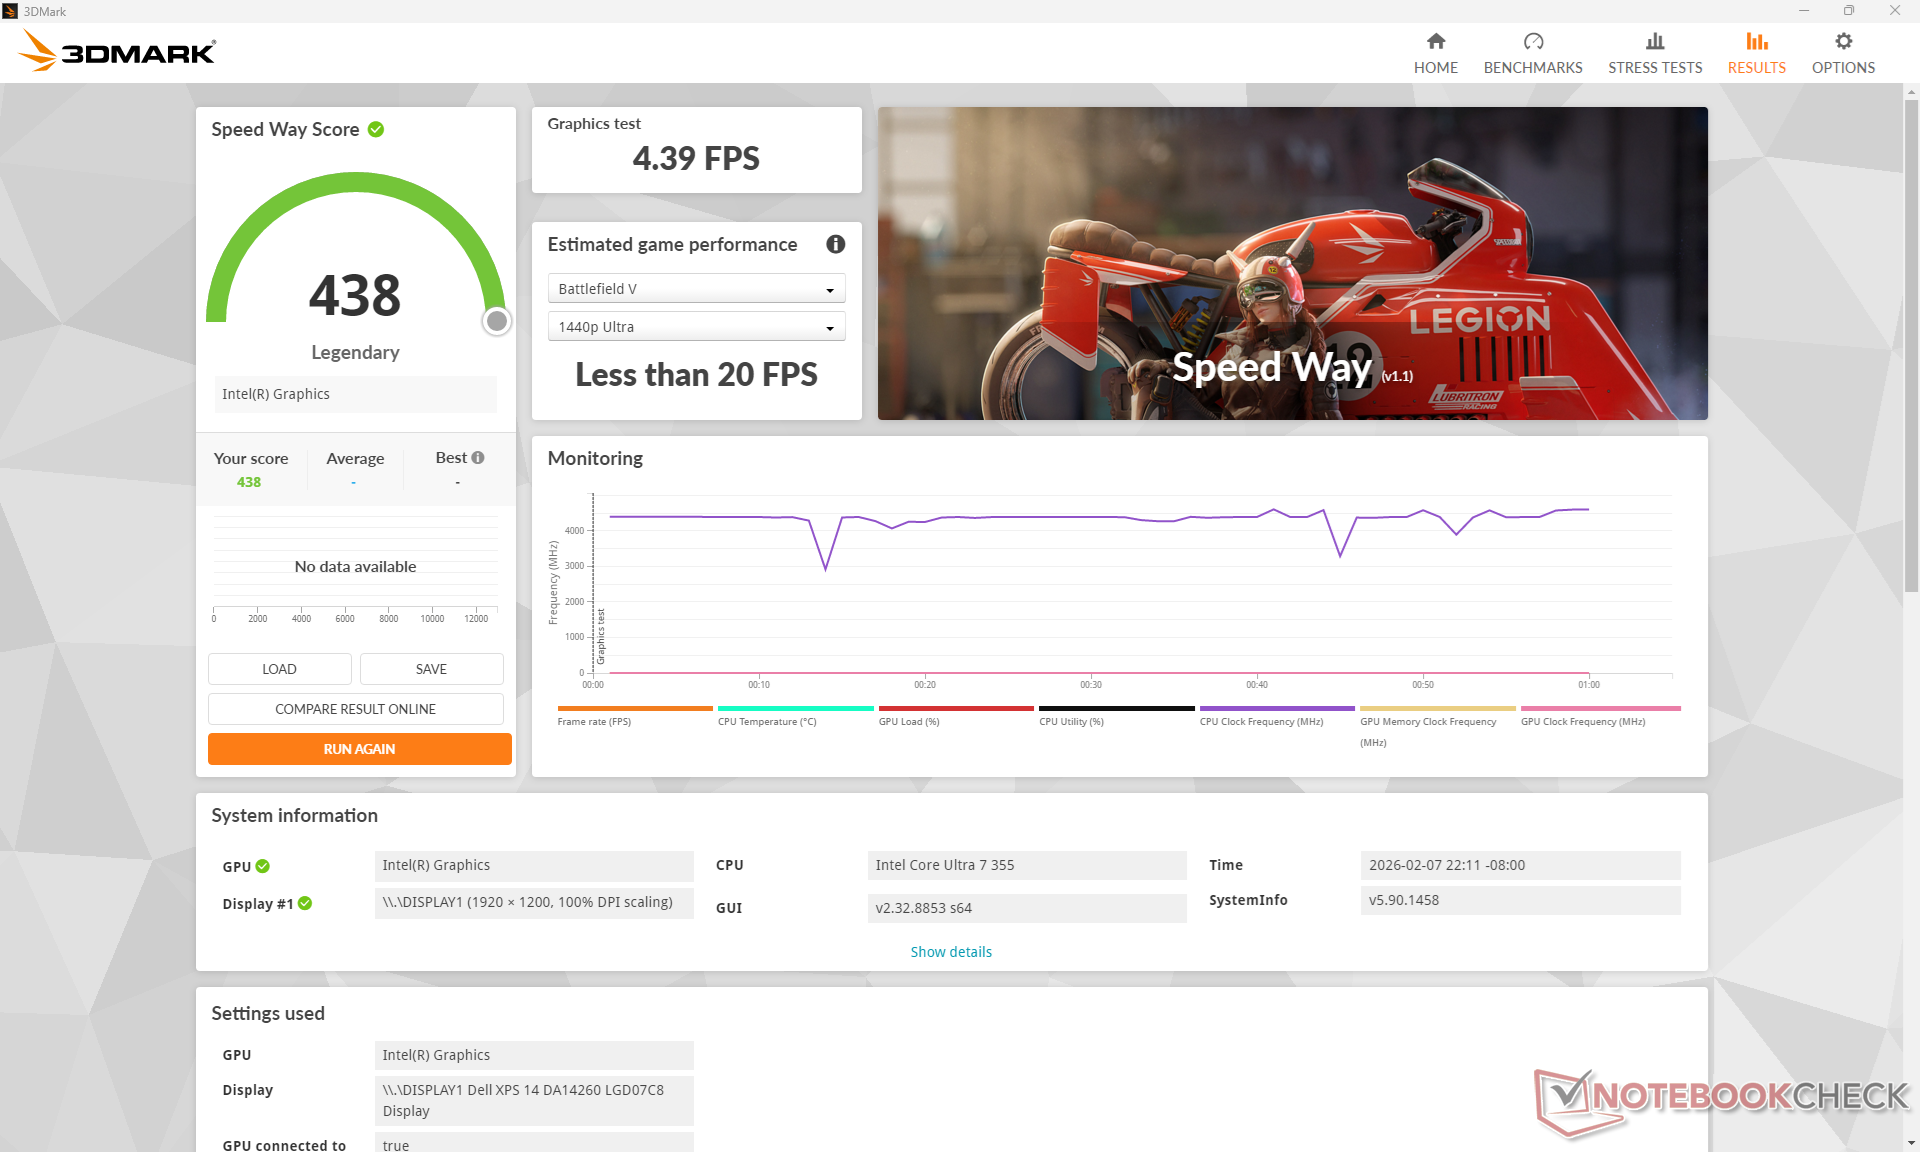
Performance du GPU
Contrairement au Core Ultra X7 et à son système intégré xe3 B390 à 12 cœurs le Core Ultra 7 355 est livré avec une carte graphique xe3 à 4 cœurs iGPU à 4 cœurs. Les performances de jeu sont environ 60 % plus lentes que celles de la carte graphique B390 à 12 cœurs, ce qui les rend à peu près comparables à celles de la carte graphique Arc 8 Arc 8 qui était la solution iGPU la plus rapide d'Intel il y a seulement deux ans. Le rendu avec Blender, cependant, peut être beaucoup plus lent, de 2,5 fois, et les performances dans les applications professionnelles avec le Xe3 à 4 cœurs peuvent donc présenter un déficit plus important.
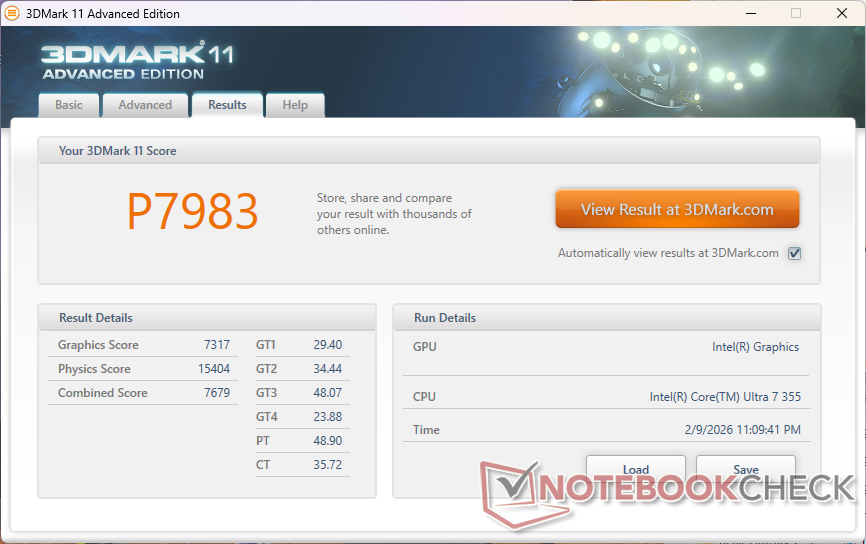
| 3DMark 11 Performance | 7983 points | |
| 3DMark Cloud Gate Standard Score | 28681 points | |
| 3DMark Fire Strike Score | 6309 points | |
| 3DMark Time Spy Score | 3250 points | |
Aide | ||
* ... Moindre est la valeur, meilleures sont les performances
| Cyberpunk 2077 - 1920x1080 Ultra Preset (FSR off) | |
| Dell XPS 14 Core Ultra X7 358H | |
| Lenovo ThinkPad T14 Gen 6 21QG001VGE | |
| Samsung Galaxy Book5 Pro 14 940XHA | |
| HP OmniBook Ultra Flip 14 | |
| Dell XPS 14 Core Ultra 7 355 | |
| Asus ExpertBook PM3406 | |
| Baldur's Gate 3 - 1920x1080 Ultra Preset AA:T | |
| Dell XPS 14 Core Ultra X7 358H | |
| HP OmniBook Ultra Flip 14 | |
| Lenovo ThinkPad T14 Gen 6 21QG001VGE | |
| Samsung Galaxy Book5 Pro 14 940XHA | |
| Dell XPS 14 Core Ultra 7 355 | |
| Asus ExpertBook PM3406 | |
| GTA V - 1920x1080 Highest AA:4xMSAA + FX AF:16x | |
| Dell XPS 14 Core Ultra X7 358H | |
| Lenovo ThinkPad T14 Gen 6 21QG001VGE | |
| HP OmniBook Ultra Flip 14 | |
| Dell XPS 14 Core Ultra 7 355 | |
| Samsung Galaxy Book5 Pro 14 940XHA | |
| Asus ExpertBook PM3406 | |
| Final Fantasy XV Benchmark - 1920x1080 High Quality | |
| Dell XPS 14 Core Ultra X7 358H | |
| Lenovo ThinkPad T14 Gen 6 21QG001VGE | |
| HP OmniBook Ultra Flip 14 | |
| Samsung Galaxy Book5 Pro 14 940XHA | |
| Dell XPS 14 Core Ultra 7 355 | |
| Asus ExpertBook PM3406 | |
| Strange Brigade - 1920x1080 ultra AA:ultra AF:16 | |
| Dell XPS 14 Core Ultra X7 358H | |
| HP OmniBook Ultra Flip 14 | |
| Samsung Galaxy Book5 Pro 14 940XHA | |
| Dell XPS 14 Core Ultra 7 355 | |
| Asus ExpertBook PM3406 | |
| Dota 2 Reborn - 1920x1080 ultra (3/3) best looking | |
| Dell XPS 14 Core Ultra X7 358H | |
| Lenovo ThinkPad T14 Gen 6 21QG001VGE | |
| HP OmniBook Ultra Flip 14 | |
| Samsung Galaxy Book5 Pro 14 940XHA | |
| Dell XPS 14 Core Ultra 7 355 | |
| Asus ExpertBook PM3406 | |
| X-Plane 11.11 - 1920x1080 high (fps_test=3) | |
| Dell XPS 14 Core Ultra X7 358H | |
| Asus ExpertBook PM3406 | |
| HP OmniBook Ultra Flip 14 | |
| Samsung Galaxy Book5 Pro 14 940XHA | |
| Lenovo ThinkPad T14 Gen 6 21QG001VGE | |
| Dell XPS 14 Core Ultra 7 355 | |
| ARC Raiders | |
| 1920x1080 Low Preset | |
| Asus ZenBook Duo UX8407AA | |
| Dell XPS 14 Core Ultra X7 358H | |
| Dell XPS 14 Core Ultra 7 355 | |
| Moyenne Intel Graphics 4 Xe3 Panther Lake iGPU (n=1) | |
| 1920x1080 Medium Preset AA:TSR | |
| Asus ZenBook Duo UX8407AA | |
| Dell XPS 14 Core Ultra X7 358H | |
| Dell XPS 14 Core Ultra 7 355 | |
| Moyenne Intel Graphics 4 Xe3 Panther Lake iGPU (n=1) | |
| 1920x1080 High Preset AA:TSR | |
| Asus ZenBook Duo UX8407AA | |
| Dell XPS 14 Core Ultra X7 358H | |
| Dell XPS 14 Core Ultra 7 355 | |
| Moyenne Intel Graphics 4 Xe3 Panther Lake iGPU (n=1) | |
| Black Myth: Wukong | |
| 1280x720 low TSR 100 | |
| Dell XPS 14 Core Ultra X7 358H | |
| Dell XPS 14 Core Ultra 7 355 | |
| Moyenne Intel Graphics 4 Xe3 Panther Lake iGPU (n=1) | |
| 1920x1080 low TSR 100 | |
| Dell XPS 14 Core Ultra X7 358H | |
| Dell XPS 14 Core Ultra 7 355 | |
| Moyenne Intel Graphics 4 Xe3 Panther Lake iGPU (n=1) | |
| 1920x1080 medium TSR 100 | |
| Dell XPS 14 Core Ultra X7 358H | |
| Dell XPS 14 Core Ultra 7 355 | |
| Moyenne Intel Graphics 4 Xe3 Panther Lake iGPU (n=1) | |
| 1920x1080 high TSR 100 | |
| Dell XPS 14 Core Ultra X7 358H | |
| Dell XPS 14 Core Ultra 7 355 | |
| Moyenne Intel Graphics 4 Xe3 Panther Lake iGPU (n=1) | |
| 1920x1080 cinematic TSR 100 | |
| Dell XPS 14 Core Ultra X7 358H | |
| Dell XPS 14 Core Ultra 7 355 | |
| Moyenne Intel Graphics 4 Xe3 Panther Lake iGPU (n=1) | |
Cyberpunk 2077 ultra FPS Chart
| Bas | Moyen | Élevé | Ultra | |
|---|---|---|---|---|
| GTA V (2015) | 165.6 | 163 | 52.9 | 20.9 |
| Dota 2 Reborn (2015) | 101.7 | 89.4 | 73.7 | 69.4 |
| Final Fantasy XV Benchmark (2018) | 67.3 | 34.9 | 25.4 | |
| X-Plane 11.11 (2018) | 43.6 | 30.9 | 30.5 | |
| Strange Brigade (2018) | 184.9 | 64.7 | 58.9 | 50.6 |
| Baldur's Gate 3 (2023) | 28.4 | 23 | 19.6 | 19.5 |
| Cyberpunk 2077 (2023) | 32.7 | 27.7 | 21 | 17.7 |
| F1 24 (2024) | 65.9 | 56.6 | 41.7 | 13.8 |
| Black Myth: Wukong (2024) | 18 | 14 | 11 | 6 |
| ARC Raiders (2025) | 48.8 | 23.5 | 17.5 | 11.4 |
Émissions
Bruit du système
Les niveaux sonores peuvent rester plus longtemps plus faibles que ceux de la configuration Core Ultra X7, mais avec un plafond par ailleurs identique. Lors de l'exécution de Cyberpunk 2077, par exemple, le bruit du ventilateur se stabilise à 35 dB(A) contre 43 dB(A) sur la configuration Core Ultra X7 plus rapide, mais un maximum presque identique est atteint entre les deux SKUs lors de l'exécution de Prime95.
Degré de la nuisance sonore
| Au repos |
| 23 / 23 / 23.1 dB(A) |
| Fortement sollicité |
| 30.8 / 45.9 dB(A) |
 | ||
30 dB silencieux 40 dB(A) audible 50 dB(A) bruyant |
||
min: | ||
| Dell XPS 14 Core Ultra 7 355 Ultra 7 355, Intel Graphics 4 Xe3 PTL | Dell XPS 14 Core Ultra X7 358H Ultra X7 358H, Arc B390 Panther Lake iGPU | Asus ExpertBook PM3406 Ryzen AI 7 350, Radeon 860M | Lenovo ThinkPad T14 Gen 6 21QG001VGE Core Ultra 7 258V, Arc 140V | HP OmniBook Ultra Flip 14 Core Ultra 7 258V, Arc 140V | Samsung Galaxy Book5 Pro 14 940XHA Core Ultra 5 226V, Arc 130V | |
|---|---|---|---|---|---|---|
| Noise | -5% | -7% | -7% | 3% | -1% | |
| arrêt / environnement * (dB) | 23 | 22.9 -0% | 25.7 -12% | 25.1 -9% | 22.9 -0% | 25.1 -9% |
| Idle Minimum * (dB) | 23 | 23.3 -1% | 25.7 -12% | 25.1 -9% | 23.2 -1% | 25.1 -9% |
| Idle Average * (dB) | 23 | 23.3 -1% | 25.7 -12% | 25.1 -9% | 23.2 -1% | 25.1 -9% |
| Idle Maximum * (dB) | 23.1 | 23.3 -1% | 25.7 -11% | 27.1 -17% | 23.2 -0% | 25.1 -9% |
| Load Average * (dB) | 30.8 | 34 -10% | 33.6 -9% | 34.8 -13% | 27.8 10% | 29.3 5% |
| Cyberpunk 2077 ultra * (dB) | 35.4 | 43.5 -23% | 39.1 -10% | 38.3 -8% | 33.6 5% | 33.1 6% |
| Load Maximum * (dB) | 45.9 | 45.7 -0% | 39.1 15% | 38.5 16% | 43.4 5% | 38.7 16% |
* ... Moindre est la valeur, meilleures sont les performances
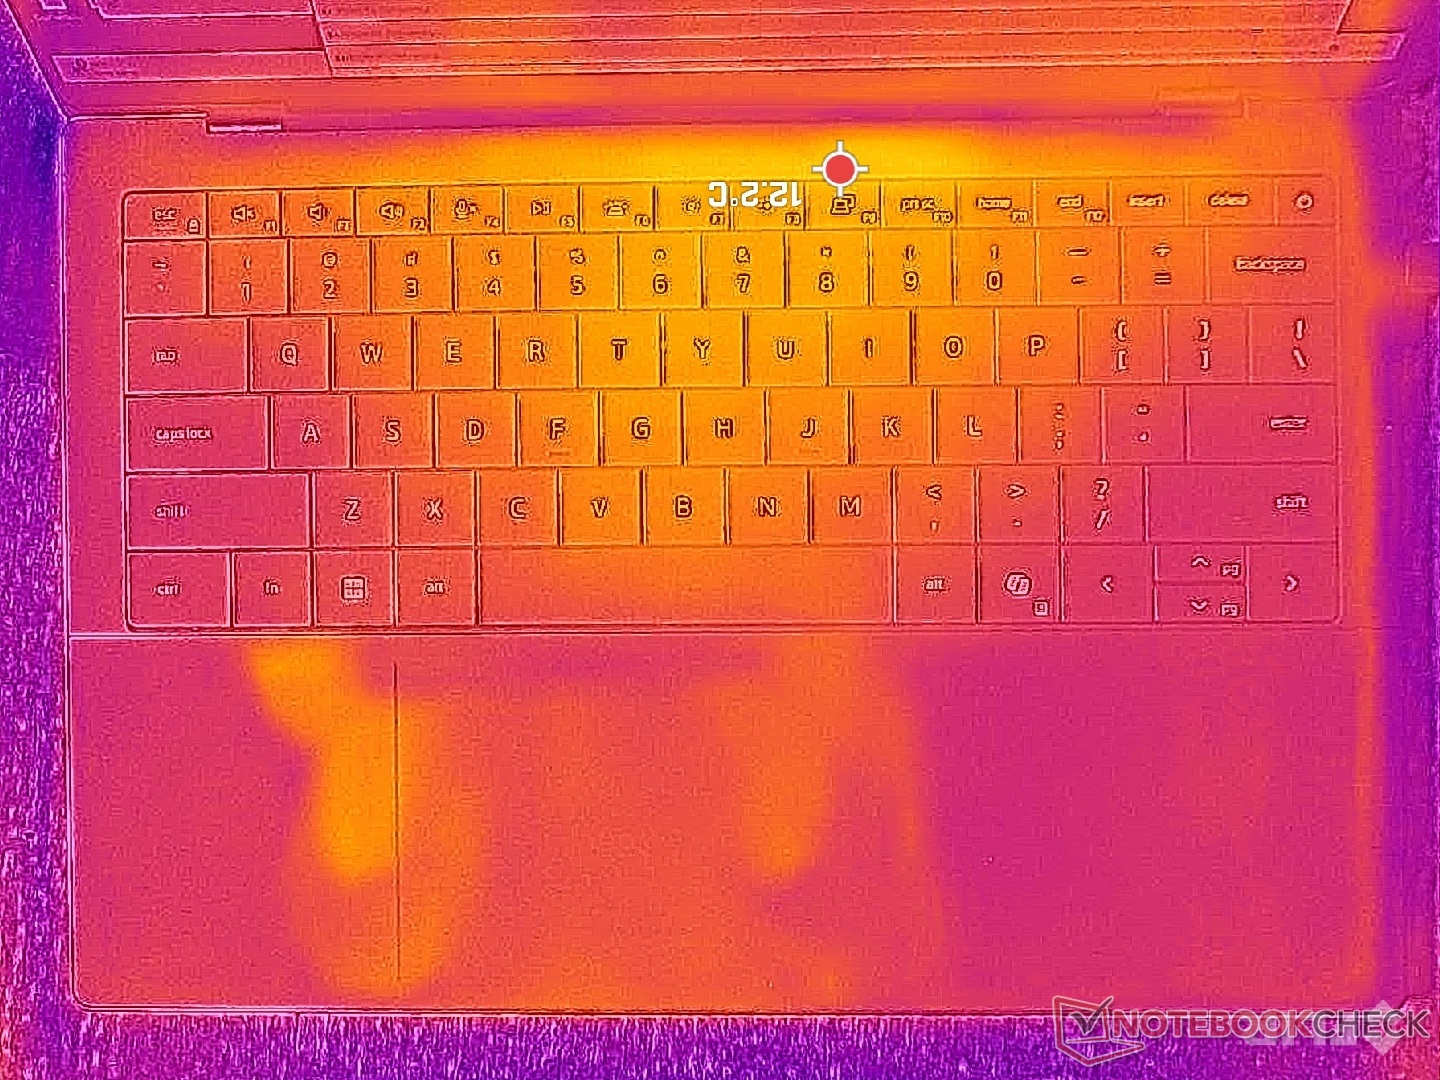
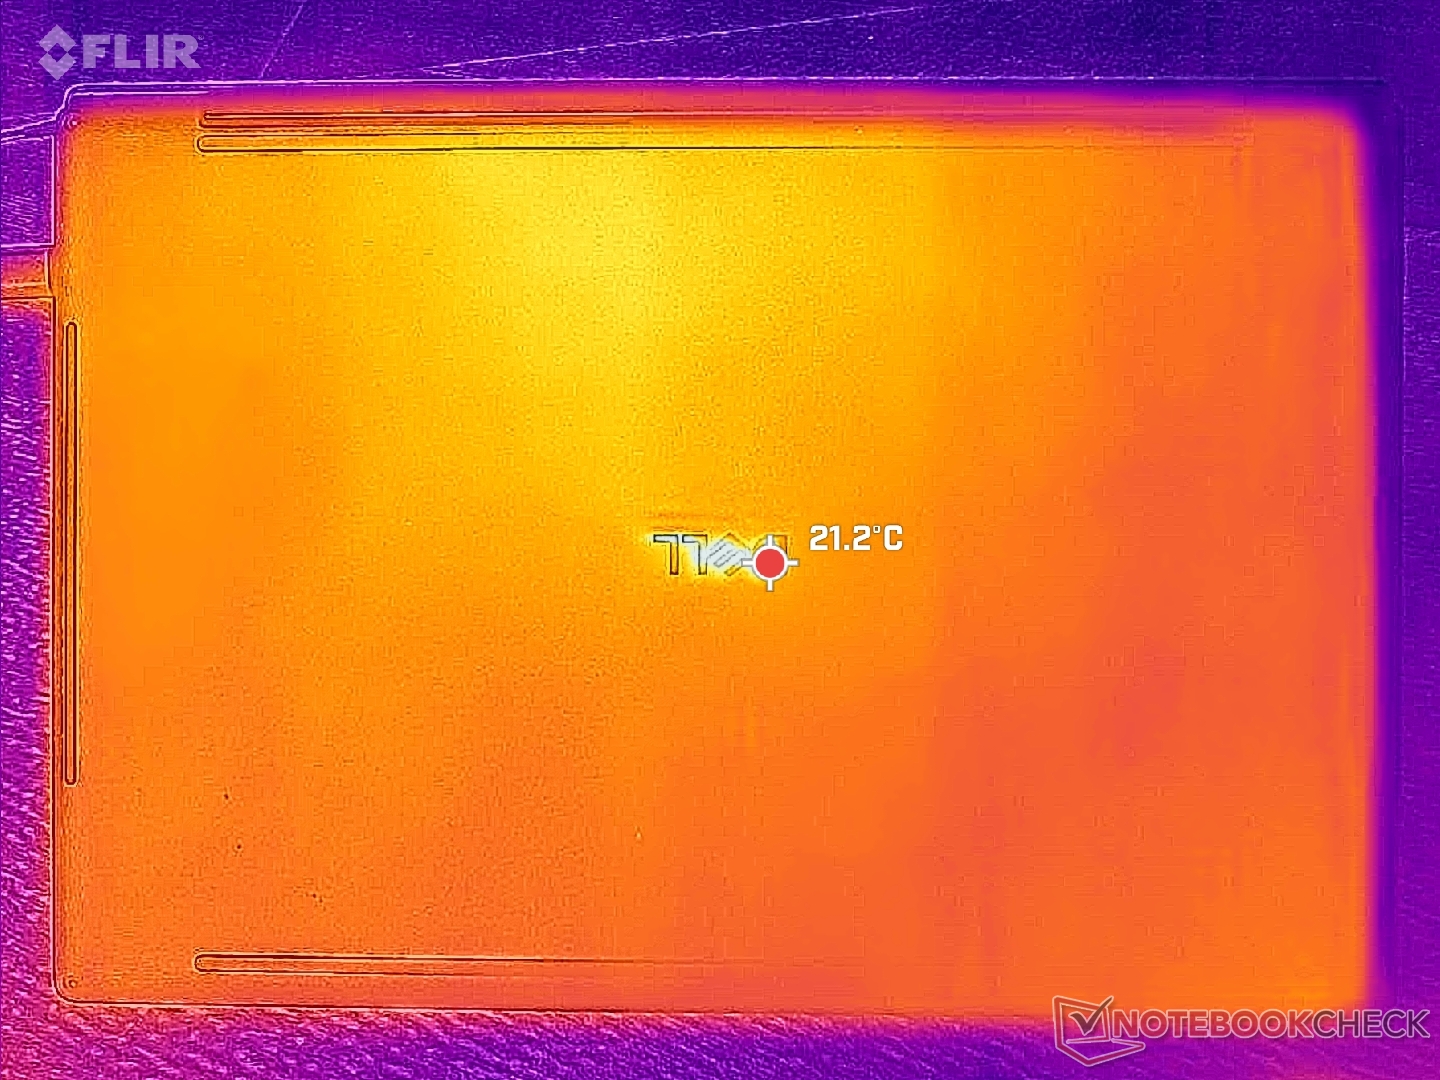
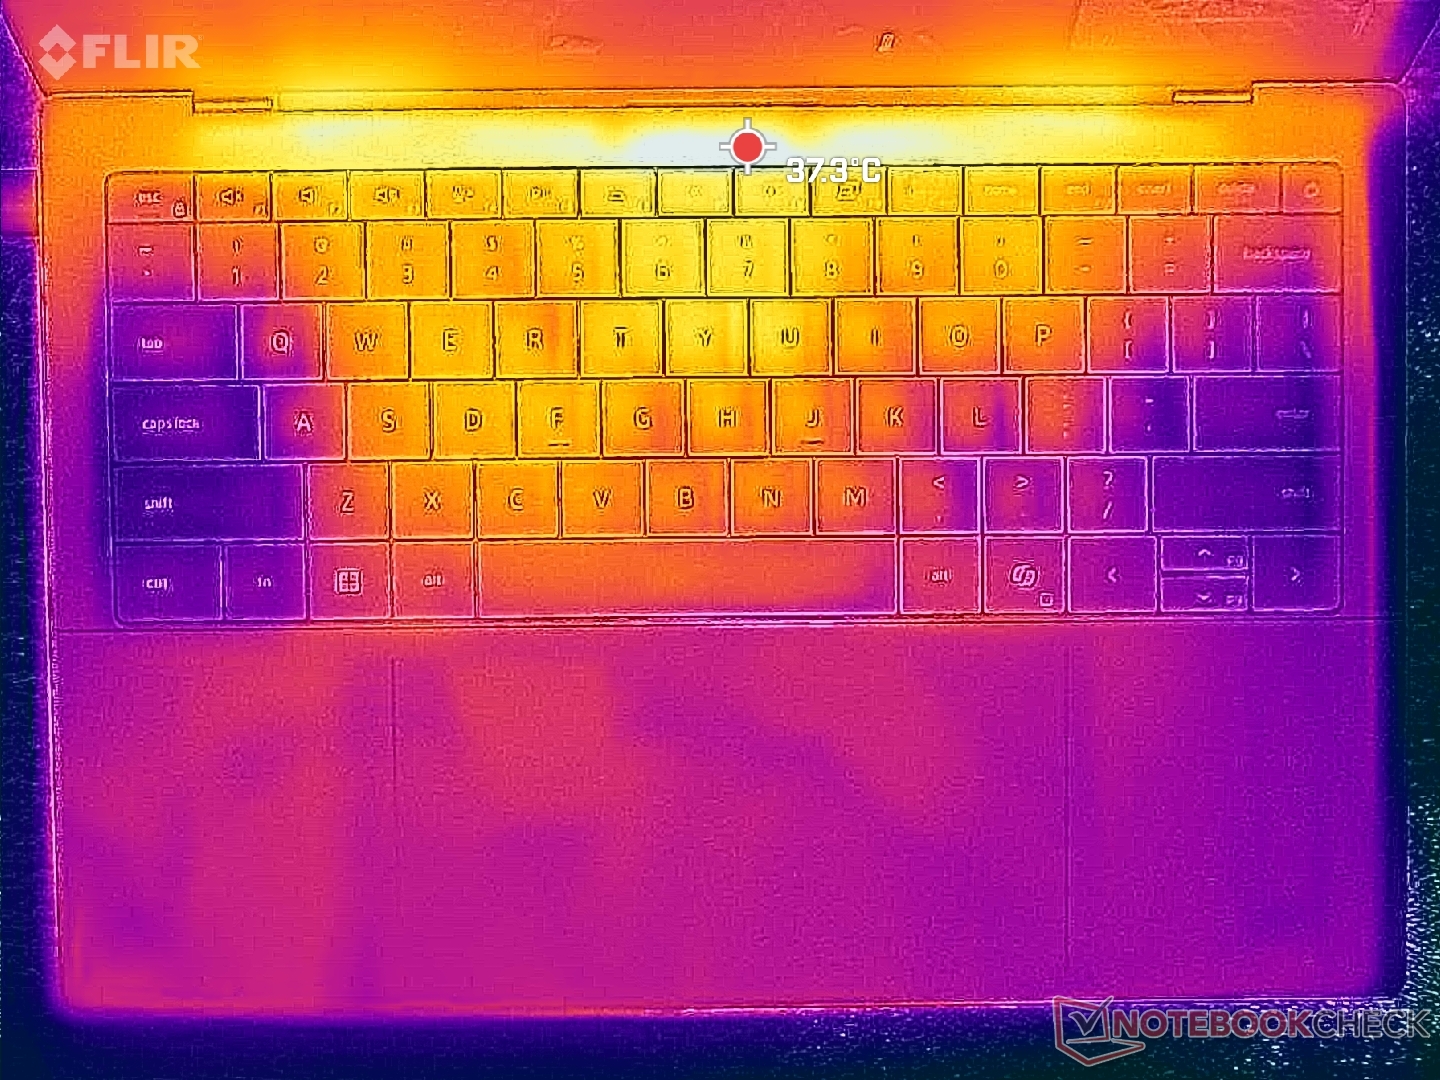
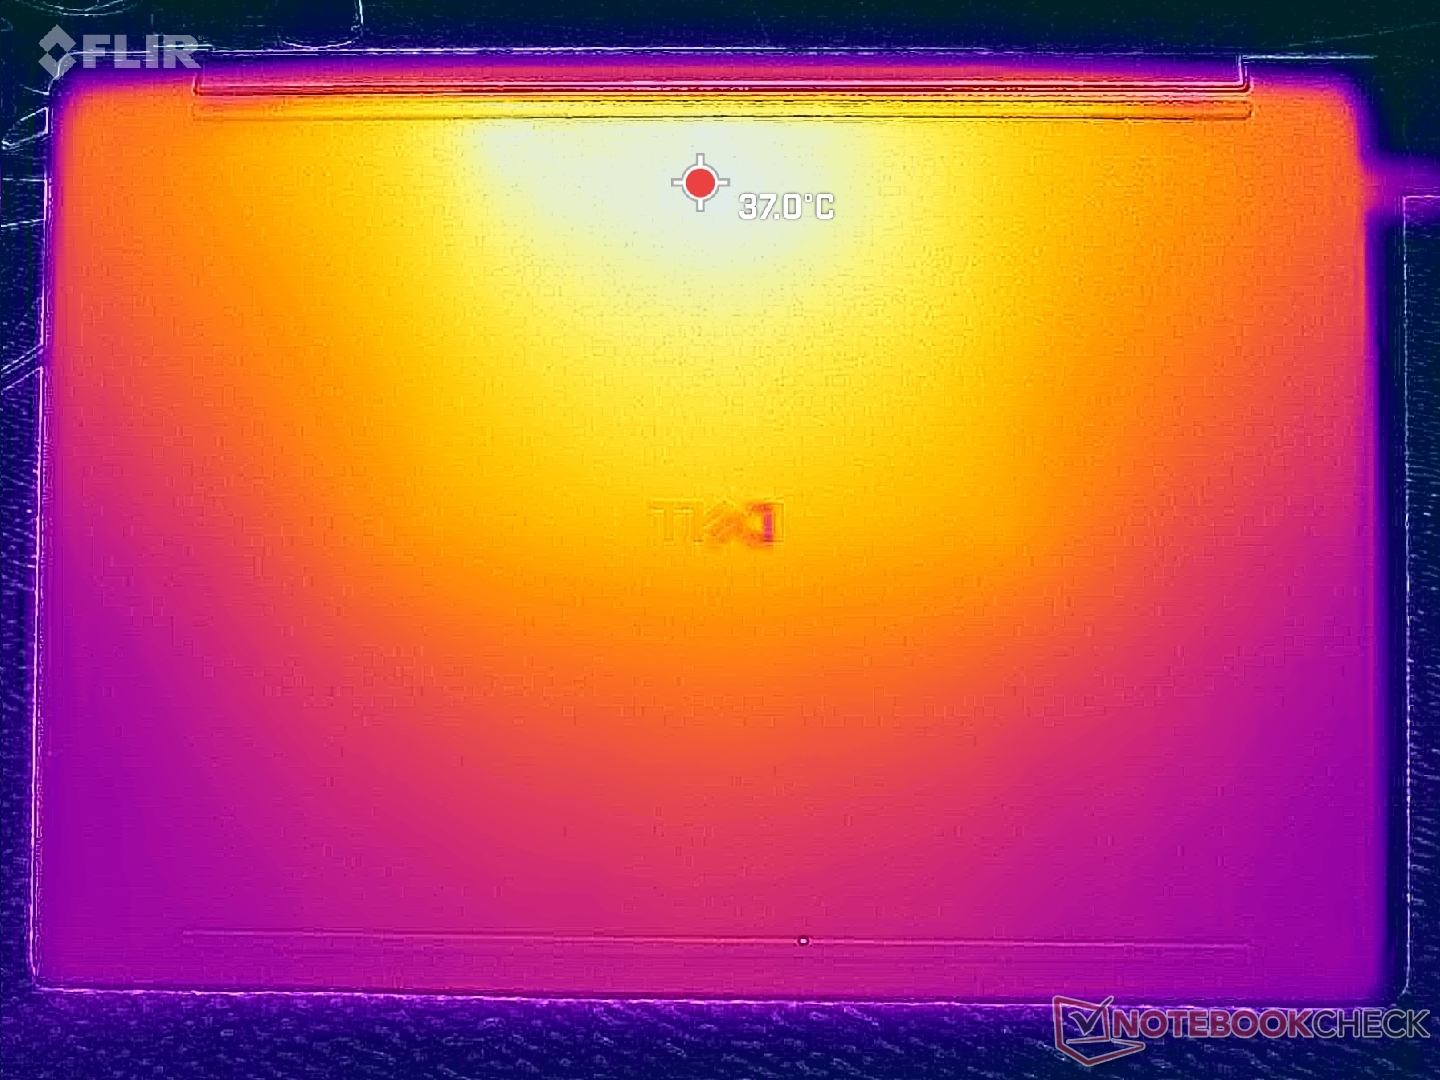
Température
Les points chauds de la température de surface se stabiliseraient à des niveaux presque identiques à ceux que nous avons observés sur l'écran du XPS 14 X7 malgré les performances nettement plus élevées de cette dernière.
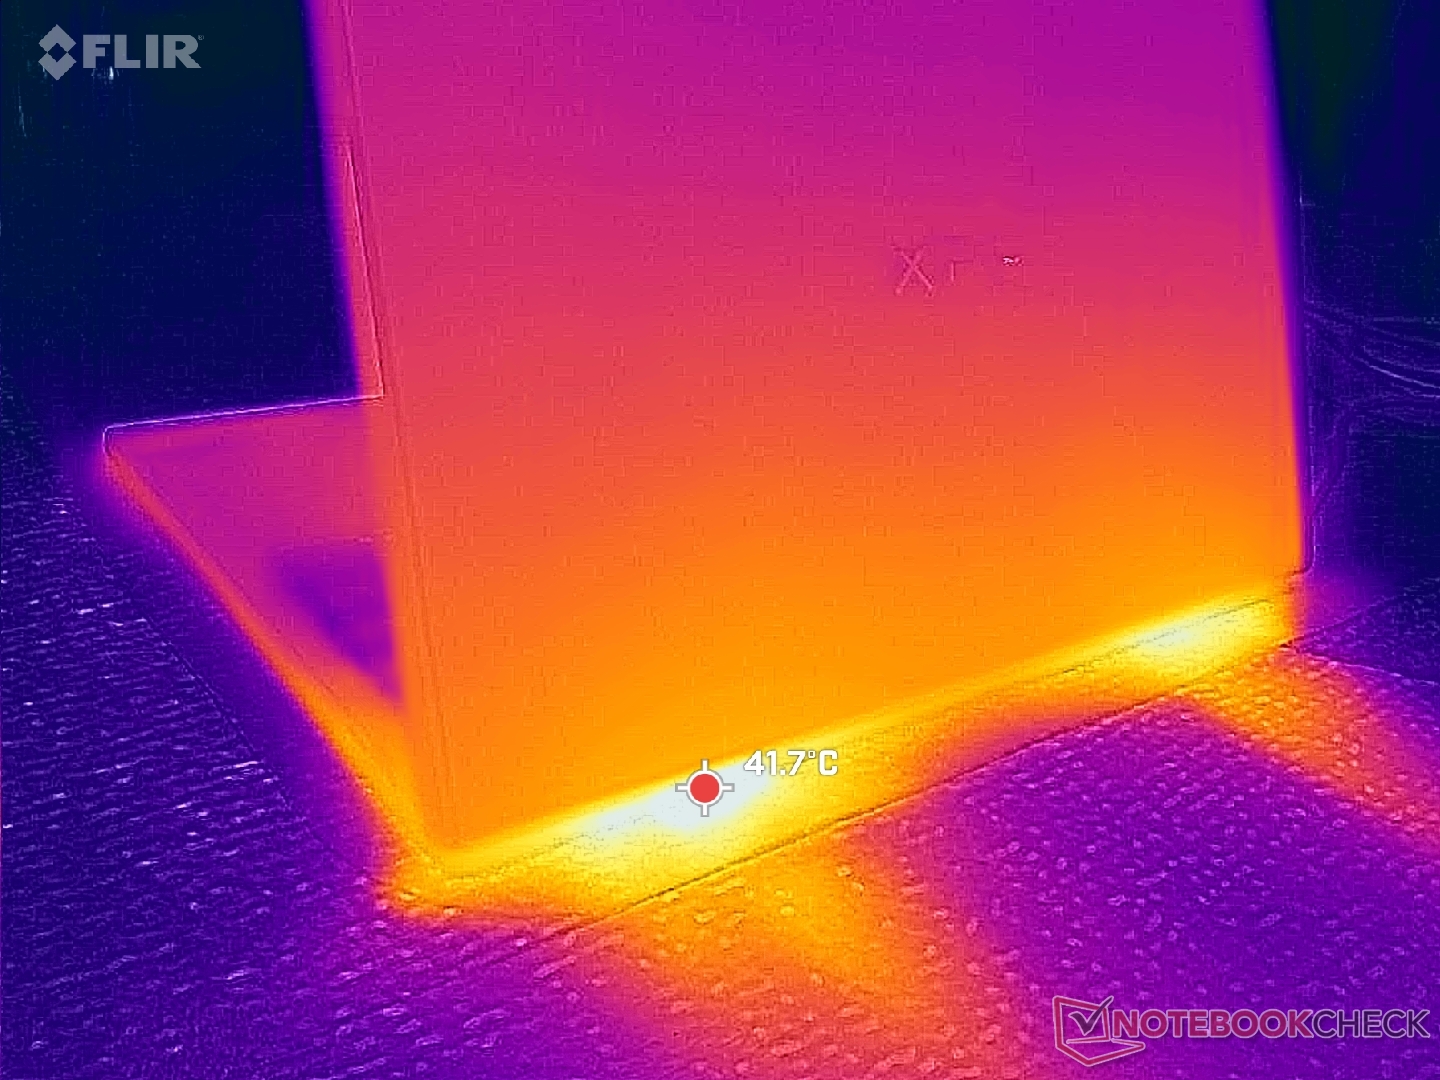
(+) La température maximale du côté supérieur est de 37.8 °C / 100 F, par rapport à la moyenne de 36.8 °C / 98 F, allant de 21 à 71 °C pour la classe Multimedia.
(+) Le fond chauffe jusqu'à un maximum de 38.6 °C / 101 F, contre une moyenne de 39.1 °C / 102 F
(+) En utilisation inactive, la température moyenne du côté supérieur est de 20.4 °C / 69 F, par rapport à la moyenne du dispositif de 31.3 °C / 88 F.
(+) Les repose-poignets et le pavé tactile sont plus froids que la température de la peau avec un maximum de 27.4 °C / 81.3 F et sont donc froids au toucher.
(±) La température moyenne de la zone de l'appui-paume de dispositifs similaires était de 28.7 °C / 83.7 F (+1.3 °C / #2.4 F).
| Dell XPS 14 Core Ultra 7 355 Ultra 7 355, Intel Graphics 4 Xe3 PTL | Dell XPS 14 Core Ultra X7 358H Ultra X7 358H, Arc B390 Panther Lake iGPU | Asus ExpertBook PM3406 Ryzen AI 7 350, Radeon 860M | Lenovo ThinkPad T14 Gen 6 21QG001VGE Core Ultra 7 258V, Arc 140V | HP OmniBook Ultra Flip 14 Core Ultra 7 258V, Arc 140V | Samsung Galaxy Book5 Pro 14 940XHA Core Ultra 5 226V, Arc 130V | |
|---|---|---|---|---|---|---|
| Heat | -7% | -14% | -12% | -9% | -16% | |
| Maximum Upper Side * (°C) | 37.8 | 34 10% | 39.8 -5% | 39.7 -5% | 35.8 5% | 41.4 -10% |
| Maximum Bottom * (°C) | 38.6 | 35.8 7% | 40.8 -6% | 38.1 1% | 37.6 3% | 44.6 -16% |
| Idle Upper Side * (°C) | 21.2 | 25.6 -21% | 26 -23% | 24.3 -15% | 25.2 -19% | 24.9 -17% |
| Idle Bottom * (°C) | 21.4 | 26.4 -23% | 26.3 -23% | 27.7 -29% | 26.6 -24% | 25.5 -19% |
* ... Moindre est la valeur, meilleures sont les performances
Test de stress
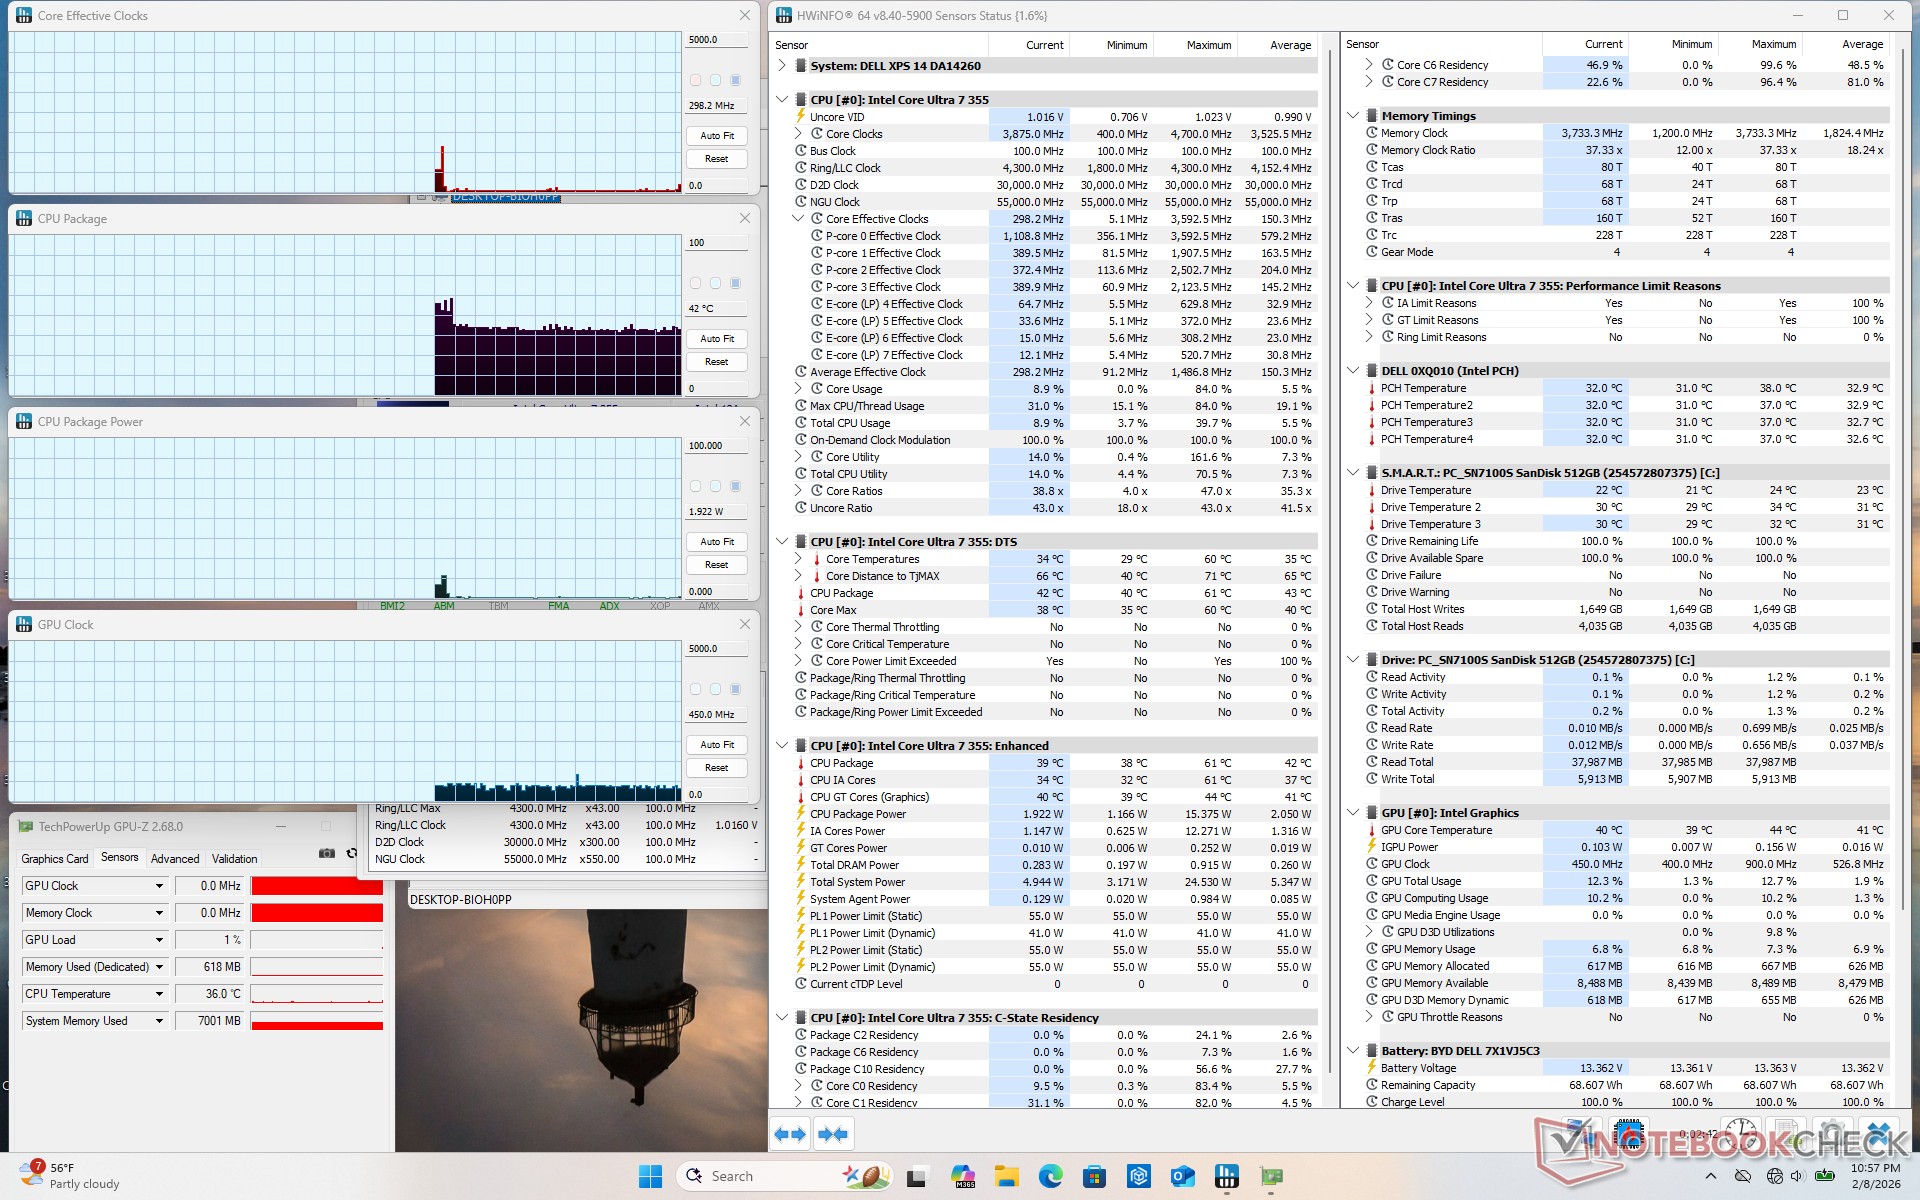
Lors de l'exécution de Prime95, le CPU atteint 3,7 GHz et 54 W pendant seulement quelques secondes à 100 C. Ensuite, il se stabilise à 2,9 GHz, 28 W et 81 C, ce qui représente un potentiel Turbo Boost limité. La température du cœur se stabilise à 80°C lors de l'exécution de charges exigeantes, ce qui est légèrement plus froid que ce que nous avons enregistré sur l'Arrow Lake-H de l'année dernière Dell 14 Premium.
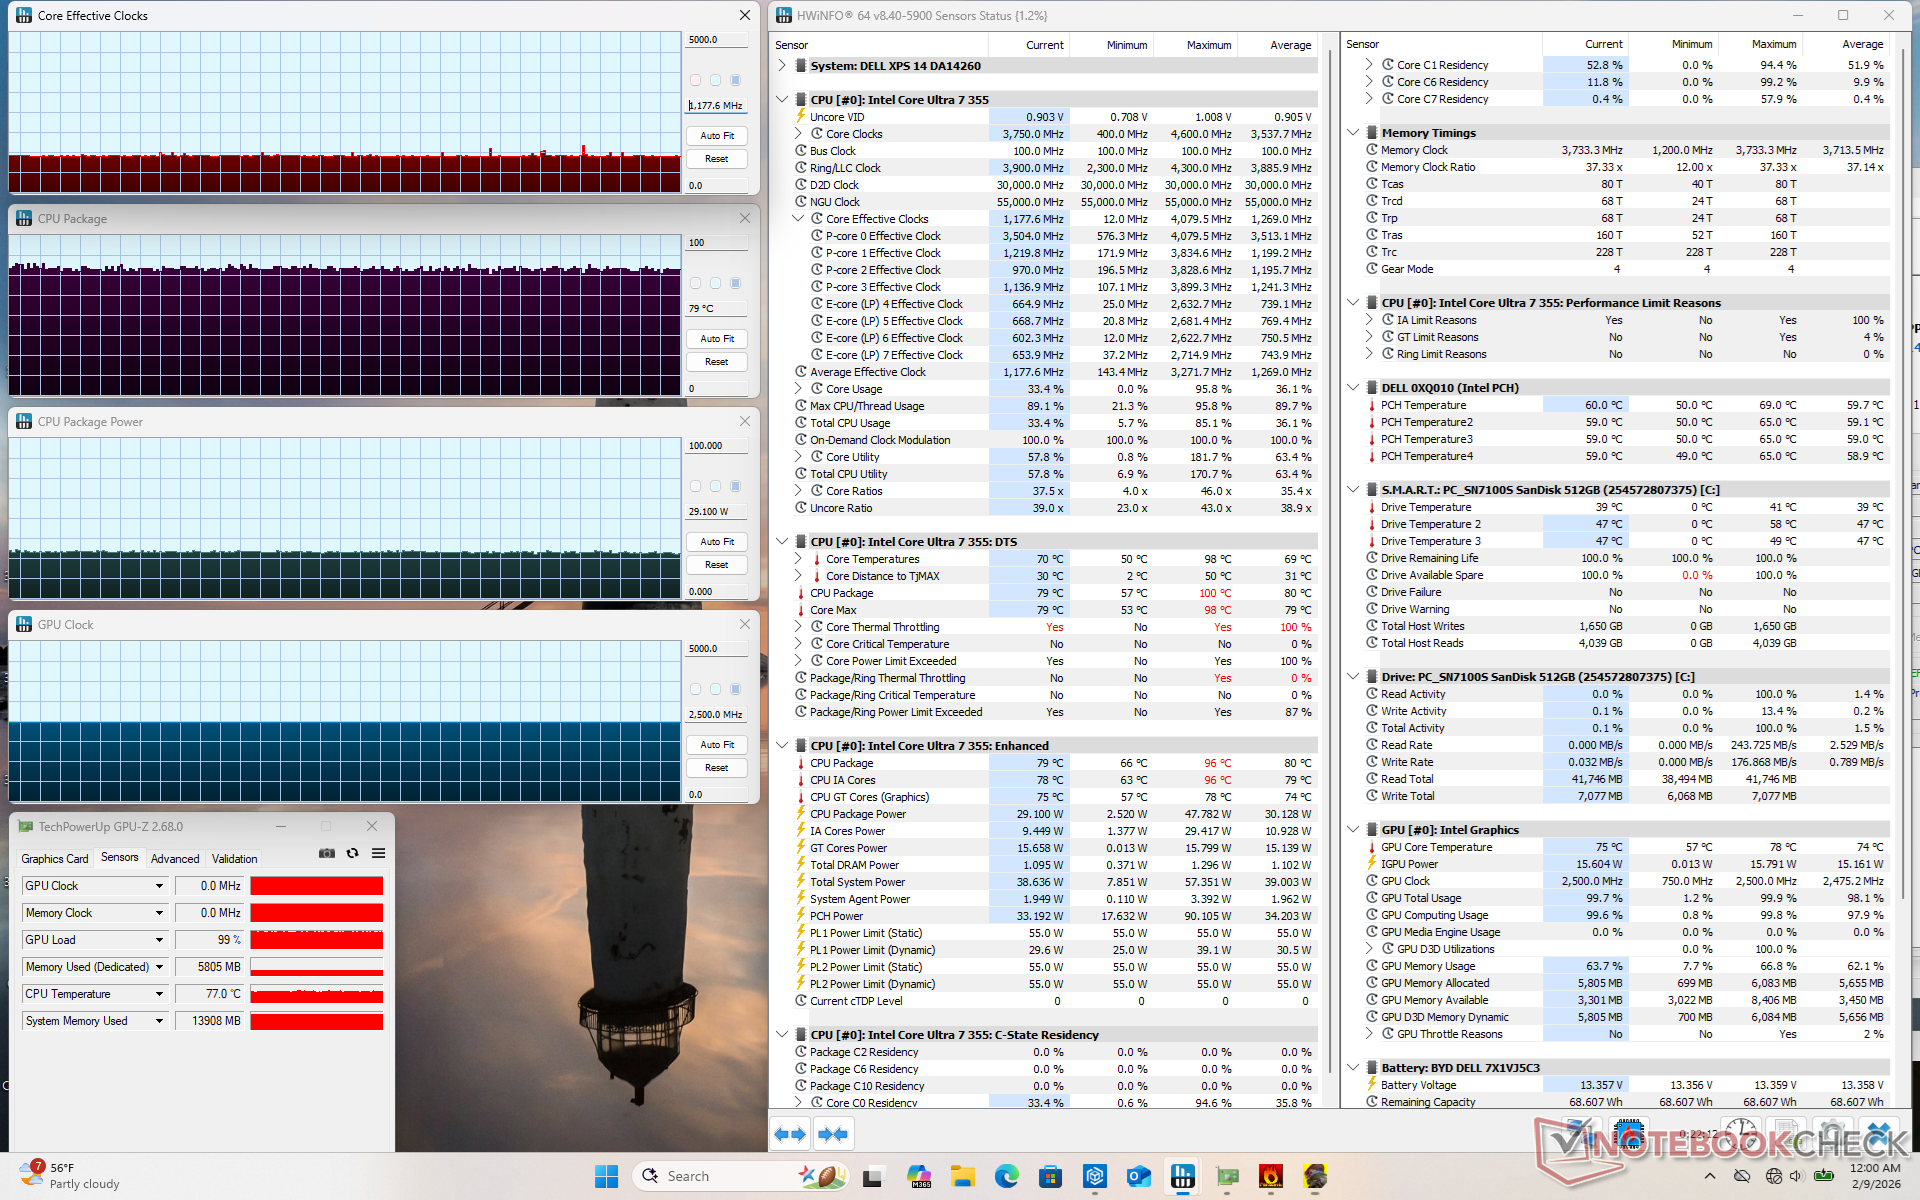
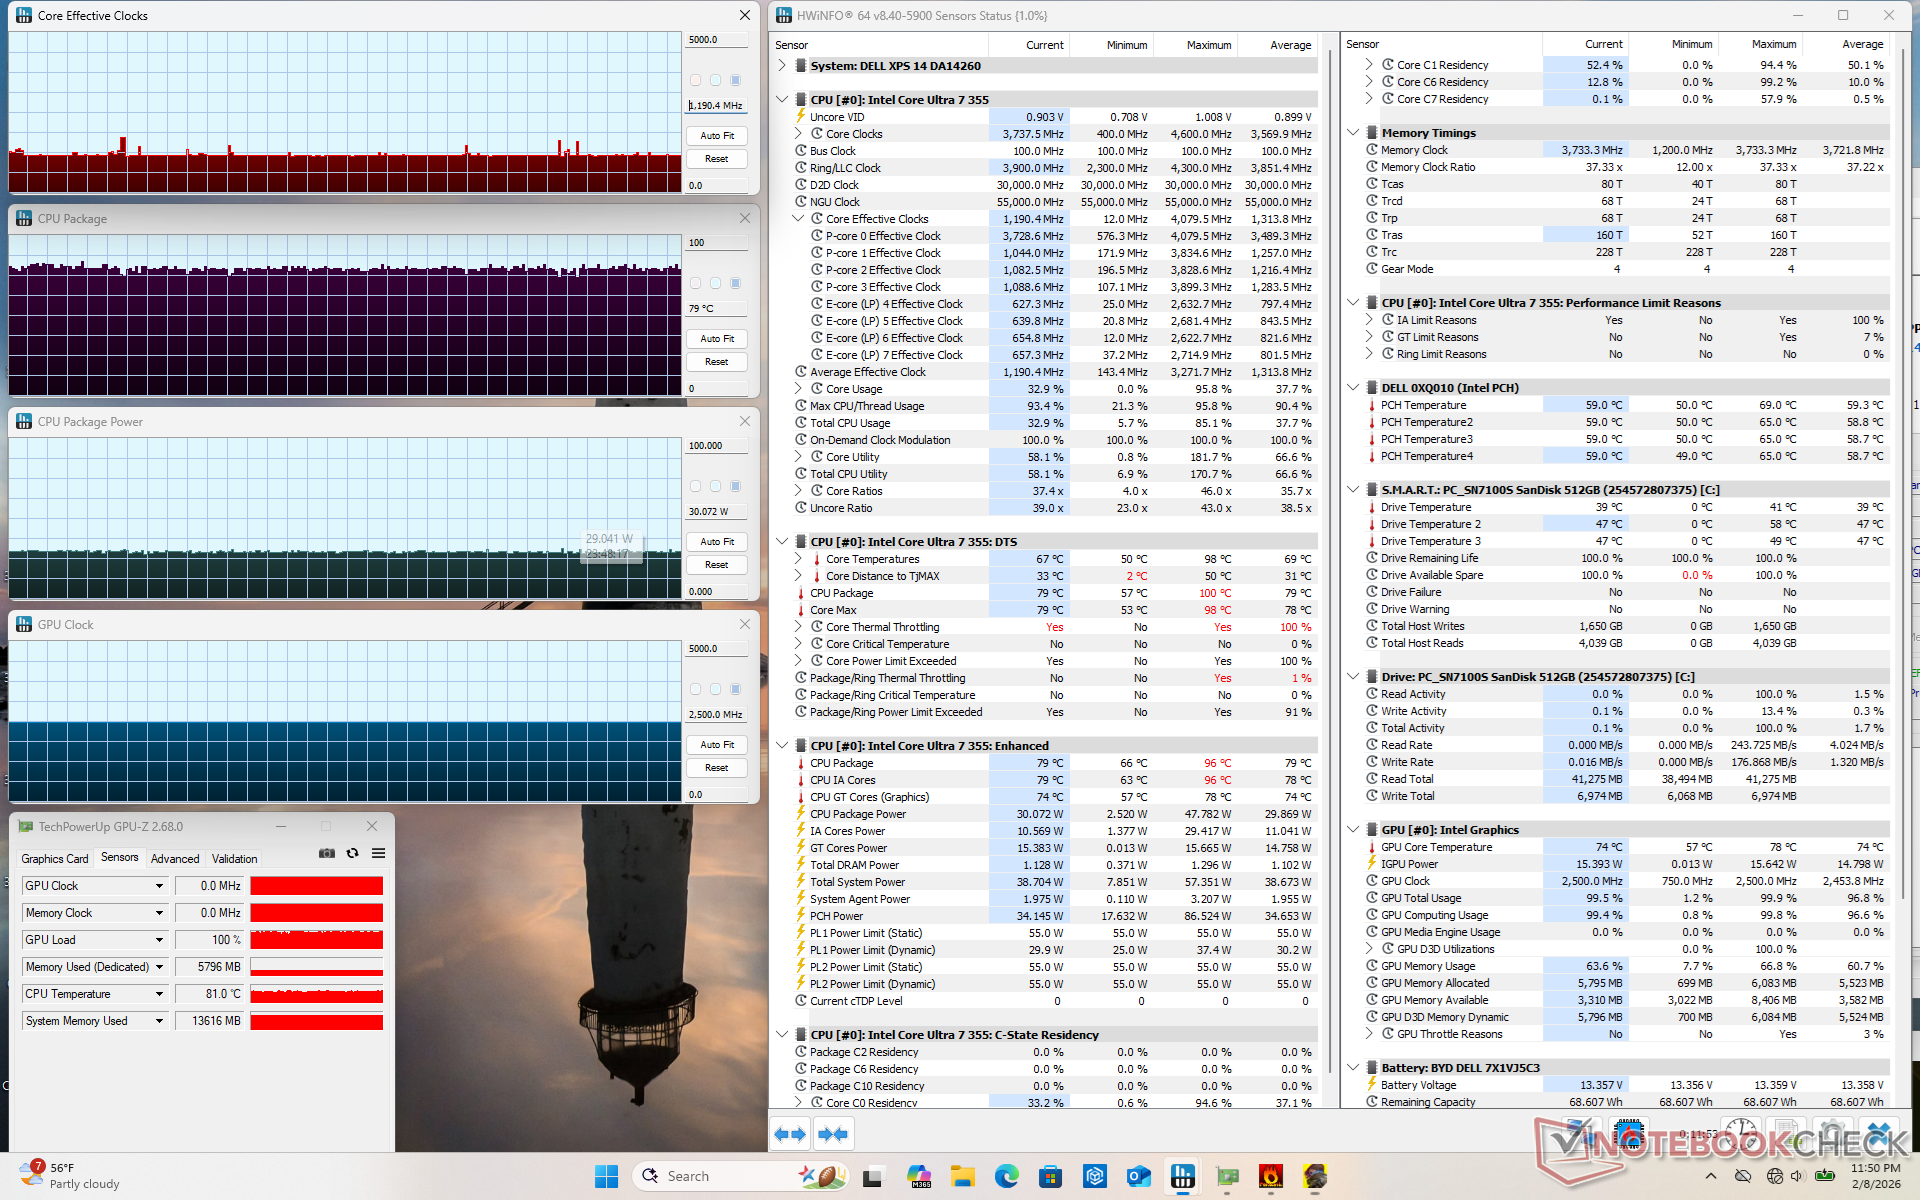
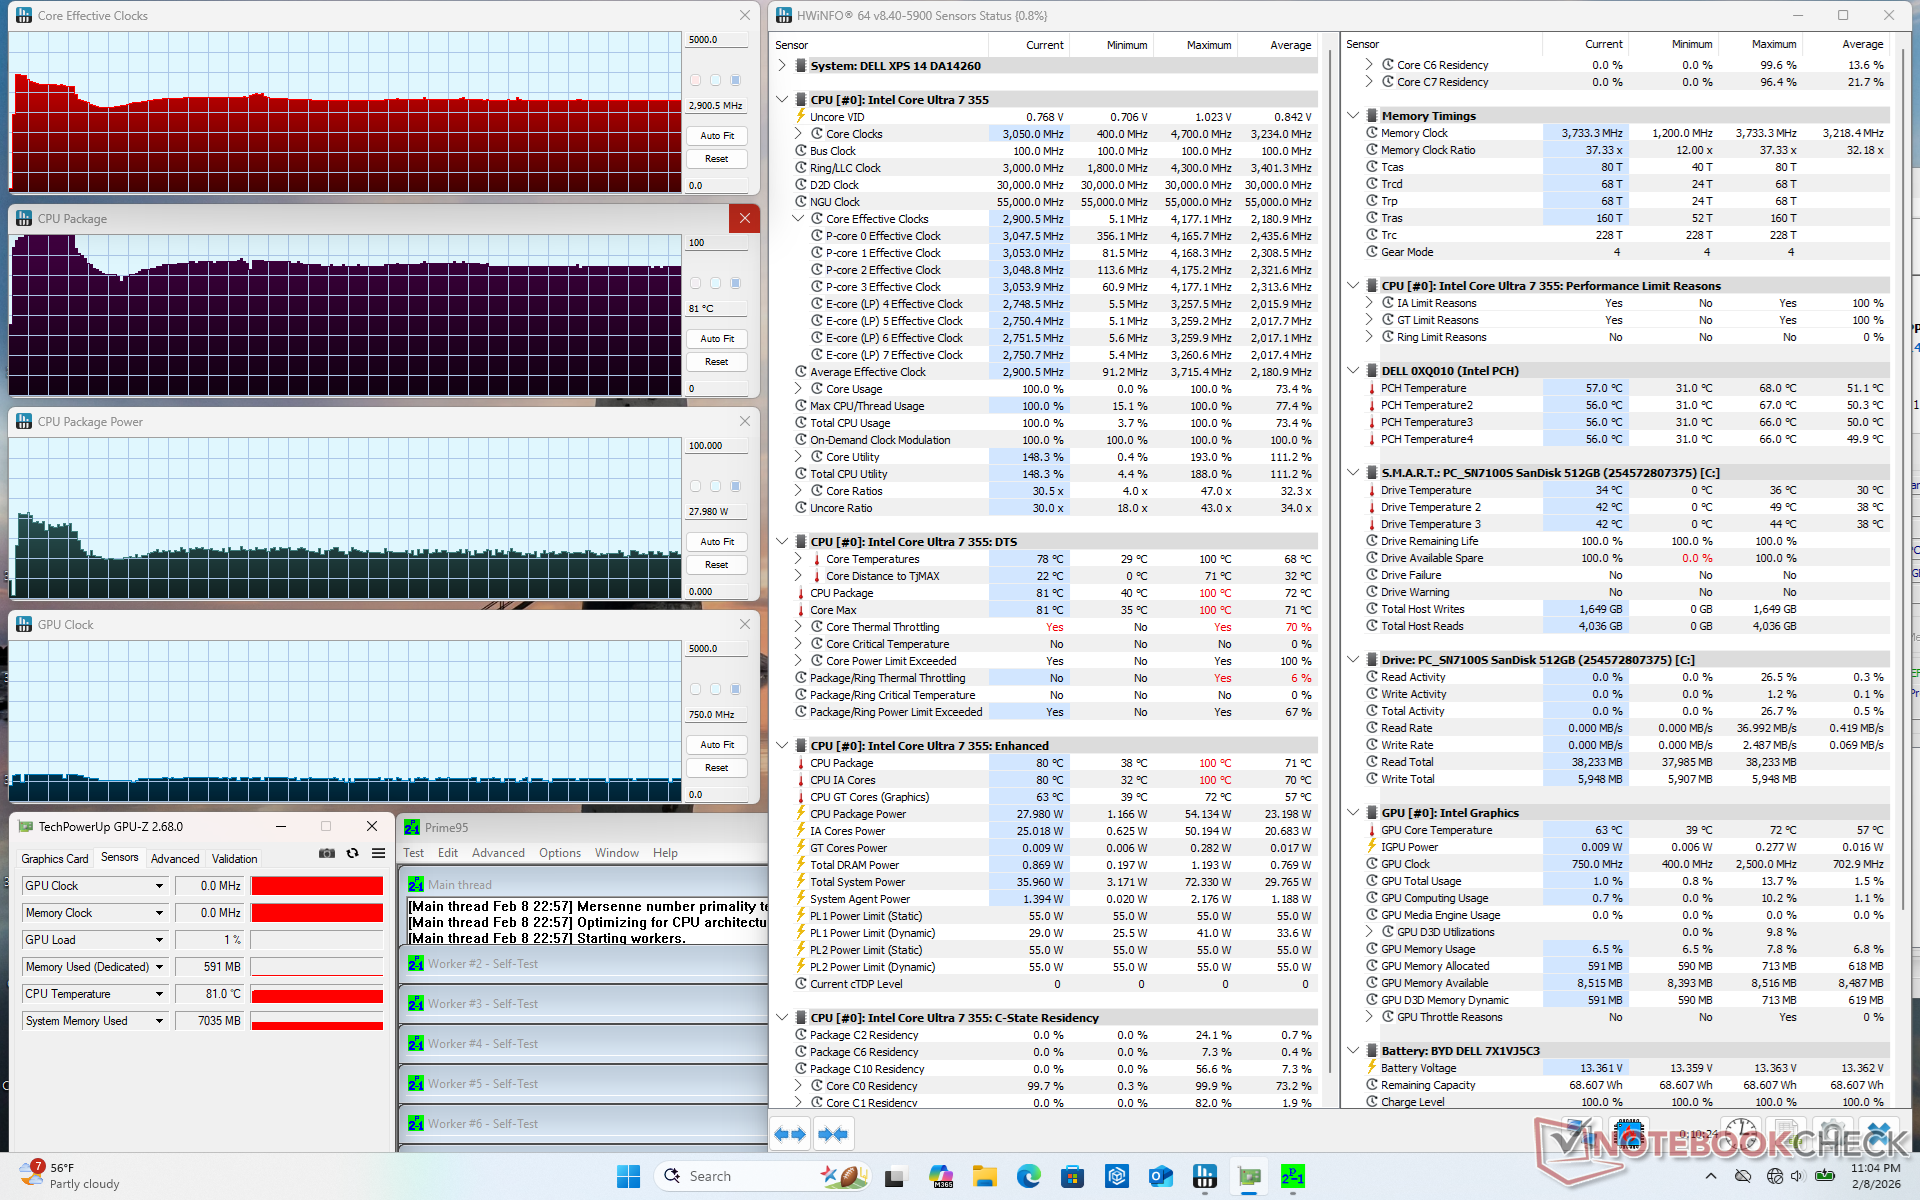
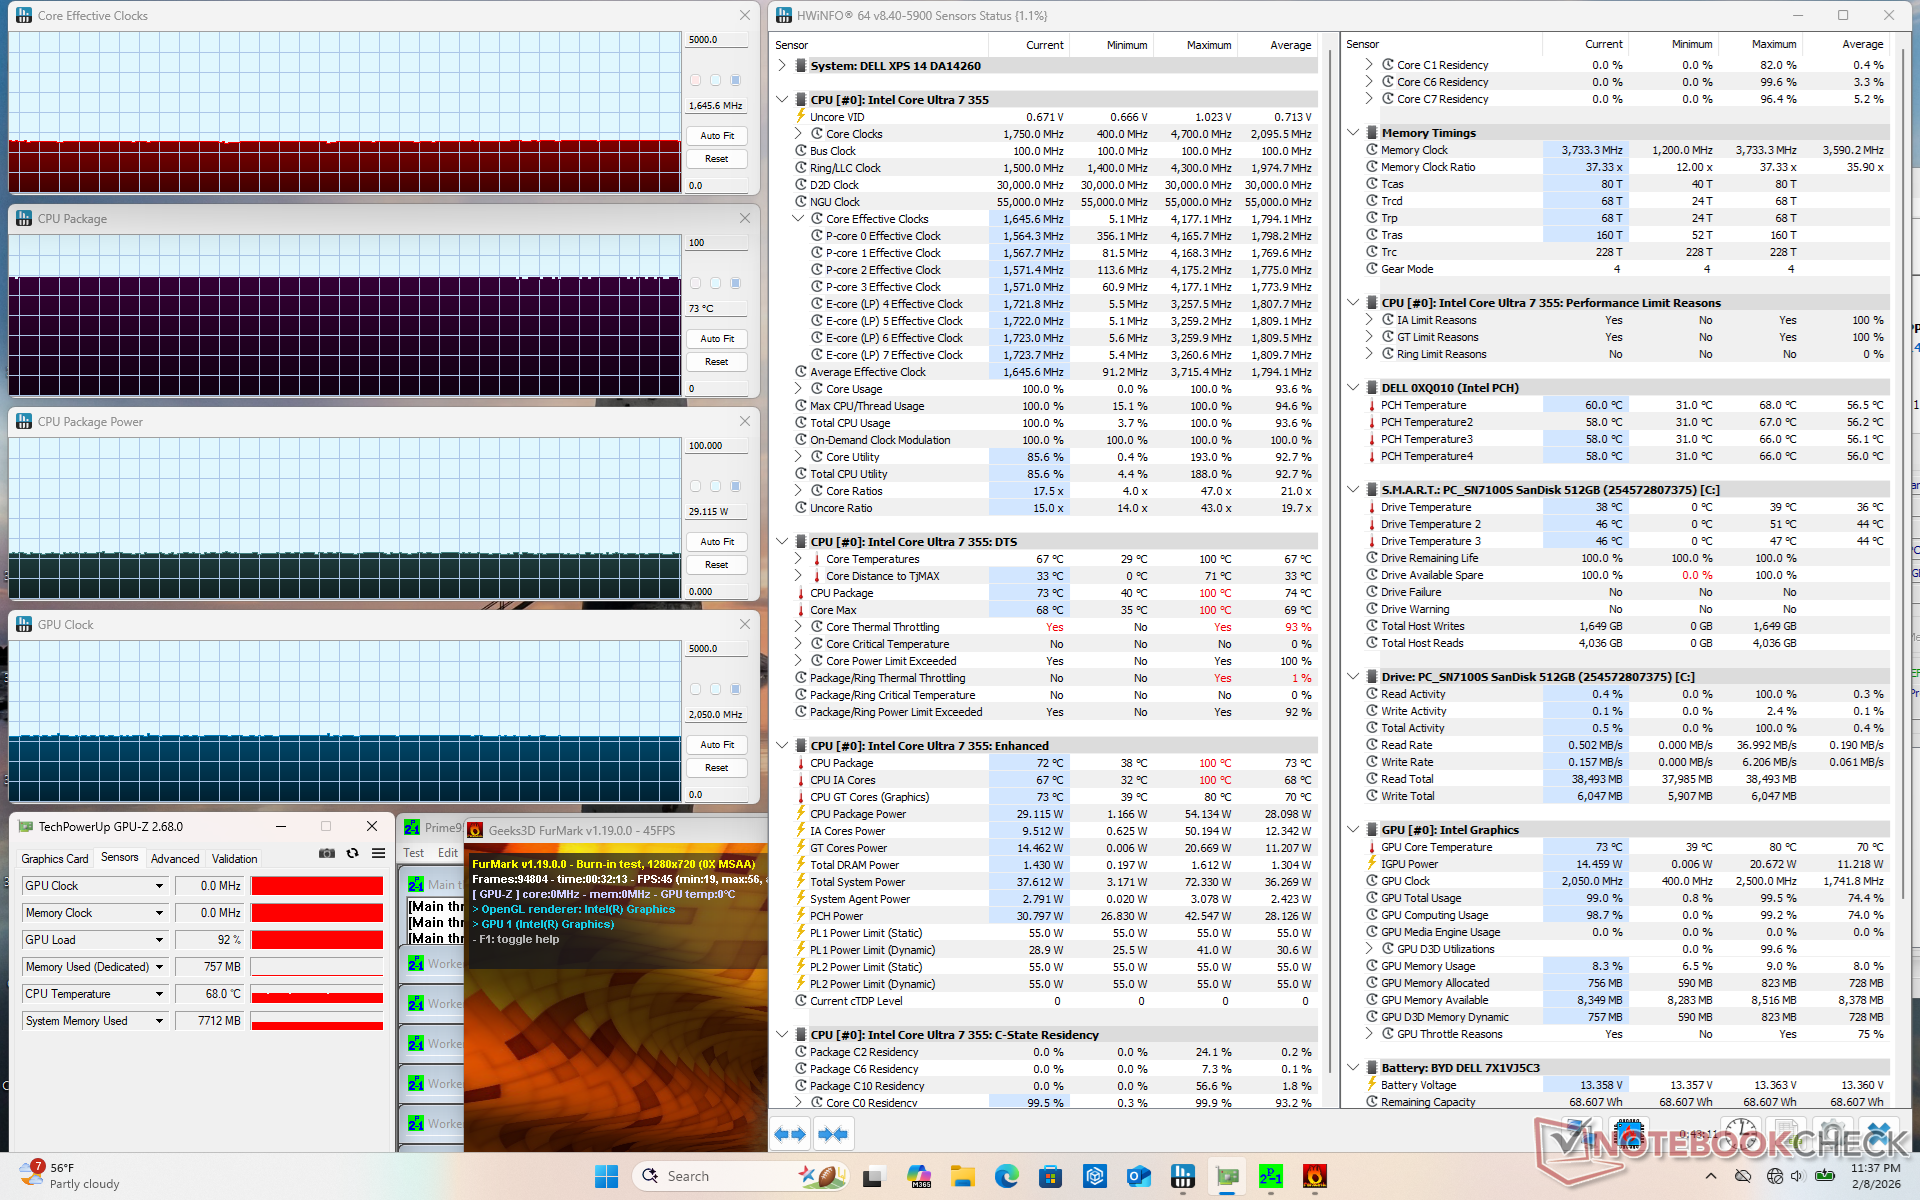
| Horloge du CPU (GHz) | Horloge du GPU (MHz) | Température moyenne du CPU (°C) | |
| Système au repos | -- | -- | 42 |
| Prime95 Stress | 2.9 | -- | 81 |
| Prime95 + FurMark Stress | 1.7 | 2050 | 73 |
| Cyberpunk 2077 Stress (mode équilibré) | 1.2 | 2500 | 79 |
| Cyberpunk 2077 Stress (mode Performance) | 1.2 | 2500 | 79 |
Intervenants
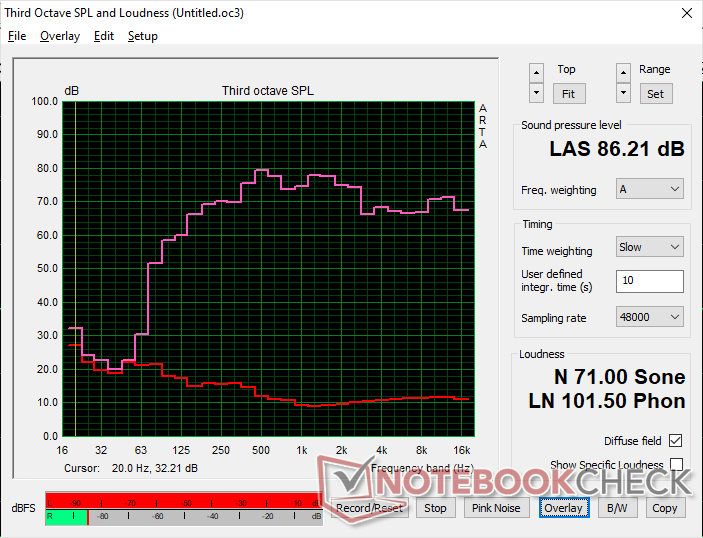
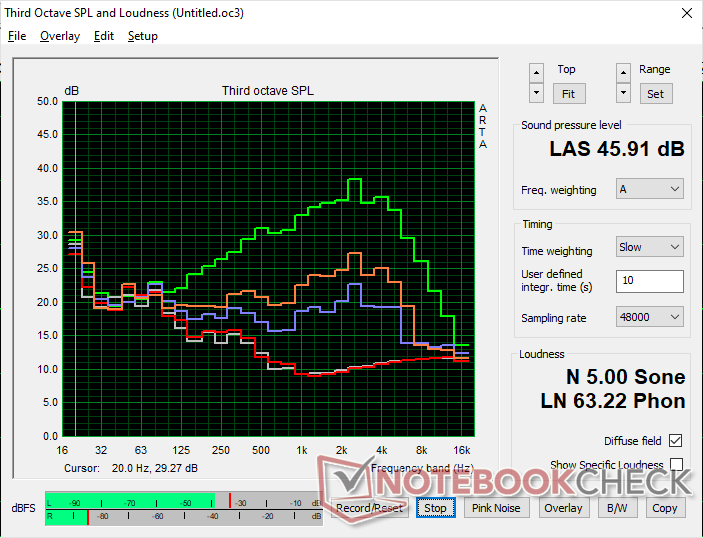
Dell XPS 14 Core Ultra 7 355 analyse audio
(+) | les haut-parleurs peuvent jouer relativement fort (86.2# dB)
Basses 100 - 315 Hz
(±) | basse réduite - en moyenne 5% inférieure à la médiane
(+) | les basses sont linéaires (5.3% delta à la fréquence précédente)
Médiums 400 - 2000 Hz
(±) | médiane supérieure - en moyenne 5.7% supérieure à la médiane
(+) | les médiums sont linéaires (4.7% delta à la fréquence précédente)
Aiguës 2 - 16 kHz
(+) | des sommets équilibrés - à seulement 3.1% de la médiane
(+) | les aigus sont linéaires (4.1% delta à la fréquence précédente)
Globalement 100 - 16 000 Hz
(+) | le son global est linéaire (7.9% différence à la médiane)
Par rapport à la même classe
» 7% de tous les appareils testés de cette catégorie étaient meilleurs, 2% similaires, 91% pires
» Le meilleur avait un delta de 5%, la moyenne était de 17%, le pire était de 45%.
Par rapport à tous les appareils testés
» 1% de tous les appareils testés étaient meilleurs, 1% similaires, 98% pires
» Le meilleur avait un delta de 4%, la moyenne était de 24%, le pire était de 134%.
Apple MacBook Pro 16 2021 M1 Pro analyse audio
(+) | les haut-parleurs peuvent jouer relativement fort (84.7# dB)
Basses 100 - 315 Hz
(+) | bonne basse - seulement 3.8% loin de la médiane
(+) | les basses sont linéaires (5.2% delta à la fréquence précédente)
Médiums 400 - 2000 Hz
(+) | médiane équilibrée - seulement 1.3% de la médiane
(+) | les médiums sont linéaires (2.1% delta à la fréquence précédente)
Aiguës 2 - 16 kHz
(+) | des sommets équilibrés - à seulement 1.9% de la médiane
(+) | les aigus sont linéaires (2.7% delta à la fréquence précédente)
Globalement 100 - 16 000 Hz
(+) | le son global est linéaire (4.6% différence à la médiane)
Par rapport à la même classe
» 0% de tous les appareils testés de cette catégorie étaient meilleurs, 0% similaires, 100% pires
» Le meilleur avait un delta de 5%, la moyenne était de 17%, le pire était de 45%.
Par rapport à tous les appareils testés
» 0% de tous les appareils testés étaient meilleurs, 0% similaires, 100% pires
» Le meilleur avait un delta de 4%, la moyenne était de 24%, le pire était de 134%.
Gestion de l'énergie
Consommation électrique
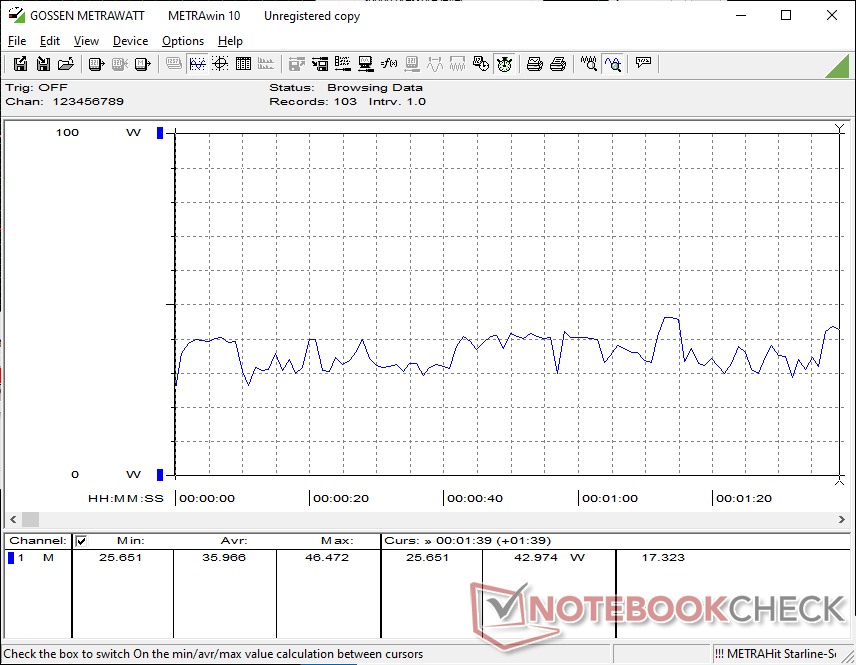
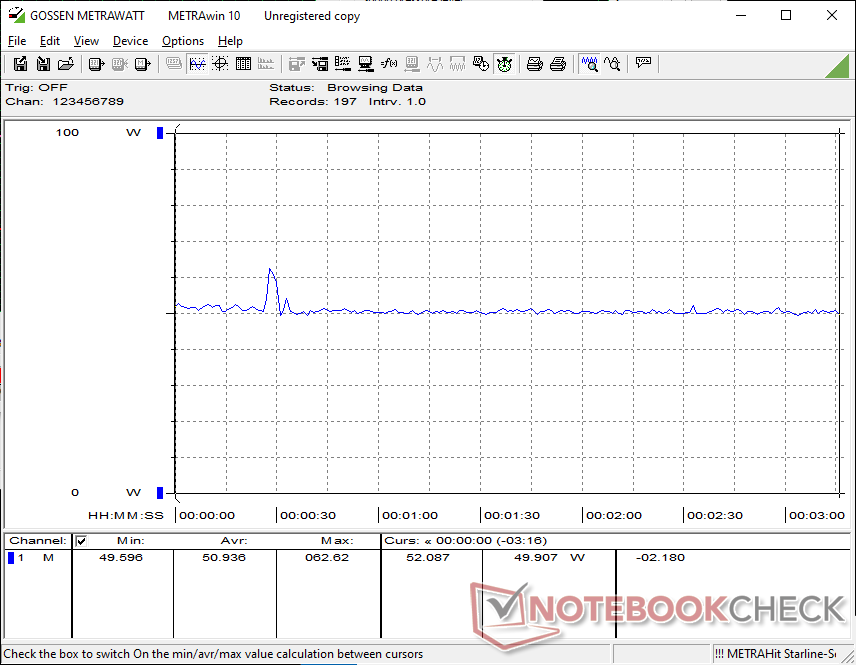
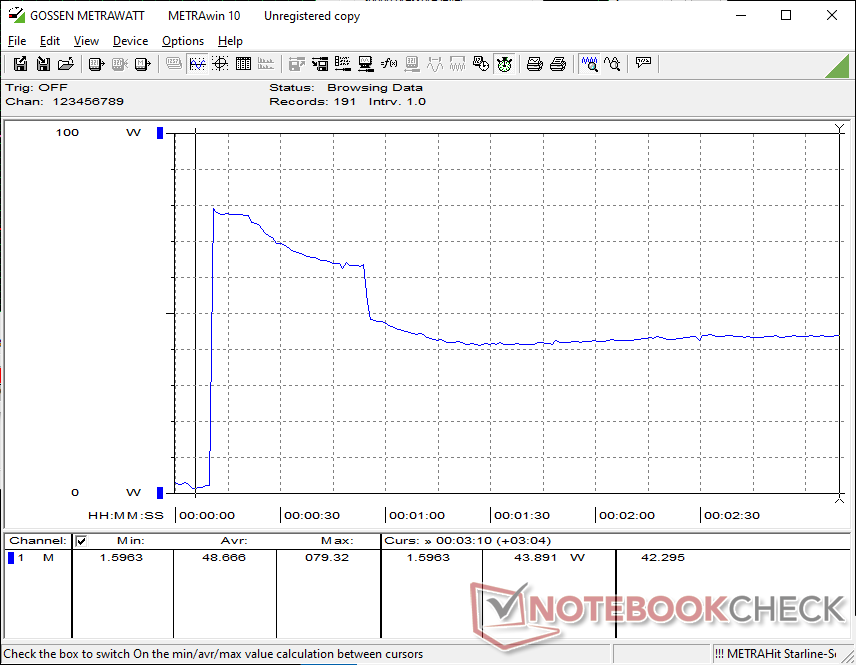
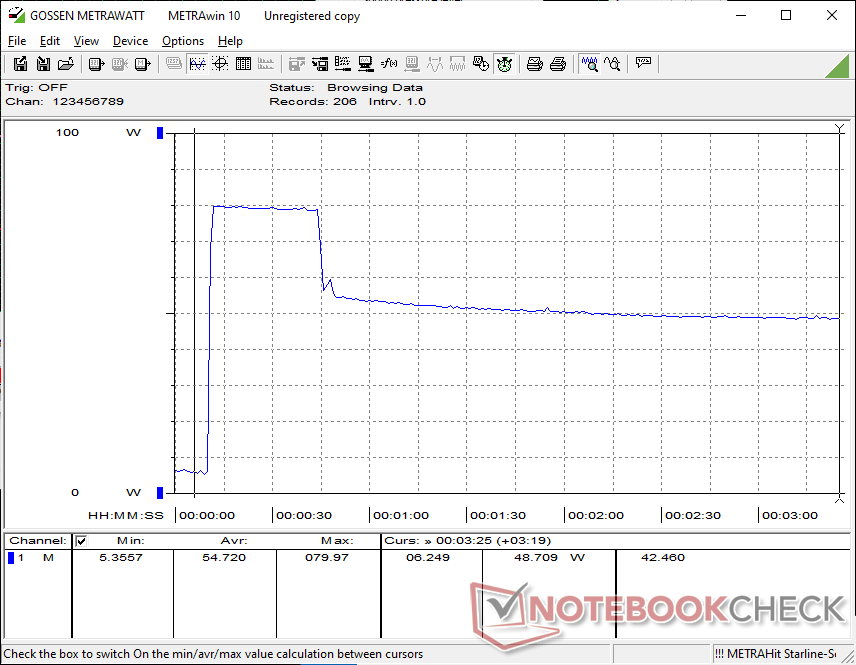
Malheureusement, le Core Ultra 7 355 n'hérite pas des avantages de la série Core Ultra X7 en termes de performances par watt. Lors de l'exécution de Prime95 sur un moniteur externe, par exemple, le système ne consommerait que 13 % de moins que le Core Ultra X7 XPS 14 tout en offrant des performances 40 % plus lentes. De même, l'exécution de Cyberpunk 2077 ou FurMark ne demanderait que 7 à 15 % d'énergie en moins tout en souffrant d'une baisse significative de 60 % des performances graphiques.
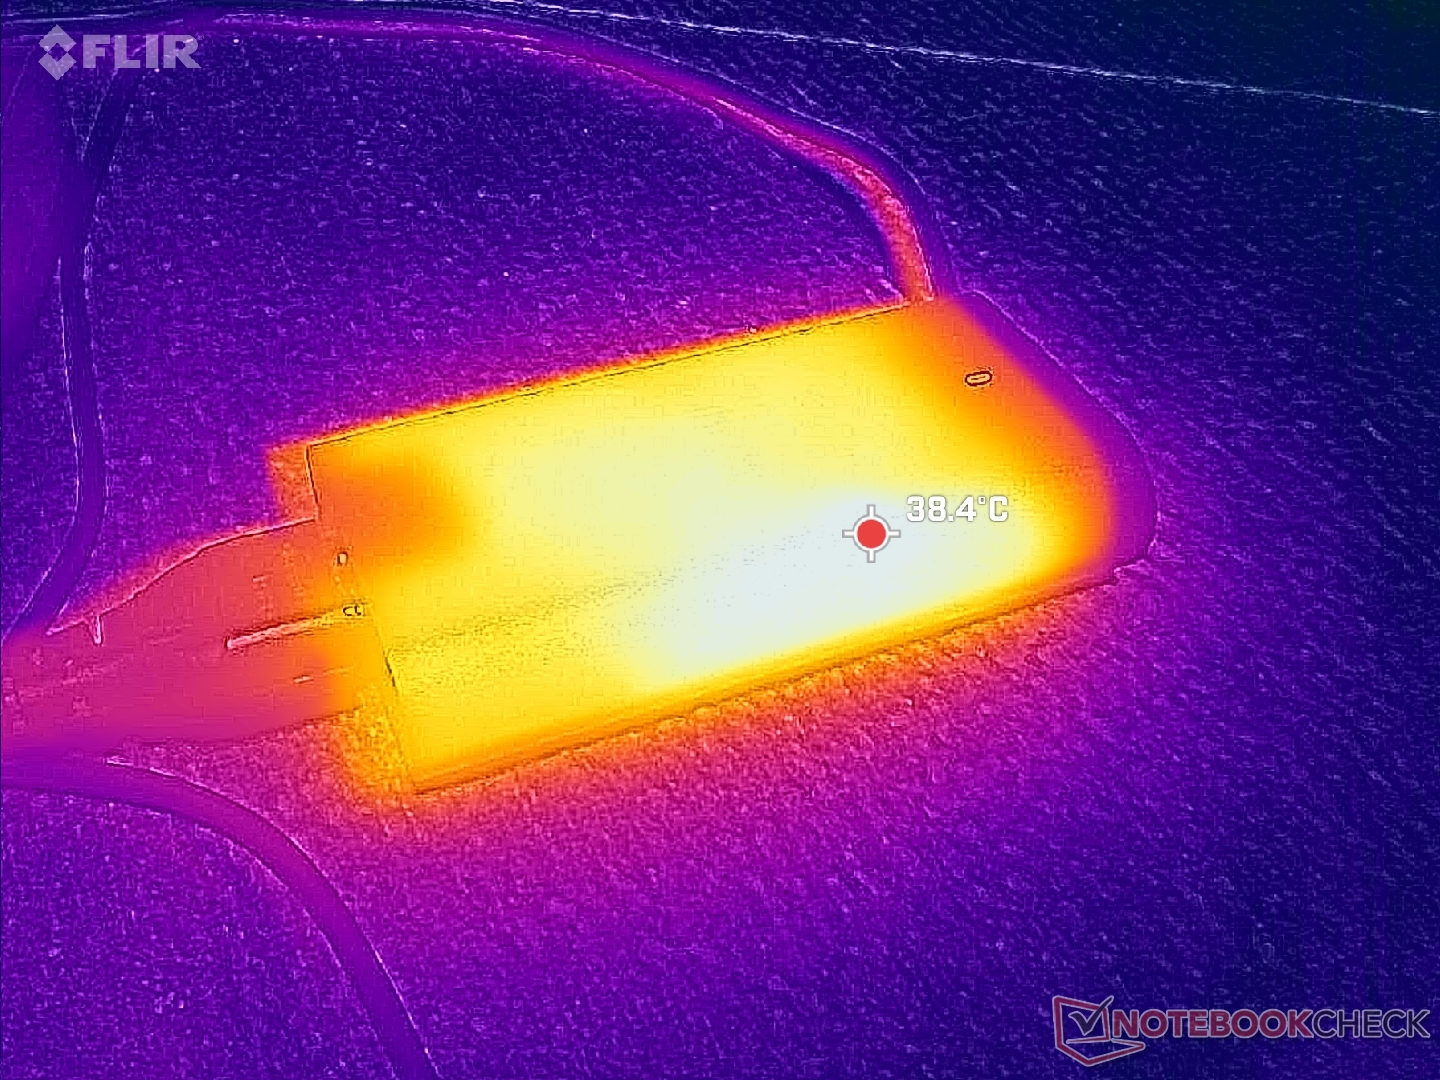
L'adaptateur secteur USB-C universel de 100 W est par ailleurs identique dans toutes les configurations du 2026 XPS 14. Cependant, le potentiel Turbo Boost étant plus faible sur le Core Ultra 7, nous ne pouvons atteindre qu'une consommation maximale de 80 W lorsque le CPU est pleinement sollicité, contre 101 W sur la configuration Core Ultra X7.
| Éteint/en veille | |
| Au repos | |
| Fortement sollicité |
|
Légende:
min: | |
| Dell XPS 14 Core Ultra 7 355 Ultra 7 355, Intel Graphics 4 Xe3 PTL, WD PC SN7100S SDFPMSL-512G-1101, IPS, 1920x1200, 14" | Dell XPS 14 Core Ultra X7 358H Ultra X7 358H, Arc B390 Panther Lake iGPU, Samsung PM9C1b MZVL81T0HFLB-00BH1, OLED, 2880x1800, 14" | Asus ExpertBook PM3406 Ryzen AI 7 350, Radeon 860M, Western Digital PC SN5000S SDEQNSJ-512G-1002, IPS, 1920x1200, 14" | Lenovo ThinkPad T14 Gen 6 21QG001VGE Core Ultra 7 258V, Arc 140V, Samsung PM9E1 1 TB MZVLC1T0HFLU, IPS LED, 1920x1200, 14" | HP OmniBook Ultra Flip 14 Core Ultra 7 258V, Arc 140V, Samsung PM9A1 MZVL22T0HBLB, OLED, 2880x1800, 14" | Samsung Galaxy Book5 Pro 14 940XHA Core Ultra 5 226V, Arc 130V, Samsung PM9C1 MZVL8512HELU, OLED, 2880x1800, 14" | |
|---|---|---|---|---|---|---|
| Power Consumption | -42% | -45% | -14% | -36% | -21% | |
| Idle Minimum * (Watt) | 1.6 | 3.1 -94% | 3.2 -100% | 2.6 -63% | 3 -88% | 3.7 -131% |
| Idle Average * (Watt) | 3.7 | 3.6 3% | 6.1 -65% | 5.2 -41% | 4.4 -19% | 5.2 -41% |
| Idle Maximum * (Watt) | 3.9 | 10 -156% | 6.9 -77% | 6.2 -59% | 9.4 -141% | 5.4 -38% |
| Load Average * (Watt) | 36 | 39.2 -9% | 56.4 -57% | 40.1 -11% | 42.3 -17% | 26.2 27% |
| Cyberpunk 2077 ultra * (Watt) | 50.9 | 51.4 -1% | 64.9 -28% | 27.4 46% | 51.1 -0% | 47.4 7% |
| Cyberpunk 2077 ultra external monitor * (Watt) | 47.7 | 51.2 -7% | 45.3 5% | 45.2 5% | 49.9 -5% | 42.7 10% |
| Load Maximum * (Watt) | 80 | 101.4 -27% | 76.1 5% | 60.3 25% | 65 19% | 63.5 21% |
* ... Moindre est la valeur, meilleures sont les performances
Consommation électrique Cyberpunk / Stress Test
Consommation électrique du moniteur externe
Autonomie de la batterie
L'autonomie du réseau local sans fil est comparable à celle du XPS 14 équipé d'un processeur Core Ultra X7 ou à celle du HP OmniBook Ultra Flip 14 équipé d'un processeur Lunar Lake HP OmniBook Ultra Flip 14 l'autonomie du WLAN est comparable à celle du Core Ultra X7 XPS 14 ou du HP OmniBook Ultra Flip 14 alimenté par Lunar Lake. Les utilisateurs ne devraient pas s'attendre à des différences majeures d'autonomie entre les configurations OLED ou IPS du modèle.
| Dell XPS 14 Core Ultra 7 355 Ultra 7 355, Intel Graphics 4 Xe3 PTL, 70 Wh | Dell XPS 14 Core Ultra X7 358H Ultra X7 358H, Arc B390 Panther Lake iGPU, 70 Wh | Asus ExpertBook PM3406 Ryzen AI 7 350, Radeon 860M, 70 Wh | Lenovo ThinkPad T14 Gen 6 21QG001VGE Core Ultra 7 258V, Arc 140V, 57 Wh | HP OmniBook Ultra Flip 14 Core Ultra 7 258V, Arc 140V, 64 Wh | Samsung Galaxy Book5 Pro 14 940XHA Core Ultra 5 226V, Arc 130V, 63 Wh | |
|---|---|---|---|---|---|---|
| Autonomie de la batterie | 16% | -3% | 34% | -3% | -30% | |
| WiFi v1.3 (h) | 14.5 | 16.8 16% | 14 -3% | 19.4 34% | 14 -3% | 10.1 -30% |
| Load (h) | 1.6 |
Notebookcheck Rating
Le Dell XPS 14 avec Core Ultra 7 355 conserve le design élégant de son frère X7 plus cher, tout en incluant un écran IPS de haute qualité, mais ses performances et son efficacité sont bien plus proches des puces de dernière génération.
Dell XPS 14 Core Ultra 7 355
- 02/14/2026 v8
Allen Ngo
 Total Sustainability Score:
 Comparaison avec des concurrents potentiels
Image | Modèle | Prix | Poids | Épaisseur | Écran |
|---|---|---|---|---|---|
1. 84.8%  | Dell XPS 14 Core Ultra 7 355 Intel Core Ultra 7 355 ⎘ Intel Graphics 4 Xe3 Panther Lake iGPU ⎘ 16 Go Mémoire, 512 Go SSD | Amazon: 1. $1,899.00 Dell XPS 14 9440 14.5" Noteb... 2. $2,267.80 Dell XPS 14 Premium Laptop D... 3. $1,599.99 Dell XPS 13 9350 AI Business... Prix de liste: 1600 USD | 1.5 kg | 15.2 mm | 14.00" 1920x1200 162 PPI IPS |
2. 87.4%  | Dell XPS 14 Core Ultra X7 358H Intel Core Ultra X7 358H ⎘ Intel Arc B390 12 Xe3 Panther Lake iGPU ⎘ 32 Go Mémoire, 1000 Go SSD | Amazon: 1. $2,267.80 Dell XPS 14 Premium Laptop D... 2. $1,899.00 Dell XPS 14 9440 14.5" Noteb... 3. $1,299.99 Dell XPS 13 9345 12-Core AI ... Prix de liste: 2200 USD | 1.4 kg | 14.62 mm | 14.00" 2880x1800 243 PPI OLED |
3. 84.7% 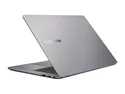 | Asus ExpertBook PM3406 AMD Ryzen AI 7 350 ⎘ AMD Radeon 860M ⎘ 16 Go Mémoire, 512 Go SSD | Amazon: Prix de liste: 979€ | 1.4 kg | 17.9 mm | 14.00" 1920x1200 162 PPI IPS |
4. 88.9%  | Lenovo ThinkPad T14 Gen 6 21QG001VGE Intel Core Ultra 7 258V ⎘ Intel Arc Graphics 140V ⎘ 32 Go Mémoire, 1024 Go SSD | Amazon: Prix de liste: 1960 Euro | 1.5 kg | 22 mm | 14.00" 1920x1200 162 PPI IPS LED |
5. 88.7% 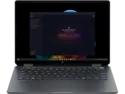 | HP OmniBook Ultra Flip 14 Intel Core Ultra 7 258V ⎘ Intel Arc Graphics 140V ⎘ 32 Go Mémoire, 2048 Go SSD | Amazon: Prix de liste: 1250 USD | 1.3 kg | 15 mm | 14.00" 2880x1800 243 PPI OLED |
6. 86.9% 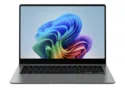 | Samsung Galaxy Book5 Pro 14 940XHA Intel Core Ultra 5 226V ⎘ Intel Arc Graphics 130V ⎘ 16 Go Mémoire, 512 Go SSD | Amazon: Prix de liste: 1699€ | 1.2 kg | 11.6 mm | 14.00" 2880x1800 243 PPI OLED |
Transparency
La sélection des appareils à examiner est effectuée par notre équipe éditoriale. L'échantillon de test a été prêté à l'auteur par le fabricant ou le détaillant pour les besoins de cet examen. Le prêteur n'a pas eu d'influence sur cette évaluation et le fabricant n'a pas reçu de copie de cette évaluation avant sa publication. Il n'y avait aucune obligation de publier cet article. En tant que média indépendant, Notebookcheck n'est pas soumis à l'autorité des fabricants, des détaillants ou des éditeurs.
Voici comment Notebookcheck teste
Chaque année, Notebookcheck examine de manière indépendante des centaines d'ordinateurs portables et de smartphones en utilisant des procédures standardisées afin de garantir que tous les résultats sont comparables. Nous avons continuellement développé nos méthodes de test depuis environ 20 ans et avons établi des normes industrielles dans le processus. Dans nos laboratoires de test, des équipements de mesure de haute qualité sont utilisés par des techniciens et des rédacteurs expérimentés. Ces tests impliquent un processus de validation en plusieurs étapes. Notre système d'évaluation complexe repose sur des centaines de mesures et de points de référence bien fondés, ce qui garantit l'objectivité.
