

Verdict : Un ordinateur portable HP puissant idéal pour les programmeurs
Le HP ZBook 8 G1i 14 est un ordinateur portable de station de travail qui présente des améliorations impressionnantes par rapport à l'ancienne gamme ZBook Firefly : Le refroidissement par double ventilateur permet de faire briller les performances, et la sélection des ports est également améliorée, tout comme l'autonomie de la batterie. Nous devons également faire l'éloge de l'excellent clavier HP.
Avec la configuration choisie, les programmeurs, qui ont besoin de la puissance du CPU mais pas nécessairement des performances du GPU, devraient être bien servis. Si vous avez besoin de plus de puissance GPU, un GPU dédié est disponible - une version du ZBook que nous examinerons bientôt.
Points positifs
Points négatifs
Prix et disponibilité
Le HP ZBook 8 G1i 14 commence à 1 679 $ lorsqu'il est configuré dans la boutique en ligne américaine de HP.
Table des matières
- Verdict : Un ordinateur portable HP puissant idéal pour les programmeurs
- Spécifications : Graphique Intel ARC et écran WQXGA
- Boîtier et connectivité : Comme un HP EliteBook 8 plus épais
- Périphériques d'entrée : Clavier HP ZBook très confortable
- Écran : L'écran WQXGA pourrait être plus lumineux
- Performance : Intel Arrow Lake H correspond à Strix Point
- Émissions et consommation d'énergie : Les haut-parleurs du HP ZBook sont puissants
- Notebookcheck Rating
- Comparaison avec des concurrents potentiels
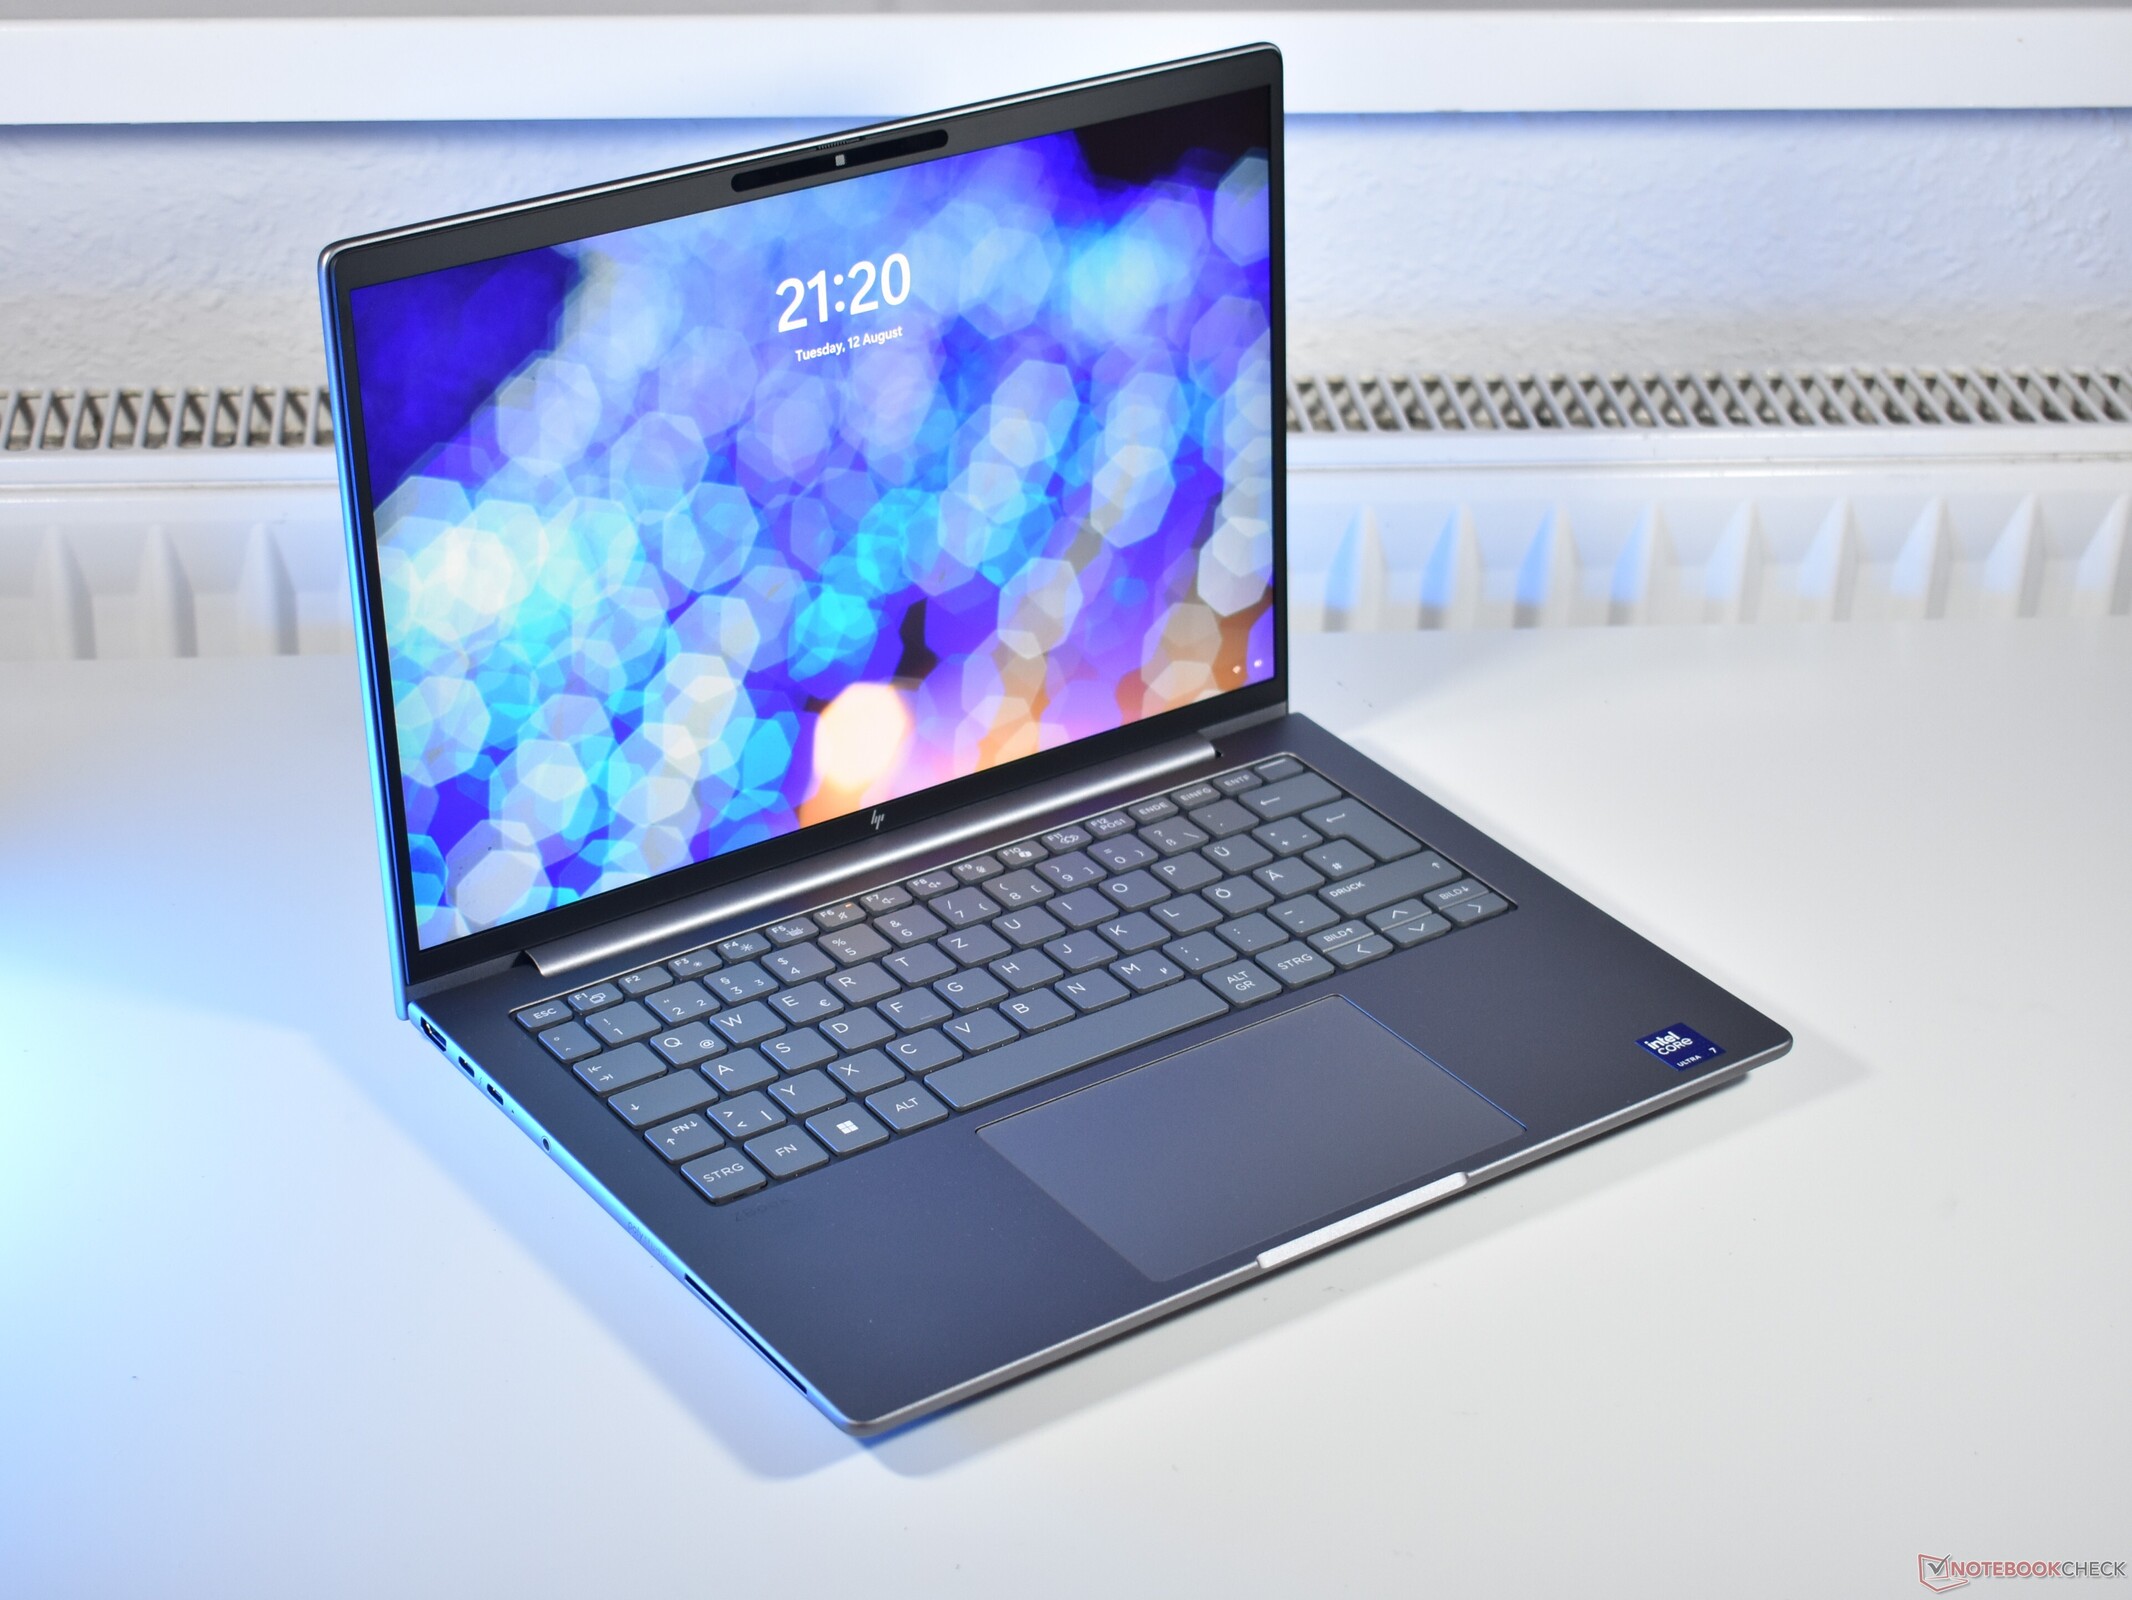
Bye bye, Firefly : HP fait ses adieux à l'ancien nom de sa gamme ZBook d'entrée de gamme. Bien entendu, les ordinateurs portables de station de travail ne disparaissent pas, ils continuent simplement à porter un nouveau nom. C'est ainsi qu'est né le HP ZBook 8, un nom qui signale la relation étroite de cette gamme avec la gamme bureautique HP EliteBook 8. Dans cet article, nous examinons le HP ZBook 8 G1i 14. Il est intéressant de noter que notre modèle spécifique ne dispose pas d'une carte graphique dédiée, obligatoire pour les stations de travail mobiles, et qu'il opte plutôt pour une carte graphique Intel intégrée.
Spécifications : Graphique Intel ARC et écran WQXGA
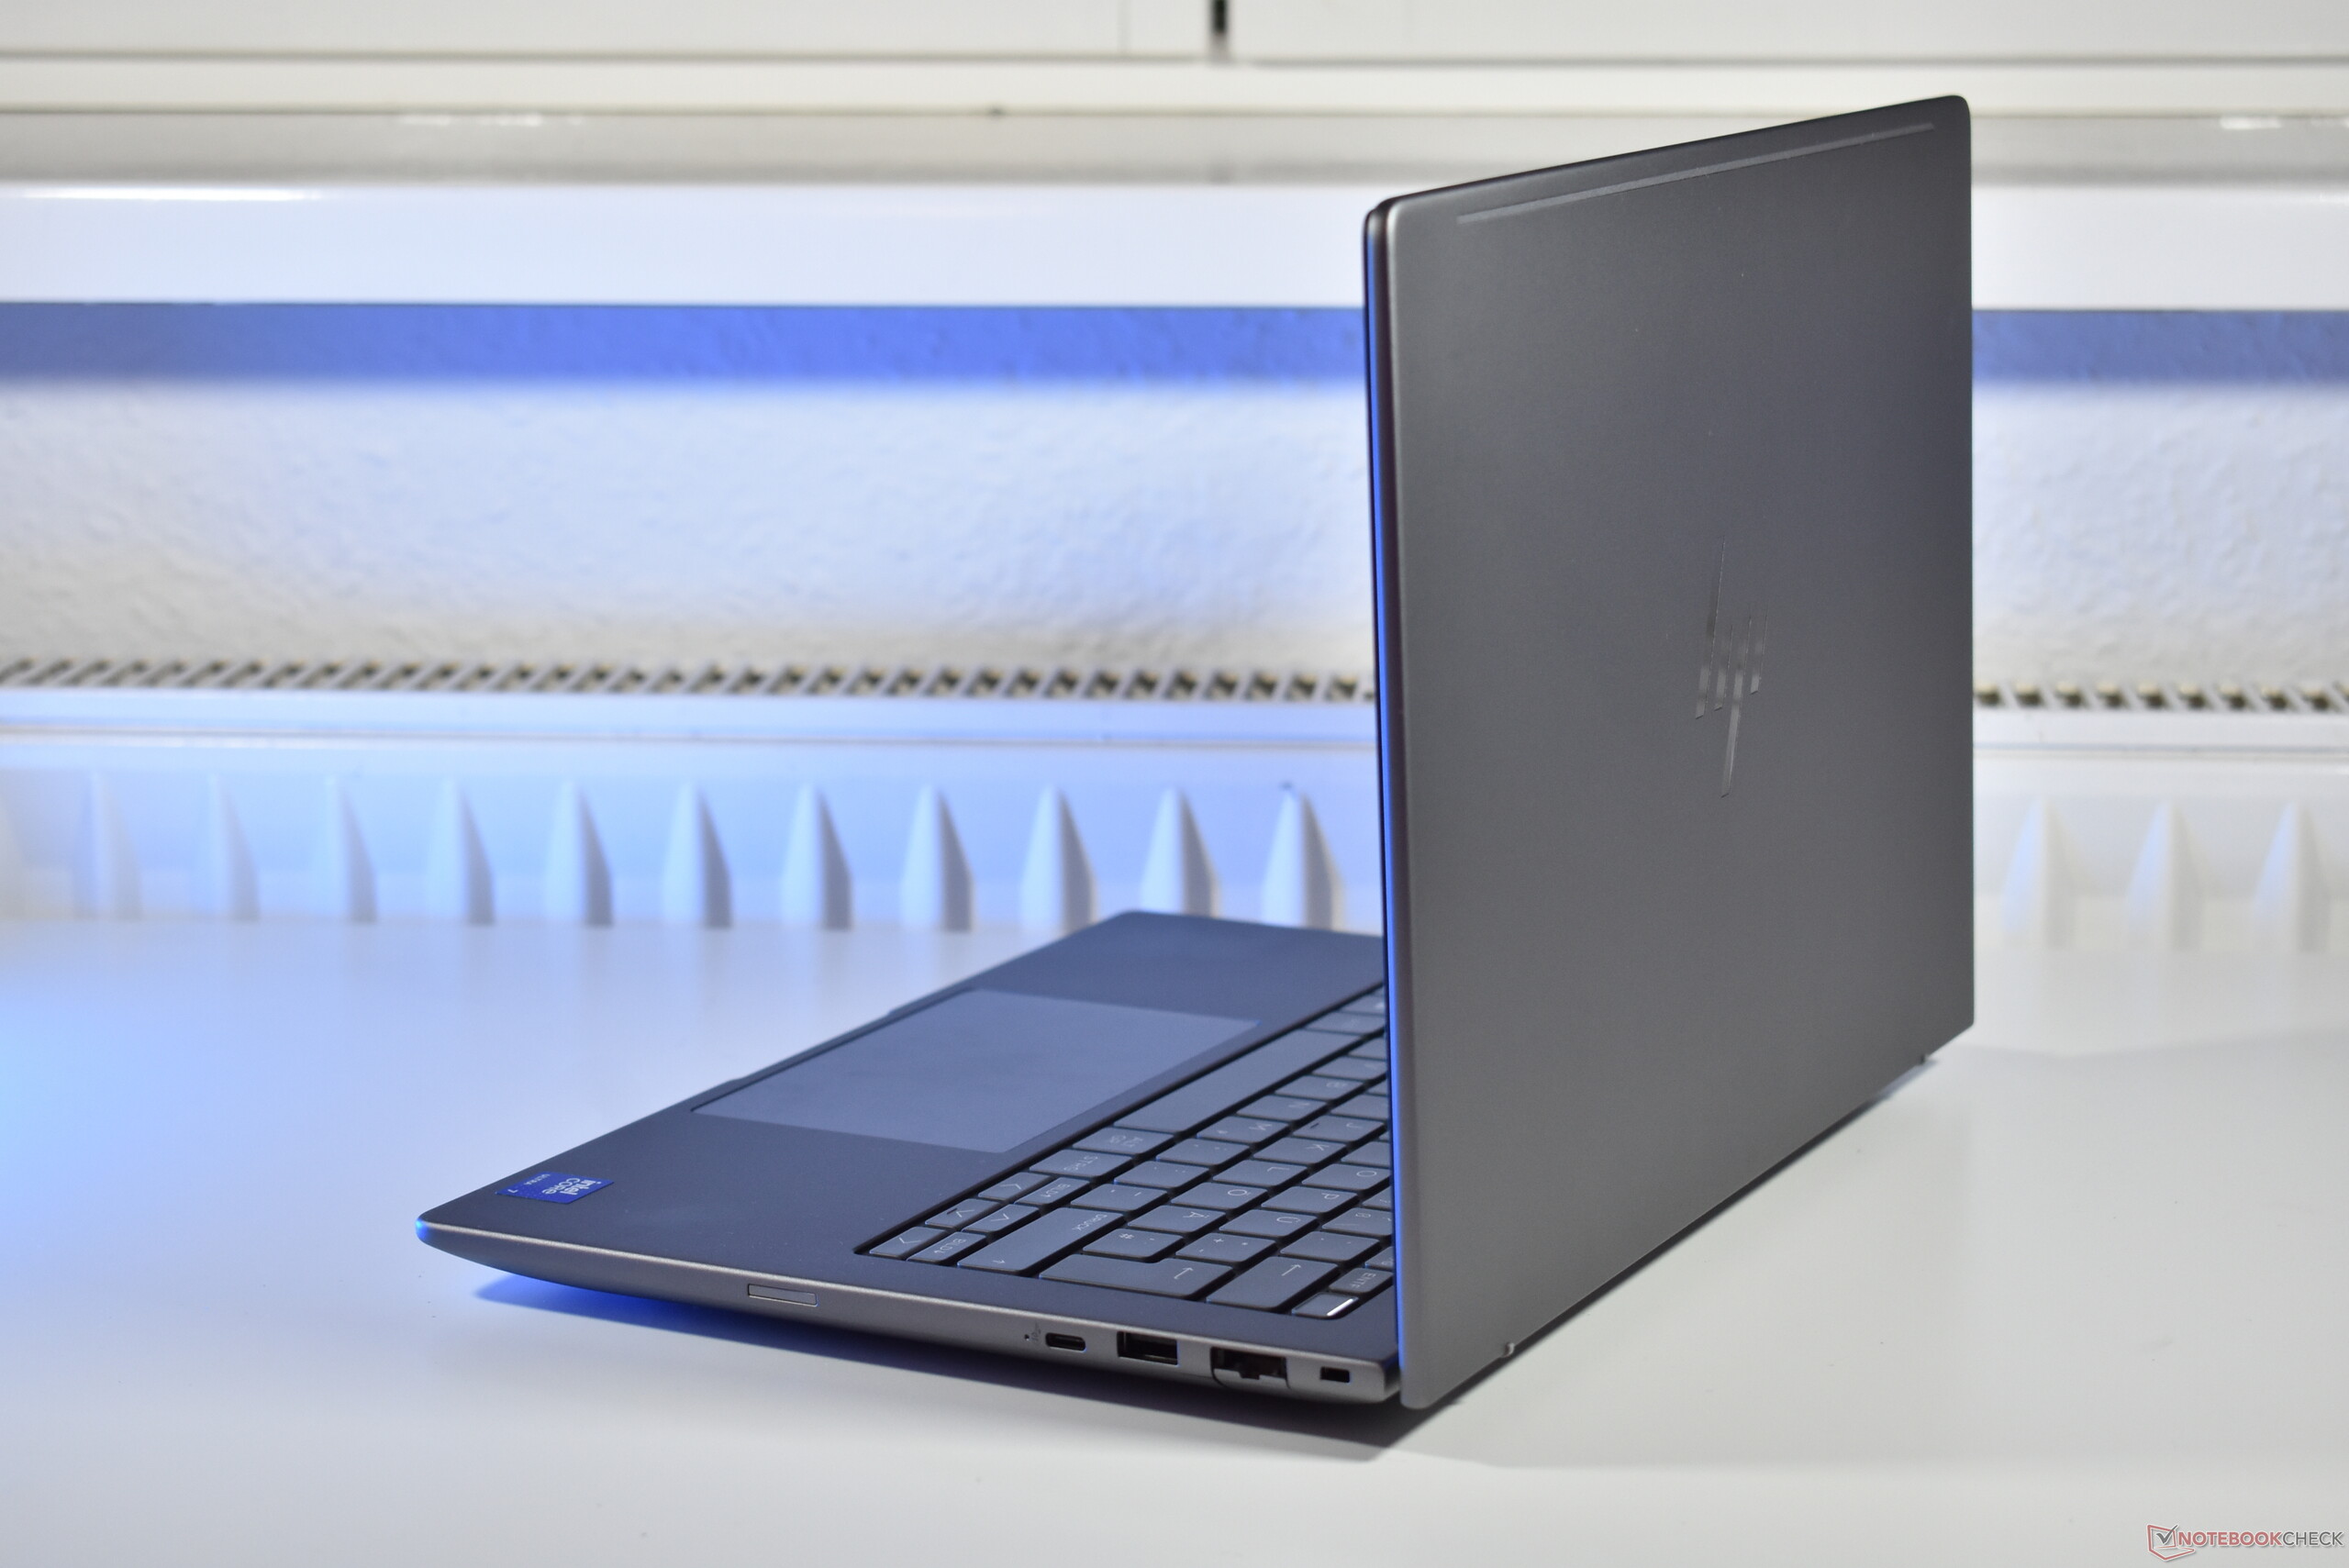
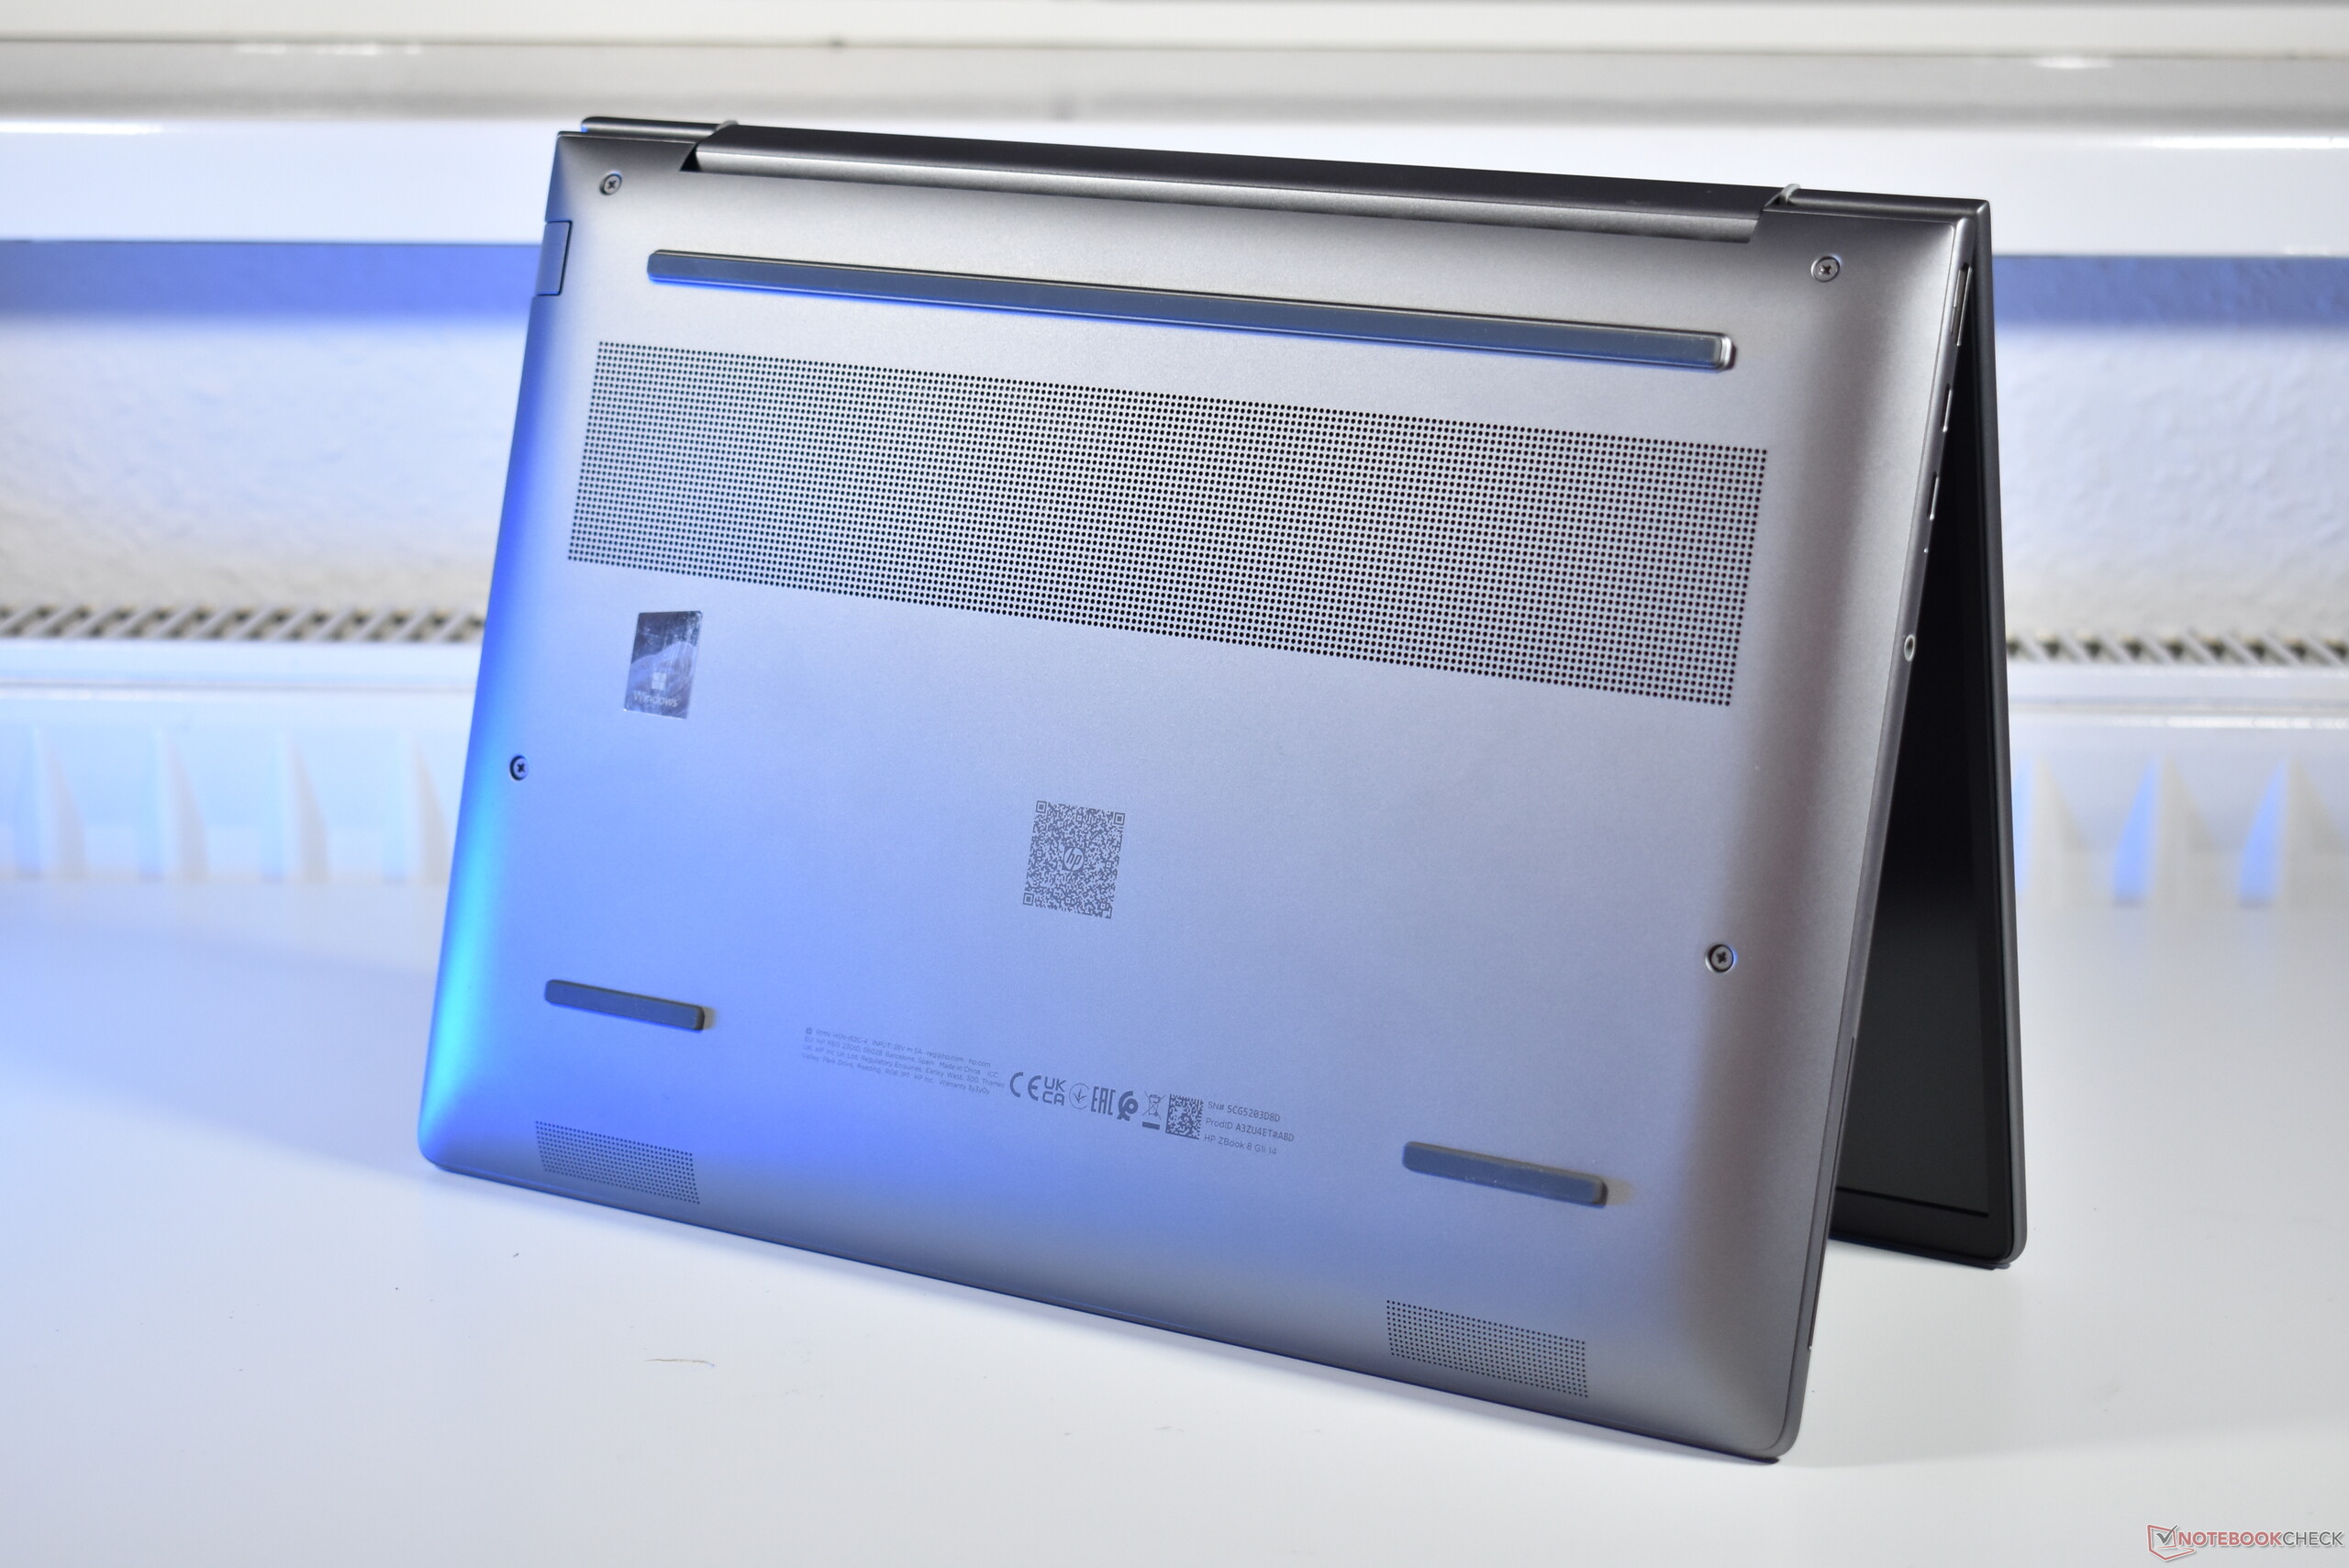
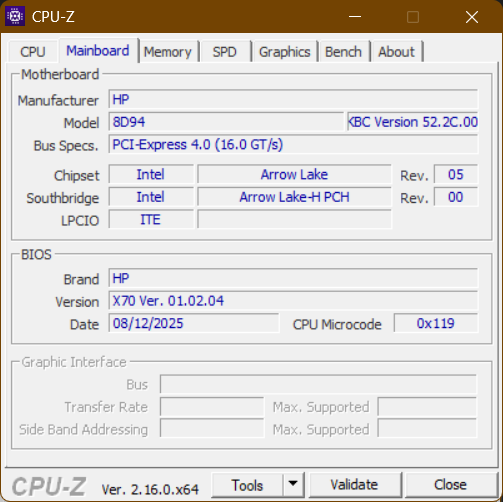
Boîtier et connectivité : Comme un HP EliteBook 8 plus épais
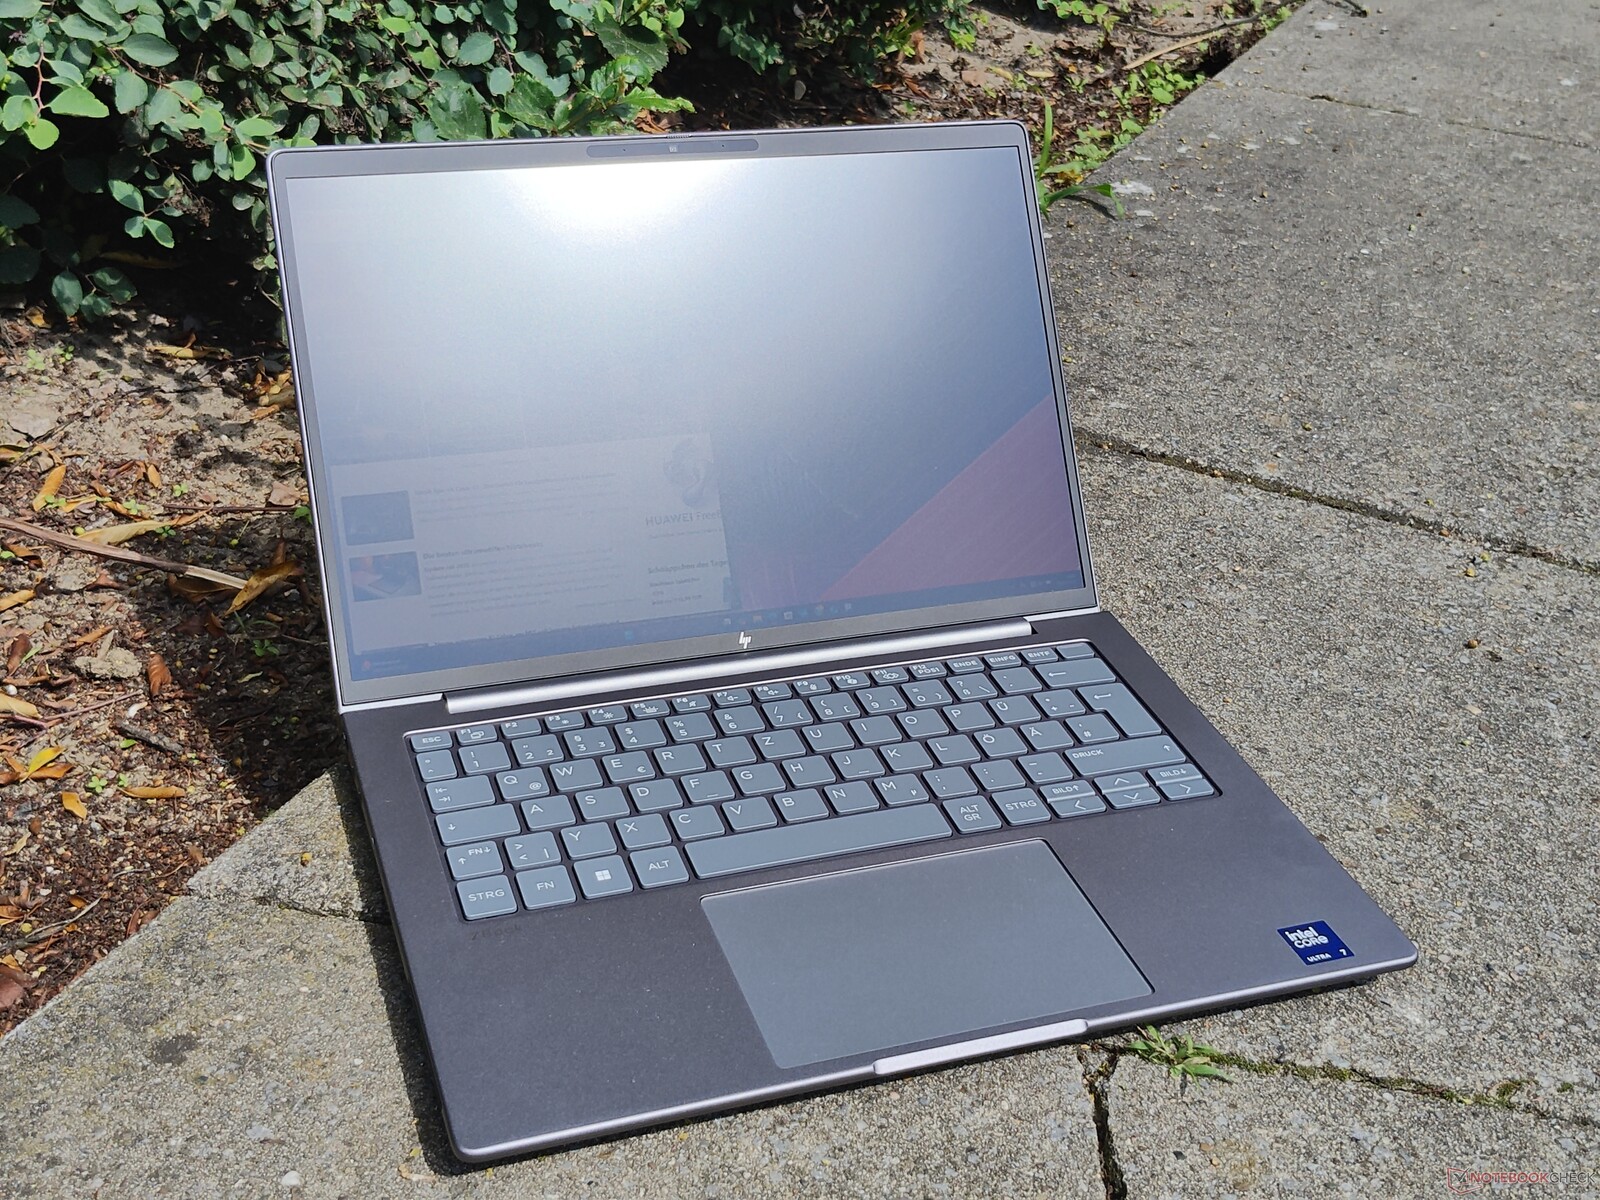
Le HP ZBook 8 G1i 14 ressemble au grand frère du HP EliteBook 8 G1a 14 HP EliteBook 8 G1a 14 que nous avons récemment examiné. Ce n'est pas une coïncidence, car les deux utilisent le même design de base et partagent des éléments tels que le pavé tactile et le clavier. Le ZBook est juste un peu plus sombre que l'EliteBook, et un peu plus épais. En termes de qualité de construction, le ZBook est tout aussi bon que son homologue de bureau avec un châssis entièrement en aluminium.
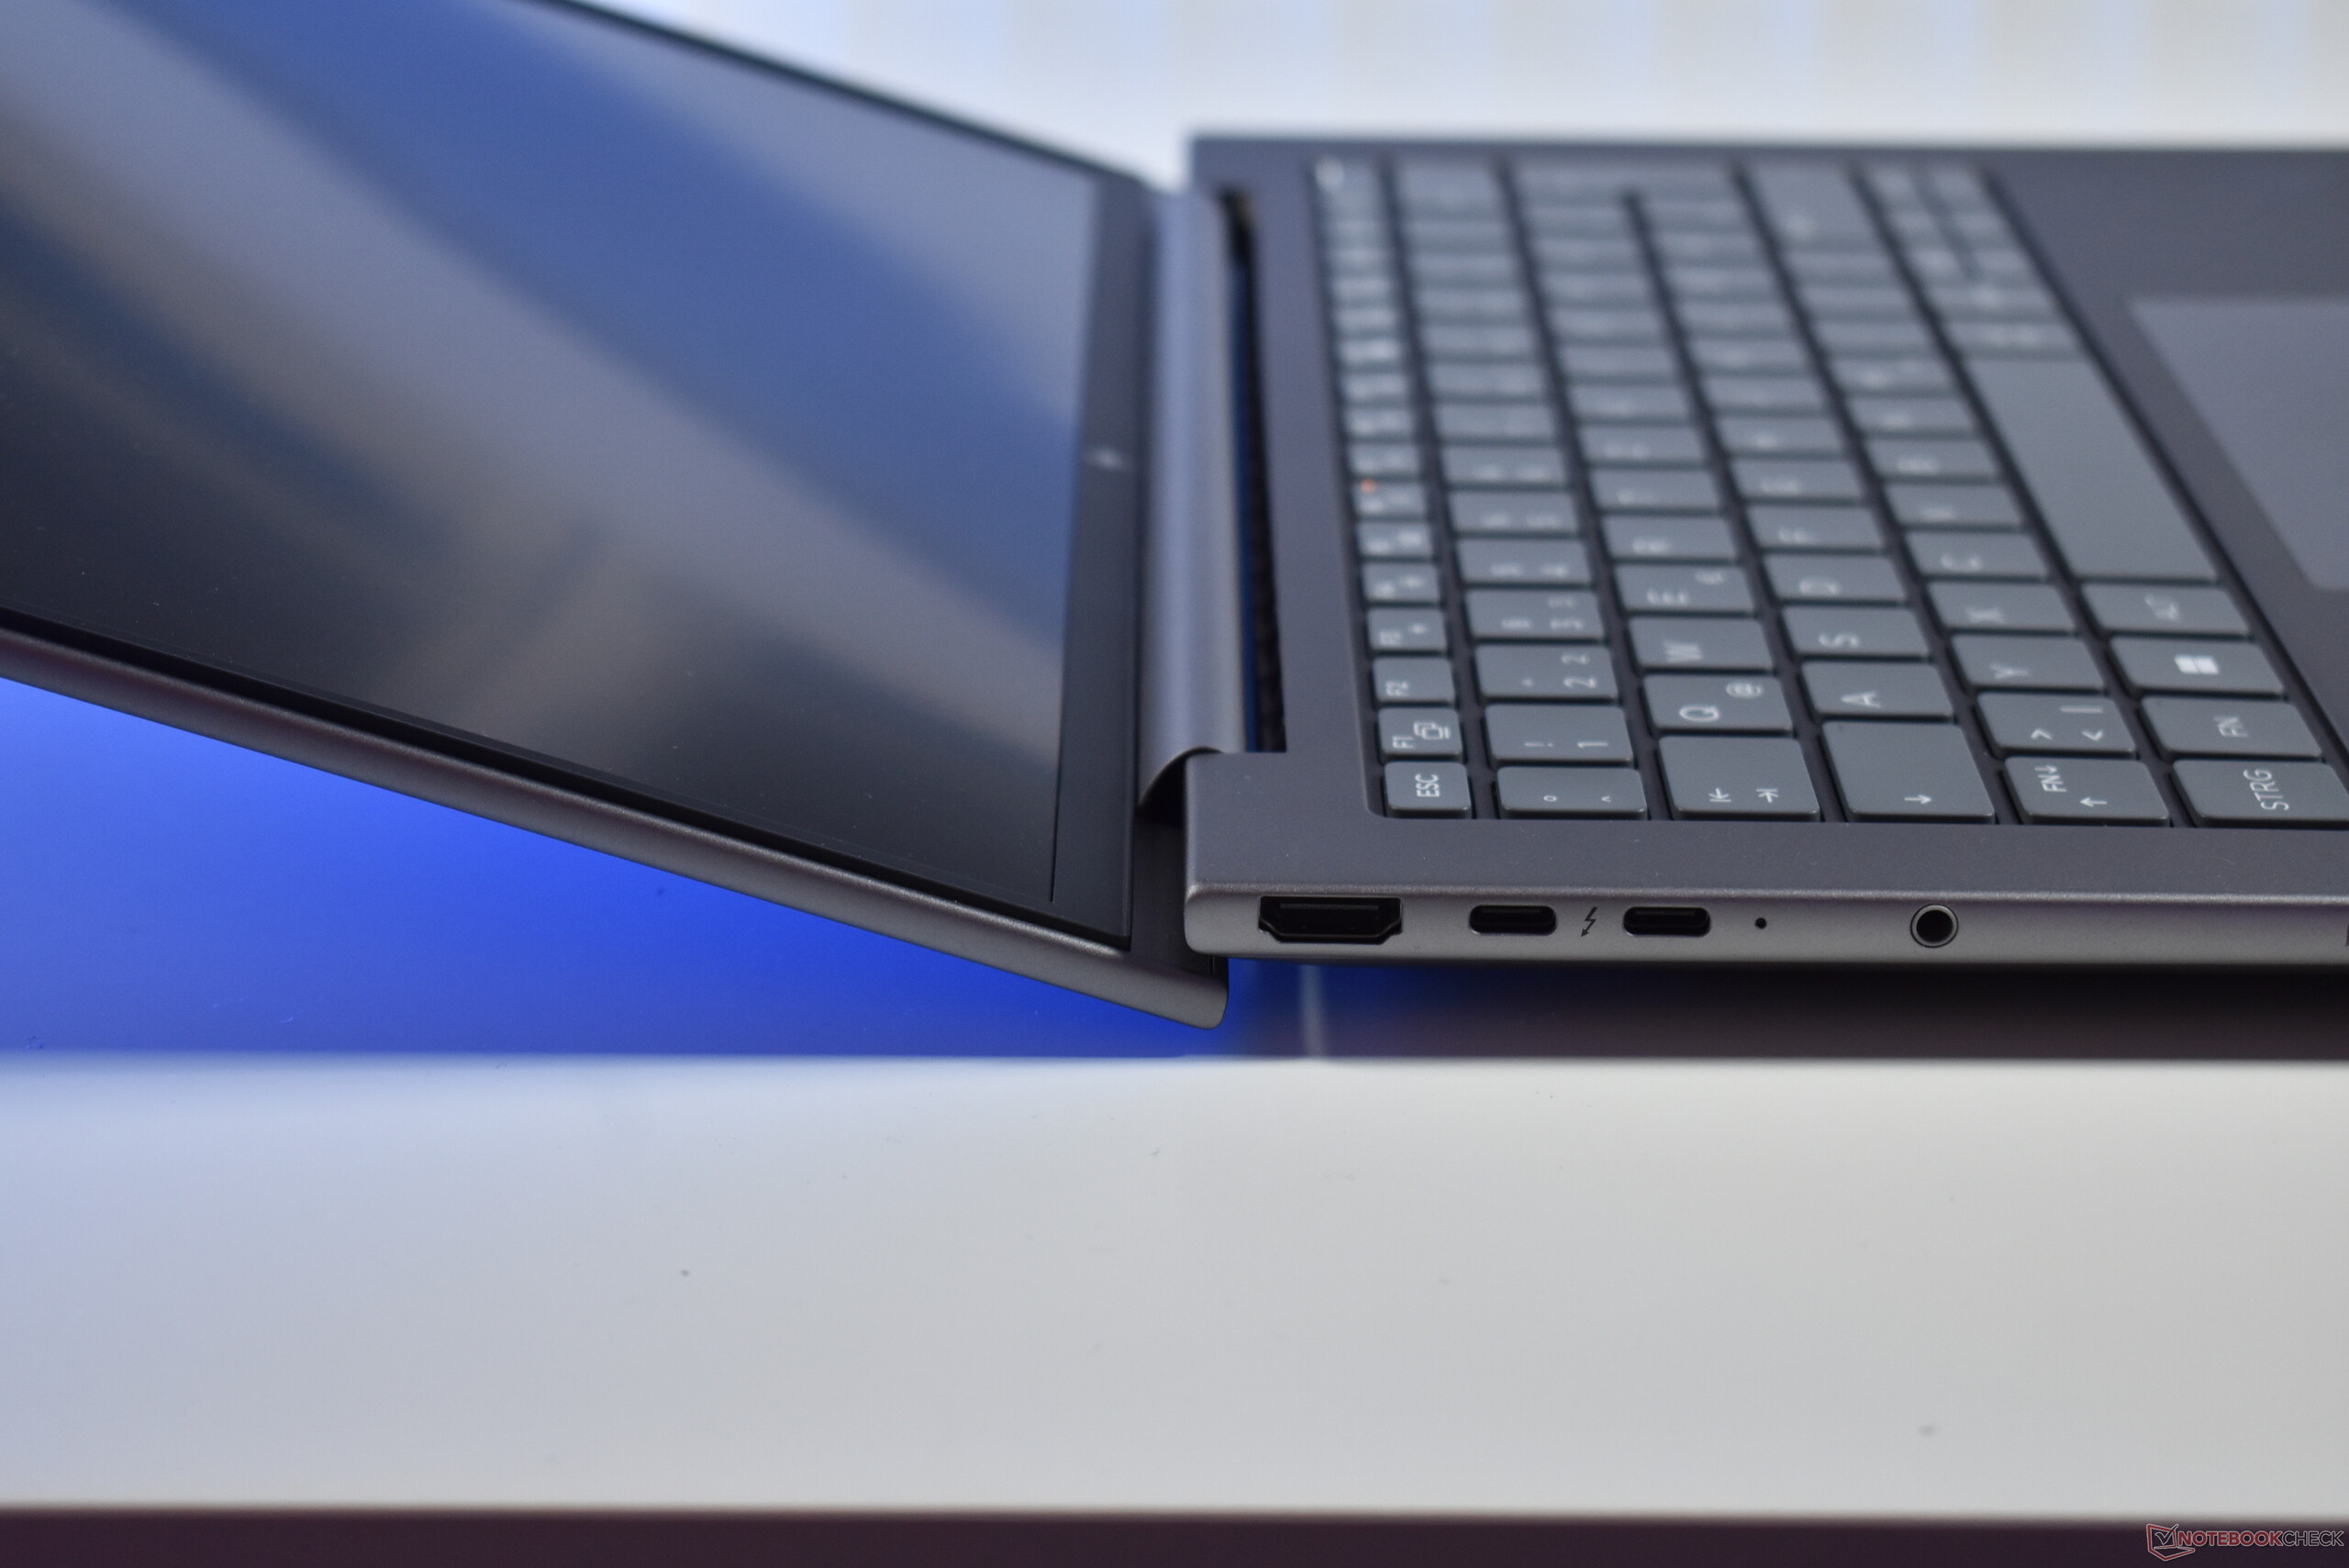
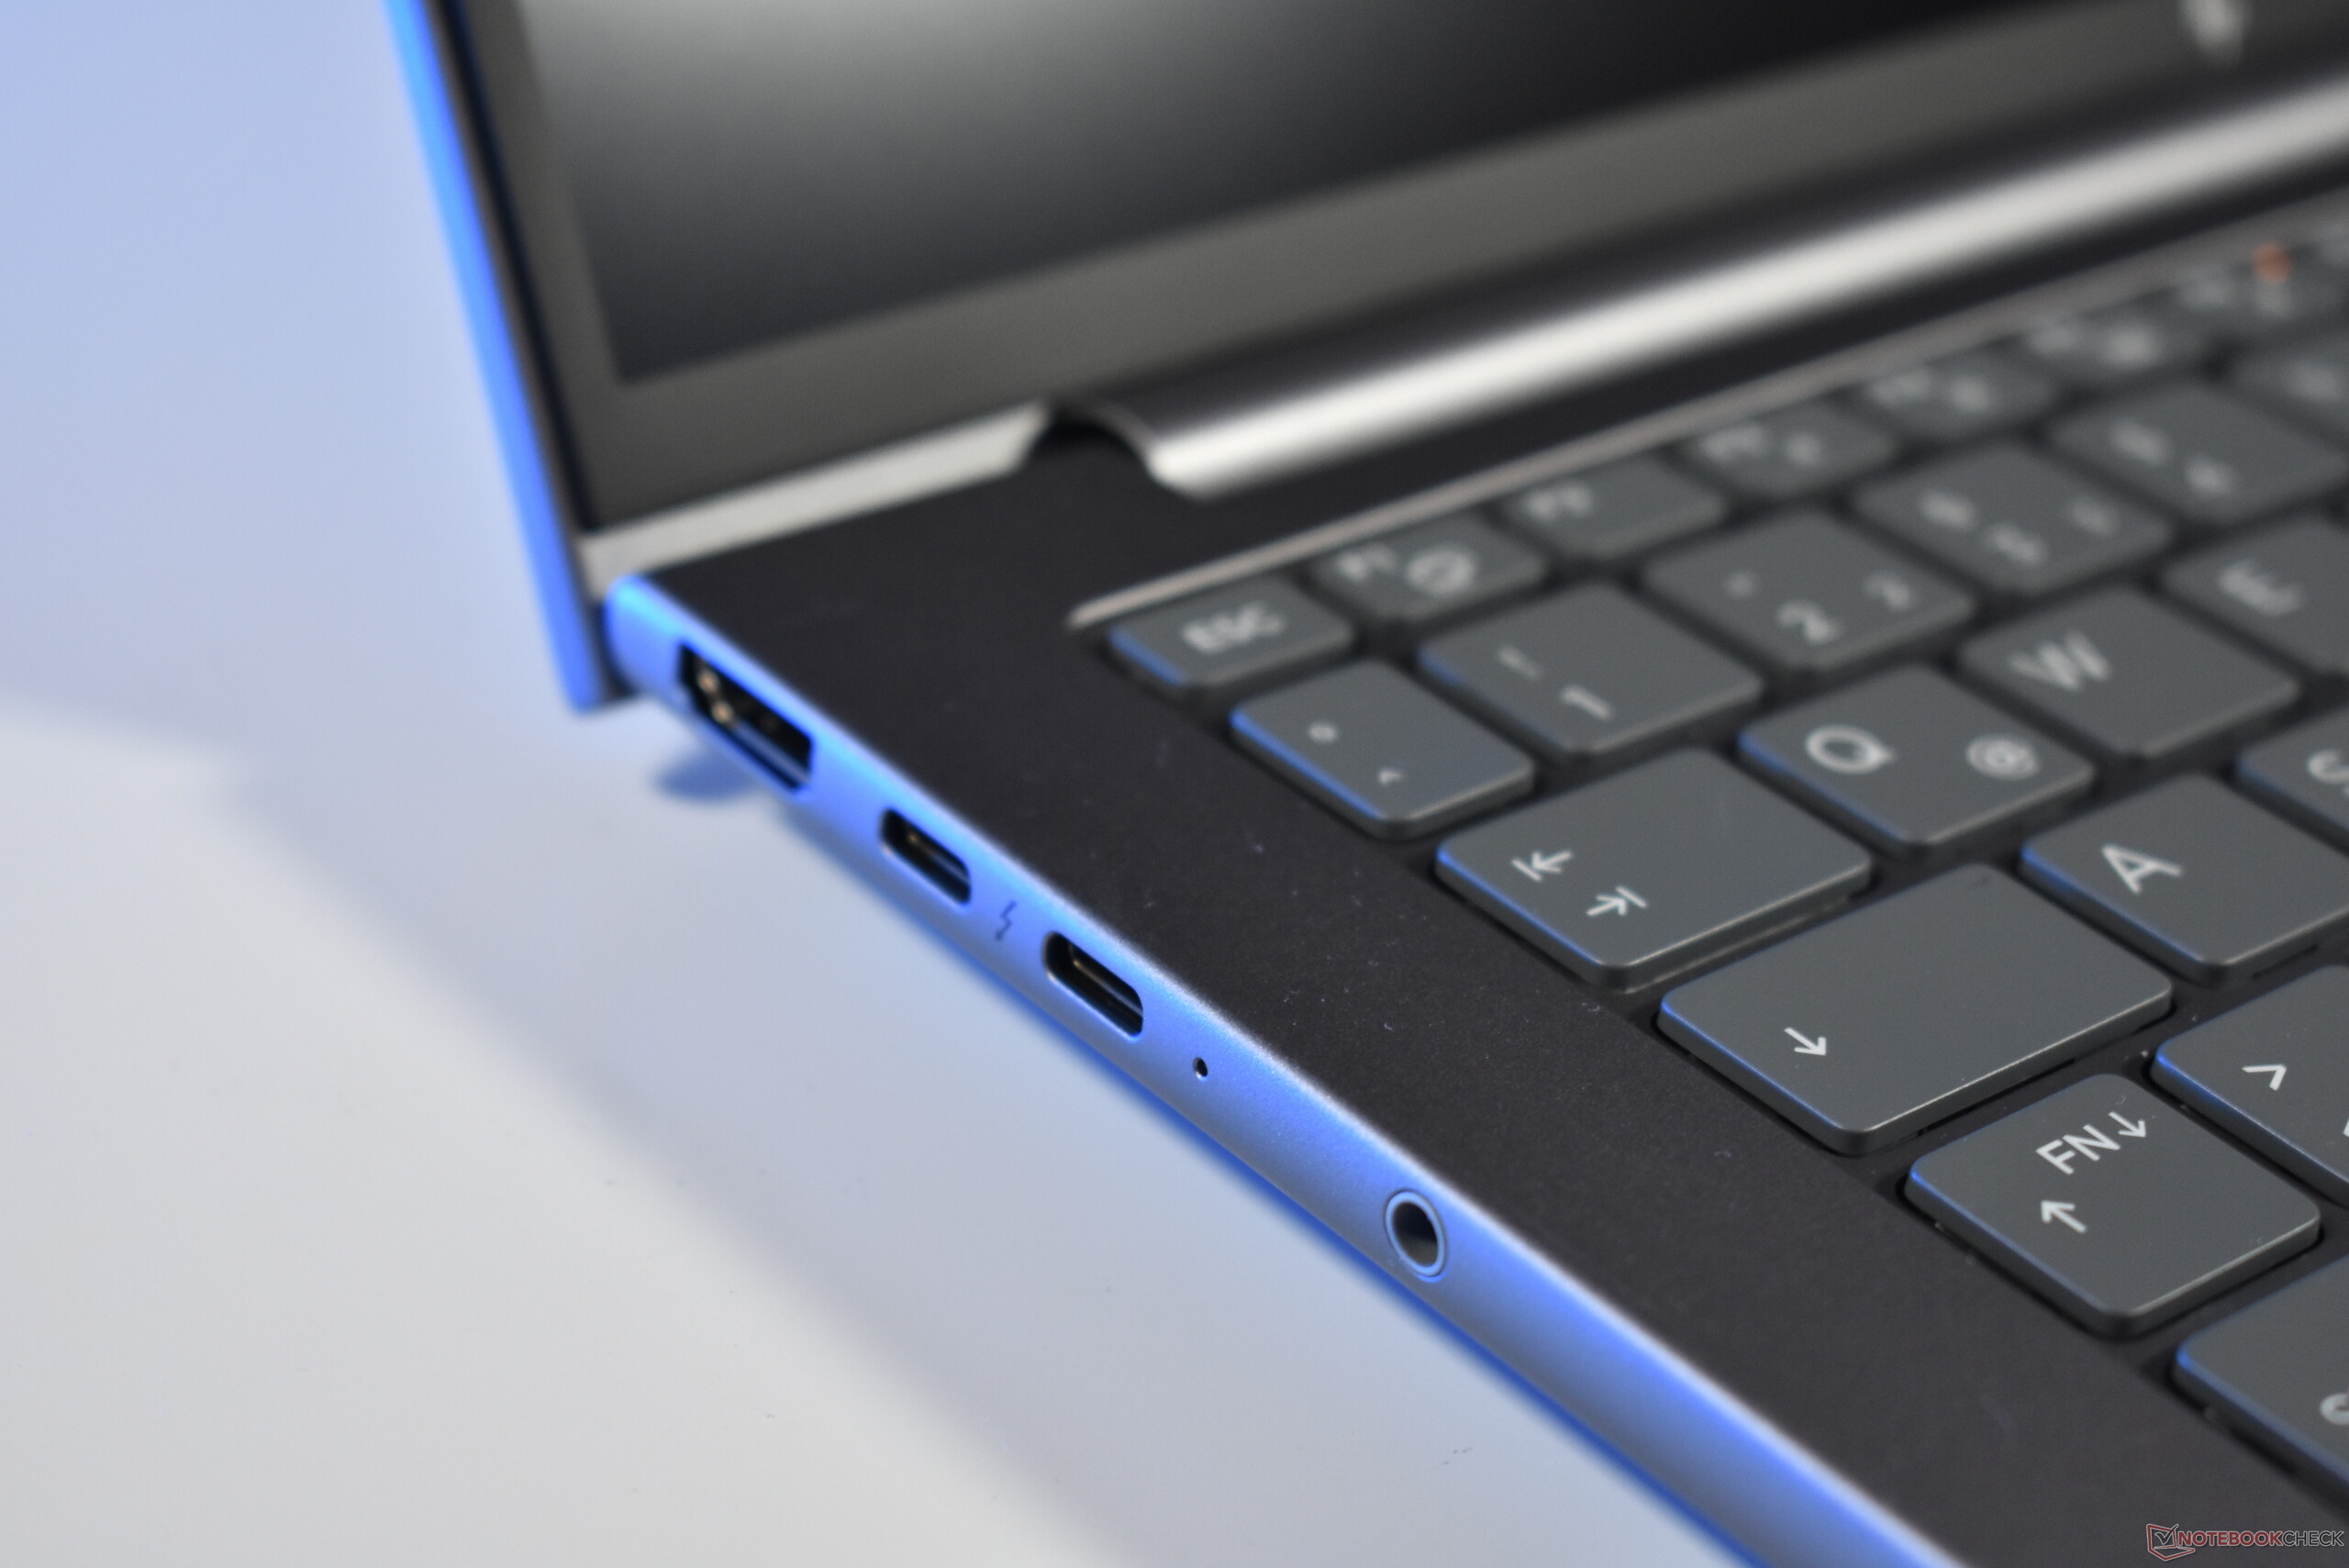
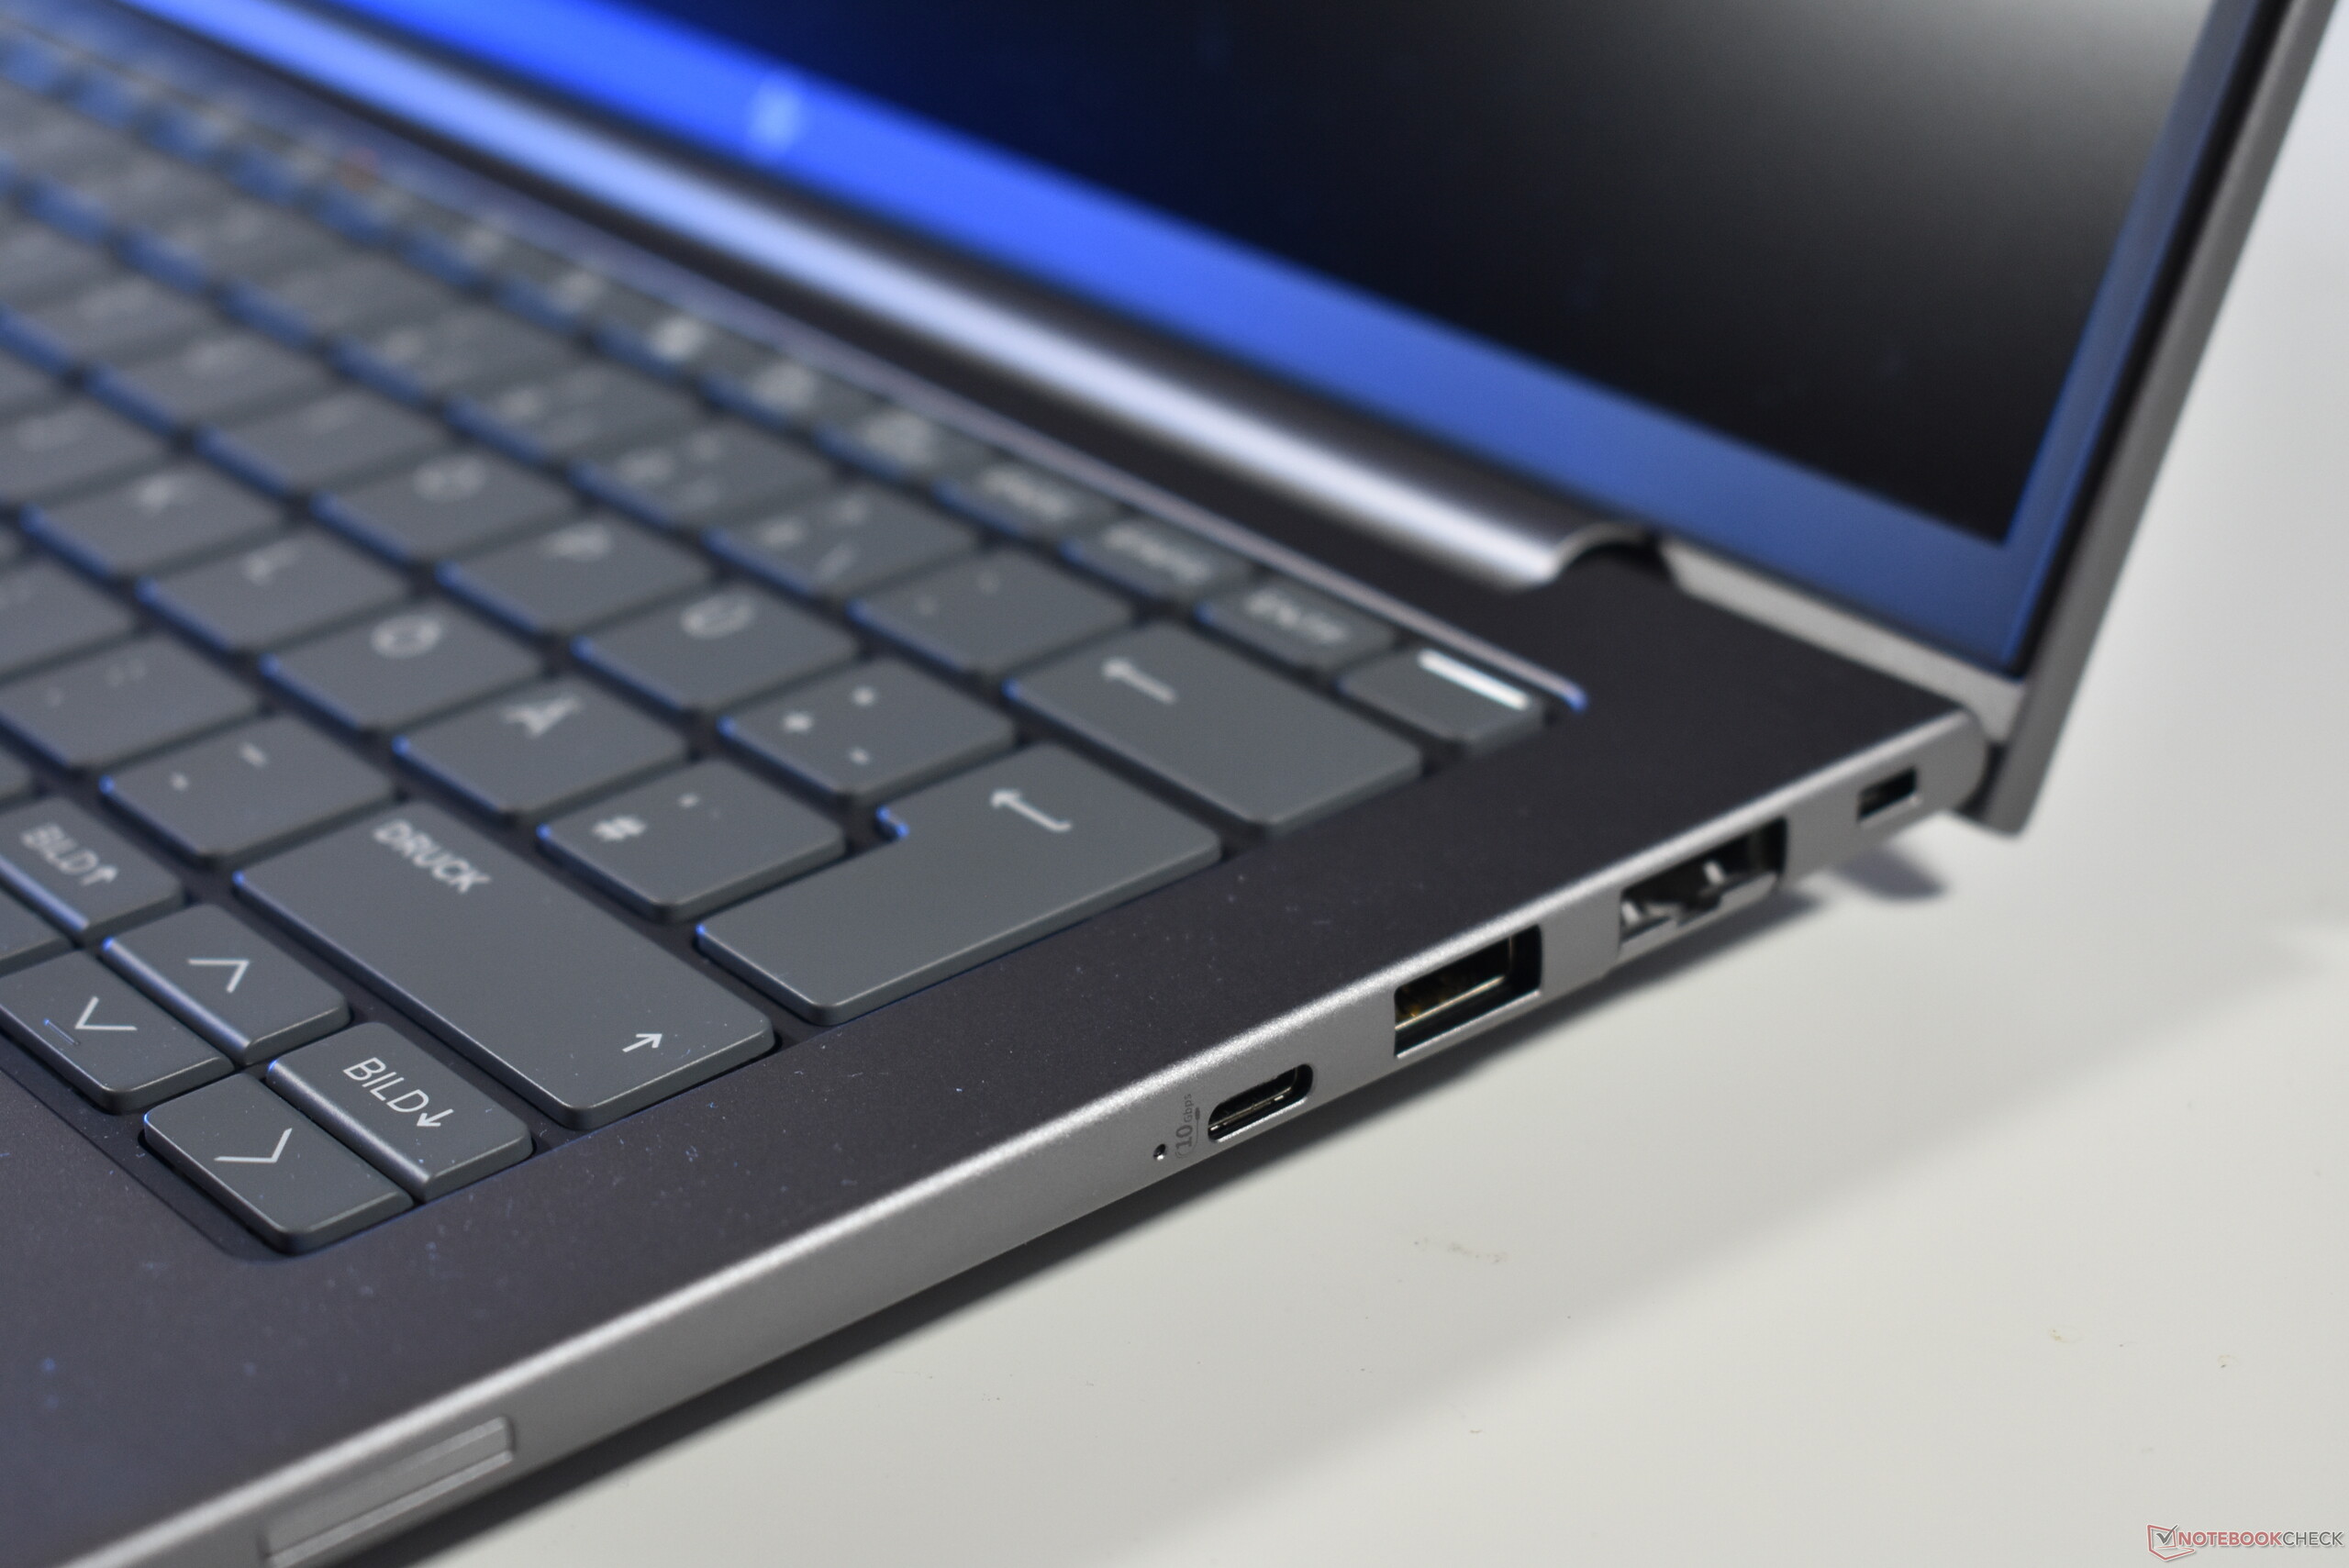
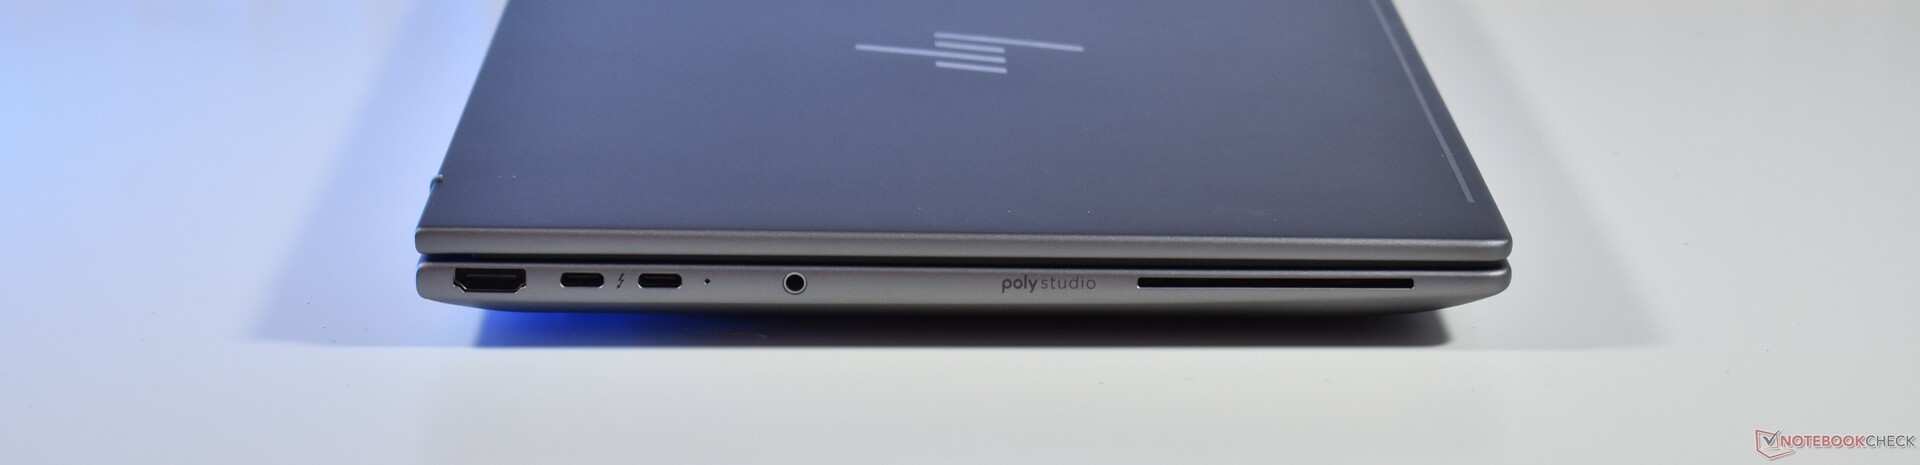
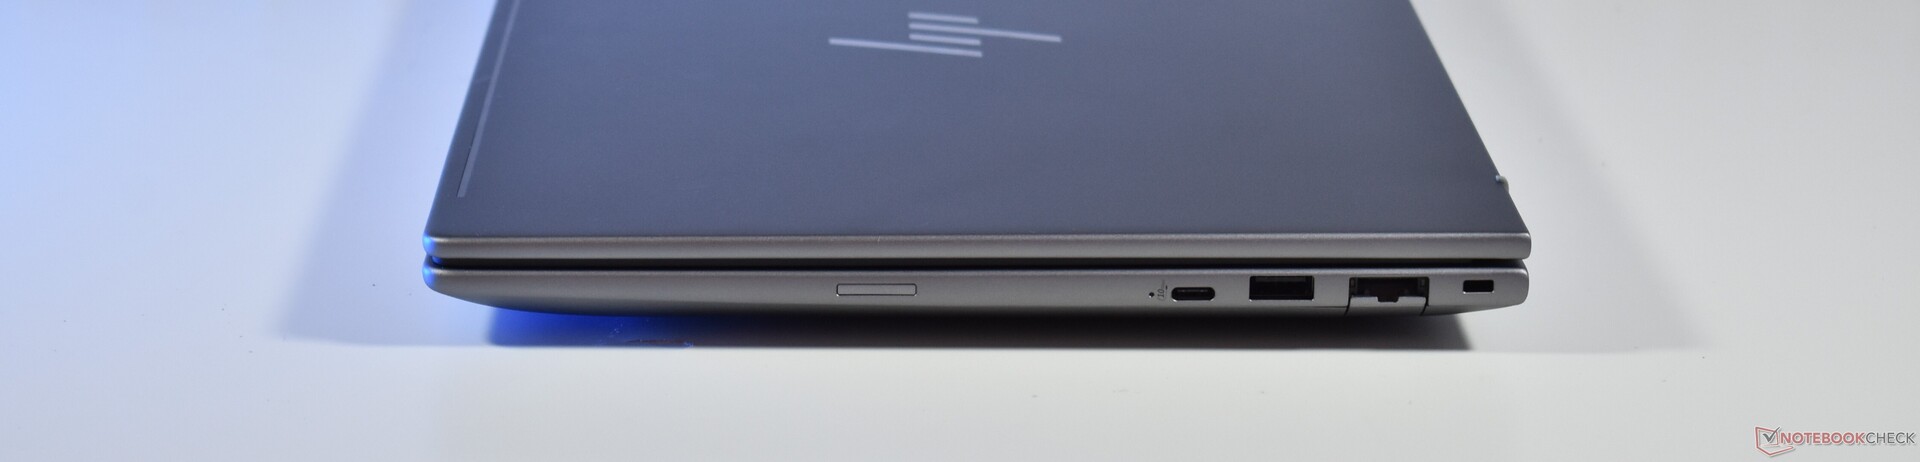
Par rapport à l'ancien ZBook Firefly 14l'un des ports USB-A a disparu au profit d'un troisième port USB-C. Les personnes ayant beaucoup d'accessoires anciens n'apprécieront peut-être pas ce changement, mais l'USB-C est plus puissant et permet également de recharger du côté droit. En outre, le nouveau ZBook 8 G1i 14 dispose désormais d'un port RJ45-Ethernet, un changement très apprécié.
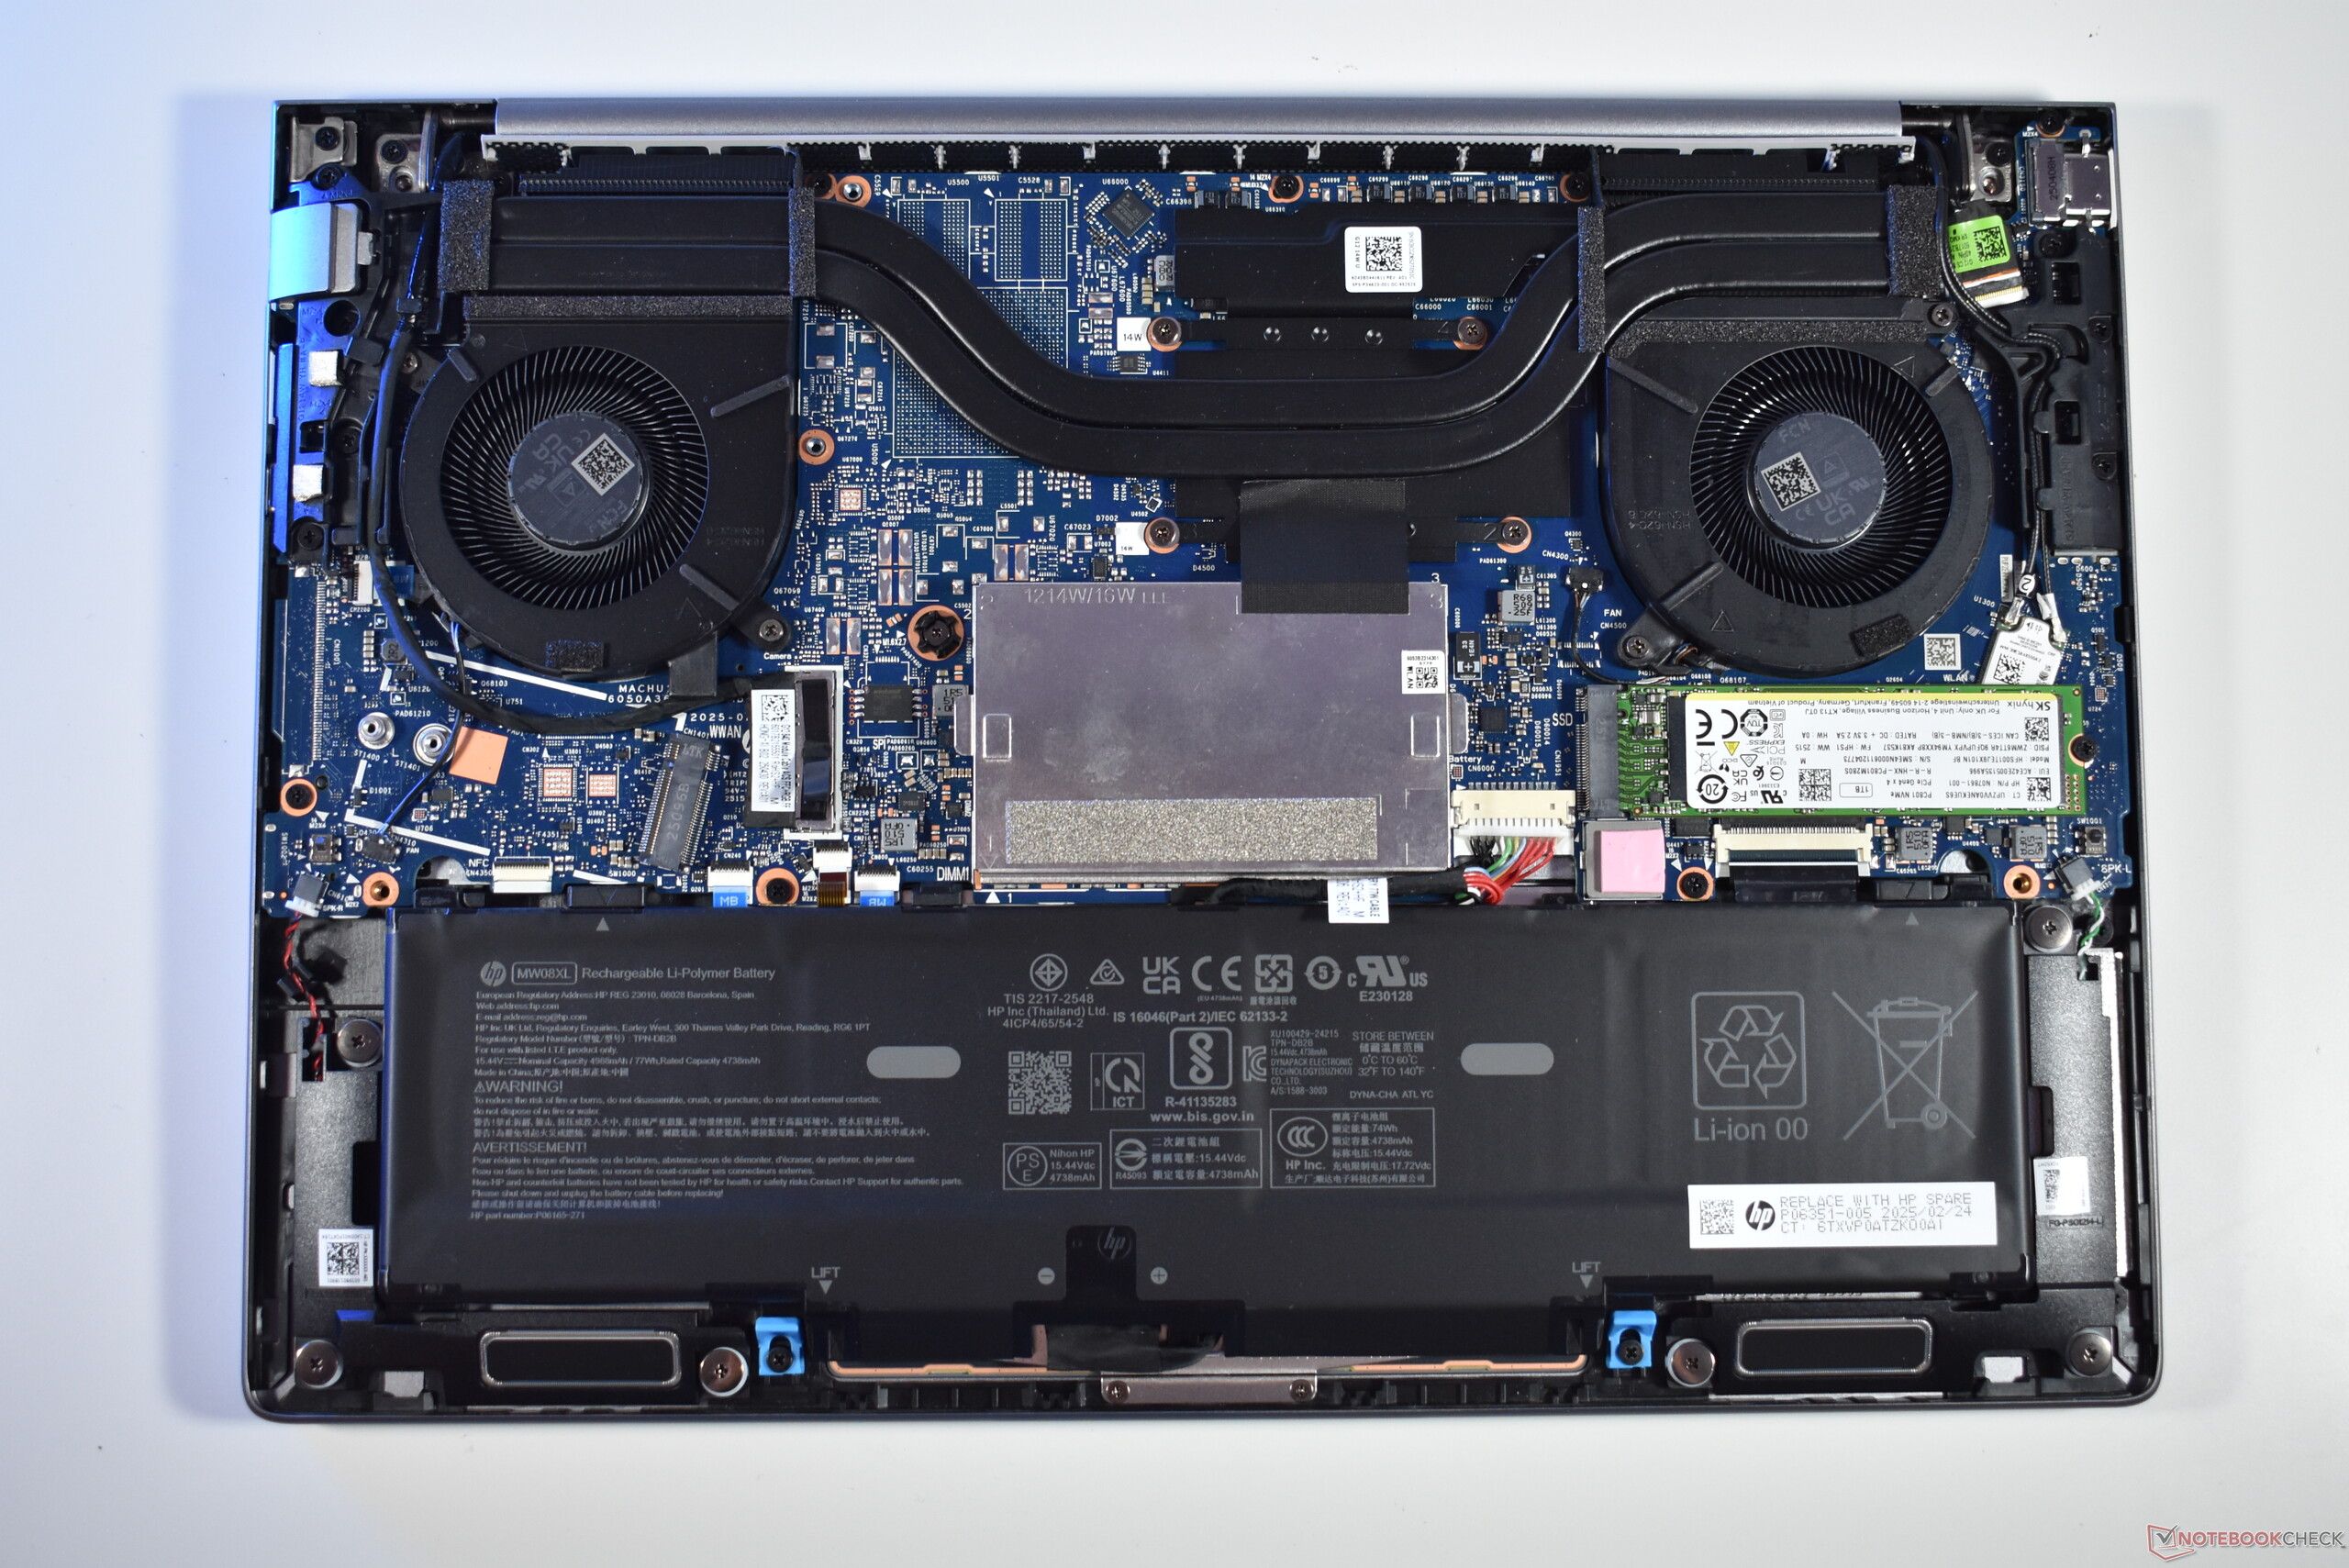
Un autre changement est l'introduction d'un deuxième ventilateur de refroidissement, l'ancien ZBook Firefly utilisait un seul ventilateur - le deuxième ventilateur est également une différence par rapport à l'EliteBook 8. Malgré ce changement, le ZBook 8 G1i 14 conserve les deux emplacements SO-DIMM ainsi que le SSD modulaire M.2 2280.


Périphériques d'entrée : Clavier HP ZBook très confortable
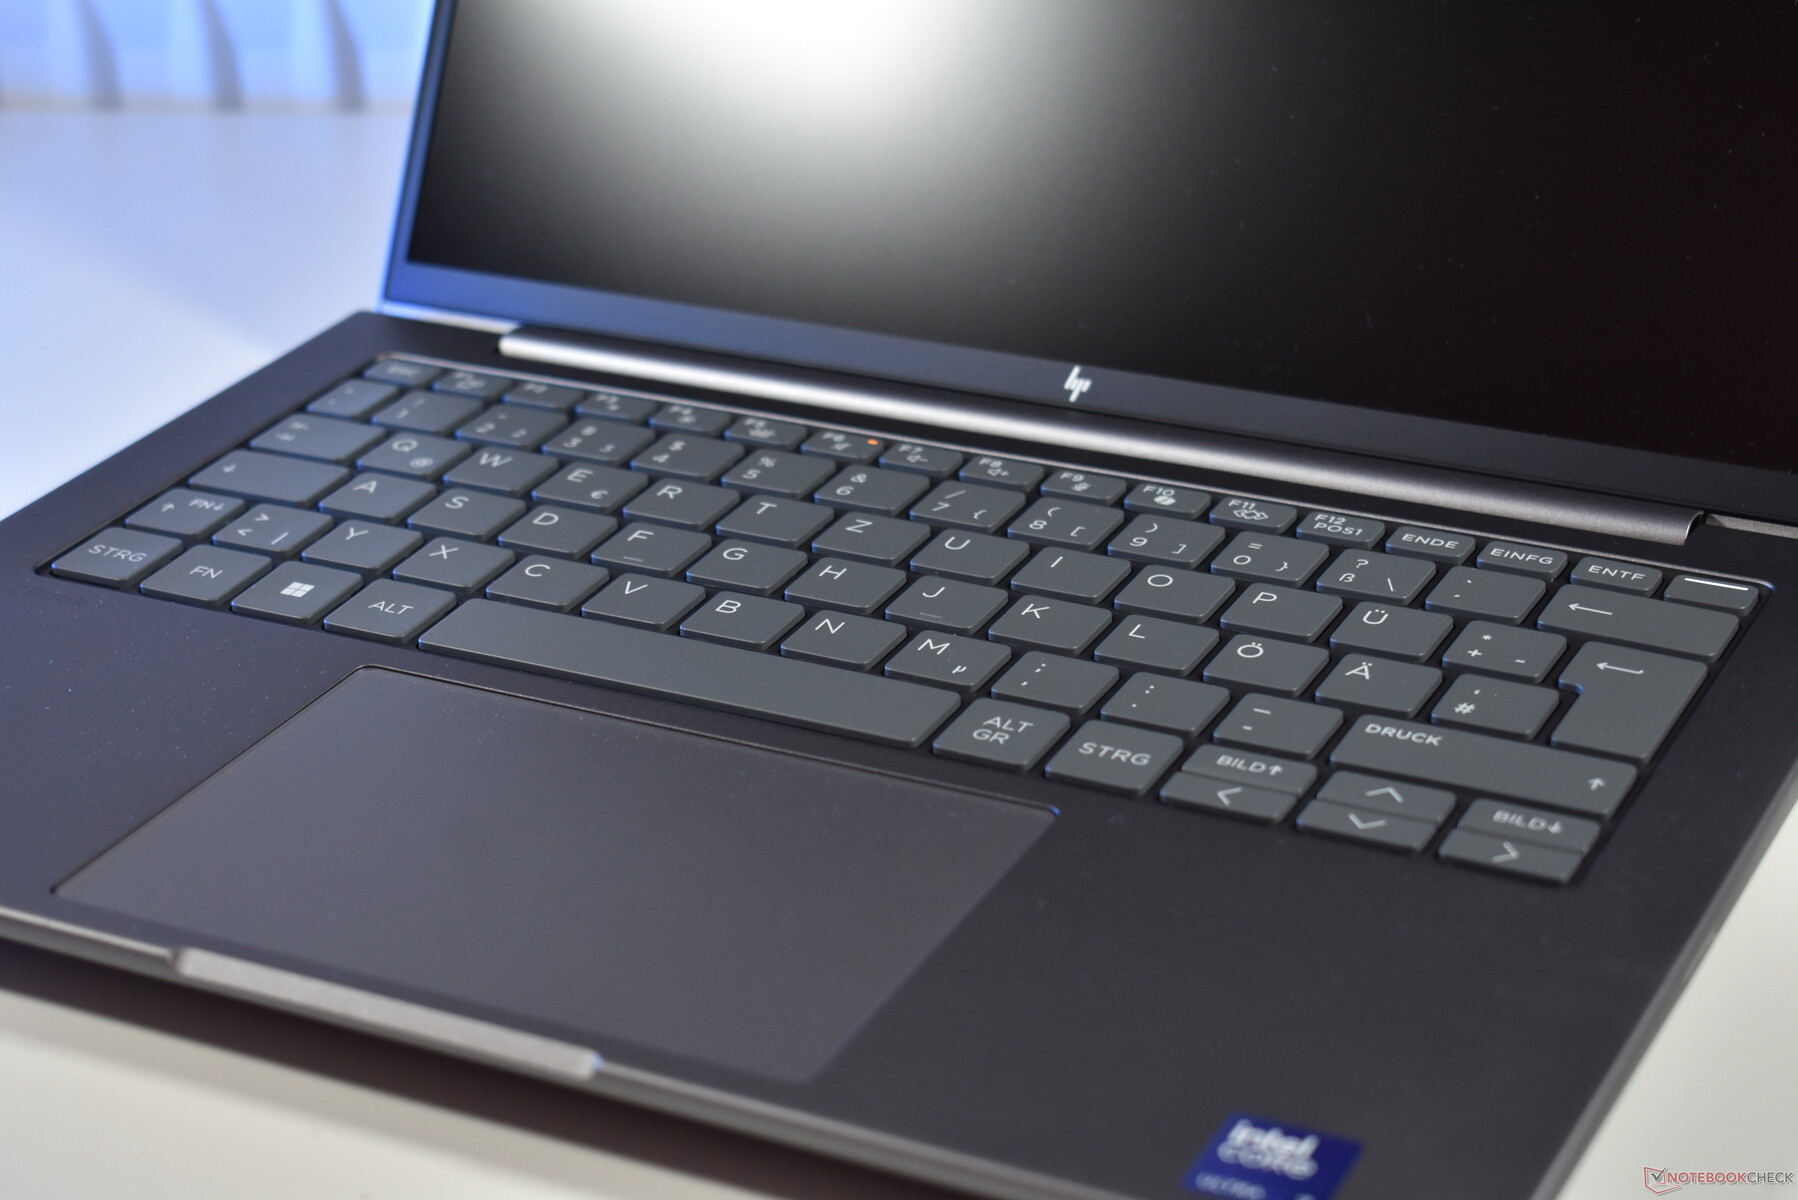
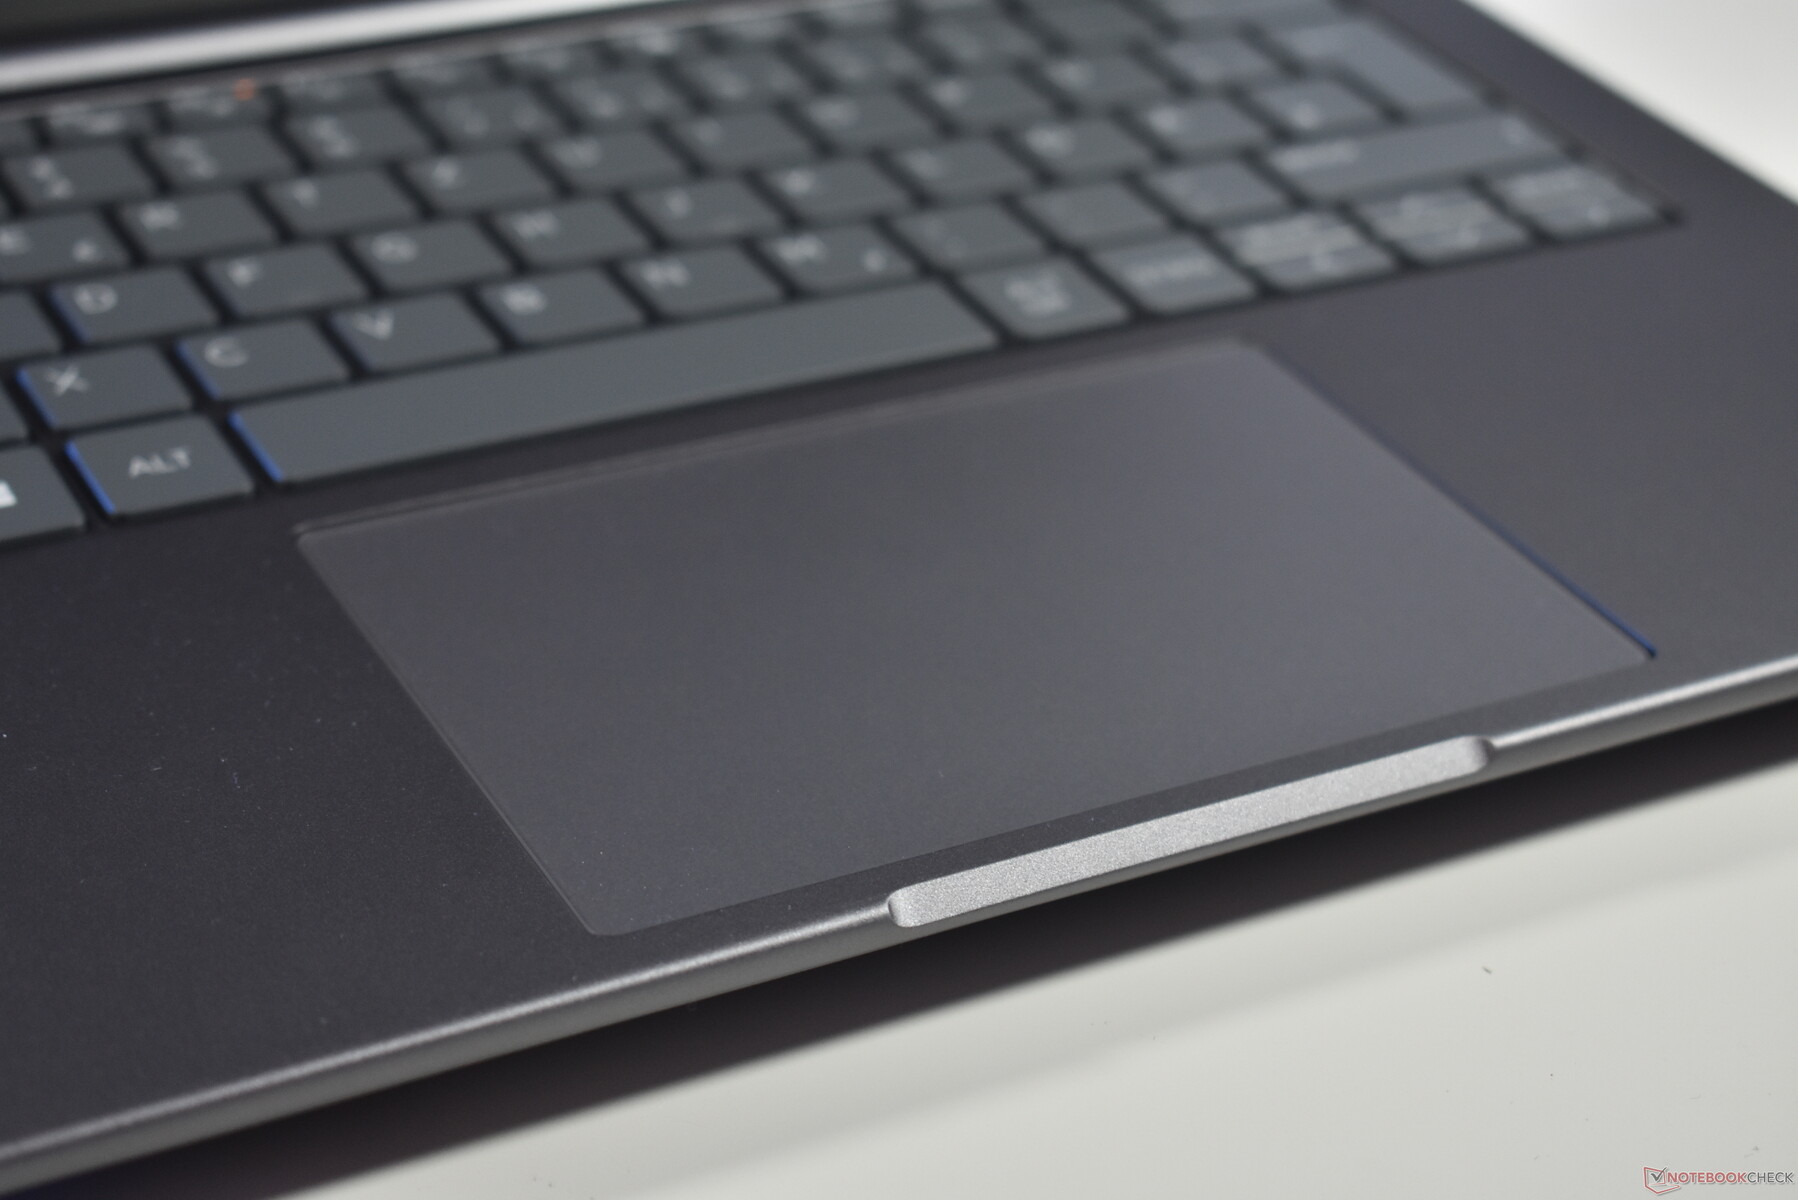
Ce que nous avons dit du clavier du HP EliteBook 8 G1a 14 s'applique également ici : C'est un excellent clavier, grâce aux touches Chiclet à course de 1,5 mm, très tactiles. La disposition peut être améliorée, mais taper et travailler avec le HP ZBook 8 G1i est un plaisir grâce au clavier. Le trackpad en verre, qui mesure 12,5 x 8 cm, est également très solide. La seule façon de l'améliorer serait d'utiliser une solution haptique au lieu d'une solution mécanique, car cela permettrait à l'utilisateur de cliquer n'importe où.
Écran : L'écran WQXGA pourrait être plus lumineux
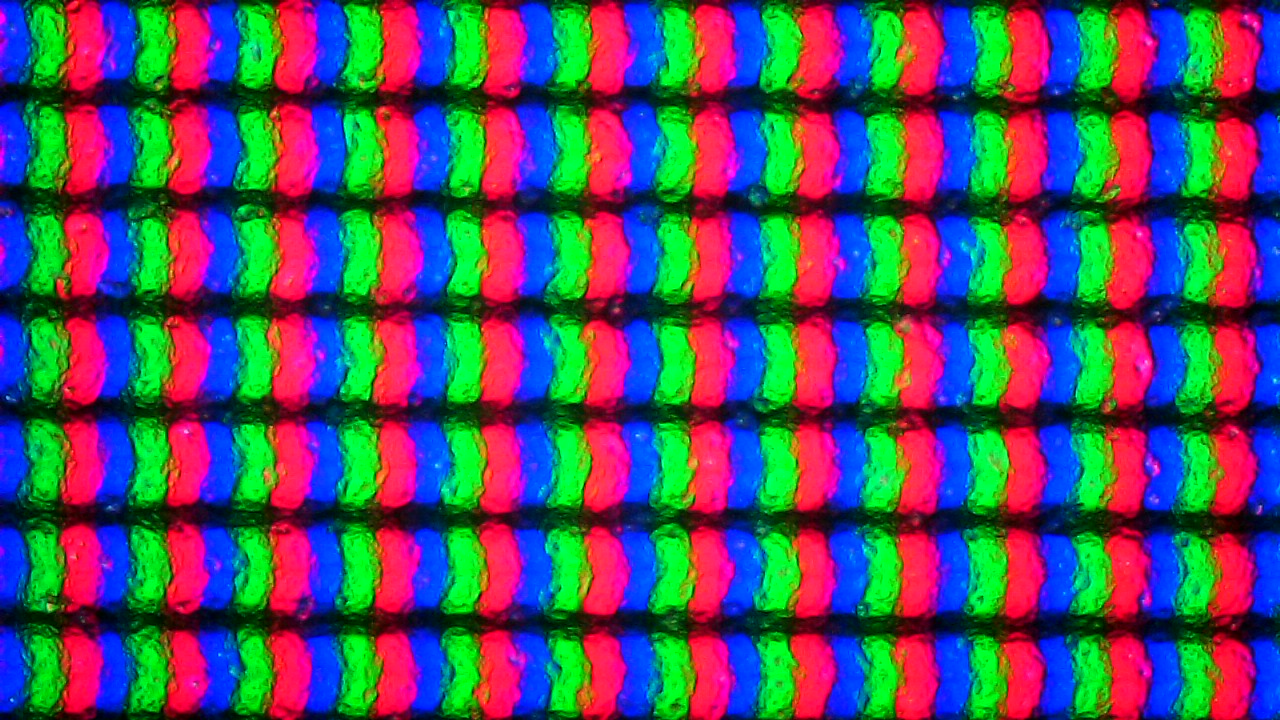
HP ne facilite pas le choix de l'écran pour le HP ZBook 8 G1i 14, puisqu'il existe au total sept écrans IPS mats de 14 pouces au format 16:10 :
- WUXGA (1 920 x 1 080), 300 cd/m², 62,5 % sRGB
- WUXGA (1 920 x 1 080), 300 cd/m², 62,5 % sRGB, tactile
- WUXGA (1 920 x 1 080), 400 cd/m², 100 % sRGB, basse consommation
- WUXGA (1 920 x 1 080), 800 cd/m², 100 % sRGB, SureView 5
- WUXGA (1 920 x 1 080), 800 cd/m², 100 % sRGB, SureView 5, tactile
- WQXGA/2.5K (2 560 x 1 600), 400 cd/m², 100 % AdobeRGB / DCI-P3, 120 Hz VRR
- WQXGA/2,5K (2 560 x 1 600), 500 cd/m², 100 % DCI-P3, 120 Hz, Dreamcolor
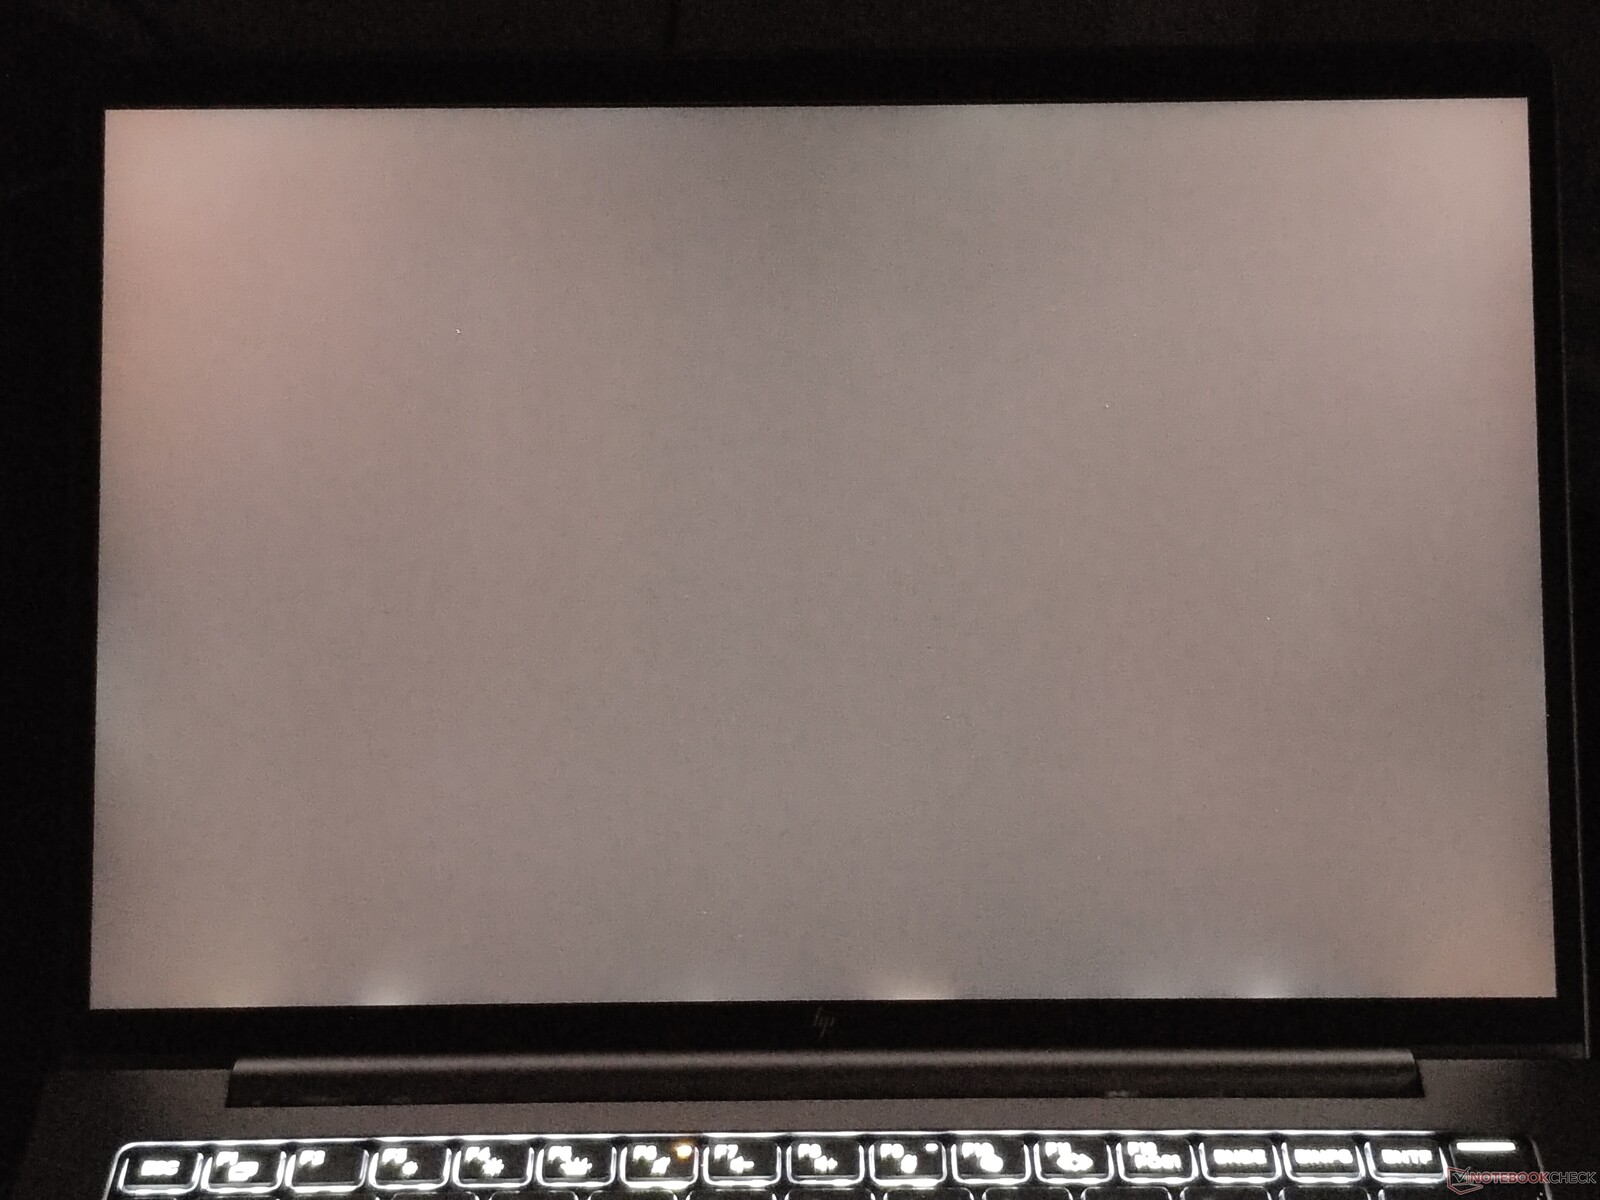
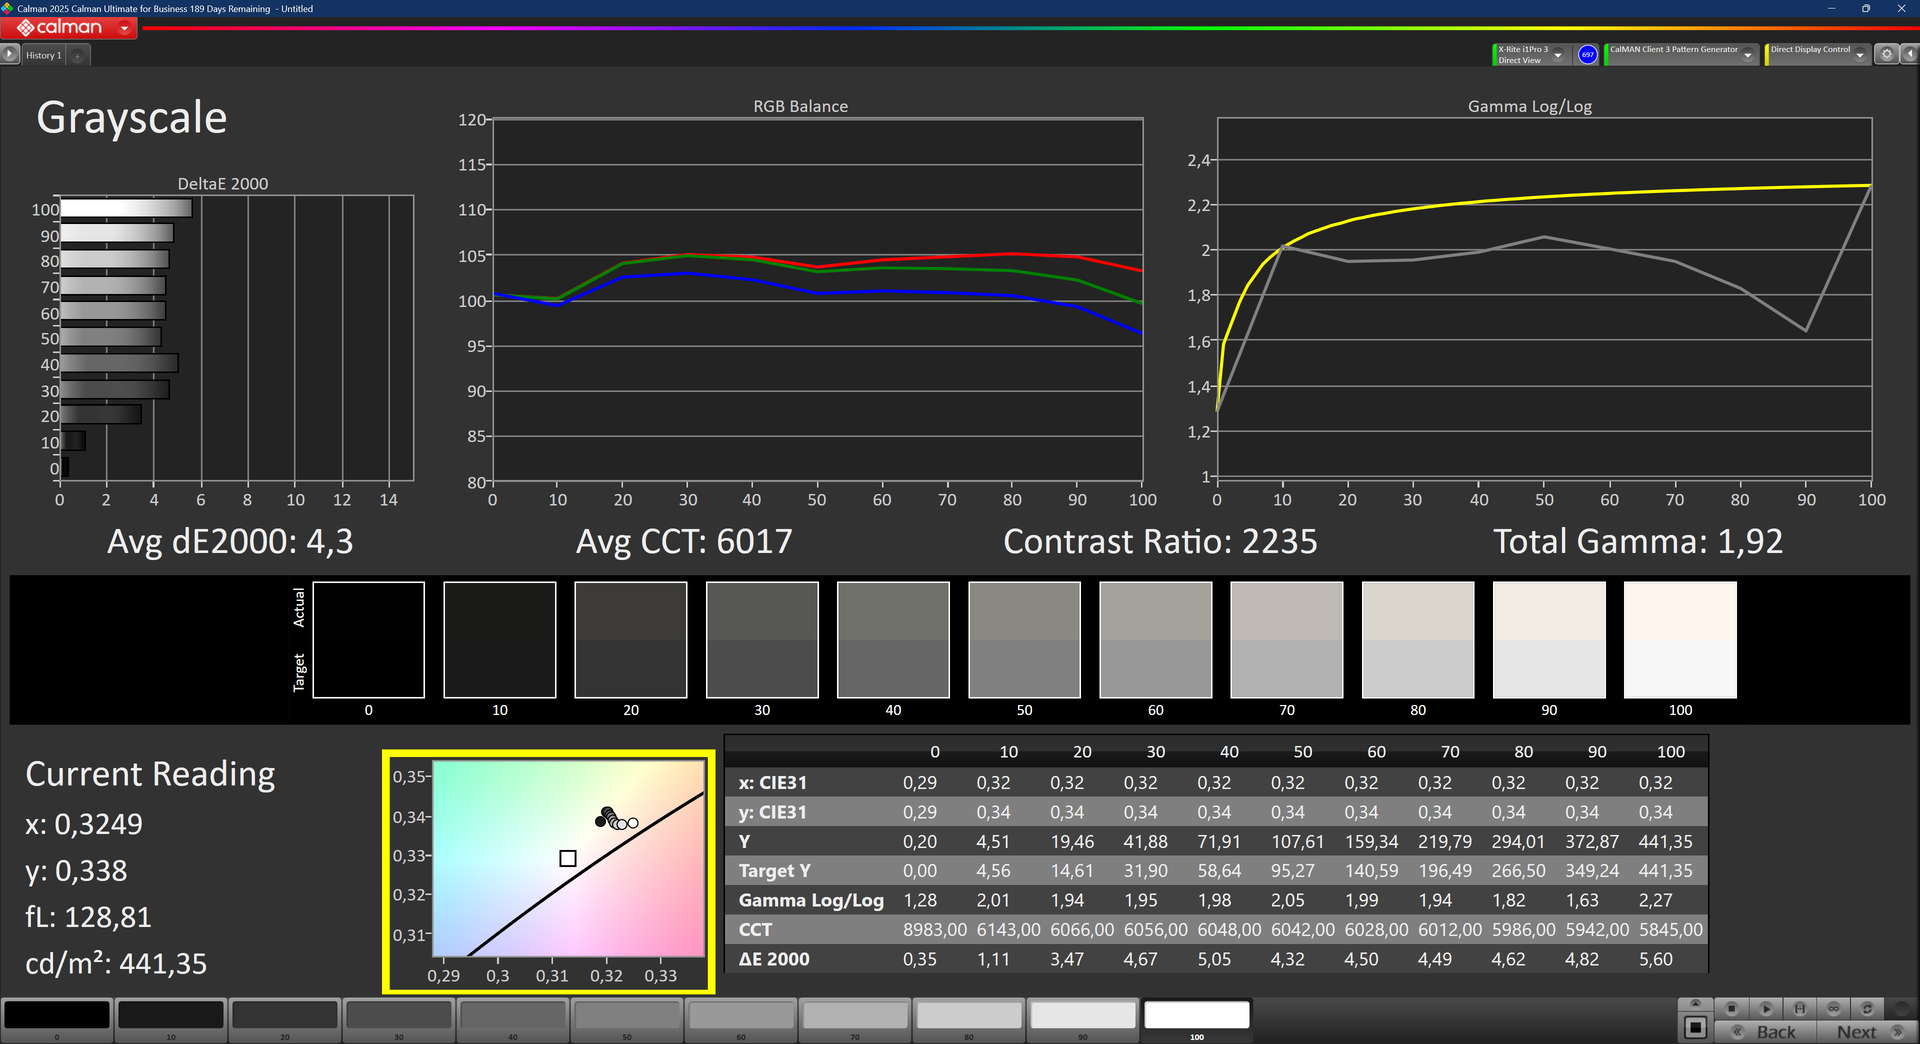
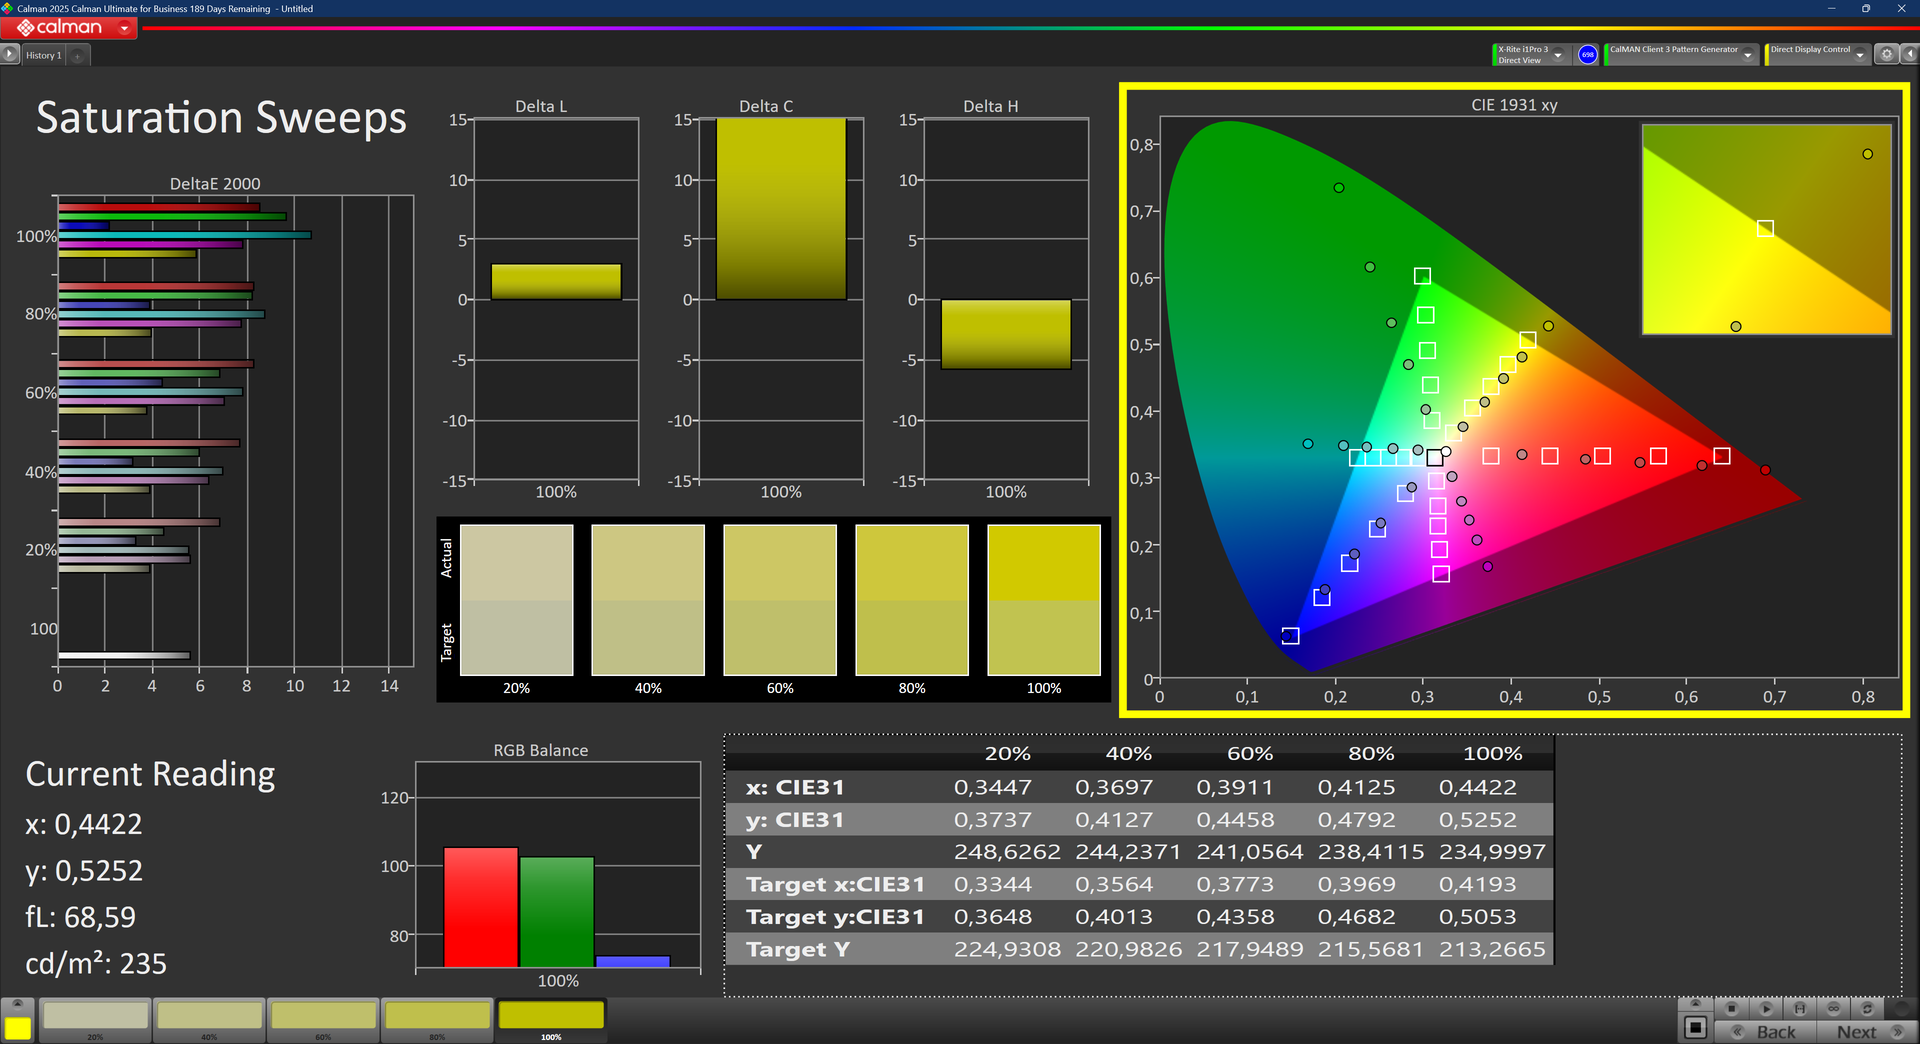
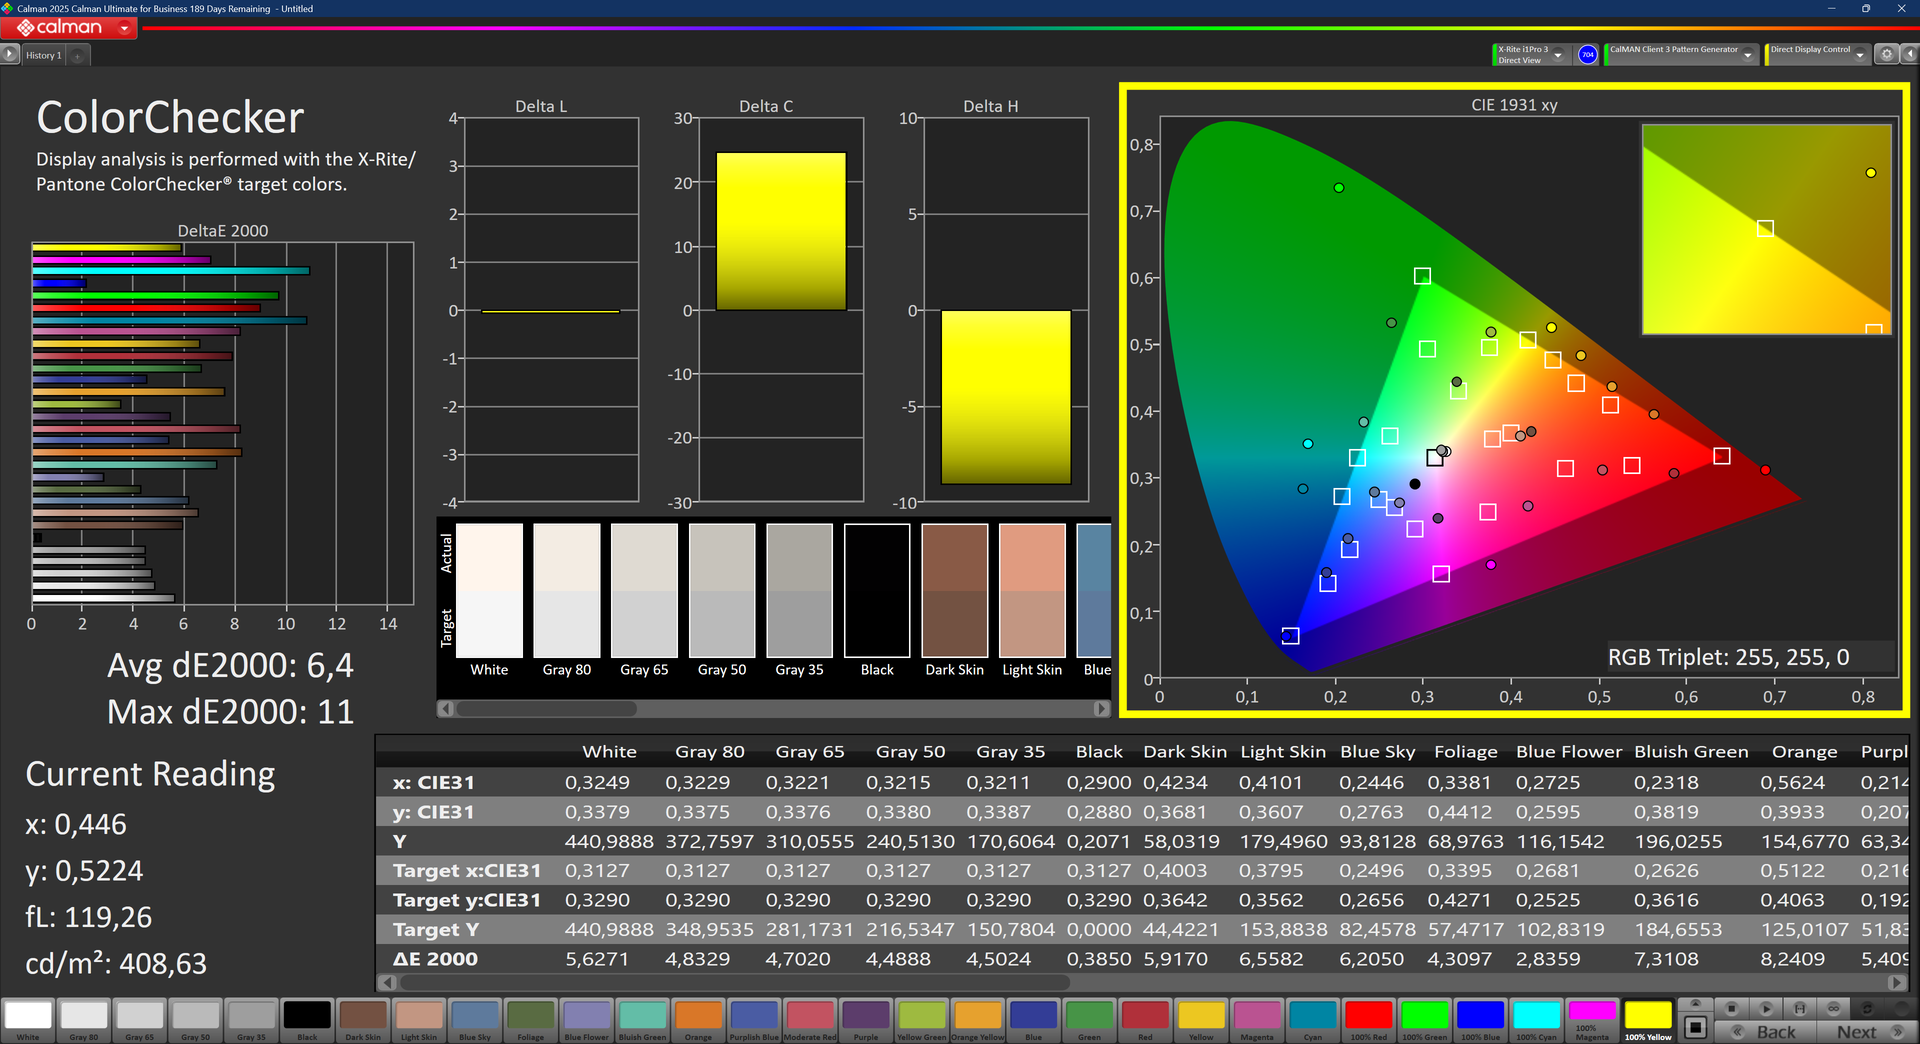
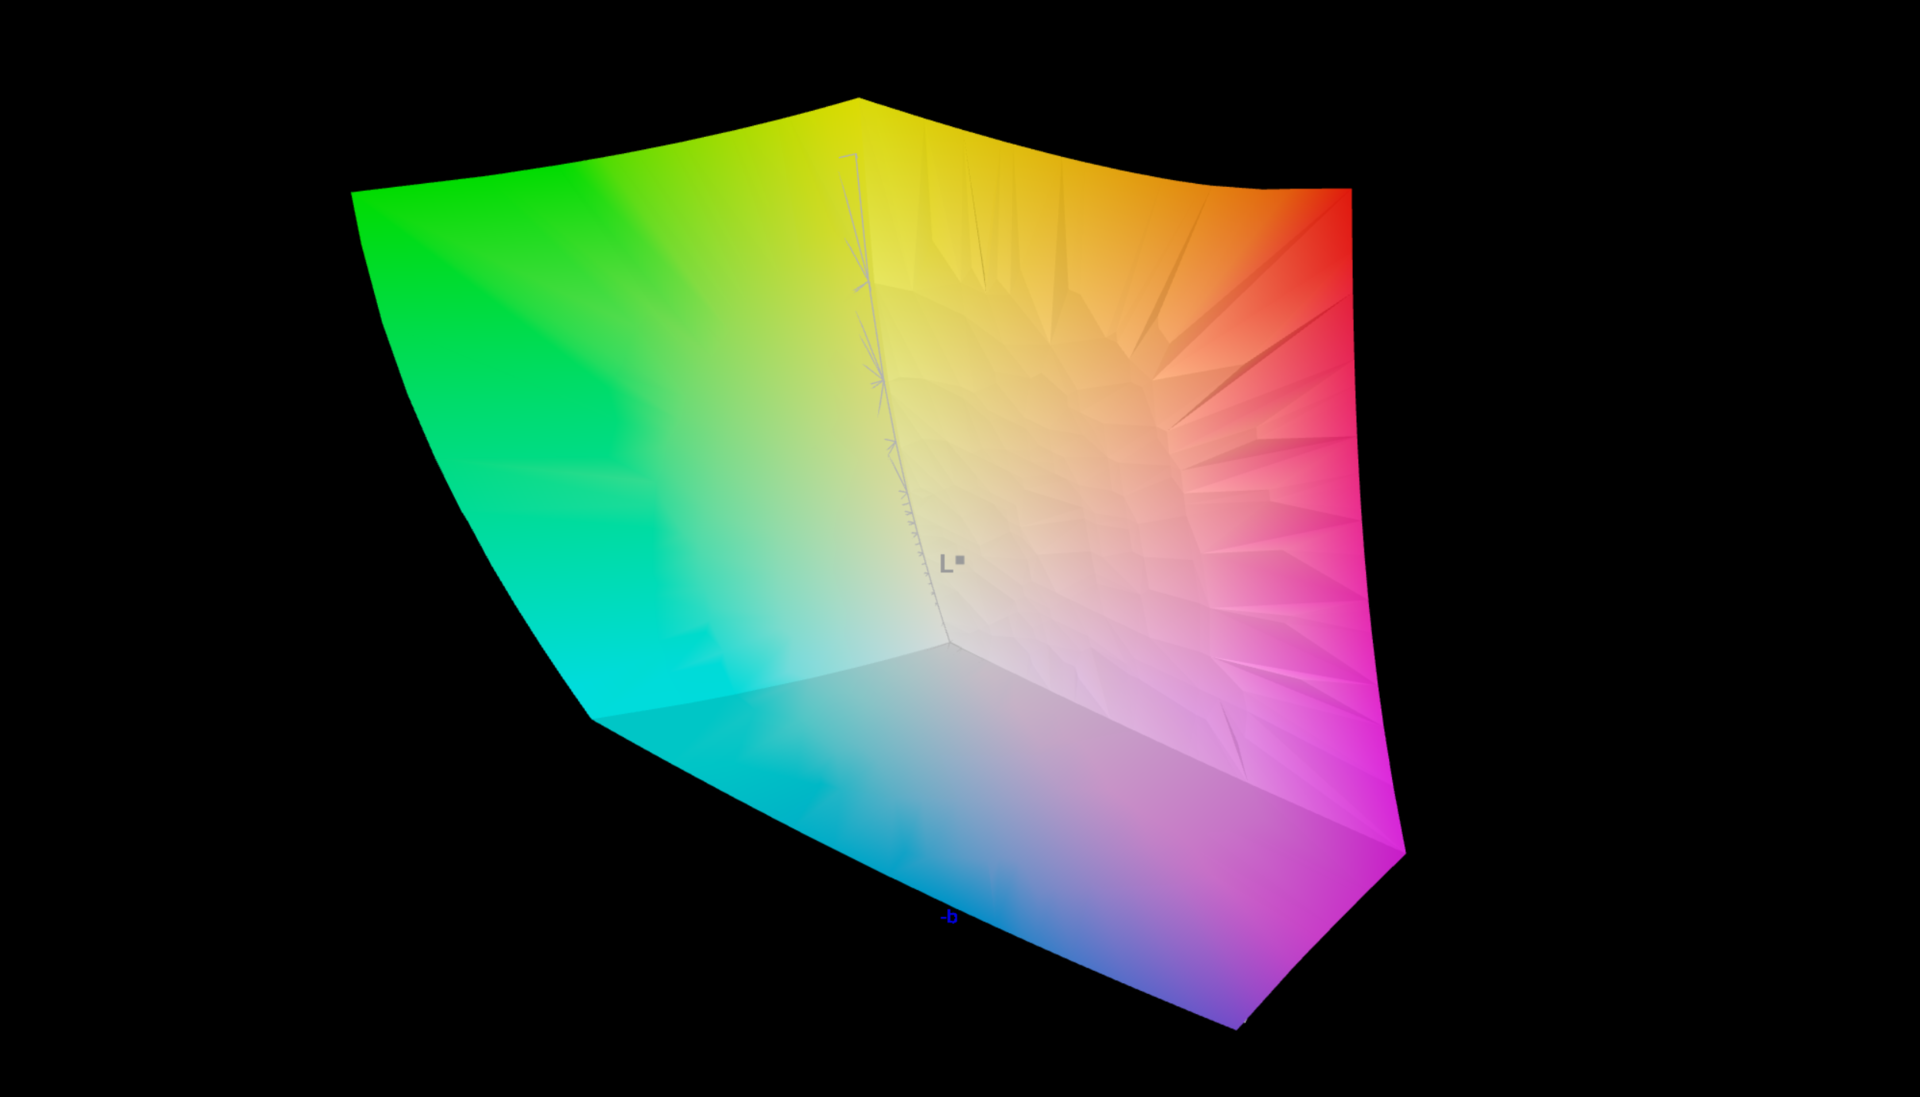
L'écran WQXGA a une bonne luminosité de plus de 400 cd/m², même si c'est moins que l'ancien ZBook Firefly. Les couleurs de l'écran sont excellentes et grâce au taux de rafraîchissement VRR de 120 Hz, l'écran n'est pas paresseux, même si les temps de réponse ne sont pas les meilleurs. Dans l'ensemble, c'est une très belle dalle pour le travail en couleur, bien que les 400 cd/m² soient un peu limités de nos jours pour un écran haut de gamme.
| |||||||||||||||||||||||||
Homogénéité de la luminosité: 92 %
Valeur mesurée au centre, sur batterie: 441 cd/m²
Contraste: 2205:1 (Valeurs des noirs: 0.2 cd/m²)
ΔE ColorChecker Calman: 6.4 | ∀{0.5-29.43 Ø4.8}
calibrated: 4.8
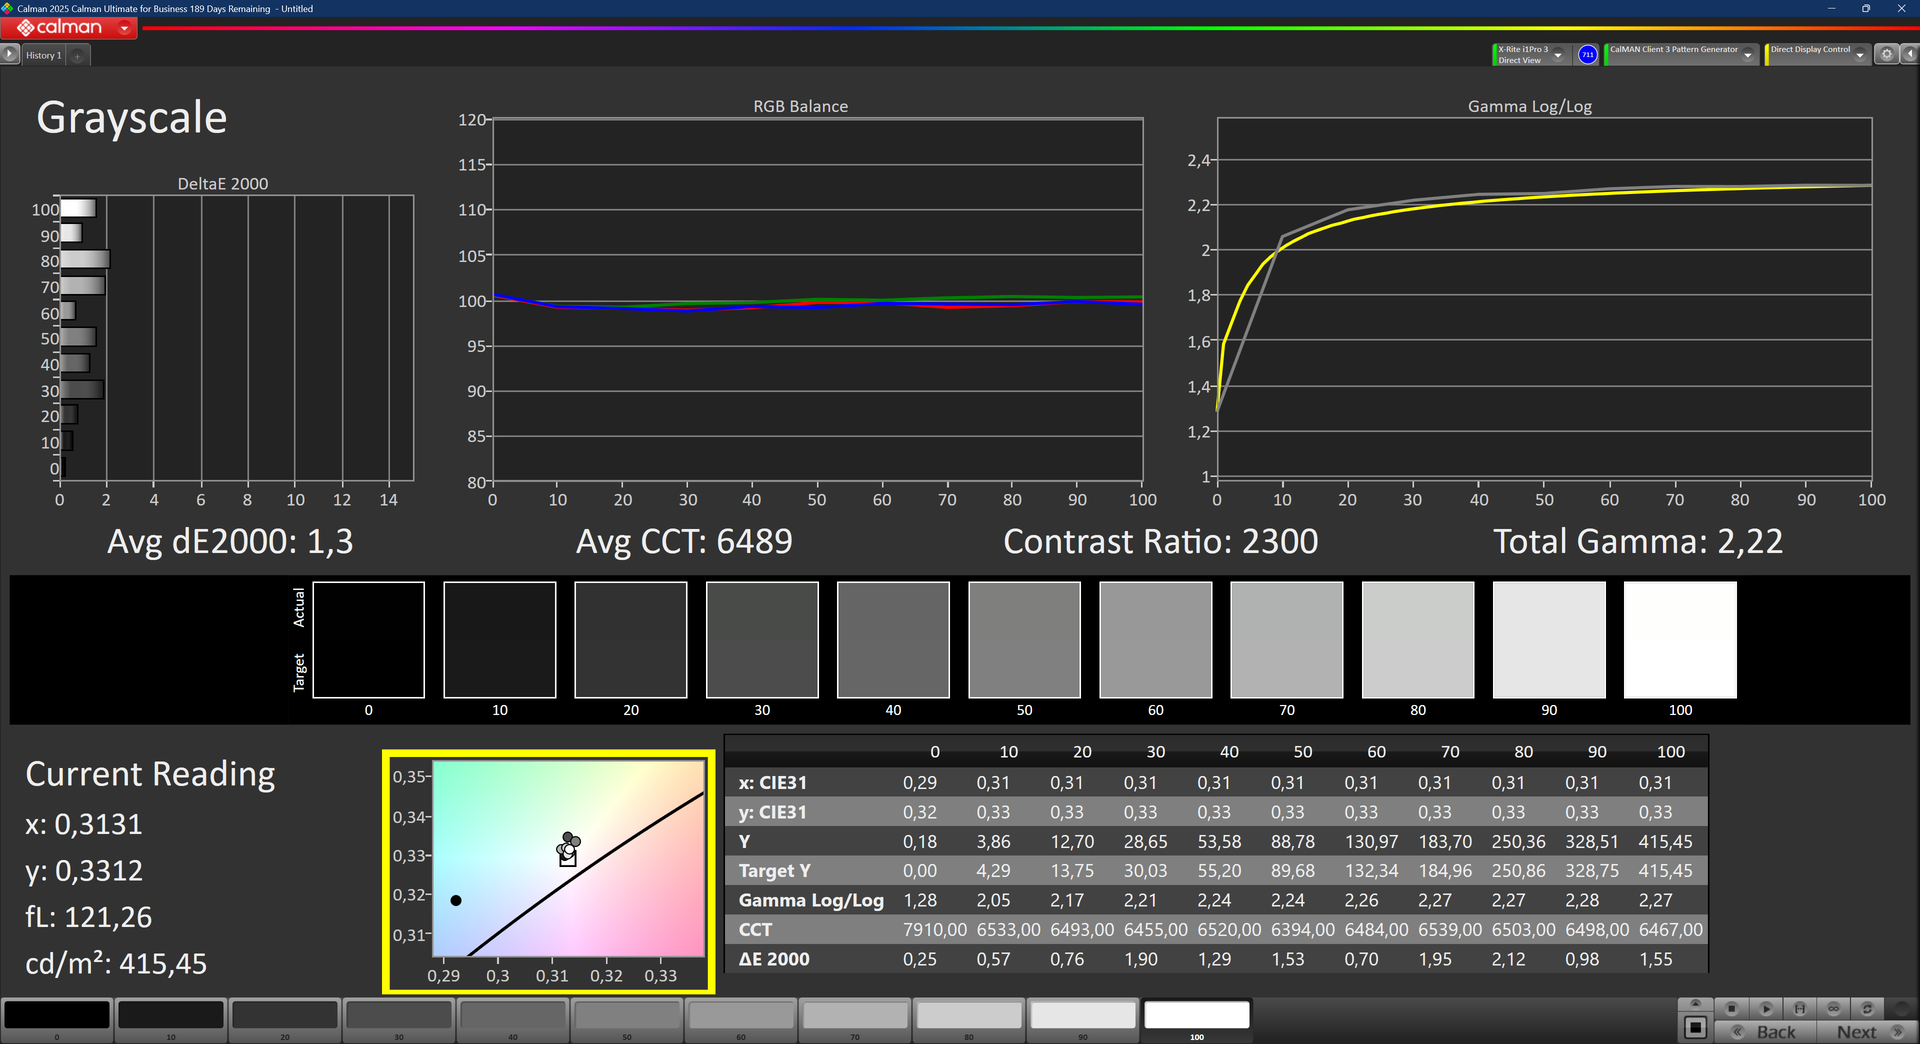
ΔE Greyscale Calman: 4.3 | ∀{0.09-98 Ø5.1}
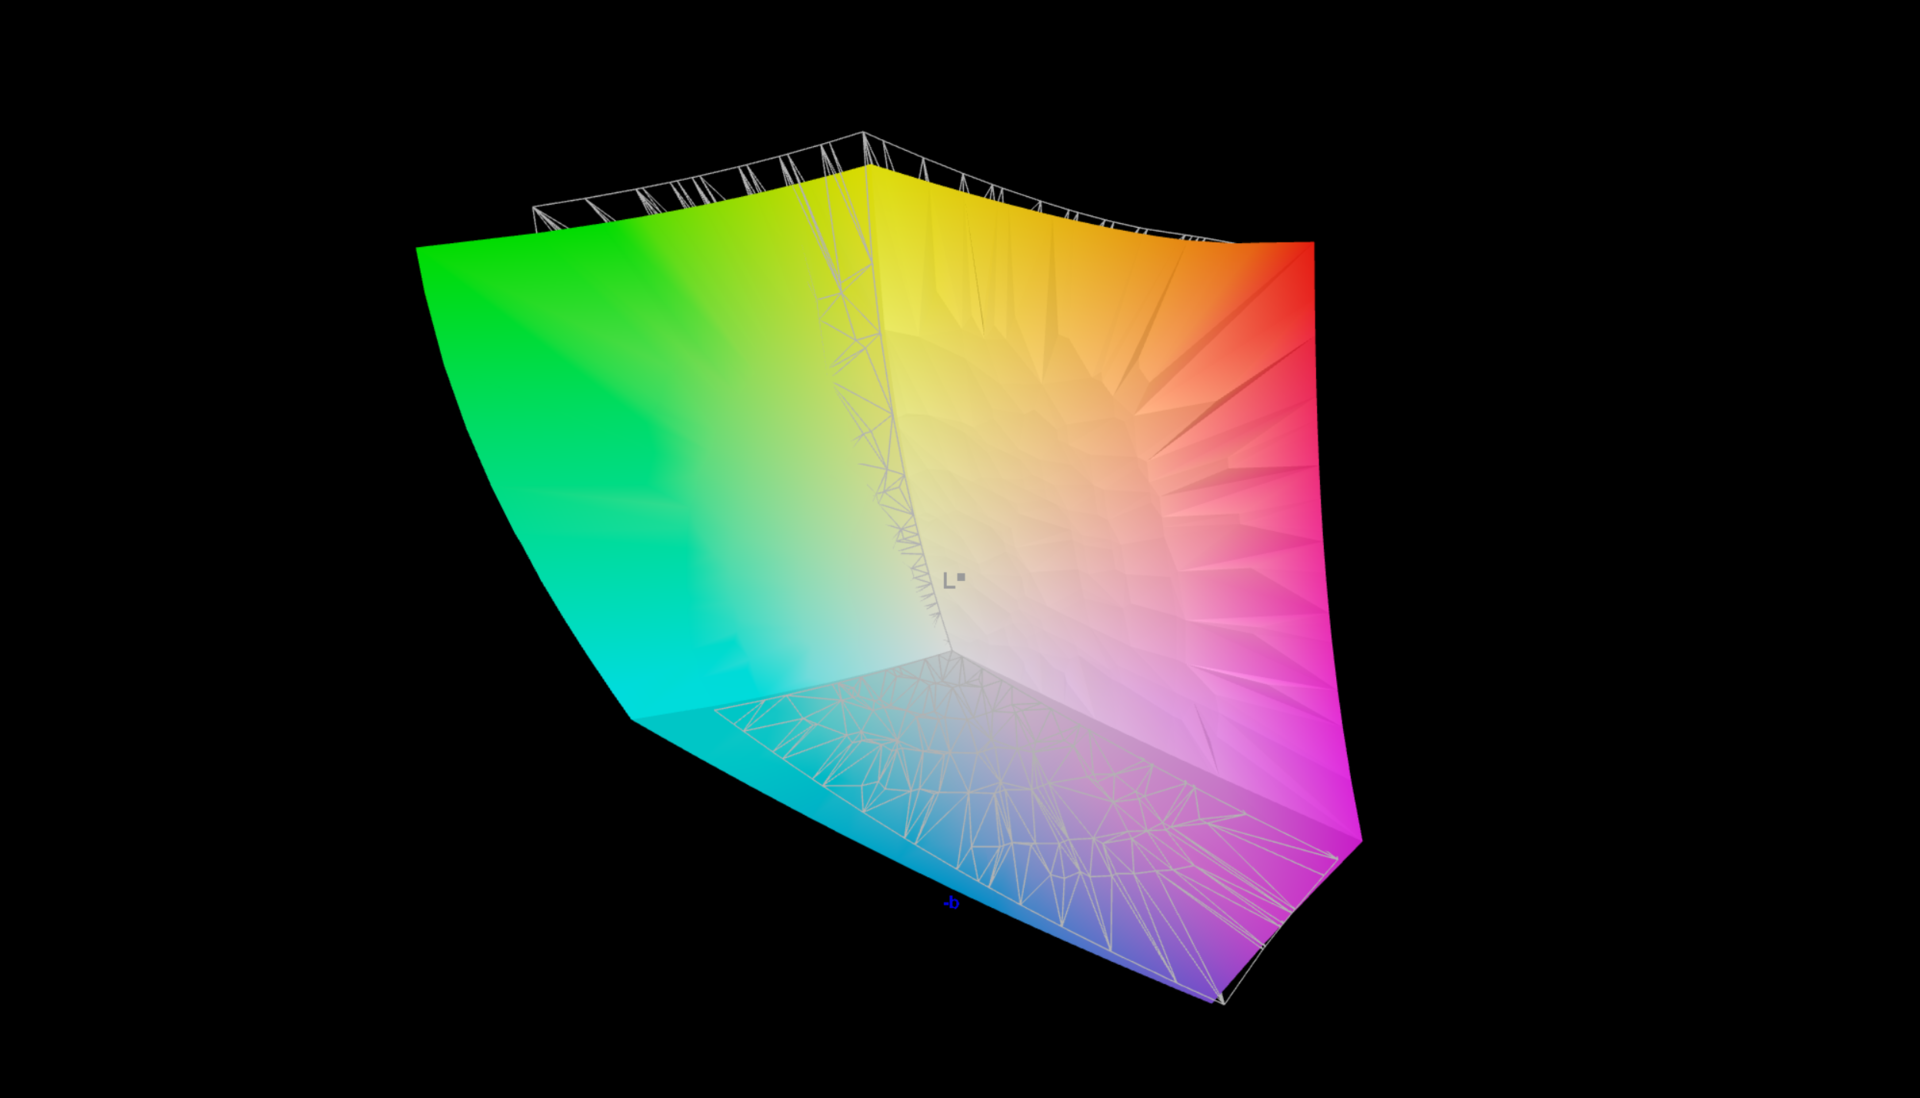
99.9% AdobeRGB 1998 (Argyll 3D)
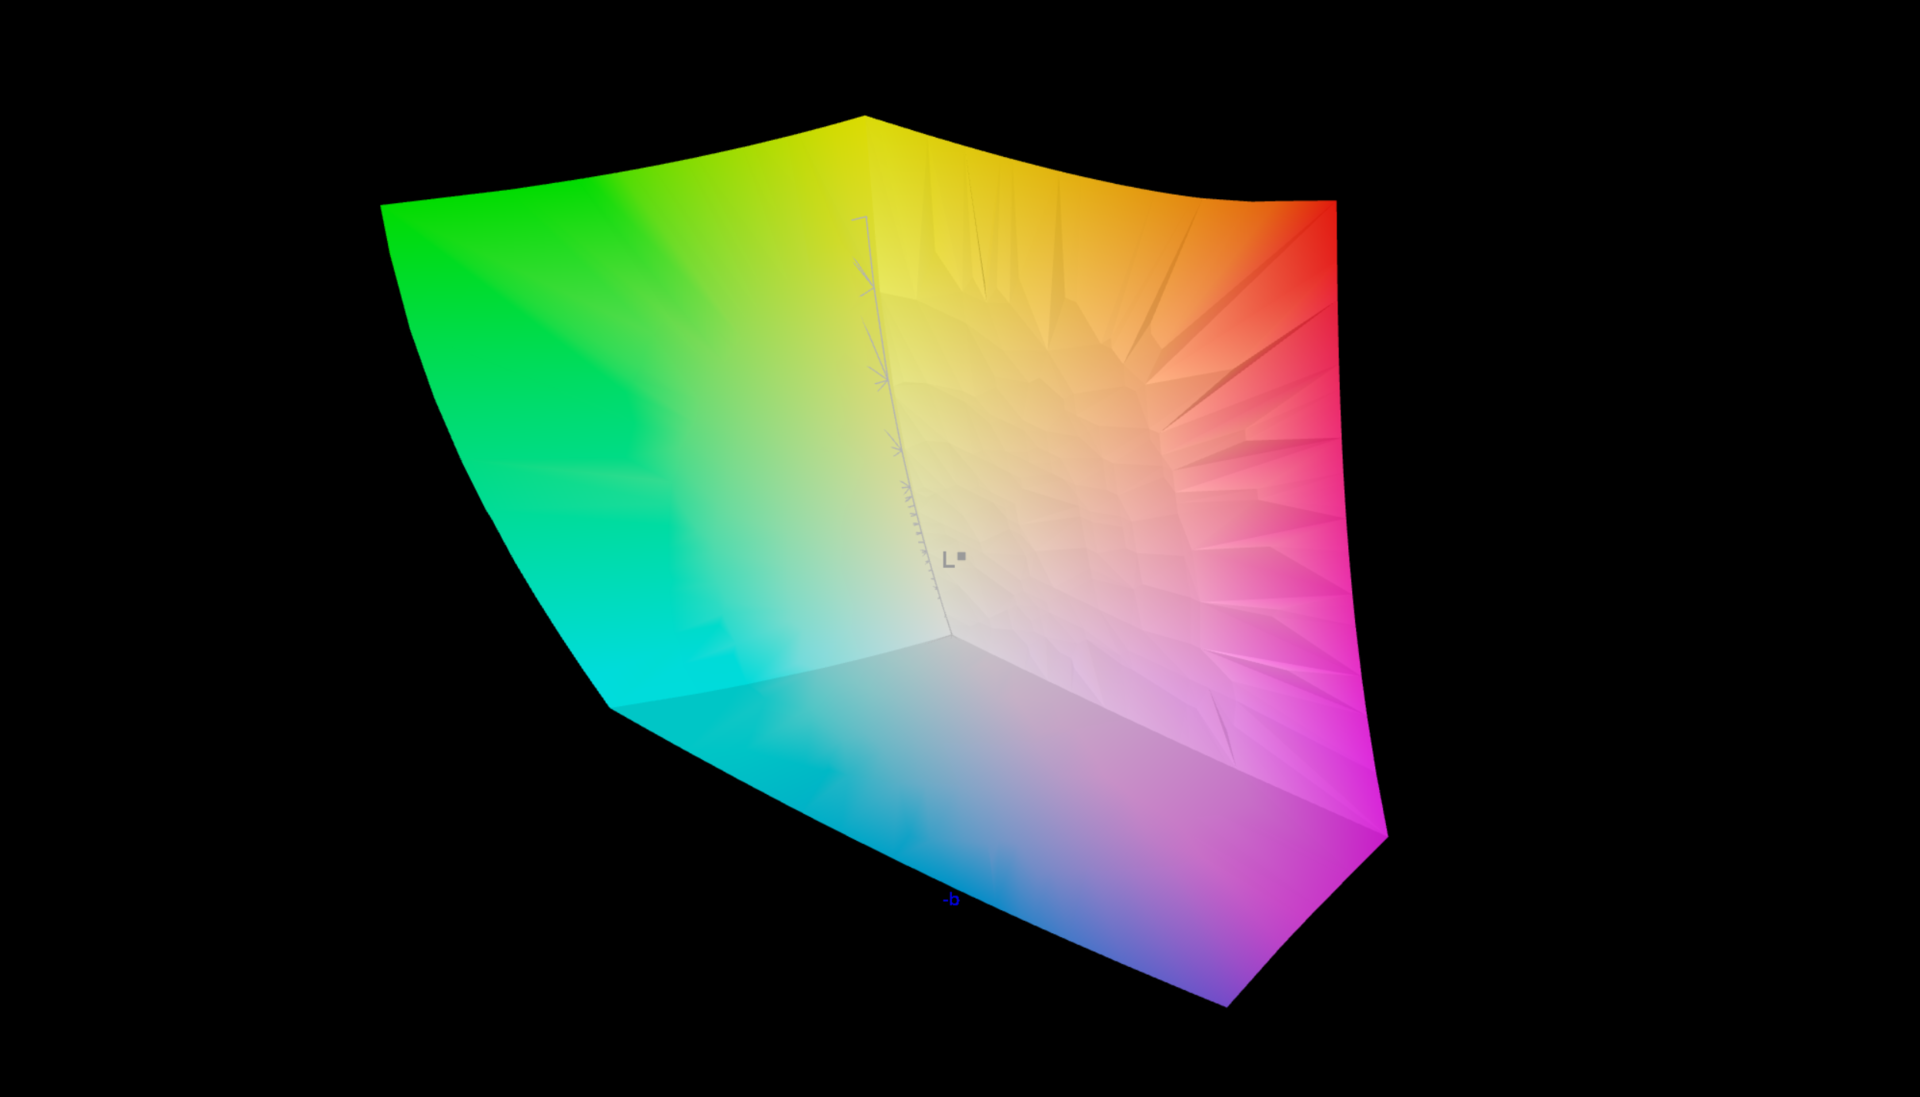
99.9% sRGB (Argyll 3D)
95.8% Display P3 (Argyll 3D)
Gamma: 1.92
CCT: 6017 K
| HP ZBook 8 G1i 14 LGD07B5, IPS LED, 2560x1600, 14", 120 Hz | HP ZBook Firefly 14 G11 AUO6DA8, IPS, 2560x1600, 14", 120 Hz | Lenovo ThinkPad P14s Gen 6 21RV0017GE NE140WUM-N6M, IPS LED, 1920x1200, 14", 60 Hz | HP ZBook Ultra G1a 14 Samsung SDC41B3, OLED, 2880x1800, 14", 120 Hz | Dell Precision 5000 5490 AU Optronics B140QAN, IPS, 2560x1600, 14", 60 Hz | |
|---|---|---|---|---|---|
| Display | -3% | -21% | 0% | -12% | |
| Display P3 Coverage (%) | 95.8 | 98.9 3% | 67.1 -30% | 99.7 4% | 79.7 -17% |
| sRGB Coverage (%) | 99.9 | 99.9 0% | 98.6 -1% | 100 0% | 100 0% |
| AdobeRGB 1998 Coverage (%) | 99.9 | 86.6 -13% | 69.2 -31% | 95.6 -4% | 79.5 -20% |
| Response Times | 61% | 3% | 78% | -62% | |
| Response Time Grey 50% / Grey 80% * (ms) | 30.3 ? | 12.3 ? 59% | 31.1 ? -3% | 0.94 ? 97% | 52.3 ? -73% |
| Response Time Black / White * (ms) | 22.2 ? | 8.3 ? 63% | 20.5 ? 8% | 1.01 ? 95% | 33.3 ? -50% |
| PWM Frequency (Hz) | 24000 ? | 492.6 | |||
| PWM Amplitude * (%) | 75 | 43 43% | |||
| Screen | 10% | 21% | 34% | 16% | |
| Brightness middle (cd/m²) | 441 | 554.1 26% | 558 27% | 384.7 -13% | 485.1 10% |
| Brightness (cd/m²) | 417 | 540 29% | 545 31% | 387 -7% | 471 13% |
| Brightness Distribution (%) | 92 | 93 1% | 91 -1% | 99 8% | 90 -2% |
| Black Level * (cd/m²) | 0.2 | 0.58 -190% | 0.32 -60% | 0.38 -90% | |
| Contrast (:1) | 2205 | 955 -57% | 1744 -21% | 1277 -42% | |
| Colorchecker dE 2000 * | 6.4 | 2.54 60% | 2.7 58% | 3.36 47% | 2.15 66% |
| Colorchecker dE 2000 max. * | 11 | 4.99 55% | 5.3 52% | 6.45 41% | 5.39 51% |
| Colorchecker dE 2000 calibrated * | 4.8 | 0.56 88% | 0.7 85% | 0.65 86% | 0.67 86% |
| Greyscale dE 2000 * | 4.3 | 1 77% | 3.5 19% | 1 77% | 2 53% |
| Gamma | 1.92 115% | 2.3 96% | 2.1 105% | 2.26 97% | 2.3 96% |
| CCT | 6017 108% | 6556 99% | 7191 90% | 6380 102% | 6826 95% |
| Moyenne finale (programmes/paramètres) | 23% /
14% | 1% /
10% | 37% /
36% | -19% /
-1% |
* ... Moindre est la valeur, meilleures sont les performances


Temps de réponse de l'écran
| ↔ Temps de réponse noir à blanc | ||
|---|---|---|
| 22.2 ms ... hausse ↗ et chute ↘ combinées | ↗ 9.3 ms hausse | 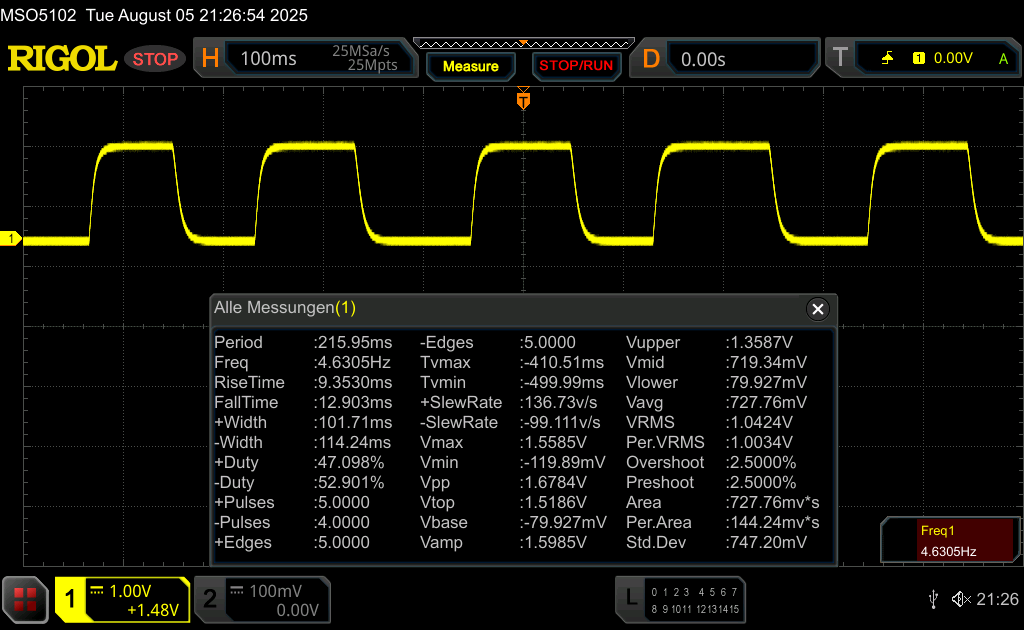 |
| ↘ 12.9 ms chute | ||
| L'écran montre de bons temps de réponse, mais insuffisant pour du jeu compétitif. En comparaison, tous les appareils testés affichent entre 0.1 (minimum) et 240 (maximum) ms. » 49 % des appareils testés affichent de meilleures performances. Cela signifie que les latences relevées sont similaires à la moyenne (20.3 ms) de tous les appareils testés. | ||
| ↔ Temps de réponse gris 50% à gris 80% | ||
| 30.3 ms ... hausse ↗ et chute ↘ combinées | ↗ 13.3 ms hausse | 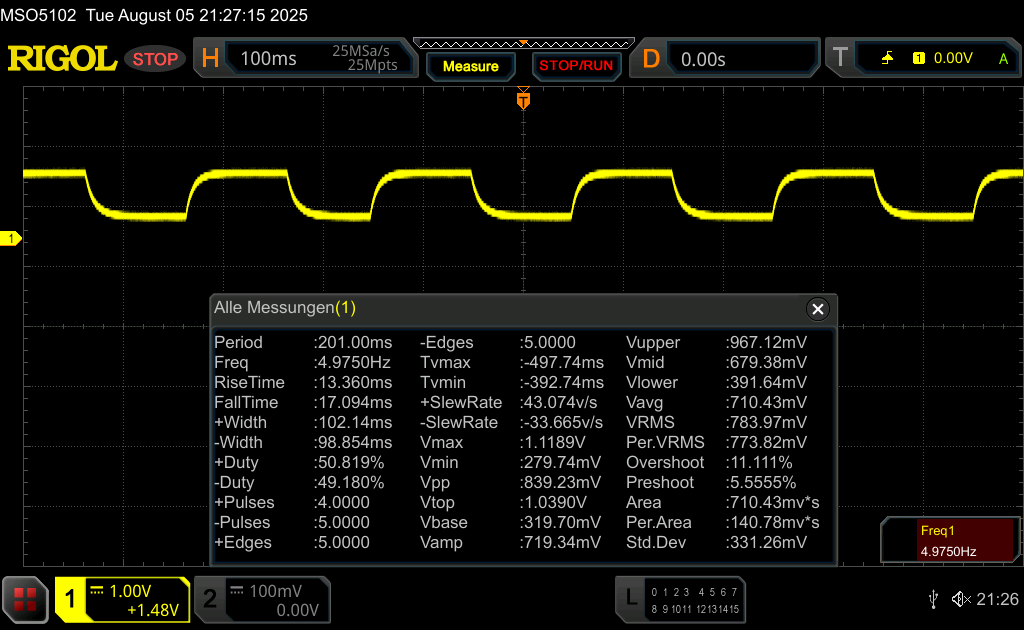 |
| ↘ 17 ms chute | ||
| L'écran souffre de latences très élevées, à éviter pour le jeu. En comparaison, tous les appareils testés affichent entre 0.165 (minimum) et 636 (maximum) ms. » 39 % des appareils testés affichent de meilleures performances. Cela signifie que les latences relevées sont similaires à la moyenne (31.8 ms) de tous les appareils testés. | ||
Scintillement / MLI (Modulation de largeur d'impulsion)
| Scintillement / MLI (Modulation de largeur d'impulsion) décelé | 24000 Hz Amplitude: 75 % | ≤ 74 Niveau de luminosité | 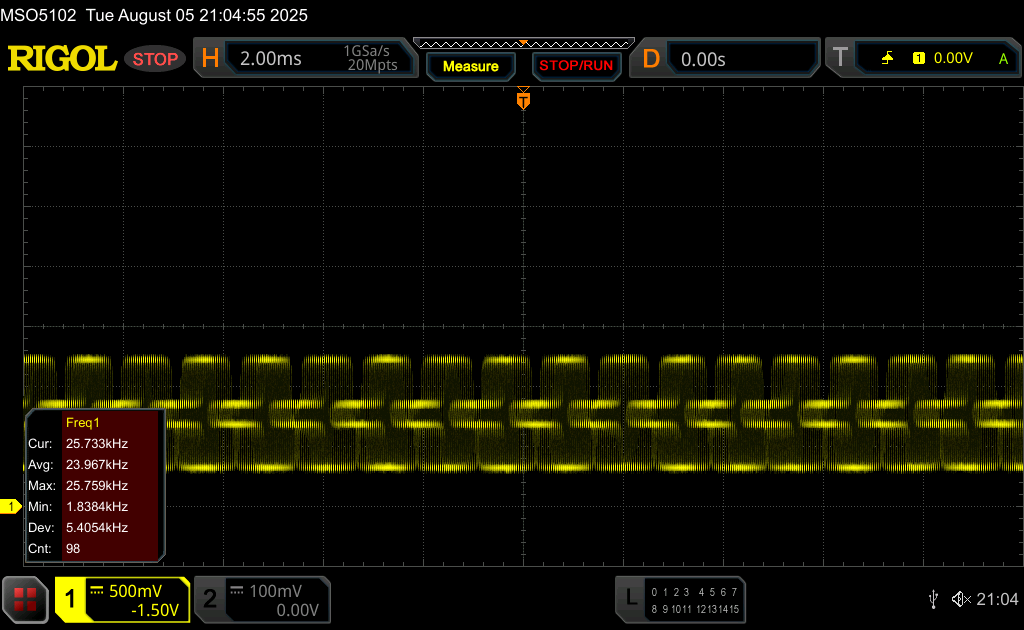 |
Le rétroéclairage de l'écran scintille à la fréquence de 24000 Hz (certainement du fait de l'utilisation d'une MDI - Modulation de largeur d'impulsion) à un niveau de luminosité inférieur ou égal à 74 % . Aucun scintillement ne devrait être perceptible au-dessus de cette valeur. La fréquence de rafraîchissement de 24000 Hz est élevée, la grande majorité des utilisateurs ne devrait pas percevoir de scintillements et être sujette à une fatigue oculaire accrue. En comparaison, 53 % des appareils testés n'emploient pas MDI pour assombrir leur écran. Nous avons relevé une moyenne à 8194 (minimum : 5 - maximum : 343500) Hz dans le cas où une MDI était active. | |||
Performance : Intel Arrow Lake H correspond à Strix Point
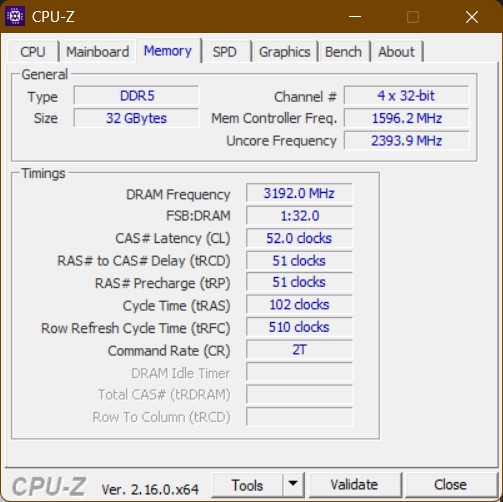
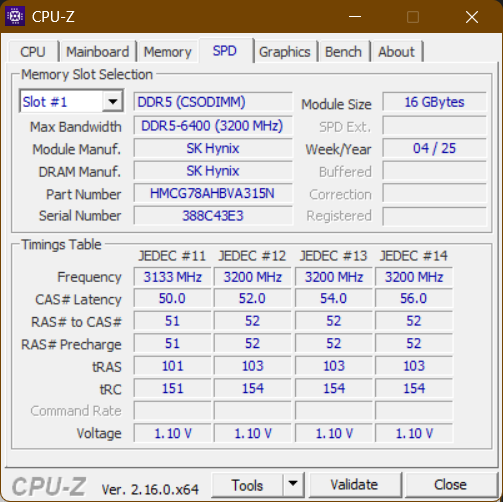
HP propose une sélection de CPU Arrow Lake U et Arrow Lake H, allant de 12 à 16 cœurs au total pour les neuf CPU proposés. Il y a quatre GPU possibles, trois d'Intel et le Nvidia RTX 500 Ada comme unique GPU dédié. Jusqu'à 64 Go de RAM DDR5-5600 (2x SO-DIMM) et un seul SSD M.2 2280 NVMe PCIe 4.0 d'une capacité maximale de 2 To sont disponibles.
Conditions d'essai
Nous avons testé notre appareil avec le mode d'alimentation "Meilleures performances". Les limites de puissance du processeur sont les suivantes :
- Meilleure efficacité énergétique : PL1 40 W / PL2 60 W
- Équilibré : PL1 60 W / PL2 60 W
- Meilleure performance : PL1 60 W / PL2 60 W
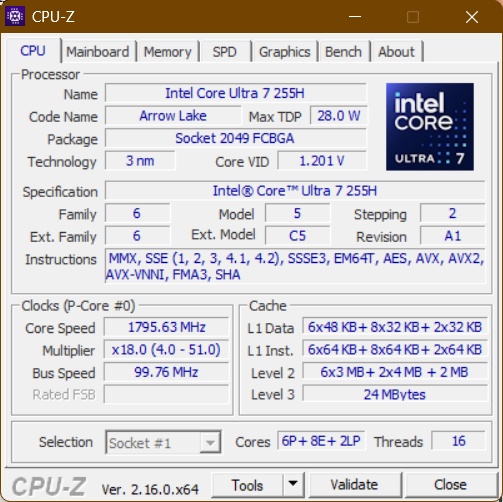
Processeur
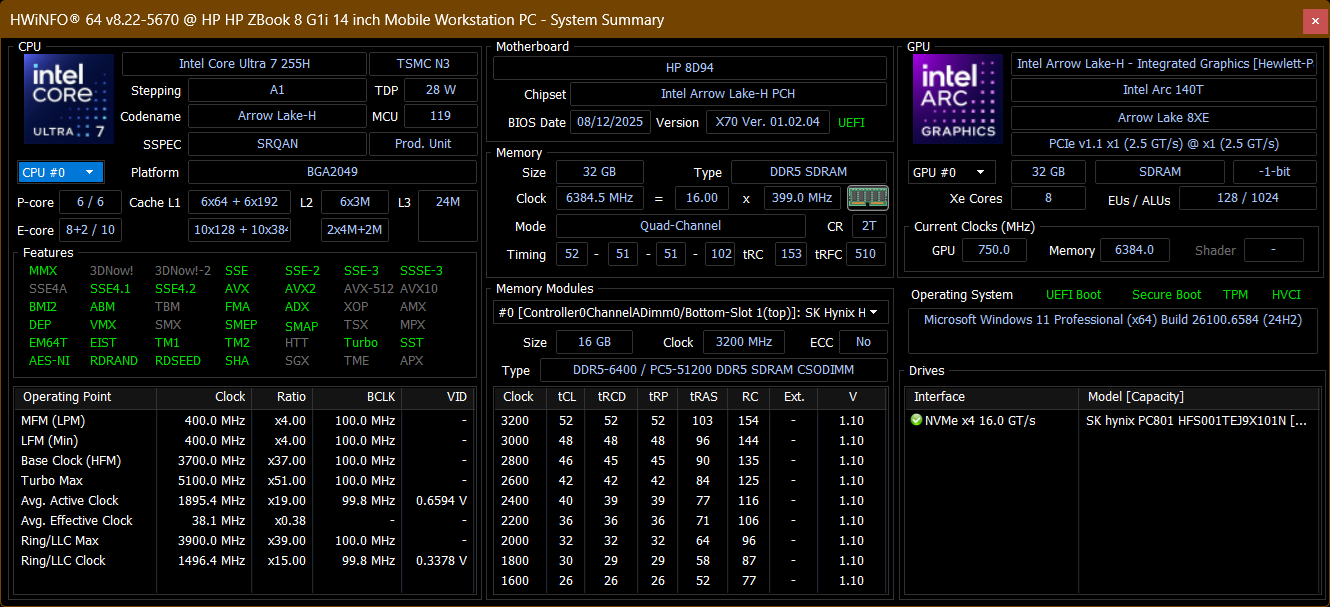
L'Intel Core Ultra 255H Intel Core Ultra 255H est un processeur Arrow Lake H avec 16 cœurs au total (six cœurs Lion Cove P, jusqu'à 5,1 GHz ; huit cœurs Skymont E, jusqu'à 4,4 GHz ; deux cœurs Low Power E, jusqu'à 2,5 GHz). Le processeur a un TDP typique de 28 W, mais il peut consommer jusqu'à 115 W si le fabricant le prévoit. Vous pouvez effectuer d'autres comparaisons grâce à notre Liste de tests de performances des processeurs.
Les performances sont clairement améliorées par rapport au ZBook Firefly G11mais c'est normal, car le TDP est passé de 26 W à 60 W, grâce au nouveau système de refroidissement à double ventilateur. Le processeur Intel fait légèrement mieux que les puces AMD en termes de charges mono-coeur, mais le Strix Halo d'AMD est bien meilleur lorsqu'il s'agit de tâches multi-coeurs. Il est à égalité avec la puce Strix Point du Lenovo ThinkPad P14s Gen 6 AMDmais il faut préciser que cette puce ne consomme que 36 W en charge soutenue.
Les performances du processeur ne sont pas bridées en mode batterie.
Cinebench R15 Multi Loop
Cinebench R23: Multi Core | Single Core
Cinebench R20: CPU (Multi Core) | CPU (Single Core)
Cinebench R15: CPU Multi 64Bit | CPU Single 64Bit
Blender: v2.79 BMW27 CPU
7-Zip 18.03: 7z b 4 | 7z b 4 -mmt1
Geekbench 6.5: Multi-Core | Single-Core
Geekbench 5.5: Multi-Core | Single-Core
HWBOT x265 Benchmark v2.2: 4k Preset
LibreOffice : 20 Documents To PDF
R Benchmark 2.5: Overall mean
| CPU Performance rating | |
| HP ZBook Ultra G1a 14 | |
| HP ZBook 8 G1i 14 | |
| Moyenne de la classe Workstation | |
| Lenovo ThinkPad P14s Gen 6 21RV0017GE | |
| Moyenne Intel Core Ultra 7 255H | |
| Dell Precision 5000 5490 | |
| HP ZBook Firefly 14 G11 | |
| Cinebench R23 / Multi Core | |
| HP ZBook Ultra G1a 14 | |
| Moyenne de la classe Workstation (13971 - 36692, n=26, 2 dernières années) | |
| HP ZBook 8 G1i 14 | |
| Lenovo ThinkPad P14s Gen 6 21RV0017GE | |
| Moyenne Intel Core Ultra 7 255H (16105 - 22578, n=14) | |
| Dell Precision 5000 5490 | |
| HP ZBook Firefly 14 G11 | |
| Cinebench R23 / Single Core | |
| Moyenne Intel Core Ultra 7 255H (1946 - 2152, n=14) | |
| HP ZBook 8 G1i 14 | |
| HP ZBook Ultra G1a 14 | |
| Lenovo ThinkPad P14s Gen 6 21RV0017GE | |
| Moyenne de la classe Workstation (1691 - 2206, n=26, 2 dernières années) | |
| Dell Precision 5000 5490 | |
| HP ZBook Firefly 14 G11 | |
| Cinebench R20 / CPU (Multi Core) | |
| HP ZBook Ultra G1a 14 | |
| Moyenne de la classe Workstation (5327 - 14341, n=26, 2 dernières années) | |
| Moyenne Intel Core Ultra 7 255H (6356 - 8860, n=13) | |
| HP ZBook 8 G1i 14 | |
| Lenovo ThinkPad P14s Gen 6 21RV0017GE | |
| Dell Precision 5000 5490 | |
| HP ZBook Firefly 14 G11 | |
| Cinebench R20 / CPU (Single Core) | |
| Moyenne Intel Core Ultra 7 255H (752 - 826, n=13) | |
| HP ZBook 8 G1i 14 | |
| HP ZBook Ultra G1a 14 | |
| Lenovo ThinkPad P14s Gen 6 21RV0017GE | |
| Moyenne de la classe Workstation (651 - 849, n=26, 2 dernières années) | |
| Dell Precision 5000 5490 | |
| HP ZBook Firefly 14 G11 | |
| Cinebench R15 / CPU Multi 64Bit | |
| HP ZBook Ultra G1a 14 | |
| Moyenne de la classe Workstation (2240 - 5509, n=26, 2 dernières années) | |
| Lenovo ThinkPad P14s Gen 6 21RV0017GE | |
| HP ZBook 8 G1i 14 | |
| Dell Precision 5000 5490 | |
| Moyenne Intel Core Ultra 7 255H (2414 - 3444, n=13) | |
| HP ZBook Firefly 14 G11 | |
| Cinebench R15 / CPU Single 64Bit | |
| HP ZBook Ultra G1a 14 | |
| HP ZBook 8 G1i 14 | |
| Moyenne Intel Core Ultra 7 255H (258 - 322, n=14) | |
| Moyenne de la classe Workstation (191.4 - 324, n=26, 2 dernières années) | |
| HP ZBook Firefly 14 G11 | |
| Dell Precision 5000 5490 | |
| Lenovo ThinkPad P14s Gen 6 21RV0017GE | |
| Blender / v2.79 BMW27 CPU | |
| HP ZBook Firefly 14 G11 | |
| Moyenne Intel Core Ultra 7 255H (157 - 293, n=13) | |
| Dell Precision 5000 5490 | |
| Moyenne de la classe Workstation (91 - 261, n=26, 2 dernières années) | |
| HP ZBook 8 G1i 14 | |
| Lenovo ThinkPad P14s Gen 6 21RV0017GE | |
| HP ZBook Ultra G1a 14 | |
| 7-Zip 18.03 / 7z b 4 | |
| HP ZBook Ultra G1a 14 | |
| Moyenne de la classe Workstation (53407 - 109760, n=26, 2 dernières années) | |
| Lenovo ThinkPad P14s Gen 6 21RV0017GE | |
| Dell Precision 5000 5490 | |
| HP ZBook 8 G1i 14 | |
| Moyenne Intel Core Ultra 7 255H (42155 - 68627, n=14) | |
| HP ZBook Firefly 14 G11 | |
| 7-Zip 18.03 / 7z b 4 -mmt1 | |
| Moyenne de la classe Workstation (4981 - 6960, n=26, 2 dernières années) | |
| Lenovo ThinkPad P14s Gen 6 21RV0017GE | |
| Moyenne Intel Core Ultra 7 255H (4589 - 6385, n=14) | |
| HP ZBook 8 G1i 14 | |
| HP ZBook Ultra G1a 14 | |
| Dell Precision 5000 5490 | |
| HP ZBook Firefly 14 G11 | |
| Geekbench 6.5 / Multi-Core | |
| HP ZBook Ultra G1a 14 | |
| HP ZBook 8 G1i 14 | |
| Moyenne Intel Core Ultra 7 255H (11979 - 17489, n=14) | |
| Lenovo ThinkPad P14s Gen 6 21RV0017GE | |
| Moyenne de la classe Workstation (10518 - 20630, n=25, 2 dernières années) | |
| Dell Precision 5000 5490 | |
| HP ZBook Firefly 14 G11 | |
| Geekbench 6.5 / Single-Core | |
| HP ZBook 8 G1i 14 | |
| Lenovo ThinkPad P14s Gen 6 21RV0017GE | |
| Moyenne Intel Core Ultra 7 255H (2712 - 2925, n=14) | |
| HP ZBook Ultra G1a 14 | |
| Moyenne de la classe Workstation (2384 - 2939, n=25, 2 dernières années) | |
| HP ZBook Firefly 14 G11 | |
| Dell Precision 5000 5490 | |
| Geekbench 5.5 / Multi-Core | |
| HP ZBook Ultra G1a 14 | |
| HP ZBook 8 G1i 14 | |
| Moyenne de la classe Workstation (9968 - 24910, n=26, 2 dernières années) | |
| Lenovo ThinkPad P14s Gen 6 21RV0017GE | |
| Moyenne Intel Core Ultra 7 255H (11348 - 17218, n=13) | |
| Dell Precision 5000 5490 | |
| HP ZBook Firefly 14 G11 | |
| Geekbench 5.5 / Single-Core | |
| Lenovo ThinkPad P14s Gen 6 21RV0017GE | |
| HP ZBook 8 G1i 14 | |
| HP ZBook Ultra G1a 14 | |
| Moyenne Intel Core Ultra 7 255H (1938 - 2121, n=13) | |
| Moyenne de la classe Workstation (1740 - 2130, n=26, 2 dernières années) | |
| HP ZBook Firefly 14 G11 | |
| Dell Precision 5000 5490 | |
| HWBOT x265 Benchmark v2.2 / 4k Preset | |
| HP ZBook Ultra G1a 14 | |
| Lenovo ThinkPad P14s Gen 6 21RV0017GE | |
| Moyenne de la classe Workstation (14.4 - 36.8, n=26, 2 dernières années) | |
| HP ZBook 8 G1i 14 | |
| Moyenne Intel Core Ultra 7 255H (13.7 - 25.8, n=13) | |
| Dell Precision 5000 5490 | |
| HP ZBook Firefly 14 G11 | |
| LibreOffice / 20 Documents To PDF | |
| HP ZBook Ultra G1a 14 | |
| Lenovo ThinkPad P14s Gen 6 21RV0017GE | |
| HP ZBook Firefly 14 G11 | |
| Moyenne de la classe Workstation (37.1 - 74.7, n=26, 2 dernières années) | |
| Moyenne Intel Core Ultra 7 255H (41.2 - 61.6, n=13) | |
| HP ZBook 8 G1i 14 | |
| Dell Precision 5000 5490 | |
| R Benchmark 2.5 / Overall mean | |
| Dell Precision 5000 5490 | |
| HP ZBook Firefly 14 G11 | |
| Moyenne Intel Core Ultra 7 255H (0.4233 - 0.515, n=13) | |
| Moyenne de la classe Workstation (0.3825 - 0.603, n=26, 2 dernières années) | |
| HP ZBook 8 G1i 14 | |
| Lenovo ThinkPad P14s Gen 6 21RV0017GE | |
| HP ZBook Ultra G1a 14 | |
* ... Moindre est la valeur, meilleures sont les performances
AIDA64: FP32 Ray-Trace | FPU Julia | CPU SHA3 | CPU Queen | FPU SinJulia | FPU Mandel | CPU AES | CPU ZLib | FP64 Ray-Trace | CPU PhotoWorxx
| Performance rating | |
| HP ZBook Ultra G1a 14 | |
| Lenovo ThinkPad P14s Gen 6 21RV0017GE | |
| Moyenne de la classe Workstation | |
| HP ZBook 8 G1i 14 | |
| Dell Precision 5000 5490 | |
| Moyenne Intel Core Ultra 7 255H | |
| HP ZBook Firefly 14 G11 | |
| AIDA64 / FP32 Ray-Trace | |
| HP ZBook Ultra G1a 14 | |
| Lenovo ThinkPad P14s Gen 6 21RV0017GE | |
| Moyenne de la classe Workstation (10658 - 61611, n=27, 2 dernières années) | |
| HP ZBook 8 G1i 14 | |
| Moyenne Intel Core Ultra 7 255H (13863 - 24741, n=11) | |
| Dell Precision 5000 5490 | |
| HP ZBook Firefly 14 G11 | |
| AIDA64 / FPU Julia | |
| HP ZBook Ultra G1a 14 | |
| Lenovo ThinkPad P14s Gen 6 21RV0017GE | |
| Moyenne de la classe Workstation (56664 - 186971, n=27, 2 dernières années) | |
| HP ZBook 8 G1i 14 | |
| Moyenne Intel Core Ultra 7 255H (71030 - 118886, n=11) | |
| Dell Precision 5000 5490 | |
| HP ZBook Firefly 14 G11 | |
| AIDA64 / CPU SHA3 | |
| HP ZBook Ultra G1a 14 | |
| Lenovo ThinkPad P14s Gen 6 21RV0017GE | |
| Moyenne de la classe Workstation (2608 - 8975, n=27, 2 dernières années) | |
| HP ZBook 8 G1i 14 | |
| Moyenne Intel Core Ultra 7 255H (3408 - 5548, n=11) | |
| Dell Precision 5000 5490 | |
| HP ZBook Firefly 14 G11 | |
| AIDA64 / CPU Queen | |
| HP ZBook Ultra G1a 14 | |
| Moyenne de la classe Workstation (60778 - 144411, n=27, 2 dernières années) | |
| Dell Precision 5000 5490 | |
| Lenovo ThinkPad P14s Gen 6 21RV0017GE | |
| HP ZBook Firefly 14 G11 | |
| HP ZBook 8 G1i 14 | |
| Moyenne Intel Core Ultra 7 255H (59098 - 68308, n=11) | |
| AIDA64 / FPU SinJulia | |
| HP ZBook Ultra G1a 14 | |
| Lenovo ThinkPad P14s Gen 6 21RV0017GE | |
| Moyenne de la classe Workstation (7906 - 29343, n=27, 2 dernières années) | |
| Dell Precision 5000 5490 | |
| HP ZBook 8 G1i 14 | |
| HP ZBook Firefly 14 G11 | |
| Moyenne Intel Core Ultra 7 255H (6716 - 8931, n=11) | |
| AIDA64 / FPU Mandel | |
| HP ZBook Ultra G1a 14 | |
| Lenovo ThinkPad P14s Gen 6 21RV0017GE | |
| Moyenne de la classe Workstation (27301 - 98153, n=27, 2 dernières années) | |
| HP ZBook 8 G1i 14 | |
| Moyenne Intel Core Ultra 7 255H (37031 - 63347, n=11) | |
| Dell Precision 5000 5490 | |
| HP ZBook Firefly 14 G11 | |
| AIDA64 / CPU AES | |
| HP ZBook Ultra G1a 14 | |
| Lenovo ThinkPad P14s Gen 6 21RV0017GE | |
| Moyenne de la classe Workstation (56077 - 187841, n=27, 2 dernières années) | |
| Dell Precision 5000 5490 | |
| HP ZBook 8 G1i 14 | |
| Moyenne Intel Core Ultra 7 255H (58402 - 83398, n=11) | |
| HP ZBook Firefly 14 G11 | |
| AIDA64 / CPU ZLib | |
| HP ZBook Ultra G1a 14 | |
| Moyenne de la classe Workstation (742 - 2116, n=27, 2 dernières années) | |
| Lenovo ThinkPad P14s Gen 6 21RV0017GE | |
| HP ZBook 8 G1i 14 | |
| Dell Precision 5000 5490 | |
| Moyenne Intel Core Ultra 7 255H (822 - 1316, n=11) | |
| HP ZBook Firefly 14 G11 | |
| AIDA64 / FP64 Ray-Trace | |
| HP ZBook Ultra G1a 14 | |
| Lenovo ThinkPad P14s Gen 6 21RV0017GE | |
| Moyenne de la classe Workstation (5580 - 32891, n=27, 2 dernières années) | |
| HP ZBook 8 G1i 14 | |
| Moyenne Intel Core Ultra 7 255H (7384 - 13231, n=11) | |
| Dell Precision 5000 5490 | |
| HP ZBook Firefly 14 G11 | |
| AIDA64 / CPU PhotoWorxx | |
| HP ZBook Ultra G1a 14 | |
| Moyenne Intel Core Ultra 7 255H (23836 - 65787, n=11) | |
| HP ZBook 8 G1i 14 | |
| Dell Precision 5000 5490 | |
| Lenovo ThinkPad P14s Gen 6 21RV0017GE | |
| Moyenne de la classe Workstation (24325 - 93684, n=27, 2 dernières années) | |
| HP ZBook Firefly 14 G11 | |
Performance du système
Obtenant les meilleurs scores dans les tests de performance du système, le HP ZBook 8 G1i 14 est également très performant dans l'utilisation quotidienne.
PCMark 10: Score | Essentials | Productivity | Digital Content Creation
CrossMark: Overall | Productivity | Creativity | Responsiveness
WebXPRT 3: Overall
WebXPRT 4: Overall
Mozilla Kraken 1.1: Total
| Performance rating | |
| HP ZBook 8 G1i 14 | |
| Moyenne Intel Core Ultra 7 255H, Intel Arc Graphics 140T | |
| HP ZBook Ultra G1a 14 | |
| Lenovo ThinkPad P14s Gen 6 21RV0017GE | |
| Moyenne de la classe Workstation | |
| Dell Precision 5000 5490 | |
| HP ZBook Firefly 14 G11 | |
| PCMark 10 / Score | |
| HP ZBook Ultra G1a 14 | |
| HP ZBook 8 G1i 14 | |
| Moyenne Intel Core Ultra 7 255H, Intel Arc Graphics 140T (6878 - 7883, n=11) | |
| Moyenne de la classe Workstation (6436 - 8519, n=25, 2 dernières années) | |
| Lenovo ThinkPad P14s Gen 6 21RV0017GE | |
| Dell Precision 5000 5490 | |
| HP ZBook Firefly 14 G11 | |
| PCMark 10 / Essentials | |
| Dell Precision 5000 5490 | |
| HP ZBook 8 G1i 14 | |
| Lenovo ThinkPad P14s Gen 6 21RV0017GE | |
| Moyenne Intel Core Ultra 7 255H, Intel Arc Graphics 140T (10637 - 11556, n=11) | |
| HP ZBook Ultra G1a 14 | |
| Moyenne de la classe Workstation (9622 - 11195, n=25, 2 dernières années) | |
| HP ZBook Firefly 14 G11 | |
| PCMark 10 / Productivity | |
| Lenovo ThinkPad P14s Gen 6 21RV0017GE | |
| HP ZBook 8 G1i 14 | |
| Moyenne de la classe Workstation (8829 - 10548, n=25, 2 dernières années) | |
| HP ZBook Firefly 14 G11 | |
| Moyenne Intel Core Ultra 7 255H, Intel Arc Graphics 140T (7598 - 10842, n=11) | |
| Dell Precision 5000 5490 | |
| HP ZBook Ultra G1a 14 | |
| PCMark 10 / Digital Content Creation | |
| HP ZBook Ultra G1a 14 | |
| HP ZBook 8 G1i 14 | |
| Moyenne Intel Core Ultra 7 255H, Intel Arc Graphics 140T (10461 - 12456, n=11) | |
| Moyenne de la classe Workstation (7744 - 15631, n=25, 2 dernières années) | |
| Dell Precision 5000 5490 | |
| Lenovo ThinkPad P14s Gen 6 21RV0017GE | |
| HP ZBook Firefly 14 G11 | |
| CrossMark / Overall | |
| HP ZBook Ultra G1a 14 | |
| Moyenne Intel Core Ultra 7 255H, Intel Arc Graphics 140T (1610 - 2018, n=11) | |
| HP ZBook 8 G1i 14 | |
| Lenovo ThinkPad P14s Gen 6 21RV0017GE | |
| Moyenne de la classe Workstation (1307 - 2208, n=25, 2 dernières années) | |
| Dell Precision 5000 5490 | |
| HP ZBook Firefly 14 G11 | |
| CrossMark / Productivity | |
| Moyenne Intel Core Ultra 7 255H, Intel Arc Graphics 140T (1566 - 1908, n=11) | |
| HP ZBook 8 G1i 14 | |
| Lenovo ThinkPad P14s Gen 6 21RV0017GE | |
| Moyenne de la classe Workstation (1130 - 2020, n=25, 2 dernières années) | |
| Dell Precision 5000 5490 | |
| HP ZBook Ultra G1a 14 | |
| HP ZBook Firefly 14 G11 | |
| CrossMark / Creativity | |
| HP ZBook Ultra G1a 14 | |
| HP ZBook 8 G1i 14 | |
| Lenovo ThinkPad P14s Gen 6 21RV0017GE | |
| Moyenne Intel Core Ultra 7 255H, Intel Arc Graphics 140T (1827 - 2396, n=11) | |
| Moyenne de la classe Workstation (1655 - 2575, n=25, 2 dernières années) | |
| Dell Precision 5000 5490 | |
| HP ZBook Firefly 14 G11 | |
| CrossMark / Responsiveness | |
| Moyenne Intel Core Ultra 7 255H, Intel Arc Graphics 140T (1194 - 1781, n=11) | |
| Lenovo ThinkPad P14s Gen 6 21RV0017GE | |
| Moyenne de la classe Workstation (993 - 1908, n=25, 2 dernières années) | |
| HP ZBook Ultra G1a 14 | |
| Dell Precision 5000 5490 | |
| HP ZBook 8 G1i 14 | |
| HP ZBook Firefly 14 G11 | |
| WebXPRT 3 / Overall | |
| Lenovo ThinkPad P14s Gen 6 21RV0017GE | |
| HP ZBook 8 G1i 14 | |
| Moyenne Intel Core Ultra 7 255H, Intel Arc Graphics 140T (273 - 327, n=11) | |
| Moyenne de la classe Workstation (259 - 415, n=26, 2 dernières années) | |
| HP ZBook Firefly 14 G11 | |
| Dell Precision 5000 5490 | |
| HP ZBook Ultra G1a 14 | |
| WebXPRT 4 / Overall | |
| HP ZBook 8 G1i 14 | |
| Moyenne Intel Core Ultra 7 255H, Intel Arc Graphics 140T (247 - 317, n=11) | |
| Lenovo ThinkPad P14s Gen 6 21RV0017GE | |
| Dell Precision 5000 5490 | |
| Moyenne de la classe Workstation (189.2 - 315, n=24, 2 dernières années) | |
| HP ZBook Firefly 14 G11 | |
| HP ZBook Ultra G1a 14 | |
| Mozilla Kraken 1.1 / Total | |
| Dell Precision 5000 5490 | |
| HP ZBook Firefly 14 G11 | |
| Moyenne de la classe Workstation (424 - 571, n=26, 2 dernières années) | |
| Moyenne Intel Core Ultra 7 255H, Intel Arc Graphics 140T (427 - 510, n=11) | |
| Lenovo ThinkPad P14s Gen 6 21RV0017GE | |
| HP ZBook 8 G1i 14 | |
| HP ZBook Ultra G1a 14 | |
* ... Moindre est la valeur, meilleures sont les performances
| PCMark 10 Score | 7865 points | |
Aide | ||
| AIDA64 / Memory Copy | |
| HP ZBook Ultra G1a 14 | |
| Dell Precision 5000 5490 | |
| Moyenne Intel Core Ultra 7 255H (39188 - 108302, n=11) | |
| HP ZBook 8 G1i 14 | |
| Moyenne de la classe Workstation (34323 - 164795, n=27, 2 dernières années) | |
| HP ZBook Firefly 14 G11 | |
| Lenovo ThinkPad P14s Gen 6 21RV0017GE | |
| AIDA64 / Memory Read | |
| HP ZBook Ultra G1a 14 | |
| HP ZBook 8 G1i 14 | |
| Dell Precision 5000 5490 | |
| Lenovo ThinkPad P14s Gen 6 21RV0017GE | |
| Moyenne Intel Core Ultra 7 255H (43703 - 90552, n=11) | |
| HP ZBook Firefly 14 G11 | |
| Moyenne de la classe Workstation (30787 - 121563, n=27, 2 dernières années) | |
| AIDA64 / Memory Write | |
| HP ZBook Ultra G1a 14 | |
| Dell Precision 5000 5490 | |
| Moyenne de la classe Workstation (39362 - 214520, n=27, 2 dernières années) | |
| Lenovo ThinkPad P14s Gen 6 21RV0017GE | |
| HP ZBook 8 G1i 14 | |
| Moyenne Intel Core Ultra 7 255H (36438 - 82641, n=11) | |
| HP ZBook Firefly 14 G11 | |
| AIDA64 / Memory Latency | |
| HP ZBook Ultra G1a 14 | |
| Dell Precision 5000 5490 | |
| Moyenne Intel Core Ultra 7 255H (110.1 - 147.2, n=11) | |
| HP ZBook Firefly 14 G11 | |
| Moyenne de la classe Workstation (84.5 - 165.2, n=27, 2 dernières années) | |
| HP ZBook 8 G1i 14 | |
| Lenovo ThinkPad P14s Gen 6 21RV0017GE | |
* ... Moindre est la valeur, meilleures sont les performances
Latence DPC
L'ordinateur portable HP n'a pas présenté de problèmes liés à la latence du DPC lors de nos tests.
| DPC Latencies / LatencyMon - interrupt to process latency (max), Web, Youtube, Prime95 | |
| HP ZBook Firefly 14 G11 | |
| Dell Precision 5000 5490 | |
| HP ZBook 8 G1i 14 | |
| Lenovo ThinkPad P14s Gen 6 21RV0017GE | |
* ... Moindre est la valeur, meilleures sont les performances
Dispositifs de stockage
HP utilise un SSD SK Hynix M.2 2280 rapide qui est connecté au système via NVMe PCIe 4.0. Bien que le SSD soit en effet de bonne qualité, il souffre un peu de l'étranglement thermique sous charge. Sa vitesse est réduite de moitié en cas de charge soutenue.

* ... Moindre est la valeur, meilleures sont les performances
Throttoir de disque : Boucle de lecture DiskSpd, profondeur de la file d'attente 8
Performance du GPU
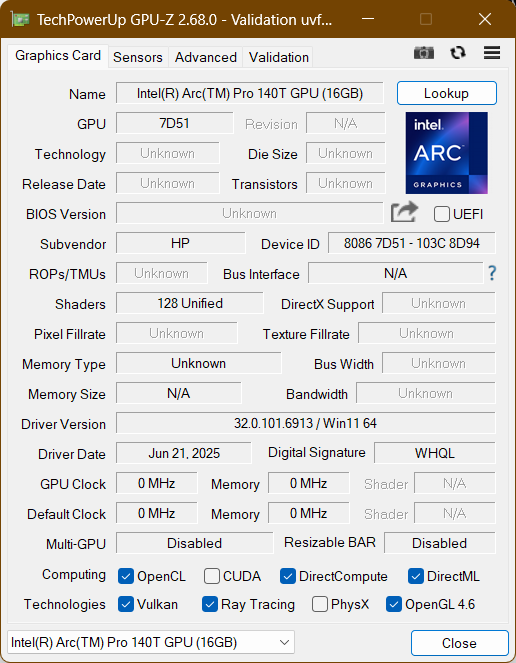
Le GPU du ZBook 8 G1i 14 est l'un des aspects les plus intéressants. Habituellement, les stations de travail utilisent un GPU dédié, mais HP utilise la solution intégrée d'Intel. Certaines stations de travail basées sur AMD ont adopté cette approche depuis quelques années, avec plus ou moins de succès. Dans ce cas, il ne s'agit clairement pas d'une solution très puissante, car le processeur Intel ARC 140T ne peut même pas rivaliser avec l'iGPU AMD intégré du Strix Point. Il est certainement utilisable pour un rendu très basique, mais pas pour des projets plus importants. Dans le benchmark SPECviewperf, il se classe dernier.
| 3DMark 11 Performance | 13217 points | |
| 3DMark Fire Strike Score | 7981 points | |
| 3DMark Time Spy Score | 4294 points | |
Aide | ||
* ... Moindre est la valeur, meilleures sont les performances
| Performance rating - Percent | |
| HP ZBook Ultra G1a 14 | |
| Moyenne de la classe Workstation | |
| Dell Precision 5000 5490 -1! | |
| HP ZBook Firefly 14 G11 -1! | |
| Lenovo ThinkPad P14s Gen 6 21RV0017GE | |
| HP ZBook 8 G1i 14 | |
| Cyberpunk 2077 2.2 Phantom Liberty - 1920x1080 Ultra Preset (FSR off) | |
| HP ZBook Ultra G1a 14 | |
| Moyenne de la classe Workstation (19.6 - 144, n=23, 2 dernières années) | |
| Dell Precision 5000 5490 | |
| Lenovo ThinkPad P14s Gen 6 21RV0017GE | |
| HP ZBook 8 G1i 14 | |
| HP ZBook Firefly 14 G11 | |
| Baldur's Gate 3 - 1920x1080 Ultra Preset AA:T | |
| HP ZBook Ultra G1a 14 | |
| Moyenne de la classe Workstation (23.7 - 204, n=21, 2 dernières années) | |
| Dell Precision 5000 5490 | |
| HP ZBook Firefly 14 G11 | |
| HP ZBook 8 G1i 14 | |
| Lenovo ThinkPad P14s Gen 6 21RV0017GE | |
| GTA V - 1920x1080 Highest Settings possible AA:4xMSAA + FX AF:16x | |
| HP ZBook Ultra G1a 14 | |
| Moyenne de la classe Workstation (18.1 - 145.6, n=23, 2 dernières années) | |
| Lenovo ThinkPad P14s Gen 6 21RV0017GE | |
| HP ZBook 8 G1i 14 | |
| Final Fantasy XV Benchmark - 1920x1080 High Quality | |
| HP ZBook Ultra G1a 14 | |
| Moyenne de la classe Workstation (25.2 - 184.2, n=26, 2 dernières années) | |
| Dell Precision 5000 5490 | |
| HP ZBook 8 G1i 14 | |
| HP ZBook Firefly 14 G11 | |
| Lenovo ThinkPad P14s Gen 6 21RV0017GE | |
| Dota 2 Reborn - 1920x1080 ultra (3/3) best looking | |
| HP ZBook Ultra G1a 14 | |
| Dell Precision 5000 5490 | |
| Moyenne de la classe Workstation (50.7 - 178.4, n=26, 2 dernières années) | |
| HP ZBook Firefly 14 G11 | |
| HP ZBook 8 G1i 14 | |
| Lenovo ThinkPad P14s Gen 6 21RV0017GE | |
Cyberpunk 2077 ultra FPS Chart
| Bas | Moyen | Élevé | Ultra | QHD | |
|---|---|---|---|---|---|
| GTA V (2015) | 179.2 | 169.1 | 44.4 | 18.1 | 12.3 |
| Dota 2 Reborn (2015) | 105.6 | 91.2 | 69.6 | 83.2 | |
| Final Fantasy XV Benchmark (2018) | 88.7 | 44.9 | 31.7 | 23.4 | |
| X-Plane 11.11 (2018) | 58.8 | 47.3 | 36.1 | ||
| Baldur's Gate 3 (2023) | 41.5 | 32.6 | 28.3 | 27.8 | 19.5 |
| Cyberpunk 2077 2.2 Phantom Liberty (2023) | 38.4 | 30.8 | 27.5 | 24.8 | 15.8 |
| F1 25 (2025) | 70.8 | 59.4 | 46.9 | 9.58 |
Émissions et consommation d'énergie : Les haut-parleurs du HP ZBook sont puissants
Bruit du système
Dans l'ensemble, le HP ZBook 8 G1i 14 n'est pas un système bruyant, car les ventilateurs restent éteints lors d'une utilisation quotidienne normale. Même en cas de charge maximale soutenue, lorsque les ventilateurs se mettent en marche, ils ne s'emballent pas, avec un maximum de 44,1 dB(a).
Le bruit de la bobine n'a pas été un problème avec cet ordinateur portable HP.
Degré de la nuisance sonore
| Au repos |
| 24.9 / 24.9 / 30.3 dB(A) |
| Fortement sollicité |
| 44.1 / 44.1 dB(A) |
 | ||
30 dB silencieux 40 dB(A) audible 50 dB(A) bruyant |
||
min: | ||
| HP ZBook 8 G1i 14 Arc 140T, Ultra 7 255H, SK hynix PC801 HFS001TEJ9X101N | HP ZBook Firefly 14 G11 RTX A500 Laptop GPU, Ultra 7 165H, Kioxia XG8 KXG80ZNV512G | Lenovo ThinkPad P14s Gen 6 21RV0017GE Radeon 890M, Ryzen AI 9 HX PRO 370, SK hynix PC801 HFS001TEJ9X162N | HP ZBook Ultra G1a 14 Radeon 8060S, Ryzen AI Max+ PRO 395, WDC PC SN810 2TB | Dell Precision 5000 5490 NVIDIA RTX 3000 Ada Generation Laptop GPU, Ultra 9 185H, Kioxia XG8 KXG80ZNV1T02 | |
|---|---|---|---|---|---|
| Noise | 3% | 4% | -1% | 5% | |
| arrêt / environnement * (dB) | 24.9 | 24.3 2% | 24.5 2% | 23.9 4% | 22.8 8% |
| Idle Minimum * (dB) | 24.9 | 24.6 1% | 24.5 2% | 23.9 4% | 23.8 4% |
| Idle Average * (dB) | 24.9 | 25.2 -1% | 24.5 2% | 23.9 4% | 23.8 4% |
| Idle Maximum * (dB) | 30.3 | 26.8 12% | 24.5 19% | 26.8 12% | 24.7 18% |
| Load Average * (dB) | 44.1 | 38.9 12% | 36.5 17% | 42.2 4% | 38.9 12% |
| Cyberpunk 2077 ultra * (dB) | 40.4 | 41.8 -3% | 44.7 -11% | 49.1 -22% | |
| Load Maximum * (dB) | 44.1 | 45.8 -4% | 44.9 -2% | 49.2 -12% | 51.4 -17% |
| Witcher 3 ultra * (dB) | 49.9 |
* ... Moindre est la valeur, meilleures sont les performances
Température
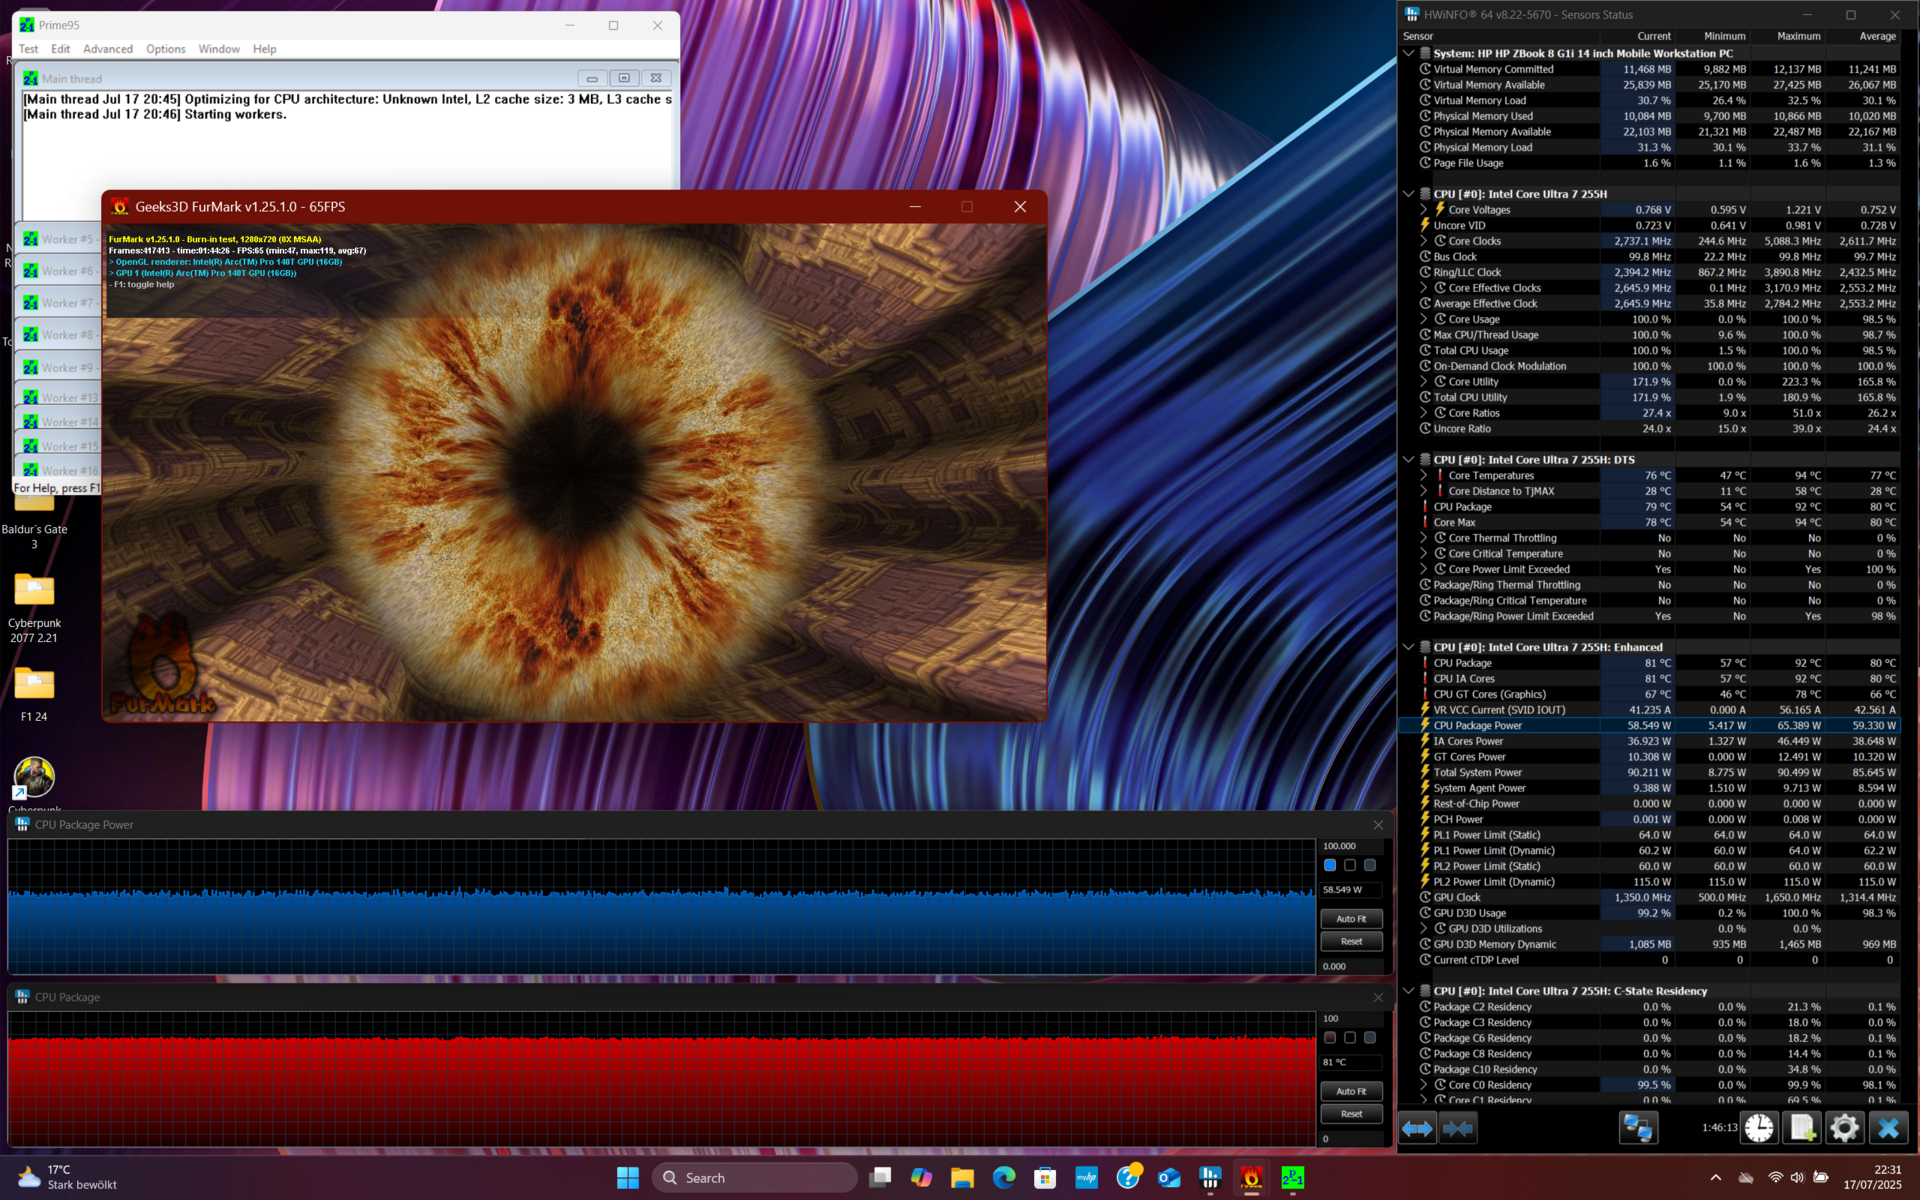
Avec un peu plus de 40,3 degrés Celsius ou 105 F, le HP ZBook 8 G1i 14 ne chauffe pas du tout sous charge. La zone de l'appui-paume reste également assez froide, même sous une charge soutenue.
Il n'y a pas de ralentissement pendant le test de stress.
(±) La température maximale du côté supérieur est de 40.3 °C / 105 F, par rapport à la moyenne de 38.3 °C / 101 F, allant de 22.2 à 69.8 °C pour la classe Workstation.
(+) Le fond chauffe jusqu'à un maximum de 38.4 °C / 101 F, contre une moyenne de 41.3 °C / 106 F
(+) En utilisation inactive, la température moyenne du côté supérieur est de 27.4 °C / 81 F, par rapport à la moyenne du dispositif de 32 °C / 90 F.
(±) 3: The average temperature for the upper side is 32.3 °C / 90 F, compared to the average of 32 °C / 90 F for the class Workstation.
(+) Les repose-poignets et le pavé tactile sont plus froids que la température de la peau avec un maximum de 29.3 °C / 84.7 F et sont donc froids au toucher.
(±) La température moyenne de la zone de l'appui-paume de dispositifs similaires était de 27.9 °C / 82.2 F (-1.4 °C / #-2.5 F).
| HP ZBook 8 G1i 14 Intel Core Ultra 7 255H, Intel Arc Graphics 140T | HP ZBook Firefly 14 G11 Intel Core Ultra 7 165H, NVIDIA RTX A500 Laptop GPU | Lenovo ThinkPad P14s Gen 6 21RV0017GE AMD Ryzen AI 9 HX PRO 370, AMD Radeon 890M | HP ZBook Ultra G1a 14 AMD Ryzen AI Max+ PRO 395, AMD Radeon 8060S | Dell Precision 5000 5490 Intel Core Ultra 9 185H, NVIDIA RTX 3000 Ada Generation Laptop GPU | |
|---|---|---|---|---|---|
| Heat | -7% | -14% | -6% | -4% | |
| Maximum Upper Side * (°C) | 40.3 | 42.8 -6% | 50.5 -25% | 41.4 -3% | 43.2 -7% |
| Maximum Bottom * (°C) | 38.4 | 44 -15% | 50.2 -31% | 36.6 5% | 38.4 -0% |
| Idle Upper Side * (°C) | 29.4 | 30.6 -4% | 29.1 1% | 34 -16% | 31.6 -7% |
| Idle Bottom * (°C) | 30.3 | 31.4 -4% | 30.1 1% | 33.6 -11% | 30.6 -1% |
* ... Moindre est la valeur, meilleures sont les performances
Intervenants
Une véritable explosion : Les haut-parleurs de l'ordinateur portable HP ZBook sont bien supérieurs aux haut-parleurs des ordinateurs concurrents Lenovo ThinkPad P14s Gen 6 AMD. En termes de volume et de qualité des haut-parleurs, l'appareil HP surpasse l'ordinateur portable ThinkPad.
HP ZBook 8 G1i 14 analyse audio
(+) | les haut-parleurs peuvent jouer relativement fort (87.8# dB)
Basses 100 - 315 Hz
(-) | presque aucune basse - en moyenne 15% plus bas que la médiane
(±) | la linéarité des basses est moyenne (11.7% delta à la fréquence précédente)
Médiums 400 - 2000 Hz
(+) | médiane équilibrée - seulement 2% de la médiane
(+) | les médiums sont linéaires (3.4% delta à la fréquence précédente)
Aiguës 2 - 16 kHz
(+) | des sommets équilibrés - à seulement 4.3% de la médiane
(+) | les aigus sont linéaires (5.3% delta à la fréquence précédente)
Globalement 100 - 16 000 Hz
(+) | le son global est linéaire (10.6% différence à la médiane)
Par rapport à la même classe
» 7% de tous les appareils testés de cette catégorie étaient meilleurs, 5% similaires, 89% pires
» Le meilleur avait un delta de 7%, la moyenne était de 18%, le pire était de 35%.
Par rapport à tous les appareils testés
» 5% de tous les appareils testés étaient meilleurs, 1% similaires, 94% pires
» Le meilleur avait un delta de 4%, la moyenne était de 24%, le pire était de 134%.
Lenovo ThinkPad P14s Gen 6 21RV0017GE analyse audio
(±) | le niveau sonore du haut-parleur est moyen mais bon (78# dB)
Basses 100 - 315 Hz
(-) | presque aucune basse - en moyenne 16.2% plus bas que la médiane
(±) | la linéarité des basses est moyenne (12.4% delta à la fréquence précédente)
Médiums 400 - 2000 Hz
(±) | médiane supérieure - en moyenne 6% supérieure à la médiane
(+) | les médiums sont linéaires (3.3% delta à la fréquence précédente)
Aiguës 2 - 16 kHz
(+) | des sommets équilibrés - à seulement 1.9% de la médiane
(+) | les aigus sont linéaires (3.9% delta à la fréquence précédente)
Globalement 100 - 16 000 Hz
(±) | la linéarité du son global est moyenne (17.4% de différence avec la médiane)
Par rapport à la même classe
» 50% de tous les appareils testés de cette catégorie étaient meilleurs, 11% similaires, 39% pires
» Le meilleur avait un delta de 7%, la moyenne était de 18%, le pire était de 35%.
Par rapport à tous les appareils testés
» 32% de tous les appareils testés étaient meilleurs, 8% similaires, 60% pires
» Le meilleur avait un delta de 4%, la moyenne était de 24%, le pire était de 134%.
Consommation électrique
La consommation d'énergie est légèrement inférieure au ralenti, mais légèrement supérieure en charge, par rapport au HP ZBook Firefly G11. C'est logique, car l'absence de GPU dédié et le CPU Arrow Lake plus efficace amélioreraient l'efficacité au ralenti, mais la limite de puissance plus élevée avec le refroidissement à double ventilateur l'augmenterait sous charge.
L'ordinateur portable HP reste dans l'enveloppe du chargeur USB-C de 100 W.
| Éteint/en veille | |
| Au repos | |
| Fortement sollicité |
|
Légende:
min: | |
Consommation électrique Cyberpunk / Stress Test
Consommation électrique du moniteur externe
Autonomie de la batterie
Malgré l'utilisation d'un écran haute résolution et d'un processeur de classe H, l'autonomie du HP ZBook 8 G1i 14 est bonne. 12 heures lors de notre test de navigation Wi-Fi (luminosité de l'écran de 150 cd/m²) est respectable, surtout dans la catégorie des stations de travail gourmandes en énergie.
| HP ZBook 8 G1i 14 Ultra 7 255H, Arc 140T, 77 Wh | HP ZBook Firefly 14 G11 Ultra 7 165H, RTX A500 Laptop GPU, 56 Wh | Lenovo ThinkPad P14s Gen 6 21RV0017GE Ryzen AI 9 HX PRO 370, Radeon 890M, 57 Wh | HP ZBook Ultra G1a 14 Ryzen AI Max+ PRO 395, Radeon 8060S, 74.5 Wh | Dell Precision 5000 5490 Ultra 9 185H, NVIDIA RTX 3000 Ada Generation Laptop GPU, 72 Wh | Moyenne de la classe Workstation | |
|---|---|---|---|---|---|---|
| Autonomie de la batterie | -28% | -11% | -42% | -8% | -7% | |
| WiFi v1.3 (h) | 12 | 8.6 -28% | 9.3 -22% | 7 -42% | 11 -8% | 8.15 ? -32% |
| Load (h) | 1.1 | 1.1 0% | 1.304 ? 19% |
Notebookcheck Rating
Le HP ZBook 8 G1i est un très bon choix pour un ordinateur portable de travail puissant. Notre configuration spécifique est particulièrement adaptée aux tâches lourdes pour le processeur. L'appareil ne présente pas d'énormes faiblesses.
HP ZBook 8 G1i 14
- 10/14/2025 v8
Benjamin Herzig
 Total Sustainability Score:
 Comparaison avec des concurrents potentiels
Image | Modèle | Prix | Poids | Épaisseur | Écran |
|---|---|---|---|---|---|
1. 82% 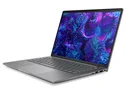 | HP ZBook 8 G1i 14 Intel Core Ultra 7 255H ⎘ Intel Arc Graphics 140T ⎘ 32 Go Mémoire, 1024 Go SSD | Amazon: $2,968.00 Prix de liste: 1860 Euro | 1.7 kg | 23 mm | 14.00" 2560x1600 216 PPI IPS LED |
2. 80.3%  | HP ZBook Firefly 14 G11 Intel Core Ultra 7 165H ⎘ NVIDIA RTX A500 Laptop GPU ⎘ 32 Go Mémoire, 512 Go SSD | Amazon: $2,199.00 Prix de liste: 3500 USD | 1.5 kg | 19.2 mm | 14.00" 2560x1600 216 PPI IPS |
3. 81.6% 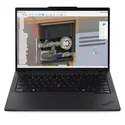 | Lenovo ThinkPad P14s Gen 6 21RV0017GE AMD Ryzen AI 9 HX PRO 370 ⎘ AMD Radeon 890M ⎘ 64 Go Mémoire, 1024 Go SSD | Amazon: 1. $1,120.00 Lenovo ThinkPad P14s Gen 6 L... 2. $1,316.80 Lenovo ThinkPad P14s Gen 6 L... 3. $1,434.00 Lenovo ThinkPad P14s Gen 5 L... Prix de liste: 2289 Euro | 1.4 kg | 22 mm | 14.00" 1920x1200 162 PPI IPS LED |
4. 87.4% 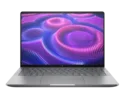 | HP ZBook Ultra G1a 14 AMD Ryzen AI Max+ PRO 395 ⎘ AMD Radeon 8060S ⎘ 128 Go Mémoire, 2048 Go SSD | Amazon: 1. $3,699.77 HP ZBook Ultra G1a 14" Touch... 2. $3,285.35 HP ZBook Ultra G1a 14" Touch... 3. $2,655.19 HP ZBook Ultra G1a 14" Mobil... Prix de liste: 4000 USD | 1.6 kg | 18.5 mm | 14.00" 2880x1800 243 PPI OLED |
5. 89.3% v7 (old)  | Dell Precision 5000 5490 Intel Core Ultra 9 185H ⎘ NVIDIA RTX 3000 Ada Generation Laptop GPU ⎘ 64 Go Mémoire, 1024 Go SSD | Amazon: $1,603.92 Prix de liste: 3800 USD | 1.6 kg | 18.95 mm | 14.00" 2560x1600 216 PPI IPS |
Transparency
La sélection des appareils à examiner est effectuée par notre équipe éditoriale. L'échantillon de test a été prêté à l'auteur par le fabricant ou le détaillant pour les besoins de cet examen. Le prêteur n'a pas eu d'influence sur cette évaluation et le fabricant n'a pas reçu de copie de cette évaluation avant sa publication. Il n'y avait aucune obligation de publier cet article. En tant que média indépendant, Notebookcheck n'est pas soumis à l'autorité des fabricants, des détaillants ou des éditeurs.
Voici comment Notebookcheck teste
Chaque année, Notebookcheck examine de manière indépendante des centaines d'ordinateurs portables et de smartphones en utilisant des procédures standardisées afin de garantir que tous les résultats sont comparables. Nous avons continuellement développé nos méthodes de test depuis environ 20 ans et avons établi des normes industrielles dans le processus. Dans nos laboratoires de test, des équipements de mesure de haute qualité sont utilisés par des techniciens et des rédacteurs expérimentés. Ces tests impliquent un processus de validation en plusieurs étapes. Notre système d'évaluation complexe repose sur des centaines de mesures et de points de référence bien fondés, ce qui garantit l'objectivité.
