Test de l'ordinateur portable MSI Pulse GL76 : tGP 105 W GeForce Graphique RTX 3070
Le Pulse GL76 est un ordinateur portable de jeu MSI de milieu de gamme qui se situe entre les séries Katana ou Sword, moins chères, et les séries GE Raider ou GT Titan, plus onéreuses. Il s'agit essentiellement de la version 17,3 pouces du modèle plus petit de 15,6 pouces Pulse GL66. Les modèles 2021 et 2022 GL76 ont des châssis identiques.
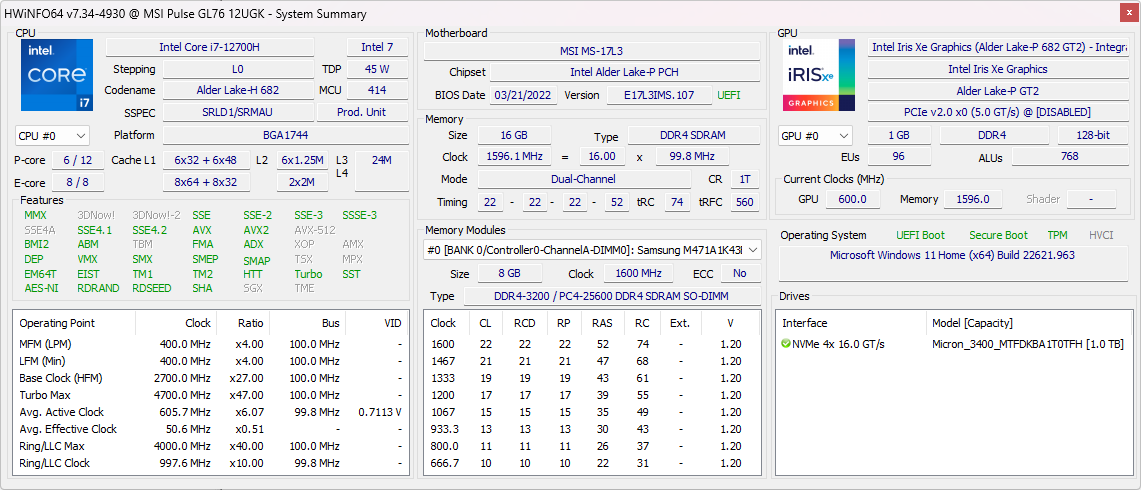
L'unité que nous avons examinée est une configuration haut de gamme avec le processeur Core i7-12700H de 12e génération, le GPU RTX 3070 de 105 W de GeForce et l'écran IPS 1080p de 360 Hz pour un prix de détail d'environ 1300 $ US. D'autres SKU sont disponibles avec des taux de rafraîchissement d'écran plus faibles, des GPU GeForce RTX 3050/3050 Ti/3060, ou le CPU Core i5-12500H à la place.
Parmi les concurrents du Pulse GL76, on trouve d'autres ordinateurs portables de milieu de gamme de 17,3 pouces pour le jeu, comme le Acer Nitro 5, La série TUF d'Asus, La série HP Victusou la Série G de Dell.
Plus de commentaires sur MSI :
Comparaison avec les concurrents potentiels
Note | Date | Modèle | Poids | Épaisseur | Taille | Résolution | Prix |
|---|---|---|---|---|---|---|---|
| 83.2 % v7 (old) | 01/23 | MSI Pulse GL76 12UGK i7-12700H, GeForce RTX 3070 Laptop GPU | 2.6 kg | 24.2 mm | 17.30" | 1920x1080 | |
| 86.1 % v7 (old) | 01/23 | Alienware m17 R5 (R9 6900HX, RX 6850M XT) R9 6900HX, Radeon RX 6850M XT | 3.4 kg | 26.7 mm | 17.00" | 3840x2160 | |
| 86.9 % v7 (old) | 11/22 | Asus ROG Strix Scar 17 SE G733CX-LL014W i9-12950HX, GeForce RTX 3080 Ti Laptop GPU | 2.9 kg | 28.3 mm | 17.30" | 2560x1440 | |
| 86.5 % v7 (old) | 11/22 | Acer Predator Helios 300 (i7-12700H, RTX 3070 Ti) i7-12700H, GeForce RTX 3070 Ti Laptop GPU | 3 kg | 27.65 mm | 17.30" | 2560x1440 | |
| 89.9 % v7 (old) | 07/22 | Razer Blade 17 Early 2022 i9-12900H, GeForce RTX 3080 Ti Laptop GPU | 2.8 kg | 19.9 mm | 17.30" | 3840x2160 | |
| 86.7 % v7 (old) | 05/22 | MSI Vector GP76 12UGS-434 i7-12700H, GeForce RTX 3070 Ti Laptop GPU | 2.9 kg | 25.9 mm | 17.30" | 1920x1080 |
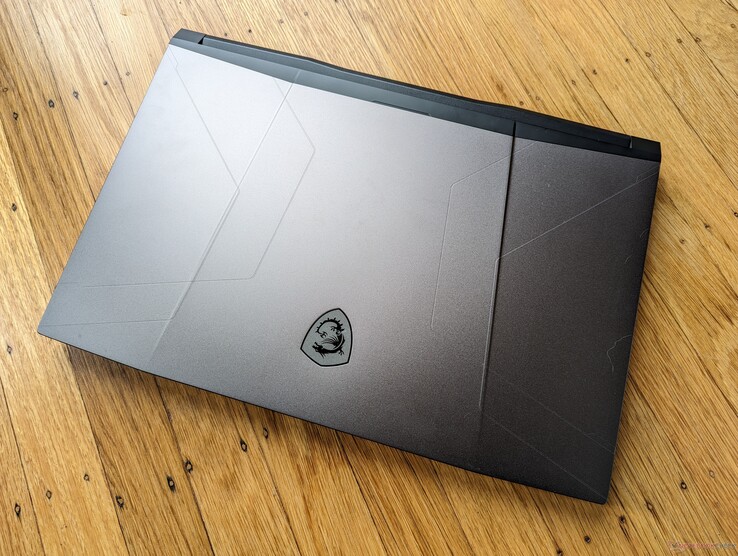
Boîtier - Pas de couleurs fantaisistes ou de LEDs
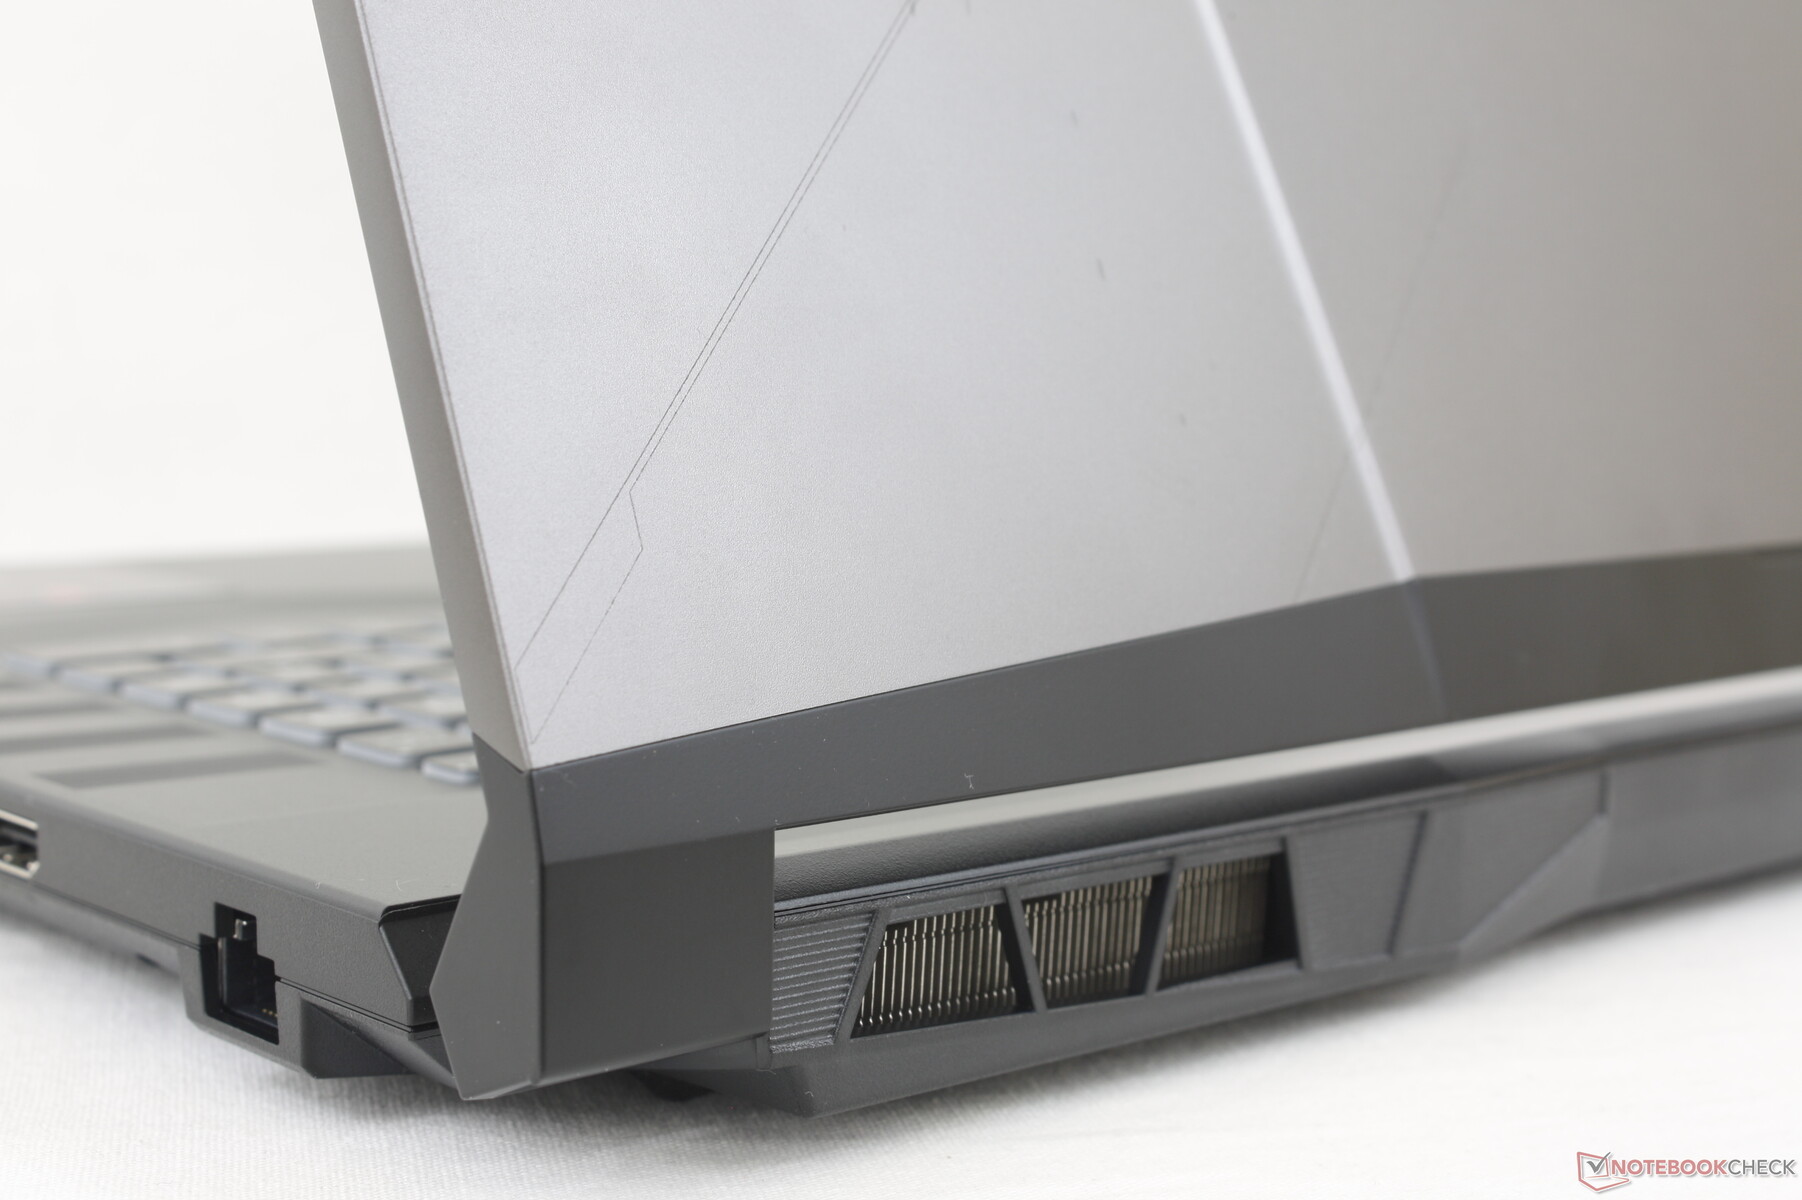
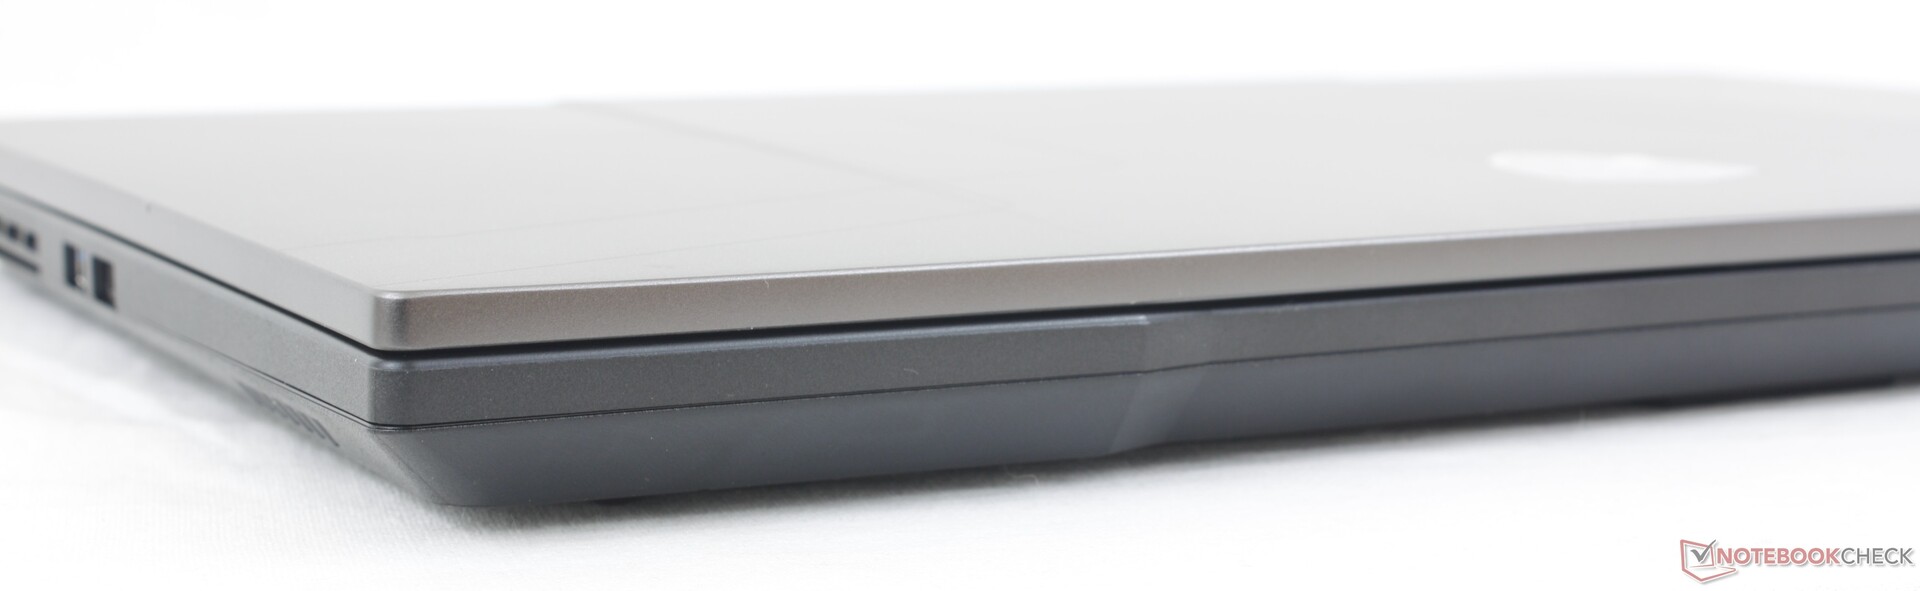
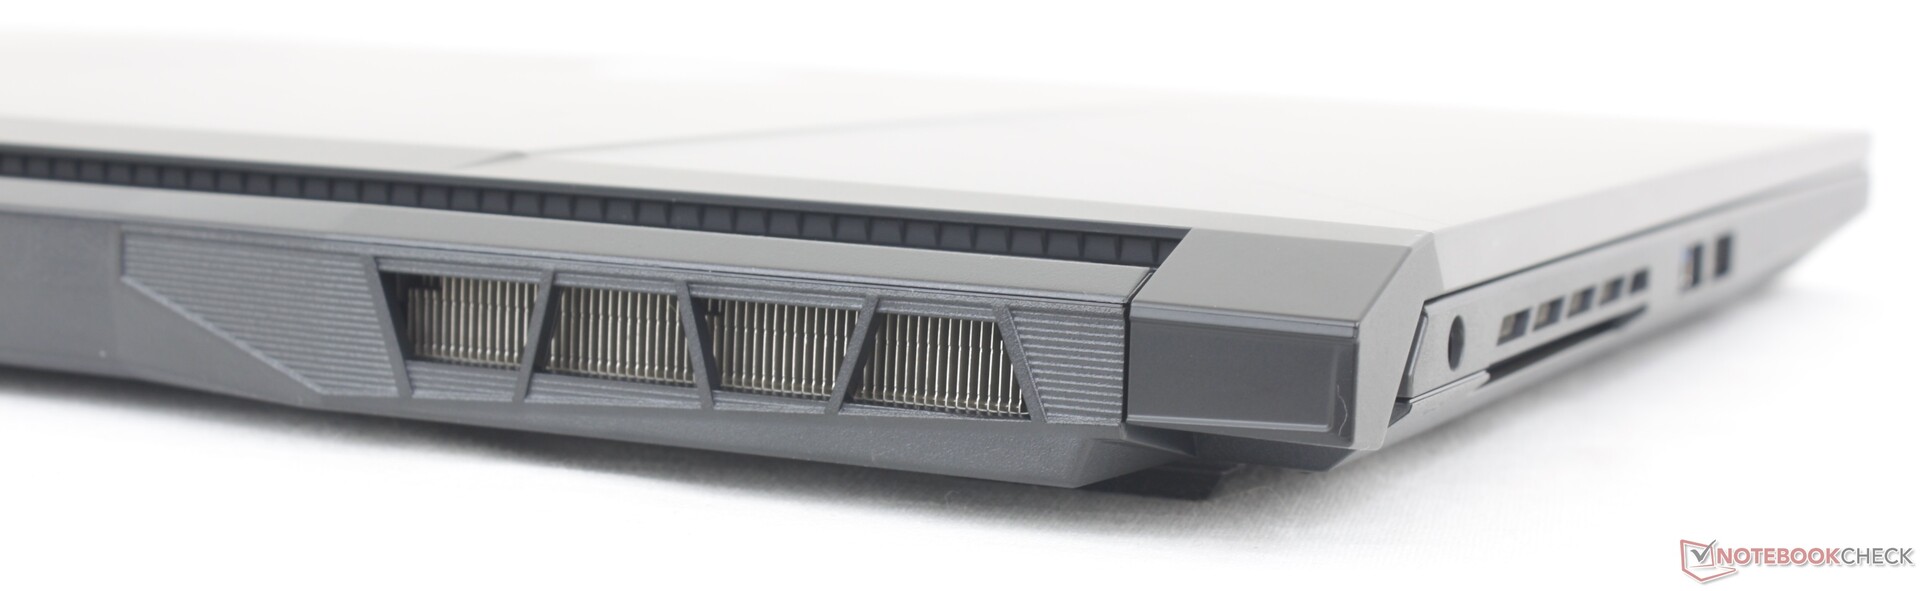
Le châssis est principalement en plastique, comme c'est le cas pour tous les ordinateurs portables de jeu de MSI de budget et de milieu de gamme. Il n'a pas les touches luxueuses, les voyants lumineux et la sensation plus douce des modèles haut de gamme comme le MSI GE77 ou Razer Blade 17 pour une impression plus fade. Cela ne devrait pas être surprenant car l'apparence est l'une des premières choses à être sacrifiée lorsque l'on réduit les coûts sur les modèles de jeu de budget à milieu de gamme.
La rigidité du châssis n'est heureusement pas compromise. Bien que les surfaces en plastique soient plus fragiles au toucher que sur un modèle GE, GS ou GT, elles sont néanmoins assez robustes et résistantes aux torsions ou aux dépressions, même au niveau du centre du clavier ou du couvercle extérieur. Il n'y a pas non plus de problèmes majeurs de grincement. Cependant, les charnières auraient pu être plus rigides à des angles plus larges pour une meilleure impression de longévité.

Le système est plus léger que prévu, surtout pour un ordinateur portable de jeu de 17,3 pouces. Avec ses 2,6 kg, il est plus léger que le Razer Blade 17, l'Asus ROG Strix Scar 17 et l'Acer Predator Helios 300.Acer Predator Helios 300 de quelques centaines de grammes chacun. Cet avantage de poids est probablement dû à la longueur sensiblement plus courte du châssis GL76. Il est un peu plus large cependant, mais le gain de poids compense l'empreinte légèrement plus longue.
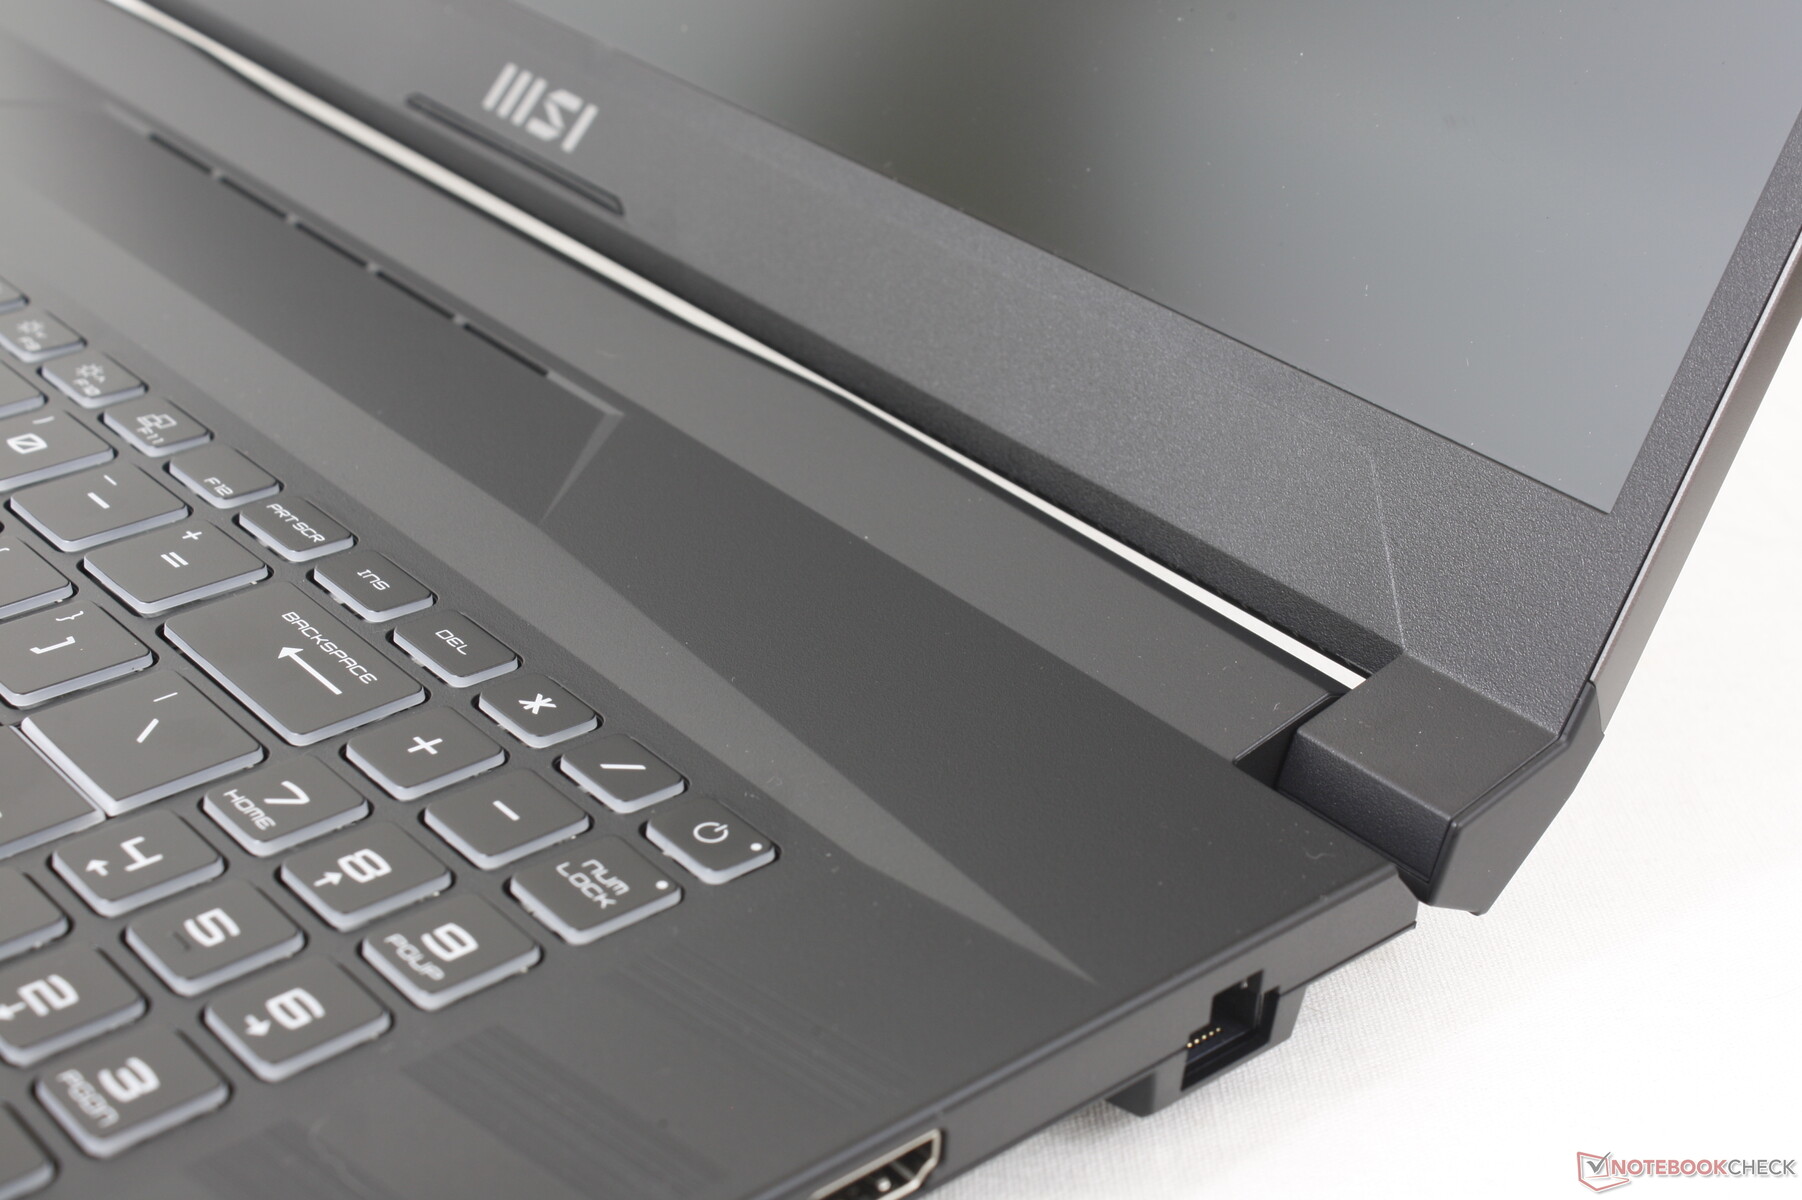

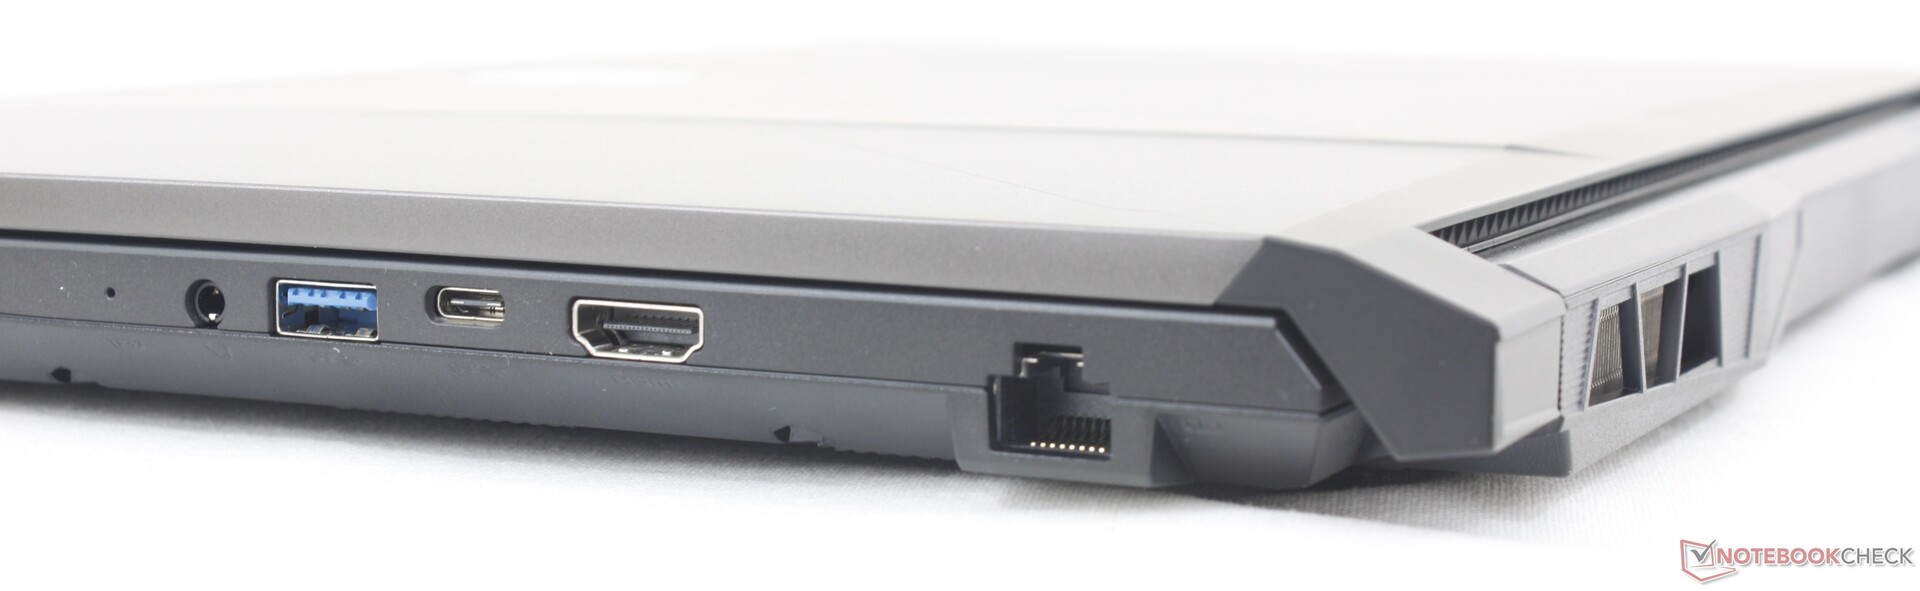
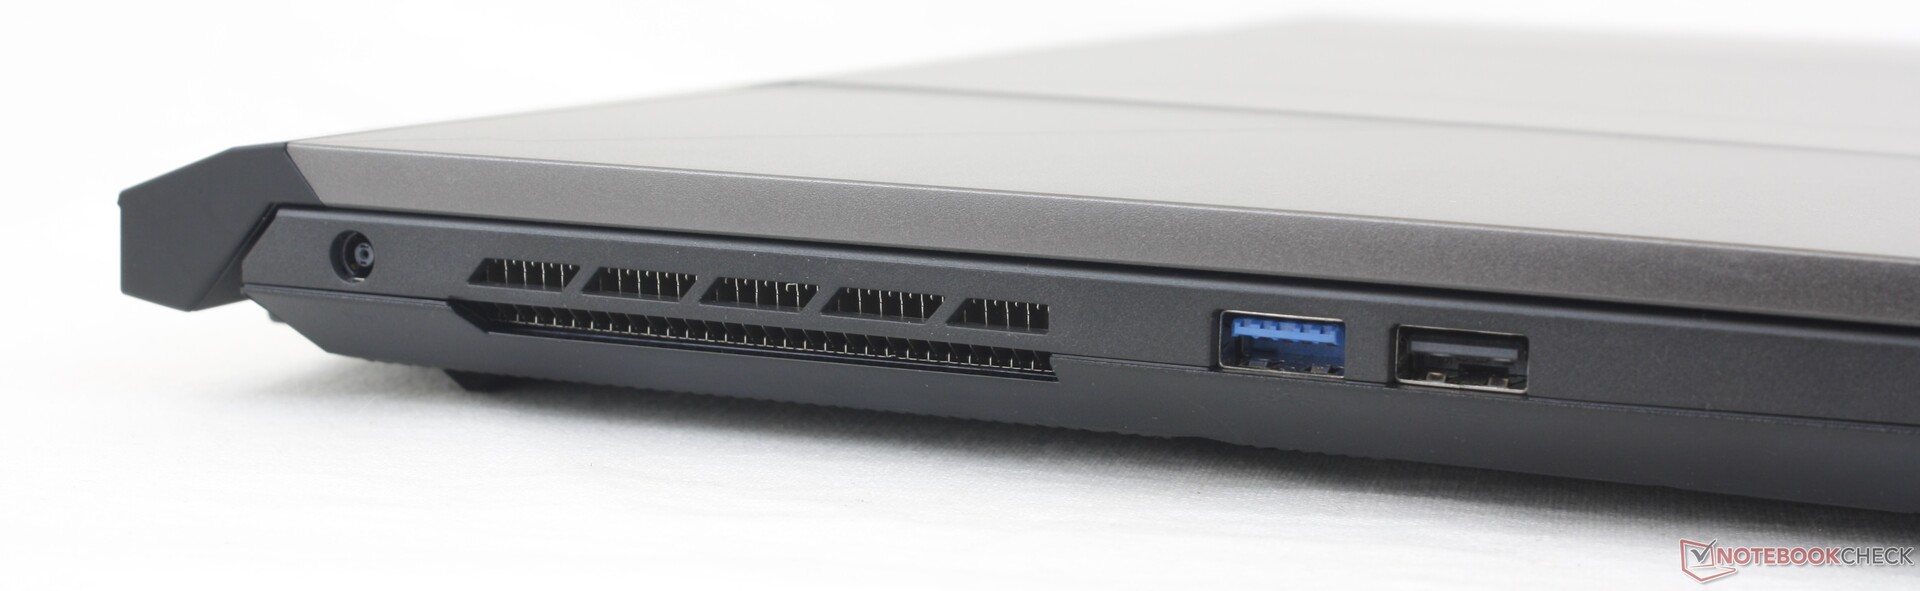
Connectivité - Limitée pour la taille
Les options de port sont plus limitées par rapport à d'autres ordinateurs portables de jeu de milieu de gamme comme le Dell G16l'Acer Nitro 5 ou l'Asus TUF G17. L'omission la plus importante ici est l'absence de support Thunderbolt alors que les trois alternatives susmentionnées l'ont. Il s'agit probablement d'un effort conscient de la part de MSI pour encourager les utilisateurs à considérer plutôt les séries haut de gamme GE, GS ou GT.
DisplayPort-over-USB n'est pas supporté. Notre unité de test n'a reconnu aucun de nos moniteurs externes via USB-C.
Communication
Un Intel AX201 est fourni en standard pour la connectivité Wi-Fi 6 et Bluetooth 5.2. Le Wi-Fi 6E n'est pas inclus, probablement pour économiser sur les coûts, mais une mise à niveau pour l'utilisateur final est néanmoins simple. Les performances sont toujours stables, sans problème notable, lorsqu'il est couplé à notre routeur Asus AXE11000.
| Networking | |
| iperf3 transmit AX12 | |
| MSI Vector GP76 12UGS-434 | |
| iperf3 receive AX12 | |
| MSI Vector GP76 12UGS-434 | |
| iperf3 receive AXE11000 6GHz | |
| Asus ROG Strix Scar 17 SE G733CX-LL014W | |
| Acer Predator Helios 300 (i7-12700H, RTX 3070 Ti) | |
| iperf3 receive AXE11000 | |
| Razer Blade 17 Early 2022 | |
| MSI Pulse GL76 12UGK | |
| Alienware m17 R5 (R9 6900HX, RX 6850M XT) | |
| iperf3 transmit AXE11000 | |
| MSI Pulse GL76 12UGK | |
| Alienware m17 R5 (R9 6900HX, RX 6850M XT) | |
| iperf3 transmit AXE11000 6GHz | |
| Asus ROG Strix Scar 17 SE G733CX-LL014W | |
| Acer Predator Helios 300 (i7-12700H, RTX 3070 Ti) | |
Webcam
La webcam 720p intégrée produit des images boueuses aux couleurs médiocres. Une alternative sans jeu comme le HP Spectre est recommandée si la qualité de la caméra est importante.
Le bouton d'arrêt de l'appareil photo numérique est lié à la touche F7 et Windows Hello n'est pas pris en charge.


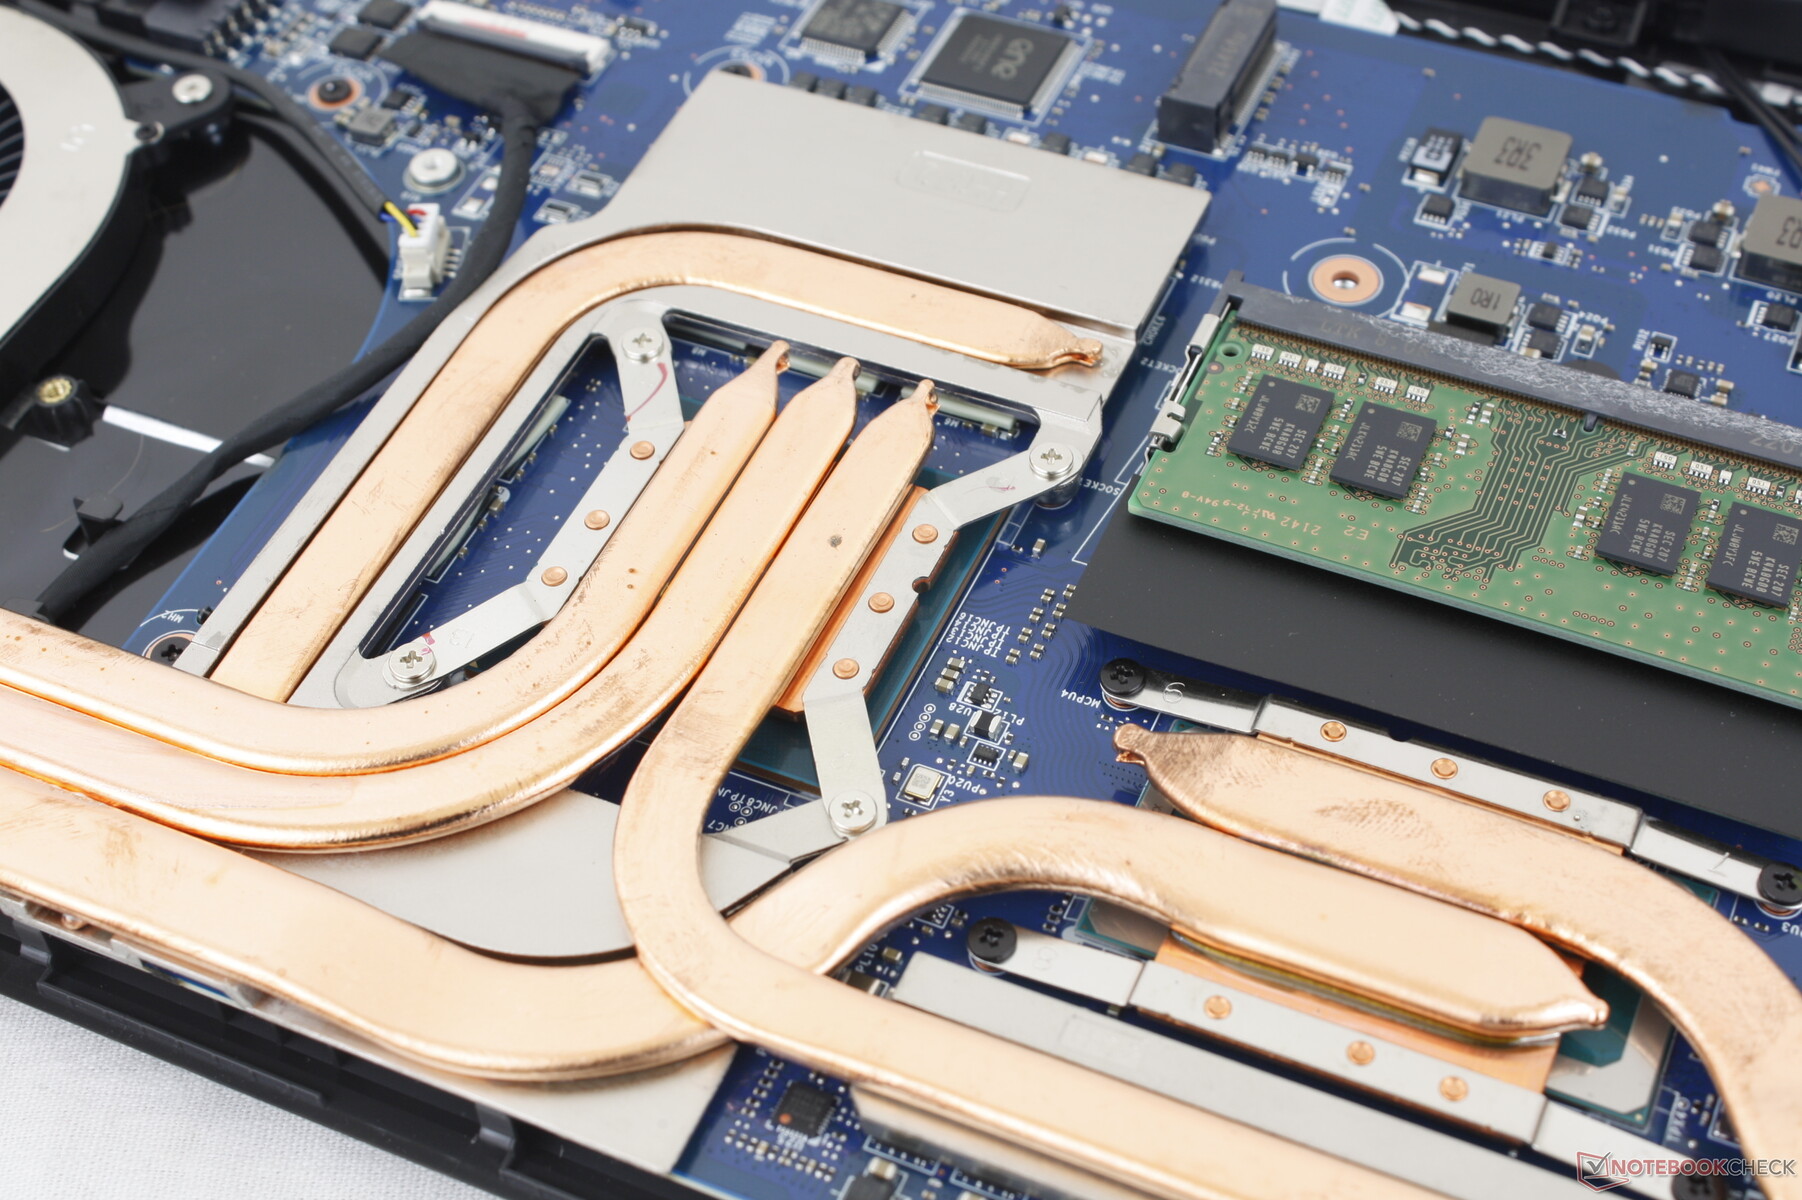
Maintenance
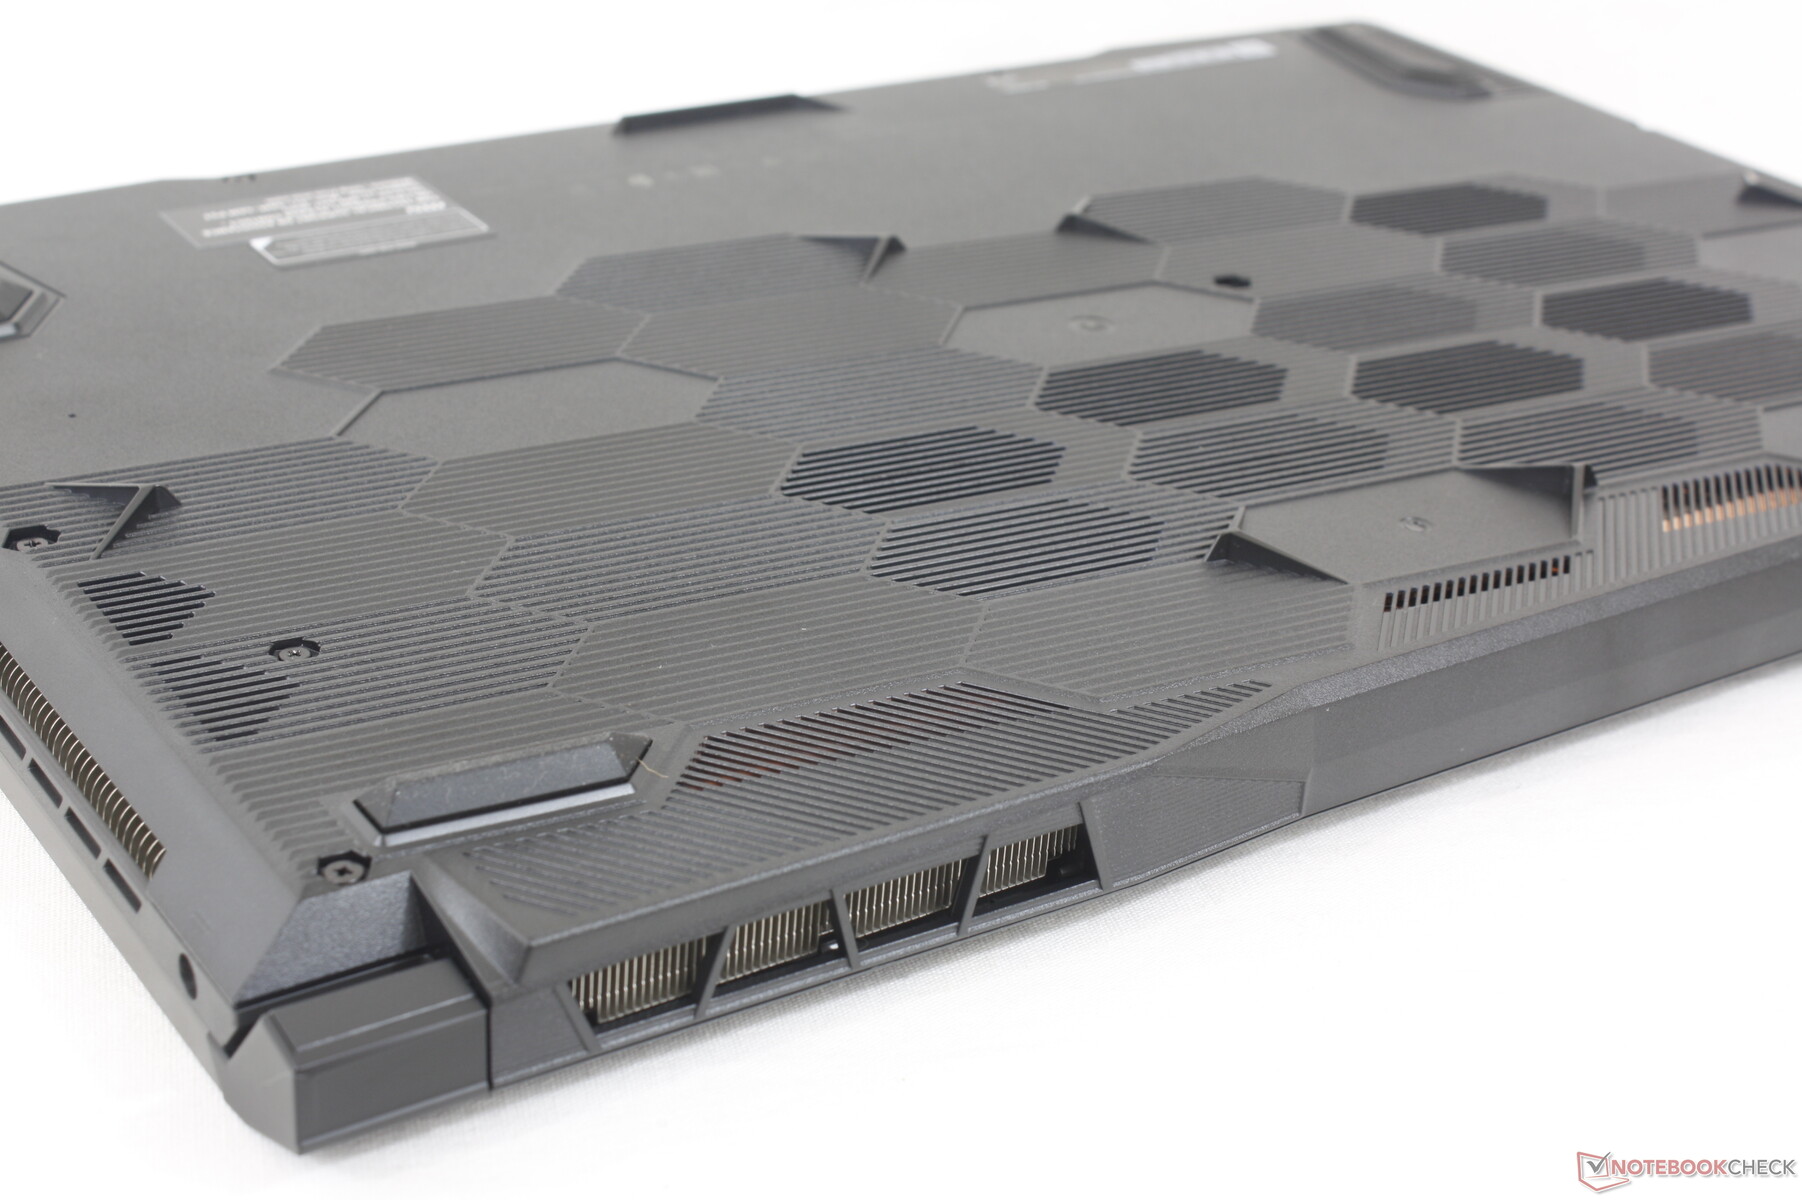
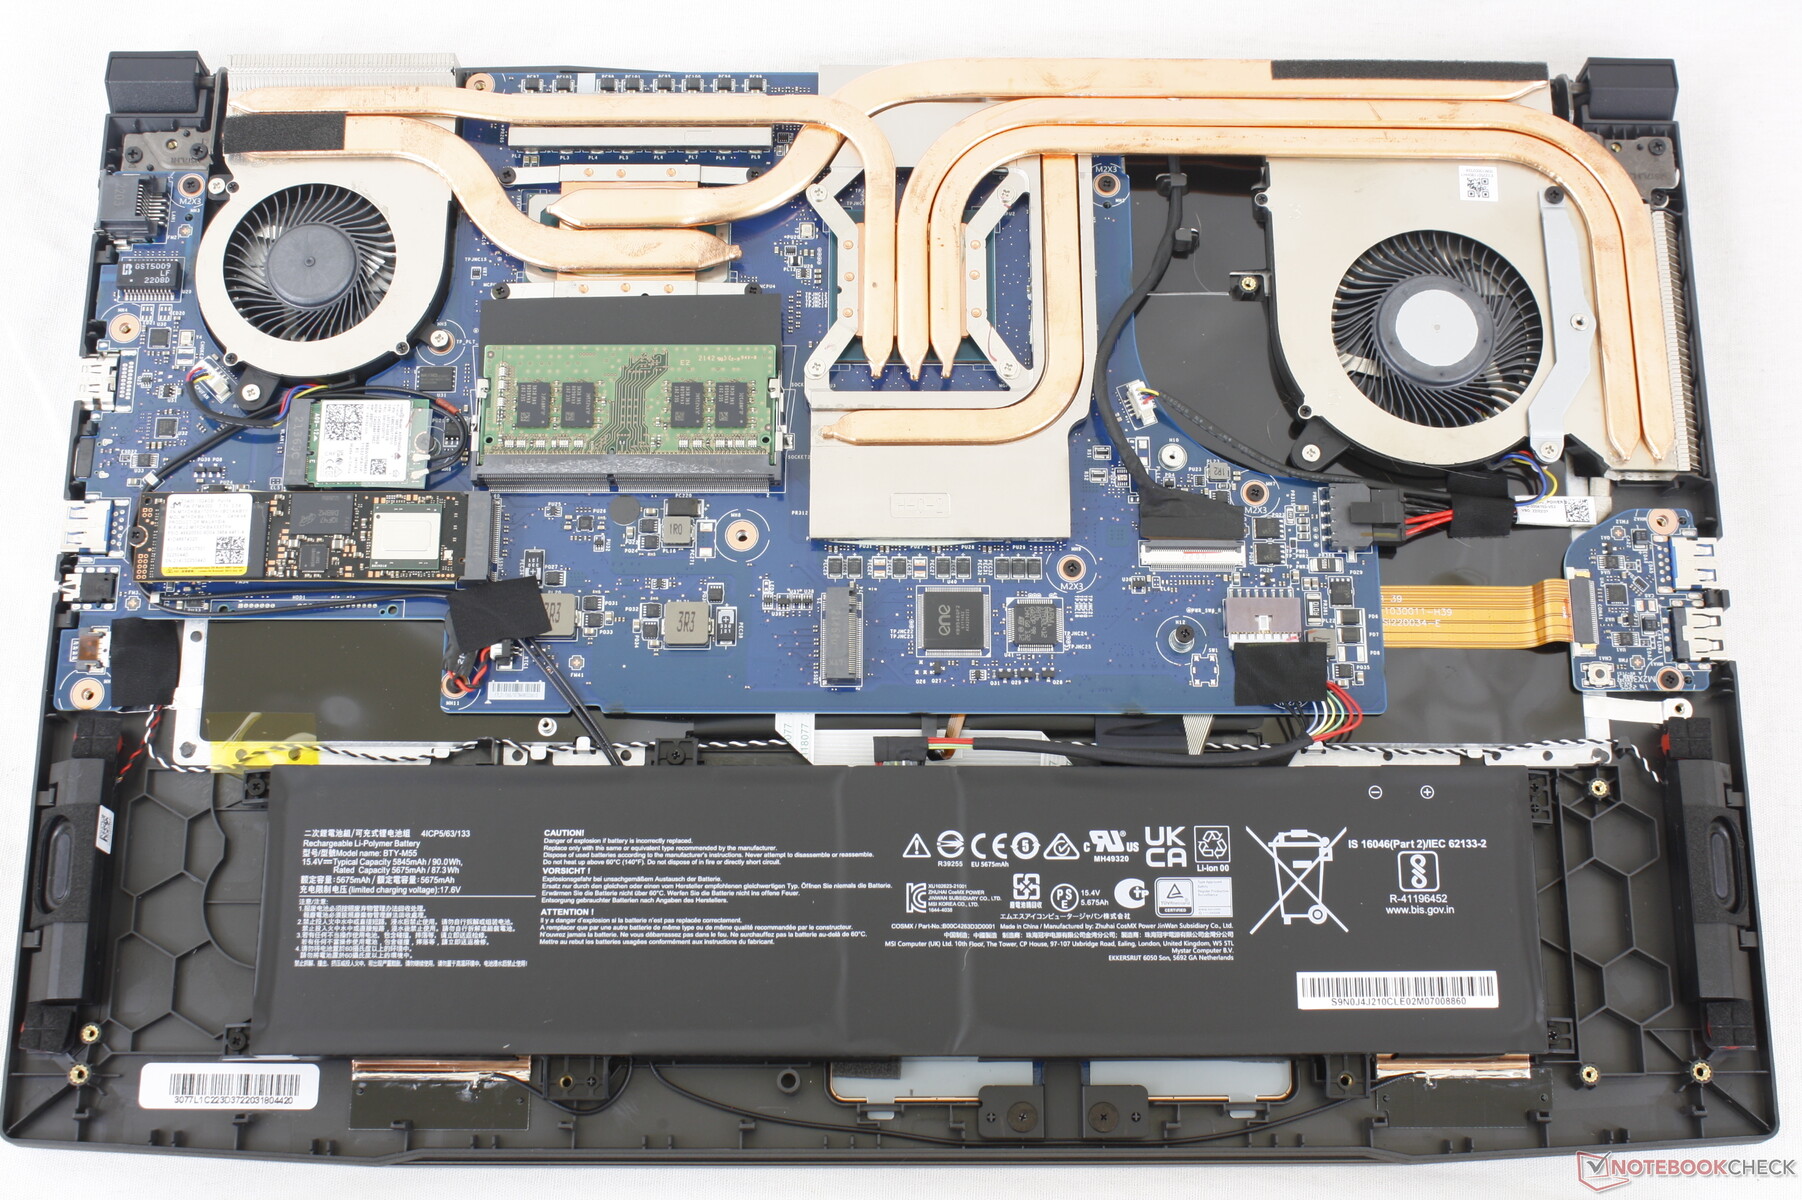
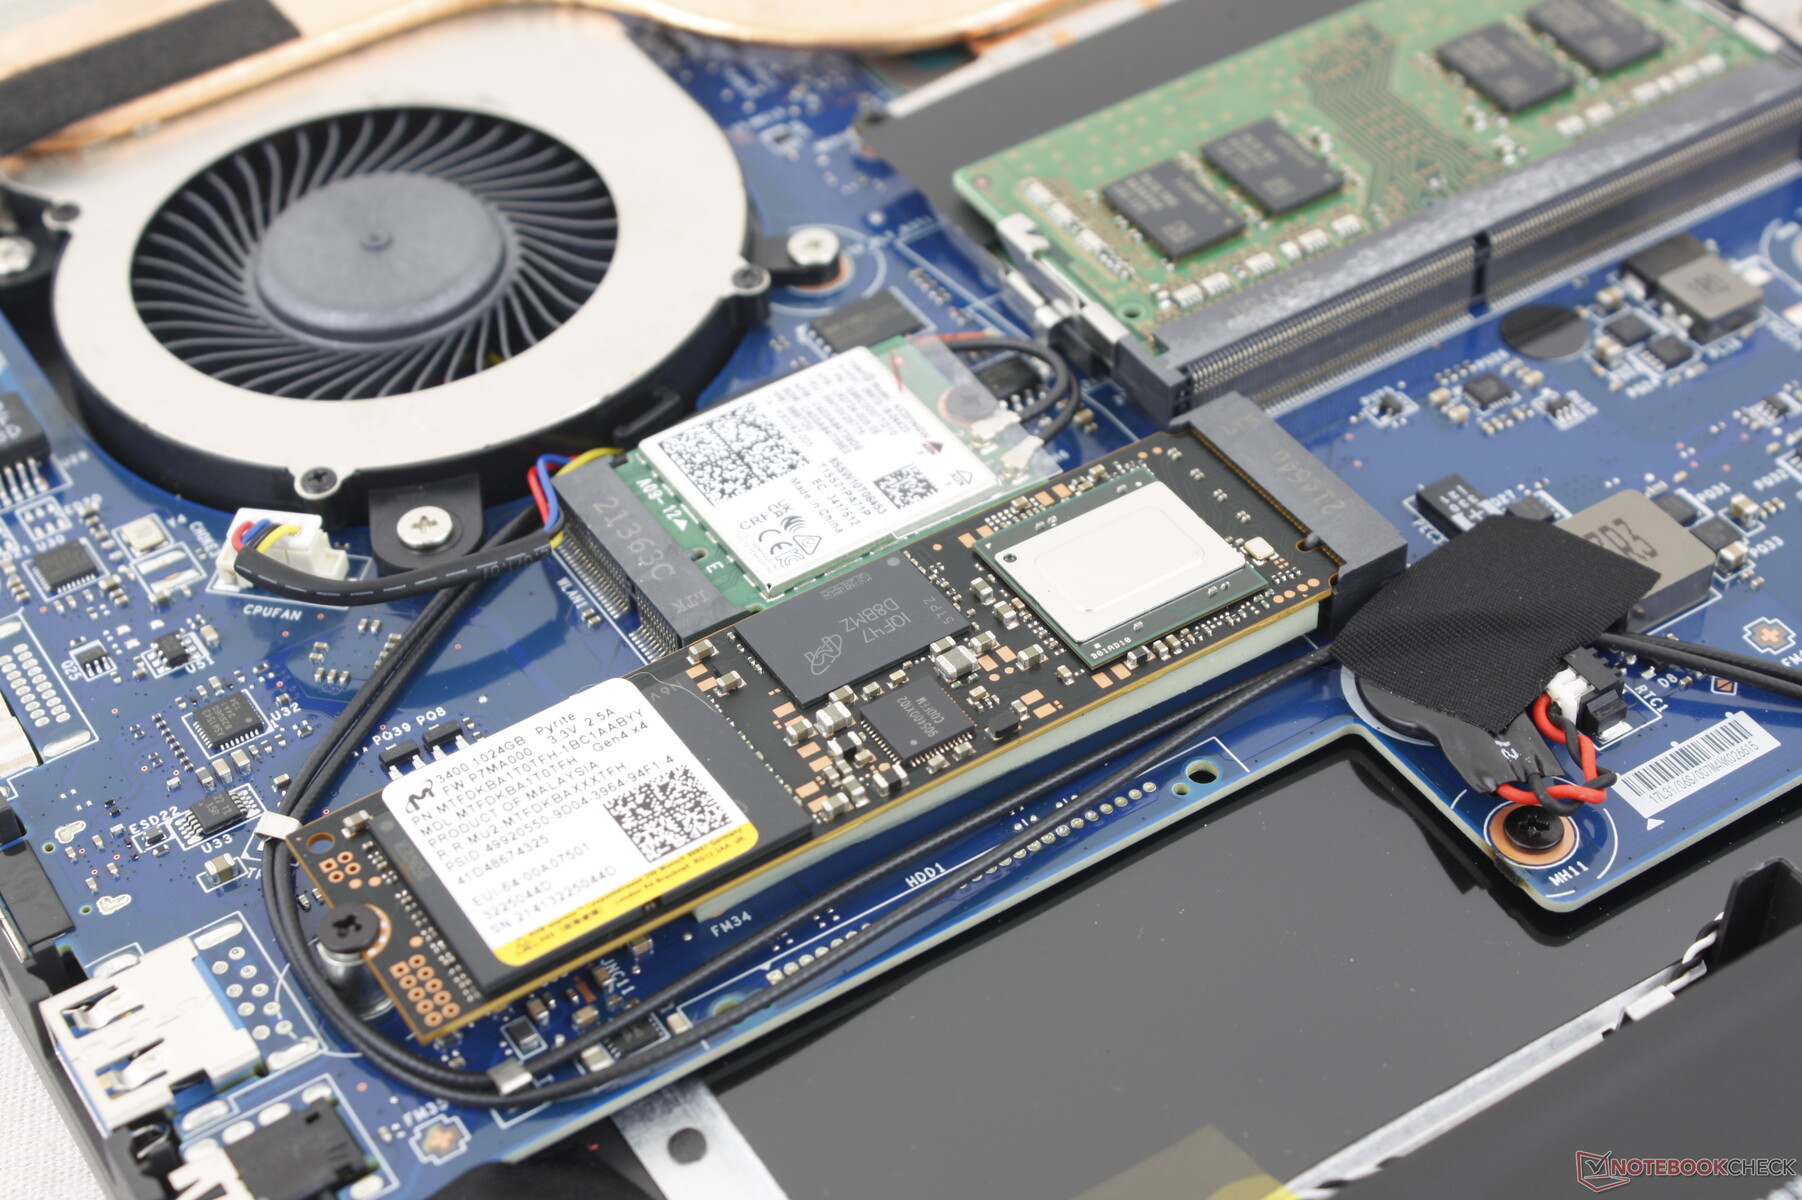
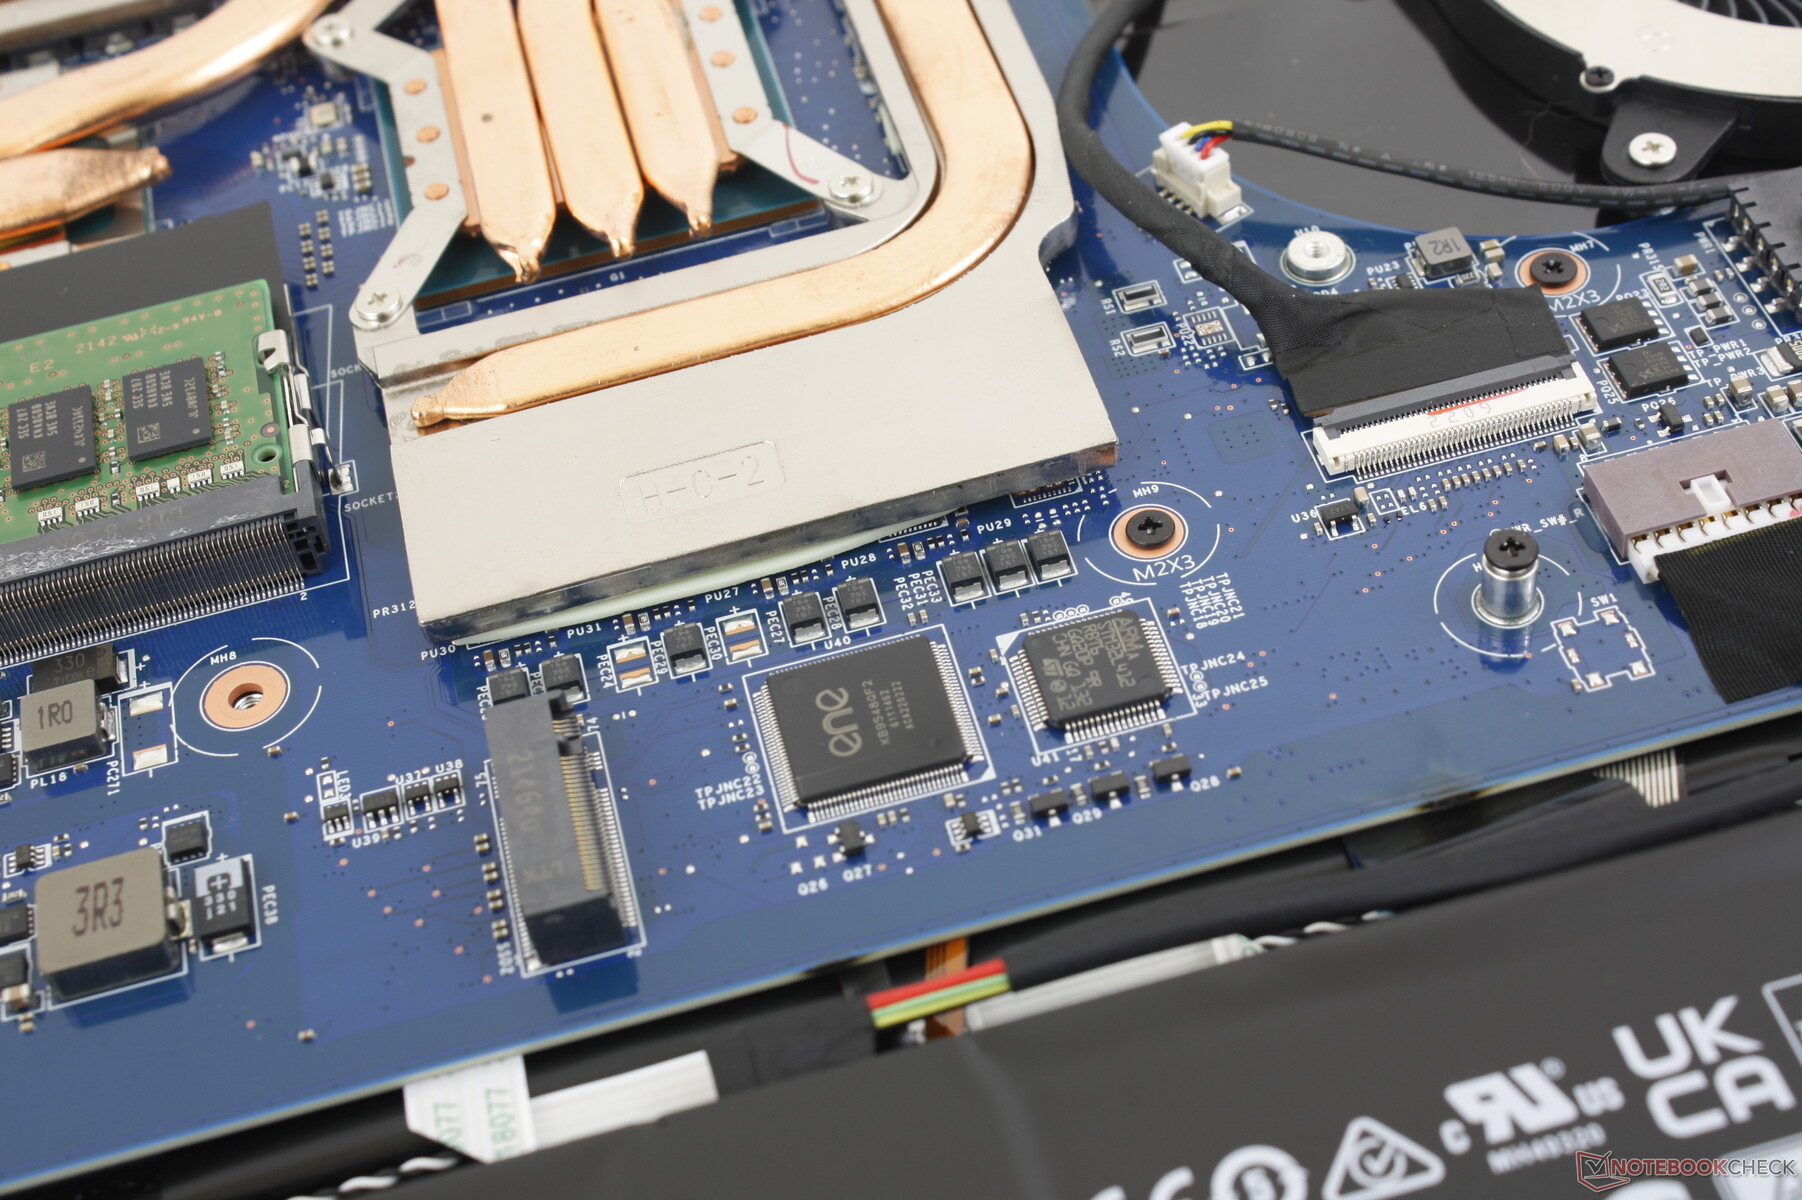
Le panneau inférieur est fixé par 13 vis Philips faciles à retirer. Cependant, gardez à l'esprit qu'il faut casser l'autocollant d'usine pour pouvoir le faire. MSI continue d'être l'un des très rares grands fabricants à avoir un autocollant de scellement d'usine pour les mises à niveau même simples comme la RAM ou le stockage.
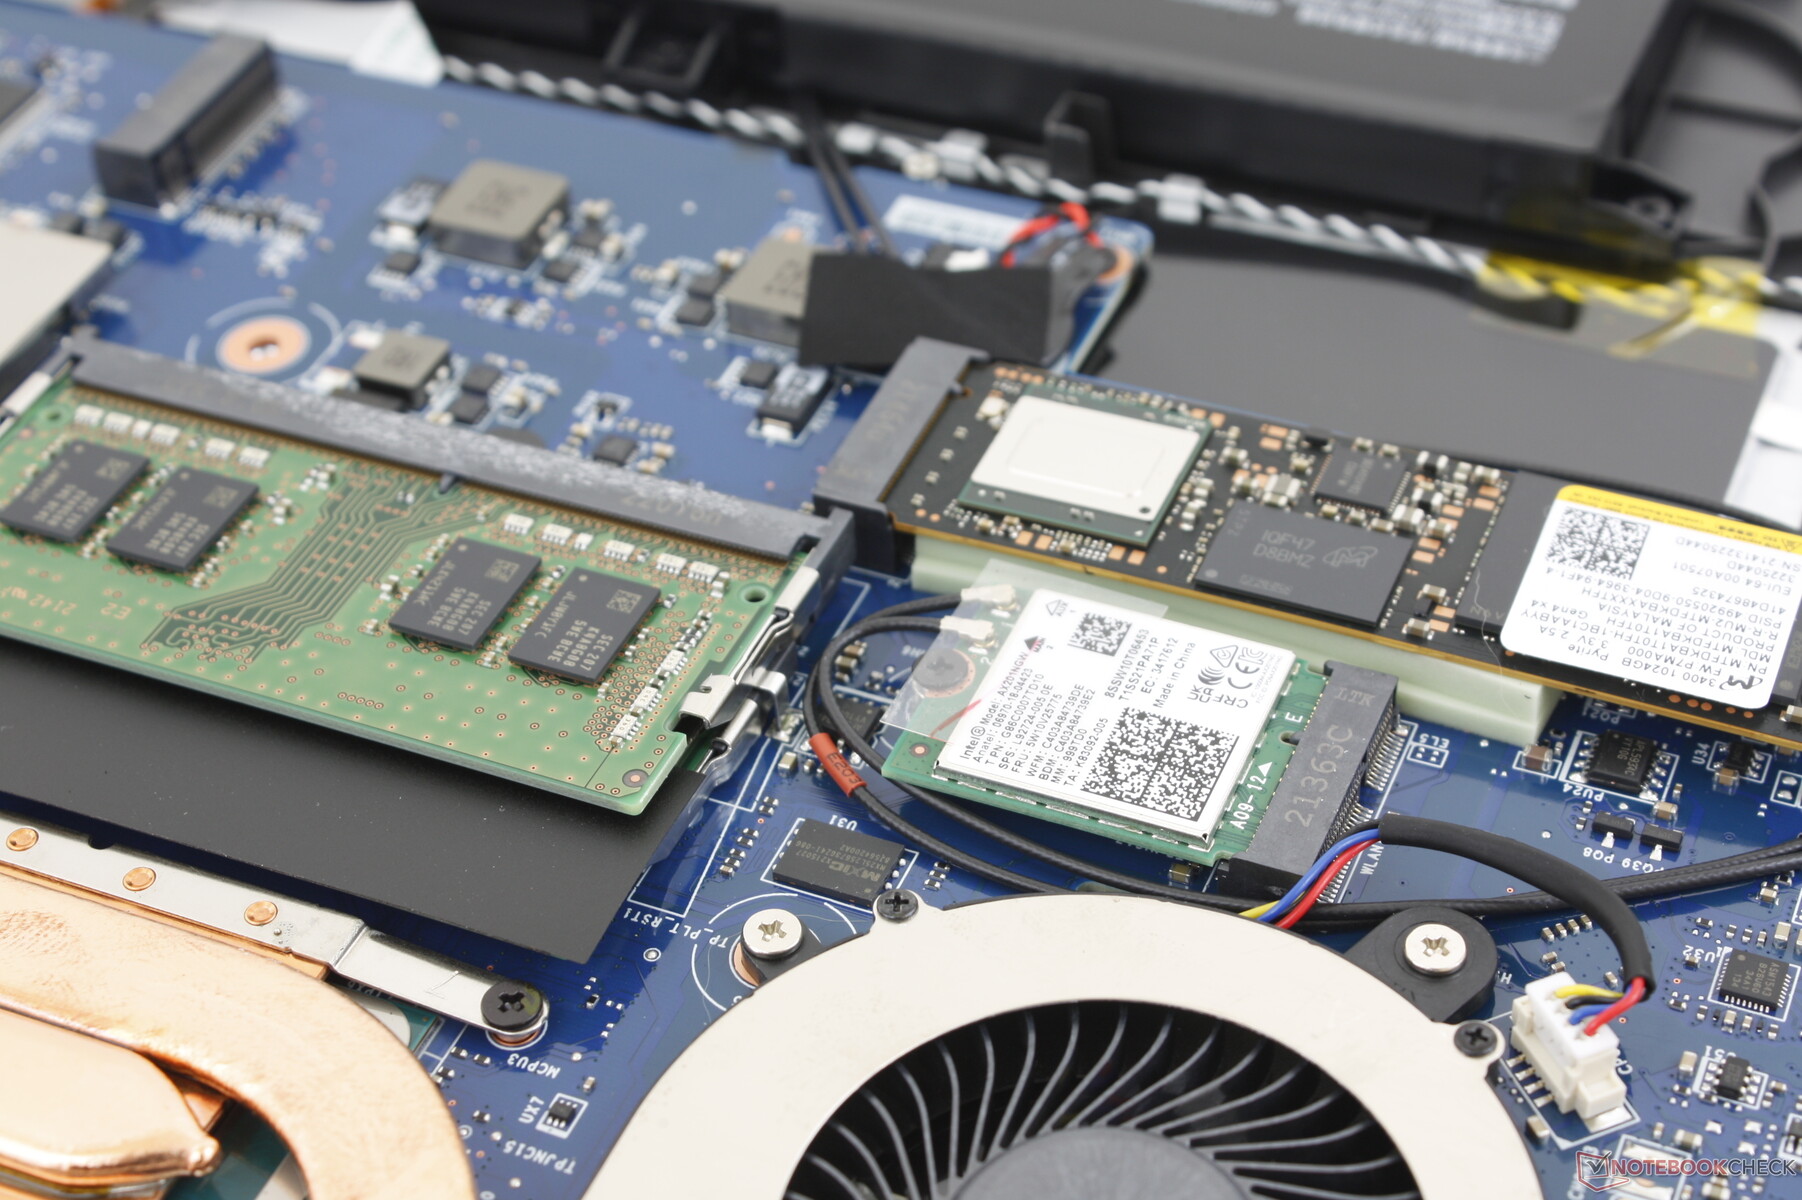
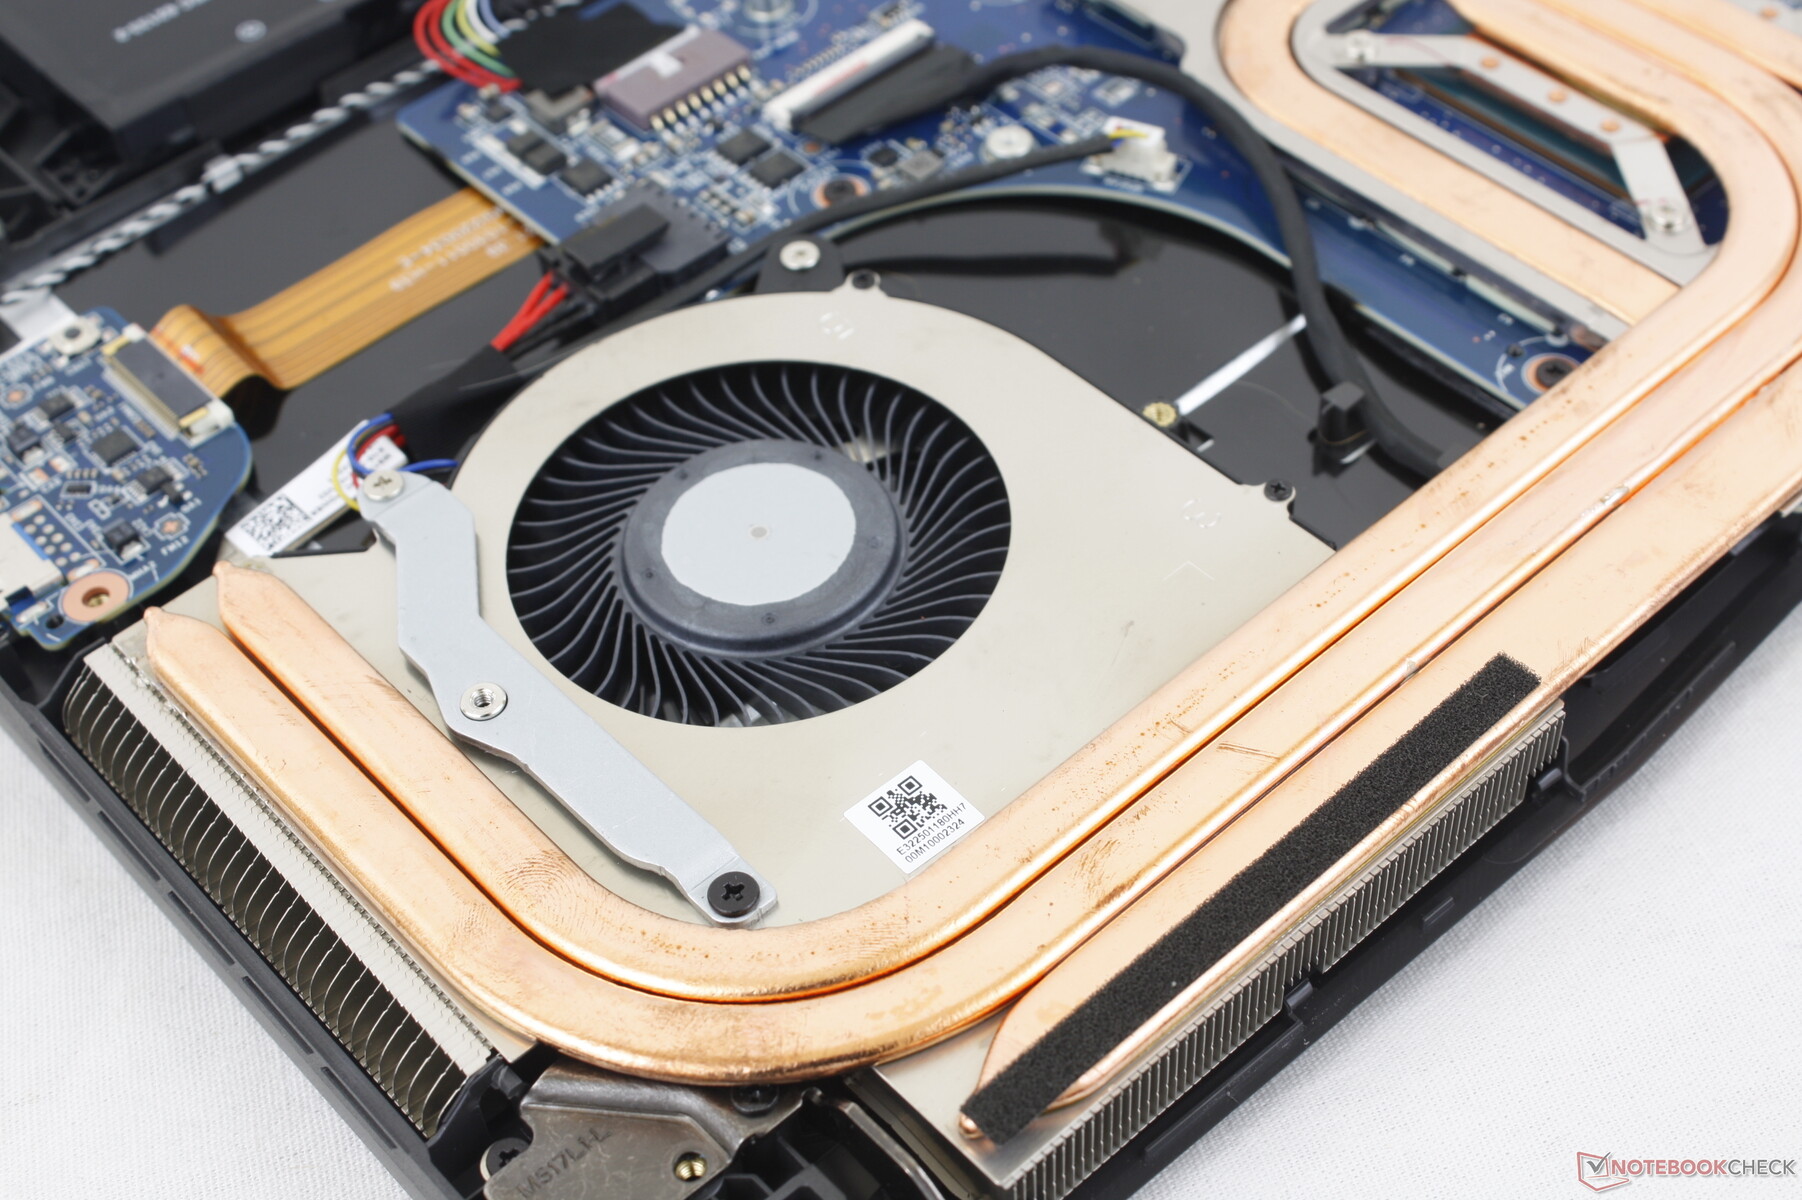
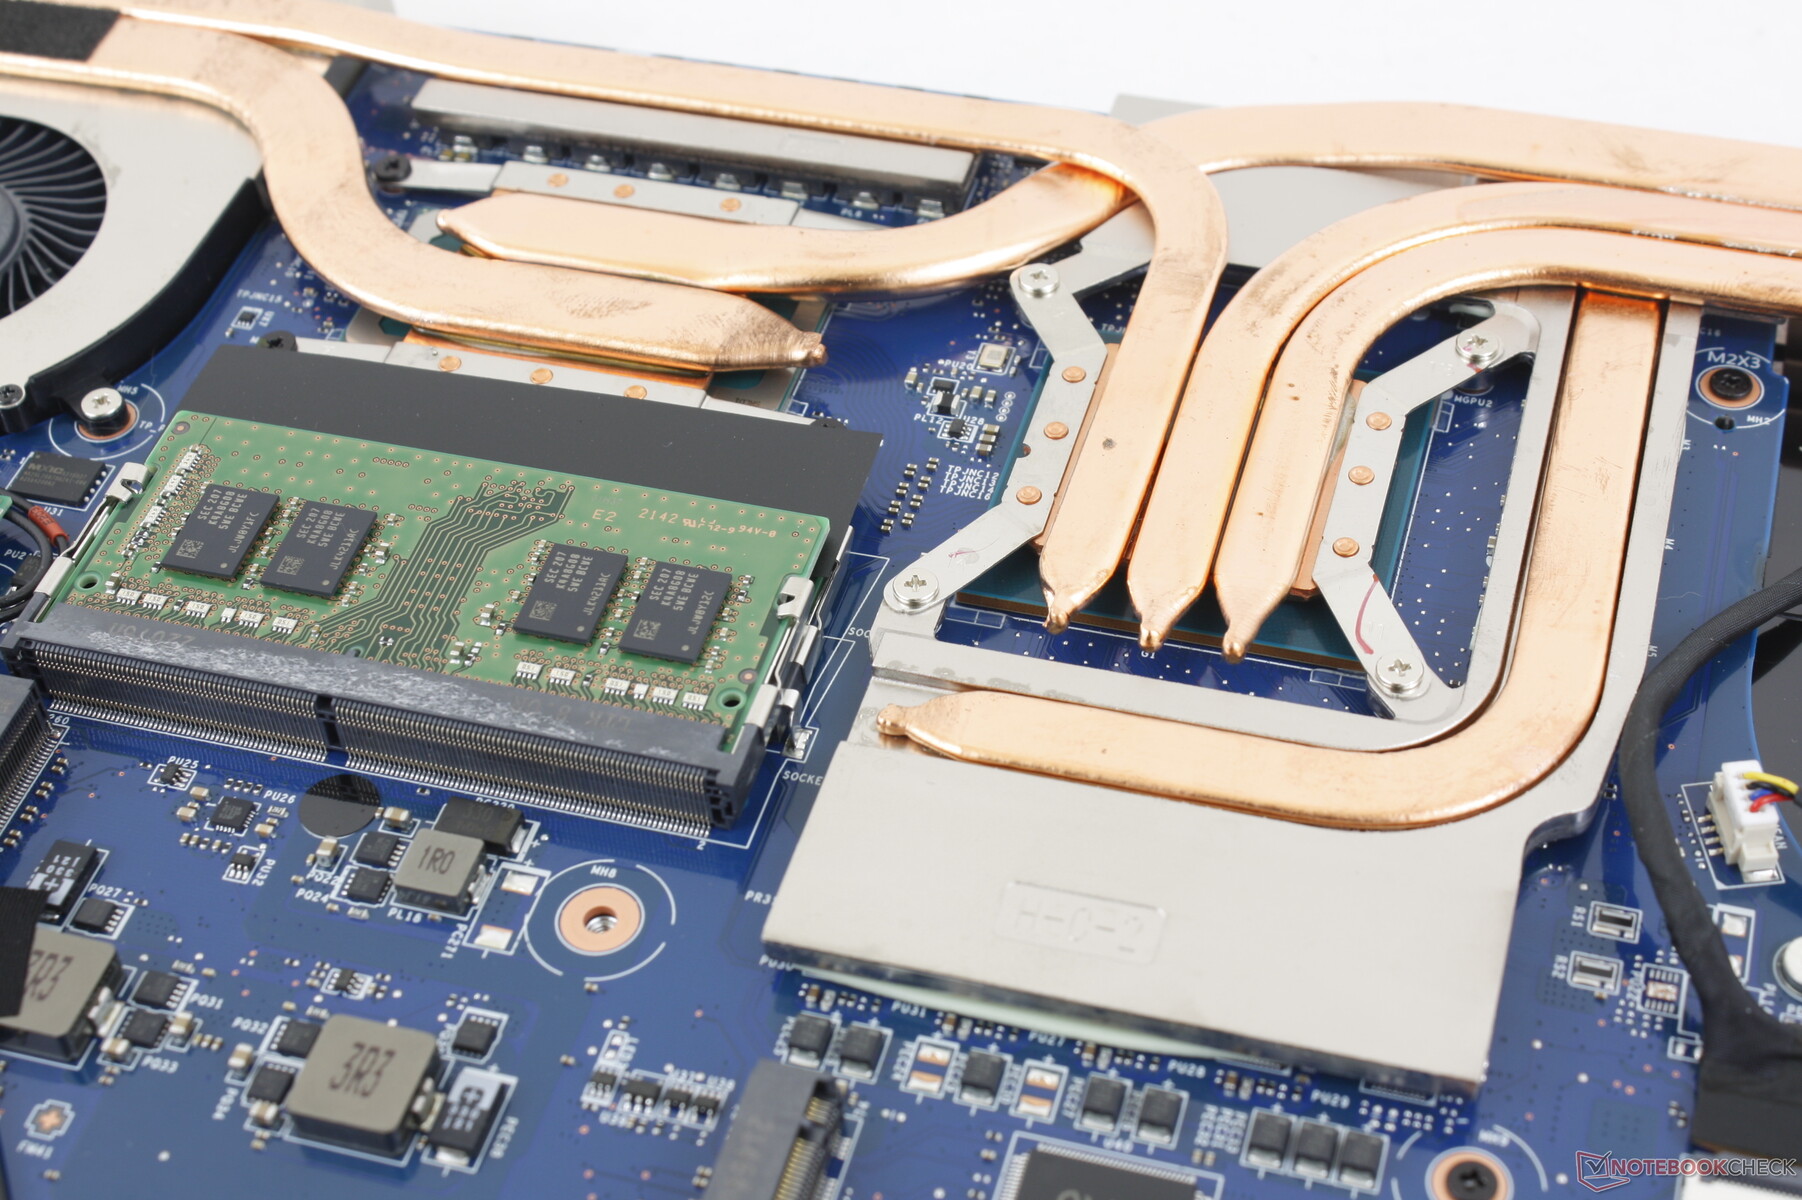
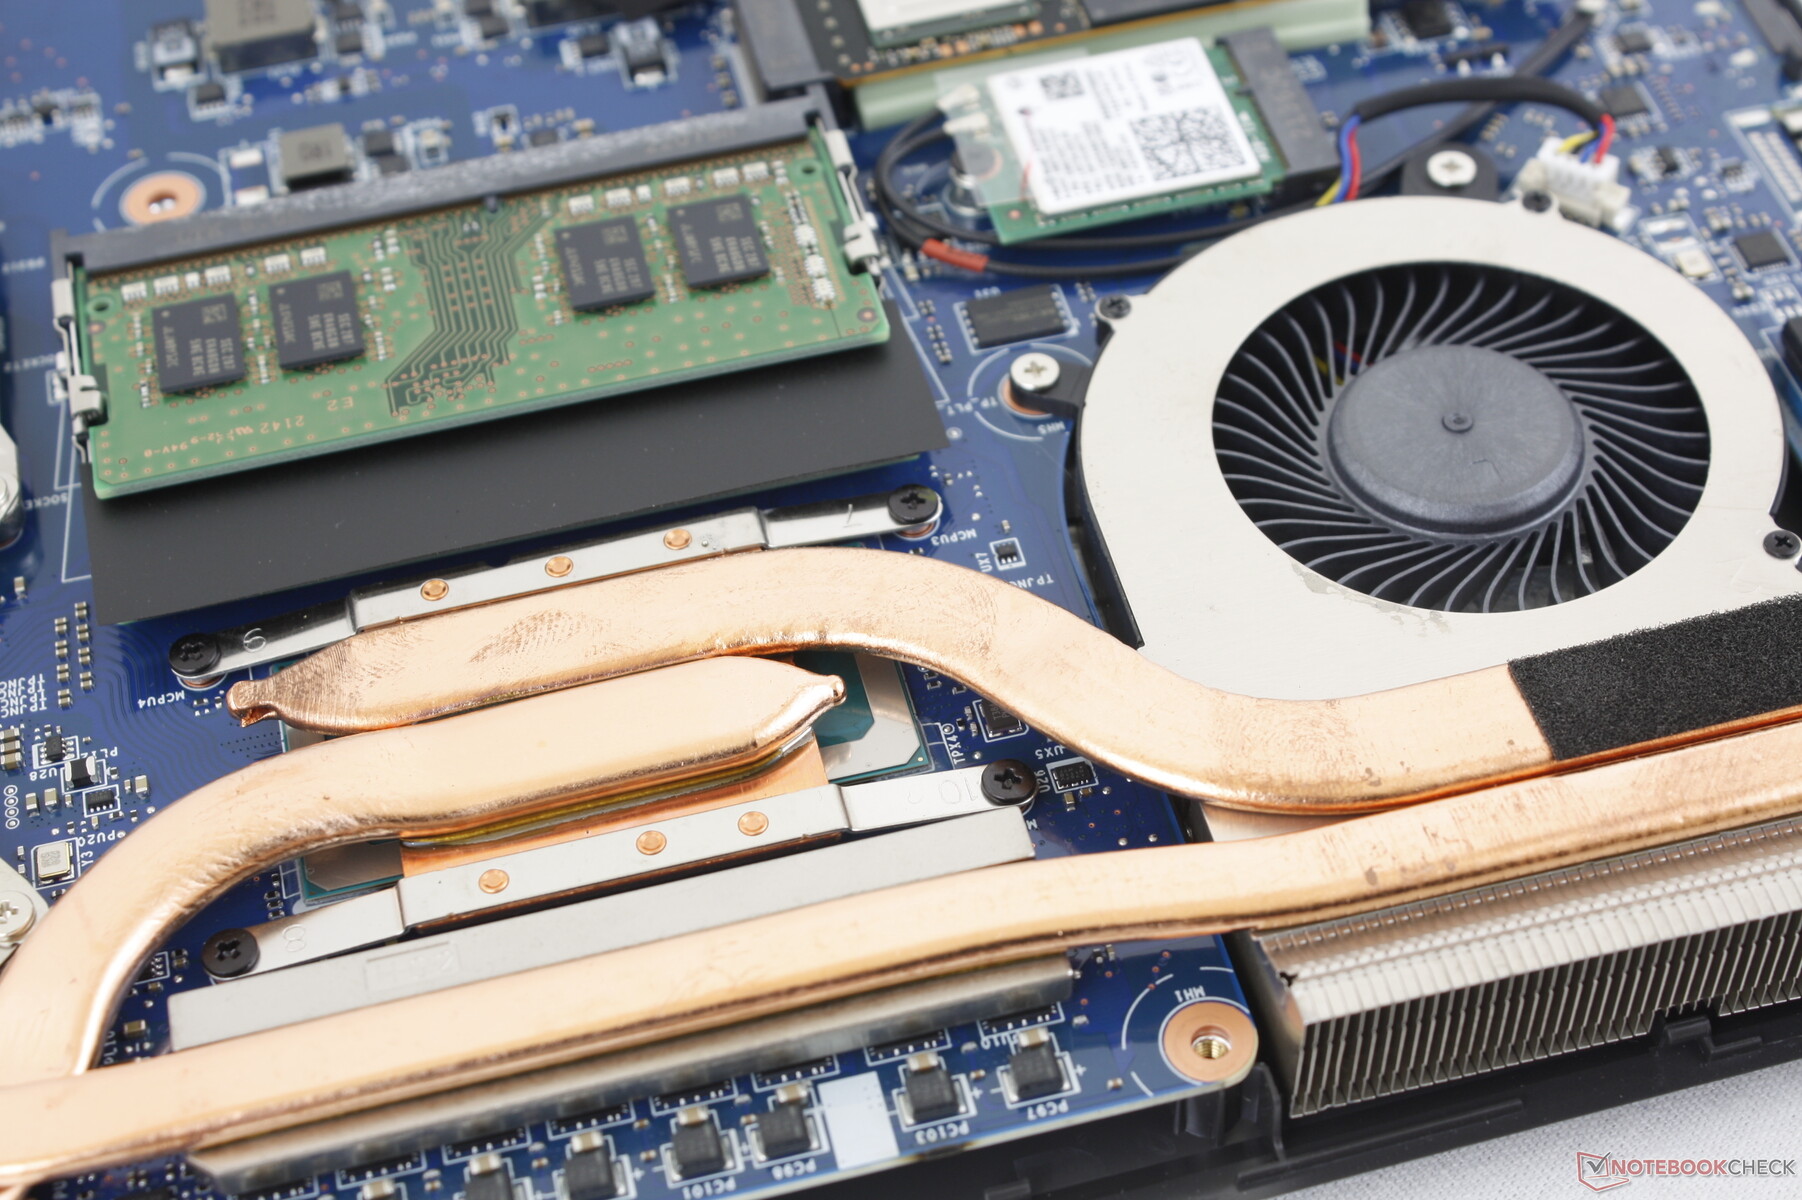
Une fois à l'intérieur, les utilisateurs auront un accès direct à 2 emplacements PCIe4 SSD, 2 emplacements SODIMM, le module WLAN, la batterie et la solution de refroidissement.
Accessoires et garantie
Il n'y a pas d'autres éléments dans la boîte de détail que l'adaptateur secteur et les documents. Une garantie limitée standard d'un an s'applique si l'appareil est acheté aux États-Unis.
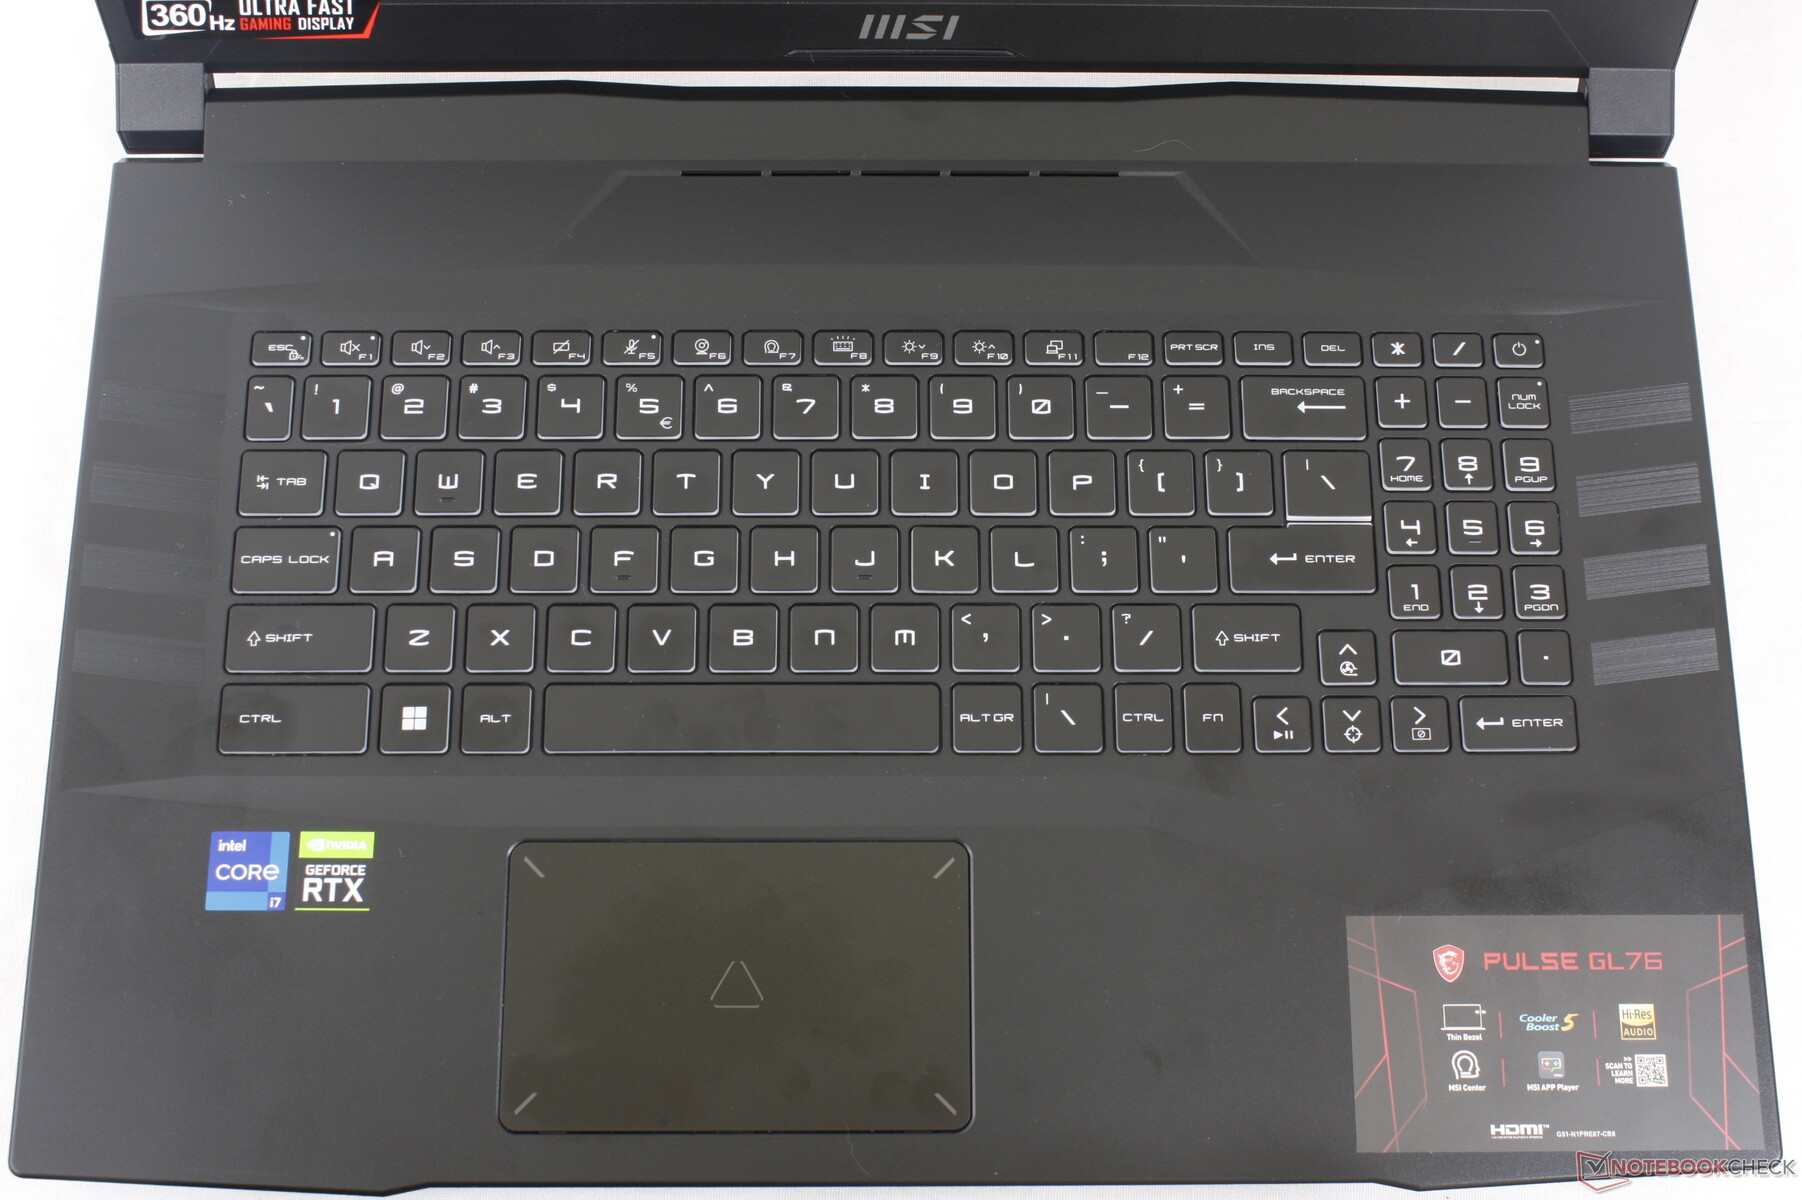
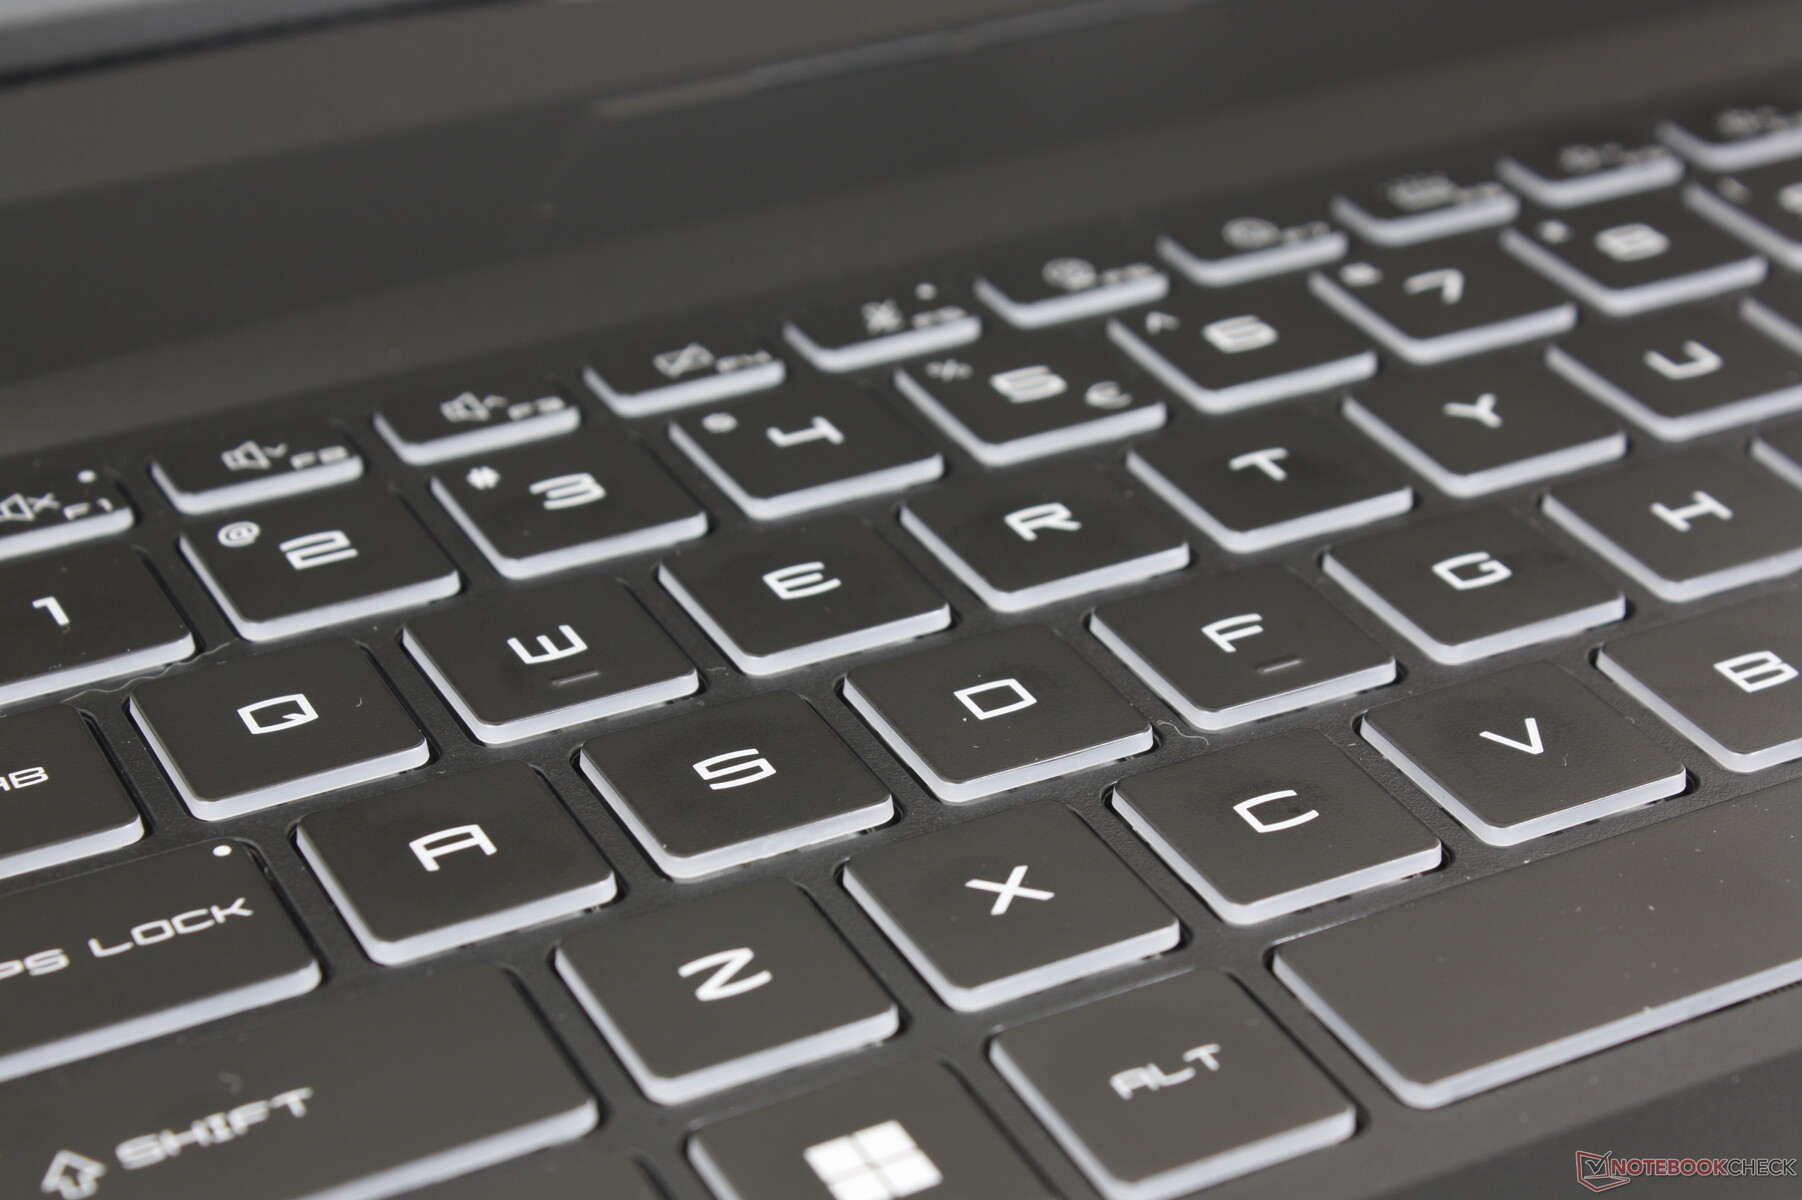
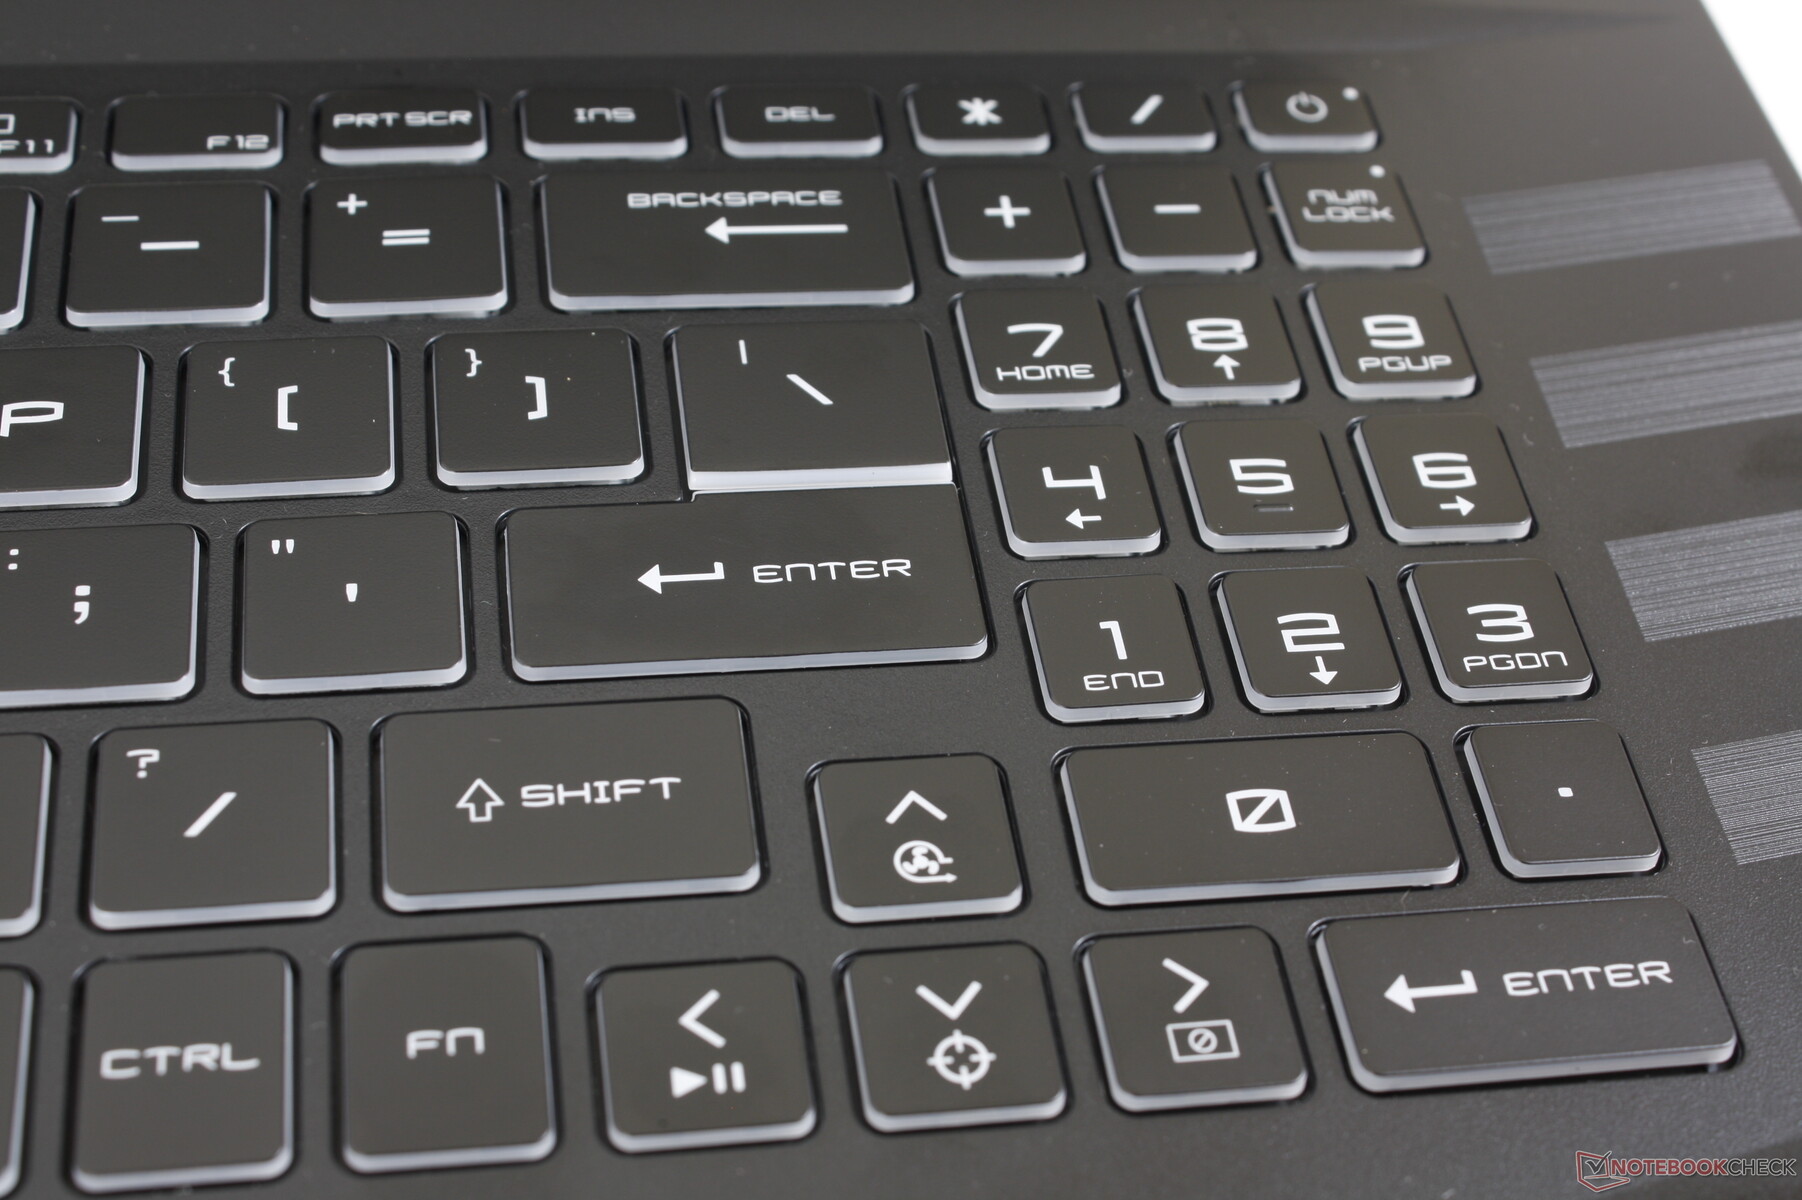
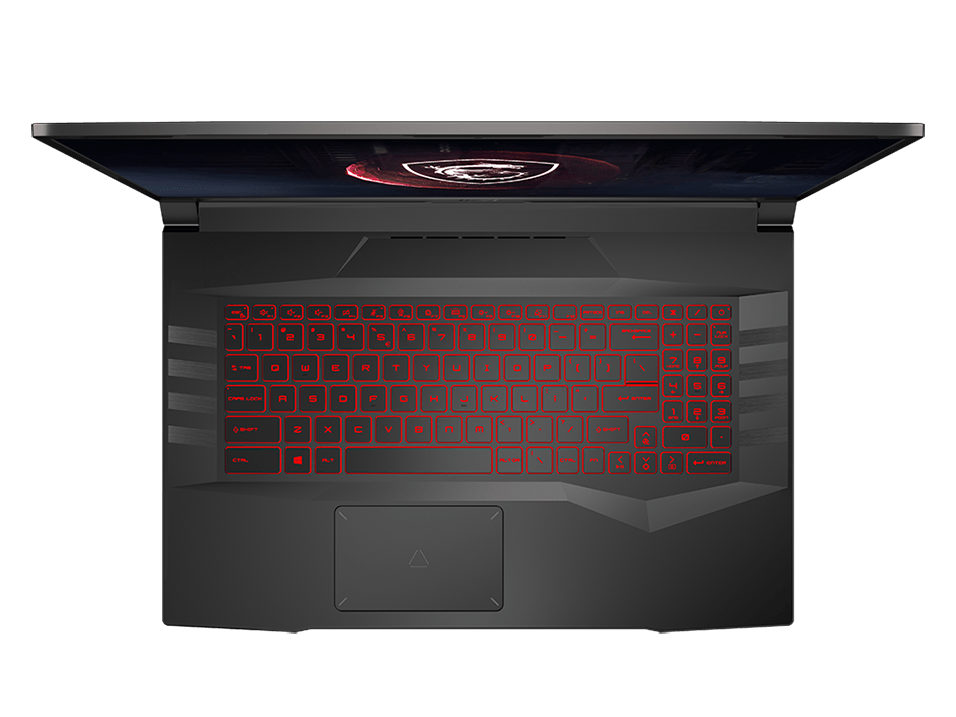
Périphériques d'entrée - Clavier OK, pavé tactile spongieux
Clavier
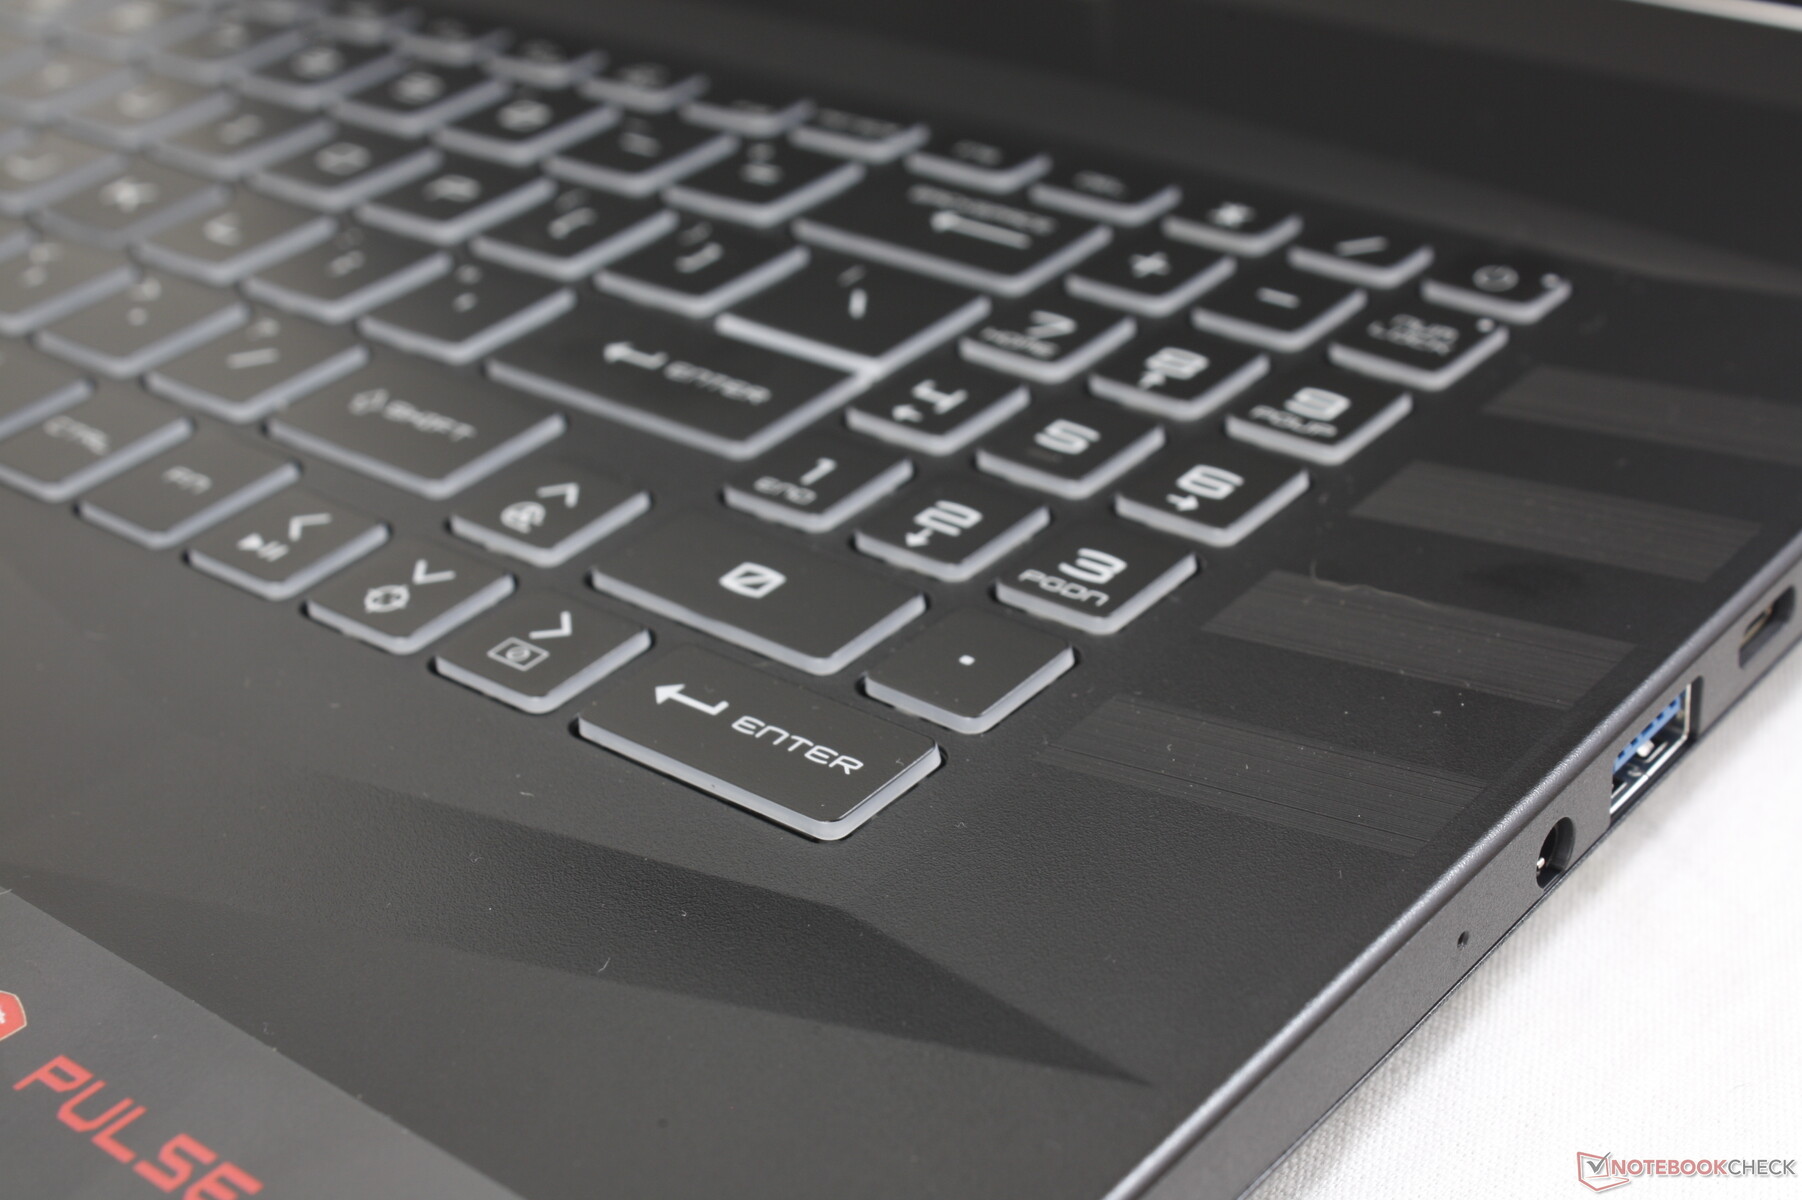
Le GL76 partage le même clavier et la même expérience de frappe que sur le GL66 malgré les différences de facteur de forme. Ainsi, la faible course des touches et le retour d'information acceptable du GL66 s'appliquent également au GL76. Il est regrettable que MSI n'ait pas mieux utilisé le facteur de forme plus grand de 17,3 pouces en augmentant la taille du pavé numérique et des touches fléchées, car ils sont plus petits, plus spongieux, et plus à l'étroit par rapport aux grandes touches QWERTY. Ce trait est partagé avec le Asus TUF Gaming F17.
Un rétroéclairage RVB à zone unique est fourni en standard, sans option RVB par touche. Toutes les touches et tous les symboles sont éclairés.
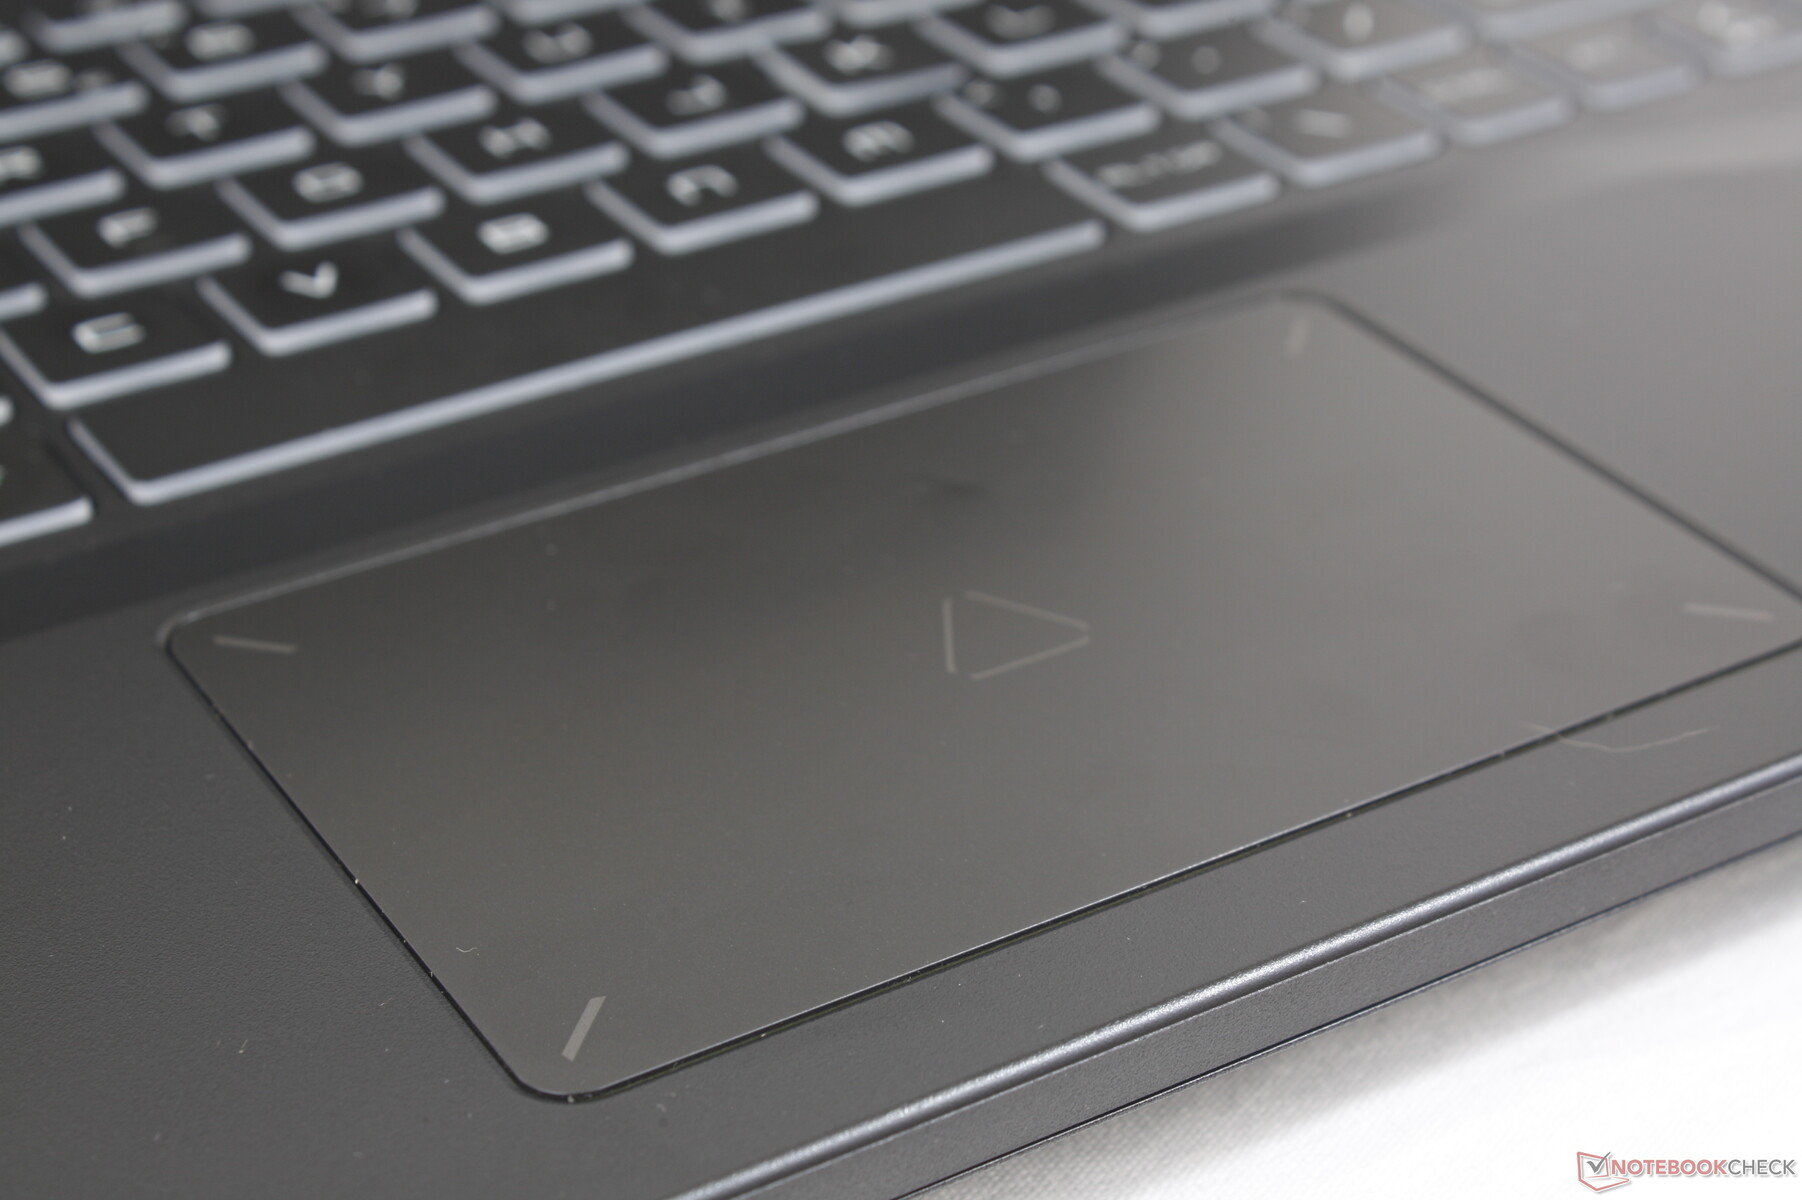
Pavé tactile
Le pavé tactile est relativement petit (10,5 x 6,7 cm), mais il est au moins légèrement plus grand que le pavé tactile de 10,5 x 6 cm du Dell G16. Sa surface en plastique a tendance à coller lorsqu'elle glisse à des vitesses moyennes ou lentes, ce qui peut rendre le contrôle du curseur un peu cahoteux par moments. De plus, le retour d'information lorsque l'on clique sur la surface est spongieux, ce qui donne une sensation très peu satisfaisante. Vous voudrez certainement avoir une souris externe appropriée à portée de main lorsque cela est possible.
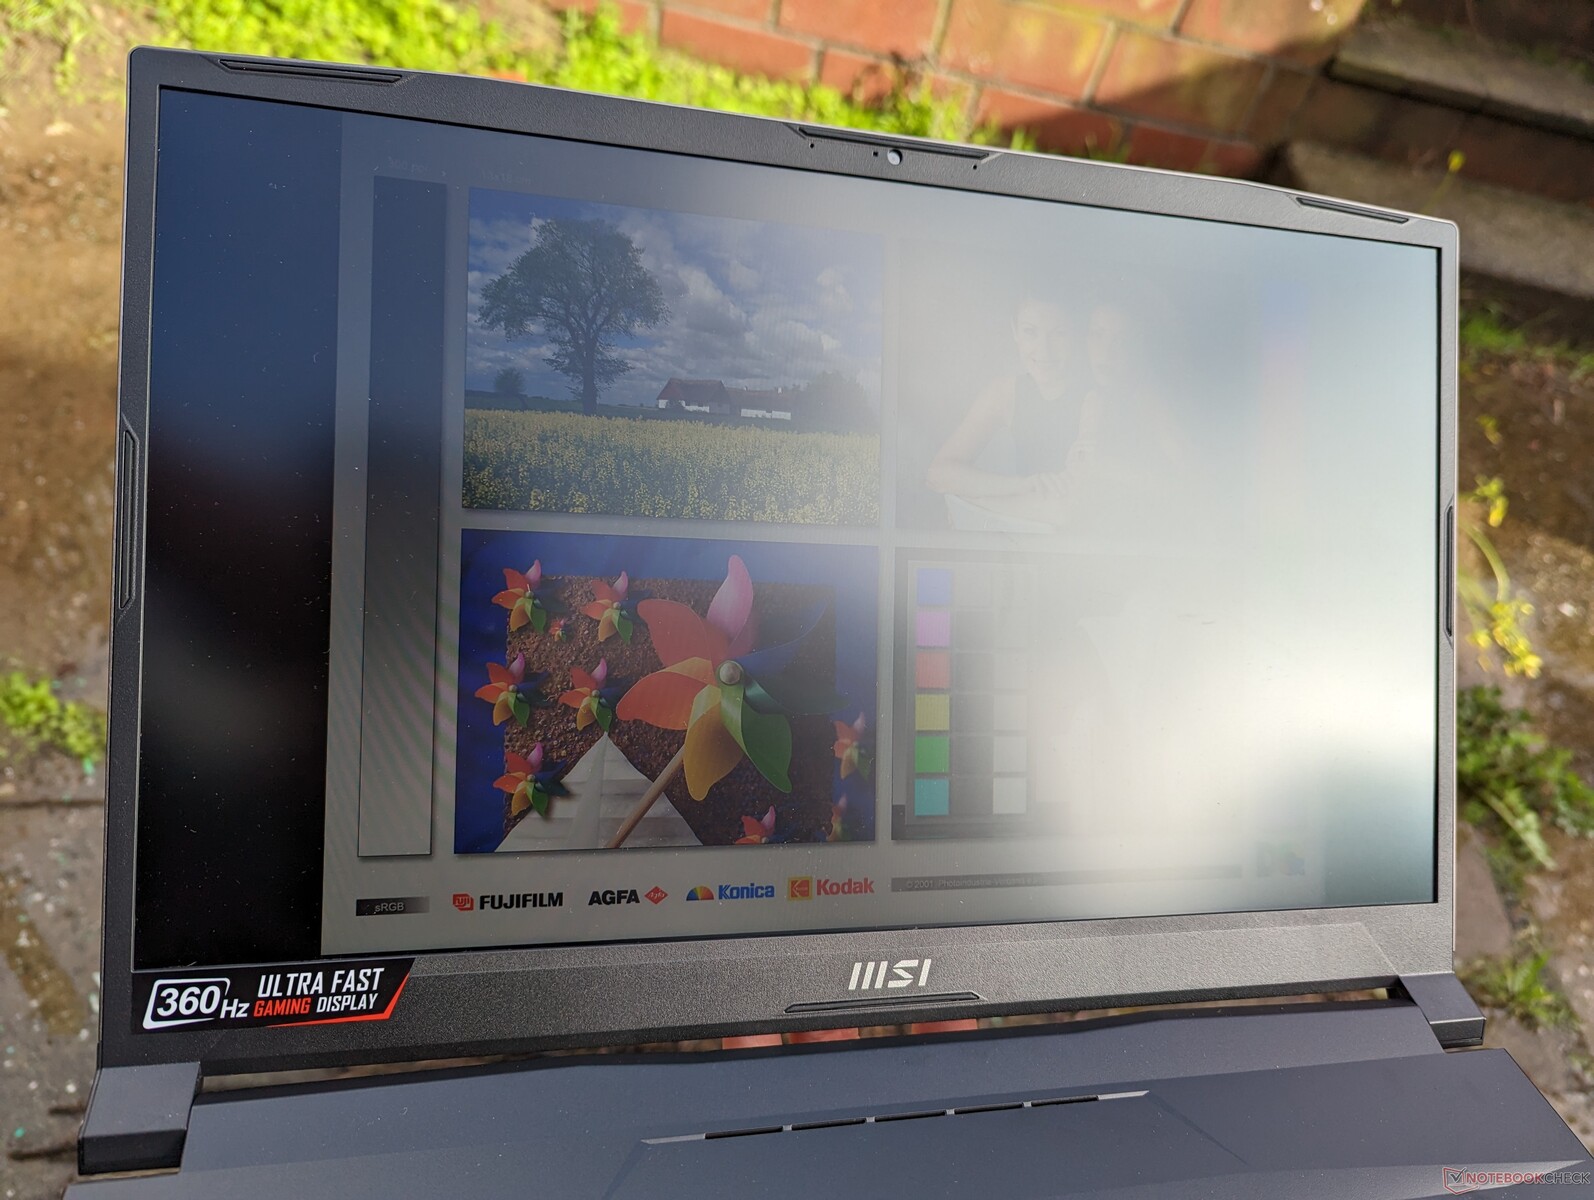
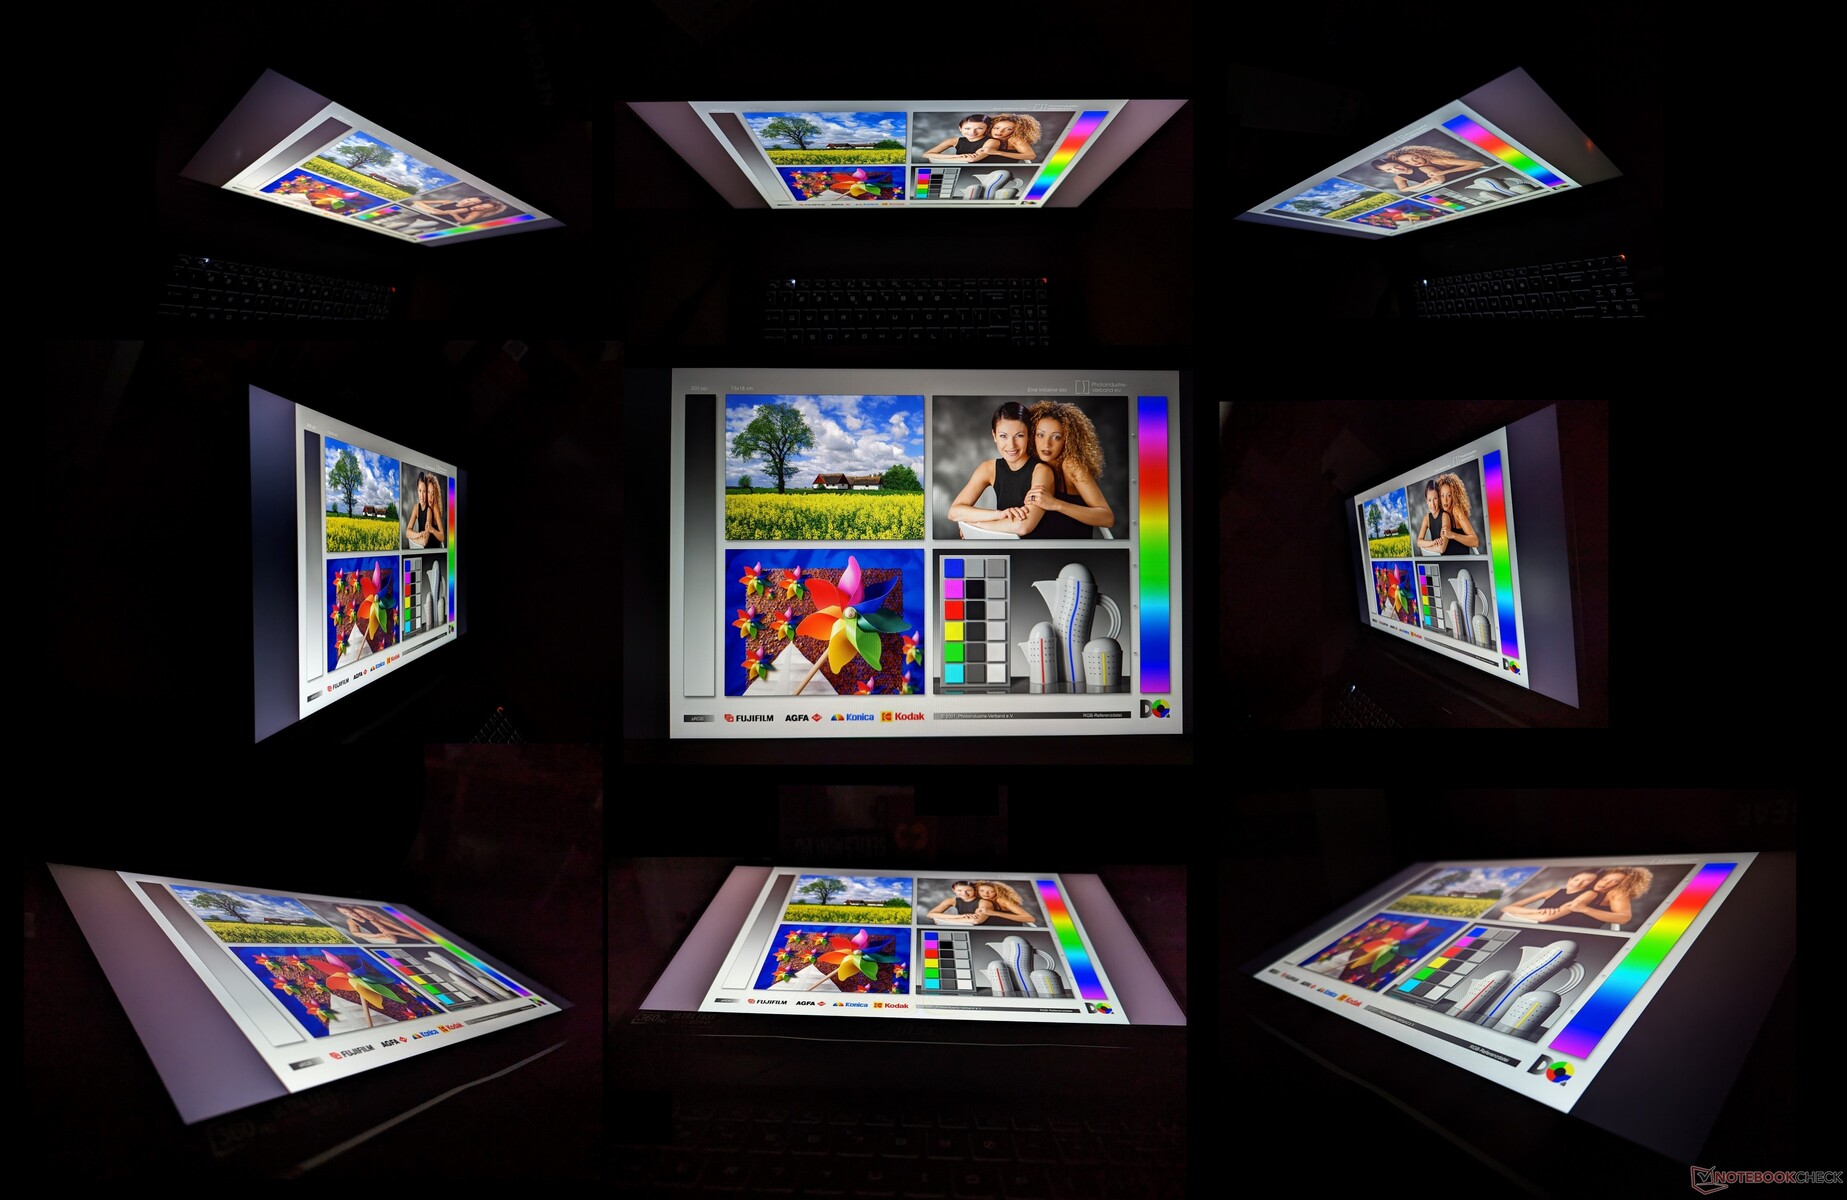
Affichage - 1080p uniquement
Il n'y a que deux options de panneau pour le 2022 GL76 comme indiqué ci-dessous. la résolution 1080p est la seule option pour l'instant, alors que le modèle 2021 avait un SKU QHD.
- 144 Hz, 1080p, 60% sRGB, IPS
- 360 Hz, 1080p, 100% sRGB, IPS
La dalle 360 Hz a des temps de réponse noir-blanc beaucoup plus rapides que la dalle 144 Hz. Il s'agit également de la même dalle IPS Sharp LQ173M1JW08 que MSI utilise également sur son flagship Titan GT77. Nous recommandons d'éviter l'option 144 Hz car son espace couleur limité est un bon indicateur d'une dalle très bon marché.
La qualité d'image est excellente et douce comme du beurre grâce au taux de rafraîchissement incroyablement rapide. Gardez à l'esprit qu'elle n'est pas aussi nette que celle de la plupart des Ultrabooks ou des petits ordinateurs portables de jeu de 15,6 pouces en raison du PPI relativement faible. Ce panneau particulier donne la priorité à la réactivité et aux fréquences d'images plutôt qu'à la résolution.

| |||||||||||||||||||||||||
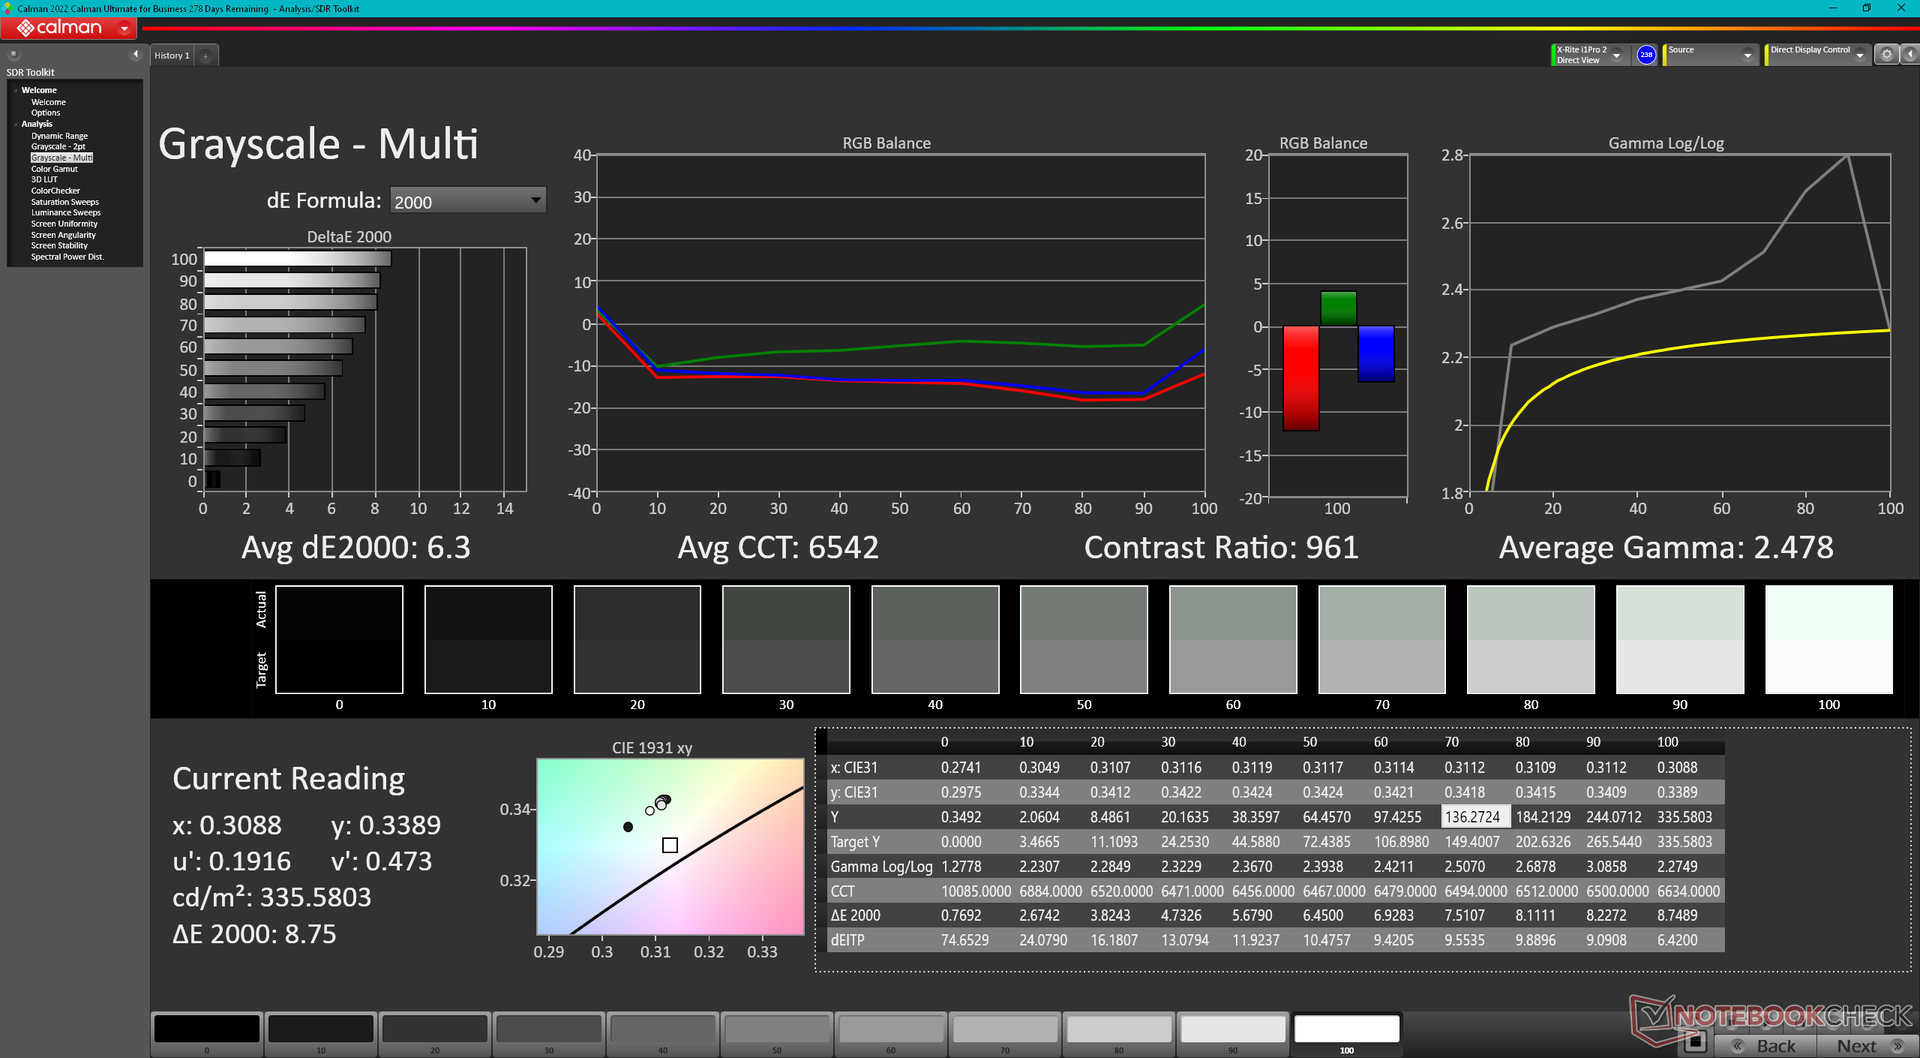
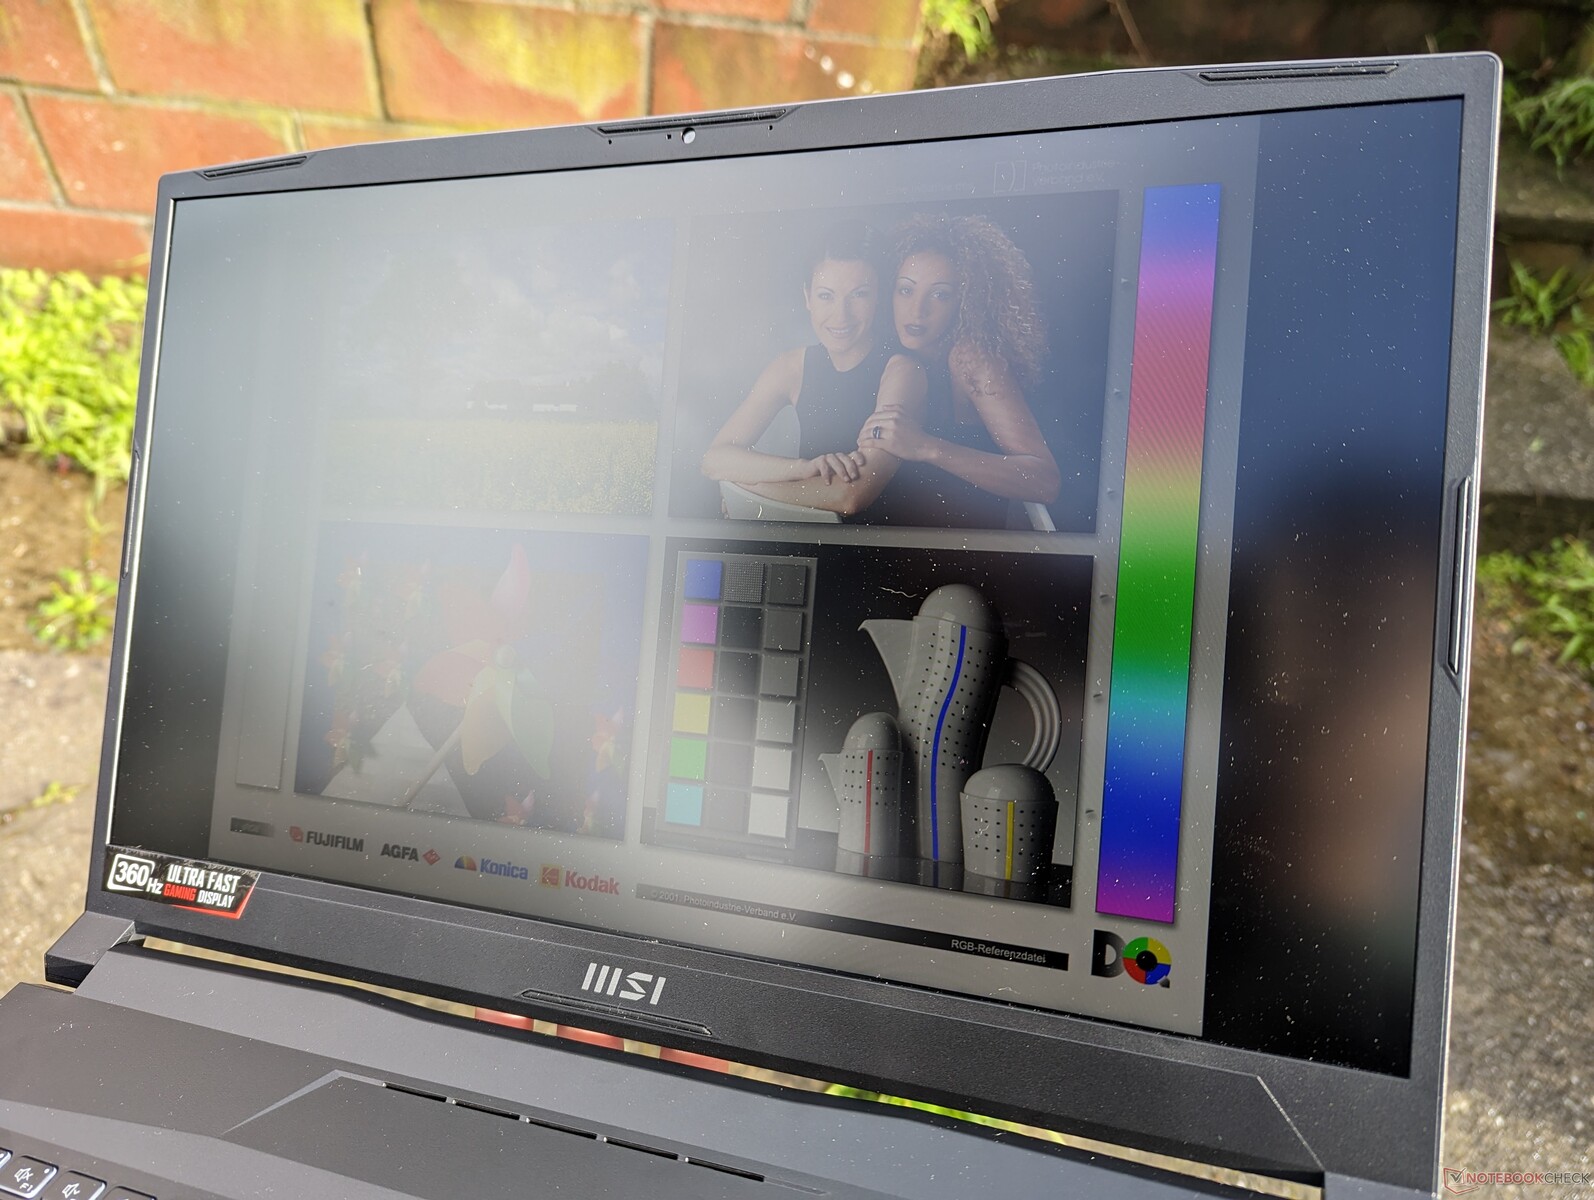
Homogénéité de la luminosité: 82 %
Valeur mesurée au centre, sur batterie: 337.7 cd/m²
Contraste: 1089:1 (Valeurs des noirs: 0.31 cd/m²)
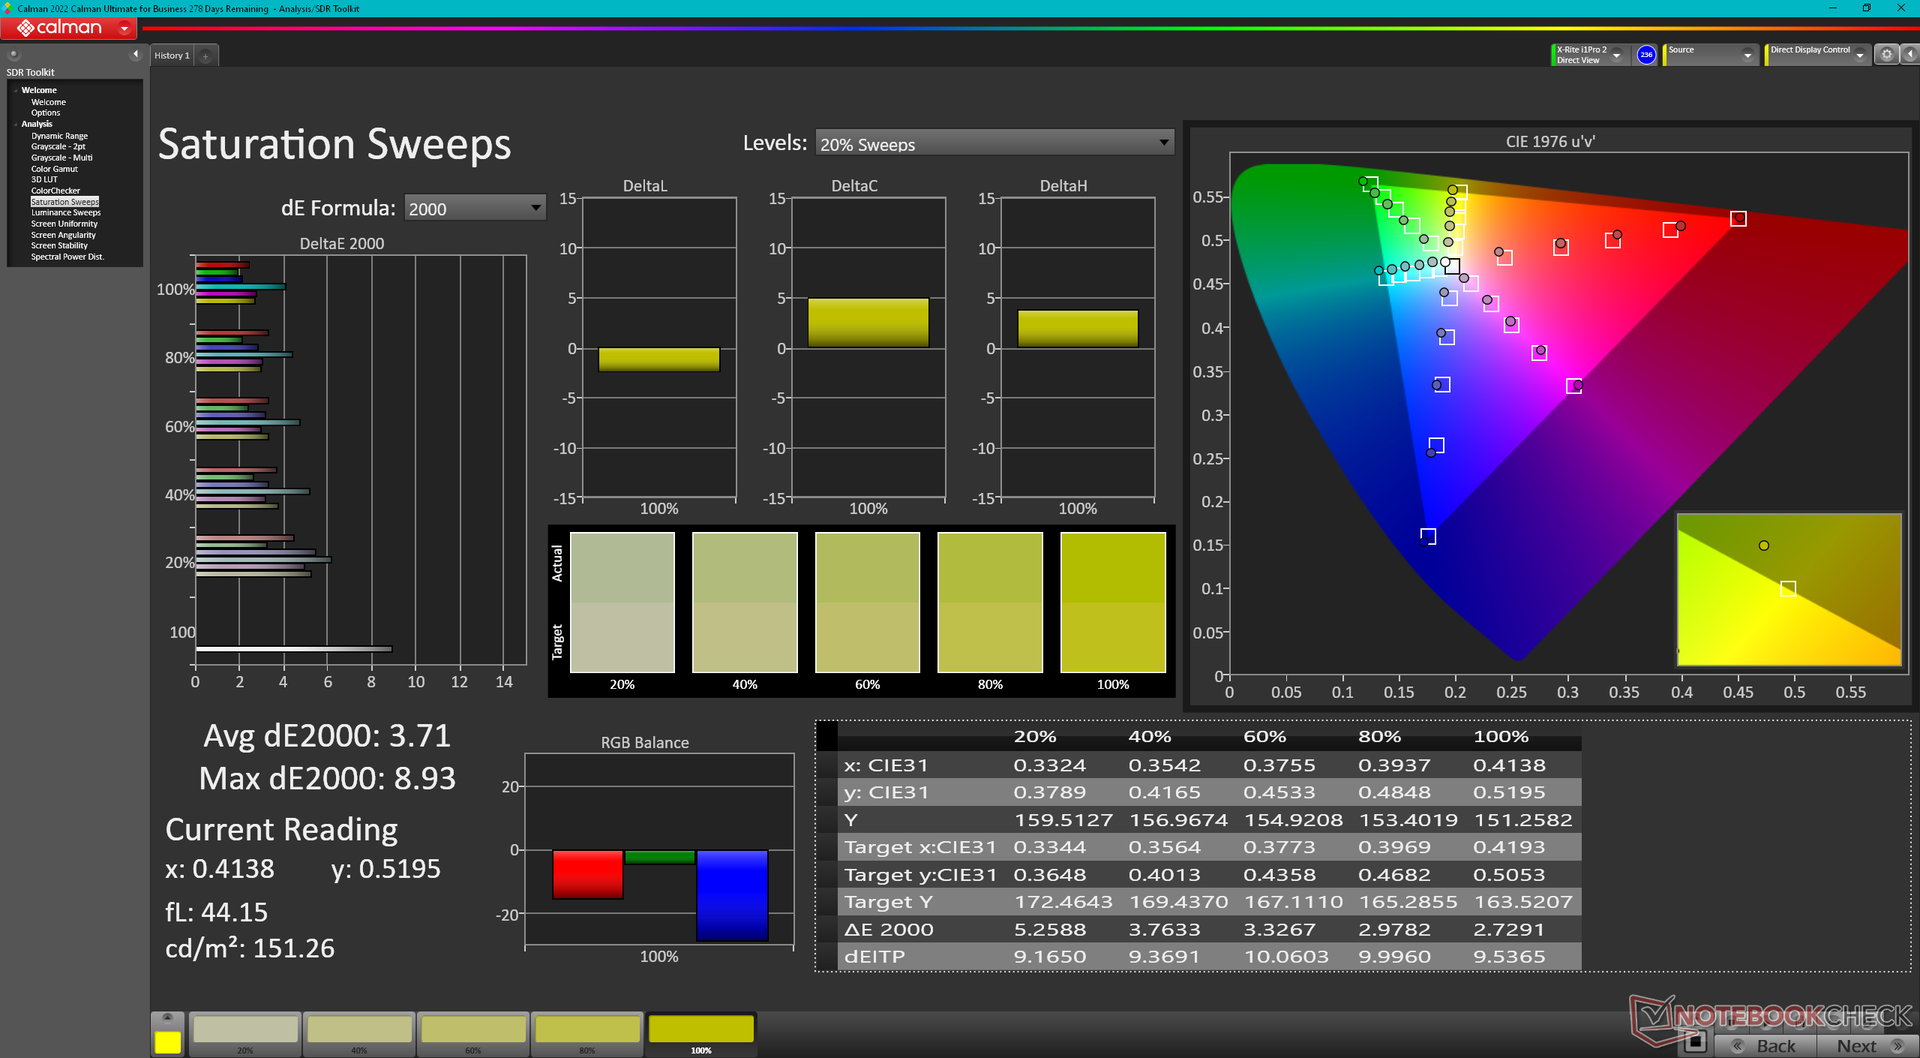
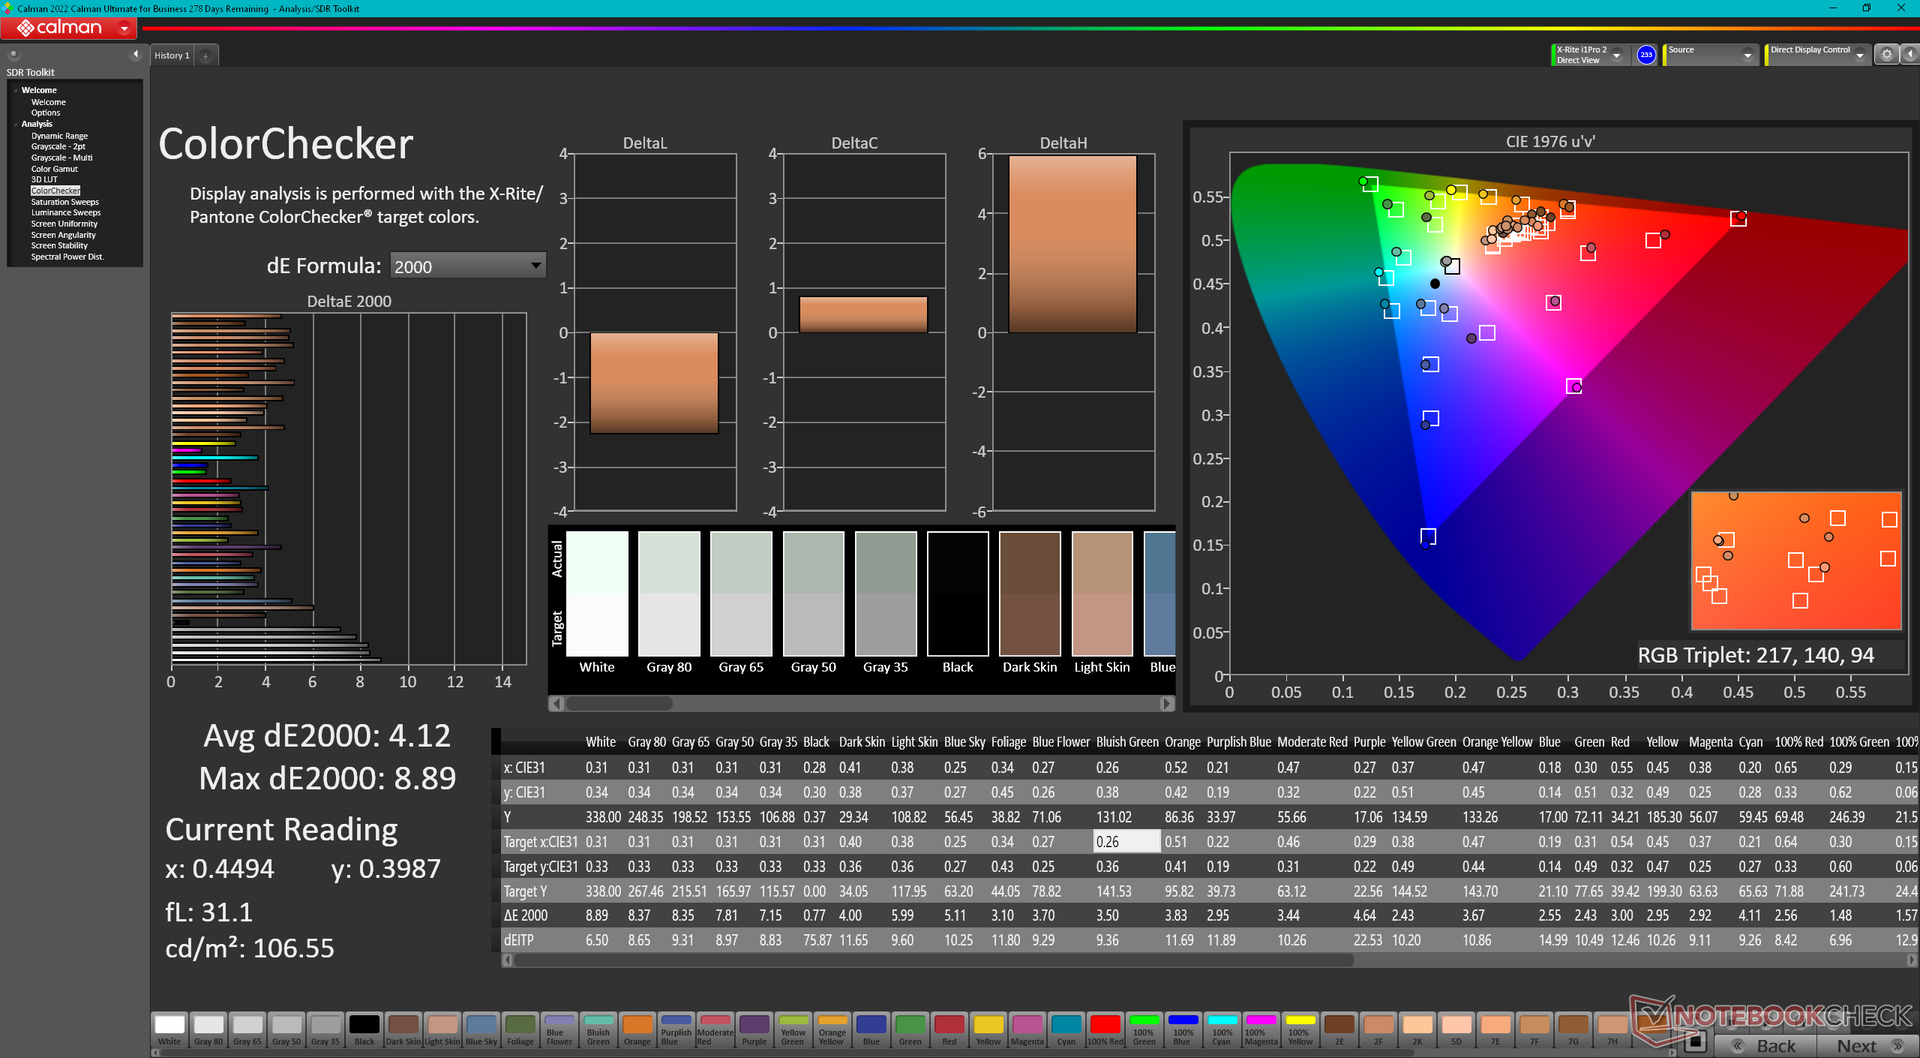
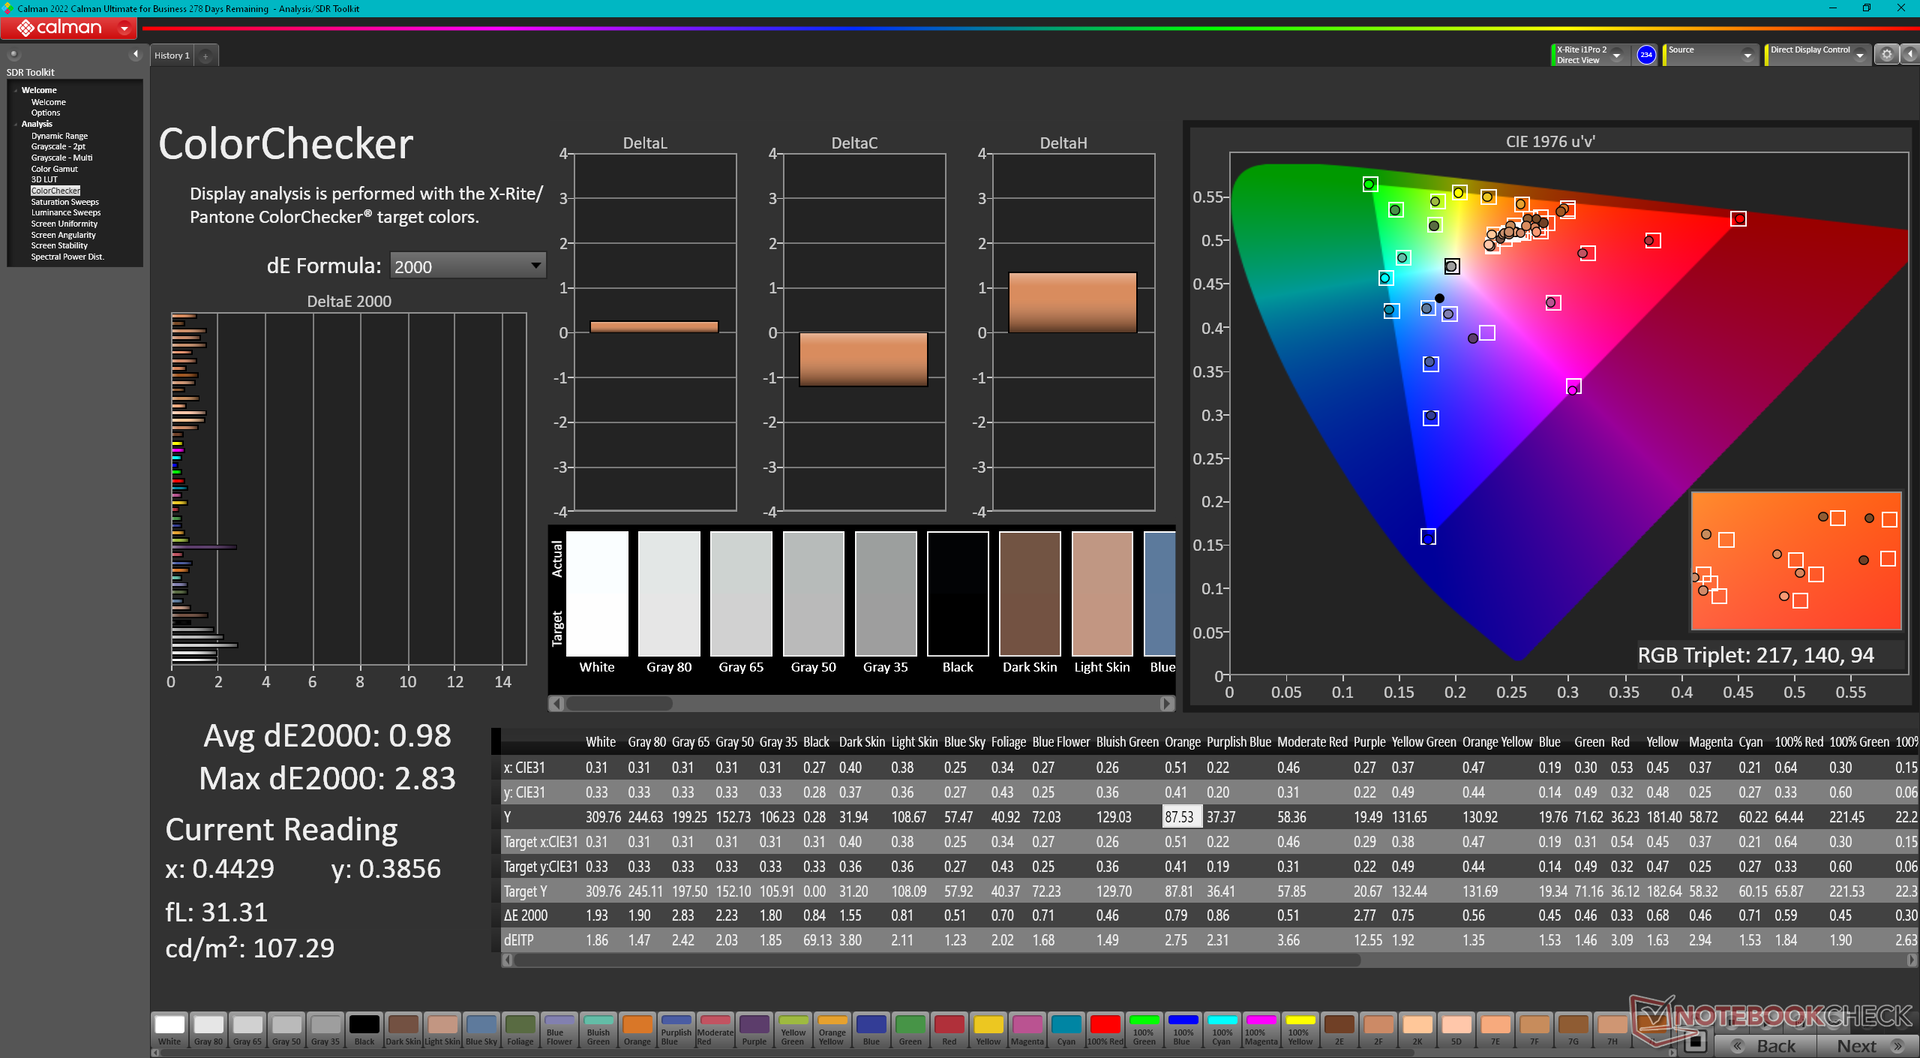
ΔE ColorChecker Calman: 4.12 | ∀{0.5-29.43 Ø4.73}
calibrated: 0.98
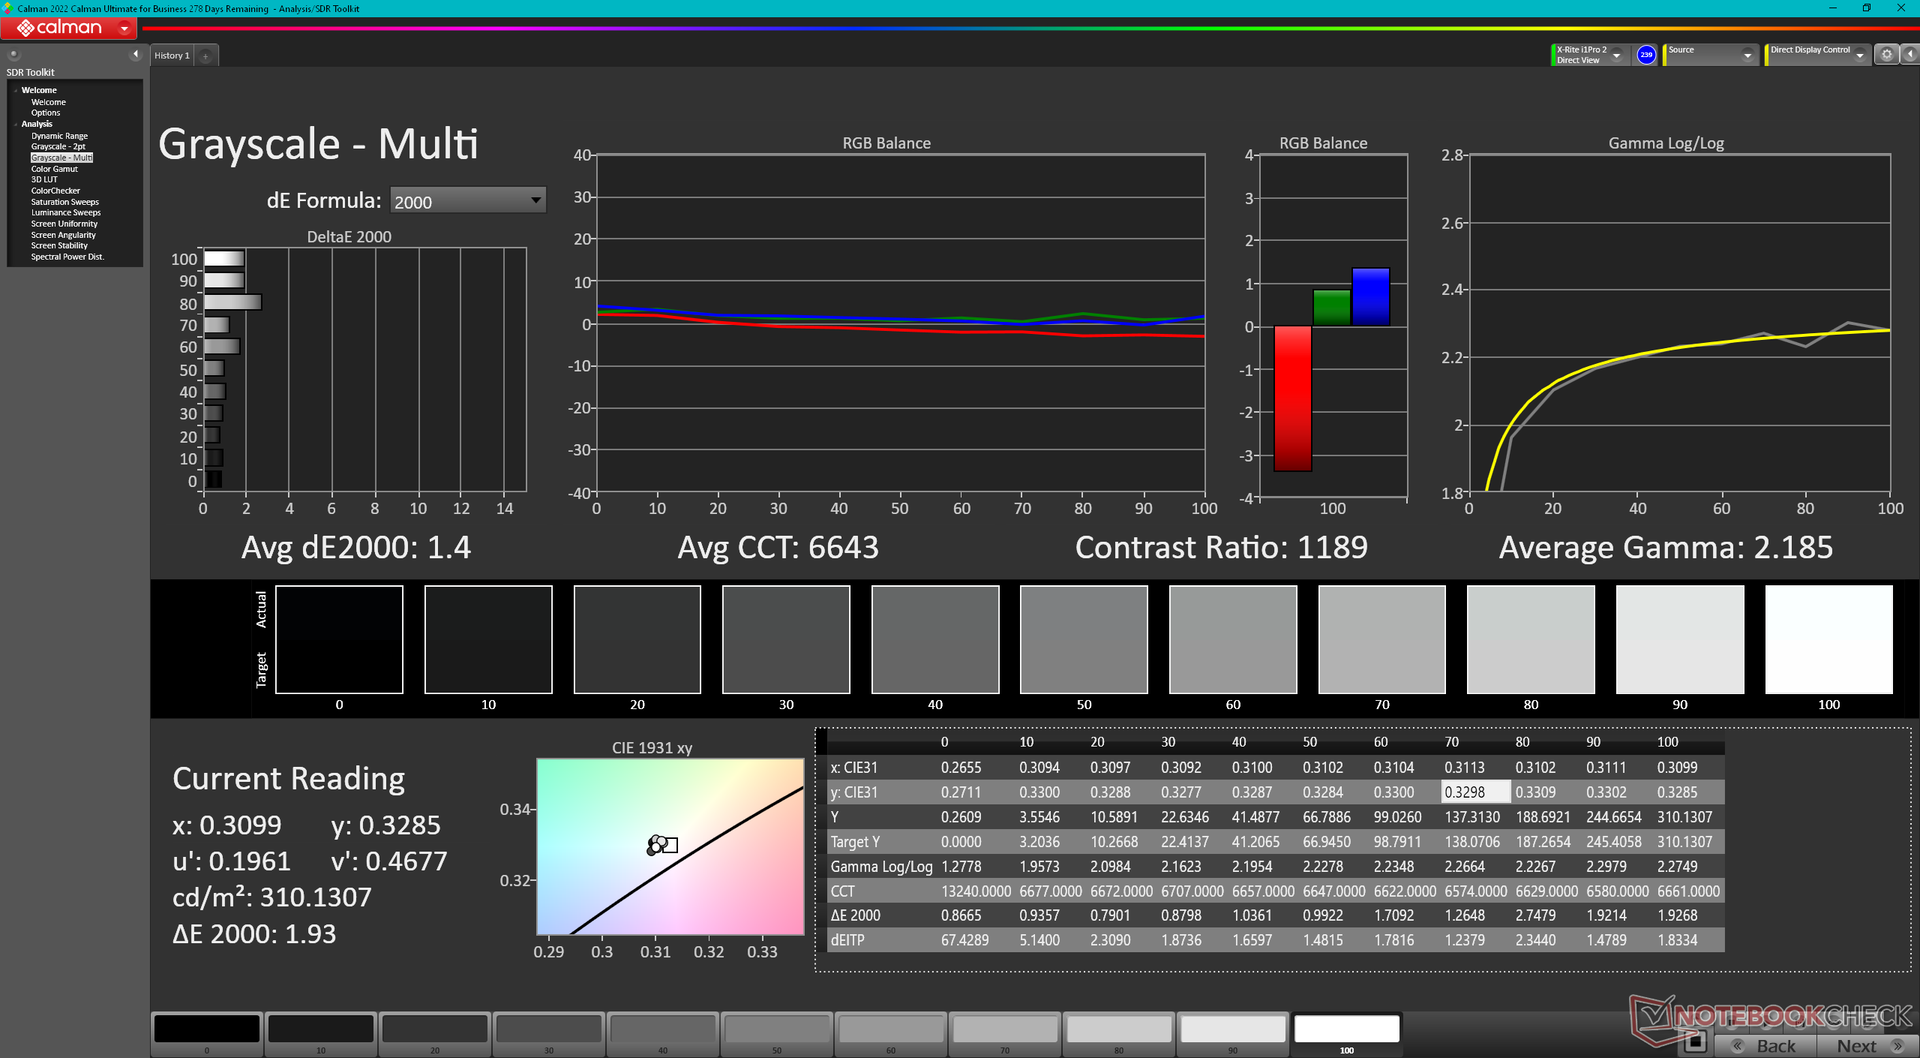
ΔE Greyscale Calman: 6.3 | ∀{0.09-98 Ø4.97}
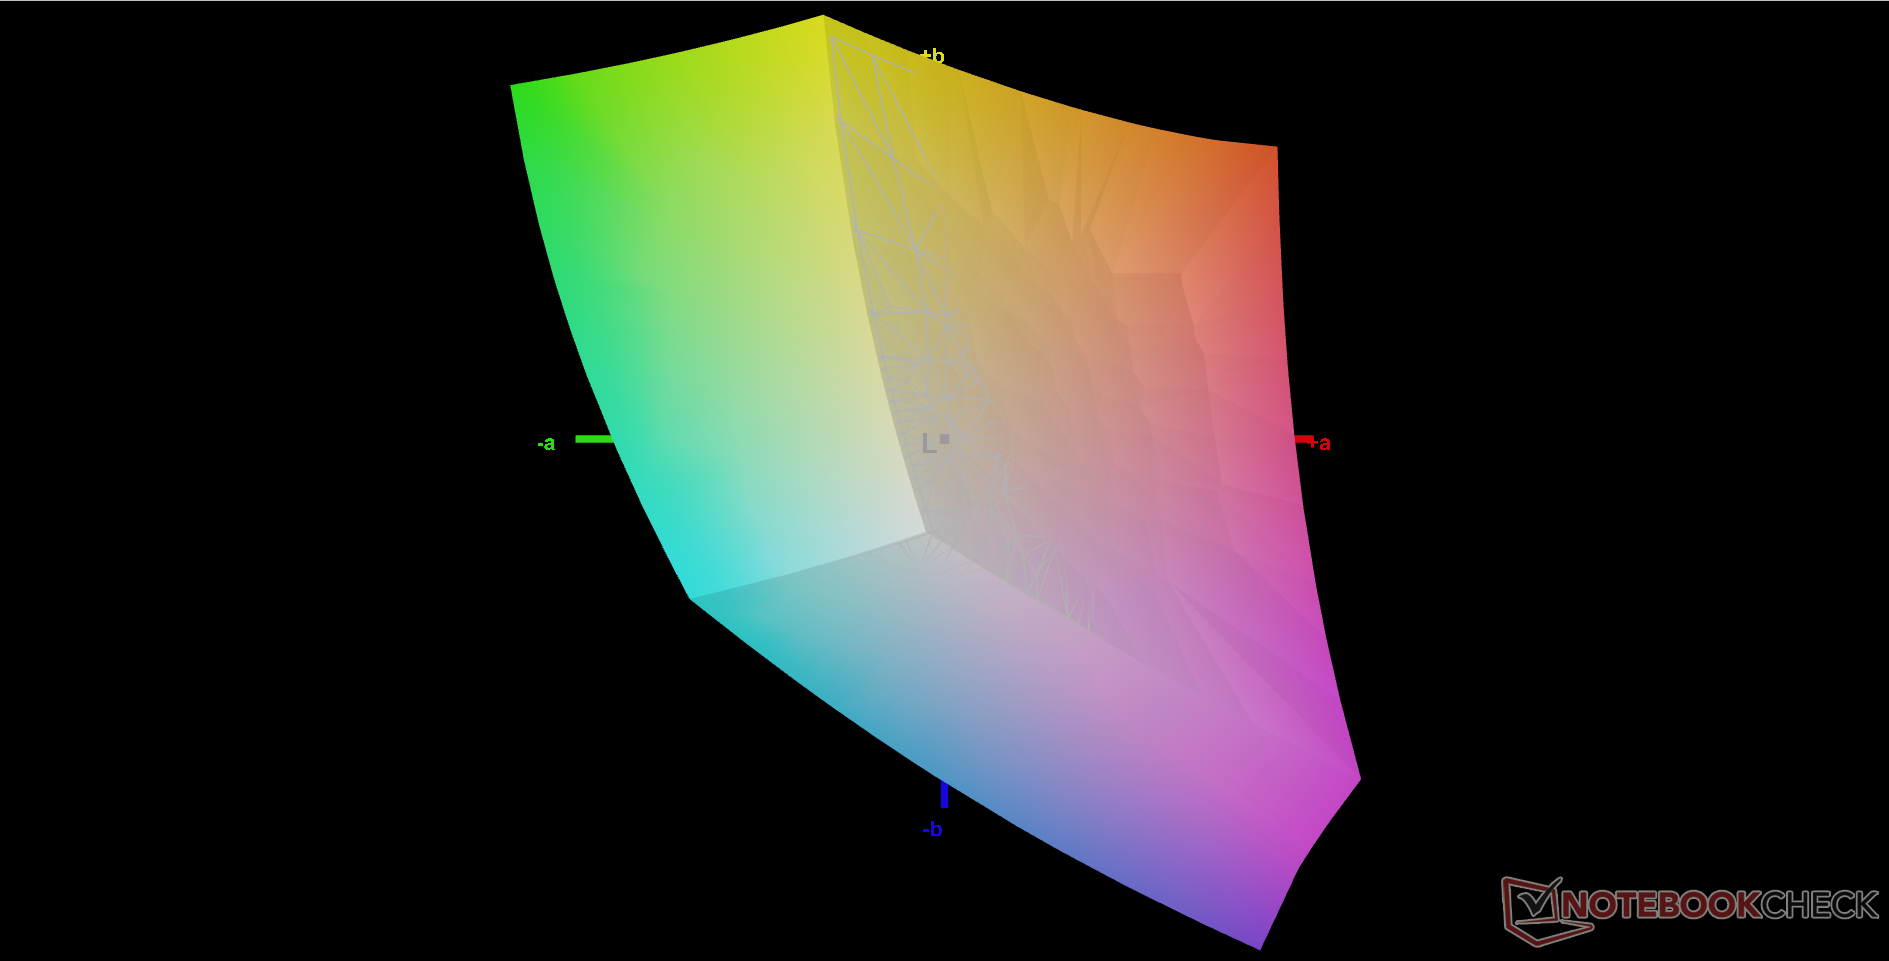
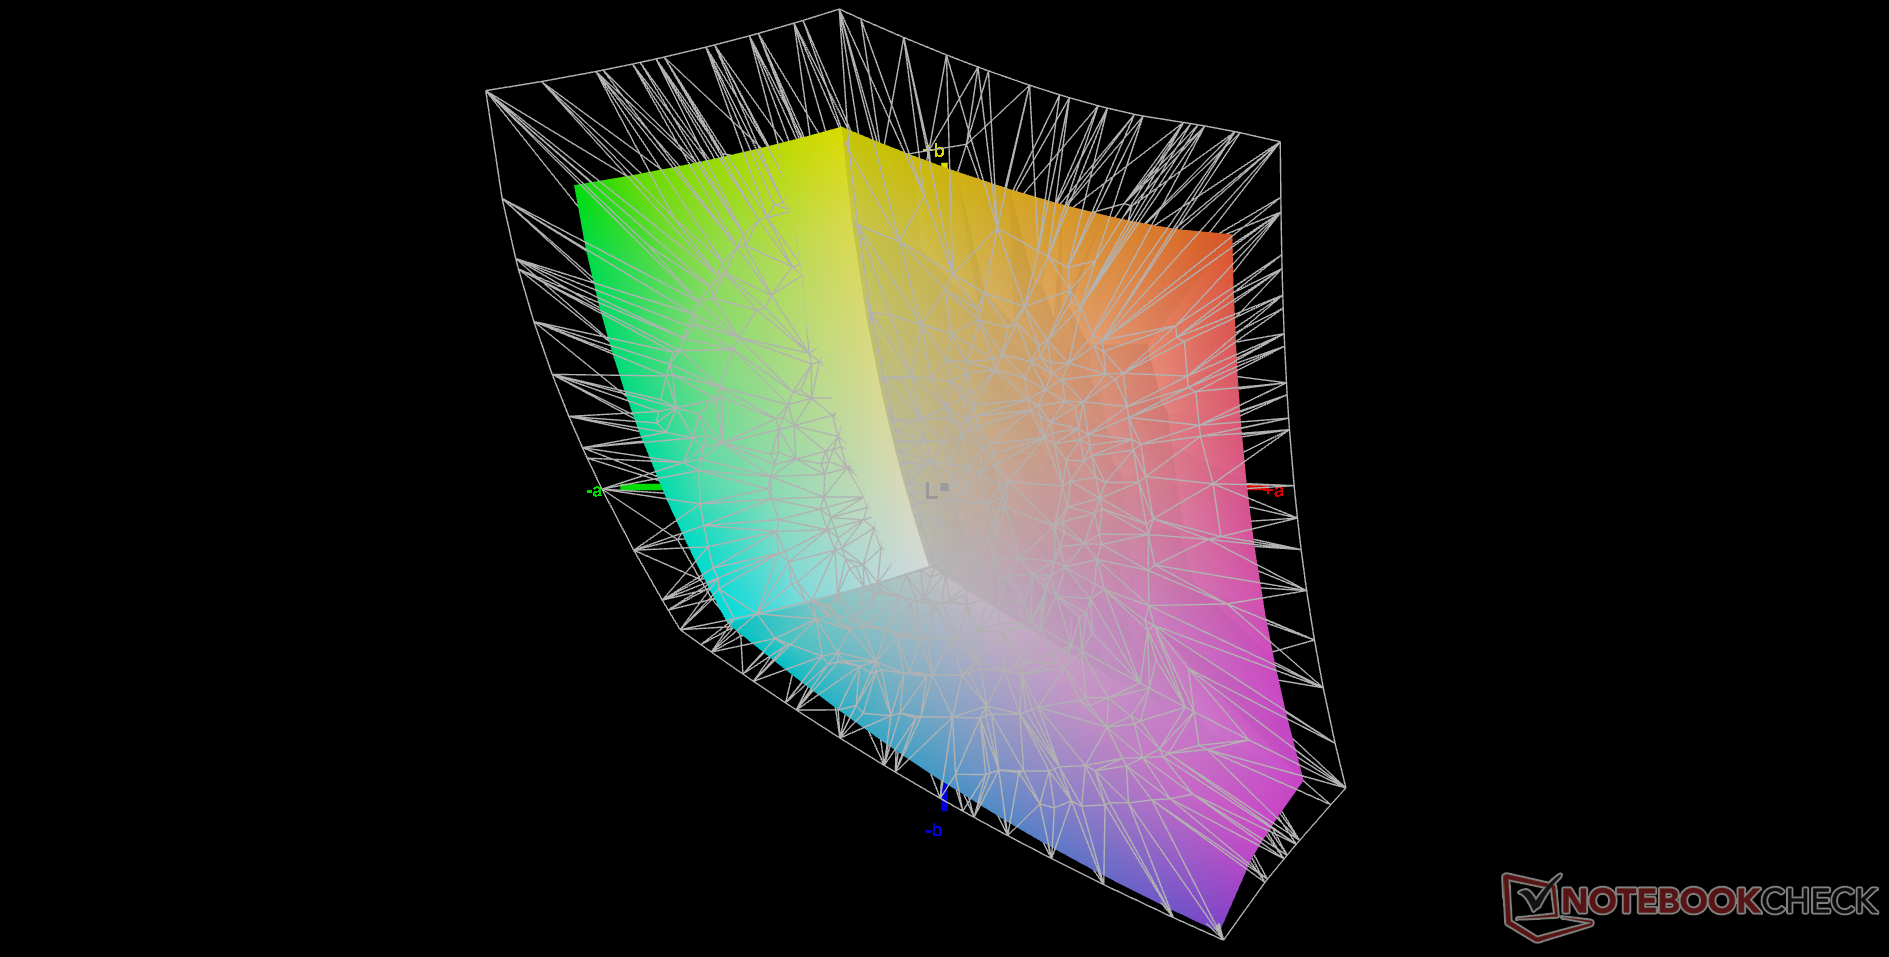
73.7% AdobeRGB 1998 (Argyll 3D)
99.9% sRGB (Argyll 3D)
71.9% Display P3 (Argyll 3D)
Gamma: 2.48
CCT: 6542 K
| MSI Pulse GL76 12UGK Sharp LQ173M1JW08, IPS, 1920x1080, 17.3" | Alienware m17 R5 (R9 6900HX, RX 6850M XT) AU Optronics AUODBA3, IPS, 3840x2160, 17" | Asus ROG Strix Scar 17 SE G733CX-LL014W NE173QHM-NZ2, IPS, 2560x1440, 17.3" | Acer Predator Helios 300 (i7-12700H, RTX 3070 Ti) BOE0A1A, IPS, 2560x1440, 17.3" | Razer Blade 17 Early 2022 AU Optronics B173ZAN06.9, IPS, 3840x2160, 17.3" | MSI Vector GP76 12UGS-434 AUO B173HAN05.4, IPS, 1920x1080, 17.3" | |
|---|---|---|---|---|---|---|
| Display | 18% | 17% | 17% | 19% | -3% | |
| Display P3 Coverage (%) | 71.9 | 97.2 35% | 97.1 35% | 96.8 35% | 99.4 38% | 70.09 -3% |
| sRGB Coverage (%) | 99.9 | 99.6 0% | 99.9 0% | 99.9 0% | 100 0% | 98.98 -1% |
| AdobeRGB 1998 Coverage (%) | 73.7 | 88.4 20% | 84.8 15% | 84.8 15% | 87.3 18% | 70.91 -4% |
| Response Times | -131% | -7% | -129% | -7% | 21% | |
| Response Time Grey 50% / Grey 80% * (ms) | 4.6 ? | 16.4 ? -257% | 5.7 ? -24% | 16.4 ? -257% | 7.5 ? -63% | 4 ? 13% |
| Response Time Black / White * (ms) | 11.2 ? | 11.6 ? -4% | 10.1 ? 10% | 11.2 ? -0% | 5.6 ? 50% | 8 ? 29% |
| PWM Frequency (Hz) | ||||||
| Screen | -43% | 28% | -12% | 34% | 11% | |
| Brightness middle (cd/m²) | 337.7 | 484 43% | 320 -5% | 366 8% | 503 49% | 274 -19% |
| Brightness (cd/m²) | 331 | 449 36% | 303 -8% | 340 3% | 486 47% | 264 -20% |
| Brightness Distribution (%) | 82 | 87 6% | 87 6% | 85 4% | 84 2% | 87 6% |
| Black Level * (cd/m²) | 0.31 | 0.55 -77% | 0.3 3% | 0.31 -0% | 0.44 -42% | 0.25 19% |
| Contrast (:1) | 1089 | 880 -19% | 1067 -2% | 1181 8% | 1143 5% | 1096 1% |
| Colorchecker dE 2000 * | 4.12 | 4.8 -17% | 1.1 73% | 3.56 14% | 1.08 74% | 2.53 39% |
| Colorchecker dE 2000 max. * | 8.89 | 7.48 16% | 2.7 70% | 5.66 36% | 4.54 49% | 6.76 24% |
| Colorchecker dE 2000 calibrated * | 0.98 | 4.74 -384% | 3.31 -238% | 0.6 39% | 0.98 -0% | |
| Greyscale dE 2000 * | 6.3 | 5.5 13% | 1.1 83% | 2.84 55% | 1.3 79% | 3.49 45% |
| Gamma | 2.48 89% | 2.42 91% | 2.13 103% | 2.29 96% | 2.151 102% | 2.31 95% |
| CCT | 6542 99% | 6148 106% | 6599 98% | 6835 95% | 6541 99% | 6714 97% |
| Moyenne finale (programmes/paramètres) | -52% /
-42% | 13% /
20% | -41% /
-23% | 15% /
25% | 10% /
9% |
* ... Moindre est la valeur, meilleures sont les performances
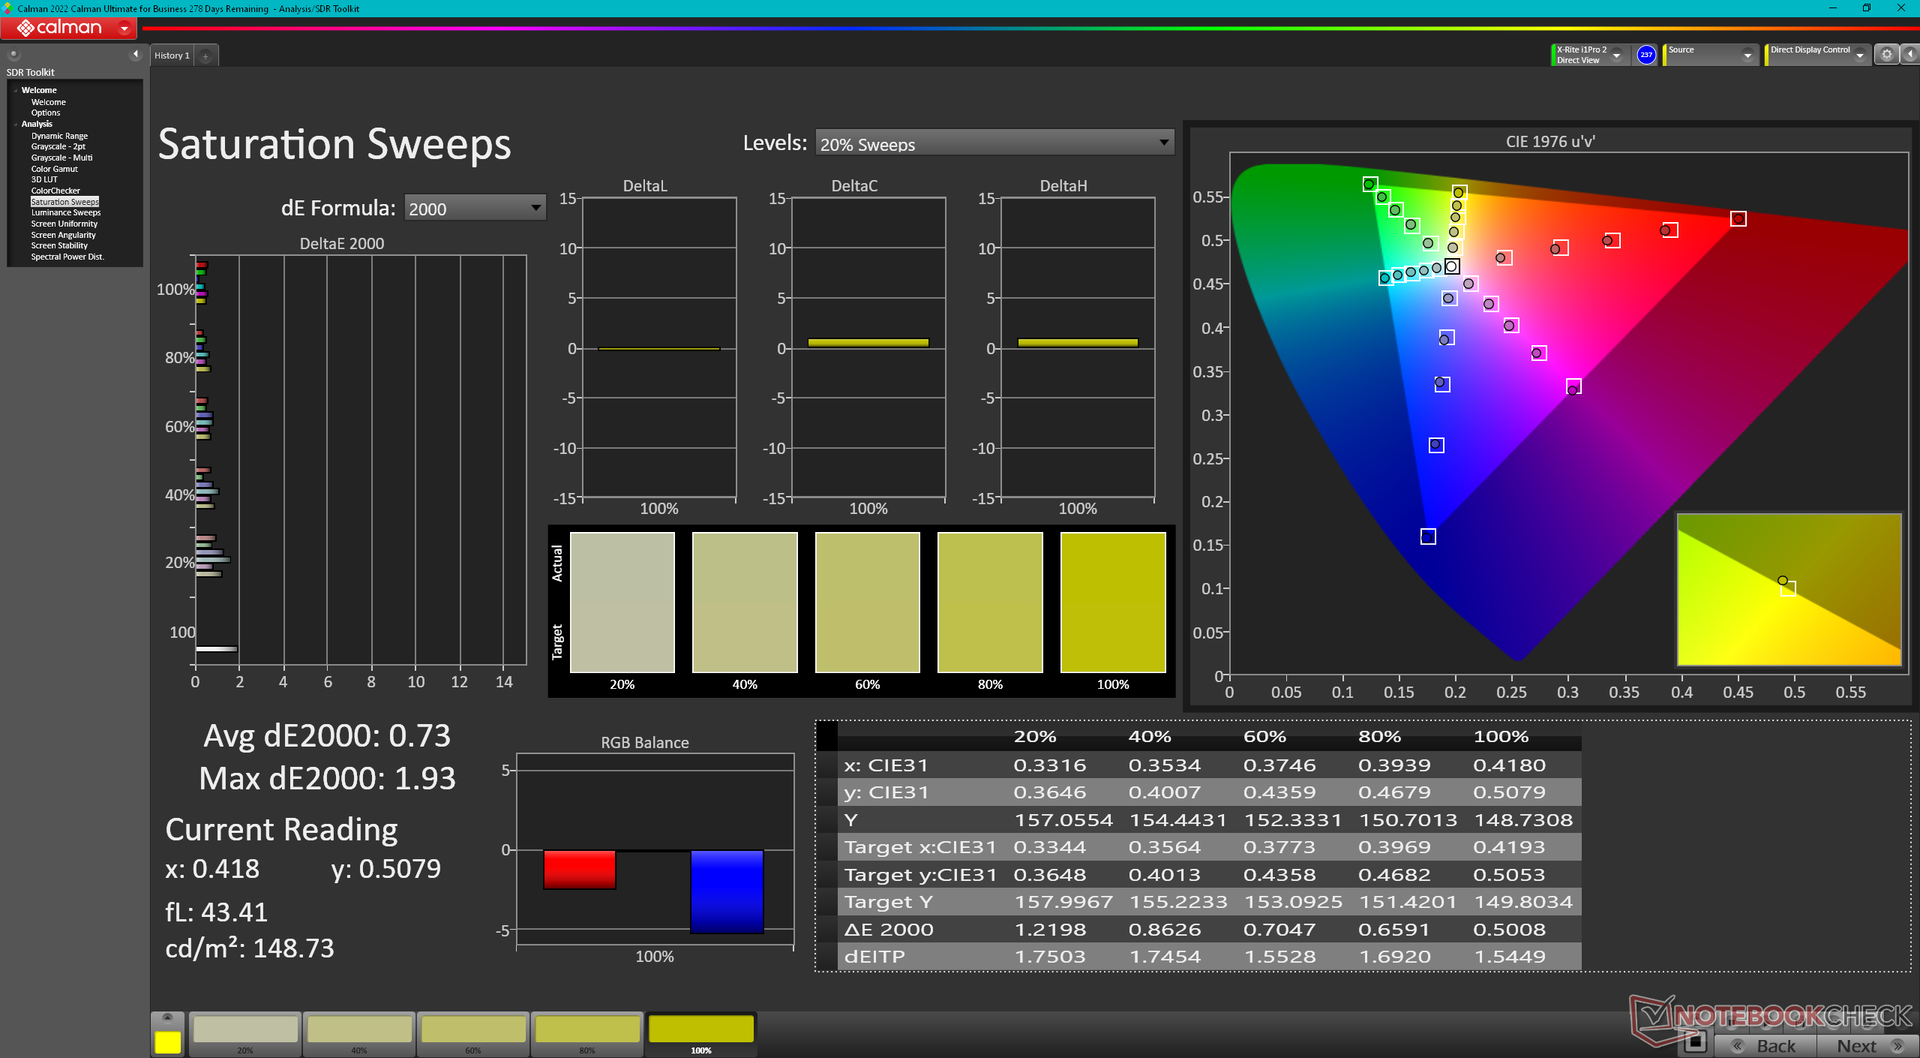
L'écran n'est pas calibré dès sa sortie de l'emballage. Les valeurs DeltaE moyennes des niveaux de gris et des couleurs s'amélioreraient considérablement, passant de 6,3 et 4,12 à seulement 1,4 et 0,98, respectivement, après un calibrage correct avec un colorimètre X-Rite. Nous recommandons d'appliquer notre profil ICM ci-dessus pour mieux exploiter la couverture sRGB complète du panneau.
Temps de réponse de l'écran
| ↔ Temps de réponse noir à blanc | ||
|---|---|---|
| 11.2 ms ... hausse ↗ et chute ↘ combinées | ↗ 6.8 ms hausse | 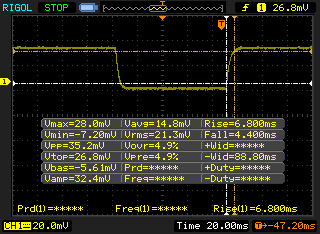 |
| ↘ 4.4 ms chute | ||
| L'écran montre de bons temps de réponse, mais insuffisant pour du jeu compétitif. En comparaison, tous les appareils testés affichent entre 0.1 (minimum) et 240 (maximum) ms. » 30 % des appareils testés affichent de meilleures performances. Cela signifie que les latences relevées sont meilleures que la moyenne (19.9 ms) de tous les appareils testés. | ||
| ↔ Temps de réponse gris 50% à gris 80% | ||
| 4.6 ms ... hausse ↗ et chute ↘ combinées | ↗ 2.2 ms hausse | 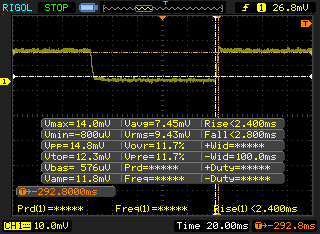 |
| ↘ 2.4 ms chute | ||
| L'écran montre de très faibles temps de réponse, parfait pour le jeu. En comparaison, tous les appareils testés affichent entre 0.165 (minimum) et 636 (maximum) ms. » 16 % des appareils testés affichent de meilleures performances. Cela signifie que les latences relevées sont meilleures que la moyenne (31.1 ms) de tous les appareils testés. | ||
Scintillement / MLI (Modulation de largeur d'impulsion)
| Scintillement / MLI (Modulation de largeur d'impulsion) non décelé | 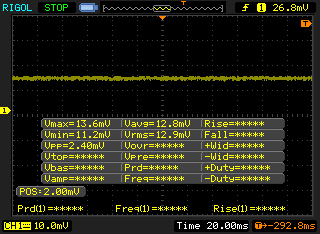 | ||
En comparaison, 52 % des appareils testés n'emploient pas MDI pour assombrir leur écran. Nous avons relevé une moyenne à 7798 (minimum : 5 - maximum : 343500) Hz dans le cas où une MDI était active. | |||
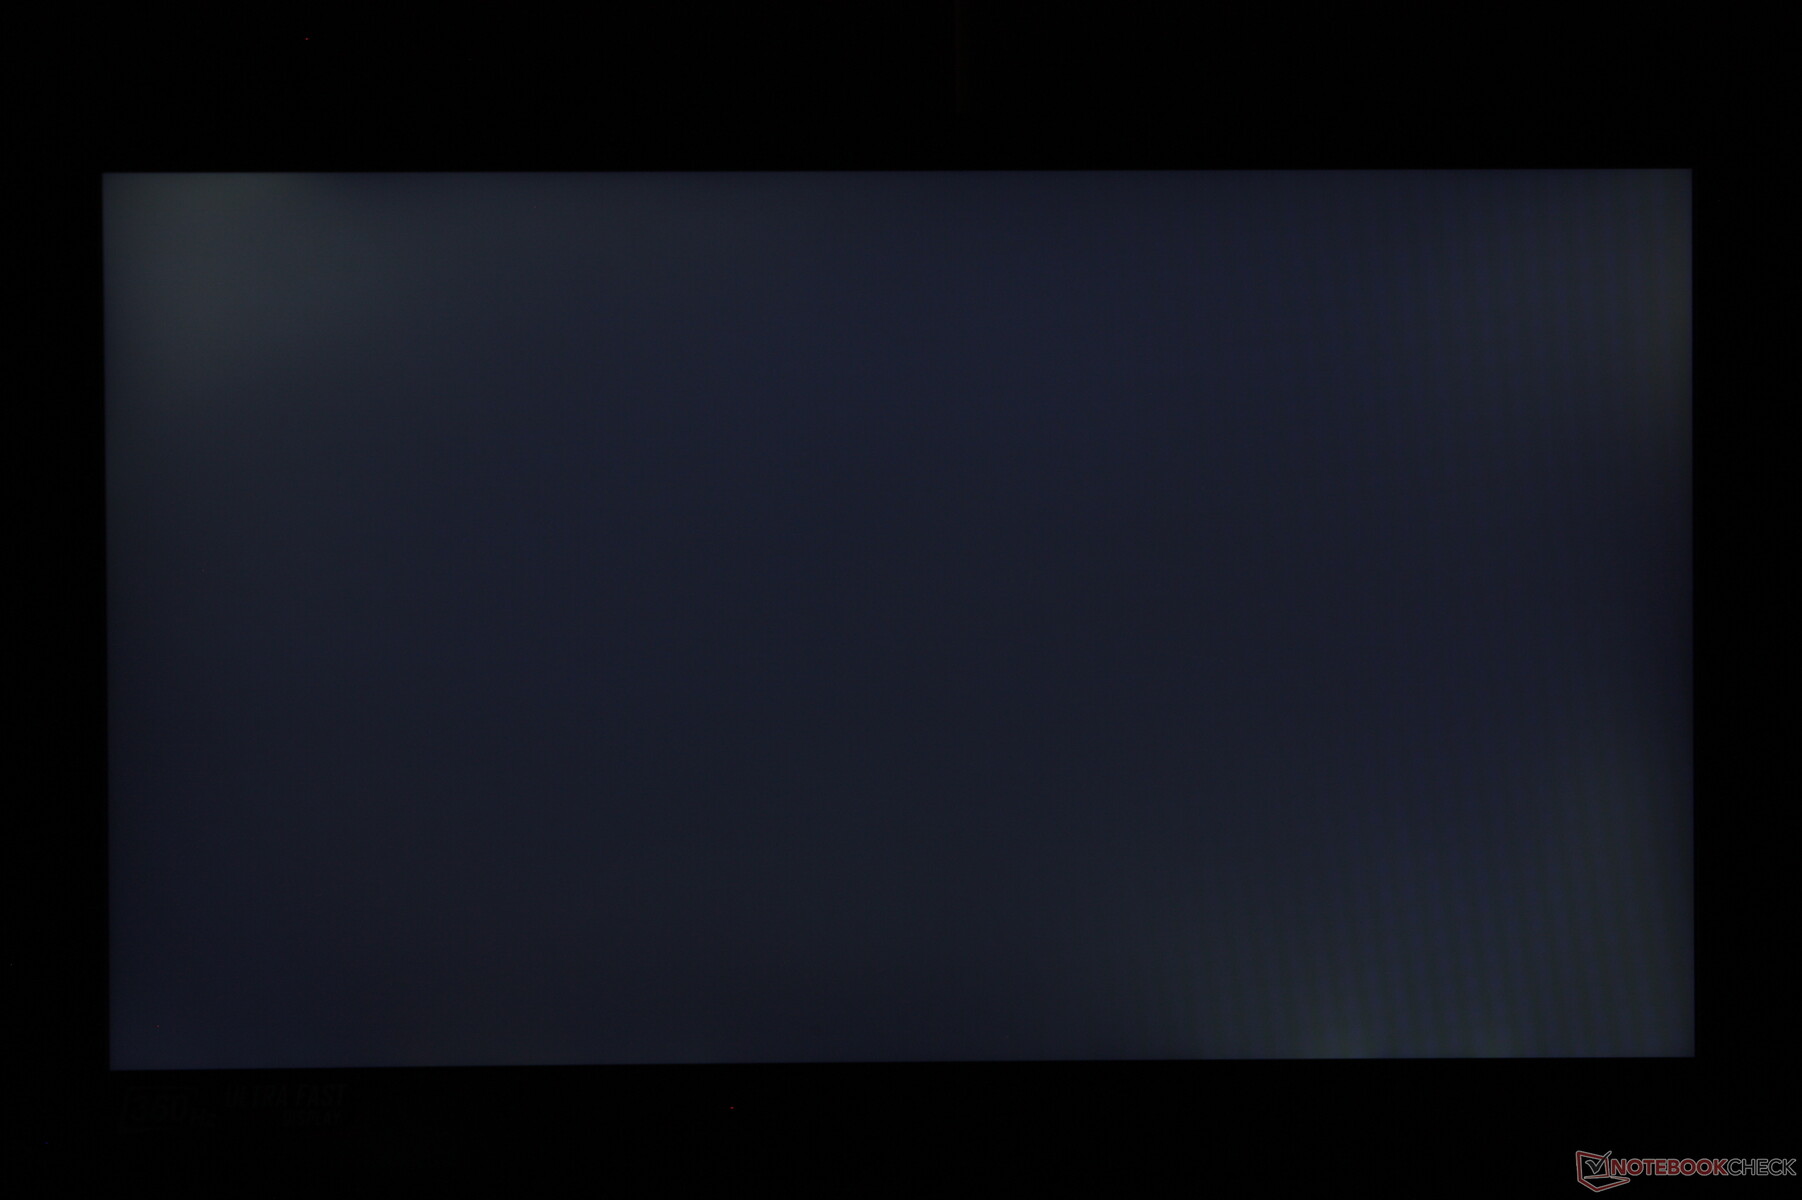
L'écran mat est suffisamment lumineux pour être utilisé à l'ombre, mais il n'est autrement pas conçu pour des conditions extérieures plus lumineuses. Quelques ordinateurs portables de jeu, tels que le Razer Blade 17 OLEDsont dotés d'un écran plus lumineux de 500 lumens pour une meilleure lisibilité en extérieur.

Performances - Intel 12e génération Alder Lake-H
Conditions d'essai
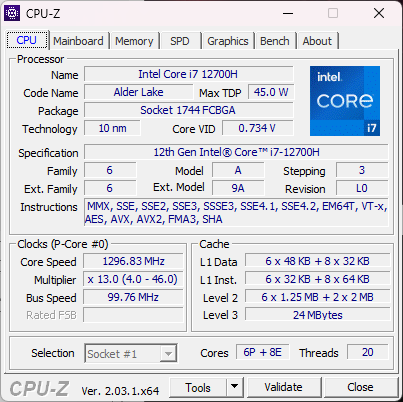
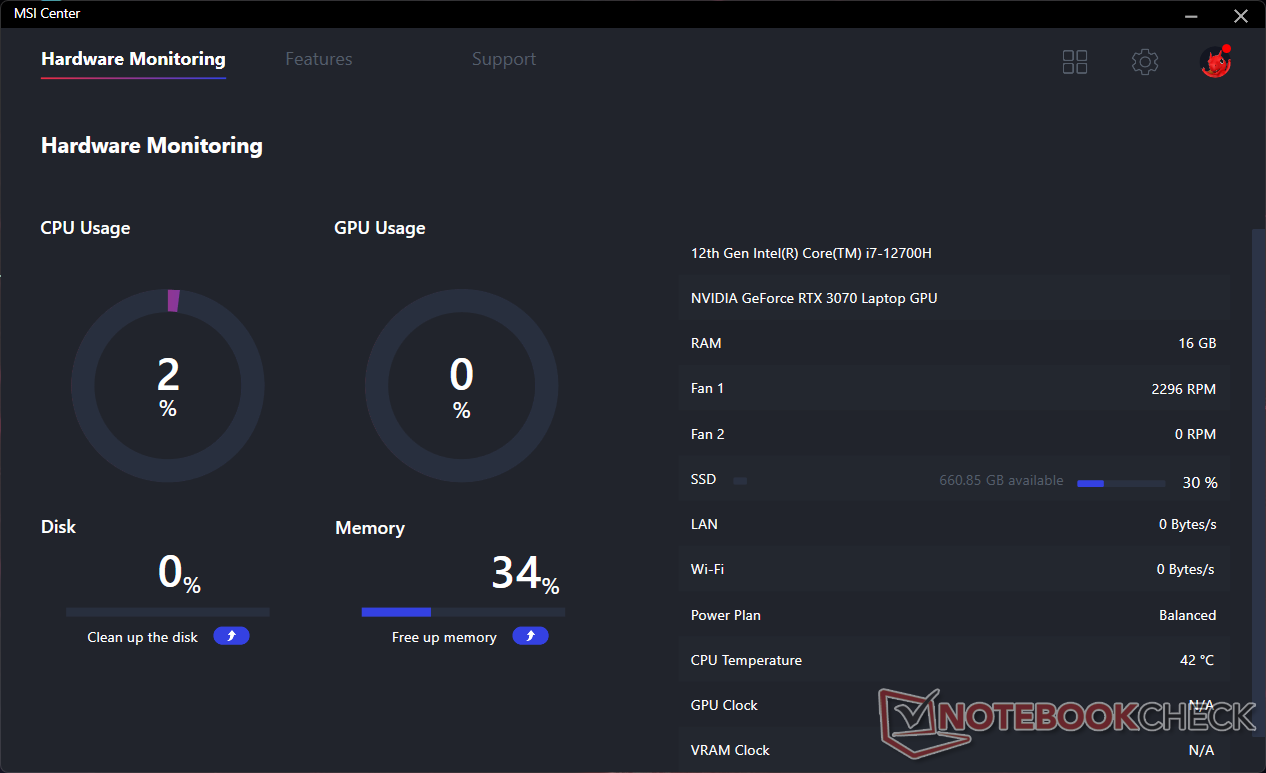
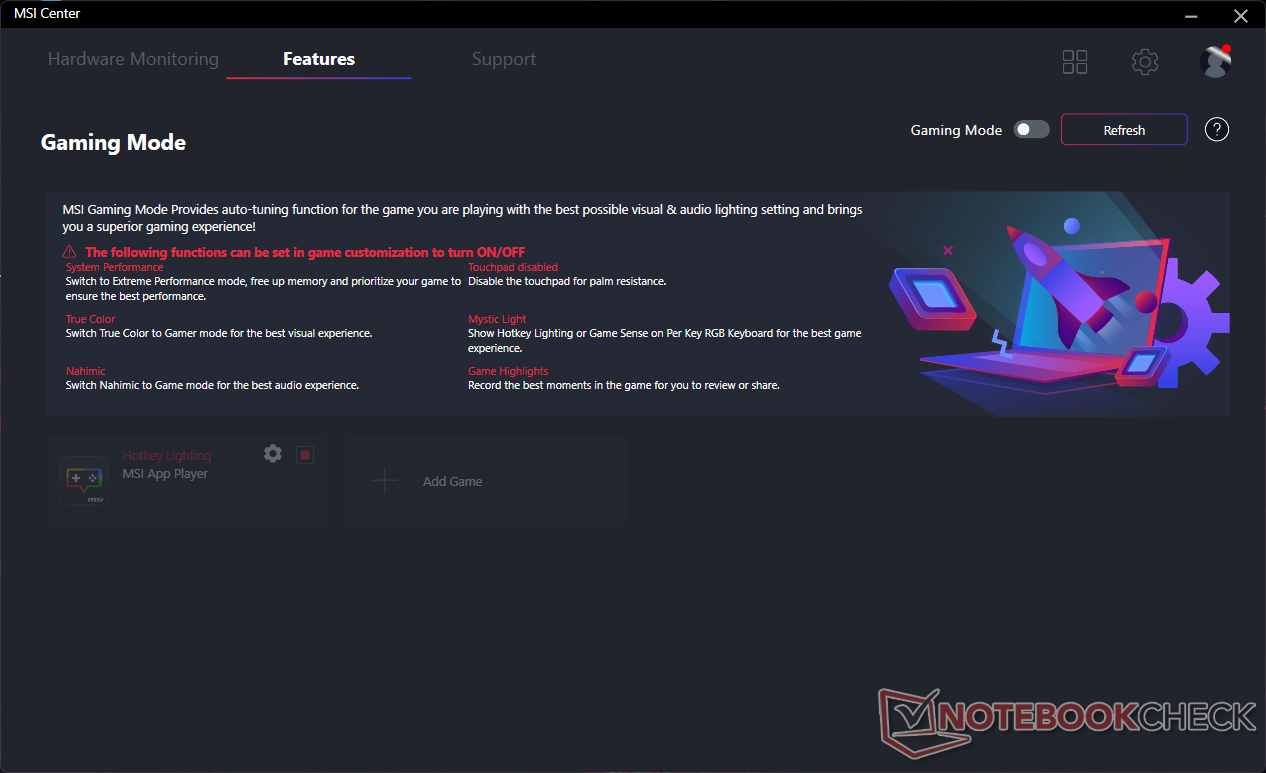
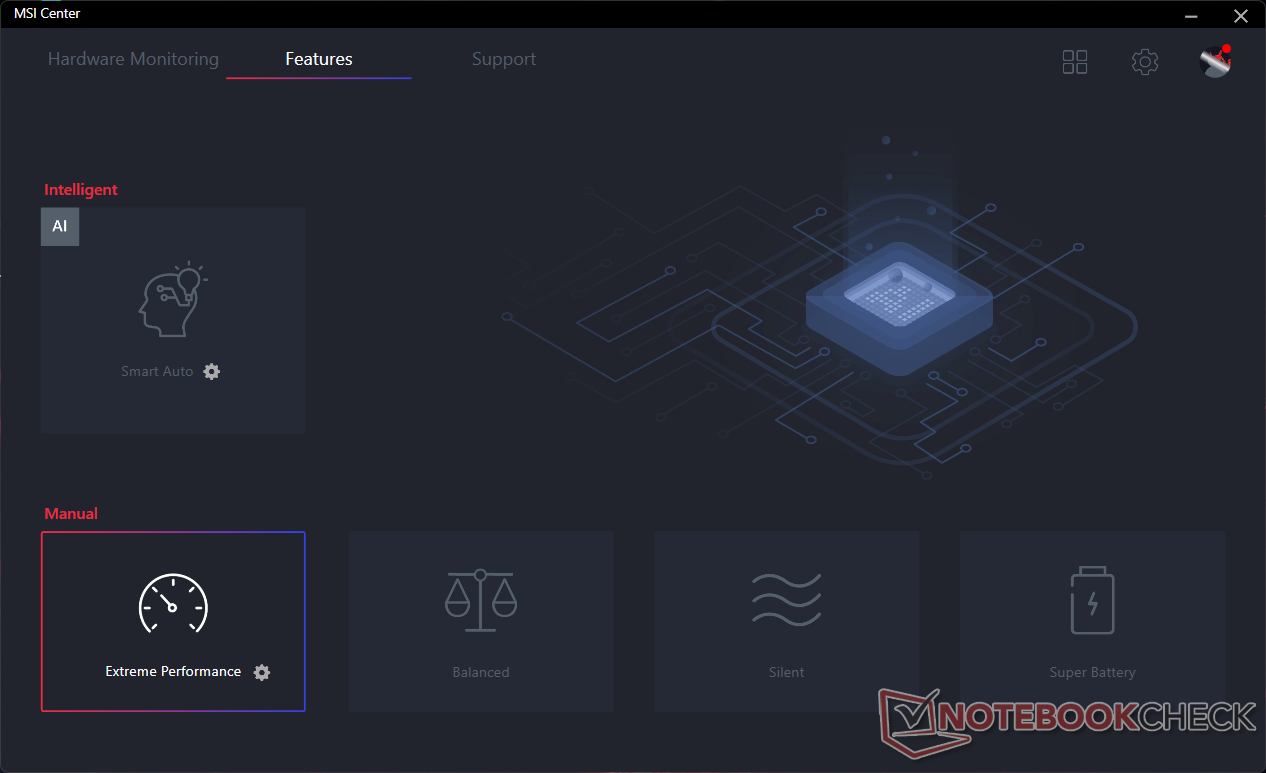
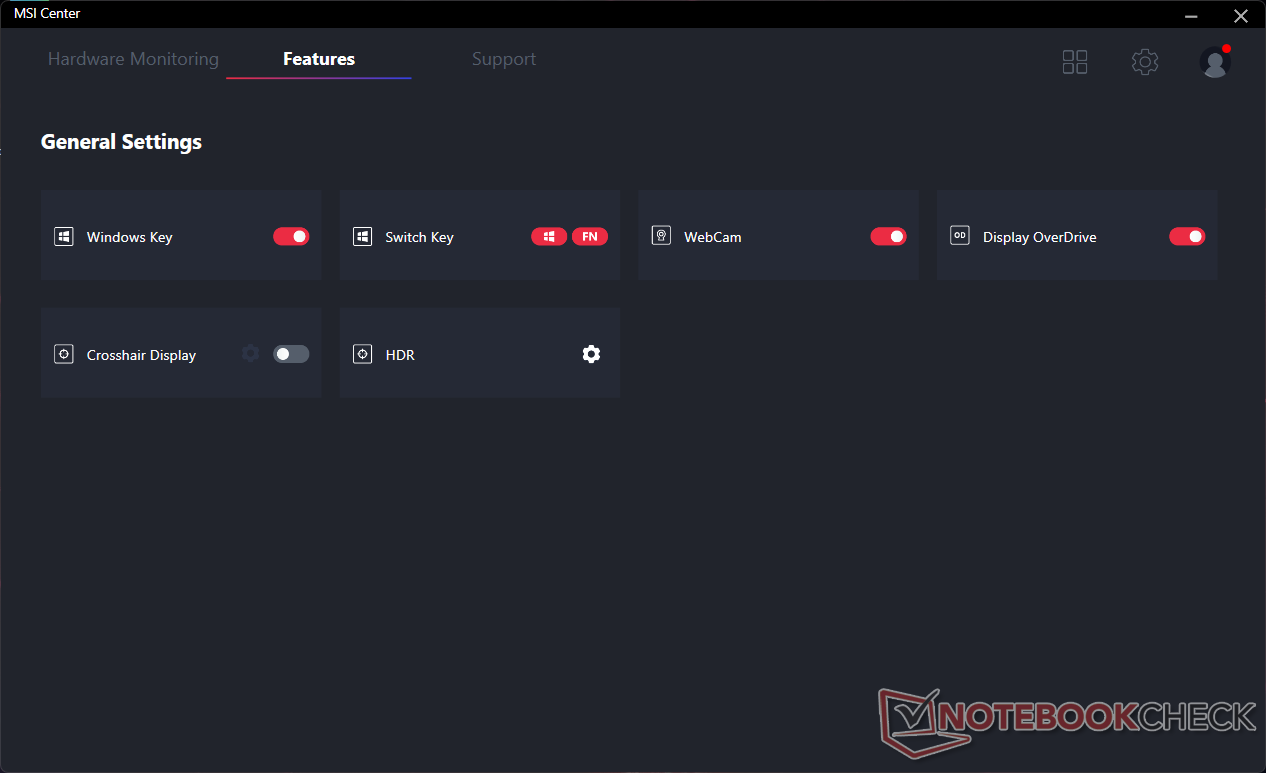
Nous avons réglé notre unité en mode Performance via Windows et en mode Performance Extrême via MSI Center avec le dGPU actif avant d'exécuter les benchmarks de performance ci-dessous. Le mode ventilateur était également réglé sur Auto. Les utilisateurs doivent se familiariser avec le Centre MSI, car il s'agit du centre de contrôle des mises à jour spécifiques à MSI, des profils de performance, de la surveillance du matériel, et plus encore, comme le montrent les captures d'écran ci-dessous.
Il n'y a pas de support Advanced Optimus ou MUX sur la série GL76.
Processeur
Les performances du processeur sont excellentes, avec des résultats multithread qui sont environ 10 % plus rapides que ceux de l'ordinateur portable moyen de notre base de données équipé du même Core i7-12700H DE NOTRE BASE DE DONNÉES. Il est globalement à quelques points de pourcentage près du Core i9-12900H de l'ordinateur beaucoup plus cher Alienware x15 R2.
En optant pour le Core i5-12500H au lieu de notre configuration Core i7, les performances multithread seraient inférieures d'environ 15 %.
Cinebench R15 Multi Loop
Cinebench R20: CPU (Multi Core) | CPU (Single Core)
Cinebench R23: Multi Core | Single Core
Cinebench R15: CPU Multi 64Bit | CPU Single 64Bit
Blender: v2.79 BMW27 CPU
7-Zip 18.03: 7z b 4 | 7z b 4 -mmt1
Geekbench 5.5: Multi-Core | Single-Core
HWBOT x265 Benchmark v2.2: 4k Preset
LibreOffice : 20 Documents To PDF
R Benchmark 2.5: Overall mean
| HWBOT x265 Benchmark v2.2 / 4k Preset | |
| MSI GE67 HX 12UGS | |
| Asus ROG Strix Scar 17 SE G733CX-LL014W | |
| Alienware x15 R2 P111F | |
| MSI Pulse GL76 12UGK | |
| Razer Blade 15 2022 | |
| Alienware m17 R5 (R9 6900HX, RX 6850M XT) | |
| Moyenne Intel Core i7-12700H (4.67 - 21.8, n=64) | |
| HP Omen 16-n0033dx | |
| Lenovo IdeaPad Gaming 3 15IAH7 | |
| MSI GE76 Raider 10UH | |
| Schenker XMG Apex 15 Max | |
* ... Moindre est la valeur, meilleures sont les performances
AIDA64: FP32 Ray-Trace | FPU Julia | CPU SHA3 | CPU Queen | FPU SinJulia | FPU Mandel | CPU AES | CPU ZLib | FP64 Ray-Trace | CPU PhotoWorxx
| AIDA64 / FP32 Ray-Trace | |
| Asus ROG Strix Scar 17 SE G733CX-LL014W | |
| Acer Predator Helios 300 (i7-12700H, RTX 3070 Ti) | |
| MSI Pulse GL76 12UGK | |
| Alienware m17 R5 (R9 6900HX, RX 6850M XT) | |
| Moyenne Intel Core i7-12700H (2585 - 17957, n=64) | |
| MSI Vector GP76 12UGS-434 | |
| Razer Blade 17 Early 2022 | |
| AIDA64 / FP64 Ray-Trace | |
| Acer Predator Helios 300 (i7-12700H, RTX 3070 Ti) | |
| Asus ROG Strix Scar 17 SE G733CX-LL014W | |
| MSI Pulse GL76 12UGK | |
| Alienware m17 R5 (R9 6900HX, RX 6850M XT) | |
| Moyenne Intel Core i7-12700H (1437 - 9692, n=64) | |
| MSI Vector GP76 12UGS-434 | |
| Razer Blade 17 Early 2022 | |
| AIDA64 / CPU PhotoWorxx | |
| Asus ROG Strix Scar 17 SE G733CX-LL014W | |
| Acer Predator Helios 300 (i7-12700H, RTX 3070 Ti) | |
| Razer Blade 17 Early 2022 | |
| Moyenne Intel Core i7-12700H (12863 - 52207, n=64) | |
| Alienware m17 R5 (R9 6900HX, RX 6850M XT) | |
| MSI Pulse GL76 12UGK | |
| MSI Vector GP76 12UGS-434 | |
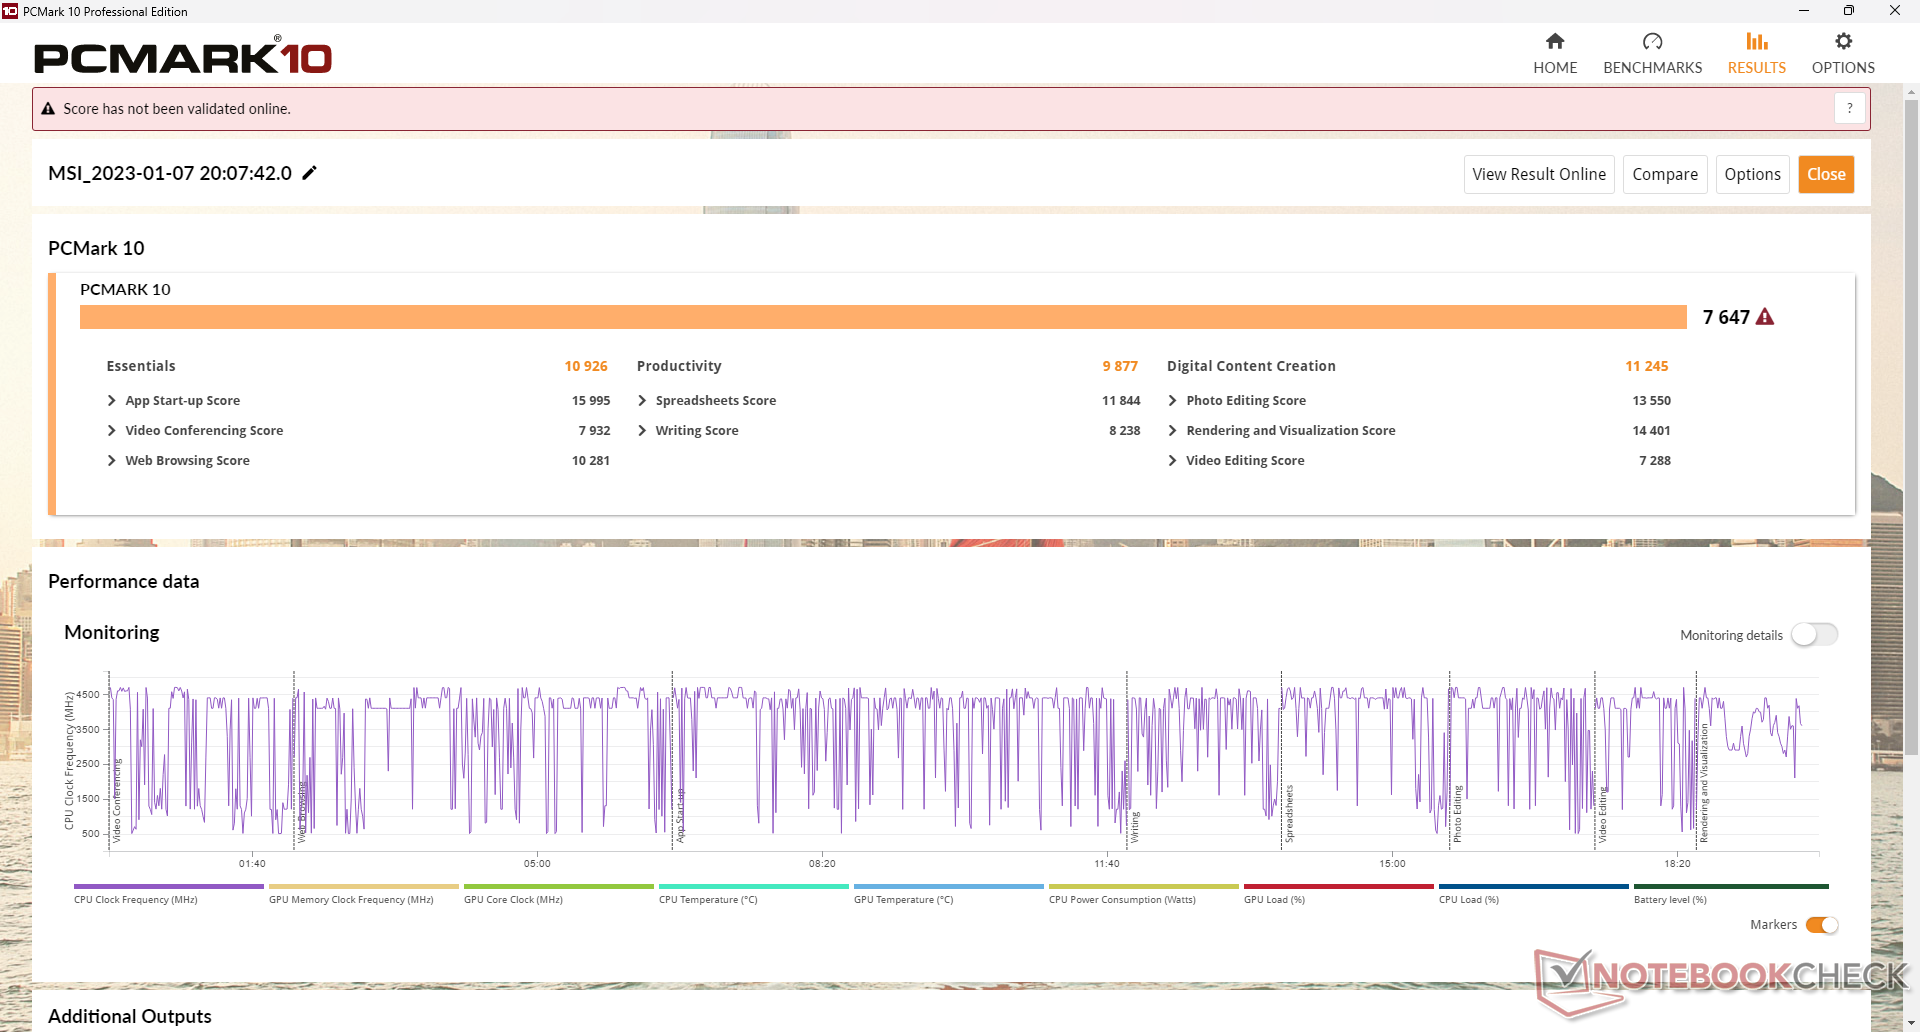
Performance du système
Les résultats PCMark sont excellents et comparables à ceux des ordinateurs portables de jeu haut de gamme comme leAsus ROG Strix Scar 17. En d'autres termes, le GL76 peut offrir presque les mêmes performances qu'un ordinateur phare, mais pour un prix beaucoup moins élevé.
CrossMark: Overall | Productivity | Creativity | Responsiveness
| PCMark 10 / Score | |
| MSI Vector GP76 12UGS-434 | |
| Acer Predator Helios 300 (i7-12700H, RTX 3070 Ti) | |
| MSI Pulse GL76 12UGK | |
| Moyenne Intel Core i7-12700H, NVIDIA GeForce RTX 3070 Laptop GPU (7082 - 7647, n=2) | |
| Alienware m17 R5 (R9 6900HX, RX 6850M XT) | |
| Asus ROG Strix Scar 17 SE G733CX-LL014W | |
| Razer Blade 17 Early 2022 | |
| PCMark 10 / Essentials | |
| MSI Pulse GL76 12UGK | |
| Acer Predator Helios 300 (i7-12700H, RTX 3070 Ti) | |
| MSI Vector GP76 12UGS-434 | |
| Moyenne Intel Core i7-12700H, NVIDIA GeForce RTX 3070 Laptop GPU (10076 - 10926, n=2) | |
| Asus ROG Strix Scar 17 SE G733CX-LL014W | |
| Razer Blade 17 Early 2022 | |
| Alienware m17 R5 (R9 6900HX, RX 6850M XT) | |
| PCMark 10 / Productivity | |
| MSI Vector GP76 12UGS-434 | |
| Acer Predator Helios 300 (i7-12700H, RTX 3070 Ti) | |
| MSI Pulse GL76 12UGK | |
| Asus ROG Strix Scar 17 SE G733CX-LL014W | |
| Moyenne Intel Core i7-12700H, NVIDIA GeForce RTX 3070 Laptop GPU (9460 - 9877, n=2) | |
| Razer Blade 17 Early 2022 | |
| Alienware m17 R5 (R9 6900HX, RX 6850M XT) | |
| PCMark 10 / Digital Content Creation | |
| Acer Predator Helios 300 (i7-12700H, RTX 3070 Ti) | |
| MSI Vector GP76 12UGS-434 | |
| Alienware m17 R5 (R9 6900HX, RX 6850M XT) | |
| MSI Pulse GL76 12UGK | |
| Moyenne Intel Core i7-12700H, NVIDIA GeForce RTX 3070 Laptop GPU (10113 - 11245, n=2) | |
| Razer Blade 17 Early 2022 | |
| Asus ROG Strix Scar 17 SE G733CX-LL014W | |
| CrossMark / Overall | |
| Asus ROG Strix Scar 17 SE G733CX-LL014W | |
| MSI Vector GP76 12UGS-434 | |
| Moyenne Intel Core i7-12700H, NVIDIA GeForce RTX 3070 Laptop GPU (1844 - 2003, n=2) | |
| Acer Predator Helios 300 (i7-12700H, RTX 3070 Ti) | |
| MSI Pulse GL76 12UGK | |
| Razer Blade 17 Early 2022 | |
| Alienware m17 R5 (R9 6900HX, RX 6850M XT) | |
| CrossMark / Productivity | |
| Asus ROG Strix Scar 17 SE G733CX-LL014W | |
| MSI Vector GP76 12UGS-434 | |
| Moyenne Intel Core i7-12700H, NVIDIA GeForce RTX 3070 Laptop GPU (1785 - 1971, n=2) | |
| MSI Pulse GL76 12UGK | |
| Acer Predator Helios 300 (i7-12700H, RTX 3070 Ti) | |
| Razer Blade 17 Early 2022 | |
| Alienware m17 R5 (R9 6900HX, RX 6850M XT) | |
| CrossMark / Creativity | |
| Asus ROG Strix Scar 17 SE G733CX-LL014W | |
| Acer Predator Helios 300 (i7-12700H, RTX 3070 Ti) | |
| Moyenne Intel Core i7-12700H, NVIDIA GeForce RTX 3070 Laptop GPU (1912 - 1979, n=2) | |
| MSI Vector GP76 12UGS-434 | |
| MSI Pulse GL76 12UGK | |
| Razer Blade 17 Early 2022 | |
| Alienware m17 R5 (R9 6900HX, RX 6850M XT) | |
| CrossMark / Responsiveness | |
| MSI Vector GP76 12UGS-434 | |
| Moyenne Intel Core i7-12700H, NVIDIA GeForce RTX 3070 Laptop GPU (1824 - 2182, n=2) | |
| Asus ROG Strix Scar 17 SE G733CX-LL014W | |
| MSI Pulse GL76 12UGK | |
| Acer Predator Helios 300 (i7-12700H, RTX 3070 Ti) | |
| Razer Blade 17 Early 2022 | |
| Alienware m17 R5 (R9 6900HX, RX 6850M XT) | |
| PCMark 10 Score | 7647 points | |
Aide | ||
| AIDA64 / Memory Latency | |
| Alienware m17 R5 (R9 6900HX, RX 6850M XT) | |
| MSI Pulse GL76 12UGK | |
| MSI Vector GP76 12UGS-434 | |
| Acer Predator Helios 300 (i7-12700H, RTX 3070 Ti) | |
| Asus ROG Strix Scar 17 SE G733CX-LL014W | |
| Moyenne Intel Core i7-12700H (76.2 - 133.9, n=62) | |
* ... Moindre est la valeur, meilleures sont les performances
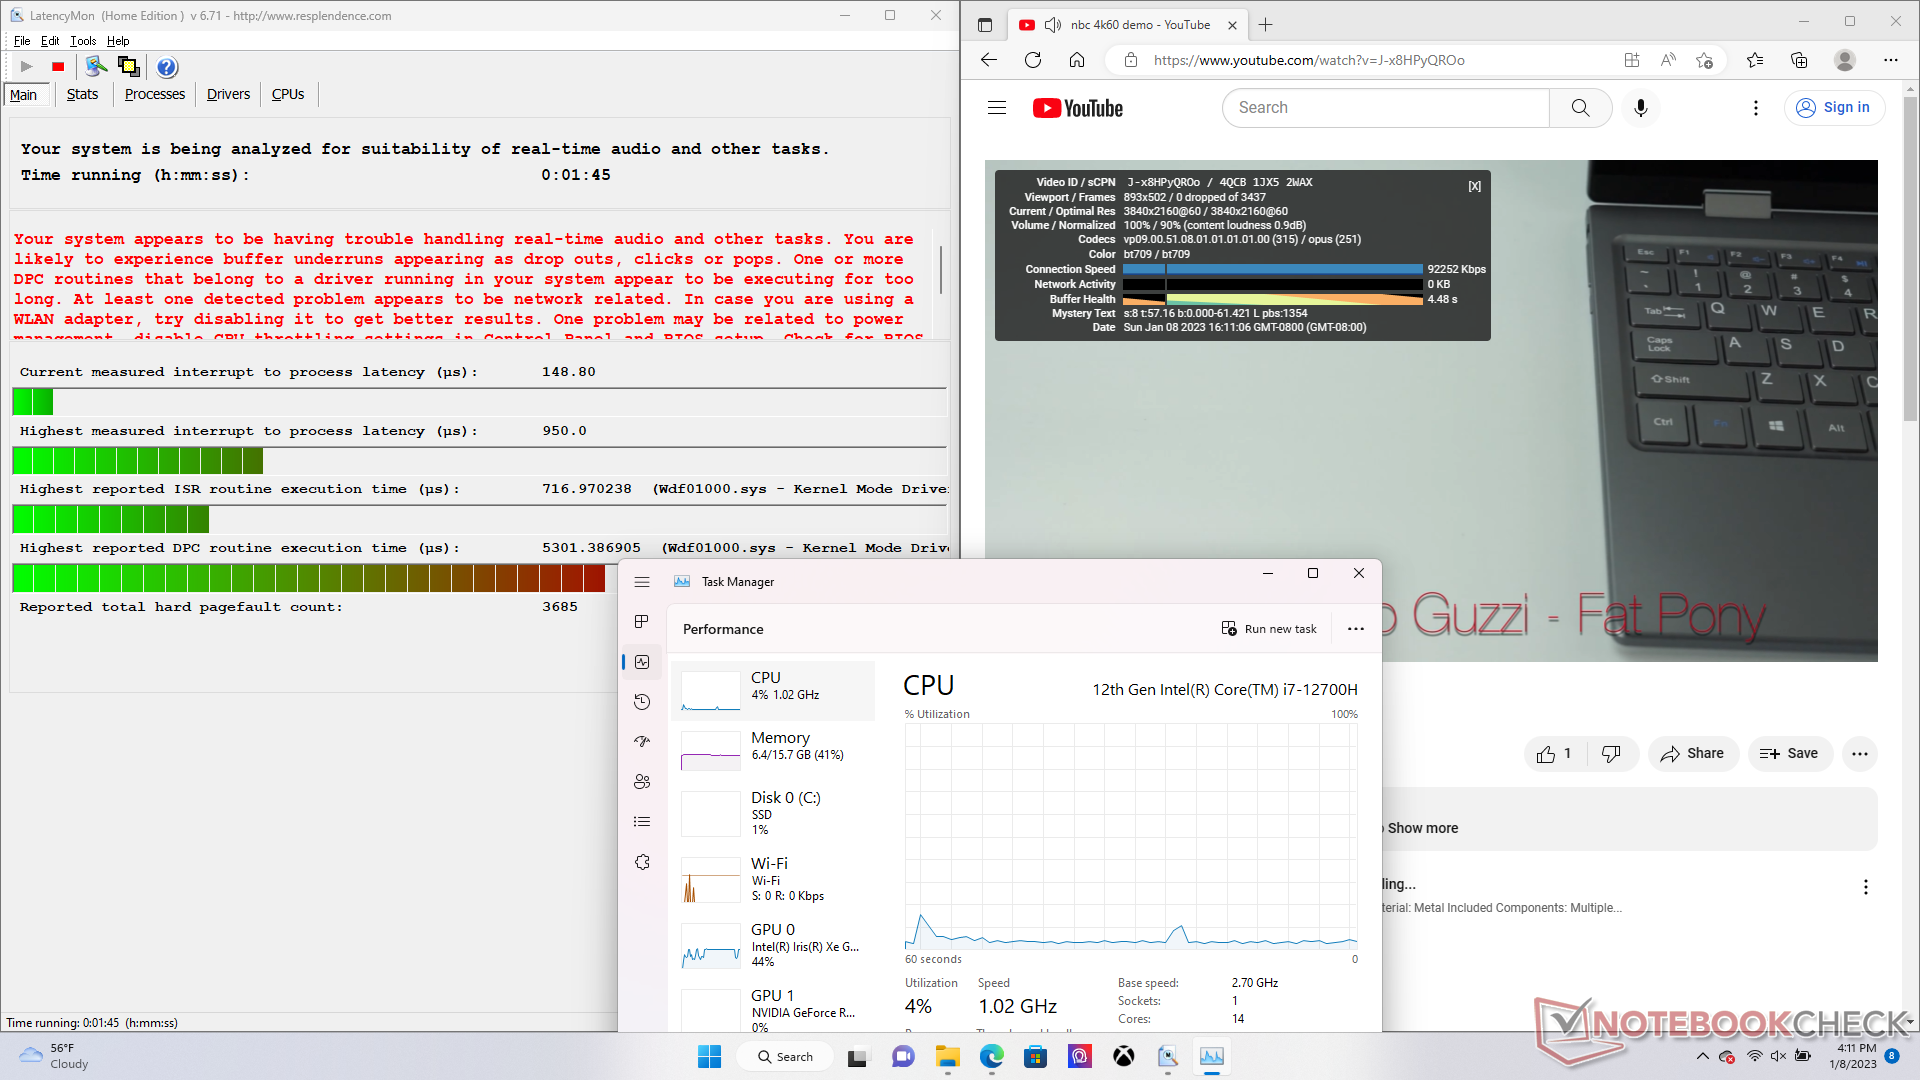
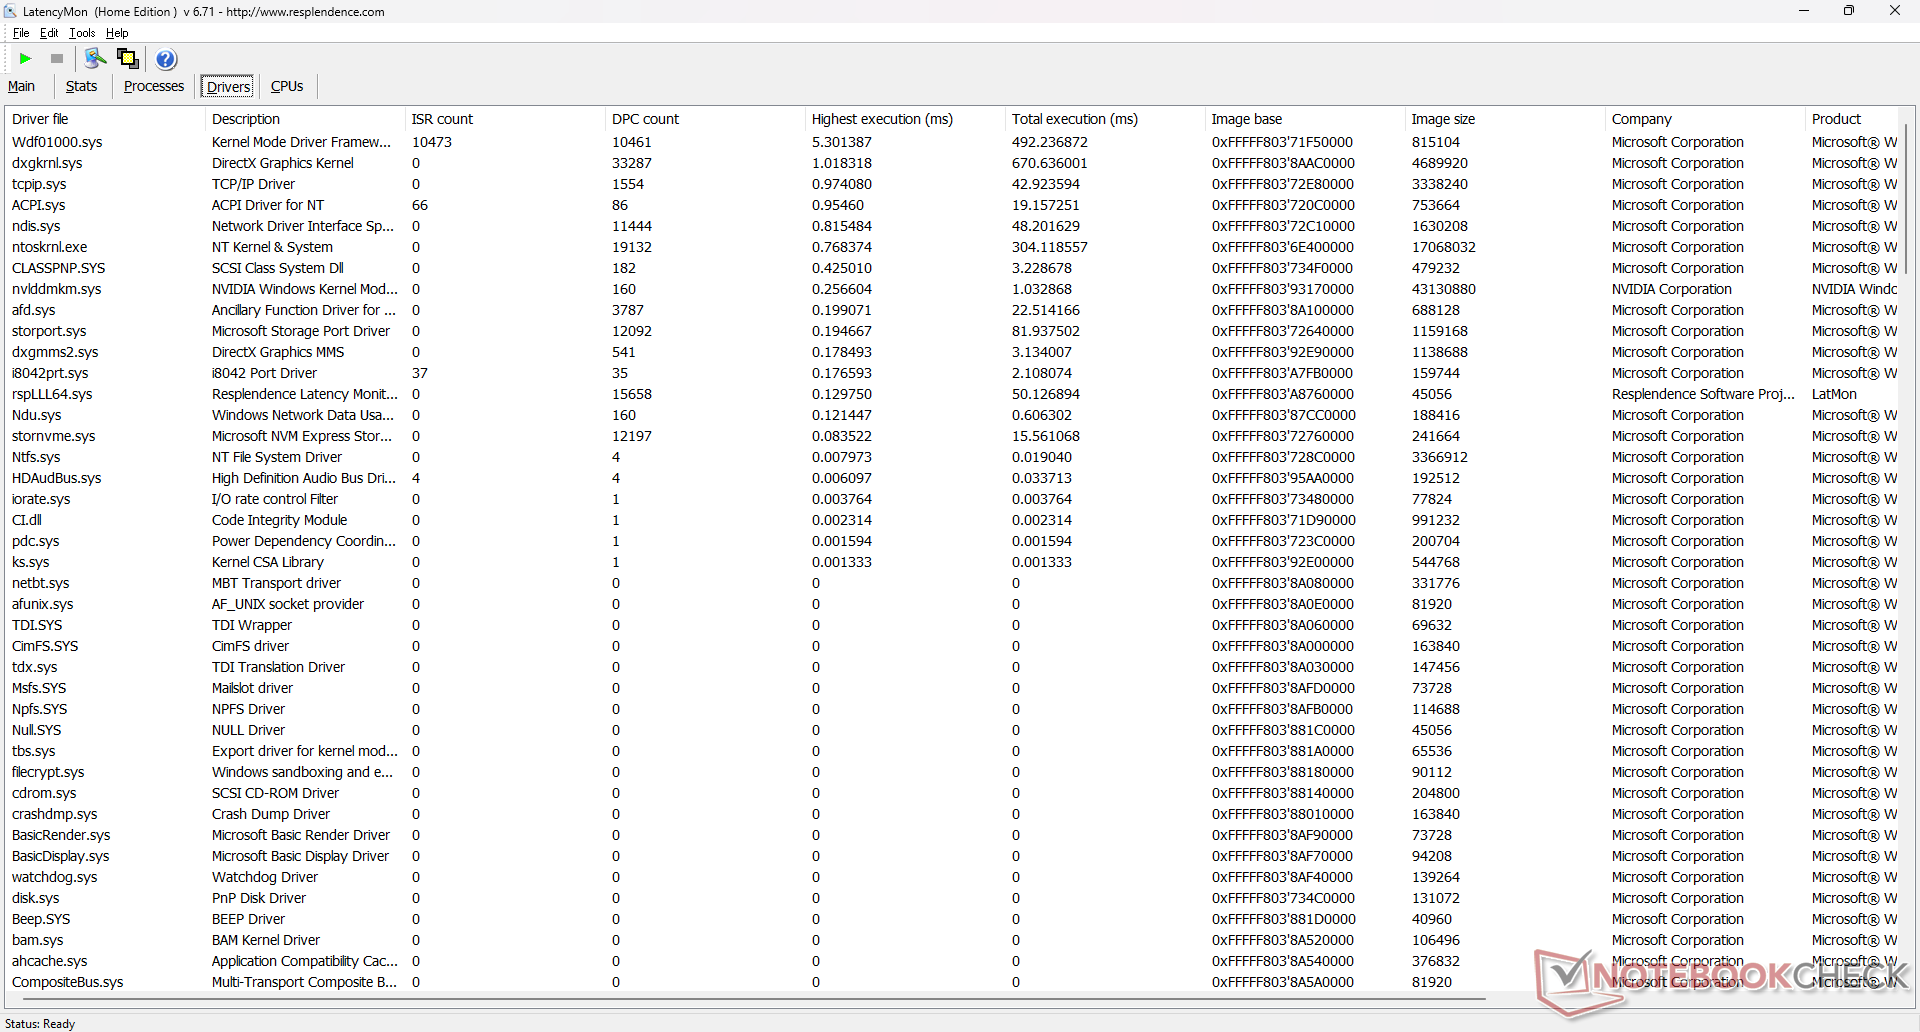
Latence DPC
LatencyMon ne révèle aucun problème de CPD lors de l'ouverture de plusieurs onglets de navigateur de notre page d'accueil. la lecture de vidéos 4K à 60 FPS est également impeccable, sans aucune perte d'images.
| DPC Latencies / LatencyMon - interrupt to process latency (max), Web, Youtube, Prime95 | |
| Asus ROG Strix Scar 17 SE G733CX-LL014W | |
| MSI Vector GP76 12UGS-434 | |
| Acer Predator Helios 300 (i7-12700H, RTX 3070 Ti) | |
| Alienware m17 R5 (R9 6900HX, RX 6850M XT) | |
| MSI Pulse GL76 12UGK | |
| Razer Blade 17 Early 2022 | |
* ... Moindre est la valeur, meilleures sont les performances
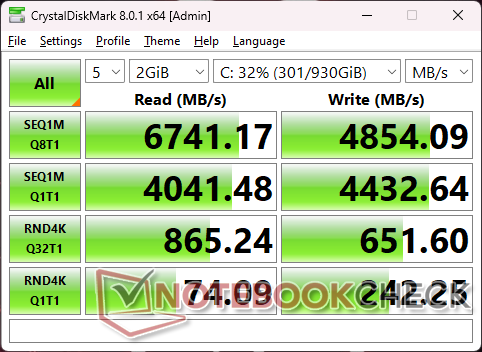
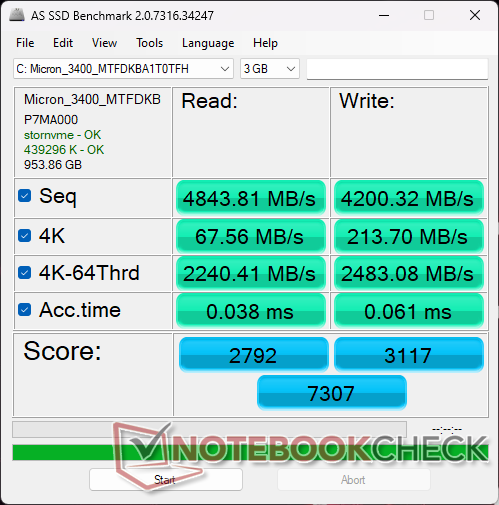
Périphériques de stockage - Jusqu'à deux SSD NVMe
Notre unité est livrée avec un micron 3400 de 1 To PCIe4 x4 NVMe SSD de 1 To au lieu du Samsung PM9A1 de 1 To plus courant, probablement pour réduire les coûts. Les taux de transfert sont juste un peu plus lents, d'environ 10 % en moyenne. Nous sommes plus impressionnés par la capacité du disque à maintenir des taux de transfert très élevés de plus de 6400 Mo/s pendant des périodes prolongées sans diffuseur de chaleur.

* ... Moindre est la valeur, meilleures sont les performances
Disk Throttling: DiskSpd Read Loop, Queue Depth 8
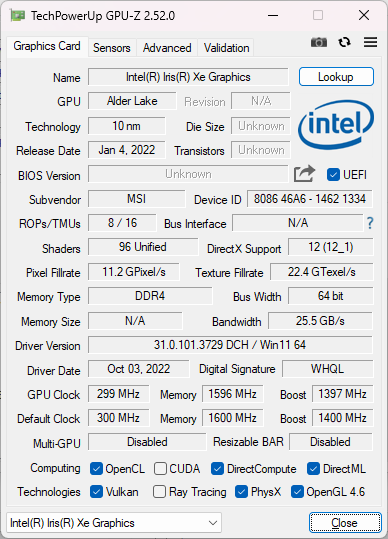
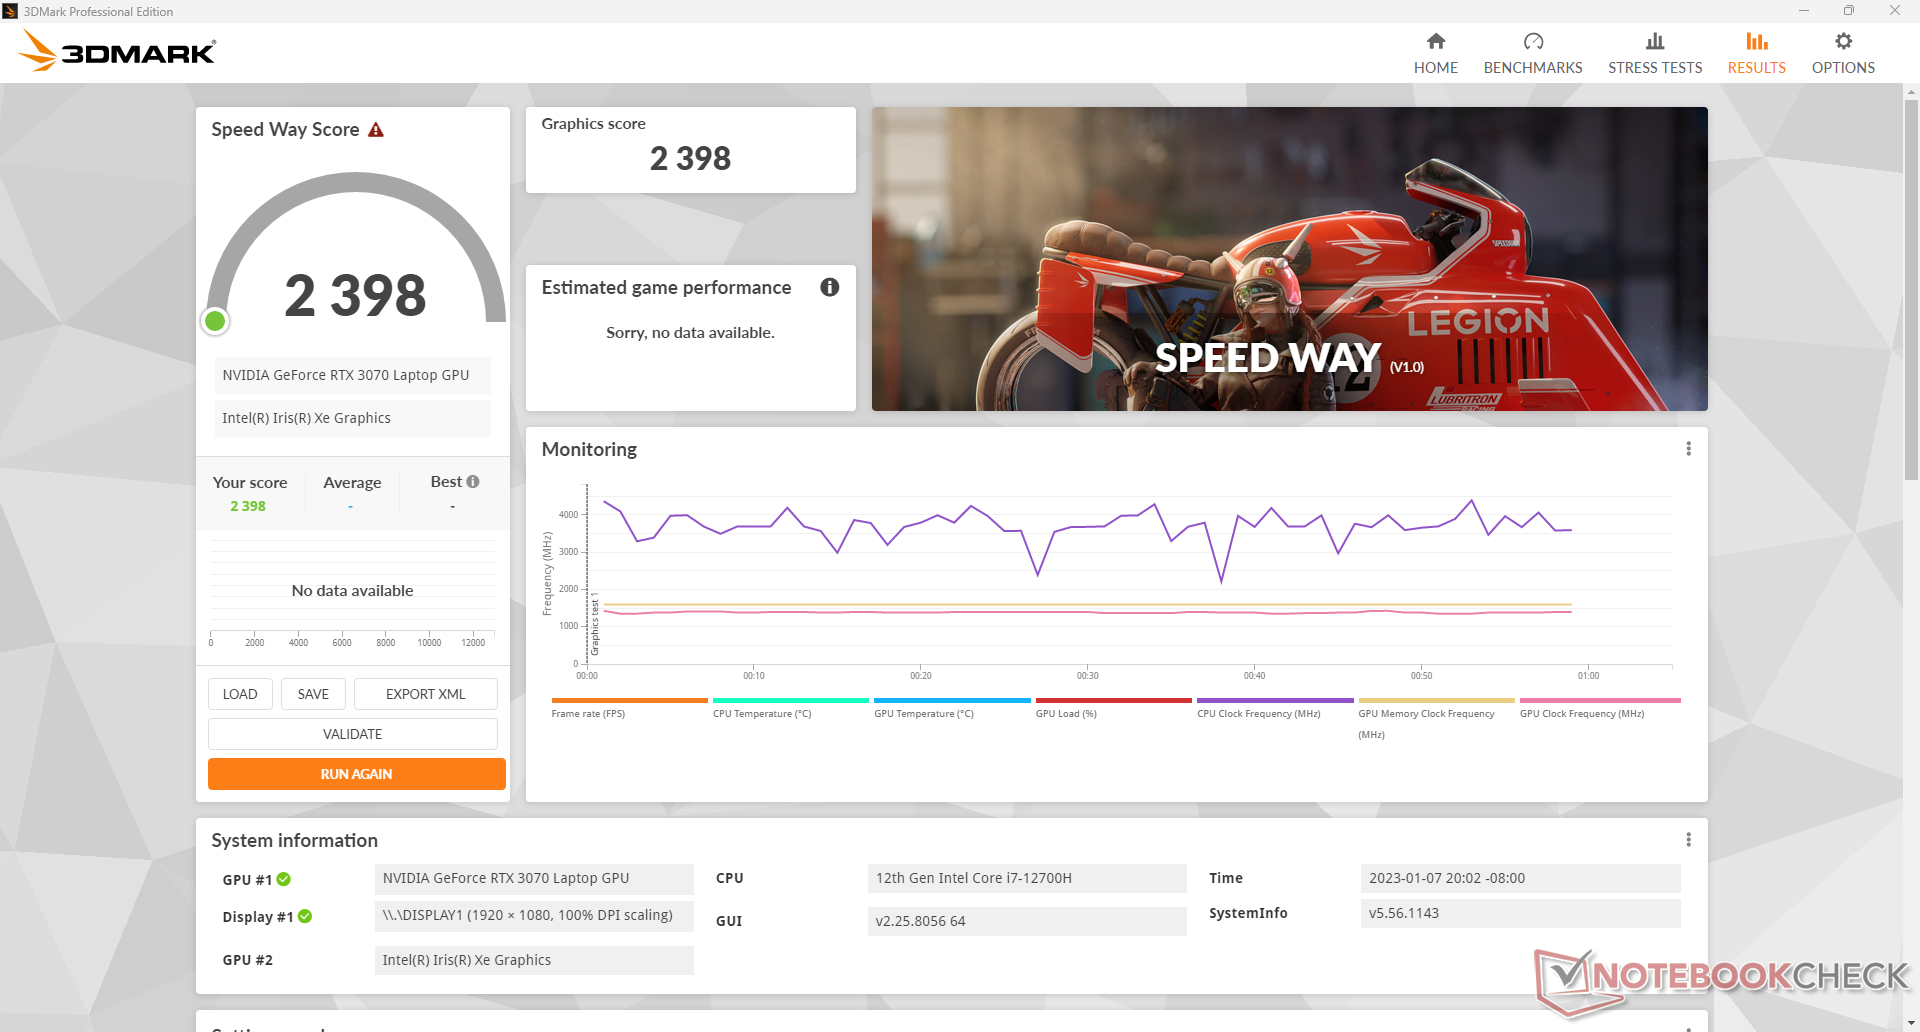
Performances du GPU - 105 W TGP Graphics
Les performances graphiques brutes sont environ 25 % plus lentes que celles de notre modèle de référence RTX 3070 GeForce Référence RTX 3070 pour ordinateur de bureau. Par rapport au modèle 115 WGeForce RTX 3070 dans le Schenker XMG Apex 15notre version 105 W n'est qu'à environ 5 % derrière. En rétrogradant vers le RTX 3060 ou RTX 3050 aura un impact sur les performances graphiques d'environ 10 à 15 % et 40 à 45 %, respectivement.
Tous les titres actuels sont jouables à la résolution native de 1080p avec les paramètres au maximum. Cependant, pour mieux exploiter le taux de rafraîchissement natif rapide de 360 Hz, vous pouvez envisager de régler les paramètres sur moyen ou inférieur, en particulier pour les jeux compétitifs comme CS:GO ou Overwatch.
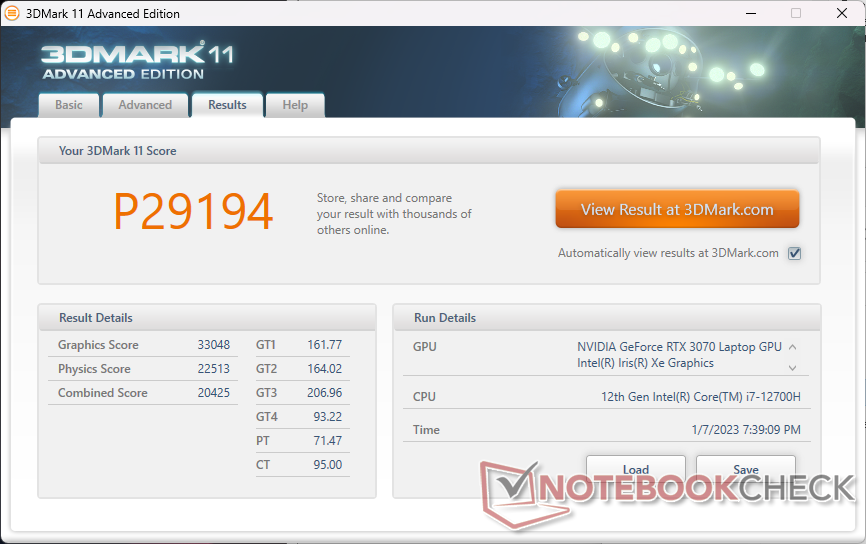
| 3DMark 11 Performance | 29194 points | |
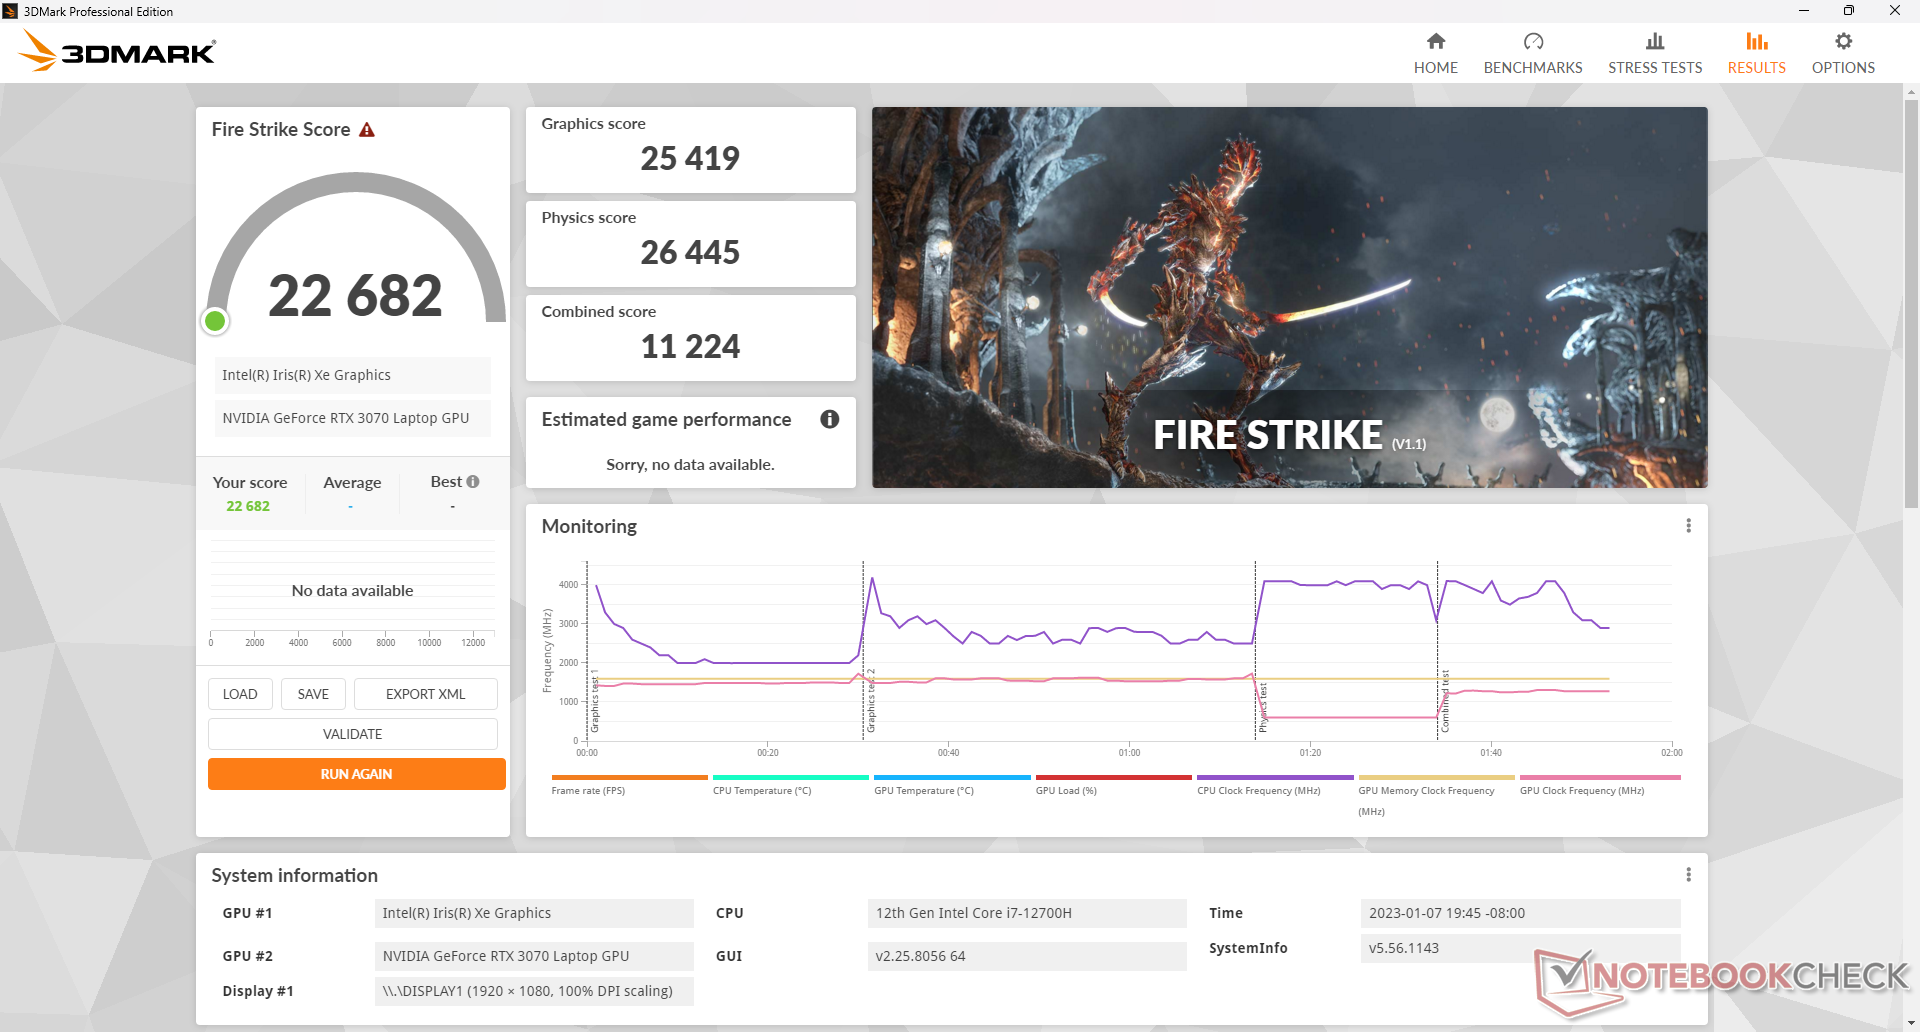
| 3DMark Fire Strike Score | 22682 points | |
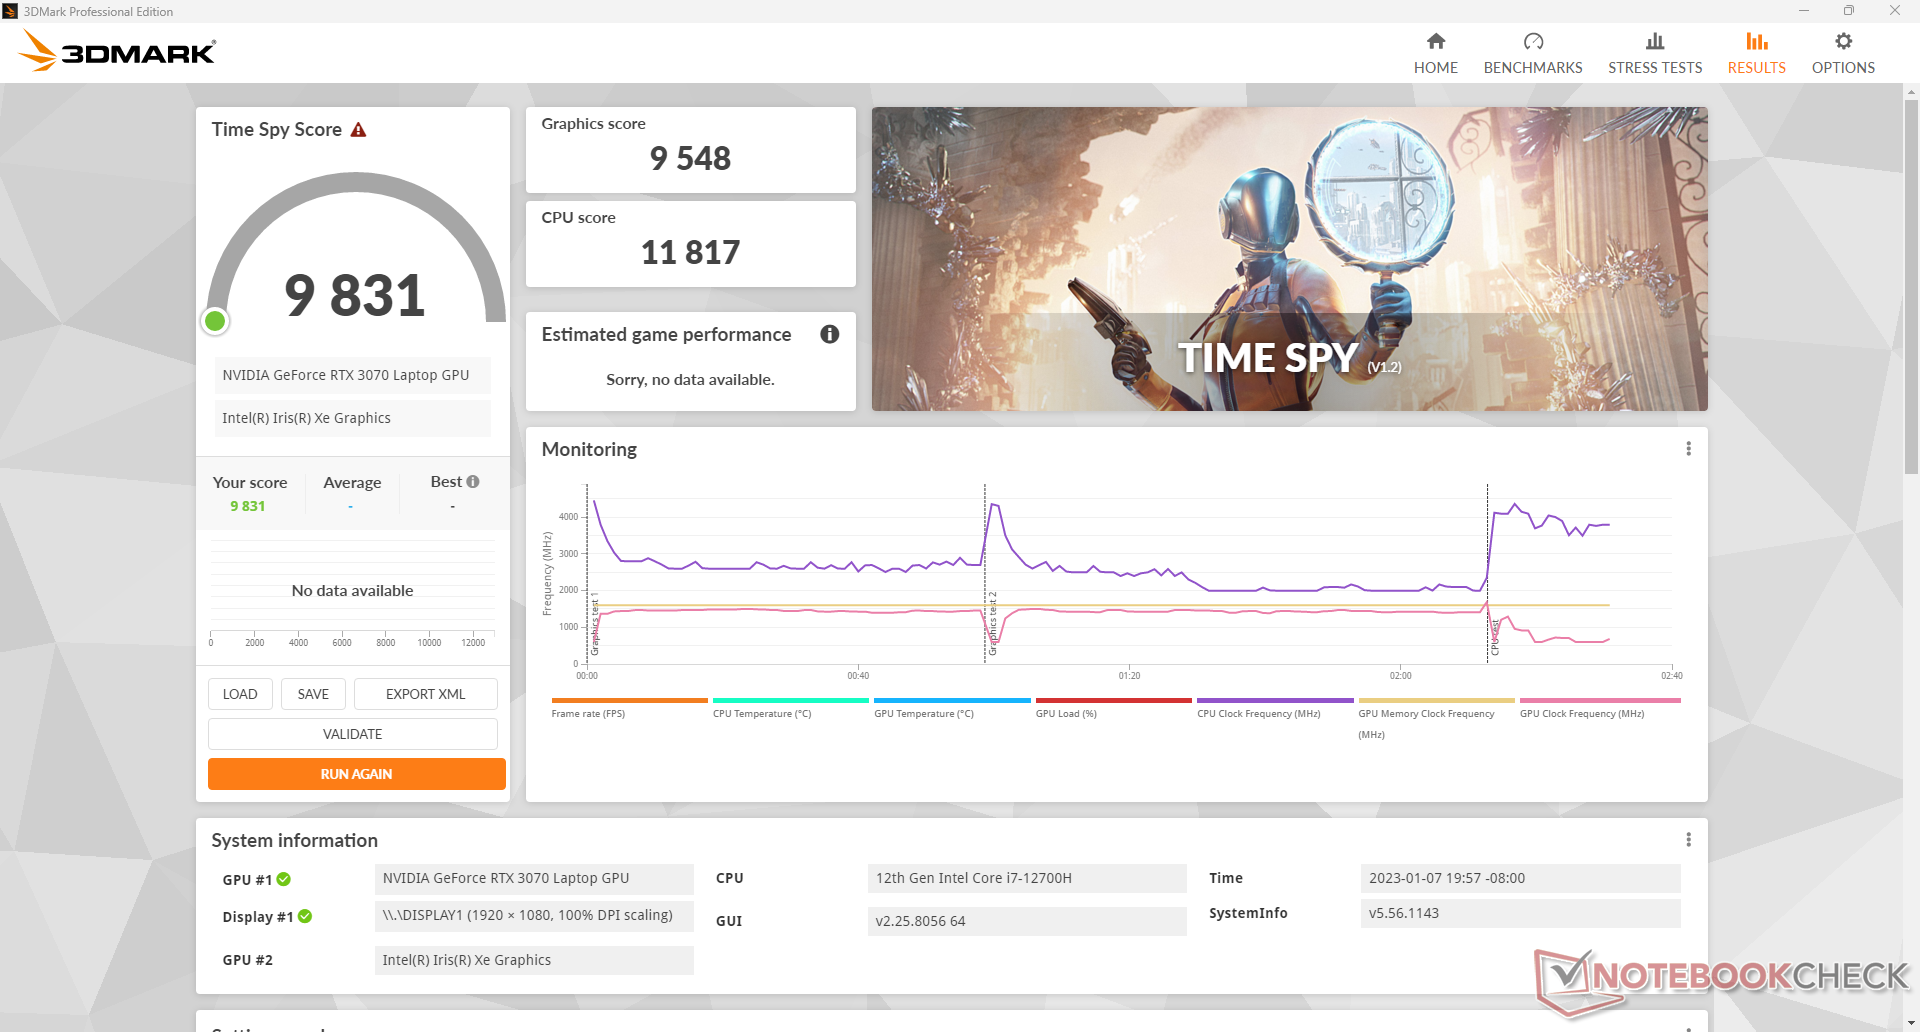
| 3DMark Time Spy Score | 9831 points | |
Aide | ||
* ... Moindre est la valeur, meilleures sont les performances
Witcher 3 FPS Chart
| Bas | Moyen | Élevé | Ultra | |
|---|---|---|---|---|
| GTA V (2015) | 185.7 | 182.3 | 175.5 | 108.1 |
| The Witcher 3 (2015) | 377.1 | 252.8 | 170.5 | 92.8 |
| Dota 2 Reborn (2015) | 168.1 | 152.1 | 141.2 | 132.8 |
| Final Fantasy XV Benchmark (2018) | 186.3 | 118.5 | 89.7 | |
| X-Plane 11.11 (2018) | 139.9 | 122.9 | 97.7 | |
| Strange Brigade (2018) | 414 | 224 | 186.6 | 164.5 |
| Cyberpunk 2077 1.6 (2022) | 118.8 | 102.4 | 83.2 | 69.8 |
Émissions - Pas trop fort
Bruit du système
Les ventilateurs ne tournent jamais au ralenti, même lorsqu'ils sont réglés sur le mode "Silencieux". Nous sommes capables d'enregistrer un minimum de 26,9 dB(A) contre un fond silencieux de 24,1 dB(A), ce qui est à peine audible dans la plupart des scénarios. En revanche, le mode "Silencieux" est excellent pour empêcher les ventilateurs internes de pulser en réponse aux changements de charge à l'écran. Lors de la lecture de vidéos en continu ou de la navigation sur Internet, par exemple, le mode "Silencieux" est recommandé par rapport au mode "Équilibré", où les ventilateurs pulsent fréquemment entre 27 et 43,8 dB(A).
Le bruit des ventilateurs en fonctionnement Witcher 3 se stabilise à un peu moins de 45 dB(A), ce qui le rend plus silencieux que celui de bon nombre de ses concurrents, comme le montre le tableau ci-dessous. Si Cooler Boost (c'est-à-dire le mode de ventilation maximale) est activé, le bruit du ventilateur peut atteindre 58 dB(A). Ce mode sert davantage à réduire les températures qu'à augmenter les performances et n'est donc pas nécessaire pour la plupart des scénarios de jeu.
Degré de la nuisance sonore
| Au repos |
| 26.9 / 26.9 / 27 dB(A) |
| Fortement sollicité |
| 43.8 / 58.3 dB(A) |
 | ||
30 dB silencieux 40 dB(A) audible 50 dB(A) bruyant |
||
min: | ||
| MSI Pulse GL76 12UGK GeForce RTX 3070 Laptop GPU, i7-12700H, Micron 3400 1TB MTFDKBA1T0TFH | Alienware m17 R5 (R9 6900HX, RX 6850M XT) Radeon RX 6850M XT, R9 6900HX, SSSTC CA6-8D1024 | Asus ROG Strix Scar 17 SE G733CX-LL014W GeForce RTX 3080 Ti Laptop GPU, i9-12950HX, Samsung PM9A1 MZVL22T0HBLB | Acer Predator Helios 300 (i7-12700H, RTX 3070 Ti) GeForce RTX 3070 Ti Laptop GPU, i7-12700H, Samsung PM9A1 MZVL21T0HCLR | Razer Blade 17 Early 2022 GeForce RTX 3080 Ti Laptop GPU, i9-12900H, Samsung PM9A1 MZVL21T0HCLR | MSI Vector GP76 12UGS-434 GeForce RTX 3070 Ti Laptop GPU, i7-12700H, Micron 2450 1TB MTFDKBA1T0TFK | |
|---|---|---|---|---|---|---|
| Noise | 6% | 13% | -10% | -6% | -6% | |
| arrêt / environnement * (dB) | 24.1 | 23 5% | 23.9 1% | 23 5% | 26 -8% | 25.6 -6% |
| Idle Minimum * (dB) | 26.9 | 23 14% | 23.9 11% | 23 14% | 26 3% | 27 -0% |
| Idle Average * (dB) | 26.9 | 28.11 -4% | 23.9 11% | 25.92 4% | 27 -0% | 27 -0% |
| Idle Maximum * (dB) | 27 | 28.11 -4% | 23.9 11% | 40.67 -51% | 32 -19% | 30.1 -11% |
| Load Average * (dB) | 43.8 | 30.62 30% | 34.3 22% | 42.7 3% | 50 -14% | 54.4 -24% |
| Witcher 3 ultra * (dB) | 44.7 | 49.75 -11% | 62.48 -40% | 51 -14% | ||
| Load Maximum * (dB) | 58.3 | 50.17 14% | 45.9 21% | 62.67 -7% | 51 13% | 56.2 4% |
* ... Moindre est la valeur, meilleures sont les performances
Température
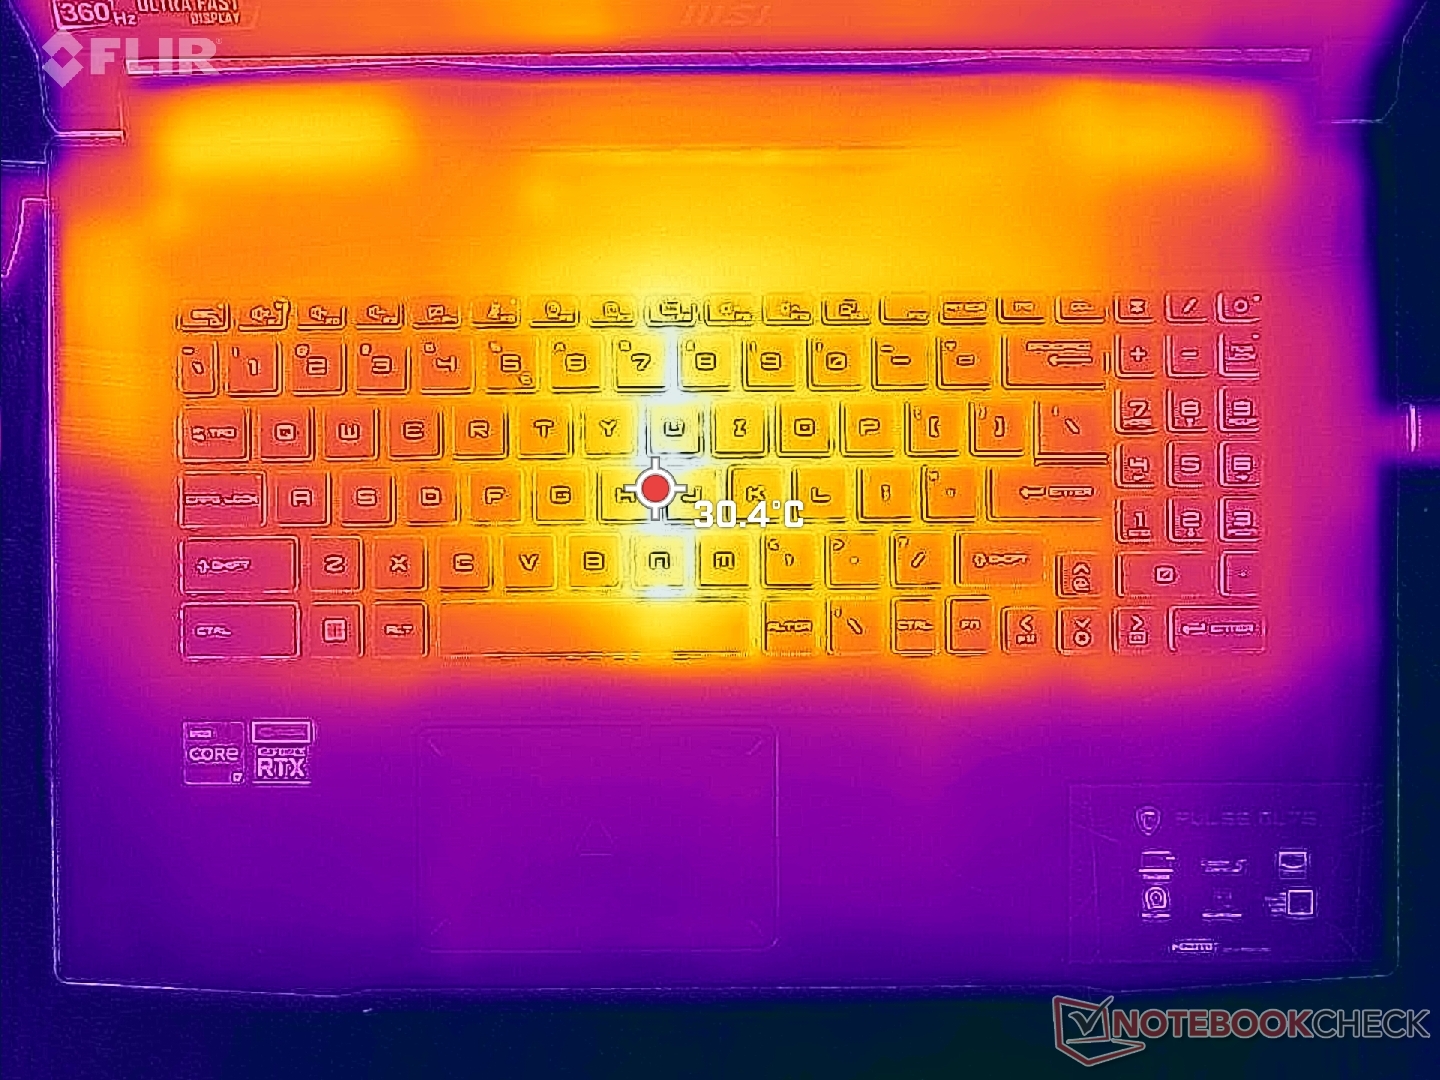
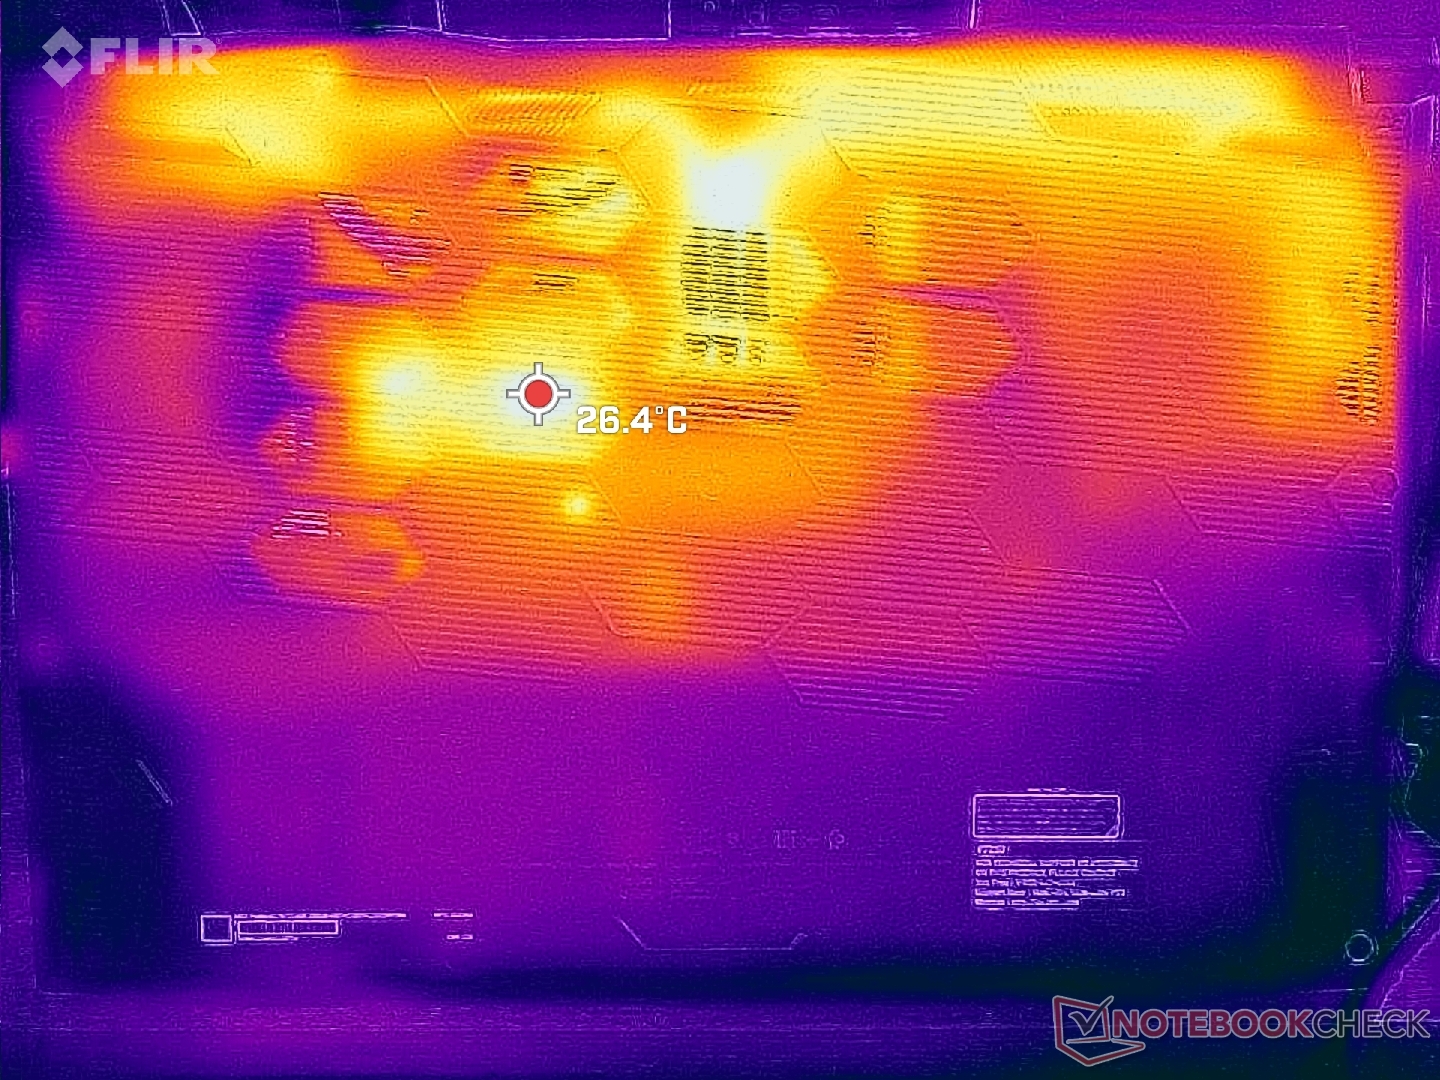
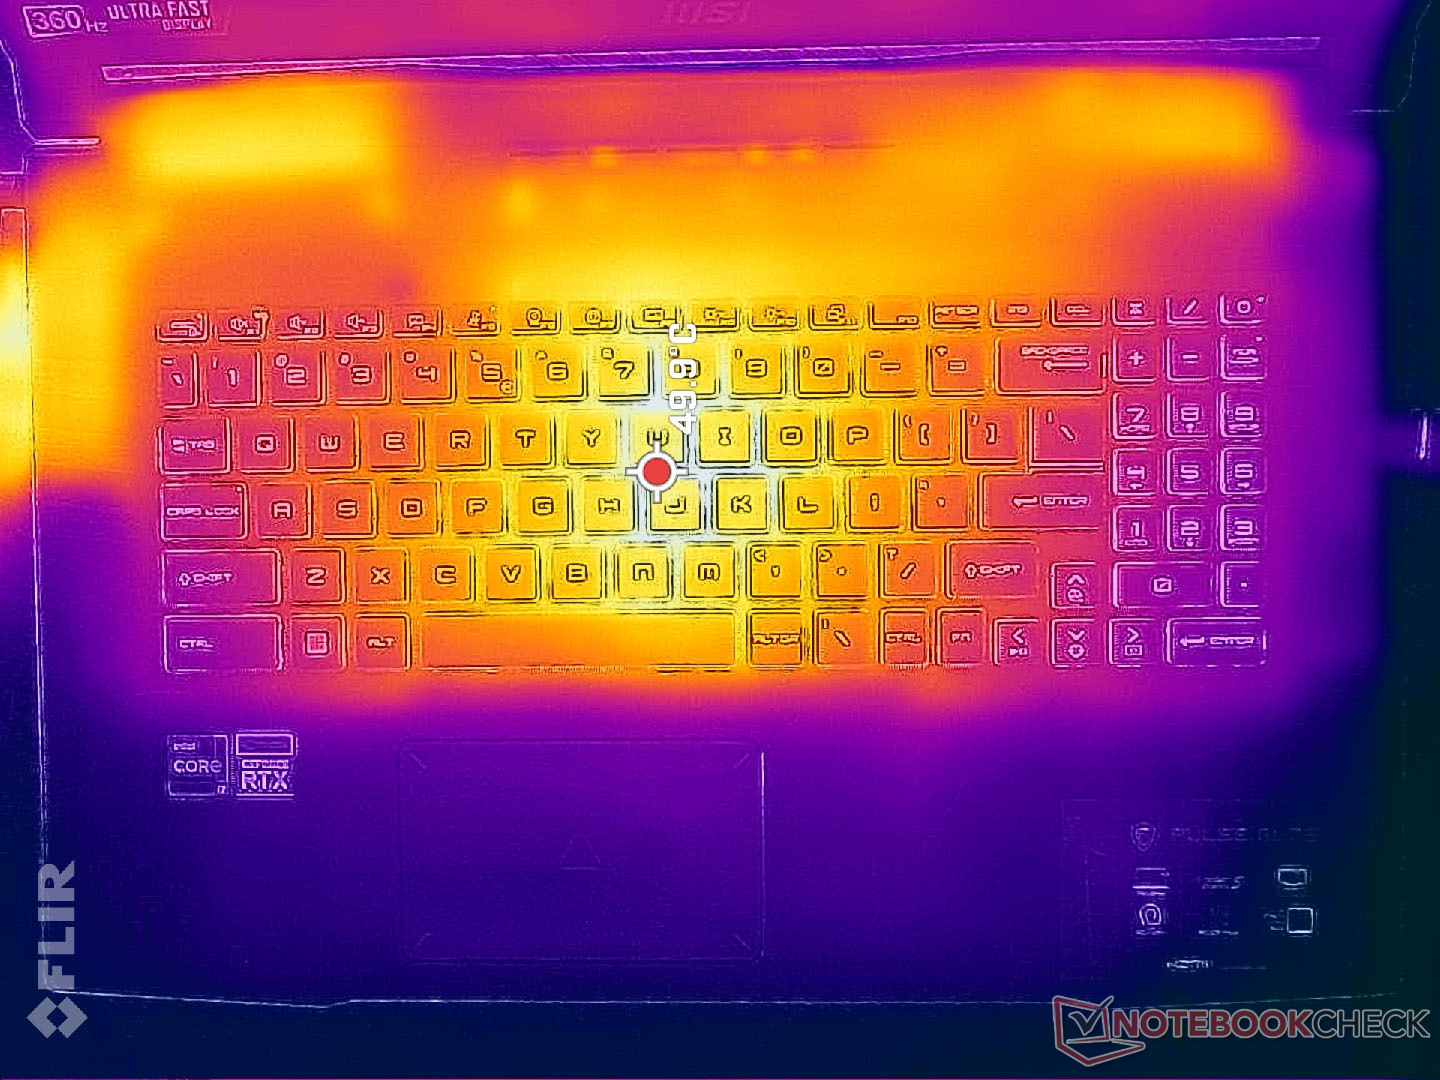
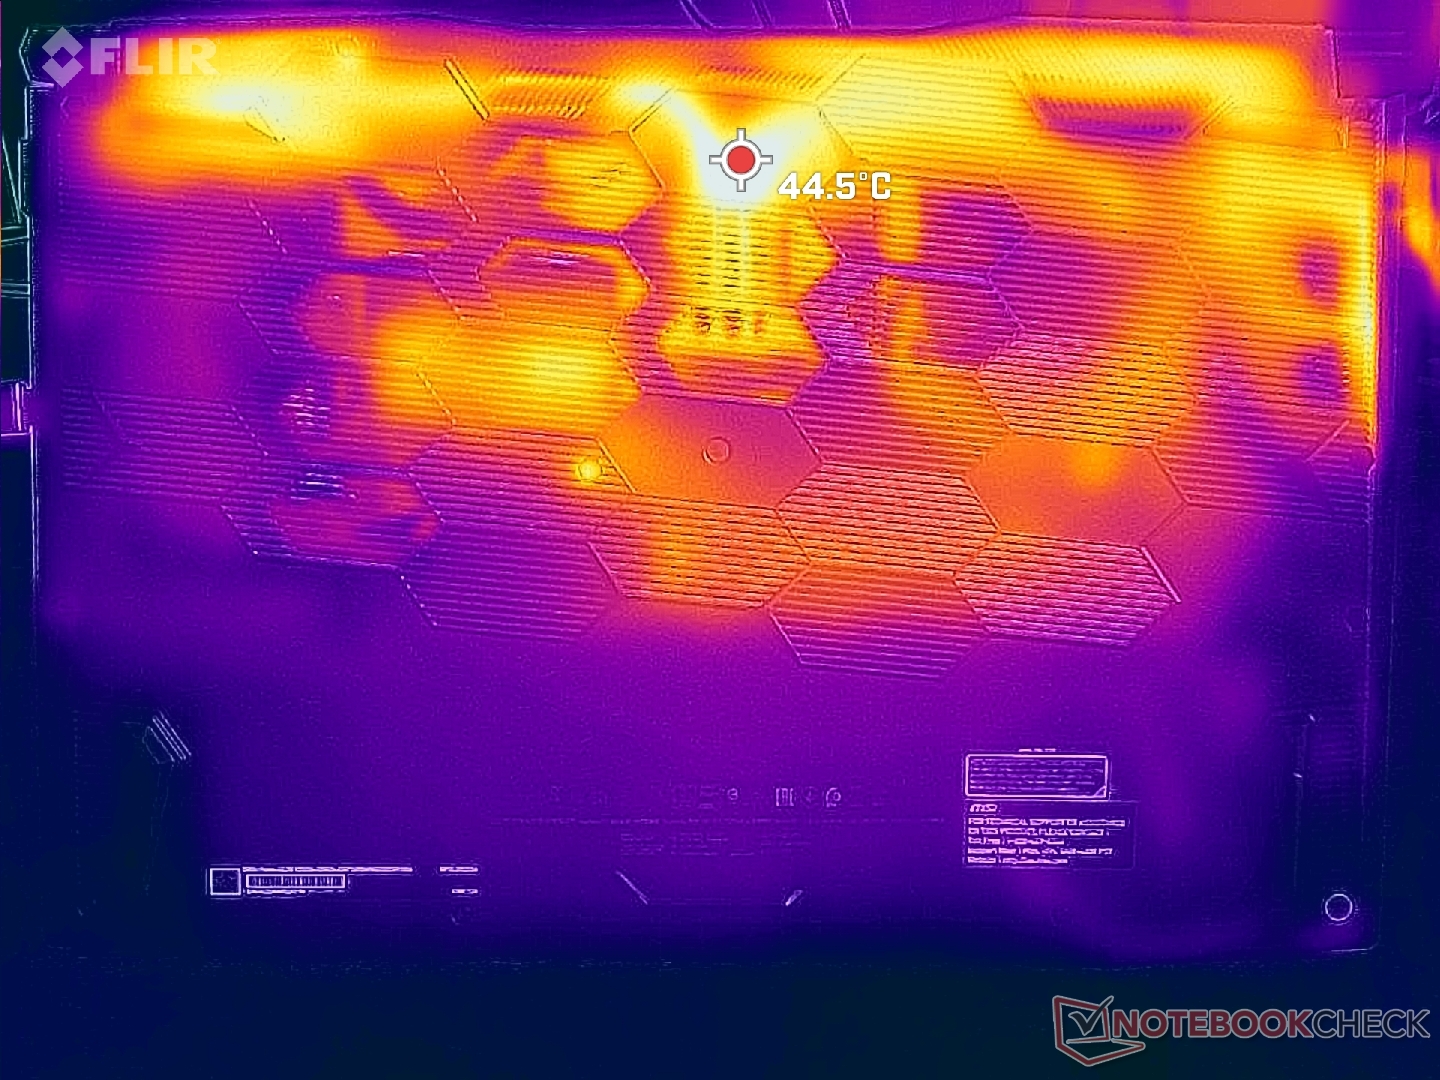
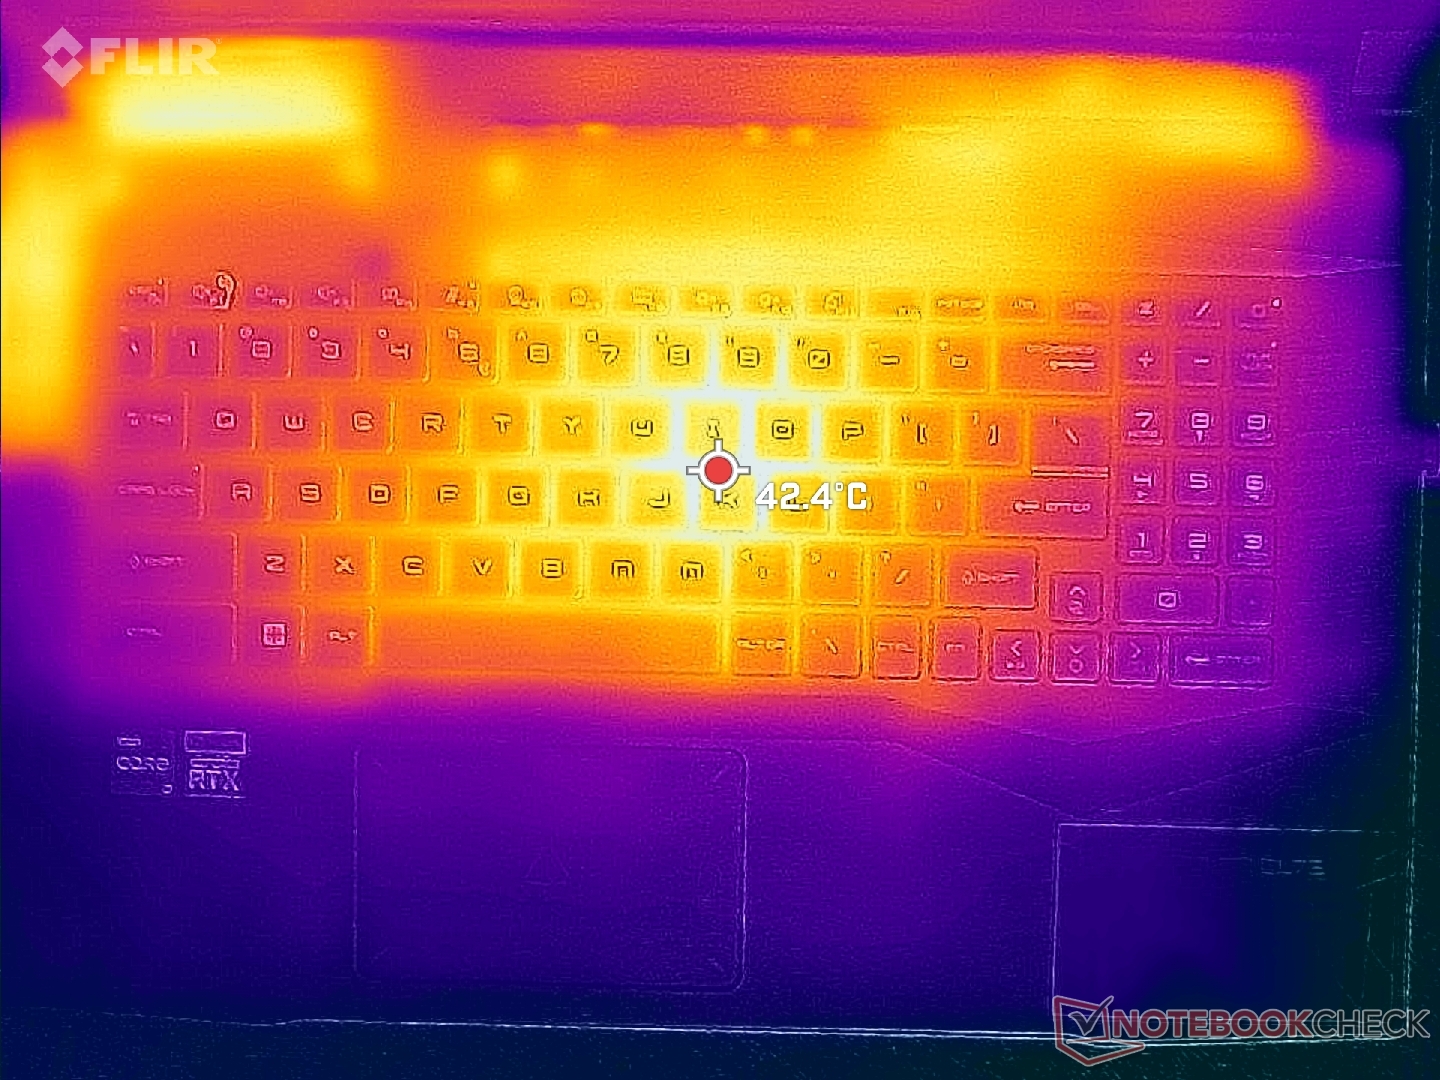
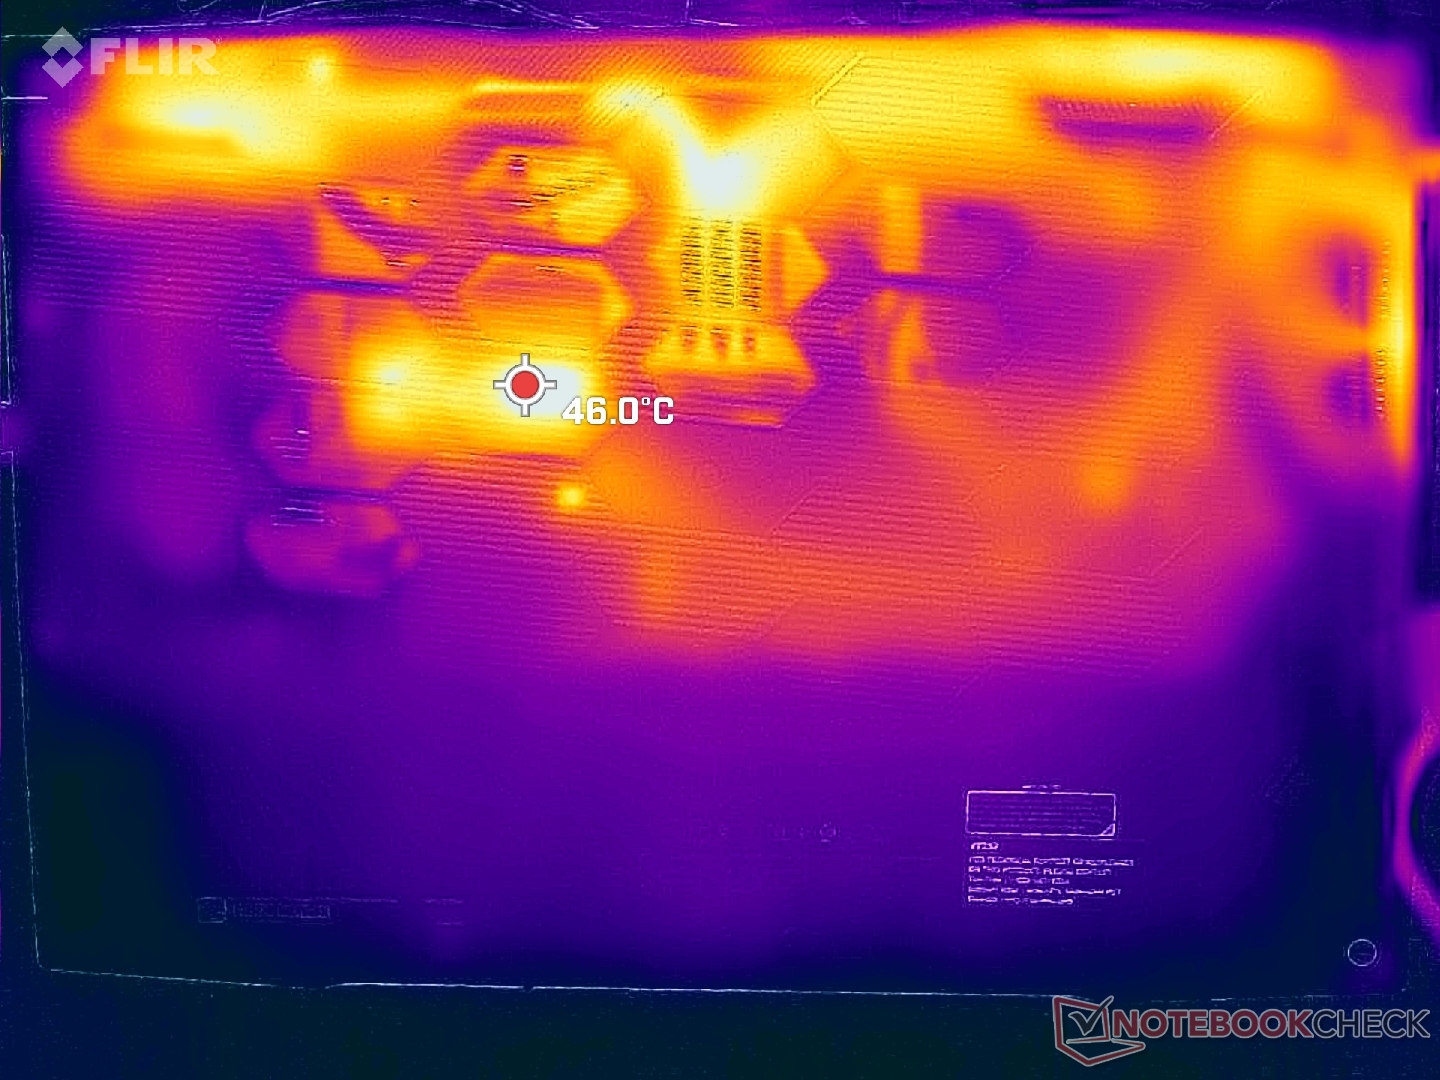
Les températures de surface moyennes ne sont pas inconfortablement chaudes et les points chauds sont très isolés en raison du grand format de 17,3 pouces et du châssis essentiellement en plastique. Le centre du clavier, par exemple, peut atteindre près de 50°C en jouant, tandis que les repose-poignets et les côtés du clavier sont beaucoup plus frais, respectivement dans la fourchette des 20°C et 30°C. Les points chauds situés sur le dessus et le dessous sont rarement perceptibles lors des jeux, car le contact avec la peau est rare à ces endroits.
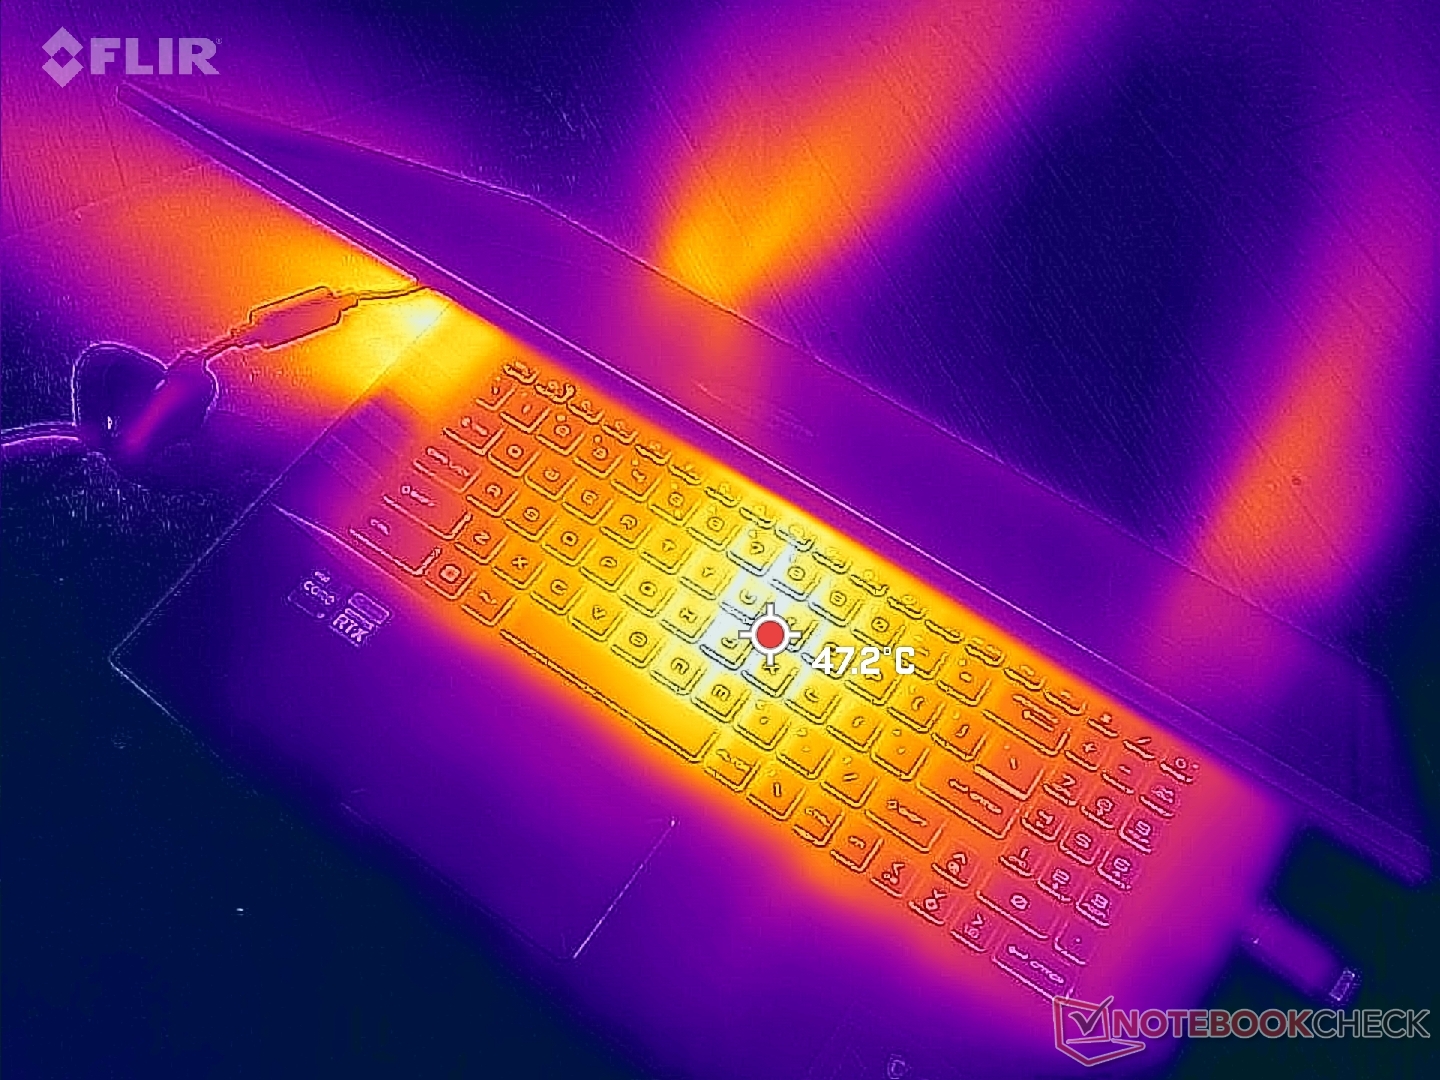
(±) La température maximale du côté supérieur est de 44.2 °C / 112 F, par rapport à la moyenne de 40.4 °C / 105 F, allant de 21.2 à 68.8 °C pour la classe Gaming.
(-) Le fond chauffe jusqu'à un maximum de 45.2 °C / 113 F, contre une moyenne de 43.2 °C / 110 F
(+) En utilisation inactive, la température moyenne du côté supérieur est de 27.7 °C / 82 F, par rapport à la moyenne du dispositif de 33.9 °C / 93 F.
(±) En jouant à The Witcher 3, la température moyenne du côté supérieur est de 35.1 °C / 95 F, alors que la moyenne de l'appareil est de 33.9 °C / 93 F.
(+) Les repose-poignets et le pavé tactile sont plus froids que la température de la peau avec un maximum de 25.4 °C / 77.7 F et sont donc froids au toucher.
(+) La température moyenne de la zone de l'appui-paume de dispositifs similaires était de 28.8 °C / 83.8 F (+3.4 °C / #6.1 F).
| MSI Pulse GL76 12UGK Intel Core i7-12700H, NVIDIA GeForce RTX 3070 Laptop GPU | Alienware m17 R5 (R9 6900HX, RX 6850M XT) AMD Ryzen 9 6900HX, AMD Radeon RX 6850M XT | Asus ROG Strix Scar 17 SE G733CX-LL014W Intel Core i9-12950HX, NVIDIA GeForce RTX 3080 Ti Laptop GPU | Acer Predator Helios 300 (i7-12700H, RTX 3070 Ti) Intel Core i7-12700H, NVIDIA GeForce RTX 3070 Ti Laptop GPU | Razer Blade 17 Early 2022 Intel Core i9-12900H, NVIDIA GeForce RTX 3080 Ti Laptop GPU | MSI Vector GP76 12UGS-434 Intel Core i7-12700H, NVIDIA GeForce RTX 3070 Ti Laptop GPU | |
|---|---|---|---|---|---|---|
| Heat | -3% | -2% | 6% | -12% | -3% | |
| Maximum Upper Side * (°C) | 44.2 | 53 -20% | 48.8 -10% | 35 21% | 50 -13% | 46.3 -5% |
| Maximum Bottom * (°C) | 45.2 | 56 -24% | 52.4 -16% | 53 -17% | 56 -24% | 45 -0% |
| Idle Upper Side * (°C) | 35.4 | 30 15% | 30.4 14% | 29 18% | 36 -2% | 34.2 3% |
| Idle Bottom * (°C) | 35 | 29 17% | 34.1 3% | 34 3% | 38 -9% | 38.3 -9% |
* ... Moindre est la valeur, meilleures sont les performances
Test de stress
Lors de l'exécution de Prime95, les fréquences d'horloge du CPU et la consommation d'énergie de la carte passent à 4,1 GHz et 110 W, respectivement, pendant quelques secondes seulement ou jusqu'à ce que la température du cœur atteigne 95 C. Ensuite, les fréquences d'horloge et la consommation d'énergie de la carte baissent à 3,6 GHz et 92 W avant de se stabiliser à 3,1 à 3,6 GHz et 85 W, respectivement. La température du cœur se stabilise également à 90°C, ce qui indique que la solution de refroidissement est pratiquement à sa limite.
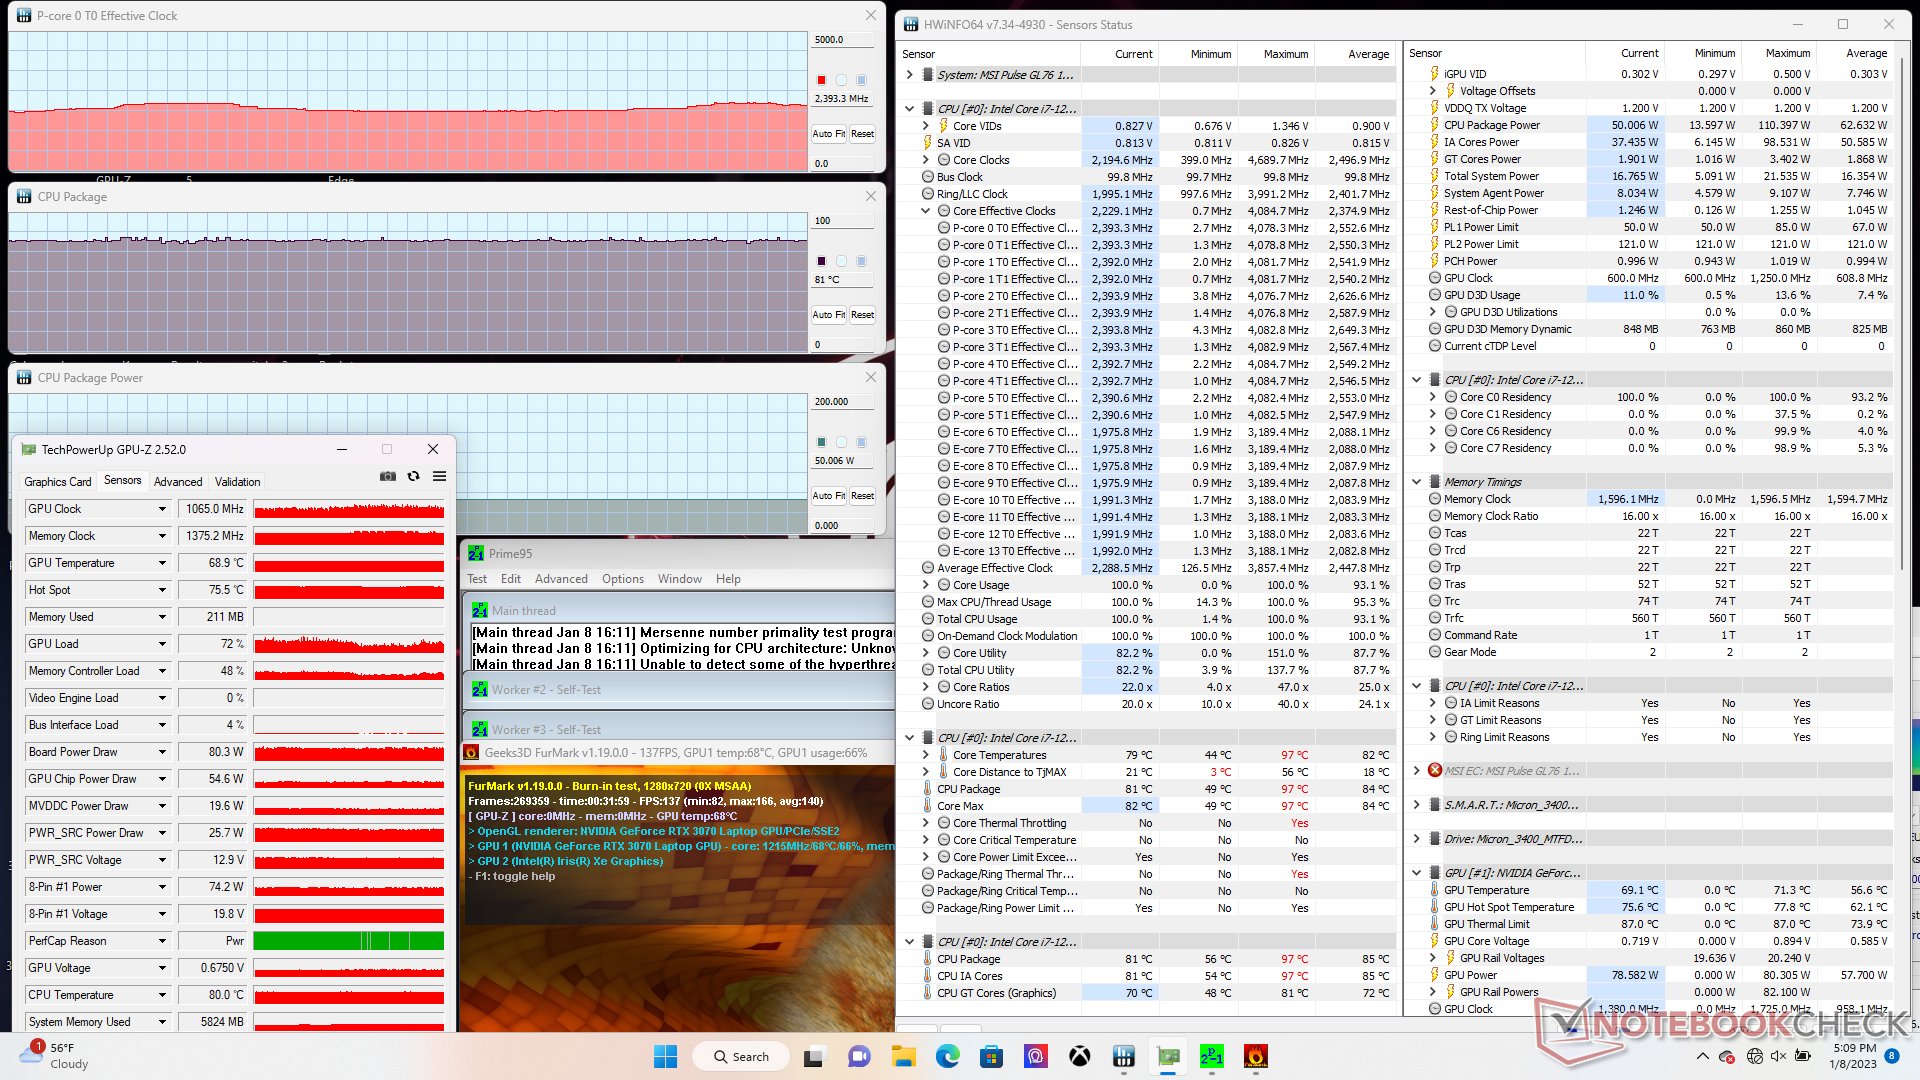
Le GPU Nvidia se stabiliserait à 1575 MHz et 76 C lors de l'exécution de Witcher 3 par rapport à 1725 MHz et 72 C sur le Razer Blade 17 équipé d'un TGP plus élevé de 130 W GeForce RTX 3070. GPU-Z sur notre unité de test MSI indique également une consommation de 102 W pour la carte graphique, ce qui est très proche de l'objectif annoncé de 105 W.
Le fonctionnement sur batterie limite les performances. Un test 3DMark 11 sur batterie donnerait des scores de physique et de graphisme de 9089 et 11291 points, respectivement, contre 22513 et 33048 points sur secteur.
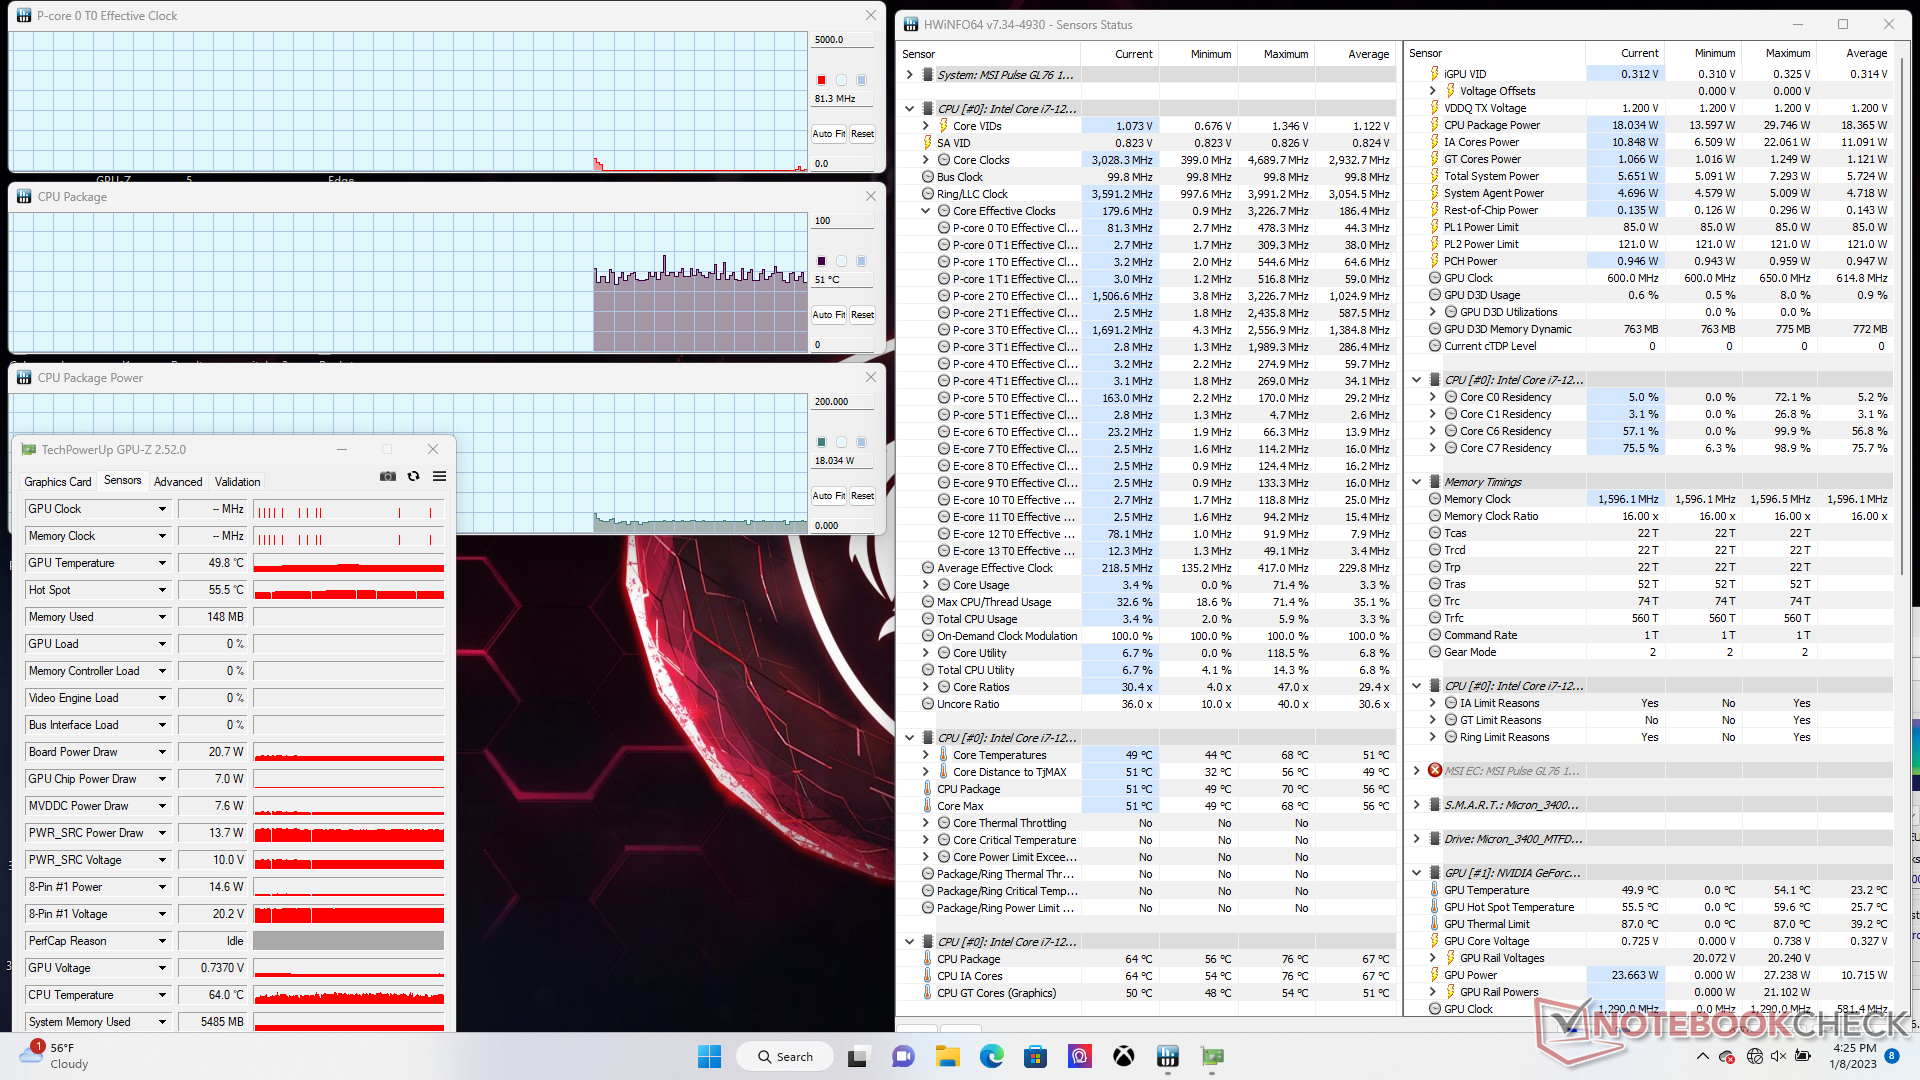
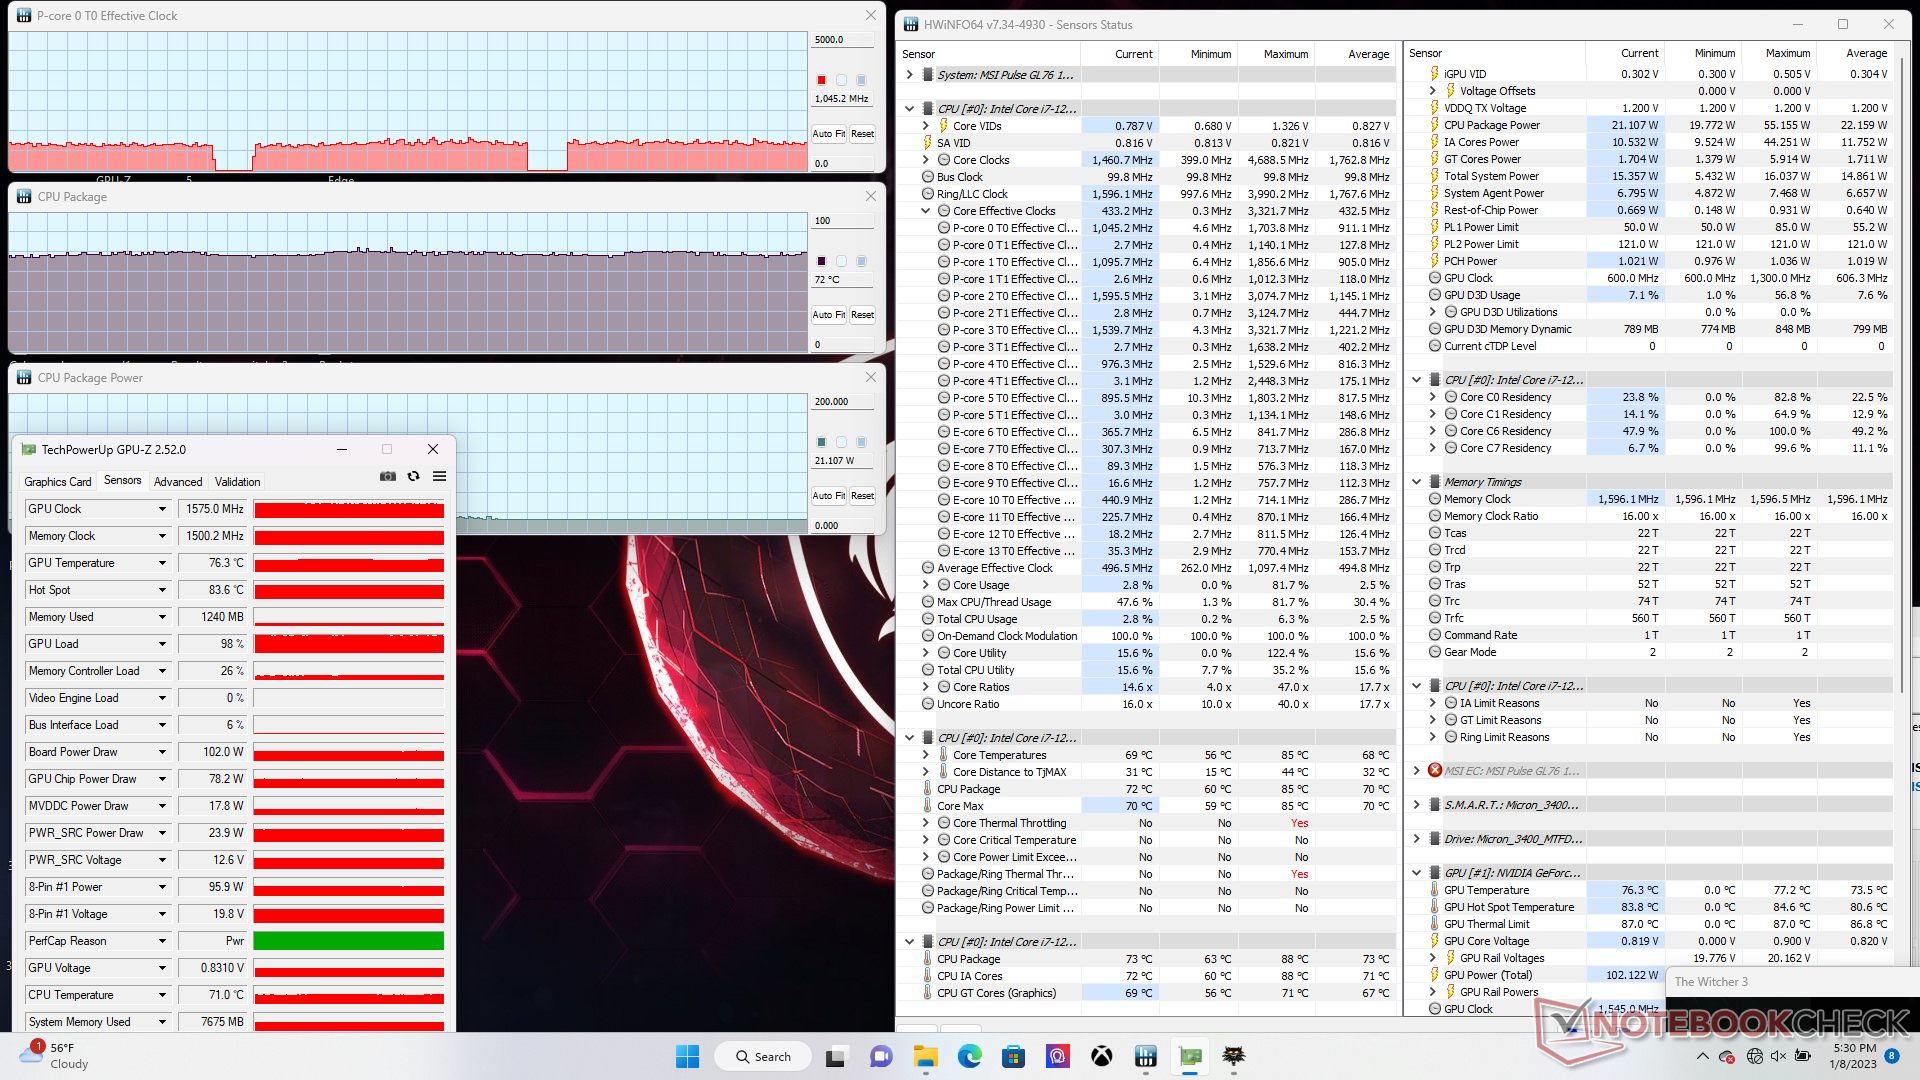
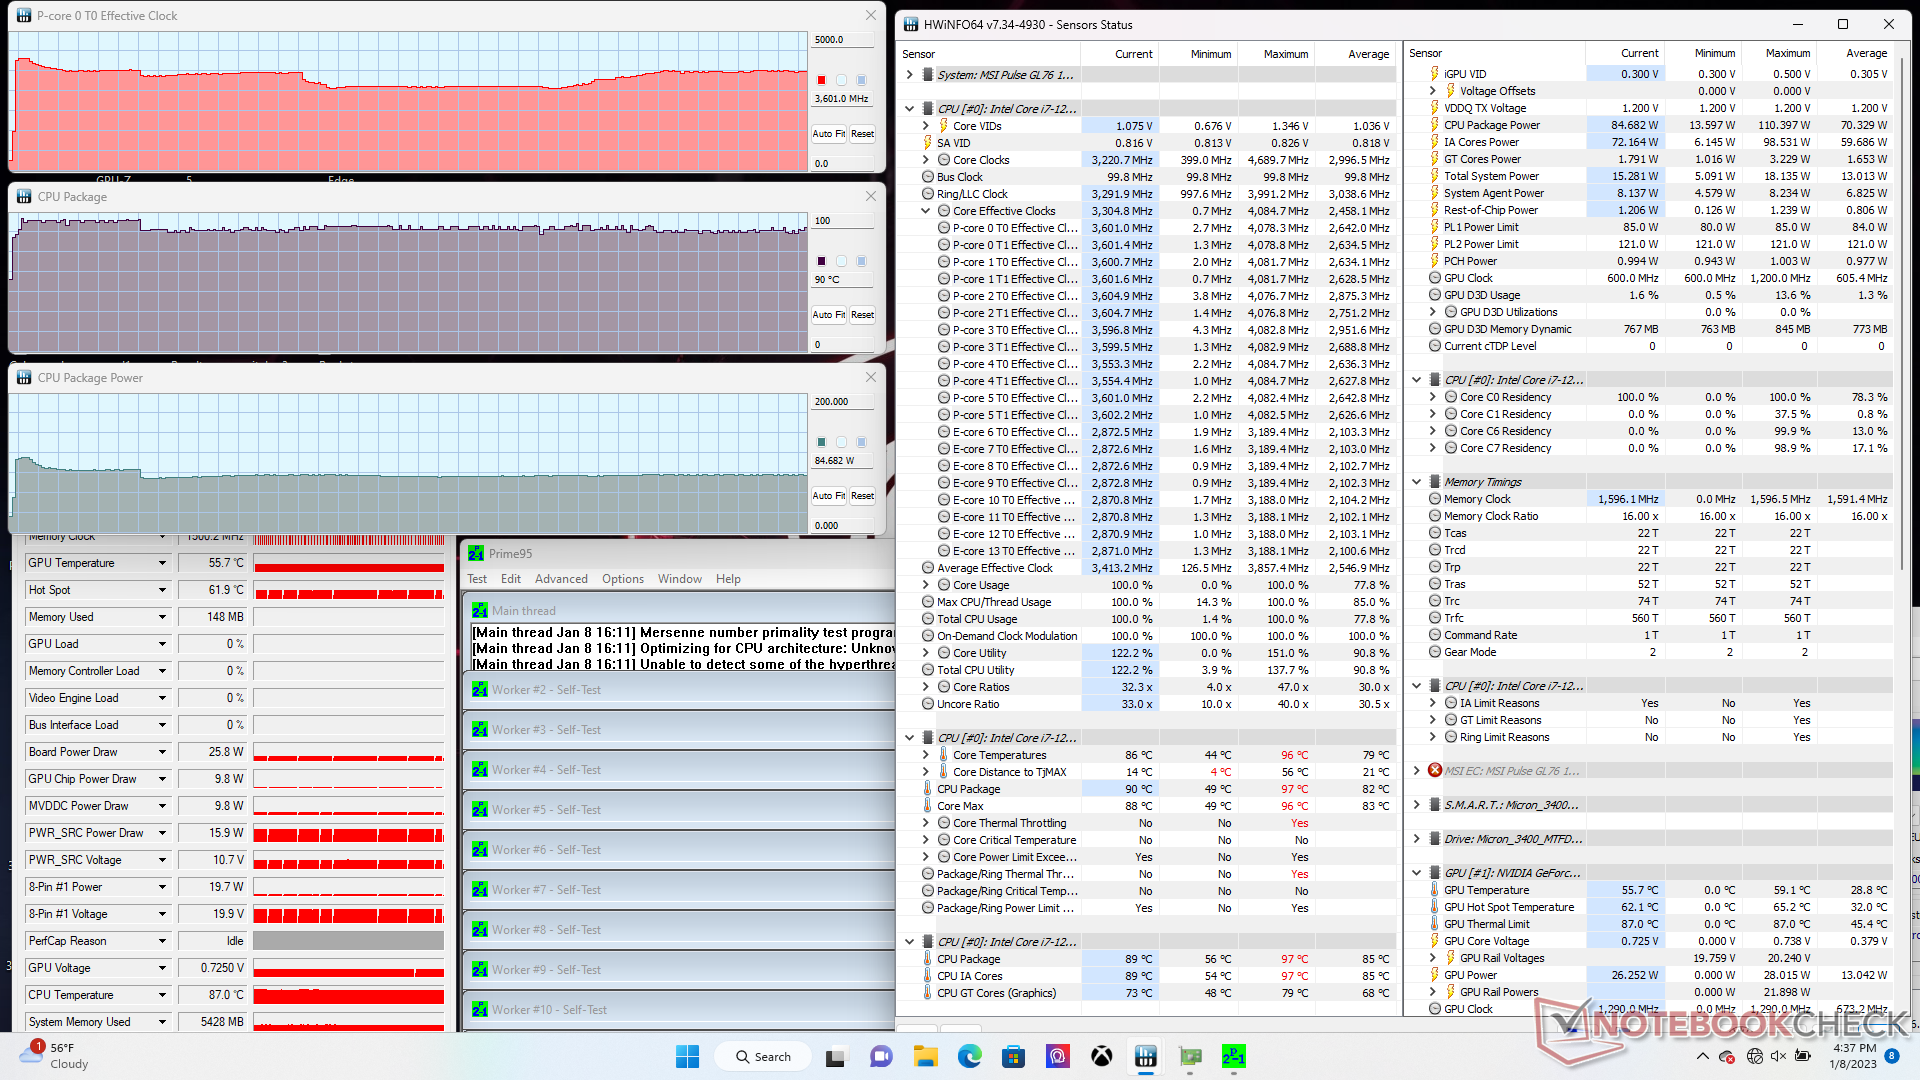
| Fréquence du CPU (GHz) | Fréquence du GPU (MHz) | Température moyenne du CPU (°C) | Température moyenne du GPU (°C) | |
| Système au repos | -- | -- | 51 | 50 |
| Prime95 Stress | 3.4 - 3.6 | -- | 90 | 56 |
| Prime95+ FurMark Stress | 2.3 - 2.4 | 1065 | 81 | 69 |
| Witcher 3 Stress | ~1.1 | 1575 | 72 | 76 |
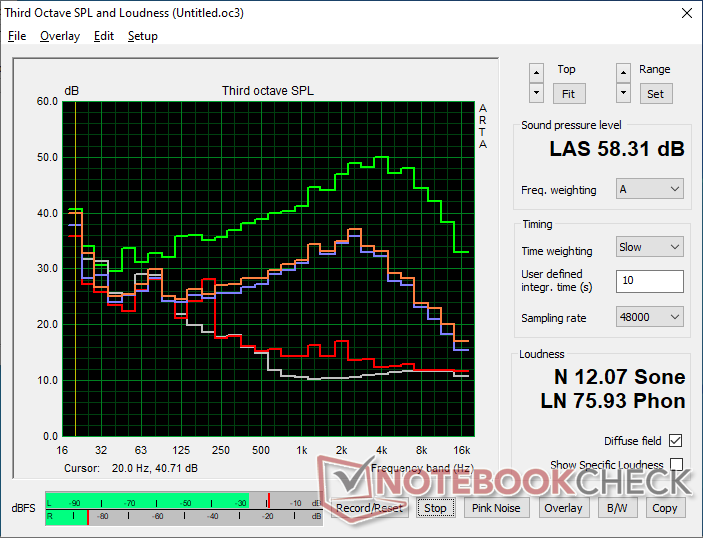
Haut-parleurs
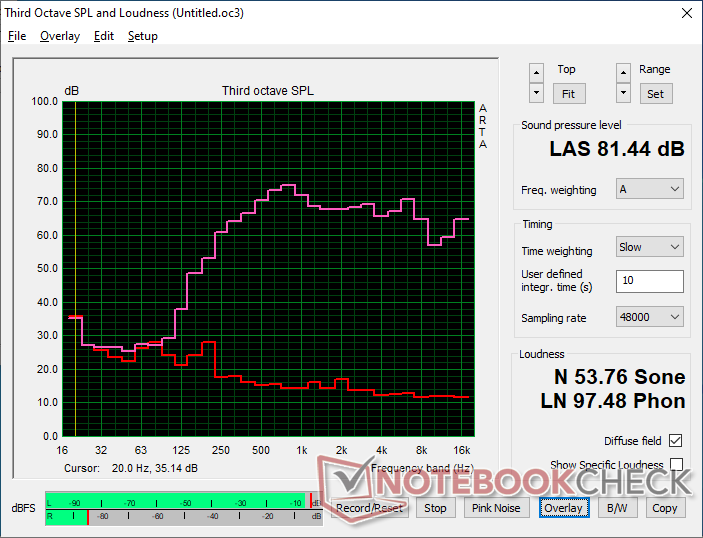
MSI Pulse GL76 12UGK analyse audio
(±) | le niveau sonore du haut-parleur est moyen mais bon (81.4# dB)
Basses 100 - 315 Hz
(-) | presque aucune basse - en moyenne 17.5% plus bas que la médiane
(±) | la linéarité des basses est moyenne (11.8% delta à la fréquence précédente)
Médiums 400 - 2000 Hz
(+) | médiane équilibrée - seulement 3.7% de la médiane
(+) | les médiums sont linéaires (4.3% delta à la fréquence précédente)
Aiguës 2 - 16 kHz
(+) | des sommets équilibrés - à seulement 3.1% de la médiane
(+) | les aigus sont linéaires (6.6% delta à la fréquence précédente)
Globalement 100 - 16 000 Hz
(+) | le son global est linéaire (14.8% différence à la médiane)
Par rapport à la même classe
» 29% de tous les appareils testés de cette catégorie étaient meilleurs, 7% similaires, 64% pires
» Le meilleur avait un delta de 6%, la moyenne était de 18%, le pire était de 132%.
Par rapport à tous les appareils testés
» 20% de tous les appareils testés étaient meilleurs, 4% similaires, 76% pires
» Le meilleur avait un delta de 4%, la moyenne était de 24%, le pire était de 134%.
Apple MacBook Pro 16 2021 M1 Pro analyse audio
(+) | les haut-parleurs peuvent jouer relativement fort (84.7# dB)
Basses 100 - 315 Hz
(+) | bonne basse - seulement 3.8% loin de la médiane
(+) | les basses sont linéaires (5.2% delta à la fréquence précédente)
Médiums 400 - 2000 Hz
(+) | médiane équilibrée - seulement 1.3% de la médiane
(+) | les médiums sont linéaires (2.1% delta à la fréquence précédente)
Aiguës 2 - 16 kHz
(+) | des sommets équilibrés - à seulement 1.9% de la médiane
(+) | les aigus sont linéaires (2.7% delta à la fréquence précédente)
Globalement 100 - 16 000 Hz
(+) | le son global est linéaire (4.6% différence à la médiane)
Par rapport à la même classe
» 0% de tous les appareils testés de cette catégorie étaient meilleurs, 0% similaires, 100% pires
» Le meilleur avait un delta de 5%, la moyenne était de 17%, le pire était de 45%.
Par rapport à tous les appareils testés
» 0% de tous les appareils testés étaient meilleurs, 0% similaires, 100% pires
» Le meilleur avait un delta de 4%, la moyenne était de 24%, le pire était de 134%.
Gestion de l'énergie - Plus économe en énergie que prévu
Consommation d'énergie
La marche au ralenti sur le bureau ne consomme que 12 W en profil Economiseur d'énergie avec l'iGPU actif et la luminosité réglée au minimum. À l'inverse, la marche au ralenti sur le bureau peut consommer un peu plus de 25 W en mode Performances extrêmes avec la luminosité réglée au maximum. Ainsi, le passage d'un mode d'alimentation à l'autre est un facteur important pour prolonger l'autonomie de la batterie.
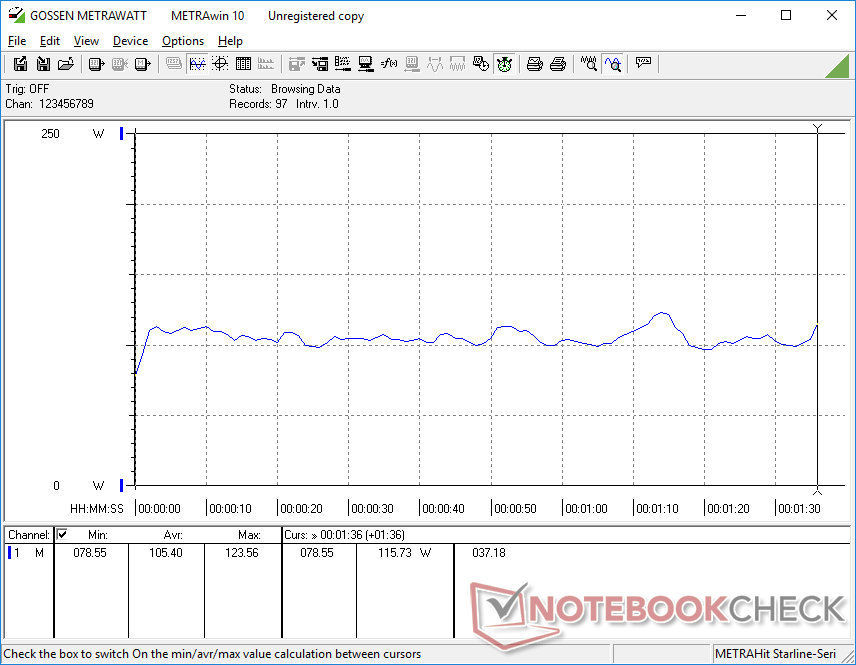
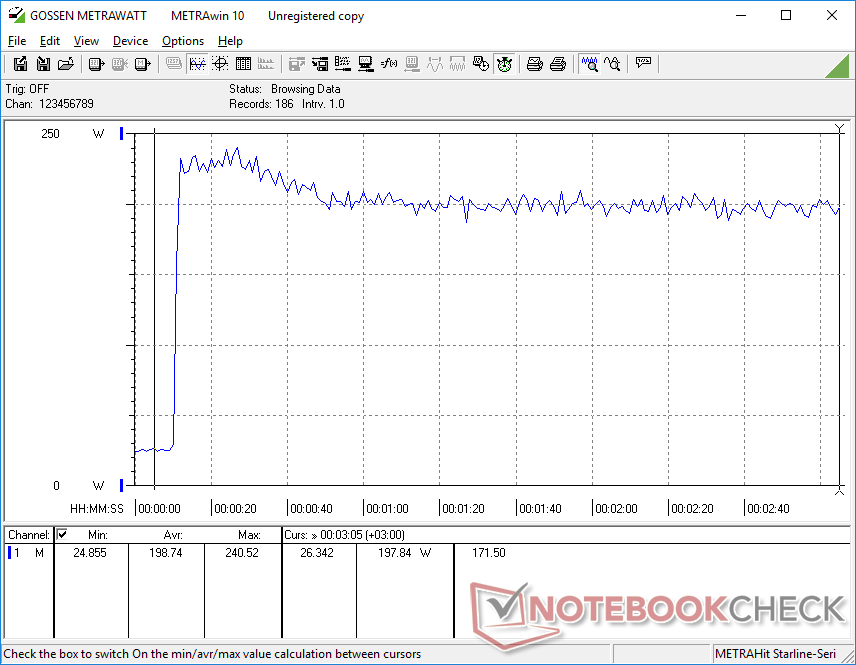
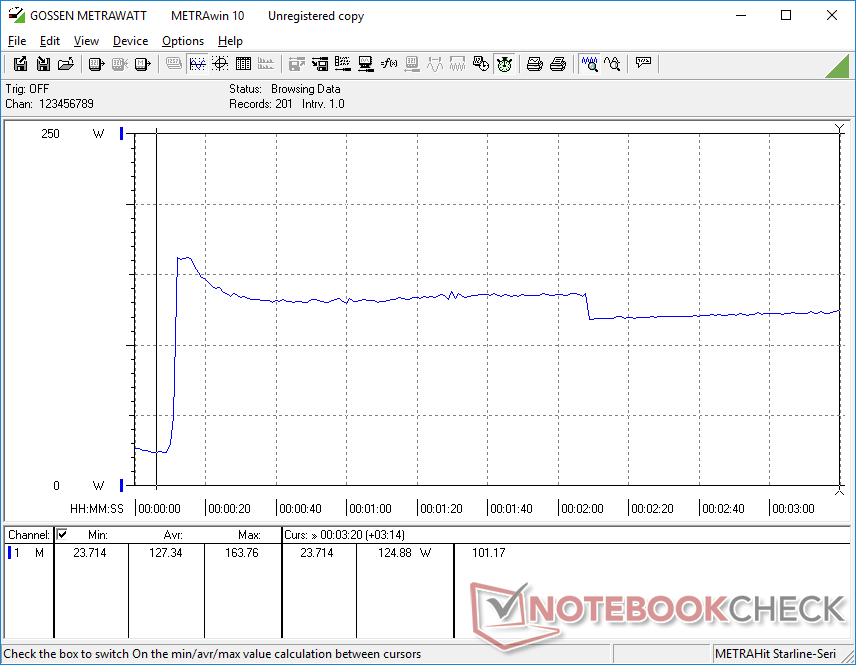
La consommation d'énergie globale est inférieure à celle de la plupart des autres ordinateurs portables de 17,3 pouces destinés aux jeux. L'exécution de Witcher 3, par exemple, ne consomme que 150 W, contre 199 W et 231 W sur le MSI Vector GP76 et l'Acer Predator Helios 300, respectivement, tous deux équipés du GPU RTX 3070 Ti. La consommation est également nettement inférieure à celle de l'Alienware m17 R5 équipé de la Radeon RX 6850M XT, tout en offrant pratiquement les mêmes performances graphiques brutes.
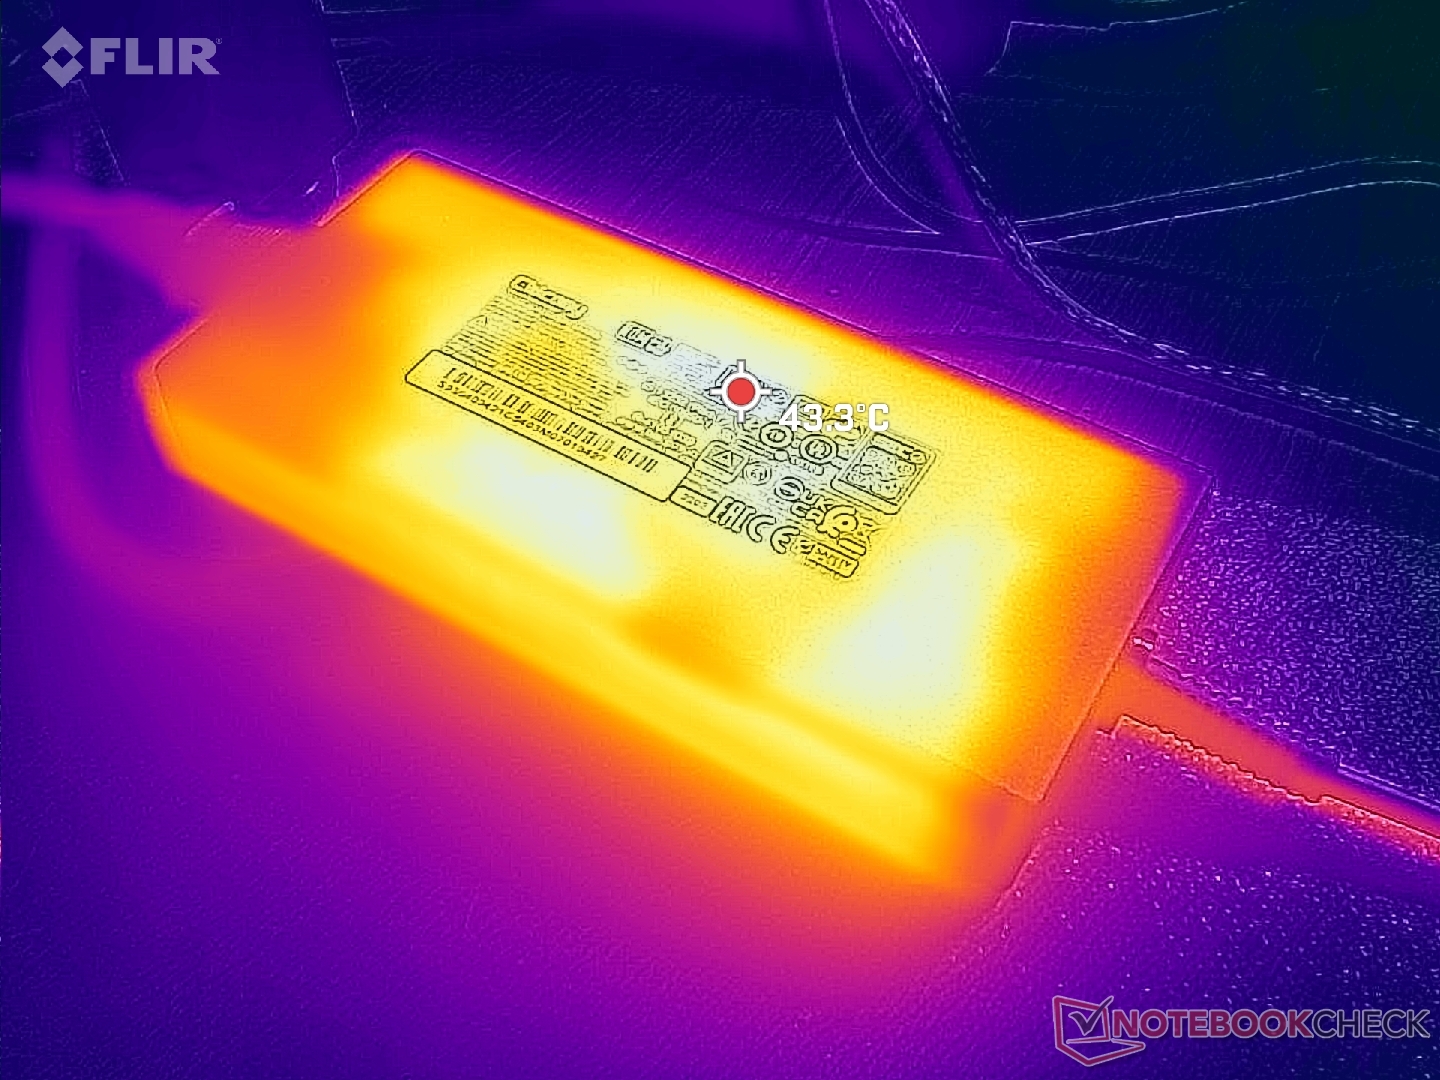
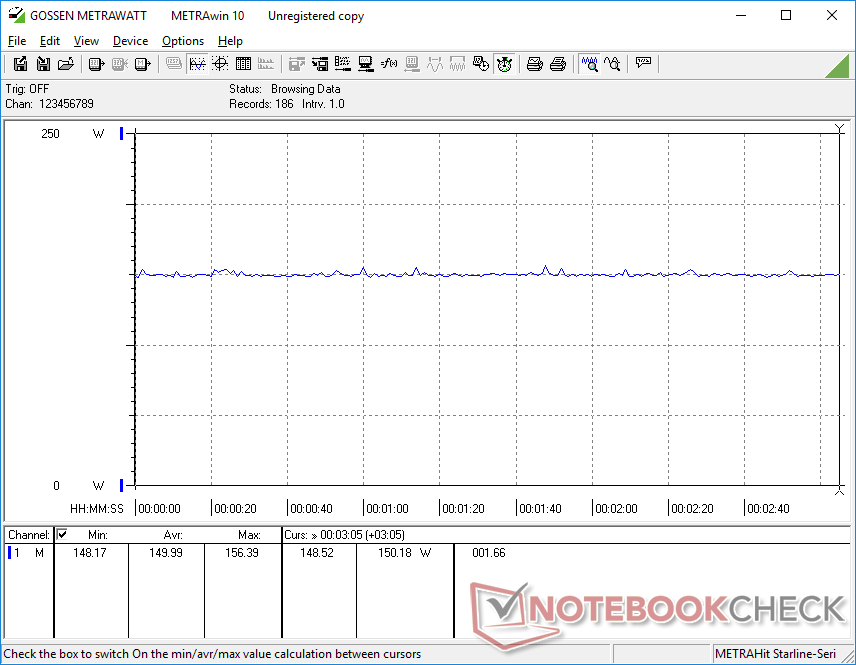
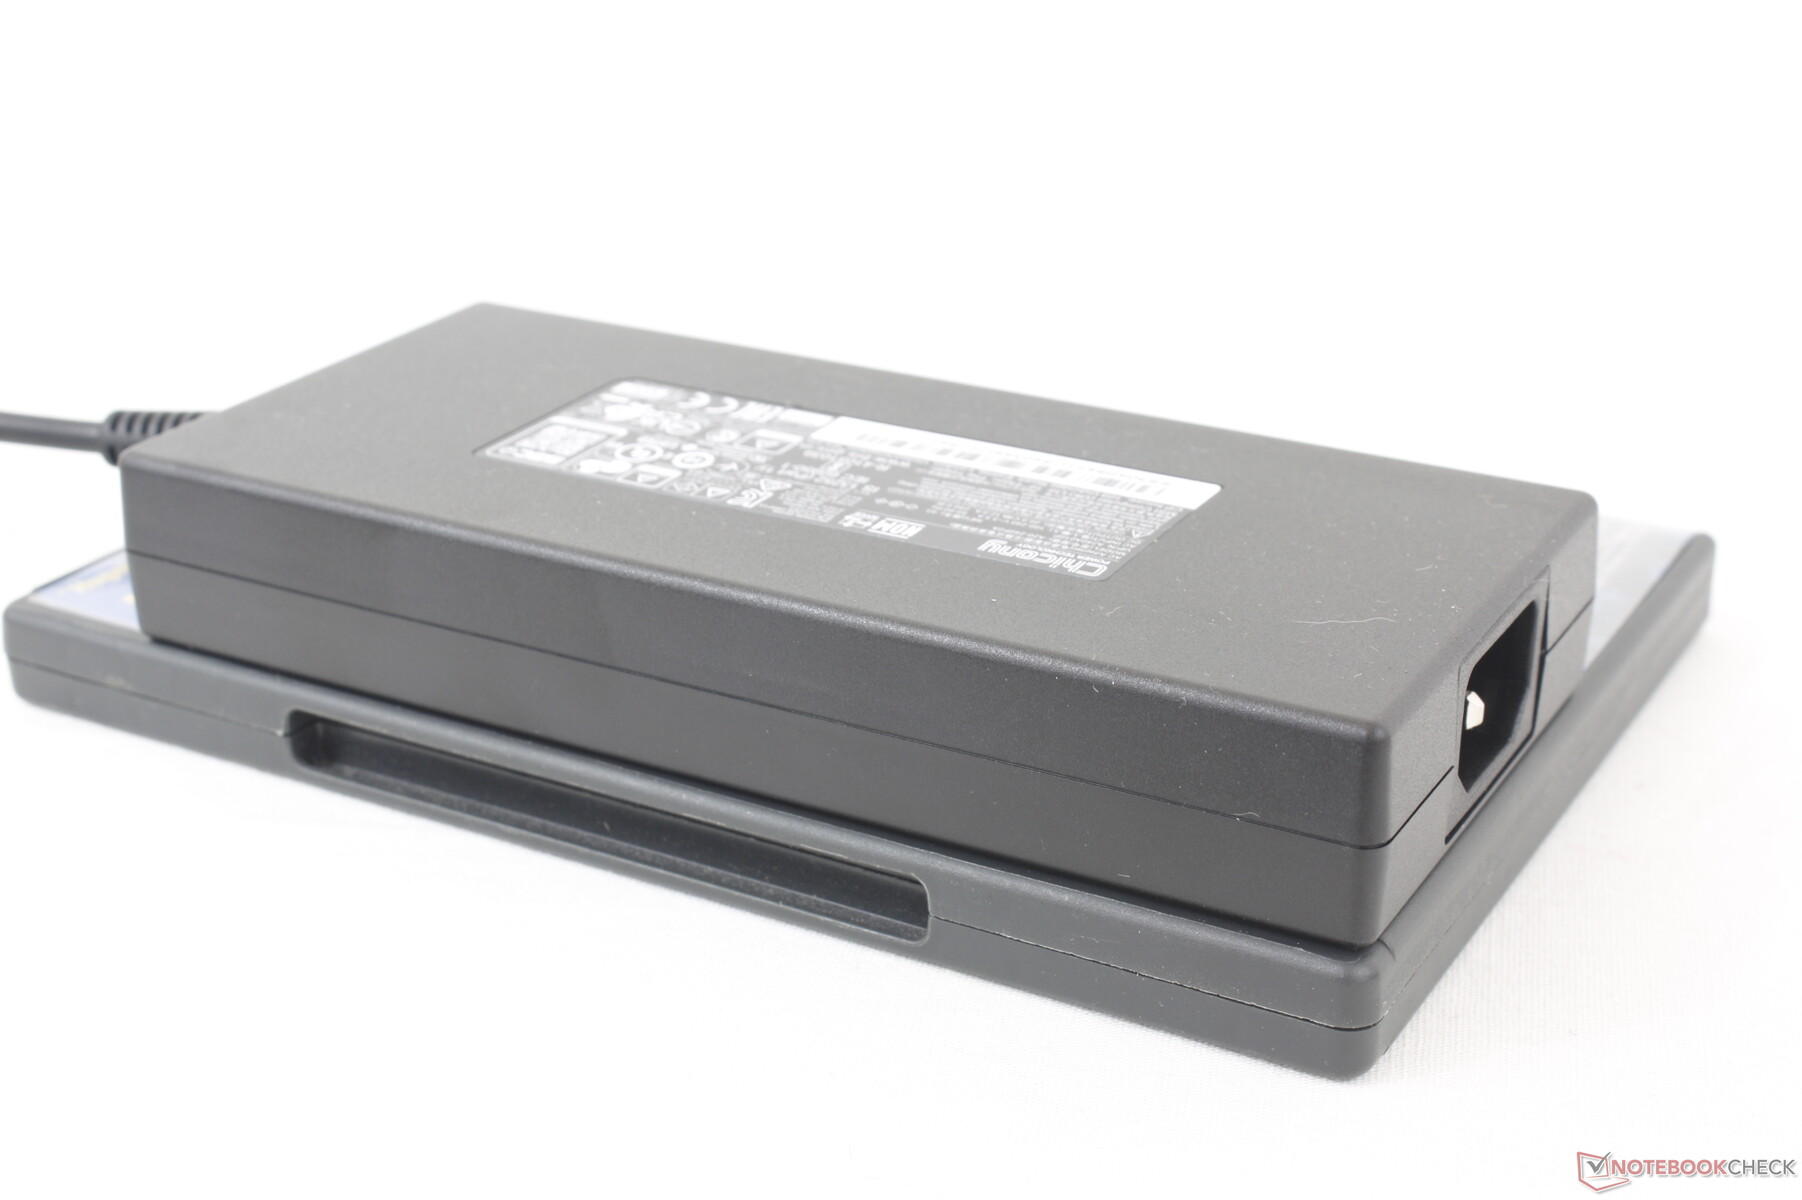
Nous avons pu mesurer une consommation maximale de 241 W sur l'adaptateur secteur 240 W de taille moyenne (~16,4 x 7,4 x 2,5 cm) lorsque le CPU et le GPU sont tous deux utilisés à 100 %. Ce taux n'est que temporaire comme le montrent les captures d'écran ci-dessous en raison du potentiel limité de Turbo Boost du CPU. La batterie peut encore se charger à un taux décent lors de l'exécution de charges élevées comme les jeux.
| Éteint/en veille | |
| Au repos | |
| Fortement sollicité |
|
Légende:
min: | |
| MSI Pulse GL76 12UGK i7-12700H, GeForce RTX 3070 Laptop GPU, Micron 3400 1TB MTFDKBA1T0TFH, IPS, 1920x1080, 17.3" | Alienware m17 R5 (R9 6900HX, RX 6850M XT) R9 6900HX, Radeon RX 6850M XT, SSSTC CA6-8D1024, IPS, 3840x2160, 17" | Asus ROG Strix Scar 17 SE G733CX-LL014W i9-12950HX, GeForce RTX 3080 Ti Laptop GPU, Samsung PM9A1 MZVL22T0HBLB, IPS, 2560x1440, 17.3" | Acer Predator Helios 300 (i7-12700H, RTX 3070 Ti) i7-12700H, GeForce RTX 3070 Ti Laptop GPU, Samsung PM9A1 MZVL21T0HCLR, IPS, 2560x1440, 17.3" | Razer Blade 17 Early 2022 i9-12900H, GeForce RTX 3080 Ti Laptop GPU, Samsung PM9A1 MZVL21T0HCLR, IPS, 3840x2160, 17.3" | MSI Vector GP76 12UGS-434 i7-12700H, GeForce RTX 3070 Ti Laptop GPU, Micron 2450 1TB MTFDKBA1T0TFK, IPS, 1920x1080, 17.3" | |
|---|---|---|---|---|---|---|
| Power Consumption | -8% | -46% | -27% | -36% | -27% | |
| Idle Minimum * (Watt) | 12.4 | 13 -5% | 19.3 -56% | 15 -21% | 17 -37% | 13.5 -9% |
| Idle Average * (Watt) | 13.1 | 16.5 -26% | 26.5 -102% | 20 -53% | 23 -76% | 15.6 -19% |
| Idle Maximum * (Watt) | 25.3 | 17 33% | 27.1 -7% | 22.3 12% | 34 -34% | 20.6 19% |
| Load Average * (Watt) | 105.4 | 93 12% | 141 -34% | 133 -26% | 120 -14% | 198 -88% |
| Witcher 3 ultra * (Watt) | 150 | 239 -59% | 225 -50% | 231 -54% | 229 -53% | 199 -33% |
| Load Maximum * (Watt) | 240.5 | 251 -4% | 307.9 -28% | 290 -21% | 243 -1% | 319 -33% |
* ... Moindre est la valeur, meilleures sont les performances
Power Consumption Witcher 3 / Stresstest
Power Consumption external Monitor
Autonomie de la batterie - Pack Li-Ion de 99 Wh
Il est intéressant de noter que les spécifications officielles de MSI https://us.msi.com/Laptop/Pulse-GL76-12UX/Specification font état d'une batterie de 53 Wh pour le GL76, alors qu'un regard plus attentif sur HWiNFO et sur la batterie physique de notre unité de test montre une capacité de 90 Wh. Cet écart est probablement une erreur de la part du fabricant. Néanmoins, l'autonomie de la batterie est bonne pour un ordinateur portable de jeu. Nous avons pu enregistrer une autonomie WLAN d'un peu moins de 6 heures, soit environ 2 heures de plus que sur le Razer Blade 17 ou l'Asus ROG Strix Scar 17.
Le chargement d'une batterie vide à sa pleine capacité prend un peu plus de 2 heures. L'USB-PD n'est pas pris en charge et le système ne peut donc être rechargé qu'avec l'adaptateur secteur de type tonneau fourni.
| MSI Pulse GL76 12UGK i7-12700H, GeForce RTX 3070 Laptop GPU, 90 Wh | Alienware m17 R5 (R9 6900HX, RX 6850M XT) R9 6900HX, Radeon RX 6850M XT, 97 Wh | Asus ROG Strix Scar 17 SE G733CX-LL014W i9-12950HX, GeForce RTX 3080 Ti Laptop GPU, 90 Wh | Acer Predator Helios 300 (i7-12700H, RTX 3070 Ti) i7-12700H, GeForce RTX 3070 Ti Laptop GPU, 90 Wh | Razer Blade 17 Early 2022 i9-12900H, GeForce RTX 3080 Ti Laptop GPU, 82 Wh | MSI Vector GP76 12UGS-434 i7-12700H, GeForce RTX 3070 Ti Laptop GPU, 65 Wh | |
|---|---|---|---|---|---|---|
| Autonomie de la batterie | -17% | -29% | -6% | -19% | -11% | |
| Reader / Idle (h) | 7.3 | 7.1 -3% | 7.3 0% | |||
| WiFi v1.3 (h) | 5.9 | 4.8 -19% | 4.2 -29% | 6 2% | 3.8 -36% | 5.1 -14% |
| Load (h) | 2.1 | 1.8 -14% | 1.8 -14% | 1.7 -19% | 1.7 -19% | |
| H.264 (h) | 4.9 | 5.9 | 4.8 |
Points positifs
Points négatifs
Verdict - Beaucoup de puissance brute, mais quelques caractéristiques clés manquantes
Le Pulse GL76 est un excellent choix en termes de prix, de performances et d'affichage. Le Core i7-12700H se marie bien avec la RTX 3070 de GeForce, tandis que l'écran 1080p à 360 Hz est le même que celui utilisé par MSI pour son bien plus cher GT77 Titan. Pour 1400 USD ou même 1200 USD en solde, il serait difficile de trouver un autre portable de jeu de 17,3 pouces avec un meilleur CPU, GPU et écran que notre GL76.
Cependant, une fois que vous regardez au-delà des processeurs et de l'écran, les coupures commencent à se faire sentir. L'absence de G-Sync, de MUX, d'Advanced Optimus et de prise en charge de Thunderbolt, en particulier, met un frein à un système autrement puissant. Des alternatives comme le Asus TUF Gaming F17 ou le Acer Predator Helios 300 offrent plusieurs de ces fonctionnalités manquantes que les utilisateurs avancés ou les joueurs pourraient apprécier. Nous ne nous attendons pas à ce que les ordinateurs portables de jeu à petit budget disposent de telles fonctionnalités modernes, mais le GL76 coûte bien plus de 1000 $ US et mérite d'en avoir au moins quelques-unes.
Le MSI Pulse GL76 donne la priorité aux performances brutes d'Intel et de Nvidia, ainsi qu'à un écran IPS 360 Hz de haute qualité. Quelques fonctionnalités avancées sont absentes, probablement pour limiter les coûts.
D'autres inconvénients comme le pavé tactile spongieux, la webcam boueuse, les charnières moyennes, le design essentiellement en plastique et l'absence d'éclairage RVB par touche sont typiques des ordinateurs portables de jeu de milieu de gamme et ne constituent pas des obstacles. Les joueurs qui veulent maximiser les performances et la qualité d'affichage sans se ruiner devraient quand même considérer le GL76.
Prix et disponibilité
Le Pulse GL76 tel que configuré est actuellement disponible sur Costco pour $1200 à $1400 USD. Le modèle est également disponible sur Amazon pour $1650 USD, Newegg pour $1750 USD, ou Best Buy pour $1700 USD.
MSI Pulse GL76 12UGK
- 01/11/2023 v7 (old)
Allen Ngo
Price comparison

