Test de l'Asus Zenbook Pro 15 OLED UM535Q : comme un XPS 15 équipé d'AMD
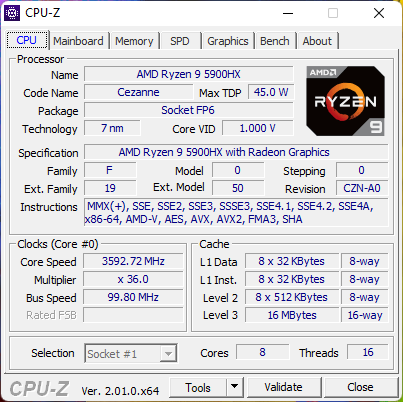
Cela fait deux ans que nous n'avons pas examiné la série Zenbook 535. Notre dernier modèle, le 2020 UX535 doté d'un processeur Intel Coffee Lake-H de 10e génération et d'une carte graphique GeForce GTX 1650 Max-Q, était équipé d'un ScreenPad pour une surface d'écran supplémentaire. La version 2022 que nous examinons est équipée d'un nouveau processeur AMD Zen 3 5900HX et d'un GPU GeForce RTX 3050 Ti, mais sans le ScreenPad du modèle 2020. Notre configuration OLED FHD haut de gamme peut être trouvée en ligne pour environ 1500 USD au détail, mais des SKUs avec le CPU Ryzen 5 5600H ou un écran OLED 4K UHD sont également disponibles
Les alternatives au Zenbook UM535 d'Asus comprennent d'autres ordinateurs portables multimédias ou prosommateurs de 15,6 pouces comme le MSI Prestige 15, Dell XPS 15, HP Spectre x360 15ou le Microsoft Surface Laptop 15.
Plus de commentaires sur Asus
Comparaison avec les concurrents potentiels
Note | Date | Modèle | Poids | Épaisseur | Taille | Résolution | Prix |
|---|---|---|---|---|---|---|---|
| 87.7 % v7 (old) | 05/22 | Asus Zenbook Pro 15 OLED UM535Q R9 5900HX, GeForce RTX 3050 Ti Laptop GPU | 1.9 kg | 18 mm | 15.60" | 1920x1080 | |
| 87 % v7 (old) | 12/20 | Asus ZenBook UX535-M01440 i7-10750H, GeForce GTX 1650 Ti Max-Q | 2 kg | 20 mm | 15.60" | 3840x2160 | |
| 85.2 % v7 (old) | 04/20 | Asus ZenBook 15 UX534FTC-A8190T i7-10510U, GeForce GTX 1650 Max-Q | 1.6 kg | 18.9 mm | 15.60" | 1920x1080 | |
| 87.1 % v7 (old) | 04/21 | Lenovo Yoga Creator 7 15IMH05 82DS000VGE i7-10750H, GeForce GTX 1650 Mobile | 1.8 kg | 17.5 mm | 15.60" | 1920x1080 | |
| 83 % v7 (old) | 09/20 | HP Envy 15-ep0098nr i7-10750H, GeForce RTX 2060 Max-Q | 2 kg | 19 mm | 15.60" | 3840x2160 | |
| 88.4 % v7 (old) | 08/21 | Dell XPS 15 9510 11800H RTX 3050 Ti OLED i7-11800H, GeForce RTX 3050 Ti Laptop GPU | 1.9 kg | 18 mm | 15.60" | 3456x2160 |
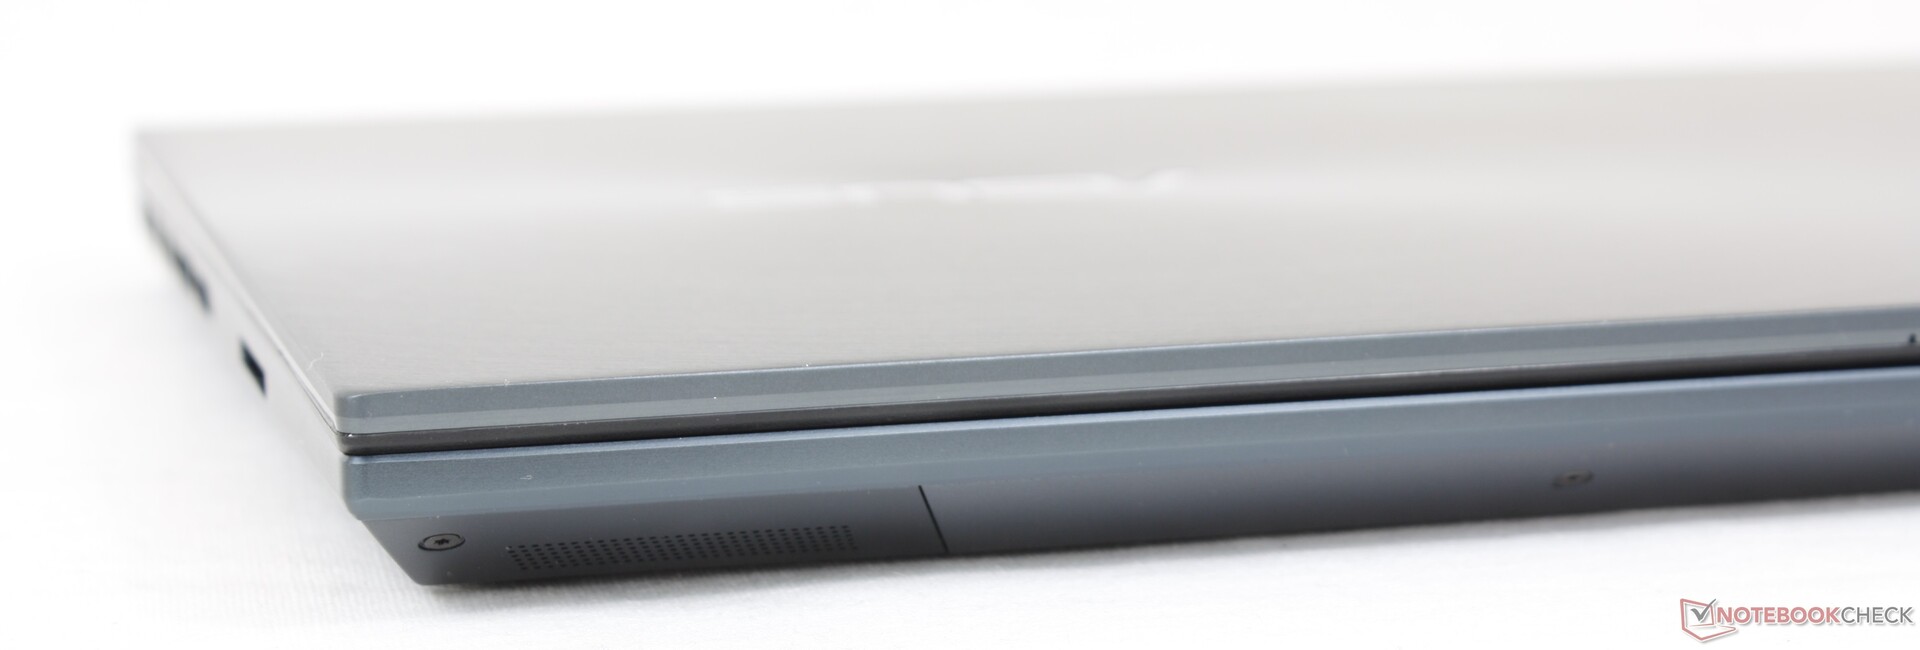
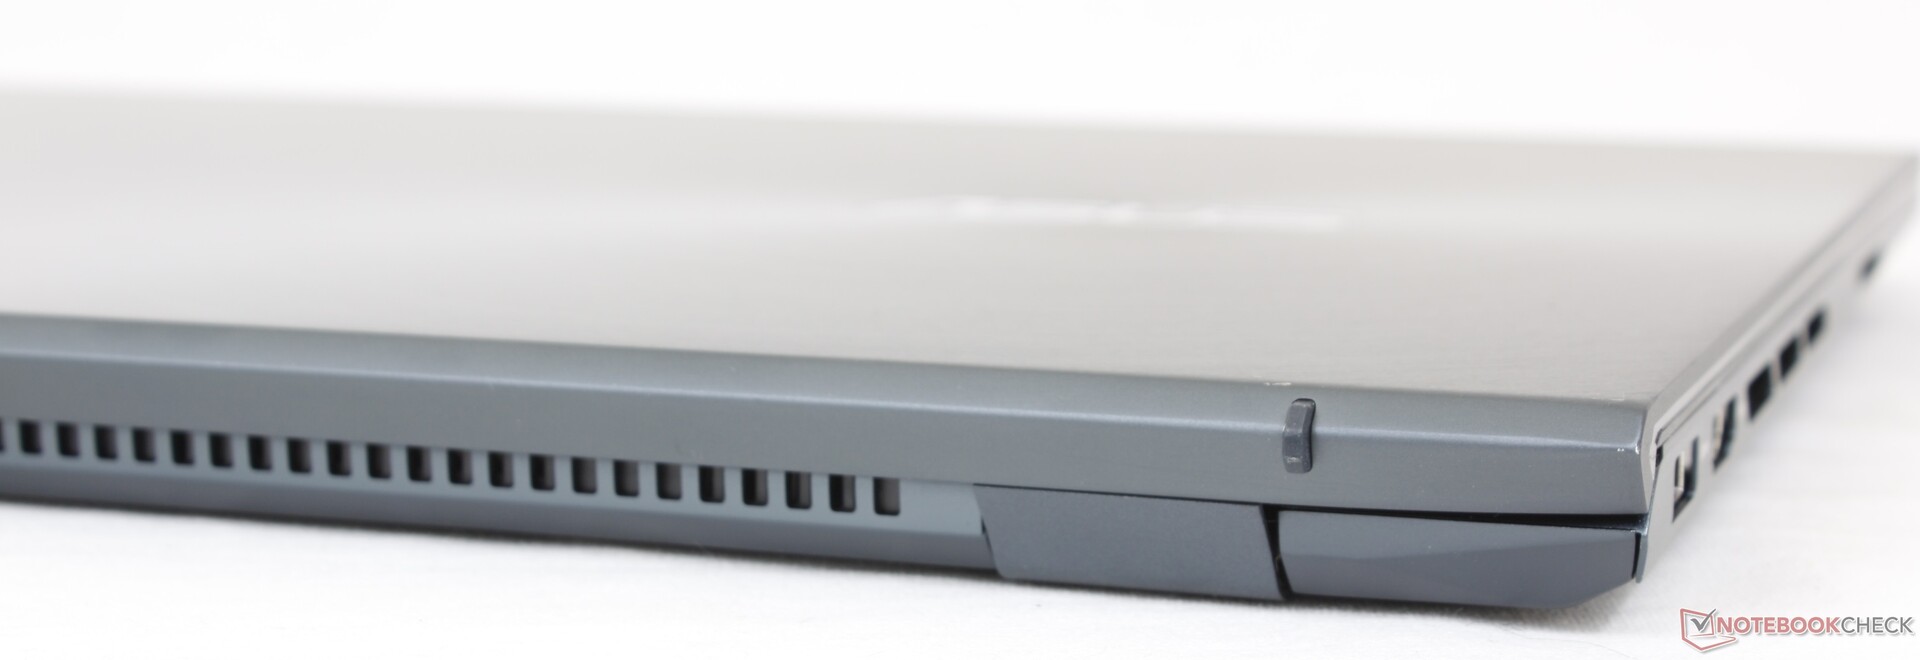
Mallette - Base et couvercle solides
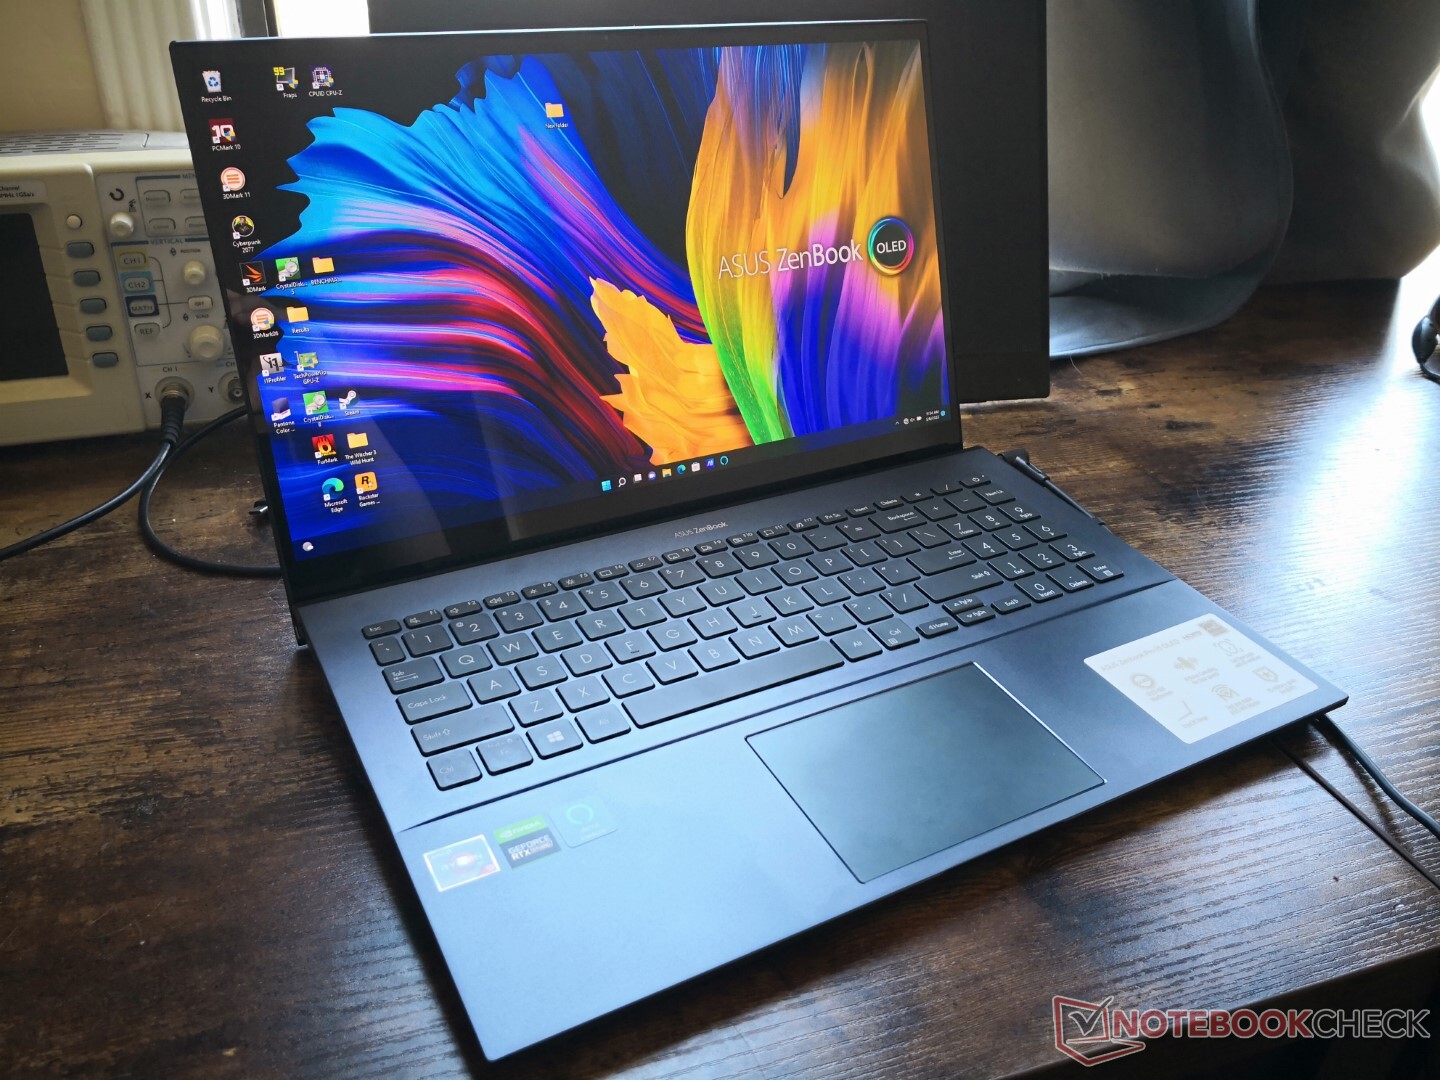
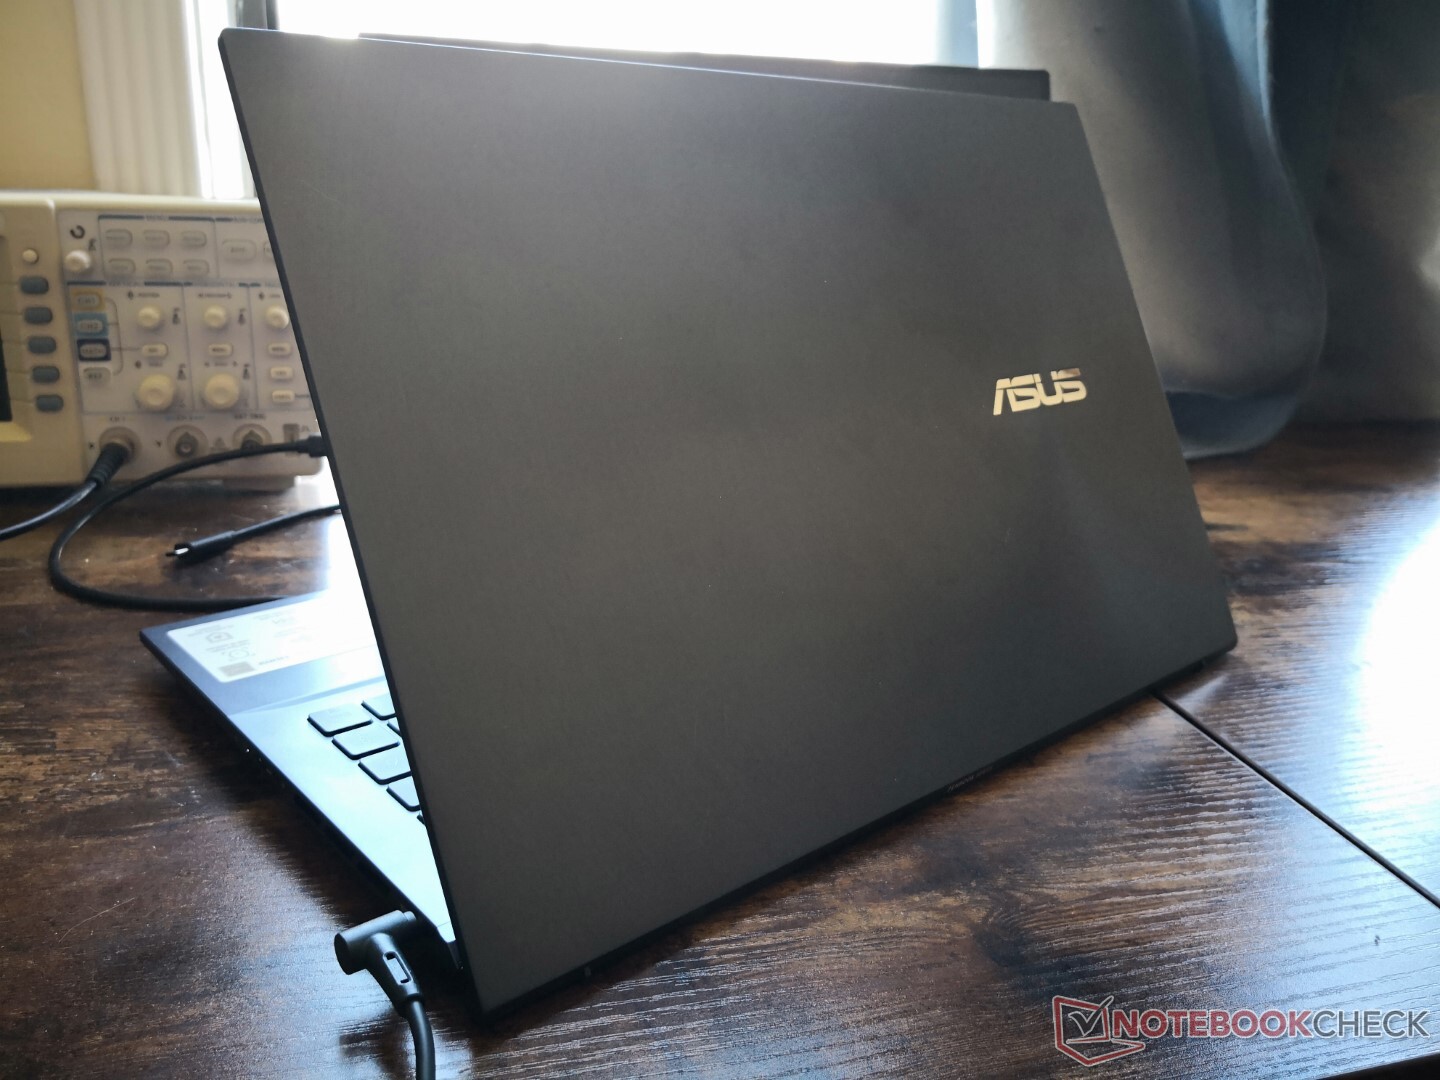
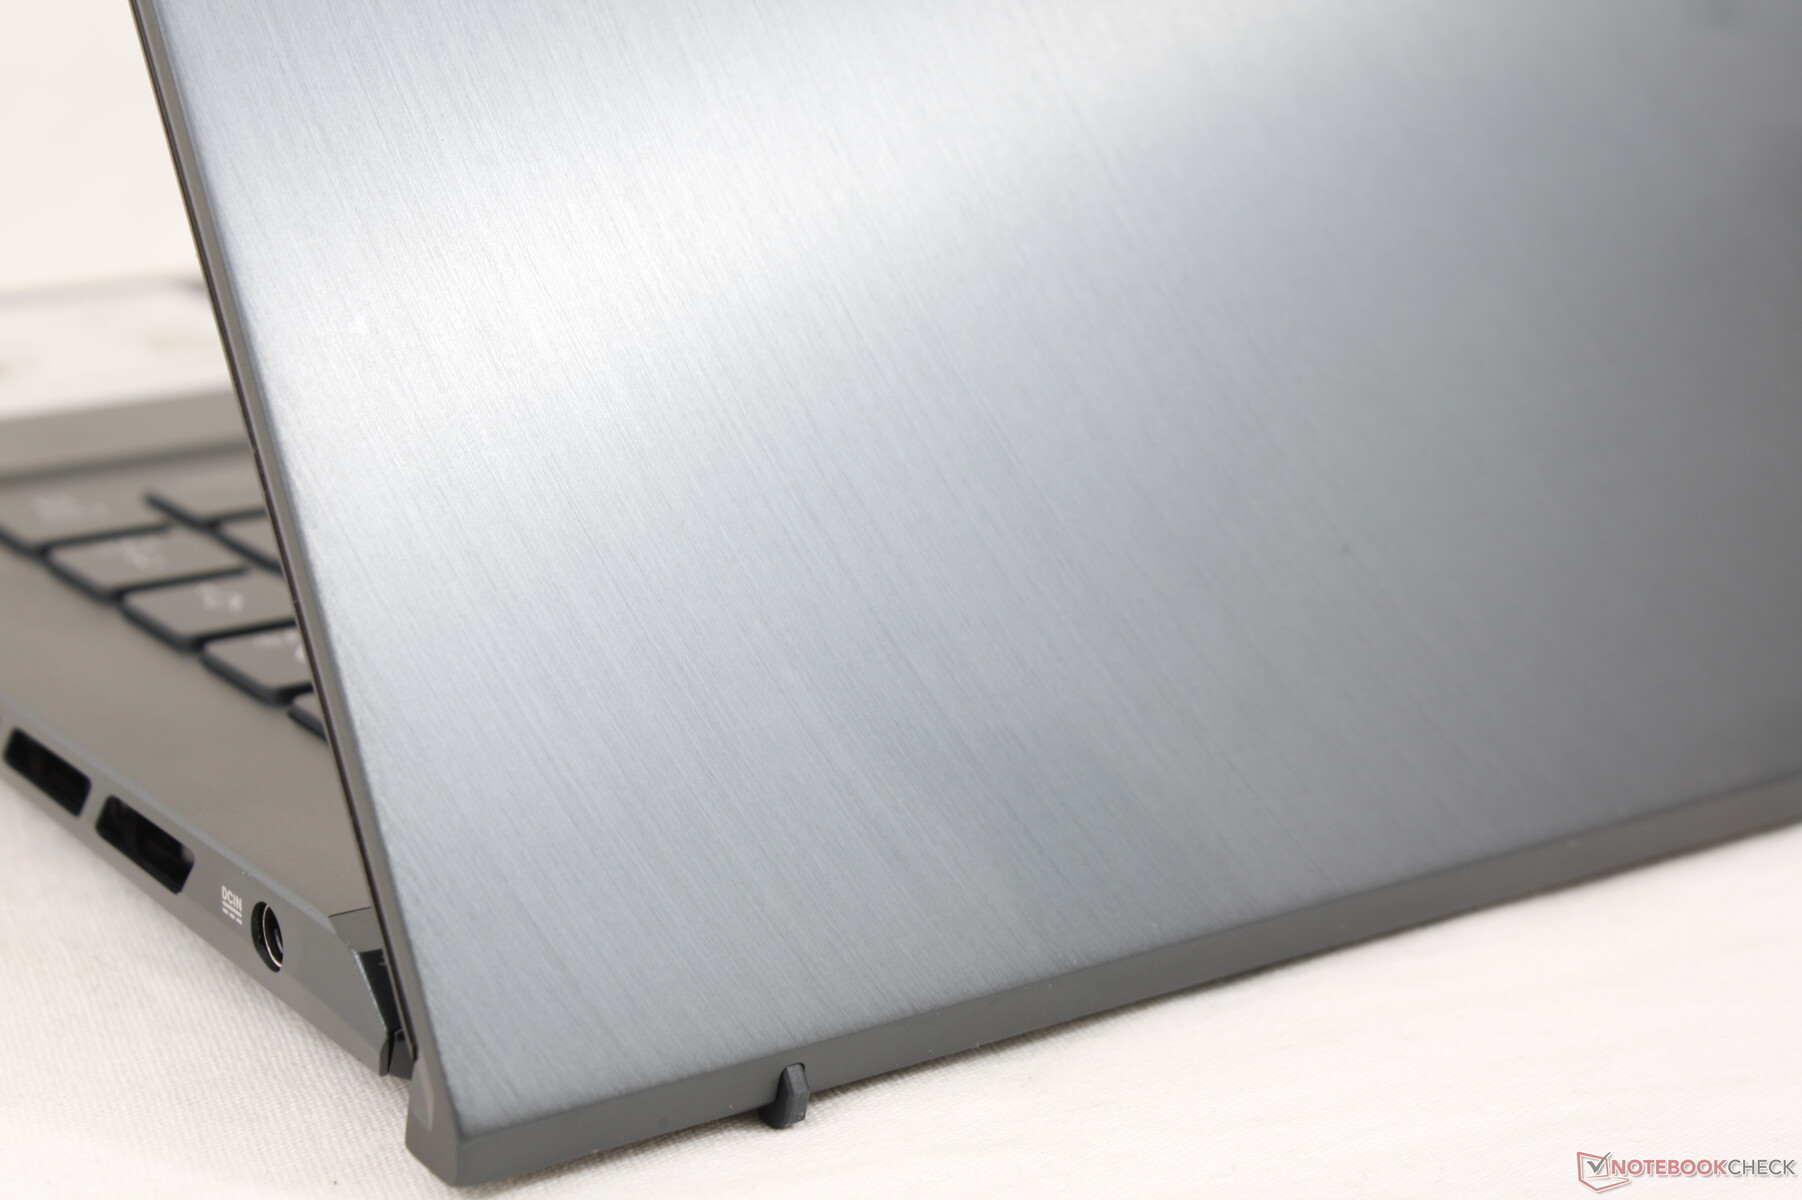
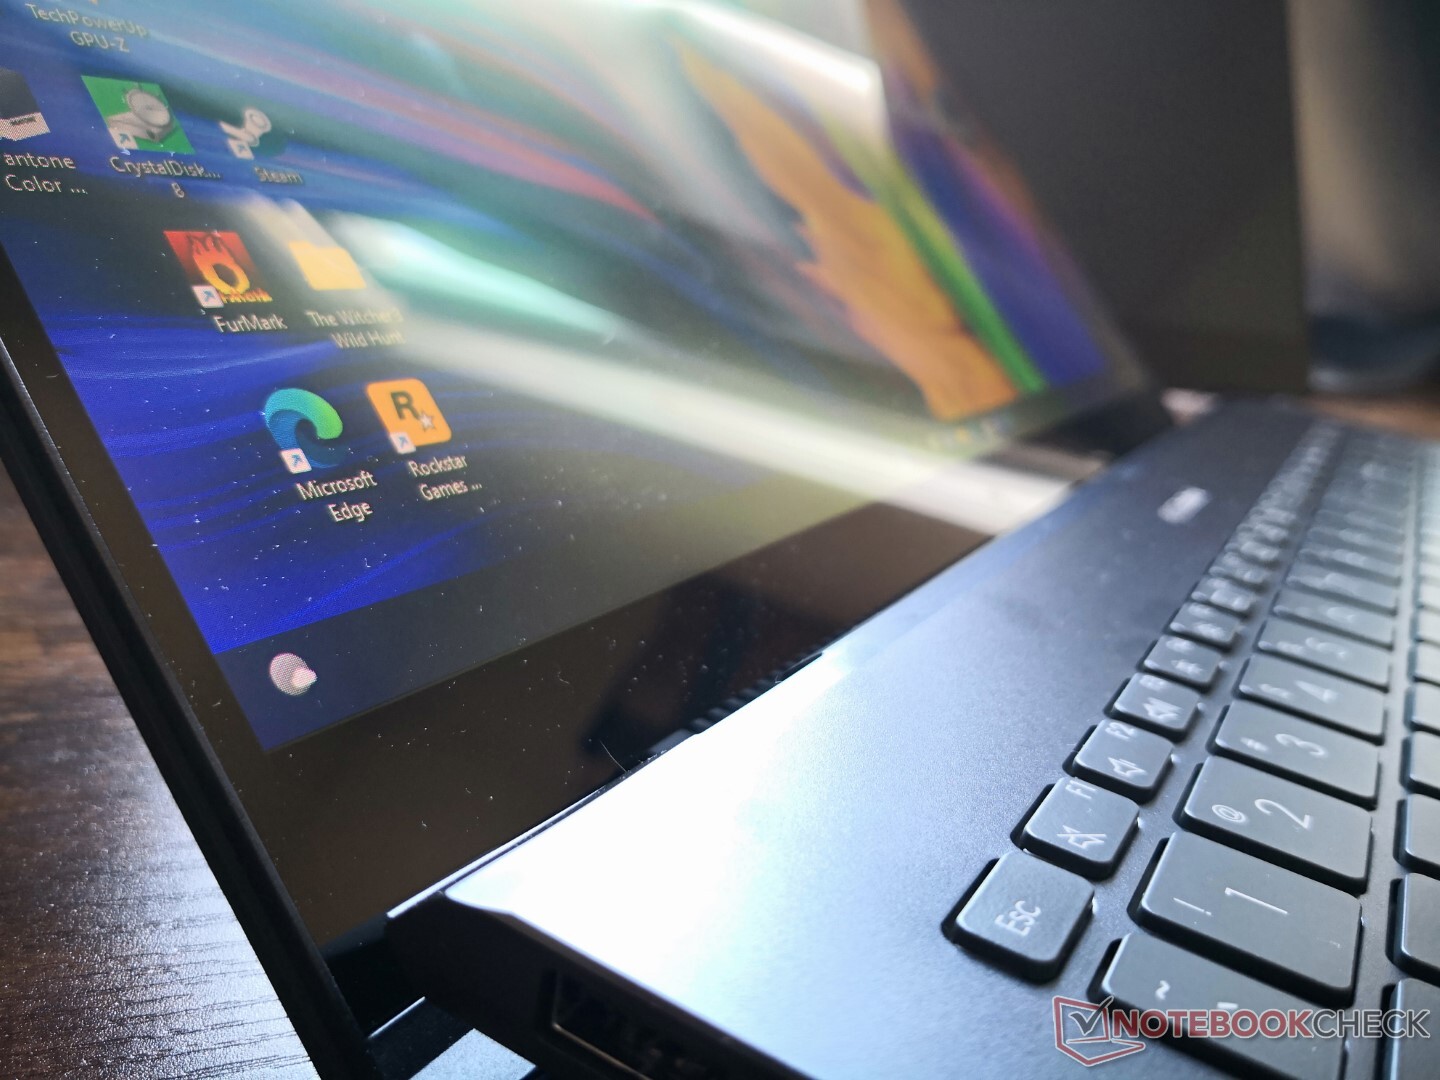
L'UM535 est la version AMD de l'UX535 existant. Son châssis est toujours aussi élégant malgré ses deux ans d'âge, mais il commence à montrer son âge avec sa grande taille et son format 16:9. La rigidité du châssis reste forte avec seulement des torsions et des grincements minimes, même sur le couvercle puisque toutes les UGS ont un renforcement en verre pour l'écran.
En termes de taille et de poids, l'UX535 est plus grand et légèrement plus lourd que le Dell XPS 15 ou le Lenovo Yoga Creator 7 15, qui offrent tous deux des CPU de série H et des GPU GeForce similaires.
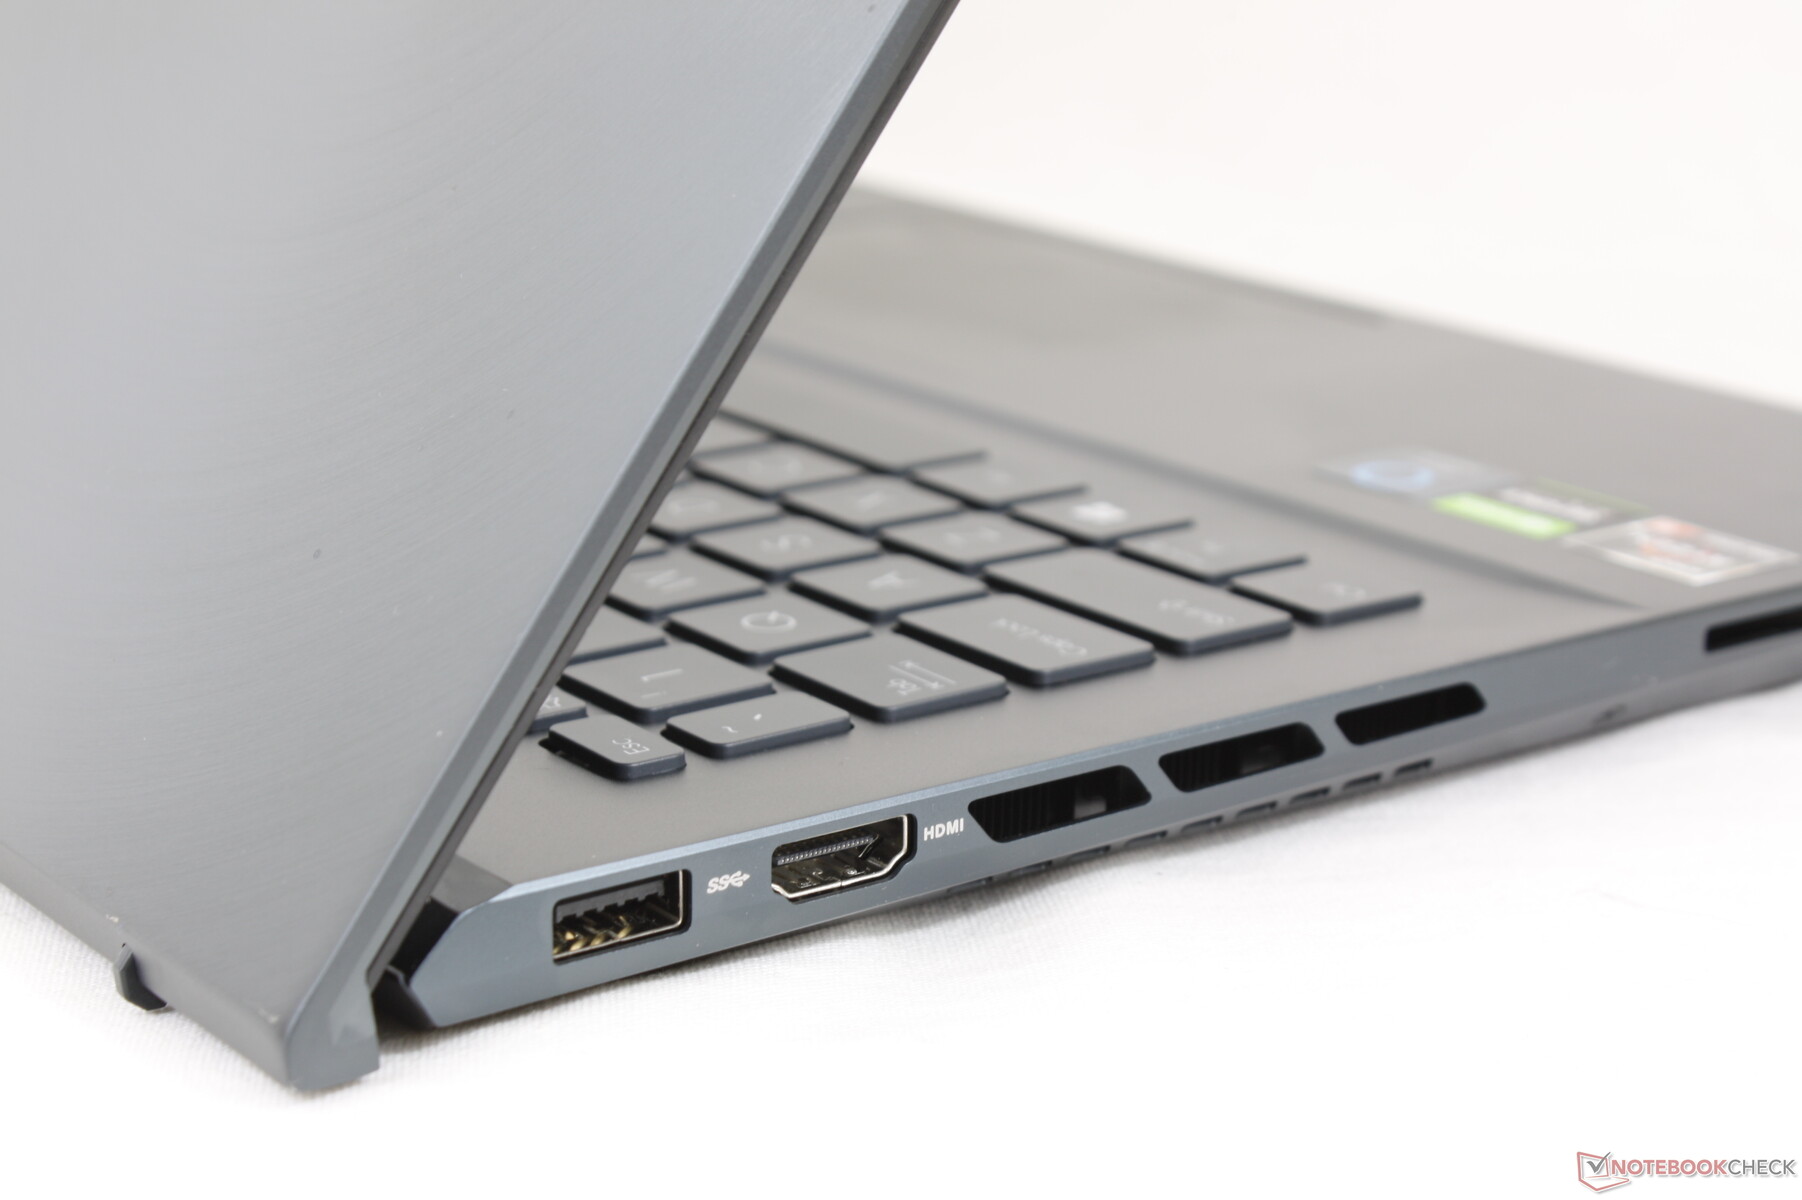
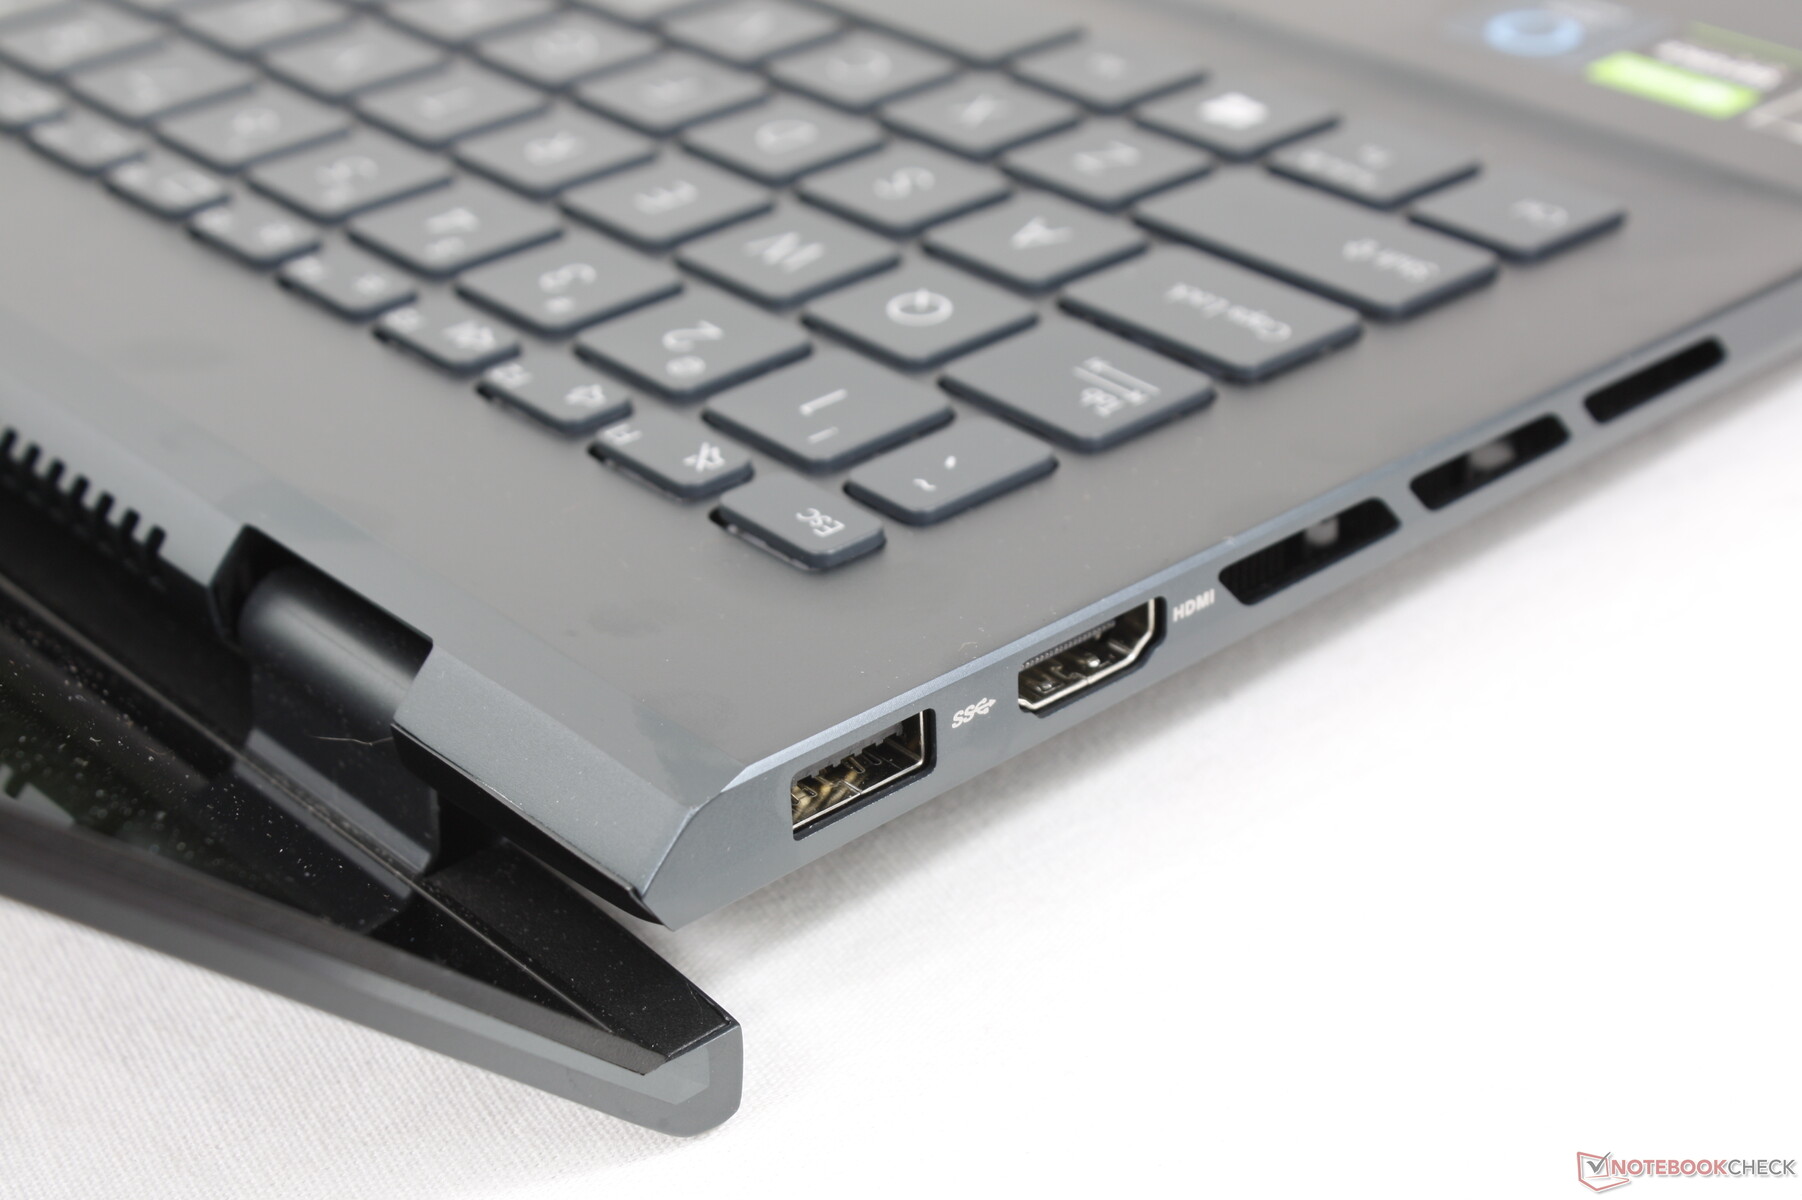
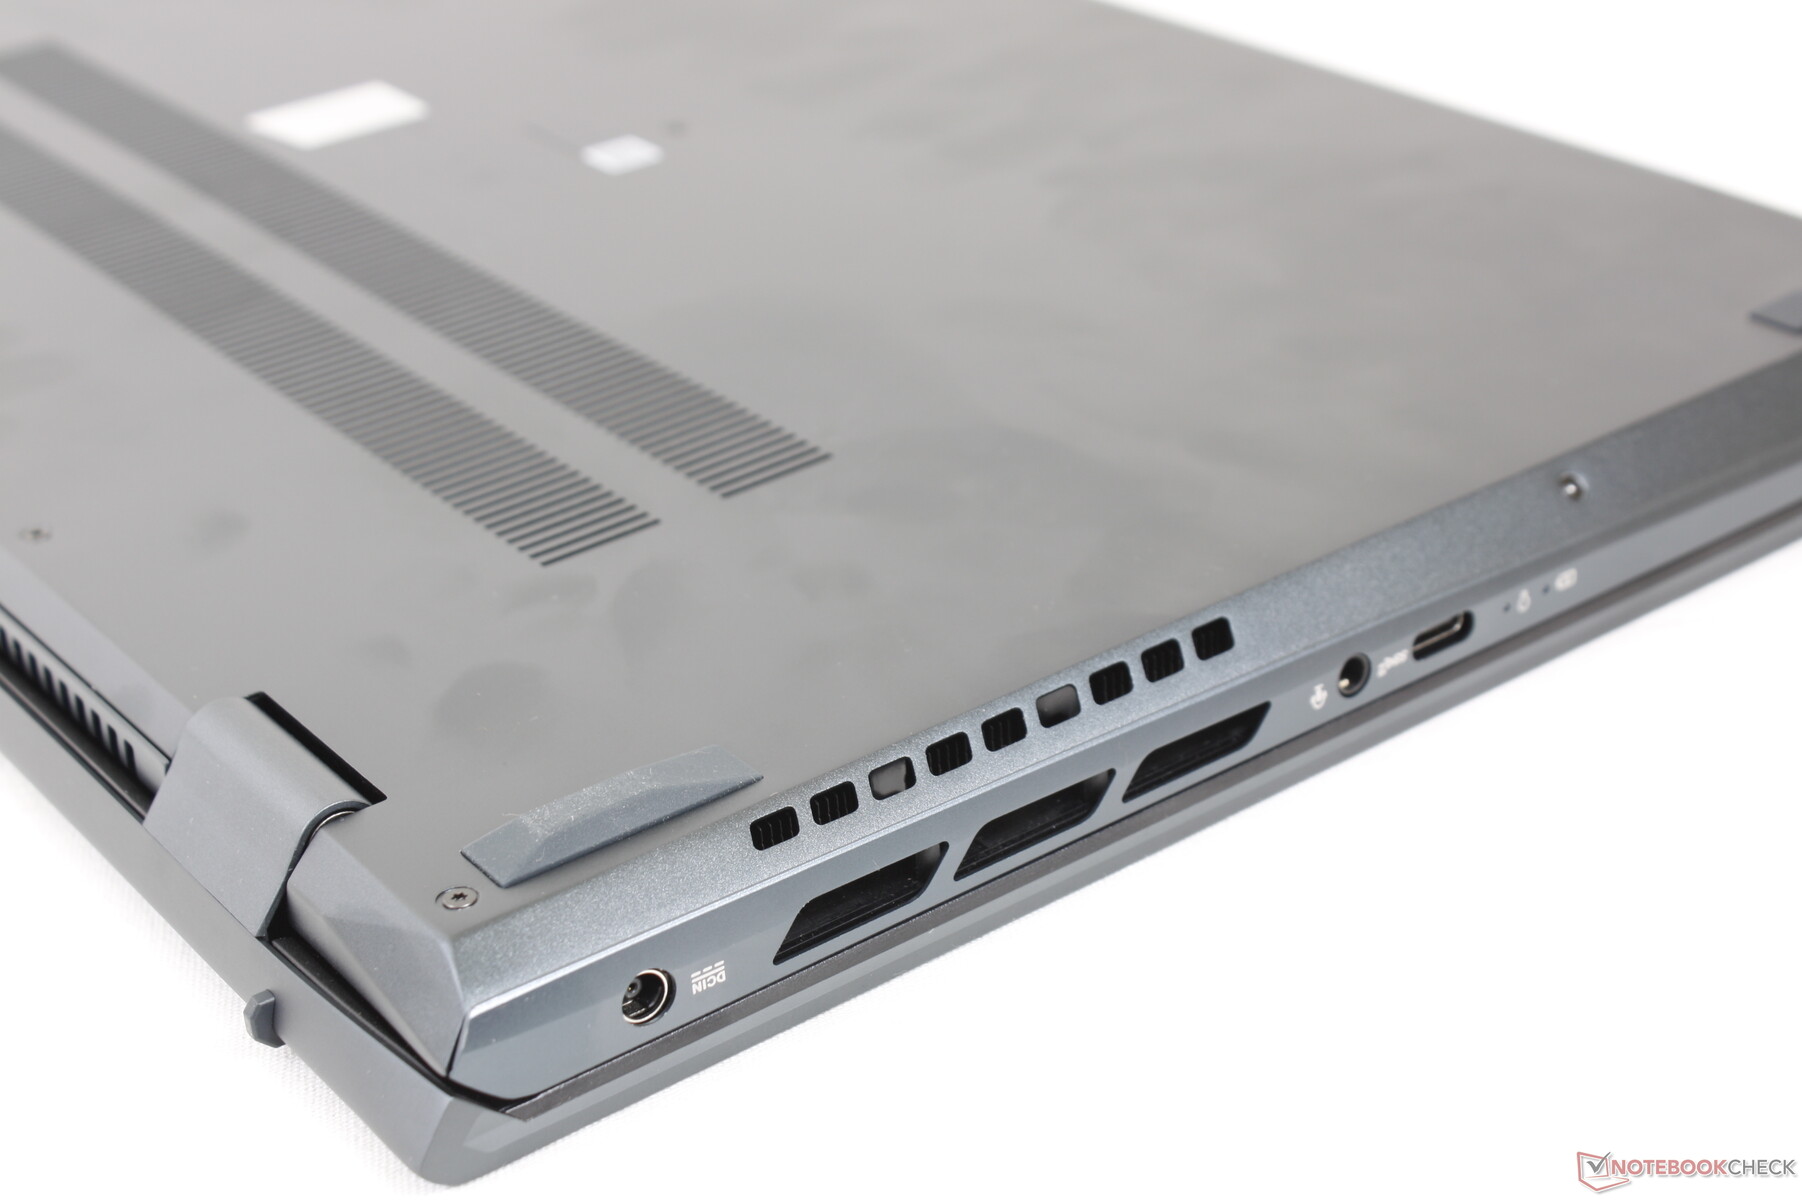
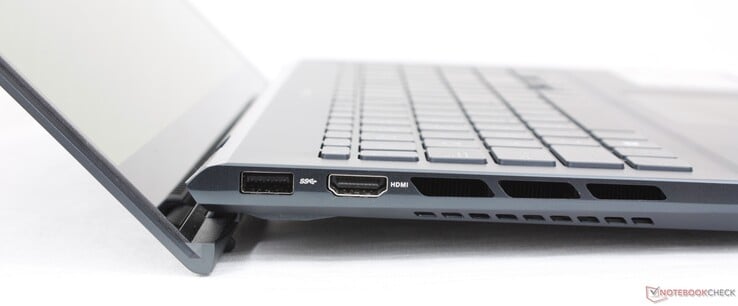
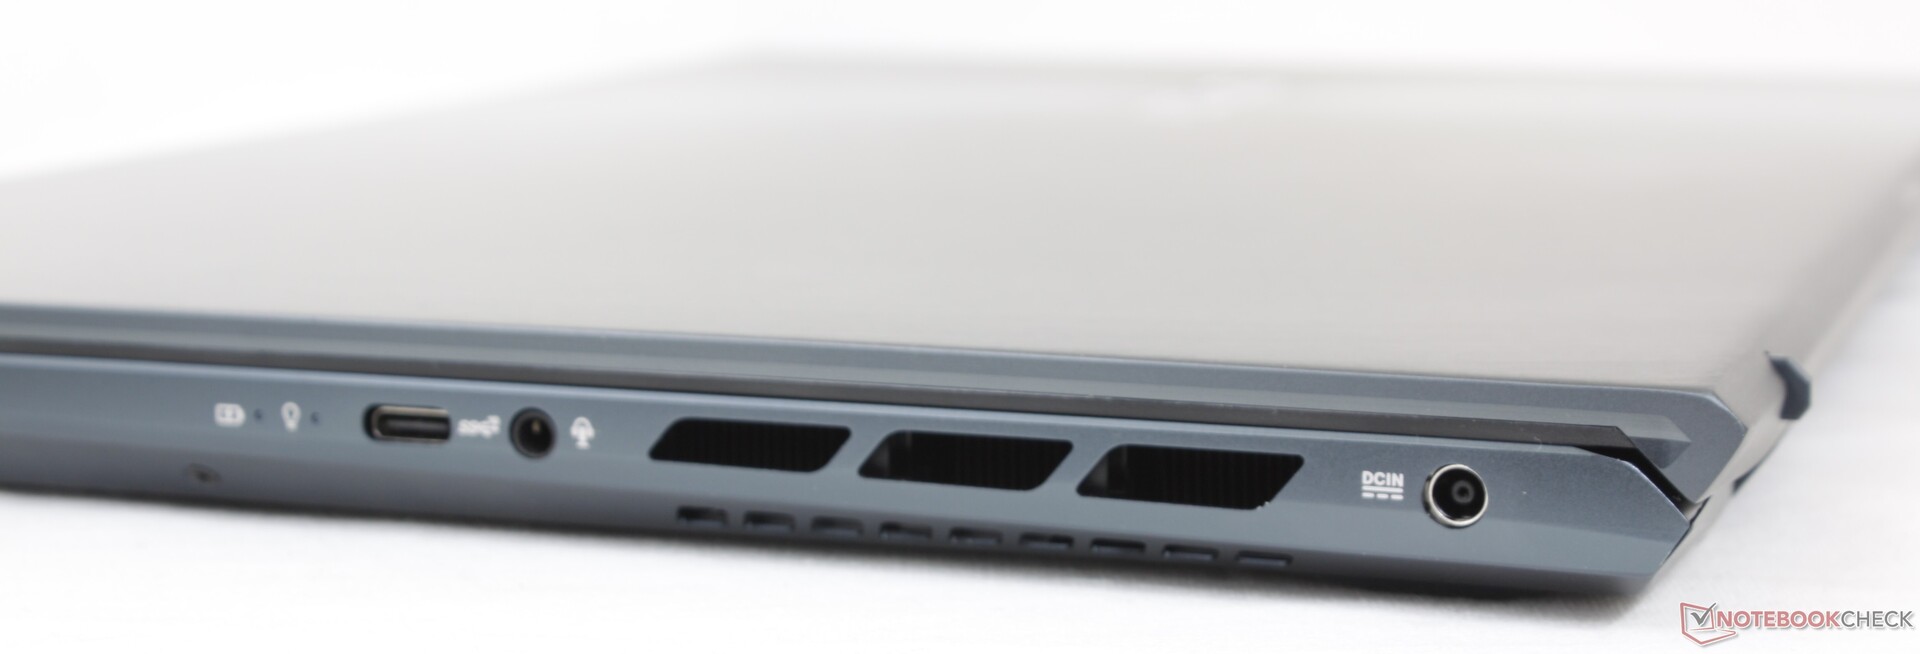
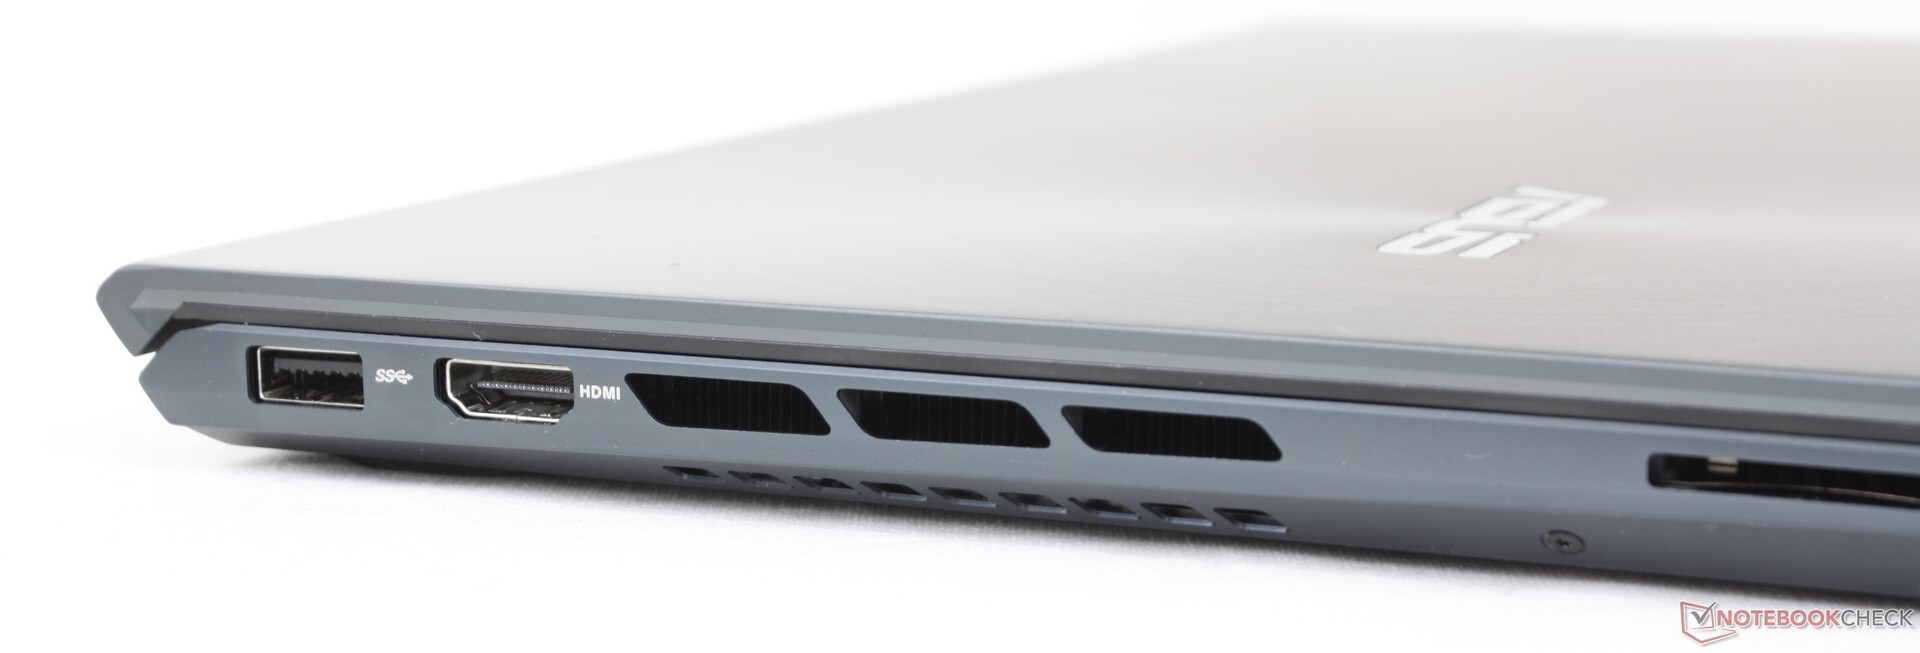
Connectivité - Pas de support Thunderbolt
Les options de port sont identiques à celles de l'UX535, à une différence près : le port USB-C n'est pas compatible Thunderbolt et ne prend pas en charge Power Delivery ou DisplayPort. Le système offre très peu de ports USB compte tenu de son facteur de forme de 15,6 pouces.
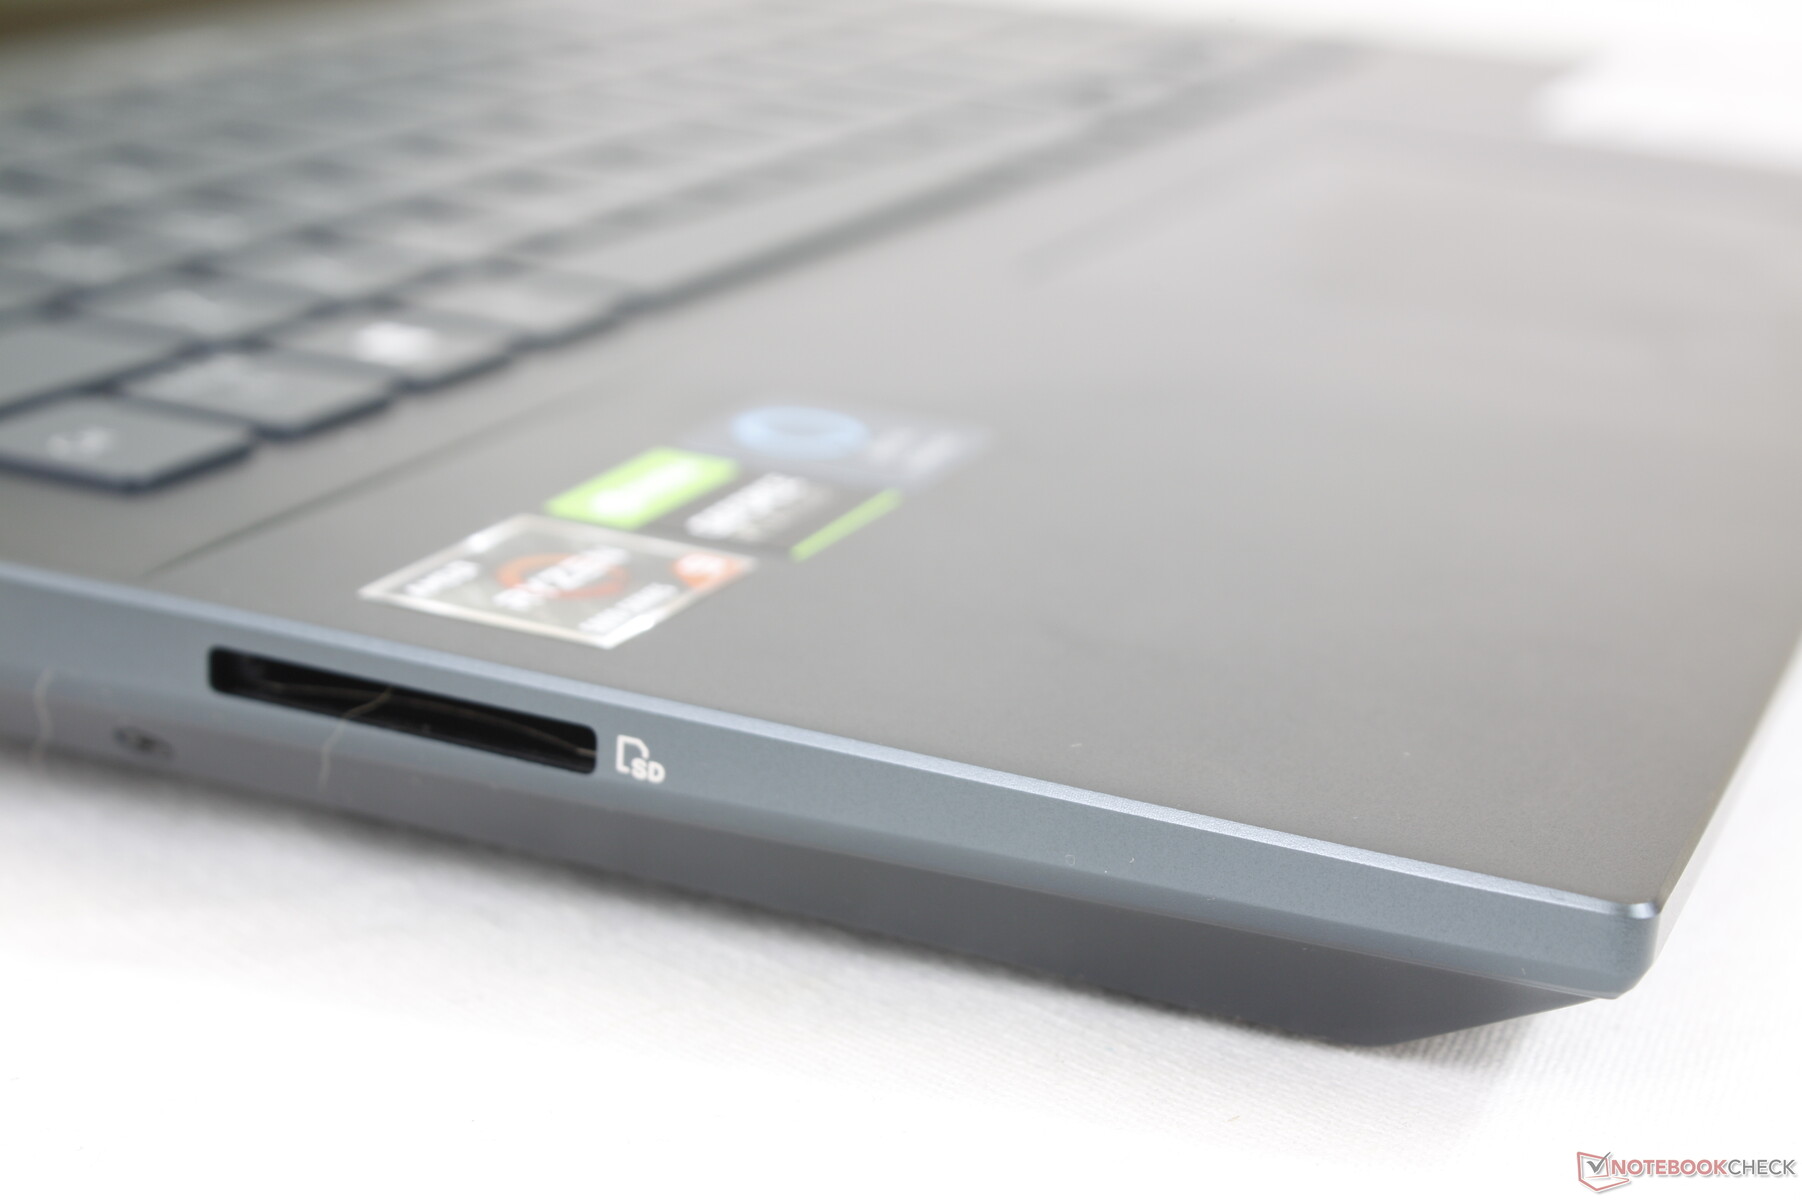
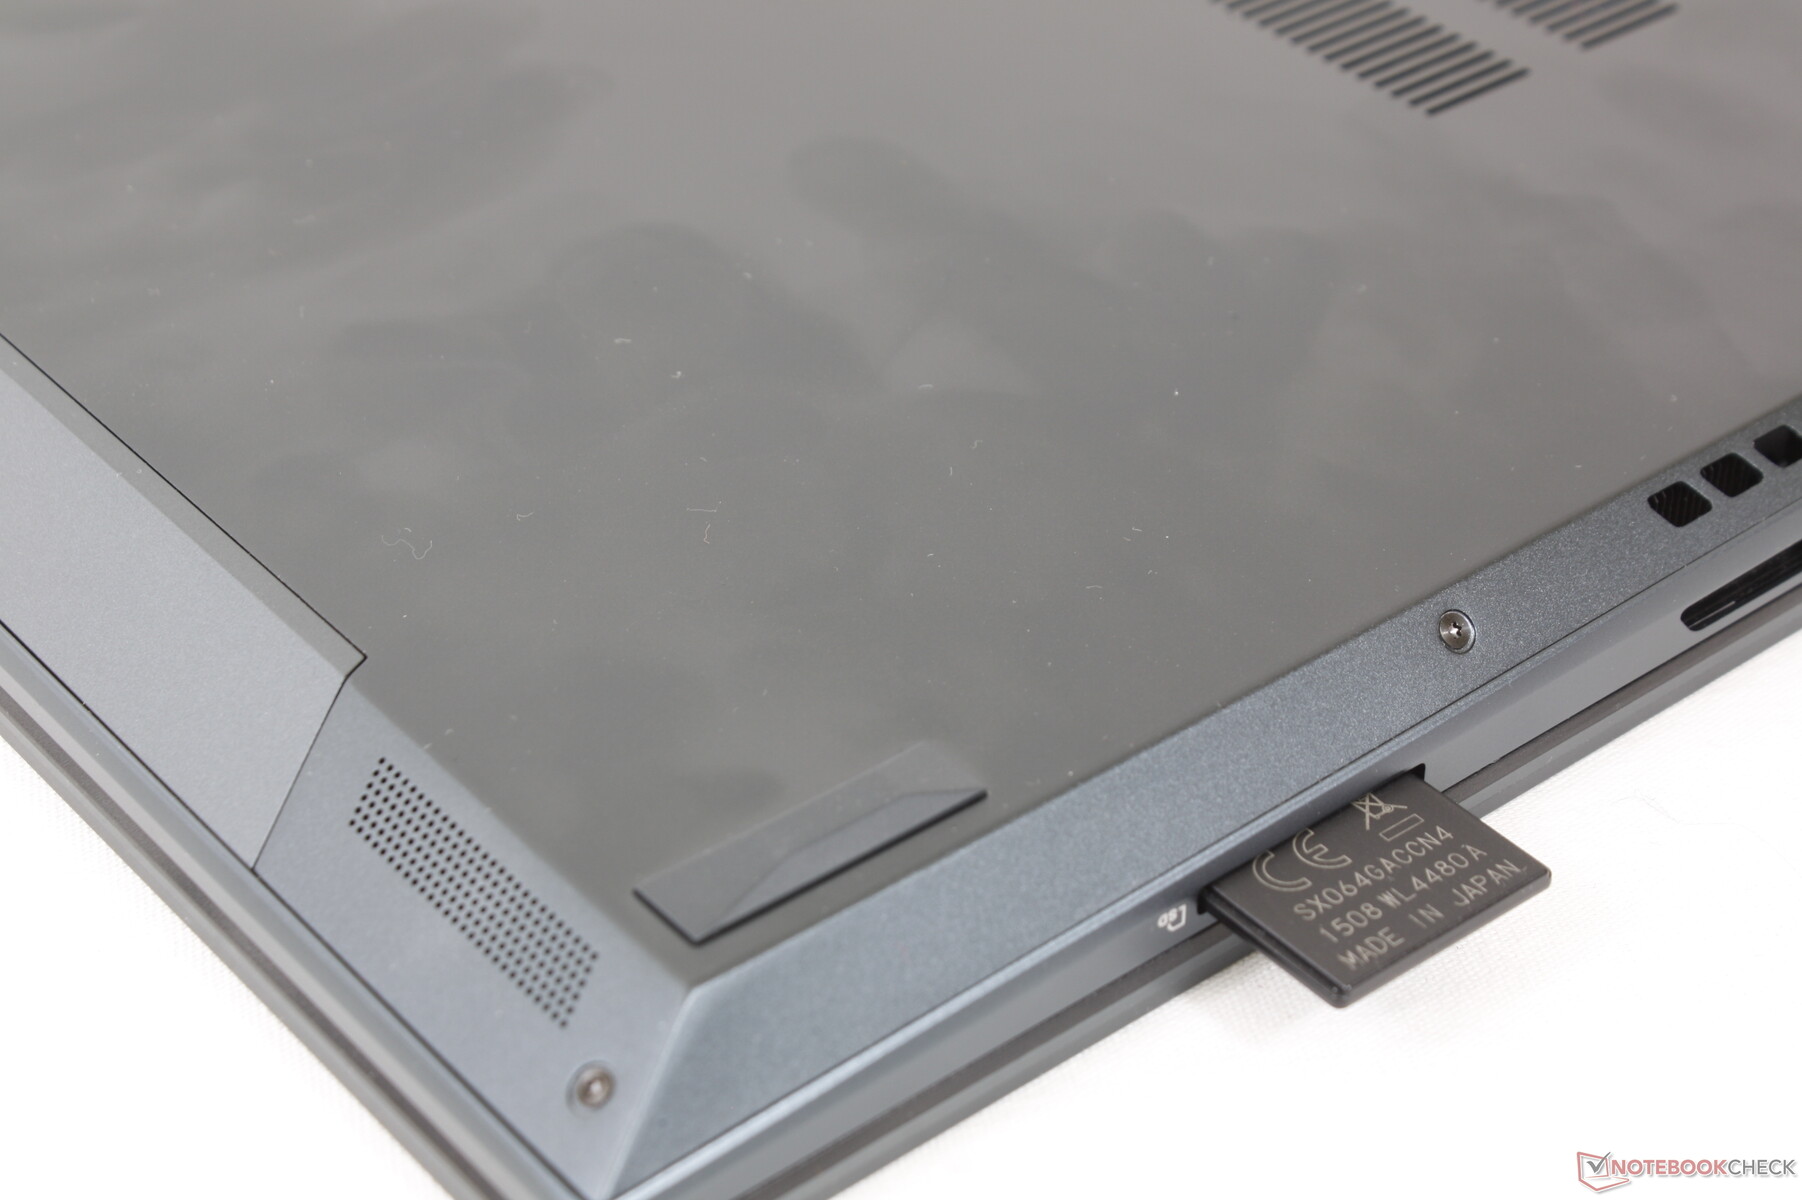
Lecteur de carte SD
Comme tous les autres Zenbookles taux de transfert sont relativement lents avec le lecteur SD intégré. Déplacer 1 Go d'images de notre carte de test UHS-II vers le bureau prend environ 13 secondes, contre la moitié sur le XPS 15.
| SD Card Reader | |
| average JPG Copy Test (av. of 3 runs) | |
| Dell XPS 15 9510 11800H RTX 3050 Ti OLED (AV Pro V60) | |
| Asus Zenbook Pro 15 OLED UM535Q (Toshiba Exceria Pro SDXC 64 GB UHS-II) | |
| Asus ZenBook 15 UX534FTC-A8190T (Toshiba Exceria Pro SDXC 64 GB UHS-II) | |
| Asus ZenBook UX535-M01440 (Toshiba Exceria Pro M501 microSDXC 64GB) | |
| HP Envy 15-ep0098nr (Toshiba Exceria Pro M501 UHS-II) | |
| Lenovo Yoga Creator 7 15IMH05 82DS000VGE (Toshiba Exceria Pro SDXC 64 GB UHS-II) | |
| maximum AS SSD Seq Read Test (1GB) | |
| Dell XPS 15 9510 11800H RTX 3050 Ti OLED (AV Pro V60) | |
| HP Envy 15-ep0098nr (Toshiba Exceria Pro M501 UHS-II) | |
| Asus Zenbook Pro 15 OLED UM535Q (Toshiba Exceria Pro SDXC 64 GB UHS-II) | |
| Asus ZenBook UX535-M01440 (Toshiba Exceria Pro M501 microSDXC 64GB) | |
| Lenovo Yoga Creator 7 15IMH05 82DS000VGE (Toshiba Exceria Pro SDXC 64 GB UHS-II) | |
Communication
Un Intel 9260 est fourni en standard pour la connectivité Wi-Fi 6, alors que de nombreux autres ordinateurs portables multimédia haut de gamme commencent à être livrés avec un support Wi-Fi 6E. Nous avons constaté des taux de transmission plus lents que d'habitude sur notre machine, même après plusieurs nouveaux tests. Il est recommandé de vérifier la connectivité et la stabilité sans fil après l'achat pour identifier tout problème potentiel.
Webcam
La webcam est limitée à 720p, contre 1080p sur le Razer Blade 15. Un bouton d'arrêt de la caméra et un capteur infrarouge sont présents pour la prise en charge de Windows Hello.


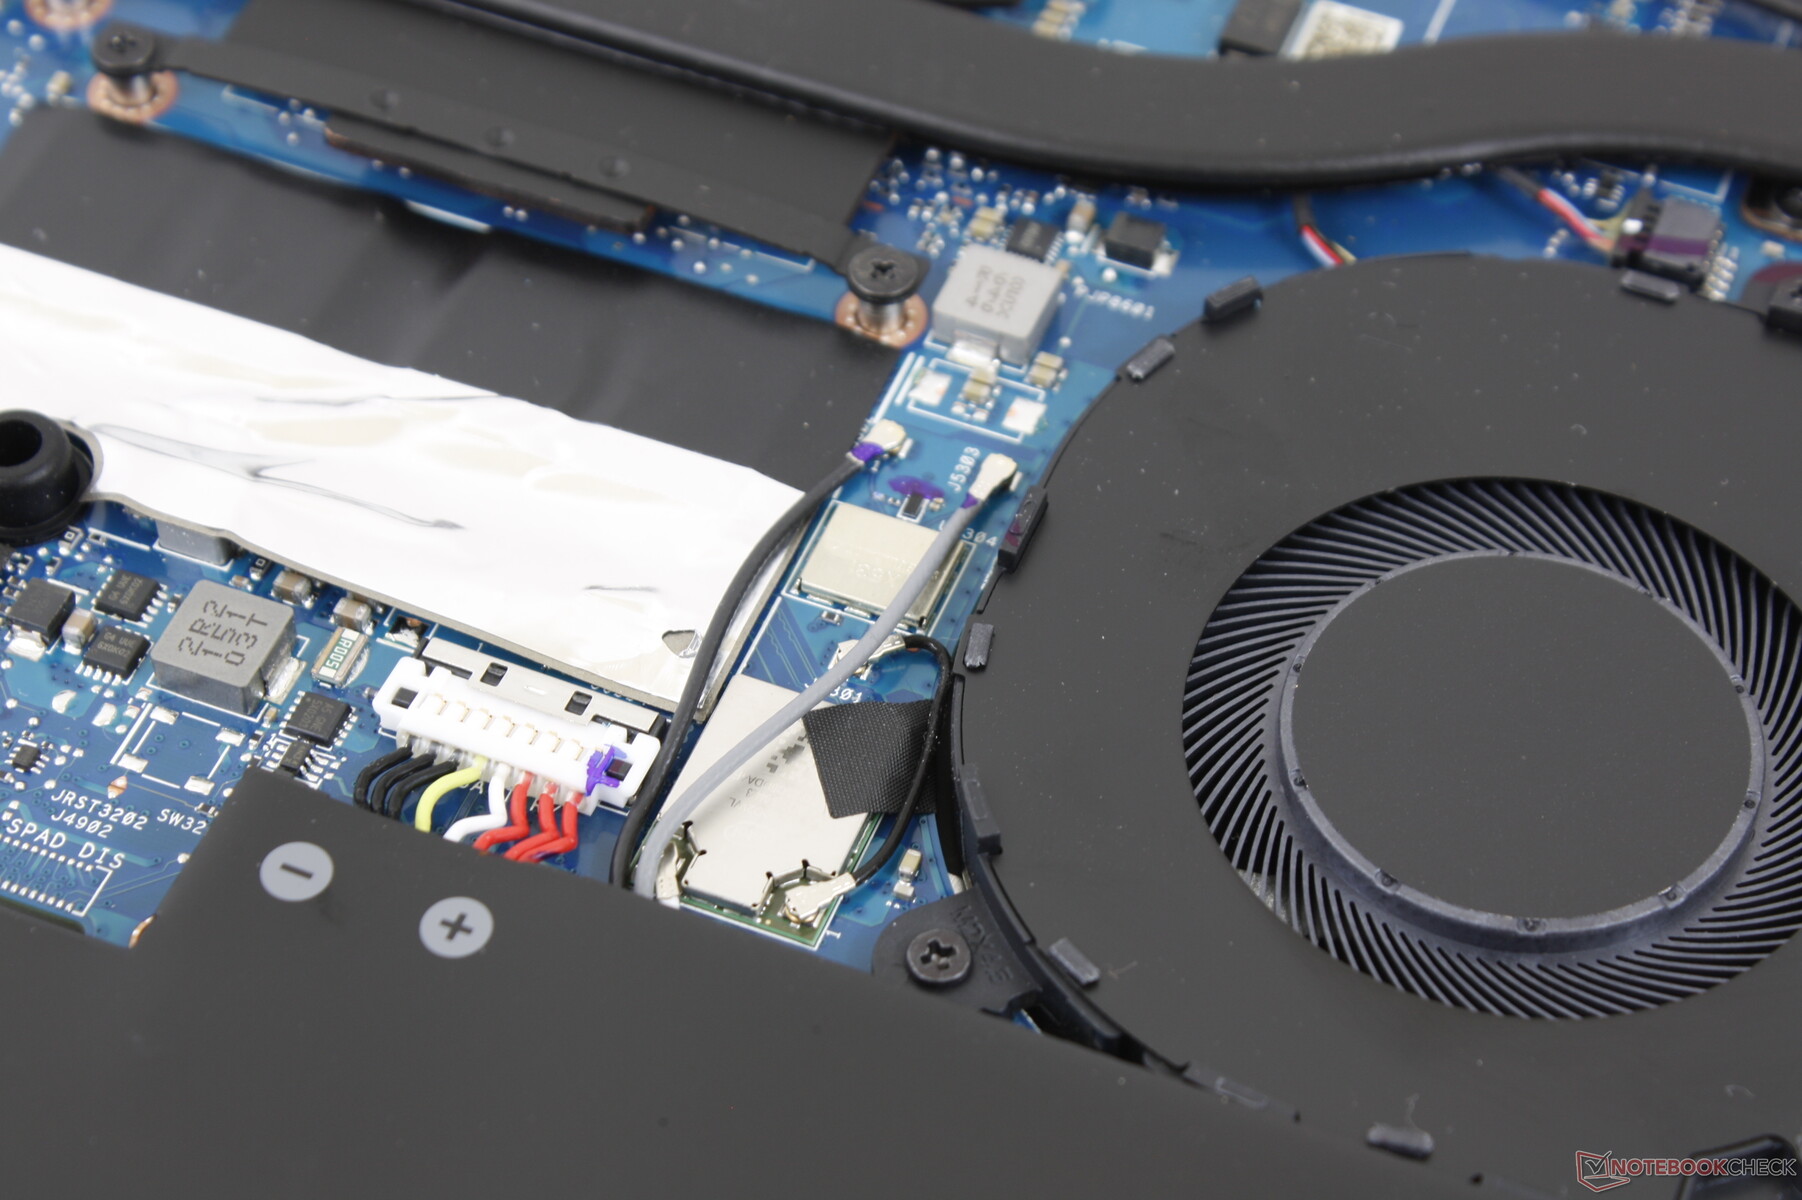
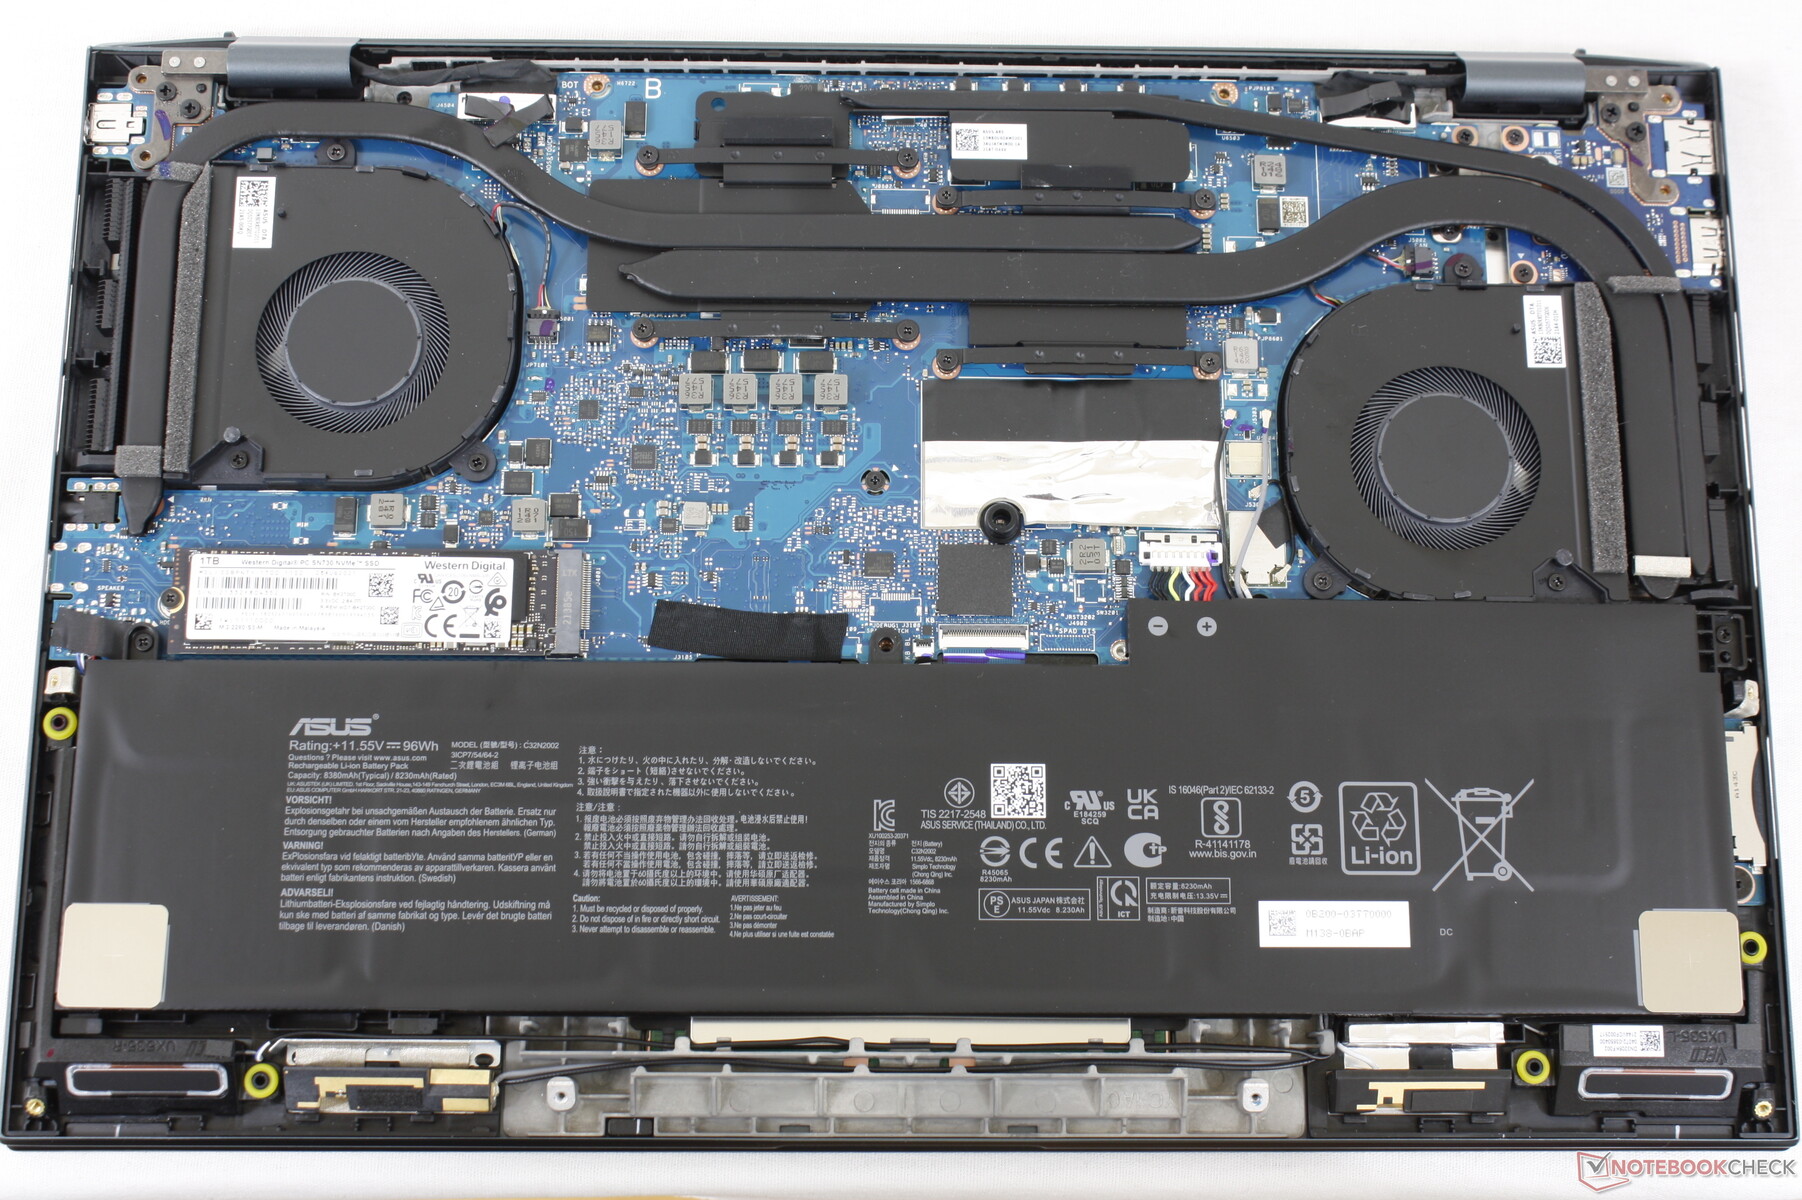
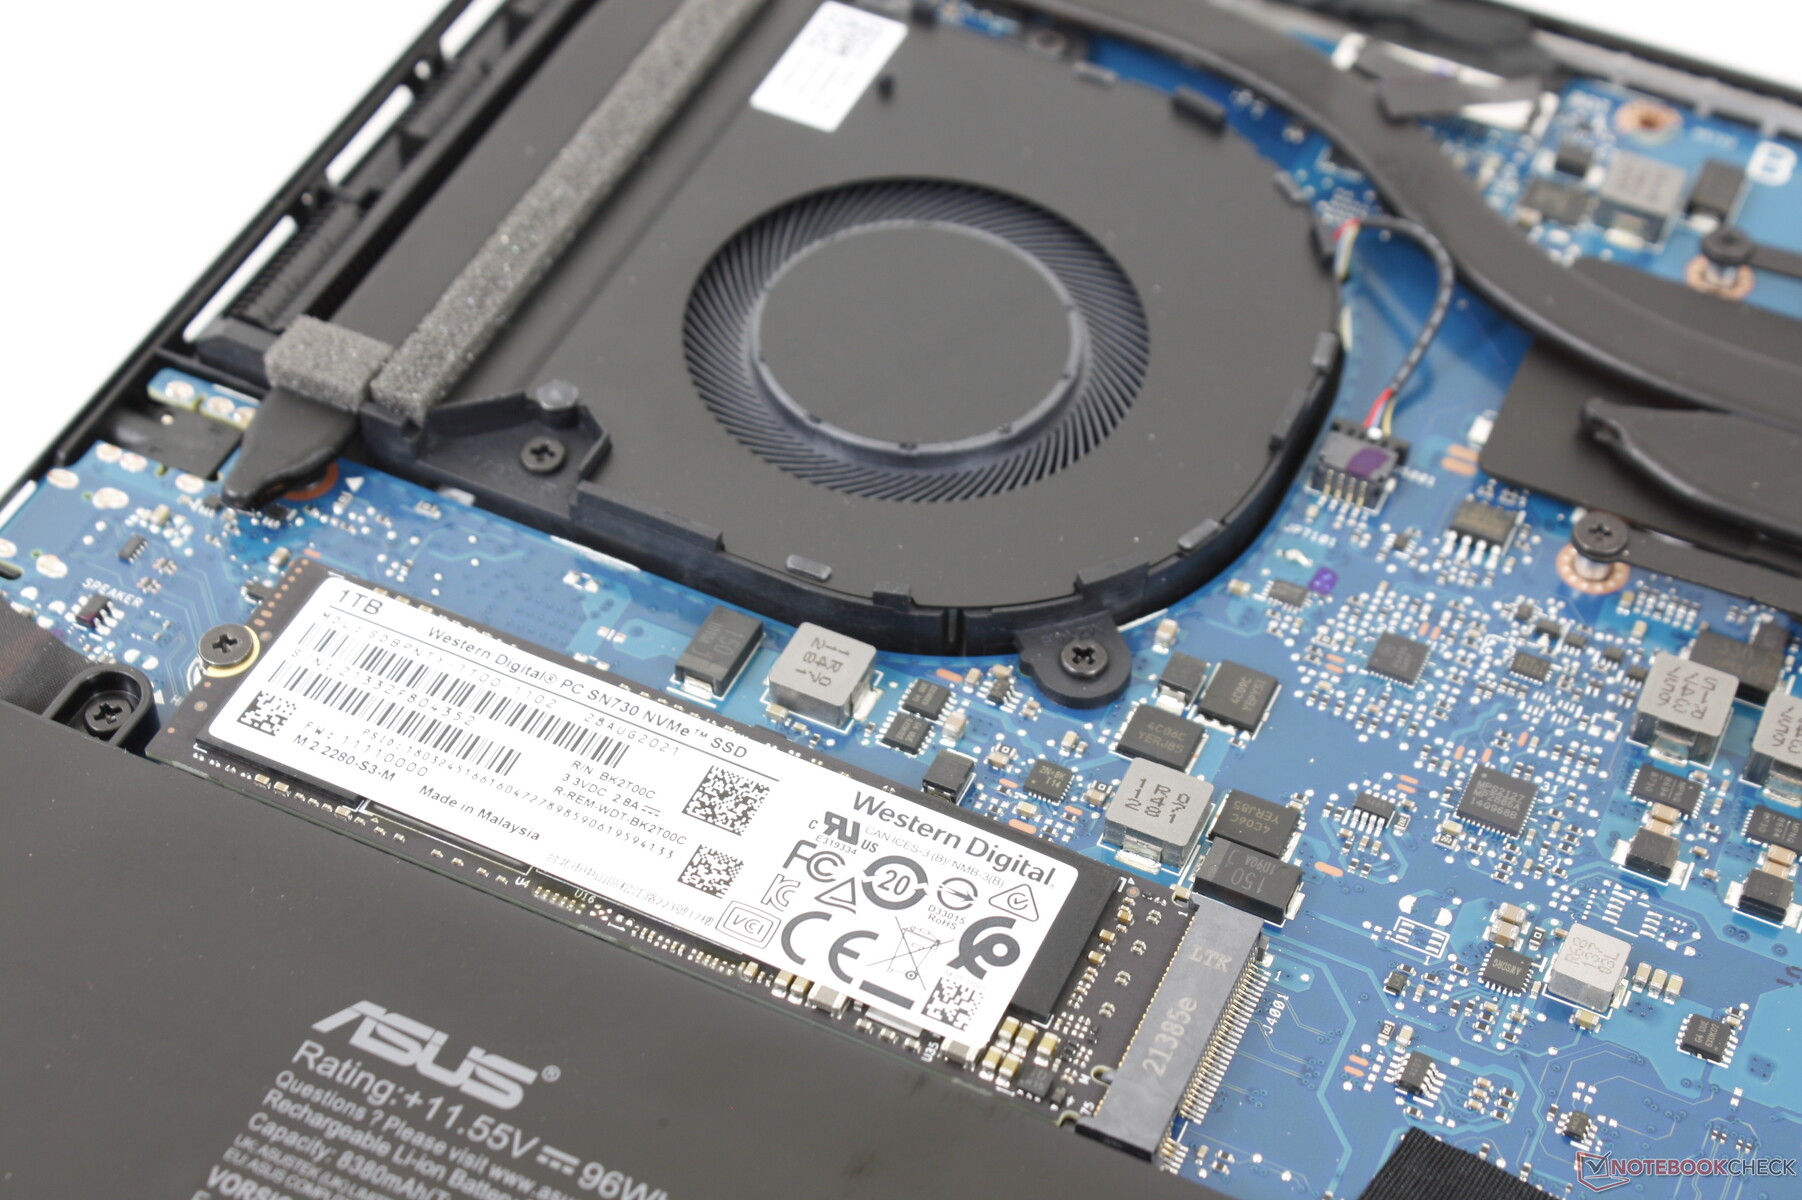
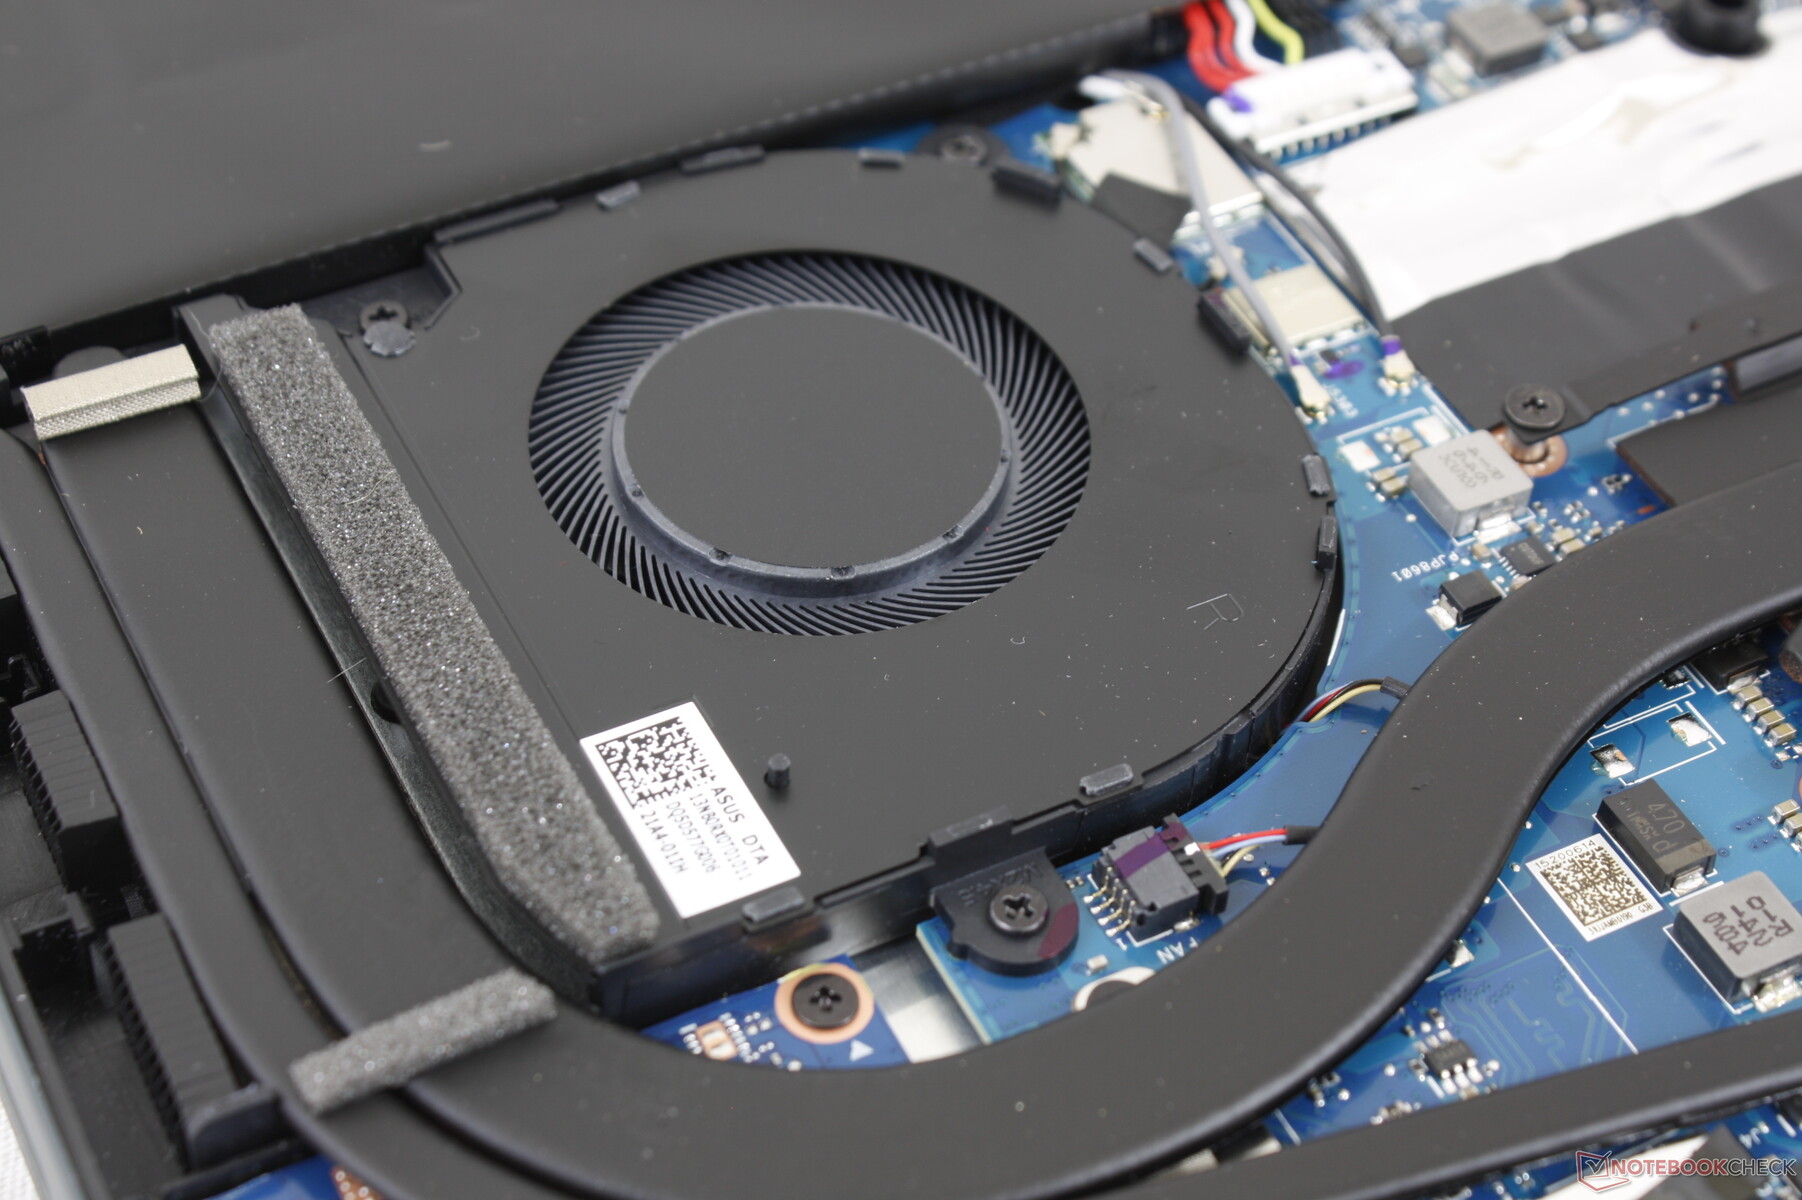
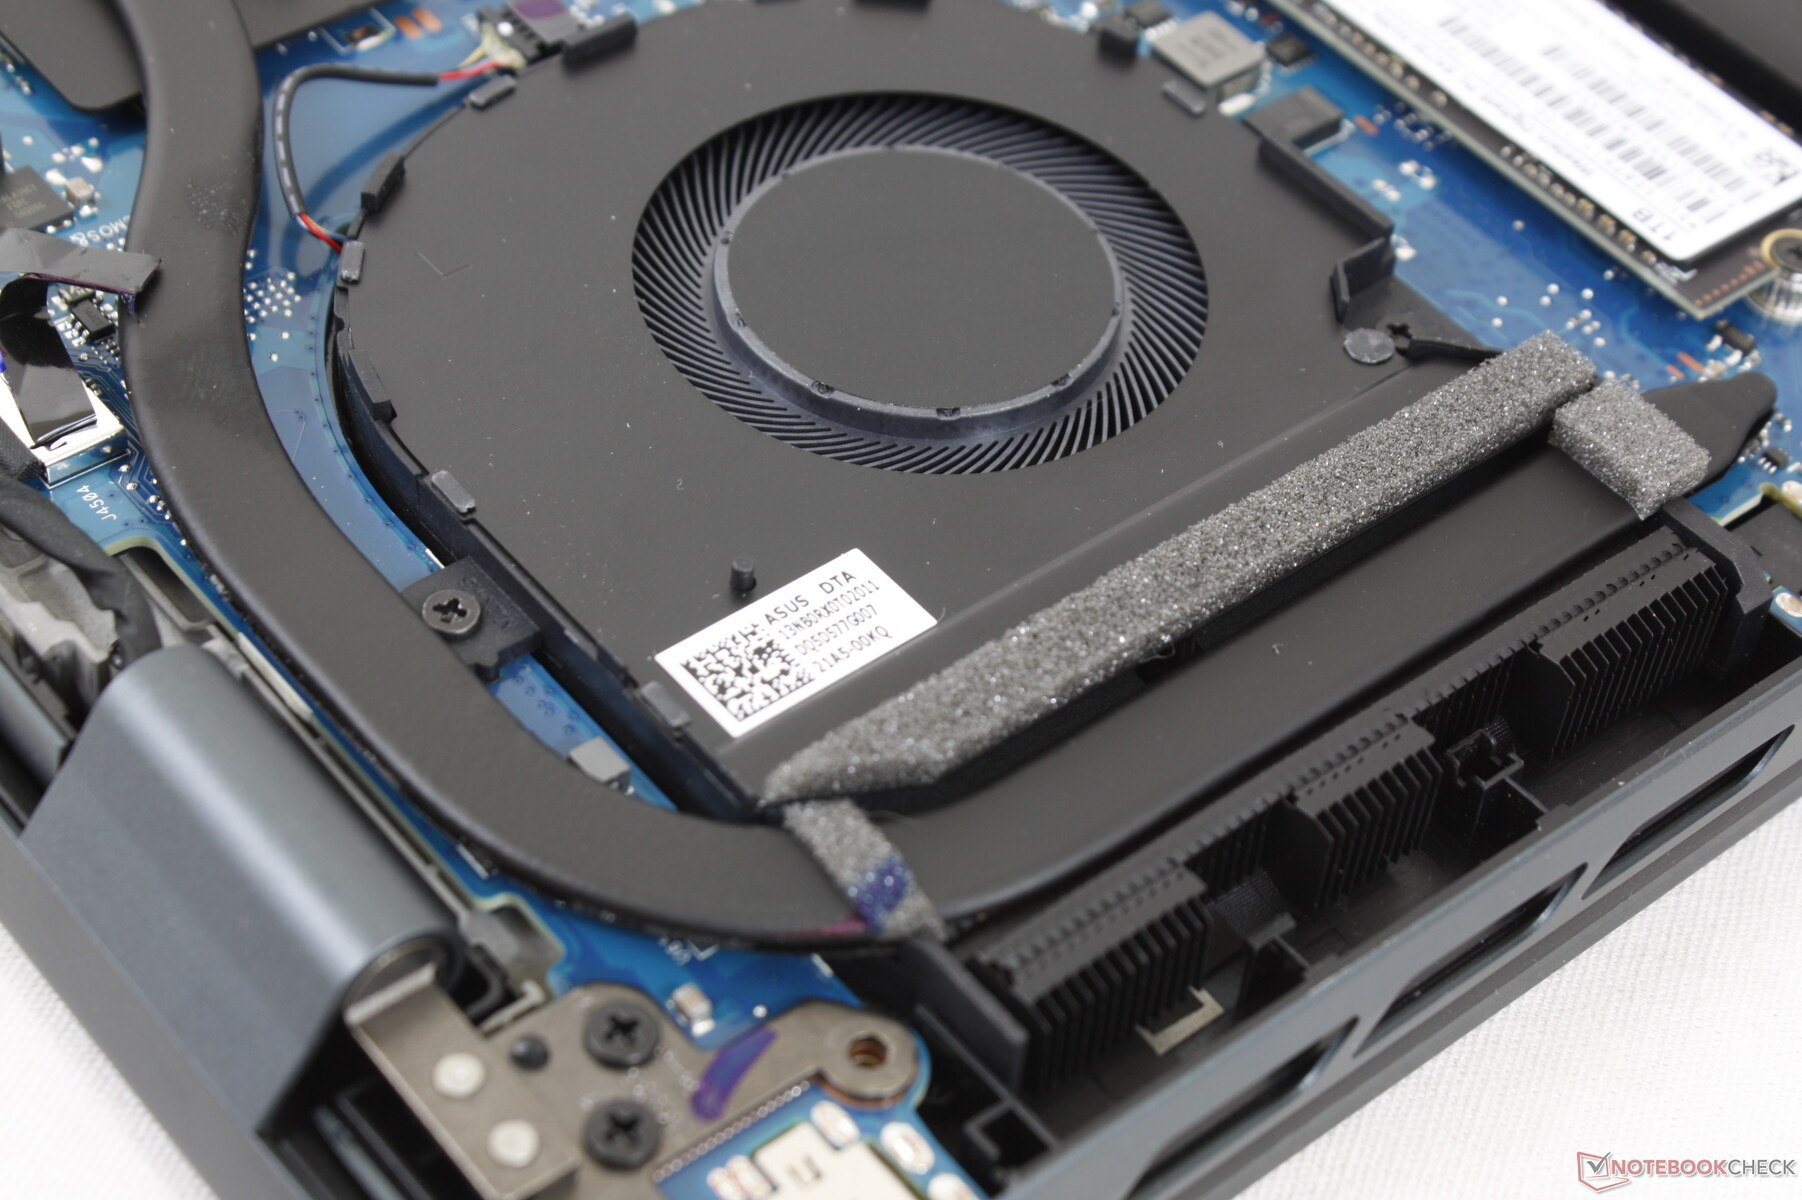
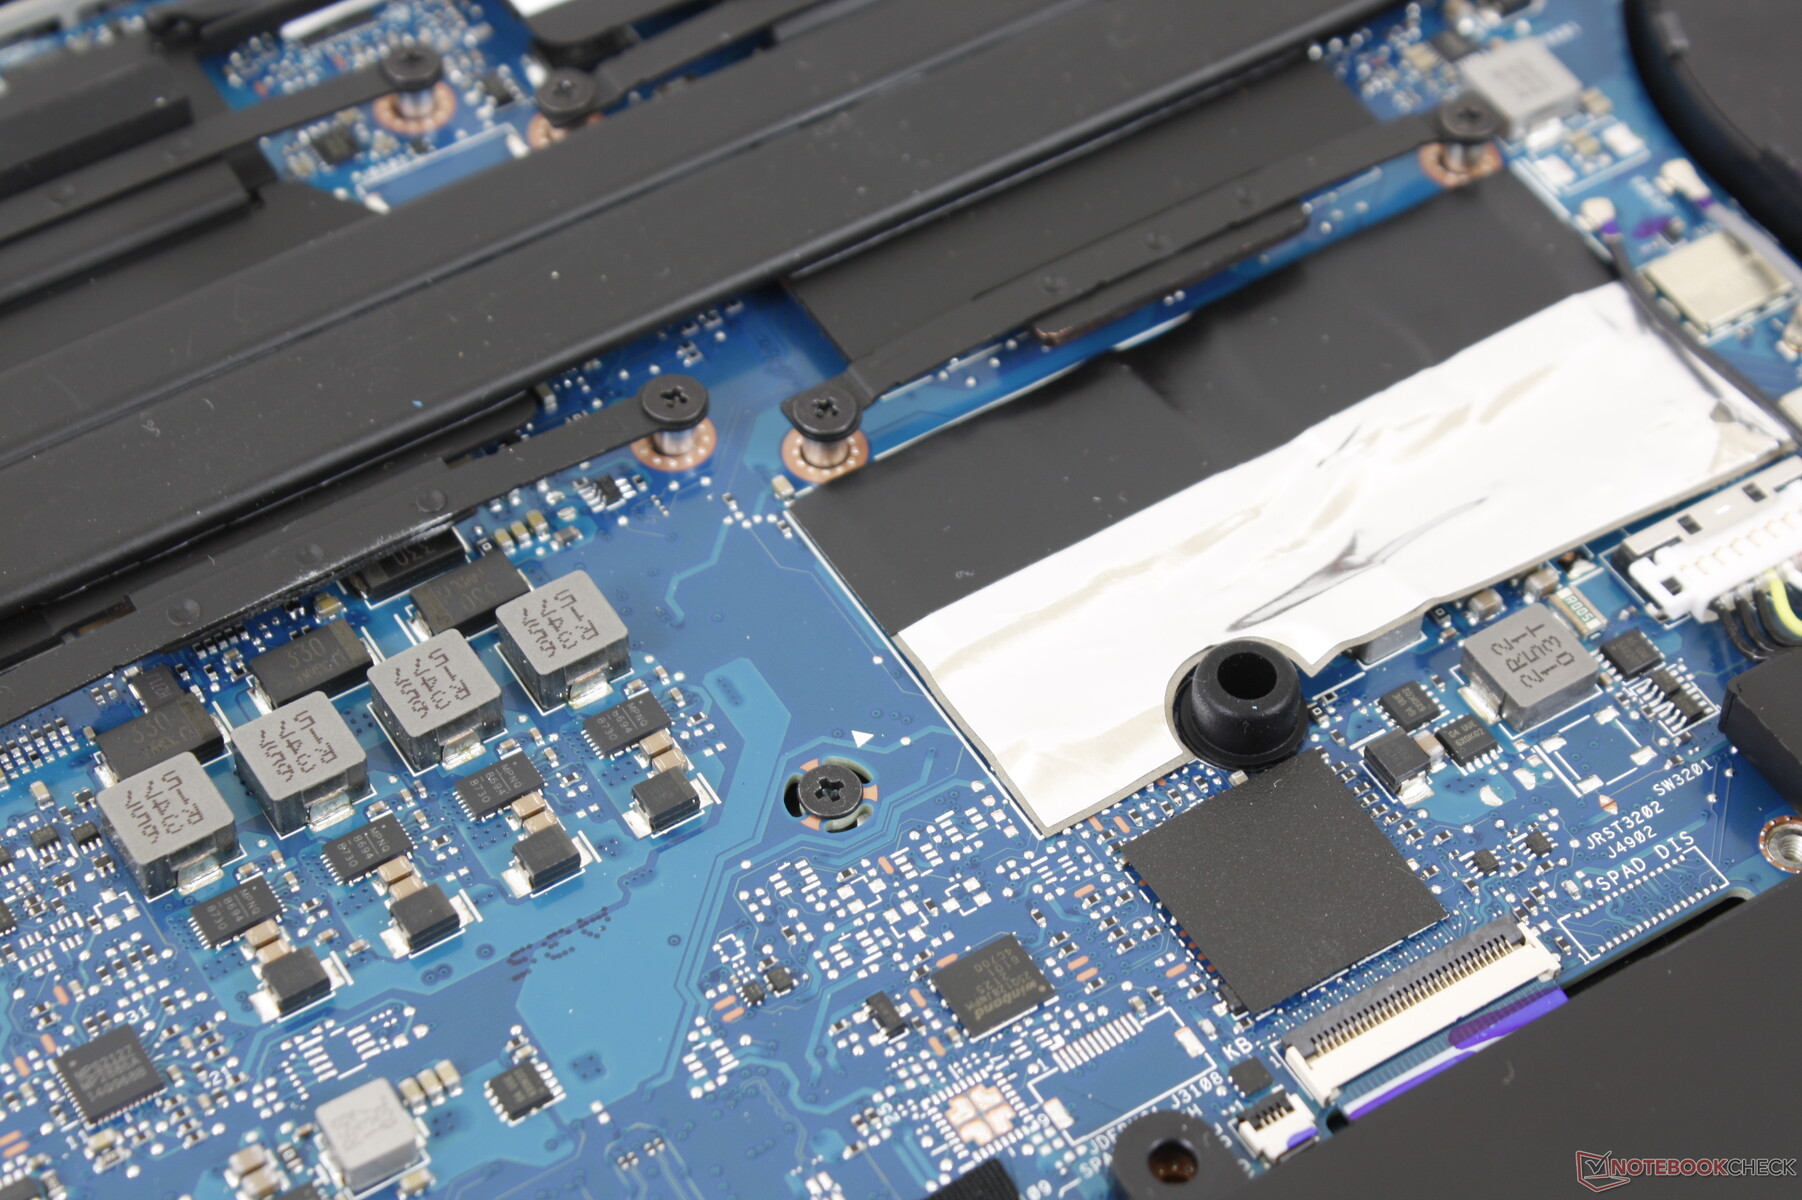
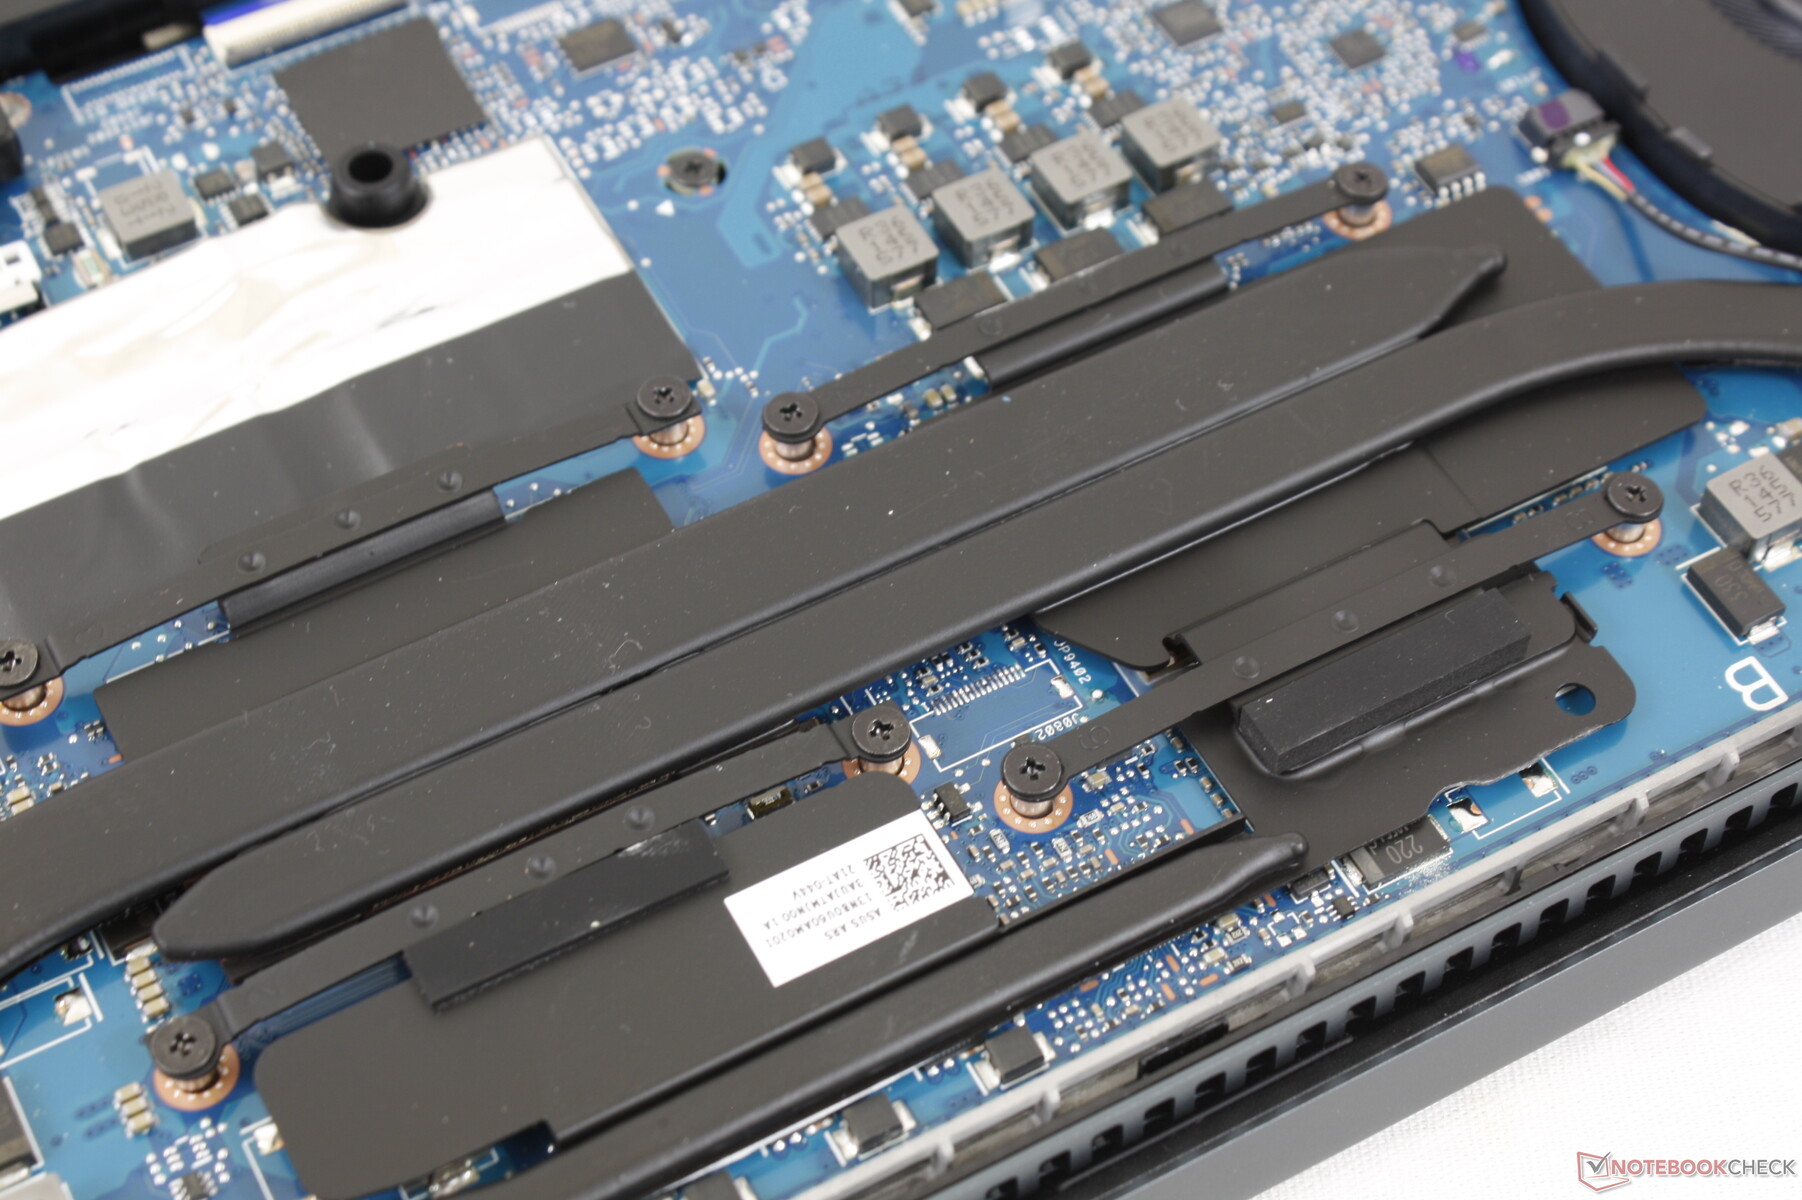
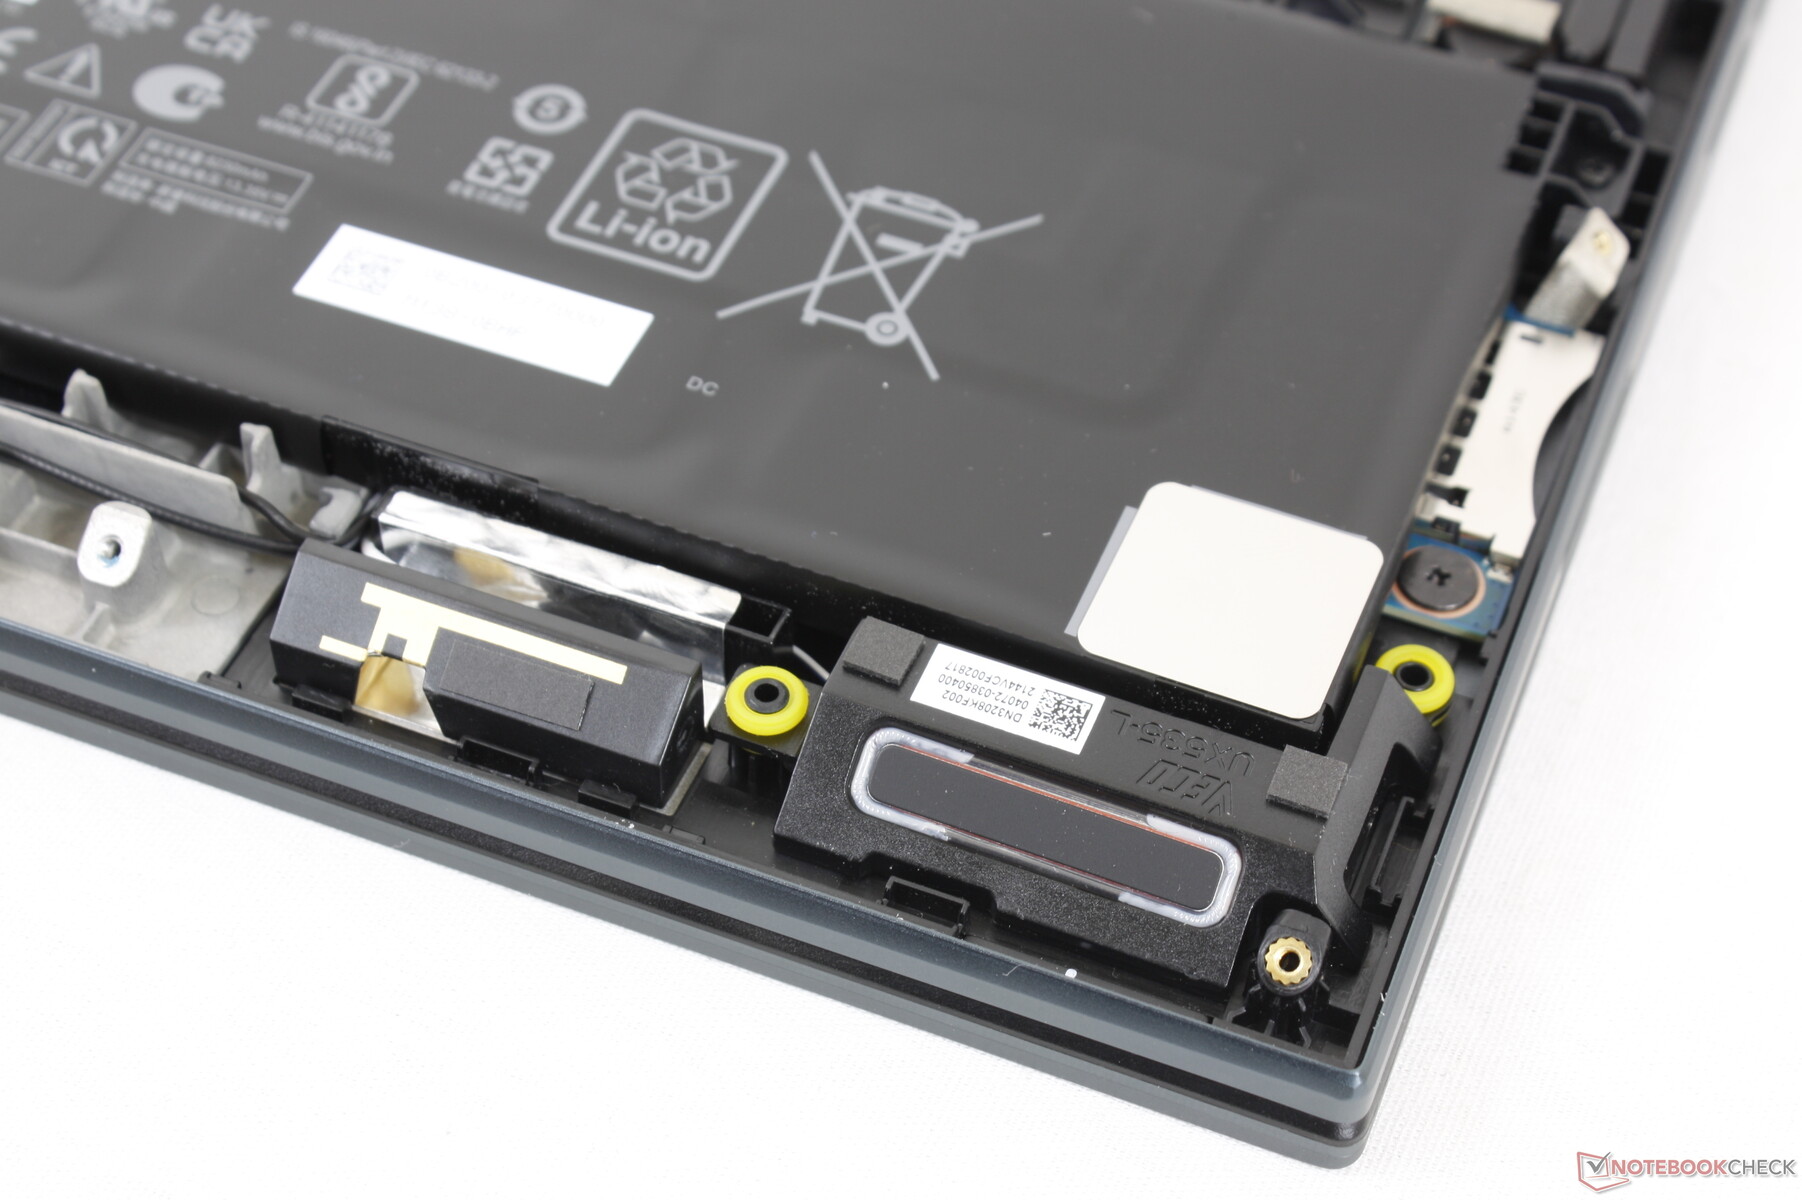
Maintenance
Le panneau inférieur nécessite une clé Torx T5, un tournevis Philips et un bord tranchant pour être retiré. Il est ennuyeux de constater que des vis supplémentaires sont cachées sous les pieds en caoutchouc arrière. La RAM et le WLAN sont soudés et ne peuvent donc pas être mis à niveau.
Accessoires et garantie
Il n'y a pas d'autres éléments dans la boîte, à part l'adaptateur secteur et les documents. La garantie limitée standard d'un an s'applique.
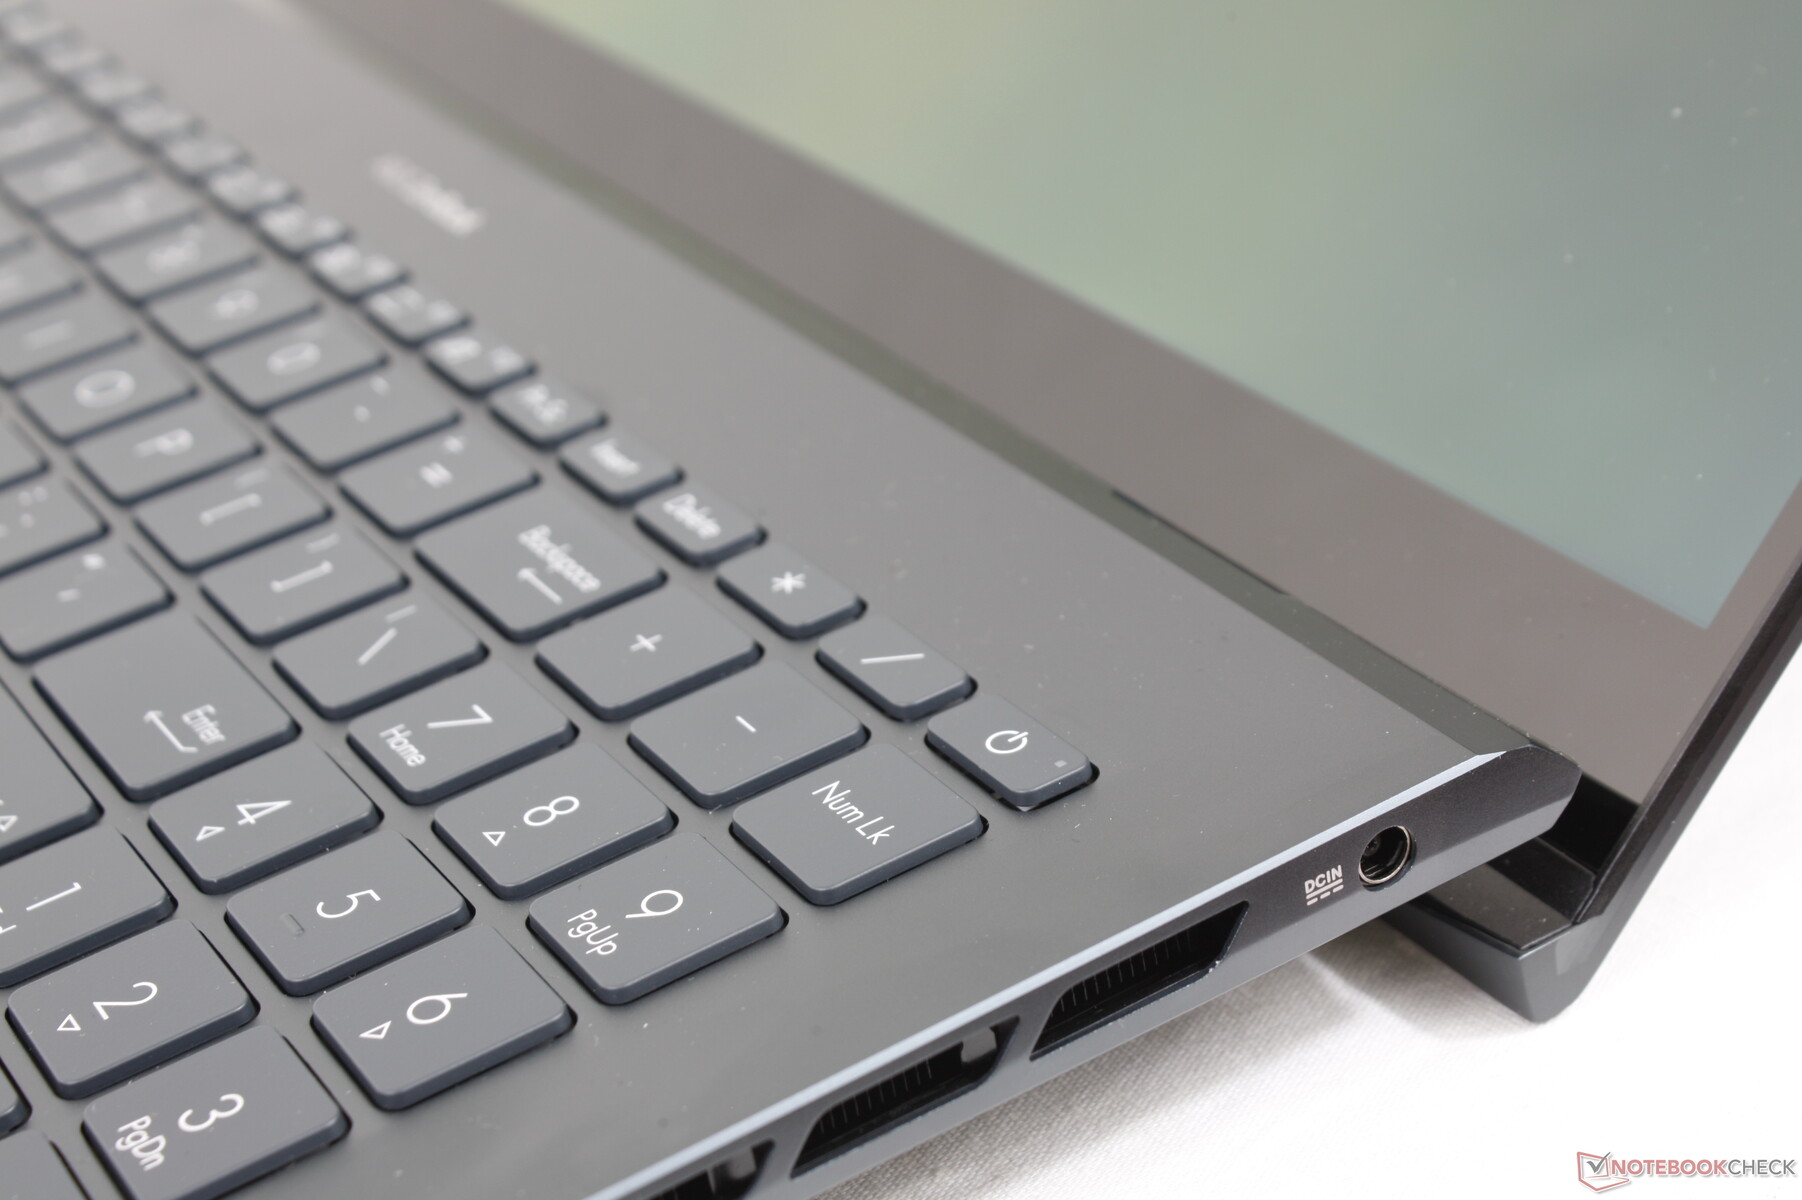
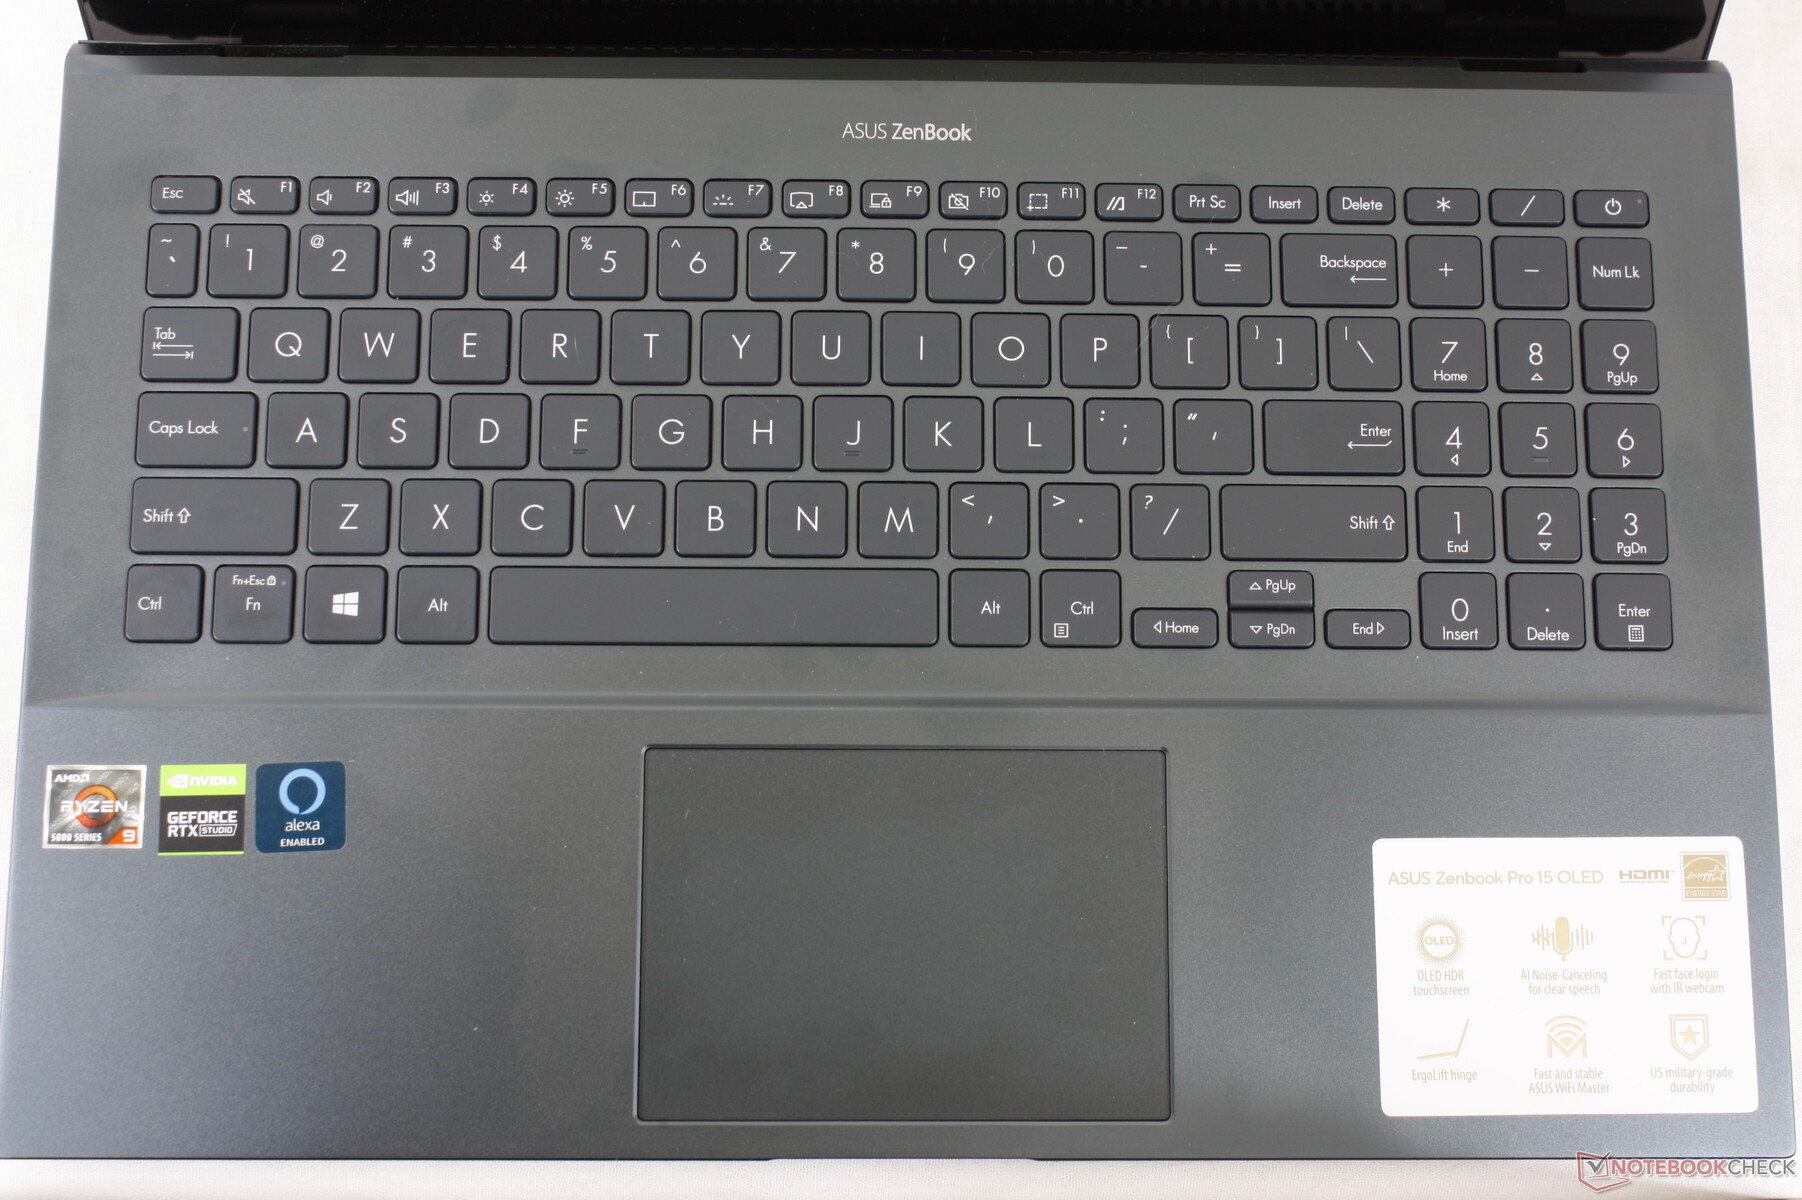
Périphériques d'entrée - Feels Like a Vivobook
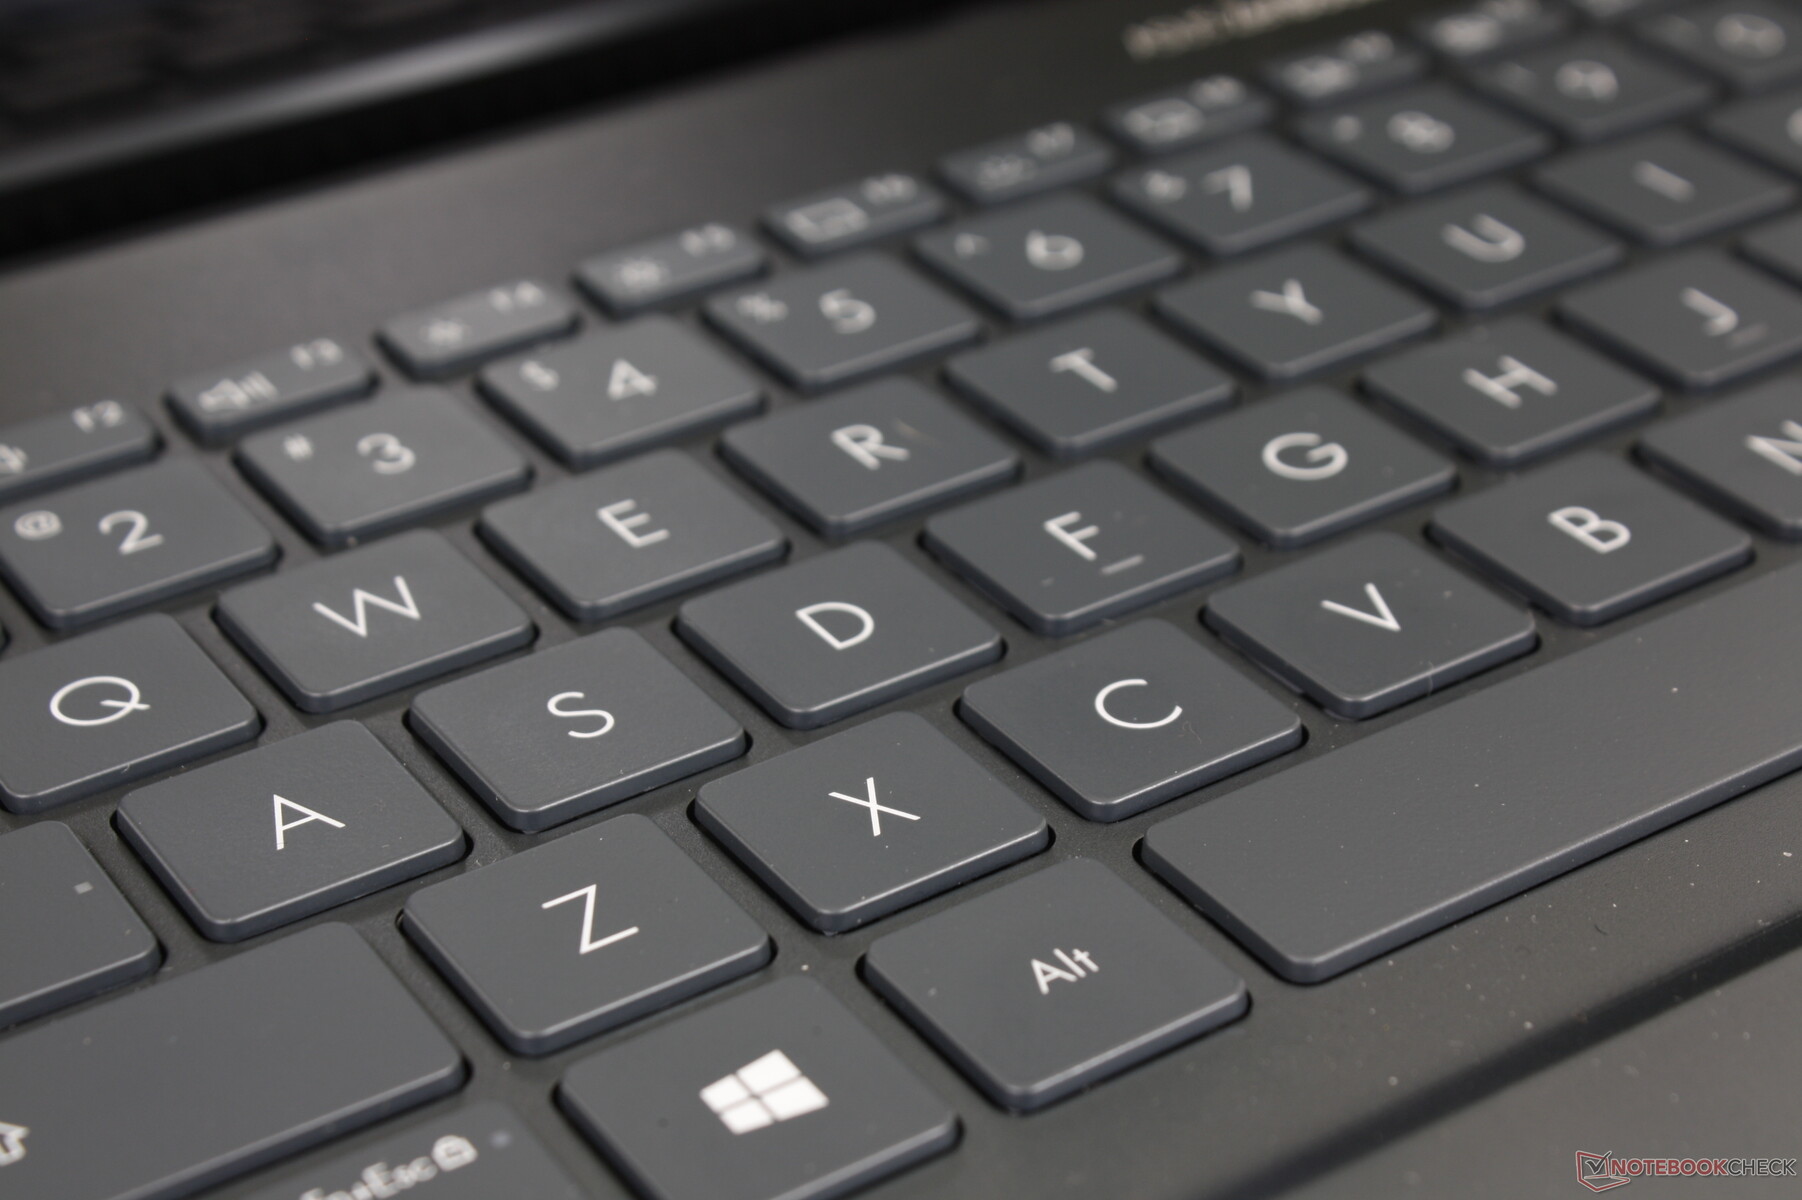
Clavier
La sensation générale des touches est similaire à celle du Razer Blade 15 et à la plupart des modèles Vivobook. La course et le retour d'information sont adéquats, si ce n'est qu'ils sont un peu moins profonds et plus souples, respectivement. Les touches du HP Envy 15 ou Lenovo ThinkPad série X sont nettement plus fermes et profondes, ce qui permet un retour d'information plus satisfaisant. Il est dommage qu'il n'y ait pas d'amélioration notable en termes de clavier lorsque l'on passe d'un Vivobook moins cher au Zenbook plus cher.
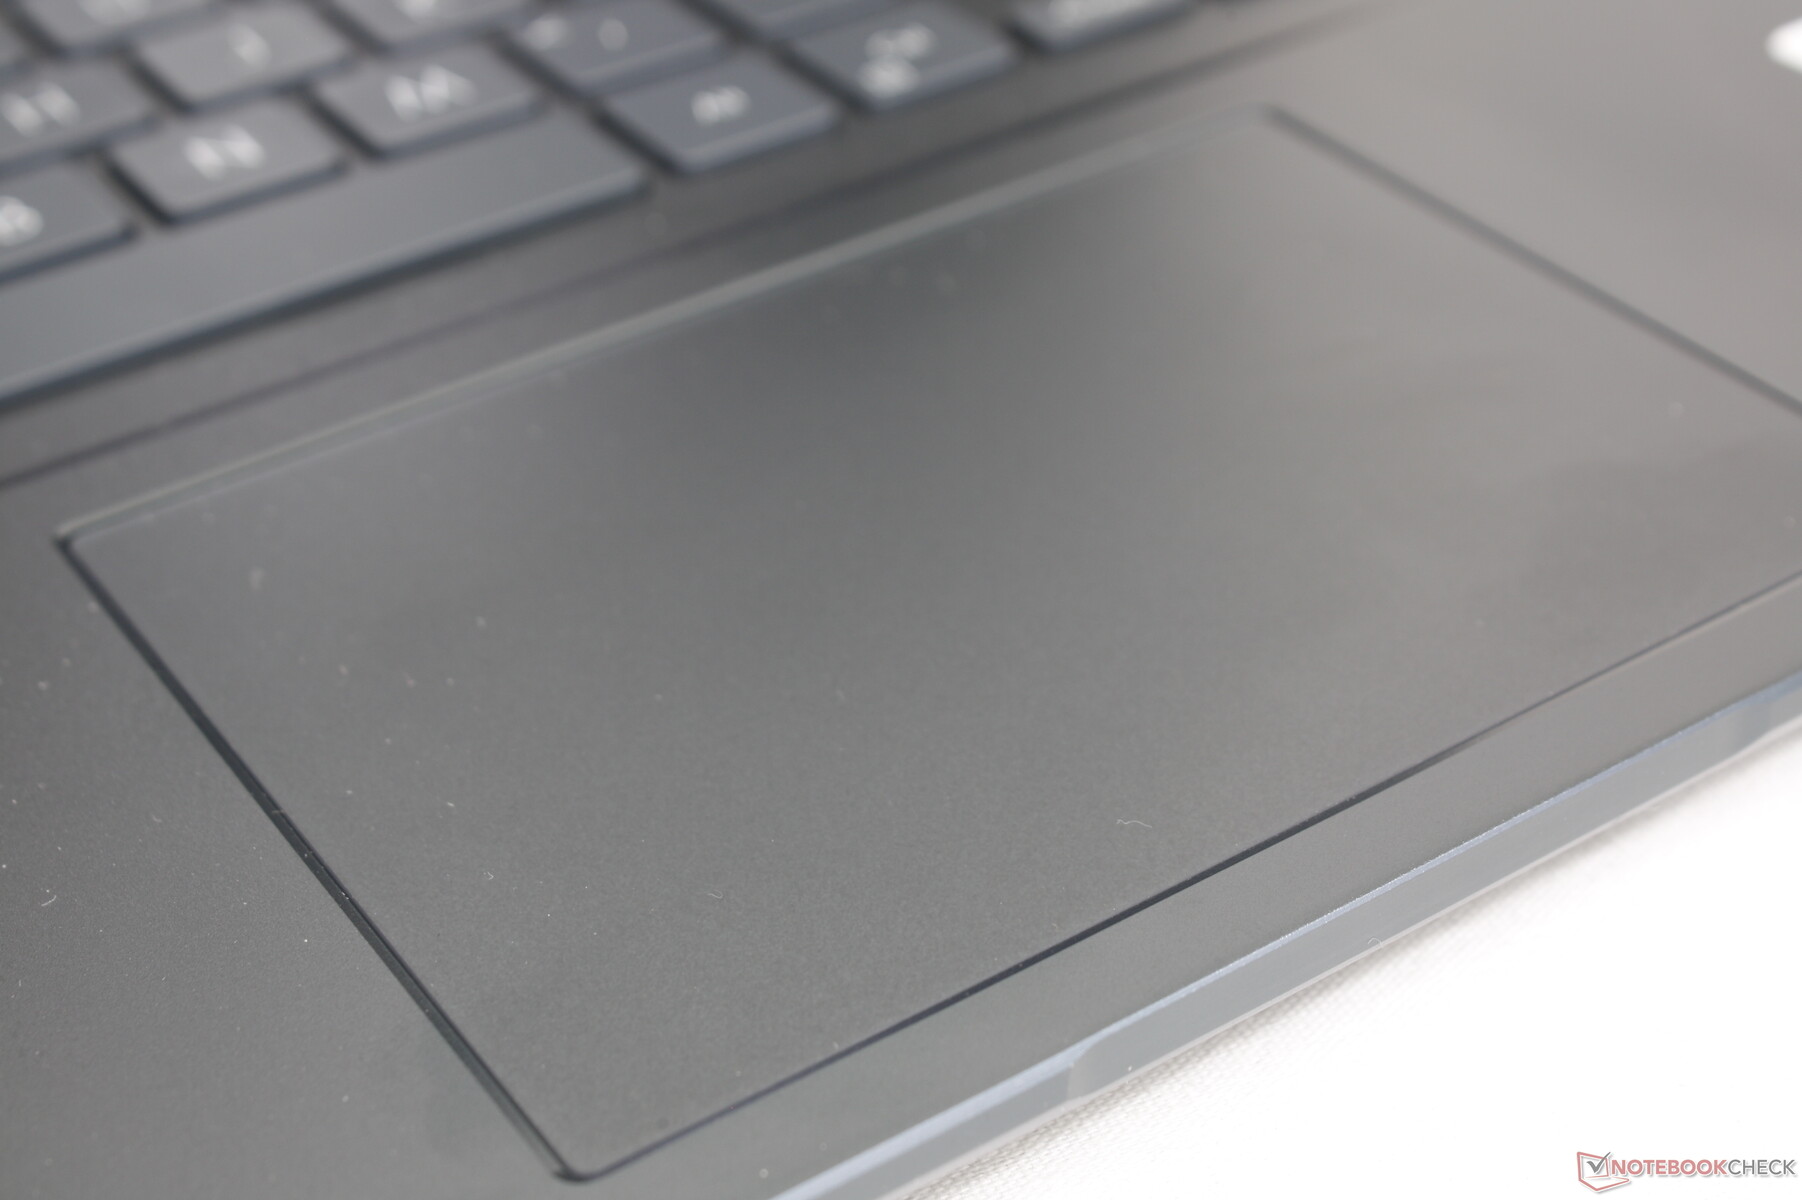
Pavé tactile
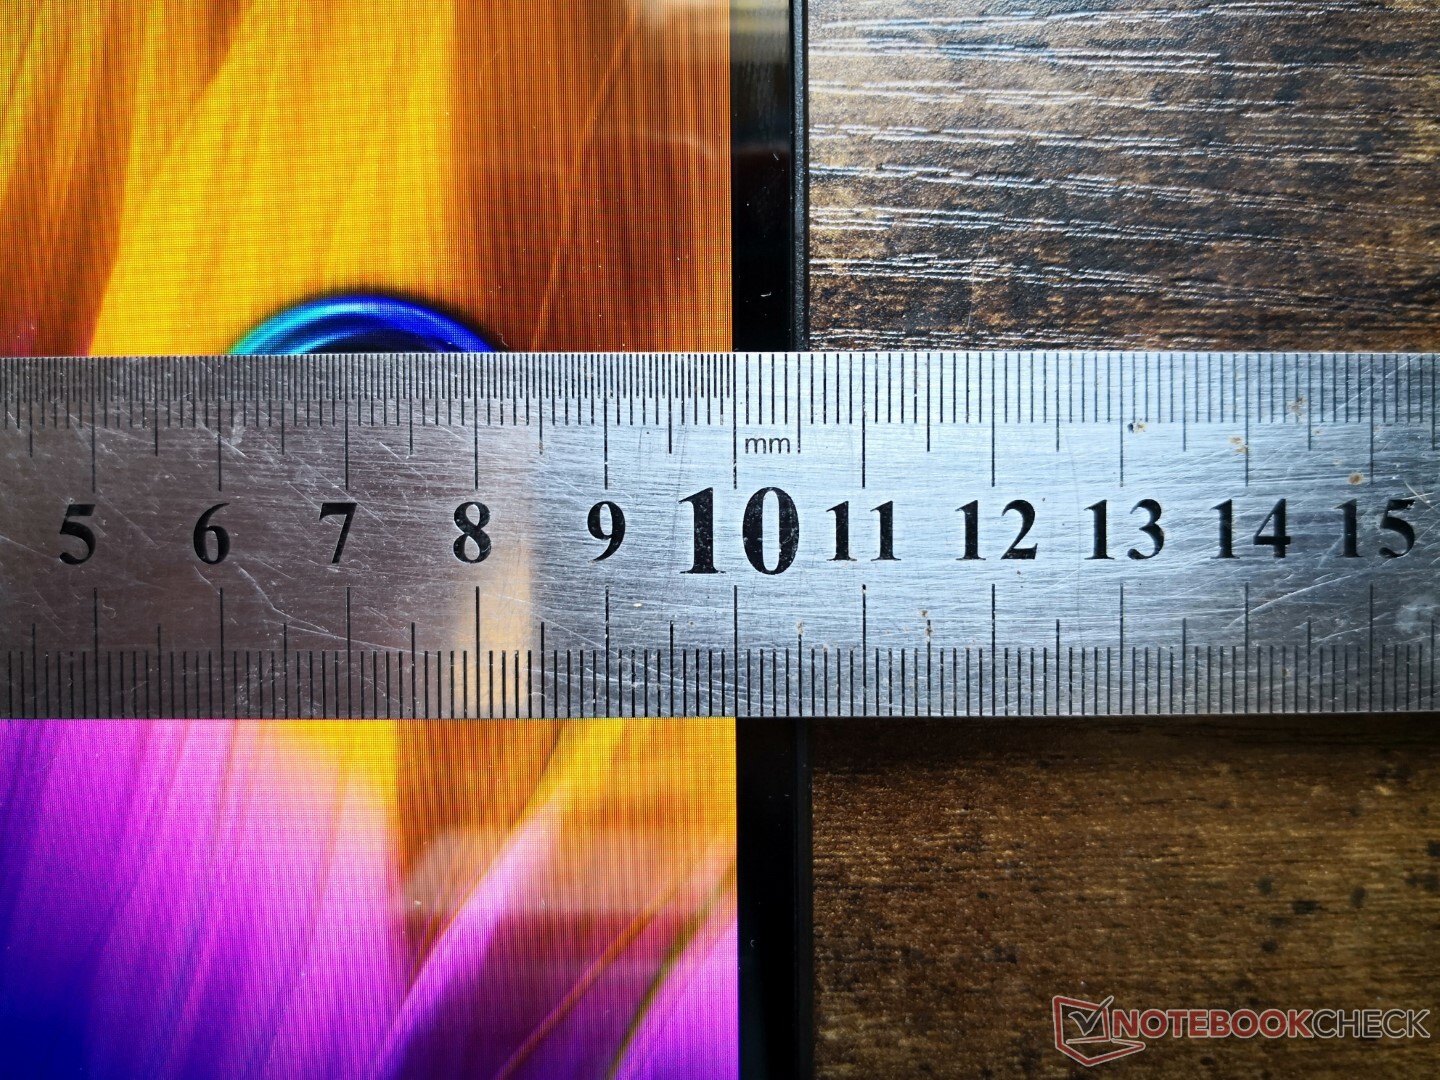
Le pavé tactile est beaucoup plus petit que celui du XPS 15 (10,5 x 7,3 cm contre 15,1 x 9 cm) malgré l'encombrement plus important du Zenbook Pro 15. Néanmoins, le retour d'information est plus ferme et plus satisfaisant lorsqu'on appuie dessus, par rapport au pavé tactile plus doux et plus silencieux du Dell. La traction est douce avec juste un peu de collage lors de la glisse à des vitesses lentes.
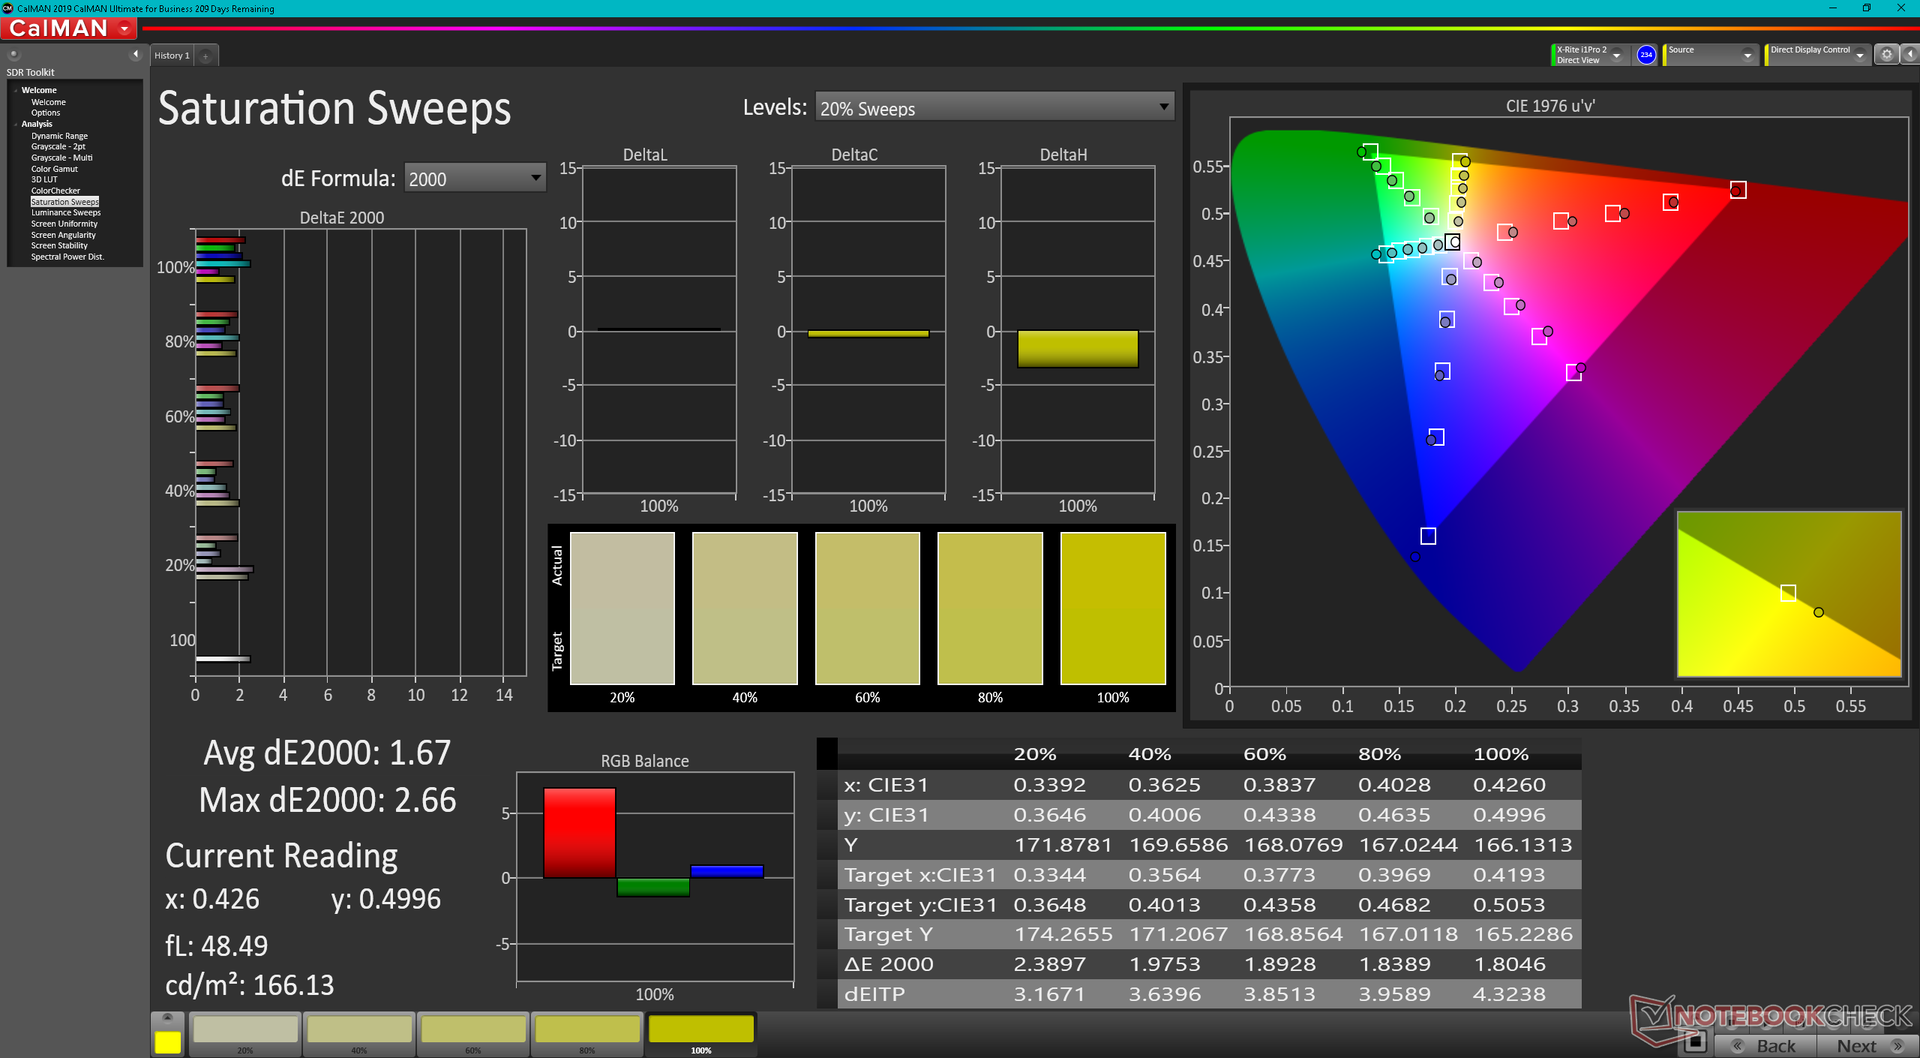
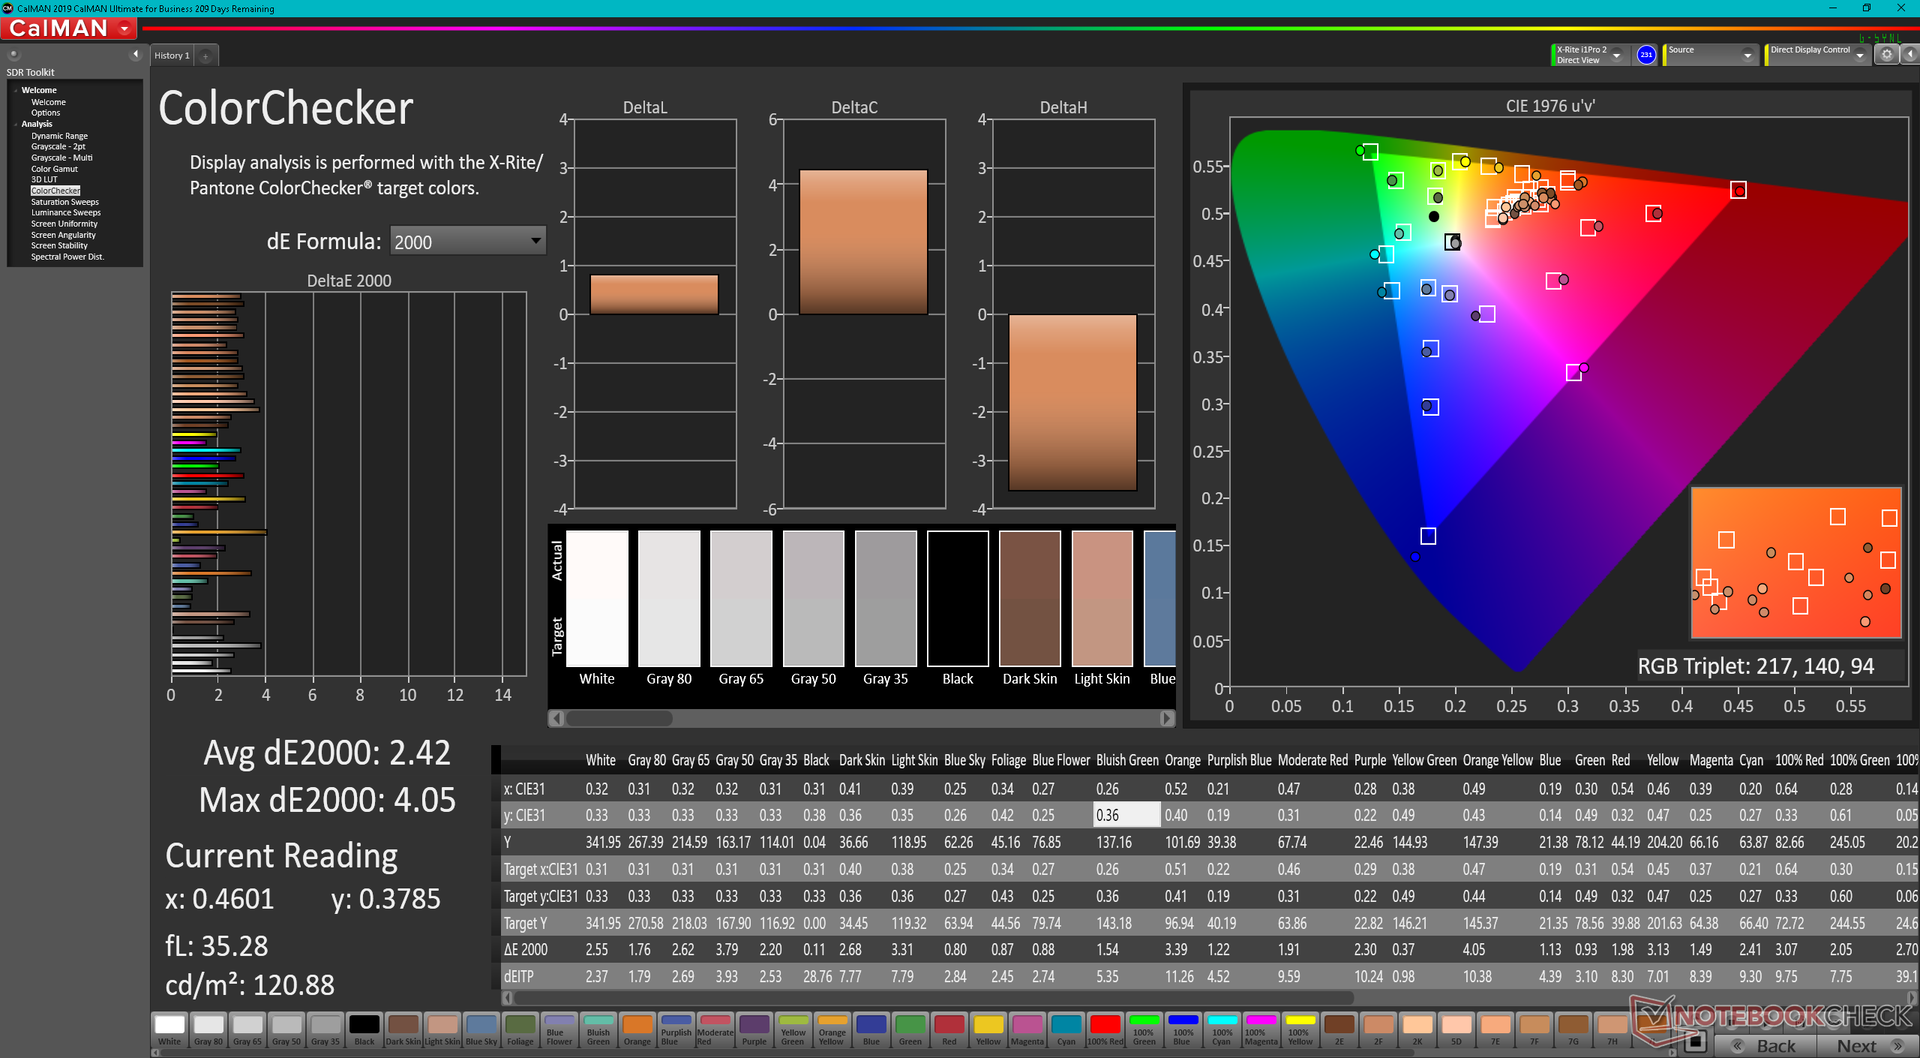
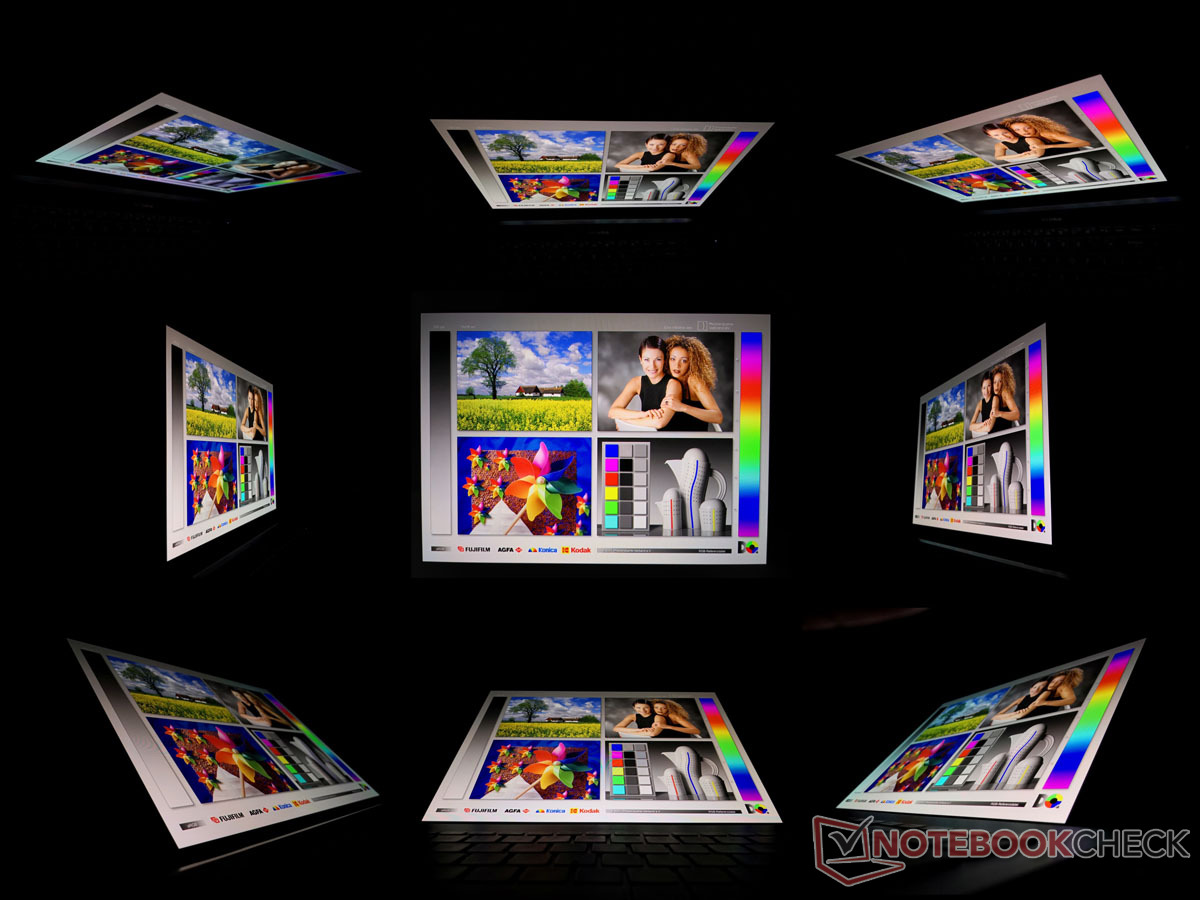
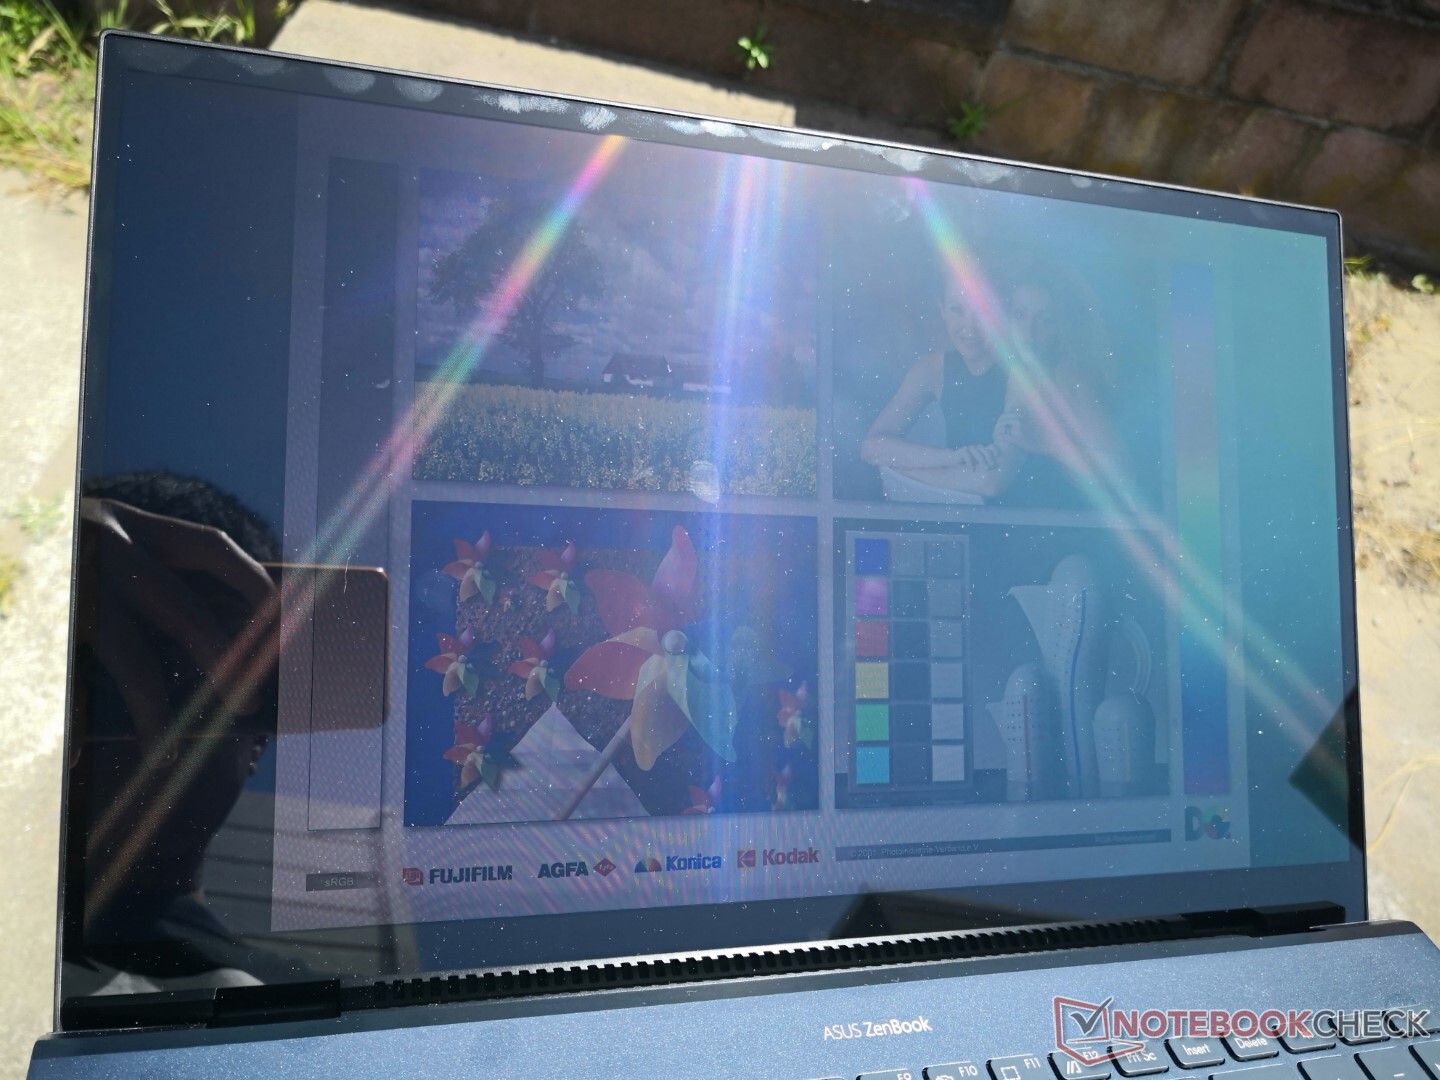
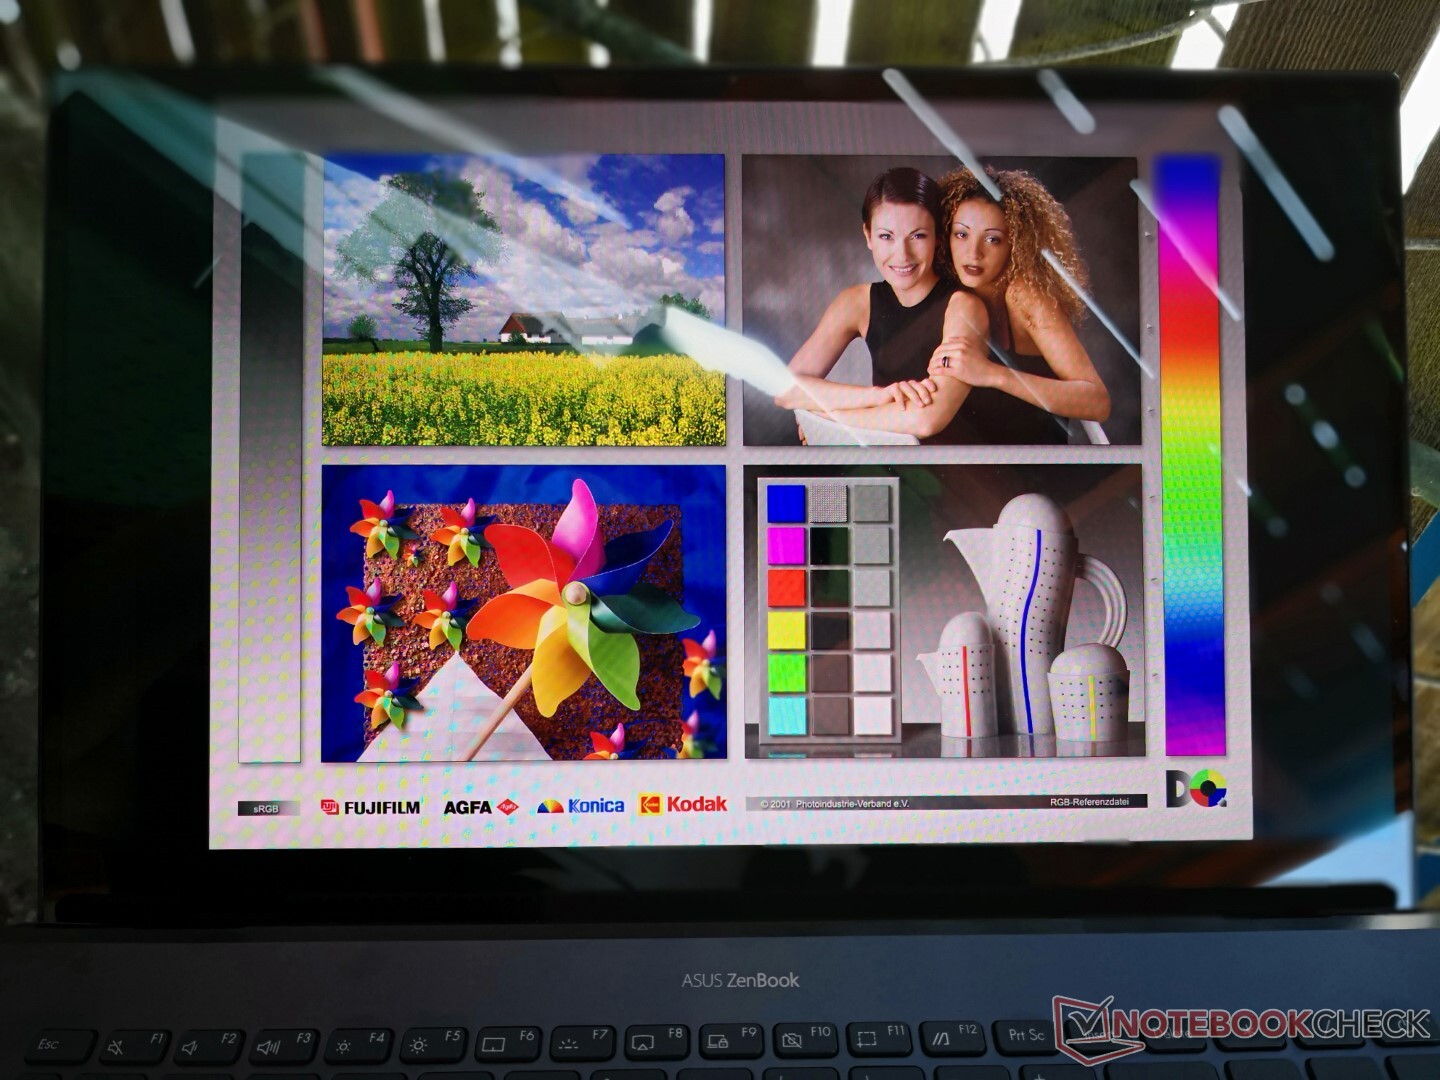
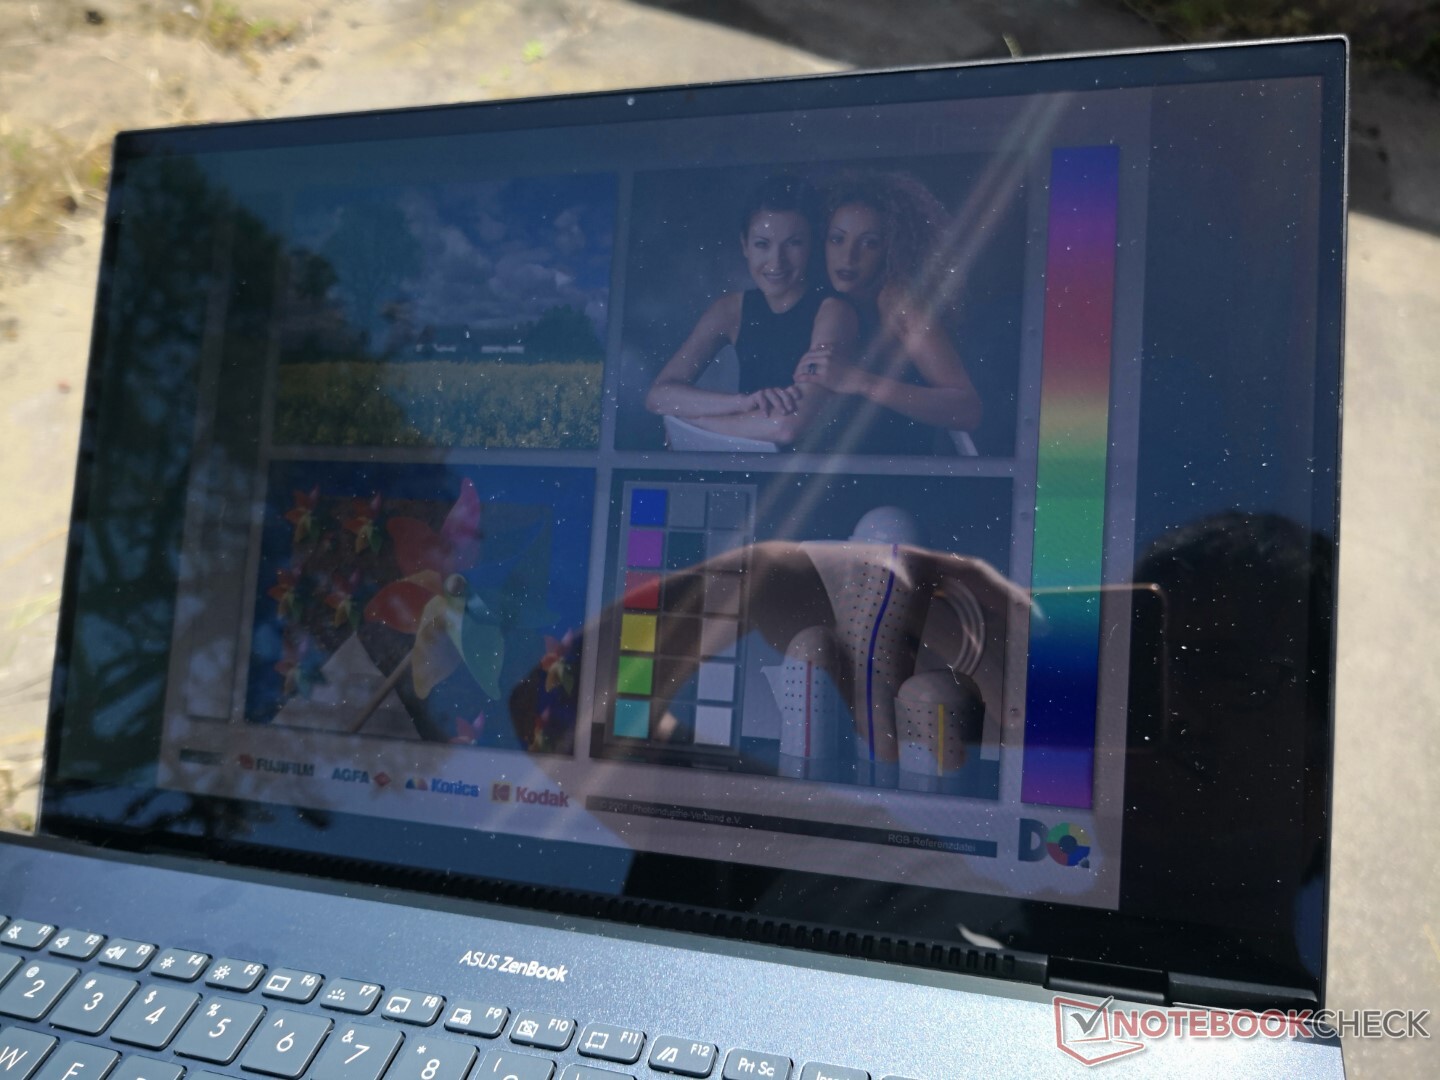
Ecrans - Pousser l'OLED vers le grand public
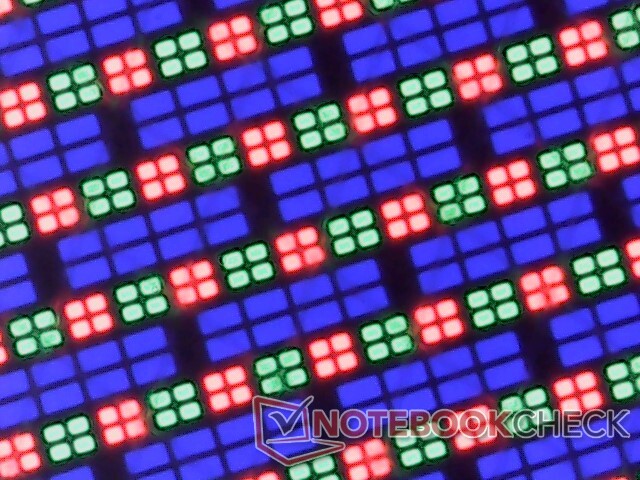
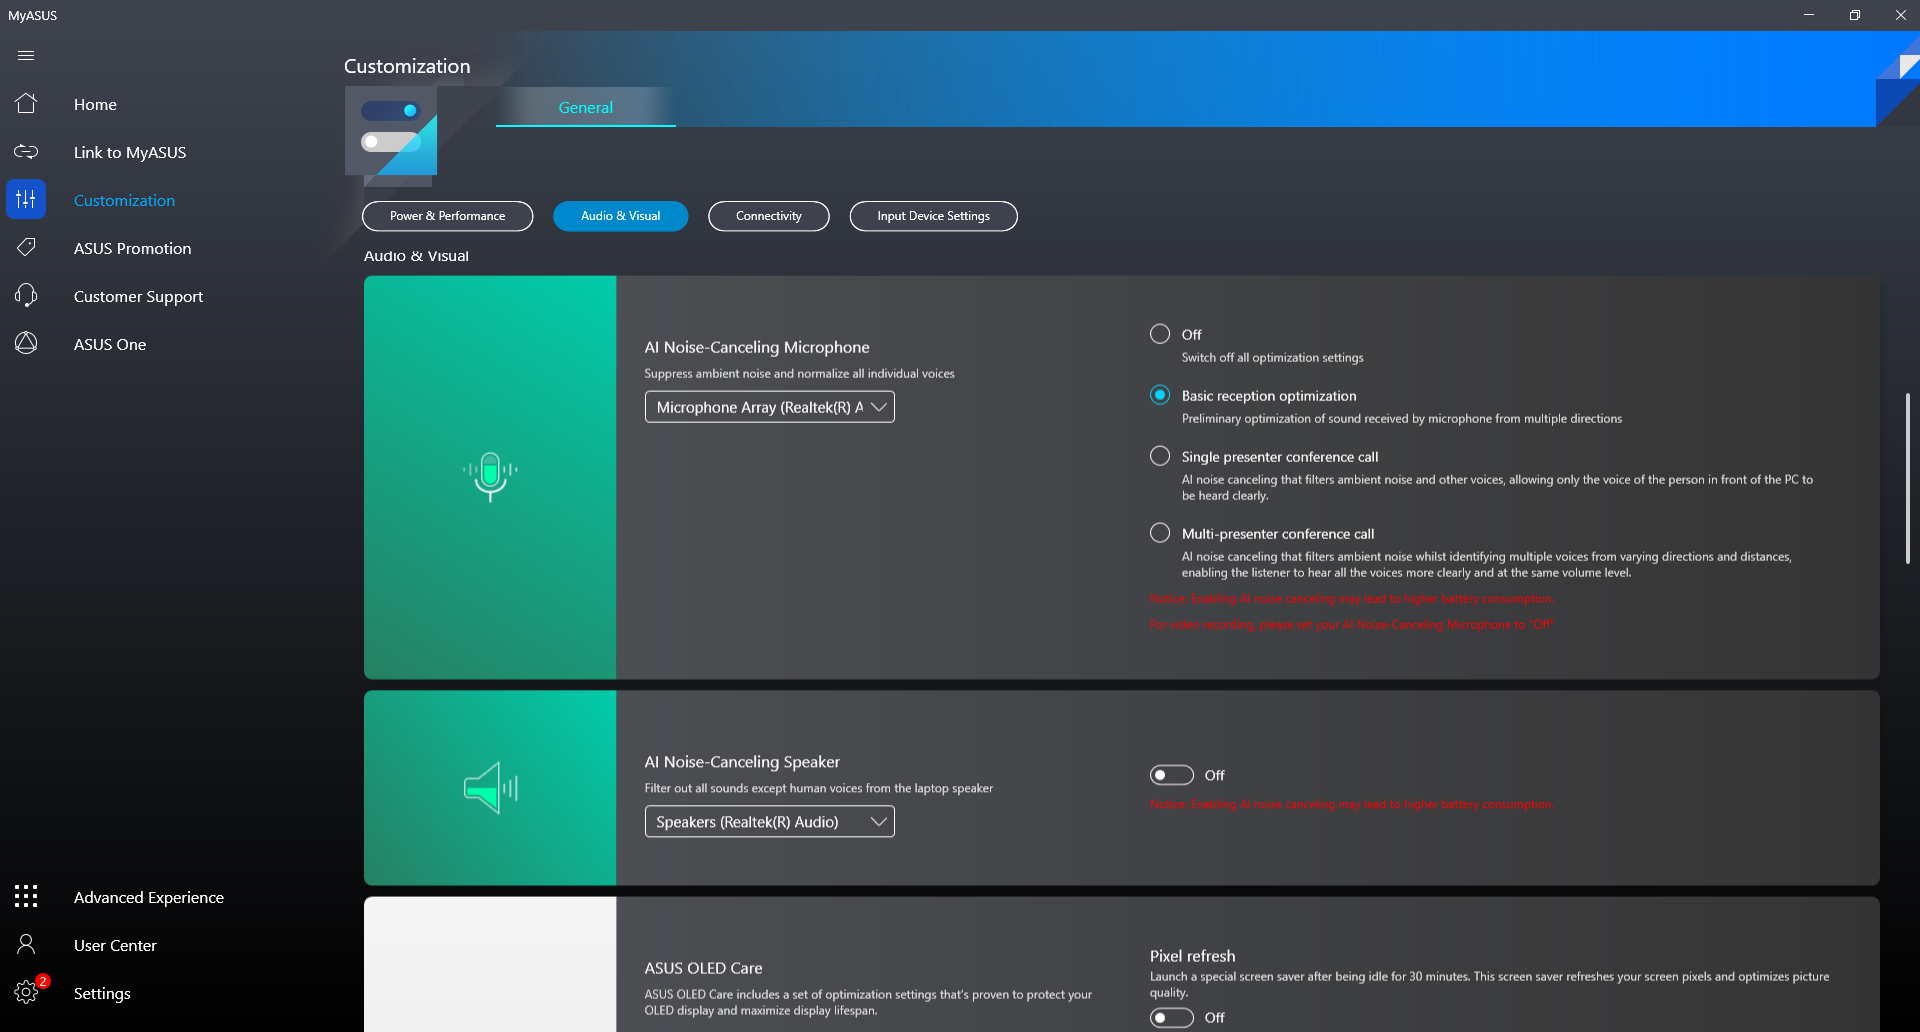
Asus utilise la même dalle OLED Samsung ATNA56YX03 1080p 60 Hz sur plusieurs de ses ordinateurs portables de 15,6 pouces, notamment le VivoBook 15 KM513, le VivoBook 15 Pro M3500QC, le VivoBook 15 M513UA et le Vivobook 15 K513EQ. Ainsi, tous ces ordinateurs portables partagent des caractéristiques visuelles très similaires, comme des temps de réponse extrêmement rapides et une répartition uniforme de la luminosité, des niveaux de noir profonds et de bons niveaux de luminosité maximale. Ces attributs permettent au contenu d'un écran OLED d'être beaucoup plus vivant que celui d'un écran IPS classique. Étrangement, cependant, nous ne sommes en mesure d'enregistrer une couverture DCI-P3 que de 79%, même après avoir essayé d'ajuster les couleurs par défaut via le logiciel MyAsus. Le fabricant annonce une couverture DCI-P3 complète et nous l'avons confirmé sur tous les ordinateurs portables VivoBook susmentionnés, ce qui peut suggérer qu'il pourrait y avoir un bug dans la façon dont les profils de couleur fonctionnent entre les paramètres d'Asus et ceux de Windows.
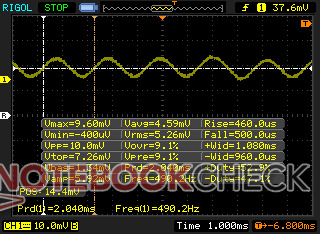
Gardez à l'esprit que la modulation de largeur d'impulsion est présente sur tous les niveaux de luminosité à 490 Hz de 0 à 49% de luminosité et 60 Hz à partir de 50% de luminosité. Le logiciel MyAsus propose un curseur permettant de limiter la luminosité maximale de l'écran en plus du curseur de luminosité normal via les paramètres Windows, afin de tenter de minimiser l'intensité du scintillement.
| |||||||||||||||||||||||||
Homogénéité de la luminosité: 98 %
Valeur mesurée au centre, sur batterie: 342.9 cd/m²
Contraste: ∞:1 (Valeurs des noirs: 0 cd/m²)
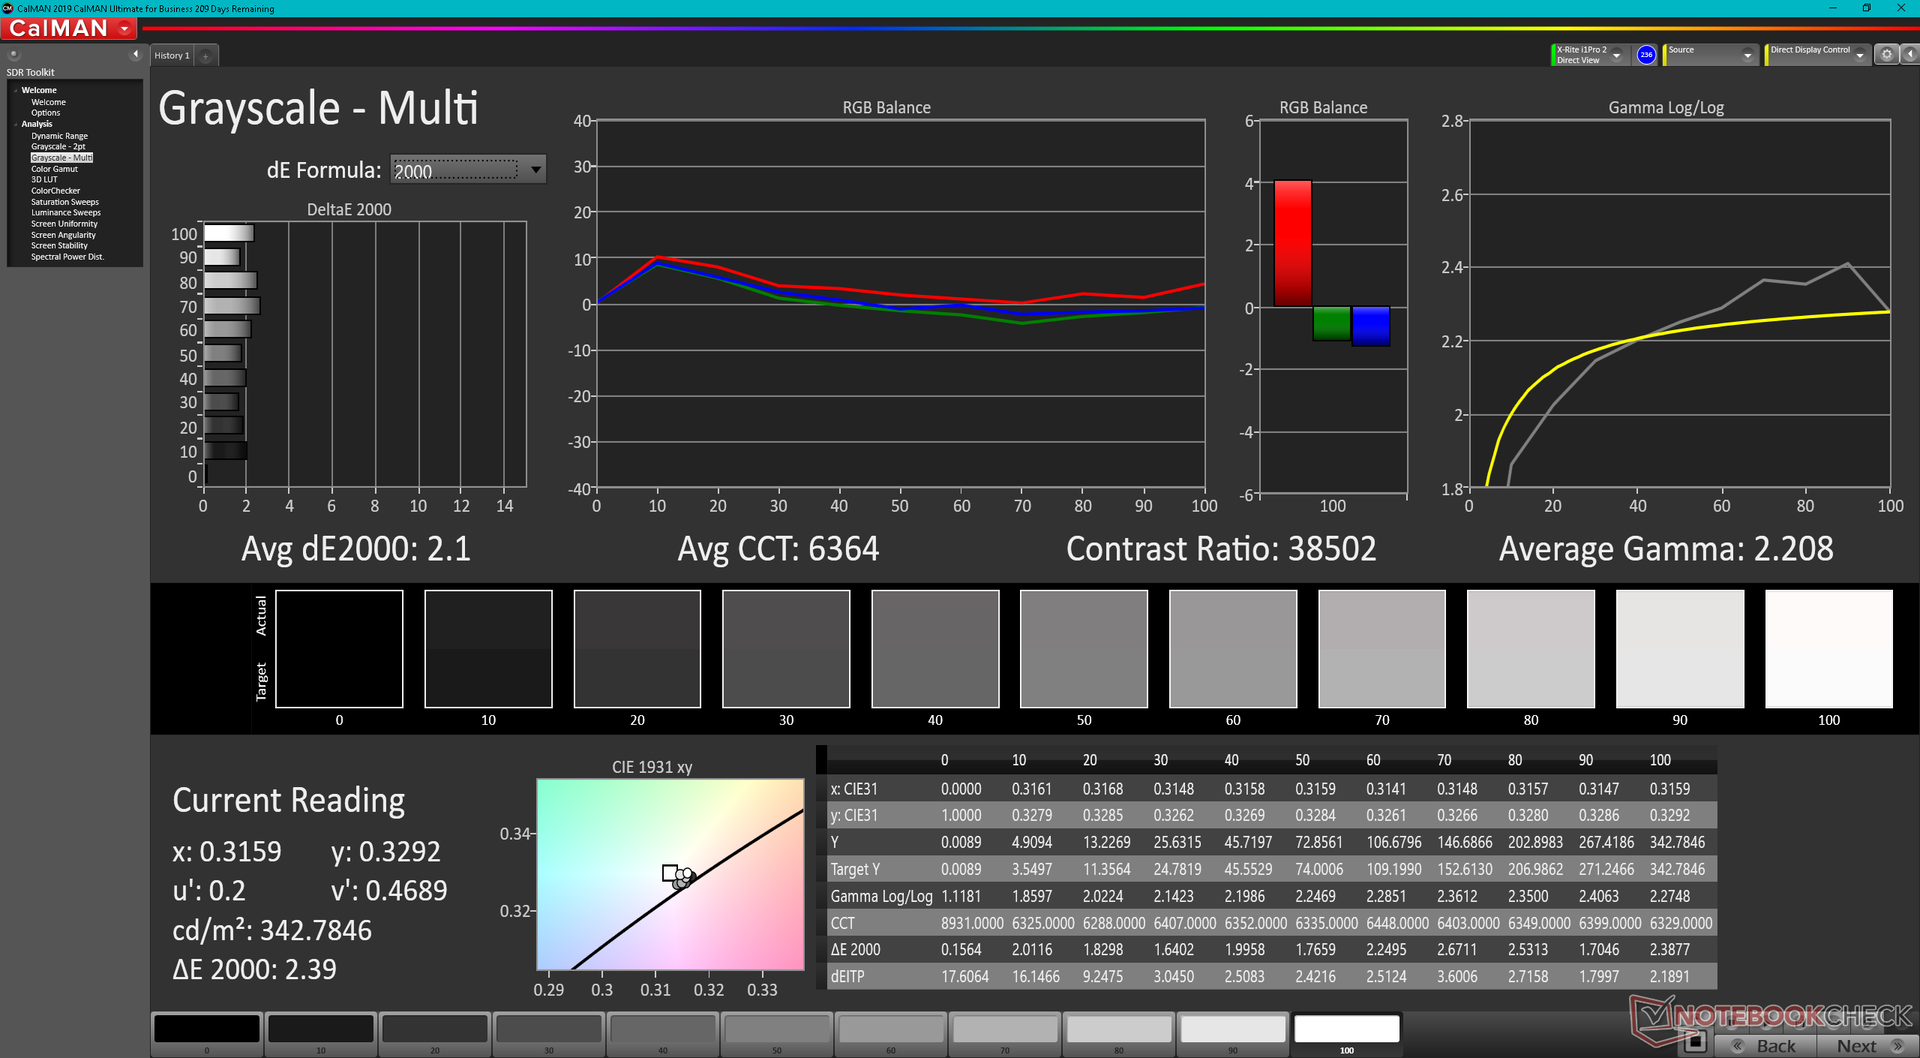
ΔE ColorChecker Calman: 2.42 | ∀{0.5-29.43 Ø4.73}
ΔE Greyscale Calman: 2.1 | ∀{0.09-98 Ø4.97}
87.3% AdobeRGB 1998 (Argyll 3D)
95.6% sRGB (Argyll 3D)
79.3% Display P3 (Argyll 3D)
Gamma: 2.21
CCT: 6364 K
| Asus Zenbook Pro 15 OLED UM535Q Samsung ATNA56YX03-0, OLED, 1920x1080, 15.6" | Asus ZenBook UX535-M01440 BOE0866, IPS, 3840x2160, 15.6" | Asus ZenBook 15 UX534FTC-A8190T BOE CQ NV156FHM-N63, IPS, 1920x1080, 15.6" | Lenovo Yoga Creator 7 15IMH05 82DS000VGE BOE CQ NV156FHM-N69, IPS, 1920x1080, 15.6" | HP Envy 15-ep0098nr Samsung SDC4145, AMOLED, 3840x2160, 15.6" | Dell XPS 15 9510 11800H RTX 3050 Ti OLED SDC414D, OLED, 3456x2160, 15.6" | |
|---|---|---|---|---|---|---|
| Display | -10% | -19% | -10% | 10% | 14% | |
| Display P3 Coverage (%) | 79.3 | 68.8 -13% | 65 -18% | 68.7 -13% | 88.5 12% | 99.9 26% |
| sRGB Coverage (%) | 95.6 | 99.5 4% | 86.2 -10% | 97.1 2% | 100 5% | 100 5% |
| AdobeRGB 1998 Coverage (%) | 87.3 | 70.1 -20% | 62.9 -28% | 70.3 -19% | 99.9 14% | 98.1 12% |
| Response Times | -1231% | -1667% | -150% | 23% | -47% | |
| Response Time Grey 50% / Grey 80% * (ms) | 2.1 ? | 34 ? -1519% | 45 ? -2043% | 5 ? -138% | 0.8 ? 62% | 3.6 ? -71% |
| Response Time Black / White * (ms) | 2.3 ? | 24 ? -943% | 32 ? -1291% | 6 ? -161% | 2.7 ? -17% | 2.8 ? -22% |
| PWM Frequency (Hz) | 60.2 | 242.7 ? | 59.5 ? | |||
| Screen | -1% | -55% | -155% | -38% | 9% | |
| Brightness middle (cd/m²) | 342.9 | 402 17% | 299 -13% | 360 5% | 374.3 9% | 362 6% |
| Brightness (cd/m²) | 346 | 375 8% | 280 -19% | 320 -8% | 379 10% | 367 6% |
| Brightness Distribution (%) | 98 | 84 -14% | 89 -9% | 81 -17% | 91 -7% | 97 -1% |
| Black Level * (cd/m²) | 0.35 | 0.21 | 0.18 | 0.06 | ||
| Colorchecker dE 2000 * | 2.42 | 2.47 -2% | 4.76 -97% | 6.84 -183% | 5.47 -126% | 2.1 13% |
| Colorchecker dE 2000 max. * | 4.05 | 4.32 -7% | 9 -122% | 12.52 -209% | 8.22 -103% | 4.1 -1% |
| Greyscale dE 2000 * | 2.1 | 2.26 -8% | 3.53 -68% | 12.94 -516% | 2.3 -10% | 1.4 33% |
| Gamma | 2.21 100% | 2.49 88% | 2.3 96% | 2.55 86% | 2.09 105% | 2.18 101% |
| CCT | 6364 102% | 6285 103% | 7228 90% | 6973 93% | 6340 103% | 6608 98% |
| Contrast (:1) | 1149 | 1424 | 2000 | 6033 | ||
| Colorchecker dE 2000 calibrated * | 2.36 | 2.54 | 4.61 | 2.5 | ||
| Color Space (Percent of AdobeRGB 1998) (%) | 99 | 56 | 63 | 87.8 | ||
| Color Space (Percent of sRGB) (%) | 86 | 97 | 100 | |||
| Moyenne finale (programmes/paramètres) | -414% /
-227% | -580% /
-338% | -105% /
-114% | -2% /
-14% | -8% /
1% |
* ... Moindre est la valeur, meilleures sont les performances
Comparez l'espace colorimétrique de l'appareil à sRGB et AdobeRGB/Display P3 (surtout pour les appareils professionnels).
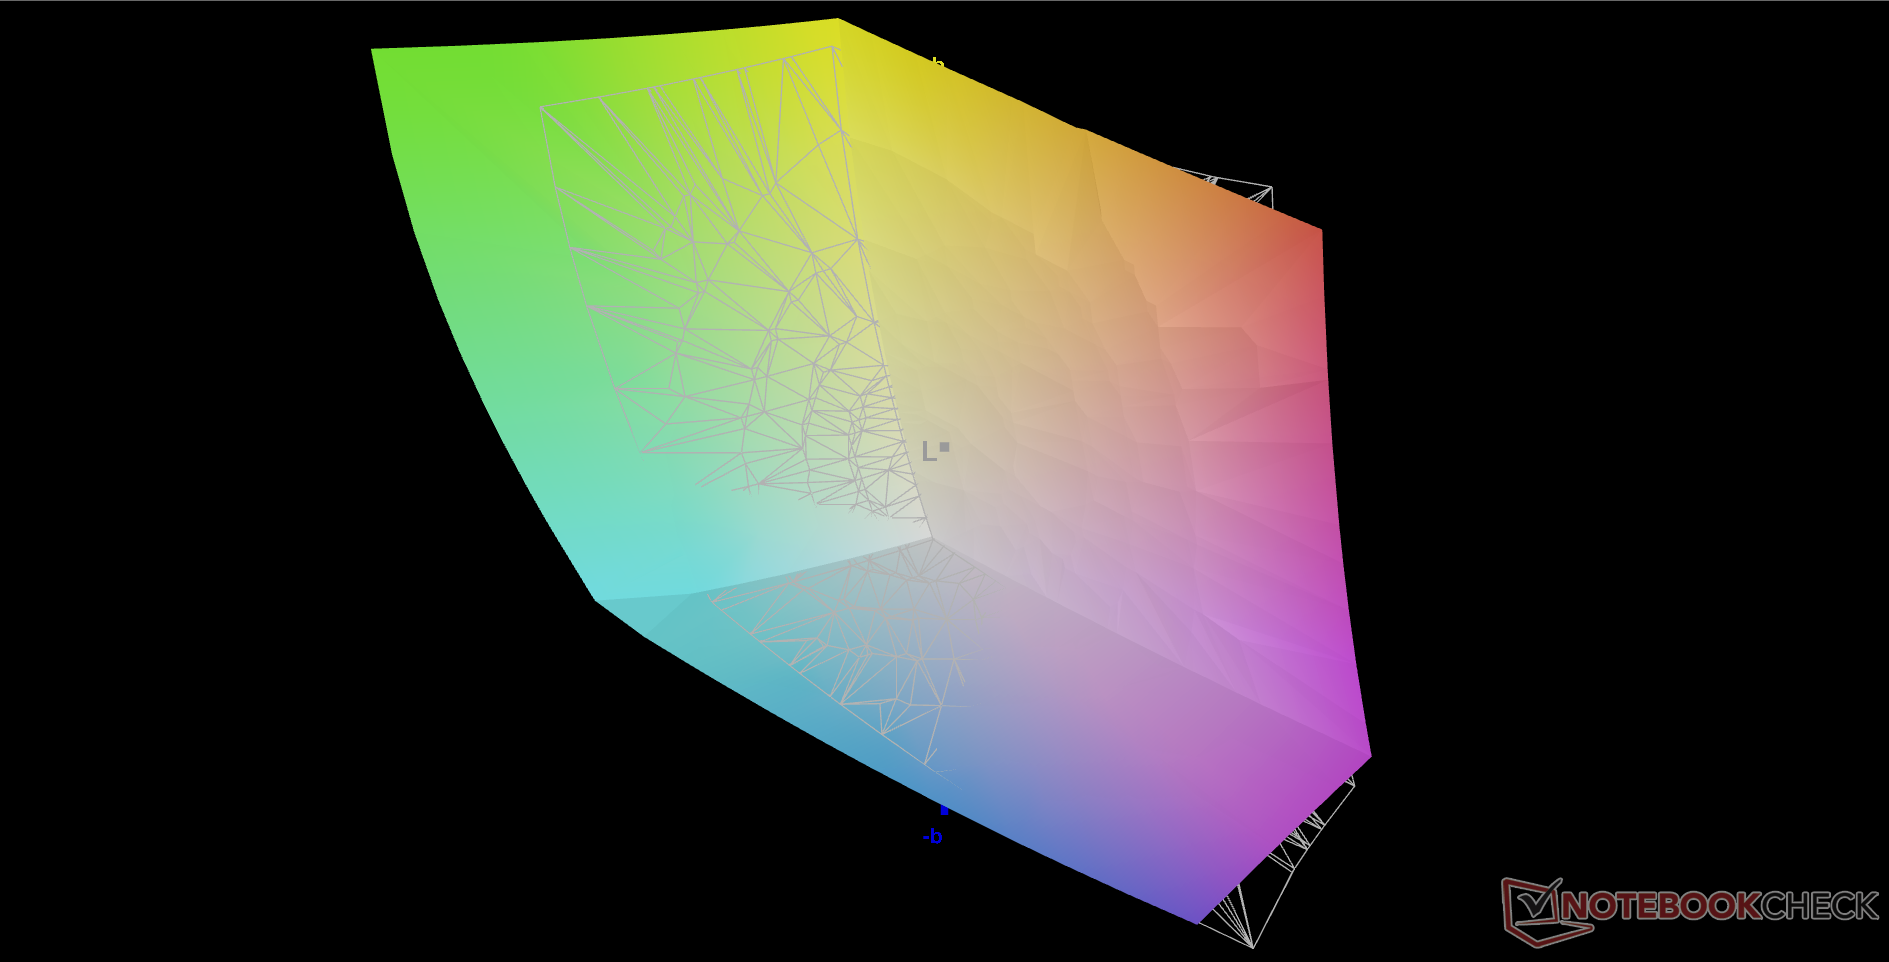
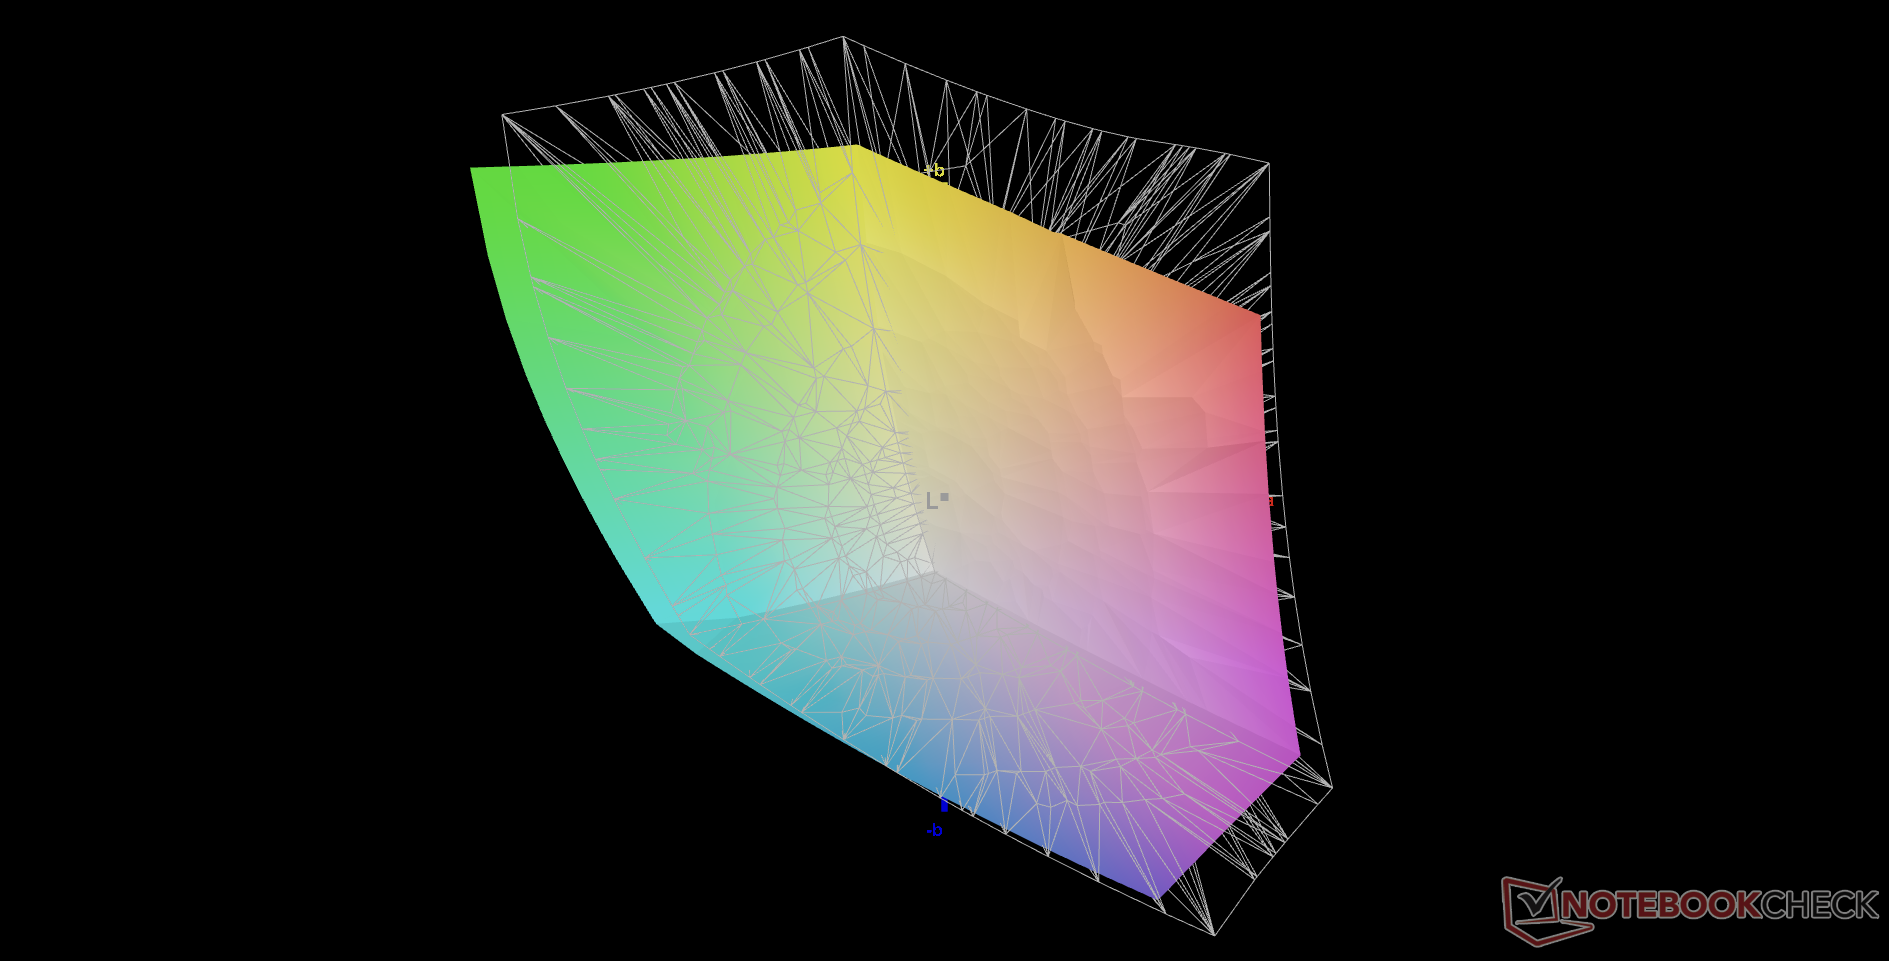
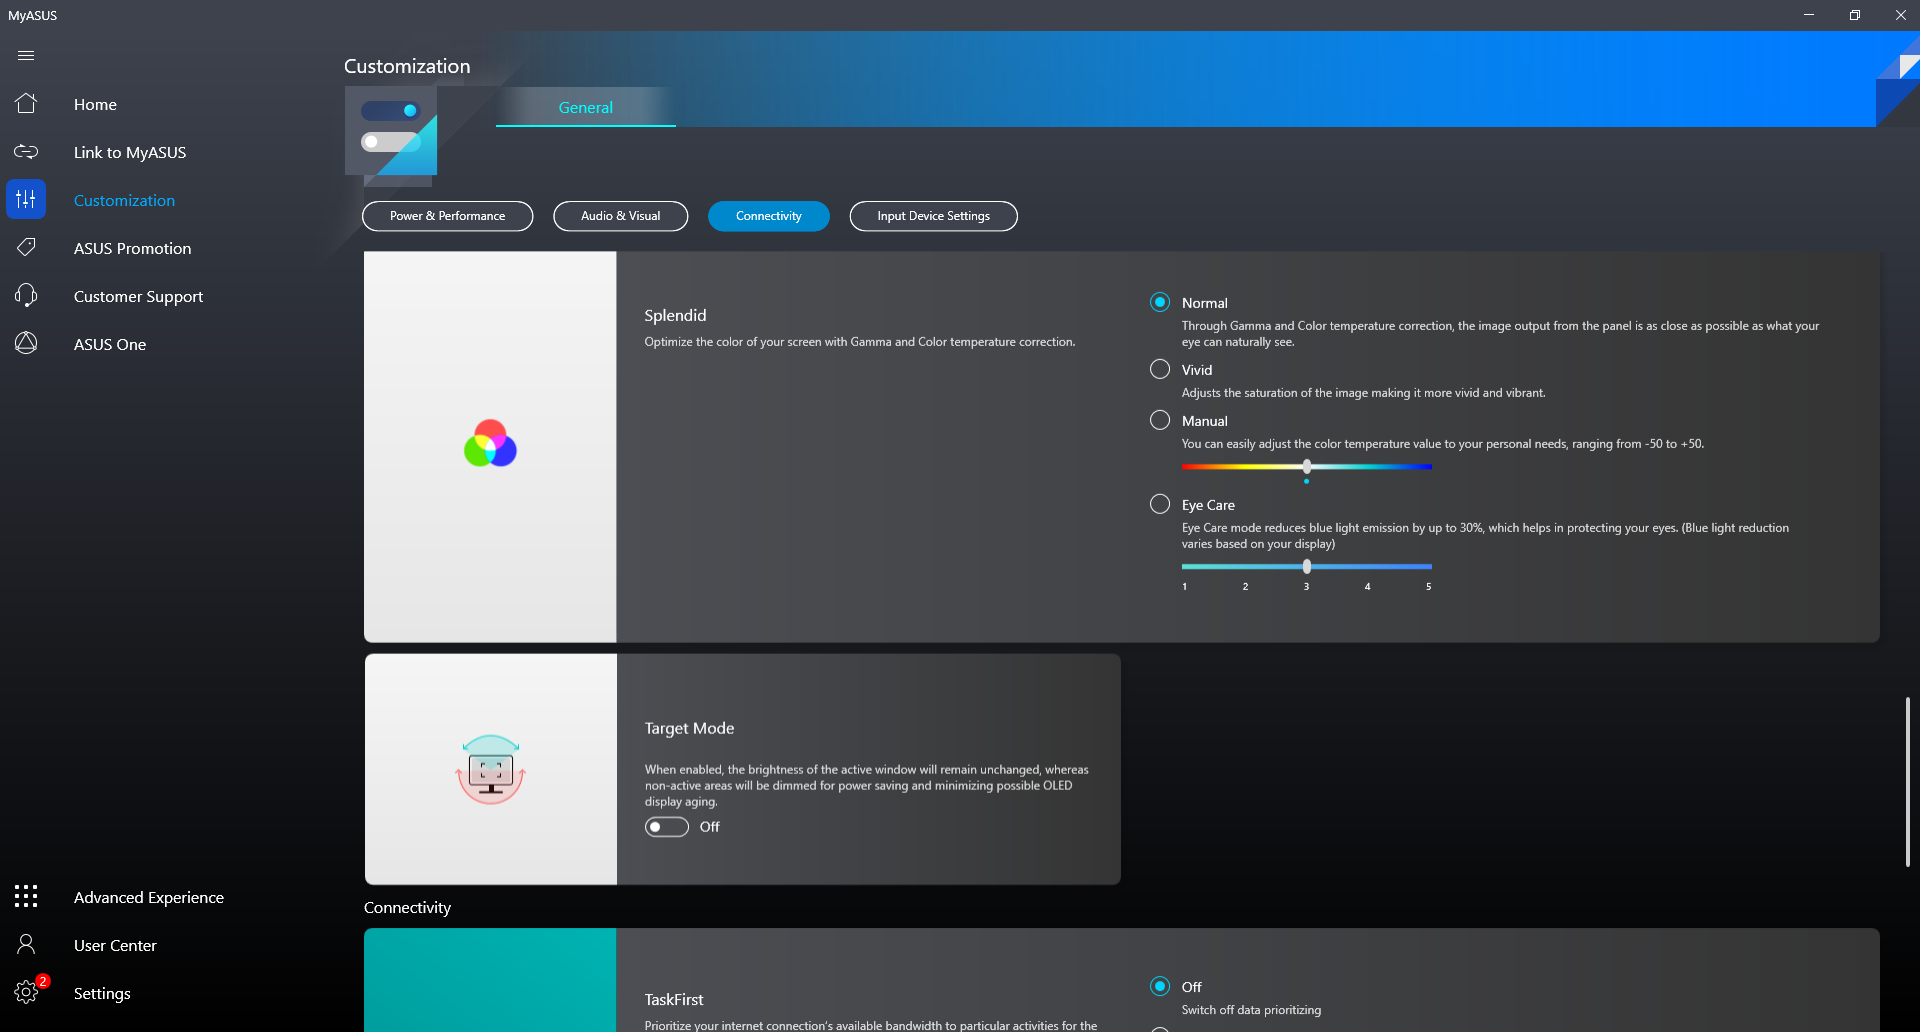
L'écran est réglé par défaut sur sRGB, même si le panneau est capable de reproduire DCI-P3. Tenter de corriger cela via MyAsus ou Windows ne semble pas avoir d'effet sur le profil de couleur.
Temps de réponse de l'écran
| ↔ Temps de réponse noir à blanc | ||
|---|---|---|
| 2.3 ms ... hausse ↗ et chute ↘ combinées | ↗ 1.1 ms hausse | 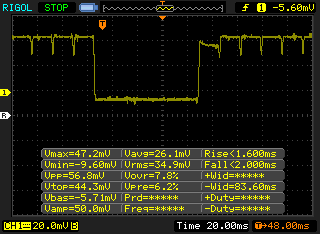 |
| ↘ 1.2 ms chute | ||
| L'écran montre de très faibles temps de réponse, parfait pour le jeu. En comparaison, tous les appareils testés affichent entre 0.1 (minimum) et 240 (maximum) ms. » 12 % des appareils testés affichent de meilleures performances. Cela signifie que les latences relevées sont meilleures que la moyenne (19.9 ms) de tous les appareils testés. | ||
| ↔ Temps de réponse gris 50% à gris 80% | ||
| 2.1 ms ... hausse ↗ et chute ↘ combinées | ↗ 1 ms hausse | 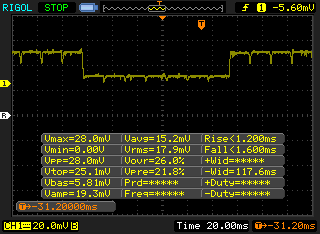 |
| ↘ 1.1 ms chute | ||
| L'écran montre de très faibles temps de réponse, parfait pour le jeu. En comparaison, tous les appareils testés affichent entre 0.165 (minimum) et 636 (maximum) ms. » 11 % des appareils testés affichent de meilleures performances. Cela signifie que les latences relevées sont meilleures que la moyenne (31.1 ms) de tous les appareils testés. | ||
Scintillement / MLI (Modulation de largeur d'impulsion)
| Scintillement / MLI (Modulation de largeur d'impulsion) décelé | 60.2 Hz | 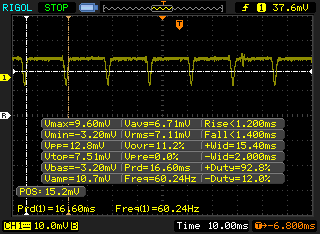 | |
Le rétroéclairage de l'écran scintille à la fréquence de 60.2 Hz (certainement du fait de l'utilisation d'une MDI - Modulation de largeur d'impulsion) . La fréquence de rafraîchissement de 60.2 Hz est extrêmement faible, de grands risques de fatigue oculaire accrue et de maux de tête en cas d'utilisation prolongée. En comparaison, 52 % des appareils testés n'emploient pas MDI pour assombrir leur écran. Nous avons relevé une moyenne à 7798 (minimum : 5 - maximum : 343500) Hz dans le cas où une MDI était active. | |||
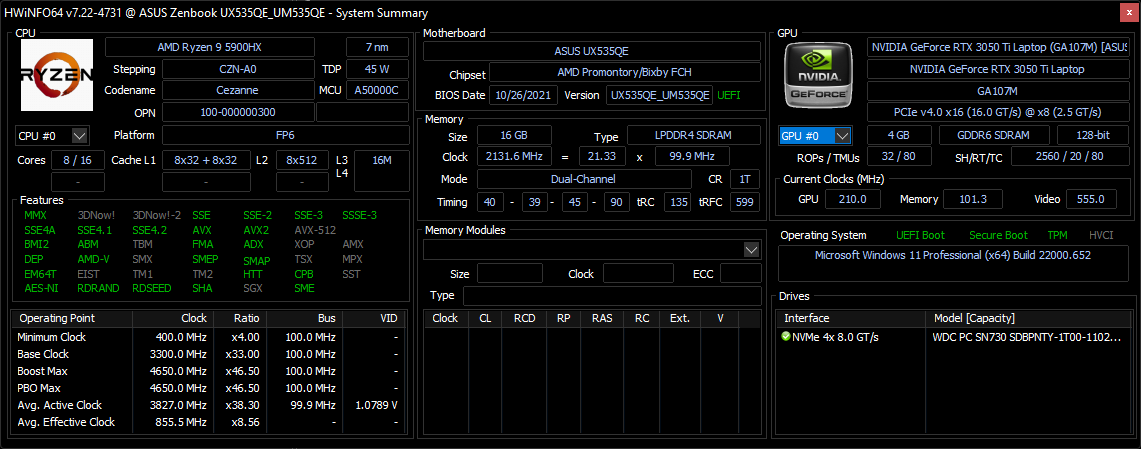
Performances - Zen 3 Ryzen 9 est toujours de premier ordre
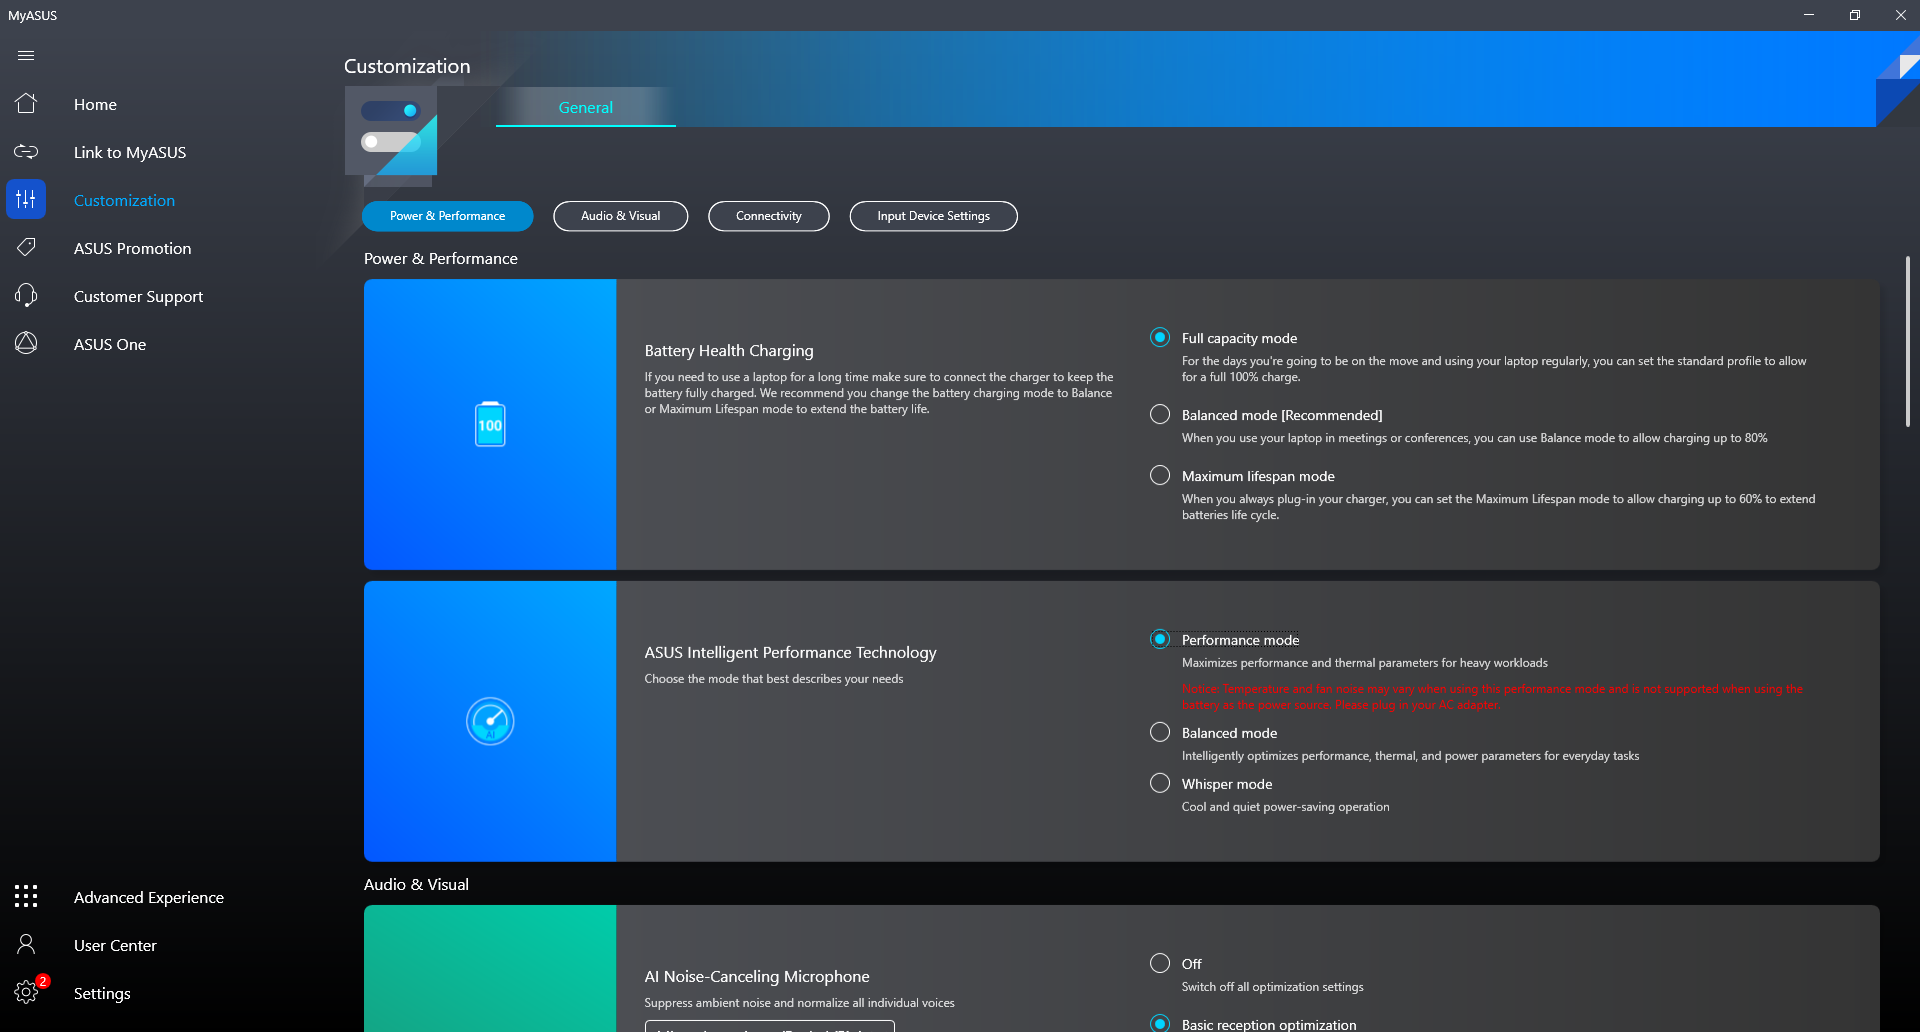
Conditions d'essai
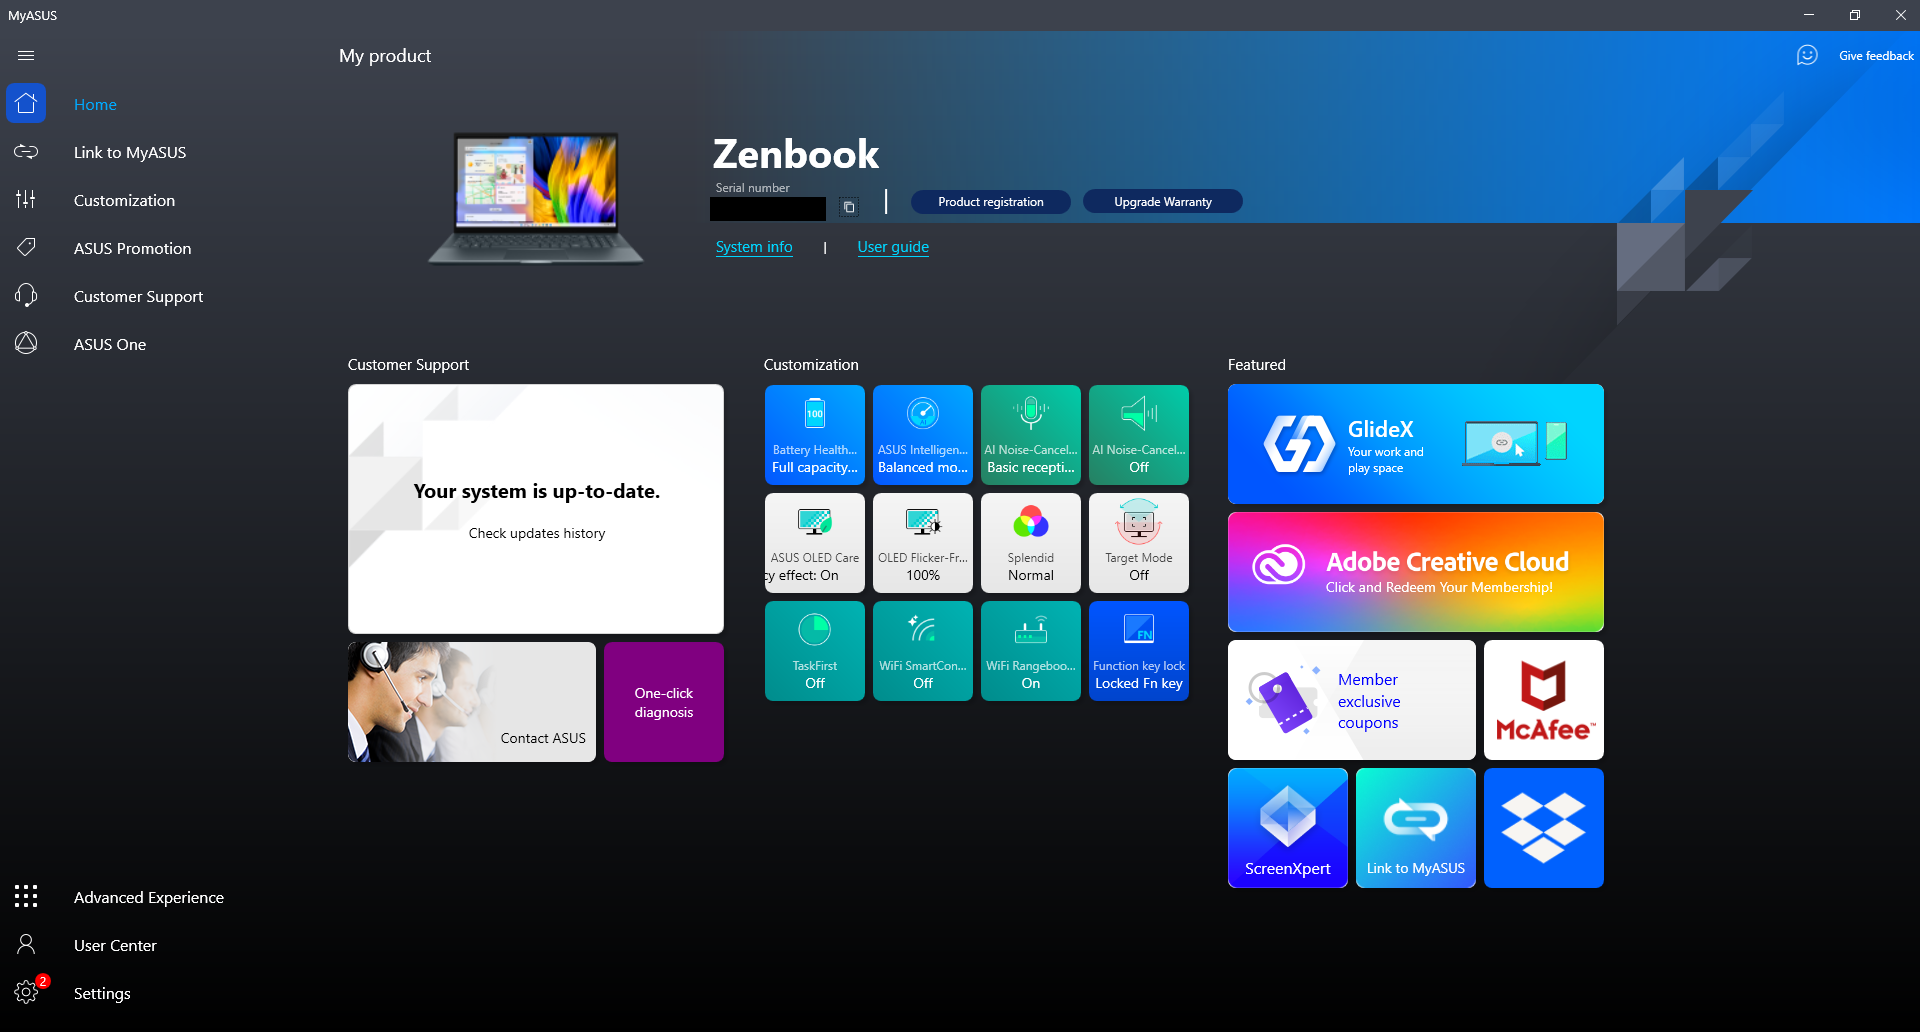
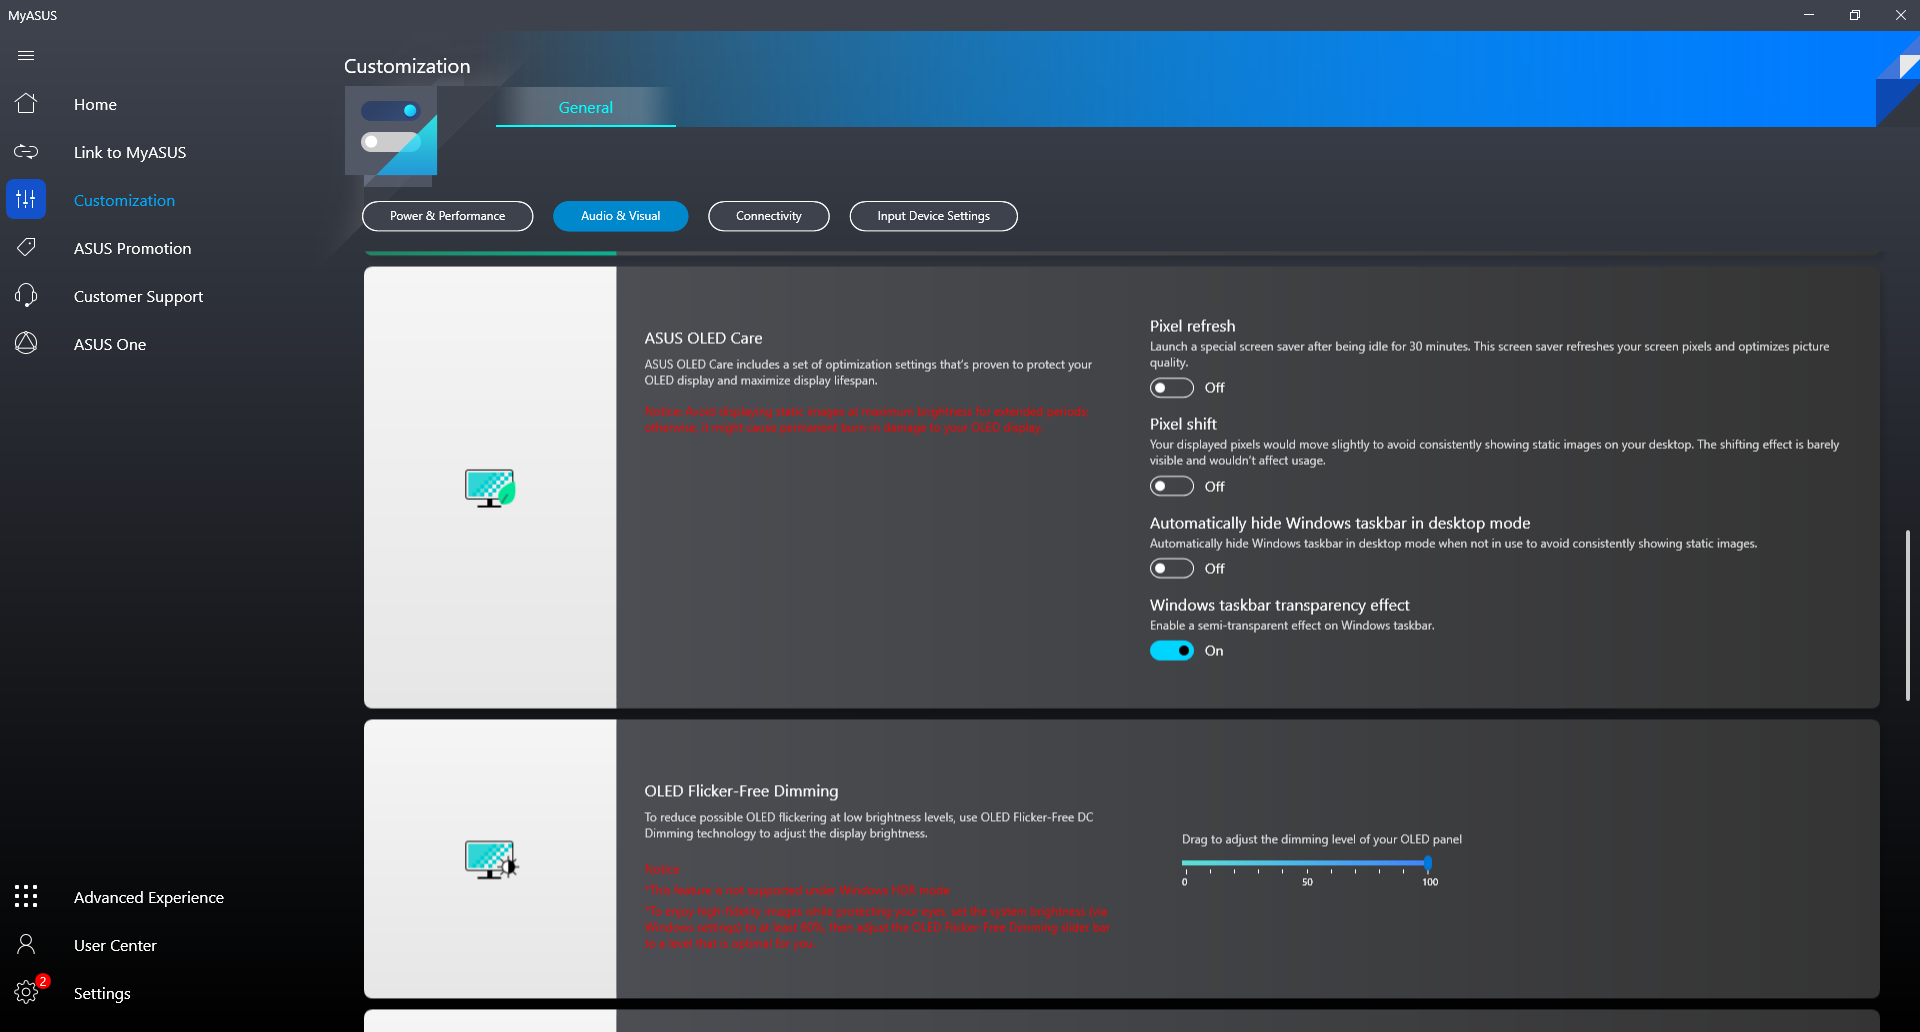
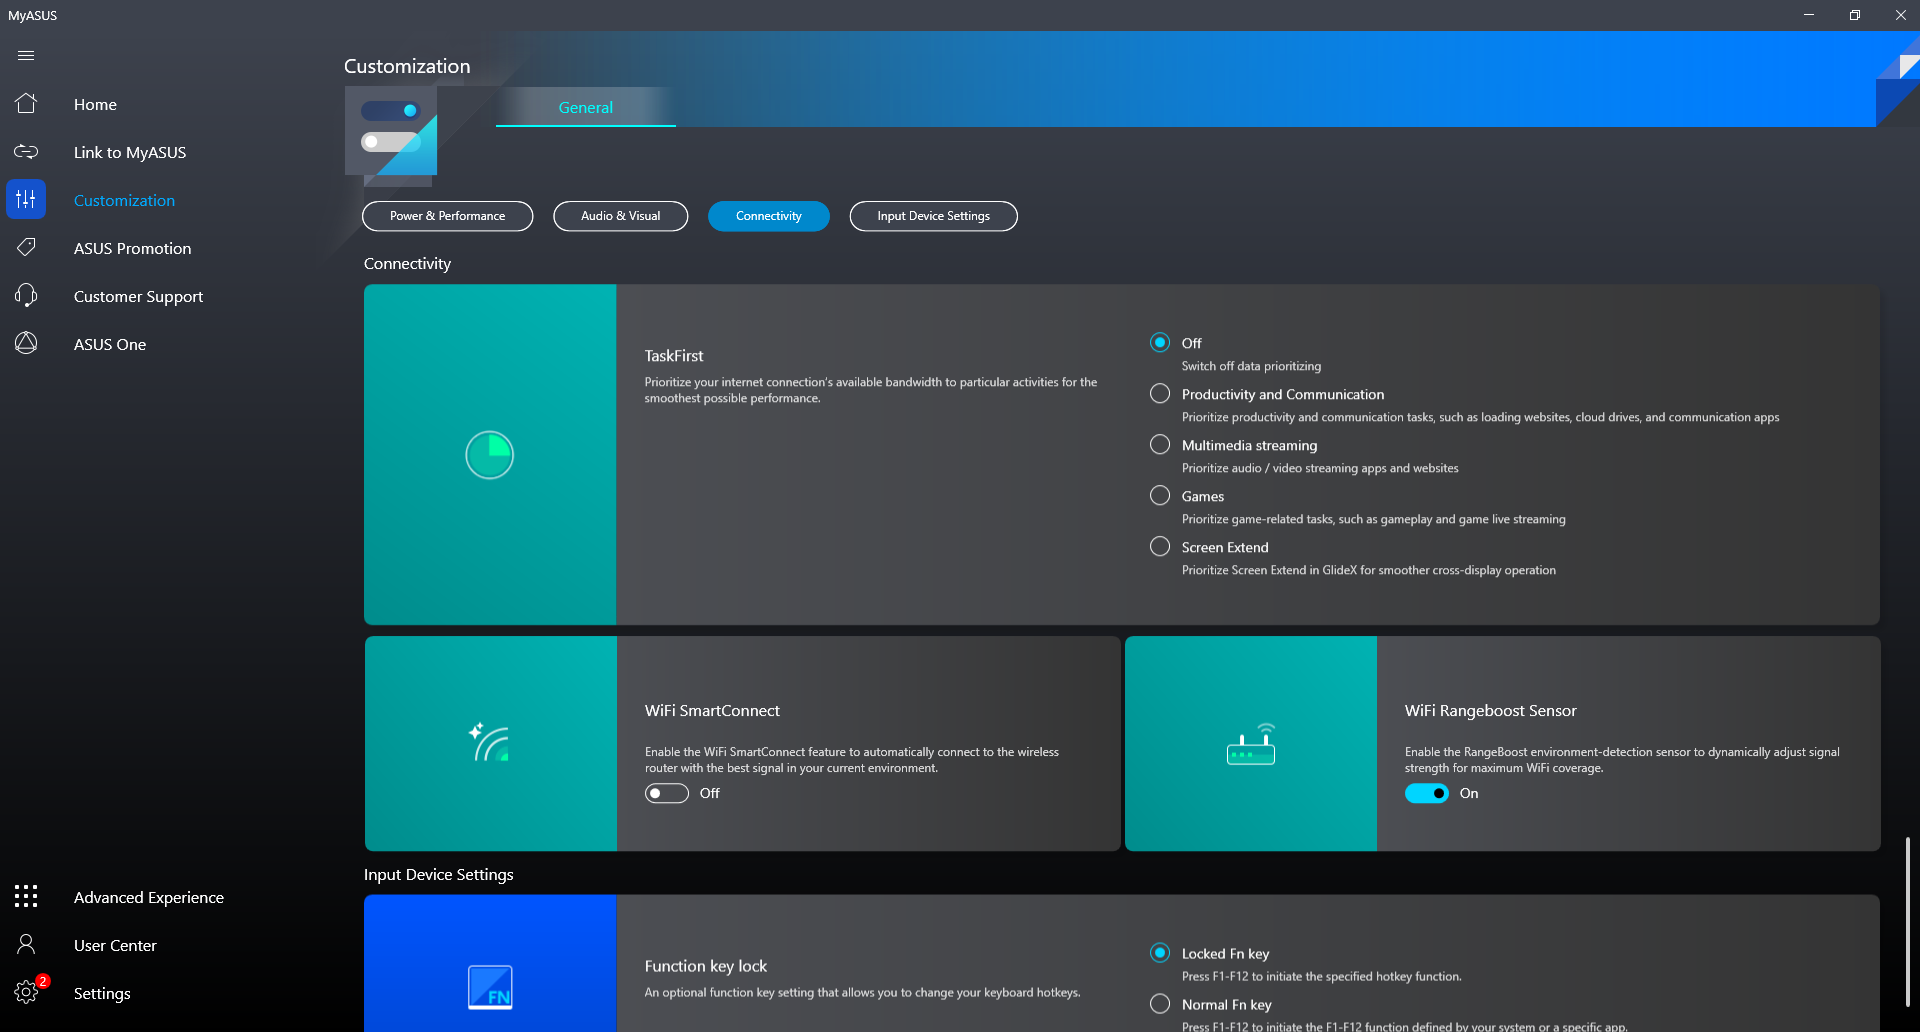
Notre appareil a été réglé en mode Performance via Windows et le logiciel MyAsus avant d'effectuer les tests ci-dessous pour obtenir les meilleurs résultats possibles. Il est fortement recommandé aux utilisateurs de se familiariser avec le logiciel MyAsus car les fonctions clés liées à la batterie, aux performances, aux couleurs et au WiFi sont toutes basculées ici.
Optimus 1.0 est fourni en standard pour la commutation automatique entre le CPU et le GPU Nvidia. Comme prévu, il n'y a pas de commutateur MUX ou de support G-Sync interne puisque le Zenbook Pro 15 n'est pas une machine de jeu.
Processeur
Les performances et la durabilité du CPU sont toutes deux excellentes et là où nous nous attendons à ce qu'elles soient par rapport aux autres ordinateurs portables équipés du même Ryzen 9 5900HX. Les performances globales ne sont que de 5 à 15 % inférieures à celles du tout nouveau Zen 3+ Ryzen 9 6900HX, de sorte que les utilisateurs ne manqueront pas grand-chose en optant pour l'ancien 5900HX. Le Core i7-12800H concurrent est environ 25 % plus lent en termes de performances brutes multithread.
Cinebench R15 Multi Loop
Cinebench R23: Multi Core | Single Core
Cinebench R15: CPU Multi 64Bit | CPU Single 64Bit
Blender: v2.79 BMW27 CPU
7-Zip 18.03: 7z b 4 | 7z b 4 -mmt1
Geekbench 5.5: Multi-Core | Single-Core
HWBOT x265 Benchmark v2.2: 4k Preset
LibreOffice : 20 Documents To PDF
R Benchmark 2.5: Overall mean
* ... Moindre est la valeur, meilleures sont les performances
AIDA64: FP32 Ray-Trace | FPU Julia | CPU SHA3 | CPU Queen | FPU SinJulia | FPU Mandel | CPU AES | CPU ZLib | FP64 Ray-Trace | CPU PhotoWorxx
| Performance rating | |
| Asus Zenbook Pro 15 OLED UM535Q | |
| Moyenne AMD Ryzen 9 5900HX | |
| Lenovo Yoga Creator 7 15IMH05 82DS000VGE | |
| Dell XPS 15 9510 11800H RTX 3050 Ti OLED -9! | |
| AIDA64 / FP32 Ray-Trace | |
| Asus Zenbook Pro 15 OLED UM535Q | |
| Moyenne AMD Ryzen 9 5900HX (12470 - 16014, n=26) | |
| Lenovo Yoga Creator 7 15IMH05 82DS000VGE | |
| AIDA64 / FPU Julia | |
| Asus Zenbook Pro 15 OLED UM535Q | |
| Moyenne AMD Ryzen 9 5900HX (79554 - 101008, n=26) | |
| Lenovo Yoga Creator 7 15IMH05 82DS000VGE | |
| AIDA64 / CPU SHA3 | |
| Asus Zenbook Pro 15 OLED UM535Q | |
| Moyenne AMD Ryzen 9 5900HX (2754 - 3444, n=26) | |
| Lenovo Yoga Creator 7 15IMH05 82DS000VGE | |
| AIDA64 / CPU Queen | |
| Asus Zenbook Pro 15 OLED UM535Q | |
| Moyenne AMD Ryzen 9 5900HX (87865 - 105123, n=26) | |
| Lenovo Yoga Creator 7 15IMH05 82DS000VGE | |
| AIDA64 / FPU SinJulia | |
| Asus Zenbook Pro 15 OLED UM535Q | |
| Moyenne AMD Ryzen 9 5900HX (10899 - 12806, n=26) | |
| Lenovo Yoga Creator 7 15IMH05 82DS000VGE | |
| AIDA64 / FPU Mandel | |
| Asus Zenbook Pro 15 OLED UM535Q | |
| Moyenne AMD Ryzen 9 5900HX (43685 - 55702, n=26) | |
| Lenovo Yoga Creator 7 15IMH05 82DS000VGE | |
| AIDA64 / CPU AES | |
| Asus Zenbook Pro 15 OLED UM535Q | |
| Moyenne AMD Ryzen 9 5900HX (109927 - 137901, n=26) | |
| Lenovo Yoga Creator 7 15IMH05 82DS000VGE | |
| AIDA64 / CPU ZLib | |
| Asus Zenbook Pro 15 OLED UM535Q | |
| Moyenne AMD Ryzen 9 5900HX (706 - 878, n=26) | |
| Lenovo Yoga Creator 7 15IMH05 82DS000VGE | |
| Dell XPS 15 9510 11800H RTX 3050 Ti OLED | |
| AIDA64 / FP64 Ray-Trace | |
| Asus Zenbook Pro 15 OLED UM535Q | |
| Moyenne AMD Ryzen 9 5900HX (6664 - 8644, n=26) | |
| Lenovo Yoga Creator 7 15IMH05 82DS000VGE | |
| AIDA64 / CPU PhotoWorxx | |
| Lenovo Yoga Creator 7 15IMH05 82DS000VGE | |
| Asus Zenbook Pro 15 OLED UM535Q | |
| Moyenne AMD Ryzen 9 5900HX (14344 - 25533, n=26) | |
Performance du système
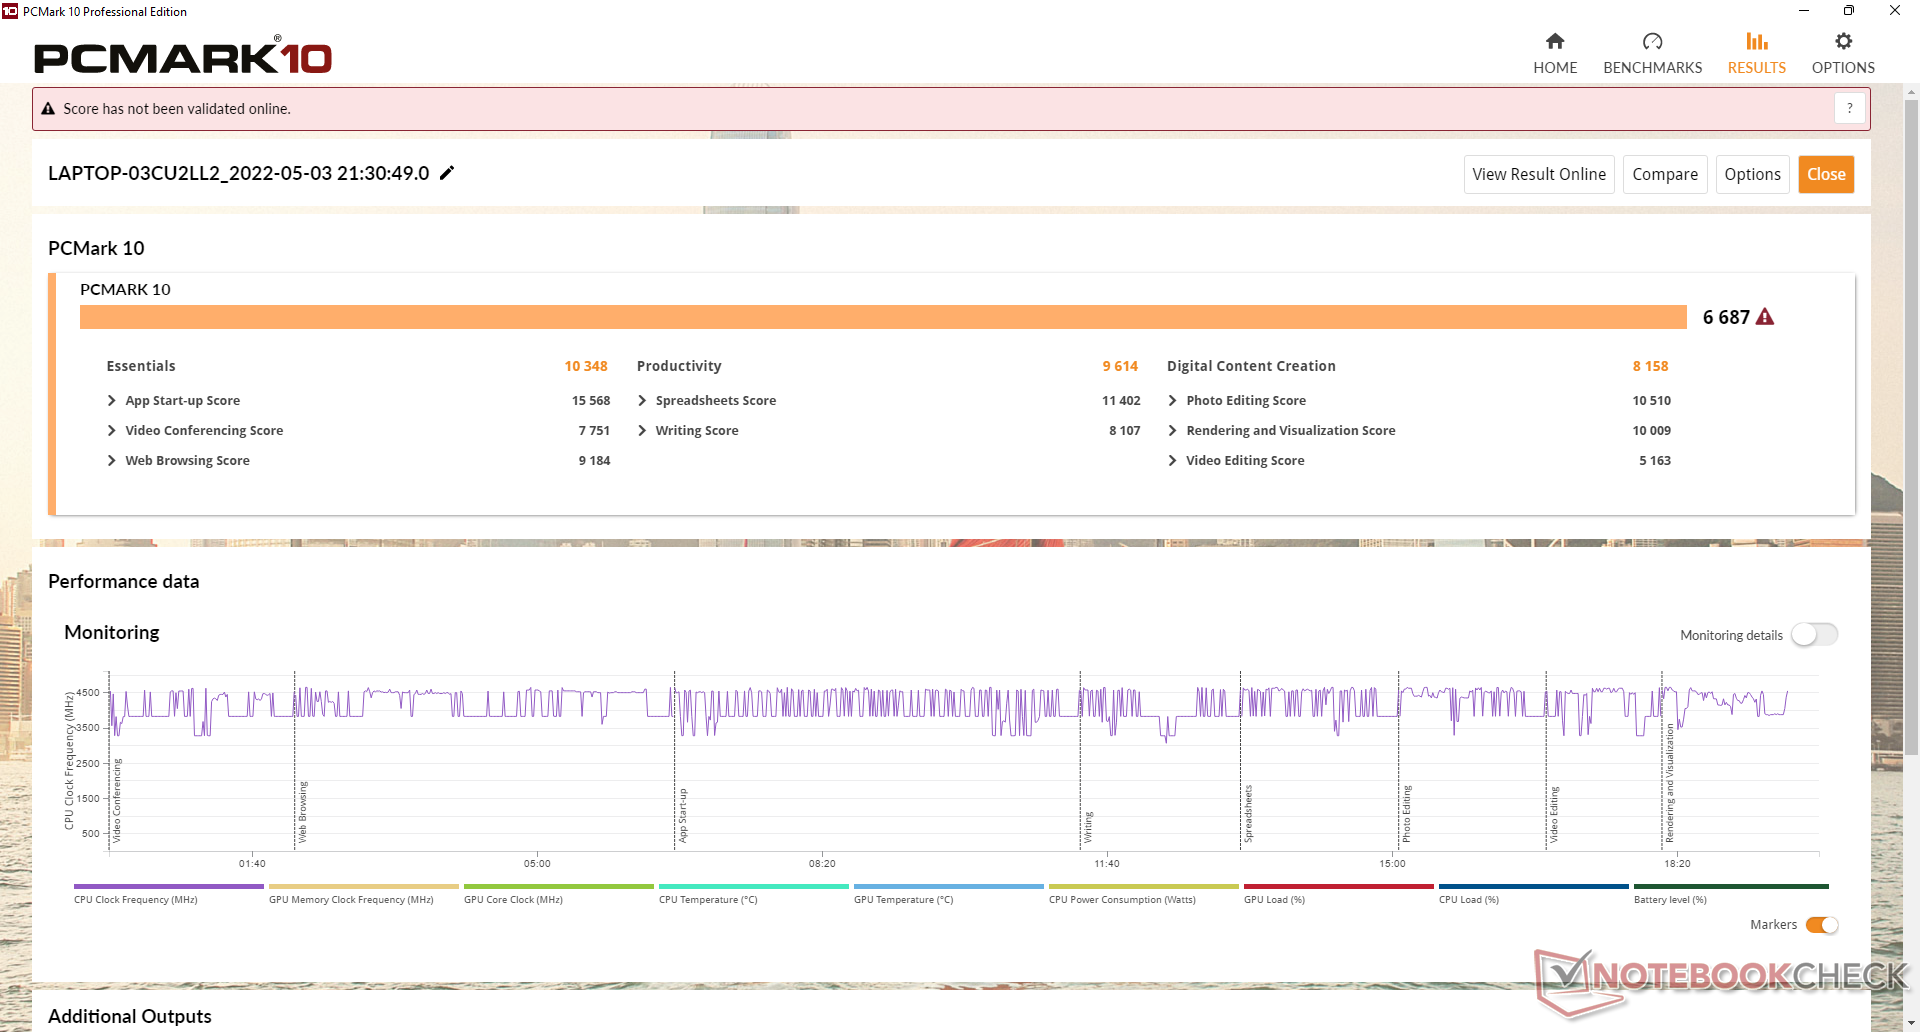
Les scores PCMark 10 sont systématiquement plus élevés que sur l'ancien 2020 UX535 en raison de l'augmentation significative des performances du CPU et du GPU. Nous n'avons rencontré aucun problème logiciel lors de notre passage sur l'unité de test, à l'exception de l'espace couleur par défaut plus étroit que prévu.
CrossMark: Overall | Productivity | Creativity | Responsiveness
| PCMark 10 / Score | |
| Asus Zenbook Pro 15 OLED UM535Q | |
| Moyenne AMD Ryzen 9 5900HX, NVIDIA GeForce RTX 3050 Ti Laptop GPU (6592 - 6687, n=2) | |
| Dell XPS 15 9510 11800H RTX 3050 Ti OLED | |
| HP Envy 15-ep0098nr | |
| Lenovo Yoga Creator 7 15IMH05 82DS000VGE | |
| Asus ZenBook UX535-M01440 | |
| Asus ZenBook 15 UX534FTC-A8190T | |
| PCMark 10 / Essentials | |
| Moyenne AMD Ryzen 9 5900HX, NVIDIA GeForce RTX 3050 Ti Laptop GPU (10348 - 10491, n=2) | |
| Asus Zenbook Pro 15 OLED UM535Q | |
| Dell XPS 15 9510 11800H RTX 3050 Ti OLED | |
| HP Envy 15-ep0098nr | |
| Lenovo Yoga Creator 7 15IMH05 82DS000VGE | |
| Asus ZenBook UX535-M01440 | |
| Asus ZenBook 15 UX534FTC-A8190T | |
| PCMark 10 / Productivity | |
| Moyenne AMD Ryzen 9 5900HX, NVIDIA GeForce RTX 3050 Ti Laptop GPU (9614 - 9665, n=2) | |
| Asus Zenbook Pro 15 OLED UM535Q | |
| Dell XPS 15 9510 11800H RTX 3050 Ti OLED | |
| HP Envy 15-ep0098nr | |
| Lenovo Yoga Creator 7 15IMH05 82DS000VGE | |
| Asus ZenBook 15 UX534FTC-A8190T | |
| Asus ZenBook UX535-M01440 | |
| PCMark 10 / Digital Content Creation | |
| Asus Zenbook Pro 15 OLED UM535Q | |
| Moyenne AMD Ryzen 9 5900HX, NVIDIA GeForce RTX 3050 Ti Laptop GPU (7667 - 8158, n=2) | |
| Dell XPS 15 9510 11800H RTX 3050 Ti OLED | |
| HP Envy 15-ep0098nr | |
| Lenovo Yoga Creator 7 15IMH05 82DS000VGE | |
| Asus ZenBook UX535-M01440 | |
| Asus ZenBook 15 UX534FTC-A8190T | |
| CrossMark / Overall | |
| Asus Zenbook Pro 15 OLED UM535Q | |
| Moyenne AMD Ryzen 9 5900HX, NVIDIA GeForce RTX 3050 Ti Laptop GPU (n=1) | |
| CrossMark / Productivity | |
| Asus Zenbook Pro 15 OLED UM535Q | |
| Moyenne AMD Ryzen 9 5900HX, NVIDIA GeForce RTX 3050 Ti Laptop GPU (n=1) | |
| CrossMark / Creativity | |
| Asus Zenbook Pro 15 OLED UM535Q | |
| Moyenne AMD Ryzen 9 5900HX, NVIDIA GeForce RTX 3050 Ti Laptop GPU (n=1) | |
| CrossMark / Responsiveness | |
| Asus Zenbook Pro 15 OLED UM535Q | |
| Moyenne AMD Ryzen 9 5900HX, NVIDIA GeForce RTX 3050 Ti Laptop GPU (n=1) | |
| PCMark 10 Score | 6687 points | |
Aide | ||
| AIDA64 / Memory Copy | |
| Asus Zenbook Pro 15 OLED UM535Q | |
| Moyenne AMD Ryzen 9 5900HX (36725 - 43318, n=26) | |
| Lenovo Yoga Creator 7 15IMH05 82DS000VGE | |
| AIDA64 / Memory Read | |
| Moyenne AMD Ryzen 9 5900HX (41378 - 47593, n=26) | |
| Asus Zenbook Pro 15 OLED UM535Q | |
| Lenovo Yoga Creator 7 15IMH05 82DS000VGE | |
| AIDA64 / Memory Write | |
| Asus Zenbook Pro 15 OLED UM535Q | |
| Moyenne AMD Ryzen 9 5900HX (32536 - 46718, n=26) | |
| Lenovo Yoga Creator 7 15IMH05 82DS000VGE | |
| AIDA64 / Memory Latency | |
| Asus Zenbook Pro 15 OLED UM535Q | |
| Moyenne AMD Ryzen 9 5900HX (73.5 - 97.1, n=26) | |
| Lenovo Yoga Creator 7 15IMH05 82DS000VGE | |
| Dell XPS 15 9510 11800H RTX 3050 Ti OLED | |
* ... Moindre est la valeur, meilleures sont les performances
Latence DPC
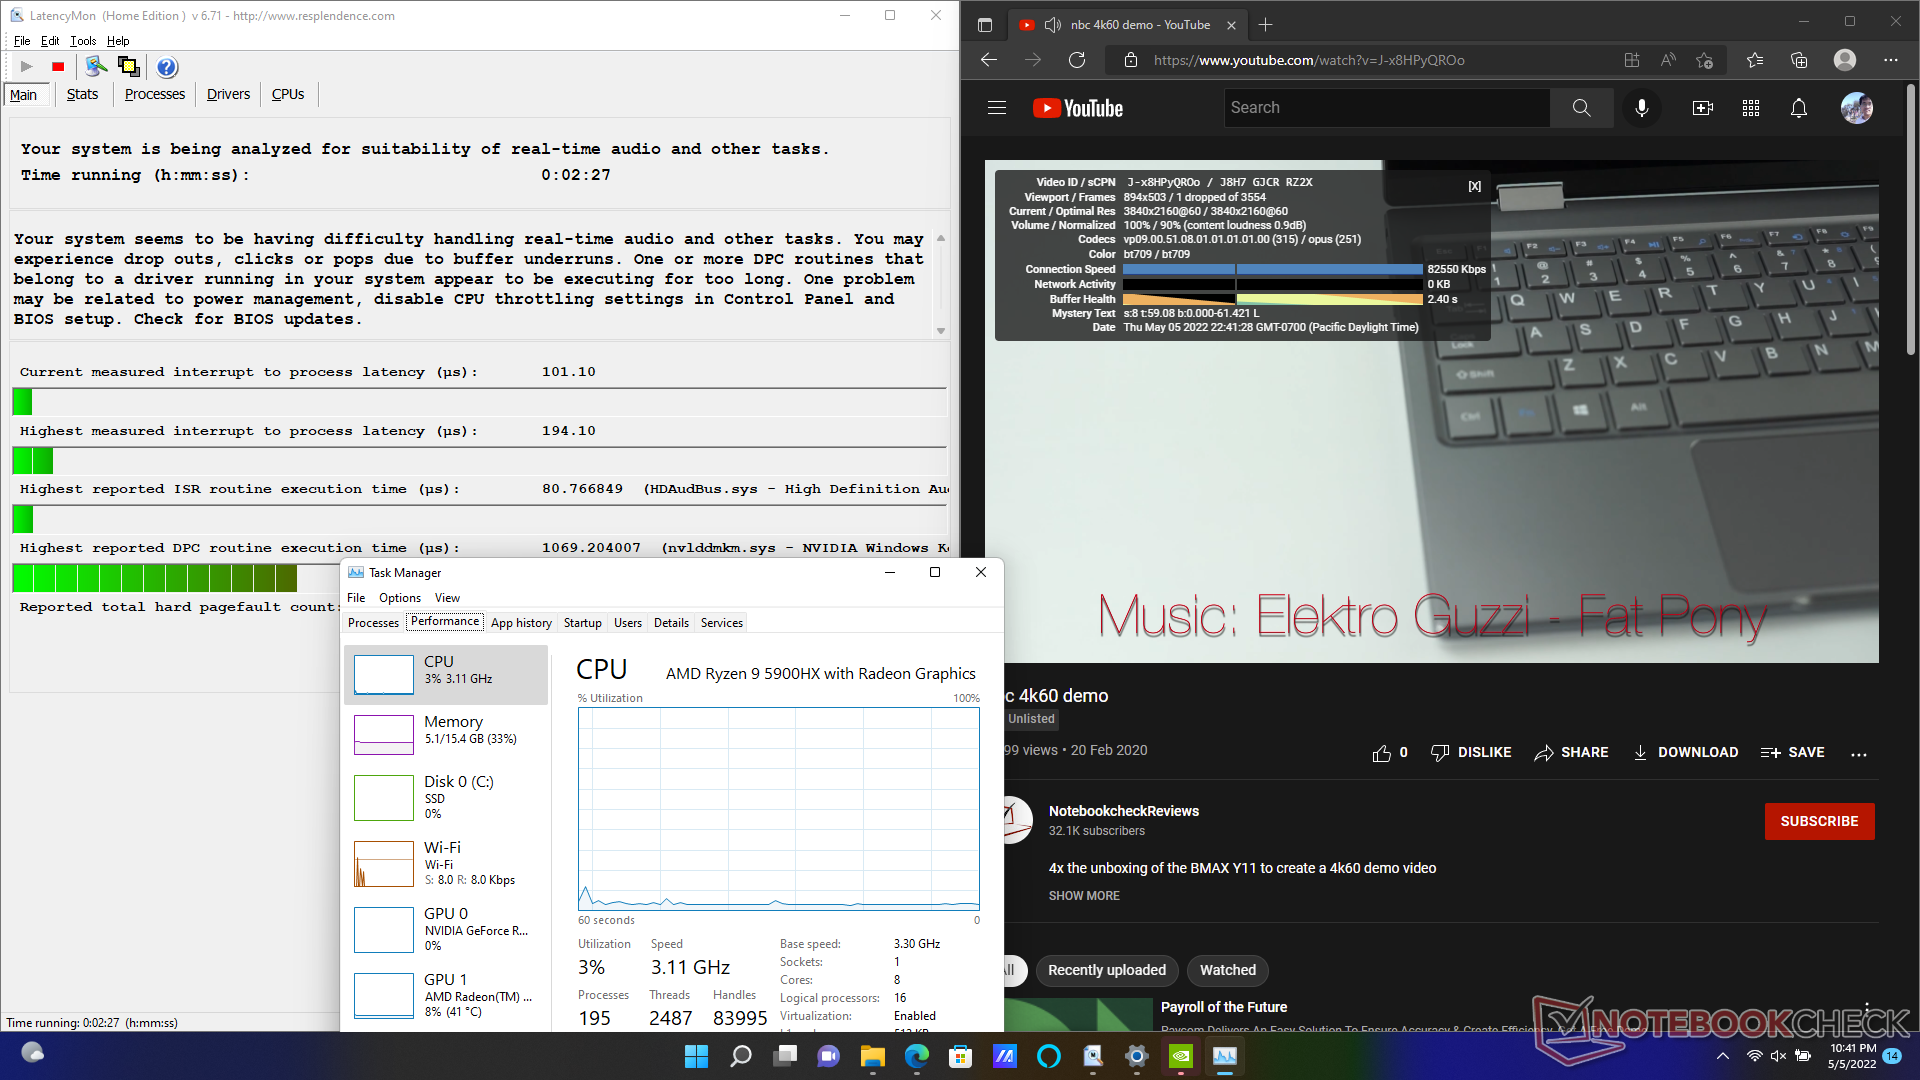
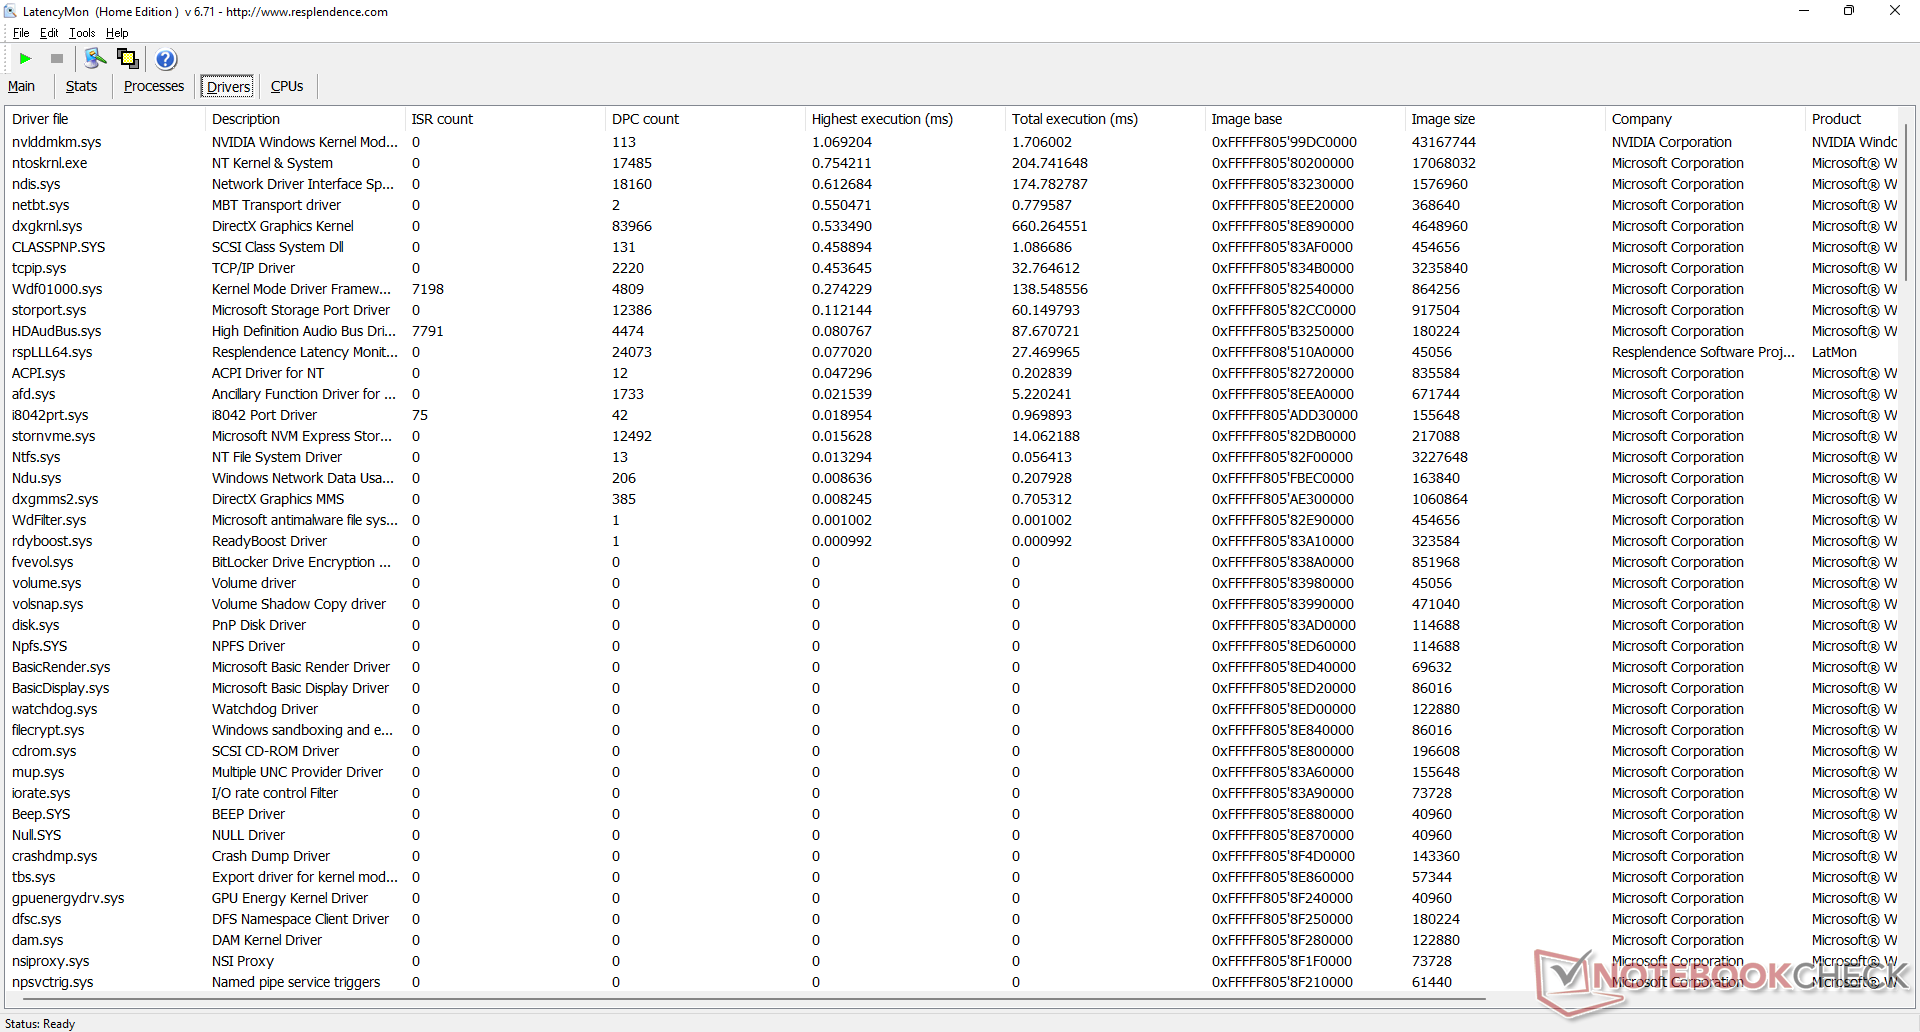
LatencyMon révèle des problèmes mineurs de DPC lors de l'ouverture de plusieurs onglets de navigateur de notre page d'accueil. la lecture de vidéos 4K à 60 FPS est par ailleurs parfaite, avec une seule image perdue pendant notre vidéo de test d'une minute.
| DPC Latencies / LatencyMon - interrupt to process latency (max), Web, Youtube, Prime95 | |
| HP Envy 15-ep0098nr | |
| Dell XPS 15 9510 11800H RTX 3050 Ti OLED | |
| Asus ZenBook UX535-M01440 | |
| Lenovo Yoga Creator 7 15IMH05 82DS000VGE | |
| Asus Zenbook Pro 15 OLED UM535Q | |
* ... Moindre est la valeur, meilleures sont les performances
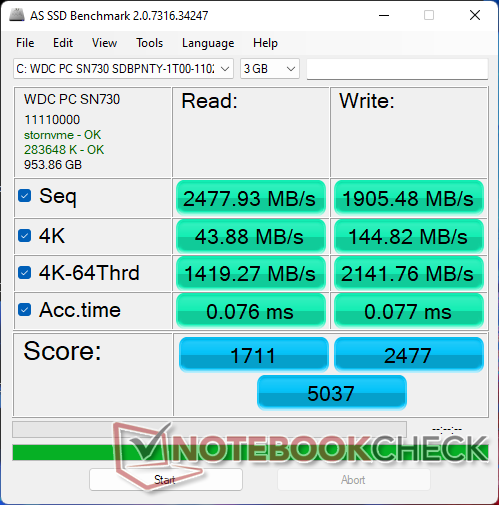
Périphériques de stockage - jusqu'à PCIe3 x4 uniquement
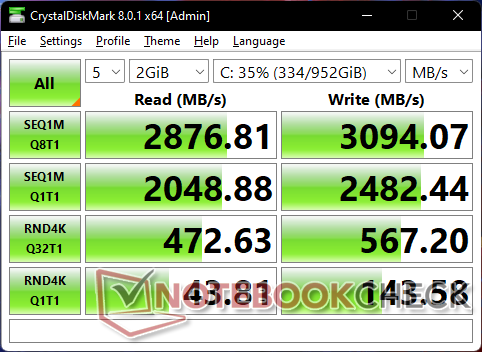
Notre unité de test est équipée d'un disque dur de milieu de gamme de 1 To De milieu de gamme WDC PC SN730 NVMe SSD de milieu de gamme offrant des taux de lecture et d'écriture séquentiels d'environ 2900 Mo/s et 3000 Mo/s, respectivement. Le disque n'a aucun problème à maintenir ses taux de transfert maximums pendant des périodes prolongées lorsque nous exécutons DiskSpd en boucle. Les vitesses PCIe4 ne sont pas prises en charge en raison du chipset Zen 3.

* ... Moindre est la valeur, meilleures sont les performances
Disk Throttling: DiskSpd Read Loop, Queue Depth 8
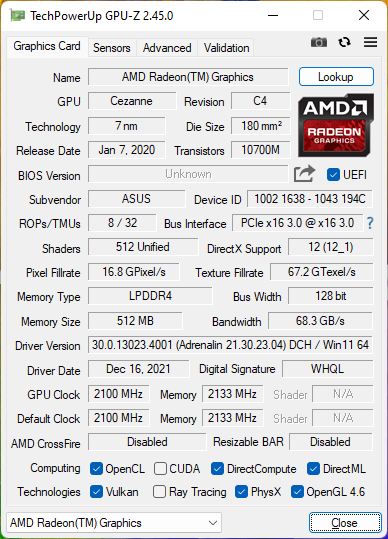
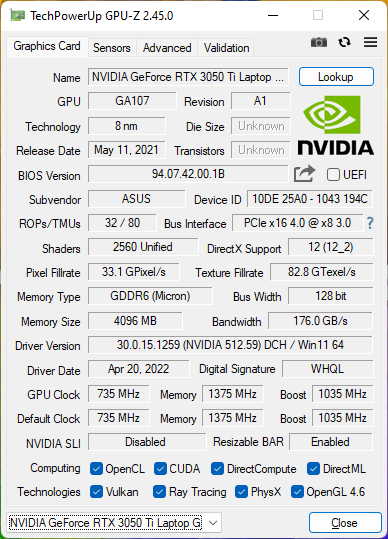
Performances du GPU - La GTX 1660 Ti aurait été meilleure
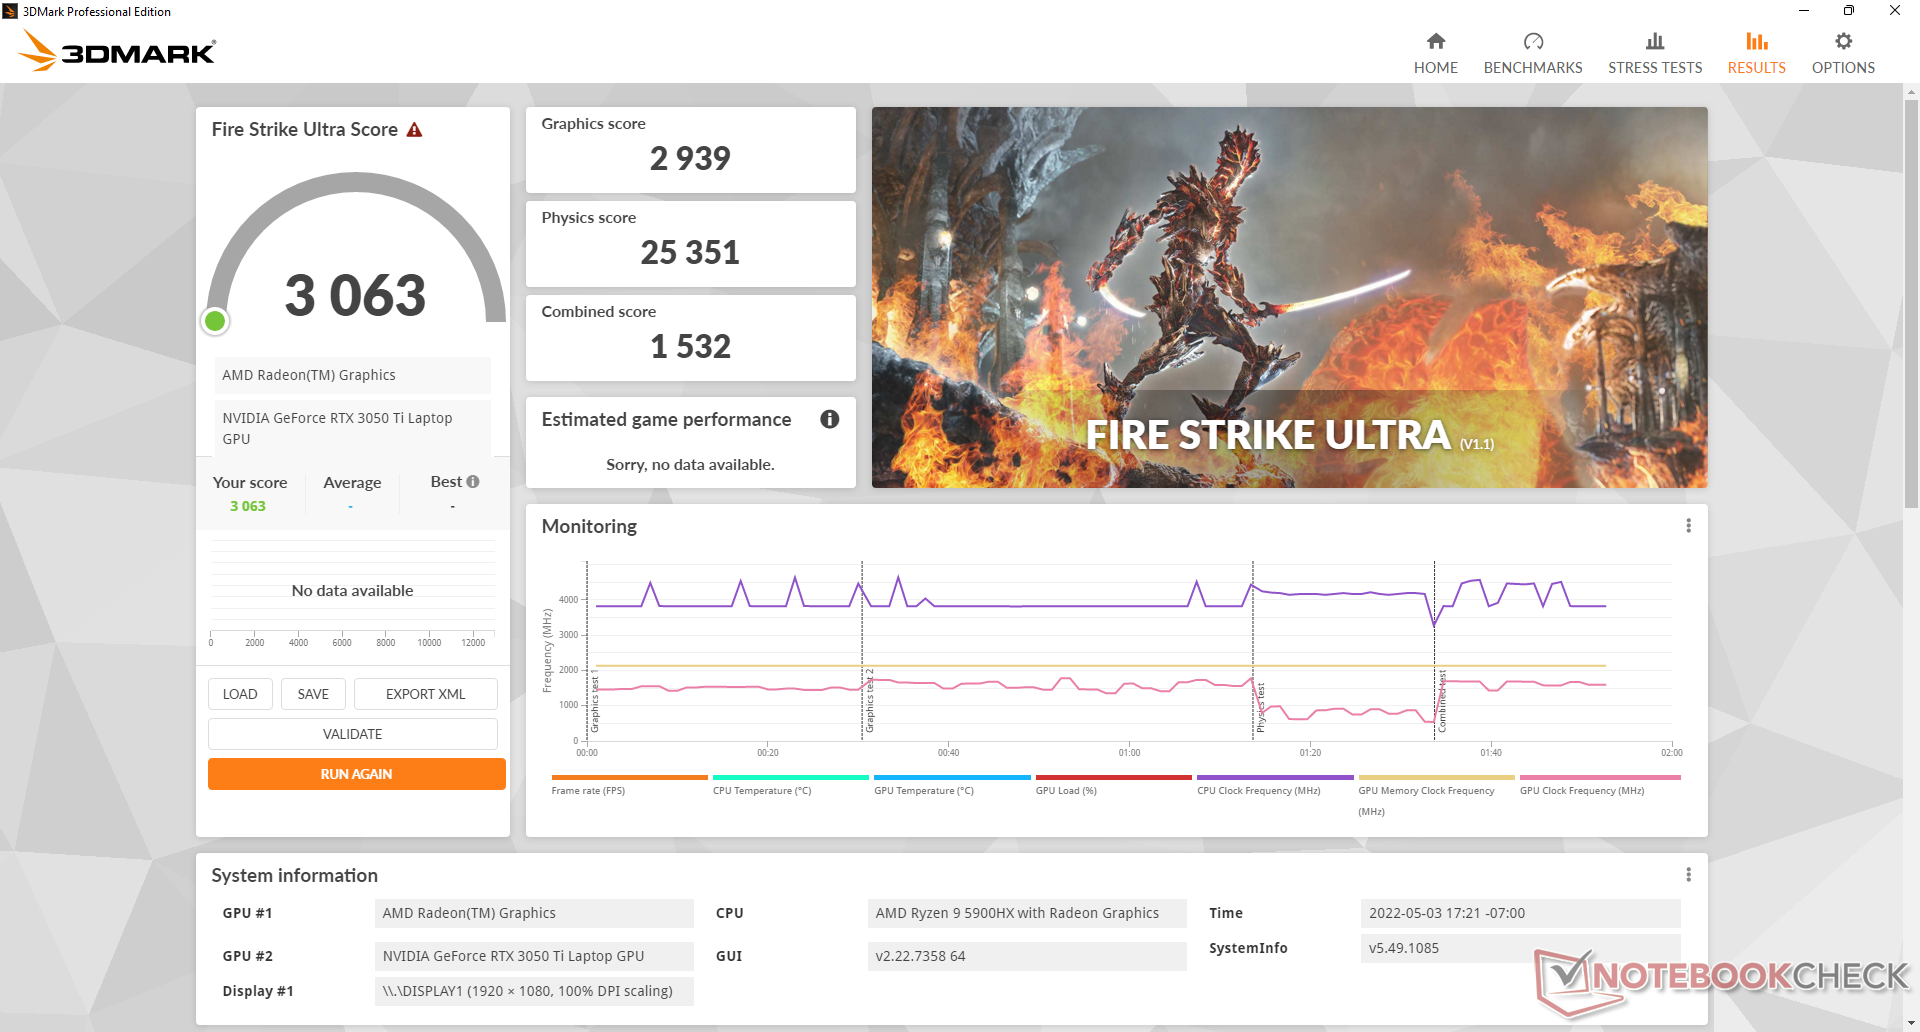
Le site GeForce RTX 3050 Ti est un GPU décevant. Bien qu'il soit nettement plus rapide que le modèle d'entrée de gamme GTX 1650d'entrée de gamme, il n'arrive pas à la cheville du moins cher GTX 1660 Ti moins chère, d'environ 20 %. Ses performances en ray-tracing sont nettement plus lentes que celles de la rTX 2060 mobile déjà lente.
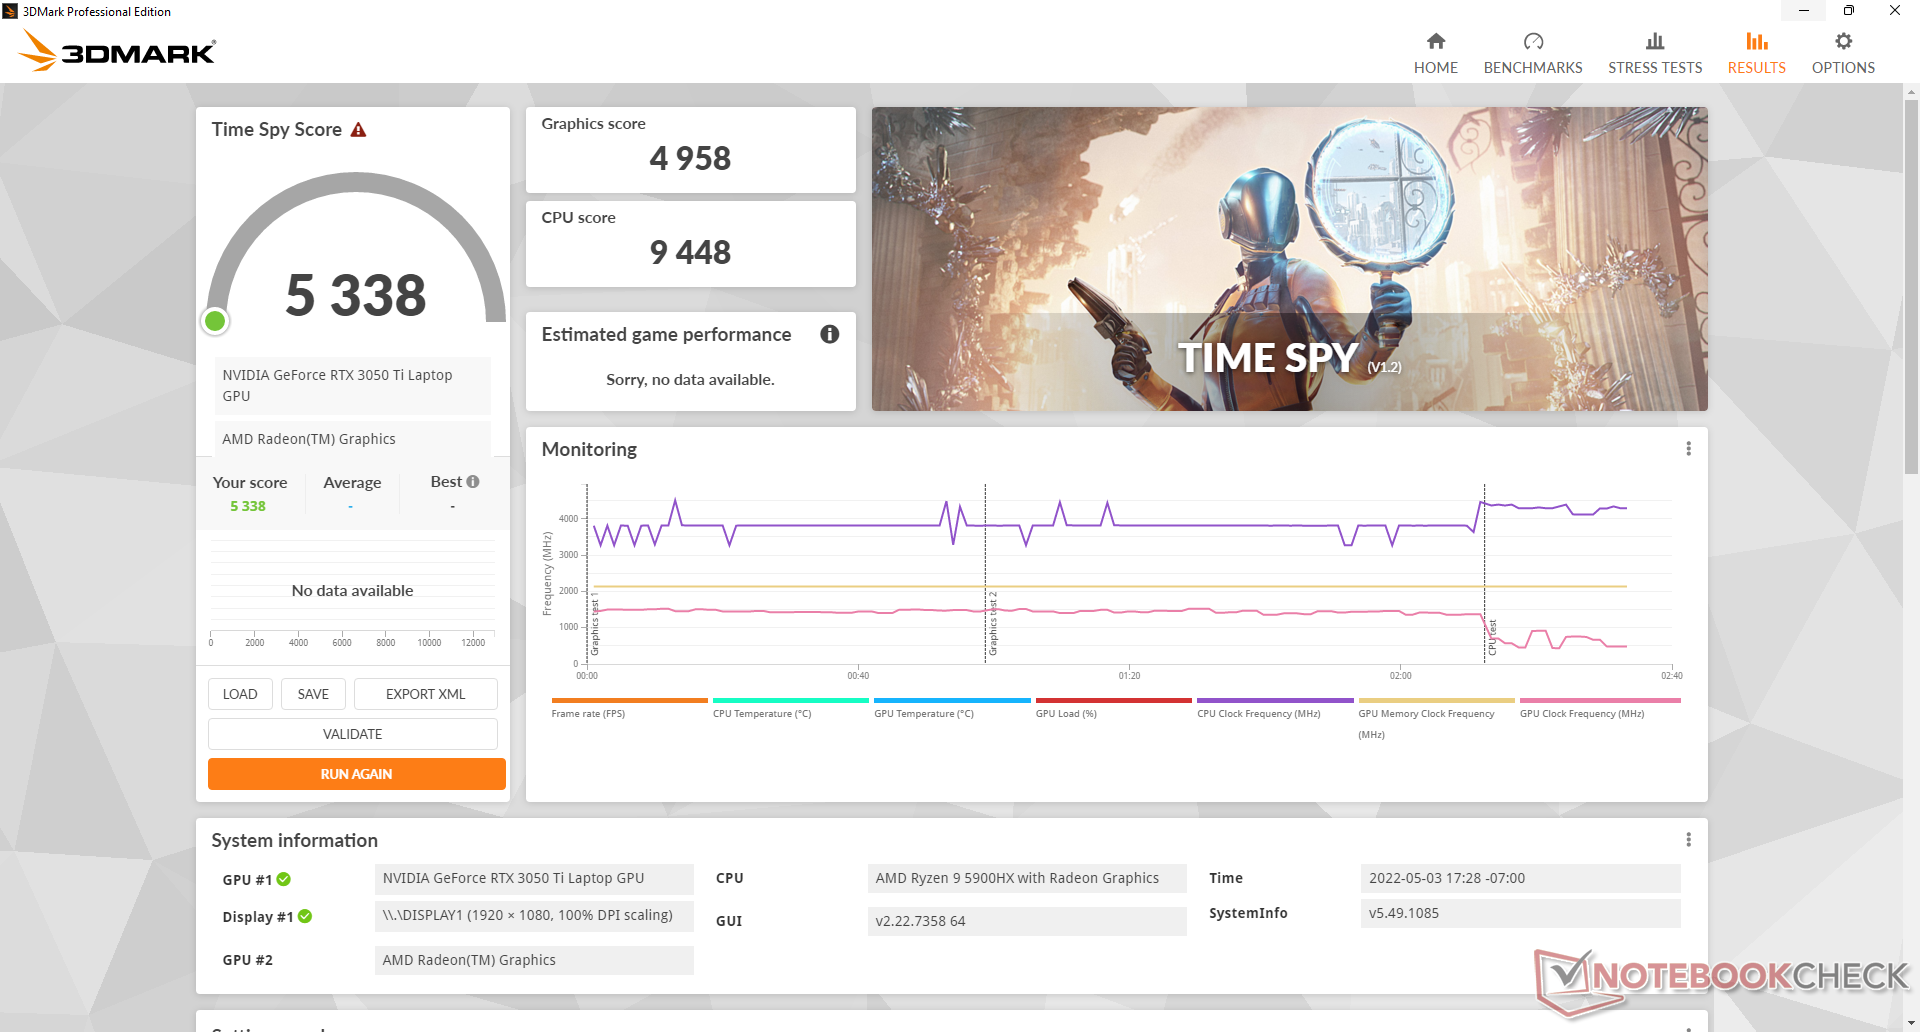
L'exécution en mode équilibré au lieu du mode performance a un impact sur les performances du GPU, tandis que les performances du CPU restent à peu près les mêmes. Un test sur Fire Strike en mode équilibré donnerait un score graphique inférieur de 9 %.
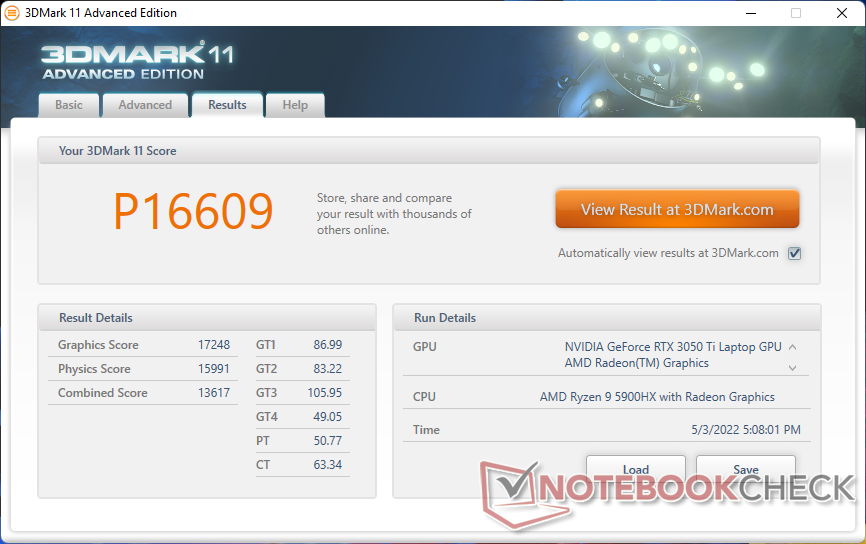
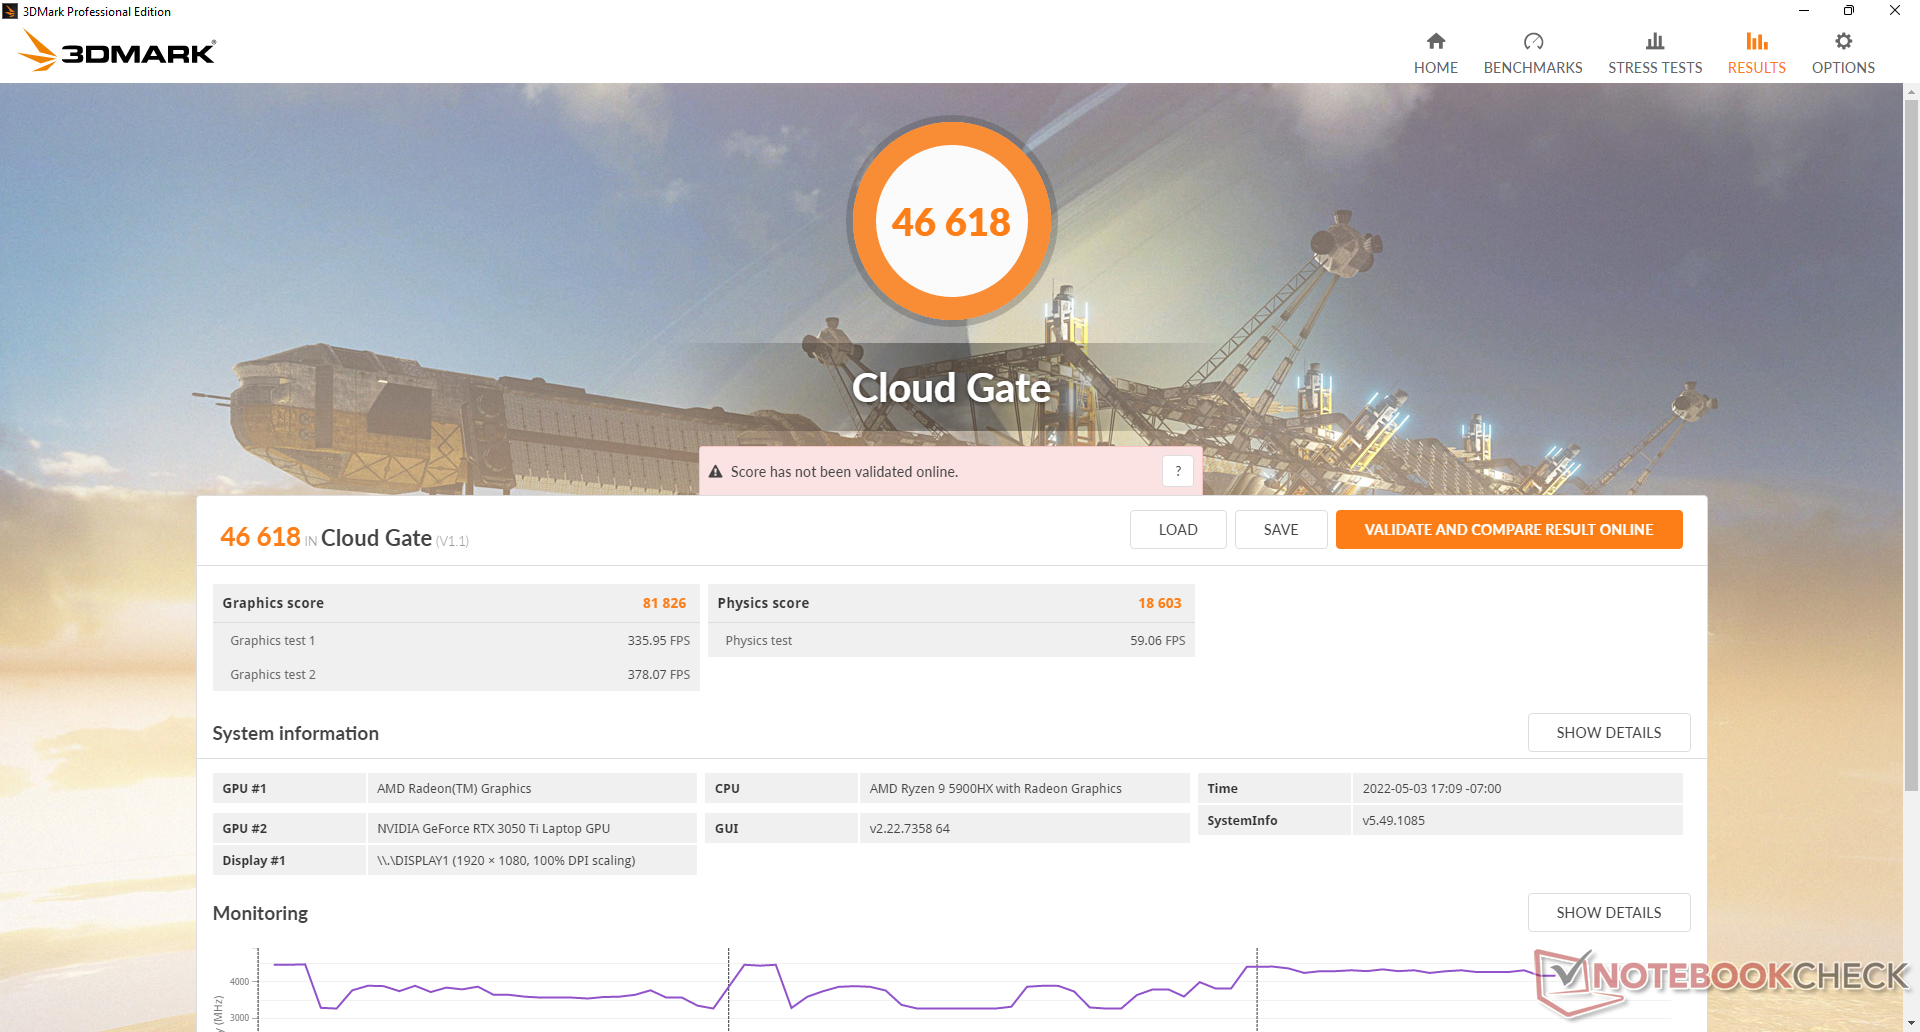

| 3DMark 11 Performance | 16609 points | |
| 3DMark Cloud Gate Standard Score | 46618 points | |
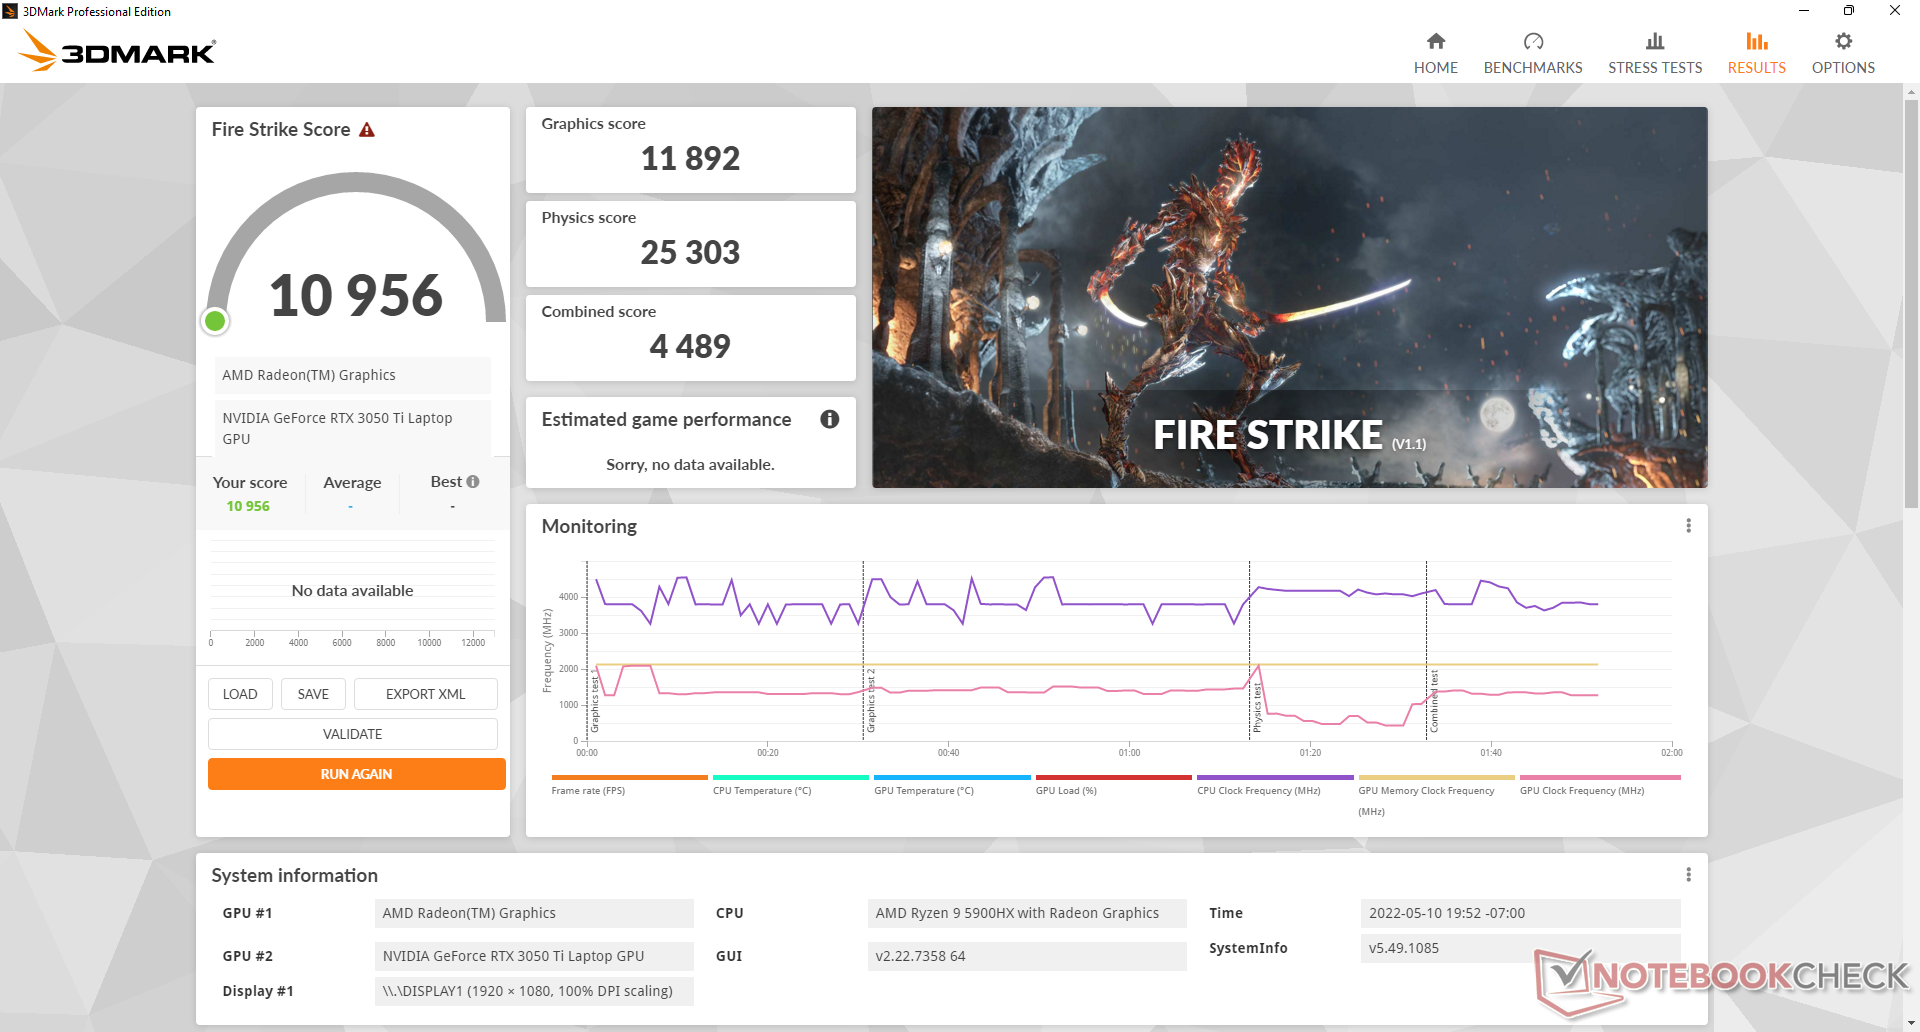
| 3DMark Fire Strike Score | 11932 points | |
| 3DMark Time Spy Score | 5338 points | |
Aide | ||
Witcher 3 FPS Chart
| Bas | Moyen | Élevé | Ultra | |
|---|---|---|---|---|
| GTA V (2015) | 172.8 | 167.2 | 123.7 | 66.7 |
| The Witcher 3 (2015) | 220 | 161.6 | 92.1 | 49.9 |
| Dota 2 Reborn (2015) | 133.6 | 123.7 | 116.9 | 112.1 |
| Final Fantasy XV Benchmark (2018) | 115.9 | 71 | 50.2 | |
| X-Plane 11.11 (2018) | 96.6 | 84 | 68.5 | |
| Strange Brigade (2018) | 259 | 126.9 | 102.1 | 87.5 |
| Cyberpunk 2077 1.6 (2022) | 70.6 | 59 | 44.5 | 44 |
Émissions
Bruit du système - silencieux lors de la navigation, fort lors des jeux
Le bruit du ventilateur dépend des trois paramètres du profil d'alimentation MyAsus : Performance, Équilibré et Chuchotement. Cependant, même en mode Performance, les ventilateurs sont à peine perceptibles lors de la navigation ou du streaming. Ils ont tendance à osciller autour de 26 à 28 dB(A) lorsqu'ils sont soumis à de telles charges, contre un fond silencieux de 22,8 dB(A)
L'exécution de Witcher 3 en mode équilibré et en mode performance se traduit par un bruit de ventilateur constant de 34,7 dB(A) et 47,3 dB(A), respectivement. Les utilisateurs peuvent envisager de jouer en mode équilibré pour un bruit de ventilateur beaucoup plus faible malgré le léger déficit de performances mentionné ci-dessus. Le bruit du ventilateur lors de l'exécution de charges élevées est plus fort que sur le Dell XPS 15 9510, mais plus silencieux que sur le HP Envy 15, plus puissant.
Le bruit du ventilateur peut atteindre 53 dB(A) lorsque le CPU et le GPU sont utilisés au maximum, ce qui est plus fort que sur la plupart des autres ordinateurs portables multimédia de 15,6 pouces.
Degré de la nuisance sonore
| Au repos |
| 22.9 / 22.9 / 22.9 dB(A) |
| Fortement sollicité |
| 33.2 / 52.8 dB(A) |
 | ||
30 dB silencieux 40 dB(A) audible 50 dB(A) bruyant |
||
min: | ||
| Asus Zenbook Pro 15 OLED UM535Q GeForce RTX 3050 Ti Laptop GPU, R9 5900HX, WDC PC SN730 SDBPNTY-1T00 | Asus ZenBook UX535-M01440 GeForce GTX 1650 Ti Max-Q, i7-10750H, WDC PC SN730 SDBPNTY-1T00 | Asus ZenBook 15 UX534FTC-A8190T GeForce GTX 1650 Max-Q, i7-10510U, Samsung SSD PM981 MZVLB1T0HALR | Lenovo Yoga Creator 7 15IMH05 82DS000VGE GeForce GTX 1650 Mobile, i7-10750H, Samsung PM981a MZVLB1T0HBLR | HP Envy 15-ep0098nr GeForce RTX 2060 Max-Q, i7-10750H, Intel Optane Memory H10 with Solid State Storage 32GB + 512GB HBRPEKNX0202A(L/H) | Dell XPS 15 9510 11800H RTX 3050 Ti OLED GeForce RTX 3050 Ti Laptop GPU, i7-11800H, Micron 2300 512GB MTFDHBA512TDV | |
|---|---|---|---|---|---|---|
| Noise | -3% | -11% | -8% | -30% | 4% | |
| arrêt / environnement * (dB) | 22.8 | 24.6 -8% | 30.3 -33% | 24.9 -9% | 26.4 -16% | 23.8 -4% |
| Idle Minimum * (dB) | 22.9 | 24.6 -7% | 30.3 -32% | 24.9 -9% | 32.2 -41% | 23.8 -4% |
| Idle Average * (dB) | 22.9 | 24.6 -7% | 30.3 -32% | 24.9 -9% | 32.2 -41% | 23.8 -4% |
| Idle Maximum * (dB) | 22.9 | 24.6 -7% | 30.9 -35% | 30.8 -34% | 32.2 -41% | 23.8 -4% |
| Load Average * (dB) | 33.2 | 41.3 -24% | 31.3 6% | 41.9 -26% | 48.3 -45% | 36 -8% |
| Witcher 3 ultra * (dB) | 47.3 | 42 11% | 38.1 19% | 41.9 11% | 53.7 -14% | 36 24% |
| Load Maximum * (dB) | 52.8 | 41.4 22% | 38.2 28% | 41.7 21% | 58.8 -11% | 38.2 28% |
* ... Moindre est la valeur, meilleures sont les performances
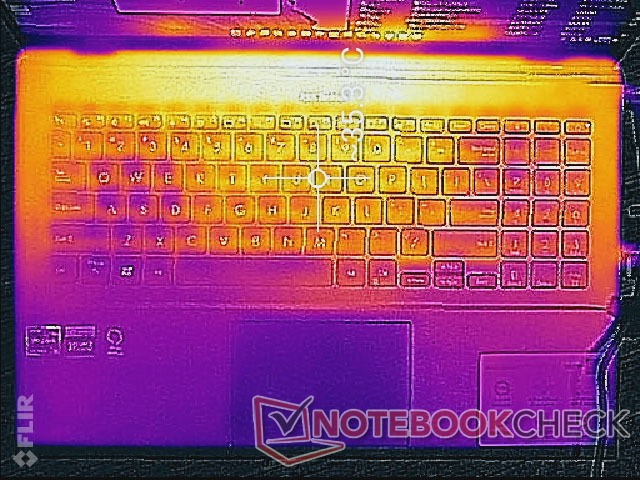
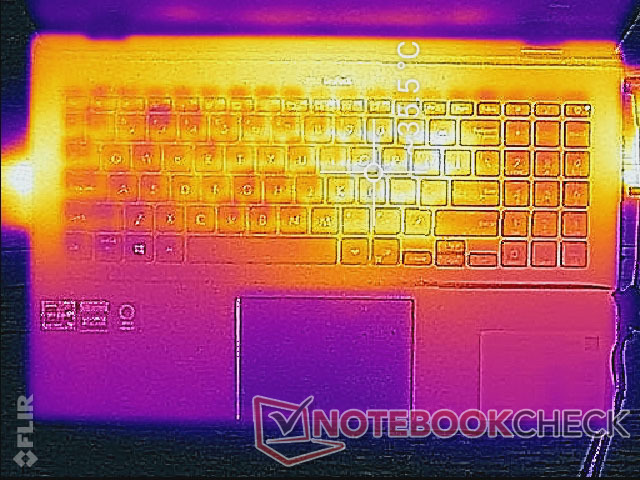
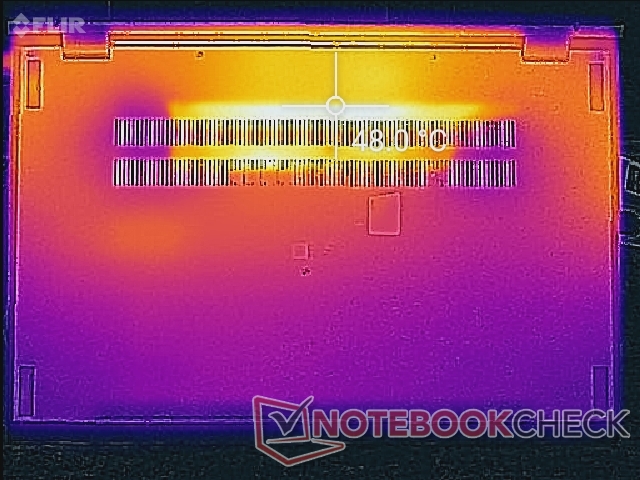
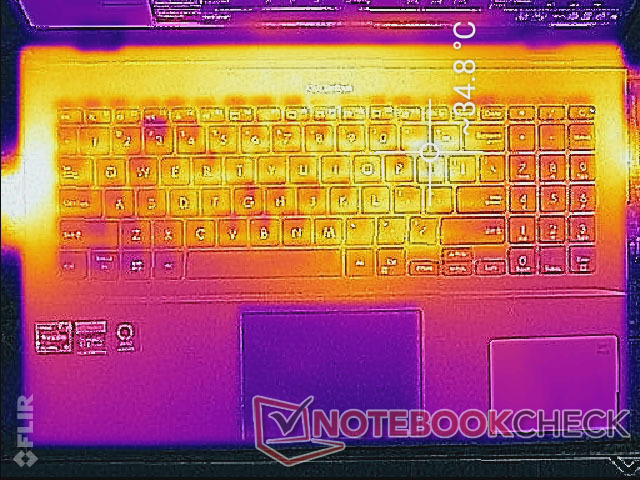
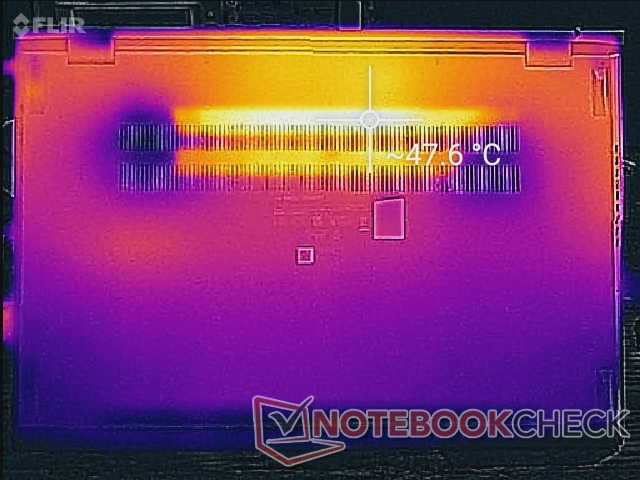
Température
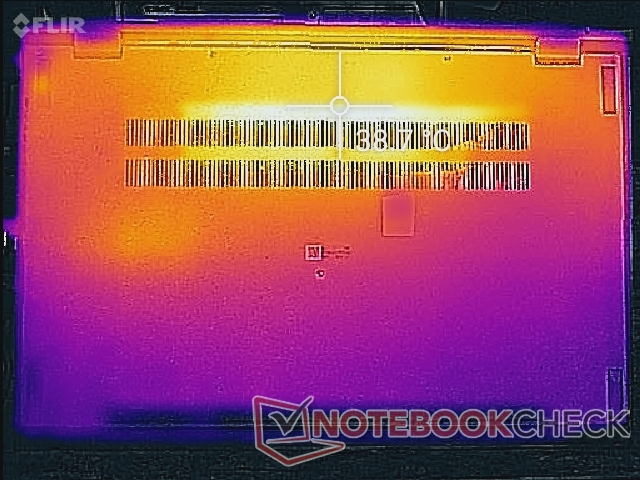
Les températures de surface sont un peu chaudes, même en l'absence d'activités exigeantes. Les points chauds lorsque le bureau tourne au ralenti peuvent atteindre 35 C à 39 C sur le dessus et le dessous, respectivement, contre 33 C sur le Dell XPS 15 9500
Lorsque vous jouez ou exécutez des charges plus élevées, les points chauds sur le dessus et le dessous peuvent atteindre 35 C et 48 C, respectivement, contre 44 C et 49 C sur le Dell susmentionné. La conception d'Asus fait un bon travail en gardant la surface supérieure beaucoup plus froide que la surface inférieure pour des paumes et des doigts plus confortables.
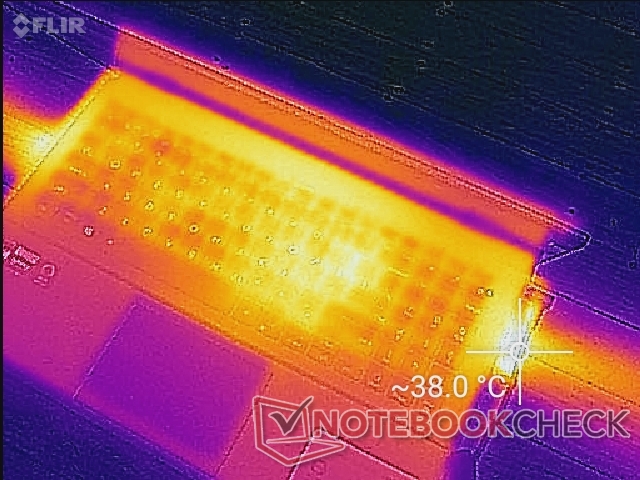
(+) La température maximale du côté supérieur est de 36 °C / 97 F, par rapport à la moyenne de 36.8 °C / 98 F, allant de 21 à 71 °C pour la classe Multimedia.
(-) Le fond chauffe jusqu'à un maximum de 47.2 °C / 117 F, contre une moyenne de 39.1 °C / 102 F
(±) En utilisation inactive, la température moyenne du côté supérieur est de 34.2 °C / 94 F, par rapport à la moyenne du dispositif de 31.3 °C / 88 F.
(±) En jouant à The Witcher 3, la température moyenne du côté supérieur est de 32.3 °C / 90 F, alors que la moyenne de l'appareil est de 31.3 °C / 88 F.
(+) Les repose-poignets et le pavé tactile atteignent la température maximale de la peau (32.4 °C / 90.3 F) et ne sont donc pas chauds.
(-) La température moyenne de la zone de l'appui-paume de dispositifs similaires était de 28.7 °C / 83.7 F (-3.7 °C / #-6.6 F).
| Asus Zenbook Pro 15 OLED UM535Q AMD Ryzen 9 5900HX, NVIDIA GeForce RTX 3050 Ti Laptop GPU | Asus ZenBook UX535-M01440 Intel Core i7-10750H, NVIDIA GeForce GTX 1650 Ti Max-Q | Asus ZenBook 15 UX534FTC-A8190T Intel Core i7-10510U, NVIDIA GeForce GTX 1650 Max-Q | Lenovo Yoga Creator 7 15IMH05 82DS000VGE Intel Core i7-10750H, NVIDIA GeForce GTX 1650 Mobile | HP Envy 15-ep0098nr Intel Core i7-10750H, NVIDIA GeForce RTX 2060 Max-Q | Dell XPS 15 9510 11800H RTX 3050 Ti OLED Intel Core i7-11800H, NVIDIA GeForce RTX 3050 Ti Laptop GPU | |
|---|---|---|---|---|---|---|
| Heat | 14% | 16% | 23% | 1% | 10% | |
| Maximum Upper Side * (°C) | 36 | 37.8 -5% | 41.4 -15% | 39.8 -11% | 47.6 -32% | 45.5 -26% |
| Maximum Bottom * (°C) | 47.2 | 44.2 6% | 40.3 15% | 36.5 23% | 52 -10% | 44.2 6% |
| Idle Upper Side * (°C) | 37 | 28.1 24% | 25.7 31% | 22.9 38% | 28.6 23% | 27 27% |
| Idle Bottom * (°C) | 39.2 | 27.7 29% | 25.8 34% | 23 41% | 31 21% | 26.7 32% |
* ... Moindre est la valeur, meilleures sont les performances
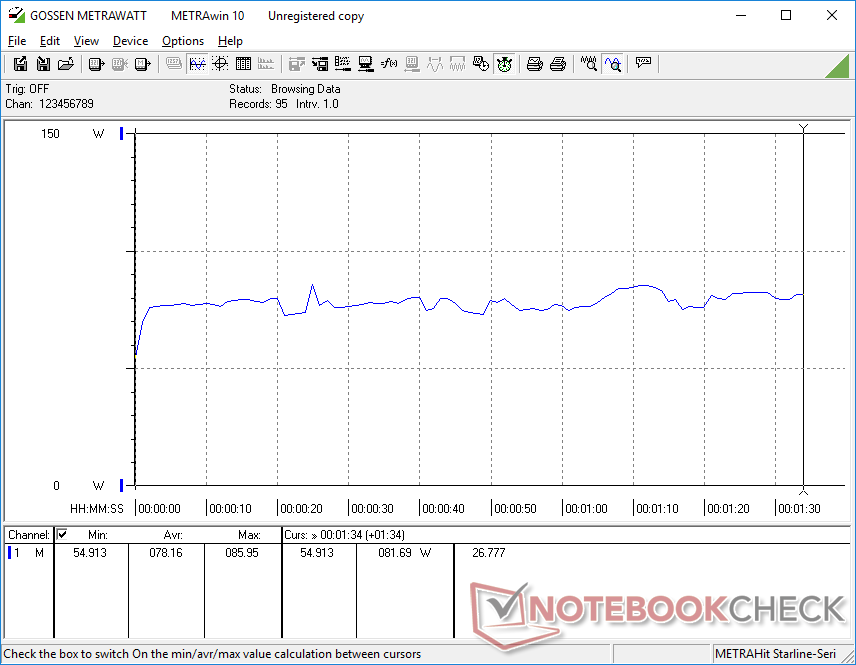
Test de stress
L'exécution de Prime95 pour stresser le CPU fait grimper les fréquences d'horloge et la température à 4,1 GHz et 81 C, respectivement, pendant environ 30 secondes. Le CPU descend ensuite à 3,9 GHz pendant les minutes qui suivent avant de se stabiliser à 3,5 GHz et 76 C. La puissance de l'ensemble du CPU peut atteindre 65 W au début du test avant de se stabiliser à 54 W.
L'exécution de Witcher 3 les températures du CPU et du GPU se stabilisent à 70 C et 65 C, respectivement, contre 71 C et 73 C sur le Vivobook 15 K513E Vivobook 15 K513EQ. La consommation électrique de la carte GPU serait stable à 49 W, soit juste en dessous de l'objectif de 50 W.
Les performances sont limitées en cas d'alimentation par batterie. Un test Fire Strike sur batteries donnerait des scores de physique et de graphisme de 21320 et 9084 points, respectivement, contre 25284 et 13002 points sur secteur.
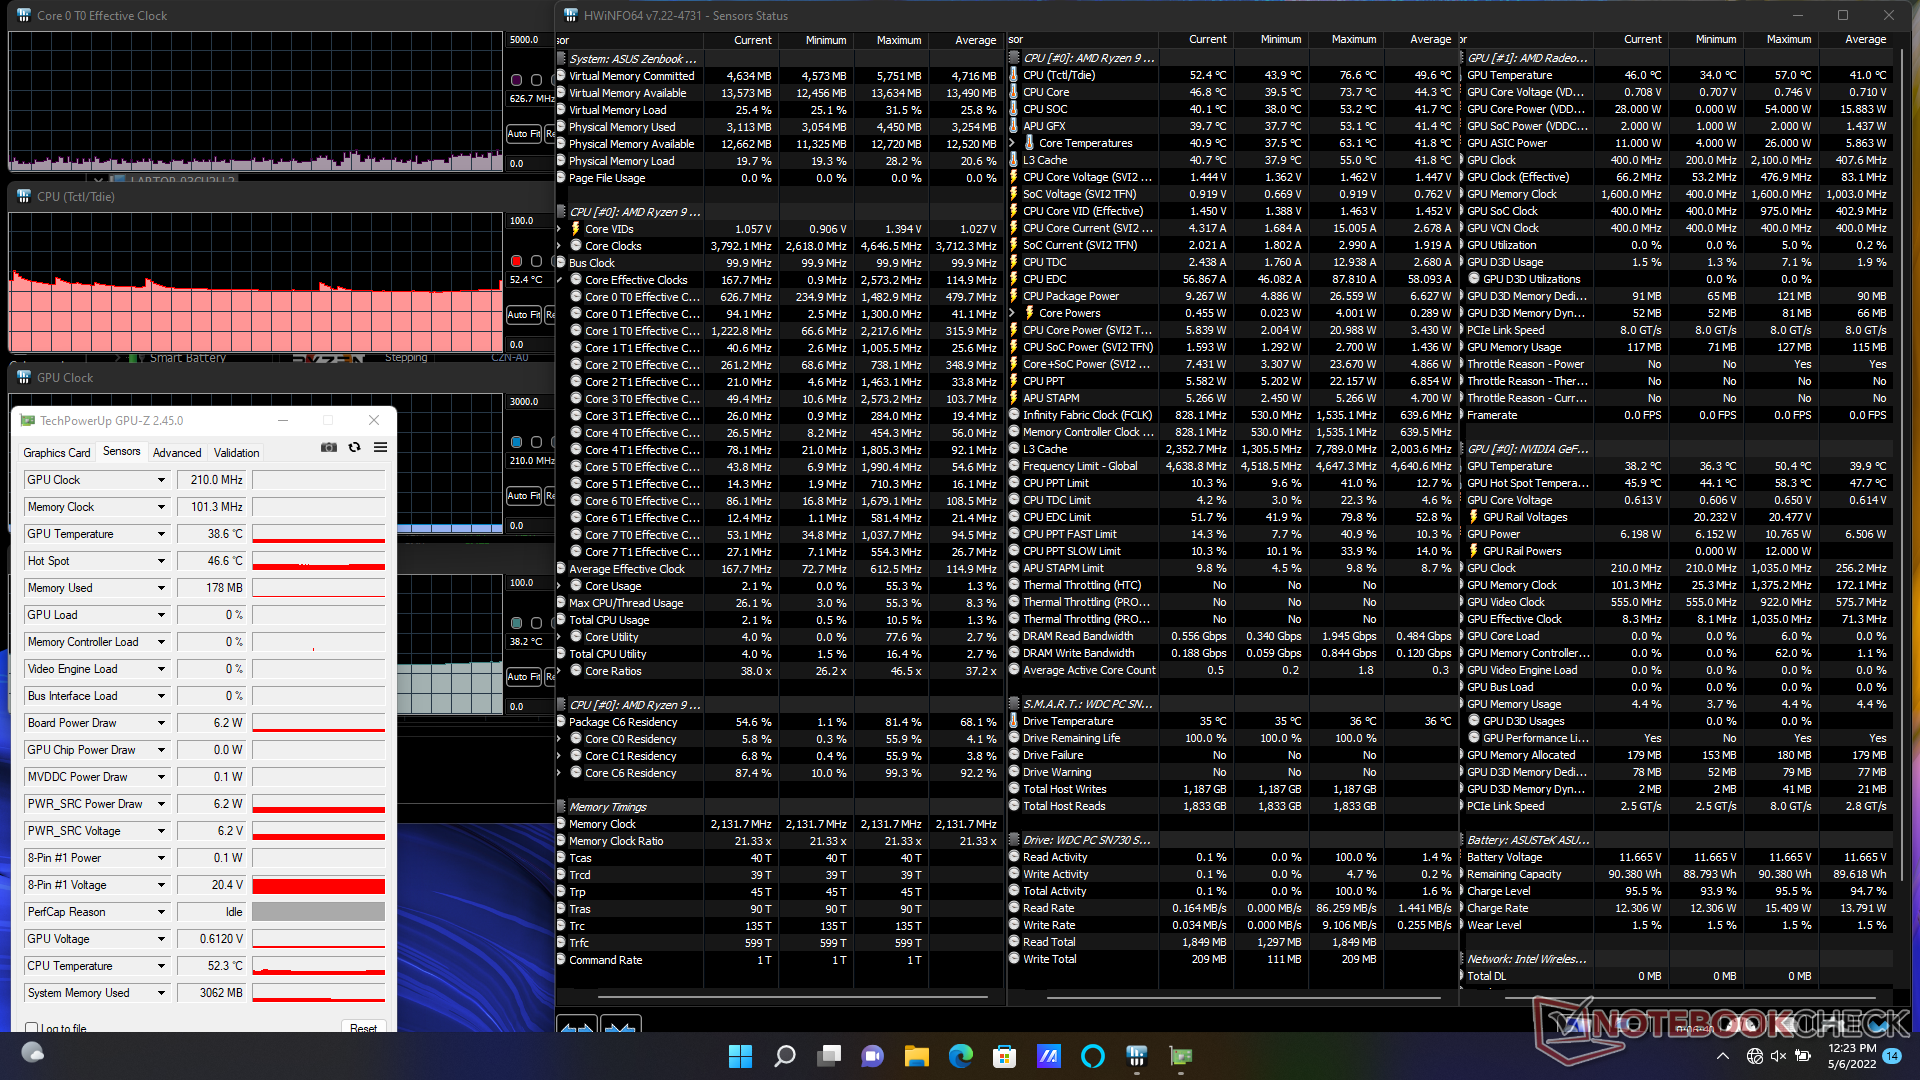
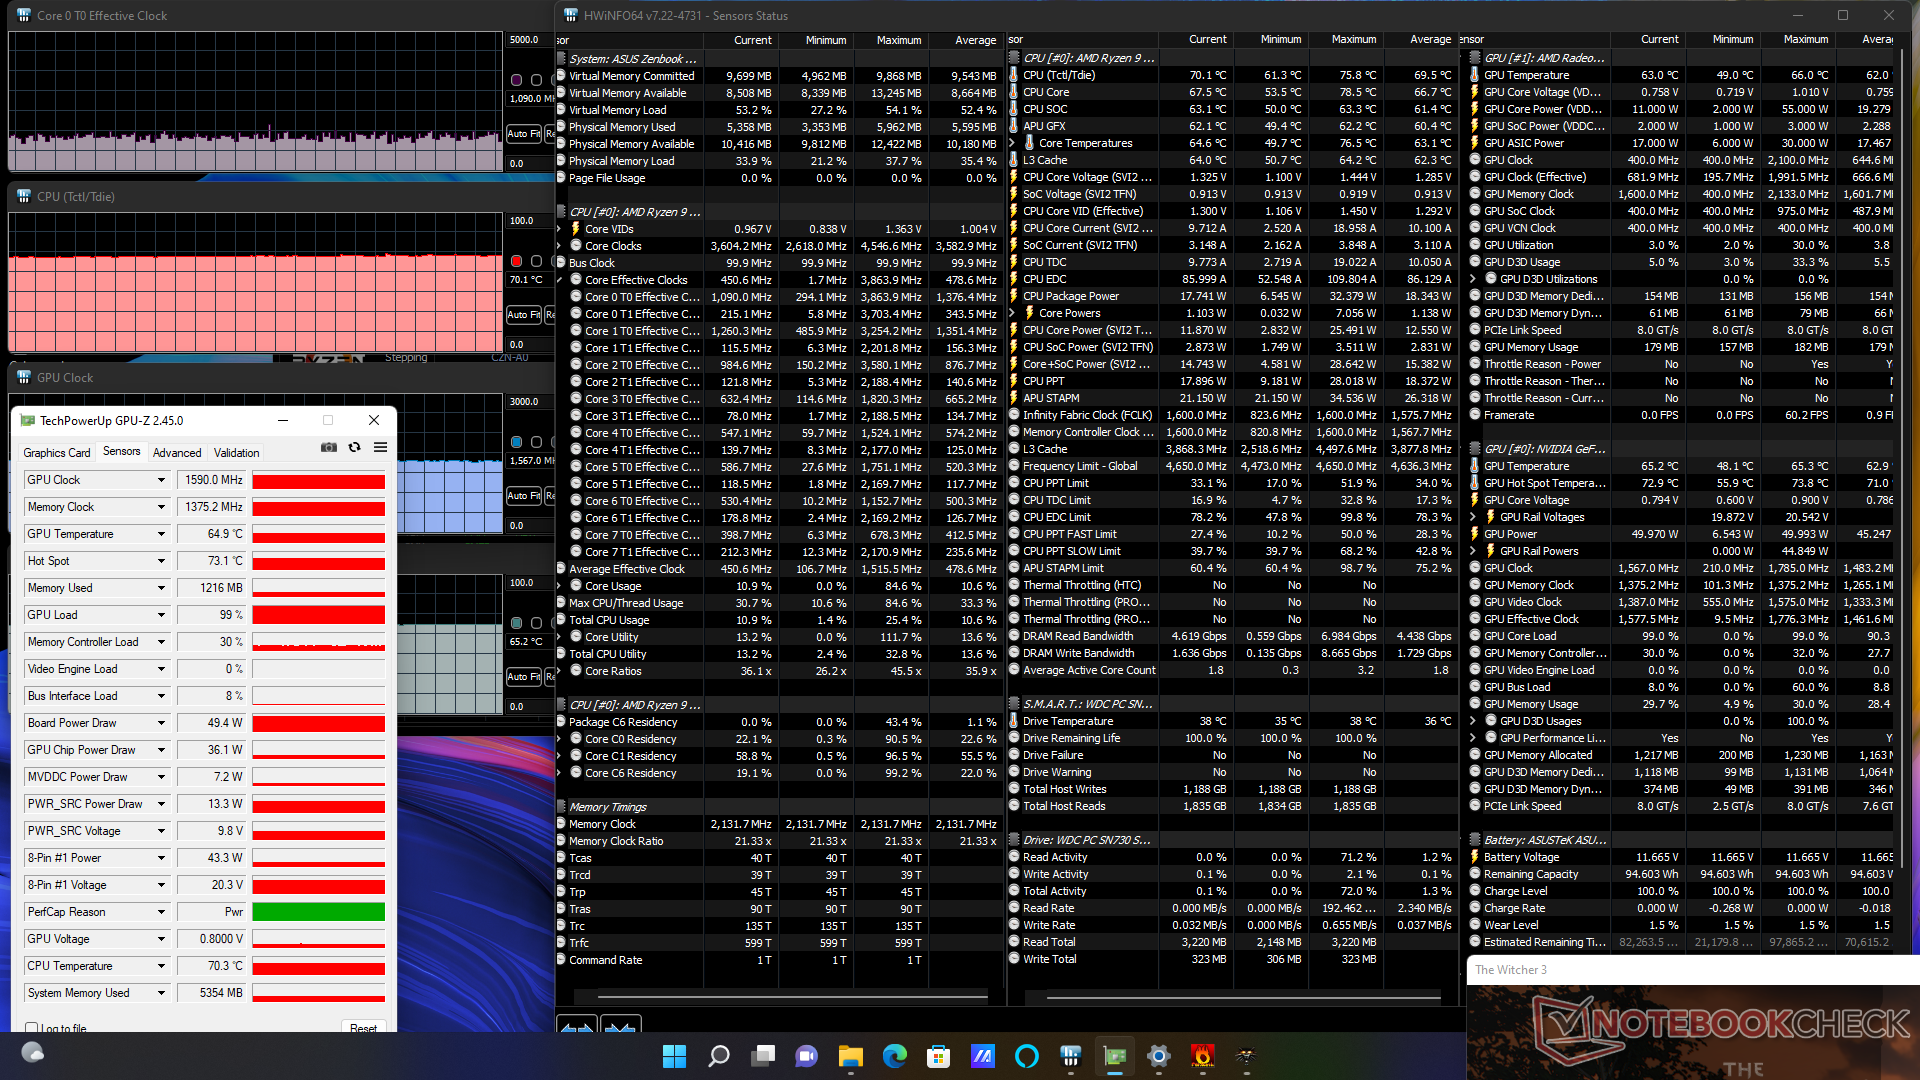
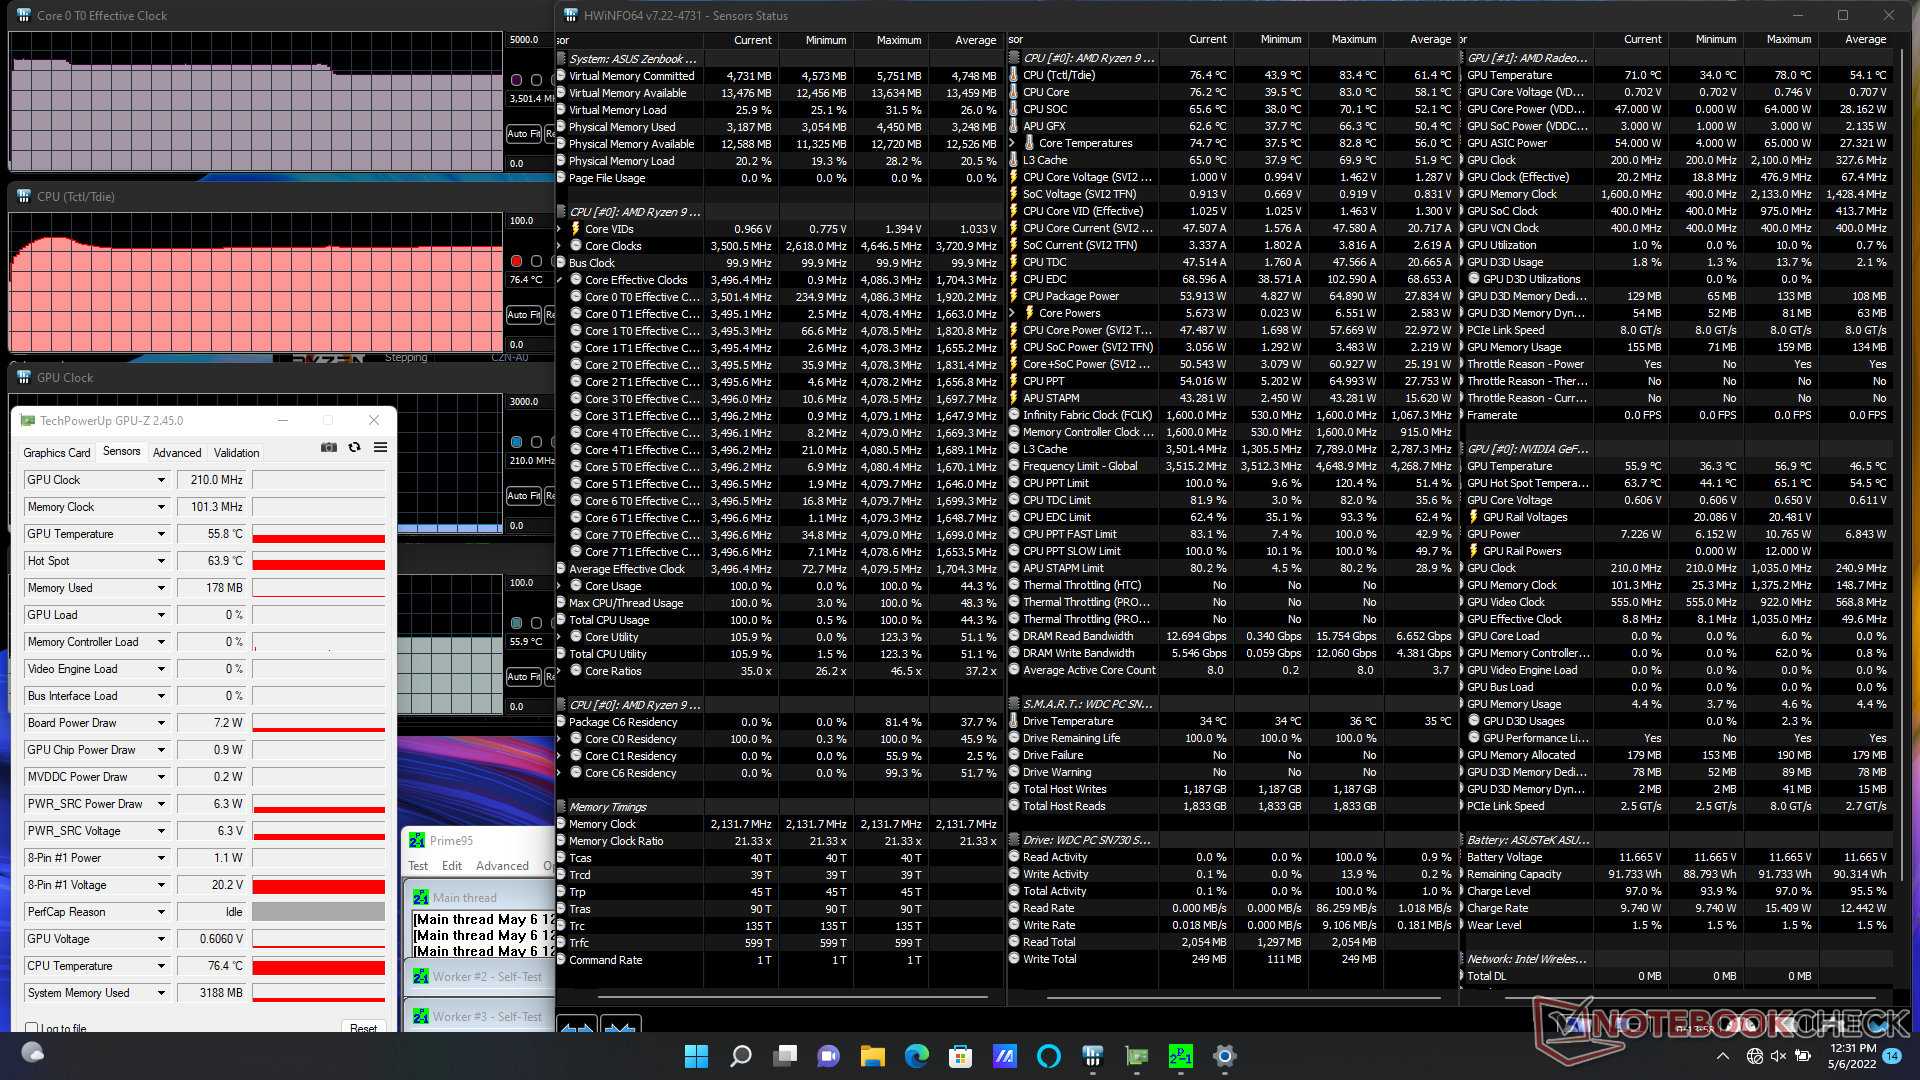
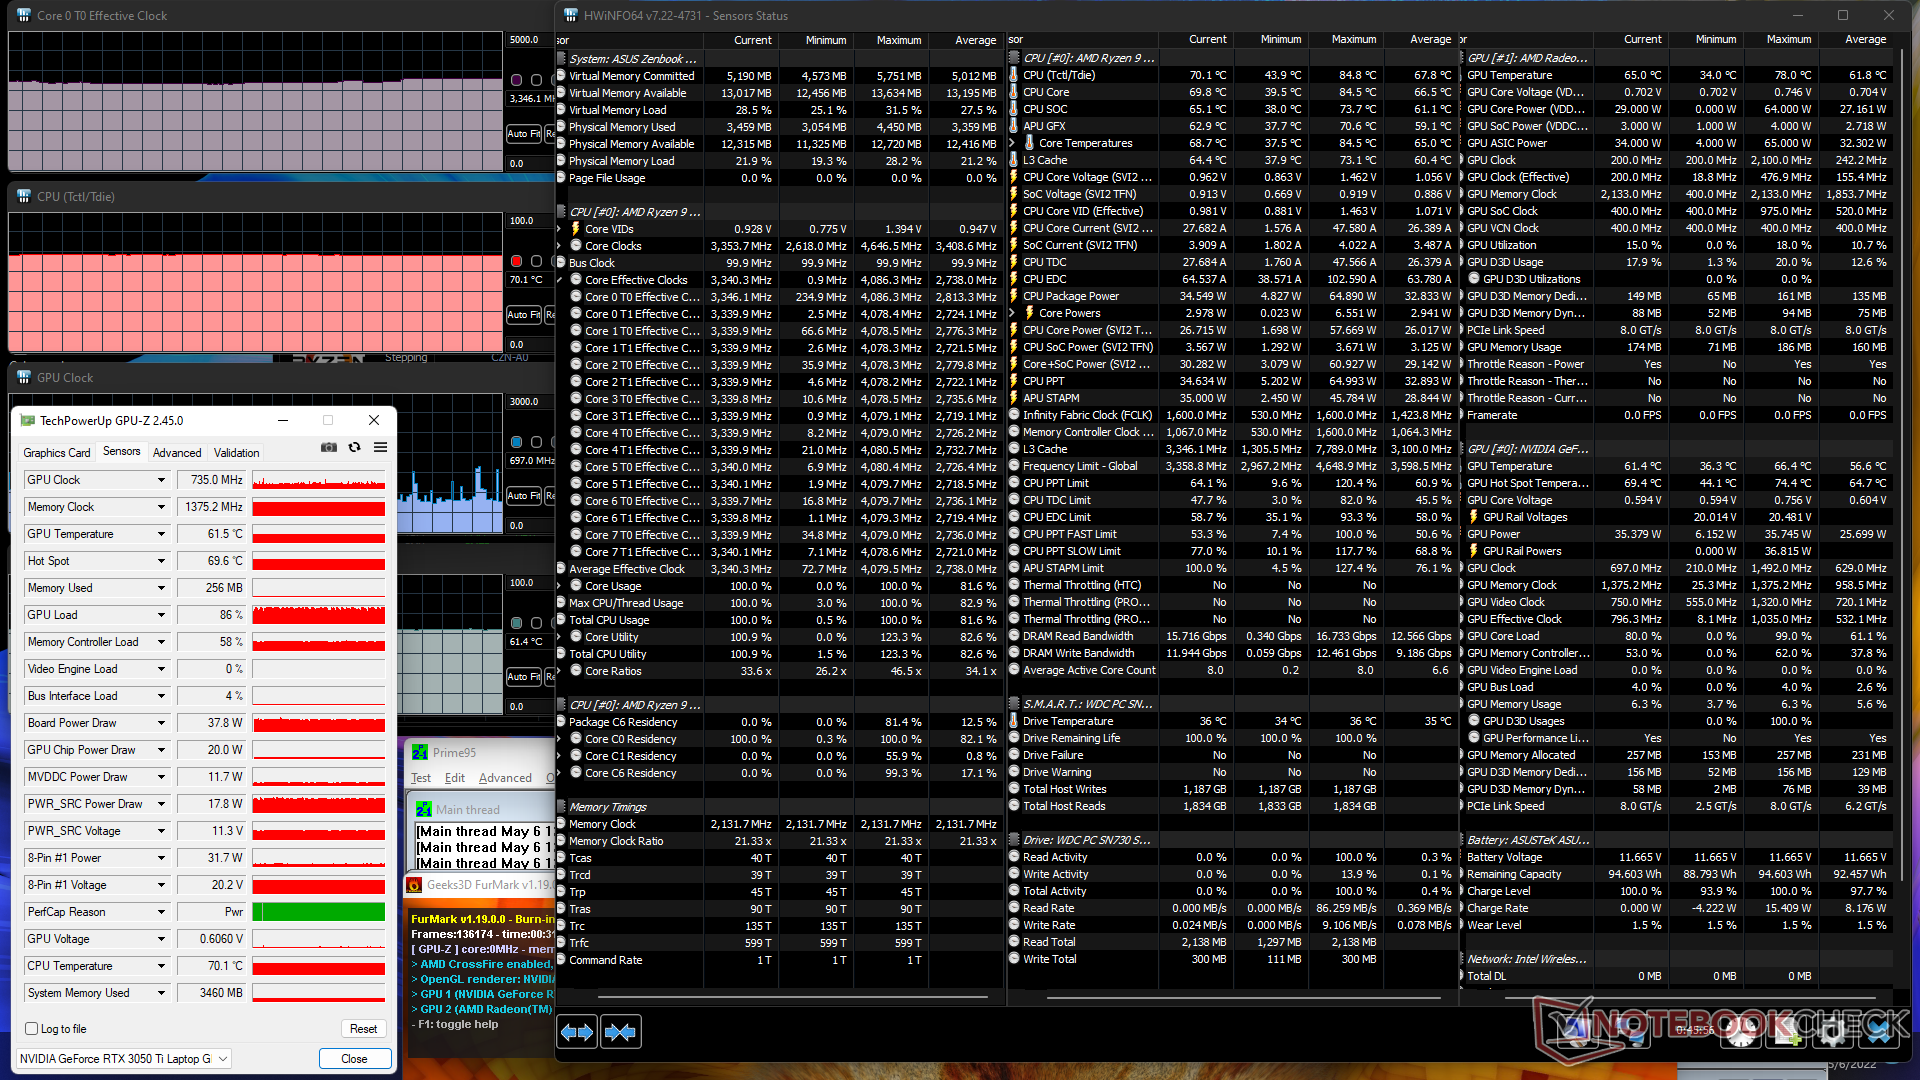
| Fréquence du CPU (GHz) | Fréquence du GPU (MHz) | Température moyenne du CPU Tctl/Tdie (°C) | Température moyenne du GPU (°C) | |
| Système au repos | -- | -- | 52 | 39 |
| Prime95 Stress | 3.5 | -- | 76 | 56 |
| Prime95+ FurMark Stress | 3.3 | 735 | 70 | 62 |
| Witcher 3 Stress | ~1.0 | 1590 | 70 | 65 |
Haut-parleurs
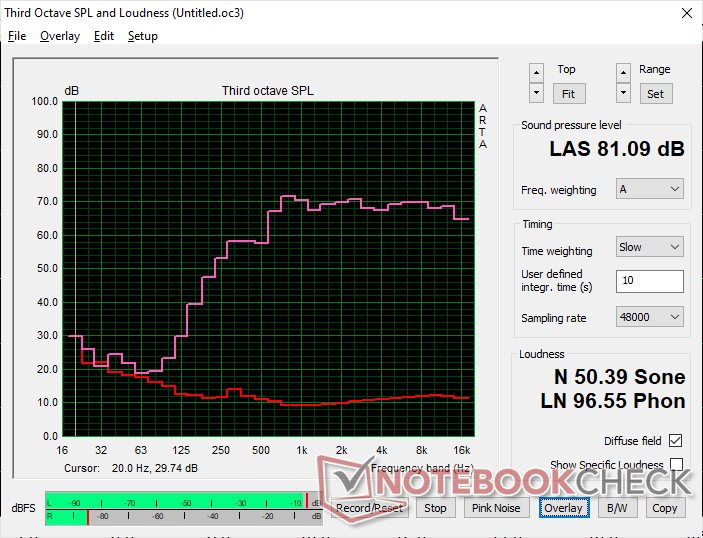
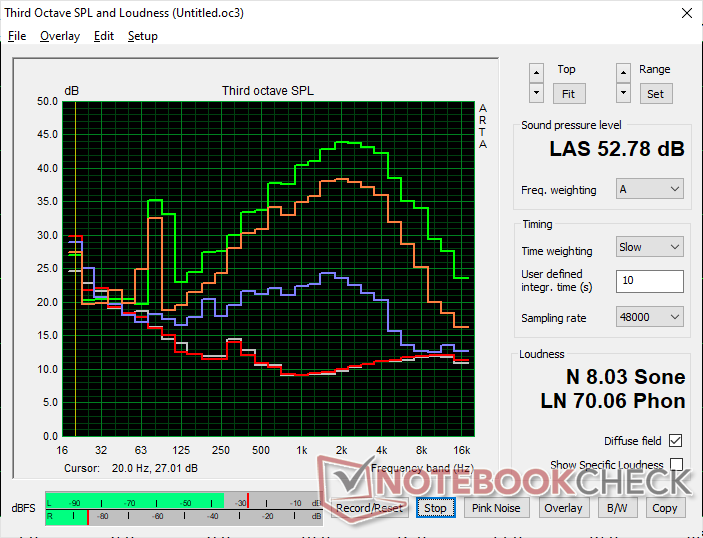
Asus Zenbook Pro 15 OLED UM535Q analyse audio
(±) | le niveau sonore du haut-parleur est moyen mais bon (81.1# dB)
Basses 100 - 315 Hz
(-) | presque aucune basse - en moyenne 25.6% plus bas que la médiane
(±) | la linéarité des basses est moyenne (11.5% delta à la fréquence précédente)
Médiums 400 - 2000 Hz
(+) | médiane équilibrée - seulement 3.8% de la médiane
(+) | les médiums sont linéaires (4.8% delta à la fréquence précédente)
Aiguës 2 - 16 kHz
(+) | des sommets équilibrés - à seulement 1.6% de la médiane
(+) | les aigus sont linéaires (2.3% delta à la fréquence précédente)
Globalement 100 - 16 000 Hz
(±) | la linéarité du son global est moyenne (16.4% de différence avec la médiane)
Par rapport à la même classe
» 42% de tous les appareils testés de cette catégorie étaient meilleurs, 7% similaires, 51% pires
» Le meilleur avait un delta de 5%, la moyenne était de 17%, le pire était de 45%.
Par rapport à tous les appareils testés
» 27% de tous les appareils testés étaient meilleurs, 6% similaires, 67% pires
» Le meilleur avait un delta de 4%, la moyenne était de 24%, le pire était de 134%.
Apple MacBook Pro 16 2021 M1 Pro analyse audio
(+) | les haut-parleurs peuvent jouer relativement fort (84.7# dB)
Basses 100 - 315 Hz
(+) | bonne basse - seulement 3.8% loin de la médiane
(+) | les basses sont linéaires (5.2% delta à la fréquence précédente)
Médiums 400 - 2000 Hz
(+) | médiane équilibrée - seulement 1.3% de la médiane
(+) | les médiums sont linéaires (2.1% delta à la fréquence précédente)
Aiguës 2 - 16 kHz
(+) | des sommets équilibrés - à seulement 1.9% de la médiane
(+) | les aigus sont linéaires (2.7% delta à la fréquence précédente)
Globalement 100 - 16 000 Hz
(+) | le son global est linéaire (4.6% différence à la médiane)
Par rapport à la même classe
» 0% de tous les appareils testés de cette catégorie étaient meilleurs, 0% similaires, 100% pires
» Le meilleur avait un delta de 5%, la moyenne était de 17%, le pire était de 45%.
Par rapport à tous les appareils testés
» 0% de tous les appareils testés étaient meilleurs, 0% similaires, 100% pires
» Le meilleur avait un delta de 4%, la moyenne était de 24%, le pire était de 134%.
Gestion de l'énergie
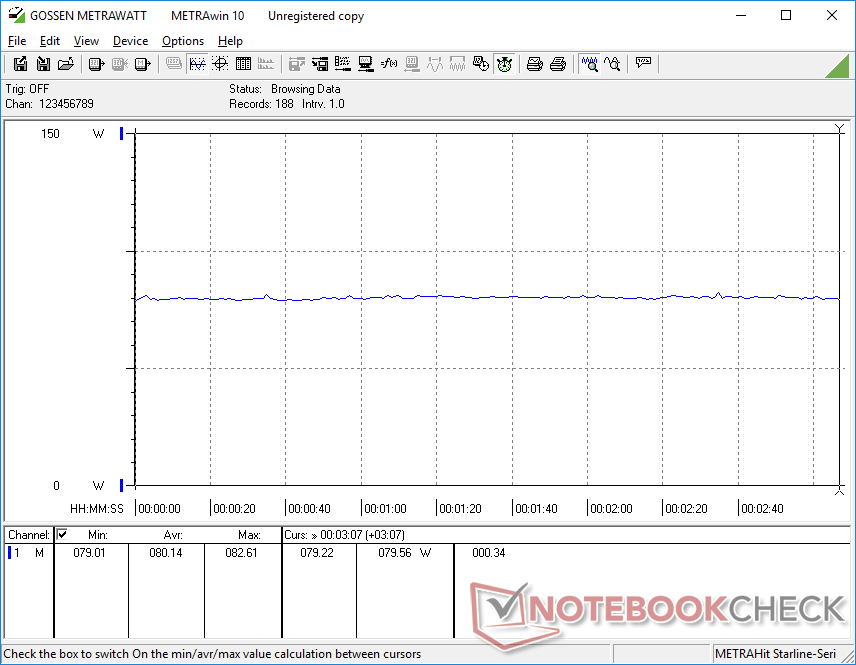
Consommation d'énergie - Grande batterie de 96 Wh
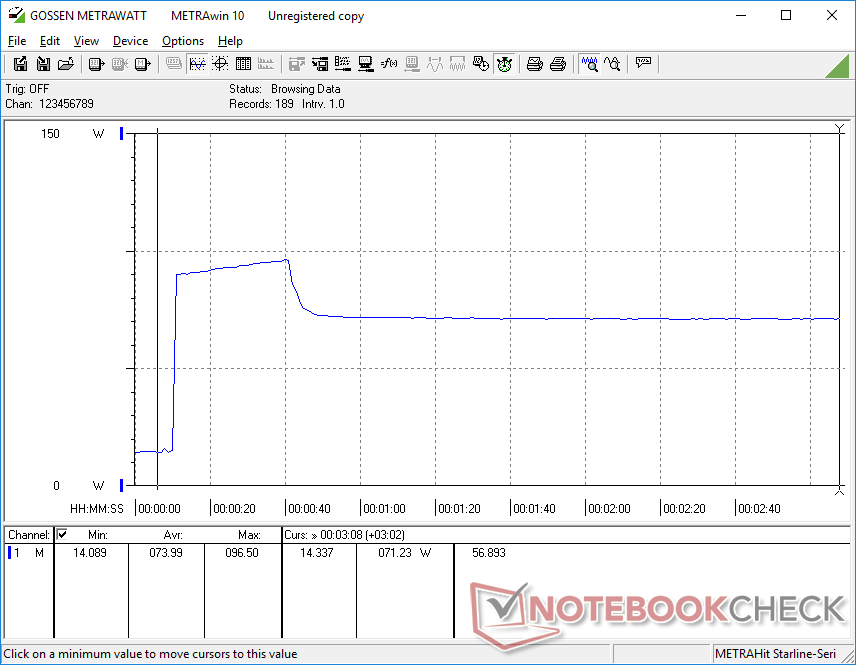
Le ralenti sur le bureau peut varier entre 5 W et 15 W selon le niveau de luminosité et le profil d'alimentation. Comme il s'agit d'un panneau OLED, l'affichage de couleurs blanches vives demandera beaucoup plus d'énergie que les autres couleurs, comme le montrent les exemples suivants autres ordinateurs portables avec panneaux OLED.
L'exécution de Witcher 3 consomme environ 20 % d'énergie en plus que sur le Zenbook UM535. Cependant, notre UM535Q est capable d'offrir des performances CPU multithread et GPU respectivement 70 % et 60 % plus rapides que l'UM535. L'augmentation de la consommation d'énergie est faible par rapport à l'augmentation plus importante des performances globales.
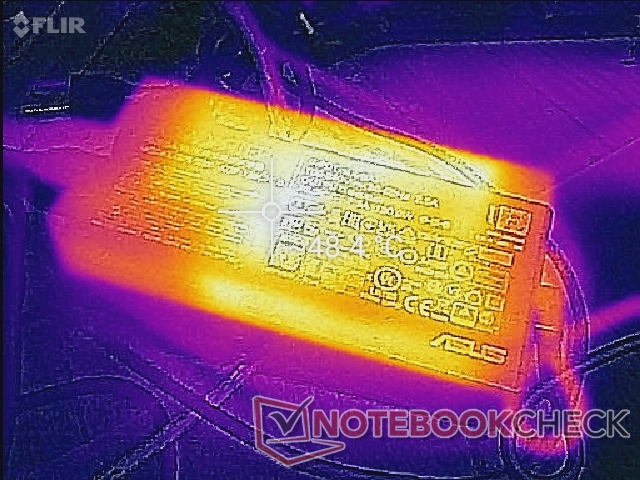
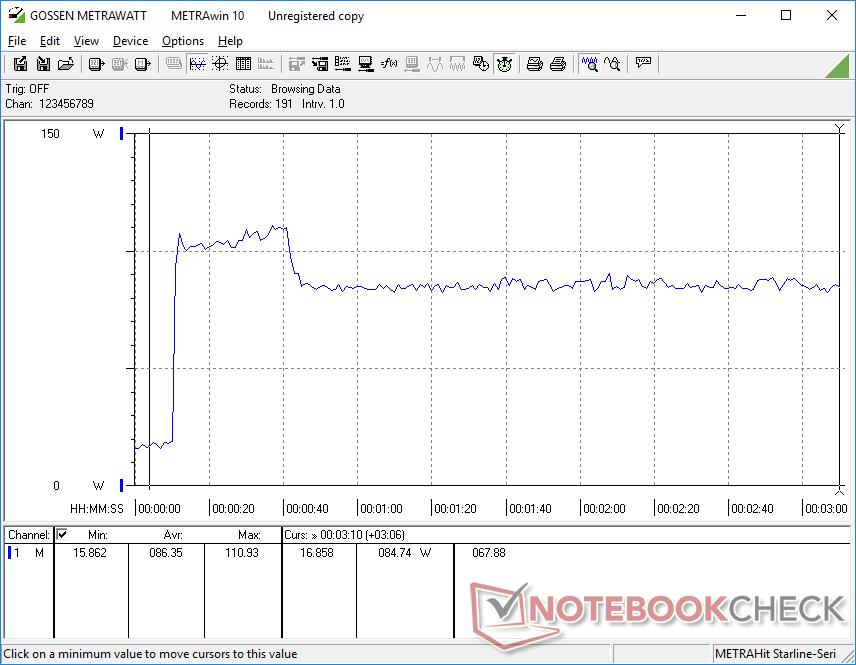
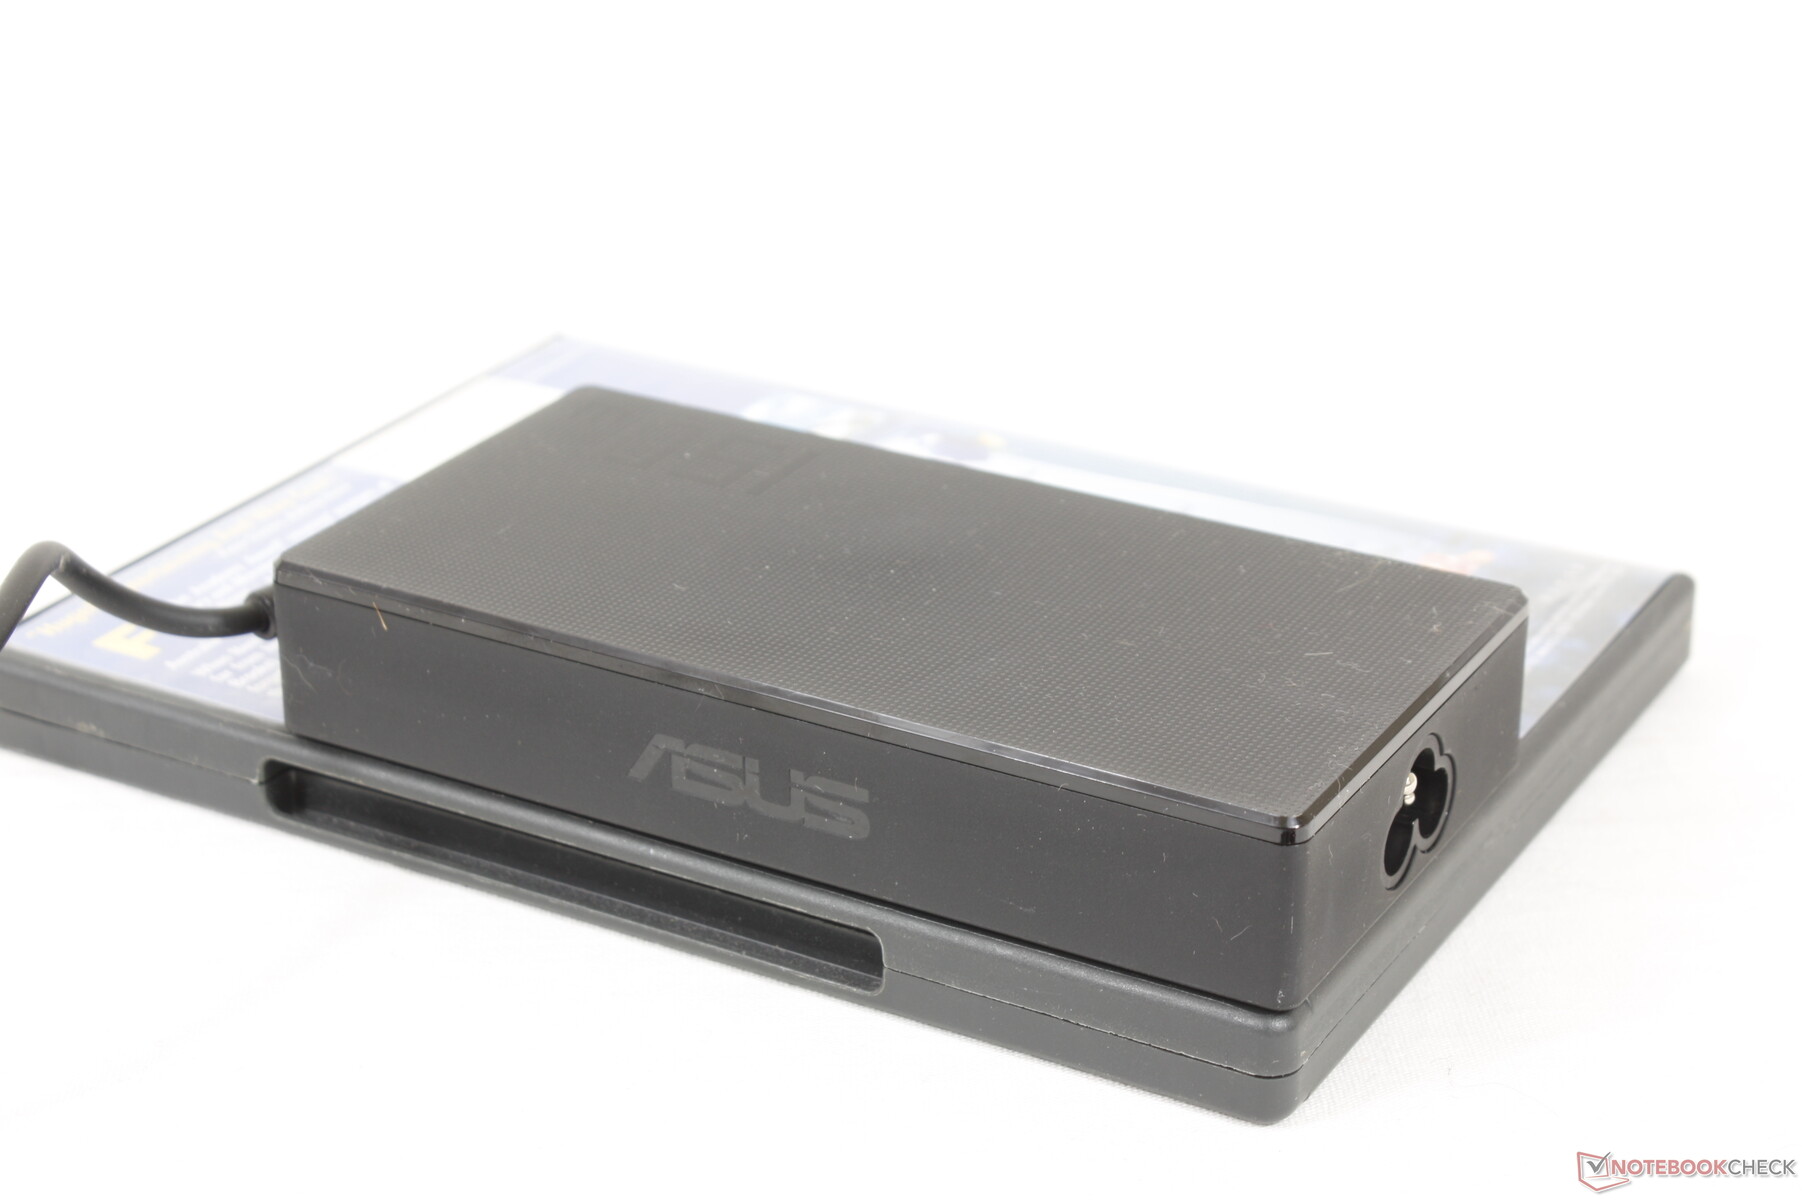
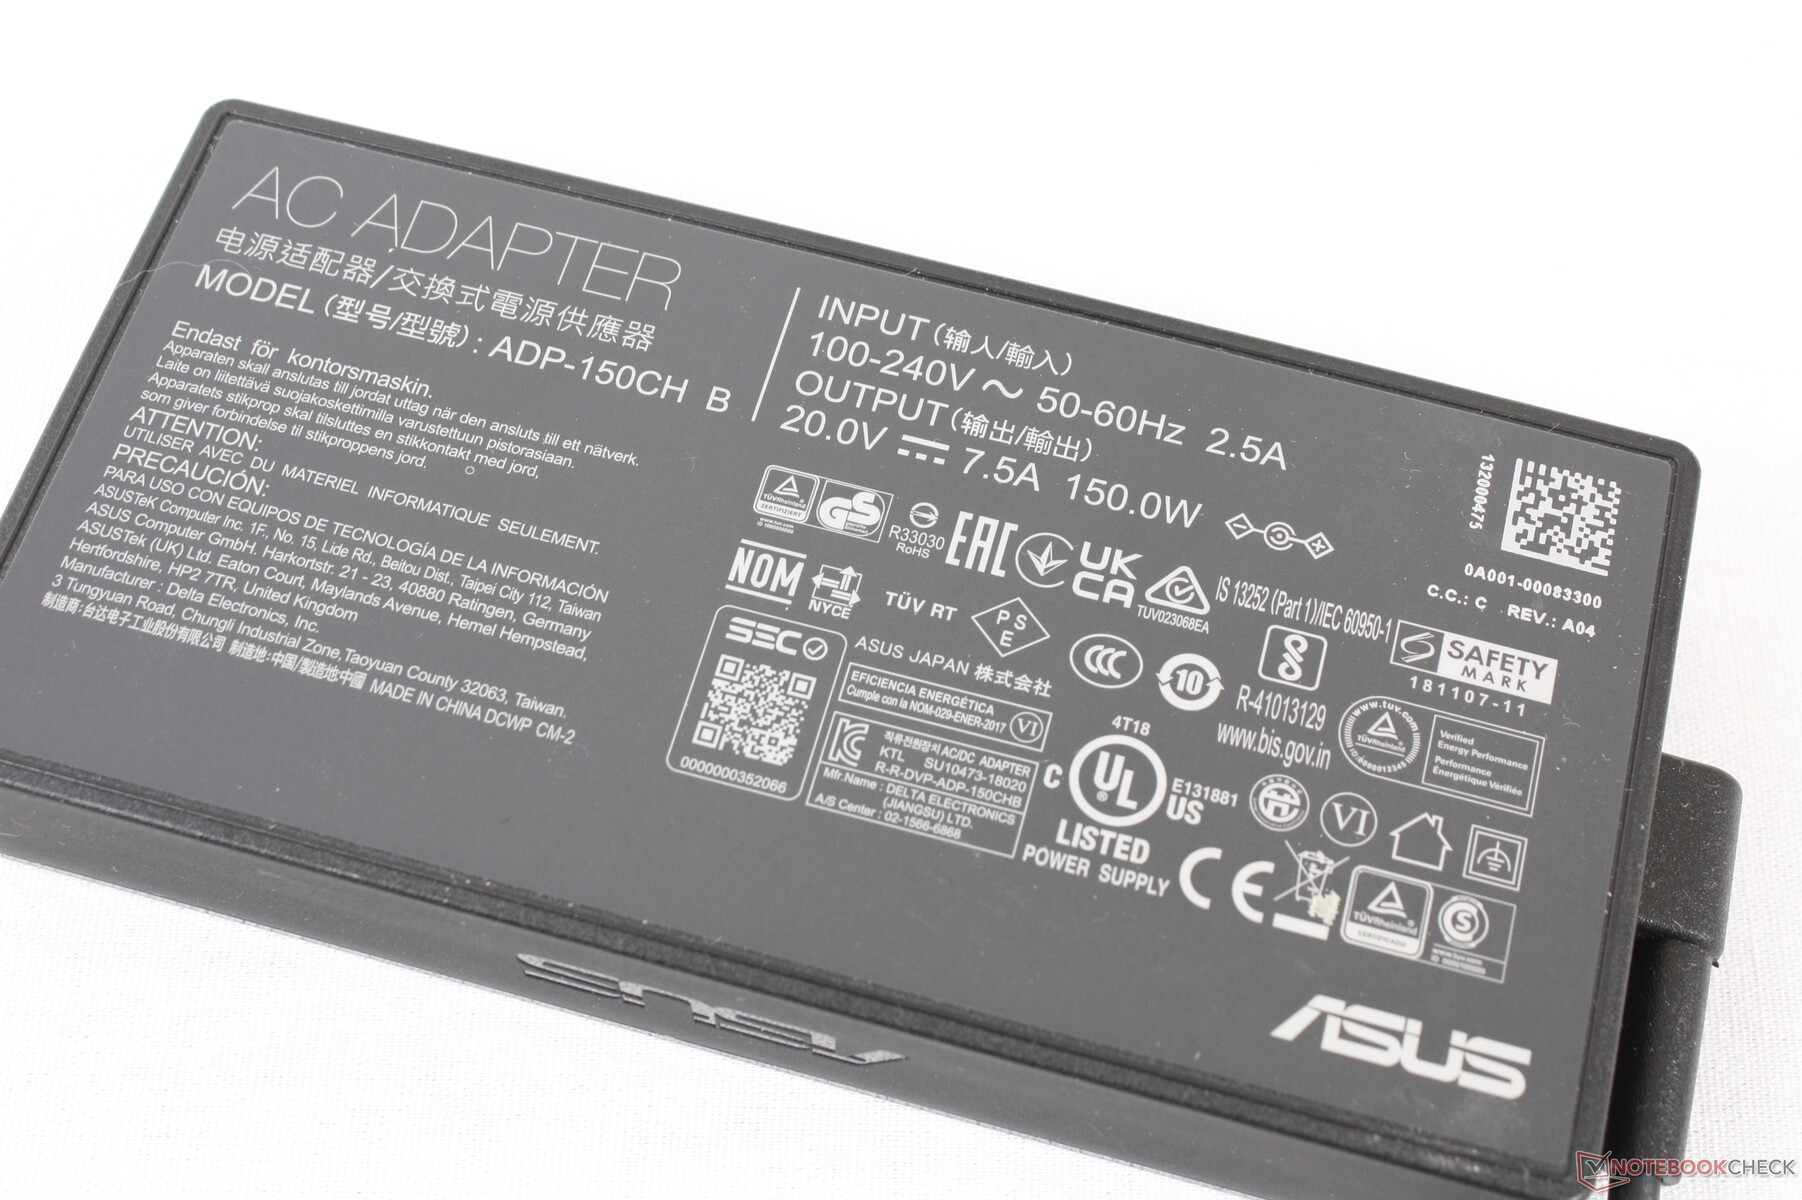
Nous avons pu mesurer une consommation maximale temporaire de 111 W sur l'adaptateur secteur 150 W de taille moyenne (~13,8 x 6,8 x 2,4 cm) lors de l'exécution simultanée de Prime95 et FurMark.
| Éteint/en veille | |
| Au repos | |
| Fortement sollicité |
|
Légende:
min: | |
| Asus Zenbook Pro 15 OLED UM535Q R9 5900HX, GeForce RTX 3050 Ti Laptop GPU, WDC PC SN730 SDBPNTY-1T00, OLED, 1920x1080, 15.6" | Asus ZenBook UX535-M01440 i7-10750H, GeForce GTX 1650 Ti Max-Q, WDC PC SN730 SDBPNTY-1T00, IPS, 3840x2160, 15.6" | Asus ZenBook 15 UX534FTC-A8190T i7-10510U, GeForce GTX 1650 Max-Q, Samsung SSD PM981 MZVLB1T0HALR, IPS, 1920x1080, 15.6" | Lenovo Yoga Creator 7 15IMH05 82DS000VGE i7-10750H, GeForce GTX 1650 Mobile, Samsung PM981a MZVLB1T0HBLR, IPS, 1920x1080, 15.6" | HP Envy 15-ep0098nr i7-10750H, GeForce RTX 2060 Max-Q, Intel Optane Memory H10 with Solid State Storage 32GB + 512GB HBRPEKNX0202A(L/H), AMOLED, 3840x2160, 15.6" | Dell XPS 15 9510 11800H RTX 3050 Ti OLED i7-11800H, GeForce RTX 3050 Ti Laptop GPU, Micron 2300 512GB MTFDHBA512TDV, OLED, 3456x2160, 15.6" | |
|---|---|---|---|---|---|---|
| Power Consumption | -2% | 21% | -14% | -60% | -10% | |
| Idle Minimum * (Watt) | 5.5 | 4.4 20% | 2.8 49% | 6.9 -25% | 9.2 -67% | 7.6 -38% |
| Idle Average * (Watt) | 7.4 | 9.8 -32% | 7.7 -4% | 10 -35% | 14.5 -96% | 9.9 -34% |
| Idle Maximum * (Watt) | 14.9 | 14.5 3% | 9.4 37% | 12.6 15% | 18 -21% | 10.8 28% |
| Load Average * (Watt) | 78.2 | 83 -6% | 57 27% | 96 -23% | 110.9 -42% | 81 -4% |
| Witcher 3 ultra * (Watt) | 80.1 | 67 16% | 62 23% | 75 6% | 125.5 -57% | 76.2 5% |
| Load Maximum * (Watt) | 110.9 | 123 -11% | 116 -5% | 134 -21% | 194.6 -75% | 131 -18% |
* ... Moindre est la valeur, meilleures sont les performances
Power Consumption Witcher 3 / Stresstest
Power Consumption external Monitor
Autonomie de la batterie - bonne pour toute la journée
Les durées d'exécution sont plus longues que celles que nous avons enregistrées sur l'UX535, de quelques heures. Attendez-vous à presque 13 heures d'utilisation du WLAN dans le monde réel avec le profil d'alimentation équilibré
Le chargement de la batterie vide à la pleine capacité prend environ 1,5 heure. Malheureusement, le système ne peut pas être rechargé via USB-C, contrairement à la plupart des autres Ultrabooks de nos jours.
| Asus Zenbook Pro 15 OLED UM535Q R9 5900HX, GeForce RTX 3050 Ti Laptop GPU, 96 Wh | Asus ZenBook UX535-M01440 i7-10750H, GeForce GTX 1650 Ti Max-Q, 96 Wh | Asus ZenBook 15 UX534FTC-A8190T i7-10510U, GeForce GTX 1650 Max-Q, 71 Wh | Lenovo Yoga Creator 7 15IMH05 82DS000VGE i7-10750H, GeForce GTX 1650 Mobile, 70 Wh | HP Envy 15-ep0098nr i7-10750H, GeForce RTX 2060 Max-Q, 83 Wh | Dell XPS 15 9510 11800H RTX 3050 Ti OLED i7-11800H, GeForce RTX 3050 Ti Laptop GPU, 86 Wh | |
|---|---|---|---|---|---|---|
| Autonomie de la batterie | -32% | -11% | -35% | -51% | -48% | |
| Reader / Idle (h) | 26.2 | 18.3 -30% | 27.2 4% | 25.7 -2% | 15 -43% | |
| WiFi v1.3 (h) | 12.8 | 10.1 -21% | 12.4 -3% | 9 -30% | 6 -53% | 7 -45% |
| Load (h) | 3.6 | 2 -44% | 2.4 -33% | 1 -72% | 1.6 -56% | 1.8 -50% |
| H.264 (h) | 11.9 | 11.9 | 13.9 | 10.4 |
Points positifs
Points négatifs
Verdict : CPU, châssis et écran solides

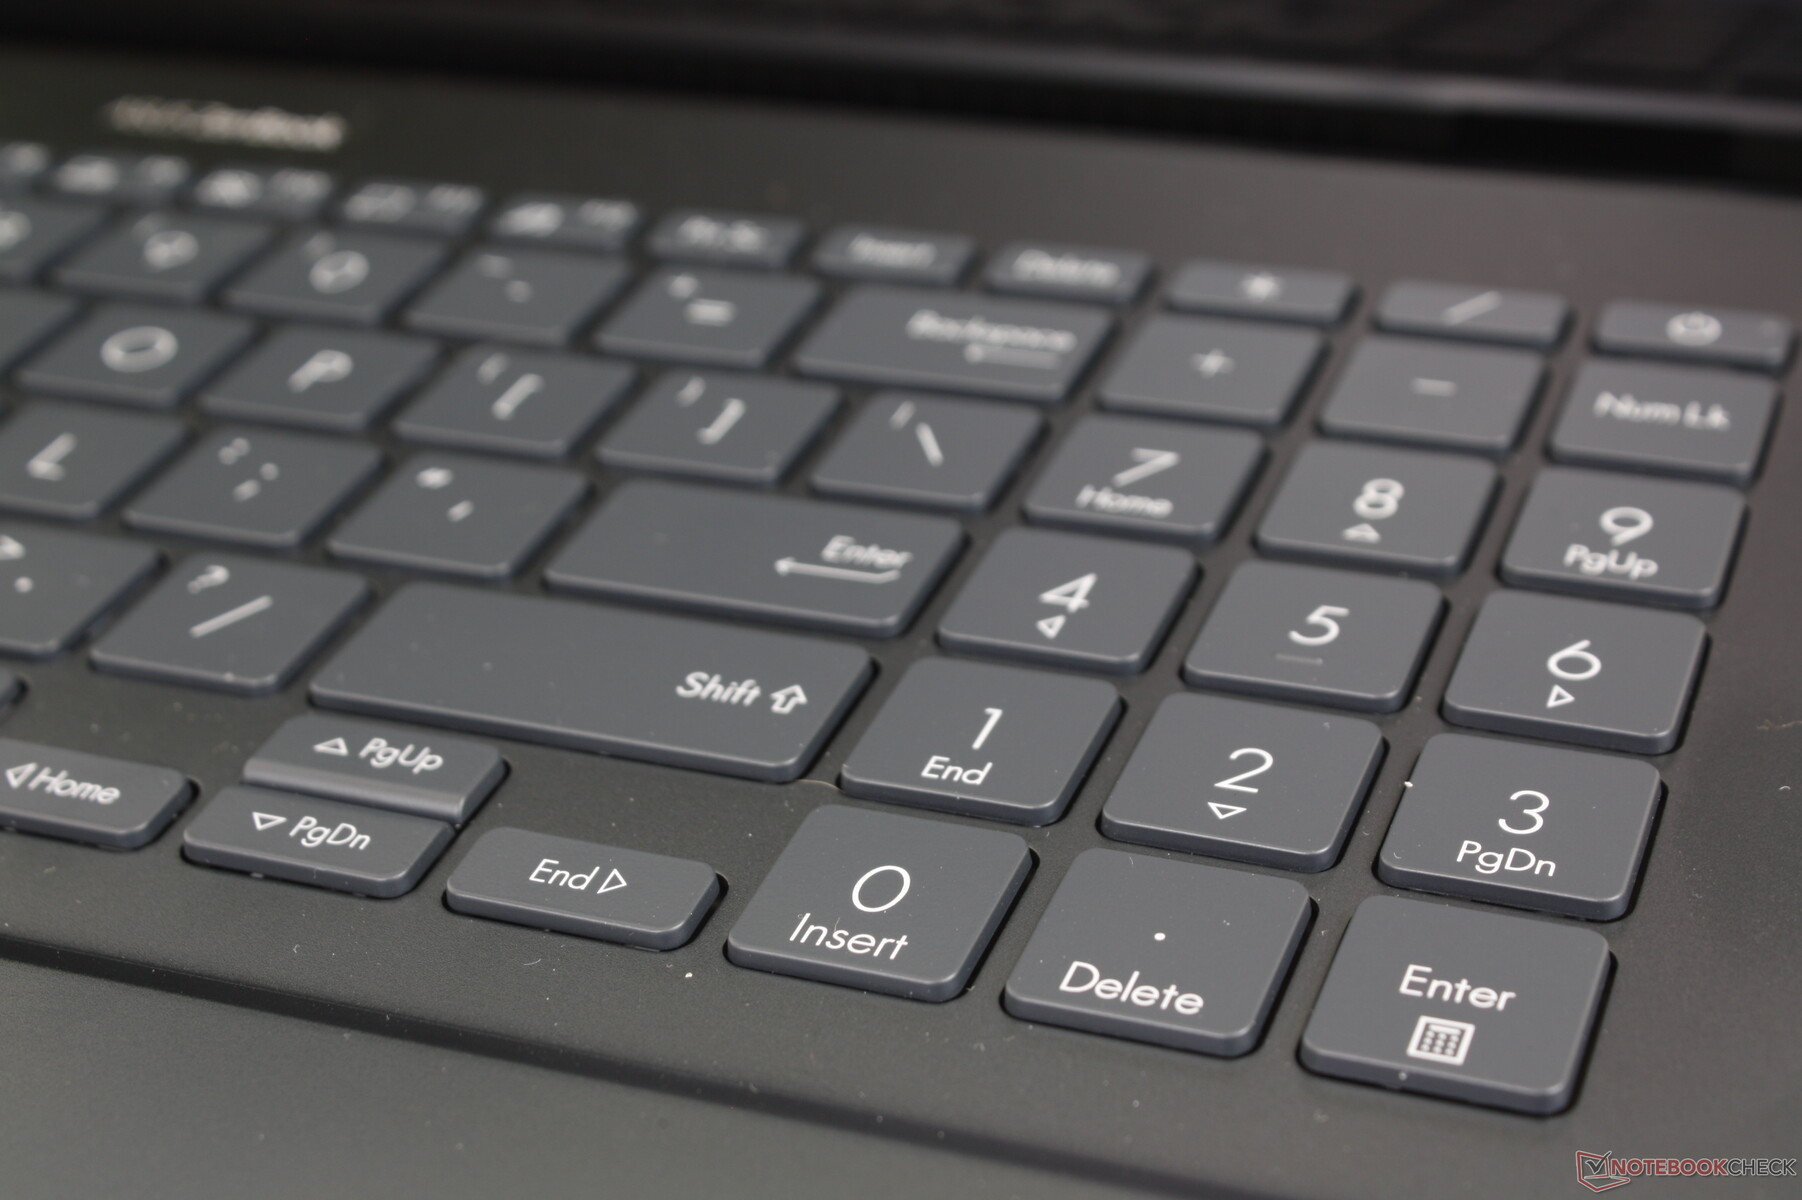
L'un des ordinateurs portables de 15,6 pouces les plus populaires auprès des professionnels ou des utilisateurs multimédia est le Dell XPS 15. Les comparaisons entre ce dernier et le Zenbook Pro 15 d'Asus sont donc inévitables. Asus a quelques atouts dans sa manche que les utilisateurs du XPS n'ont toujours pas, notamment un écran OLED 1080p et un processeur AMD Ryzen qui aident à distinguer le Zenbook Pro 15 du XPS 15. Il intègre également un pavé numérique et quelques options de port supplémentaires, bien qu'au prix d'un châssis plus grand. Si ces facteurs de différenciation sont importants pour vos charges de travail quotidiennes, alors le Zenbook Pro 15 serait une meilleure alternative à la machine Dell concurrente sans avoir à sacrifier l'autonomie de la batterie ou les performances graphiques en cours de route.
Le processeur AMD Ryzen 9 et l'écran tactile OLED 1080p sont les vedettes de ce Zenbook Asus bien équilibré. Ses capacités de connexion USB-C sont toutefois insuffisantes.
L'omission la plus notable sur l'Asus est peut-être son manque de support pour Thunderbolt, DisplayPort-over-USB-C, et Power Delivery. Les capacités d'ancrage sont donc plus limitées sur l'Asus par rapport à la plupart des autres ordinateurs portables multimédias. Si ces fonctionnalités USB-C sont importantes, il est préférable de chercher ailleurs dans le portefeuille d'Asus.
Prix et disponibilité
Xotic PC expédie maintenant le ZenBook Pro 15 UM535QE tel que configuré dans notre revue pour $1500 USD. Alternativement, les utilisateurs peuvent acheter à partir d'un SKU différent sur Amazon avec la moitié de l'espace de stockage pour $1380 USD.
Asus Zenbook Pro 15 OLED UM535Q
- 08/30/2022 v7 (old)
Allen Ngo
Price comparison

