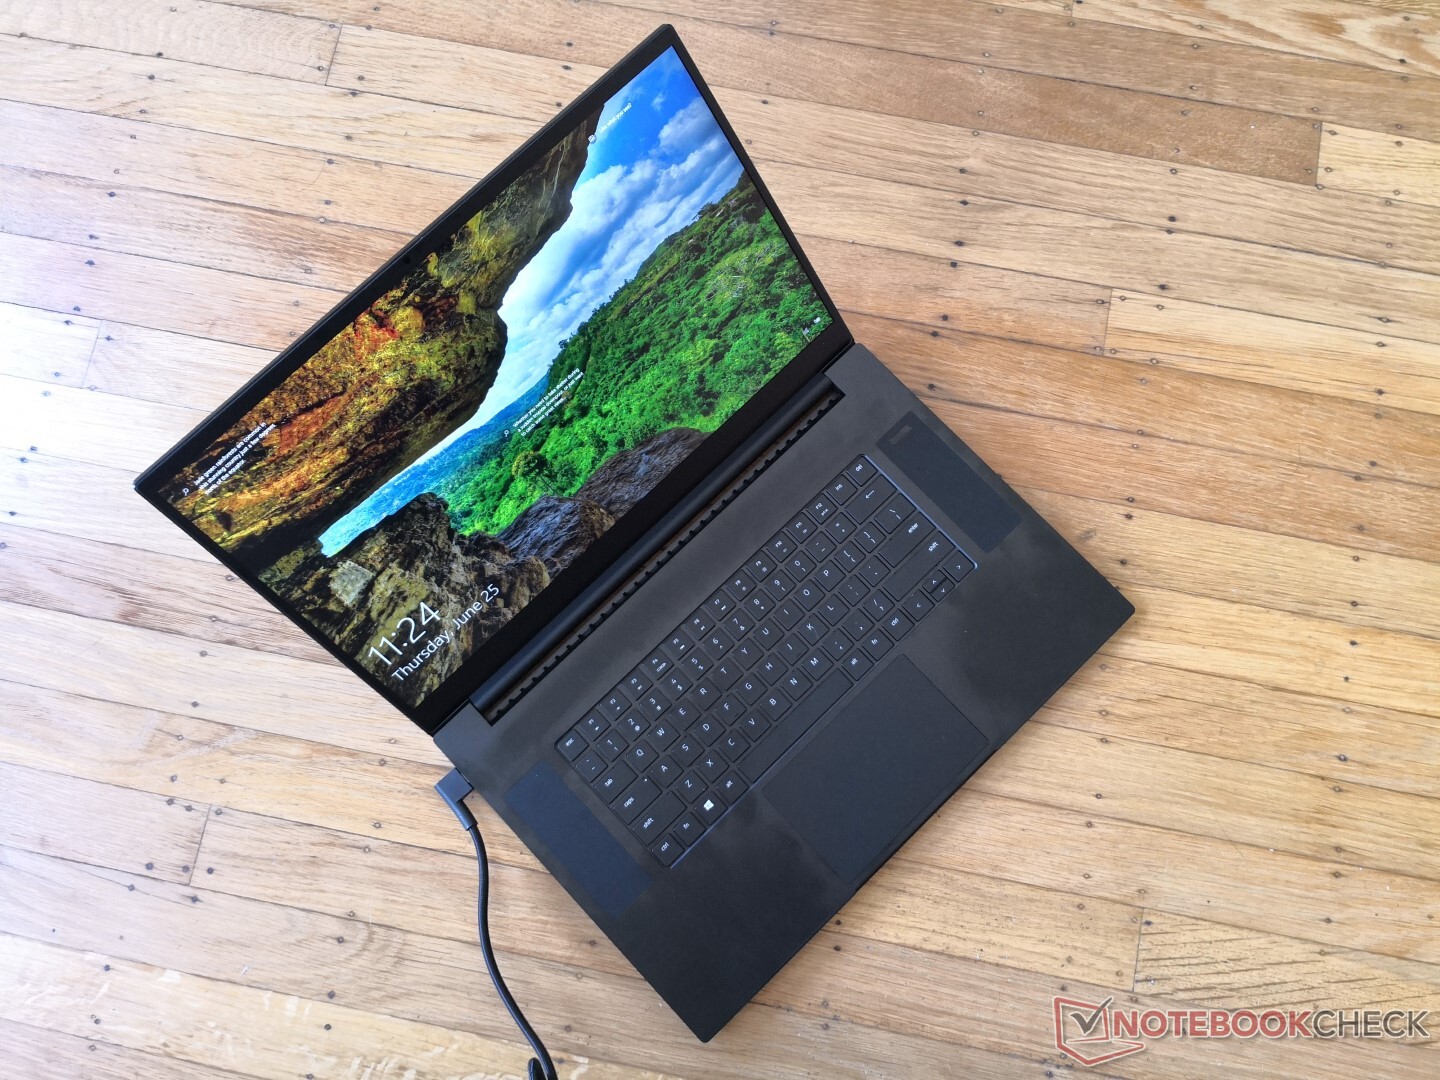
Test du Razer Blade Pro 17 2020 (i7-10875H, RTX 2070 Max-Q, FHD, 300 Hz) : a-t-on vraiment besoin d'un PC portable 300 Hz ?
Note | Date | Modèle | Poids | Épaisseur | Taille | Résolution | Prix |
|---|---|---|---|---|---|---|---|
| 87.4 % v7 (old) | 08/20 | Razer Blade Pro 17 RTX 2070 Max-Q 300 Hz i7-10875H, GeForce RTX 2070 Max-Q | 2.7 kg | 19.9 mm | 17.30" | 1920x1080 | |
| 81.2 % v7 (old) | 01/20 | Asus ROG Zephyrus S GX701GXR i7-9750H, GeForce RTX 2080 Max-Q | 2.7 kg | 18.7 mm | 17.30" | 1920x1080 | |
| 82.9 % v7 (old) | 07/19 | MSI GS75 Stealth 9SG i7-9750H, GeForce RTX 2080 Max-Q | 2.3 kg | 18.9 mm | 17.30" | 1920x1080 | |
| 84.2 % v7 (old) | 03/20 | Alienware m17 R2 P41E i9-9980HK, GeForce RTX 2080 Max-Q | 2.6 kg | 20.5 mm | 17.30" | 1920x1080 | |
| 86.5 % v7 (old) | 06/20 | Aorus 17G XB i7-10875H, GeForce RTX 2070 Super Max-Q | 2.7 kg | 26 mm | 17.30" | 1920x1080 |
| SD Card Reader | |
| average JPG Copy Test (av. of 3 runs) | |
| Aorus 17G XB (Toshiba Exceria Pro SDXC 64 GB UHS-II) | |
| Razer Blade Pro 17 RTX 2070 Max-Q 300 Hz (Toshiba Exceria Pro SDXC 64 GB UHS-II) | |
| Dell XPS 15 9500 Core i7 4K UHD (Toshiba Exceria Pro SDXC 64 GB UHS-II) | |
| Razer Blade Pro 17 4K UHD 120 Hz (Toshiba Exceria Pro SDXC 64 GB UHS-II) | |
| MSI GS63VR 7RG-005 (Toshiba Exceria Pro SDXC 64 GB UHS-II) | |
| maximum AS SSD Seq Read Test (1GB) | |
| Aorus 17G XB (Toshiba Exceria Pro SDXC 64 GB UHS-II) | |
| Razer Blade Pro 17 RTX 2070 Max-Q 300 Hz (Toshiba Exceria Pro SDXC 64 GB UHS-II) | |
| MSI GS63VR 7RG-005 (Toshiba Exceria Pro SDXC 64 GB UHS-II) | |
| Razer Blade Pro 17 4K UHD 120 Hz (Toshiba Exceria Pro SDXC 64 GB UHS-II) | |
| Dell XPS 15 9500 Core i7 4K UHD (Toshiba Exceria Pro SDXC 64 GB UHS-II) | |


| |||||||||||||||||||||||||
Homogénéité de la luminosité: 78 %
Valeur mesurée au centre, sur batterie: 328 cd/m²
Contraste: 937:1 (Valeurs des noirs: 0.35 cd/m²)
ΔE ColorChecker Calman: 4.74 | ∀{0.5-29.43 Ø4.72}
calibrated: 2.12
ΔE Greyscale Calman: 6.8 | ∀{0.09-98 Ø4.97}
98.6% sRGB (Argyll 1.6.3 3D)
64.8% AdobeRGB 1998 (Argyll 1.6.3 3D)
73% AdobeRGB 1998 (Argyll 3D)
98.5% sRGB (Argyll 3D)
72.2% Display P3 (Argyll 3D)
Gamma: 2.2
CCT: 6446 K
| Razer Blade Pro 17 RTX 2070 Max-Q 300 Hz Sharp LQ173M1JW02, IPS, 17.3", 1920x1080 | Asus ROG Zephyrus S GX701GXR AU Optronics B173HAN05.1, IPS, 17.3", 1920x1080 | MSI GS75 Stealth 9SG Chi Mei N173HCE-G33 (CMN175C), IPS, 17.3", 1920x1080 | Alienware m17 R2 P41E Chi Mei 173HCE, CMN175F, IPS, 17.3", 1920x1080 | Aorus 17G XB AU Optronics B173HAN05.0 (AUO509D), IPS, 17.3", 1920x1080 | Razer Blade Pro 17 4K UHD 120 Hz AU Optronics B173ZAN03.3, IPS, 17.3", 3840x2160 | |
|---|---|---|---|---|---|---|
| Display | -2% | -10% | -1% | -1% | 18% | |
| Display P3 Coverage (%) | 72.2 | 70 -3% | 62.6 -13% | 70.8 -2% | 70.6 -2% | 84.8 17% |
| sRGB Coverage (%) | 98.5 | 96.6 -2% | 93.5 -5% | 98.5 0% | 97.2 -1% | 99.9 1% |
| AdobeRGB 1998 Coverage (%) | 73 | 72.3 -1% | 64.7 -11% | 72.2 -1% | 72.8 0% | 98.6 35% |
| Response Times | 11% | -17% | -110% | -106% | -90% | |
| Response Time Grey 50% / Grey 80% * (ms) | 5.6 ? | 5.6 ? -0% | 7.2 ? -29% | 17.2 ? -207% | 16 ? -186% | 15.2 ? -171% |
| Response Time Black / White * (ms) | 9.6 ? | 7.6 ? 21% | 10 ? -4% | 10.8 ? -13% | 12 ? -25% | 10.4 ? -8% |
| PWM Frequency (Hz) | 25510 ? | 26320 ? | ||||
| Screen | 23% | 31% | 32% | 31% | 3% | |
| Brightness middle (cd/m²) | 328 | 288 -12% | 366 12% | 384.2 17% | 293 -11% | 346.7 6% |
| Brightness (cd/m²) | 329 | 276 -16% | 343 4% | 357 9% | 285 -13% | 332 1% |
| Brightness Distribution (%) | 78 | 93 19% | 91 17% | 90 15% | 95 22% | 91 17% |
| Black Level * (cd/m²) | 0.35 | 0.24 31% | 0.29 17% | 0.29 17% | 0.24 31% | 0.27 23% |
| Contrast (:1) | 937 | 1200 28% | 1262 35% | 1325 41% | 1221 30% | 1284 37% |
| Colorchecker dE 2000 * | 4.74 | 1.92 59% | 1.51 68% | 1.35 72% | 1.27 73% | 5.62 -19% |
| Colorchecker dE 2000 max. * | 8.99 | 4.57 49% | 3.22 64% | 3.45 62% | 2.24 75% | 9.36 -4% |
| Colorchecker dE 2000 calibrated * | 2.12 | 1.14 46% | 0.71 67% | 1.42 33% | 1.06 50% | 3.81 -80% |
| Greyscale dE 2000 * | 6.8 | 3.08 55% | 1.93 72% | 1.2 82% | 1.34 80% | 5.5 19% |
| Gamma | 2.2 100% | 2.42 91% | 2.38 92% | 2.23 99% | 2.38 92% | 2.25 98% |
| CCT | 6446 101% | 7055 92% | 6881 94% | 6580 99% | 6542 99% | 6175 105% |
| Color Space (Percent of AdobeRGB 1998) (%) | 64.8 | 65 0% | 60 -7% | 65.5 1% | 73 13% | 87.2 35% |
| Color Space (Percent of sRGB) (%) | 98.6 | 96 -3% | 94 -5% | 98.5 0% | 94 -5% | 100 1% |
| Moyenne finale (programmes/paramètres) | 11% /
17% | 1% /
18% | -26% /
8% | -25% /
8% | -23% /
-6% |
* ... Moindre est la valeur, meilleures sont les performances
Temps de réponse de l'écran
| ↔ Temps de réponse noir à blanc | ||
|---|---|---|
| 9.6 ms ... hausse ↗ et chute ↘ combinées | ↗ 5.2 ms hausse | 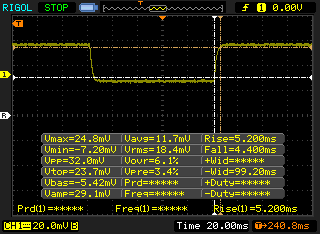 |
| ↘ 4.4 ms chute | ||
| L'écran montre de faibles temps de réponse, un bon écran pour jouer. En comparaison, tous les appareils testés affichent entre 0.1 (minimum) et 240 (maximum) ms. » 26 % des appareils testés affichent de meilleures performances. Cela signifie que les latences relevées sont meilleures que la moyenne (19.8 ms) de tous les appareils testés. | ||
| ↔ Temps de réponse gris 50% à gris 80% | ||
| 5.6 ms ... hausse ↗ et chute ↘ combinées | ↗ 2.6 ms hausse | 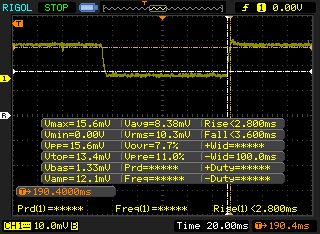 |
| ↘ 3 ms chute | ||
| L'écran montre de très faibles temps de réponse, parfait pour le jeu. En comparaison, tous les appareils testés affichent entre 0.165 (minimum) et 636 (maximum) ms. » 18 % des appareils testés affichent de meilleures performances. Cela signifie que les latences relevées sont meilleures que la moyenne (31 ms) de tous les appareils testés. | ||
Scintillement / MLI (Modulation de largeur d'impulsion)
| Scintillement / MLI (Modulation de largeur d'impulsion) non décelé | 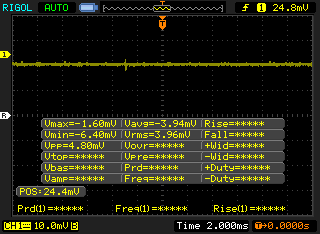 | ||
En comparaison, 52 % des appareils testés n'emploient pas MDI pour assombrir leur écran. Nous avons relevé une moyenne à 7781 (minimum : 5 - maximum : 343500) Hz dans le cas où une MDI était active. | |||
Cinebench R15: CPU Multi 64Bit | CPU Single 64Bit
Blender: v2.79 BMW27 CPU
7-Zip 18.03: 7z b 4 -mmt1 | 7z b 4
Geekbench 5.5: Single-Core | Multi-Core
HWBOT x265 Benchmark v2.2: 4k Preset
LibreOffice : 20 Documents To PDF
R Benchmark 2.5: Overall mean
| Blender / v2.79 BMW27 CPU | |
| MSI GF75 Thin 10SCXR | |
| Acer Nitro 5 AN517-52-77DS | |
| Acer Nitro 5 AN515-44-R5FT | |
| Moyenne Intel Core i7-10875H (259 - 535, n=30) | |
| Razer Blade Pro 17 RTX 2070 Max-Q 300 Hz | |
| Asus Zephyrus G14 GA401IV | |
| MSI GE75 9SG | |
| MSI GE66 Raider 10SFS | |
| Asus TUF A17 FA706IU-AS76 | |
| 7-Zip 18.03 / 7z b 4 -mmt1 | |
| MSI GE66 Raider 10SFS | |
| Moyenne Intel Core i7-10875H (5071 - 5780, n=31) | |
| Razer Blade Pro 17 RTX 2070 Max-Q 300 Hz | |
| Acer Nitro 5 AN517-52-77DS | |
| MSI GE75 9SG | |
| Asus TUF A17 FA706IU-AS76 | |
| MSI GF75 Thin 10SCXR | |
| Asus Zephyrus G14 GA401IV | |
| Acer Nitro 5 AN515-44-R5FT | |
| Geekbench 5.5 / Single-Core | |
| MSI GE66 Raider 10SFS | |
| Moyenne Intel Core i7-10875H (1233 - 1371, n=29) | |
| Razer Blade Pro 17 RTX 2070 Max-Q 300 Hz | |
| Acer Nitro 5 AN517-52-77DS | |
| Asus Zephyrus G14 GA401IV | |
| Asus TUF A17 FA706IU-AS76 | |
| MSI GF75 Thin 10SCXR | |
| Acer Nitro 5 AN515-44-R5FT | |
| Geekbench 5.5 / Multi-Core | |
| MSI GE66 Raider 10SFS | |
| Asus TUF A17 FA706IU-AS76 | |
| Moyenne Intel Core i7-10875H (5715 - 8620, n=29) | |
| Asus Zephyrus G14 GA401IV | |
| Razer Blade Pro 17 RTX 2070 Max-Q 300 Hz | |
| Acer Nitro 5 AN517-52-77DS | |
| Acer Nitro 5 AN515-44-R5FT | |
| MSI GF75 Thin 10SCXR | |
| HWBOT x265 Benchmark v2.2 / 4k Preset | |
| MSI GE66 Raider 10SFS | |
| Asus TUF A17 FA706IU-AS76 | |
| Asus Zephyrus G14 GA401IV | |
| MSI GE75 9SG | |
| Moyenne Intel Core i7-10875H (7.27 - 14.1, n=27) | |
| Acer Nitro 5 AN517-52-77DS | |
| Acer Nitro 5 AN515-44-R5FT | |
| MSI GF75 Thin 10SCXR | |
| LibreOffice / 20 Documents To PDF | |
| Acer Nitro 5 AN515-44-R5FT | |
| Asus TUF A17 FA706IU-AS76 | |
| MSI GF75 Thin 10SCXR | |
| Razer Blade Pro 17 RTX 2070 Max-Q 300 Hz | |
| MSI GE66 Raider 10SFS | |
| Moyenne Intel Core i7-10875H (30.2 - 84.3, n=30) | |
| Acer Nitro 5 AN517-52-77DS | |
| R Benchmark 2.5 / Overall mean | |
| MSI GF75 Thin 10SCXR | |
| Acer Nitro 5 AN517-52-77DS | |
| Acer Nitro 5 AN515-44-R5FT | |
| Asus TUF A17 FA706IU-AS76 | |
| Moyenne Intel Core i7-10875H (0.546 - 0.662, n=29) | |
| MSI GE66 Raider 10SFS | |
* ... Moindre est la valeur, meilleures sont les performances
| PCMark 8 Home Score Accelerated v2 | 5217 points | |
| PCMark 8 Work Score Accelerated v2 | 6317 points | |
| PCMark 10 Score | 6290 points | |
Aide | ||
| DPC Latencies / LatencyMon - interrupt to process latency (max), Web, Youtube, Prime95 | |
| Asus TUF A17 FA706IU-AS76 | |
| MSI GF75 Thin 10SCXR | |
| Asus Zephyrus G14 GA401IV | |
| Razer Blade Pro 17 RTX 2070 Max-Q 300 Hz | |
* ... Moindre est la valeur, meilleures sont les performances
| Razer Blade Pro 17 RTX 2070 Max-Q 300 Hz Lite-On CA5-8D512 | MSI GS75 Stealth 9SG 2x Samsung SSD PM981 MZVLB1T0HALR (RAID 0) | Alienware m17 R2 P41E 2x SK Hynix PC601 NVMe 512 GB (RAID 0) | Aorus 17G XB Samsung SSD PM981a MZVLB512HBJQ | Razer Blade Pro 17 4K UHD 120 Hz Samsung SSD PM981 MZVLB1T0HALR | |
|---|---|---|---|---|---|
| AS SSD | 41% | 26% | 68% | 54% | |
| Seq Read (MB/s) | 2019 | 2855 41% | 1938 -4% | 1791 -11% | 1881 -7% |
| Seq Write (MB/s) | 1314 | 2687 104% | 2094 59% | 2193 67% | 2354 79% |
| 4K Read (MB/s) | 46.61 | 30.31 -35% | 25.88 -44% | 50.7 9% | 43.42 -7% |
| 4K Write (MB/s) | 90.2 | 96.3 7% | 100.8 12% | 116.8 29% | 104.1 15% |
| 4K-64 Read (MB/s) | 665 | 1460 120% | 1217 83% | 1525 129% | 1805 171% |
| 4K-64 Write (MB/s) | 813 | 1224 51% | 1137 40% | 1958 141% | 1775 118% |
| Access Time Read * (ms) | 0.058 | 0.054 7% | 0.051 12% | 0.07 -21% | 0.049 16% |
| Access Time Write * (ms) | 0.167 | 0.038 77% | 0.107 36% | 0.032 81% | 0.106 37% |
| Score Read (Points) | 913 | 1776 95% | 1437 57% | 1755 92% | 2037 123% |
| Score Write (Points) | 1034 | 1589 54% | 1447 40% | 2294 122% | 2115 105% |
| Score Total (Points) | 2392 | 4259 78% | 3624 52% | 4972 108% | 5215 118% |
| Copy ISO MB/s (MB/s) | 1715 | 2226 30% | 1926 12% | 1877 9% | |
| Copy Program MB/s (MB/s) | 622 | 426.4 -31% | 626 1% | 539 -13% | |
| Copy Game MB/s (MB/s) | 1506 | 1152 -24% | 1533 2% | 1368 -9% | |
| CrystalDiskMark 5.2 / 6 | 4% | -3% | 5% | -10% | |
| Write 4K (MB/s) | 119 | 95.5 -20% | 110.6 -7% | 123.4 4% | 121.7 2% |
| Read 4K (MB/s) | 51.9 | 42.59 -18% | 41.46 -20% | 45.02 -13% | 43.81 -16% |
| Write Seq (MB/s) | 2258 | 2851 26% | 2378 5% | 2526 12% | 1276 -43% |
| Read Seq (MB/s) | 2283 | 2696 18% | 2114 -7% | 2062 -10% | 1183 -48% |
| Write 4K Q32T1 (MB/s) | 491 | 402.6 -18% | 445.4 -9% | 497.9 1% | 527 7% |
| Read 4K Q32T1 (MB/s) | 540 | 443.9 -18% | 509 -6% | 579 7% | 592 10% |
| Write Seq Q32T1 (MB/s) | 2253 | 3420 52% | 2735 21% | 2982 32% | 2379 6% |
| Read Seq Q32T1 (MB/s) | 3172 | 3514 11% | 3206 1% | 3440 8% | 3213 1% |
| Moyenne finale (programmes/paramètres) | 23% /
28% | 12% /
15% | 37% /
41% | 22% /
31% |
* ... Moindre est la valeur, meilleures sont les performances

Disk Throttling: DiskSpd Read Loop, Queue Depth 8
| 3DMark 11 Performance | 23306 points | |
| 3DMark Cloud Gate Standard Score | 48701 points | |
| 3DMark Fire Strike Score | 18543 points | |
| 3DMark Time Spy Score | 8236 points | |
Aide | ||
| Bas | Moyen | Élevé | Ultra | |
|---|---|---|---|---|
| The Witcher 3 (2015) | 355.6 | 254.3 | 151.4 | 80.9 |
| Dota 2 Reborn (2015) | 143 | 138 | 135 | 126 |
| X-Plane 11.11 (2018) | 112 | 101 | 85.3 |
| Razer Blade Pro 17 RTX 2070 Max-Q 300 Hz GeForce RTX 2070 Max-Q, i7-10875H, Lite-On CA5-8D512 | Asus ROG Zephyrus S GX701GXR GeForce RTX 2080 Max-Q, i7-9750H, Samsung SSD PM981 MZVLB1T0HALR | MSI GS75 Stealth 9SG GeForce RTX 2080 Max-Q, i7-9750H, 2x Samsung SSD PM981 MZVLB1T0HALR (RAID 0) | Alienware m17 R2 P41E GeForce RTX 2080 Max-Q, i9-9980HK, 2x SK Hynix PC601 NVMe 512 GB (RAID 0) | Aorus 17G XB GeForce RTX 2070 Super Max-Q, i7-10875H, Samsung SSD PM981a MZVLB512HBJQ | Razer Blade Pro 17 RTX 2080 Max-Q GeForce RTX 2080 Max-Q, i7-9750H, Samsung SSD PM981 MZVLB512HAJQ | |
|---|---|---|---|---|---|---|
| Noise | -3% | -6% | -3% | -12% | 1% | |
| arrêt / environnement * (dB) | 28.2 | 30 -6% | 30 -6% | 29.1 -3% | 30 -6% | 28.2 -0% |
| Idle Minimum * (dB) | 28.2 | 32 -13% | 31 -10% | 29.4 -4% | 35 -24% | 28.2 -0% |
| Idle Average * (dB) | 28.2 | 33 -17% | 32 -13% | 29.4 -4% | 36 -28% | 28.2 -0% |
| Idle Maximum * (dB) | 30.5 | 34 -11% | 38 -25% | 31.5 -3% | 41 -34% | 30.8 -1% |
| Load Average * (dB) | 42.2 | 40 5% | 47 -11% | 49.7 -18% | 47 -11% | 42 -0% |
| Witcher 3 ultra * (dB) | 53 | 49 8% | 48 9% | 49.5 7% | 48 9% | 51 4% |
| Load Maximum * (dB) | 55.5 | 50 10% | 49 12% | 53.3 4% | 49 12% | 53 5% |
* ... Moindre est la valeur, meilleures sont les performances
Degré de la nuisance sonore
| Au repos |
| 28.2 / 28.2 / 30.5 dB(A) |
| Fortement sollicité |
| 42.2 / 55.5 dB(A) |
 | ||
30 dB silencieux 40 dB(A) audible 50 dB(A) bruyant |
||
min: | ||
(±) La température maximale du côté supérieur est de 40.8 °C / 105 F, par rapport à la moyenne de 40.4 °C / 105 F, allant de 21.2 à 68.8 °C pour la classe Gaming.
(-) Le fond chauffe jusqu'à un maximum de 48.4 °C / 119 F, contre une moyenne de 43.2 °C / 110 F
(±) En utilisation inactive, la température moyenne du côté supérieur est de 33.3 °C / 92 F, par rapport à la moyenne du dispositif de 33.9 °C / 93 F.
(±) En jouant à The Witcher 3, la température moyenne du côté supérieur est de 35.4 °C / 96 F, alors que la moyenne de l'appareil est de 33.9 °C / 93 F.
(+) Les repose-poignets et le pavé tactile atteignent la température maximale de la peau (33.2 °C / 91.8 F) et ne sont donc pas chauds.
(-) La température moyenne de la zone de l'appui-paume de dispositifs similaires était de 28.8 °C / 83.8 F (-4.4 °C / #-8 F).
| Éteint/en veille | |
| Au repos | |
| Fortement sollicité |
|
Légende:
min: | |
| Razer Blade Pro 17 RTX 2070 Max-Q 300 Hz i7-10875H, GeForce RTX 2070 Max-Q, Lite-On CA5-8D512, IPS, 1920x1080, 17.3" | Asus ROG Zephyrus S GX701GXR i7-9750H, GeForce RTX 2080 Max-Q, Samsung SSD PM981 MZVLB1T0HALR, IPS, 1920x1080, 17.3" | MSI GS75 Stealth 9SG i7-9750H, GeForce RTX 2080 Max-Q, 2x Samsung SSD PM981 MZVLB1T0HALR (RAID 0), IPS, 1920x1080, 17.3" | Alienware m17 R2 P41E i9-9980HK, GeForce RTX 2080 Max-Q, 2x SK Hynix PC601 NVMe 512 GB (RAID 0), IPS, 1920x1080, 17.3" | Aorus 17G XB i7-10875H, GeForce RTX 2070 Super Max-Q, Samsung SSD PM981a MZVLB512HBJQ, IPS, 1920x1080, 17.3" | Razer Blade Pro 17 4K UHD 120 Hz i7-9750H, GeForce RTX 2080 Max-Q, Samsung SSD PM981 MZVLB1T0HALR, IPS, 3840x2160, 17.3" | |
|---|---|---|---|---|---|---|
| Power Consumption | -14% | 16% | -39% | -3% | -32% | |
| Idle Minimum * (Watt) | 19.6 | 32 -63% | 13 34% | 24.7 -26% | 20 -2% | 34.2 -74% |
| Idle Average * (Watt) | 21.7 | 34 -57% | 17 22% | 35.9 -65% | 23 -6% | 37.2 -71% |
| Idle Maximum * (Watt) | 36.1 | 36 -0% | 25 31% | 69.6 -93% | 38 -5% | 50 -39% |
| Load Average * (Watt) | 115.6 | 95 18% | 96 17% | 141.8 -23% | 105 9% | 106.1 8% |
| Witcher 3 ultra * (Watt) | 157 | 155 1% | 156 1% | 185.8 -18% | 158 -1% | 178.7 -14% |
| Load Maximum * (Watt) | 219.9 | 187 15% | 239 -9% | 235.4 -7% | 243 -11% | 223.6 -2% |
* ... Moindre est la valeur, meilleures sont les performances
| Razer Blade Pro 17 RTX 2070 Max-Q 300 Hz i7-10875H, GeForce RTX 2070 Max-Q, 70 Wh | Asus ROG Zephyrus S GX701GXR i7-9750H, GeForce RTX 2080 Max-Q, 76 Wh | MSI GS75 Stealth 9SG i7-9750H, GeForce RTX 2080 Max-Q, 80.25 Wh | Alienware m17 R2 P41E i9-9980HK, GeForce RTX 2080 Max-Q, 76 Wh | Aorus 17G XB i7-10875H, GeForce RTX 2070 Super Max-Q, 94 Wh | Razer Blade Pro 17 4K UHD 120 Hz i7-9750H, GeForce RTX 2080 Max-Q, 70 Wh | |
|---|---|---|---|---|---|---|
| Autonomie de la batterie | -39% | 22% | -2% | 53% | -24% | |
| WiFi v1.3 (h) | 4.9 | 3 -39% | 6 22% | 4.8 -2% | 7.5 53% | 3.7 -24% |
| Reader / Idle (h) | 4.1 | 7.7 | 7.1 | 10 | ||
| Load (h) | 1.2 | 1.2 | 0.5 | 2.2 |
Points positifs
Points négatifs
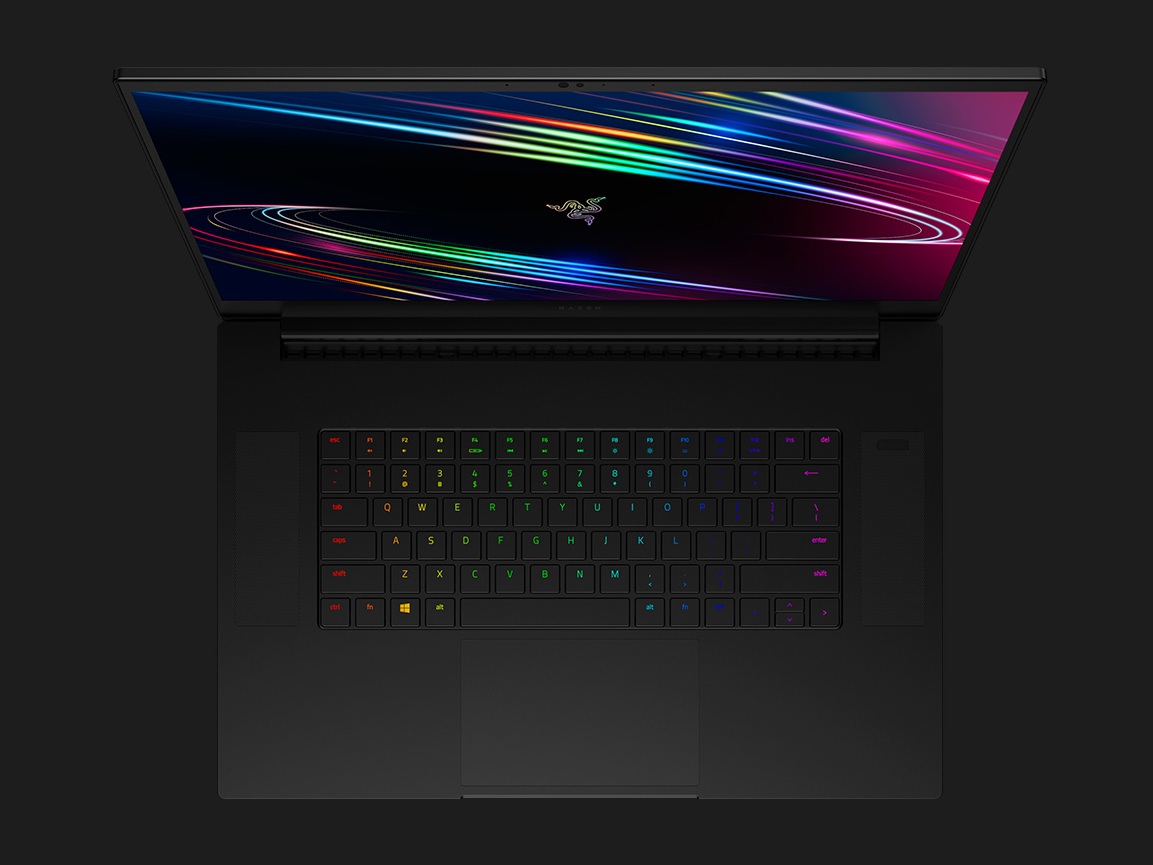
Tout comme le Blade 15 2019 est une mise à jour mineure du Blade 15 2019, le Blade Pro 17 2020 est une évolution du Blade Pro 17 2019. Le nouveau processeur 8 cœurs, les cartes graphiques Super Max-Q, et l'écran 300 Hz sont les principaux arguments du modèle 2020 par rapport à celui de 2019, qui possédait un processeur 6 cœurs, des cartes graphiques Max-Q, et un écran 240 Hz. Les mises à jour matérielles n'améliorent que légèrement l'expérience de jeu, si bien que l'on ne manquera pas grand-chose en choisissant le modèle de l'an dernier. Gardons à l'esprit qu'il n'est pas nécessaire d'atteindre 300 FPS en jeu pour profiter de l'écran 300 Hz.
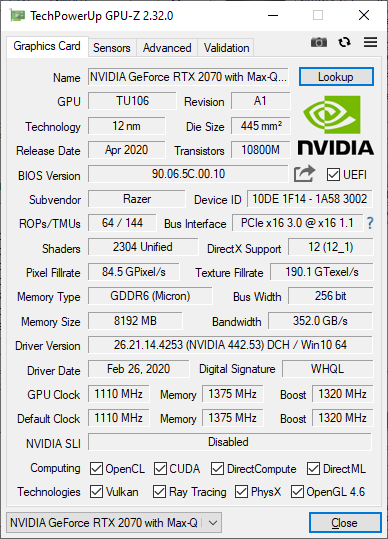
Mais le plus surprenant avec le Blade Pro 17 n'est pas le CPU Core de 10e génération ou l'écran 300 Hz, mais le niveau de performances que peut attendre la GeForce RTX 2070 Max-Q. Les résultats 3DMark sont d'environ 20 % supérieurs à la moyenne des RTX 2070 Max-Q de notre base de donnée. Ainsi, la RTX 2070 Max-Q du Blade Pro 17 est capable de faire mieux que les RTX 2070 Super Max-Q ou RTX 2020 Super Max-Q de certains PC portables de jeu. Ceux qui choisissent le Blade Pro 17 2020 peuvent être tranquilles, s'agissant de l'un des PC les plus rapides avec la GeForce RTX 2070 Max-Q.
Le taux de rafraîchissement de 300 Hz est un luxe que seuls les joueurs les plus extrêmes vous vouloir. Pour les autres, les 240 Hz sont plus que suffisants. La série Blade Pro 2019 séduira plus une large audience, parce que la version 2020 plus chère n'offre pas de gros gains de performances d'un année sur l'autre.
L’intégralité de cette critique est disponible en anglais en suivant ce lien.
Razer Blade Pro 17 RTX 2070 Max-Q 300 Hz
- 06/27/2020 v7 (old)
Allen Ngo
Price comparison
