L'Intel Core i7-12800HX est démentiel : test du MSI Raider GE67 HX 12UGS
Le MSI GE67 est une série de jeux haut de gamme qui se situe au-dessus des séries moins chères Katana GF ou Vector GP, mais en dessous de la série Titan GT pour les passionnés. Notre unité de test GE67 est le successeur direct du GE66 de 2020. Au lieu d'être livré avec des processeurs Intel 10e génération Comet Lake-H et des GPU Nvidia GeForce Super, le GE67 est livré avec des processeurs Alder Lake-H 12e génération et des GPU mobiles GeForce Ti
Nous vous recommandons de consulter nos existants deux critiques sur le GE66 car le GE67 utilise principalement le même design de châssis et les mêmes caractéristiques. Il existe néanmoins quelques différences visuelles relativement mineures que nous détaillerons dans notre revue ci-dessous
Notre unité de test est équipée d'un processeur Core i7-12800HX à 16 cœurs, d'un GPU RTX 3070 Ti GeForce et d'une dalle OLED QHD 240 Hz promettant une couverture DCI-P3 complète pour un prix de détail d'environ 2 500 USD. Les concurrents directs dans cet espace comprennent d'autres ordinateurs portables de jeu haut de gamme de 15,6 pouces comme le Asus ROG Strix Scar 15, Razer Blade 15ouAlienware m15 R6.
Plus de commentaires sur MSI :
Comparaison avec les concurrents potentiels
Note | Date | Modèle | Poids | Épaisseur | Taille | Résolution | Prix |
|---|---|---|---|---|---|---|---|
| 87.7 % v7 (old) | 07/22 | MSI GE67 HX 12UGS i7-12800HX, GeForce RTX 3070 Ti Laptop GPU | 2.5 kg | 23.4 mm | 15.60" | 1920x1080 | |
| 87.4 % v7 (old) | 06/22 | MSI Raider GE66 12UHS i9-12900HK, GeForce RTX 3080 Ti Laptop GPU | 2.4 kg | 23.4 mm | 15.60" | 3840x2160 | |
| 86.9 % v7 (old) | 03/22 | MSI Vector GP66 12UGS i9-12900H, GeForce RTX 3070 Ti Laptop GPU | 2.3 kg | 23.4 mm | 15.60" | 1920x1080 | |
| 86.3 % v7 (old) | 06/22 | Asus ROG Strix Scar 15 G533ZW-LN106WS i9-12900H, GeForce RTX 3070 Ti Laptop GPU | 2.3 kg | 27.2 mm | 15.60" | 2560x1440 | |
| 86.1 % v7 (old) | 11/21 | Alienware m15 R6, i7-11800H RTX 3080 i7-11800H, GeForce RTX 3080 Laptop GPU | 2.5 kg | 22.85 mm | 15.60" | 1920x1080 | |
| 89.1 % v7 (old) | 03/22 | Razer Blade 15 2022 i7-12800H, GeForce RTX 3080 Ti Laptop GPU | 2.1 kg | 16.99 mm | 15.60" | 2560x1440 |
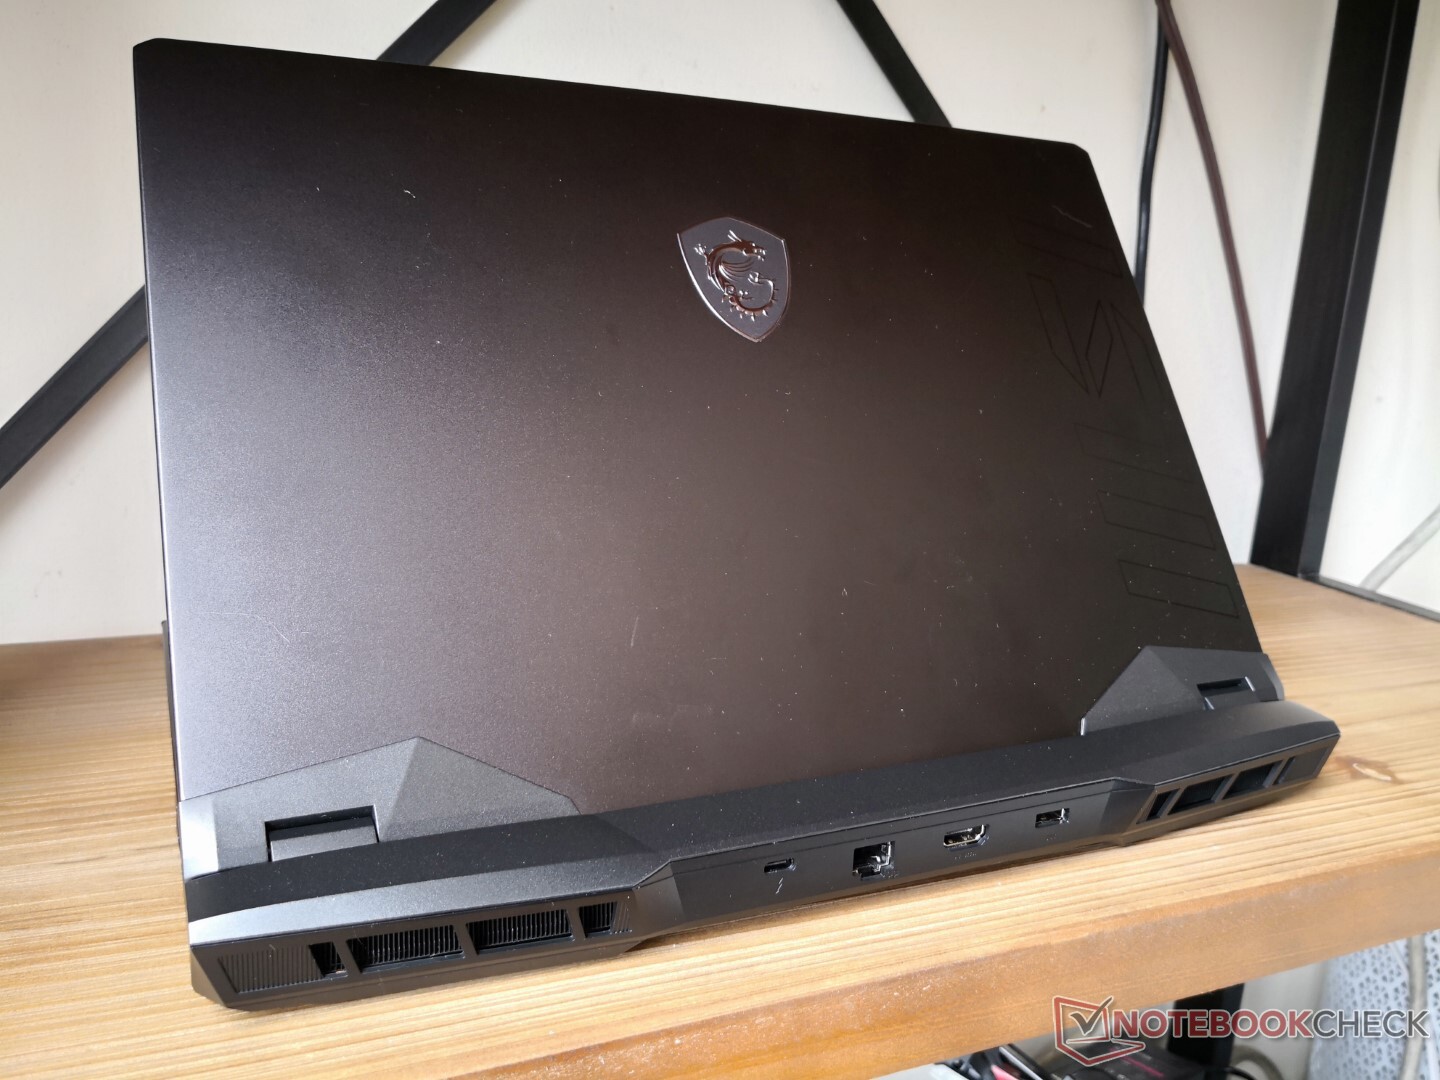
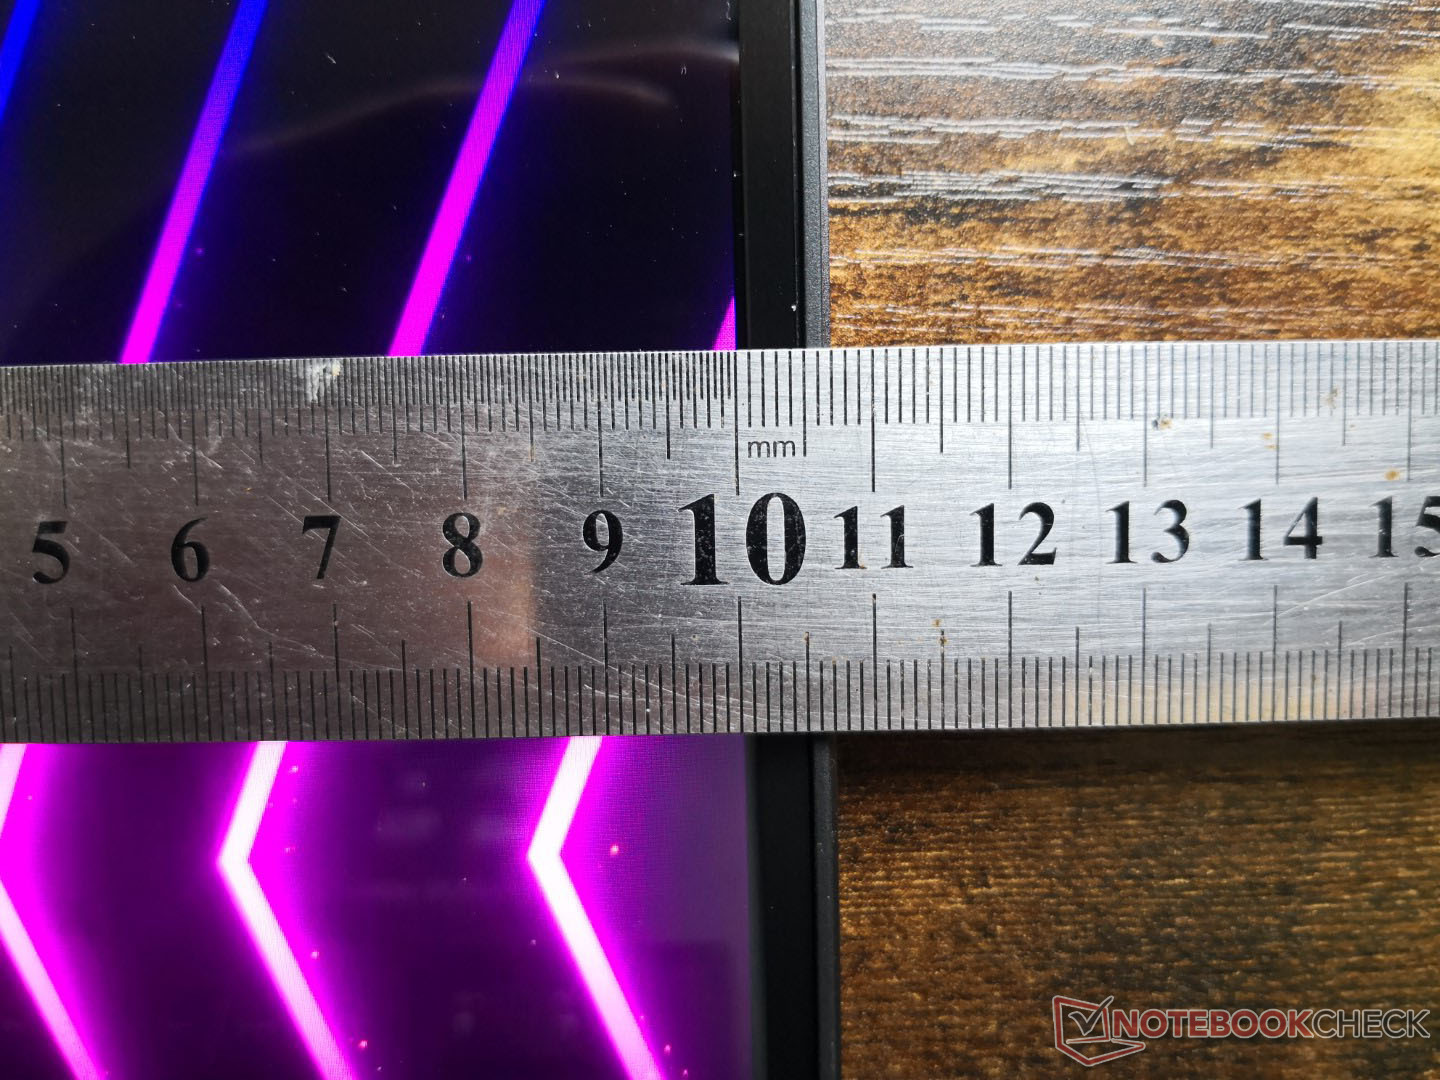
Cas - Même en haut, différent en bas
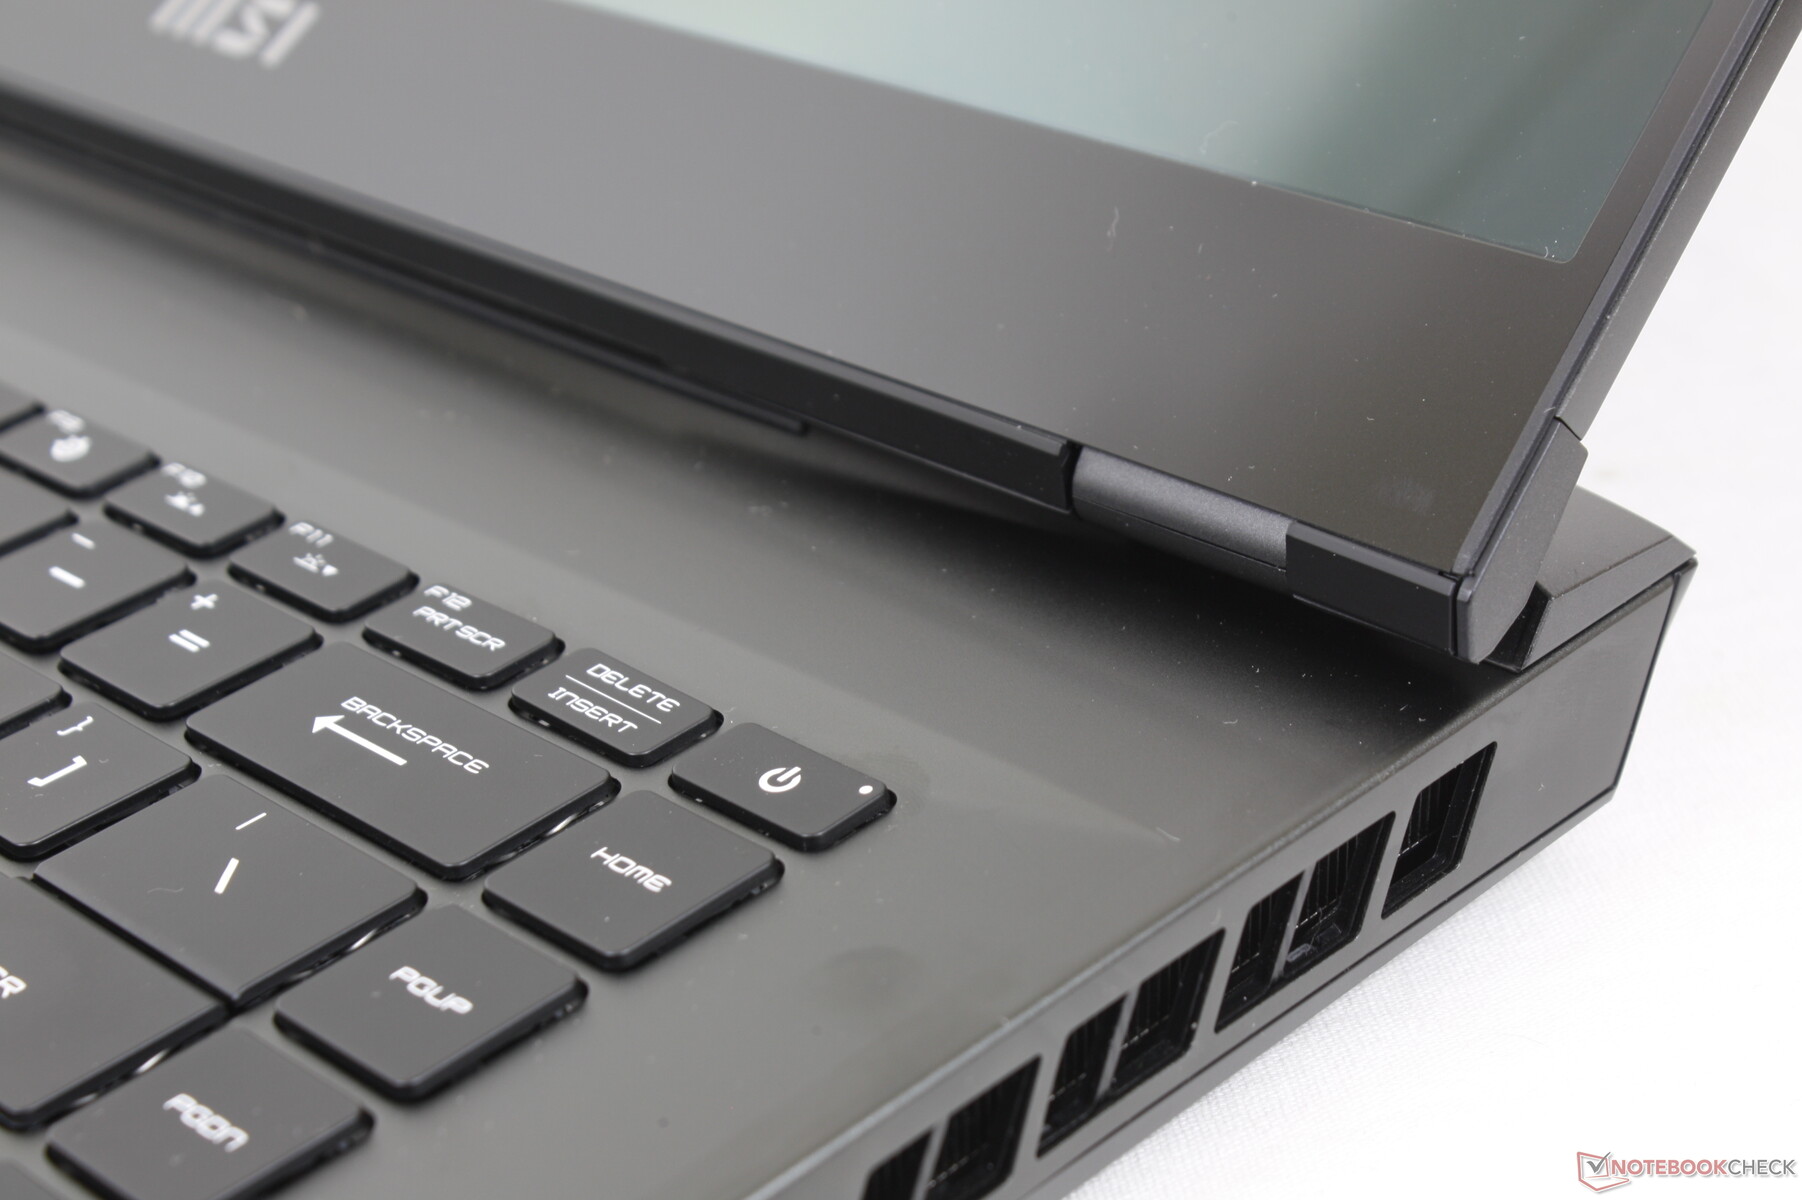
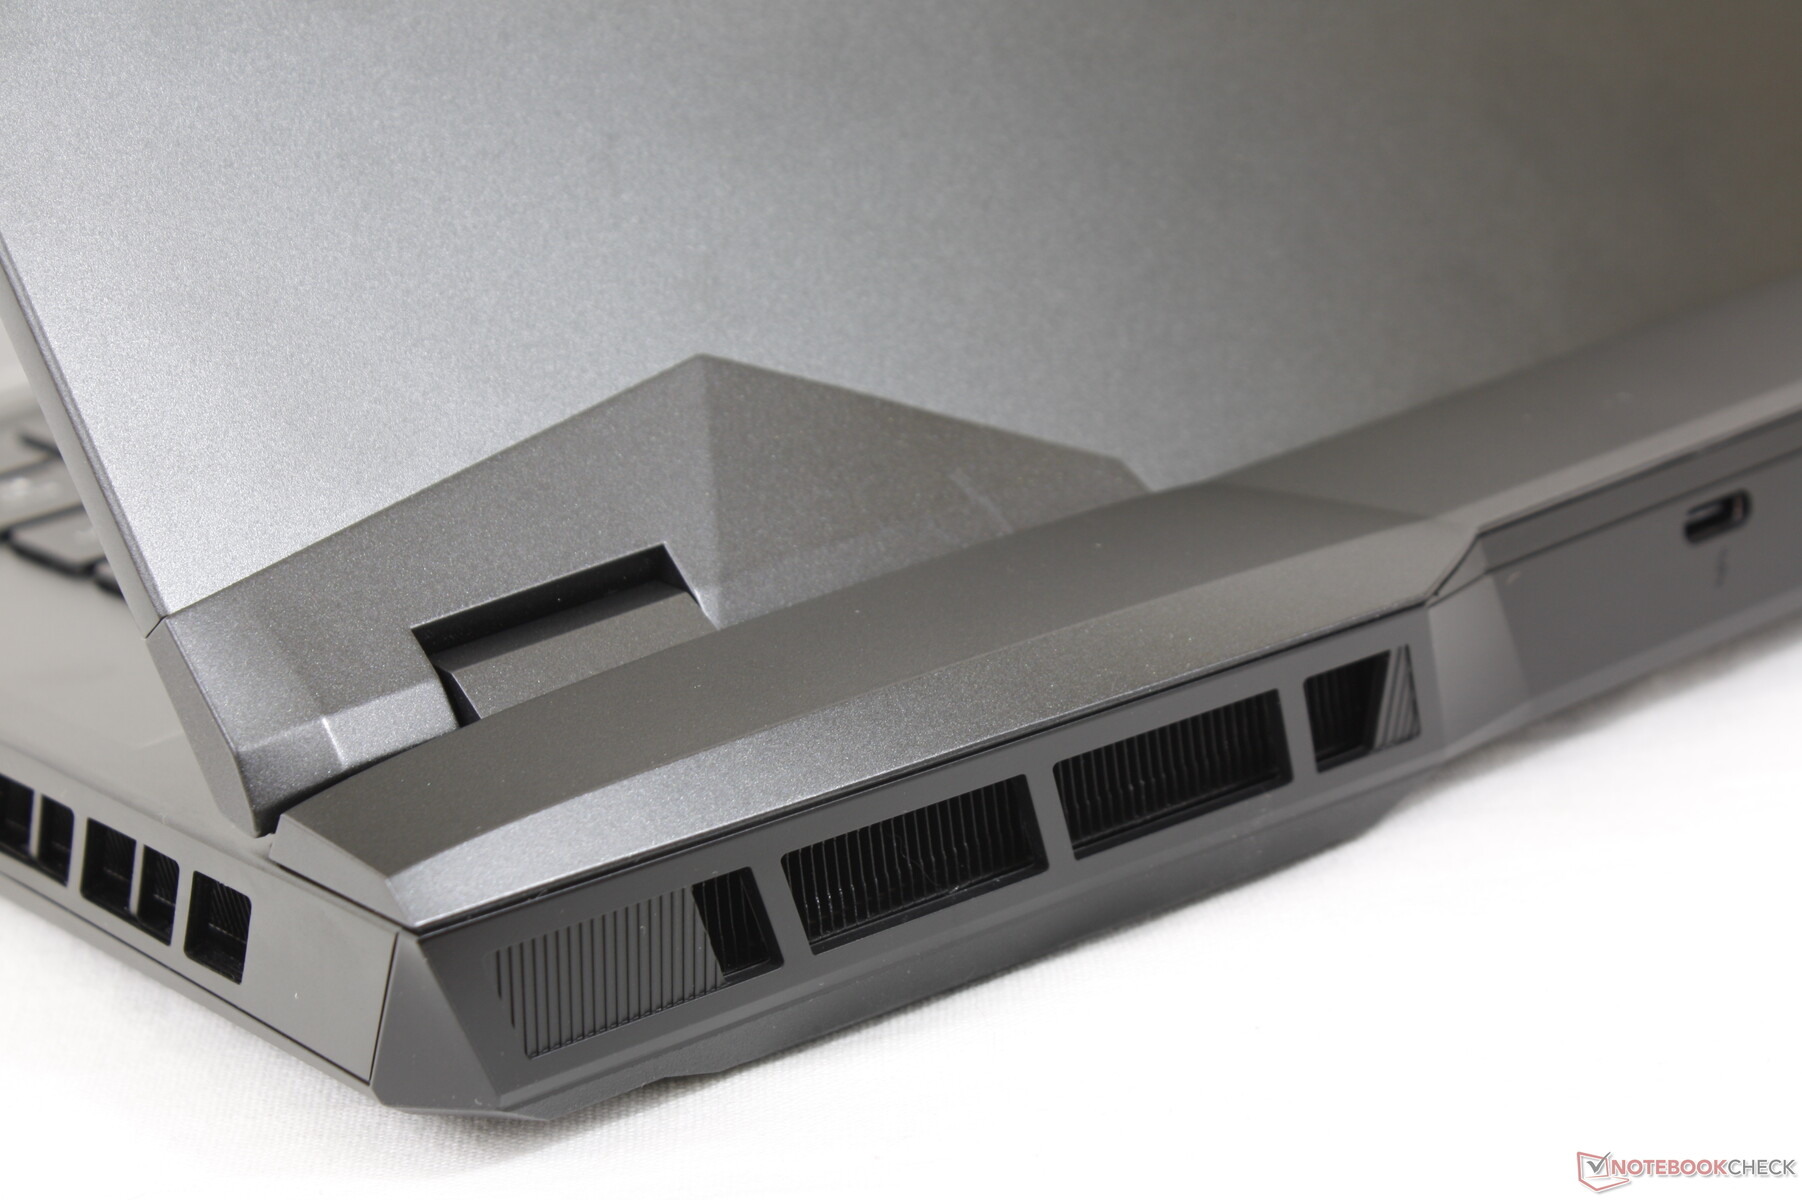
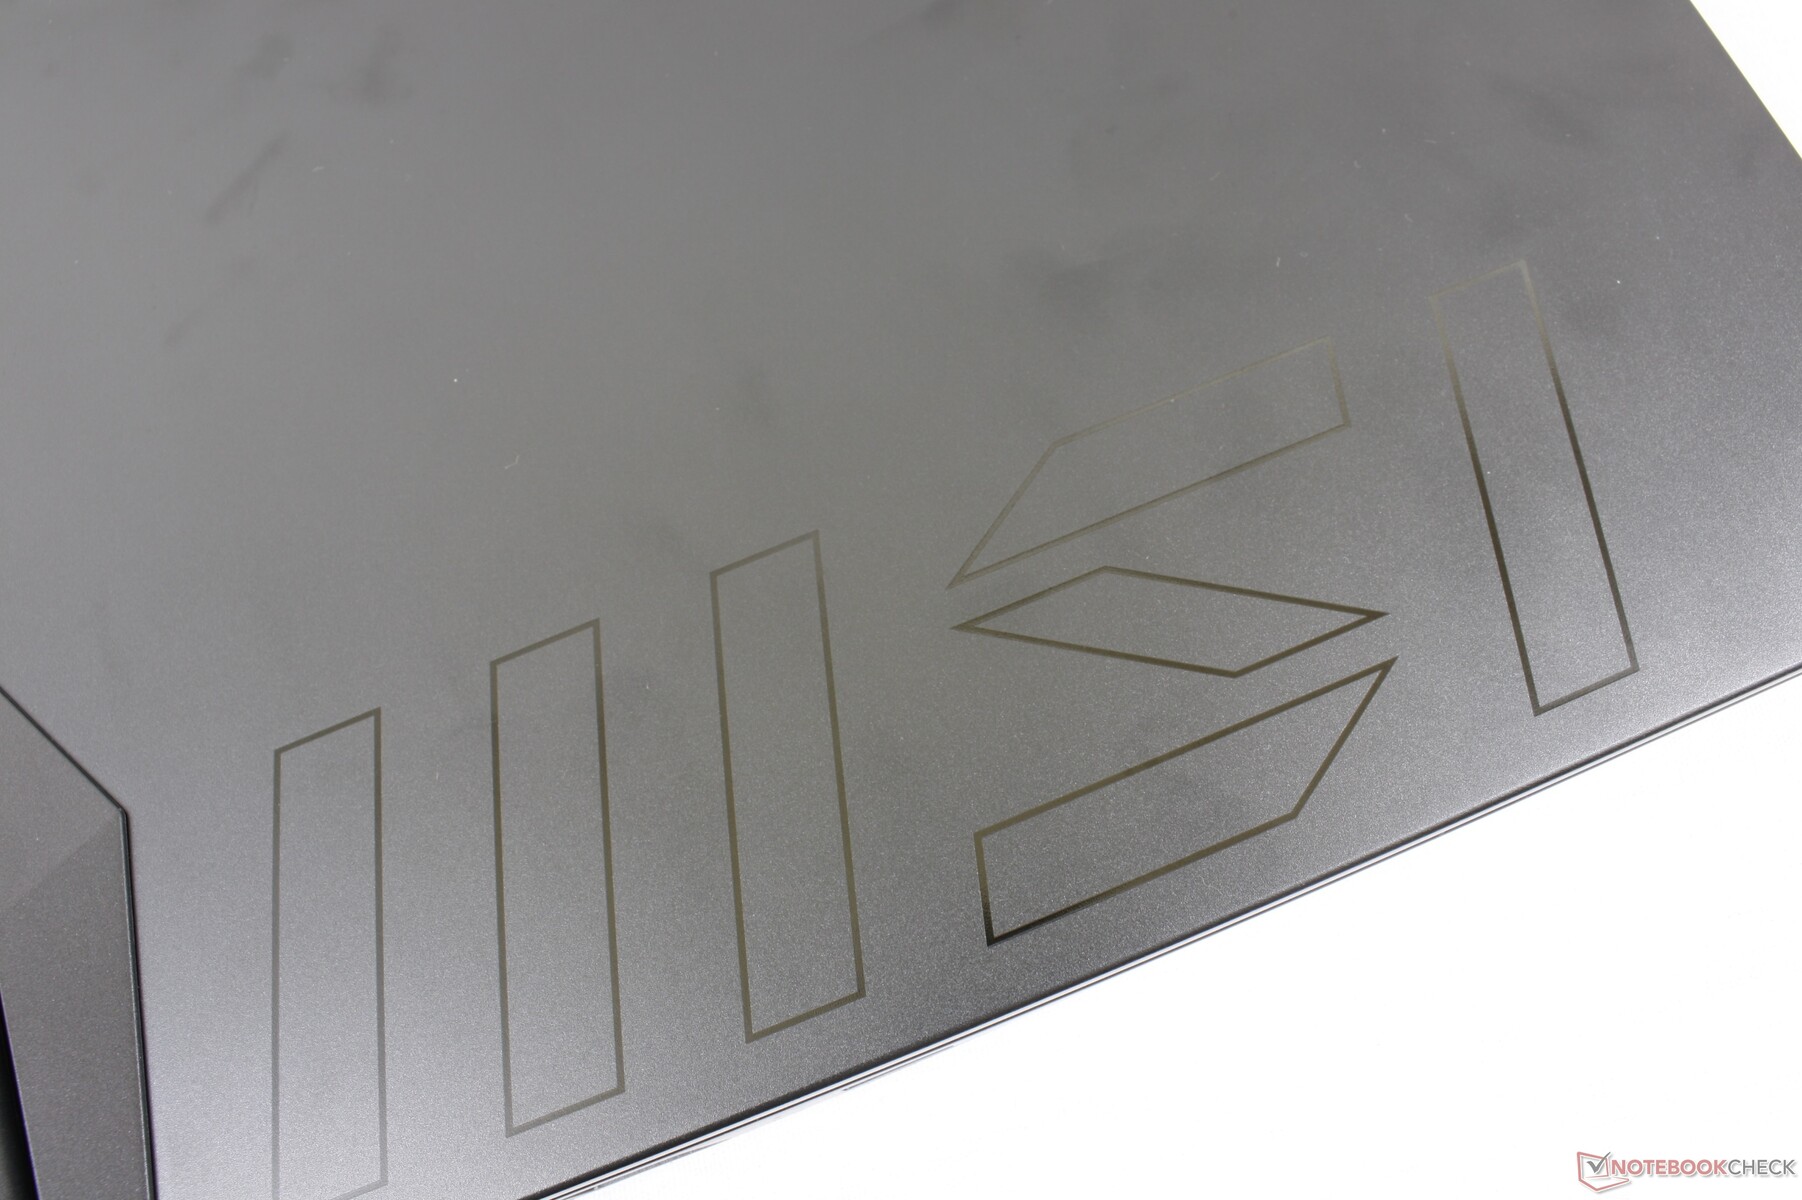
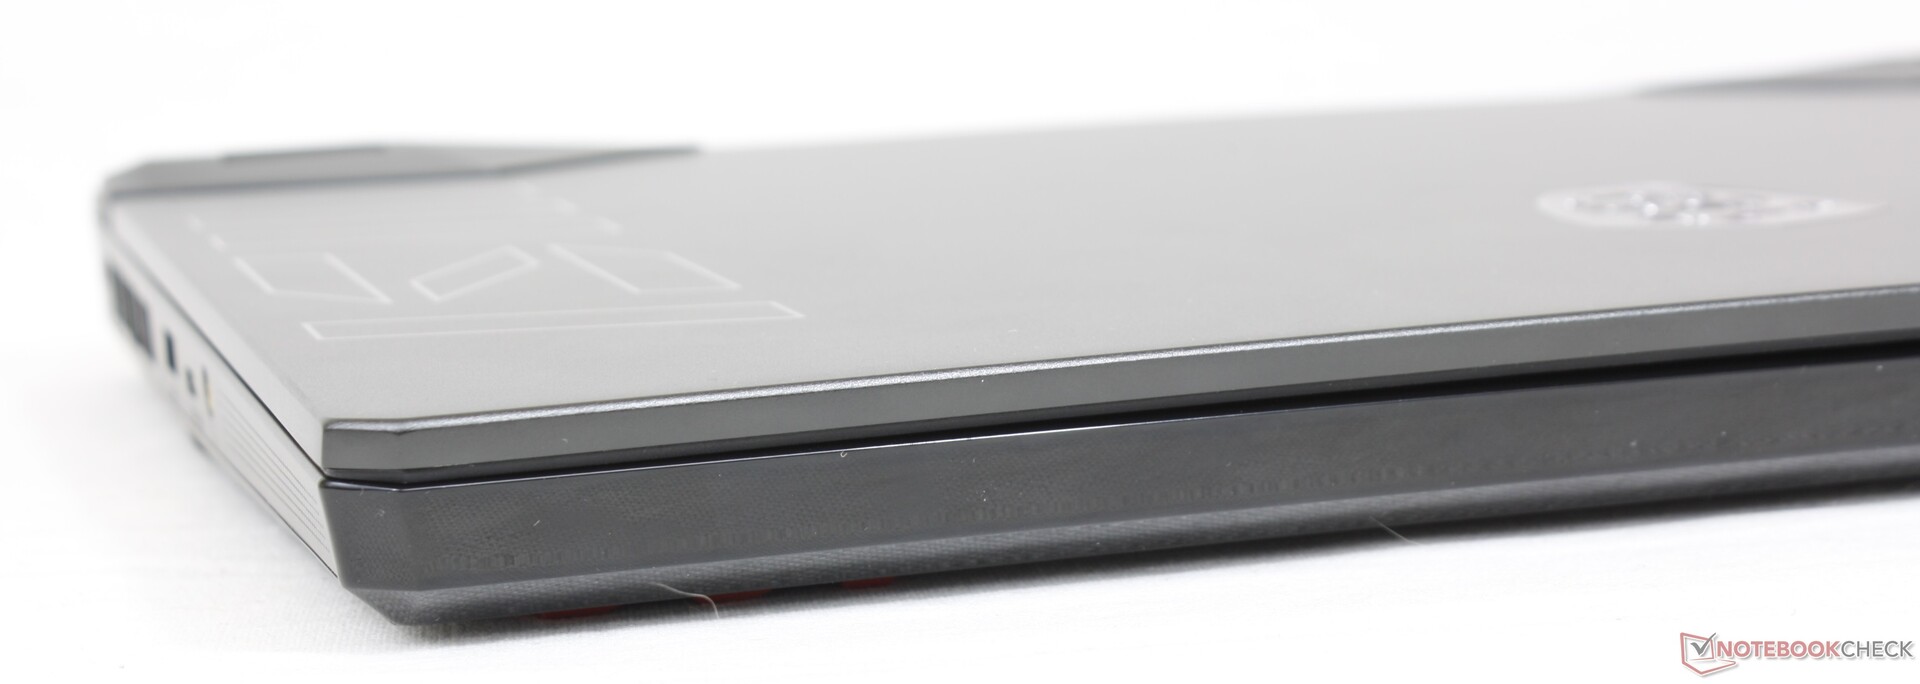
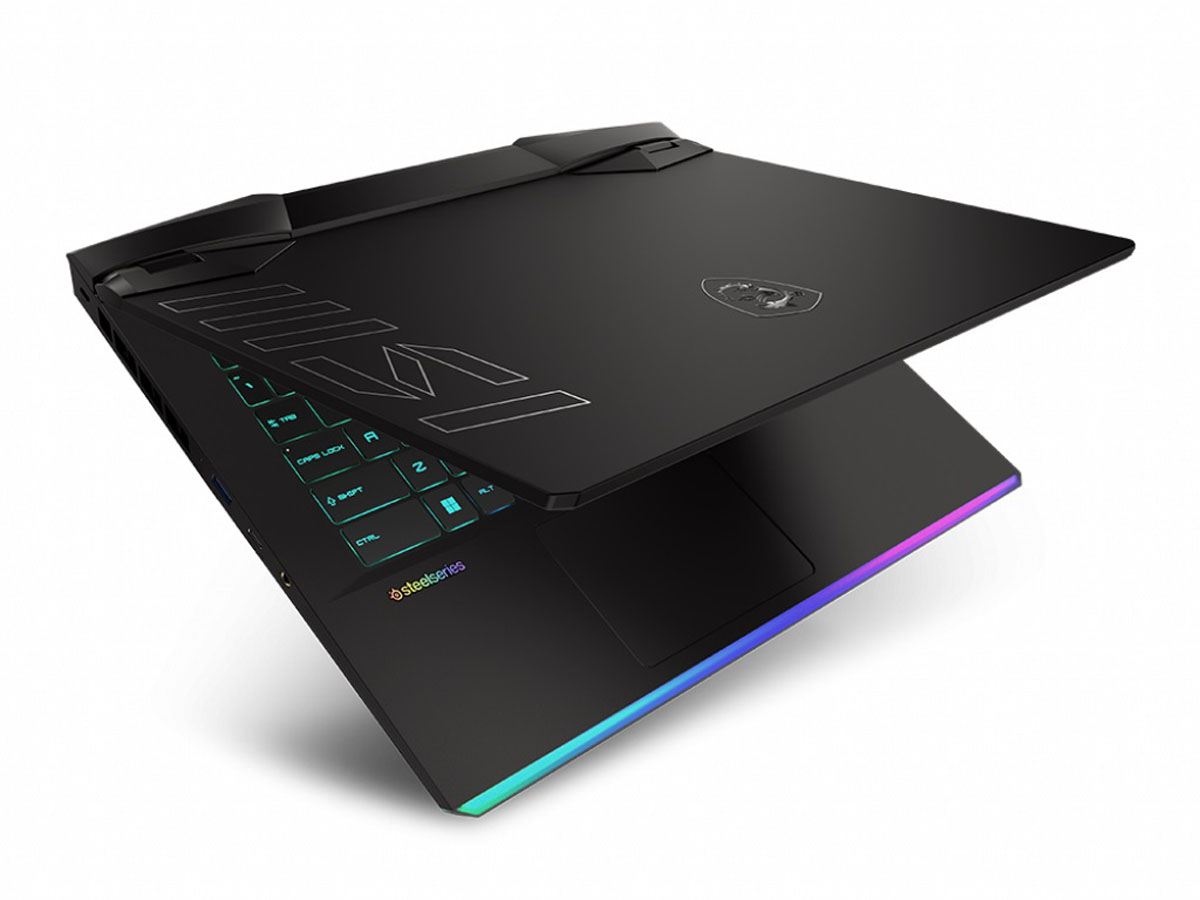
Alors que les dimensions du châssis sont exactement les mêmes que sur le GE66, il y a un certain nombre de différences visuelles. Tout d'abord, le GE67 comprend un grand logo MSI le long du bord gauche du couvercle extérieur, ce qui permet de distinguer plus facilement le GE66 du GE67. Deuxièmement, MSI a complètement redessiné la face inférieure du GE67 afin d'améliorer le potentiel de refroidissement global du modèle. Sinon, le GE66 et le GE67 utilisent tous deux des matériaux métalliques similaires pour le couvercle et le clavier, et du plastique pour la plaque inférieure. La barre de LED sur le bord avant n'a pas été touchée.
Le nouveau modèle est légèrement plus lourd que son prédécesseur d'environ 100 g, probablement en raison de ces changements mineurs.
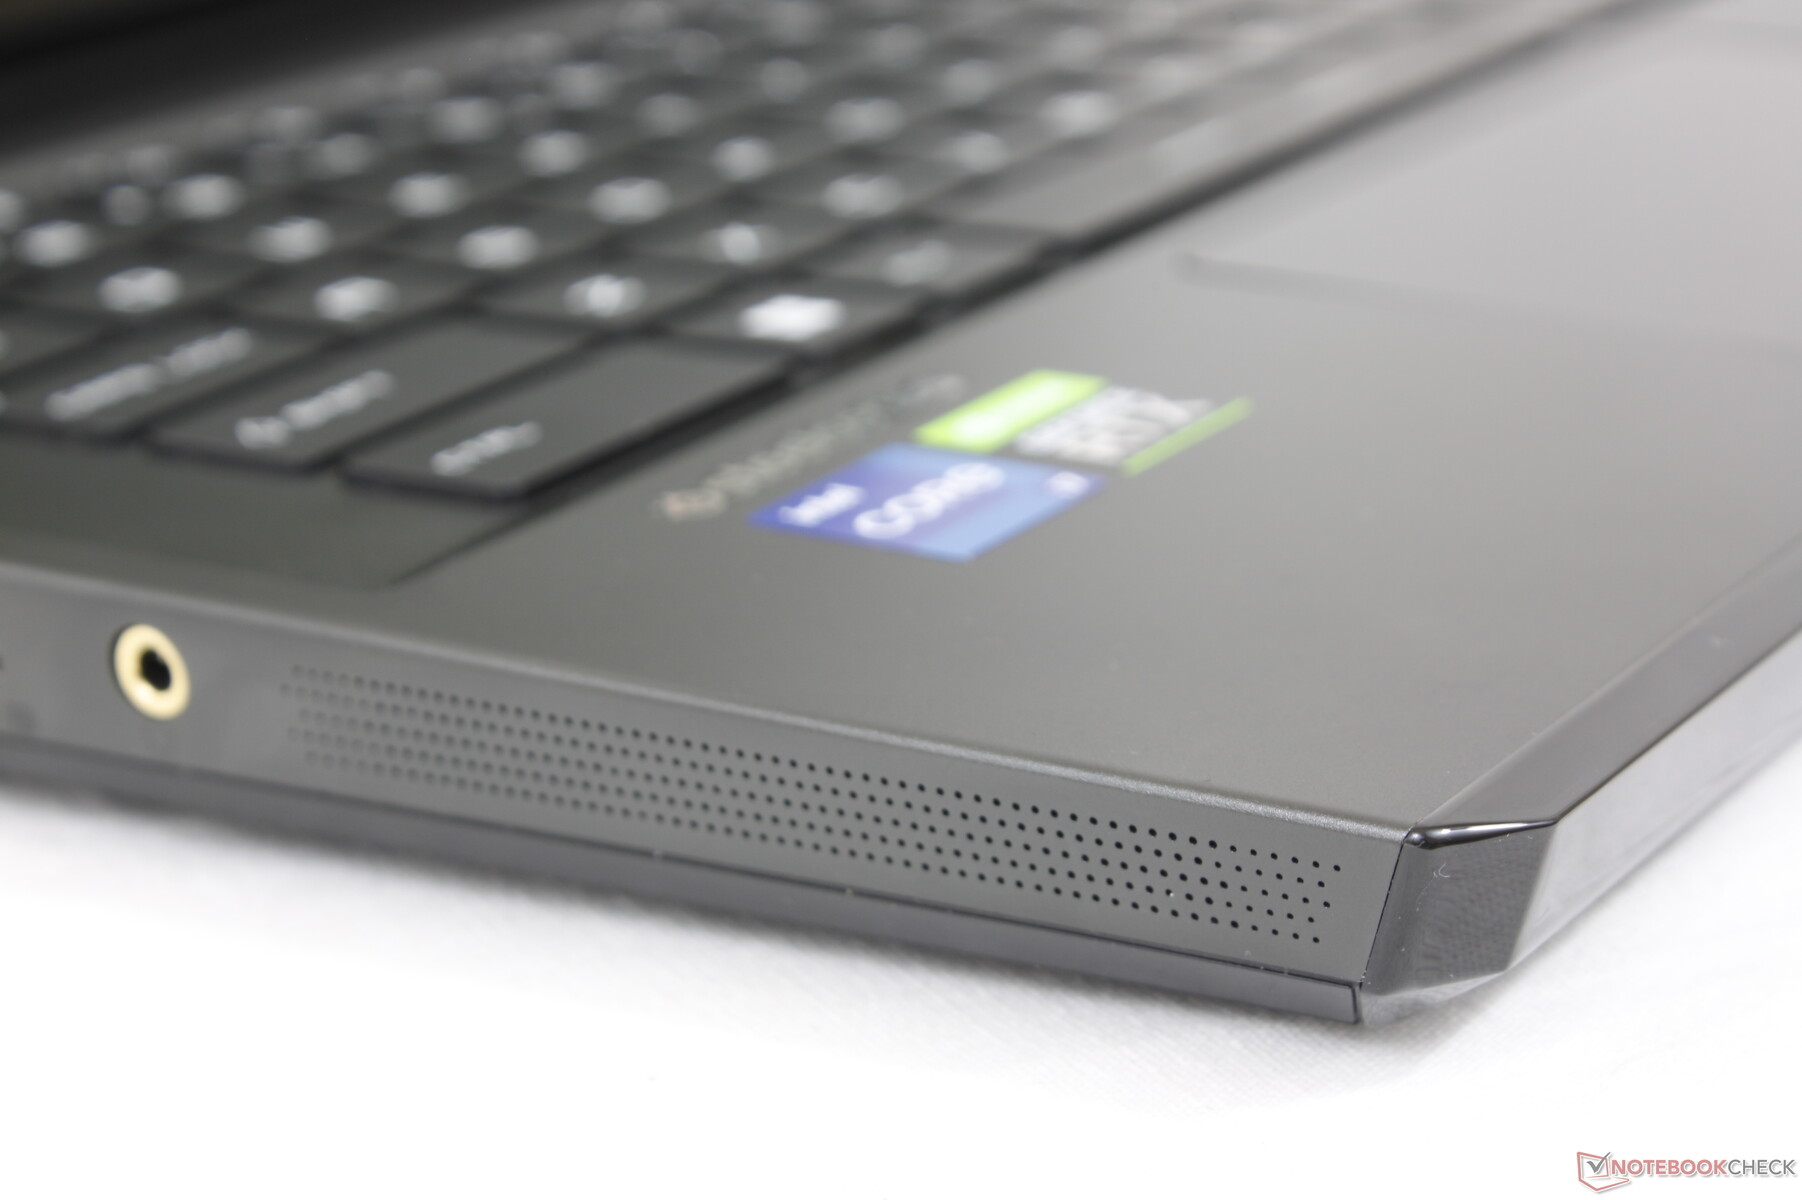
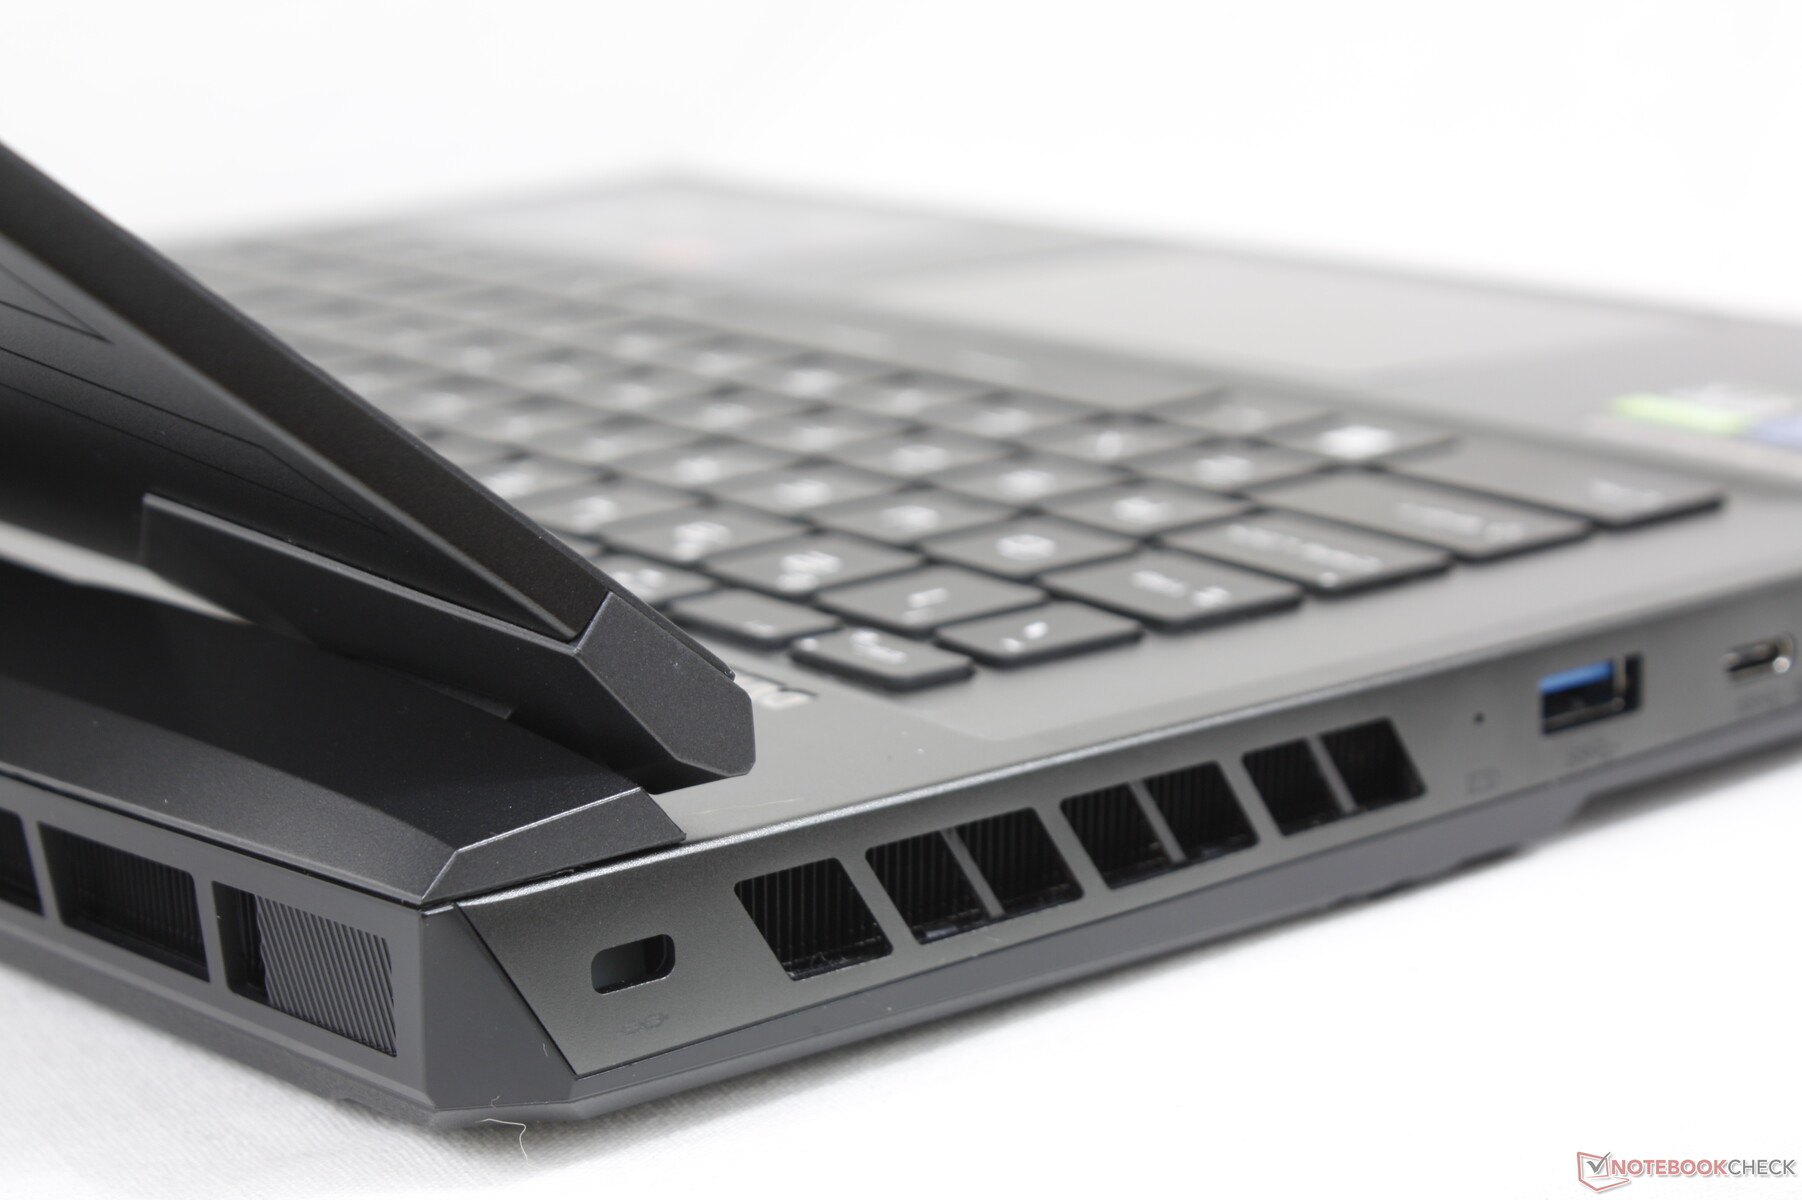
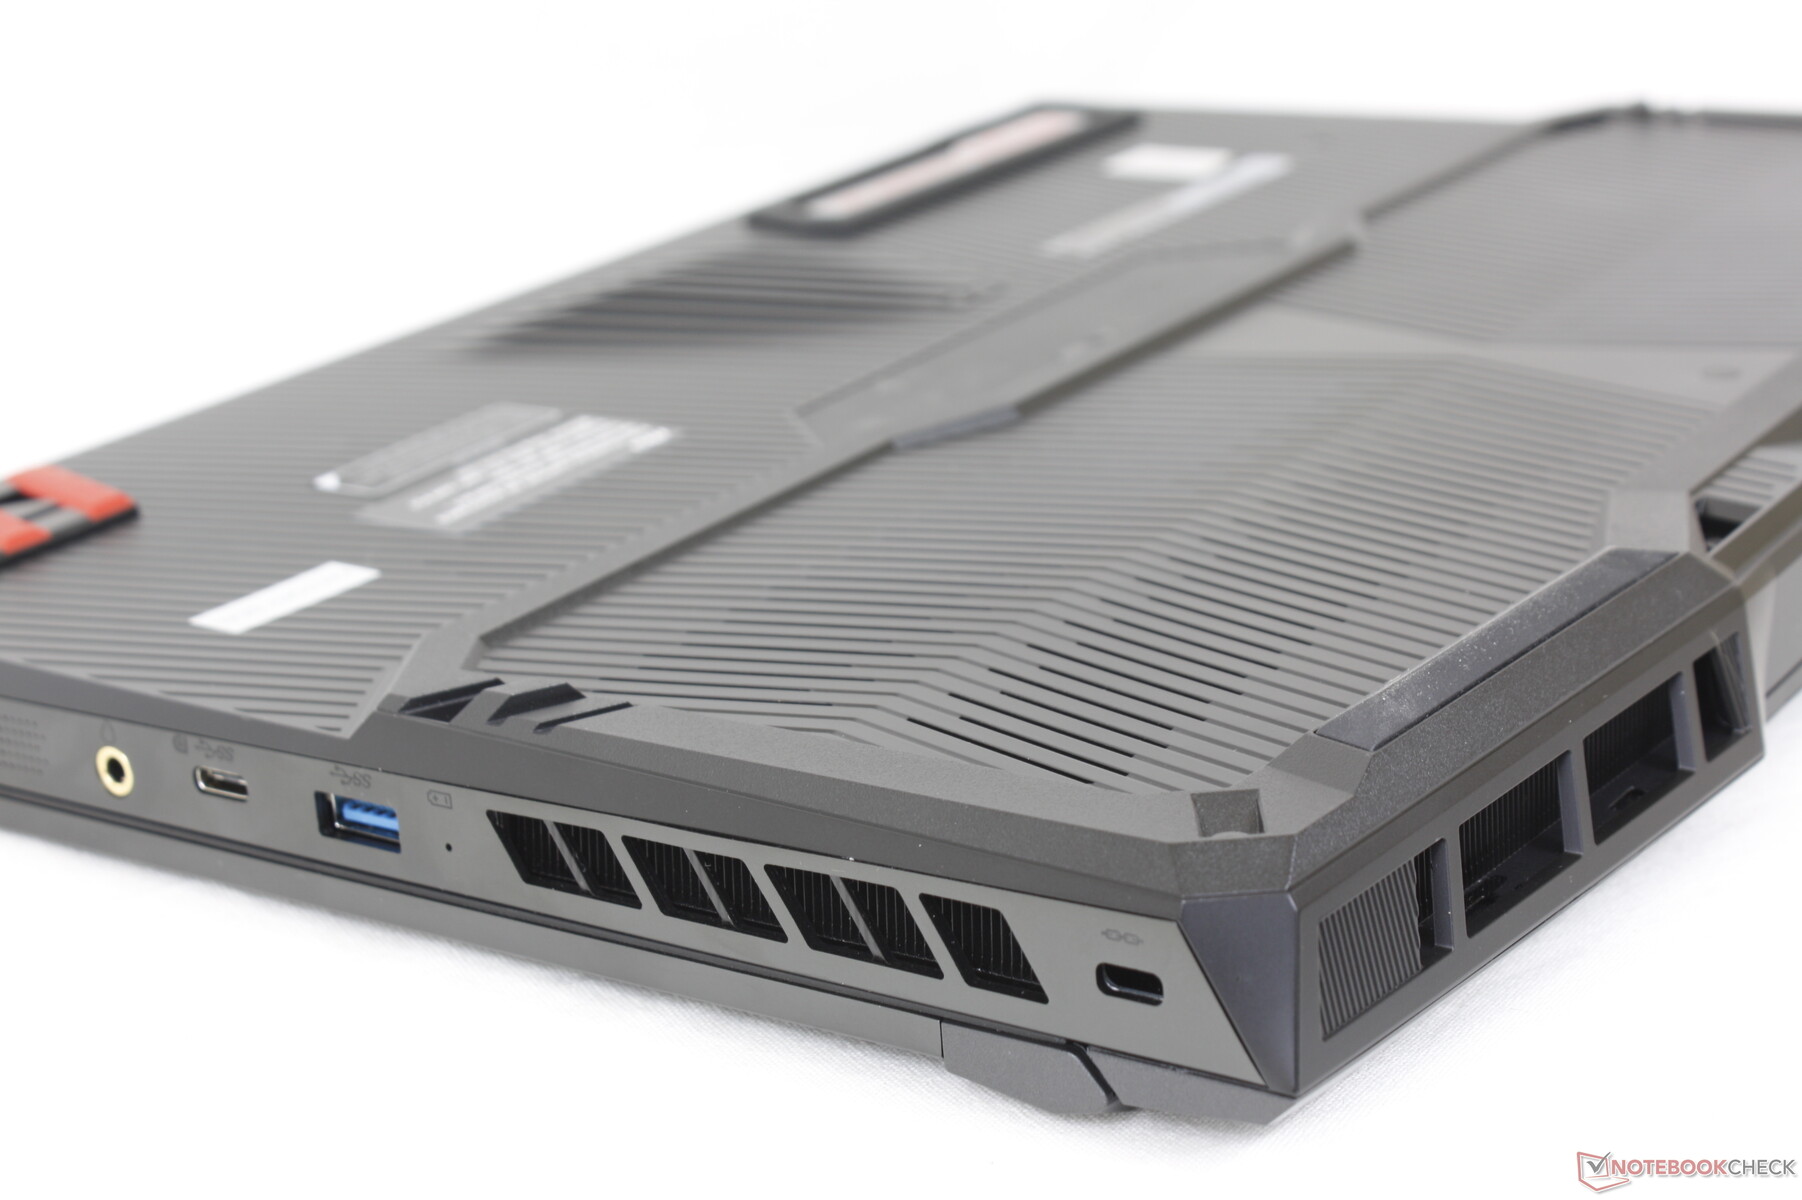
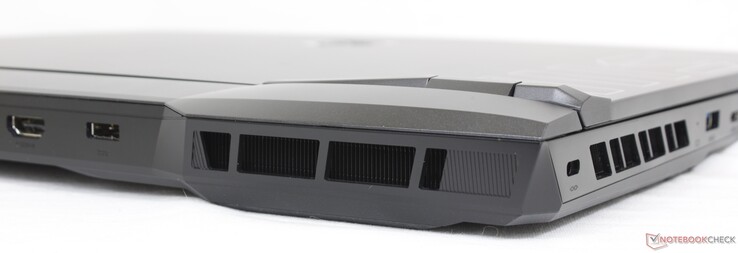
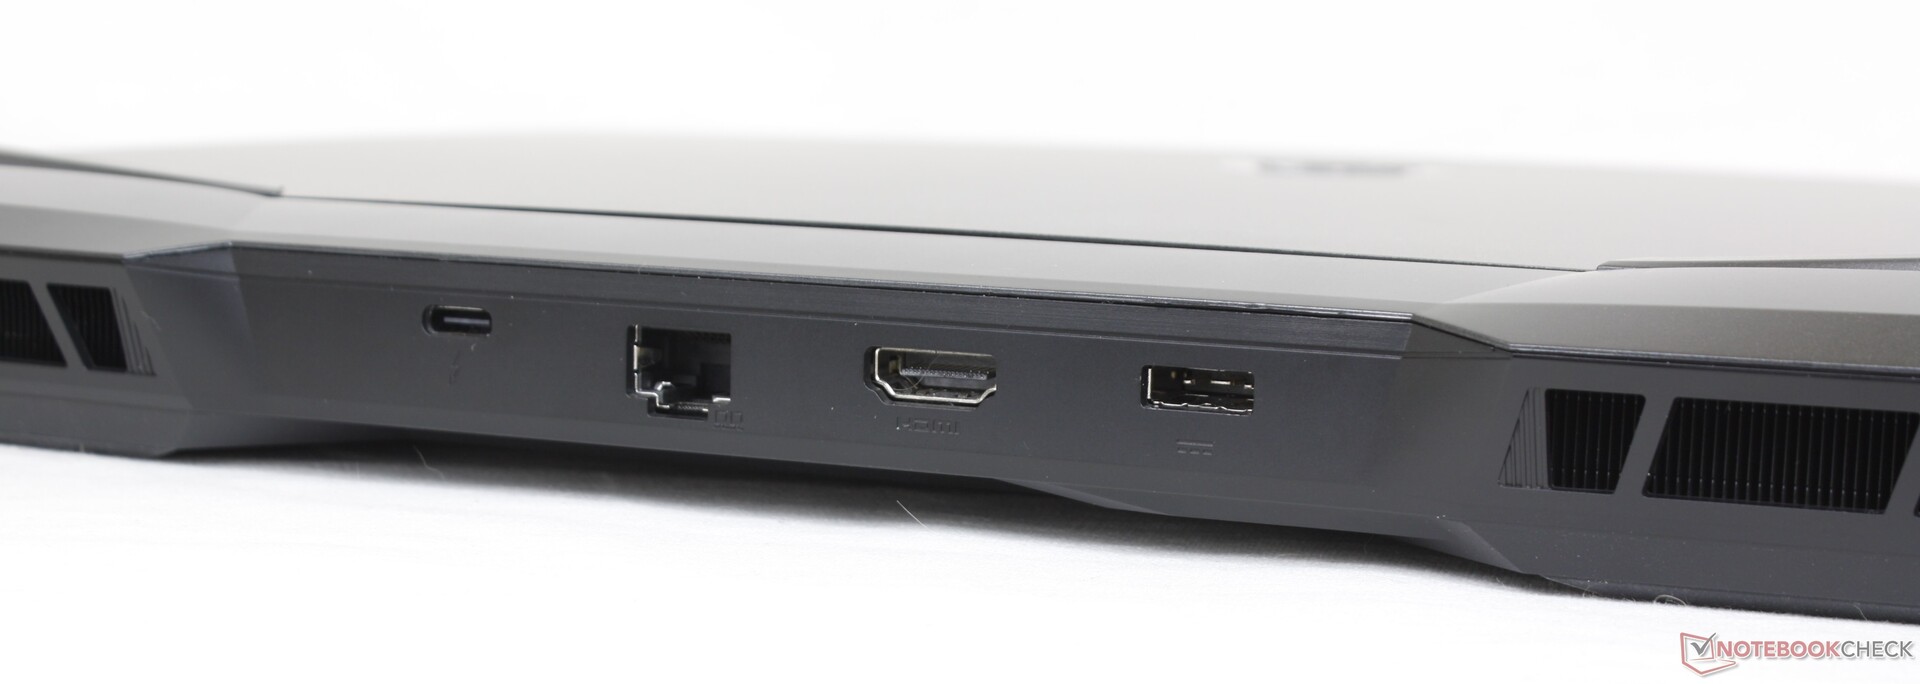
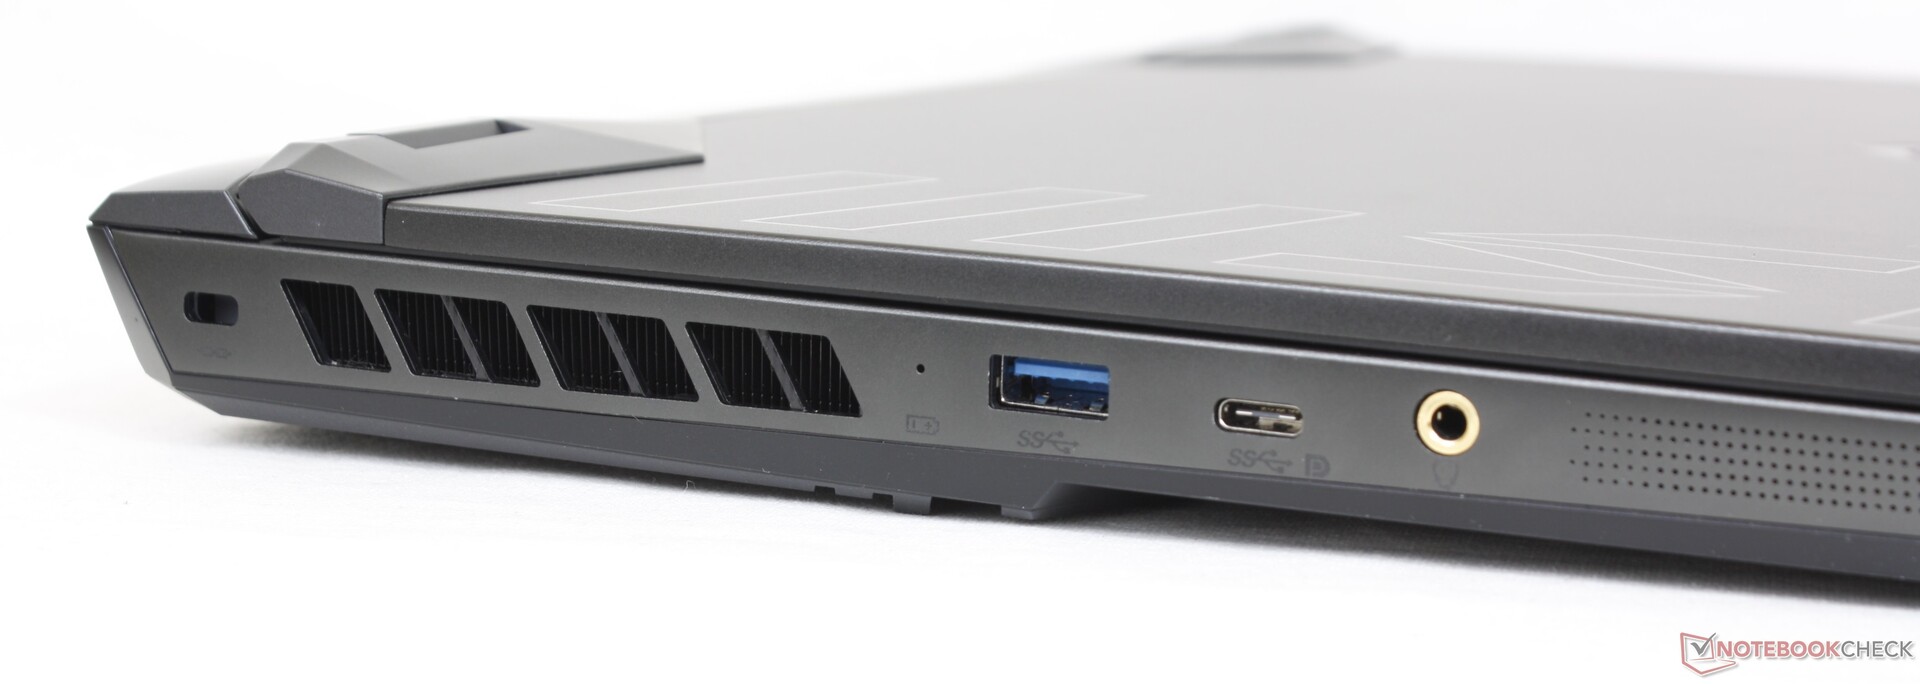
Connectivité - Plus de Mini-DisplayPort
Le GE67 a abandonné le mini-DisplayPort dédié qui était présent sur le GE66. Le DisplayPort est toujours pris en charge par les deux ports USB-C.
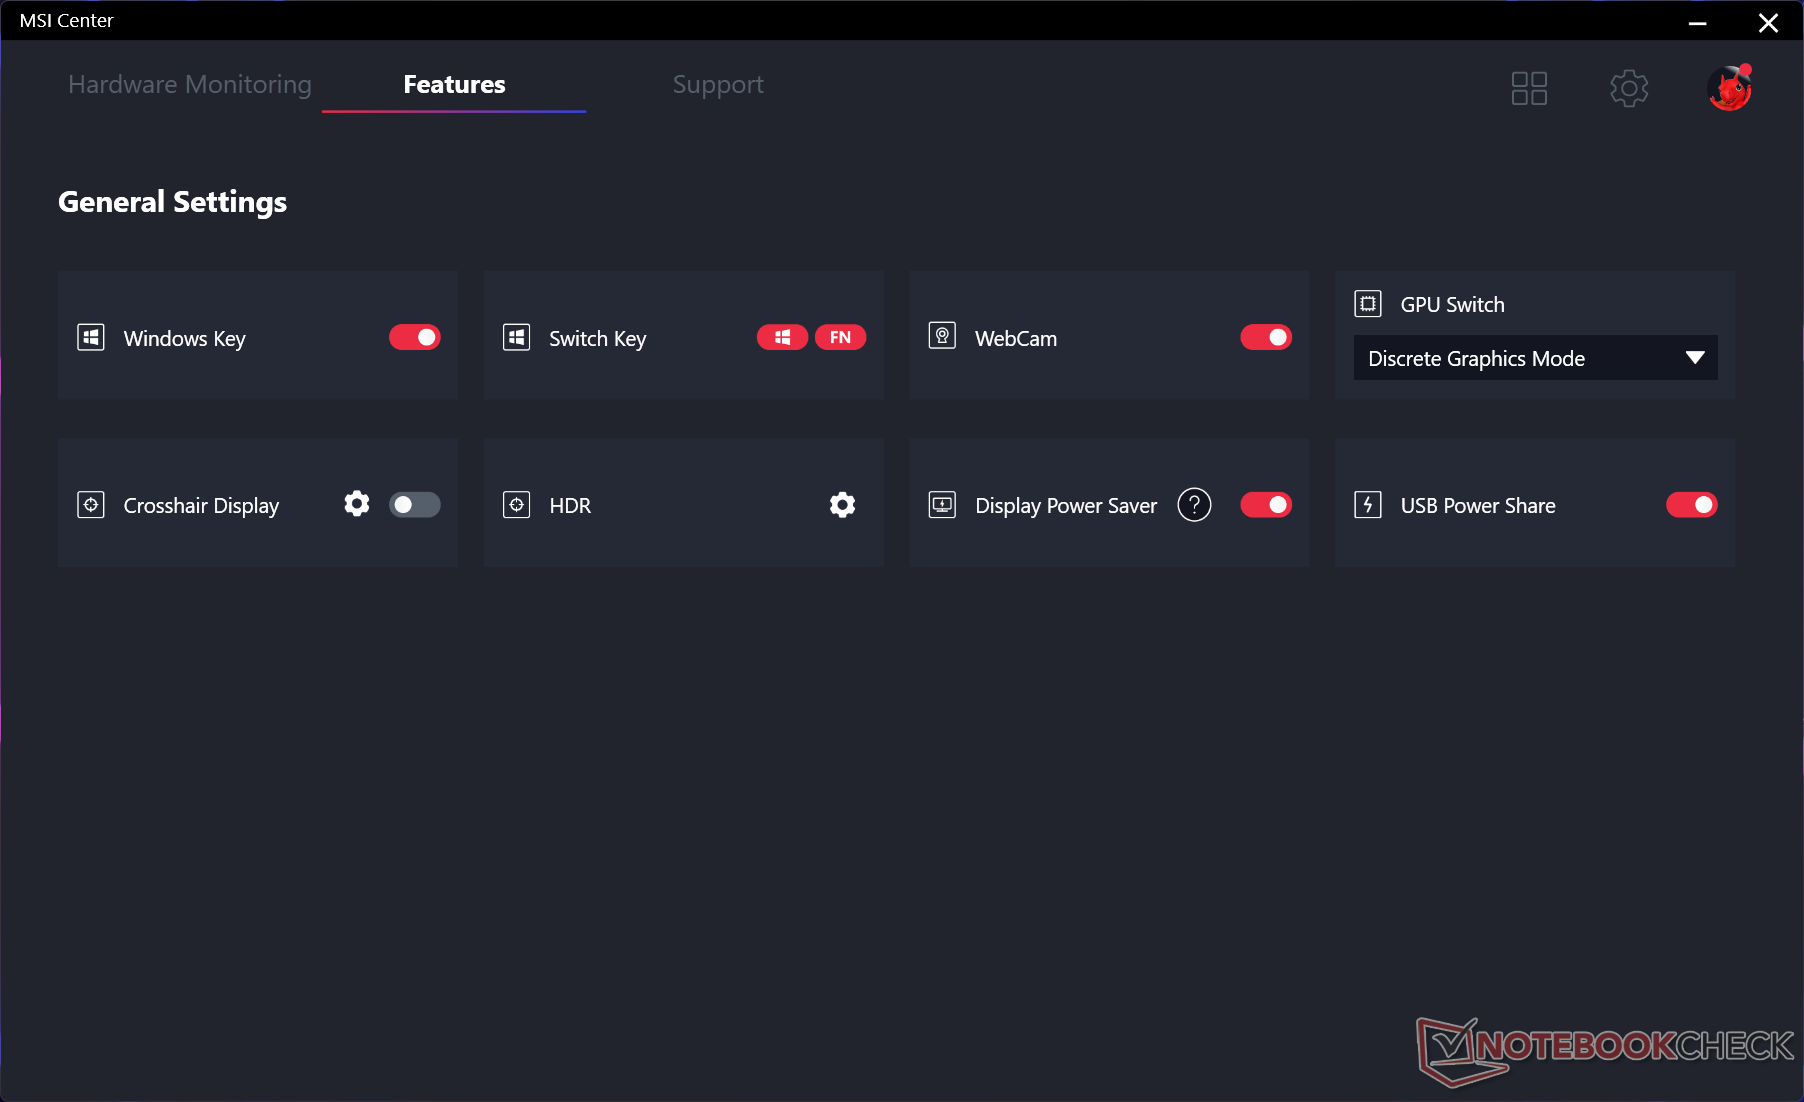
Comme avec d'autres ordinateurs portables de jeu basés sur la plate-forme Alder-Lake-H comme le Asus TUF Gaming F15 FX507ZMla connectivité Thunderbolt 4 sera désactivée en cas de fonctionnement en mode graphique discret.
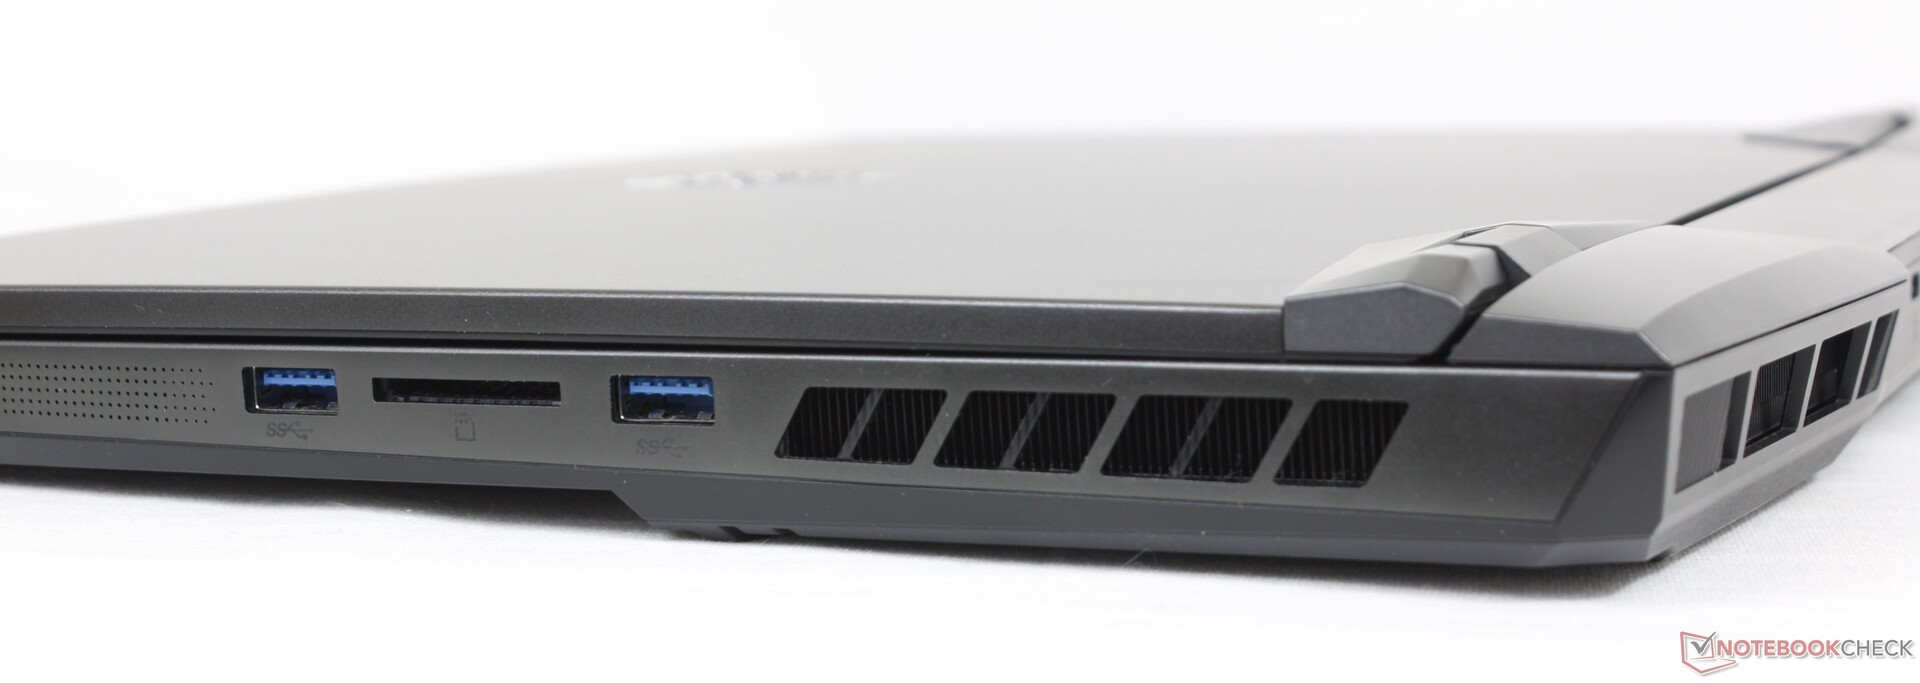
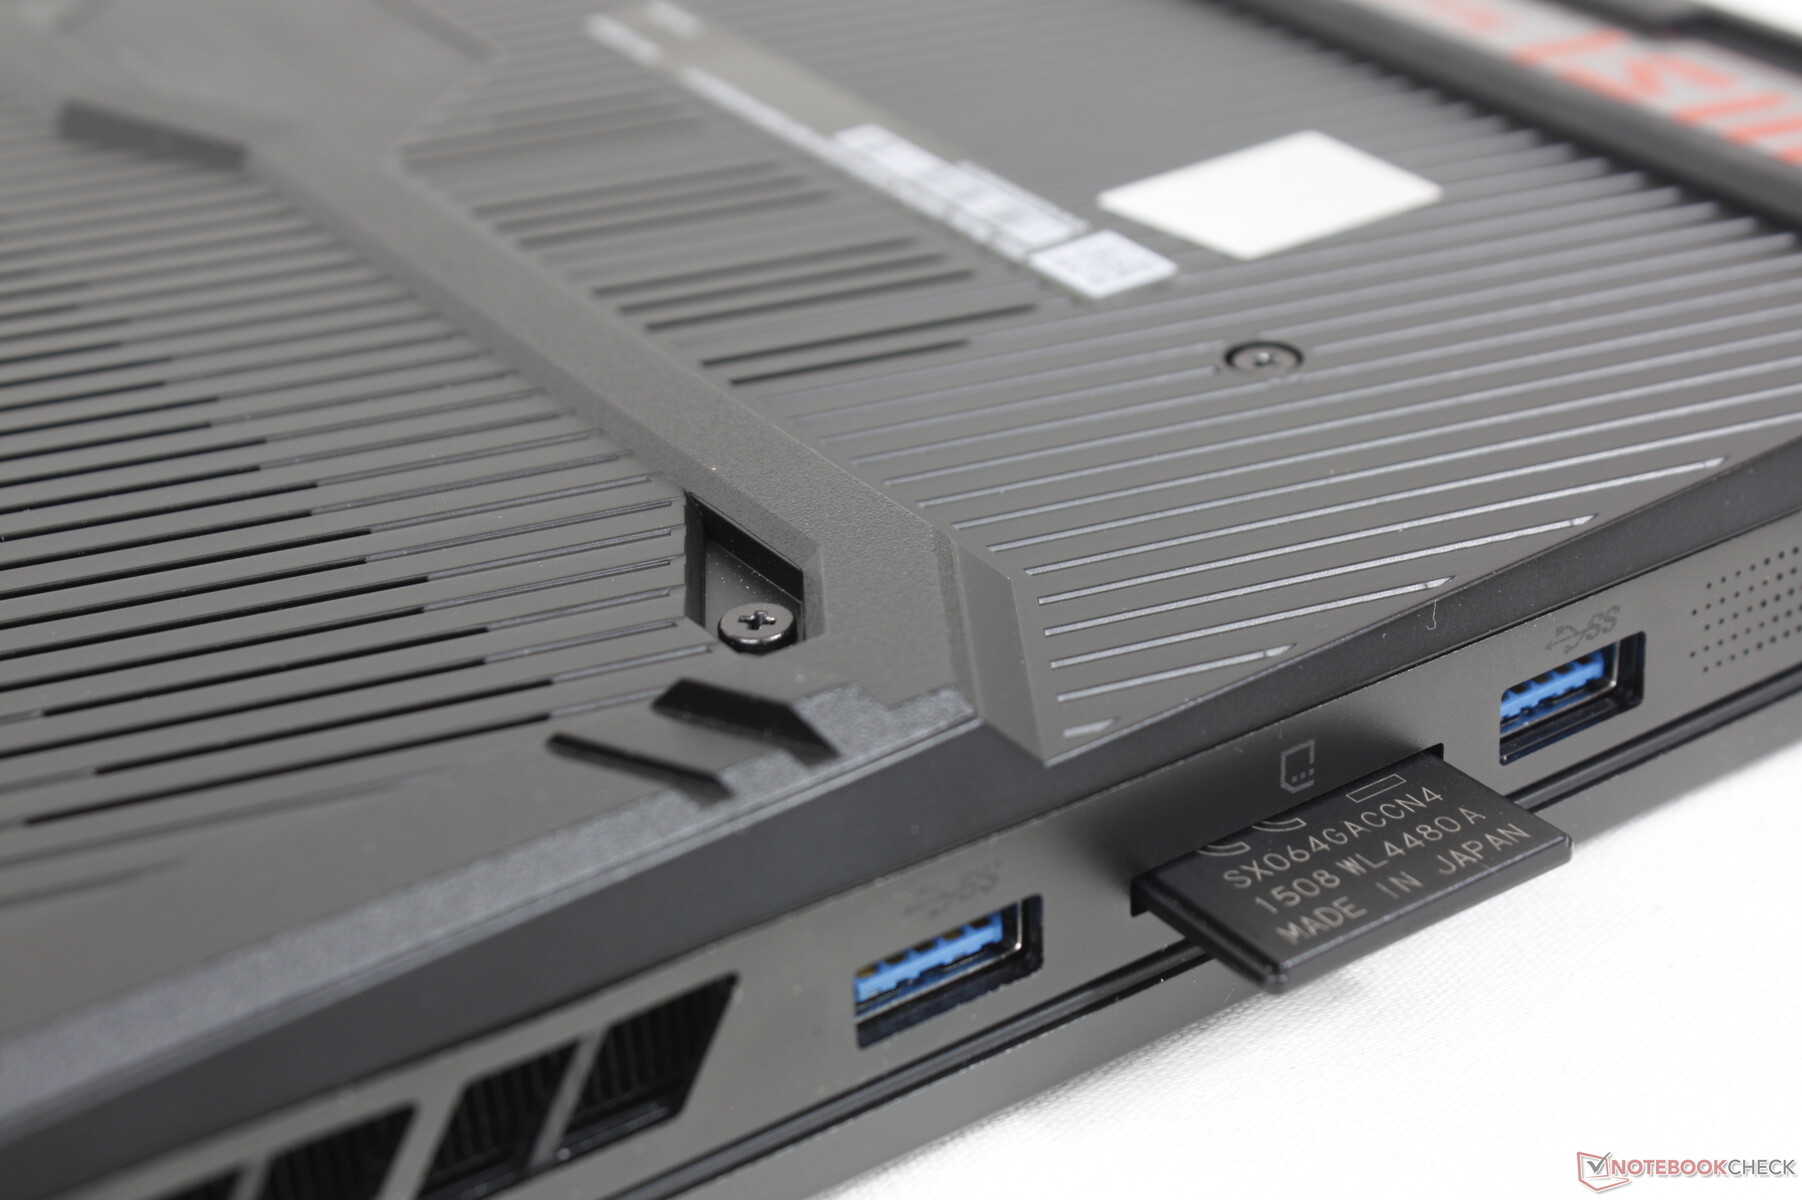
Lecteur de carte SD
Les taux de transfert du lecteur de carte SD intégré sont lents par rapport au prix demandé pour cette configuration. Les utilisateurs verront des performances de lecteur SD 2x plus rapides sur des modèles concurrents comme le Razer Blade 15 ou l'Asus ROG Zephyrus Duo 16.
| SD Card Reader | |
| average JPG Copy Test (av. of 3 runs) | |
| Razer Blade 15 2022 (Toshiba Exceria Pro SDXC 64 GB UHS-II) | |
| MSI GE67 HX 12UGS (Toshiba Exceria Pro SDXC 64 GB UHS-II) | |
| MSI Raider GE66 12UHS (AV PRO microSD 128 GB V60) | |
| maximum AS SSD Seq Read Test (1GB) | |
| Razer Blade 15 2022 (Toshiba Exceria Pro SDXC 64 GB UHS-II) | |
| MSI GE67 HX 12UGS (Toshiba Exceria Pro SDXC 64 GB UHS-II) | |
Communication
| Networking | |
| iperf3 transmit AX12 | |
| Razer Blade 15 2022 | |
| MSI Vector GP66 12UGS | |
| Alienware m15 R6, i7-11800H RTX 3080 | |
| iperf3 receive AX12 | |
| Razer Blade 15 2022 | |
| MSI Vector GP66 12UGS | |
| Alienware m15 R6, i7-11800H RTX 3080 | |
| iperf3 receive AXE11000 6GHz | |
| Asus ROG Strix Scar 15 G533ZW-LN106WS | |
| MSI GE67 HX 12UGS | |
| iperf3 transmit AXE11000 6GHz | |
| Asus ROG Strix Scar 15 G533ZW-LN106WS | |
| MSI GE67 HX 12UGS | |
Webcam
La webcam de 2 mégapixels n'a pas été modifiée, ce qui signifie qu'il n'y a toujours pas d'obturateur de confidentialité physique ni même de prise en charge de Windows Hello. Les utilisateurs peuvent désactiver la webcam électroniquement à l'aide de la touche F4.
Notez que le voyant d'activité de la webcam clignote toujours lorsque celle-ci est active. C'est particulièrement gênant pendant les appels vidéo et nous ne trouvons aucune option pour désactiver ce voyant.


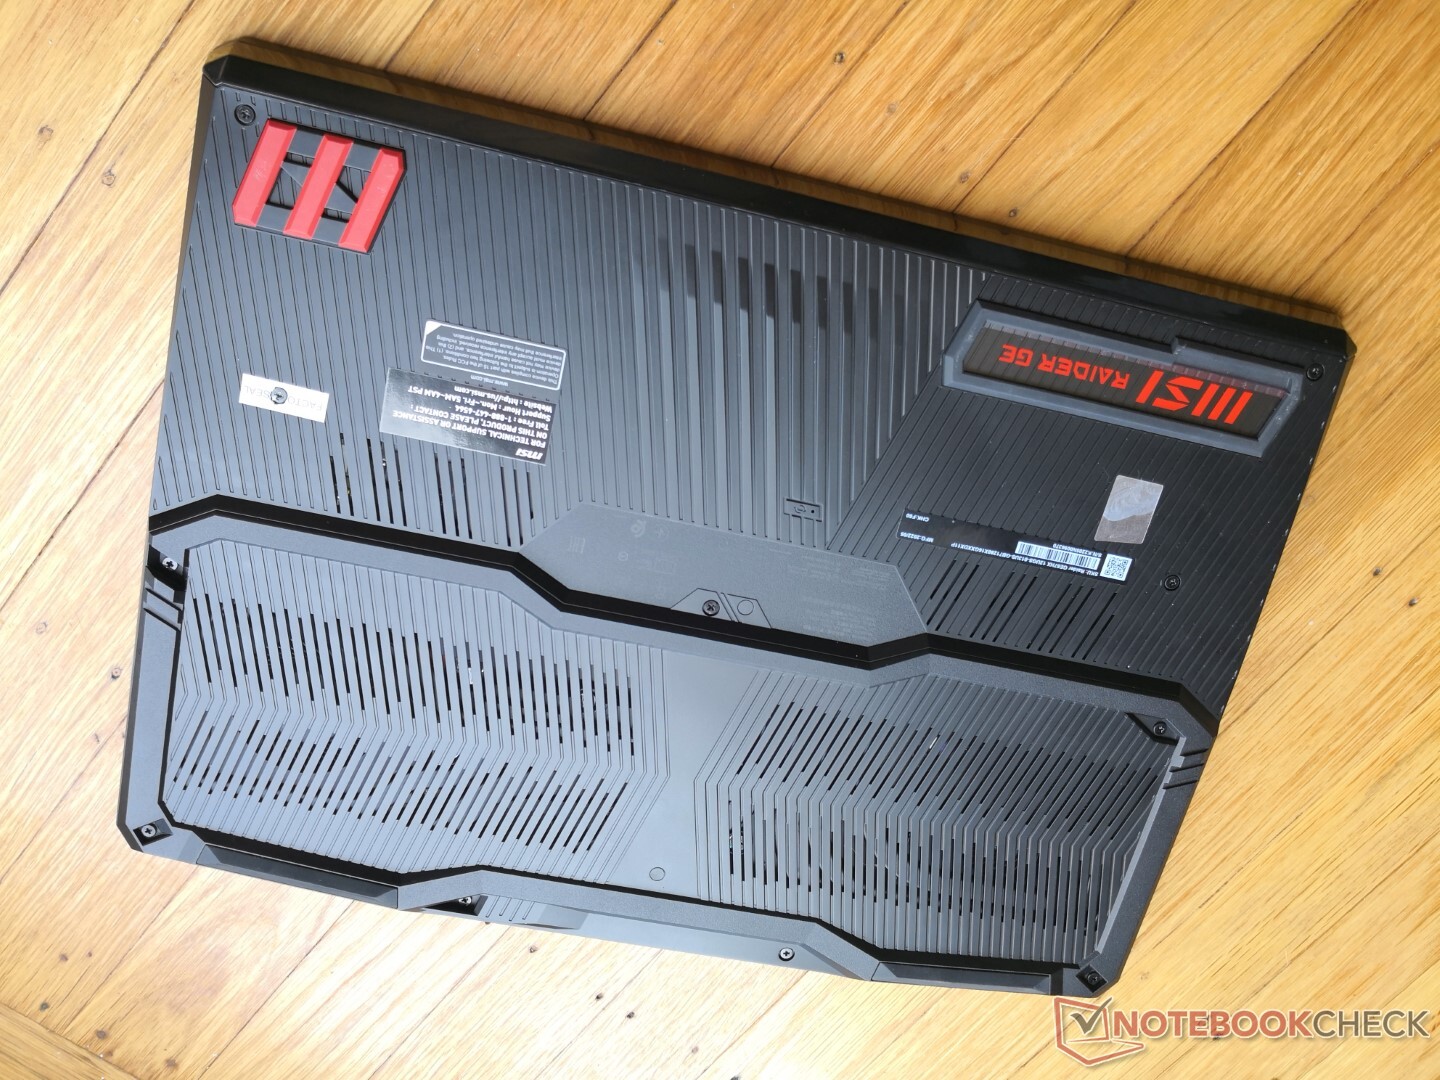
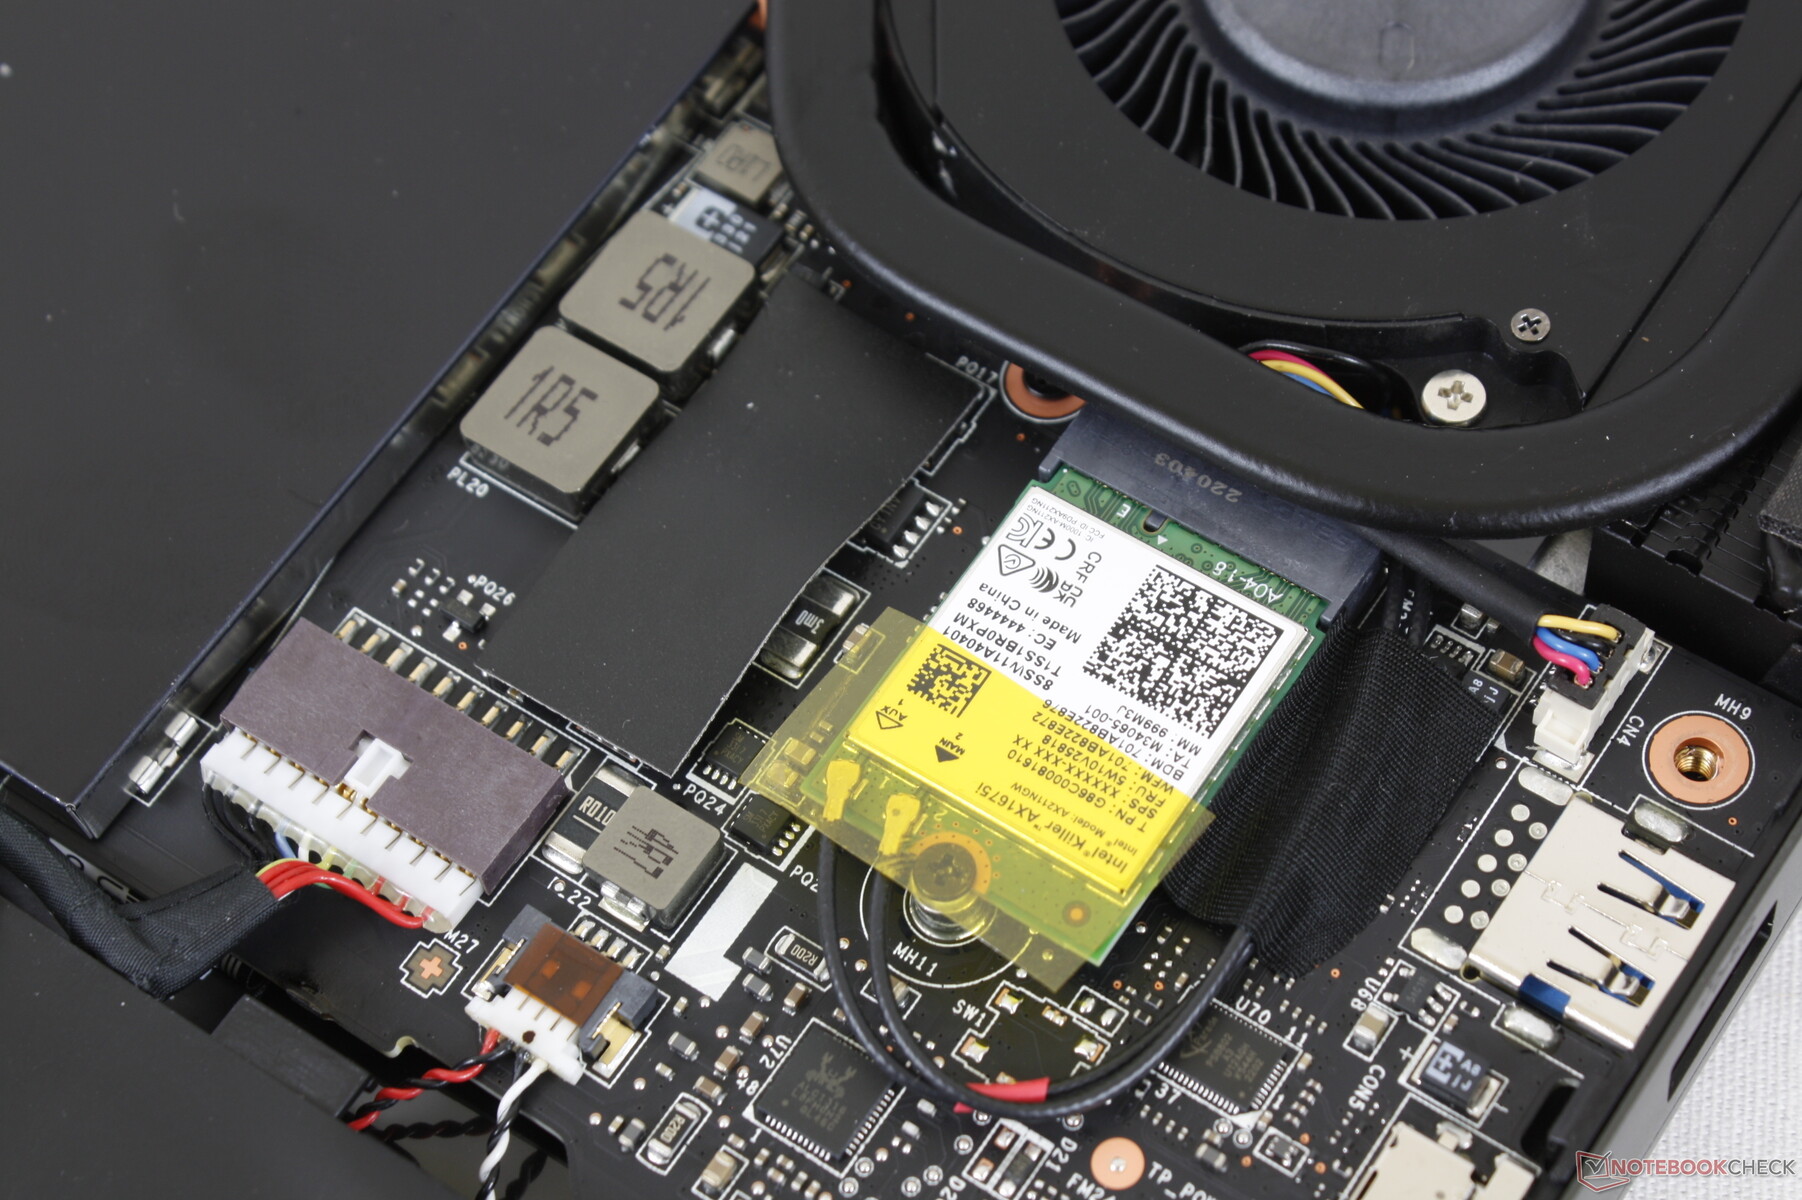
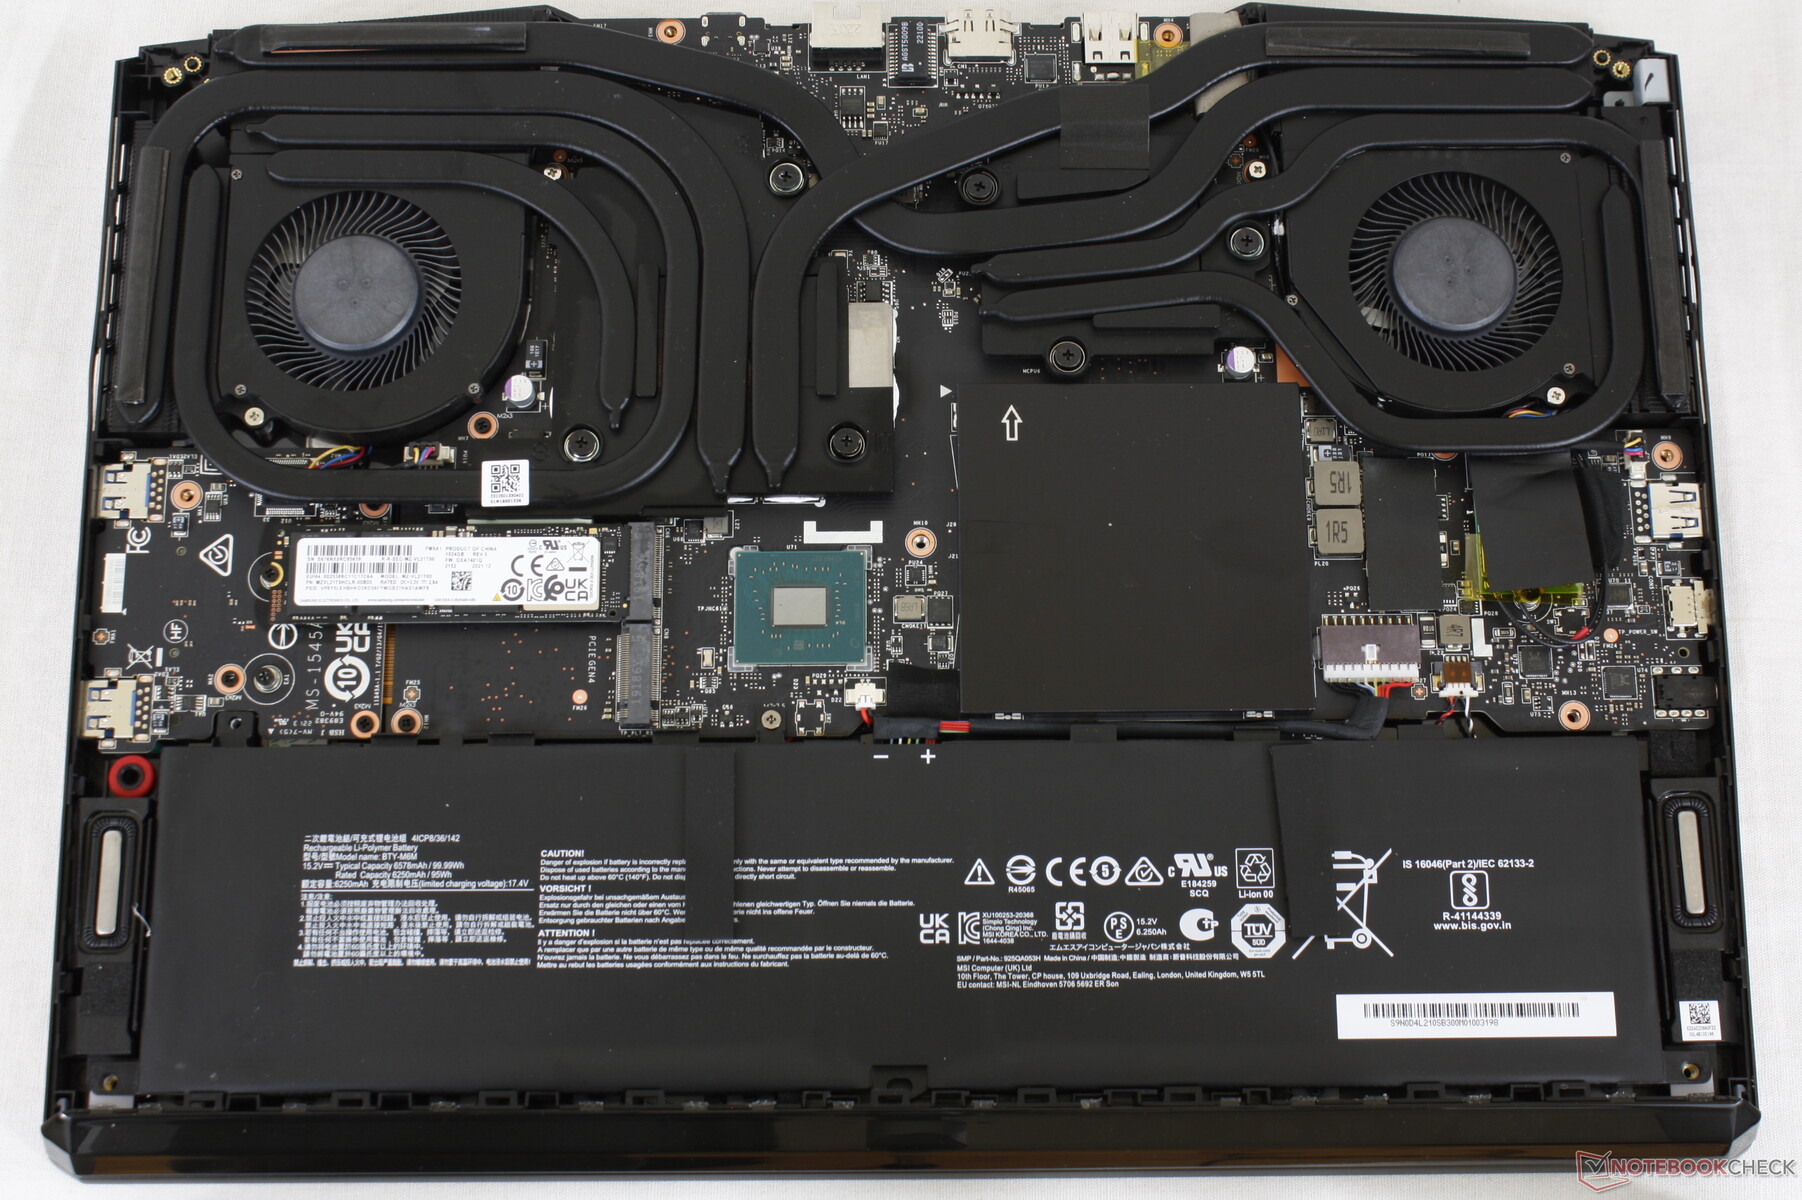
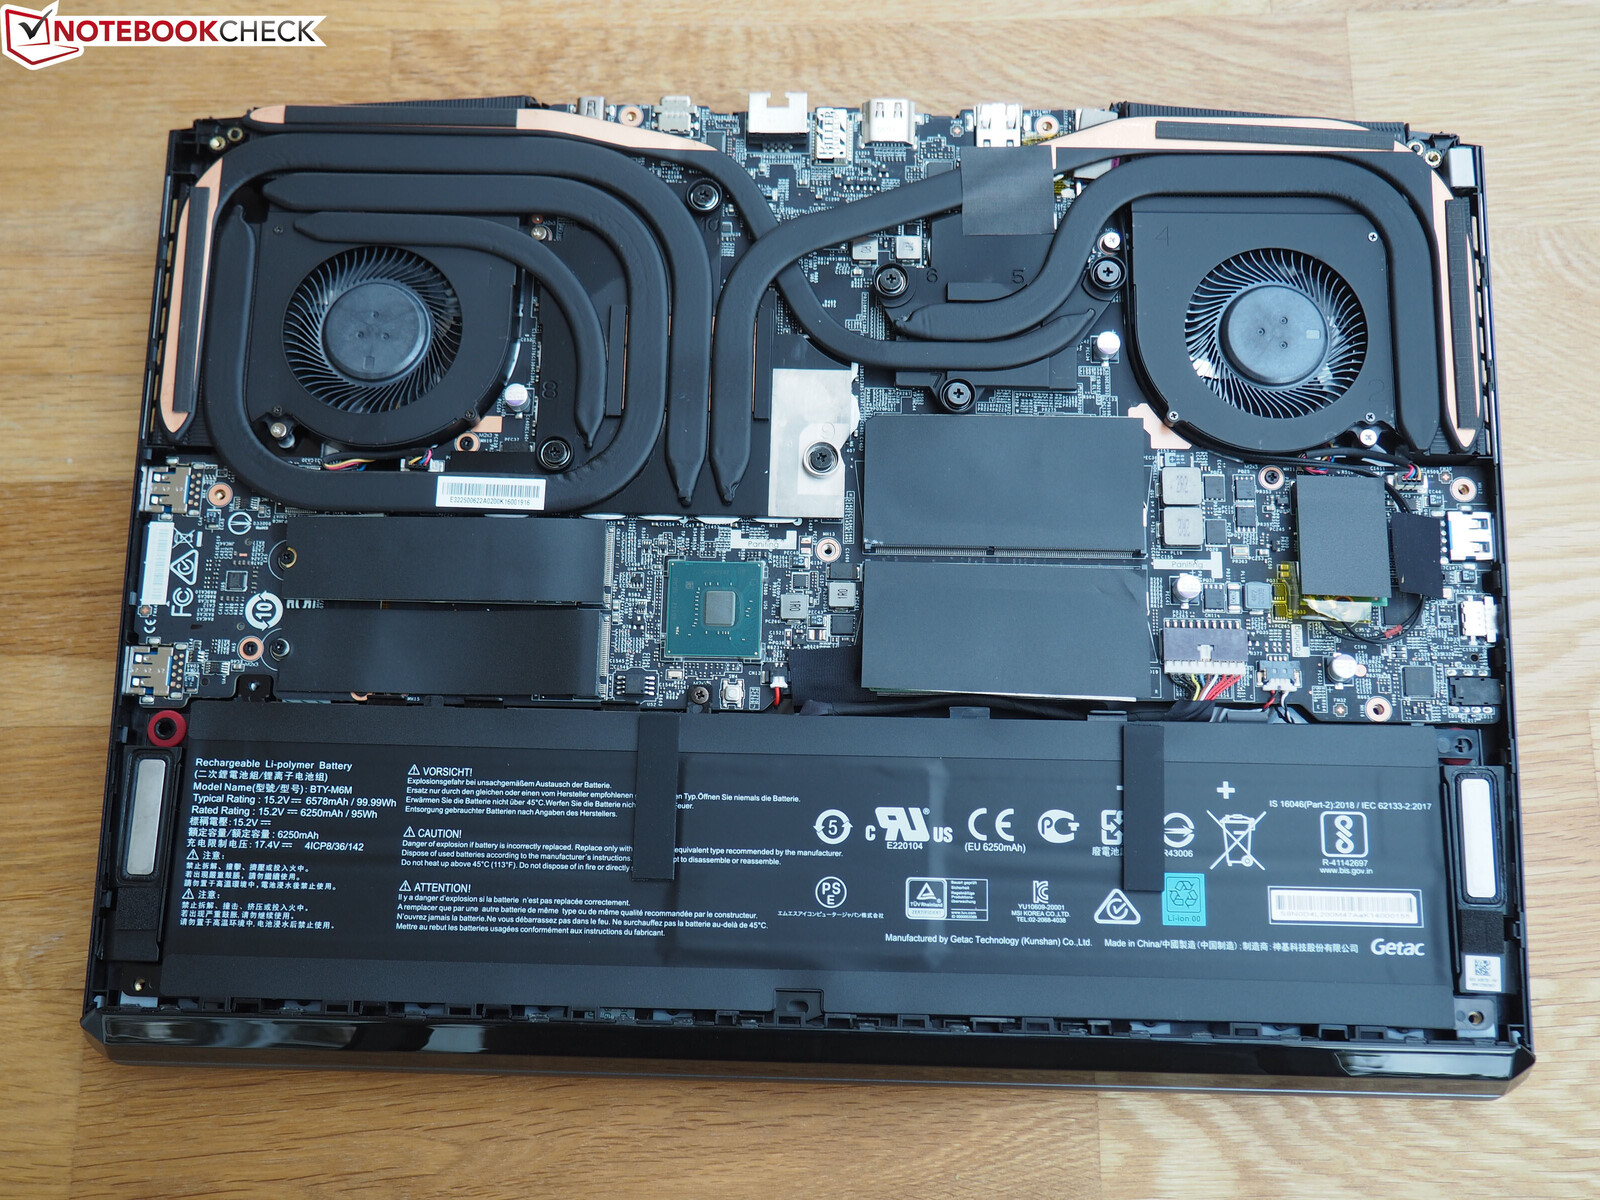
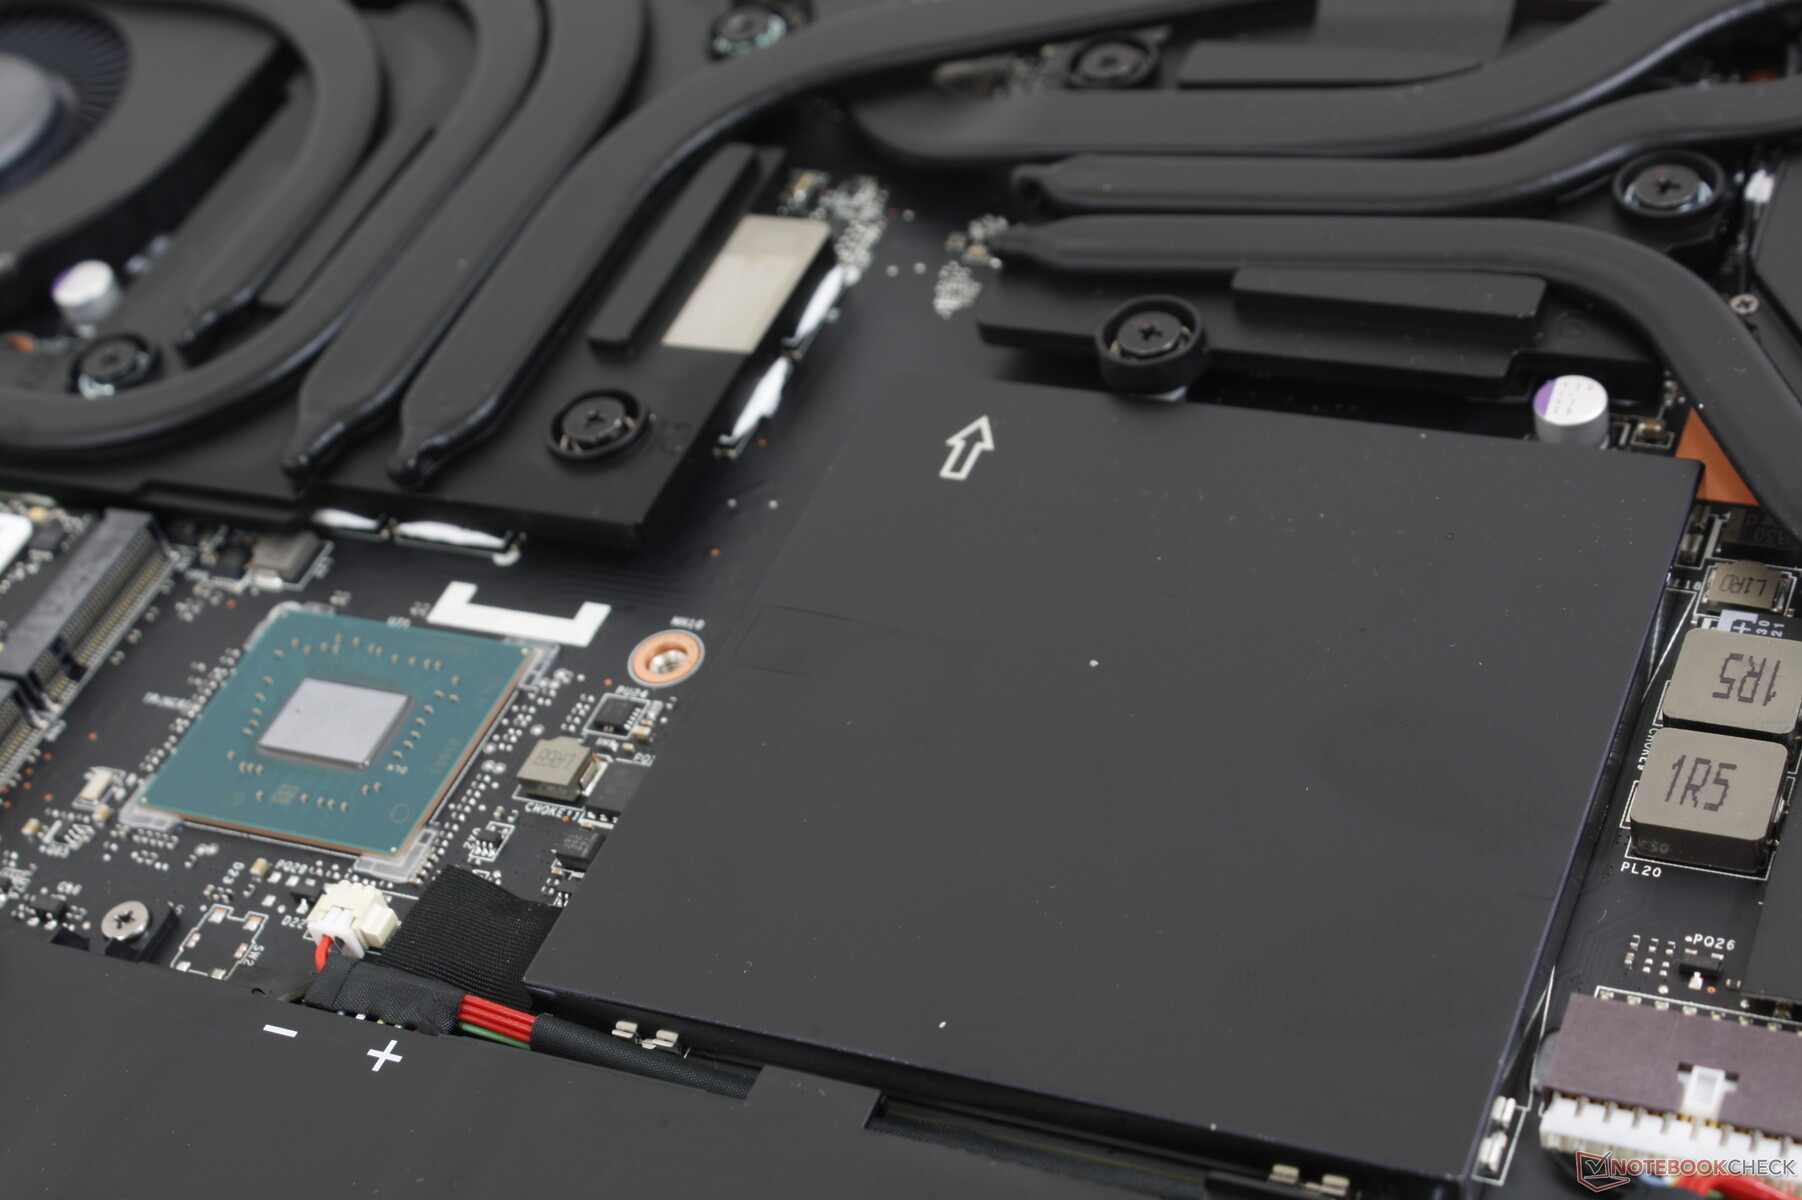
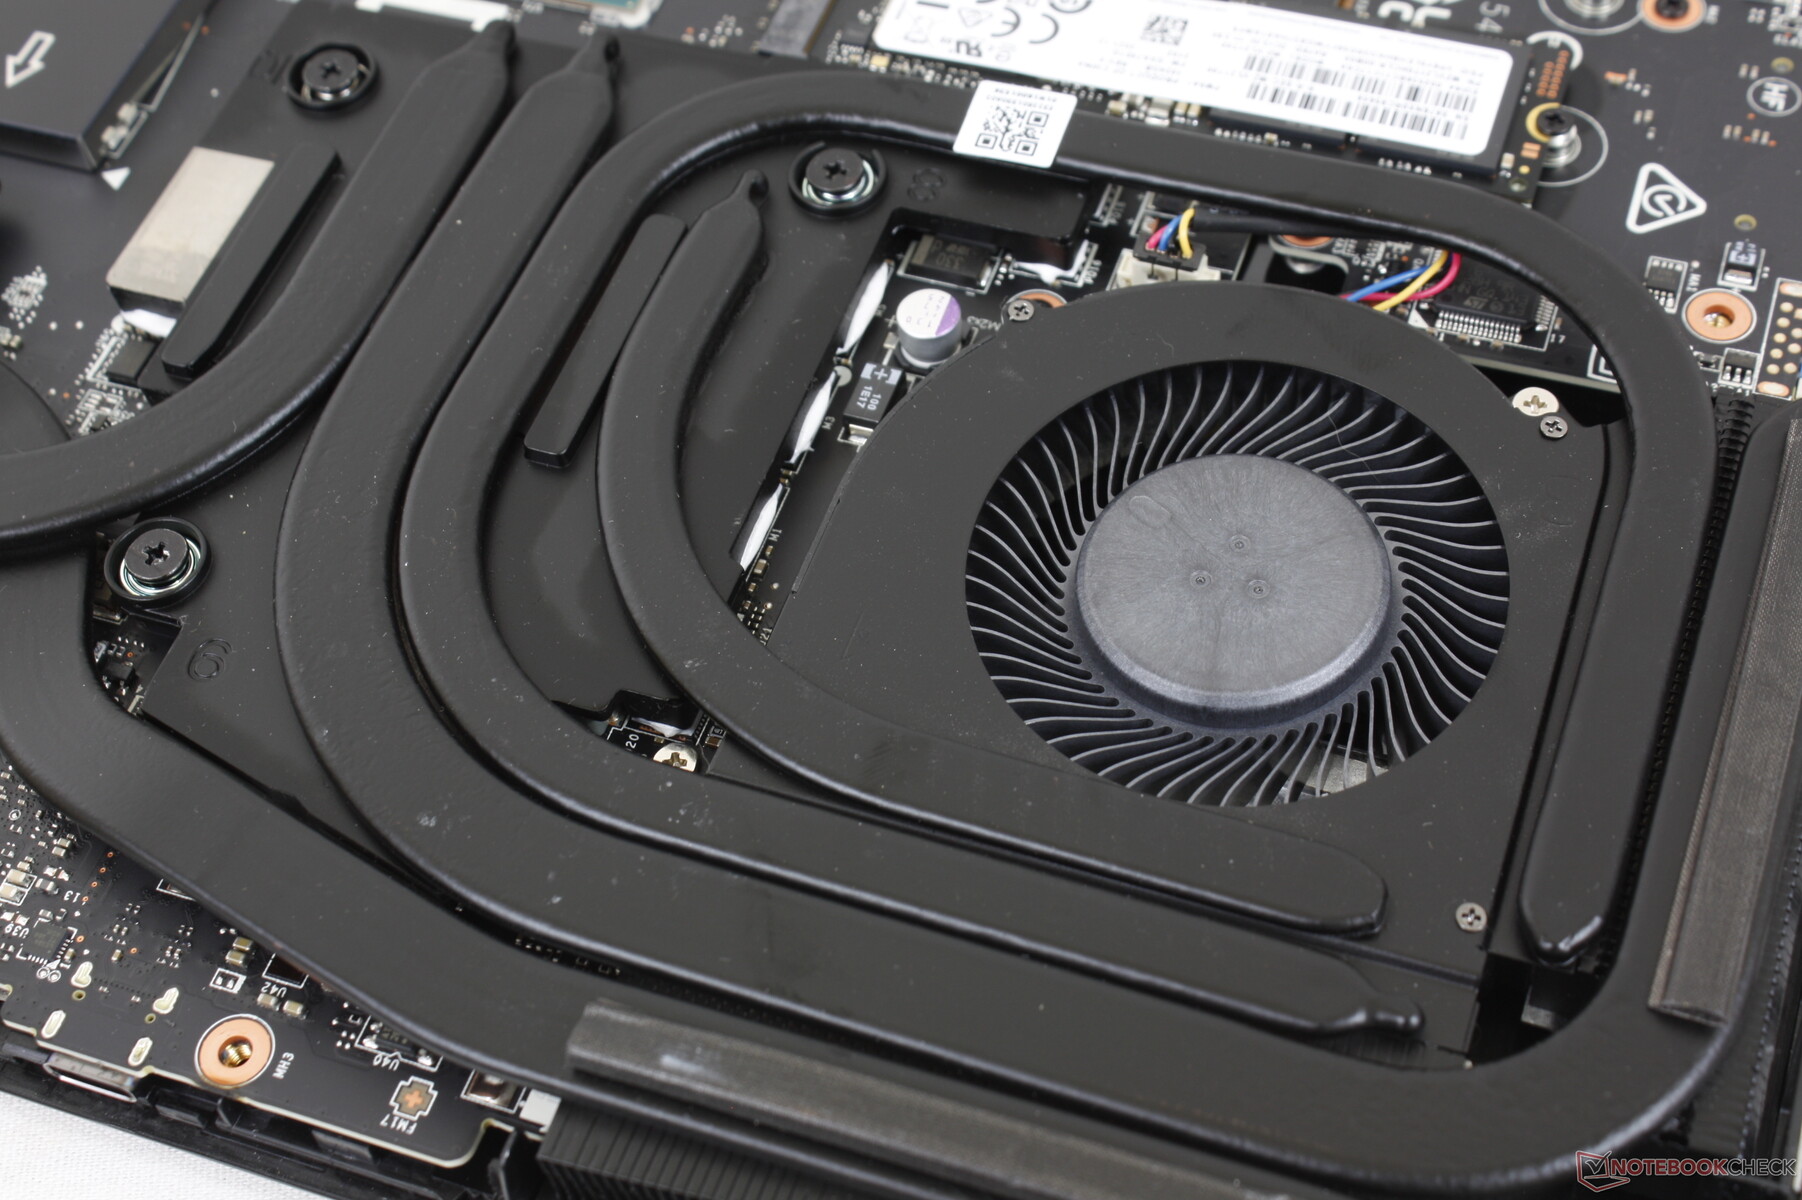
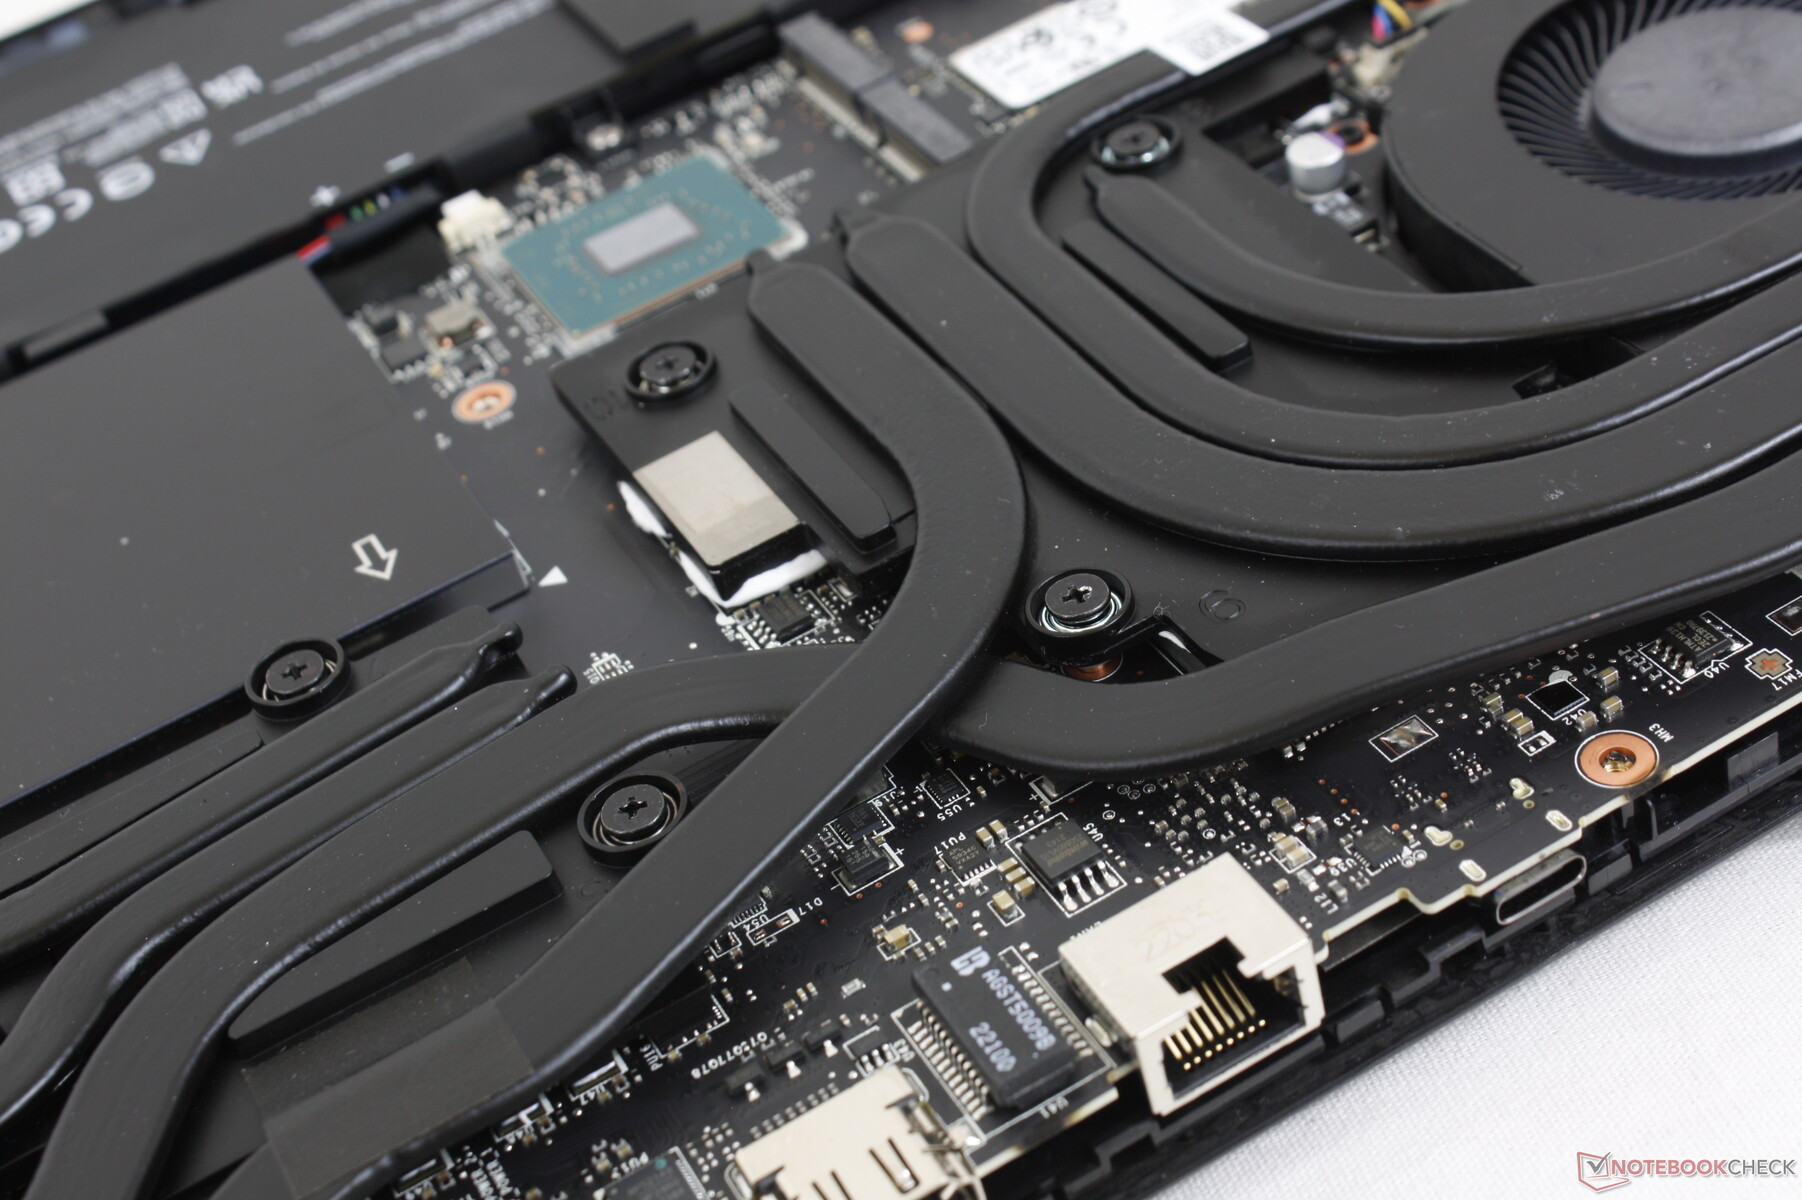
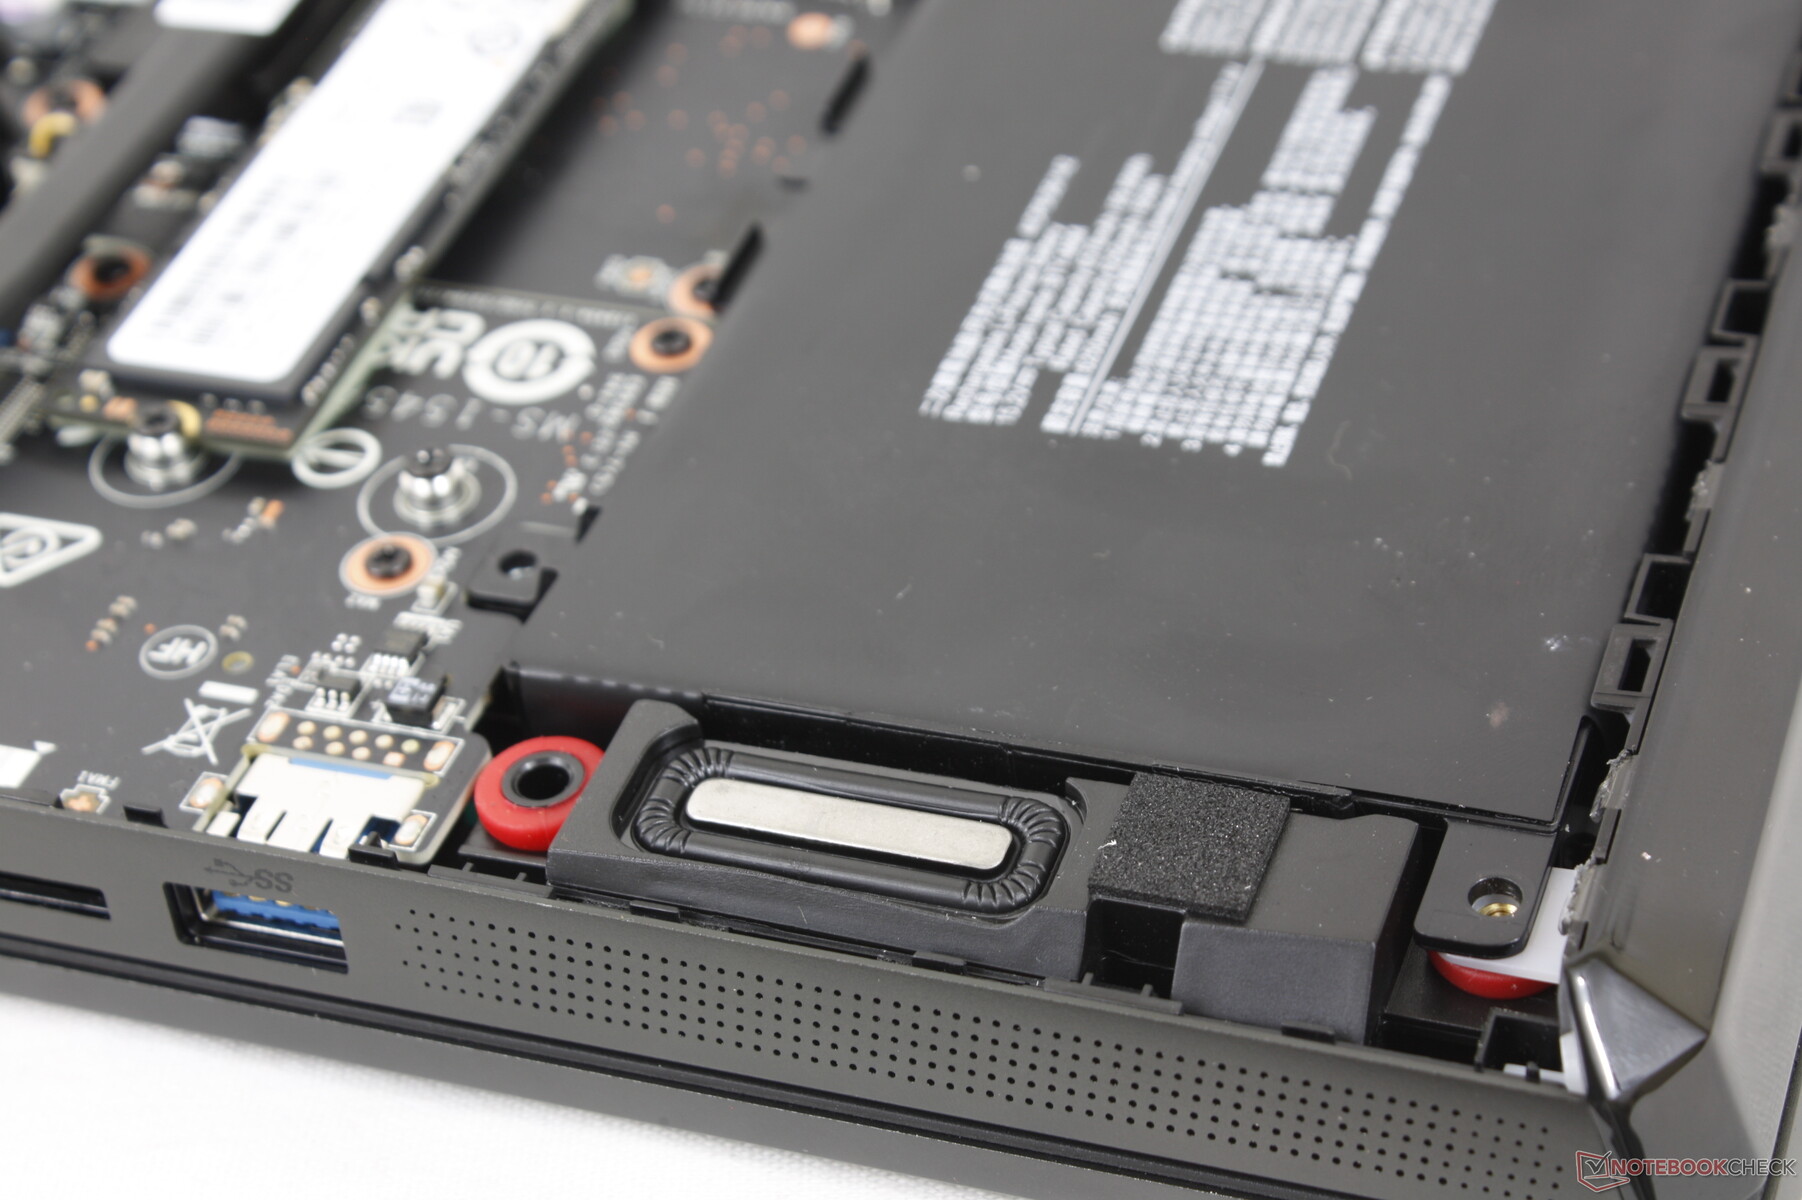
Maintenance
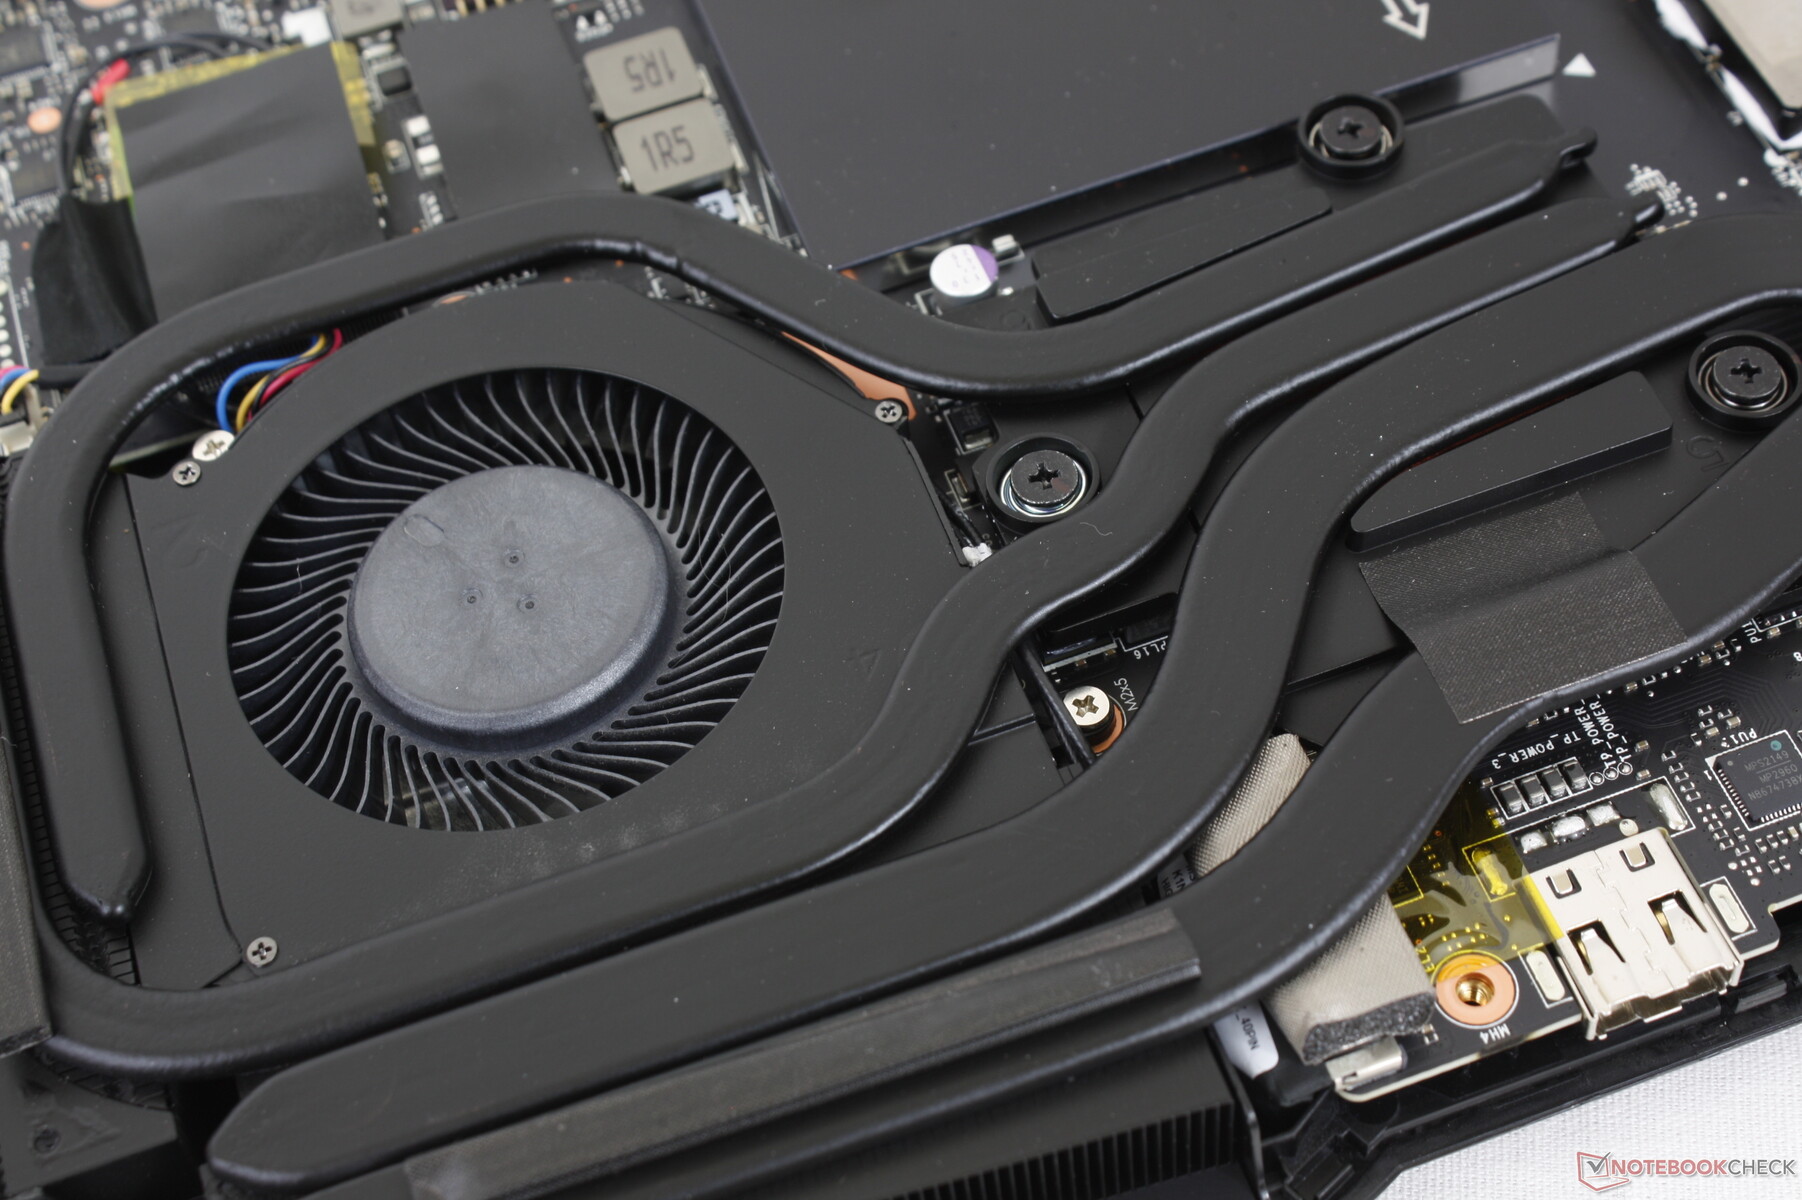
Le panneau inférieur nécessite un tournevis Philips et un bord plat pour être retiré. Par rapport au GE66, le GE67 possède un caloduc supplémentaire au-dessus du CPU, comme illustré ci-dessous, pour améliorer le refroidissement.
Accessoires et garantie
La boîte de vente au détail comprend une grande lingette en velours en plus de l'adaptateur secteur et de la documentation. La garantie standard d'un an du fabricant s'applique si l'appareil est acheté aux États-Unis.
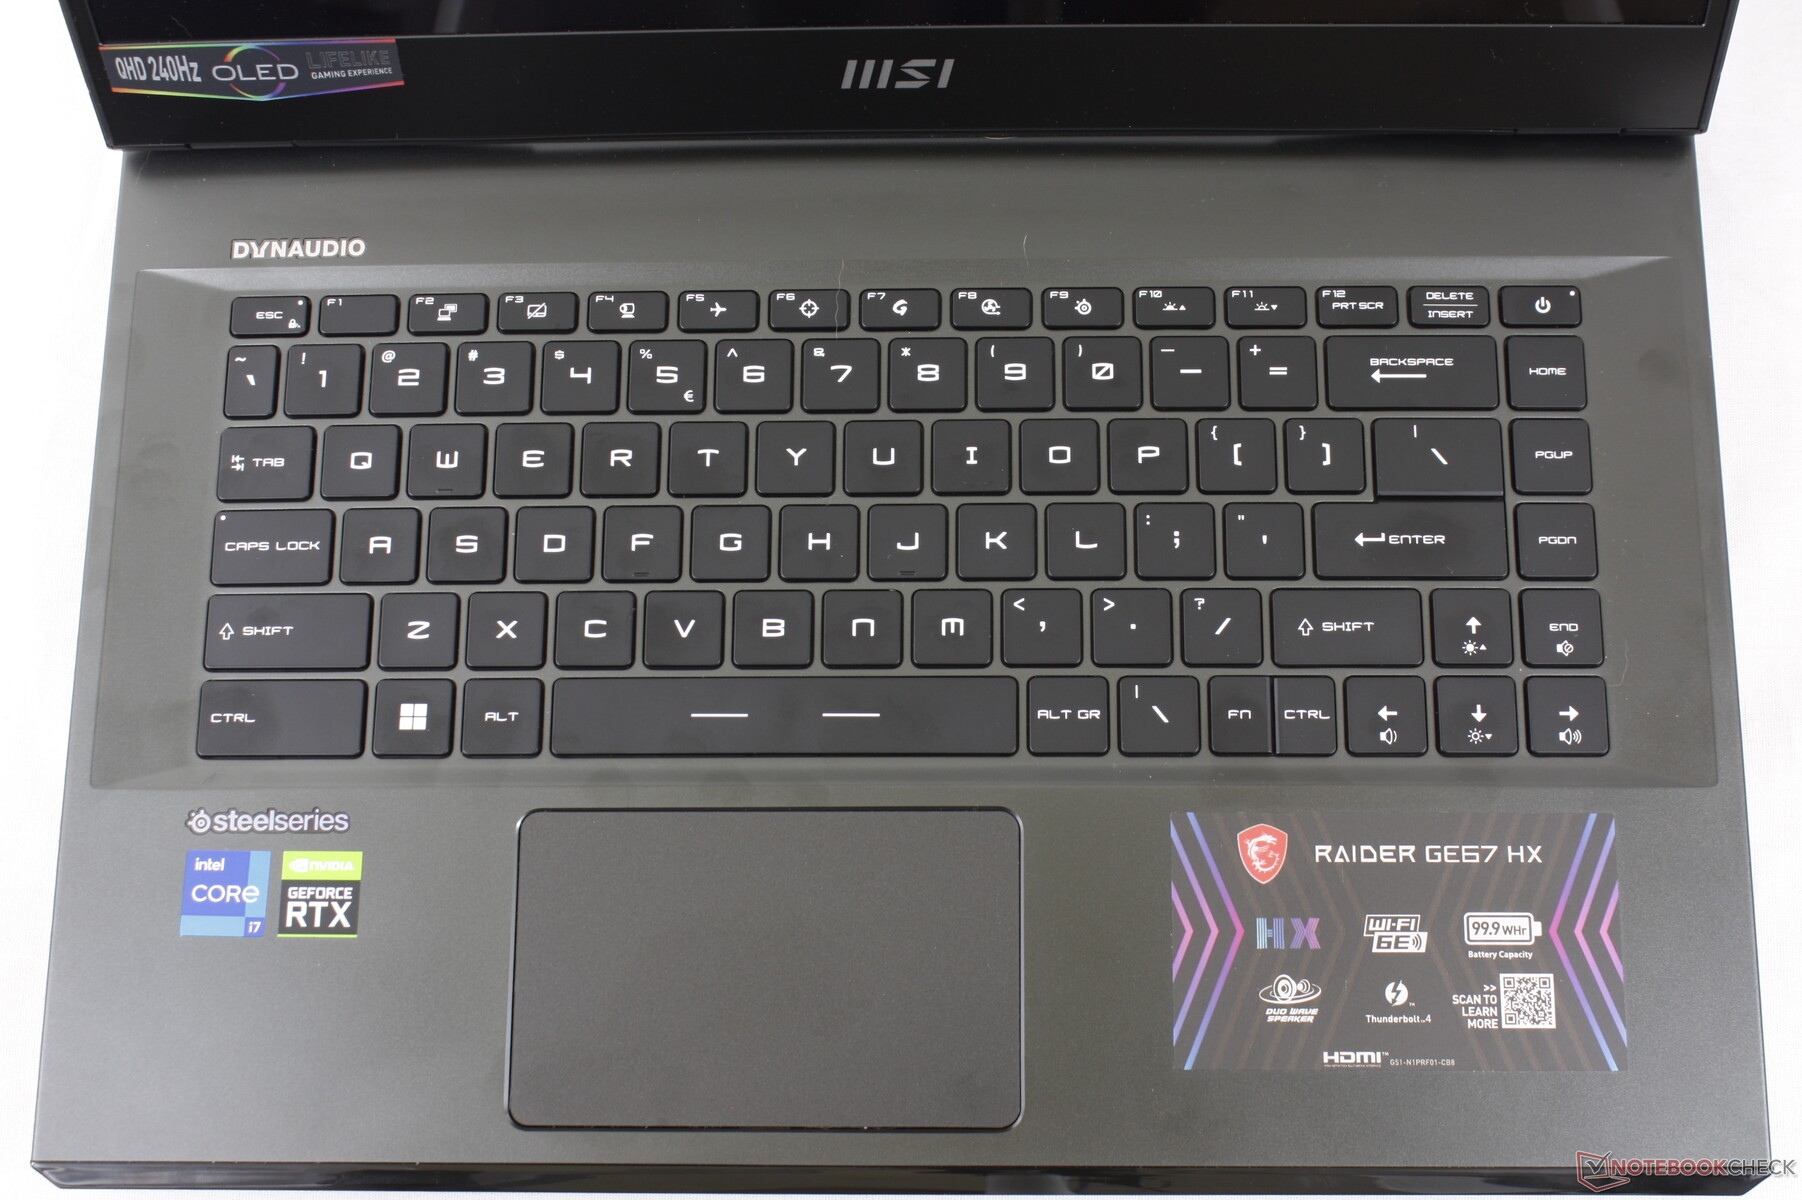
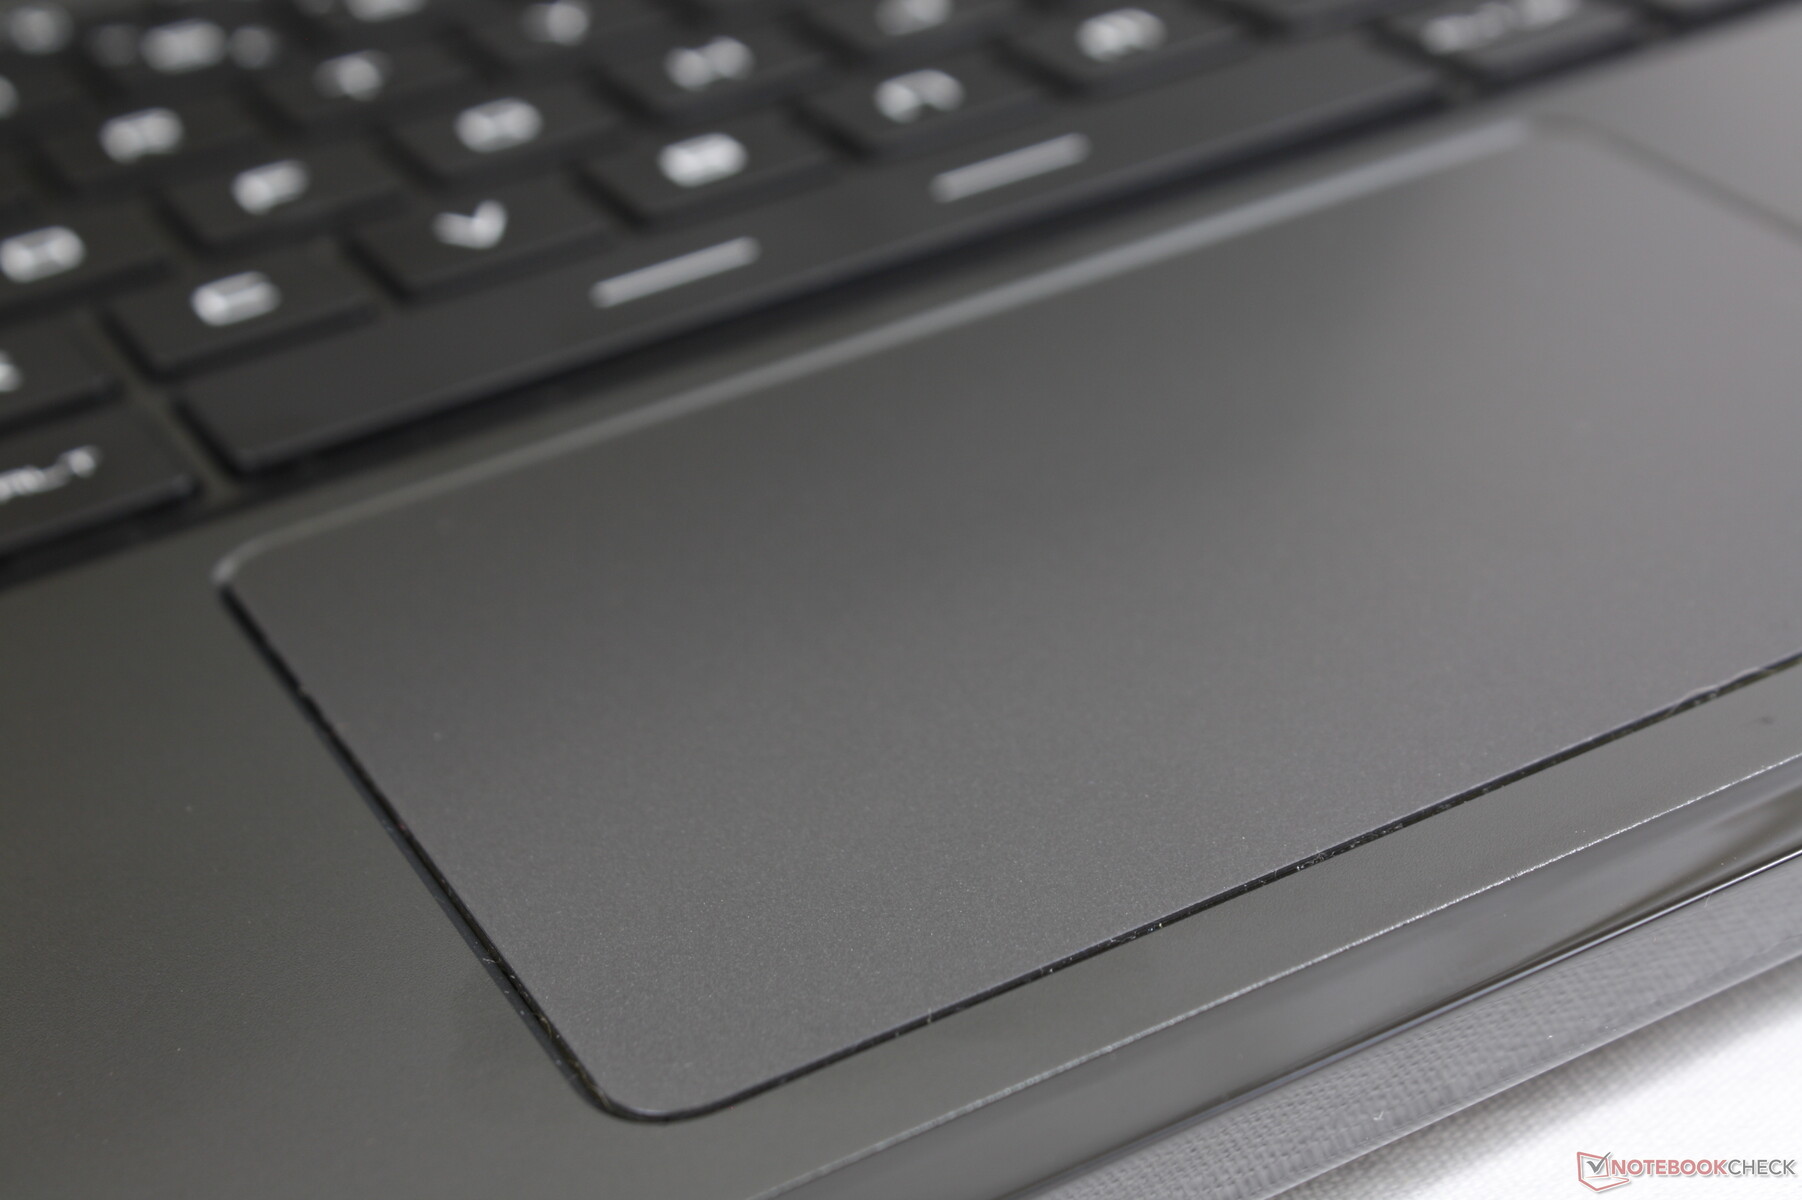
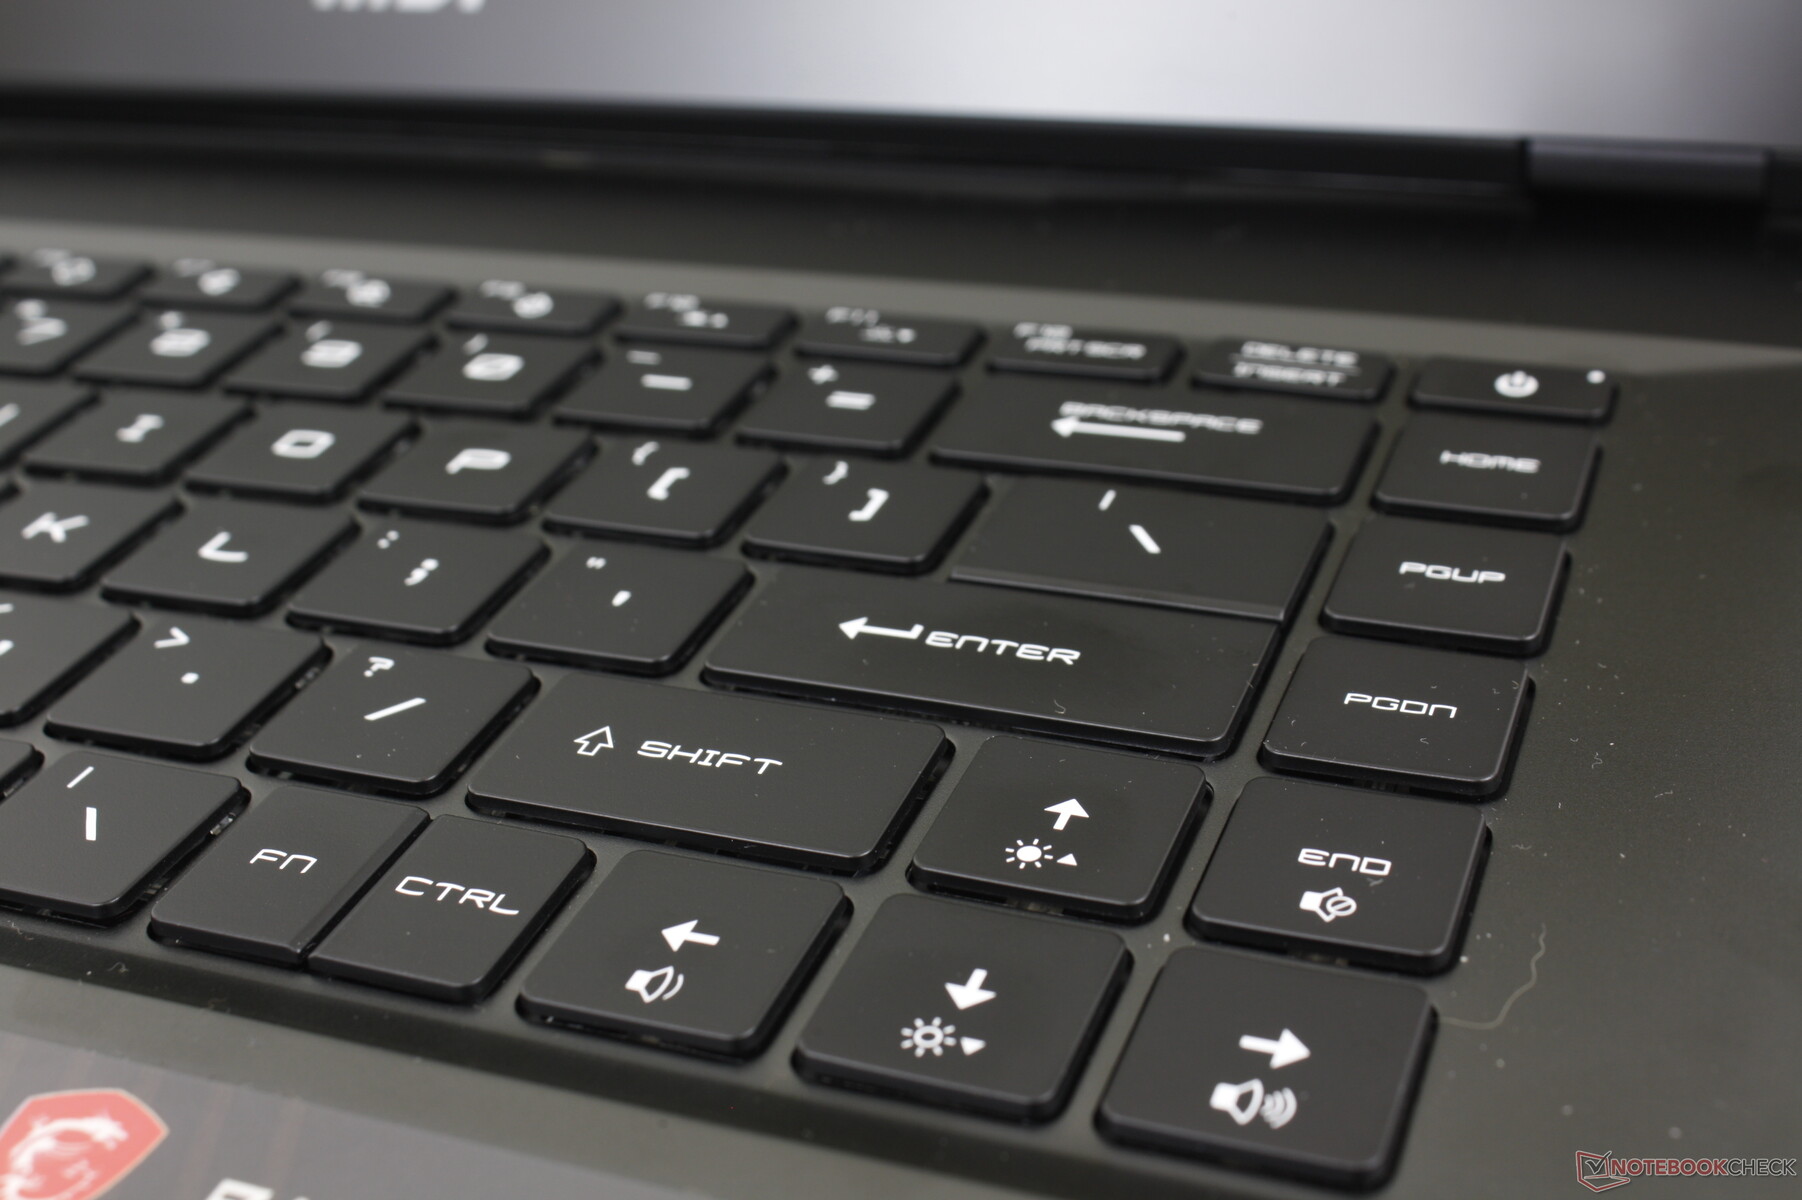
Périphériques d'entrée - Pas de changements majeurs par rapport à GE66
Clavier et pavé tactile
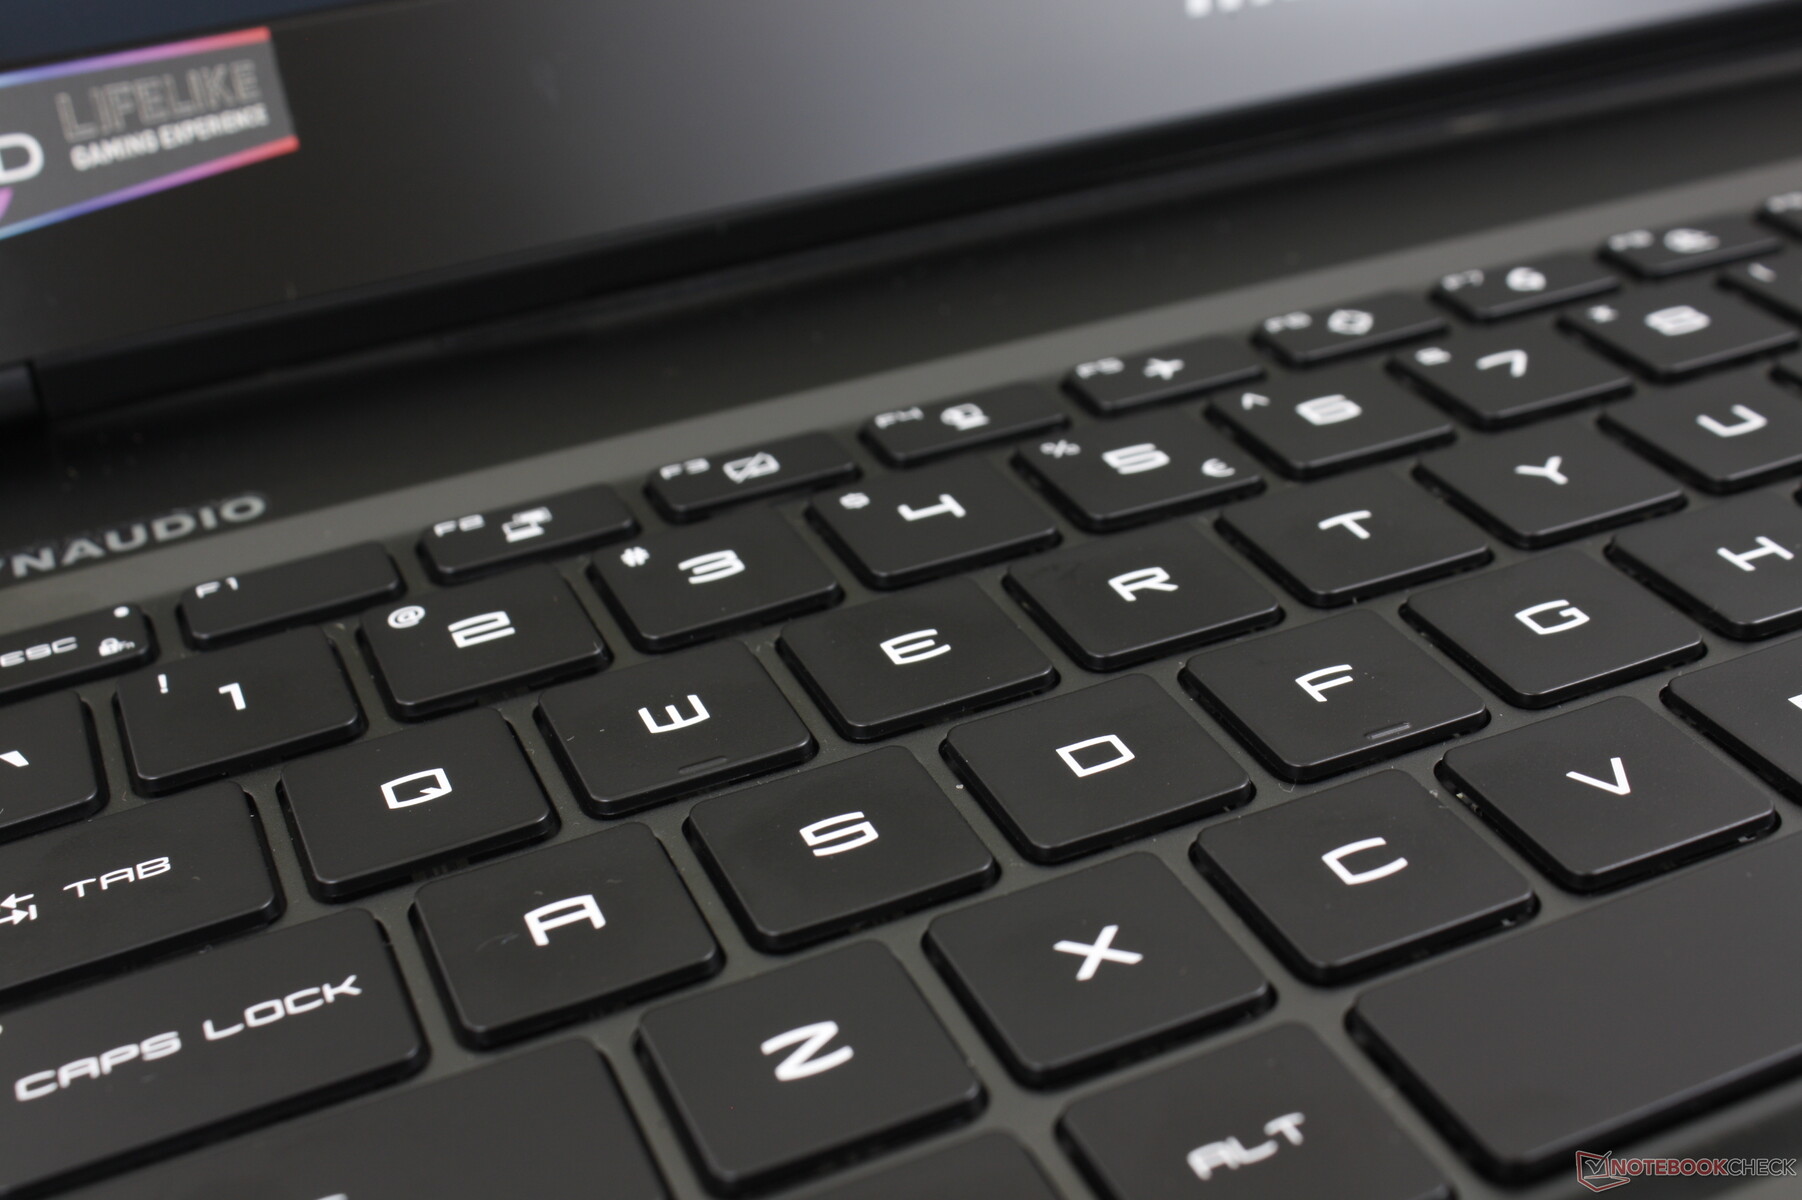
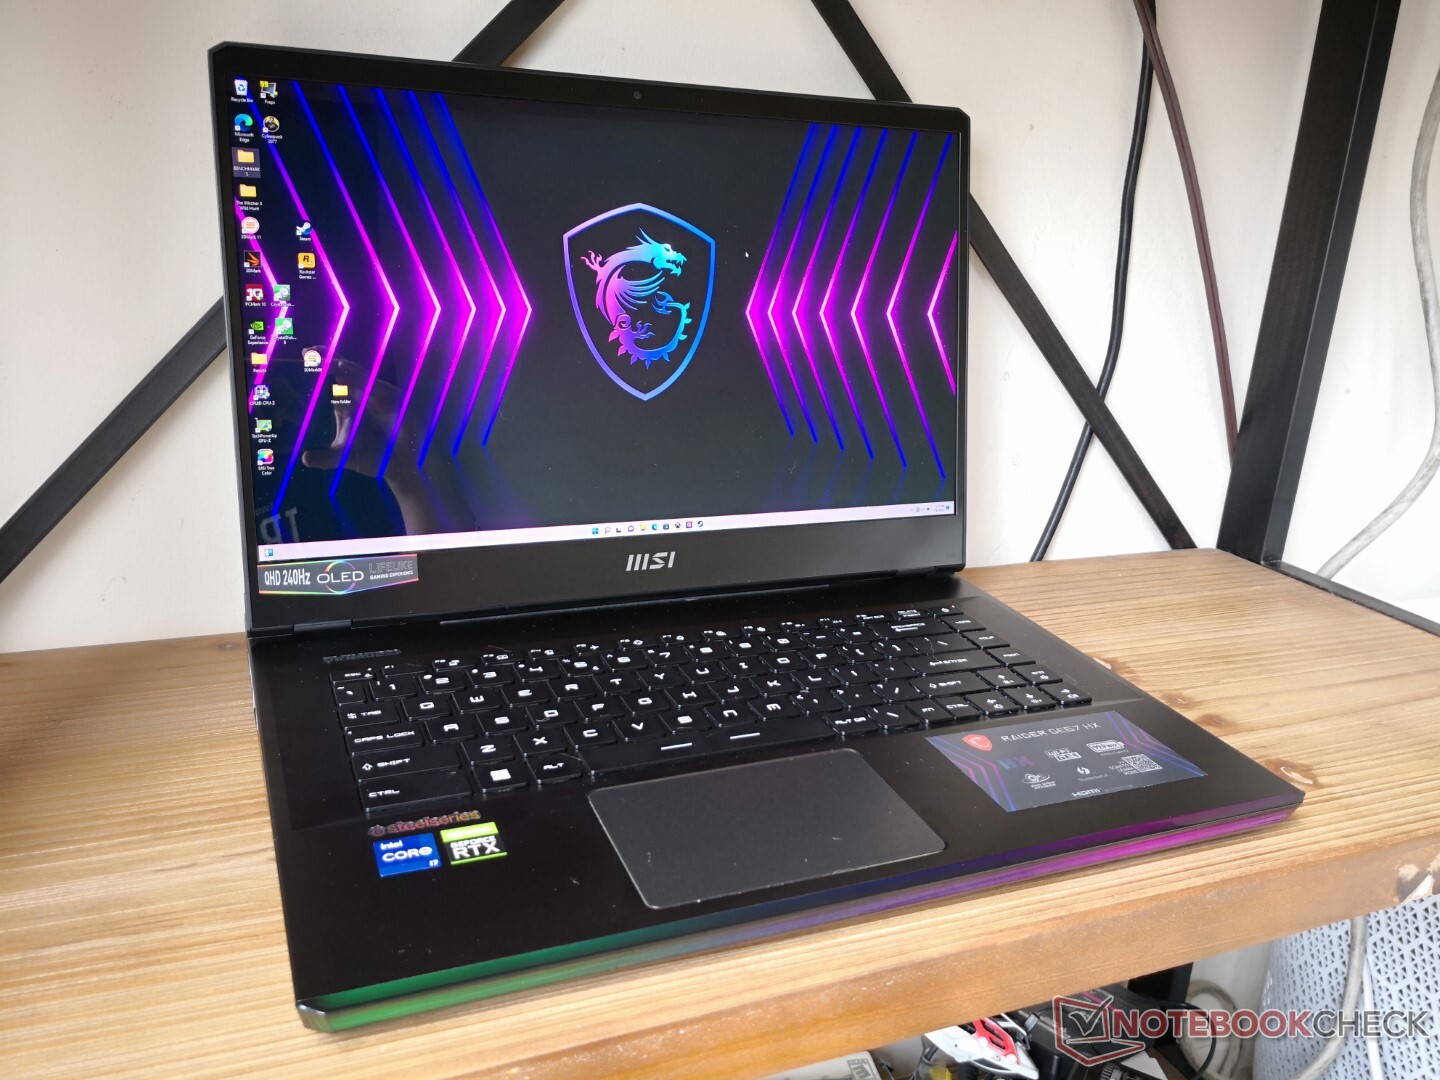
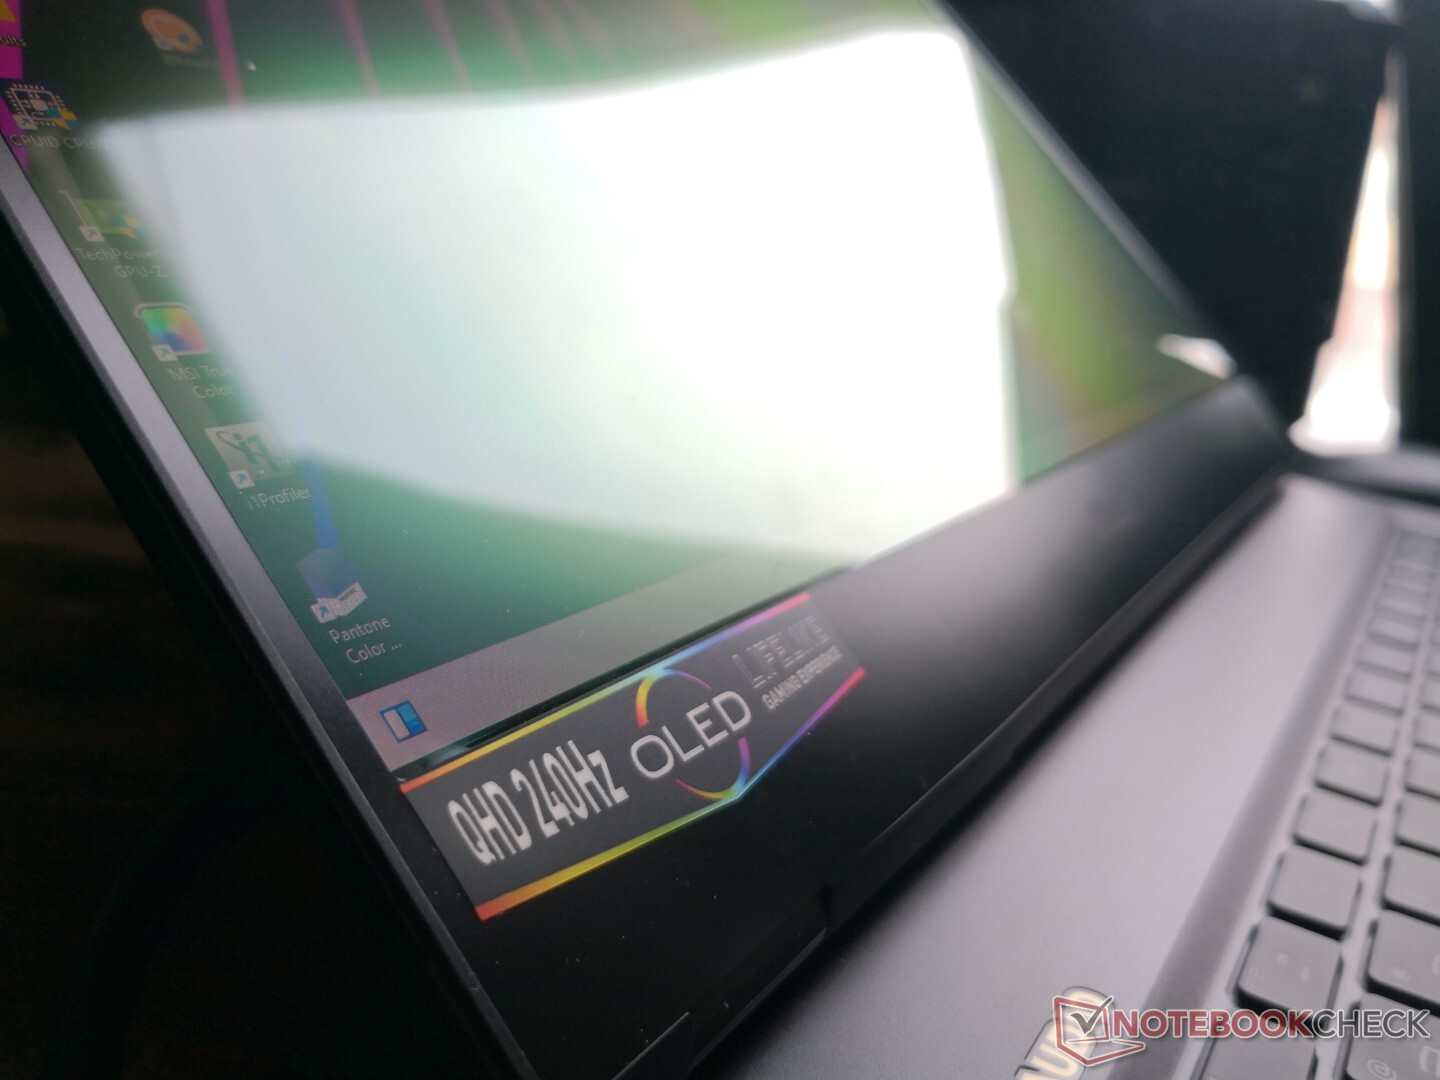
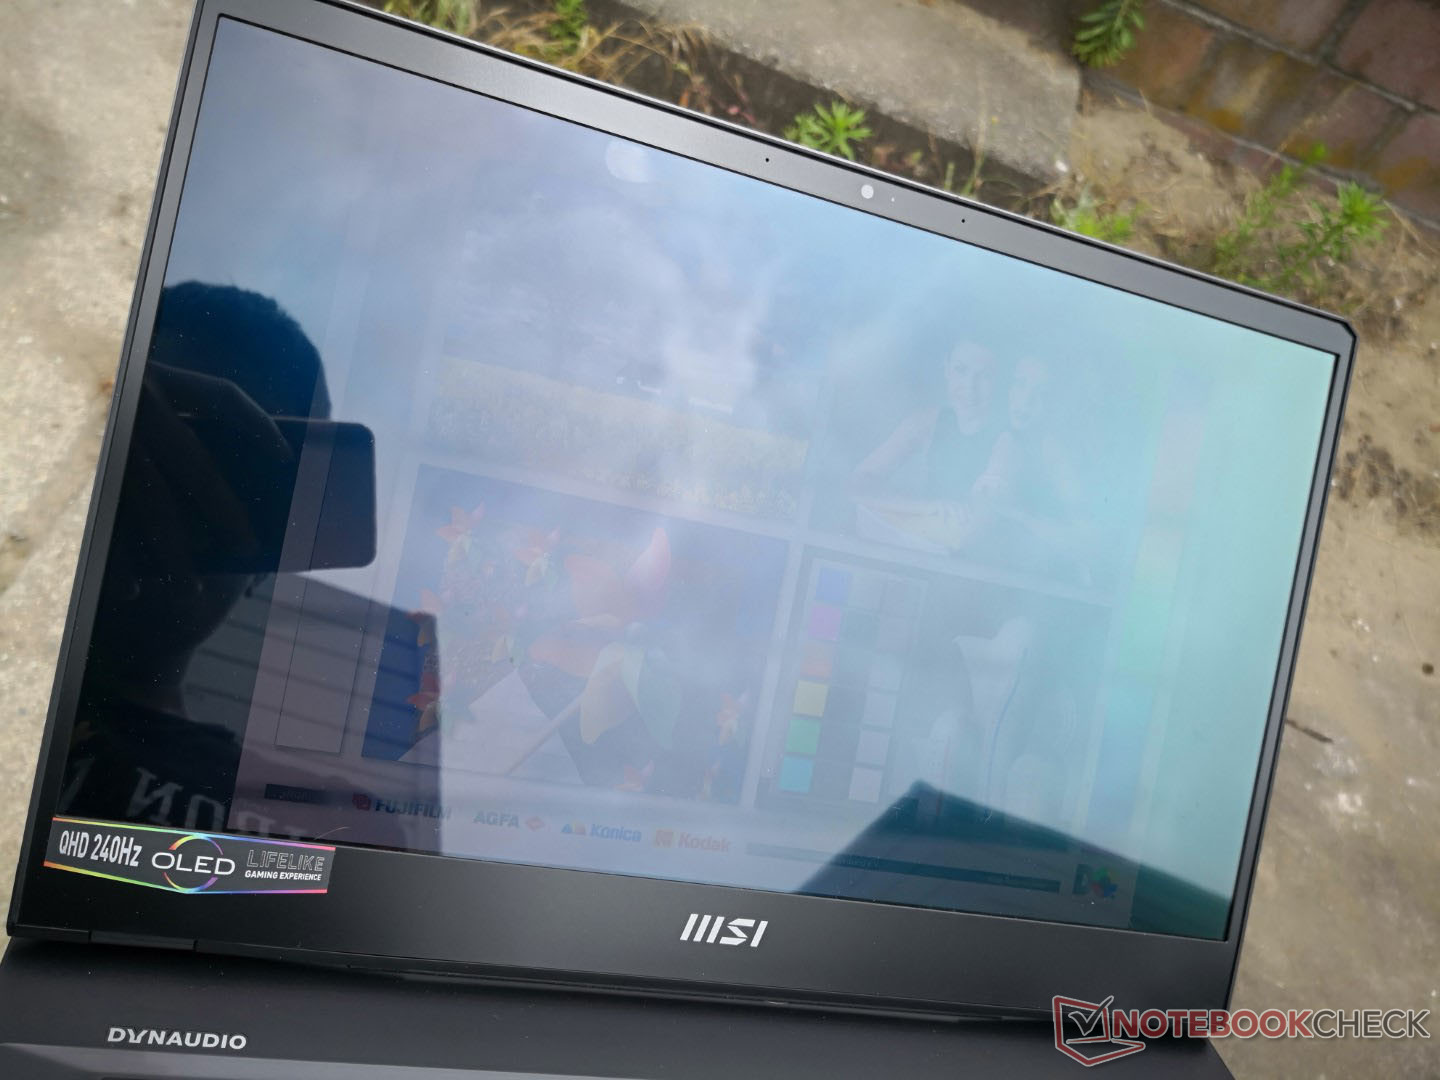
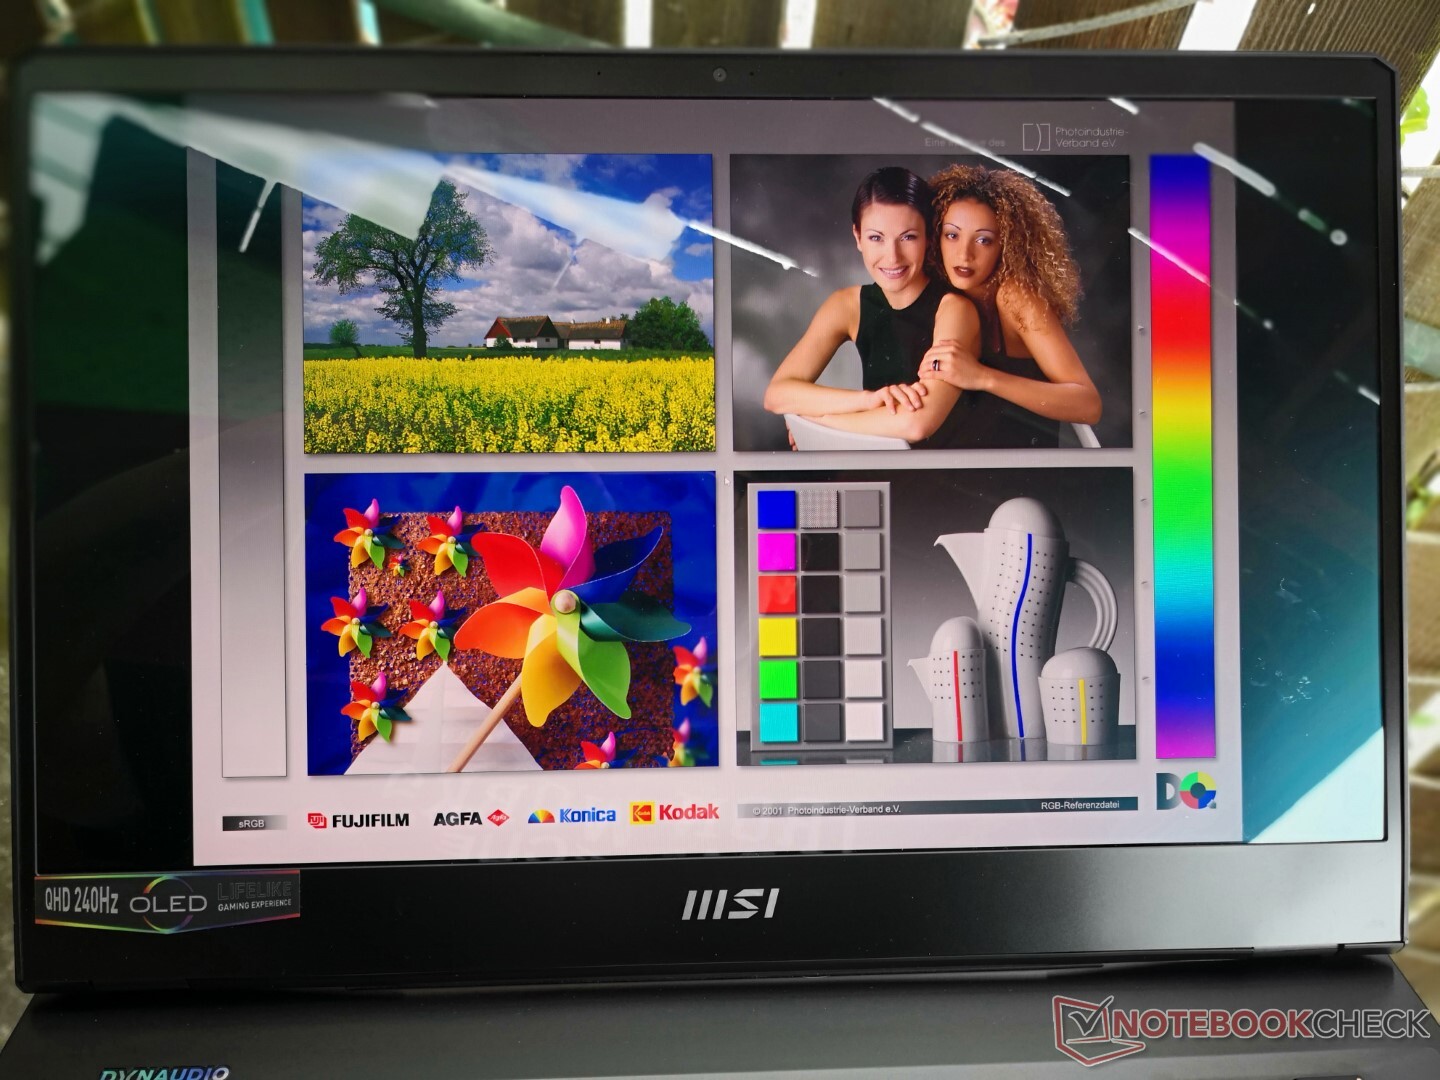
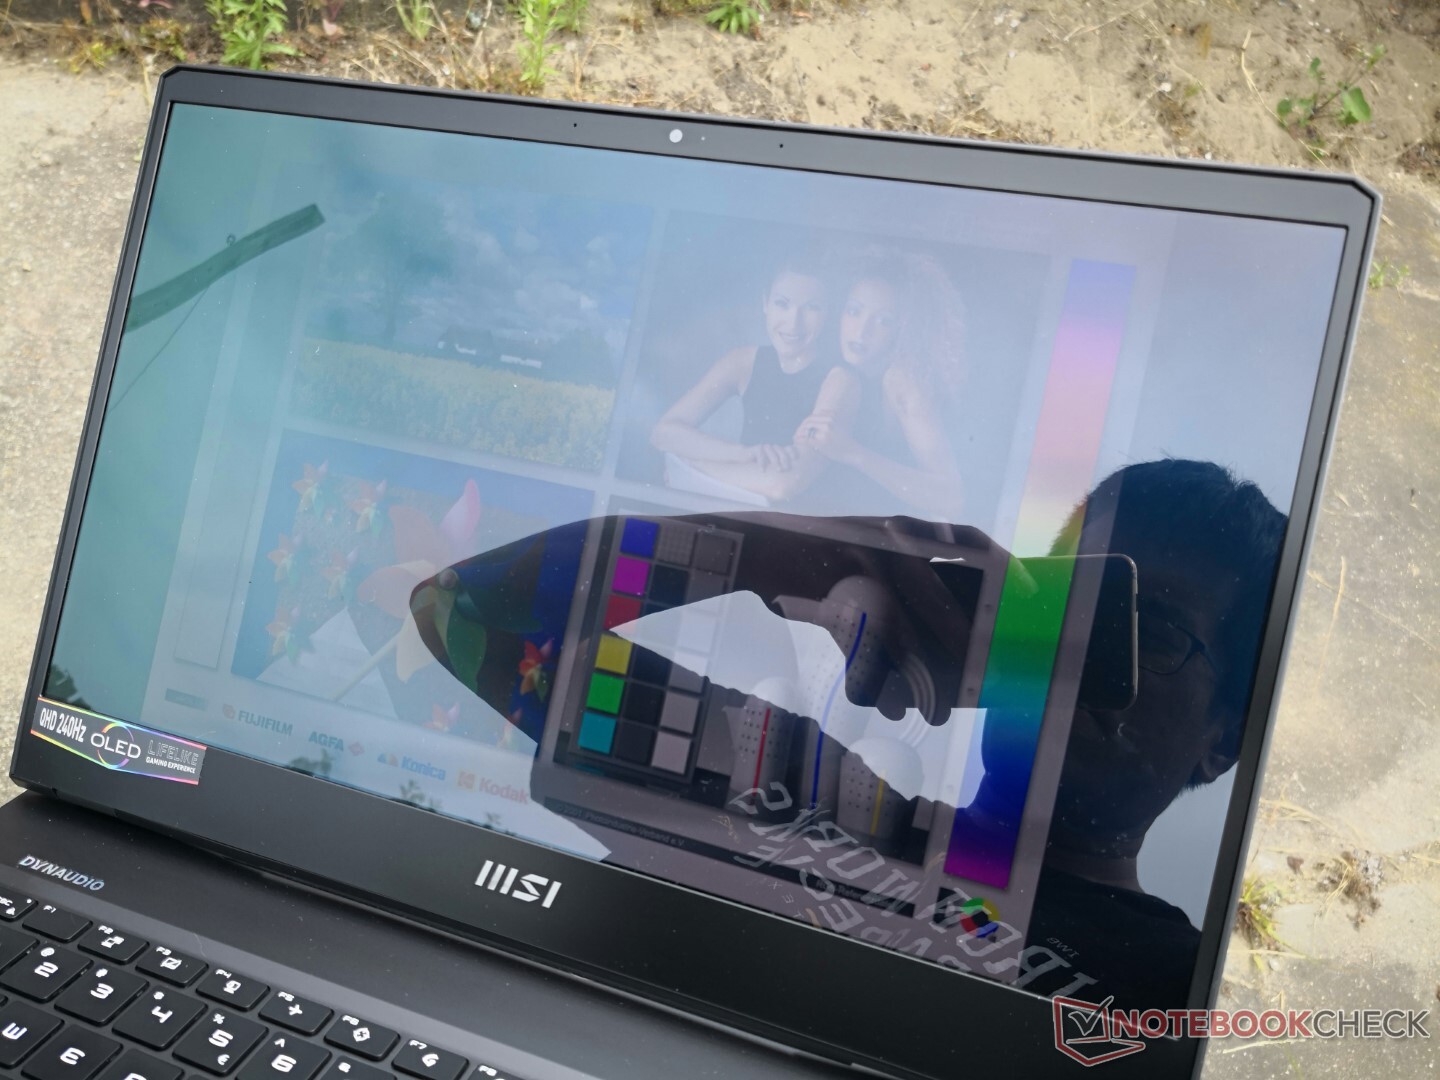
Affichage - Presque idéal pour les jeux
Le MSI GE67 et Razer Blade 15 sont deux des premiers ordinateurs portables à offrir des options d'affichage QHD OLED 240 Hz. Bien que cela puisse sembler excellent sur le papier, il y a quelques astérisques à garder à l'esprit
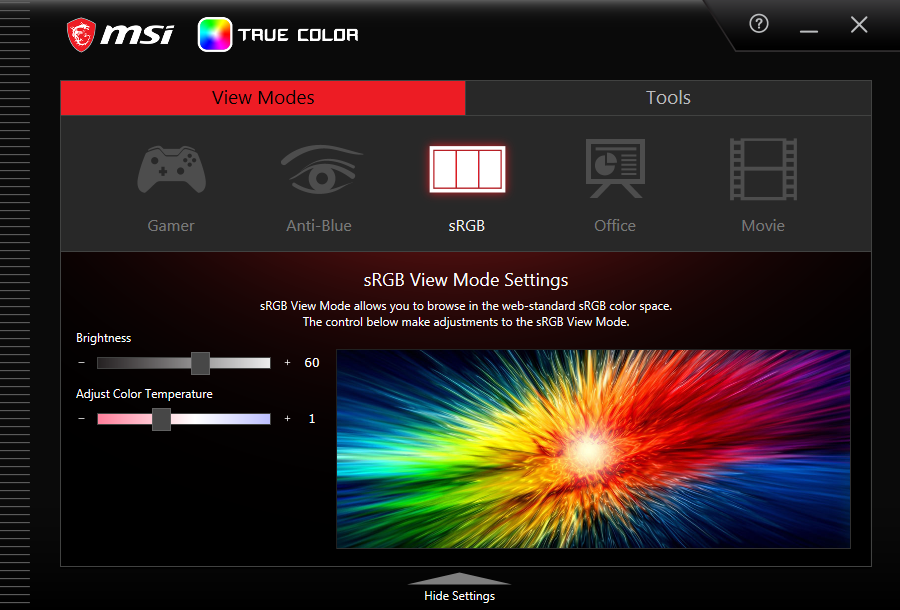
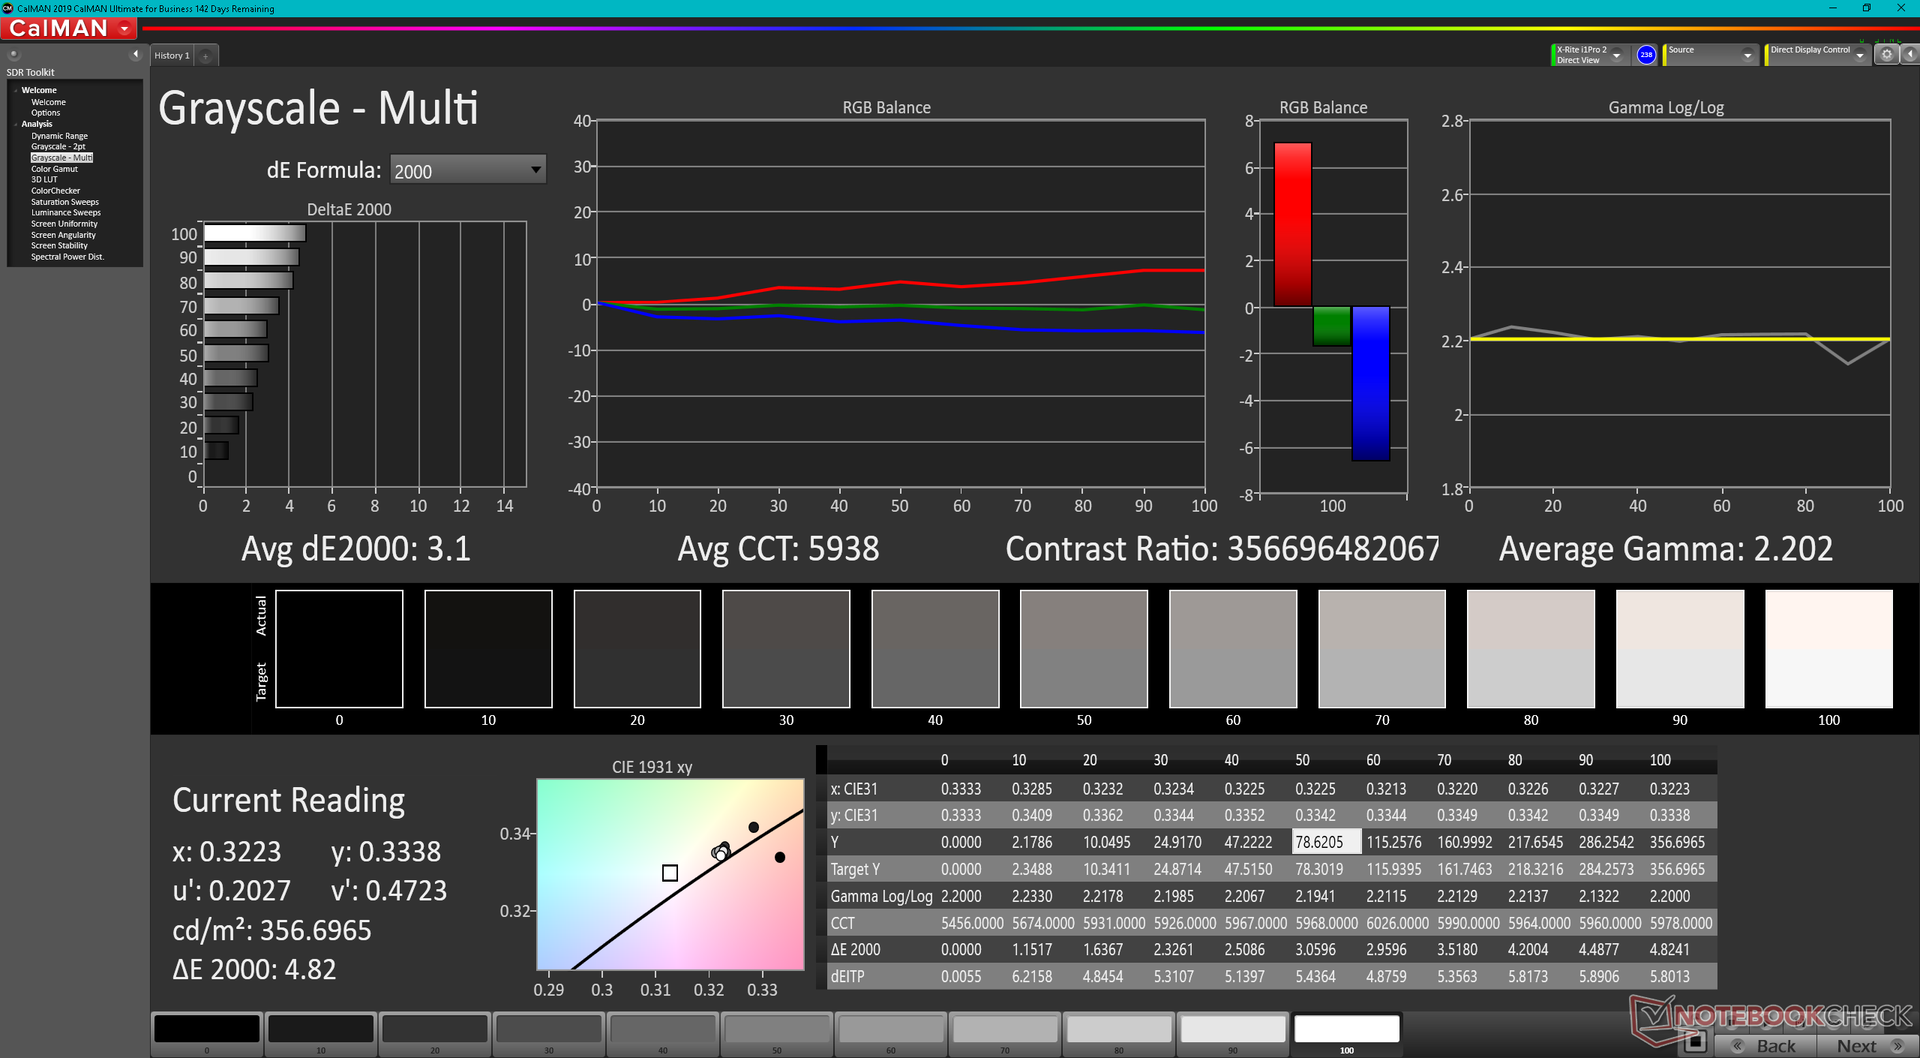
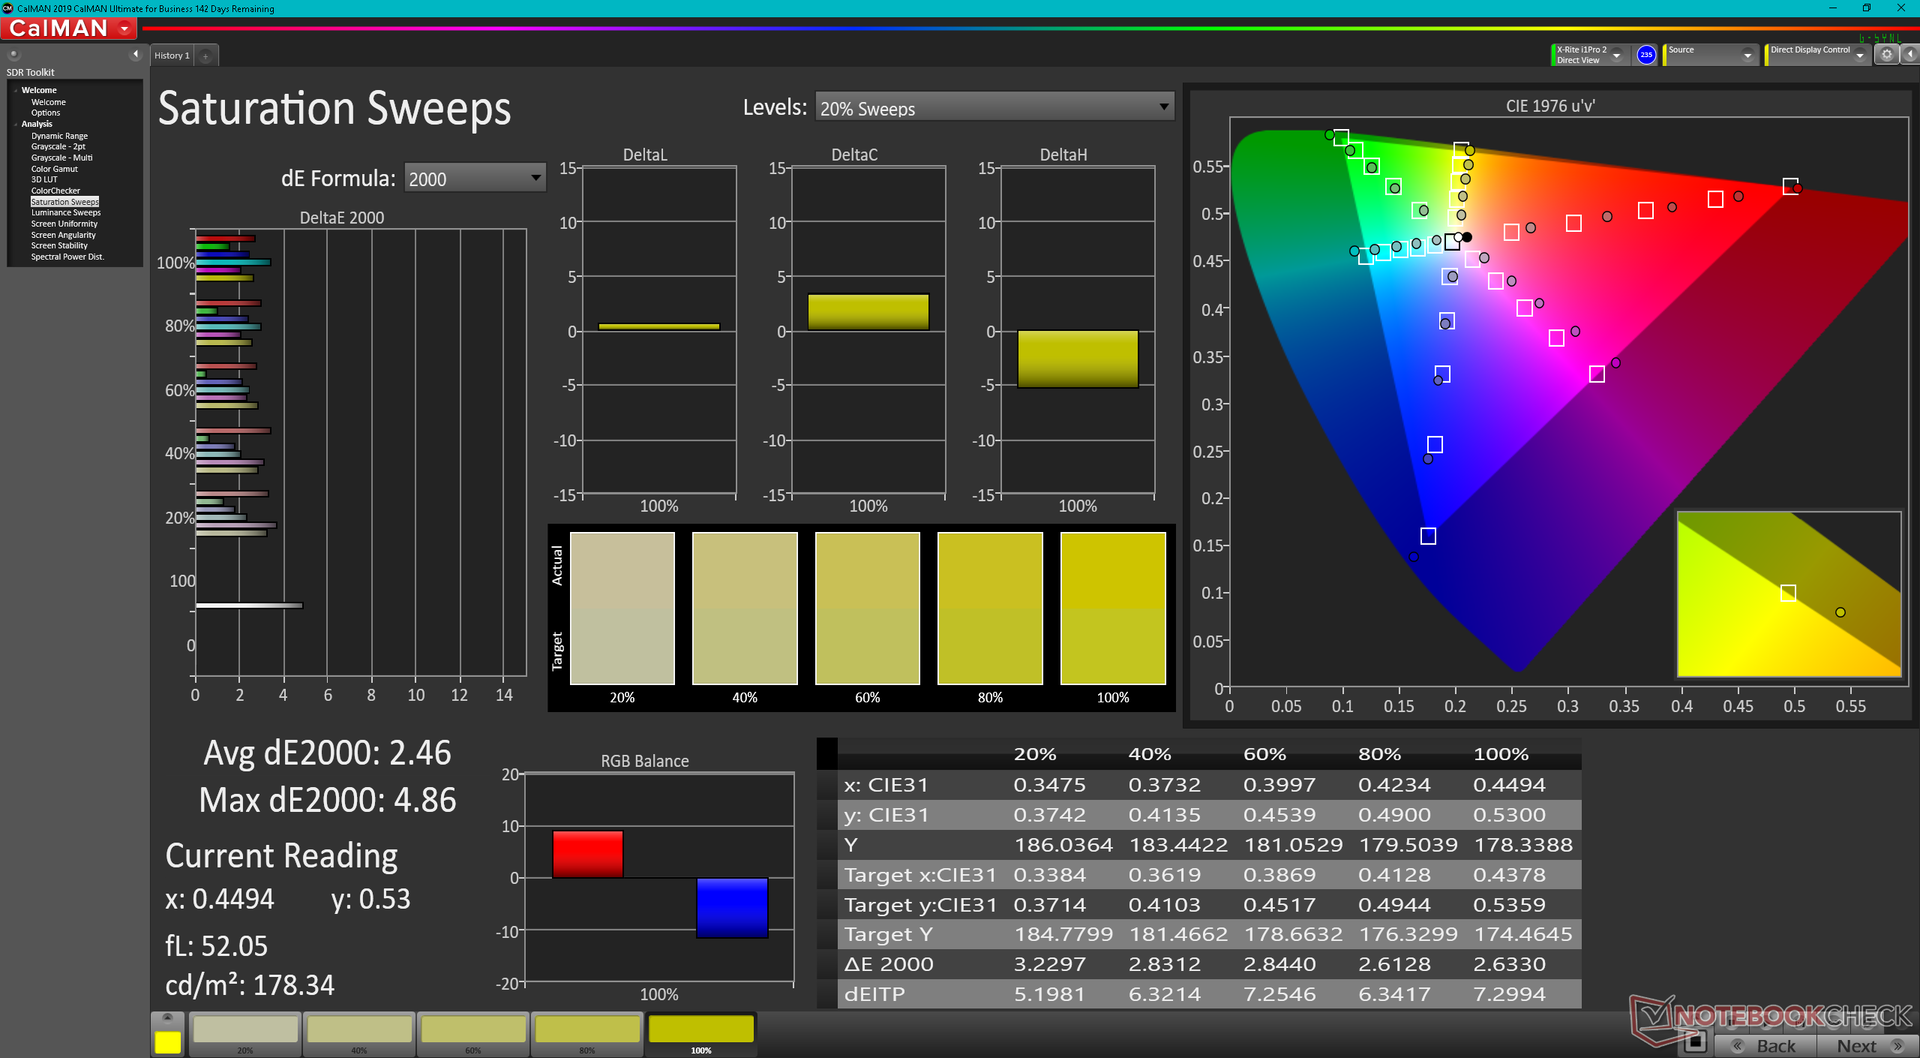
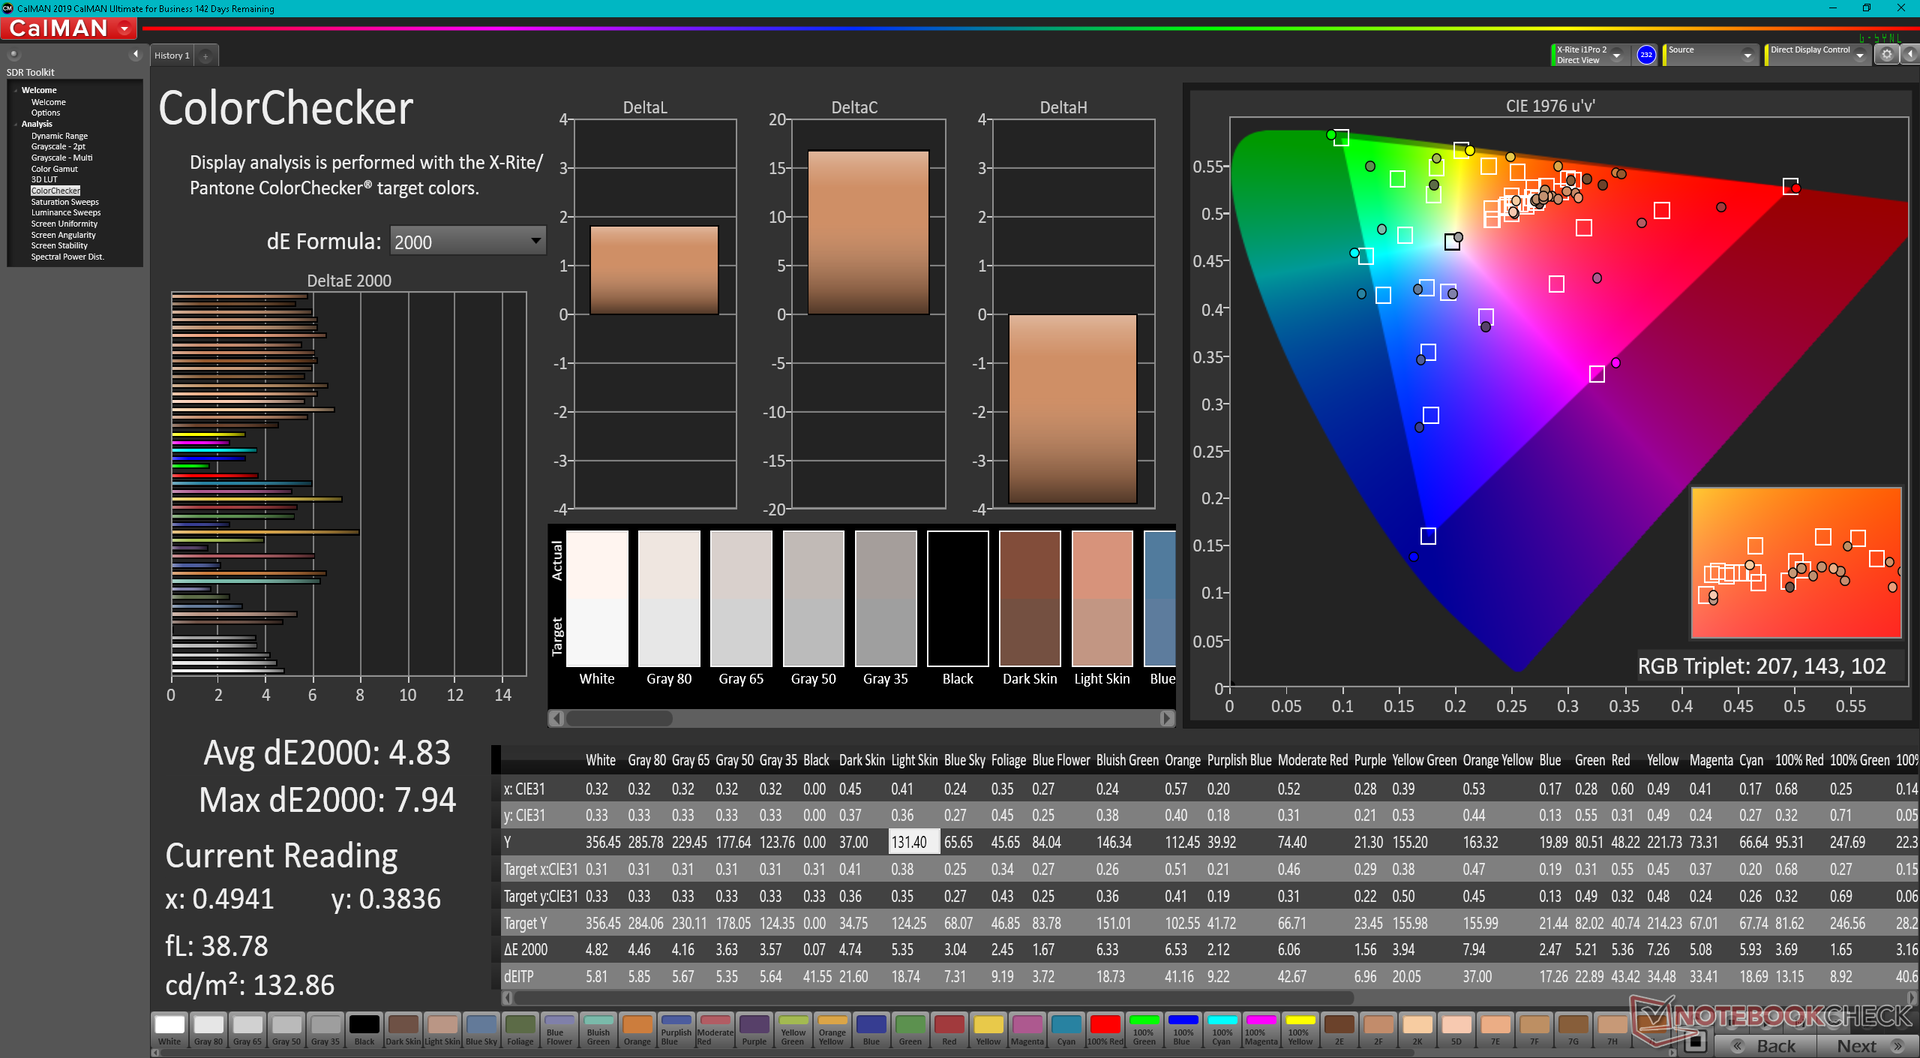
Tout d'abord, l'écran du GE67 n'est pas calibré en usine, même si le panneau OLED annonce une couverture DCI-P3 complète. En fait, nous ne sommes en mesure d'enregistrer qu'une couverture de 72% et le logiciel True Color de MSI n'a pas d'option DCI-P3 à choisir. Lorsqu'on lui a demandé de commenter, MSI a répondu que le mode DCI-P3 est "plutôt destiné aux éditeurs vidéo et à notre série d'ordinateurs portables Creator" et que le GE67 met en œuvre le mode Display P3 à la place
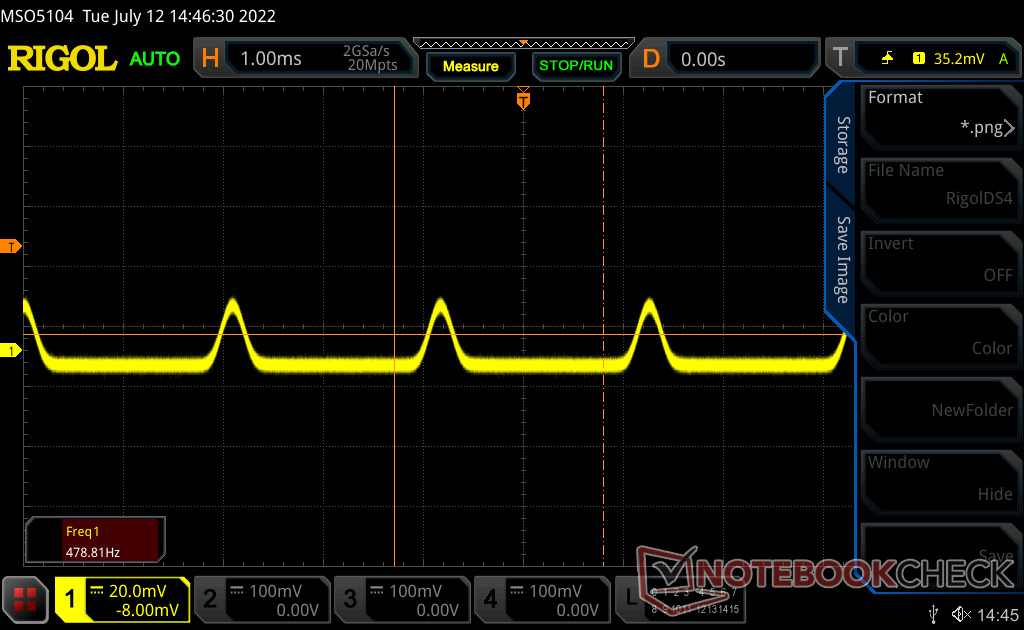
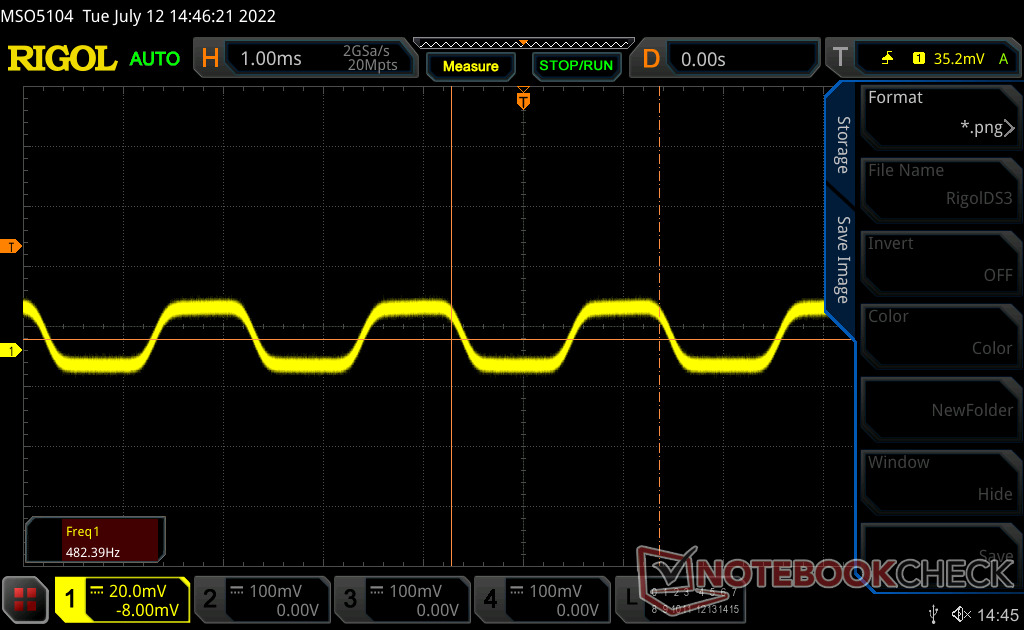
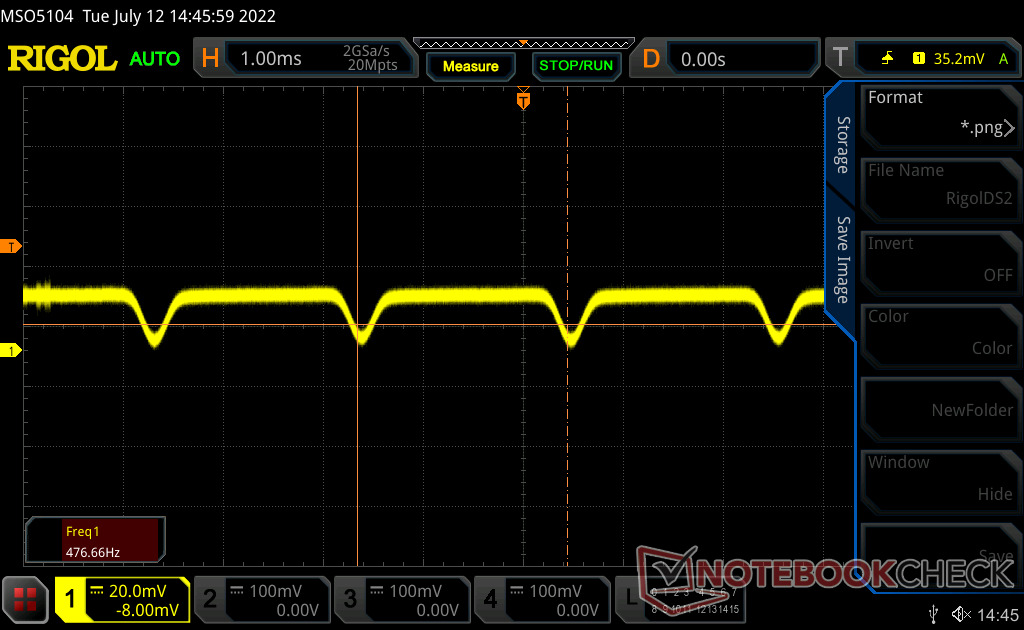
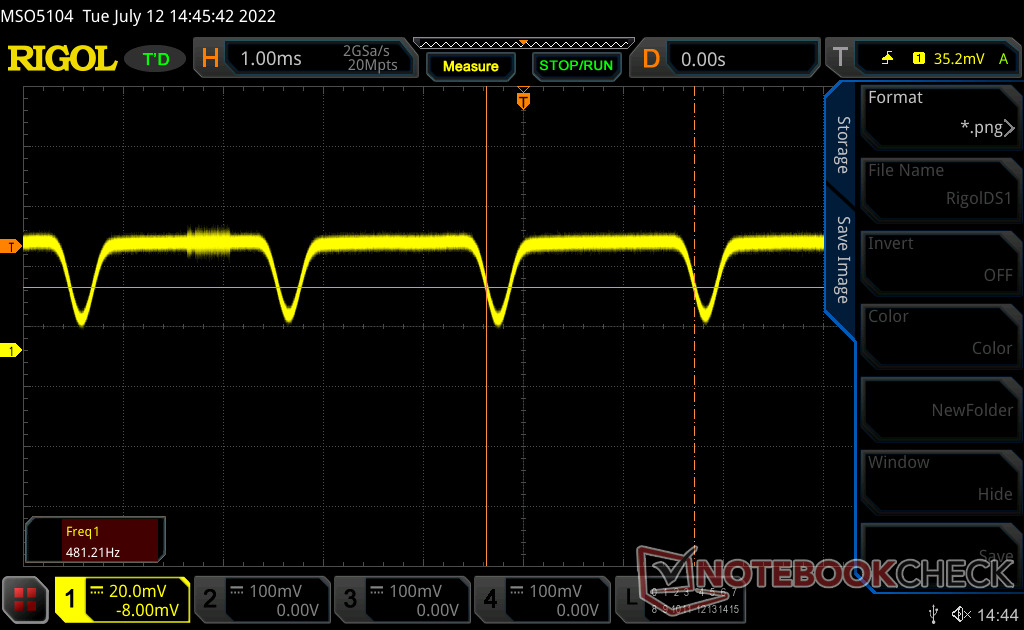
Deuxièmement, l'écran présente un scintillement à 480 Hz à tous les niveaux de luminosité, y compris à 100 %. Nous avons enregistré des résultats similaires sur de nombreux récents Asus Vivobook et Zenbook OLED récents. Si vos yeux sont sensibles au scintillement à l'écran, il est préférable de réduire la luminosité ou d'éviter d'utiliser le GE67 pendant de longues périodes
Enfin, l'écran interne ne prend pas en charge G-Sync ou la synchronisation adaptative
En dehors de ces inconvénients, l'écran QHD OLED 240 Hz offre certainement l'une des expériences OLED les plus fluides que nous ayons vues dans les jeux. Les anciens panneaux OLED étaient limités à 60 Hz, ce qui, bien que parfaitement adapté à des fins d'édition, ne serait pas attrayant pour les joueurs enthousiastes. MSI a conçu cet écran pour le jeu et moins pour l'édition ou les professionnels.
| |||||||||||||||||||||||||
Homogénéité de la luminosité: 99 %
Valeur mesurée au centre, sur batterie: 356.1 cd/m²
Contraste: ∞:1 (Valeurs des noirs: 0 cd/m²)
ΔE ColorChecker Calman: 4.83 | ∀{0.5-29.43 Ø4.71}
ΔE Greyscale Calman: 3.1 | ∀{0.09-98 Ø4.96}
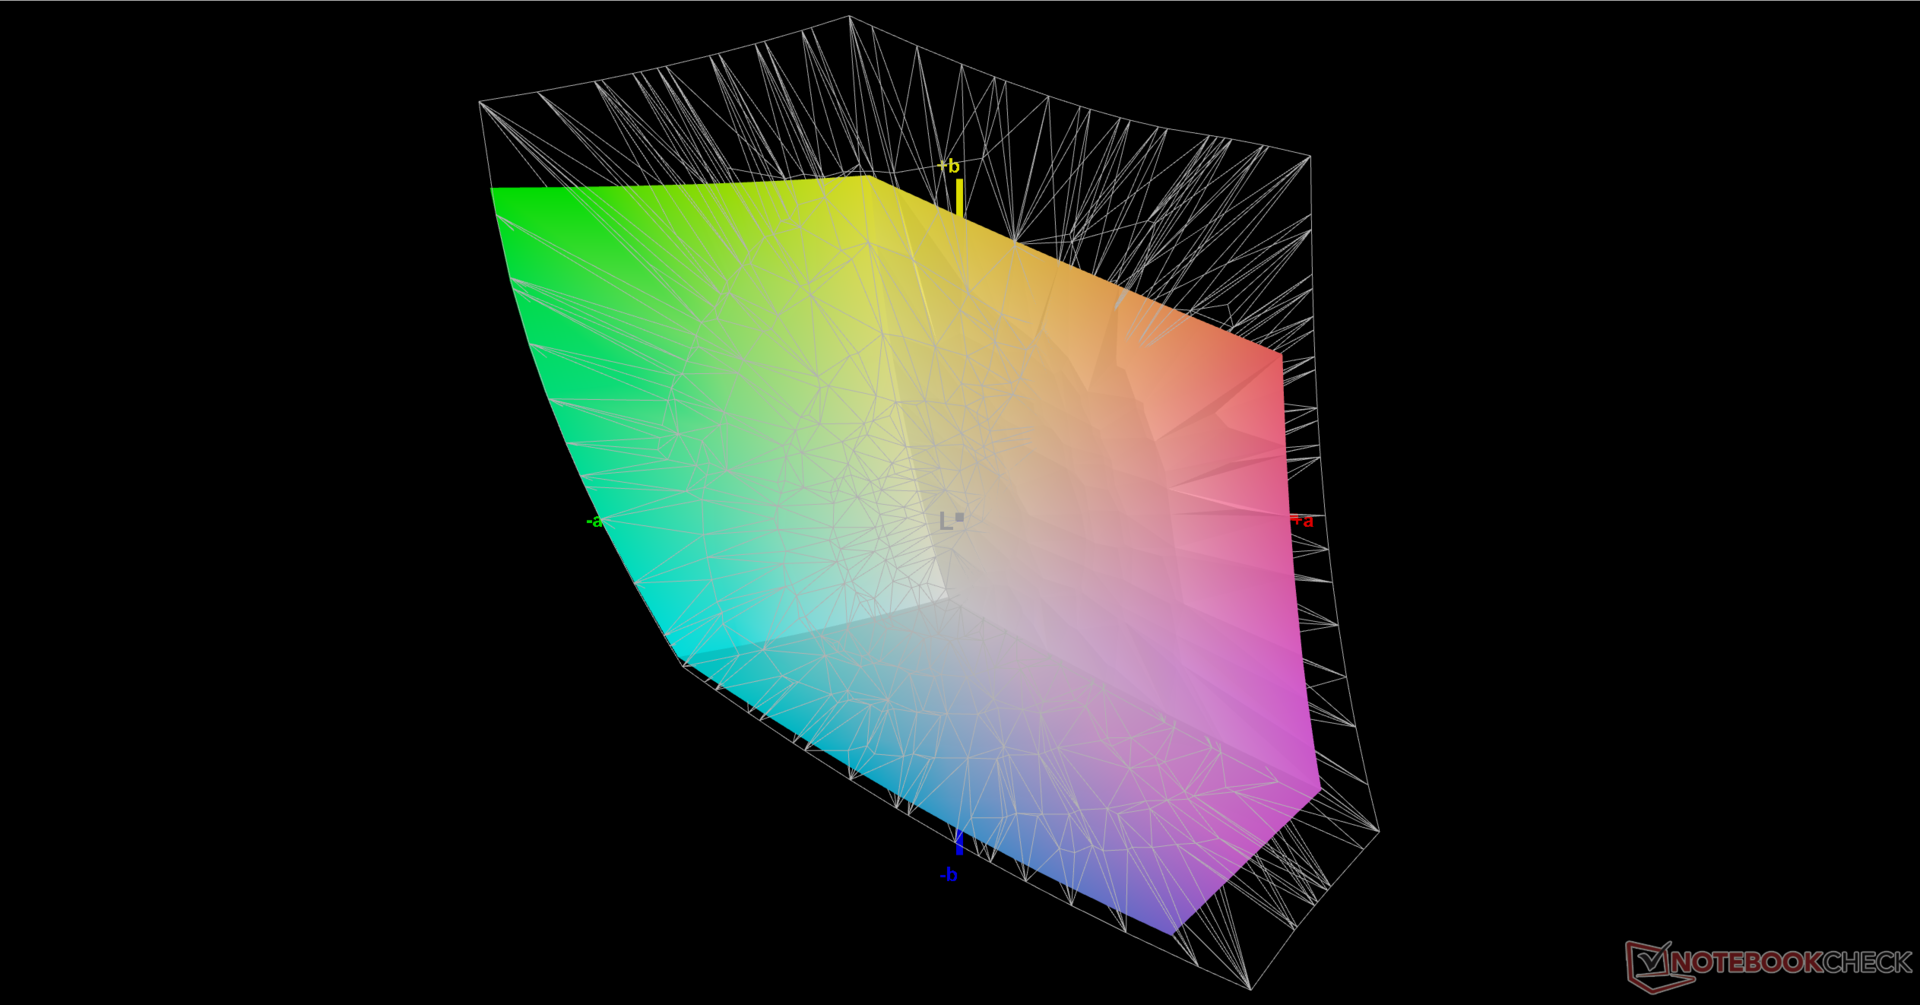
75.2% AdobeRGB 1998 (Argyll 3D)
89.7% sRGB (Argyll 3D)
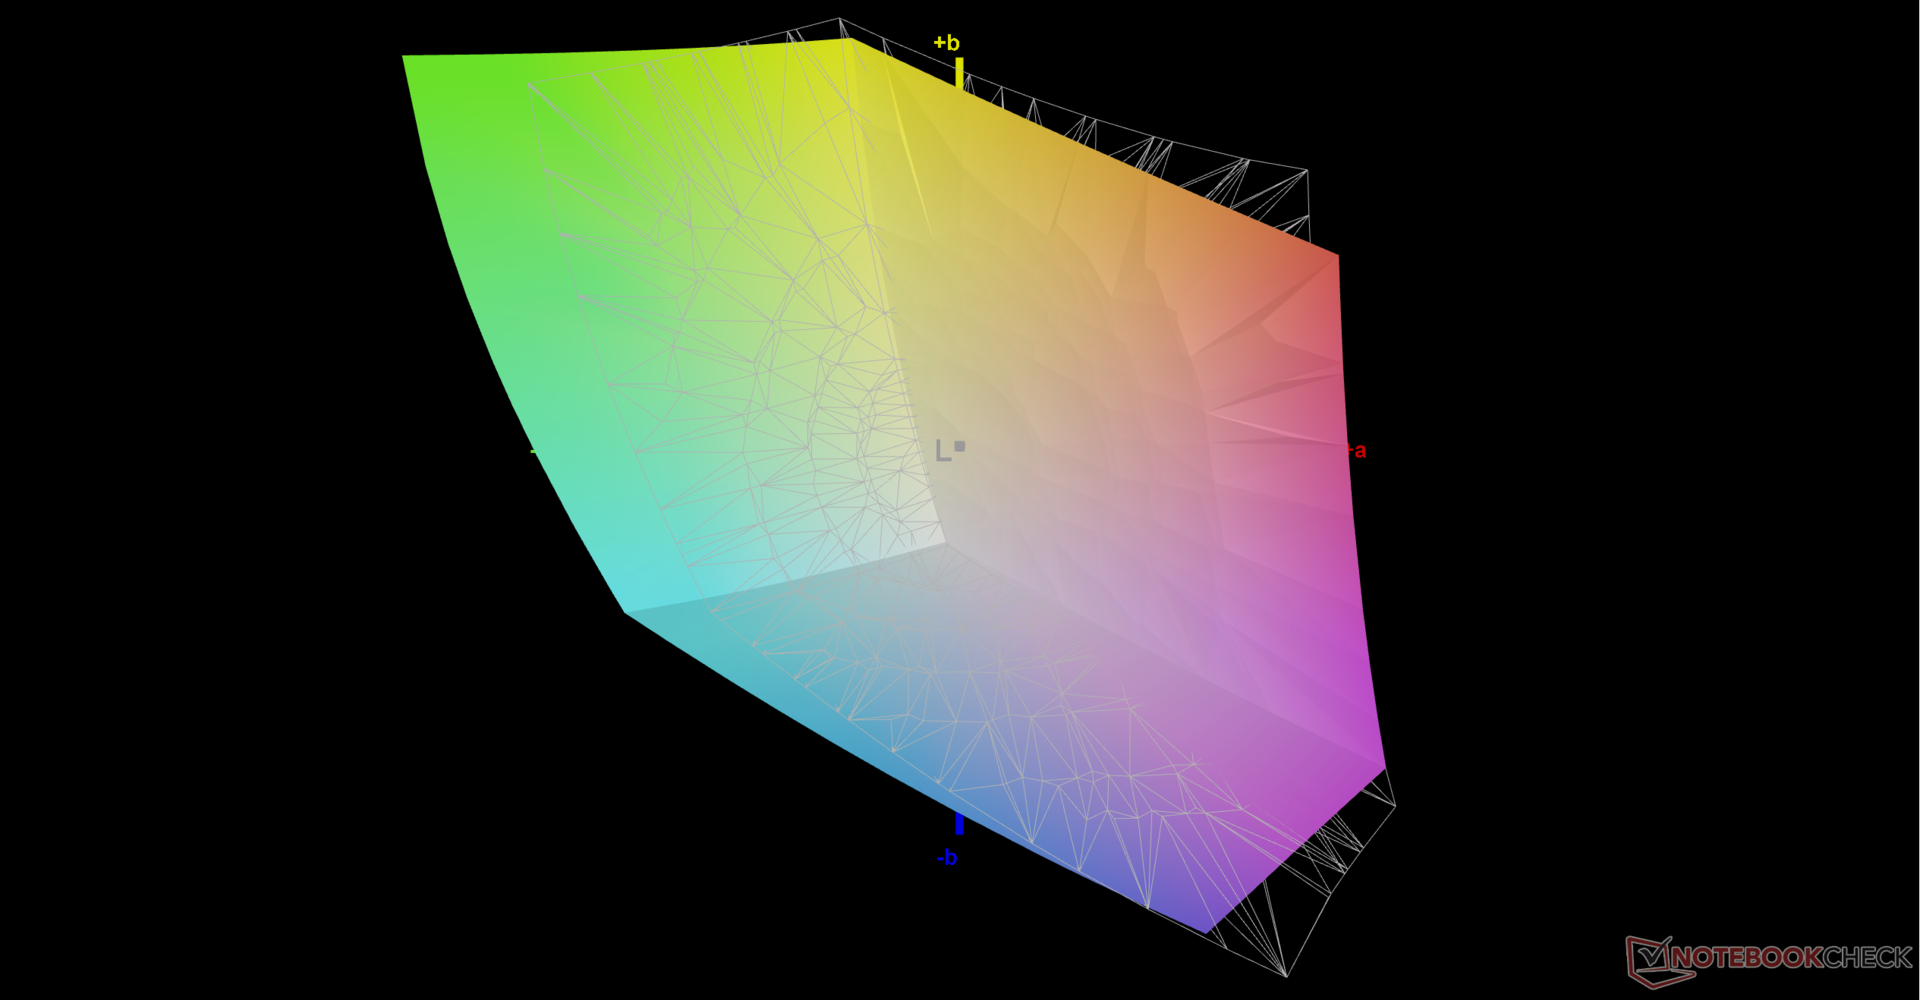
71.7% Display P3 (Argyll 3D)
Gamma: 2.2
CCT: 5938 K
| MSI GE67 HX 12UGS Samsung ATNA562P02-0, OLED, 1920x1080, 15.6" | MSI Raider GE66 12UHS AUO51EB, IPS, 3840x2160, 15.6" | MSI Vector GP66 12UGS BOE NE156FHM-NZ3, IPS, 1920x1080, 15.6" | Asus ROG Strix Scar 15 G533ZW-LN106WS BOE CQ NE156QHM-NZ2, IPS-level, 2560x1440, 15.6" | Alienware m15 R6, i7-11800H RTX 3080 AU Optronics AUO9092 (B156HAN), IPS, 1920x1080, 15.6" | Razer Blade 15 2022 Sharp LQ156T1JW03, IPS, 2560x1440, 15.6" | |
|---|---|---|---|---|---|---|
| Display | 16% | 2% | 19% | 5% | 21% | |
| Display P3 Coverage (%) | 71.7 | 80.4 12% | 70.1 -2% | 96.2 34% | 74.1 3% | 99.1 38% |
| sRGB Coverage (%) | 89.7 | 98.4 10% | 99.5 11% | 99.9 11% | 99.5 11% | 99.9 11% |
| AdobeRGB 1998 Coverage (%) | 75.2 | 94.7 26% | 72.1 -4% | 84.5 12% | 75.7 1% | 86.8 15% |
| Response Times | -5260% | -2260% | -2134% | -1160% | -4230% | |
| Response Time Grey 50% / Grey 80% * (ms) | 0.25 ? | 18.8 ? -7420% | 5.8 ? -2220% | 7.86 ? -3044% 4.21 ? -1584% | 2.8 -1020% | 14.4 ? -5660% |
| Response Time Black / White * (ms) | 0.4 ? | 12.8 ? -3100% | 9.6 ? -2300% | 7.5 ? -1775% | 5.6 -1300% | 11.6 ? -2800% |
| PWM Frequency (Hz) | 480.4 ? | |||||
| Screen | -1% | 6% | 9% | 6% | 15% | |
| Brightness middle (cd/m²) | 356.1 | 351 -1% | 353.1 -1% | 346 -3% | 359 1% | 286 -20% |
| Brightness (cd/m²) | 358 | 347 -3% | 325 -9% | 329 -8% | 344 -4% | 271 -24% |
| Brightness Distribution (%) | 99 | 90 -9% | 85 -14% | 91 -8% | 85 -14% | 89 -10% |
| Black Level * (cd/m²) | 0.35 | 0.38 | 0.59 | 0.35 | 0.25 | |
| Colorchecker dE 2000 * | 4.83 | 2.54 47% | 2.24 54% | 3.06 37% | 3.3 32% | 2.74 43% |
| Colorchecker dE 2000 max. * | 7.94 | 8.36 -5% | 5 37% | 5.81 27% | 4.84 39% | 5.21 34% |
| Greyscale dE 2000 * | 3.1 | 4.1 -32% | 4 -29% | 3.66 -18% | 1.1 65% | |
| Gamma | 2.2 100% | 2.089 105% | 2.24 98% | 2.12 104% | 2.43 91% | 2.2 100% |
| CCT | 5938 109% | 7036 92% | 6864 95% | 7021 93% | 5896 110% | 6408 101% |
| Contrast (:1) | 1003 | 929 | 586 | 1026 | 1144 | |
| Colorchecker dE 2000 calibrated * | 0.67 | 1.02 | 2.57 | 3.28 | 2.52 | |
| Moyenne finale (programmes/paramètres) | -1748% /
-952% | -751% /
-407% | -702% /
-573% | -383% /
-206% | -1398% /
-755% |
* ... Moindre est la valeur, meilleures sont les performances
Temps de réponse de l'écran
| ↔ Temps de réponse noir à blanc | ||
|---|---|---|
| 0.4 ms ... hausse ↗ et chute ↘ combinées | ↗ 0.2 ms hausse | 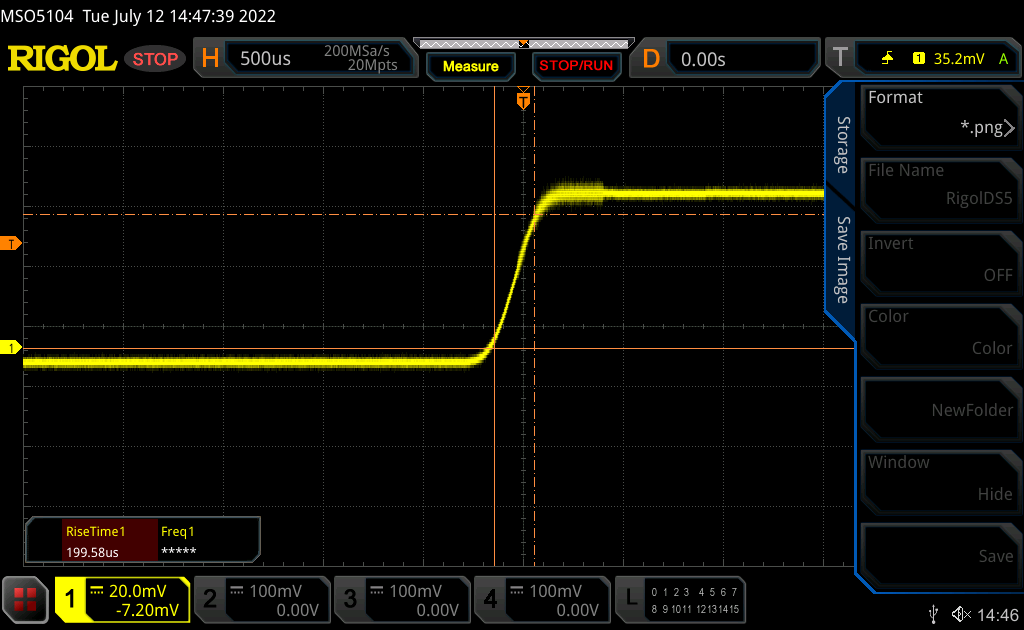 |
| ↘ 0.2 ms chute | ||
| L'écran montre de très faibles temps de réponse, parfait pour le jeu. En comparaison, tous les appareils testés affichent entre 0.1 (minimum) et 240 (maximum) ms. » 0 % des appareils testés affichent de meilleures performances. Cela signifie que les latences relevées sont meilleures que la moyenne (19.8 ms) de tous les appareils testés. | ||
| ↔ Temps de réponse gris 50% à gris 80% | ||
| 0.25 ms ... hausse ↗ et chute ↘ combinées | ↗ 0.13 ms hausse | 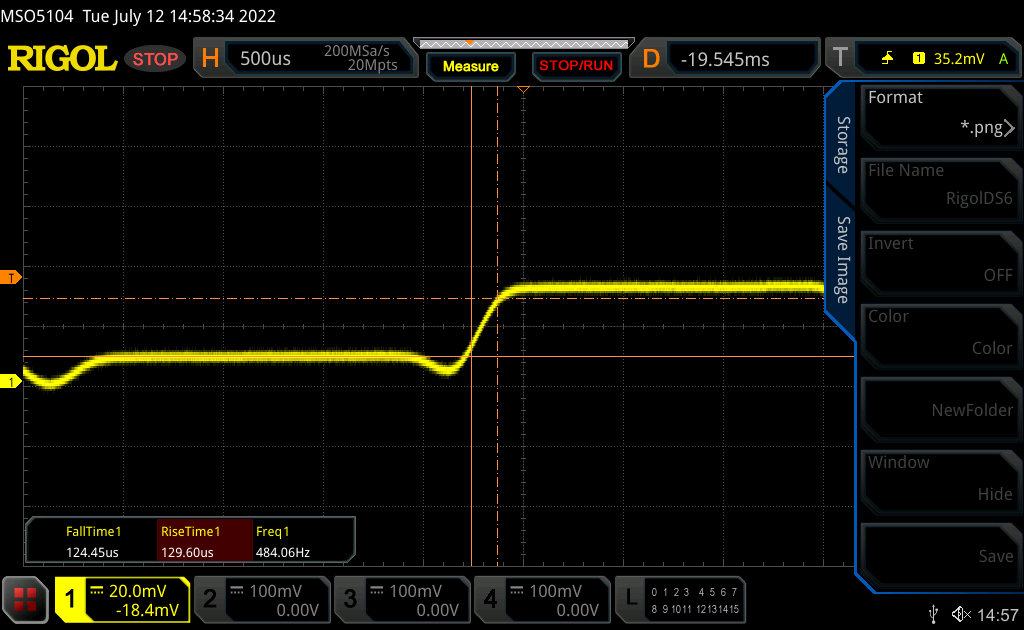 |
| ↘ 0.12 ms chute | ||
| L'écran montre de très faibles temps de réponse, parfait pour le jeu. En comparaison, tous les appareils testés affichent entre 0.165 (minimum) et 636 (maximum) ms. » 0 % des appareils testés affichent de meilleures performances. Cela signifie que les latences relevées sont meilleures que la moyenne (30.9 ms) de tous les appareils testés. | ||
Scintillement / MLI (Modulation de largeur d'impulsion)
| Scintillement / MLI (Modulation de largeur d'impulsion) décelé | 480.4 Hz | ≤ 100 Niveau de luminosité | 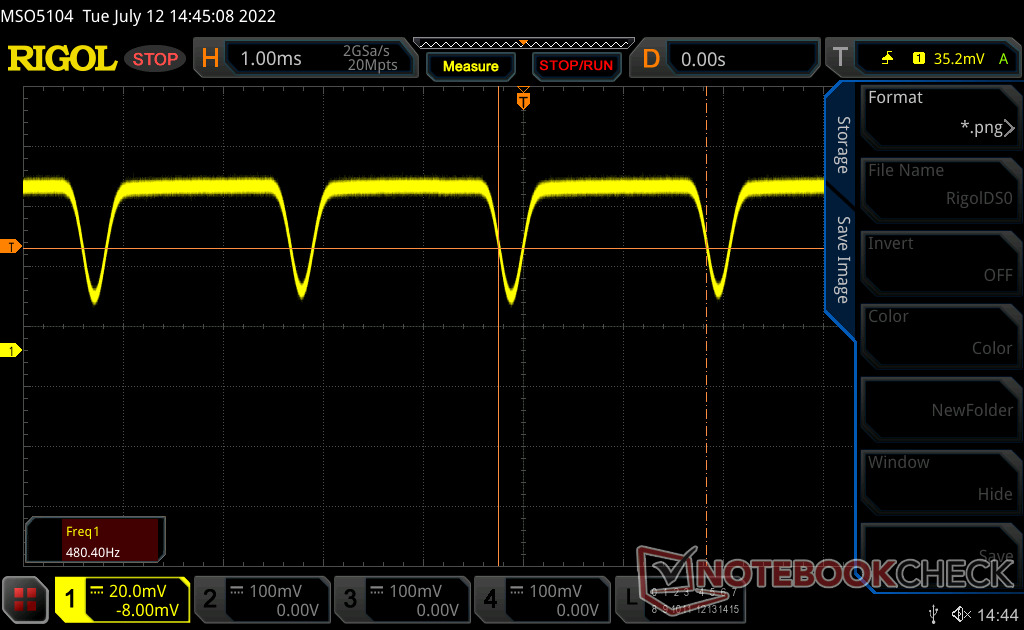 |
Le rétroéclairage de l'écran scintille à la fréquence de 480.4 Hz (certainement du fait de l'utilisation d'une MDI - Modulation de largeur d'impulsion) à un niveau de luminosité inférieur ou égal à 100 % . Aucun scintillement ne devrait être perceptible au-dessus de cette valeur. La fréquence de rafraîchissement de 480.4 Hz est relativement élevée, la grande majorité des utilisateurs ne devrait pas percevLa fréquence de rafraîchissement de 480.4 Hz est relativement élevée, la grande majorité des utilisateurs ne devrait pas percevoir de scintillements et être sujette à une fatigue oculaire accrue.oir de scintillements et être sujette à une fatigue oculaire accrue. Néanmoins certaines personnes pourront toujours percevoir un scintillement. En comparaison, 52 % des appareils testés n'emploient pas MDI pour assombrir leur écran. Nous avons relevé une moyenne à 7741 (minimum : 5 - maximum : 343500) Hz dans le cas où une MDI était active. | |||


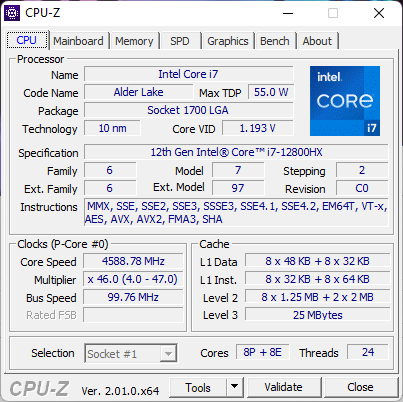
Performances - 16 cœurs et 24 threads
Conditions d'essai
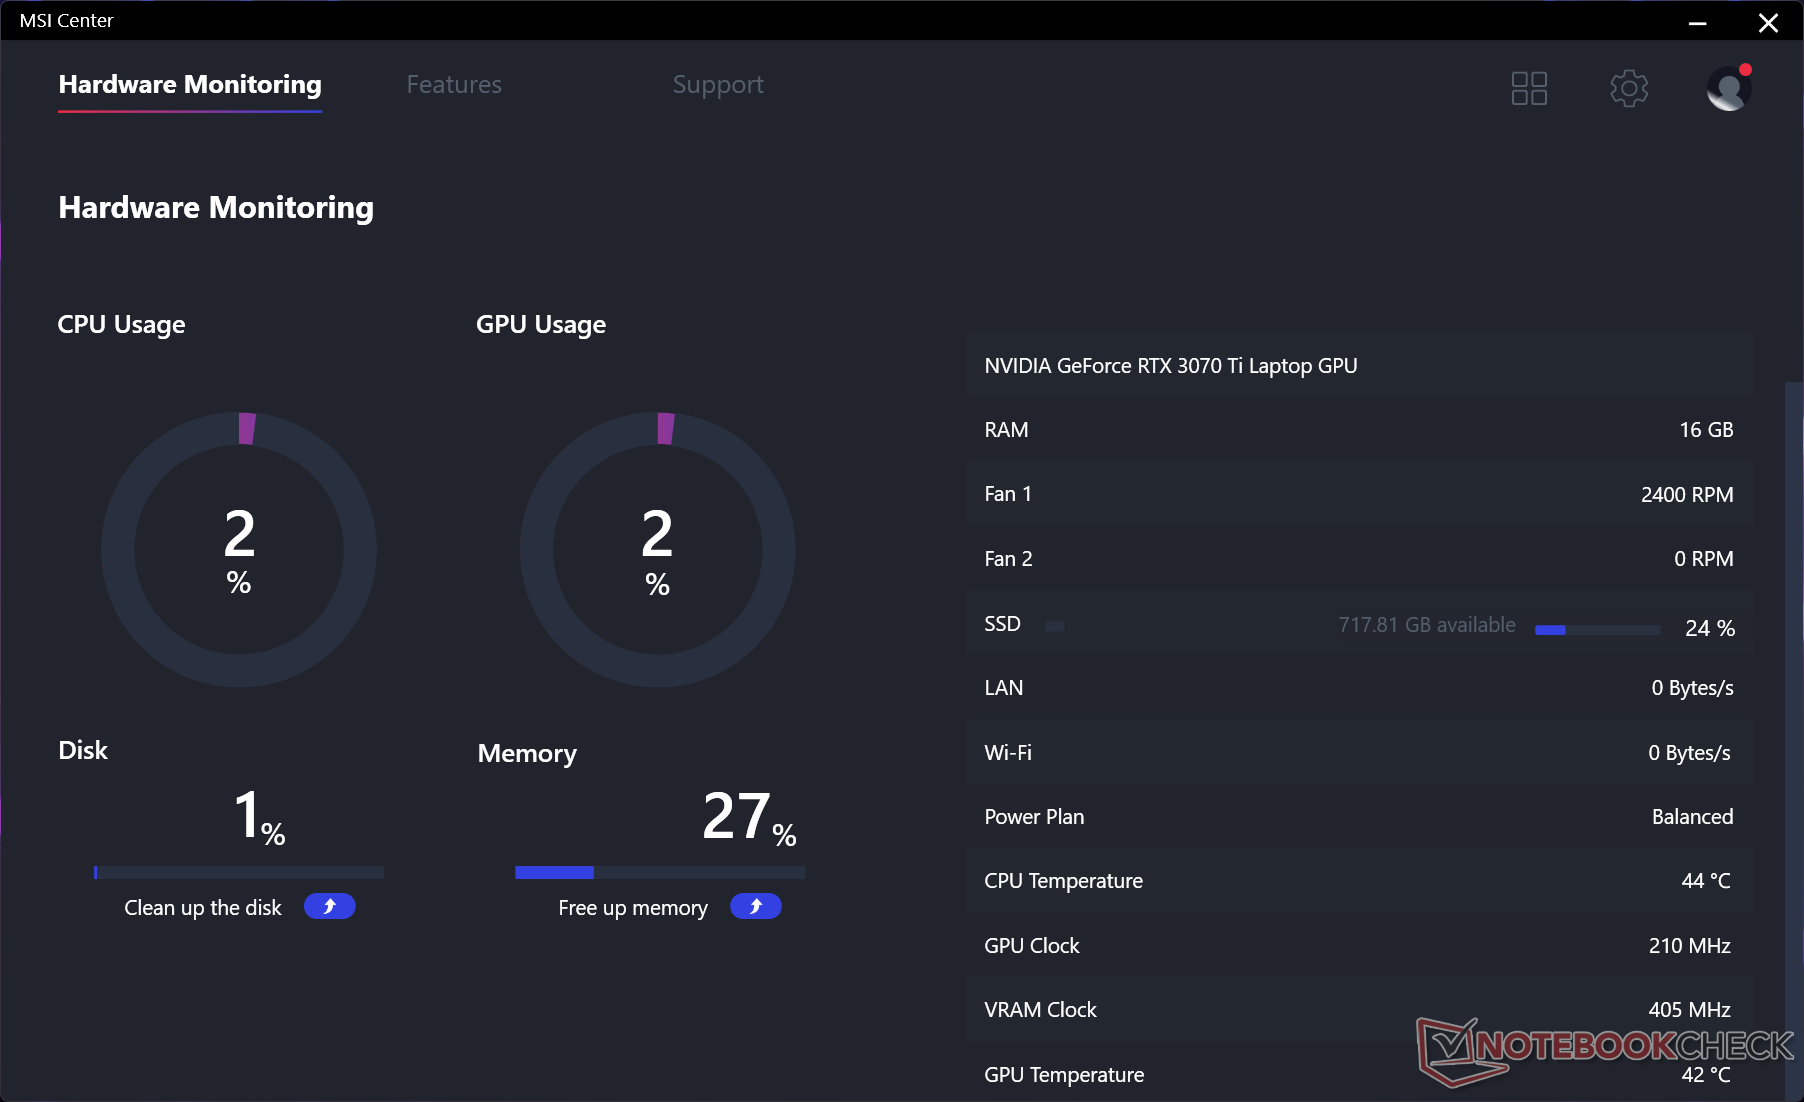
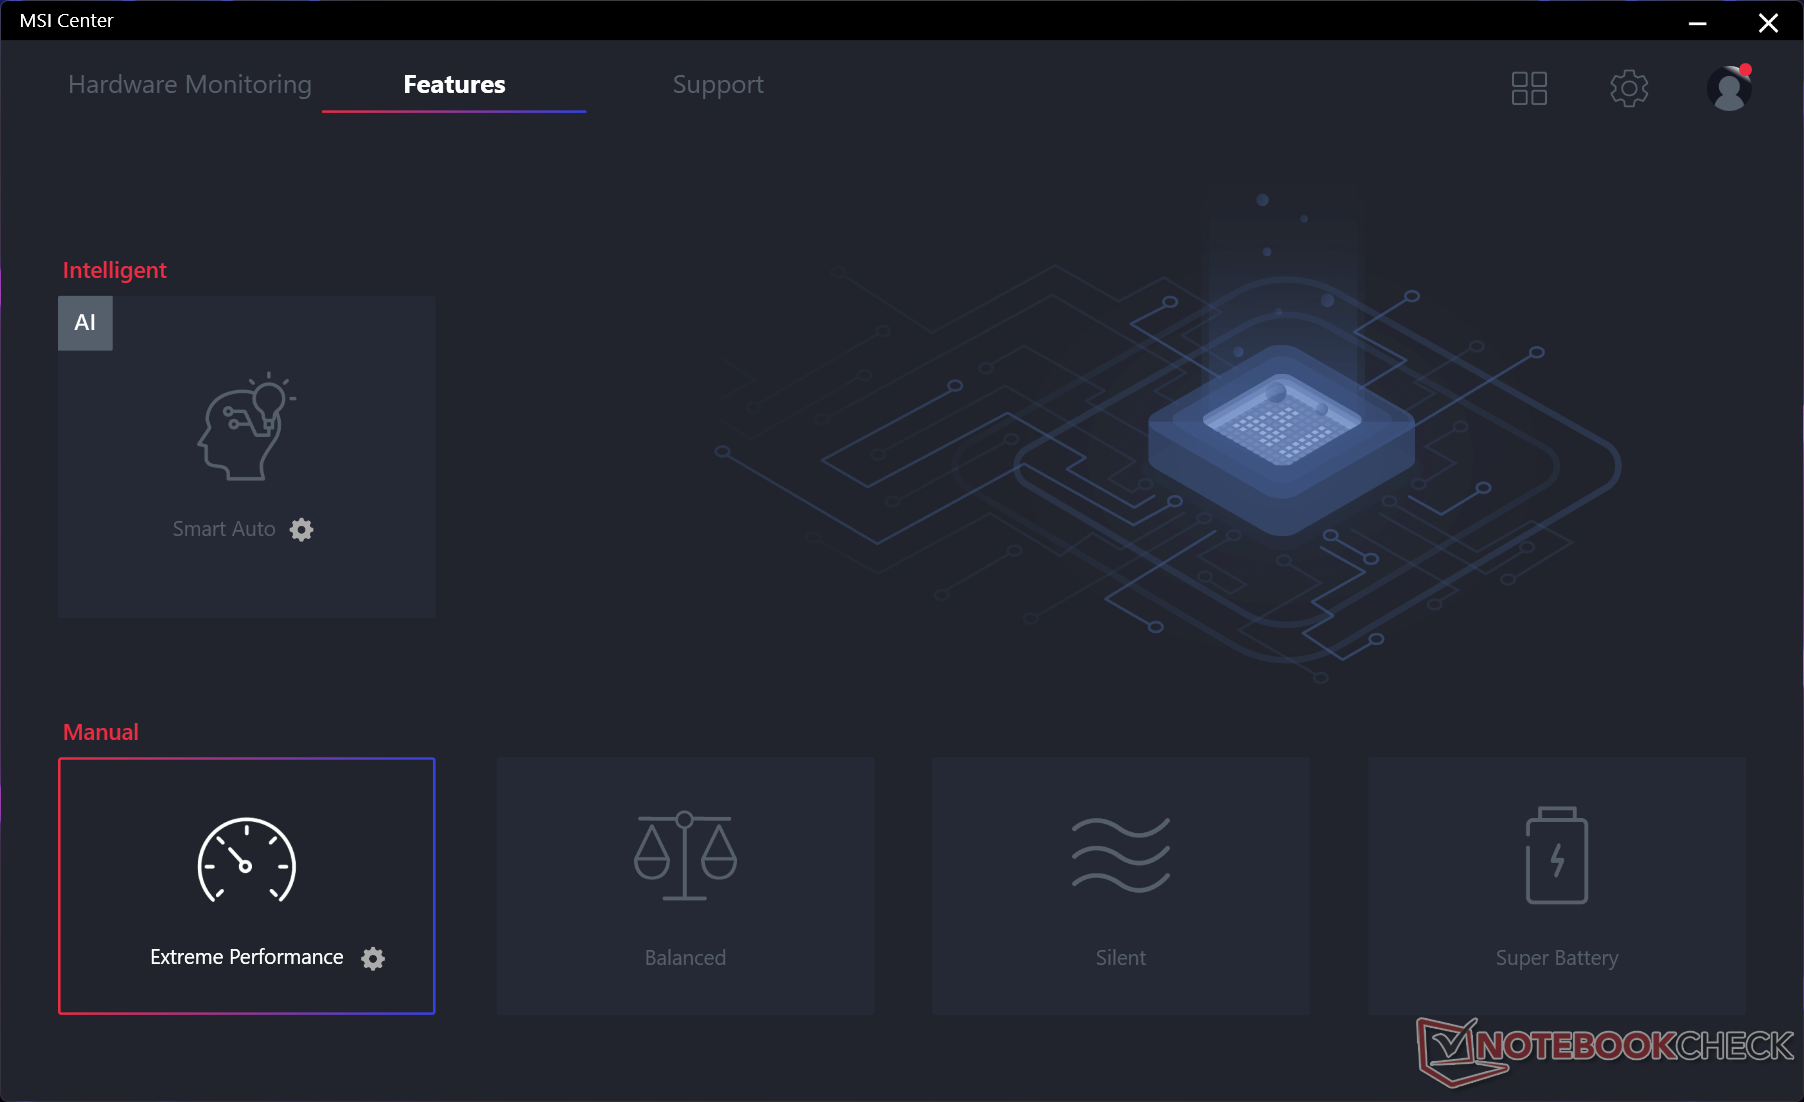
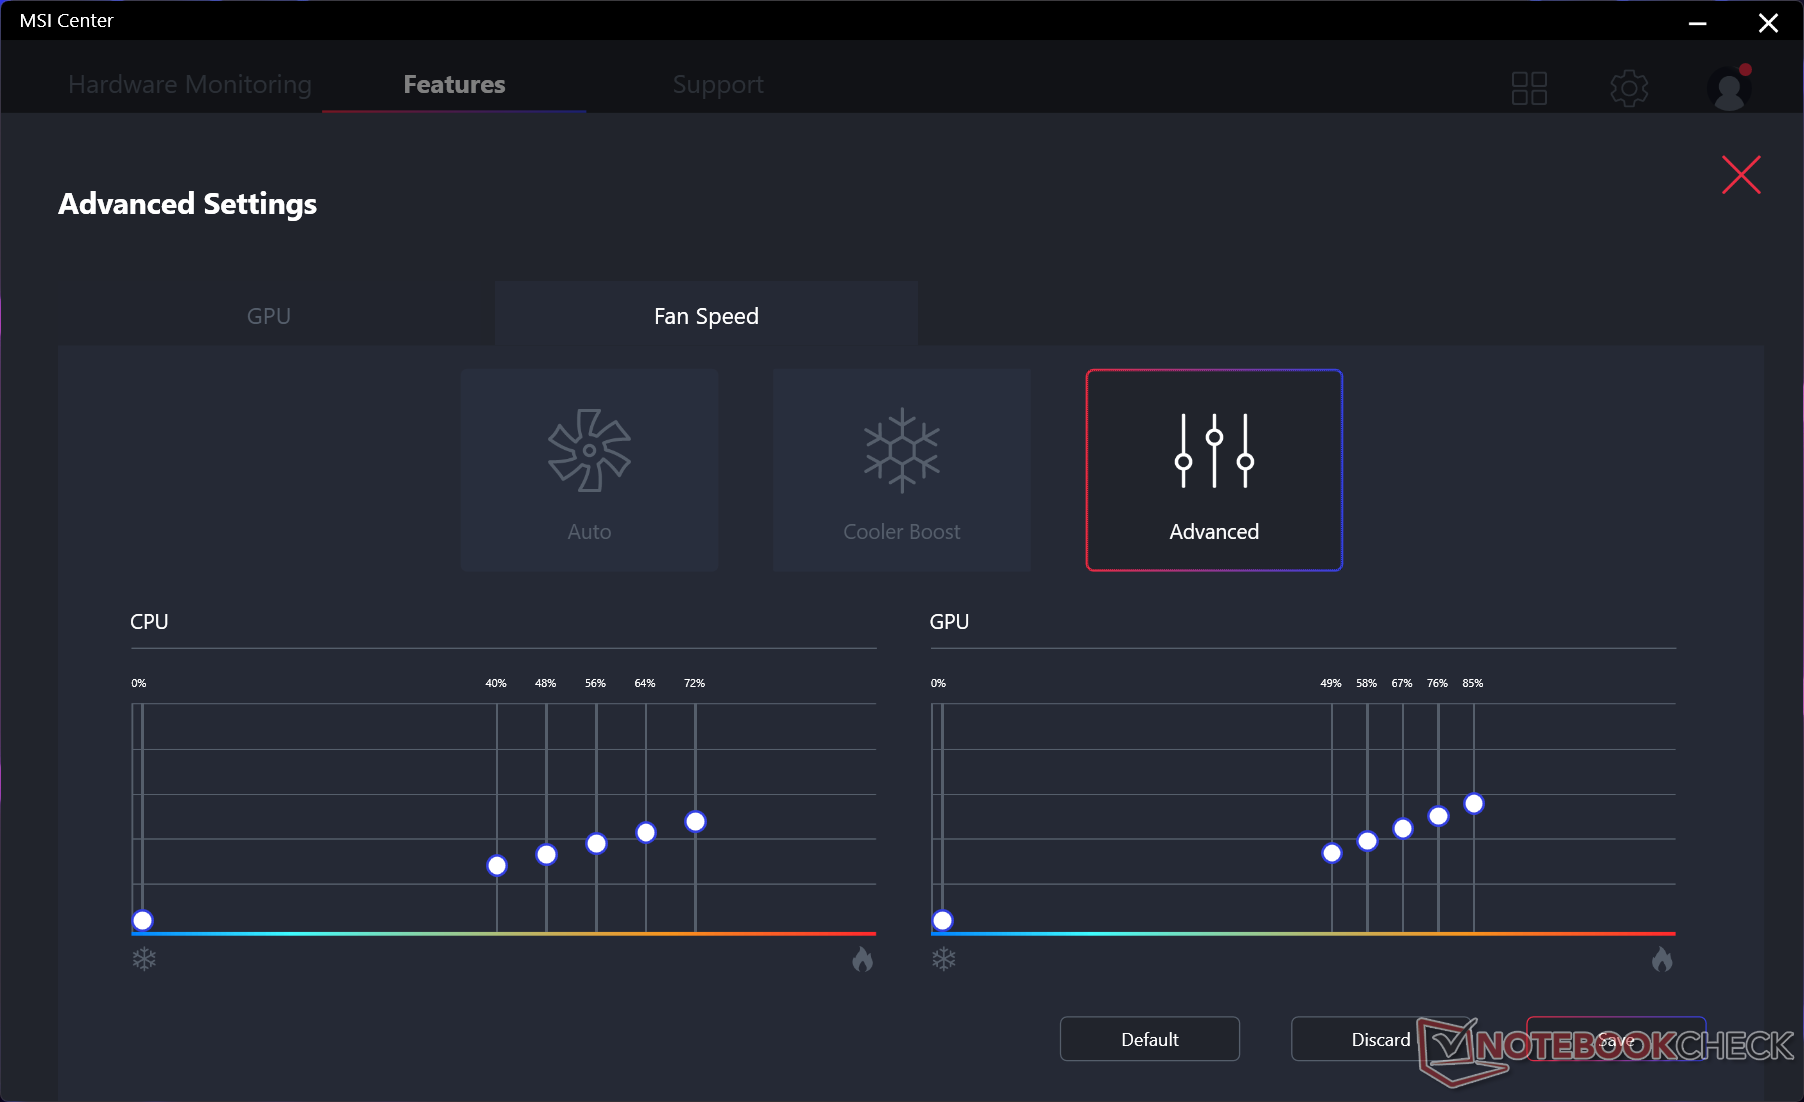
Nous avons réglé notre unité en mode Performance via Windows, en mode Performance extrême via le MSI Center, et le GPU discret actif au lieu du mode MSHybrid avant d'exécuter les benchmarks ci-dessous. Nous recommandons aux utilisateurs de se familiariser avec le logiciel préinstallé MSI Center, car les performances clés et les fonctions auxiliaires sont basculées ici.
Processeur
Le siteCore i7-12800HX est sans conteste l'un des points forts du GE67 HX. Les performances brutes en multithread sont environ 25 % plus rapides que celles duCore i9-12900HK dans le GE66 du T1 2022, et ce delta est encore plus important lorsqu'on le compare au Core i9-10980HK dans le GE66 original de 2020. Il surpasse facilement tous les processeurs mobiles de la gamme Zen 3 d'AMD. Le site Ryzen 9 5900HXpar exemple, est plus lent de 40 à 45 % en charge multithread
La durabilité des performances est également très bonne, sans baisse importante des fréquences d'horloge au fil du temps, même en cas de sollicitation prolongée
Les performances en single-thread restent similaires à celles du Core i9-12900HK, malgré leurs différences en termes de nombre de cœurs (16 contre 14) et de nombre de threads (24 contre 20).
Cinebench R15 Multi Loop
Cinebench R23: Multi Core | Single Core
Cinebench R15: CPU Multi 64Bit | CPU Single 64Bit
Blender: v2.79 BMW27 CPU
7-Zip 18.03: 7z b 4 | 7z b 4 -mmt1
Geekbench 5.5: Multi-Core | Single-Core
HWBOT x265 Benchmark v2.2: 4k Preset
LibreOffice : 20 Documents To PDF
R Benchmark 2.5: Overall mean
| Cinebench R23 / Multi Core | |
| Intel Core i9-12900K | |
| MSI GE67 HX 12UGS | |
| Moyenne Intel Core i7-12800HX (n=1) | |
| MSI GE76 Raider | |
| Schenker XMG Neo 15 (i7-12700H, RTX 3080 Ti) | |
| Eurocom Raptor X15 | |
| Asus ROG Strix Scar 15 G533zm | |
| MSI Raider GE66 12UHS | |
| Schenker XMG Apex 15 NH57E PS | |
| MSI Delta 15 A5EFK | |
| Cinebench R23 / Single Core | |
| Intel Core i9-12900K | |
| MSI GE76 Raider | |
| MSI Raider GE66 12UHS | |
| MSI GE67 HX 12UGS | |
| Moyenne Intel Core i7-12800HX (n=1) | |
| Schenker XMG Neo 15 (i7-12700H, RTX 3080 Ti) | |
| Eurocom Raptor X15 | |
| Asus ROG Strix Scar 15 G533zm | |
| MSI Delta 15 A5EFK | |
| Schenker XMG Apex 15 NH57E PS | |
Cinebench R23: Multi Core | Single Core
Cinebench R15: CPU Multi 64Bit | CPU Single 64Bit
Blender: v2.79 BMW27 CPU
7-Zip 18.03: 7z b 4 | 7z b 4 -mmt1
Geekbench 5.5: Multi-Core | Single-Core
HWBOT x265 Benchmark v2.2: 4k Preset
LibreOffice : 20 Documents To PDF
R Benchmark 2.5: Overall mean
* ... Moindre est la valeur, meilleures sont les performances
AIDA64: FP32 Ray-Trace | FPU Julia | CPU SHA3 | CPU Queen | FPU SinJulia | FPU Mandel | CPU AES | CPU ZLib | FP64 Ray-Trace | CPU PhotoWorxx
| Performance rating | |
| Alienware m15 R6, i7-11800H RTX 3080 | |
| MSI GE67 HX 12UGS | |
| Moyenne Intel Core i7-12800HX | |
| Asus ROG Strix Scar 15 G533ZW-LN106WS | |
| MSI Raider GE66 12UHS | |
| MSI Vector GP66 12UGS | |
| Razer Blade 15 2022 | |
| AIDA64 / FP32 Ray-Trace | |
| Alienware m15 R6, i7-11800H RTX 3080 | |
| MSI GE67 HX 12UGS | |
| Moyenne Intel Core i7-12800HX (n=1) | |
| Asus ROG Strix Scar 15 G533ZW-LN106WS | |
| MSI Raider GE66 12UHS | |
| MSI Vector GP66 12UGS | |
| Razer Blade 15 2022 | |
| AIDA64 / FPU Julia | |
| Alienware m15 R6, i7-11800H RTX 3080 | |
| MSI GE67 HX 12UGS | |
| Moyenne Intel Core i7-12800HX (n=1) | |
| Asus ROG Strix Scar 15 G533ZW-LN106WS | |
| MSI Raider GE66 12UHS | |
| MSI Vector GP66 12UGS | |
| Razer Blade 15 2022 | |
| AIDA64 / CPU SHA3 | |
| Alienware m15 R6, i7-11800H RTX 3080 | |
| MSI GE67 HX 12UGS | |
| Moyenne Intel Core i7-12800HX (n=1) | |
| Asus ROG Strix Scar 15 G533ZW-LN106WS | |
| MSI Vector GP66 12UGS | |
| MSI Raider GE66 12UHS | |
| Razer Blade 15 2022 | |
| AIDA64 / CPU Queen | |
| MSI Vector GP66 12UGS | |
| MSI Raider GE66 12UHS | |
| Asus ROG Strix Scar 15 G533ZW-LN106WS | |
| Razer Blade 15 2022 | |
| Alienware m15 R6, i7-11800H RTX 3080 | |
| MSI GE67 HX 12UGS | |
| Moyenne Intel Core i7-12800HX (n=1) | |
| AIDA64 / FPU SinJulia | |
| MSI GE67 HX 12UGS | |
| Moyenne Intel Core i7-12800HX (n=1) | |
| Asus ROG Strix Scar 15 G533ZW-LN106WS | |
| Alienware m15 R6, i7-11800H RTX 3080 | |
| MSI Vector GP66 12UGS | |
| MSI Raider GE66 12UHS | |
| Razer Blade 15 2022 | |
| AIDA64 / FPU Mandel | |
| Alienware m15 R6, i7-11800H RTX 3080 | |
| MSI GE67 HX 12UGS | |
| Moyenne Intel Core i7-12800HX (n=1) | |
| Asus ROG Strix Scar 15 G533ZW-LN106WS | |
| MSI Raider GE66 12UHS | |
| MSI Vector GP66 12UGS | |
| Razer Blade 15 2022 | |
| AIDA64 / CPU AES | |
| Alienware m15 R6, i7-11800H RTX 3080 | |
| MSI GE67 HX 12UGS | |
| Moyenne Intel Core i7-12800HX (n=1) | |
| Asus ROG Strix Scar 15 G533ZW-LN106WS | |
| MSI Vector GP66 12UGS | |
| MSI Raider GE66 12UHS | |
| Razer Blade 15 2022 | |
| AIDA64 / CPU ZLib | |
| MSI GE67 HX 12UGS | |
| Moyenne Intel Core i7-12800HX (n=1) | |
| Asus ROG Strix Scar 15 G533ZW-LN106WS | |
| MSI Vector GP66 12UGS | |
| MSI Raider GE66 12UHS | |
| Razer Blade 15 2022 | |
| Alienware m15 R6, i7-11800H RTX 3080 | |
| AIDA64 / FP64 Ray-Trace | |
| Alienware m15 R6, i7-11800H RTX 3080 | |
| MSI GE67 HX 12UGS | |
| Moyenne Intel Core i7-12800HX (n=1) | |
| Asus ROG Strix Scar 15 G533ZW-LN106WS | |
| MSI Raider GE66 12UHS | |
| MSI Vector GP66 12UGS | |
| Razer Blade 15 2022 | |
| AIDA64 / CPU PhotoWorxx | |
| Razer Blade 15 2022 | |
| MSI Raider GE66 12UHS | |
| Asus ROG Strix Scar 15 G533ZW-LN106WS | |
| MSI GE67 HX 12UGS | |
| Moyenne Intel Core i7-12800HX (n=1) | |
| MSI Vector GP66 12UGS | |
| Alienware m15 R6, i7-11800H RTX 3080 | |
Performance du système
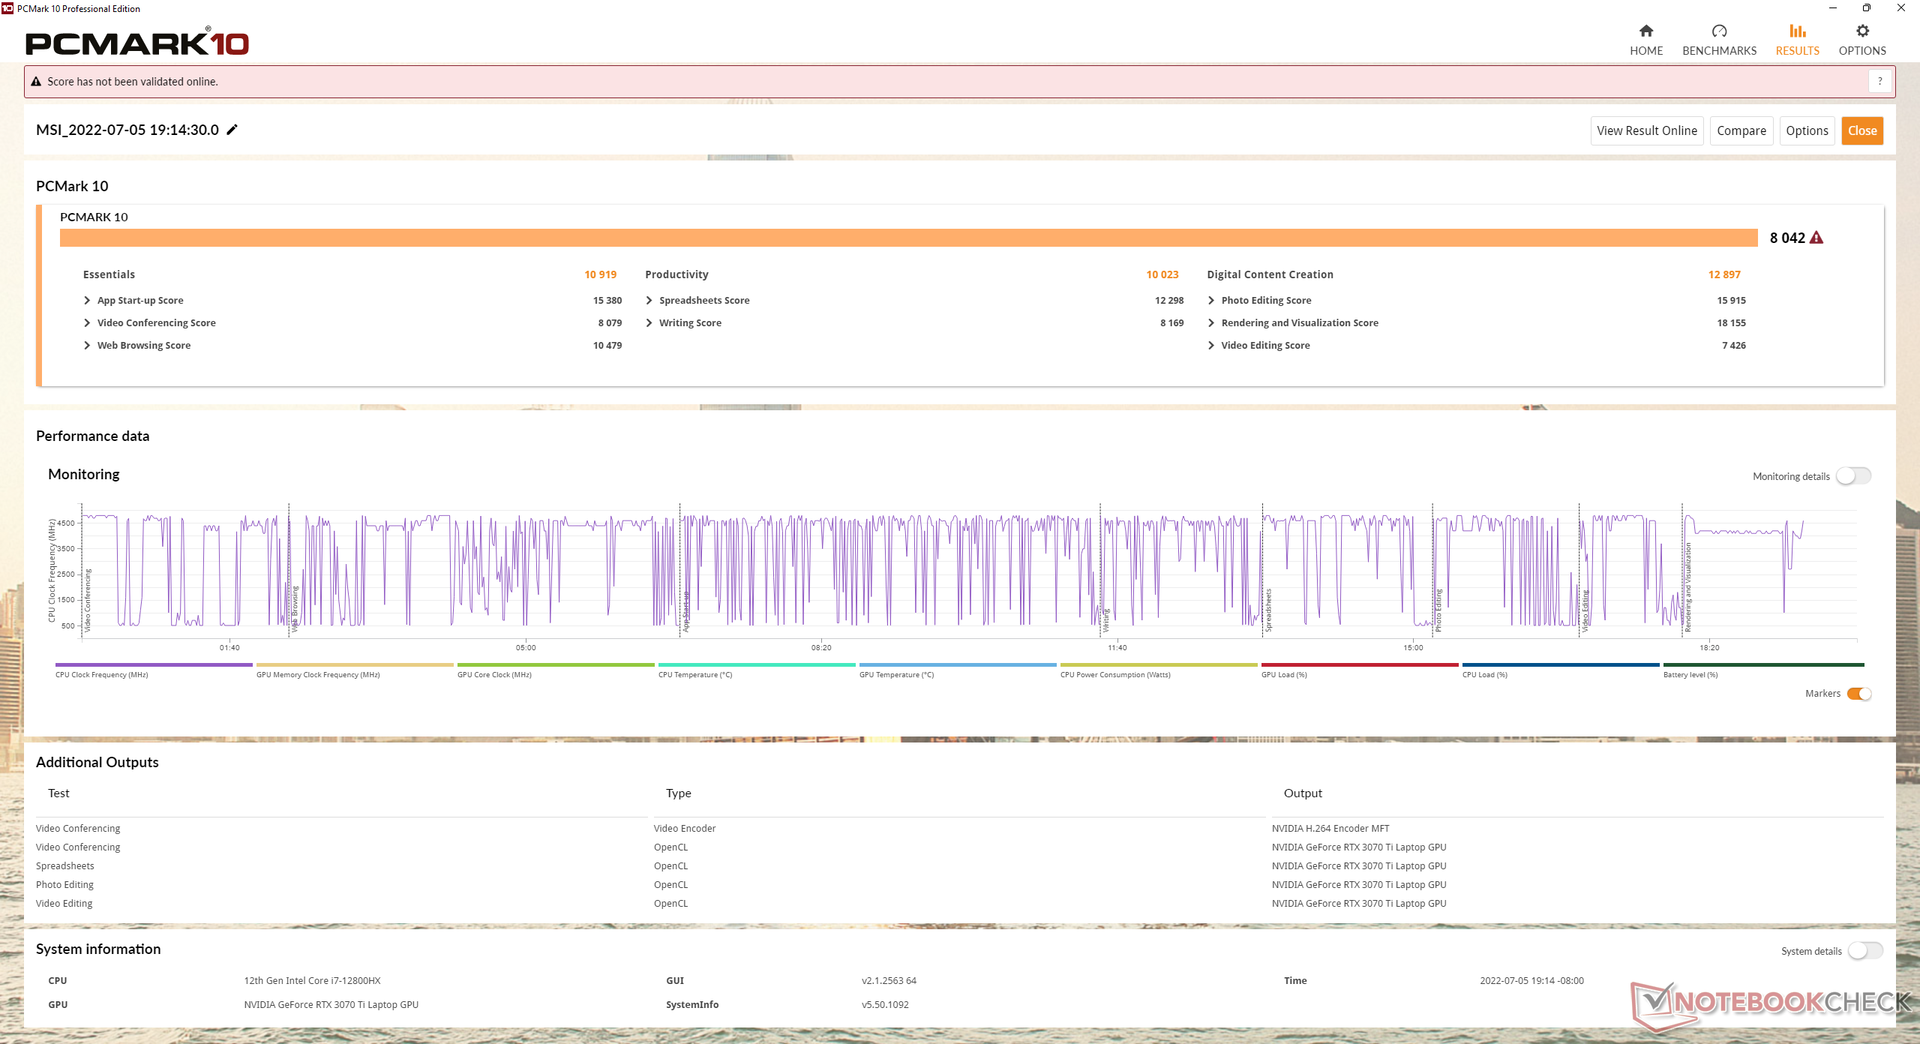
Les résultats de PCMark 10 sont parmi les plus élevés de notre base de données avec des scores qui sont similaires à ceux que nous avons observés sur l'ancien GE66 fonctionnant avec le Core i9-12900HK plus lent mais le GeForce RTX 3080 Ti plus rapide.
Il est intéressant de noter que le sous-score de création de contenu numérique chute de 12897 points à seulement 9568 points en mode MSHybrid.
CrossMark: Overall | Productivity | Creativity | Responsiveness
| PCMark 10 / Score | |
| MSI Raider GE66 12UHS | |
| MSI GE67 HX 12UGS | |
| Moyenne Intel Core i7-12800HX, NVIDIA GeForce RTX 3070 Ti Laptop GPU (n=1) | |
| MSI Vector GP66 12UGS | |
| Asus ROG Strix Scar 15 G533ZW-LN106WS | |
| Razer Blade 15 2022 | |
| Alienware m15 R6, i7-11800H RTX 3080 | |
| PCMark 10 / Essentials | |
| MSI Raider GE66 12UHS | |
| MSI Vector GP66 12UGS | |
| MSI GE67 HX 12UGS | |
| Moyenne Intel Core i7-12800HX, NVIDIA GeForce RTX 3070 Ti Laptop GPU (n=1) | |
| Razer Blade 15 2022 | |
| Asus ROG Strix Scar 15 G533ZW-LN106WS | |
| Alienware m15 R6, i7-11800H RTX 3080 | |
| PCMark 10 / Productivity | |
| Asus ROG Strix Scar 15 G533ZW-LN106WS | |
| MSI Raider GE66 12UHS | |
| MSI Vector GP66 12UGS | |
| MSI GE67 HX 12UGS | |
| Moyenne Intel Core i7-12800HX, NVIDIA GeForce RTX 3070 Ti Laptop GPU (n=1) | |
| Razer Blade 15 2022 | |
| Alienware m15 R6, i7-11800H RTX 3080 | |
| PCMark 10 / Digital Content Creation | |
| MSI GE67 HX 12UGS | |
| Moyenne Intel Core i7-12800HX, NVIDIA GeForce RTX 3070 Ti Laptop GPU (n=1) | |
| MSI Raider GE66 12UHS | |
| MSI Vector GP66 12UGS | |
| Razer Blade 15 2022 | |
| Asus ROG Strix Scar 15 G533ZW-LN106WS | |
| Alienware m15 R6, i7-11800H RTX 3080 | |
| CrossMark / Overall | |
| Asus ROG Strix Scar 15 G533ZW-LN106WS | |
| MSI GE67 HX 12UGS | |
| Moyenne Intel Core i7-12800HX, NVIDIA GeForce RTX 3070 Ti Laptop GPU (n=1) | |
| CrossMark / Productivity | |
| Asus ROG Strix Scar 15 G533ZW-LN106WS | |
| MSI GE67 HX 12UGS | |
| Moyenne Intel Core i7-12800HX, NVIDIA GeForce RTX 3070 Ti Laptop GPU (n=1) | |
| CrossMark / Creativity | |
| Asus ROG Strix Scar 15 G533ZW-LN106WS | |
| MSI GE67 HX 12UGS | |
| Moyenne Intel Core i7-12800HX, NVIDIA GeForce RTX 3070 Ti Laptop GPU (n=1) | |
| CrossMark / Responsiveness | |
| Asus ROG Strix Scar 15 G533ZW-LN106WS | |
| MSI GE67 HX 12UGS | |
| Moyenne Intel Core i7-12800HX, NVIDIA GeForce RTX 3070 Ti Laptop GPU (n=1) | |
| PCMark 10 Score | 8042 points | |
Aide | ||
| AIDA64 / Memory Copy | |
| MSI Raider GE66 12UHS | |
| Razer Blade 15 2022 | |
| Asus ROG Strix Scar 15 G533ZW-LN106WS | |
| MSI GE67 HX 12UGS | |
| Moyenne Intel Core i7-12800HX (n=1) | |
| MSI Vector GP66 12UGS | |
| Alienware m15 R6, i7-11800H RTX 3080 | |
| AIDA64 / Memory Read | |
| MSI Raider GE66 12UHS | |
| Razer Blade 15 2022 | |
| Asus ROG Strix Scar 15 G533ZW-LN106WS | |
| MSI GE67 HX 12UGS | |
| Moyenne Intel Core i7-12800HX (n=1) | |
| Alienware m15 R6, i7-11800H RTX 3080 | |
| MSI Vector GP66 12UGS | |
| AIDA64 / Memory Write | |
| Razer Blade 15 2022 | |
| MSI Raider GE66 12UHS | |
| Asus ROG Strix Scar 15 G533ZW-LN106WS | |
| MSI GE67 HX 12UGS | |
| Moyenne Intel Core i7-12800HX (n=1) | |
| MSI Vector GP66 12UGS | |
| Alienware m15 R6, i7-11800H RTX 3080 | |
| AIDA64 / Memory Latency | |
| Asus ROG Strix Scar 15 G533ZW-LN106WS | |
| Alienware m15 R6, i7-11800H RTX 3080 | |
| MSI GE67 HX 12UGS | |
| Moyenne Intel Core i7-12800HX (n=1) | |
| MSI Raider GE66 12UHS | |
| MSI Vector GP66 12UGS | |
| Razer Blade 15 2022 | |
* ... Moindre est la valeur, meilleures sont les performances
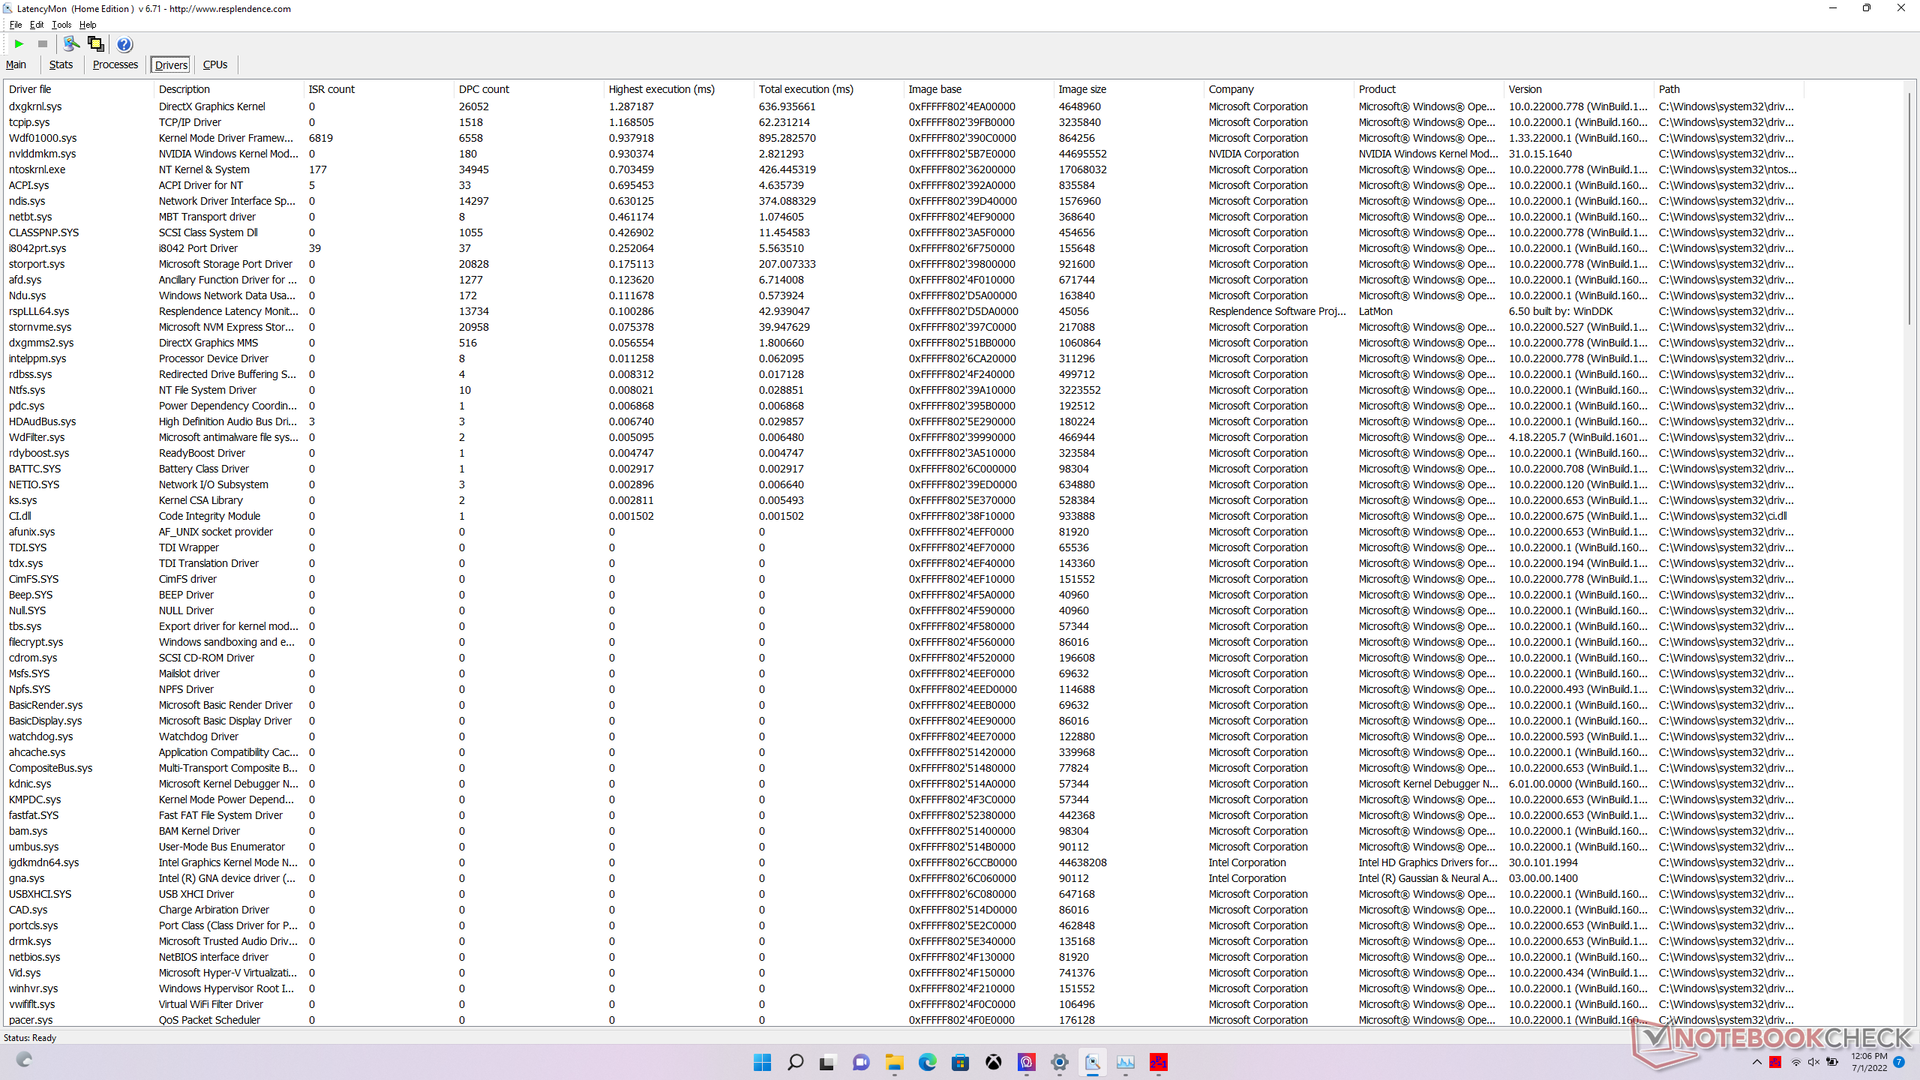
Latence DPC
LatencyMon révèle des problèmes mineurs de CPD lors de l'ouverture de plusieurs onglets de navigateur sur notre page d'accueil. la lecture de vidéos 4K à 60 FPS est autrement fluide, avec une seule image perdue pendant notre test vidéo de 60 secondes.
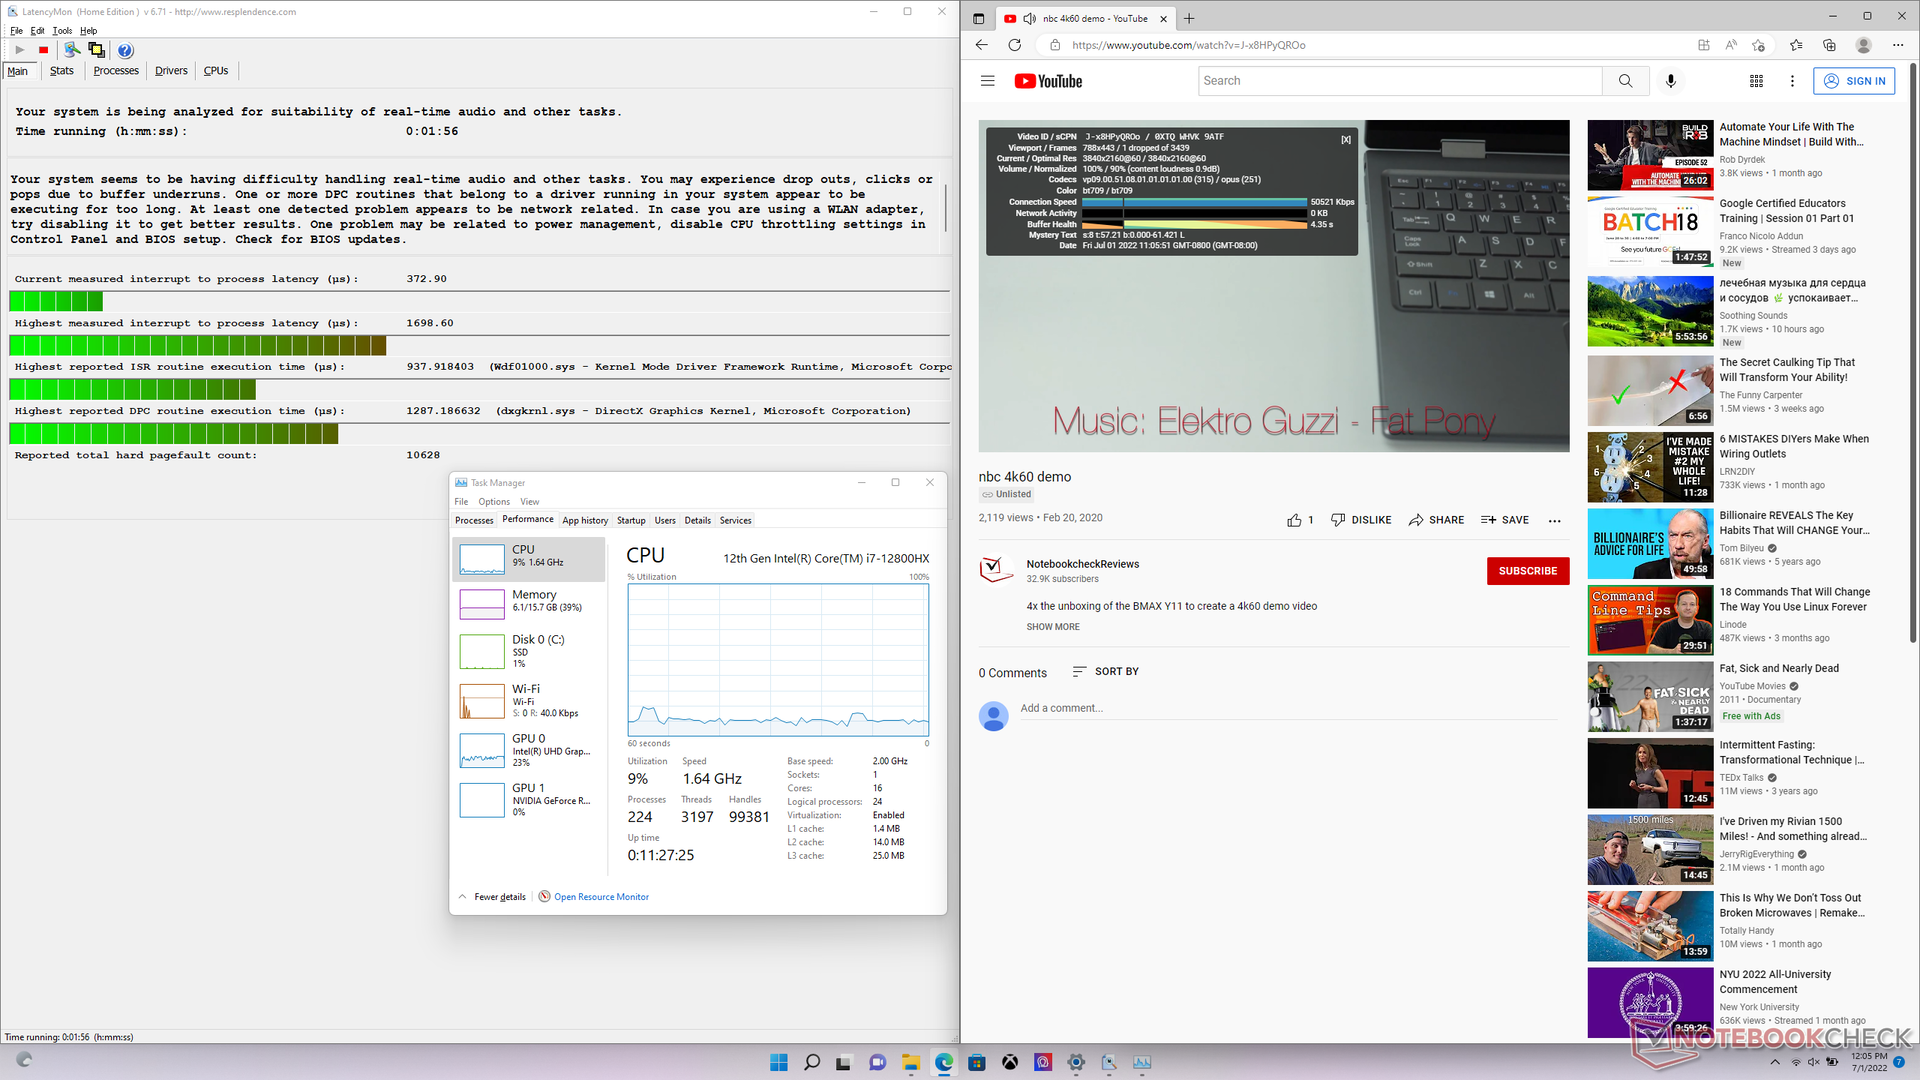
| DPC Latencies / LatencyMon - interrupt to process latency (max), Web, Youtube, Prime95 | |
| MSI Raider GE66 12UHS | |
| MSI Vector GP66 12UGS | |
| MSI GE67 HX 12UGS | |
| Razer Blade 15 2022 | |
| Alienware m15 R6, i7-11800H RTX 3080 | |
| Asus ROG Strix Scar 15 G533ZW-LN106WS | |
* ... Moindre est la valeur, meilleures sont les performances
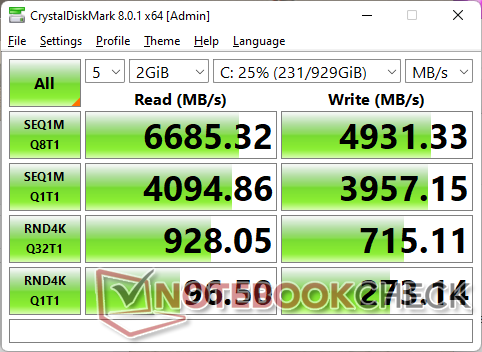
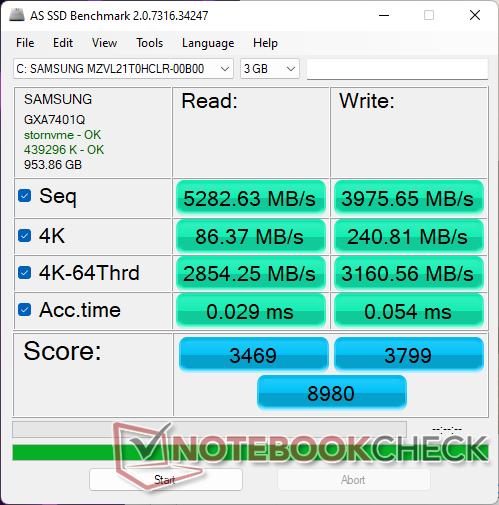
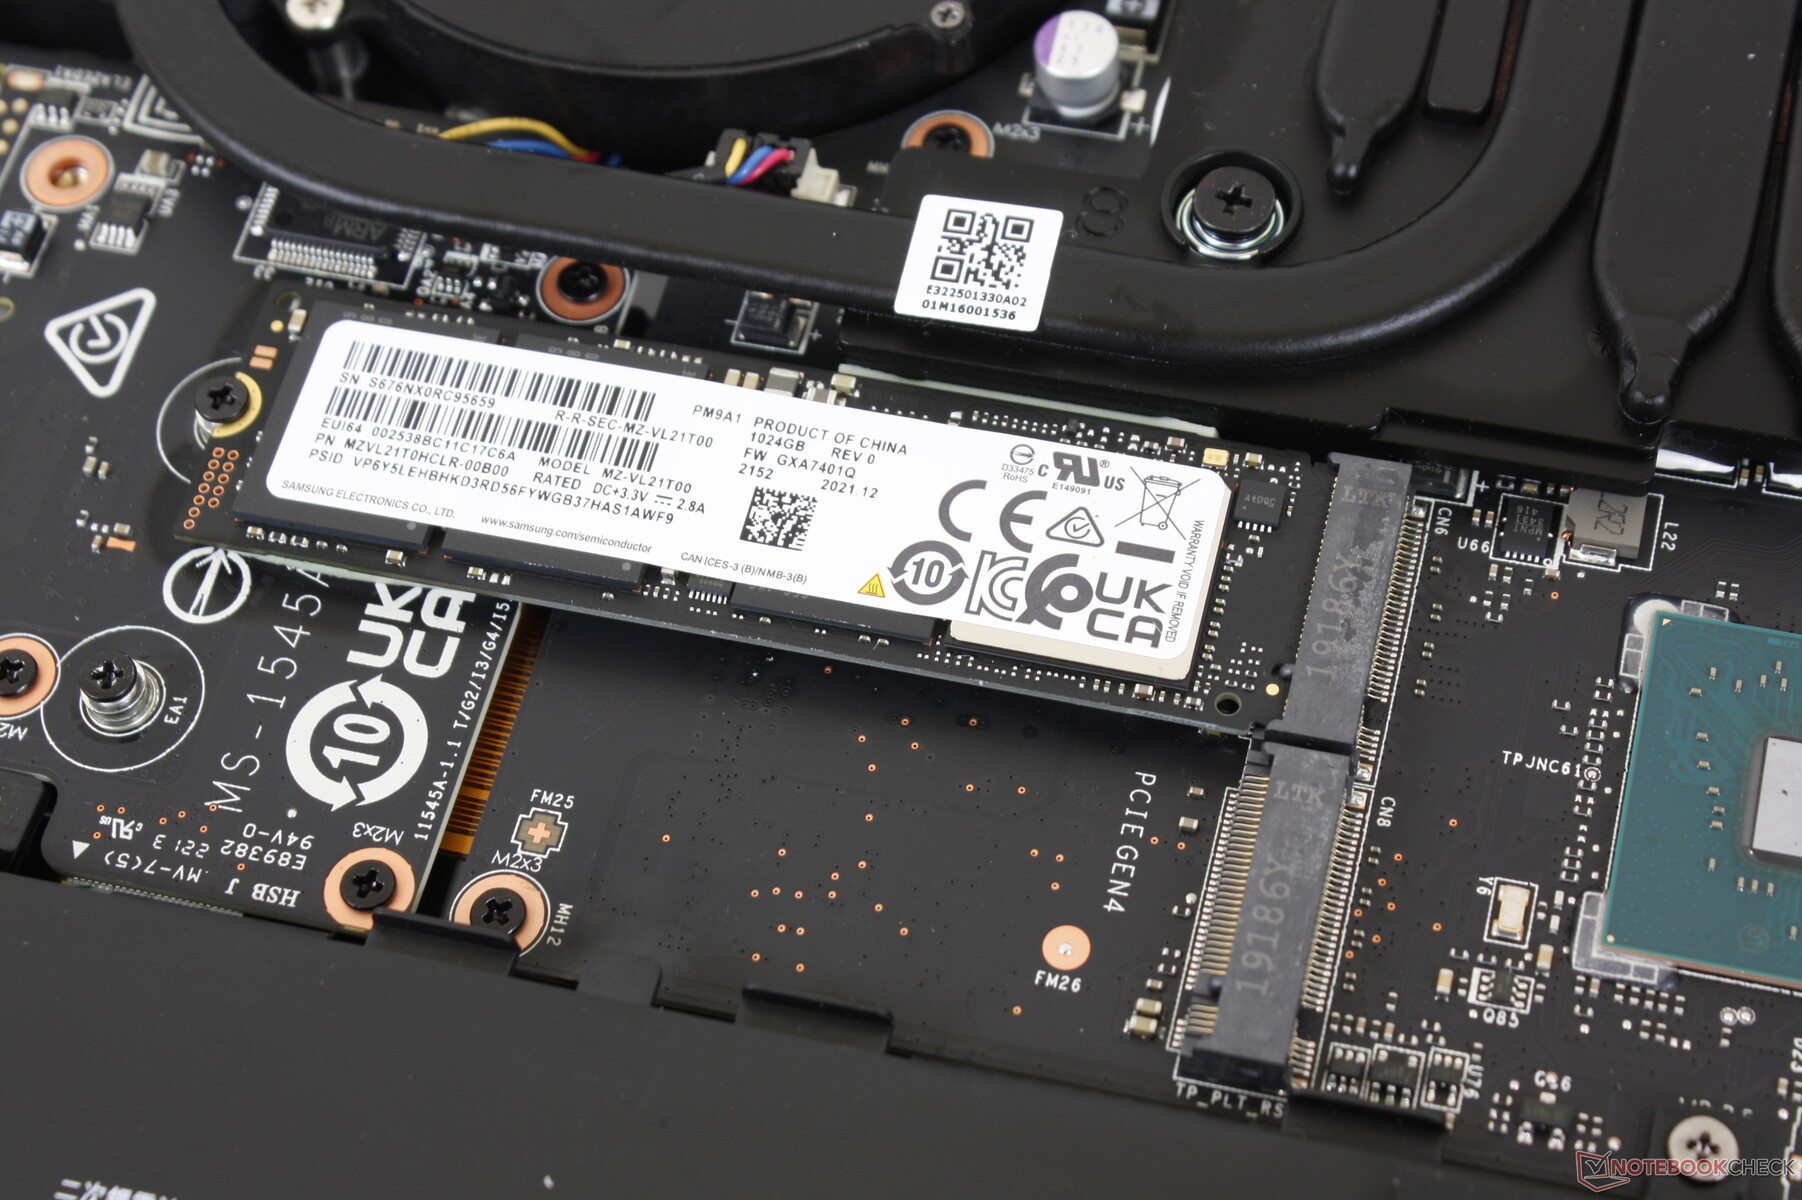
Périphériques de stockage - PCIe4 x4 Standard
Notre unité est livrée avec un disque dur de 1 ToSamsung PM9A1 PCIe4 x4 NVMe SSD pour des taux de lecture et d'écriture séquentiels allant jusqu'à 7000 Mo/s et 5100 Mo/s, respectivement. Malheureusement, notre disque avait des difficultés à maintenir son taux de lecture maximal pendant des périodes prolongées, comme le montre notre test en boucle DiskSpd ci-dessous. Les taux de lecture ont fini par tomber à 1500 Mo/s, probablement en raison des limites de température et de l'absence d'un diffuseur de chaleur approprié sur le SSD.

* ... Moindre est la valeur, meilleures sont les performances
Disk Throttling: DiskSpd Read Loop, Queue Depth 8
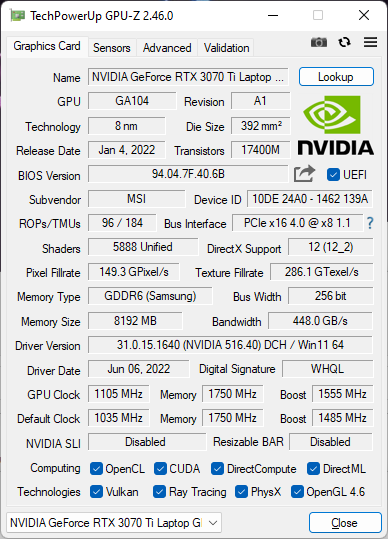
Performance du GPU - 150 W avec 25 W Dynamic Boost
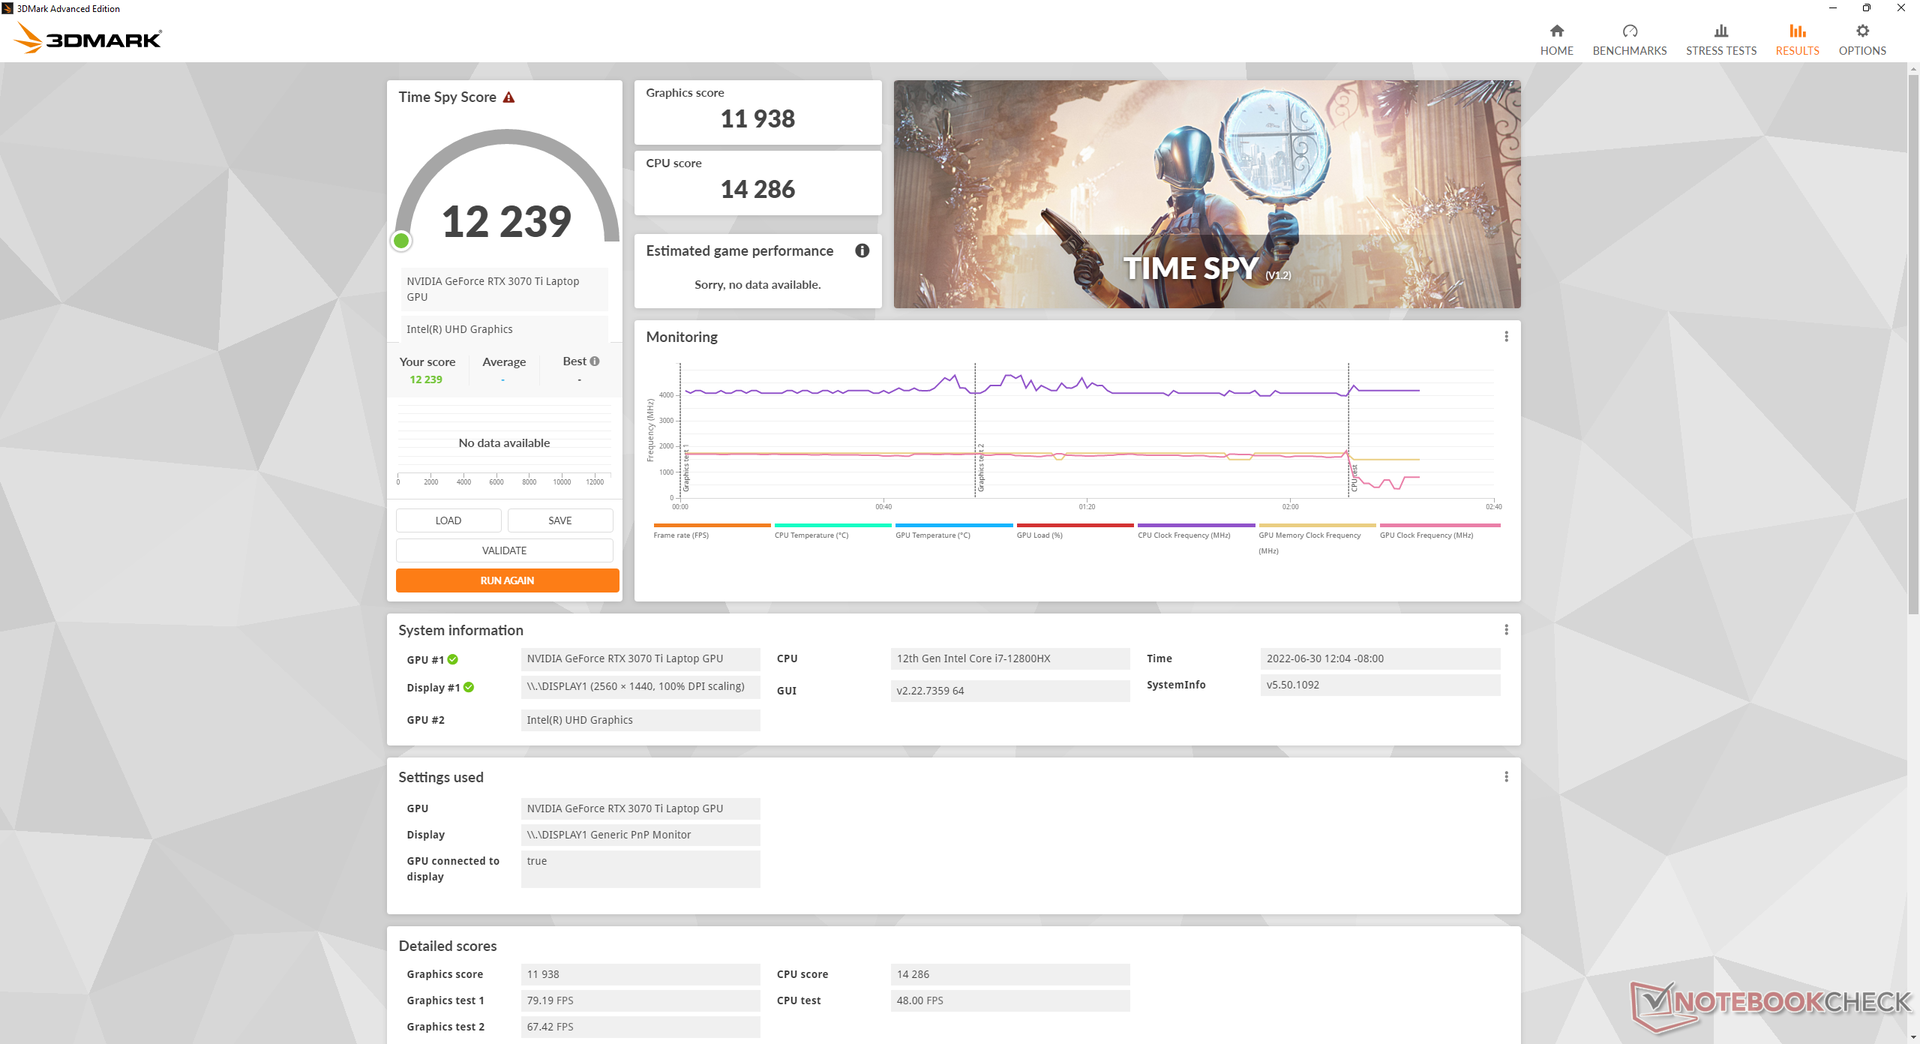
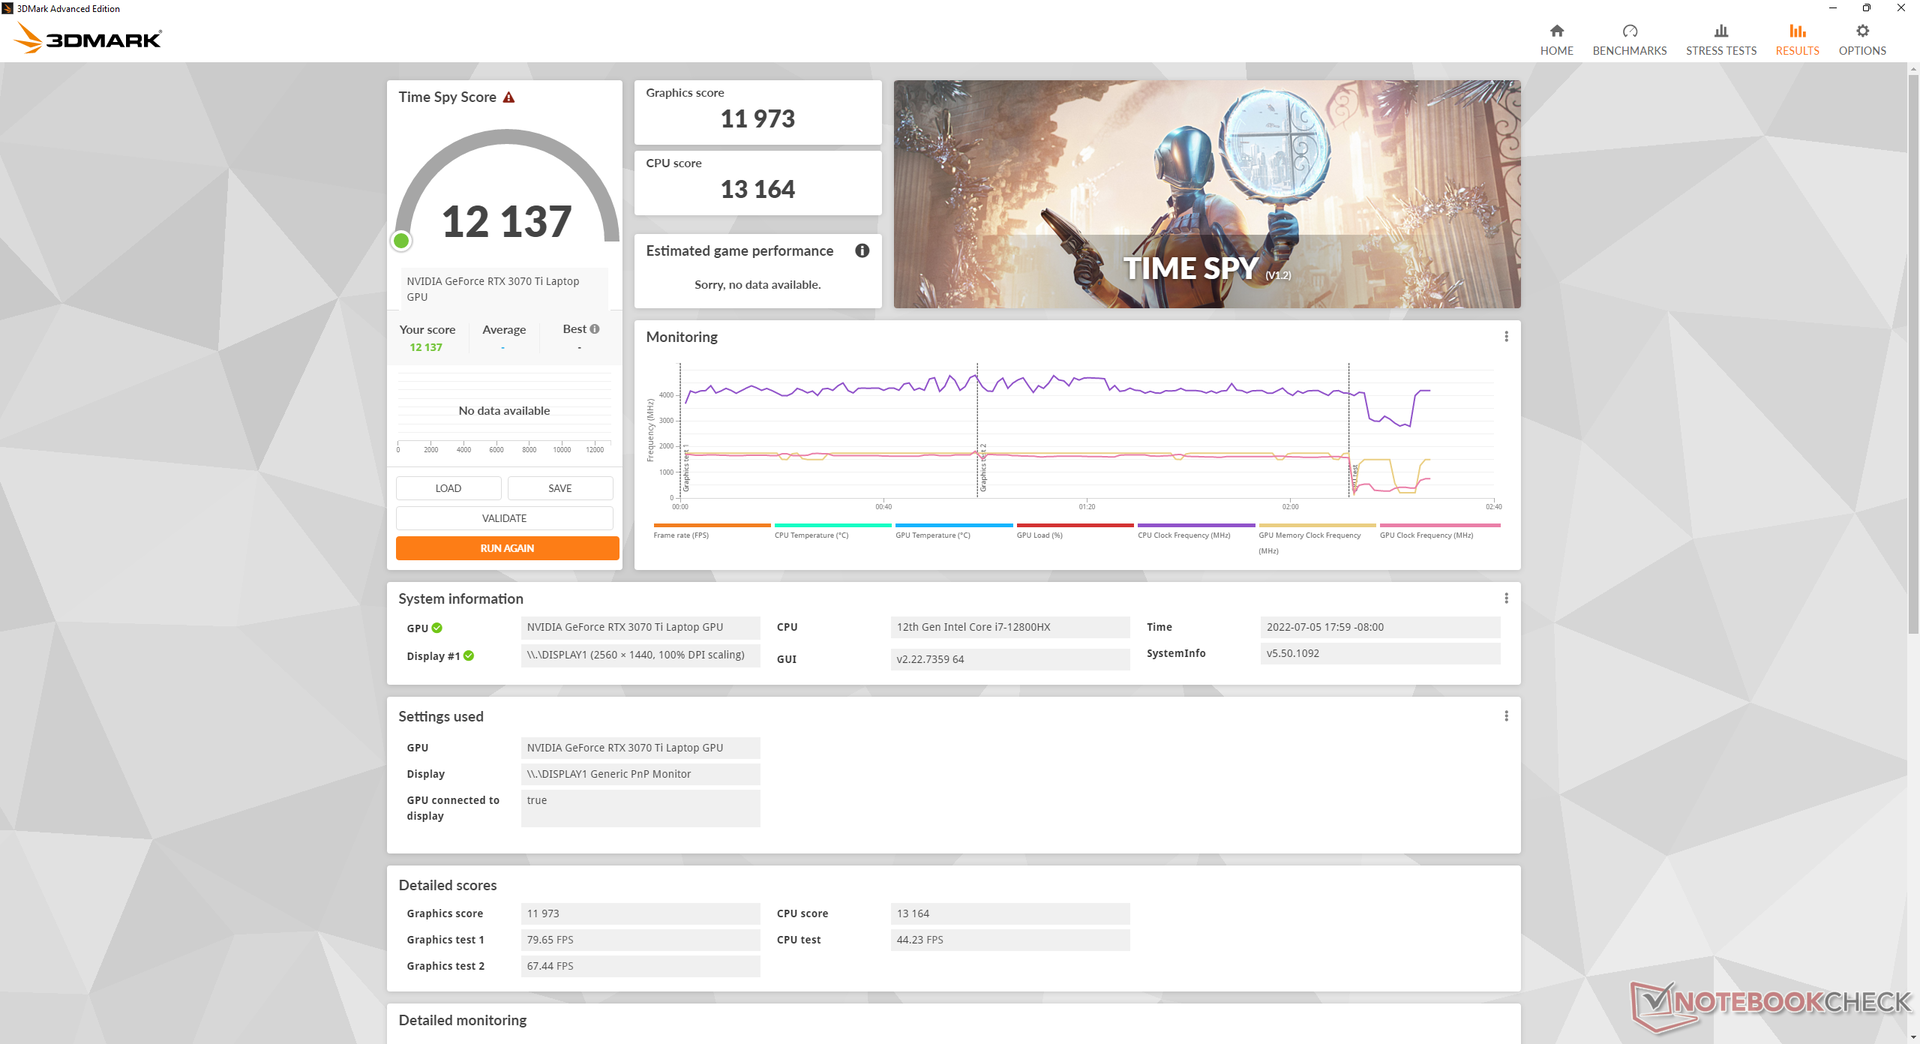
les résultats 3DMark sont environ 12 % plus élevés que ceux de l'ordinateur portable moyen de notre base de données équipé du même GPU mobile GeForce RTX 3070 Ti. Ces chiffres plus élevés que prévu peuvent être attribués à l'objectif élevé de 150 W du TGP et à la RAM DDR5 rapide, alors que la majorité des ordinateurs portables de jeu fonctionnent encore avec des GPU de 130 W ou moins et/ou une RAM DDR4 plus lente. Les différences sont suffisantes pour propulser notre GTX 3070 Ti mobile à des performances similaires à celles de la RTX 3080 Ti mobile fonctionnant sur l'ancien GE66 Q1 2022.
Pour les jeux, le GPU Nvidia aurait des performances presque identiques entre les modes MSHybrid et discret.
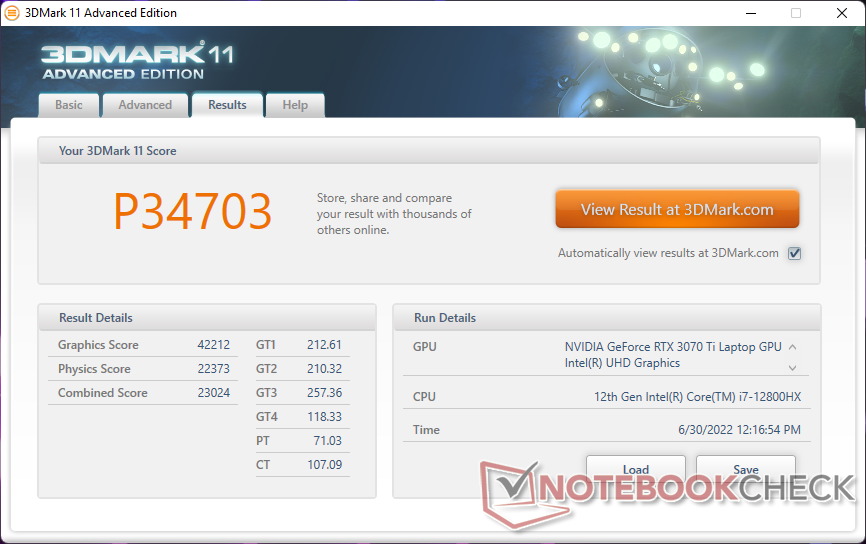
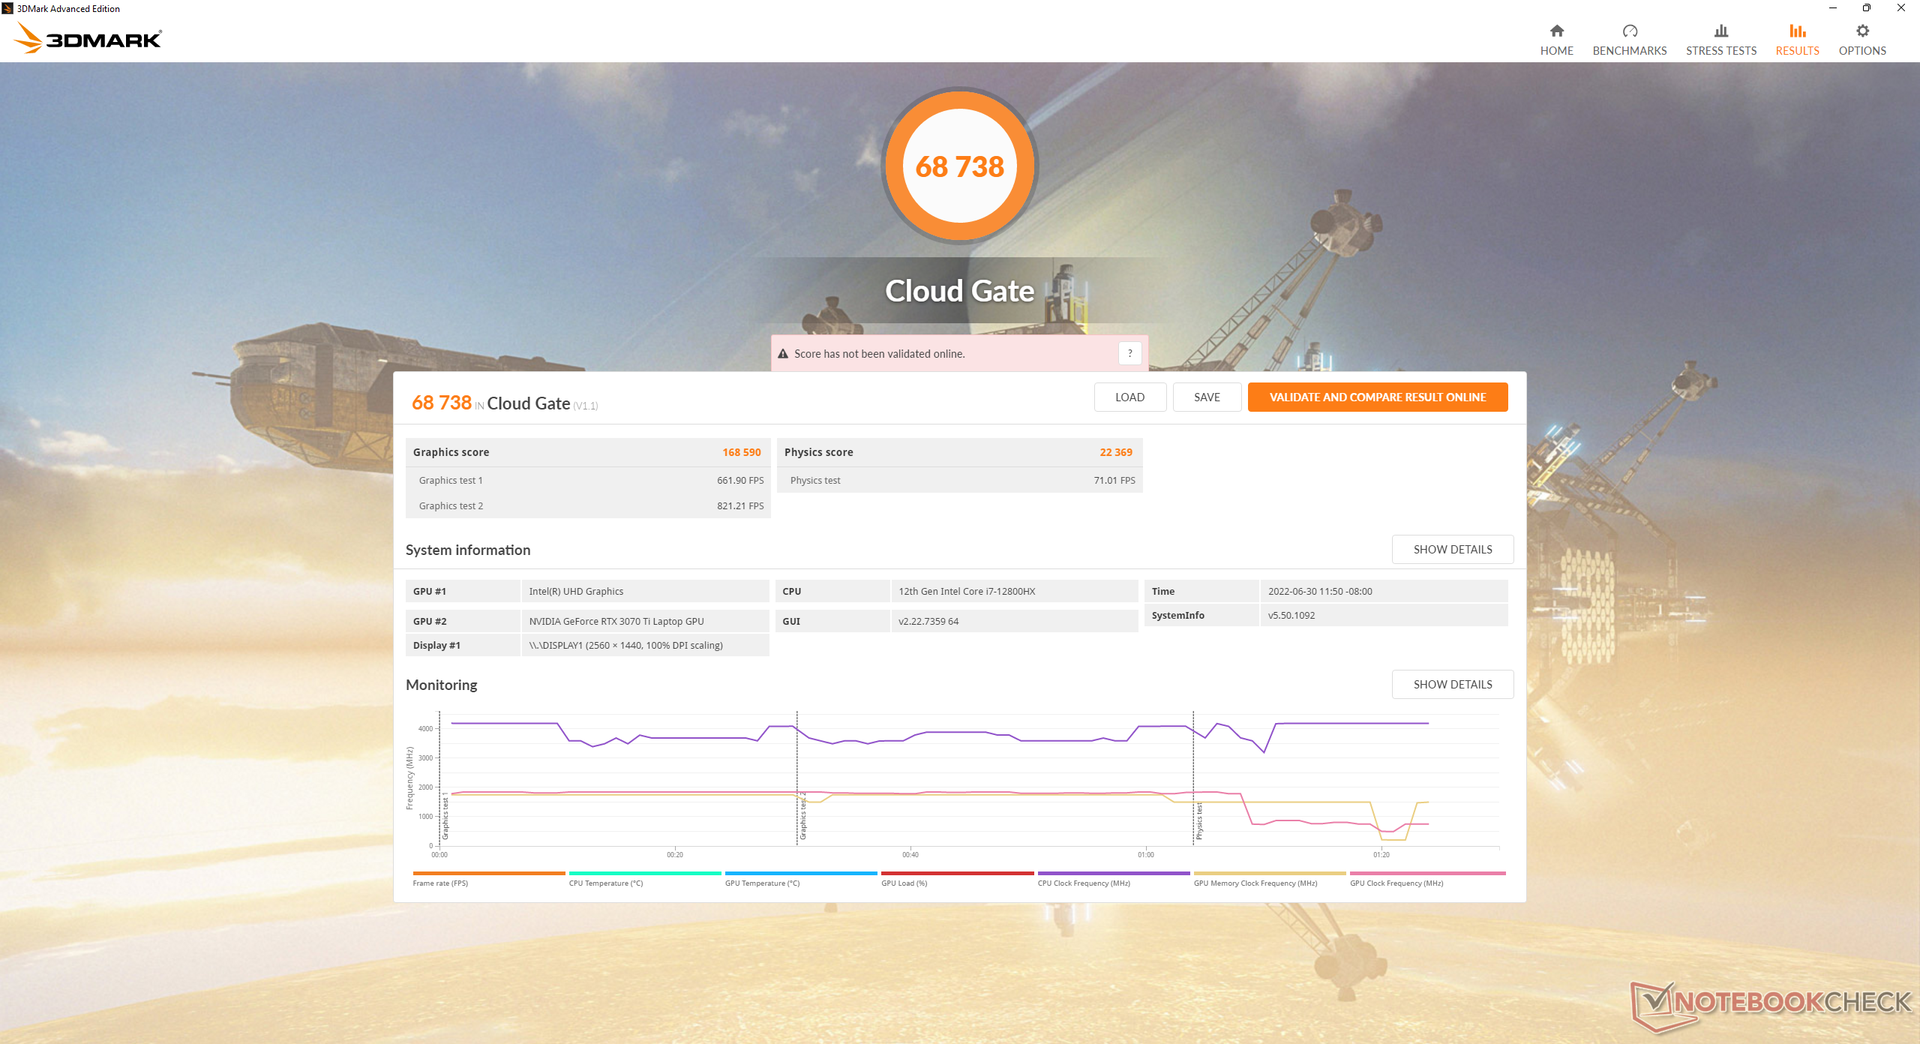
| 3DMark 11 Performance | 34703 points | |
| 3DMark Cloud Gate Standard Score | 68738 points | |
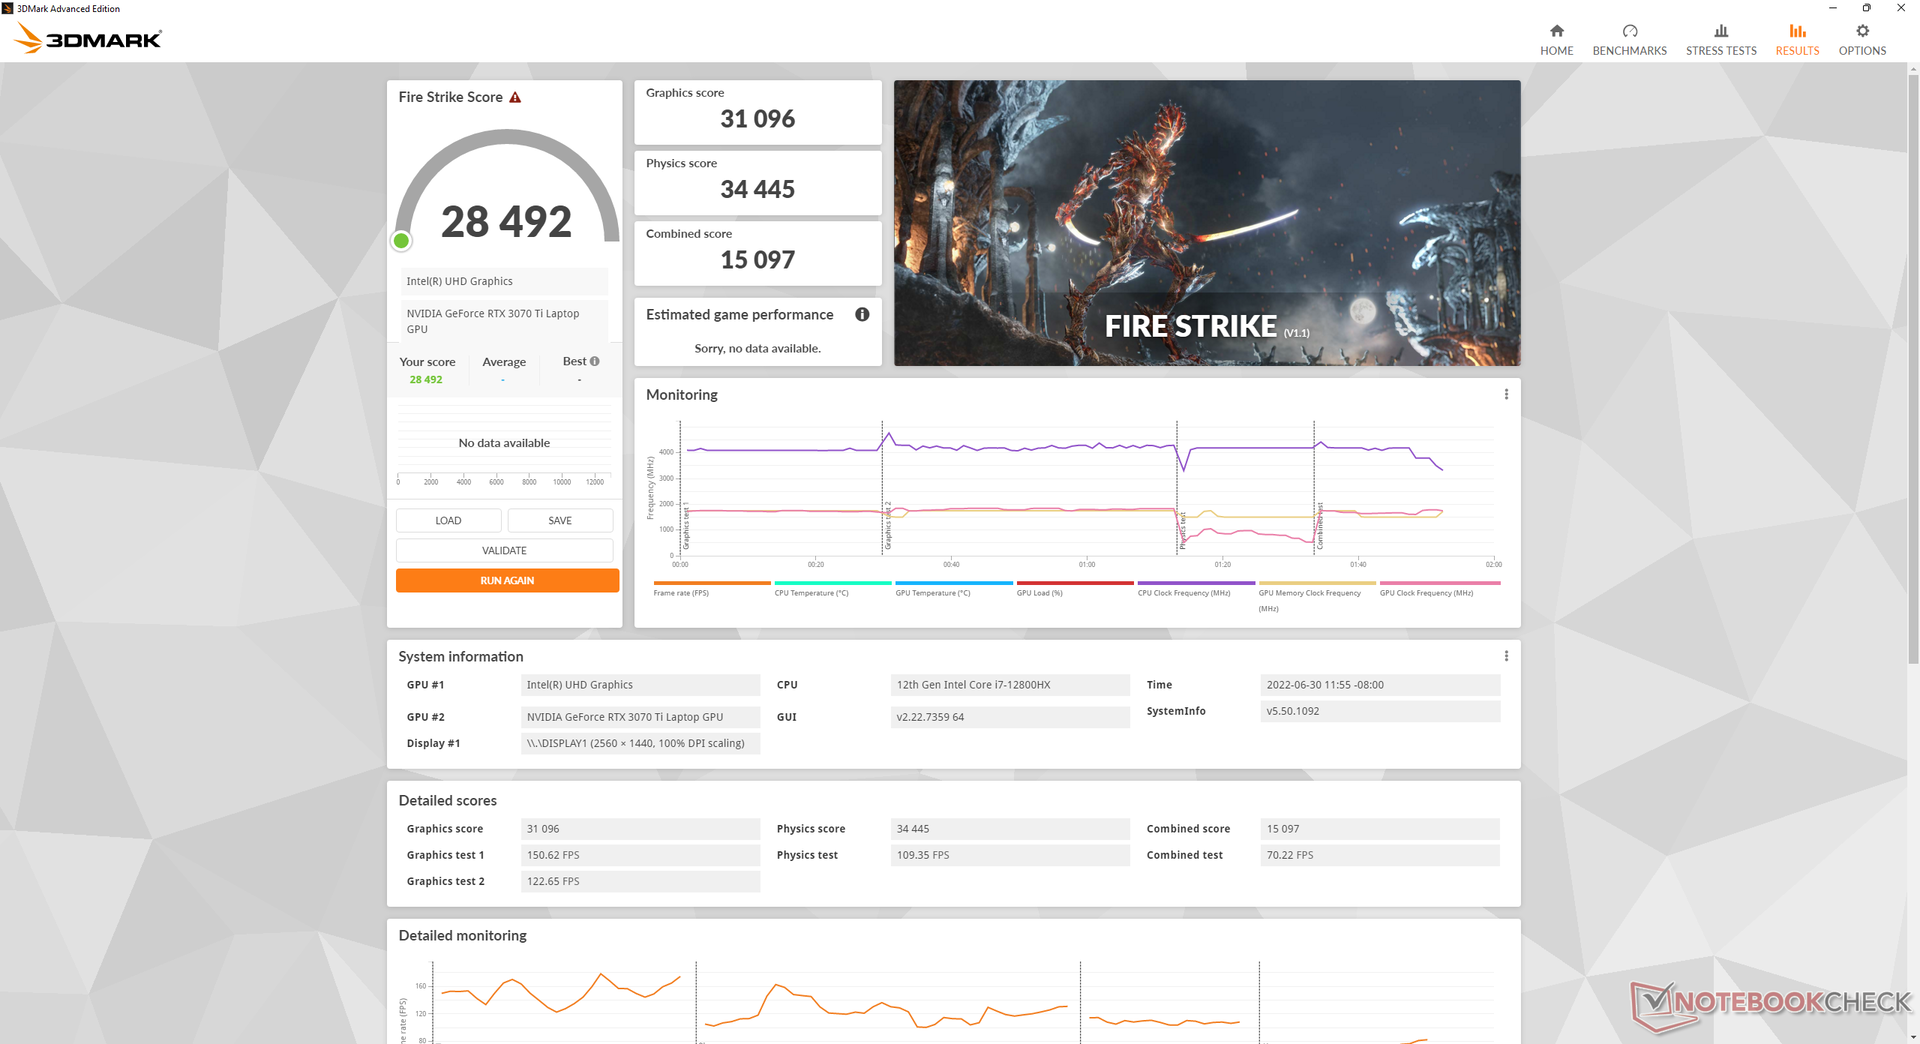
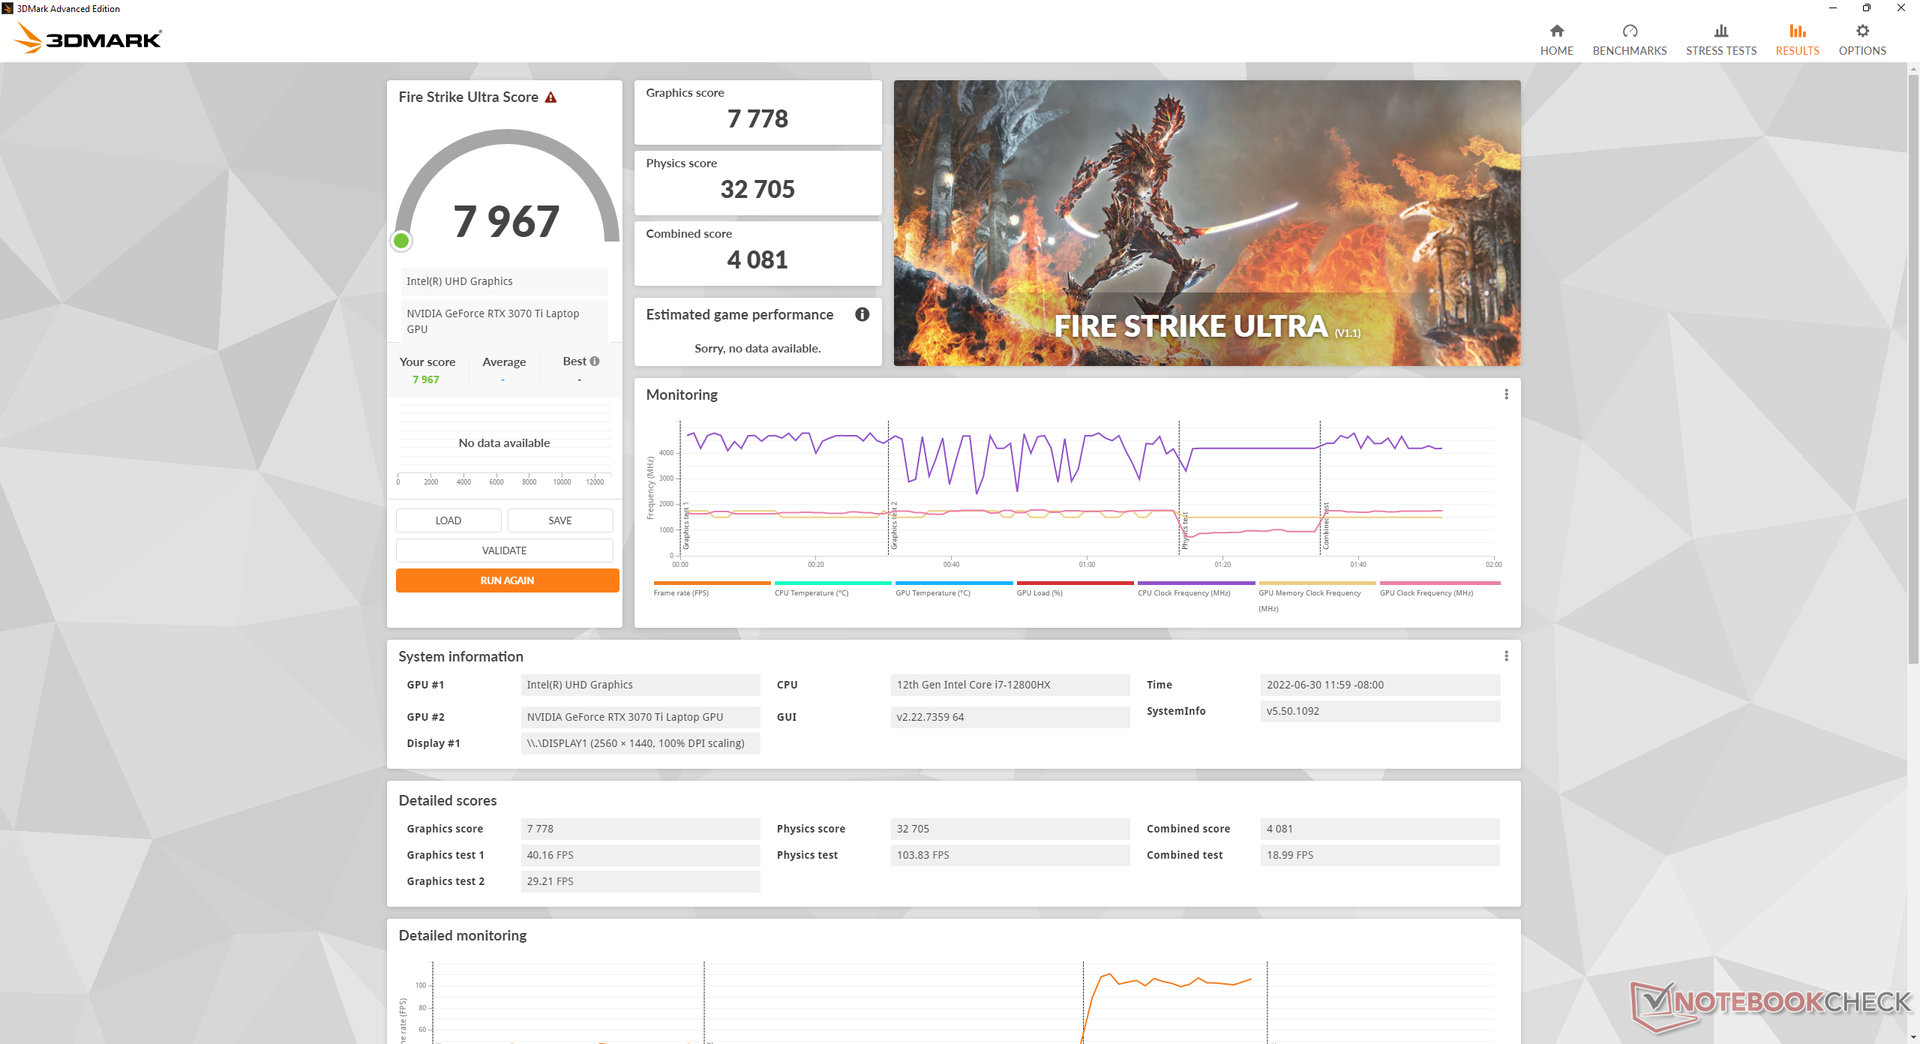
| 3DMark Fire Strike Score | 28492 points | |
| 3DMark Time Spy Score | 12239 points | |
Aide | ||
Witcher 3 FPS Chart
| Bas | Moyen | Élevé | Ultra | QHD | 4K | |
|---|---|---|---|---|---|---|
| GTA V (2015) | 186.8 | 184.7 | 178.1 | 122 | 108.7 | |
| The Witcher 3 (2015) | 426.4 | 329 | 223.3 | 112.7 | ||
| Dota 2 Reborn (2015) | 181.2 | 165.6 | 155.3 | 147.7 | 148.9 | |
| Final Fantasy XV Benchmark (2018) | 201 | 162.6 | 122.4 | 93 | ||
| X-Plane 11.11 (2018) | 145.5 | 133.4 | 105.9 | |||
| Strange Brigade (2018) | 453 | 288 | 235 | 207 | 154.1 | |
| Cyberpunk 2077 1.6 (2022) | 141.2 | 133.2 | 106 | 88.1 | 56.4 |
Émissions
Bruit du système
Le bruit du ventilateur dépend des cinq profils d'alimentation prédéfinis, comme mentionné dans les conditions de test ci-dessus. Lorsqu'il tourne au ralenti sur le bureau sans application en cours, notre appareil est capable de rester silencieux à 22,9 dB(A) même lorsqu'il est réglé sur le profil Performance extrême. Cependant, les petites demandes comme la navigation web ou le streaming vidéo induiront un bruit de ventilateur dans la gamme audible de 30 à 34 dB(A), quel que soit le réglage du profil. L'exécution de la première scène de benchmark de 3DMark 06 en mode équilibré induit un bruit de ventilateur de 44 dB(A), similaire à celui que nous avons enregistré sur le GE66 ou le Razer Blade 15 Razer Blade 15.
L'exécution de Witcher 3 en mode équilibré et en mode performances extrêmes se traduirait par un bruit de ventilateur de 49,8 dB(A) et 55,7 dB(A), respectivement. Nous considérons que tout ce qui se situe dans la gamme des 50 dB(A) est très fort, au point qu'il est recommandé de porter un casque pour jouer. Néanmoins, cette gamme est malheureusement commune sur de nombreux ordinateurs portables de jeu enthousiastes, notamment le Vector GP66, l'Asus ROG Strix Scar 15 ou l'Alienware m15 R6. Si Cooler Boost (c'est-à-dire le mode de bruit maximal du ventilateur) est activé, le bruit du ventilateur sera encore plus élevé, à 57,4 dB(A). Les utilisateurs devront jouer en mode Performance Extrême sur le GE67 pour maximiser le TGP comme le montrera notre section Test de stress ci-dessous. Le GE66 n'était pas aussi bruyant dans des conditions similaires.
Degré de la nuisance sonore
| Au repos |
| 22.9 / 22.9 / 22.9 dB(A) |
| Fortement sollicité |
| 44.4 / 57.4 dB(A) |
 | ||
30 dB silencieux 40 dB(A) audible 50 dB(A) bruyant |
||
min: | ||
| MSI GE67 HX 12UGS GeForce RTX 3070 Ti Laptop GPU, i7-12800HX, Samsung PM9A1 MZVL21T0HCLR | MSI Raider GE66 12UHS GeForce RTX 3080 Ti Laptop GPU, i9-12900HK, Samsung PM9A1 MZVL22T0HBLB | MSI Vector GP66 12UGS GeForce RTX 3070 Ti Laptop GPU, i9-12900H | Asus ROG Strix Scar 15 G533ZW-LN106WS GeForce RTX 3070 Ti Laptop GPU, i9-12900H, Samsung PM9A1 MZVL22T0HBLB | Alienware m15 R6, i7-11800H RTX 3080 GeForce RTX 3080 Laptop GPU, i7-11800H, Samsung PM9A1 MZVL21T0HCLR | Razer Blade 15 2022 GeForce RTX 3080 Ti Laptop GPU, i7-12800H, SSSTC CA6-8D1024 | |
|---|---|---|---|---|---|---|
| Noise | -14% | -2% | -36% | -2% | -5% | |
| arrêt / environnement * (dB) | 22.7 | 26 -15% | 22.9 -1% | 26.86 -18% | 23 -1% | 25.4 -12% |
| Idle Minimum * (dB) | 22.9 | 27 -18% | 23.4 -2% | 39.07 -71% | 23 -0% | 26.2 -14% |
| Idle Average * (dB) | 22.9 | 30 -31% | 23.4 -2% | 39.07 -71% | 23 -0% | 26.2 -14% |
| Idle Maximum * (dB) | 22.9 | 39 -70% | 27.4 -20% | 39.07 -71% | 30 -31% | 28.4 -24% |
| Load Average * (dB) | 44.4 | 45 -1% | 36 19% | 53.34 -20% | 41.26 7% | 44.7 -1% |
| Witcher 3 ultra * (dB) | 55.7 | 45 19% | 58.2 -4% | 56.6 -2% | 53.4 4% | 44.7 20% |
| Load Maximum * (dB) | 57.4 | 47 18% | 58 -1% | 56.6 1% | 53.37 7% | 51.9 10% |
* ... Moindre est la valeur, meilleures sont les performances
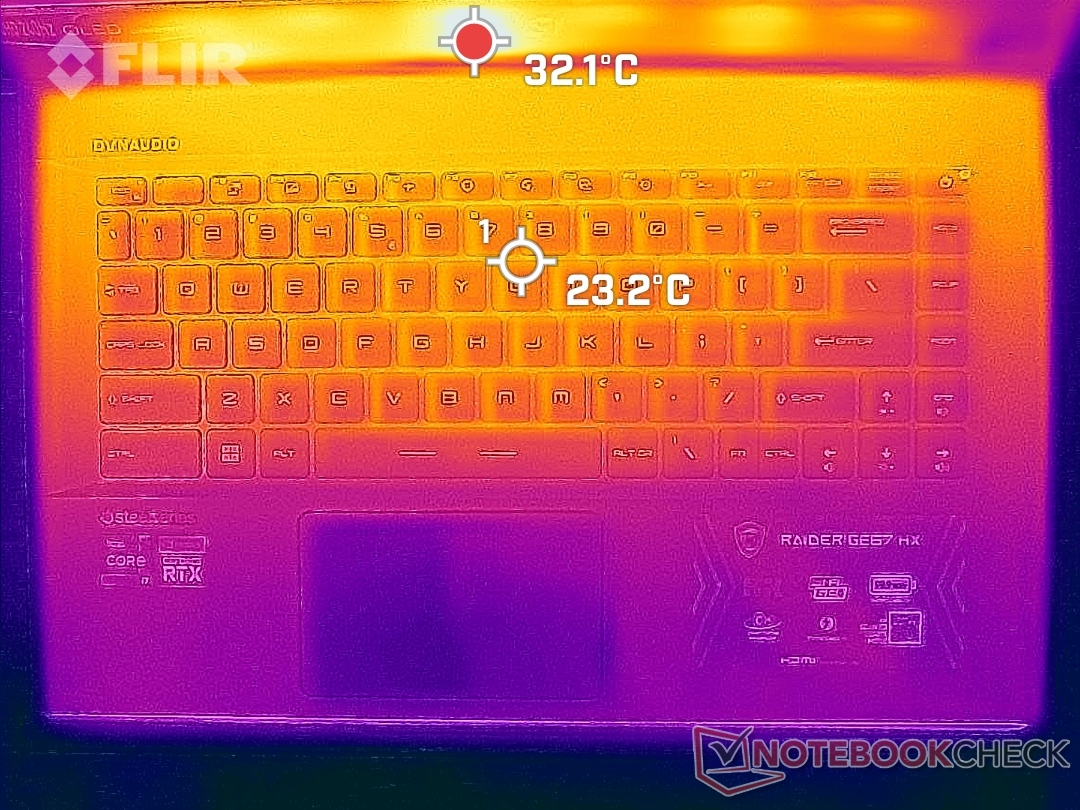
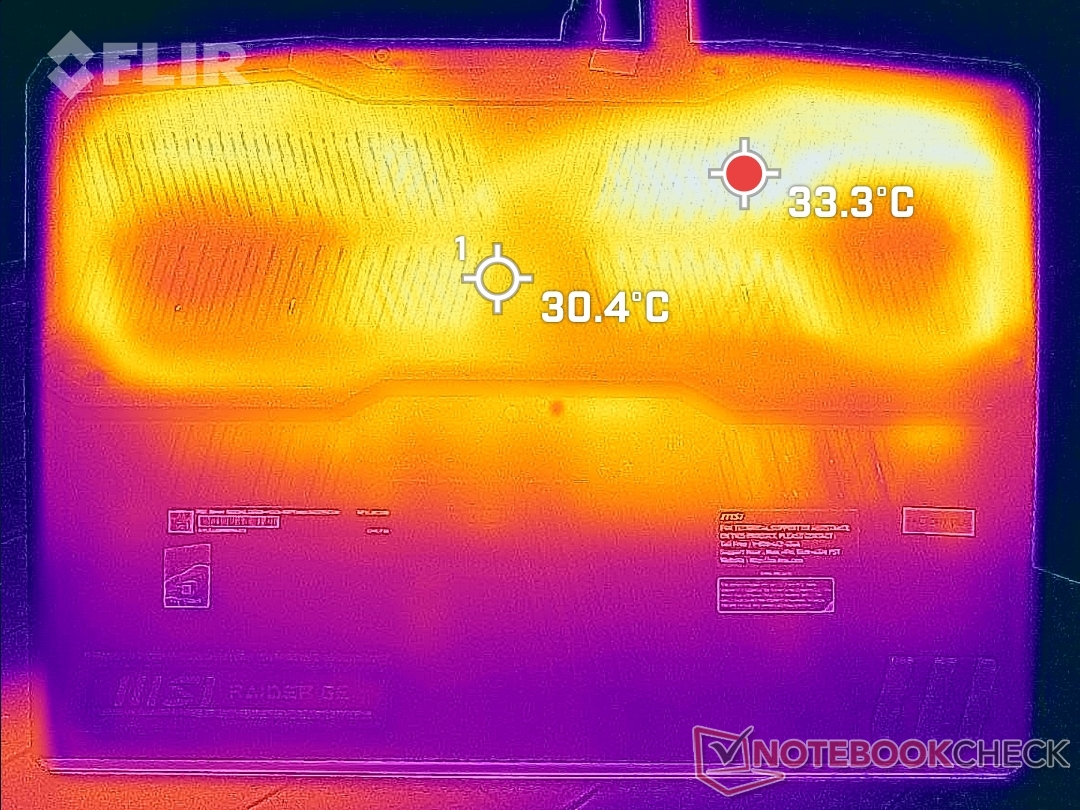
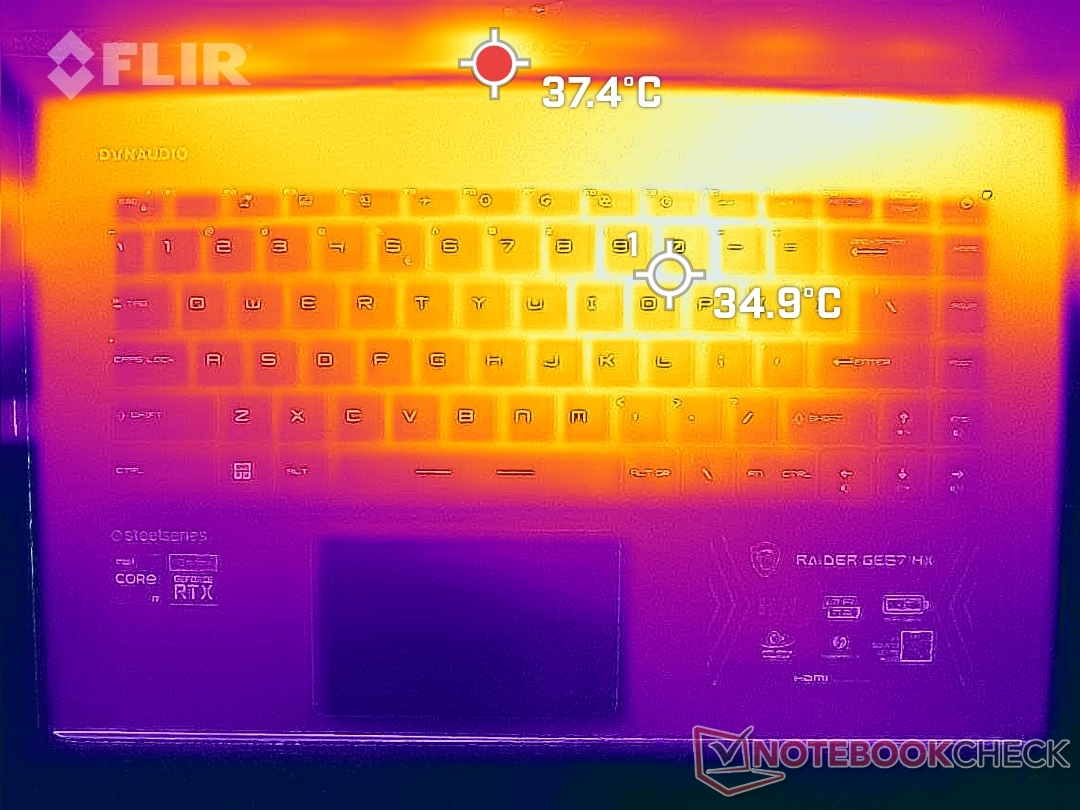
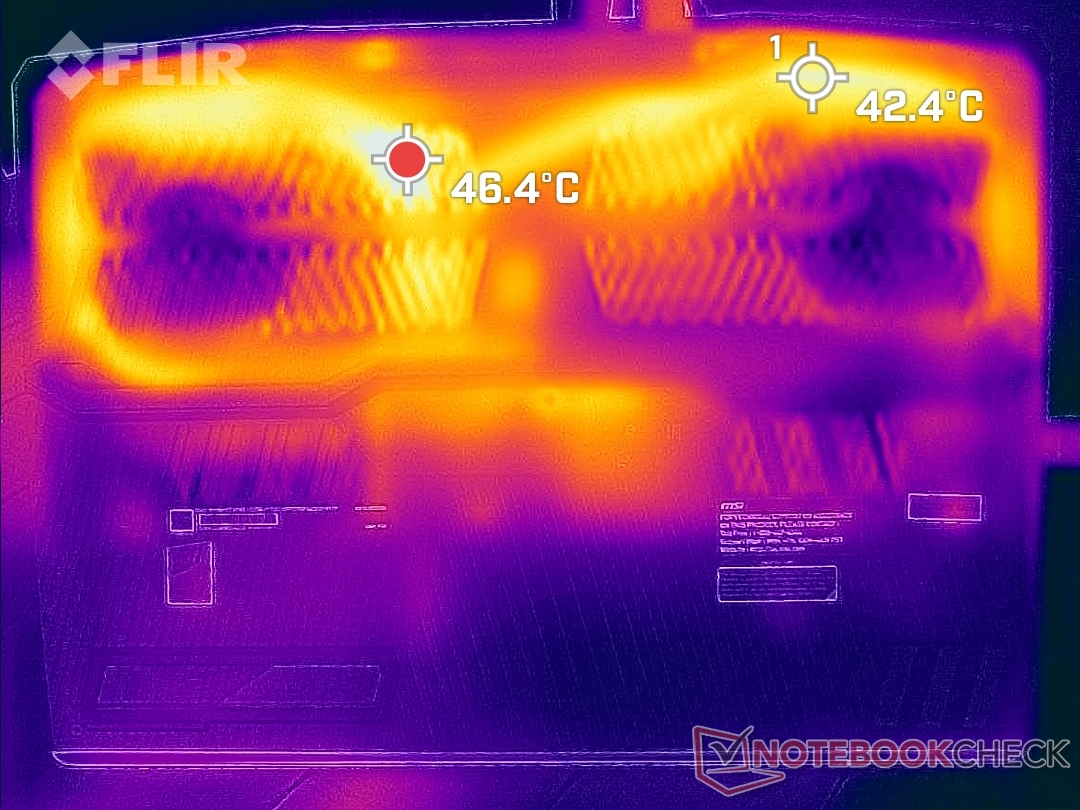
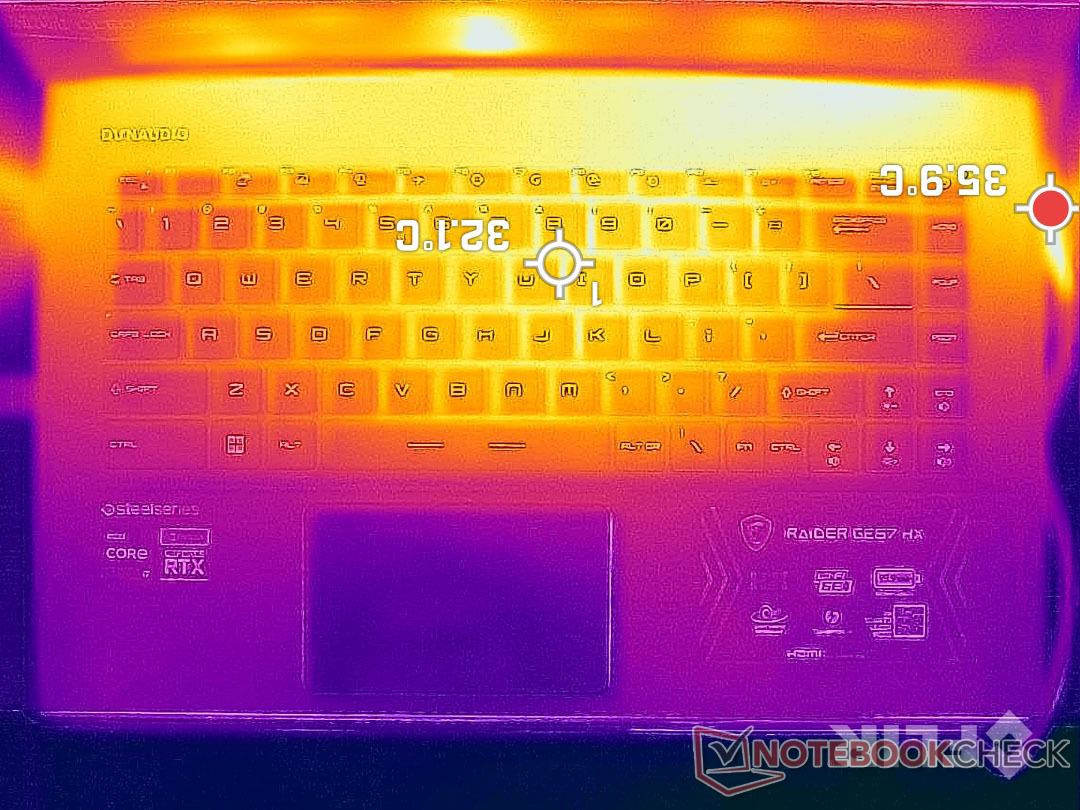
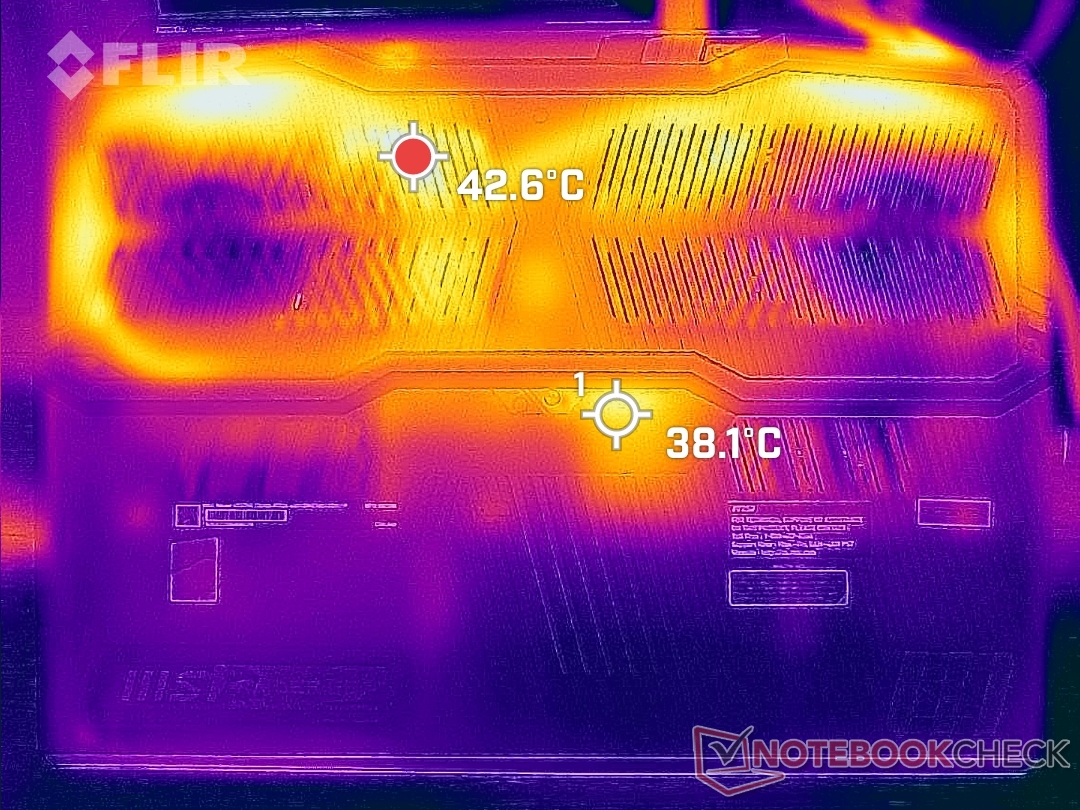
Température
Les températures de surface sont plus fraîches que celles que nous avons observées sur l'ancien GE66. Lorsque vous jouez, les points chauds sur le plateau du clavier et le panneau inférieur peuvent atteindre 35 C et 46 C, respectivement. Ces zones se trouvent vers l'arrière du châssis comme le montrent les cartes de température ci-dessous.
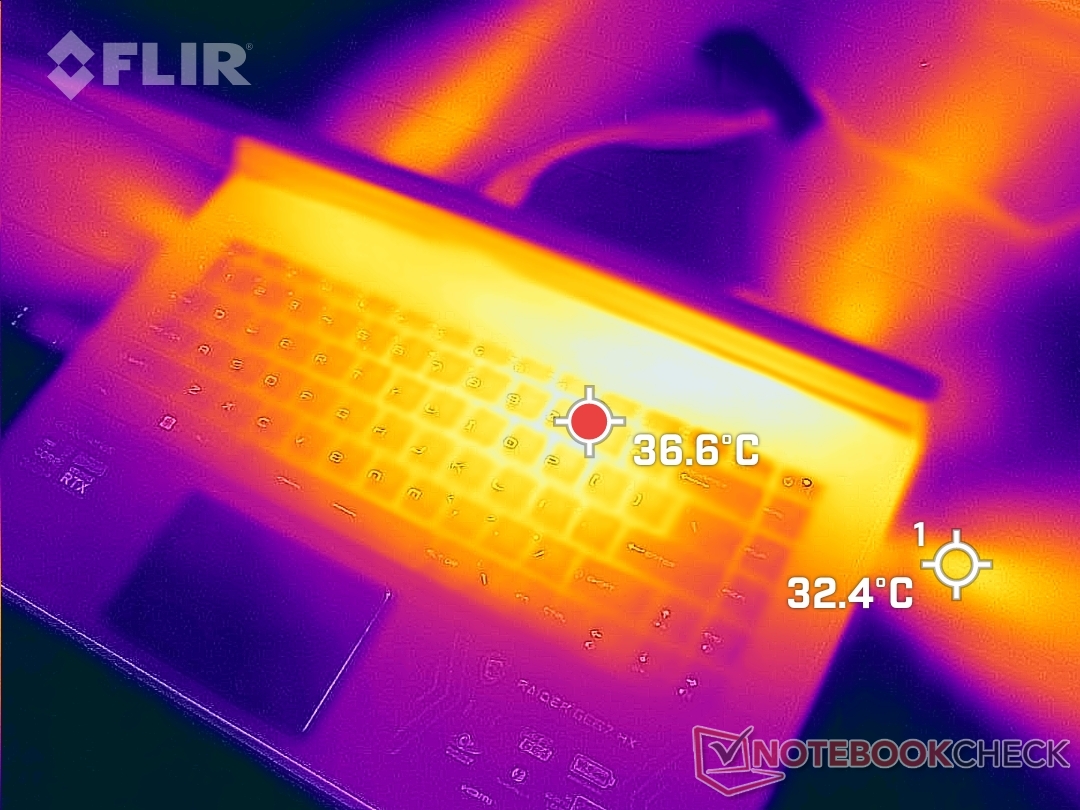
(+) La température maximale du côté supérieur est de 34.4 °C / 94 F, par rapport à la moyenne de 40.4 °C / 105 F, allant de 21.2 à 68.8 °C pour la classe Gaming.
(±) Le fond chauffe jusqu'à un maximum de 42 °C / 108 F, contre une moyenne de 43.2 °C / 110 F
(+) En utilisation inactive, la température moyenne du côté supérieur est de 21.4 °C / 71 F, par rapport à la moyenne du dispositif de 33.9 °C / 93 F.
(+) En jouant à The Witcher 3, la température moyenne du côté supérieur est de 27.9 °C / 82 F, alors que la moyenne de l'appareil est de 33.9 °C / 93 F.
(+) Les repose-poignets et le pavé tactile sont plus froids que la température de la peau avec un maximum de 20.4 °C / 68.7 F et sont donc froids au toucher.
(+) La température moyenne de la zone de l'appui-paume de dispositifs similaires était de 28.8 °C / 83.8 F (+8.4 °C / #15.1 F).
| MSI GE67 HX 12UGS Intel Core i7-12800HX, NVIDIA GeForce RTX 3070 Ti Laptop GPU | MSI Raider GE66 12UHS Intel Core i9-12900HK, NVIDIA GeForce RTX 3080 Ti Laptop GPU | MSI Vector GP66 12UGS Intel Core i9-12900H, NVIDIA GeForce RTX 3070 Ti Laptop GPU | Asus ROG Strix Scar 15 G533ZW-LN106WS Intel Core i9-12900H, NVIDIA GeForce RTX 3070 Ti Laptop GPU | Alienware m15 R6, i7-11800H RTX 3080 Intel Core i7-11800H, NVIDIA GeForce RTX 3080 Laptop GPU | Razer Blade 15 2022 Intel Core i7-12800H, NVIDIA GeForce RTX 3080 Ti Laptop GPU | |
|---|---|---|---|---|---|---|
| Heat | -36% | -19% | -29% | -45% | -32% | |
| Maximum Upper Side * (°C) | 34.4 | 54 -57% | 40.2 -17% | 42.6 -24% | 61 -77% | 50 -45% |
| Maximum Bottom * (°C) | 42 | 65 -55% | 43.8 -4% | 50.2 -20% | 58 -38% | 47 -12% |
| Idle Upper Side * (°C) | 24 | 30 -25% | 34.8 -45% | 36.2 -51% | 38 -58% | 37.4 -56% |
| Idle Bottom * (°C) | 33.2 | 35 -5% | 37 -11% | 40.2 -21% | 36 -8% | 38.4 -16% |
* ... Moindre est la valeur, meilleures sont les performances
Test de stress
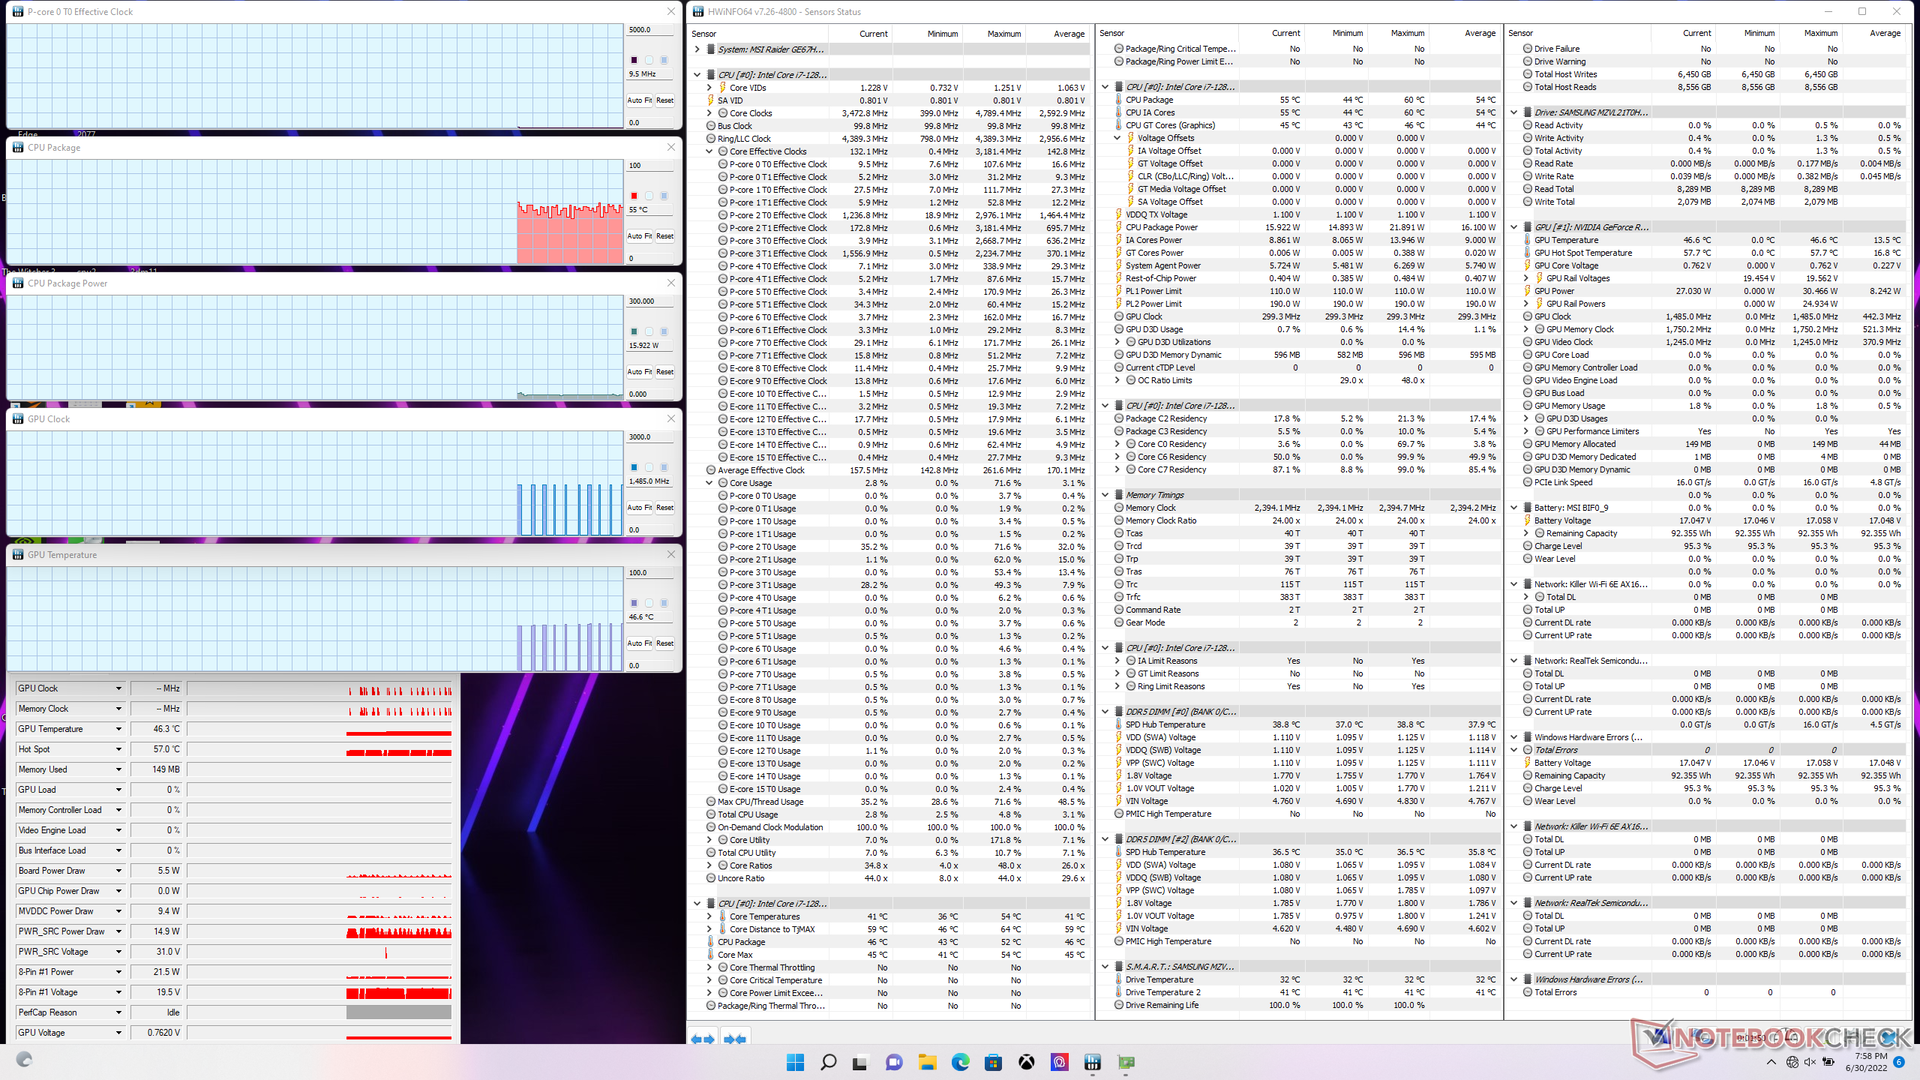
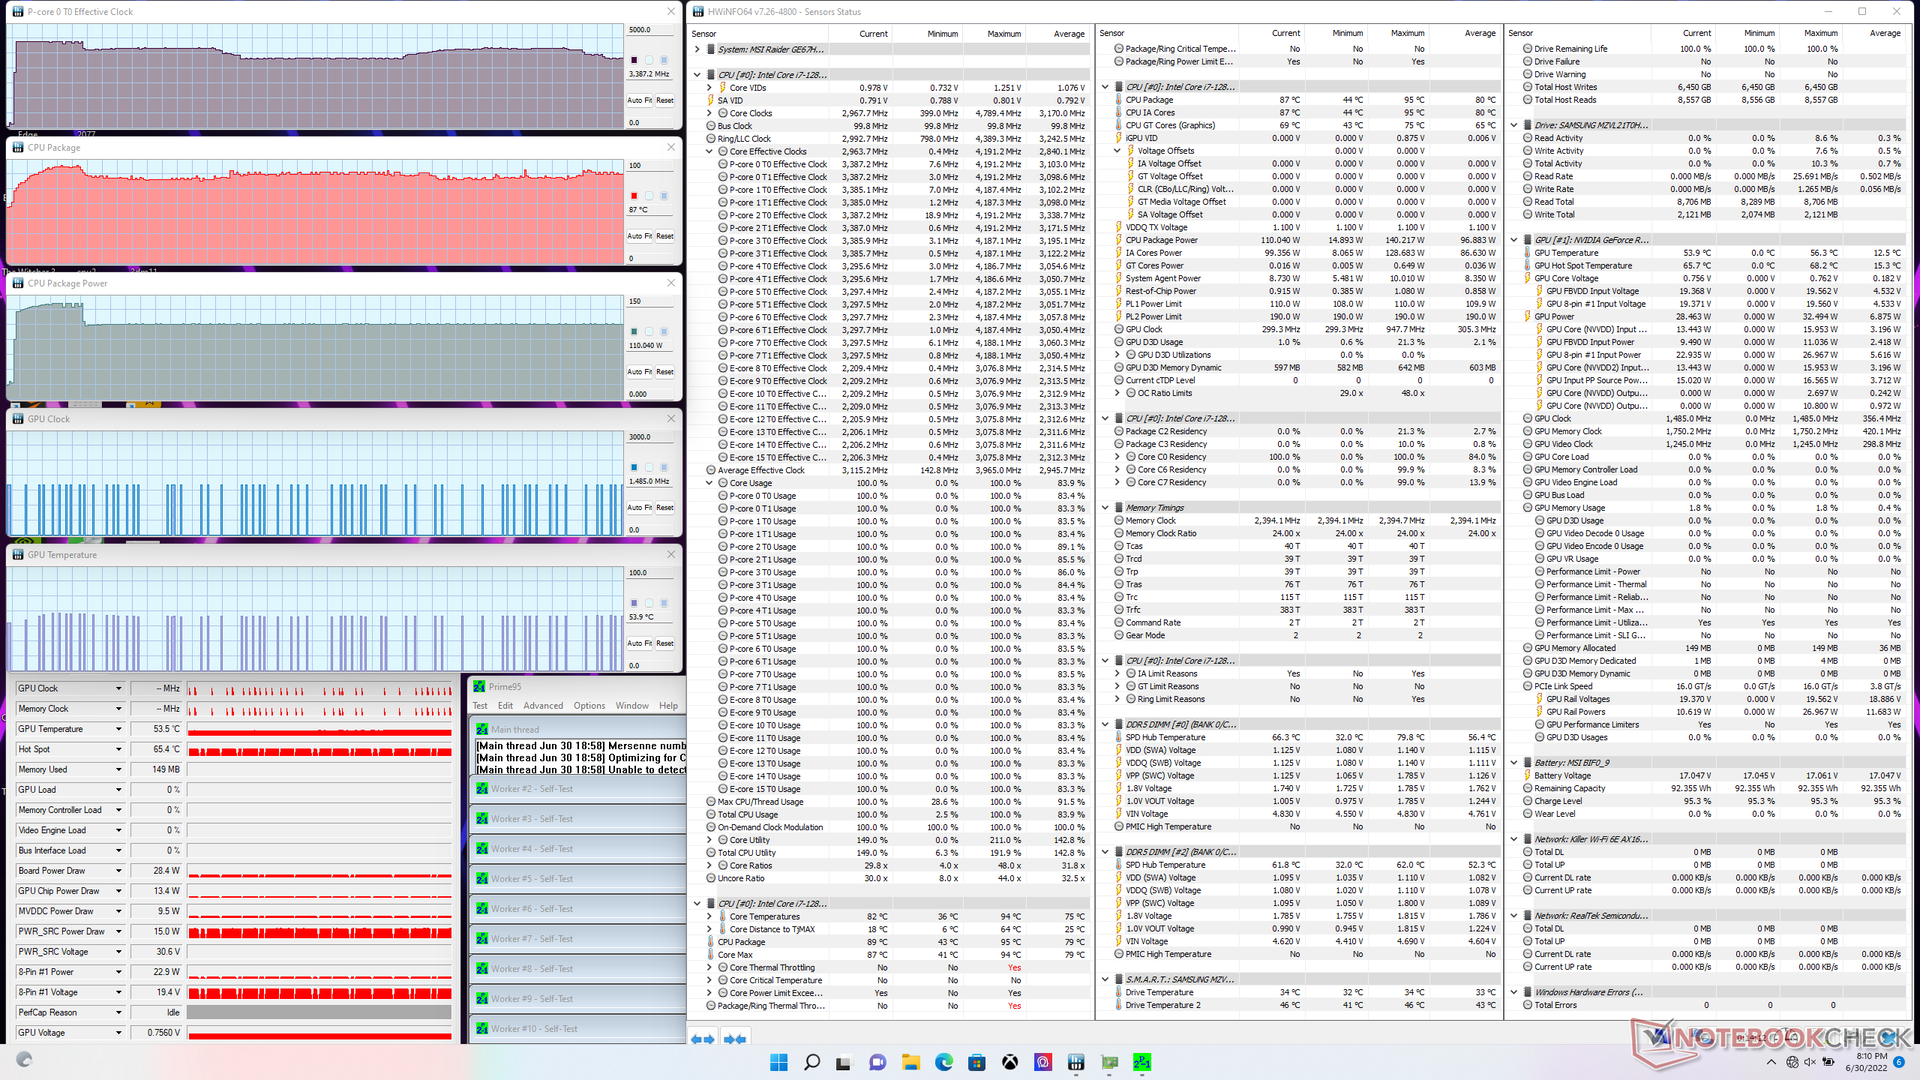
Lorsqu'il est sollicité sous Prime95, le CPU monte à 4,2 GHz jusqu'à environ 90 secondes plus tard, lorsque la température du cœur atteint 96 C. Ensuite, les fréquences d'horloge descendent dans la gamme de 3,4 à 3,7 GHz afin de maintenir une température du cœur plus fraîche d'environ 87 C. La consommation d'énergie de l'ensemble du CPU peut atteindre 140 W pendant les 90 premières secondes du test avant de se stabiliser à 110 W. En comparaison, le Core i7-12900HK dans l'ancien GE66 se stabilise à seulement 45 W dans des conditions similaires.
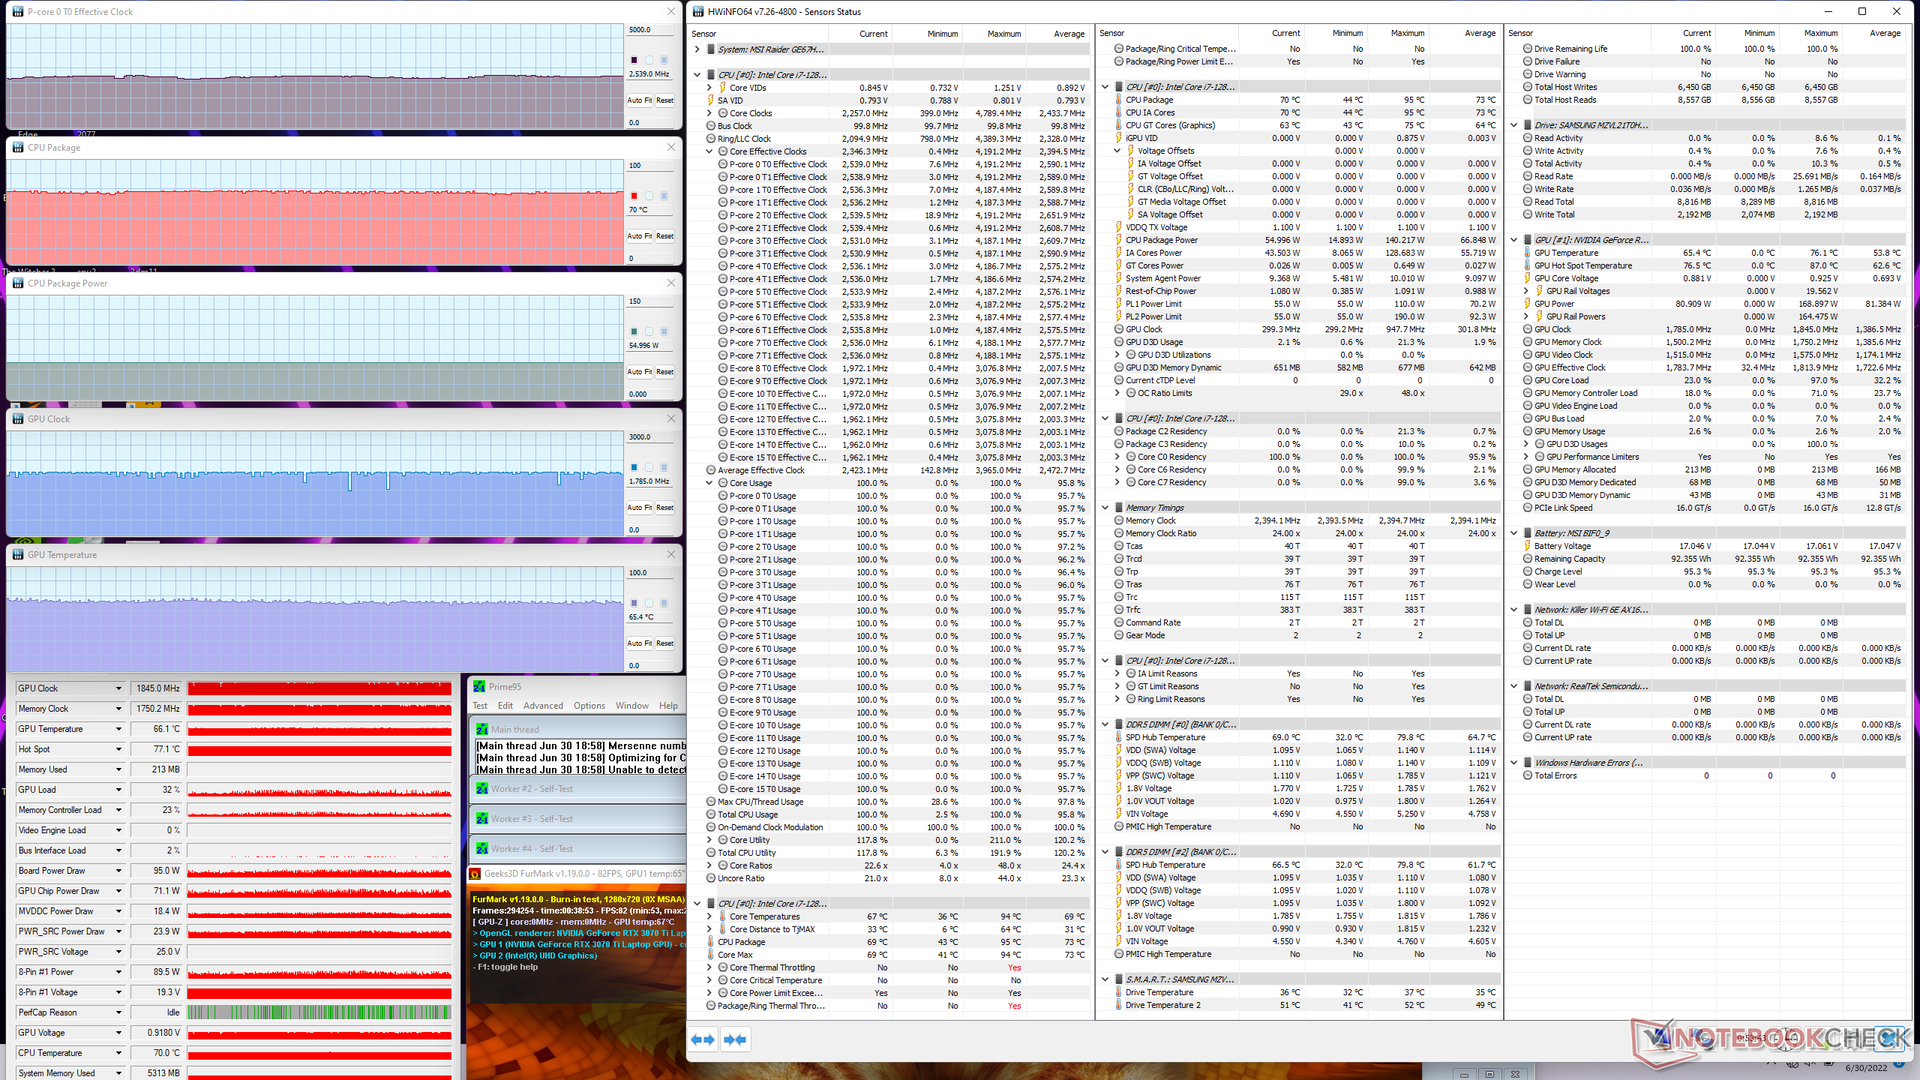
La consommation d'énergie de la carte graphique atteindrait 148 W en mode Performances extrêmes, contre ~135 W en mode Équilibré. Vous allez vouloir activer le mode Extreme Performance pour maximiser le potentiel du GPU. Les températures moyennes du CPU et du GPU sont raisonnables à 69 C et 77 C, respectivement, par rapport à 71 C et 70 C sur le Vector GP66 qui est équipé du même GPU GeForce RTX 3070 Ti mais d'un CPU de 11e génération plus lent.
Il est intéressant de noter que nous n'avons pu atteindre qu'une consommation de 148 W pour la carte GPU, malgré la publicité de MSI de 150 W + 25 W Dynamic Boost, même en fonctionnant en mode Performance Extrême, du moins selon GPU-Z.
Le fonctionnement sur batterie a un impact sur les performances. Un test Fire Strike sur batterie donnerait des scores de physique et de graphisme de 22492 et 11614 points, respectivement, contre 34445 et 31096 points sur secteur.
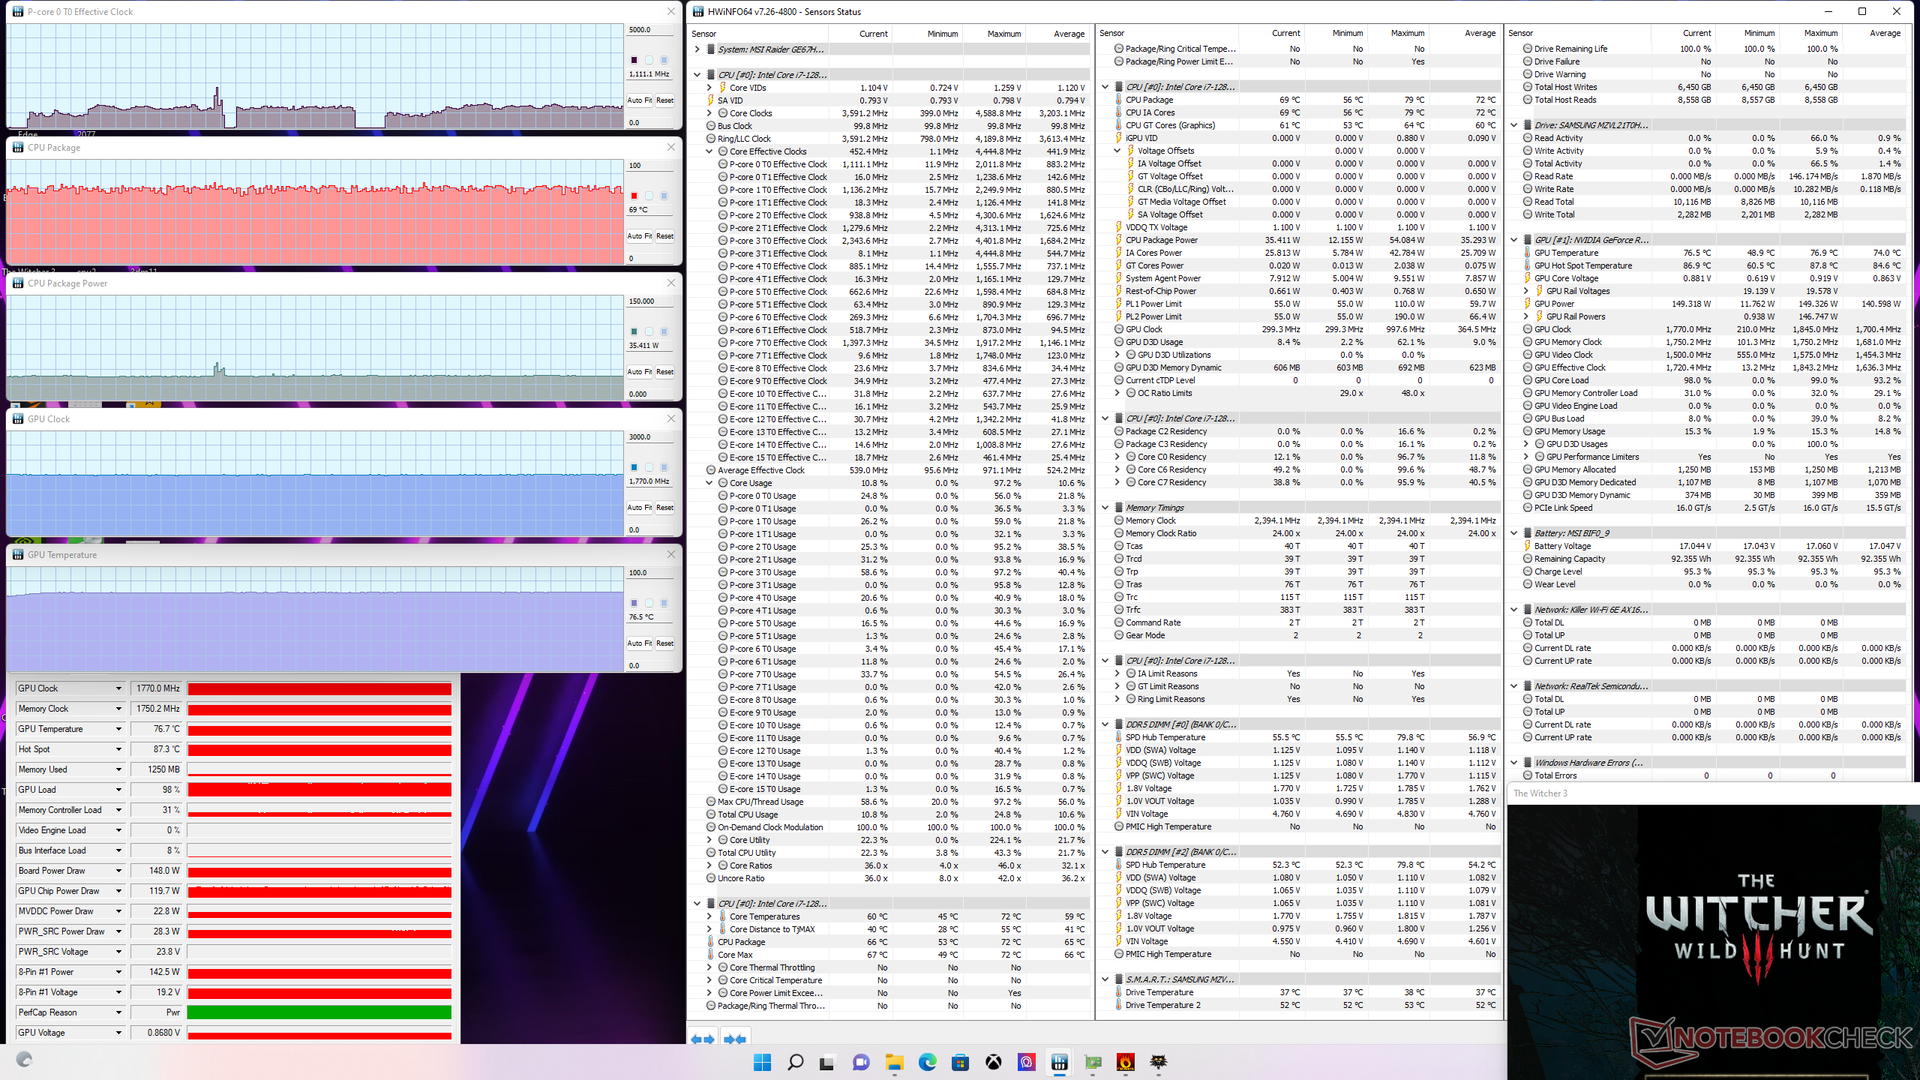
| Fréquence CPU (GHz) | Fréquence GPU (MHz) | Température CPU moyenne (°C) | Température GPU moyenne (°C) | |
| Système en veille | -- | -- | 55 | 47 |
| Prime95 Stress | 3.4 - 3.7 | -- | 87 | 54 |
| Prime95 + FurMark Stress | 2.6 | 1845 | 70 | 65 |
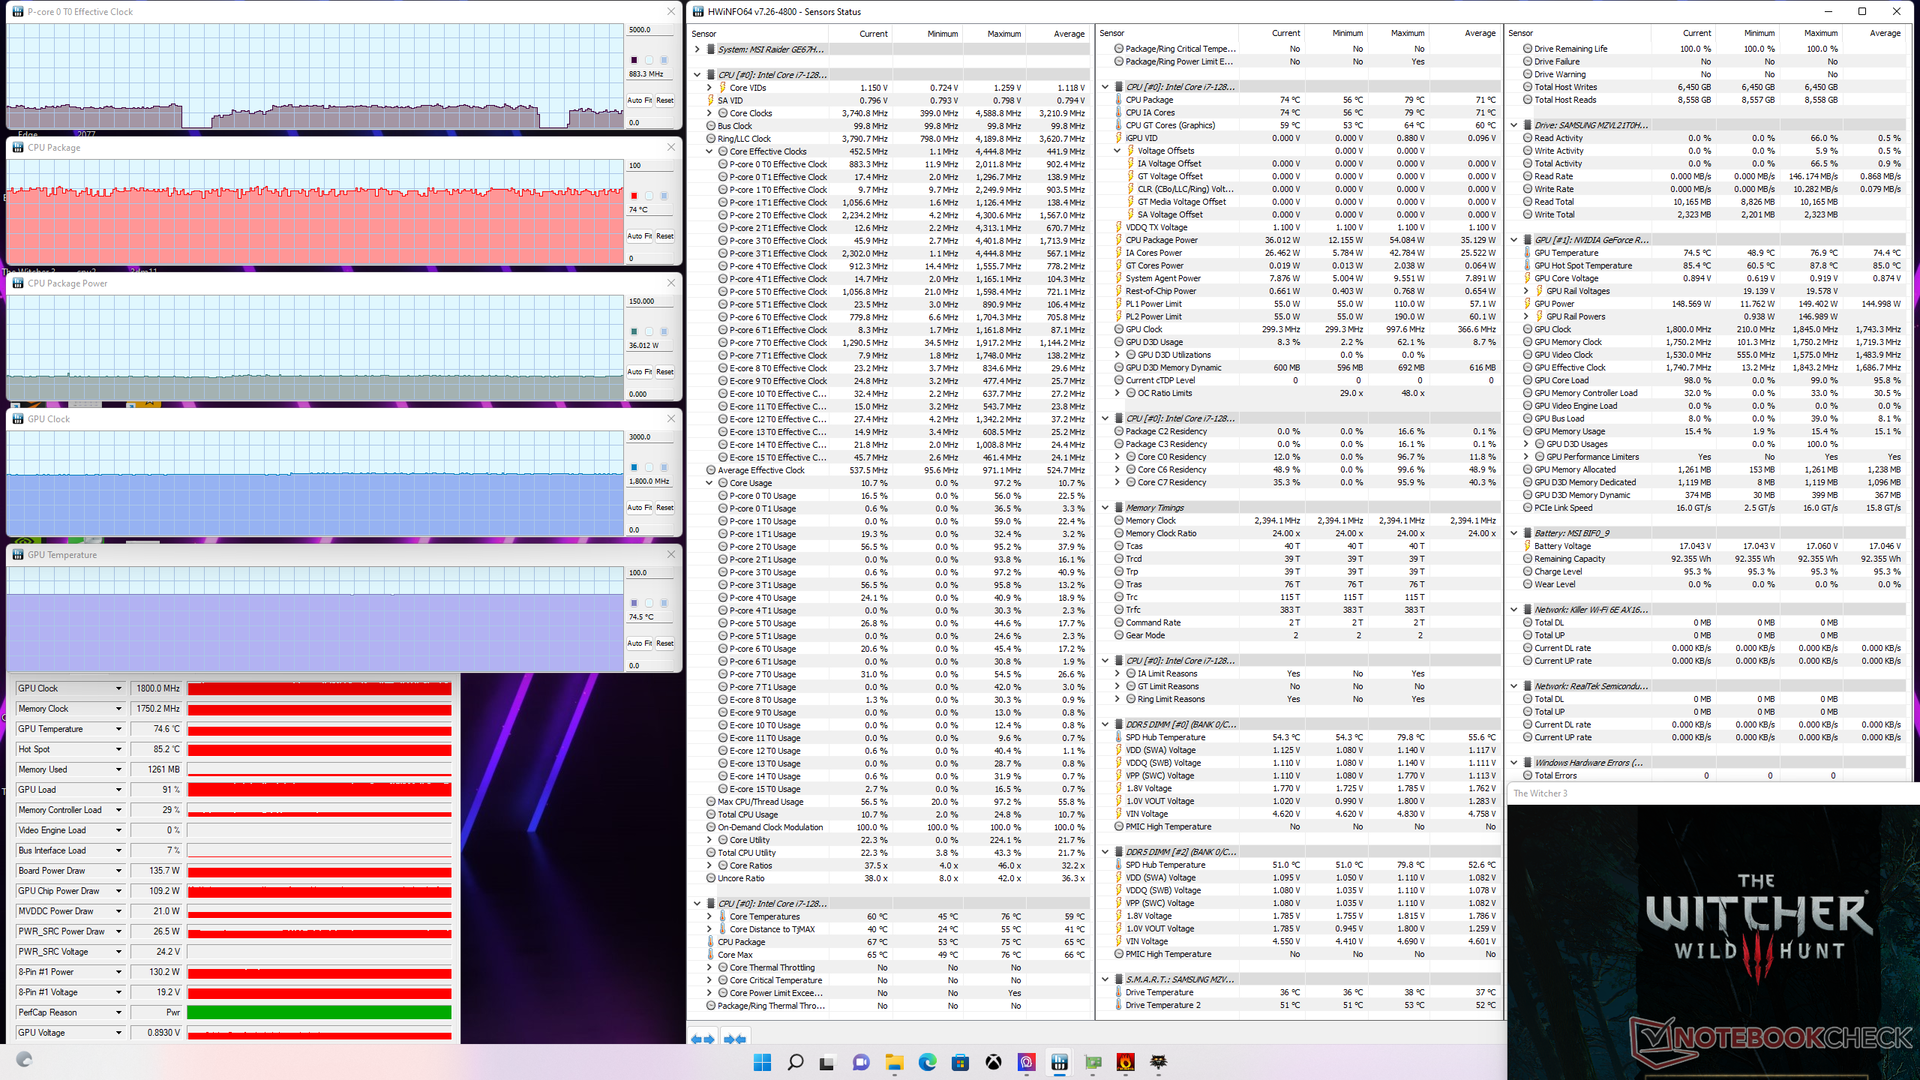
| Witcher 3 Stress (mode équilibré) | 0.9 | 1800 | 74 | 75 |
| Witcher 3 Stress (mode Performance Extrême) | 1.1 | 1770 | 69 | 77 |
Haut-parleurs
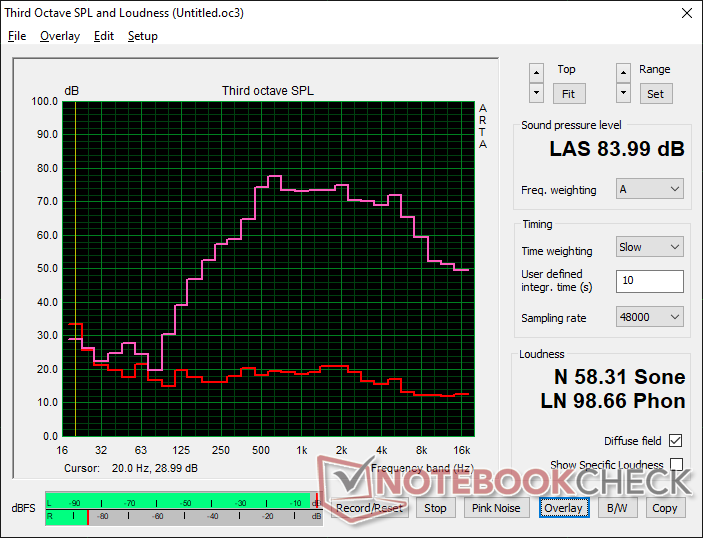
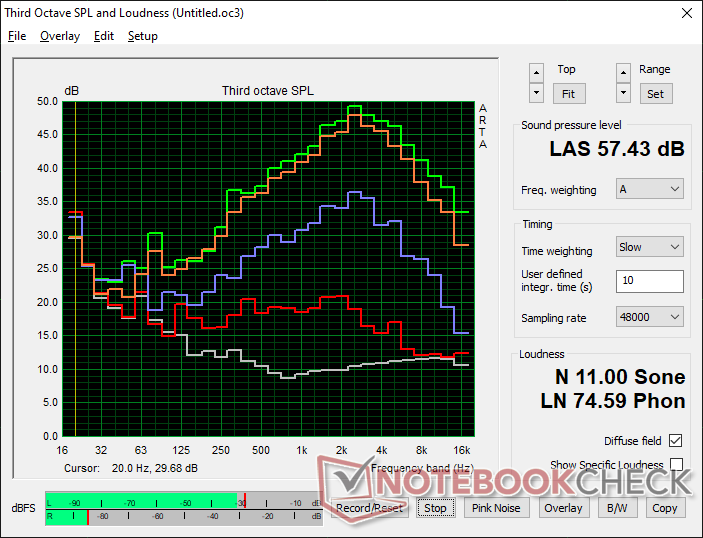
MSI GE67 HX 12UGS analyse audio
(+) | les haut-parleurs peuvent jouer relativement fort (84# dB)
Basses 100 - 315 Hz
(-) | presque aucune basse - en moyenne 17.9% plus bas que la médiane
(±) | la linéarité des basses est moyenne (13.7% delta à la fréquence précédente)
Médiums 400 - 2000 Hz
(±) | médiane supérieure - en moyenne 7.9% supérieure à la médiane
(+) | les médiums sont linéaires (6.6% delta à la fréquence précédente)
Aiguës 2 - 16 kHz
(±) | sommets plus élevés - en moyenne 5.5% plus élevés que la médiane
(±) | la linéarité des aigus est moyenne (8.6% delta à la fréquence précédente)
Globalement 100 - 16 000 Hz
(±) | la linéarité du son global est moyenne (22.1% de différence avec la médiane)
Par rapport à la même classe
» 79% de tous les appareils testés de cette catégorie étaient meilleurs, 6% similaires, 15% pires
» Le meilleur avait un delta de 6%, la moyenne était de 18%, le pire était de 132%.
Par rapport à tous les appareils testés
» 64% de tous les appareils testés étaient meilleurs, 6% similaires, 30% pires
» Le meilleur avait un delta de 4%, la moyenne était de 23%, le pire était de 134%.
Apple MacBook Pro 16 2021 M1 Pro analyse audio
(+) | les haut-parleurs peuvent jouer relativement fort (84.7# dB)
Basses 100 - 315 Hz
(+) | bonne basse - seulement 3.8% loin de la médiane
(+) | les basses sont linéaires (5.2% delta à la fréquence précédente)
Médiums 400 - 2000 Hz
(+) | médiane équilibrée - seulement 1.3% de la médiane
(+) | les médiums sont linéaires (2.1% delta à la fréquence précédente)
Aiguës 2 - 16 kHz
(+) | des sommets équilibrés - à seulement 1.9% de la médiane
(+) | les aigus sont linéaires (2.7% delta à la fréquence précédente)
Globalement 100 - 16 000 Hz
(+) | le son global est linéaire (4.6% différence à la médiane)
Par rapport à la même classe
» 0% de tous les appareils testés de cette catégorie étaient meilleurs, 0% similaires, 100% pires
» Le meilleur avait un delta de 5%, la moyenne était de 17%, le pire était de 45%.
Par rapport à tous les appareils testés
» 0% de tous les appareils testés étaient meilleurs, 0% similaires, 100% pires
» Le meilleur avait un delta de 4%, la moyenne était de 23%, le pire était de 134%.
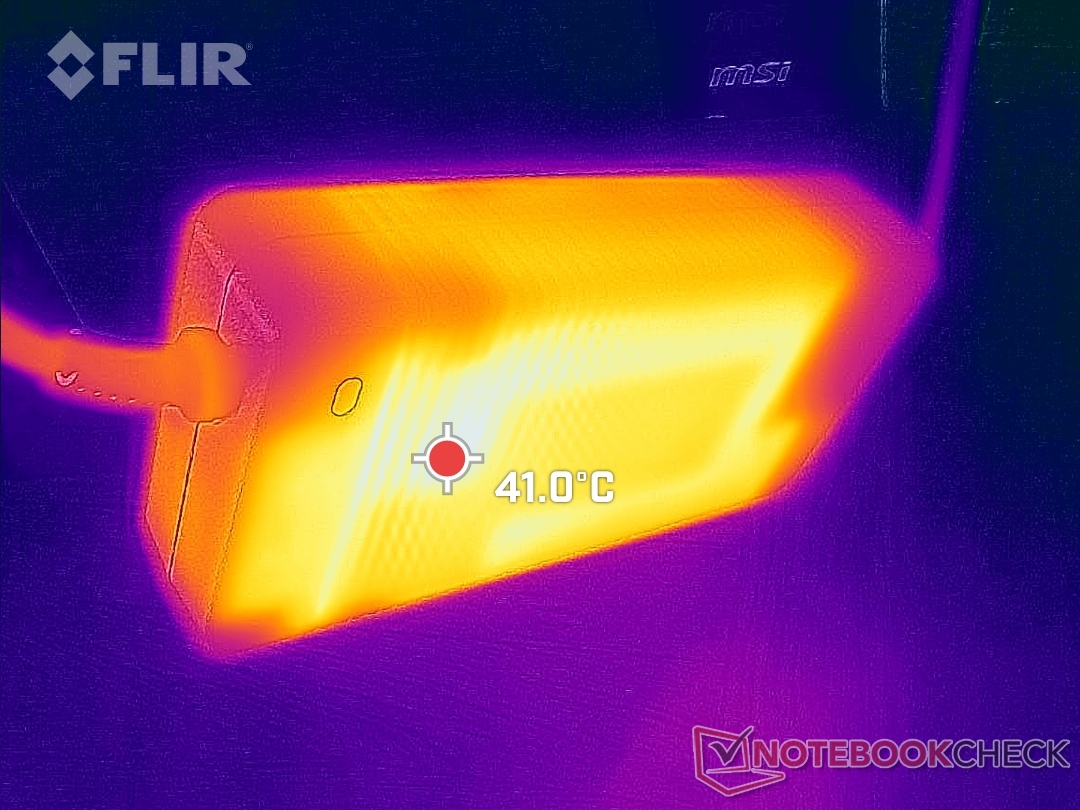
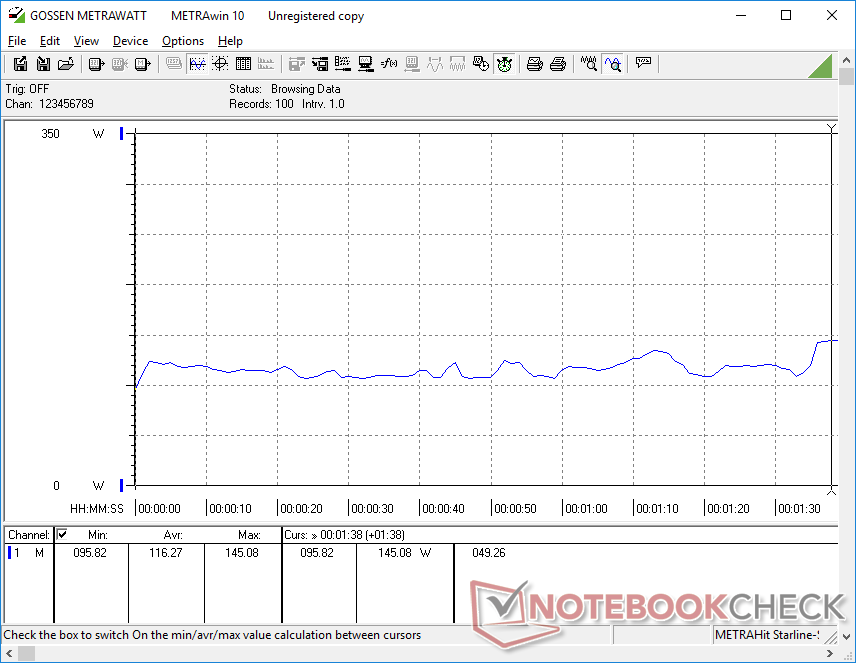
Gestion de l'énergie - Brique à forte consommation et forte puissance
Consommation d'énergie
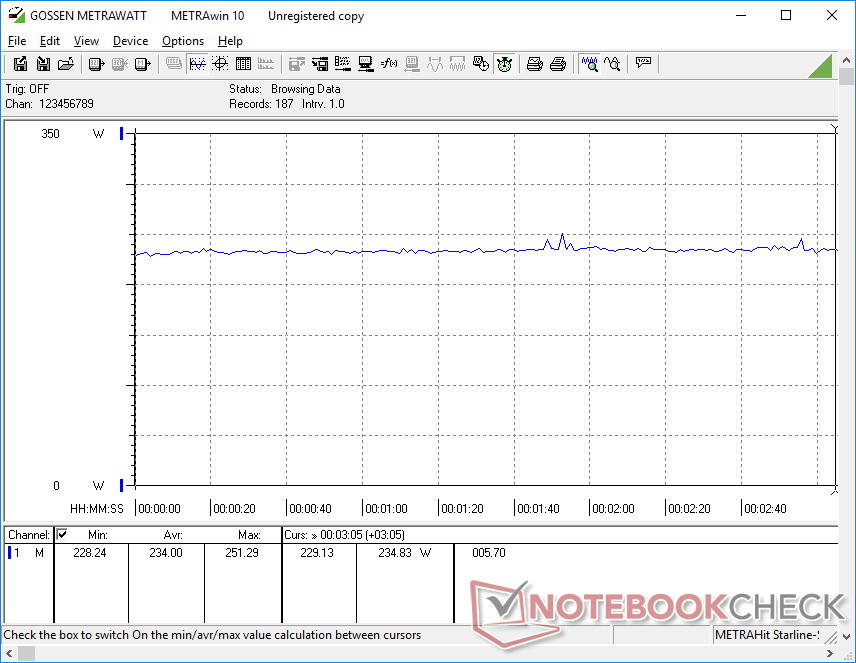
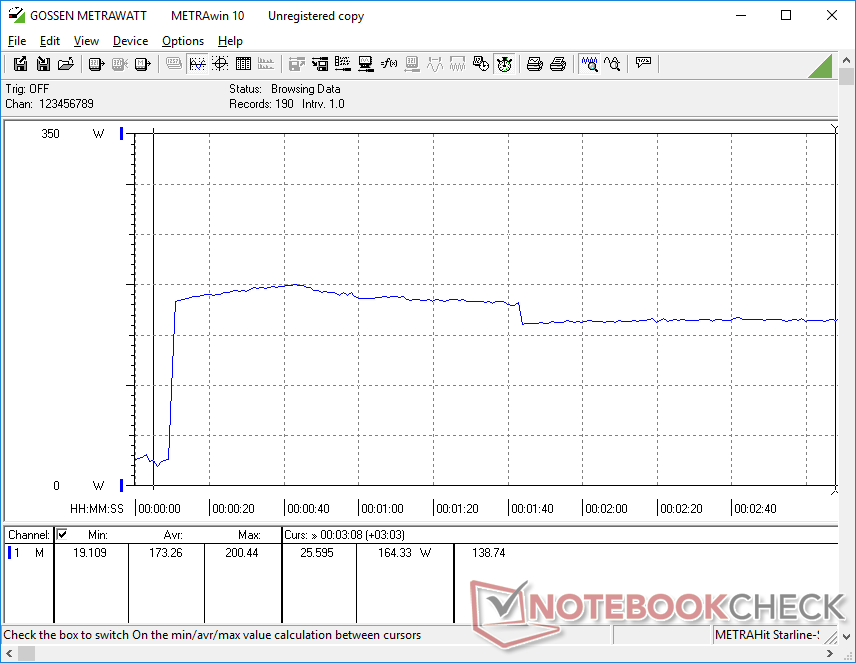
La consommation est sensiblement plus élevée que celle que nous avons enregistrée sur l'ancien Core i9-12900HK GE66, en particulier lors de l'exécution d'applications gourmandes en ressources CPU. Prime95, par exemple, consommerait environ 165 W sur notre GE67 contre seulement 90 W sur le GE66, soit une augmentation de 83 %. C'est un prix élevé à payer pour l'augmentation de 35 à 40 % des performances brutes en multithread entre le Core i9-12900HK et le Core i7-12800HX
L'exécution de Witcher 3 consommerait environ 237 W, ce qui est à nouveau supérieur aux 202 W que nous avons enregistrés sur le GE66. Même lorsqu'on le compare à d'autres ordinateurs portables de jeu à hautes performances comme le Asus ROG Strix Scar 15 ou l'Alienware m15 R6 Alienware m15 R6le GE67 est plus gourmand en énergie dans les deux cas
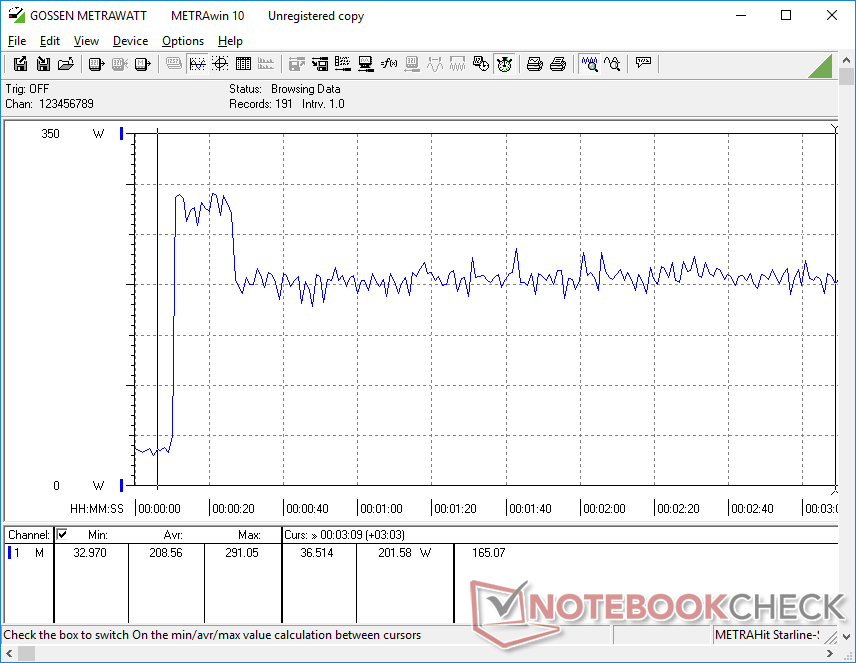
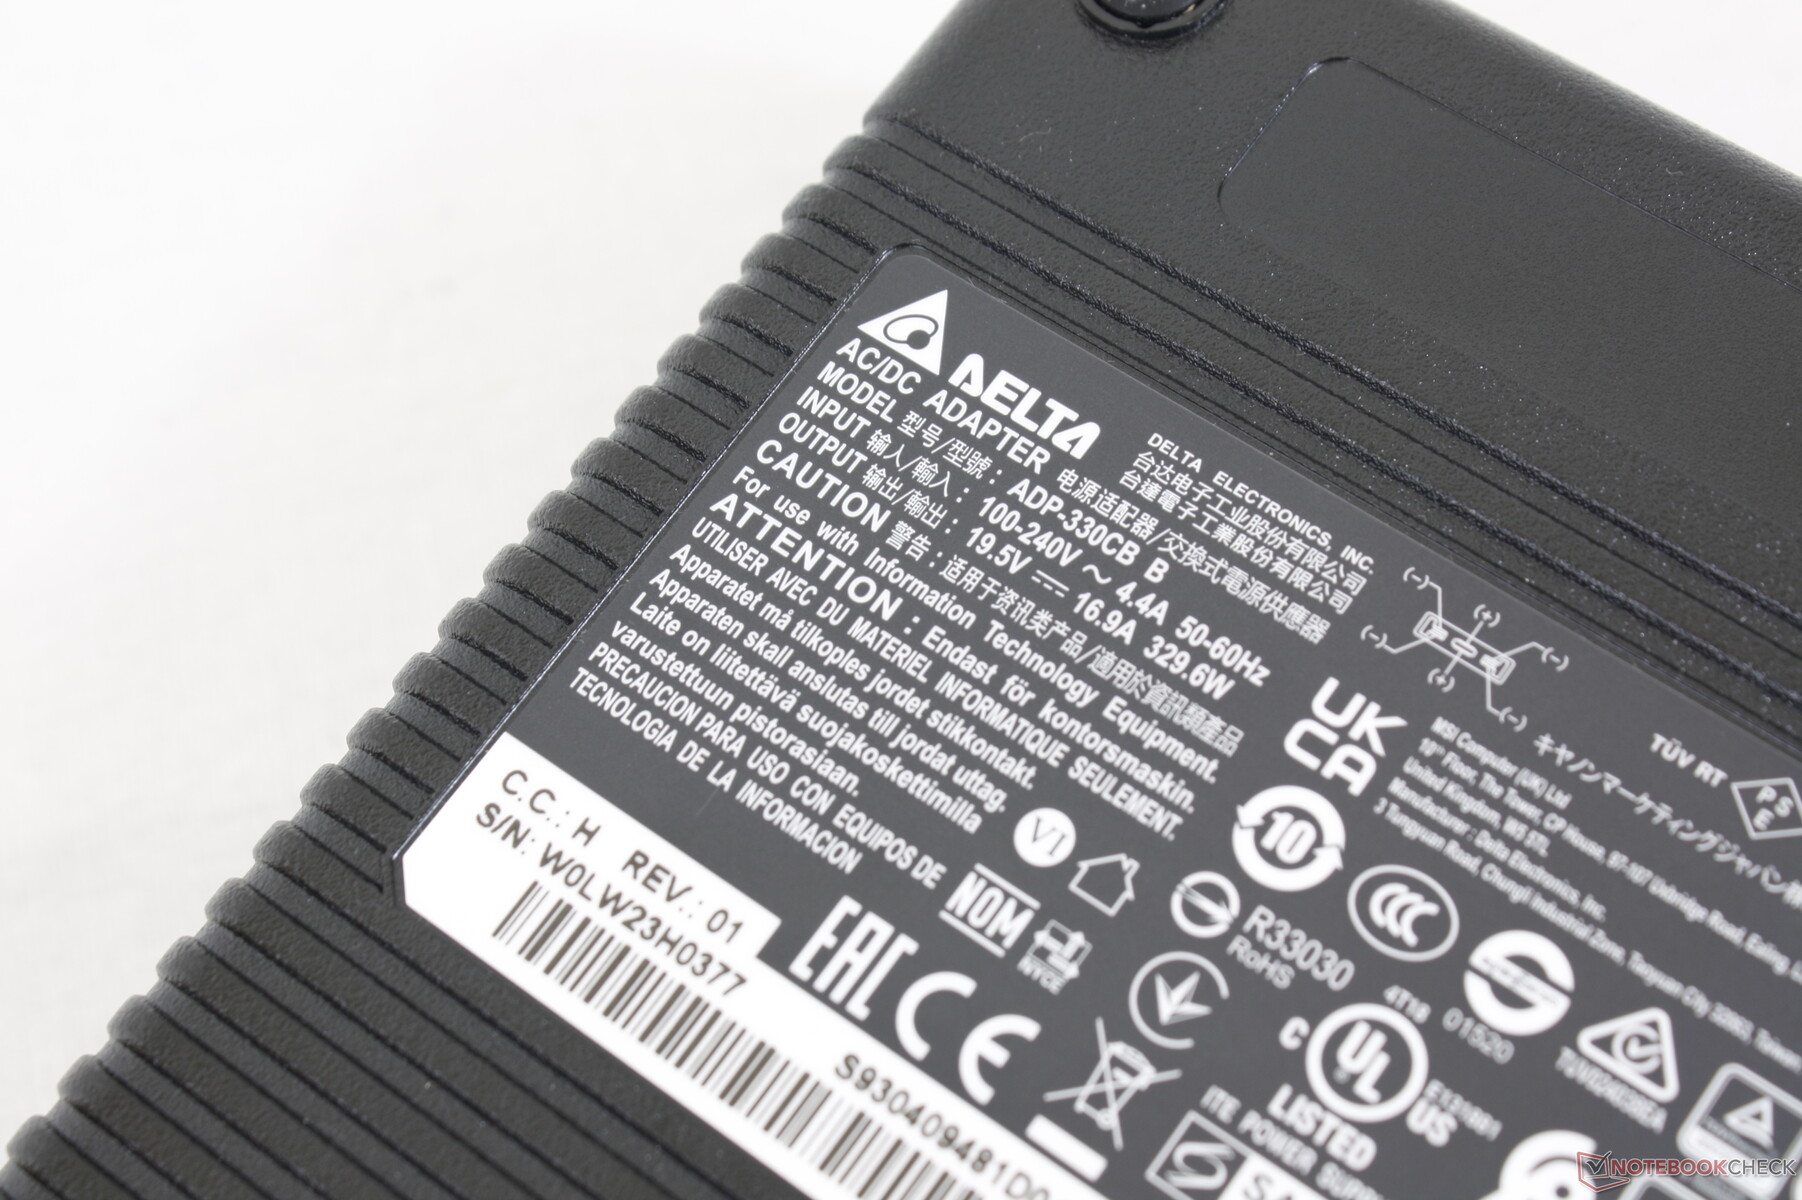
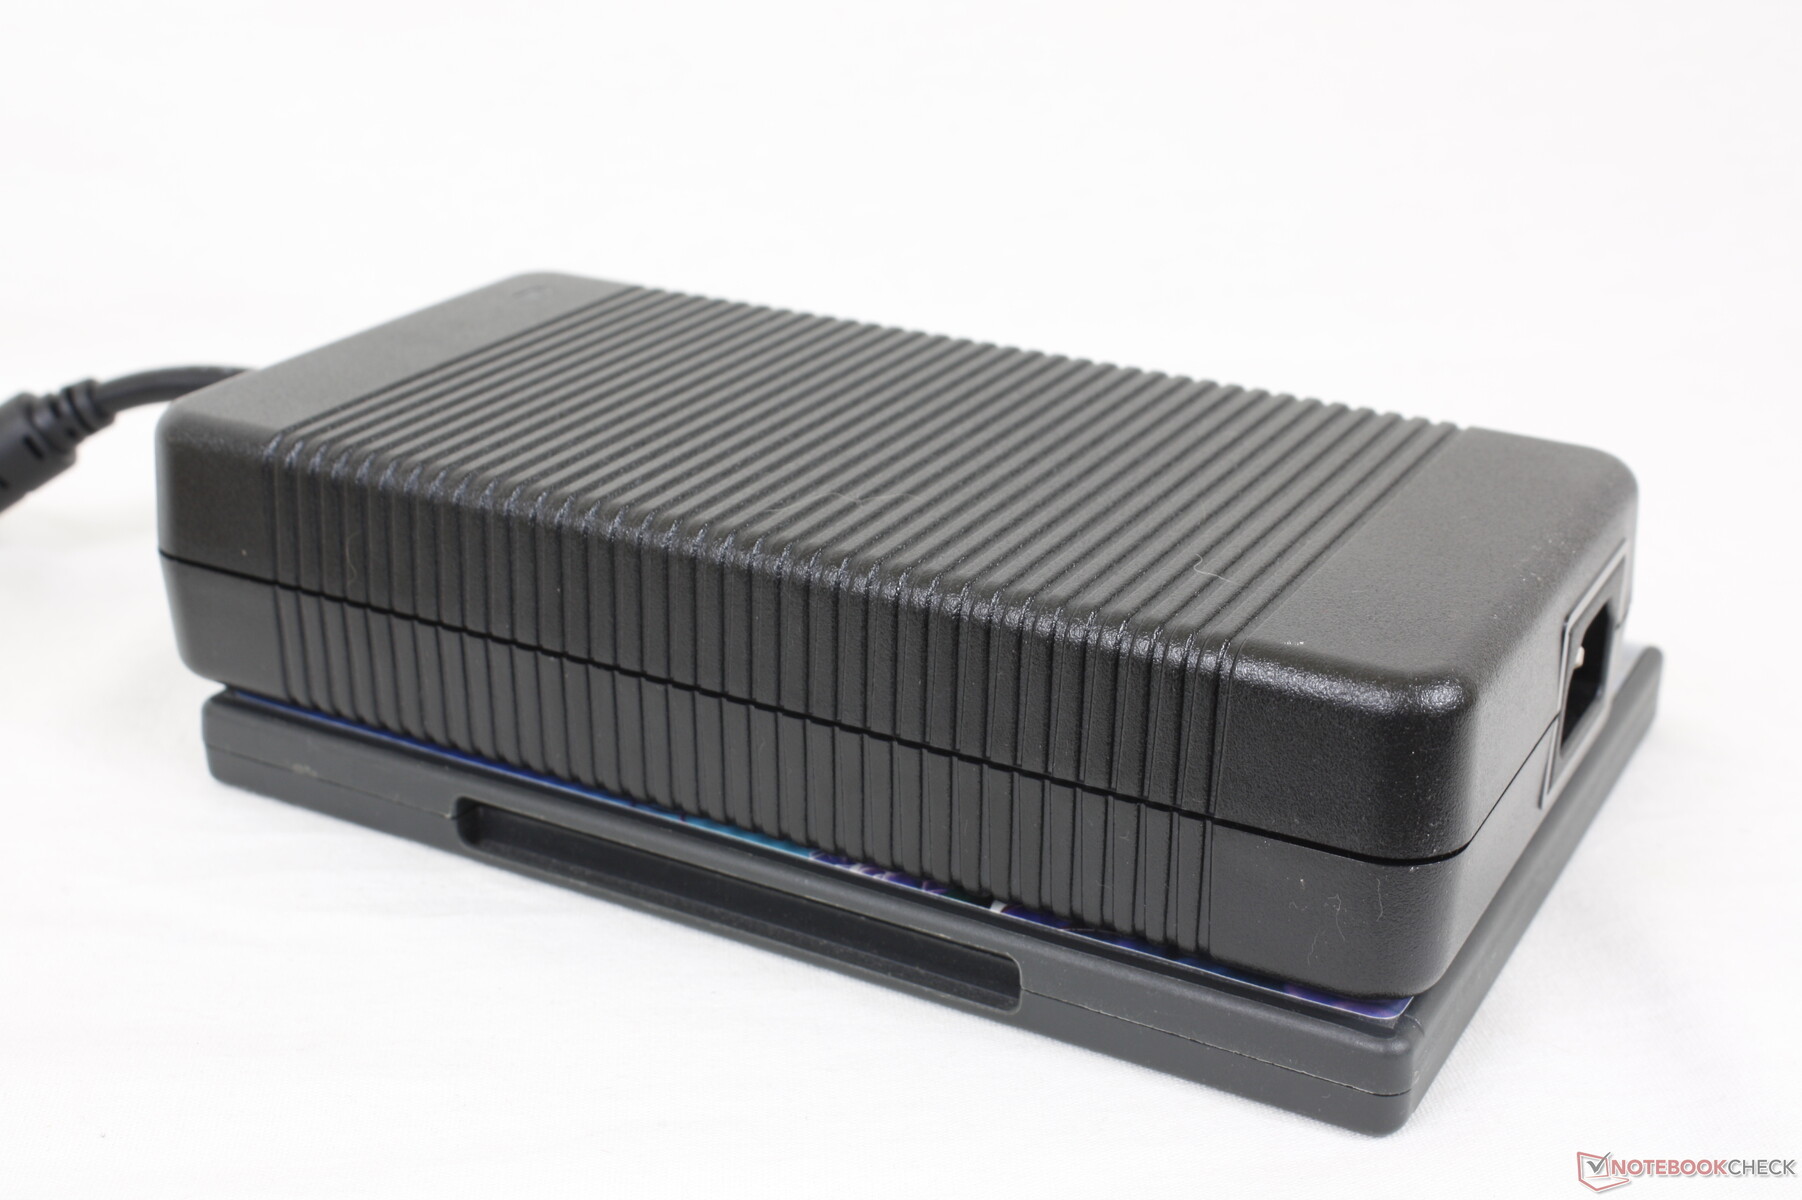
Nous avons pu enregistrer une consommation maximale de 291 W de la brique d'alimentation massive (~20 x 9,8 x 4,3 cm) et lourde (1,3 kg) de 330 W lors de l'exécution simultanée de Prime95 et FurMark. Notez que la plupart des autres ordinateurs portables de jeu sont livrés avec des adaptateurs secteur de 280 W ou moins.
| Éteint/en veille | |
| Au repos | |
| Fortement sollicité |
|
Légende:
min: | |
| MSI GE67 HX 12UGS i7-12800HX, GeForce RTX 3070 Ti Laptop GPU, Samsung PM9A1 MZVL21T0HCLR, OLED, 1920x1080, 15.6" | MSI Raider GE66 12UHS i9-12900HK, GeForce RTX 3080 Ti Laptop GPU, Samsung PM9A1 MZVL22T0HBLB, IPS, 3840x2160, 15.6" | MSI Vector GP66 12UGS i9-12900H, GeForce RTX 3070 Ti Laptop GPU, , IPS, 1920x1080, 15.6" | Asus ROG Strix Scar 15 G533ZW-LN106WS i9-12900H, GeForce RTX 3070 Ti Laptop GPU, Samsung PM9A1 MZVL22T0HBLB, IPS-level, 2560x1440, 15.6" | Alienware m15 R6, i7-11800H RTX 3080 i7-11800H, GeForce RTX 3080 Laptop GPU, Samsung PM9A1 MZVL21T0HCLR, IPS, 1920x1080, 15.6" | Razer Blade 15 2022 i7-12800H, GeForce RTX 3080 Ti Laptop GPU, SSSTC CA6-8D1024, IPS, 2560x1440, 15.6" | |
|---|---|---|---|---|---|---|
| Power Consumption | 5% | -15% | 21% | 12% | -35% | |
| Idle Minimum * (Watt) | 16.1 | 16 1% | 17.5 -9% | 7.56 53% | 14 13% | 33.2 -106% |
| Idle Average * (Watt) | 17.1 | 19 -11% | 20.1 -18% | 13.5 21% | 18 -5% | 36.4 -113% |
| Idle Maximum * (Watt) | 26.6 | 26 2% | 47.3 -78% | 16.87 37% | 29 -9% | 37.6 -41% |
| Load Average * (Watt) | 116.3 | 110 5% | 107.3 8% | 128.9 -11% | 93 20% | 116.7 -0% |
| Witcher 3 ultra * (Watt) | 237 | 202 15% | 225 5% | 196.2 17% | 190 20% | 172 27% |
| Load Maximum * (Watt) | 291.1 | 242 17% | 277.7 5% | 274.86 6% | 203 30% | 228.6 21% |
* ... Moindre est la valeur, meilleures sont les performances
Power Consumption Witcher 3 / Stresstest
Power Consumption external Monitor
Autonomie de la batterie - Pas mal en fait
La capacité de la batterie est la plus grande autorisée à 99,9 Wh, car toute capacité supérieure violerait les règles de sécurité de la FAA relatives aux batteries au lithium. Les utilisateurs peuvent s'attendre à une autonomie WLAN d'environ 5,5 heures lorsqu'elle est réglée sur le profil d'alimentation équilibré, ce qui est similaire à ce que nous avons enregistré sur le GE66 malgré leurs différences de performances.
La charge de la batterie vide à la batterie pleine est lente et dure de 2 à 2,5 heures. Le système ne peut pas être chargé via USB-C, contrairement à la série Razer Blade ou à la plupart des modèles Asus ROG.
| MSI GE67 HX 12UGS i7-12800HX, GeForce RTX 3070 Ti Laptop GPU, 99.9 Wh | MSI Raider GE66 12UHS i9-12900HK, GeForce RTX 3080 Ti Laptop GPU, 99 Wh | MSI Vector GP66 12UGS i9-12900H, GeForce RTX 3070 Ti Laptop GPU, 65 Wh | Asus ROG Strix Scar 15 G533ZW-LN106WS i9-12900H, GeForce RTX 3070 Ti Laptop GPU, 90 Wh | Alienware m15 R6, i7-11800H RTX 3080 i7-11800H, GeForce RTX 3080 Laptop GPU, 84 Wh | Razer Blade 15 2022 i7-12800H, GeForce RTX 3080 Ti Laptop GPU, 80 Wh | |
|---|---|---|---|---|---|---|
| Autonomie de la batterie | -9% | -19% | -4% | -18% | -12% | |
| Reader / Idle (h) | 8.4 | 7.9 -6% | ||||
| WiFi v1.3 (h) | 5.6 | 5.7 2% | 5.7 2% | 8.4 50% | 5 -11% | 4.9 -12% |
| Load (h) | 2.1 | 1.7 -19% | 1 -52% | 0.9 -57% | 1.6 -24% | |
| H.264 (h) | 7.1 | 8.5 | 5.6 | |||
| Witcher 3 ultra (h) | 1.2 |
Points positifs
Points négatifs
Verdict - Performances supérieures, factures d'électricité supérieures
Les avantages du Core i7-12800HX en termes de performances sont indéniables. En comparaison avec le Ryzen 7 5800H ou même au Core i9-12900Hle processeur Intel HX peut offrir des performances multithread jusqu'à 80 % plus rapides que le premier et 30 à 60 % plus rapides que le second. Ces gains sont suffisamment significatifs pour devancer le Core i7-12700K dans de nombreux cas. Les passionnés et les joueurs qui savent qu'ils peuvent tirer parti du processeur, par exemple pour obtenir des taux de trame plus élevés dans les jeux, trouveront beaucoup à aimer dans ce que le GE67 peut offrir.
Toutes ces performances supplémentaires ne sont pas gratuites. Alors que le GE66 était livré avec un adaptateur secteur plus fin de 280 W, le GE67 est livré avec un adaptateur secteur plus volumineux de 330 W, juste pour accueillir le CPU Intel HX de 12e génération, très gourmand en énergie. La consommation d'énergie est donc incontestablement plus élevée. Certains utilisateurs peuvent trouver que ces inconvénients valent la peine d'être pris en compte si l'on considère les immenses gains du CPU, mais c'est tout de même quelque chose à garder à l'esprit si l'on se place dans une perspective de performance par watt.
Le GE67 est l'un des ordinateurs portables de jeu de 15,6 pouces les plus rapides grâce au CPU Core i7-12800HX et au GPU RTX de 150 W de GeForce. C'est aussi l'un des plus gourmands en énergie puisqu'il nécessite une grosse brique d'alimentation de 330 W pour fonctionner.
Quant à l'écran QHD OLED 240 Hz, il s'agit sans conteste de la meilleure dalle OLED actuellement disponible pour les jeux et elle se marie très bien avec le CPU HX et le GPU 150 W GeForce RTX 3070 Ti. Sa mise en œuvre sur le GE67 n'est pas destinée à des fins d'édition professionnelle, cependant, et le scintillement peut avoir un impact sur une minorité d'utilisateurs.
Prix et disponibilité
Le MSI GE67 n'est pas encore largement disponible sur Amazon ou Best Buy à ce jour. Cependant, des points de vente comme XoticPC et EXcaliberPC ont des SKU en stock à partir de $2500 USD.
MSI GE67 HX 12UGS
- 08/30/2022 v7 (old)
Allen Ngo
Price comparison

