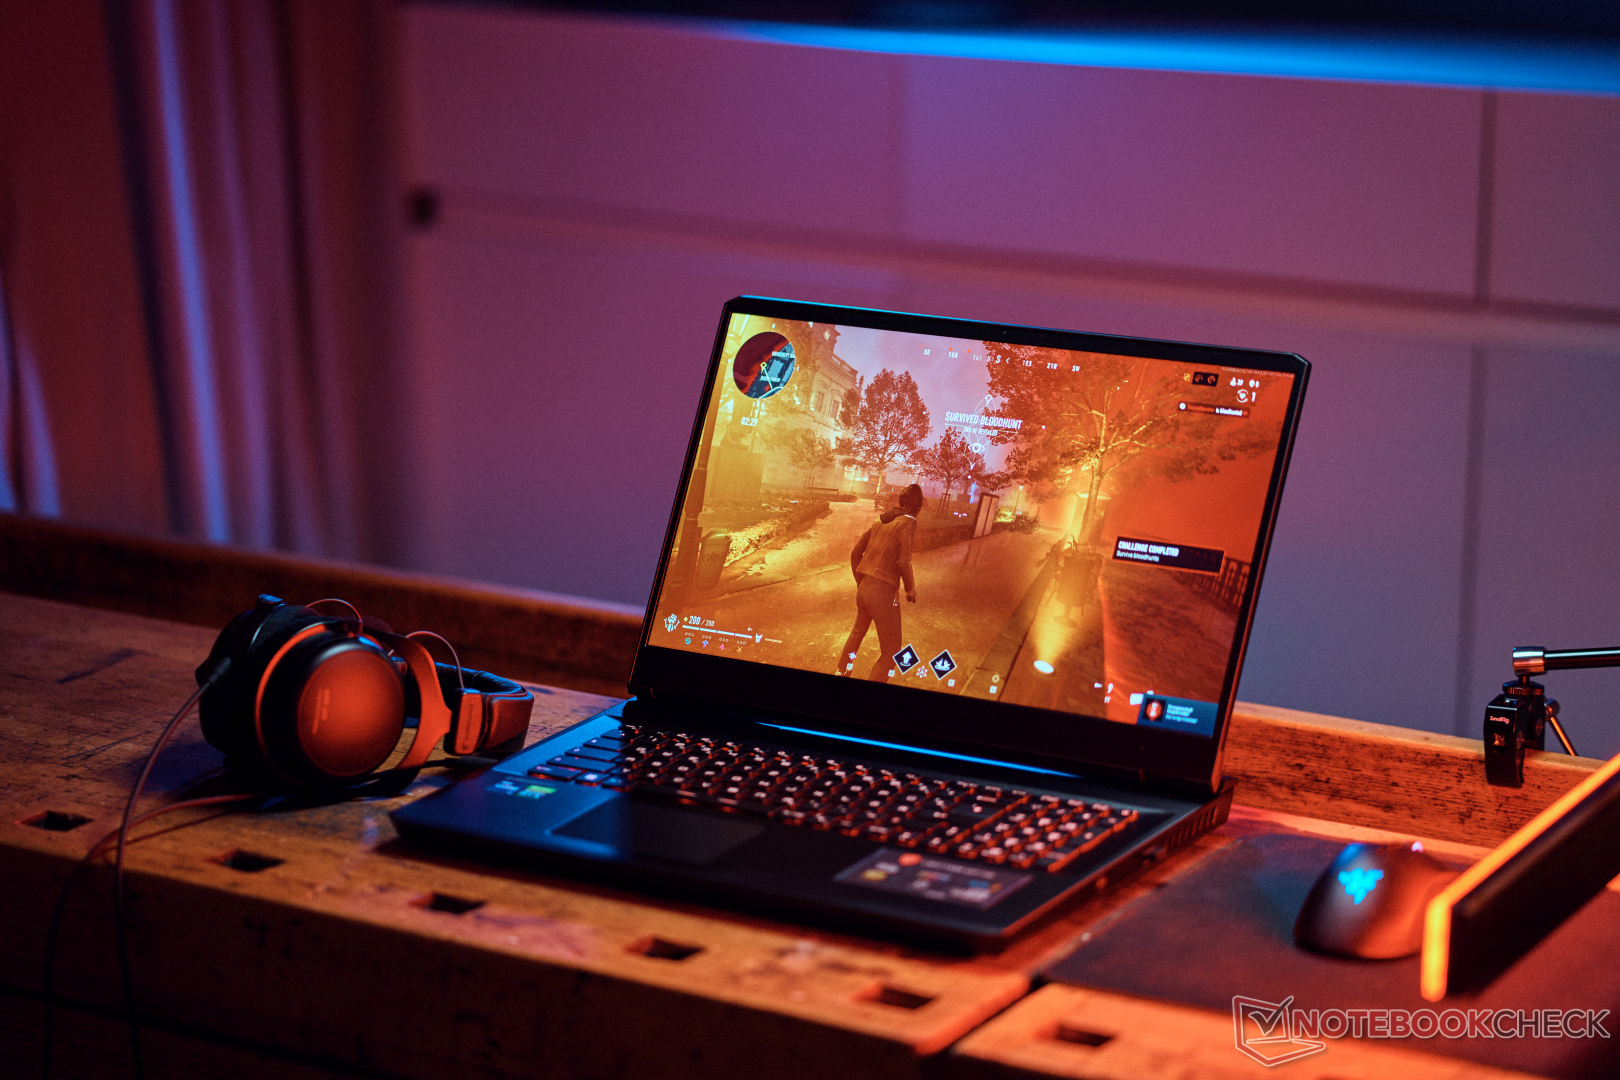
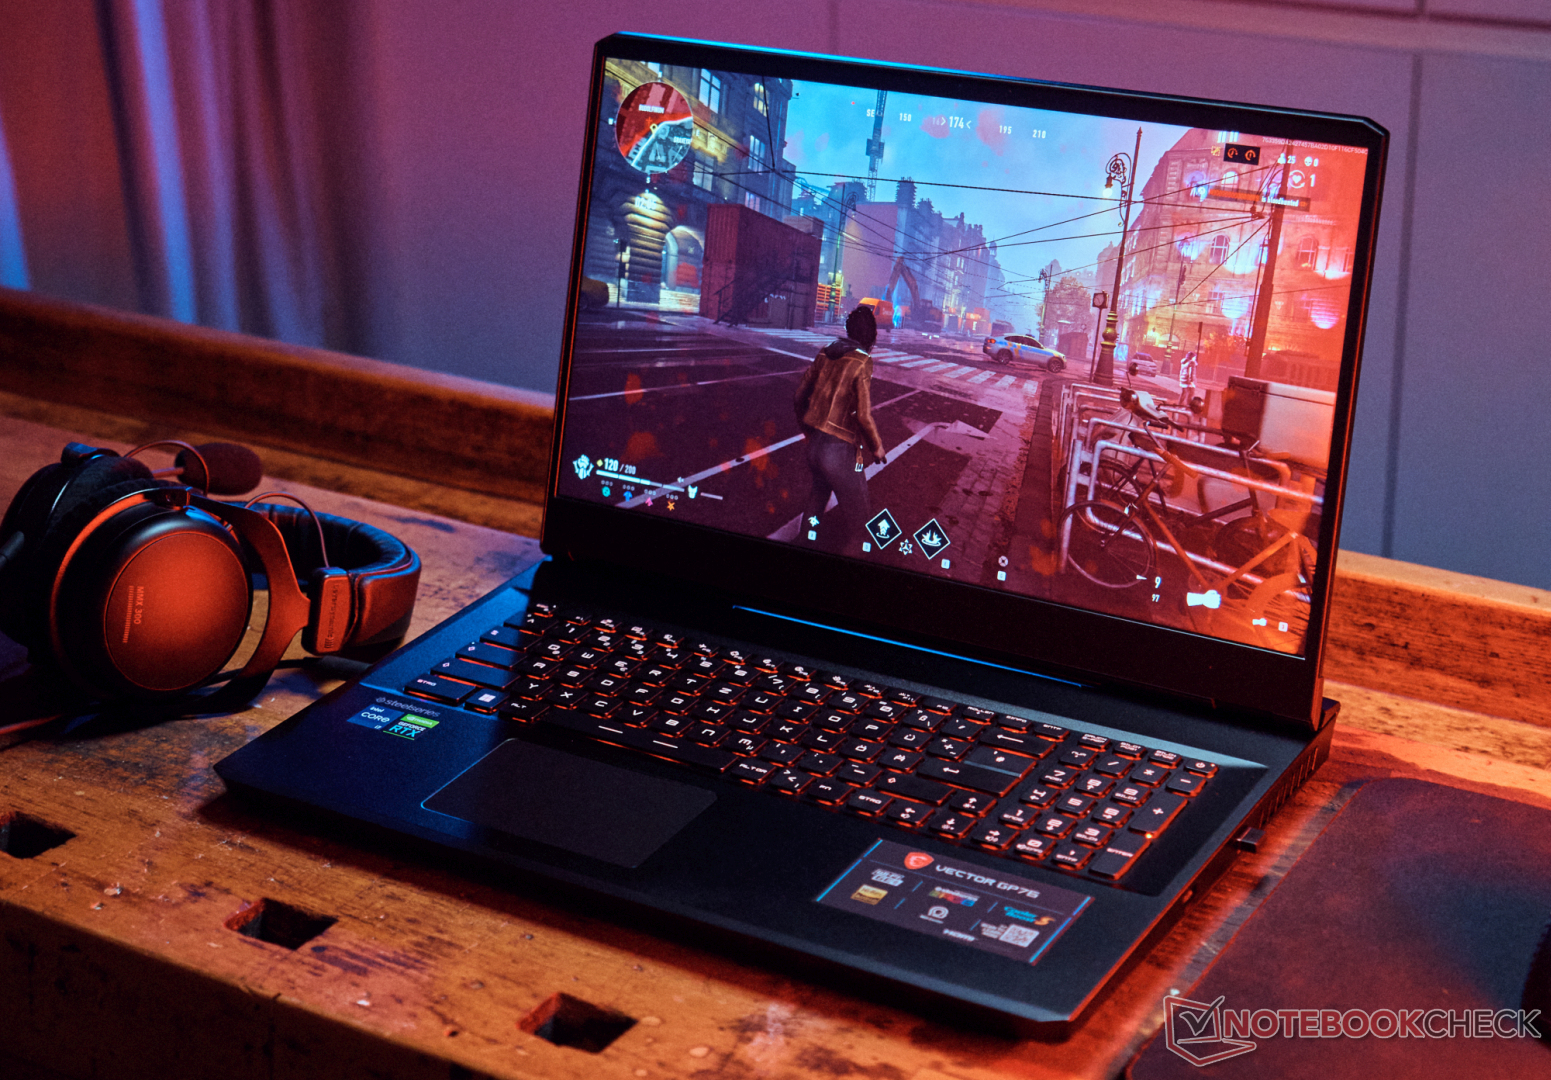
Test du MSI Vector GP76 12UGS : un ordinateur portable de jeu puissant

Avec sa nouvelle série Vector, MSI introduit deux nouveaux ordinateurs portables sur les champs de bataille du jeu cette année. Le plus petit de 15 pouces offre déjà des performances exceptionnelles, mais quelles améliorations le Vector GP76 offre-t-il en tant que successeur direct duGP76 Leopard? contrairement au MSI Alpha, Katana ou Pulsela gamme Vector n'est pas conçue pour les utilisateurs d'entrée ou de milieu de gamme, mais propose des machines de jeu haut de gamme avec des éléments de milieu de gamme, ce qui se reflète également dans le prix d'environ 2 600 USD.
Cependant, quelques caractéristiques manquent par rapport à laSérie GE pour les passionnés et la série compacte Série GS. Par exemple, Thunderbolt 4, un lecteur de carte et la charge USB-C sont omis, ainsi qu'un manque d'options pour les écrans QHD ou UHD, ou un système d'alimentation en eau Nvidia GeForce RTX 3080 Tide plus, il est équipé d'une RAM DDR4 un peu plus lente et d'une batterie plus petite. Néanmoins, il y a de nombreuses caractéristiques et mises à niveau solides que nous soulignons dans ce rapport, comme le panneau rapide de 360 Hz avec un temps de réponse de 4 ms.
Parmi les concurrents, citons Asus ROG Strix G17le Gigabyte Aorus 17, Le XMG Neo 17 de Schenker et Le Legion 5 Pro de Lenovo. La comparaison avec le modèle de prix similaire suivant est également intéressante Asus ROG Zephyrus M16.
Comparaison avec les concurrents potentiels
Note | Date | Modèle | Poids | Épaisseur | Taille | Résolution | Prix |
|---|---|---|---|---|---|---|---|
| 86.7 % v7 (old) | 05/22 | MSI Vector GP76 12UGS-434 i7-12700H, GeForce RTX 3070 Ti Laptop GPU | 2.9 kg | 25.9 mm | 17.30" | 1920x1080 | |
| 85.1 % v7 (old) | 03/21 | MSI GP76 Leopard 10UG i7-10750H, GeForce RTX 3070 Laptop GPU | 2.9 kg | 26 mm | 17.30" | 1920x1080 | |
| 83.4 % v7 (old) | 08/21 | Asus ROG Strix G17 G713QE-RB74 R7 5800H, GeForce RTX 3050 Ti Laptop GPU | 2.5 kg | 24.6 mm | 17.30" | 1920x1080 | |
| 85.2 % v7 (old) | 04/22 | Aorus 17 XE4 i7-12700H, GeForce RTX 3070 Ti Laptop GPU | 2.6 kg | 27 mm | 17.30" | 1920x1080 | |
| 87.4 % v7 (old) | 09/21 | Schenker XMG NEO 17 GM7TG8S i7-11800H, GeForce RTX 3080 Laptop GPU | 2.6 kg | 27.45 mm | 17.30" | 2560x1440 | |
| 88 % v7 (old) | 03/22 | Lenovo Legion 5 Pro 16 G7 i7 RTX 3070Ti i7-12700H, GeForce RTX 3070 Ti Laptop GPU | 2.6 kg | 26.6 mm | 16.00" | 2560x1600 | |
| 85.6 % v7 (old) | 07/21 | Asus ROG Zephyrus M16 GU603H i9-11900H, GeForce RTX 3070 Laptop GPU | 2 kg | 20 mm | 16.00" | 2560x1600 | |
| 86.9 % v7 (old) | 03/22 | MSI Vector GP66 12UGS i9-12900H, GeForce RTX 3070 Ti Laptop GPU | 2.3 kg | 23.4 mm | 15.60" | 1920x1080 |
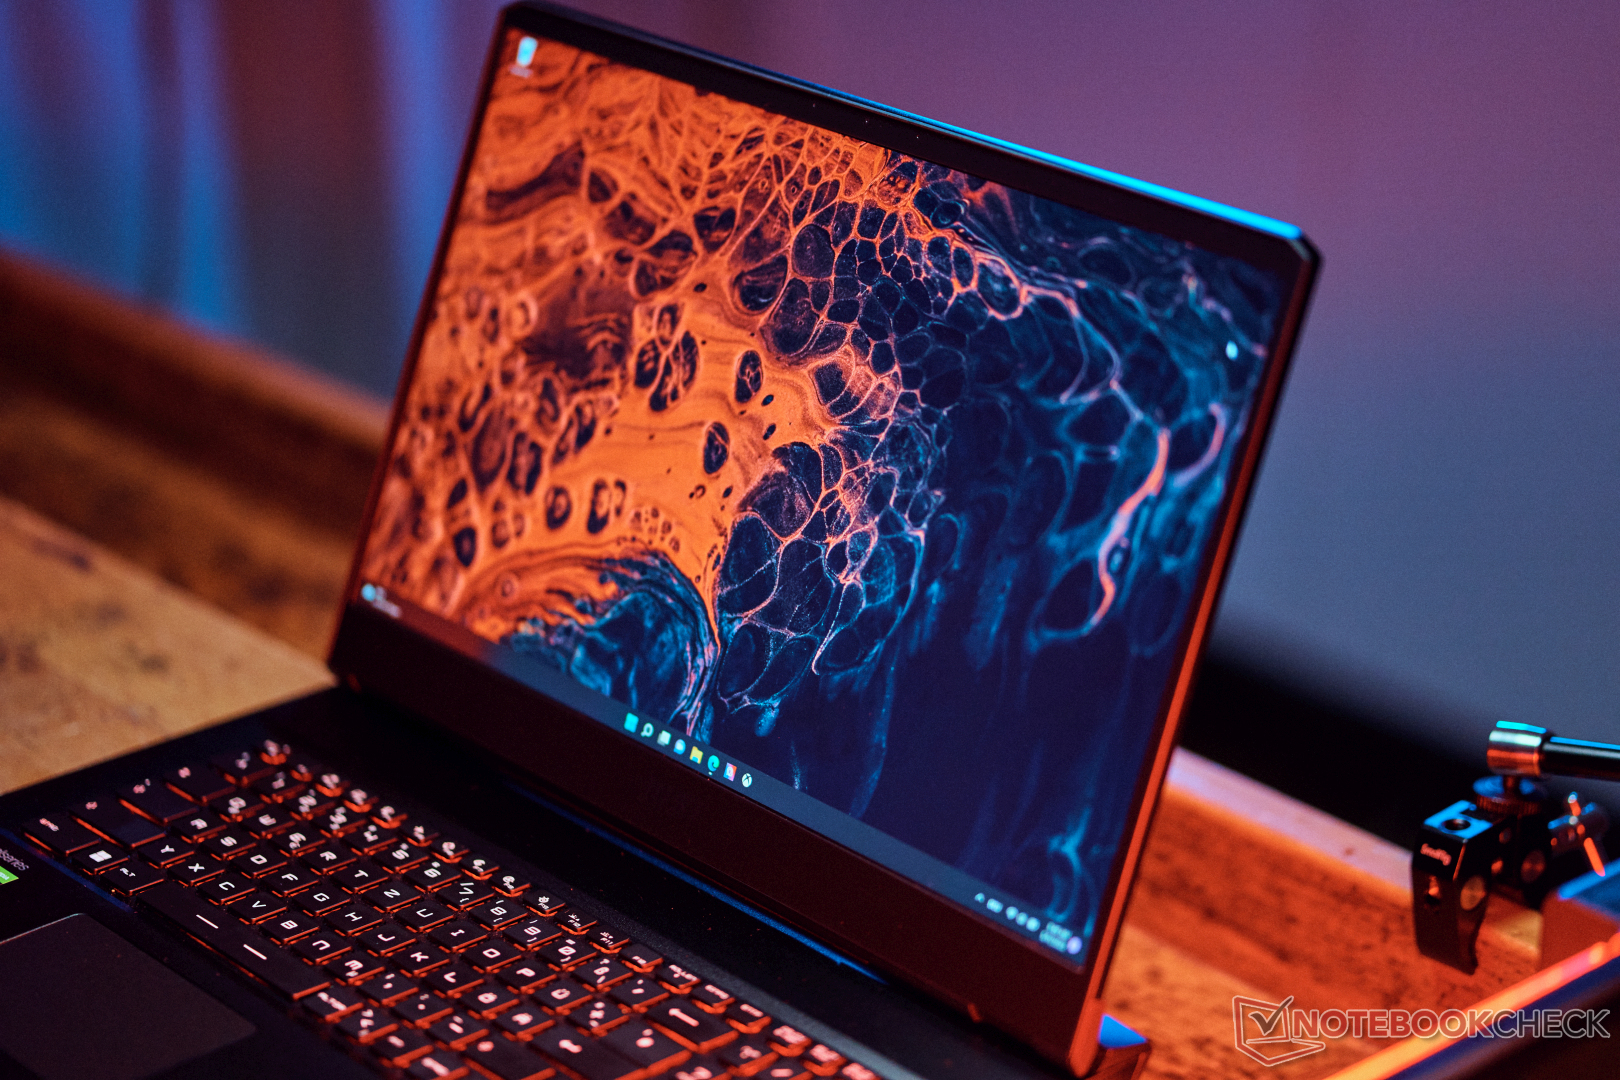
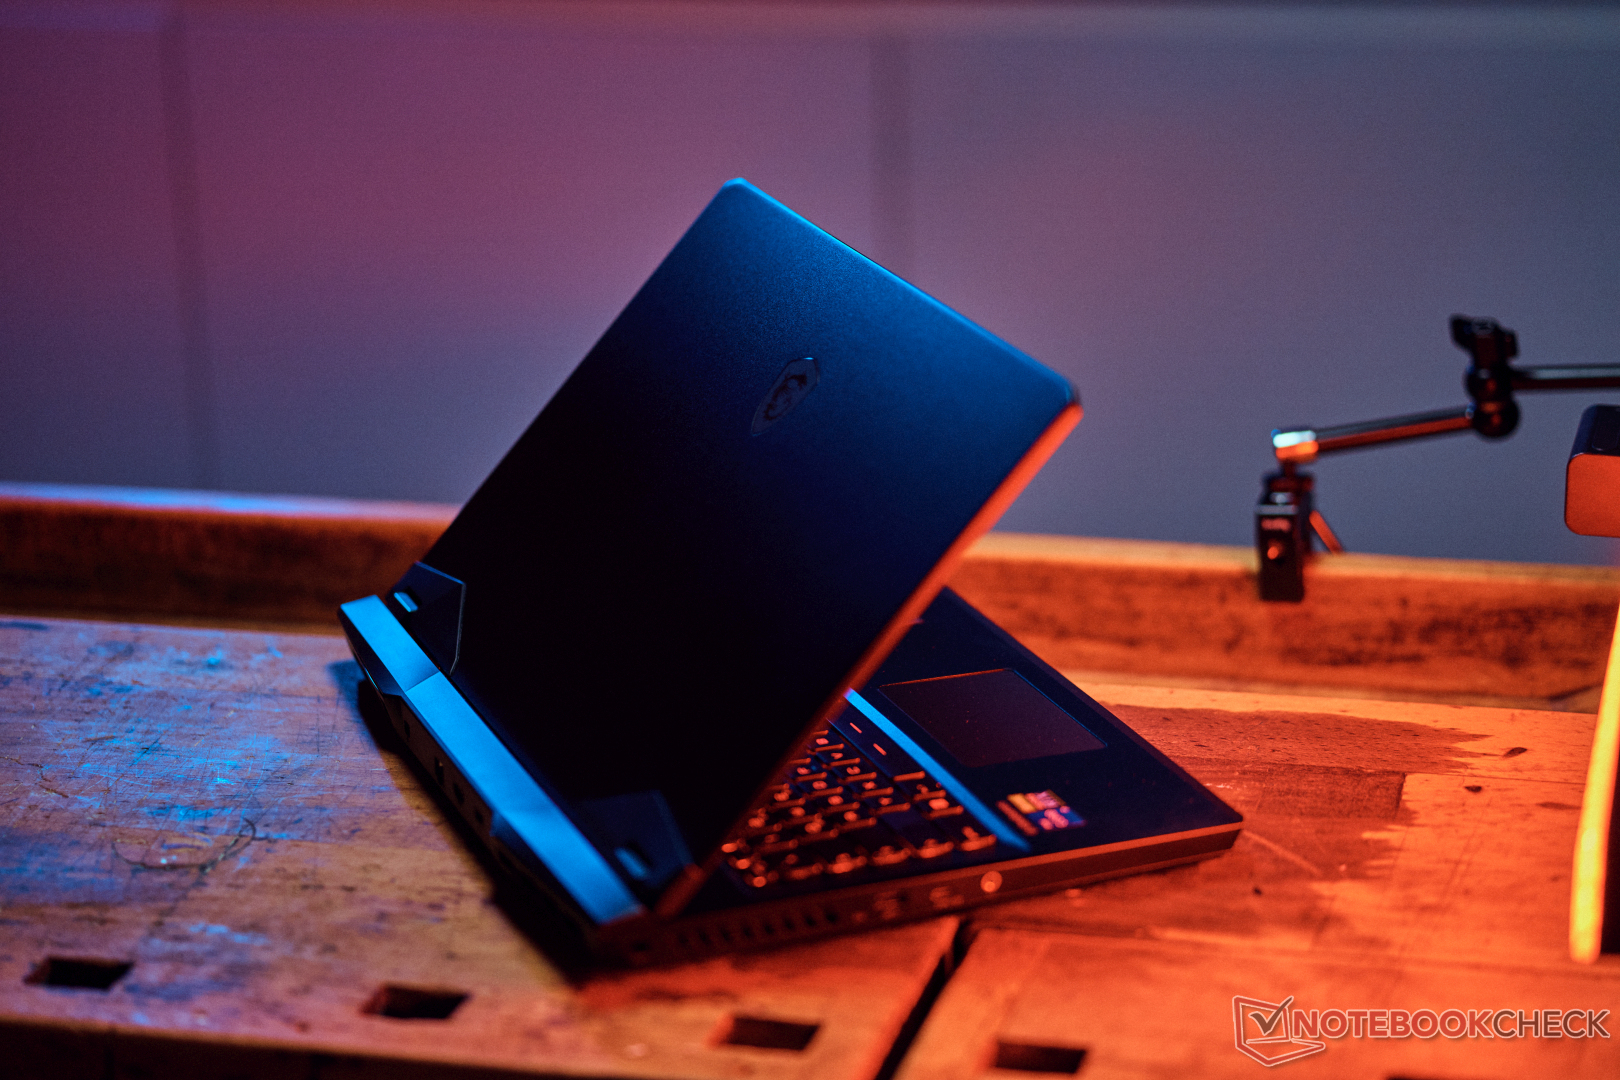
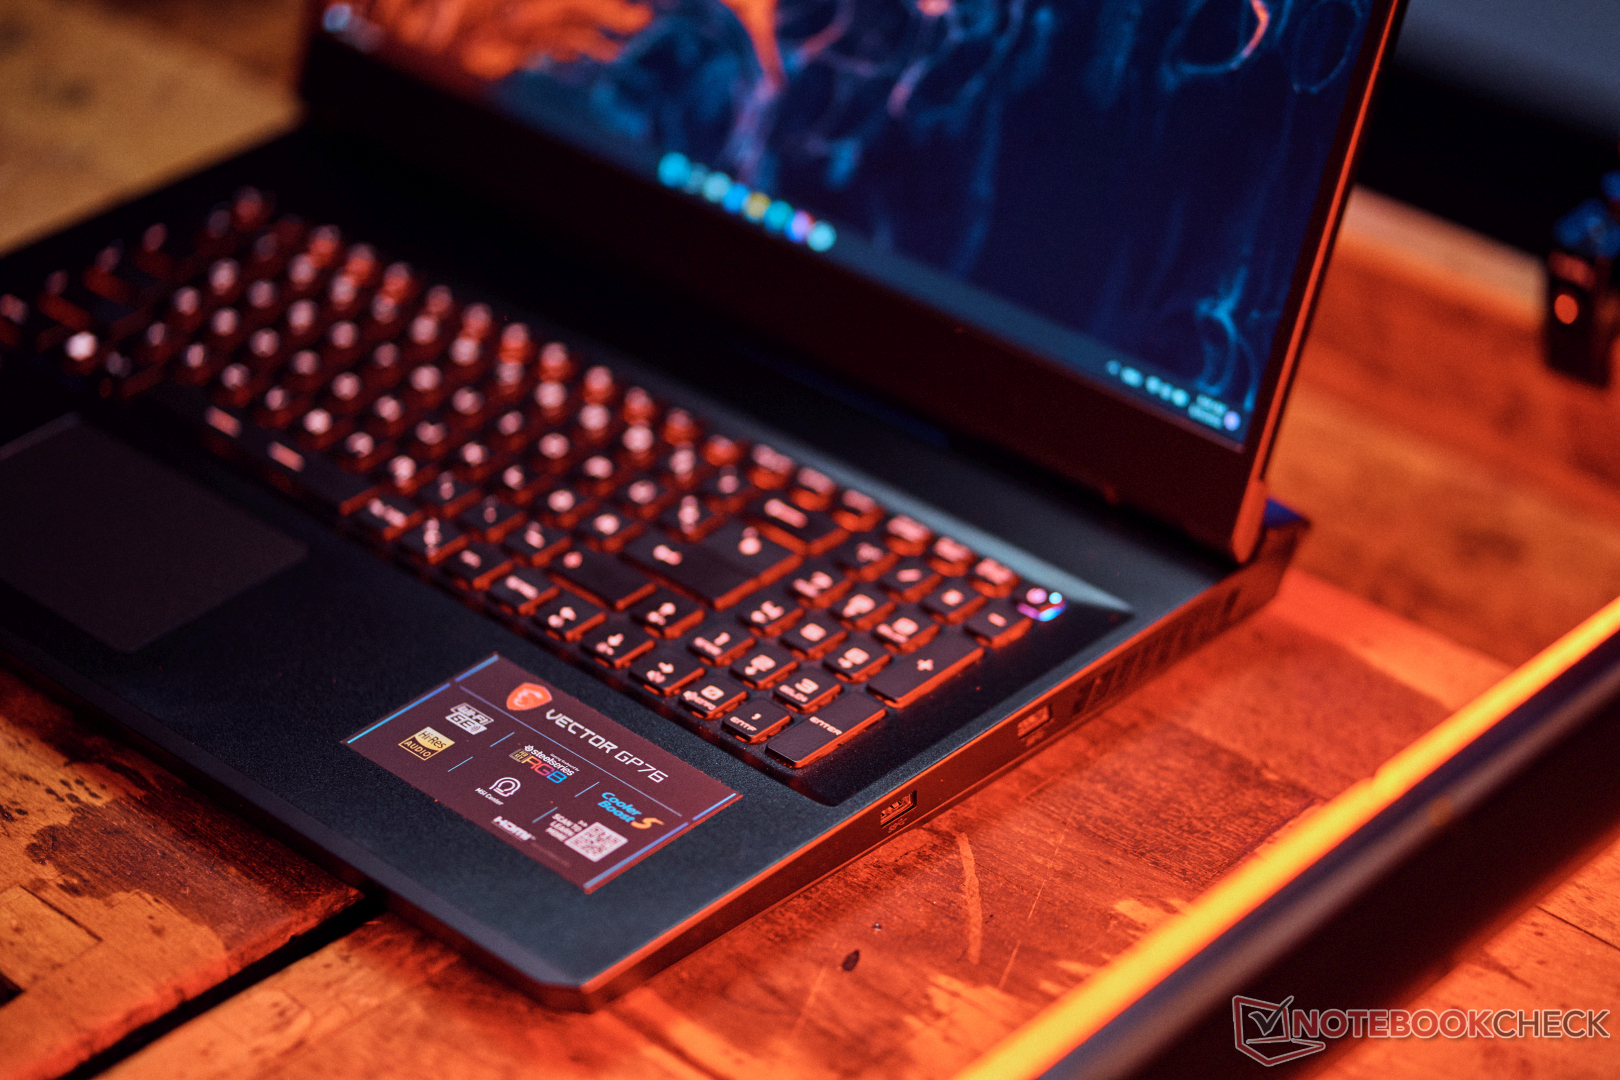
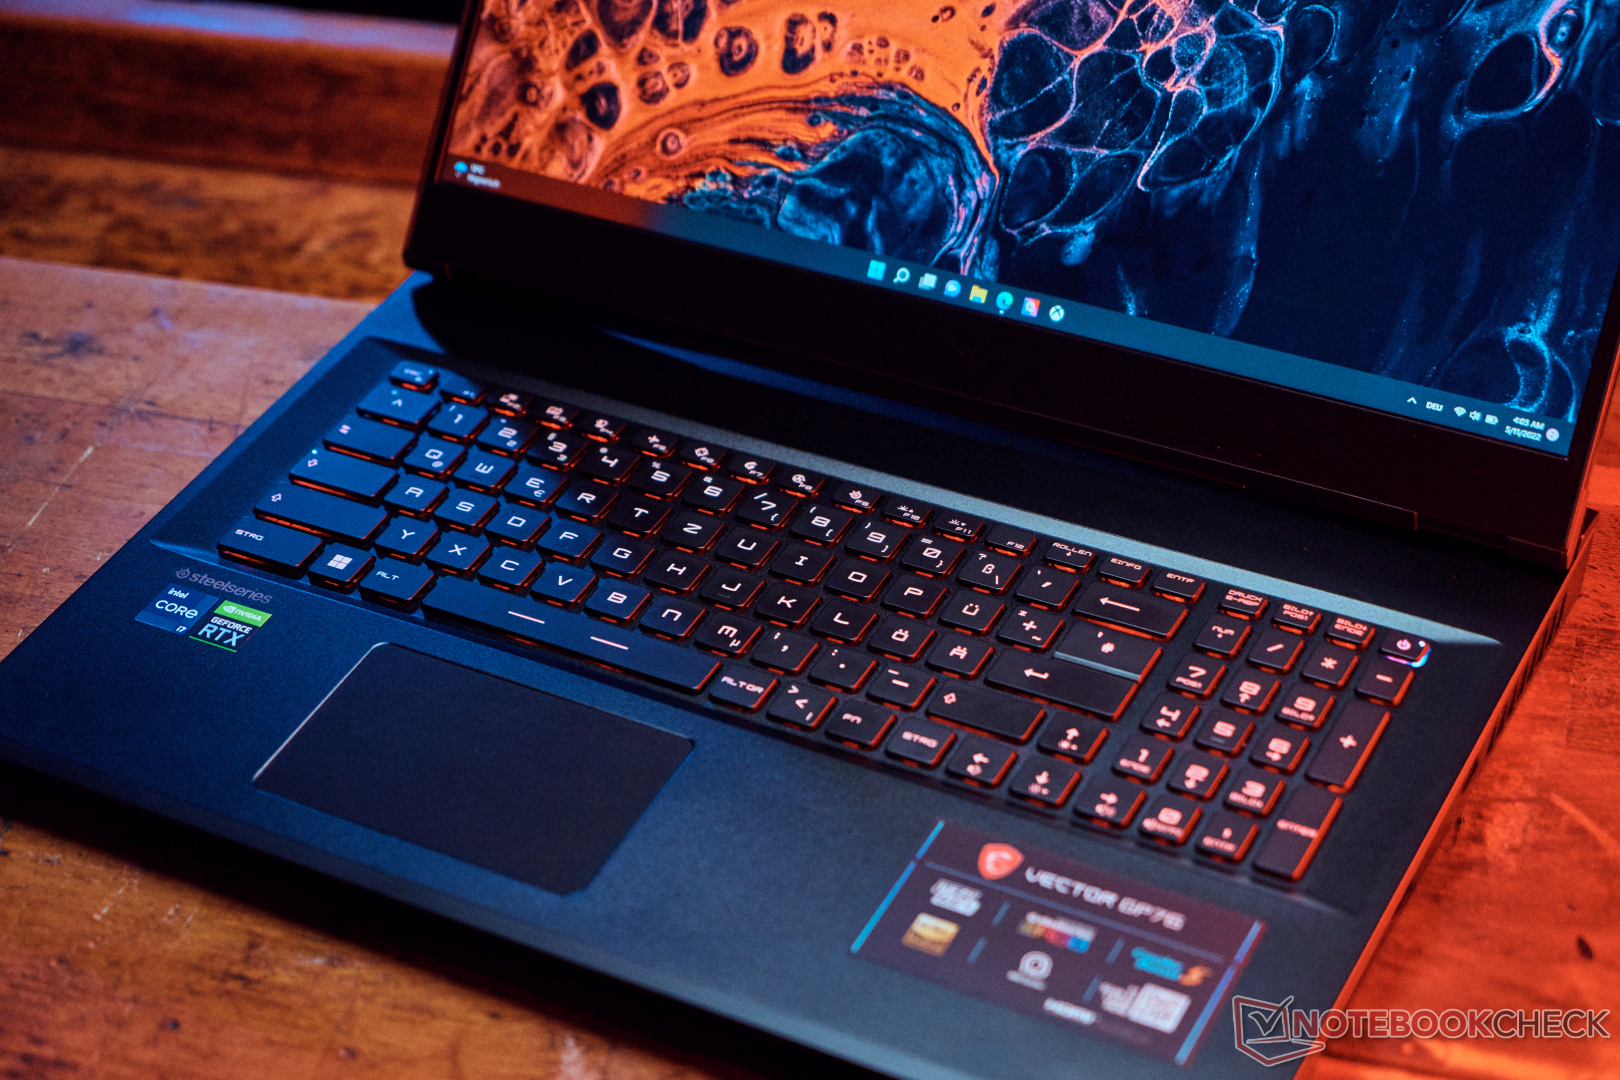
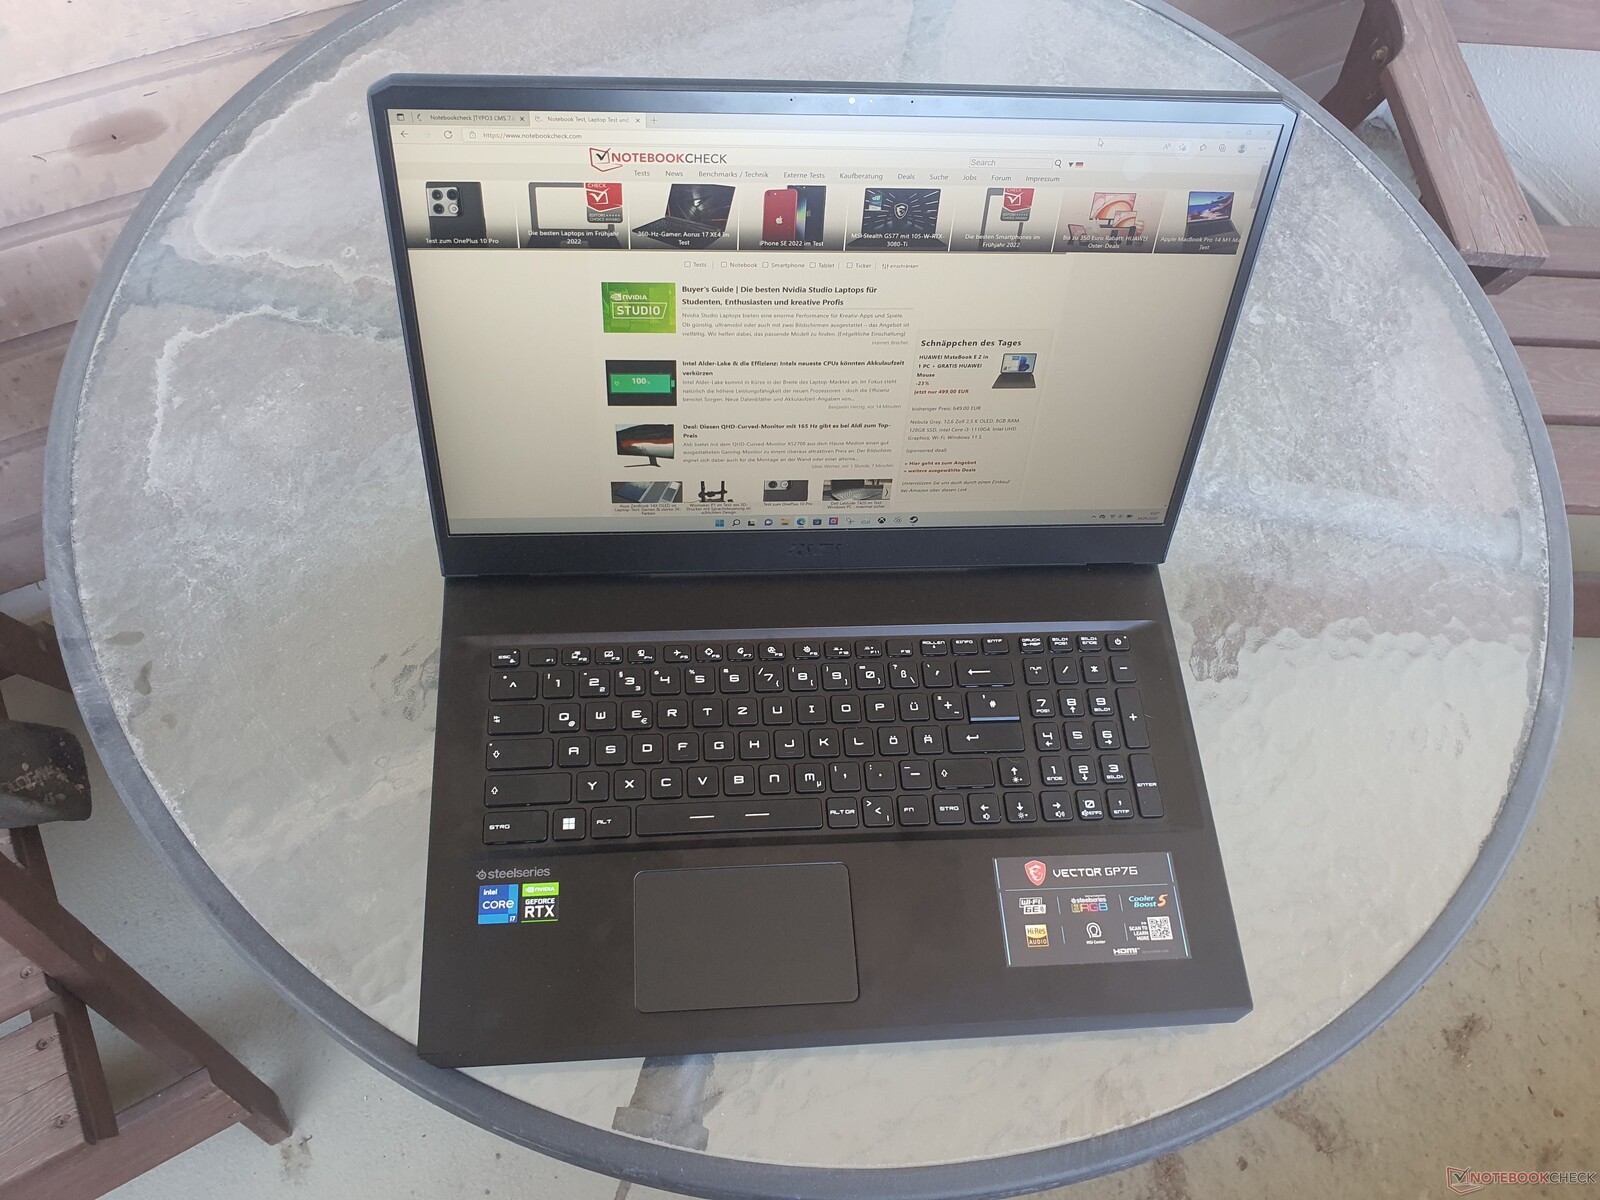
Boîtier : MSI avec Vector stable et beaucoup de métal
Le MSI Vector GP76, qui n'est disponible qu'en "Coral Black", possède un boîtier extrêmement robuste avec un couvercle d'écran et une zone de clavier en aluminium. Par rapport au modèle précédent, le boîtier est resté en grande partie le même et possède un dessous en plastique. Le Vector est résistant à la torsion, y compris l'écran, et une pression ciblée sur le dos de l'écran ne provoque aucune déformation de l'image. Seul le bas du cadre de l'écran cède un peu à la pression, mais ce n'est pas un problème majeur. L'écran ne vacille que légèrement.
Le couvercle s'ouvre d'une seule main, mais l'angle d'ouverture maximal de 140 degrés est un peu faible. Le clavier est bien encastré dans le boîtier et ne se plie pas du tout. Les surfaces sont légèrement rugueuses et ont un toucher de haute qualité. Certains bords sont un peu aigus en raison de la conception du jeu, mais ils restent acceptables. Cependant, comme le bord avant du boîtier est relié au panneau inférieur, celui-ci peut se desserrer ou se détacher un peu avec le temps, ce qui gâche l'impression générale de qualité.


Le poids de 2,85 kg est acceptable compte tenu du fait qu'il s'agit d'une machine de jeu de 17 pouces dotée de composants puissants. La concurrence propose des appareils encore plus légers, dans la catégorie des 16 pouces, tels que le Asus ROG Zephyrus M16est nettement plus léger, avec un poids de seulement 2 kg, et est de loin l'appareil le plus compact de la comparaison. La différence ici est assez significative et vaut vraiment la peine d'être prise en considération pour les jeux mobiles. L'épaisseur de 26 mm n'est pas mauvaise. Dans l'ensemble, le GP76 est légèrement plus épais que les autres appareils comparables de 17 pouces.
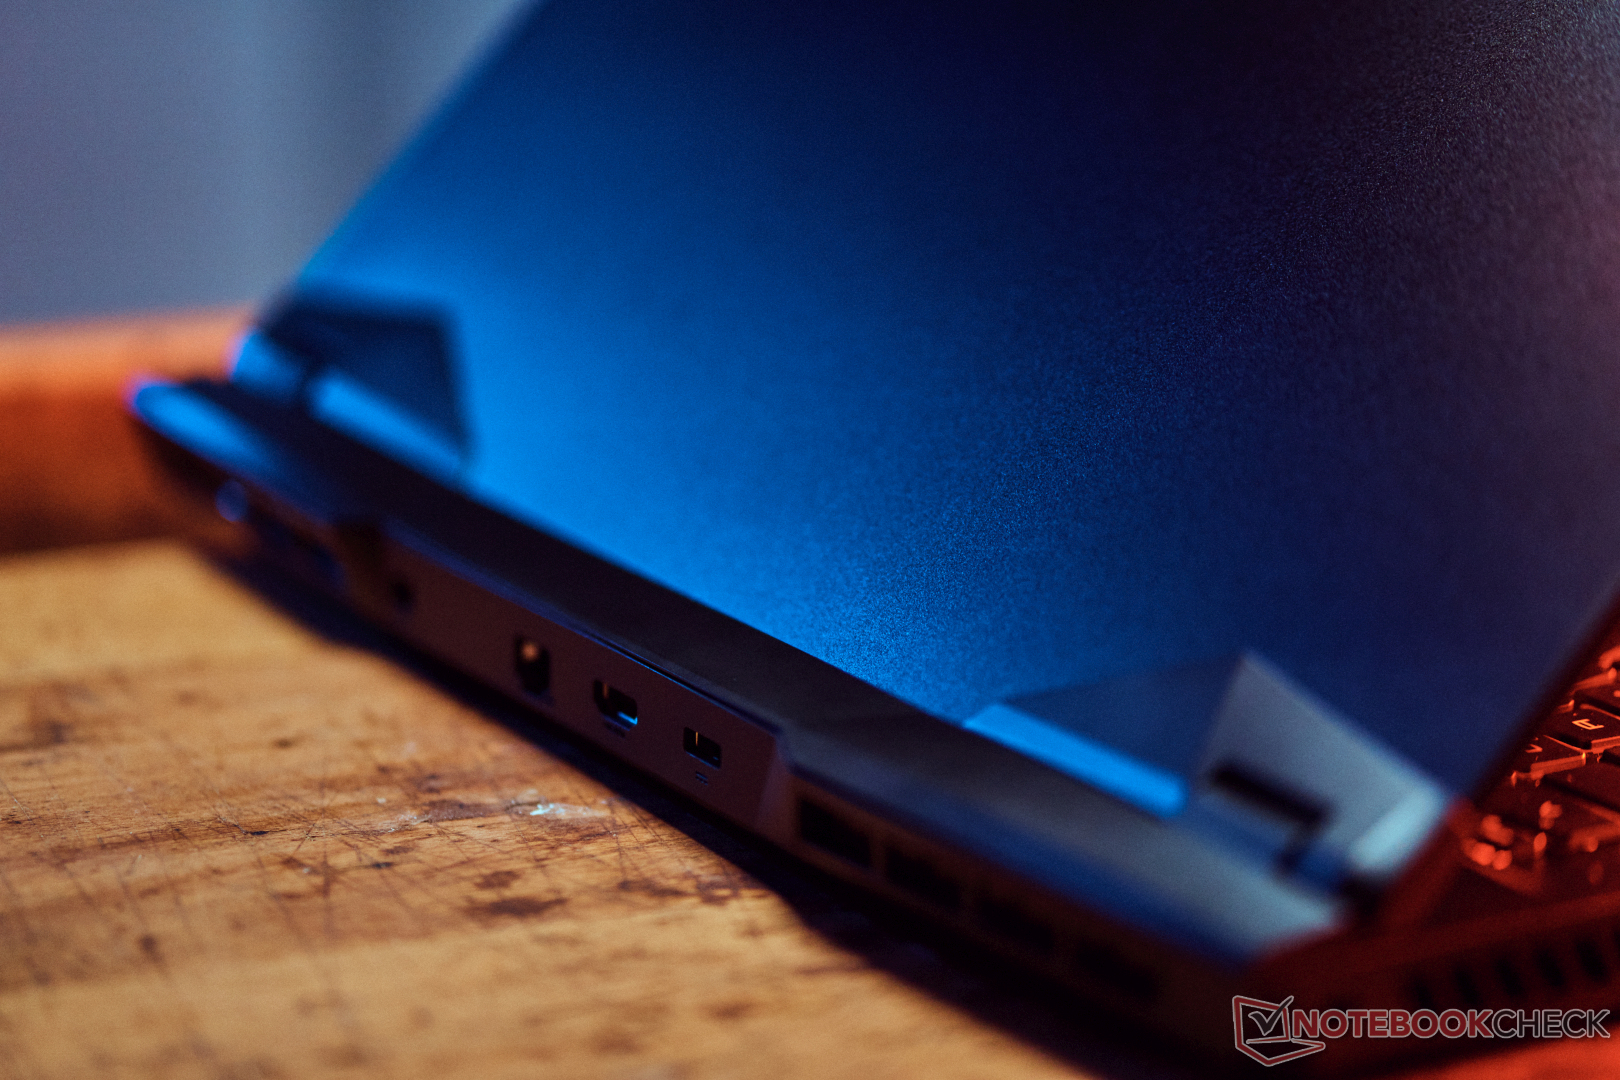
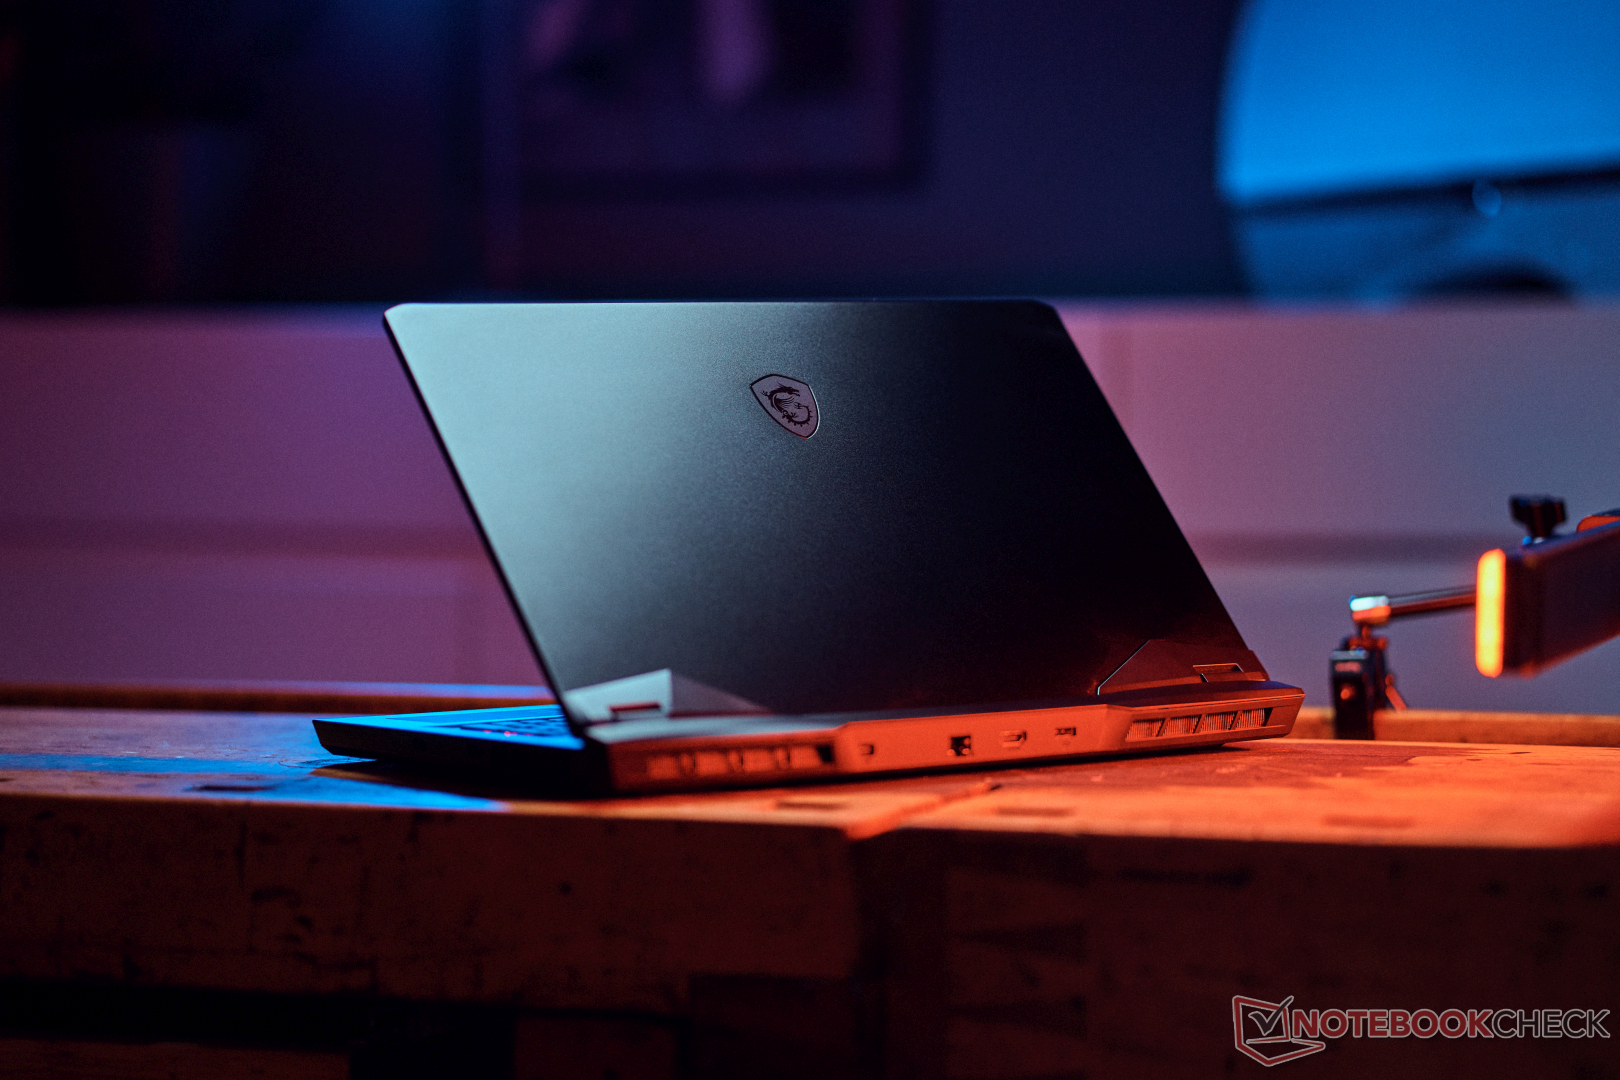
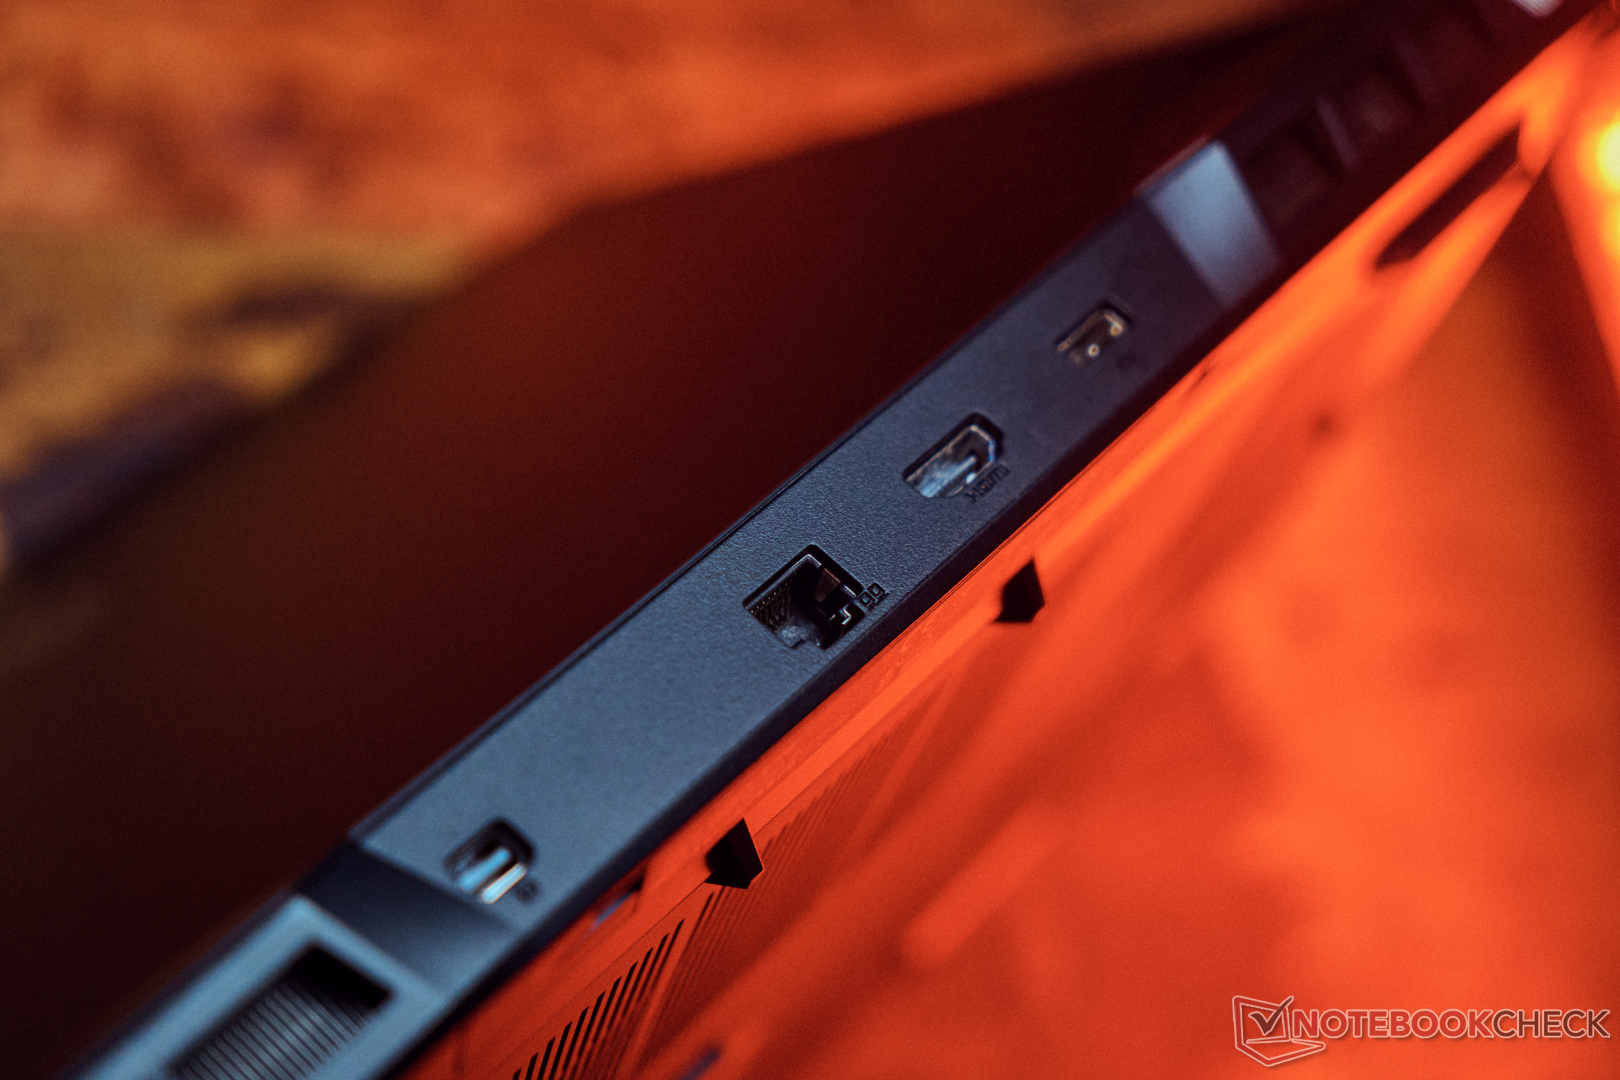
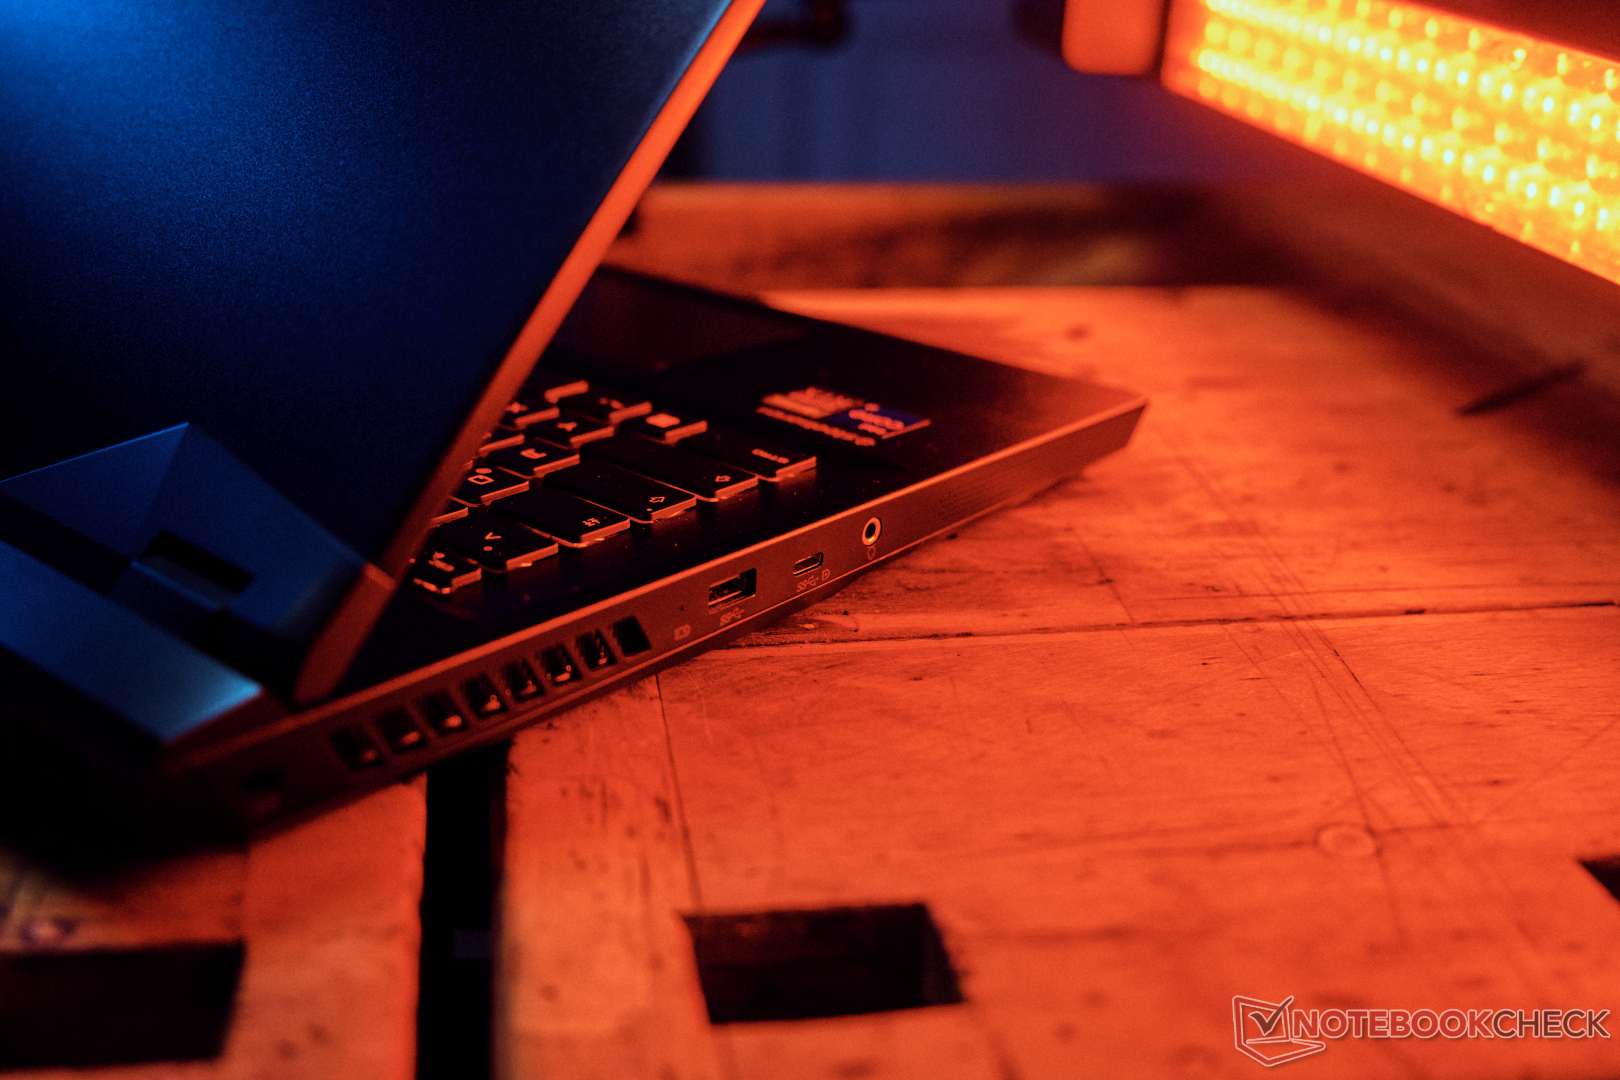
Matériel : Pas de chargement via USB-C
Heureusement, certains des ports sont situés à l'arrière de l'appareil afin que les câbles correspondants ne soient pas visibles. Un mini DisplayPort avec Adaptive Sync est présent, ainsi qu'une sortie HDMI (4K @120Hz), un LAN 2,5 Gbits et le connecteur d'alimentation propriétaire.
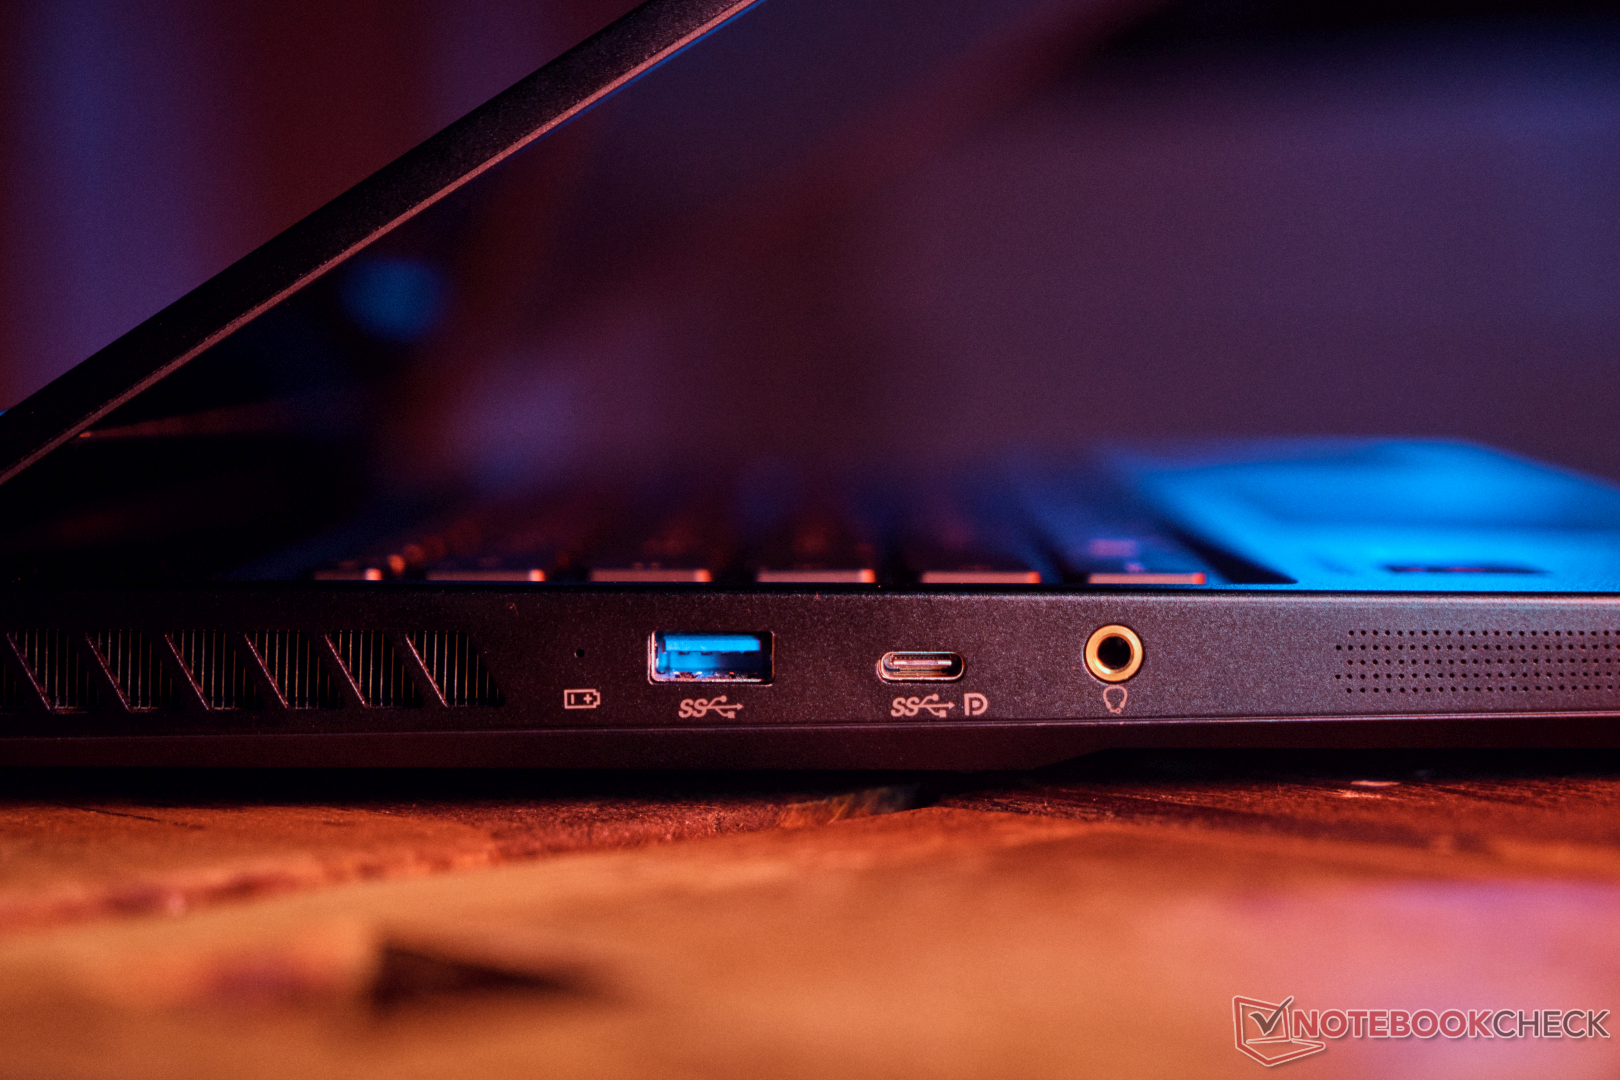
Sur le côté gauche, on trouve un verrou Kensington, 1x USB-A 3.2 Gen1 (5 GBit/s), 1x USB-C 3.2 Gen2 (10 GBit/s) avec fonctionnalité DisplayPort. Cependant, Power Delivery et Thunderbolt sont absents. Le jeu mobile en l'absence d'une alimentation de 800 grammes ne peut donc pas être garanti. Une carte graphique externe plus puissante ne peut pas non plus être utilisée.
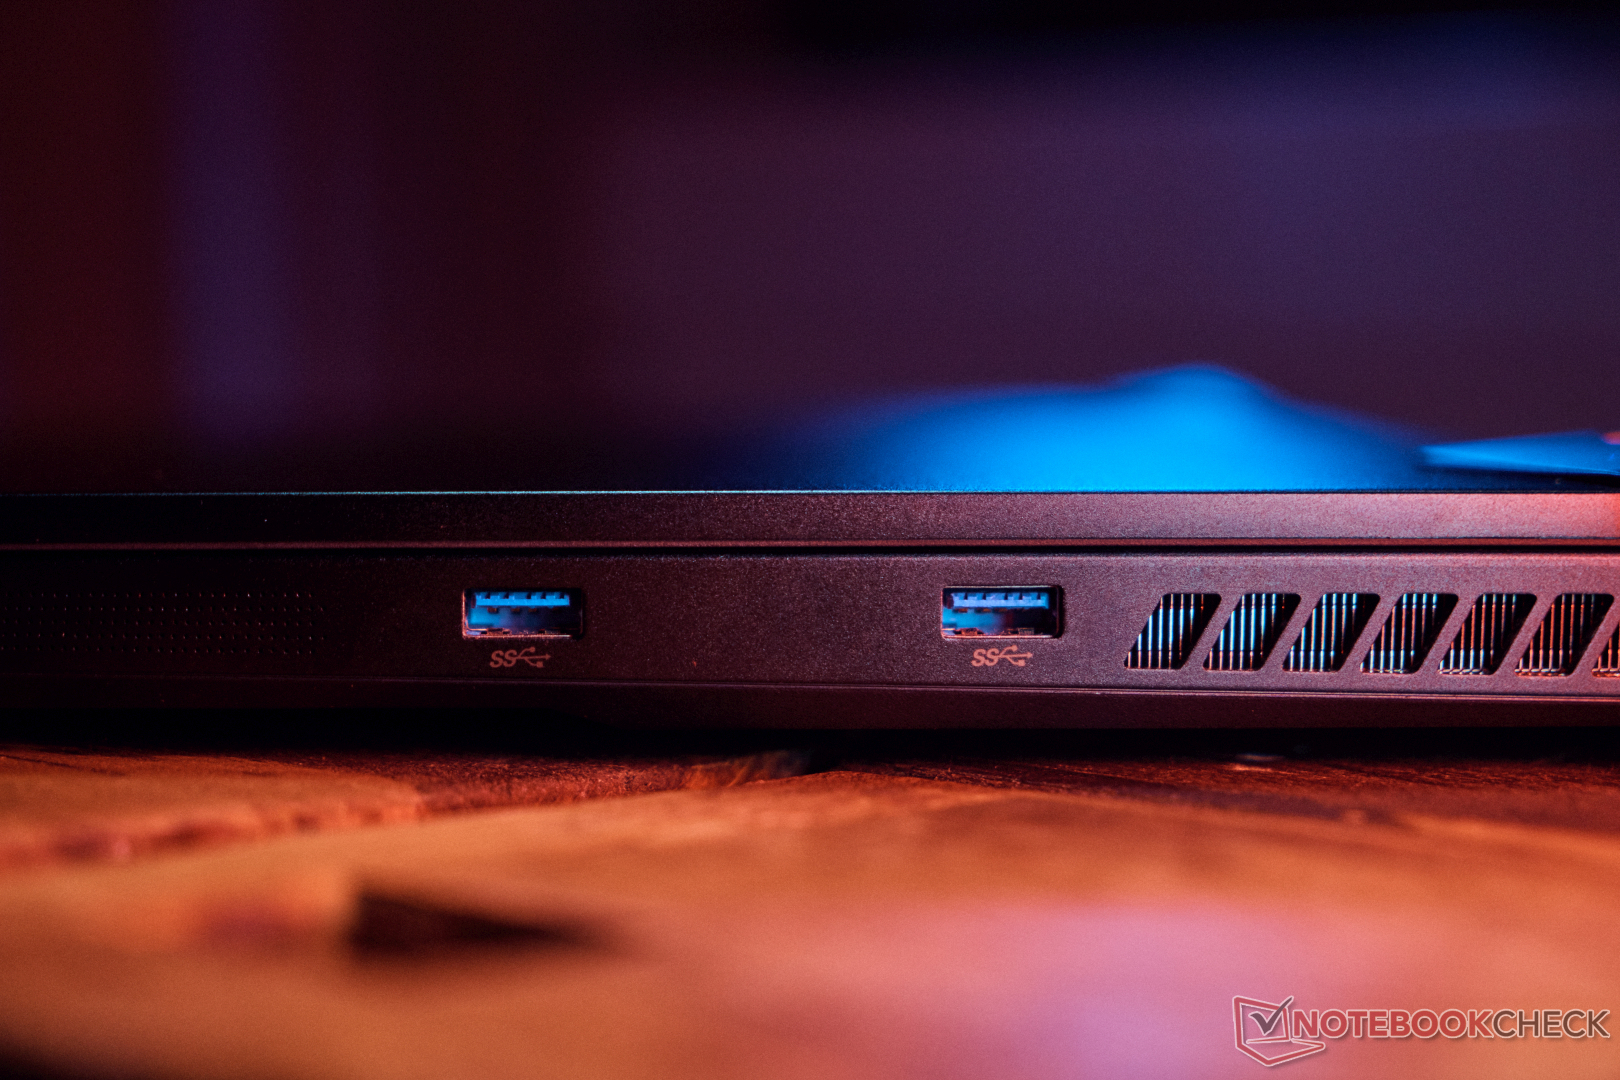
Sinon, il y a une connexion jack et deux autres ports USB A 3.2 Gen1 sur le côté droit de l'ordinateur portable. Il n'y a pas de lecteur de carte SD ni de lecteur d'empreintes digitales. Avec un disque dur externe, nous avons obtenu des taux de transfert d'environ 1 Go/s sur le port le plus rapide (USB-C à 10GBIt/s), ce qui correspond à peu près au maximum du port. Le SSD externe (USB 3.2 Gen 2x2) atteint un taux de transfert deux fois plus élevé sur un port Thunderbolt.
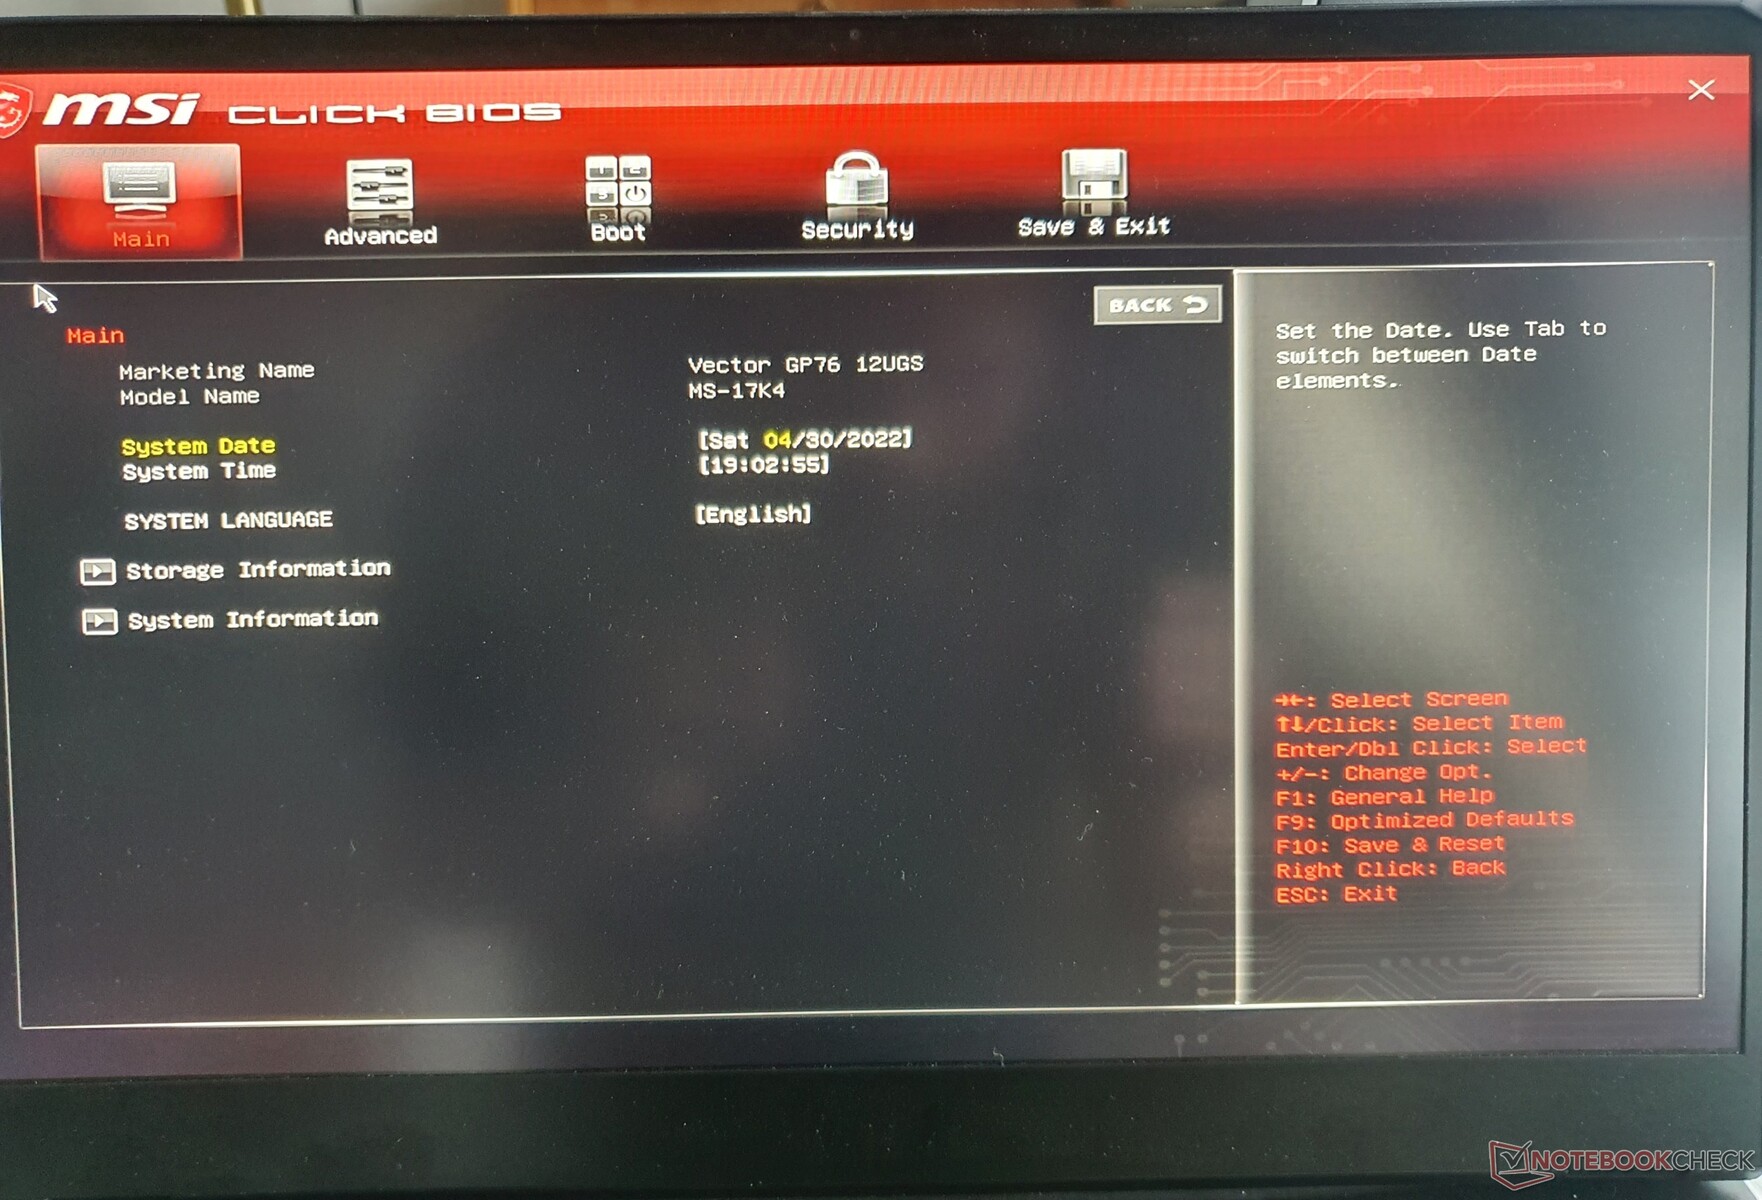
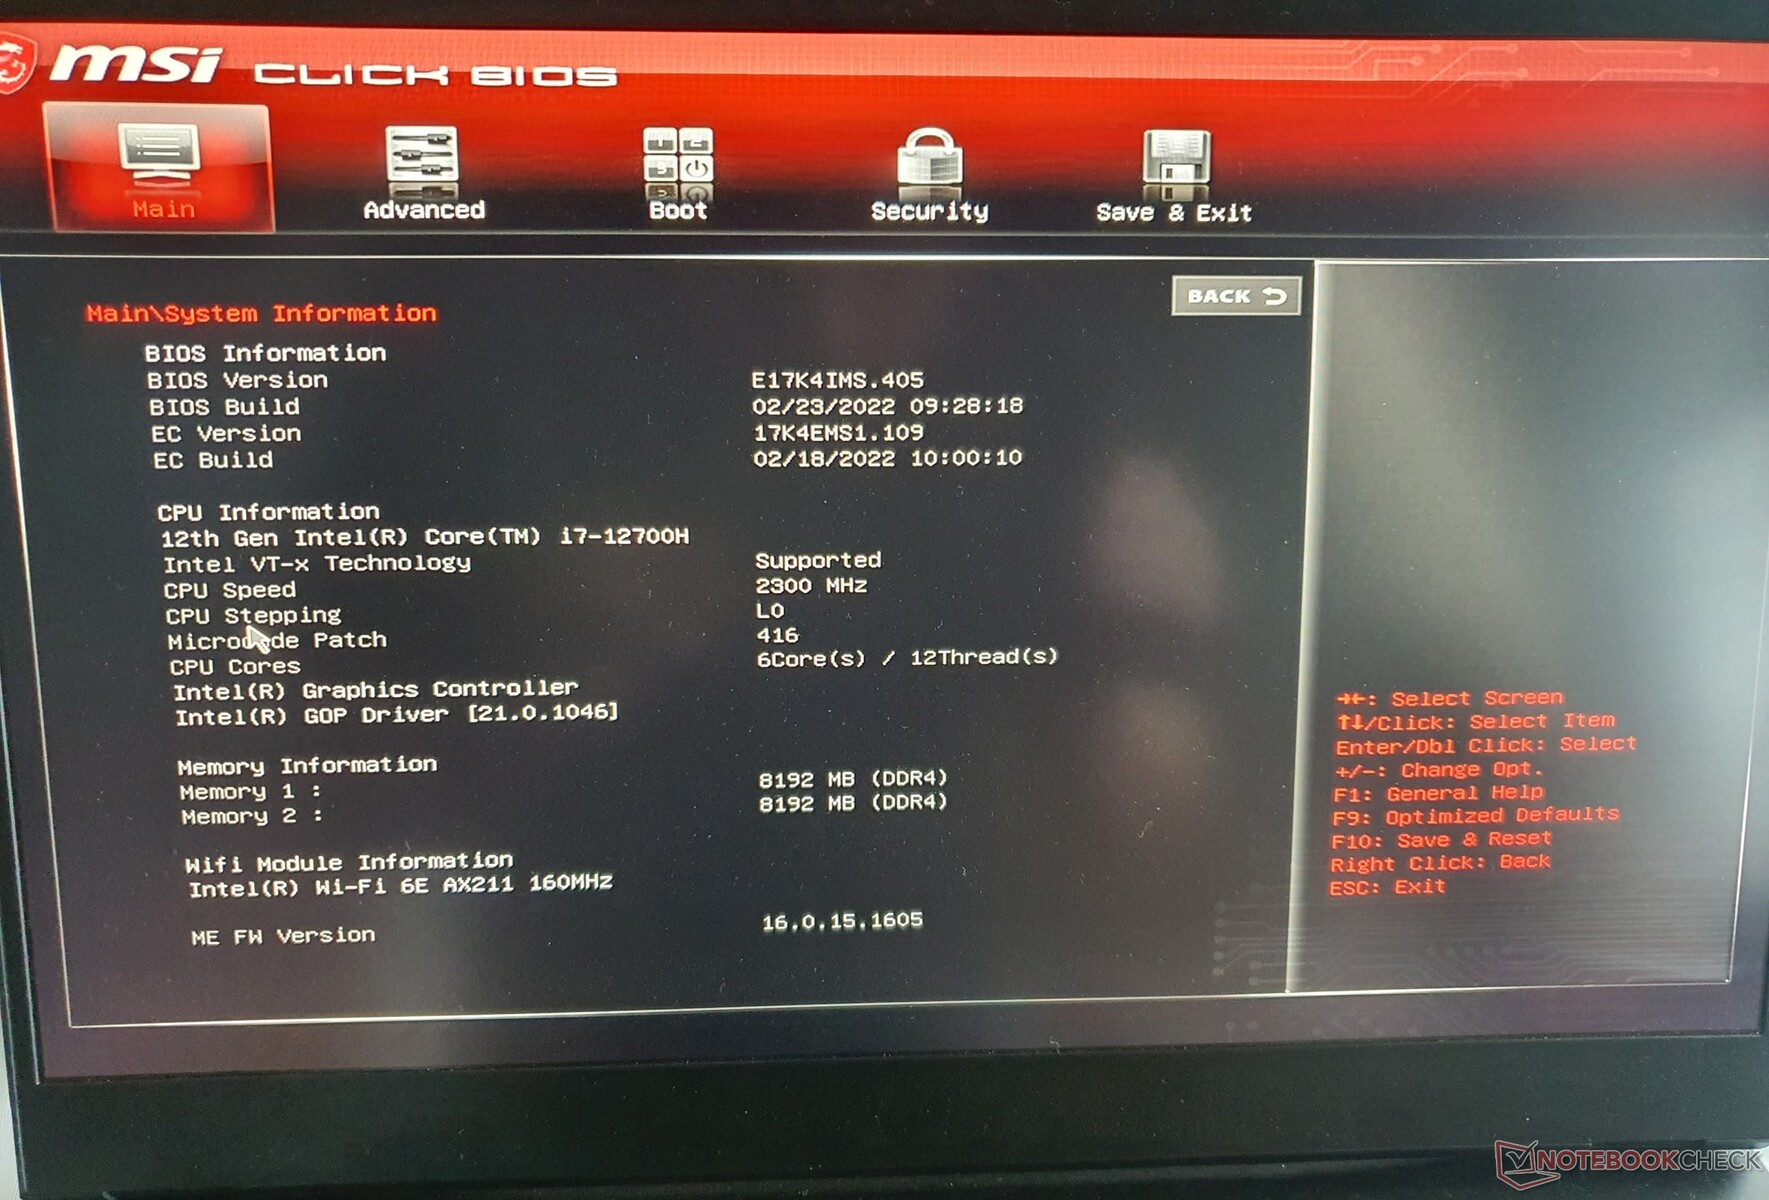
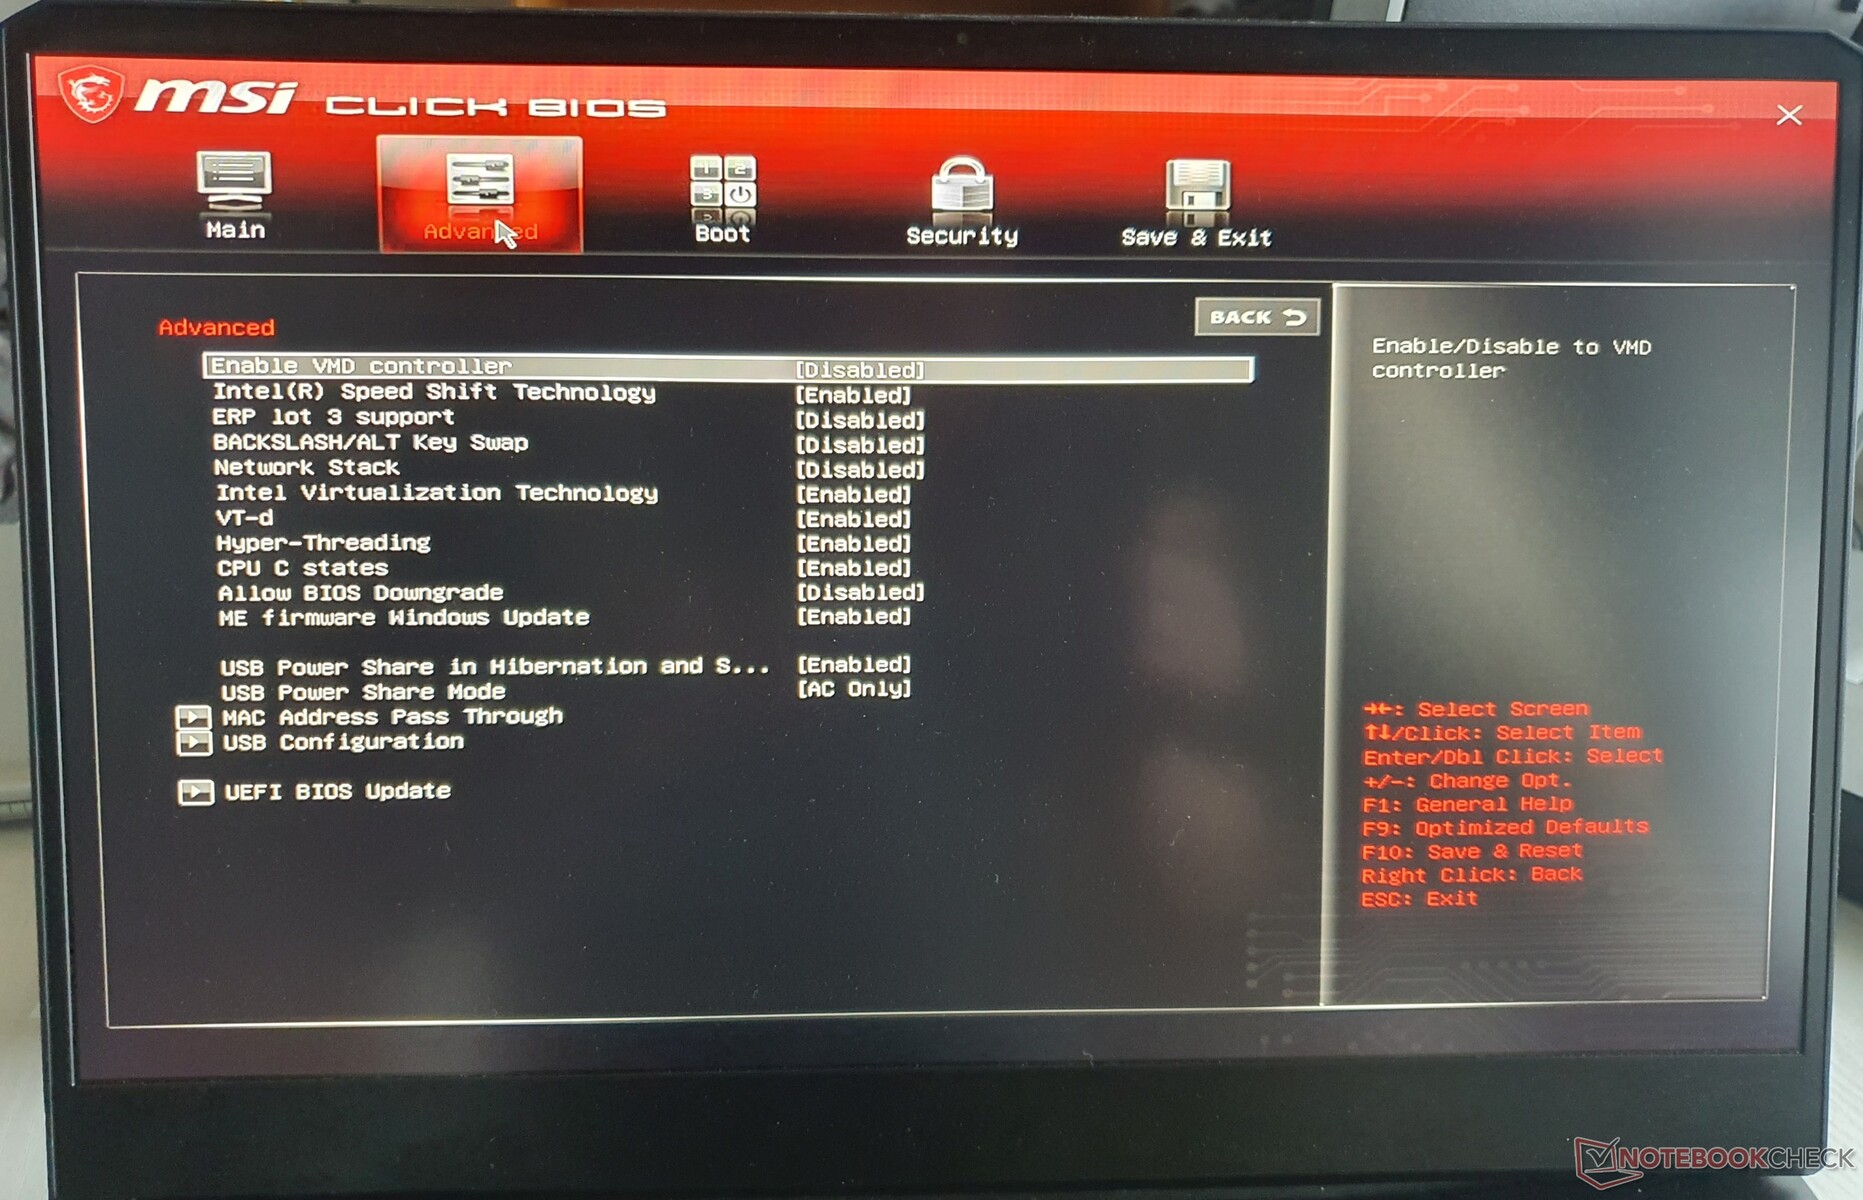
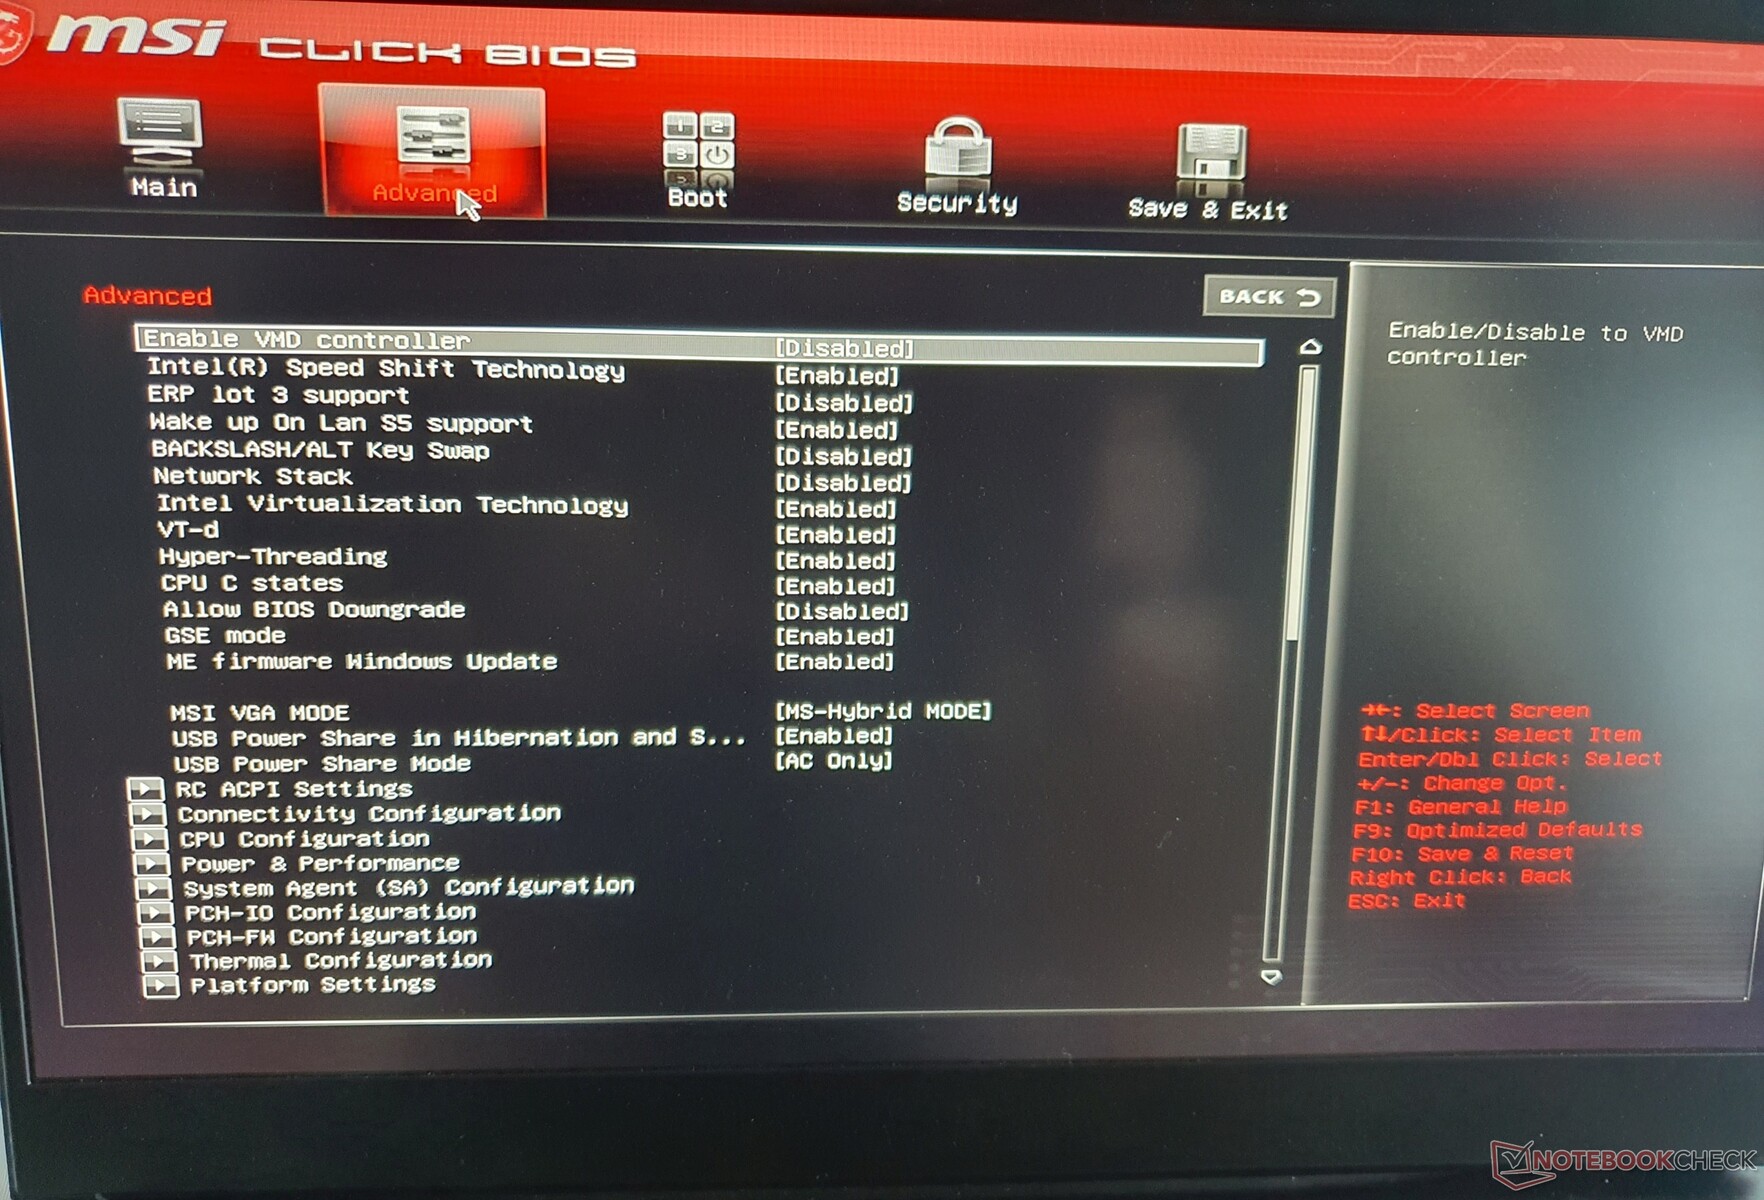
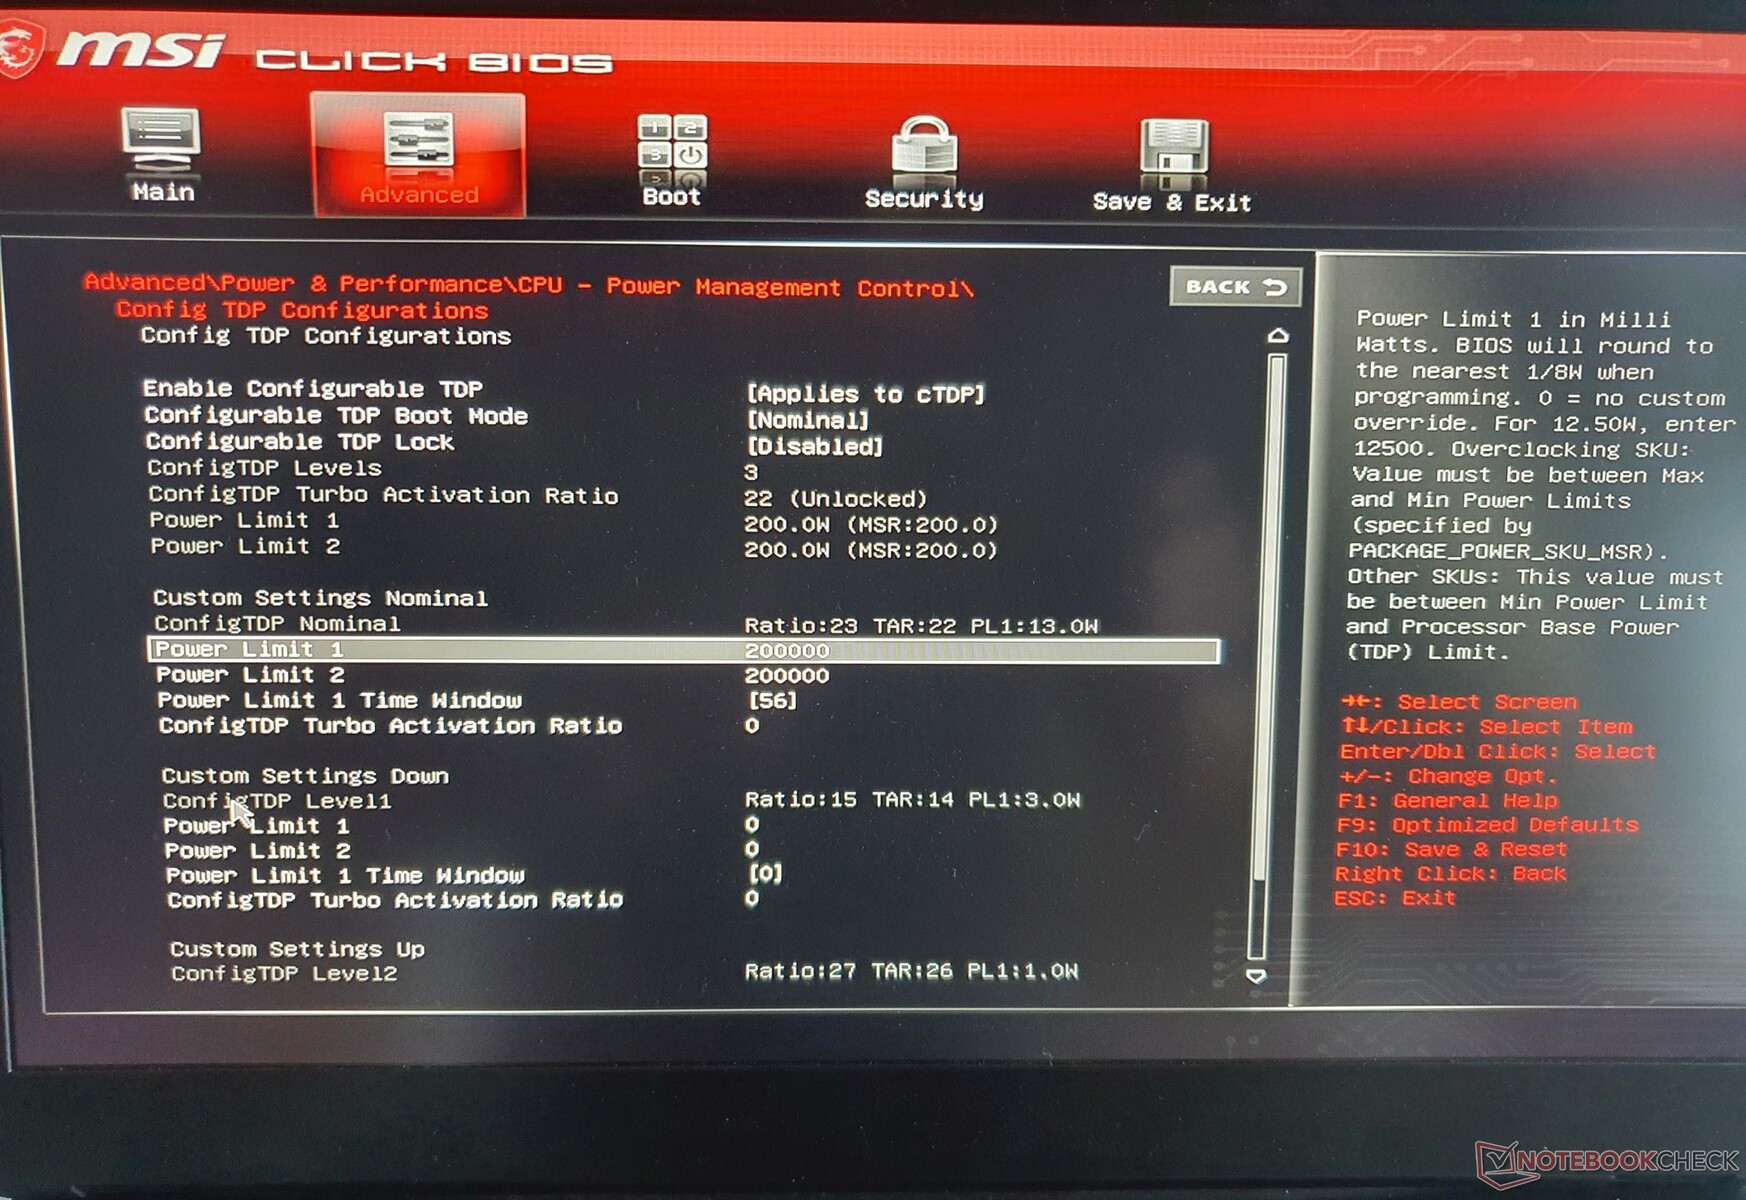
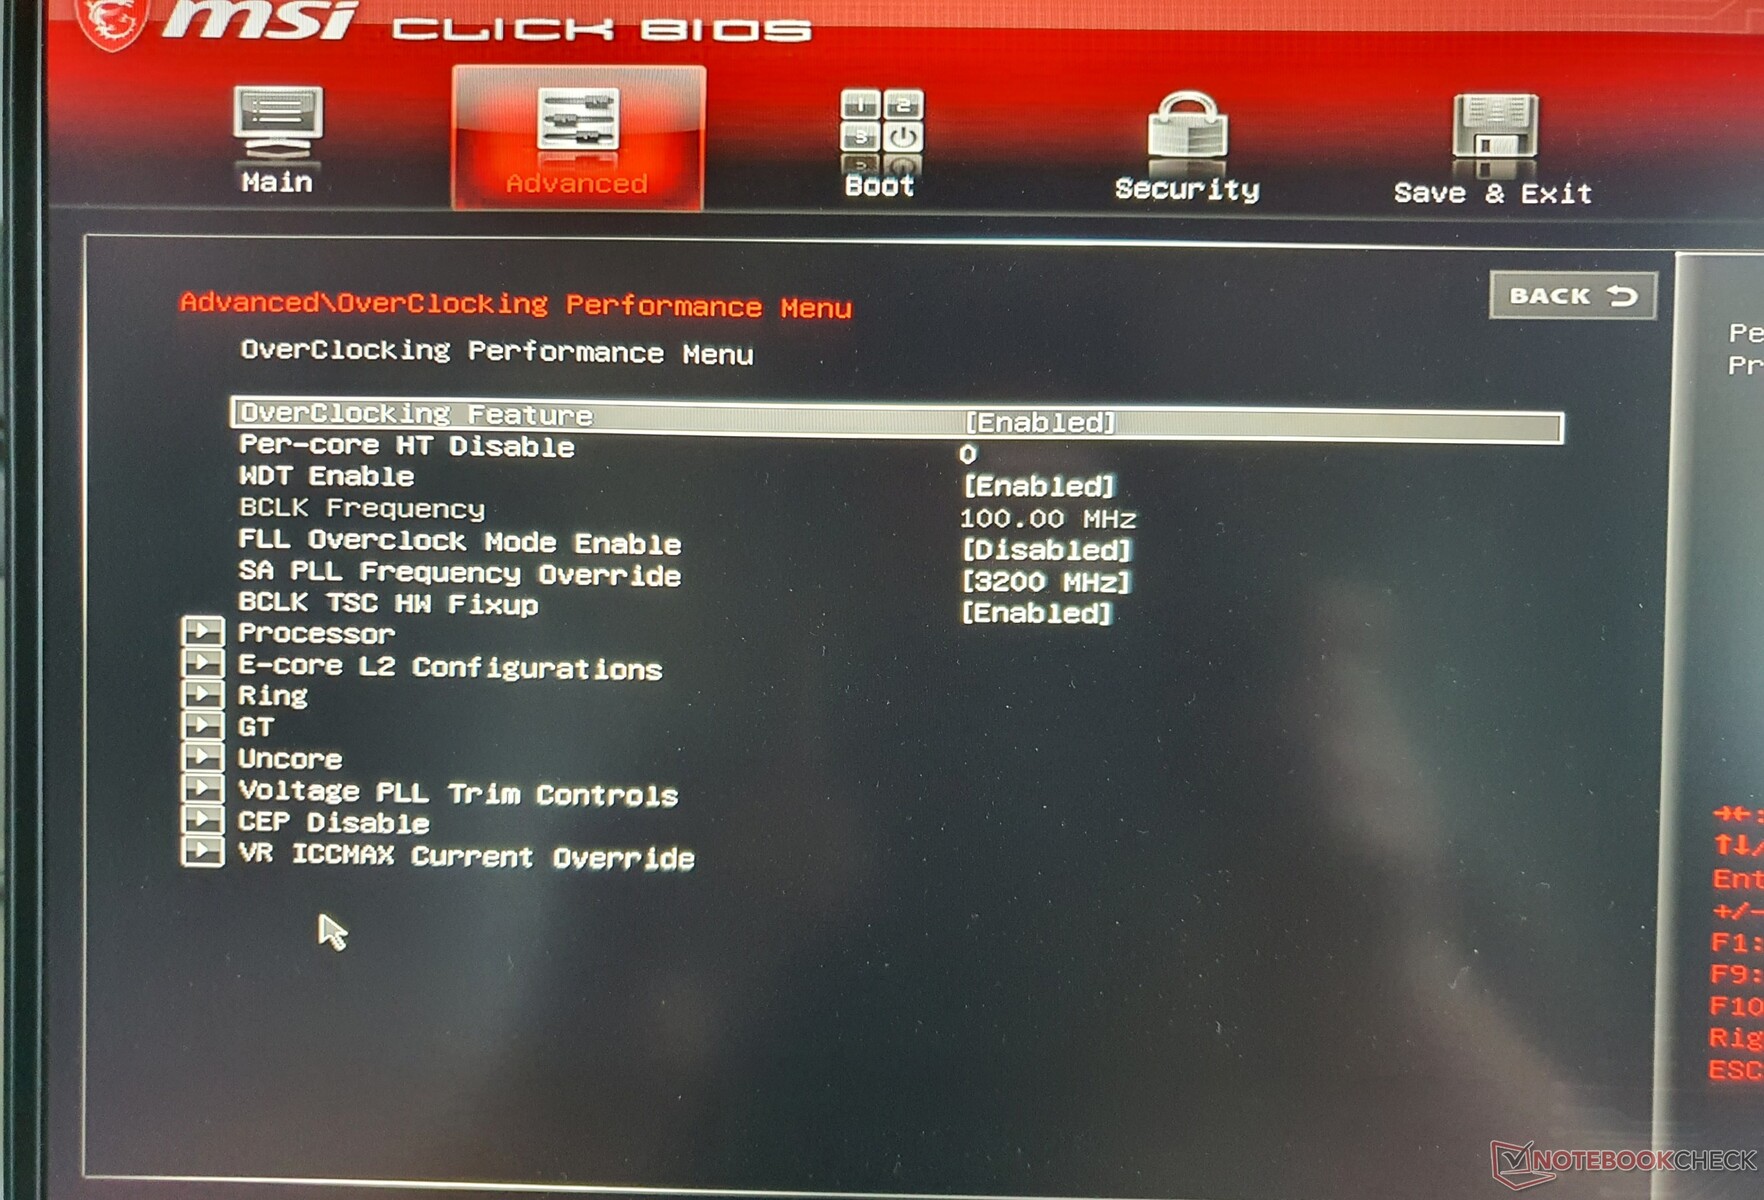
BIOS
Le BIOS est généralement accessible sur les ordinateurs portables de jeu MSI via la combinaison "F1 + DEL". À première vue, il n'y a pas grand-chose à voir, mais la combinaison de touches "Shift (droite) + CTRL (droite) + ALT + F2" permet de déverrouiller toutes les fonctions possibles du BIOS, qu'il s'agisse des limites de performance, des réglages thermiques ou des possibilités d'overclock (à vos propres risques, bien sûr).
Communication
Le module vissé Wi-Fi 6 d'Intel (AX211) libère tout son potentiel avec une puissance de signal d'environ 1,6 GBit/s. Les ordinateurs portables concurrents dotés d'une carte WLAN identique ou similaire affichent des niveaux similaires en moyenne. Les deux portables Asus sont loin derrière dans le champ de comparaison.
En outre, le Vector GP76 dispose de Bluetooth 5.2, mais pas de WWAN, qui ne peut pas non plus être installé ultérieurement.
Webcam

La webcam, dont la résolution est de 1280x720, offre une qualité inférieure à la norme. le 1080p doit encore atteindre la série Vector, même en 2022. L'IR, Windows Hello et un obturateur mécanique sont également absents.


Accessoires
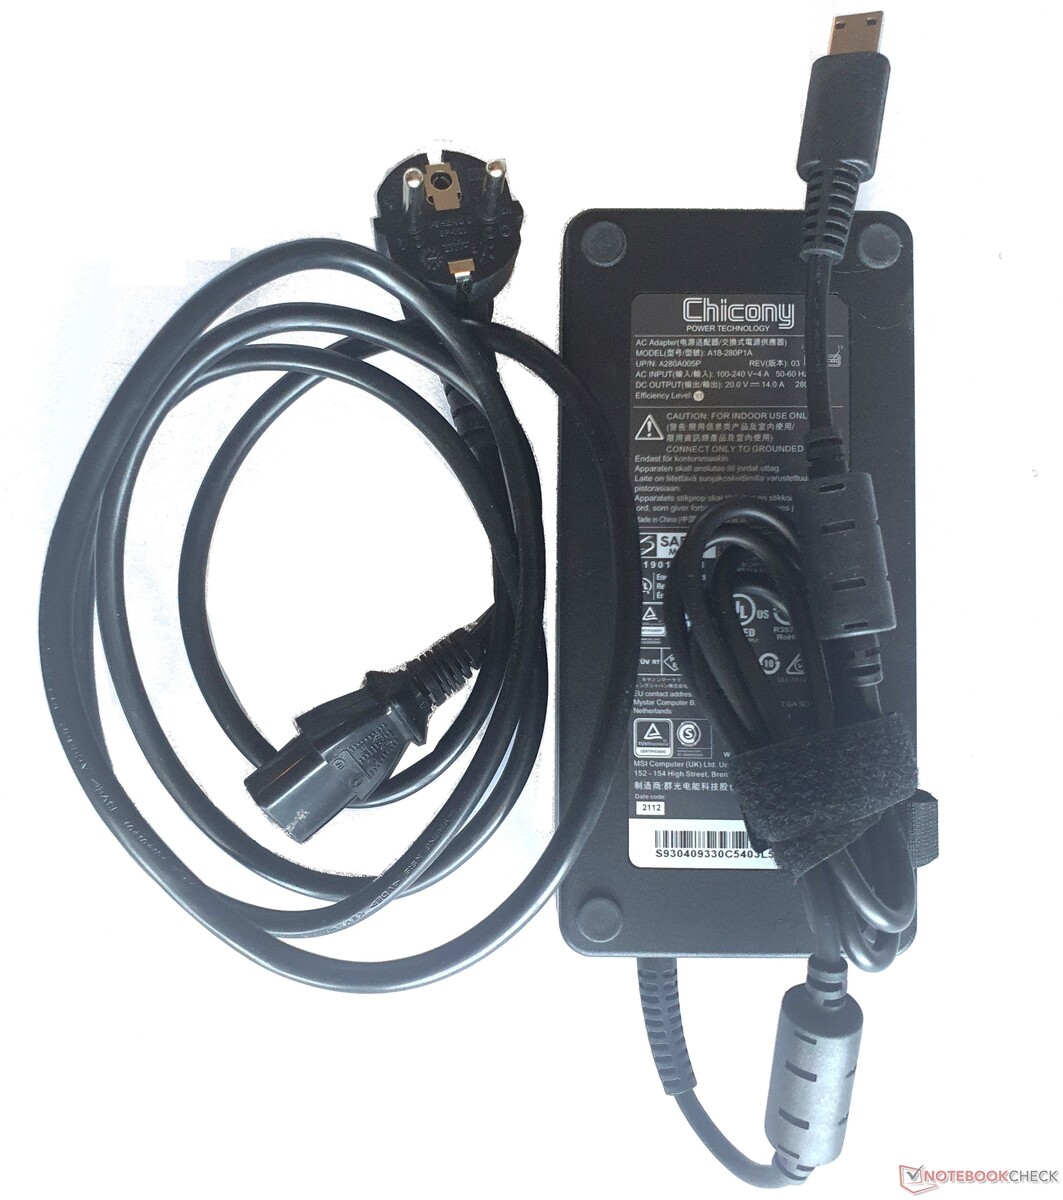
La livraison comprend un bloc d'alimentation de 280 watts, qui délivre 50 watts de plus que son prédécesseur. Il n'y a pas d'autres accessoires et les matériaux recyclés ne sont pas (encore) utilisés dans l'emballage.
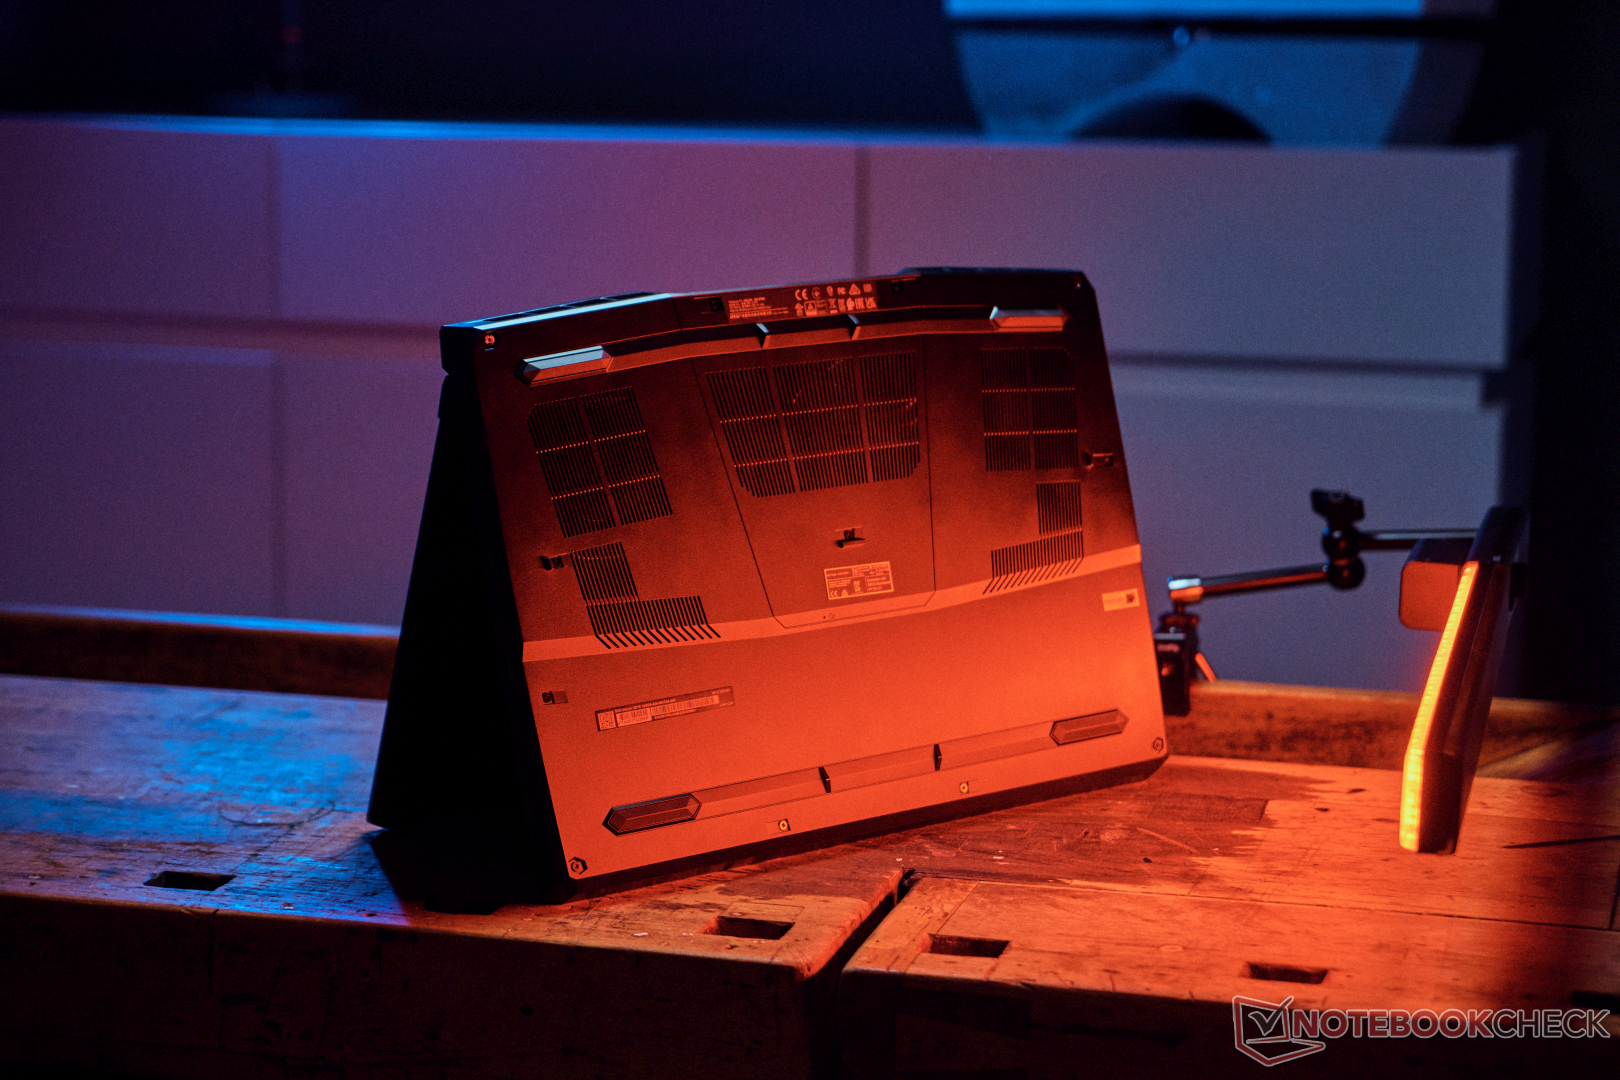
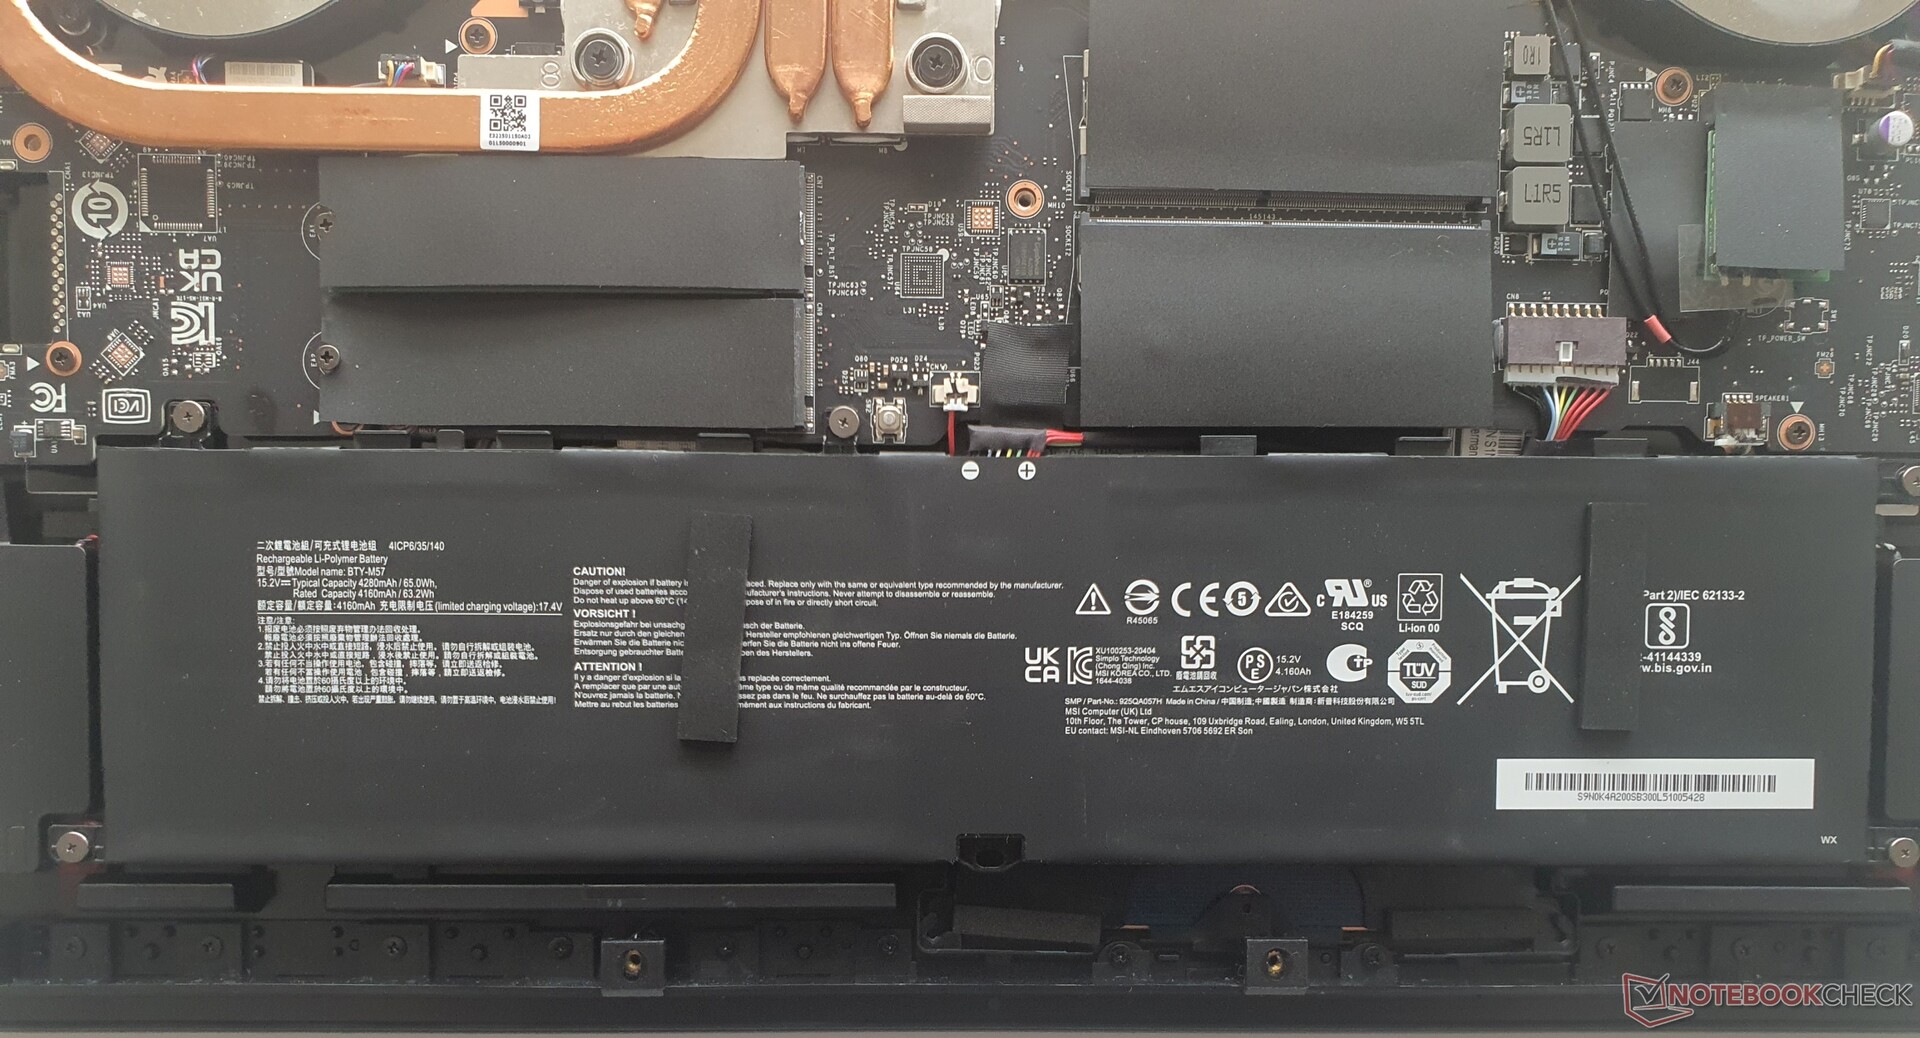
Maintenance
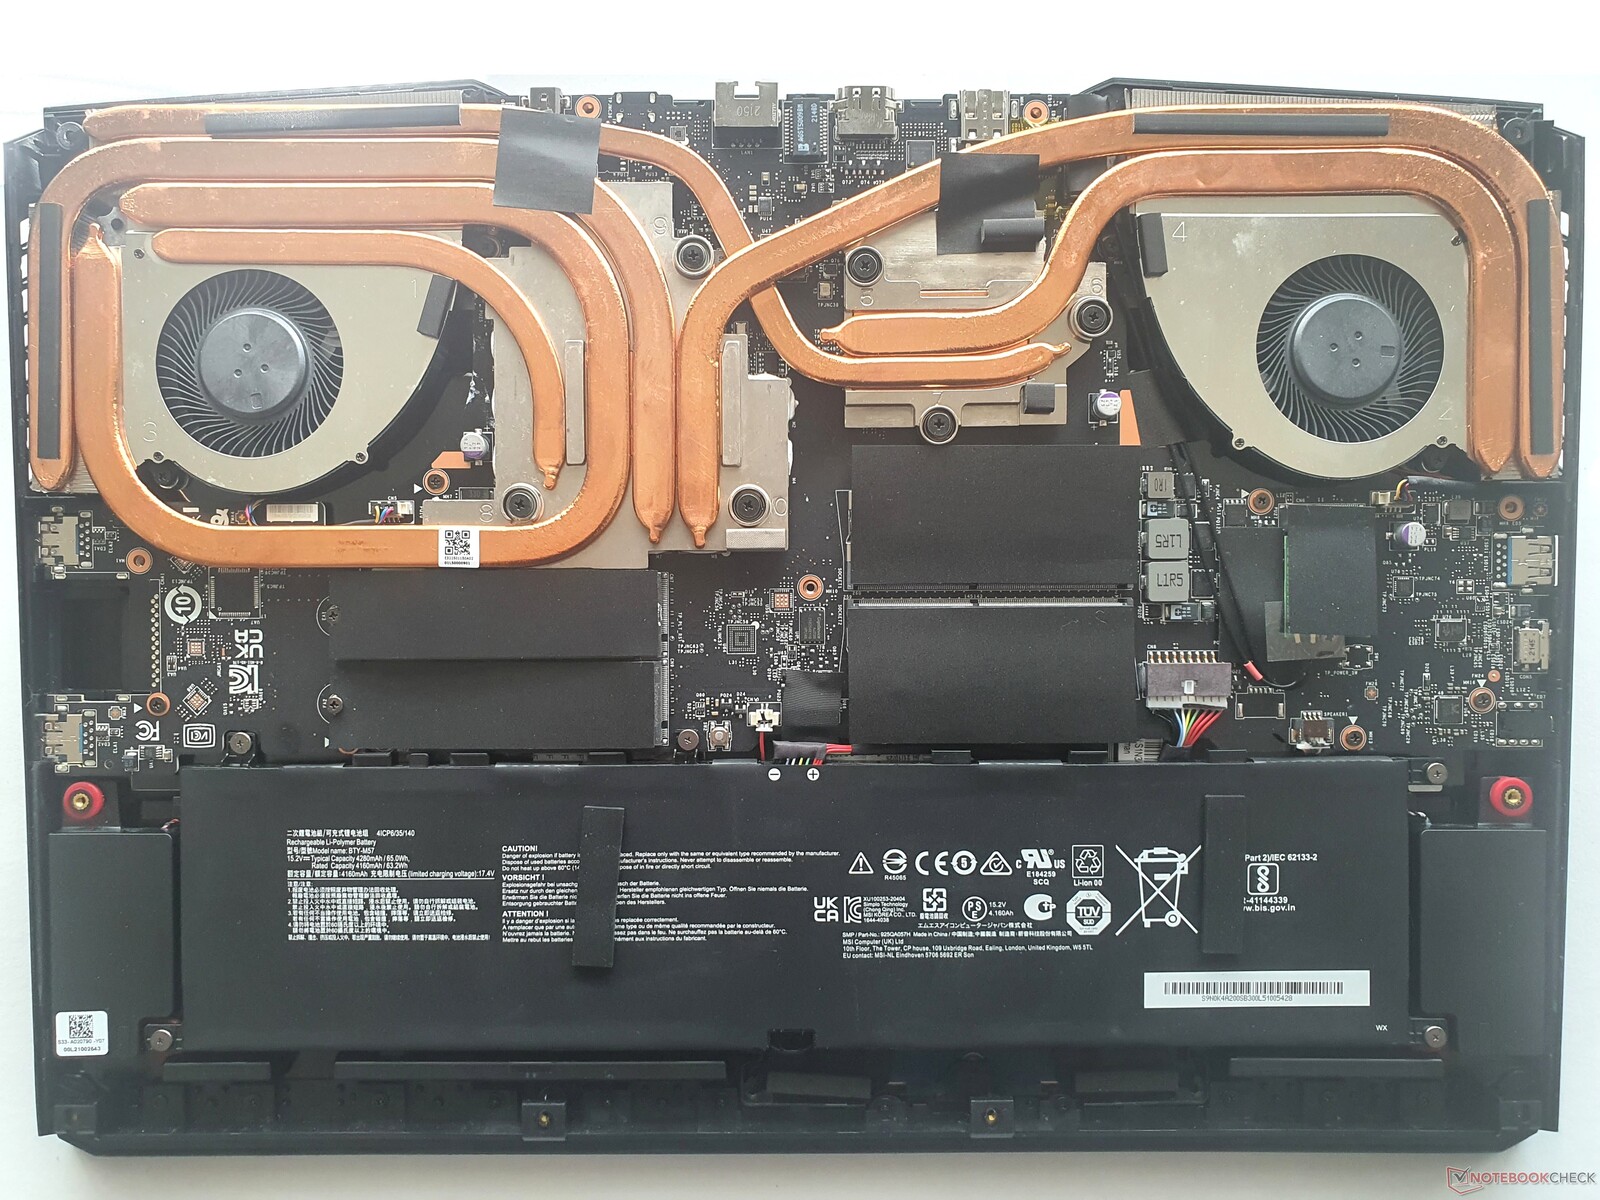
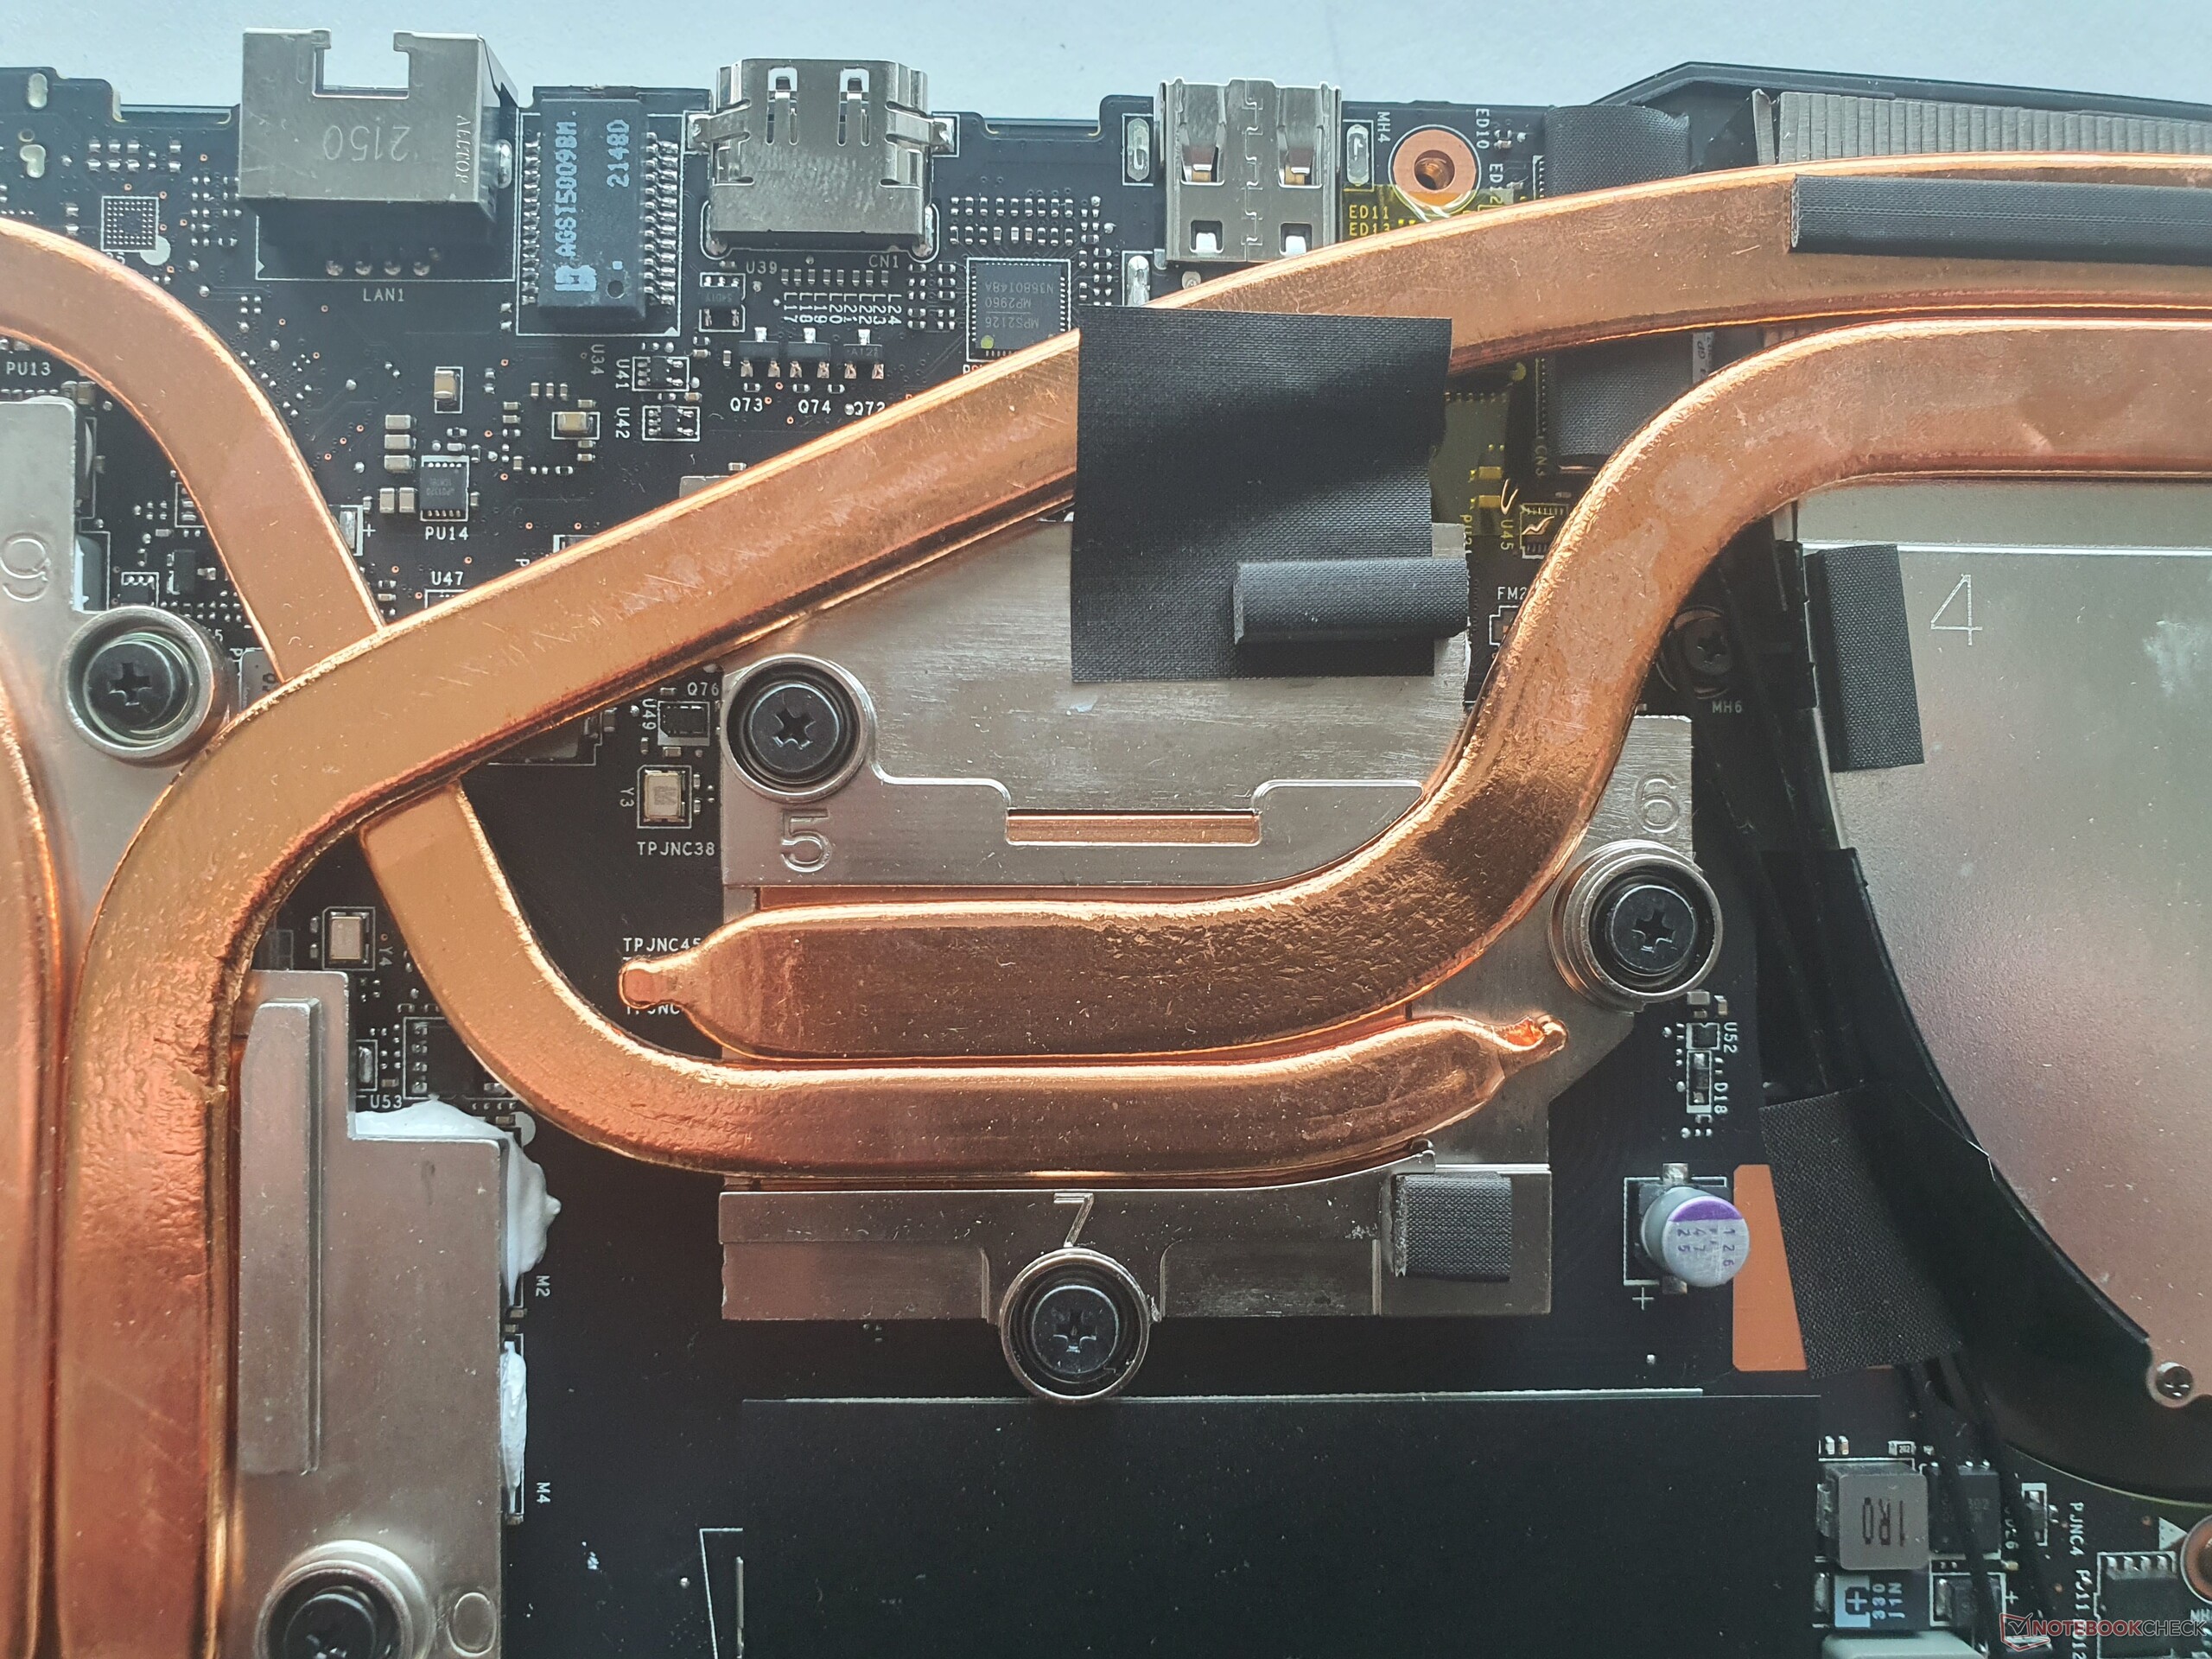
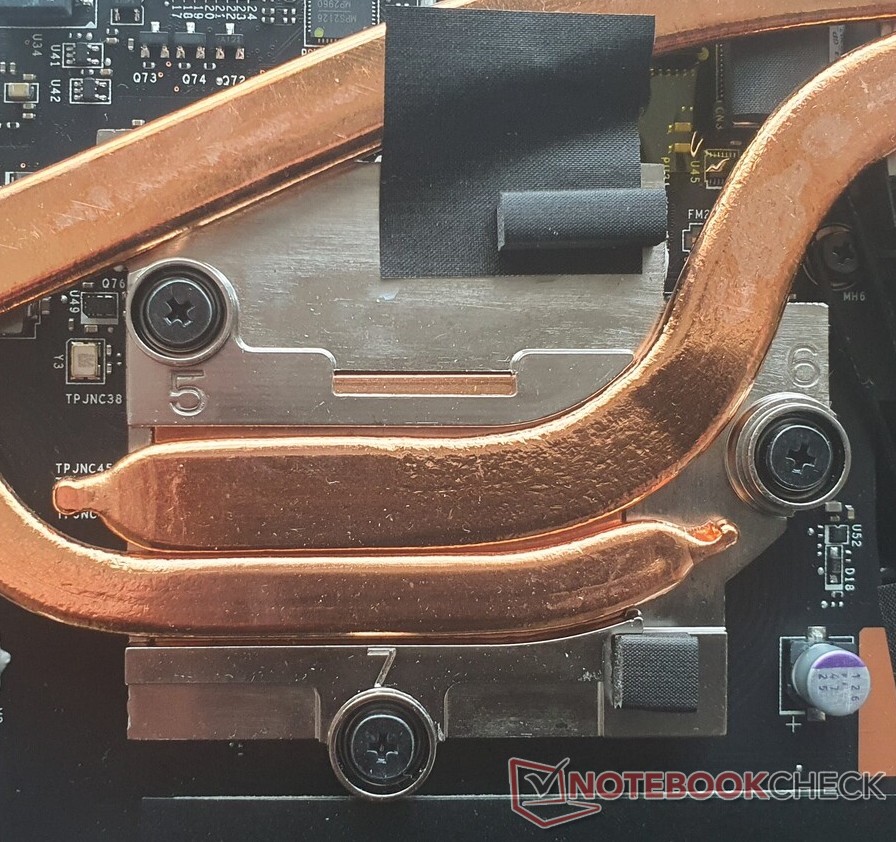
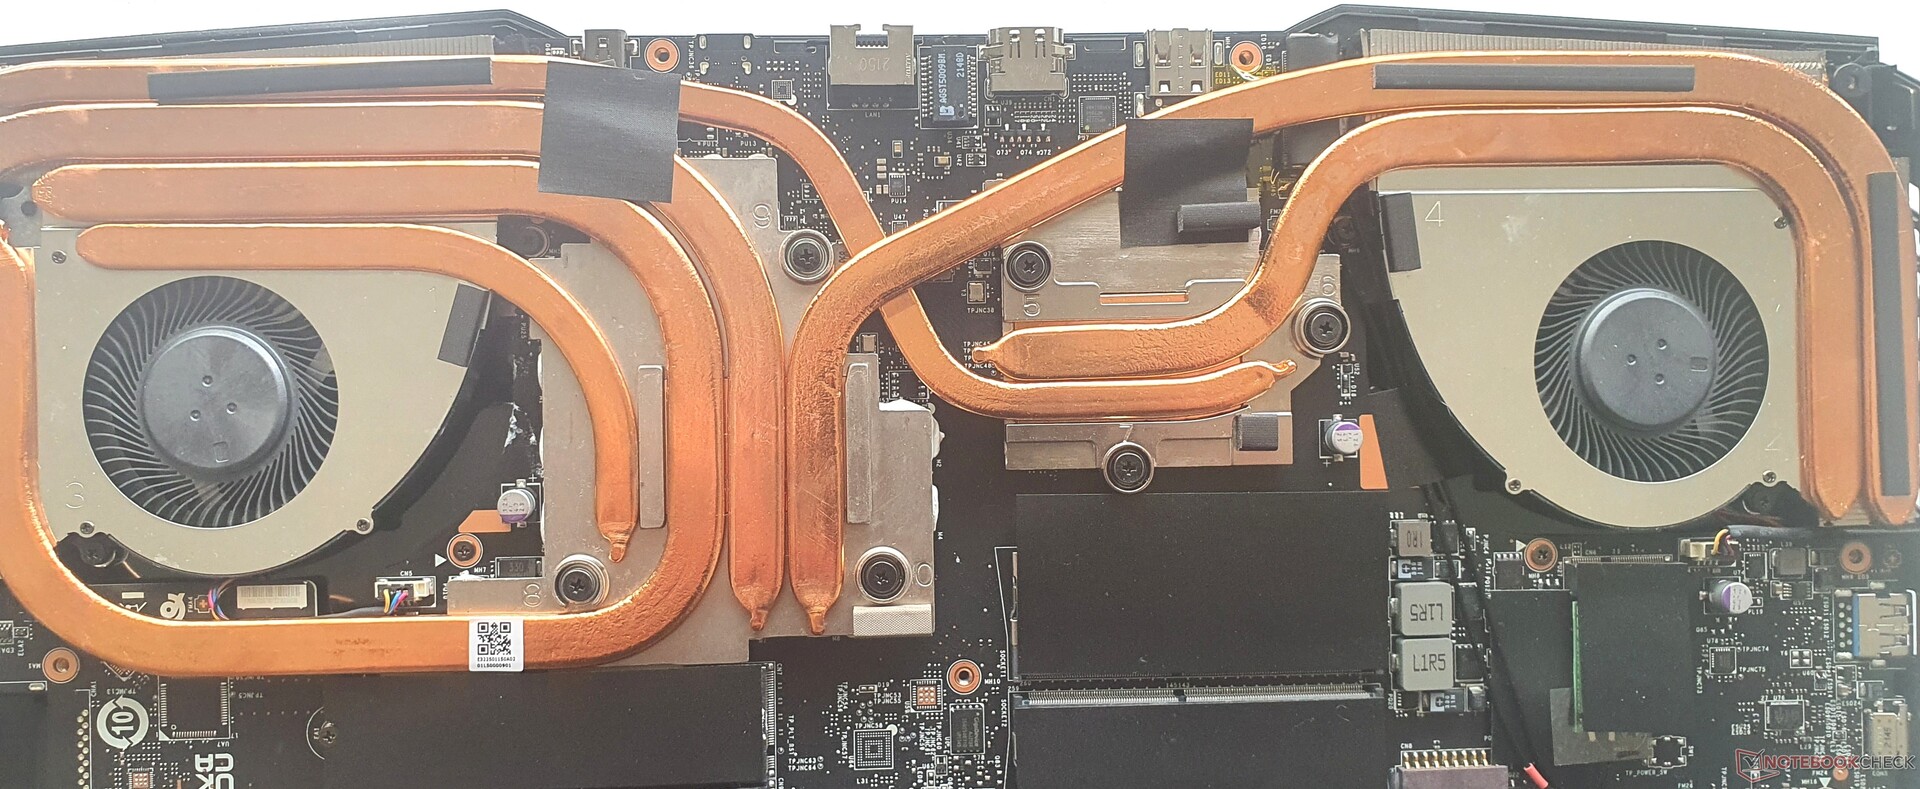
L'arrière de l'étui peut être détaché après avoir retiré 13 vis Phillips et utilisé un outil de déblocage. Le bord avant, qui atteint le haut de l'ordinateur portable et comporte de nombreux crochets, nécessite quelques doses de force et d'habileté bien appliquées.
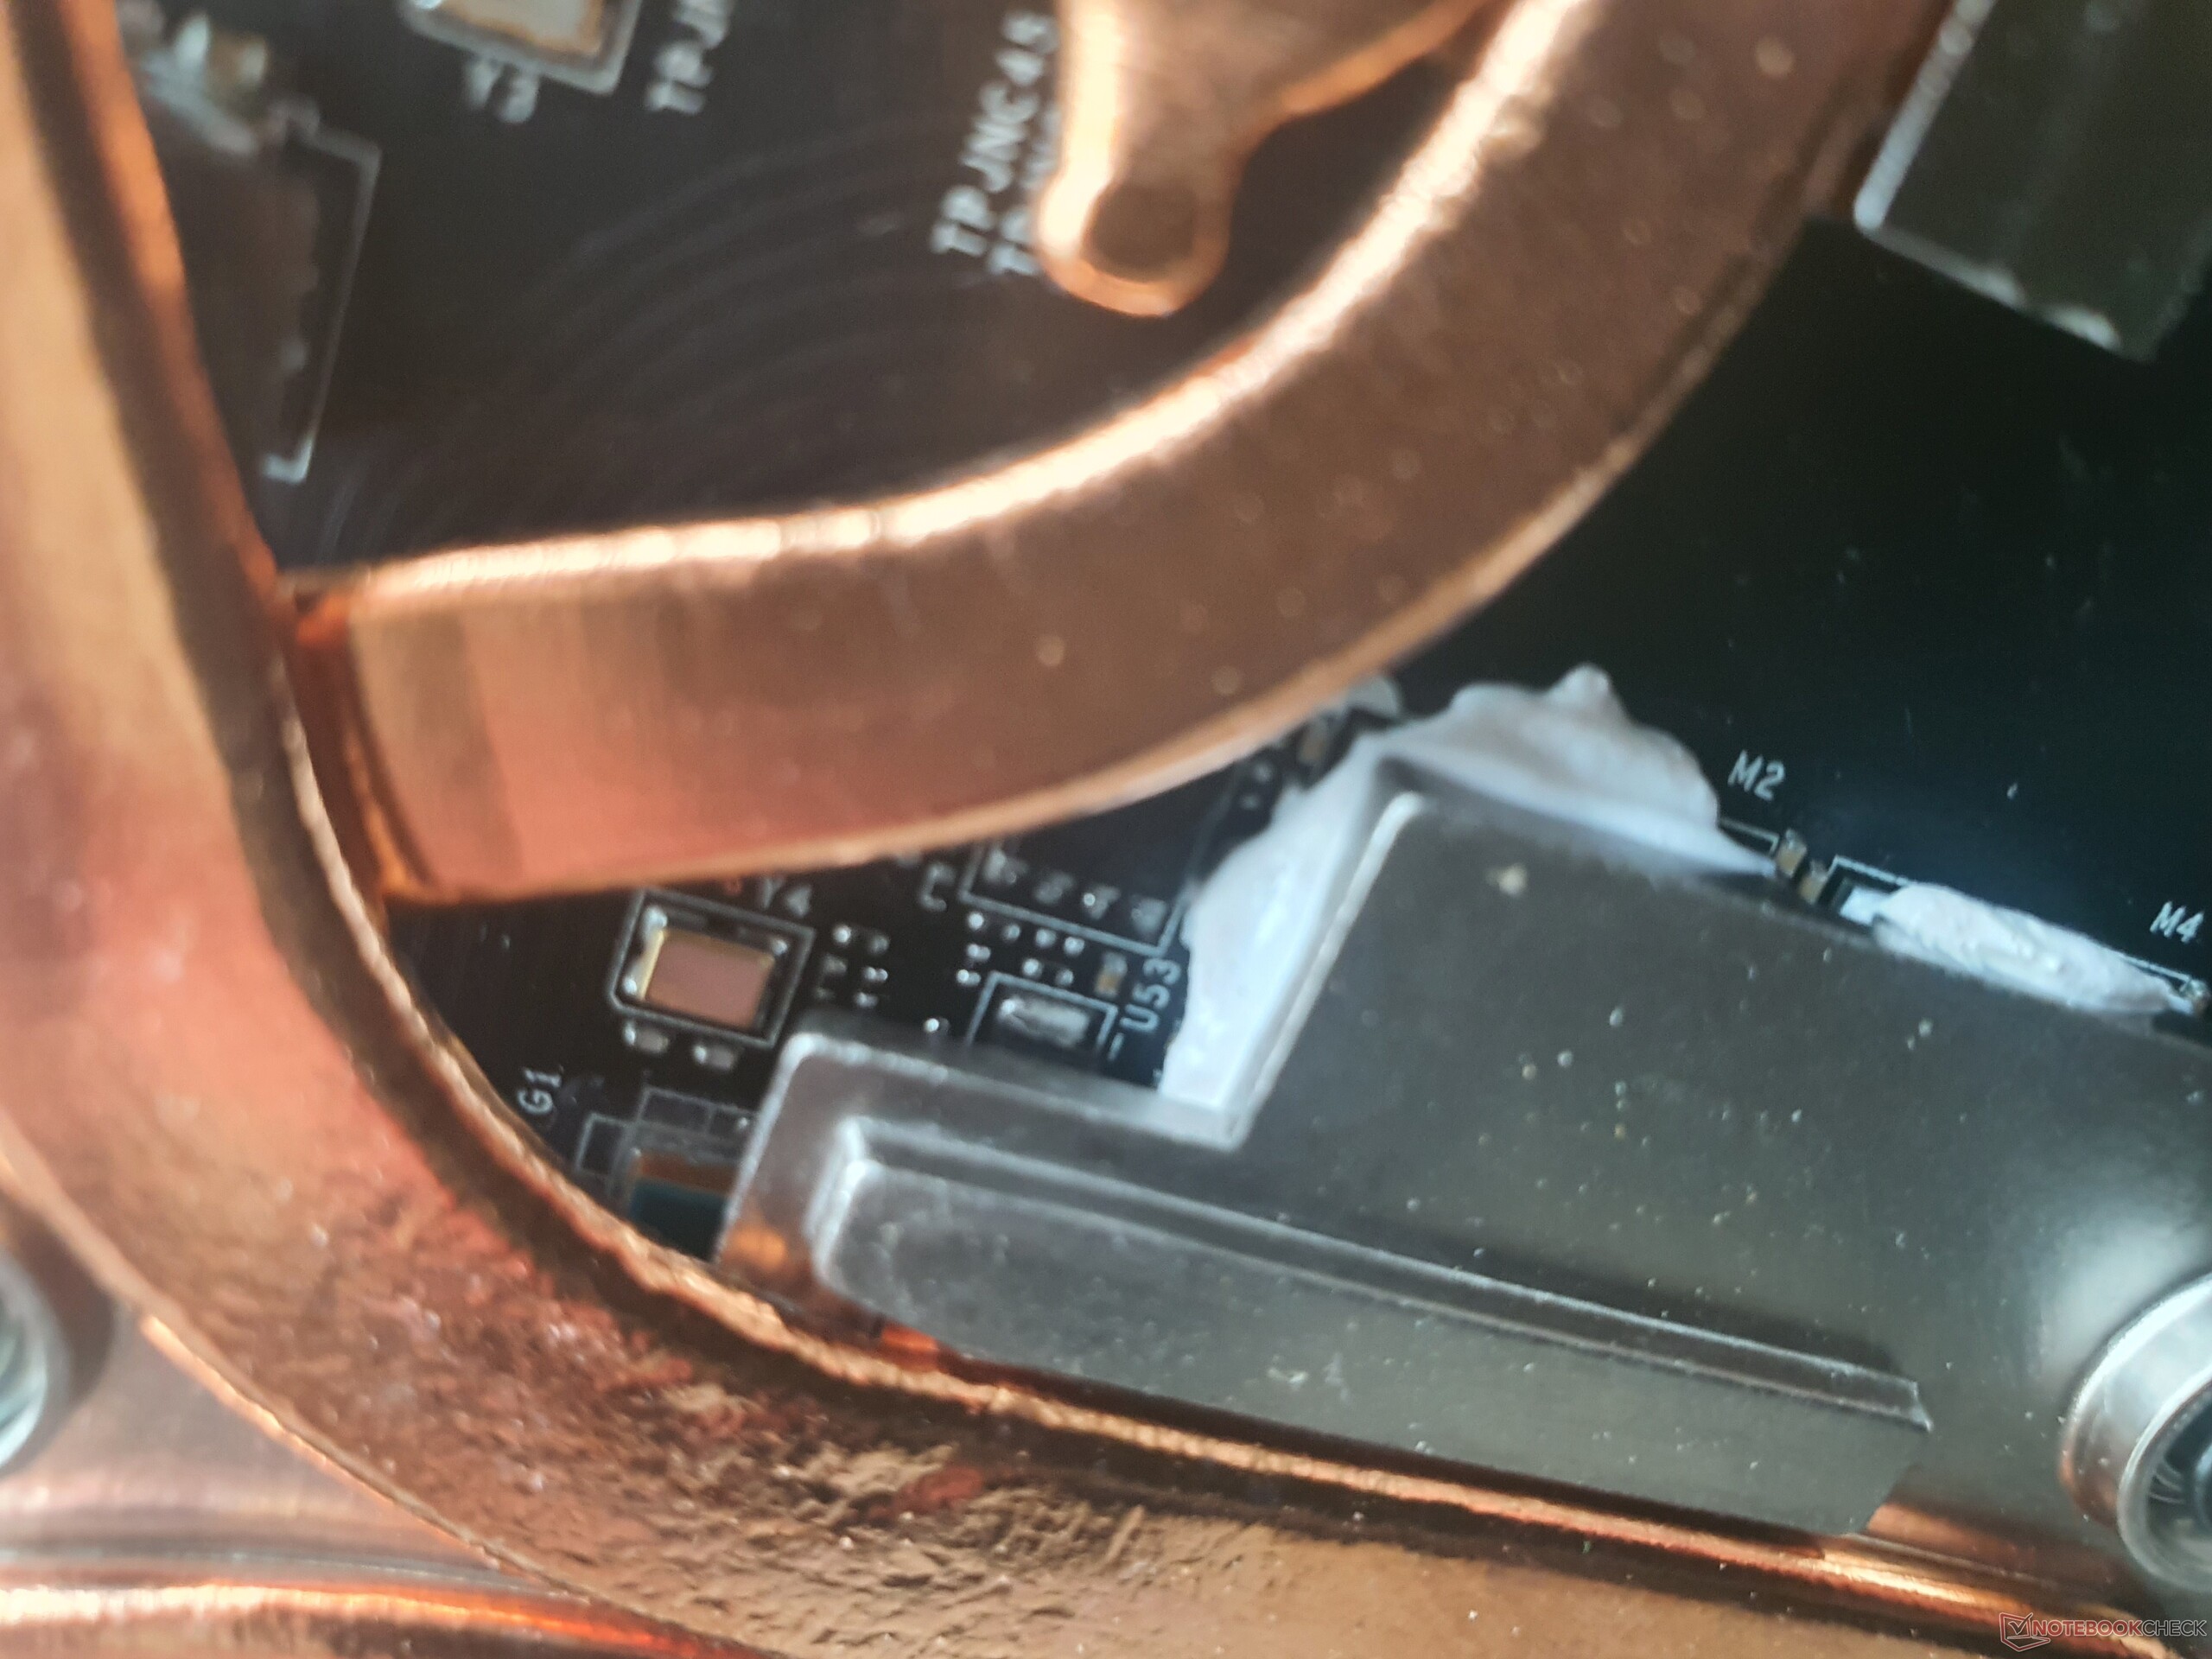
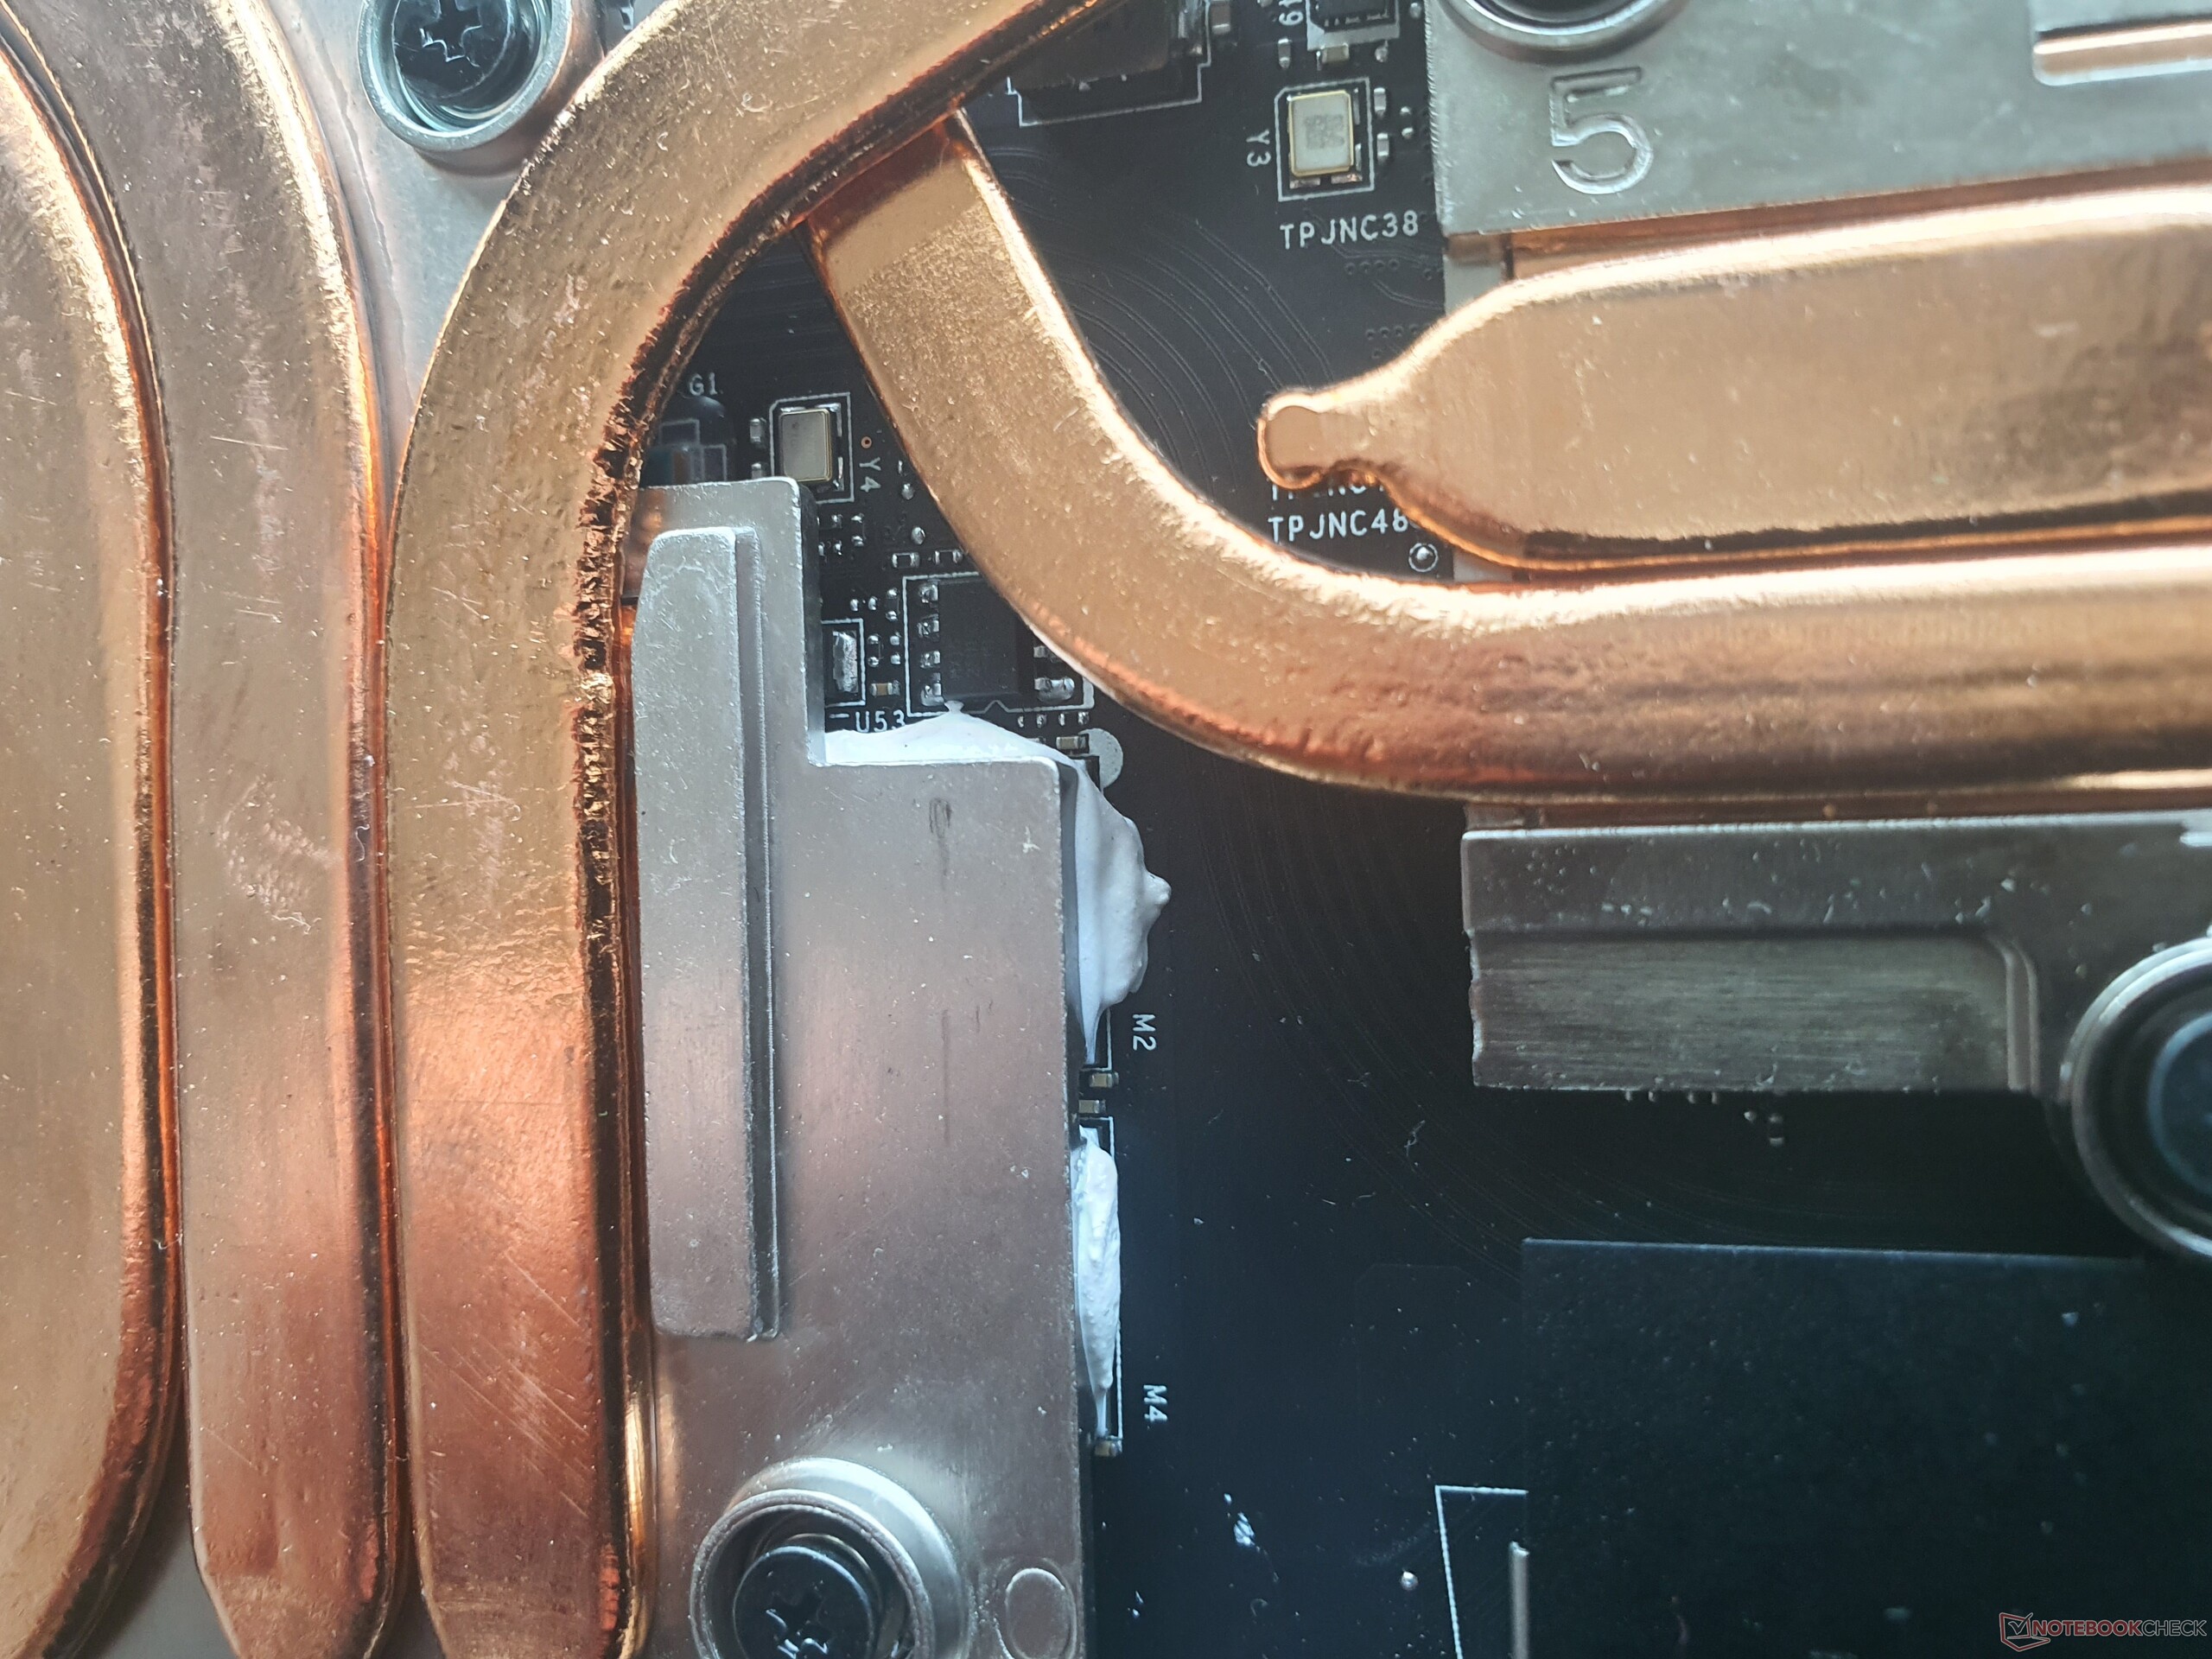
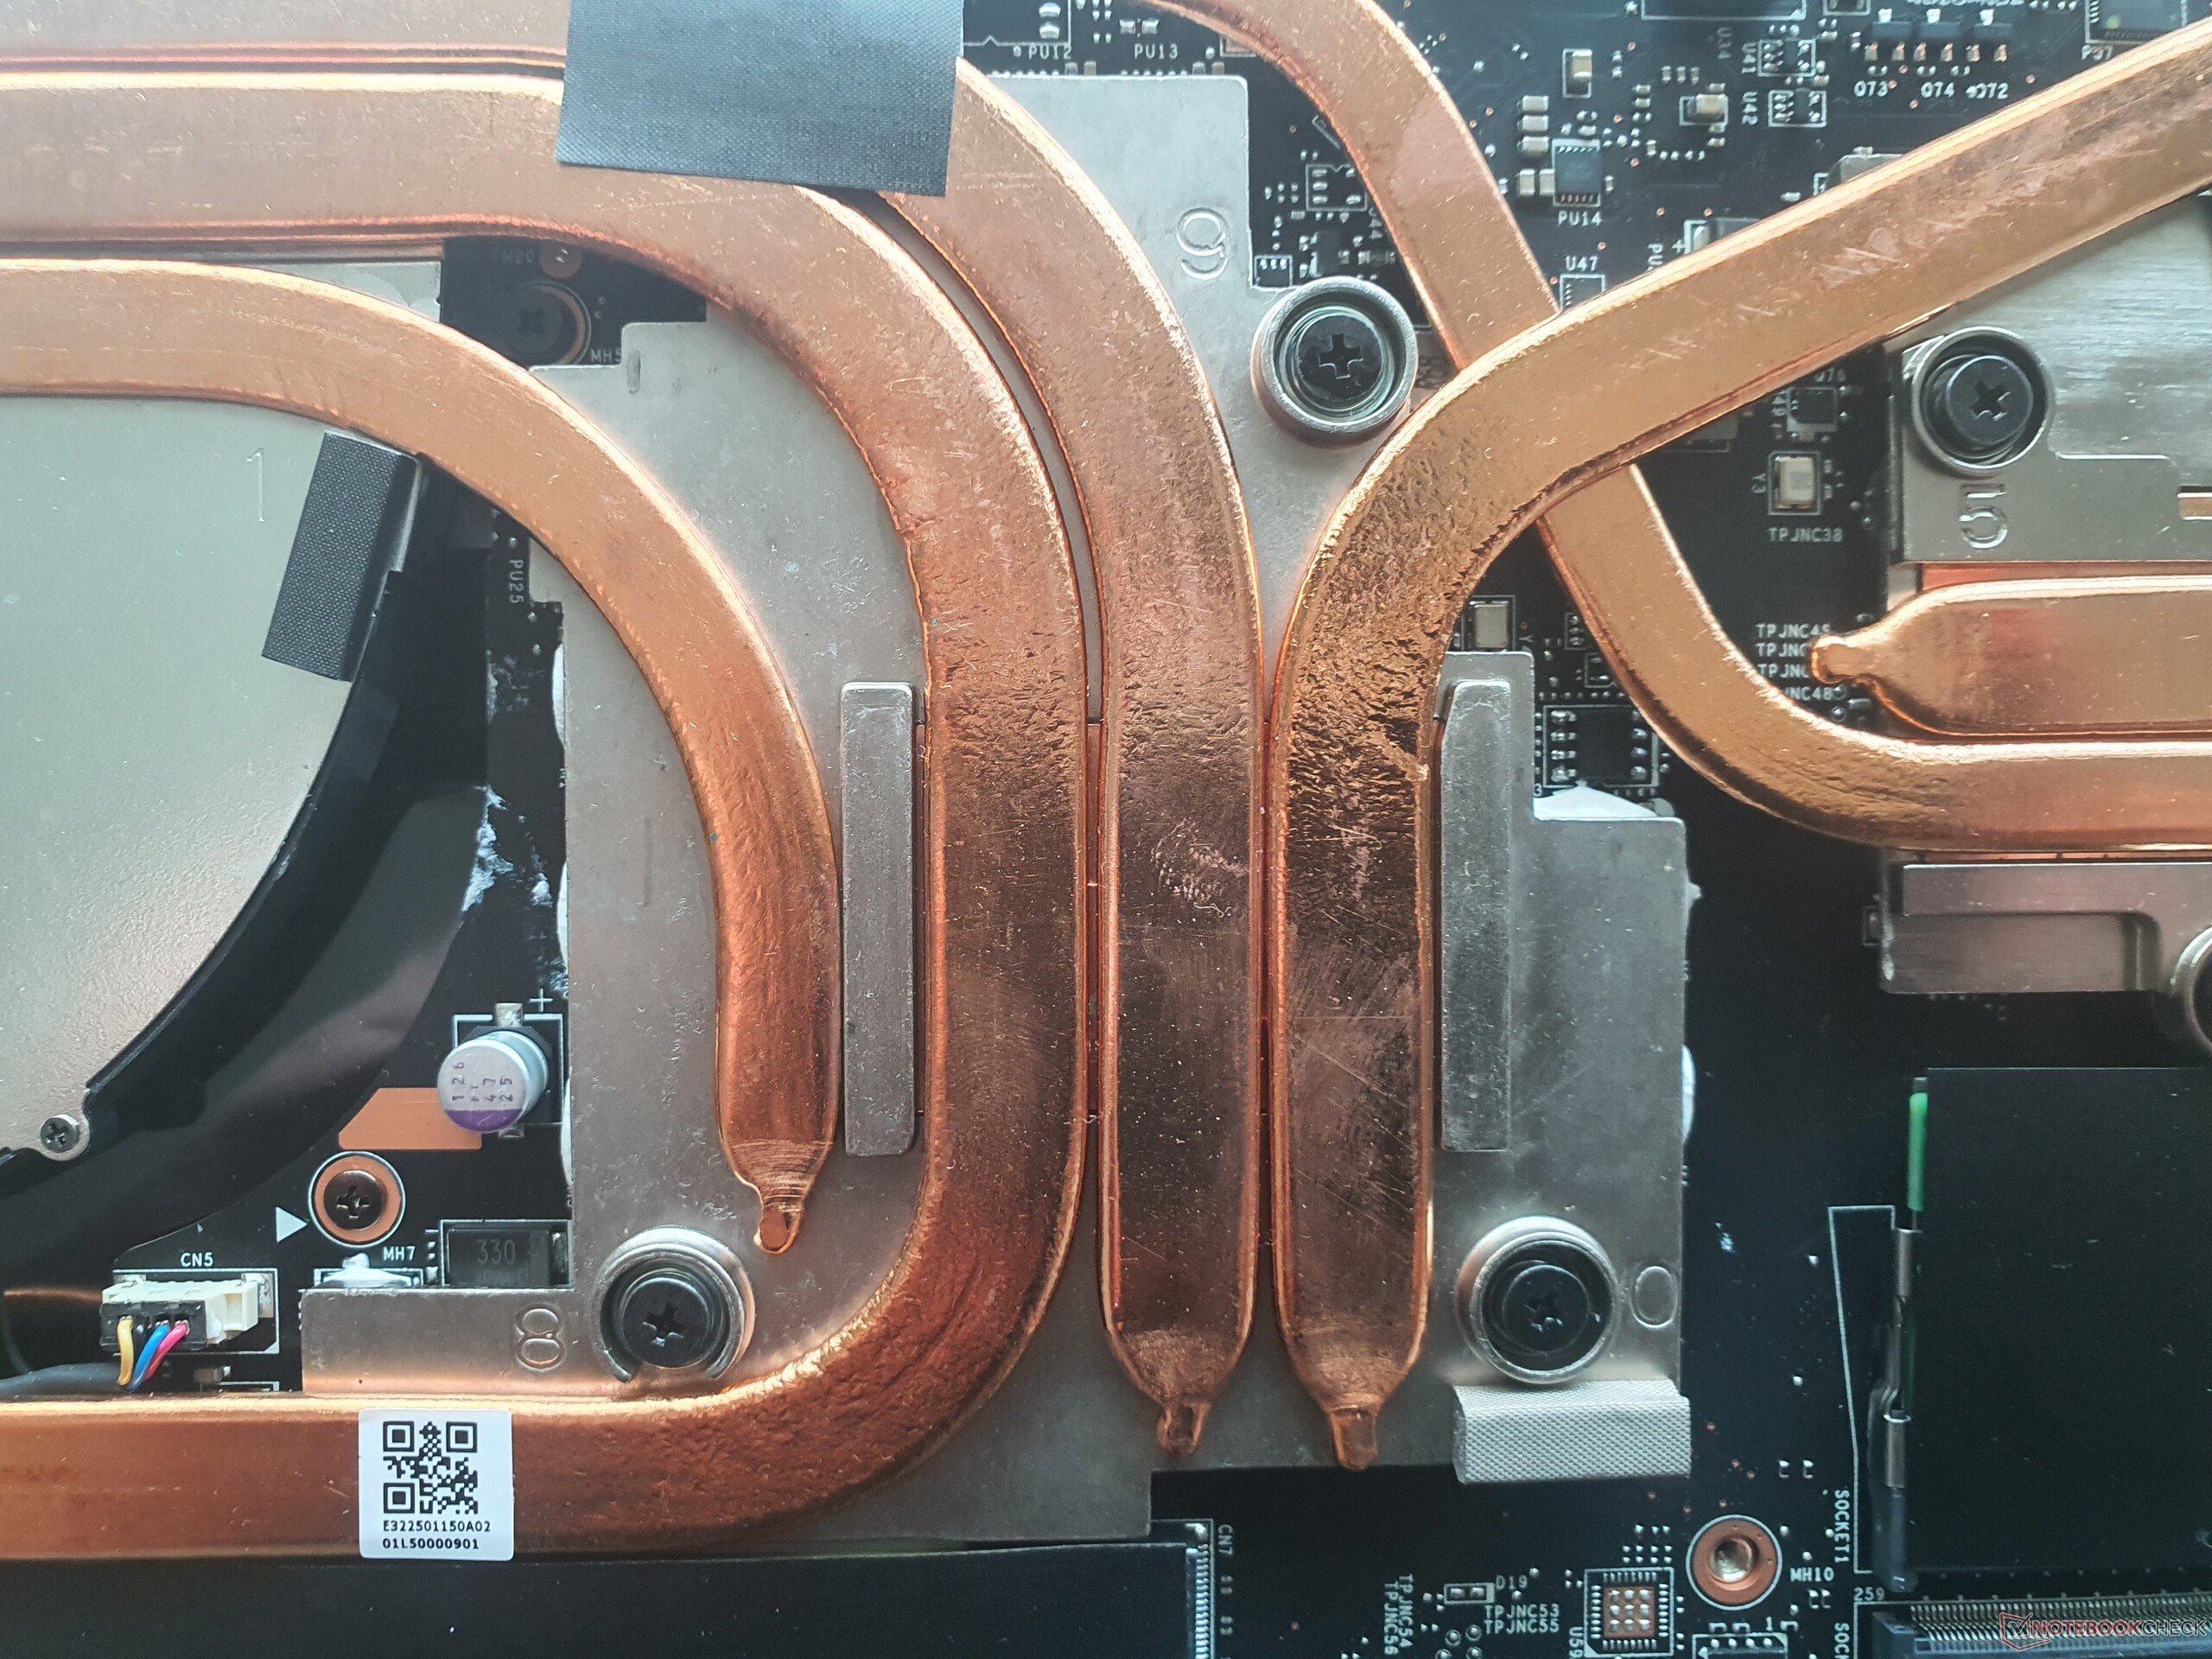
Ensuite, on rencontre une grande quantité de cuivre sous la forme de 6 caloducs, dont deux grands ventilateurs qui peuvent être nettoyés. Les éléments qui peuvent être refroidis, comme le CPU et le GPU, sont recouverts de pâte thermoconductrice qui "déborde" et se répand en partie sur le circuit imprimé.
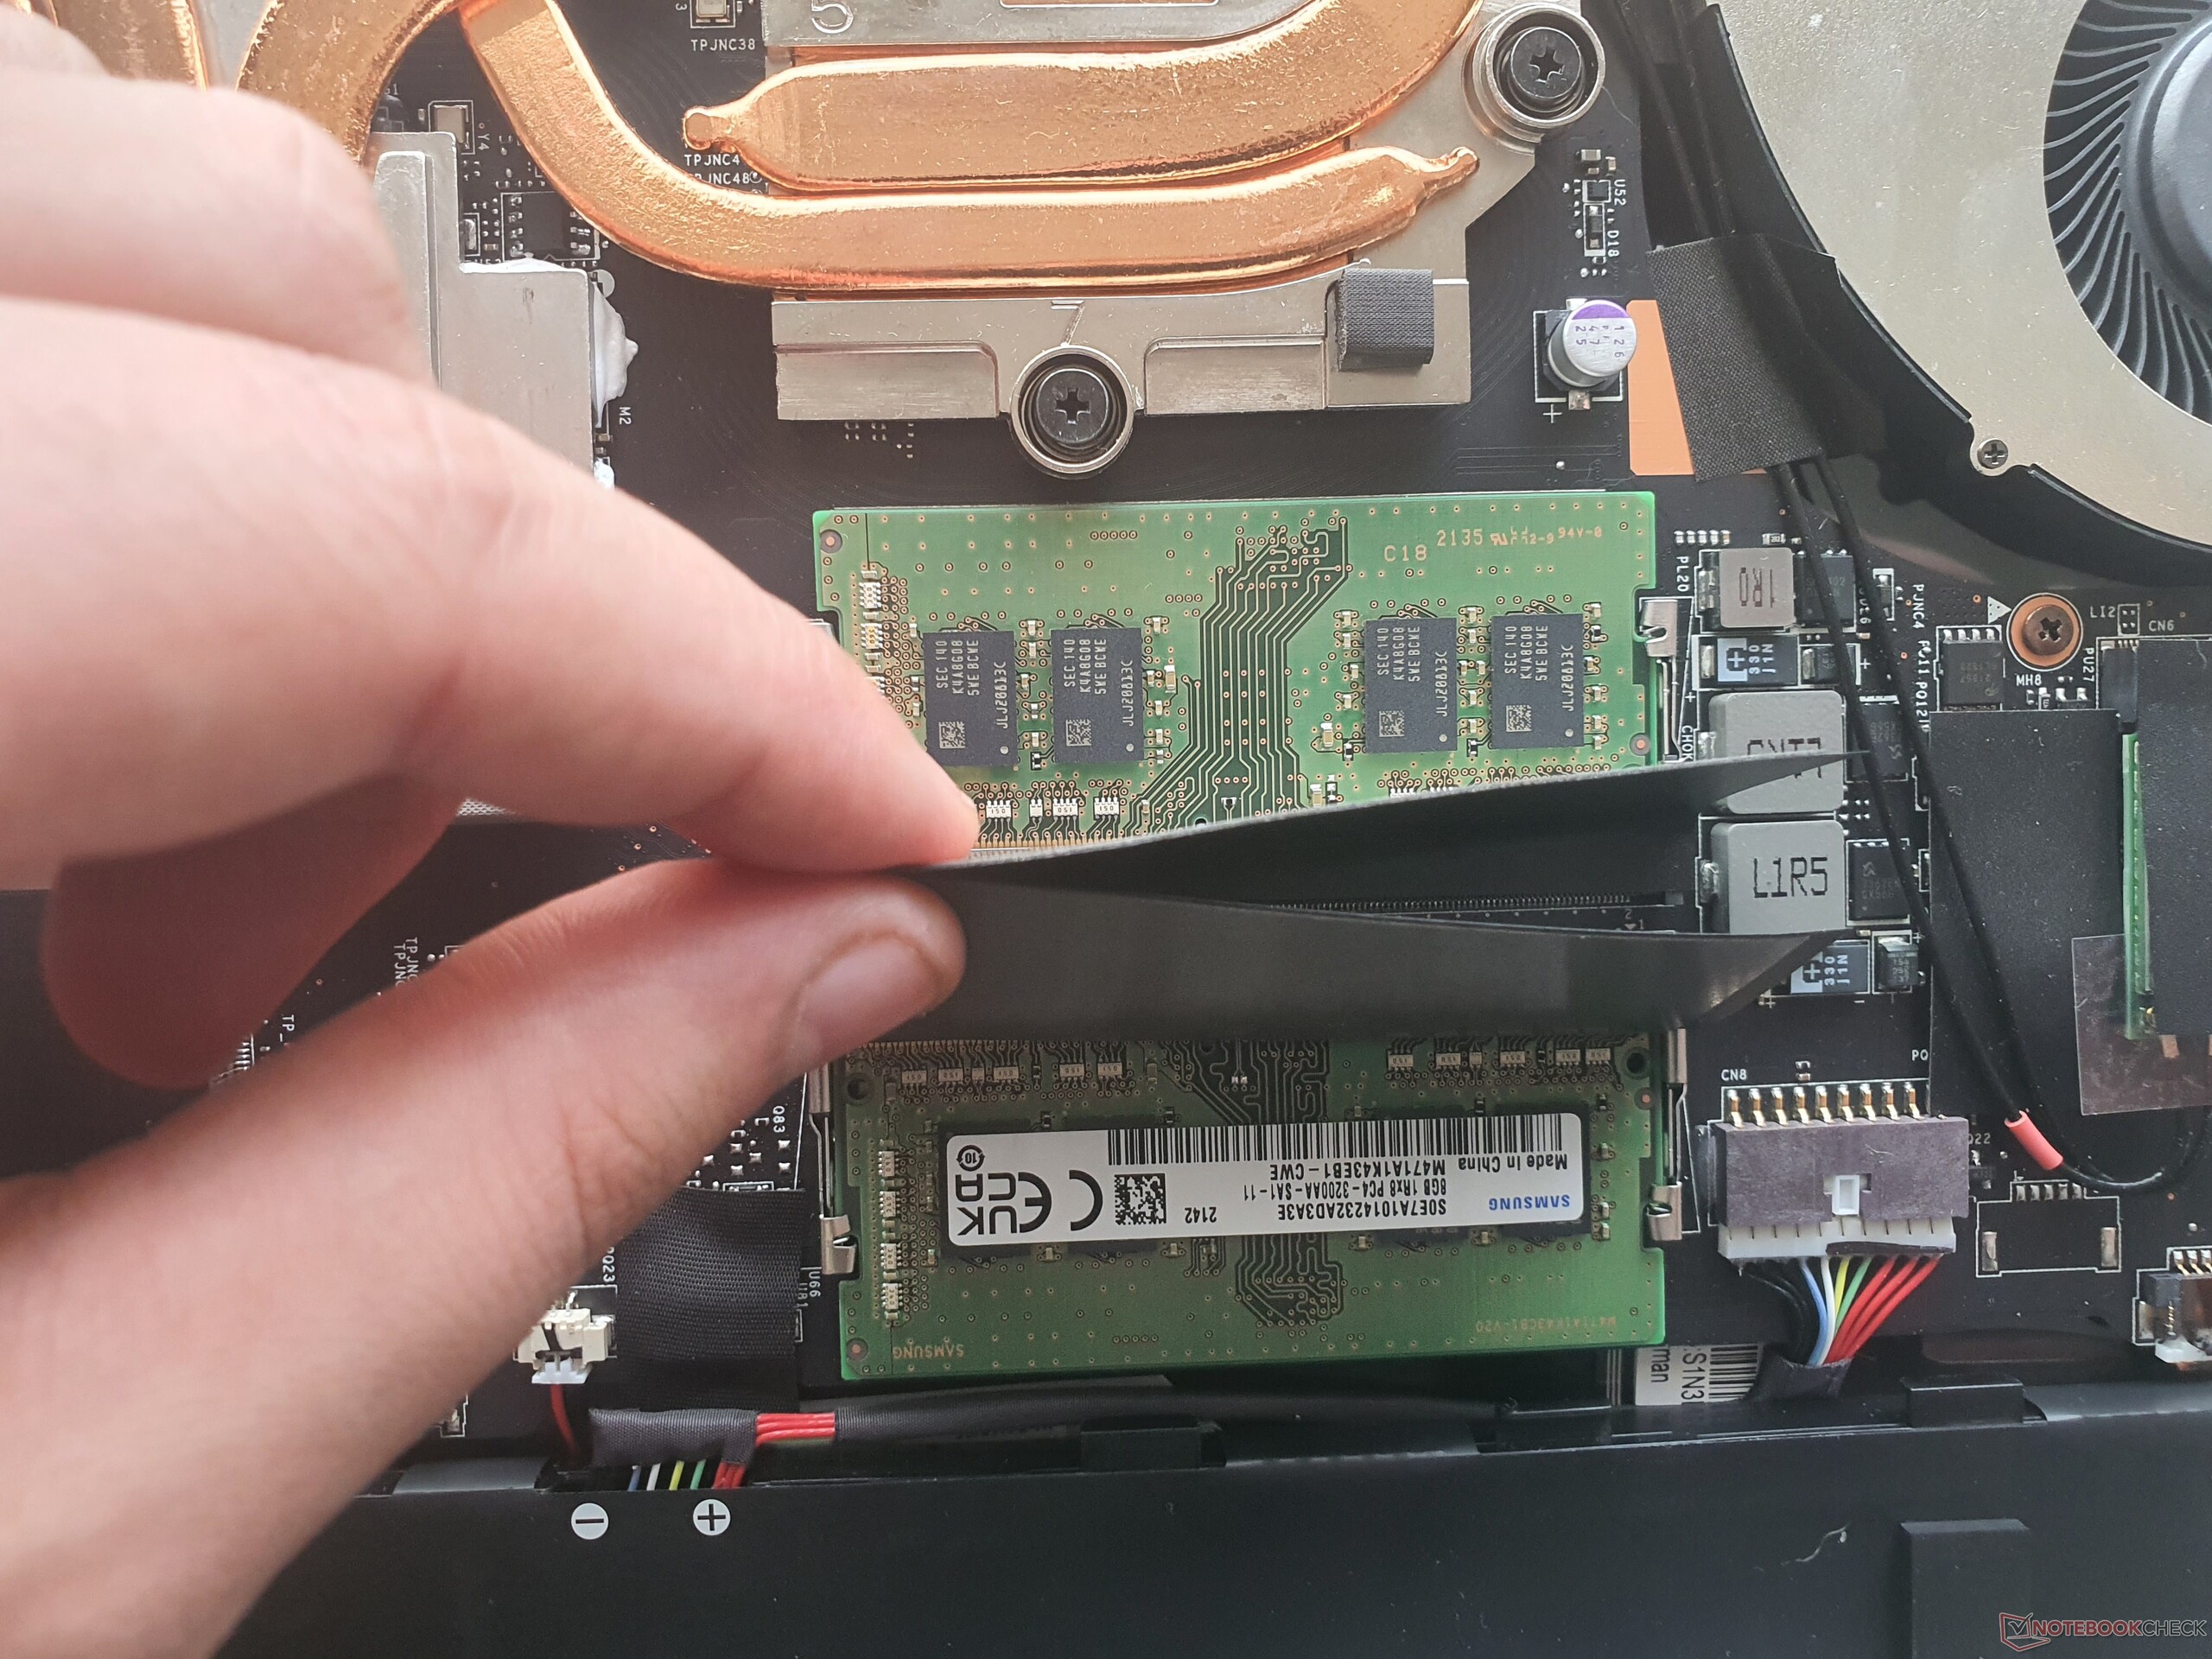
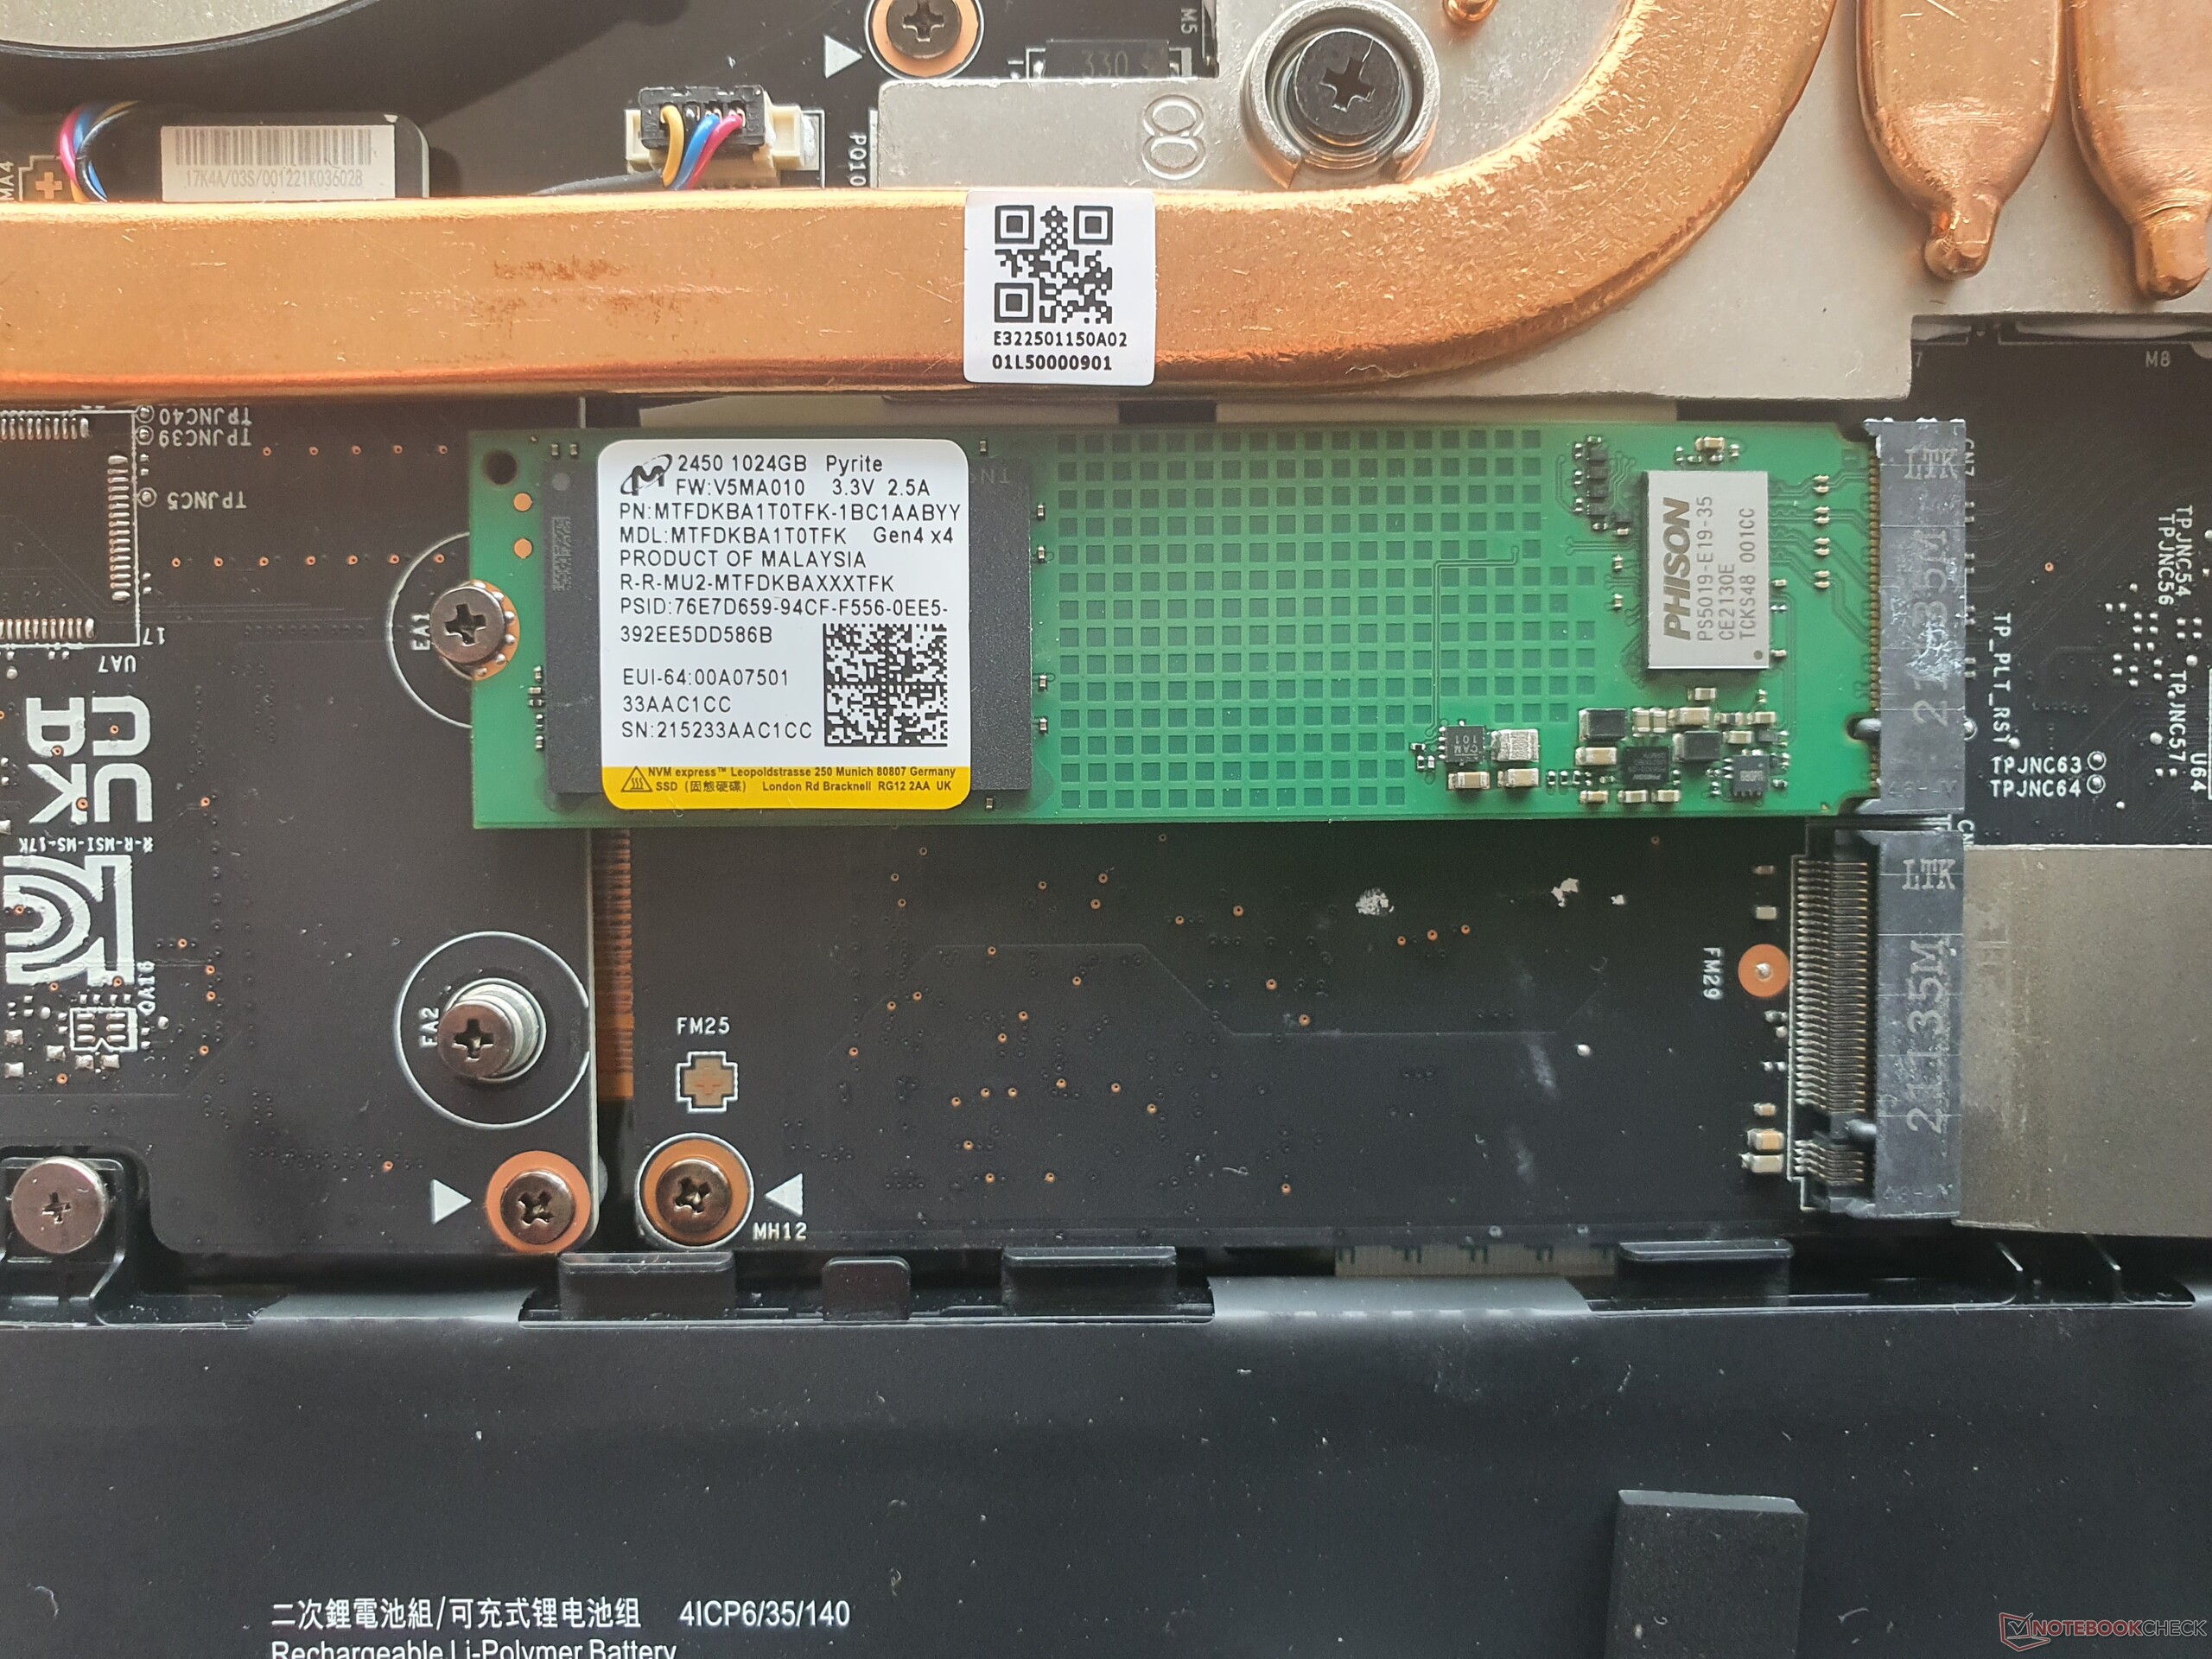
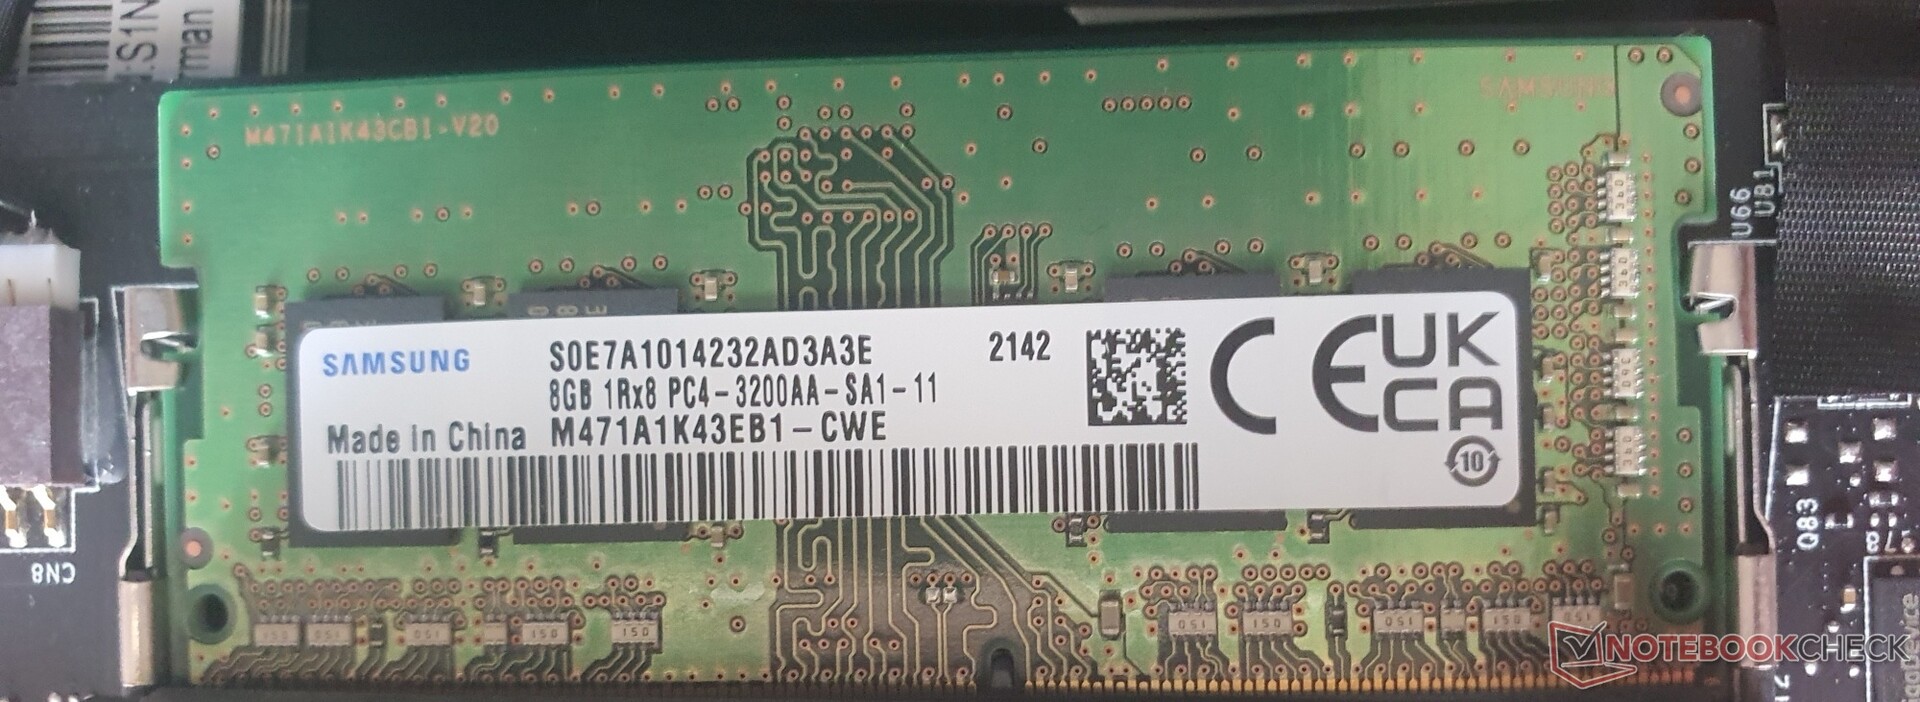
Le composant suivant, le plus grand et le plus facile à entretenir, est la batterie de 65 Wh (vissée). En outre, deux emplacements M.2 avec spécification PCIe4x4 (compatible RAID 0.1) sont fournis, qui sont complétés par deux SODIMM pour un maximum de 64 Go de RAM DDR4-3200. Comme déjà mentionné, le module Wi-Fi est également remplaçable. Dans l'ensemble, le Vector GP76 est donc facile à entretenir.
Garantie
La garantie au sein de l'UE est de 24 mois avec service d'enlèvement. Dans la plupart des autres régions, elle est de 12 mois. Une extension est également possible moyennant un supplément.
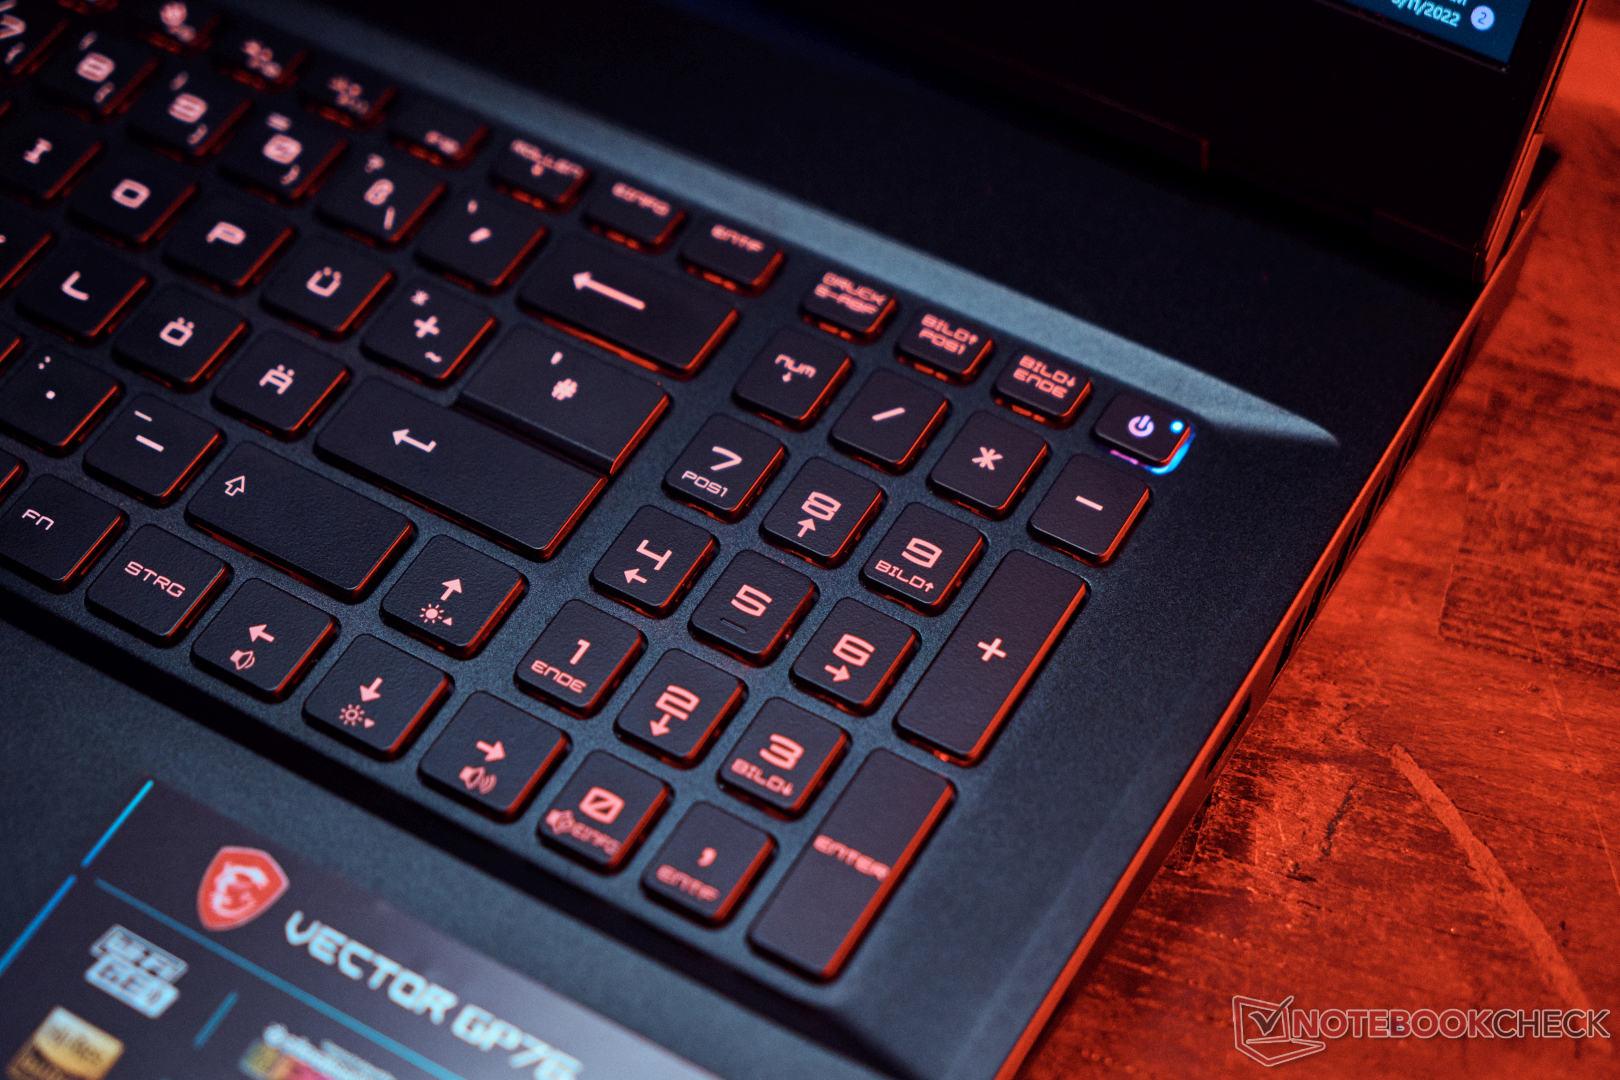
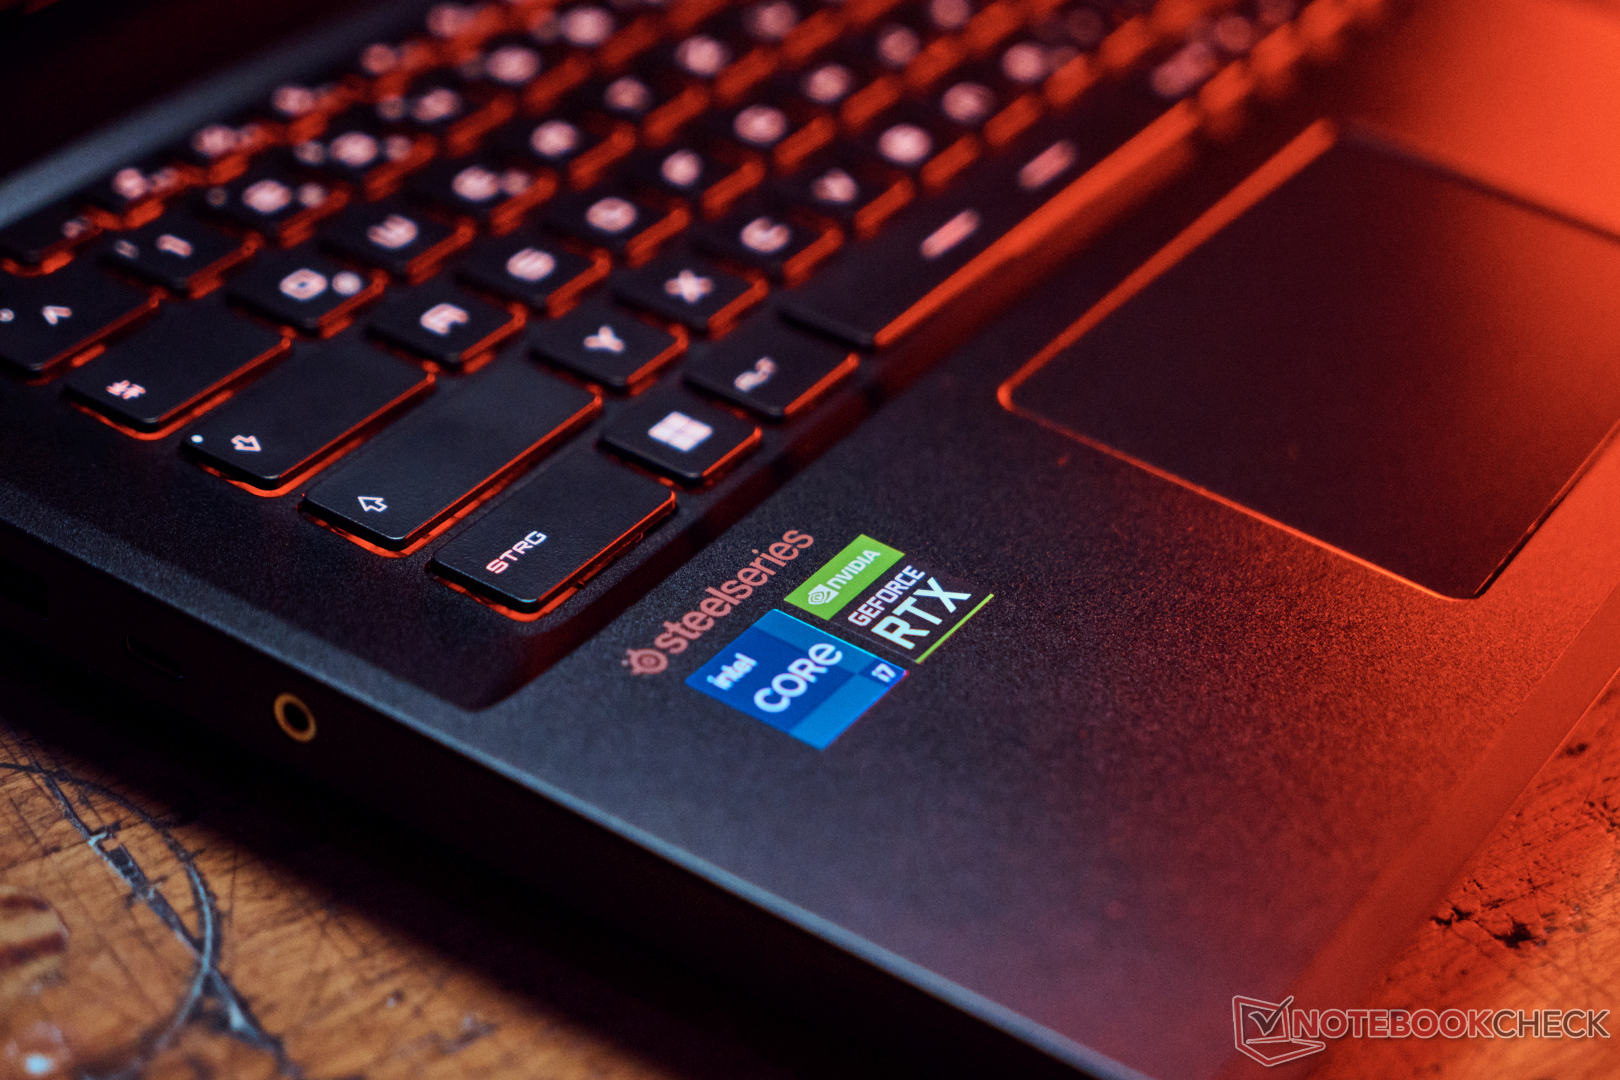
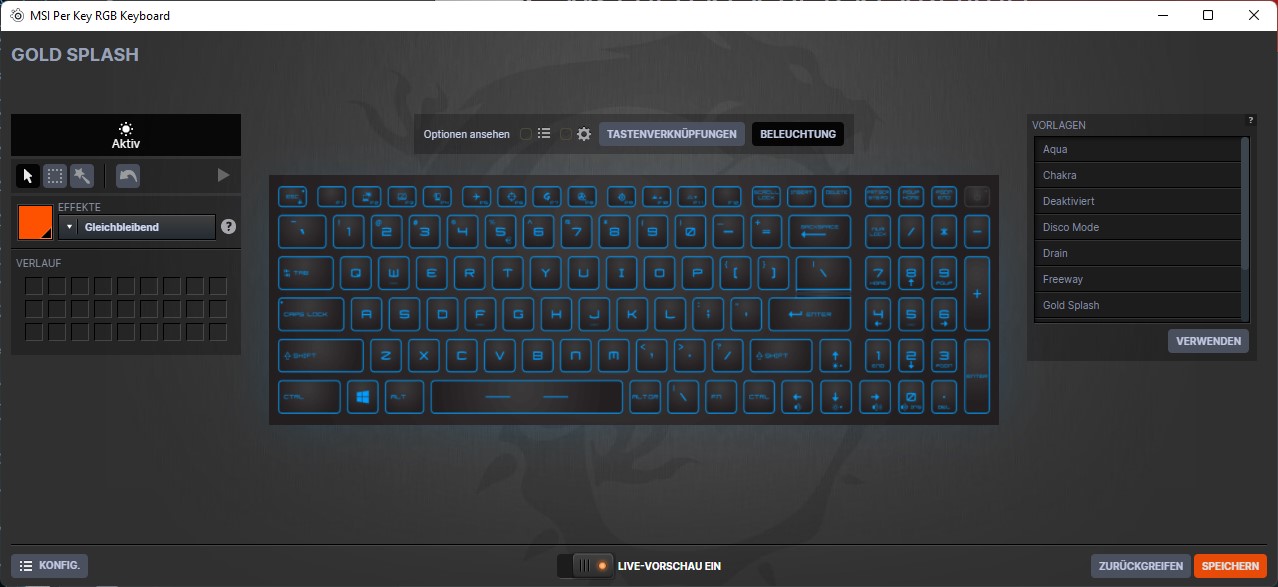
Périphériques d'entrée : MSI avec RGB par touche pour une touche de couleur
Clavier
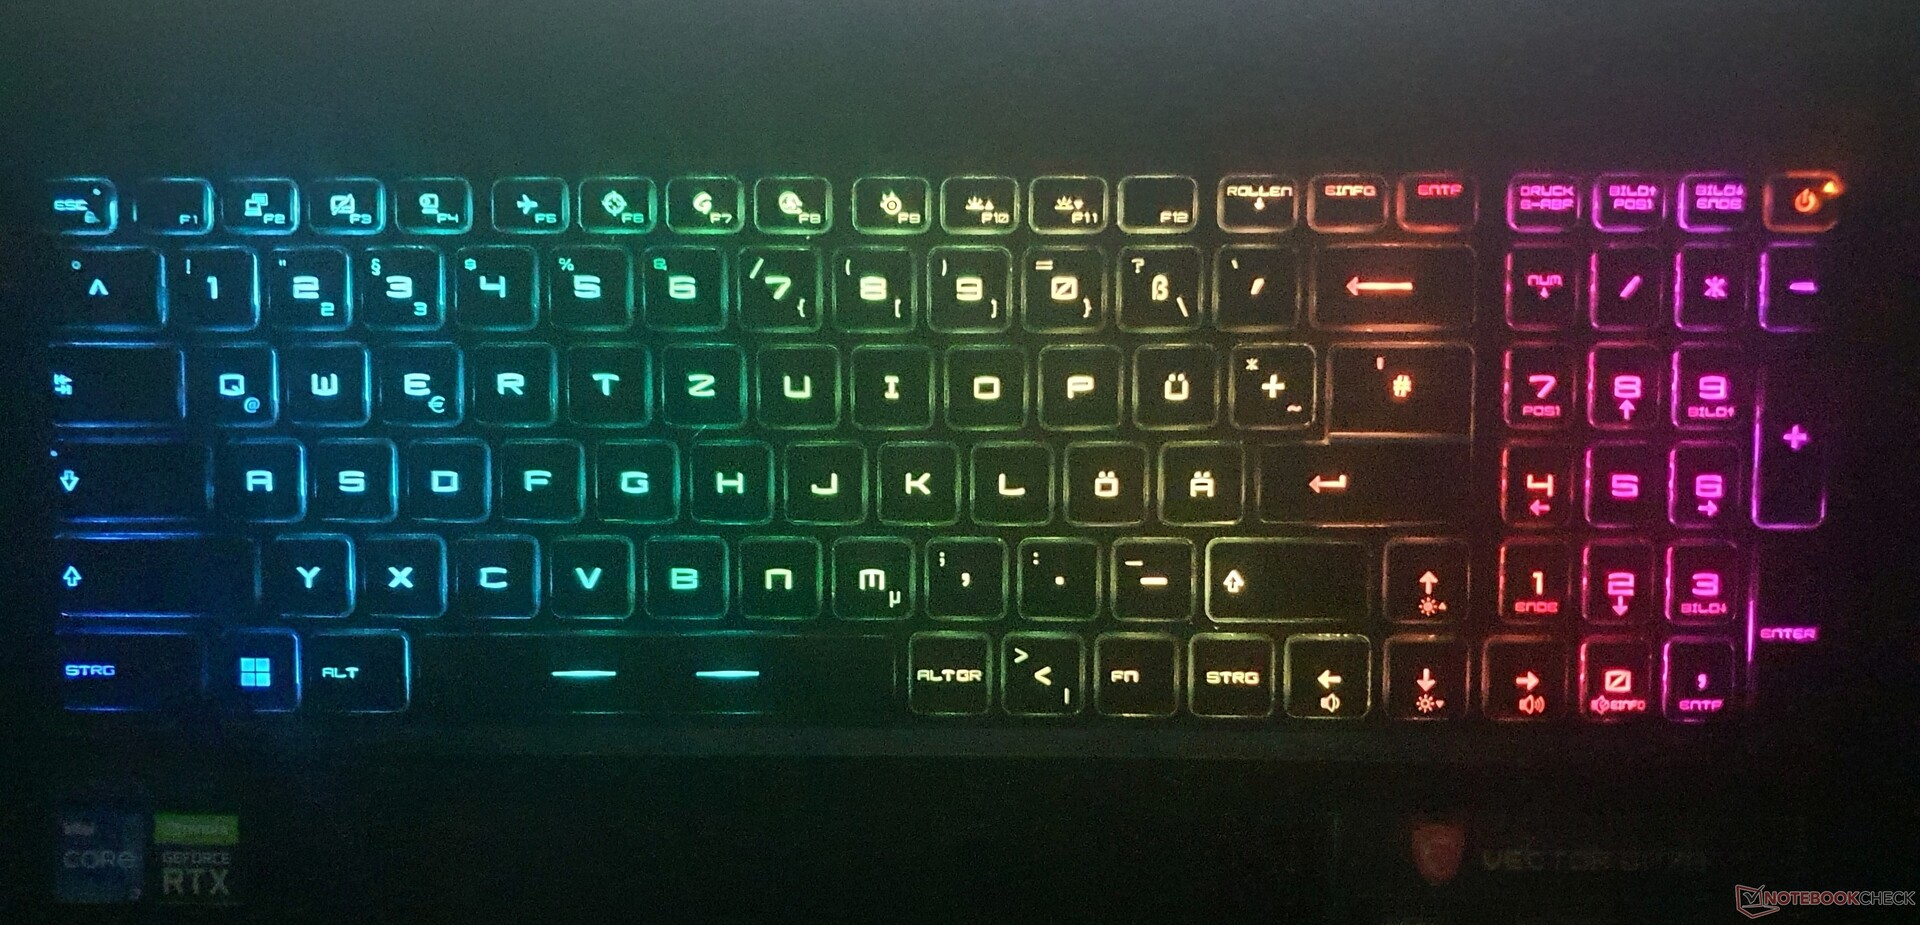
Le clavier SteelSeries, qui n'a pas changé depuis des générations, offre des touches un peu plus petites mais adhérentes, avec un point de pression modéré et une course moyenne.
Les textes longs peuvent être écrits sans problème, même si la frappe est un peu molle. Il y a quelques points à noter concernant la disposition des touches : Comme la plupart des autres touches, les touches fléchées ont une taille de 15x15mm, mais la touche Enter est divisée et les touches Shift, bloc numérique et F de droite sont plus petites. Le clavier correspond donc à celui du marché américain avec un étiquetage DE adapté. Certaines touches de fonction ont également une double fonction.
Un des avantages est le faible niveau sonore. Grâce à l'anti-ghosting, jusqu'à 10 frappes sont possibles en même temps et le rétro-éclairage individuel des touches peut être configuré à l'aide du logiciel "SteelSeries Engine 3".
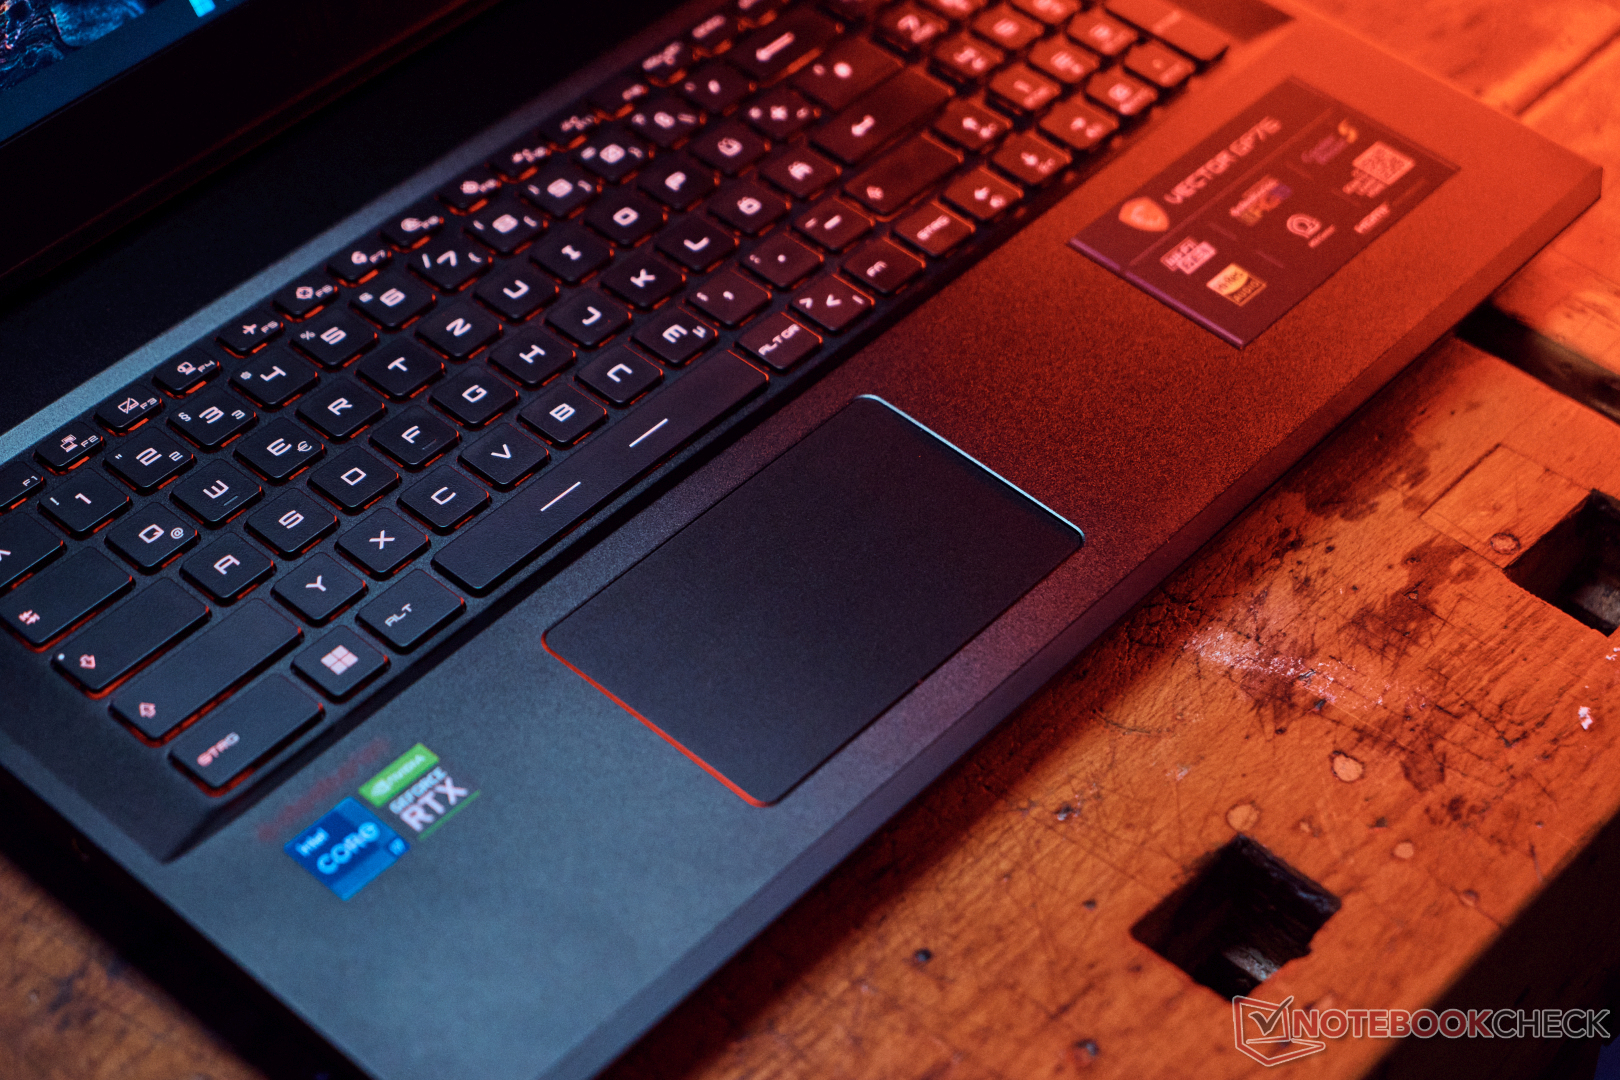
Pavé tactile

Le pavé tactile mesure 10,5 x 6,5 cm et n'est donc pas le plus grand, mais la qualité de glissement est très bonne et fonctionne de manière très précise. En revanche, les boutons de clic intégrés ne fonctionnent qu'avec une forte pression et n'offrent pas un retour optimal. Cela dit, il existe des clickpads bien pires sur le marché.
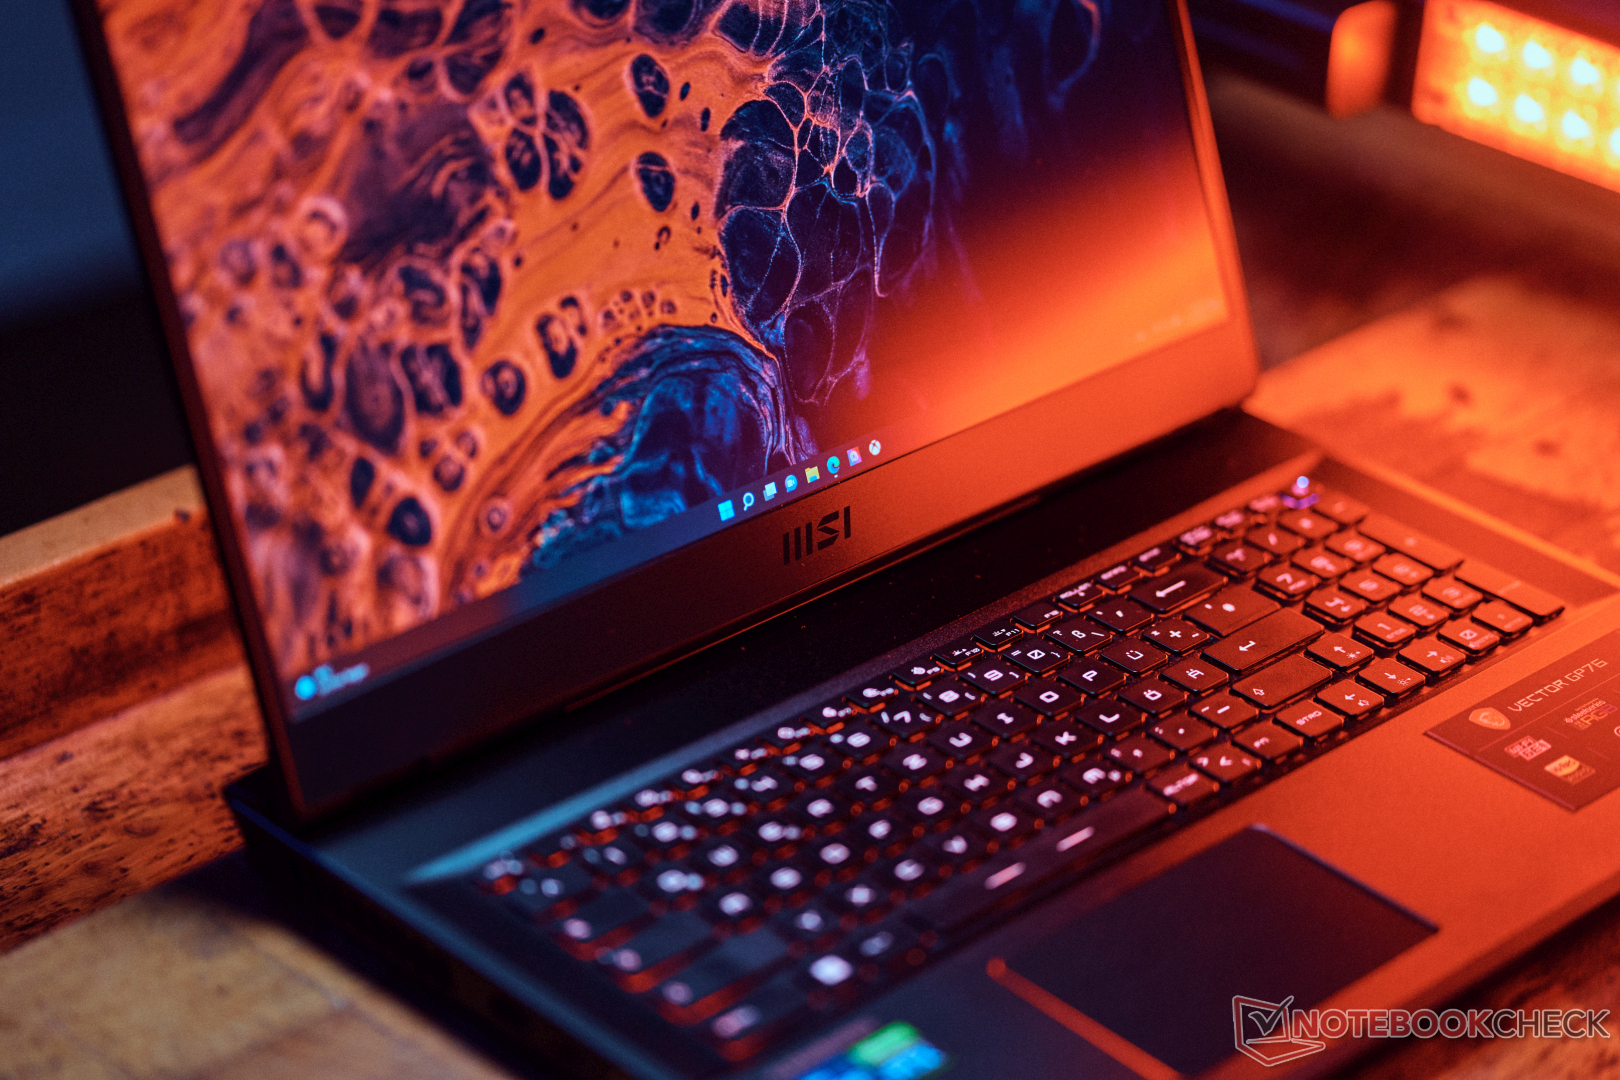
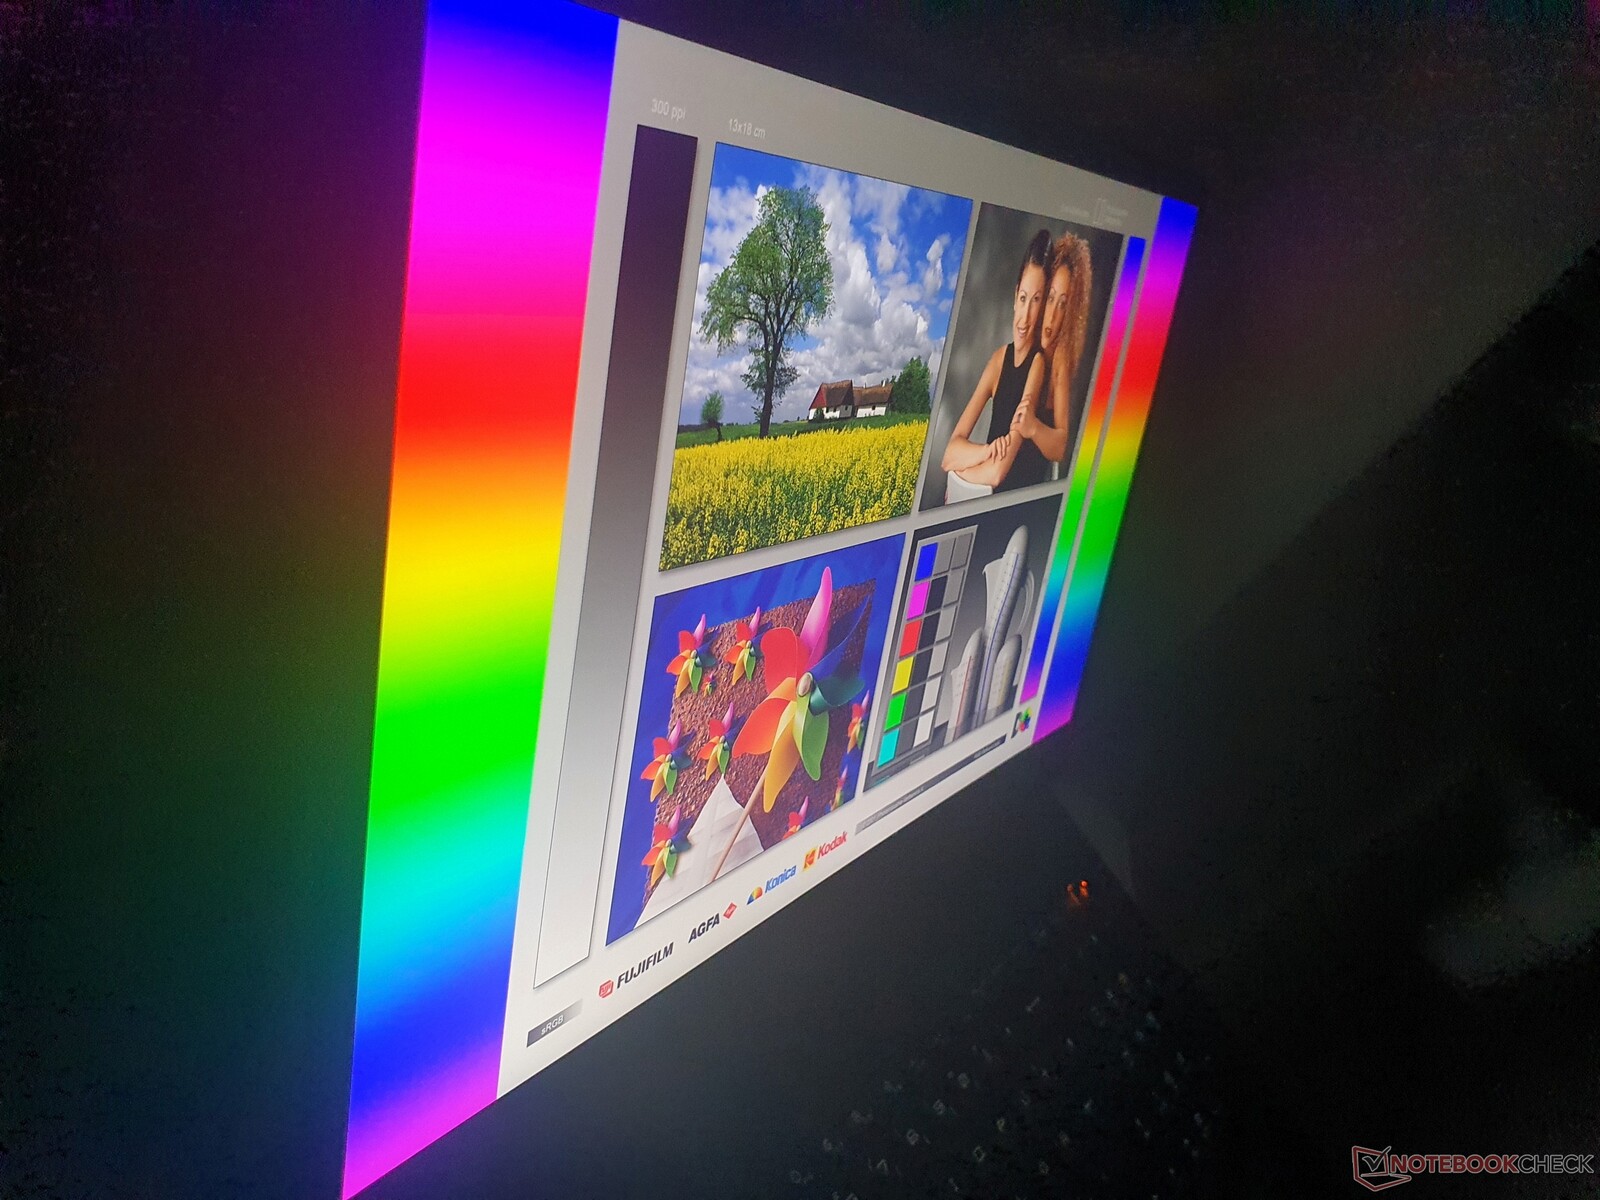
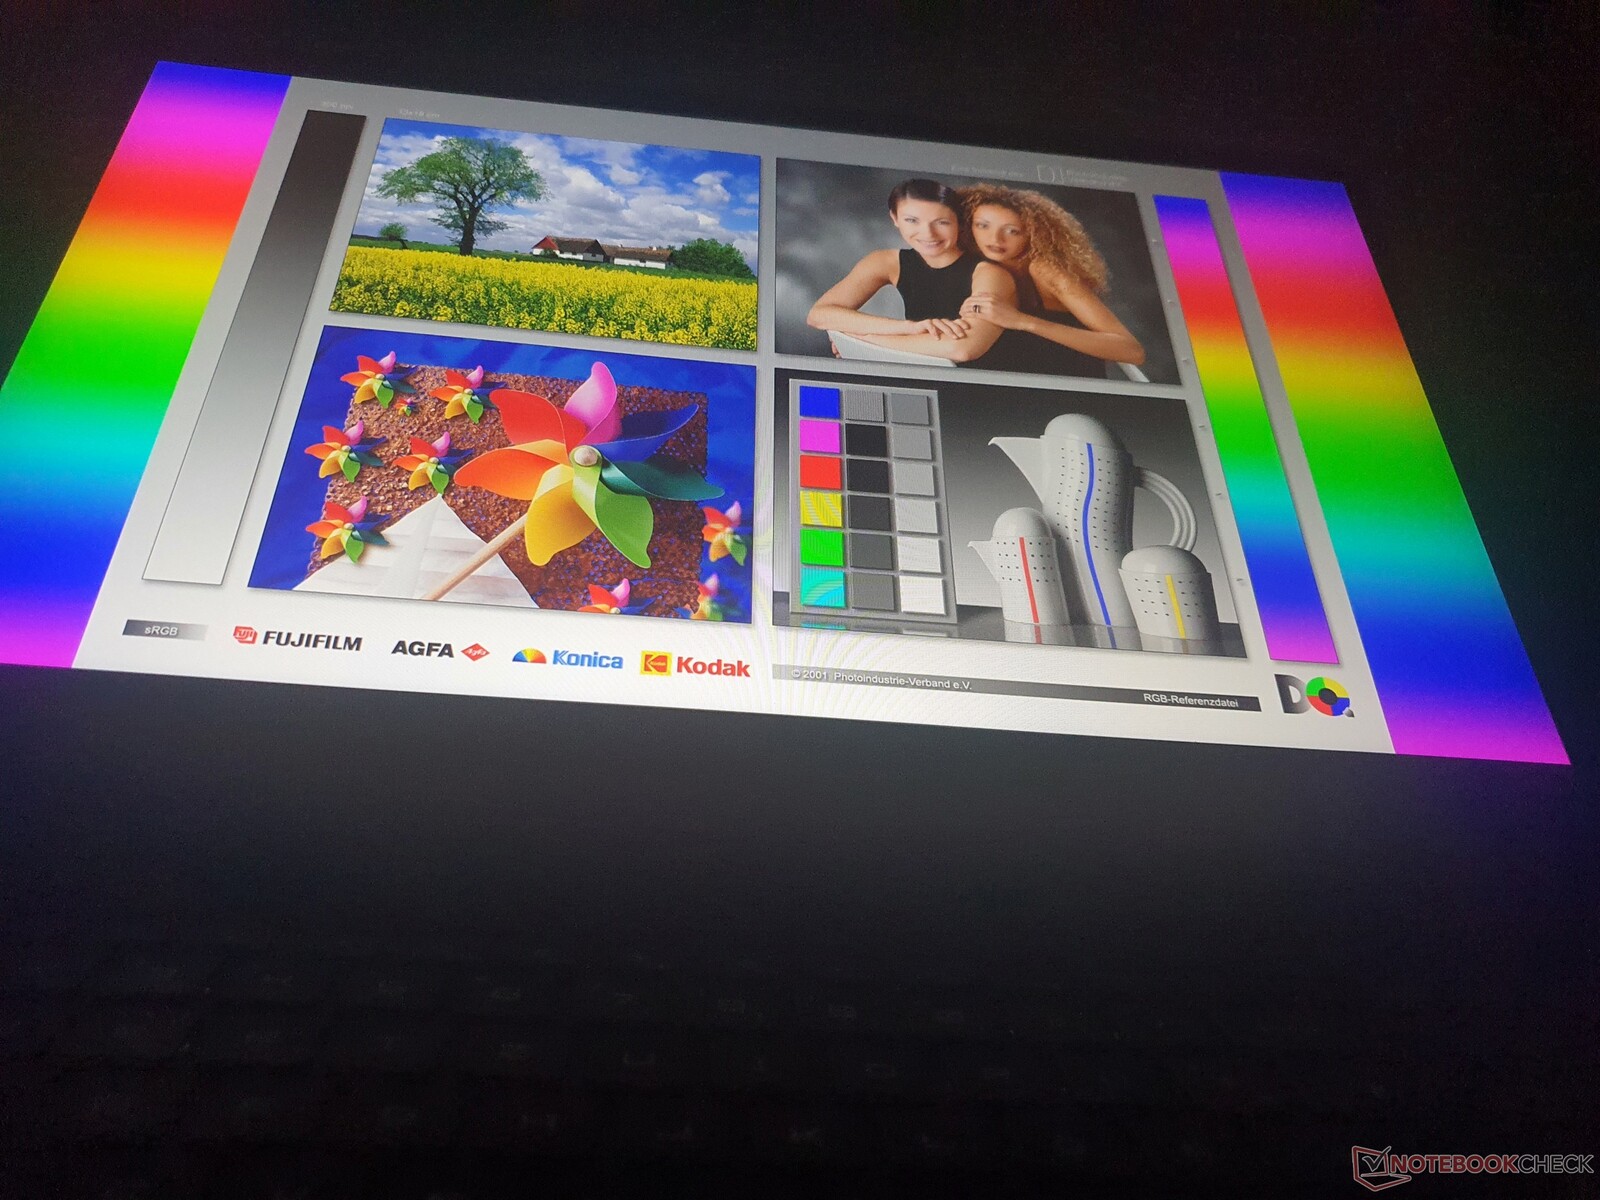
Affichage : Rapide à 360 Hz et 4ms de gris à gris sur le Vector GP76

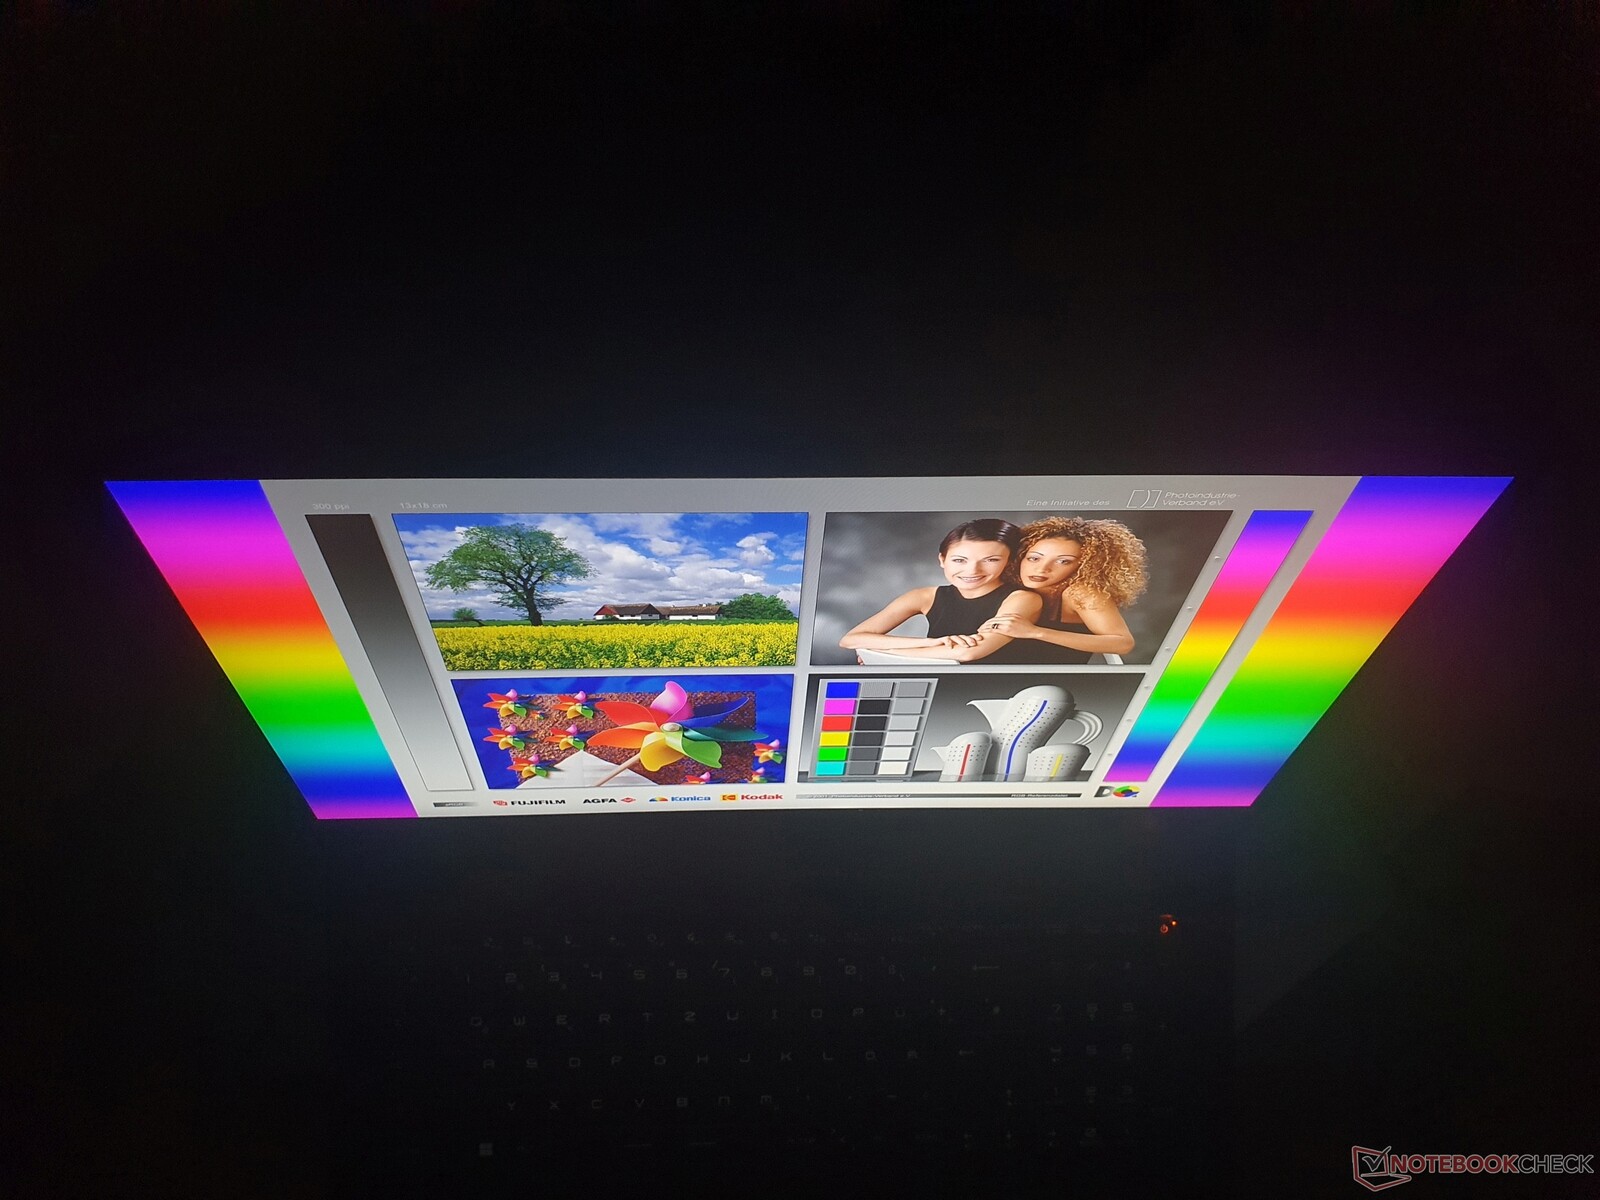
L'écran IPS mat de 17,3 pouces au format 16:9 offre une luminosité médiocre de 264 cd/m², qui s'avère suffisante pour une utilisation en intérieur. La résolution de 1920x1080 (Full HD) est la seule que MSI propose dans la série Vector et elle est suffisamment nette tant que l'on ne colle pas son nez à l'écran. Les images sont également très nettes et claires, renforcées par une bonne qualité des sous-pixels.
Le contraste de 1 096:1 est acceptable, et la bonne valeur de noir de 0,25 donne un noir riche. Bien que le champ de comparaison soit généralement d'un niveau similaire, le petit Vector GP66 (ainsi que son prédécesseur) est encore plus lumineux avec 324 cd/m². Cependant, le Legion 5 Pro et Zephyrus M16surpassent la concurrence avec un peu moins de 500 cd/m² et sont donc également adaptés à une utilisation en extérieur.
En termes de temps de réponse, rien ne peut rivaliser avec le GP76 : En plus de la fréquence de rafraîchissement ultra-rapide de 360 Hz, un signal de gris à gris ne prend que 4 ms et le noir à blanc est encore un très bon 8 ms. La concurrence se situe entre 15 et 27 ms pour le gris à gris. Globalement, le panneau correspond aux spécifications haut de gamme appropriées pour le jeu. Le prédécesseur utilise un panneau de 144 Hz.
Cependant, il n'y a pas de G-Sync interne. La synchronisation adaptative est prise en charge sur un moniteur externe via DisplayPort. Aucun scintillement PWM n'a été détecté
| |||||||||||||||||||||||||
Homogénéité de la luminosité: 87 %
Valeur mesurée au centre, sur batterie: 270 cd/m²
Contraste: 1096:1 (Valeurs des noirs: 0.25 cd/m²)
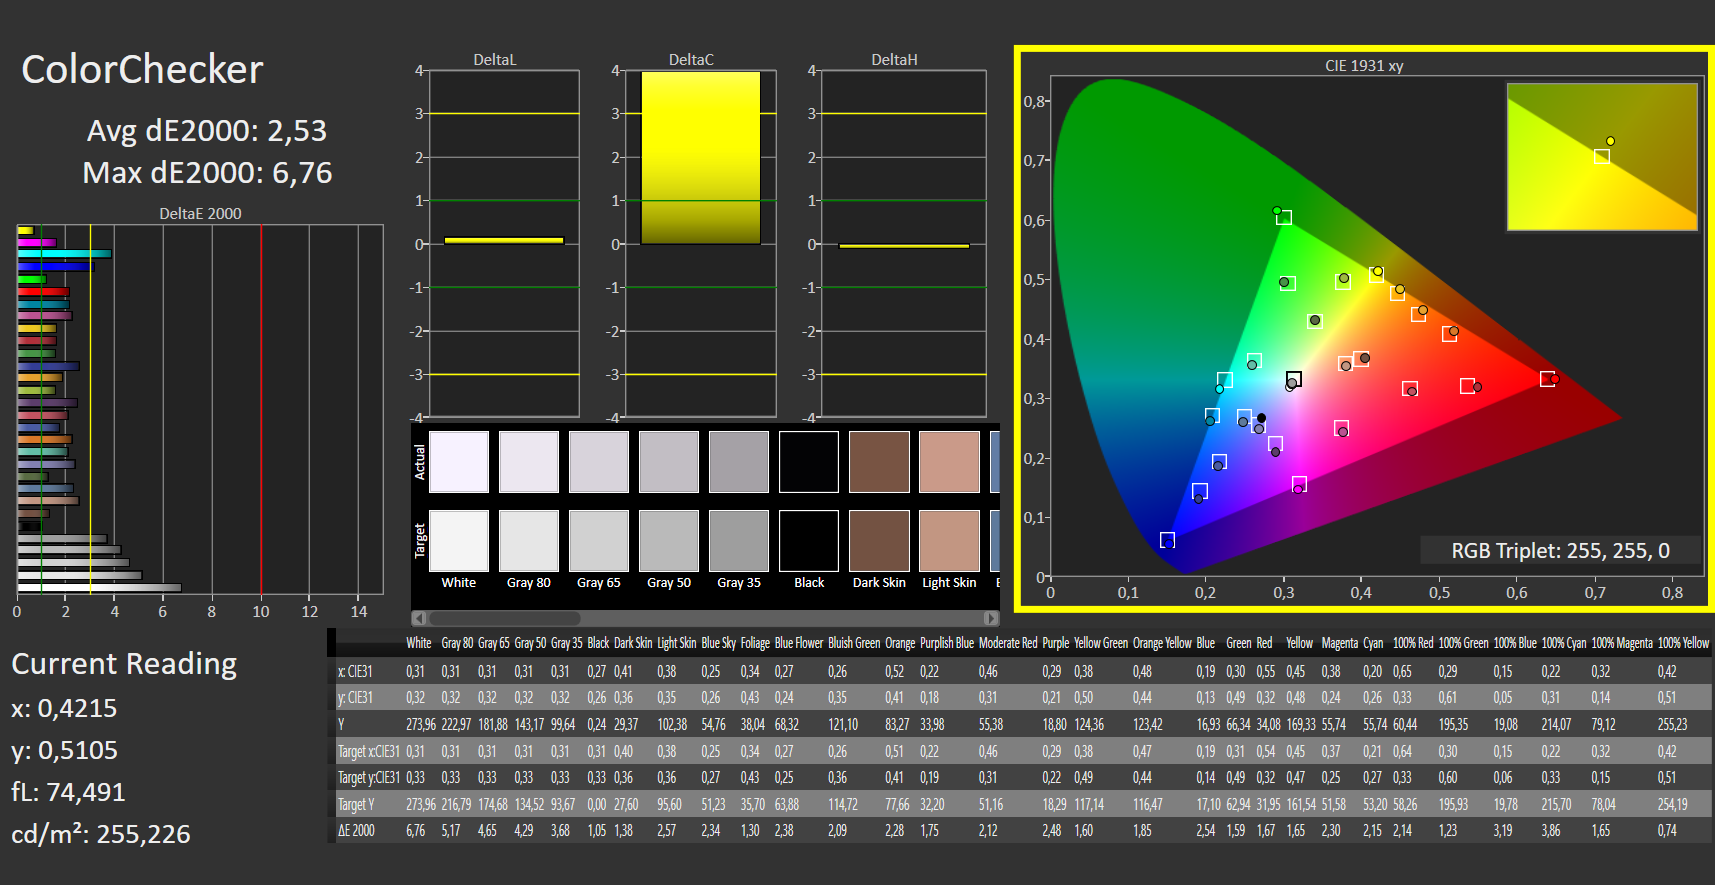
ΔE ColorChecker Calman: 2.53 | ∀{0.5-29.43 Ø4.71}
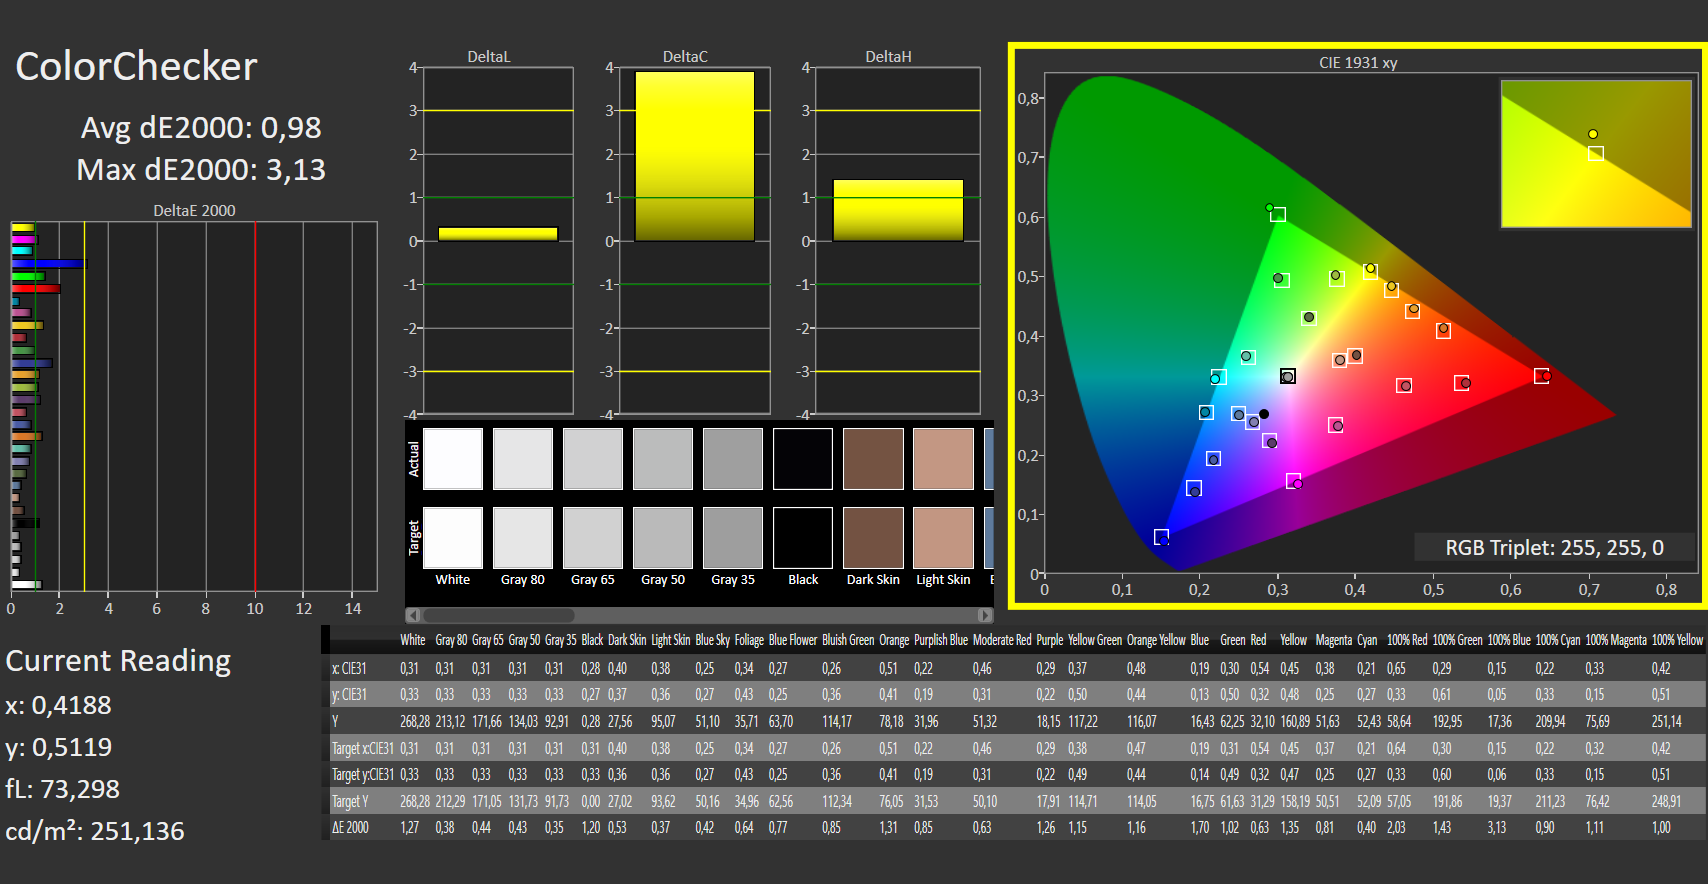
calibrated: 0.98
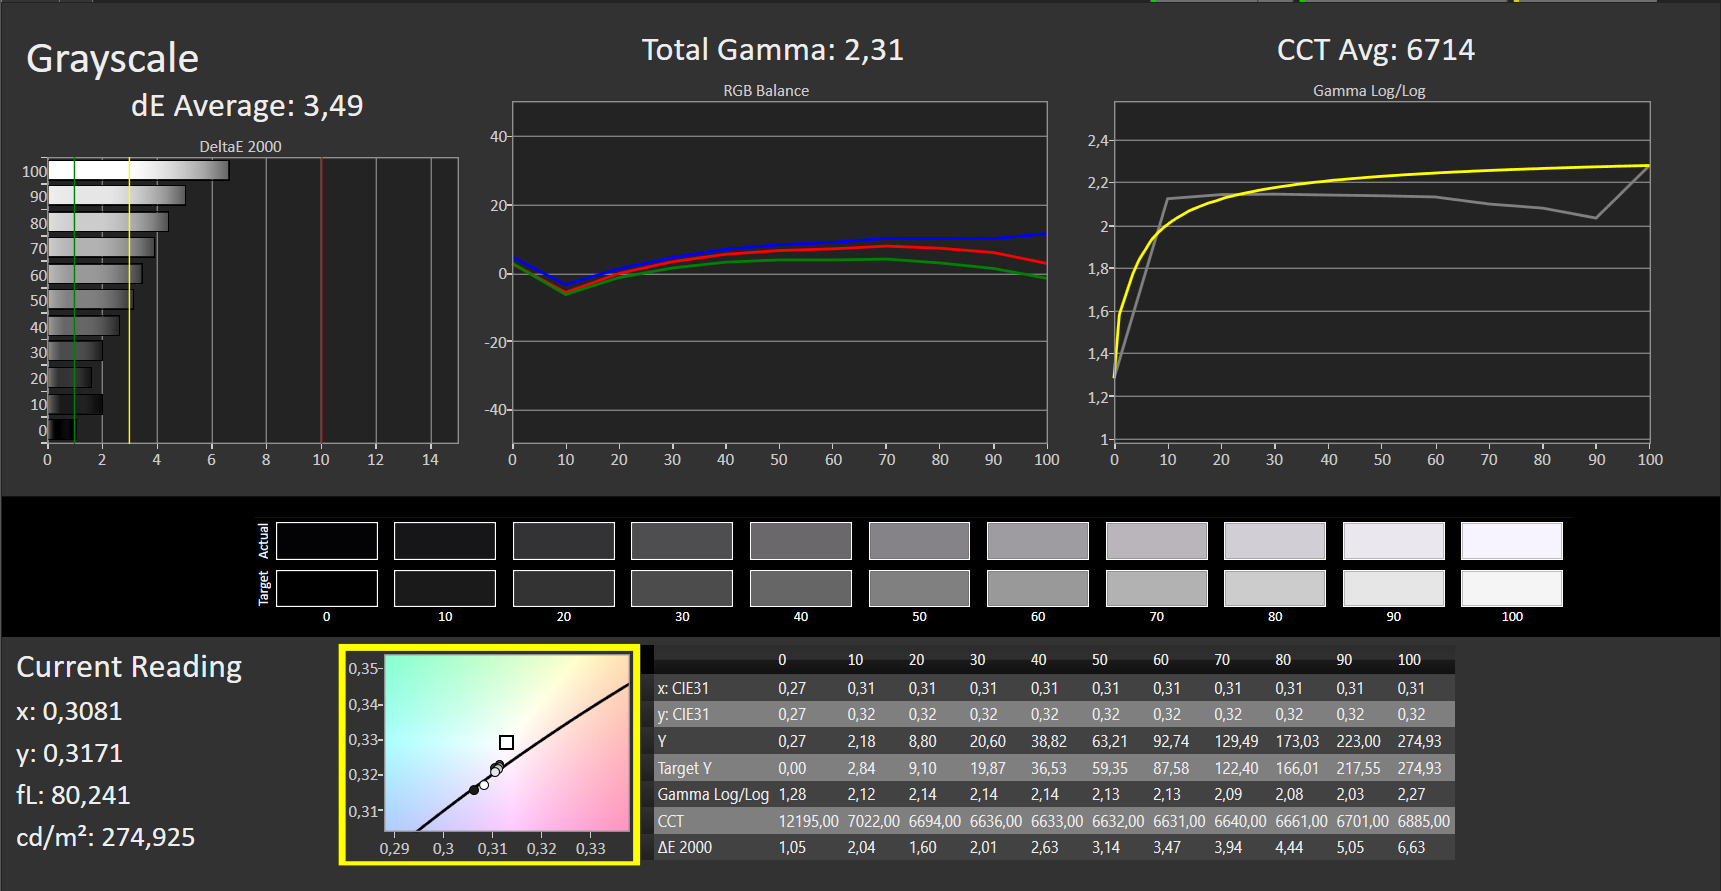
ΔE Greyscale Calman: 3.49 | ∀{0.09-98 Ø4.96}
70.91% AdobeRGB 1998 (Argyll 3D)
98.98% sRGB (Argyll 3D)
70.09% Display P3 (Argyll 3D)
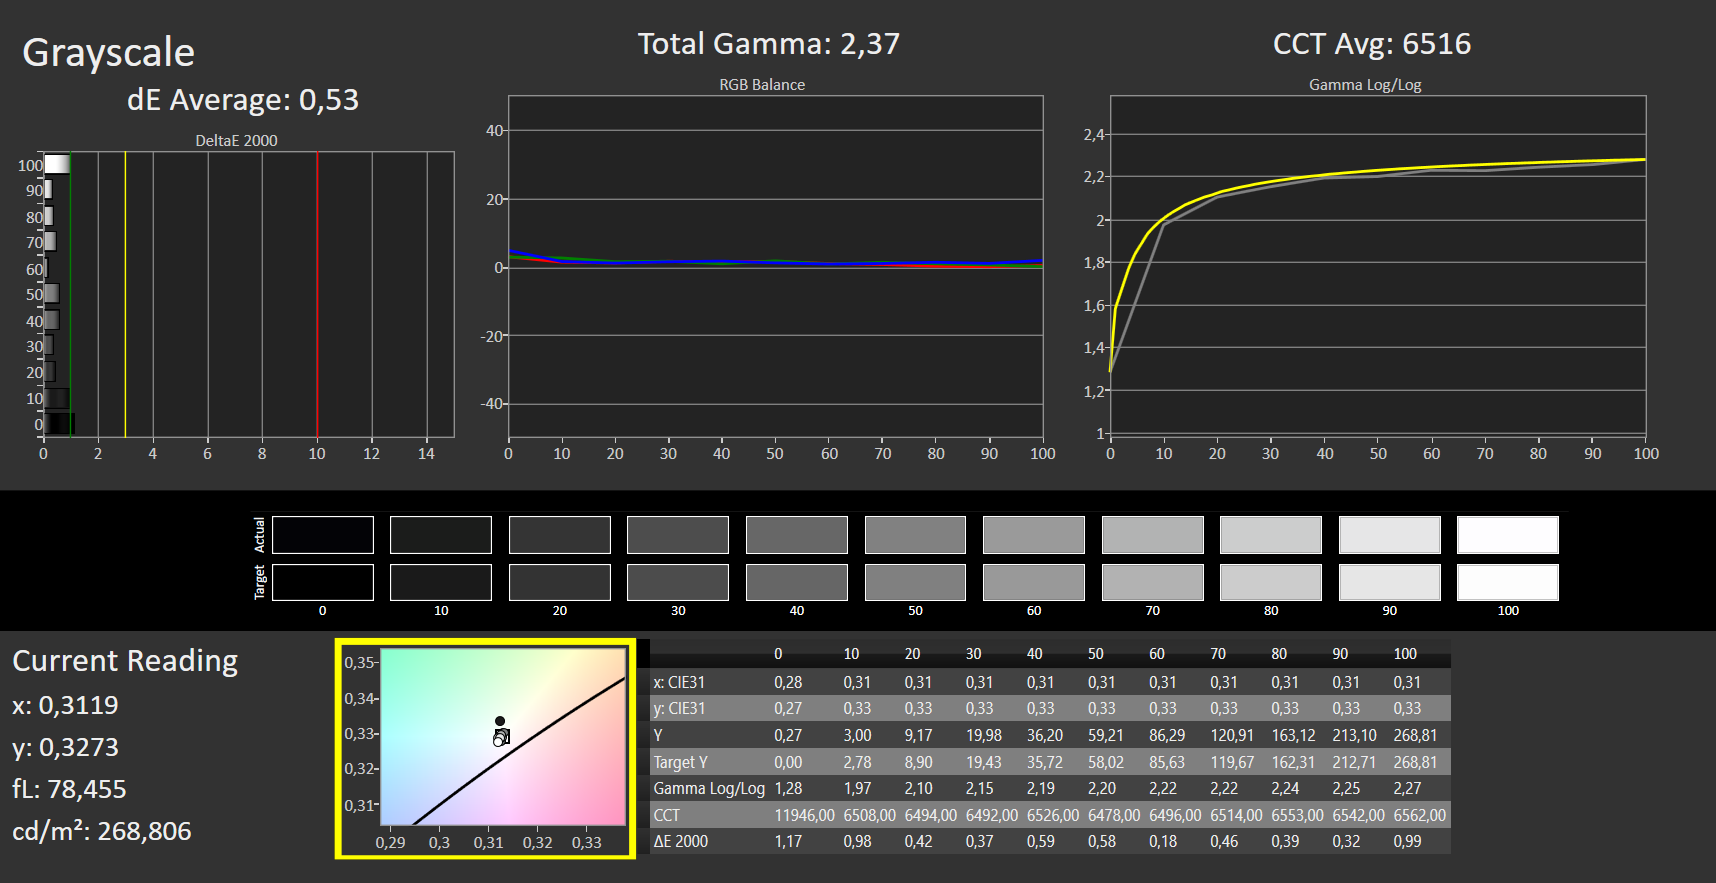
Gamma: 2.31
CCT: 6714 K
| MSI Vector GP76 12UGS-434 AUO B173HAN05.4, IPS, 1920x1080, 17.3" | MSI GP76 Leopard 10UG Chi Mei CMN176E, IPS, 1920x1080, 17.3" | Asus ROG Strix G17 G713QE-RB74 AU Optronics B173HAN04.9, IPS, 1920x1080, 17.3" | Aorus 17 XE4 Sharp LQ173M1JW12, IPS, 1920x1080, 17.3" | Schenker XMG NEO 17 GM7TG8S BOE0977 (NE173QHM-NY2), IPS, 2560x1440, 17.3" | Lenovo Legion 5 Pro 16 G7 i7 RTX 3070Ti NE160QDM-NY1, IPS, 2560x1600, 16" | Asus ROG Zephyrus M16 GU603H AU Optronics AUOC199, IPS, 2560x1600, 16" | MSI Vector GP66 12UGS BOE NE156FHM-NZ3, IPS, 1920x1080, 15.6" | |
|---|---|---|---|---|---|---|---|---|
| Display | -6% | -41% | -1% | -3% | -1% | 1% | ||
| Display P3 Coverage (%) | 70.09 | 64.7 -8% | 40.2 -43% | 69 -2% | 67.1 -4% | 68.7 -2% | 70.1 0% | |
| sRGB Coverage (%) | 98.98 | 96.4 -3% | 60.3 -39% | 99.4 0% | 96.3 -3% | 97.6 -1% | 99.5 1% | |
| AdobeRGB 1998 Coverage (%) | 70.91 | 66.9 -6% | 41.6 -41% | 71.2 0% | 68.6 -3% | 70.9 0% | 72.1 2% | |
| Response Times | -60% | -355% | -160% | -145% | -168% | 3% | -33% | |
| Response Time Grey 50% / Grey 80% * (ms) | 4 ? | 7.4 ? -85% | 26.8 ? -570% | 15.2 ? -280% | 15.2 -280% | 17.6 ? -340% | 4.8 ? -20% | 5.8 ? -45% |
| Response Time Black / White * (ms) | 8 ? | 10.8 ? -35% | 19.2 ? -140% | 11.2 ? -40% | 8.8 -10% | 7.6 ? 5% | 6 ? 25% | 9.6 ? -20% |
| PWM Frequency (Hz) | 24510 ? | |||||||
| Screen | 14% | -30% | 8% | 11% | 17% | -19% | 0% | |
| Brightness middle (cd/m²) | 274 | 328 20% | 270.5 -1% | 274 0% | 396 45% | 502 83% | 448 64% | 353.1 29% |
| Brightness (cd/m²) | 264 | 314 19% | 269 2% | 267 1% | 366 39% | 491 86% | 446 69% | 325 23% |
| Brightness Distribution (%) | 87 | 87 0% | 92 6% | 82 -6% | 82 -6% | 91 5% | 86 -1% | 85 -2% |
| Black Level * (cd/m²) | 0.25 | 0.29 -16% | 0.19 24% | 0.25 -0% | 0.45 -80% | 0.37 -48% | 0.48 -92% | 0.38 -52% |
| Contrast (:1) | 1096 | 1131 3% | 1424 30% | 1096 0% | 880 -20% | 1357 24% | 933 -15% | 929 -15% |
| Colorchecker dE 2000 * | 2.53 | 1.93 24% | 4.39 -74% | 2.07 18% | 1.43 43% | 2.7 -7% | 2.76 -9% | 2.24 11% |
| Colorchecker dE 2000 max. * | 6.76 | 4.94 27% | 20.8 -208% | 4.89 28% | 2.2 67% | 4.5 33% | 7.09 -5% | 5 26% |
| Colorchecker dE 2000 calibrated * | 0.98 | 0.68 31% | 1.56 -59% | 0.83 15% | 1.34 -37% | 1.4 -43% | 2.86 -192% | 1.02 -4% |
| Greyscale dE 2000 * | 3.49 | 2.8 20% | 3.1 11% | 3 14% | 1.8 48% | 2.7 23% | 3.1 11% | 4 -15% |
| Gamma | 2.31 95% | 2.18 101% | 2.14 103% | 2.207 100% | 2.4 92% | 2.44 90% | 2.153 102% | 2.24 98% |
| CCT | 6714 97% | 7023 93% | 6927 94% | 6999 93% | 6489 100% | 6326 103% | 6826 95% | 6864 95% |
| Color Space (Percent of AdobeRGB 1998) (%) | 67 | 87 | ||||||
| Color Space (Percent of sRGB) (%) | 89 | 100 | ||||||
| Moyenne finale (programmes/paramètres) | -17% /
-1% | -142% /
-79% | -51% /
-18% | -46% /
-14% | -51% /
-13% | -8% /
-15% | -11% /
-4% |
* ... Moindre est la valeur, meilleures sont les performances
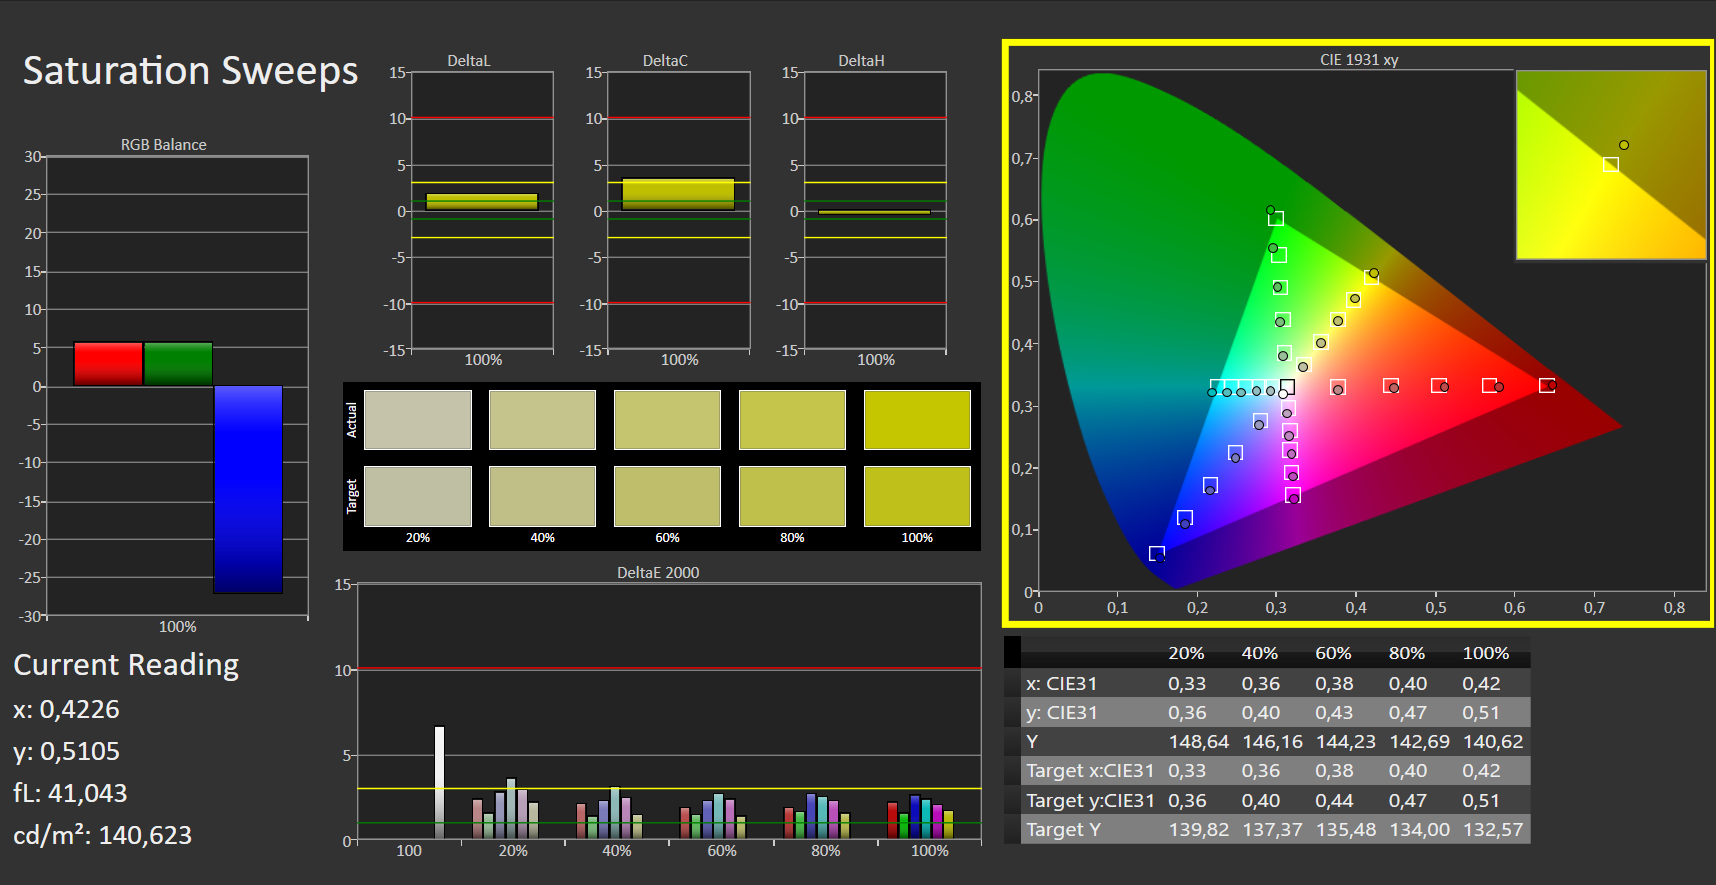
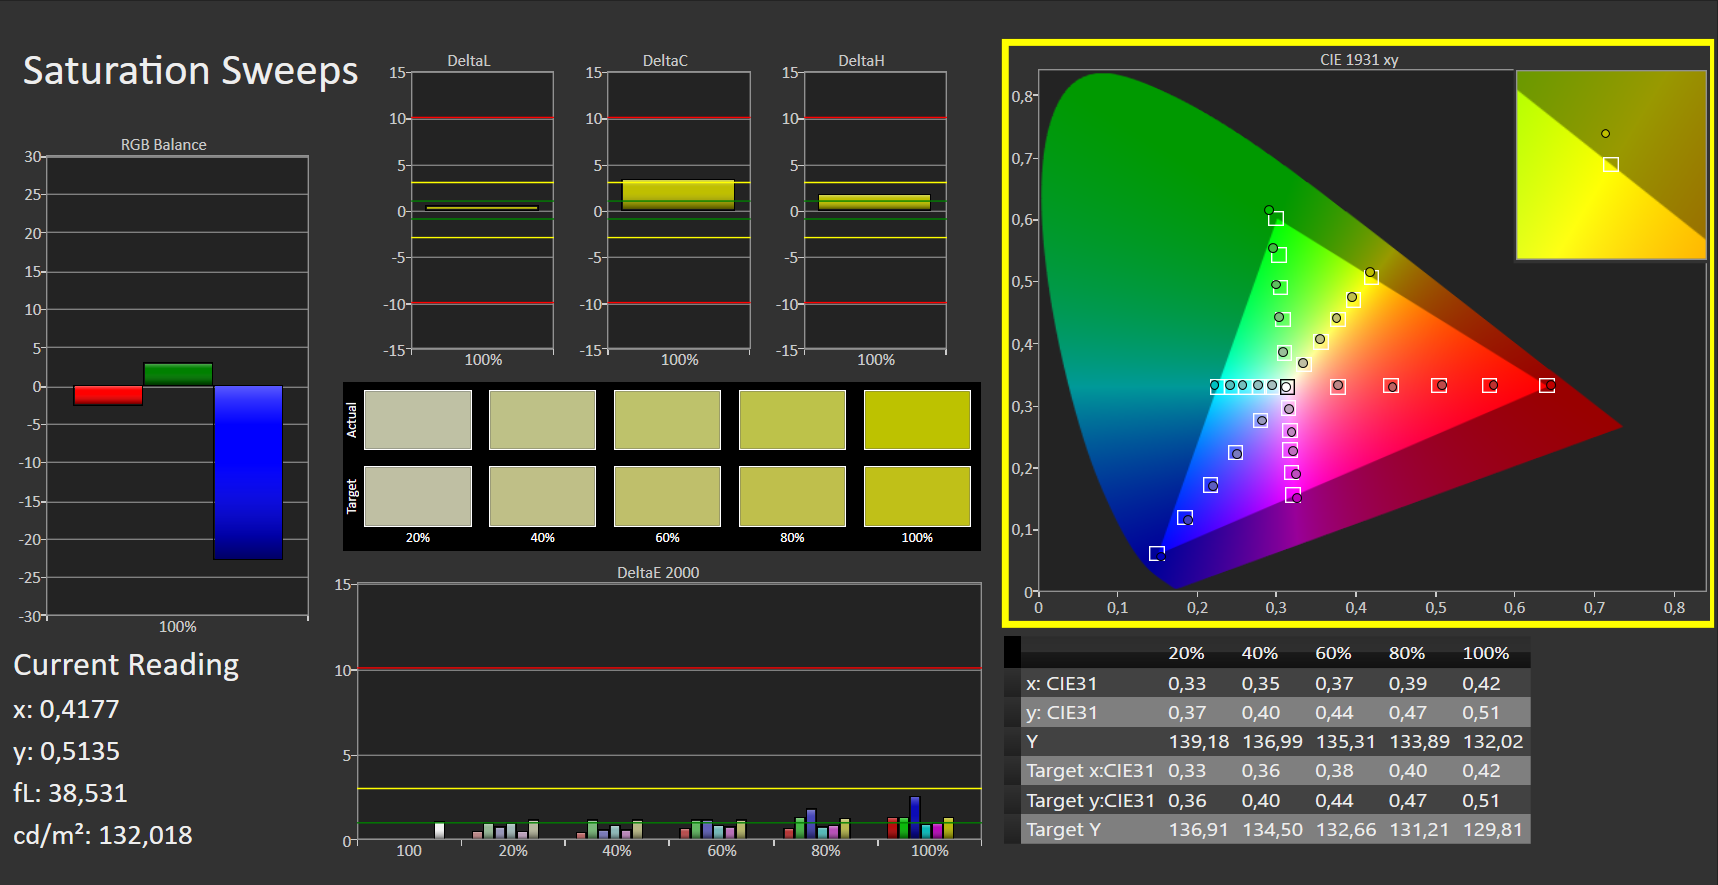
La gamme de couleurs sRGB est très bien couverte, avec un peu moins de 99 %. Pour DCI-P3 et AdobeRGB, elle est de 70 à 71 %, ce qui est suffisant pour cette catégorie d'ordinateurs portables. La valeur DeltaE de 2,54 est légèrement supérieure au seuil de 2 et correspond donc à peu près à celle de la concurrence.
L'étalonnage améliore les valeurs, mais le bleu légèrement sous-représenté ne peut être que légèrement optimisé. La perception subjective des couleurs témoigne également de tons de couleurs relativement peu altérés, qui apparaissent très riches, mais pas particulièrement sursaturés. Le fichier ICC de l'étalonnage peut être téléchargé dans la fenêtre située à côté du graphique de couverture.
Temps de réponse de l'écran
| ↔ Temps de réponse noir à blanc | ||
|---|---|---|
| 8 ms ... hausse ↗ et chute ↘ combinées | ↗ 4 ms hausse |  |
| ↘ 4 ms chute | ||
| L'écran montre de faibles temps de réponse, un bon écran pour jouer. En comparaison, tous les appareils testés affichent entre 0.1 (minimum) et 240 (maximum) ms. » 22 % des appareils testés affichent de meilleures performances. Cela signifie que les latences relevées sont meilleures que la moyenne (19.8 ms) de tous les appareils testés. | ||
| ↔ Temps de réponse gris 50% à gris 80% | ||
| 4 ms ... hausse ↗ et chute ↘ combinées | ↗ 1 ms hausse |  |
| ↘ 3 ms chute | ||
| L'écran montre de très faibles temps de réponse, parfait pour le jeu. En comparaison, tous les appareils testés affichent entre 0.165 (minimum) et 636 (maximum) ms. » 15 % des appareils testés affichent de meilleures performances. Cela signifie que les latences relevées sont meilleures que la moyenne (30.9 ms) de tous les appareils testés. | ||
Scintillement / MLI (Modulation de largeur d'impulsion)
| Scintillement / MLI (Modulation de largeur d'impulsion) non décelé |  | ||
En comparaison, 52 % des appareils testés n'emploient pas MDI pour assombrir leur écran. Nous avons relevé une moyenne à 7744 (minimum : 5 - maximum : 343500) Hz dans le cas où une MDI était active. | |||
Si vous voulez profiter du jeu au grand air, vous devez le faire à l'ombre. Plus qu'une LAN party sous le pavillon n'est pas possible avec une luminosité de 264 cd/m², même avec un écran mat.
Les angles de vision sont bons sur tous les écrans IPS, y compris sur notre modèle de test. Aucun souhait ne reste inassouvi ici. L'OLED, par exemple, offre une stabilité des angles de vision encore meilleure
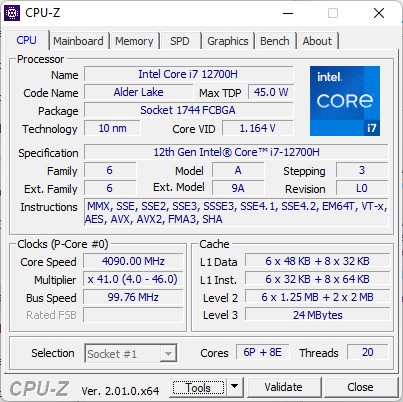
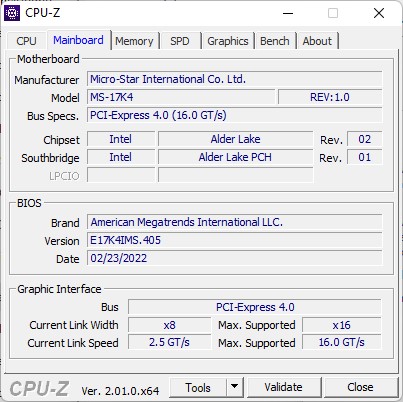
Performances : MSI pousse la RTX 3070 Ti GeForce au maximum
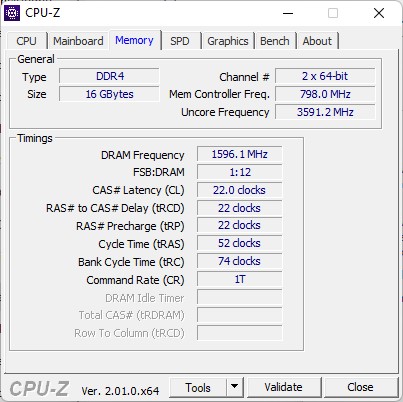
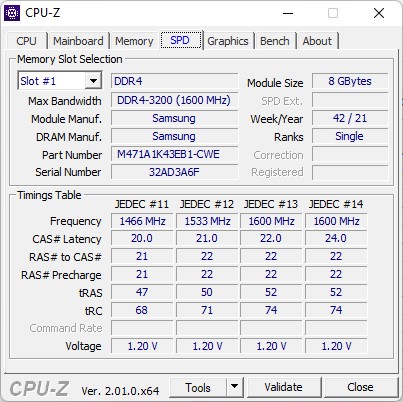
En ce qui concerne le processeur, les acheteurs intéressés peuvent choisir entre leCore i7-12700H ou le processeur Intel i9-12900HK. Pour les graphismes, il n'y a que la Nvidia RTX 3070 Ti(150 W) et la RTX 3080 (non-Ti, 165 W). La RAM est toujours livrée en 2x 8GB DDR4-3200 départ usine (2x 16 GB dans d'autres régions du monde).
La RAM DDR5, plus rapide d'environ 25% (voir ci-dessous : tableau de comparaison AIDA), est réservée aux classes haut de gamme de MSI. Toutefois, cela n'a aucun impact négatif sur les jeux et les applications graphiques professionnelles, auxquels le Vector GP76 est destiné. On trouve également en standard un SSD PCIe4x4 de 1 To, dont les performances sont testées ci-dessous.

Conditions d'essai
Nous avons d'abord testé le MSI Vector GP76 en mode Auto. Bien sûr, nous avons également testé les performances en mode Performance Extrême, mais au milieu de ce test, nous avons rencontré le problème suivant avec le contrôle des ventilateurs :
Les ventilateurs ne fonctionnaient qu'à une vitesse très faible, même à pleine charge, ce qui entraînait une surchauffe du système, suivie d'un étranglement important, jusqu'à rendre le système inutilisable. Nous connaissons déjà cette erreur sur les ordinateurs portables de jeu MSI, qui a été résolue par des mises à jour du BIOS et de l'EC.
Comme nous utilisions déjà le dernier BIOS à ce moment-là, nous avons pu résoudre temporairement le problème en appuyant deux fois sur le bouton "Turbo Fan", mais il s'est reproduit un peu plus tard, si bien que nous n'avons pas pu terminer les tests en mode Extreme Performance.
Toutefois, ce mode n'a aucune influence sur les performances pures du CPU, tandis qu'environ 7 % de performances supplémentaires sont possibles dans les jeux. Le site Witcher 3 et PCMark 10 ont tout de même réussi à fonctionner en mode Performance extrême. Vous pouvez également jeter un coup d'œil au MSI Vector GP66 Test de l'ordinateur portable MSI Vector GP66 12UGS : 150 W TGP GeForce RTX 3070 Ti sweet spot que nous avons récemment examiné, qui a été entièrement testé en mode Extreme Performance et a généré des valeurs très similaires. Les benchmarks GPU ont également été effectués en mode discrete GPU.
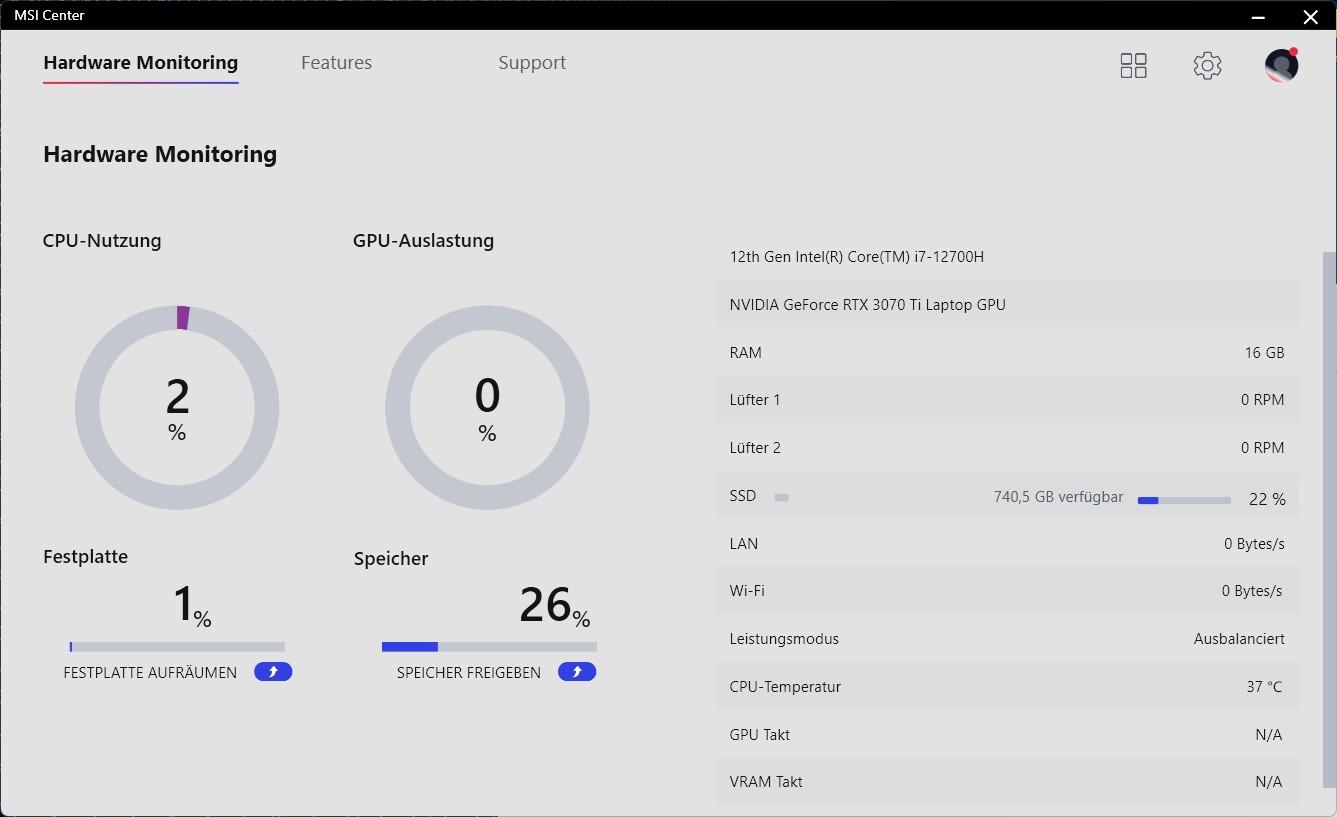
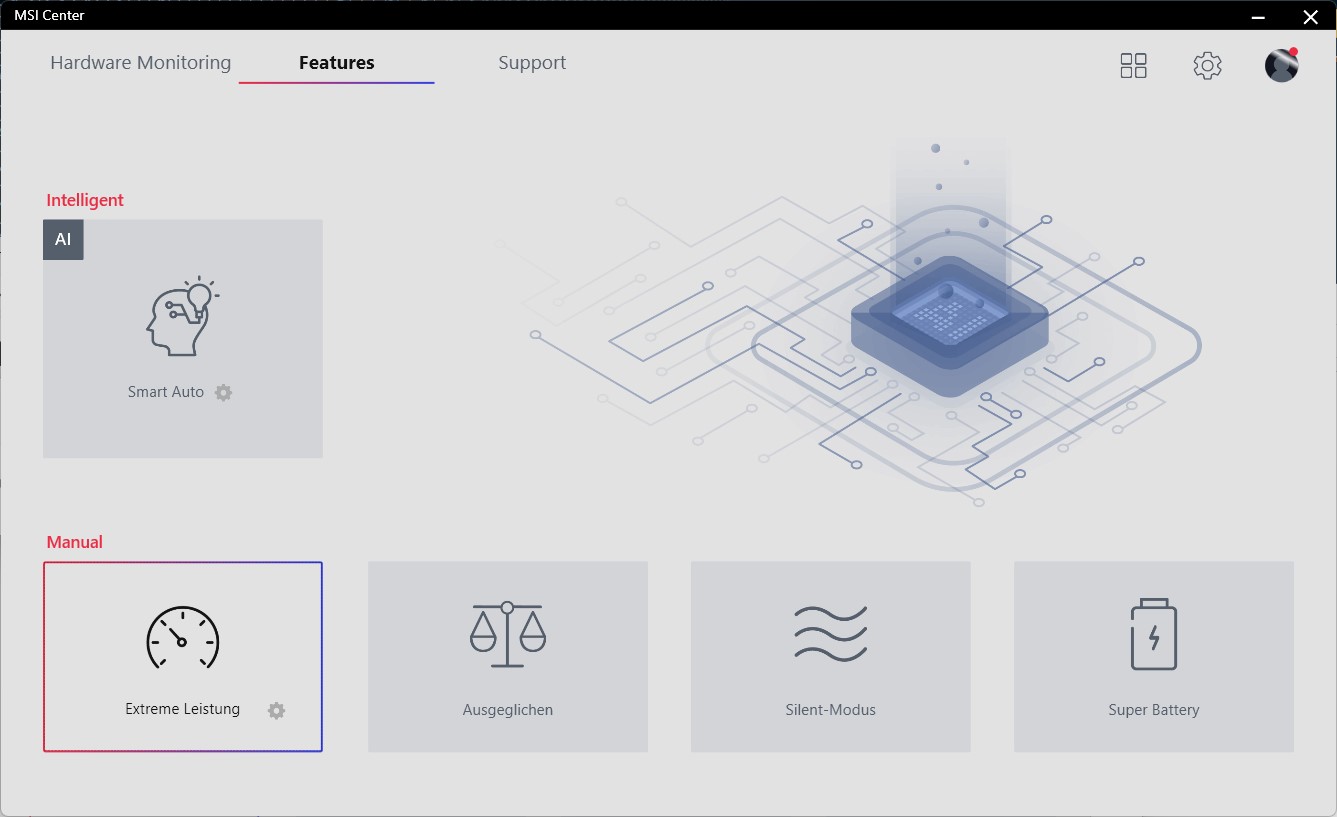
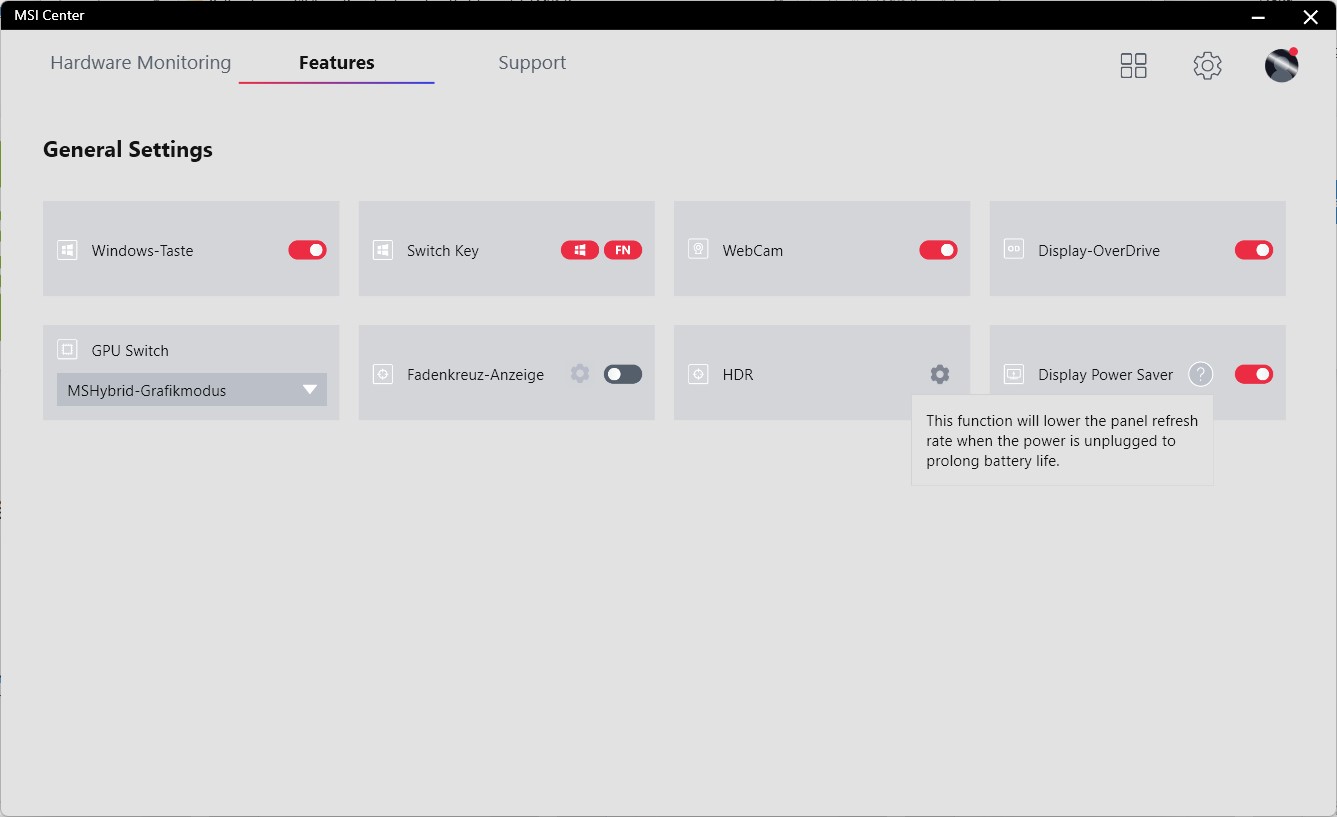
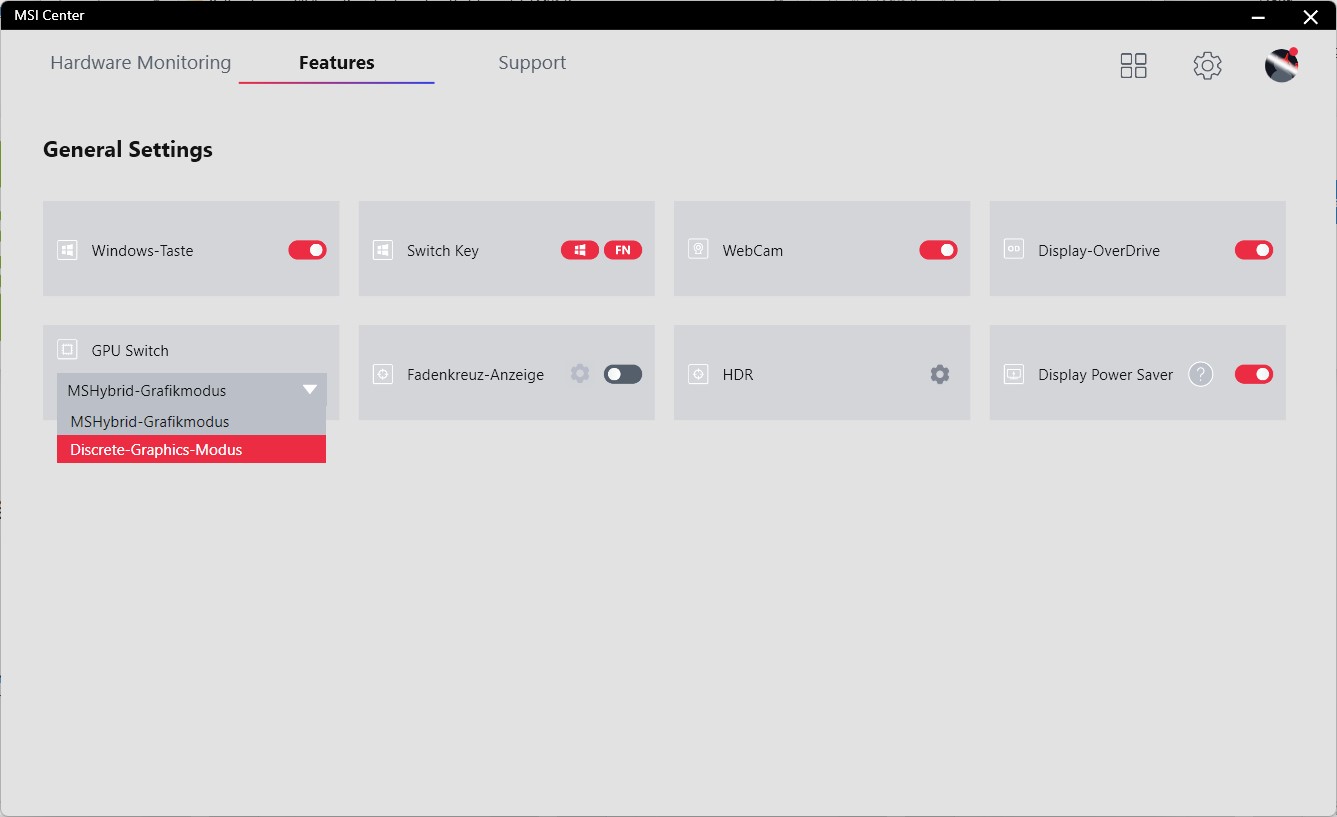
Centre MSI :
Le MSI Center offre un certain nombre de paramètres en plus des quatre modes " Extreme Performance ", " Balanced ", " Silent " et " Super Battery ", comme le commutateur MUX et une fonction qui permet de passer à un taux de rafraîchissement de 60 Hz en mode batterie pour économiser de l'énergie.
| Szenario | Mode silencieux | Mode automatique | Extrême-Perf. | Batterie |
|---|---|---|---|---|
| CPU-Last | 30 Watt | 45 Watt | 70 Watt | 15 Watt |
| GPU-Last | 125 Watt | 125 Watt | 150 Watt | 35 Watt |
| Stresstest | CPU : 30 Watt | CPU : 50 Watt | CPU : 70 Watt | |
| GPU : 35 Watt | GPU : 120 watts | GPU : 150 Watt |
Processeur
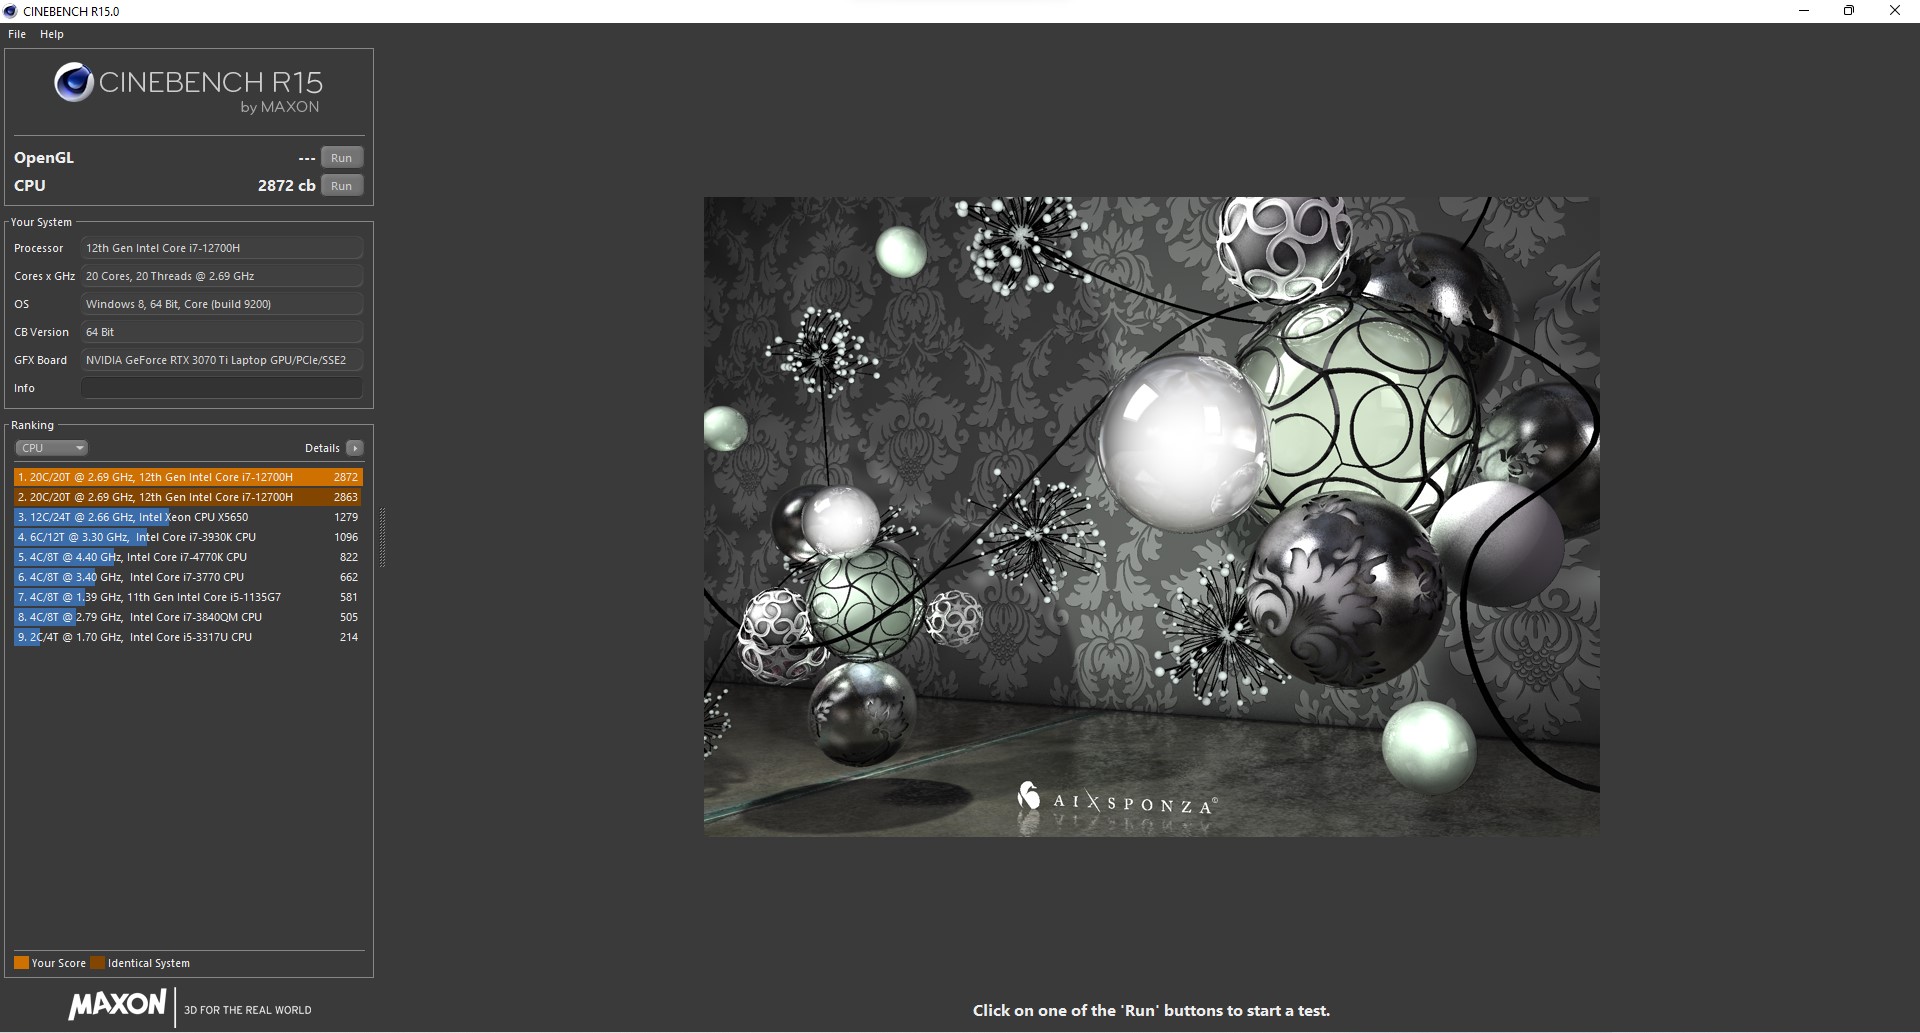
Le site Core i7-12700Hest environ deux fois plus rapide que son prédécesseur en charge soutenue et n'est pas inférieur au Core i9-12900H. Seul Legion 5 Pro de Lenovo de Lenovo est plus rapide, car il n'a pas de verrou TDP et peut consommer 127 watts en continu. Le Core i7 du Vector GP76, quant à lui, est régulé à la baisse de 100 watts à 45 watts après peu de temps, ce que montre la boucle Cinebench R15. Les performances sont ainsi réduites de 20 %.
La fréquence d'horloge des cœurs de performance est stable à 3,7 GHz et les températures se situent dans un territoire plus frais à environ 74°C. En termes de charge pure du processeur, le système de refroidissement a une grande marge d'amélioration. En mode Performance extrême, le CPU se traite lui-même à 70 watts, ce qui n'améliore pas vraiment les résultats, du moins pas dans Cinebench R15.
En mode batterie, le TDP du CPU, typique des ordinateurs portables avec un TDP combiné élevé, est sévèrement limité à 15 watts. En conséquence, les performances du processeur Intel chutent de 40 % (voir les captures d'écran de CB15). Cependant, cela reste 45% plus rapide que les performances complètes du prédécesseur, et si vous regardez la valeur sous une charge soutenue, la perte n'est que d'environ 25%.
Les processeurs de 45 watts d'AMD, tels que le Ryzen 7 5800H dans le Asus ROG Strix G17sont généralement un peu plus lents, mais ils n'affichent pratiquement aucune perte de performances lorsqu'ils fonctionnent sur batterie.

Cinebench R15 Multi Sustained Load
Cinebench R23: Multi Core | Single Core
Cinebench R20: CPU (Multi Core) | CPU (Single Core)
Cinebench R15: CPU Multi 64Bit | CPU Single 64Bit
Blender: v2.79 BMW27 CPU
7-Zip 18.03: 7z b 4 | 7z b 4 -mmt1
Geekbench 5.5: Multi-Core | Single-Core
HWBOT x265 Benchmark v2.2: 4k Preset
LibreOffice : 20 Documents To PDF
R Benchmark 2.5: Overall mean
Geekbench 5.5: OpenCL Score
| CPU Performance rating | |
| Moyenne de la classe Gaming | |
| Lenovo Legion 5 Pro 16 G7 i7 RTX 3070Ti | |
| MSI Vector GP66 12UGS | |
| MSI Vector GP76 12UGS-434 | |
| Aorus 17 XE4 | |
| Moyenne Intel Core i7-12700H | |
| Asus ROG Zephyrus M16 GU603H -2! | |
| Schenker XMG NEO 17 GM7TG8S | |
| Asus ROG Strix G17 G713QE-RB74 -3! | |
| MSI GP76 Leopard 10UG -2! | |
| Cinebench R23 / Multi Core | |
| Moyenne de la classe Gaming (10488 - 42661, n=104, 2 dernières années) | |
| Lenovo Legion 5 Pro 16 G7 i7 RTX 3070Ti | |
| MSI Vector GP76 12UGS-434 | |
| MSI Vector GP66 12UGS | |
| Aorus 17 XE4 | |
| Moyenne Intel Core i7-12700H (4032 - 19330, n=64) | |
| Asus ROG Strix G17 G713QE-RB74 | |
| Schenker XMG NEO 17 GM7TG8S | |
| Cinebench R23 / Single Core | |
| Moyenne de la classe Gaming (1601 - 2415, n=104, 2 dernières années) | |
| MSI Vector GP66 12UGS | |
| Lenovo Legion 5 Pro 16 G7 i7 RTX 3070Ti | |
| Aorus 17 XE4 | |
| MSI Vector GP76 12UGS-434 | |
| Moyenne Intel Core i7-12700H (778 - 1826, n=63) | |
| Schenker XMG NEO 17 GM7TG8S | |
| Asus ROG Strix G17 G713QE-RB74 | |
| Cinebench R20 / CPU (Multi Core) | |
| Moyenne de la classe Gaming (4029 - 16433, n=103, 2 dernières années) | |
| Lenovo Legion 5 Pro 16 G7 i7 RTX 3070Ti | |
| MSI Vector GP76 12UGS-434 | |
| MSI Vector GP66 12UGS | |
| Aorus 17 XE4 | |
| Moyenne Intel Core i7-12700H (1576 - 7407, n=64) | |
| Asus ROG Zephyrus M16 GU603H | |
| Asus ROG Strix G17 G713QE-RB74 | |
| Schenker XMG NEO 17 GM7TG8S | |
| MSI GP76 Leopard 10UG | |
| Cinebench R20 / CPU (Single Core) | |
| Moyenne de la classe Gaming (622 - 913, n=103, 2 dernières années) | |
| MSI Vector GP66 12UGS | |
| Lenovo Legion 5 Pro 16 G7 i7 RTX 3070Ti | |
| Aorus 17 XE4 | |
| MSI Vector GP76 12UGS-434 | |
| Moyenne Intel Core i7-12700H (300 - 704, n=64) | |
| Asus ROG Zephyrus M16 GU603H | |
| Schenker XMG NEO 17 GM7TG8S | |
| Asus ROG Strix G17 G713QE-RB74 | |
| MSI GP76 Leopard 10UG | |
| Cinebench R15 / CPU Multi 64Bit | |
| Moyenne de la classe Gaming (1578 - 6330, n=102, 2 dernières années) | |
| Lenovo Legion 5 Pro 16 G7 i7 RTX 3070Ti | |
| MSI Vector GP76 12UGS-434 | |
| Aorus 17 XE4 | |
| Moyenne Intel Core i7-12700H (1379 - 2916, n=70) | |
| MSI Vector GP66 12UGS | |
| Asus ROG Zephyrus M16 GU603H | |
| Asus ROG Strix G17 G713QE-RB74 | |
| Schenker XMG NEO 17 GM7TG8S | |
| MSI GP76 Leopard 10UG | |
| Cinebench R15 / CPU Single 64Bit | |
| Moyenne de la classe Gaming (188.8 - 350, n=103, 2 dernières années) | |
| MSI Vector GP66 12UGS | |
| Lenovo Legion 5 Pro 16 G7 i7 RTX 3070Ti | |
| Aorus 17 XE4 | |
| MSI Vector GP76 12UGS-434 | |
| Moyenne Intel Core i7-12700H (113 - 263, n=65) | |
| Asus ROG Zephyrus M16 GU603H | |
| Asus ROG Strix G17 G713QE-RB74 | |
| Schenker XMG NEO 17 GM7TG8S | |
| MSI GP76 Leopard 10UG | |
| Blender / v2.79 BMW27 CPU | |
| MSI GP76 Leopard 10UG | |
| Schenker XMG NEO 17 GM7TG8S | |
| Asus ROG Zephyrus M16 GU603H | |
| Asus ROG Strix G17 G713QE-RB74 | |
| Aorus 17 XE4 | |
| Moyenne Intel Core i7-12700H (168 - 732, n=63) | |
| MSI Vector GP76 12UGS-434 | |
| MSI Vector GP66 12UGS | |
| Lenovo Legion 5 Pro 16 G7 i7 RTX 3070Ti | |
| Moyenne de la classe Gaming (79 - 330, n=101, 2 dernières années) | |
| 7-Zip 18.03 / 7z b 4 | |
| Moyenne de la classe Gaming (33491 - 148086, n=102, 2 dernières années) | |
| Lenovo Legion 5 Pro 16 G7 i7 RTX 3070Ti | |
| MSI Vector GP66 12UGS | |
| MSI Vector GP76 12UGS-434 | |
| Moyenne Intel Core i7-12700H (22844 - 73067, n=63) | |
| Aorus 17 XE4 | |
| Asus ROG Strix G17 G713QE-RB74 | |
| Asus ROG Zephyrus M16 GU603H | |
| Schenker XMG NEO 17 GM7TG8S | |
| MSI GP76 Leopard 10UG | |
| 7-Zip 18.03 / 7z b 4 -mmt1 | |
| Moyenne de la classe Gaming (4824 - 7436, n=102, 2 dernières années) | |
| MSI Vector GP66 12UGS | |
| Aorus 17 XE4 | |
| Lenovo Legion 5 Pro 16 G7 i7 RTX 3070Ti | |
| Moyenne Intel Core i7-12700H (2743 - 5972, n=63) | |
| Asus ROG Zephyrus M16 GU603H | |
| Asus ROG Strix G17 G713QE-RB74 | |
| Schenker XMG NEO 17 GM7TG8S | |
| MSI Vector GP76 12UGS-434 | |
| MSI GP76 Leopard 10UG | |
| Geekbench 5.5 / Multi-Core | |
| Moyenne de la classe Gaming (6460 - 28263, n=102, 2 dernières années) | |
| Lenovo Legion 5 Pro 16 G7 i7 RTX 3070Ti | |
| MSI Vector GP66 12UGS | |
| Aorus 17 XE4 | |
| MSI Vector GP76 12UGS-434 | |
| Moyenne Intel Core i7-12700H (5144 - 13745, n=64) | |
| Asus ROG Zephyrus M16 GU603H | |
| Schenker XMG NEO 17 GM7TG8S | |
| MSI GP76 Leopard 10UG | |
| Geekbench 5.5 / Single-Core | |
| Moyenne de la classe Gaming (1403 - 2474, n=102, 2 dernières années) | |
| MSI Vector GP66 12UGS | |
| Aorus 17 XE4 | |
| MSI Vector GP76 12UGS-434 | |
| Lenovo Legion 5 Pro 16 G7 i7 RTX 3070Ti | |
| Moyenne Intel Core i7-12700H (803 - 1851, n=64) | |
| Asus ROG Zephyrus M16 GU603H | |
| Schenker XMG NEO 17 GM7TG8S | |
| MSI GP76 Leopard 10UG | |
| HWBOT x265 Benchmark v2.2 / 4k Preset | |
| Moyenne de la classe Gaming (11.5 - 44.4, n=102, 2 dernières années) | |
| Lenovo Legion 5 Pro 16 G7 i7 RTX 3070Ti | |
| MSI Vector GP66 12UGS | |
| MSI Vector GP76 12UGS-434 | |
| Moyenne Intel Core i7-12700H (4.67 - 21.8, n=64) | |
| Aorus 17 XE4 | |
| Asus ROG Zephyrus M16 GU603H | |
| Asus ROG Strix G17 G713QE-RB74 | |
| Schenker XMG NEO 17 GM7TG8S | |
| MSI GP76 Leopard 10UG | |
| LibreOffice / 20 Documents To PDF | |
| Asus ROG Strix G17 G713QE-RB74 | |
| MSI GP76 Leopard 10UG | |
| Moyenne de la classe Gaming (33.2 - 88.8, n=102, 2 dernières années) | |
| Moyenne Intel Core i7-12700H (34.2 - 95.3, n=63) | |
| MSI Vector GP76 12UGS-434 | |
| Lenovo Legion 5 Pro 16 G7 i7 RTX 3070Ti | |
| Asus ROG Zephyrus M16 GU603H | |
| MSI Vector GP66 12UGS | |
| Schenker XMG NEO 17 GM7TG8S | |
| Aorus 17 XE4 | |
| R Benchmark 2.5 / Overall mean | |
| MSI GP76 Leopard 10UG | |
| Schenker XMG NEO 17 GM7TG8S | |
| Asus ROG Zephyrus M16 GU603H | |
| Asus ROG Strix G17 G713QE-RB74 | |
| Moyenne Intel Core i7-12700H (0.4441 - 1.052, n=63) | |
| MSI Vector GP76 12UGS-434 | |
| Aorus 17 XE4 | |
| Lenovo Legion 5 Pro 16 G7 i7 RTX 3070Ti | |
| Moyenne de la classe Gaming (0.3439 - 0.59, n=102, 2 dernières années) | |
| MSI Vector GP66 12UGS | |
| Geekbench 5.5 / OpenCL Score | |
| Moyenne de la classe Gaming (80702 - 277970, n=98, 2 dernières années) | |
| Aorus 17 XE4 | |
| Schenker XMG NEO 17 GM7TG8S | |
| Lenovo Legion 5 Pro 16 G7 i7 RTX 3070Ti | |
| MSI Vector GP76 12UGS-434 | |
| MSI Vector GP66 12UGS | |
| Asus ROG Zephyrus M16 GU603H | |
| MSI GP76 Leopard 10UG | |
| Moyenne Intel Core i7-12700H (13944 - 148757, n=62) | |
* ... Moindre est la valeur, meilleures sont les performances
AIDA64: FP32 Ray-Trace | FPU Julia | CPU SHA3 | CPU Queen | FPU SinJulia | FPU Mandel | CPU AES | CPU ZLib | FP64 Ray-Trace | CPU PhotoWorxx
| Performance rating | |
| Moyenne de la classe Gaming | |
| Asus ROG Strix G17 G713QE-RB74 | |
| Lenovo Legion 5 Pro 16 G7 i7 RTX 3070Ti | |
| Moyenne Intel Core i7-12700H | |
| MSI Vector GP76 12UGS-434 | |
| MSI Vector GP66 12UGS | |
| Aorus 17 XE4 | |
| MSI GP76 Leopard 10UG | |
| AIDA64 / FP32 Ray-Trace | |
| Moyenne de la classe Gaming (10227 - 85542, n=102, 2 dernières années) | |
| Asus ROG Strix G17 G713QE-RB74 | |
| Moyenne Intel Core i7-12700H (2585 - 17957, n=64) | |
| Lenovo Legion 5 Pro 16 G7 i7 RTX 3070Ti | |
| MSI GP76 Leopard 10UG | |
| MSI Vector GP66 12UGS | |
| MSI Vector GP76 12UGS-434 | |
| Aorus 17 XE4 | |
| AIDA64 / FPU Julia | |
| Moyenne de la classe Gaming (51376 - 372155, n=102, 2 dernières années) | |
| Asus ROG Strix G17 G713QE-RB74 | |
| Moyenne Intel Core i7-12700H (12439 - 90760, n=64) | |
| MSI GP76 Leopard 10UG | |
| Lenovo Legion 5 Pro 16 G7 i7 RTX 3070Ti | |
| MSI Vector GP76 12UGS-434 | |
| MSI Vector GP66 12UGS | |
| Aorus 17 XE4 | |
| AIDA64 / CPU SHA3 | |
| Moyenne de la classe Gaming (2180 - 10115, n=102, 2 dernières années) | |
| Lenovo Legion 5 Pro 16 G7 i7 RTX 3070Ti | |
| MSI Vector GP76 12UGS-434 | |
| Asus ROG Strix G17 G713QE-RB74 | |
| Moyenne Intel Core i7-12700H (833 - 4242, n=64) | |
| MSI Vector GP66 12UGS | |
| Aorus 17 XE4 | |
| MSI GP76 Leopard 10UG | |
| AIDA64 / CPU Queen | |
| Moyenne de la classe Gaming (49785 - 173351, n=86, 2 dernières années) | |
| MSI Vector GP66 12UGS | |
| Aorus 17 XE4 | |
| Lenovo Legion 5 Pro 16 G7 i7 RTX 3070Ti | |
| Moyenne Intel Core i7-12700H (57923 - 103202, n=63) | |
| MSI Vector GP76 12UGS-434 | |
| Asus ROG Strix G17 G713QE-RB74 | |
| MSI GP76 Leopard 10UG | |
| AIDA64 / FPU SinJulia | |
| Moyenne de la classe Gaming (4424 - 33636, n=102, 2 dernières années) | |
| Asus ROG Strix G17 G713QE-RB74 | |
| Lenovo Legion 5 Pro 16 G7 i7 RTX 3070Ti | |
| MSI Vector GP76 12UGS-434 | |
| MSI Vector GP66 12UGS | |
| Moyenne Intel Core i7-12700H (3249 - 9939, n=64) | |
| Aorus 17 XE4 | |
| MSI GP76 Leopard 10UG | |
| AIDA64 / FPU Mandel | |
| Moyenne de la classe Gaming (25115 - 196829, n=102, 2 dernières années) | |
| Asus ROG Strix G17 G713QE-RB74 | |
| Moyenne Intel Core i7-12700H (7135 - 44760, n=64) | |
| Lenovo Legion 5 Pro 16 G7 i7 RTX 3070Ti | |
| MSI Vector GP66 12UGS | |
| MSI GP76 Leopard 10UG | |
| MSI Vector GP76 12UGS-434 | |
| Aorus 17 XE4 | |
| AIDA64 / CPU AES | |
| Asus ROG Strix G17 G713QE-RB74 | |
| Moyenne de la classe Gaming (39258 - 247074, n=102, 2 dernières années) | |
| Lenovo Legion 5 Pro 16 G7 i7 RTX 3070Ti | |
| MSI Vector GP76 12UGS-434 | |
| MSI Vector GP66 12UGS | |
| Moyenne Intel Core i7-12700H (31839 - 144360, n=64) | |
| Aorus 17 XE4 | |
| MSI GP76 Leopard 10UG | |
| AIDA64 / CPU ZLib | |
| Moyenne de la classe Gaming (574 - 2531, n=102, 2 dernières années) | |
| Lenovo Legion 5 Pro 16 G7 i7 RTX 3070Ti | |
| MSI Vector GP76 12UGS-434 | |
| MSI Vector GP66 12UGS | |
| Moyenne Intel Core i7-12700H (305 - 1171, n=64) | |
| Aorus 17 XE4 | |
| Asus ROG Strix G17 G713QE-RB74 | |
| MSI GP76 Leopard 10UG | |
| AIDA64 / FP64 Ray-Trace | |
| Moyenne de la classe Gaming (5509 - 45446, n=102, 2 dernières années) | |
| Asus ROG Strix G17 G713QE-RB74 | |
| Moyenne Intel Core i7-12700H (1437 - 9692, n=64) | |
| Lenovo Legion 5 Pro 16 G7 i7 RTX 3070Ti | |
| MSI GP76 Leopard 10UG | |
| MSI Vector GP66 12UGS | |
| MSI Vector GP76 12UGS-434 | |
| Aorus 17 XE4 | |
| AIDA64 / CPU PhotoWorxx | |
| Moyenne de la classe Gaming (12271 - 89891, n=102, 2 dernières années) | |
| Lenovo Legion 5 Pro 16 G7 i7 RTX 3070Ti | |
| Moyenne Intel Core i7-12700H (12863 - 52207, n=64) | |
| MSI Vector GP66 12UGS | |
| MSI Vector GP76 12UGS-434 | |
| Aorus 17 XE4 | |
| MSI GP76 Leopard 10UG | |
| Asus ROG Strix G17 G713QE-RB74 | |
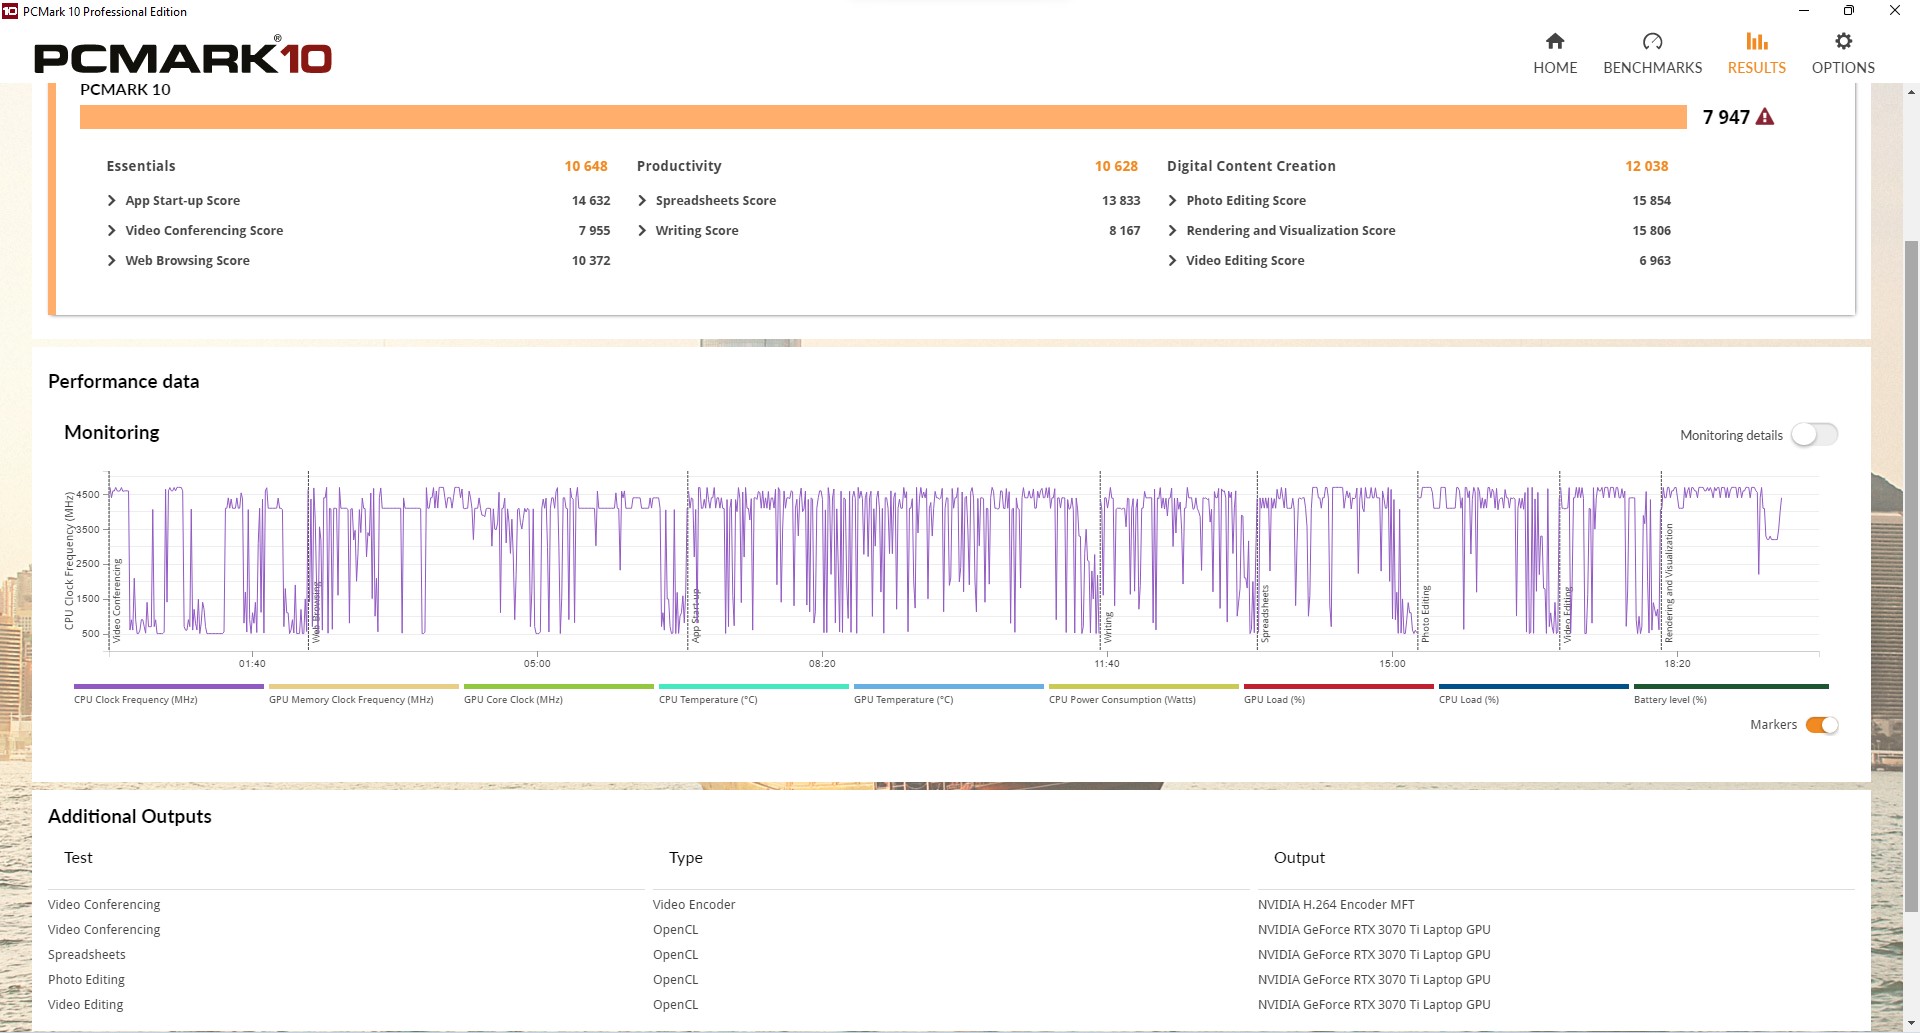
Performance du système
Ici, l'appareil que nous avons examiné est en tête de liste ; en fait, il n'y a pratiquement pas de meilleur résultat dans toute notre base de données. Le prédécesseur est surclassé de 33%. Les programmes s'ouvrent immédiatement, tout comme les multiples onglets du navigateur.
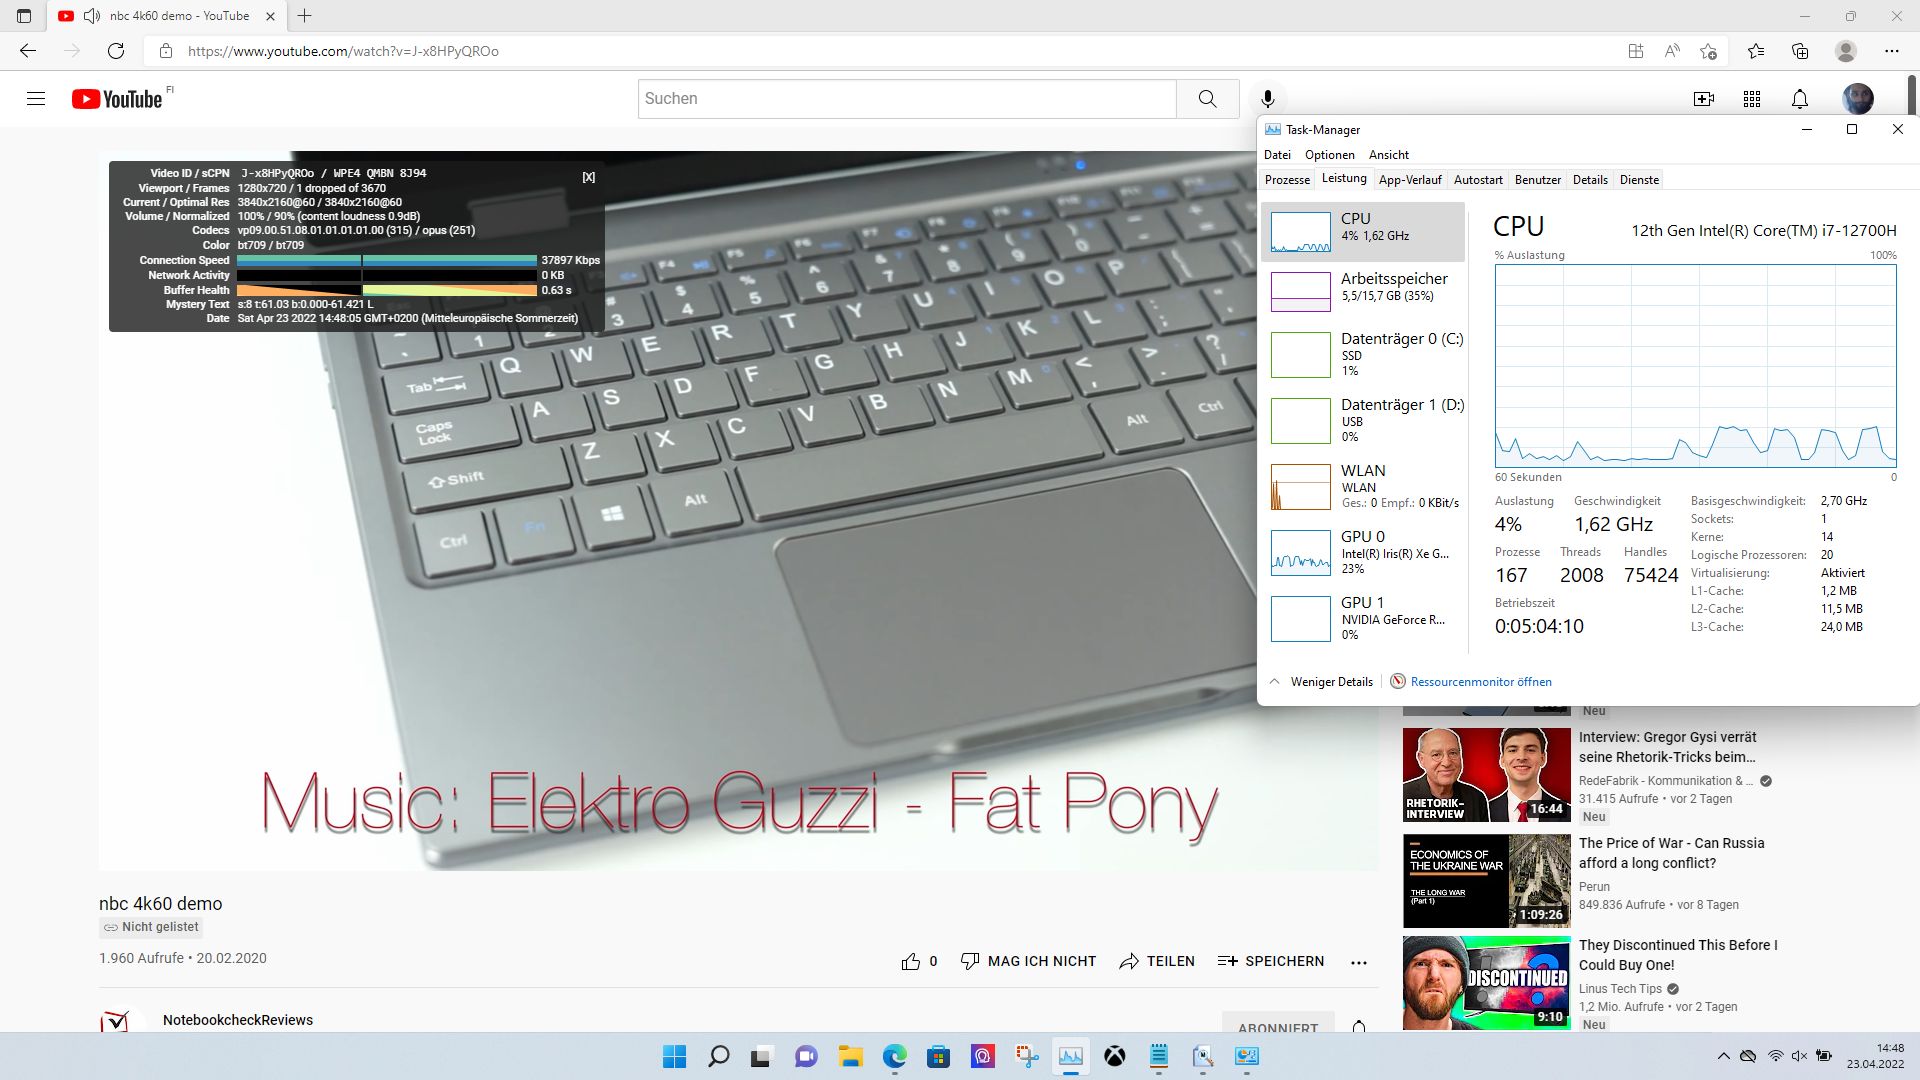
La dalle 360 Hz contribue définitivement à un système très réactif. la lecture de YouTube 4K nécessite également très peu de ressources CPU
CrossMark: Overall | Productivity | Creativity | Responsiveness
| PCMark 10 / Score | |
| Moyenne de la classe Gaming (5828 - 12414, n=93, 2 dernières années) | |
| MSI Vector GP66 12UGS | |
| MSI Vector GP76 12UGS-434 | |
| Aorus 17 XE4 | |
| Lenovo Legion 5 Pro 16 G7 i7 RTX 3070Ti | |
| Moyenne Intel Core i7-12700H, NVIDIA GeForce RTX 3070 Ti Laptop GPU (6941 - 7947, n=11) | |
| Schenker XMG NEO 17 GM7TG8S | |
| Asus ROG Zephyrus M16 GU603H | |
| Asus ROG Strix G17 G713QE-RB74 | |
| MSI GP76 Leopard 10UG | |
| PCMark 10 / Essentials | |
| MSI Vector GP66 12UGS | |
| Aorus 17 XE4 | |
| Moyenne de la classe Gaming (8810 - 11935, n=97, 2 dernières années) | |
| MSI Vector GP76 12UGS-434 | |
| Asus ROG Zephyrus M16 GU603H | |
| Moyenne Intel Core i7-12700H, NVIDIA GeForce RTX 3070 Ti Laptop GPU (9892 - 10935, n=11) | |
| Schenker XMG NEO 17 GM7TG8S | |
| Asus ROG Strix G17 G713QE-RB74 | |
| Lenovo Legion 5 Pro 16 G7 i7 RTX 3070Ti | |
| MSI GP76 Leopard 10UG | |
| PCMark 10 / Productivity | |
| Moyenne de la classe Gaming (6845 - 25323, n=95, 2 dernières années) | |
| MSI Vector GP76 12UGS-434 | |
| MSI Vector GP66 12UGS | |
| Lenovo Legion 5 Pro 16 G7 i7 RTX 3070Ti | |
| Aorus 17 XE4 | |
| Moyenne Intel Core i7-12700H, NVIDIA GeForce RTX 3070 Ti Laptop GPU (9024 - 10638, n=11) | |
| Schenker XMG NEO 17 GM7TG8S | |
| Asus ROG Strix G17 G713QE-RB74 | |
| Asus ROG Zephyrus M16 GU603H | |
| MSI GP76 Leopard 10UG | |
| PCMark 10 / Digital Content Creation | |
| Moyenne de la classe Gaming (7602 - 19954, n=95, 2 dernières années) | |
| MSI Vector GP66 12UGS | |
| MSI Vector GP76 12UGS-434 | |
| Lenovo Legion 5 Pro 16 G7 i7 RTX 3070Ti | |
| Aorus 17 XE4 | |
| Moyenne Intel Core i7-12700H, NVIDIA GeForce RTX 3070 Ti Laptop GPU (10165 - 12546, n=11) | |
| Schenker XMG NEO 17 GM7TG8S | |
| Asus ROG Zephyrus M16 GU603H | |
| Asus ROG Strix G17 G713QE-RB74 | |
| MSI GP76 Leopard 10UG | |
| CrossMark / Overall | |
| Aorus 17 XE4 | |
| Moyenne de la classe Gaming (1366 - 2409, n=94, 2 dernières années) | |
| MSI Vector GP76 12UGS-434 | |
| Lenovo Legion 5 Pro 16 G7 i7 RTX 3070Ti | |
| Moyenne Intel Core i7-12700H, NVIDIA GeForce RTX 3070 Ti Laptop GPU (974 - 2000, n=12) | |
| CrossMark / Productivity | |
| Aorus 17 XE4 | |
| MSI Vector GP76 12UGS-434 | |
| Lenovo Legion 5 Pro 16 G7 i7 RTX 3070Ti | |
| Moyenne de la classe Gaming (1386 - 2254, n=94, 2 dernières années) | |
| Moyenne Intel Core i7-12700H, NVIDIA GeForce RTX 3070 Ti Laptop GPU (907 - 1962, n=12) | |
| CrossMark / Creativity | |
| Moyenne de la classe Gaming (1343 - 2786, n=94, 2 dernières années) | |
| Lenovo Legion 5 Pro 16 G7 i7 RTX 3070Ti | |
| Aorus 17 XE4 | |
| MSI Vector GP76 12UGS-434 | |
| Moyenne Intel Core i7-12700H, NVIDIA GeForce RTX 3070 Ti Laptop GPU (1027 - 2057, n=12) | |
| CrossMark / Responsiveness | |
| Aorus 17 XE4 | |
| MSI Vector GP76 12UGS-434 | |
| Lenovo Legion 5 Pro 16 G7 i7 RTX 3070Ti | |
| Moyenne Intel Core i7-12700H, NVIDIA GeForce RTX 3070 Ti Laptop GPU (1029 - 2142, n=12) | |
| Moyenne de la classe Gaming (1226 - 2334, n=94, 2 dernières années) | |
| PCMark 10 Score | 7947 points | |
Aide | ||
| AIDA64 / Memory Copy | |
| Moyenne de la classe Gaming (21750 - 129946, n=102, 2 dernières années) | |
| Moyenne Intel Core i7-12700H (25615 - 80511, n=64) | |
| Lenovo Legion 5 Pro 16 G7 i7 RTX 3070Ti | |
| MSI Vector GP66 12UGS | |
| Aorus 17 XE4 | |
| MSI Vector GP76 12UGS-434 | |
| Asus ROG Strix G17 G713QE-RB74 | |
| MSI GP76 Leopard 10UG | |
| AIDA64 / Memory Read | |
| Moyenne de la classe Gaming (22956 - 118858, n=102, 2 dernières années) | |
| Lenovo Legion 5 Pro 16 G7 i7 RTX 3070Ti | |
| Moyenne Intel Core i7-12700H (25586 - 79442, n=64) | |
| MSI Vector GP66 12UGS | |
| Aorus 17 XE4 | |
| MSI Vector GP76 12UGS-434 | |
| Asus ROG Strix G17 G713QE-RB74 | |
| MSI GP76 Leopard 10UG | |
| AIDA64 / Memory Write | |
| Moyenne de la classe Gaming (22297 - 135096, n=102, 2 dernières années) | |
| Lenovo Legion 5 Pro 16 G7 i7 RTX 3070Ti | |
| Moyenne Intel Core i7-12700H (23679 - 88660, n=64) | |
| MSI Vector GP76 12UGS-434 | |
| MSI Vector GP66 12UGS | |
| Aorus 17 XE4 | |
| MSI GP76 Leopard 10UG | |
| Asus ROG Strix G17 G713QE-RB74 | |
| AIDA64 / Memory Latency | |
| Moyenne de la classe Gaming (75.3 - 165.4, n=102, 2 dernières années) | |
| Lenovo Legion 5 Pro 16 G7 i7 RTX 3070Ti | |
| MSI Vector GP76 12UGS-434 | |
| Aorus 17 XE4 | |
| MSI Vector GP66 12UGS | |
| Asus ROG Strix G17 G713QE-RB74 | |
| Moyenne Intel Core i7-12700H (76.2 - 133.9, n=62) | |
| MSI GP76 Leopard 10UG | |
| Asus ROG Zephyrus M16 GU603H | |
| Schenker XMG NEO 17 GM7TG8S | |
* ... Moindre est la valeur, meilleures sont les performances
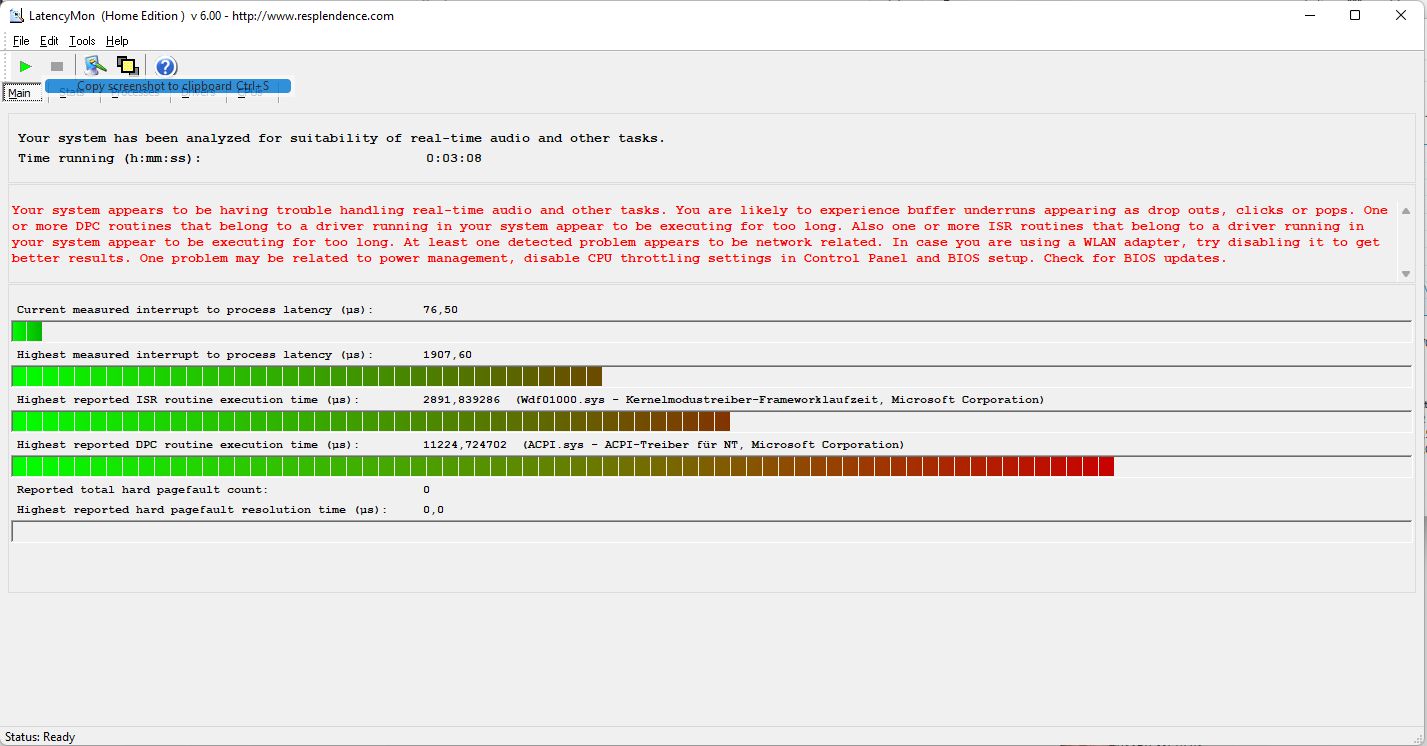
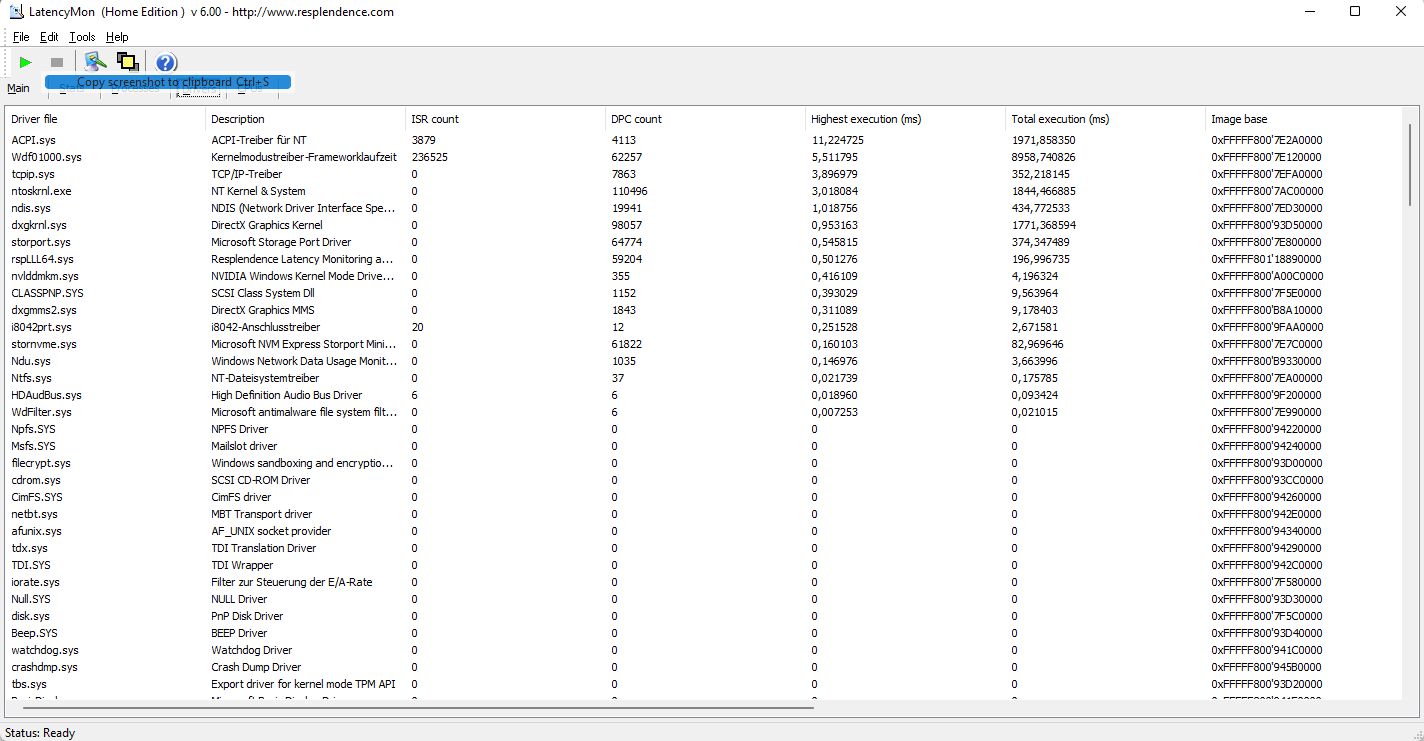
Latences DPC
Les latences DPC montrent le délai entre l'entrée et l'affichage : le système ici s'avère inadapté au montage vidéo et audio en temps réel car les latences sont très élevées avec un délai de 1 907 ms. Le pilote ACPI est ici le coupable. Cependant, cela peut être amélioré après une mise à jour du BIOS.
Heureusement, il n'y a pas eu d'images perdues pendant la lecture de YouTube 4K et la charge du CPU est restée faible. Cependant, le GPU Intel intégré reste un peu occupé avec une charge de 23%.
| DPC Latencies / LatencyMon - interrupt to process latency (max), Web, Youtube, Prime95 | |
| Schenker XMG NEO 17 GM7TG8S | |
| MSI Vector GP66 12UGS | |
| MSI Vector GP76 12UGS-434 | |
| Aorus 17 XE4 | |
| MSI GP76 Leopard 10UG | |
| Asus ROG Strix G17 G713QE-RB74 | |
| Asus ROG Zephyrus M16 GU603H | |
| Lenovo Legion 5 Pro 16 G7 i7 RTX 3070Ti | |
* ... Moindre est la valeur, meilleures sont les performances
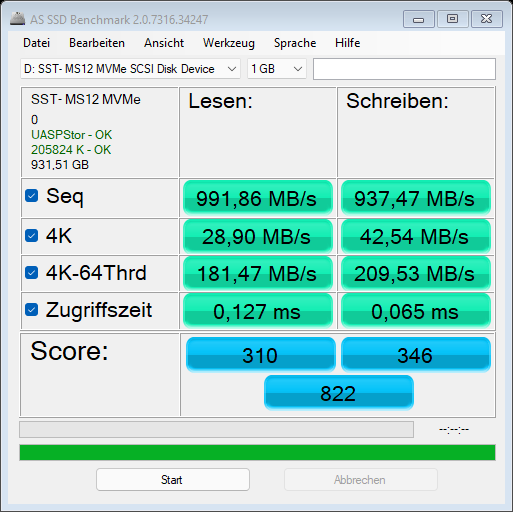
Périphériques de stockage
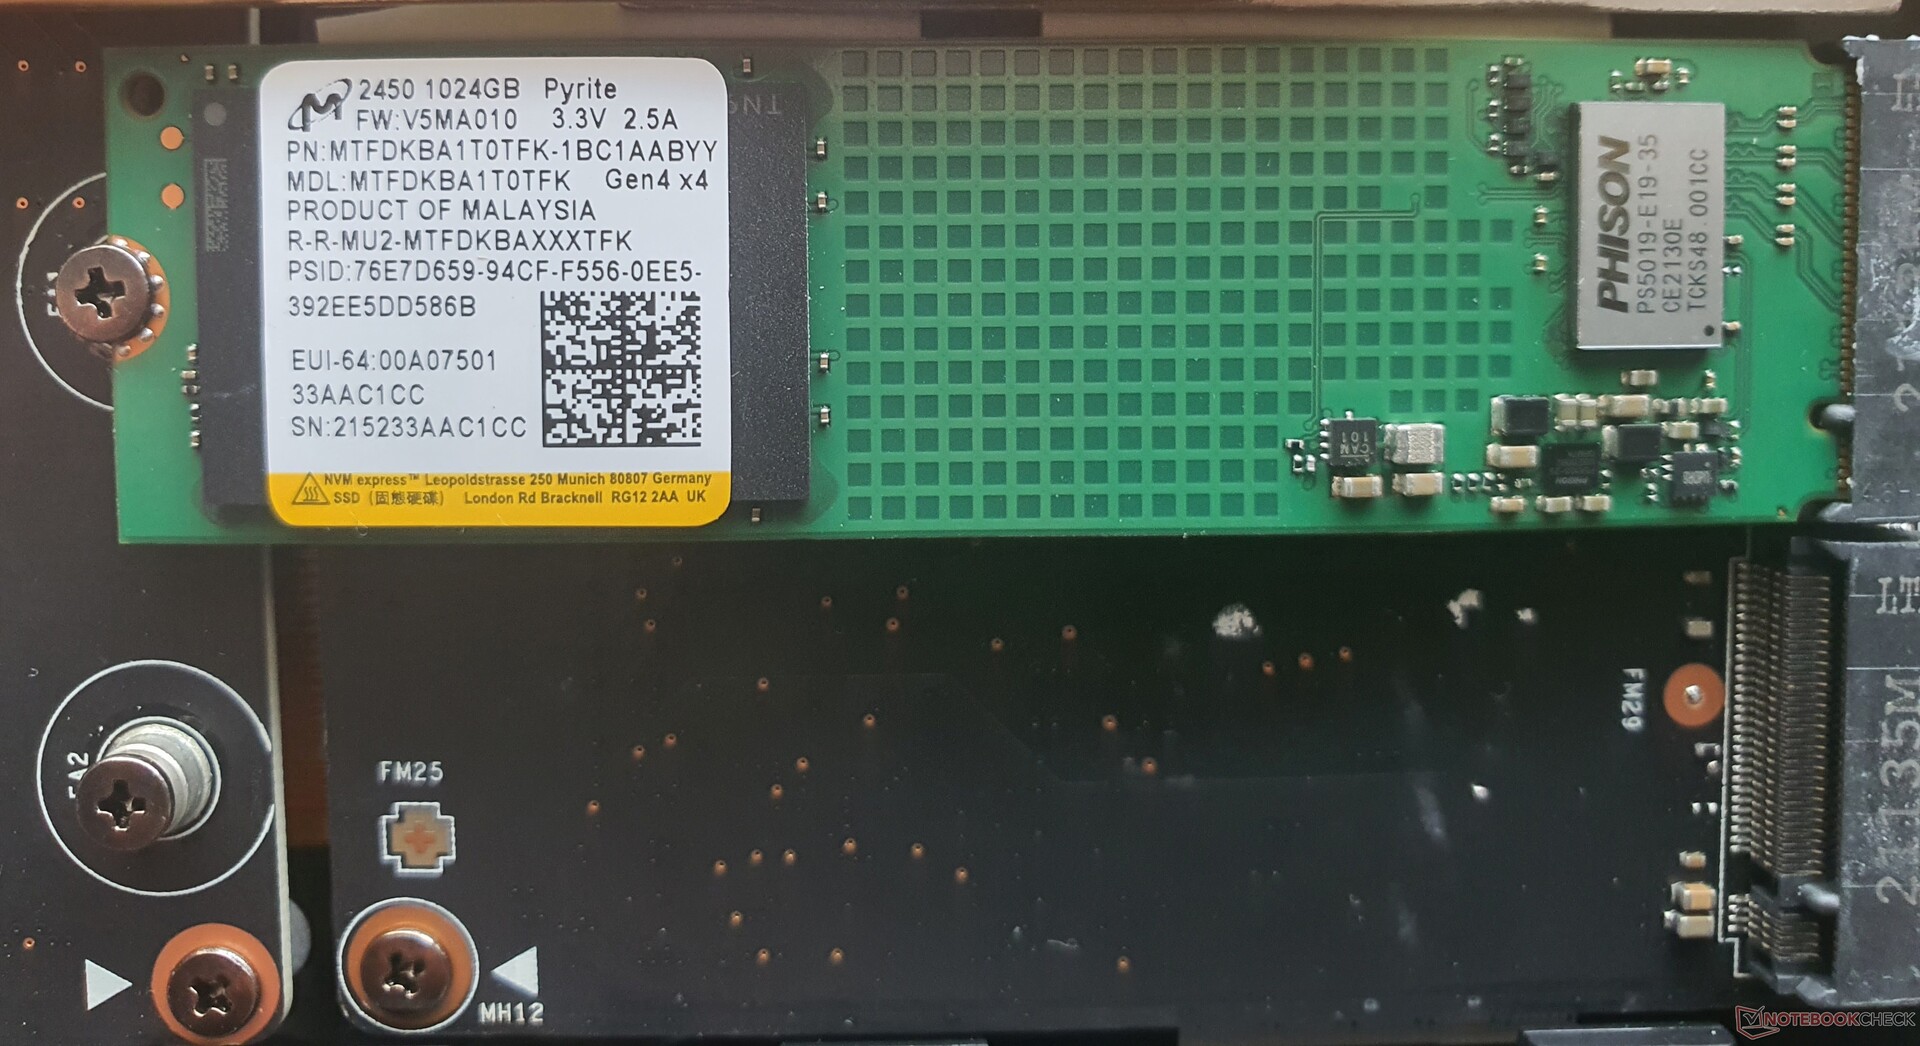
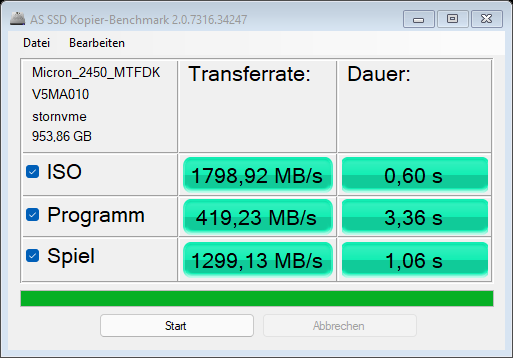
Le SSD M.2 2280 NVMe de 1 To de Micron utilise la dernière norme PCIe4x4, mais il doit être considéré comme un SSD économique qui n'atteint que les vitesses PCIe 3.0.
Néanmoins, deux disques durs plus rapides peuvent être installés ultérieurement et également en configuration RAID (0,1). Le champ de comparaison offre des SSD plus rapides mais au moins le prédécesseur est clairement surpassé.
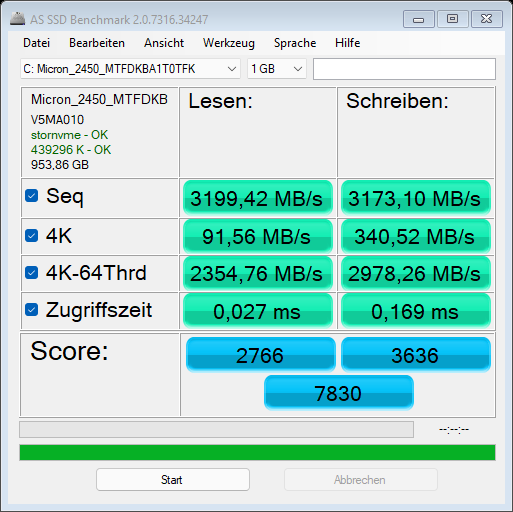
| MSI Vector GP76 12UGS-434 GeForce RTX 3070 Ti Laptop GPU, i7-12700H, Micron 2450 1TB MTFDKBA1T0TFK | MSI GP76 Leopard 10UG GeForce RTX 3070 Laptop GPU, i7-10750H, Kingston OM8PCP3512F-AB | Asus ROG Strix G17 G713QE-RB74 GeForce RTX 3050 Ti Laptop GPU, R7 5800H, Samsung PM991 MZVLQ512HBLU | Aorus 17 XE4 GeForce RTX 3070 Ti Laptop GPU, i7-12700H, Gigabyte AG470S1TB-SI B10 | Schenker XMG NEO 17 GM7TG8S GeForce RTX 3080 Laptop GPU, i7-11800H, Samsung SSD 980 Pro 1TB MZ-V8P1T0BW | Lenovo Legion 5 Pro 16 G7 i7 RTX 3070Ti GeForce RTX 3070 Ti Laptop GPU, i7-12700H, Samsung PM9A1 MZVL21T0HCLR | Asus ROG Zephyrus M16 GU603H GeForce RTX 3070 Laptop GPU, i9-11900H, Samsung PM9A1 MZVL22T0HBLB | MSI Vector GP66 12UGS GeForce RTX 3070 Ti Laptop GPU, i9-12900H | |
|---|---|---|---|---|---|---|---|---|
| AS SSD | -98% | -45% | 13% | 27% | 36% | 9% | -5% | |
| Seq Read (MB/s) | 3199 | 1659 -48% | 2602 -19% | 5031 57% | 5223 63% | 5036 57% | 5615 76% | 3080 -4% |
| Seq Write (MB/s) | 3173 | 921 -71% | 1218 -62% | 3162 0% | 3922 24% | 3784 19% | 4297 35% | 2997 -6% |
| 4K Read (MB/s) | 91.56 | 51 -44% | 42.31 -54% | 108 18% | 82.2 -10% | 88.1 -4% | 55.3 -40% | 70 -24% |
| 4K Write (MB/s) | 340.52 | 120.1 -65% | 122 -64% | 308.6 -9% | 207.6 -39% | 240.4 -29% | 170.5 -50% | 352 3% |
| 4K-64 Read (MB/s) | 2355 | 463.5 -80% | 1182 -50% | 2938 25% | 2439 4% | 2788 18% | 2591 10% | 1630 -31% |
| 4K-64 Write (MB/s) | 2978 | 909 -69% | 972 -67% | 3371 13% | 2652 -11% | 3424 15% | 3190 7% | 2435 -18% |
| Access Time Read * (ms) | 0.027 | 0.179 -563% | 0.101 -274% | 0.048 -78% | 0.022 19% | 0.02 26% | 0.04 -48% | 0.033 -22% |
| Access Time Write * (ms) | 0.169 | 0.032 81% | 0.096 43% | 0.013 92% | 0.021 88% | 0.018 89% | 0.025 85% | 0.425 -151% |
| Score Read (Points) | 2766 | 680 -75% | 1484 -46% | 3549 28% | 3044 10% | 3380 22% | 3208 16% | 2008 -27% |
| Score Write (Points) | 3636 | 1121 -69% | 1216 -67% | 3996 10% | 3252 -11% | 4043 11% | 3790 4% | 3087 -15% |
| Score Total (Points) | 7830 | 2130 -73% | 3394 -57% | 9279 19% | 7794 0% | 9094 16% | 8563 9% | 6130 -22% |
| Copy ISO MB/s (MB/s) | 1799 | 1538 -15% | 1967 9% | 3221 79% | 3221 79% | 3576 99% | ||
| Copy Program MB/s (MB/s) | 419 | 805 92% | 458.2 9% | 1151 175% | 939 124% | 791 89% | ||
| Copy Game MB/s (MB/s) | 1299 | 1418 9% | 1194 -8% | 1194 -8% | 1995 54% | 2134 64% |
* ... Moindre est la valeur, meilleures sont les performances

* ... Moindre est la valeur, meilleures sont les performances
Sustained Read Performance: DiskSpd Read Loop, Queue Depth 8
GPU
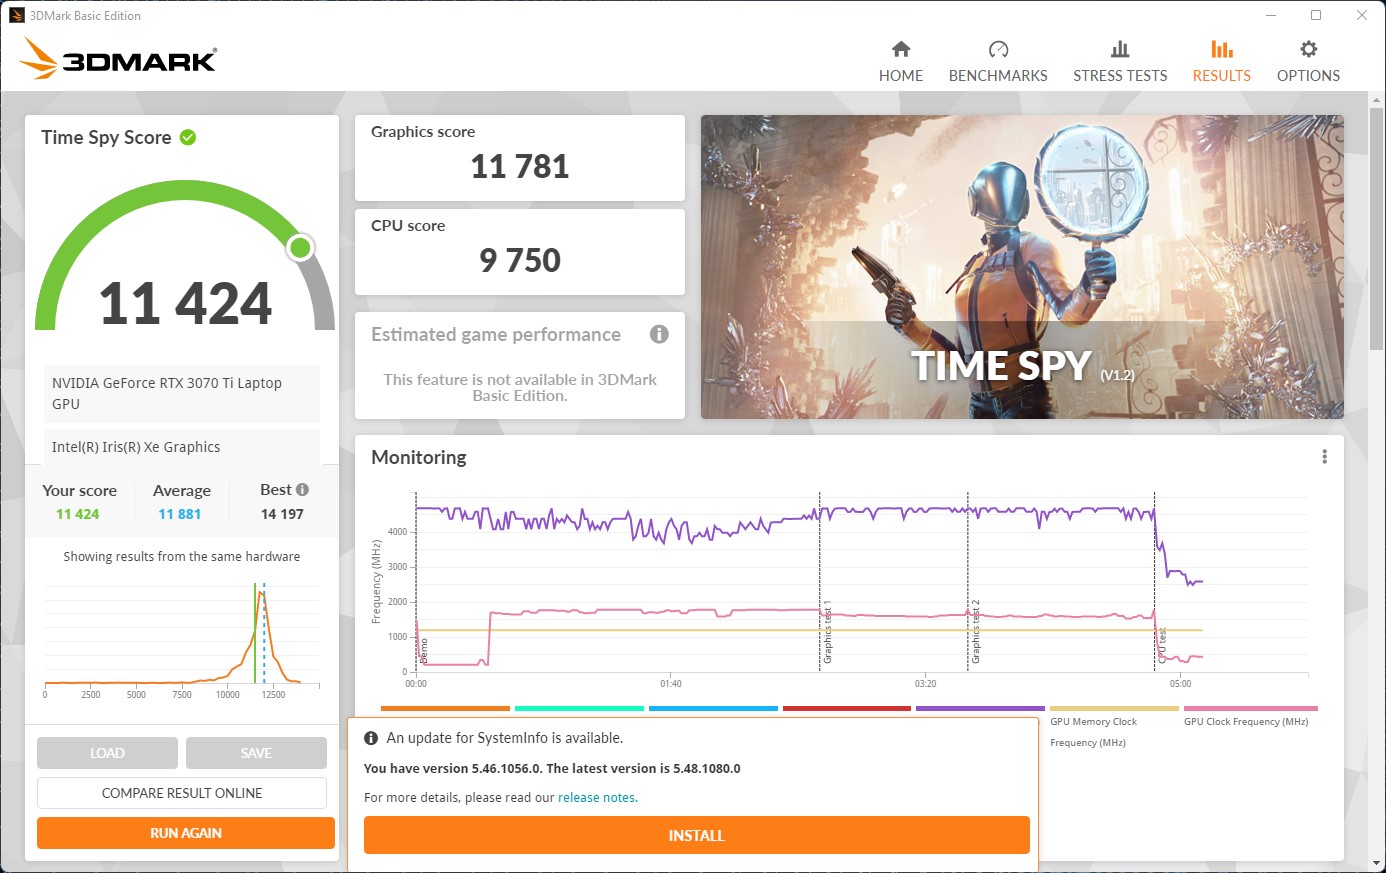
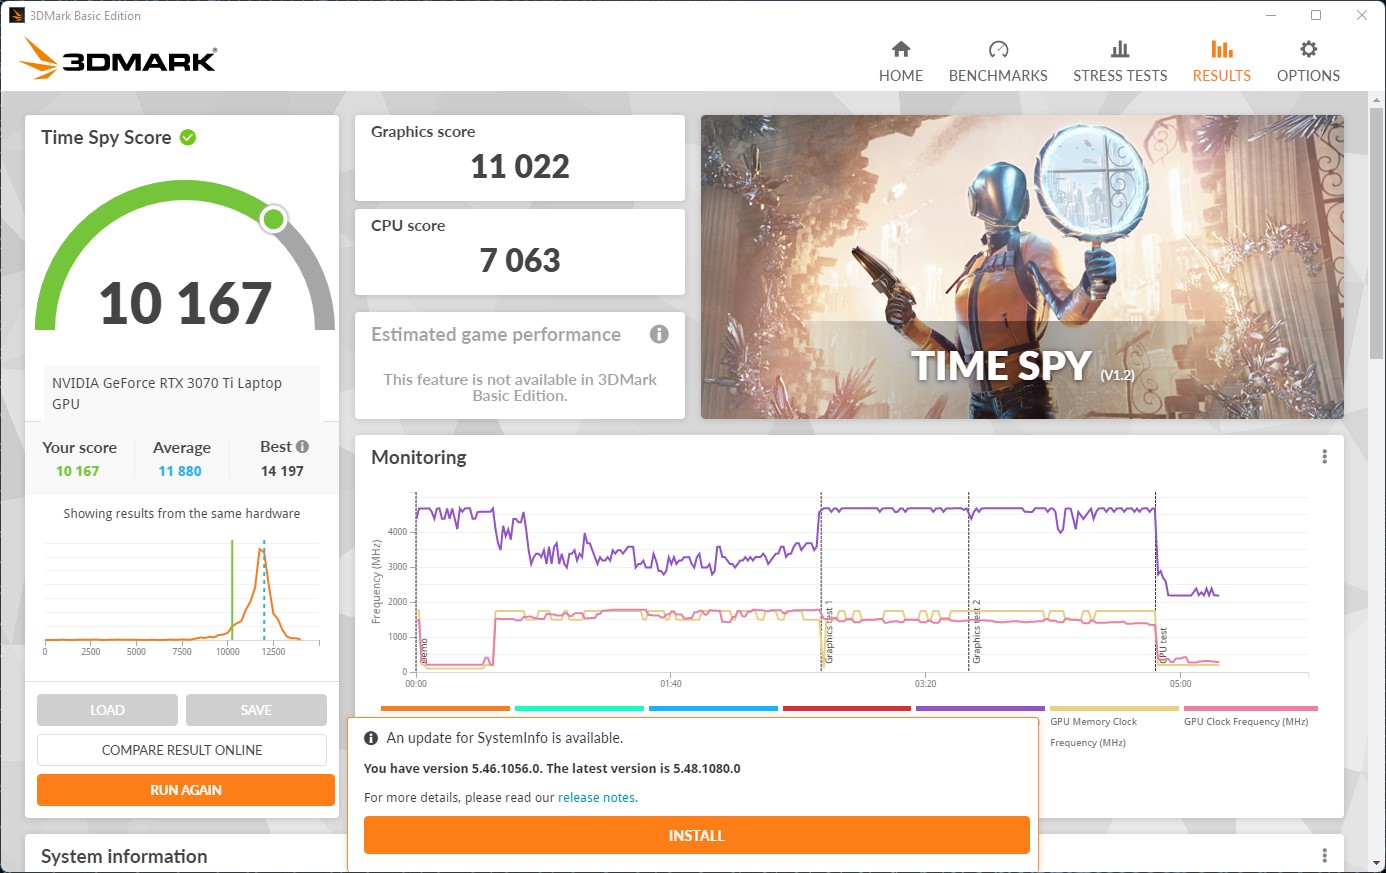
MSI promet une horloge boost de 1 585 MHz, soit 100 MHz de plus, pour laRTX 3070 Ti (8 GB VRAM). Dans l'ensemble, le GPU n'est qu'environ 5 % plus lent qu'une RTX 3080 mobile et environ 10% en dessous d'une RTX-3070. La finesse Asus ROG Zephyrus M16 est même battu de 80%.
Dans le secteur mobile, il n'existe pratiquement pas de GPU plus puissants. Il convient de noter que les résultats en mode Extrême sont supérieurs d'environ 7 %. Le mode silencieux ne réduit les résultats que de 10 %, alors que les ventilateurs sont beaucoup plus silencieux et que vous pouvez même utiliser les haut-parleurs internes lorsque vous jouez. Cependant, cela augmente les températures de surface.
En mode batterie, le TGP et donc les performances sont fortement réduits : Avec une consommation totale autorisée de 50 watts (CPU : 15 W + GPU : 35 W), le résultat de 3DMark Time Spy est presque triplé et se situe donc à peu près au niveau d'uneGTX 1650 Ti.
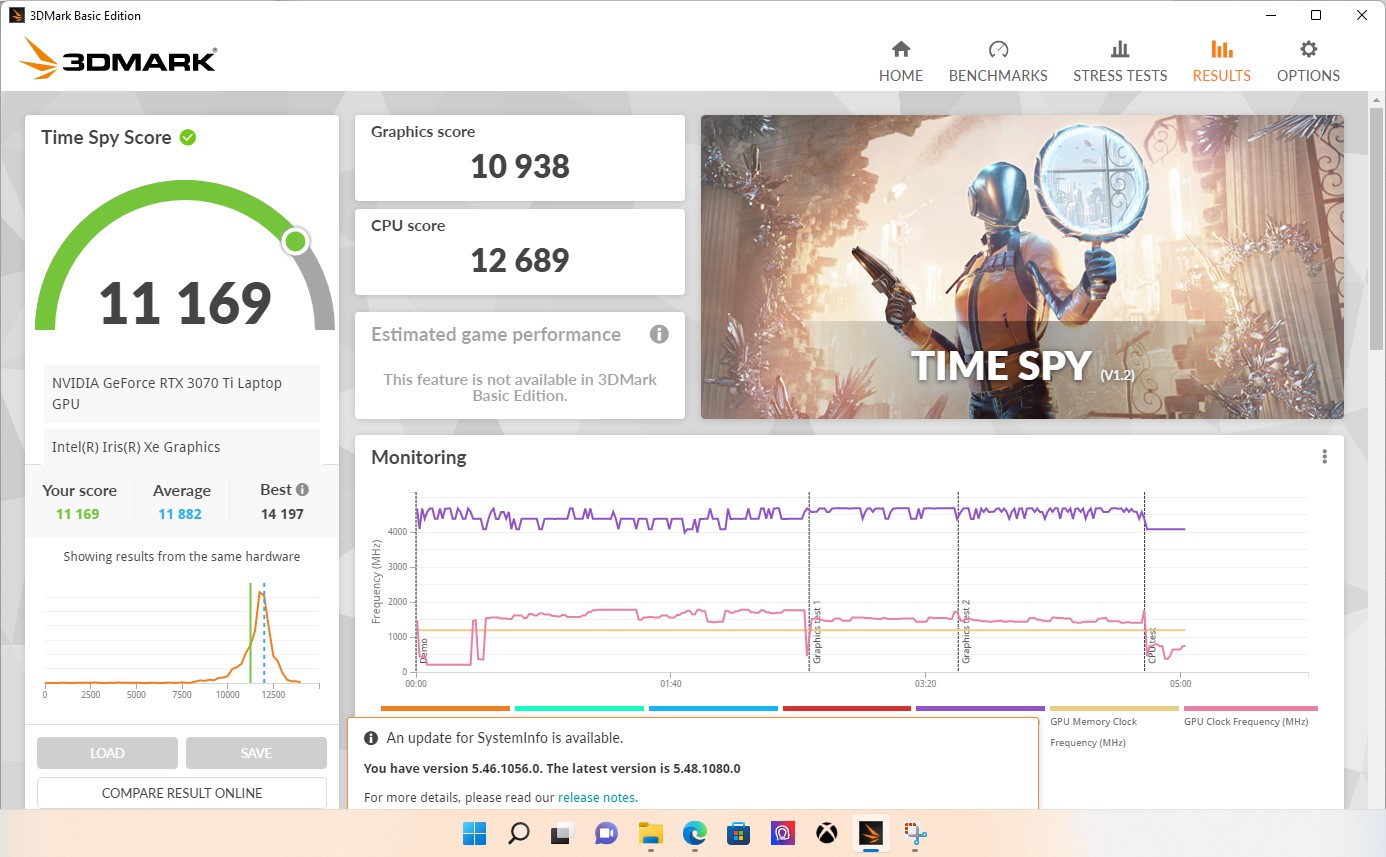
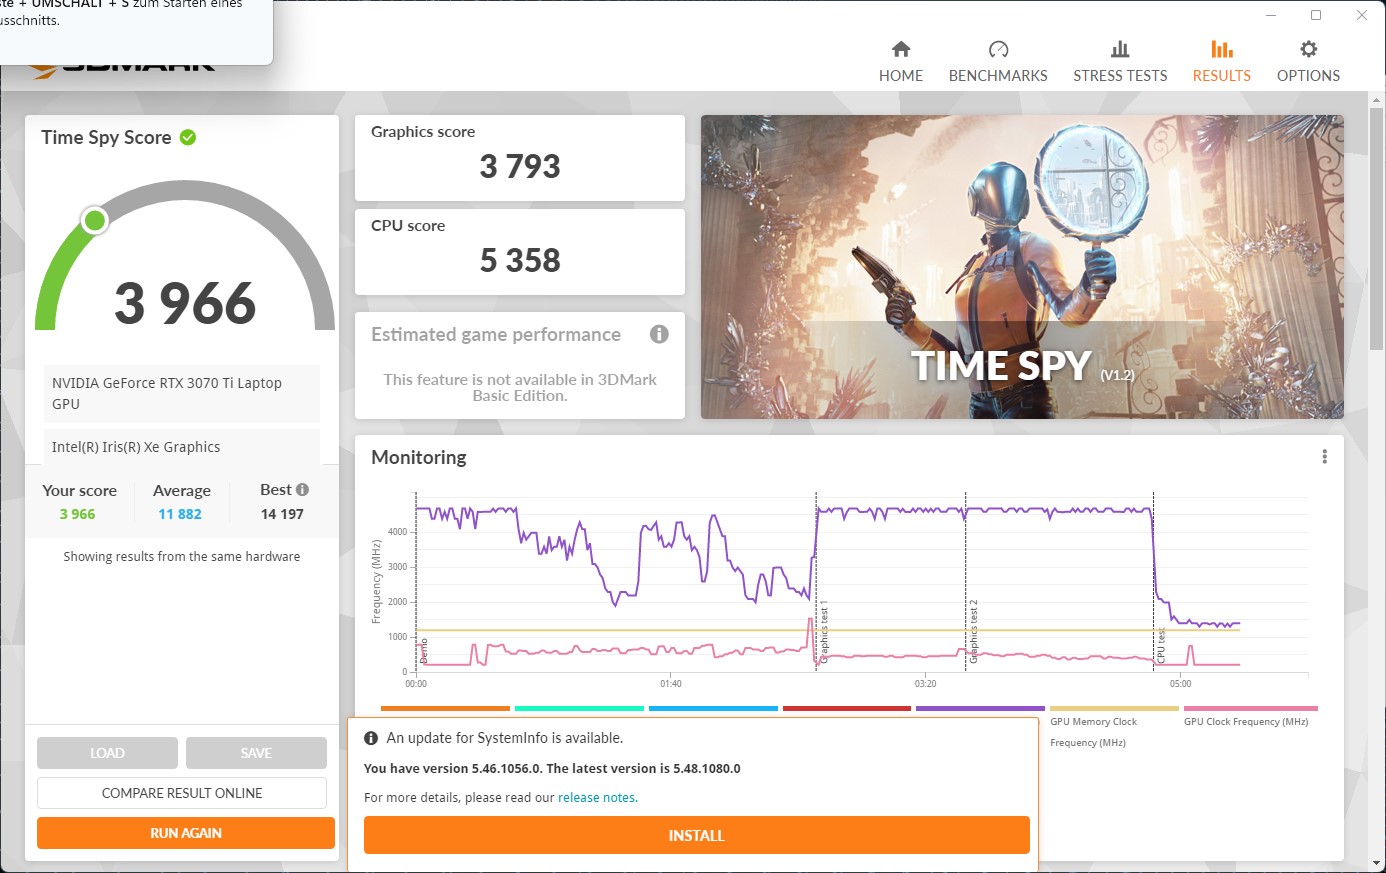
| 3DMark 11 Performance | 32326 points | |
| 3DMark Fire Strike Score | 25633 points | |
| 3DMark Time Spy Score | 11169 points | |
Aide | ||
Performances en matière de jeux
Les solides performances de la RTX 3070 Ti avec son TGP de 150 watts se reflètent également dans les jeux. Tous les jeux fonctionnent avec des FPS élevés. Même avec les paramètres maximaux et avec un moniteur externe correspondant, les résolutions 4K sont irréprochables.
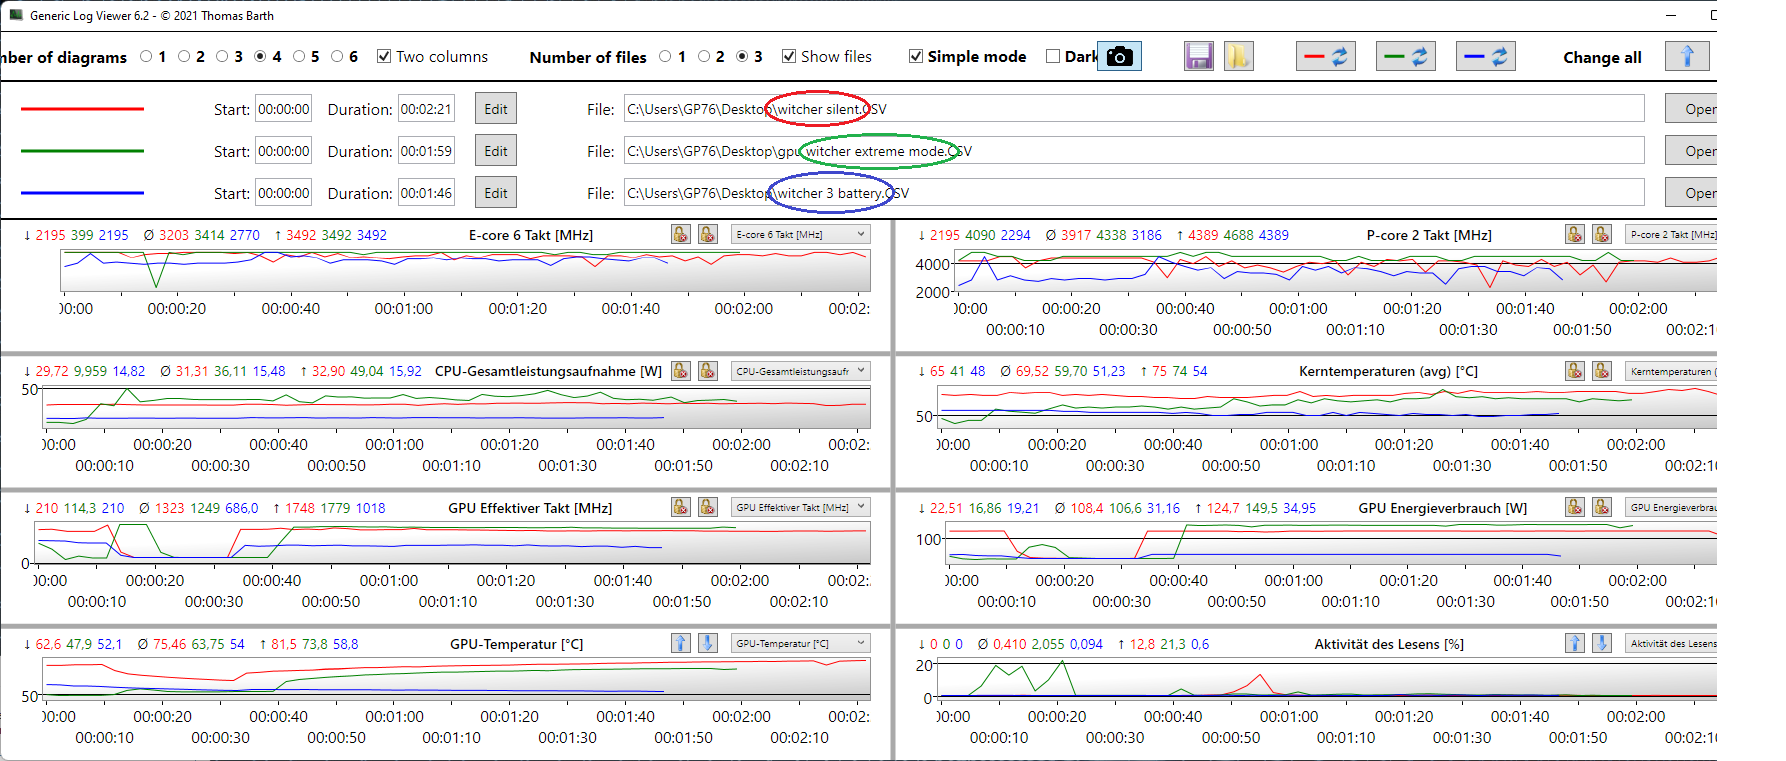
Alors que The Witcher 3 atteint 113 FPS aux paramètres maximum @FHD, cela chute légèrement à 105 FPS en mode silencieux et à un peu moins de 24 FPS en mode batterie, ce qui oblige à réduire considérablement les détails sans alimentation externe.
Le tableau ci-dessous montre les modes "Extrême", "Silencieux" et "Batterie". Le TGP tombe à environ 125 watts en mode silencieux. L'horloge du GPU est presque entièrement utilisée en mode Extrême à 1 780 MHz.
| Elden Ring | |
| 1920x1080 High Preset | |
| MSI Vector GP76 12UGS-434 | |
| Moyenne NVIDIA GeForce RTX 3070 Ti Laptop GPU (59.8 - 59.9, n=2) | |
| 1920x1080 Maximum Preset | |
| Moyenne NVIDIA GeForce RTX 3070 Ti Laptop GPU (46.3 - 59.7, n=2) | |
| MSI Vector GP76 12UGS-434 | |
| Elex 2 | |
| 1920x1080 High / On AA:FX AF:16x | |
| MSI Vector GP76 12UGS-434 | |
| Moyenne NVIDIA GeForce RTX 3070 Ti Laptop GPU (83 - 99.4, n=3) | |
| Aorus 17 XE4 | |
| 1920x1080 Ultra / On AA:SM AF:16x | |
| MSI Vector GP76 12UGS-434 | |
| Moyenne NVIDIA GeForce RTX 3070 Ti Laptop GPU (75 - 89, n=3) | |
| Aorus 17 XE4 | |
Le graphique Witcher 3 ne révèle pas de chutes d'images ni de bégaiements dans les modes testés.
Witcher 3 FPS Diagram
| Bas | Moyen | Élevé | Ultra | |
|---|---|---|---|---|
| GTA V (2015) | 179.1 | 167.9 | 109.7 | |
| The Witcher 3 (2015) | 219 | 112.8 | ||
| Dota 2 Reborn (2015) | 164.8 | 150.7 | 140.9 | 134.5 |
| Final Fantasy XV Benchmark (2018) | 107.7 | |||
| X-Plane 11.11 (2018) | 139.1 | 114.7 | 91.1 | |
| Far Cry 5 (2018) | 147 | 138 | ||
| Strange Brigade (2018) | 263 | 222 | 195.1 | |
| Shadow of the Tomb Raider (2018) | 131 | 129 | ||
| Elden Ring (2022) | 59.9 | 46.3 | ||
| Elex 2 (2022) | 99.4 | 89 |
Les émissions du Vector GP76 : Le mode silencieux pour gagner
Bruit
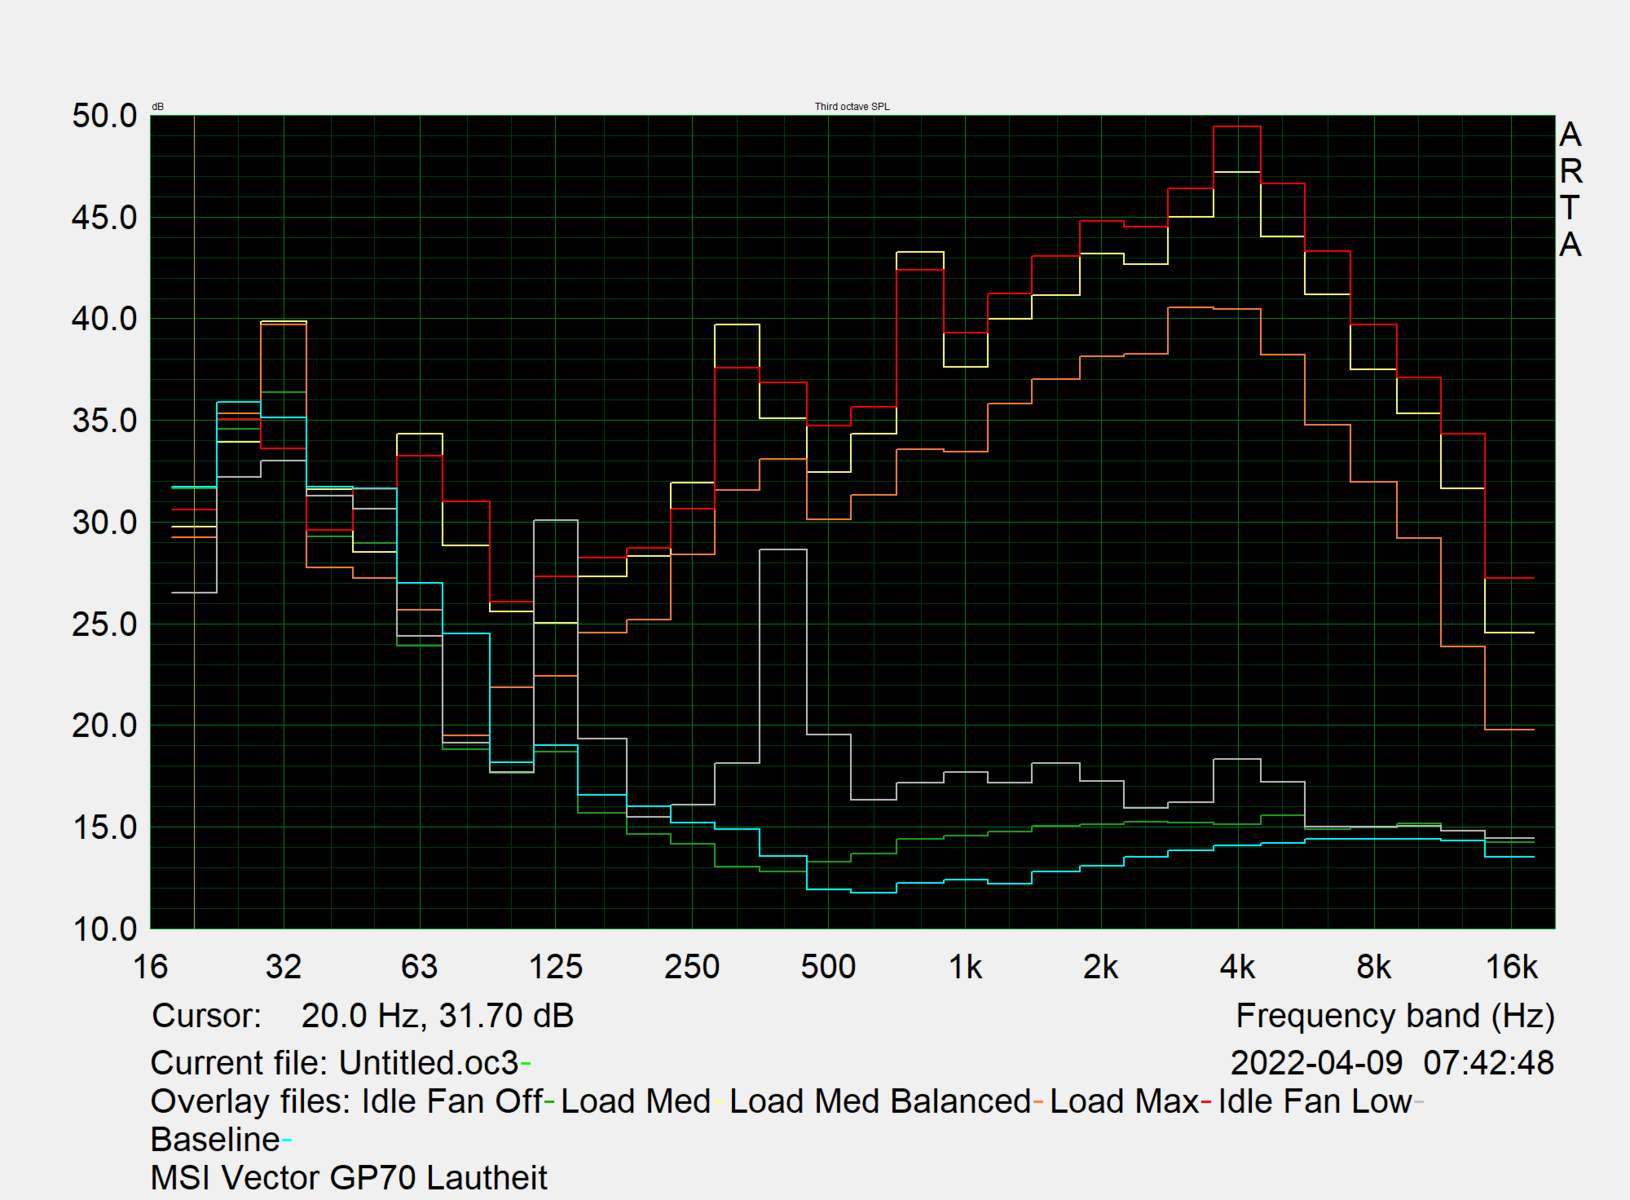
Au ralenti, le MSI Vector GP76 est presque silencieux et comme le mode Silencieux ne limite pas les performances du CPU, il n'y a pas de bruit de ventilateur trop gênant sous une charge appropriée et aucune fréquence aiguë ne peut être entendue.
En revanche, lorsque vous jouez en mode Extrême, il devient assez bruyant au point d'être gênant. Un système de sonorisation externe ou des écouteurs seraient appropriés dans ce cas, ou vous pouvez utiliser le mode Silencieux. Mais même en mode Équilibré, le bruit est bien meilleur avec seulement de très légères pertes de performances
Degré de la nuisance sonore
| Au repos |
| 27 / 27 / 30.1 dB(A) |
| Fortement sollicité |
| 54.4 / 56.2 dB(A) |
 | ||
30 dB silencieux 40 dB(A) audible 50 dB(A) bruyant |
||
min: | ||
| MSI Vector GP76 12UGS-434 GeForce RTX 3070 Ti Laptop GPU, i7-12700H, Micron 2450 1TB MTFDKBA1T0TFK | MSI GP76 Leopard 10UG GeForce RTX 3070 Laptop GPU, i7-10750H, Kingston OM8PCP3512F-AB | Asus ROG Strix G17 G713QE-RB74 GeForce RTX 3050 Ti Laptop GPU, R7 5800H, Samsung PM991 MZVLQ512HBLU | Aorus 17 XE4 GeForce RTX 3070 Ti Laptop GPU, i7-12700H, Gigabyte AG470S1TB-SI B10 | Schenker XMG NEO 17 GM7TG8S GeForce RTX 3080 Laptop GPU, i7-11800H, Samsung SSD 980 Pro 1TB MZ-V8P1T0BW | Lenovo Legion 5 Pro 16 G7 i7 RTX 3070Ti GeForce RTX 3070 Ti Laptop GPU, i7-12700H, Samsung PM9A1 MZVL21T0HCLR | Asus ROG Zephyrus M16 GU603H GeForce RTX 3070 Laptop GPU, i9-11900H, Samsung PM9A1 MZVL22T0HBLB | MSI Vector GP66 12UGS GeForce RTX 3070 Ti Laptop GPU, i9-12900H | |
|---|---|---|---|---|---|---|---|---|
| Noise | -2% | 13% | -0% | 16% | 2% | -6% | 13% | |
| arrêt / environnement * (dB) | 25.6 | 24 6% | 24.9 3% | 24 6% | 23 10% | 24.6 4% | 25 2% | 22.9 11% |
| Idle Minimum * (dB) | 27 | 25 7% | 25.1 7% | 30 -11% | 23 15% | 28.4 -5% | 25 7% | 23.4 13% |
| Idle Average * (dB) | 27 | 32 -19% | 25.1 7% | 31 -15% | 23 15% | 28.4 -5% | 31 -15% | 23.4 13% |
| Idle Maximum * (dB) | 30.1 | 34 -13% | 25.1 17% | 34 -13% | 23 24% | 28.4 6% | 42 -40% | 27.4 9% |
| Load Average * (dB) | 54.4 | 54 1% | 36.3 33% | 44 19% | 39.5 27% | 49.4 9% | 48 12% | 36 34% |
| Load Maximum * (dB) | 56.2 | 54 4% | 49.9 11% | 49 13% | 55.09 2% | 54.7 3% | 56 -0% | 58 -3% |
| Witcher 3 ultra * (dB) | 51 | 49.9 | 51 | 54.5 | 49.4 | 52 | 58.2 |
* ... Moindre est la valeur, meilleures sont les performances
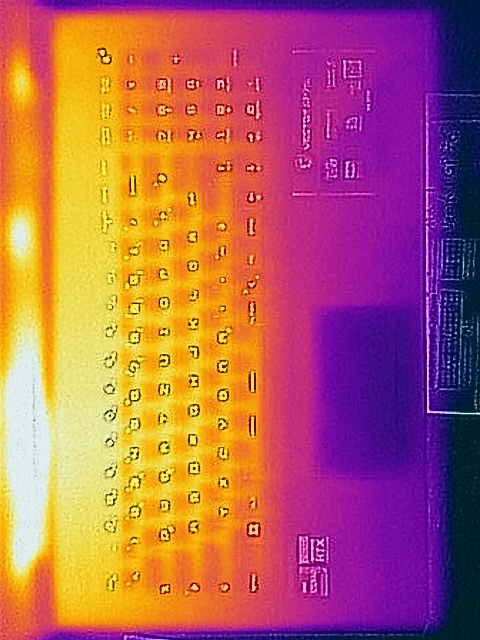
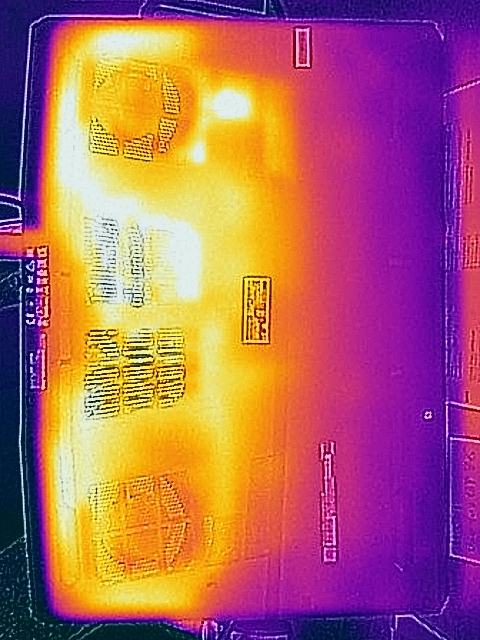
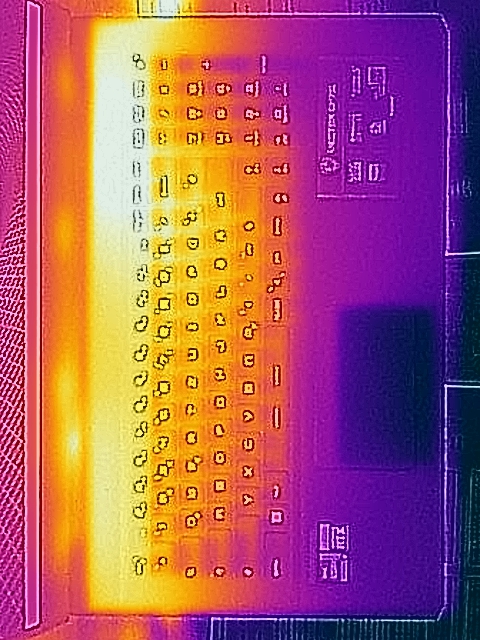
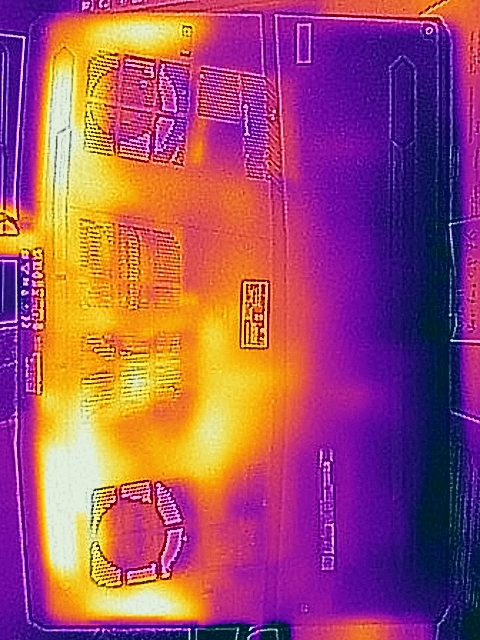
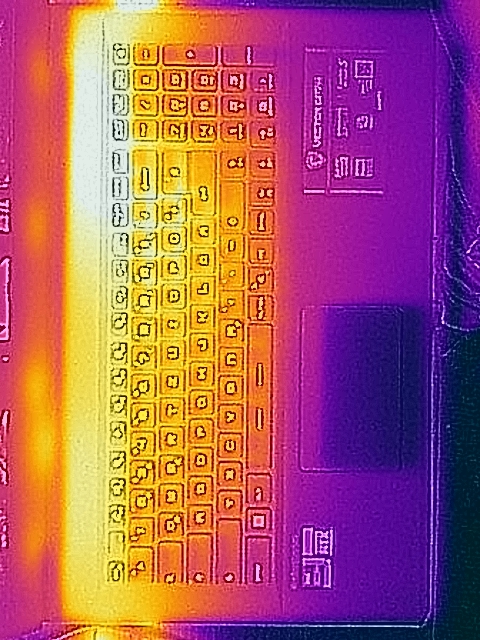
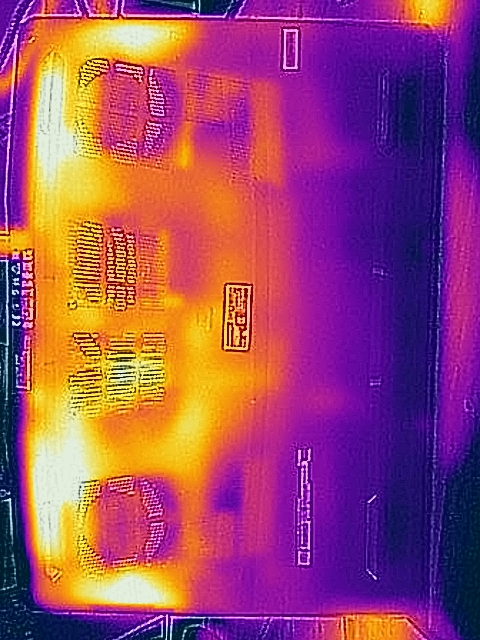
Température
L'ordinateur portable de jeu de MSI est assez frais dans tous les scénarios, sauf en mode silencieux pendant le jeu, où les ventilateurs tournent beaucoup plus lentement. Cependant, les surfaces ne deviennent jamais trop chaudes. Les appareils plus minces comme leMSI Stealth GS66 ou le Razer Blade 15ont du mal à supporter des températures nettement plus élevées.
(-) La température maximale du côté supérieur est de 46.3 °C / 115 F, par rapport à la moyenne de 40.4 °C / 105 F, allant de 21.2 à 68.8 °C pour la classe Gaming.
(±) Le fond chauffe jusqu'à un maximum de 45 °C / 113 F, contre une moyenne de 43.2 °C / 110 F
(+) En utilisation inactive, la température moyenne du côté supérieur est de 30.8 °C / 87 F, par rapport à la moyenne du dispositif de 33.9 °C / 93 F.
(±) En jouant à The Witcher 3, la température moyenne du côté supérieur est de 34.8 °C / 95 F, alors que la moyenne de l'appareil est de 33.9 °C / 93 F.
(+) Les repose-poignets et le pavé tactile sont plus froids que la température de la peau avec un maximum de 27.4 °C / 81.3 F et sont donc froids au toucher.
(±) La température moyenne de la zone de l'appui-paume de dispositifs similaires était de 28.8 °C / 83.8 F (+1.4 °C / #2.5 F).
| MSI Vector GP76 12UGS-434 Intel Core i7-12700H, NVIDIA GeForce RTX 3070 Ti Laptop GPU | MSI GP76 Leopard 10UG Intel Core i7-10750H, NVIDIA GeForce RTX 3070 Laptop GPU | Asus ROG Strix G17 G713QE-RB74 AMD Ryzen 7 5800H, NVIDIA GeForce RTX 3050 Ti Laptop GPU | Aorus 17 XE4 Intel Core i7-12700H, NVIDIA GeForce RTX 3070 Ti Laptop GPU | Schenker XMG NEO 17 GM7TG8S Intel Core i7-11800H, NVIDIA GeForce RTX 3080 Laptop GPU | Lenovo Legion 5 Pro 16 G7 i7 RTX 3070Ti Intel Core i7-12700H, NVIDIA GeForce RTX 3070 Ti Laptop GPU | Asus ROG Zephyrus M16 GU603H Intel Core i9-11900H, NVIDIA GeForce RTX 3070 Laptop GPU | MSI Vector GP66 12UGS Intel Core i9-12900H, NVIDIA GeForce RTX 3070 Ti Laptop GPU | |
|---|---|---|---|---|---|---|---|---|
| Heat | 7% | -0% | -2% | -12% | 0% | -12% | 4% | |
| Maximum Upper Side * (°C) | 46.3 | 43 7% | 43.8 5% | 50 -8% | 51 -10% | 45.3 2% | 52 -12% | 40.2 13% |
| Maximum Bottom * (°C) | 45 | 47 -4% | 47.2 -5% | 58 -29% | 62 -38% | 61.2 -36% | 53 -18% | 43.8 3% |
| Idle Upper Side * (°C) | 34.2 | 30 12% | 33.4 2% | 30 12% | 35 -2% | 28.6 16% | 38 -11% | 34.8 -2% |
| Idle Bottom * (°C) | 38.3 | 33 14% | 39.4 -3% | 32 16% | 38 1% | 31.4 18% | 41 -7% | 37 3% |
* ... Moindre est la valeur, meilleures sont les performances
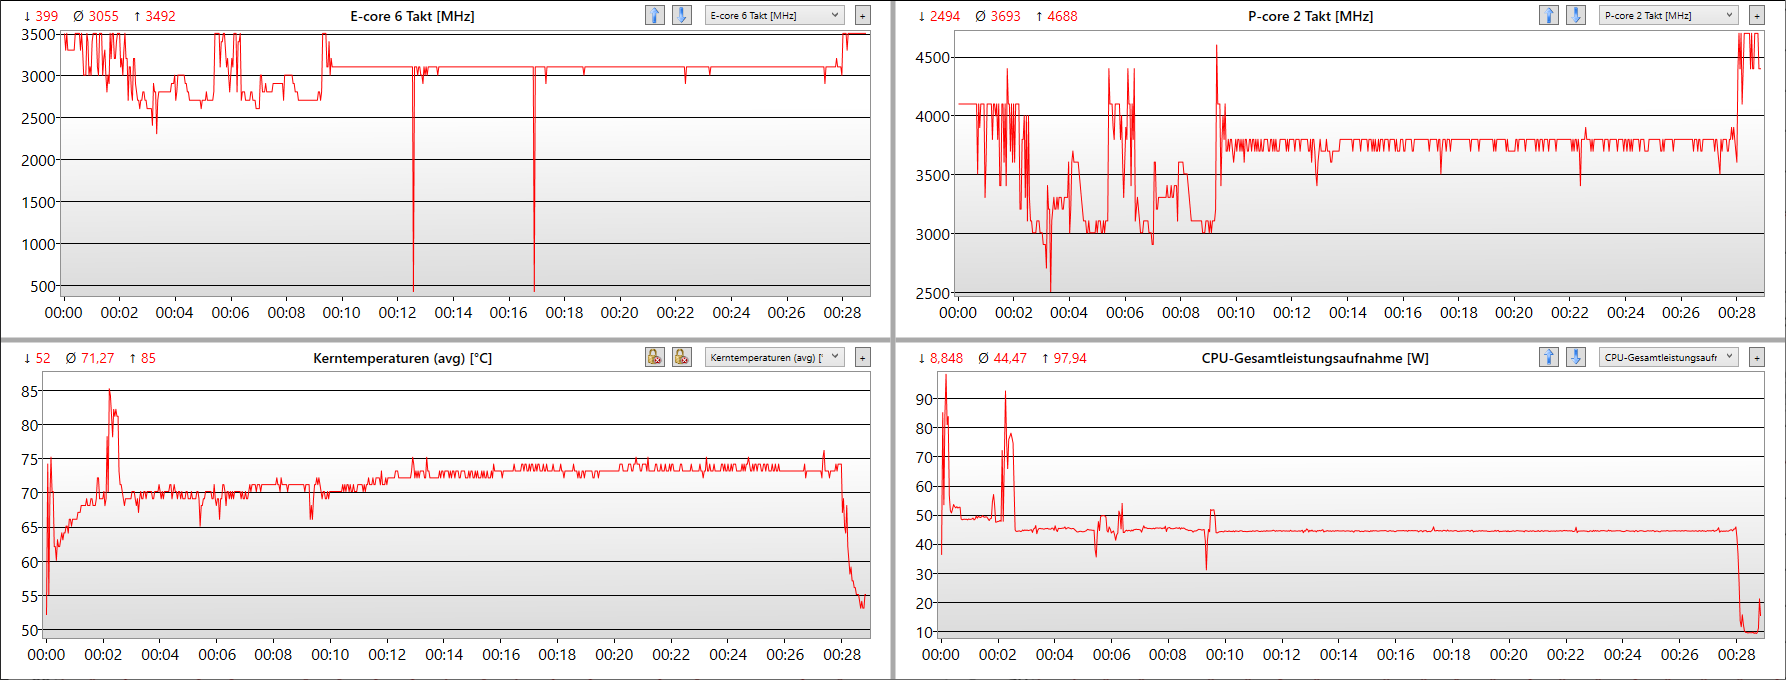
Test de stress
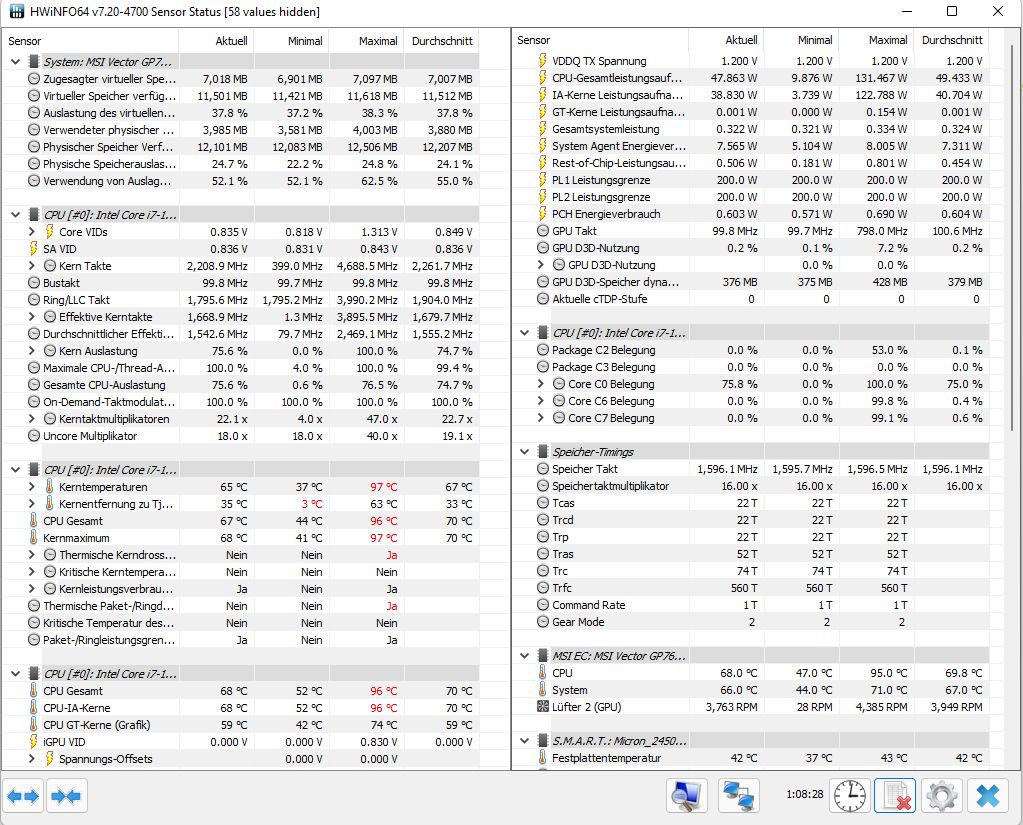
À 2,3 GHz, le CPU ne fonctionne que 100 MHz en dessous de la vitesse d'horloge de base dans le test de stress combiné (Prime95 + FurMark), tandis que le GP66 Vector, plus petit, ne parvient qu'à 1 GHz. Le GPU peut également fonctionner à pleine vitesse d'horloge dans ce scénario extrême. Le throttling n'entre donc pas en jeu, et aucune réduction de performance n'est visible dans le benchmark 3D directement après le test de stress.
Le processeur a démarré à 131 watts, mais il a été rapidement réduit à 50 watts, ce qui a permis de maintenir les températures du cœur très basses. Les températures du GPU Nvidia peuvent également être décrites comme très discrètes, bien qu'il consomme encore plus de 140 watts. En cas de stress CPU pur, il se permet une consommation constante de 70 watts (mode extrême) et reste assez frais à 76°C.
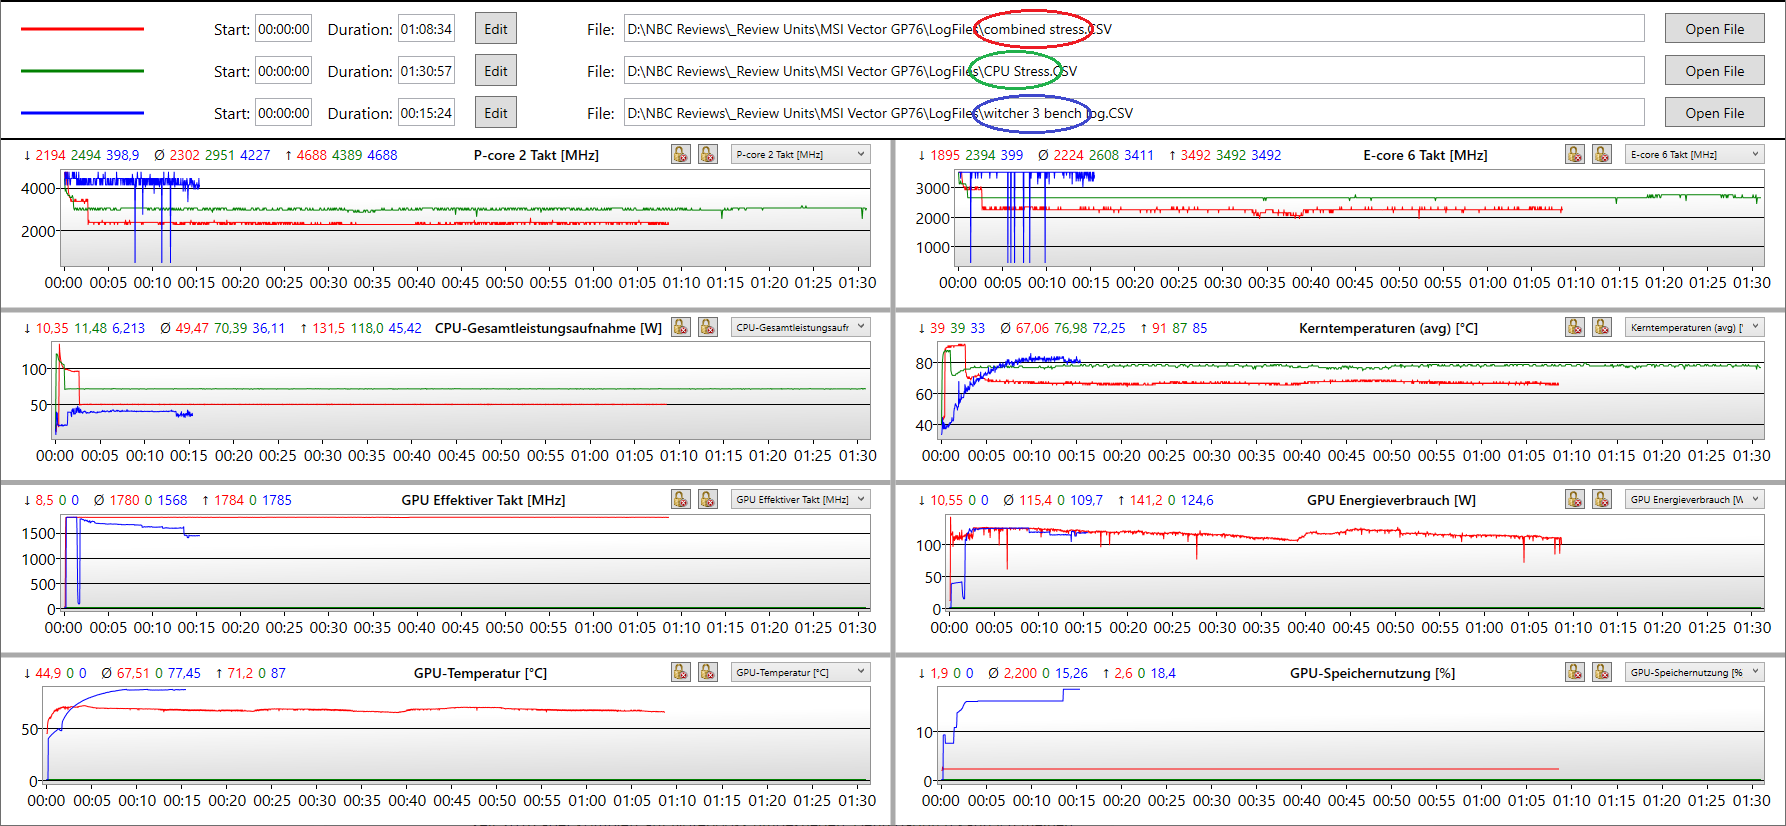
| Fréquence du CPU (GHz) | Fréquence du GPU (MHz) | Température moyenne du CPU (°C) | Température moyenne du GPU (°C) | |
| Système au repos | -- | 200 | 36 | 40 |
| Prime95 Stress | 2.6 | 200 | 77 | -- |
| Prime95 + FurMark Stress | 2.2 | 1.780 | 67 | 68 |
| Witcher 3 Stress | 3.4 | 1.780 | 82 | 78 |
| Witcher 3 @Battery | 3.2 | 1.000 | 51 | 59 |
Haut-parleurs
Les haut-parleurs sont décents, même si Asus fait mieux avec sa série SCAR.Série SCARsCAR. Mais ils sont certainement meilleurs que ceux de la série Aorus de Gigabyte.
Les aigus et les médiums sont très bien reproduits, tandis que les basses sont rudimentaires. Le volume maximal est bon. Vous ne pouvez pas obtenir beaucoup plus d'un système de haut-parleurs stéréo avec 2x 2,5 watts.
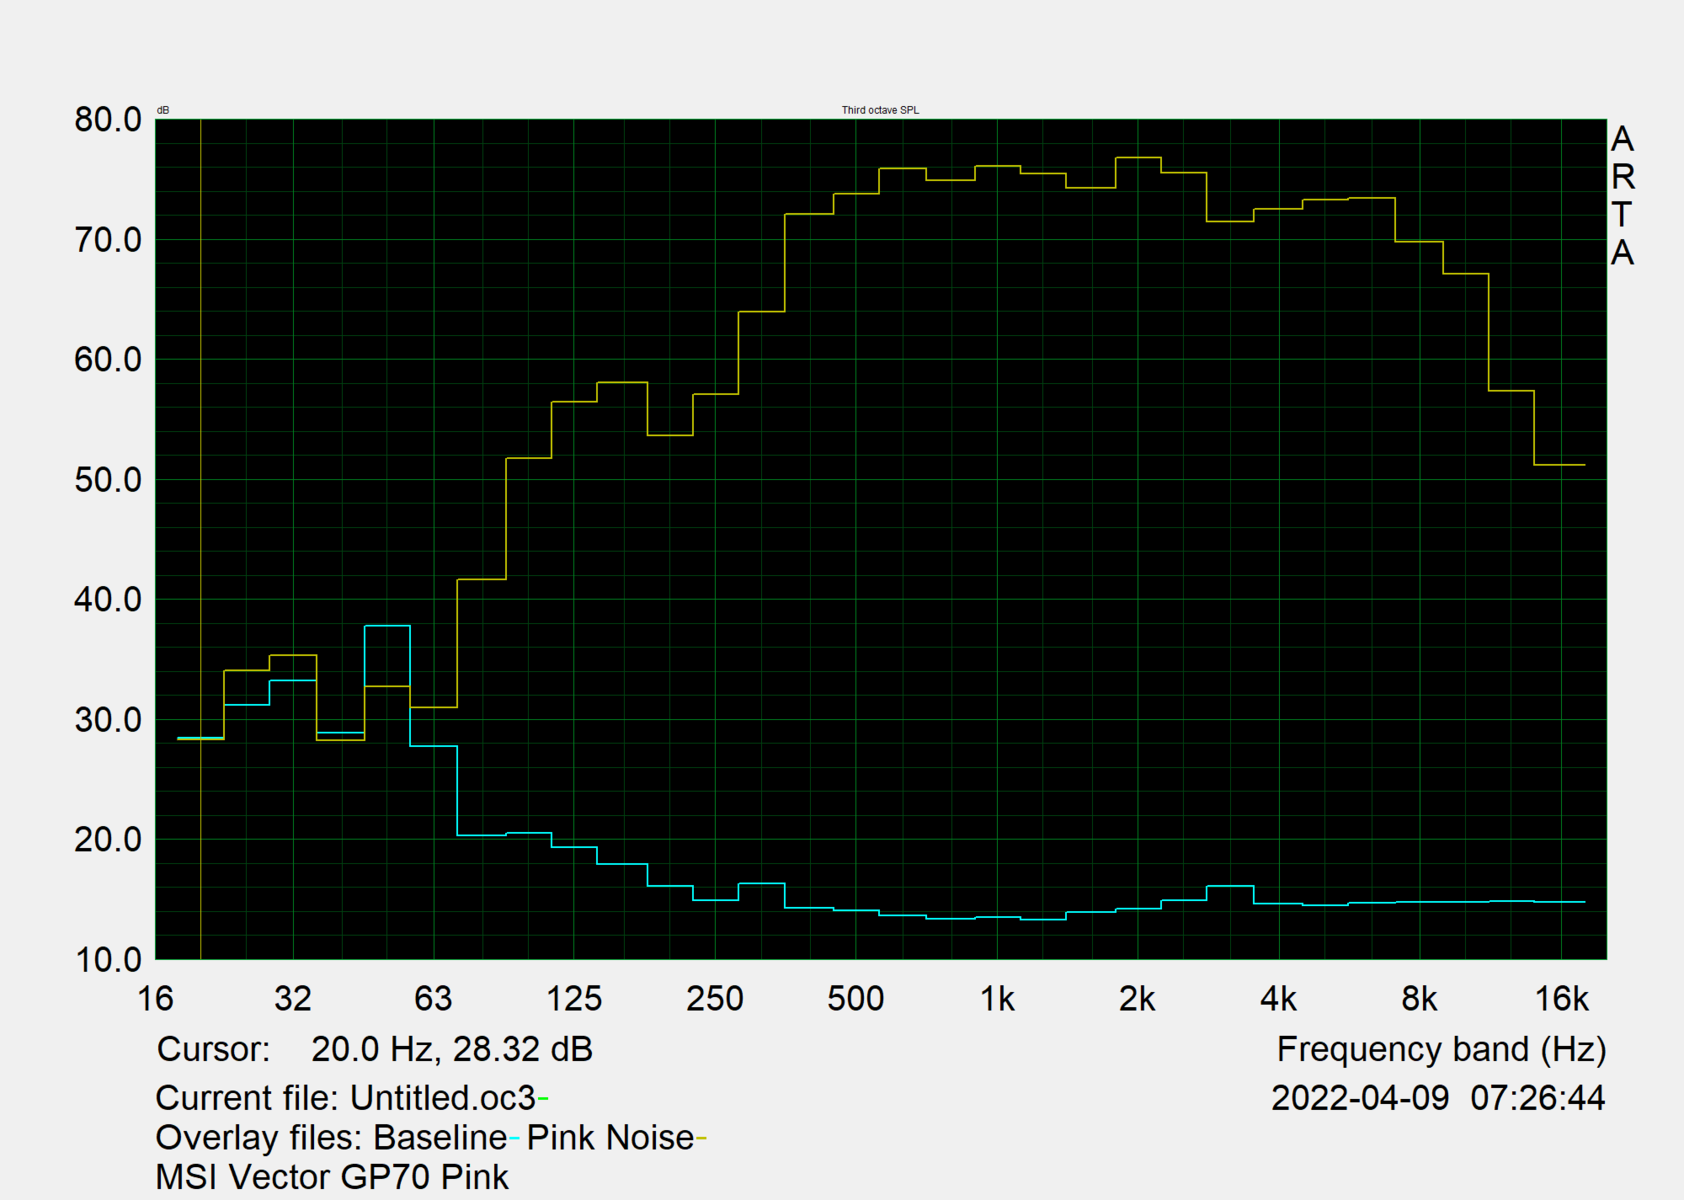
MSI Vector GP76 12UGS-434 analyse audio
(±) | le niveau sonore du haut-parleur est moyen mais bon (76.7# dB)
Basses 100 - 315 Hz
(-) | presque aucune basse - en moyenne 15.3% plus bas que la médiane
(±) | la linéarité des basses est moyenne (9% delta à la fréquence précédente)
Médiums 400 - 2000 Hz
(+) | médiane équilibrée - seulement 2.8% de la médiane
(+) | les médiums sont linéaires (4% delta à la fréquence précédente)
Aiguës 2 - 16 kHz
(+) | des sommets équilibrés - à seulement 2% de la médiane
(+) | les aigus sont linéaires (3.4% delta à la fréquence précédente)
Globalement 100 - 16 000 Hz
(+) | le son global est linéaire (12.6% différence à la médiane)
Par rapport à la même classe
» 16% de tous les appareils testés de cette catégorie étaient meilleurs, 4% similaires, 81% pires
» Le meilleur avait un delta de 6%, la moyenne était de 18%, le pire était de 132%.
Par rapport à tous les appareils testés
» 11% de tous les appareils testés étaient meilleurs, 3% similaires, 86% pires
» Le meilleur avait un delta de 4%, la moyenne était de 23%, le pire était de 134%.
Asus ROG Strix G17 G713QE-RB74 analyse audio
(±) | le niveau sonore du haut-parleur est moyen mais bon (73.5# dB)
Basses 100 - 315 Hz
(±) | basse réduite - en moyenne 13% inférieure à la médiane
(±) | la linéarité des basses est moyenne (9.8% delta à la fréquence précédente)
Médiums 400 - 2000 Hz
(±) | médiane supérieure - en moyenne 5.6% supérieure à la médiane
(+) | les médiums sont linéaires (6.5% delta à la fréquence précédente)
Aiguës 2 - 16 kHz
(+) | des sommets équilibrés - à seulement 3.4% de la médiane
(±) | la linéarité des aigus est moyenne (12% delta à la fréquence précédente)
Globalement 100 - 16 000 Hz
(±) | la linéarité du son global est moyenne (16.9% de différence avec la médiane)
Par rapport à la même classe
» 44% de tous les appareils testés de cette catégorie étaient meilleurs, 11% similaires, 44% pires
» Le meilleur avait un delta de 6%, la moyenne était de 18%, le pire était de 132%.
Par rapport à tous les appareils testés
» 30% de tous les appareils testés étaient meilleurs, 8% similaires, 62% pires
» Le meilleur avait un delta de 4%, la moyenne était de 23%, le pire était de 134%.
Gestion de l'alimentation : MSI améliore l'autonomie de la batterie du Vector GP76
Consommation d'énergie
Pour une machine de jeu, la consommation en mode veille de 15,6 watts est moyenne à bonne, tandis que la consommation en mode veille de 0,5 watts est agréable et promet une autonomie de plus de 5 jours (généralement beaucoup plus longue en pratique).
La consommation maximale permanente en charge et en jeu combinés se situe juste en dessous de 200 watts. En principe, une valeur élevée est bonne ici, ce qui signifie que le GPU peut consommer beaucoup d'énergie et donc travailler plus rapidement. En cas de charge pure du CPU, la valeur (selon HWInfo) devrait se situer entre 50 et 80 watts, selon le mode.
En mode Équilibré et Silencieux, les valeurs de consommation sont plus faibles selon le tableau ci-dessus ("Conditions de test"). Une charge de pointe d'un peu moins de 320 watts ne se produit que très brièvement au début du test de stress combiné et ne se produit pas dans l'utilisation quotidienne. Dans l'ensemble, le bloc d'alimentation de 280 watts est suffisamment dimensionné.
| Éteint/en veille | |
| Au repos | |
| Fortement sollicité |
|
Légende:
min: | |
| MSI Vector GP76 12UGS-434 i7-12700H, GeForce RTX 3070 Ti Laptop GPU, Micron 2450 1TB MTFDKBA1T0TFK, IPS, 1920x1080, 17.3" | MSI GP76 Leopard 10UG i7-10750H, GeForce RTX 3070 Laptop GPU, Kingston OM8PCP3512F-AB, IPS, 1920x1080, 17.3" | Asus ROG Strix G17 G713QE-RB74 R7 5800H, GeForce RTX 3050 Ti Laptop GPU, Samsung PM991 MZVLQ512HBLU, IPS, 1920x1080, 17.3" | Aorus 17 XE4 i7-12700H, GeForce RTX 3070 Ti Laptop GPU, Gigabyte AG470S1TB-SI B10, IPS, 1920x1080, 17.3" | Schenker XMG NEO 17 GM7TG8S i7-11800H, GeForce RTX 3080 Laptop GPU, Samsung SSD 980 Pro 1TB MZ-V8P1T0BW, IPS, 2560x1440, 17.3" | Lenovo Legion 5 Pro 16 G7 i7 RTX 3070Ti i7-12700H, GeForce RTX 3070 Ti Laptop GPU, Samsung PM9A1 MZVL21T0HCLR, IPS, 2560x1600, 16" | Asus ROG Zephyrus M16 GU603H i9-11900H, GeForce RTX 3070 Laptop GPU, Samsung PM9A1 MZVL22T0HBLB, IPS, 2560x1600, 16" | MSI Vector GP66 12UGS i9-12900H, GeForce RTX 3070 Ti Laptop GPU, , IPS, 1920x1080, 15.6" | Moyenne NVIDIA GeForce RTX 3070 Ti Laptop GPU | Moyenne de la classe Gaming | |
|---|---|---|---|---|---|---|---|---|---|---|
| Power Consumption | 10% | 29% | -12% | -12% | 12% | 8% | -24% | -0% | 5% | |
| Idle Minimum * (Watt) | 13.5 | 12 11% | 9.2 32% | 20 -48% | 19 -41% | 8.6 36% | 11 19% | 17.5 -30% | 14.2 ? -5% | 13.1 ? 3% |
| Idle Average * (Watt) | 15.6 | 16 -3% | 12.6 19% | 23 -47% | 25 -60% | 17.6 -13% | 20 -28% | 20.1 -29% | 19.9 ? -28% | 19 ? -22% |
| Idle Maximum * (Watt) | 20.6 | 28 -36% | 23.3 -13% | 28 -36% | 28 -36% | 18.5 10% | 30 -46% | 47.3 -130% | 26.2 ? -27% | 24.6 ? -19% |
| Load Average * (Watt) | 198 | 92 54% | 89.3 55% | 120 39% | 105 47% | 110 44% | 111 44% | 107.3 46% | 125.8 ? 36% | 111.3 ? 44% |
| Witcher 3 ultra * (Watt) | 199 | 198 1% | 136 32% | 196 2% | 223 -12% | 227 -14% | 156 22% | 225 -13% | ||
| Load Maximum * (Watt) | 319 | 210 34% | 162.7 49% | 257 19% | 226 29% | 294.6 8% | 197 38% | 277.7 13% | 248 ? 22% | 260 ? 18% |
* ... Moindre est la valeur, meilleures sont les performances
Power Consumption Witcher 3 / Stress test
Power Consumption with external monitor
Autonomie de la batterie
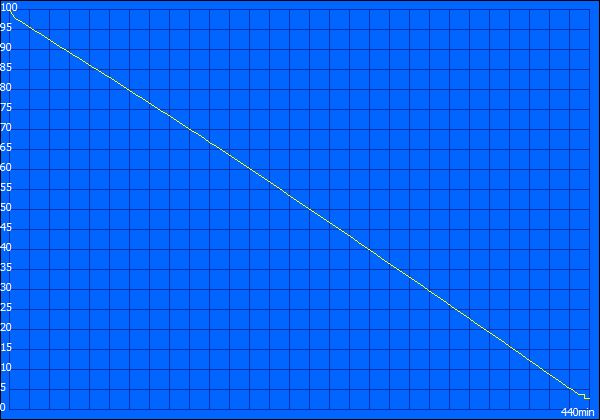
L'autonomie de la batterie a été améliorée de 20 % en moyenne par rapport à son prédécesseur. Le reste du champ de test n'offre pas beaucoup plus, même avec des batteries plus puissantes, à l'exception du minceZephyrus M16.
Un peu plus de 5 heures ont été possibles dans notre test WLAN à une luminosité de 150 cd/m² en mode performance Windows équilibré. La batterie de 65 Wh a mis près de 2,5 heures pour être entièrement rechargée. C'est nettement plus long que de nombreux autres ordinateurs portables de toutes catégories.
| MSI Vector GP76 12UGS-434 i7-12700H, GeForce RTX 3070 Ti Laptop GPU, 65 Wh | MSI GP76 Leopard 10UG i7-10750H, GeForce RTX 3070 Laptop GPU, 65 Wh | Asus ROG Strix G17 G713QE-RB74 R7 5800H, GeForce RTX 3050 Ti Laptop GPU, 56 Wh | Aorus 17 XE4 i7-12700H, GeForce RTX 3070 Ti Laptop GPU, 99 Wh | Schenker XMG NEO 17 GM7TG8S i7-11800H, GeForce RTX 3080 Laptop GPU, 62 Wh | Lenovo Legion 5 Pro 16 G7 i7 RTX 3070Ti i7-12700H, GeForce RTX 3070 Ti Laptop GPU, 80 Wh | Asus ROG Zephyrus M16 GU603H i9-11900H, GeForce RTX 3070 Laptop GPU, 90 Wh | MSI Vector GP66 12UGS i9-12900H, GeForce RTX 3070 Ti Laptop GPU, 65 Wh | Moyenne de la classe Gaming | |
|---|---|---|---|---|---|---|---|---|---|
| Autonomie de la batterie | -31% | 12% | 4% | -17% | -30% | 42% | -7% | 11% | |
| Reader / Idle (h) | 7.3 | 5.6 -23% | 11.1 52% | 8.6 18% | 13.3 82% | 7.9 8% | 7.84 ? 7% | ||
| WiFi v1.3 (h) | 5.1 | 4.2 -18% | 6 18% | 5.1 0% | 3.7 -27% | 5.4 6% | 7.7 51% | 5.7 12% | 7.08 ? 39% |
| Load (h) | 1.7 | 0.8 -53% | 1.1 -35% | 1.6 -6% | 1.6 -6% | 0.6 -65% | 1.6 -6% | 1 -41% | 1.496 ? -12% |
| H.264 (h) | 6.1 | 3.7 | 6.3 | 8.27 ? |
Points positifs
Points négatifs
Verdict : des performances optimales à tous les niveaux grâce aux graphiques Vector de MSI
Les avantages sont clairs : le Vector GP76 est un vrai gamer avec son écran 360 Hz et ses temps de réponse ultra rapides. De plus, le Core i7-12700H est deux fois plus puissant que le processeur de son prédécesseur et un autre atout est la Nvidia RTX 3070 Ti dont la consommation réelle est de 150 watts. Cela place l'appareil dans la fourchette haute de notre base de données.
Le Vector peut également fonctionner plutôt silencieusement, offre une gamme sonore complète, une meilleure autonomie de la batterie, un clavier RVB configurable par touches, un châssis très stable et de bonnes options de mise à niveau. En outre, l'écran produit une belle image, riche et claire, mais pourrait briller un peu plus et offrir des résolutions plus élevées en option.
Le MSI Vector GP76 fonctionne avec rapidité à tous les niveaux : L'écran, le processeur et un GPU avec un TGP de 150 watts. Les critiques ne portent que sur des points mineurs, comme l'écran un peu sombre.
En outre, il n'y a pas de Thunderbolt ni de Power Delivery via USB-C. Le bloc d'alimentation est lourd et encombrant, et il n'y a pas de lecteur de carte SD. Le SSD n'est pas le plus rapide du marché et les performances sont nettement réduites en mode batterie. En outre, le prix de 2 649 dollars US actuellement est un peu élevé.
Si vous pouvez vivre avec ces limitations, vous obtenez une machine de jeu très solide. Vous pouvez également opter pour le Zephyrus M16 Test de l'Asus ROG Zephyrus M16 : le jeu en 16:10 si la compacité est plus importante pour vous que les performances complètes, ou le Legion 5 Pro pour un meilleur rapport qualité-prix, un écran plus lumineux, un meilleur clavier et le Core i9 déchaîné. Le Asus ROG Strix G17 est également un bon choix avec la bonne configuration (écran QHD + RTX 3070) car non seulement il est abordable et extrêmement robuste, mais il est très silencieux et frais grâce à AMD. Il possède également le meilleur clavier de sa catégorie.
Prix et disponibilité
Le modèle que nous avons examiné (12UGS-434) ne semble pas être disponible en dehors de l'Allemagne au moment de la publication. A la place, Amazon US propose deux variantes sous la forme du 12UGS-298 et le 12UGS-61. Le premier est équipé d'un Intel i7-12700H et le second d'un Intel i9-12900HK . Les prix commencent respectivement à 2 449,00 et 2 649,00 dollars et sont susceptibles d'être modifiés en fonction de la configuration SSD choisie.
MSI Vector GP76 12UGS-434
- 05/06/2022 v7 (old)
Marvin Gollor
Price comparison

