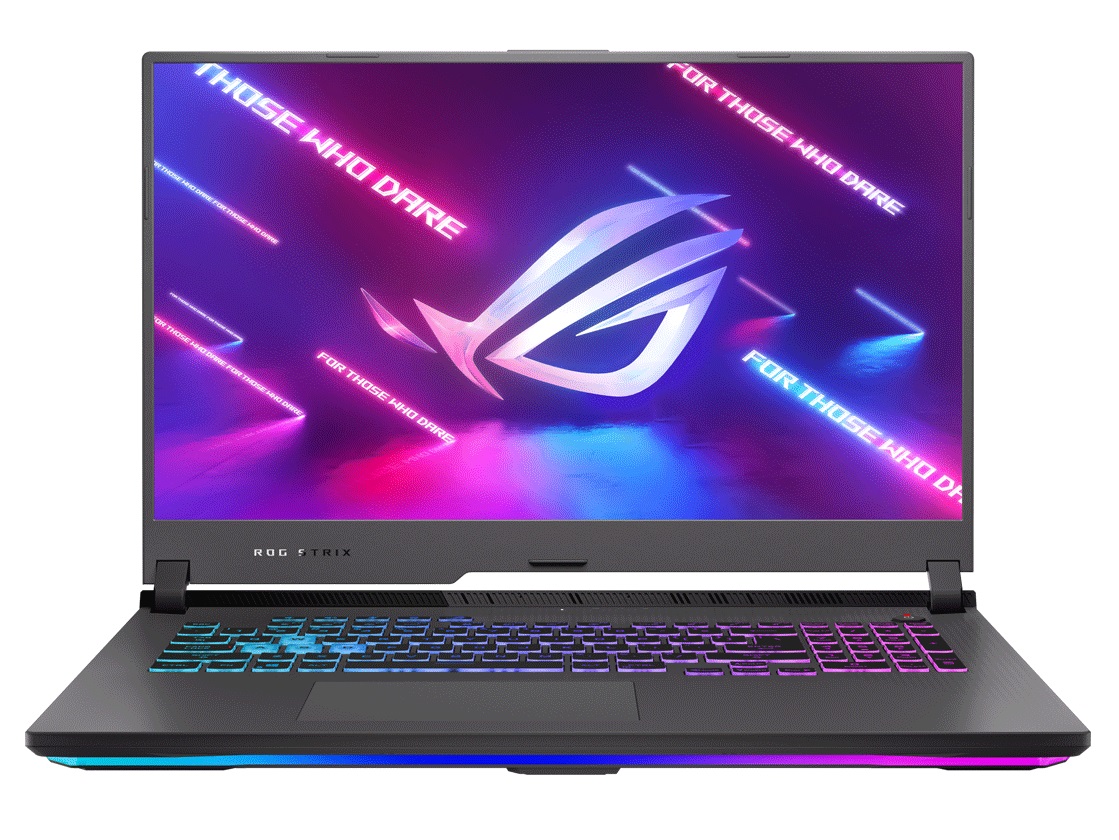
Test de l'Asus ROG Strix G17 G713QE : la GeForce RTX 3050 Ti tire vers le bas un excellent système

La série ROG Strix G17 G713 succède à la série G712 de l'année dernière Série G712 en remplaçant Intel par AMD et en mettant à jour la plupart des SKUs avec des graphiques Ampère GeForce. Les options configurables sont nombreuses avec pas moins de 16 ( !) SKUs individuels tous détaillés ici sur la page officielle des produits d'Asus. Les options sont ensuite massives, allant du Zen 2 Ryzen 7 4800H au Zen 3 Ryzen 9 5900HX CPU et 65 W GeForce GTX 1650 graphiques jusqu'au 130 W GeForce RTX 3070. Les options d'affichage varient également considérablement, de la dalle FHD 144 Hz de base à la QHD 165 Hz ou à la FHD 300 Hz avec des couleurs plus riches. Même les capacités de la batterie, les épaisseurs et les adaptateurs secteur sont différents en fonction des graphiques.
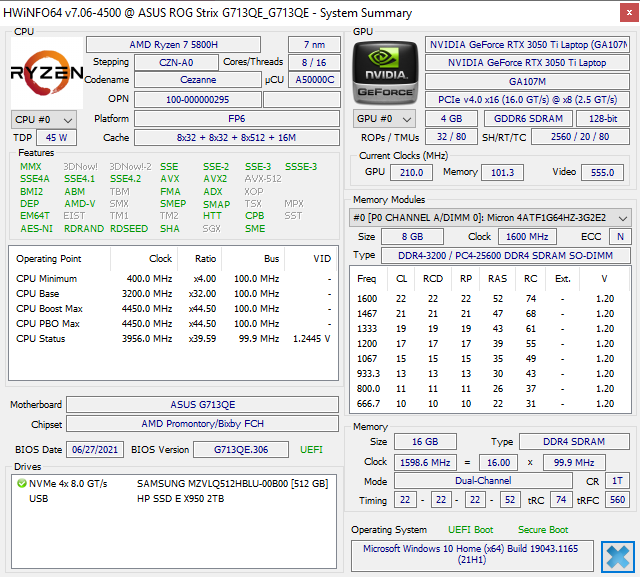
Notre unité de test d'aujourd'hui est un SKU de milieu de gamme équipé du CPU Ryzen 7 5800H, du GPU RTX 3050 Ti 95 W et d'un écran FHD 144 Hz. Les concurrents dans cet espace comprennent d'autres ordinateurs portables de jeu de 17,3 pouces d'entrée et de milieu de gamme comme le MSI Katana GF76, Acer Nitro 5, Dell série Gou Lenovo Legion 5.
Plus de commentaires sur Asus :
potential competitors in comparison
Note | Date | Modèle | Poids | Épaisseur | Taille | Résolution | Prix |
|---|---|---|---|---|---|---|---|
| 83.4 % v7 (old) | 08/21 | Asus ROG Strix G17 G713QE-RB74 R7 5800H, GeForce RTX 3050 Ti Laptop GPU | 2.5 kg | 24.6 mm | 17.30" | 1920x1080 | |
| 81.1 % v7 (old) | 08/21 | Acer Nitro 5 AN517-53-54DQ i5-11300H, GeForce RTX 3050 4GB Laptop GPU | 2.6 kg | 25 mm | 17.30" | 1920x1080 | |
| 80.4 % v7 (old) | 06/21 | MSI Katana GF76 11UE i7-11800H, GeForce RTX 3060 Laptop GPU | 2.7 kg | 25.2 mm | 17.30" | 1920x1080 | |
| 86.6 % v7 (old) | 05/21 | Asus Strix Scar 17 G733QSA-XS99 R9 5900HX, GeForce RTX 3080 Laptop GPU | 2.8 kg | 28.3 mm | 17.30" | 1920x1080 | |
| 83.3 % v7 (old) | 02/21 | MSI Alpha 17 A4DEK R7 4800H, Radeon RX 5600M | 2.6 kg | 28 mm | 17.30" | 1920x1080 | |
| 83.1 % v7 (old) | 10/20 | Asus Strix G17 G712LWS i7-10750H, GeForce RTX 2070 Super Mobile | 2.8 kg | 26.5 mm | 17.30" | 1920x1080 |
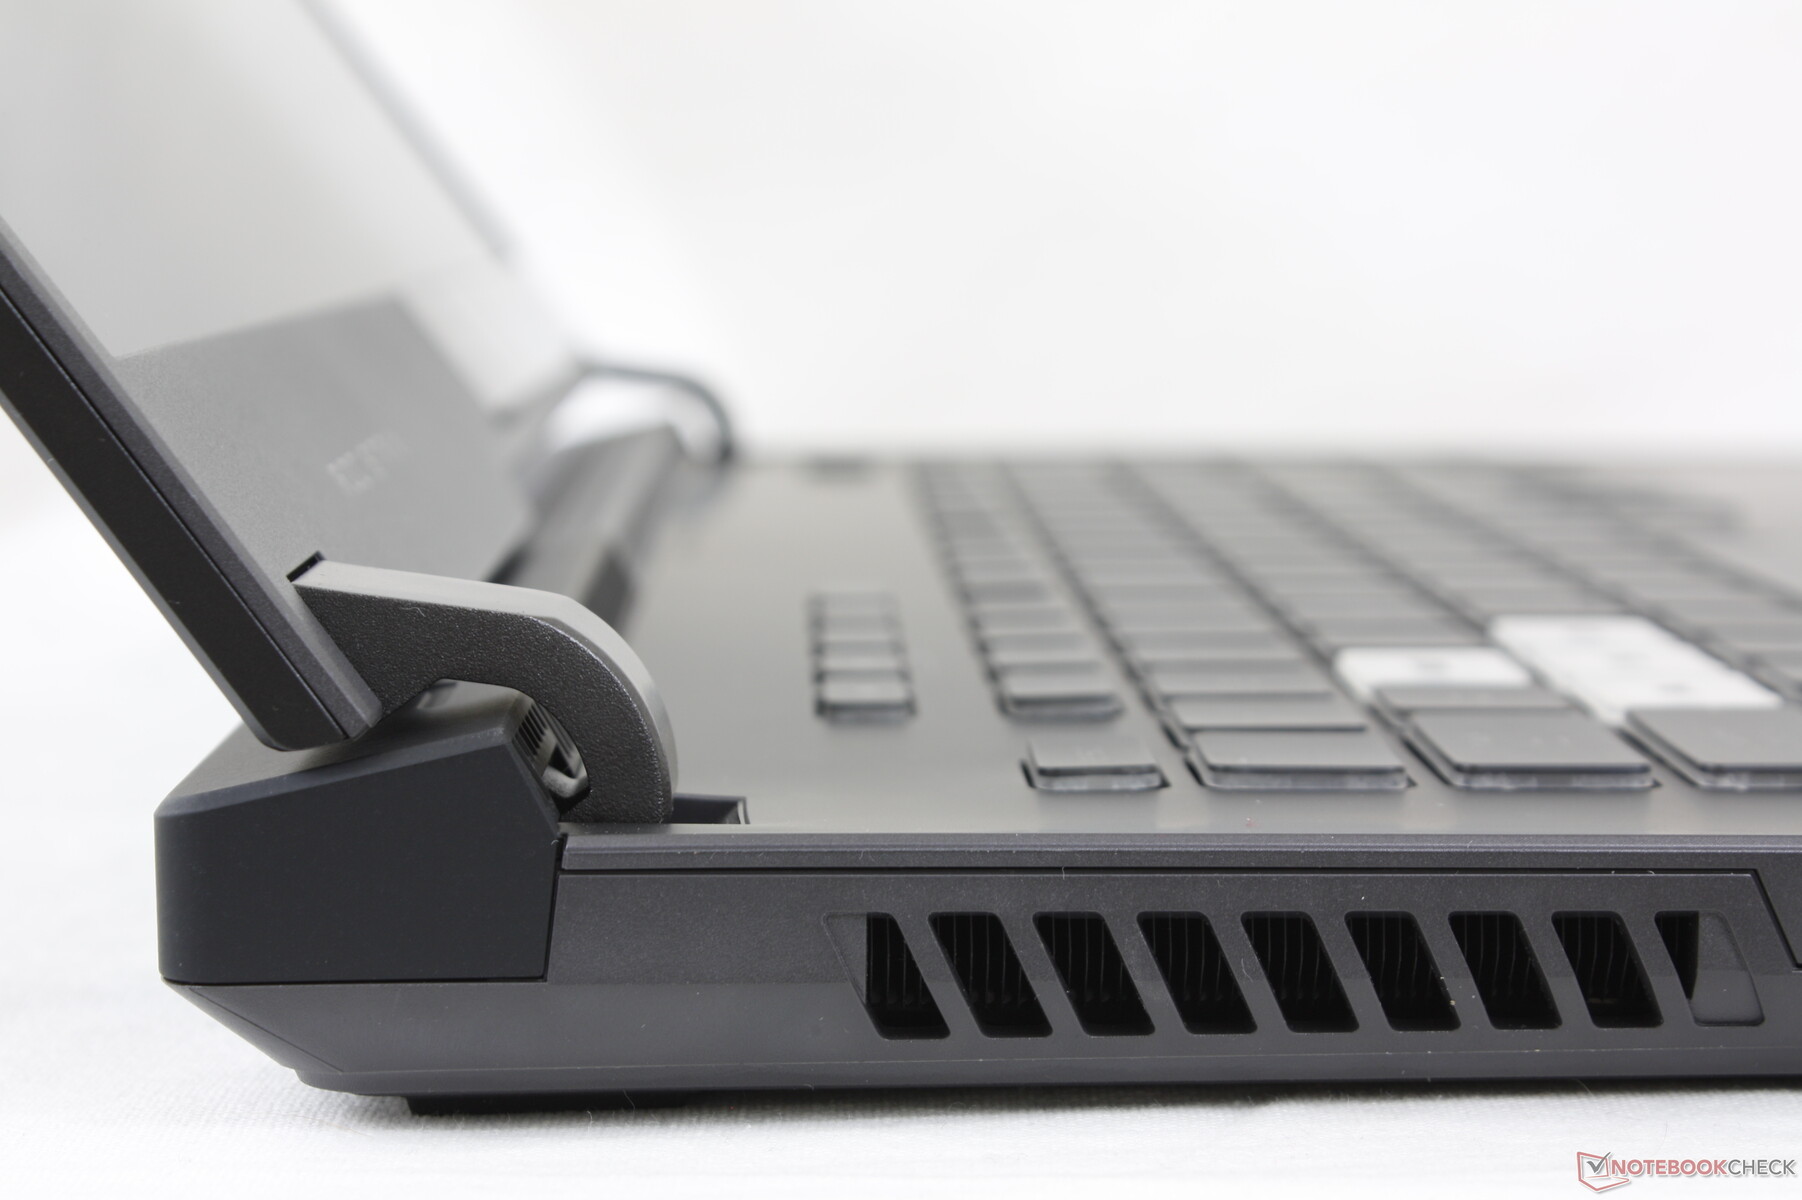
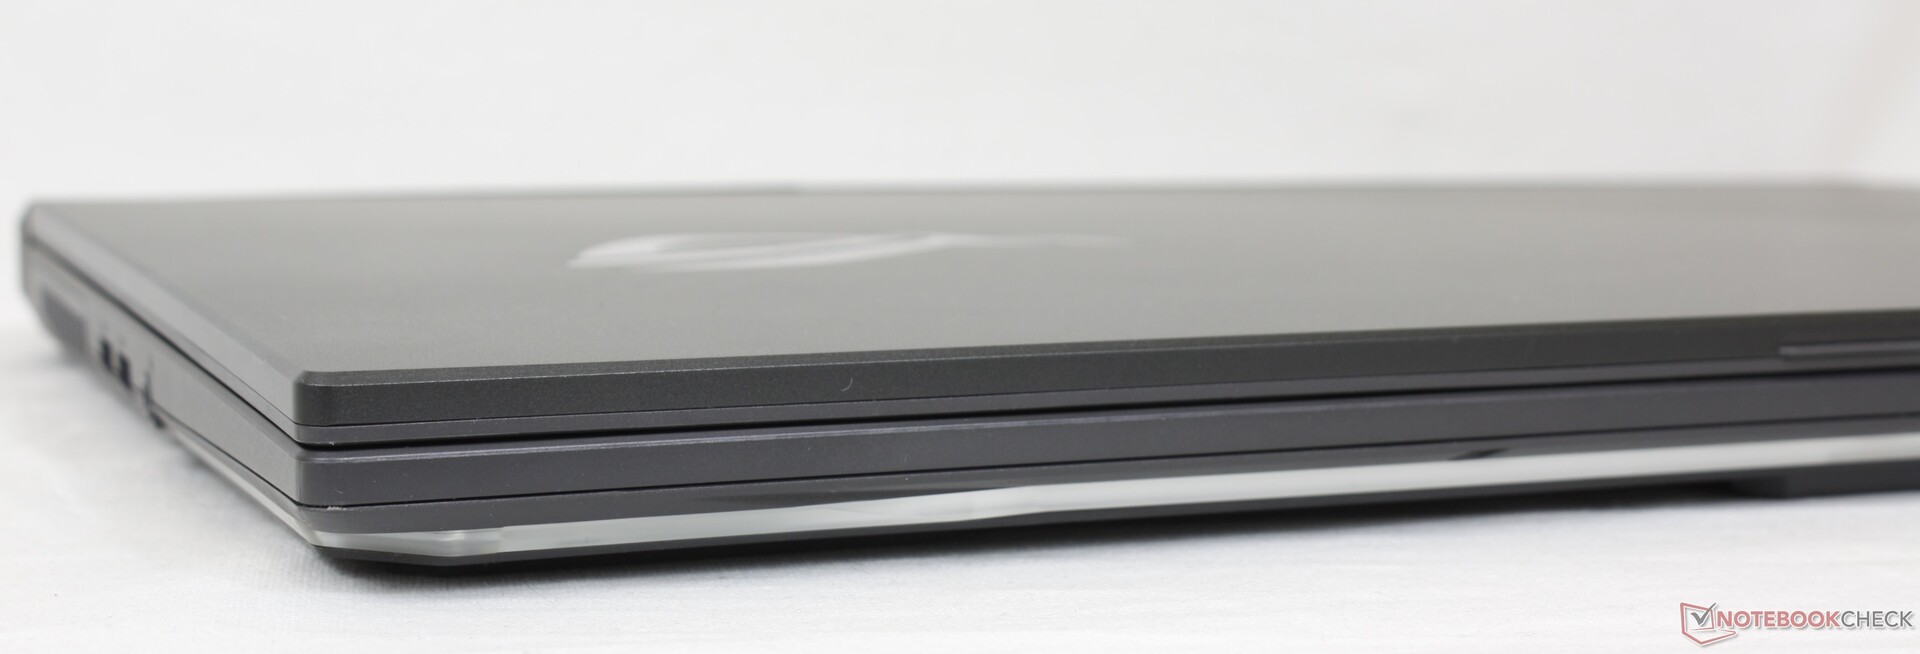
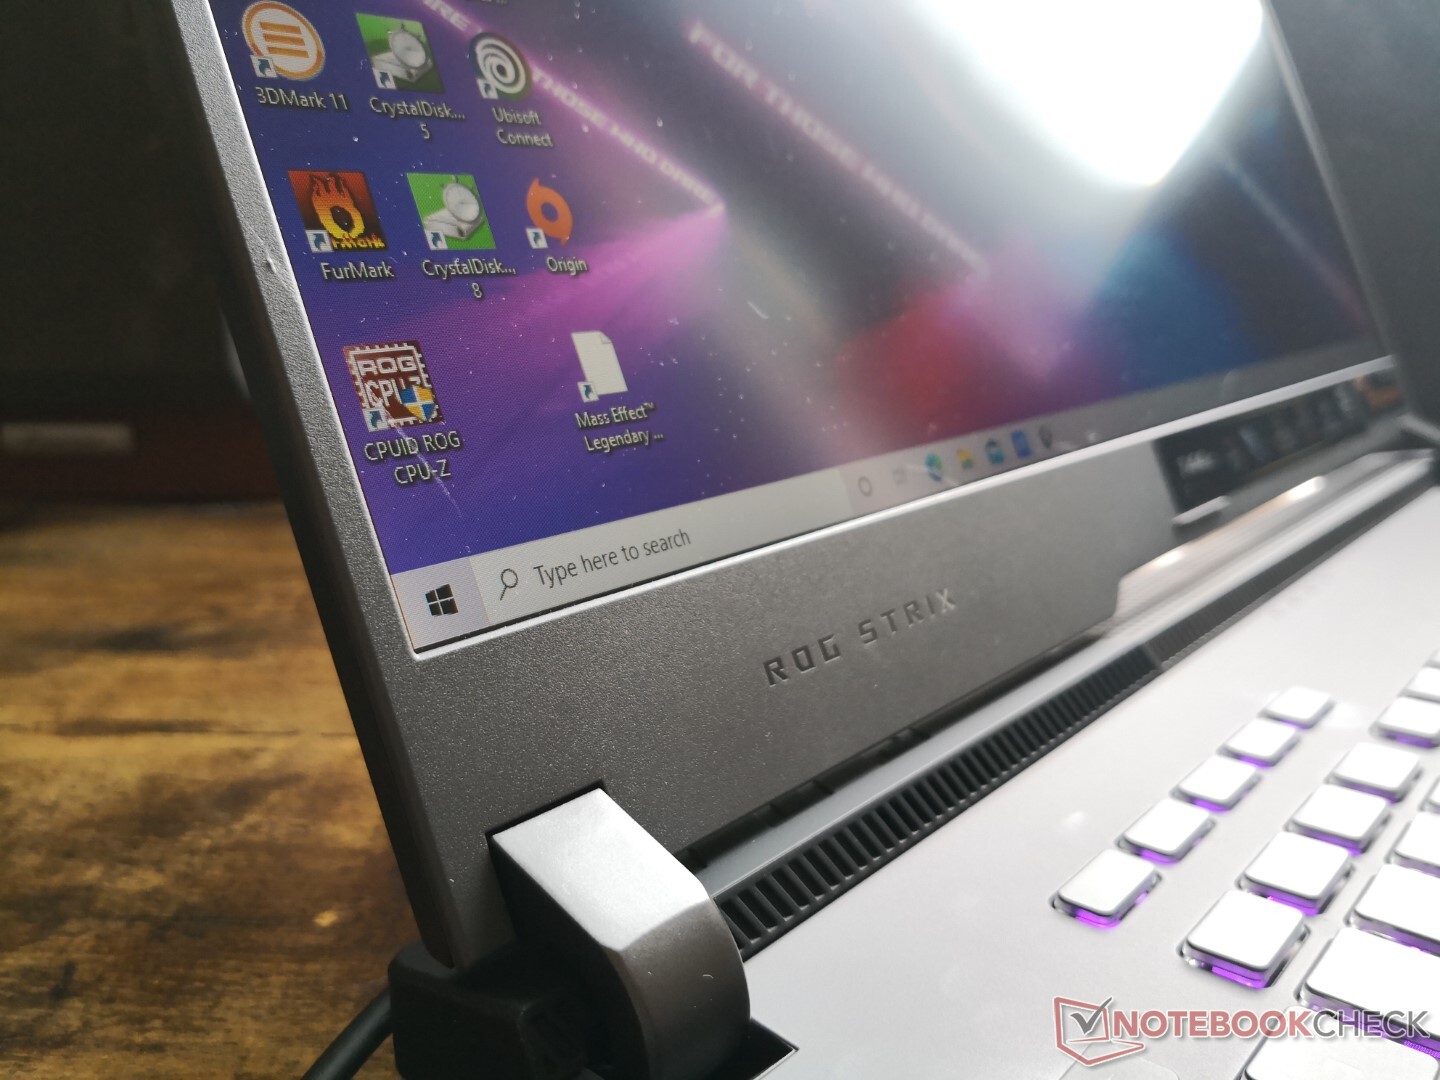
Le cas - familier, mais différent
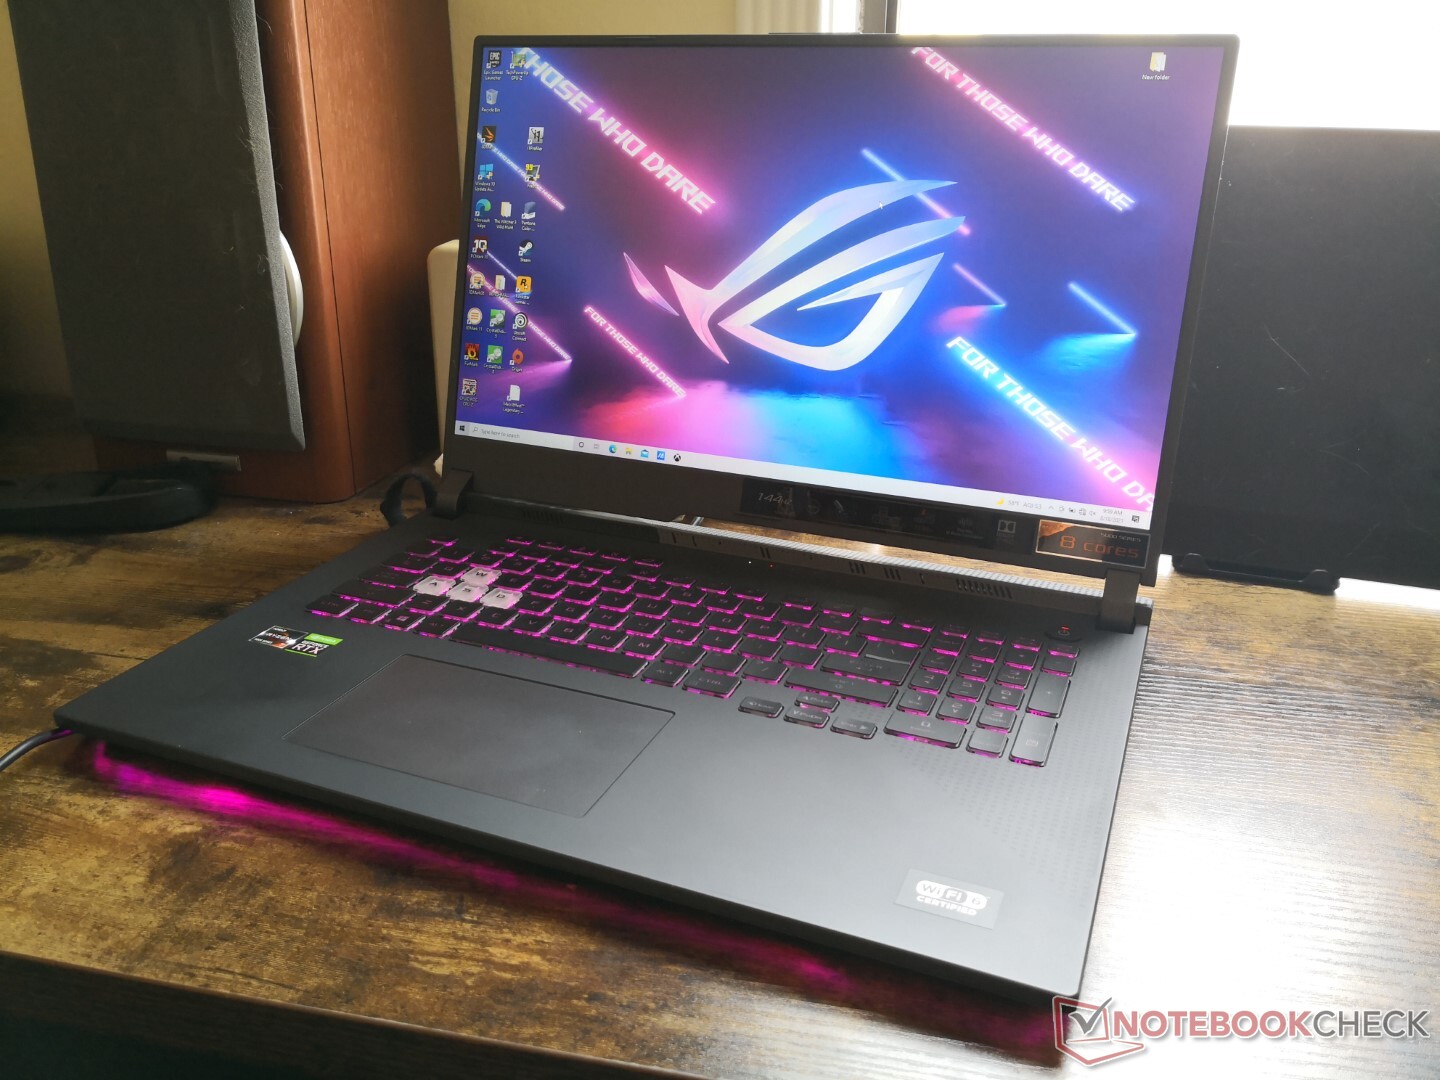
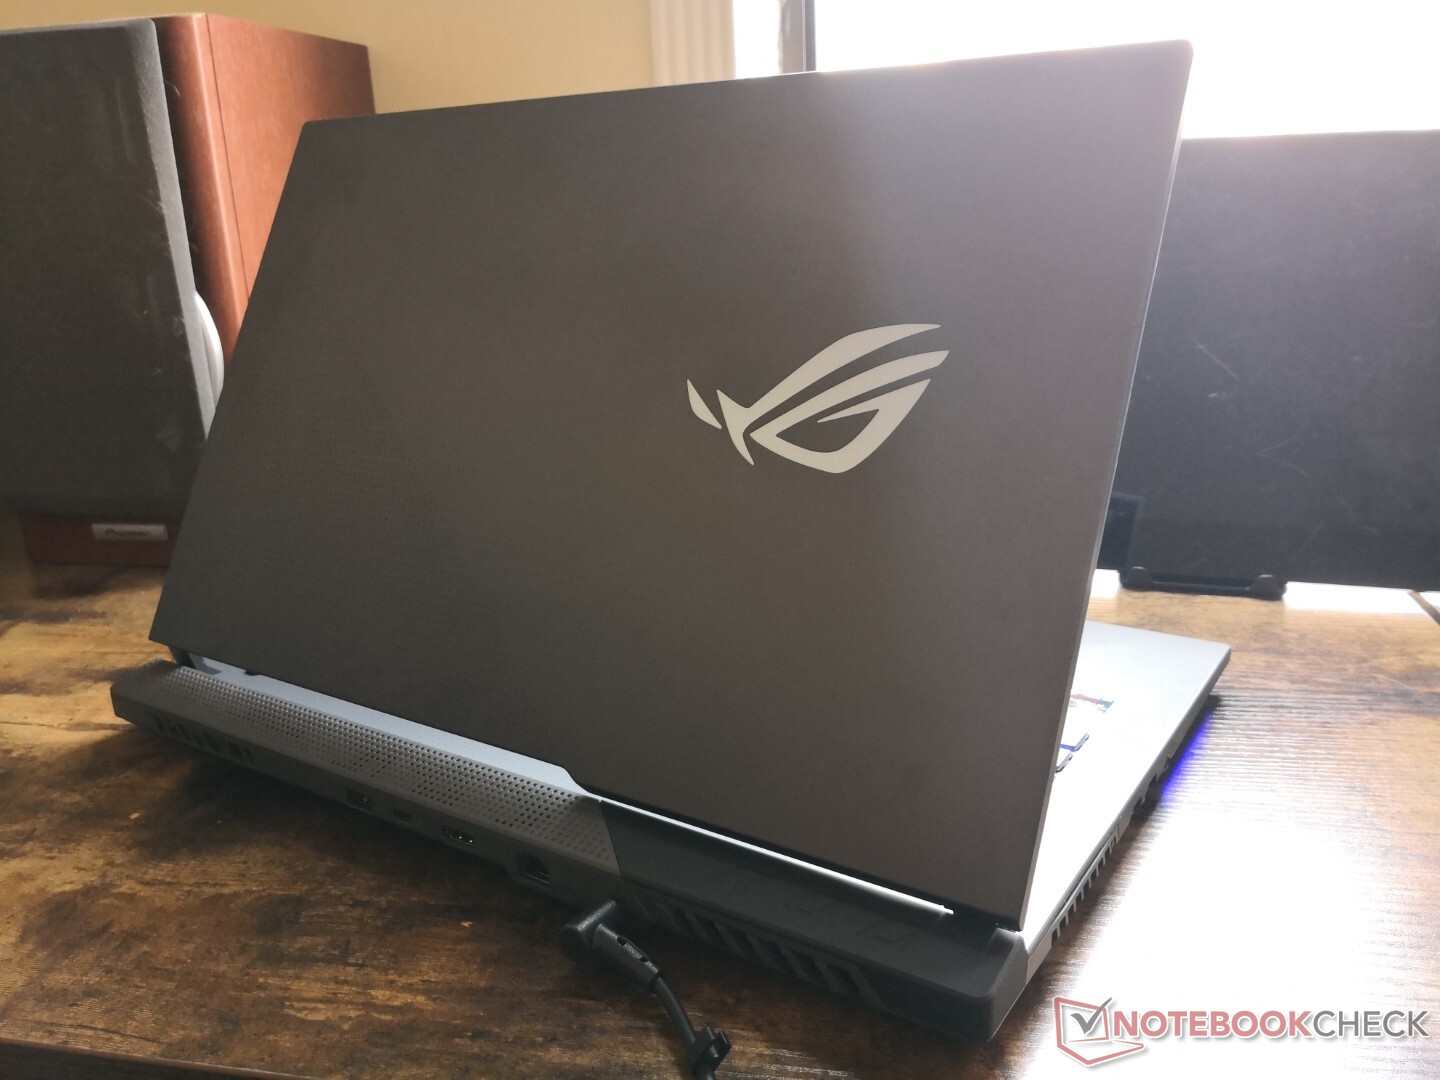
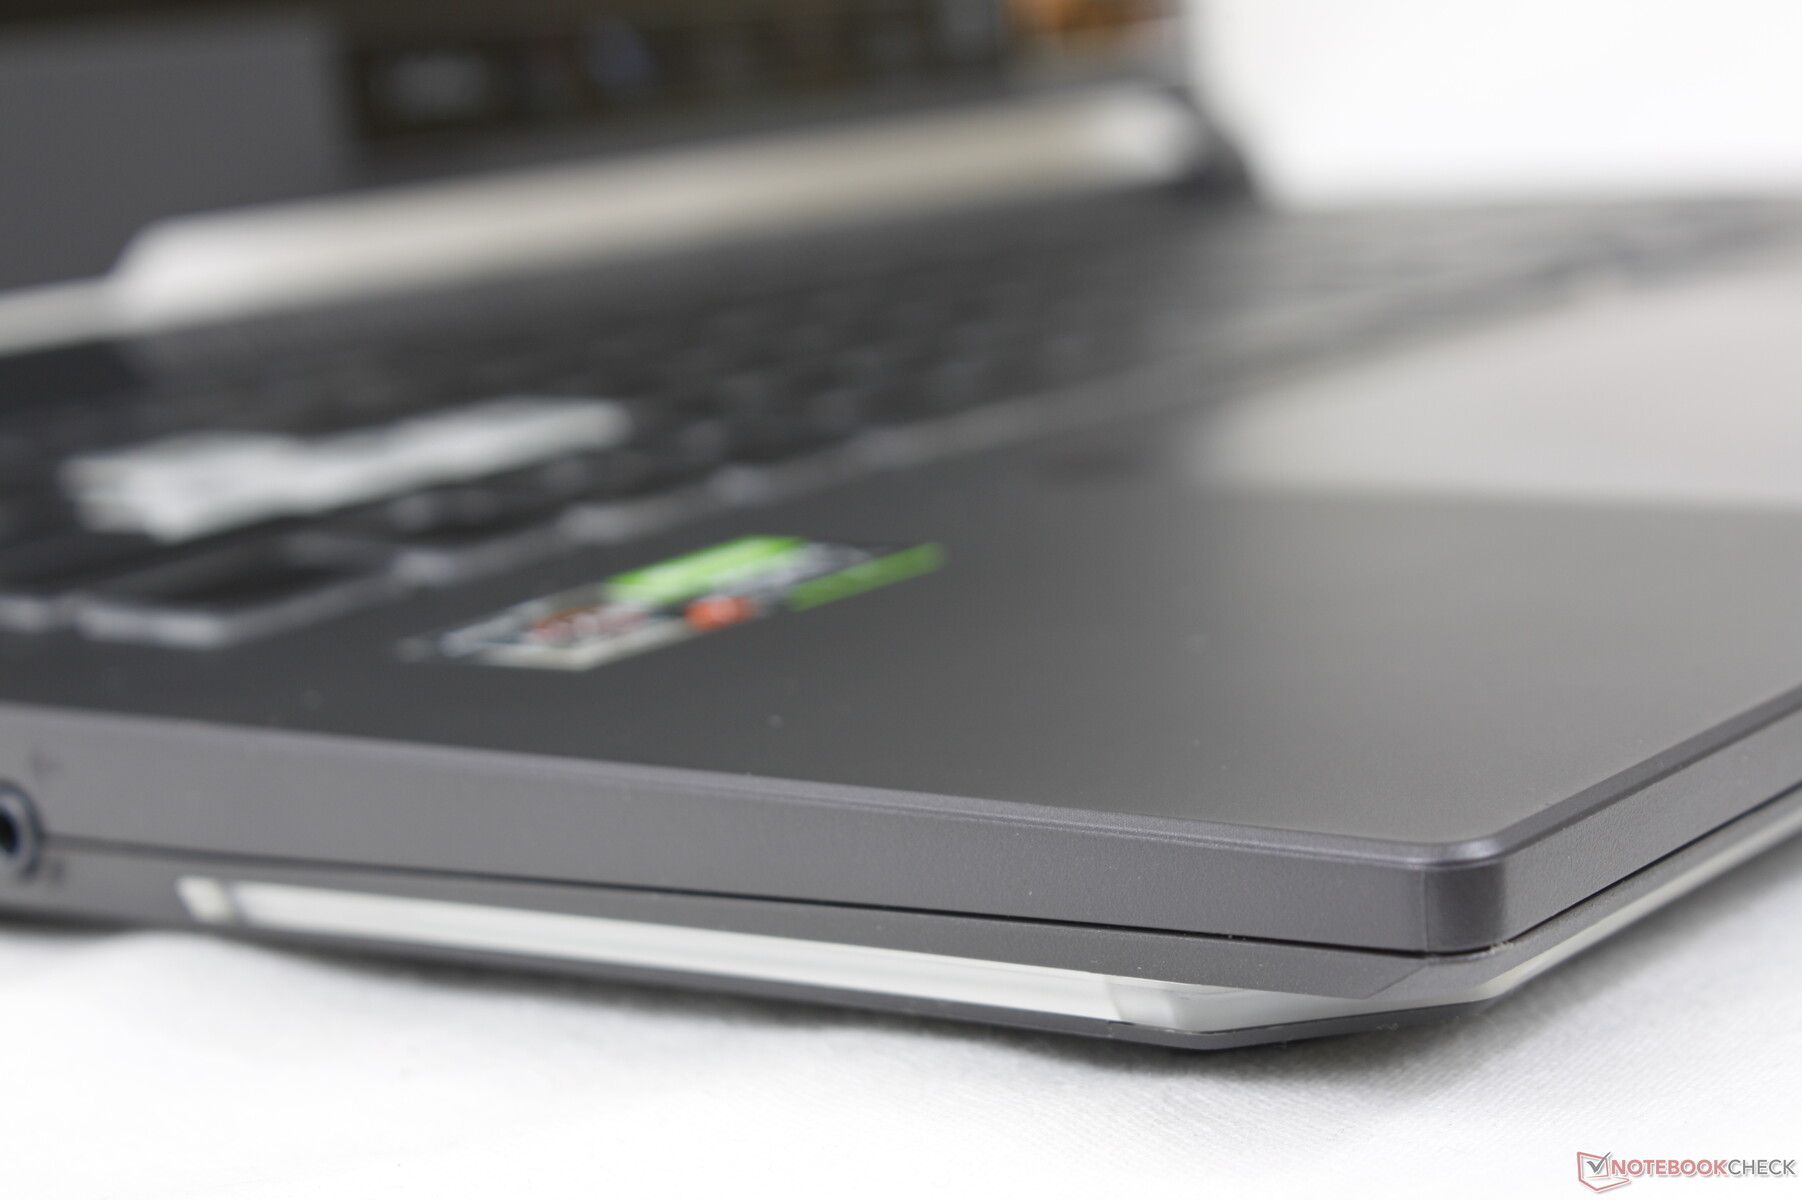
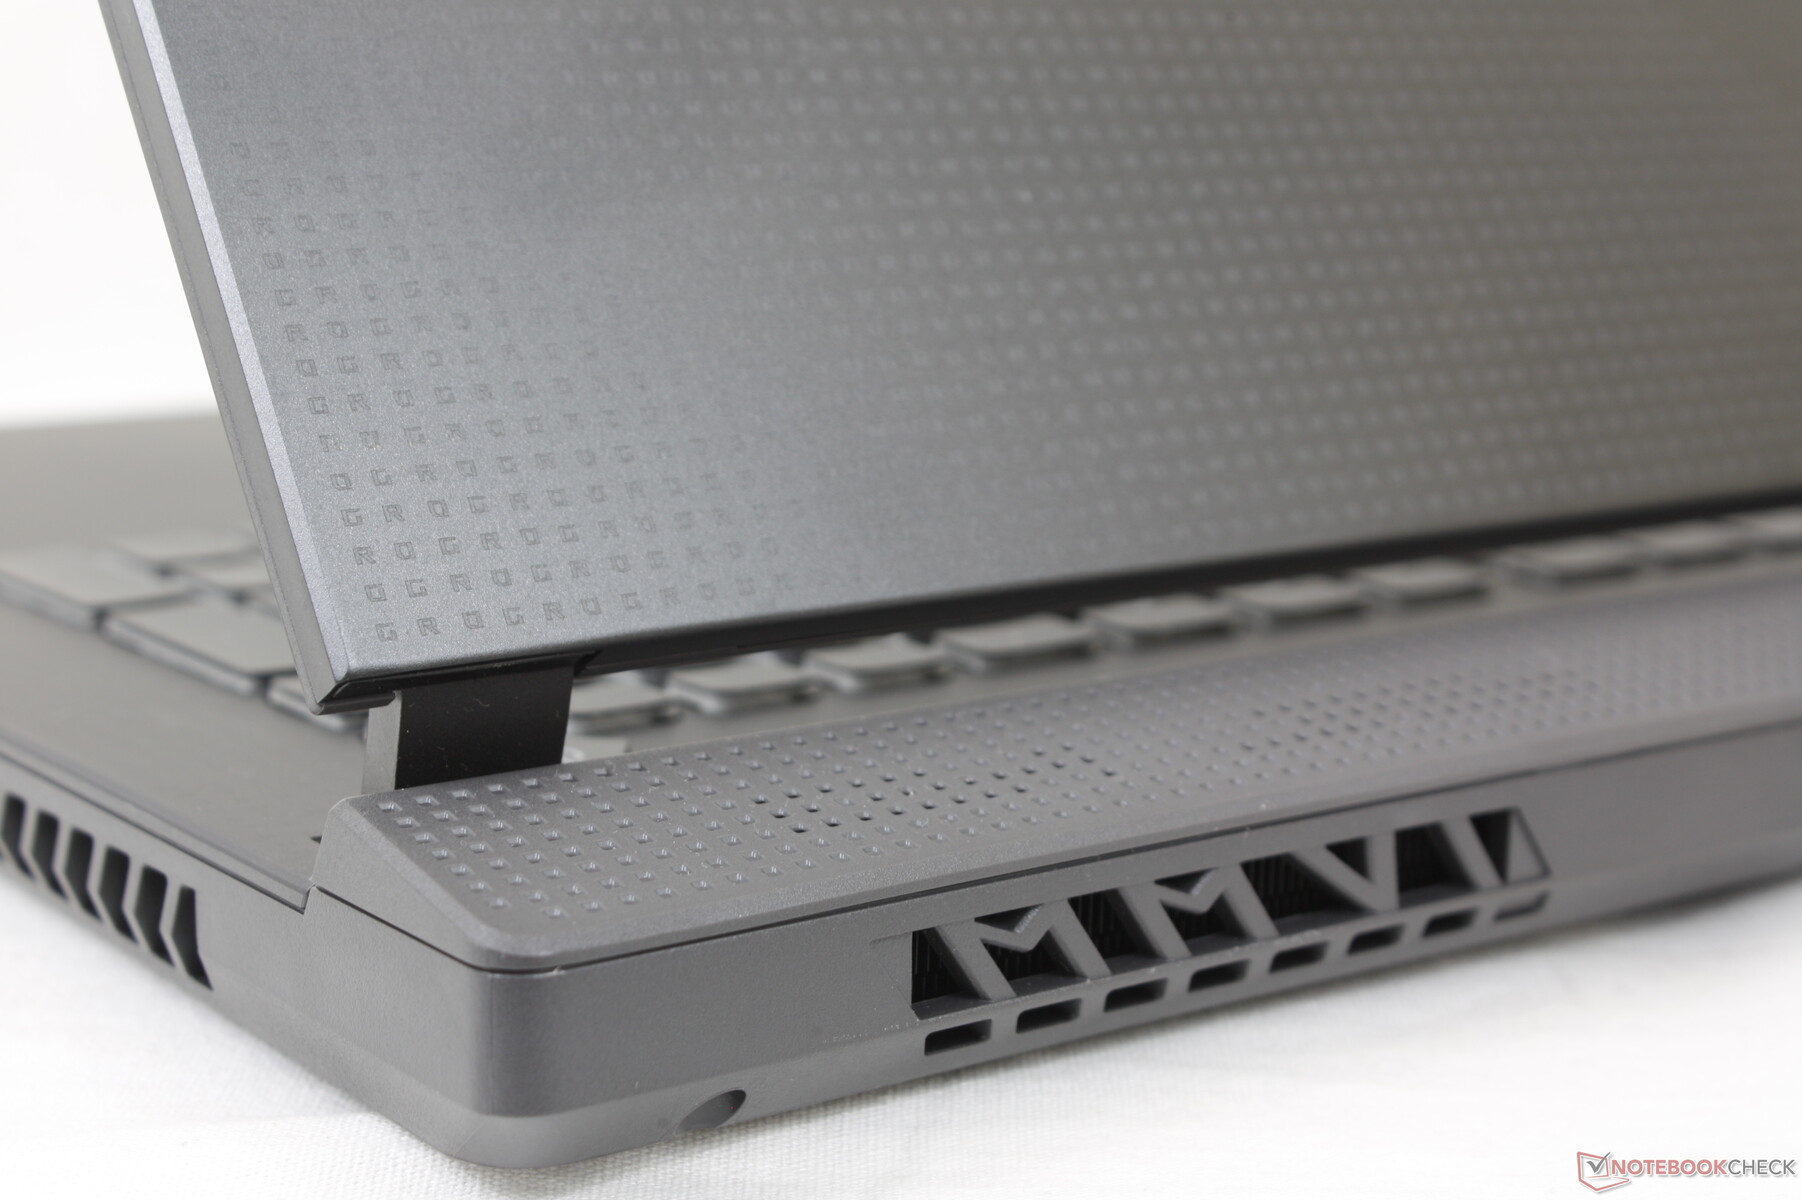
Il peut être difficile de distinguer les différents modèles ROG Strix car ils partagent le même design visuel. L'arrière allongé en forme de réacteur, les grandes charnières visibles, l'épaisse lunette du menton, le clavier légèrement caoutchouté et l'absence de webcam intégrée sont tous des éléments inchangés par rapport aux générations précédentes. Les principales différences se situent au niveau du style, certaines parties du châssis étant désormais plus plates et plus lisses pour un look plus épuré. Le bord droit et le couvercle extérieur, par exemple, sont ornés d'un nouveau motif ROG qui n'est pas présent sur les anciens modèles.
La rigidité du châssis n'a pas été améliorée par rapport au G712 de l'année dernière. Il est cependant toujours plus solide que les séries GF ou GP de MSI, notamment en ce qui concerne les charnières.
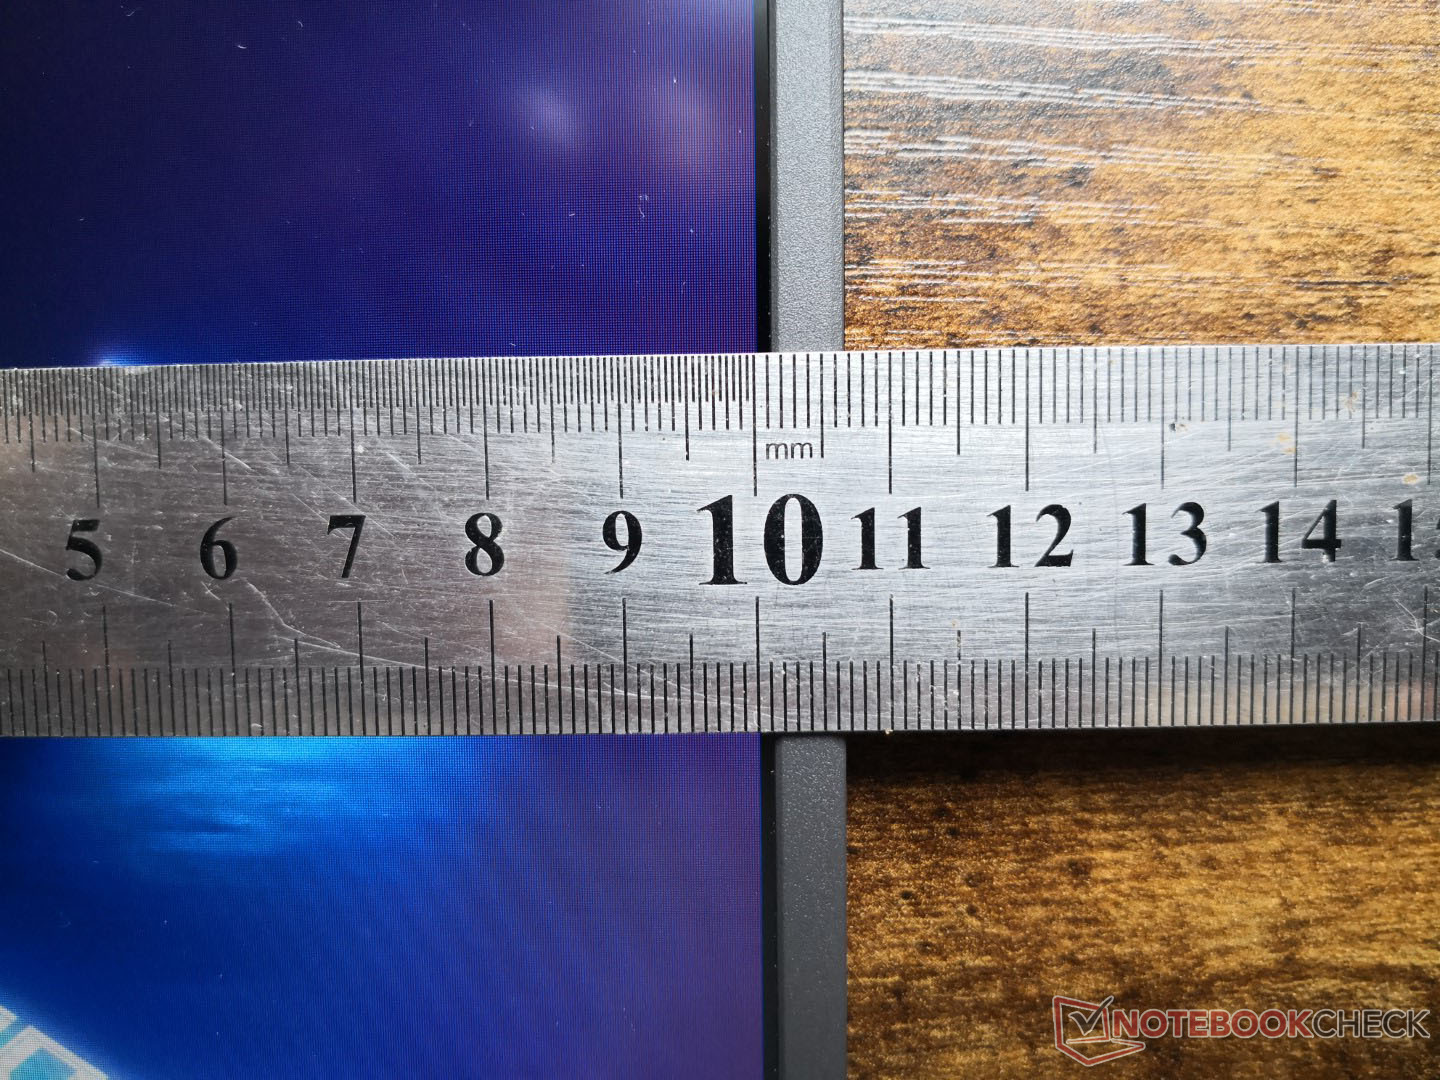
Malheureusement, le G713 est livré en deux versions qui diffèrent à la fois en poids et en dimensions selon la configuration. Notre unité spécifique est la plus petite version avec une épaisseur et un poids de 2,46 cm et 2,5 kg, respectivement, tandis que les configurations avec la RTX 3060 ou plus rapide sont plus épaisses (2,83 cm) et plus lourdes (2,7+ kg). C'est un système lourd qui se situe entre le Zephyrus S17, plus fin, et le Zephyrus S17, plus épais Lenovo Legion 5.
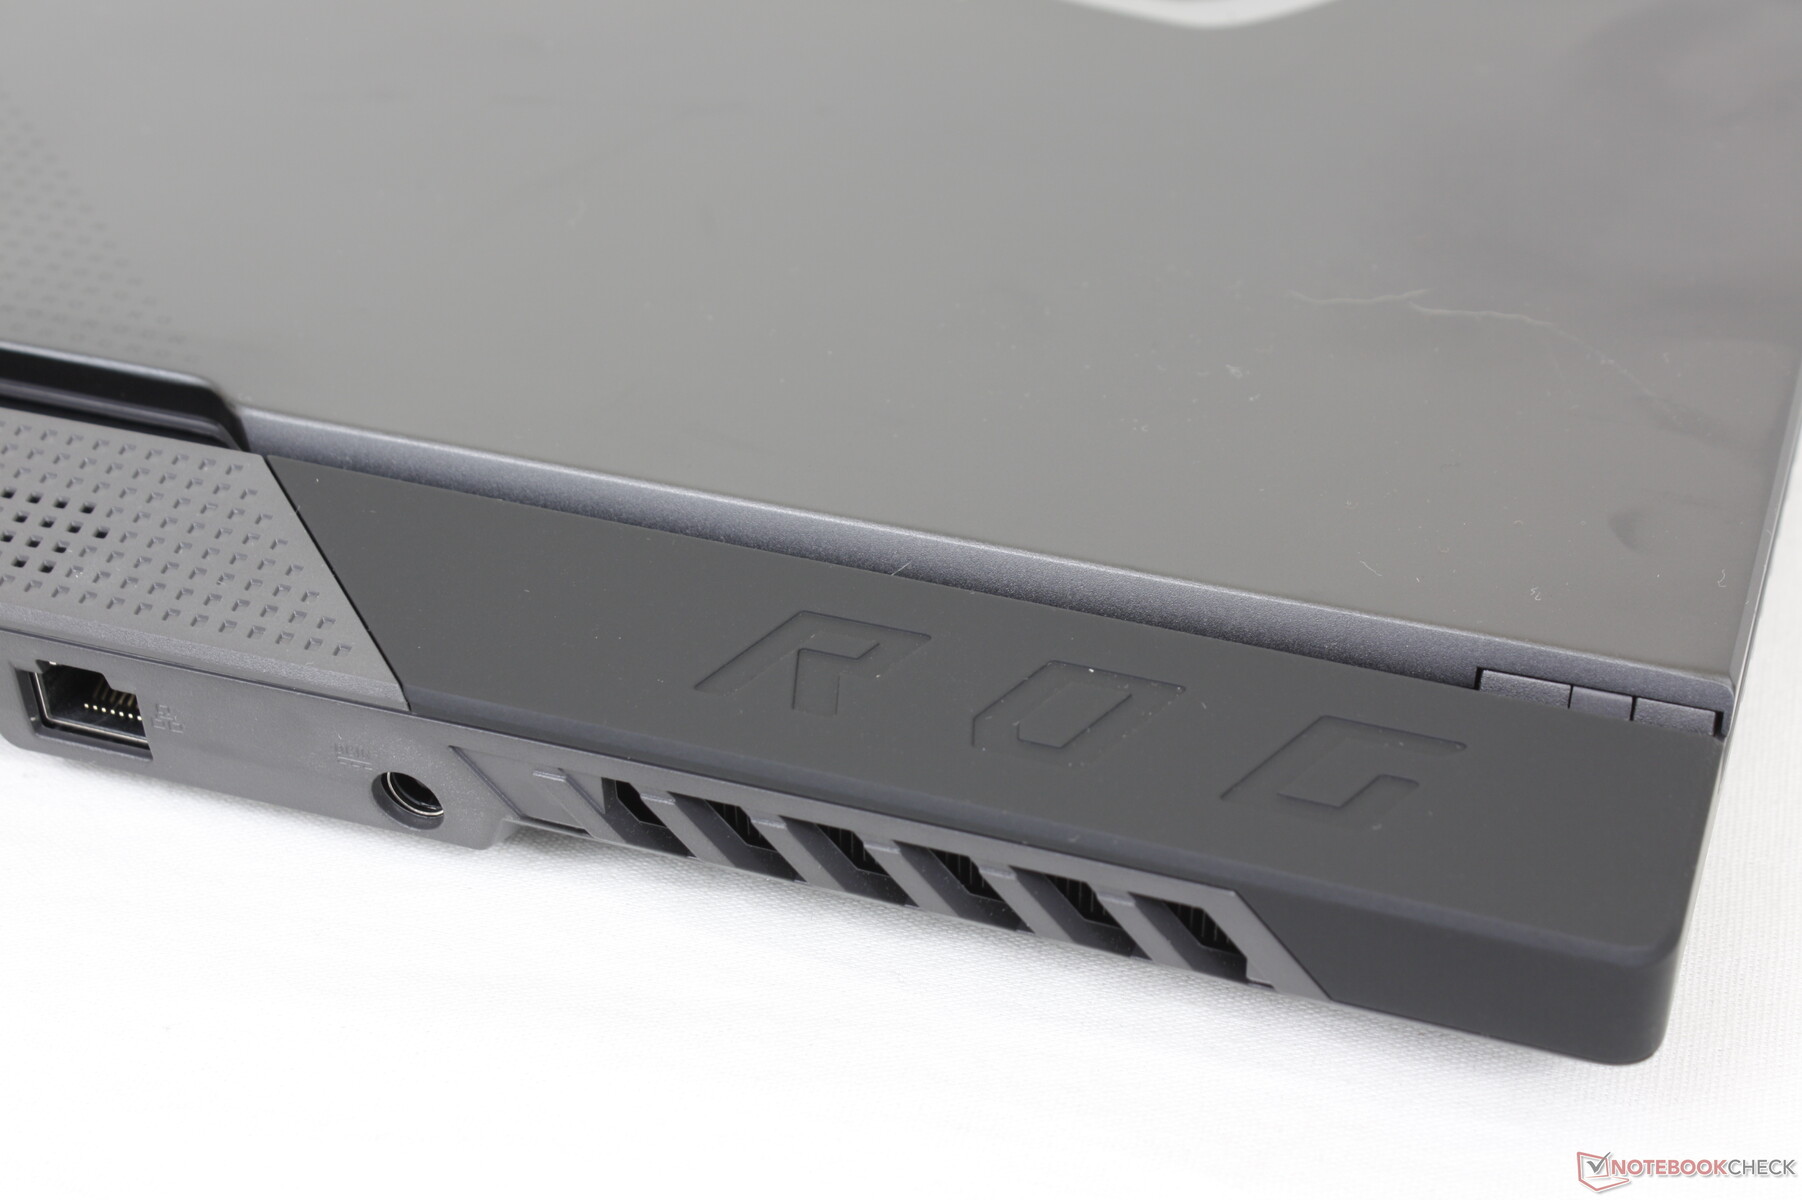
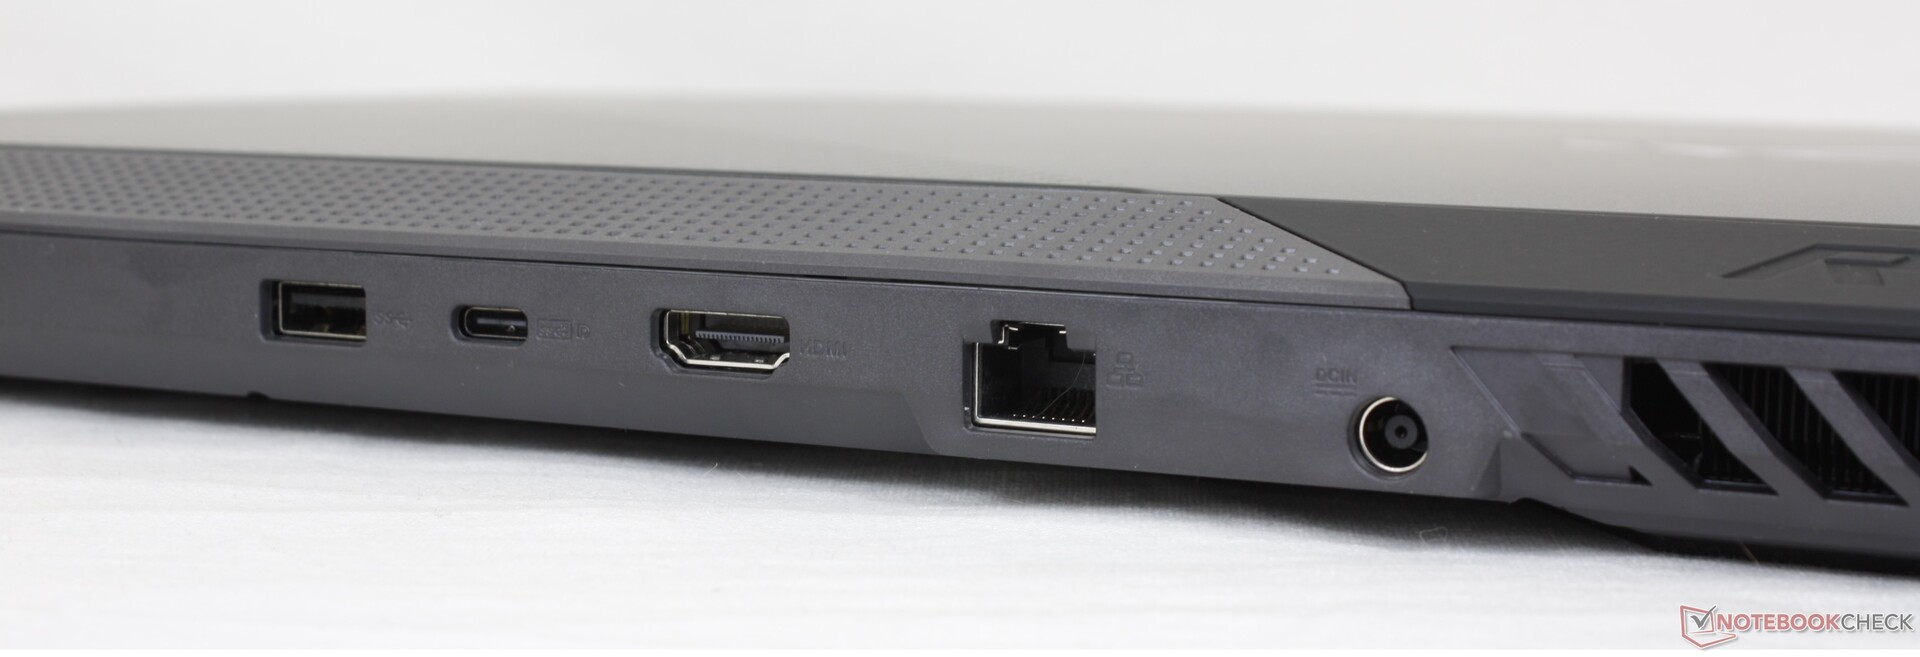
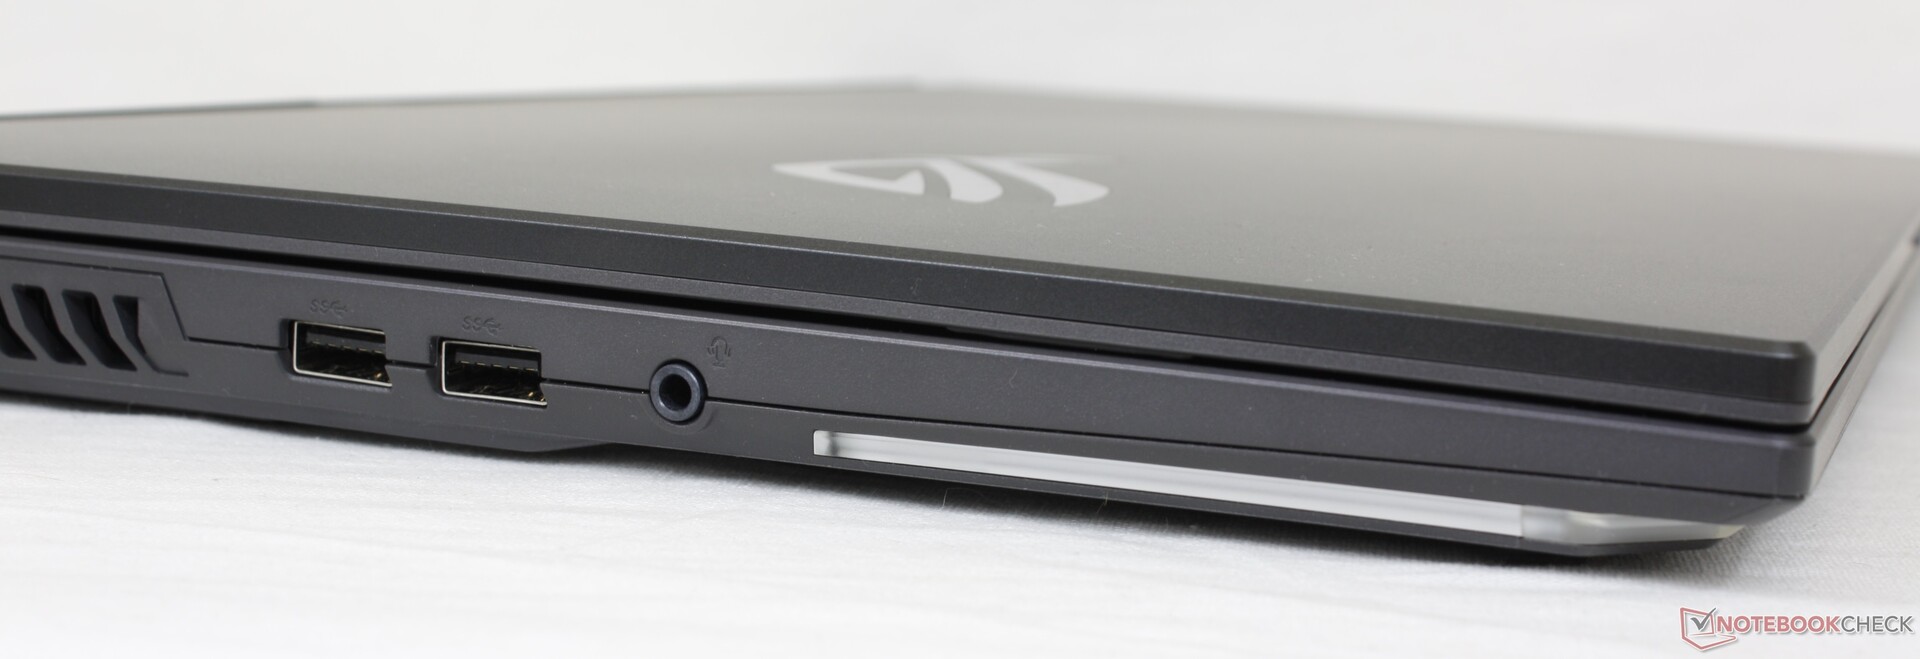
Connectivité - Pas de Thunderbolt
Les ports sont identiques à ceux du modèle plus onéreux G733QS mais sans la clé de voûte Asus, car le fabricant aime réserver cette fonctionnalité à ses modèles phares. Le positionnement des ports peut être défavorable pour certains utilisateurs car il n'y a aucun port le long du bord droit tandis que les ports le long de l'arrière peuvent être difficiles à atteindre.
Communication
Le MediaTek MT7921, doté du Wi-Fi 6, est en concurrence avec la série Intel AX200/201, plus courante. Bien que fiables en termes de navigation et de streaming vidéo, ses performances ne sont pas aussi rapides que celles de la solution Intel qui dépasse régulièrement les 1 Gbps.
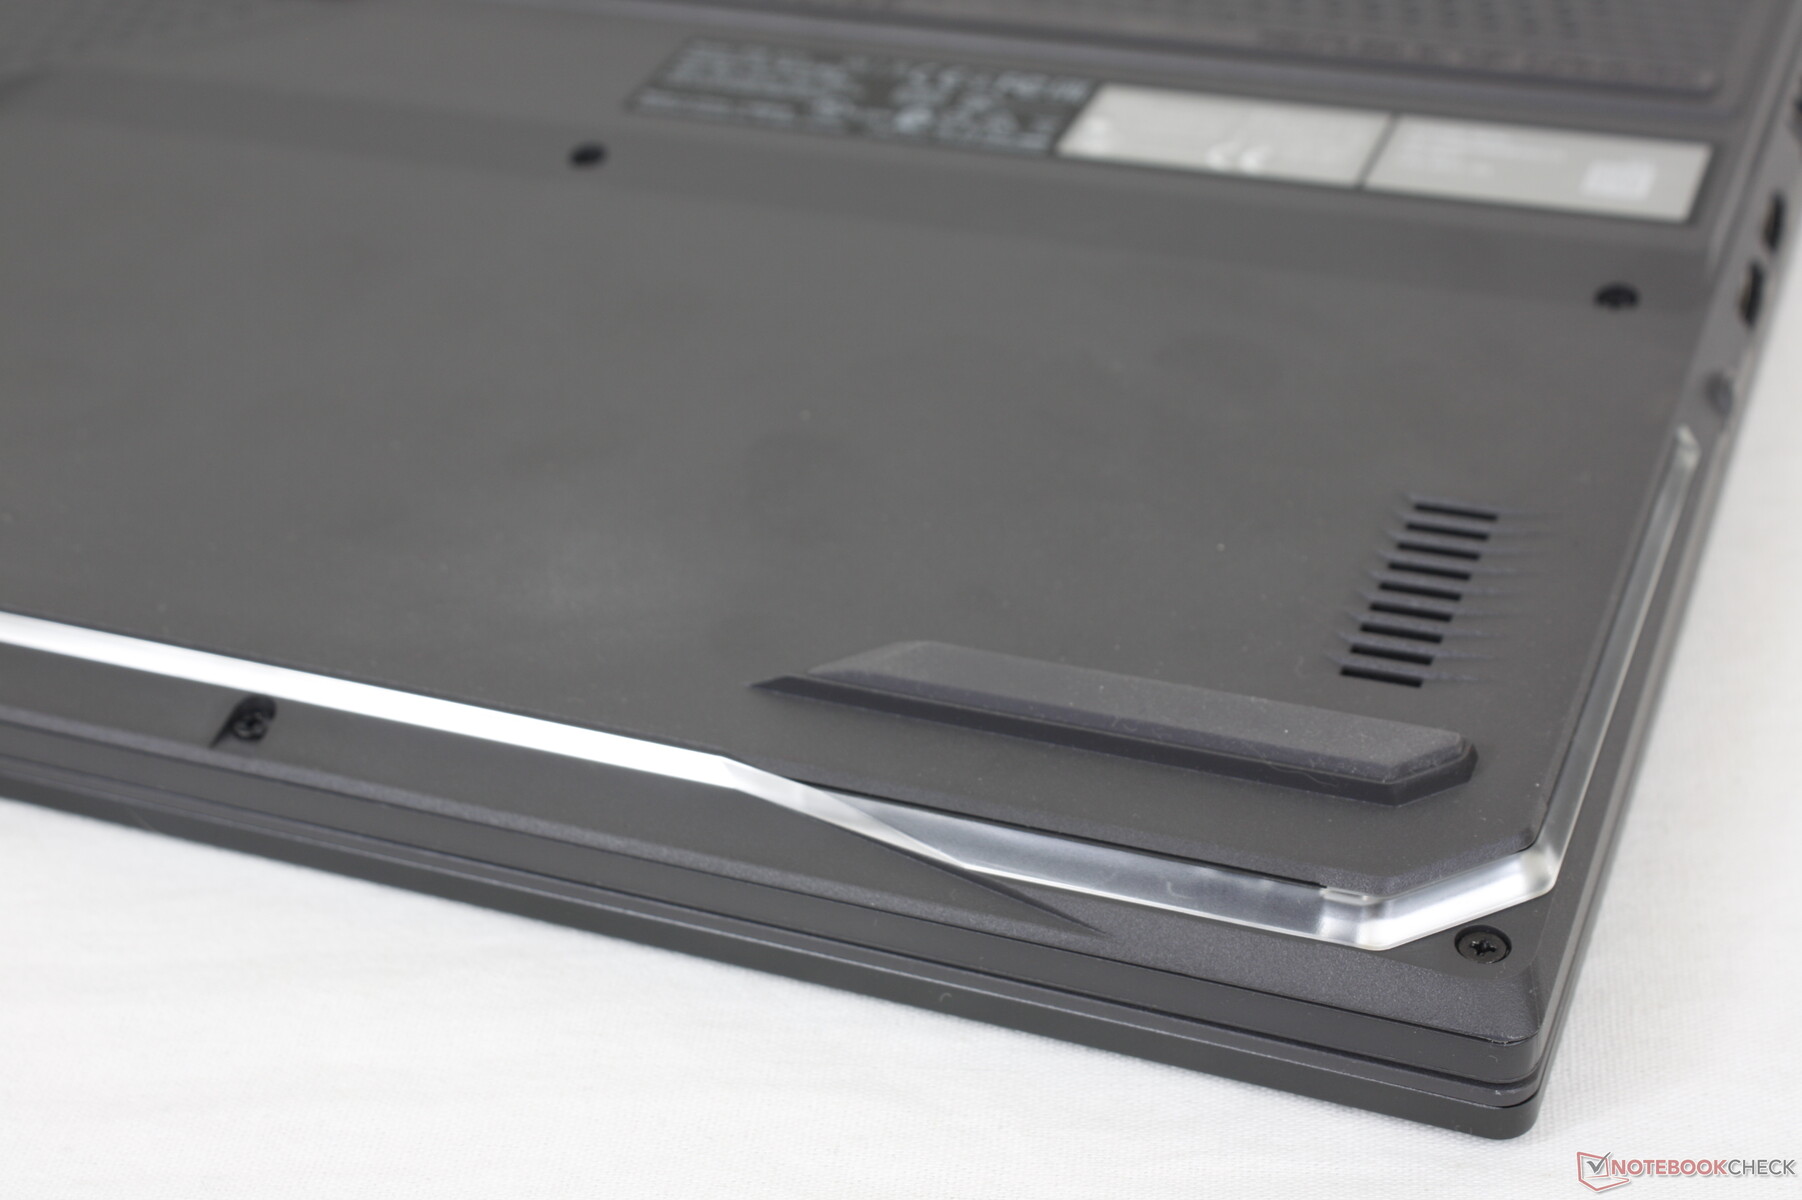
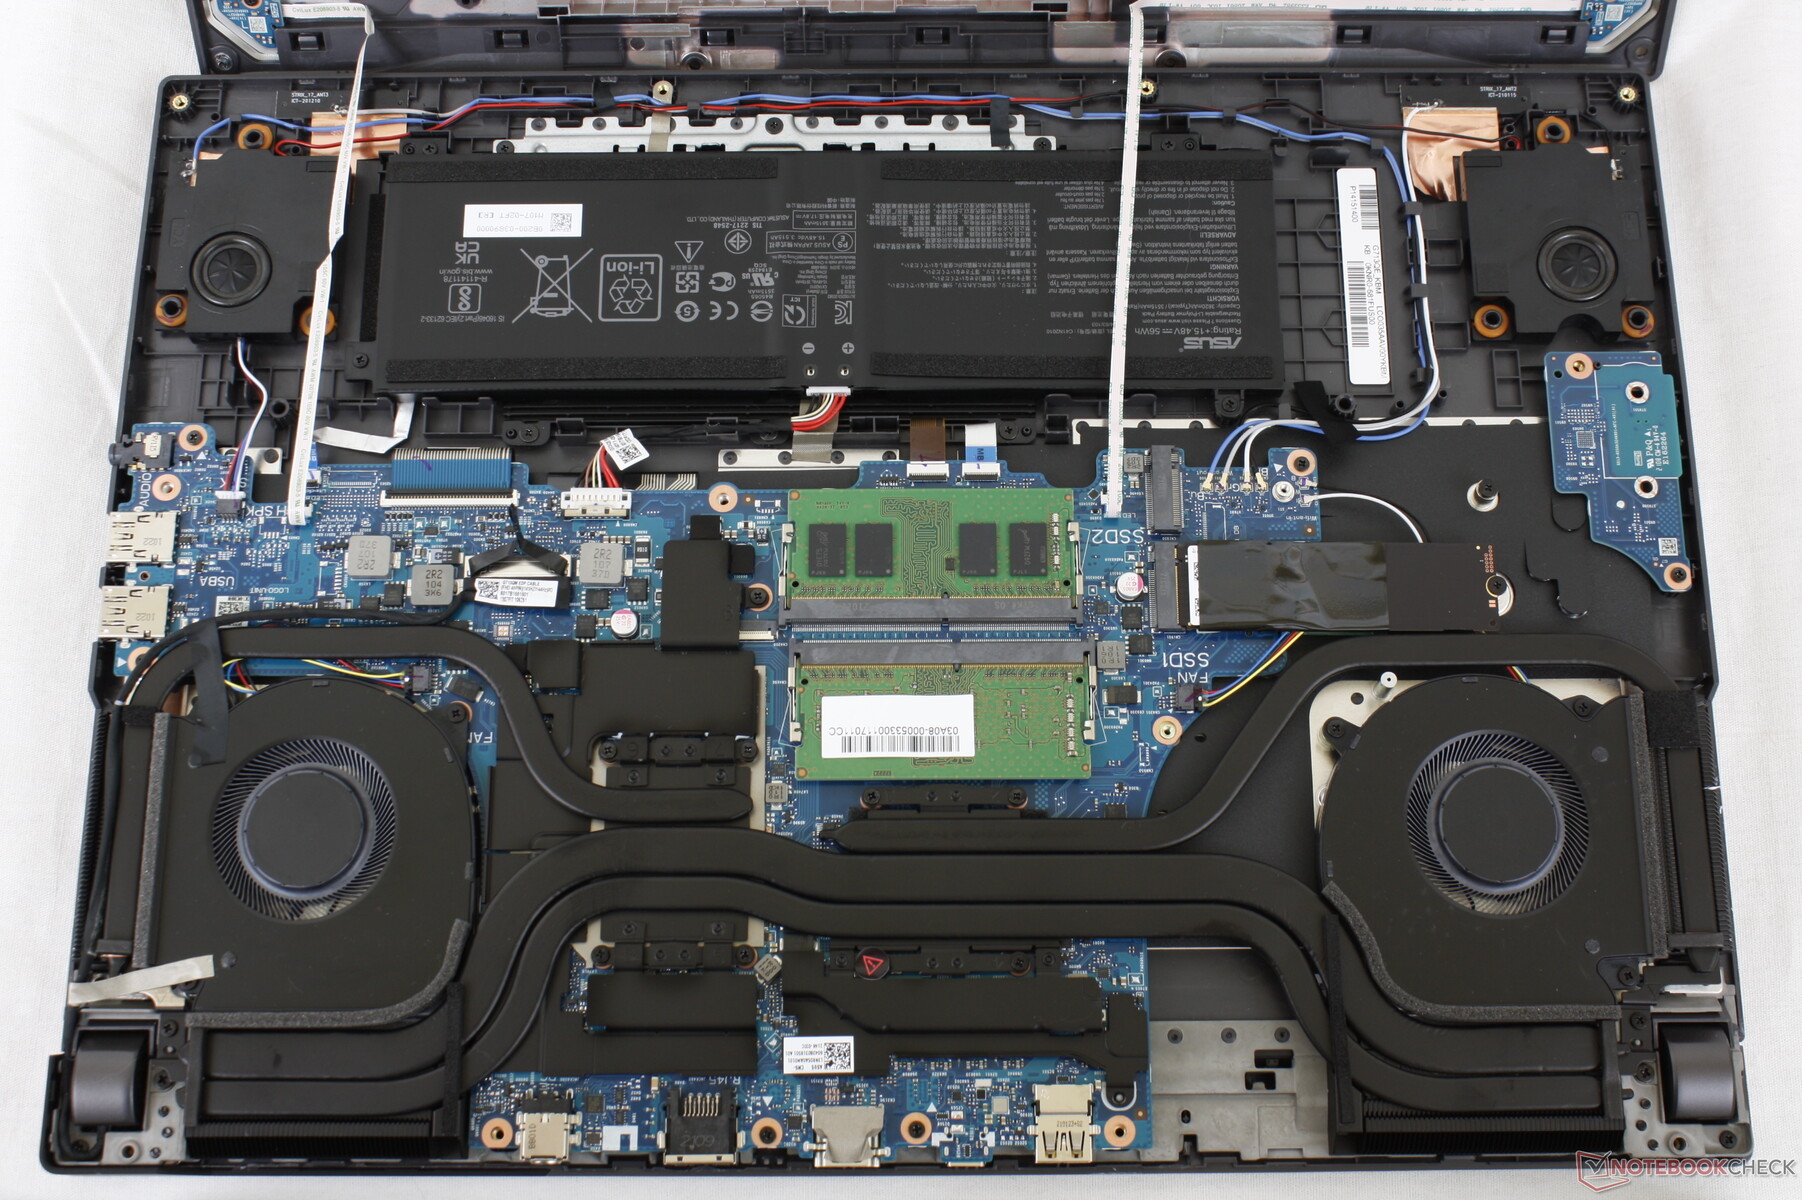
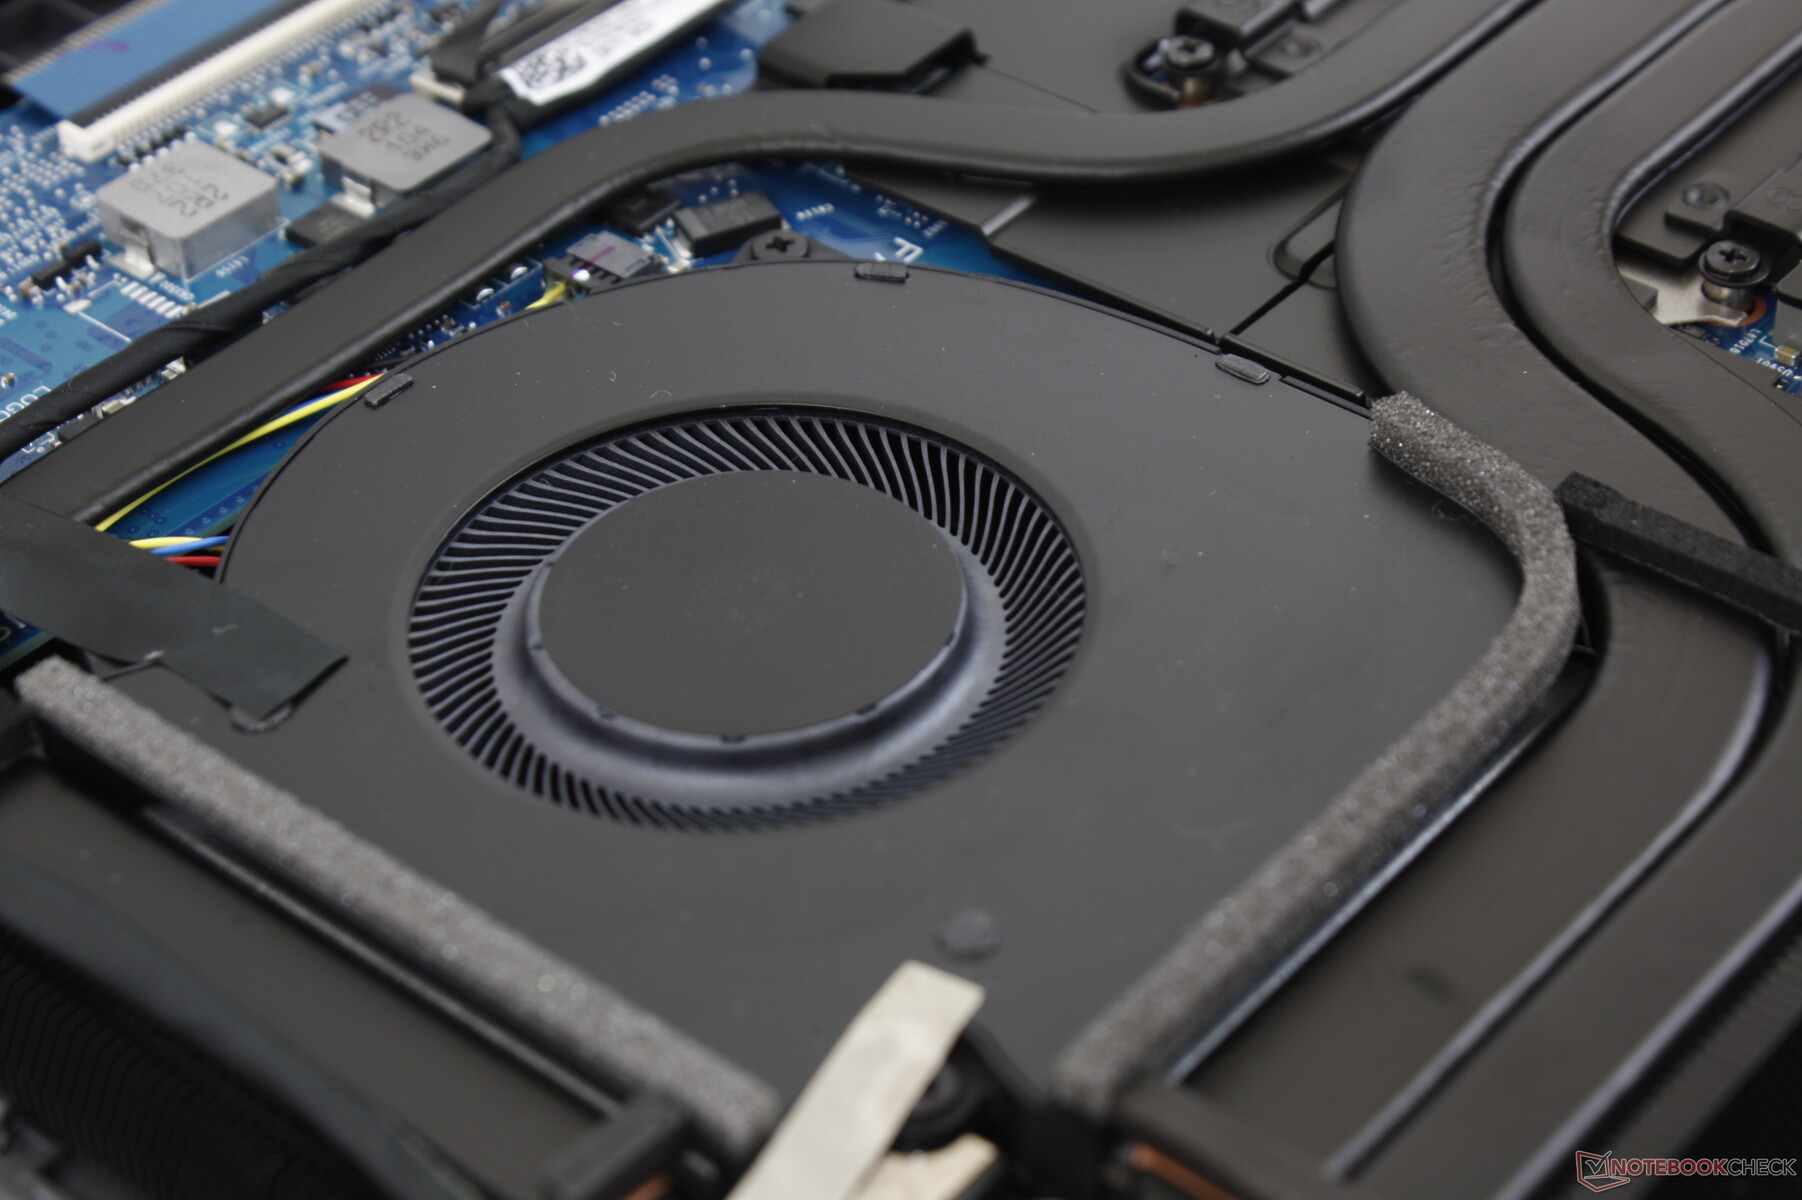
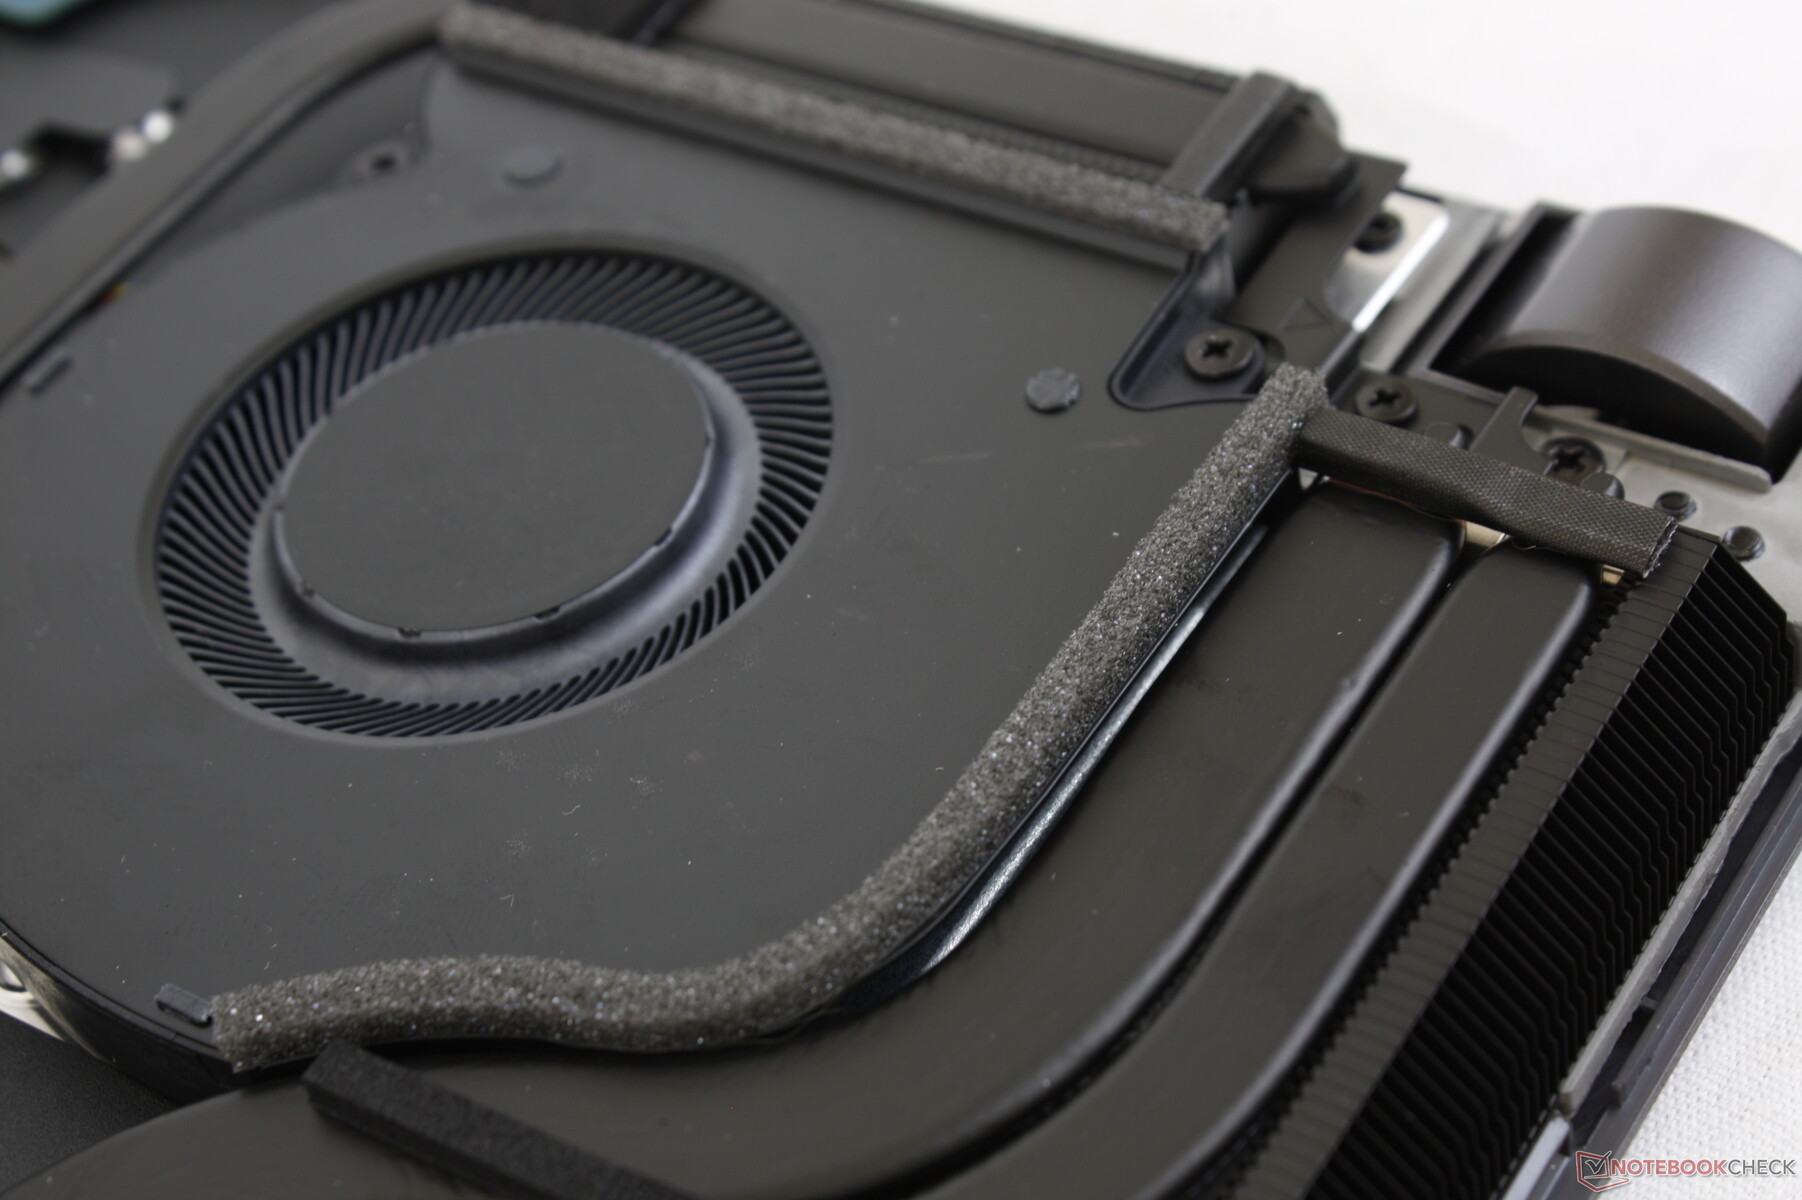
Maintenance - Mises à jour faciles
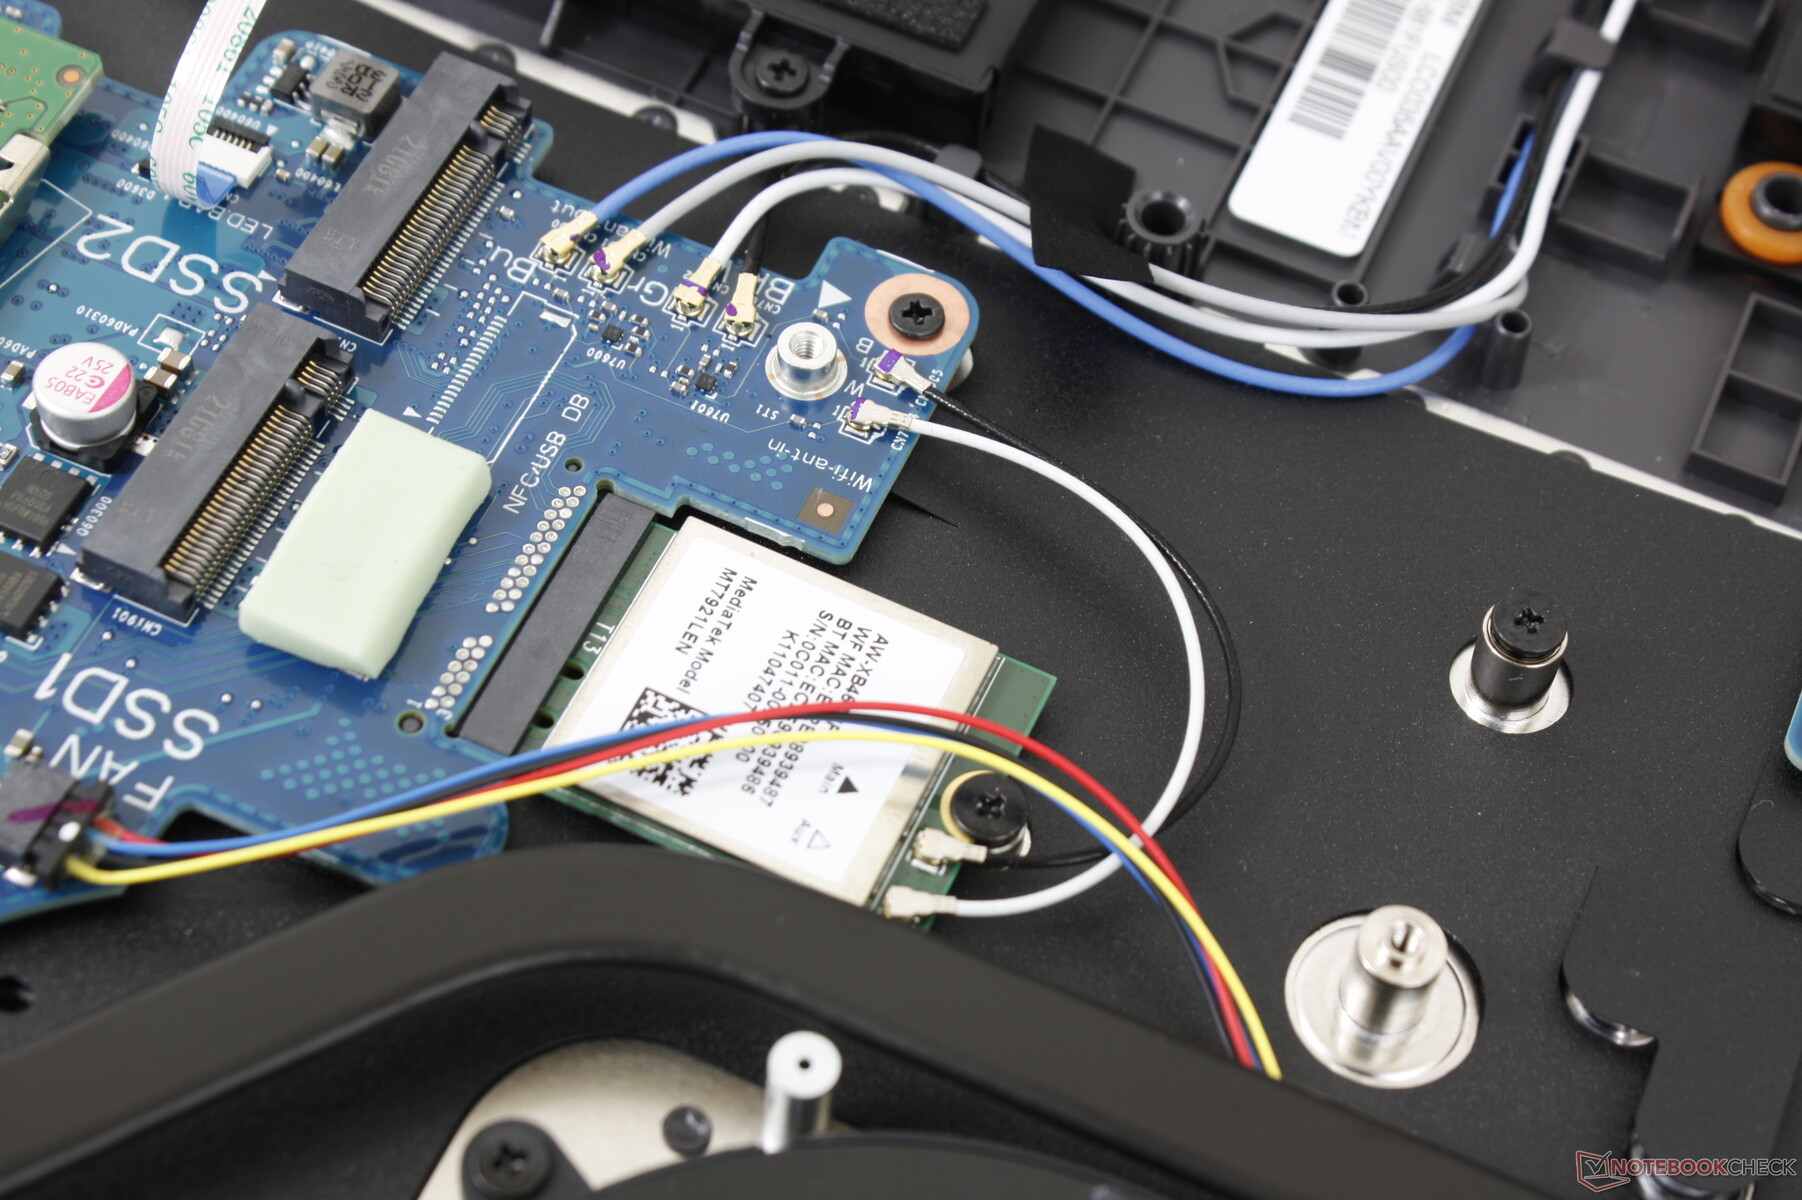
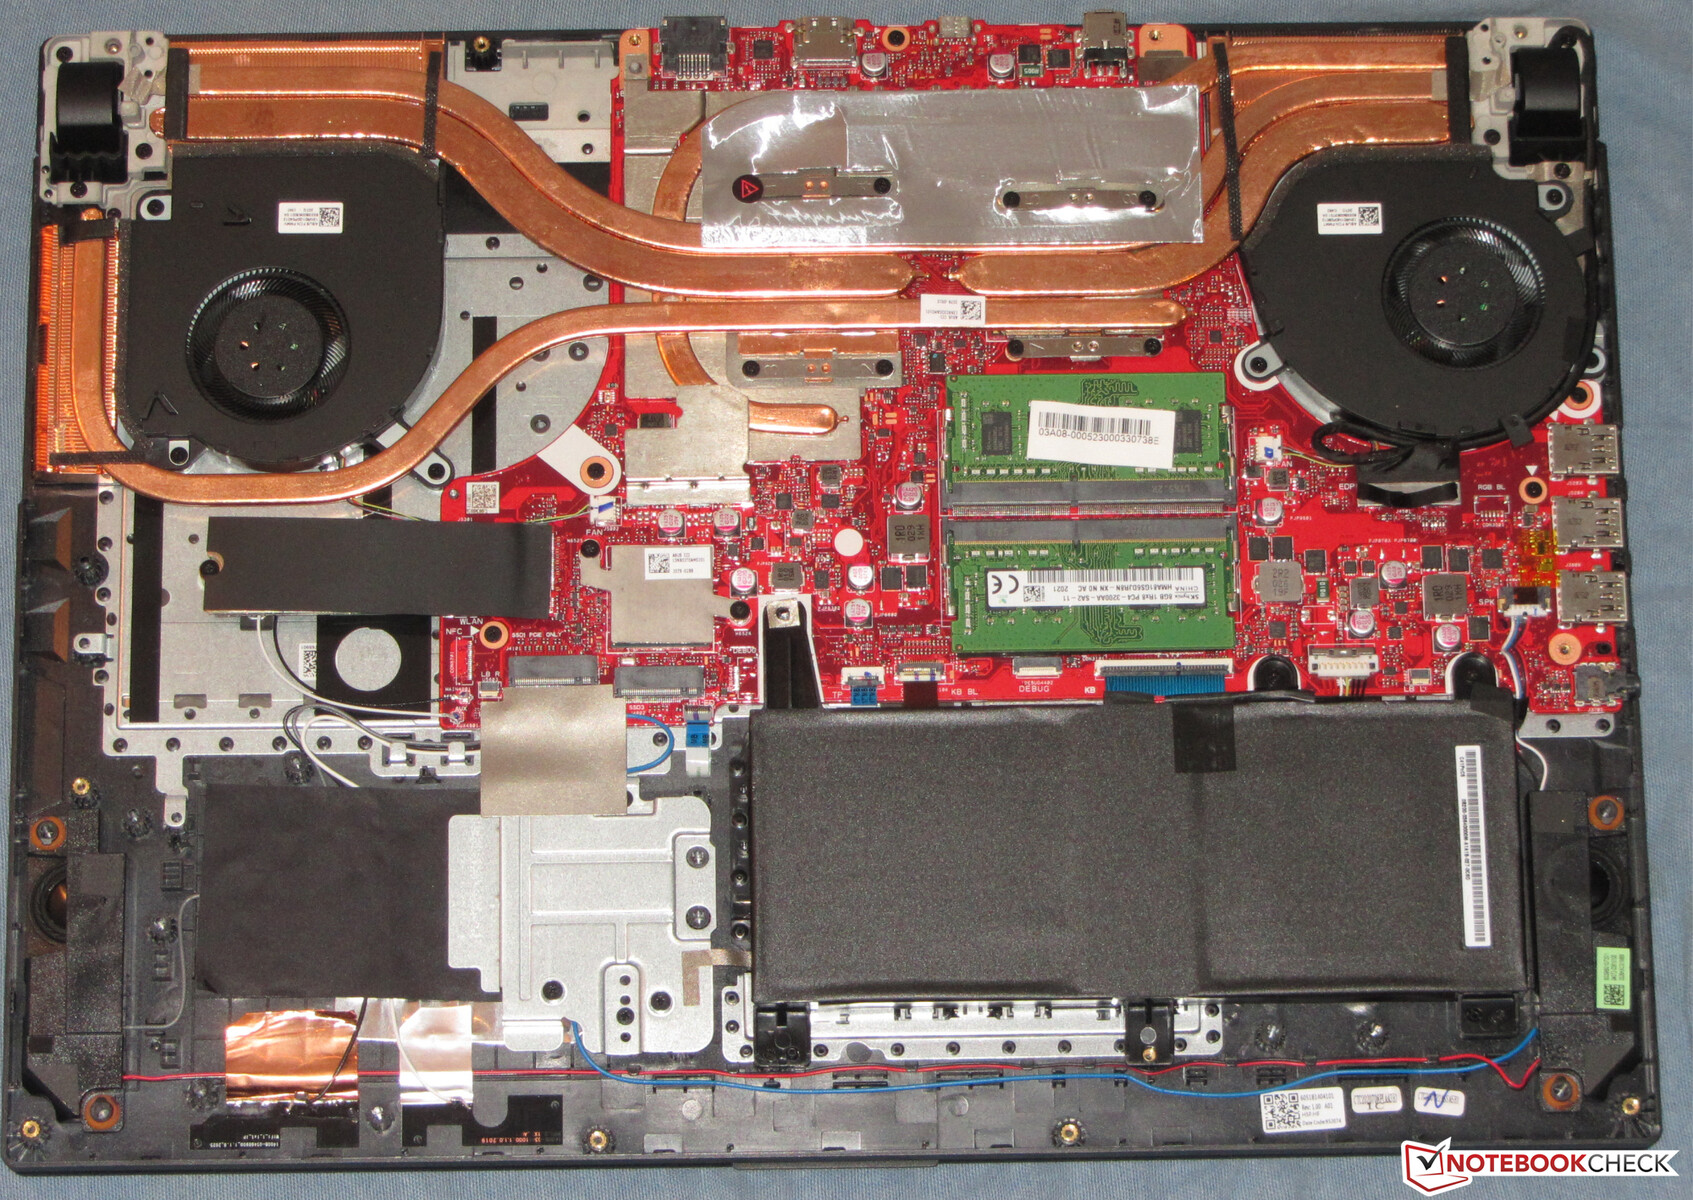
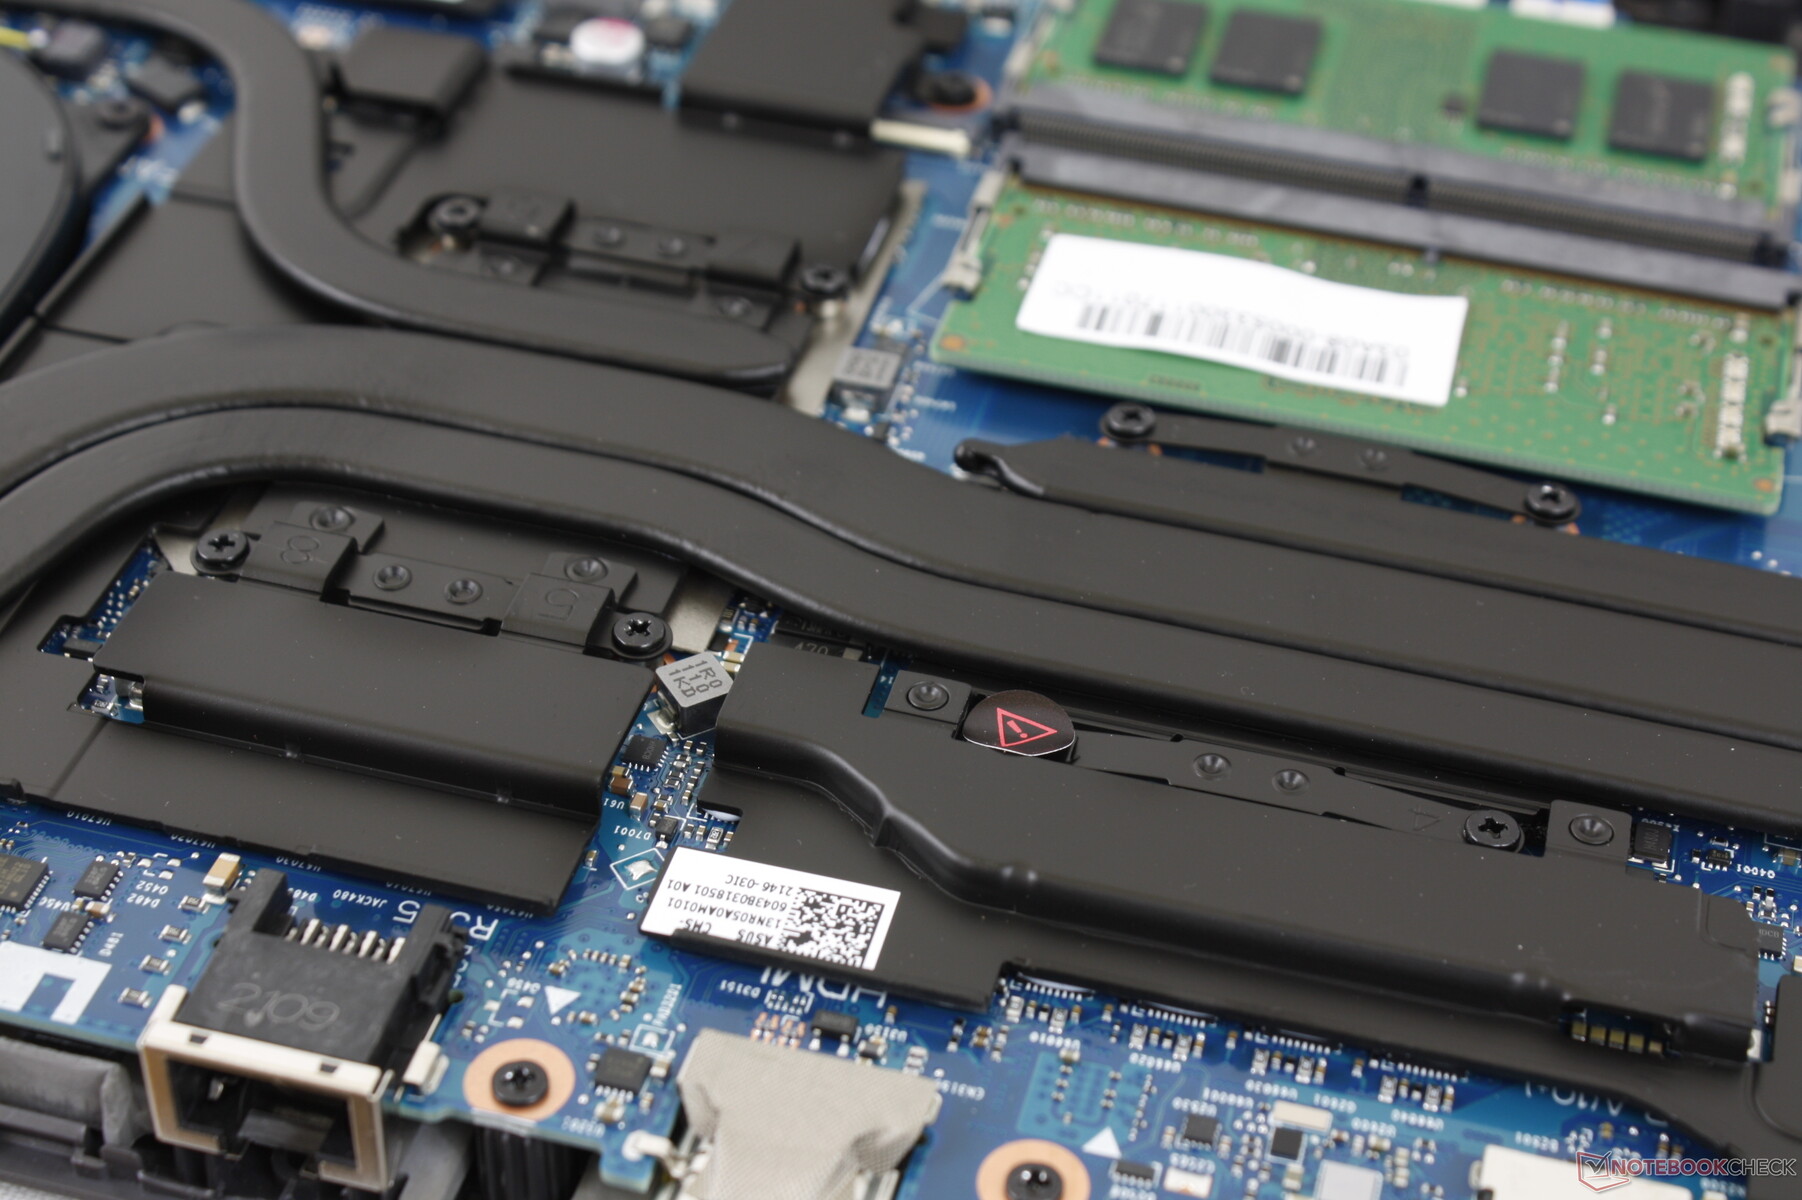
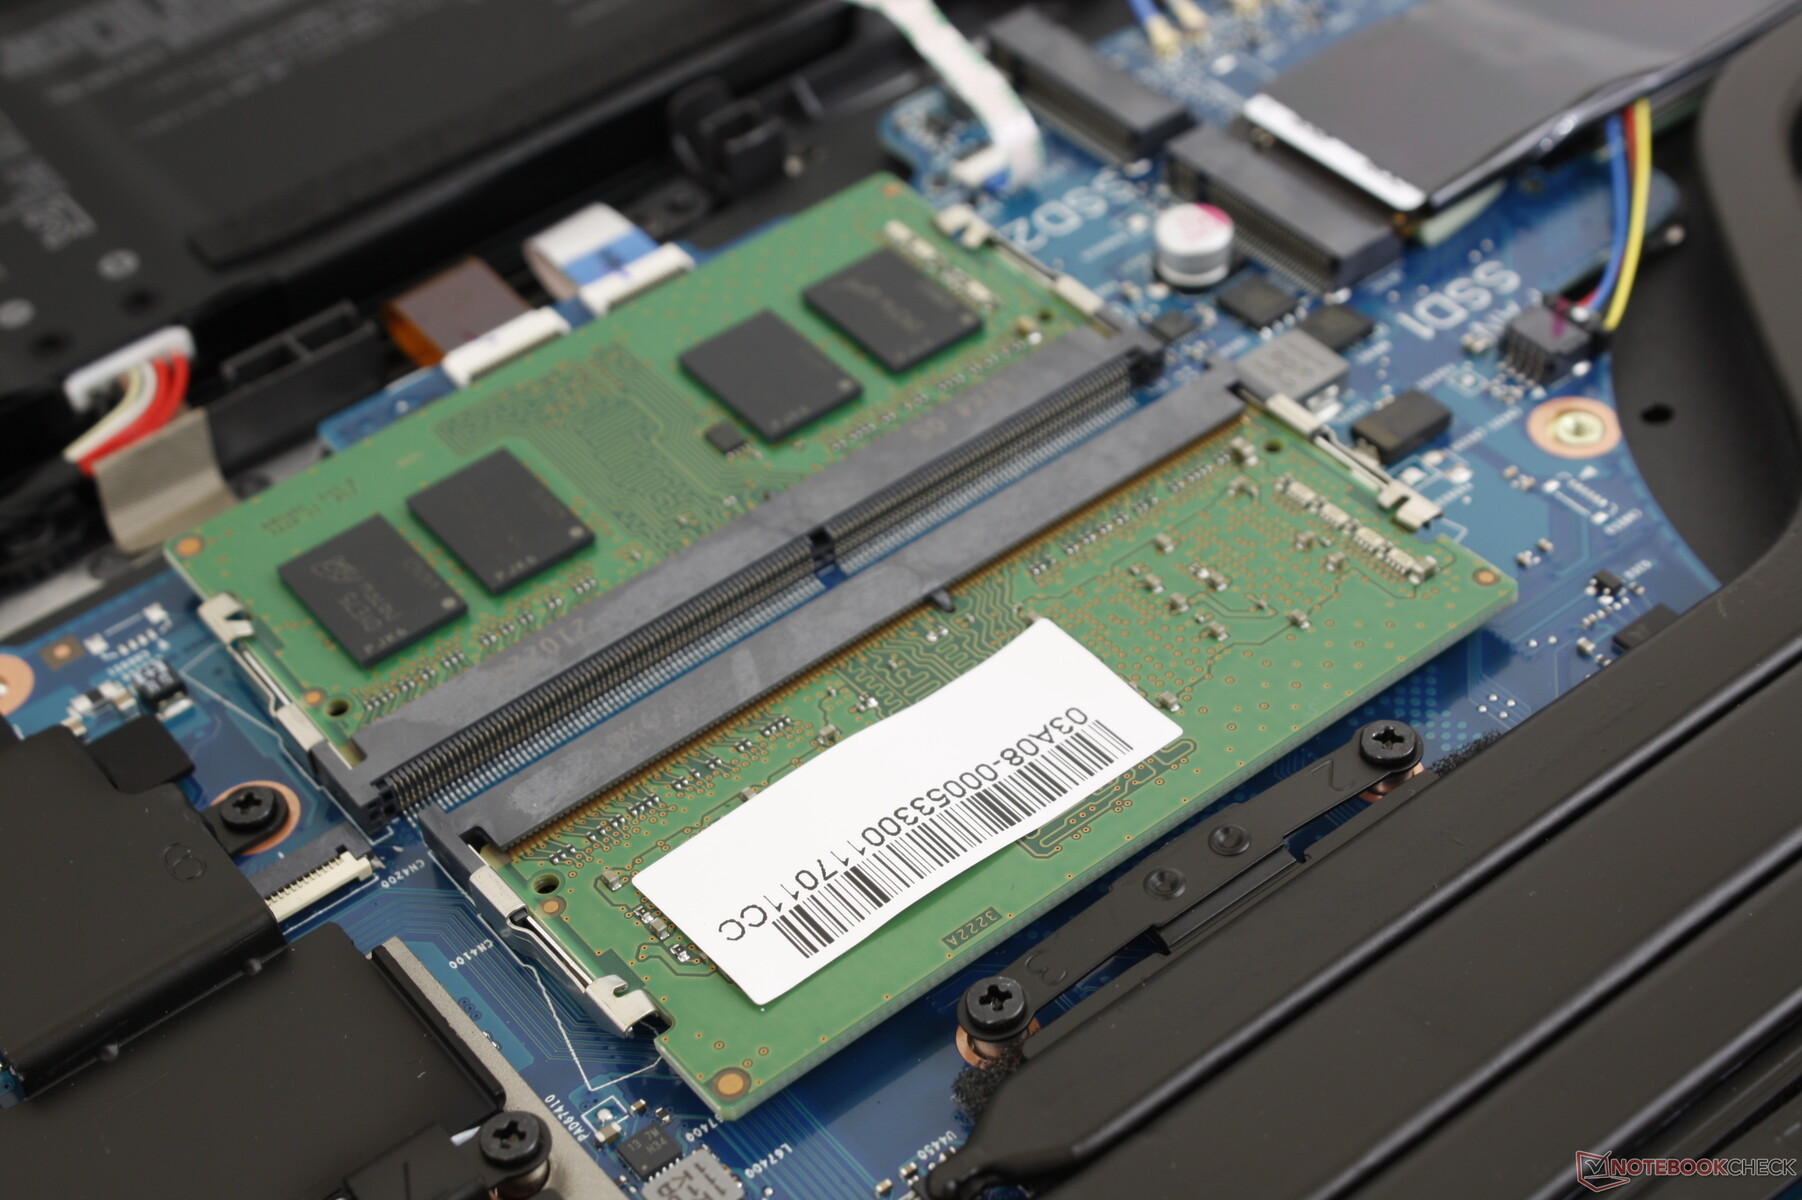
Le panneau inférieur est fermement verrouillé à la base et il faut donc un bord tranchant pour le démonter. En interne, le système diffère sensiblement du G712 en termes de batterie, de haut-parleurs et de taille de la solution de refroidissement.
Veillez à ne pas endommager les deux rubans fragiles qui relient le panneau inférieur à la carte mère. Ces rubans ne sont pas présents sur la plupart des autres ordinateurs portables puisque le G713 possède des LED personnalisables le long du bord avant.
Accessoires et garantie
Il n'y a pas d'extras dans la boîte en dehors de l'adaptateur secteur et des documents. La garantie limitée habituelle d'un an du fabricant s'applique.
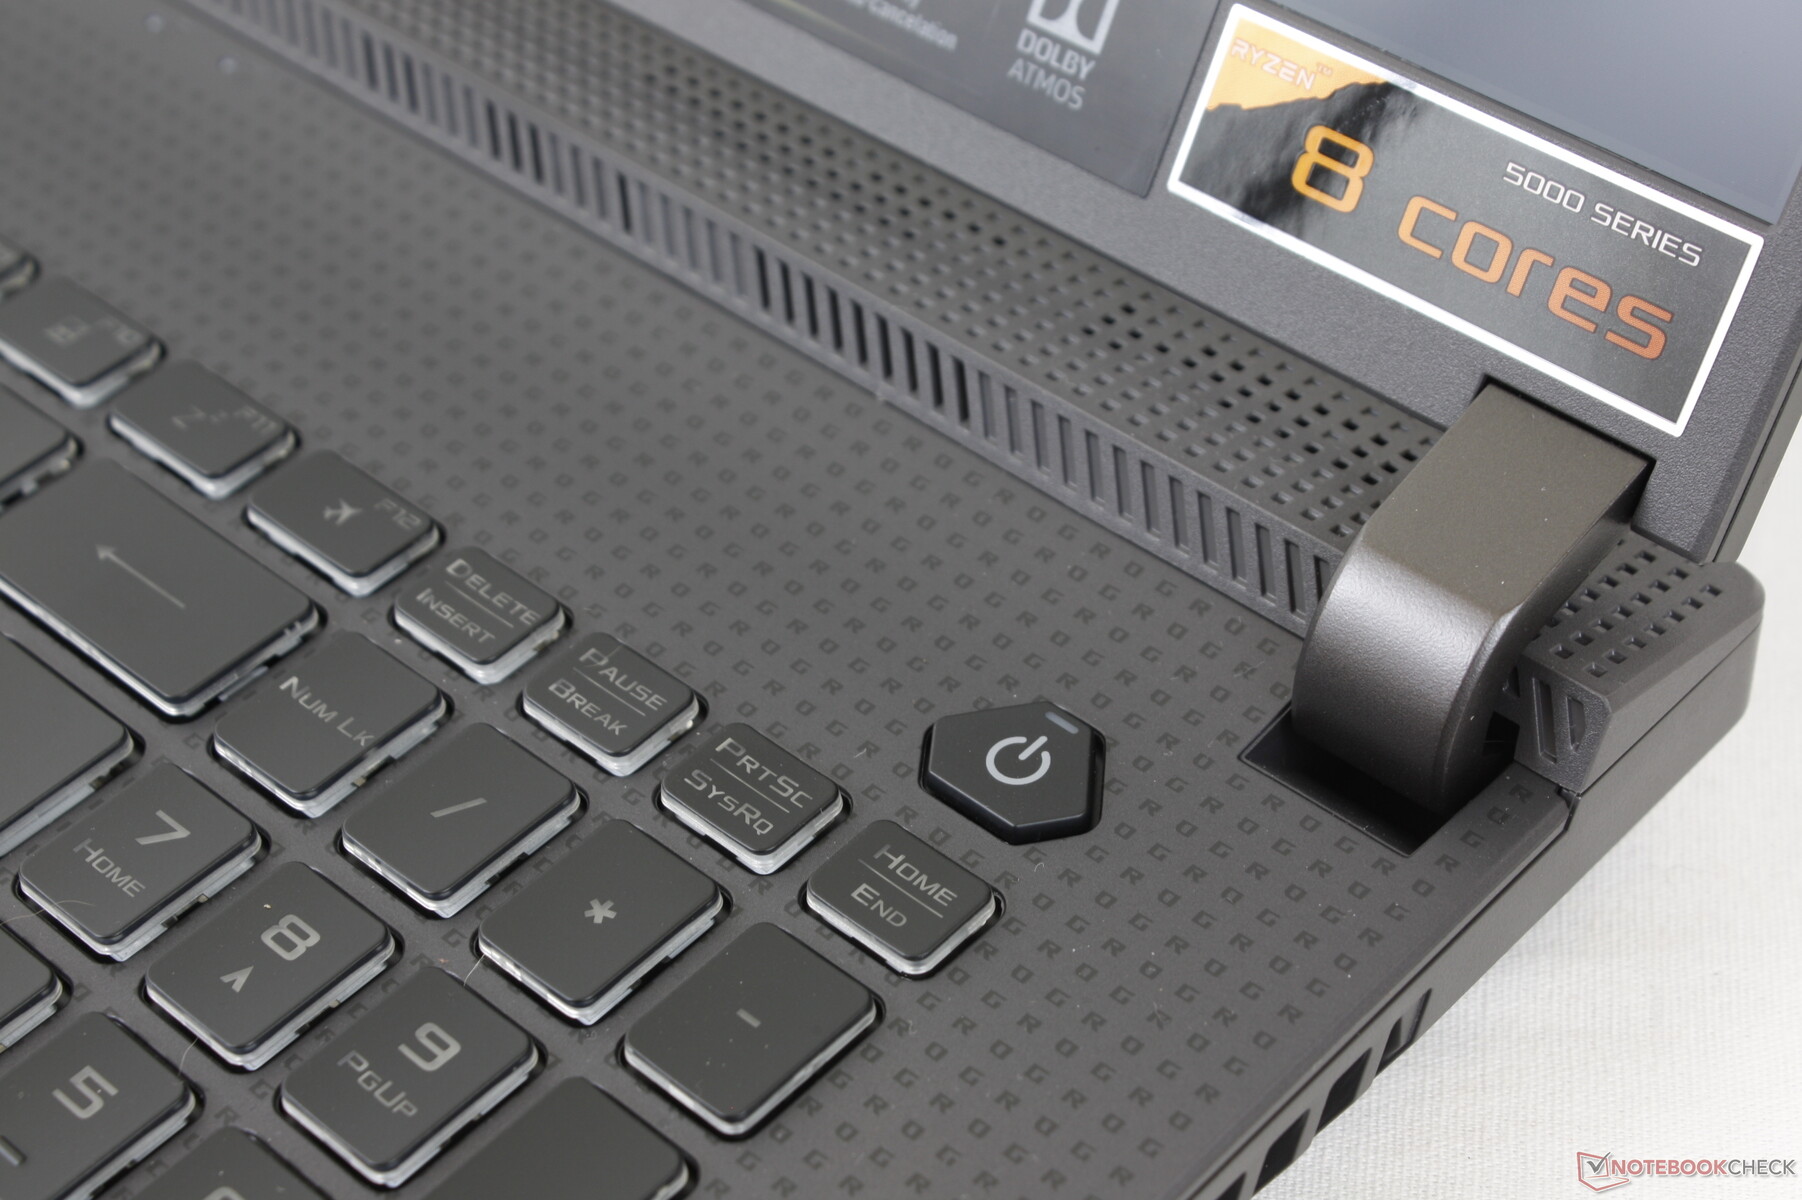
Périphériques d'entrée - Bruyants et cliquables
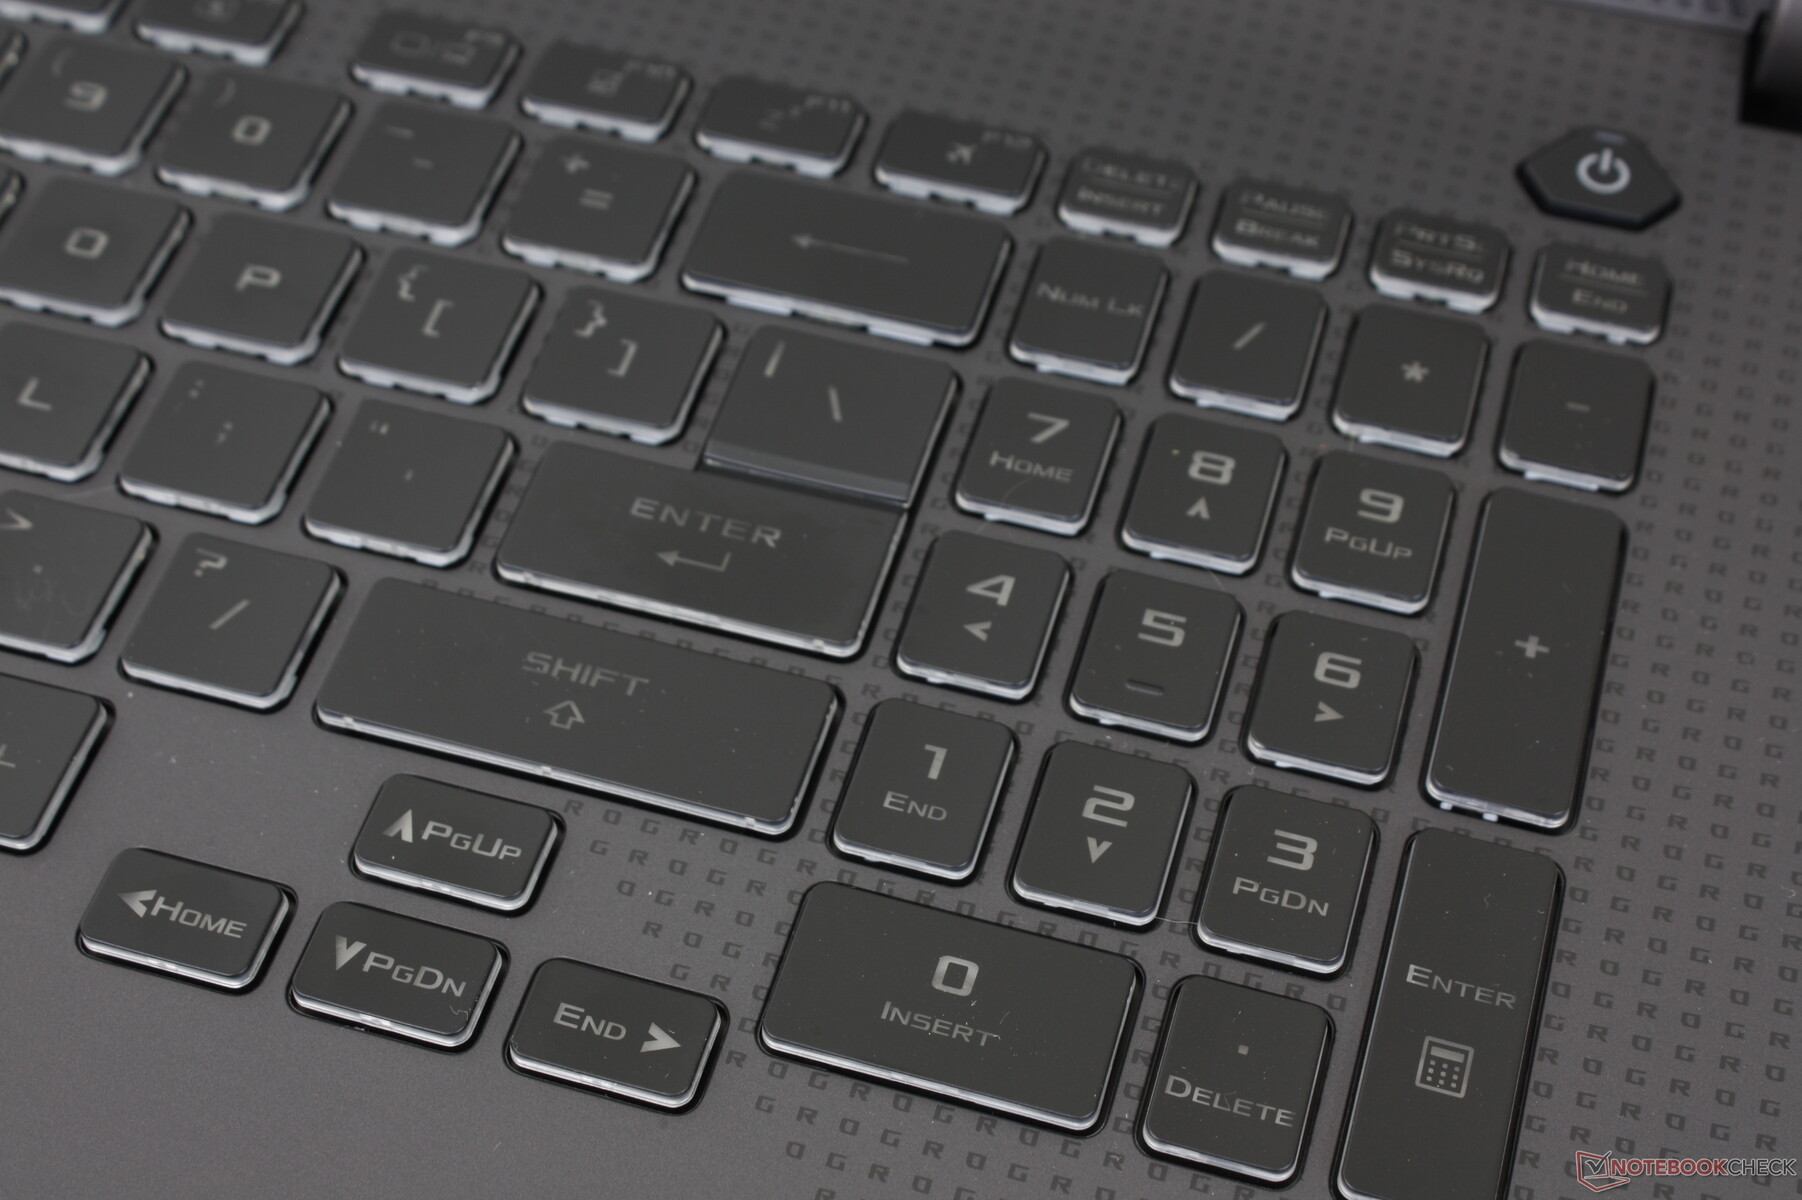
Clavier
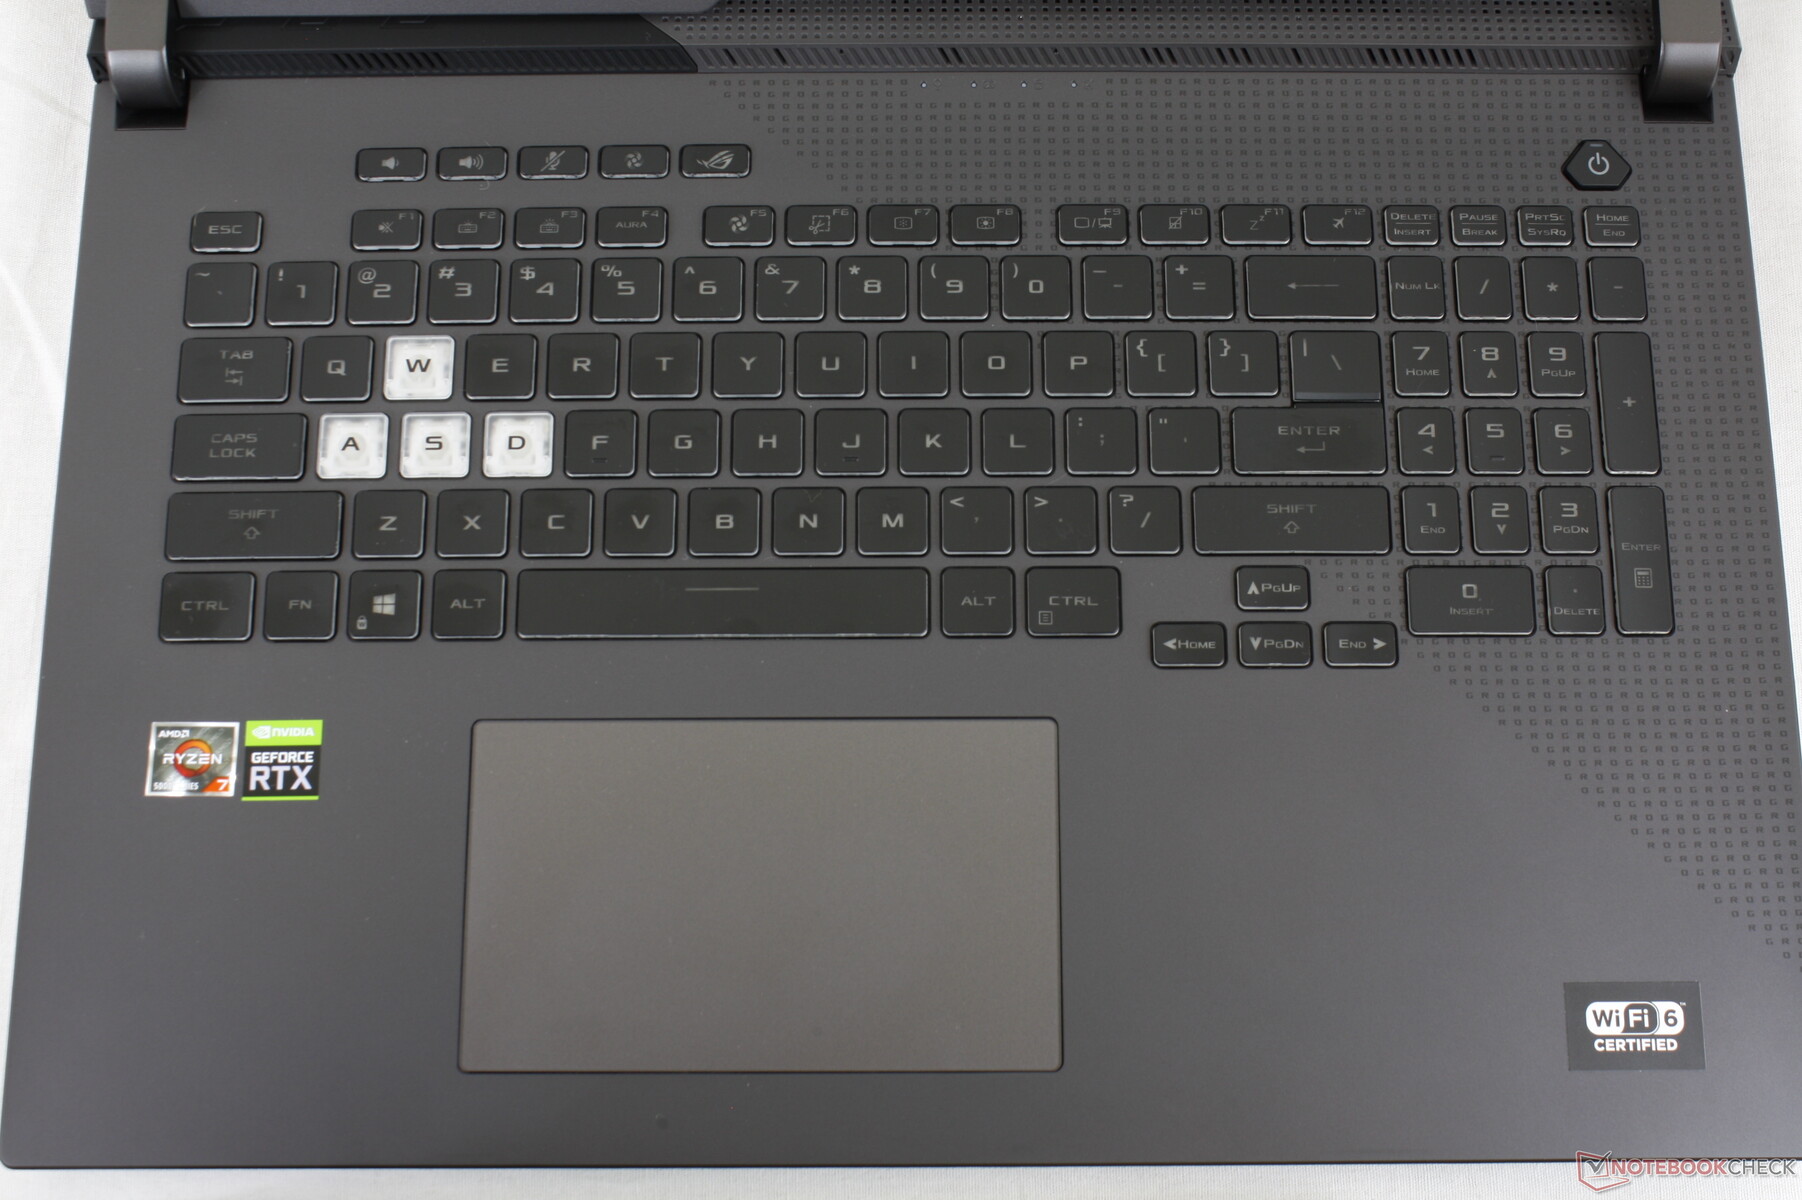
À l'exception des modèles phares les plus récents dotés de commutateurs mécaniques, l'expérience de frappe sur la plupart des ordinateurs portables ROG Strix est presque identique puisqu'ils utilisent tous des châssis de conception similaire. Les touches ont un retour plus profond et plus satisfaisant que sur un portable Razer, mais avec un bruit plus fort que sur le Katana de MSI. Le pavé numérique et les touches fléchées restent plus petits et plus exigus que les touches QWERTY principales
L'éclairage RVB à quatre zones est disponible sur la plupart des modèles, tandis que les modèles haut de gamme disposent d'un éclairage RVB par touche.
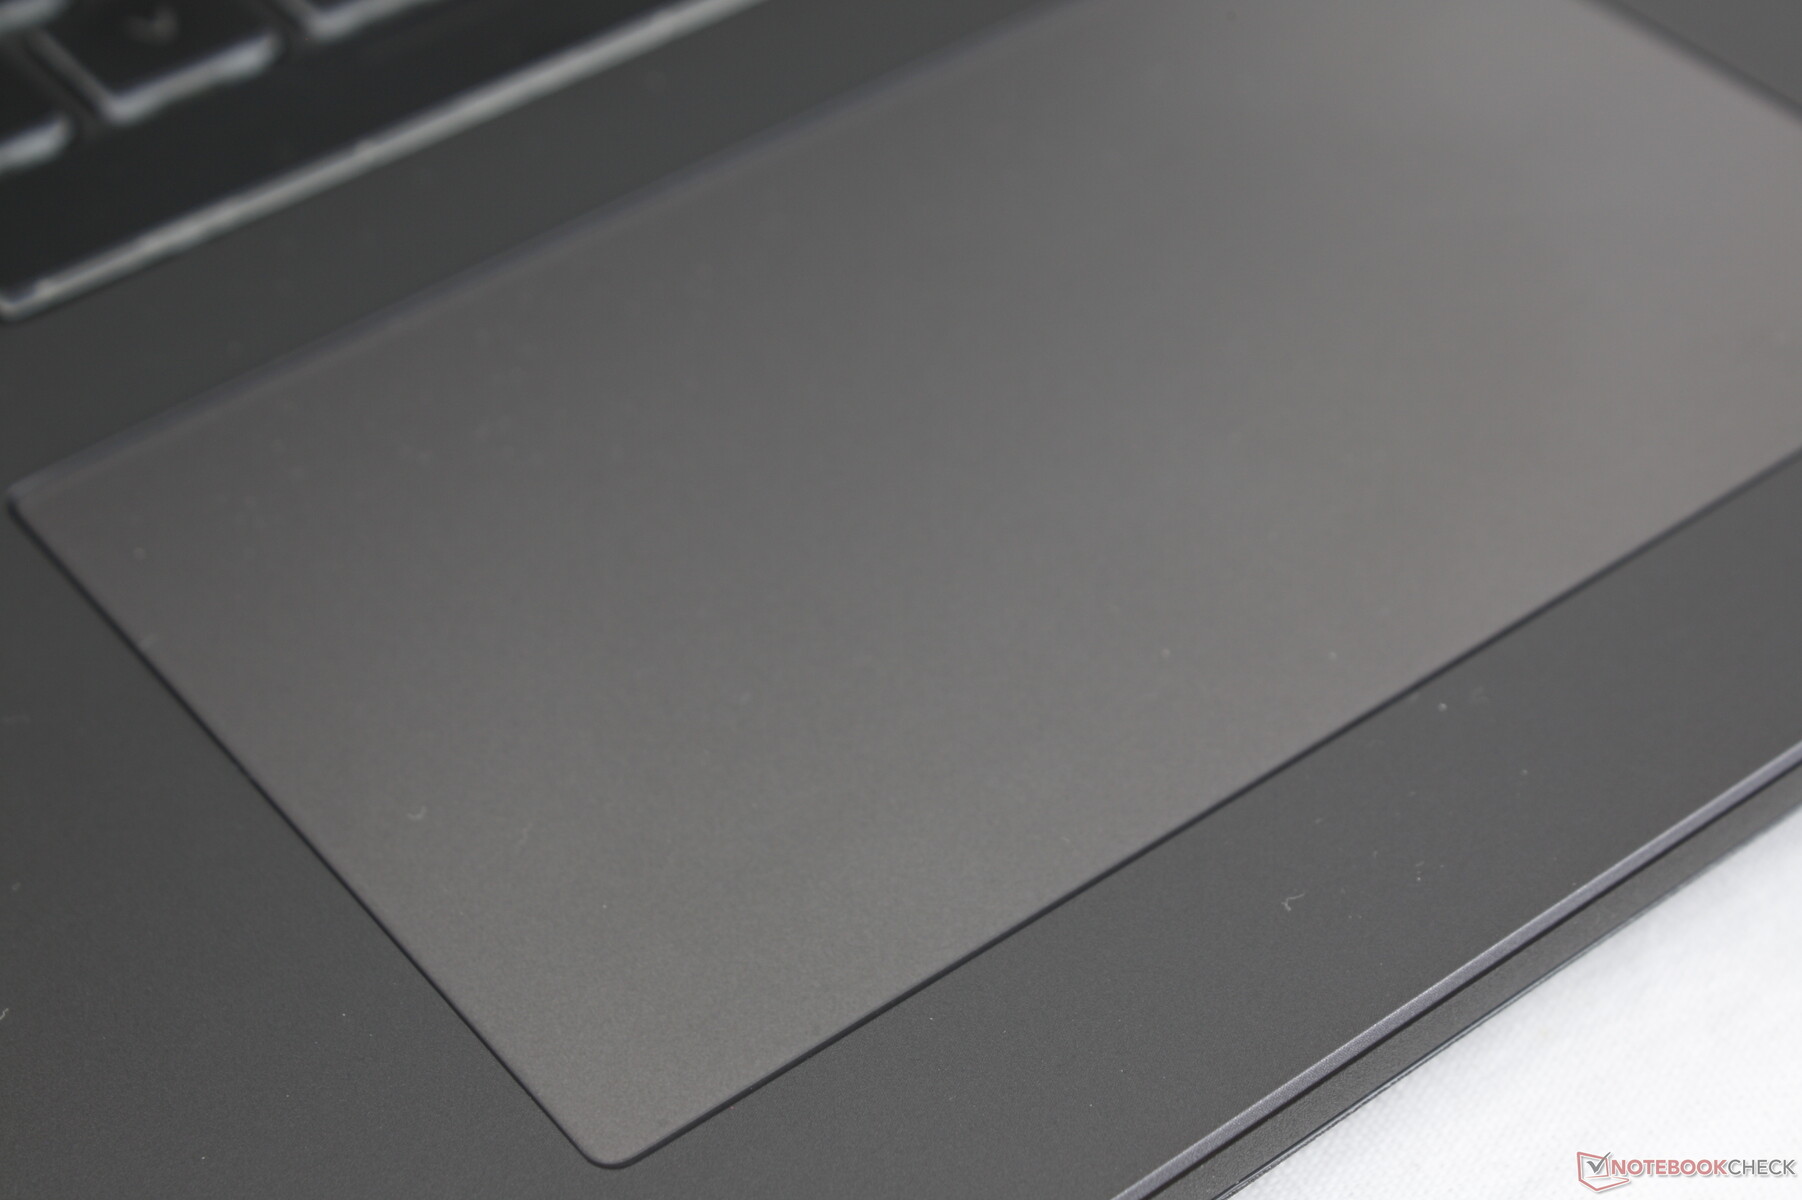
Pavé tactile
Le pavé tactile est plus grand que celui du G733 (13 x 7,7 cm contre 10,8 x 6 cm) car Asus a abandonné les boutons dédiés à la souris au profit d'une plus grande surface. La glisse sur le clickpad est douce et avec seulement très peu de collage à des vitesses lentes. Pendant ce temps, les touches de clic intégrées sont fortes et relativement fermes pour un clic satisfaisant lorsqu'elles sont pressées.

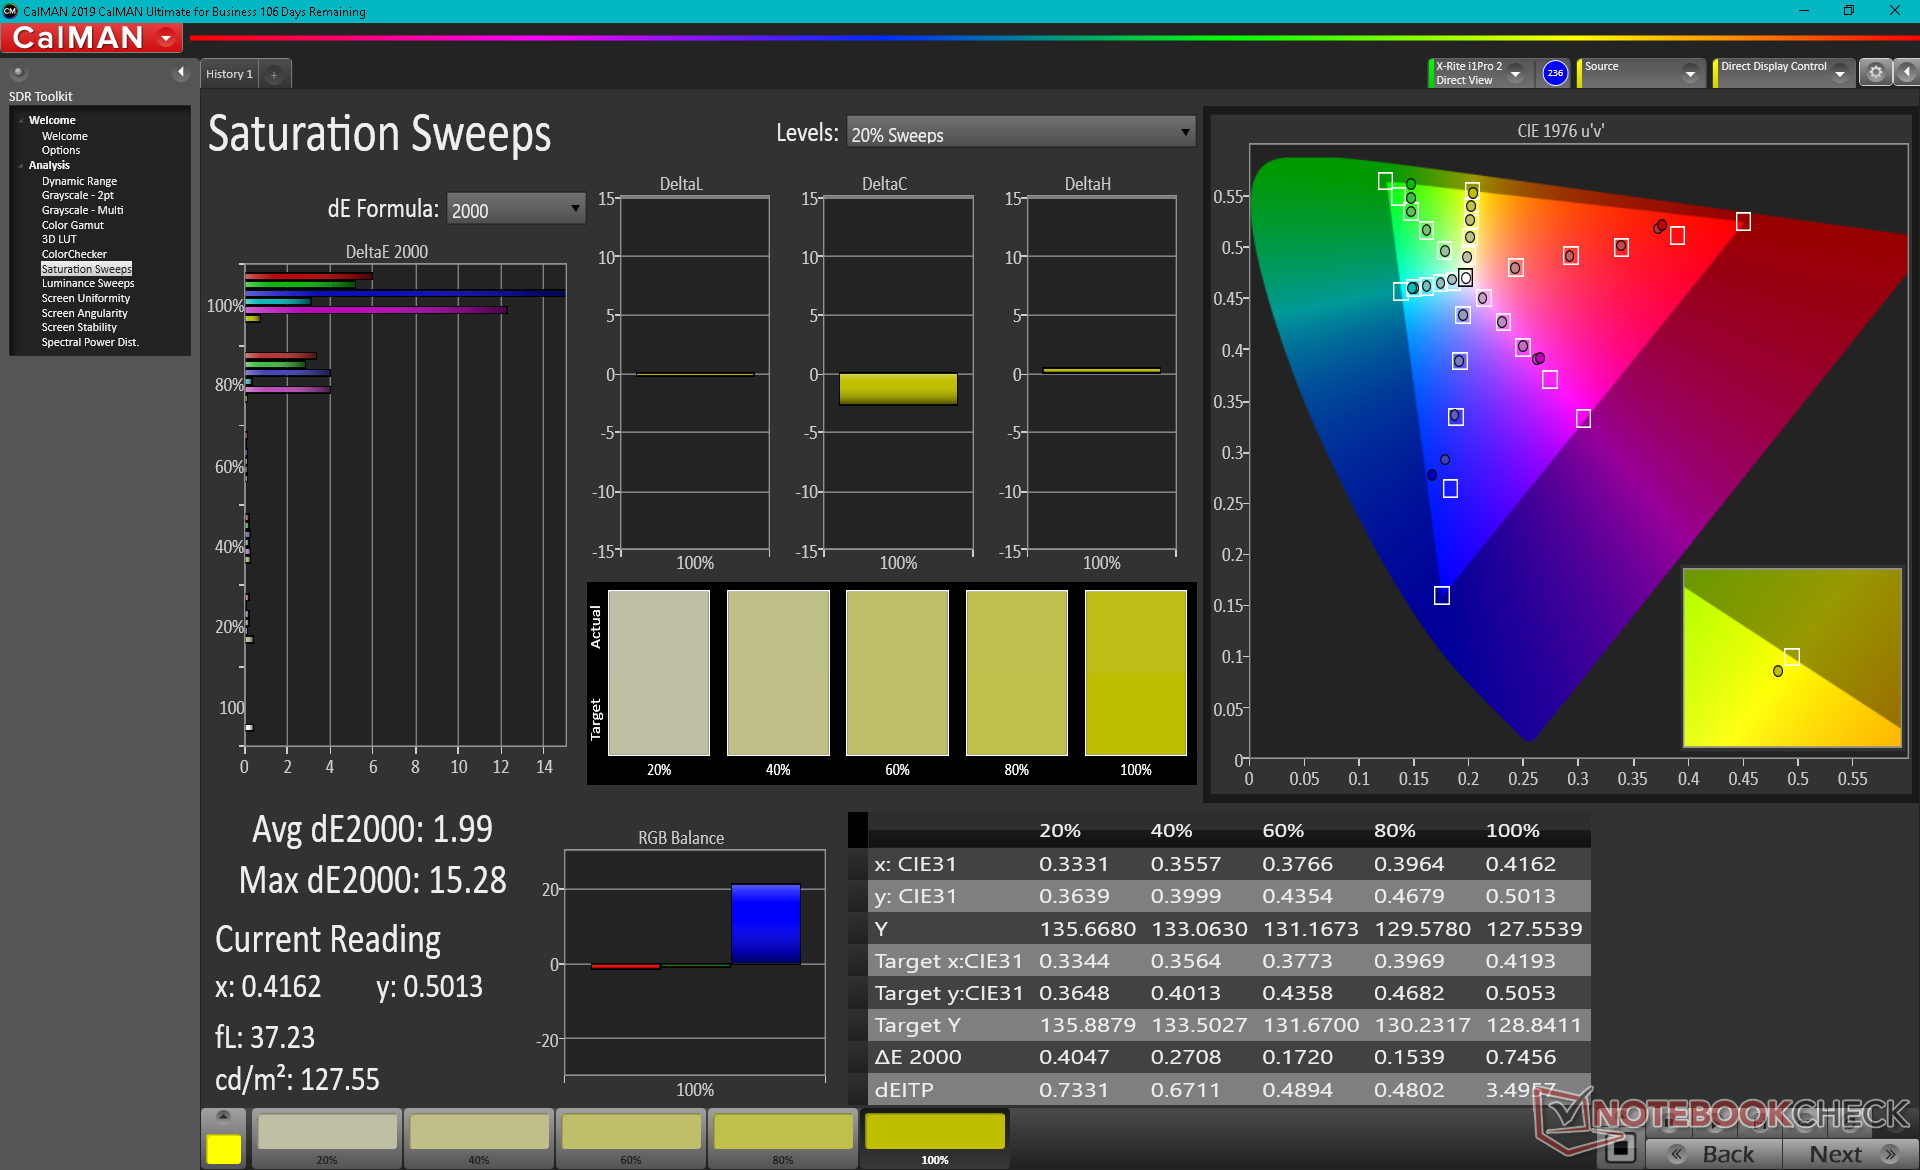
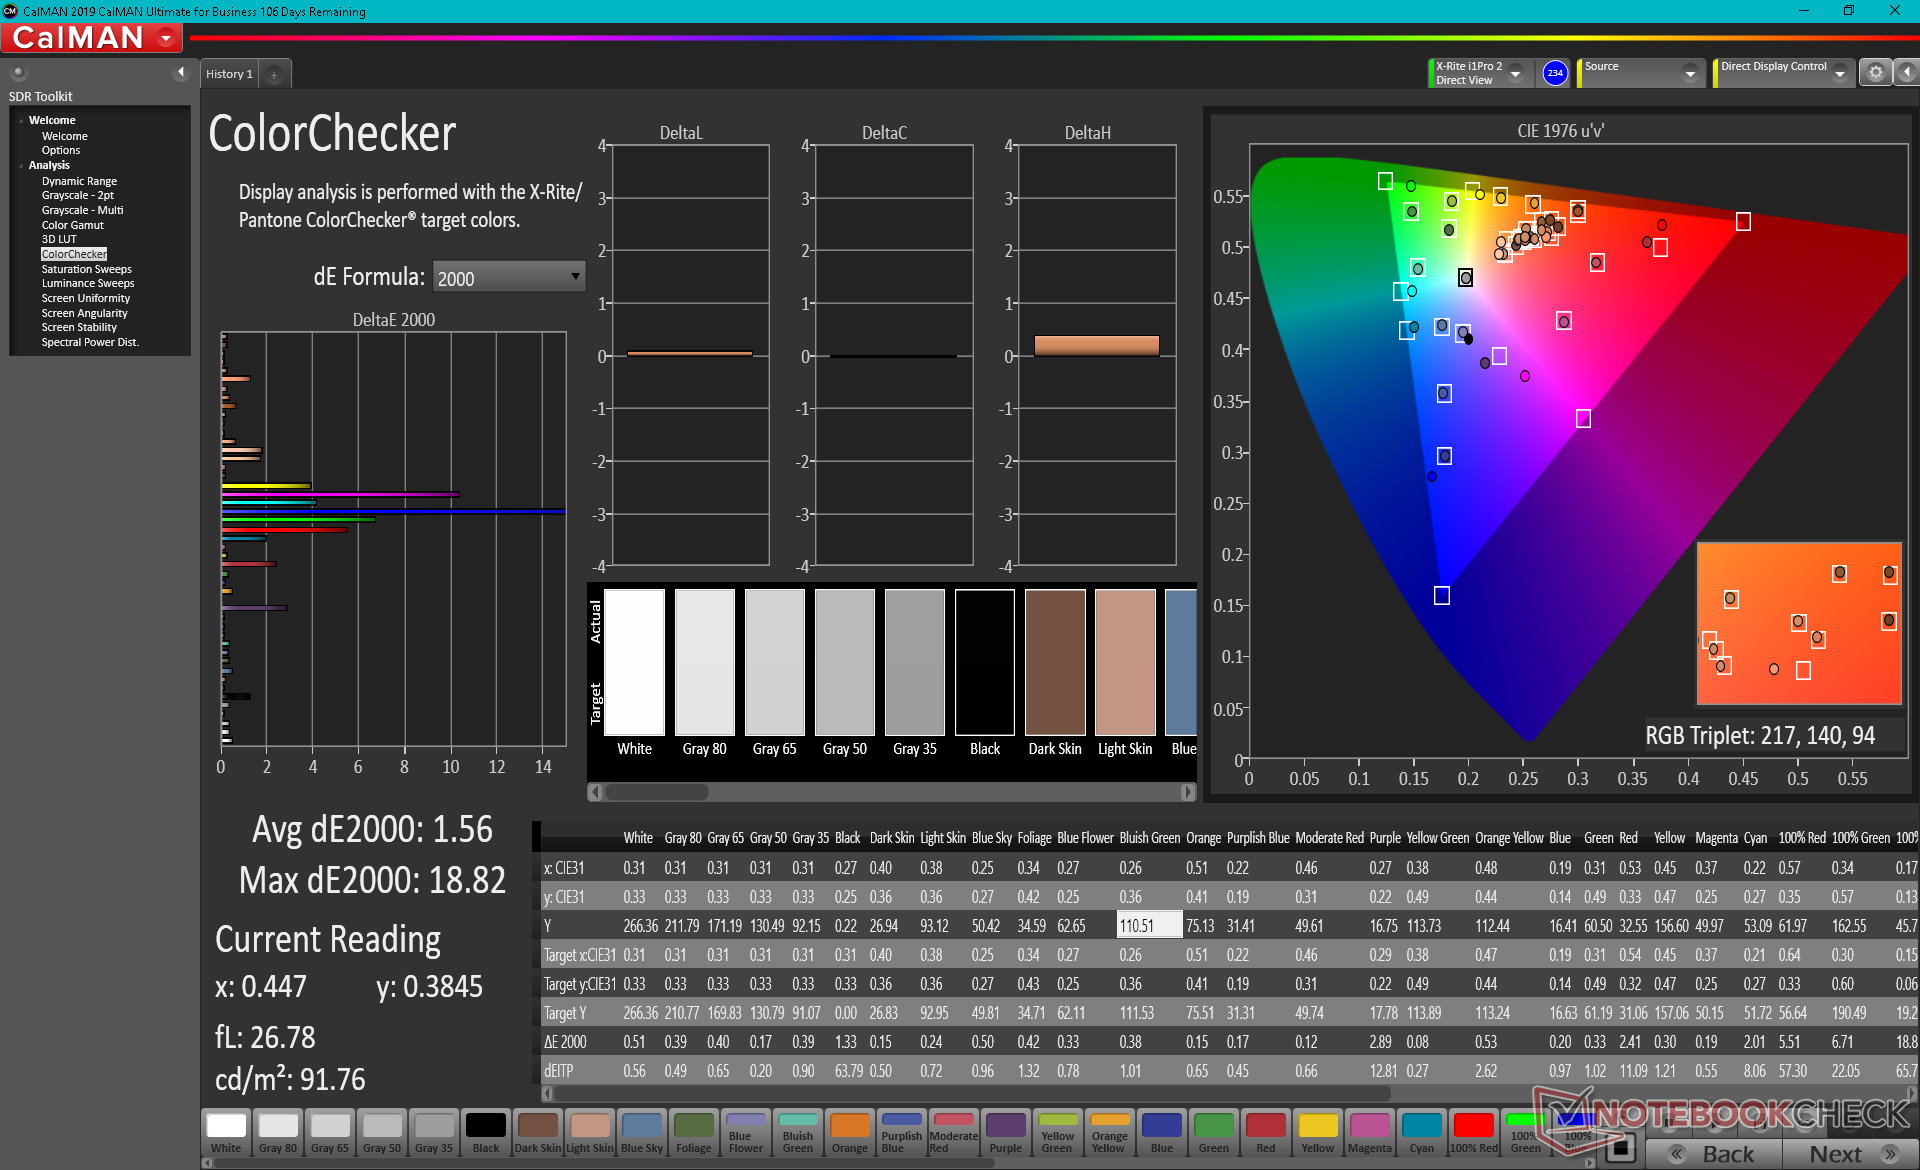
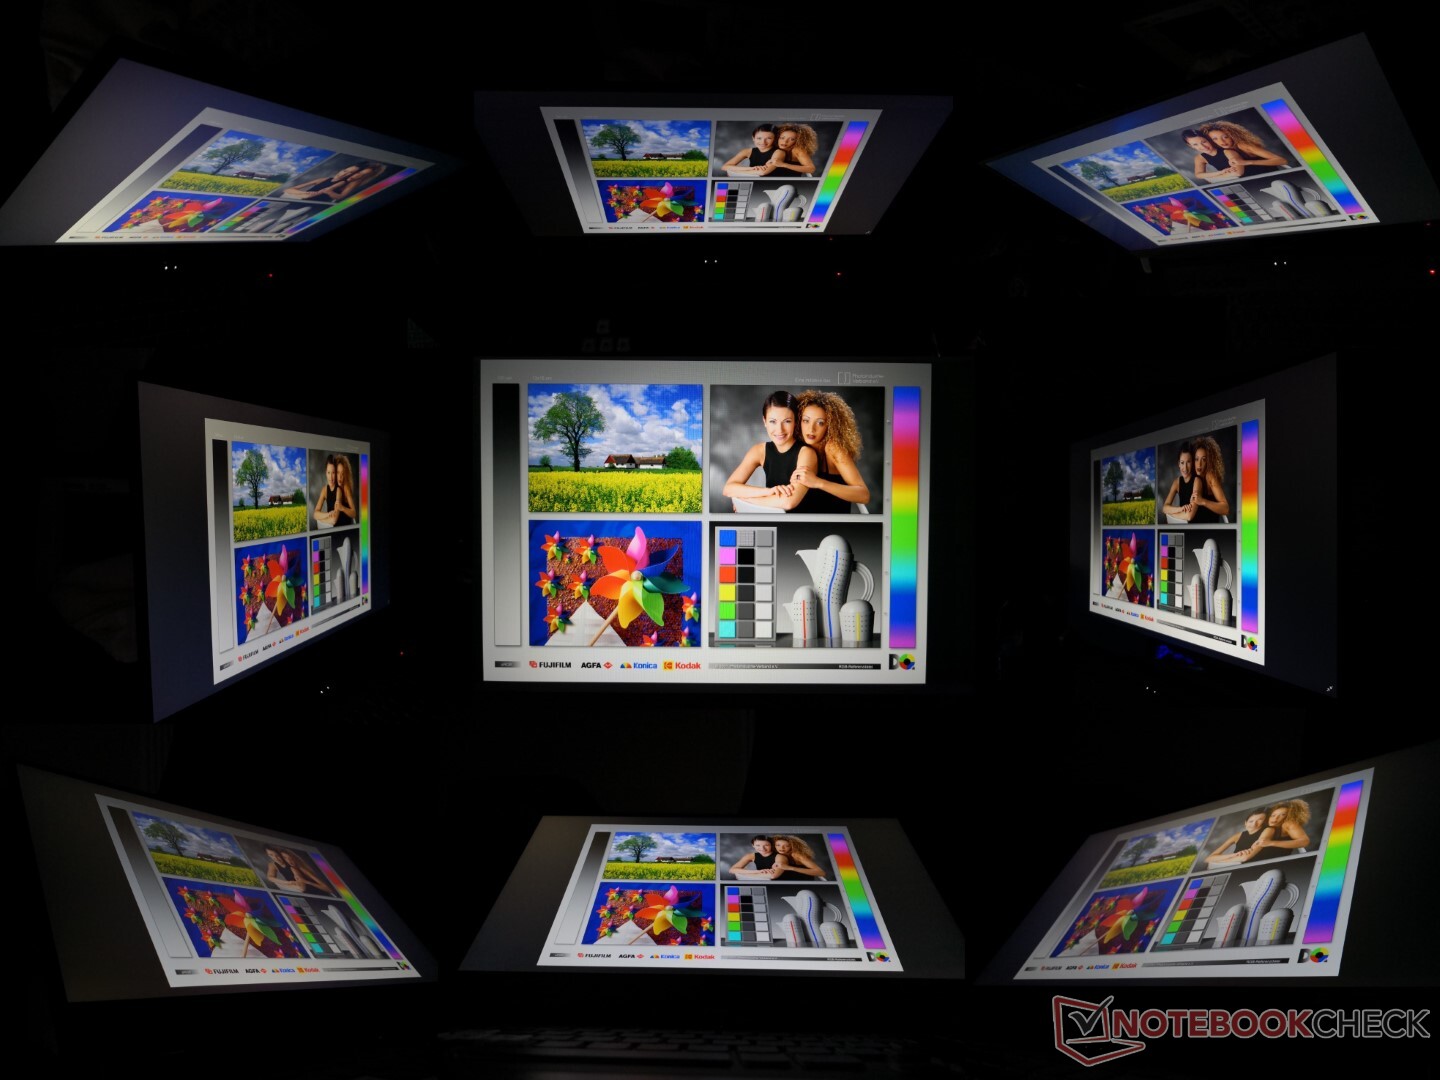
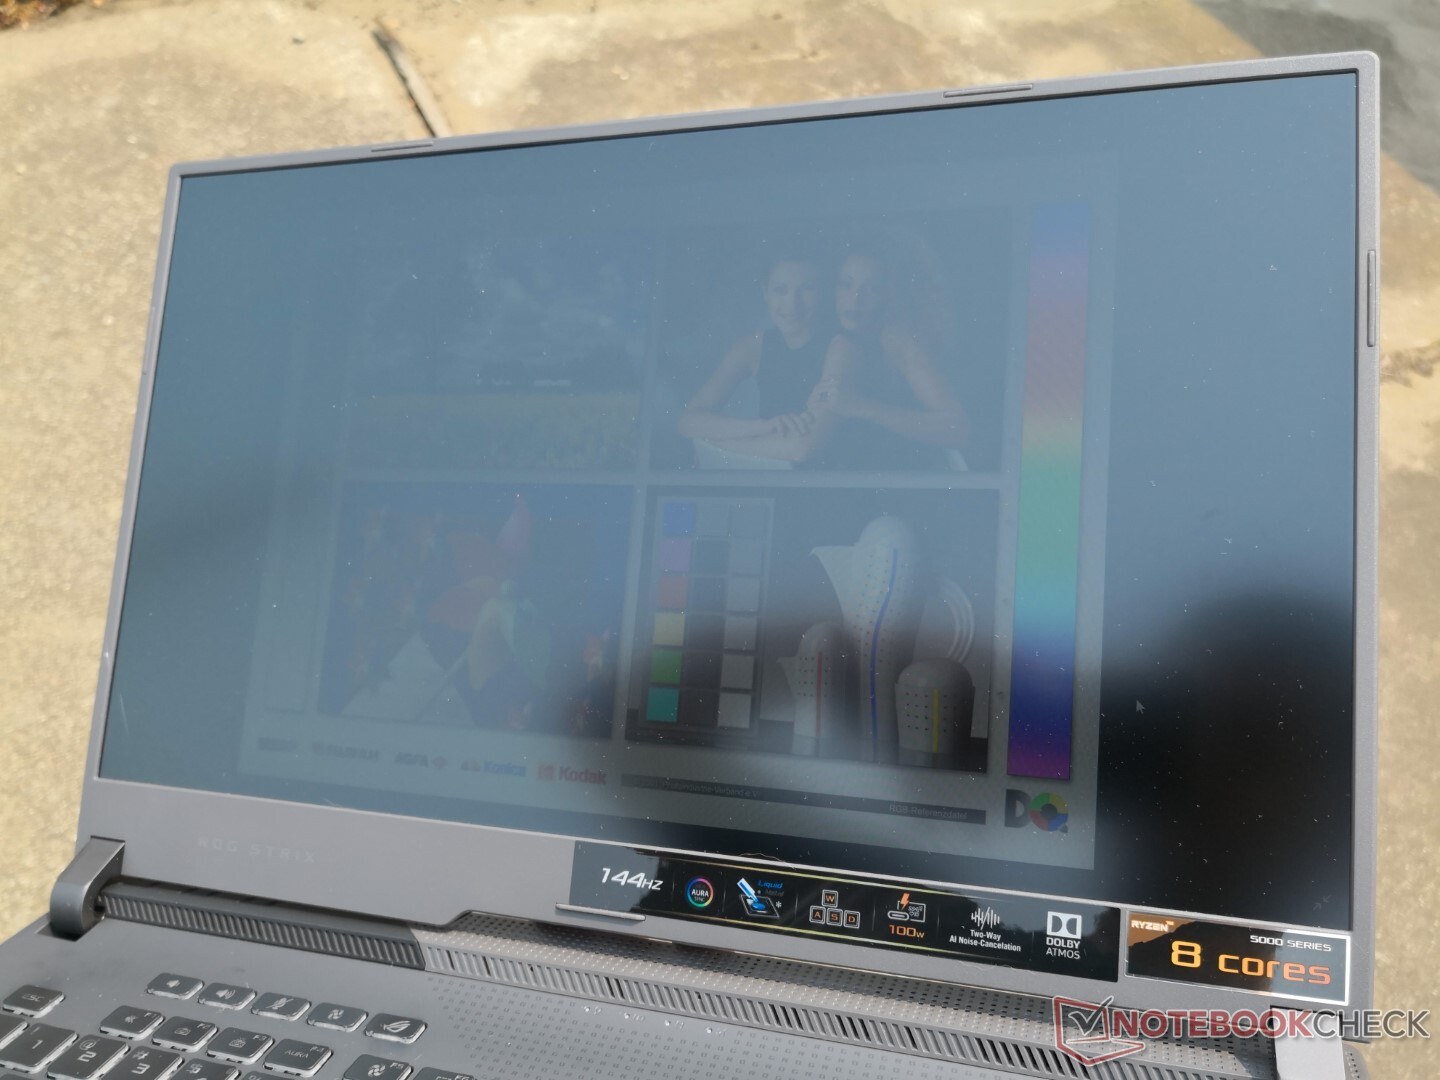
Affichage - Fréquence de rafraîchissement élevée, couleurs superficielles
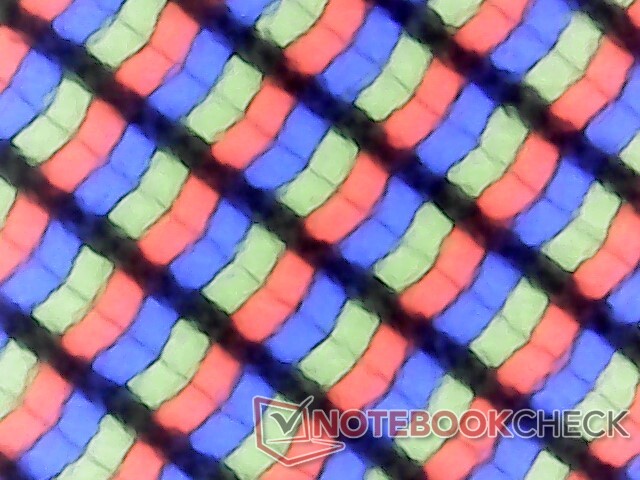
Notre configuration Asus utilise la même dalle IPS AU Optronics B173HAN04.9 que l'on trouve sur le concurrent MSI Katana pour des caractéristiques similaires entre eux. Cette dalle 1080p est remarquable pour son taux de rafraîchissement natif de 144 Hz et son support FreeSync, mais elle est un peu en deçà des temps de réponse et de la précision des couleurs.
Asus propose au moins deux autres options de dalle (1080p 300 Hz et 1440p 165 Hz), chacune présentant des caractéristiques différentes de notre unité 1080p 144 Hz, notamment des temps de réponse plus rapides et/ou des couleurs plus profondes. Ainsi, nos mesures ci-dessous reflètent uniquement l'option 1080p 144 Hz.
| |||||||||||||||||||||||||
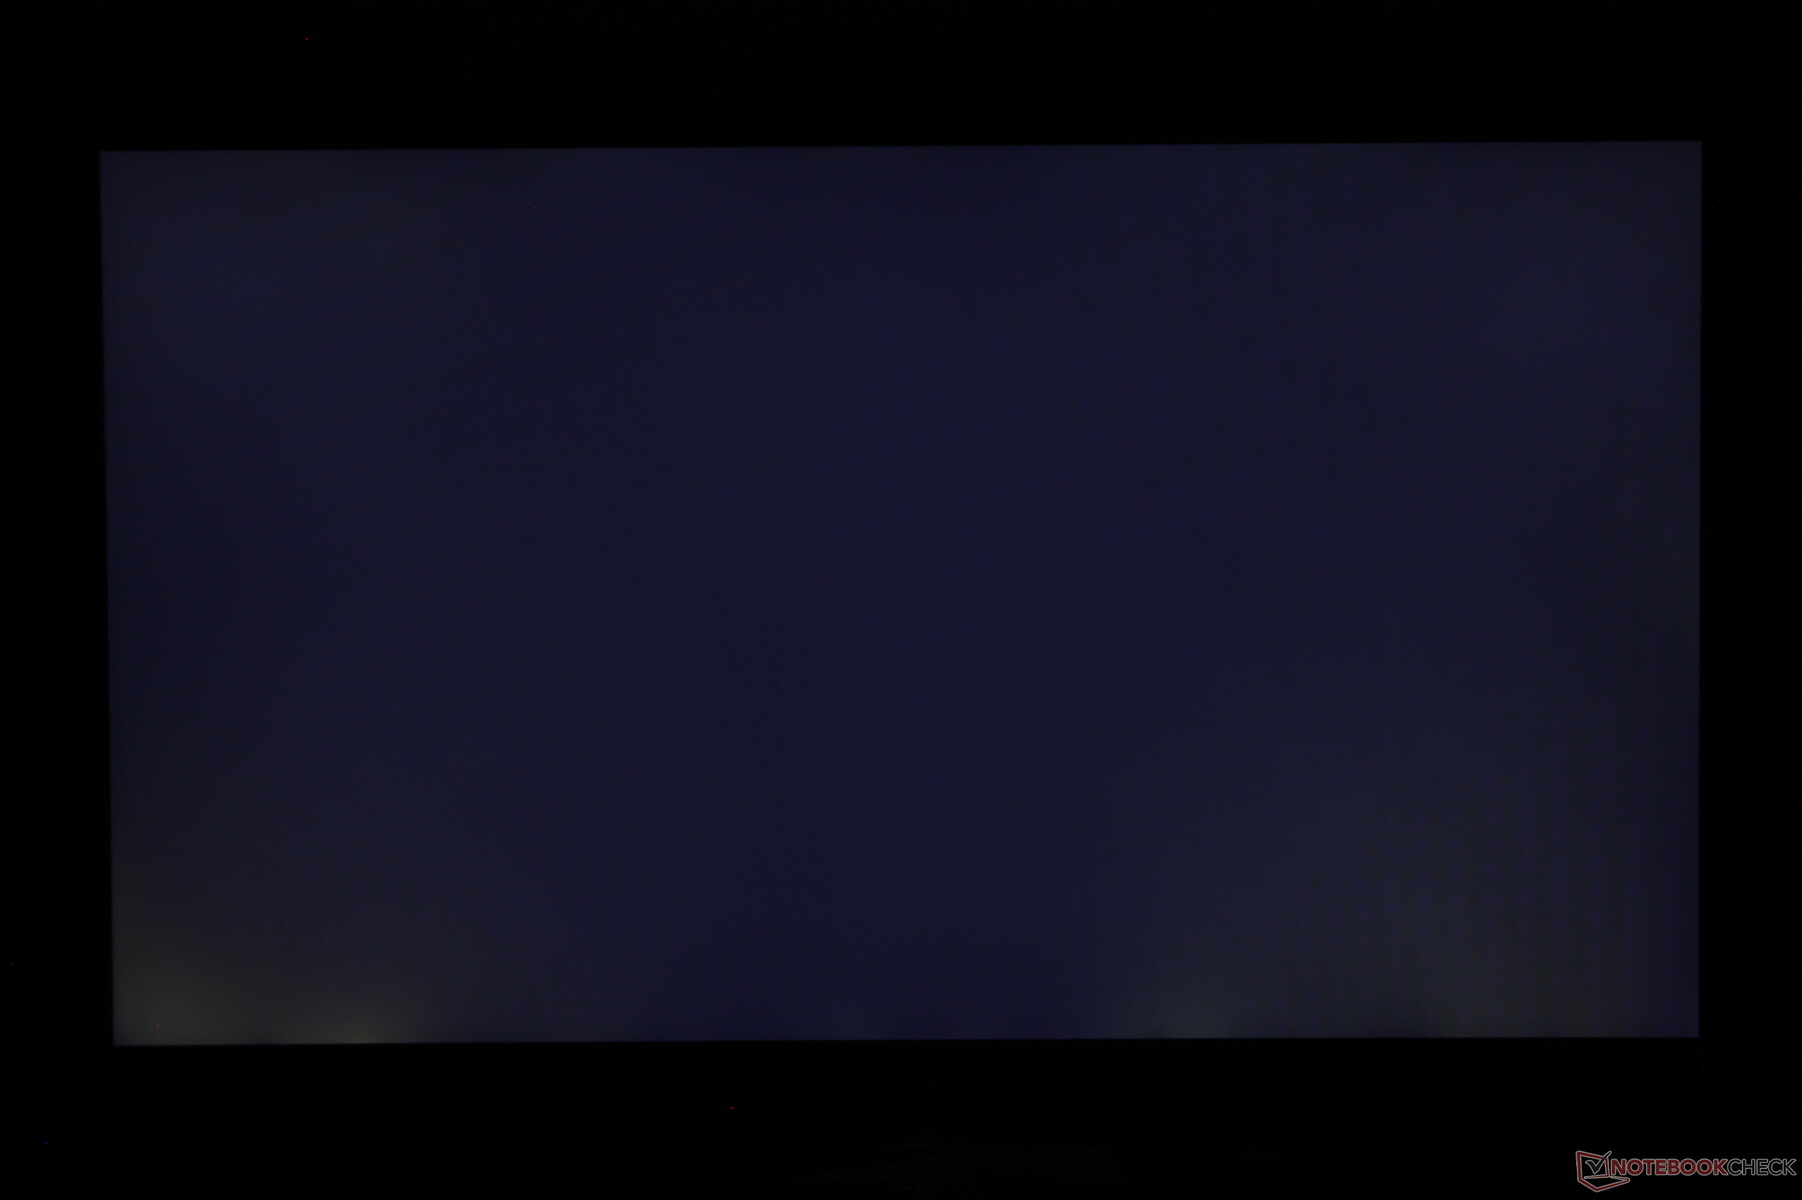
Homogénéité de la luminosité: 92 %
Valeur mesurée au centre, sur batterie: 270.5 cd/m²
Contraste: 1424:1 (Valeurs des noirs: 0.19 cd/m²)
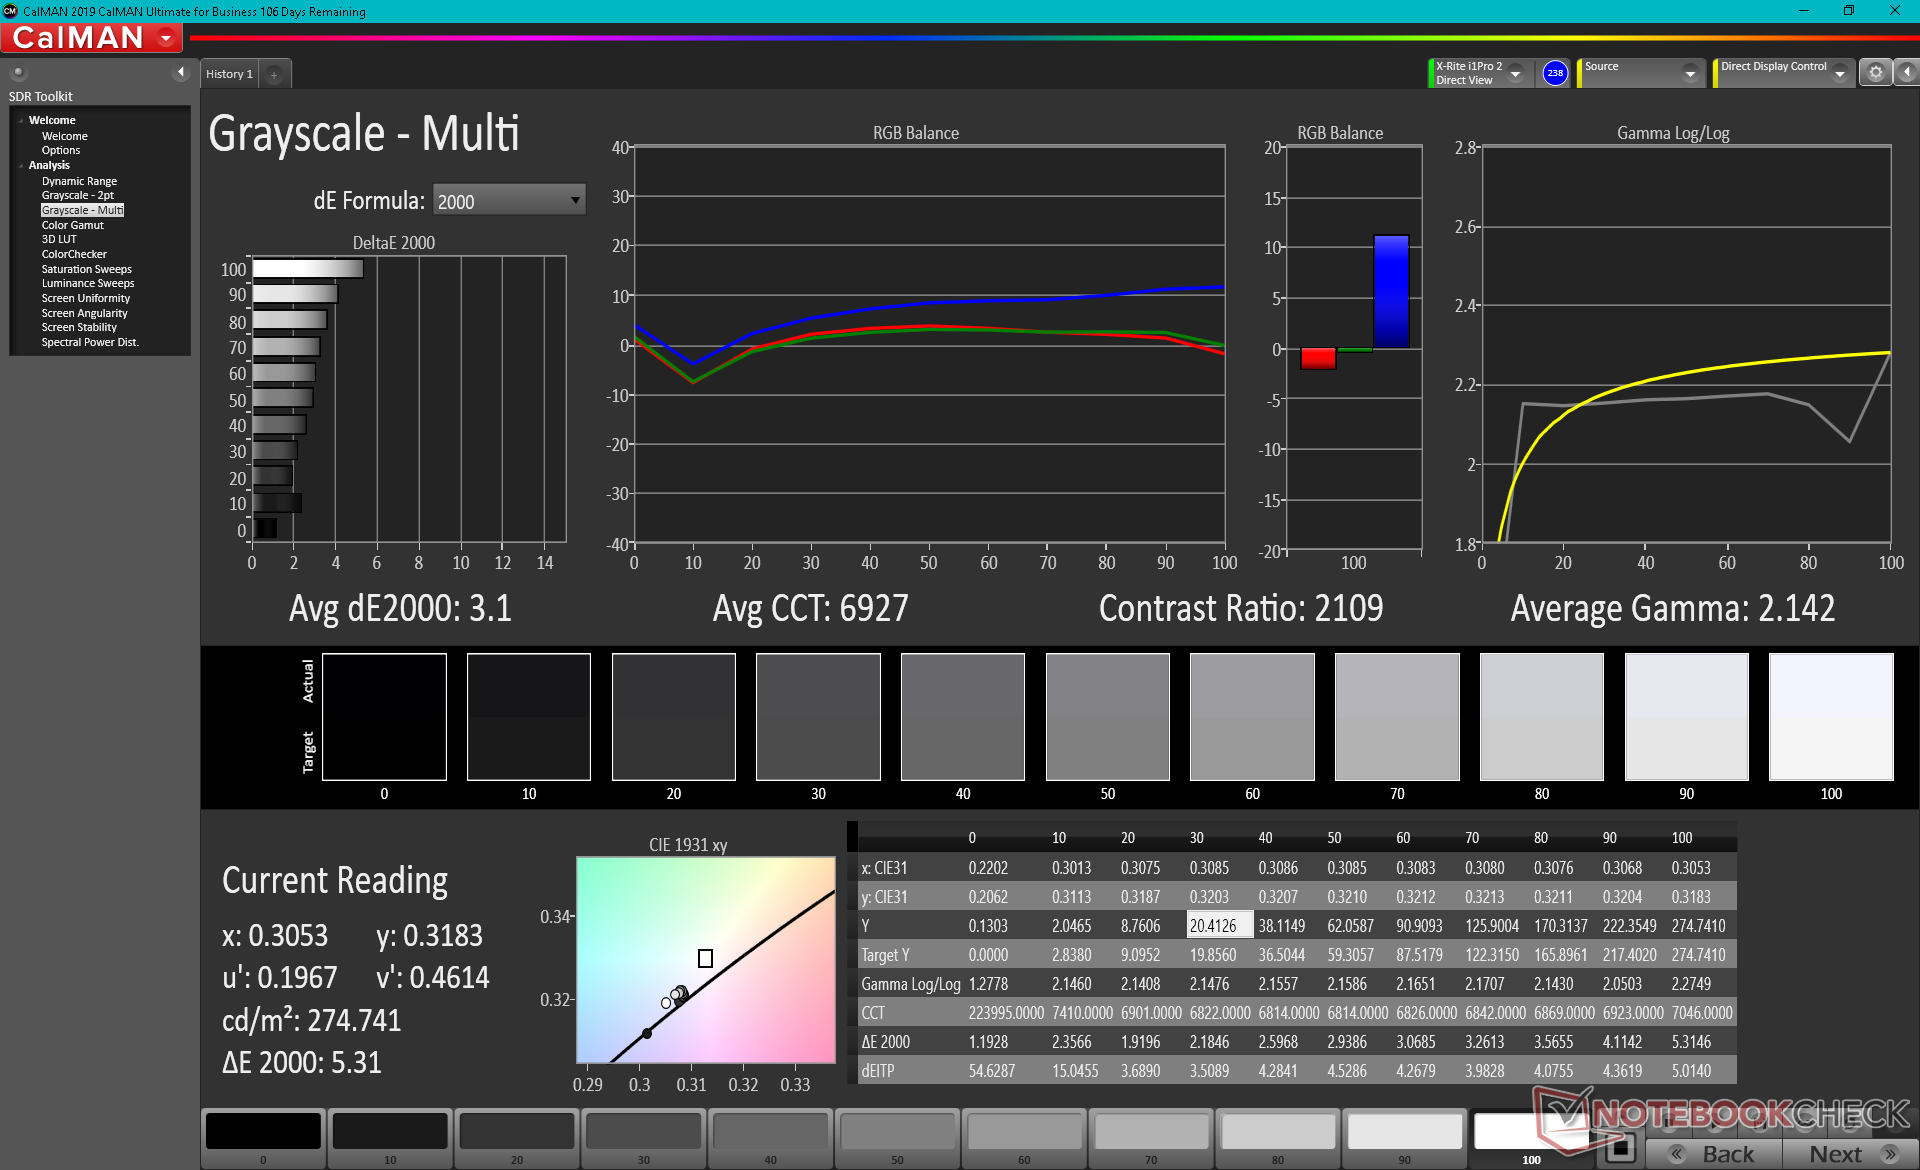
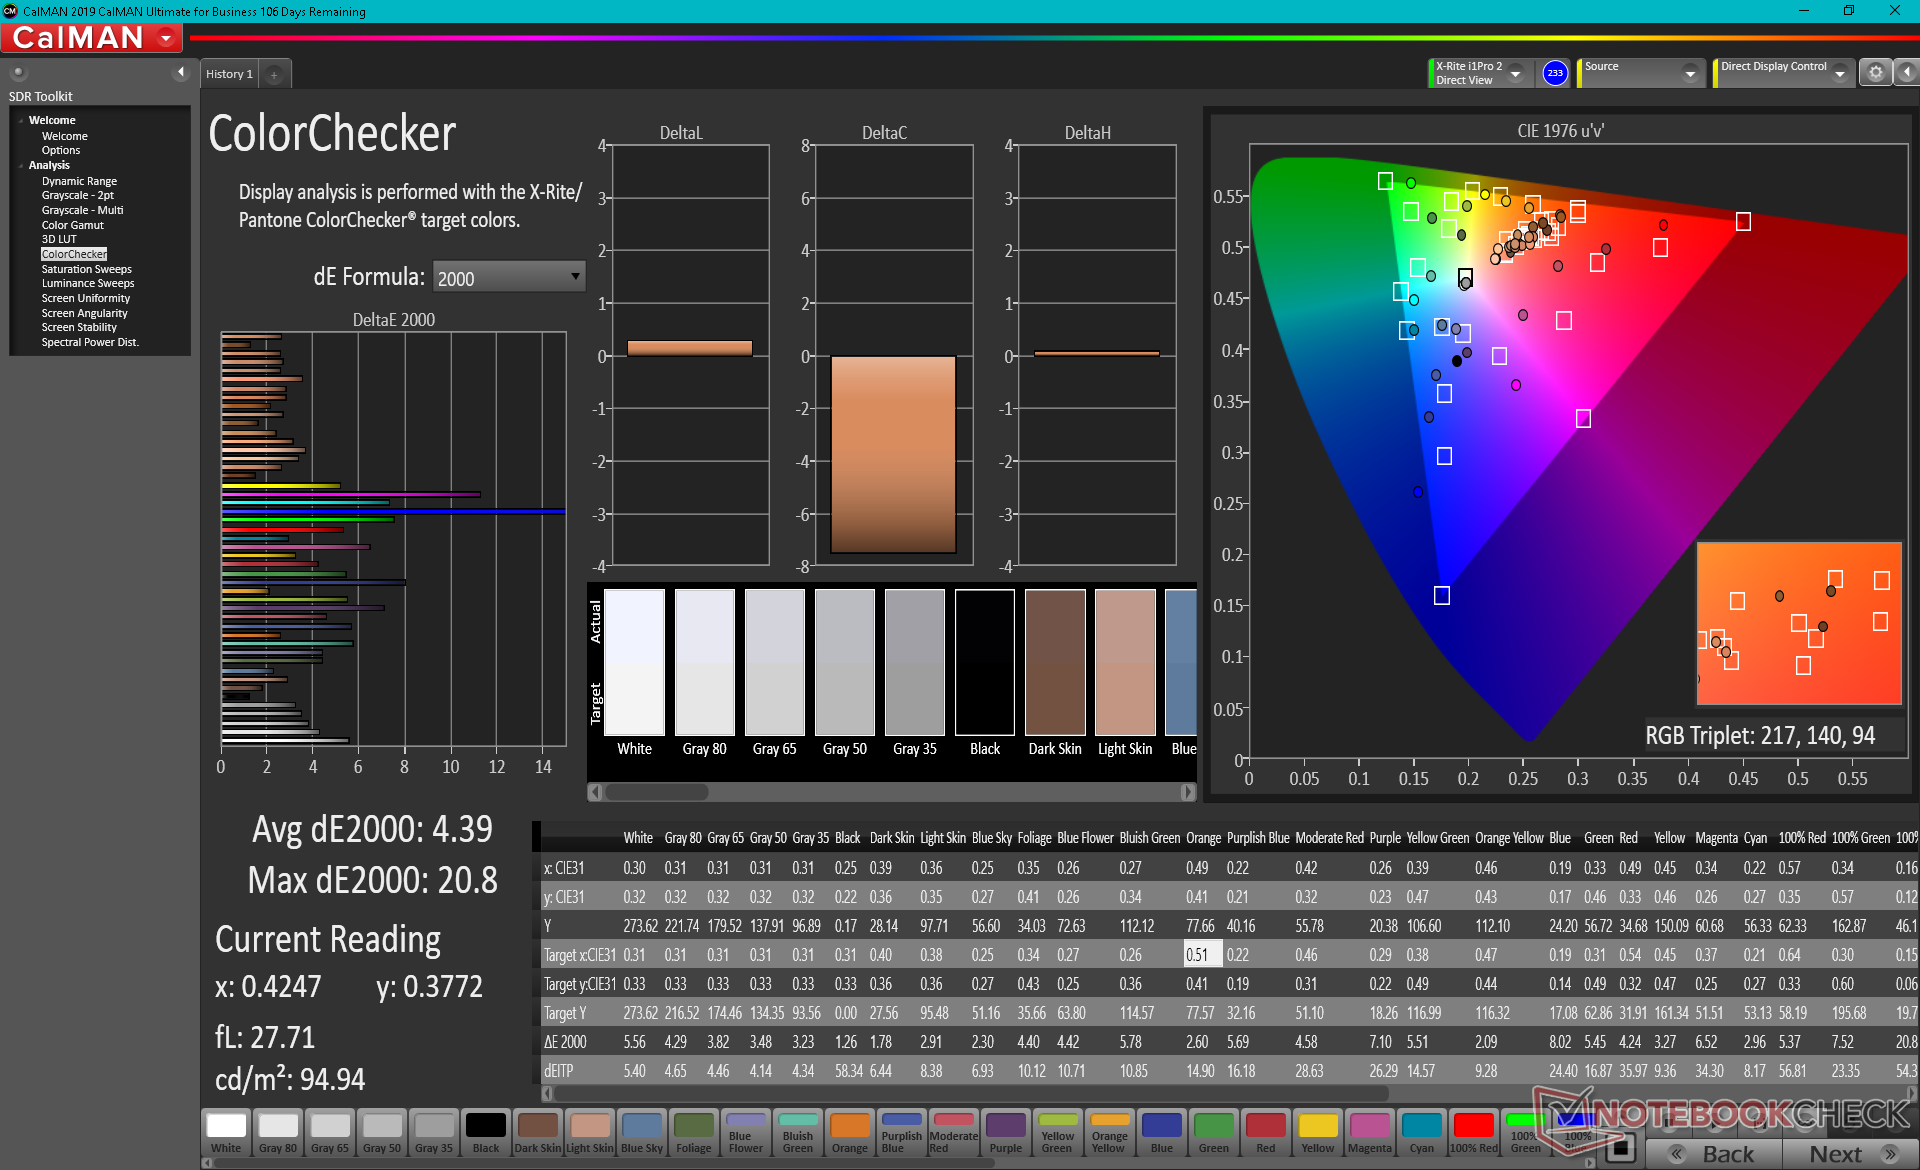
ΔE ColorChecker Calman: 4.39 | ∀{0.5-29.43 Ø4.72}
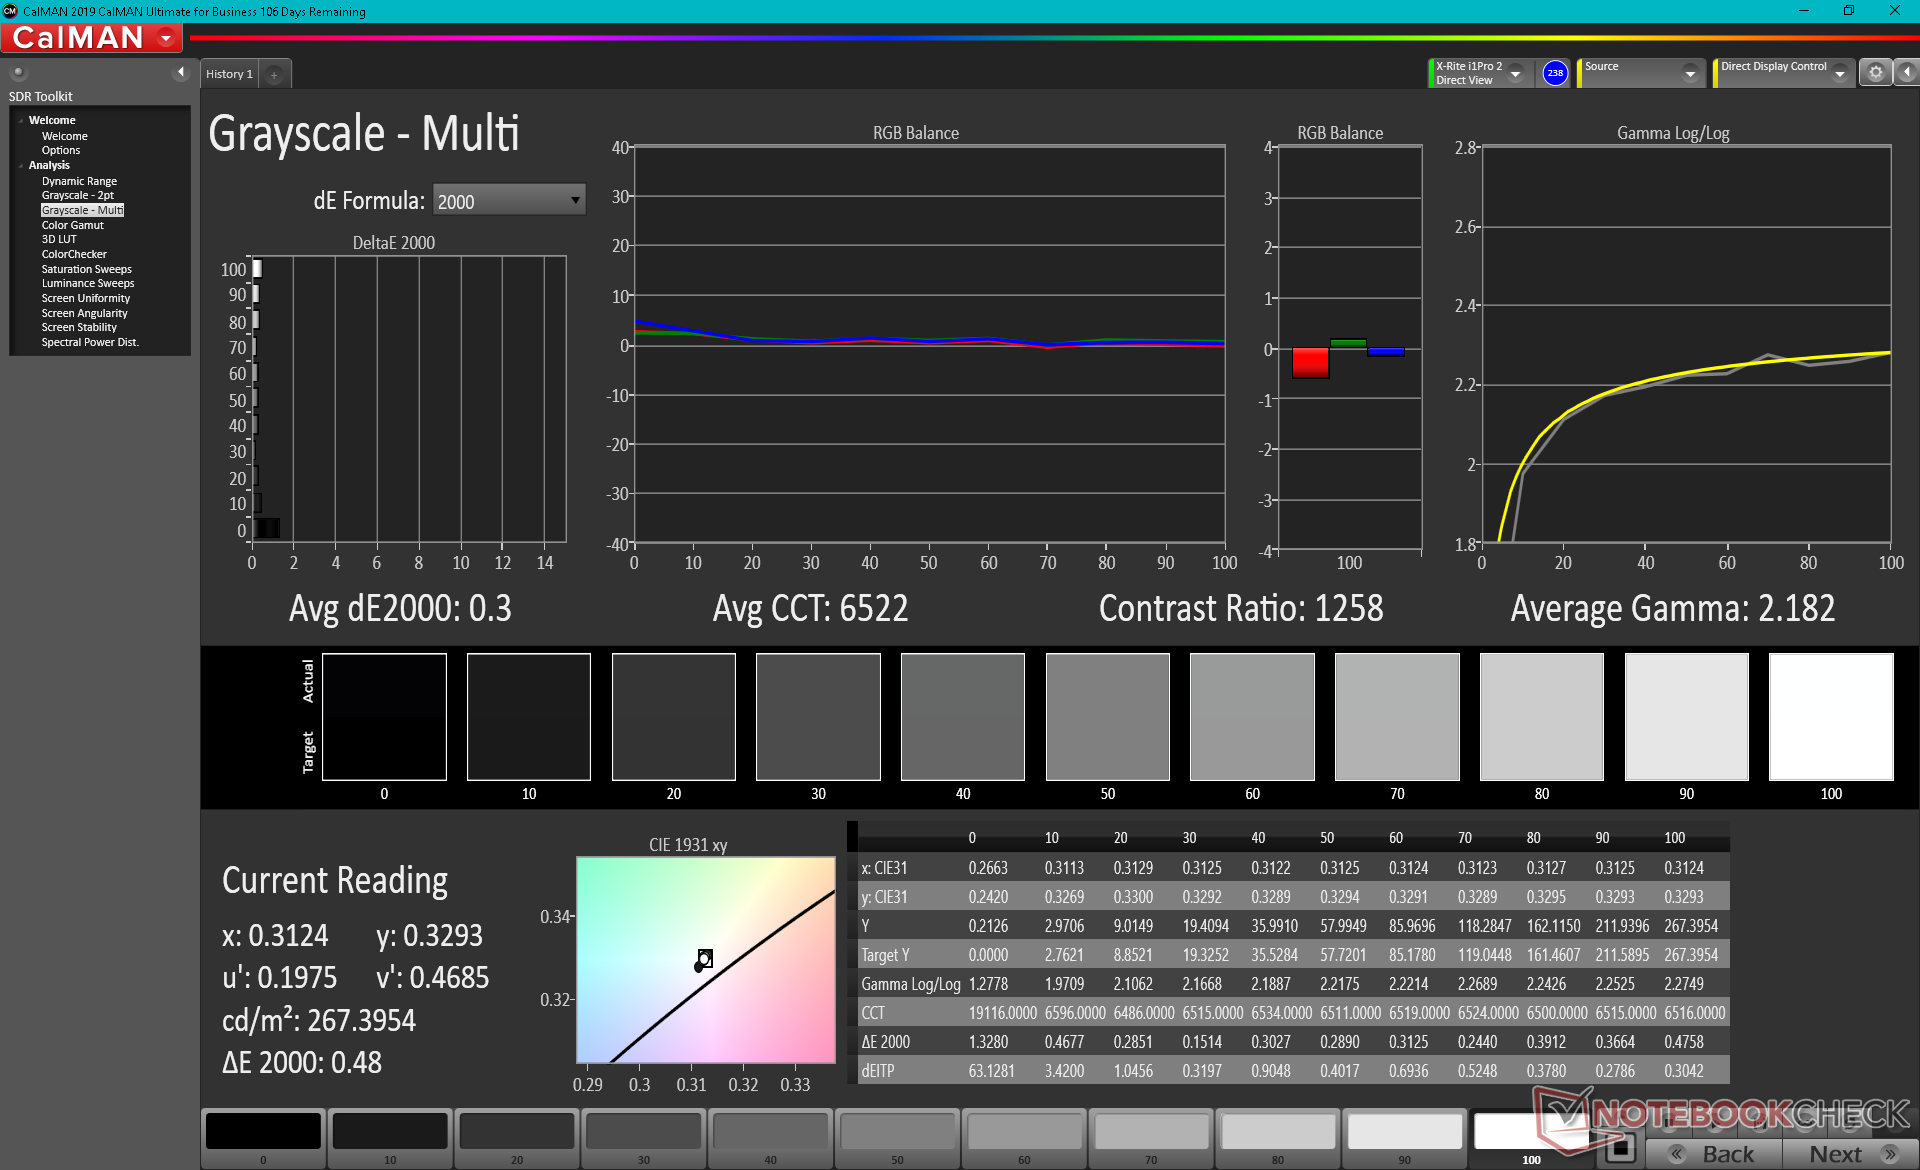
calibrated: 1.56
ΔE Greyscale Calman: 3.1 | ∀{0.09-98 Ø4.97}
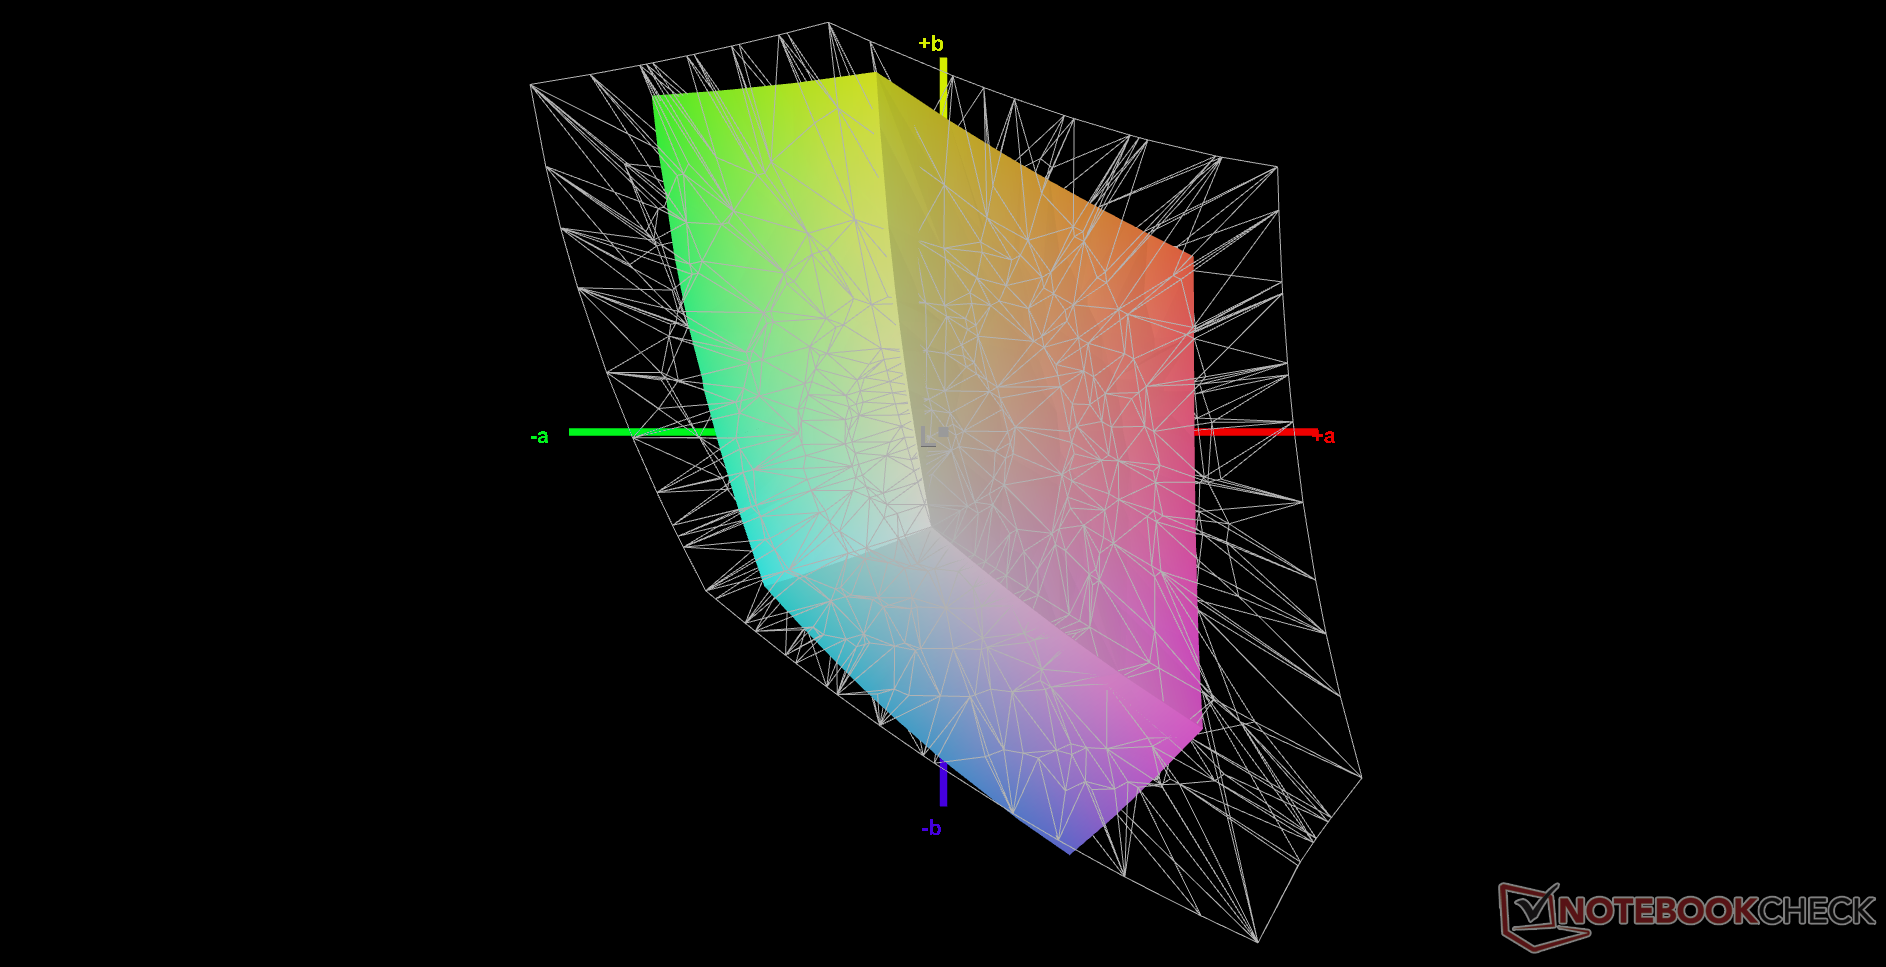
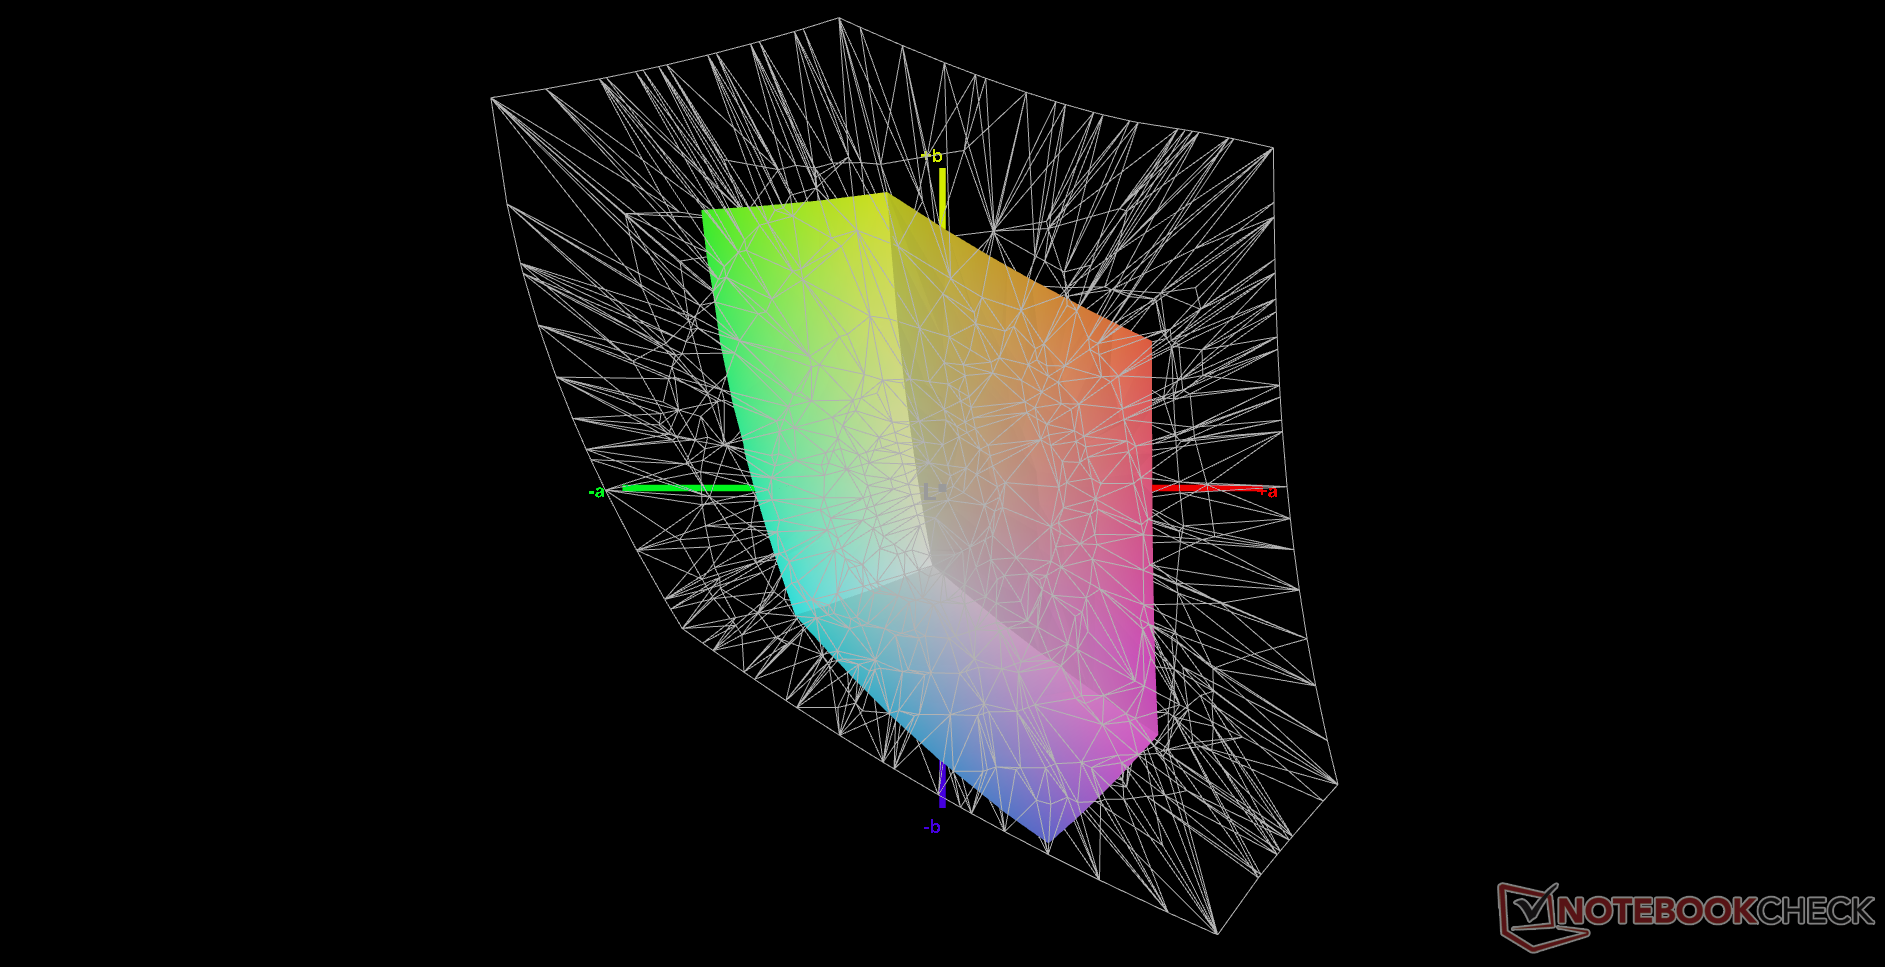
41.6% AdobeRGB 1998 (Argyll 3D)
60.3% sRGB (Argyll 3D)
40.2% Display P3 (Argyll 3D)
Gamma: 2.14
CCT: 6927 K
| Asus ROG Strix G17 G713QE-RB74 AU Optronics B173HAN04.9, IPS, 17.3", 1920x1080 | Acer Nitro 5 AN517-53-54DQ BOE NV173FHM-NX4 (BOE09B4), IPS, 17.3", 1920x1080 | MSI Katana GF76 11UE AU Optronics B173HAN04.9, IPS, 17.3", 1920x1080 | Asus Strix Scar 17 G733QSA-XS99 AU Optronics B173HAN05.4, IPS, 17.3", 1920x1080 | MSI Alpha 17 A4DEK AU Optronics AUO978F, IPS, 17.3", 1920x1080 | Asus Strix G17 G712LWS LG Philips LP173WFG-SPB3, IPS, 17.3", 1920x1080 | |
|---|---|---|---|---|---|---|
| Display | -9% | -1% | 72% | -2% | 61% | |
| Display P3 Coverage (%) | 40.2 | 36.7 -9% | 39.8 -1% | 71 77% | 39.55 -2% | 65.2 62% |
| sRGB Coverage (%) | 60.3 | 55 -9% | 59.5 -1% | 99.4 65% | 59.2 -2% | 96.8 61% |
| AdobeRGB 1998 Coverage (%) | 41.6 | 37.9 -9% | 41.12 -1% | 72.2 74% | 40.86 -2% | 66.4 60% |
| Response Times | 5% | -36% | 60% | -51% | 46% | |
| Response Time Grey 50% / Grey 80% * (ms) | 26.8 ? | 24.8 ? 7% | 36.8 ? -37% | 6.6 ? 75% | 40 ? -49% | 14.4 ? 46% |
| Response Time Black / White * (ms) | 19.2 ? | 18.8 ? 2% | 26 ? -35% | 10.8 ? 44% | 29.2 ? -52% | 10.4 ? 46% |
| PWM Frequency (Hz) | ||||||
| Screen | -23% | -18% | 16% | -21% | 5% | |
| Brightness middle (cd/m²) | 270.5 | 286 6% | 260 -4% | 303.8 12% | 254 -6% | 323 19% |
| Brightness (cd/m²) | 269 | 261 -3% | 251 -7% | 292 9% | 254 -6% | 300 12% |
| Brightness Distribution (%) | 92 | 83 -10% | 85 -8% | 85 -8% | 93 1% | 89 -3% |
| Black Level * (cd/m²) | 0.19 | 0.23 -21% | 0.26 -37% | 0.23 -21% | 0.23 -21% | 0.31 -63% |
| Contrast (:1) | 1424 | 1243 -13% | 1000 -30% | 1321 -7% | 1104 -22% | 1042 -27% |
| Colorchecker dE 2000 * | 4.39 | 4.92 -12% | 3.9 11% | 1.87 57% | 4.12 6% | 3.01 31% |
| Colorchecker dE 2000 max. * | 20.8 | 19.29 7% | 20.64 1% | 3.26 84% | 19.66 5% | 7.65 63% |
| Colorchecker dE 2000 calibrated * | 1.56 | 4.73 -203% | 3.71 -138% | 1.45 7% | 3.78 -142% | 1 36% |
| Greyscale dE 2000 * | 3.1 | 1.9 39% | 1.6 48% | 2.7 13% | 3.2 -3% | 3.8 -23% |
| Gamma | 2.14 103% | 2.175 101% | 2.068 106% | 2.26 97% | 2.179 101% | 2.154 102% |
| CCT | 6927 94% | 6782 96% | 6511 100% | 6436 101% | 6754 96% | 7507 87% |
| Color Space (Percent of AdobeRGB 1998) (%) | 65.6 | 41 | 66 | |||
| Color Space (Percent of sRGB) (%) | 99.4 | 59 | 90 | |||
| Moyenne finale (programmes/paramètres) | -9% /
-16% | -18% /
-17% | 49% /
34% | -25% /
-21% | 37% /
23% |
* ... Moindre est la valeur, meilleures sont les performances
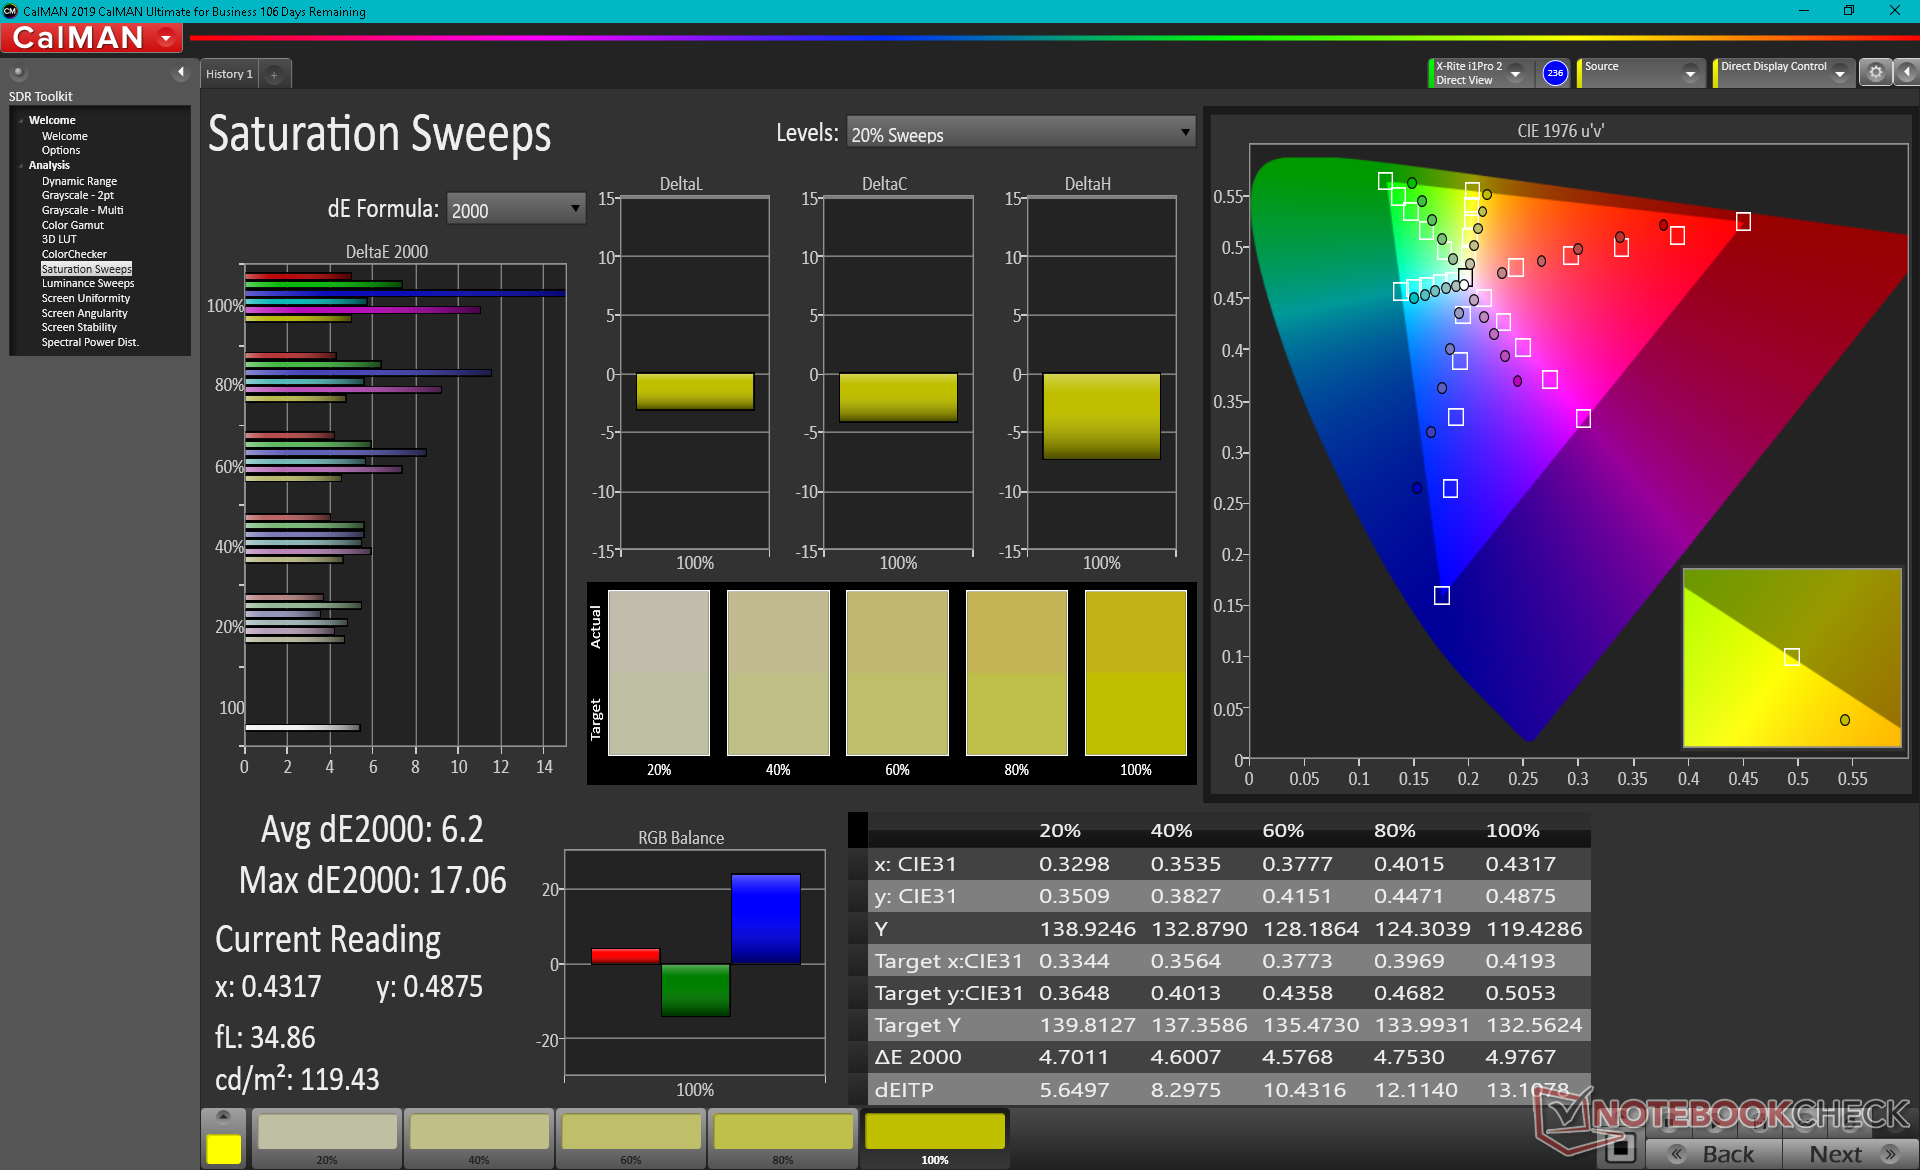
La gamme est étroite, avec seulement 60 % de sRGB, ce qui indique que cet écran n'est pas adapté à l'édition graphique professionnelle. En effet, de tels panneaux sont courants sur les ordinateurs portables de jeu à bas prix où les temps de réponse sont souvent prioritaires sur la précision des couleurs. Asus offre des panneaux plus haut de gamme avec une couverture complète de sRGB ou P3 sur cette série particulière de G713 pour couvrir toutes les bases.
Bien qu'elles ne soient pas mauvaises, les couleurs et les niveaux de gris peuvent être améliorés. En calibrant nous-mêmes l'écran, nous pourrions améliorer les valeurs DeltaE moyennes des niveaux de gris et des couleurs de 3,1 et 4,39 à seulement 0,3 et 1,56, respectivement. Néanmoins, les couleurs deviennent inévitablement beaucoup plus imprécises à des niveaux de saturation plus élevés en raison de l'espace colorimétrique limité mentionné ci-dessus.
Temps de réponse de l'écran
| ↔ Temps de réponse noir à blanc | ||
|---|---|---|
| 19.2 ms ... hausse ↗ et chute ↘ combinées | ↗ 10.8 ms hausse | 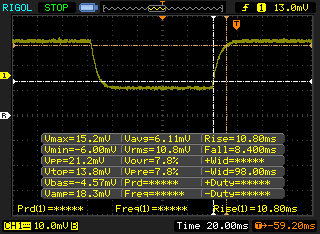 |
| ↘ 8.4 ms chute | ||
| L'écran montre de bons temps de réponse, mais insuffisant pour du jeu compétitif. En comparaison, tous les appareils testés affichent entre 0.1 (minimum) et 240 (maximum) ms. » 43 % des appareils testés affichent de meilleures performances. Cela signifie que les latences relevées sont similaires à la moyenne (19.8 ms) de tous les appareils testés. | ||
| ↔ Temps de réponse gris 50% à gris 80% | ||
| 26.8 ms ... hausse ↗ et chute ↘ combinées | ↗ 14 ms hausse | 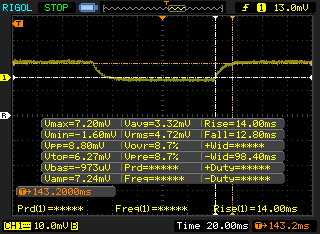 |
| ↘ 12.8 ms chute | ||
| L'écran souffre de latences relativement élevées, insuffisant pour le jeu. En comparaison, tous les appareils testés affichent entre 0.165 (minimum) et 636 (maximum) ms. » 37 % des appareils testés affichent de meilleures performances. Cela signifie que les latences relevées sont meilleures que la moyenne (31 ms) de tous les appareils testés. | ||
Scintillement / MLI (Modulation de largeur d'impulsion)
| Scintillement / MLI (Modulation de largeur d'impulsion) non décelé |  | ||
En comparaison, 52 % des appareils testés n'emploient pas MDI pour assombrir leur écran. Nous avons relevé une moyenne à 7778 (minimum : 5 - maximum : 343500) Hz dans le cas où une MDI était active. | |||
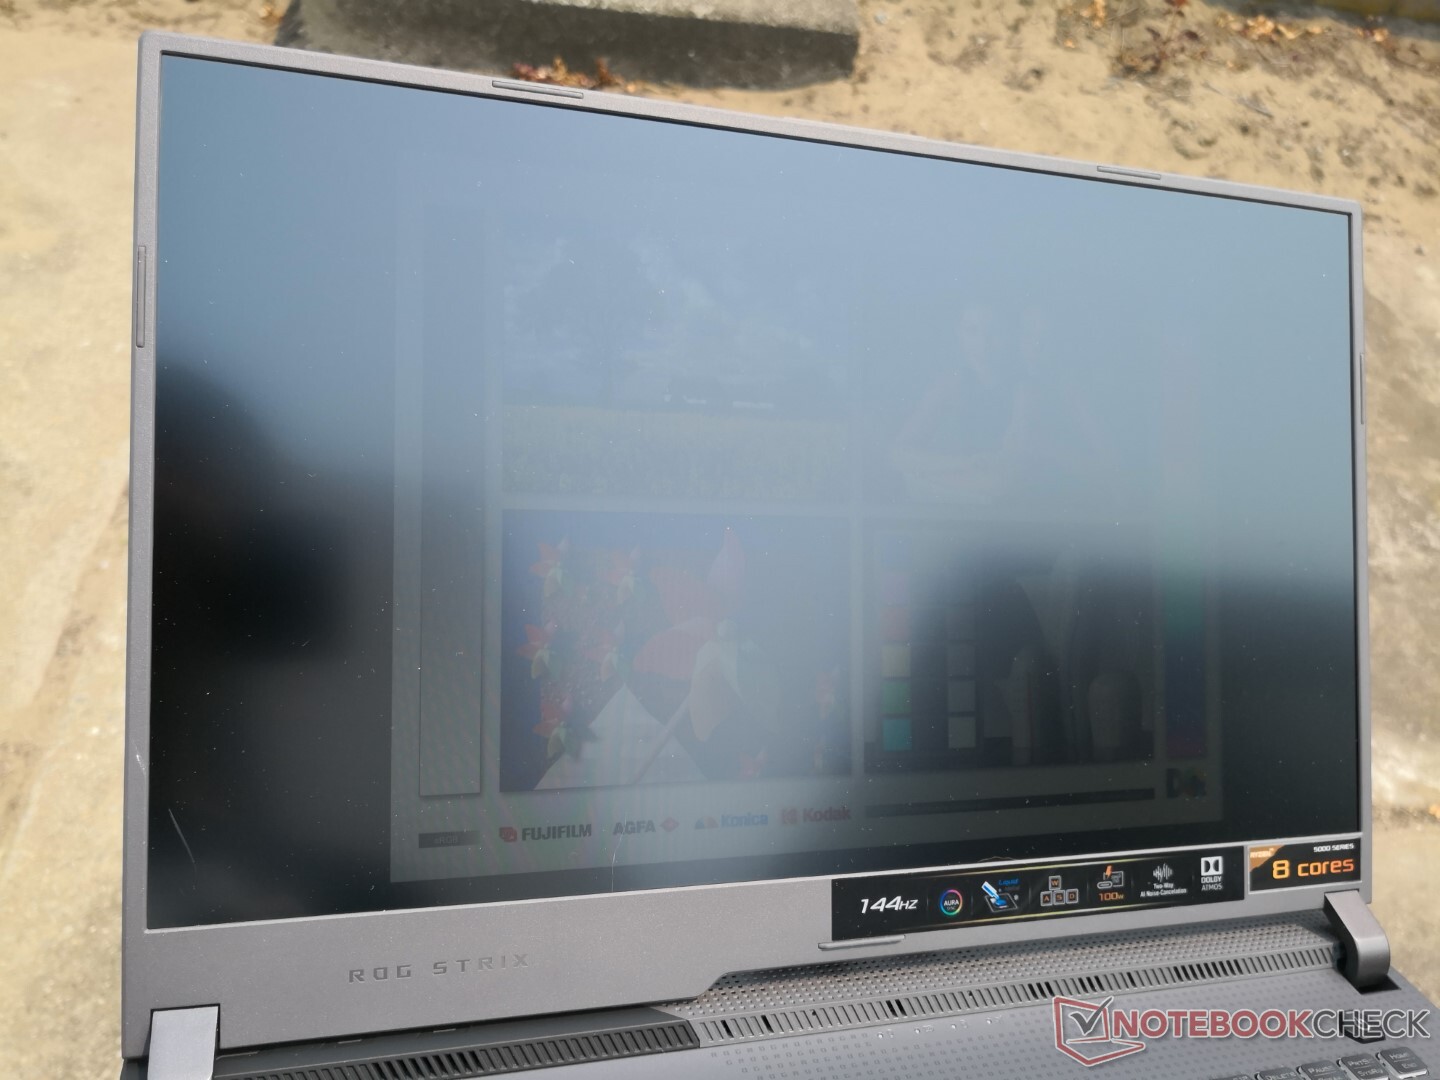
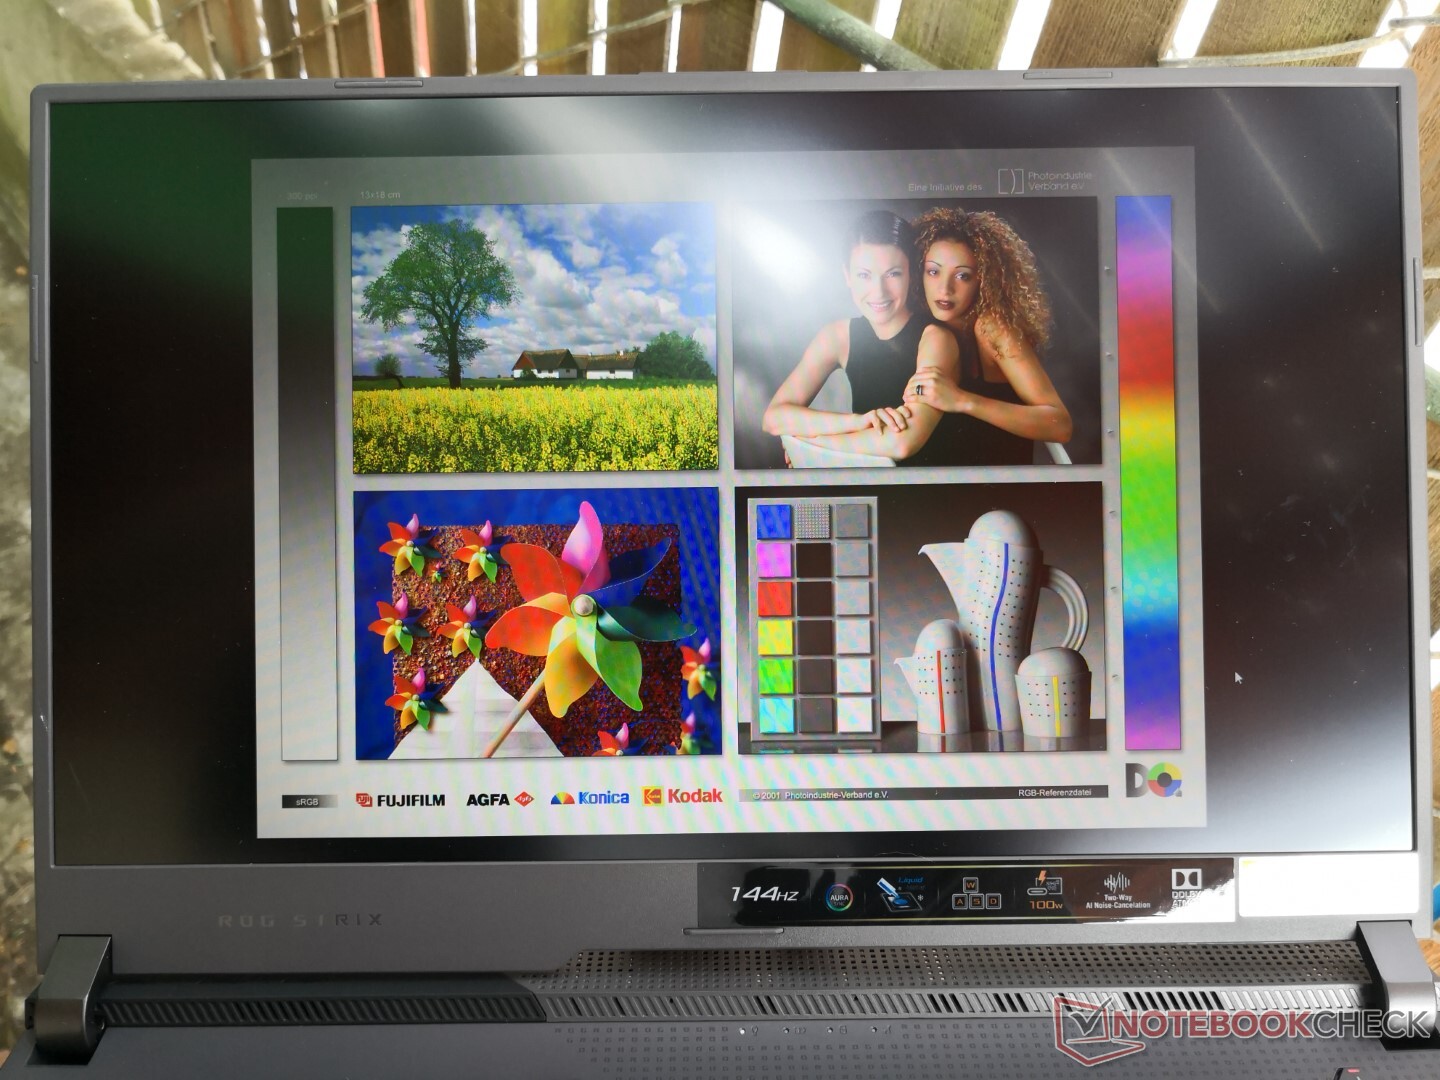
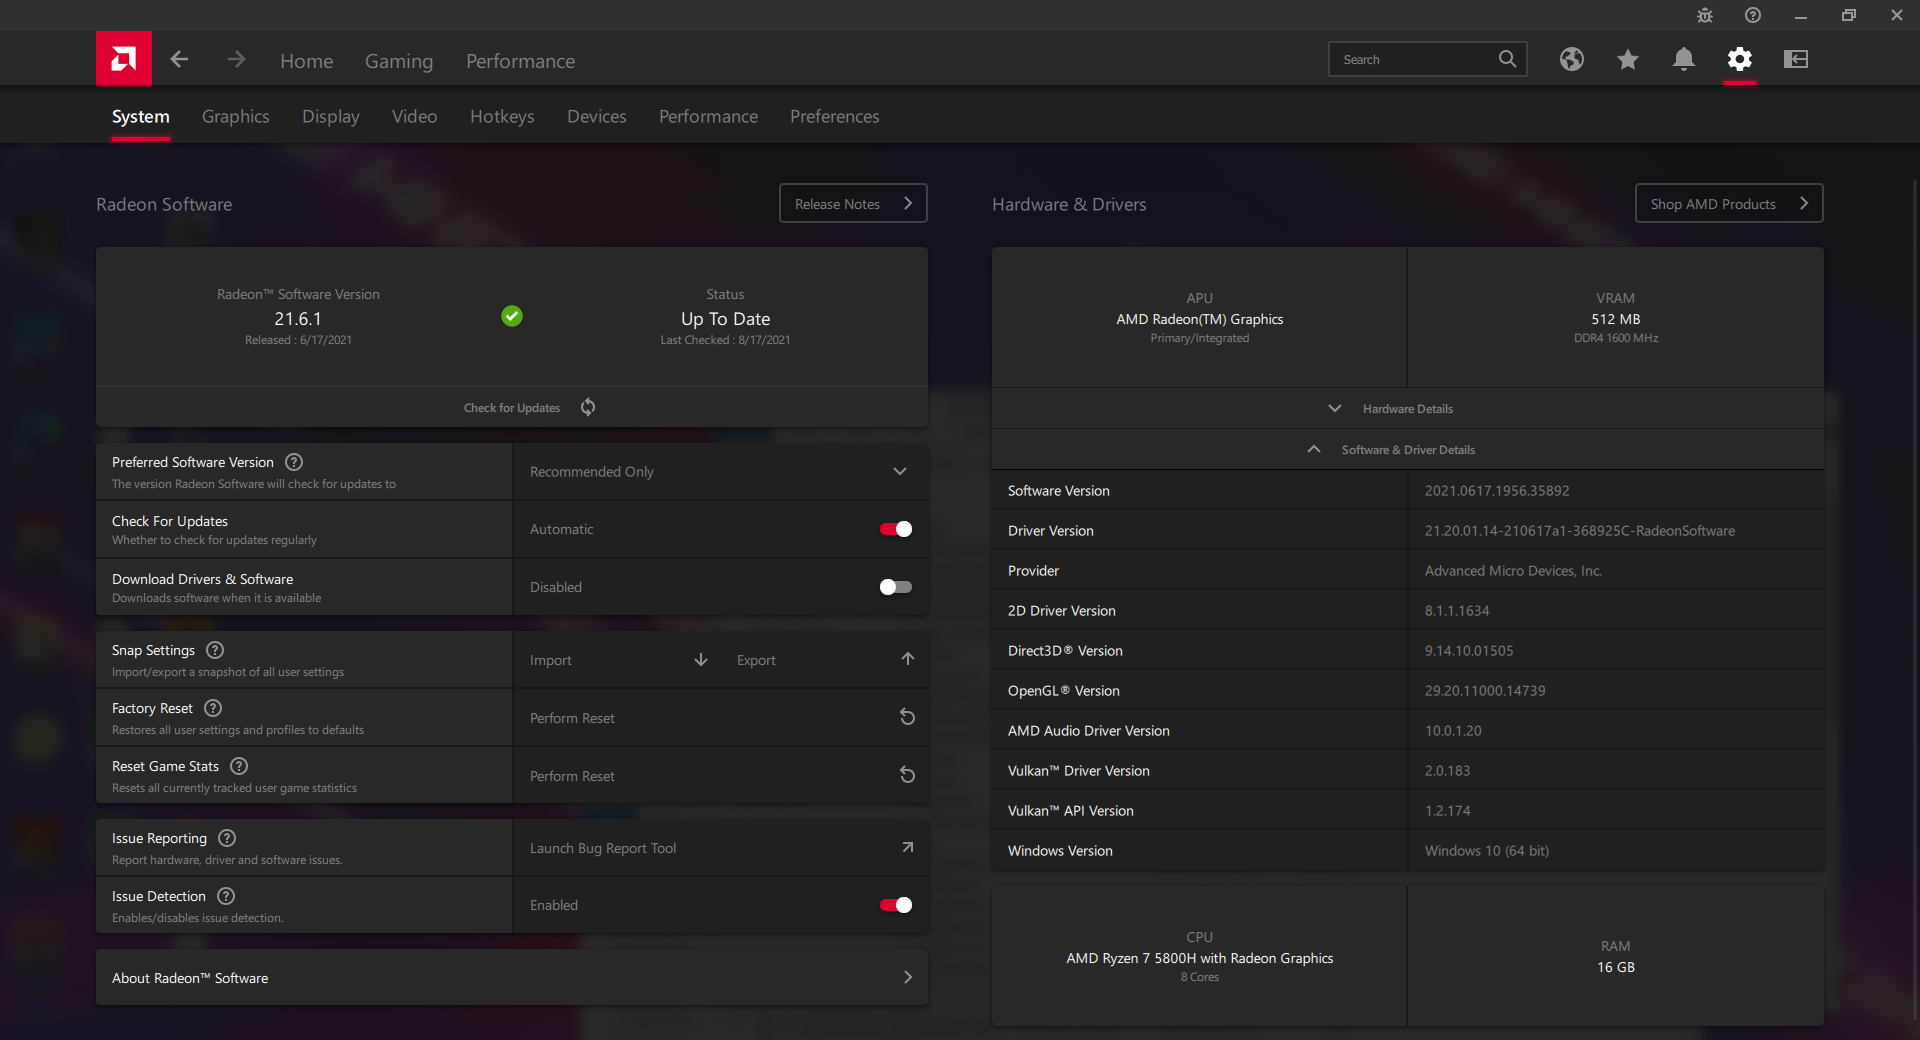
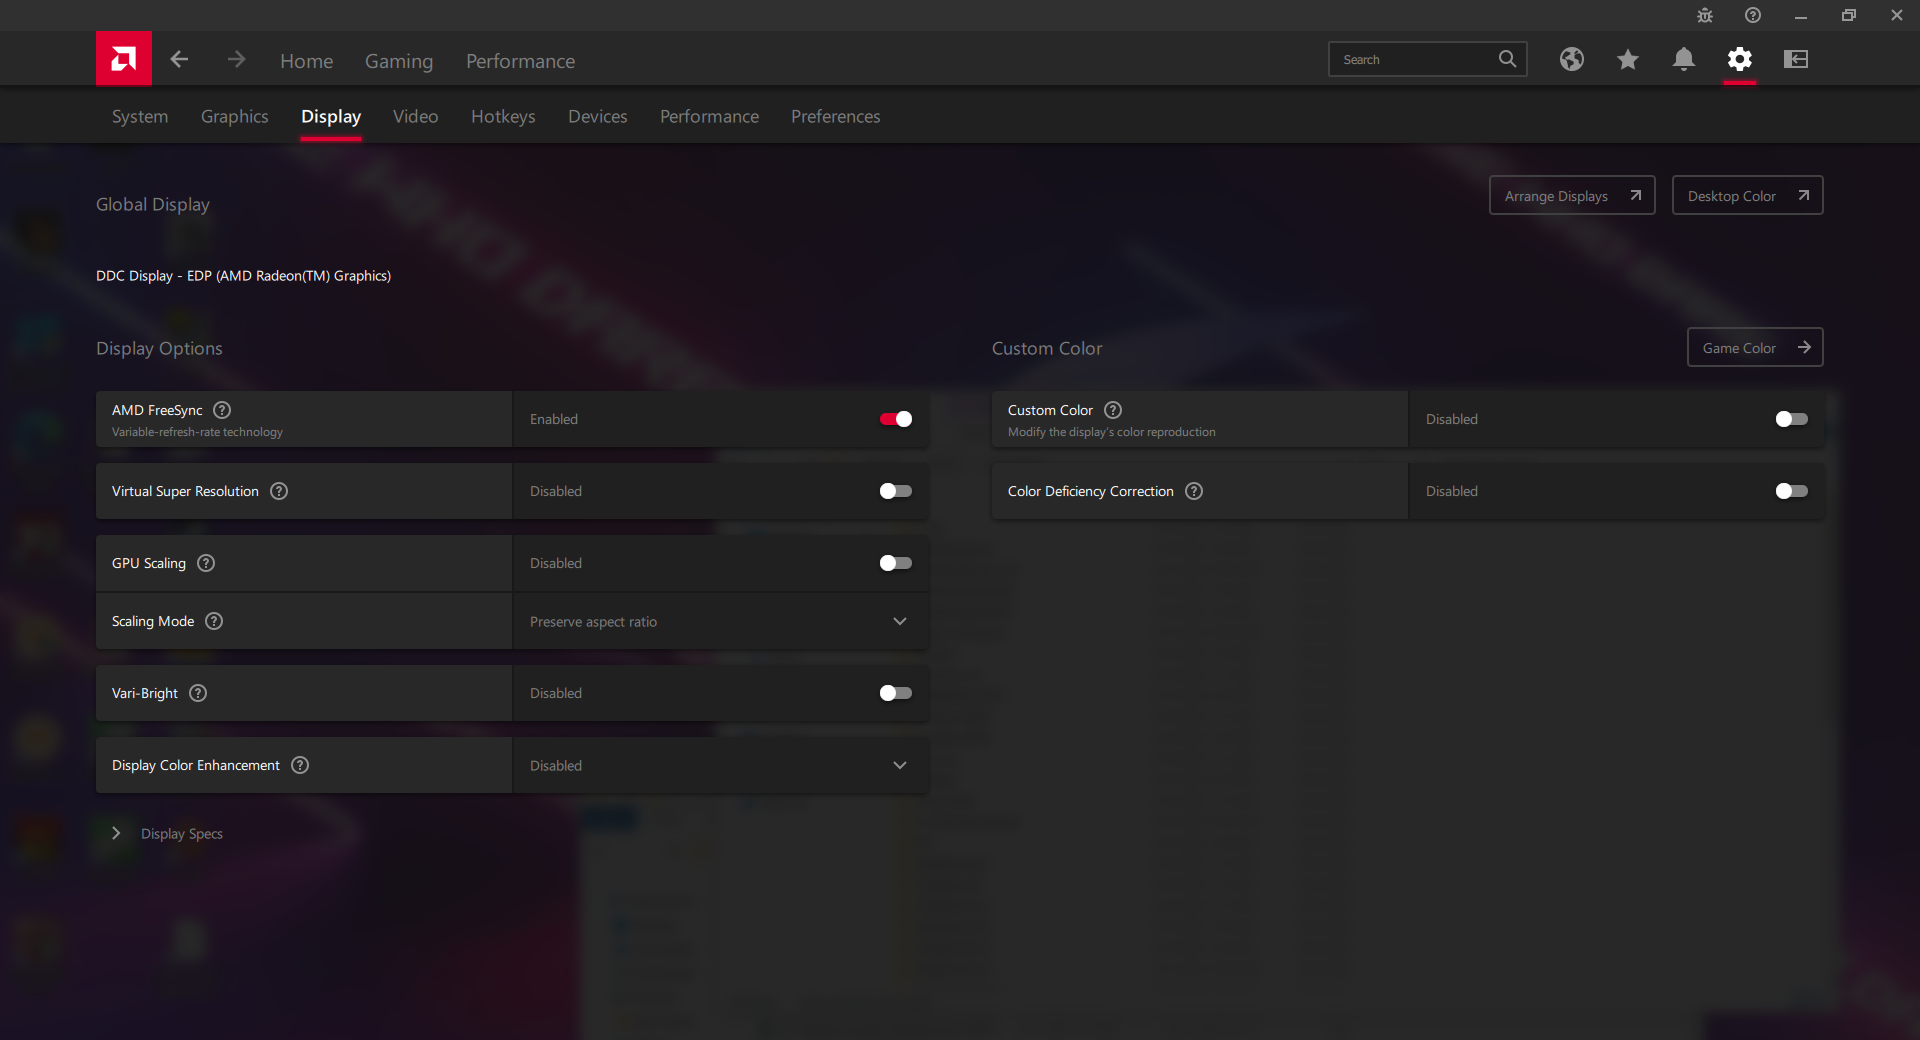
La luminosité maximale est dans la moyenne pour un ordinateur portable de jeu de 17,3 pouces et la visibilité extérieure n'a rien de spécial sur le G713. N'oubliez pas de désactiver la fonction Vari-Bright d'AMD par le biais du logiciel Radeon d'AMD, sinon la luminosité maximale tombera à 175 nits seulement sur batterie.
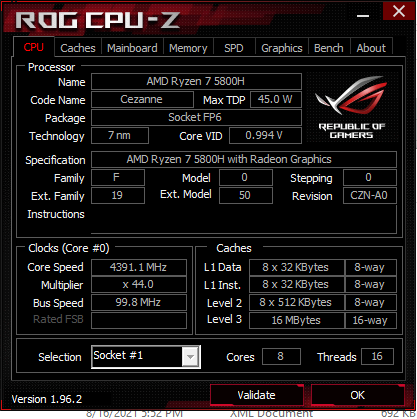
Performances - Processeur de niveau Core i9
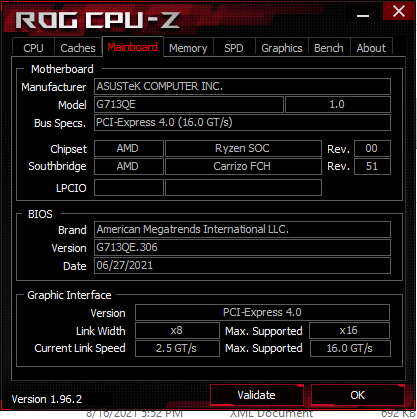
Toutes les configurations G713 sont pour l'instant équipées de processeurs AMD, pour le meilleur et pour le pire. Si les séries Zen 2 et Zen 3 peuvent souvent surpasser les meilleurs processeurs Core-H d'Intel, elles ne prennent pas en charge PCIe 4 et Thunderbolt 4, ce qui peut irriter certains joueurs.
Côté graphisme, les GPU vont de la GeForce GTX 1650 à la RTX 3070 pour répondre à un très large éventail de budgets. Les fonctions Resizable Bar et FreeSync sont prises en charge, tandis que Advanced Optimus ne l'est pas. Un interrupteur manuel pour désactiver le GPU Nvidia discret peut être trouvé dans le logiciel Asus Armoury Crate.
Notre appareil a été réglé en mode Turbo avant d'exécuter les tests de performance ci-dessous pour obtenir les meilleurs résultats possibles.
Processeur
Les performances brutes du processeur sont excellentes pour rivaliser avec les processeurs Core i9 11th gen Tiger Lake-H d'Intel. Les processeurs concurrents Core i9-11900Hpar exemple, offre des performances multithread similaires mais des performances single-thread légèrement plus rapides, comme d'habitude lorsque l'on compare les processeurs Intel et AMD. D'une génération à l'autre, le Ryzen 7 5800H est à peine plus rapide que le Ryzen 7 4800H puisque la série Zen 2 H était déjà un énorme bond en avant par rapport au Ryzen 7 3750H
La durabilité des performances est également excellente, sans baisse des scores au fil du temps lors de l'exécution de CineBench R15 xT en boucle continue. Cependant, il est difficile de recommander le Ryzen 9 5900HX par rapport au Ryzen 7 5800H car leurs performances sont presque identiques.
Cinebench R15 Multi Loop
Cinebench R23: Multi Core | Single Core
Cinebench R15: CPU Multi 64Bit | CPU Single 64Bit
Blender: v2.79 BMW27 CPU
7-Zip 18.03: 7z b 4 -mmt1 | 7z b 4
Geekbench 5.5: Single-Core | Multi-Core
HWBOT x265 Benchmark v2.2: 4k Preset
LibreOffice : 20 Documents To PDF
R Benchmark 2.5: Overall mean
| Cinebench R23 / Multi Core | |
| Asus Strix Scar 17 G733QSA-XS99 | |
| Asus ROG Strix G17 G713QE-RB74 | |
| Asus ROG Zephyrus S17 GX703HSD | |
| Acer Nitro 5 AN517-41-R9S5 | |
| Moyenne AMD Ryzen 7 5800H (8812 - 13214, n=29) | |
| Medion Erazer Beast X20 | |
| Huawei MateBook D 16-53011VFJ | |
| Cinebench R23 / Single Core | |
| Asus ROG Zephyrus S17 GX703HSD | |
| Asus Strix Scar 17 G733QSA-XS99 | |
| Acer Nitro 5 AN517-41-R9S5 | |
| Asus ROG Strix G17 G713QE-RB74 | |
| Moyenne AMD Ryzen 7 5800H (1294 - 1441, n=29) | |
| Medion Erazer Beast X20 | |
| Huawei MateBook D 16-53011VFJ | |
Cinebench R23: Multi Core | Single Core
Cinebench R15: CPU Multi 64Bit | CPU Single 64Bit
Blender: v2.79 BMW27 CPU
7-Zip 18.03: 7z b 4 -mmt1 | 7z b 4
Geekbench 5.5: Single-Core | Multi-Core
HWBOT x265 Benchmark v2.2: 4k Preset
LibreOffice : 20 Documents To PDF
R Benchmark 2.5: Overall mean
* ... Moindre est la valeur, meilleures sont les performances
Performance du système
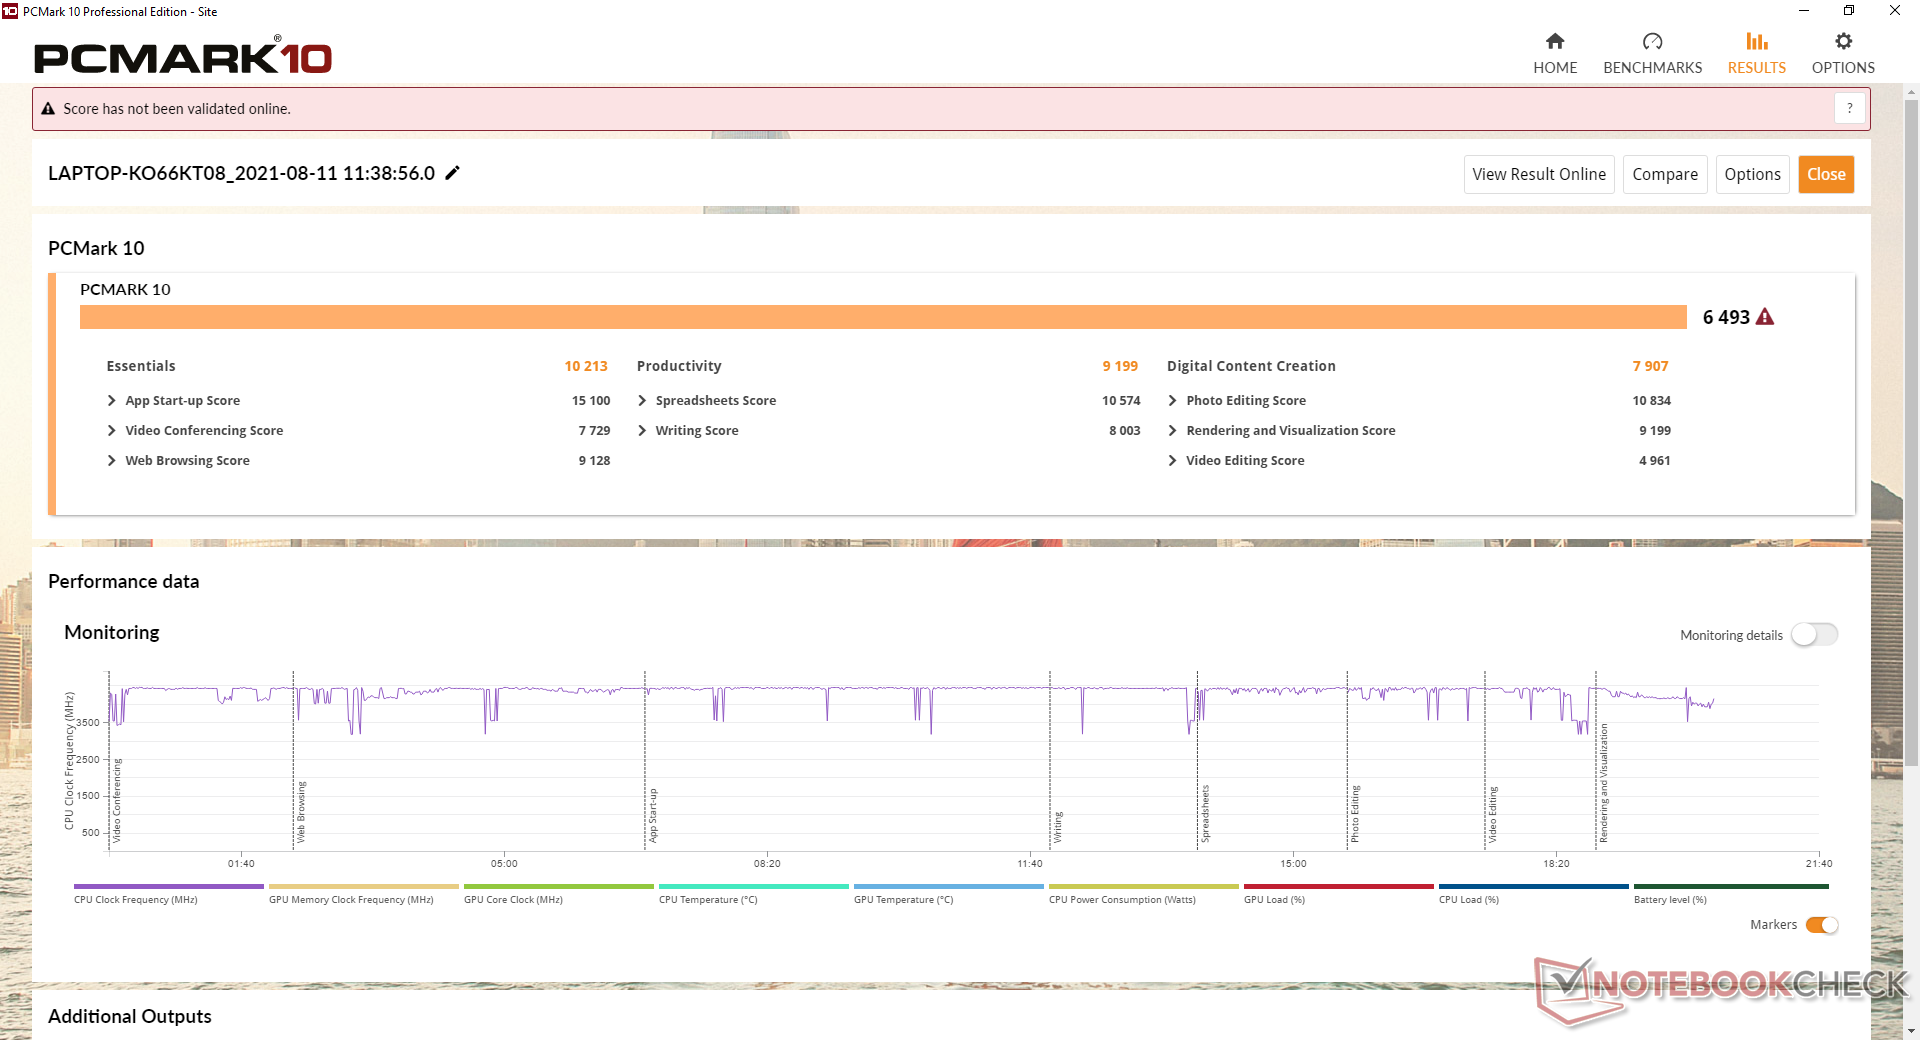
Les résultats de PCMark 10 sont légèrement plus élevés que prévu, probablement en raison du CPU Ryzen 7 très rapide, mais la RTX 3050 Ti plus lente fait tout tomber. Au moins les résultats sont constamment plus élevés que le MSI Alpha 17 alimenté uniquement par du matériel AMD.
| PCMark 10 / Score | |
| Asus Strix Scar 17 G733QSA-XS99 | |
| MSI Katana GF76 11UE | |
| Asus ROG Strix G17 G713QE-RB74 | |
| Moyenne AMD Ryzen 7 5800H, NVIDIA GeForce RTX 3050 Ti Laptop GPU (6098 - 6493, n=2) | |
| MSI Alpha 17 A4DEK | |
| Acer Nitro 5 AN517-53-54DQ | |
| Asus Strix G17 G712LWS | |
| PCMark 10 / Essentials | |
| Asus Strix Scar 17 G733QSA-XS99 | |
| Asus ROG Strix G17 G713QE-RB74 | |
| Moyenne AMD Ryzen 7 5800H, NVIDIA GeForce RTX 3050 Ti Laptop GPU (9631 - 10213, n=2) | |
| MSI Katana GF76 11UE | |
| Asus Strix G17 G712LWS | |
| Acer Nitro 5 AN517-53-54DQ | |
| MSI Alpha 17 A4DEK | |
| PCMark 10 / Productivity | |
| Asus Strix Scar 17 G733QSA-XS99 | |
| Asus ROG Strix G17 G713QE-RB74 | |
| Moyenne AMD Ryzen 7 5800H, NVIDIA GeForce RTX 3050 Ti Laptop GPU (8625 - 9199, n=2) | |
| MSI Katana GF76 11UE | |
| Acer Nitro 5 AN517-53-54DQ | |
| Asus Strix G17 G712LWS | |
| MSI Alpha 17 A4DEK | |
| PCMark 10 / Digital Content Creation | |
| Asus Strix Scar 17 G733QSA-XS99 | |
| MSI Katana GF76 11UE | |
| MSI Alpha 17 A4DEK | |
| Asus ROG Strix G17 G713QE-RB74 | |
| Moyenne AMD Ryzen 7 5800H, NVIDIA GeForce RTX 3050 Ti Laptop GPU (7408 - 7907, n=2) | |
| Acer Nitro 5 AN517-53-54DQ | |
| Asus Strix G17 G712LWS | |
| PCMark 10 Score | 6493 points | |
Aide | ||
Latence DPC
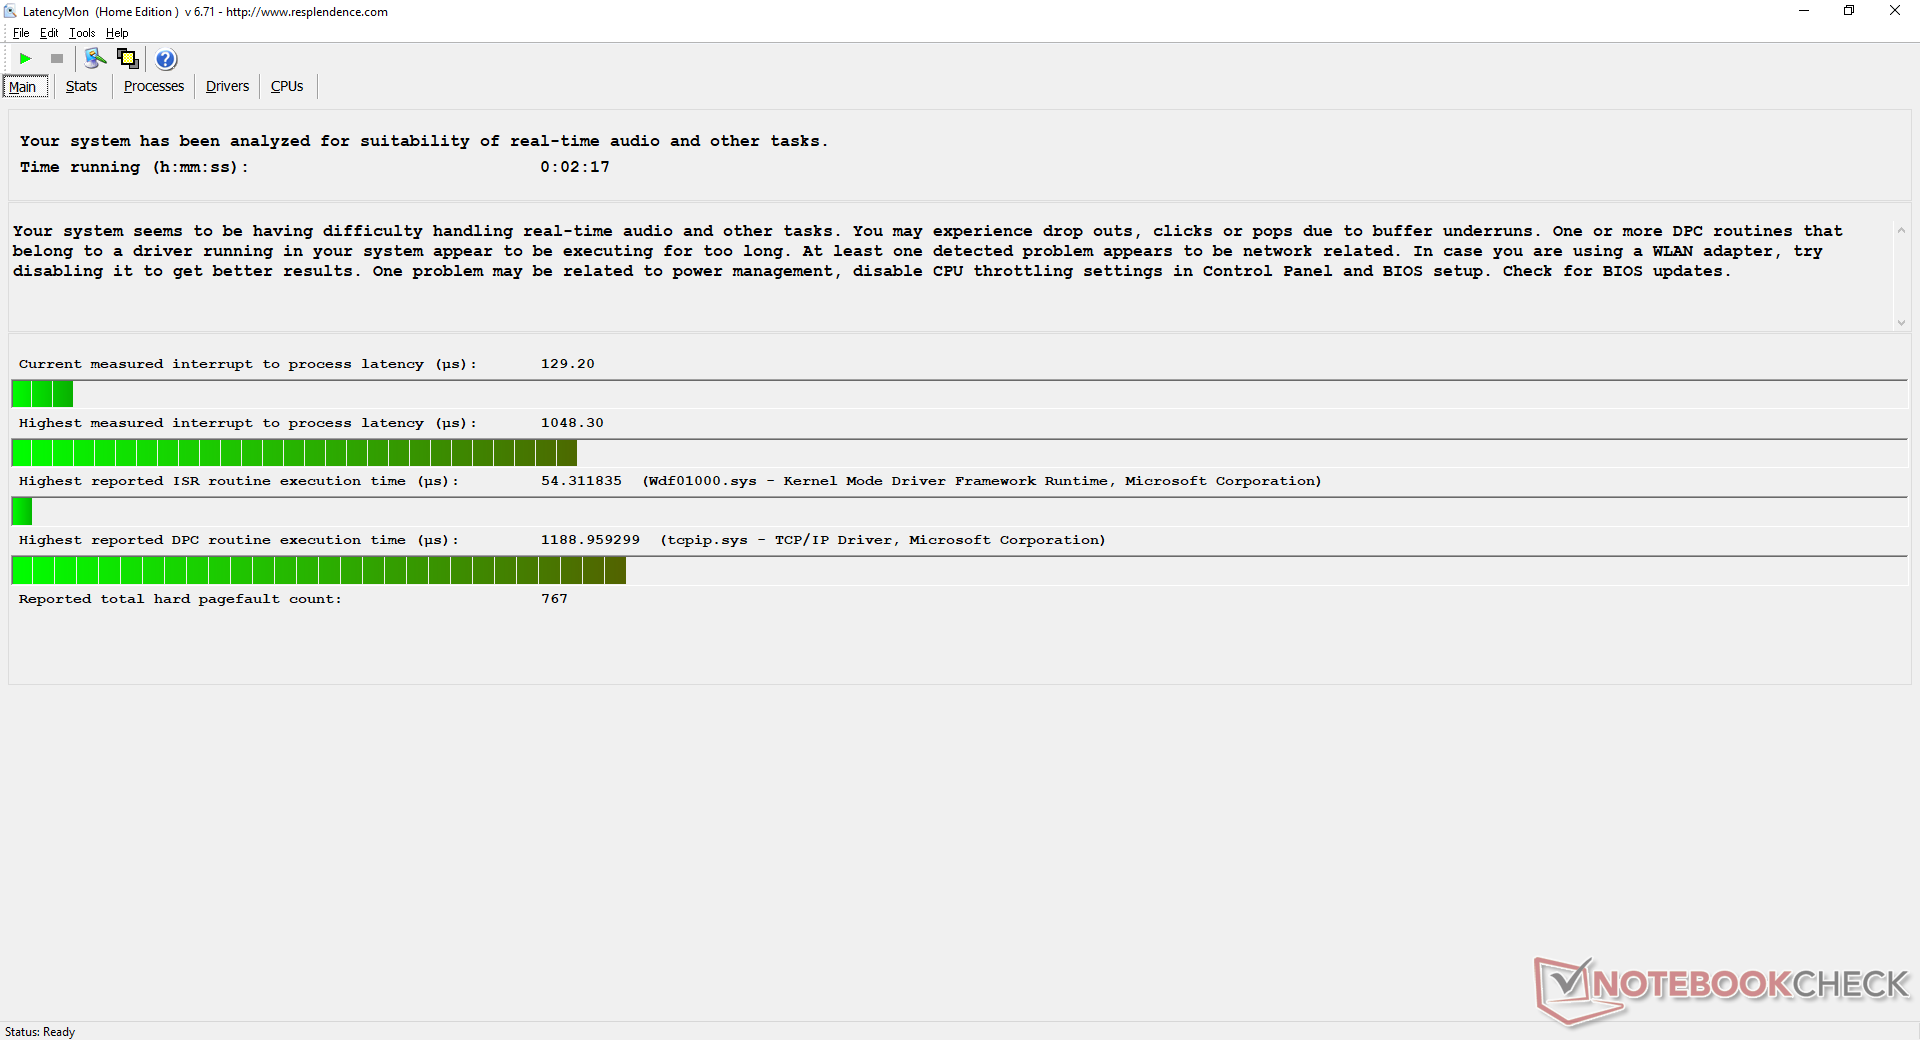
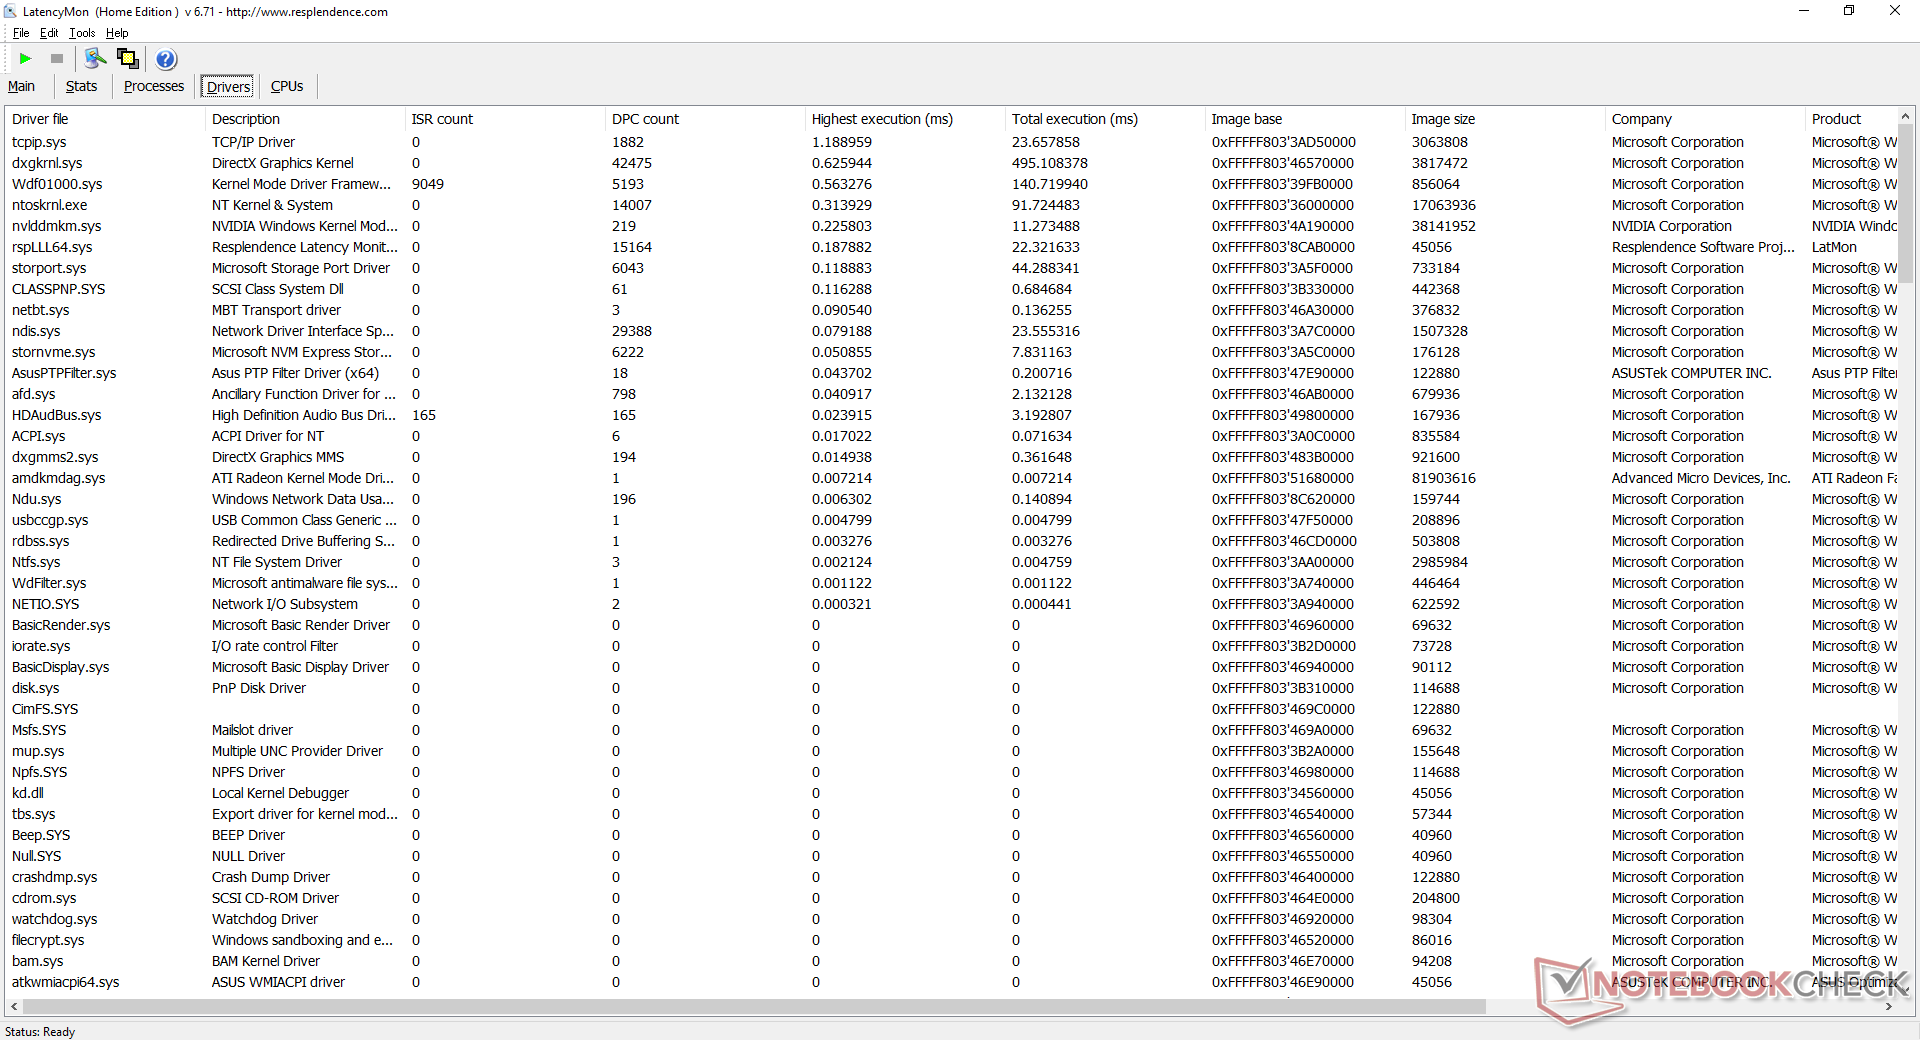
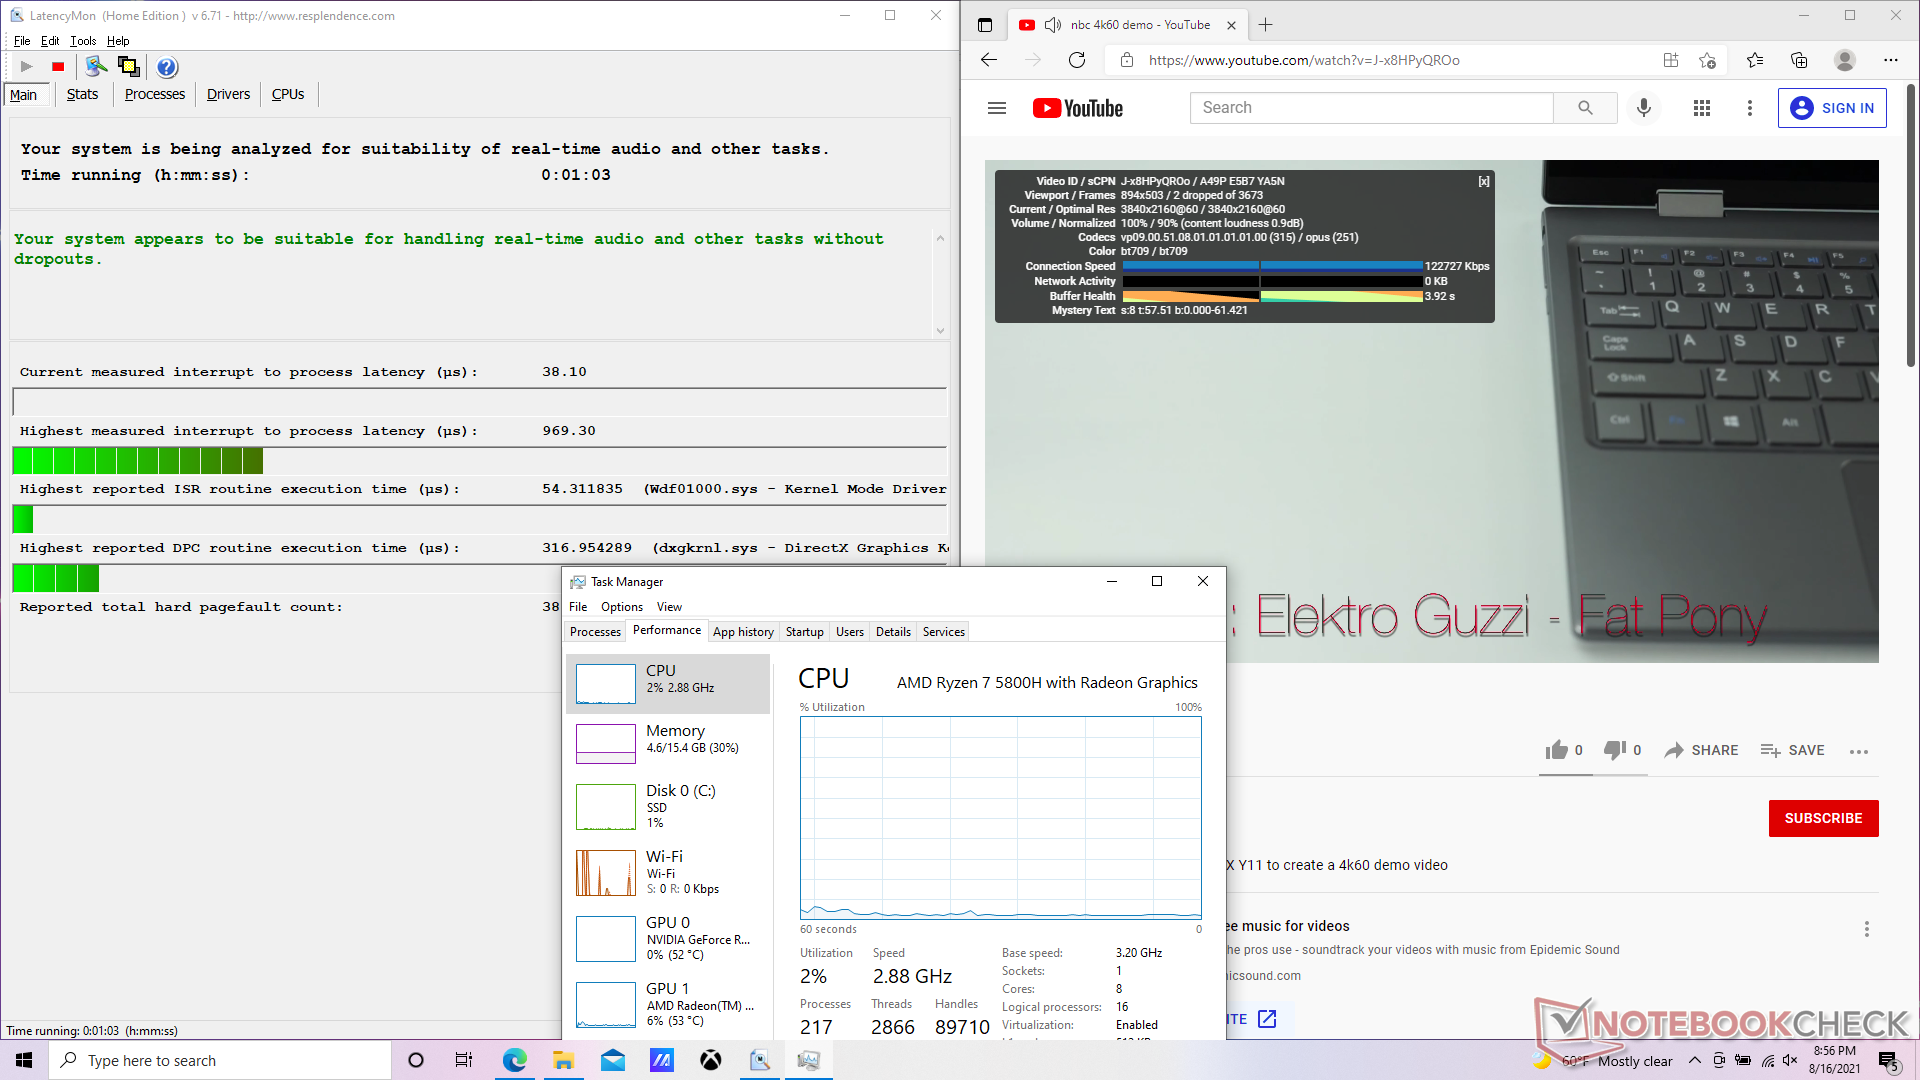
LatencyMon montre des problèmes de latence mineurs lors de l'ouverture de plusieurs onglets de navigateur sur notre page d'accueil. La lecture de vidéos 4K à 60 FPS est autrement fluide avec seulement 2 images perdues pendant notre vidéo de test d'une minute.
| DPC Latencies / LatencyMon - interrupt to process latency (max), Web, Youtube, Prime95 | |
| MSI Alpha 17 A4DEK | |
| MSI Katana GF76 11UE | |
| Asus Strix G17 G712LWS | |
| Acer Nitro 5 AN517-53-54DQ | |
| Asus ROG Strix G17 G713QE-RB74 | |
| Asus Strix Scar 17 G733QSA-XS99 | |
* ... Moindre est la valeur, meilleures sont les performances
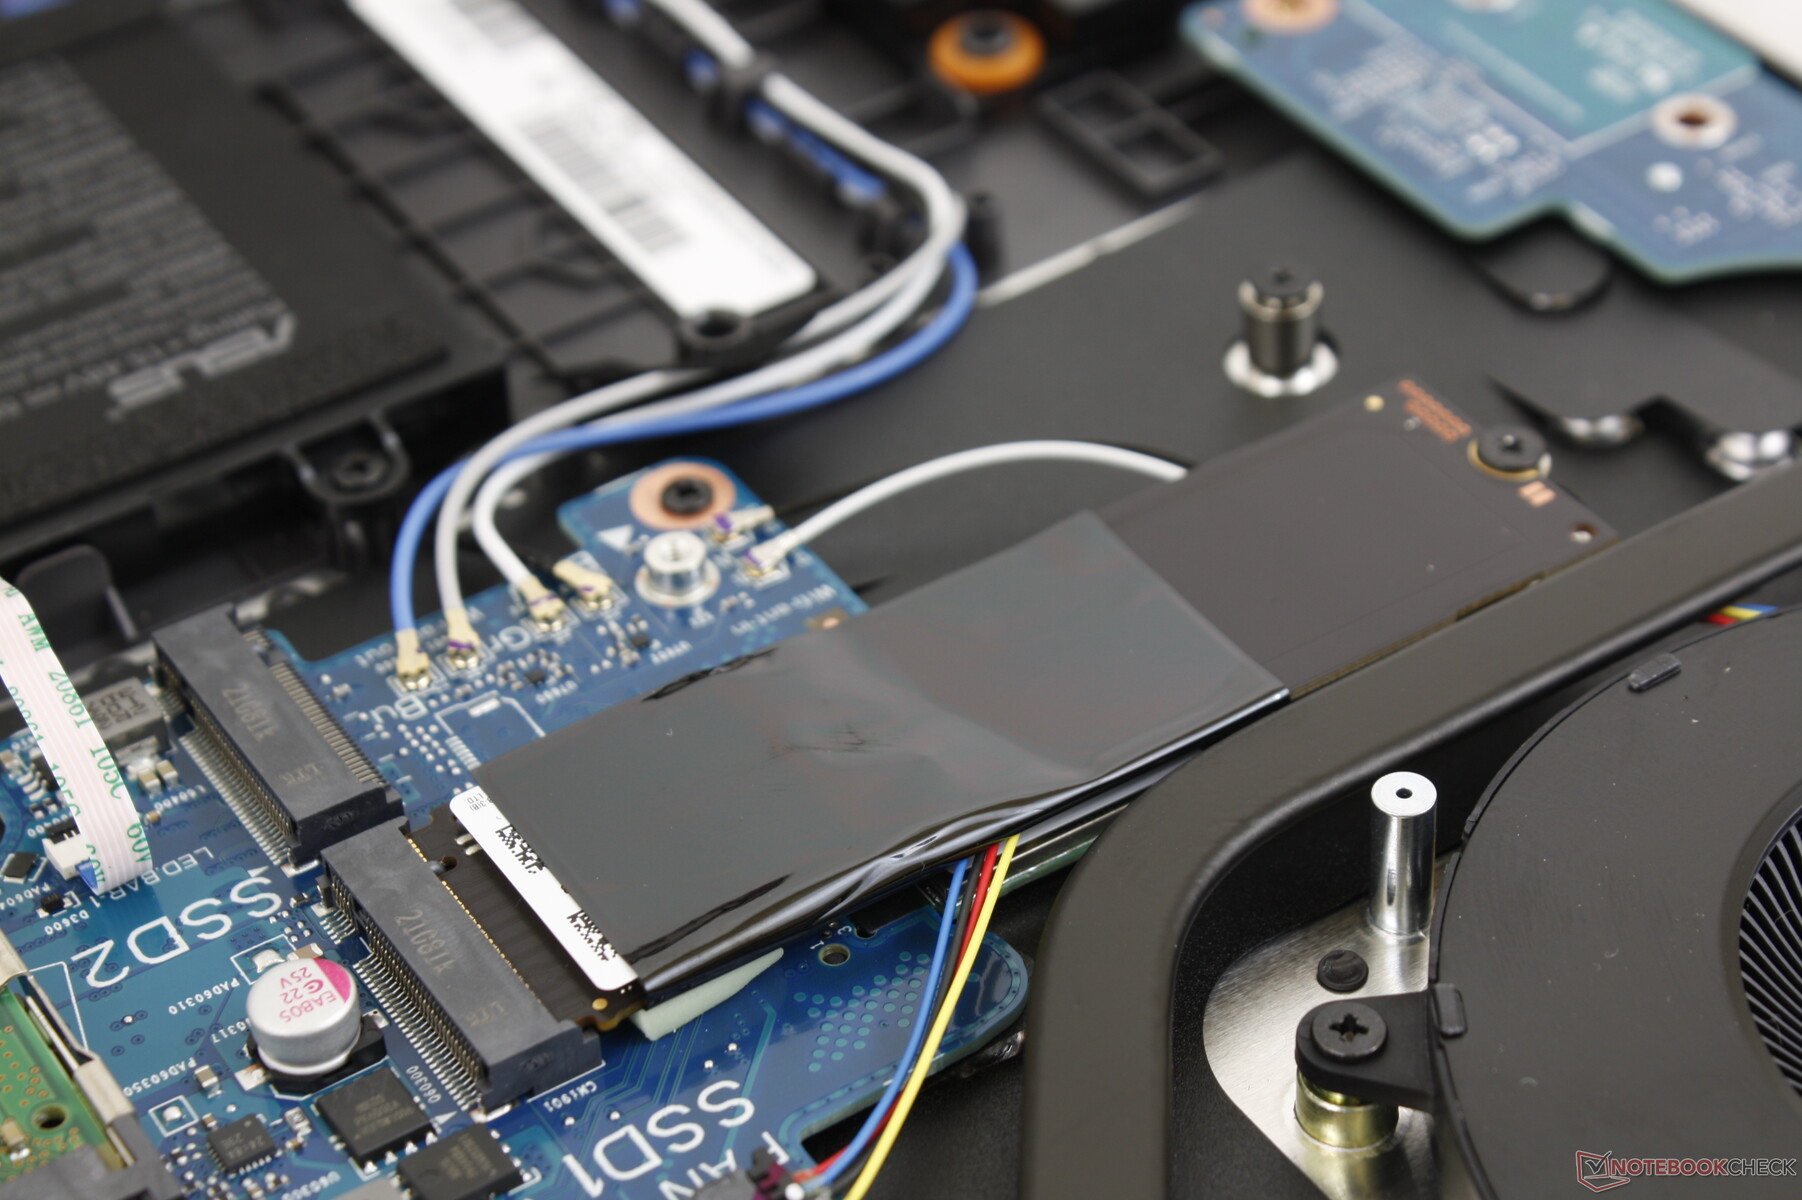
Périphériques de stockage - Pas de lecteurs de 2,5 pouces
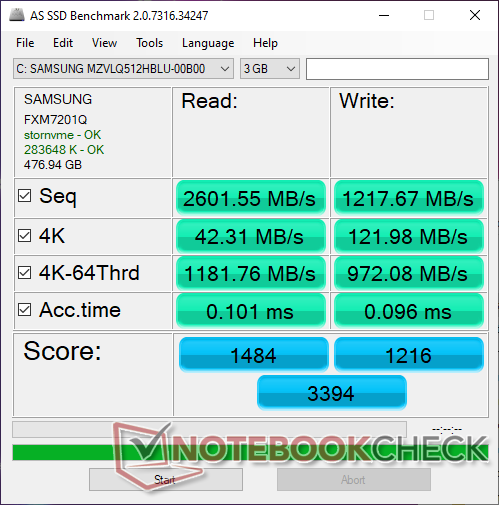
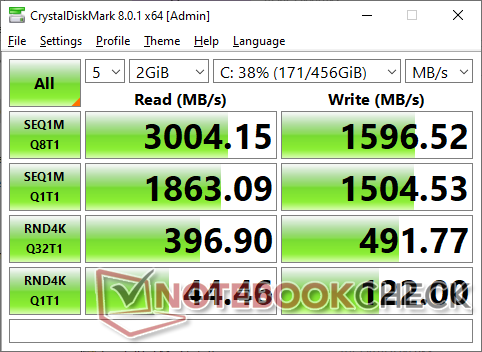
Le Samsung PM991a MZVLQ512HBLU est un SSD NVMe PCIe 3 de milieu de gamme avec des taux théoriques de lecture et d'écriture séquentielles de 3100 Mo/s et 1800 Mo/s, respectivement, pour être plus lent que le PM981a qui peut atteindre des vitesses allant jusqu'à 3500 Mo/s et 2900 Mo/s. Les propriétaires peuvent installer jusqu'à deux SSD NVMe M.2 internes.
| Asus ROG Strix G17 G713QE-RB74 Samsung PM991 MZVLQ512HBLU | Acer Nitro 5 AN517-53-54DQ SK Hynix BC711 HFM512GD3HX015N | MSI Katana GF76 11UE Kingston OM8PCP3512F-AB | Asus Strix G17 G712LWS Intel SSD 660p 1TB SSDPEKNW010T8 | Lenovo IdeaPad 5 Pro 16IHU6 Samsung SSD PM981a MZVLB512HBJQ | |
|---|---|---|---|---|---|
| AS SSD | 60% | -42% | -11% | 43% | |
| Seq Read (MB/s) | 2602 | 2859 10% | 1704 -35% | 1778 -32% | 2541 -2% |
| Seq Write (MB/s) | 1218 | 2693 121% | 716 -41% | 1478 21% | 2555 110% |
| 4K Read (MB/s) | 42.31 | 68.8 63% | 37.77 -11% | 49.76 18% | 56 32% |
| 4K Write (MB/s) | 122 | 154.5 27% | 66 -46% | 117.9 -3% | 129.6 6% |
| 4K-64 Read (MB/s) | 1182 | 1860 57% | 441.2 -63% | 591 -50% | 1633 38% |
| 4K-64 Write (MB/s) | 972 | 1680 73% | 735 -24% | 875 -10% | 1863 92% |
| Access Time Read * (ms) | 0.101 | 0.043 57% | 0.191 -89% | 0.082 19% | 0.077 24% |
| Access Time Write * (ms) | 0.096 | 0.028 71% | 0.053 45% | 0.041 57% | 0.029 70% |
| Score Read (Points) | 1484 | 2214 49% | 649 -56% | 818 -45% | 1944 31% |
| Score Write (Points) | 1216 | 2104 73% | 872 -28% | 1140 -6% | 2248 85% |
| Score Total (Points) | 3394 | 5451 61% | 1816 -46% | 2377 -30% | 5192 53% |
| Copy ISO MB/s (MB/s) | 1538 | 912 -41% | 1495 -3% | 2246 46% | |
| Copy Program MB/s (MB/s) | 805 | 278.9 -65% | 446 -45% | 861 7% | |
| Copy Game MB/s (MB/s) | 1418 | 144.6 -90% | 697 -51% | 1552 9% | |
| CrystalDiskMark 5.2 / 6 | 58% | -19% | 4% | 43% | |
| Write 4K (MB/s) | 120.8 | 206.1 71% | 107.3 -11% | 141.1 17% | 203 68% |
| Read 4K (MB/s) | 44.19 | 77.8 76% | 45.46 3% | 60.9 38% | 52.3 18% |
| Write Seq (MB/s) | 1518 | 2842 87% | 978 -36% | 1681 11% | 2138 41% |
| Read Seq (MB/s) | 1828 | 2552 40% | 1255 -31% | 1602 -12% | 1974 8% |
| Write 4K Q32T1 (MB/s) | 492.5 | 583 18% | 579 18% | 406.6 -17% | 640 30% |
| Read 4K Q32T1 (MB/s) | 390.7 | 663 70% | 299.6 -23% | 470.2 20% | 707 81% |
| Write Seq Q32T1 (MB/s) | 1602 | 3014 88% | 978 -39% | 1759 10% | 2973 86% |
| Read Seq Q32T1 (MB/s) | 3086 | 3556 15% | 1977 -36% | 1932 -37% | 3559 15% |
| Moyenne finale (programmes/paramètres) | 59% /
59% | -31% /
-34% | -4% /
-6% | 43% /
43% |
* ... Moindre est la valeur, meilleures sont les performances

Disk Throttling: DiskSpd Read Loop, Queue Depth 8
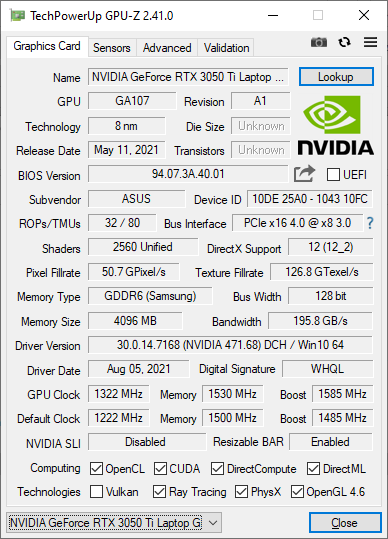
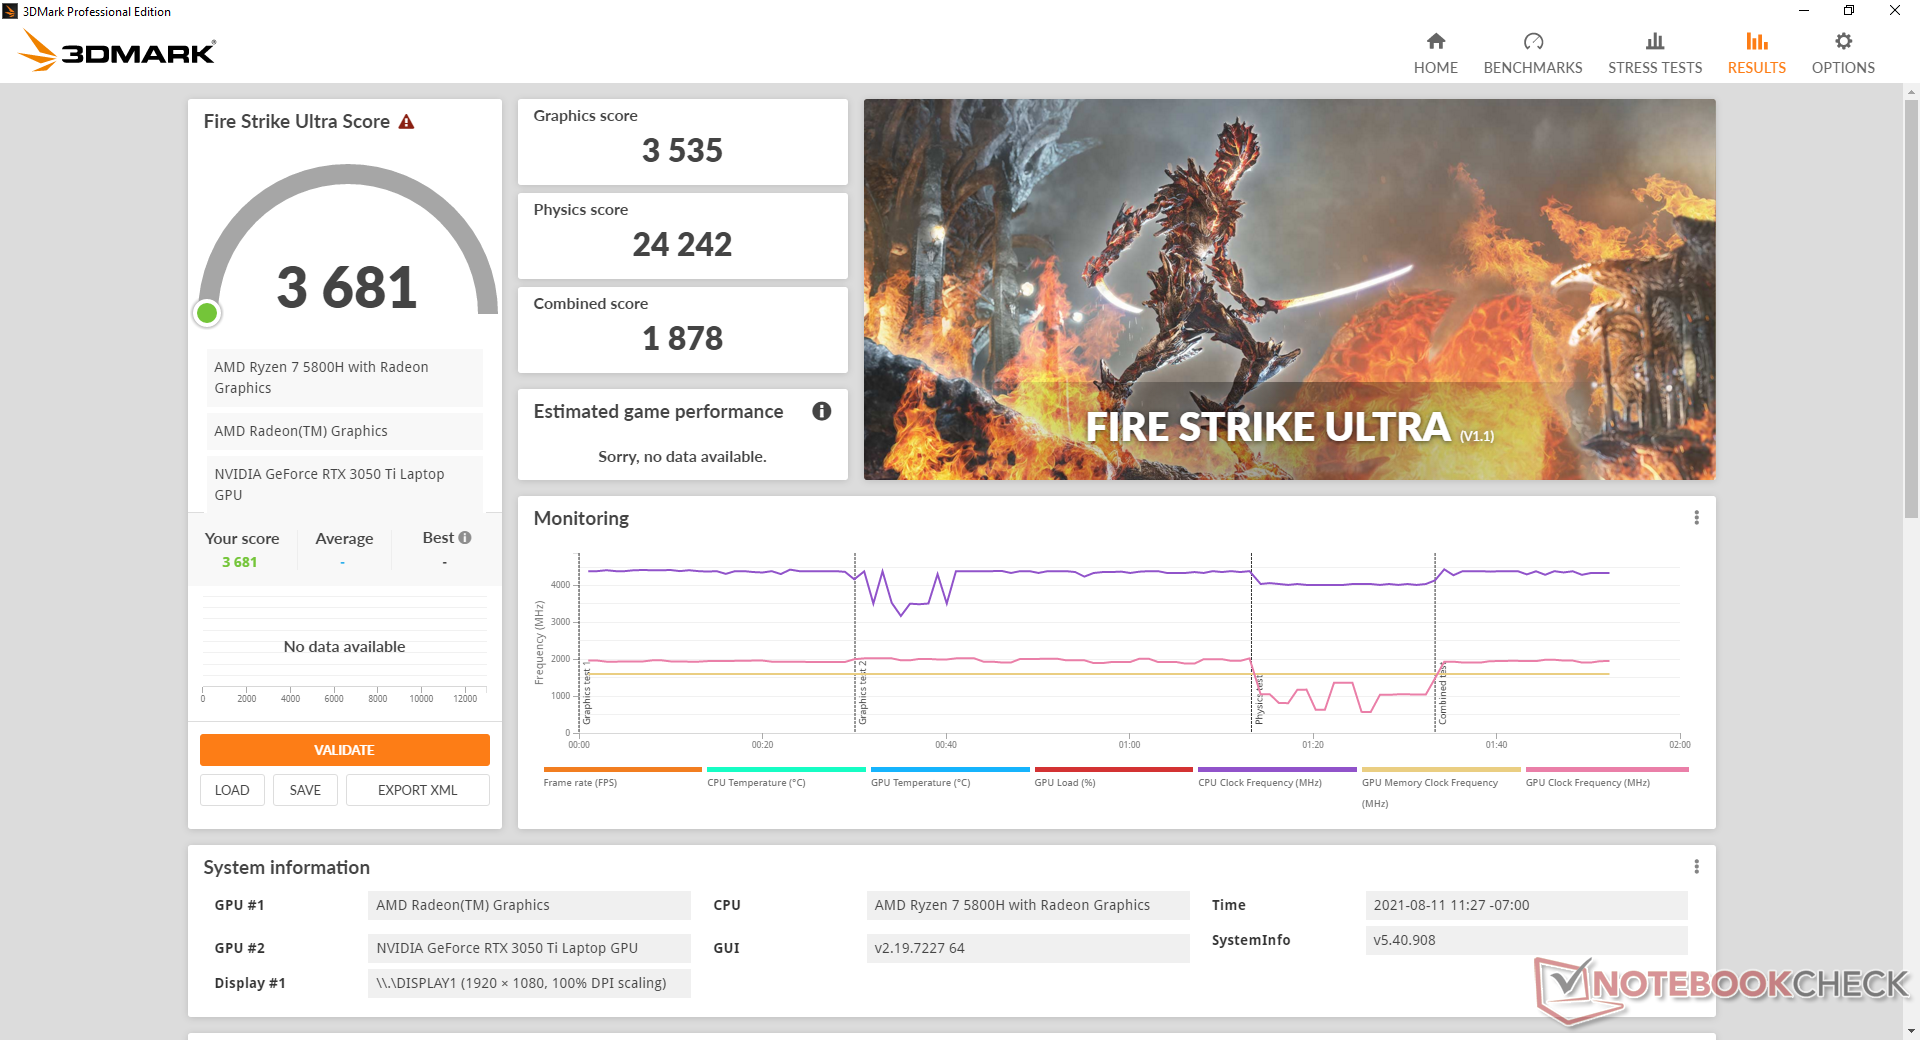
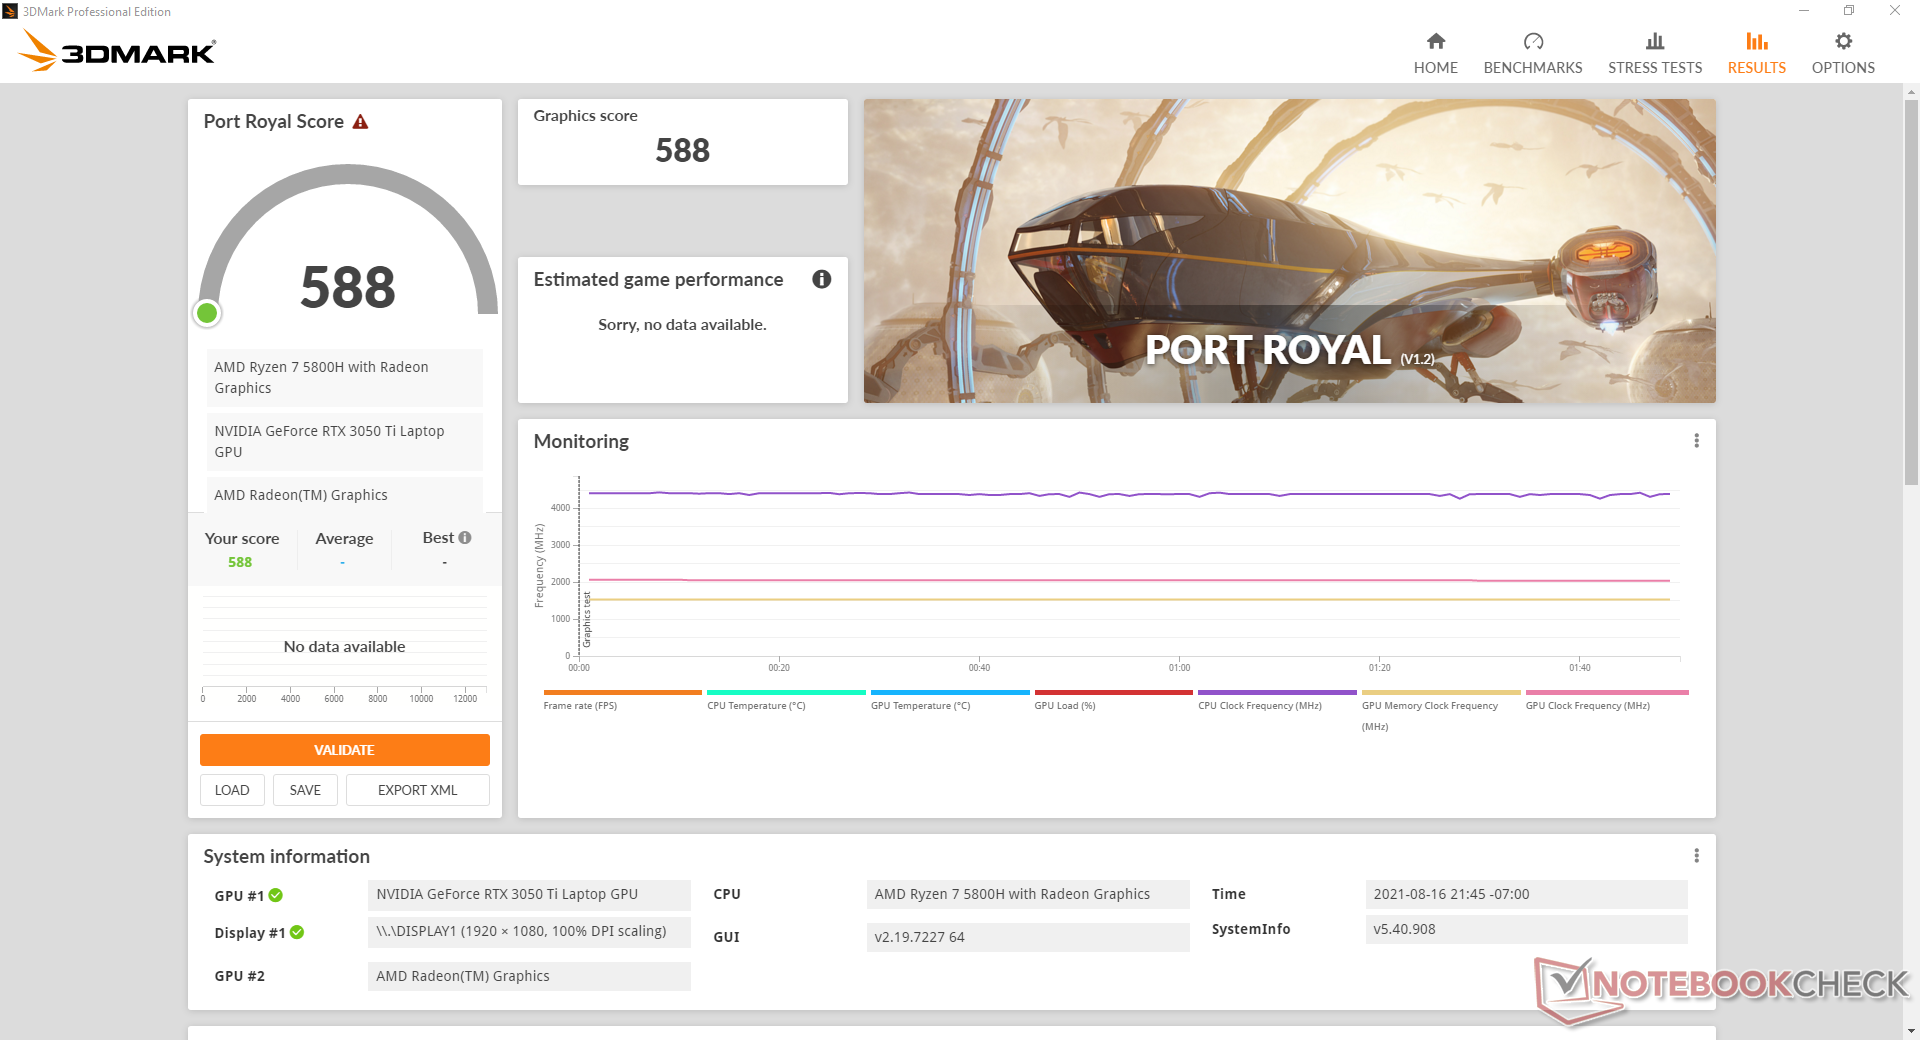
Performances du GPU - Plus lent que le GeForce GTX 1660 Ti
Les performances graphiques sont décevantes pour une carte graphique basée sur RTX. Les résultats 3DMark sont environ 16 à 25 pour cent plus rapides que ceux de la RTX 3050 dans l'Acer Nitro 5 pour être à égalité avec la carte moins chère GeForce GTX 1660 Ti au mieux. En fait, la GTX 1660 Ti dépassera toujours notre RTX 3050 Ti dans la plupart des scénarios de jeu, en particulier avec des paramètres 1080p plus élevés. La mise à niveau vers la RTX 3060 permettra aux utilisateurs de bénéficier d'un gain graphique brut de 40 à 50 %.
Les performances graphiques baisseront légèrement si vous n'utilisez pas le mode Turbo d'Asus, comme l'illustre notre test de stress ci-dessous.
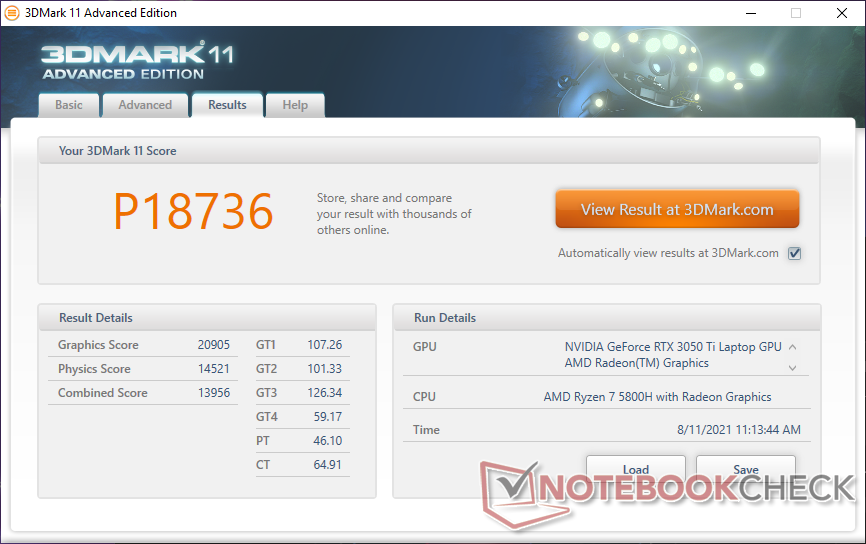
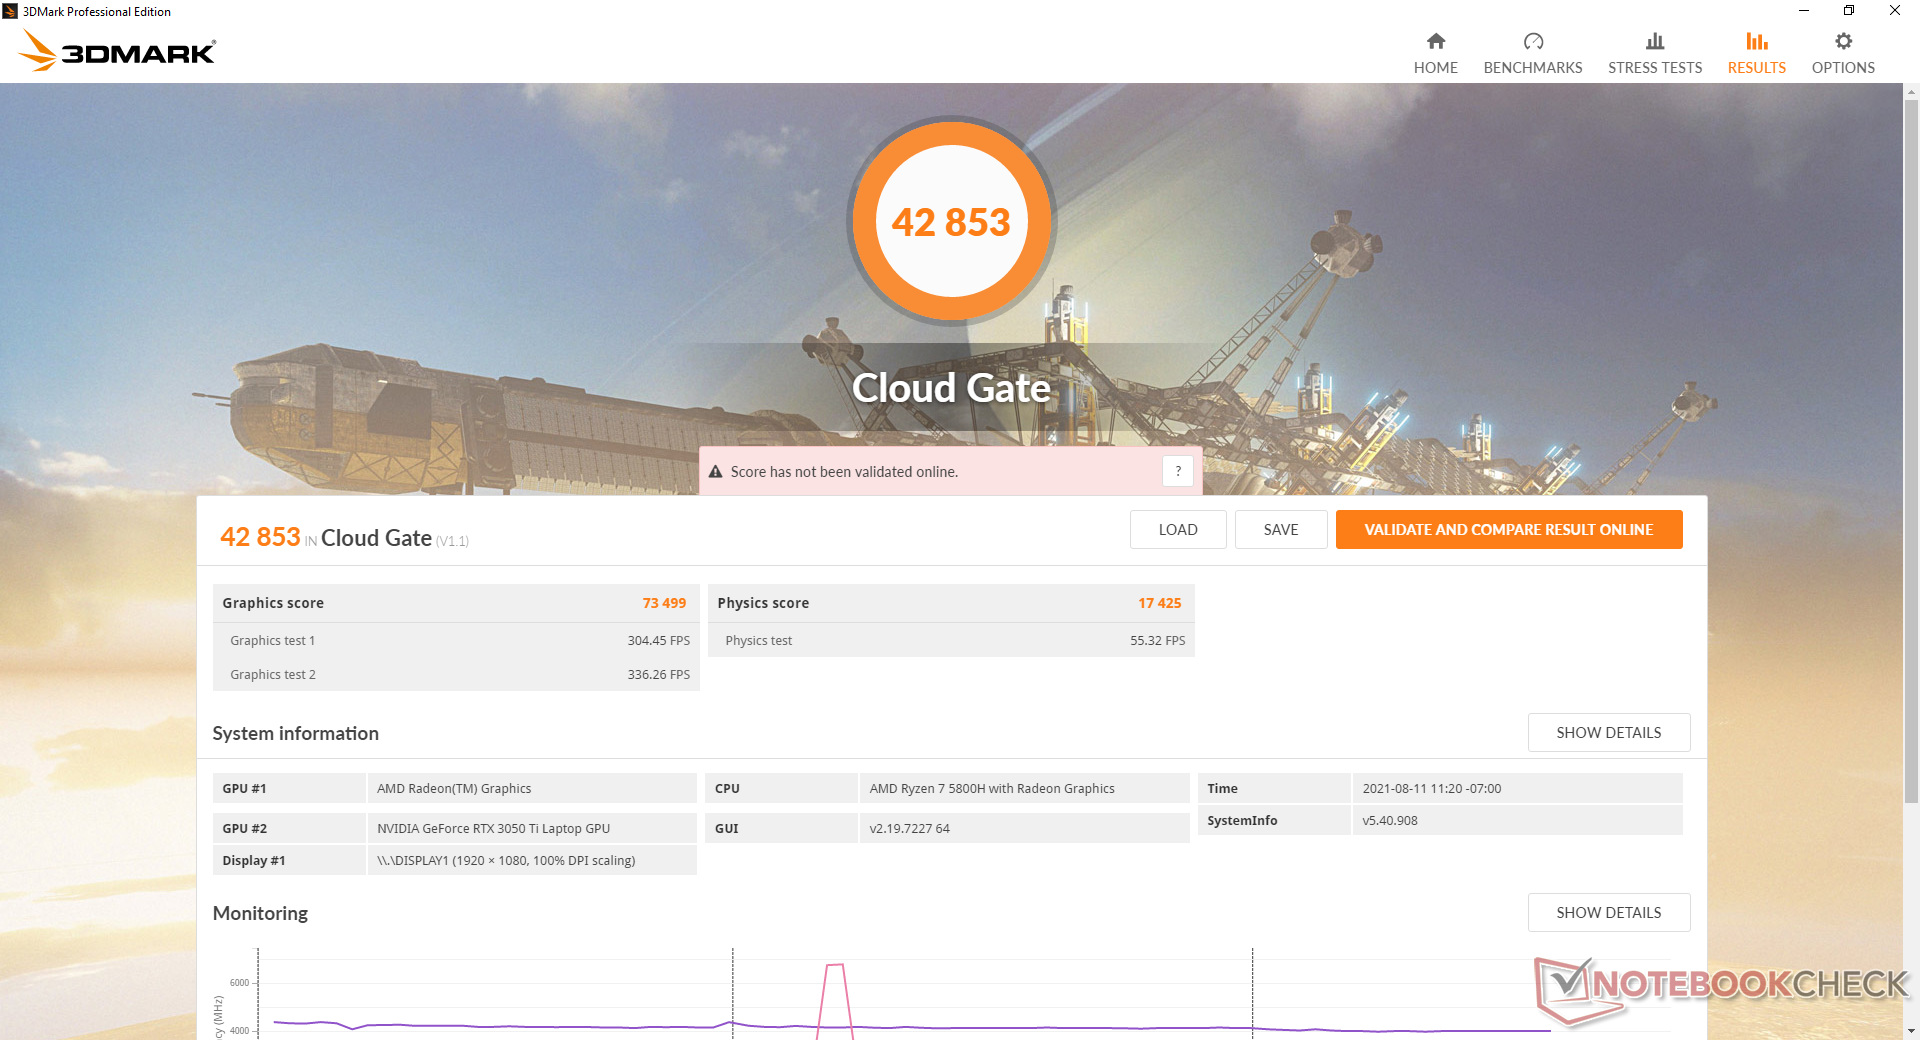
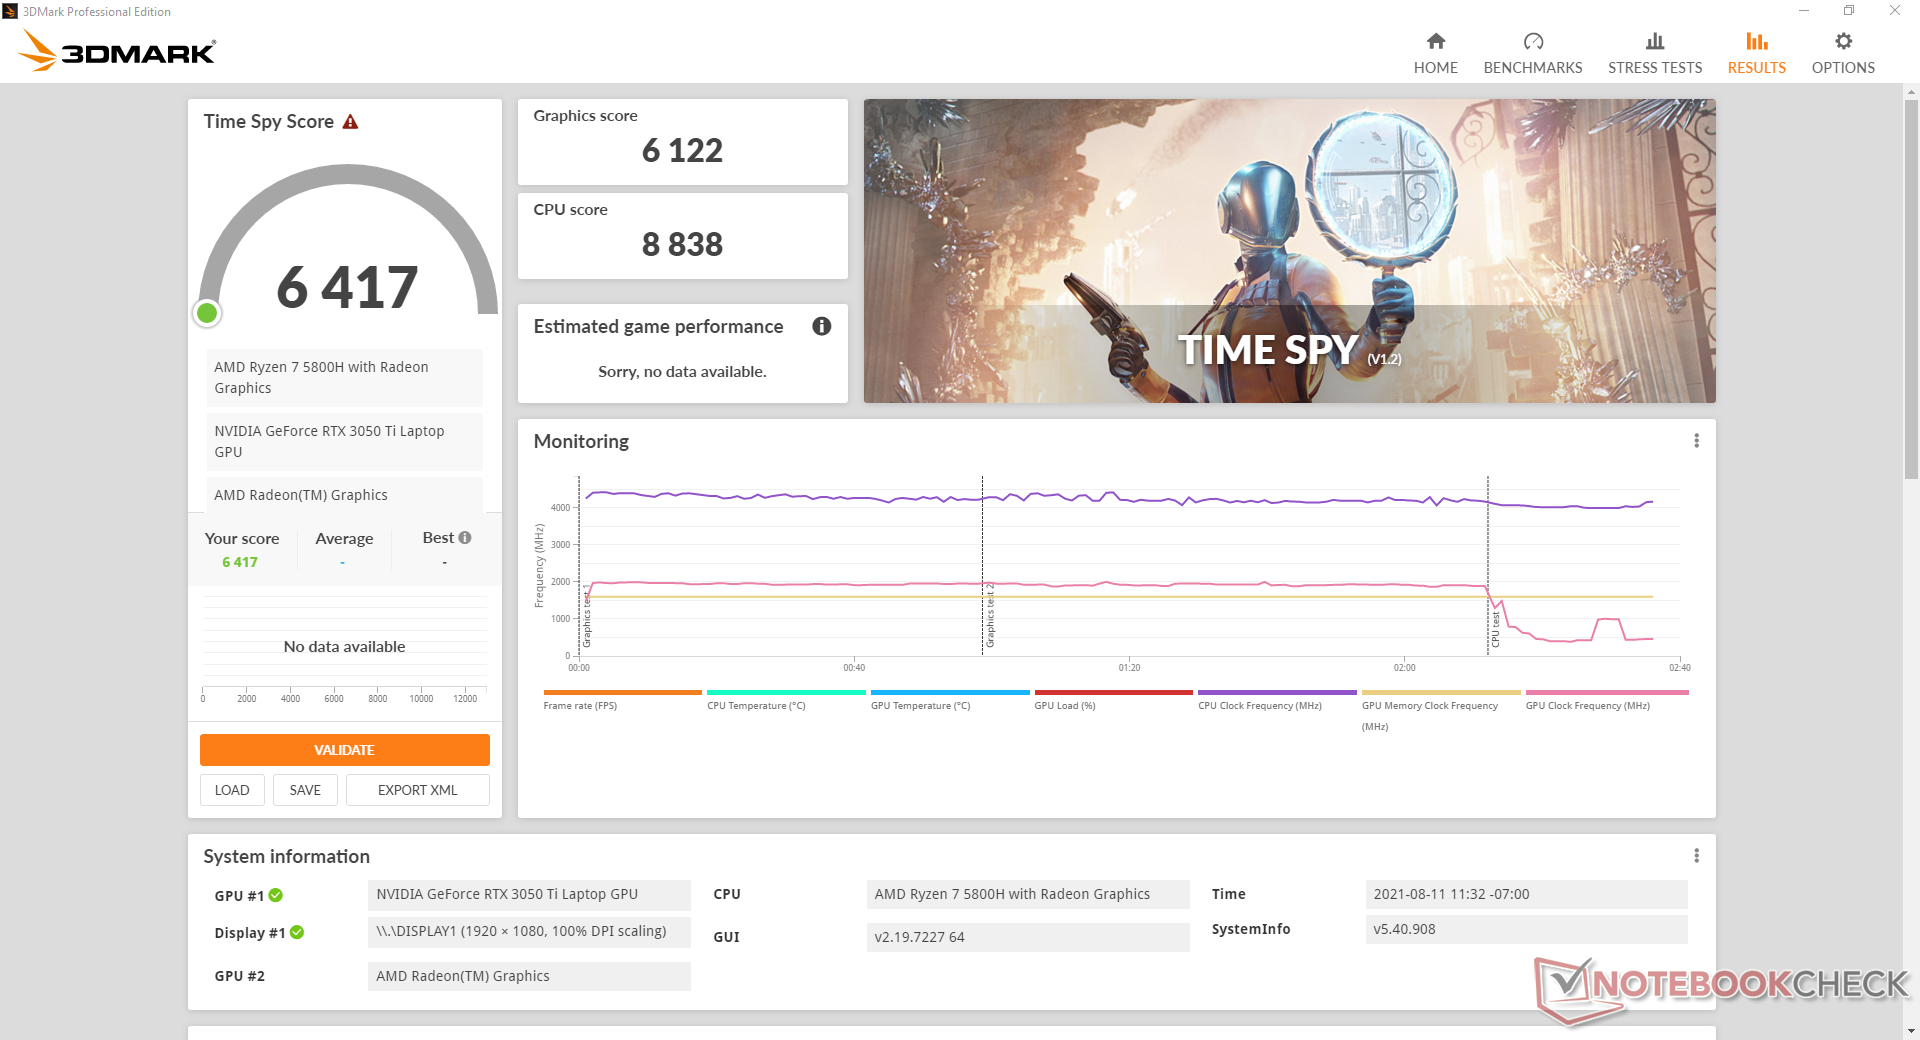
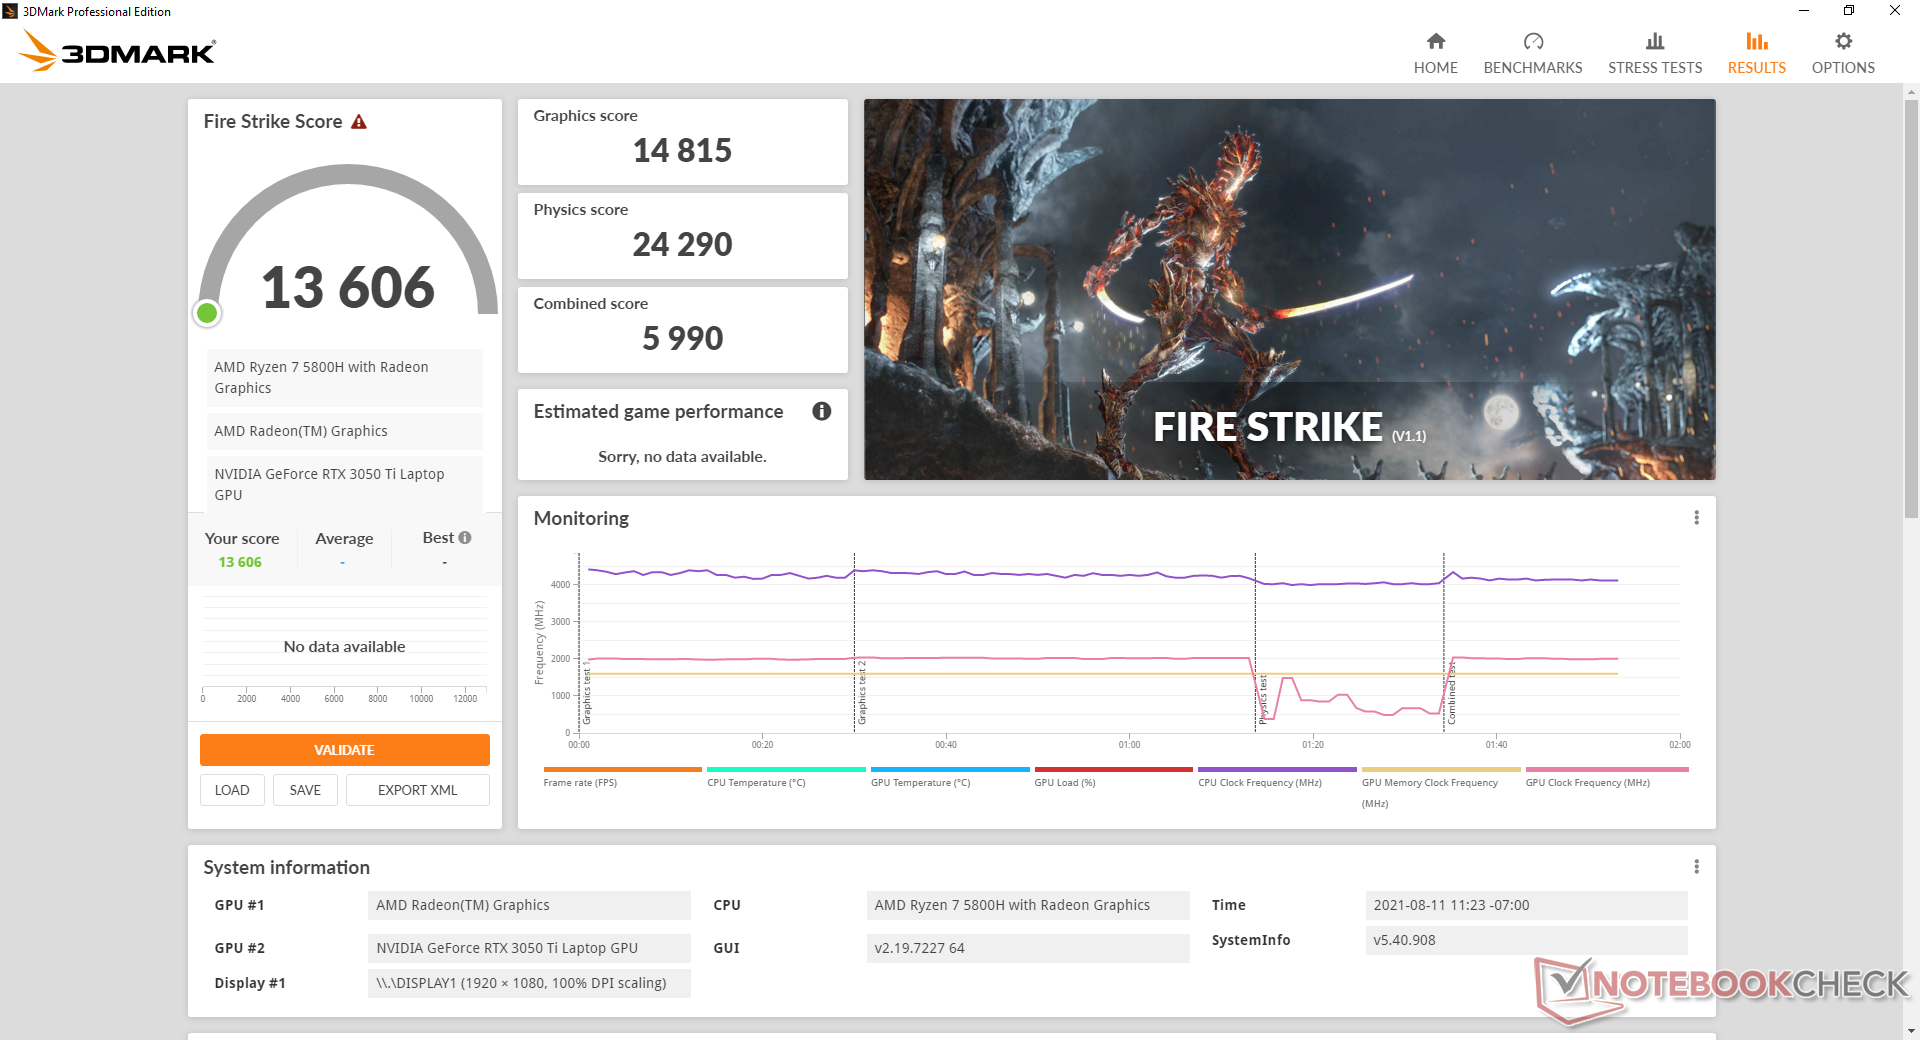
| 3DMark 11 Performance | 18736 points | |
| 3DMark Cloud Gate Standard Score | 42853 points | |
| 3DMark Fire Strike Score | 13606 points | |
| 3DMark Time Spy Score | 6417 points | |
Aide | ||
L'exécution de Witcher 3 pendant une heure complète montre des performances stables, à l'exception d'une chute inattendue dans la fourchette des 20 FPS. Cette baisse indique une activité d'arrière-plan interrompue pendant le jeu qui est potentiellement liée à un logiciel Asus préinstallé ou à d'autres pop-ups. Heureusement, cela ne se produit pas régulièrement.
Witcher 3 FPS Chart
| Bas | Moyen | Élevé | Ultra | |
|---|---|---|---|---|
| GTA V (2015) | 172 | 122 | 72.2 | |
| The Witcher 3 (2015) | 262.3 | 104.2 | 58.4 | |
| Dota 2 Reborn (2015) | 134 | 131 | 111 | 107 |
| Final Fantasy XV Benchmark (2018) | 132 | 81.8 | 56.6 | |
| X-Plane 11.11 (2018) | 94.1 | 81.6 | 68.4 | |
| Far Cry 5 (2018) | 125 | 101 | 94 | 89 |
| Strange Brigade (2018) | 227 | 134 | 114 | 100 |
| Shadow of the Tomb Raider (2018) | 115 | 92 | 83 | 72 |
| Far Cry New Dawn (2019) | 94 | 80 | 78 | 70 |
| Metro Exodus (2019) | 126.3 | 71.2 | 55.3 | 43.5 |
| Borderlands 3 (2019) | 123.5 | 88 | 56.8 | 36.8 |
| Gears Tactics (2020) | 125.9 | 136.4 | 90.6 | 64.7 |
| Horizon Zero Dawn (2020) | 52 | 47 | 44 | 41 |
| Watch Dogs Legion (2020) | 44 | 46 | 42 | 28 |
| Dirt 5 (2020) | 111.8 | 77.4 | 67.3 | 53.3 |
| Assassin´s Creed Valhalla (2020) | 84 | 53 | 34 | 24 |
| Immortals Fenyx Rising (2020) | 89 | 73 | 58 | 54 |
| Hitman 3 (2021) | 121.3 | 95.3 | 82.7 | 79.8 |
| F1 2021 (2021) | 200 | 141 | 125 | 69 |
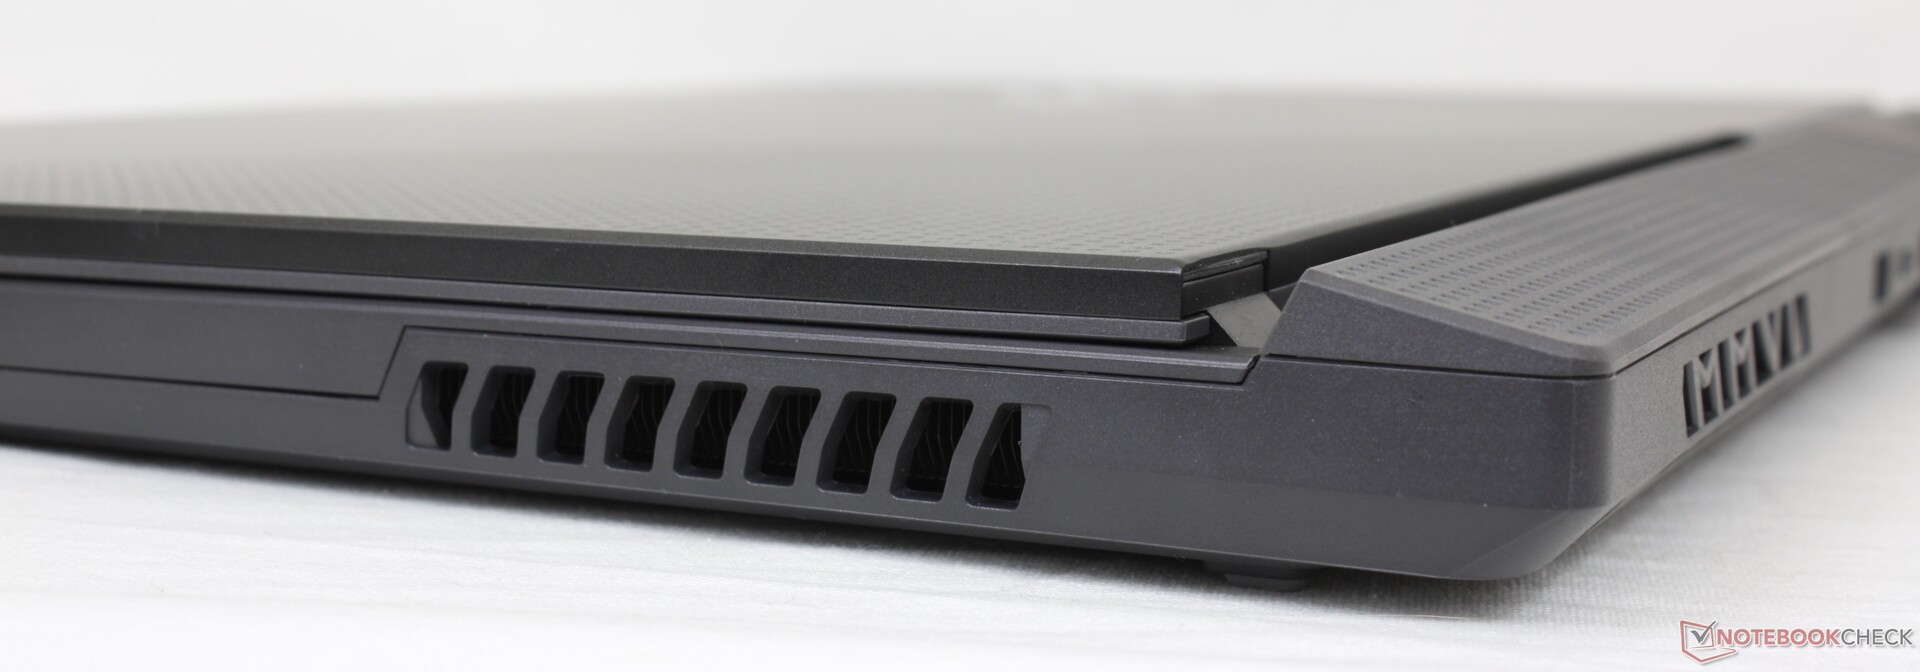
Emissions — Loud Only When Gaming
Bruit du système
Le bruit des ventilateurs est étroitement lié aux profils d'alimentation Armoury Crate. Cette fois, cependant, Asus semble avoir amélioré le comportement des ventilateurs. Alors que les ventilateurs des anciens modèles Strix atteignaient automatiquement le régime maximal lorsqu'ils étaient réglés sur le mode Turbo, ils semblent être plus silencieux, quel que soit le mode, jusqu'à ce que la puissance supplémentaire soit réellement nécessaire. Les utilisateurs peuvent diffuser des vidéos et effectuer d'autres tâches légères en mode Turbo sans que les ventilateurs ne pulsent constamment.
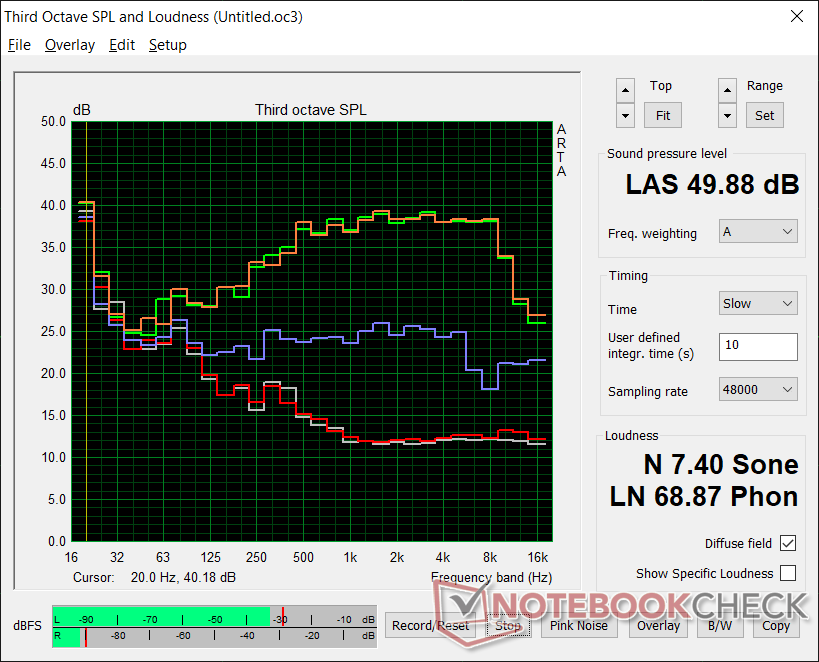
Il y a une différence de bruit de ventilateur notable entre le mode Performance et le mode Turbo. En jouant en mode Performance, le bruit du ventilateur est de 46,4 dB(A), tandis qu'en mode Turbo, il atteint 49,9 dB(A). Les ventilateurs plus bruyants s'accompagnent de performances graphiques plus rapides, comme le montre notre section Test de stress ci-dessous.
| Asus ROG Strix G17 G713QE-RB74 GeForce RTX 3050 Ti Laptop GPU, R7 5800H, Samsung PM991 MZVLQ512HBLU | Acer Nitro 5 AN517-53-54DQ GeForce RTX 3050 4GB Laptop GPU, i5-11300H, SK Hynix BC711 HFM512GD3HX015N | MSI Katana GF76 11UE GeForce RTX 3060 Laptop GPU, i7-11800H, Kingston OM8PCP3512F-AB | Asus Strix Scar 17 G733QSA-XS99 GeForce RTX 3080 Laptop GPU, R9 5900HX, 2x Samsung PM981a MZVLB1T0HBLR (RAID 0) | MSI Alpha 17 A4DEK Radeon RX 5600M, R7 4800H, Kingston OM8PCP3512F-AB | Asus Strix G17 G712LWS GeForce RTX 2070 Super Mobile, i7-10750H, Intel SSD 660p 1TB SSDPEKNW010T8 | |
|---|---|---|---|---|---|---|
| Noise | -8% | -23% | 1% | -12% | -22% | |
| arrêt / environnement * (dB) | 24.9 | 25 -0% | 25 -0% | 25 -0% | 25 -0% | 25 -0% |
| Idle Minimum * (dB) | 25.1 | 25 -0% | 33 -31% | 25.2 -0% | 31 -24% | 32 -27% |
| Idle Average * (dB) | 25.1 | 31 -24% | 34 -35% | 25.2 -0% | 32 -27% | 34 -35% |
| Idle Maximum * (dB) | 25.1 | 33 -31% | 35 -39% | 25.2 -0% | 33 -31% | 37 -47% |
| Load Average * (dB) | 36.3 | 43 -18% | 53 -46% | 30.7 15% | 38 -5% | 51 -40% |
| Witcher 3 ultra * (dB) | 49.9 | 44 12% | 49 2% | 51.3 -3% | 46 8% | 50 -0% |
| Load Maximum * (dB) | 49.9 | 47 6% | 57 -14% | 51.3 -3% | 54 -8% | 53 -6% |
* ... Moindre est la valeur, meilleures sont les performances
Degré de la nuisance sonore
| Au repos |
| 25.1 / 25.1 / 25.1 dB(A) |
| Fortement sollicité |
| 36.3 / 49.9 dB(A) |
 | ||
30 dB silencieux 40 dB(A) audible 50 dB(A) bruyant |
||
min: | ||
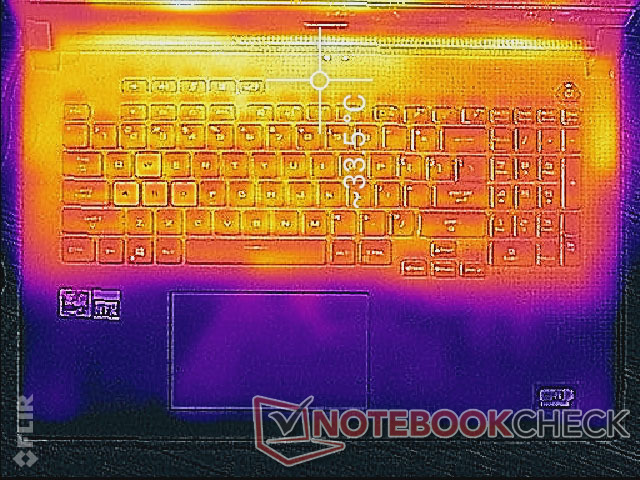
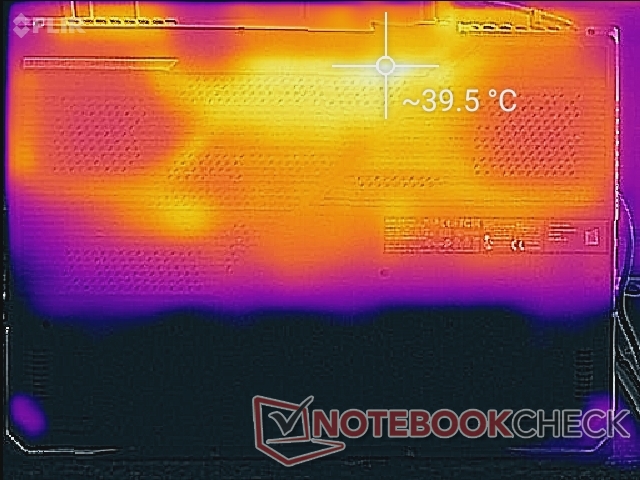
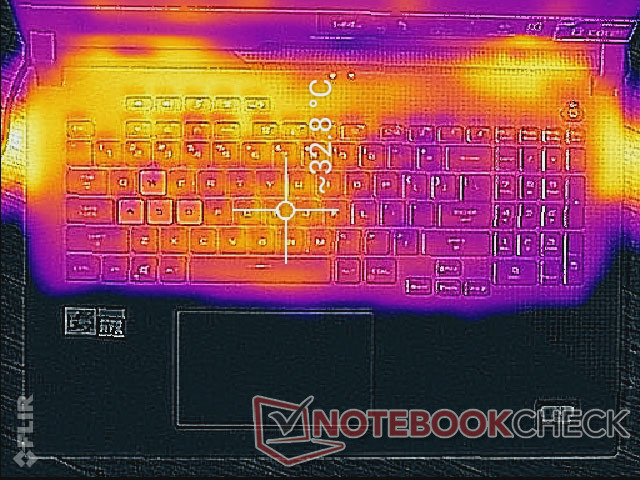
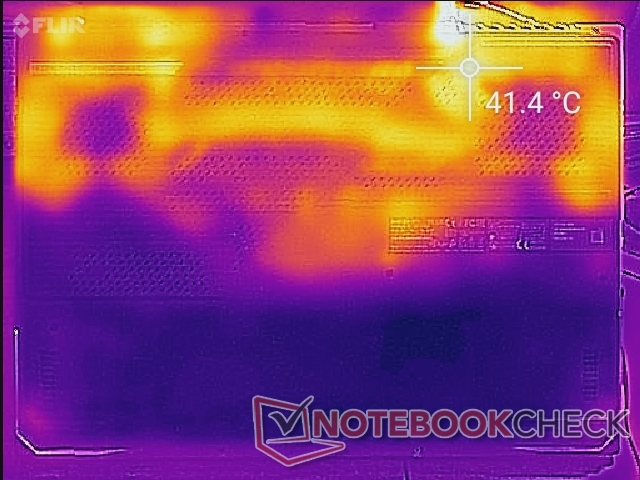
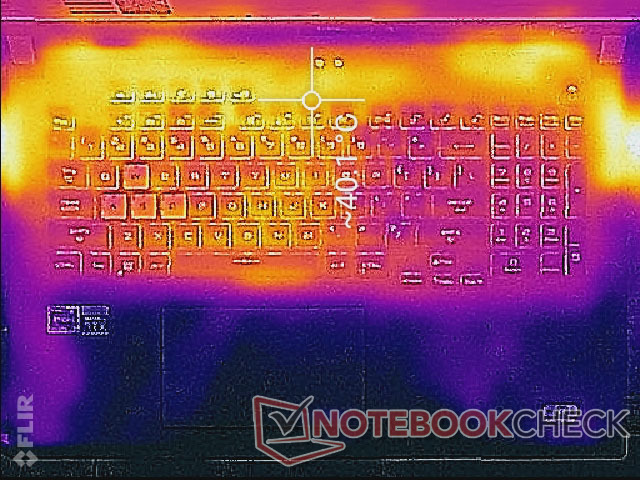
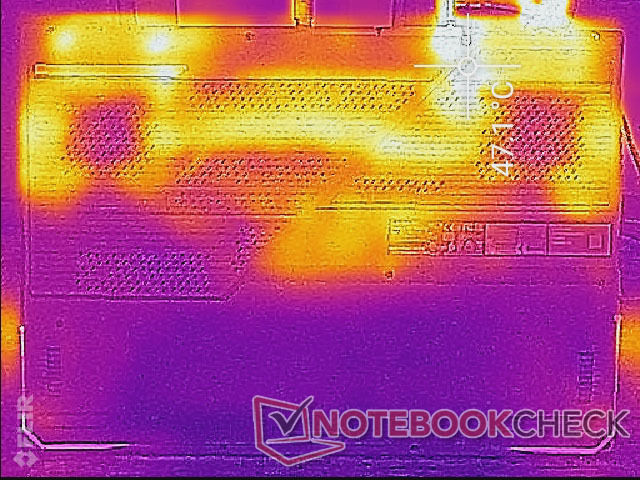
Température - presque toujours chaude
Les températures de surface sont fraîches le long des quadrants avant et se réchauffent progressivement vers l'arrière. Étant donné que les ventilateurs internes aiment tourner au ralenti lorsque les charges de traitement sont faibles, les points chauds sont plus chauds, atteignant respectivement 33 C et 40 C sur les points chauds supérieurs et inférieurs
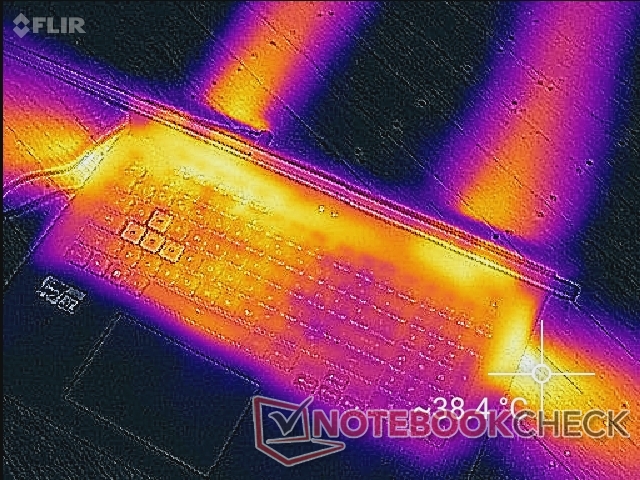
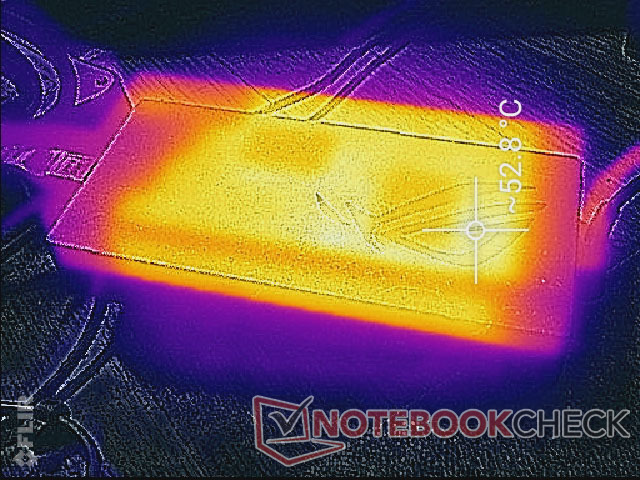
(±) La température maximale du côté supérieur est de 43.8 °C / 111 F, par rapport à la moyenne de 40.4 °C / 105 F, allant de 21.2 à 68.8 °C pour la classe Gaming.
(-) Le fond chauffe jusqu'à un maximum de 47.2 °C / 117 F, contre une moyenne de 43.2 °C / 110 F
(+) En utilisation inactive, la température moyenne du côté supérieur est de 29.5 °C / 85 F, par rapport à la moyenne du dispositif de 33.9 °C / 93 F.
(+) En jouant à The Witcher 3, la température moyenne du côté supérieur est de 28.8 °C / 84 F, alors que la moyenne de l'appareil est de 33.9 °C / 93 F.
(+) Les repose-poignets et le pavé tactile sont plus froids que la température de la peau avec un maximum de 29.6 °C / 85.3 F et sont donc froids au toucher.
(±) La température moyenne de la zone de l'appui-paume de dispositifs similaires était de 28.8 °C / 83.8 F (-0.8 °C / #-1.5 F).
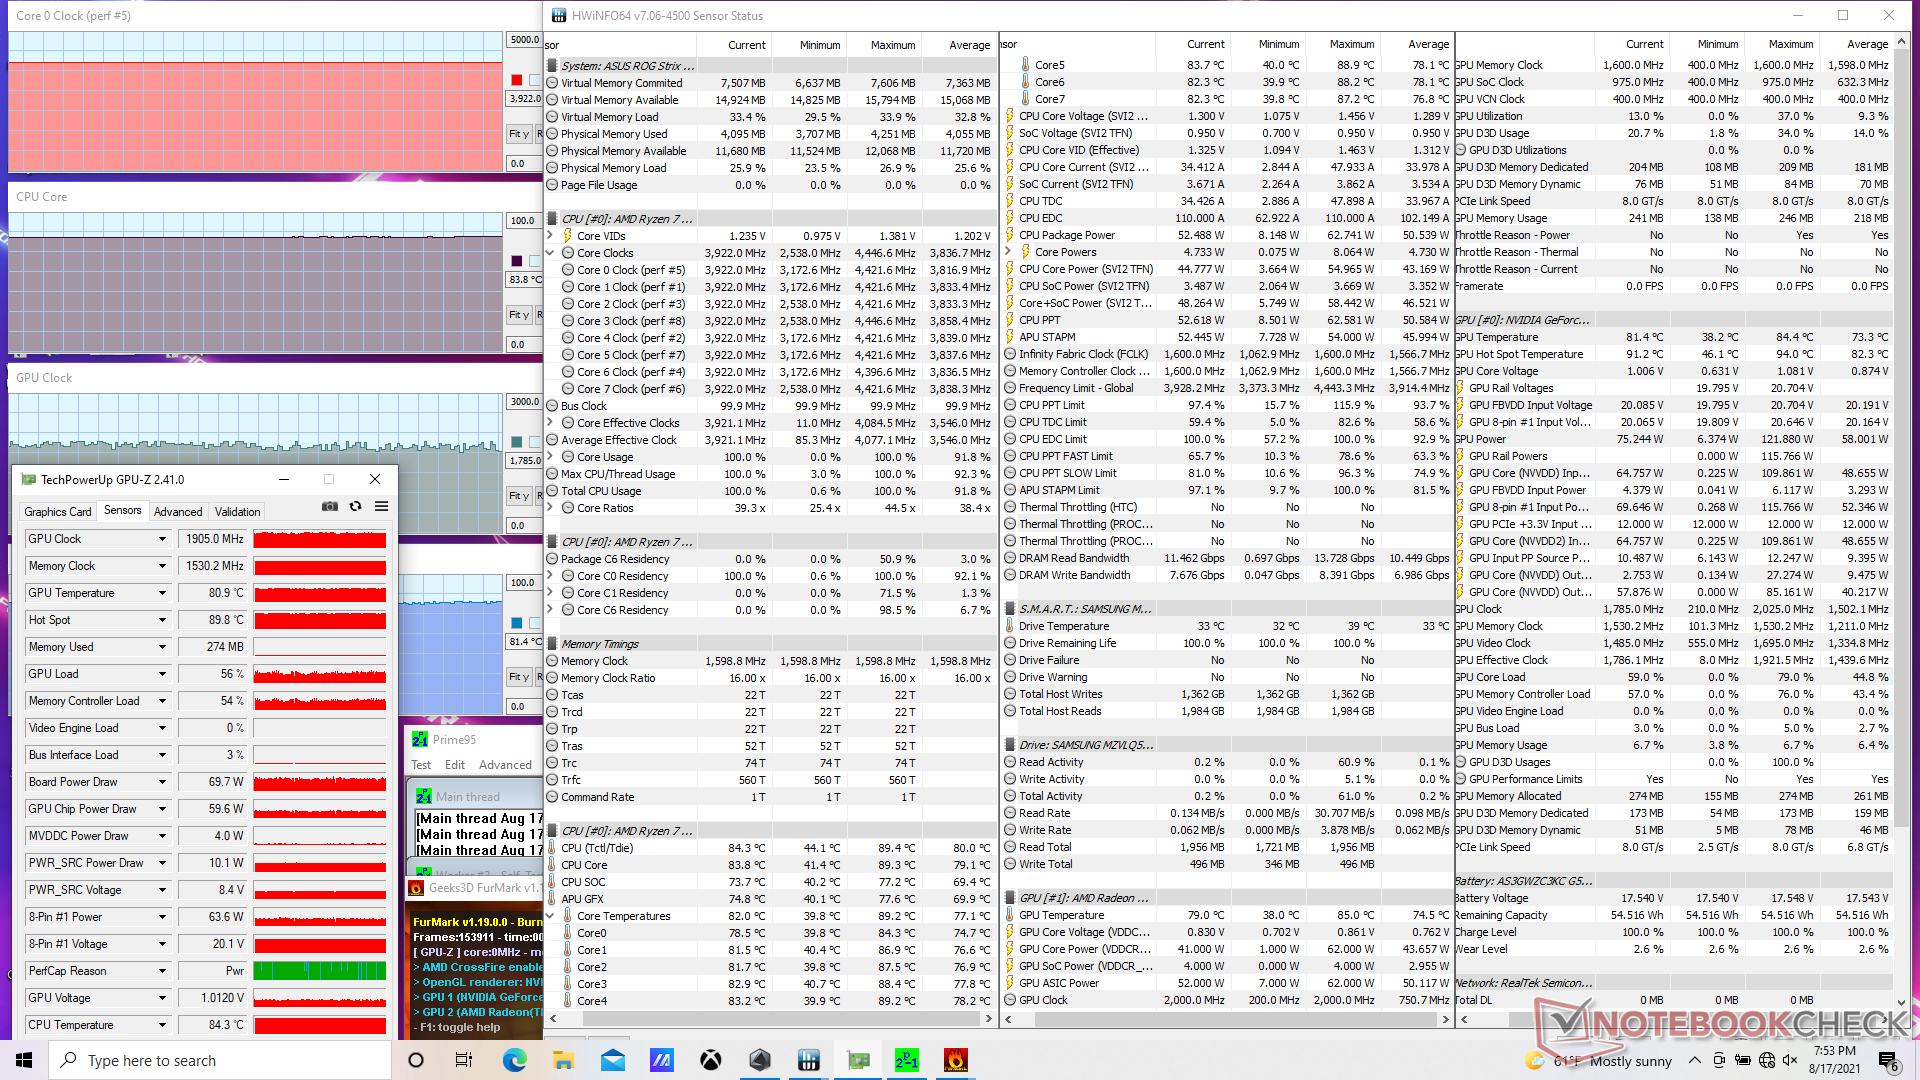
Test de stress - Excellente durabilité de l'accélération du processeur
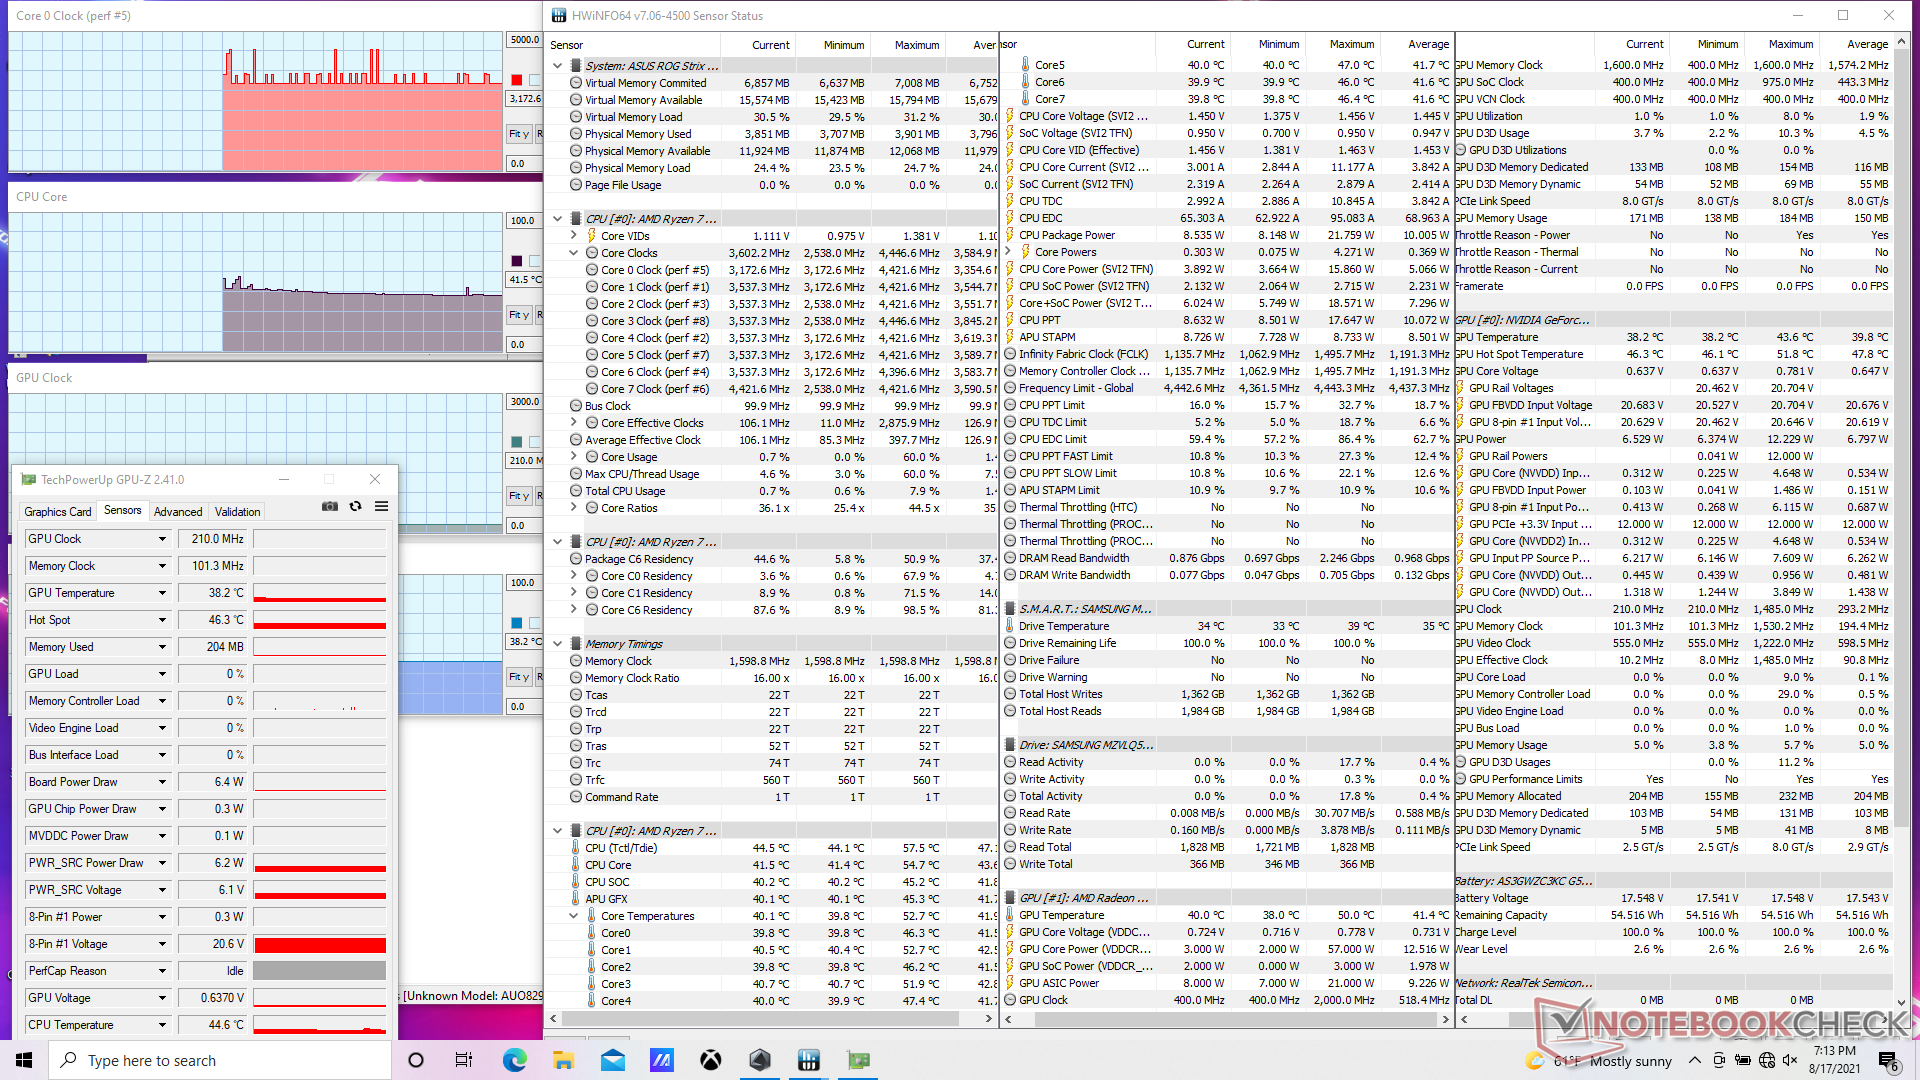
Sous l'effet de Prime95, le CPU passe momentanément à 4,1 GHz avant de se stabiliser à 4 GHz et 76 C. La fréquence d'horloge maximale de Boost du Ryzen 7 5800H est de 4,4 GHz et la stabilité à 4 GHz est donc respectable. Le CPU atteint un maximum de 84°C lorsqu'il est soumis à des charges extrêmes pendant de longues périodes.
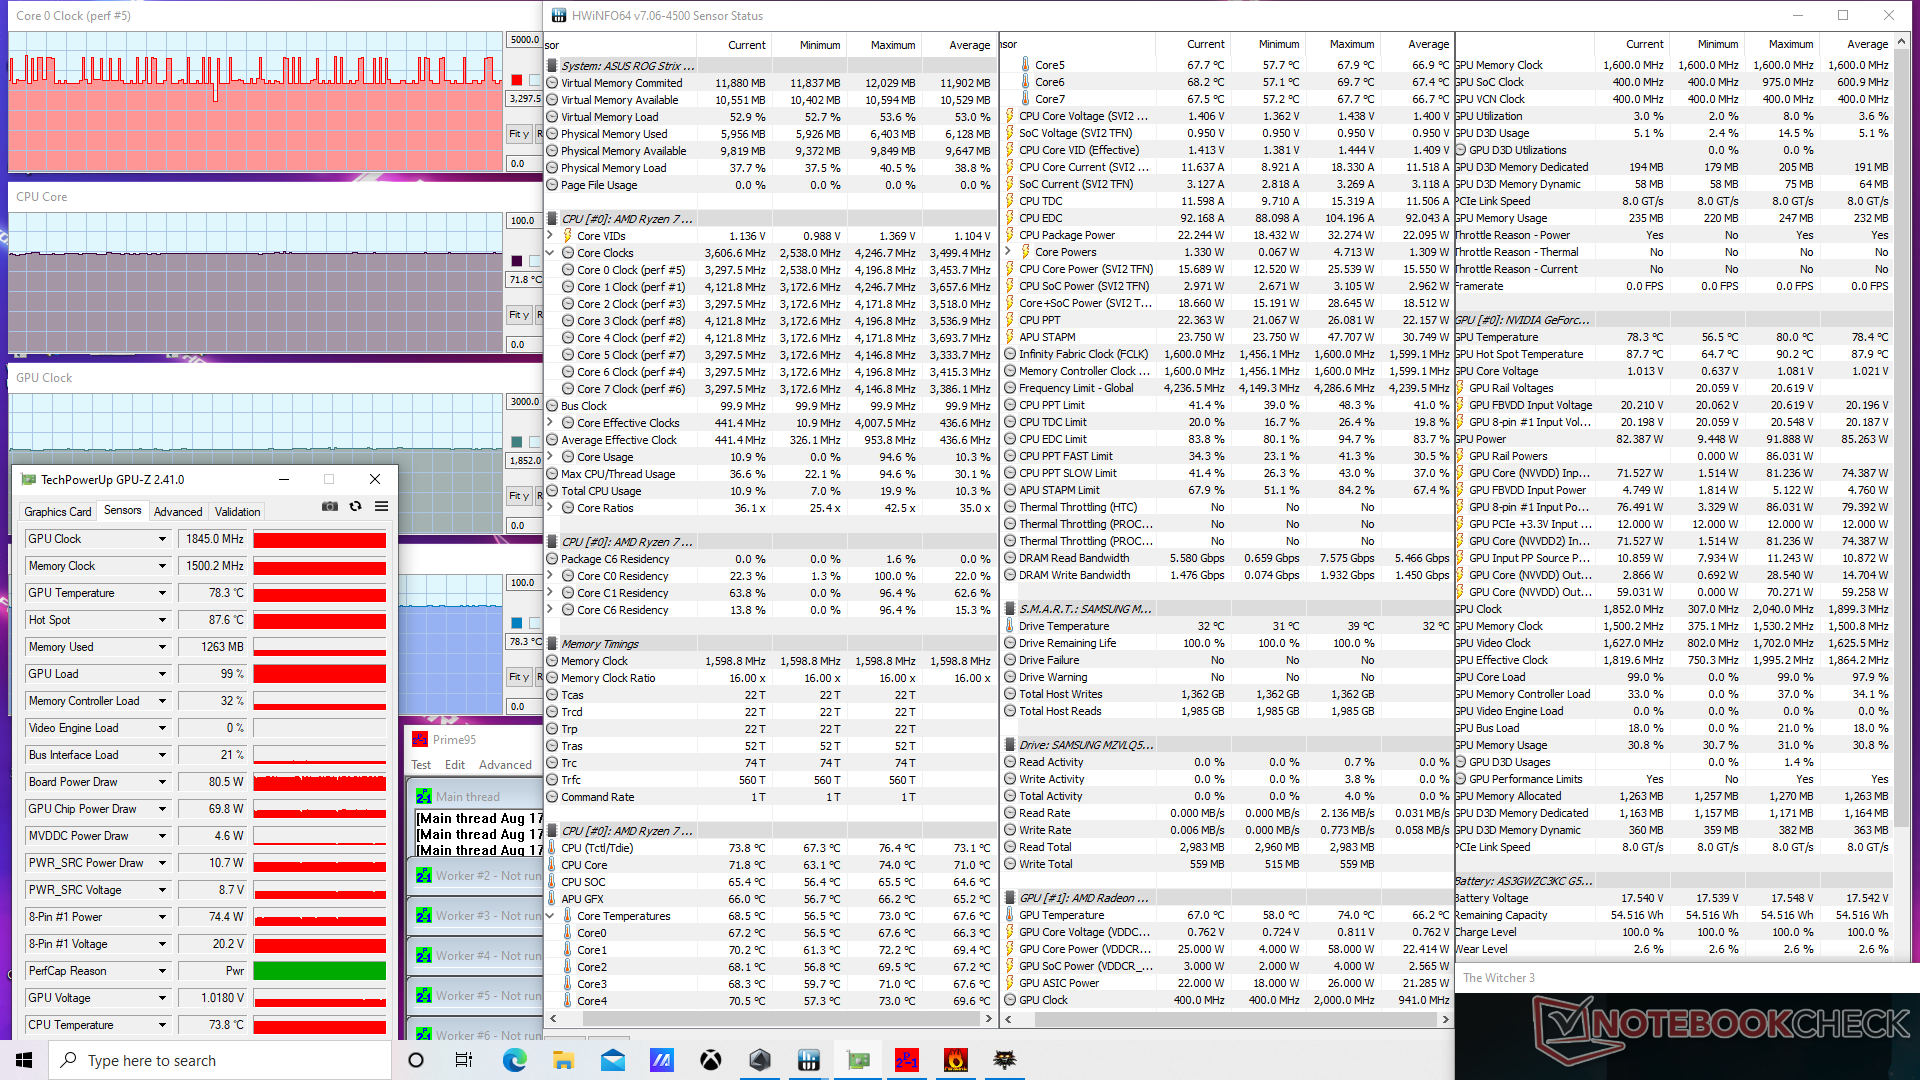
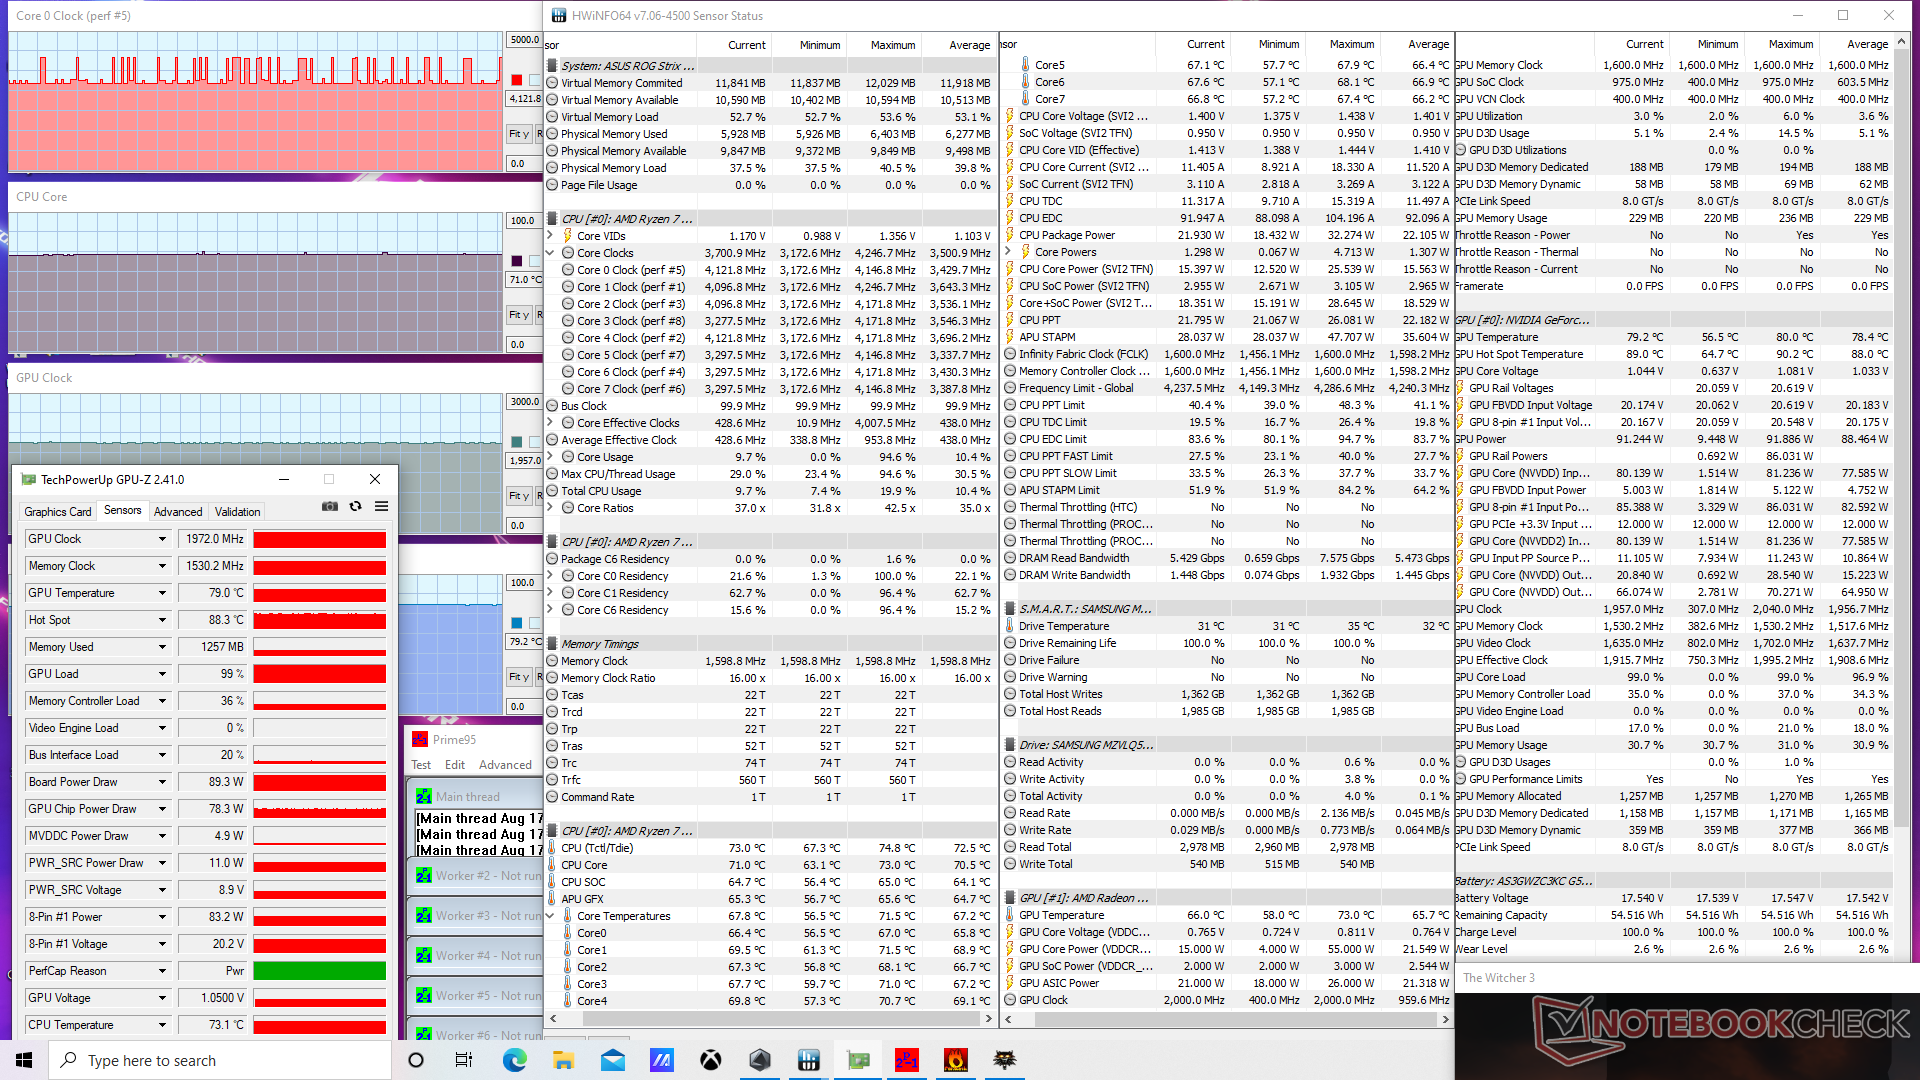
Le CPU et le GPU se stabilisent à 72 C et 78 C, respectivement, lorsqu'ils fonctionnent Witcher 3. Il est intéressant de noter que ces températures restent à peu près les mêmes, quel que soit le réglage du mode Turbo, mais la plupart des joueurs voudront de toute façon activer le mode Turbo, car les fréquences d'horloge du GPU et de la mémoire deviennent légèrement plus rapides (1845 MHz à 1972 MHz pour le GPU et 1500 MHz à 1530 MHz pour la mémoire), au prix de ventilateurs plus bruyants. La consommation maximale du GPU passe également de 80 à 90 W en mode Turbo, ce qui est proche des 95 W annoncés par Asus pour le GPU TGP.
Le fonctionnement sur batterie limitera les performances graphiques, d'autant plus que le mode Turbo n'est disponible que sur secteur. Un test 3DMark 11 sur batterie donne des scores de physique et de graphisme de 13986 et 12434 points, respectivement, contre 14521 et 20905 points sur secteur.
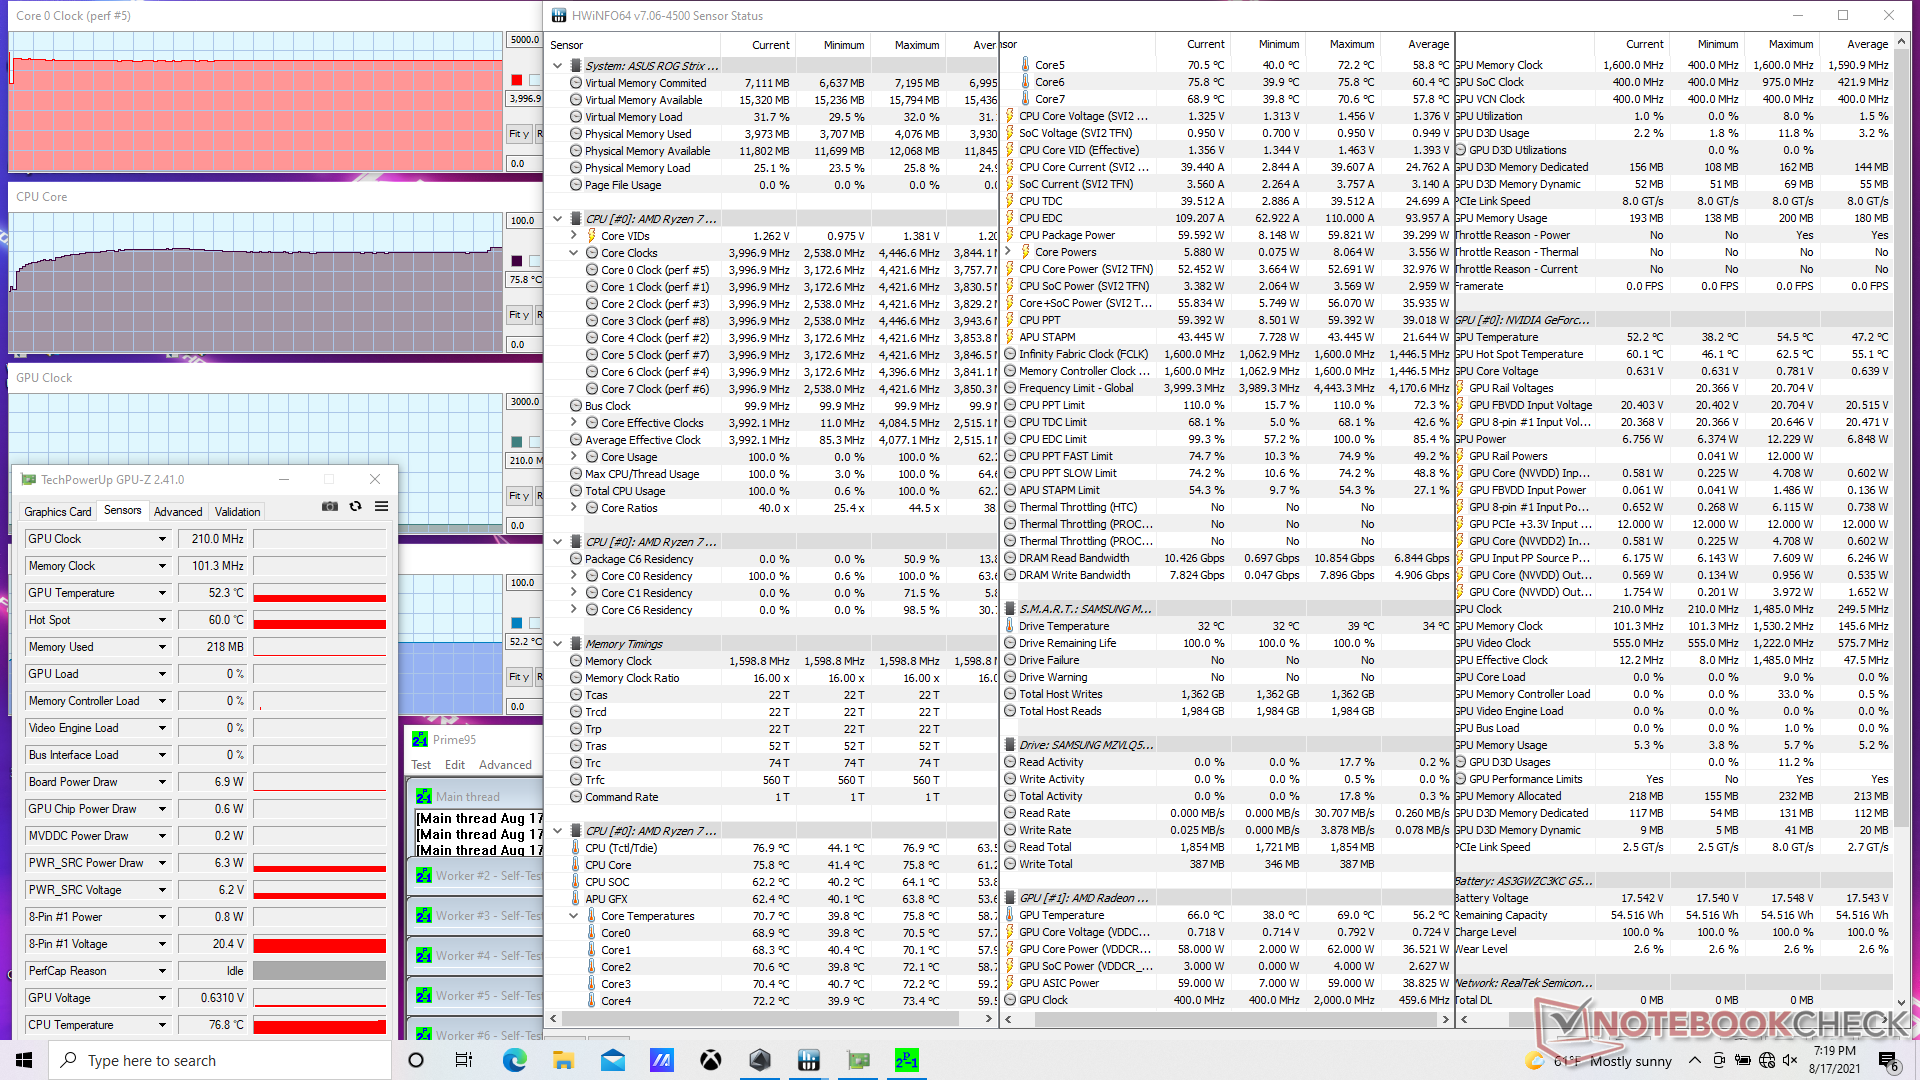
| Fréquence CPU(GHz) | Fréquence GPU(MHz) | Température CPU moyenne(°C) | Température GPUmoyenne(°C) |
| Système au repos | - | - | 42 |
| Prime95 Stress (Turbo on) | 4.0 | ||
| Prime95+ FurMark Stress (Turbo on) | 3.9 | 1905 | 84 |
| Witcher 3 Stress (Turbo désactivé) | 3.3 - 4.1 | 1845 | 72 |
| Witcher 3 Stress (Turbo activé) | 3.3 - 4.1 | 1972 | 71 |
Haut-parleurs
Les haut-parleurs stéréo de 2 W sont relativement faibles. Même les haut-parleurs du petit modèle de 13 pouces HP Pavilion Aero 13 de 13 pouces sont plus forts et ont une portée plus large que ceux de notre Strix G17.


Asus ROG Strix G17 G713QE-RB74 analyse audio
(±) | le niveau sonore du haut-parleur est moyen mais bon (73.5# dB)
Basses 100 - 315 Hz
(±) | basse réduite - en moyenne 13% inférieure à la médiane
(±) | la linéarité des basses est moyenne (9.8% delta à la fréquence précédente)
Médiums 400 - 2000 Hz
(±) | médiane supérieure - en moyenne 5.6% supérieure à la médiane
(+) | les médiums sont linéaires (6.5% delta à la fréquence précédente)
Aiguës 2 - 16 kHz
(+) | des sommets équilibrés - à seulement 3.4% de la médiane
(±) | la linéarité des aigus est moyenne (12% delta à la fréquence précédente)
Globalement 100 - 16 000 Hz
(±) | la linéarité du son global est moyenne (16.9% de différence avec la médiane)
Par rapport à la même classe
» 44% de tous les appareils testés de cette catégorie étaient meilleurs, 11% similaires, 45% pires
» Le meilleur avait un delta de 6%, la moyenne était de 18%, le pire était de 132%.
Par rapport à tous les appareils testés
» 30% de tous les appareils testés étaient meilleurs, 8% similaires, 62% pires
» Le meilleur avait un delta de 4%, la moyenne était de 24%, le pire était de 134%.
Apple MacBook 12 (Early 2016) 1.1 GHz analyse audio
(+) | les haut-parleurs peuvent jouer relativement fort (83.6# dB)
Basses 100 - 315 Hz
(±) | basse réduite - en moyenne 11.3% inférieure à la médiane
(±) | la linéarité des basses est moyenne (14.2% delta à la fréquence précédente)
Médiums 400 - 2000 Hz
(+) | médiane équilibrée - seulement 2.4% de la médiane
(+) | les médiums sont linéaires (5.5% delta à la fréquence précédente)
Aiguës 2 - 16 kHz
(+) | des sommets équilibrés - à seulement 2% de la médiane
(+) | les aigus sont linéaires (4.5% delta à la fréquence précédente)
Globalement 100 - 16 000 Hz
(+) | le son global est linéaire (10.2% différence à la médiane)
Par rapport à la même classe
» 7% de tous les appareils testés de cette catégorie étaient meilleurs, 2% similaires, 91% pires
» Le meilleur avait un delta de 5%, la moyenne était de 18%, le pire était de 53%.
Par rapport à tous les appareils testés
» 5% de tous les appareils testés étaient meilleurs, 1% similaires, 94% pires
» Le meilleur avait un delta de 4%, la moyenne était de 24%, le pire était de 134%.
Energy Management — Poor GPU Performance-per-Watt
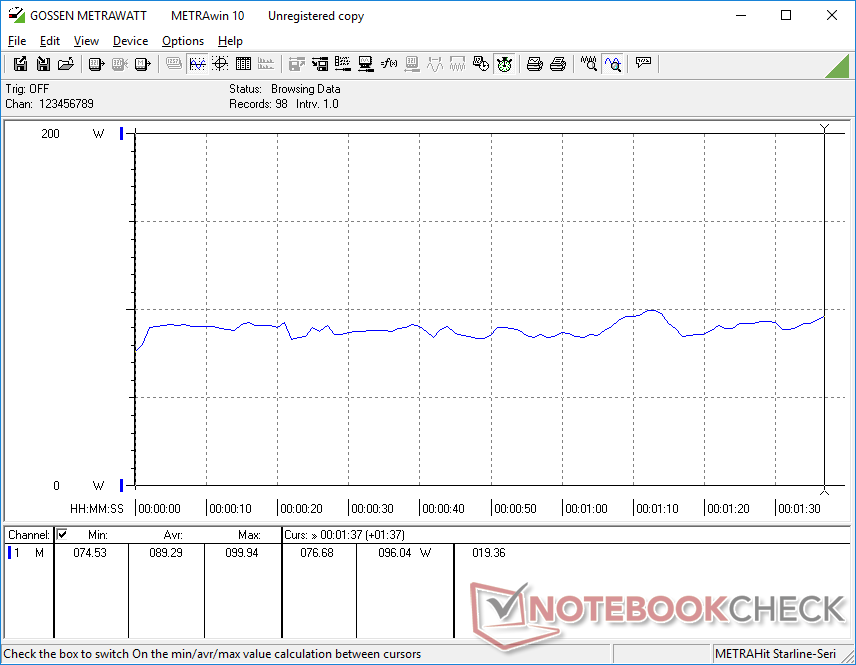
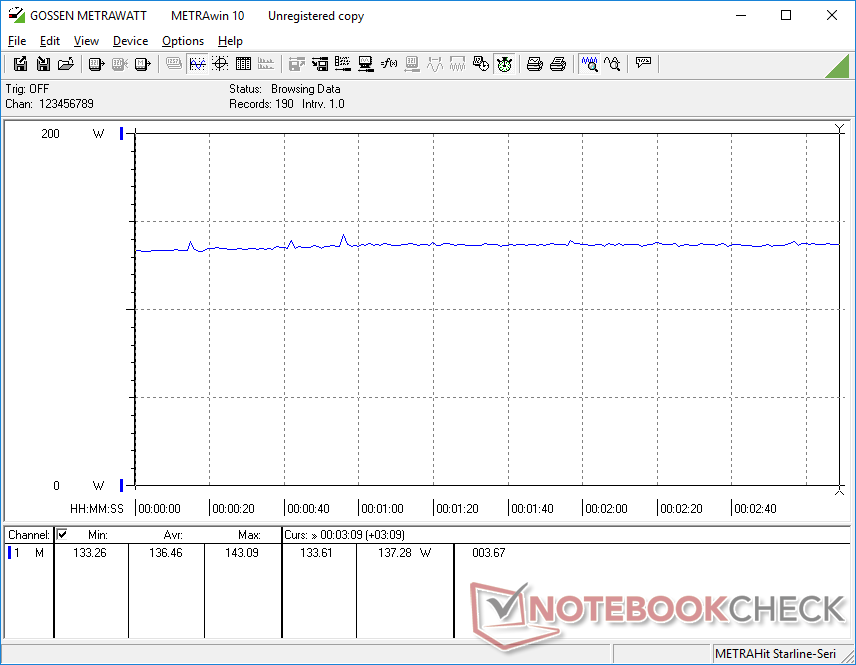
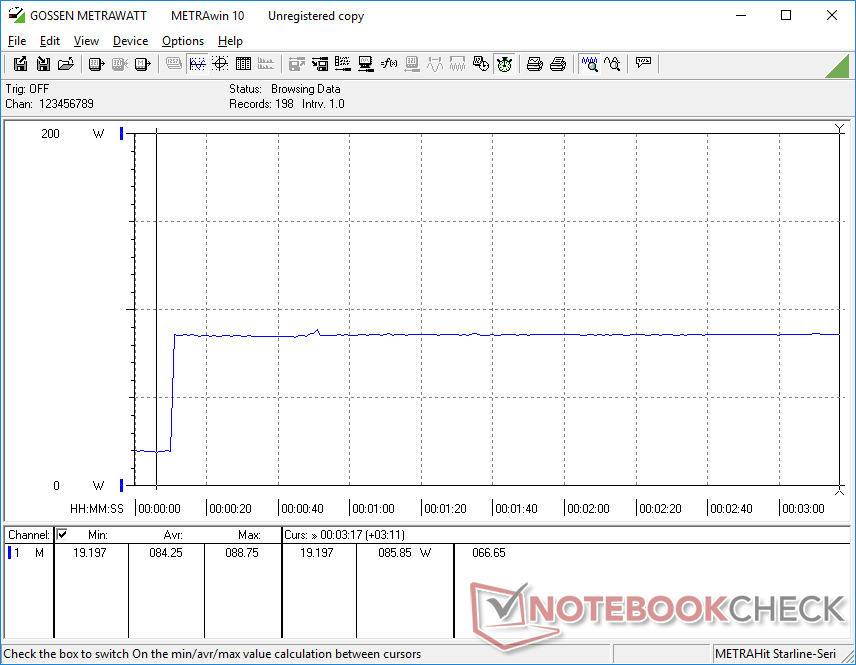
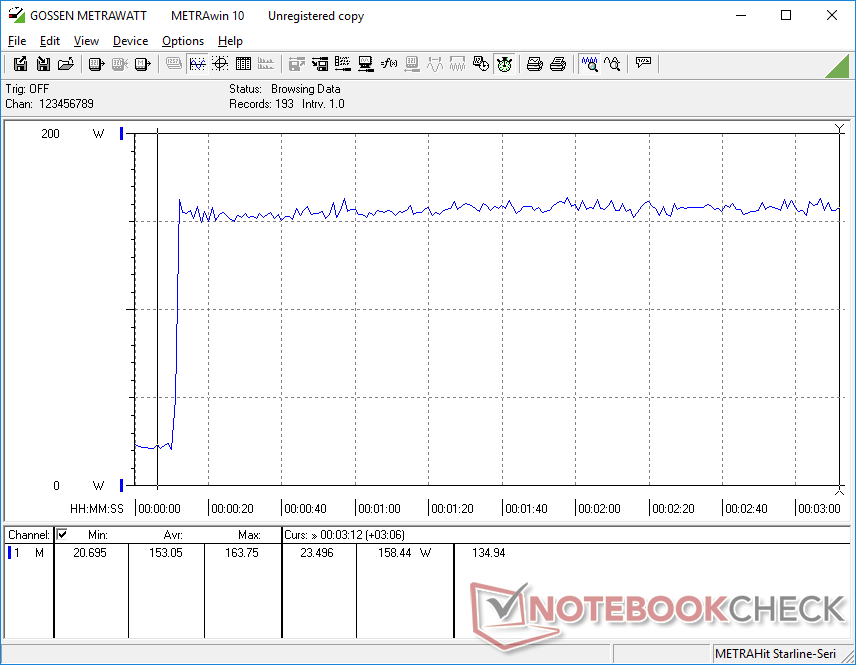
Consommation d'énergie
La consommation d'énergie globale est proche de ce que nous avons observé sur le MSI Katana avec le GPU RTX 3060 plus rapide. L'exécution de Witcher 3 consommerait environ 9 % de moins d'énergie sur notre Asus malgré son déficit de 30 % de performances graphiques, ce qui montre une performance par watt inférieure à celle de la RTX 3050 Ti
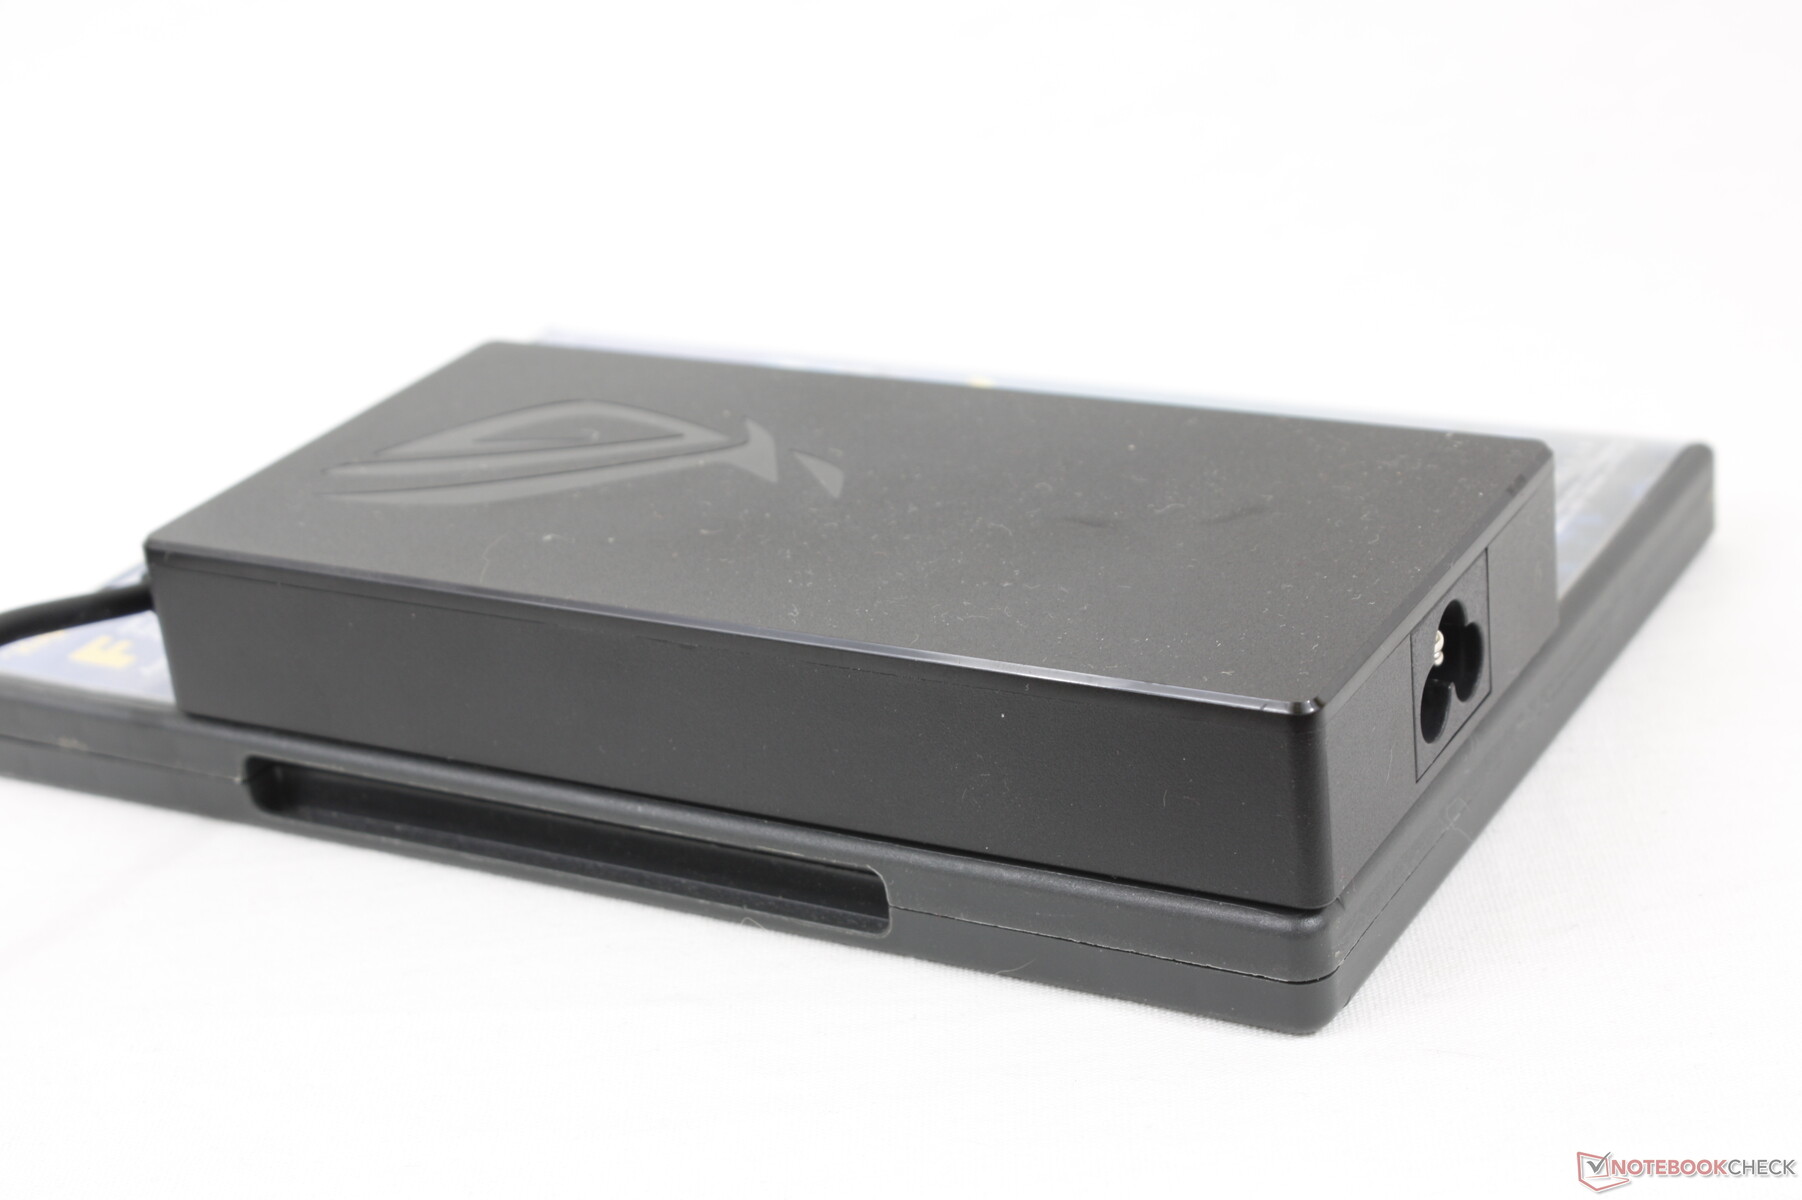
Nous avons pu enregistrer une consommation maximale de 163 W sur l'adaptateur secteur 200 W de taille moyenne (~15,2 x 7,3 x 2,3 cm). Notre configuration n'a aucun problème pour charger et faire tourner des jeux simultanément. D'autres SKUs peuvent être livrés avec des adaptateurs plus petits de 160 W ou plus grands de 240 W selon l'option graphique.
| Éteint/en veille | |
| Au repos | |
| Fortement sollicité |
|
Légende:
min: | |
| Asus ROG Strix G17 G713QE-RB74 R7 5800H, GeForce RTX 3050 Ti Laptop GPU, Samsung PM991 MZVLQ512HBLU, IPS, 1920x1080, 17.3" | Acer Nitro 5 AN517-53-54DQ i5-11300H, GeForce RTX 3050 4GB Laptop GPU, SK Hynix BC711 HFM512GD3HX015N, IPS, 1920x1080, 17.3" | MSI Katana GF76 11UE i7-11800H, GeForce RTX 3060 Laptop GPU, Kingston OM8PCP3512F-AB, IPS, 1920x1080, 17.3" | Asus Strix Scar 17 G733QSA-XS99 R9 5900HX, GeForce RTX 3080 Laptop GPU, 2x Samsung PM981a MZVLB1T0HBLR (RAID 0), IPS, 1920x1080, 17.3" | MSI Alpha 17 A4DEK R7 4800H, Radeon RX 5600M, Kingston OM8PCP3512F-AB, IPS, 1920x1080, 17.3" | Asus Strix G17 G712LWS i7-10750H, GeForce RTX 2070 Super Mobile, Intel SSD 660p 1TB SSDPEKNW010T8, IPS, 1920x1080, 17.3" | |
|---|---|---|---|---|---|---|
| Power Consumption | 28% | -4% | -25% | 2% | -26% | |
| Idle Minimum * (Watt) | 9.2 | 4 57% | 9 2% | 10.9 -18% | 9 2% | 10 -9% |
| Idle Average * (Watt) | 12.6 | 9 29% | 13 -3% | 14.7 -17% | 12 5% | 14 -11% |
| Idle Maximum * (Watt) | 23.3 | 15 36% | 20 14% | 26.8 -15% | 18 23% | 25 -7% |
| Load Average * (Watt) | 89.3 | 85 5% | 102 -14% | 106.7 -19% | 76 15% | 134 -50% |
| Witcher 3 ultra * (Watt) | 136 | 104 24% | 149 -10% | 192.4 -41% | 136 -0% | 186 -37% |
| Load Maximum * (Watt) | 162.7 | 135 17% | 187 -15% | 228.4 -40% | 222 -36% | 230 -41% |
* ... Moindre est la valeur, meilleures sont les performances
Power Consumption Witcher 3 / Stresstest
Autonomie de la batterie
La capacité de la batterie est plus faible que sur la dernière génération de G712 (56 Wh contre 66 Wh), mais les durées d'exécution restent à peu près les mêmes, soit 5,5 à 6 heures d'utilisation réelle du WLAN en profil d'alimentation équilibré avec le GPU intégré actif. Le Strix Scar 17 G733, plus cher, peut tenir plusieurs heures de plus grâce à sa batterie de 90 Wh, beaucoup plus importante. Les configurations haut de gamme du G713 sont équipées d'une batterie de 90 Wh au lieu de la batterie de base de 56 Wh, ce qui permet de prolonger l'autonomie de la batterie.
Le chargement d'une batterie vide à une batterie pleine prend environ 1,5 heure. La recharge USB-C PD est prise en charge, mais à un rythme plus lent.
| Asus ROG Strix G17 G713QE-RB74 R7 5800H, GeForce RTX 3050 Ti Laptop GPU, 56 Wh | Acer Nitro 5 AN517-53-54DQ i5-11300H, GeForce RTX 3050 4GB Laptop GPU, 57 Wh | MSI Katana GF76 11UE i7-11800H, GeForce RTX 3060 Laptop GPU, 53 Wh | Asus Strix Scar 17 G733QSA-XS99 R9 5900HX, GeForce RTX 3080 Laptop GPU, 90 Wh | MSI Alpha 17 A4DEK R7 4800H, Radeon RX 5600M, 65 Wh | Asus Strix G17 G712LWS i7-10750H, GeForce RTX 2070 Super Mobile, 66 Wh | |
|---|---|---|---|---|---|---|
| Autonomie de la batterie | 35% | -26% | 34% | 18% | 6% | |
| Reader / Idle (h) | 11.1 | 17.4 57% | 4.8 -57% | 13.3 20% | 10.5 -5% | 9.1 -18% |
| WiFi v1.3 (h) | 6 | 7.2 20% | 3.7 -38% | 9.3 55% | 7.3 22% | 5.5 -8% |
| Load (h) | 1.1 | 1.4 27% | 1.3 18% | 1.4 27% | 1.5 36% | 1.6 45% |
| Witcher 3 ultra (h) | 0.8 |
Points positifs
Points négatifs
Verdict - Choisissez votre configuration avec soin
Comme indiqué précédemment, il n'existe pas moins de 16 configurations du Asus ROG Strix G17 G713 avec des épaisseurs, des poids, des adaptateurs secteur, des écrans, des capacités de batterie, des éclairages RVB, etc. différents. Les acheteurs potentiels devraient choisir leur SKU respectif avec soin en consultant les spécifications sur le site officiel d'Asus https://rog.asus.com/laptops/rog-strix/2021-rog-strix-g17-series/spec qui détaillent toutes les différences entre eux.
Pour notre configuration de test en particulier, le CPU AMD Zen 3 et le taux de rafraîchissement rapide de l'écran à 144 Hz méritent des éloges. Les RTX 3050 et RTX 3050 Ti sont plus difficiles à recommander, cependant, car leurs niveaux de performance sont au mieux inférieurs à ceux de la GTX 1660 Ti. Une mise à niveau vers la RTX 3060 ou une version plus récente permettra de bénéficier d'une plus grande autonomie et d'une performance par watt nettement supérieure
Malheureusement, opter pour la RTX 3060 ou plus entraîne quelques inconvénients car ces SKU sont plus épais, plus lourds, et avec des adaptateurs CA plus grands que notre SKU RTX 3050 Ti. La convention de dénomination d'Asus est particulièrement déroutante à cet égard car la série G713 se compose en fait de deux modèles distincts et pourtant ils partagent presque les mêmes noms de détail. La base solide, les charnières rigides et la facilité de mise à niveau sont néanmoins meilleures que celles de la plupart des autres ordinateurs portables de jeu à petit budget, notamment les modèles HP Pavilion Gaming, Lenovo Legion 5, MSI Katana, ou Dell G5 series, au prix d'un encombrement plus important
Prix et disponibilité
Asus ROG Strix G17 G713QE-RB74
- 08/20/2021 v7 (old)
Allen Ngo
Price comparison

