Verdict - Le ThinkPad T16g Gen 3 est doté de nombreuses fonctionnalités, mais ses performances sont médiocres
Lorsqu'il s'agit de stations de travail mobiles de grande taille, vous êtes en droit d'attendre d'excellentes performances. Cependant, Lenovo s'est rendu la tâche inutilement difficile avec ses nouveaux ThinkPad T16g Gen 3 et ThinkPad P16 Gen 3 en n'utilisant qu'un faible bloc d'alimentation de 180 watts. Bien que les performances du processeur soient très bonnes, il s'agit de la plus lente GeForce RTX 5080 (TGP de 105 watts) que nous ayons testée jusqu'à présent. Même les concurrents équipés de la RTX 5070 Ti sont généralement plus rapides, et ces limitations s'appliquent naturellement aux GPU RTX PRO du ThinkPad P16 Gen 3. De plus, dès que vous mettez les composants à l'œuvre, la batterie se vide à plusieurs reprises parce que l'alimentation électrique est tout simplement insuffisante, et les ventilateurs deviennent très bruyants.
En termes de caractéristiques, d'options de maintenance et de fonctionnalités générales, le ThinkPad T16g Gen 3 obtient d'excellents résultats, ce qui en fait une "bonne" station de travail dans l'ensemble. L'écran OLED tandem mat offre également une bonne qualité d'image, bien que l'écran tactile mat rende les images affichées légèrement granuleuses.
Bien que le nouveau châssis ait amélioré la portabilité, on peut se demander si les performances n'ont pas été trop sacrifiées.
Points positifs
Points négatifs
Prix et disponibilité
Le ThinkPad T16g Gen 3 n'est pas encore disponible chez Lenovo, mais le modèle ThinkPad P16 Gen 3, structurellement identique, peut être acheté pour environ 2 399 $.
Table des matières
- Verdict - Le ThinkPad T16g Gen 3 est doté de nombreuses fonctionnalités, mais ses performances sont médiocres
- Spécifications
- Boîtier et caractéristiques
- Dispositifs d'entrée - Un clavier standard
- Écran - Tandem OLED
- Performance - Arrow Lake HX et Blackwell cuisson à feu doux
- Émissions et énergie
- Notebookcheck note globale
- Comparaison des alternatives possibles
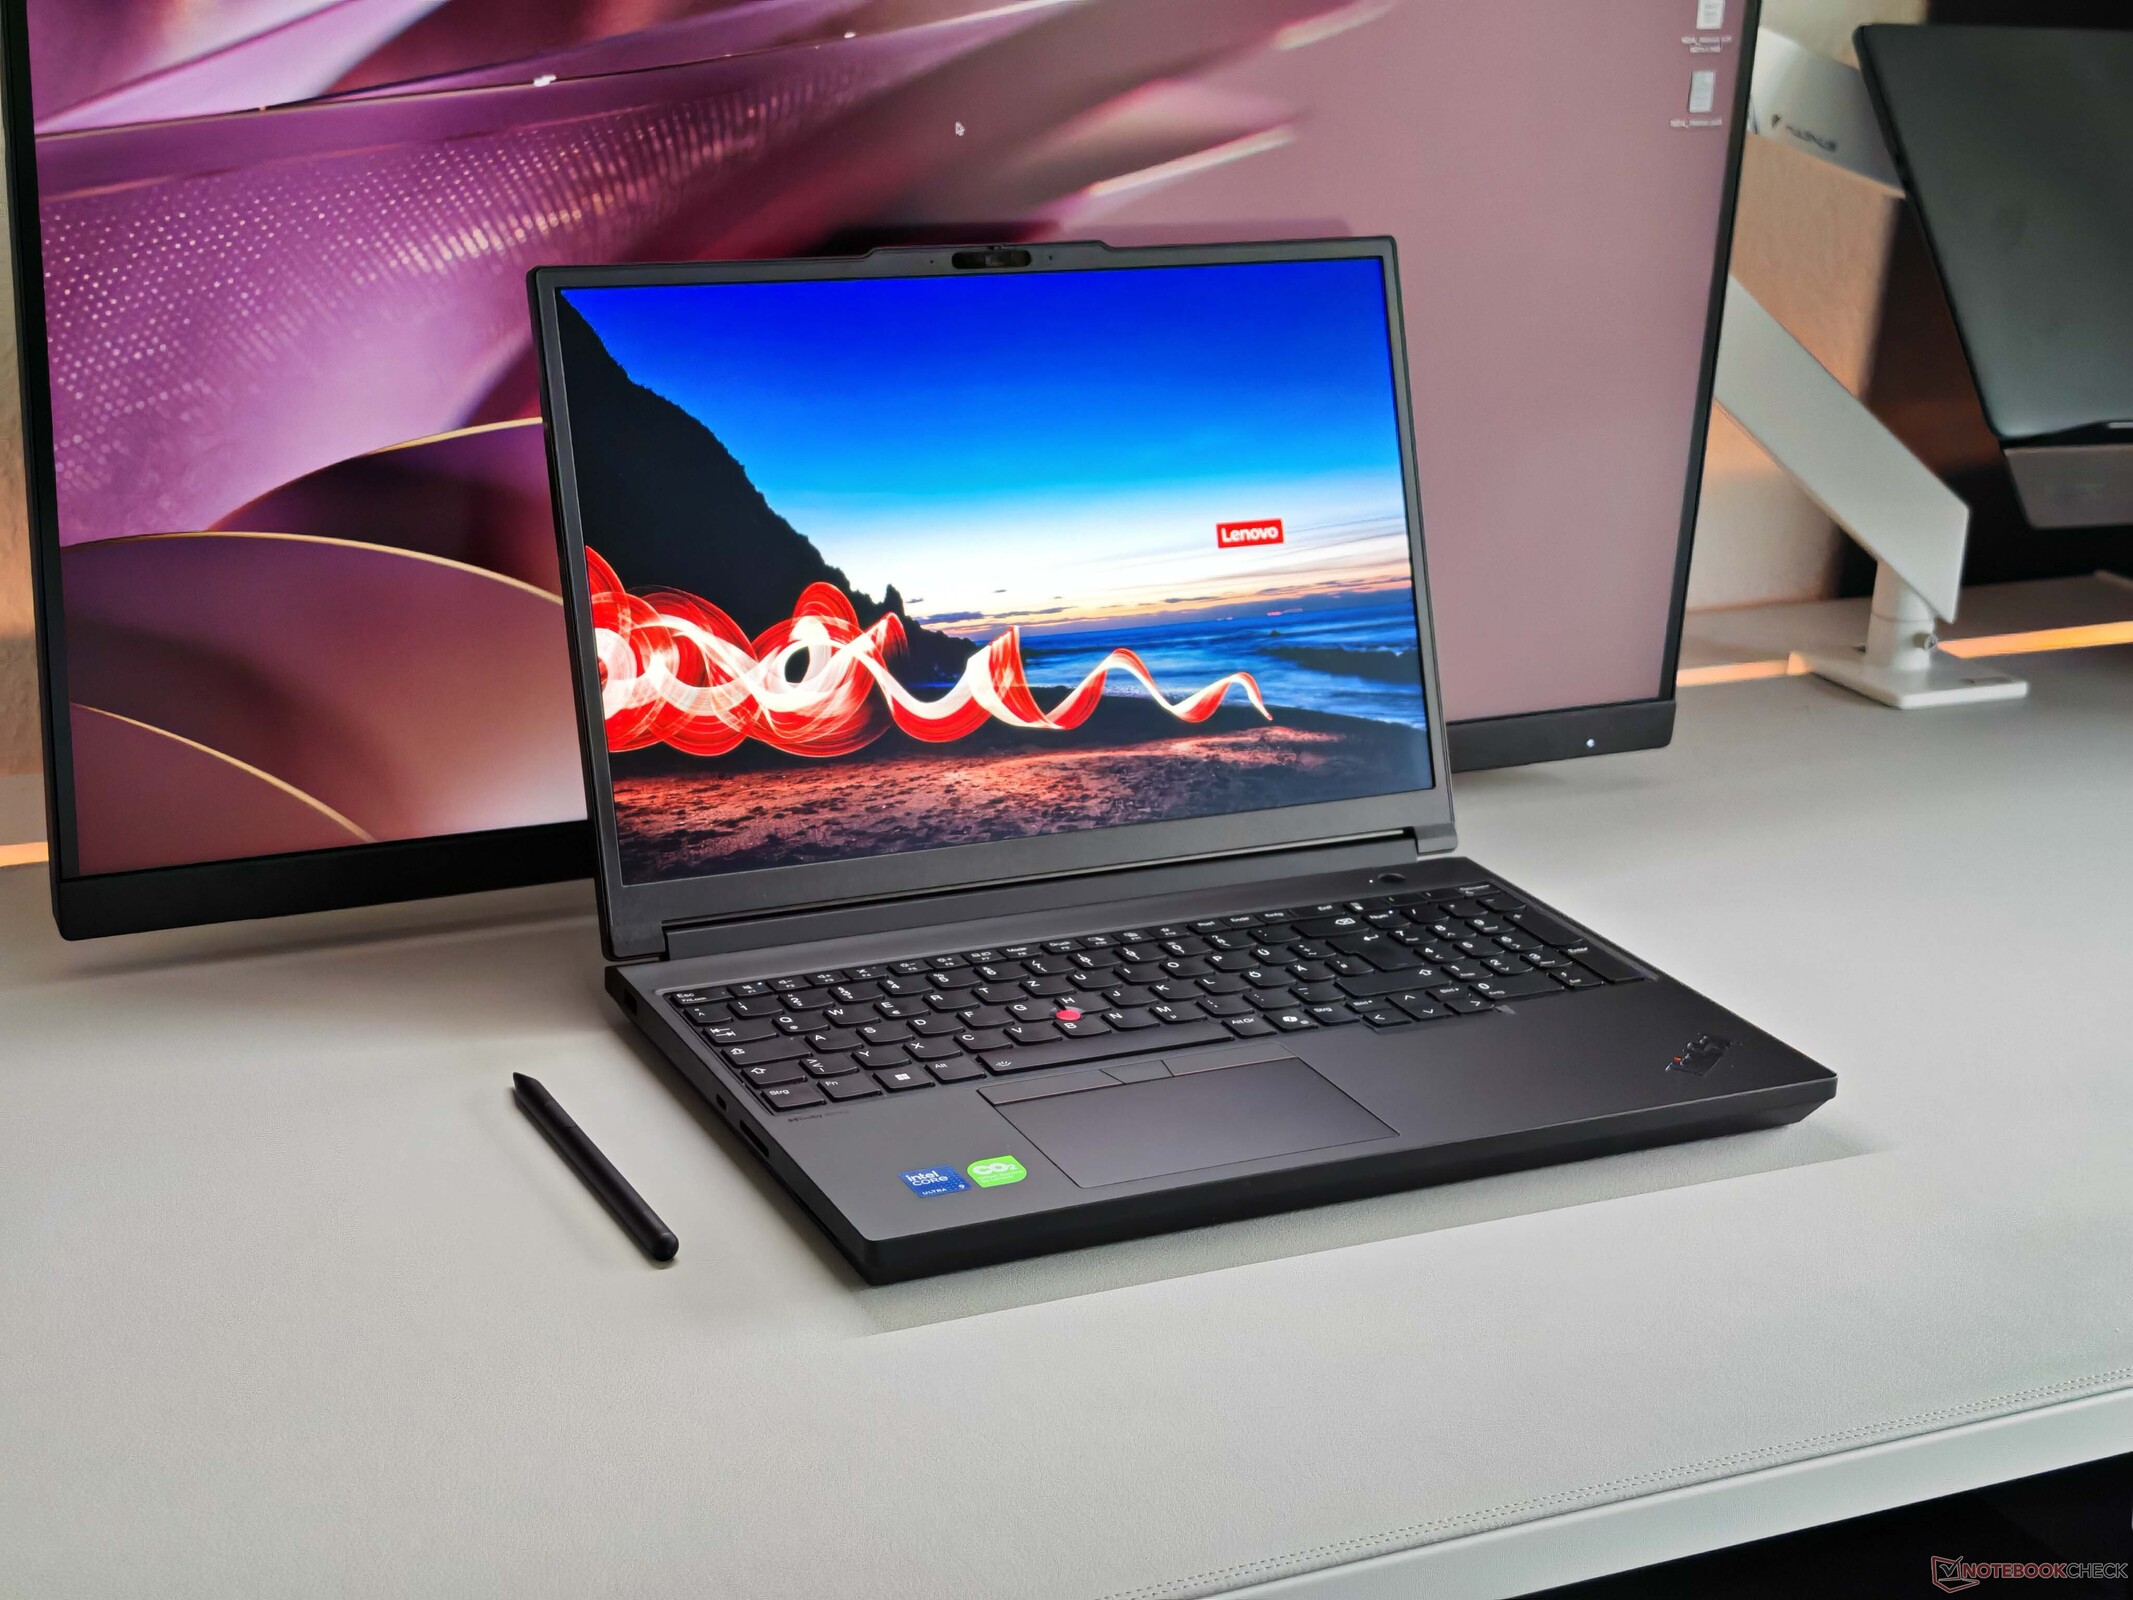
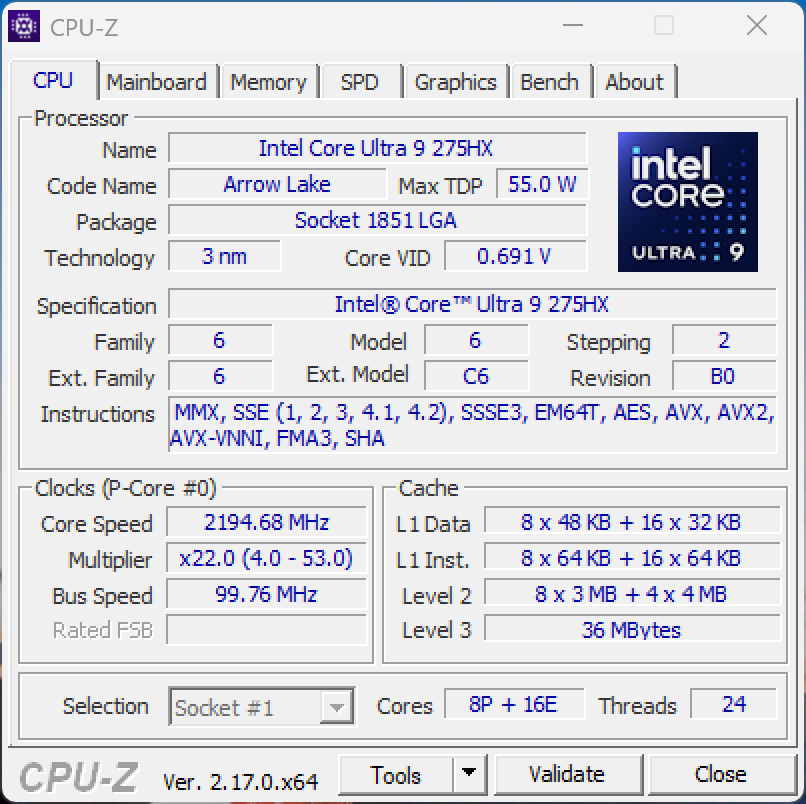
Cette année, Lenovo a entièrement redessiné son grand ThinkPad P16 Gen ThinkPad P16 Gen 3 le fabricant propose également le ThinkPad T16g Gen 3, pratiquement identique, qui remplace le GPU RTX PRO par un GPU classique GeForce. Nous avons examiné la variante haut de gamme avec le Core Ultra 9 275HX, la carte graphique pour ordinateur portable GeForce RTX 5080, 64 Go de RAM et l'écran tactile OLED tandem mat, au prix d'environ 5 600 $.
Spécifications
Boîtier et caractéristiques
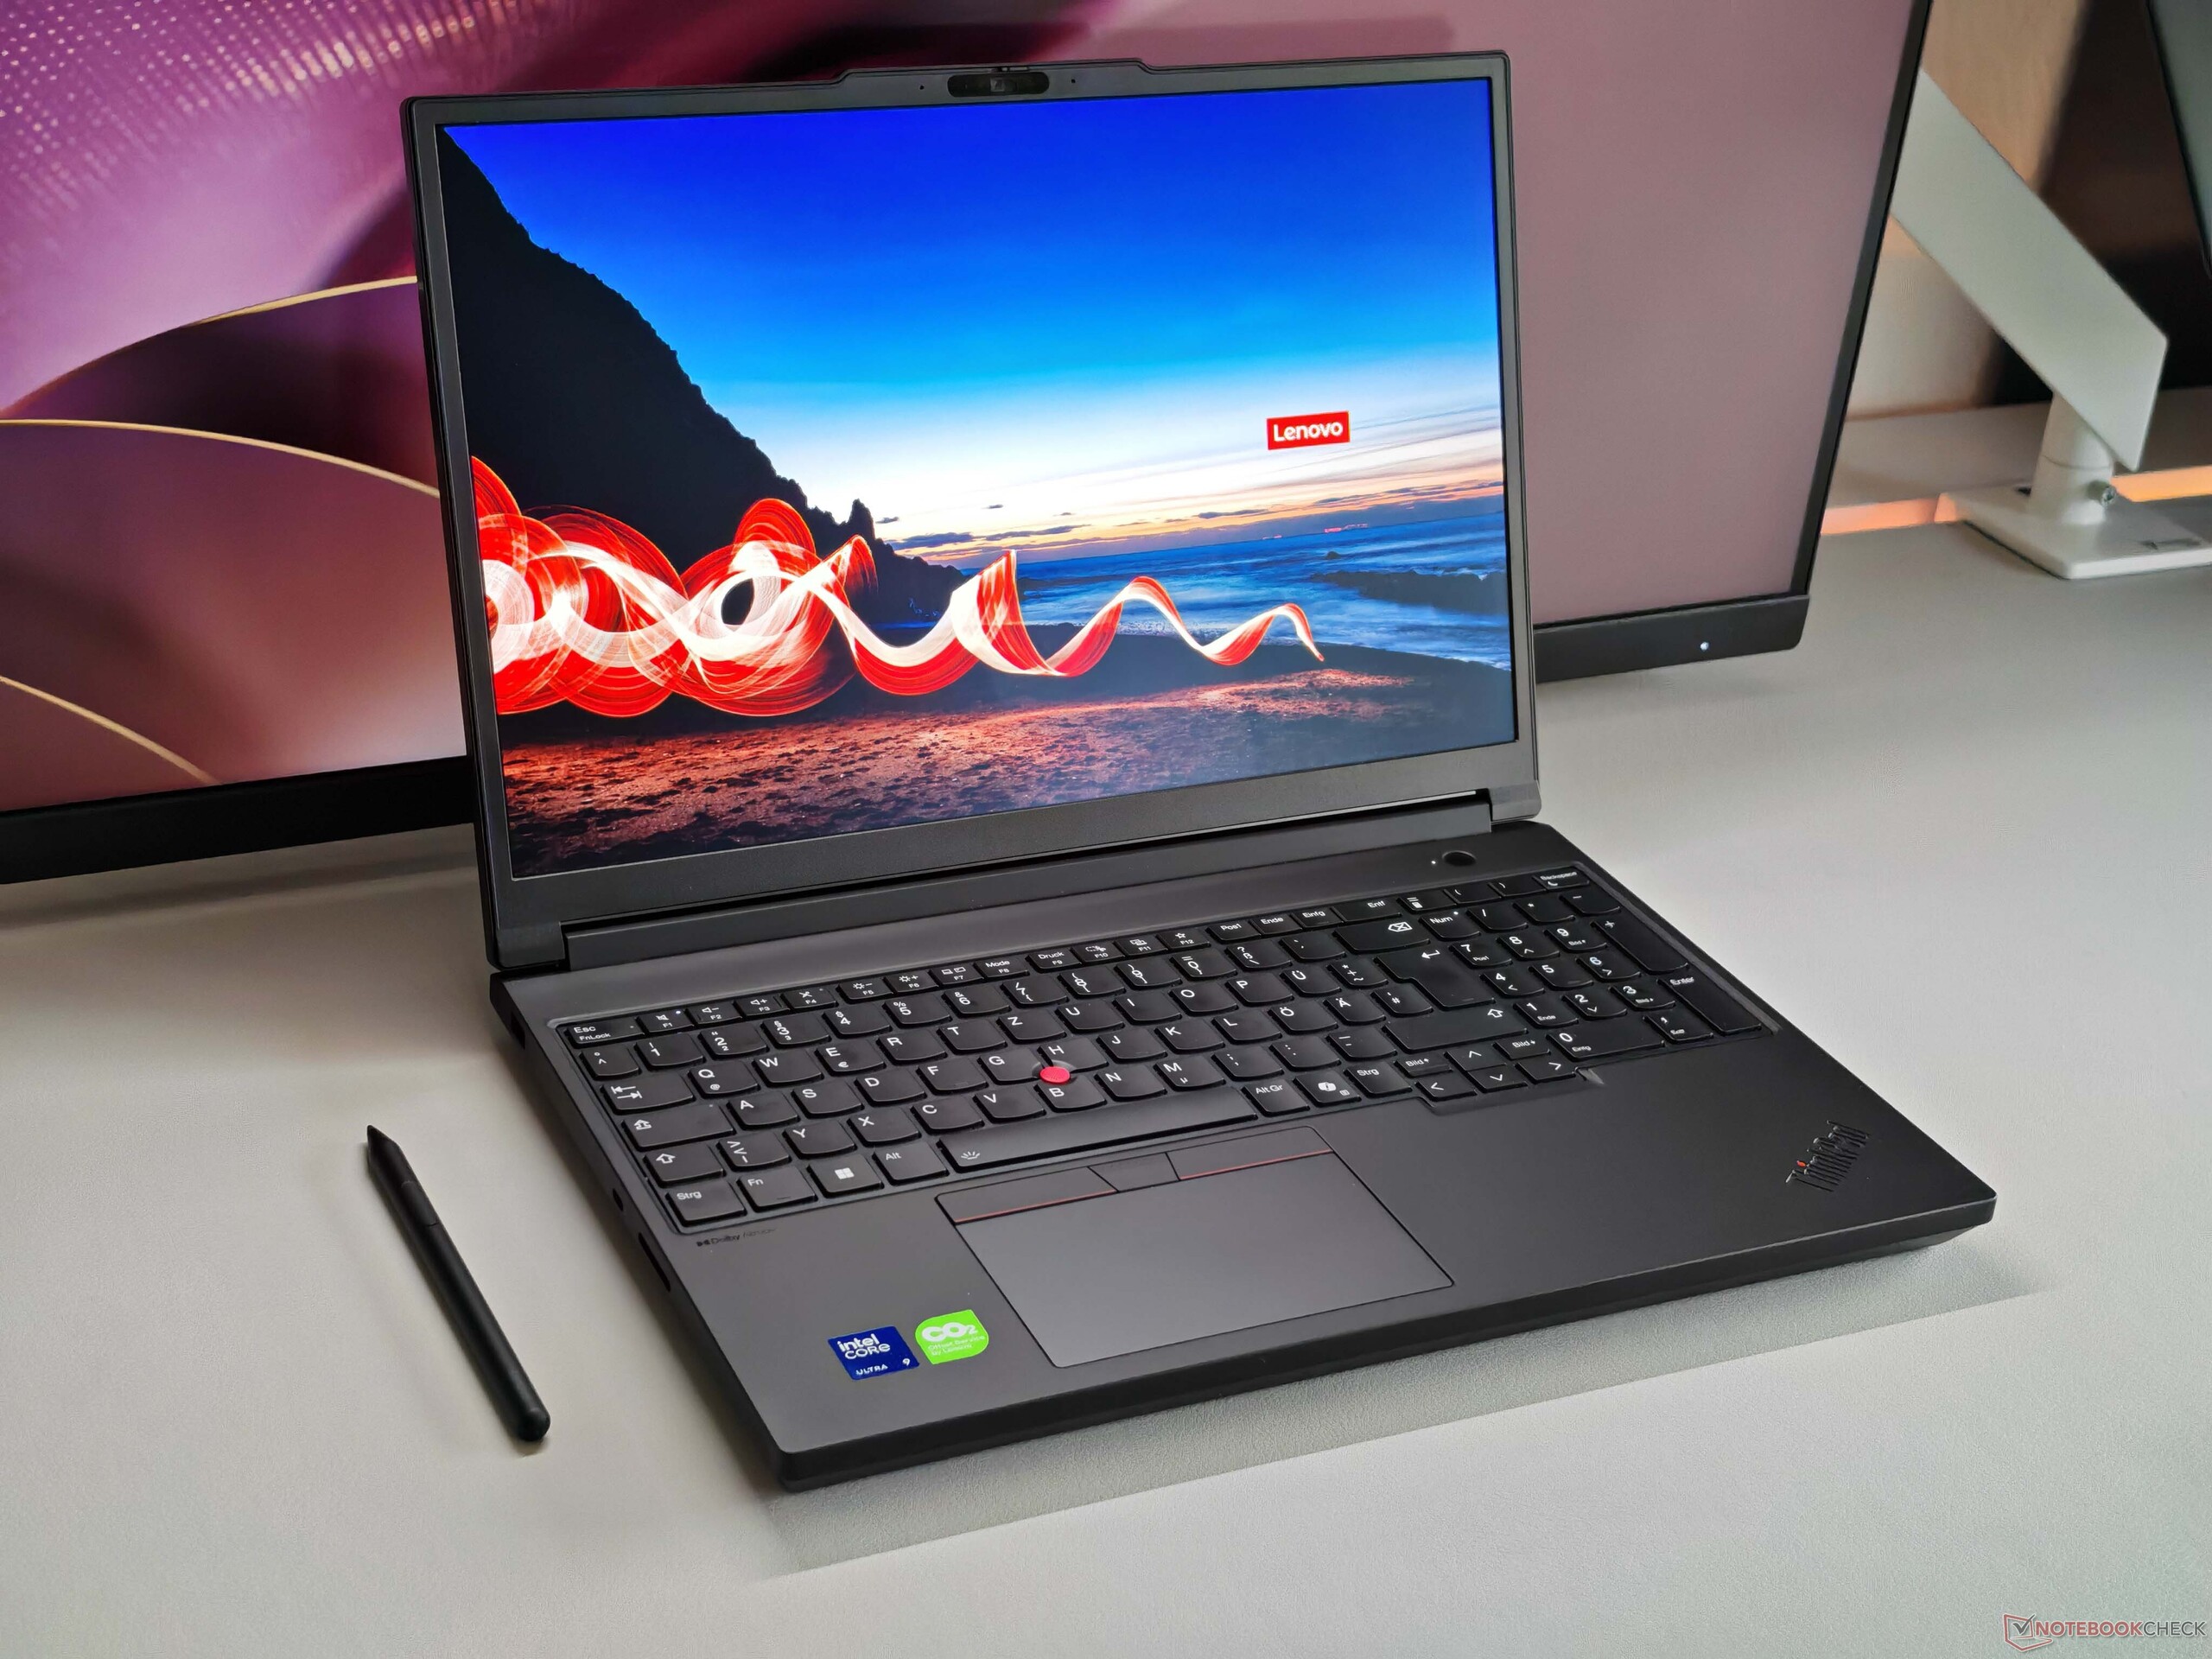
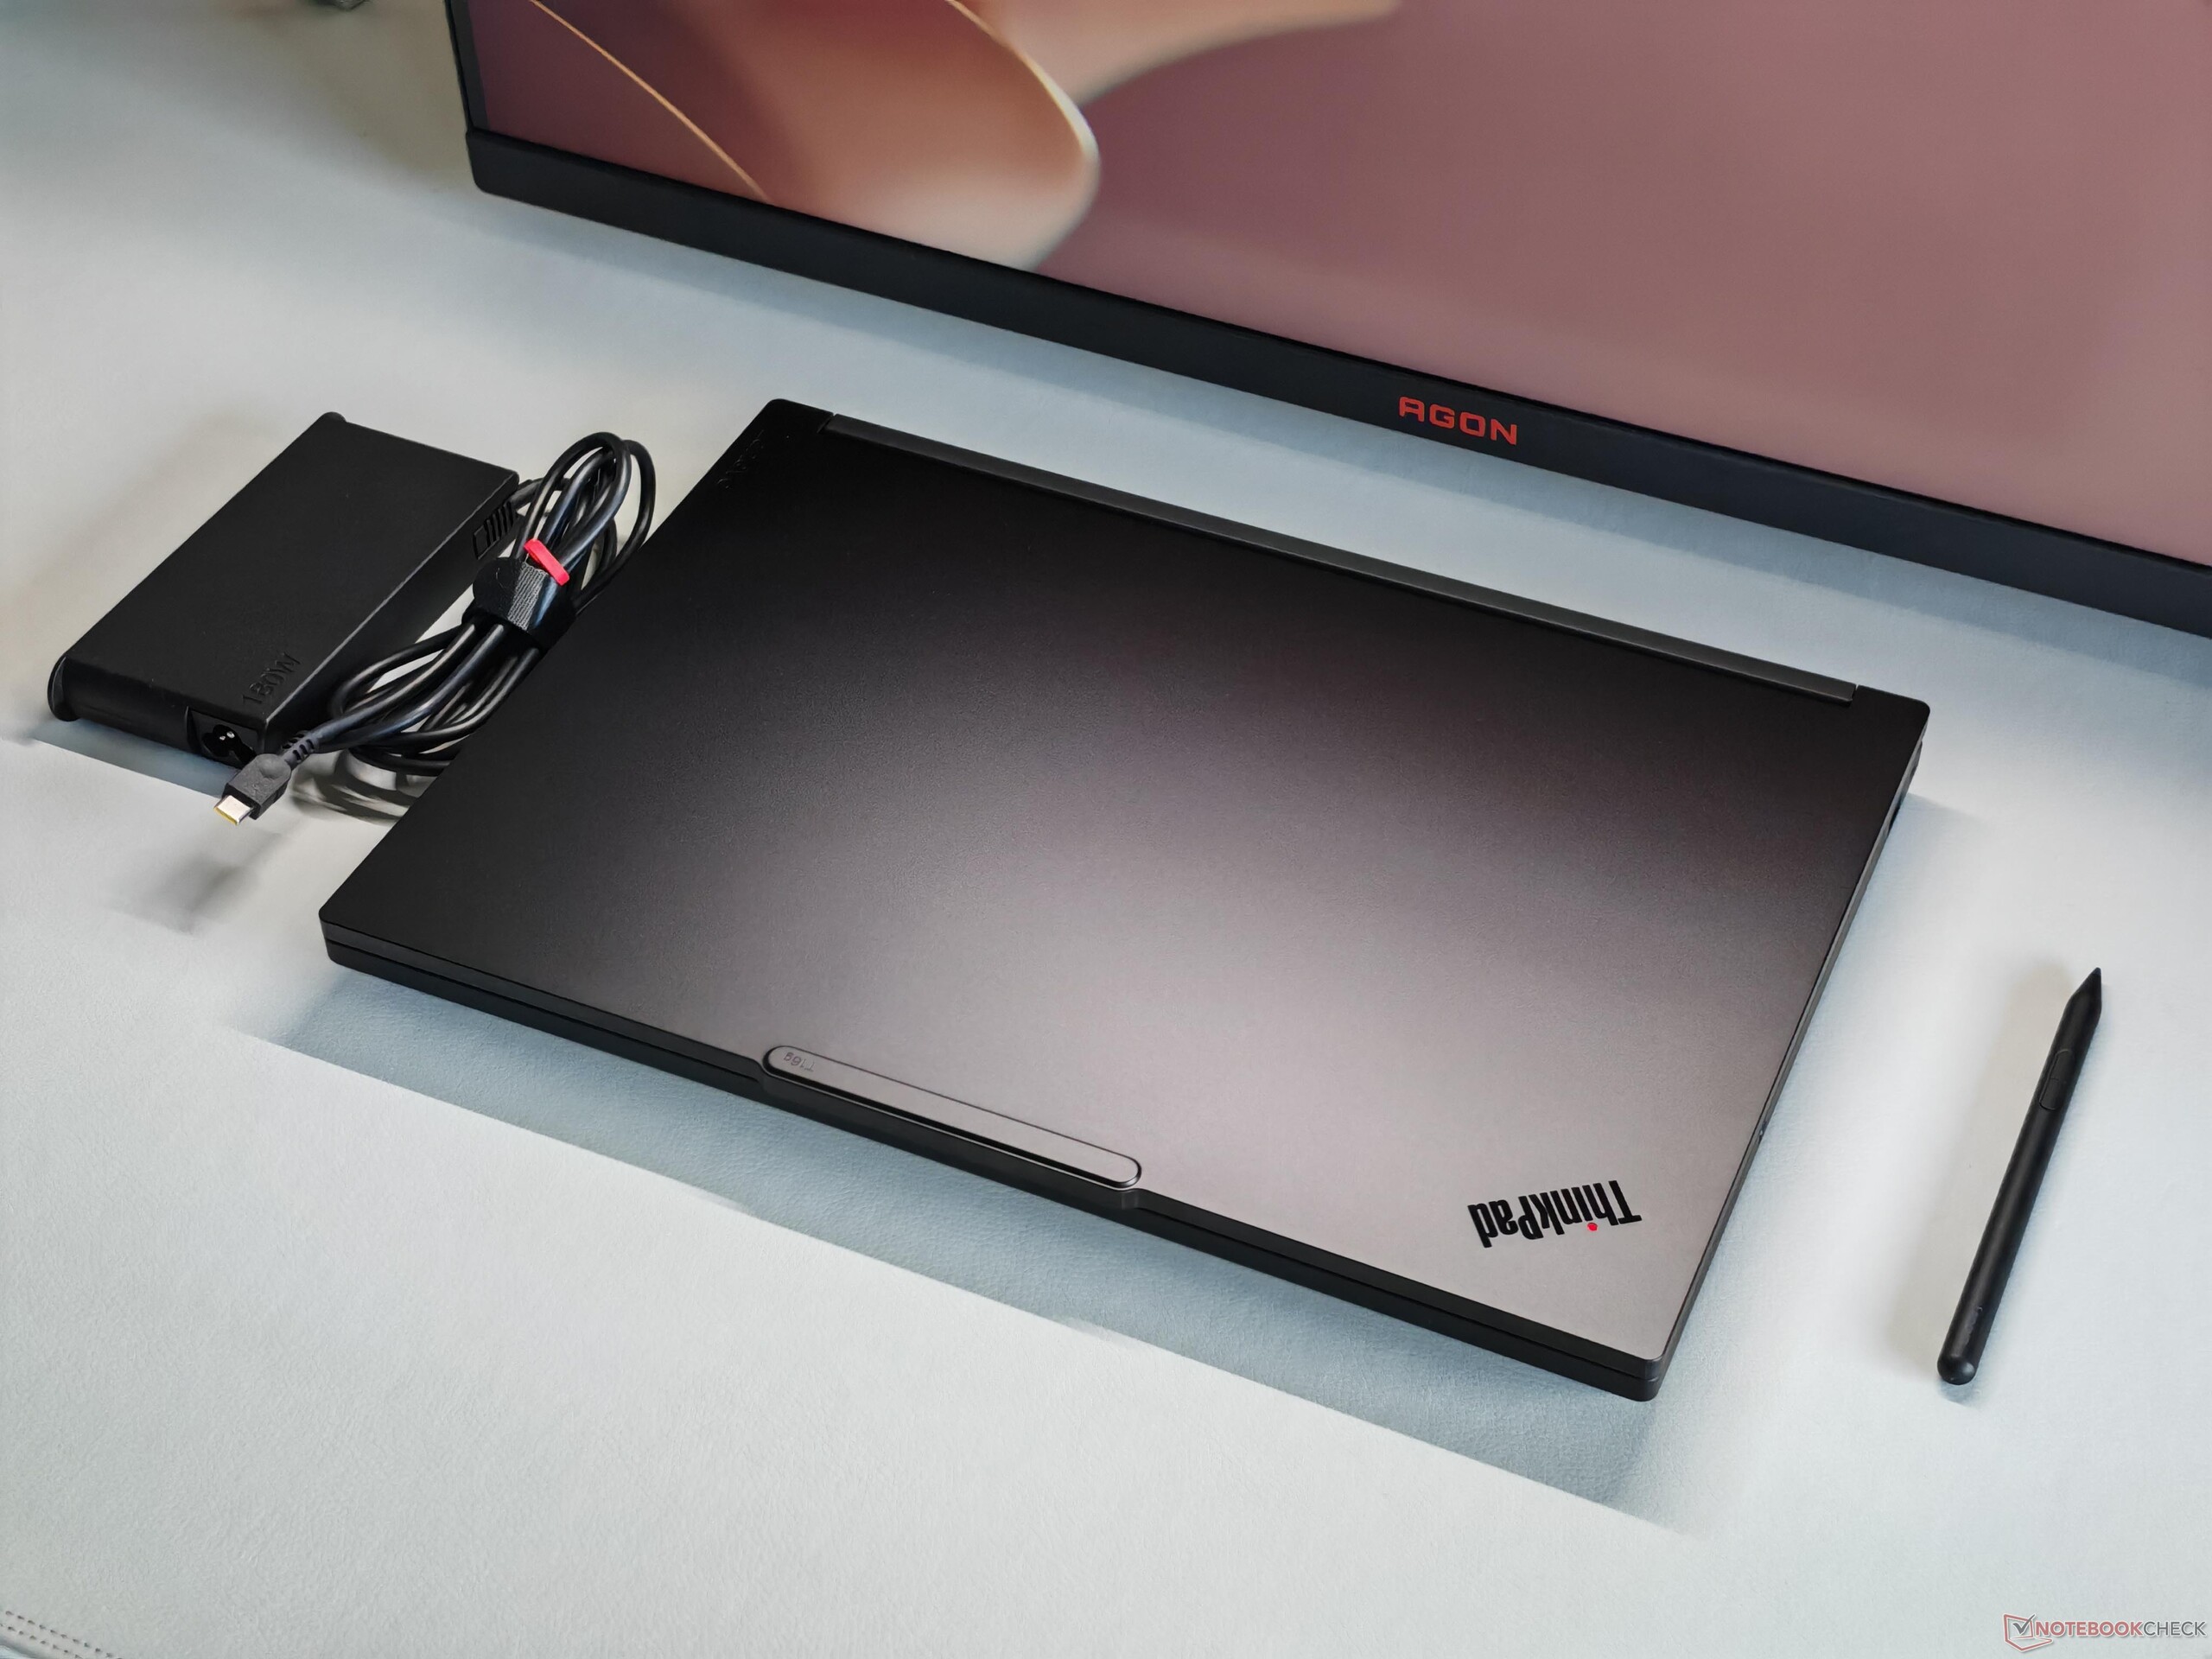
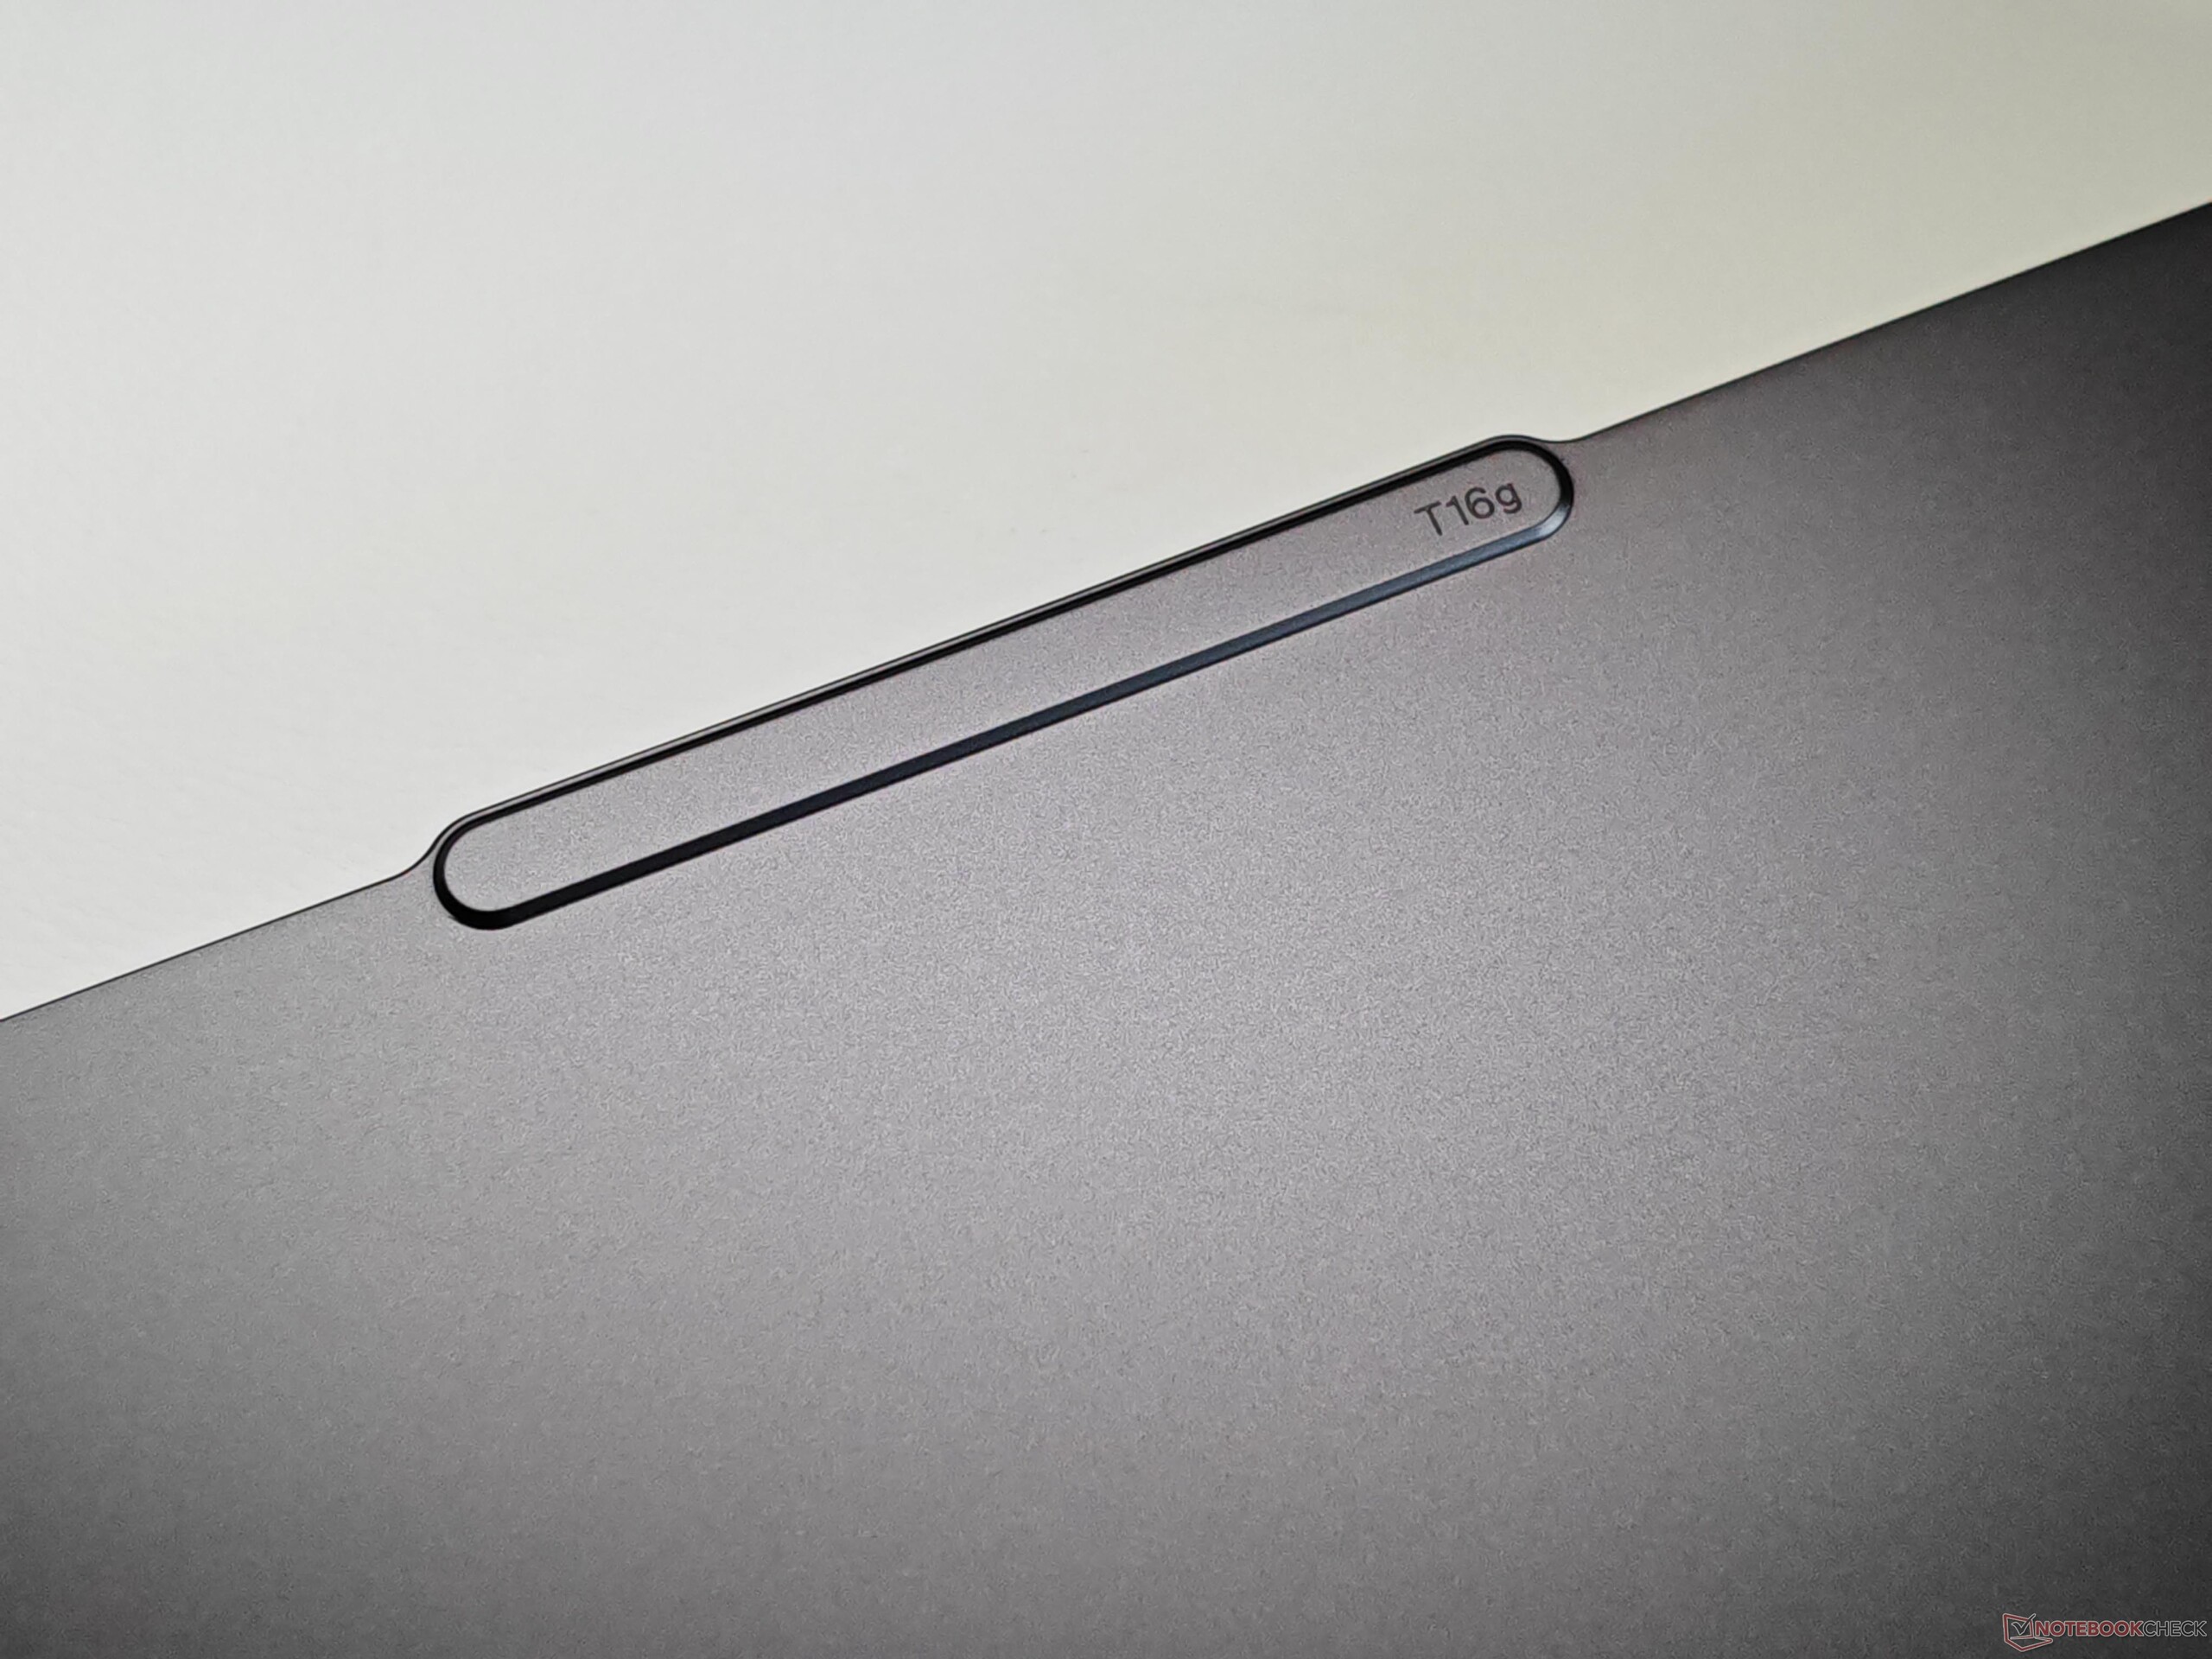
Par rapport à l'ancien ThinkPad P16 Gen 2lenovo a complètement revu le boîtier, en mettant l'accent sur la mobilité et l'amélioration de la facilité d'entretien. Avec un poids d'environ 2,6 kg, le nouveau modèle est presque 500 grammes plus léger que son prédécesseur, mais sa hauteur n'a été que légèrement réduite (30,2 mm contre 29,8 mm). Cette réduction de poids n'a pas compromis la stabilité, et tant l'unité de base que le couvercle de l'écran sont très robustes. Le couvercle de l'écran en aluminium peut être sujet aux traces de doigts, mais le dessus de l'unité de base en plastique renforcé de fibres de carbone s'en sort mieux dans ce domaine. D'un point de vue visuel, le T16g Gen 3 adhère au design actuel du ThinkPad, qui comprend la bosse proéminente de l'appareil photo.
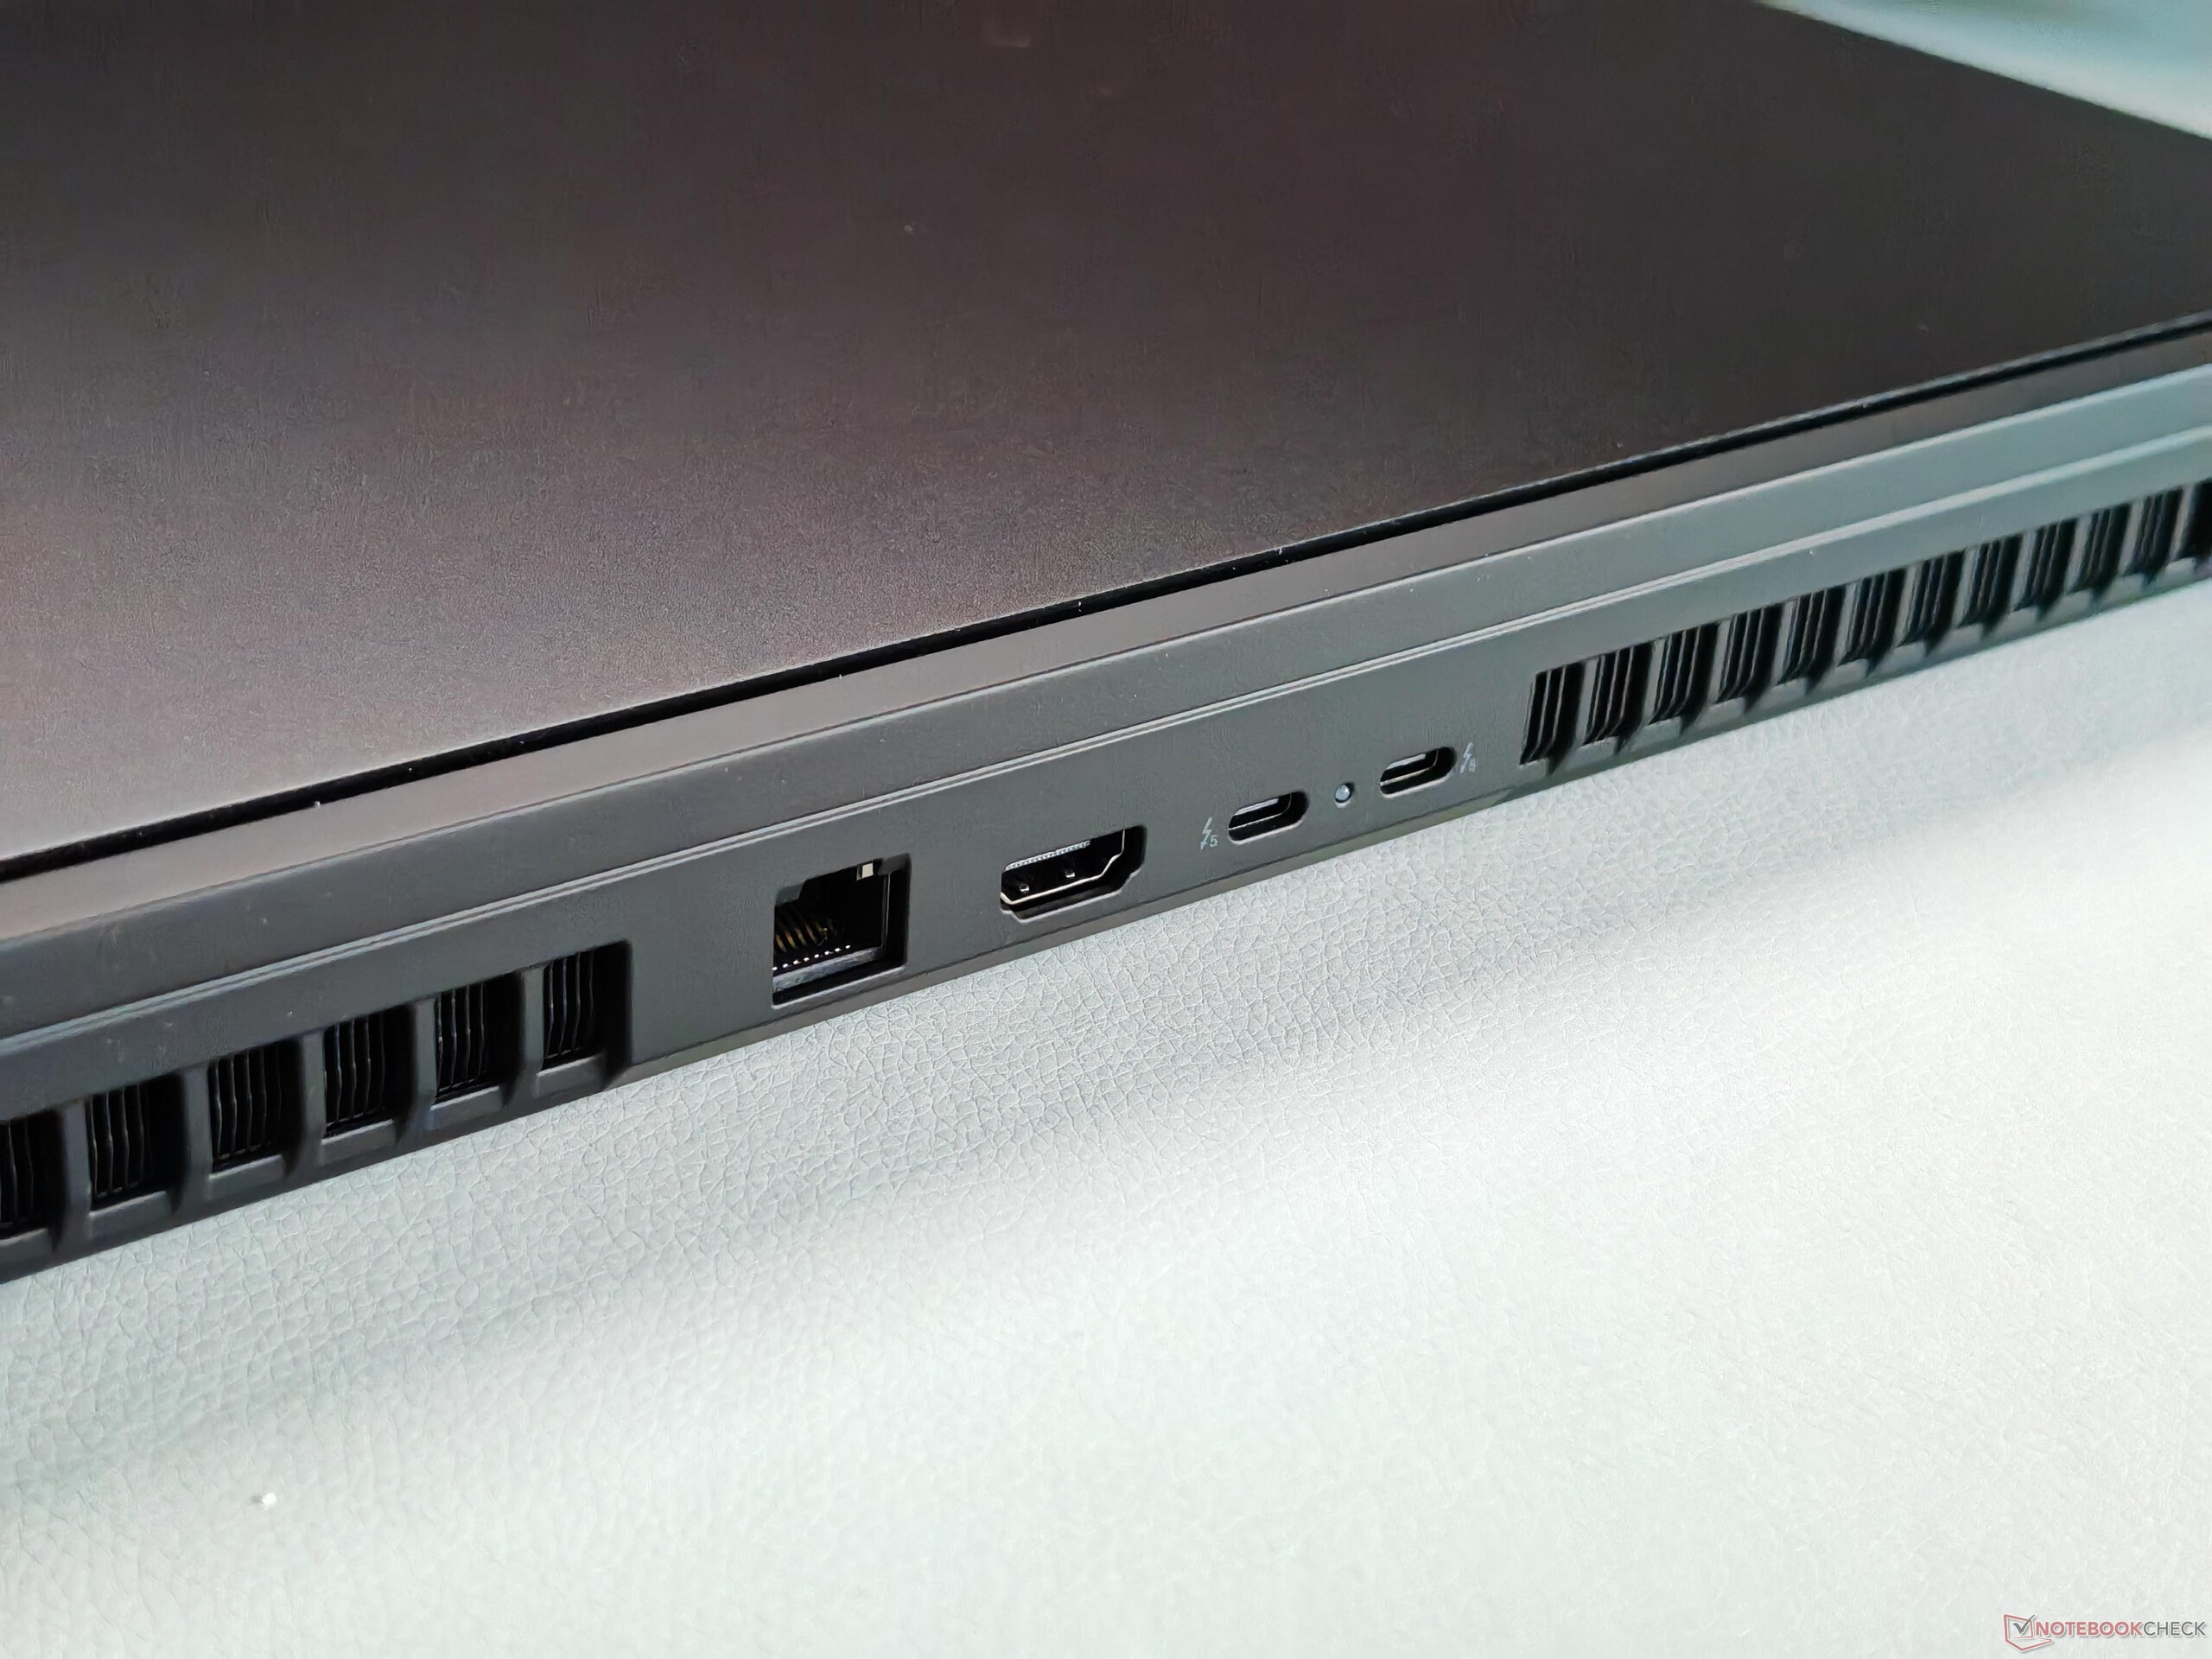
En termes de fonctionnalités, le T16g offre tout ce que vous pouvez souhaiter (Thunderbolt 5, Ethernet 2,5 Gbps, Wi-Fi 7), et un lecteur de SmartCard et un modem 5G sont également disponibles en option, bien qu'ils doivent être commandés en même temps (ils ne peuvent pas être ajoutés ultérieurement). Le lecteur de cartes prend déjà en charge le SD Express 8.0 et, avec une carte compatible, nous avons pu atteindre des vitesses de transfert de plus de 1,4 Go/s. L'appareil photo de 5 MP (avec ouverture mécanique et IR pour la détection des visages) prend des photos correctes. Le port de charge SlimTip a été supprimé, et le T16g se charge exclusivement via l'USB-C.


| SD Card Reader | |
| average JPG Copy Test (av. of 3 runs) | |
| Lenovo ThinkPad T16g Gen 3 RTX 5080 (ADATA SD8.0 Express 512 GB) | |
| Lenovo ThinkPad T16g Gen 3 RTX 5080 (Angelbird AV Pro V60) | |
| Moyenne de la classe Workstation (49.6 - 681, n=13, 2 dernières années) | |
| Schenker XMG Pro 16 (E25) (Angelbird AV Pro V60) | |
| HP ZBook Fury 16 G11 (Toshiba Exceria Pro SDXC 64 GB UHS-II) | |
| Lenovo ThinkPad P16 Gen 2 (Toshiba Exceria Pro SDXC 64 GB UHS-II) | |
| Dell Pro Max 16 Plus (Toshiba Exceria Pro SDXC 64 GB UHS-II) | |
| maximum AS SSD Seq Read Test (1GB) | |
| Lenovo ThinkPad T16g Gen 3 RTX 5080 (ADATA SD8.0 Express 512 GB) | |
| Lenovo ThinkPad T16g Gen 3 RTX 5080 (Angelbird AV Pro V60) | |
| Schenker XMG Pro 16 (E25) (Angelbird AV Pro V60) | |
| Moyenne de la classe Workstation (87.6 - 1455, n=13, 2 dernières années) | |
| HP ZBook Fury 16 G11 (Toshiba Exceria Pro SDXC 64 GB UHS-II) | |
| Dell Pro Max 16 Plus (Toshiba Exceria Pro SDXC 64 GB UHS-II) | |
| Lenovo ThinkPad P16 Gen 2 (Toshiba Exceria Pro SDXC 64 GB UHS-II) | |
| Networking | |
| Lenovo ThinkPad T16g Gen 3 RTX 5080 | |
| iperf3 transmit AXE11000 | |
| iperf3 receive AXE11000 | |
| HP ZBook Studio 16 G11 | |
| iperf3 transmit AXE11000 | |
| iperf3 receive AXE11000 | |
| iperf3 transmit AXE11000 6GHz | |
| iperf3 receive AXE11000 6GHz | |
| Dell Pro Max 16 Plus | |
| iperf3 transmit AXE11000 | |
| iperf3 receive AXE11000 | |
| iperf3 transmit AXE11000 6GHz | |
| iperf3 receive AXE11000 6GHz | |
| Lenovo ThinkPad P16 Gen 2 | |
| iperf3 transmit AXE11000 | |
| iperf3 receive AXE11000 | |
| iperf3 transmit AXE11000 6GHz | |
| iperf3 receive AXE11000 6GHz | |
| HP ZBook Fury 16 G11 | |
| iperf3 transmit AXE11000 | |
| iperf3 receive AXE11000 | |
| iperf3 transmit AXE11000 6GHz | |
| iperf3 receive AXE11000 6GHz | |
| Schenker XMG Pro 16 (E25) | |
| iperf3 transmit AXE11000 | |
| iperf3 receive AXE11000 | |


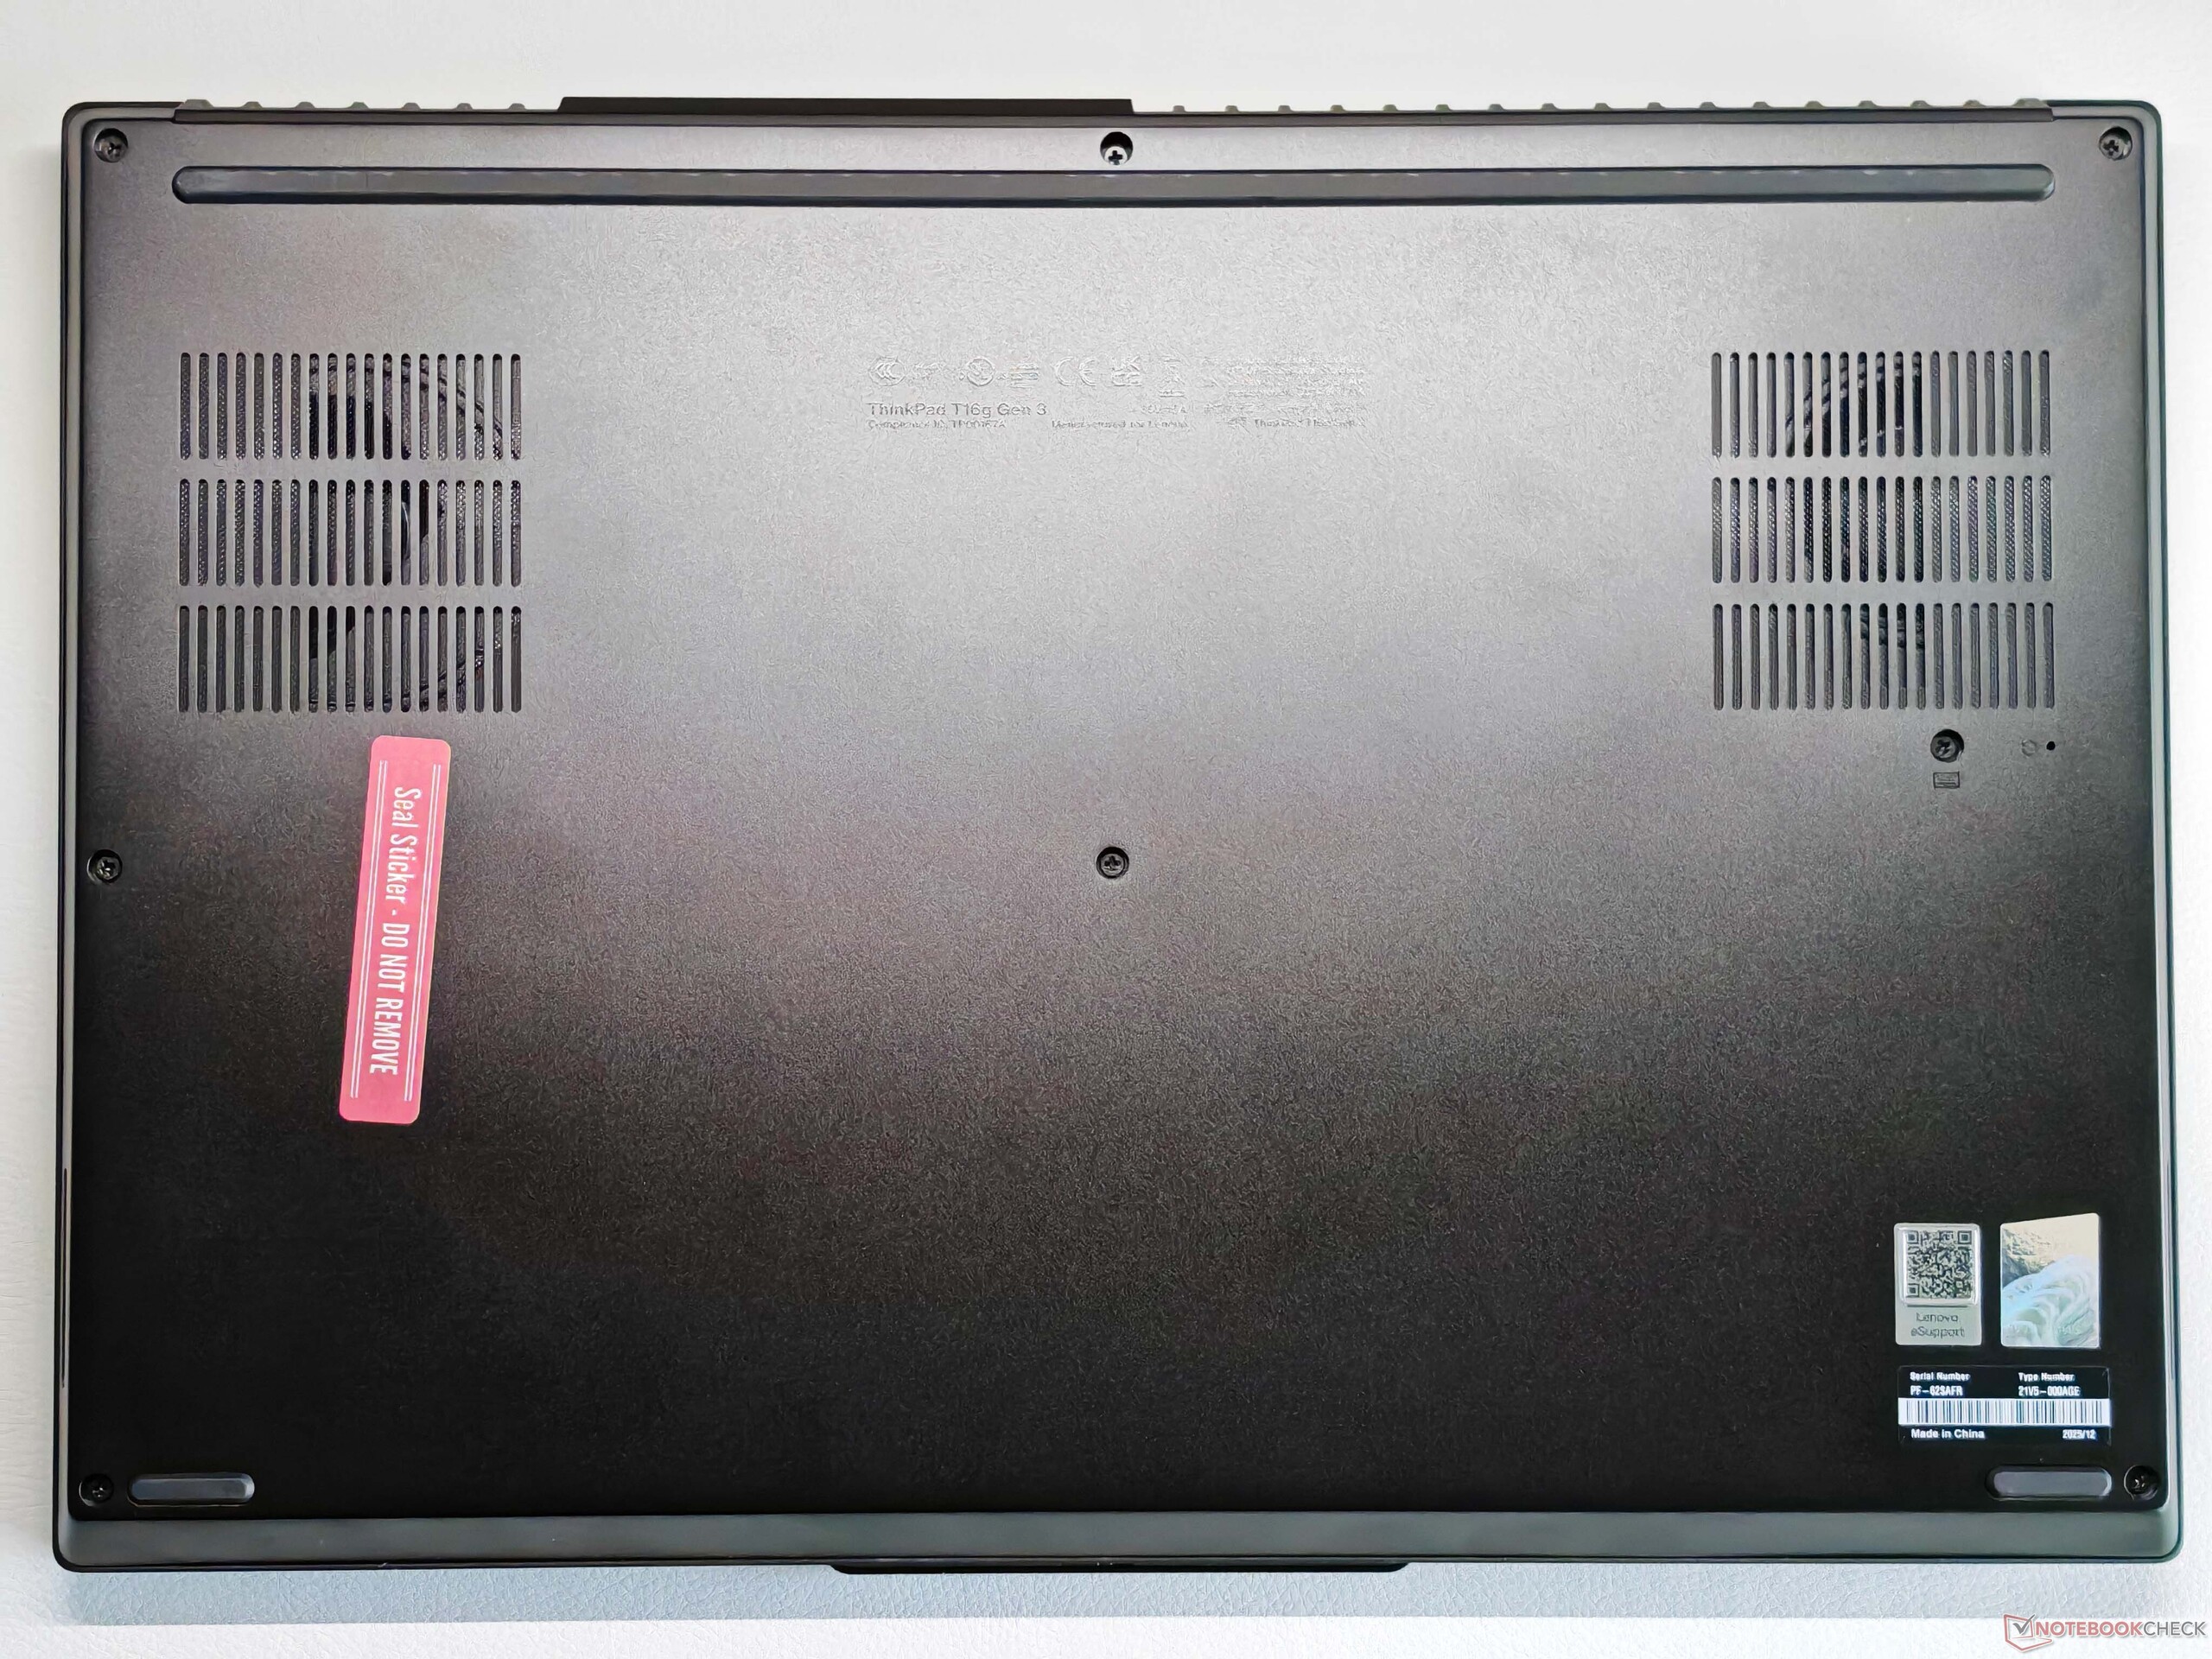
Maintenance
Bien que le T16g Gen 3 soit dépourvu de la petite trappe de maintenance que l'on trouvait sur le modèle précédent, les options de maintenance globales restent excellentes. Le couvercle inférieur peut être facilement retiré, révélant le module Wi-Fi, le SSD primaire et les quatre emplacements de RAM. Pour retirer le clavier, vous n'aurez qu'à desserrer deux vis sur la face inférieure. Cela vous permet d'accéder aux deux emplacements SSD supplémentaires.


Durabilité


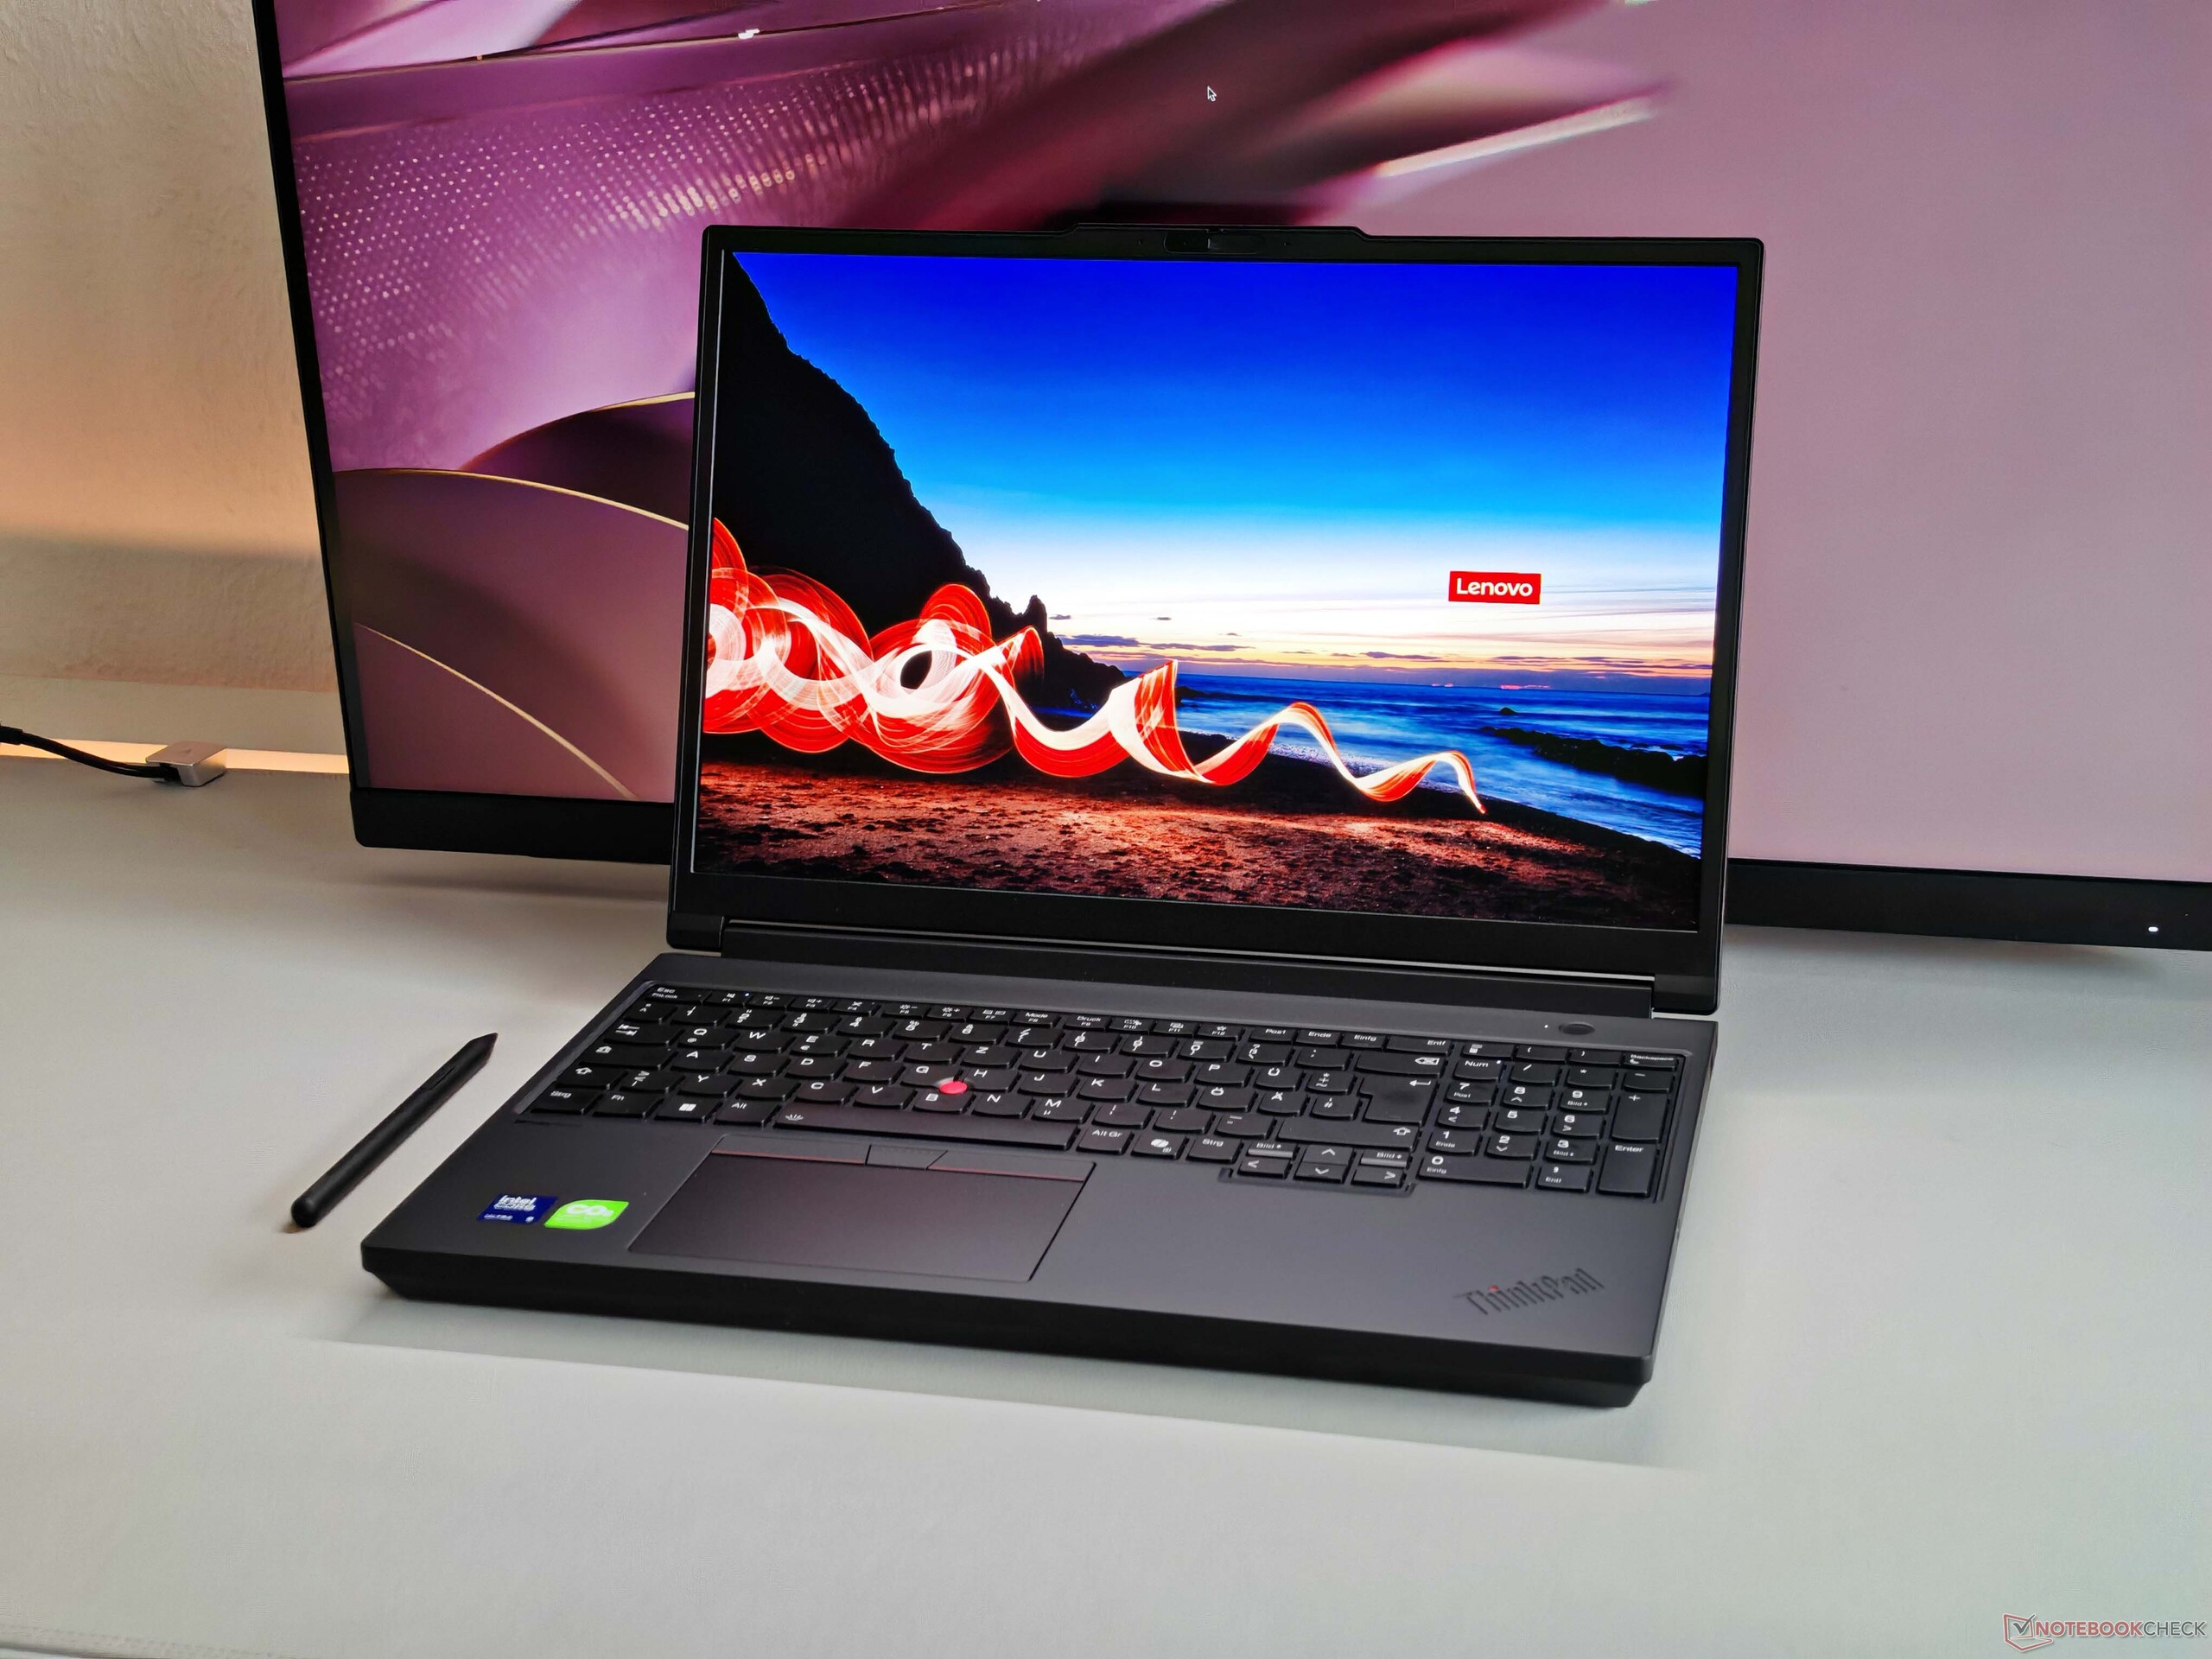
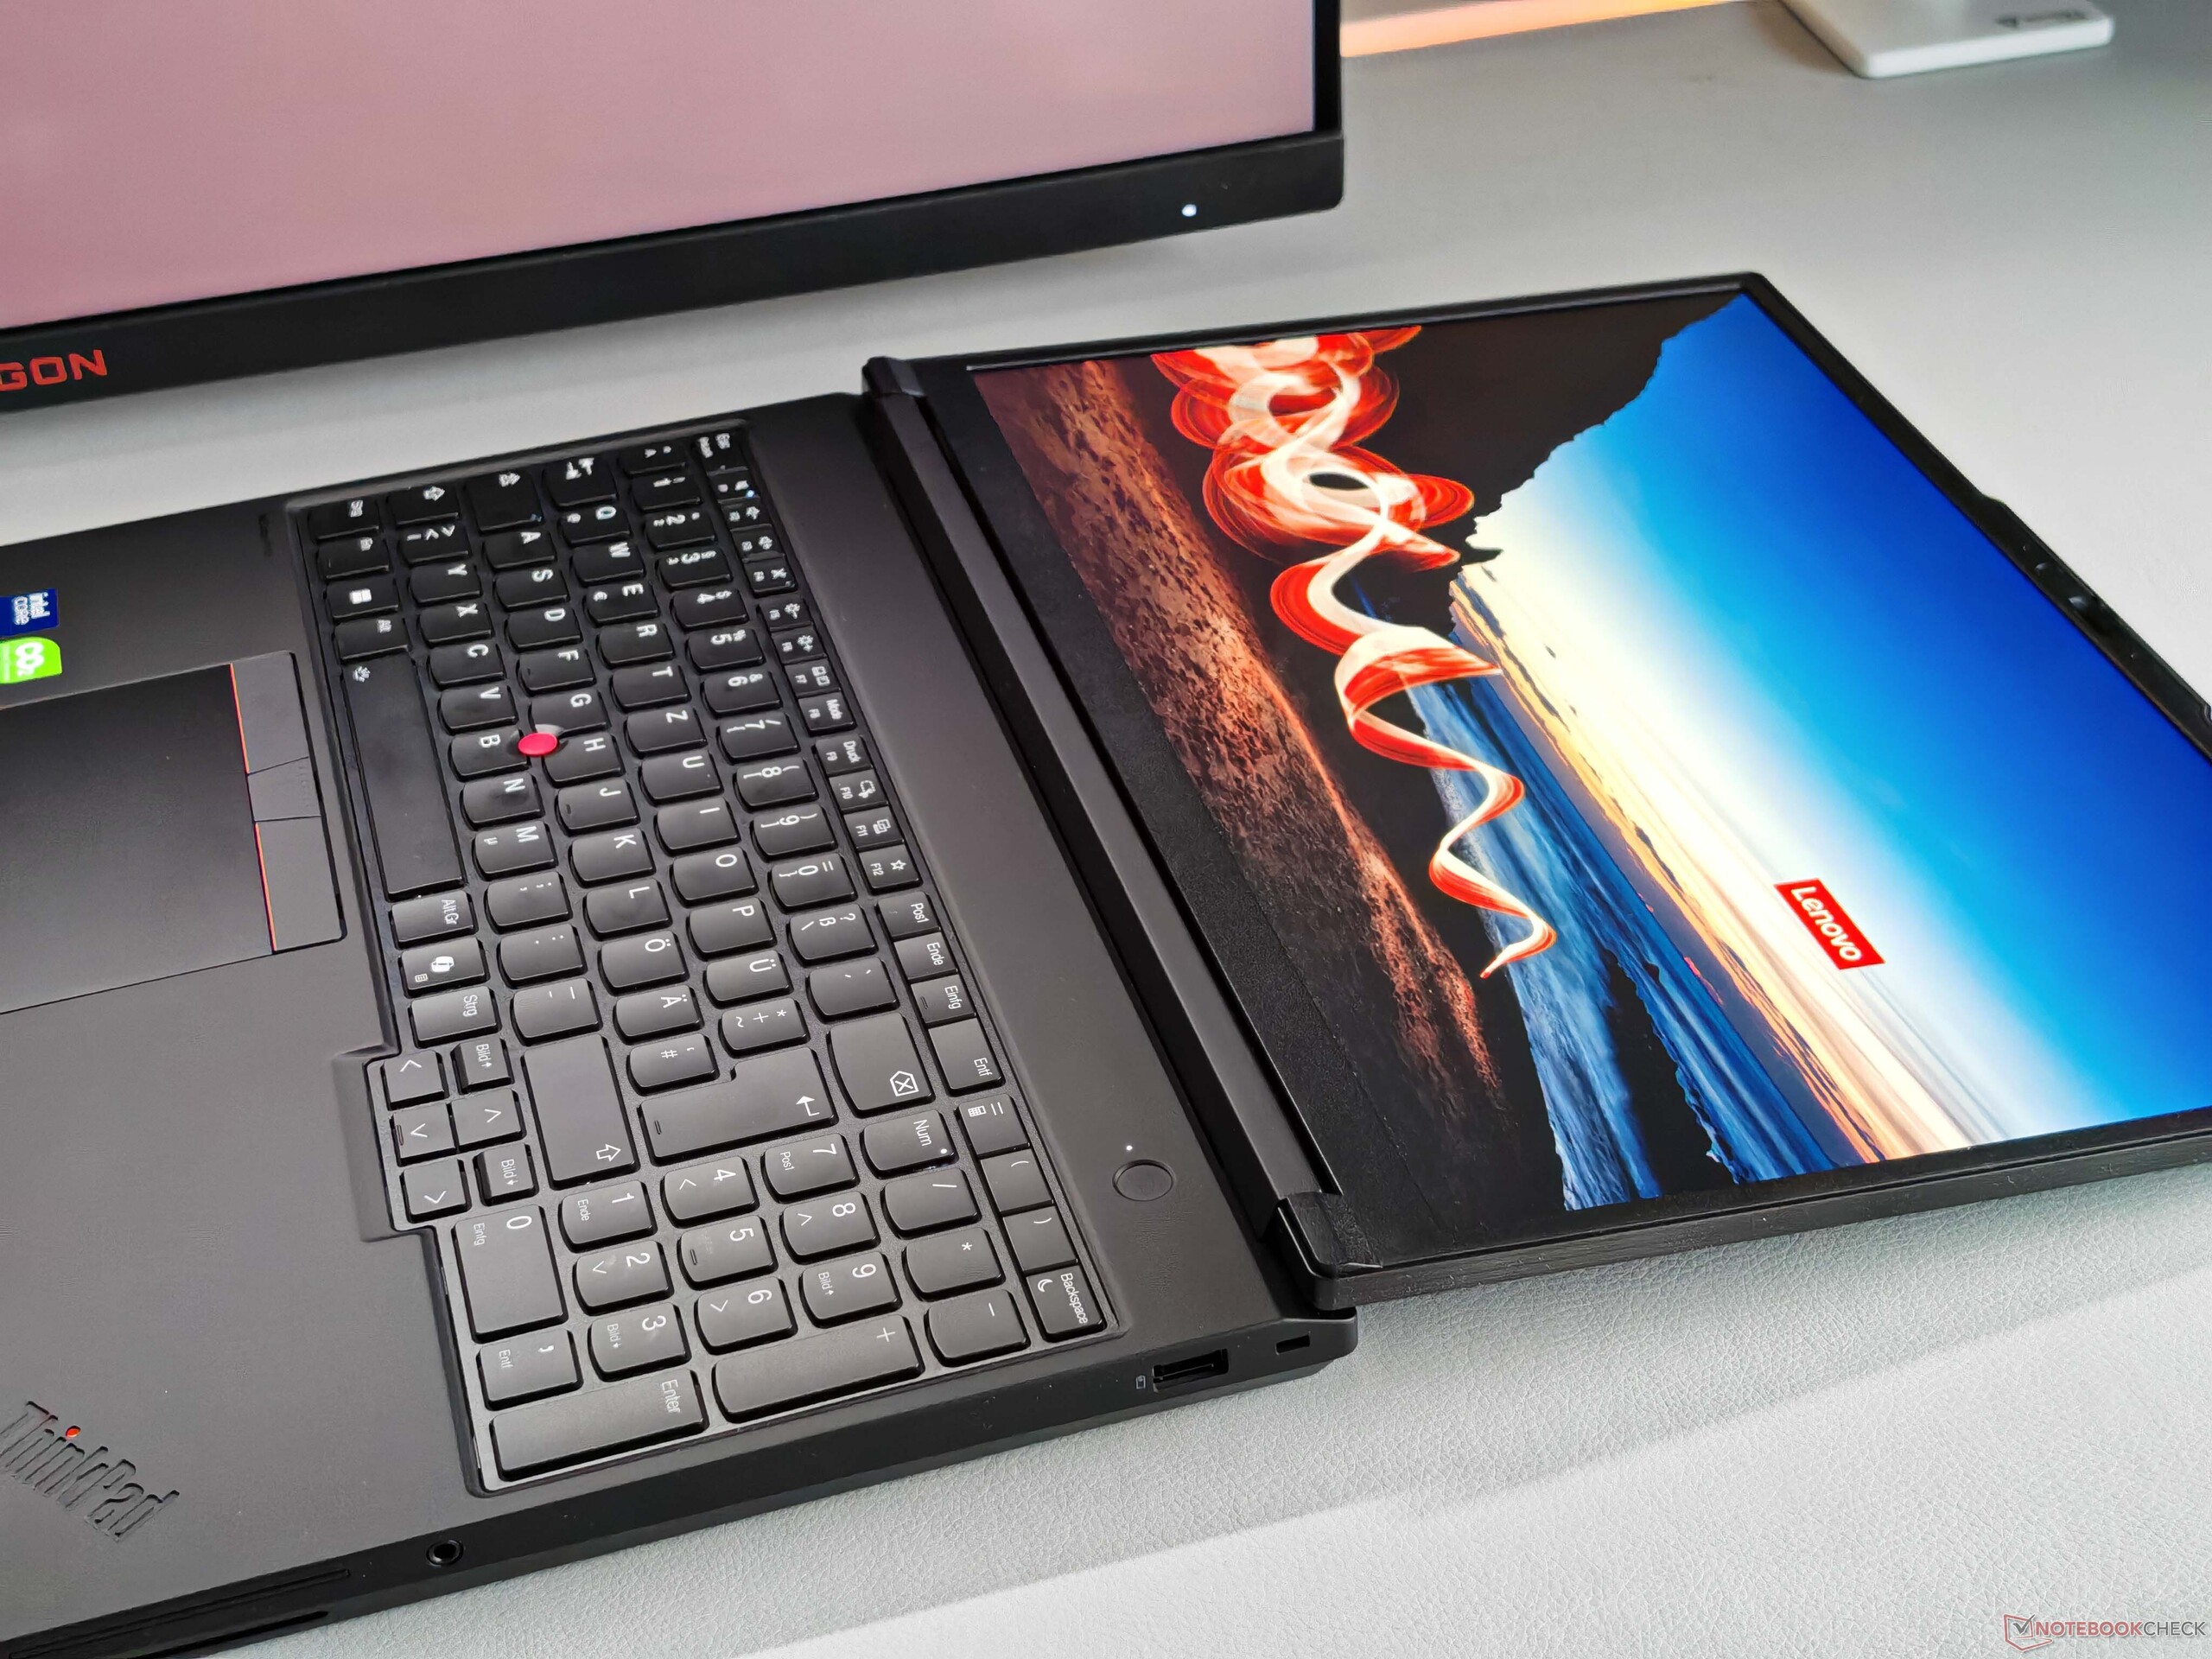
Dispositifs d'entrée - Un clavier standard
Le clavier est rétroéclairé et comporte un pavé numérique dédié. Le confort haptique de la frappe (course des touches de 1,5 mm) n'est pas tout à fait à la hauteur de l'excellente qualité du clavier ThinkPad T1g Gen 8 et sont pratiquement identiques à celles du ThinkPad P16v en comparaison directe. Lenovo faisant appel à différents fournisseurs de claviers, il peut y avoir de légères variations en fonction de l'unité spécifique.
Le ClickPad et le TrackPoint (y compris les boutons dédiés) fonctionnent parfaitement, et le mécanisme des touches semble à la fois solide et de haute qualité. Les clics sont agréablement silencieux et l'écran tactile (qui prend en charge le stylet) fonctionne également sans problème.


Écran - Tandem OLED
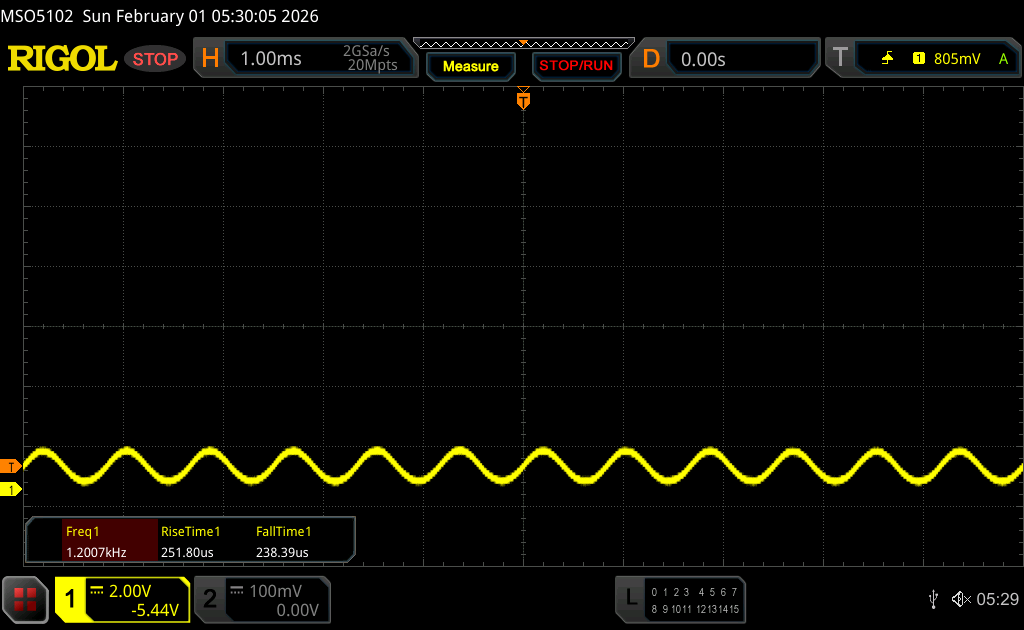
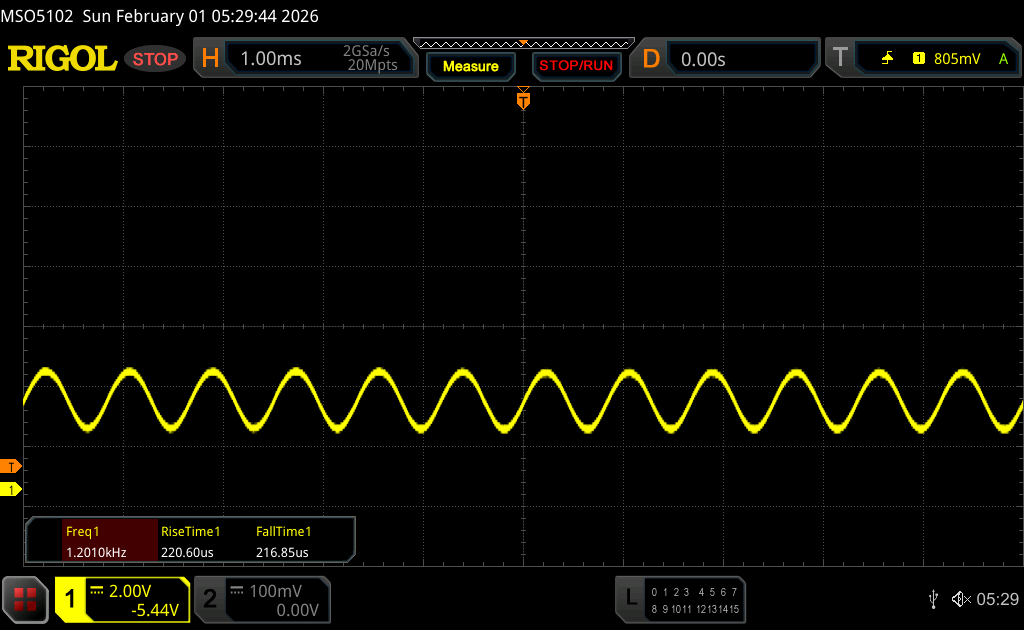
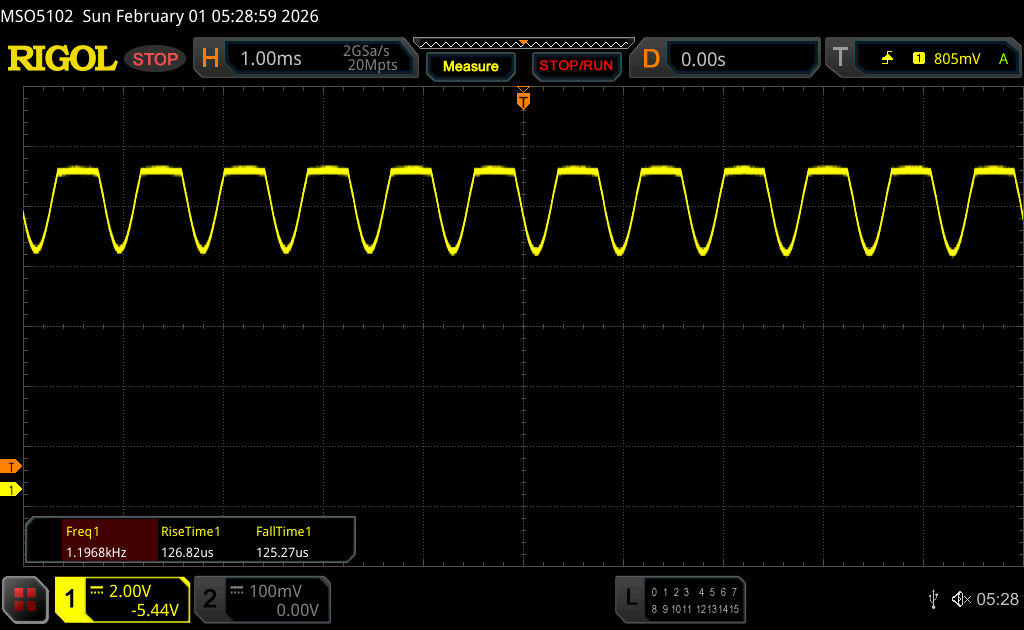
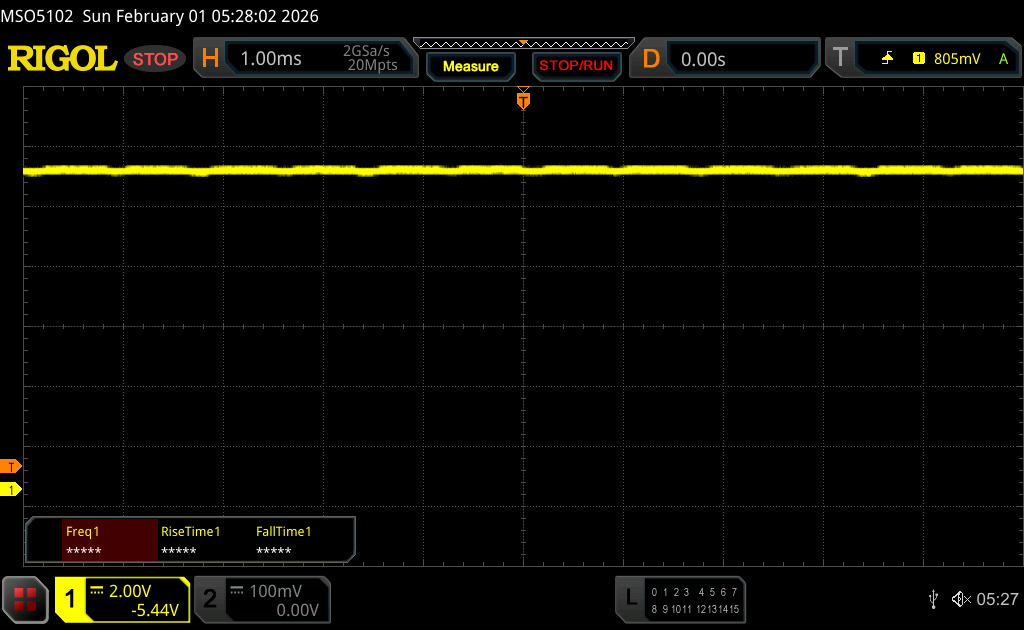
Les options d'affichage sont les mêmes que sur le ThinkPad t1g Gen 8 récemment testé. Il s'agit soit de deux panneaux IPS avec un taux de rafraîchissement de 60 Hz (1080p à 500 cd/m² ou 4K à 800 cd/m²), soit de l'écran tactile OLED tandem mat, qui offre un taux de rafraîchissement de 120 Hz et qui se trouve également dans notre unité d'examen. La qualité d'image est généralement très bonne et la luminosité est particulièrement impressionnante. Malgré cela, les images apparaissent légèrement plus granuleuses que ce que l'on peut attendre d'un écran brillant. Le PWM est présent, mais la fréquence est très élevée (1,2 kHz). L'amplitude est également très faible, ce qui ne devrait pas poser de problème majeur.
En mode SDR, le panneau a atteint une très bonne luminosité de près de 600 cd/m², et en mode HDR, il a atteint plus de 1 500 cd/m². Plusieurs profils de couleurs sont disponibles, et le calibrage d'usine a déjà donné de très bons résultats lors de notre analyse à l'aide du logiciel professionnel CalMAN. Nous n'avons pas été en mesure d'améliorer davantage l'affichage en utilisant notre propre étalonnage.
| |||||||||||||||||||||||||
Homogénéité de la luminosité: 98 %
Valeur mesurée au centre, sur batterie: 585 cd/m²
Contraste: ∞:1 (Valeurs des noirs: 0 cd/m²)
ΔE ColorChecker Calman: 0.9 | ∀{0.5-29.43 Ø4.74}
ΔE Greyscale Calman: 1.4 | ∀{0.09-98 Ø4.99}
88.9% AdobeRGB 1998 (Argyll 3D)
100% sRGB (Argyll 3D)
98.8% Display P3 (Argyll 3D)
Gamma: 2.18
CCT: 6442 K
| Lenovo ThinkPad T16g Gen 3 RTX 5080 ATNA60KA02-0, OLED, 3200x2000, 16", 120 Hz | HP ZBook Studio 16 G11 AUO87A8, IPS, 3840x2400, 16", 120 Hz | Dell Pro Max 16 Plus Samsung 160HC01, OLED, 3840x2400, 16", 120 Hz | Lenovo ThinkPad P16 Gen 2 NE160QDM-NY1, IPS, 2560x1600, 16", 165 Hz | HP ZBook Fury 16 G11 AUO87A8, IPS, 3840x2400, 16", 120 Hz | Schenker XMG Pro 16 (E25) NE160QDM-NZL, IPS, 2560x1600, 16", 300 Hz | |
|---|---|---|---|---|---|---|
| Display | -2% | -1% | -18% | -1% | -13% | |
| Display P3 Coverage (%) | 98.8 | 97.7 -1% | 97.3 -2% | 68.4 -31% | 98.4 0% | 74.7 -24% |
| sRGB Coverage (%) | 100 | 99.9 0% | 100 0% | 96.9 -3% | 99.9 0% | 99.8 0% |
| AdobeRGB 1998 Coverage (%) | 88.9 | 85.7 -4% | 88.8 0% | 70.6 -21% | 86 -3% | 75.4 -15% |
| Response Times | -1575% | -24% | -1492% | -1232% | -861% | |
| Response Time Grey 50% / Grey 80% * (ms) | 1.51 ? | 14.2 ? -840% | 0.63 ? 58% | 14.1 ? -834% | 11.4 ? -655% | 10.5 ? -595% |
| Response Time Black / White * (ms) | 0.44 ? | 10.6 ? -2309% | 0.89 ? -102% | 9.9 ? -2150% | 8.4 ? -1809% | 5.4 ? -1127% |
| PWM Frequency (Hz) | 1200 ? | 479.9 ? | ||||
| PWM Amplitude * (%) | 22 | 28 -27% | ||||
| Screen | -63% | -43% | -29% | -69% | -47% | |
| Brightness middle (cd/m²) | 585 | 404.3 -31% | 530.9 -9% | 531.5 -9% | 457.6 -22% | 538 -8% |
| Brightness (cd/m²) | 590 | 405 -31% | 540 -8% | 499 -15% | 466 -21% | 508 -14% |
| Brightness Distribution (%) | 98 | 92 -6% | 95 -3% | 89 -9% | 83 -15% | 88 -10% |
| Black Level * (cd/m²) | 0.28 | 0.38 | 0.43 | 0.47 | ||
| Colorchecker dE 2000 * | 0.9 | 2.63 -192% | 2.42 -169% | 1.82 -102% | 2.78 -209% | 1.9 -111% |
| Colorchecker dE 2000 max. * | 2.7 | 4.48 -66% | 5.76 -113% | 4.1 -52% | 5.53 -105% | 4 -48% |
| Greyscale dE 2000 * | 1.4 | 2.1 -50% | 0.8 43% | 1.2 14% | 2 -43% | 2.7 -93% |
| Gamma | 2.18 101% | 2.3 96% | 2.23 99% | 2.15 102% | 2.28 96% | 2.24 98% |
| CCT | 6442 101% | 6810 95% | 6488 100% | 6484 100% | 6806 96% | 7027 93% |
| Contrast (:1) | 1444 | 1399 | 1064 | 1145 | ||
| Colorchecker dE 2000 calibrated * | 1.46 | 0.7 | 0.63 | 1.37 | ||
| Moyenne finale (programmes/paramètres) | -547% /
-321% | -23% /
-28% | -513% /
-292% | -434% /
-262% | -307% /
-186% |
* ... Moindre est la valeur, meilleures sont les performances


Temps de réponse de l'écran
| ↔ Temps de réponse noir à blanc | ||
|---|---|---|
| 0.44 ms ... hausse ↗ et chute ↘ combinées | ↗ 0.24 ms hausse | 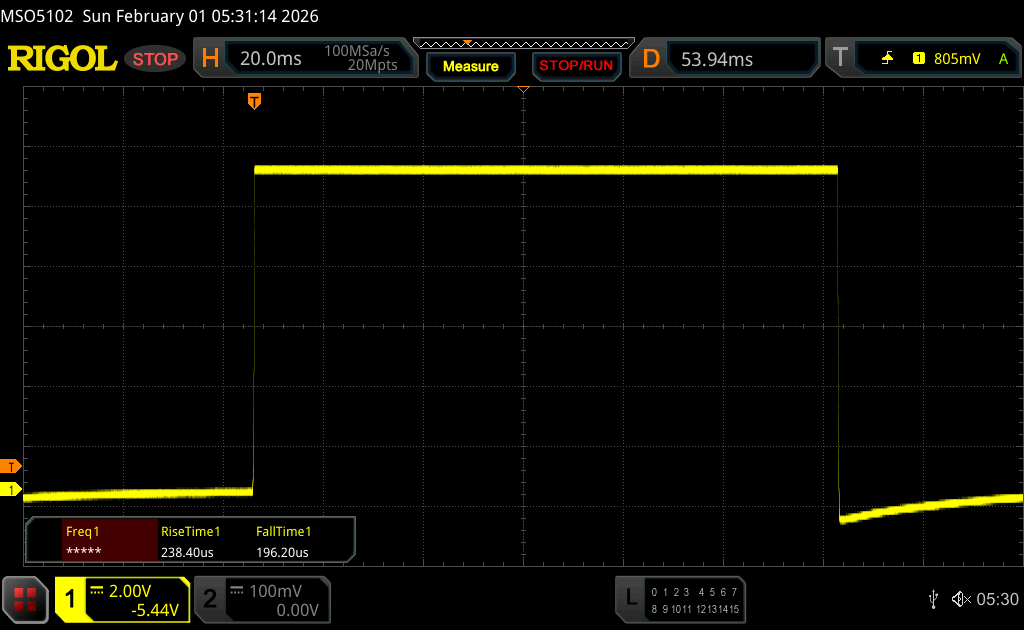 |
| ↘ 0.2 ms chute | ||
| L'écran montre de très faibles temps de réponse, parfait pour le jeu. En comparaison, tous les appareils testés affichent entre 0.1 (minimum) et 240 (maximum) ms. » 1 % des appareils testés affichent de meilleures performances. Cela signifie que les latences relevées sont meilleures que la moyenne (20 ms) de tous les appareils testés. | ||
| ↔ Temps de réponse gris 50% à gris 80% | ||
| 1.51 ms ... hausse ↗ et chute ↘ combinées | ↗ 0.73 ms hausse | 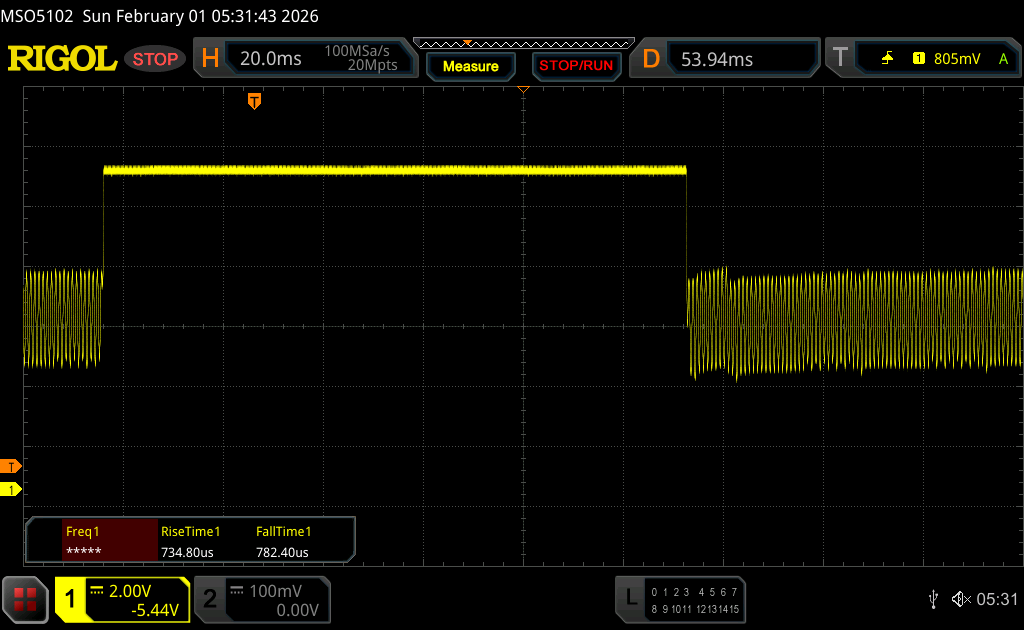 |
| ↘ 0.78 ms chute | ||
| L'écran montre de très faibles temps de réponse, parfait pour le jeu. En comparaison, tous les appareils testés affichent entre 0.165 (minimum) et 636 (maximum) ms. » 7 % des appareils testés affichent de meilleures performances. Cela signifie que les latences relevées sont meilleures que la moyenne (31.3 ms) de tous les appareils testés. | ||
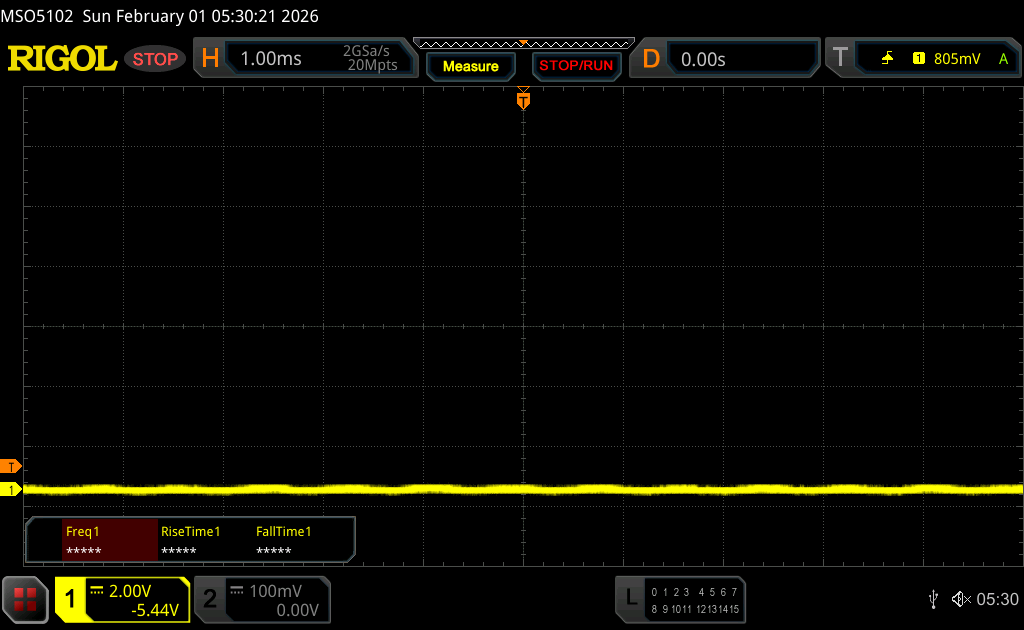
Scintillement / MLI (Modulation de largeur d'impulsion)
| Scintillement / MLI (Modulation de largeur d'impulsion) décelé | 1200 Hz Amplitude: 22 % | ≤ 70 Niveau de luminosité | 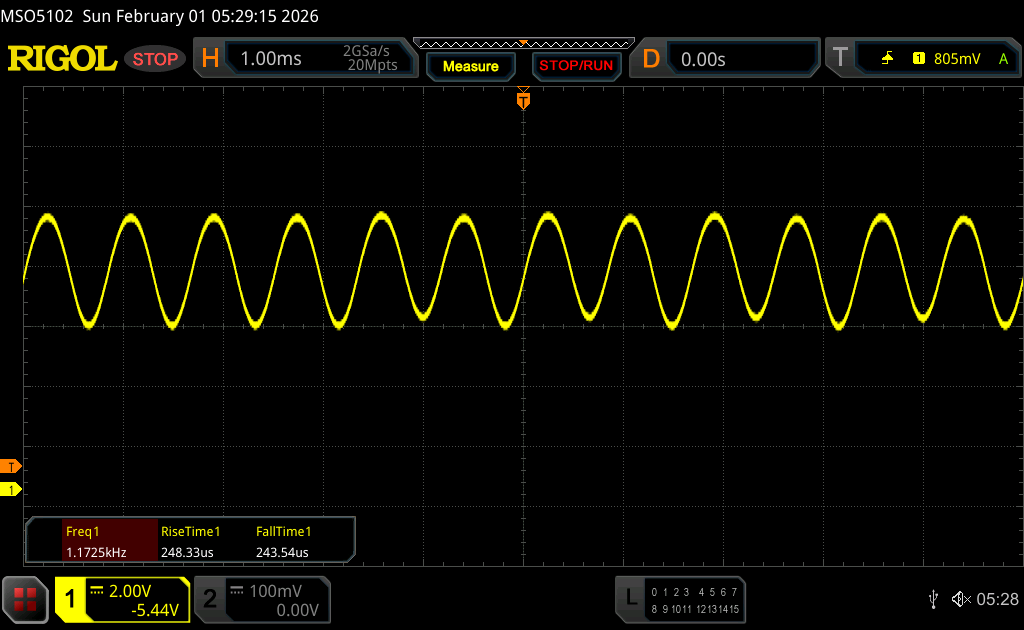 |
Le rétroéclairage de l'écran scintille à la fréquence de 1200 Hz (certainement du fait de l'utilisation d'une MDI - Modulation de largeur d'impulsion) à un niveau de luminosité inférieur ou égal à 70 % . Aucun scintillement ne devrait être perceptible au-dessus de cette valeur. La fréquence de rafraîchissement de 1200 Hz est élevée, la grande majorité des utilisateurs ne devrait pas percevoir de scintillements et être sujette à une fatigue oculaire accrue. En comparaison, 53 % des appareils testés n'emploient pas MDI pour assombrir leur écran. Nous avons relevé une moyenne à 7923 (minimum : 5 - maximum : 343500) Hz dans le cas où une MDI était active. | |||


Performance - Arrow Lake HX et Blackwell cuisson à feu doux
Conditions d'essai
Les profils énergétiques de Lenovo sont liés aux paramètres de Windows. Nous avons effectué les tests de référence en utilisant le mode Meilleures performances.
Processeur

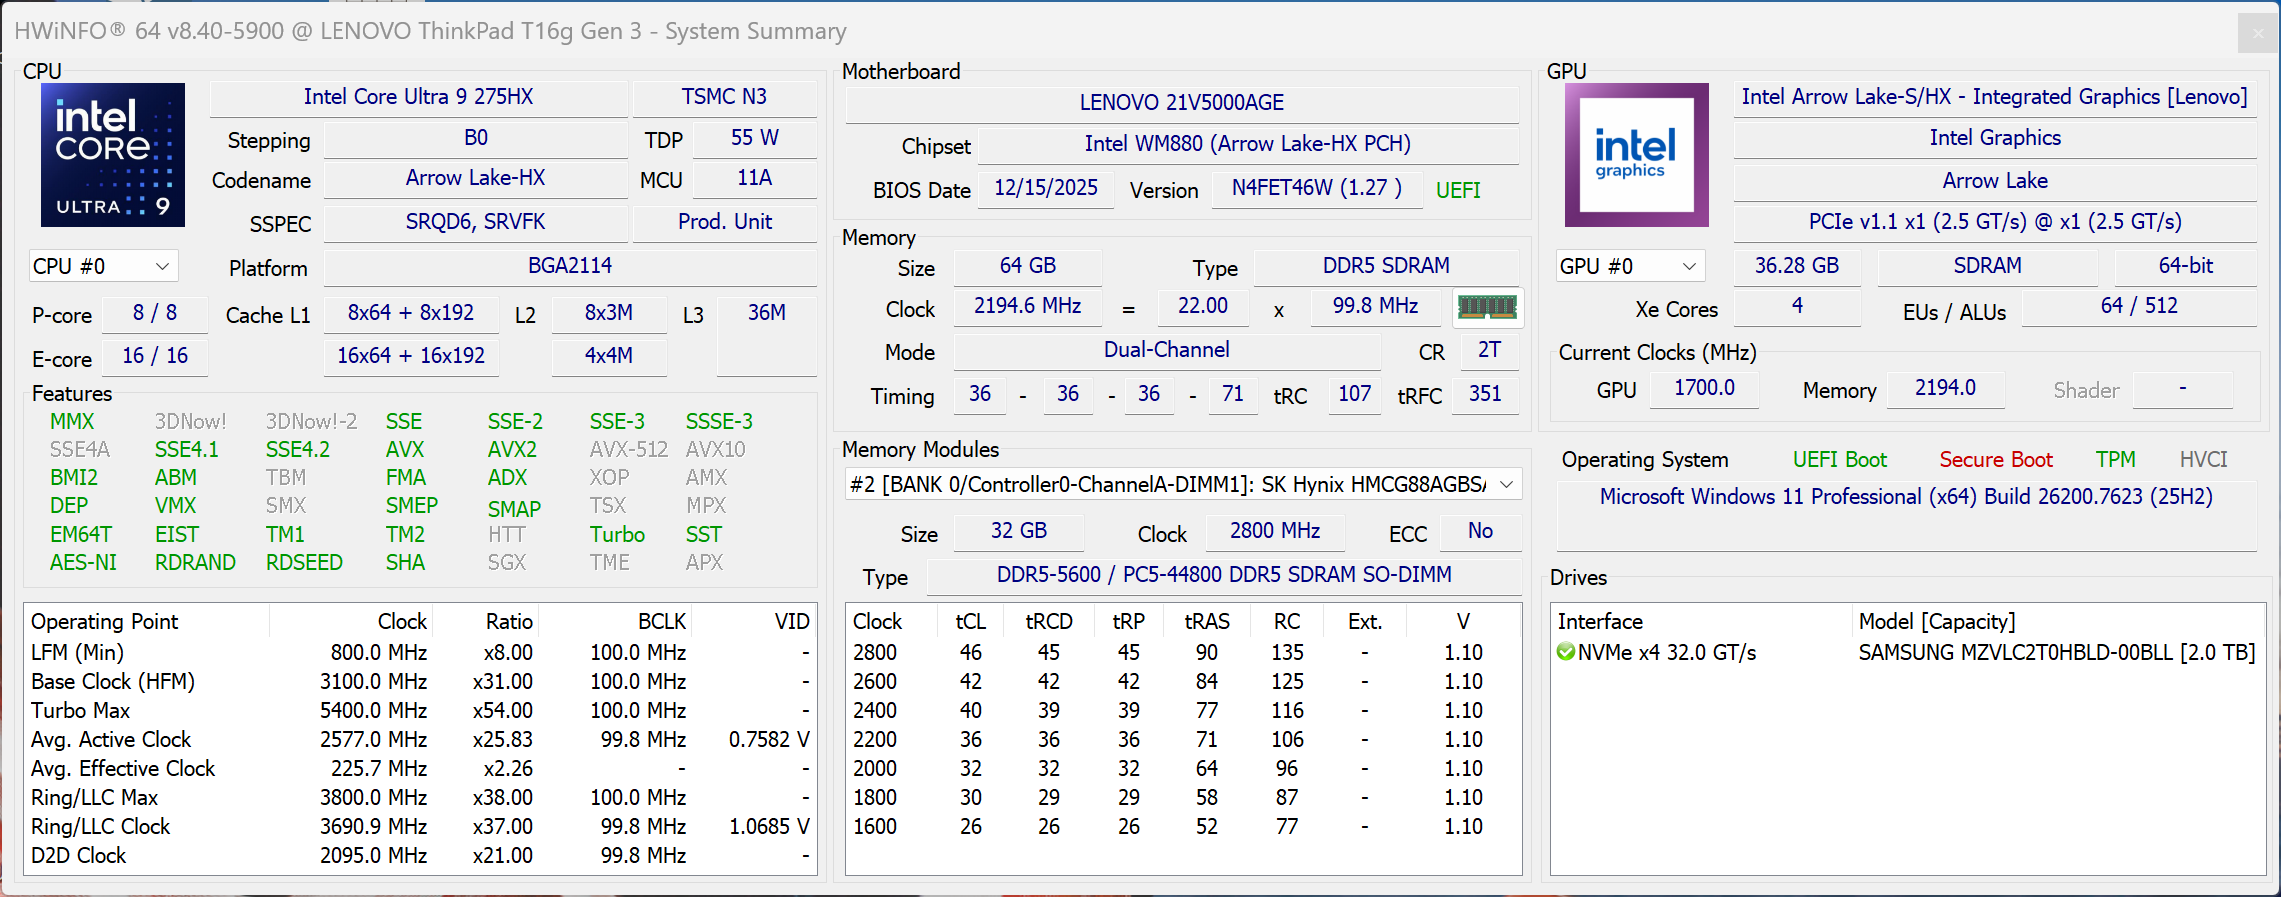
L'appareil que nous avons examiné est équipé d'un processeur Intel Core Ultra 9 275HX Intel Core Ultra 9 275HX (Arrow Lake HX), mais ses performances laissent à désirer. Le processeur est autorisé à consommer brièvement 160 watts, puis environ 110 watts, mais après environ une minute, la valeur tombe à seulement 65 watts et fluctue ensuite entre 65 et un maximum de 90 watts. Cela signifie que les performances à court terme (et donc les performances dans de nombreux benchmarks) sont bonnes, mais que les performances sont loin d'être stables. Dans l'ensemble, le résultat est décevant, surtout si l'on considère le grand châssis. Lorsqu'il fonctionne sur batterie, le processeur est autorisé à consommer un maximum de 62 watts (-14% multi-cœur).
Test Cinebench R15 Multi Sustained
Cinebench 2024: CPU Multi Core | CPU Single Core
Cinebench R23: Multi Core | Single Core
Cinebench R20: CPU (Multi Core) | CPU (Single Core)
Cinebench R15: CPU Multi 64Bit | CPU Single 64Bit
Blender: v2.79 BMW27 CPU
7-Zip 18.03: 7z b 4 | 7z b 4 -mmt1
Geekbench 6.6: Multi-Core | Single-Core
Geekbench 5.5: Multi-Core | Single-Core
HWBOT x265 Benchmark v2.2: 4k Preset
LibreOffice : 20 Documents To PDF
R Benchmark 2.5: Overall mean
| CPU Performance rating | |
| Schenker XMG Pro 16 (E25) | |
| Moyenne Intel Core Ultra 9 275HX | |
| Lenovo ThinkPad T16g Gen 3 RTX 5080 | |
| Dell Pro Max 16 Plus | |
| HP ZBook Fury 16 G11 | |
| Lenovo ThinkPad P16 Gen 2 | |
| Moyenne de la classe Workstation | |
| HP ZBook Studio 16 G11 | |
| Cinebench 2024 / CPU Multi Core | |
| Schenker XMG Pro 16 (E25) | |
| Moyenne Intel Core Ultra 9 275HX (1547 - 2288, n=26) | |
| Dell Pro Max 16 Plus | |
| Lenovo ThinkPad T16g Gen 3 RTX 5080 | |
| Moyenne de la classe Workstation (616 - 2049, n=18, 2 dernières années) | |
| Lenovo ThinkPad P16 Gen 2 | |
| HP ZBook Fury 16 G11 | |
| HP ZBook Studio 16 G11 | |
| Cinebench 2024 / CPU Single Core | |
| Schenker XMG Pro 16 (E25) | |
| Moyenne Intel Core Ultra 9 275HX (123.1 - 138.2, n=26) | |
| Lenovo ThinkPad T16g Gen 3 RTX 5080 | |
| Dell Pro Max 16 Plus | |
| HP ZBook Fury 16 G11 | |
| Lenovo ThinkPad P16 Gen 2 | |
| Moyenne de la classe Workstation (101.6 - 132.2, n=17, 2 dernières années) | |
| HP ZBook Studio 16 G11 | |
| Cinebench R23 / Multi Core | |
| Lenovo ThinkPad T16g Gen 3 RTX 5080 | |
| Schenker XMG Pro 16 (E25) | |
| Moyenne Intel Core Ultra 9 275HX (30712 - 40970, n=31) | |
| Dell Pro Max 16 Plus | |
| HP ZBook Fury 16 G11 | |
| Lenovo ThinkPad P16 Gen 2 | |
| Moyenne de la classe Workstation (14055 - 38520, n=27, 2 dernières années) | |
| HP ZBook Studio 16 G11 | |
| Cinebench R23 / Single Core | |
| Schenker XMG Pro 16 (E25) | |
| Lenovo ThinkPad T16g Gen 3 RTX 5080 | |
| Moyenne Intel Core Ultra 9 275HX (2009 - 2267, n=31) | |
| HP ZBook Fury 16 G11 | |
| Lenovo ThinkPad P16 Gen 2 | |
| Dell Pro Max 16 Plus | |
| Moyenne de la classe Workstation (1712 - 2228, n=27, 2 dernières années) | |
| HP ZBook Studio 16 G11 | |
| Cinebench R20 / CPU (Multi Core) | |
| Lenovo ThinkPad T16g Gen 3 RTX 5080 | |
| Schenker XMG Pro 16 (E25) | |
| Moyenne Intel Core Ultra 9 275HX (12026 - 16108, n=30) | |
| Dell Pro Max 16 Plus | |
| HP ZBook Fury 16 G11 | |
| Lenovo ThinkPad P16 Gen 2 | |
| Moyenne de la classe Workstation (5471 - 15043, n=27, 2 dernières années) | |
| HP ZBook Studio 16 G11 | |
| Cinebench R20 / CPU (Single Core) | |
| Schenker XMG Pro 16 (E25) | |
| Lenovo ThinkPad T16g Gen 3 RTX 5080 | |
| Moyenne Intel Core Ultra 9 275HX (774 - 870, n=30) | |
| HP ZBook Fury 16 G11 | |
| Dell Pro Max 16 Plus | |
| Lenovo ThinkPad P16 Gen 2 | |
| Moyenne de la classe Workstation (671 - 857, n=27, 2 dernières années) | |
| HP ZBook Studio 16 G11 | |
| Cinebench R15 / CPU Multi 64Bit | |
| Lenovo ThinkPad T16g Gen 3 RTX 5080 | |
| Schenker XMG Pro 16 (E25) | |
| Moyenne Intel Core Ultra 9 275HX (4737 - 6271, n=30) | |
| Dell Pro Max 16 Plus | |
| HP ZBook Fury 16 G11 | |
| Lenovo ThinkPad P16 Gen 2 | |
| Moyenne de la classe Workstation (2489 - 5810, n=27, 2 dernières années) | |
| HP ZBook Studio 16 G11 | |
| Cinebench R15 / CPU Single 64Bit | |
| Schenker XMG Pro 16 (E25) | |
| Moyenne Intel Core Ultra 9 275HX (306 - 343, n=31) | |
| Lenovo ThinkPad T16g Gen 3 RTX 5080 | |
| Dell Pro Max 16 Plus | |
| HP ZBook Fury 16 G11 | |
| Moyenne de la classe Workstation (191.4 - 328, n=27, 2 dernières années) | |
| Lenovo ThinkPad P16 Gen 2 | |
| HP ZBook Studio 16 G11 | |
| Blender / v2.79 BMW27 CPU | |
| HP ZBook Studio 16 G11 | |
| Moyenne de la classe Workstation (91 - 261, n=27, 2 dernières années) | |
| Lenovo ThinkPad P16 Gen 2 | |
| HP ZBook Fury 16 G11 | |
| Dell Pro Max 16 Plus | |
| Moyenne Intel Core Ultra 9 275HX (82 - 116, n=29) | |
| Lenovo ThinkPad T16g Gen 3 RTX 5080 | |
| Schenker XMG Pro 16 (E25) | |
| 7-Zip 18.03 / 7z b 4 | |
| Schenker XMG Pro 16 (E25) | |
| Moyenne Intel Core Ultra 9 275HX (98236 - 124155, n=30) | |
| Dell Pro Max 16 Plus | |
| Lenovo ThinkPad T16g Gen 3 RTX 5080 | |
| HP ZBook Fury 16 G11 | |
| Lenovo ThinkPad P16 Gen 2 | |
| Moyenne de la classe Workstation (54741 - 116969, n=27, 2 dernières années) | |
| HP ZBook Studio 16 G11 | |
| 7-Zip 18.03 / 7z b 4 -mmt1 | |
| Schenker XMG Pro 16 (E25) | |
| HP ZBook Fury 16 G11 | |
| Lenovo ThinkPad P16 Gen 2 | |
| Lenovo ThinkPad T16g Gen 3 RTX 5080 | |
| Moyenne Intel Core Ultra 9 275HX (6026 - 7149, n=30) | |
| Dell Pro Max 16 Plus | |
| Moyenne de la classe Workstation (4981 - 6960, n=27, 2 dernières années) | |
| HP ZBook Studio 16 G11 | |
| Geekbench 6.6 / Multi-Core | |
| Dell Pro Max 16 Plus | |
| Schenker XMG Pro 16 (E25) | |
| Moyenne Intel Core Ultra 9 275HX (16033 - 21668, n=32) | |
| Lenovo ThinkPad T16g Gen 3 RTX 5080 | |
| Lenovo ThinkPad P16 Gen 2 | |
| Moyenne de la classe Workstation (12196 - 20887, n=27, 2 dernières années) | |
| HP ZBook Fury 16 G11 | |
| HP ZBook Studio 16 G11 | |
| Geekbench 6.6 / Single-Core | |
| Schenker XMG Pro 16 (E25) | |
| Lenovo ThinkPad T16g Gen 3 RTX 5080 | |
| Moyenne Intel Core Ultra 9 275HX (2843 - 3160, n=32) | |
| HP ZBook Fury 16 G11 | |
| Dell Pro Max 16 Plus | |
| Lenovo ThinkPad P16 Gen 2 | |
| Moyenne de la classe Workstation (2384 - 3065, n=27, 2 dernières années) | |
| HP ZBook Studio 16 G11 | |
| Geekbench 5.5 / Multi-Core | |
| Dell Pro Max 16 Plus | |
| Schenker XMG Pro 16 (E25) | |
| Moyenne Intel Core Ultra 9 275HX (19105 - 25855, n=31) | |
| Lenovo ThinkPad T16g Gen 3 RTX 5080 | |
| HP ZBook Fury 16 G11 | |
| Lenovo ThinkPad P16 Gen 2 | |
| Moyenne de la classe Workstation (11542 - 25554, n=27, 2 dernières années) | |
| HP ZBook Studio 16 G11 | |
| Geekbench 5.5 / Single-Core | |
| Schenker XMG Pro 16 (E25) | |
| Moyenne Intel Core Ultra 9 275HX (2033 - 2292, n=31) | |
| Lenovo ThinkPad T16g Gen 3 RTX 5080 | |
| Dell Pro Max 16 Plus | |
| HP ZBook Fury 16 G11 | |
| Lenovo ThinkPad P16 Gen 2 | |
| Moyenne de la classe Workstation (1759 - 2183, n=27, 2 dernières années) | |
| HP ZBook Studio 16 G11 | |
| HWBOT x265 Benchmark v2.2 / 4k Preset | |
| Schenker XMG Pro 16 (E25) | |
| Moyenne Intel Core Ultra 9 275HX (30.7 - 43.8, n=30) | |
| Lenovo ThinkPad T16g Gen 3 RTX 5080 | |
| Dell Pro Max 16 Plus | |
| HP ZBook Fury 16 G11 | |
| Moyenne de la classe Workstation (14.4 - 40.5, n=27, 2 dernières années) | |
| Lenovo ThinkPad P16 Gen 2 | |
| HP ZBook Studio 16 G11 | |
| LibreOffice / 20 Documents To PDF | |
| Schenker XMG Pro 16 (E25) | |
| HP ZBook Fury 16 G11 | |
| Moyenne de la classe Workstation (37.1 - 74.7, n=27, 2 dernières années) | |
| Lenovo ThinkPad P16 Gen 2 | |
| Lenovo ThinkPad T16g Gen 3 RTX 5080 | |
| HP ZBook Studio 16 G11 | |
| Dell Pro Max 16 Plus | |
| Moyenne Intel Core Ultra 9 275HX (33.2 - 62.1, n=30) | |
| R Benchmark 2.5 / Overall mean | |
| HP ZBook Studio 16 G11 | |
| Moyenne de la classe Workstation (0.3825 - 0.603, n=27, 2 dernières années) | |
| Dell Pro Max 16 Plus | |
| Lenovo ThinkPad T16g Gen 3 RTX 5080 | |
| Moyenne Intel Core Ultra 9 275HX (0.3943 - 0.4568, n=30) | |
| Schenker XMG Pro 16 (E25) | |
| Lenovo ThinkPad P16 Gen 2 | |
| HP ZBook Fury 16 G11 | |
* ... Moindre est la valeur, meilleures sont les performances
AIDA64: FP32 Ray-Trace | FPU Julia | CPU SHA3 | CPU Queen | FPU SinJulia | FPU Mandel | CPU AES | CPU ZLib | FP64 Ray-Trace | CPU PhotoWorxx
| Performance rating | |
| Moyenne Intel Core Ultra 9 275HX | |
| Schenker XMG Pro 16 (E25) | |
| Lenovo ThinkPad T16g Gen 3 RTX 5080 | |
| Dell Pro Max 16 Plus | |
| Moyenne de la classe Workstation | |
| Lenovo ThinkPad P16 Gen 2 | |
| HP ZBook Fury 16 G11 | |
| HP ZBook Studio 16 G11 | |
| AIDA64 / FP32 Ray-Trace | |
| Moyenne Intel Core Ultra 9 275HX (28039 - 39895, n=30) | |
| Lenovo ThinkPad T16g Gen 3 RTX 5080 | |
| Schenker XMG Pro 16 (E25) | |
| Dell Pro Max 16 Plus | |
| Moyenne de la classe Workstation (10658 - 61611, n=27, 2 dernières années) | |
| Lenovo ThinkPad P16 Gen 2 | |
| HP ZBook Fury 16 G11 | |
| HP ZBook Studio 16 G11 | |
| AIDA64 / FPU Julia | |
| Moyenne Intel Core Ultra 9 275HX (140254 - 200744, n=30) | |
| Lenovo ThinkPad T16g Gen 3 RTX 5080 | |
| Schenker XMG Pro 16 (E25) | |
| Dell Pro Max 16 Plus | |
| Moyenne de la classe Workstation (56664 - 186971, n=27, 2 dernières années) | |
| Lenovo ThinkPad P16 Gen 2 | |
| HP ZBook Fury 16 G11 | |
| HP ZBook Studio 16 G11 | |
| AIDA64 / CPU SHA3 | |
| Moyenne Intel Core Ultra 9 275HX (6710 - 9817, n=30) | |
| Lenovo ThinkPad T16g Gen 3 RTX 5080 | |
| Schenker XMG Pro 16 (E25) | |
| Dell Pro Max 16 Plus | |
| Moyenne de la classe Workstation (2608 - 8975, n=27, 2 dernières années) | |
| Lenovo ThinkPad P16 Gen 2 | |
| HP ZBook Fury 16 G11 | |
| HP ZBook Studio 16 G11 | |
| AIDA64 / CPU Queen | |
| Lenovo ThinkPad P16 Gen 2 | |
| Lenovo ThinkPad T16g Gen 3 RTX 5080 | |
| HP ZBook Fury 16 G11 | |
| Dell Pro Max 16 Plus | |
| Moyenne Intel Core Ultra 9 275HX (113887 - 140937, n=30) | |
| Schenker XMG Pro 16 (E25) | |
| Moyenne de la classe Workstation (60778 - 144411, n=27, 2 dernières années) | |
| HP ZBook Studio 16 G11 | |
| AIDA64 / FPU SinJulia | |
| Schenker XMG Pro 16 (E25) | |
| Moyenne Intel Core Ultra 9 275HX (11172 - 14425, n=30) | |
| Lenovo ThinkPad T16g Gen 3 RTX 5080 | |
| Lenovo ThinkPad P16 Gen 2 | |
| HP ZBook Fury 16 G11 | |
| Moyenne de la classe Workstation (8165 - 29343, n=27, 2 dernières années) | |
| Dell Pro Max 16 Plus | |
| HP ZBook Studio 16 G11 | |
| AIDA64 / FPU Mandel | |
| Moyenne Intel Core Ultra 9 275HX (72596 - 104508, n=30) | |
| Lenovo ThinkPad T16g Gen 3 RTX 5080 | |
| Schenker XMG Pro 16 (E25) | |
| Dell Pro Max 16 Plus | |
| Moyenne de la classe Workstation (27301 - 98153, n=27, 2 dernières années) | |
| Lenovo ThinkPad P16 Gen 2 | |
| HP ZBook Fury 16 G11 | |
| HP ZBook Studio 16 G11 | |
| AIDA64 / CPU AES | |
| Lenovo ThinkPad T16g Gen 3 RTX 5080 | |
| Moyenne Intel Core Ultra 9 275HX (105608 - 247074, n=30) | |
| Schenker XMG Pro 16 (E25) | |
| Dell Pro Max 16 Plus | |
| Moyenne de la classe Workstation (56077 - 187841, n=27, 2 dernières années) | |
| Lenovo ThinkPad P16 Gen 2 | |
| HP ZBook Fury 16 G11 | |
| HP ZBook Studio 16 G11 | |
| AIDA64 / CPU ZLib | |
| Lenovo ThinkPad T16g Gen 3 RTX 5080 | |
| Moyenne Intel Core Ultra 9 275HX (1582 - 2263, n=30) | |
| Schenker XMG Pro 16 (E25) | |
| Dell Pro Max 16 Plus | |
| Lenovo ThinkPad P16 Gen 2 | |
| HP ZBook Fury 16 G11 | |
| Moyenne de la classe Workstation (742 - 2148, n=27, 2 dernières années) | |
| HP ZBook Studio 16 G11 | |
| AIDA64 / FP64 Ray-Trace | |
| Lenovo ThinkPad T16g Gen 3 RTX 5080 | |
| Moyenne Intel Core Ultra 9 275HX (14847 - 21854, n=30) | |
| Schenker XMG Pro 16 (E25) | |
| Dell Pro Max 16 Plus | |
| Moyenne de la classe Workstation (5580 - 32891, n=27, 2 dernières années) | |
| Lenovo ThinkPad P16 Gen 2 | |
| HP ZBook Fury 16 G11 | |
| HP ZBook Studio 16 G11 | |
| AIDA64 / CPU PhotoWorxx | |
| Dell Pro Max 16 Plus | |
| Schenker XMG Pro 16 (E25) | |
| HP ZBook Studio 16 G11 | |
| Moyenne de la classe Workstation (37151 - 93684, n=27, 2 dernières années) | |
| Moyenne Intel Core Ultra 9 275HX (37482 - 62916, n=30) | |
| Lenovo ThinkPad P16 Gen 2 | |
| Lenovo ThinkPad T16g Gen 3 RTX 5080 | |
| HP ZBook Fury 16 G11 | |
Performance du système
Les performances du système et les impressions subjectives de performance sont excellentes, et les résultats des tests de référence peuvent également être considérés comme très bons.
PCMark 10: Score | Essentials | Productivity | Digital Content Creation
CrossMark: Overall | Productivity | Creativity | Responsiveness
WebXPRT 3: Overall
WebXPRT 4: Overall
Mozilla Kraken 1.1: Total
| Performance rating | |
| Lenovo ThinkPad T16g Gen 3 RTX 5080 | |
| Schenker XMG Pro 16 (E25) | |
| Dell Pro Max 16 Plus -4! | |
| Moyenne Intel Core Ultra 9 275HX, NVIDIA GeForce RTX 5080 Laptop | |
| Lenovo ThinkPad P16 Gen 2 | |
| HP ZBook Fury 16 G11 | |
| Moyenne de la classe Workstation | |
| HP ZBook Studio 16 G11 | |
| PCMark 10 / Score | |
| Lenovo ThinkPad T16g Gen 3 RTX 5080 | |
| Moyenne Intel Core Ultra 9 275HX, NVIDIA GeForce RTX 5080 Laptop (7805 - 10409, n=9) | |
| Schenker XMG Pro 16 (E25) | |
| Lenovo ThinkPad P16 Gen 2 | |
| Moyenne de la classe Workstation (6436 - 10409, n=22, 2 dernières années) | |
| HP ZBook Fury 16 G11 | |
| HP ZBook Studio 16 G11 | |
| PCMark 10 / Essentials | |
| Schenker XMG Pro 16 (E25) | |
| Lenovo ThinkPad P16 Gen 2 | |
| Moyenne Intel Core Ultra 9 275HX, NVIDIA GeForce RTX 5080 Laptop (10206 - 11472, n=9) | |
| Moyenne de la classe Workstation (9622 - 11157, n=22, 2 dernières années) | |
| HP ZBook Studio 16 G11 | |
| Lenovo ThinkPad T16g Gen 3 RTX 5080 | |
| HP ZBook Fury 16 G11 | |
| PCMark 10 / Productivity | |
| Lenovo ThinkPad T16g Gen 3 RTX 5080 | |
| Moyenne de la classe Workstation (8789 - 20616, n=22, 2 dernières années) | |
| Moyenne Intel Core Ultra 9 275HX, NVIDIA GeForce RTX 5080 Laptop (8319 - 20616, n=9) | |
| Lenovo ThinkPad P16 Gen 2 | |
| Schenker XMG Pro 16 (E25) | |
| HP ZBook Fury 16 G11 | |
| HP ZBook Studio 16 G11 | |
| PCMark 10 / Digital Content Creation | |
| Moyenne Intel Core Ultra 9 275HX, NVIDIA GeForce RTX 5080 Laptop (10505 - 19351, n=9) | |
| Schenker XMG Pro 16 (E25) | |
| Lenovo ThinkPad P16 Gen 2 | |
| Lenovo ThinkPad T16g Gen 3 RTX 5080 | |
| HP ZBook Fury 16 G11 | |
| Moyenne de la classe Workstation (7744 - 15631, n=22, 2 dernières années) | |
| HP ZBook Studio 16 G11 | |
| CrossMark / Overall | |
| Lenovo ThinkPad T16g Gen 3 RTX 5080 | |
| Dell Pro Max 16 Plus | |
| Schenker XMG Pro 16 (E25) | |
| Moyenne Intel Core Ultra 9 275HX, NVIDIA GeForce RTX 5080 Laptop (1857 - 2244, n=9) | |
| HP ZBook Fury 16 G11 | |
| Lenovo ThinkPad P16 Gen 2 | |
| Moyenne de la classe Workstation (1307 - 2267, n=26, 2 dernières années) | |
| HP ZBook Studio 16 G11 | |
| CrossMark / Productivity | |
| Lenovo ThinkPad T16g Gen 3 RTX 5080 | |
| Schenker XMG Pro 16 (E25) | |
| Dell Pro Max 16 Plus | |
| Moyenne Intel Core Ultra 9 275HX, NVIDIA GeForce RTX 5080 Laptop (1764 - 2122, n=9) | |
| HP ZBook Fury 16 G11 | |
| Lenovo ThinkPad P16 Gen 2 | |
| Moyenne de la classe Workstation (1130 - 2122, n=26, 2 dernières années) | |
| HP ZBook Studio 16 G11 | |
| CrossMark / Creativity | |
| Dell Pro Max 16 Plus | |
| Schenker XMG Pro 16 (E25) | |
| Lenovo ThinkPad T16g Gen 3 RTX 5080 | |
| Moyenne Intel Core Ultra 9 275HX, NVIDIA GeForce RTX 5080 Laptop (2115 - 2498, n=9) | |
| Lenovo ThinkPad P16 Gen 2 | |
| HP ZBook Fury 16 G11 | |
| Moyenne de la classe Workstation (1657 - 2725, n=26, 2 dernières années) | |
| HP ZBook Studio 16 G11 | |
| CrossMark / Responsiveness | |
| Lenovo ThinkPad T16g Gen 3 RTX 5080 | |
| Moyenne Intel Core Ultra 9 275HX, NVIDIA GeForce RTX 5080 Laptop (1466 - 2096, n=9) | |
| Dell Pro Max 16 Plus | |
| Schenker XMG Pro 16 (E25) | |
| HP ZBook Fury 16 G11 | |
| Lenovo ThinkPad P16 Gen 2 | |
| Moyenne de la classe Workstation (993 - 2096, n=26, 2 dernières années) | |
| HP ZBook Studio 16 G11 | |
| WebXPRT 3 / Overall | |
| Schenker XMG Pro 16 (E25) | |
| Moyenne Intel Core Ultra 9 275HX, NVIDIA GeForce RTX 5080 Laptop (306 - 378, n=9) | |
| Lenovo ThinkPad P16 Gen 2 | |
| Lenovo ThinkPad T16g Gen 3 RTX 5080 | |
| Dell Pro Max 16 Plus | |
| HP ZBook Fury 16 G11 | |
| Moyenne de la classe Workstation (260 - 360, n=27, 2 dernières années) | |
| HP ZBook Studio 16 G11 | |
| WebXPRT 4 / Overall | |
| Schenker XMG Pro 16 (E25) | |
| Moyenne Intel Core Ultra 9 275HX, NVIDIA GeForce RTX 5080 Laptop (285 - 336, n=9) | |
| Lenovo ThinkPad T16g Gen 3 RTX 5080 | |
| Dell Pro Max 16 Plus | |
| HP ZBook Fury 16 G11 | |
| Lenovo ThinkPad P16 Gen 2 | |
| Moyenne de la classe Workstation (189.2 - 326, n=27, 2 dernières années) | |
| HP ZBook Studio 16 G11 | |
| Mozilla Kraken 1.1 / Total | |
| HP ZBook Studio 16 G11 | |
| Moyenne de la classe Workstation (411 - 538, n=27, 2 dernières années) | |
| Lenovo ThinkPad P16 Gen 2 | |
| HP ZBook Fury 16 G11 | |
| Dell Pro Max 16 Plus | |
| Lenovo ThinkPad T16g Gen 3 RTX 5080 | |
| Moyenne Intel Core Ultra 9 275HX, NVIDIA GeForce RTX 5080 Laptop (405 - 432, n=9) | |
| Schenker XMG Pro 16 (E25) | |
* ... Moindre est la valeur, meilleures sont les performances
| PCMark 10 Score | 10409 points | |
Aide | ||
| AIDA64 / Memory Copy | |
| Dell Pro Max 16 Plus | |
| Schenker XMG Pro 16 (E25) | |
| Moyenne de la classe Workstation (56003 - 164795, n=27, 2 dernières années) | |
| Moyenne Intel Core Ultra 9 275HX (56003 - 94460, n=30) | |
| HP ZBook Studio 16 G11 | |
| Lenovo ThinkPad T16g Gen 3 RTX 5080 | |
| Lenovo ThinkPad P16 Gen 2 | |
| HP ZBook Fury 16 G11 | |
| AIDA64 / Memory Read | |
| Dell Pro Max 16 Plus | |
| Schenker XMG Pro 16 (E25) | |
| Moyenne Intel Core Ultra 9 275HX (55795 - 97151, n=30) | |
| HP ZBook Studio 16 G11 | |
| Moyenne de la classe Workstation (55795 - 121563, n=27, 2 dernières années) | |
| Lenovo ThinkPad P16 Gen 2 | |
| Lenovo ThinkPad T16g Gen 3 RTX 5080 | |
| HP ZBook Fury 16 G11 | |
| AIDA64 / Memory Write | |
| Dell Pro Max 16 Plus | |
| Schenker XMG Pro 16 (E25) | |
| Moyenne de la classe Workstation (55663 - 214520, n=27, 2 dernières années) | |
| Moyenne Intel Core Ultra 9 275HX (55663 - 116129, n=30) | |
| HP ZBook Studio 16 G11 | |
| Lenovo ThinkPad T16g Gen 3 RTX 5080 | |
| Lenovo ThinkPad P16 Gen 2 | |
| HP ZBook Fury 16 G11 | |
| AIDA64 / Memory Latency | |
| Lenovo ThinkPad T16g Gen 3 RTX 5080 | |
| HP ZBook Studio 16 G11 | |
| Moyenne de la classe Workstation (84.5 - 165.2, n=27, 2 dernières années) | |
| Moyenne Intel Core Ultra 9 275HX (105.8 - 161.6, n=30) | |
| Dell Pro Max 16 Plus | |
| Schenker XMG Pro 16 (E25) | |
| HP ZBook Fury 16 G11 | |
| Lenovo ThinkPad P16 Gen 2 | |
* ... Moindre est la valeur, meilleures sont les performances
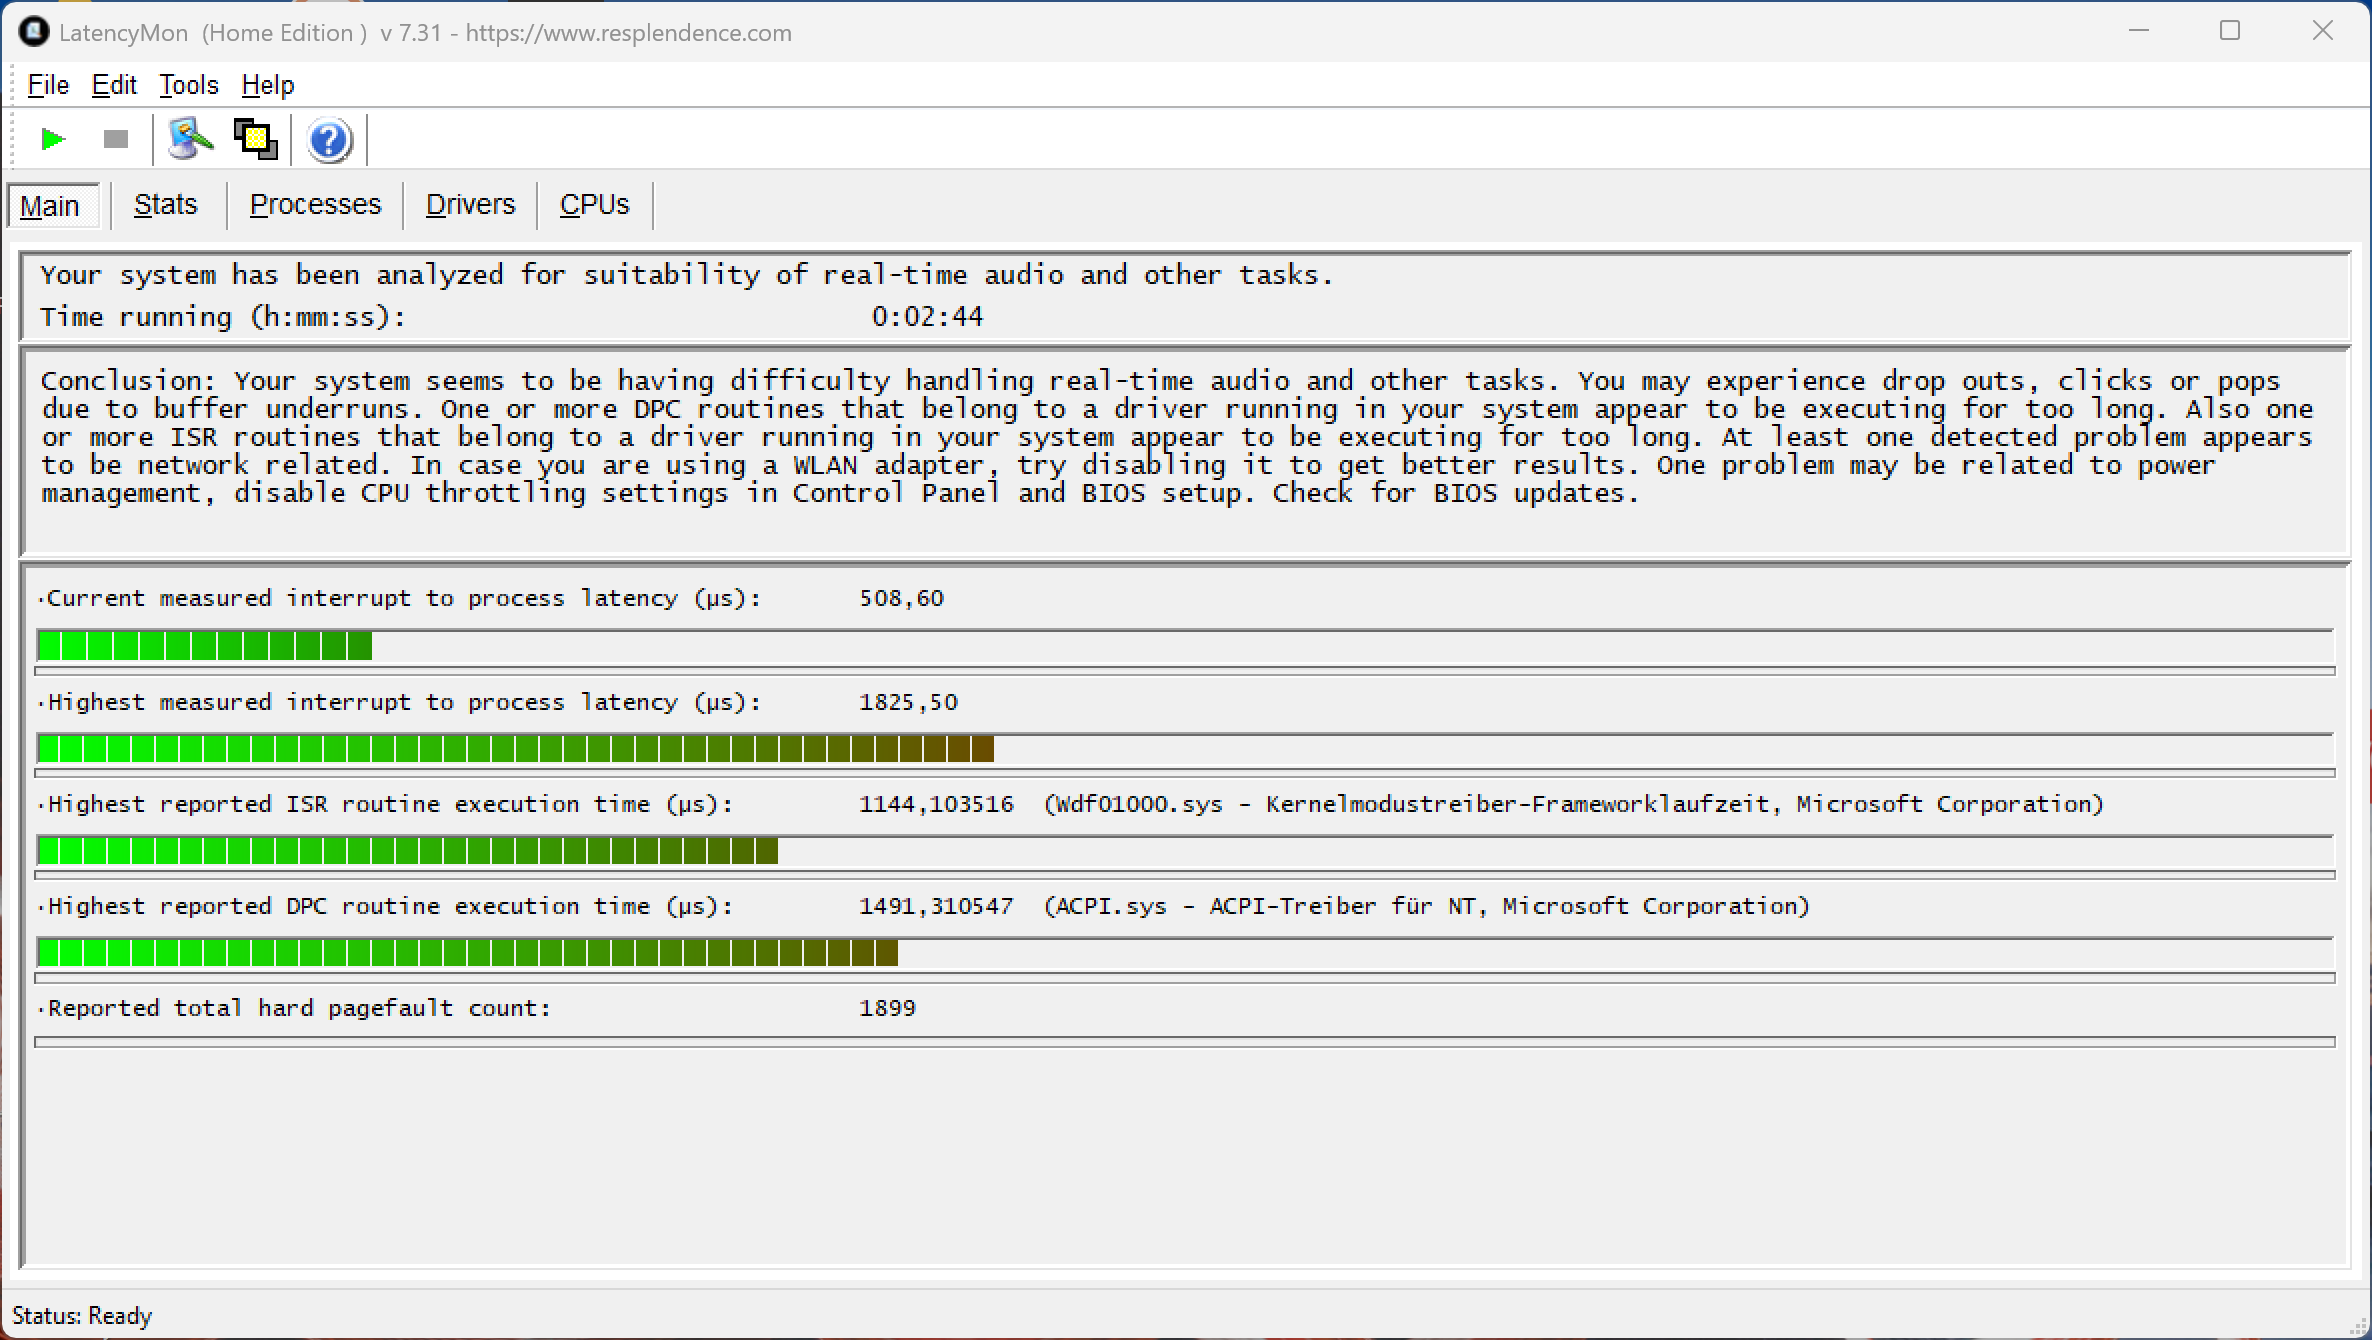
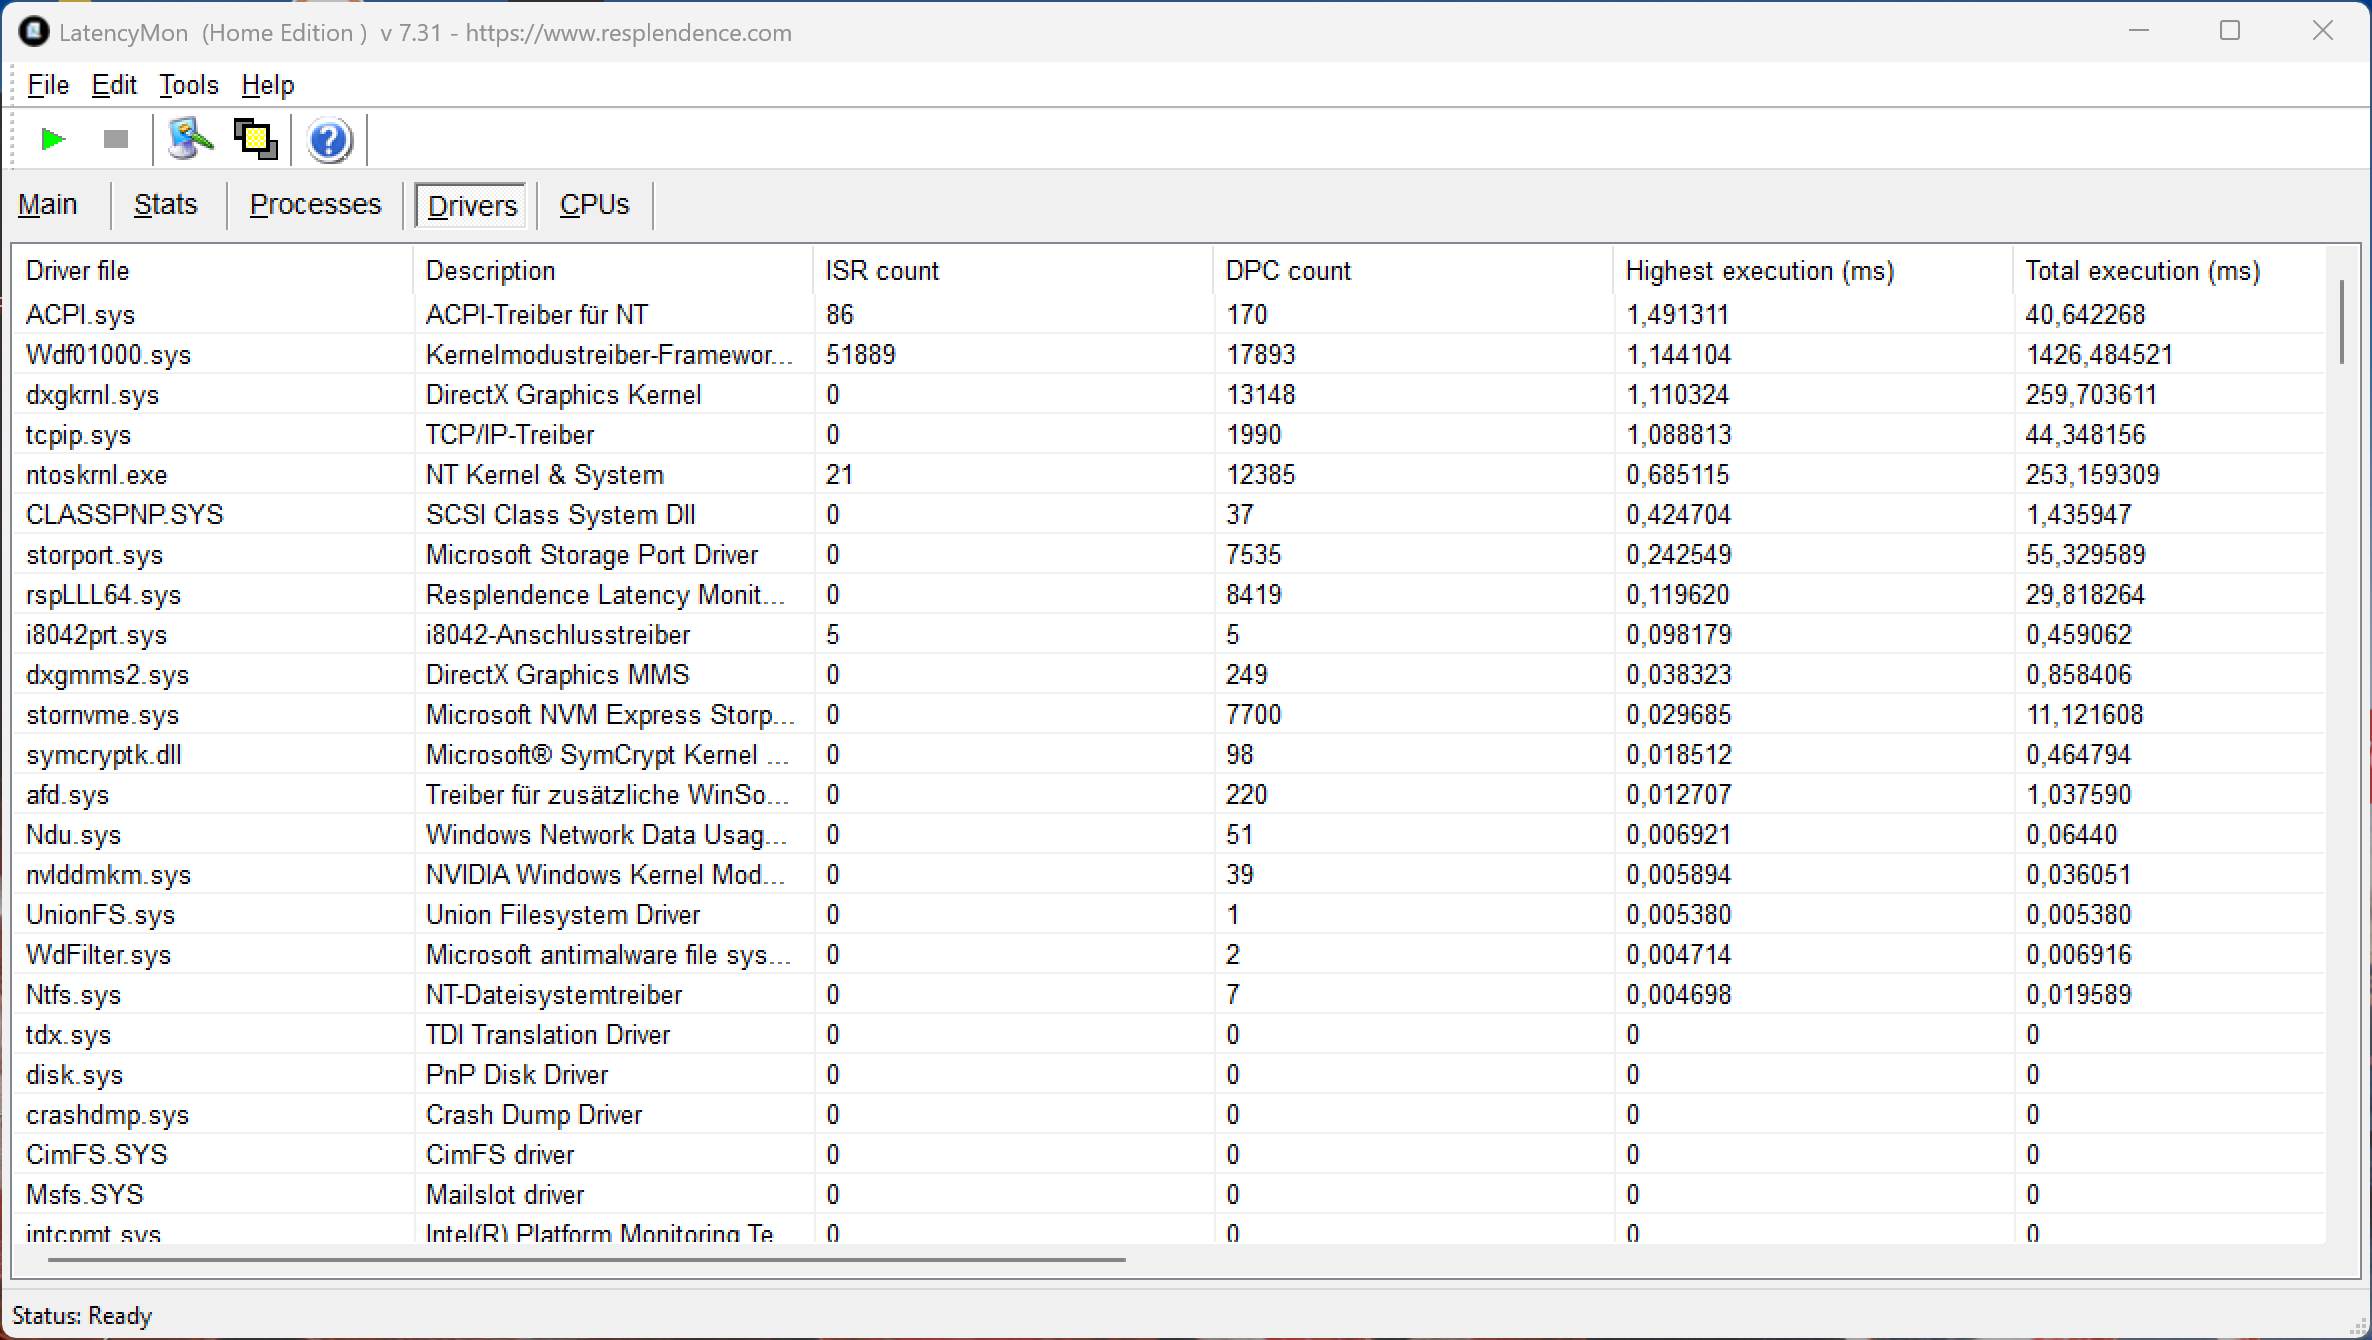
Latences DPC
Dans notre test de latence standardisé, la T16g avec la version actuelle du BIOS a montré de légères limitations lors de l'utilisation d'applications audio en temps réel.
| DPC Latencies / LatencyMon - interrupt to process latency (max), Web, Youtube, Prime95 | |
| HP ZBook Fury 16 G11 | |
| Dell Pro Max 16 Plus | |
| Lenovo ThinkPad T16g Gen 3 RTX 5080 | |
| Schenker XMG Pro 16 (E25) | |
| HP ZBook Studio 16 G11 | |
| Lenovo ThinkPad P16 Gen 2 | |
* ... Moindre est la valeur, meilleures sont les performances
Mémoire de masse
Le ThinkPad T16g dispose d'un emplacement PCIe 5.0 rapide, dans lequel notre unité d'évaluation était occupée par un disque SSD Samsung de 2 To (1,75 To libre). Avec des vitesses de transfert allant jusqu'à 13 Go/s, les performances sont généralement élevées, mais ce niveau ne peut pas être maintenu en cas de charge soutenue, et les performances chutent d'environ 50 %. Deux emplacements SSD supplémentaires (PCIe 4.0) sont disponibles pour un espace de stockage supplémentaire.

* ... Moindre est la valeur, meilleures sont les performances
Performance soutenue en lecture : Boucle de lecture DiskSpd, profondeur de la file d'attente 8
Performance du GPU
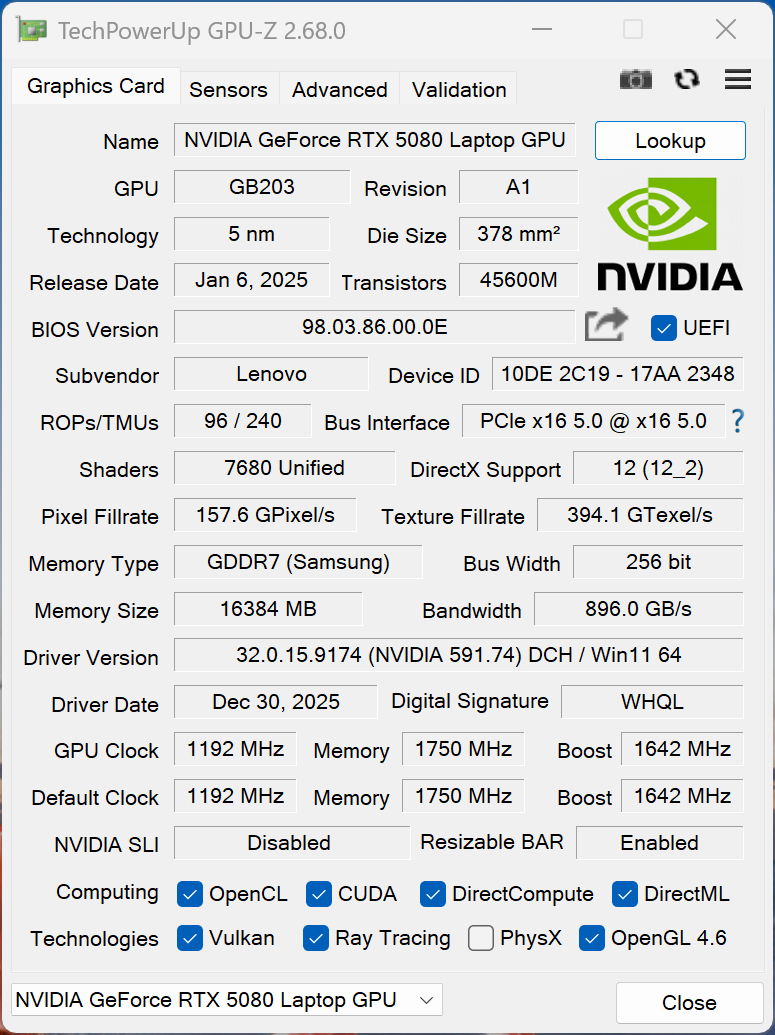
Lenovo a équipé la carte mobile GeForce RTX 5080 d'un TGP de seulement 105 watts, ce qui en fait l'une des implémentations les plus lentes que nous ayons testées jusqu'à présent (à titre de comparaison, même la compacte Asus ROG Zephyrus G14 permet à la 5080 de consommer 110 watts), et même la RTX 5070 Ti du XMG Pro 16 est plus rapide. En outre, dans ce domaine, la 5080 est même plus lente que la RTX 4000 de l'ancien ThinkPad P16 Gen 2, qui était lui-même basé sur la RTX 4080.
Cependant, les performances graphiques restent stables et les 16 Go de VRAM peuvent certainement être bénéfiques en fonction de l'application. Même dans les tests professionnels SPECviewperf, la 5080 obtient de très bons résultats dans certains sous-tests, de sorte que ces applications sont également possibles. Les performances de jeu sont nettement inférieures à celles des autres systèmes équipés de la RTX 5080. Lorsqu'il fonctionne sur batterie, le GPU est limité à une consommation maximale de 60 watts, ce qui se traduit par une réduction des performances d'environ 35 %.
| 3DMark 11 Performance | 42195 points | |
| 3DMark Fire Strike Score | 33297 points | |
| 3DMark Time Spy Score | 15900 points | |
| 3DMark Steel Nomad Score | 4022 points | |
| 3DMark Steel Nomad Light Score | 17002 points | |
Aide | ||
SPECviewperf 2020: 3840x2160 Solidworks (solidworks-07) 4k | 1920x1080 Solidworks (solidworks-07) | 1920x1080 Solidworks (solidworks-05) | 1920x1080 Siemens NX (snx-04) | 1920x1080 Medical (medical-03) | 1920x1080 Maya (maya-06) | 1920x1080 Energy (energy-03) | 1920x1080 Creo (creo-03) | 1920x1080 CATIA (catia-06) | 1920x1080 3ds Max (3dsmax-07) | 3840x2160 Solidworks (solidworks-05) | 3840x2160 Siemens NX (snx-04) | 3840x2160 Medical (medical-03) | 3840x2160 Maya (maya-06) | 3840x2160 Energy (energy-03) | 3840x2160 Creo (creo-03) | 3840x2160 CATIA (catia-06) | 3840x2160 3ds Max (3dsmax-07)
| SPECviewperf 15 / Siemens NX 2406 (snx-05) | |
| Lenovo ThinkPad P16v G3 21RS000DGE | |
| Razer Blade 16 Early 2023 | |
| Lenovo ThinkPad T16g Gen 3 RTX 5080 | |
| SPECviewperf 15 / Unreal Engine 5.4.2 (unreal_engine-01) | |
| Razer Blade 16 Early 2023 | |
| Lenovo ThinkPad T16g Gen 3 RTX 5080 | |
| Lenovo ThinkPad P1 Gen 8 | |
| Lenovo ThinkPad P16v G3 21RS000DGE | |
| SPECviewperf 15 / Solidworks 2024 (solidworks-08) | |
| Lenovo ThinkPad P1 Gen 8 | |
| Lenovo ThinkPad P16v G3 21RS000DGE | |
| Razer Blade 16 Early 2023 | |
| Lenovo ThinkPad T16g Gen 3 RTX 5080 | |
| SPECviewperf 15 / Tuvok (medical-04) | |
| Lenovo ThinkPad P1 Gen 8 | |
| Lenovo ThinkPad P16v G3 21RS000DGE | |
| Razer Blade 16 Early 2023 | |
| Lenovo ThinkPad T16g Gen 3 RTX 5080 | |
| SPECviewperf 15 / Maya 2025 (maya-07) | |
| Lenovo ThinkPad T16g Gen 3 RTX 5080 | |
| Razer Blade 16 Early 2023 | |
| Lenovo ThinkPad P1 Gen 8 | |
| Lenovo ThinkPad P16v G3 21RS000DGE | |
| SPECviewperf 15 / Enscape 4.0 (enscape-01) | |
| Lenovo ThinkPad T16g Gen 3 RTX 5080 | |
| Razer Blade 16 Early 2023 | |
| Lenovo ThinkPad P1 Gen 8 | |
| Lenovo ThinkPad P16v G3 21RS000DGE | |
| SPECviewperf 15 / OpendTect (energy-04) | |
| Razer Blade 16 Early 2023 | |
| Lenovo ThinkPad T16g Gen 3 RTX 5080 | |
| Lenovo ThinkPad P1 Gen 8 | |
| Lenovo ThinkPad P16v G3 21RS000DGE | |
| SPECviewperf 15 / Creo 9 (creo-04) | |
| Razer Blade 16 Early 2023 | |
| Lenovo ThinkPad P1 Gen 8 | |
| Lenovo ThinkPad T16g Gen 3 RTX 5080 | |
| Lenovo ThinkPad P16v G3 21RS000DGE | |
| SPECviewperf 15 / Catia V5 (catia-07) | |
| Lenovo ThinkPad T16g Gen 3 RTX 5080 | |
| Razer Blade 16 Early 2023 | |
| SPECviewperf 15 / Blender 3.6 (blender-01) | |
| Lenovo ThinkPad T16g Gen 3 RTX 5080 | |
| Razer Blade 16 Early 2023 | |
| Lenovo ThinkPad P1 Gen 8 | |
| Lenovo ThinkPad P16v G3 21RS000DGE | |
| SPECviewperf 15 / 3ds Max 2023 (3dsmax-08) | |
| Lenovo ThinkPad T16g Gen 3 RTX 5080 | |
| Razer Blade 16 Early 2023 | |
| Lenovo ThinkPad P1 Gen 8 | |
| Lenovo ThinkPad P16v G3 21RS000DGE | |
| SPECviewperf 2020 / Solidworks (solidworks-07) 4k | |
| Dell Pro Max 16 Plus | |
| Lenovo ThinkPad T16g Gen 3 RTX 5080 | |
| Lenovo ThinkPad P16 Gen 2 | |
| Lenovo ThinkPad P1 Gen 8 | |
| HP ZBook Fury 16 G11 | |
| Lenovo ThinkPad P16v G3 21RS000DGE | |
| HP ZBook Studio 16 G11 | |
| SPECviewperf 2020 / Solidworks (solidworks-05) | |
| Razer Blade 16 Early 2023 | |
| SPECviewperf 2020 / Solidworks (solidworks-05) | |
| Razer Blade 16 Early 2023 | |
| Blender / v3.3 Classroom OPTIX/RTX | |
| Moyenne de la classe Workstation (10 - 95, n=21, 2 dernières années) | |
| HP ZBook Studio 16 G11 | |
| HP ZBook Fury 16 G11 | |
| Lenovo ThinkPad T16g Gen 3 RTX 5080 | |
| Lenovo ThinkPad P16 Gen 2 | |
| Schenker XMG Pro 16 (E25) | |
| Moyenne NVIDIA GeForce RTX 5080 Laptop (11.6 - 17, n=13) | |
| Dell Pro Max 16 Plus | |
| Blender / v3.3 Classroom CUDA | |
| Moyenne de la classe Workstation (16 - 142, n=21, 2 dernières années) | |
| HP ZBook Studio 16 G11 | |
| HP ZBook Fury 16 G11 | |
| Schenker XMG Pro 16 (E25) | |
| Lenovo ThinkPad T16g Gen 3 RTX 5080 | |
| Moyenne NVIDIA GeForce RTX 5080 Laptop (18 - 49, n=15) | |
| Lenovo ThinkPad P16 Gen 2 | |
| Dell Pro Max 16 Plus | |
| Blender / v3.3 Classroom CPU | |
| HP ZBook Studio 16 G11 | |
| Moyenne de la classe Workstation (148 - 464, n=27, 2 dernières années) | |
| HP ZBook Fury 16 G11 | |
| Lenovo ThinkPad P16 Gen 2 | |
| Lenovo ThinkPad T16g Gen 3 RTX 5080 | |
| Dell Pro Max 16 Plus | |
| Moyenne NVIDIA GeForce RTX 5080 Laptop (123 - 243, n=14) | |
| Schenker XMG Pro 16 (E25) | |
* ... Moindre est la valeur, meilleures sont les performances
| Final Fantasy XV Benchmark - 1920x1080 High Quality | |
| Dell Pro Max 16 Plus | |
| Lenovo ThinkPad T16g Gen 3 RTX 5080 | |
| Lenovo ThinkPad P16 Gen 2 | |
| Schenker XMG Pro 16 (E25) | |
| HP ZBook Fury 16 G11 | |
| Moyenne de la classe Workstation (26.4 - 197.6, n=27, 2 dernières années) | |
| HP ZBook Studio 16 G11 | |
| F1 24 - 2560x1440 Ultra High Preset AA:T AF:16x | |
| Dell Pro Max 16 Plus | |
| Moyenne NVIDIA GeForce RTX 5080 Laptop (60.6 - 92.6, n=11) | |
| Schenker XMG Pro 16 (E25) | |
| Moyenne de la classe Workstation (22 - 101.8, n=9, 2 dernières années) | |
| Lenovo ThinkPad T16g Gen 3 RTX 5080 | |
Cyberpunk 2077 ultra FPS diagramme
| Bas | Moyen | Élevé | Ultra | QHD DLSS | QHD | 4K DLSS | 4K | |
|---|---|---|---|---|---|---|---|---|
| GTA V (2015) | 141.3 | 128.1 | ||||||
| Dota 2 Reborn (2015) | 210 | 184.4 | 176.6 | 164.8 | 148.3 | |||
| Final Fantasy XV Benchmark (2018) | 220 | 196.9 | 152.1 | 121.1 | 71.3 | |||
| X-Plane 11.11 (2018) | 154.1 | 117.8 | 110.4 | 88 | ||||
| Strange Brigade (2018) | 505 | 350 | 343 | 311 | 181.6 | 125.7 | ||
| Baldur's Gate 3 (2023) | 189.7 | 163 | 148.2 | 145.9 | 107 | 57.3 | ||
| Cyberpunk 2077 (2023) | 135.8 | 131.2 | 119 | 107.6 | 84.5 | 74.4 | 41.9 | 34.6 |
| F1 24 (2024) | 274 | 239 | 96.5 | 97.7 | 60.6 | 52.2 | 31 | |
| F1 25 (2025) | 213 | 198.3 | 179.2 | 38.6 | 42.6 | 23.6 | 21.2 | 11.2 |
Émissions et énergie
Émissions sonores

Les ventilateurs présentent des aspects positifs et négatifs. Dans les deux modes d'alimentation, Balanced et Best Performance, les ventilateurs tournent constamment à faible vitesse, ce qui signifie qu'ils sont rarement bruyants, même lors de courtes périodes de charge ou d'une utilisation quotidienne. Cependant, lorsque la puissance maximale est requise, les deux ventilateurs deviennent très bruyants à 57 dB(A)(équilibré: 50,3 dB(A), meilleure efficacité énergétique: 42,7 dB(A), batterie: max. 57.7 dB(A)). Compte tenu des performances offertes, ce niveau sonore est beaucoup trop élevé et plus élevé que celui des modèles concurrents. Aucun autre bruit électronique n'a été détecté.
Degré de la nuisance sonore
| Au repos |
| 24.7 / 28.9 / 28.9 dB(A) |
| Fortement sollicité |
| 30.4 / 57.7 dB(A) |
 | ||
30 dB silencieux 40 dB(A) audible 50 dB(A) bruyant |
||
min: | ||
| Lenovo ThinkPad T16g Gen 3 RTX 5080 Ultra 9 275HX, GeForce RTX 5080 Laptop | HP ZBook Studio 16 G11 Ultra 9 185H, RTX 3000 Ada Generation Laptop | Dell Pro Max 16 Plus Ultra 9 285HX, RTX PRO 5000 Blackwell Generation Laptop | Lenovo ThinkPad P16 Gen 2 i7-14700HX, RTX 4000 Ada Generation Laptop | HP ZBook Fury 16 G11 i9-14900HX, RTX 3500 Ada Generation Laptop | Schenker XMG Pro 16 (E25) Ultra 9 275HX, GeForce RTX 5070 Ti Laptop | |
|---|---|---|---|---|---|---|
| Noise | 6% | -6% | -5% | 3% | -0% | |
| arrêt / environnement * (dB) | 24.7 | 23.8 4% | 23.2 6% | 23.9 3% | 23.2 6% | 23.3 6% |
| Idle Minimum * (dB) | 24.7 | 23.8 4% | 26.7 -8% | 29.1 -18% | 23.2 6% | 25 -1% |
| Idle Average * (dB) | 28.9 | 26.4 9% | 30.5 -6% | 29.1 -1% | 23.2 20% | 25 13% |
| Idle Maximum * (dB) | 28.9 | 26.4 9% | 34 -18% | 29.1 -1% | 29.5 -2% | 25 13% |
| Load Average * (dB) | 30.4 | 33.7 -11% | 39.8 -31% | 41 -35% | 43 -41% | 45.5 -50% |
| Cyberpunk 2077 ultra * (dB) | 57.7 | 46.1 20% | 54.3 6% | 52.8 8% | 48.2 16% | 53.3 8% |
| Load Maximum * (dB) | 57.7 | 53.2 8% | 54.3 6% | 52.9 8% | 48.2 16% | 53.3 8% |
* ... Moindre est la valeur, meilleures sont les performances
Température
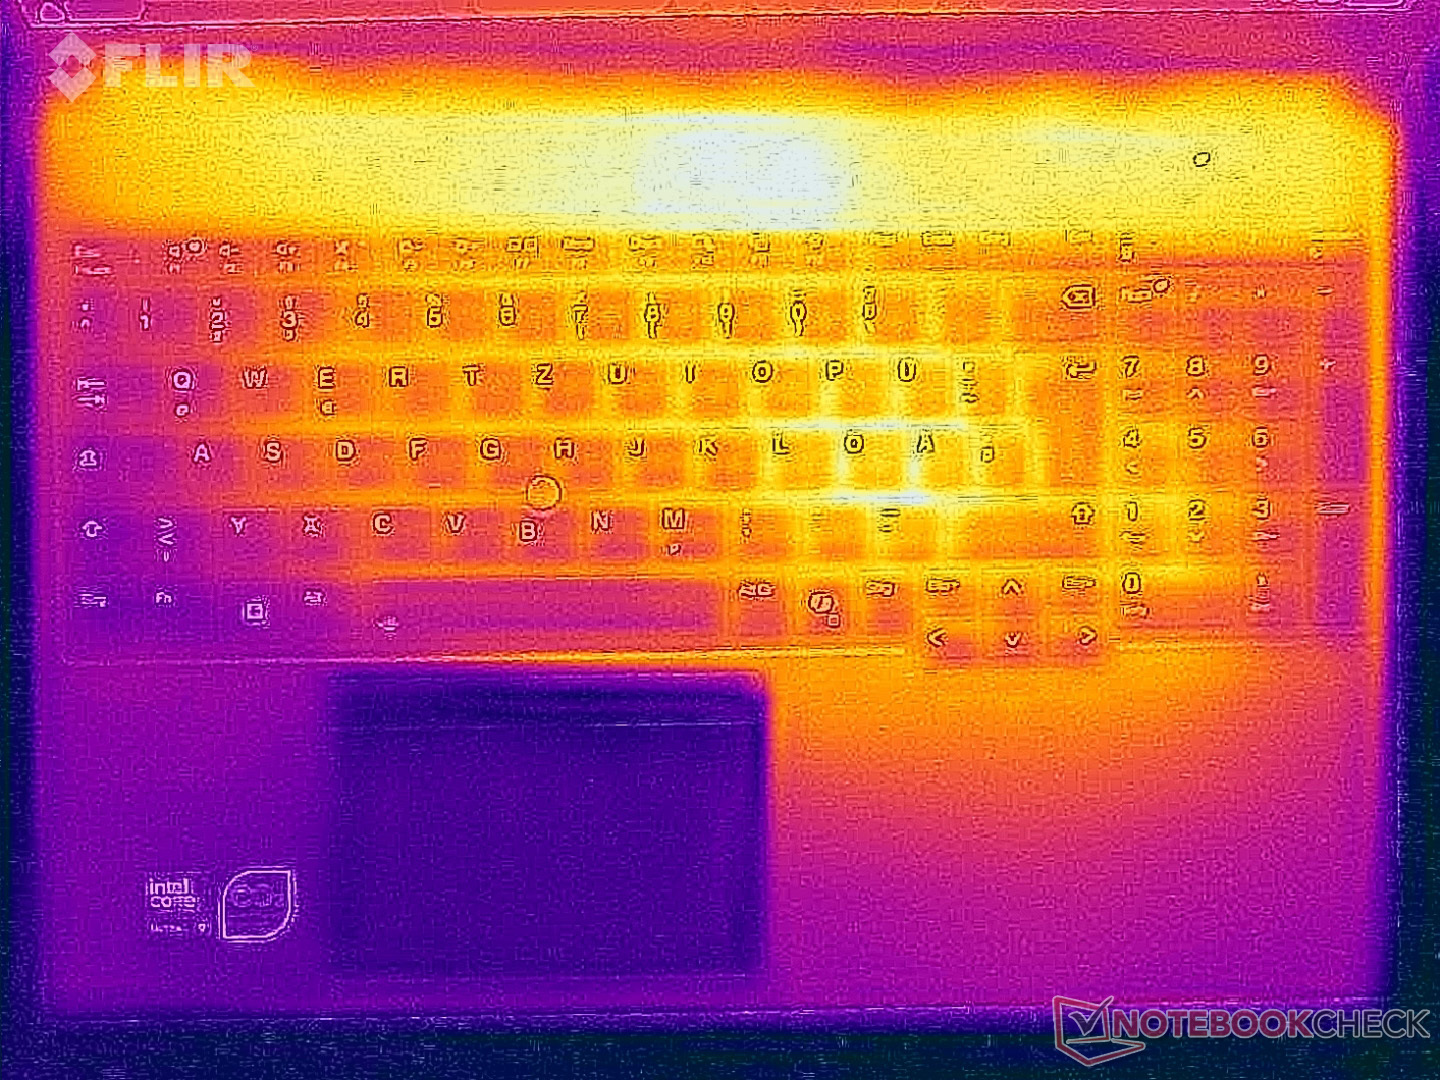
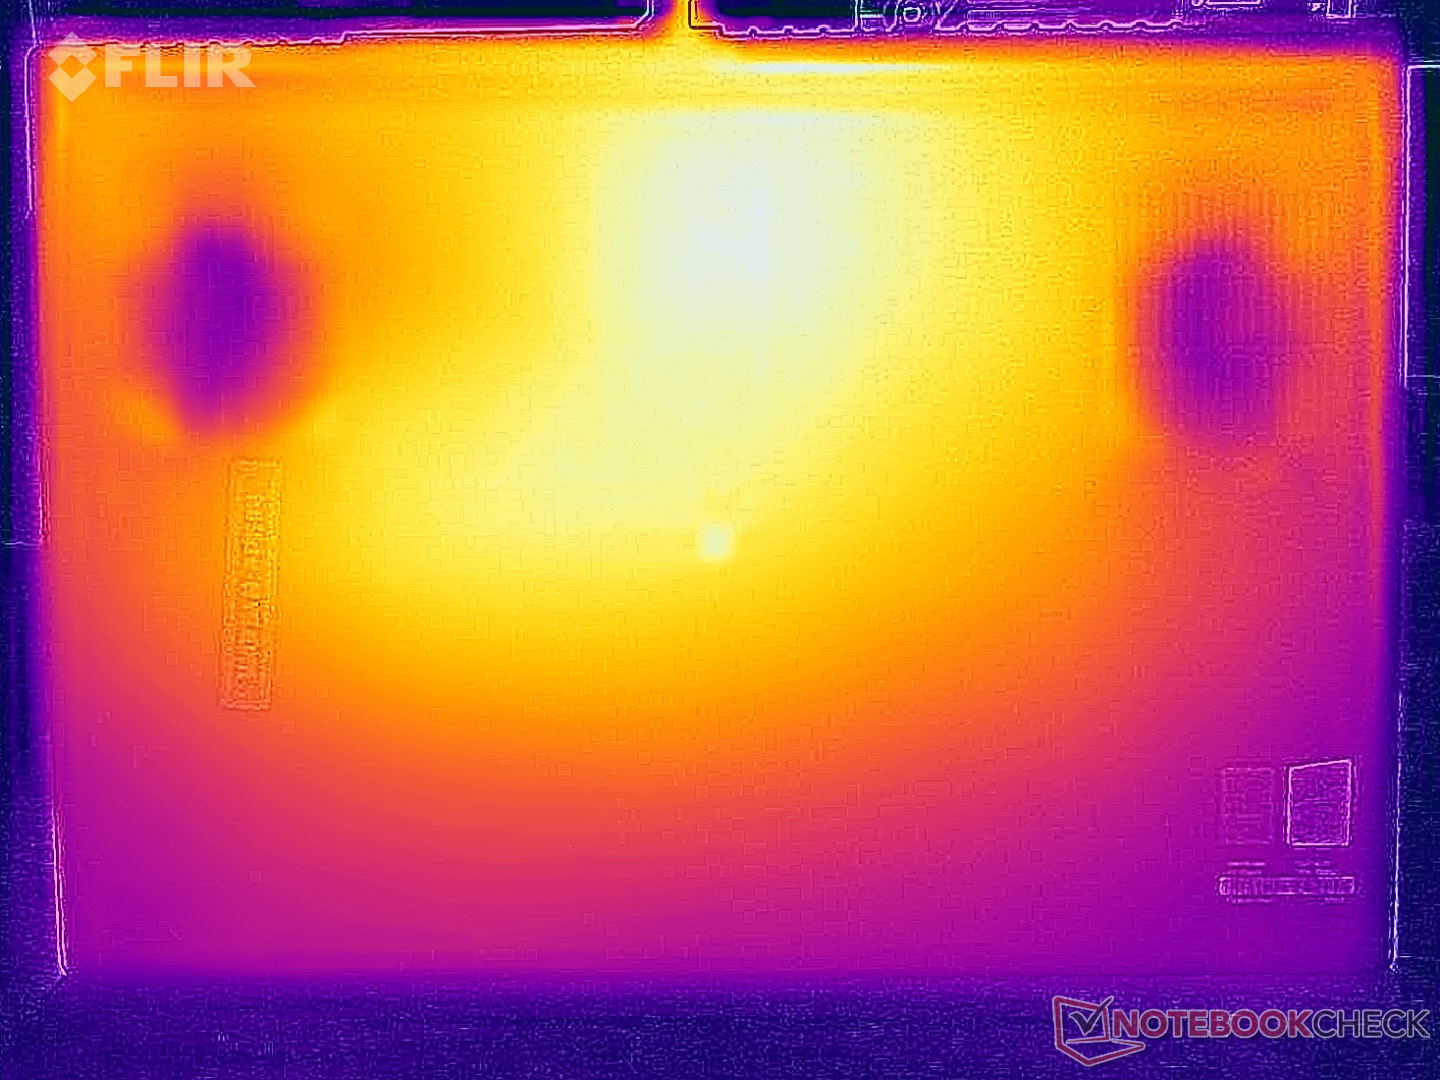
L'un des avantages de l'activité élevée des ventilateurs est la faible température de surface, bien que cela ne soit pas vraiment surprenant, compte tenu de la consommation totale de 130 watts dans un boîtier aussi épais. Lors du test de stress, la carte graphique reste à sa puissance maximale de 105 watts (78 °C), tandis que le processeur est réduit à seulement 25 watts (73 °C).

(±) La température maximale du côté supérieur est de 43.9 °C / 111 F, par rapport à la moyenne de 38.2 °C / 101 F, allant de 22.2 à 69.8 °C pour la classe Workstation.
(-) Le fond chauffe jusqu'à un maximum de 45.4 °C / 114 F, contre une moyenne de 41.1 °C / 106 F
(+) En utilisation inactive, la température moyenne du côté supérieur est de 27.1 °C / 81 F, par rapport à la moyenne du dispositif de 32 °C / 90 F.
(-) 3: The average temperature for the upper side is 39.4 °C / 103 F, compared to the average of 32 °C / 90 F for the class Workstation.
(±) Les repose-poignets et le pavé tactile peuvent devenir très chauds au toucher, avec un maximum de 38 °C / 100.4# F.
(-) La température moyenne de la zone de l'appui-paume de dispositifs similaires était de 27.8 °C / 82 F (-10.2 °C / #-18.4 F).
| Lenovo ThinkPad T16g Gen 3 RTX 5080 Ultra 9 275HX, GeForce RTX 5080 Laptop | HP ZBook Studio 16 G11 Ultra 9 185H, RTX 3000 Ada Generation Laptop | Dell Pro Max 16 Plus Ultra 9 285HX, RTX PRO 5000 Blackwell Generation Laptop | Lenovo ThinkPad P16 Gen 2 i7-14700HX, RTX 4000 Ada Generation Laptop | HP ZBook Fury 16 G11 i9-14900HX, RTX 3500 Ada Generation Laptop | Schenker XMG Pro 16 (E25) Ultra 9 275HX, GeForce RTX 5070 Ti Laptop | |
|---|---|---|---|---|---|---|
| Heat | -6% | -6% | 1% | -16% | -206% | |
| Maximum Upper Side * (°C) | 43.9 | 36.6 17% | 40.4 8% | 46.6 -6% | 42.2 4% | 43.2 2% |
| Maximum Bottom * (°C) | 45.4 | 47.8 -5% | 45.6 -0% | 51 -12% | 48 -6% | 46 -1% |
| Idle Upper Side * (°C) | 27.7 | 31.4 -13% | 32.8 -18% | 24.8 10% | 37 -34% | 27.7 -0% |
| Idle Bottom * (°C) | 28.6 | 35.6 -24% | 33 -15% | 25.6 10% | 36.8 -29% | 264 -823% |
* ... Moindre est la valeur, meilleures sont les performances
Intervenants
Dans l'ensemble, les haut-parleurs sont très bons et nettement meilleurs que ceux des appareils concurrents.
Lenovo ThinkPad T16g Gen 3 RTX 5080 analyse audio
(+) | les haut-parleurs peuvent jouer relativement fort (84.2# dB)
Basses 100 - 315 Hz
(±) | basse réduite - en moyenne 11.5% inférieure à la médiane
(±) | la linéarité des basses est moyenne (13.2% delta à la fréquence précédente)
Médiums 400 - 2000 Hz
(+) | médiane équilibrée - seulement 2.9% de la médiane
(+) | les médiums sont linéaires (3% delta à la fréquence précédente)
Aiguës 2 - 16 kHz
(+) | des sommets équilibrés - à seulement 1.4% de la médiane
(+) | les aigus sont linéaires (3.6% delta à la fréquence précédente)
Globalement 100 - 16 000 Hz
(+) | le son global est linéaire (10.2% différence à la médiane)
Par rapport à la même classe
» 6% de tous les appareils testés de cette catégorie étaient meilleurs, 5% similaires, 89% pires
» Le meilleur avait un delta de 7%, la moyenne était de 17%, le pire était de 35%.
Par rapport à tous les appareils testés
» 5% de tous les appareils testés étaient meilleurs, 1% similaires, 94% pires
» Le meilleur avait un delta de 4%, la moyenne était de 24%, le pire était de 134%.
HP ZBook Studio 16 G11 analyse audio
(+) | les haut-parleurs peuvent jouer relativement fort (82.7# dB)
Basses 100 - 315 Hz
(-) | presque aucune basse - en moyenne 17.4% plus bas que la médiane
(±) | la linéarité des basses est moyenne (11.8% delta à la fréquence précédente)
Médiums 400 - 2000 Hz
(+) | médiane équilibrée - seulement 3.4% de la médiane
(±) | la linéarité des médiums est moyenne (7% delta à la fréquence précédente)
Aiguës 2 - 16 kHz
(+) | des sommets équilibrés - à seulement 2.4% de la médiane
(+) | les aigus sont linéaires (2.6% delta à la fréquence précédente)
Globalement 100 - 16 000 Hz
(±) | la linéarité du son global est moyenne (15.2% de différence avec la médiane)
Par rapport à la même classe
» 33% de tous les appareils testés de cette catégorie étaient meilleurs, 10% similaires, 57% pires
» Le meilleur avait un delta de 7%, la moyenne était de 17%, le pire était de 35%.
Par rapport à tous les appareils testés
» 21% de tous les appareils testés étaient meilleurs, 4% similaires, 75% pires
» Le meilleur avait un delta de 4%, la moyenne était de 24%, le pire était de 134%.
Dell Pro Max 16 Plus analyse audio
(+) | les haut-parleurs peuvent jouer relativement fort (91.6# dB)
Basses 100 - 315 Hz
(-) | presque aucune basse - en moyenne 20.9% plus bas que la médiane
(+) | les basses sont linéaires (5.9% delta à la fréquence précédente)
Médiums 400 - 2000 Hz
(+) | médiane équilibrée - seulement 4.5% de la médiane
(+) | les médiums sont linéaires (4% delta à la fréquence précédente)
Aiguës 2 - 16 kHz
(+) | des sommets équilibrés - à seulement 3.7% de la médiane
(+) | les aigus sont linéaires (2.9% delta à la fréquence précédente)
Globalement 100 - 16 000 Hz
(+) | le son global est linéaire (14.3% différence à la médiane)
Par rapport à la même classe
» 30% de tous les appareils testés de cette catégorie étaient meilleurs, 4% similaires, 67% pires
» Le meilleur avait un delta de 7%, la moyenne était de 17%, le pire était de 35%.
Par rapport à tous les appareils testés
» 17% de tous les appareils testés étaient meilleurs, 4% similaires, 79% pires
» Le meilleur avait un delta de 4%, la moyenne était de 24%, le pire était de 134%.
Lenovo ThinkPad P16 Gen 2 analyse audio
(±) | le niveau sonore du haut-parleur est moyen mais bon (80.7# dB)
Basses 100 - 315 Hz
(±) | basse réduite - en moyenne 10.8% inférieure à la médiane
(±) | la linéarité des basses est moyenne (8% delta à la fréquence précédente)
Médiums 400 - 2000 Hz
(±) | médiane supérieure - en moyenne 5.4% supérieure à la médiane
(+) | les médiums sont linéaires (6.2% delta à la fréquence précédente)
Aiguës 2 - 16 kHz
(+) | des sommets équilibrés - à seulement 3.3% de la médiane
(+) | les aigus sont linéaires (5.5% delta à la fréquence précédente)
Globalement 100 - 16 000 Hz
(±) | la linéarité du son global est moyenne (15.6% de différence avec la médiane)
Par rapport à la même classe
» 35% de tous les appareils testés de cette catégorie étaient meilleurs, 11% similaires, 54% pires
» Le meilleur avait un delta de 7%, la moyenne était de 17%, le pire était de 35%.
Par rapport à tous les appareils testés
» 23% de tous les appareils testés étaient meilleurs, 5% similaires, 72% pires
» Le meilleur avait un delta de 4%, la moyenne était de 24%, le pire était de 134%.
HP ZBook Fury 16 G11 analyse audio
(+) | les haut-parleurs peuvent jouer relativement fort (88.9# dB)
Basses 100 - 315 Hz
(±) | basse réduite - en moyenne 13.3% inférieure à la médiane
(±) | la linéarité des basses est moyenne (11.2% delta à la fréquence précédente)
Médiums 400 - 2000 Hz
(+) | médiane équilibrée - seulement 2.2% de la médiane
(+) | les médiums sont linéaires (3.2% delta à la fréquence précédente)
Aiguës 2 - 16 kHz
(+) | des sommets équilibrés - à seulement 3.7% de la médiane
(+) | les aigus sont linéaires (4.6% delta à la fréquence précédente)
Globalement 100 - 16 000 Hz
(+) | le son global est linéaire (12.9% différence à la médiane)
Par rapport à la même classe
» 21% de tous les appareils testés de cette catégorie étaient meilleurs, 6% similaires, 72% pires
» Le meilleur avait un delta de 7%, la moyenne était de 17%, le pire était de 35%.
Par rapport à tous les appareils testés
» 12% de tous les appareils testés étaient meilleurs, 3% similaires, 85% pires
» Le meilleur avait un delta de 4%, la moyenne était de 24%, le pire était de 134%.
Schenker XMG Pro 16 (E25) analyse audio
(±) | le niveau sonore du haut-parleur est moyen mais bon (79.2# dB)
Basses 100 - 315 Hz
(±) | basse réduite - en moyenne 14.2% inférieure à la médiane
(±) | la linéarité des basses est moyenne (10.6% delta à la fréquence précédente)
Médiums 400 - 2000 Hz
(±) | médiane supérieure - en moyenne 8.2% supérieure à la médiane
(±) | la linéarité des médiums est moyenne (9.9% delta à la fréquence précédente)
Aiguës 2 - 16 kHz
(+) | des sommets équilibrés - à seulement 3.8% de la médiane
(+) | les aigus sont linéaires (5.9% delta à la fréquence précédente)
Globalement 100 - 16 000 Hz
(±) | la linéarité du son global est moyenne (18.5% de différence avec la médiane)
Par rapport à la même classe
» 60% de tous les appareils testés de cette catégorie étaient meilleurs, 8% similaires, 32% pires
» Le meilleur avait un delta de 6%, la moyenne était de 18%, le pire était de 132%.
Par rapport à tous les appareils testés
» 41% de tous les appareils testés étaient meilleurs, 8% similaires, 51% pires
» Le meilleur avait un delta de 4%, la moyenne était de 24%, le pire était de 134%.
Consommation électrique

Comme décrit au début, le T16g Gen 3 est chargé exclusivement via USB-C, et les ports peuvent supporter un maximum de 180 watts, ce qui est la raison pour laquelle un adaptateur d'alimentation assez compact de 180 watts est inclus. Lorsque les composants sont en charge (et pas seulement pendant notre test de stress), l'énergie de la batterie est régulièrement tirée pendant une courte période, ce qui n'est certainement pas bon pour la santé de la batterie. En période de pointe, HWiNFO affiche une consommation totale de plus de 280 watts au début de la charge combinée.
| Éteint/en veille | |
| Au repos | |
| Fortement sollicité |
|
Légende:
min: | |
| Lenovo ThinkPad T16g Gen 3 RTX 5080 Ultra 9 275HX, GeForce RTX 5080 Laptop, Samsung PM9E1 MZVLC2T0HBLD, OLED, 3200x2000, 16" | HP ZBook Studio 16 G11 Ultra 9 185H, RTX 3000 Ada Generation Laptop, Kioxia XG8 KXG80ZNV1T02, IPS, 3840x2400, 16" | Dell Pro Max 16 Plus Ultra 9 285HX, RTX PRO 5000 Blackwell Generation Laptop, SK hynix PCB01 HFS001TFM9X186N, OLED, 3840x2400, 16" | Lenovo ThinkPad P16 Gen 2 i7-14700HX, RTX 4000 Ada Generation Laptop, SK hynix PC801 HFS001TEJ9X162N, IPS, 2560x1600, 16" | HP ZBook Fury 16 G11 i9-14900HX, RTX 3500 Ada Generation Laptop, SK hynix PC801 HFS001TEJ9X101N, IPS, 3840x2400, 16" | Schenker XMG Pro 16 (E25) Ultra 9 275HX, GeForce RTX 5070 Ti Laptop, Samsung 9100 Pro 1 TB, IPS, 2560x1600, 16" | Moyenne NVIDIA GeForce RTX 5080 Laptop | Moyenne de la classe Workstation | |
|---|---|---|---|---|---|---|---|---|
| Power Consumption | -2% | -104% | -15% | -5% | -24% | -54% | 12% | |
| Idle Minimum * (Watt) | 9.9 | 14 -41% | 35.1 -255% | 7.9 20% | 8.6 13% | 11.7 -18% | 18.7 ? -89% | 8.98 ? 9% |
| Idle Average * (Watt) | 17.1 | 22.4 -31% | 39.2 -129% | 13.1 23% | 14.8 13% | 16.6 3% | 25.3 ? -48% | 13.7 ? 20% |
| Idle Maximum * (Watt) | 17.7 | 25.7 -45% | 56 -216% | 24.2 -37% | 15.7 11% | 17.1 3% | 28.9 ? -63% | 17.9 ? -1% |
| Load Average * (Watt) | 125.6 | 90.2 28% | 130.2 -4% | 127.4 -1% | 129.4 -3% | 122.4 3% | 127.5 ? -2% | 94.3 ? 25% |
| Cyberpunk 2077 ultra external monitor * (Watt) | 166.8 | 120.3 28% | 213 -28% | 219 -31% | 192.6 -15% | 241 -44% | ||
| Cyberpunk 2077 ultra * (Watt) | 160.5 | 125.4 22% | 229 -43% | 225 -40% | 199.4 -24% | 245 -53% | ||
| Load Maximum * (Watt) | 182.8 | 142 22% | 285.2 -56% | 248.5 -36% | 236.1 -29% | 291.5 -59% | 310 ? -70% | 173.8 ? 5% |
* ... Moindre est la valeur, meilleures sont les performances
Consommation électrique Cyberpunk / stress test
Consommation électrique avec un moniteur externe
Durée de vie des batteries
Lenovo a installé une batterie de 99,9 Wh, et l'autonomie mesurée est très bonne pour cette catégorie d'appareil. Lors de notre test Wi-Fi à 150 cd/m² et 60 Hz, il a tenu environ 9,5 heures, et même à pleine luminosité, il a tenu 6 heures au total.
Notebookcheck note globale
Lenovo ThinkPad T16g Gen 3 RTX 5080
- 02/04/2026 v8
Andreas Osthoff
 Total Sustainability Score:
 Comparaison des alternatives possibles
Image | Modèle | Prix | Poids | Épaisseur | Écran |
|---|---|---|---|---|---|
1. 87.3%  | Lenovo ThinkPad T16g Gen 3 RTX 5080 Intel Core Ultra 9 275HX ⎘ NVIDIA GeForce RTX 5080 Laptop ⎘ 64 Go Mémoire, 2048 Go SSD | Amazon: 1. $2,599.99 Lenovo ThinkPad P16 Gen 3 Mo... 2. $1,399.99 Lenovo ThinkPad E16 Gen 3 Bu... 3. $829.42 Lenovo ThinkPad E16 Gen 3 Bu... Prix de liste: 4800€ | 2.6 kg | 29.8 mm | 16.00" 3200x2000 236 PPI OLED |
2. 84.2%  | HP ZBook Studio 16 G11 Intel Core Ultra 9 185H ⎘ NVIDIA RTX 3000 Ada Generation Laptop ⎘ 64 Go Mémoire, 1024 Go SSD | Amazon: Prix de liste: 4300 USD | 1.8 kg | 19 mm | 16.00" 3840x2400 283 PPI IPS |
3. 88.4%  | Dell Pro Max 16 Plus Intel Core Ultra 9 285HX ⎘ NVIDIA RTX PRO 5000 Blackwell Generation Laptop ⎘ 128 Go Mémoire, SSD | Amazon: Prix de liste: 5000 USD | 2.8 kg | 30.9 mm | 16.00" 3840x2400 283 PPI OLED |
4. 85.9%  | Lenovo ThinkPad P16 Gen 2 Intel Core i7-14700HX ⎘ NVIDIA RTX 4000 Ada Generation Laptop ⎘ 32 Go Mémoire, 1024 Go SSD | Amazon: Prix de liste: 3500 USD | 3.1 kg | 30.23 mm | 16.00" 2560x1600 189 PPI IPS |
5. 85.9%  | HP ZBook Fury 16 G11 Intel Core i9-14900HX ⎘ NVIDIA RTX 3500 Ada Generation Laptop ⎘ 64 Go Mémoire, 1024 Go SSD | Prix de liste: 3300 USD | 2.6 kg | 28.5 mm | 16.00" 3840x2400 283 PPI IPS |
6. 87.4%  | Schenker XMG Pro 16 (E25) Intel Core Ultra 9 275HX ⎘ NVIDIA GeForce RTX 5070 Ti Laptop ⎘ 32 Go Mémoire, 1024 Go SSD | Amazon: 1. atFoliX Plastic Glass Protec... 2. atFoliX Screen Protection Fi... 3. atFoliX Screen Protector com... Prix de liste: 2480€ | 2.5 kg | 26.5 mm | 16.00" 2560x1600 189 PPI IPS |
Transparency
La sélection des appareils à examiner est effectuée par notre équipe éditoriale. L'échantillon de test a été prêté à l'auteur par le fabricant ou le détaillant pour les besoins de cet examen. Le prêteur n'a pas eu d'influence sur cette évaluation et le fabricant n'a pas reçu de copie de cette évaluation avant sa publication. Il n'y avait aucune obligation de publier cet article. En tant que média indépendant, Notebookcheck n'est pas soumis à l'autorité des fabricants, des détaillants ou des éditeurs.
Voici comment Notebookcheck teste
Chaque année, Notebookcheck examine de manière indépendante des centaines d'ordinateurs portables et de smartphones en utilisant des procédures standardisées afin de garantir que tous les résultats sont comparables. Nous avons continuellement développé nos méthodes de test depuis environ 20 ans et avons établi des normes industrielles dans le processus. Dans nos laboratoires de test, des équipements de mesure de haute qualité sont utilisés par des techniciens et des rédacteurs expérimentés. Ces tests impliquent un processus de validation en plusieurs étapes. Notre système d'évaluation complexe repose sur des centaines de mesures et de points de référence bien fondés, ce qui garantit l'objectivité.
