Verdict - Plus de fonctionnalités pour un prix plus élevé
L'une de nos principales plaintes concernant l'Alienware 16X Aurora 2025 était son manque d'options OLED, de support HDR et de GeForce RTX 5070 Ti. Aujourd'hui, un an plus tard, l'Alienware 16X Aurora 2026 peut être configuré avec toutes ces fonctionnalités manquantes, ainsi qu'avec le tout nouveau Core Ultra 9 290HX Plus en tant qu'option CPU de niveau supérieur par rapport au Core Ultra 9 275HX existant.
Tout d'abord, le nouveau CPU n'apporte pas grand-chose, surtout pour les joueurs, et c'est sans doute la pire raison de choisir le 2026 16X Aurora plutôt que le modèle 2025. Au lieu de cela, la nouvelle option RTX 5070 Ti est le principal argument de vente car elle est raisonnablement plus rapide que la RTX 5070 de l'année dernière.
Par ailleurs, le panneau OLED mat est unique en son genre, la plupart des autres étant brillants. La qualité d'image est meilleure que celle de l'option IPS de base, déjà excellente, mais la couche mate introduit un peu de grain pour réduire les reflets. La luminosité est également moyenne pour un écran OLED Lenovo Legion Pro 5 est équipé d'une dalle OLED brillante et plus lumineuse.
Pour le reste, l'expérience utilisateur est la même que l'année dernière. Le poids reste plus élevé que la plupart des concurrents, mais l'extensibilité décente et le design très rigide compensent partiellement cet inconvénient. L'aspect le plus ennuyeux de ce modèle est que la nouvelle option RTX 5070 Ti est liée au Core Ultra 9 290HX Plus alors que le CPU n'ajoute presque rien à l'expérience de jeu par rapport au Core Ultra 9 275HX existant. Avec des prix d'ordinateurs portables aussi élevés qu'ils le sont aujourd'hui, une plus grande liberté dans les configurations aurait rendu l'Alienware plus facile à acheter pour beaucoup.
Points positifs
Points négatifs
Prix et disponibilité
Dell commercialise actuellement l'Alienware 16X Aurora, tel que configuré dans cette revue, au prix de 3 000 $.
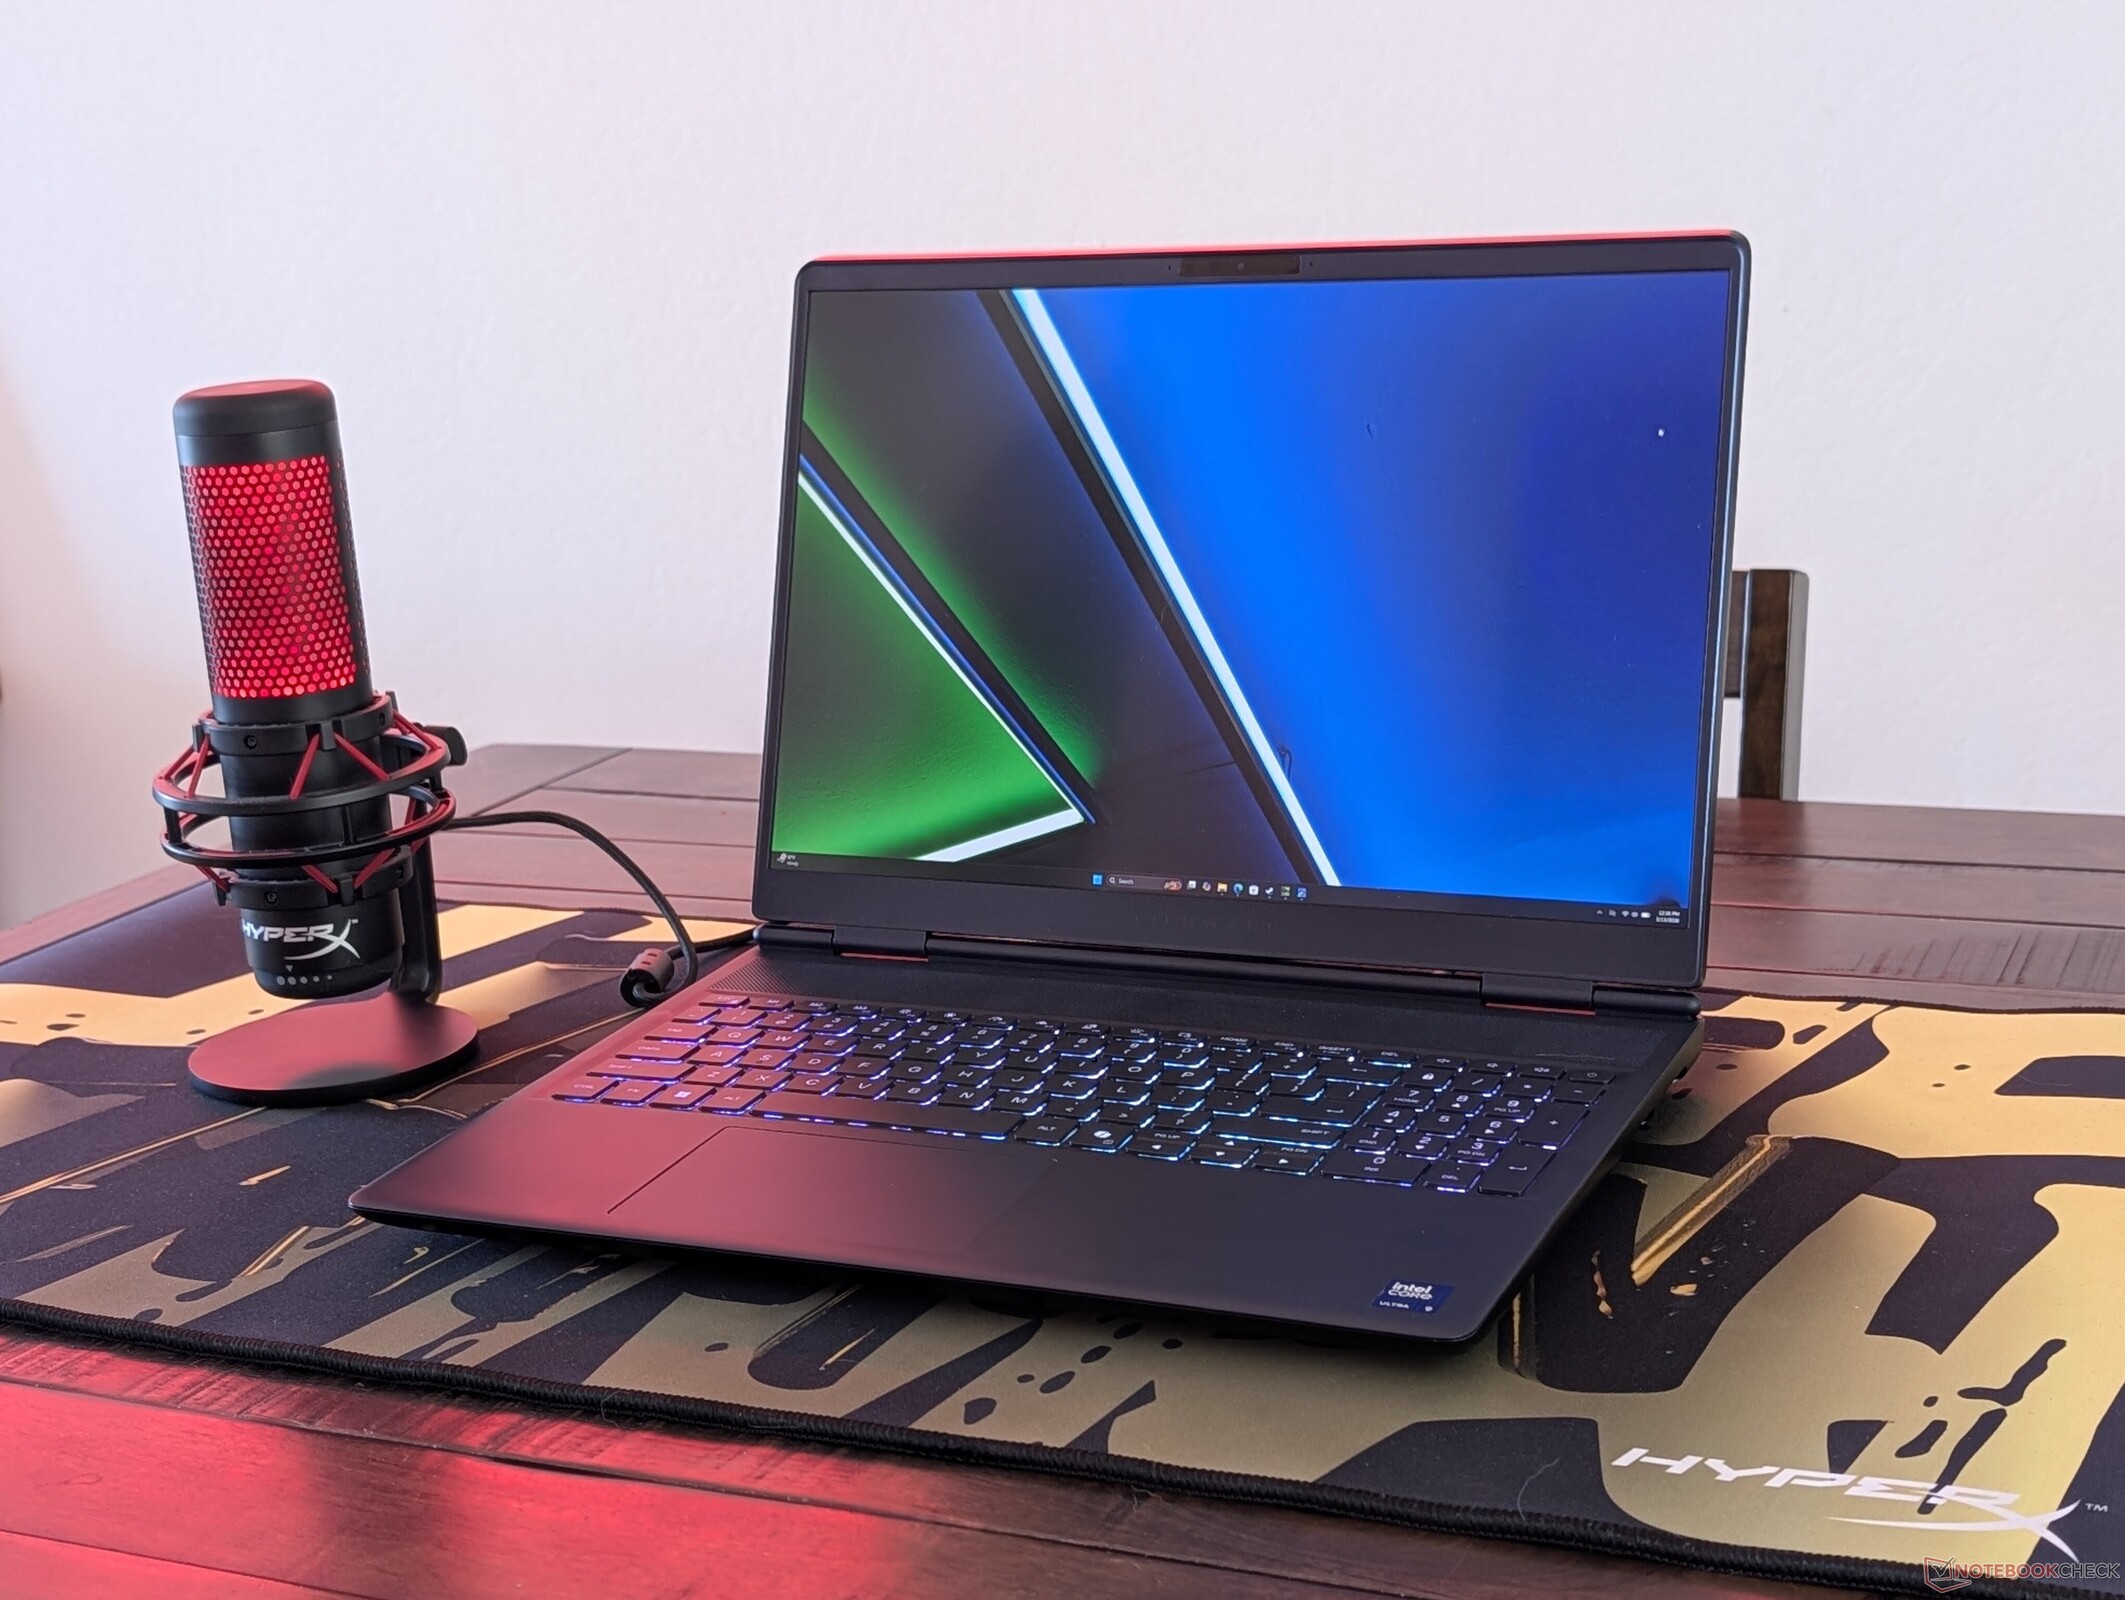
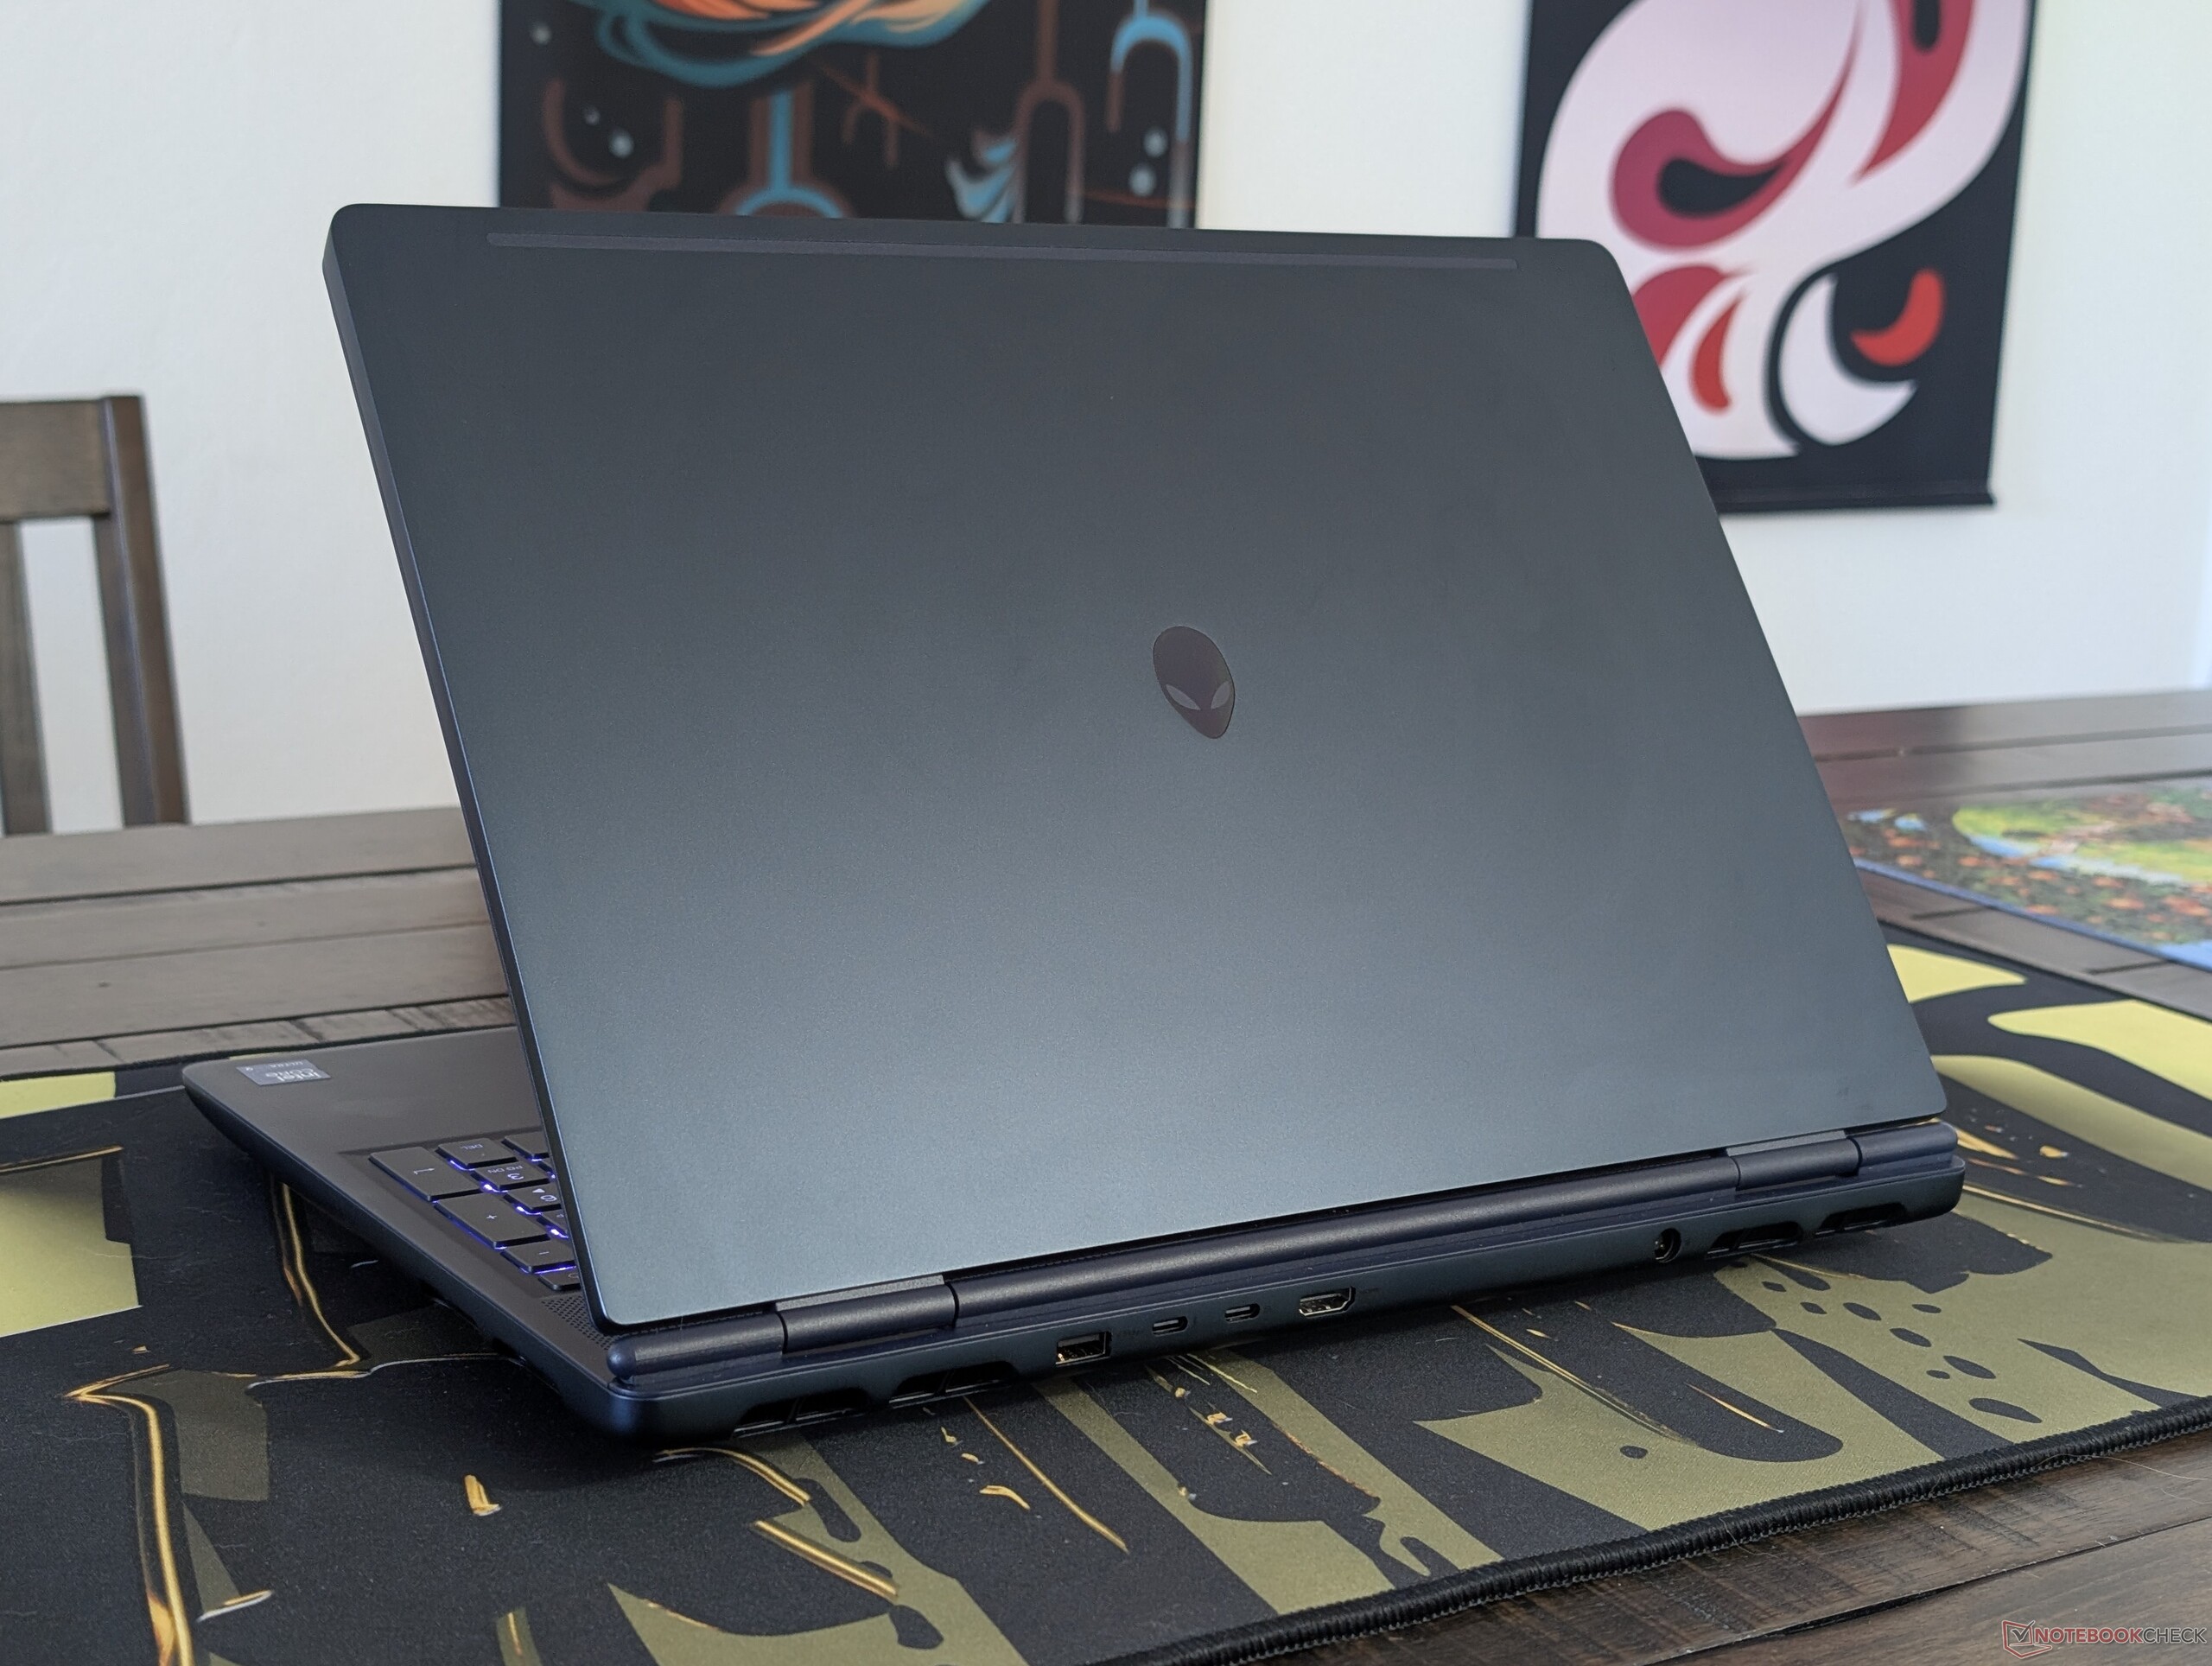
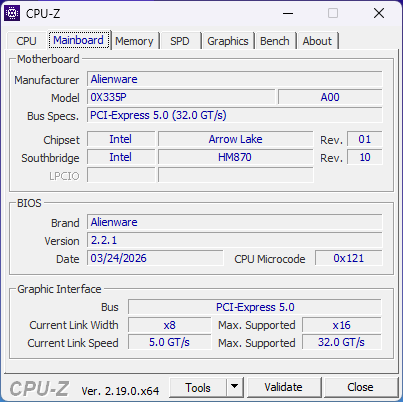
L'Alienware 16X Aurora est de retour cette année avec de nouvelles options de CPU, GPU et écran pour compléter les options existantes sur le modèle 2025. Le châssis est par ailleurs visuellement identique au modèle 2025 et plus de détails peuvent être trouvés sur notre revue de l'Aurora ici.
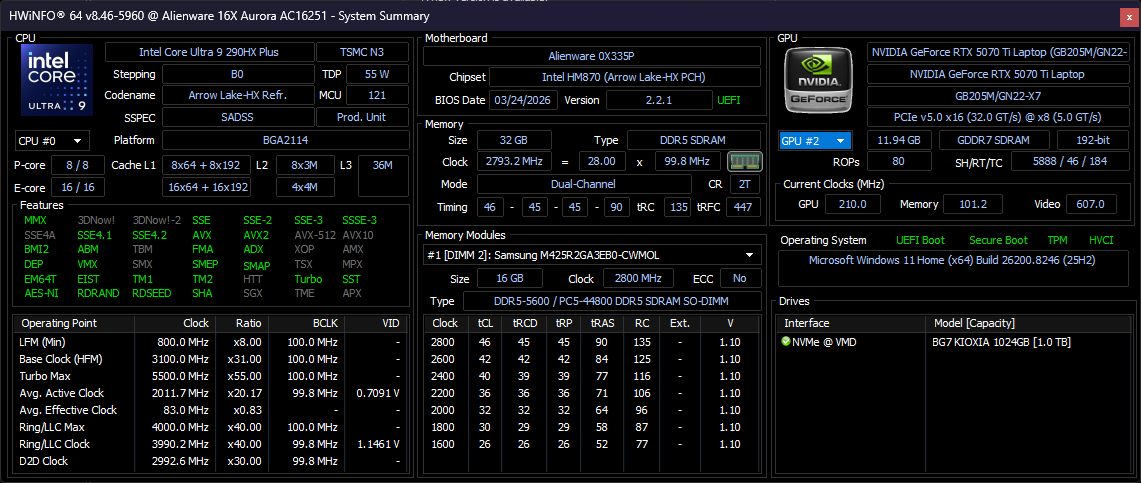
Notre unité de test est la configuration la plus élevée avec le Core Lake Ultra 9 290HX Plus, GeForce RTX 5070 Ti, et un écran OLED 1600p pour environ 3000$. Auparavant, le 16X Aurora était limité au Core Ultra 9 275HX, à la RTX 5070 et à un écran IPS 1600p.
Les concurrents dans ce domaine comprennent d'autres ordinateurs portables de jeu de 16 pouces de milieu de gamme supérieur comme le Asus ROG Zephyrus G16, Acer Predator Helios Neoou le MSI Vector 16 HX.
Plus d'avis sur Alienware :
Spécifications
Cas
Connectivité


Communication
Webcam


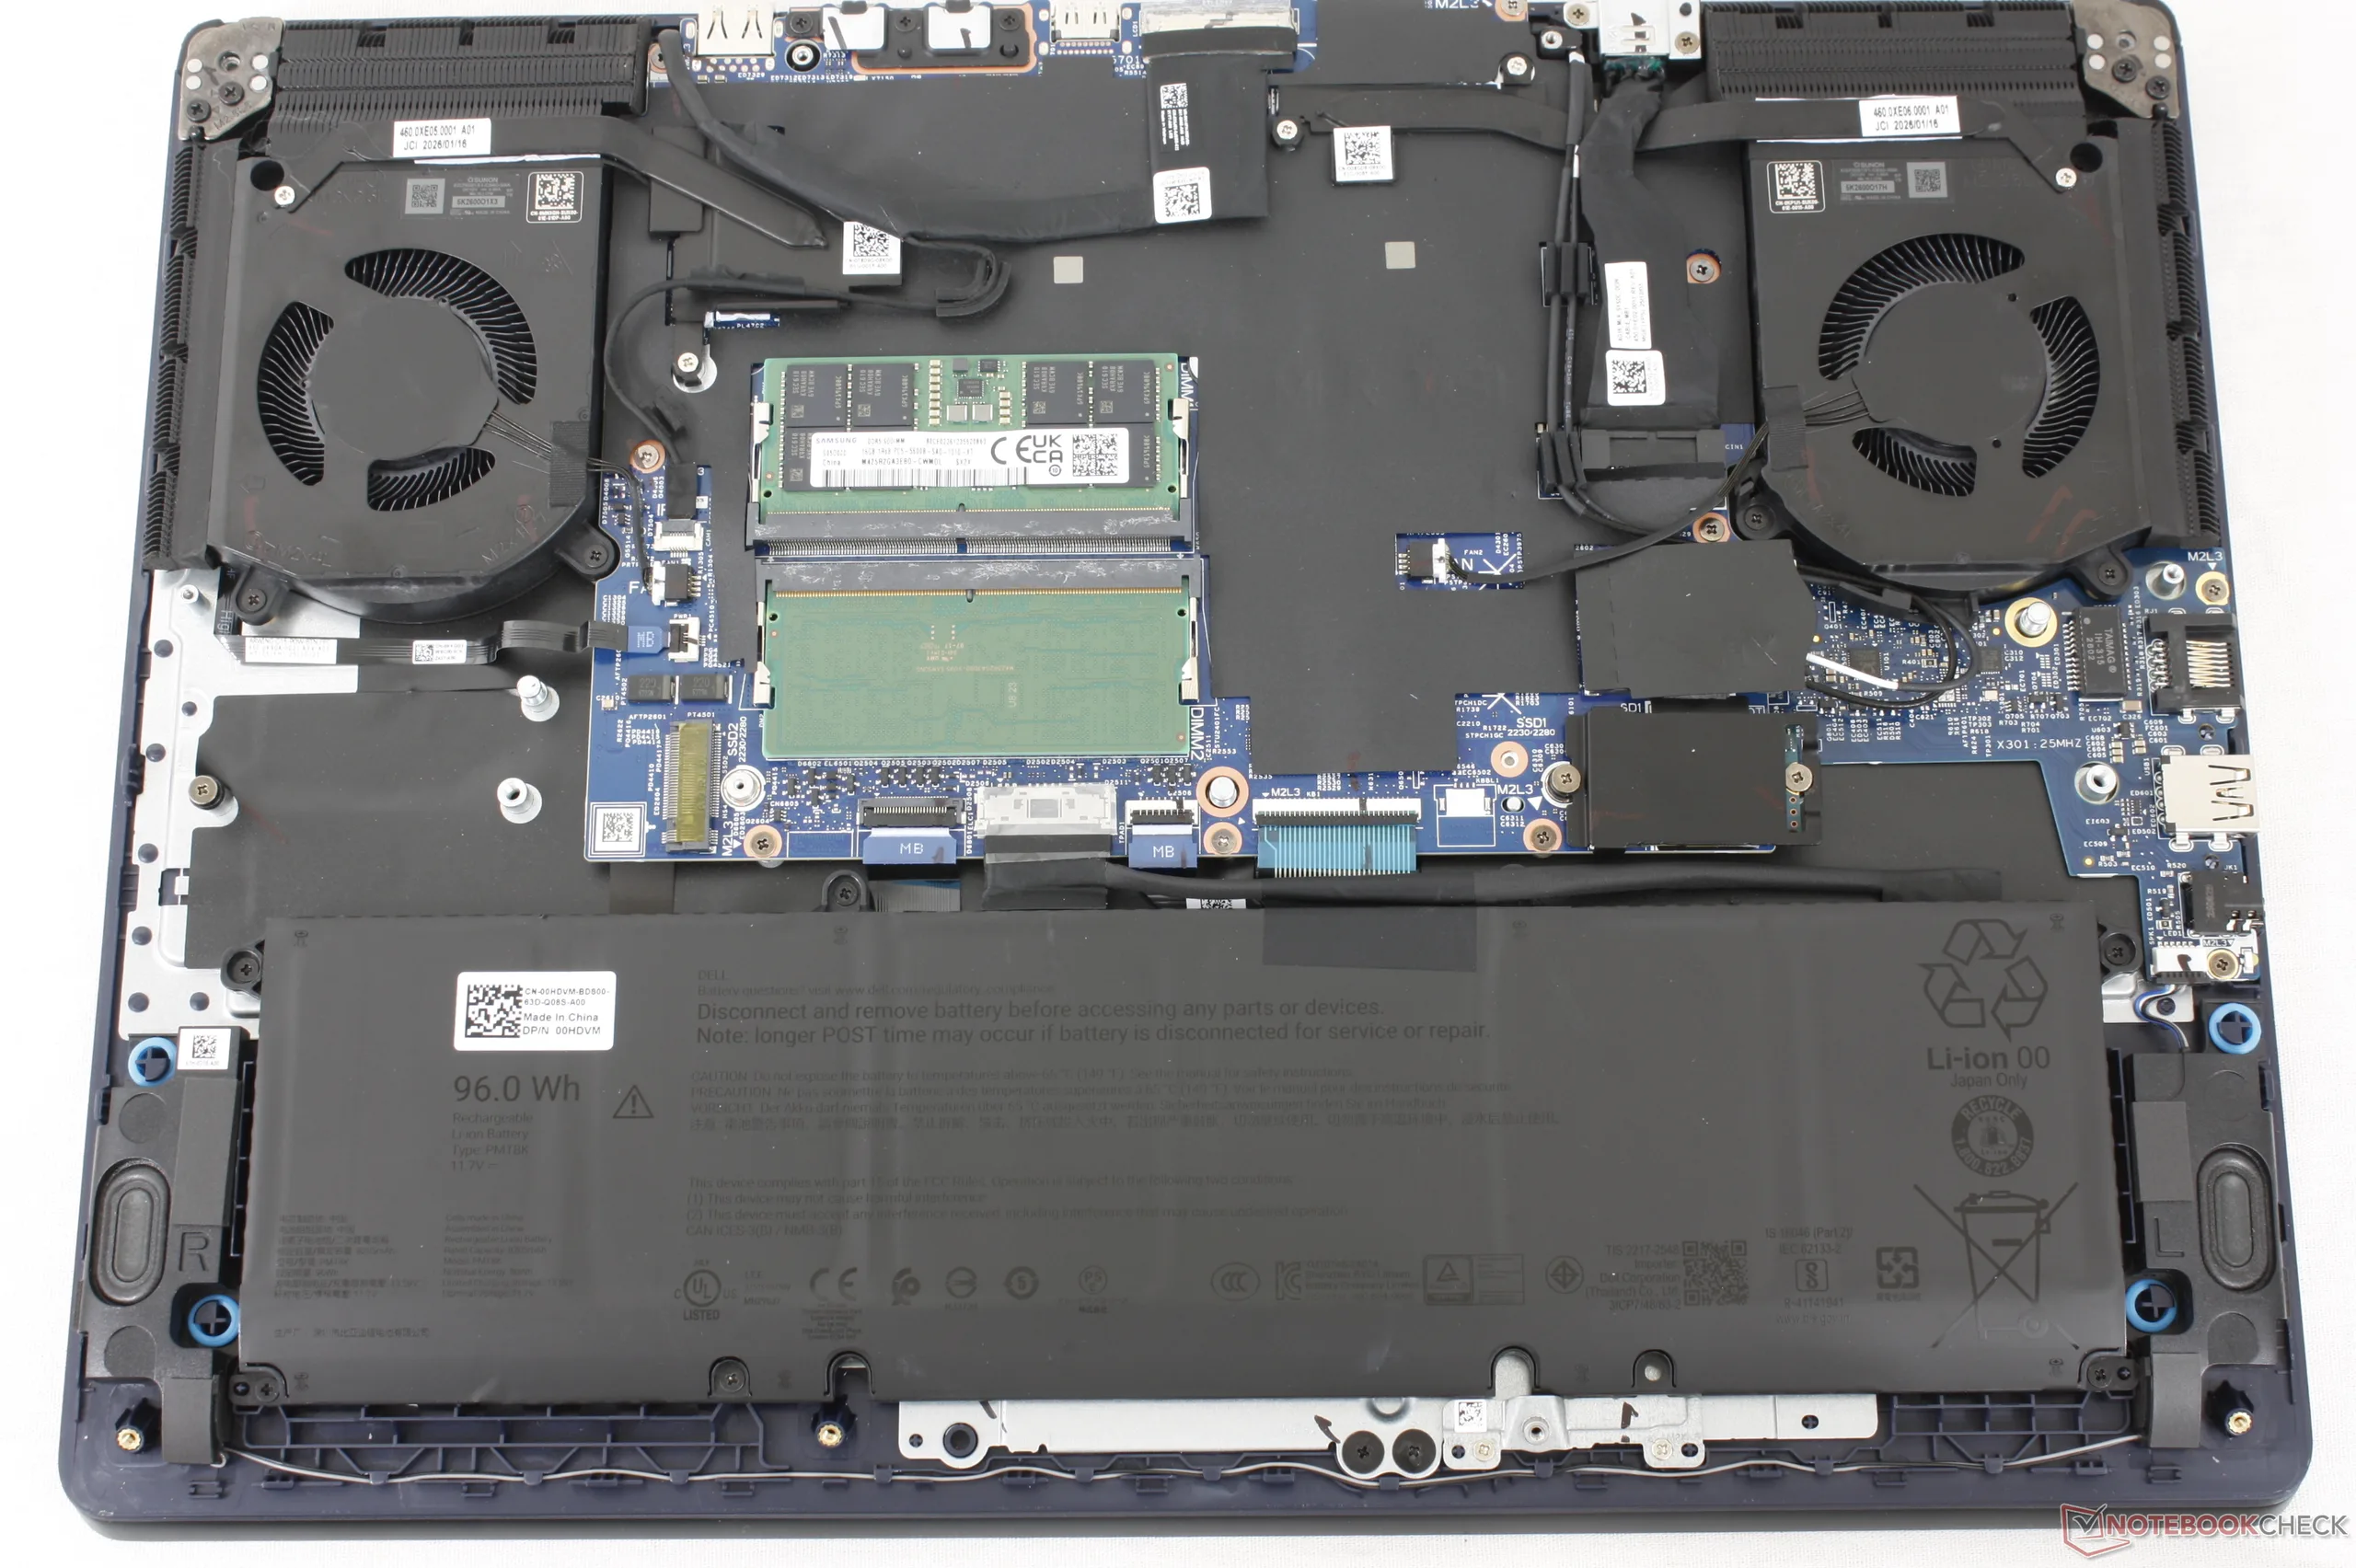
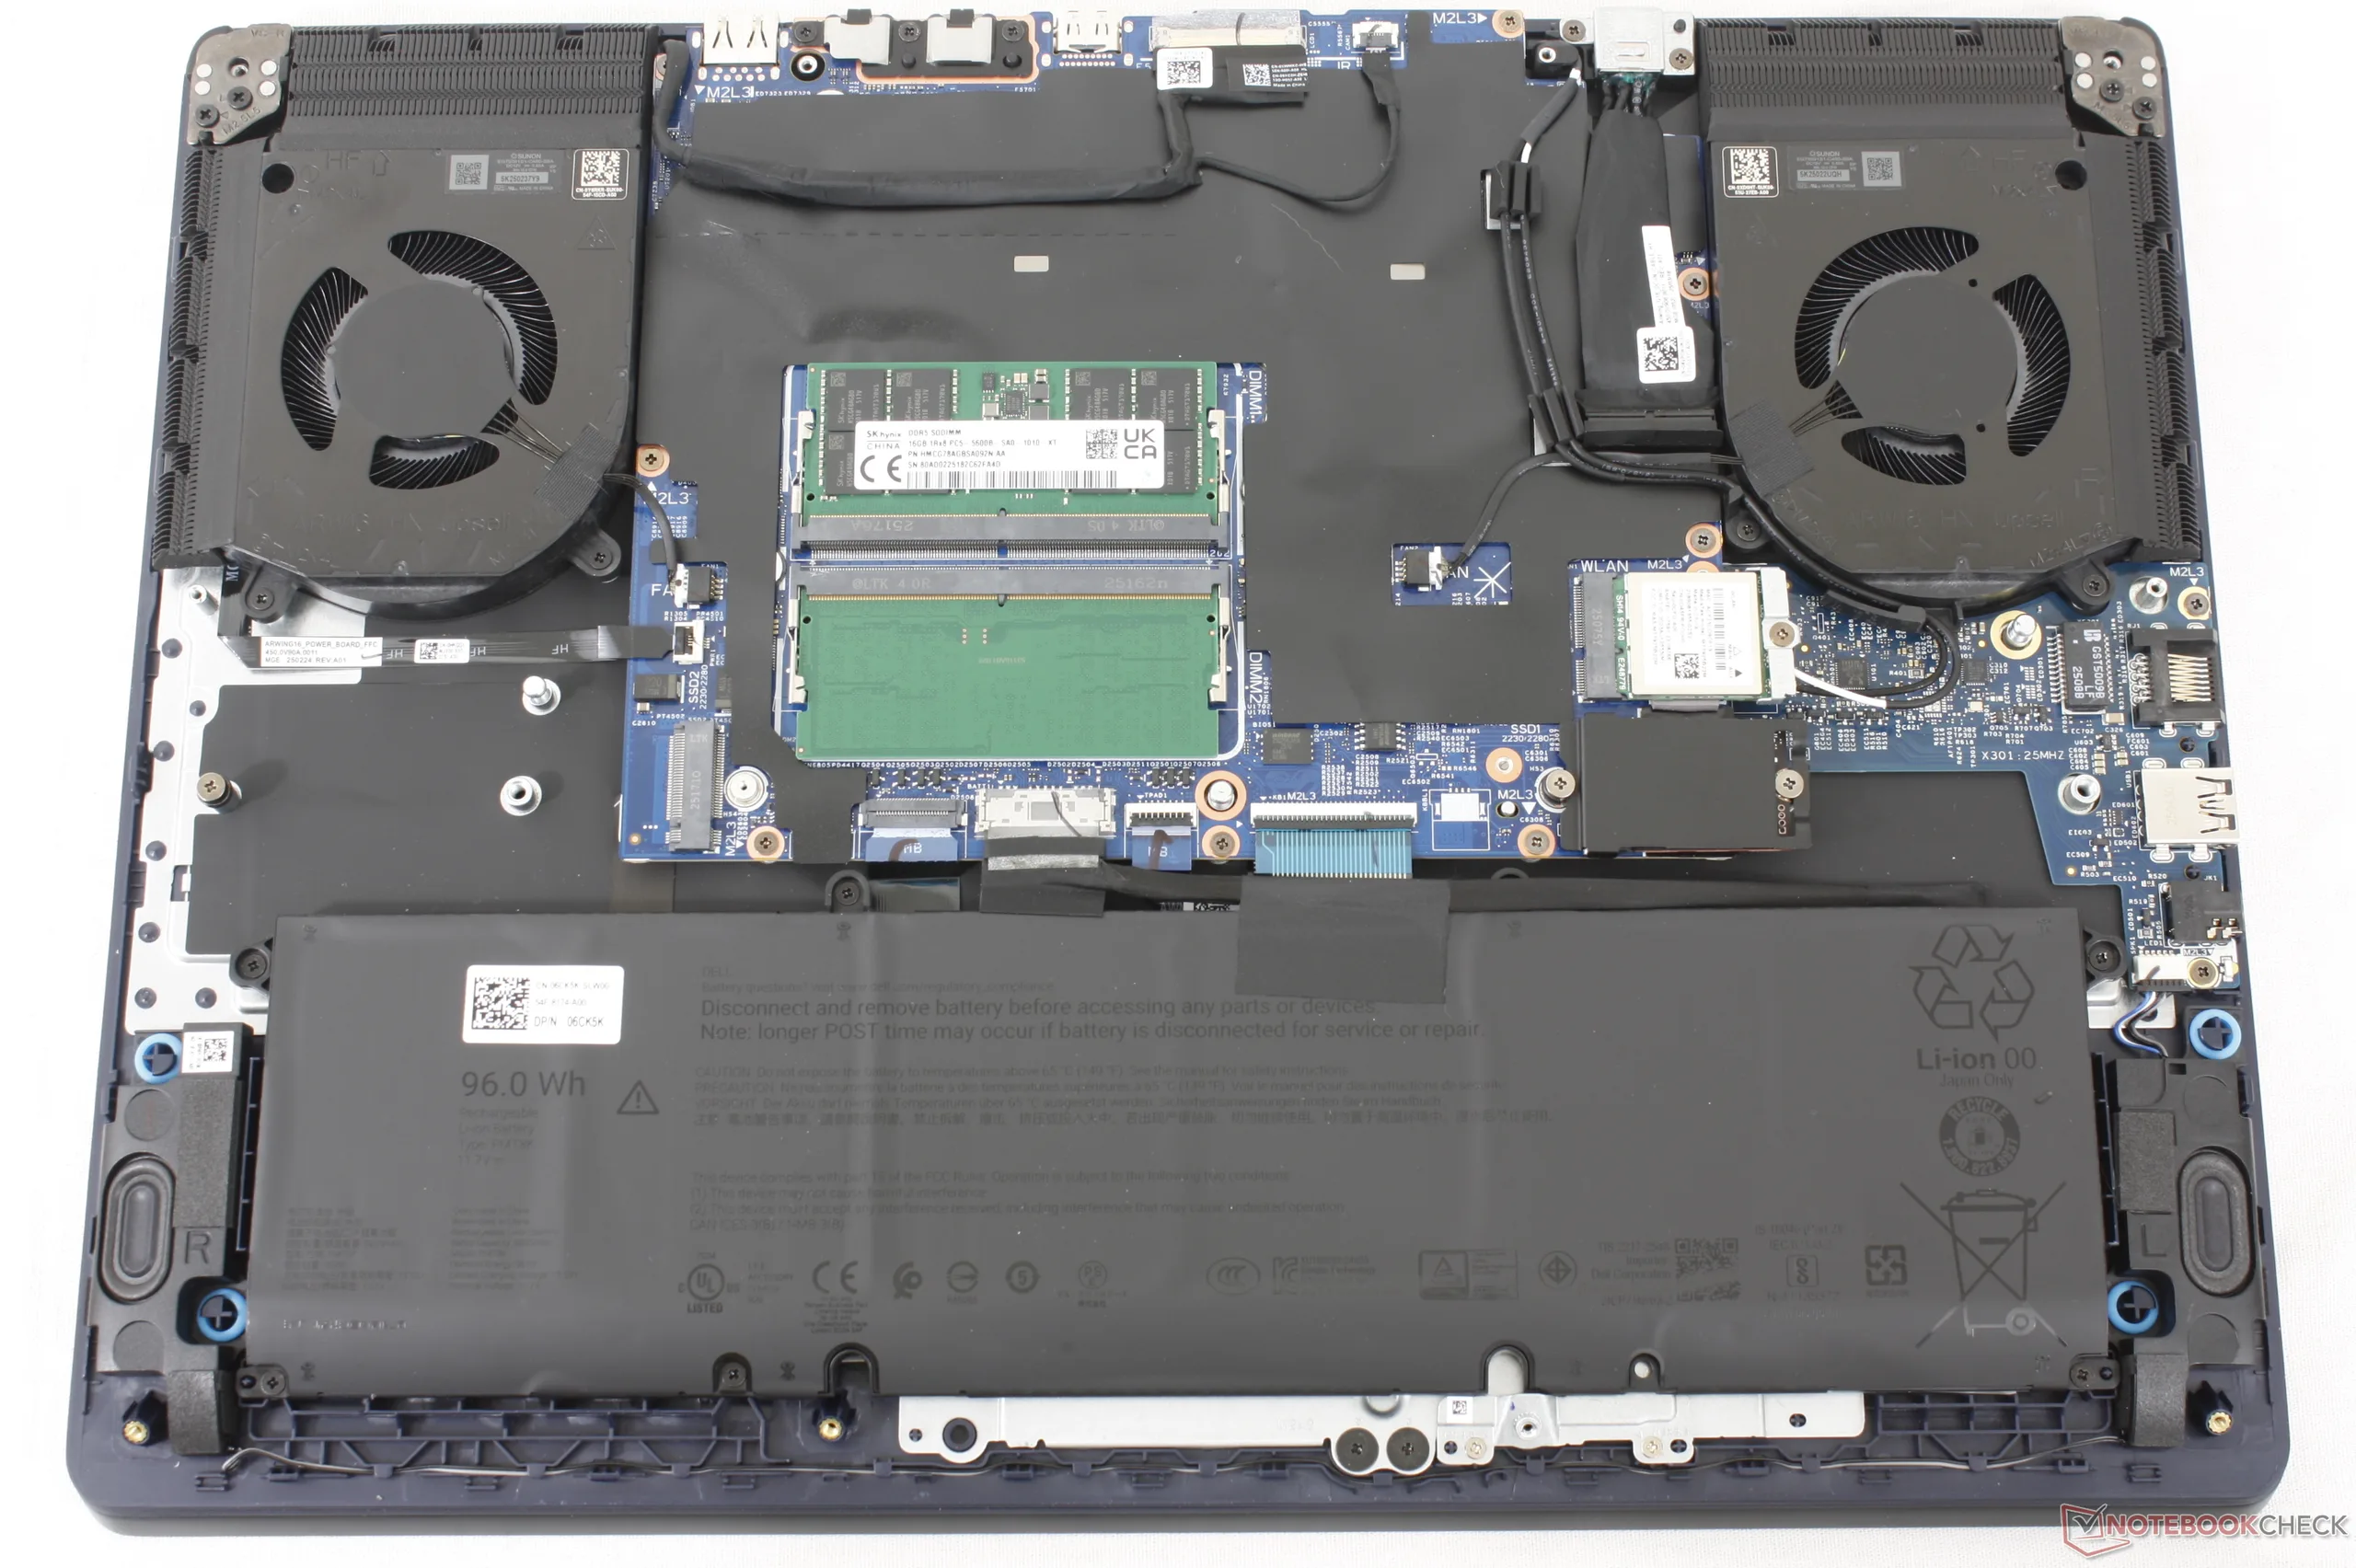
Maintenance
Périphériques d'entrée
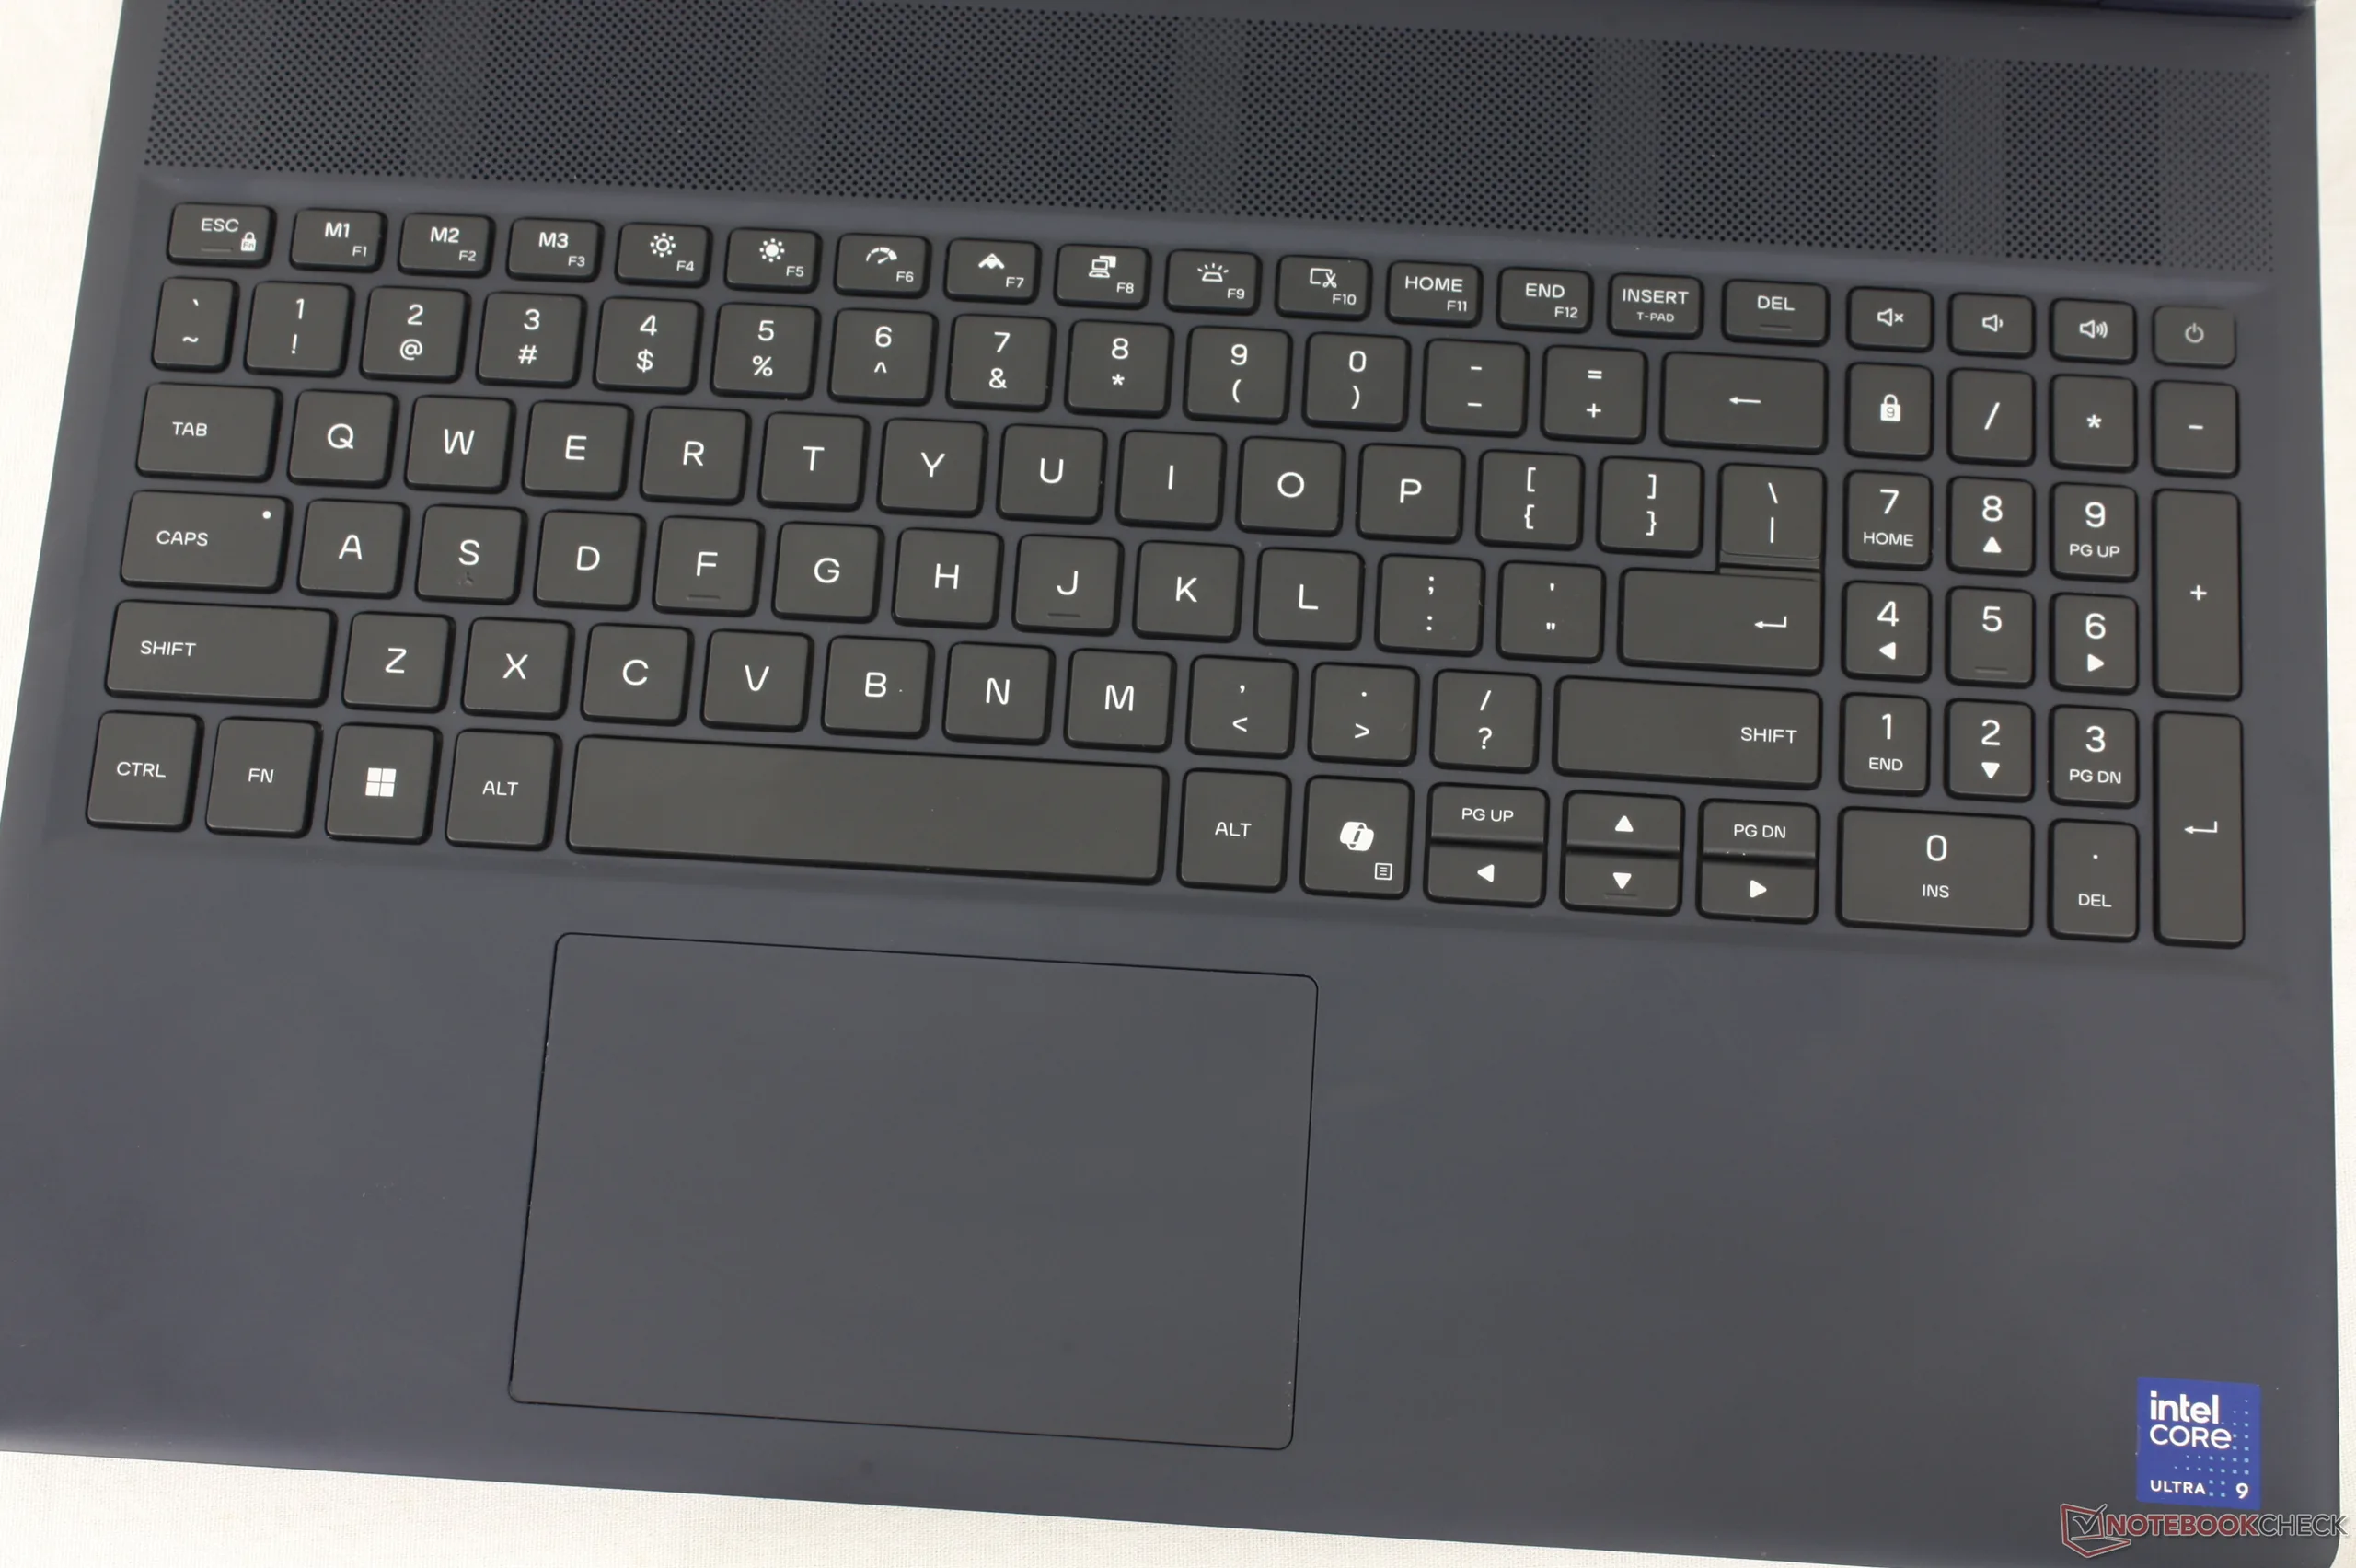
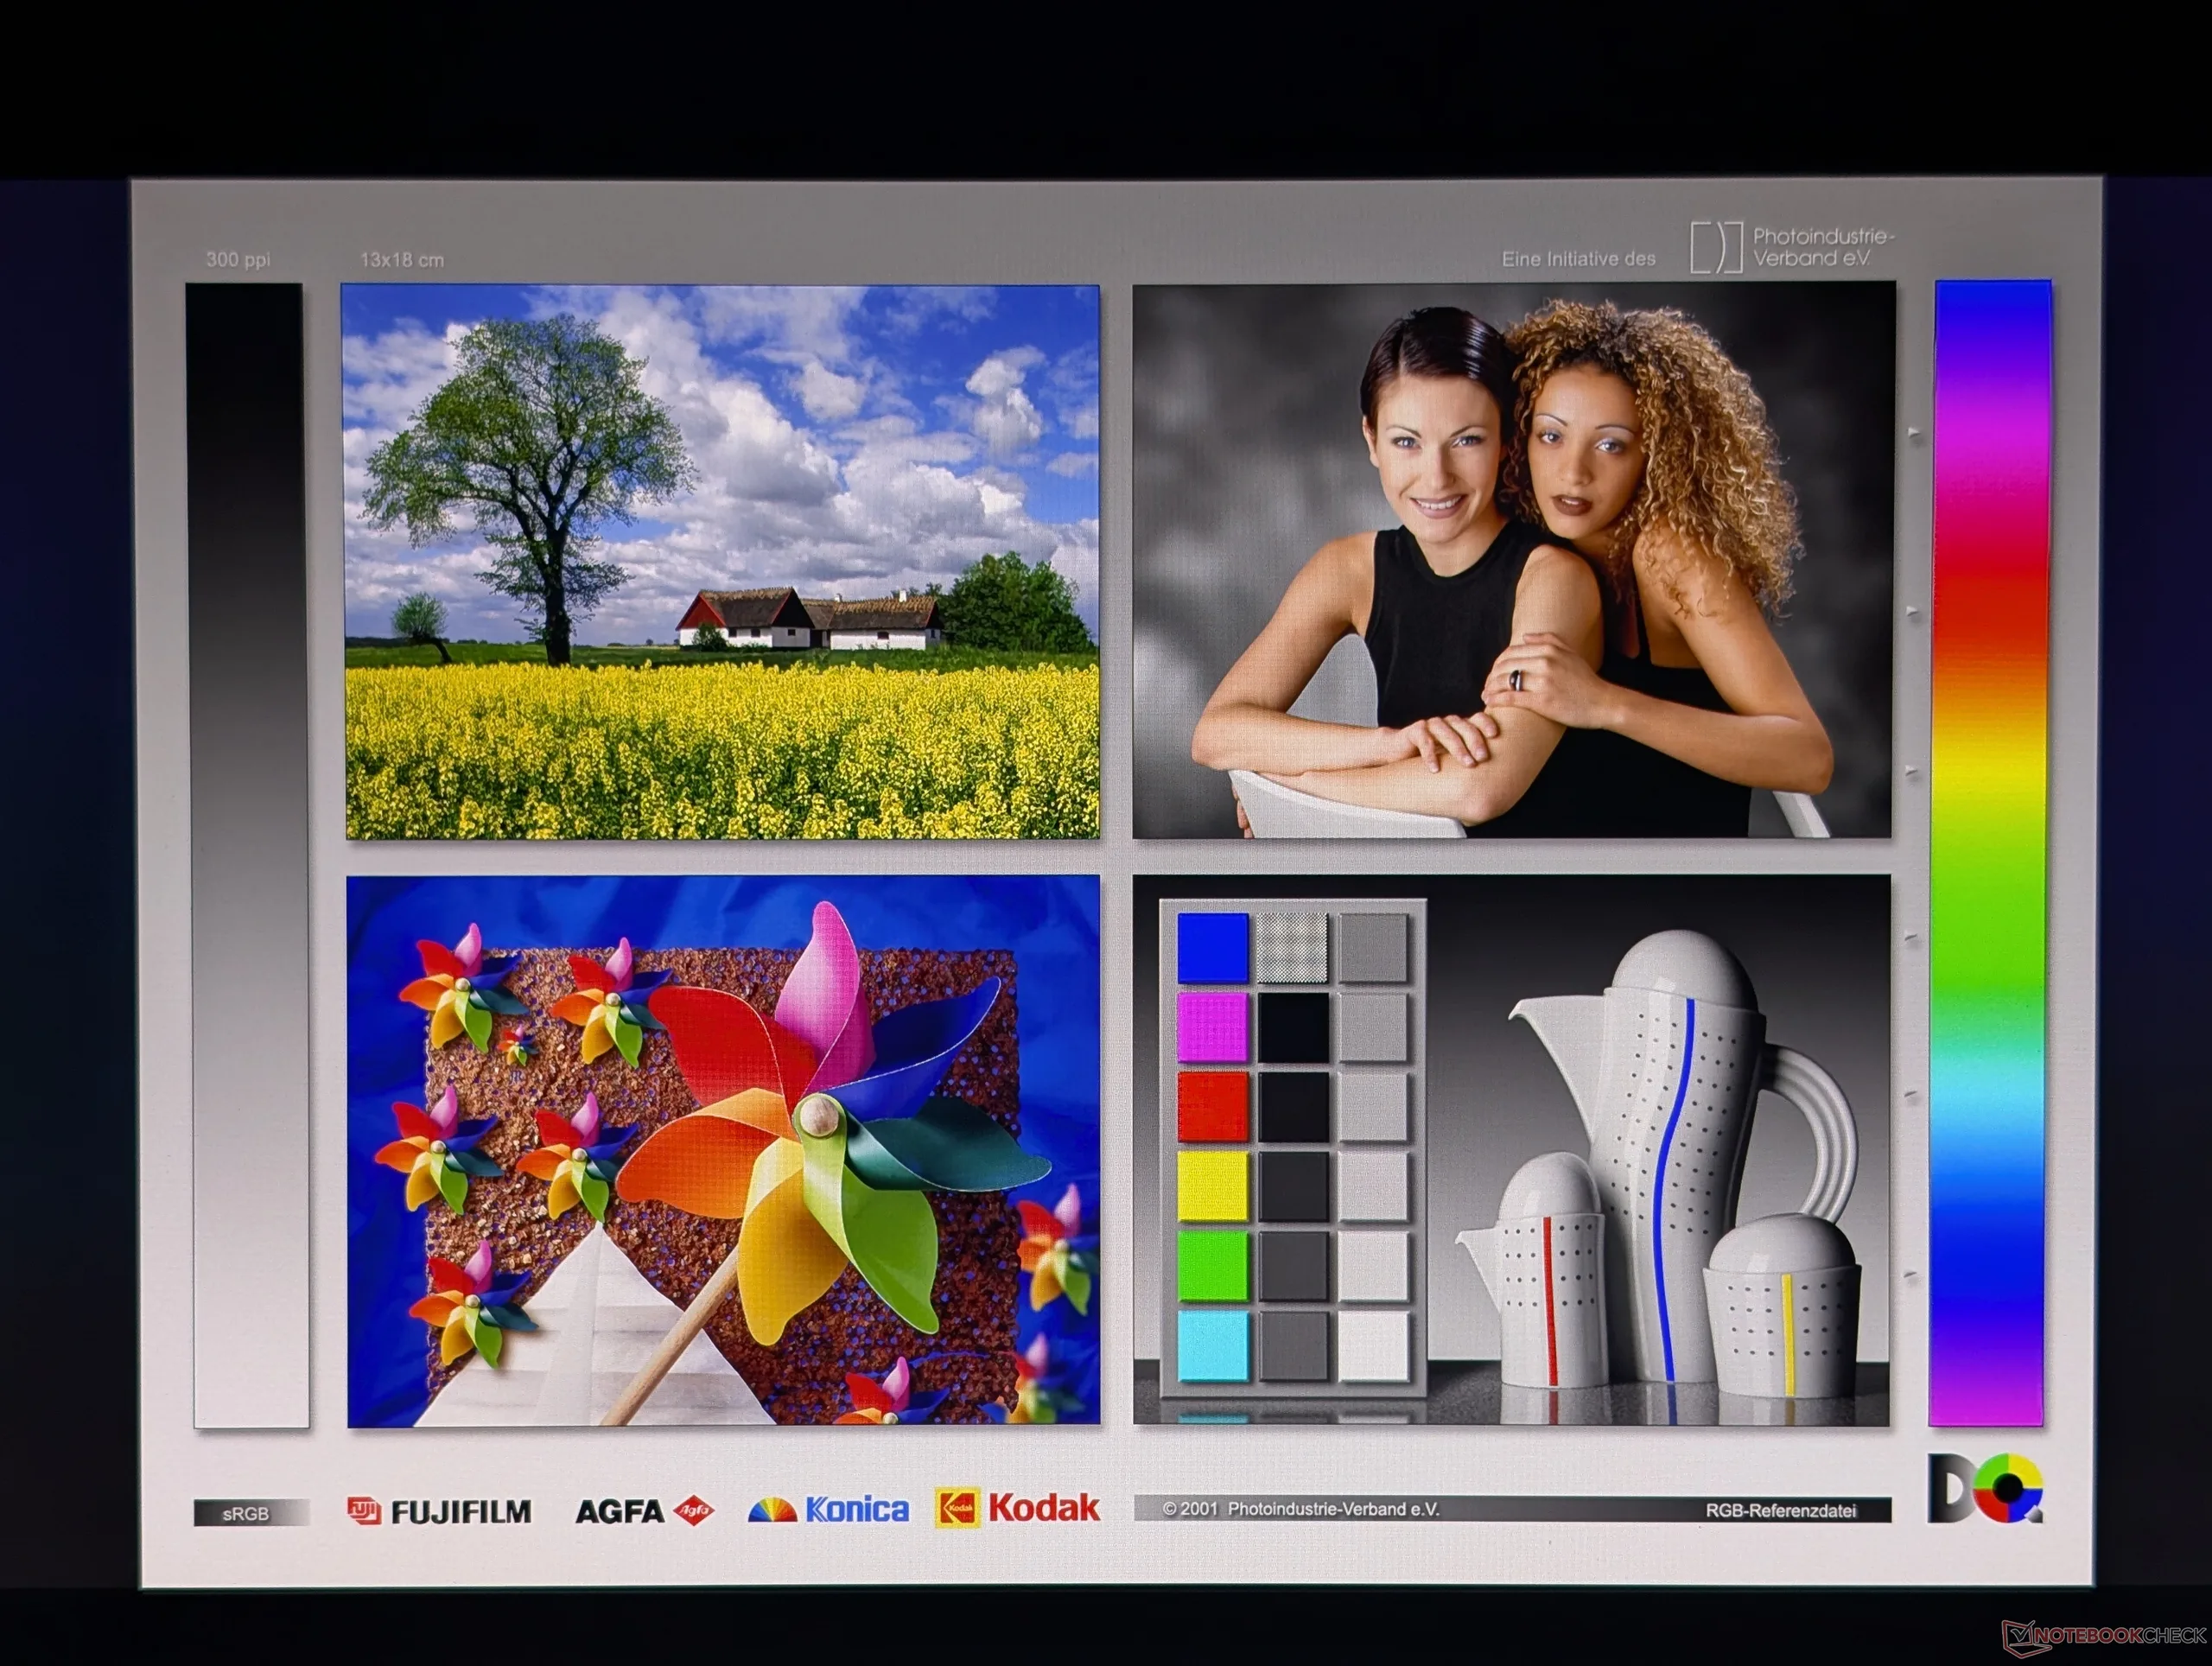
Affichage

La nouveauté de cette année pour la série Aurora 16X est le panneau OLED mat qui offre le même taux de rafraîchissement natif de 240 Hz, la même résolution de 2560 x 1600 et le même support G-Sync que l'option IPS existante, mais avec tous les avantages de l'OLED, y compris des temps de réponse plus rapides, des niveaux de noir plus profonds et un support HDR adéquat.
L'inconvénient notable de la dalle OLED est qu'elle est moins lumineuse que la dalle IPS d'environ 100 nits en mode SDR, comme le montre notre tableau comparatif ci-dessous. La luminosité maximale atteint 390 nits en mode SDR et jusqu'à 621 nits en mode HDR, ce qui correspond aux 620 nits annoncés par le fabricant.
Malheureusement, la dalle OLED mate présente toujours un niveau de grain similaire à celui que nous avions constaté sur la dalle IPS de l'année dernière. Bien qu'elle ne soit pas particulièrement gênante, elle n'est certainement pas aussi nette que la dalle OLED brillante du nouveau XPS 16.
| |||||||||||||||||||||||||
Homogénéité de la luminosité: 98 %
Valeur mesurée au centre, sur batterie: 380.5 cd/m²
Contraste: ∞:1 (Valeurs des noirs: 0 cd/m²)
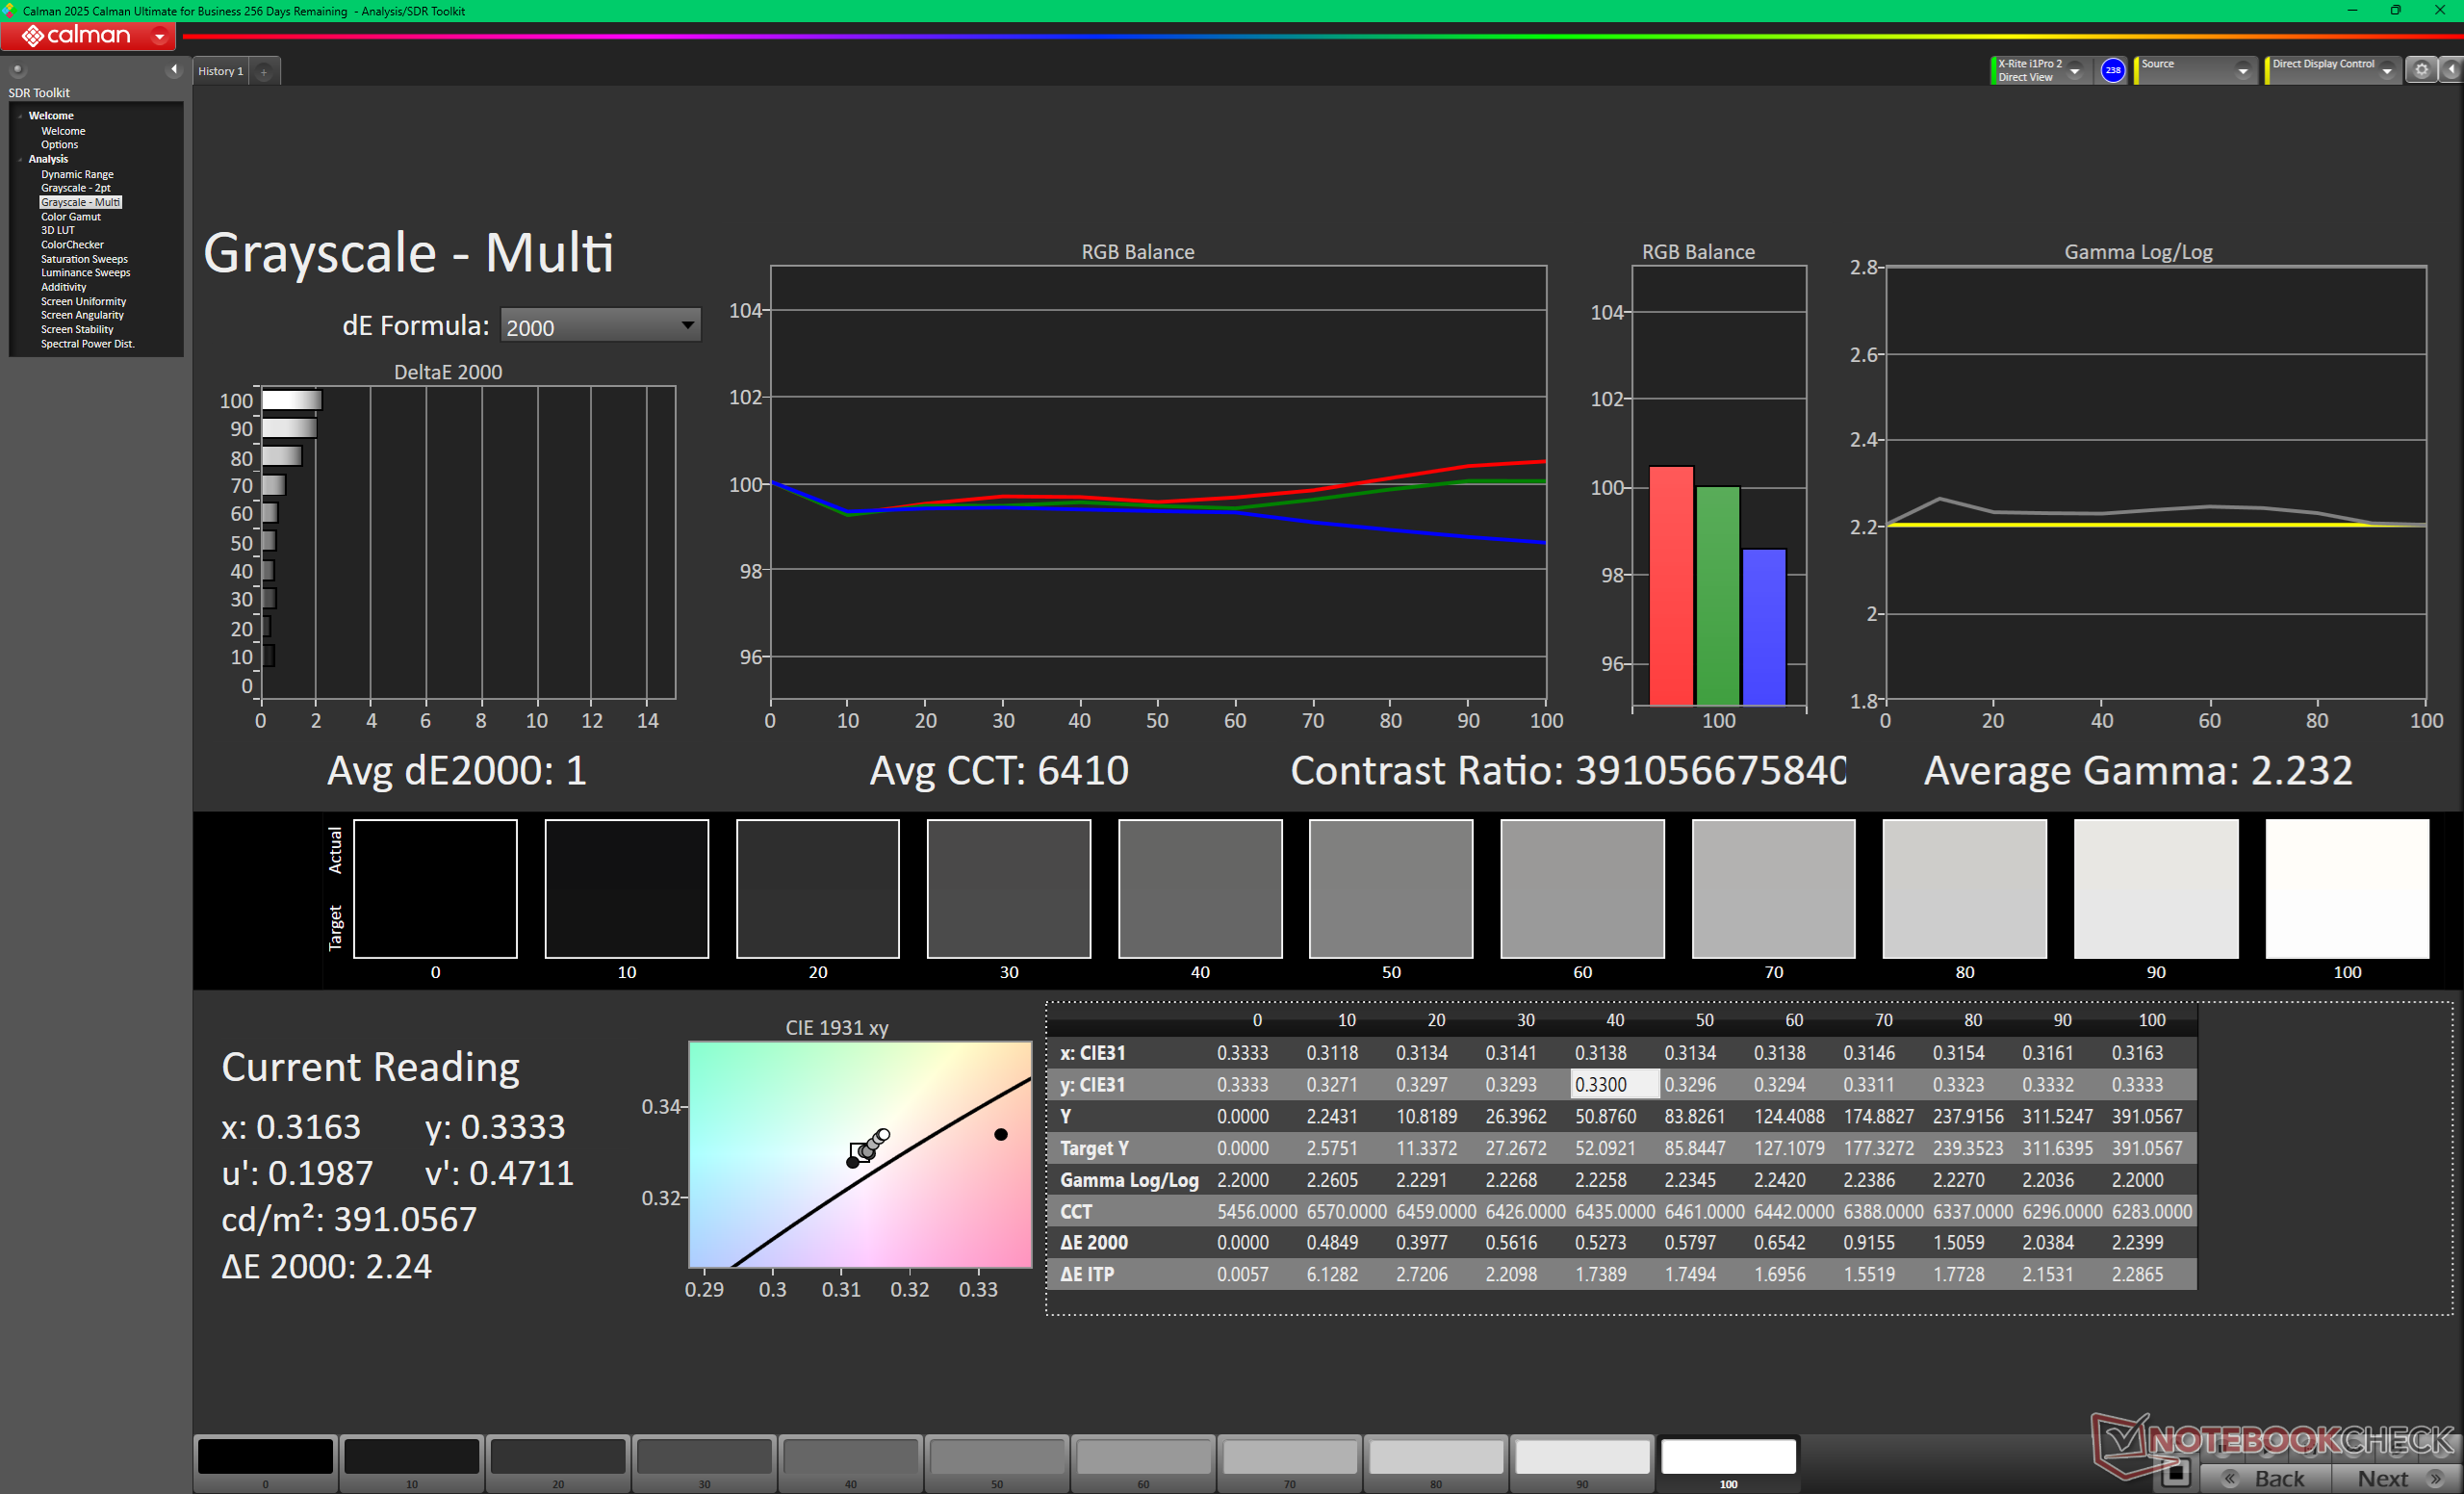
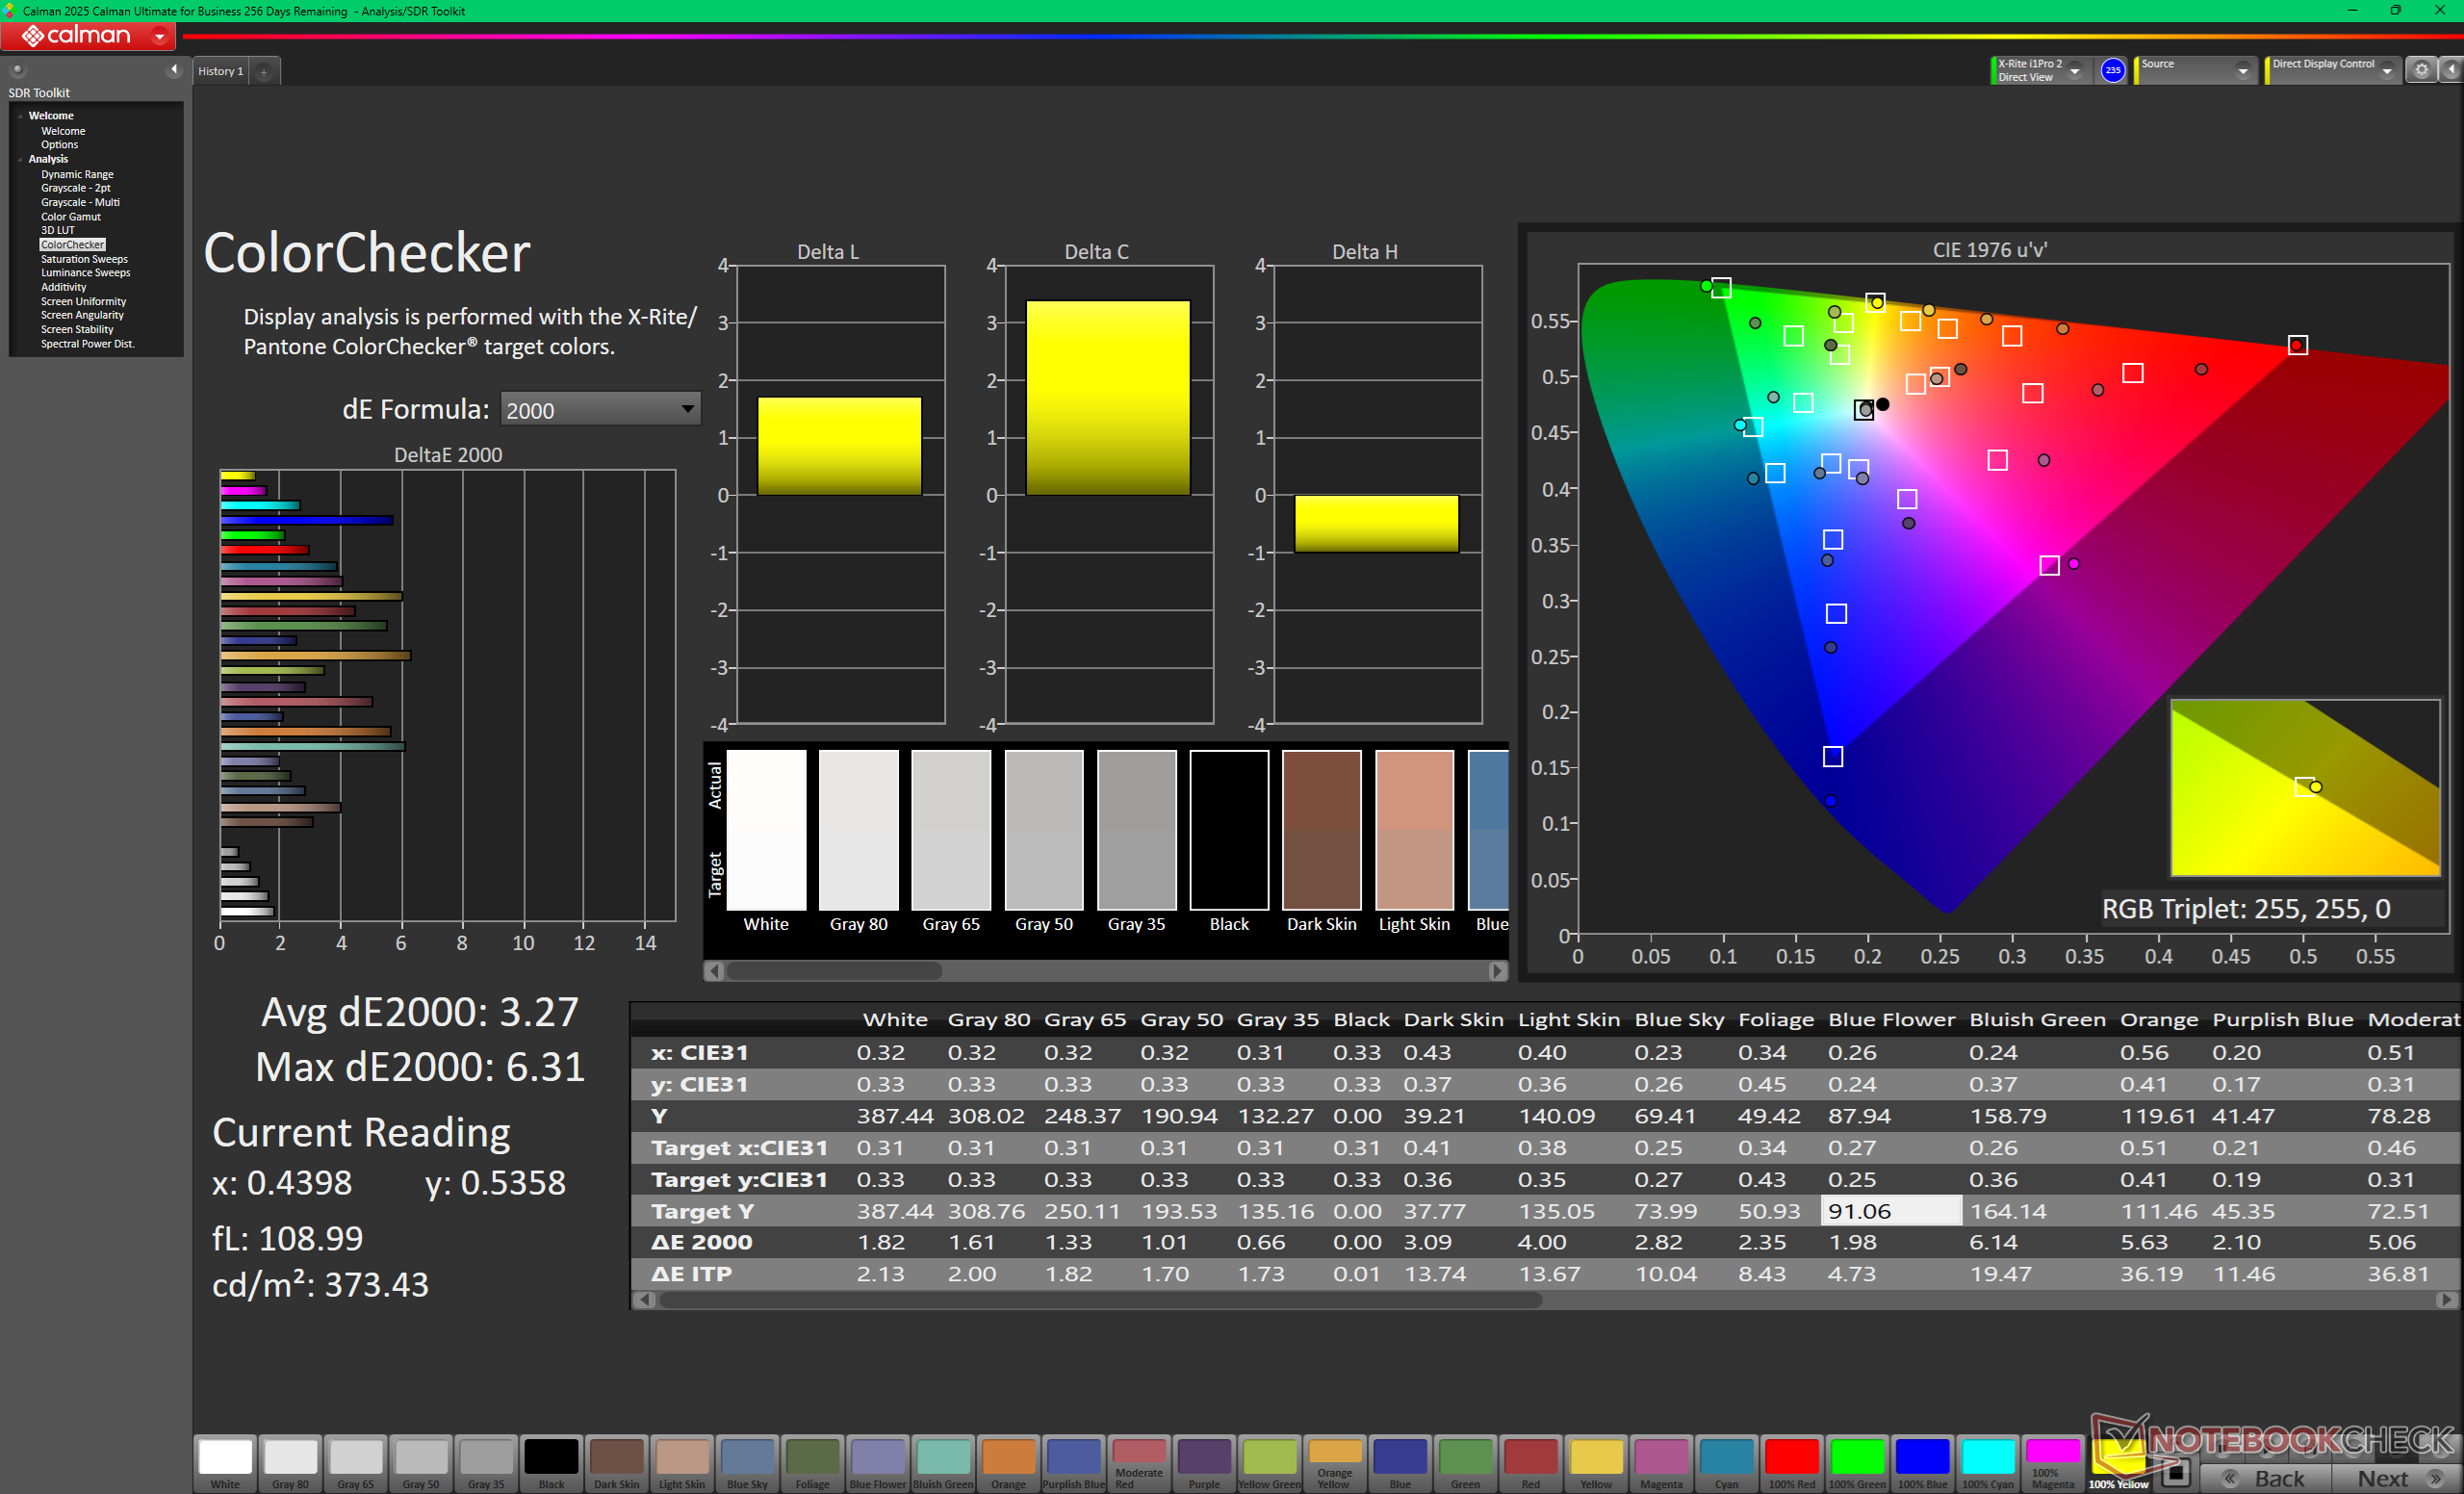
ΔE ColorChecker Calman: 3.27 | ∀{0.5-29.43 Ø4.74}
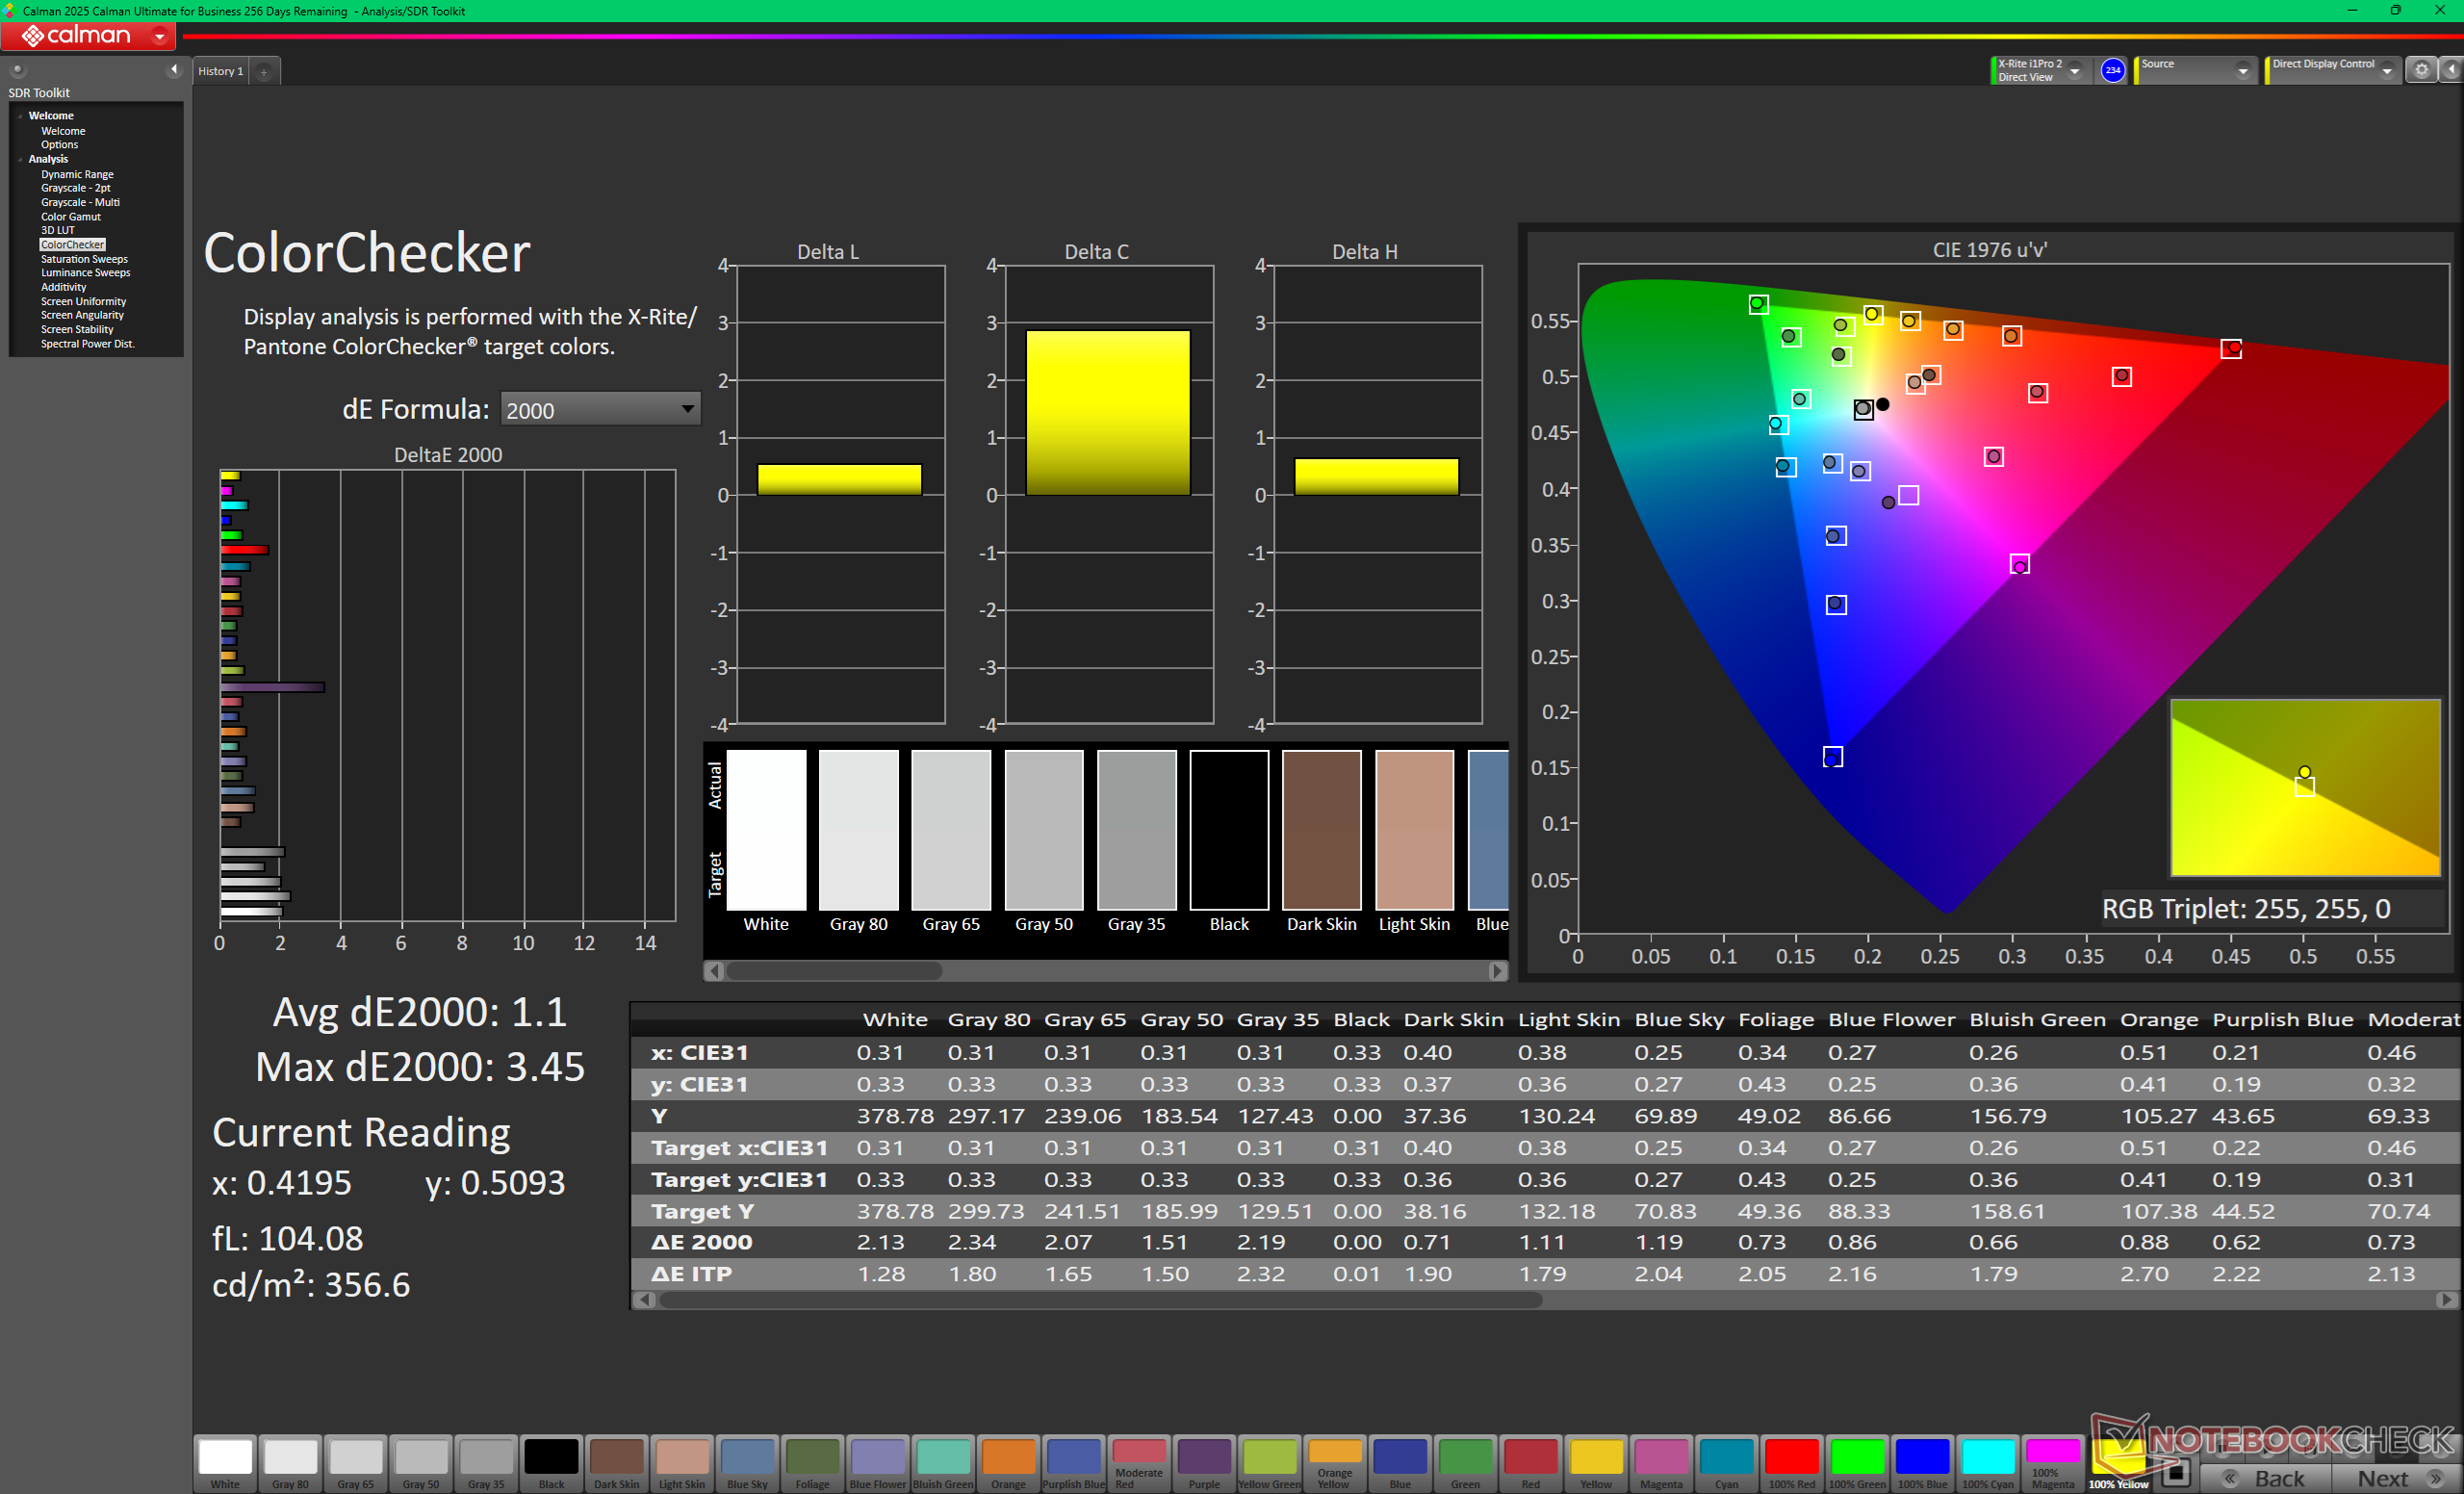
calibrated: 1.1
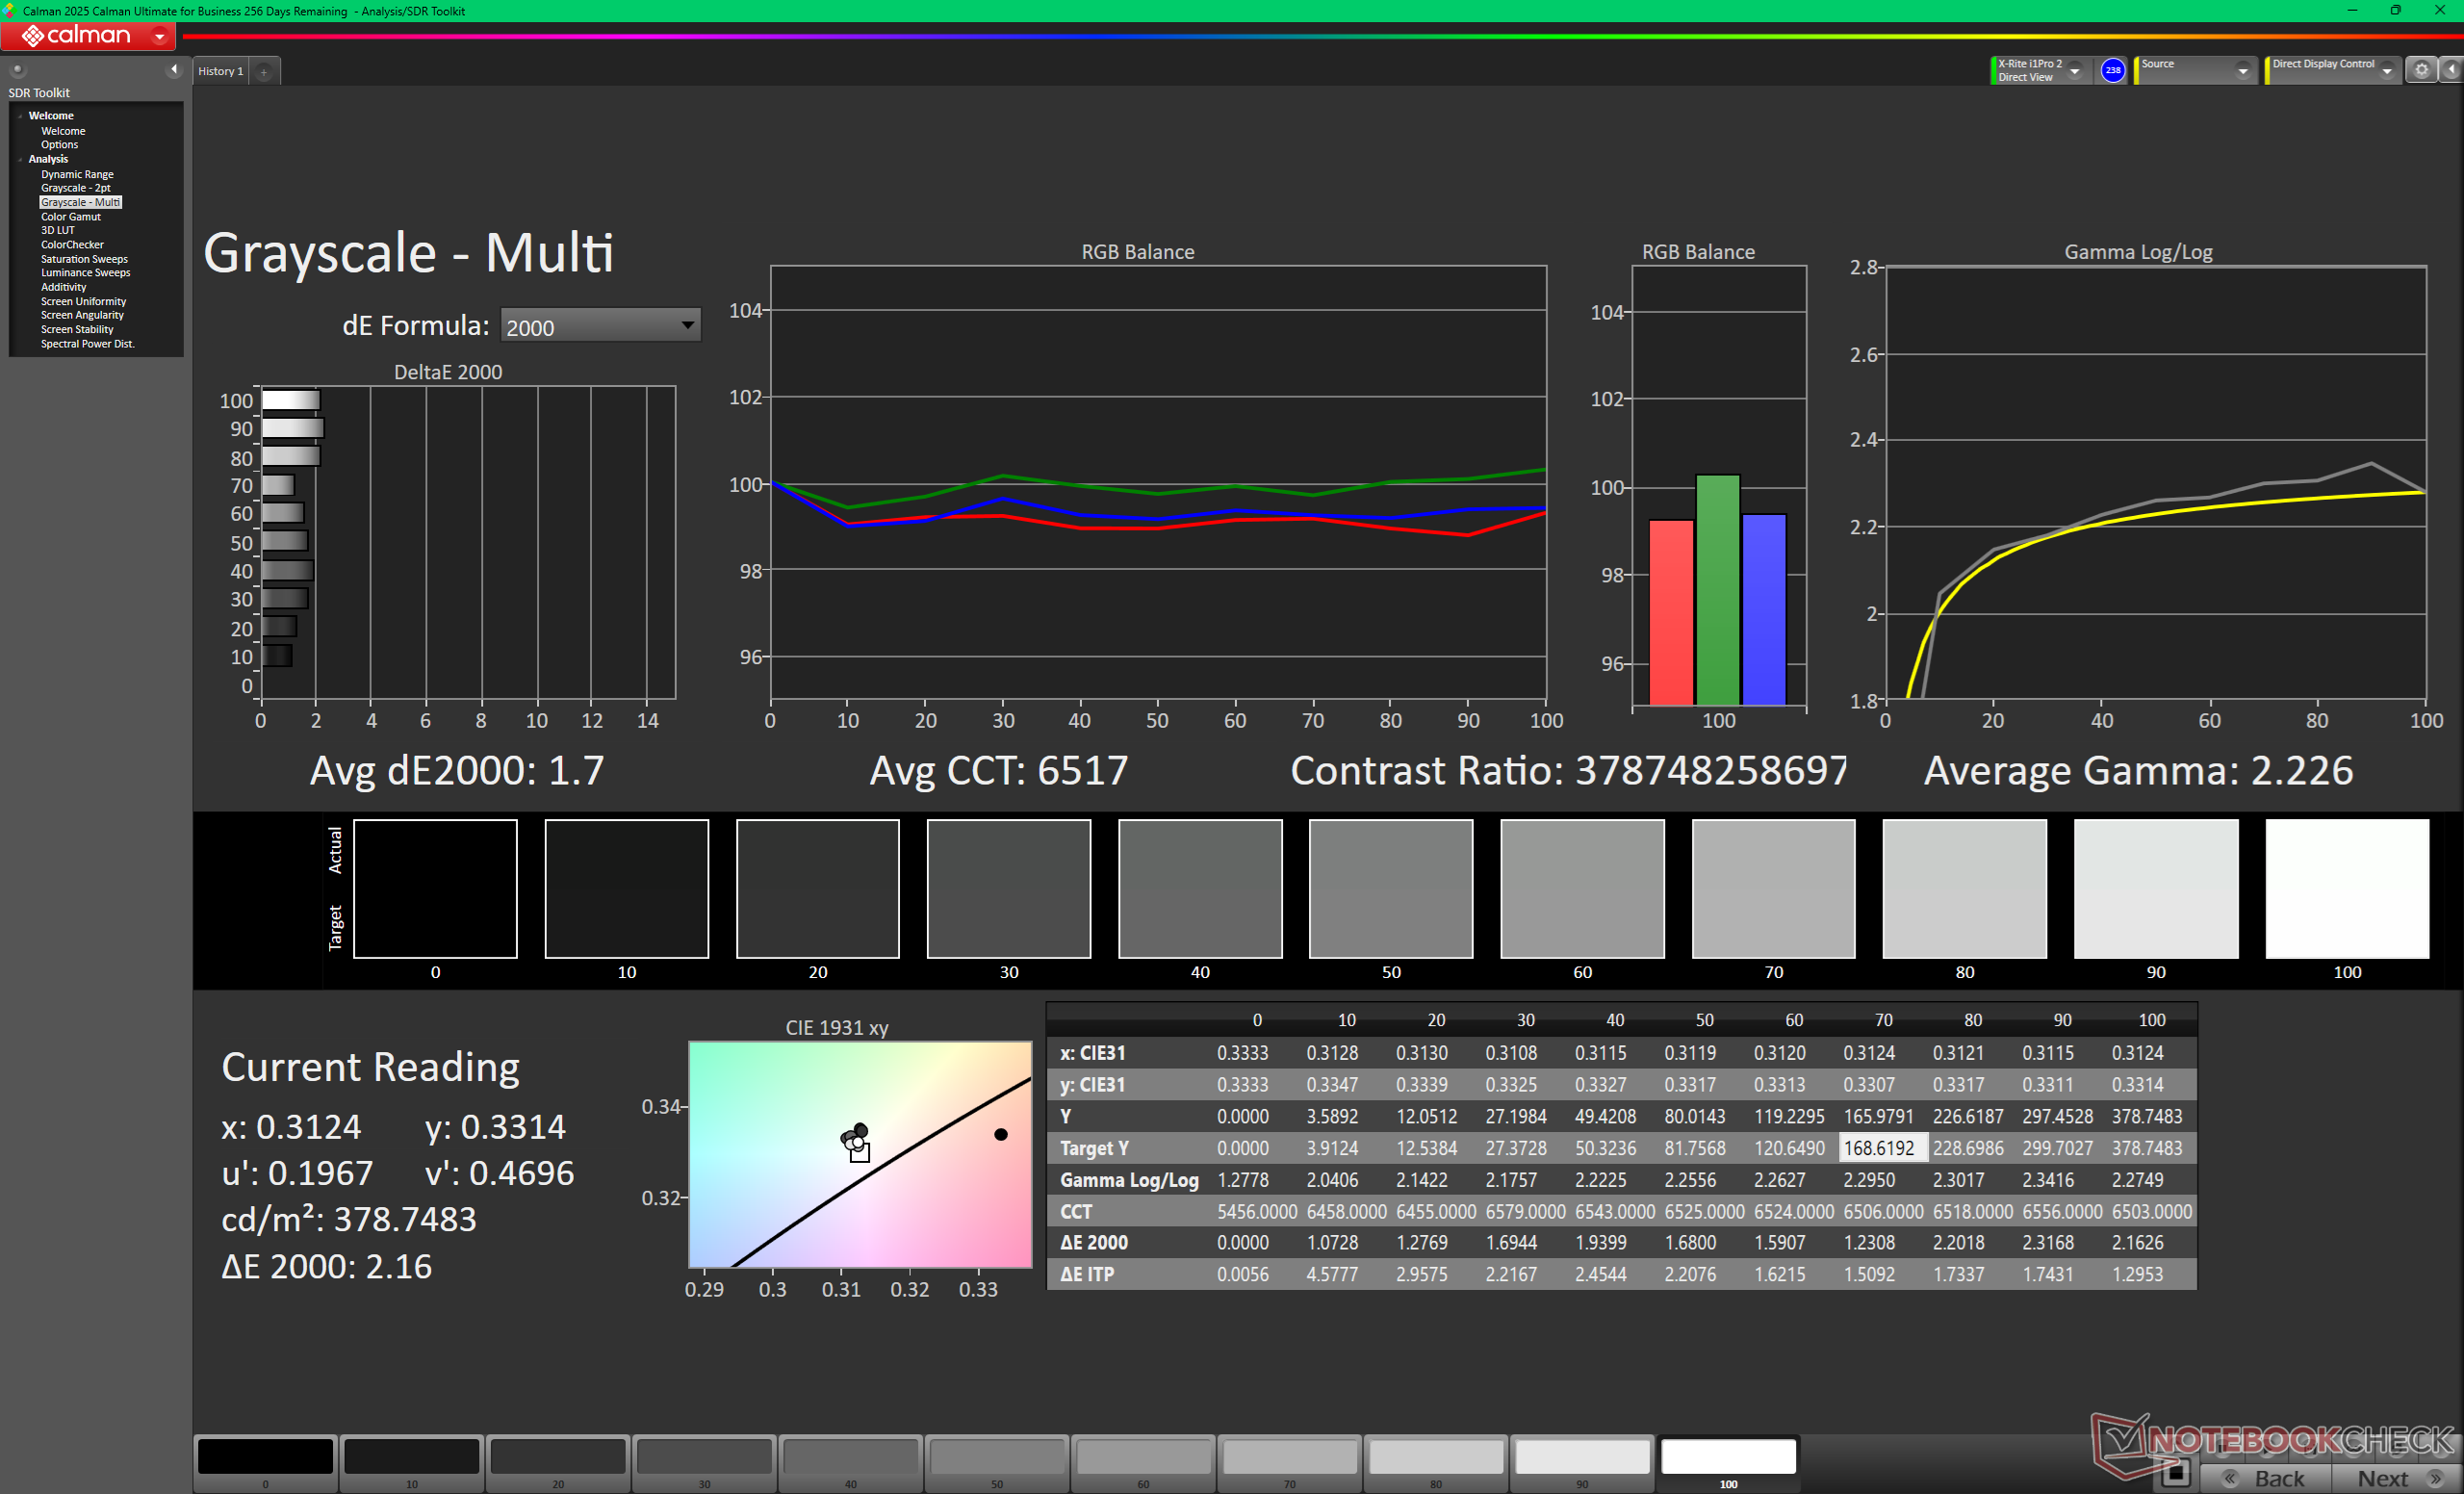
ΔE Greyscale Calman: 1 | ∀{0.09-98 Ø4.98}
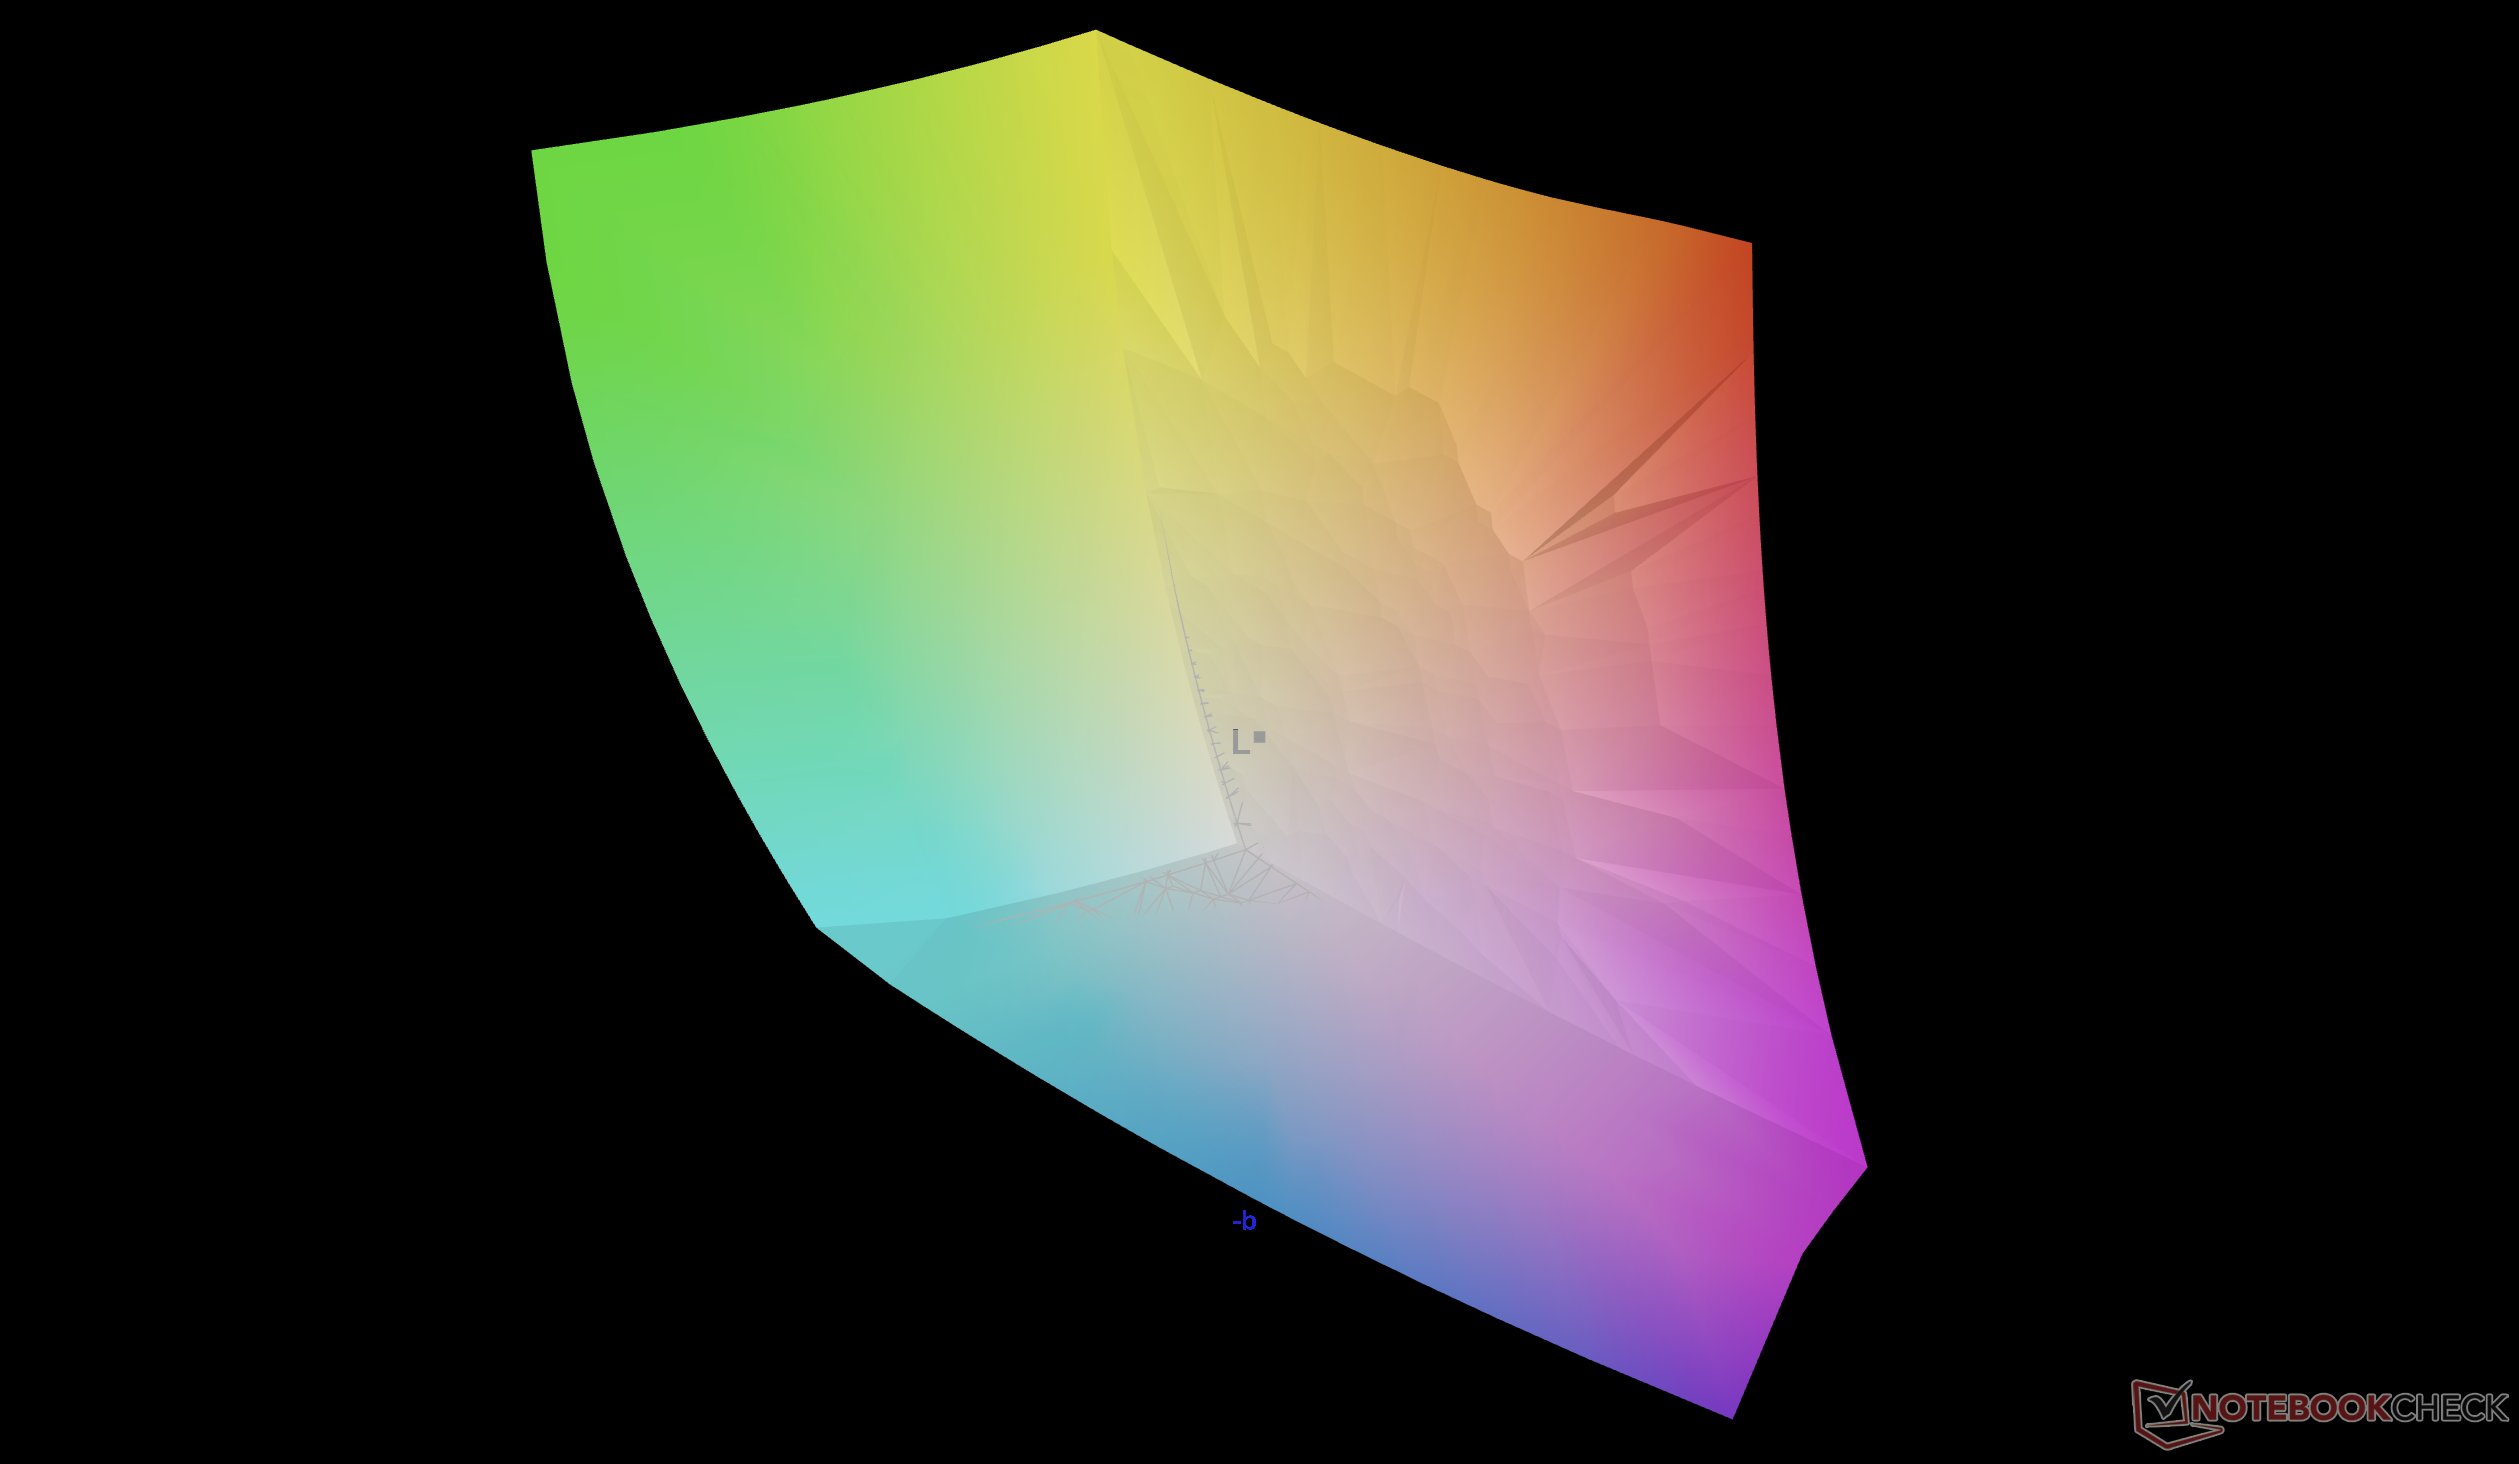
93.9% AdobeRGB 1998 (Argyll 3D)
100% sRGB (Argyll 3D)
99.6% Display P3 (Argyll 3D)
Gamma: 2.23
CCT: 6410 K
| Alienware 16X Aurora Core Ultra 9 290HX Plus Samsung 160HU05, OLED, 2560x1600, 16", 240 Hz | Alienware 16X Aurora, RTX 5070 LG Philips 160WQG, IPS, 2560x1600, 16", 240 Hz | Acer Predator Helios Neo 16S AI PHN16S-71-94L9 Samsung ATNA60DL03-0, OLED, 2560x1600, 16", 240 Hz | Lenovo Legion Pro 5 16IAX10, RTX 5070 ATNA60HS01-0 (Samsung SDC420A), OLED, 2650x1600, 16", 165 Hz | MSI Vector 16 HX AI A2XWHG B160QAN02.3 (AUO7DB2), IPS, 2560x1600, 16", 240 Hz | Asus ROG Zephyrus G16 GU605CW Samsung ATNA60DL01-0, OLED, 2560x1600, 16", 240 Hz | |
|---|---|---|---|---|---|---|
| Display | -2% | 1% | 0% | -4% | -1% | |
| Display P3 Coverage (%) | 99.6 | 96.9 -3% | 99.9 0% | 99.3 0% | 96.6 -3% | 96.5 -3% |
| sRGB Coverage (%) | 100 | 99.8 0% | 100 0% | 100 0% | 99.8 0% | 99.2 -1% |
| AdobeRGB 1998 Coverage (%) | 93.9 | 89.7 -4% | 96.5 3% | 93.9 0% | 84.4 -10% | 94.5 1% |
| Response Times | -1608% | 1% | -253% | -1308% | -404% | |
| Response Time Grey 50% / Grey 80% * (ms) | 0.29 ? | 4.3 ? -1383% | 0.2 ? 31% | 2 ? -590% | 4.3 ? -1383% | 0.32 ? -10% |
| Response Time Black / White * (ms) | 0.45 ? | 8.7 ? -1833% | 0.25 ? 44% | 1.4 ? -211% | 6 ? -1233% | 6 ? -1233% |
| PWM Frequency (Hz) | 1439.8 ? | 960 | 1300 | 960 | ||
| PWM Amplitude * (%) | 29 | 50 -72% | 16.7 42% | 20 31% | ||
| Screen | -29% | 5% | -32% | -33% | -14% | |
| Brightness middle (cd/m²) | 380.5 | 493.2 30% | 390 2% | 521 37% | 473 24% | 394 4% |
| Brightness (cd/m²) | 384 | 477 24% | 394 3% | 519 35% | 426 11% | 398 4% |
| Brightness Distribution (%) | 98 | 93 -5% | 98 0% | 98 0% | 85 -13% | 98 0% |
| Black Level * (cd/m²) | 0.5 | 0.04 | 0.075 | 0.42 | 0.0084 | |
| Colorchecker dE 2000 * | 3.27 | 3.57 -9% | 1.61 51% | 2.5 24% | 3.47 -6% | 2.41 26% |
| Colorchecker dE 2000 max. * | 6.31 | 7.03 -11% | 3.49 45% | 4.85 23% | 7.24 -15% | 3.82 39% |
| Colorchecker dE 2000 calibrated * | 1.1 | 0.68 38% | 1.59 -45% | 2.5 -127% | 1.36 -24% | 1.41 -28% |
| Greyscale dE 2000 * | 1 | 3.7 -270% | 1.2 -20% | 3.17 -217% | 3.1 -210% | 2.4 -140% |
| Gamma | 2.23 99% | 2.16 102% | 2.235 98% | 2.35 94% | 2.486 88% | 2.16 102% |
| CCT | 6410 101% | 5876 111% | 6580 99% | 6454 101% | 6832 95% | 6544 99% |
| Contrast (:1) | 986 | 9750 | 6947 | 1126 | 46905 | |
| Moyenne finale (programmes/paramètres) | -546% /
-286% | 2% /
3% | -95% /
-76% | -448% /
-239% | -140% /
-101% |
* ... Moindre est la valeur, meilleures sont les performances


Temps de réponse de l'écran
| ↔ Temps de réponse noir à blanc | ||
|---|---|---|
| 0.45 ms ... hausse ↗ et chute ↘ combinées | ↗ 0.23 ms hausse | 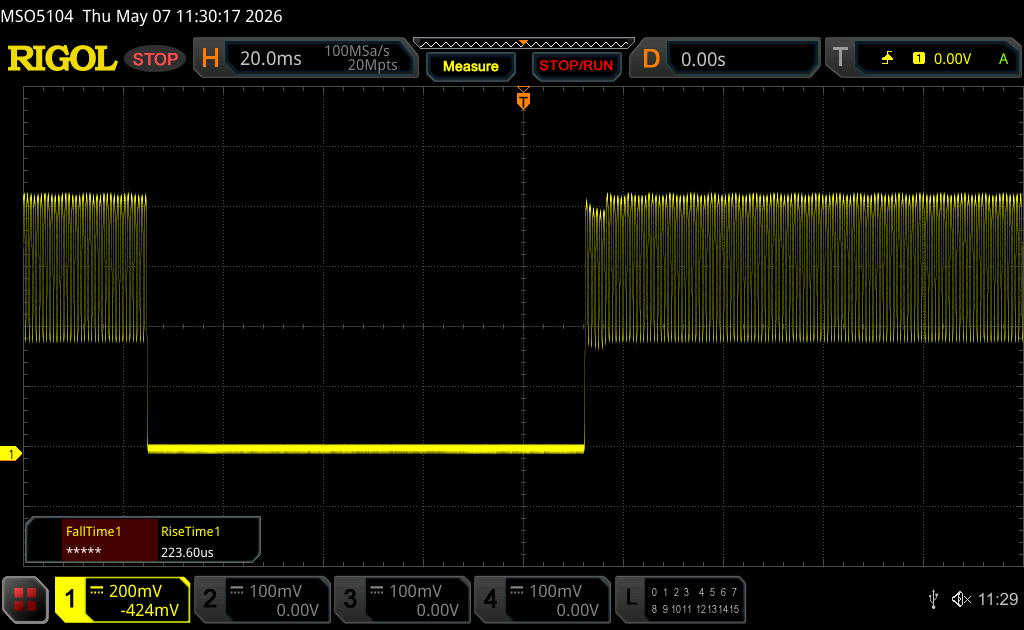 |
| ↘ 0.22 ms chute | ||
| L'écran montre de très faibles temps de réponse, parfait pour le jeu. En comparaison, tous les appareils testés affichent entre 0.1 (minimum) et 240 (maximum) ms. » 1 % des appareils testés affichent de meilleures performances. Cela signifie que les latences relevées sont meilleures que la moyenne (19.9 ms) de tous les appareils testés. | ||
| ↔ Temps de réponse gris 50% à gris 80% | ||
| 0.29 ms ... hausse ↗ et chute ↘ combinées | ↗ 0.15 ms hausse | 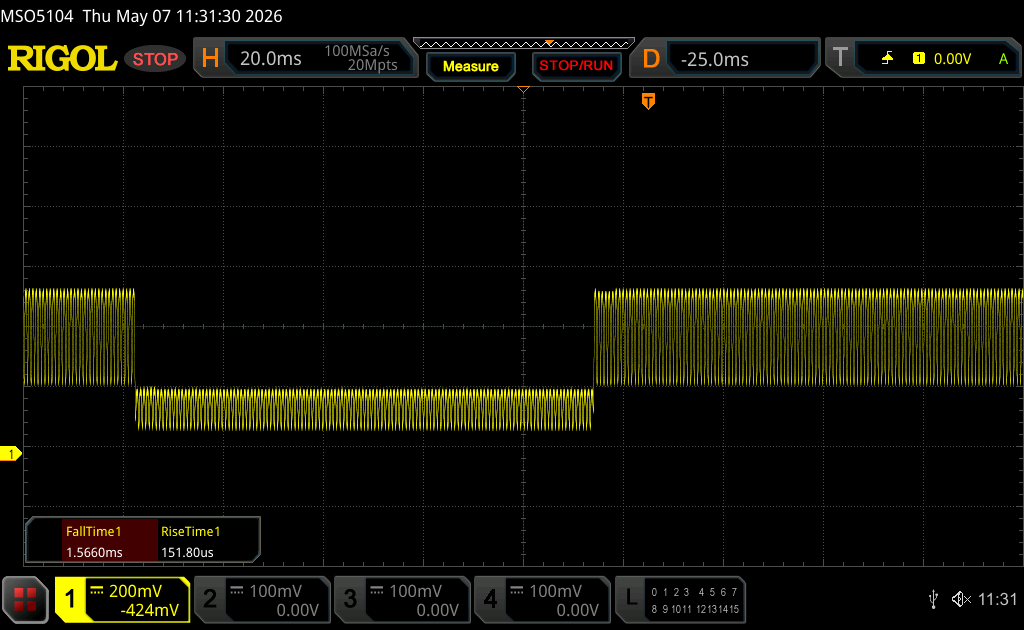 |
| ↘ 0.14 ms chute | ||
| L'écran montre de très faibles temps de réponse, parfait pour le jeu. En comparaison, tous les appareils testés affichent entre 0.165 (minimum) et 636 (maximum) ms. » 0 % des appareils testés affichent de meilleures performances. Cela signifie que les latences relevées sont meilleures que la moyenne (31.2 ms) de tous les appareils testés. | ||
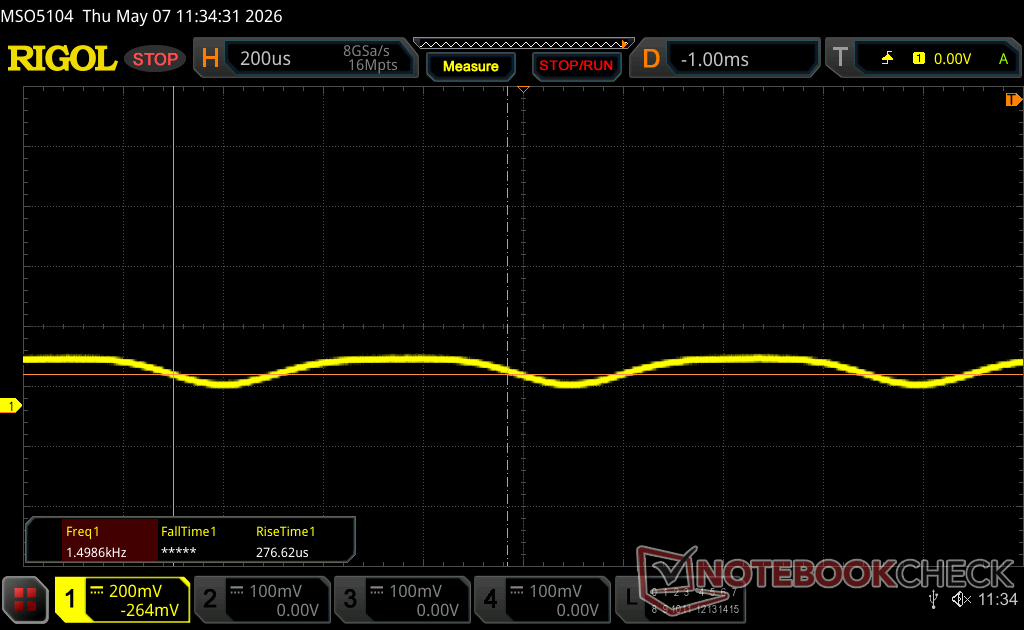
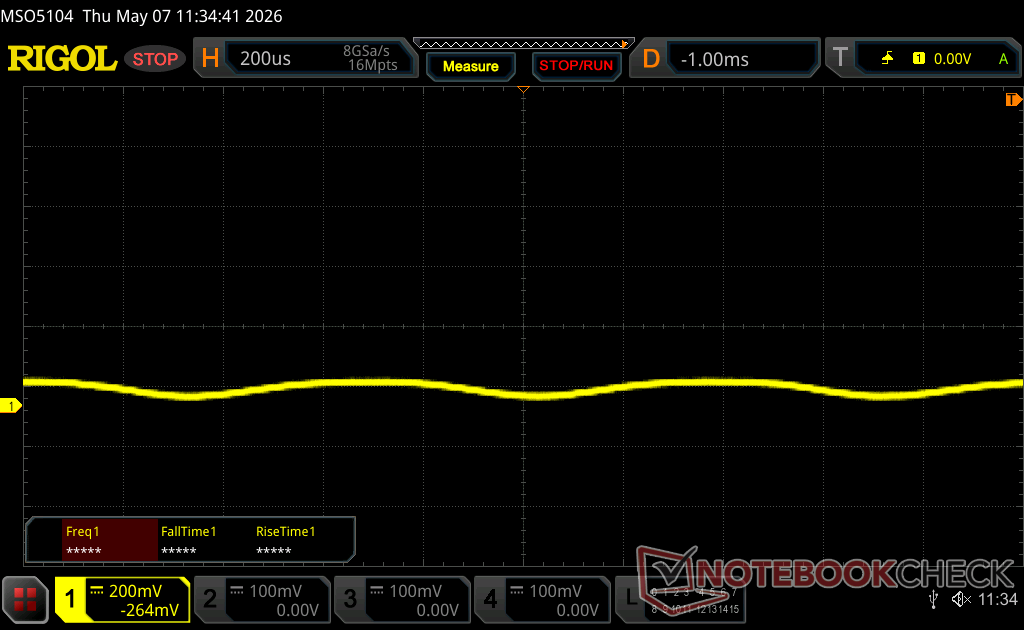
Scintillement / MLI (Modulation de largeur d'impulsion)
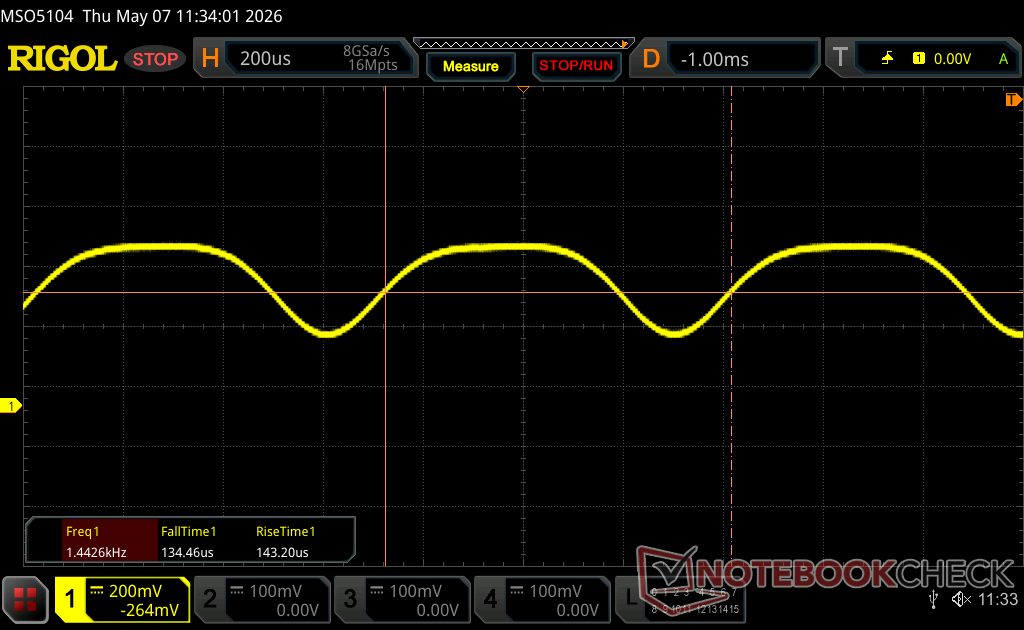
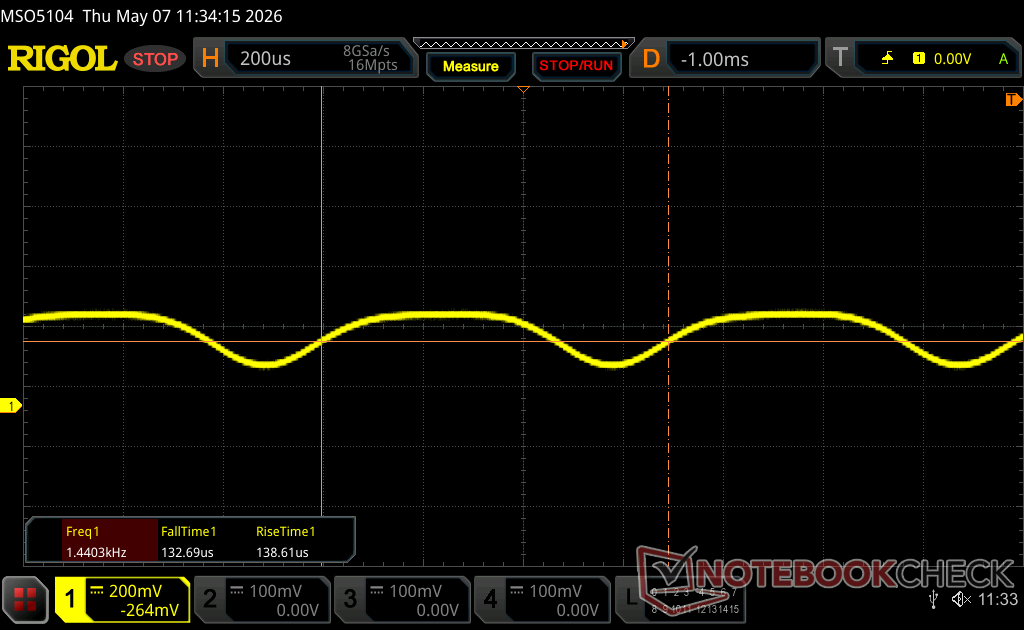
| Scintillement / MLI (Modulation de largeur d'impulsion) décelé | 1439.8 Hz Amplitude: 29 % | ≤ 100 Niveau de luminosité | 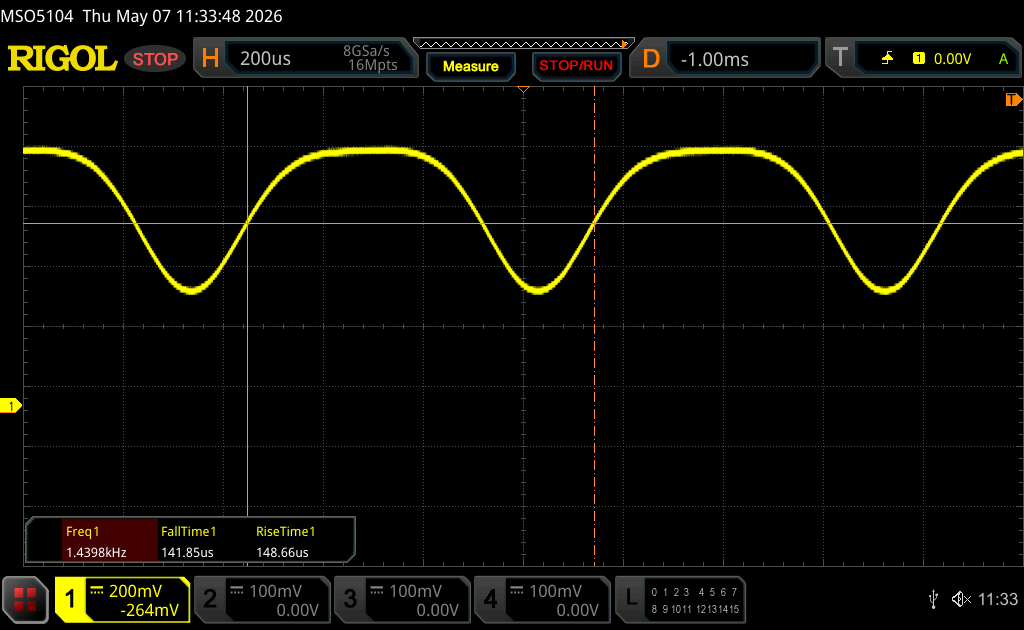 |
Le rétroéclairage de l'écran scintille à la fréquence de 1439.8 Hz (certainement du fait de l'utilisation d'une MDI - Modulation de largeur d'impulsion) à un niveau de luminosité inférieur ou égal à 100 % . Aucun scintillement ne devrait être perceptible au-dessus de cette valeur. La fréquence de rafraîchissement de 1439.8 Hz est élevée, la grande majorité des utilisateurs ne devrait pas percevoir de scintillements et être sujette à une fatigue oculaire accrue. En comparaison, 52 % des appareils testés n'emploient pas MDI pour assombrir leur écran. Nous avons relevé une moyenne à 7864 (minimum : 5 - maximum : 343500) Hz dans le cas où une MDI était active. | |||


Performance
Conditions d'essai
Nous avons réglé Alienware Command Center sur le mode Performance avant d'effectuer les tests ci-dessous. Un mode "Overdrive" est également disponible et permet d'augmenter la vitesse de rotation du ventilateur au maximum, mais les avantages en termes de performances par rapport au mode Performance ne sont que mineurs.
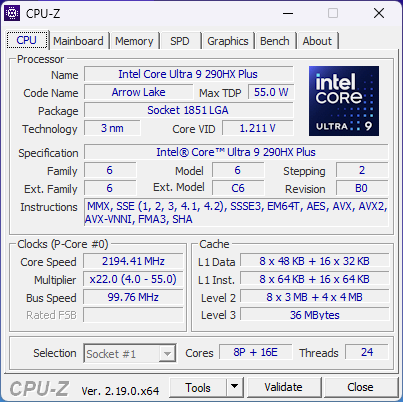
Processeur
Le Core Ultra 9 290HX Plus n'est que de 5 points de pourcentage plus rapide que le Core Ultra 9 275HX du modèle de l'année dernière. L'exécution en mode Overdrive n'améliorerait pas les résultats de manière plus significative.
Cinebench R15 Multi Loop
Cinebench R23: Multi Core | Single Core
Cinebench R20: CPU (Multi Core) | CPU (Single Core)
Cinebench R15: CPU Multi 64Bit | CPU Single 64Bit
Blender: v2.79 BMW27 CPU
7-Zip 18.03: 7z b 4 | 7z b 4 -mmt1
Geekbench 6.6: Multi-Core | Single-Core
Geekbench 5.5: Multi-Core | Single-Core
HWBOT x265 Benchmark v2.2: 4k Preset
LibreOffice : 20 Documents To PDF
R Benchmark 2.5: Overall mean
* ... Moindre est la valeur, meilleures sont les performances
AIDA64: FP32 Ray-Trace | FPU Julia | CPU SHA3 | CPU Queen | FPU SinJulia | FPU Mandel | CPU AES | CPU ZLib | FP64 Ray-Trace | CPU PhotoWorxx | CPU CheckMate
| Performance rating | |
| Moyenne Intel Core Ultra 9 290HX Plus -1! | |
| Alienware 16X Aurora Core Ultra 9 290HX Plus -1! | |
| Lenovo Legion Pro 5 16IAX10, RTX 5070 -1! | |
| Alienware 16X Aurora, RTX 5070 -1! | |
| Acer Predator Helios Neo 16S AI PHN16S-71-94L9 -1! | |
| MSI Vector 16 HX AI A2XWHG -1! | |
| Asus ROG Zephyrus G16 GU605CW -1! | |
| AIDA64 / FP32 Ray-Trace | |
| Moyenne Intel Core Ultra 9 290HX Plus (34761 - 39607, n=2) | |
| Alienware 16X Aurora Core Ultra 9 290HX Plus (v8.20.8100) | |
| Lenovo Legion Pro 5 16IAX10, RTX 5070 (v6.92.6600) | |
| Alienware 16X Aurora, RTX 5070 (v6.92.6600) | |
| Acer Predator Helios Neo 16S AI PHN16S-71-94L9 (v6.92.6600) | |
| MSI Vector 16 HX AI A2XWHG (v6.92.6600) | |
| Asus ROG Zephyrus G16 GU605CW (v6.92.6600) | |
| AIDA64 / FPU Julia | |
| Moyenne Intel Core Ultra 9 290HX Plus (174665 - 204103, n=2) | |
| Alienware 16X Aurora Core Ultra 9 290HX Plus (v8.20.8100) | |
| Lenovo Legion Pro 5 16IAX10, RTX 5070 (v6.92.6600) | |
| Alienware 16X Aurora, RTX 5070 (v6.92.6600) | |
| Acer Predator Helios Neo 16S AI PHN16S-71-94L9 (v6.92.6600) | |
| MSI Vector 16 HX AI A2XWHG (v6.92.6600) | |
| Asus ROG Zephyrus G16 GU605CW (v6.92.6600) | |
| AIDA64 / CPU SHA3 | |
| Moyenne Intel Core Ultra 9 290HX Plus (8352 - 9516, n=2) | |
| Alienware 16X Aurora Core Ultra 9 290HX Plus (v8.20.8100) | |
| Alienware 16X Aurora, RTX 5070 (v6.92.6600) | |
| Lenovo Legion Pro 5 16IAX10, RTX 5070 (v6.92.6600) | |
| Acer Predator Helios Neo 16S AI PHN16S-71-94L9 (v6.92.6600) | |
| MSI Vector 16 HX AI A2XWHG (v6.92.6600) | |
| Asus ROG Zephyrus G16 GU605CW (v6.92.6600) | |
| AIDA64 / CPU Queen | |
| Lenovo Legion Pro 5 16IAX10, RTX 5070 (v6.92.6600) | |
| Alienware 16X Aurora, RTX 5070 (v6.92.6600) | |
| Acer Predator Helios Neo 16S AI PHN16S-71-94L9 (v6.92.6600) | |
| MSI Vector 16 HX AI A2XWHG (v6.92.6600) | |
| Asus ROG Zephyrus G16 GU605CW (v6.92.6600) | |
| AIDA64 / FPU SinJulia | |
| Alienware 16X Aurora Core Ultra 9 290HX Plus (v8.20.8100) | |
| Moyenne Intel Core Ultra 9 290HX Plus (13612 - 13687, n=2) | |
| Alienware 16X Aurora, RTX 5070 (v6.92.6600) | |
| Lenovo Legion Pro 5 16IAX10, RTX 5070 (v6.92.6600) | |
| Acer Predator Helios Neo 16S AI PHN16S-71-94L9 (v6.92.6600) | |
| MSI Vector 16 HX AI A2XWHG (v6.92.6600) | |
| Asus ROG Zephyrus G16 GU605CW (v6.92.6600) | |
| AIDA64 / FPU Mandel | |
| Moyenne Intel Core Ultra 9 290HX Plus (91215 - 106285, n=2) | |
| Alienware 16X Aurora Core Ultra 9 290HX Plus (v8.20.8100) | |
| Lenovo Legion Pro 5 16IAX10, RTX 5070 (v6.92.6600) | |
| Alienware 16X Aurora, RTX 5070 (v6.92.6600) | |
| Acer Predator Helios Neo 16S AI PHN16S-71-94L9 (v6.92.6600) | |
| MSI Vector 16 HX AI A2XWHG (v6.92.6600) | |
| Asus ROG Zephyrus G16 GU605CW (v6.92.6600) | |
| AIDA64 / CPU AES | |
| Moyenne Intel Core Ultra 9 290HX Plus (127585 - 130696, n=2) | |
| Alienware 16X Aurora Core Ultra 9 290HX Plus (v8.20.8100) | |
| Alienware 16X Aurora, RTX 5070 (v6.92.6600) | |
| Lenovo Legion Pro 5 16IAX10, RTX 5070 (v6.92.6600) | |
| Acer Predator Helios Neo 16S AI PHN16S-71-94L9 (v6.92.6600) | |
| MSI Vector 16 HX AI A2XWHG (v6.92.6600) | |
| Asus ROG Zephyrus G16 GU605CW (v6.92.6600) | |
| AIDA64 / CPU ZLib | |
| Moyenne Intel Core Ultra 9 290HX Plus (1967 - 2162, n=2) | |
| Alienware 16X Aurora Core Ultra 9 290HX Plus (v8.20.8100) | |
| Alienware 16X Aurora, RTX 5070 (v6.92.6600) | |
| Lenovo Legion Pro 5 16IAX10, RTX 5070 (v6.92.6600) | |
| Acer Predator Helios Neo 16S AI PHN16S-71-94L9 (v6.92.6600) | |
| MSI Vector 16 HX AI A2XWHG (v6.92.6600) | |
| Asus ROG Zephyrus G16 GU605CW (v6.92.6600) | |
| AIDA64 / FP64 Ray-Trace | |
| Moyenne Intel Core Ultra 9 290HX Plus (18611 - 21472, n=2) | |
| Alienware 16X Aurora Core Ultra 9 290HX Plus (v8.20.8100) | |
| Lenovo Legion Pro 5 16IAX10, RTX 5070 (v6.92.6600) | |
| Alienware 16X Aurora, RTX 5070 (v6.92.6600) | |
| Acer Predator Helios Neo 16S AI PHN16S-71-94L9 (v6.92.6600) | |
| MSI Vector 16 HX AI A2XWHG (v6.92.6600) | |
| Asus ROG Zephyrus G16 GU605CW (v6.92.6600) | |
| AIDA64 / CPU PhotoWorxx | |
| Asus ROG Zephyrus G16 GU605CW (v6.92.6600) | |
| Lenovo Legion Pro 5 16IAX10, RTX 5070 (v6.92.6600) | |
| Acer Predator Helios Neo 16S AI PHN16S-71-94L9 (v6.92.6600) | |
| Moyenne Intel Core Ultra 9 290HX Plus (51199 - 55731, n=2) | |
| Alienware 16X Aurora Core Ultra 9 290HX Plus (v8.20.8100) | |
| Alienware 16X Aurora, RTX 5070 (v6.92.6600) | |
| MSI Vector 16 HX AI A2XWHG (v6.92.6600) | |
| AIDA64 / CPU CheckMate | |
| Moyenne Intel Core Ultra 9 290HX Plus (7624 - 8106, n=2) | |
| Alienware 16X Aurora Core Ultra 9 290HX Plus (v8.20.8100) | |
Performance du système
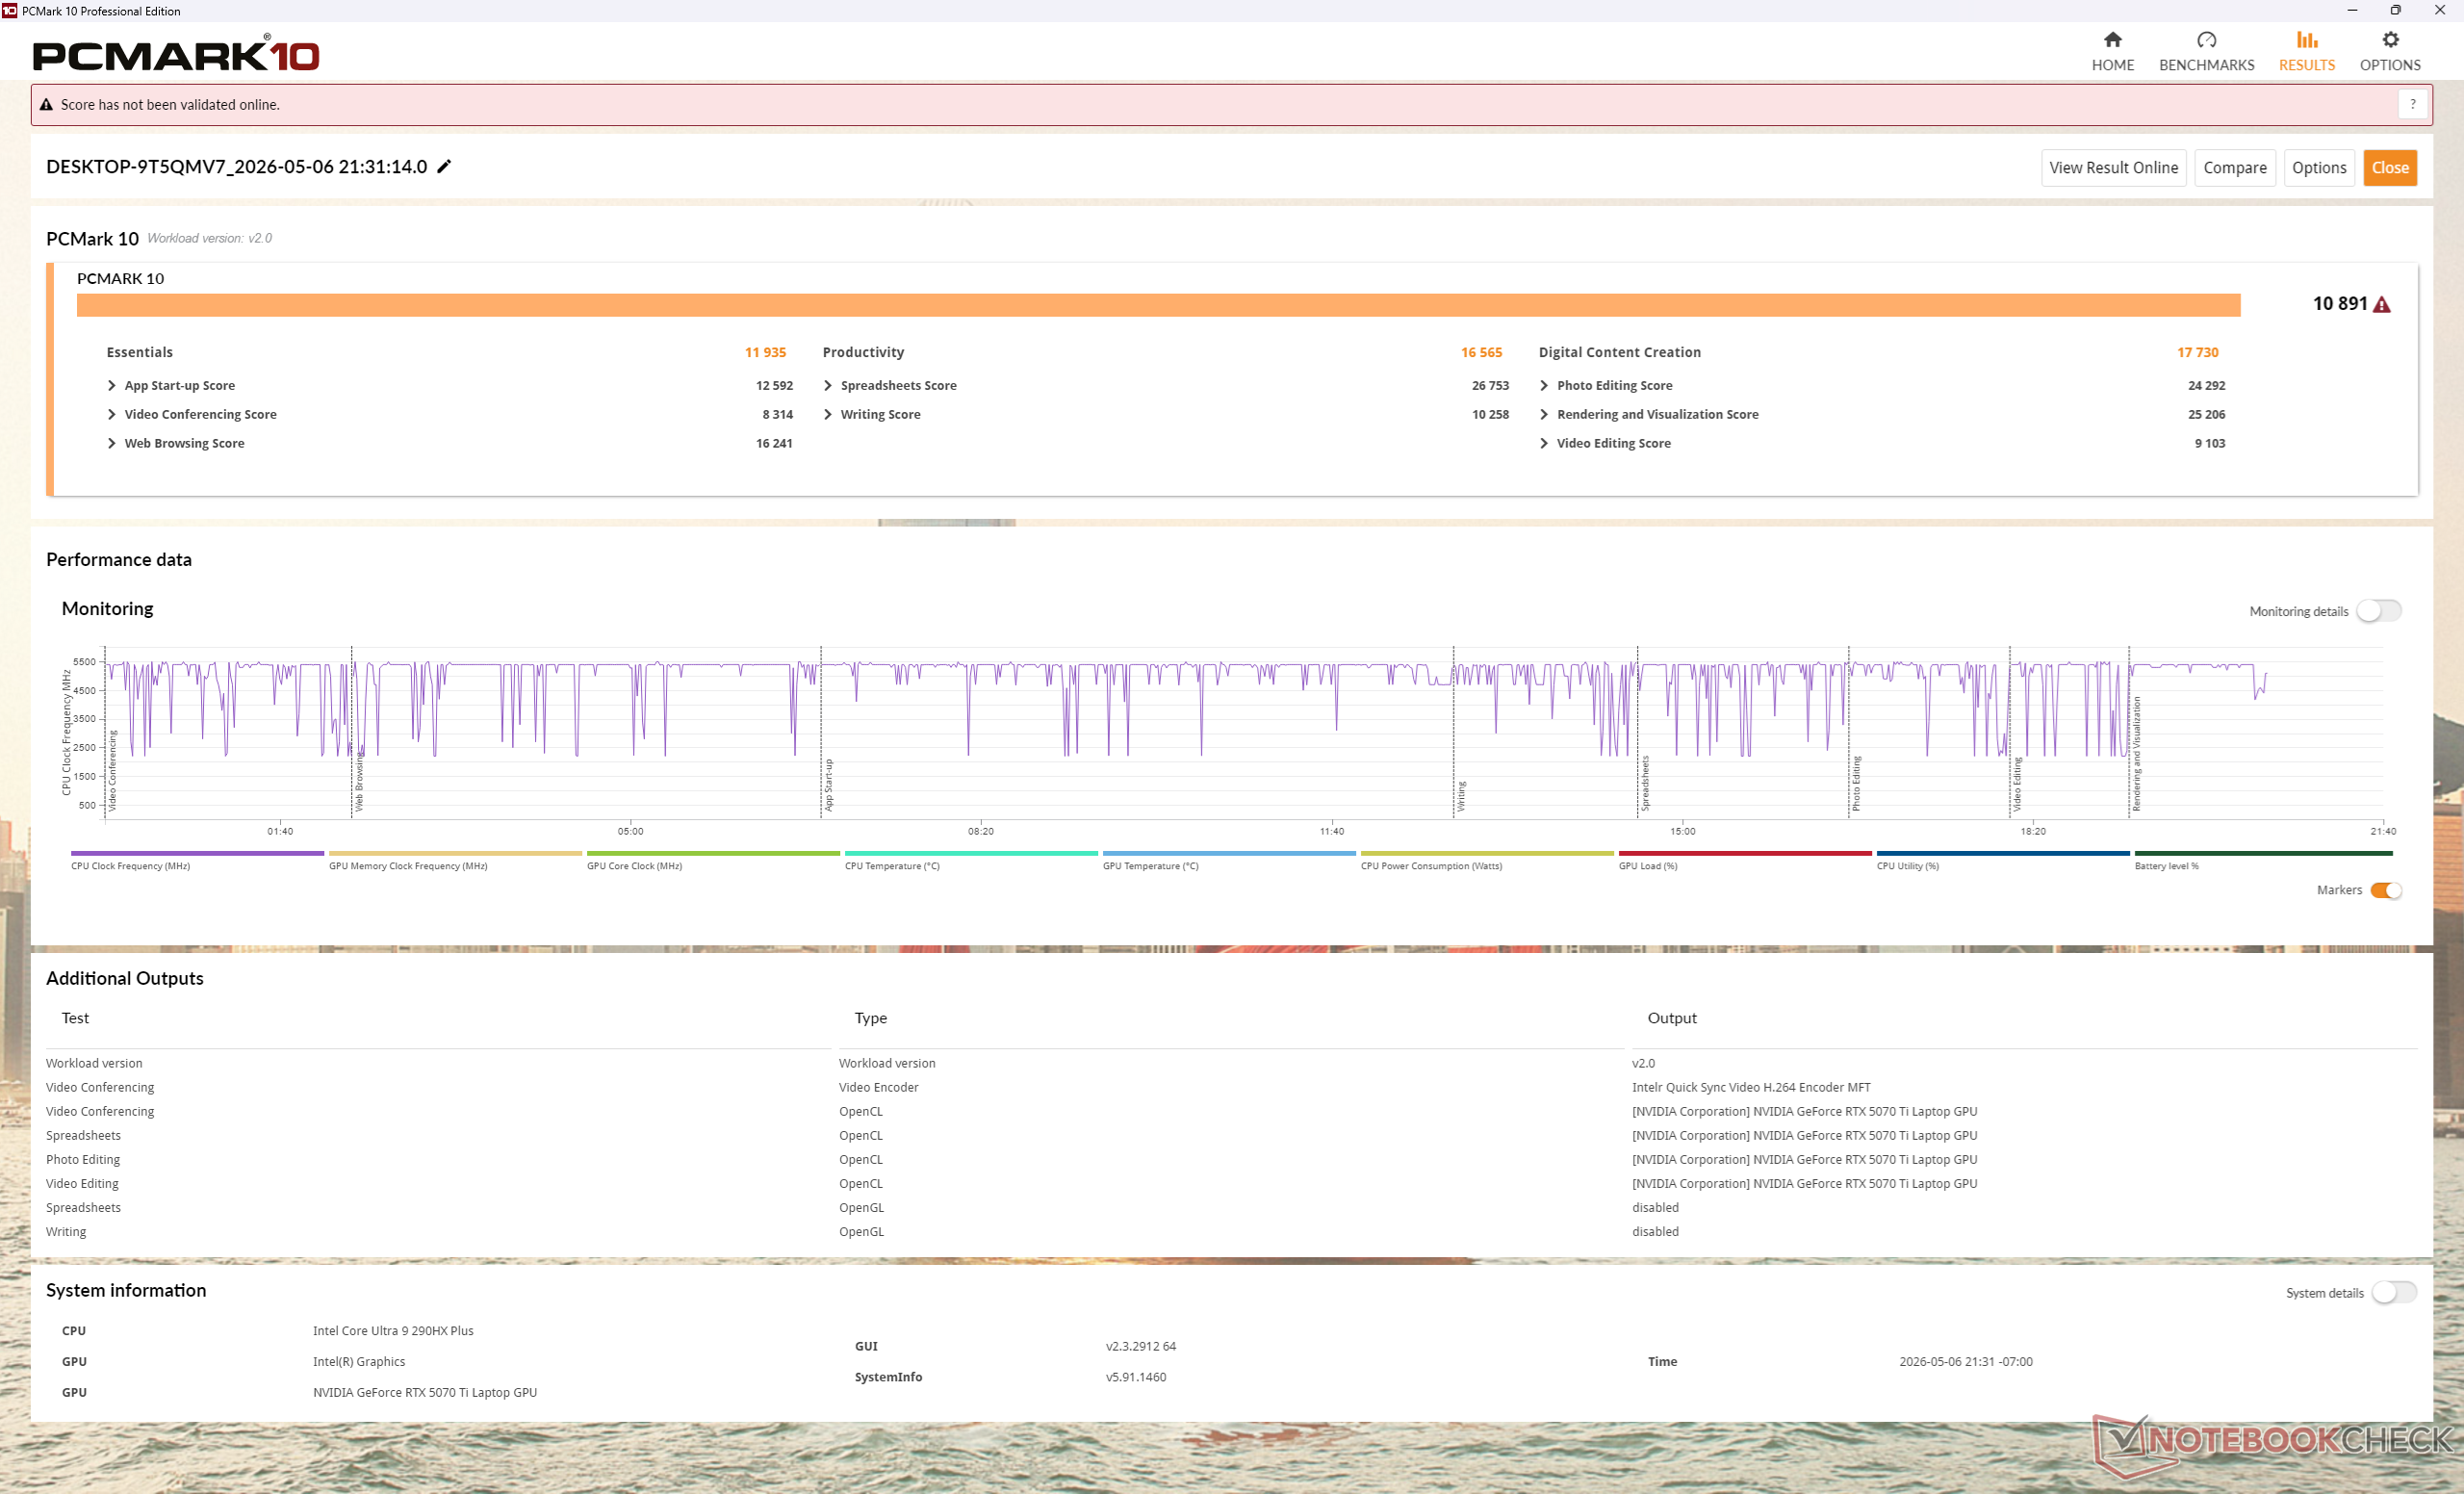
PCMark 10: Score | Essentials | Productivity | Digital Content Creation
CrossMark: Overall | Productivity | Creativity | Responsiveness
WebXPRT 3: Overall
WebXPRT 4: Overall
Mozilla Kraken 1.1: Total
Geekbench AI: Quantized GPU 1.7 | Half Precision GPU 1.7 | Single Precision GPU 1.7
| Performance rating | |
| Alienware 16X Aurora Core Ultra 9 290HX Plus | |
| Moyenne Intel Core Ultra 9 290HX Plus, NVIDIA GeForce RTX 5070 Ti Laptop | |
| Alienware 16X Aurora, RTX 5070 -4! | |
| Lenovo Legion Pro 5 16IAX10, RTX 5070 | |
| Acer Predator Helios Neo 16S AI PHN16S-71-94L9 -3! | |
| MSI Vector 16 HX AI A2XWHG -3! | |
| Asus ROG Zephyrus G16 GU605CW -3! | |
| PCMark 10 / Score | |
| Alienware 16X Aurora Core Ultra 9 290HX Plus | |
| Moyenne Intel Core Ultra 9 290HX Plus, NVIDIA GeForce RTX 5070 Ti Laptop (n=1) | |
| Lenovo Legion Pro 5 16IAX10, RTX 5070 | |
| Acer Predator Helios Neo 16S AI PHN16S-71-94L9 | |
| MSI Vector 16 HX AI A2XWHG | |
| Asus ROG Zephyrus G16 GU605CW | |
| PCMark 10 / Essentials | |
| Alienware 16X Aurora Core Ultra 9 290HX Plus | |
| Moyenne Intel Core Ultra 9 290HX Plus, NVIDIA GeForce RTX 5070 Ti Laptop (n=1) | |
| Lenovo Legion Pro 5 16IAX10, RTX 5070 | |
| Acer Predator Helios Neo 16S AI PHN16S-71-94L9 | |
| MSI Vector 16 HX AI A2XWHG | |
| Asus ROG Zephyrus G16 GU605CW | |
| PCMark 10 / Productivity | |
| Alienware 16X Aurora Core Ultra 9 290HX Plus | |
| Moyenne Intel Core Ultra 9 290HX Plus, NVIDIA GeForce RTX 5070 Ti Laptop (n=1) | |
| Lenovo Legion Pro 5 16IAX10, RTX 5070 | |
| Acer Predator Helios Neo 16S AI PHN16S-71-94L9 | |
| MSI Vector 16 HX AI A2XWHG | |
| Asus ROG Zephyrus G16 GU605CW | |
| PCMark 10 / Digital Content Creation | |
| Alienware 16X Aurora Core Ultra 9 290HX Plus | |
| Moyenne Intel Core Ultra 9 290HX Plus, NVIDIA GeForce RTX 5070 Ti Laptop (n=1) | |
| Lenovo Legion Pro 5 16IAX10, RTX 5070 | |
| Acer Predator Helios Neo 16S AI PHN16S-71-94L9 | |
| Asus ROG Zephyrus G16 GU605CW | |
| MSI Vector 16 HX AI A2XWHG | |
| CrossMark / Overall | |
| Alienware 16X Aurora Core Ultra 9 290HX Plus | |
| Moyenne Intel Core Ultra 9 290HX Plus, NVIDIA GeForce RTX 5070 Ti Laptop (n=1) | |
| Alienware 16X Aurora, RTX 5070 | |
| Acer Predator Helios Neo 16S AI PHN16S-71-94L9 | |
| Lenovo Legion Pro 5 16IAX10, RTX 5070 | |
| MSI Vector 16 HX AI A2XWHG | |
| Asus ROG Zephyrus G16 GU605CW | |
| CrossMark / Productivity | |
| Alienware 16X Aurora Core Ultra 9 290HX Plus | |
| Moyenne Intel Core Ultra 9 290HX Plus, NVIDIA GeForce RTX 5070 Ti Laptop (n=1) | |
| Alienware 16X Aurora, RTX 5070 | |
| Acer Predator Helios Neo 16S AI PHN16S-71-94L9 | |
| Lenovo Legion Pro 5 16IAX10, RTX 5070 | |
| MSI Vector 16 HX AI A2XWHG | |
| Asus ROG Zephyrus G16 GU605CW | |
| CrossMark / Creativity | |
| Alienware 16X Aurora Core Ultra 9 290HX Plus | |
| Moyenne Intel Core Ultra 9 290HX Plus, NVIDIA GeForce RTX 5070 Ti Laptop (n=1) | |
| Acer Predator Helios Neo 16S AI PHN16S-71-94L9 | |
| Alienware 16X Aurora, RTX 5070 | |
| Lenovo Legion Pro 5 16IAX10, RTX 5070 | |
| MSI Vector 16 HX AI A2XWHG | |
| Asus ROG Zephyrus G16 GU605CW | |
| CrossMark / Responsiveness | |
| Alienware 16X Aurora Core Ultra 9 290HX Plus | |
| Moyenne Intel Core Ultra 9 290HX Plus, NVIDIA GeForce RTX 5070 Ti Laptop (n=1) | |
| Alienware 16X Aurora, RTX 5070 | |
| Lenovo Legion Pro 5 16IAX10, RTX 5070 | |
| Acer Predator Helios Neo 16S AI PHN16S-71-94L9 | |
| MSI Vector 16 HX AI A2XWHG | |
| Asus ROG Zephyrus G16 GU605CW | |
| WebXPRT 3 / Overall | |
| Alienware 16X Aurora Core Ultra 9 290HX Plus | |
| Moyenne Intel Core Ultra 9 290HX Plus, NVIDIA GeForce RTX 5070 Ti Laptop (n=1) | |
| Alienware 16X Aurora, RTX 5070 | |
| Lenovo Legion Pro 5 16IAX10, RTX 5070 | |
| Acer Predator Helios Neo 16S AI PHN16S-71-94L9 | |
| MSI Vector 16 HX AI A2XWHG | |
| Asus ROG Zephyrus G16 GU605CW | |
| WebXPRT 4 / Overall | |
| Alienware 16X Aurora Core Ultra 9 290HX Plus | |
| Moyenne Intel Core Ultra 9 290HX Plus, NVIDIA GeForce RTX 5070 Ti Laptop (n=1) | |
| Alienware 16X Aurora, RTX 5070 | |
| Lenovo Legion Pro 5 16IAX10, RTX 5070 | |
| Acer Predator Helios Neo 16S AI PHN16S-71-94L9 | |
| MSI Vector 16 HX AI A2XWHG | |
| Asus ROG Zephyrus G16 GU605CW | |
| Mozilla Kraken 1.1 / Total | |
| Asus ROG Zephyrus G16 GU605CW | |
| Lenovo Legion Pro 5 16IAX10, RTX 5070 | |
| MSI Vector 16 HX AI A2XWHG | |
| Alienware 16X Aurora, RTX 5070 | |
| Acer Predator Helios Neo 16S AI PHN16S-71-94L9 | |
| Alienware 16X Aurora Core Ultra 9 290HX Plus | |
| Moyenne Intel Core Ultra 9 290HX Plus, NVIDIA GeForce RTX 5070 Ti Laptop (n=1) | |
| Geekbench AI / Quantized GPU 1.7 | |
| Alienware 16X Aurora Core Ultra 9 290HX Plus | |
| Moyenne Intel Core Ultra 9 290HX Plus, NVIDIA GeForce RTX 5070 Ti Laptop (n=1) | |
| Alienware 16X Aurora, RTX 5070 | |
| Lenovo Legion Pro 5 16IAX10, RTX 5070 | |
| Geekbench AI / Half Precision GPU 1.7 | |
| Alienware 16X Aurora Core Ultra 9 290HX Plus | |
| Moyenne Intel Core Ultra 9 290HX Plus, NVIDIA GeForce RTX 5070 Ti Laptop (n=1) | |
| Alienware 16X Aurora, RTX 5070 | |
| Lenovo Legion Pro 5 16IAX10, RTX 5070 | |
| Geekbench AI / Single Precision GPU 1.7 | |
| Alienware 16X Aurora Core Ultra 9 290HX Plus | |
| Moyenne Intel Core Ultra 9 290HX Plus, NVIDIA GeForce RTX 5070 Ti Laptop (n=1) | |
| Alienware 16X Aurora, RTX 5070 | |
| Lenovo Legion Pro 5 16IAX10, RTX 5070 | |
* ... Moindre est la valeur, meilleures sont les performances
| PCMark 10 Score | 10891 points | |
Aide | ||
| AIDA64 / Memory Copy | |
| Asus ROG Zephyrus G16 GU605CW | |
| Acer Predator Helios Neo 16S AI PHN16S-71-94L9 | |
| Lenovo Legion Pro 5 16IAX10, RTX 5070 | |
| Moyenne Intel Core Ultra 9 290HX Plus (76912 - 85698, n=2) | |
| Alienware 16X Aurora, RTX 5070 | |
| Alienware 16X Aurora Core Ultra 9 290HX Plus | |
| MSI Vector 16 HX AI A2XWHG | |
| AIDA64 / Memory Read | |
| Acer Predator Helios Neo 16S AI PHN16S-71-94L9 | |
| Lenovo Legion Pro 5 16IAX10, RTX 5070 | |
| Moyenne Intel Core Ultra 9 290HX Plus (84638 - 93496, n=2) | |
| Alienware 16X Aurora, RTX 5070 | |
| Alienware 16X Aurora Core Ultra 9 290HX Plus | |
| MSI Vector 16 HX AI A2XWHG | |
| Asus ROG Zephyrus G16 GU605CW | |
| AIDA64 / Memory Write | |
| Acer Predator Helios Neo 16S AI PHN16S-71-94L9 | |
| Lenovo Legion Pro 5 16IAX10, RTX 5070 | |
| Moyenne Intel Core Ultra 9 290HX Plus (76094 - 81688, n=2) | |
| Alienware 16X Aurora, RTX 5070 | |
| Alienware 16X Aurora Core Ultra 9 290HX Plus | |
| Asus ROG Zephyrus G16 GU605CW | |
| MSI Vector 16 HX AI A2XWHG | |
| AIDA64 / Memory Latency | |
| Asus ROG Zephyrus G16 GU605CW | |
| Alienware 16X Aurora, RTX 5070 | |
| Acer Predator Helios Neo 16S AI PHN16S-71-94L9 | |
| Alienware 16X Aurora Core Ultra 9 290HX Plus | |
| Moyenne Intel Core Ultra 9 290HX Plus (105.5 - 108.4, n=2) | |
| MSI Vector 16 HX AI A2XWHG | |
| Lenovo Legion Pro 5 16IAX10, RTX 5070 | |
* ... Moindre est la valeur, meilleures sont les performances
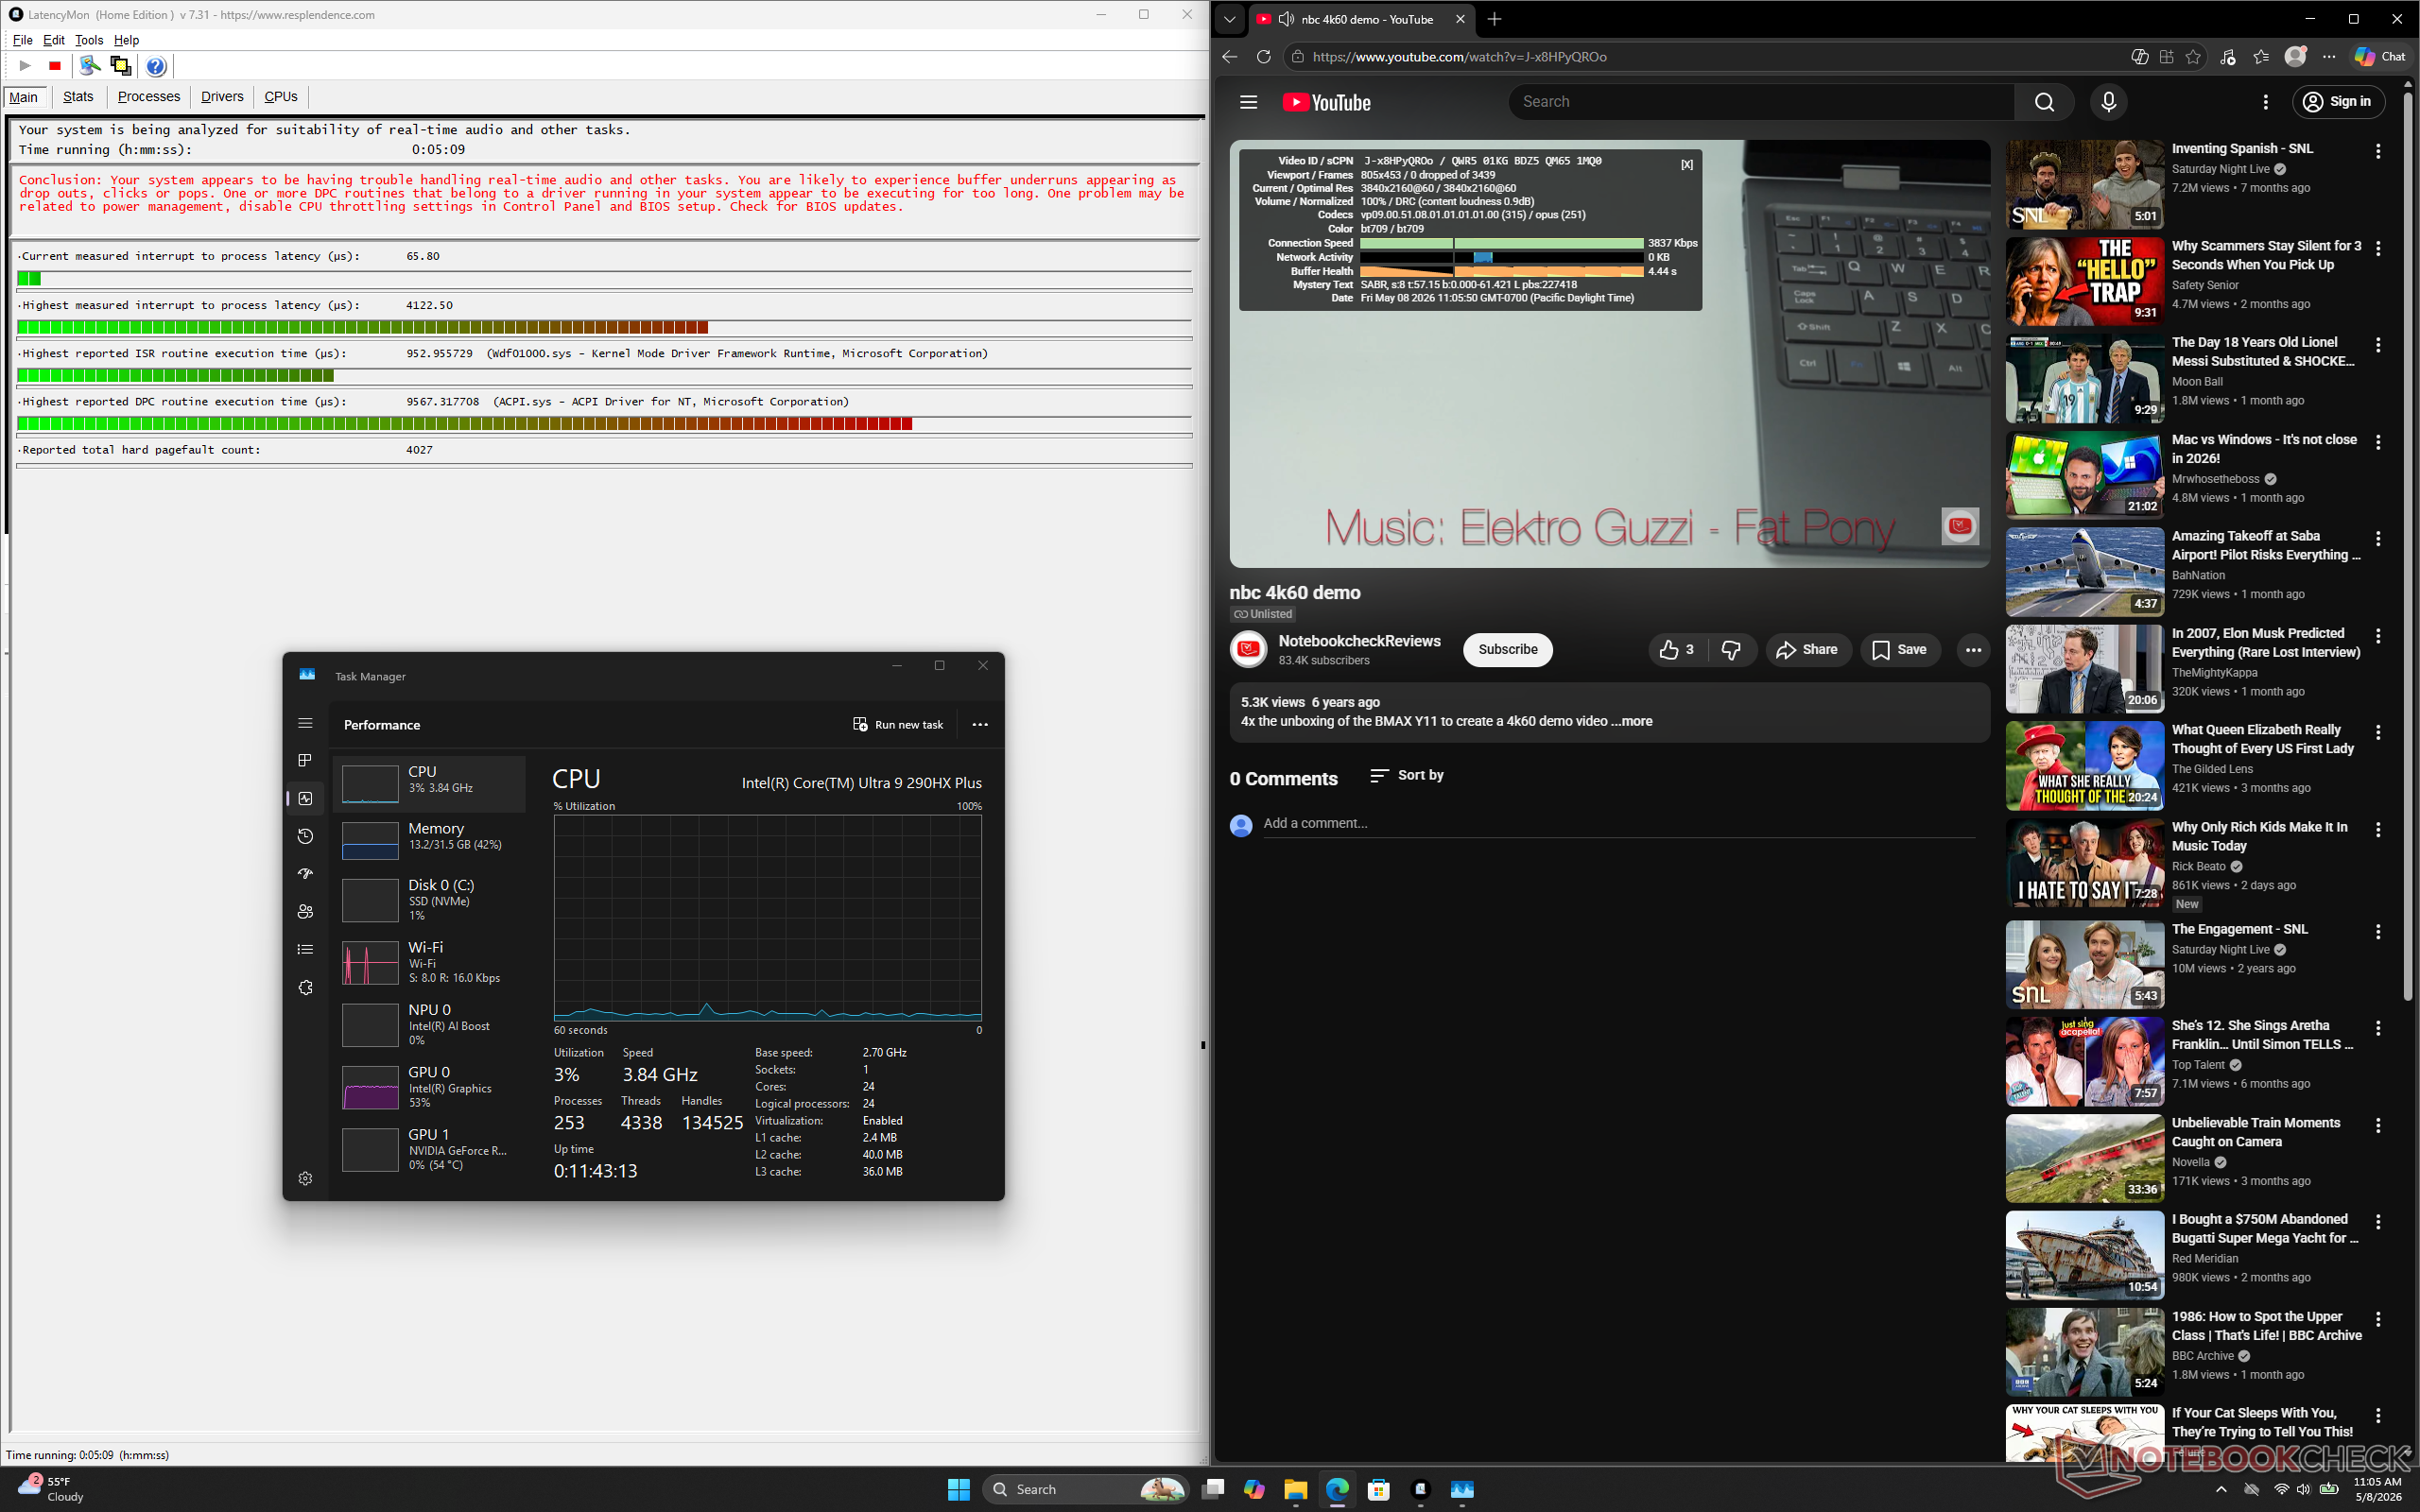
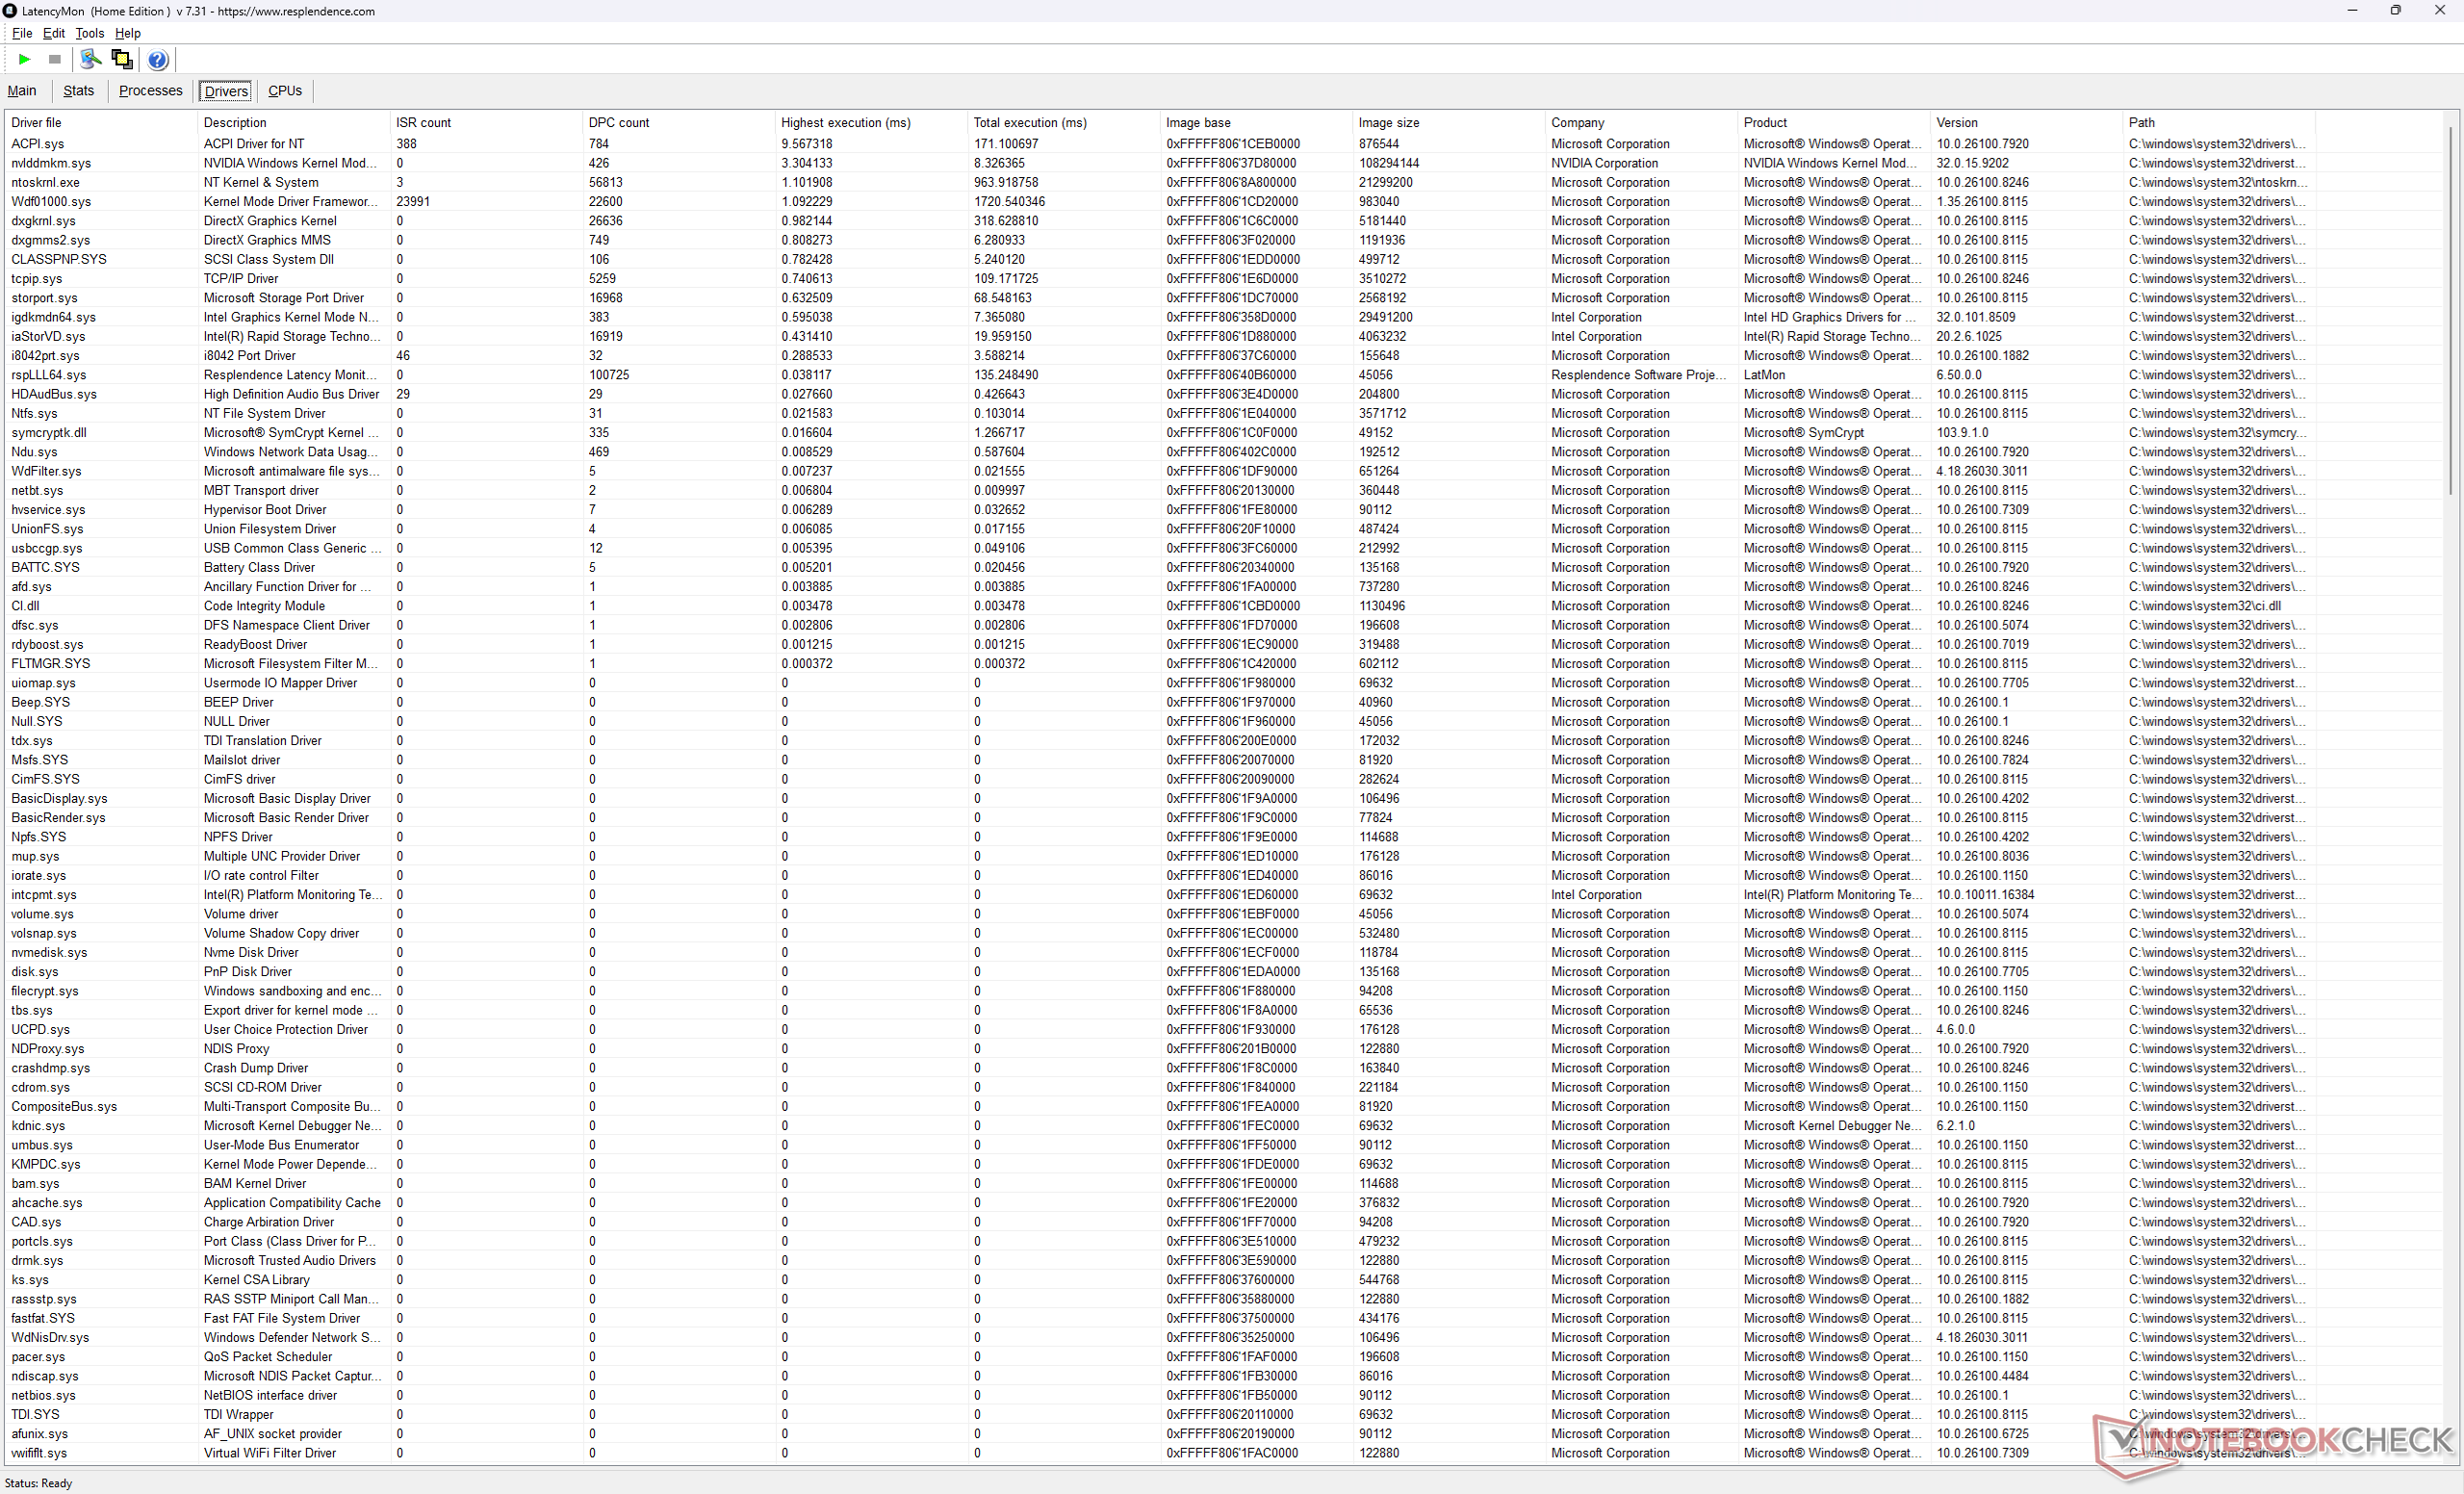
Latence DPC
| DPC Latencies / LatencyMon - interrupt to process latency (max), Web, Youtube, Prime95 | |
| MSI Vector 16 HX AI A2XWHG | |
| Alienware 16X Aurora Core Ultra 9 290HX Plus | |
| Acer Predator Helios Neo 16S AI PHN16S-71-94L9 | |
| Alienware 16X Aurora, RTX 5070 | |
| Asus ROG Zephyrus G16 GU605CW | |
| Lenovo Legion Pro 5 16IAX10, RTX 5070 | |
* ... Moindre est la valeur, meilleures sont les performances
Dispositifs de stockage
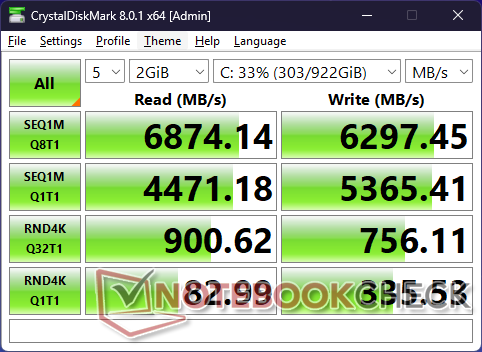
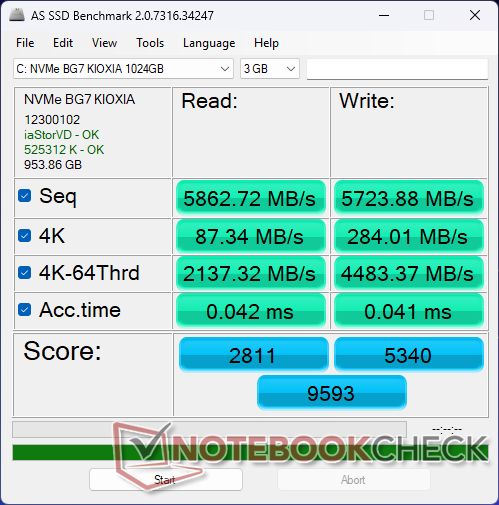
Alors que le modèle de l'année dernière était livré avec un Micron 2650, notre modèle 2026 est livré avec un Micron 2650 Kioxia BG7 à la place. Ce SSD M.2 2242 PCIe4 x4 NVMe offre des taux de transfert stables de ~7000 Mo/s sans problème d'étranglement, ce qui constitue une amélioration par rapport au Micron.

* ... Moindre est la valeur, meilleures sont les performances
Throttoir de disque : Boucle de lecture DiskSpd, profondeur de la file d'attente 8
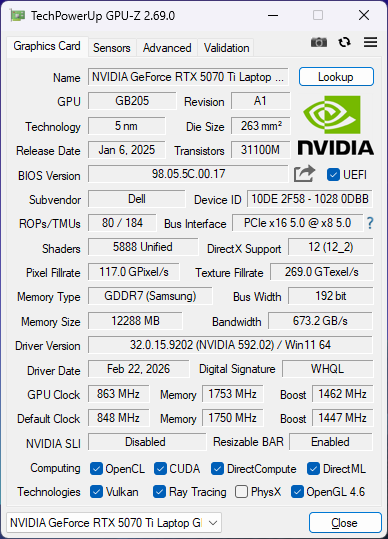
Performance du GPU
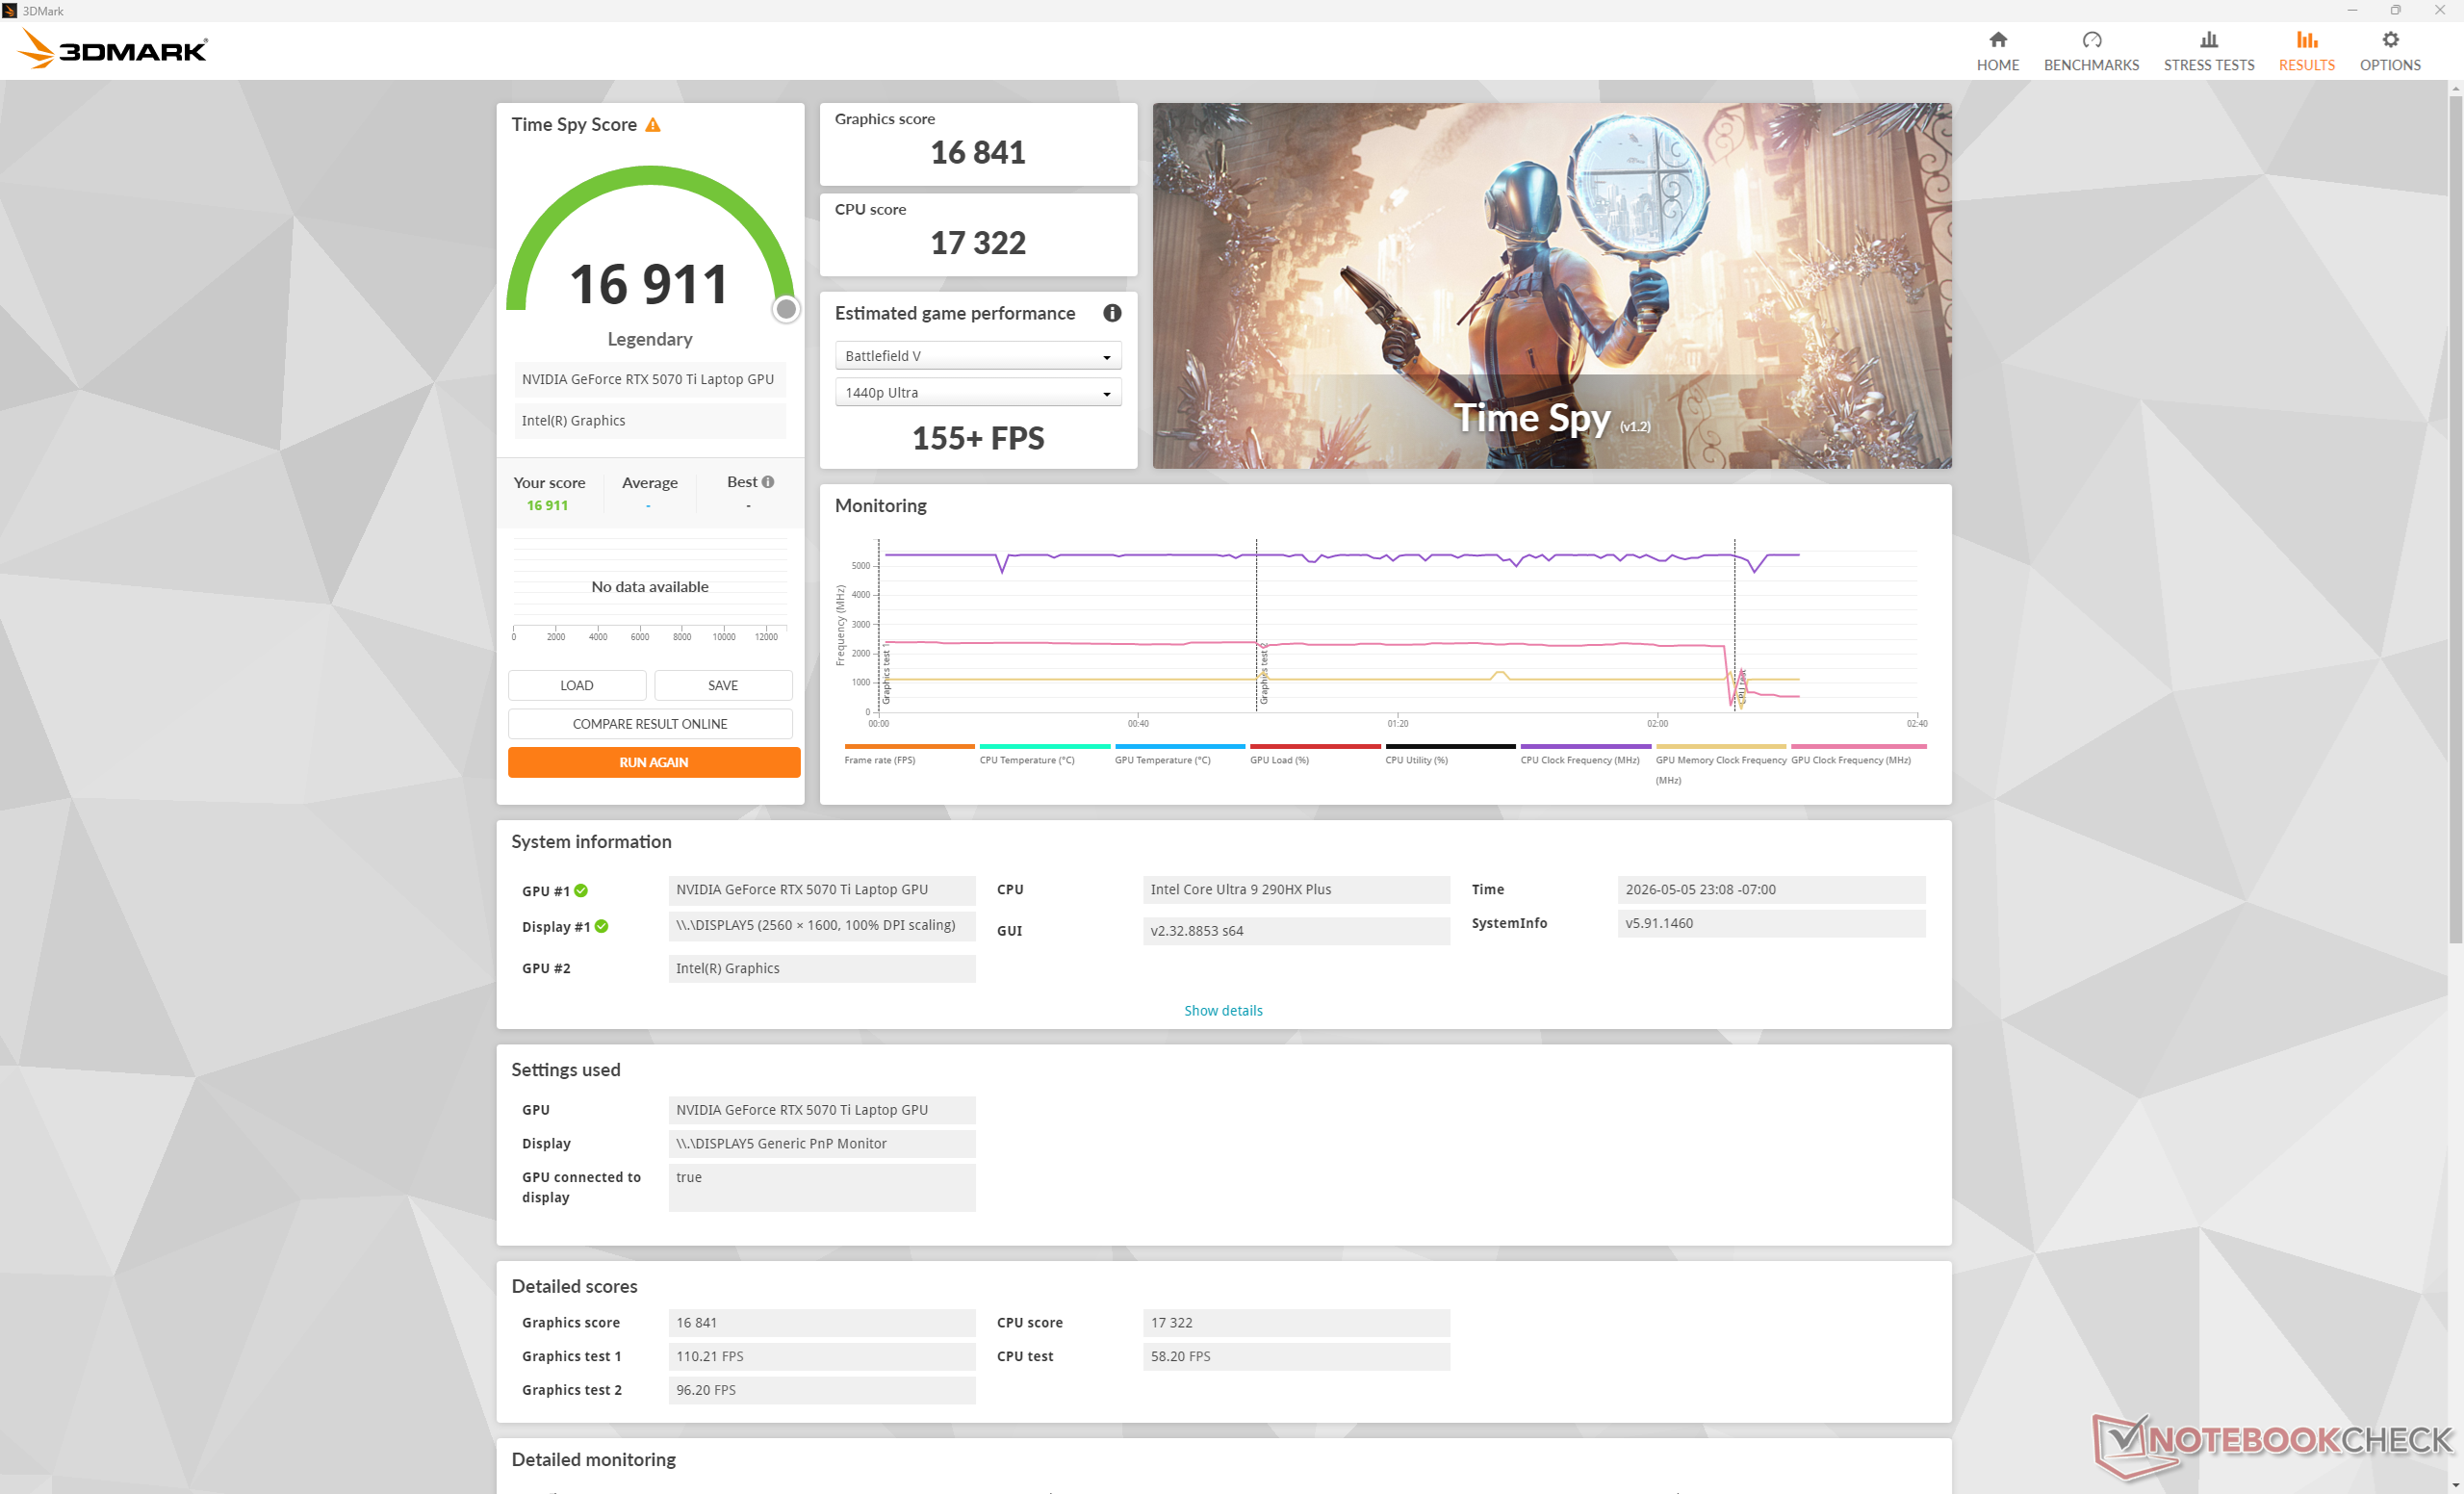
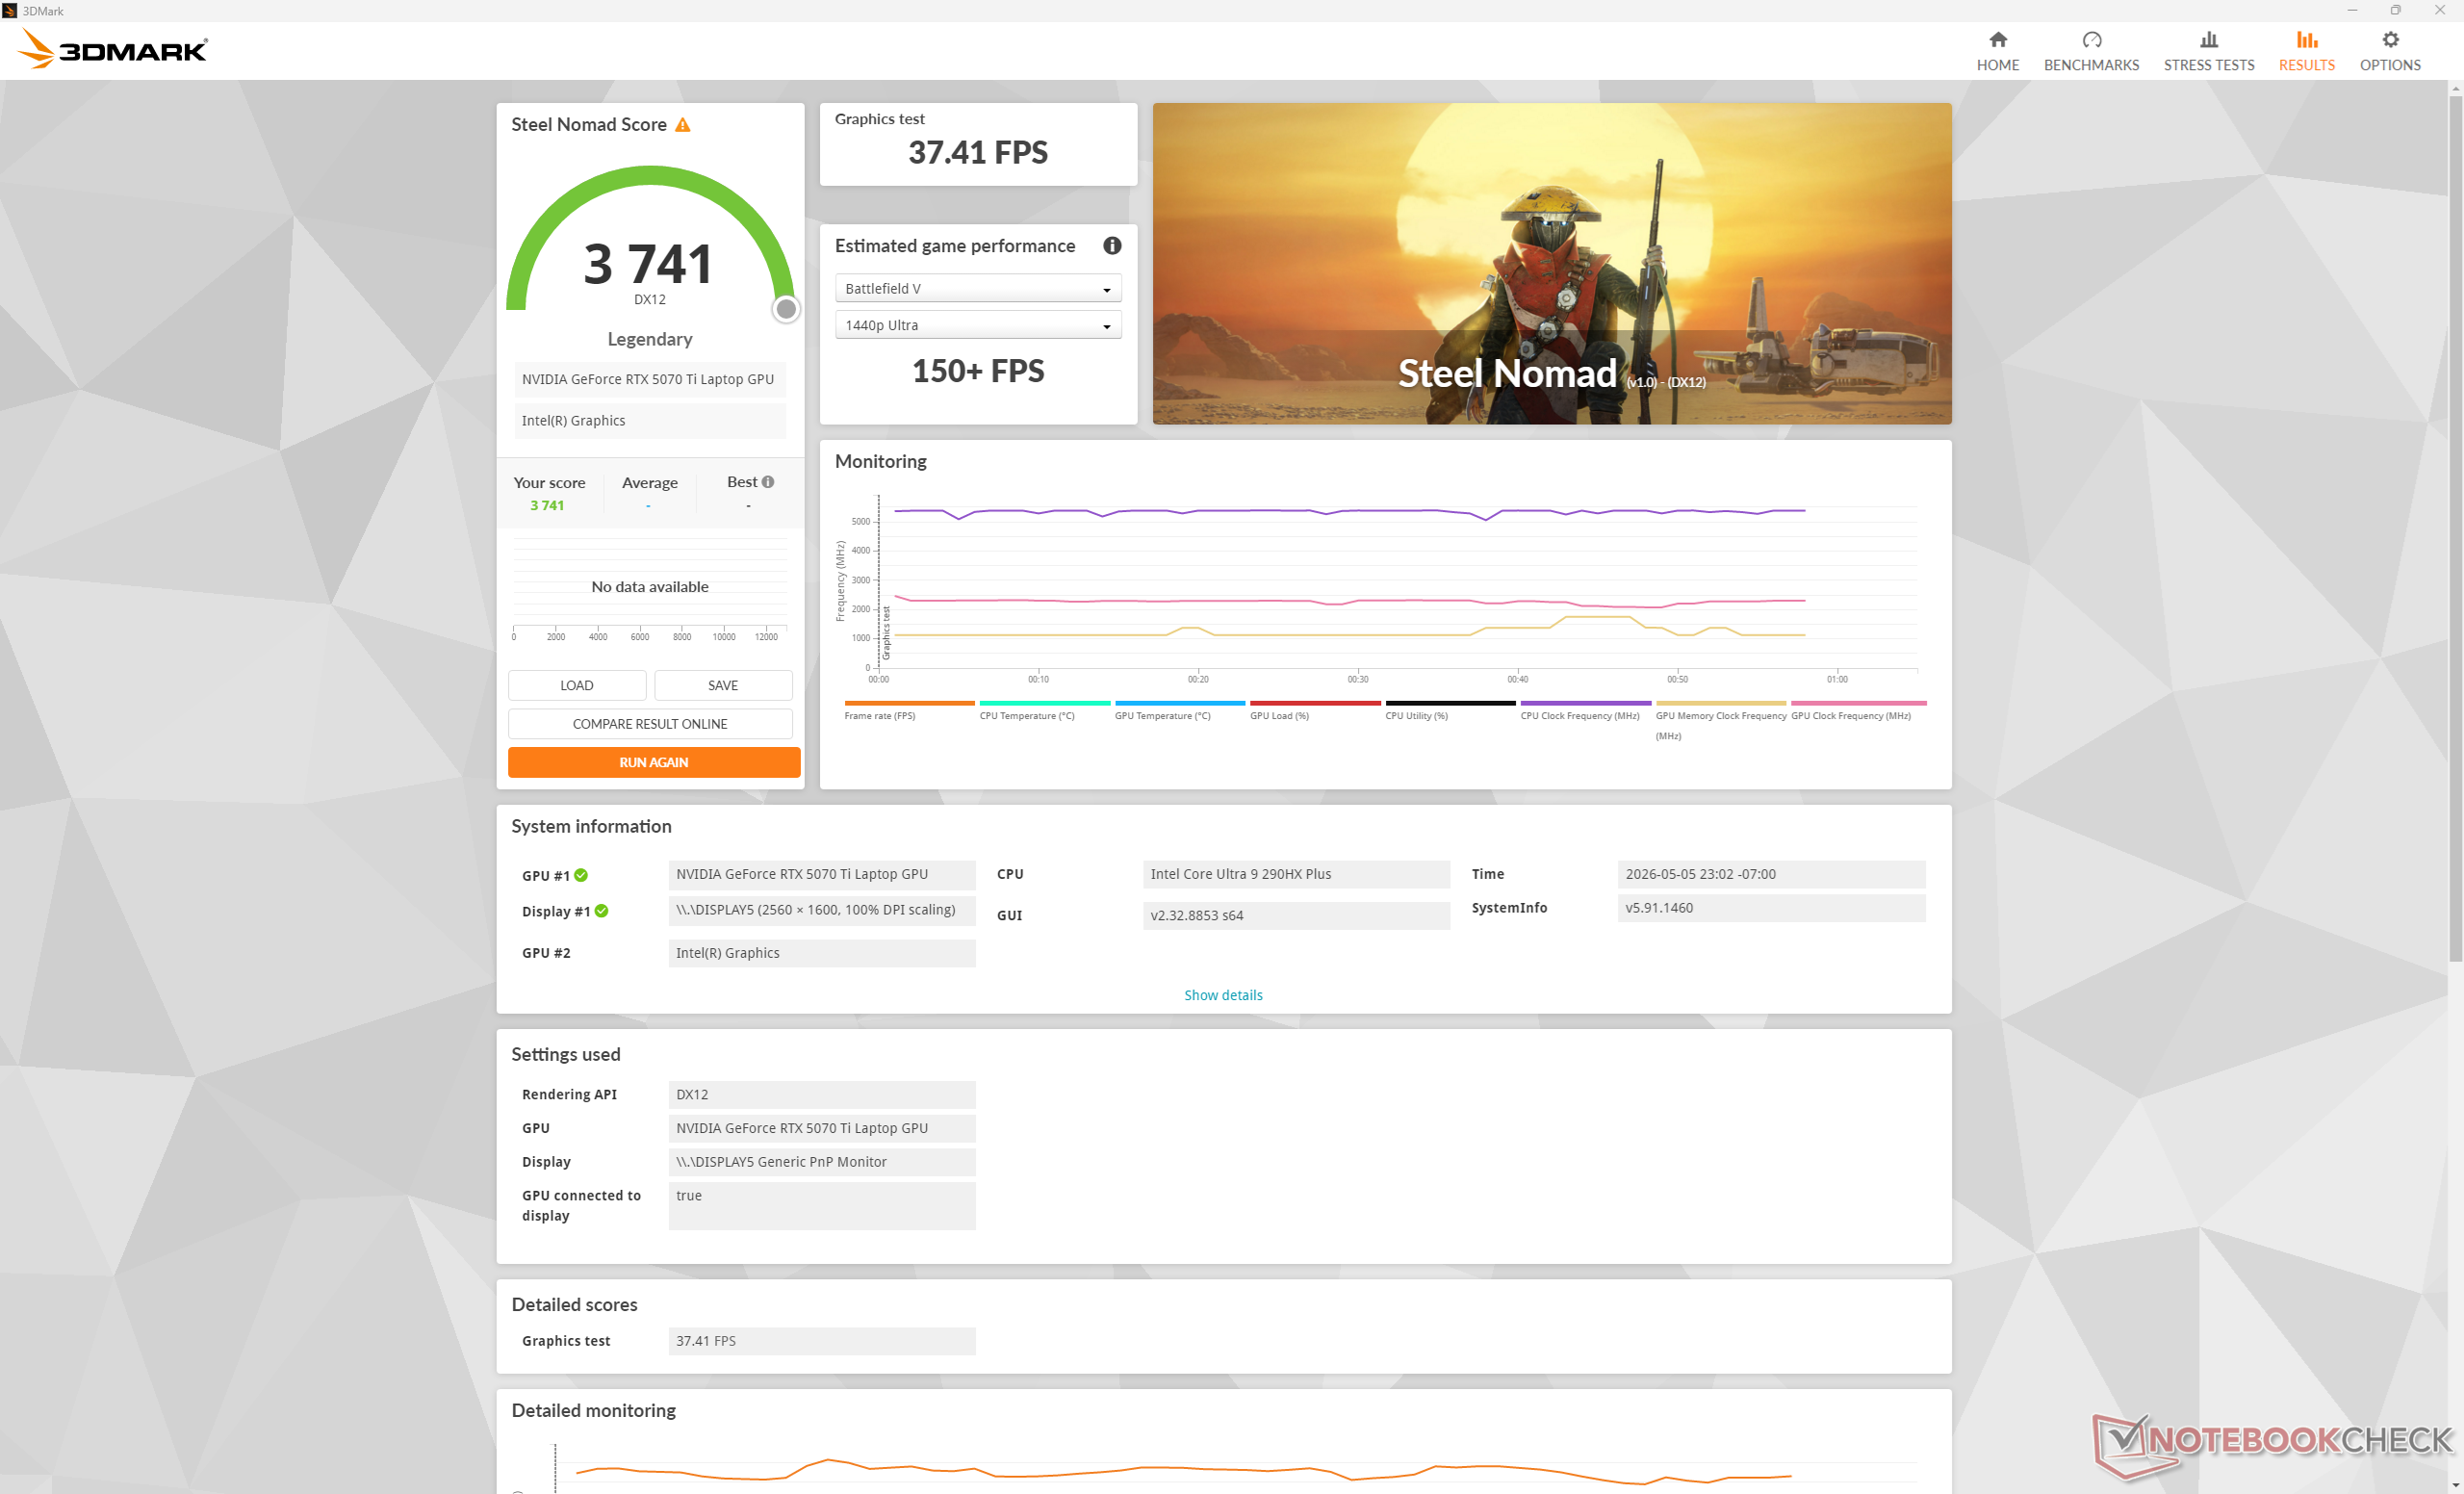
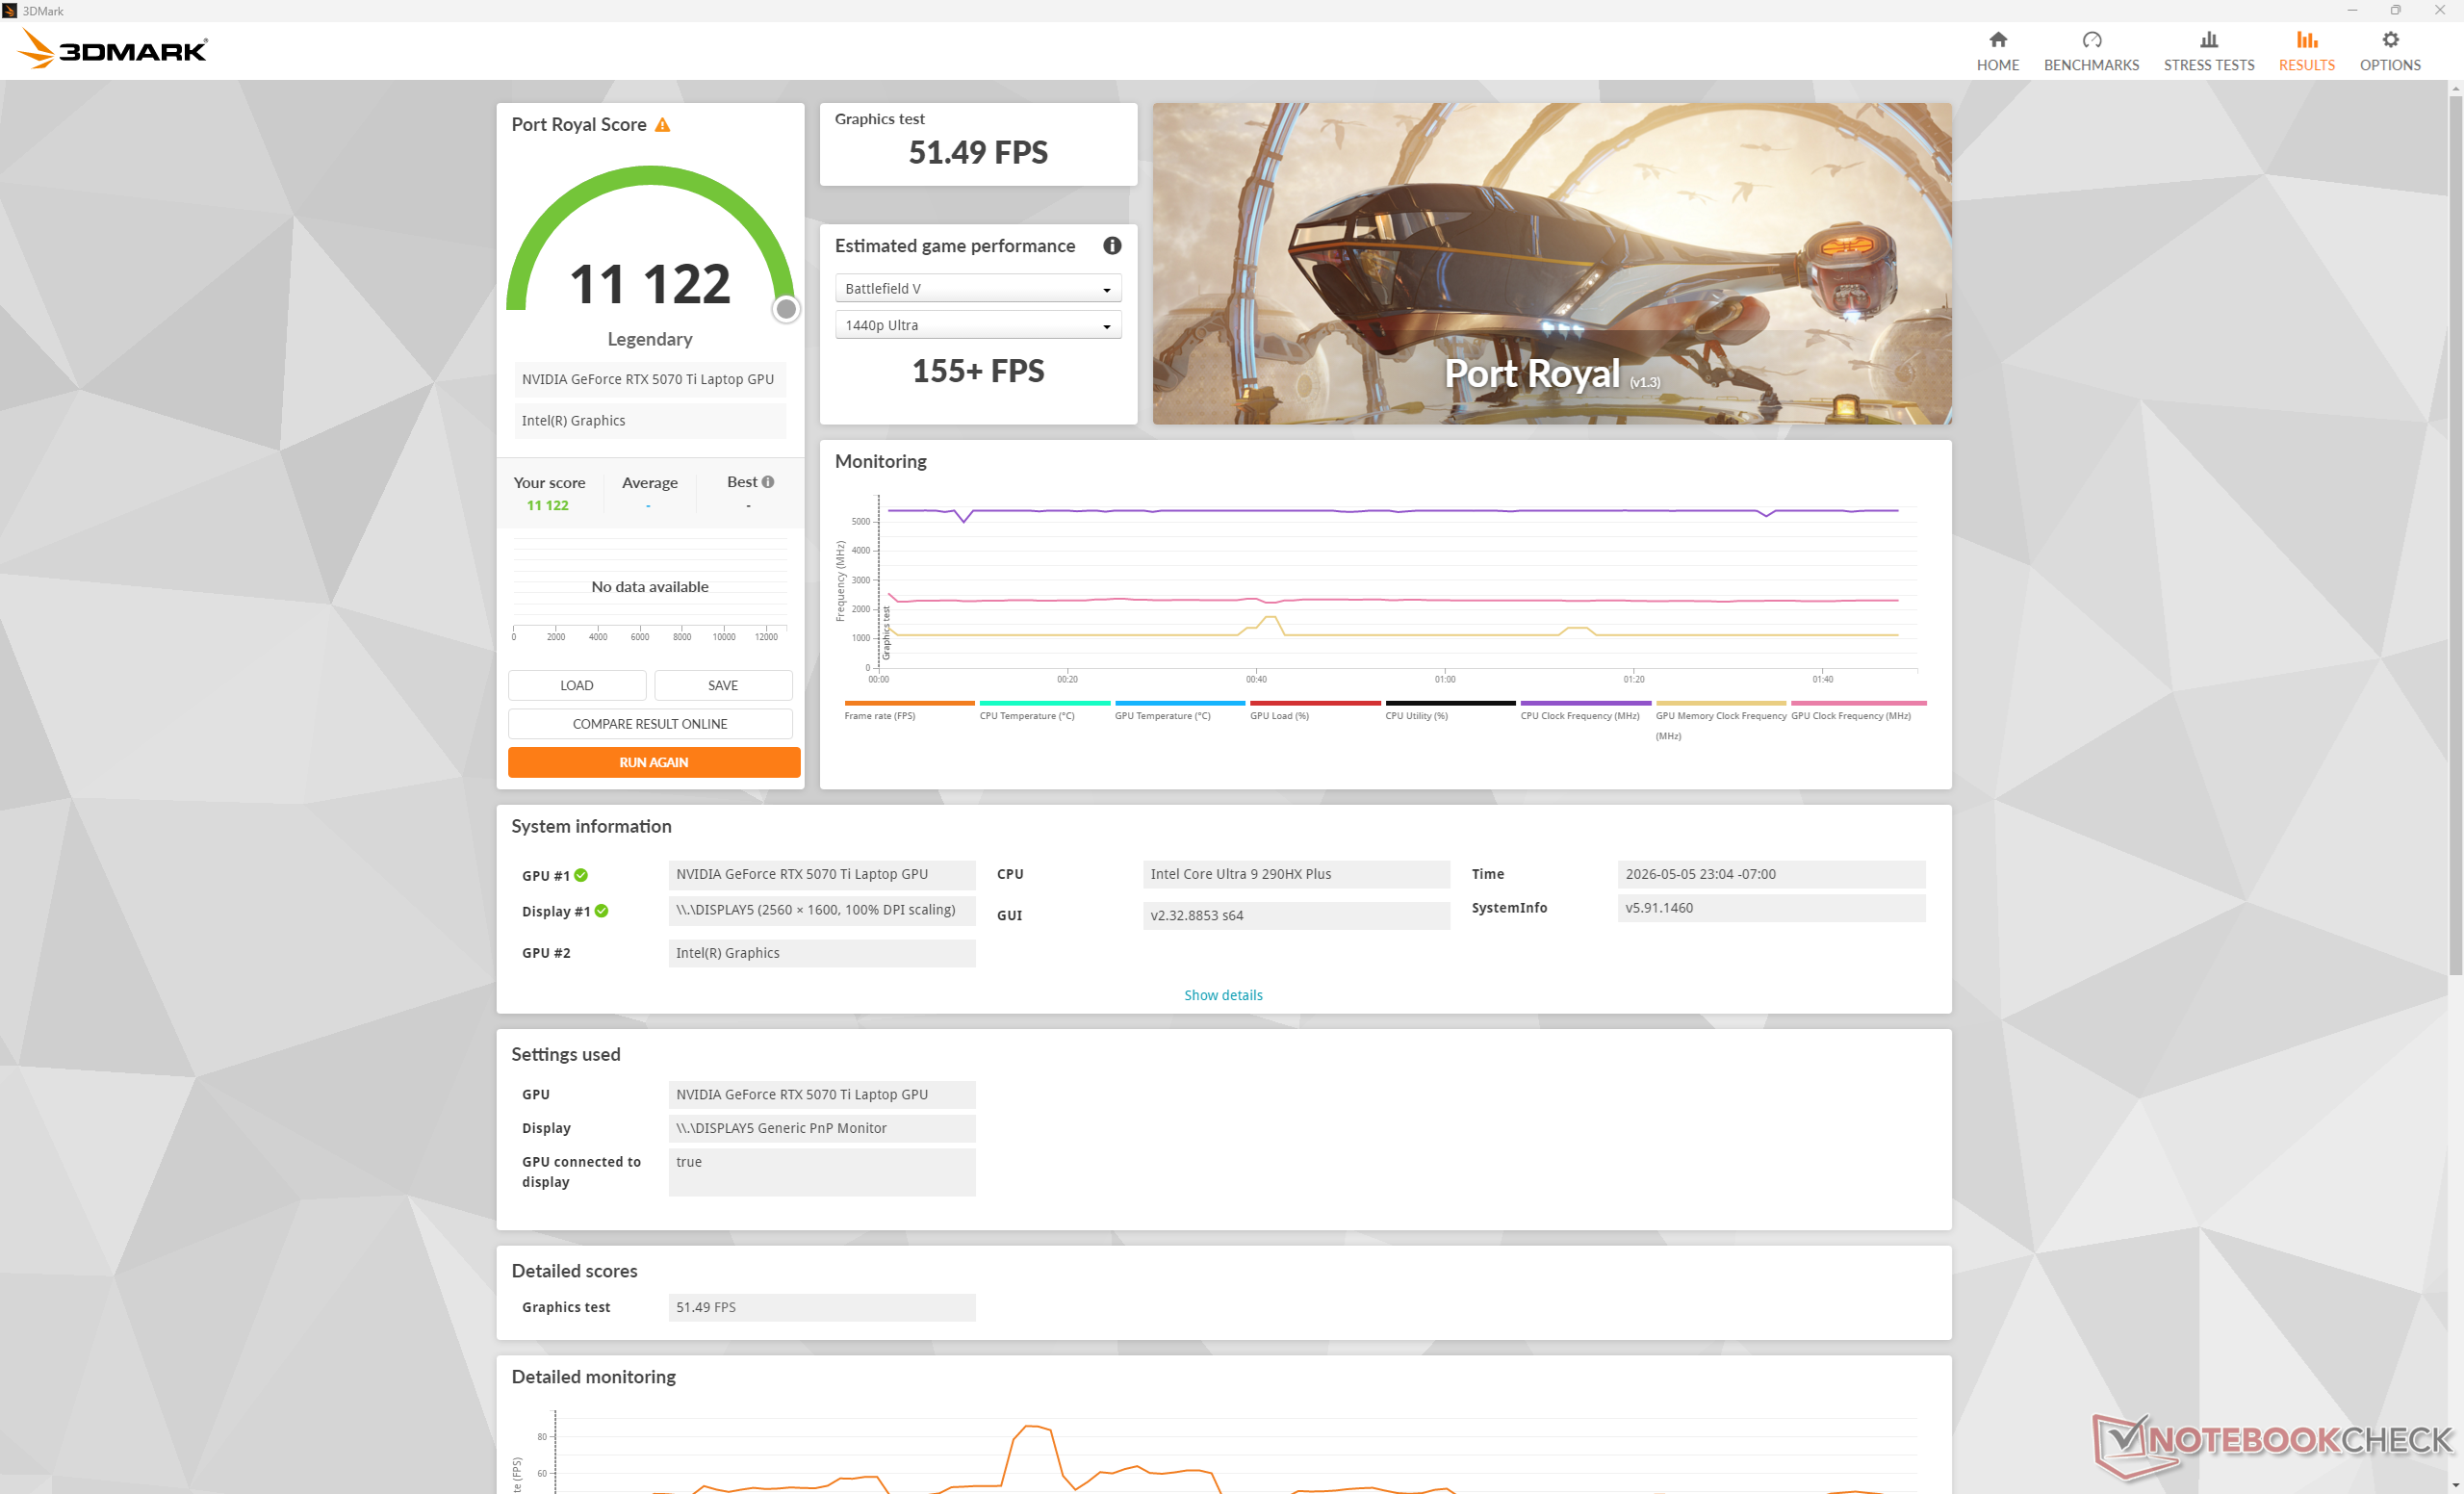
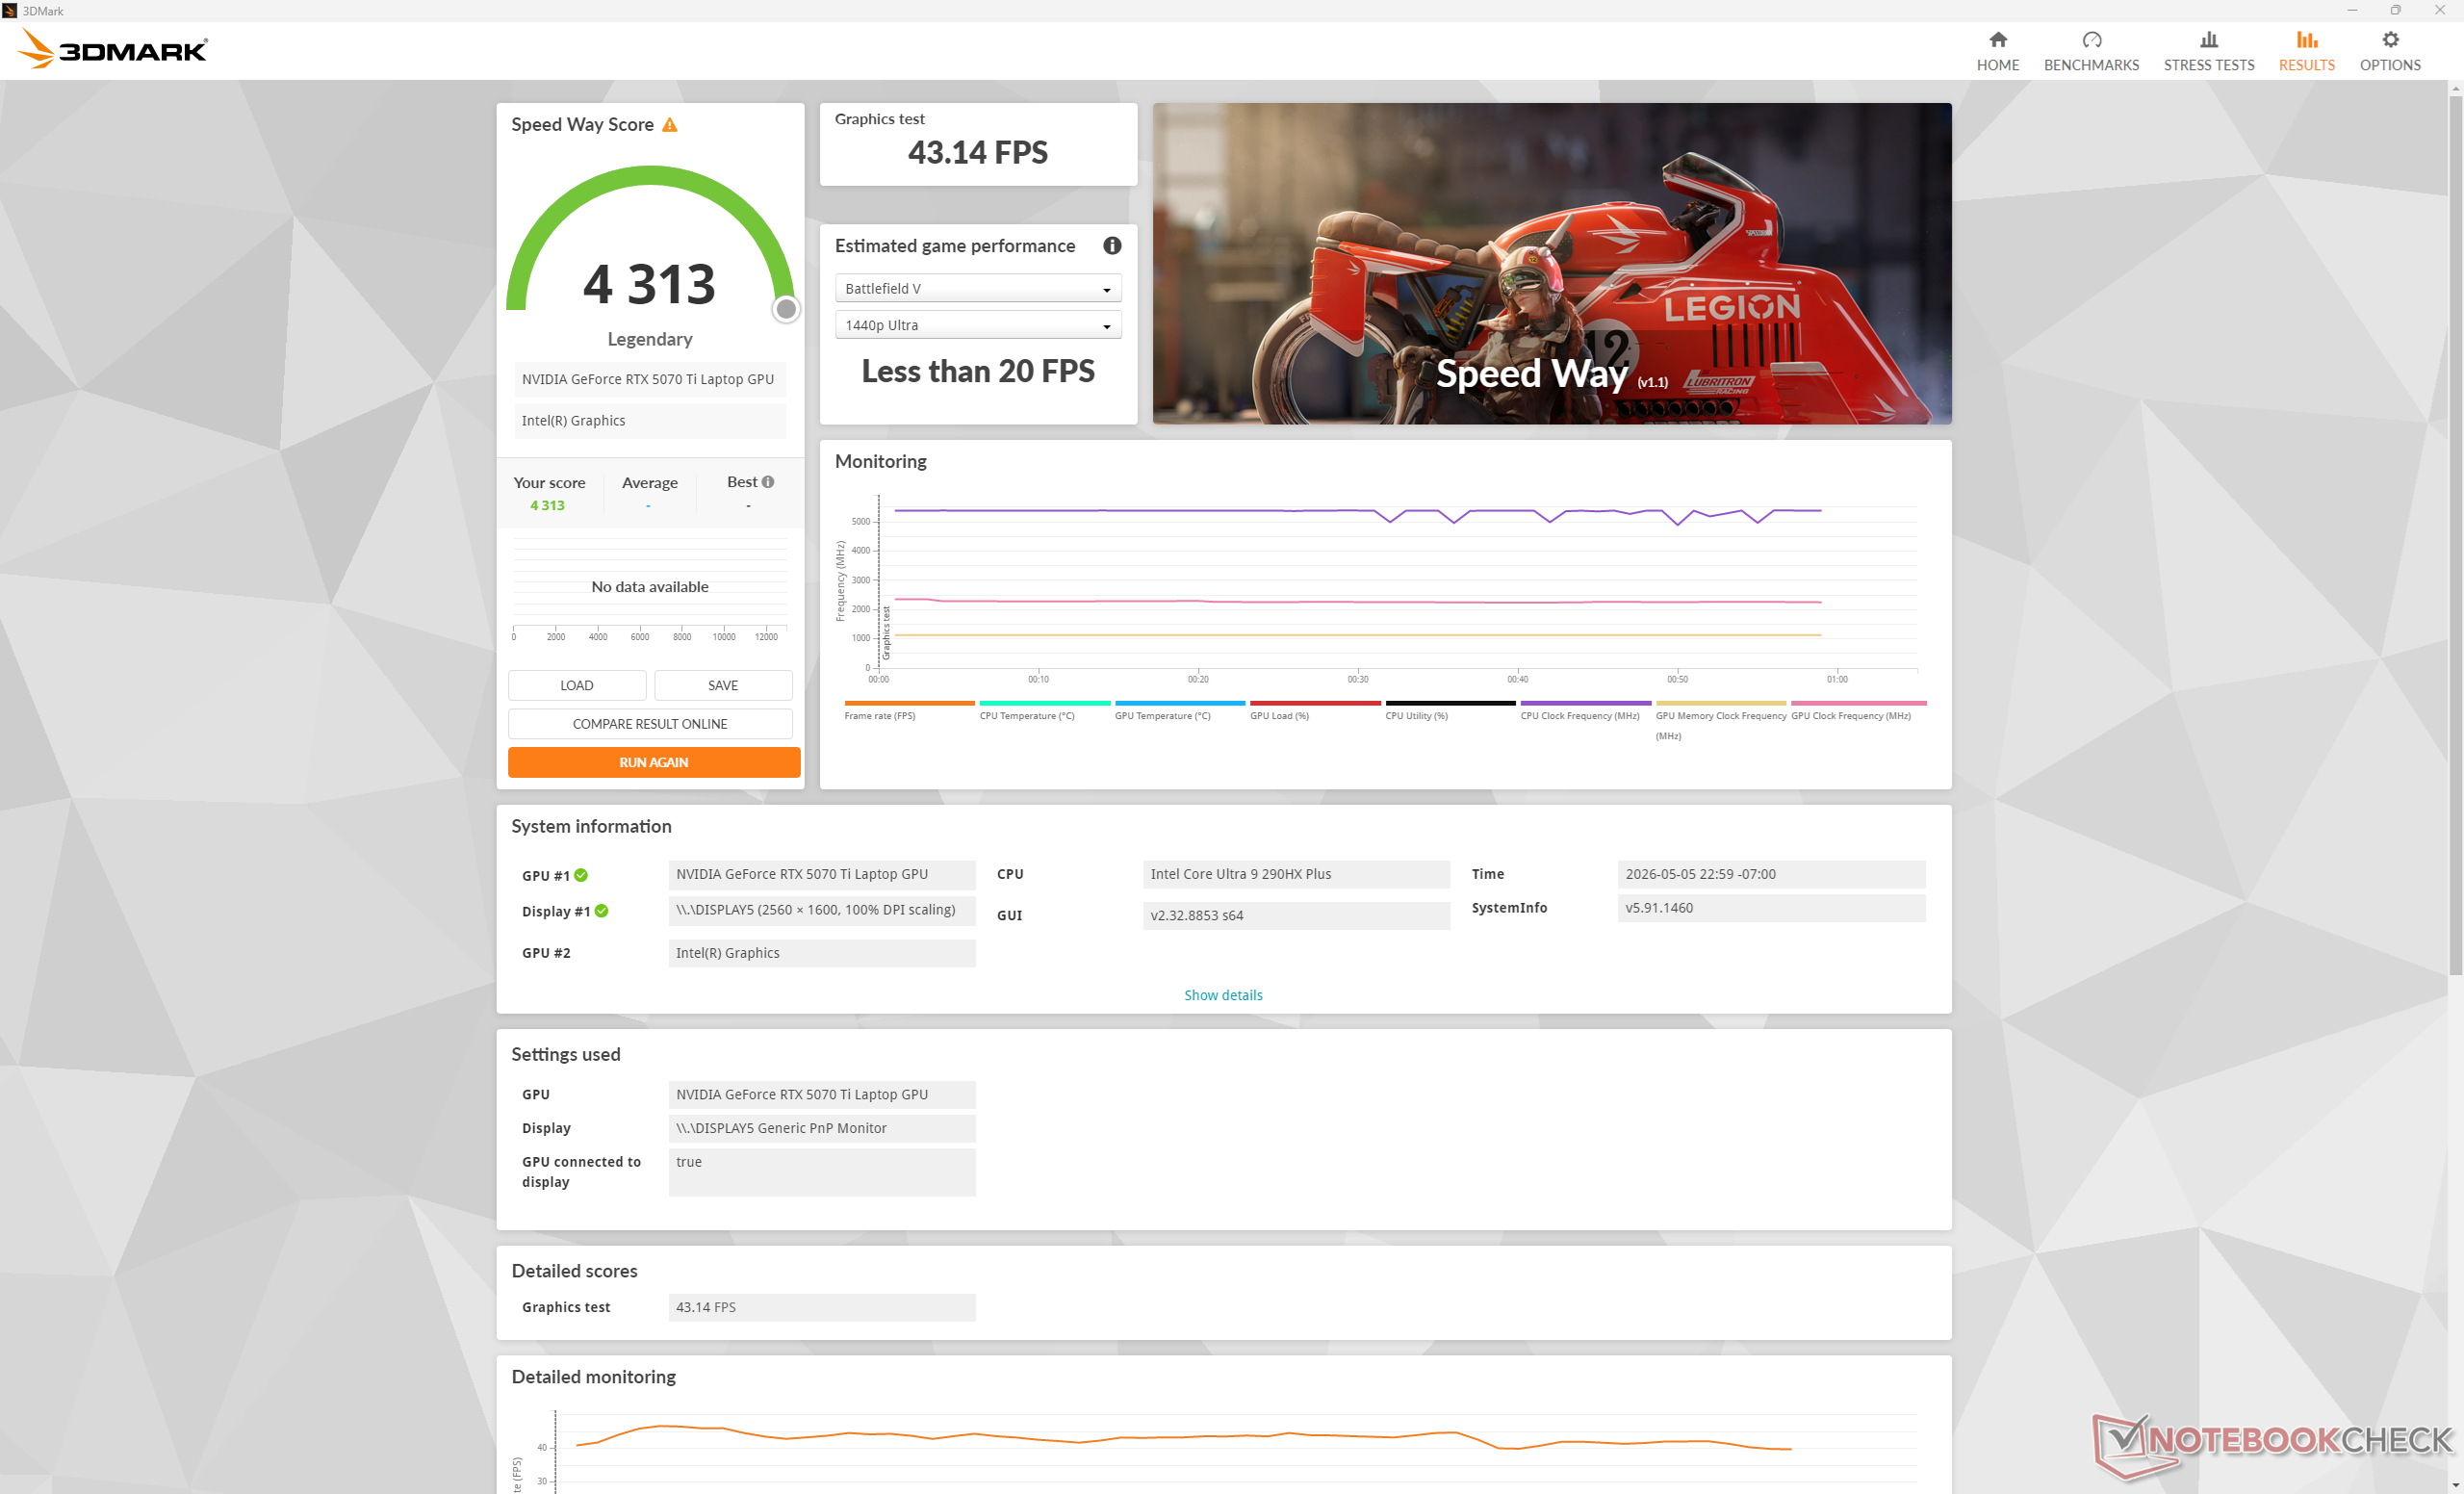
Le mobile GeForce RTX 5070 Ti est environ 20 % plus rapide que la rTX 5070 mobile de l'Aurora 16X de l'année dernière. Plus particulièrement, la RTX 5070 Ti mobile offre plus de VRAM que la rTX 5070 mobile ou inférieure.
Notez que le fait d'utiliser le mode Performance au lieu du mode Overdrive n'aurait qu'un impact minime sur les performances, comme le montrent les résultats de notre site Time Spy ci-dessous. Ce n'est que lorsque vous passez en mode équilibré que l'impact sur les performances de jeu devient perceptible.
| Profil de puissance | Score graphique | Score physique | Score combiné |
| Mode Overdrive | 16841 | 17322 | 16911 |
| Mode Performance | 16458 (-2%) | 17318 (-0%) | 16581 (-2%) |
| Mode équilibré | 15234 (-10%) | 17079 (-1%) | 15484 (-8%) |
| Puissance de la batterie | 11934 (-29%) | 14833 (-14%) | 12294 (-27%) |
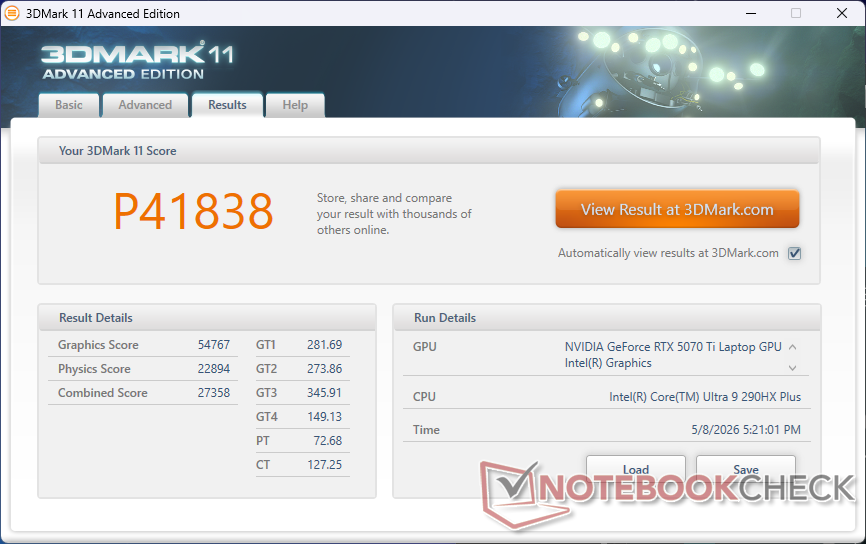
| 3DMark 11 Performance | 41838 points | |
| 3DMark Cloud Gate Standard Score | 72346 points | |
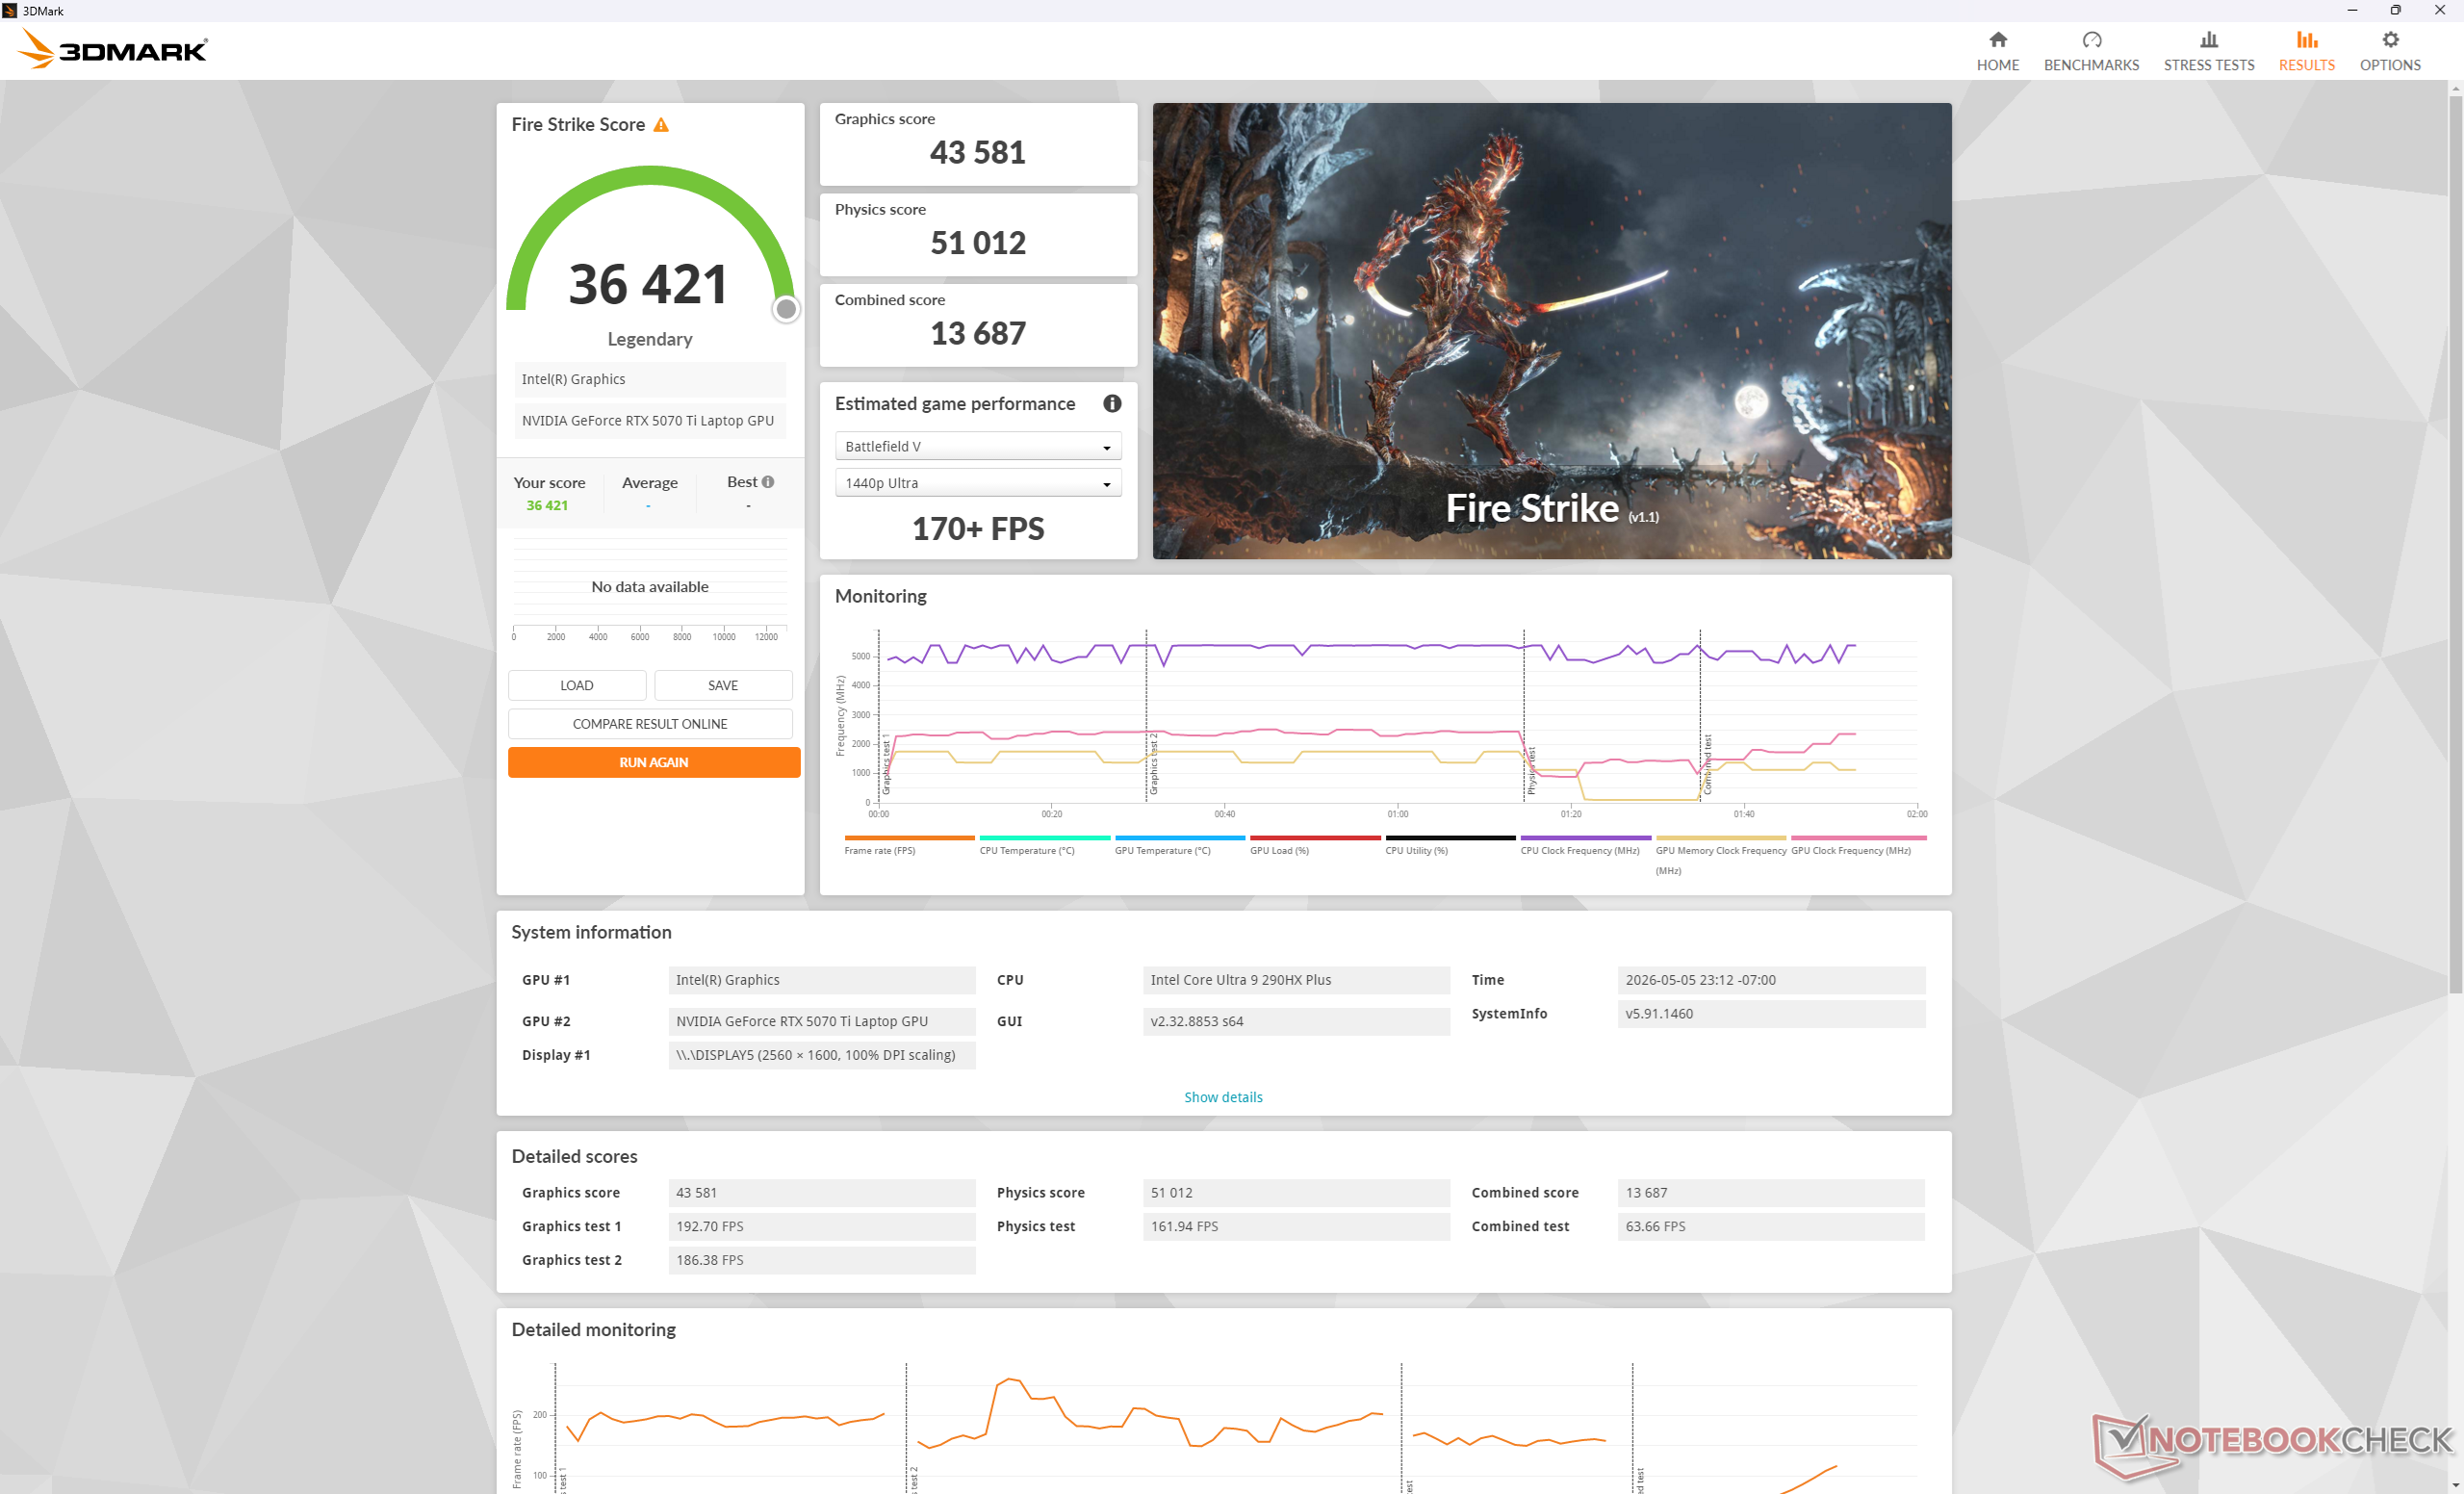
| 3DMark Fire Strike Score | 36421 points | |
| 3DMark Time Spy Score | 16581 points | |
| 3DMark Steel Nomad Score | 3741 points | |
Aide | ||
* ... Moindre est la valeur, meilleures sont les performances
Performances des jeux
Les performances dans les jeux sont en moyenne 15 % plus rapides que celles de la 2025 16X Aurora avec la GeForce RTX 5070.
| GTA V - 1920x1080 Highest AA:4xMSAA + FX AF:16x | |
| Alienware 16X Aurora Core Ultra 9 290HX Plus | |
| Alienware 16X Aurora, RTX 5070 | |
| Lenovo Legion Pro 5 16IAX10, RTX 5070 | |
| Acer Predator Helios Neo 16S AI PHN16S-71-94L9 | |
| MSI Vector 16 HX AI A2XWHG | |
| Final Fantasy XV Benchmark - 1920x1080 High Quality | |
| MSI Vector 16 HX AI A2XWHG | |
| Alienware 16X Aurora Core Ultra 9 290HX Plus | |
| Alienware 16X Aurora, RTX 5070 | |
| Lenovo Legion Pro 5 16IAX10, RTX 5070 | |
| Asus ROG Zephyrus G16 2025 5070 Ti | |
| Strange Brigade - 1920x1080 ultra AA:ultra AF:16 | |
| Alienware 16X Aurora Core Ultra 9 290HX Plus | |
| Asus ROG Zephyrus G16 2025 5070 Ti | |
| Alienware 16X Aurora, RTX 5070 | |
| Lenovo Legion Pro 5 16IAX10, RTX 5070 | |
Cyberpunk 2077 ultra FPS Chart
| Bas | Moyen | Élevé | Ultra | QHD DLSS | QHD | |
|---|---|---|---|---|---|---|
| GTA V (2015) | 187.6 | 187.2 | 184.9 | 159.2 | 134.4 | |
| Dota 2 Reborn (2015) | 236 | 207 | 199.9 | 184.7 | ||
| Final Fantasy XV Benchmark (2018) | 233 | 209 | 161.1 | 120.3 | ||
| X-Plane 11.11 (2018) | 154.1 | 137.3 | 110.4 | |||
| Strange Brigade (2018) | 572 | 337 | 281 | 314 | 210 | |
| Baldur's Gate 3 (2023) | 181.6 | 162.4 | 159.3 | 157.7 | 109.5 | |
| Cyberpunk 2077 (2023) | 171.3 | 146.5 | 126.1 | 114.9 | 86.9 | 75.1 |
| F1 24 (2024) | 324 | 318 | 268 | 97.7 | 99 | 62.8 |
| Black Myth: Wukong (2024) | 126 | 94 | 73 | 42 | 47 | 31 |
| Assassin's Creed Shadows (2025) | 89 | 83 | 71 | 52 | 54 | 44 |
Émissions
Bruit du système
Les changements de vitesse de rotation du ventilateur sont rapides et soudains lorsque des charges plus élevées sont introduites, même lorsque la carte est réglée sur Optimus et le profil de puissance équilibré. Le bruit du ventilateur est pratiquement identique à celui du modèle 2025 et le modèle 2026 n'est ni plus bruyant ni plus silencieux dans les jeux.
Le bruit du ventilateur lors de l'exécution de Cyberpunk 2077 en mode équilibré, performance et Overdrive se stabilise à environ 48,7 dB(A), 51,5 dB(A) et 59,8 dB(A), respectivement. Étant donné que les gains de performances en mode Overdrive sont très faibles, nous vous recommandons de jouer en mode Performance pour bénéficier de ventilateurs nettement plus silencieux.
Degré de la nuisance sonore
| Au repos |
| 23.8 / 23.8 / 31.4 dB(A) |
| Fortement sollicité |
| 48.7 / 59.8 dB(A) |
 | ||
30 dB silencieux 40 dB(A) audible 50 dB(A) bruyant |
||
min: | ||
| Alienware 16X Aurora Core Ultra 9 290HX Plus Ultra 9 290HX Plus, GeForce RTX 5070 Ti Laptop | Alienware 16X Aurora, RTX 5070 Ultra 9 275HX, GeForce RTX 5070 Laptop | Acer Predator Helios Neo 16S AI PHN16S-71-94L9 Ultra 9 275HX, GeForce RTX 5070 Ti Laptop | Lenovo Legion Pro 5 16IAX10, RTX 5070 Ultra 7 255HX, GeForce RTX 5070 Laptop | MSI Vector 16 HX AI A2XWHG Ultra 7 255HX, GeForce RTX 5070 Ti Laptop | Asus ROG Zephyrus G16 GU605CW Ultra 9 285H, GeForce RTX 5080 Laptop | |
|---|---|---|---|---|---|---|
| Noise | 9% | -6% | 8% | -11% | -9% | |
| arrêt / environnement * (dB) | 23.4 | 23.7 -1% | 24 -3% | 23 2% | 25 -7% | 25.56 -9% |
| Idle Minimum * (dB) | 23.8 | 23.9 -0% | 24 -1% | 23 3% | 33 -39% | 30 -26% |
| Idle Average * (dB) | 23.8 | 23.9 -0% | 30 -26% | 23 3% | 34 -43% | 30 -26% |
| Idle Maximum * (dB) | 31.4 | 26.1 17% | 35 -11% | 23 27% | 38 -21% | 30 4% |
| Load Average * (dB) | 48.7 | 26.8 45% | 53 -9% | 43.85 10% | 46 6% | 53.55 -10% |
| Cyberpunk 2077 ultra * (dB) | 51.5 | 51.8 -1% | 52 -1% | 50.27 2% | 47 9% | 53.5 -4% |
| Load Maximum * (dB) | 59.8 | 58 3% | 54 10% | 52.9 12% | 49 18% | 54.02 10% |
* ... Moindre est la valeur, meilleures sont les performances
Température
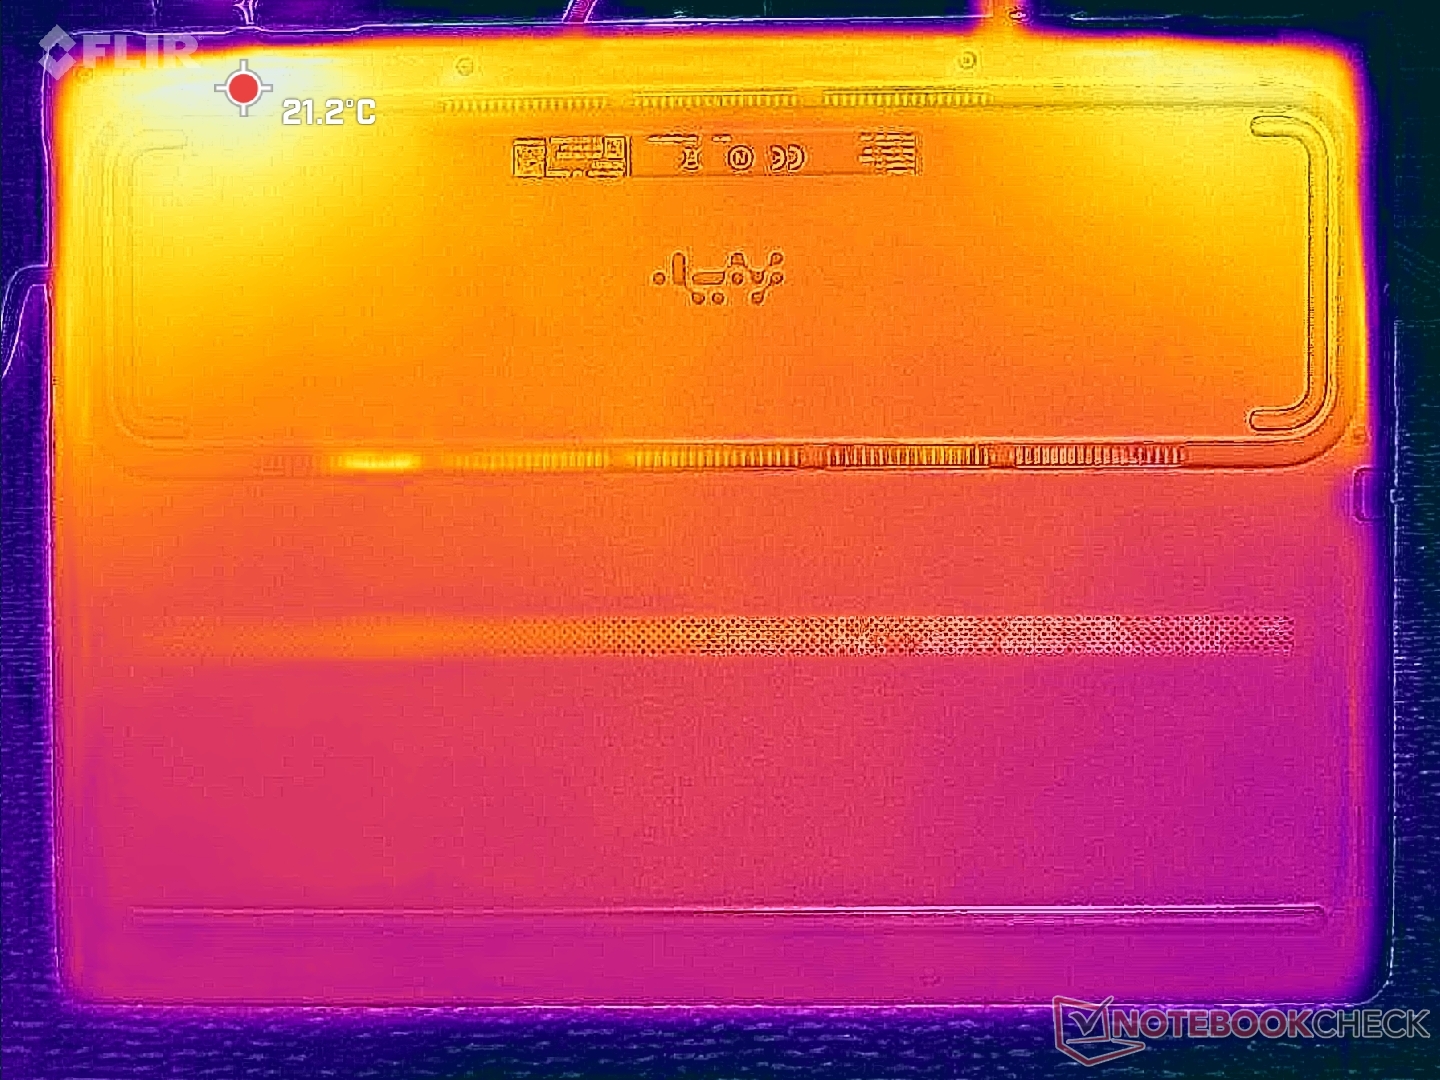
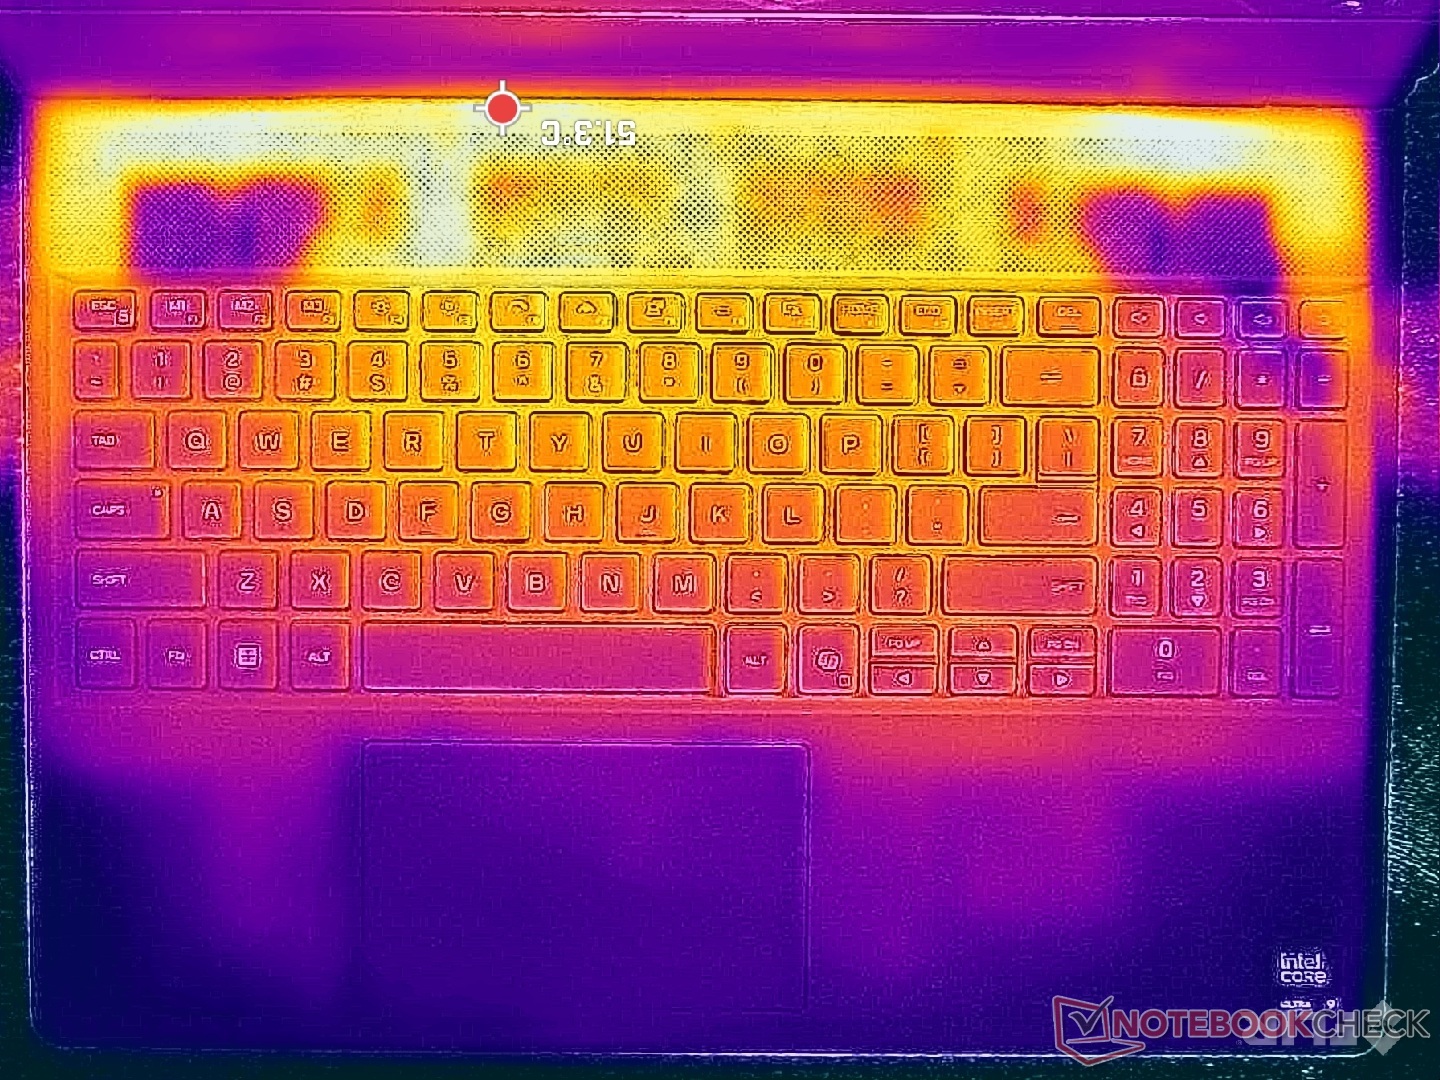
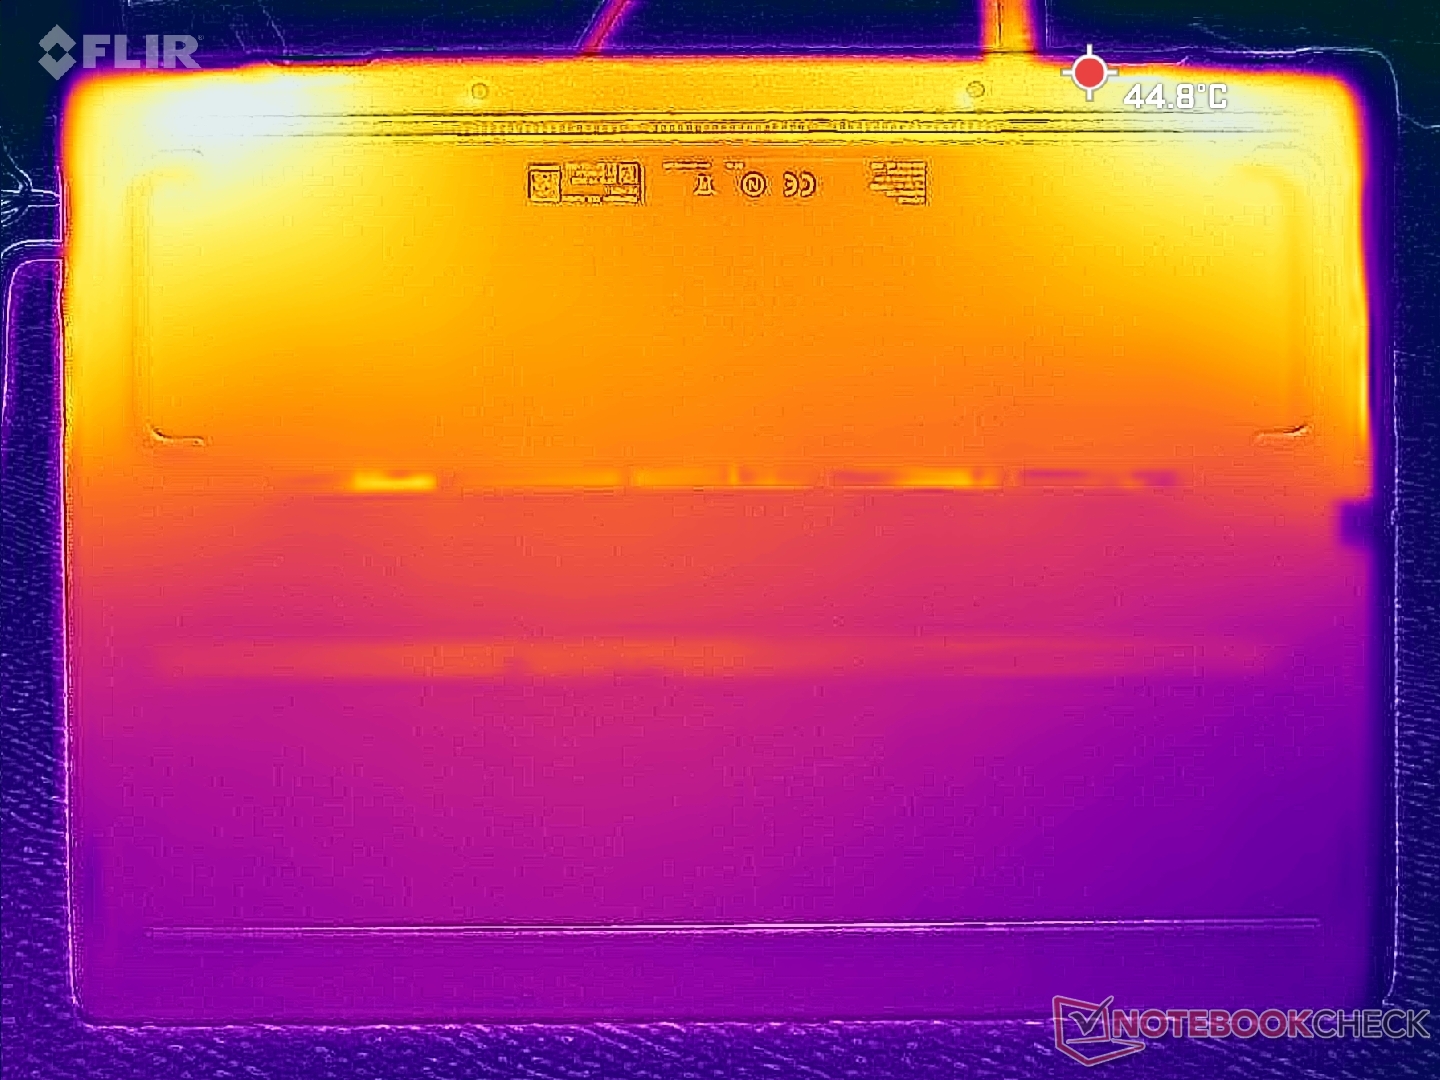
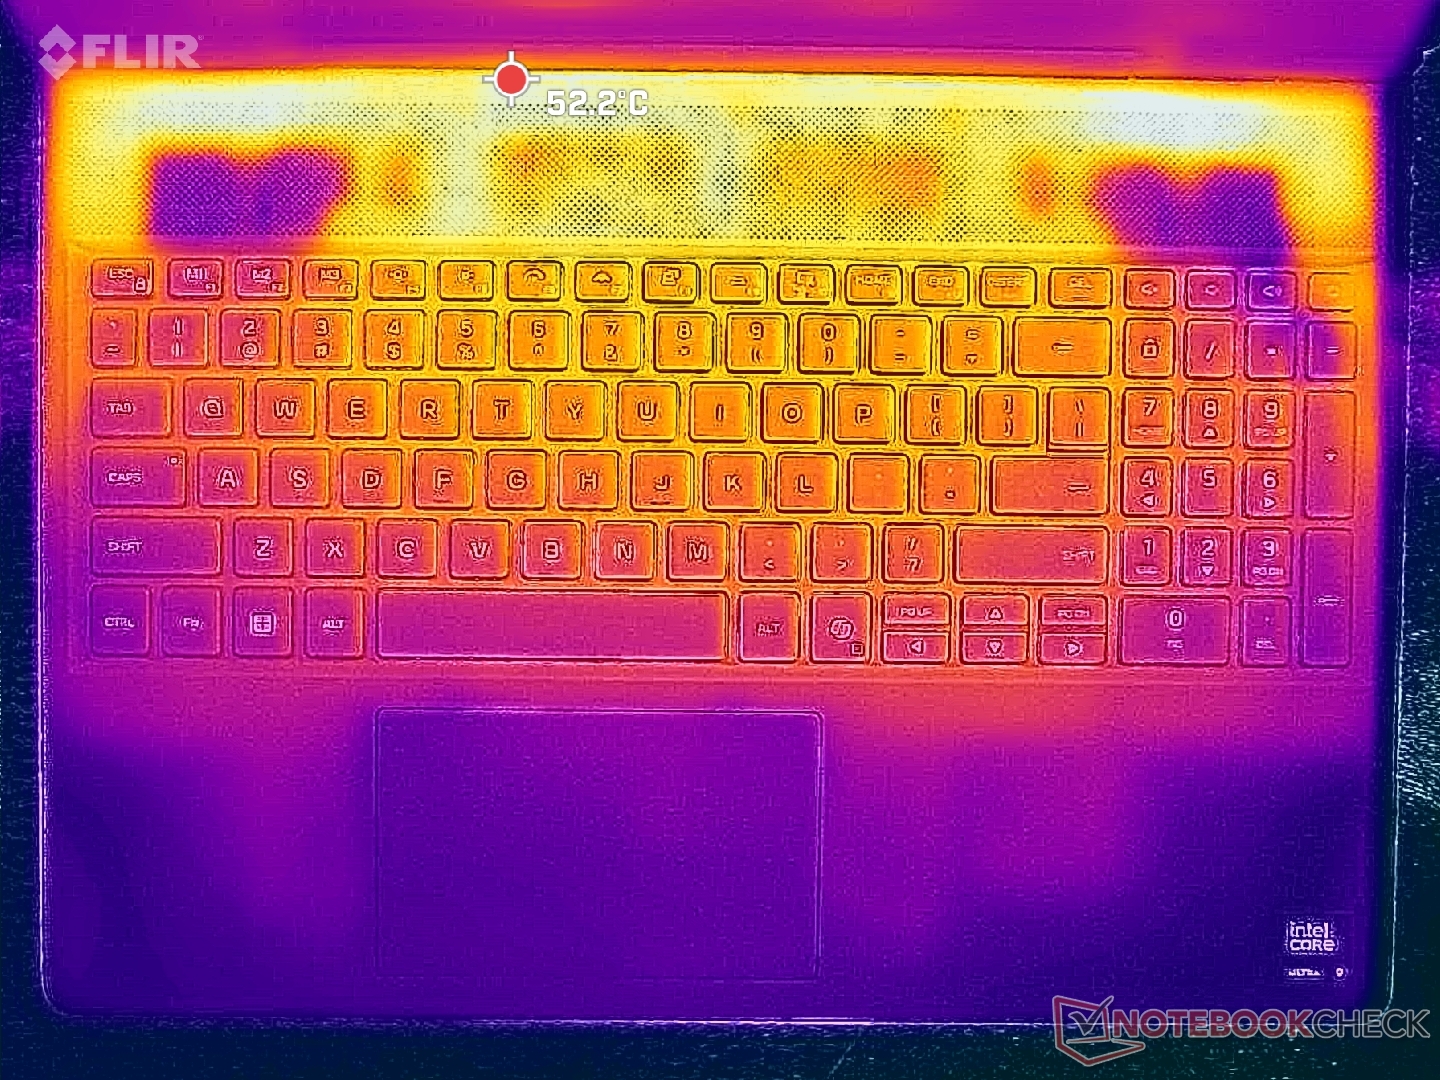
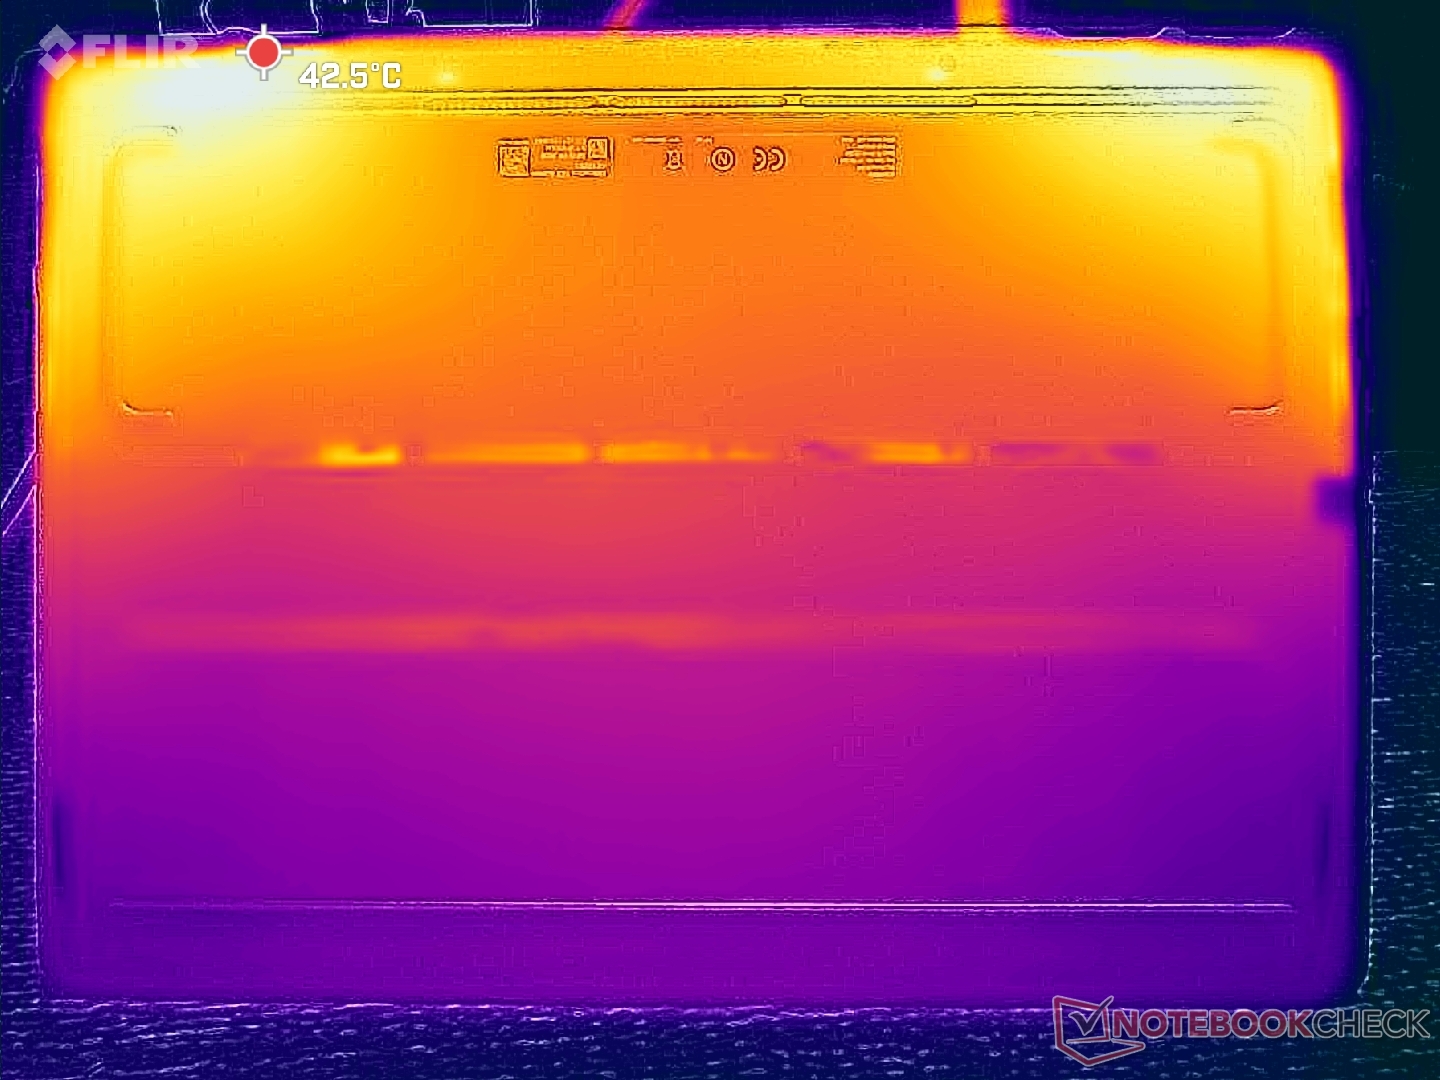
Les températures de surface sont légèrement plus fraîches en moyenne de quelques degrés C que ce que nous avons enregistré dans la configuration de l'année dernière. Les résultats sont en corrélation avec nos analyses dans la section "Stress Test" ci-dessous.
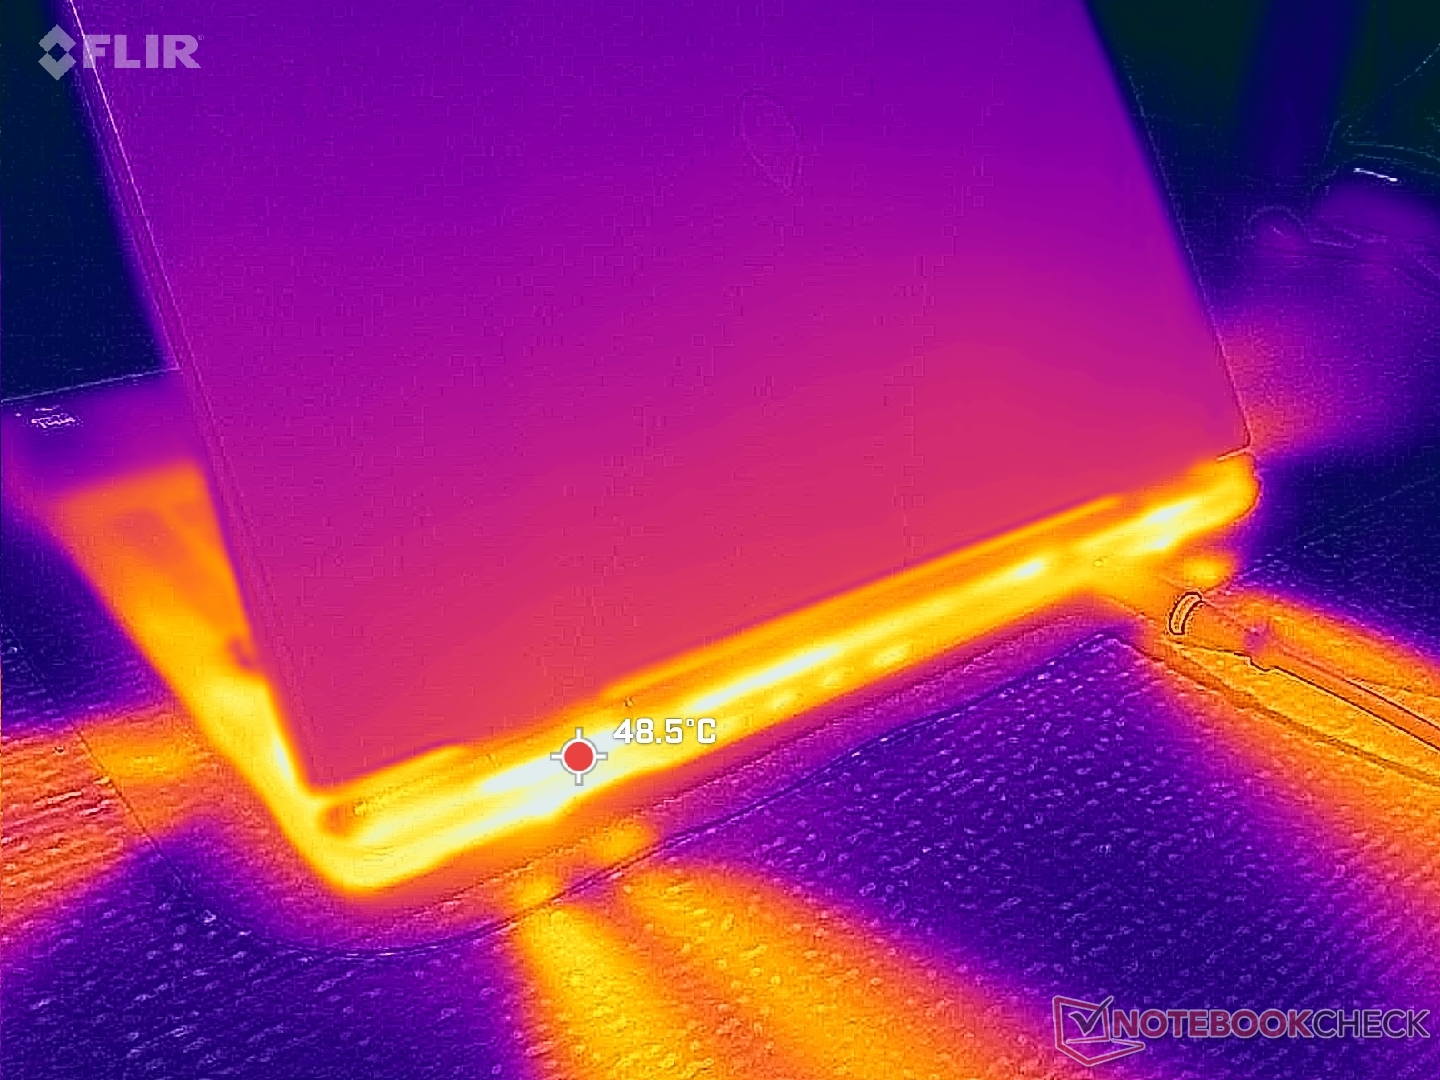
(-) La température maximale du côté supérieur est de 48.2 °C / 119 F, par rapport à la moyenne de 40.4 °C / 105 F, allant de 21.2 à 68.8 °C pour la classe Gaming.
(±) Le fond chauffe jusqu'à un maximum de 41 °C / 106 F, contre une moyenne de 43.2 °C / 110 F
(+) En utilisation inactive, la température moyenne du côté supérieur est de 26 °C / 79 F, par rapport à la moyenne du dispositif de 33.9 °C / 93 F.
(-) 3: The average temperature for the upper side is 39.4 °C / 103 F, compared to the average of 33.9 °C / 93 F for the class Gaming.
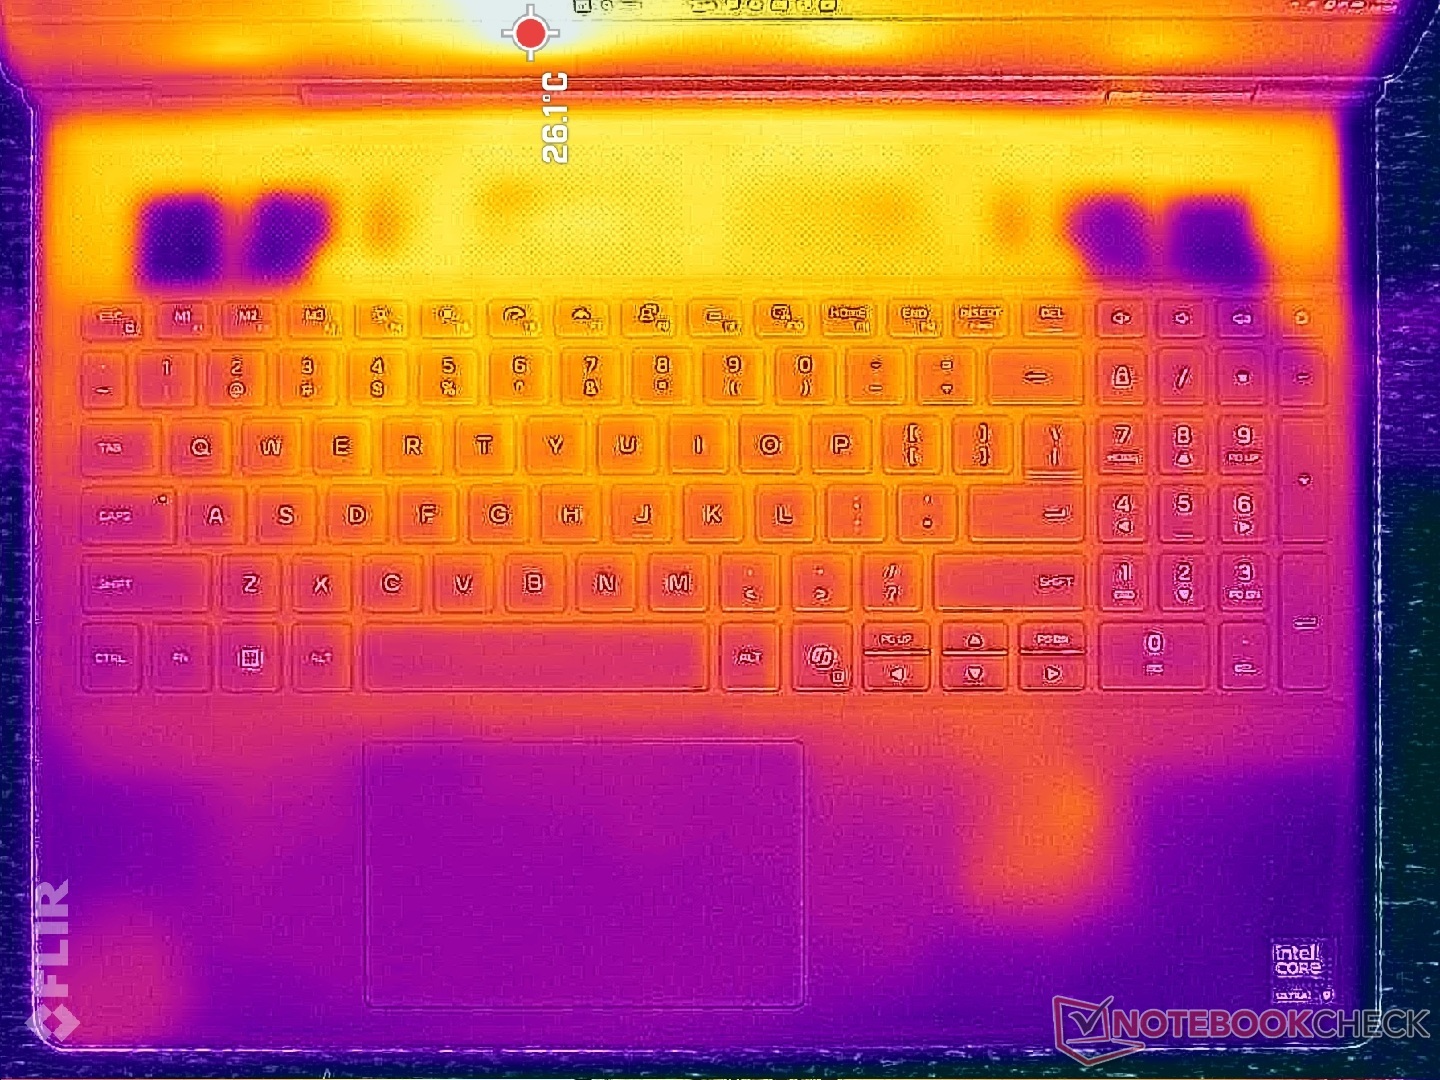
(+) Les repose-poignets et le pavé tactile sont plus froids que la température de la peau avec un maximum de 31 °C / 87.8 F et sont donc froids au toucher.
(-) La température moyenne de la zone de l'appui-paume de dispositifs similaires était de 28.8 °C / 83.8 F (-2.2 °C / #-4 F).
| Alienware 16X Aurora Core Ultra 9 290HX Plus Ultra 9 290HX Plus, GeForce RTX 5070 Ti Laptop | Alienware 16X Aurora, RTX 5070 Ultra 9 275HX, GeForce RTX 5070 Laptop | Acer Predator Helios Neo 16S AI PHN16S-71-94L9 Ultra 9 275HX, GeForce RTX 5070 Ti Laptop | Lenovo Legion Pro 5 16IAX10, RTX 5070 Ultra 7 255HX, GeForce RTX 5070 Laptop | MSI Vector 16 HX AI A2XWHG Ultra 7 255HX, GeForce RTX 5070 Ti Laptop | Asus ROG Zephyrus G16 GU605CW Ultra 9 285H, GeForce RTX 5080 Laptop | |
|---|---|---|---|---|---|---|
| Heat | -7% | -11% | -10% | -16% | -25% | |
| Maximum Upper Side * (°C) | 48.2 | 51 -6% | 47 2% | 42 13% | 53 -10% | 49.2 -2% |
| Maximum Bottom * (°C) | 41 | 45.6 -11% | 55 -34% | 44 -7% | 52 -27% | 50.2 -22% |
| Idle Upper Side * (°C) | 28.2 | 29.8 -6% | 28 1% | 33 -17% | 33 -17% | 37.2 -32% |
| Idle Bottom * (°C) | 26.2 | 27.4 -5% | 29 -11% | 34 -30% | 29 -11% | 37.4 -43% |
* ... Moindre est la valeur, meilleures sont les performances
Test de stress
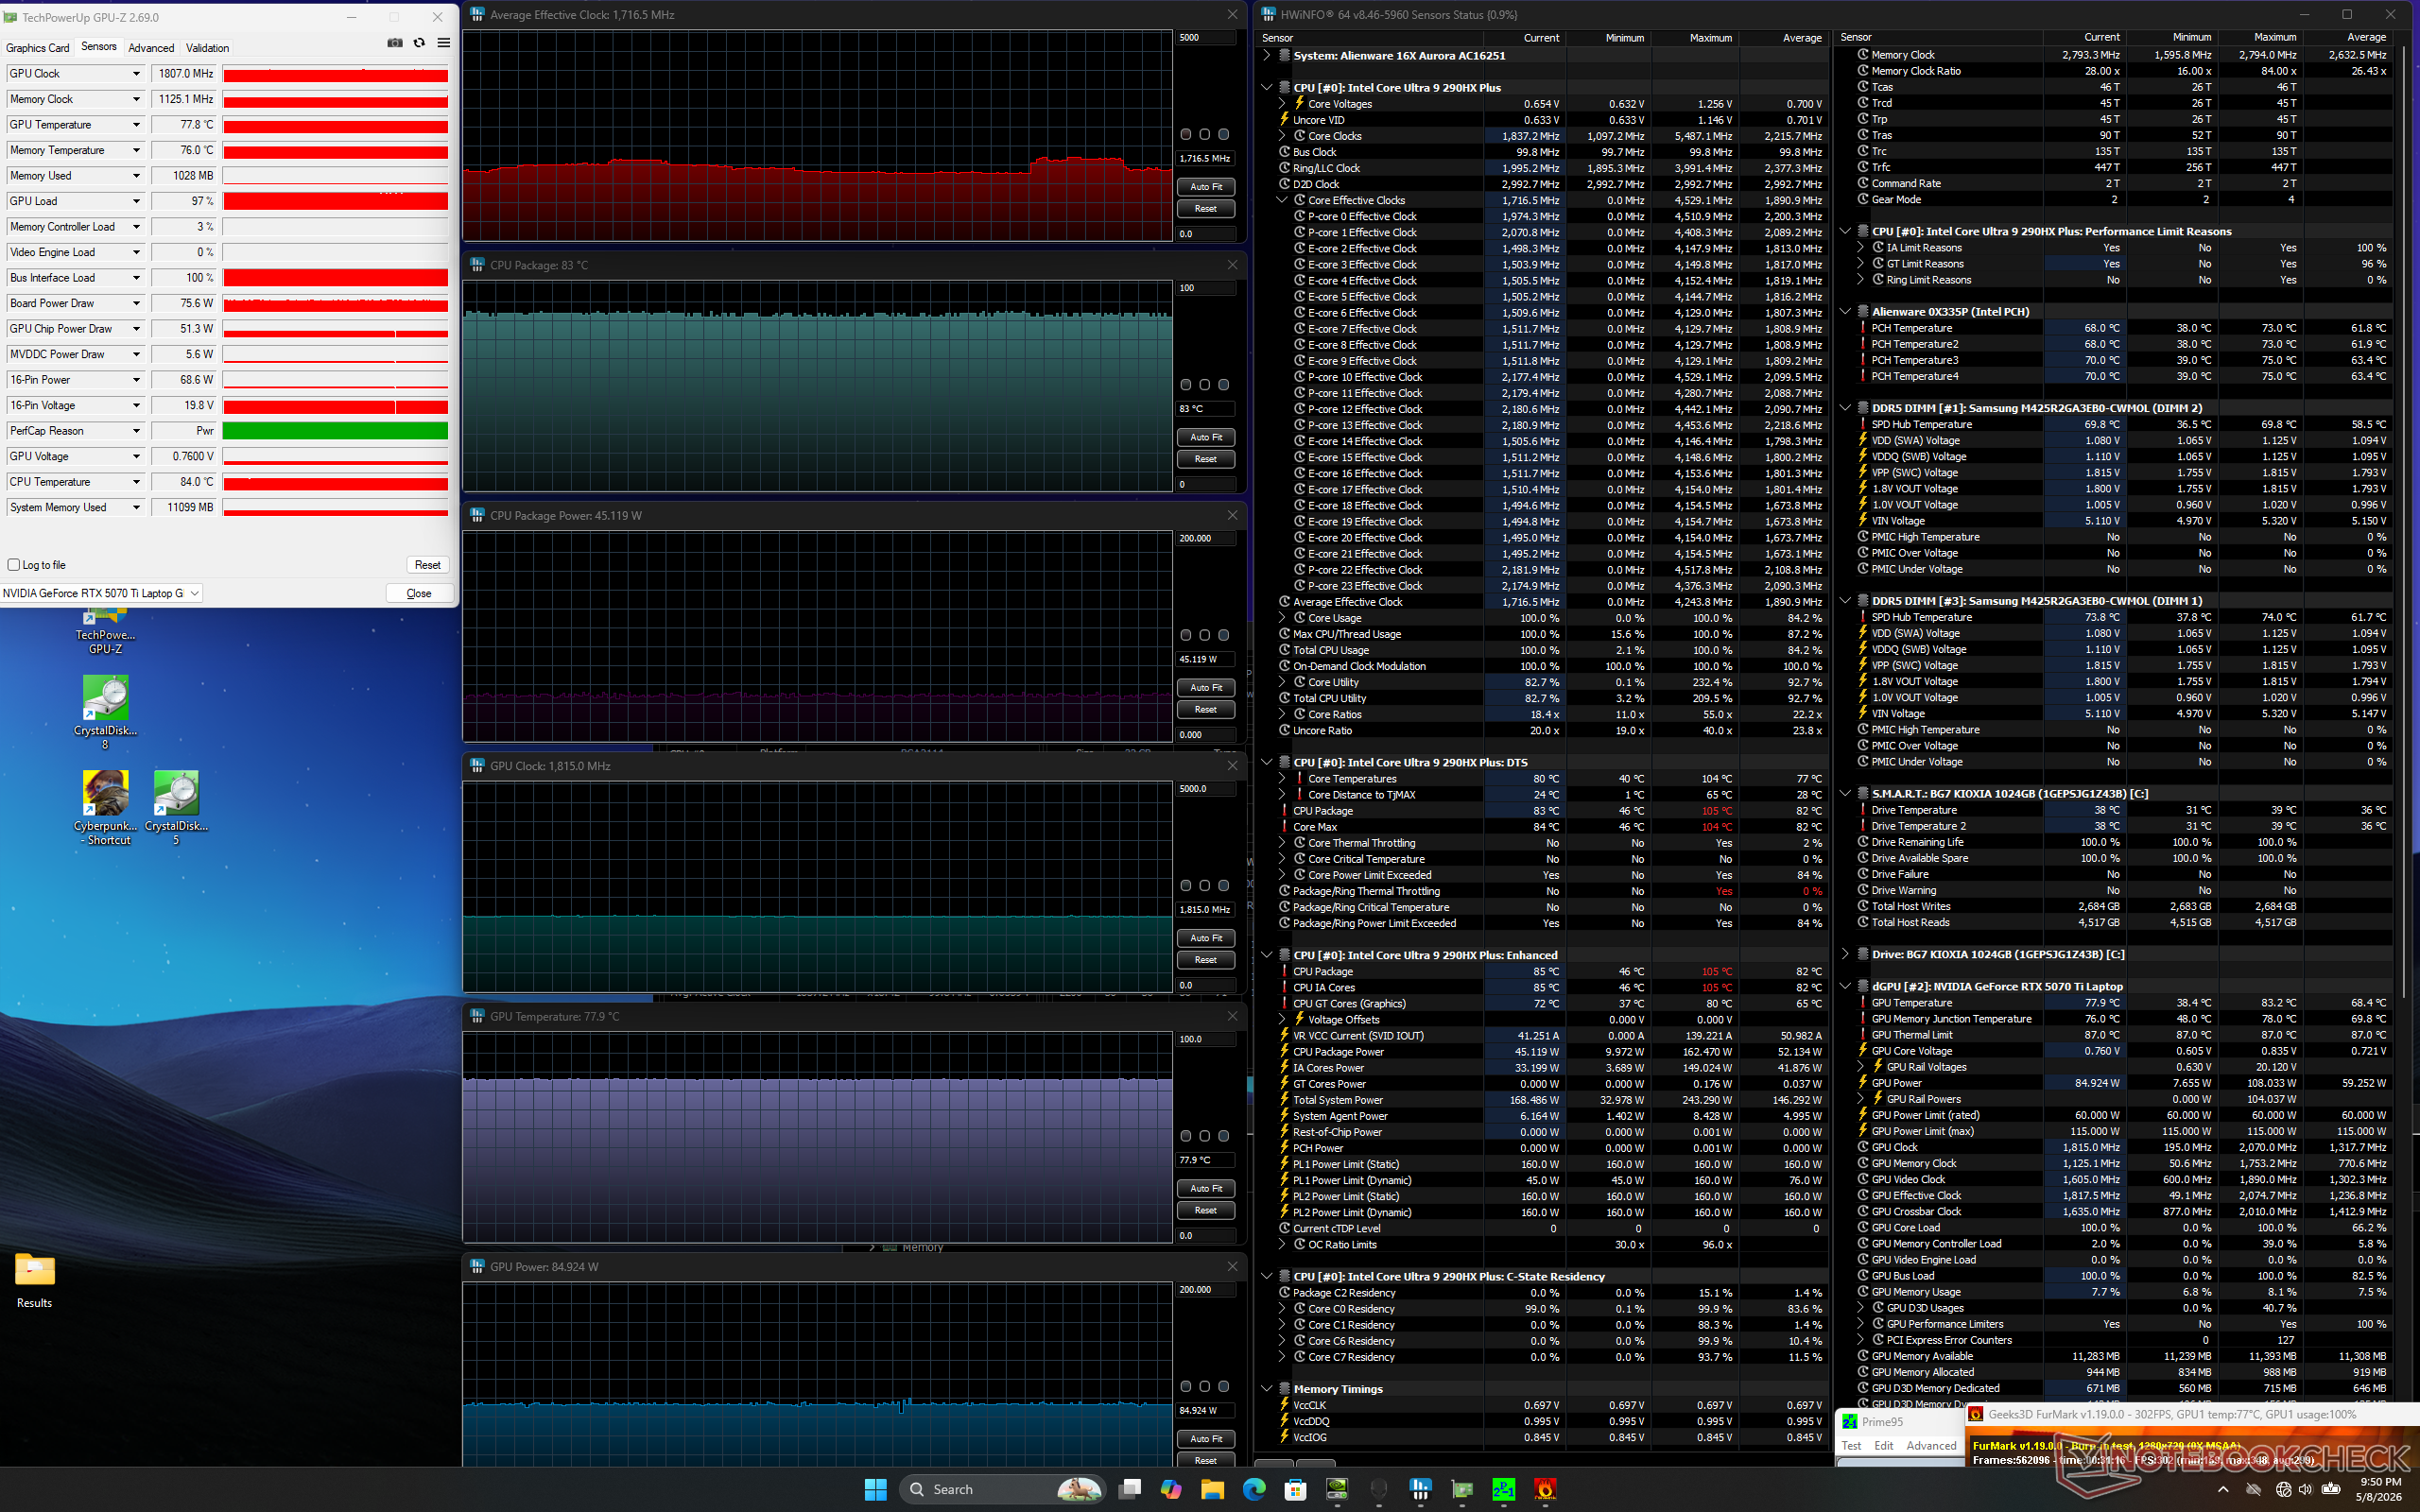
Température du cœur lors de l'exécution de Prime95 sur la machine de l'année dernière 16X Aurora atteindrait presque 100 C. Le Core Ultra 9 290HX Plus dans le 2026 16X Aurora vise des fréquences d'horloge encore plus élevées qui, sans surprise, atteindrait aussi presque 100 C lors de l'exécution de Prime95. Le processeur aurait probablement pu être plus performant si la solution de refroidissement de l'ordinateur portable avait été plus efficace. Par exemple, le CPU atteindrait 4,3 GHz et 163 W pendant seulement une ou deux secondes avant de redescendre régulièrement à 3,4 GHz et 97 W, ce qui indique un potentiel Turbo Boost limité.
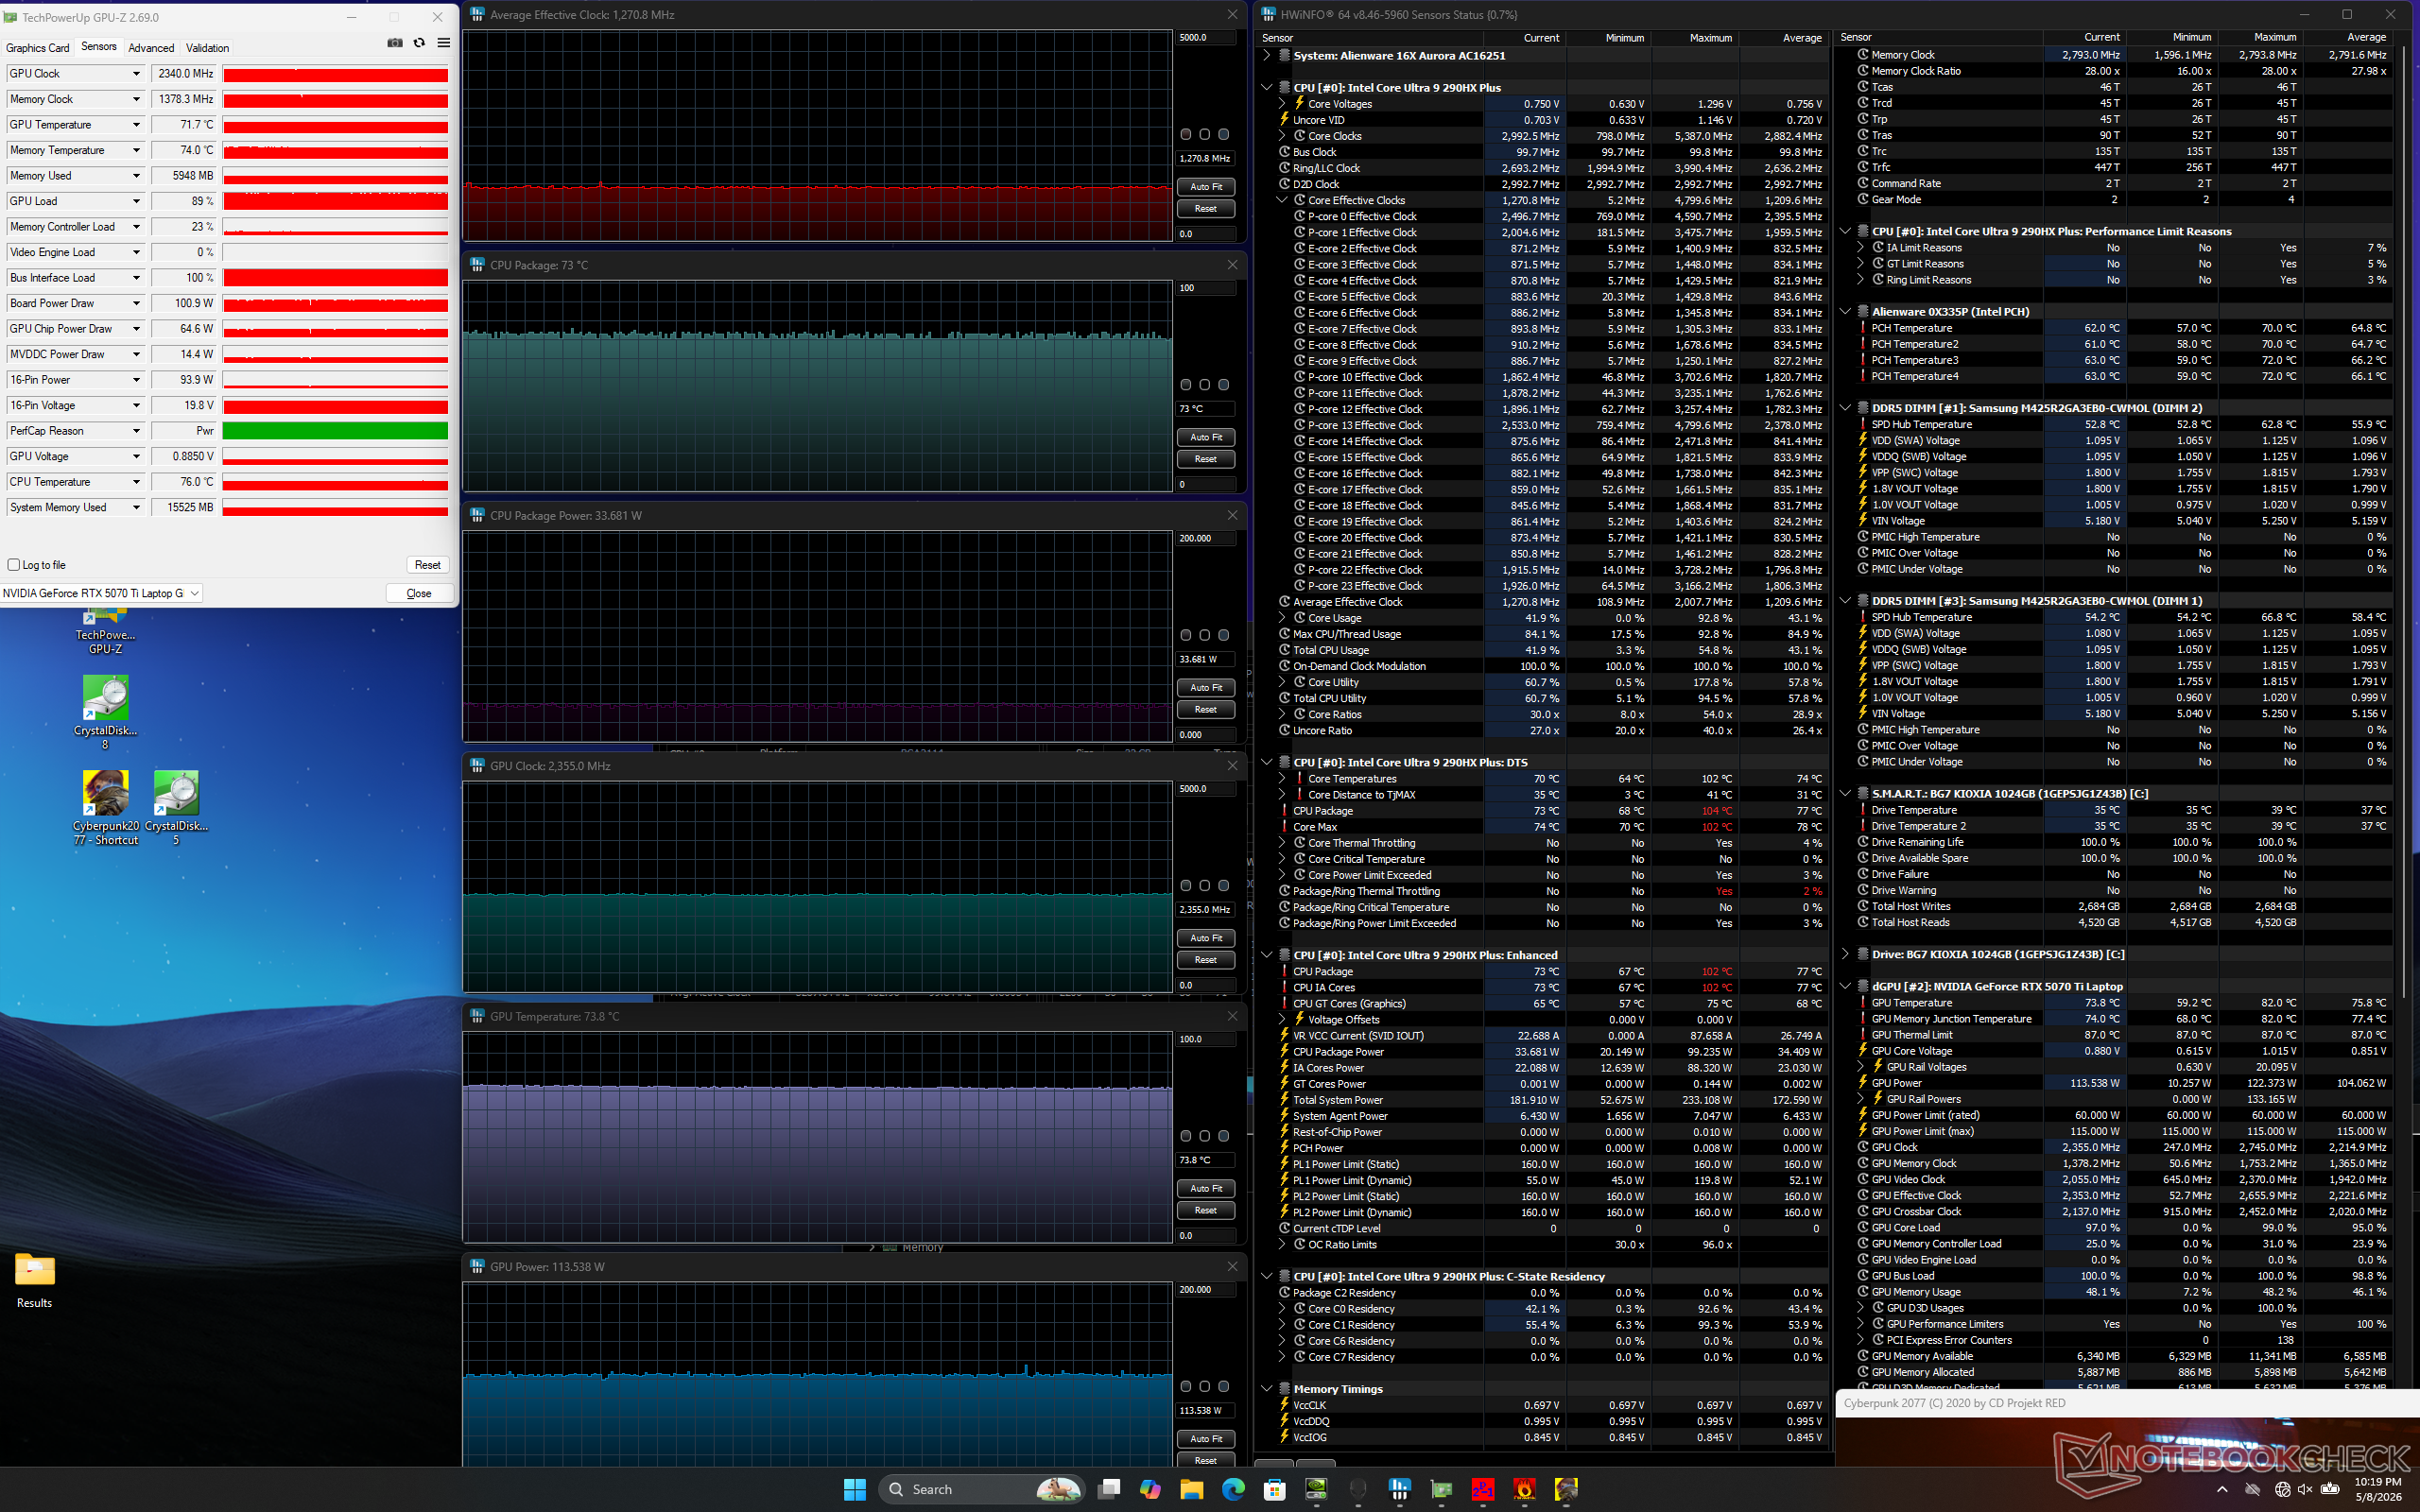
Les températures des cœurs en jeu sont également plus basses sur le modèle de cette année par rapport à l'année précédente en raison des différences de configuration. Plus précisément, la RTX 5070 Ti vise des fréquences d'horloge plus lentes que la RTX 5070 pour des températures de fonctionnement plus basses de quelques degrés Celsius. La consommation du GPU en mode Overdrive, Performance et Balanced se stabilise à 114 W, 97 W et 84 W, respectivement.
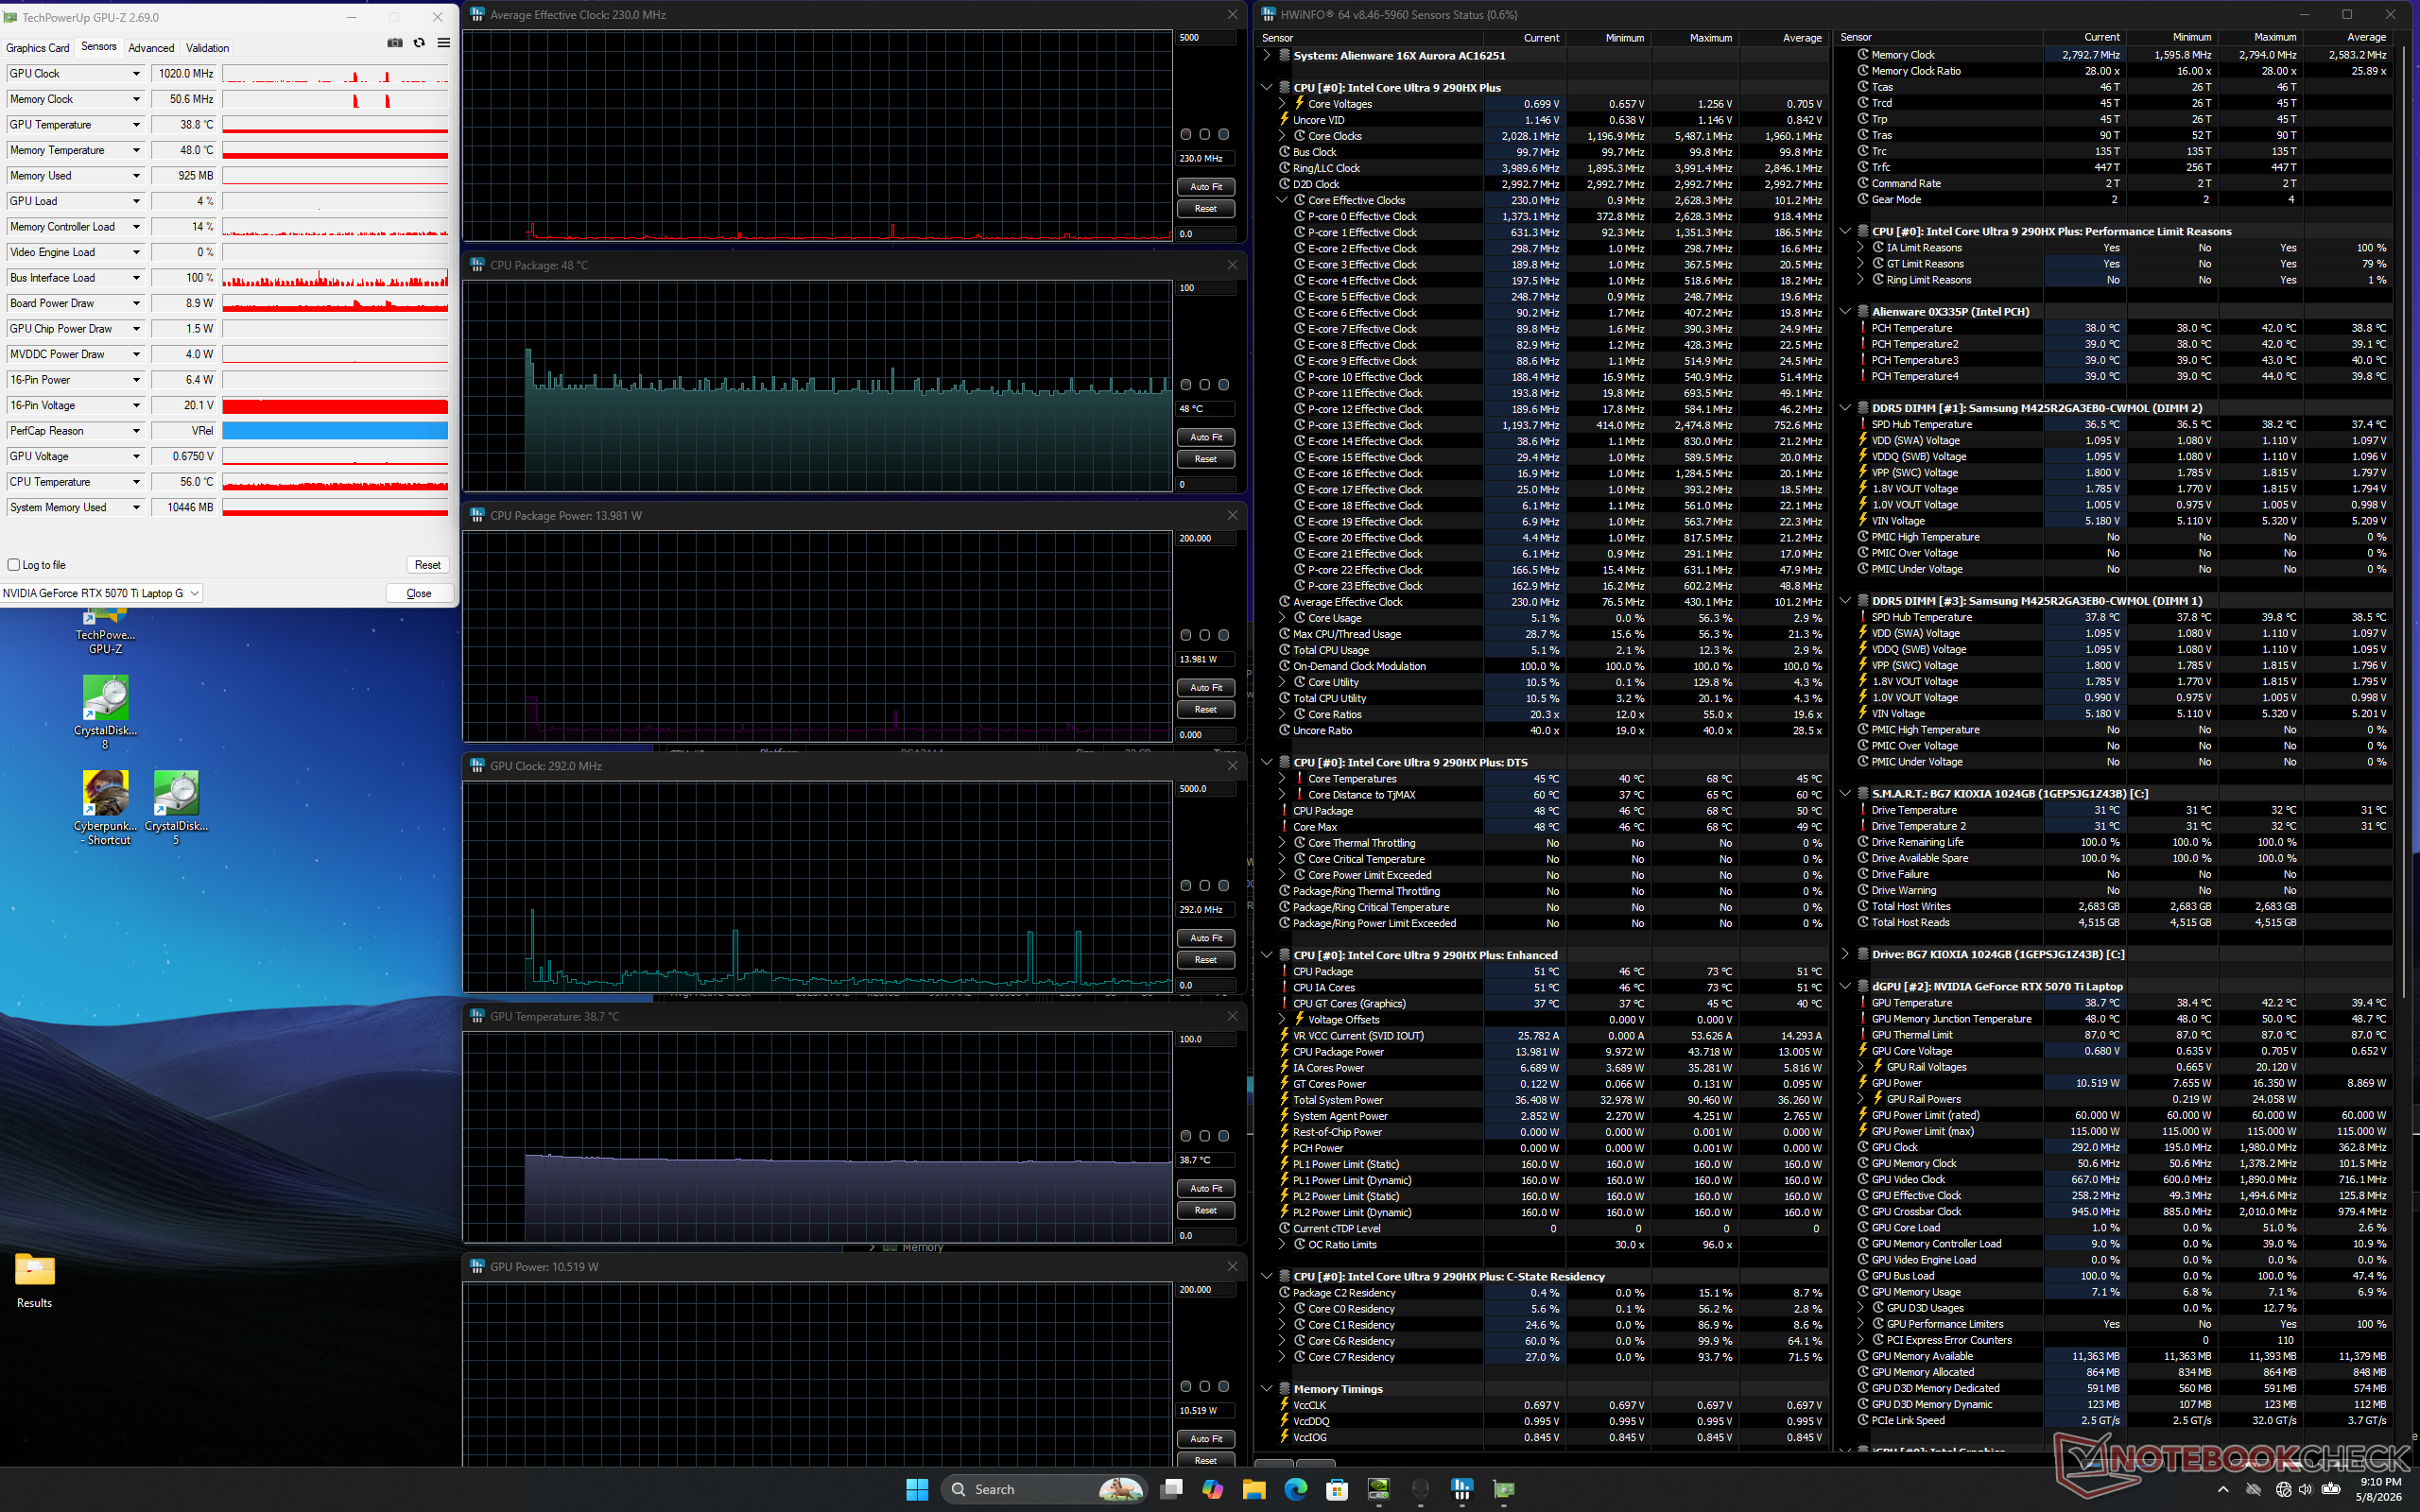
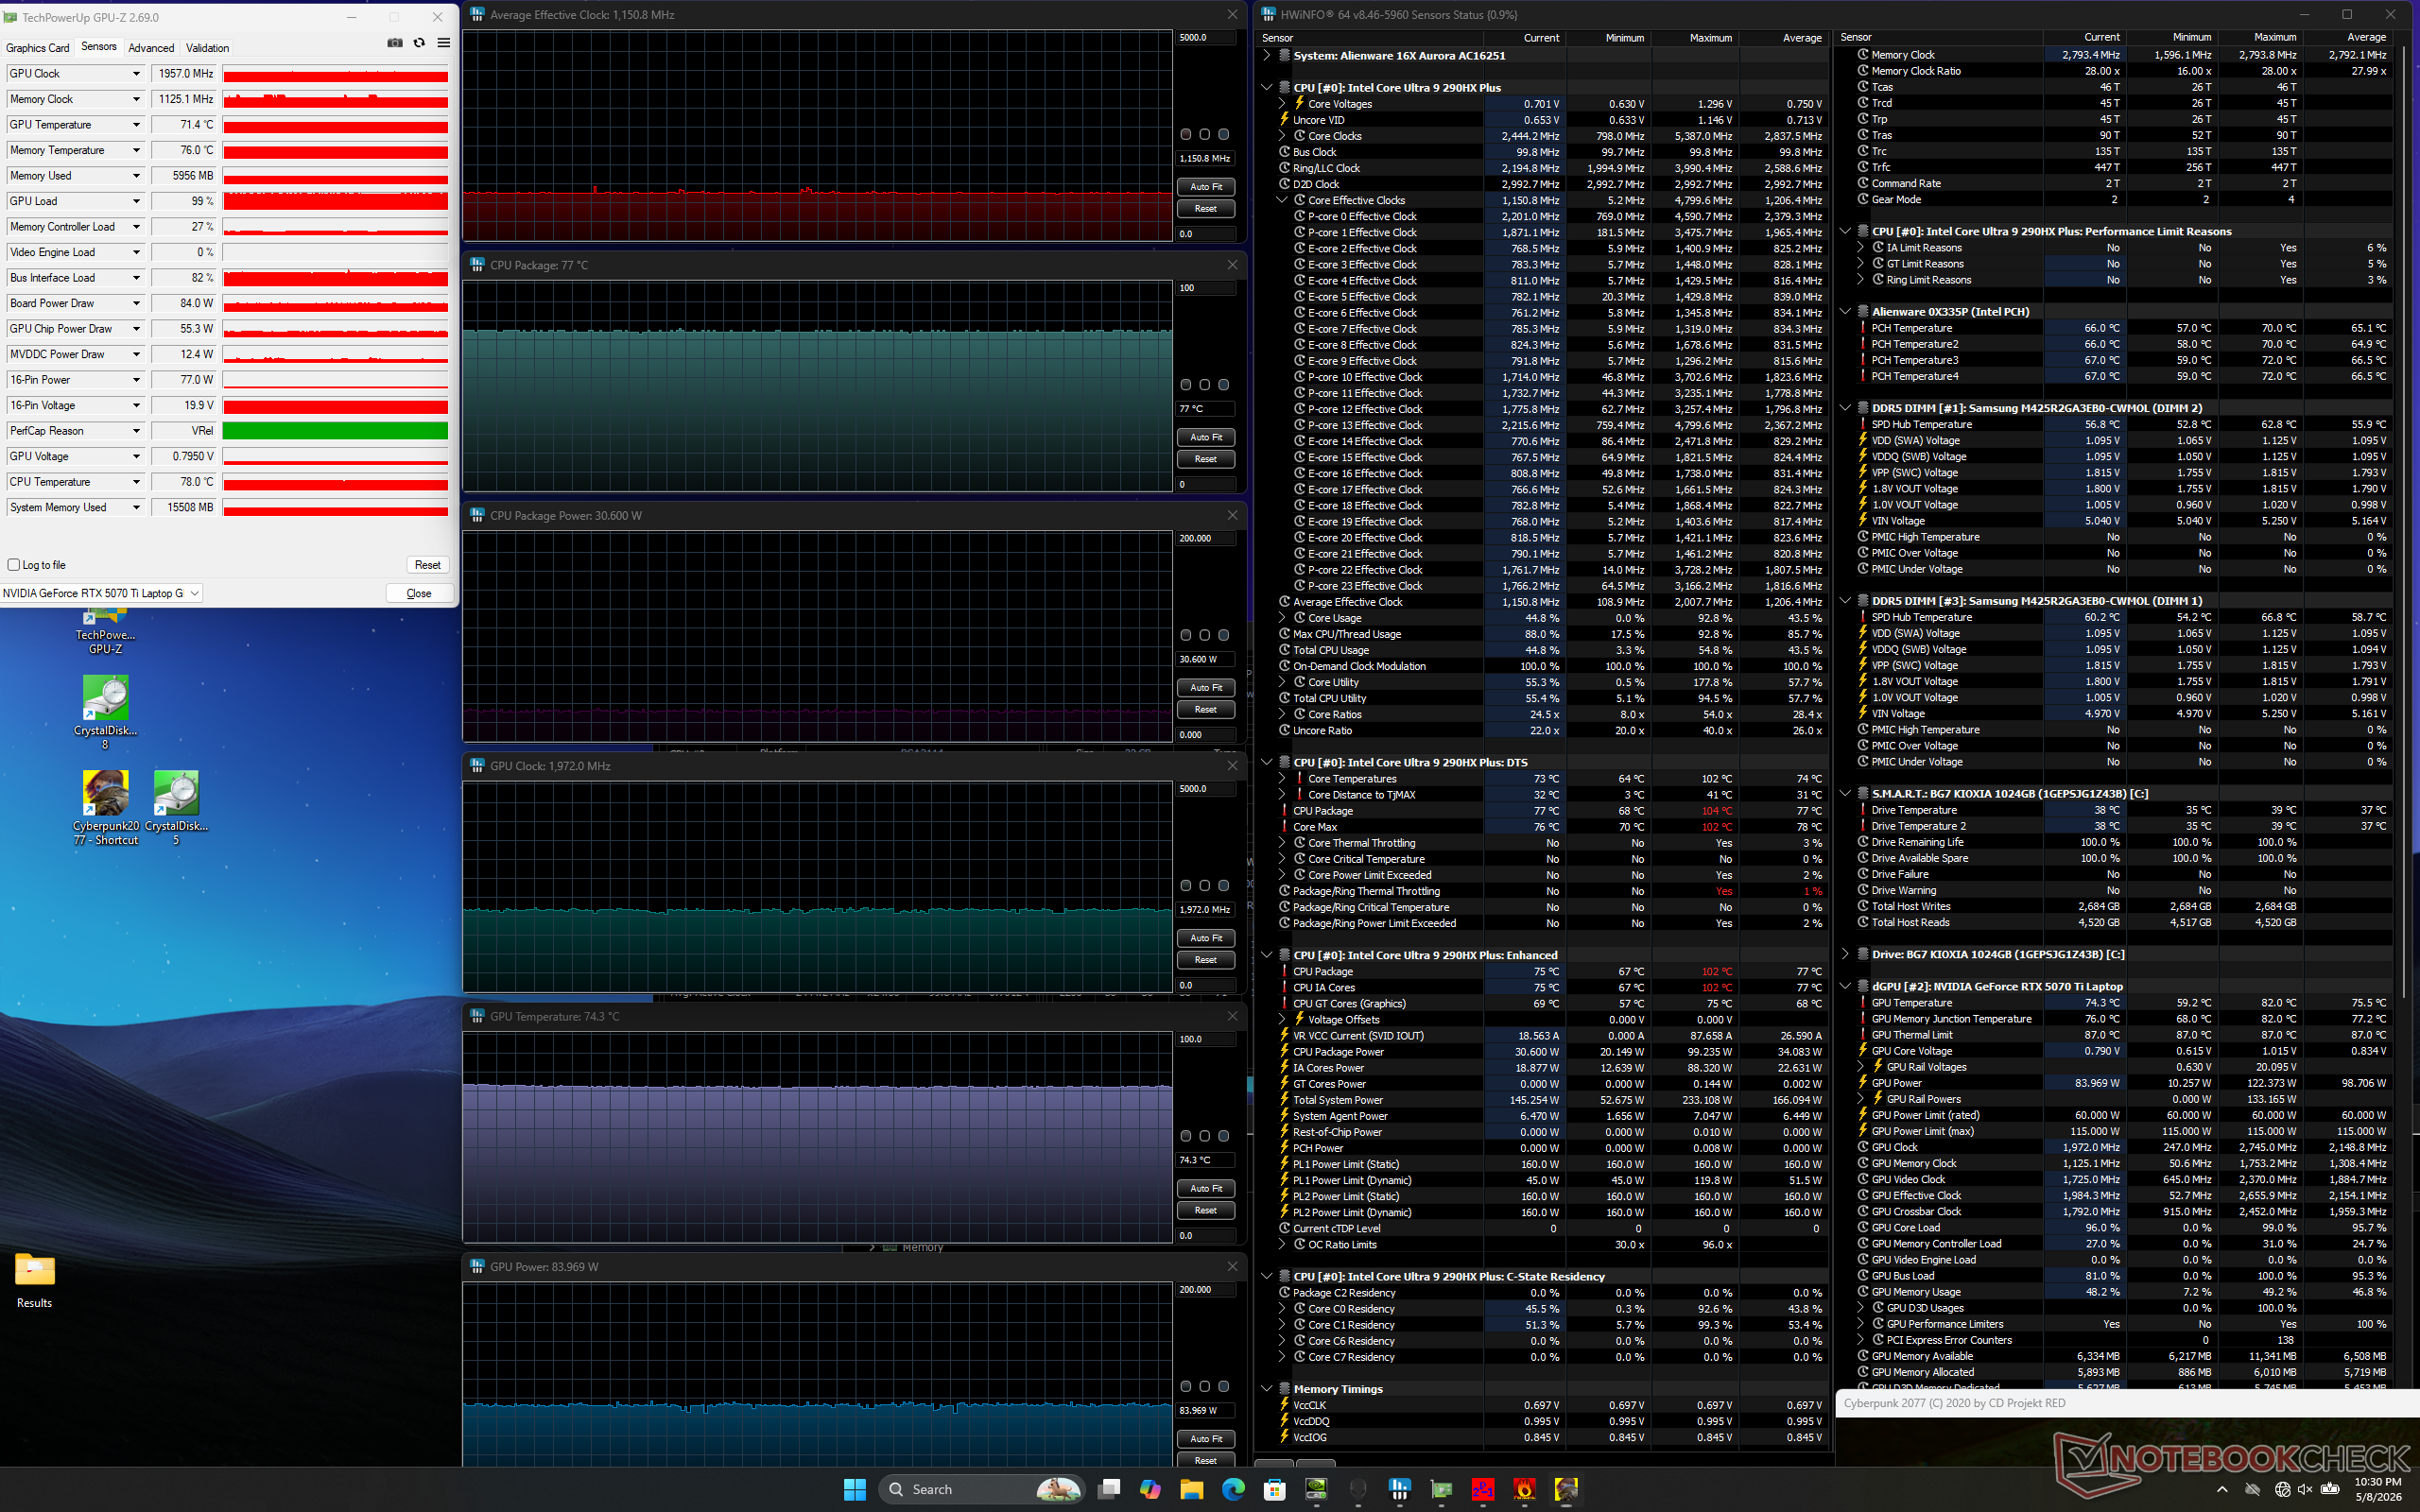
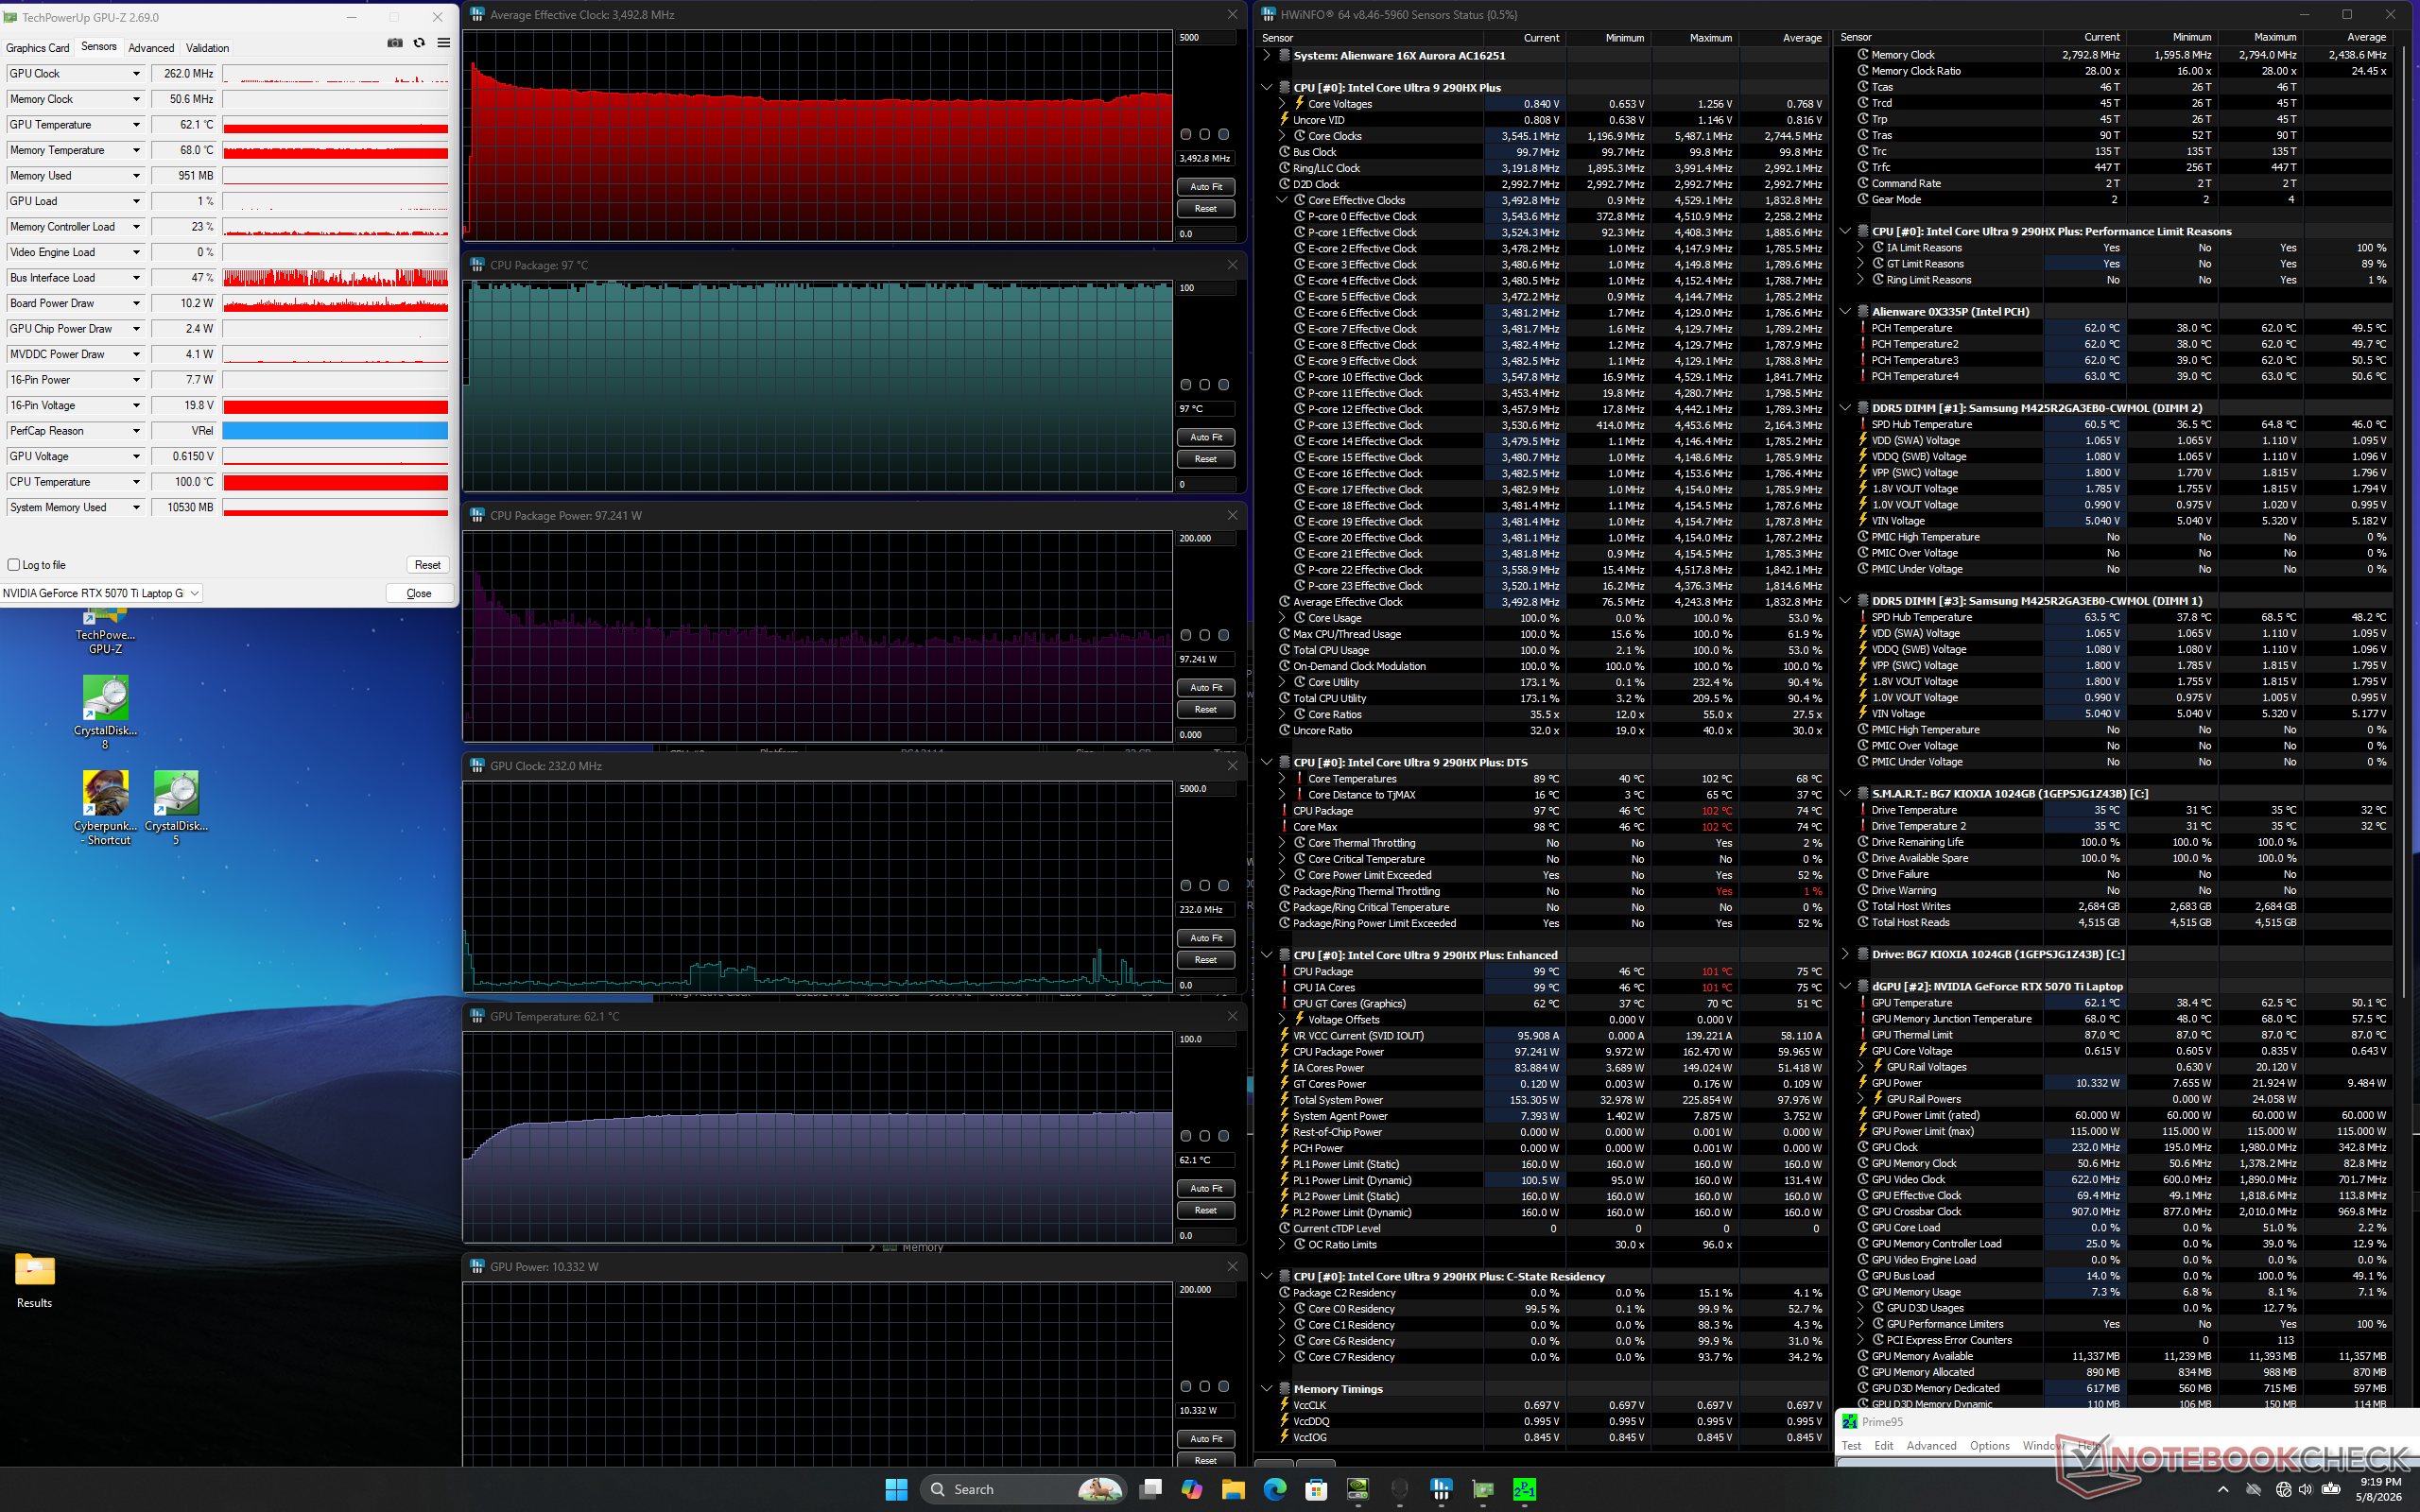
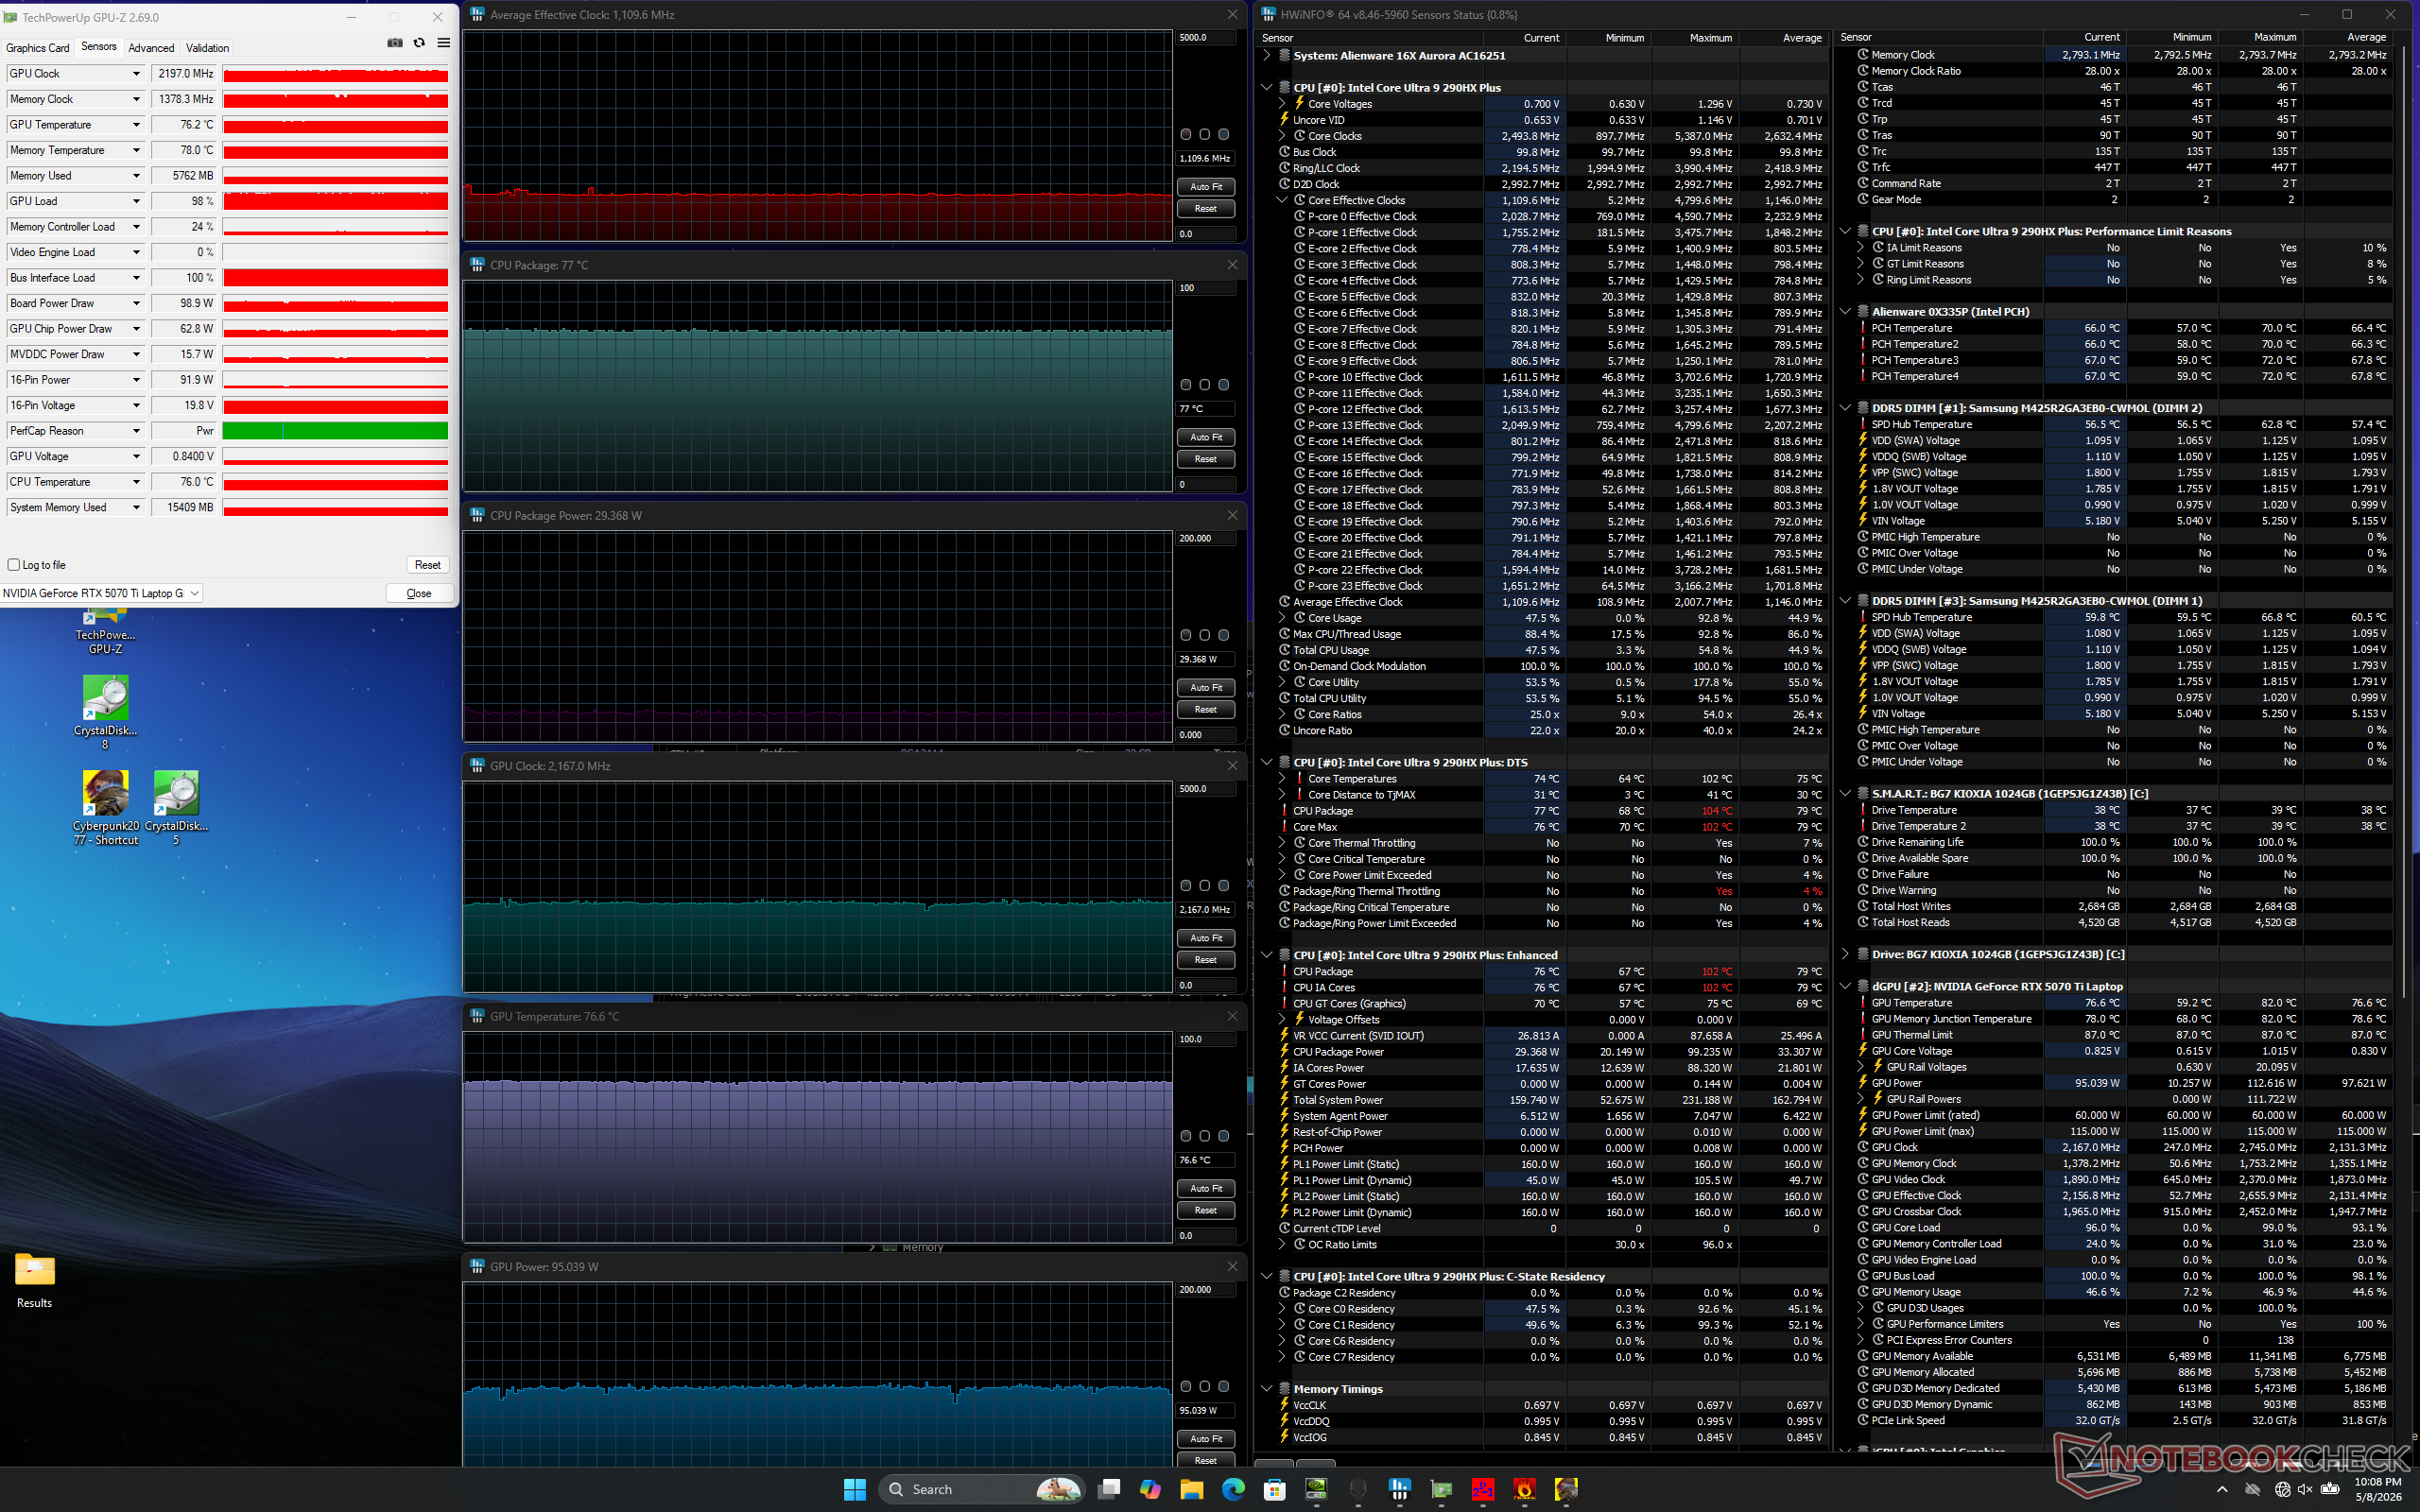
| Horloge moyenne du CPU (GHz) | Horloge du GPU (MHz) | Température moyenne du CPU (°C) | Température moyenne du GPU (°C) | |
| Système au repos | -- | -- | 48 | 39 |
| Prime95 Stress | 3.5 | -- | 97 | 62 |
| Prime95 + FurMark Stress | 1.7 | 1815 | 83 | 78 |
| Cyberpunk 2077 Stress (mode équilibré) | 1.2 | 1972 | 77 | 74 |
| Cyberpunk 2077 Stress (mode Performance) | 1.1 | 2167 | 77 | 77 |
| Cyberpunk2077 Stress (mode Overdrive) | 1.3 | 2355 | 73 | 74 |
Intervenants
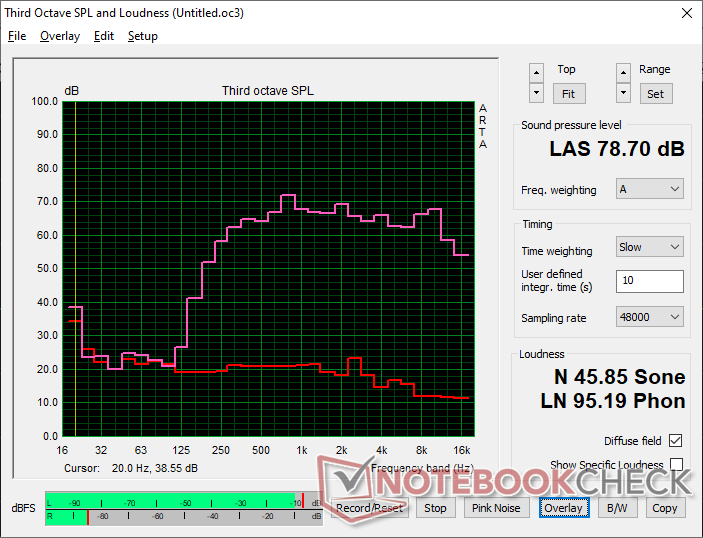
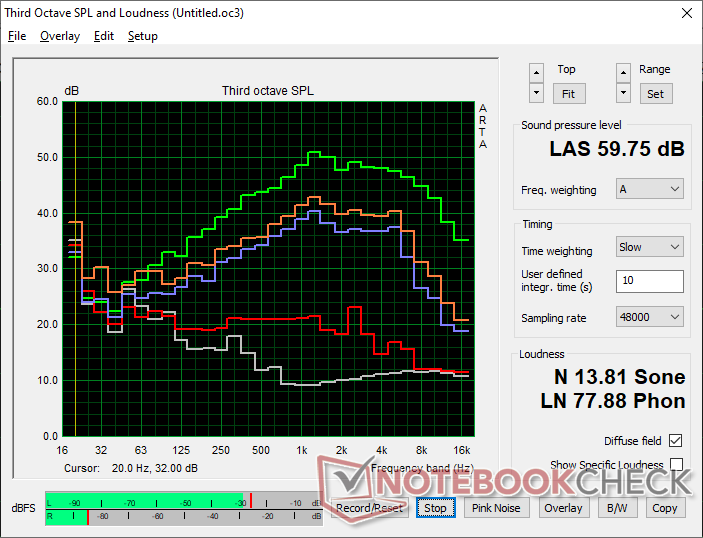
Alienware 16X Aurora Core Ultra 9 290HX Plus analyse audio
(±) | le niveau sonore du haut-parleur est moyen mais bon (78.7# dB)
Basses 100 - 315 Hz
(-) | presque aucune basse - en moyenne 20.8% plus bas que la médiane
(-) | les basses ne sont pas linéaires (16% delta à la fréquence précédente)
Médiums 400 - 2000 Hz
(+) | médiane équilibrée - seulement 3% de la médiane
(+) | les médiums sont linéaires (5.1% delta à la fréquence précédente)
Aiguës 2 - 16 kHz
(+) | des sommets équilibrés - à seulement 1.7% de la médiane
(+) | les aigus sont linéaires (4.9% delta à la fréquence précédente)
Globalement 100 - 16 000 Hz
(±) | la linéarité du son global est moyenne (18.5% de différence avec la médiane)
Par rapport à la même classe
» 60% de tous les appareils testés de cette catégorie étaient meilleurs, 9% similaires, 32% pires
» Le meilleur avait un delta de 6%, la moyenne était de 18%, le pire était de 132%.
Par rapport à tous les appareils testés
» 41% de tous les appareils testés étaient meilleurs, 8% similaires, 51% pires
» Le meilleur avait un delta de 4%, la moyenne était de 24%, le pire était de 134%.
Apple MacBook Pro 16 2021 M1 Pro analyse audio
(+) | les haut-parleurs peuvent jouer relativement fort (84.7# dB)
Basses 100 - 315 Hz
(+) | bonne basse - seulement 3.8% loin de la médiane
(+) | les basses sont linéaires (5.2% delta à la fréquence précédente)
Médiums 400 - 2000 Hz
(+) | médiane équilibrée - seulement 1.3% de la médiane
(+) | les médiums sont linéaires (2.1% delta à la fréquence précédente)
Aiguës 2 - 16 kHz
(+) | des sommets équilibrés - à seulement 1.9% de la médiane
(+) | les aigus sont linéaires (2.7% delta à la fréquence précédente)
Globalement 100 - 16 000 Hz
(+) | le son global est linéaire (4.6% différence à la médiane)
Par rapport à la même classe
» 0% de tous les appareils testés de cette catégorie étaient meilleurs, 0% similaires, 100% pires
» Le meilleur avait un delta de 5%, la moyenne était de 17%, le pire était de 45%.
Par rapport à tous les appareils testés
» 0% de tous les appareils testés étaient meilleurs, 0% similaires, 100% pires
» Le meilleur avait un delta de 4%, la moyenne était de 24%, le pire était de 134%.
Gestion de l'énergie
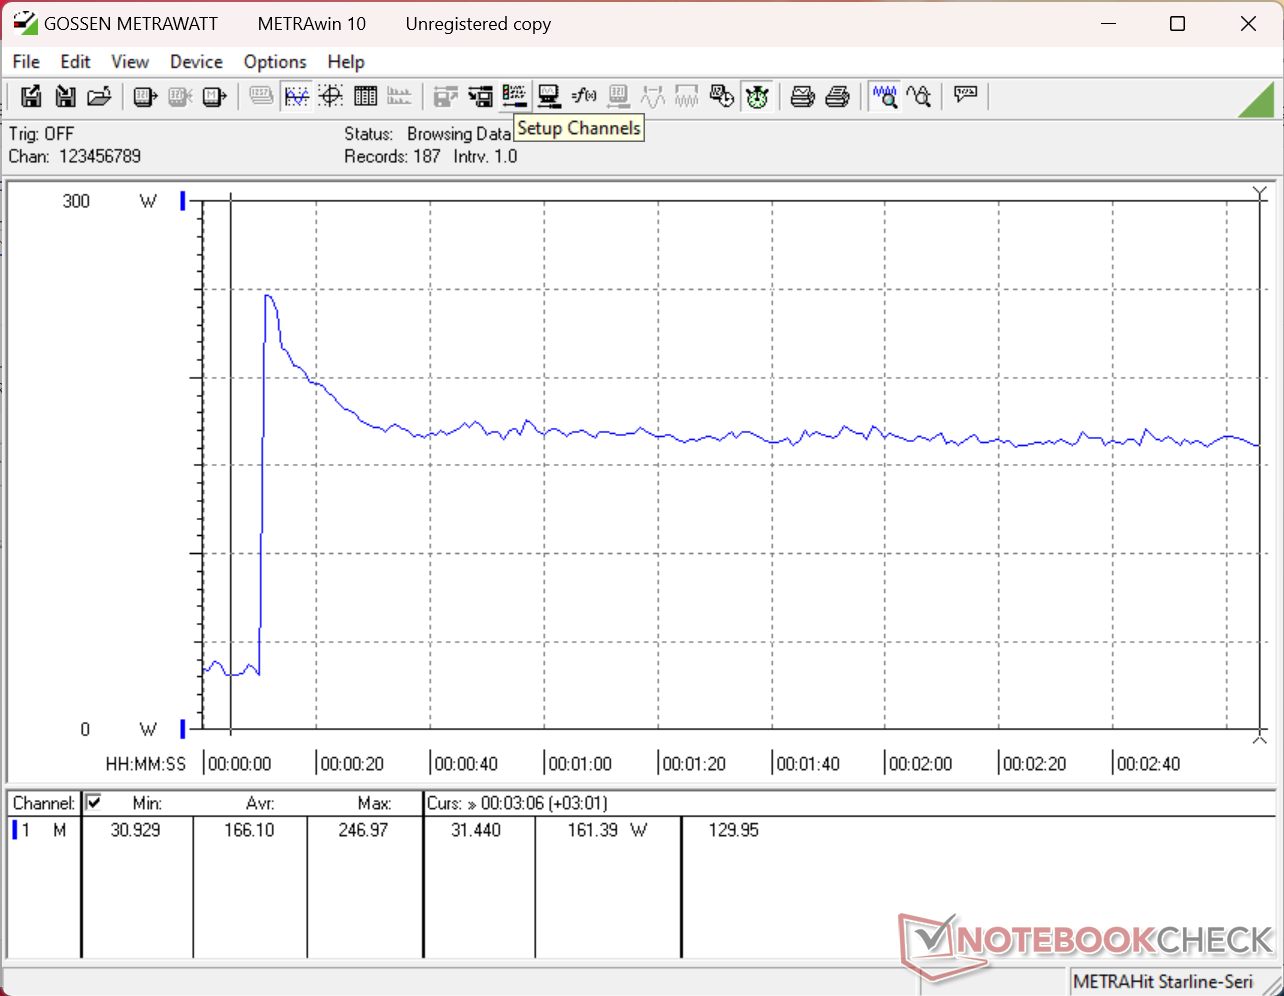
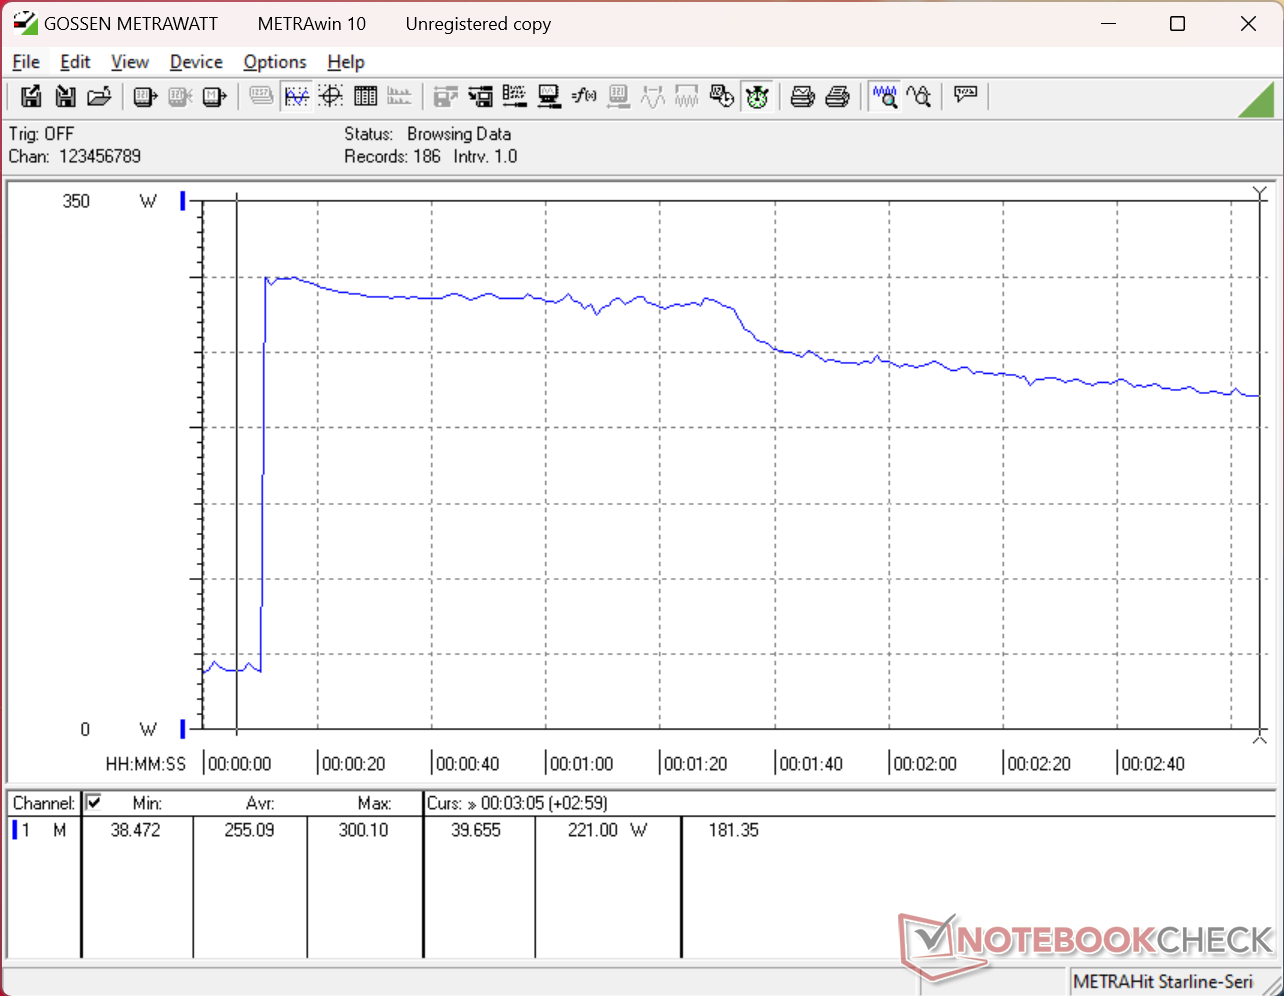
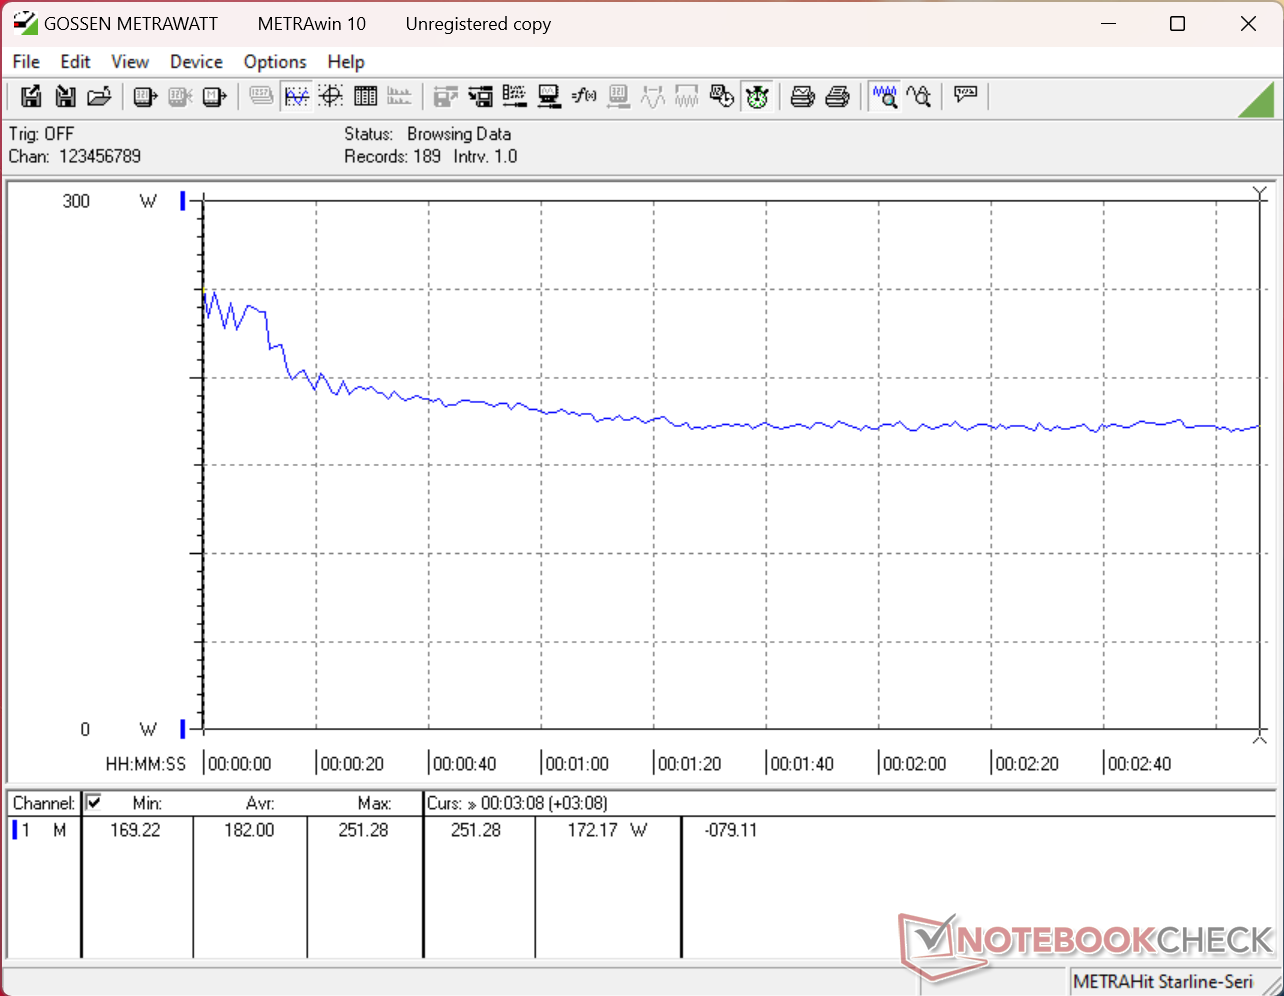
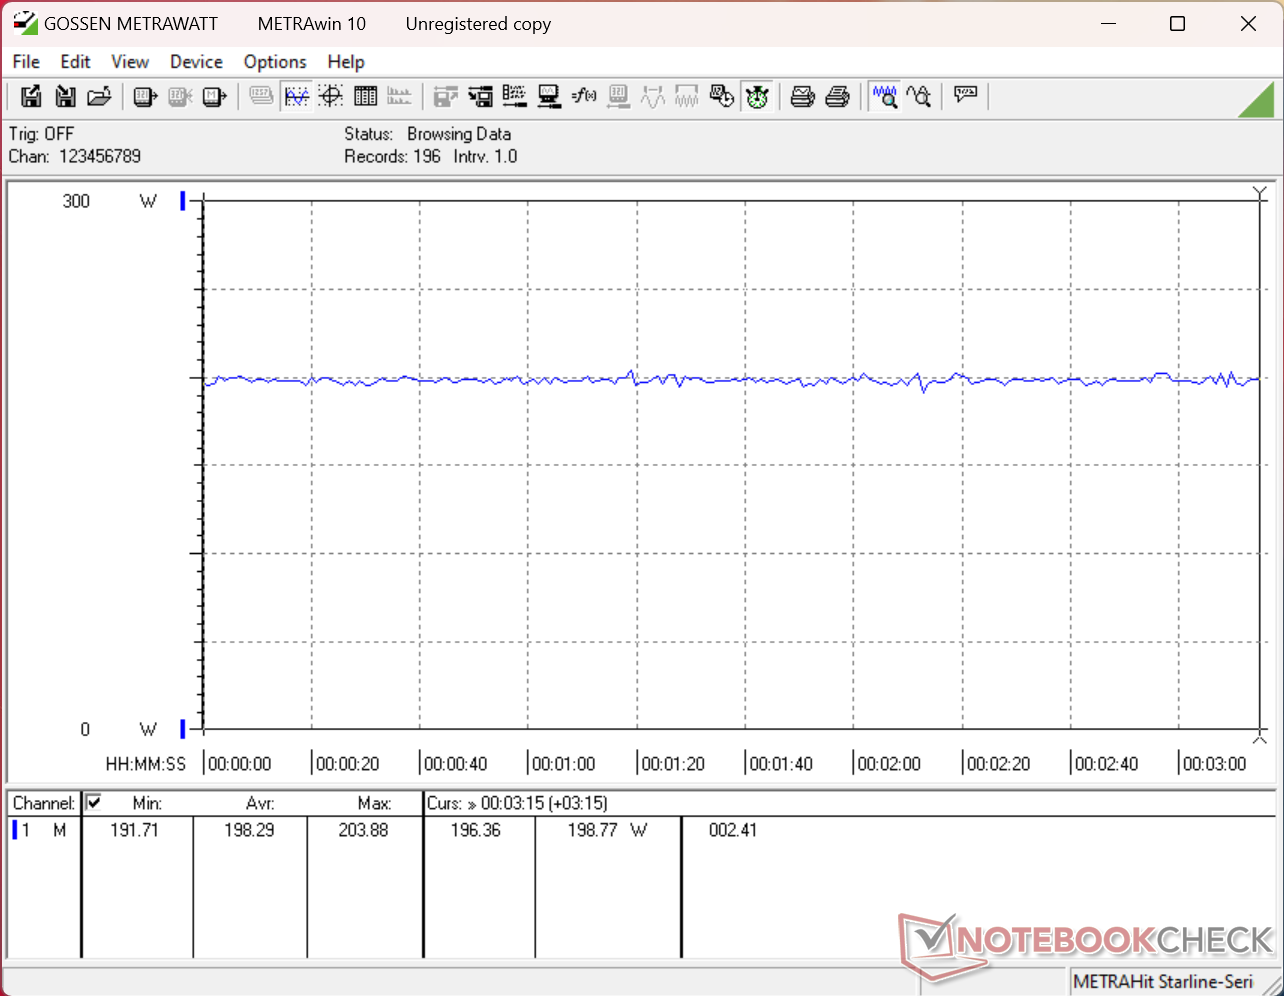
Consommation électrique
La consommation au ralenti peut être de l'ordre de 10 %, ce qui est bien inférieur à ce que nous avons enregistré sur le modèle 2025. Autrement, les résultats sont presque identiques entre les deux modèles lorsque des charges plus élevées sont introduites, y compris le pic et le taux progressif de diminution sur Prime95 et/ou FurMark.
La consommation en mode Cyberpunk 2077 serait en moyenne de 172 W et 199 W en mode Performance et Overdrive, respectivement, soit quelques watts de plus que ce que nous avons enregistré sur le modèle de l'année dernière. Cependant, la petite augmentation de 4 % de la consommation vaut bien l'augmentation de 20 % des taux d'images.
| Éteint/en veille | |
| Au repos | |
| Fortement sollicité |
|
Légende:
min: | |
| Alienware 16X Aurora Core Ultra 9 290HX Plus Ultra 9 290HX Plus, GeForce RTX 5070 Ti Laptop, , OLED, 2560x1600, 16" | Alienware 16X Aurora, RTX 5070 Ultra 9 275HX, GeForce RTX 5070 Laptop, , IPS, 2560x1600, 16" | Acer Predator Helios Neo 16S AI PHN16S-71-94L9 Ultra 9 275HX, GeForce RTX 5070 Ti Laptop, Micron 3500 1TB MTFDKBA1T0TGD, OLED, 2560x1600, 16" | Lenovo Legion Pro 5 16IAX10, RTX 5070 Ultra 7 255HX, GeForce RTX 5070 Laptop, SK Hynix HFS001TEJ9X115N, OLED, 2650x1600, 16" | MSI Vector 16 HX AI A2XWHG Ultra 7 255HX, GeForce RTX 5070 Ti Laptop, Micron 2400 MTFDKBA512QFM, IPS, 2560x1600, 16" | Asus ROG Zephyrus G16 GU605CW Ultra 9 285H, GeForce RTX 5080 Laptop, Micron 2500 2TB MTFDKBA2T0QGN-1BN1AABGA, OLED, 2560x1600, 16" | |
|---|---|---|---|---|---|---|
| Power Consumption | -62% | 17% | -11% | -20% | -3% | |
| Idle Minimum * (Watt) | 6.9 | 20.1 -191% | 3.9 43% | 10.6 -54% | 7.1 -3% | 12.6 -83% |
| Idle Average * (Watt) | 8.1 | 27.6 -241% | 11 -36% | 12.3 -52% | 15.9 -96% | 13.4 -65% |
| Idle Maximum * (Watt) | 31 | 31.8 -3% | 16.9 45% | 18.6 40% | 29.5 5% | 15.1 51% |
| Load Average * (Watt) | 131.6 | 102.7 22% | 123 7% | 104 21% | 124 6% | 116.3 12% |
| Cyberpunk 2077 ultra * (Watt) | 198.3 | 217 -9% | 152.7 23% | 231 -16% | 222 -12% | 156.4 21% |
| Cyberpunk 2077 ultra external monitor * (Watt) | 172.1 | 192.3 -12% | 144.9 16% | 227 -32% | 217 -26% | 157.9 8% |
| Load Maximum * (Watt) | 300.1 | 292 3% | 229 24% | 248 17% | 336 -12% | 199 34% |
* ... Moindre est la valeur, meilleures sont les performances
Consommation électrique Cyberpunk / Stress Test
Consommation électrique du moniteur externe
Autonomie de la batterie
La réduction de la consommation au ralenti mentionnée ci-dessus a permis d'augmenter l'autonomie de la batterie par rapport au modèle de l'année dernière, malgré le passage de l'IPS à l'OLED. Toutefois, veillez à régler le GPU sur "Automatique", l'écran sur 60 Hz et le profil d'alimentation sur "Équilibré" ou moins pour atteindre des durées d'utilisation du réseau local sans fil de plus de 7 heures.
| Alienware 16X Aurora Core Ultra 9 290HX Plus Ultra 9 290HX Plus, GeForce RTX 5070 Ti Laptop, 96 Wh | Alienware 16X Aurora, RTX 5070 Ultra 9 275HX, GeForce RTX 5070 Laptop, 96 Wh | Acer Predator Helios Neo 16S AI PHN16S-71-94L9 Ultra 9 275HX, GeForce RTX 5070 Ti Laptop, 76 Wh | Lenovo Legion Pro 5 16IAX10, RTX 5070 Ultra 7 255HX, GeForce RTX 5070 Laptop, 80 Wh | MSI Vector 16 HX AI A2XWHG Ultra 7 255HX, GeForce RTX 5070 Ti Laptop, 90 Wh | Asus ROG Zephyrus G16 GA605WV Ryzen AI 9 HX 370, GeForce RTX 4060 Laptop GPU, 90 Wh | |
|---|---|---|---|---|---|---|
| Autonomie de la batterie | -42% | -32% | -16% | -5% | 8% | |
| WiFi v1.3 (h) | 7.4 | 4.3 -42% | 5 -32% | 6.2 -16% | 7 -5% | 8 8% |
| H.264 (h) | 6.1 | 13.7 | ||||
| Load (h) | 1.8 | 1.7 |
Notebookcheck Rating
L'Alienware 16X Aurora 2026 offre des configurations plus avancées que l'année précédente, mais certaines options sont malheureusement liées ou groupées à d'autres pour des prix gonflés.
Alienware 16X Aurora Core Ultra 9 290HX Plus
- 05/14/2026 v8
Allen Ngo
 Total Sustainability Score:
 Comparaison avec des concurrents potentiels
Image | Modèle | Prix | Poids | Épaisseur | Écran |
|---|---|---|---|---|---|
1. 85.9%  | Alienware 16X Aurora Core Ultra 9 290HX Plus Intel Core Ultra 9 290HX Plus ⎘ NVIDIA GeForce RTX 5070 Ti Laptop ⎘ 32 Go Mémoire | Amazon: Prix de liste: 3000 USD | 2.6 kg | 23.4 mm | 16.00" 2560x1600 189 PPI OLED |
2. 84.9%  | Alienware 16X Aurora, RTX 5070 Intel Core Ultra 9 275HX ⎘ NVIDIA GeForce RTX 5070 Laptop ⎘ 32 Go Mémoire | Prix de liste: 1800 USD | 2.5 kg | 23.4 mm | 16.00" 2560x1600 189 PPI IPS |
3. 82%  | Acer Predator Helios Neo 16S AI PHN16S-71-94L9 Intel Core Ultra 9 275HX ⎘ NVIDIA GeForce RTX 5070 Ti Laptop ⎘ 32 Go Mémoire, 1024 Go SSD | Prix de liste: 2400 EUR | 2.2 kg | 19.9 mm | 16.00" 2560x1600 189 PPI OLED |
4. 86.2%  | Lenovo Legion Pro 5 16IAX10, RTX 5070 Intel Core Ultra 7 255HX ⎘ NVIDIA GeForce RTX 5070 Laptop ⎘ 32 Go Mémoire, 1024 Go SSD | Prix de liste: 1800 Euro | 2.3 kg | 25.95 mm | 16.00" 2650x1600 189 PPI OLED |
5. 84%  | MSI Vector 16 HX AI A2XWHG Intel Core Ultra 7 255HX ⎘ NVIDIA GeForce RTX 5070 Ti Laptop ⎘ 16 Go Mémoire, 512 Go SSD | Prix de liste: 2000 EUR | 2.6 kg | 28.6 mm | 16.00" 2560x1600 189 PPI IPS |
6.  | Asus ROG Zephyrus G16 GU605CW Intel Core Ultra 9 285H ⎘ NVIDIA GeForce RTX 5080 Laptop ⎘ 32 Go Mémoire, 2048 Go SSD | Prix de liste: 3800€ | 2 kg | 14.9 mm | 16.00" 2560x1600 189 PPI OLED |
Transparency
La sélection des appareils à examiner est effectuée par notre équipe éditoriale. L'échantillon de test a été prêté à l'auteur par le fabricant ou le détaillant pour les besoins de cet examen. Le prêteur n'a pas eu d'influence sur cette évaluation et le fabricant n'a pas reçu de copie de cette évaluation avant sa publication. Il n'y avait aucune obligation de publier cet article. En tant que média indépendant, Notebookcheck n'est pas soumis à l'autorité des fabricants, des détaillants ou des éditeurs.
Voici comment Notebookcheck teste
Chaque année, Notebookcheck examine de manière indépendante des centaines d'ordinateurs portables et de smartphones en utilisant des procédures standardisées afin de garantir que tous les résultats sont comparables. Nous avons continuellement développé nos méthodes de test depuis environ 20 ans et avons établi des normes industrielles dans le processus. Dans nos laboratoires de test, des équipements de mesure de haute qualité sont utilisés par des techniciens et des rédacteurs expérimentés. Ces tests impliquent un processus de validation en plusieurs étapes. Notre système d'évaluation complexe repose sur des centaines de mesures et de points de référence bien fondés, ce qui garantit l'objectivité.
