Verdict - Le Yoga Pro 7i 15 est un très bon ordinateur portable multimédia, mais cher
Le nouveau Yoga Pro 7i 15 Aura Edition de Lenovo offre un très bon ensemble avec de bonnes performances du processeur Panther Lake et du GPU GeForce, de solides options de connectivité, un magnifique écran tactile OLED avec 165 Hz et des profils de couleurs précis, d'excellents périphériques d'entrée et un très bon système audio. Vous bénéficiez également d'un châssis en aluminium avec deux emplacements pour SSD, mais les charnières de notre appareil produisaient quelques grincements, ce qui ne correspond pas vraiment au prix élevé de l'appareil.
Le prix de départ est de 2600$, ce qui est élevé pour un ordinateur portable avec la RTX 5060, mais malheureusement, il semble que nous devions nous y habituer maintenant après la crise de la mémoire. D'autres inconvénients sont les ventilateurs bruyants lorsque vous sollicitez le système, de sorte que le Yoga est encore plus bruyant que certains ordinateurs portables de jeu, ainsi que le mode d'alimentation Creator supplémentaire de Lenovo, qui n'a tout simplement pas de sens lorsque vous avez déjà un mode Haute Performance, qui est maintenant assez inutile.
Points positifs
Points négatifs
Prix et disponibilité
Vous pouvez obtenir notre SKU de revue avec la RTX 5060 pour 2619 $ directement auprès de Lenovo dès maintenant.
- $49.91Original New for Lenovo Yoga Pro 7 15IPH11 (Machine Type : 83SN) Keyboard Backlit 83SN0002US 83SN0003US 83SN0004US
- $889.00Lenovo Yoga 7 2-in-1 Laptop 14" WUXGA OLED Touch (100% DCI-P3, 600nits HDR) AMD 6-core Ryzen AI 5 340 (Up to 50 Tops) 16GB RAM 512GB SSD Pen for Designer Business Work Win11Pro ICP Hub
- $1,049.00Lenovo Yoga 7 2-in-1 Laptop 16" WUXGA IPS Touch (Glossy Anti-Fingerprint) AMD 8-core Ryzen AI 7 350 (Up to 50 AI Tops) 16GB RAM 1TB SSD for Creator Business Professional Win11Pro ICP Hub
Table des matières
- Verdict - Le Yoga Pro 7i 15 est un très bon ordinateur portable multimédia, mais cher
- Spécifications
- Boîtier et connectivité
- Périphériques d'entrée
- Écran - Superbe OLED de 165 Hz
- Performance - Panther Lake rencontre Blackwell
- Émissions et consommation d'énergie
- Notebookcheck Rating
- Comparaison avec des concurrents potentiels
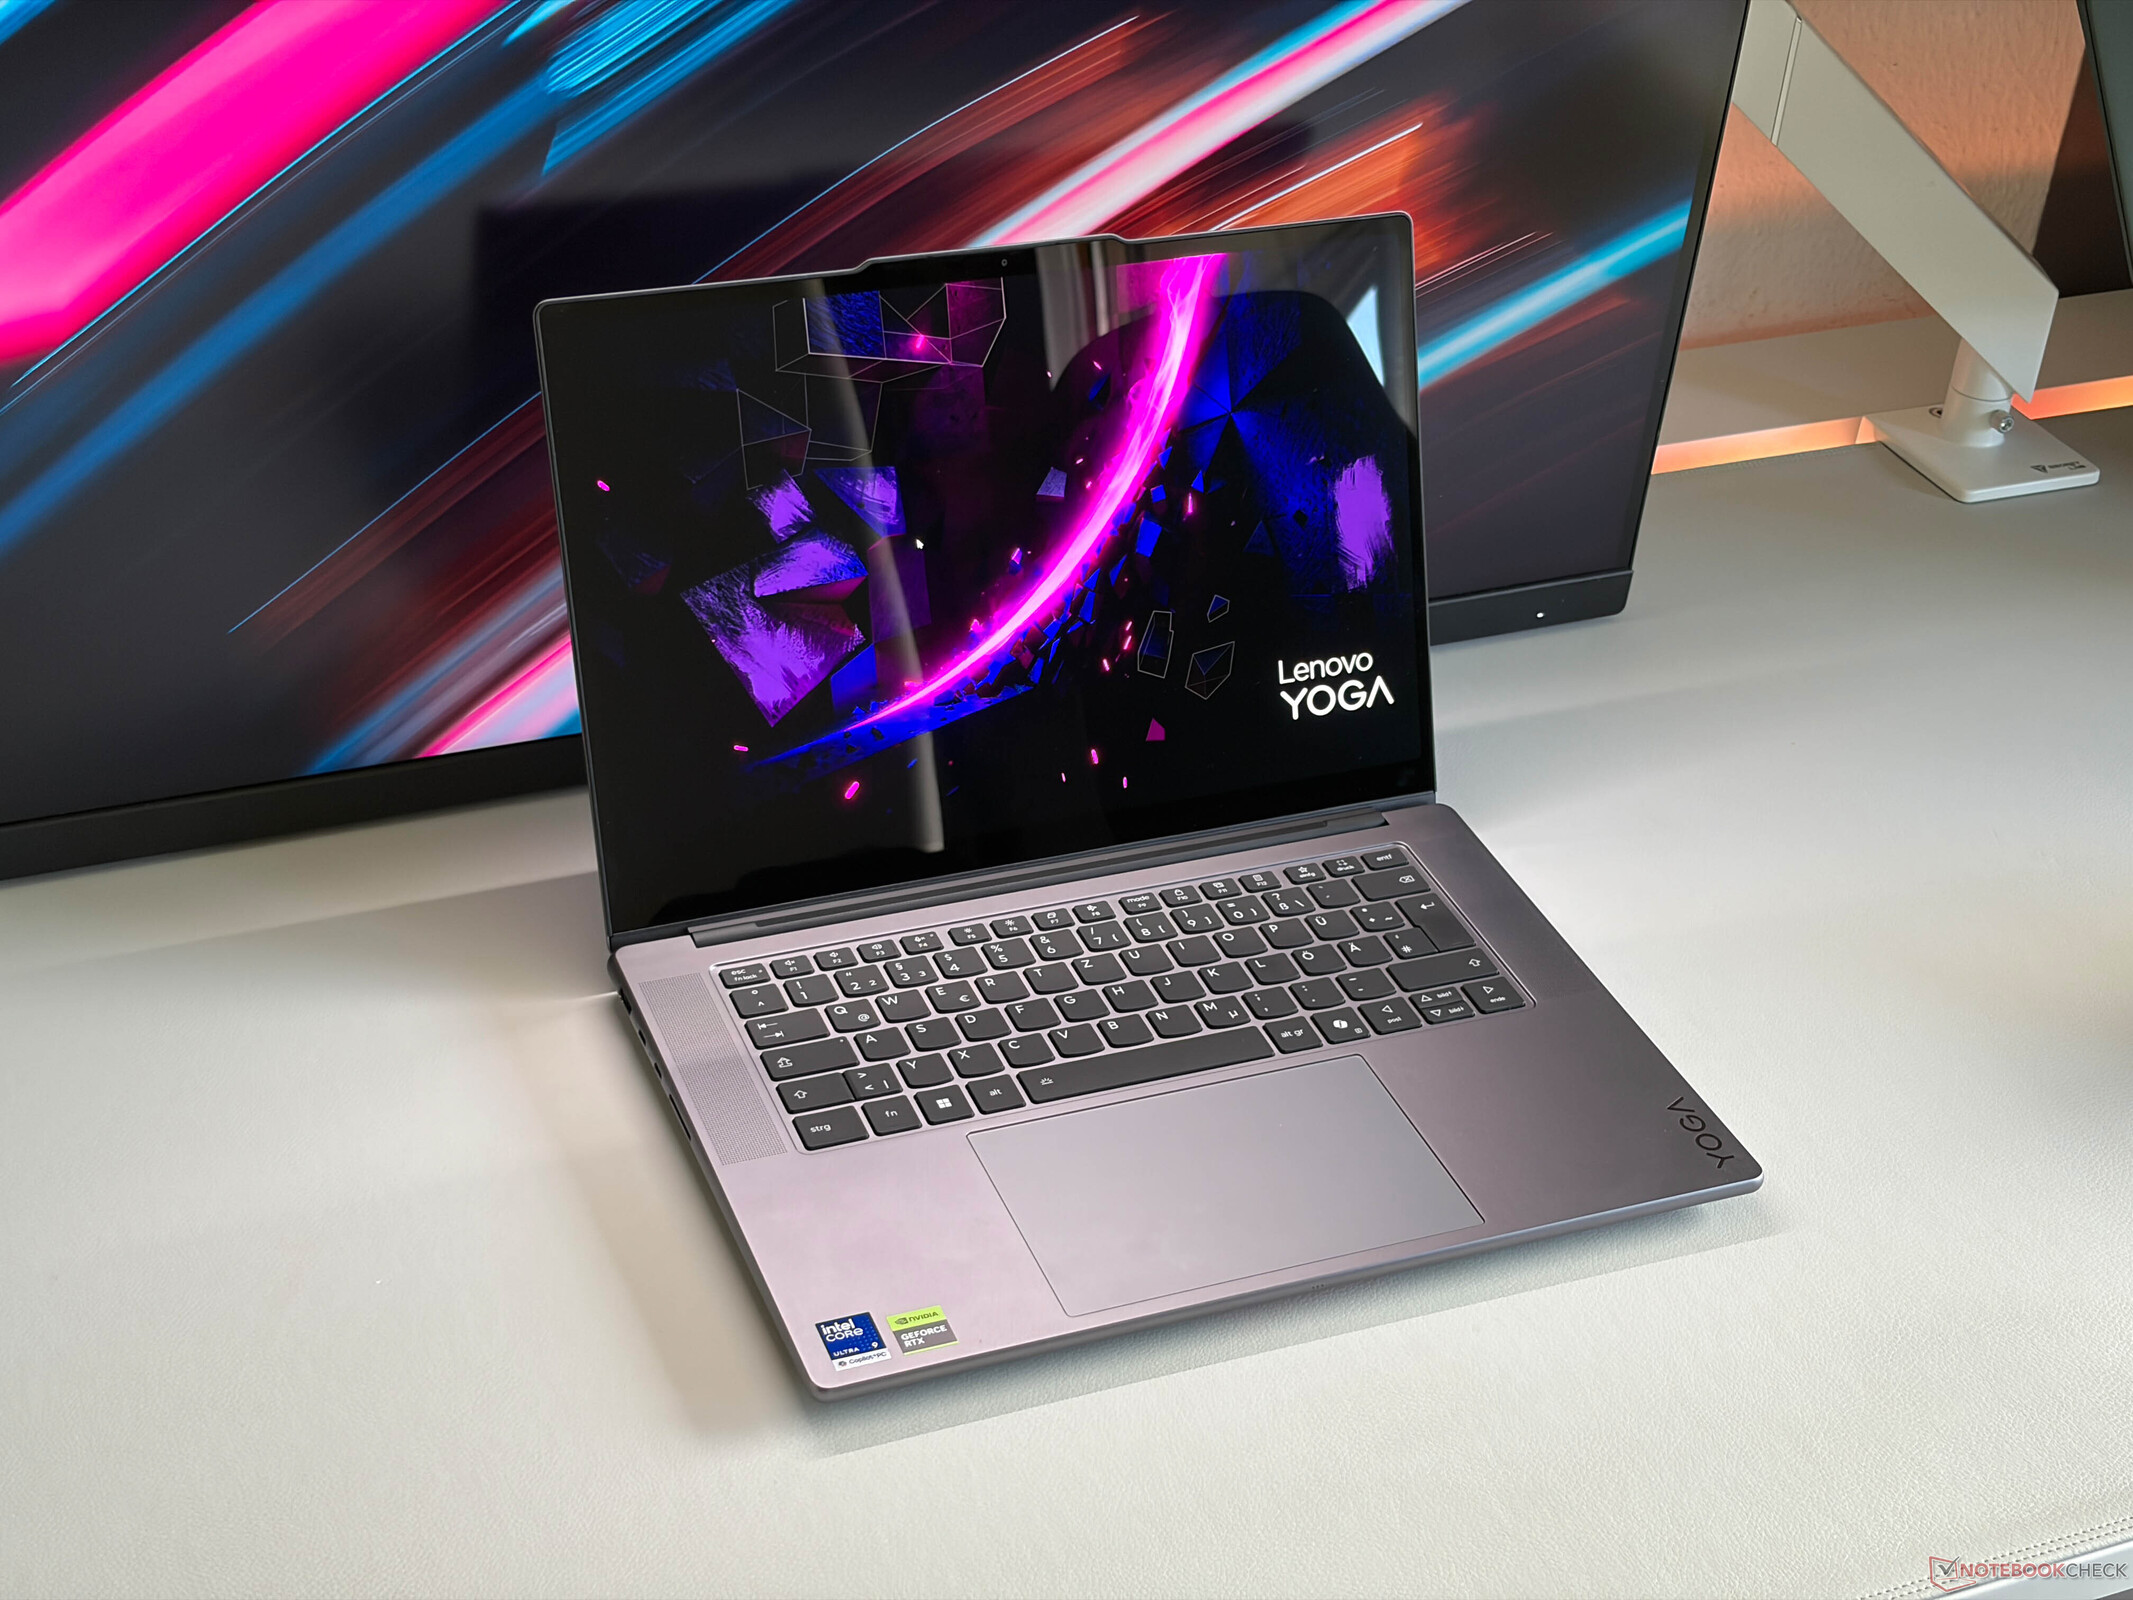
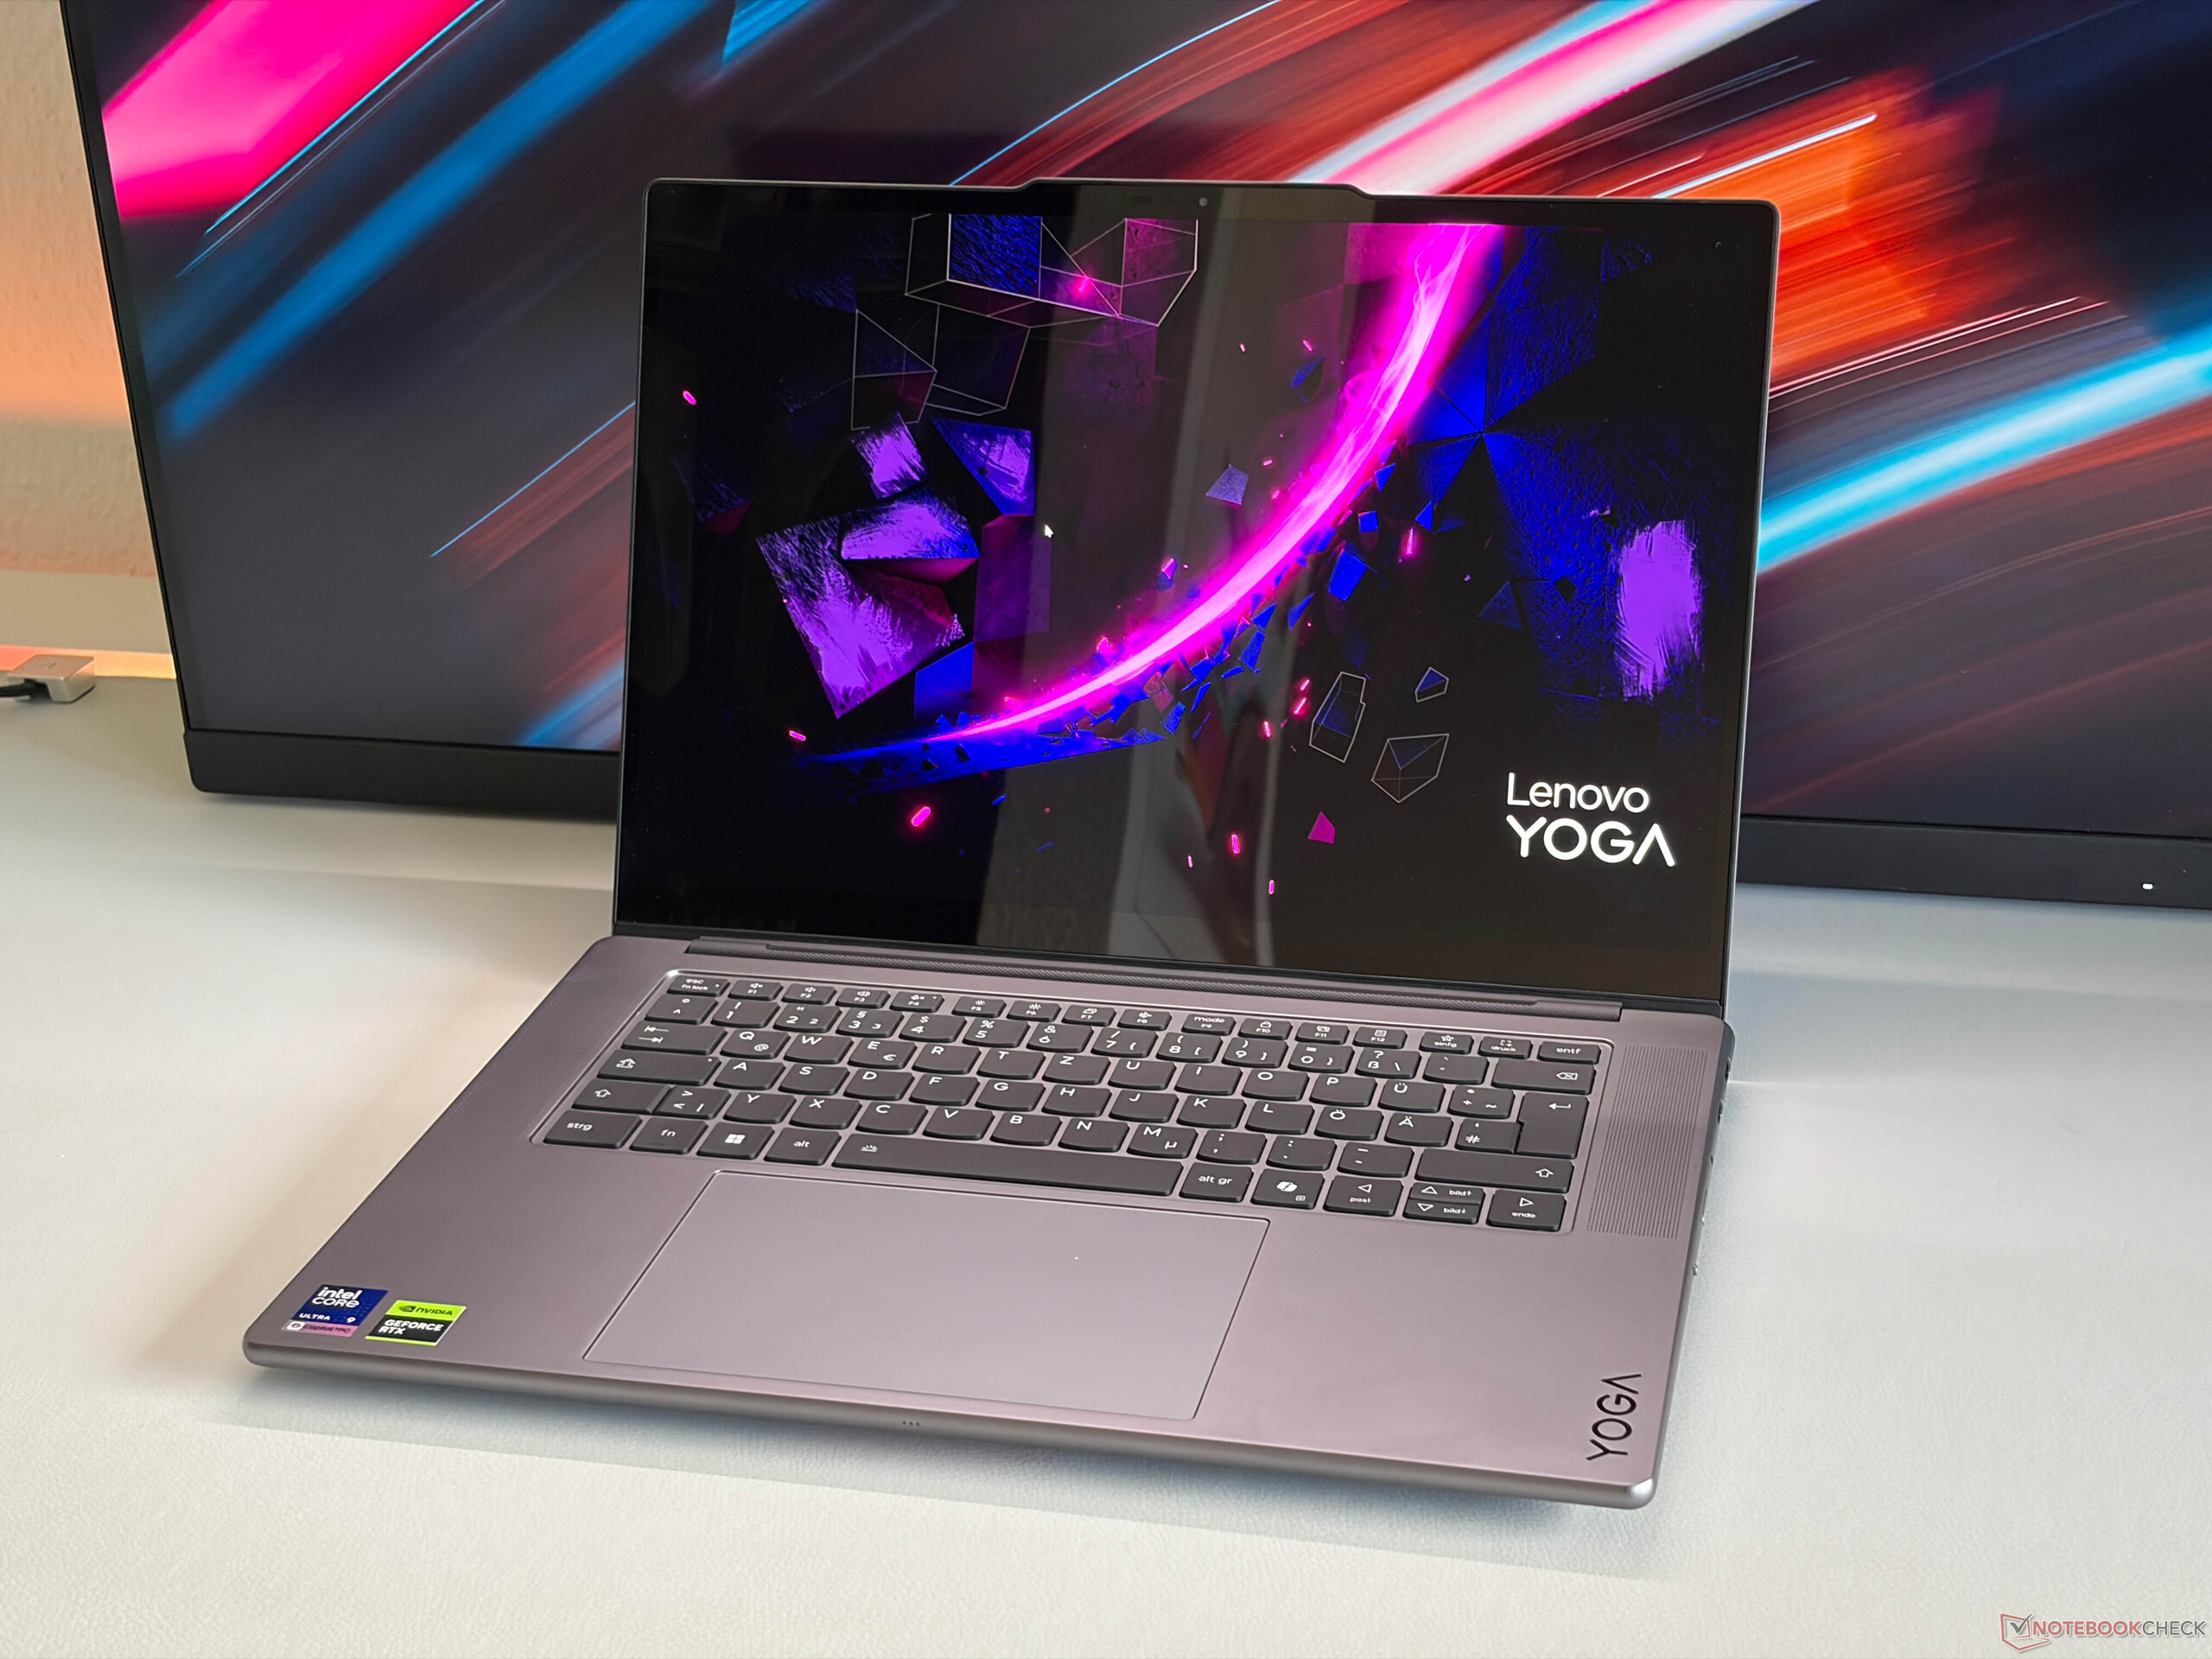
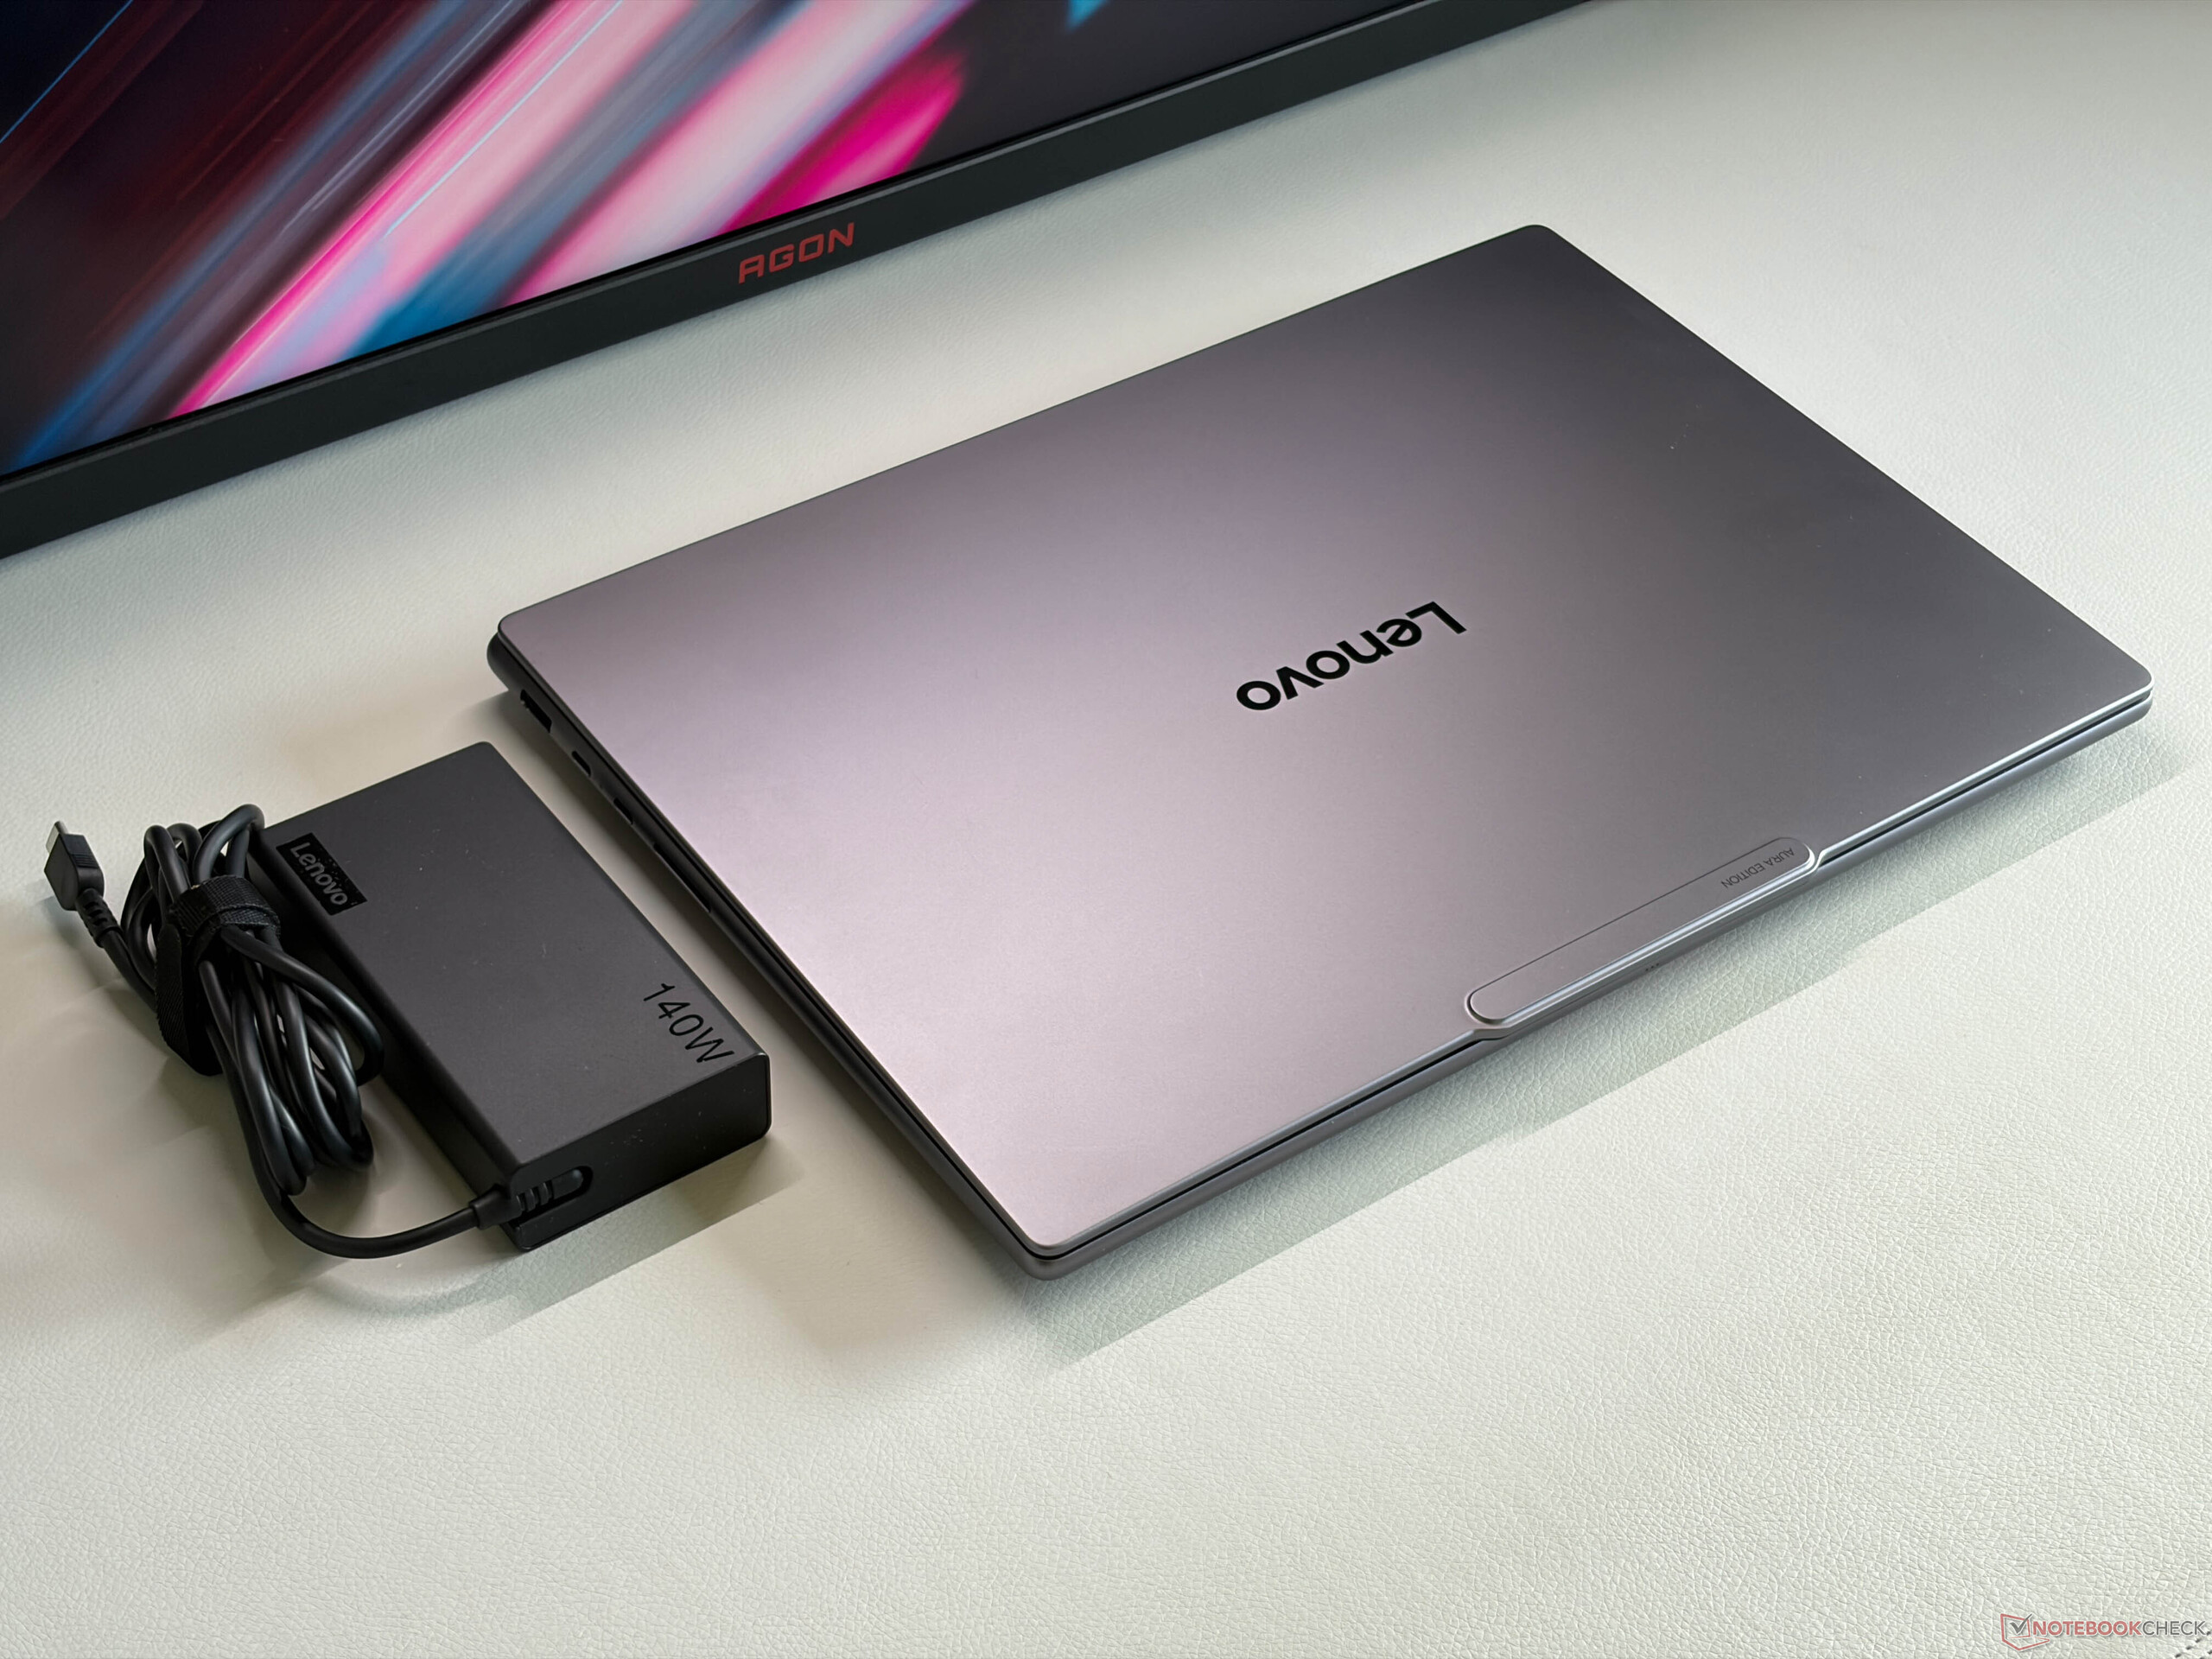
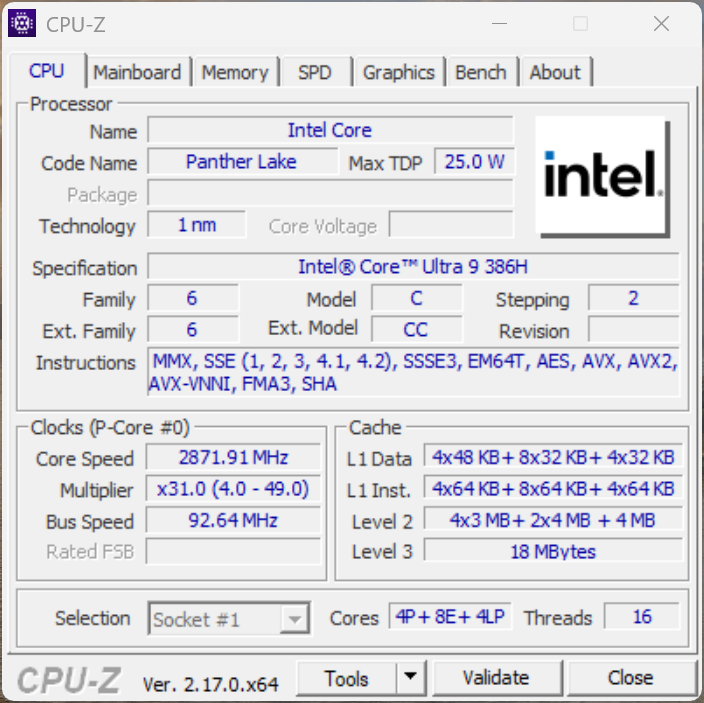
Le Yoga Pro 7i 15 G11 de Lenovo est un nouvel ordinateur portable multimédia de 15 pouces à un prix élevé. Il est assez unique sur le marché actuel, car les autres marques ne proposent généralement que des modèles de 14 ou 16 pouces pour l'instant. Les spécifications de notre revue avec le Core Ultra 9 386Hle Core Ultra 9 386H est équipé d'une mémoire vive de 32 Go et d'un disque dur SSD de 1 To, GeForce RTX 5060 et l'écran tactile OLED haute résolution de 165 Hz est actuellement vendu au prix de 2619 $.
Spécifications
Boîtier et connectivité
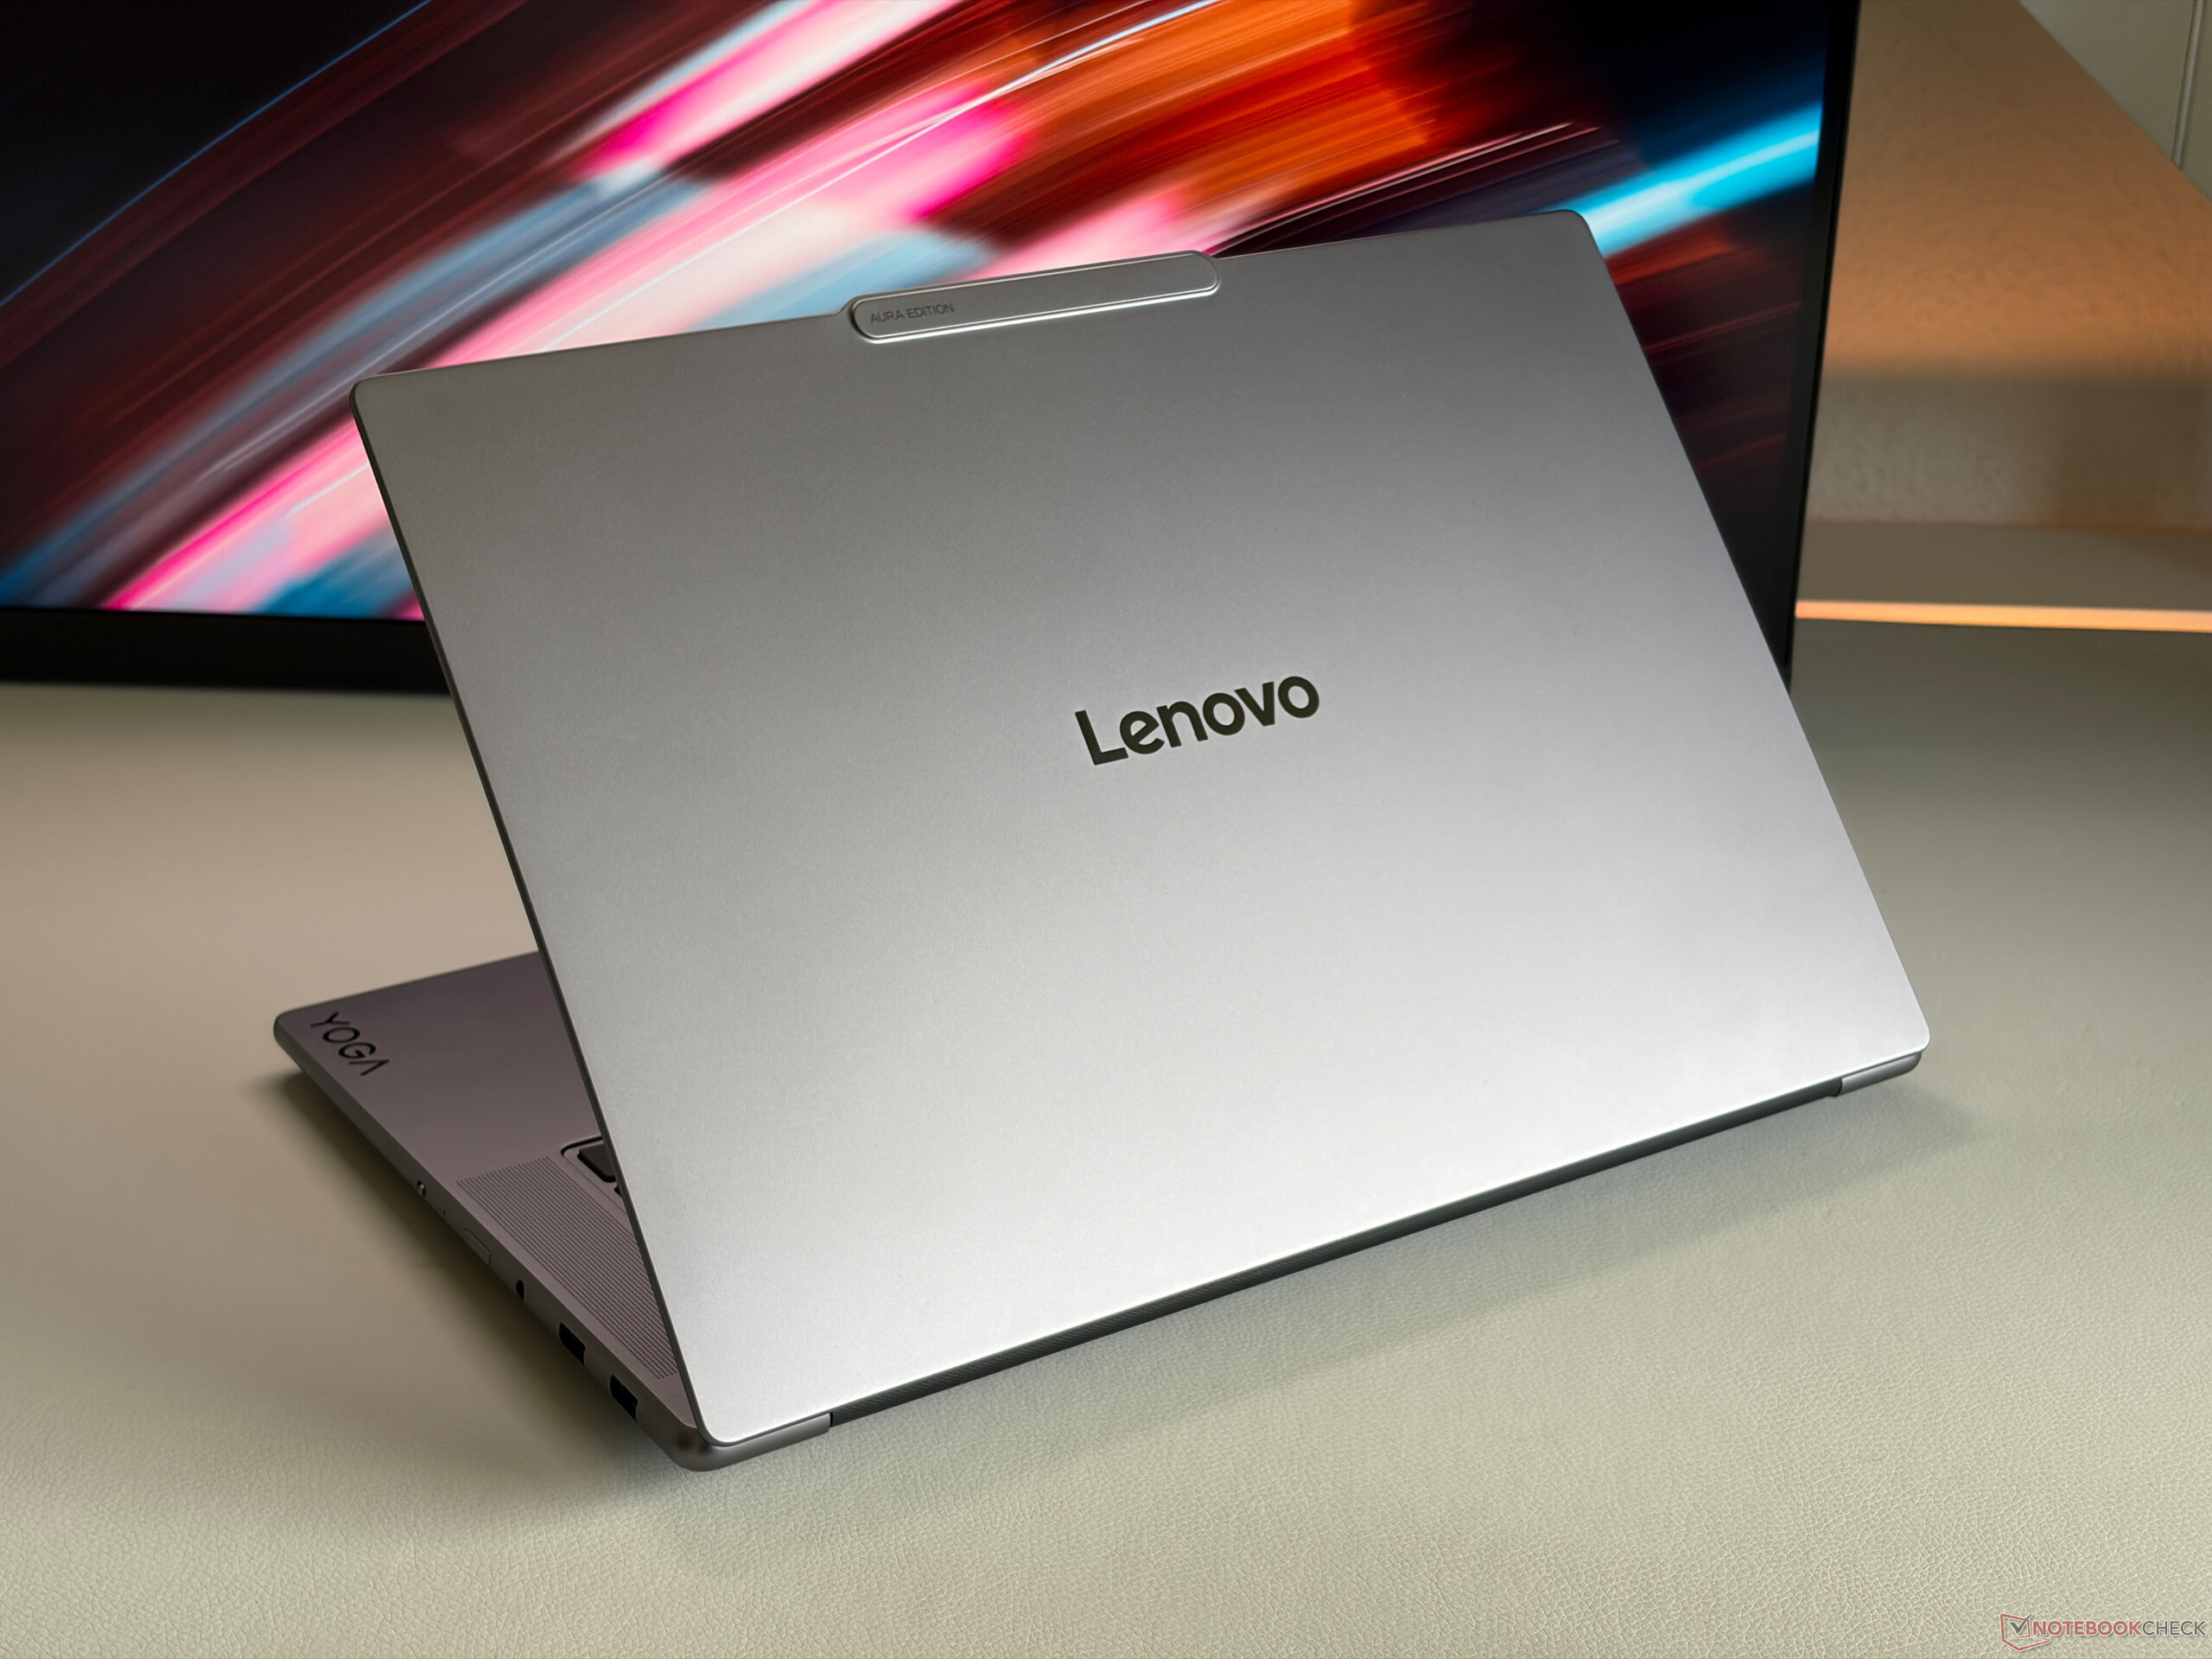
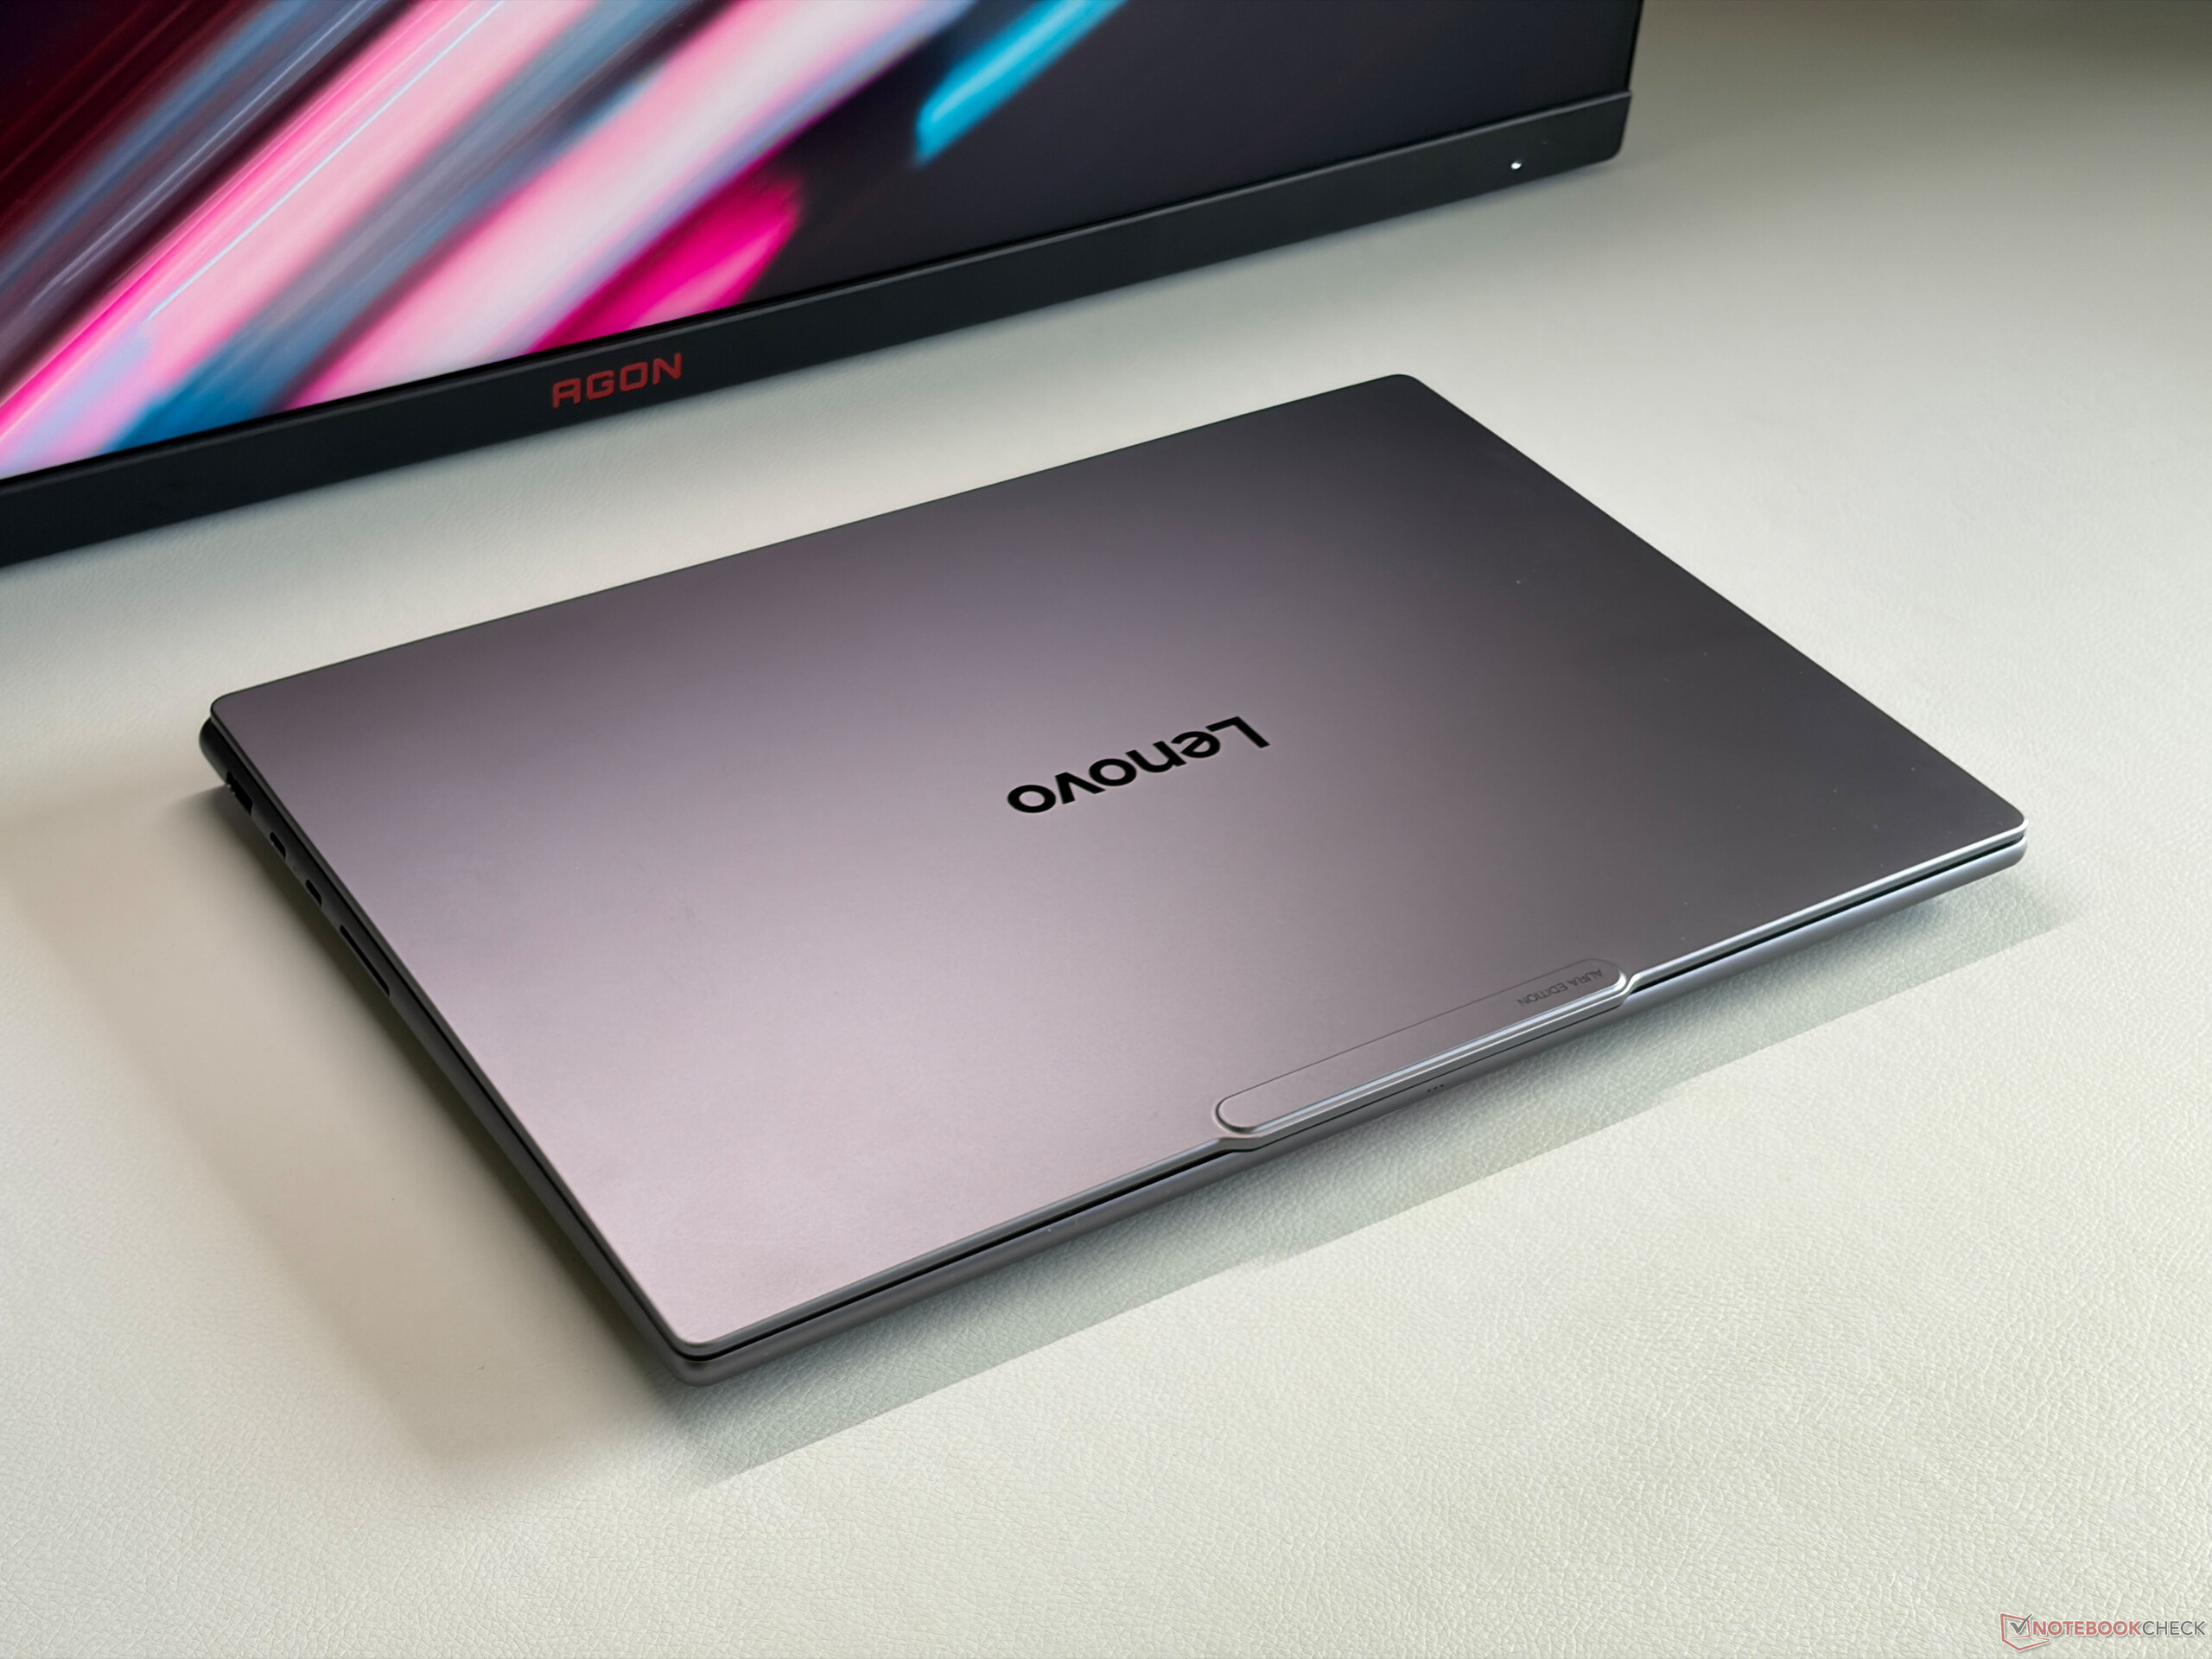
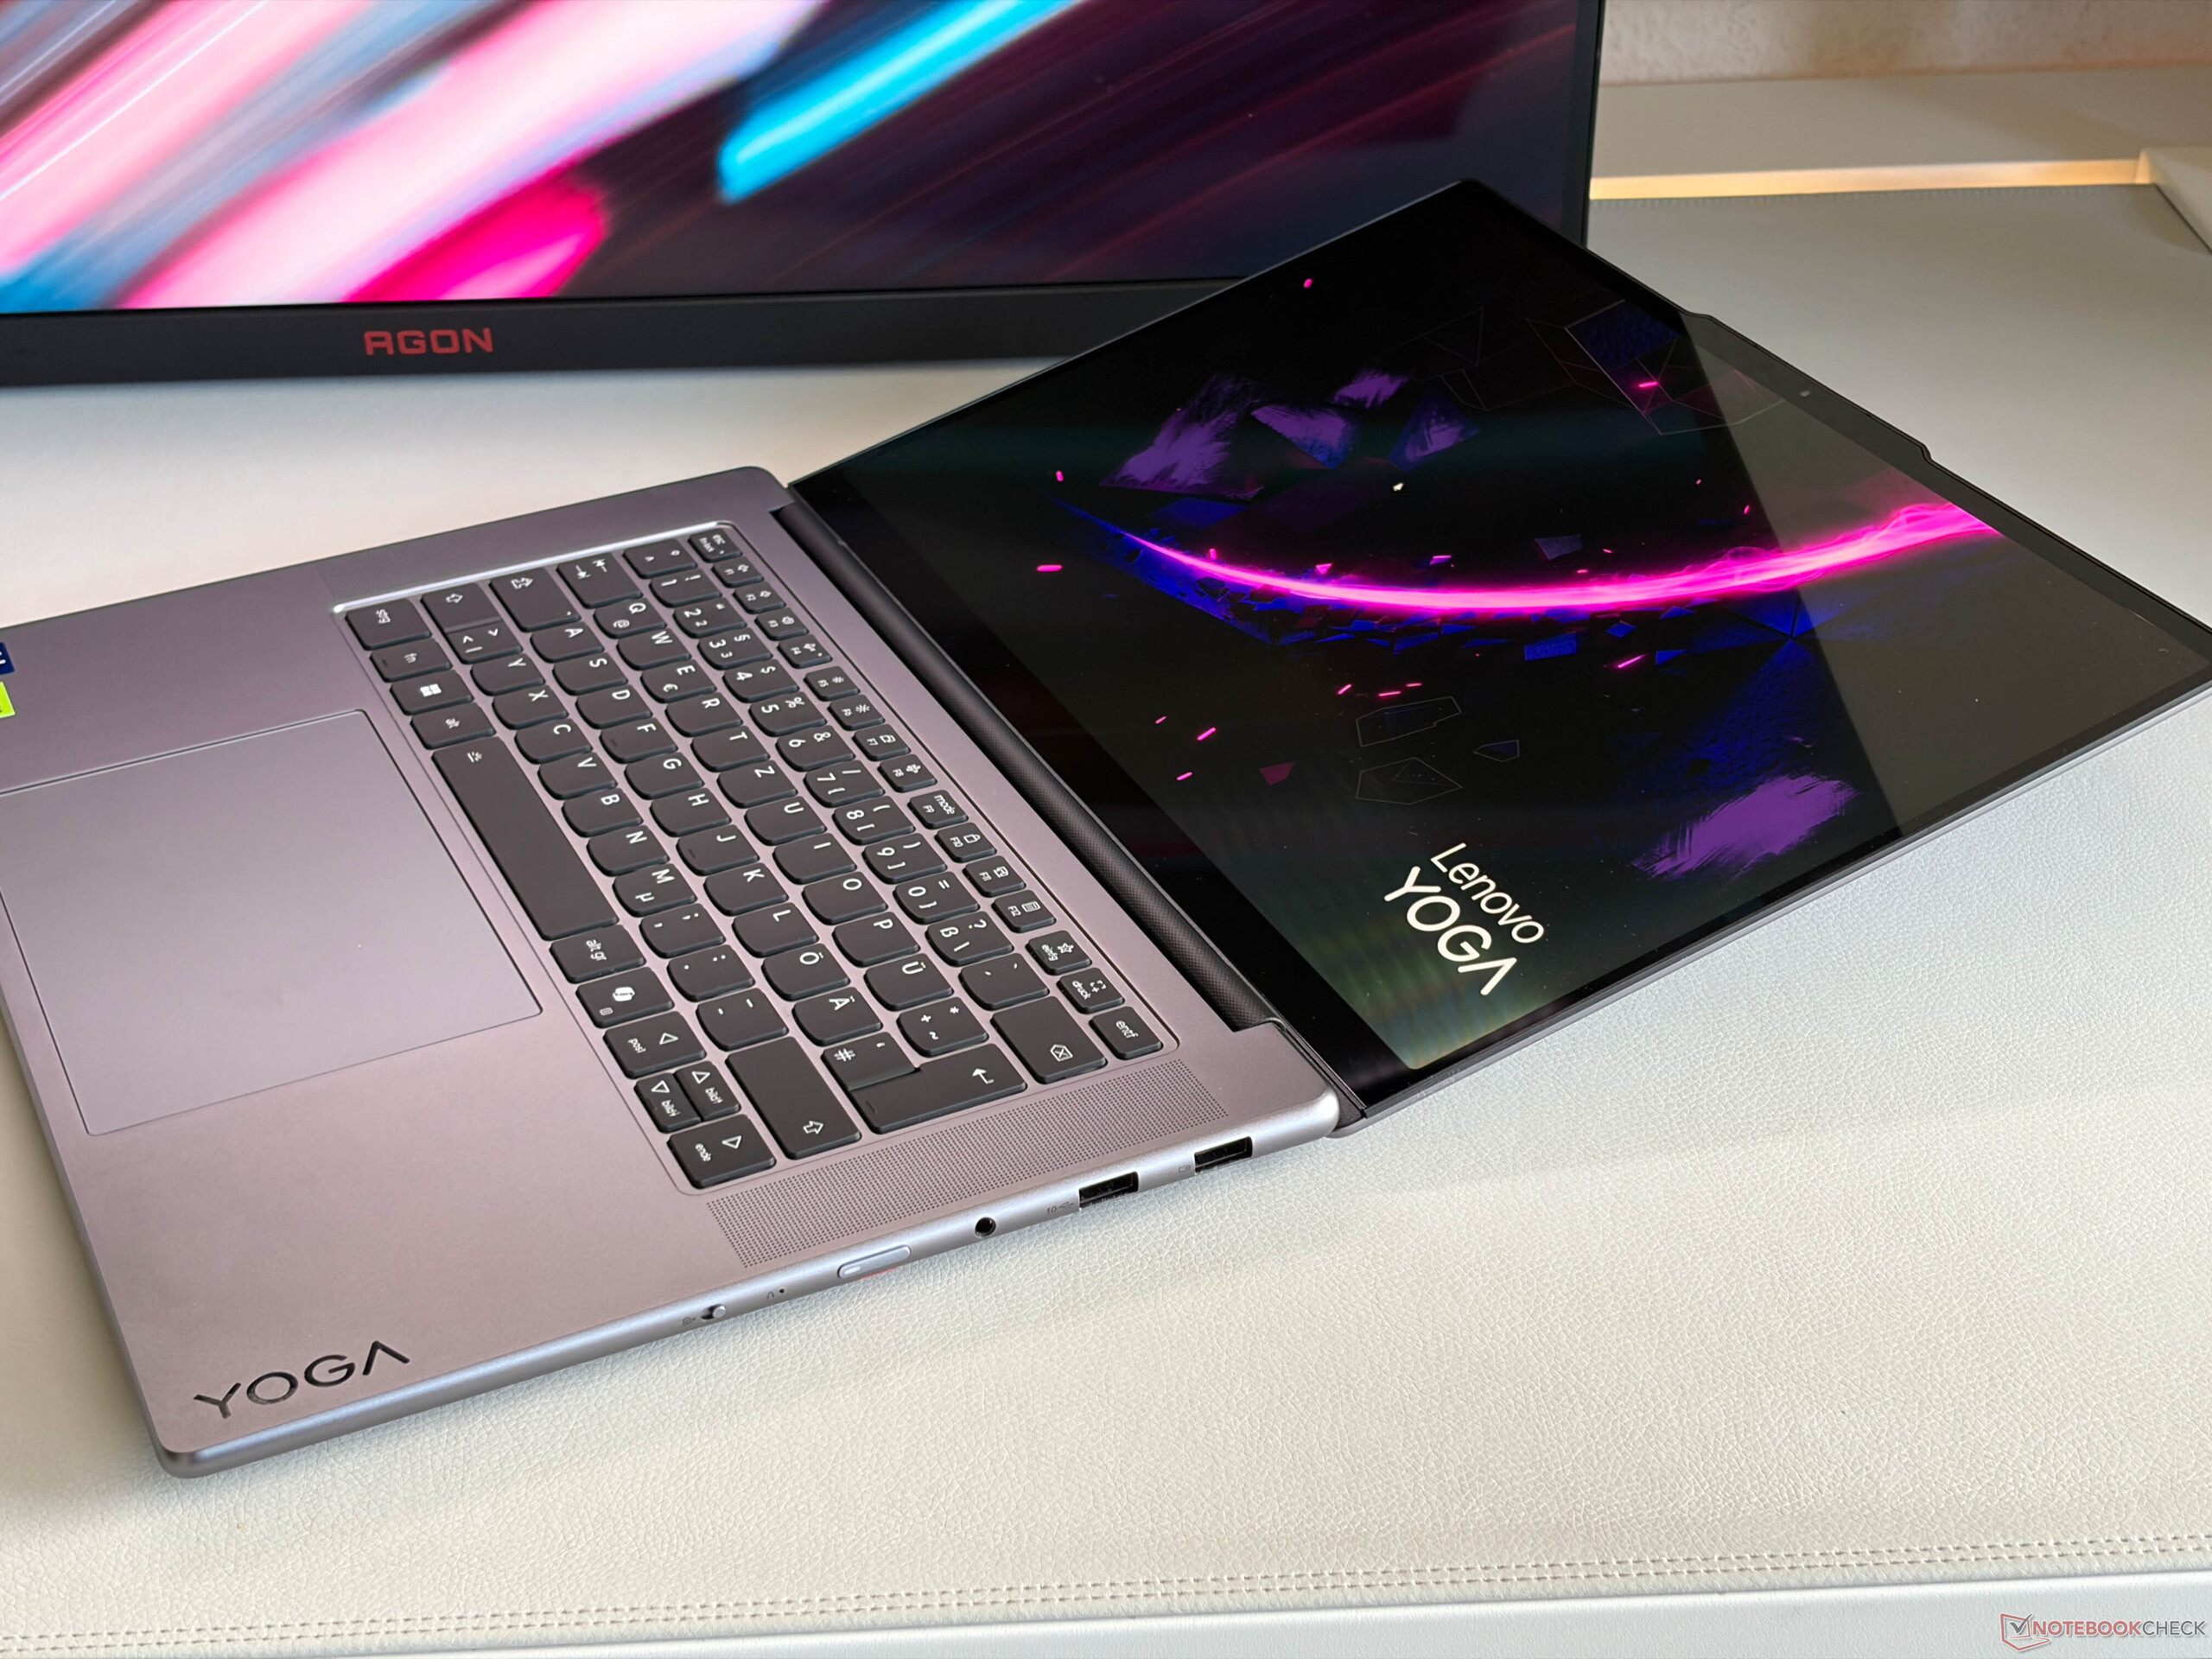
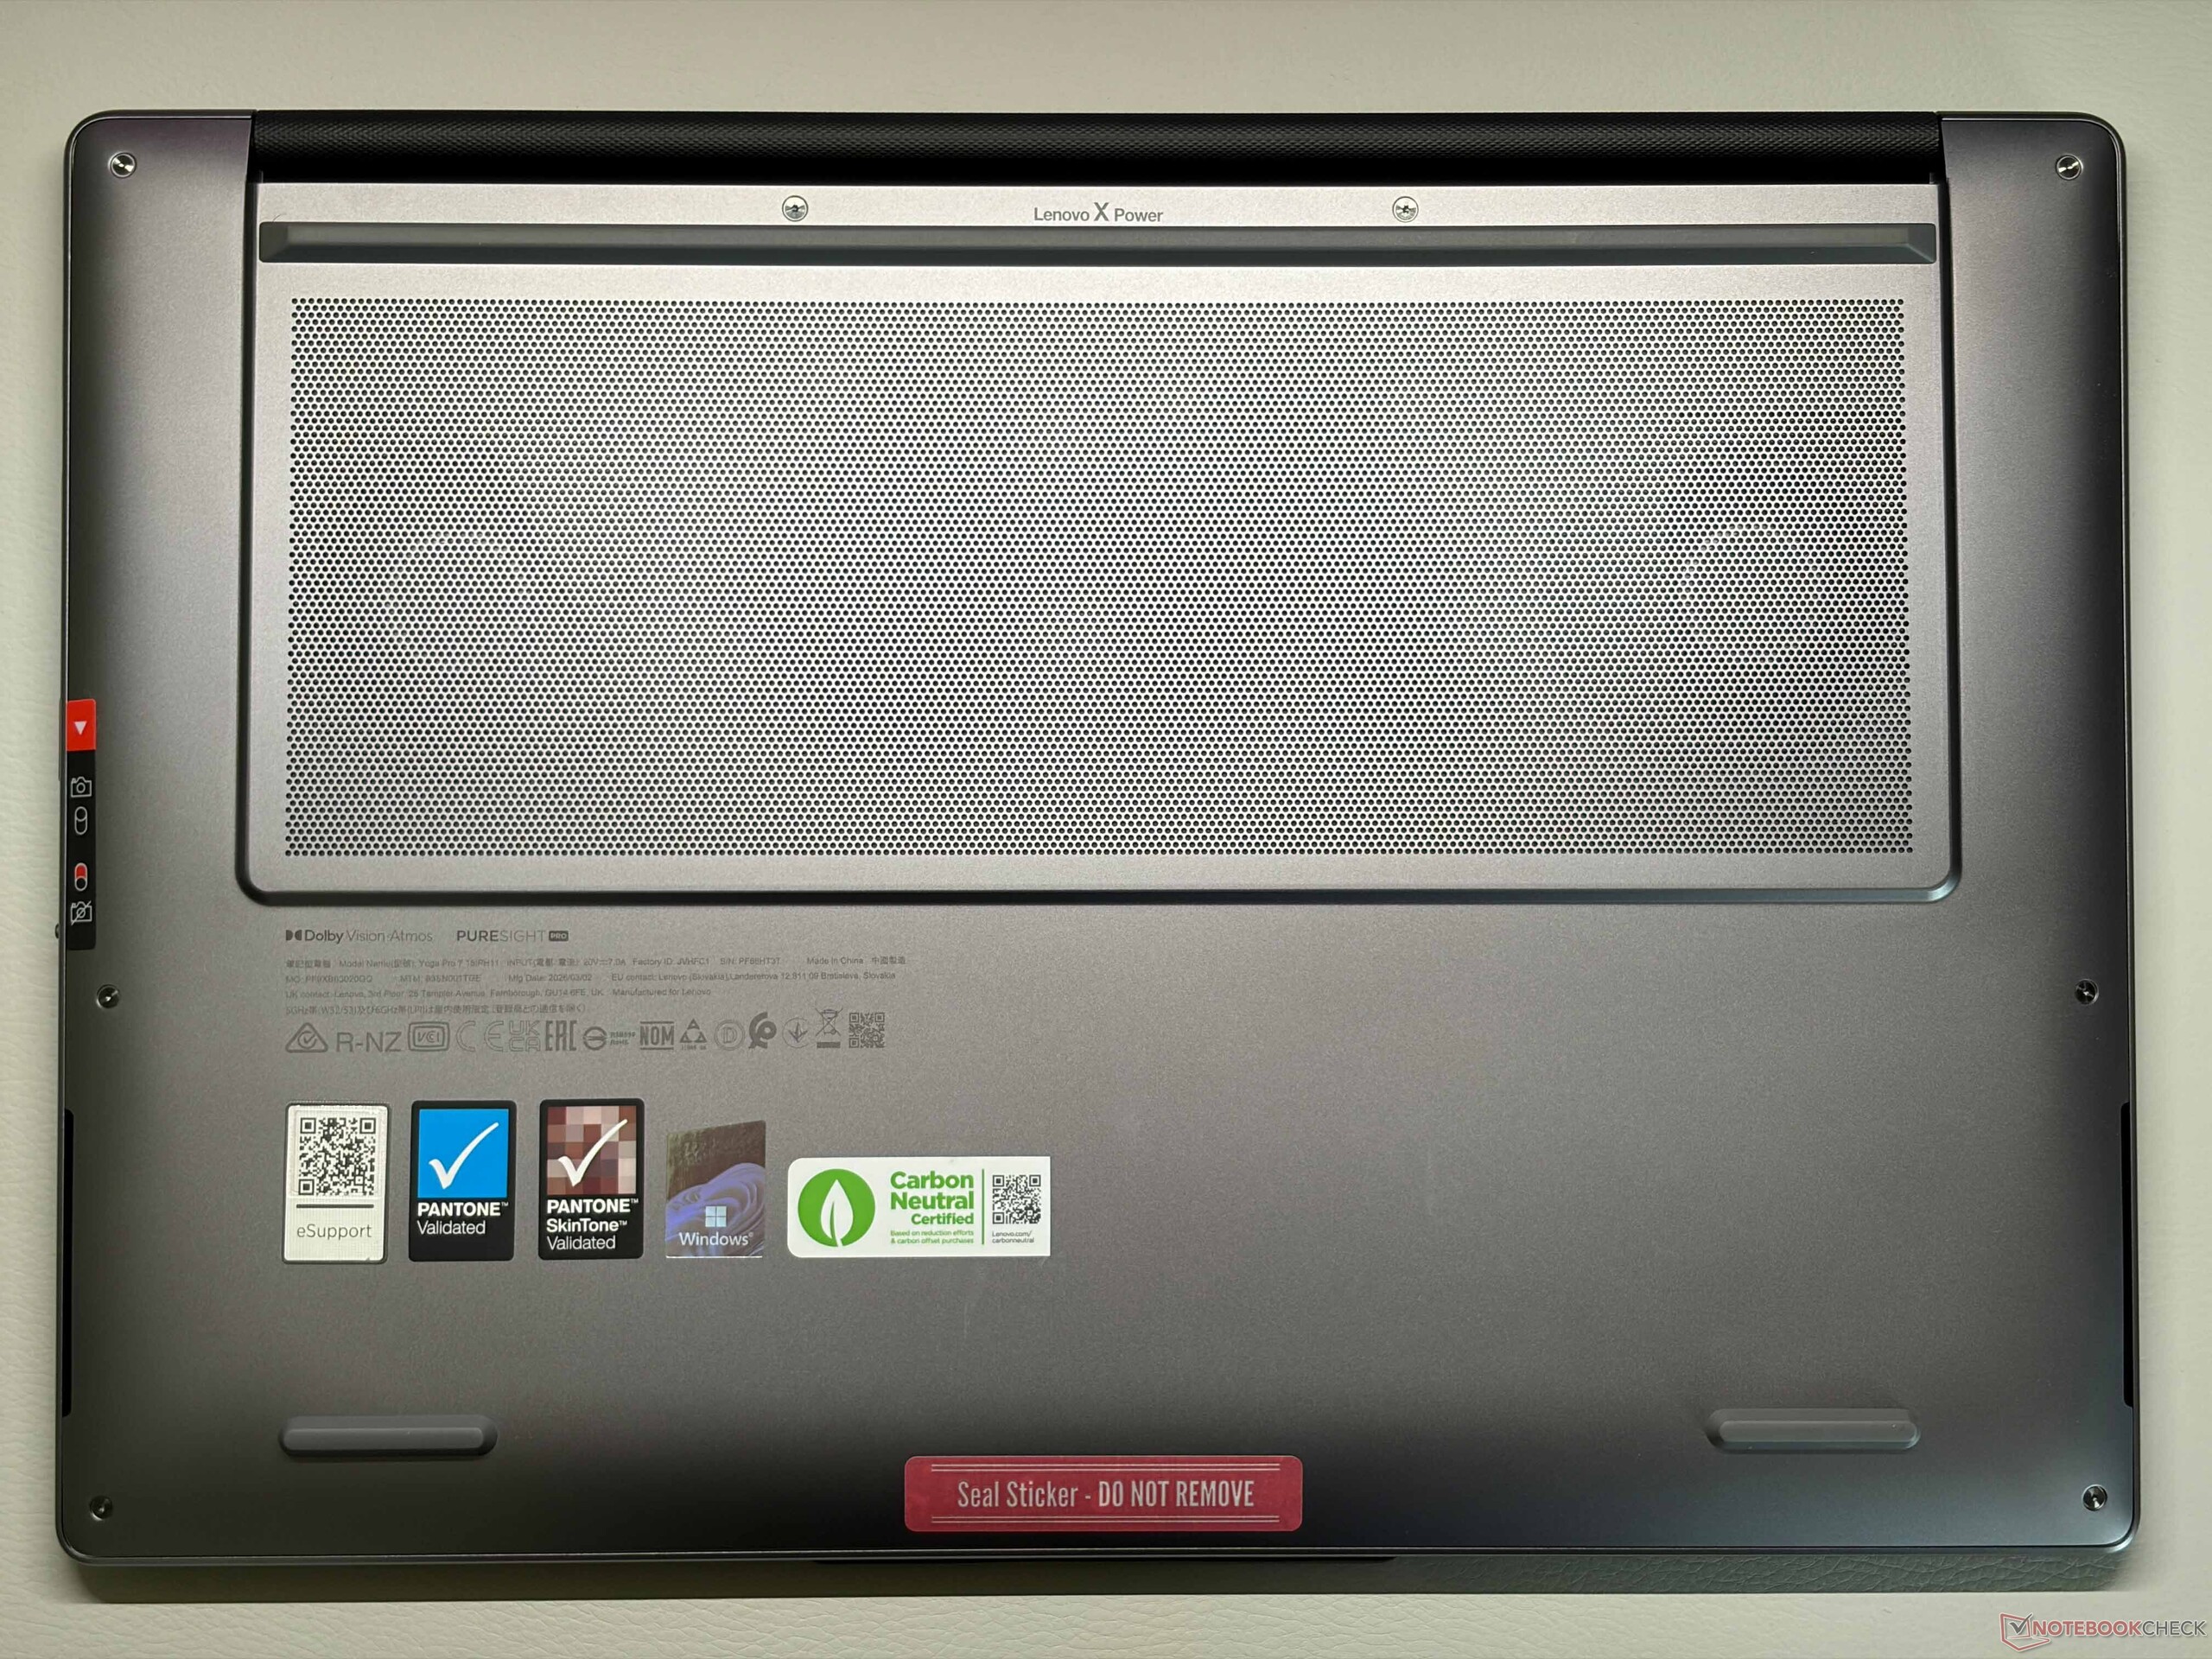
Lenovo utilise une construction en aluminium pour le Yoga Pro 7i 15 et la qualité générale est très bonne, mais il y a deux points faibles. Il semble solide et la stabilité de l'unité de base ainsi que du couvercle est excellente, mais nous avons remarqué des craquements mineurs au niveau des charnières. La fonctionnalité n'est cependant pas affectée, les charnières sont bien réglées (angle d'ouverture maximal de 170 degrés) et il n'y a que de légers rebonds. L'autre problème concerne le bouton d'alimentation, qui fait un peu de bruit. La couleur gris foncé n'attire pas vraiment les traces de doigts, mais la bosse de l'appareil photo n'est pas très belle. La mémoire et le module Wi-Fi sont soudés, mais vous pouvez implémenter deux SSD (1x M.2-2242, 1x M.2-2280).
En termes de connectivité, le Yoga offre à peu près tout ce que vous pouvez souhaiter, y compris Thunderbolt 4, deux ports USB-A ordinaires, un lecteur de carte SD rapide (même s'il n'y a pas de support pour SD-Express) et un module Wi-Fi 7 moderne, qui gère d'excellents taux de transfert avec un routeur correspondant. Vous disposez également d'une webcam de 5 MP (avec eShutter) et il s'agit évidemment d'un ordinateur portable certifié Copilot+.


| SD Card Reader | |
| average JPG Copy Test (av. of 3 runs) | |
| Schenker XMG Core 15 (M25) (AV PRO microSD 128 GB V60) | |
| Lenovo Yoga Pro 7 15IPH11 (Angelbird AV Pro V60) | |
| Lenovo Legion 7 16 AGP11 (Angelbird AV Pro V60) | |
| Lenovo Pro 9 16IPH11 (Toshiba Exceria Pro SDXC 64 GB UHS-II) | |
| Moyenne de la classe Multimedia (22.2 - 531, n=45, 2 dernières années) | |
| Samsung Galaxy Book6 Ultra (Angelbird AV Pro V60) | |
| maximum AS SSD Seq Read Test (1GB) | |
| Lenovo Pro 9 16IPH11 (Toshiba Exceria Pro SDXC 64 GB UHS-II) | |
| Lenovo Yoga Pro 7 15IPH11 (Angelbird AV Pro V60) | |
| Lenovo Legion 7 16 AGP11 (Angelbird AV Pro V60) | |
| Moyenne de la classe Multimedia (27.9 - 1455, n=44, 2 dernières années) | |
| Samsung Galaxy Book6 Ultra (Angelbird AV Pro V60) | |
| Networking | |
| Lenovo Yoga Pro 7 15IPH11 | |
| iperf3 transmit RT-BE96U WiFi7 | |
| iperf3 receive RT-BE96U WiFi7 | |
| Lenovo Pro 9 16IPH11 | |
| iperf3 transmit AXE11000 | |
| iperf3 receive AXE11000 | |
| iperf3 transmit AXE11000 6GHz | |
| iperf3 receive AXE11000 6GHz | |
| Samsung Galaxy Book6 Ultra | |
| iperf3 transmit AXE11000 | |
| iperf3 receive AXE11000 | |
| Lenovo Legion 7 16 AGP11 | |
| iperf3 transmit RT-BE96U WiFi7 | |
| iperf3 receive RT-BE96U WiFi7 | |
| Schenker XMG Core 15 (M25) | |
| iperf3 transmit AXE11000 | |
| iperf3 receive AXE11000 | |
| Dell XPS 16 Core Ultra X7 358H | |
| iperf3 transmit AXE11000 | |
| iperf3 receive AXE11000 | |
| iperf3 transmit AXE11000 6GHz | |
| iperf3 receive AXE11000 6GHz | |


Périphériques d'entrée
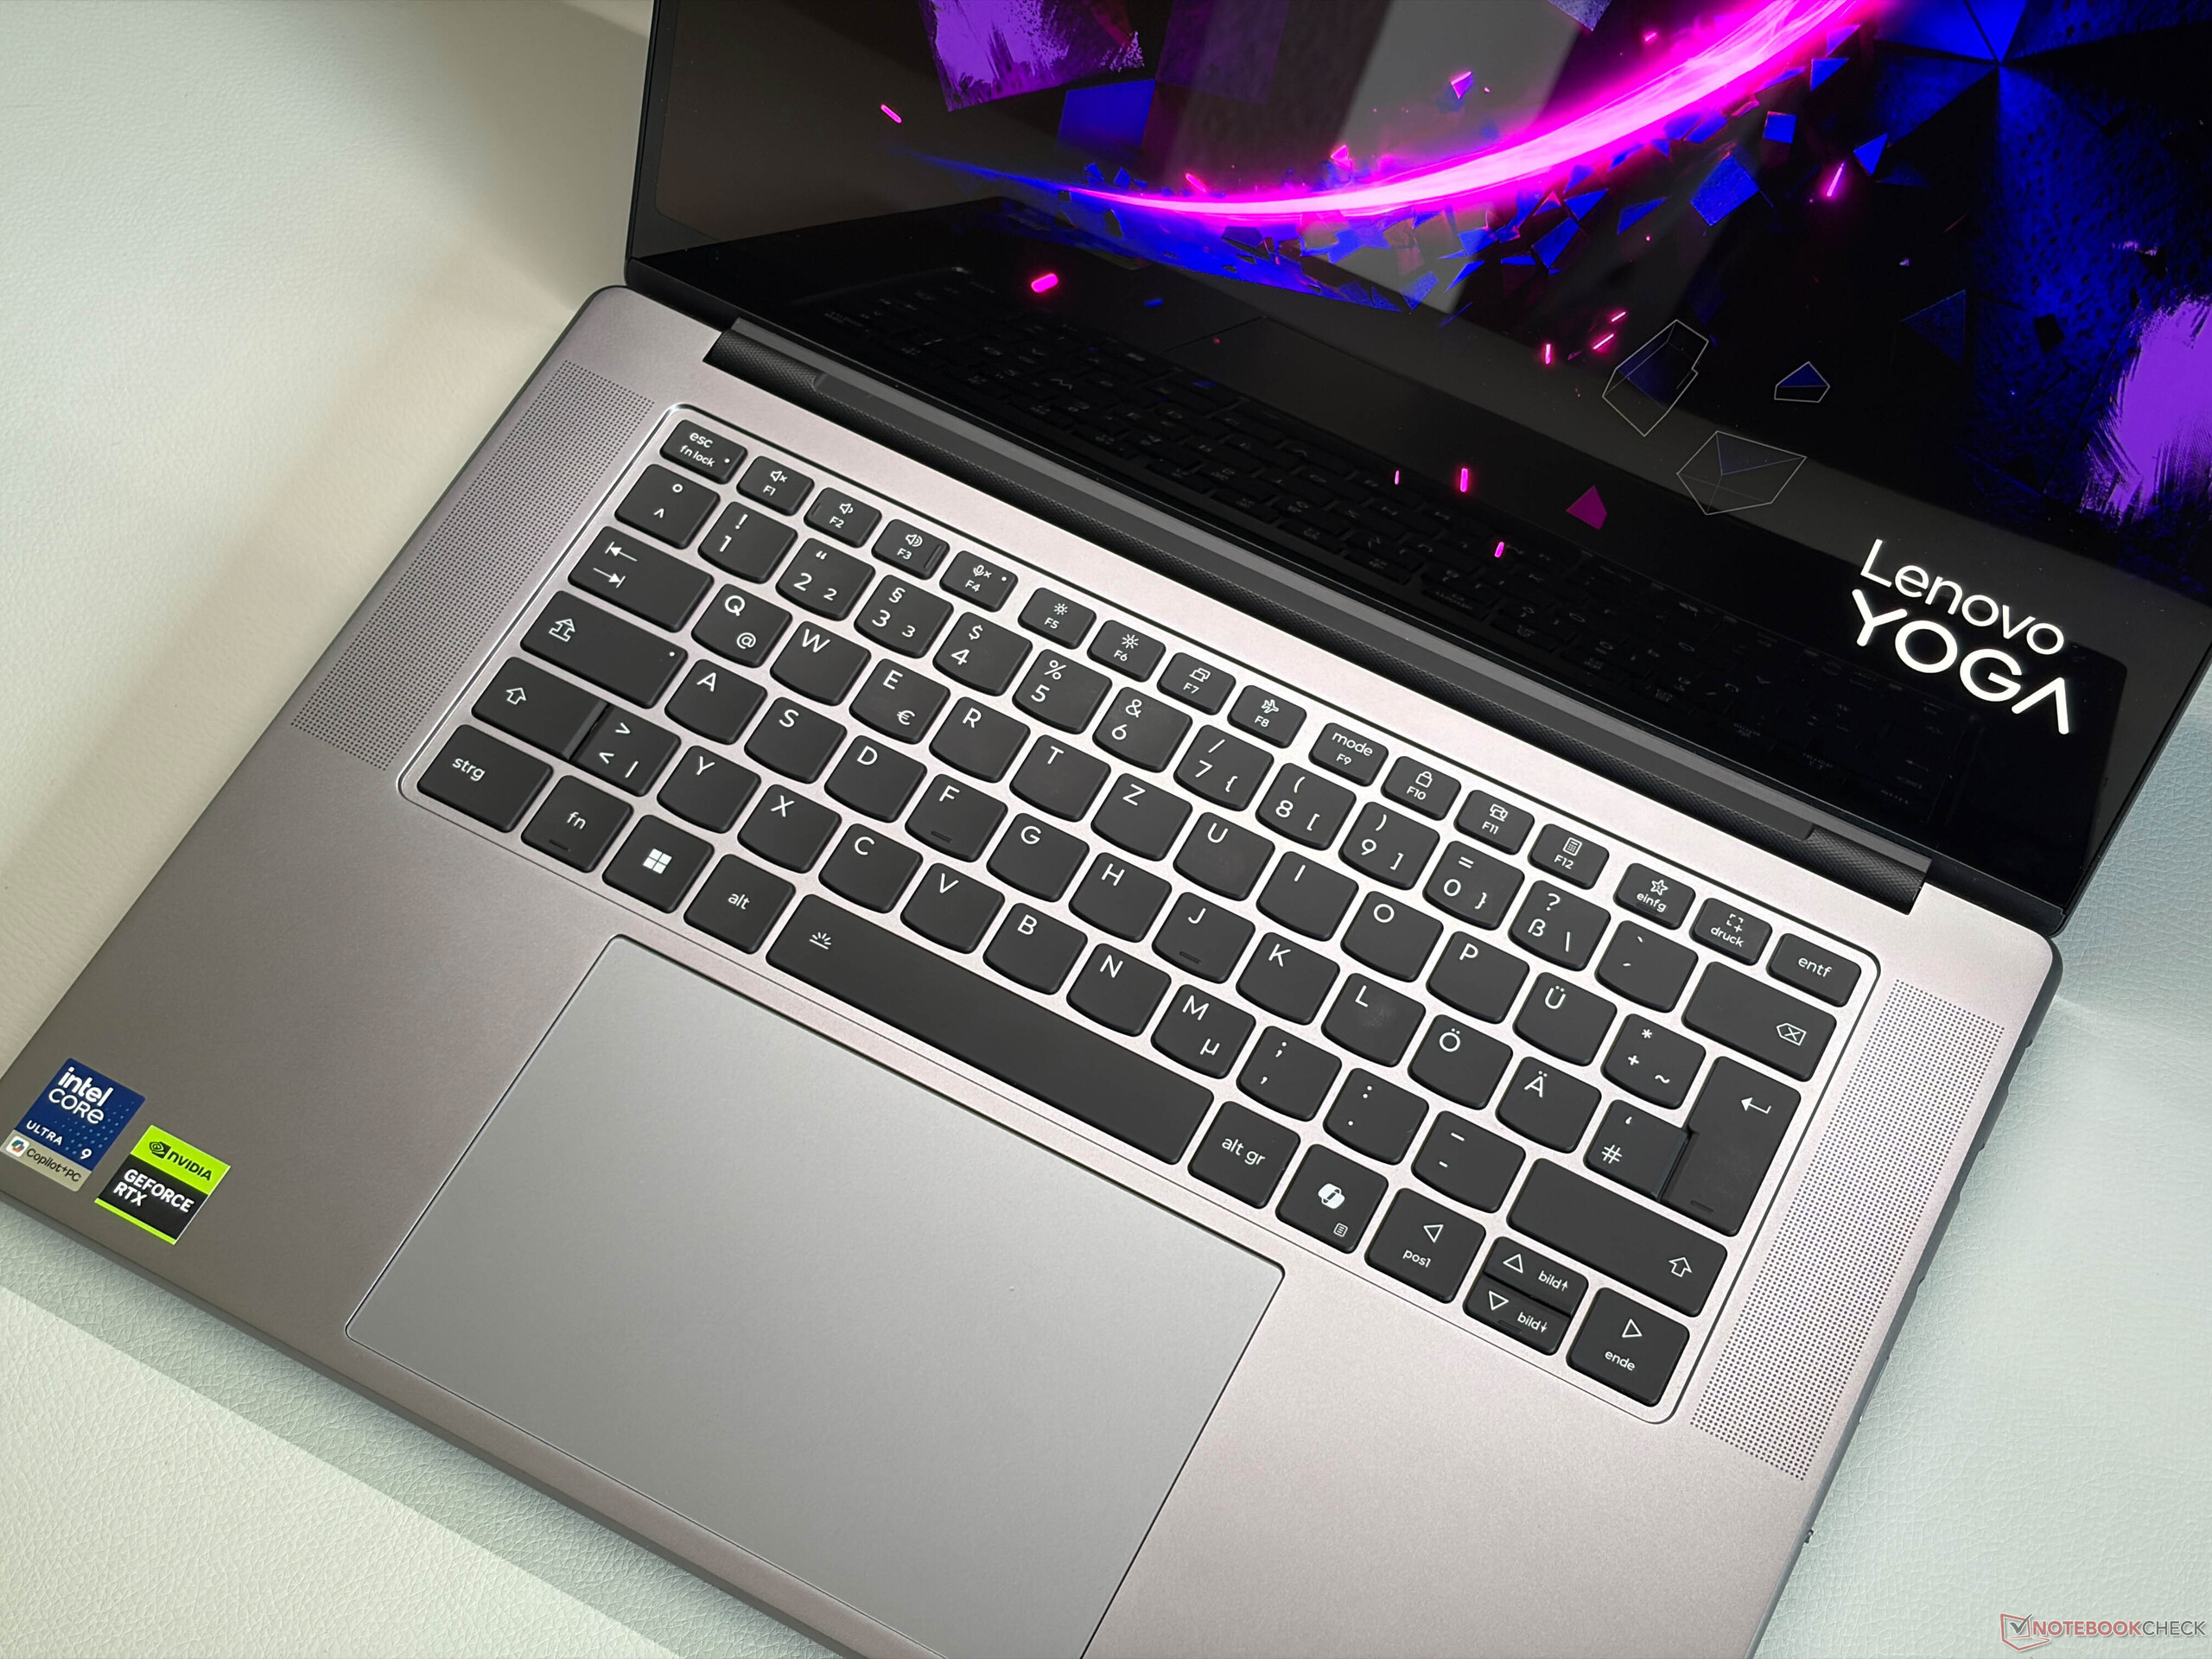
Le Yoga offre un clavier très confortable (course de 1,5 mm) avec un éclairage à deux niveaux, qui peut également être activé par un capteur. La frappe des touches est très précise et, combinée à l'unité de base rigide, c'est l'un des meilleurs claviers que vous puissiez trouver à l'heure actuelle. Lenovo propose deux pavés tactiles différents (15 x 9,5 cm, surface en verre) et notre appareil est équipé du pavé tactile classique, qui fonctionne très bien et offre des clics mécaniques de haute qualité dans la moitié inférieure du pavé. Vous pouvez également opter pour un pavé tactile à force. Notre appareil est également équipé d'un écran tactile capacitif.


Écran - Superbe OLED de 165 Hz
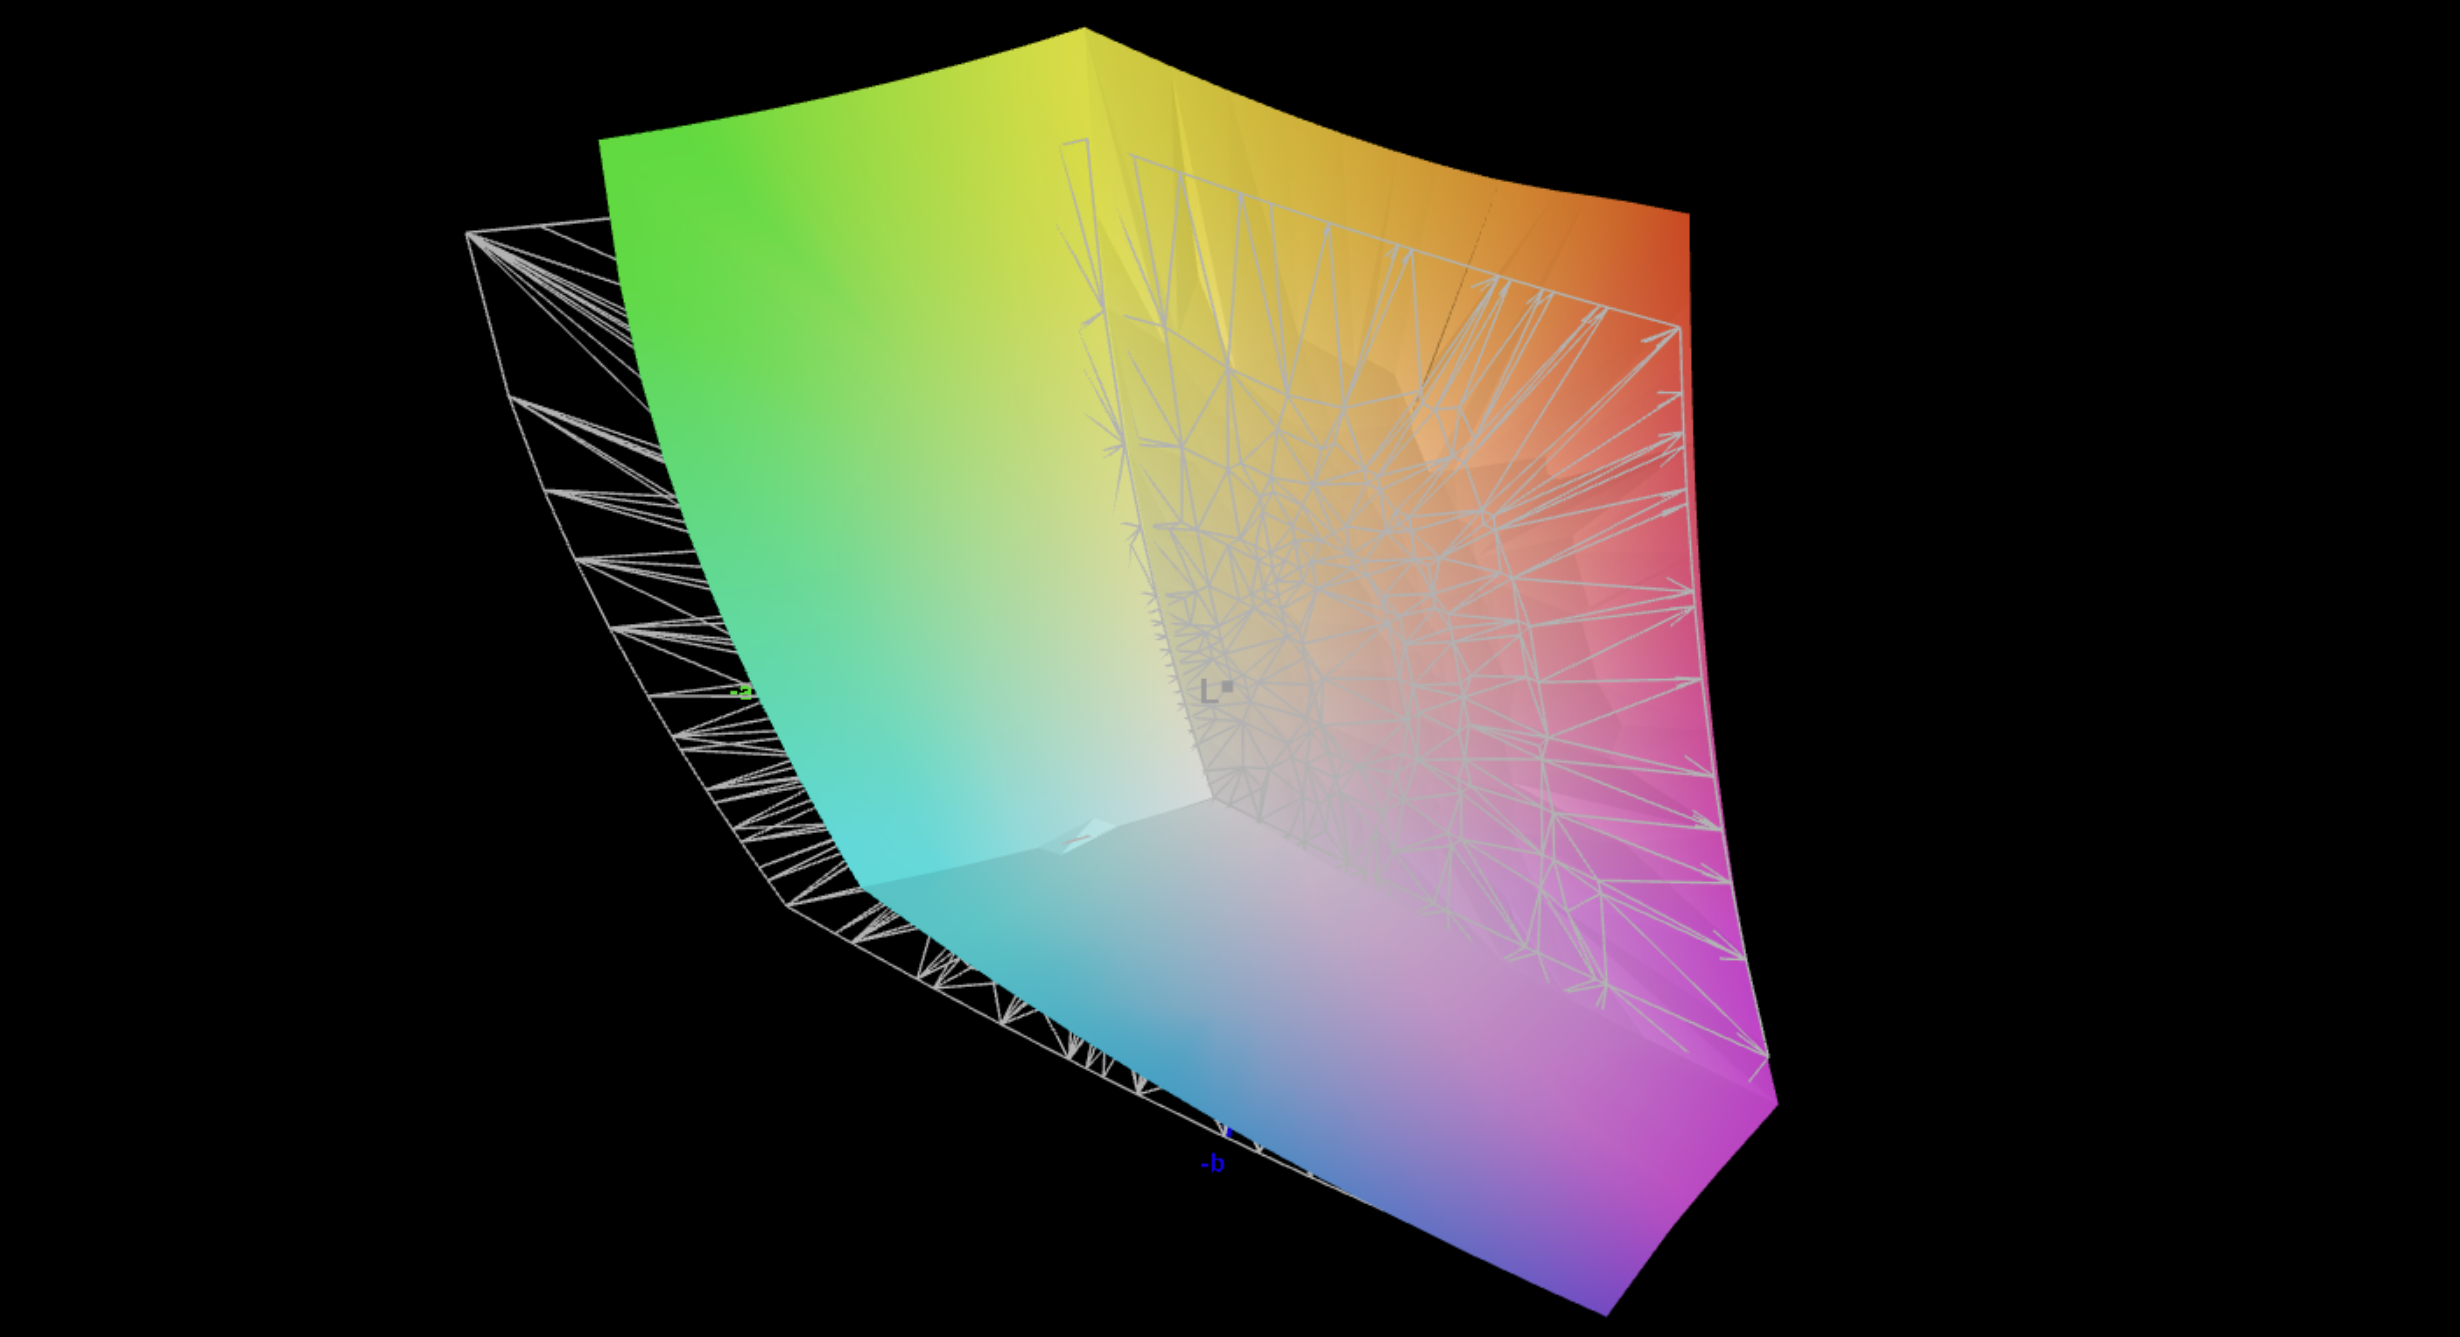
Le Yoga Pro 7i 15 Aura Edition est équipé d'un écran OLED 2.8K avec une fréquence de 165 Hz, mais vous pouvez opter pour une version tactile ou non tactile. Nous sommes heureux de constater que la couche tactile supplémentaire n'affecte pas la qualité de l'image, car même les contenus blancs n'ont pas l'air granuleux (ce qui est souvent un problème pour les écrans tactiles OLED). La qualité globale de l'image est tout simplement excellente, avec des couleurs riches, des noirs profonds et des temps de réponse rapides. Nous avons mesuré un scintillement PWM, mais la fréquence est assez élevée (1,3 kHz), ce qui ne devrait pas poser de problème.
Notre analyse avec le logiciel professionnel CalMAN révèle une luminosité SDR maximale de près de 500 nits et jusqu'à 1107 nits (784 nits en plein écran) pour les contenus HDR. Lenovo propose différents profils de couleurs et le profil P3 est déjà très bien calibré avec de faibles écarts de couleurs. Vous disposez également d'un profil pour les contenus sRGB, de sorte que l'édition d'images ne pose aucun problème. Nous n'avons pas été en mesure d'améliorer la précision des couleurs avec notre propre étalonnage.
| |||||||||||||||||||||||||
Homogénéité de la luminosité: 99 %
Valeur mesurée au centre, sur batterie: 483 cd/m²
Contraste: ∞:1 (Valeurs des noirs: 0 cd/m²)
ΔE ColorChecker Calman: 1.3 | ∀{0.5-29.43 Ø4.73}
ΔE Greyscale Calman: 1.7 | ∀{0.09-98 Ø4.98}
86.5% AdobeRGB 1998 (Argyll 3D)
99.9% sRGB (Argyll 3D)
97.1% Display P3 (Argyll 3D)
Gamma: 2.14
CCT: 6338 K
| Lenovo Yoga Pro 7 15IPH11 EF25QBA63.B, OLED, 2560x1600, 15.3", 165 Hz | Lenovo Pro 9 16IPH11 Samsung ATNA60KA04-0, Tandem OLED, 3200x2000, 16", 120 Hz | Samsung Galaxy Book6 Ultra ATNA60HR05-0, OLED, 2880x1800, 16", 120 Hz | Lenovo Legion 7 16 AGP11 ATNA60HU02-0, OLED, 2560x1600, 16", 240 Hz | Schenker XMG Core 15 (M25) NE153QDM-NZ2 (BOE0D5F), IPS, 2560x1600, 15.3", 300 Hz | Dell XPS 16 Core Ultra X7 358H LG Philips 160WV1, OLED, 3200x2000, 16", 120 Hz | |
|---|---|---|---|---|---|---|
| Display | 4% | -0% | 2% | -14% | 5% | |
| Display P3 Coverage (%) | 97.1 | 98.8 2% | 97 0% | 99.2 2% | 71.7 -26% | 99.5 2% |
| sRGB Coverage (%) | 99.9 | 100 0% | 99.9 0% | 100 0% | 99.9 0% | 100 0% |
| AdobeRGB 1998 Coverage (%) | 86.5 | 95.7 11% | 85.3 -1% | 90.2 4% | 73.6 -15% | 96.5 12% |
| Response Times | -67% | -88% | -155% | -3178% | -96% | |
| Response Time Grey 50% / Grey 80% * (ms) | 0.24 ? | 0.58 ? -142% | 0.5 ? -108% | 1.41 ? -488% | 12.4 ? -5067% | 0.65 ? -171% |
| Response Time Black / White * (ms) | 0.36 ? | 0.79 ? -119% | 0.4 ? -11% | 0.25 ? 31% | 5 ? -1289% | 0.87 ? -142% |
| PWM Frequency (Hz) | 1.31 ? | 1173.2 | 240 ? | 1440 ? | 240.2 ? | |
| PWM Amplitude * (%) | 41 | 16 61% | 100 -144% | 44 -7% | 31 24% | |
| Screen | -16% | 12% | -70% | -41% | -67% | |
| Brightness middle (cd/m²) | 483 | 930.9 93% | 499 3% | 499 3% | 545 13% | 395.4 -18% |
| Brightness (cd/m²) | 484 | 947 96% | 505 4% | 502 4% | 530 10% | 392 -19% |
| Brightness Distribution (%) | 99 | 94 -5% | 97 -2% | 98 -1% | 94 -5% | 95 -4% |
| Black Level * (cd/m²) | 0.02 | 0.54 | ||||
| Colorchecker dE 2000 * | 1.3 | 3.51 -170% | 0.9 31% | 2.5 -92% | 2.29 -76% | 3.69 -184% |
| Colorchecker dE 2000 max. * | 3 | 6.48 -116% | 2.1 30% | 7.8 -160% | 5.42 -81% | 7.94 -165% |
| Greyscale dE 2000 * | 1.7 | 1.6 6% | 1.6 6% | 4.7 -176% | 3.5 -106% | 1.9 -12% |
| Gamma | 2.14 103% | 2.34 94% | 2.22 99% | 2.21 100% | 2.317 95% | 2.28 96% |
| CCT | 6338 103% | 6398 102% | 6445 101% | 6715 97% | 6957 93% | 6274 104% |
| Colorchecker dE 2000 calibrated * | 1.55 | 1.05 | 0.68 | |||
| Contrast (:1) | 24950 | 1009 | ||||
| Moyenne finale (programmes/paramètres) | -26% /
-24% | -25% /
-16% | -74% /
-73% | -1078% /
-604% | -53% /
-56% |
* ... Moindre est la valeur, meilleures sont les performances


Temps de réponse de l'écran
| ↔ Temps de réponse noir à blanc | ||
|---|---|---|
| 0.36 ms ... hausse ↗ et chute ↘ combinées | ↗ 0.2 ms hausse | 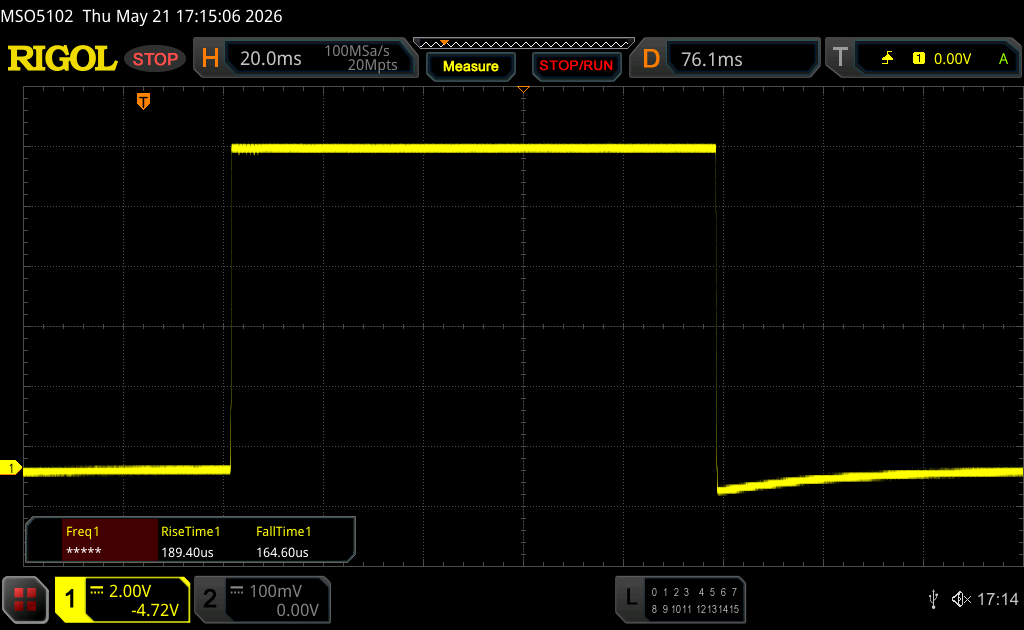 |
| ↘ 0.16 ms chute | ||
| L'écran montre de très faibles temps de réponse, parfait pour le jeu. En comparaison, tous les appareils testés affichent entre 0.1 (minimum) et 240 (maximum) ms. » 0 % des appareils testés affichent de meilleures performances. Cela signifie que les latences relevées sont meilleures que la moyenne (19.9 ms) de tous les appareils testés. | ||
| ↔ Temps de réponse gris 50% à gris 80% | ||
| 0.24 ms ... hausse ↗ et chute ↘ combinées | ↗ 0.13 ms hausse | 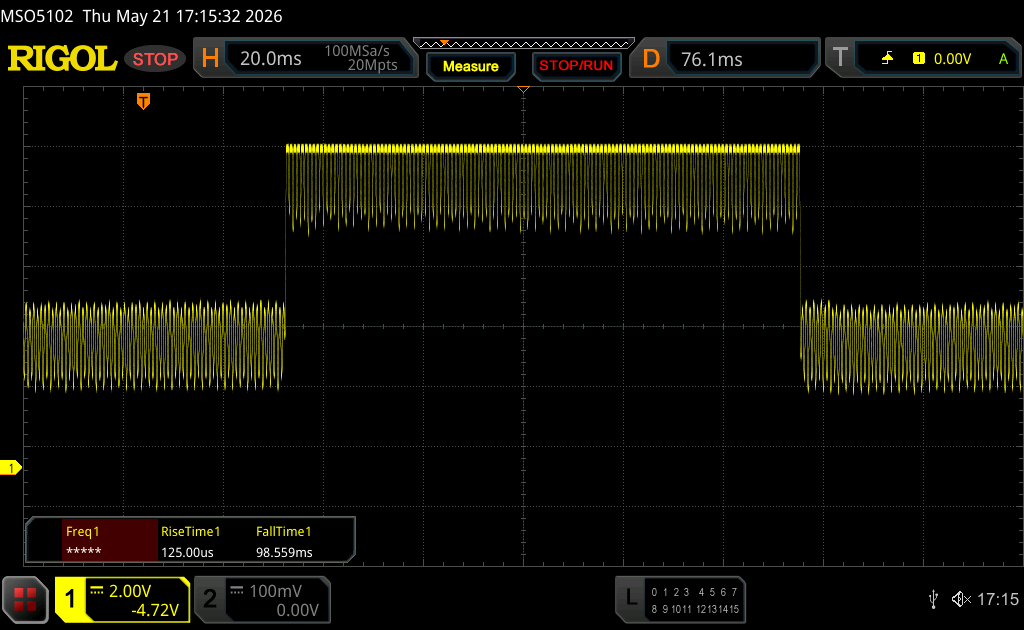 |
| ↘ 0.11 ms chute | ||
| L'écran montre de très faibles temps de réponse, parfait pour le jeu. En comparaison, tous les appareils testés affichent entre 0.165 (minimum) et 636 (maximum) ms. » 0 % des appareils testés affichent de meilleures performances. Cela signifie que les latences relevées sont meilleures que la moyenne (31.1 ms) de tous les appareils testés. | ||
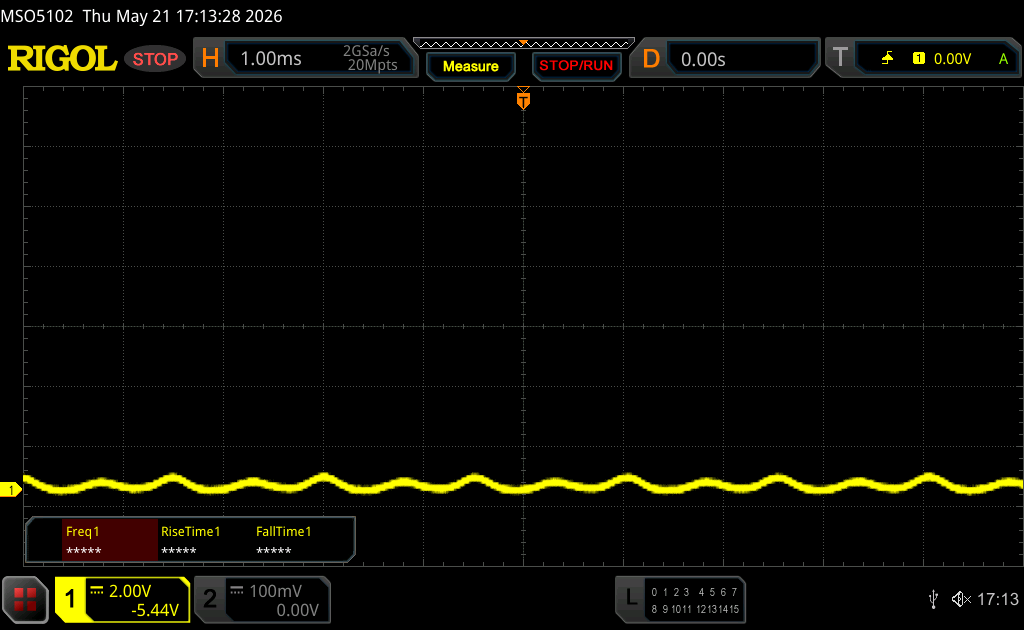
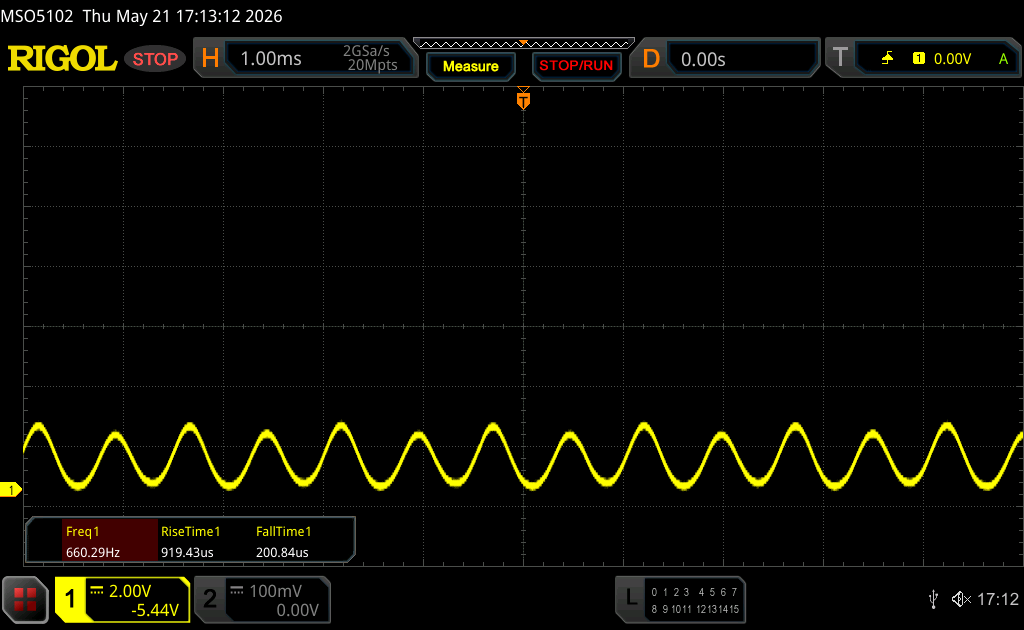
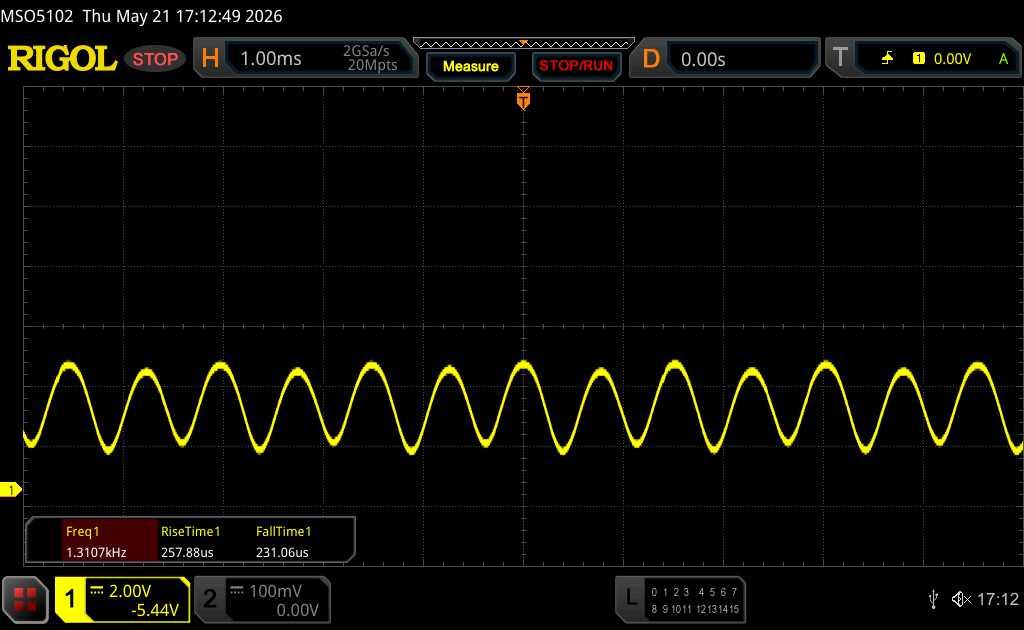
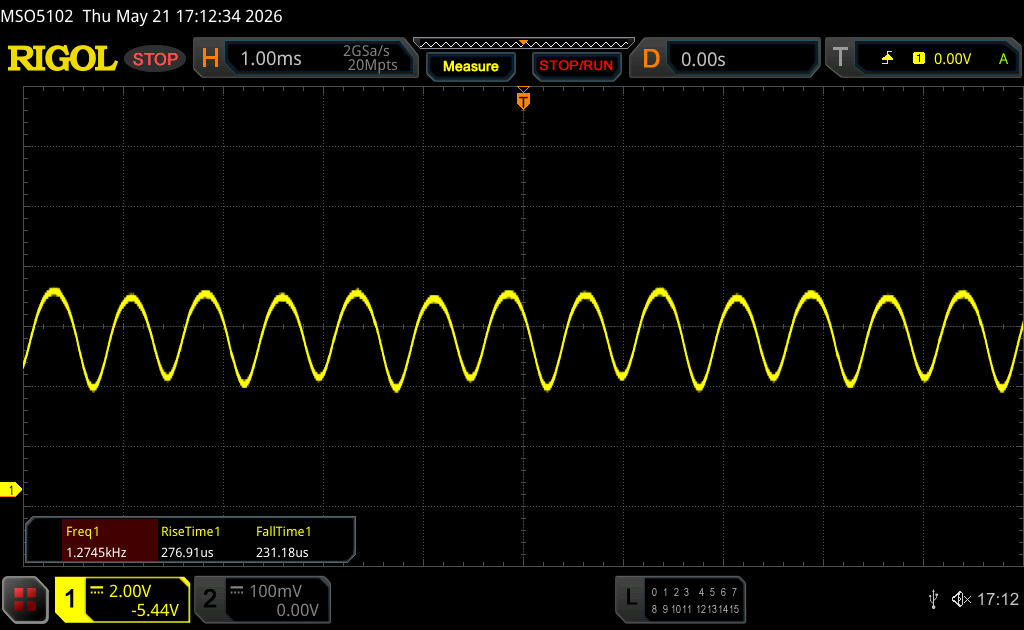
Scintillement / MLI (Modulation de largeur d'impulsion)
| Scintillement / MLI (Modulation de largeur d'impulsion) décelé | 1.31 Hz Amplitude: 41 % | ≤ 95 Niveau de luminosité | 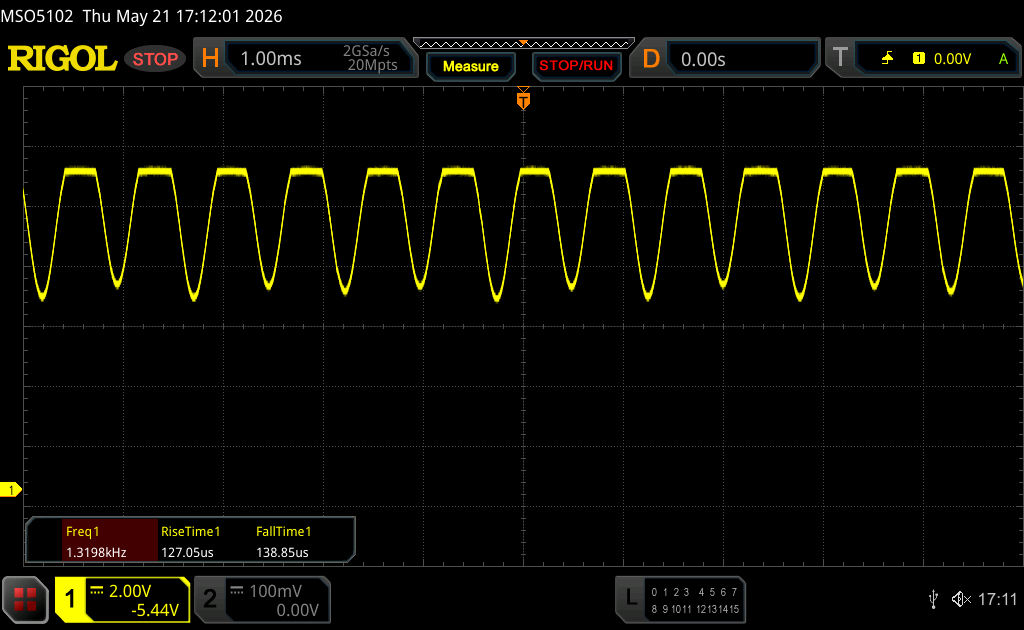 |
Le rétroéclairage de l'écran scintille à la fréquence de 1.31 Hz (certainement du fait de l'utilisation d'une MDI - Modulation de largeur d'impulsion) à un niveau de luminosité inférieur ou égal à 95 % . Aucun scintillement ne devrait être perceptible au-dessus de cette valeur. La fréquence de rafraîchissement de 1.31 Hz est extrêmement faible, de grands risques de fatigue oculaire accrue et de maux de tête en cas d'utilisation prolongée. En comparaison, 52 % des appareils testés n'emploient pas MDI pour assombrir leur écran. Nous avons relevé une moyenne à 7818 (minimum : 1.31 - maximum : 343500) Hz dans le cas où une MDI était active. | |||


Performance - Panther Lake rencontre Blackwell
Conditions d'essai
Lenovo propose ses propres modes d'alimentation, qui peuvent être synchronisés avec les paramètres Windows. Cependant, en plus du mode Haute performance, vous disposez désormais d'un mode Créateur encore plus rapide. Le problème est que ce changement n'a pas vraiment de sens, car le mode Haute performance est maintenant pratiquement identique au mode Auto , comme vous pouvez le voir dans le tableau ci-dessous. Il ne peut pas non plus être sélectionné via la combinaison de touches Fn+Q, ce qui est également ennuyeux. Le mode Créateur est également le seul moyen d'obtenir les performances complètes du GPU et nous l'avons utilisé pour nos tests.
| Profil énergétique | CPU TDP | CB24 Multi | GPU TGP | Time Spy Graphics | Cyberpunk 2077 QHD Ultra | bruit max. du ventilateur |
|---|---|---|---|---|---|---|
| Économiseur de batterie | 40/15 W | 582 points | 24 W | 2458 points | 6,9 fps | 31,7 dB(A) |
| Auto | 60/45 W | 1121 points | 60 W | 9306 points | 41.7 fps | 46 dB(A) |
| Haute performance | 70/55 W | 1187 points | 60 W | 9363 points | 43.3 fps | 49.5 dB(A) |
| Creator | 70/60 W | 1219 points | 85 W | 11166 points | 51.5 fps | 54.4 dB(A) |
| Batterie | 70/55 W | 1194 points | 55 W | 8747 points | 40.9 fps | 49.5 dB(A) |
Processeur
Le nouveau Core Ultra 9 386H fonctionne jusqu'à 70 Watts dans le Yoga Pro 7i 15 et se stabilise à 60 Watts, de sorte que les performances multicœurs sont assez stables. Les performances sont bonnes dans l'ensemble, même si le processeur ne peut pas rivaliser avec les puces ARM actuelles de Apple ou Qualcomm si vous avez besoin de performances multicœurs et monocœurs encore plus élevées.
Cinebench R15 Multi Loop
Cinebench R23: Multi Core | Single Core
Cinebench R20: CPU (Multi Core) | CPU (Single Core)
Cinebench R15: CPU Multi 64Bit | CPU Single 64Bit
Blender: v2.79 BMW27 CPU
7-Zip 18.03: 7z b 4 | 7z b 4 -mmt1
Geekbench 6.6: Multi-Core | Single-Core
Geekbench 5.5: Multi-Core | Single-Core
HWBOT x265 Benchmark v2.2: 4k Preset
LibreOffice : 20 Documents To PDF
R Benchmark 2.5: Overall mean
| CPU Performance rating | |
| Lenovo Yoga Pro 7 15IPH11 | |
| Lenovo Legion 7 16 AGP11 | |
| Lenovo Pro 9 16IPH11 | |
| Samsung Galaxy Book6 Ultra | |
| Dell XPS 16 Core Ultra X7 358H | |
| Moyenne Intel Core Ultra 9 386H | |
| Schenker XMG Core 15 (M25) | |
| Moyenne de la classe Multimedia | |
| Cinebench R23 / Multi Core | |
| Lenovo Legion 7 16 AGP11 | |
| Lenovo Yoga Pro 7 15IPH11 | |
| Lenovo Pro 9 16IPH11 | |
| Samsung Galaxy Book6 Ultra | |
| Moyenne Intel Core Ultra 9 386H (12144 - 21100, n=6) | |
| Dell XPS 16 Core Ultra X7 358H | |
| Moyenne de la classe Multimedia (4861 - 33362, n=83, 2 dernières années) | |
| Schenker XMG Core 15 (M25) | |
| Cinebench R23 / Single Core | |
| Dell XPS 16 Core Ultra X7 358H | |
| Lenovo Yoga Pro 7 15IPH11 | |
| Moyenne Intel Core Ultra 9 386H (2010 - 2101, n=6) | |
| Lenovo Legion 7 16 AGP11 | |
| Lenovo Pro 9 16IPH11 | |
| Samsung Galaxy Book6 Ultra | |
| Schenker XMG Core 15 (M25) | |
| Moyenne de la classe Multimedia (1128 - 2459, n=75, 2 dernières années) | |
| Cinebench R20 / CPU (Multi Core) | |
| Lenovo Legion 7 16 AGP11 | |
| Lenovo Pro 9 16IPH11 | |
| Lenovo Yoga Pro 7 15IPH11 | |
| Samsung Galaxy Book6 Ultra | |
| Moyenne Intel Core Ultra 9 386H (4757 - 8299, n=6) | |
| Dell XPS 16 Core Ultra X7 358H | |
| Moyenne de la classe Multimedia (1887 - 12912, n=66, 2 dernières années) | |
| Schenker XMG Core 15 (M25) | |
| Cinebench R20 / CPU (Single Core) | |
| Lenovo Legion 7 16 AGP11 | |
| Lenovo Yoga Pro 7 15IPH11 | |
| Moyenne Intel Core Ultra 9 386H (767 - 796, n=6) | |
| Lenovo Pro 9 16IPH11 | |
| Dell XPS 16 Core Ultra X7 358H | |
| Samsung Galaxy Book6 Ultra | |
| Schenker XMG Core 15 (M25) | |
| Moyenne de la classe Multimedia (420 - 853, n=66, 2 dernières années) | |
| Cinebench R15 / CPU Multi 64Bit | |
| Lenovo Legion 7 16 AGP11 | |
| Lenovo Pro 9 16IPH11 | |
| Lenovo Yoga Pro 7 15IPH11 | |
| Samsung Galaxy Book6 Ultra | |
| Moyenne Intel Core Ultra 9 386H (2197 - 3303, n=6) | |
| Dell XPS 16 Core Ultra X7 358H | |
| Schenker XMG Core 15 (M25) | |
| Moyenne de la classe Multimedia (856 - 5224, n=70, 2 dernières années) | |
| Cinebench R15 / CPU Single 64Bit | |
| Lenovo Pro 9 16IPH11 | |
| Lenovo Yoga Pro 7 15IPH11 | |
| Samsung Galaxy Book6 Ultra | |
| Schenker XMG Core 15 (M25) | |
| Dell XPS 16 Core Ultra X7 358H | |
| Moyenne Intel Core Ultra 9 386H (249 - 314, n=6) | |
| Moyenne de la classe Multimedia (184.8 - 326, n=68, 2 dernières années) | |
| Lenovo Legion 7 16 AGP11 | |
| Blender / v2.79 BMW27 CPU | |
| Moyenne de la classe Multimedia (100 - 557, n=67, 2 dernières années) | |
| Dell XPS 16 Core Ultra X7 358H | |
| Moyenne Intel Core Ultra 9 386H (156 - 299, n=6) | |
| Schenker XMG Core 15 (M25) | |
| Samsung Galaxy Book6 Ultra | |
| Lenovo Yoga Pro 7 15IPH11 | |
| Lenovo Pro 9 16IPH11 | |
| Lenovo Legion 7 16 AGP11 | |
| 7-Zip 18.03 / 7z b 4 | |
| Lenovo Legion 7 16 AGP11 | |
| Lenovo Yoga Pro 7 15IPH11 | |
| Lenovo Pro 9 16IPH11 | |
| Samsung Galaxy Book6 Ultra | |
| Moyenne Intel Core Ultra 9 386H (44980 - 72882, n=6) | |
| Dell XPS 16 Core Ultra X7 358H | |
| Schenker XMG Core 15 (M25) | |
| Moyenne de la classe Multimedia (29095 - 130368, n=64, 2 dernières années) | |
| 7-Zip 18.03 / 7z b 4 -mmt1 | |
| Lenovo Yoga Pro 7 15IPH11 | |
| Dell XPS 16 Core Ultra X7 358H | |
| Schenker XMG Core 15 (M25) | |
| Samsung Galaxy Book6 Ultra | |
| Lenovo Legion 7 16 AGP11 | |
| Moyenne Intel Core Ultra 9 386H (5488 - 6493, n=6) | |
| Lenovo Pro 9 16IPH11 | |
| Moyenne de la classe Multimedia (3666 - 7545, n=65, 2 dernières années) | |
| Geekbench 6.6 / Multi-Core | |
| Lenovo Yoga Pro 7 15IPH11 | |
| Dell XPS 16 Core Ultra X7 358H | |
| Lenovo Pro 9 16IPH11 | |
| Samsung Galaxy Book6 Ultra | |
| Lenovo Legion 7 16 AGP11 | |
| Moyenne Intel Core Ultra 9 386H (13776 - 17405, n=8) | |
| Moyenne de la classe Multimedia (4983 - 29415, n=81, 2 dernières années) | |
| Schenker XMG Core 15 (M25) | |
| Geekbench 6.6 / Single-Core | |
| Lenovo Legion 7 16 AGP11 | |
| Schenker XMG Core 15 (M25) | |
| Lenovo Yoga Pro 7 15IPH11 | |
| Dell XPS 16 Core Ultra X7 358H | |
| Lenovo Pro 9 16IPH11 | |
| Moyenne de la classe Multimedia (1534 - 4335, n=77, 2 dernières années) | |
| Moyenne Intel Core Ultra 9 386H (2778 - 2919, n=8) | |
| Samsung Galaxy Book6 Ultra | |
| Geekbench 5.5 / Multi-Core | |
| Lenovo Yoga Pro 7 15IPH11 | |
| Lenovo Pro 9 16IPH11 | |
| Dell XPS 16 Core Ultra X7 358H | |
| Samsung Galaxy Book6 Ultra | |
| Moyenne Intel Core Ultra 9 386H (13098 - 17557, n=6) | |
| Lenovo Legion 7 16 AGP11 | |
| Schenker XMG Core 15 (M25) | |
| Moyenne de la classe Multimedia (4652 - 20422, n=64, 2 dernières années) | |
| Geekbench 5.5 / Single-Core | |
| Lenovo Legion 7 16 AGP11 | |
| Lenovo Yoga Pro 7 15IPH11 | |
| Schenker XMG Core 15 (M25) | |
| Lenovo Pro 9 16IPH11 | |
| Dell XPS 16 Core Ultra X7 358H | |
| Moyenne Intel Core Ultra 9 386H (1992 - 2162, n=6) | |
| Samsung Galaxy Book6 Ultra | |
| Moyenne de la classe Multimedia (805 - 2974, n=64, 2 dernières années) | |
| HWBOT x265 Benchmark v2.2 / 4k Preset | |
| Lenovo Legion 7 16 AGP11 | |
| Samsung Galaxy Book6 Ultra | |
| Lenovo Pro 9 16IPH11 | |
| Lenovo Yoga Pro 7 15IPH11 | |
| Schenker XMG Core 15 (M25) | |
| Moyenne Intel Core Ultra 9 386H (13.2 - 24.8, n=6) | |
| Dell XPS 16 Core Ultra X7 358H | |
| Moyenne de la classe Multimedia (5.26 - 36.1, n=65, 2 dernières années) | |
| LibreOffice / 20 Documents To PDF | |
| Schenker XMG Core 15 (M25) | |
| Lenovo Legion 7 16 AGP11 | |
| Moyenne de la classe Multimedia (23.9 - 146.7, n=66, 2 dernières années) | |
| Dell XPS 16 Core Ultra X7 358H | |
| Samsung Galaxy Book6 Ultra | |
| Moyenne Intel Core Ultra 9 386H (38.5 - 56.1, n=6) | |
| Lenovo Yoga Pro 7 15IPH11 | |
| Lenovo Pro 9 16IPH11 | |
| R Benchmark 2.5 / Overall mean | |
| Moyenne de la classe Multimedia (0.3604 - 0.947, n=65, 2 dernières années) | |
| Lenovo Pro 9 16IPH11 | |
| Samsung Galaxy Book6 Ultra | |
| Moyenne Intel Core Ultra 9 386H (0.4055 - 0.4384, n=6) | |
| Dell XPS 16 Core Ultra X7 358H | |
| Lenovo Legion 7 16 AGP11 | |
| Lenovo Yoga Pro 7 15IPH11 | |
| Schenker XMG Core 15 (M25) | |
* ... Moindre est la valeur, meilleures sont les performances
AIDA64: FP32 Ray-Trace | FPU Julia | CPU SHA3 | CPU Queen | FPU SinJulia | FPU Mandel | CPU AES | CPU ZLib | FP64 Ray-Trace | CPU PhotoWorxx | CPU CheckMate
| Performance rating | |
| Lenovo Legion 7 16 AGP11 -1! | |
| Schenker XMG Core 15 (M25) -1! | |
| Lenovo Yoga Pro 7 15IPH11 -1! | |
| Lenovo Pro 9 16IPH11 -1! | |
| Samsung Galaxy Book6 Ultra -1! | |
| Moyenne Intel Core Ultra 9 386H -1! | |
| Moyenne de la classe Multimedia | |
| Dell XPS 16 Core Ultra X7 358H -1! | |
| AIDA64 / FP32 Ray-Trace | |
| Lenovo Legion 7 16 AGP11 (v8.20.8100) | |
| Schenker XMG Core 15 (M25) (v6.92.6600) | |
| Lenovo Pro 9 16IPH11 (v8.20.8100) | |
| Lenovo Yoga Pro 7 15IPH11 (v8.20.8100) | |
| Samsung Galaxy Book6 Ultra (v8.20.8100) | |
| Moyenne Intel Core Ultra 9 386H (10001 - 21727, n=6) | |
| Moyenne de la classe Multimedia (2214 - 50388, n=62, 2 dernières années) | |
| Dell XPS 16 Core Ultra X7 358H (v8.20.8100) | |
| AIDA64 / FPU Julia | |
| Lenovo Legion 7 16 AGP11 (v8.20.8100) | |
| Lenovo Pro 9 16IPH11 (v8.20.8100) | |
| Lenovo Yoga Pro 7 15IPH11 (v8.20.8100) | |
| Schenker XMG Core 15 (M25) (v6.92.6600) | |
| Samsung Galaxy Book6 Ultra (v8.20.8100) | |
| Moyenne Intel Core Ultra 9 386H (53370 - 113595, n=6) | |
| Dell XPS 16 Core Ultra X7 358H (v8.20.8100) | |
| Moyenne de la classe Multimedia (12867 - 201874, n=63, 2 dernières années) | |
| AIDA64 / CPU SHA3 | |
| Lenovo Legion 7 16 AGP11 (v8.20.8100) | |
| Lenovo Yoga Pro 7 15IPH11 (v8.20.8100) | |
| Lenovo Pro 9 16IPH11 (v8.20.8100) | |
| Samsung Galaxy Book6 Ultra (v8.20.8100) | |
| Moyenne Intel Core Ultra 9 386H (2776 - 5604, n=6) | |
| Schenker XMG Core 15 (M25) (v6.92.6600) | |
| Dell XPS 16 Core Ultra X7 358H (v8.20.8100) | |
| Moyenne de la classe Multimedia (653 - 8623, n=63, 2 dernières années) | |
| AIDA64 / CPU Queen | |
| Schenker XMG Core 15 (M25) (v6.92.6600) | |
| Moyenne de la classe Multimedia (13483 - 181505, n=51, 2 dernières années) | |
| AIDA64 / FPU SinJulia | |
| Lenovo Legion 7 16 AGP11 (v8.20.8100) | |
| Schenker XMG Core 15 (M25) (v6.92.6600) | |
| Moyenne de la classe Multimedia (1240 - 28794, n=63, 2 dernières années) | |
| Lenovo Yoga Pro 7 15IPH11 (v8.20.8100) | |
| Lenovo Pro 9 16IPH11 (v8.20.8100) | |
| Samsung Galaxy Book6 Ultra (v8.20.8100) | |
| Dell XPS 16 Core Ultra X7 358H (v8.20.8100) | |
| Moyenne Intel Core Ultra 9 386H (5314 - 7332, n=6) | |
| AIDA64 / FPU Mandel | |
| Lenovo Legion 7 16 AGP11 (v8.20.8100) | |
| Lenovo Pro 9 16IPH11 (v8.20.8100) | |
| Schenker XMG Core 15 (M25) (v6.92.6600) | |
| Samsung Galaxy Book6 Ultra (v8.20.8100) | |
| Lenovo Yoga Pro 7 15IPH11 (v8.20.8100) | |
| Moyenne Intel Core Ultra 9 386H (28414 - 61578, n=6) | |
| Dell XPS 16 Core Ultra X7 358H (v8.20.8100) | |
| Moyenne de la classe Multimedia (6395 - 105740, n=62, 2 dernières années) | |
| AIDA64 / CPU AES | |
| Lenovo Legion 7 16 AGP11 (v8.20.8100) | |
| Schenker XMG Core 15 (M25) (v6.92.6600) | |
| Lenovo Yoga Pro 7 15IPH11 (v8.20.8100) | |
| Lenovo Pro 9 16IPH11 (v8.20.8100) | |
| Samsung Galaxy Book6 Ultra (v8.20.8100) | |
| Moyenne de la classe Multimedia (13243 - 126790, n=63, 2 dernières années) | |
| Moyenne Intel Core Ultra 9 386H (46362 - 72112, n=6) | |
| Dell XPS 16 Core Ultra X7 358H (v8.20.8100) | |
| AIDA64 / CPU ZLib | |
| Lenovo Legion 7 16 AGP11 (v8.20.8100) | |
| Lenovo Yoga Pro 7 15IPH11 (v8.20.8100) | |
| Lenovo Pro 9 16IPH11 (v8.20.8100) | |
| Samsung Galaxy Book6 Ultra (v8.20.8100) | |
| Schenker XMG Core 15 (M25) (v6.92.6600) | |
| Moyenne Intel Core Ultra 9 386H (669 - 1271, n=6) | |
| Dell XPS 16 Core Ultra X7 358H (v8.20.8100) | |
| Moyenne de la classe Multimedia (167.2 - 2022, n=63, 2 dernières années) | |
| AIDA64 / FP64 Ray-Trace | |
| Lenovo Legion 7 16 AGP11 (v8.20.8100) | |
| Schenker XMG Core 15 (M25) (v6.92.6600) | |
| Lenovo Pro 9 16IPH11 (v8.20.8100) | |
| Samsung Galaxy Book6 Ultra (v8.20.8100) | |
| Lenovo Yoga Pro 7 15IPH11 (v8.20.8100) | |
| Moyenne de la classe Multimedia (1014 - 26875, n=63, 2 dernières années) | |
| Moyenne Intel Core Ultra 9 386H (5138 - 11627, n=6) | |
| Dell XPS 16 Core Ultra X7 358H (v8.20.8100) | |
| AIDA64 / CPU PhotoWorxx | |
| Dell XPS 16 Core Ultra X7 358H (v8.20.8100) | |
| Lenovo Yoga Pro 7 15IPH11 (v8.20.8100) | |
| Samsung Galaxy Book6 Ultra (v8.20.8100) | |
| Moyenne Intel Core Ultra 9 386H (54042 - 89891, n=6) | |
| Lenovo Pro 9 16IPH11 (v8.20.8100) | |
| Lenovo Legion 7 16 AGP11 (v8.20.8100) | |
| Moyenne de la classe Multimedia (12860 - 88154, n=63, 2 dernières années) | |
| Schenker XMG Core 15 (M25) (v6.92.6600) | |
| AIDA64 / CPU CheckMate | |
| Lenovo Legion 7 16 AGP11 (v8.20.8100) | |
| Lenovo Yoga Pro 7 15IPH11 (v8.20.8100) | |
| Lenovo Pro 9 16IPH11 (v8.20.8100) | |
| Samsung Galaxy Book6 Ultra (v8.20.8100) | |
| Moyenne Intel Core Ultra 9 386H (4051 - 4826, n=5) | |
| Dell XPS 16 Core Ultra X7 358H (v8.20.8100) | |
| Moyenne de la classe Multimedia (1570 - 4742, n=15, 2 dernières années) | |
Performance du système
Les performances du système sont excellentes, mais la prise en charge par Advanced Optimus se traduit par de courts bégaiements lorsque le dGPU est activé ou désactivé. Nous n'avons rencontré aucun problème de stabilité.
PCMark 10: Score | Essentials | Productivity | Digital Content Creation
CrossMark: Overall | Productivity | Creativity | Responsiveness
WebXPRT 3: Overall
WebXPRT 4: Overall
Mozilla Kraken 1.1: Total
| Performance rating | |
| Lenovo Yoga Pro 7 15IPH11 | |
| Moyenne Intel Core Ultra 9 386H, NVIDIA GeForce RTX 5060 Laptop | |
| Dell XPS 16 Core Ultra X7 358H | |
| Lenovo Pro 9 16IPH11 | |
| Samsung Galaxy Book6 Ultra | |
| Lenovo Legion 7 16 AGP11 | |
| Moyenne de la classe Multimedia | |
| Schenker XMG Core 15 (M25) -3! | |
| PCMark 10 / Score | |
| Dell XPS 16 Core Ultra X7 358H | |
| Lenovo Legion 7 16 AGP11 | |
| Lenovo Pro 9 16IPH11 | |
| Moyenne Intel Core Ultra 9 386H, NVIDIA GeForce RTX 5060 Laptop (9465 - 9484, n=2) | |
| Lenovo Yoga Pro 7 15IPH11 | |
| Samsung Galaxy Book6 Ultra | |
| Moyenne de la classe Multimedia (4325 - 10386, n=59, 2 dernières années) | |
| PCMark 10 / Essentials | |
| Dell XPS 16 Core Ultra X7 358H | |
| Lenovo Yoga Pro 7 15IPH11 | |
| Moyenne Intel Core Ultra 9 386H, NVIDIA GeForce RTX 5060 Laptop (10759 - 10841, n=2) | |
| Schenker XMG Core 15 (M25) | |
| Lenovo Pro 9 16IPH11 | |
| Moyenne de la classe Multimedia (8025 - 11664, n=58, 2 dernières années) | |
| Lenovo Legion 7 16 AGP11 | |
| Samsung Galaxy Book6 Ultra | |
| PCMark 10 / Productivity | |
| Samsung Galaxy Book6 Ultra | |
| Dell XPS 16 Core Ultra X7 358H | |
| Lenovo Legion 7 16 AGP11 | |
| Lenovo Pro 9 16IPH11 | |
| Moyenne Intel Core Ultra 9 386H, NVIDIA GeForce RTX 5060 Laptop (15199 - 15447, n=2) | |
| Lenovo Yoga Pro 7 15IPH11 | |
| Moyenne de la classe Multimedia (7323 - 18233, n=58, 2 dernières années) | |
| PCMark 10 / Digital Content Creation | |
| Lenovo Legion 7 16 AGP11 | |
| Lenovo Yoga Pro 7 15IPH11 | |
| Moyenne Intel Core Ultra 9 386H, NVIDIA GeForce RTX 5060 Laptop (13928 - 13963, n=2) | |
| Lenovo Pro 9 16IPH11 | |
| Dell XPS 16 Core Ultra X7 358H | |
| Samsung Galaxy Book6 Ultra | |
| Moyenne de la classe Multimedia (3651 - 16240, n=58, 2 dernières années) | |
| CrossMark / Overall | |
| Lenovo Yoga Pro 7 15IPH11 | |
| Moyenne Intel Core Ultra 9 386H, NVIDIA GeForce RTX 5060 Laptop (2108 - 2164, n=2) | |
| Dell XPS 16 Core Ultra X7 358H | |
| Lenovo Pro 9 16IPH11 | |
| Samsung Galaxy Book6 Ultra | |
| Moyenne de la classe Multimedia (866 - 2728, n=69, 2 dernières années) | |
| Schenker XMG Core 15 (M25) | |
| Lenovo Legion 7 16 AGP11 | |
| CrossMark / Productivity | |
| Lenovo Yoga Pro 7 15IPH11 | |
| Moyenne Intel Core Ultra 9 386H, NVIDIA GeForce RTX 5060 Laptop (1917 - 1973, n=2) | |
| Lenovo Pro 9 16IPH11 | |
| Dell XPS 16 Core Ultra X7 358H | |
| Moyenne de la classe Multimedia (913 - 2489, n=69, 2 dernières années) | |
| Samsung Galaxy Book6 Ultra | |
| Schenker XMG Core 15 (M25) | |
| Lenovo Legion 7 16 AGP11 | |
| CrossMark / Creativity | |
| Dell XPS 16 Core Ultra X7 358H | |
| Lenovo Pro 9 16IPH11 | |
| Moyenne Intel Core Ultra 9 386H, NVIDIA GeForce RTX 5060 Laptop (2442 - 2500, n=2) | |
| Lenovo Yoga Pro 7 15IPH11 | |
| Samsung Galaxy Book6 Ultra | |
| Moyenne de la classe Multimedia (907 - 3465, n=69, 2 dernières années) | |
| Schenker XMG Core 15 (M25) | |
| Lenovo Legion 7 16 AGP11 | |
| CrossMark / Responsiveness | |
| Lenovo Yoga Pro 7 15IPH11 | |
| Moyenne Intel Core Ultra 9 386H, NVIDIA GeForce RTX 5060 Laptop (1682 - 1988, n=2) | |
| Dell XPS 16 Core Ultra X7 358H | |
| Lenovo Pro 9 16IPH11 | |
| Samsung Galaxy Book6 Ultra | |
| Moyenne de la classe Multimedia (605 - 2024, n=69, 2 dernières années) | |
| Schenker XMG Core 15 (M25) | |
| Lenovo Legion 7 16 AGP11 | |
| WebXPRT 3 / Overall | |
| Moyenne de la classe Multimedia (136.4 - 596, n=72, 2 dernières années) | |
| Lenovo Legion 7 16 AGP11 | |
| Lenovo Pro 9 16IPH11 | |
| Moyenne Intel Core Ultra 9 386H, NVIDIA GeForce RTX 5060 Laptop (310 - 326, n=2) | |
| Lenovo Yoga Pro 7 15IPH11 | |
| Samsung Galaxy Book6 Ultra | |
| Dell XPS 16 Core Ultra X7 358H | |
| Schenker XMG Core 15 (M25) | |
| WebXPRT 4 / Overall | |
| Lenovo Pro 9 16IPH11 | |
| Dell XPS 16 Core Ultra X7 358H | |
| Moyenne Intel Core Ultra 9 386H, NVIDIA GeForce RTX 5060 Laptop (298 - 302, n=2) | |
| Lenovo Yoga Pro 7 15IPH11 | |
| Samsung Galaxy Book6 Ultra | |
| Moyenne de la classe Multimedia (167.3 - 402, n=73, 2 dernières années) | |
| Lenovo Legion 7 16 AGP11 | |
| Schenker XMG Core 15 (M25) | |
| Mozilla Kraken 1.1 / Total | |
| Samsung Galaxy Book6 Ultra | |
| Moyenne de la classe Multimedia (228 - 835, n=76, 2 dernières années) | |
| Dell XPS 16 Core Ultra X7 358H | |
| Lenovo Yoga Pro 7 15IPH11 | |
| Moyenne Intel Core Ultra 9 386H, NVIDIA GeForce RTX 5060 Laptop (442 - 446, n=2) | |
| Lenovo Pro 9 16IPH11 | |
| Schenker XMG Core 15 (M25) | |
| Lenovo Legion 7 16 AGP11 | |
* ... Moindre est la valeur, meilleures sont les performances
| PCMark 10 Score | 9465 points | |
Aide | ||
| AIDA64 / Memory Copy | |
| Dell XPS 16 Core Ultra X7 358H | |
| Lenovo Yoga Pro 7 15IPH11 | |
| Samsung Galaxy Book6 Ultra | |
| Moyenne Intel Core Ultra 9 386H (75437 - 129946, n=6) | |
| Lenovo Pro 9 16IPH11 | |
| Lenovo Legion 7 16 AGP11 | |
| Moyenne de la classe Multimedia (21158 - 132135, n=63, 2 dernières années) | |
| Schenker XMG Core 15 (M25) | |
| AIDA64 / Memory Read | |
| Dell XPS 16 Core Ultra X7 358H | |
| Lenovo Yoga Pro 7 15IPH11 | |
| Samsung Galaxy Book6 Ultra | |
| Moyenne Intel Core Ultra 9 386H (81021 - 118858, n=6) | |
| Lenovo Pro 9 16IPH11 | |
| Lenovo Legion 7 16 AGP11 | |
| Moyenne de la classe Multimedia (19699 - 174586, n=63, 2 dernières années) | |
| Schenker XMG Core 15 (M25) | |
| AIDA64 / Memory Write | |
| Dell XPS 16 Core Ultra X7 358H | |
| Lenovo Yoga Pro 7 15IPH11 | |
| Samsung Galaxy Book6 Ultra | |
| Lenovo Legion 7 16 AGP11 | |
| Moyenne Intel Core Ultra 9 386H (75959 - 135096, n=6) | |
| Lenovo Pro 9 16IPH11 | |
| Moyenne de la classe Multimedia (17733 - 134998, n=63, 2 dernières années) | |
| Schenker XMG Core 15 (M25) | |
| AIDA64 / Memory Latency | |
| Moyenne de la classe Multimedia (7 - 535, n=62, 2 dernières années) | |
| Lenovo Pro 9 16IPH11 | |
| Lenovo Legion 7 16 AGP11 | |
| Moyenne Intel Core Ultra 9 386H (87.2 - 116.9, n=6) | |
| Lenovo Yoga Pro 7 15IPH11 | |
| Schenker XMG Core 15 (M25) | |
| Samsung Galaxy Book6 Ultra | |
| Dell XPS 16 Core Ultra X7 358H | |
* ... Moindre est la valeur, meilleures sont les performances
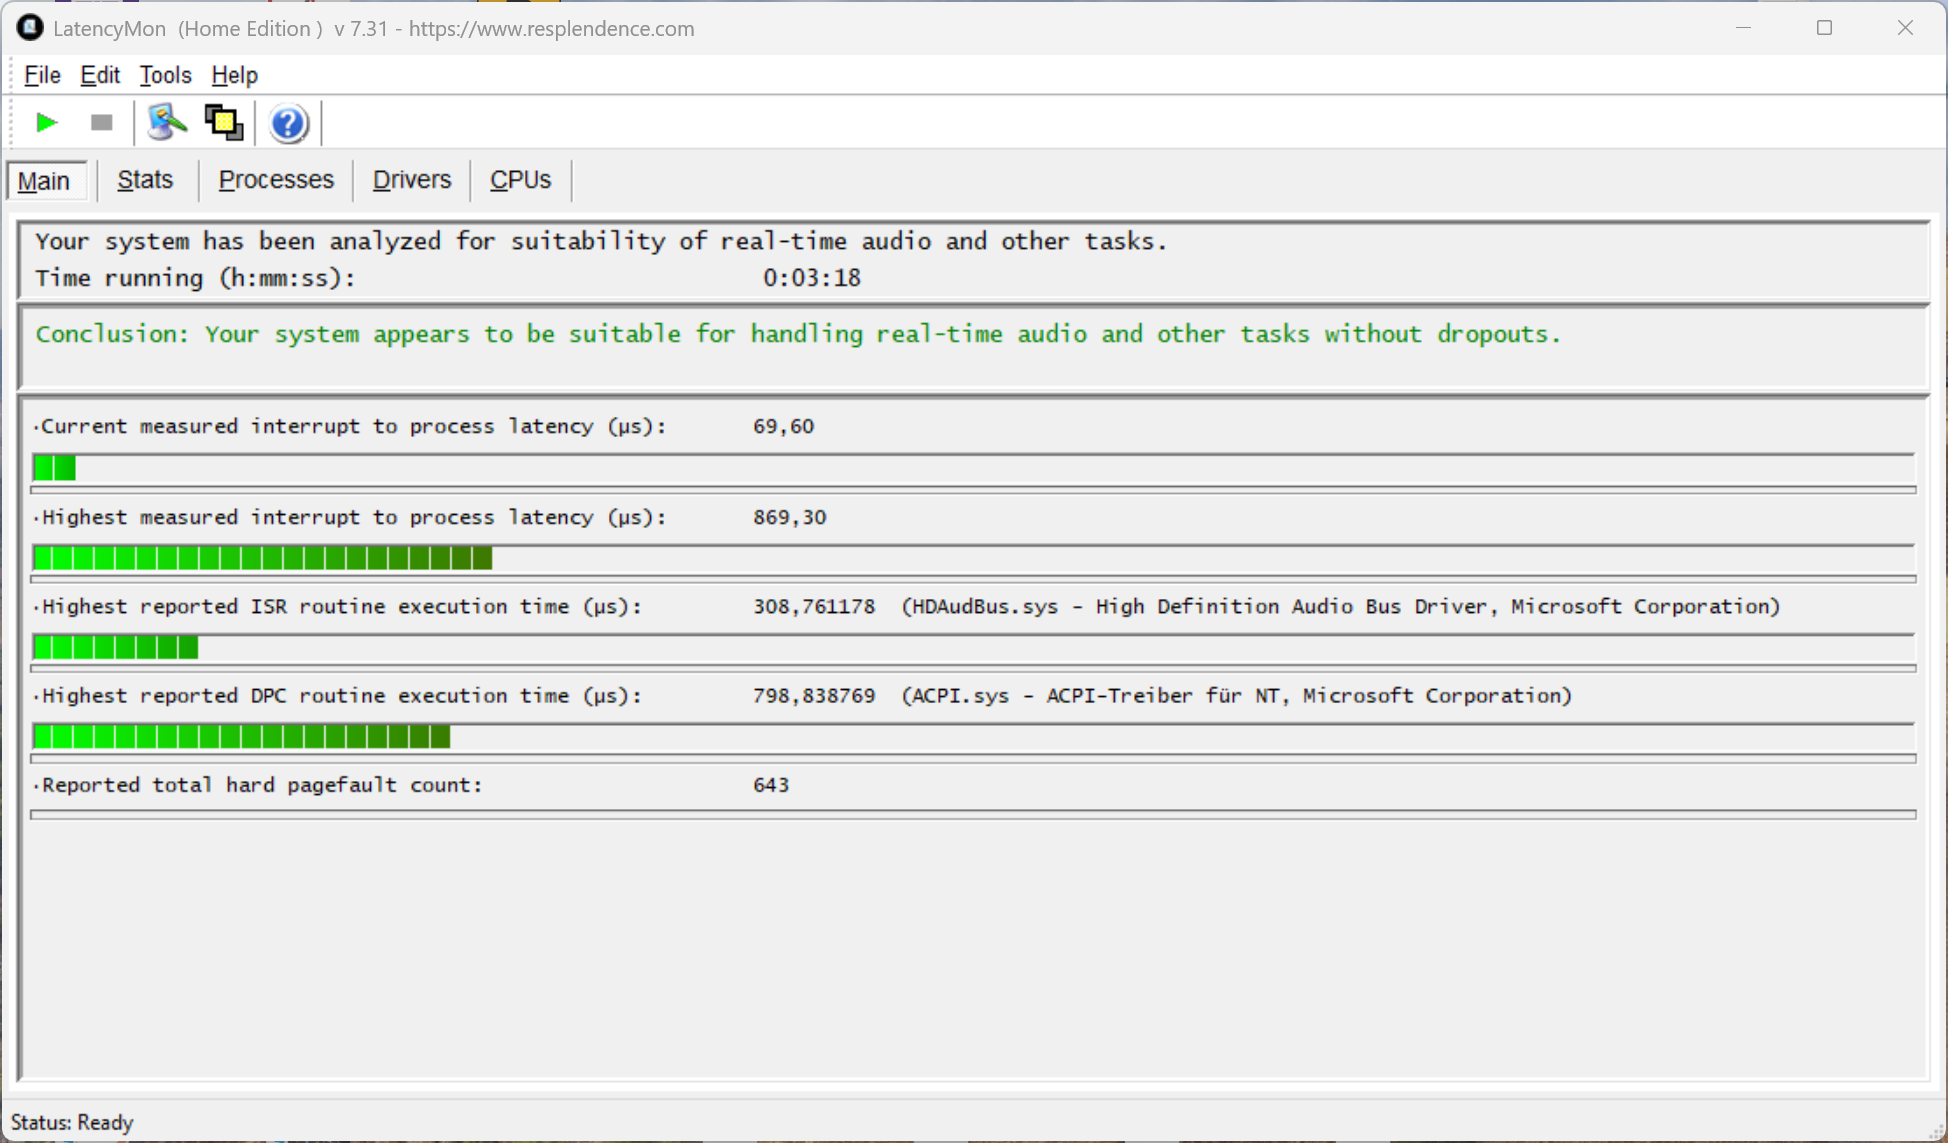
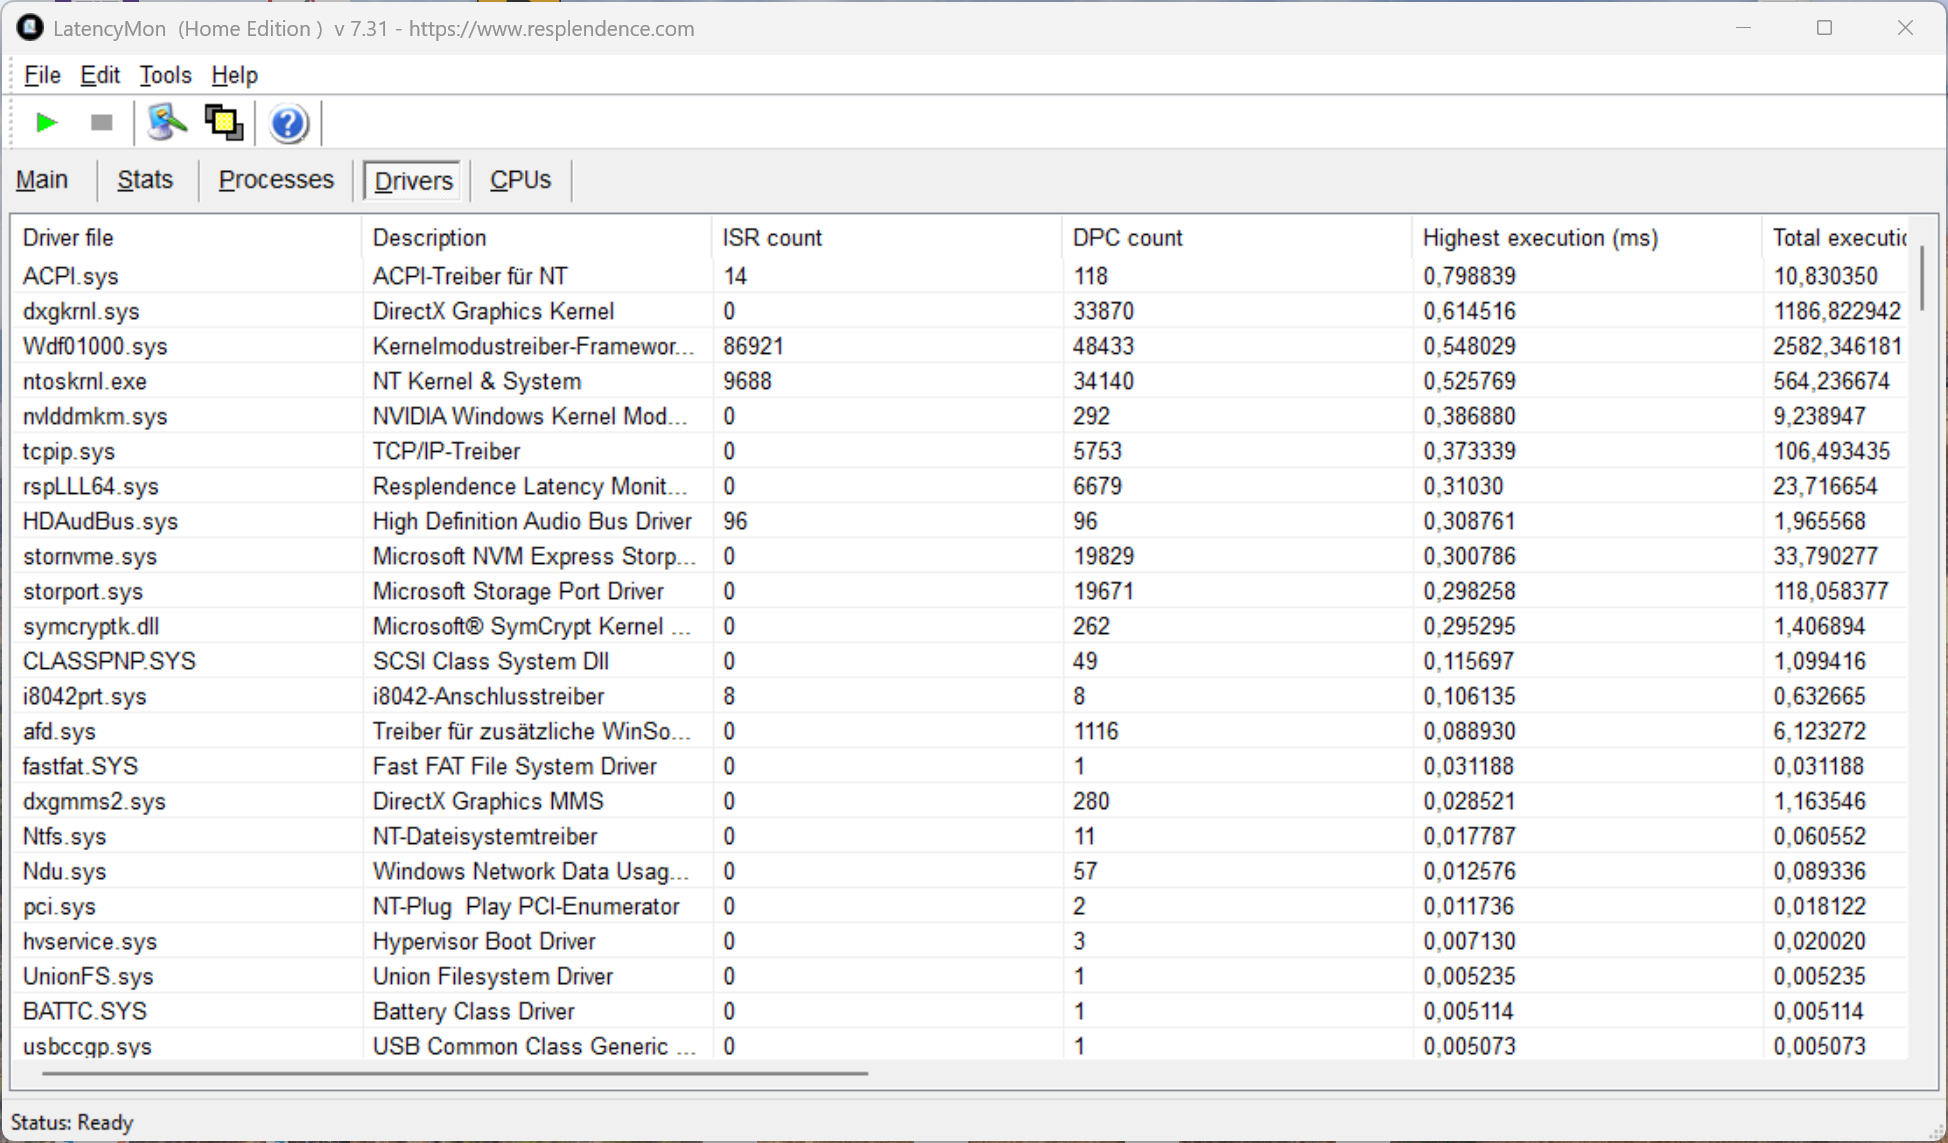
Latence DPC
Notre test de latence standardisé ne révèle aucun problème pour le Yoga Pro 7i 15 dans les applications audio en temps réel.
| DPC Latencies / LatencyMon - interrupt to process latency (max), Web, Youtube, Prime95 | |
| Lenovo Legion 7 16 AGP11 | |
| Moyenne de la classe Multimedia (327 - 7067, n=53, 2 dernières années) | |
| Lenovo Yoga Pro 7 15IPH11 | |
| Schenker XMG Core 15 (M25) | |
| Lenovo Pro 9 16IPH11 | |
| Samsung Galaxy Book6 Ultra | |
| Dell XPS 16 Core Ultra X7 358H | |
* ... Moindre est la valeur, meilleures sont les performances
Dispositifs de stockage
Le Yoga est livré par défaut avec un SSD compact M.2-2242, dans notre cas un disque de 1 To de SK hynix (853 Go libres). Les taux de transfert du SSD PCIe 4.0 sont bons et stables, mais l'emplacement supporte des disques PCIe 5.0 encore plus rapides. Si vous souhaitez augmenter la capacité de stockage, vous pouvez installer un SSD secondaire M.2-2280 (PCIe 4.0).

* ... Moindre est la valeur, meilleures sont les performances
Throttoir de disque : Boucle de lecture DiskSpd, profondeur de la file d'attente 8
Performance du GPU
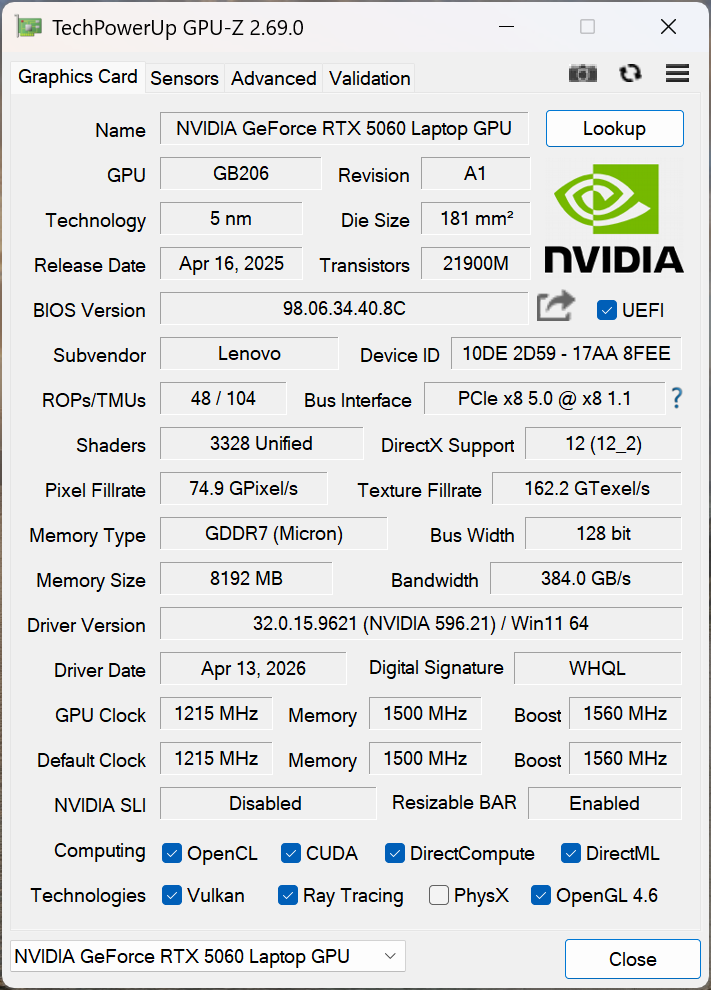
Notre Yoga Pro 7i est équipé de la fameuse GeForce RTX 5060 avec 8 Go de VRAM et un TGP maximum de 85 Watts. Les performances sont à la hauteur des attentes et nettement supérieures à celles de l'iGPU Arc B390 le plus rapide d'Intel dans le Dell XPS 16par exemple. Il s'agit donc d'une bonne solution pour les jeux, même si la VRAM peut poser quelques problèmes lorsque vous jouez VRAM peut poser quelques problèmes lorsque vous jouez à des jeux très exigeants. Si vous voulez être sûr de vous, le nouveau Yoga Pro 7i 15 est également disponible avec la RTX 5070 mise à jour, qui dispose maintenant de 12 Go de VRAM.
| 3DMark 11 Performance | 32286 points | |
| 3DMark Fire Strike Score | 26610 points | |
| 3DMark Time Spy Score | 11719 points | |
| 3DMark Steel Nomad Score | 2399 points | |
| 3DMark Steel Nomad Light Score | 11026 points | |
Aide | ||
| Blender / v3.3 Classroom OPTIX/RTX | |
| Moyenne de la classe Multimedia (12 - 105, n=25, 2 dernières années) | |
| Schenker XMG Core 15 (M25) | |
| Moyenne NVIDIA GeForce RTX 5060 Laptop (20 - 28, n=16) | |
| Lenovo Legion 7 16 AGP11 | |
| Lenovo Yoga Pro 7 15IPH11 | |
| Samsung Galaxy Book6 Ultra | |
| Lenovo Pro 9 16IPH11 | |
| Blender / v3.3 Classroom CUDA | |
| Moyenne de la classe Multimedia (20 - 186, n=25, 2 dernières années) | |
| Moyenne NVIDIA GeForce RTX 5060 Laptop (38 - 186, n=17) | |
| Schenker XMG Core 15 (M25) | |
| Lenovo Legion 7 16 AGP11 | |
| Lenovo Pro 9 16IPH11 | |
| Lenovo Yoga Pro 7 15IPH11 | |
| Samsung Galaxy Book6 Ultra | |
| Blender / v3.3 Classroom CPU | |
| Moyenne de la classe Multimedia (134.5 - 1042, n=70, 2 dernières années) | |
| Dell XPS 16 Core Ultra X7 358H | |
| Schenker XMG Core 15 (M25) | |
| Moyenne NVIDIA GeForce RTX 5060 Laptop (133 - 511, n=16) | |
| Lenovo Yoga Pro 7 15IPH11 | |
| Samsung Galaxy Book6 Ultra | |
| Lenovo Pro 9 16IPH11 | |
| Lenovo Legion 7 16 AGP11 | |
| Blender / v3.3 Classroom oneAPI/Intel | |
| Moyenne de la classe Multimedia (105 - 401, n=17, 2 dernières années) | |
| Dell XPS 16 Core Ultra X7 358H | |
* ... Moindre est la valeur, meilleures sont les performances
| Final Fantasy XV Benchmark - 1920x1080 High Quality | |
| Lenovo Pro 9 16IPH11 | |
| Lenovo Legion 7 16 AGP11 | |
| Samsung Galaxy Book6 Ultra | |
| Lenovo Yoga Pro 7 15IPH11 | |
| Dell XPS 16 Core Ultra X7 358H | |
| Moyenne de la classe Multimedia (7.61 - 144.4, n=68, 2 dernières années) | |
| Strange Brigade - 1920x1080 ultra AA:ultra AF:16 | |
| Lenovo Legion 7 16 AGP11 | |
| Samsung Galaxy Book6 Ultra | |
| Lenovo Pro 9 16IPH11 | |
| Lenovo Yoga Pro 7 15IPH11 | |
| Moyenne de la classe Multimedia (13.3 - 303, n=68, 2 dernières années) | |
| Dell XPS 16 Core Ultra X7 358H | |
Cyberpunk 2077 ultra FPS Chart
| Bas | Moyen | Élevé | Ultra | QHD DLSS | QHD | |
|---|---|---|---|---|---|---|
| GTA V (2015) | 133.8 | 105.4 | ||||
| Dota 2 Reborn (2015) | 183.5 | 167.4 | 161.7 | 152.9 | ||
| Final Fantasy XV Benchmark (2018) | 217 | 155.3 | 113.3 | 82.6 | ||
| X-Plane 11.11 (2018) | 138.1 | 110.4 | 93 | |||
| Strange Brigade (2018) | 494 | 296 | 237 | 199 | 142.7 | |
| Baldur's Gate 3 (2023) | 150.5 | 120.4 | 105.5 | 103 | 70.1 | |
| Cyberpunk 2077 (2023) | 129.3 | 107.1 | 90.5 | 82.2 | 61.4 | 51.5 |
| F1 24 (2024) | 257 | 203 | 68.2 | 68.3 | 43.6 | |
| Assassin's Creed Shadows (2025) | 60 | 56 | 48 | 34 | 28 | |
| F1 25 (2025) | 207 | 180.2 | 144.2 | 23.9 | 25.3 | 12.6 |
Émissions et consommation d'énergie
Bruit du système

Le Yoga est un appareil très silencieux lorsque vous l'utilisez pour des tâches quotidiennes peu exigeantes, mais il devient assez bruyant si vous sollicitez vraiment le système (par exemple pour les jeux). En mode Créateur le plus rapide, nous avons enregistré plus de 54 dB(A), ce qui est plus bruyant que certains ordinateurs portables de jeu. Les modes Auto (46 dB(A)) et Haute performance (49,5 dB(A)) sont également assez bruyants et nous aurions préféré un réglage autour de 40 dB(A). Le mode d'économie de la batterie est beaucoup plus silencieux, mais il s'accompagne d'une baisse importante des performances. Notre appareil n'émet aucun bruit électronique.
Degré de la nuisance sonore
| Au repos |
| 24.3 / 24.3 / 25.5 dB(A) |
| Fortement sollicité |
| 49.3 / 54.4 dB(A) |
 | ||
30 dB silencieux 40 dB(A) audible 50 dB(A) bruyant |
||
min: | ||
| Lenovo Yoga Pro 7 15IPH11 Ultra 9 386H, GeForce RTX 5060 Laptop | Lenovo Pro 9 16IPH11 Ultra 9 386H, GeForce RTX 5060 Laptop | Samsung Galaxy Book6 Ultra Ultra 7 356H, GeForce RTX 5070 Laptop | Lenovo Legion 7 16 AGP11 Ryzen AI 9 HX 470, GeForce RTX 5060 Laptop | Schenker XMG Core 15 (M25) Ryzen AI 7 350, GeForce RTX 5060 Laptop | Dell XPS 16 Core Ultra X7 358H Ultra X7 358H, Arc B390 Panther Lake iGPU | |
|---|---|---|---|---|---|---|
| Noise | 9% | 6% | 4% | -1% | 11% | |
| arrêt / environnement * (dB) | 24.3 | 23 5% | 25.1 -3% | 24.5 -1% | 24 1% | 23.3 4% |
| Idle Minimum * (dB) | 24.3 | 23.5 3% | 25.1 -3% | 24.5 -1% | 25 -3% | 23.4 4% |
| Idle Average * (dB) | 24.3 | 24 1% | 25.1 -3% | 24.5 -1% | 27 -11% | 23.4 4% |
| Idle Maximum * (dB) | 25.5 | 24 6% | 25.1 2% | 27.1 -6% | 29 -14% | 25.8 -1% |
| Load Average * (dB) | 49.3 | 32.3 34% | 36.9 25% | 34.6 30% | 48 3% | 38 23% |
| Cyberpunk 2077 ultra * (dB) | 54.4 | 50.1 8% | 48.5 11% | 53 3% | 49 10% | 38.1 30% |
| Load Maximum * (dB) | 54.4 | 50.1 8% | 48.5 11% | 53 3% | 50 8% | 48.6 11% |
* ... Moindre est la valeur, meilleures sont les performances
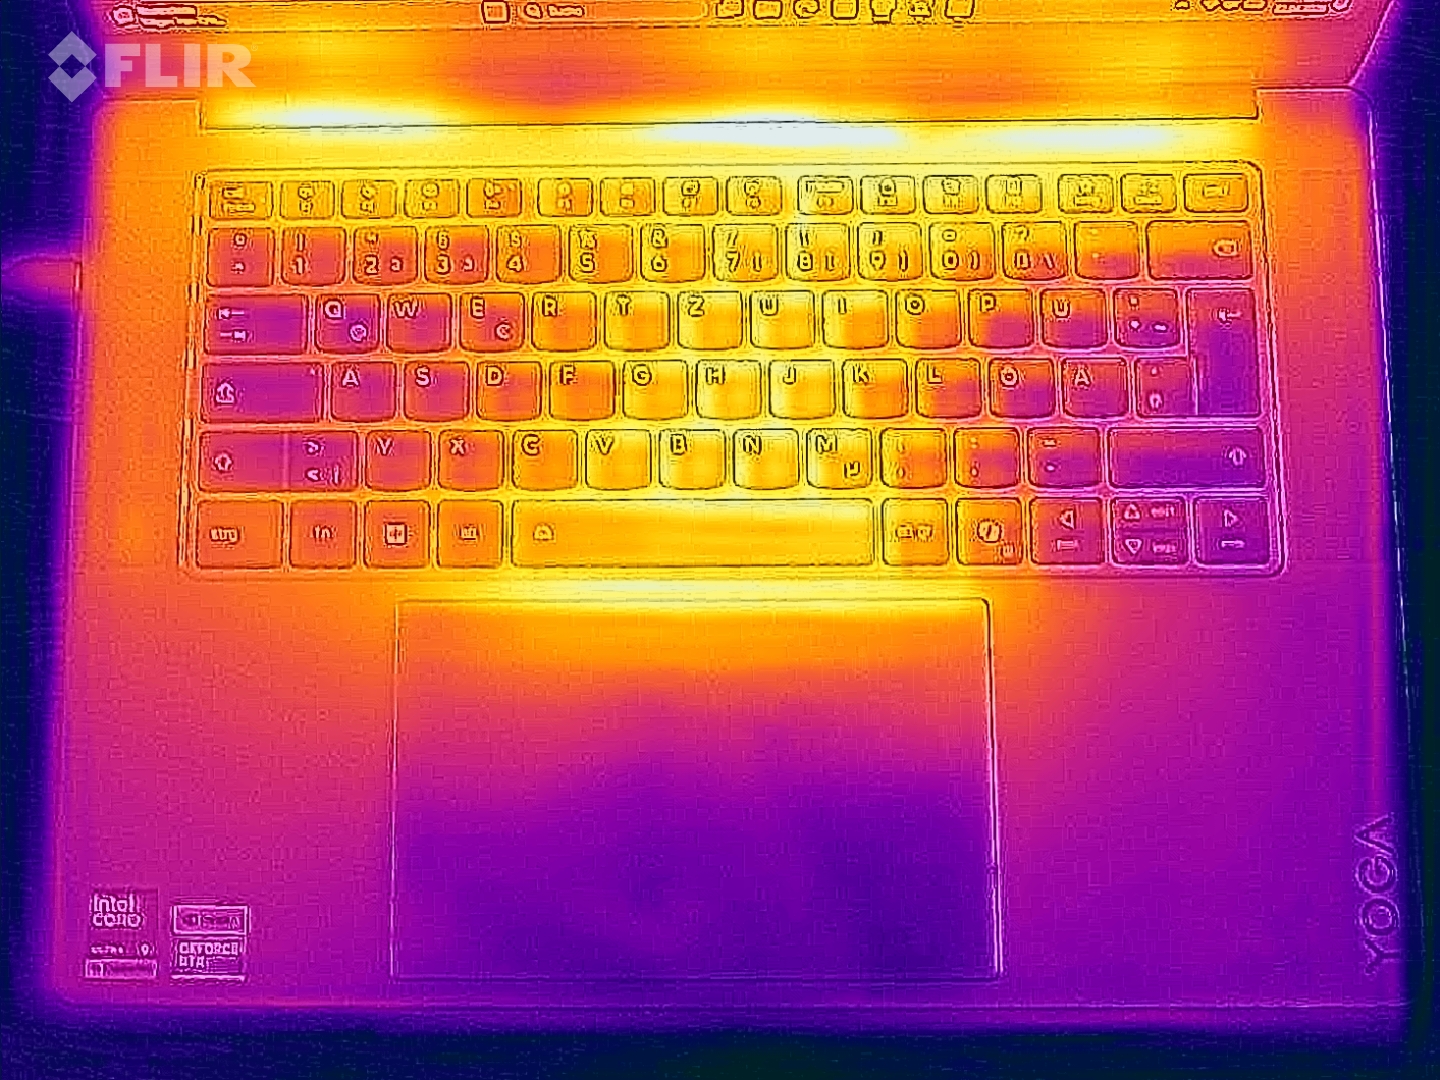
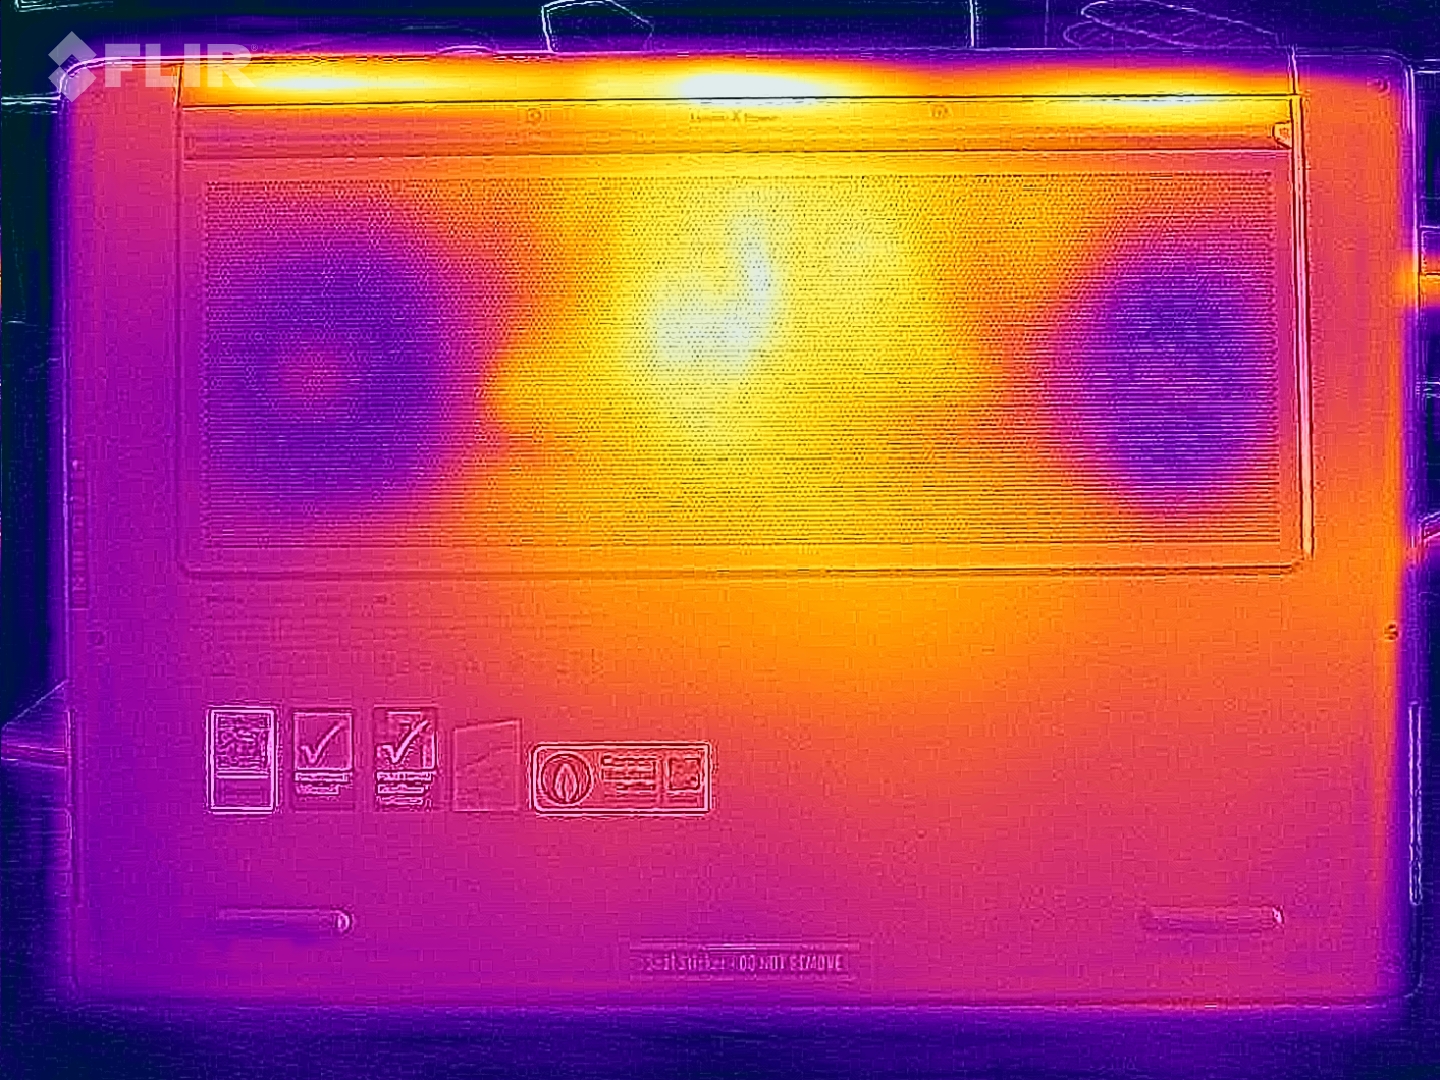
Température
Le bruit du ventilateur est compensé par les faibles températures de surface, car seuls quelques points dépassent les 40 °C sous charge. Pendant le test de stress, le CPU plafonne à 35 watts (72 °C), tandis que le GPU maintient 75 watts (68 °C).

(±) La température maximale du côté supérieur est de 40.6 °C / 105 F, par rapport à la moyenne de 36.8 °C / 98 F, allant de 21 à 71 °C pour la classe Multimedia.
(±) Le fond chauffe jusqu'à un maximum de 42.5 °C / 109 F, contre une moyenne de 39.1 °C / 102 F
(+) En utilisation inactive, la température moyenne du côté supérieur est de 25.6 °C / 78 F, par rapport à la moyenne du dispositif de 31.3 °C / 88 F.
(±) 3: The average temperature for the upper side is 35.7 °C / 96 F, compared to the average of 31.3 °C / 88 F for the class Multimedia.
(+) Les repose-poignets et le pavé tactile sont plus froids que la température de la peau avec un maximum de 31.5 °C / 88.7 F et sont donc froids au toucher.
(-) La température moyenne de la zone de l'appui-paume de dispositifs similaires était de 28.7 °C / 83.7 F (-2.8 °C / #-5 F).
| Lenovo Yoga Pro 7 15IPH11 Ultra 9 386H, GeForce RTX 5060 Laptop | Lenovo Pro 9 16IPH11 Ultra 9 386H, GeForce RTX 5060 Laptop | Samsung Galaxy Book6 Ultra Ultra 7 356H, GeForce RTX 5070 Laptop | Lenovo Legion 7 16 AGP11 Ryzen AI 9 HX 470, GeForce RTX 5060 Laptop | Schenker XMG Core 15 (M25) Ryzen AI 7 350, GeForce RTX 5060 Laptop | Dell XPS 16 Core Ultra X7 358H Ultra X7 358H, Arc B390 Panther Lake iGPU | |
|---|---|---|---|---|---|---|
| Heat | -4% | -3% | -9% | -21% | 7% | |
| Maximum Upper Side * (°C) | 40.6 | 37.8 7% | 42.7 -5% | 44.9 -11% | 49 -21% | 40.6 -0% |
| Maximum Bottom * (°C) | 42.5 | 38.2 10% | 49.1 -16% | 50.5 -19% | 59 -39% | 39.8 6% |
| Idle Upper Side * (°C) | 26.3 | 30.4 -16% | 25.4 3% | 27.3 -4% | 28 -6% | 23.2 12% |
| Idle Bottom * (°C) | 26.8 | 31 -16% | 25.5 5% | 27.5 -3% | 31 -16% | 23.8 11% |
* ... Moindre est la valeur, meilleures sont les performances
Intervenants
Le système audio est excellent et à la hauteur des plus grands Yoga Pro 9i.
Lenovo Yoga Pro 7 15IPH11 analyse audio
(+) | les haut-parleurs peuvent jouer relativement fort (86.1# dB)
Basses 100 - 315 Hz
(±) | basse réduite - en moyenne 8.5% inférieure à la médiane
(±) | la linéarité des basses est moyenne (9.8% delta à la fréquence précédente)
Médiums 400 - 2000 Hz
(+) | médiane équilibrée - seulement 2.5% de la médiane
(+) | les médiums sont linéaires (4.8% delta à la fréquence précédente)
Aiguës 2 - 16 kHz
(+) | des sommets équilibrés - à seulement 2.8% de la médiane
(+) | les aigus sont linéaires (2.7% delta à la fréquence précédente)
Globalement 100 - 16 000 Hz
(+) | le son global est linéaire (7.6% différence à la médiane)
Par rapport à la même classe
» 6% de tous les appareils testés de cette catégorie étaient meilleurs, 2% similaires, 92% pires
» Le meilleur avait un delta de 5%, la moyenne était de 17%, le pire était de 45%.
Par rapport à tous les appareils testés
» 1% de tous les appareils testés étaient meilleurs, 0% similaires, 98% pires
» Le meilleur avait un delta de 4%, la moyenne était de 24%, le pire était de 134%.
Lenovo Pro 9 16IPH11 analyse audio
(+) | les haut-parleurs peuvent jouer relativement fort (83.1# dB)
Basses 100 - 315 Hz
(±) | basse réduite - en moyenne 5.7% inférieure à la médiane
(+) | les basses sont linéaires (5.1% delta à la fréquence précédente)
Médiums 400 - 2000 Hz
(+) | médiane équilibrée - seulement 4.2% de la médiane
(+) | les médiums sont linéaires (5.4% delta à la fréquence précédente)
Aiguës 2 - 16 kHz
(+) | des sommets équilibrés - à seulement 1.8% de la médiane
(+) | les aigus sont linéaires (4.4% delta à la fréquence précédente)
Globalement 100 - 16 000 Hz
(+) | le son global est linéaire (7.7% différence à la médiane)
Par rapport à la même classe
» 6% de tous les appareils testés de cette catégorie étaient meilleurs, 2% similaires, 91% pires
» Le meilleur avait un delta de 5%, la moyenne était de 17%, le pire était de 45%.
Par rapport à tous les appareils testés
» 1% de tous les appareils testés étaient meilleurs, 0% similaires, 98% pires
» Le meilleur avait un delta de 4%, la moyenne était de 24%, le pire était de 134%.
Samsung Galaxy Book6 Ultra analyse audio
(+) | les haut-parleurs peuvent jouer relativement fort (85.6# dB)
Basses 100 - 315 Hz
(±) | basse réduite - en moyenne 5.9% inférieure à la médiane
(±) | la linéarité des basses est moyenne (7.9% delta à la fréquence précédente)
Médiums 400 - 2000 Hz
(+) | médiane équilibrée - seulement 3.7% de la médiane
(+) | les médiums sont linéaires (4.3% delta à la fréquence précédente)
Aiguës 2 - 16 kHz
(+) | des sommets équilibrés - à seulement 2.2% de la médiane
(+) | les aigus sont linéaires (3.4% delta à la fréquence précédente)
Globalement 100 - 16 000 Hz
(+) | le son global est linéaire (7.3% différence à la médiane)
Par rapport à la même classe
» 6% de tous les appareils testés de cette catégorie étaient meilleurs, 1% similaires, 94% pires
» Le meilleur avait un delta de 5%, la moyenne était de 17%, le pire était de 45%.
Par rapport à tous les appareils testés
» 1% de tous les appareils testés étaient meilleurs, 0% similaires, 99% pires
» Le meilleur avait un delta de 4%, la moyenne était de 24%, le pire était de 134%.
Lenovo Legion 7 16 AGP11 analyse audio
(±) | le niveau sonore du haut-parleur est moyen mais bon (79# dB)
Basses 100 - 315 Hz
(±) | basse réduite - en moyenne 11.4% inférieure à la médiane
(±) | la linéarité des basses est moyenne (8.7% delta à la fréquence précédente)
Médiums 400 - 2000 Hz
(+) | médiane équilibrée - seulement 3.1% de la médiane
(+) | les médiums sont linéaires (2.4% delta à la fréquence précédente)
Aiguës 2 - 16 kHz
(+) | des sommets équilibrés - à seulement 2.1% de la médiane
(+) | les aigus sont linéaires (5% delta à la fréquence précédente)
Globalement 100 - 16 000 Hz
(+) | le son global est linéaire (11.7% différence à la médiane)
Par rapport à la même classe
» 11% de tous les appareils testés de cette catégorie étaient meilleurs, 4% similaires, 86% pires
» Le meilleur avait un delta de 6%, la moyenne était de 18%, le pire était de 132%.
Par rapport à tous les appareils testés
» 8% de tous les appareils testés étaient meilleurs, 3% similaires, 89% pires
» Le meilleur avait un delta de 4%, la moyenne était de 24%, le pire était de 134%.
Schenker XMG Core 15 (M25) analyse audio
(+) | les haut-parleurs peuvent jouer relativement fort (82# dB)
Basses 100 - 315 Hz
(-) | presque aucune basse - en moyenne 18.3% plus bas que la médiane
(±) | la linéarité des basses est moyenne (9.8% delta à la fréquence précédente)
Médiums 400 - 2000 Hz
(+) | médiane équilibrée - seulement 3.4% de la médiane
(+) | les médiums sont linéaires (5.9% delta à la fréquence précédente)
Aiguës 2 - 16 kHz
(+) | des sommets équilibrés - à seulement 3.2% de la médiane
(+) | les aigus sont linéaires (4.1% delta à la fréquence précédente)
Globalement 100 - 16 000 Hz
(+) | le son global est linéaire (14.3% différence à la médiane)
Par rapport à la même classe
» 26% de tous les appareils testés de cette catégorie étaient meilleurs, 7% similaires, 67% pires
» Le meilleur avait un delta de 6%, la moyenne était de 18%, le pire était de 132%.
Par rapport à tous les appareils testés
» 17% de tous les appareils testés étaient meilleurs, 4% similaires, 79% pires
» Le meilleur avait un delta de 4%, la moyenne était de 24%, le pire était de 134%.
Dell XPS 16 Core Ultra X7 358H analyse audio
(+) | les haut-parleurs peuvent jouer relativement fort (85.1# dB)
Basses 100 - 315 Hz
(±) | basse réduite - en moyenne 7.6% inférieure à la médiane
(+) | les basses sont linéaires (6.1% delta à la fréquence précédente)
Médiums 400 - 2000 Hz
(+) | médiane équilibrée - seulement 2.1% de la médiane
(+) | les médiums sont linéaires (3.4% delta à la fréquence précédente)
Aiguës 2 - 16 kHz
(+) | des sommets équilibrés - à seulement 2.3% de la médiane
(+) | les aigus sont linéaires (4.1% delta à la fréquence précédente)
Globalement 100 - 16 000 Hz
(+) | le son global est linéaire (6.2% différence à la médiane)
Par rapport à la même classe
» 3% de tous les appareils testés de cette catégorie étaient meilleurs, 0% similaires, 96% pires
» Le meilleur avait un delta de 5%, la moyenne était de 17%, le pire était de 45%.
Par rapport à tous les appareils testés
» 0% de tous les appareils testés étaient meilleurs, 0% similaires, 99% pires
» Le meilleur avait un delta de 4%, la moyenne était de 24%, le pire était de 134%.
Consommation électrique
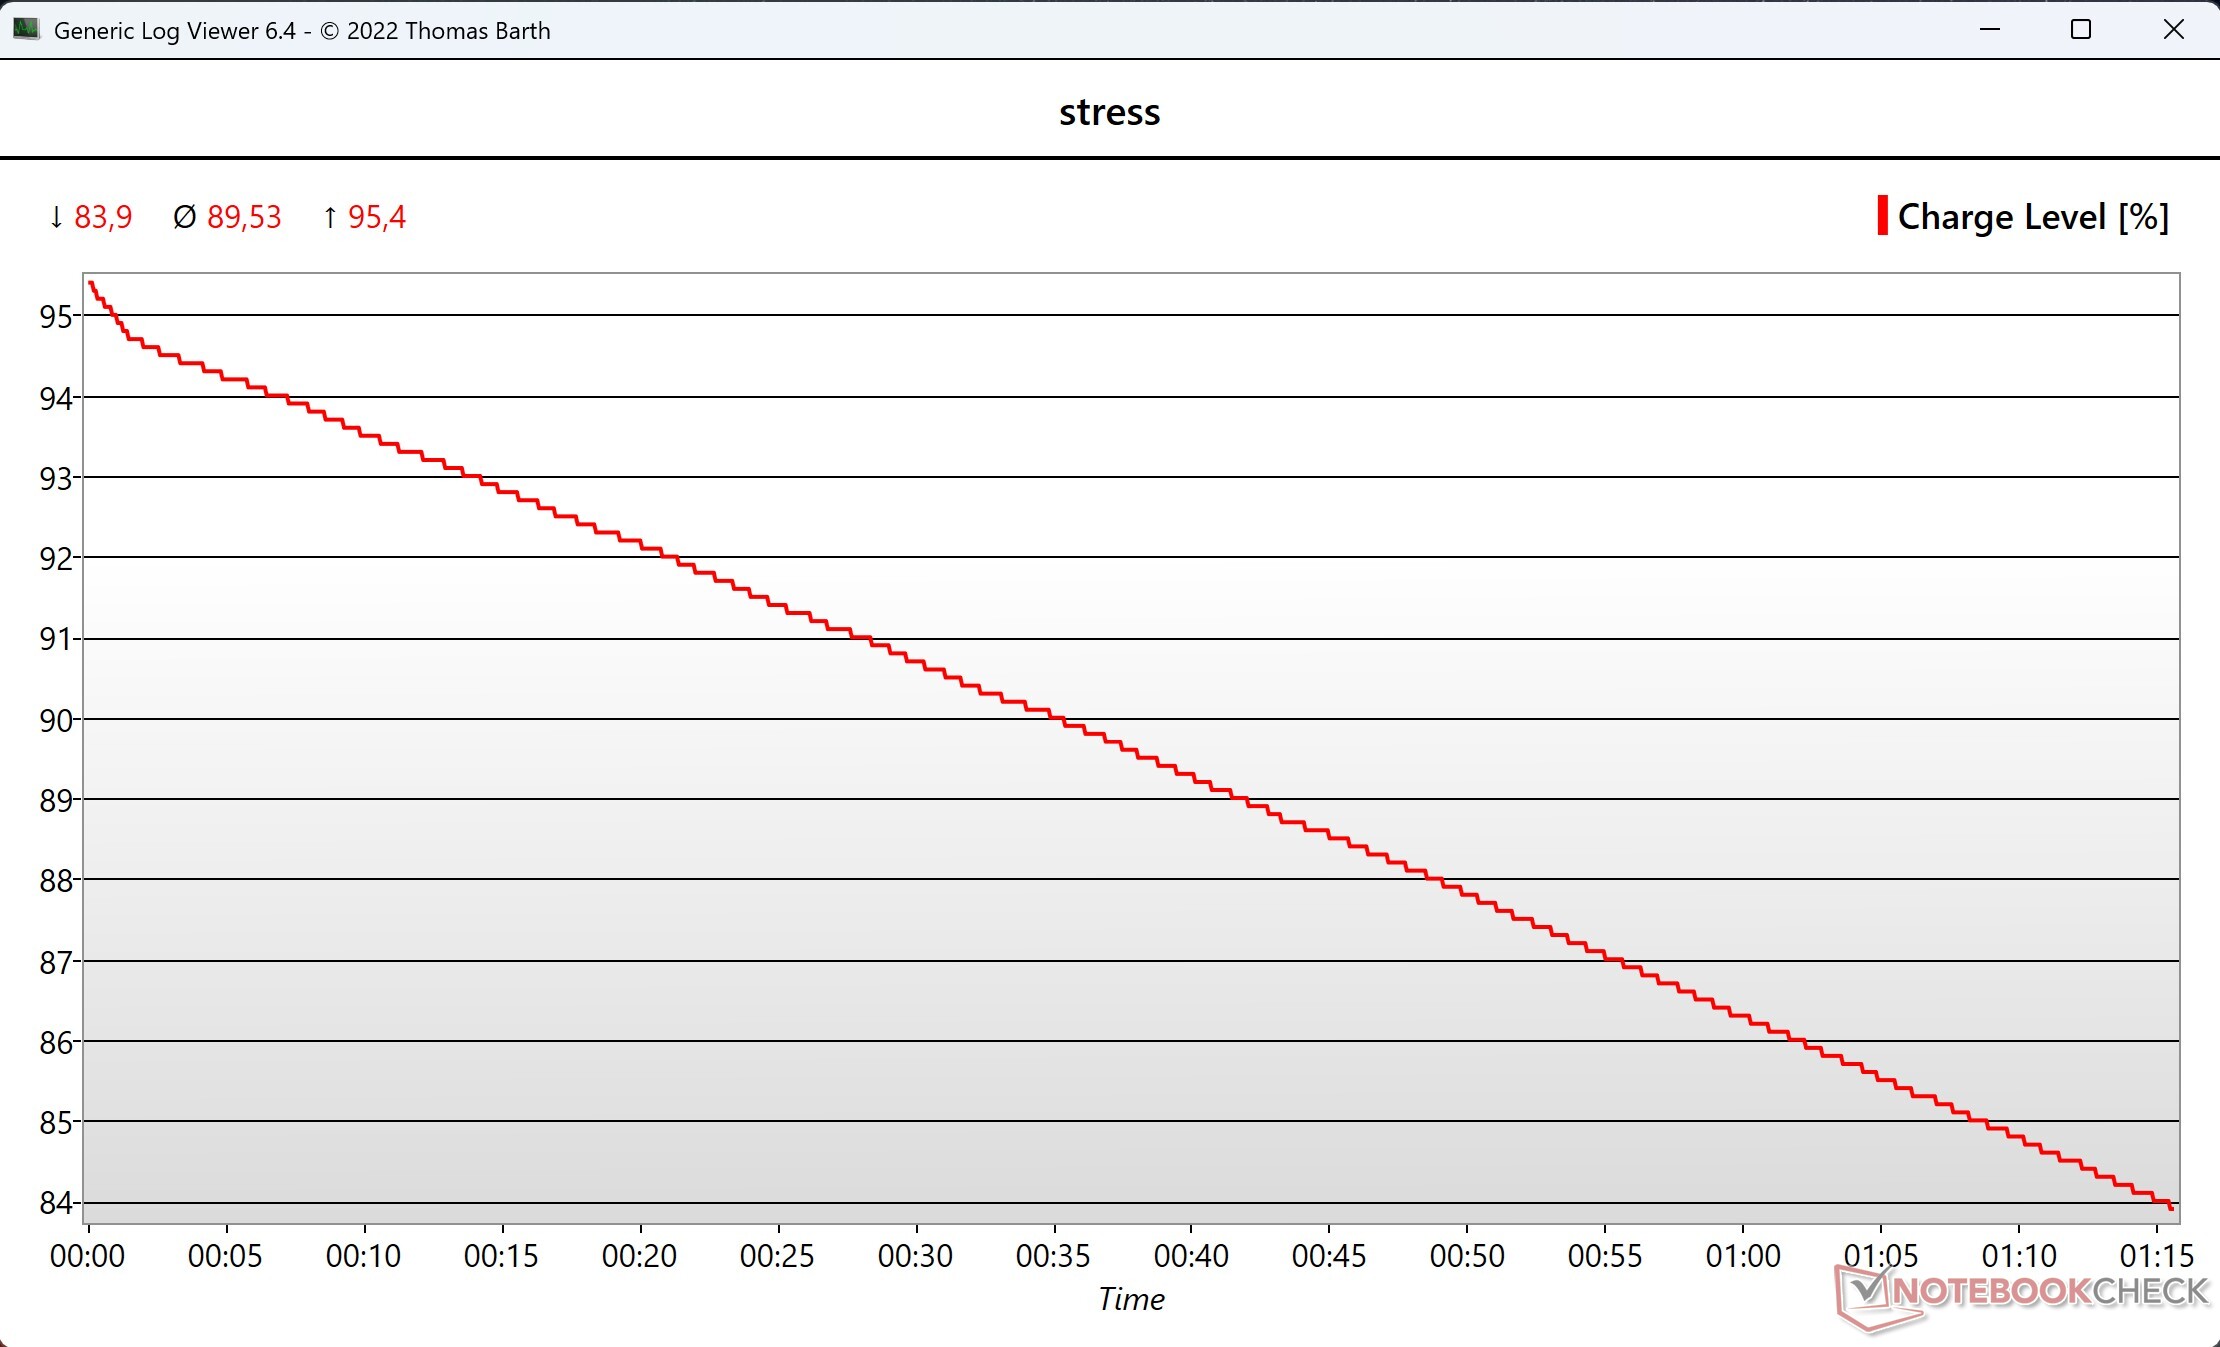
Lenovo livre le Yoga Pro 7i 15 avec un bloc d'alimentation de 140 W, mais il est insuffisant sous charge lorsque vous utilisez le mode Créateur. Pendant notre test de stress d'une heure, la capacité de la batterie a chuté d'environ 10 %. Bien sûr, c'est un scénario extrême, mais Lenovo aurait dû livrer un PSU plus puissant de 180W que nous connaissons sur certains modèles ThinkPad, par exemple. En revanche, la consommation en veille est très faible.

| Éteint/en veille | |
| Au repos | |
| Fortement sollicité |
|
Légende:
min: | |
| Lenovo Yoga Pro 7 15IPH11 Ultra 9 386H, GeForce RTX 5060 Laptop, SK hynix PVC10 HFS001TEM4X182N, OLED, 2560x1600, 15.3" | Lenovo Pro 9 16IPH11 Ultra 9 386H, GeForce RTX 5060 Laptop, SK hynix PVC10 HFS001TEM4X182N, Tandem OLED, 3200x2000, 16" | Samsung Galaxy Book6 Ultra Ultra 7 356H, GeForce RTX 5070 Laptop, Samsung PM9C1b MZVL81T0HFLB-00BH1, OLED, 2880x1800, 16" | Lenovo Legion 7 16 AGP11 Ryzen AI 9 HX 470, GeForce RTX 5060 Laptop, Lenovo UMIS AM541 1TB, OLED, 2560x1600, 16" | Schenker XMG Core 15 (M25) Ryzen AI 7 350, GeForce RTX 5060 Laptop, Samsung 990 Pro 2 TB MZVL72T0HDLB, IPS, 2560x1600, 15.3" | Dell XPS 16 Core Ultra X7 358H Ultra X7 358H, Arc B390 Panther Lake iGPU, , OLED, 3200x2000, 16" | Moyenne NVIDIA GeForce RTX 5060 Laptop | Moyenne de la classe Multimedia | |
|---|---|---|---|---|---|---|---|---|
| Power Consumption | -204% | 6% | -31% | -69% | 22% | -91% | -22% | |
| Idle Minimum * (Watt) | 5.2 | 15.1 -190% | 4.4 15% | 5.7 -10% | 10.6 -104% | 4 23% | 9.32 ? -79% | 5.67 ? -9% |
| Idle Average * (Watt) | 6.6 | 30.4 -361% | 6.4 3% | 8.7 -32% | 12.1 -83% | 4.4 33% | 13.9 ? -111% | 9.99 ? -51% |
| Idle Maximum * (Watt) | 6.8 | 46.2 -579% | 7.1 -4% | 9.1 -34% | 15.9 -134% | 10.2 -50% | 19.6 ? -188% | 12.4 ? -82% |
| Load Average * (Watt) | 75.8 | 79.5 -5% | 55.1 27% | 88.7 -17% | 95 -25% | 44.2 42% | 94.9 ? -25% | 64.7 ? 15% |
| Cyberpunk 2077 ultra * (Watt) | 131.1 | 161.2 -23% | 134.3 -2% | 160.3 -22% | 169 -29% | 62.6 52% | ||
| Load Maximum * (Watt) | 138.8 | 231.4 -67% | 143.9 -4% | 234.9 -69% | 192 -38% | 94.6 32% | 211 ? -52% | 112 ? 19% |
| Cyberpunk 2077 ultra external monitor * (Watt) | 160.7 | 133 | 156.9 | 165 | 62.4 |
* ... Moindre est la valeur, meilleures sont les performances
Consommation électrique Cyberpunk / Stress Test
Consommation électrique du moniteur externe
Autonomie de la batterie
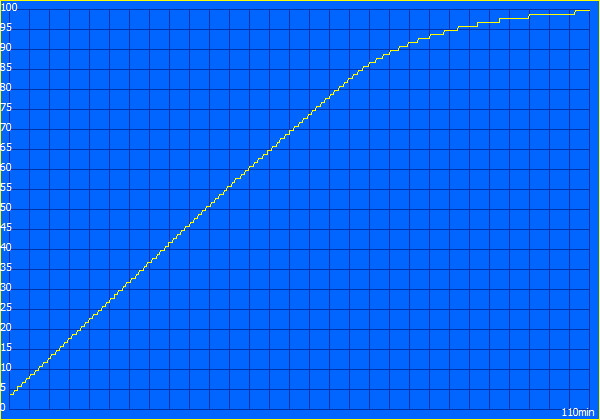
La batterie de 84 Wh offre une bonne autonomie, avec 12 heures lors de notre test Wi-Fi à 150 nits et près de 8 heures à luminosité maximale. Cela signifie que le Yoga bat la plupart de ses rivaux, seul le Samsung Galaxy Book6 Ultra est de loin supérieur à 150 nits avec près de 17 heures (mais seulement 30 minutes de plus à pleine luminosité).

| Lenovo Yoga Pro 7 15IPH11 Ultra 9 386H, GeForce RTX 5060 Laptop, 84 Wh | Lenovo Pro 9 16IPH11 Ultra 9 386H, GeForce RTX 5060 Laptop, 92.5 Wh | Samsung Galaxy Book6 Ultra Ultra 7 356H, GeForce RTX 5070 Laptop, 80.2 Wh | Lenovo Legion 7 16 AGP11 Ryzen AI 9 HX 470, GeForce RTX 5060 Laptop, 84 Wh | Schenker XMG Core 15 (M25) Ryzen AI 7 350, GeForce RTX 5060 Laptop, 99.8 Wh | Dell XPS 16 Core Ultra X7 358H Ultra X7 358H, Arc B390 Panther Lake iGPU, 70 Wh | Moyenne de la classe Multimedia | |
|---|---|---|---|---|---|---|---|
| Autonomie de la batterie | |||||||
| WiFi v1.3 (h) | 12 | 9.9 -17% | 16.8 40% | 9.2 -23% | 9.9 -17% | 10.3 -14% | 12 ? 0% |
Notebookcheck Rating
Lenovo Yoga Pro 7 15IPH11
- 06/04/2026 v8
Andreas Osthoff
 Total Sustainability Score:
 Comparaison avec des concurrents potentiels
Image | Modèle | Prix | Poids | Épaisseur | Écran |
|---|---|---|---|---|---|
1. 90.4%  | Lenovo Yoga Pro 7 15IPH11 Intel Core Ultra 9 386H ⎘ NVIDIA GeForce RTX 5060 Laptop ⎘ 32 Go Mémoire, 1024 Go SSD | Amazon: 1. $49.91 Original New for Lenovo Yoga... 2. $889.00 Lenovo Yoga 7 2-in-1 Laptop ... 3. $1,049.00 Lenovo Yoga 7 2-in-1 Laptop ... Prix de liste: 3100€ | 1.7 kg | 16.7 mm | 15.30" 2560x1600 197 PPI OLED |
2. 91%  | Lenovo Pro 9 16IPH11 Intel Core Ultra 9 386H ⎘ NVIDIA GeForce RTX 5060 Laptop ⎘ 32 Go Mémoire, 1024 Go SSD | Amazon: Prix de liste: 3100 USD | 1.9 kg | 17.3 mm | 16.00" 3200x2000 236 PPI Tandem OLED |
3. 90.7%  | Samsung Galaxy Book6 Ultra Intel Core Ultra 7 356H ⎘ NVIDIA GeForce RTX 5070 Laptop ⎘ 32 Go Mémoire, 1000 Go SSD | Amazon: Prix de liste: 3599€ | 1.9 kg | 15.4 mm | 16.00" 2880x1800 212 PPI OLED |
4. 86.4%  | Lenovo Legion 7 16 AGP11 AMD Ryzen AI 9 HX 470 ⎘ NVIDIA GeForce RTX 5060 Laptop ⎘ 32 Go Mémoire, 1024 Go SSD | Amazon: Prix de liste: 2500€ | 1.8 kg | 16.9 mm | 16.00" 2560x1600 189 PPI OLED |
5. 84.7%  | Schenker XMG Core 15 (M25) AMD Ryzen AI 7 350 ⎘ NVIDIA GeForce RTX 5060 Laptop ⎘ 64 Go Mémoire, 2048 Go SSD | Amazon: 1. $120.00 Laptop Keyboard for Schenker... Prix de liste: 1840 EUR | 1.9 kg | 22 mm | 15.30" 2560x1600 197 PPI IPS |
6. 87.2%  | Dell XPS 16 Core Ultra X7 358H Intel Core Ultra X7 358H ⎘ Intel Arc B390 12 Xe3 Panther Lake iGPU ⎘ 32 Go Mémoire | Amazon: 1. $2,999.00 Dell Premium 16 (Previously ... 2. $2,099.99 Dell XPS 16 9640 Laptop | In... 3. $1,319.99 Dell Premium 16 (Previously ... Prix de liste: 2350 USD | 1.7 kg | 14.62 mm | 16.00" 3200x2000 236 PPI OLED |
Transparency
La sélection des appareils à examiner est effectuée par notre équipe éditoriale. L'échantillon de test a été prêté à l'auteur par le fabricant ou le détaillant pour les besoins de cet examen. Le prêteur n'a pas eu d'influence sur cette évaluation et le fabricant n'a pas reçu de copie de cette évaluation avant sa publication. Il n'y avait aucune obligation de publier cet article. En tant que média indépendant, Notebookcheck n'est pas soumis à l'autorité des fabricants, des détaillants ou des éditeurs.
Voici comment Notebookcheck teste
Chaque année, Notebookcheck examine de manière indépendante des centaines d'ordinateurs portables et de smartphones en utilisant des procédures standardisées afin de garantir que tous les résultats sont comparables. Nous avons continuellement développé nos méthodes de test depuis environ 20 ans et avons établi des normes industrielles dans le processus. Dans nos laboratoires de test, des équipements de mesure de haute qualité sont utilisés par des techniciens et des rédacteurs expérimentés. Ces tests impliquent un processus de validation en plusieurs étapes. Notre système d'évaluation complexe repose sur des centaines de mesures et de points de référence bien fondés, ce qui garantit l'objectivité.
