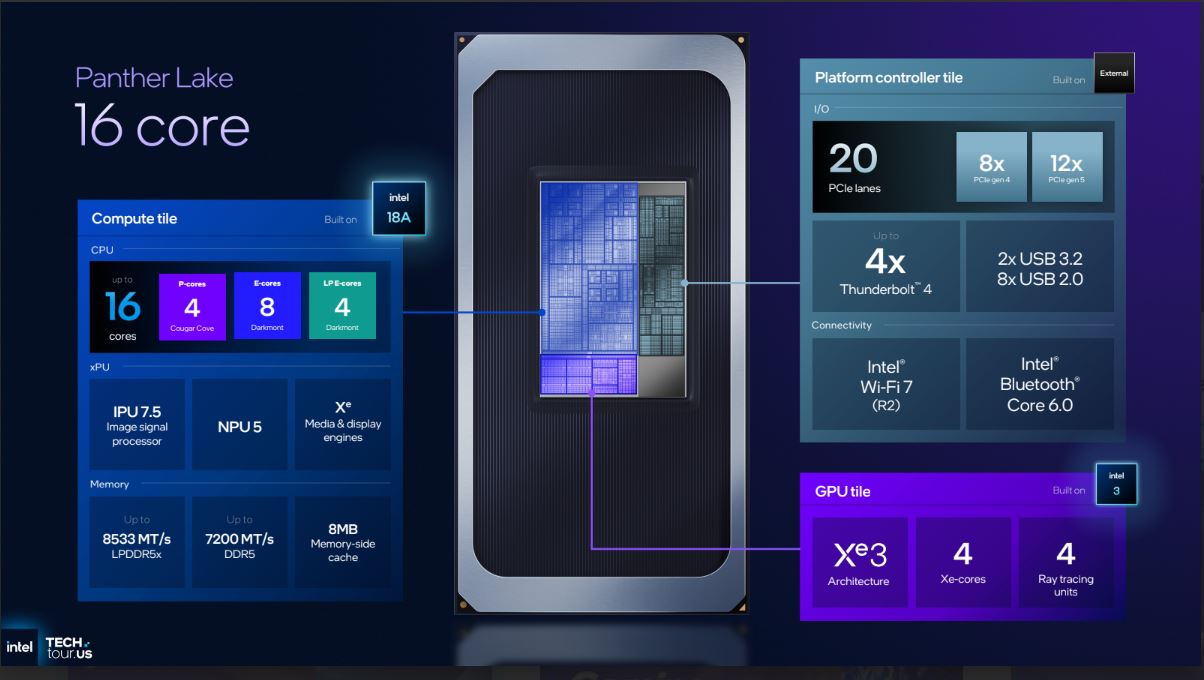
Critiques du Intel Core Ultra 9 386H processeur
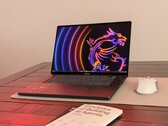
Test du MSI Stealth 16 AI B3WH : moitié gamer, moitié créateur, totalement professionnel
Contrairement aux derniers modèles Razer Blade 16 ou Lenovo Yoga Pro 9 16, le MSI Stealth 16 de 2026 est doté d’une mémoire vive remplaçable pouvant atteindre 128 Go, ce qui en fait un monstre du multitâche pour le jeu vidéo, le montage vidéo, l’IA et bien plus encore.
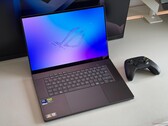
Intel Core Ultra 9 386H, NVIDIA GeForce RTX 5070 Ti Laptop, 16", 2 kgTest de l'Asus ROG Zephyrus G16 2026 : un des meilleurs PC portables de jeu ultra-fins s'améliore encore
L'Asus ROG Zephyrus G16 2026 est enfin doté d'une dalle OLED plus lumineuse à 240 Hz et intègre également un nouveau processeur Panther Lake d'Intel. Il en résulte l'un des meilleurs ordinateurs portables de jeu fins du marché, même si son prix est plus élevé que jamais.
Intel Core Ultra 9 386H, NVIDIA GeForce RTX 5080 Laptop, 16", 1.9 kgTest de l'Asus ZenBook S14 2026 : un écran OLED plus lumineux, mais un iGPU Panther Lake lent
Asus a actualisé son Zenbook S14 haut de gamme en l'équipant d'un nouveau processeur Panther Lake d'Intel, d'une batterie légèrement plus grande ainsi que d'un écran OLED plus lumineux. Si les performances du processeur ont augmenté, celles du processeur graphique sont quant à elles inférieures à celles d'avant.
Intel Core Ultra 9 386H, Intel Graphics 4 Xe3 PTL, 14", 1.2 kgTest de l'Asus ROG Zephyrus G14 2026 : un des meilleurs PC portables multimédia s'équipe d'un écran OLED plus lumineux
Asus a opté pour des processeurs Intel sur le nouveau ROG Zephyrus G14 et, équipé de la carte graphique RTX 5070 Ti d'GeForce, il reste l'un des ordinateurs portables 14 pouces les plus puissants du marché. Vous bénéficiez également d’un écran OLED 120 Hz amélioré, qui atteint désormais des niveaux de luminosité supérieurs à 1 000 nits.
Intel Core Ultra 9 386H, NVIDIA GeForce RTX 5070 Ti Laptop, 14", 1.6 kgTest du MSI Prestige 13 AI+ : le compagnon idéal pour les déplacements ?
Avec la Prestige 13 AI+, MSI vise les utilisateurs mobiles qui se déplacent souvent et apprécient un ordinateur portable compact et léger. Équipé d'un tout nouveau processeur Panther Lake, cet appareil de 13 pouces est conçu pour séduire les clients à la recherche d'une portabilité maximale.
Intel Core Ultra 9 386H, Intel Graphics 4 Xe3 PTL, 13.3", 888 gLenovo Yoga Pro 7 15IPH11: NVIDIA GeForce RTX 5060 Laptop, 15.30", 1.7 kg
Critique » Test du Lenovo Yoga Pro 7i Aura Edition : excellent PC portable multimédia de 15 pouces avec OLED 1 100 cd/m²
MSI Cubi NUC AI+ 3MG: Intel Graphics 4 Xe3 Panther Lake iGPU, 0.6 kg
Critique » Test du MSI Cubi NUC AI+ 3MG : Mini PC qui monte jusqu'à 128 Go de RAM
Razer Blade 16 Core Ultra 9 386H: NVIDIA GeForce RTX 5090 Laptop, 16.00", 2.1 kg
Critique » Test du Razer Blade 16 : l'Intel Core Ultra offre des taux de rafraîchissement plus élevés
Asus ROG Zephyrus Duo GX651: NVIDIA GeForce RTX 5090 Laptop, 16.00", 2.8 kg
Critique » Test de l'Asus ROG Zephyrus Duo GX651 : convertible de jeu à double écran avec RTX 5090
Lenovo Pro 9 16IPH11: NVIDIA GeForce RTX 5060 Laptop, 16.00", 1.9 kg
Critique » Test du Lenovo Pro 9i 16 G11 Aura Edition : une réponse directe au Dell XPS 16
HP HyperX Omen 15-ga0000nr: NVIDIA GeForce RTX 5070 Laptop, 15.30", 2.2 kg
Autres tests » HP HyperX Omen 15-ga0000nr - Tests et caractéristiques
Dell Pro Precision 7 16: NVIDIA RTX PRO 3000 Blackwell Generation Laptop, 16.00", 2.2 kg
Autres tests » Dell Pro Precision 7 16 - Tests et caractéristiques
LG gram Pro 17Z90UR: NVIDIA GeForce RTX 5050 Laptop, 17.00", 1.7 kg
Autres tests » LG gram Pro 17Z90UR - Tests et Caractéristiques
Asus ROG Zephyrus G16 GU606AX: NVIDIA GeForce RTX 5090 Laptop, 16.00", 2 kg
Autres tests » Asus ROG Zephyrus G16 GU606AX - Tests et caractéristiques
Asus ROG Zephyrus G16 GU606AR: NVIDIA GeForce RTX 5070 Ti Laptop, 16.00", 1.9 kg
Autres tests » Asus ROG Zephyrus G16 GU606AR - Tests et caractéristiques
Lenovo Pro 9 16IPH11, RTX 5070: NVIDIA GeForce RTX 5070 Laptop, 16.00", 1.9 kg
Autres tests » Lenovo Pro 9 16IPH11, RTX 5070 - Tests et Caractéristiques
Acer Predator Helios Neo 16S AI PHN16S-I51: NVIDIA GeForce RTX 5060 Laptop, 16.00", 2.2 kg
Autres tests » Acer Predator Helios Neo 16S AI PHN16S-I51 - Tests et Caractéristiques
Lenovo Yoga Pro 9i 16 Gen 11: NVIDIA GeForce RTX 5060 Laptop, 16.00", 1.9 kg
Autres tests » Lenovo Yoga Pro 9 16i Gen 11 - Tests et Caractéristiques
MSI Stealth 16 AI+ B3WI: NVIDIA GeForce RTX 5080 Laptop, 16.00", 2 kg
Autres tests » MSI Stealth 16 AI+ B3WI - Tests et caractéristiques
MSI Stealth 16 AI+ B3WH: NVIDIA GeForce RTX 5070 Ti Laptop, 16.00", 2 kg
Autres tests » MSI Stealth 16 AI+ B3WH - Tests et Caractéristiques
Acer Predator Helios 16S AI PHN16S-I51-94NV: NVIDIA GeForce RTX 5070 Laptop, 16.00", 2.2 kg
Autres tests » Acer Predator Helios 16S AI PHN16S-I51-94NV - Tests et Caractéristiques
Asus ROG Zephyrus G16 GU606AW: NVIDIA GeForce RTX 5080 Laptop, 16.00", 1.9 kg
Autres tests » Asus ROG Zephyrus G16 GU606AW - Tests et caractéristiques
Asus ROG Zephyrus G14 GU405AW: NVIDIA GeForce RTX 5080 Laptop, 14.00", 1.6 kg
Autres tests » Asus ROG Zephyrus G14 GU405AW
MSI Stealth 16 AI+ B3WF: NVIDIA GeForce RTX 5060 Laptop, 16.00", 2 kg
Autres tests » MSI Stealth 16 AI+ B3WF
Lenovo Pro 9 16IPH11: NVIDIA GeForce RTX 5060 Laptop, 16.00", 1.9 kg
Autres tests » Lenovo Pro 9 16IPH11
Lenovo Yoga Pro 7 15IPH11: NVIDIA GeForce RTX 5060 Laptop, 15.30", 1.7 kg
Autres tests » Lenovo Yoga Pro 7 15IPH11
Razer Blade 16 Core Ultra 9 386H: NVIDIA GeForce RTX 5090 Laptop, 16.00", 2.1 kg
Autres tests » Razer Blade 16 Core Ultra 9 386H
Asus ROG Zephyrus G14 GU405AR: NVIDIA GeForce RTX 5070 Ti Laptop, 14.00", 1.6 kg
Autres tests » Asus ROG Zephyrus G14 GU405AR
MSI Prestige 14 Flip AI+ D3MTG: Intel Graphics 4 Xe3 Panther Lake iGPU, 14.00", 1.4 kg
Autres tests » MSI Prestige 14 Flip AI+ D3MTG
Acer Aspire 14 AI A14-I71M: Intel Graphics 4 Xe3 Panther Lake iGPU, 14.00", 1.4 kg
Autres tests » Acer Aspire 14 AI A14-I71M
MSI Prestige 13 AI+ A3MG: Intel Graphics 4 Xe3 Panther Lake iGPU, 13.30", 0.9 kg
Autres tests » MSI Prestige 13 AI+ A3MG
MSI Prestige 16 Flip AI+ C3MTG (2026): Intel Graphics 4 Xe3 Panther Lake iGPU, 16.00", 1.7 kg
Autres tests » MSI Prestige 16 Flip AI+ C3MTG (2026)
Asus ZenBook S14 UX5406AA: Intel Graphics 4 Xe3 Panther Lake iGPU, 14.00", 1.2 kg
Autres tests » Asus ZenBook S14 UX5406AA
Asus ROG Zephyrus G14 GU405: NVIDIA GeForce RTX 5060 Laptop, 14.00", 1.5 kg
Autres tests » Asus ROG Zephyrus G14 GU405
Asus ROG Zephyrus Duo GX651: NVIDIA GeForce RTX 5090 Laptop, 16.00", 2.8 kg
Autres tests » Asus ROG Zephyrus Duo GX651
Asus ROG Zephyrus G16 GU606: NVIDIA GeForce RTX 5070 Laptop, 16.00"
Autres tests » Asus ROG Zephyrus G16 GU606
MSI Stealth 16 AI B3WH: NVIDIA GeForce RTX 5070 Ti Laptop, 16.00", 2 kg
» Le MSI Stealth 16 de 2026 abandonne une fonctionnalité importante présente sur l’ancien modèle
Asus ROG Zephyrus G16 GU606AW: NVIDIA GeForce RTX 5080 Laptop, 16.00", 1.9 kg
» Verdict de la critique de l’Asus ROG Zephyrus G16 2026 : plus de puissance, une autonomie prolongée et un prix élevé
» La carte RTX 5080 intégrée à l’Asus ROG Zephyrus G16 peut consommer jusqu’à 160 watts, mais uniquement pendant un court instant.
Asus ZenBook S14 UX5406AA: Intel Graphics 4 Xe3 Panther Lake iGPU, 14.00", 1.2 kg
» Le nouvel Asus Zenbook S14 2026 est un excellent ordinateur portable, mais il mériterait d'être équipé des puces Core Ultra X avec le processeur graphique intégré Arc B390.
» Le Zenbook S14 d'Asus, très fin, met en évidence le problème majeur des processeurs Panther Lake d'Intel
Asus ROG Zephyrus G14 GU405AR: NVIDIA GeForce RTX 5070 Ti Laptop, 14.00", 1.6 kg
» Verdict de notre test de l'Asus ROG Zephyrus G14 : un ordinateur polyvalent, puissant et efficace
» Le modèle 2026 de l'Asus ROG Zephyrus G14 est un appareil plus polyvalent, équipé d'un processeur Intel Panther Lake.
» Le ROG Zephyrus G14 2026 constitue une amélioration, mais le modèle 2025, qui coûte 600 $ de moins, reste un très bon choix
» L'Asus ROG Zephyrus G14 2026 reste l'ordinateur portable de jeu 14 pouces le plus puissant grâce à la RTX 5070 Ti
Lenovo Yoga Pro 7 15IPH11: NVIDIA GeForce RTX 5060 Laptop, 15.30", 1.7 kg
» Lorsque le MacBook Pro de Apple'est soudainement devenu l'alternative la plus avantageuse, les ordinateurs portables comme le Lenovo Yoga Pro 7i 15 ont un problème
» Lenovo demande plus de 2600 $ pour le Yoga Pro 7i 15, est-ce la nouvelle réalité ?
MSI Cubi NUC AI+ 3MG: Intel Graphics 4 Xe3 Panther Lake iGPU, 0.6 kg
» Le MSI Cubi AI+ 3MG est plus de 60 % plus rapide qu'auparavant, mais il aurait pu être encore meilleur
» Le petit PC MSI Cubi NUC AI+ 3MG est doté d'une mémoire vive amovible de 128 Go
» MSI Cubi NUC AI+ 3MG vs. Cubi NUC AI+ 2MG : Des améliorations presque partout
Razer Blade 16 Core Ultra 9 386H: NVIDIA GeForce RTX 5090 Laptop, 16.00", 2.1 kg
» La nouvelle Razer Blade 16 est deux fois plus lumineuse qu'auparavant pour une prise en charge HDR nettement améliorée
» La batterie du Razer Blade 16 dure plusieurs heures de plus avec Intel au lieu d'AMD
» 2026 Le Razer Blade 16 remplace AMD par Intel avec de très bons résultats
» Razer Blade 16 : le jeu en mode silencieux à faibles performances peut s'avérer intéressant
Lenovo Yoga Pro 7 15IPH11: NVIDIA GeForce RTX 5060 Laptop, 15.30", 1.7 kg
» Le Yoga Pro 7i 15 G11 de Lenovo est l'un des premiers ordinateurs portables multimédias équipés de la nouvelle RTX 5070 12 Go
Asus ROG Zephyrus Duo GX651: NVIDIA GeForce RTX 5090 Laptop, 16.00", 2.8 kg
» Verdict de la revue Asus ROG Zephyrus Duo GX651 - Unique, mais si cher
» Asus ROG Zephyrus Duo 2026 vs. 2023 - Sacrifier les performances pour améliorer le multitâche
Lenovo Pro 9 16IPH11: NVIDIA GeForce RTX 5060 Laptop, 16.00", 1.9 kg
» Avec près de 1600 nits, l'écran Lenovo Pro 9 16 Aura OLED est l'un des plus lumineux que l'on puisse acheter
» Les pages produits de Lenovo, granuleuses et de faible résolution, donnent au Pro 9i 16 Aura, par ailleurs élégant, une allure épouvantable
» Lenovo Pro 9 16 G11 Aura fonctionne beaucoup plus silencieusement en mode équilibré pour un impact minime sur les graphiques
» Le Core Ultra 9 386H est à peine plus rapide que le Core Ultra 9 285H dans les premiers tests de référence





 - Valeur moyenne obtenue dans le benchmark avec cette carte graphique

 Add as a preferred source on Google


