Verdict - Nouvellement optimisé pour les bureaux et le commerce de détail
Le Cubi NUC AI+ 3MG est une avancée significative par rapport au Cubi NUC AI+ 2MG de l'année dernière. Il y a beaucoup de changements sous le capot, notamment une carte mère révisée avec une RAM amovible, une procédure d'entretien encore plus facile, plus de ports utiles et un design beaucoup plus petit et discret pour mieux se fondre dans les environnements professionnels. En fait, il s'agit de l'un des plus petits mini-PC Intel supportant jusqu'à 128 Go de mémoire amovible. L'augmentation significative des performances du processeur répond également à l'une des principales préoccupations concernant l'ancien modèle Lunar Lake.
En revanche, la taille réduite de l'appareil implique certains compromis. Le lecteur MicroSD du modèle de l'année dernière a disparu et il n'y a pas de haut-parleur intégré, ce qui aurait rendu le système plus polyvalent. La température du cœur est généralement plus élevée et le bruit des ventilateurs n'est pas nécessairement meilleur ou pire qu'auparavant. La brique d'alimentation relativement grande, qui est presque aussi lourde que le mini PC lui-même, peut être difficile à ranger en fonction de l'environnement. Enfin, si la grande capacité de mémoire vive est une caractéristique remarquable, d'autres aspects ont été relégués au second plan, notamment le stockage local et les performances du GPU, alors que des modèles concurrents tels que le GMK EVO-X1 ou le Asus NUC 15 Pro+ sont tous plus rapides et disposent de plus d'options de stockage.
Points positifs
Points négatifs
Prix et disponibilité
Newegg propose actuellement le MSI Cubi NUC AI+ 3MG avec CPU Core Ultra 9 pour 830$. S'il est configuré avec 32 Go de RAM, le prix grimpe à 1220 $.
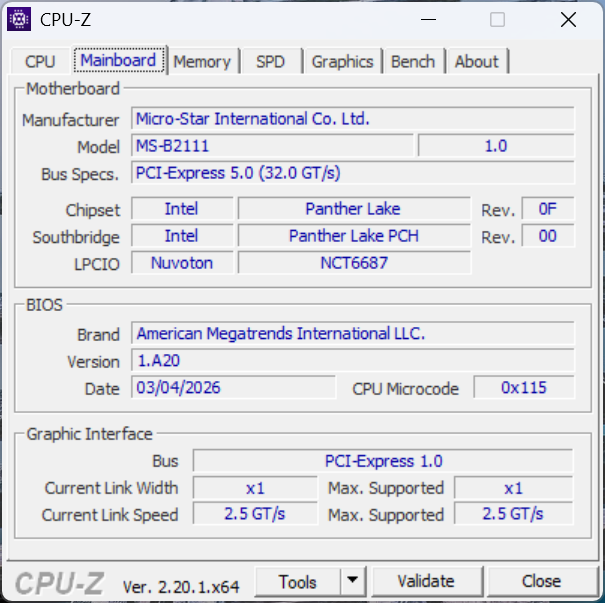
Le Cubi NUC AI+ 3MG succède au Cubi NUC AI+ 2MG de l'année dernière Cubi NUC AI+ 2MG en remplaçant le CPU Intel Lunar Lake par des options Panther Lake plus récentes. Le design extérieur a également changé pour être sensiblement plus petit et plus léger qu'auparavant.
Notre unité de test est une configuration haut de gamme avec le CPU Core Ultra 9 386H pour environ 1100 $ si elle est configurée avec de la RAM et de l'espace de stockage. Heureusement, des options dépouillées sont disponibles à des prix de départ plus bas. Des UGS avec les Core Ultra 5 et Core Ultra 7 d'entrée de gamme sont également disponibles.
Le Cubi NUC AI+ 3MG est en concurrence avec d'autres mini-PC destinés aux entreprises et aux commerces de détail/bureaux, tels que la GMK EVO series, Asus NUC 15 Pro+ou le HP EliteBoard G1a AI.
Plus d'avis sur MSI :
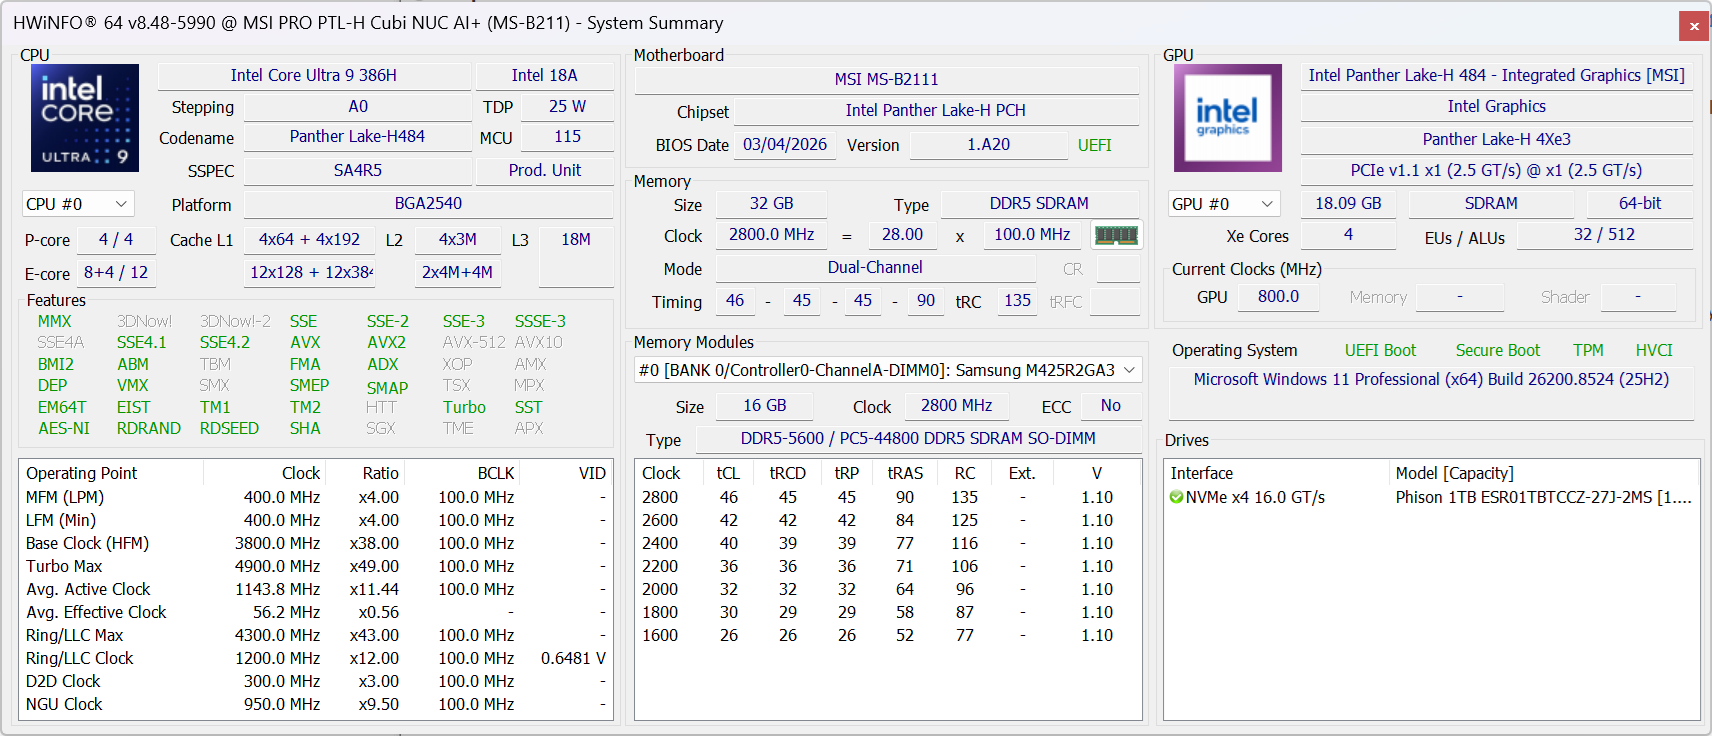
Spécifications
Cas
Le châssis utilise les mêmes matériaux en plastique noir pour des impressions similaires à celles d'avant, mais dans un volume 17% plus léger et 43% plus petit. Plus impressionnant encore, ce design plus compact n'implique pas de grilles de ventilation supplémentaires ni de modifications majeures de l'extérieur.
Connectivité
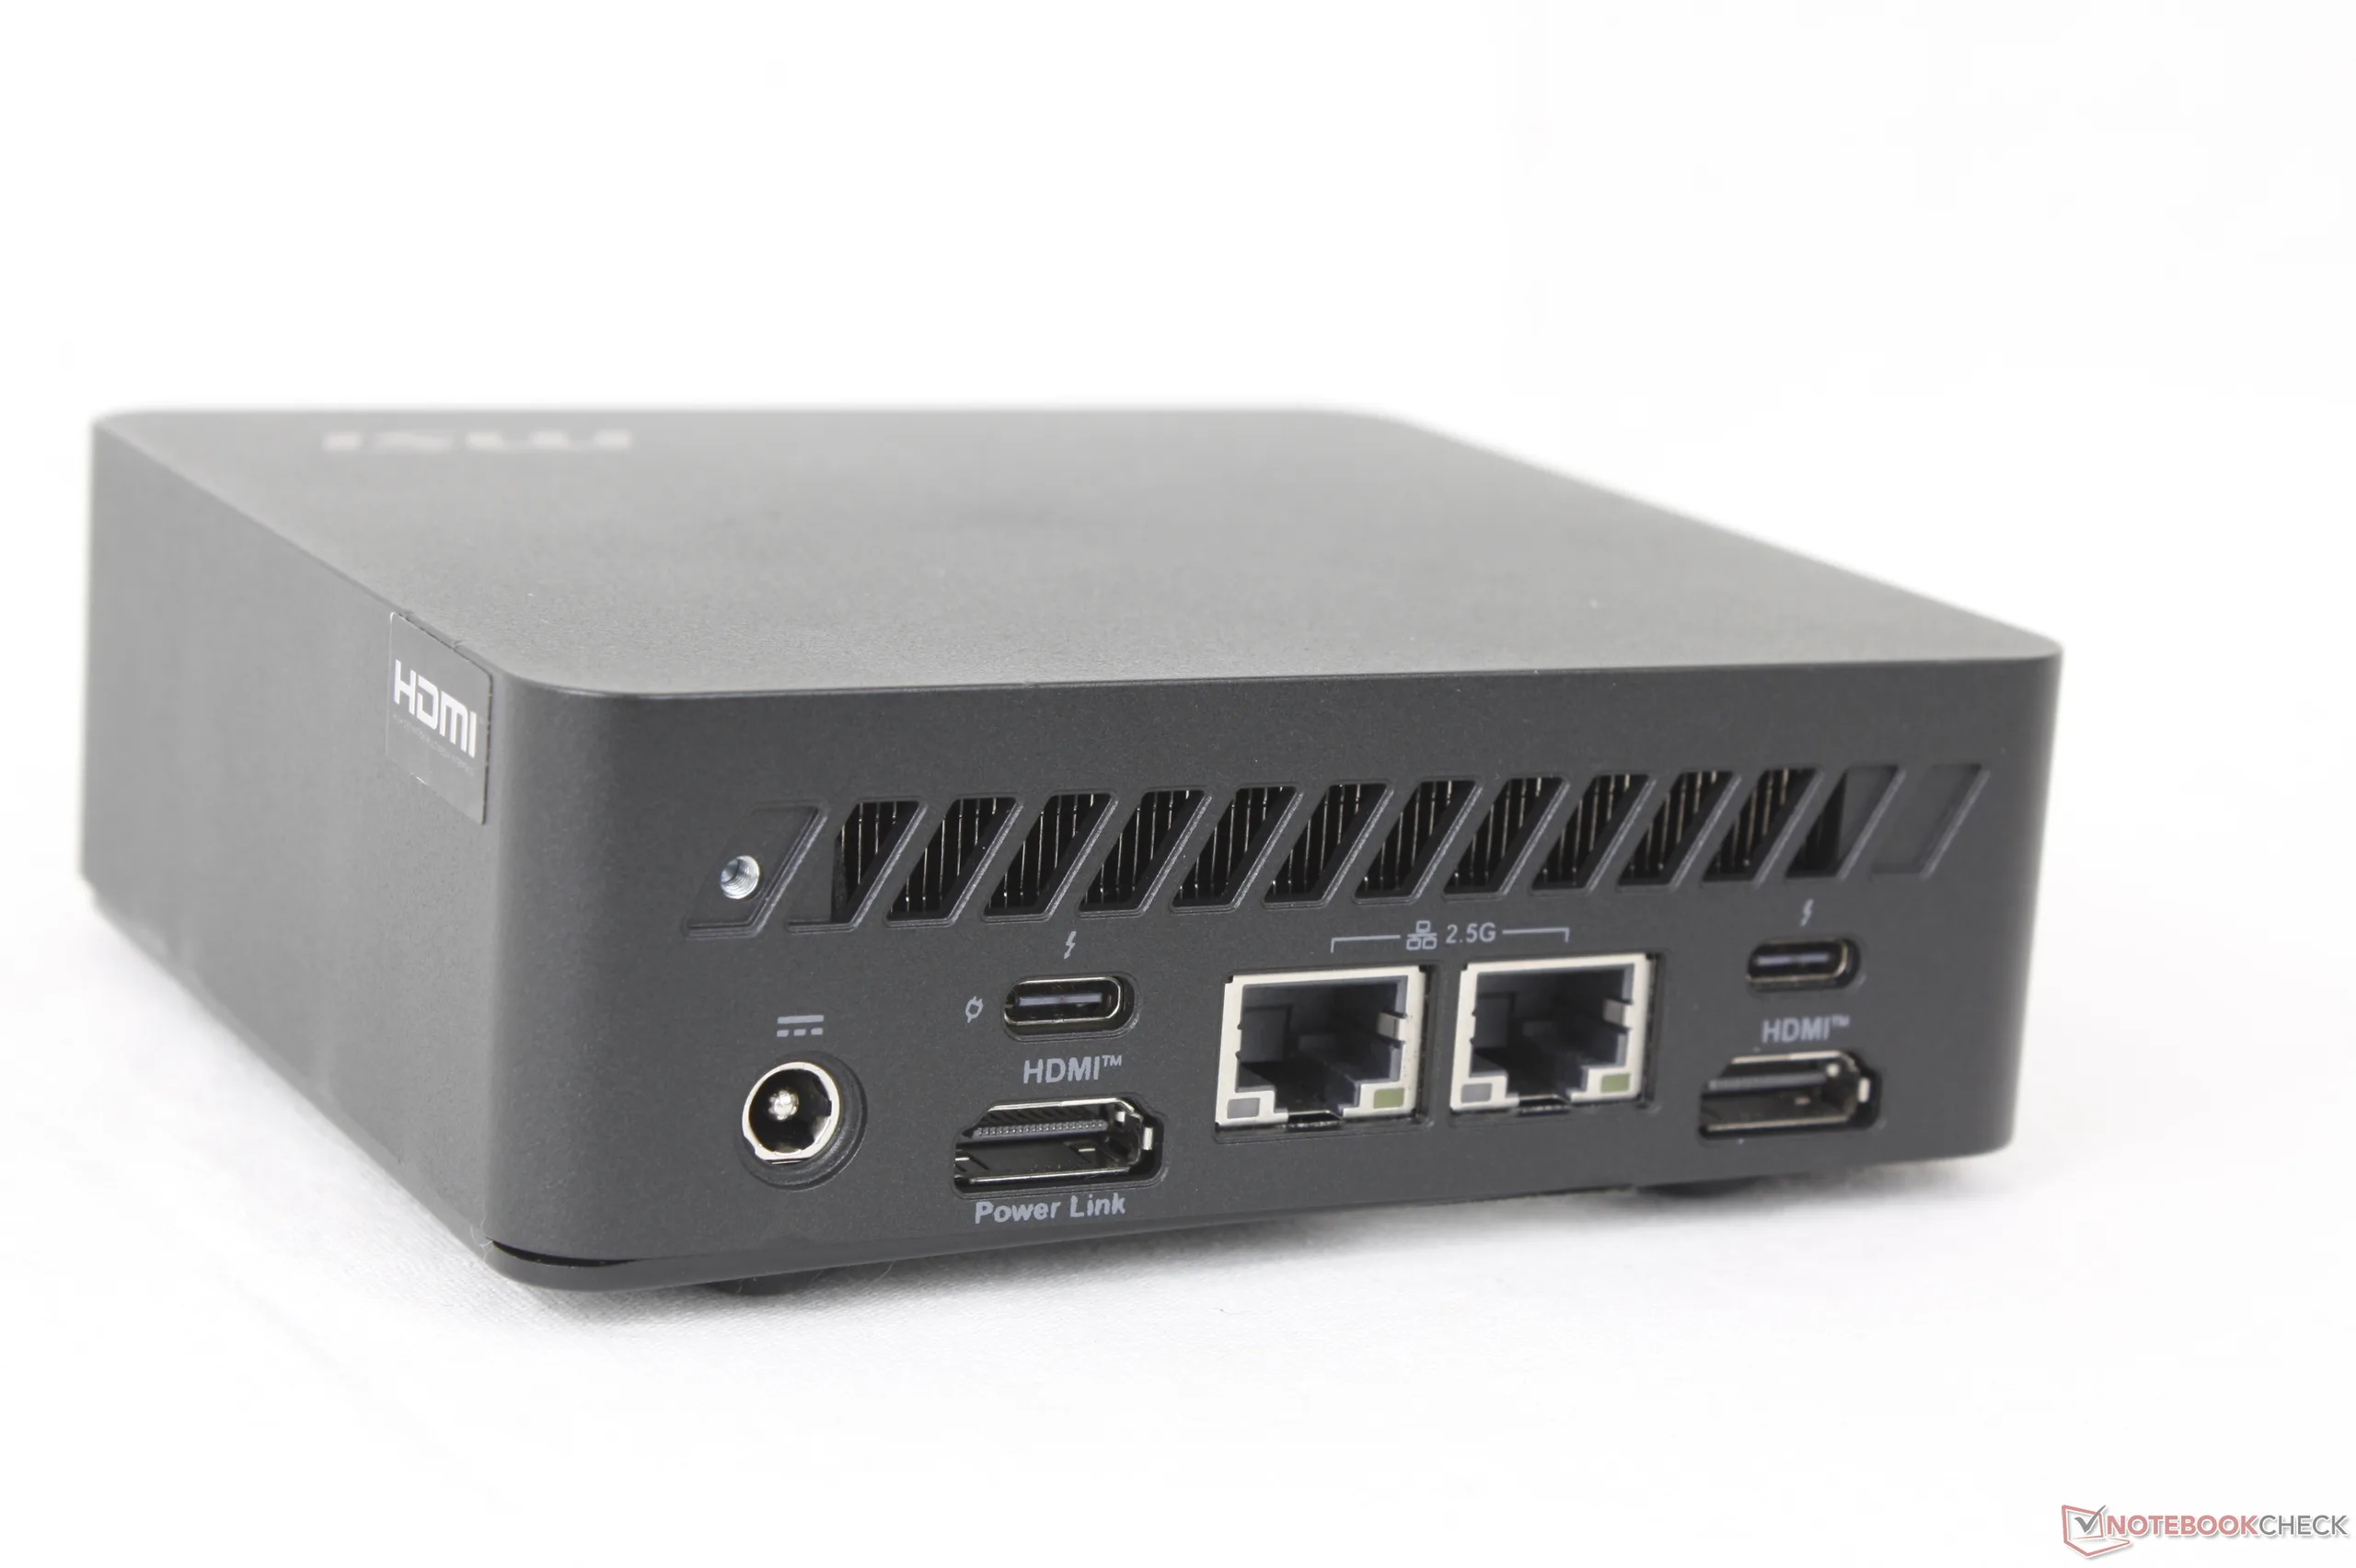
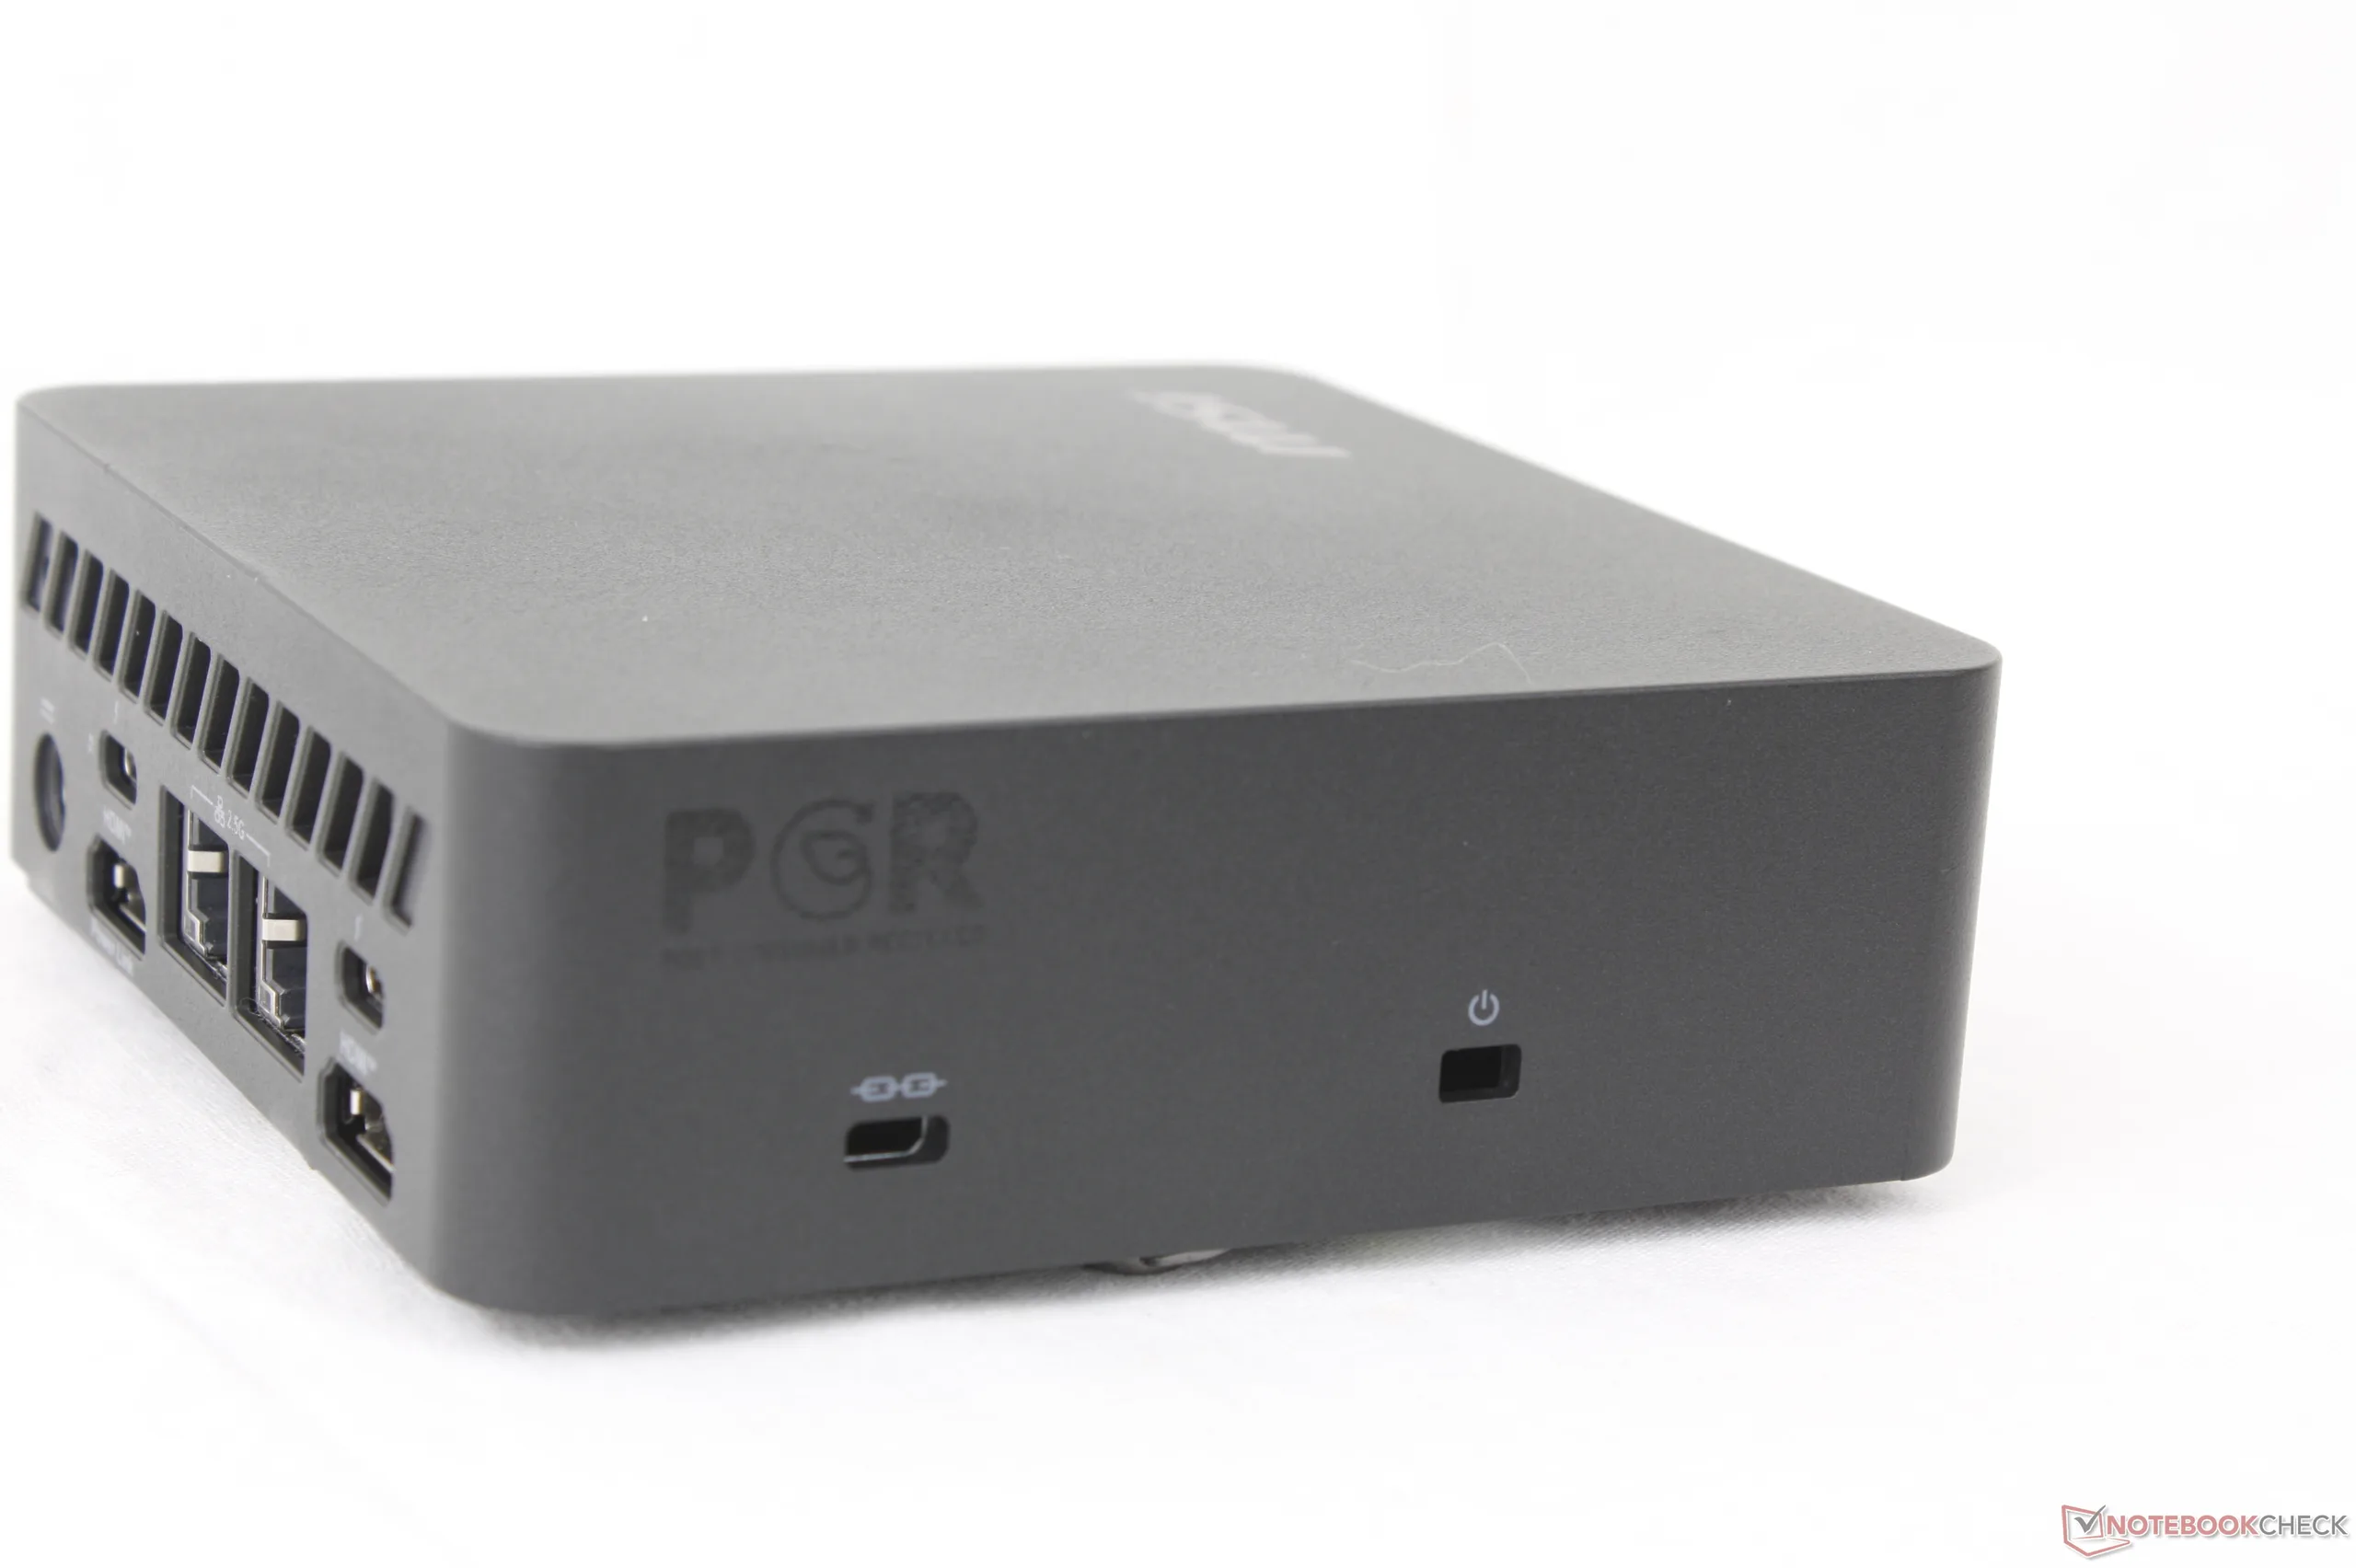
La caractéristique de connectivité la plus remarquable du Cubi 3MG est son interrupteur d'alimentation externe situé sur le côté de l'unité. Le port permet d'utiliser un bouton d'alimentation câblé pour allumer ou éteindre facilement le système si le mini-PC est placé dans un endroit difficile d'accès, comme sous un bureau ou derrière une table ou un moniteur.
Les options de port ont été considérablement modifiées par rapport au modèle de l'année dernière. Il y a désormais moins de ports USB-A et plus de lecteur de carte SD ni de prise audio, au profit de plus de ports HDMI et de ports USB-C.
Gardez à l'esprit que seul l'un des deux ports Thunderbolt 4 prend en charge Power Delivery. Ce port peut être utilisé pour alimenter le mini PC si vous disposez d'un adaptateur secteur USB-C compatible au lieu de l'adaptateur secteur à barillet fourni.
Communication
Le module WLAN est passé de Wi-Fi 6E à Wi-Fi 7 avec prise en charge de Bluetooth 6.0.
| Networking | |
| iperf3 transmit AXE11000 | |
| MSI Cubi NUC AI+ 3MG | |
| Asus NUC 15 Pro+ | |
| GMK EVO-T1 | |
| MSI Cubi NUC AI+ 2MG | |
| GMK NucBox K16 | |
| Geekom A5 Pro | |
| MSI Cubi NUC 1M | |
| iperf3 receive AXE11000 | |
| Asus NUC 15 Pro+ | |
| GMK EVO-T1 | |
| MSI Cubi NUC AI+ 3MG | |
| MSI Cubi NUC AI+ 2MG | |
| Geekom A5 Pro | |
| GMK NucBox K16 | |
| MSI Cubi NUC 1M | |
| iperf3 transmit AXE11000 6GHz | |
| GMK NucBox K16 | |
| MSI Cubi NUC AI+ 3MG | |
| Asus NUC 15 Pro+ | |
| MSI Cubi NUC 1M | |
| MSI Cubi NUC AI+ 2MG | |
| iperf3 receive AXE11000 6GHz | |
| GMK NucBox K16 | |
| MSI Cubi NUC AI+ 3MG | |
| MSI Cubi NUC AI+ 2MG | |
| Asus NUC 15 Pro+ | |
| MSI Cubi NUC 1M | |
Maintenance
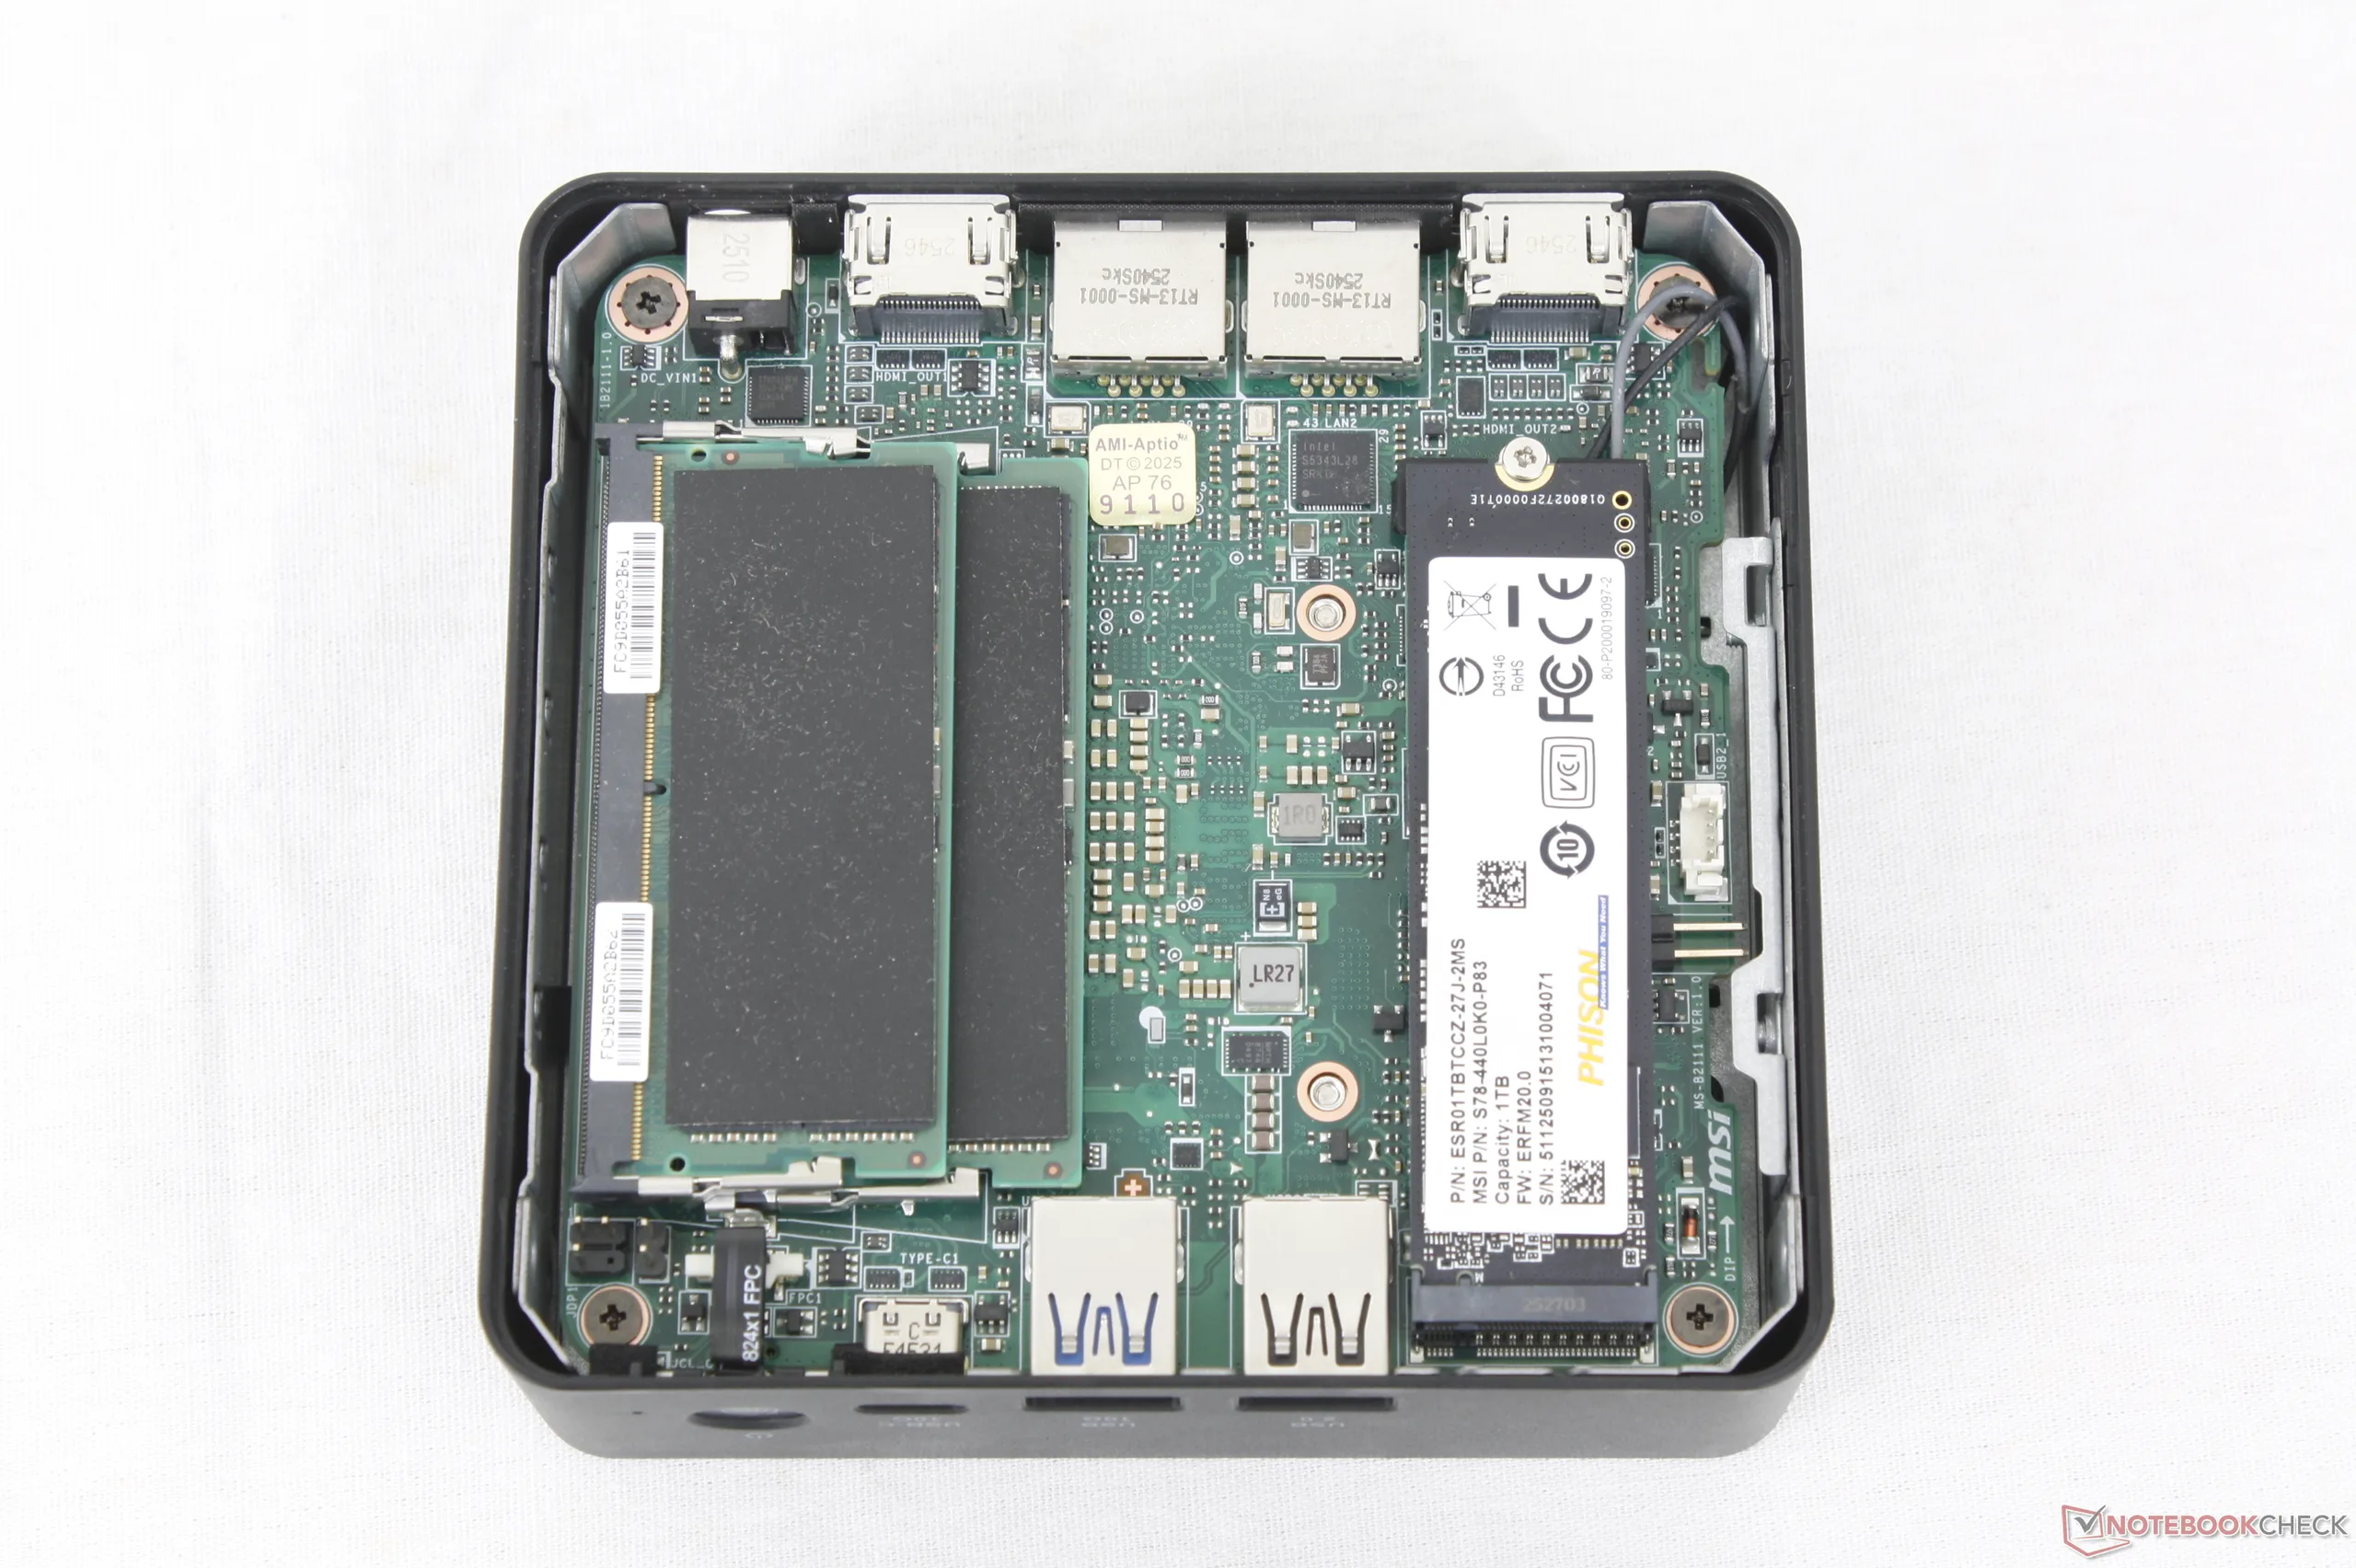
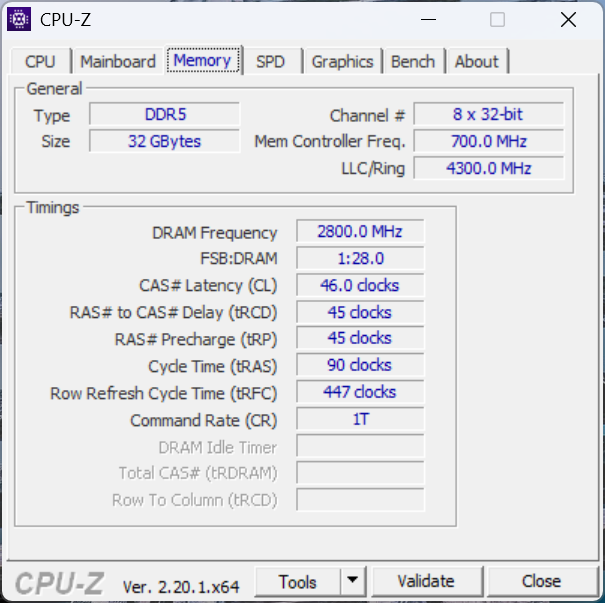
Le panneau inférieur est fixé à l'aide d'une simple vis à ailettes pour faciliter l'entretien sans aucun outil. Une fois à l'intérieur, les utilisateurs ont un accès direct à l'emplacement SSD M.2 2280, au module WLAN M.2 amovible et à deux emplacements SODIMM DDR5.
Accessoires et garantie
La boîte contient un interrupteur externe à connecter à la broche de l'interrupteur mentionnée ci-dessus. L'interrupteur externe n'est cependant pas très long (~47 cm).
Performance
Conditions d'essai
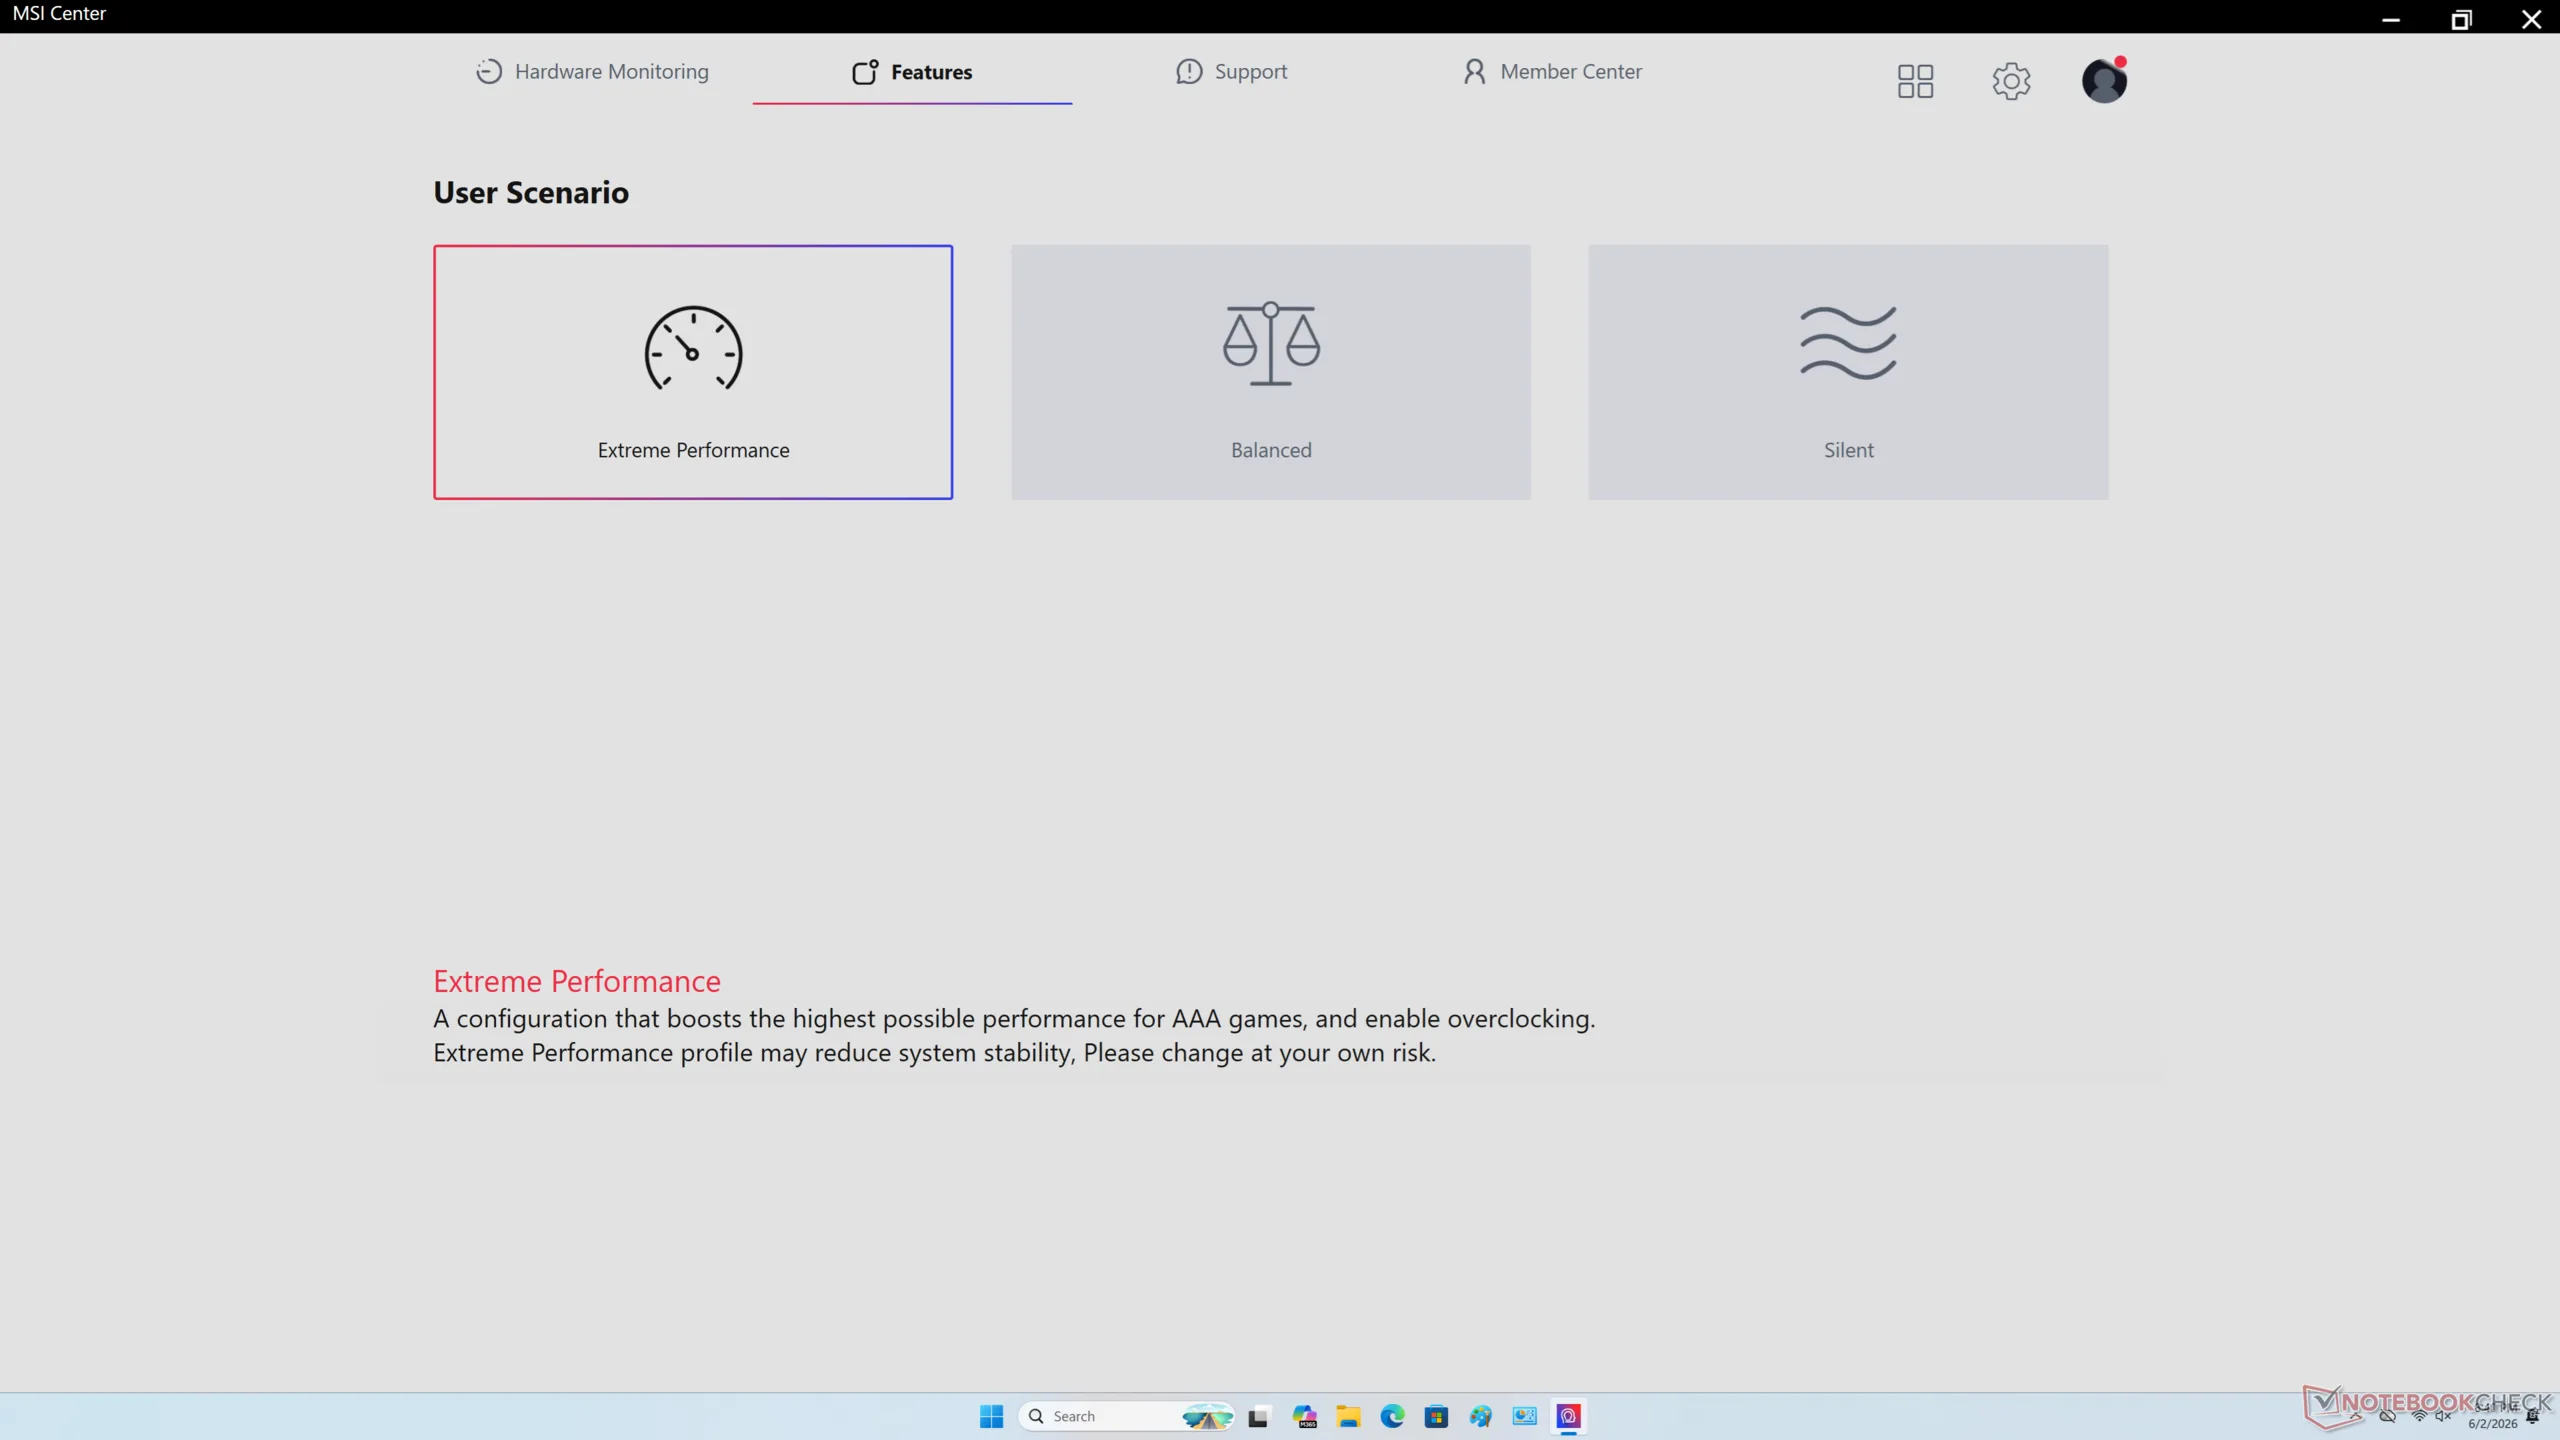
Nous avons réglé MSI Center sur le mode Performance avant d'exécuter les tests ci-dessous.
Processeur
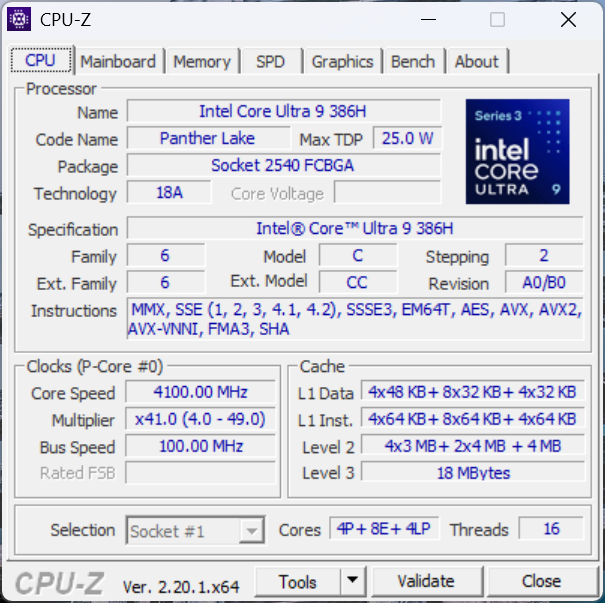
Le Cubi AI 3MG est livré avec le même Core Ultra 9 386H Que l'on trouve sur le dernier Razer Blade 16. Cependant, les performances multithread brutes sont environ 18 % plus lentes sur le MSI en raison d'un potentiel Turbo Boost limité. Lorsque vous exécutez CineBench R15 xT en boucle, par exemple, le score initial de 2792 points chute à 2380 points après seulement quelques tours, comme le montre notre graphique de comparaison ci-dessous.
Les performances brutes sont néanmoins bien supérieures à celles de la Cubi AI+ 2MG de l'année dernière, de 50 à 60 %, même en tenant compte de l'étranglement.
Cinebench R15 Multi Loop
Cinebench R23: Multi Core | Single Core
Cinebench R20: CPU (Multi Core) | CPU (Single Core)
Cinebench R15: CPU Multi 64Bit | CPU Single 64Bit
Blender: v2.79 BMW27 CPU
7-Zip 18.03: 7z b 4 | 7z b 4 -mmt1
Geekbench 6.6: Multi-Core | Single-Core
Geekbench 5.5: Multi-Core | Single-Core
HWBOT x265 Benchmark v2.2: 4k Preset
LibreOffice : 20 Documents To PDF
R Benchmark 2.5: Overall mean
| CPU Performance rating | |
| Minisforum AI X1 Pro, HX 470 | |
| Asus NUC 15 Pro+ | |
| GMK EVO-T1 | |
| Peladn HO5, AI 9 HX 370 | |
| Moyenne Intel Core Ultra 9 386H | |
| MSI Cubi NUC AI+ 3MG | |
| GMK NucBox K13 | |
| HP EliteBoard G1a AI | |
| MSI Cubi NUC AI+ 2MG | |
| GMK NucBox K16 | |
| MSI Cubi NUC 1M | |
| Minix Elite EU512-AI -2! | |
| Geekom A5 Pro | |
| Cinebench R23 / Multi Core | |
| Minisforum AI X1 Pro, HX 470 | |
| Asus NUC 15 Pro+ | |
| GMK EVO-T1 | |
| Peladn HO5, AI 9 HX 370 | |
| Moyenne Intel Core Ultra 9 386H (12144 - 21100, n=6) | |
| MSI Cubi NUC AI+ 3MG | |
| Minix Elite EU512-AI | |
| GMK NucBox K16 | |
| HP EliteBoard G1a AI | |
| GMK NucBox K13 | |
| MSI Cubi NUC AI+ 2MG | |
| MSI Cubi NUC 1M | |
| Geekom A5 Pro | |
| Cinebench R23 / Single Core | |
| Asus NUC 15 Pro+ | |
| GMK EVO-T1 | |
| Minisforum AI X1 Pro, HX 470 | |
| Moyenne Intel Core Ultra 9 386H (2010 - 2101, n=6) | |
| MSI Cubi NUC AI+ 3MG | |
| Peladn HO5, AI 9 HX 370 | |
| MSI Cubi NUC AI+ 2MG | |
| GMK NucBox K13 | |
| MSI Cubi NUC 1M | |
| HP EliteBoard G1a AI | |
| Minix Elite EU512-AI | |
| GMK NucBox K16 | |
| Geekom A5 Pro | |
| Cinebench R20 / CPU (Multi Core) | |
| Minisforum AI X1 Pro, HX 470 | |
| Asus NUC 15 Pro+ | |
| GMK EVO-T1 | |
| Peladn HO5, AI 9 HX 370 | |
| Moyenne Intel Core Ultra 9 386H (4757 - 8299, n=6) | |
| MSI Cubi NUC AI+ 3MG | |
| Minix Elite EU512-AI | |
| GMK NucBox K16 | |
| HP EliteBoard G1a AI | |
| GMK NucBox K13 | |
| MSI Cubi NUC AI+ 2MG | |
| MSI Cubi NUC 1M | |
| Geekom A5 Pro | |
| Cinebench R20 / CPU (Single Core) | |
| Asus NUC 15 Pro+ | |
| Minisforum AI X1 Pro, HX 470 | |
| GMK EVO-T1 | |
| Moyenne Intel Core Ultra 9 386H (767 - 796, n=6) | |
| MSI Cubi NUC AI+ 3MG | |
| MSI Cubi NUC AI+ 2MG | |
| Peladn HO5, AI 9 HX 370 | |
| GMK NucBox K13 | |
| MSI Cubi NUC 1M | |
| HP EliteBoard G1a AI | |
| Minix Elite EU512-AI | |
| GMK NucBox K16 | |
| Geekom A5 Pro | |
| Cinebench R15 / CPU Multi 64Bit | |
| Minisforum AI X1 Pro, HX 470 | |
| Asus NUC 15 Pro+ | |
| GMK EVO-T1 | |
| Peladn HO5, AI 9 HX 370 | |
| Moyenne Intel Core Ultra 9 386H (2197 - 3303, n=6) | |
| MSI Cubi NUC AI+ 3MG | |
| Minix Elite EU512-AI | |
| GMK NucBox K16 | |
| HP EliteBoard G1a AI | |
| GMK NucBox K13 | |
| MSI Cubi NUC AI+ 2MG | |
| Geekom A5 Pro | |
| MSI Cubi NUC 1M | |
| Cinebench R15 / CPU Single 64Bit | |
| Asus NUC 15 Pro+ | |
| Minisforum AI X1 Pro, HX 470 | |
| GMK EVO-T1 | |
| Peladn HO5, AI 9 HX 370 | |
| MSI Cubi NUC AI+ 2MG | |
| Moyenne Intel Core Ultra 9 386H (249 - 314, n=6) | |
| GMK NucBox K13 | |
| HP EliteBoard G1a AI | |
| MSI Cubi NUC AI+ 3MG | |
| MSI Cubi NUC 1M | |
| GMK NucBox K16 | |
| Minix Elite EU512-AI | |
| Geekom A5 Pro | |
| Blender / v2.79 BMW27 CPU | |
| MSI Cubi NUC 1M | |
| Geekom A5 Pro | |
| MSI Cubi NUC AI+ 2MG | |
| GMK NucBox K13 | |
| HP EliteBoard G1a AI | |
| GMK NucBox K16 | |
| Minix Elite EU512-AI | |
| MSI Cubi NUC AI+ 3MG | |
| Moyenne Intel Core Ultra 9 386H (156 - 299, n=6) | |
| GMK EVO-T1 | |
| Asus NUC 15 Pro+ | |
| Peladn HO5, AI 9 HX 370 | |
| Minisforum AI X1 Pro, HX 470 | |
| 7-Zip 18.03 / 7z b 4 -mmt1 | |
| Minisforum AI X1 Pro, HX 470 | |
| Moyenne Intel Core Ultra 9 386H (5488 - 6493, n=6) | |
| Asus NUC 15 Pro+ | |
| GMK EVO-T1 | |
| Peladn HO5, AI 9 HX 370 | |
| MSI Cubi NUC 1M | |
| MSI Cubi NUC AI+ 2MG | |
| GMK NucBox K13 | |
| HP EliteBoard G1a AI | |
| MSI Cubi NUC AI+ 3MG | |
| Geekom A5 Pro | |
| GMK NucBox K16 | |
| Minix Elite EU512-AI | |
| Geekbench 6.6 / Multi-Core | |
| Asus NUC 15 Pro+ | |
| Moyenne Intel Core Ultra 9 386H (13776 - 17405, n=8) | |
| GMK EVO-T1 | |
| MSI Cubi NUC AI+ 3MG | |
| Peladn HO5, AI 9 HX 370 | |
| Minisforum AI X1 Pro, HX 470 | |
| HP EliteBoard G1a AI | |
| GMK NucBox K13 | |
| MSI Cubi NUC AI+ 2MG | |
| MSI Cubi NUC 1M | |
| Geekom A5 Pro | |
| GMK NucBox K16 | |
| Geekbench 6.6 / Single-Core | |
| Minisforum AI X1 Pro, HX 470 | |
| GMK EVO-T1 | |
| Moyenne Intel Core Ultra 9 386H (2778 - 2919, n=8) | |
| Peladn HO5, AI 9 HX 370 | |
| MSI Cubi NUC AI+ 3MG | |
| GMK NucBox K13 | |
| MSI Cubi NUC AI+ 2MG | |
| Asus NUC 15 Pro+ | |
| MSI Cubi NUC 1M | |
| HP EliteBoard G1a AI | |
| Geekom A5 Pro | |
| GMK NucBox K16 | |
| Geekbench 5.5 / Multi-Core | |
| Moyenne Intel Core Ultra 9 386H (13098 - 17557, n=6) | |
| Asus NUC 15 Pro+ | |
| GMK EVO-T1 | |
| Peladn HO5, AI 9 HX 370 | |
| MSI Cubi NUC AI+ 3MG | |
| Minisforum AI X1 Pro, HX 470 | |
| HP EliteBoard G1a AI | |
| Minix Elite EU512-AI | |
| GMK NucBox K13 | |
| MSI Cubi NUC 1M | |
| MSI Cubi NUC AI+ 2MG | |
| GMK NucBox K16 | |
| Geekom A5 Pro | |
| Geekbench 5.5 / Single-Core | |
| Moyenne Intel Core Ultra 9 386H (1992 - 2162, n=6) | |
| Peladn HO5, AI 9 HX 370 | |
| GMK EVO-T1 | |
| MSI Cubi NUC AI+ 2MG | |
| GMK NucBox K13 | |
| MSI Cubi NUC AI+ 3MG | |
| Minisforum AI X1 Pro, HX 470 | |
| HP EliteBoard G1a AI | |
| MSI Cubi NUC 1M | |
| Asus NUC 15 Pro+ | |
| Minix Elite EU512-AI | |
| Geekom A5 Pro | |
| GMK NucBox K16 | |
| HWBOT x265 Benchmark v2.2 / 4k Preset | |
| Asus NUC 15 Pro+ | |
| Peladn HO5, AI 9 HX 370 | |
| Minisforum AI X1 Pro, HX 470 | |
| GMK EVO-T1 | |
| Moyenne Intel Core Ultra 9 386H (13.2 - 24.8, n=6) | |
| MSI Cubi NUC AI+ 3MG | |
| HP EliteBoard G1a AI | |
| Minix Elite EU512-AI | |
| GMK NucBox K13 | |
| MSI Cubi NUC AI+ 2MG | |
| GMK NucBox K16 | |
| Geekom A5 Pro | |
| MSI Cubi NUC 1M | |
| LibreOffice / 20 Documents To PDF | |
| Minix Elite EU512-AI | |
| HP EliteBoard G1a AI | |
| Minisforum AI X1 Pro, HX 470 | |
| GMK NucBox K16 | |
| Geekom A5 Pro | |
| Peladn HO5, AI 9 HX 370 | |
| Asus NUC 15 Pro+ | |
| GMK EVO-T1 | |
| MSI Cubi NUC AI+ 3MG | |
| GMK NucBox K13 | |
| Moyenne Intel Core Ultra 9 386H (38.5 - 56.1, n=6) | |
| MSI Cubi NUC AI+ 2MG | |
| MSI Cubi NUC 1M | |
| R Benchmark 2.5 / Overall mean | |
| Minix Elite EU512-AI | |
| GMK NucBox K16 | |
| Geekom A5 Pro | |
| MSI Cubi NUC AI+ 2MG | |
| HP EliteBoard G1a AI | |
| GMK NucBox K13 | |
| MSI Cubi NUC 1M | |
| GMK EVO-T1 | |
| Asus NUC 15 Pro+ | |
| MSI Cubi NUC AI+ 3MG | |
| Moyenne Intel Core Ultra 9 386H (0.4055 - 0.4384, n=6) | |
| Peladn HO5, AI 9 HX 370 | |
| Minisforum AI X1 Pro, HX 470 | |
Cinebench R23: Multi Core | Single Core
Cinebench R20: CPU (Multi Core) | CPU (Single Core)
Cinebench R15: CPU Multi 64Bit | CPU Single 64Bit
Blender: v2.79 BMW27 CPU
7-Zip 18.03: 7z b 4 | 7z b 4 -mmt1
Geekbench 6.6: Multi-Core | Single-Core
Geekbench 5.5: Multi-Core | Single-Core
HWBOT x265 Benchmark v2.2: 4k Preset
LibreOffice : 20 Documents To PDF
R Benchmark 2.5: Overall mean
* ... Moindre est la valeur, meilleures sont les performances
AIDA64: FP32 Ray-Trace | FPU Julia | CPU SHA3 | CPU Queen | FPU SinJulia | FPU Mandel | CPU AES | CPU ZLib | FP64 Ray-Trace | CPU PhotoWorxx | CPU CheckMate
| Performance rating | |
| Asus NUC 15 Pro+ -1! | |
| Moyenne Intel Core Ultra 9 386H -1! | |
| GMK EVO-T1 | |
| MSI Cubi NUC AI+ 3MG -1! | |
| GMK NucBox K16 -1! | |
| MSI Cubi NUC AI+ 2MG -1! | |
| Geekom A5 Pro | |
| MSI Cubi NUC 1M -1! | |
| AIDA64 / FP32 Ray-Trace | |
| Asus NUC 15 Pro+ (v6.92.6600) | |
| GMK EVO-T1 (v6.92.6600) | |
| GMK EVO-T1 (v8.20.8100) | |
| Moyenne Intel Core Ultra 9 386H (10001 - 21727, n=6) | |
| GMK NucBox K16 (v8.20.8100) | |
| MSI Cubi NUC AI+ 3MG (v8.20.8100) | |
| MSI Cubi NUC AI+ 2MG (v6.92.6600) | |
| Geekom A5 Pro (v8.20.8100) | |
| Geekom A5 Pro (v6.92.6600) | |
| MSI Cubi NUC 1M (v6.92.6600) | |
| AIDA64 / FPU Julia | |
| Asus NUC 15 Pro+ (v6.92.6600) | |
| GMK EVO-T1 (v6.92.6600) | |
| GMK EVO-T1 (v8.20.8100) | |
| Moyenne Intel Core Ultra 9 386H (53370 - 113595, n=6) | |
| GMK NucBox K16 (v8.20.8100) | |
| MSI Cubi NUC AI+ 3MG (v8.20.8100) | |
| MSI Cubi NUC AI+ 2MG (v6.92.6600) | |
| Geekom A5 Pro (v8.20.8100) | |
| Geekom A5 Pro (v6.92.6600) | |
| MSI Cubi NUC 1M (v6.92.6600) | |
| AIDA64 / CPU SHA3 | |
| Asus NUC 15 Pro+ (v6.92.6600) | |
| GMK EVO-T1 (v6.92.6600) | |
| GMK EVO-T1 (v8.20.8100) | |
| Moyenne Intel Core Ultra 9 386H (2776 - 5604, n=6) | |
| MSI Cubi NUC AI+ 3MG (v8.20.8100) | |
| GMK NucBox K16 (v8.20.8100) | |
| MSI Cubi NUC AI+ 2MG (v6.92.6600) | |
| MSI Cubi NUC 1M (v6.92.6600) | |
| Geekom A5 Pro (v6.92.6600) | |
| Geekom A5 Pro (v8.20.8100) | |
| AIDA64 / CPU Queen | |
| Asus NUC 15 Pro+ (v6.92.6600) | |
| Geekom A5 Pro (v6.92.6600) | |
| MSI Cubi NUC 1M (v6.92.6600) | |
| GMK EVO-T1 (v6.92.6600) | |
| MSI Cubi NUC AI+ 2MG (v6.92.6600) | |
| AIDA64 / FPU SinJulia | |
| GMK NucBox K16 (v8.20.8100) | |
| Asus NUC 15 Pro+ (v6.92.6600) | |
| GMK EVO-T1 (v6.92.6600) | |
| GMK EVO-T1 (v8.20.8100) | |
| Geekom A5 Pro (v6.92.6600) | |
| Geekom A5 Pro (v8.20.8100) | |
| Moyenne Intel Core Ultra 9 386H (5314 - 7332, n=6) | |
| MSI Cubi NUC AI+ 3MG (v8.20.8100) | |
| MSI Cubi NUC AI+ 2MG (v6.92.6600) | |
| MSI Cubi NUC 1M (v6.92.6600) | |
| AIDA64 / FPU Mandel | |
| GMK EVO-T1 (v6.92.6600) | |
| GMK EVO-T1 (v8.20.8100) | |
| Asus NUC 15 Pro+ (v6.92.6600) | |
| GMK NucBox K16 (v8.20.8100) | |
| Moyenne Intel Core Ultra 9 386H (28414 - 61578, n=6) | |
| MSI Cubi NUC AI+ 3MG (v8.20.8100) | |
| MSI Cubi NUC AI+ 2MG (v6.92.6600) | |
| Geekom A5 Pro (v6.92.6600) | |
| Geekom A5 Pro (v8.20.8100) | |
| MSI Cubi NUC 1M (v6.92.6600) | |
| AIDA64 / CPU AES | |
| Asus NUC 15 Pro+ (v6.92.6600) | |
| GMK EVO-T1 (v6.92.6600) | |
| GMK EVO-T1 (v8.20.8100) | |
| Moyenne Intel Core Ultra 9 386H (46362 - 72112, n=6) | |
| GMK NucBox K16 (v8.20.8100) | |
| MSI Cubi NUC AI+ 3MG (v8.20.8100) | |
| MSI Cubi NUC AI+ 2MG (v6.92.6600) | |
| Geekom A5 Pro (v6.92.6600) | |
| Geekom A5 Pro (v8.20.8100) | |
| MSI Cubi NUC 1M (v6.92.6600) | |
| AIDA64 / CPU ZLib | |
| Asus NUC 15 Pro+ (v6.92.6600) | |
| GMK EVO-T1 (v6.92.6600) | |
| GMK EVO-T1 (v8.20.8100) | |
| Moyenne Intel Core Ultra 9 386H (669 - 1271, n=6) | |
| MSI Cubi NUC AI+ 3MG (v8.20.8100) | |
| GMK NucBox K16 (v8.20.8100) | |
| MSI Cubi NUC AI+ 2MG (v6.92.6600) | |
| MSI Cubi NUC 1M (v6.92.6600) | |
| Geekom A5 Pro (v6.92.6600) | |
| Geekom A5 Pro (v8.20.8100) | |
| AIDA64 / FP64 Ray-Trace | |
| Asus NUC 15 Pro+ (v6.92.6600) | |
| GMK EVO-T1 (v6.92.6600) | |
| GMK EVO-T1 (v8.20.8100) | |
| Moyenne Intel Core Ultra 9 386H (5138 - 11627, n=6) | |
| GMK NucBox K16 (v8.20.8100) | |
| MSI Cubi NUC AI+ 3MG (v8.20.8100) | |
| MSI Cubi NUC AI+ 2MG (v6.92.6600) | |
| Geekom A5 Pro (v8.20.8100) | |
| Geekom A5 Pro (v6.92.6600) | |
| MSI Cubi NUC 1M (v6.92.6600) | |
| AIDA64 / CPU PhotoWorxx | |
| Moyenne Intel Core Ultra 9 386H (54042 - 89891, n=6) | |
| GMK EVO-T1 (v8.20.8100) | |
| GMK EVO-T1 (v6.92.6600) | |
| Asus NUC 15 Pro+ (v6.92.6600) | |
| MSI Cubi NUC AI+ 2MG (v6.92.6600) | |
| MSI Cubi NUC AI+ 3MG (v8.20.8100) | |
| MSI Cubi NUC 1M (v6.92.6600) | |
| Geekom A5 Pro (v6.92.6600) | |
| Geekom A5 Pro (v8.20.8100) | |
| GMK NucBox K16 (v8.20.8100) | |
| AIDA64 / CPU CheckMate | |
| Moyenne Intel Core Ultra 9 386H (4051 - 4826, n=5) | |
| MSI Cubi NUC AI+ 3MG (v8.20.8100) | |
| GMK EVO-T1 (v8.20.8100) | |
| GMK NucBox K16 (v8.20.8100) | |
| Geekom A5 Pro (v8.20.8100) | |
Performance du système
Geekbench AI: Quantized GPU 1.7 | Half Precision GPU 1.7 | Single Precision GPU 1.7
PCMark 10: Score | Essentials | Productivity | Digital Content Creation
CrossMark: Overall | Productivity | Creativity | Responsiveness
WebXPRT 3: Overall
WebXPRT 4: Overall
Mozilla Kraken 1.1: Total
| Performance rating | |
| GMK EVO-T1 | |
| MSI Cubi NUC AI+ 3MG | |
| MSI Cubi NUC AI+ 2MG | |
| Asus NUC 15 Pro+ | |
| MSI Cubi NUC 1M -3! | |
| GMK NucBox K16 -3! | |
| Geekom A5 Pro | |
| Geekbench AI / Quantized GPU 1.7 | |
| MSI Cubi NUC AI+ 2MG | |
| Asus NUC 15 Pro+ | |
| GMK EVO-T1 | |
| MSI Cubi NUC AI+ 3MG | |
| Geekom A5 Pro | |
| Geekbench AI / Half Precision GPU 1.7 | |
| MSI Cubi NUC AI+ 2MG | |
| MSI Cubi NUC AI+ 3MG | |
| GMK EVO-T1 | |
| Asus NUC 15 Pro+ | |
| Geekom A5 Pro | |
| Geekbench AI / Single Precision GPU 1.7 | |
| MSI Cubi NUC AI+ 2MG | |
| Asus NUC 15 Pro+ | |
| GMK EVO-T1 | |
| MSI Cubi NUC AI+ 3MG | |
| Geekom A5 Pro | |
| PCMark 10 / Score | |
| MSI Cubi NUC AI+ 3MG | |
| GMK EVO-T1 | |
| Asus NUC 15 Pro+ | |
| MSI Cubi NUC AI+ 2MG | |
| GMK NucBox K16 | |
| Geekom A5 Pro | |
| MSI Cubi NUC 1M | |
| PCMark 10 / Essentials | |
| MSI Cubi NUC 1M | |
| MSI Cubi NUC AI+ 3MG | |
| GMK EVO-T1 | |
| MSI Cubi NUC AI+ 2MG | |
| Asus NUC 15 Pro+ | |
| Geekom A5 Pro | |
| GMK NucBox K16 | |
| PCMark 10 / Productivity | |
| MSI Cubi NUC AI+ 3MG | |
| Geekom A5 Pro | |
| GMK NucBox K16 | |
| GMK EVO-T1 | |
| MSI Cubi NUC AI+ 2MG | |
| Asus NUC 15 Pro+ | |
| MSI Cubi NUC 1M | |
| PCMark 10 / Digital Content Creation | |
| GMK EVO-T1 | |
| Asus NUC 15 Pro+ | |
| MSI Cubi NUC AI+ 3MG | |
| MSI Cubi NUC AI+ 2MG | |
| GMK NucBox K16 | |
| MSI Cubi NUC 1M | |
| Geekom A5 Pro | |
| CrossMark / Overall | |
| GMK EVO-T1 | |
| MSI Cubi NUC AI+ 3MG | |
| Asus NUC 15 Pro+ | |
| MSI Cubi NUC 1M | |
| MSI Cubi NUC AI+ 2MG | |
| GMK NucBox K16 | |
| Geekom A5 Pro | |
| CrossMark / Productivity | |
| GMK EVO-T1 | |
| MSI Cubi NUC AI+ 3MG | |
| MSI Cubi NUC 1M | |
| Asus NUC 15 Pro+ | |
| MSI Cubi NUC AI+ 2MG | |
| GMK NucBox K16 | |
| Geekom A5 Pro | |
| CrossMark / Creativity | |
| MSI Cubi NUC AI+ 3MG | |
| GMK EVO-T1 | |
| Asus NUC 15 Pro+ | |
| MSI Cubi NUC AI+ 2MG | |
| MSI Cubi NUC 1M | |
| GMK NucBox K16 | |
| Geekom A5 Pro | |
| CrossMark / Responsiveness | |
| GMK EVO-T1 | |
| MSI Cubi NUC AI+ 3MG | |
| MSI Cubi NUC 1M | |
| Asus NUC 15 Pro+ | |
| MSI Cubi NUC AI+ 2MG | |
| GMK NucBox K16 | |
| Geekom A5 Pro | |
| WebXPRT 3 / Overall | |
| GMK EVO-T1 | |
| MSI Cubi NUC AI+ 2MG | |
| MSI Cubi NUC 1M | |
| MSI Cubi NUC AI+ 3MG | |
| Geekom A5 Pro | |
| Asus NUC 15 Pro+ | |
| GMK NucBox K16 | |
| WebXPRT 4 / Overall | |
| GMK EVO-T1 | |
| MSI Cubi NUC AI+ 3MG | |
| MSI Cubi NUC AI+ 2MG | |
| MSI Cubi NUC 1M | |
| Asus NUC 15 Pro+ | |
| Geekom A5 Pro | |
| GMK NucBox K16 | |
| Mozilla Kraken 1.1 / Total | |
| GMK NucBox K16 | |
| Geekom A5 Pro | |
| MSI Cubi NUC 1M | |
| MSI Cubi NUC AI+ 2MG | |
| Asus NUC 15 Pro+ | |
| GMK EVO-T1 | |
| MSI Cubi NUC AI+ 3MG | |
* ... Moindre est la valeur, meilleures sont les performances
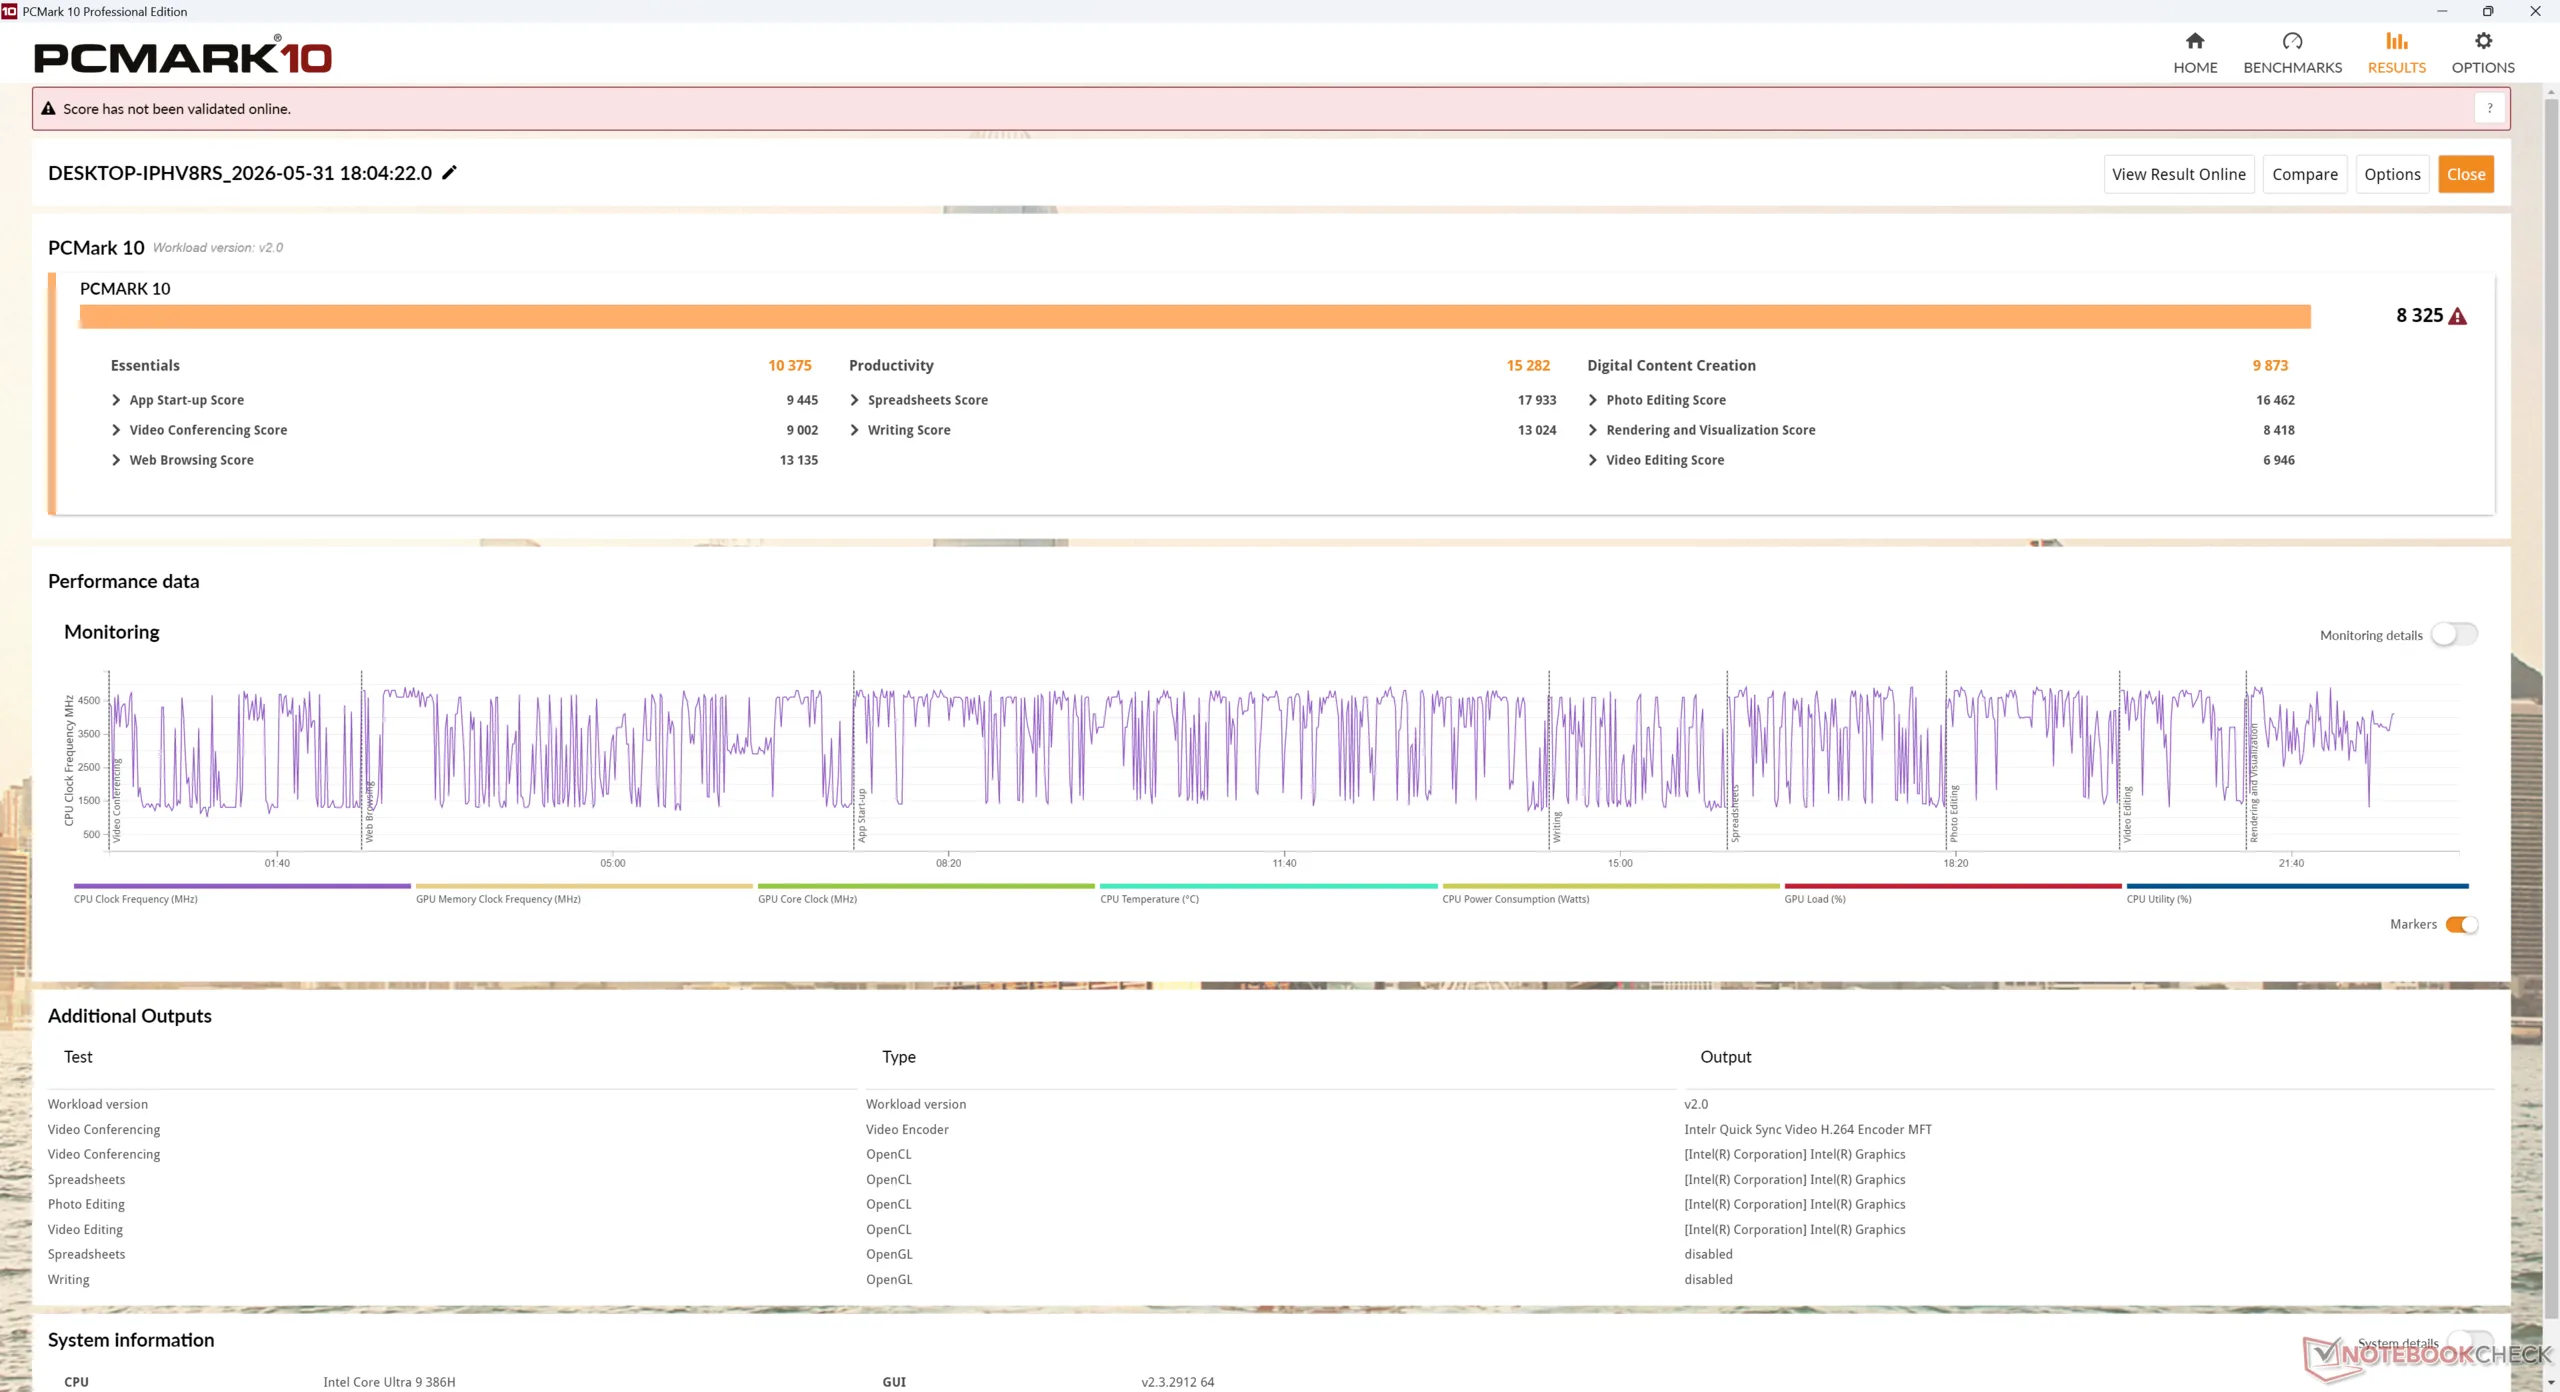
| PCMark 10 Score | 8325 points | |
Aide | ||
| AIDA64 / Memory Copy | |
| Moyenne Intel Core Ultra 9 386H (75437 - 129946, n=6) | |
| MSI Cubi NUC AI+ 2MG | |
| Asus NUC 15 Pro+ | |
| GMK EVO-T1 | |
| GMK EVO-T1 | |
| MSI Cubi NUC AI+ 3MG | |
| MSI Cubi NUC 1M | |
| Geekom A5 Pro | |
| Geekom A5 Pro | |
| GMK NucBox K16 | |
| AIDA64 / Memory Read | |
| Moyenne Intel Core Ultra 9 386H (81021 - 118858, n=6) | |
| Asus NUC 15 Pro+ | |
| MSI Cubi NUC AI+ 2MG | |
| MSI Cubi NUC AI+ 3MG | |
| GMK EVO-T1 | |
| GMK EVO-T1 | |
| MSI Cubi NUC 1M | |
| Geekom A5 Pro | |
| Geekom A5 Pro | |
| GMK NucBox K16 | |
| AIDA64 / Memory Write | |
| MSI Cubi NUC AI+ 2MG | |
| Moyenne Intel Core Ultra 9 386H (75959 - 135096, n=6) | |
| Asus NUC 15 Pro+ | |
| GMK EVO-T1 | |
| GMK EVO-T1 | |
| MSI Cubi NUC AI+ 3MG | |
| MSI Cubi NUC 1M | |
| GMK NucBox K16 | |
| Geekom A5 Pro | |
| Geekom A5 Pro | |
| AIDA64 / Memory Latency | |
| GMK EVO-T1 | |
| GMK EVO-T1 | |
| MSI Cubi NUC AI+ 3MG | |
| GMK NucBox K16 | |
| Asus NUC 15 Pro+ | |
| Moyenne Intel Core Ultra 9 386H (87.2 - 116.9, n=6) | |
| Geekom A5 Pro | |
| Geekom A5 Pro | |
| MSI Cubi NUC AI+ 2MG | |
| MSI Cubi NUC 1M | |
* ... Moindre est la valeur, meilleures sont les performances
Latence DPC
Dispositifs de stockage
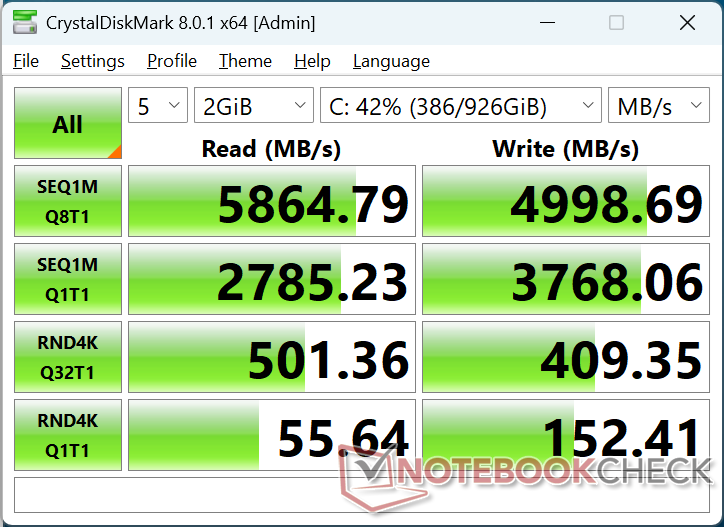
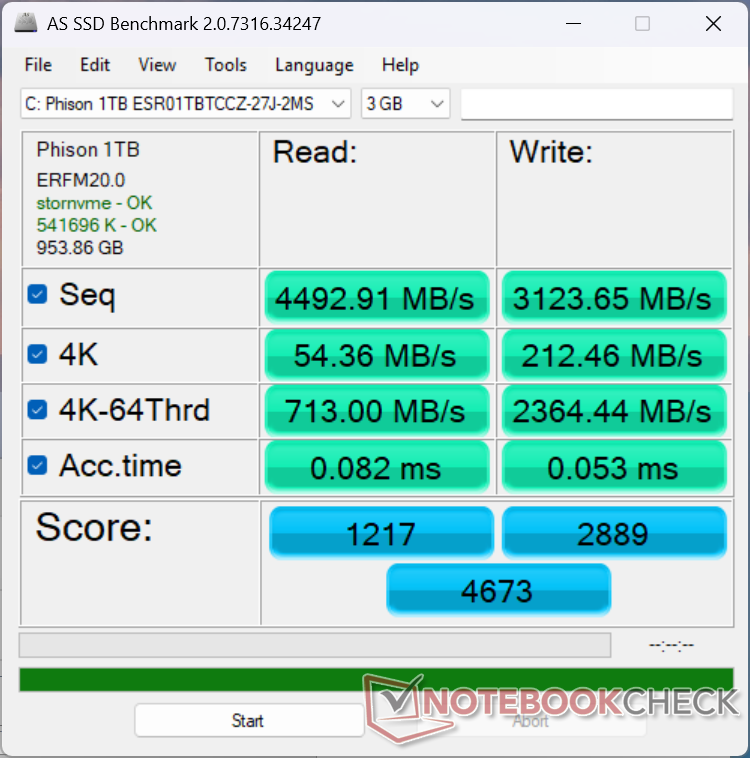
Le système est livré avec le même Phison 1 TB ESR01TBTCCZ PCIe4 NVMe SSD que l'on trouve sur le Cubi 2MG de l'année dernière.

| Drive Performance rating - Percent | |
| GMK EVO-T1 | |
| Asus NUC 15 Pro+ | |
| MSI Cubi NUC AI+ 3MG | |
| MSI Cubi NUC 1M | |
| Geekom A5 Pro | |
| MSI Cubi NUC AI+ 2MG | |
| GMK NucBox K16 | |
* ... Moindre est la valeur, meilleures sont les performances
Throttoir de disque : Boucle de lecture DiskSpd, profondeur de la file d'attente 8
Performance du GPU
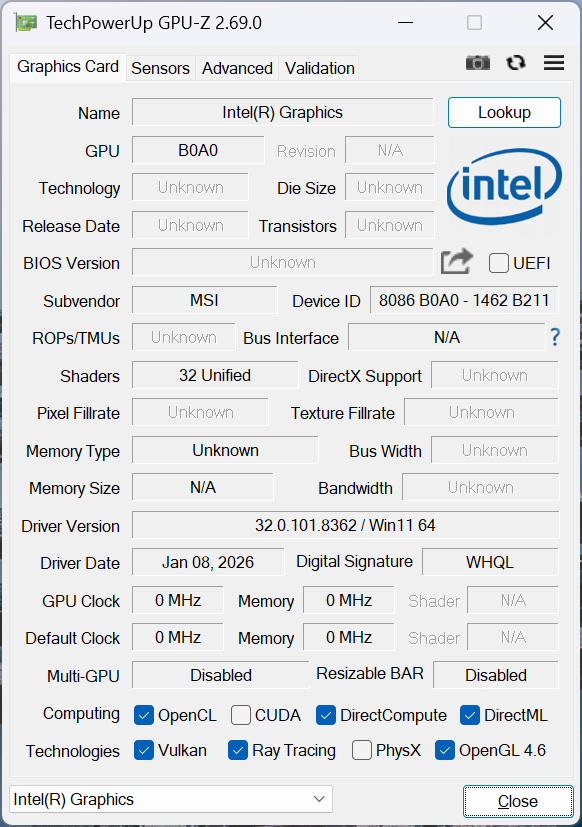
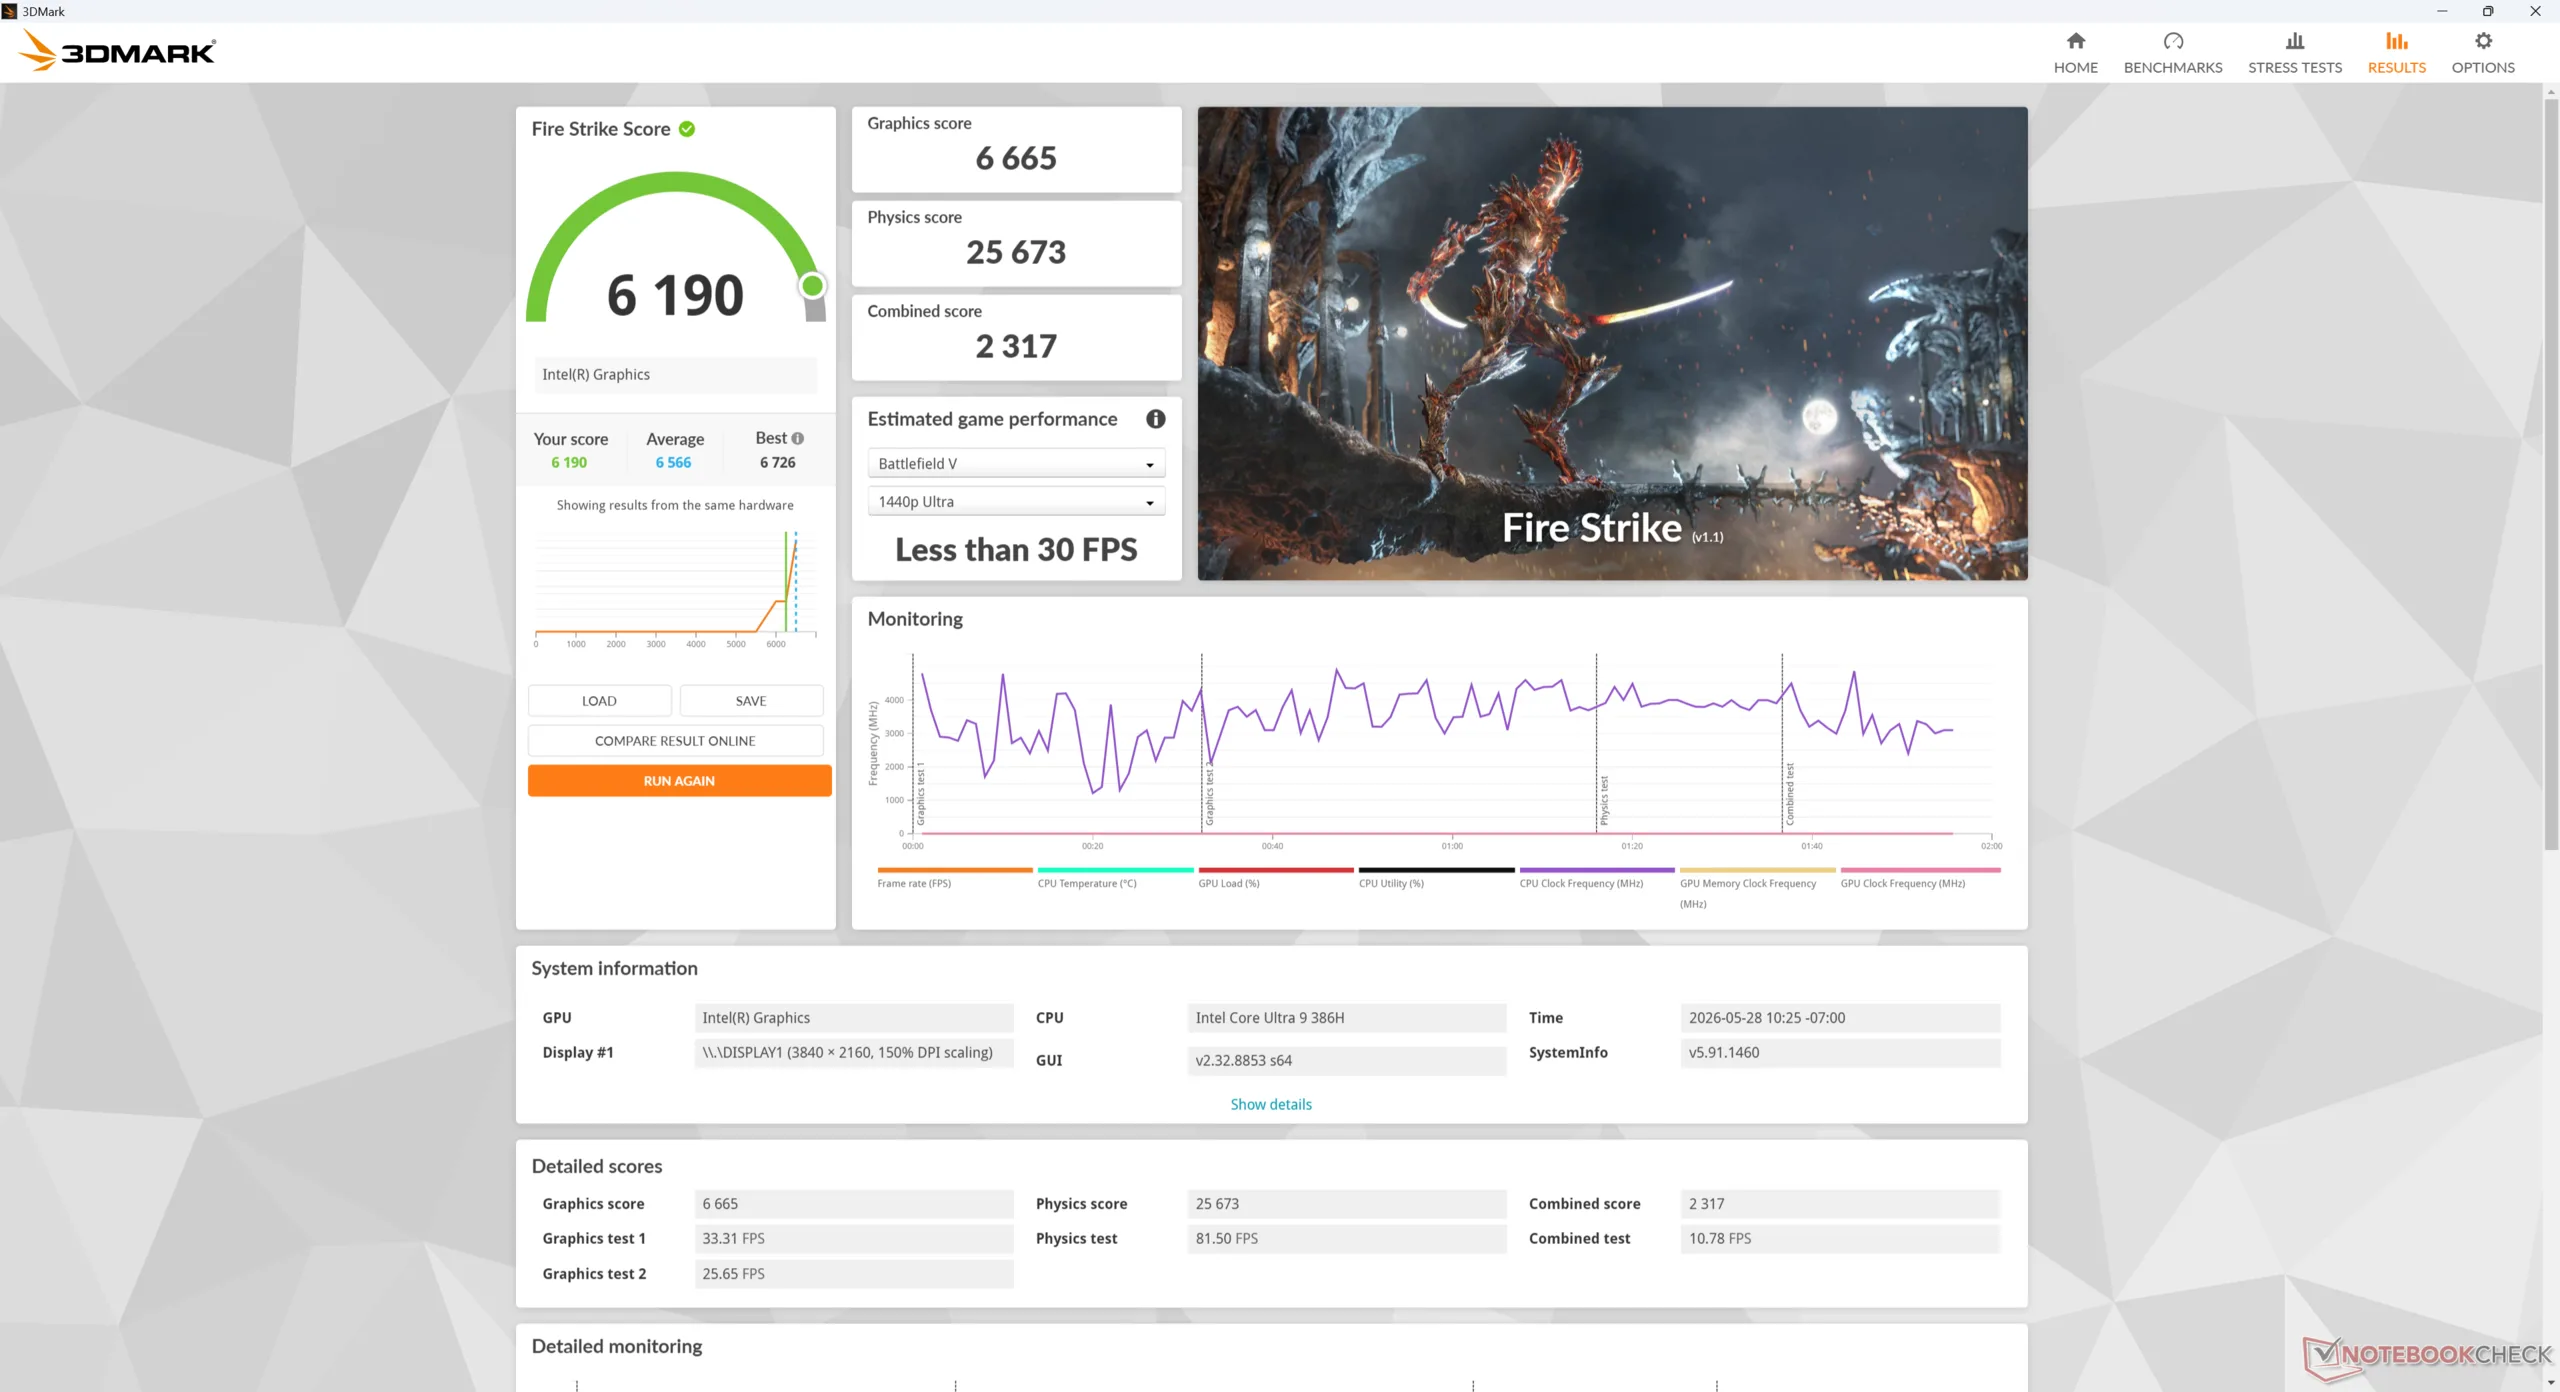
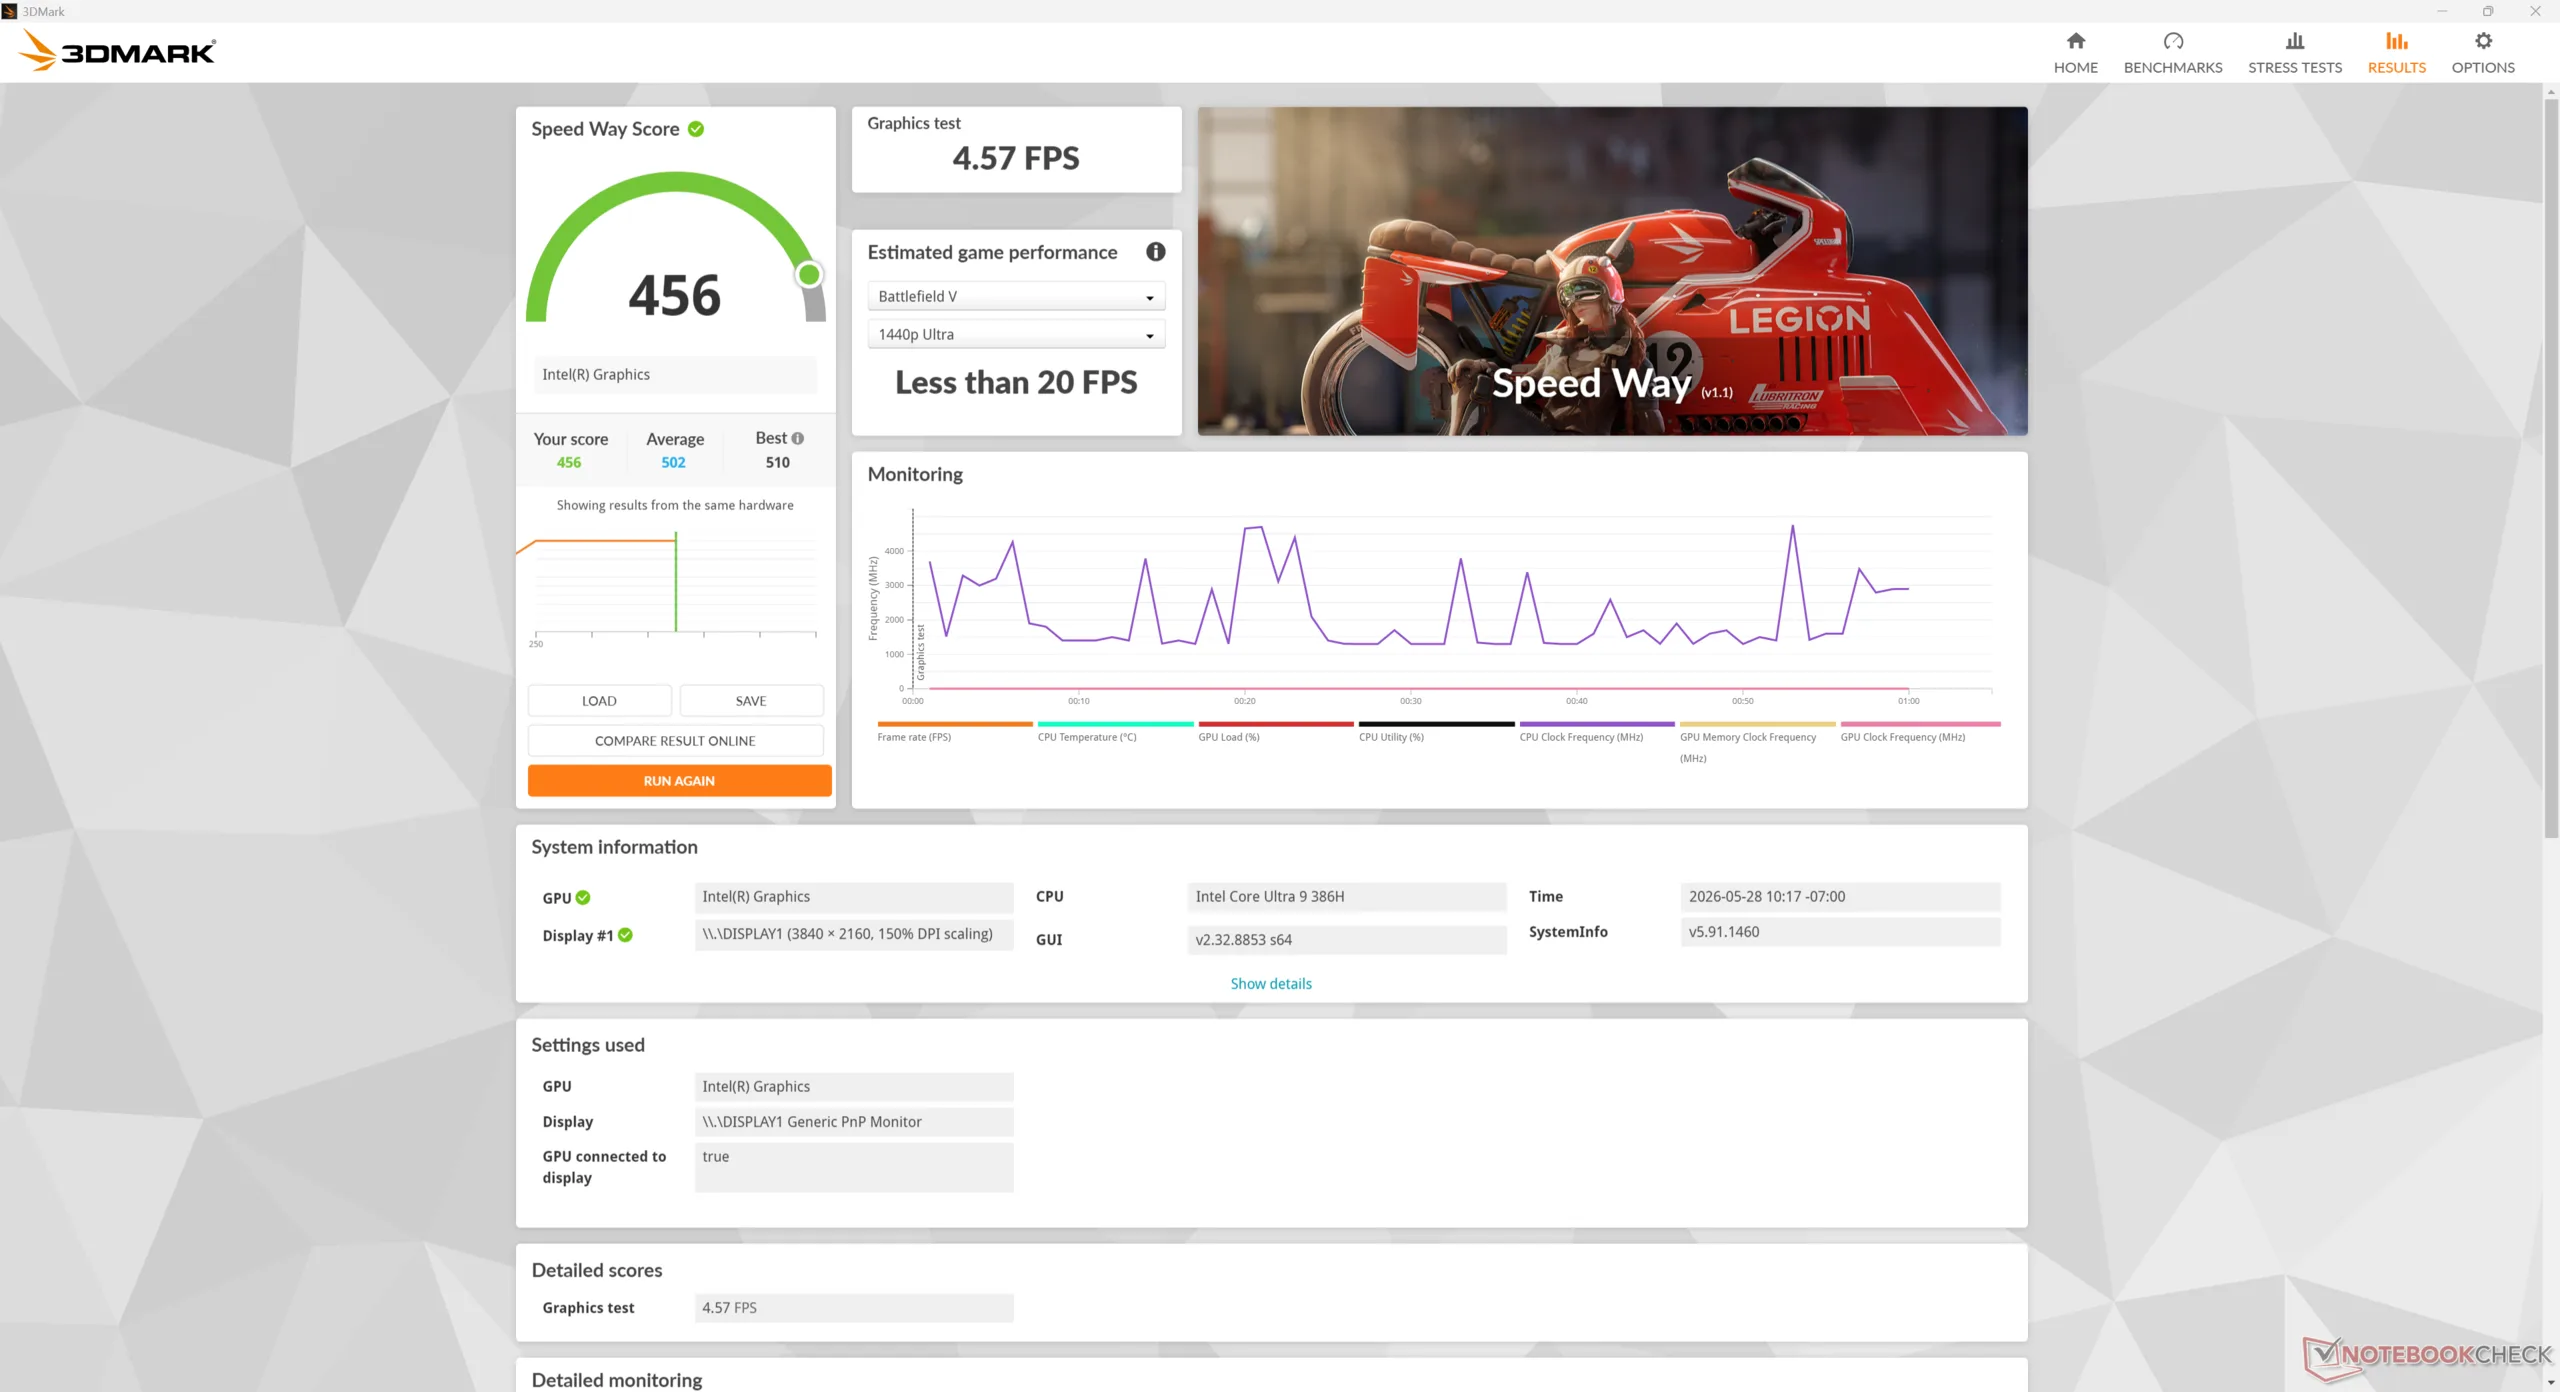
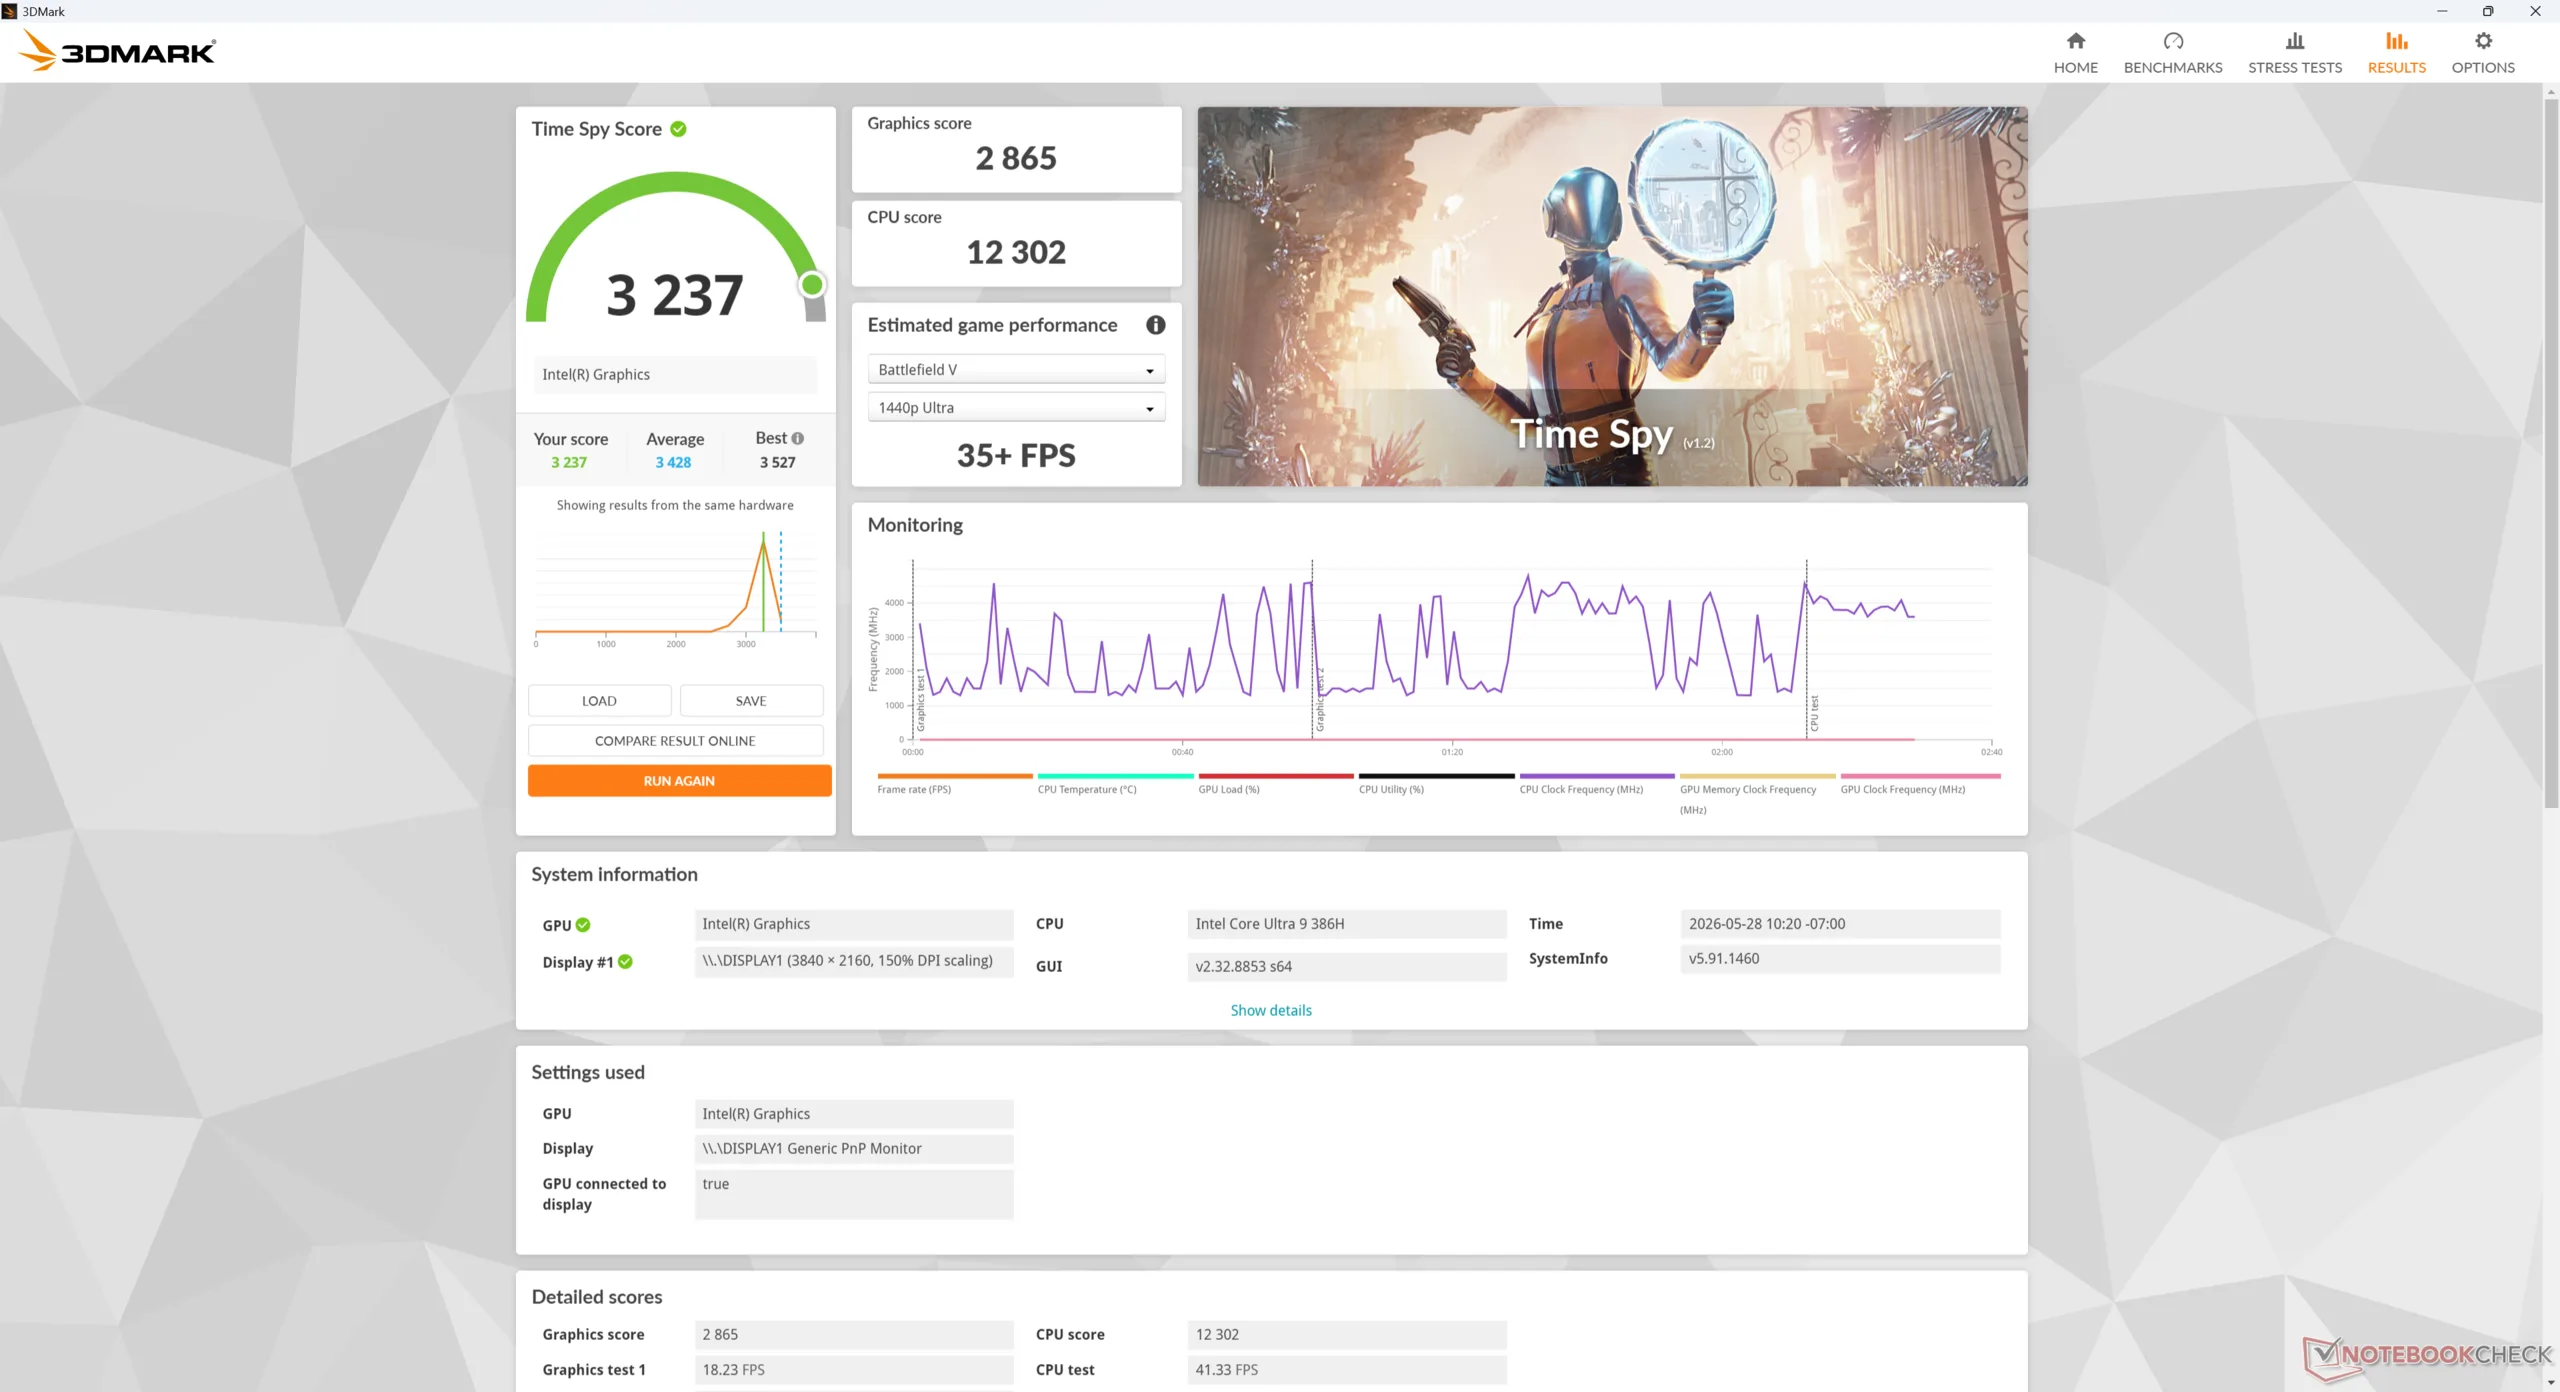
La carte graphique intégrée Graphics 4 Xe3 se comporte de la même manière que le modèle Arc 140V de l'année dernière, si ce n'est qu'il est légèrement plus rapide de quelques points de pourcentage en moyenne. Le Core Ultra 9 386H n'est pas équipé de la carte d'élite Arc B390 de la série Panther Lake X7 et la performance graphique n'est donc pas une caractéristique principale du MSI Cubi.
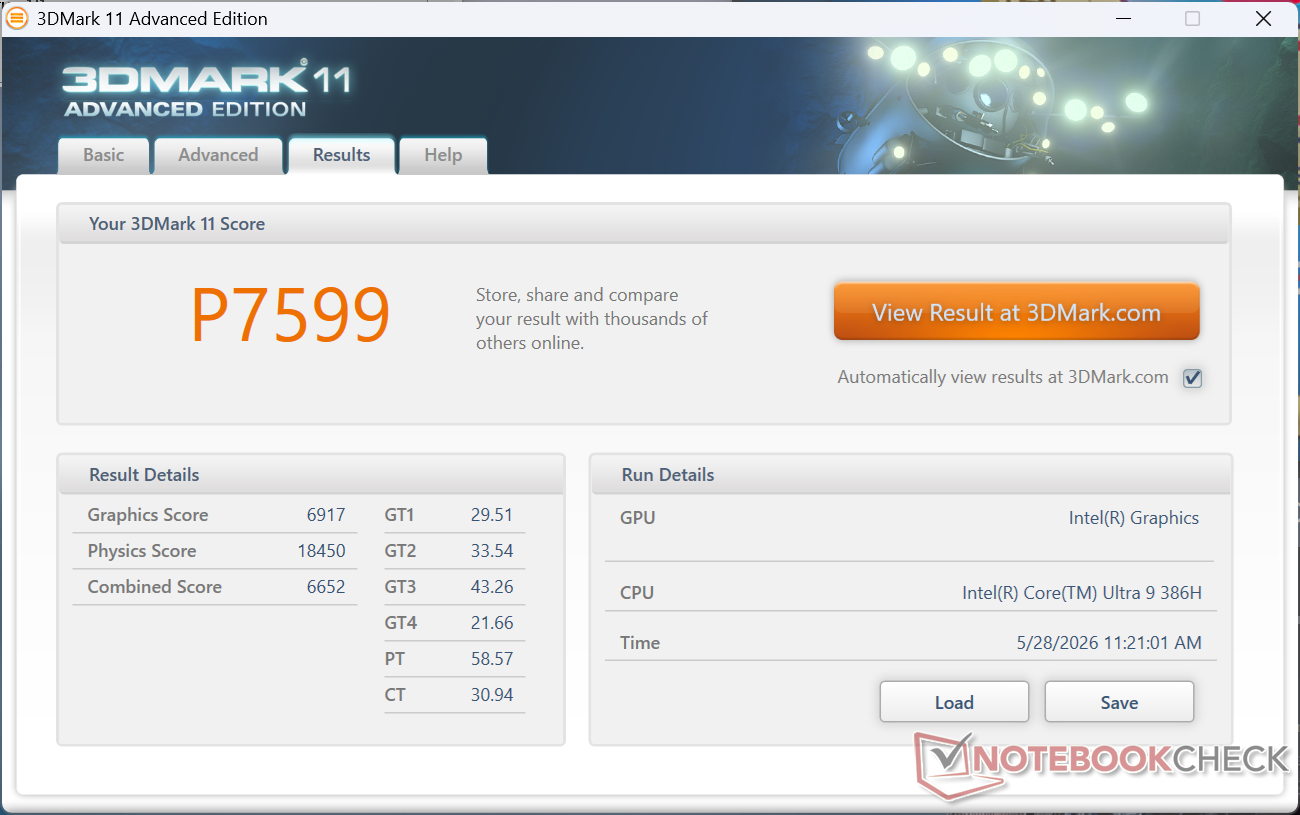
| 3DMark 11 Performance | 7599 points | |
| 3DMark Cloud Gate Standard Score | 30367 points | |
| 3DMark Fire Strike Score | 6190 points | |
| 3DMark Time Spy Score | 3237 points | |
Aide | ||
* ... Moindre est la valeur, meilleures sont les performances
| Performance rating - Percent | |
| Asus NUC 15 Pro+ | |
| GMK EVO-T1 -1! | |
| MSI Cubi NUC AI+ 2MG | |
| MSI Cubi NUC AI+ 3MG | |
| GMK NucBox K16 | |
| MSI Cubi NUC 1M -2! | |
| Geekom A5 Pro -2! | |
| Cyberpunk 2077 - 1920x1080 Ultra Preset (FSR off) | |
| Asus NUC 15 Pro+ | |
| GMK EVO-T1 | |
| MSI Cubi NUC AI+ 3MG | |
| MSI Cubi NUC AI+ 2MG | |
| GMK NucBox K16 | |
| MSI Cubi NUC 1M | |
| Geekom A5 Pro | |
| Baldur's Gate 3 - 1920x1080 Ultra Preset AA:T | |
| MSI Cubi NUC AI+ 2MG | |
| Asus NUC 15 Pro+ | |
| GMK EVO-T1 | |
| MSI Cubi NUC AI+ 3MG | |
| GMK NucBox K16 | |
| GTA V - 1920x1080 Highest AA:4xMSAA + FX AF:16x | |
| MSI Cubi NUC AI+ 2MG | |
| MSI Cubi NUC AI+ 3MG | |
| Asus NUC 15 Pro+ | |
| GMK EVO-T1 | |
| GMK NucBox K16 | |
| MSI Cubi NUC 1M | |
| Geekom A5 Pro | |
| Final Fantasy XV Benchmark - 1920x1080 High Quality | |
| GMK EVO-T1 | |
| Asus NUC 15 Pro+ | |
| MSI Cubi NUC AI+ 2MG | |
| MSI Cubi NUC AI+ 3MG | |
| MSI Cubi NUC 1M | |
| GMK NucBox K16 | |
| Geekom A5 Pro | |
| Strange Brigade - 1920x1080 ultra AA:ultra AF:16 | |
| MSI Cubi NUC AI+ 2MG | |
| Asus NUC 15 Pro+ | |
| MSI Cubi NUC AI+ 3MG | |
| GMK NucBox K16 | |
| MSI Cubi NUC 1M | |
| Dota 2 Reborn - 1920x1080 ultra (3/3) best looking | |
| Asus NUC 15 Pro+ | |
| GMK EVO-T1 | |
| MSI Cubi NUC AI+ 3MG | |
| MSI Cubi NUC AI+ 2MG | |
| MSI Cubi NUC 1M | |
| GMK NucBox K16 | |
| Geekom A5 Pro | |
| X-Plane 11.11 - 1920x1080 high (fps_test=3) | |
| Asus NUC 15 Pro+ | |
| GMK EVO-T1 | |
| MSI Cubi NUC AI+ 2MG | |
| GMK NucBox K16 | |
| MSI Cubi NUC AI+ 3MG | |
| Geekom A5 Pro | |
| F1 24 | |
| 1920x1080 Low Preset AA:T AF:16x | |
| GMK EVO-T1 | |
| Asus NUC 15 Pro+ | |
| MSI Cubi NUC AI+ 2MG | |
| MSI Cubi NUC AI+ 3MG | |
| Moyenne Intel Graphics 4 Xe3 Panther Lake iGPU (55.6 - 67.2, n=5) | |
| GMK NucBox K16 | |
| Geekom A5 Pro | |
| 1920x1080 Medium Preset AA:T AF:16x | |
| GMK EVO-T1 | |
| Asus NUC 15 Pro+ | |
| MSI Cubi NUC AI+ 3MG | |
| Moyenne Intel Graphics 4 Xe3 Panther Lake iGPU (52.7 - 64.3, n=5) | |
| GMK NucBox K16 | |
| Geekom A5 Pro | |
| 1920x1080 High Preset AA:T AF:16x | |
| GMK EVO-T1 | |
| Asus NUC 15 Pro+ | |
| MSI Cubi NUC AI+ 2MG | |
| MSI Cubi NUC AI+ 3MG | |
| Moyenne Intel Graphics 4 Xe3 Panther Lake iGPU (40.8 - 46.5, n=5) | |
| GMK NucBox K16 | |
| Geekom A5 Pro | |
| 1920x1080 Ultra High Preset AA:T AF:16x | |
| GMK EVO-T1 | |
| Asus NUC 15 Pro+ | |
| MSI Cubi NUC AI+ 2MG | |
| MSI Cubi NUC AI+ 3MG | |
| Moyenne Intel Graphics 4 Xe3 Panther Lake iGPU (13.2 - 14.8, n=5) | |
| GMK NucBox K16 | |
Cyberpunk 2077 ultra FPS Chart
| Bas | Moyen | Élevé | Ultra | |
|---|---|---|---|---|
| GTA V (2015) | 157.9 | 149.5 | 51.1 | 20.4 |
| Dota 2 Reborn (2015) | 104.1 | 80.3 | 81.2 | 79.9 |
| Final Fantasy XV Benchmark (2018) | 64.3 | 34.6 | 25.1 | |
| X-Plane 11.11 (2018) | 41.7 | 33.2 | 28.6 | |
| Strange Brigade (2018) | 172.6 | 68 | 56.9 | 48.5 |
| Baldur's Gate 3 (2023) | 31.6 | 26.3 | 23.1 | 22.8 |
| Cyberpunk 2077 (2023) | 37.1 | 28.4 | 24.5 | 21.1 |
| F1 24 (2024) | 66.9 | 61.5 | 45.8 | 14.2 |
Émissions
Bruit du système
Le ventilateur interne est toujours actif, quelle que soit la charge à l'écran, comme nous l'avons observé sur les anciens modèles Cubi. Il est suffisamment silencieux, sans problème majeur d'étranglement, pour passer inaperçu dans un bureau ou un magasin, mais il peut monter jusqu'à 40 dB(A) lors de l'exécution de charges plus exigeantes pendant des périodes prolongées, pour être aussi bruyant que certains ordinateurs portables de jeu.
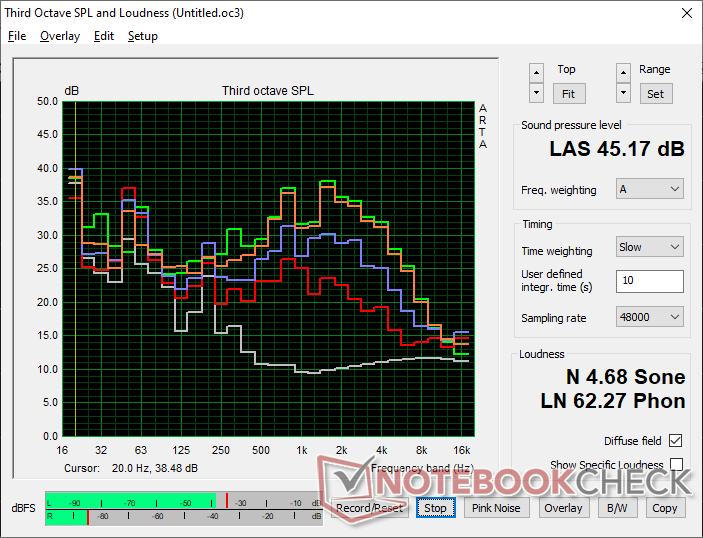
Degré de la nuisance sonore
| Au repos |
| 28 / 33.2 / 33.5 dB(A) |
| Fortement sollicité |
| 39.1 / 45.2 dB(A) |
 | ||
30 dB silencieux 40 dB(A) audible 50 dB(A) bruyant |
||
min: | ||
| MSI Cubi NUC AI+ 3MG Ultra 9 386H, Intel Graphics 4 Xe3 PTL | GMK NucBox K16 R7 7735HS, Radeon 680M | GMK EVO-T1 Ultra 9 285H, Arc 140T | Geekom A5 Pro R5 7530U, Vega 7 | Asus NUC 15 Pro+ Ultra 9 285H, Arc 140T | MSI Cubi NUC AI+ 2MG Core Ultra 7 258V, Arc 140V | MSI Cubi NUC 1M Core 7 150U, Iris Xe G7 96EUs | |
|---|---|---|---|---|---|---|---|
| Noise | -6% | -20% | 15% | -3% | -2% | 6% | |
| arrêt / environnement * (dB) | 23.6 | 23.6 -0% | 24.7 -5% | 25 -6% | 25.3 -7% | 24.8 -5% | 23.5 -0% |
| Idle Minimum * (dB) | 28 | 30.9 -10% | 38.7 -38% | 26.6 5% | 25.4 9% | 28 -0% | 29.9 -7% |
| Idle Average * (dB) | 33.2 | 31.6 5% | 38.8 -17% | 26.6 20% | 25.5 23% | 36.1 -9% | 29.9 10% |
| Idle Maximum * (dB) | 33.5 | 31.6 6% | 38.9 -16% | 26.7 20% | 37.3 -11% | 36.1 -8% | 32 4% |
| Load Average * (dB) | 39.1 | 45.3 -16% | 51.6 -32% | 33.5 14% | 44.4 -14% | 38.9 1% | 33.5 14% |
| Cyberpunk 2077 ultra * (dB) | 44.4 | 49.2 -11% | 52 -17% | 31.2 30% | 46.2 -4% | 37 17% | 39.1 12% |
| Load Maximum * (dB) | 45.2 | 51.7 -14% | 51.6 -14% | 33.8 25% | 52.7 -17% | 49.2 -9% | 40.5 10% |
| Witcher 3 ultra * (dB) | 38.7 | 31.2 | 47.7 |
* ... Moindre est la valeur, meilleures sont les performances
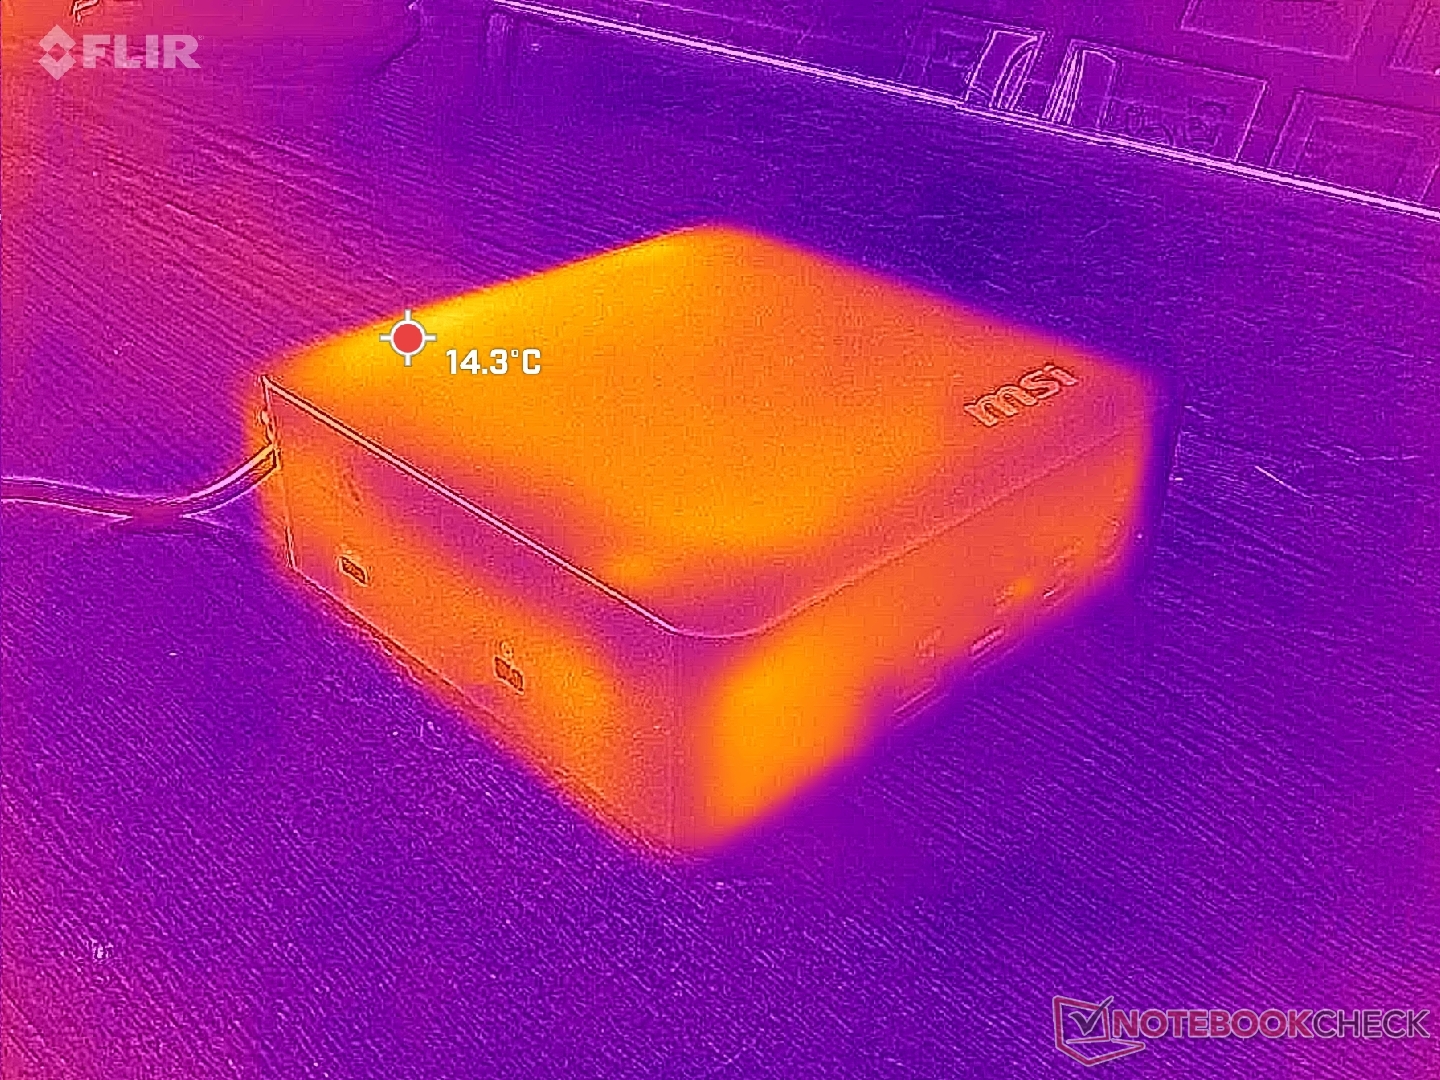
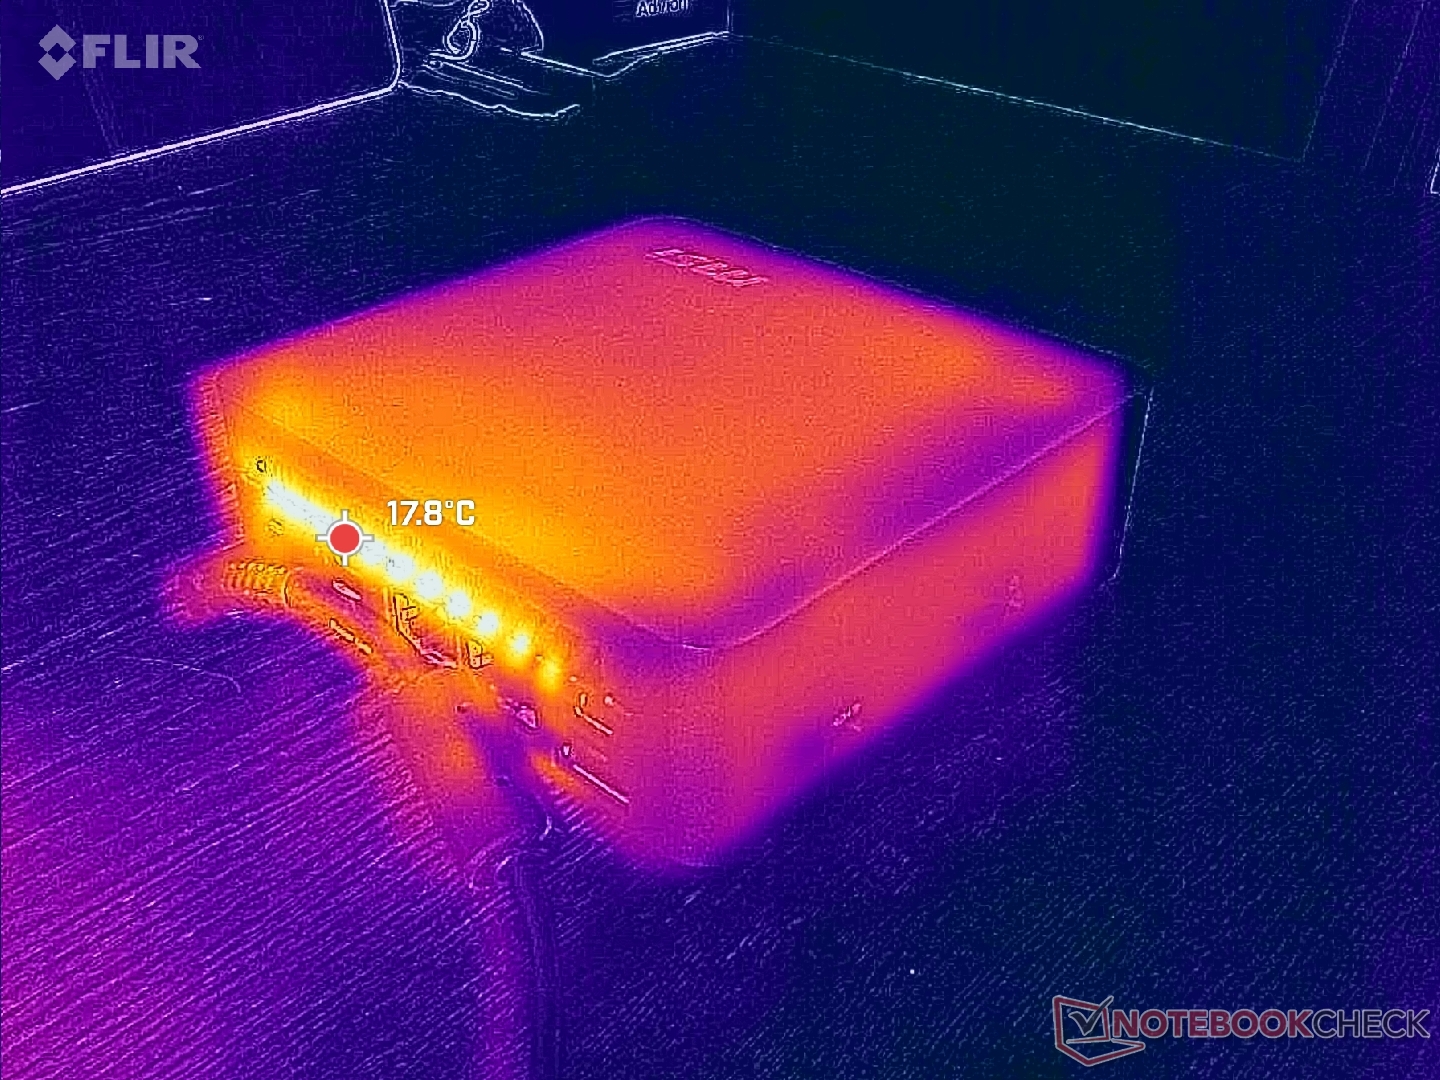
Température
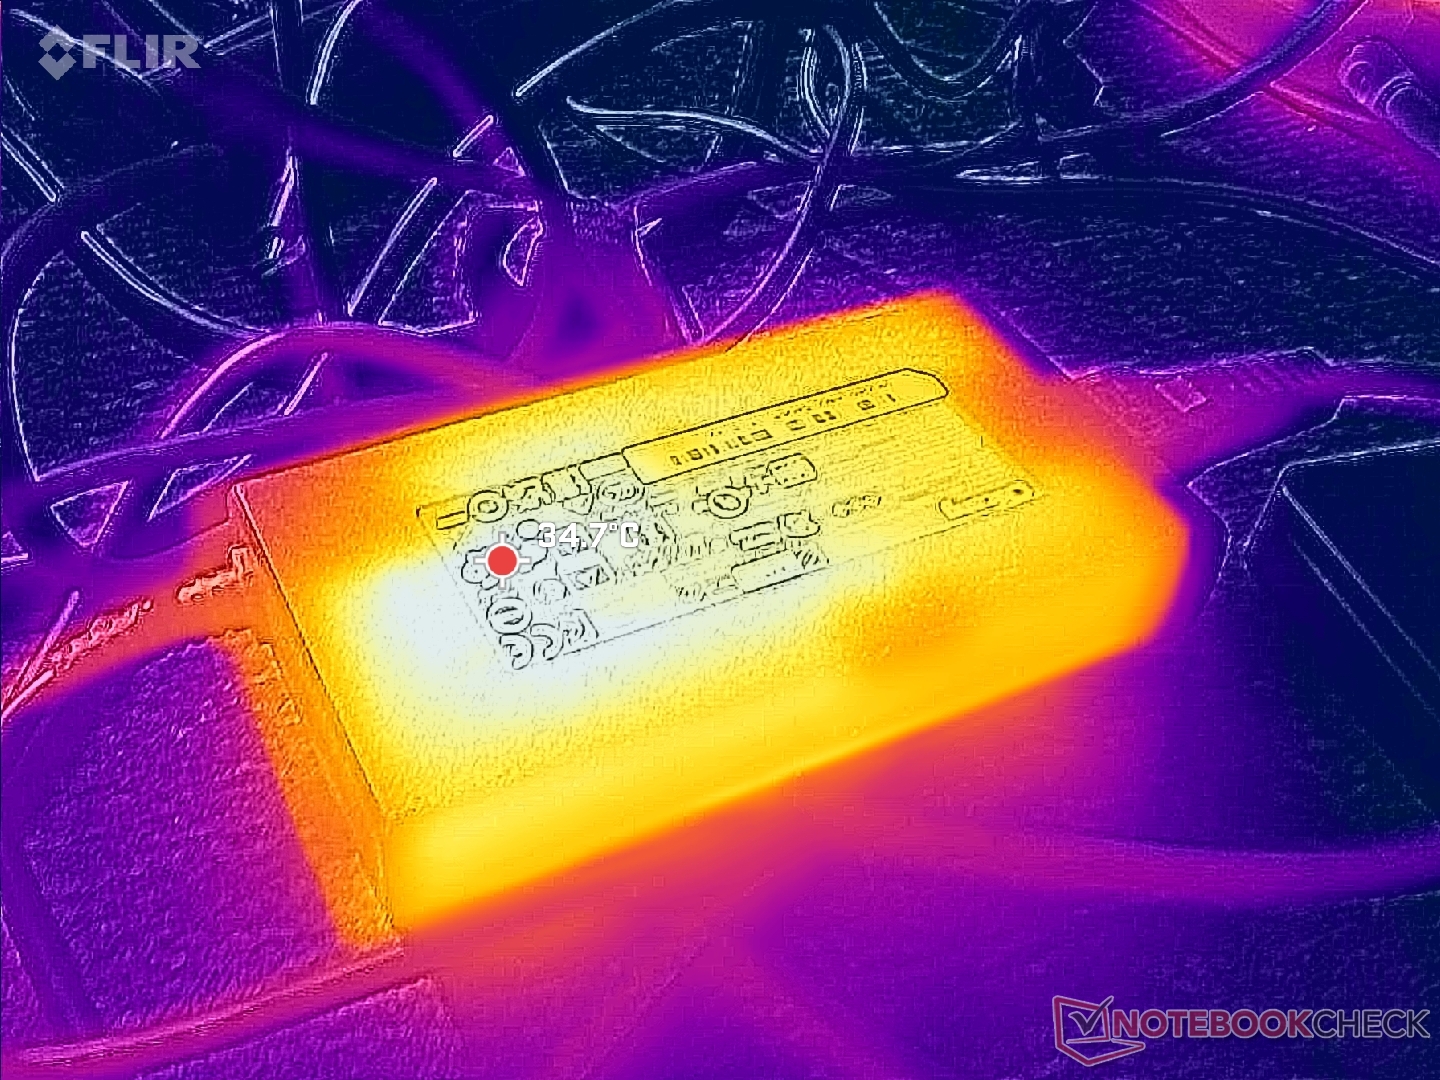
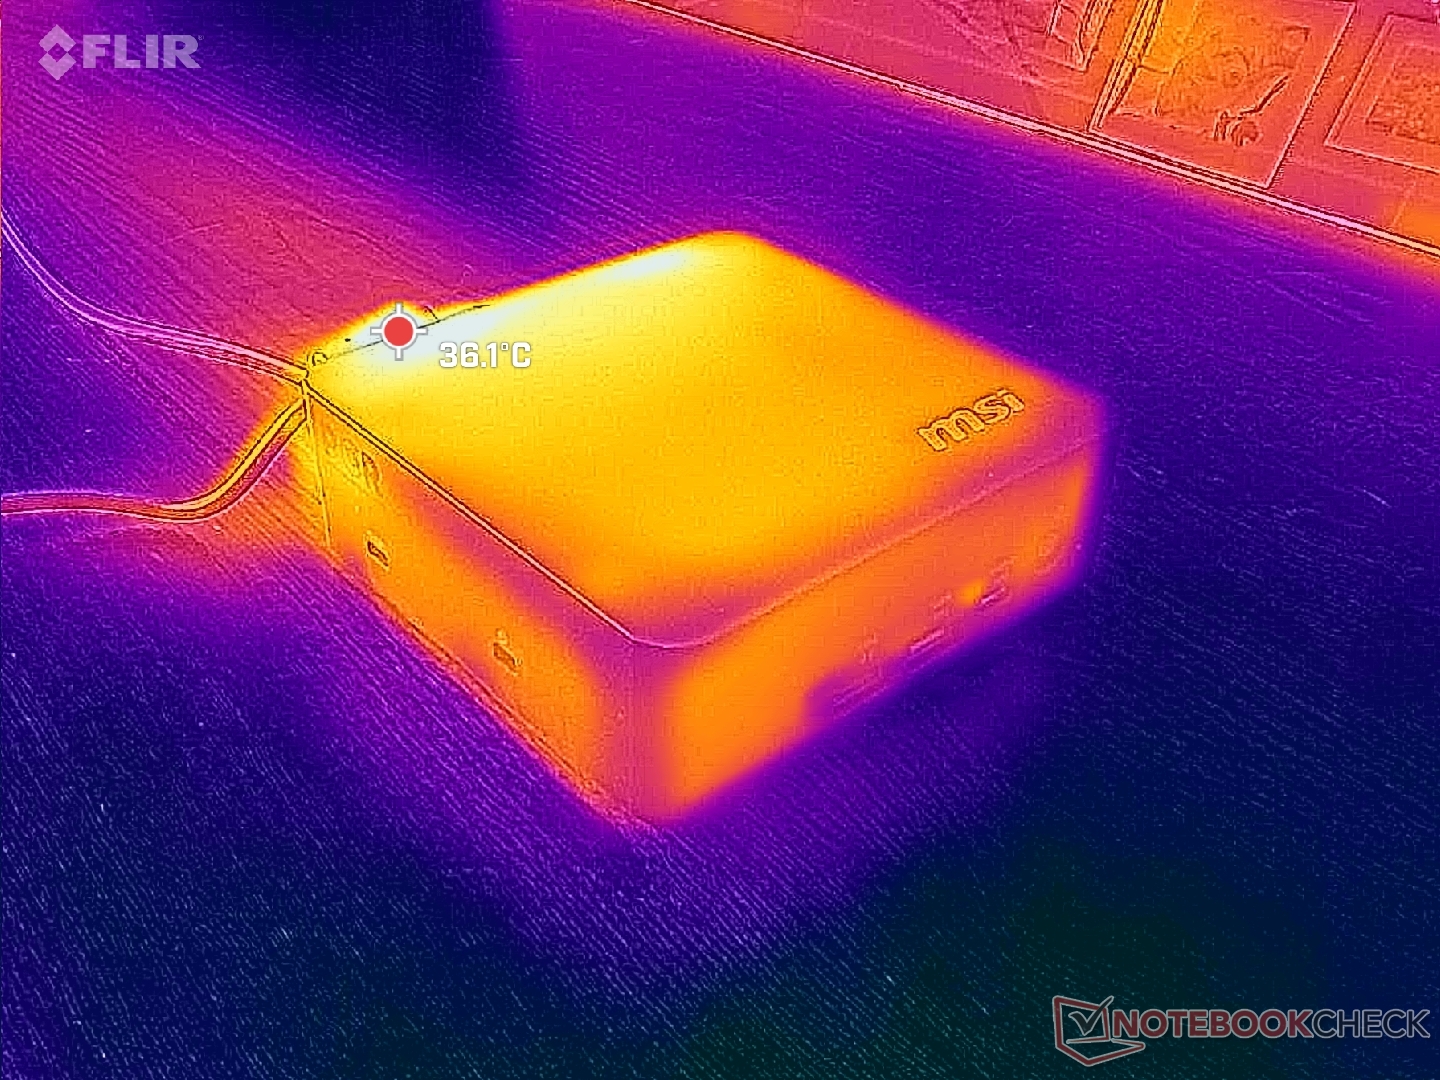
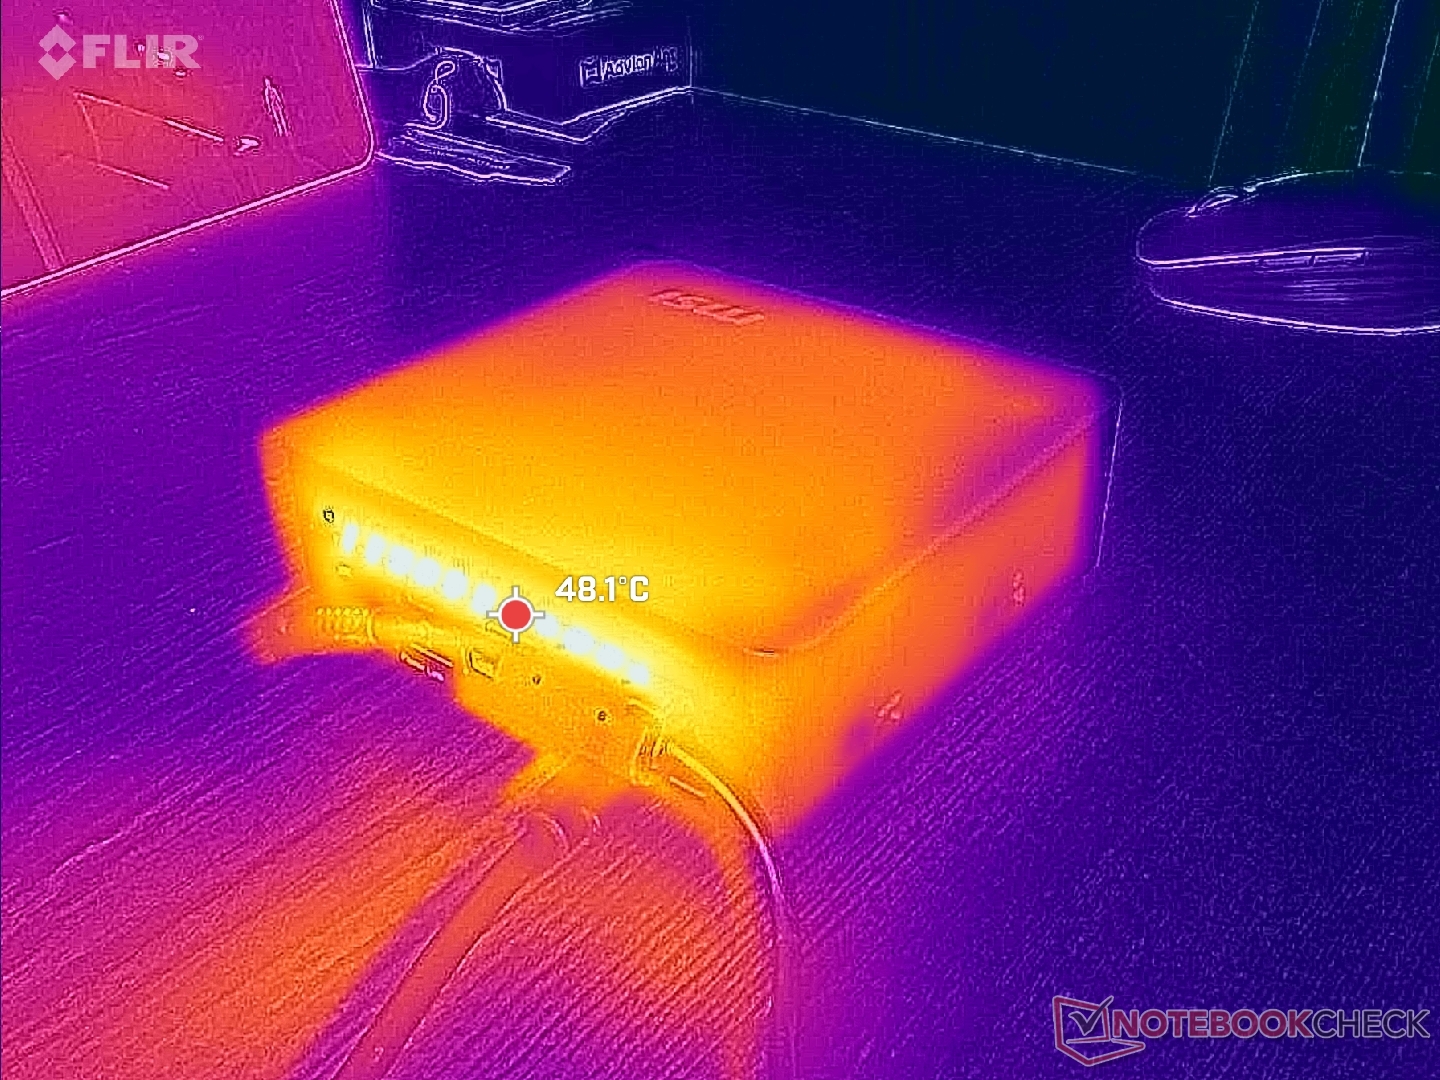
Les températures de surface sont relativement basses, en partie grâce au châssis en plastique et à l'efficacité du processeur. L'arrière devient légèrement plus chaud que l'avant, comme on peut s'y attendre.
Les grilles d'aération sont réduites au minimum, contrairement à d'autres modèles comme la GMK EVO series.
(+) La température maximale du côté supérieur est de 36.2 °C / 97 F, par rapport à la moyenne de 35.4 °C / 96 F, allant de 20.6 à 69.5 °C pour la classe Mini PC.
(+) Le fond chauffe jusqu'à un maximum de 34.6 °C / 94 F, contre une moyenne de 36.1 °C / 97 F
(+) En utilisation inactive, la température moyenne du côté supérieur est de 22.8 °C / 73 F, par rapport à la moyenne du dispositif de 32.1 °C / 90 F.
| MSI Cubi NUC AI+ 3MG Ultra 9 386H, Intel Graphics 4 Xe3 PTL | GMK NucBox K16 R7 7735HS, Radeon 680M | GMK EVO-T1 Ultra 9 285H, Arc 140T | Geekom A5 Pro R5 7530U, Vega 7 | Asus NUC 15 Pro+ Ultra 9 285H, Arc 140T | MSI Cubi NUC AI+ 2MG Core Ultra 7 258V, Arc 140V | |
|---|---|---|---|---|---|---|
| Heat | 8% | -26% | -8% | -25% | 3% | |
| Maximum Upper Side * (°C) | 36.2 | 28.4 22% | 36.4 -1% | 36.7 -1% | 42.2 -17% | 30.8 15% |
| Maximum Bottom * (°C) | 34.6 | 29.4 15% | 48.5 -40% | 40.5 -17% | 31.3 10% | 26.4 24% |
| Idle Upper Side * (°C) | 23.2 | 23.4 -1% | 29.6 -28% | 23.1 -0% | 34.9 -50% | 26.4 -14% |
| Idle Bottom * (°C) | 22.4 | 23.6 -5% | 30 -34% | 25.1 -12% | 32.2 -44% | 25.4 -13% |
* ... Moindre est la valeur, meilleures sont les performances
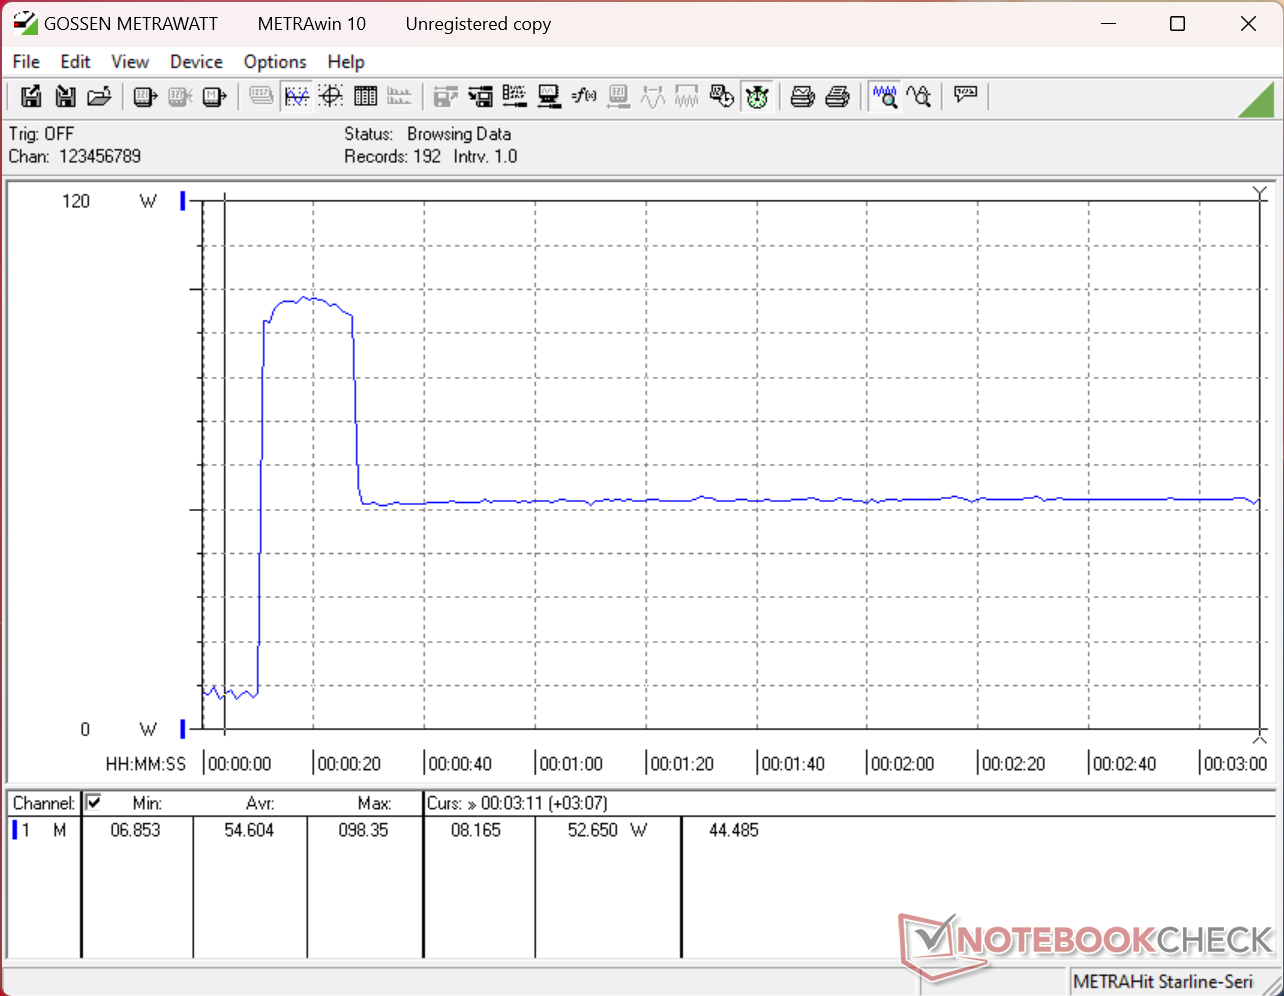
Test de stress
Le processeur atteignait 3 GHz, 61 W et 92 C lors de l'initialisation du stress Prime95. Cependant, au bout de 20 secondes, il redescend à seulement 2,1 GHz et 30 W afin de maintenir la température du cœur à 88 C. Le potentiel limité du Turbo Boost confirme nos observations en matière de consommation d'énergie et de CineBench R15.
La température du cœur se stabilise à 80°C lors de l'exécution de Cyberpunk 2077, alors qu'elle n'était que de 63°C sur le NUC 2MG de l'année dernière.
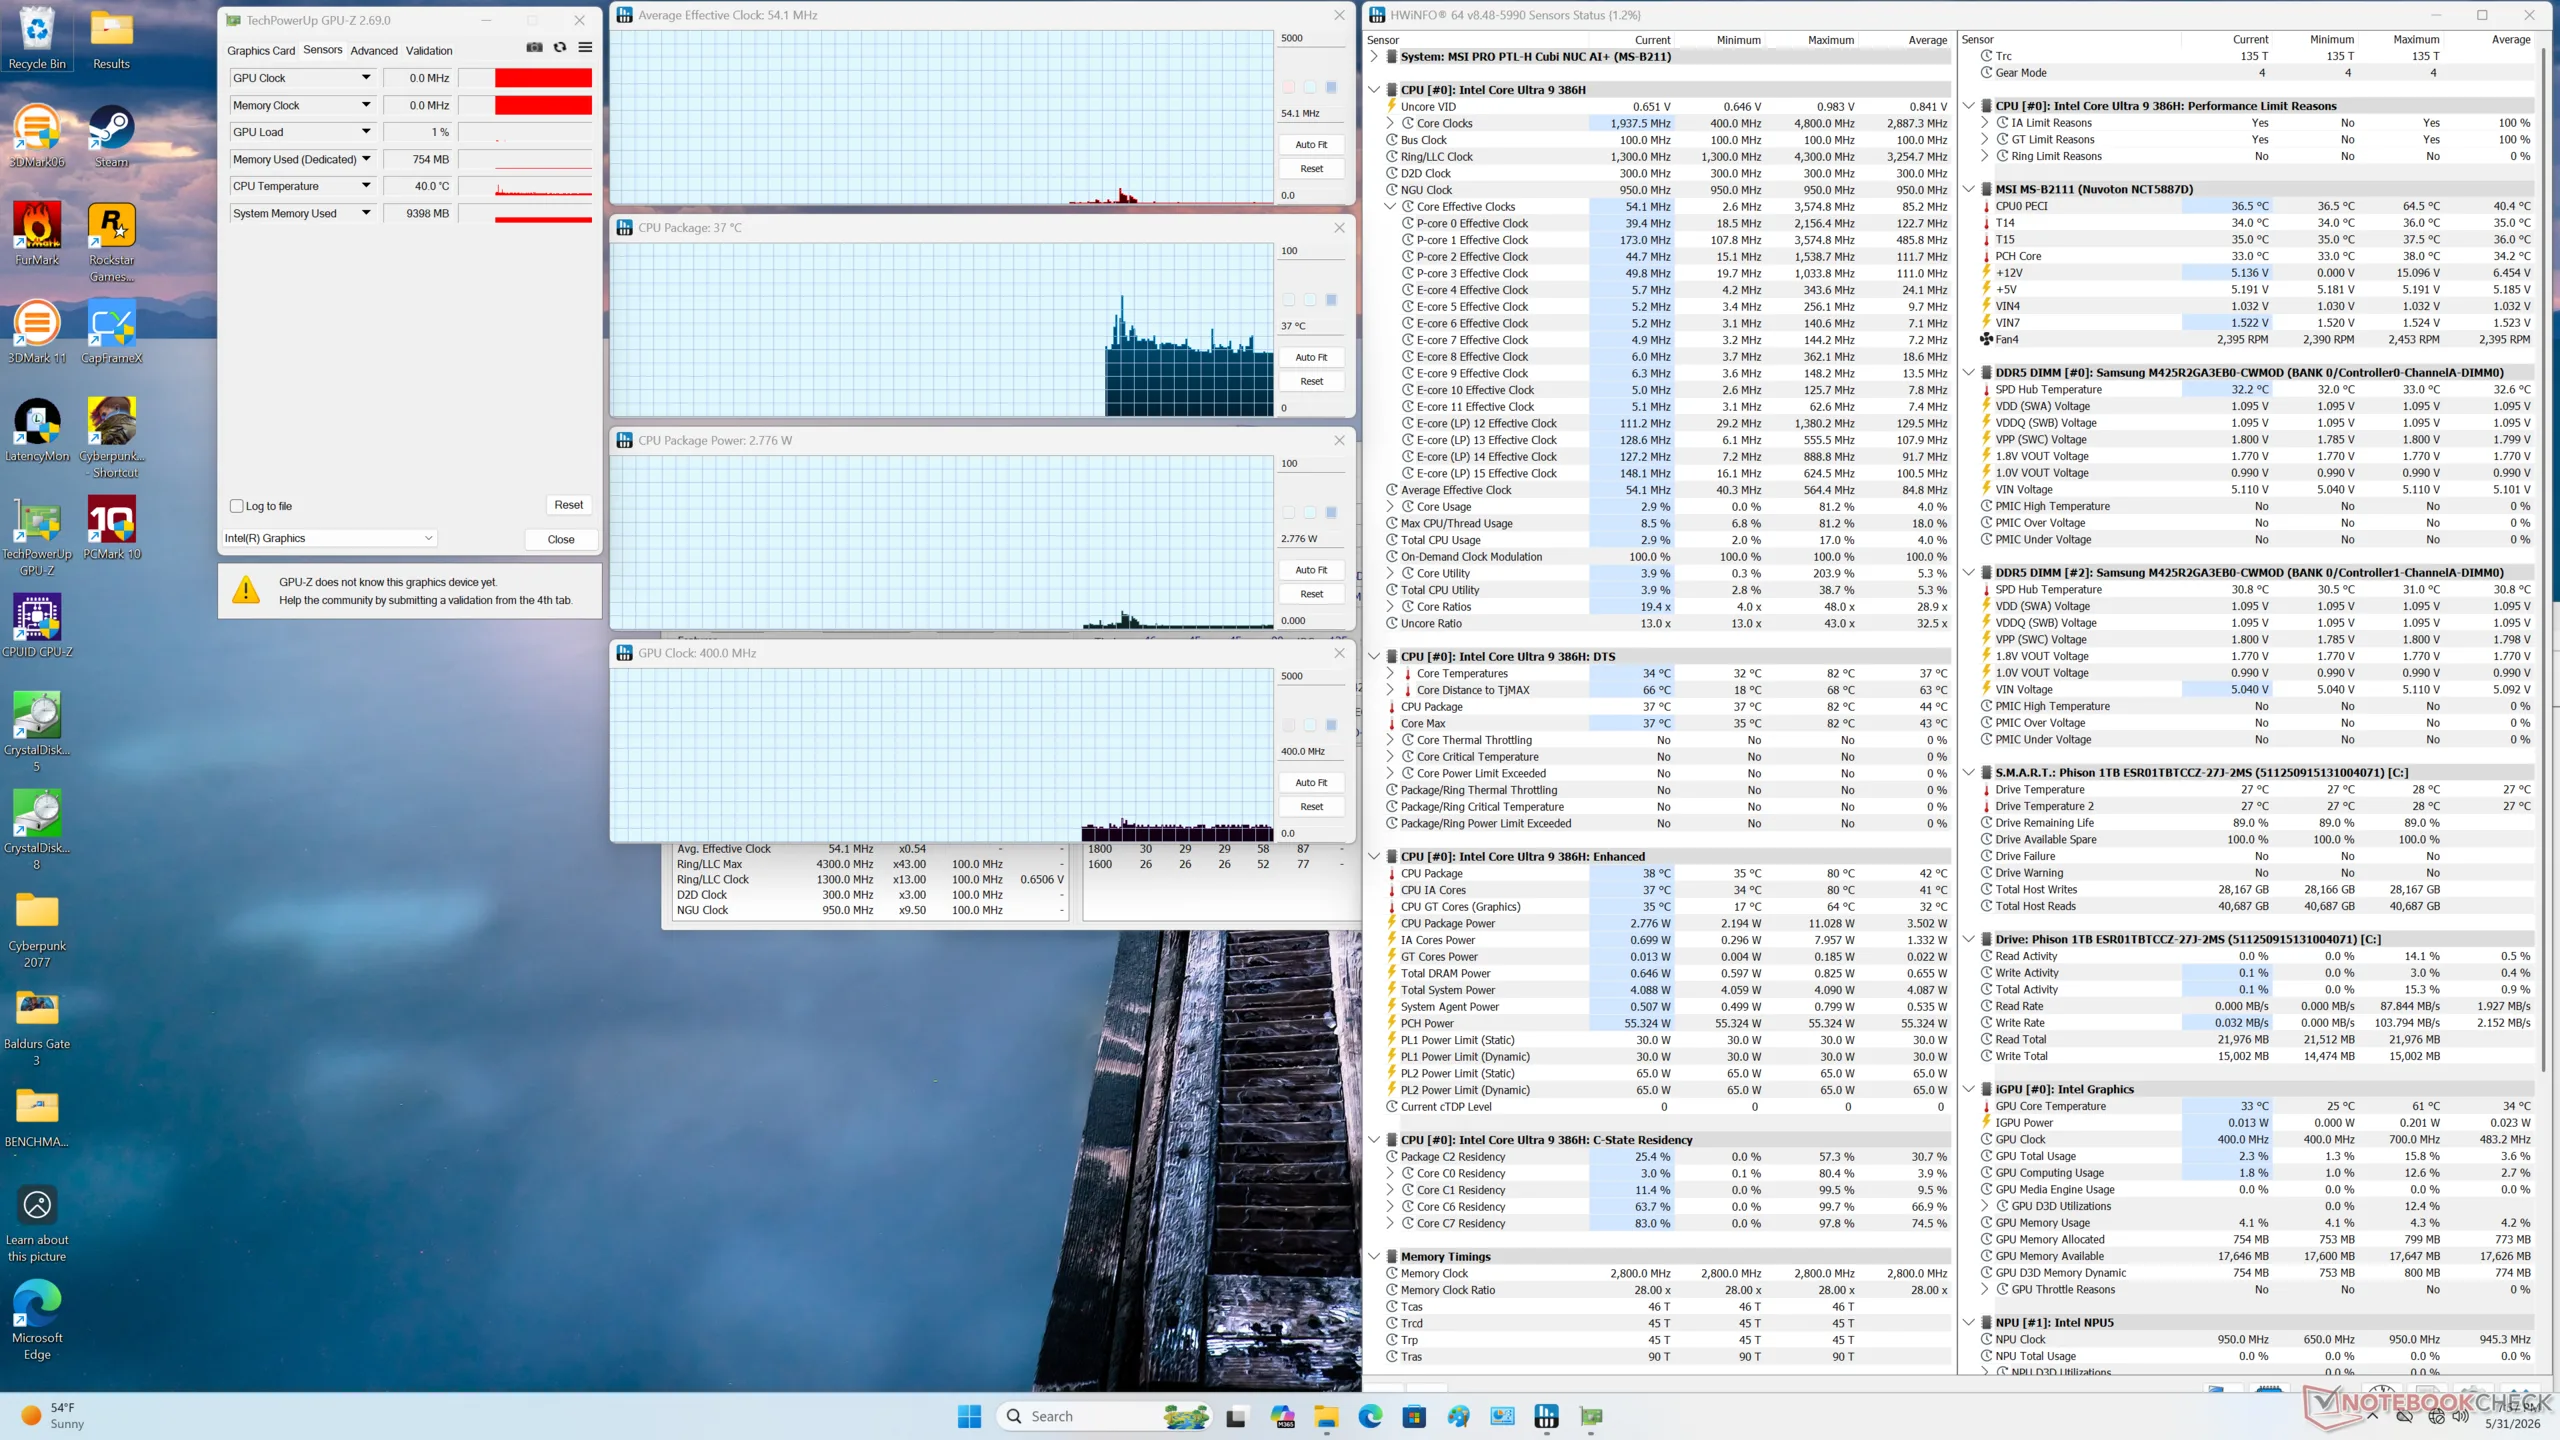
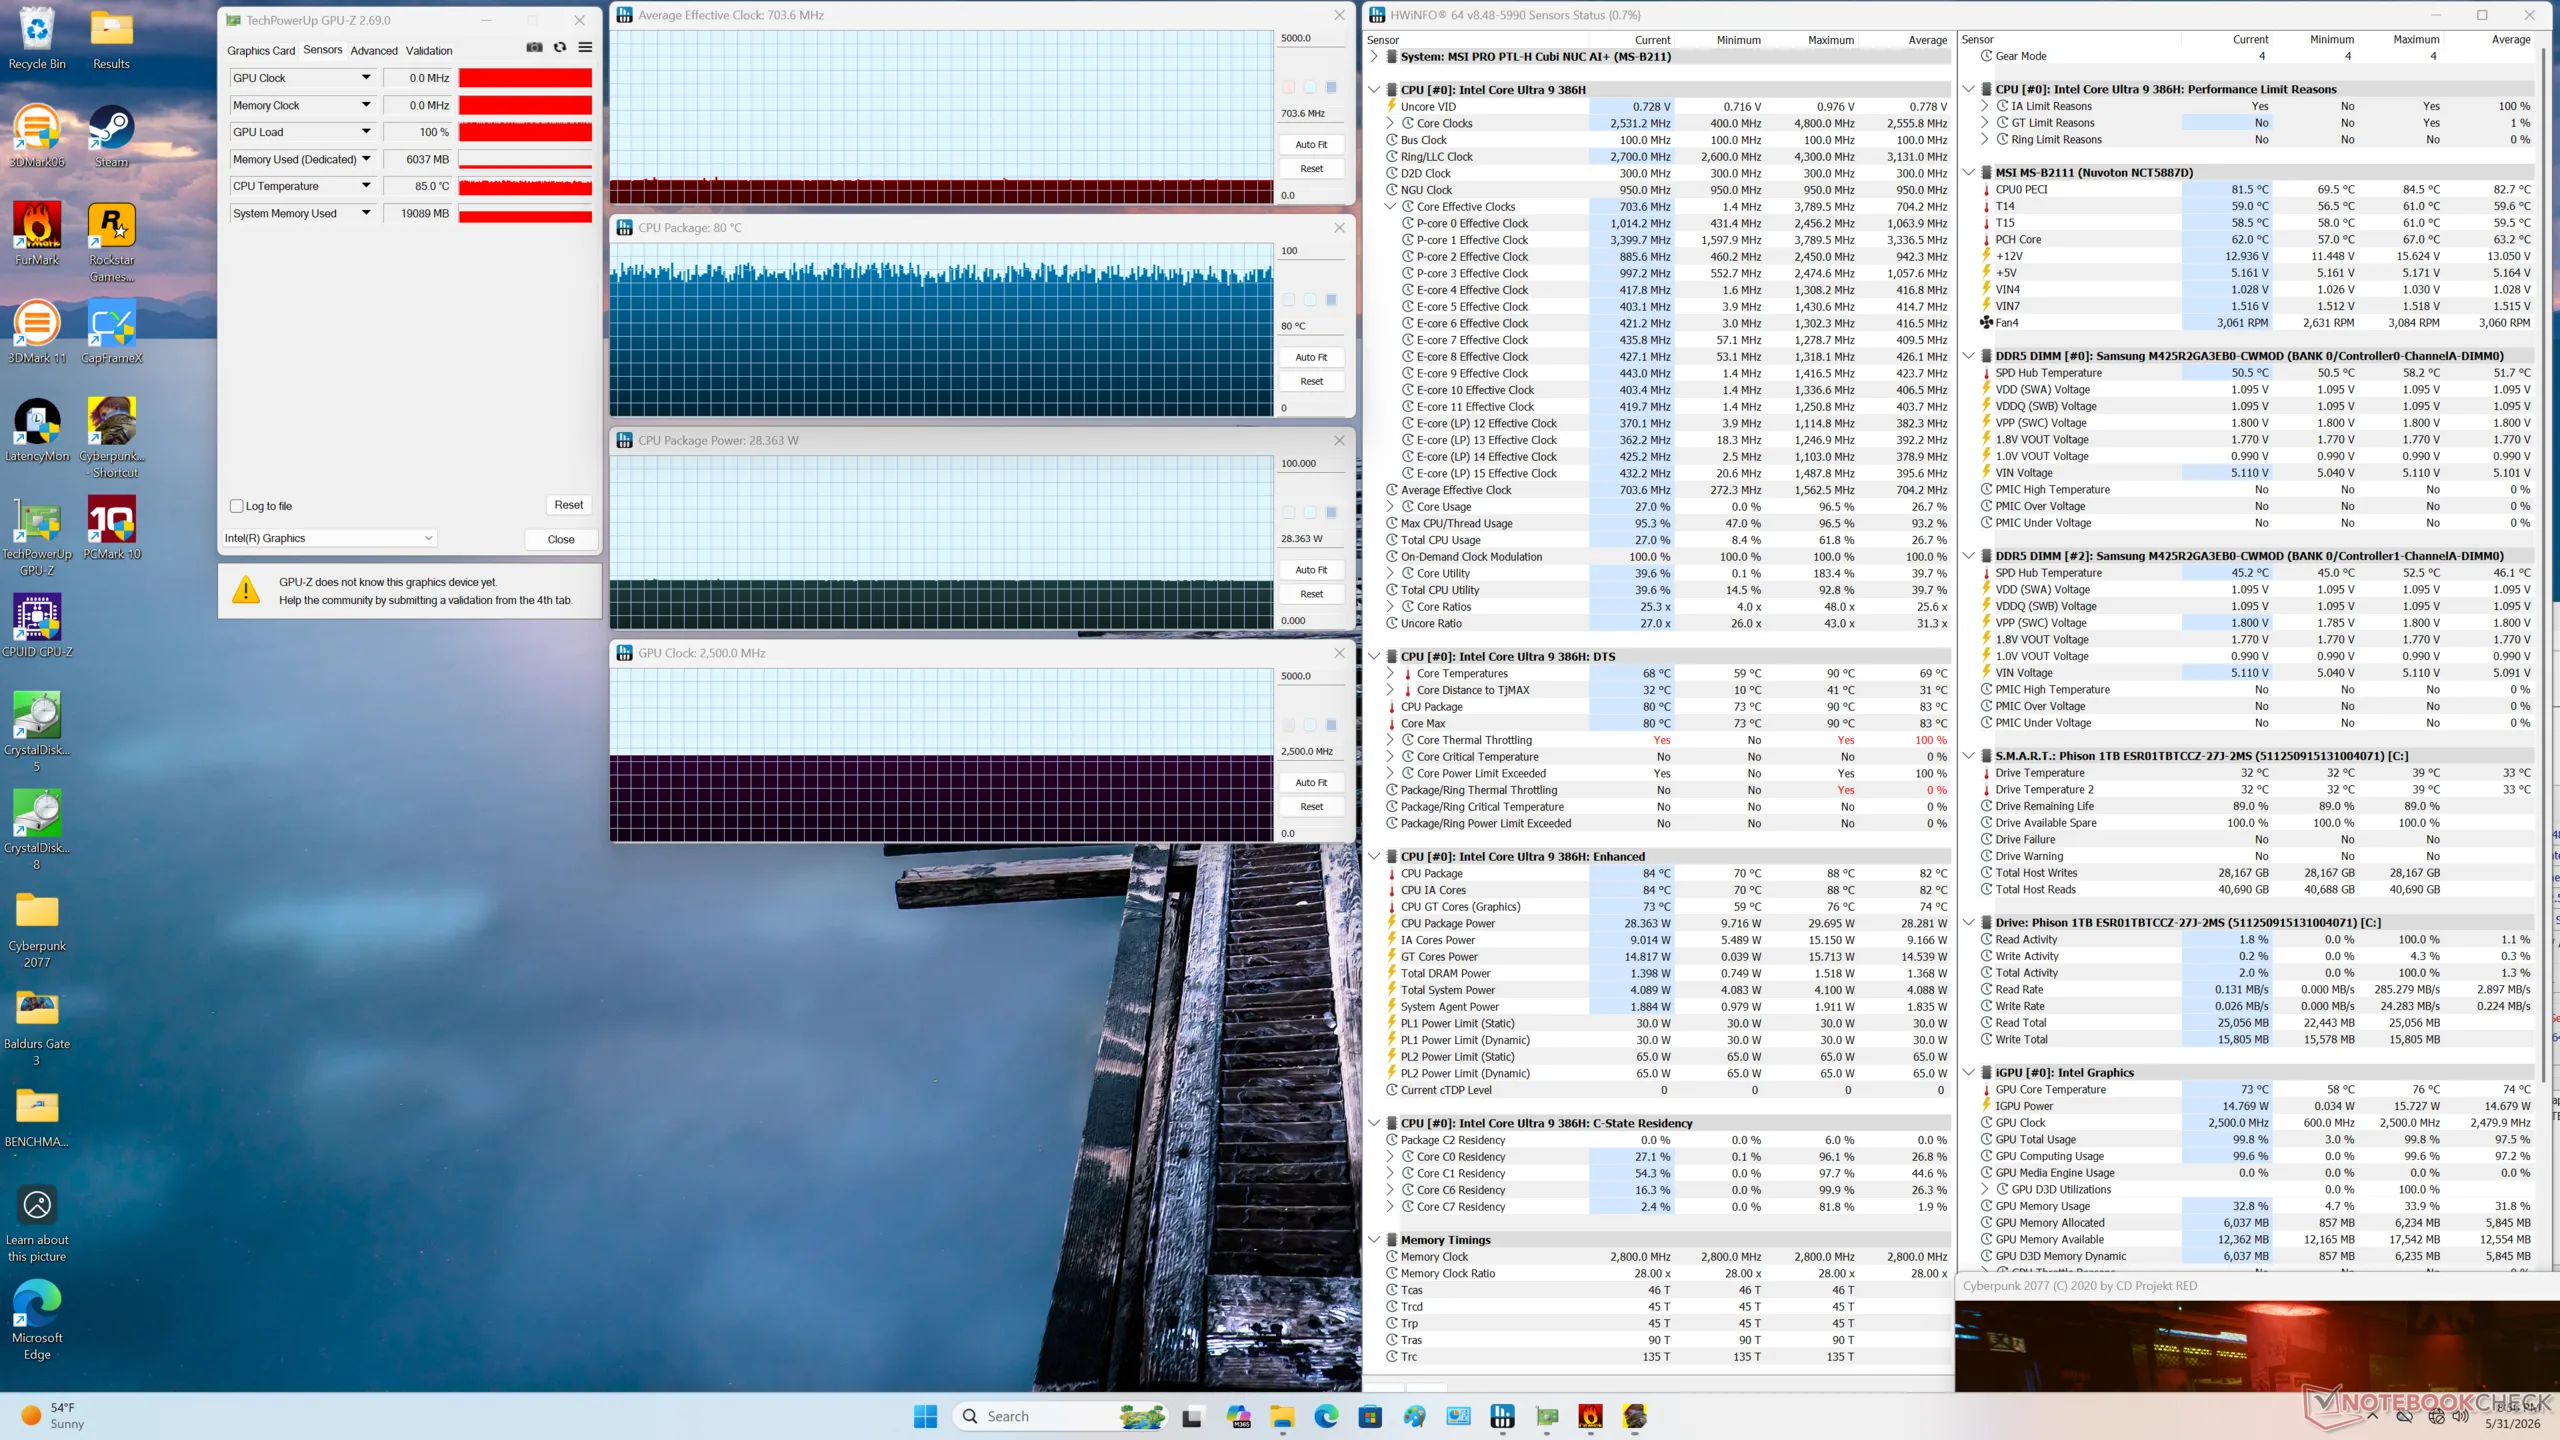
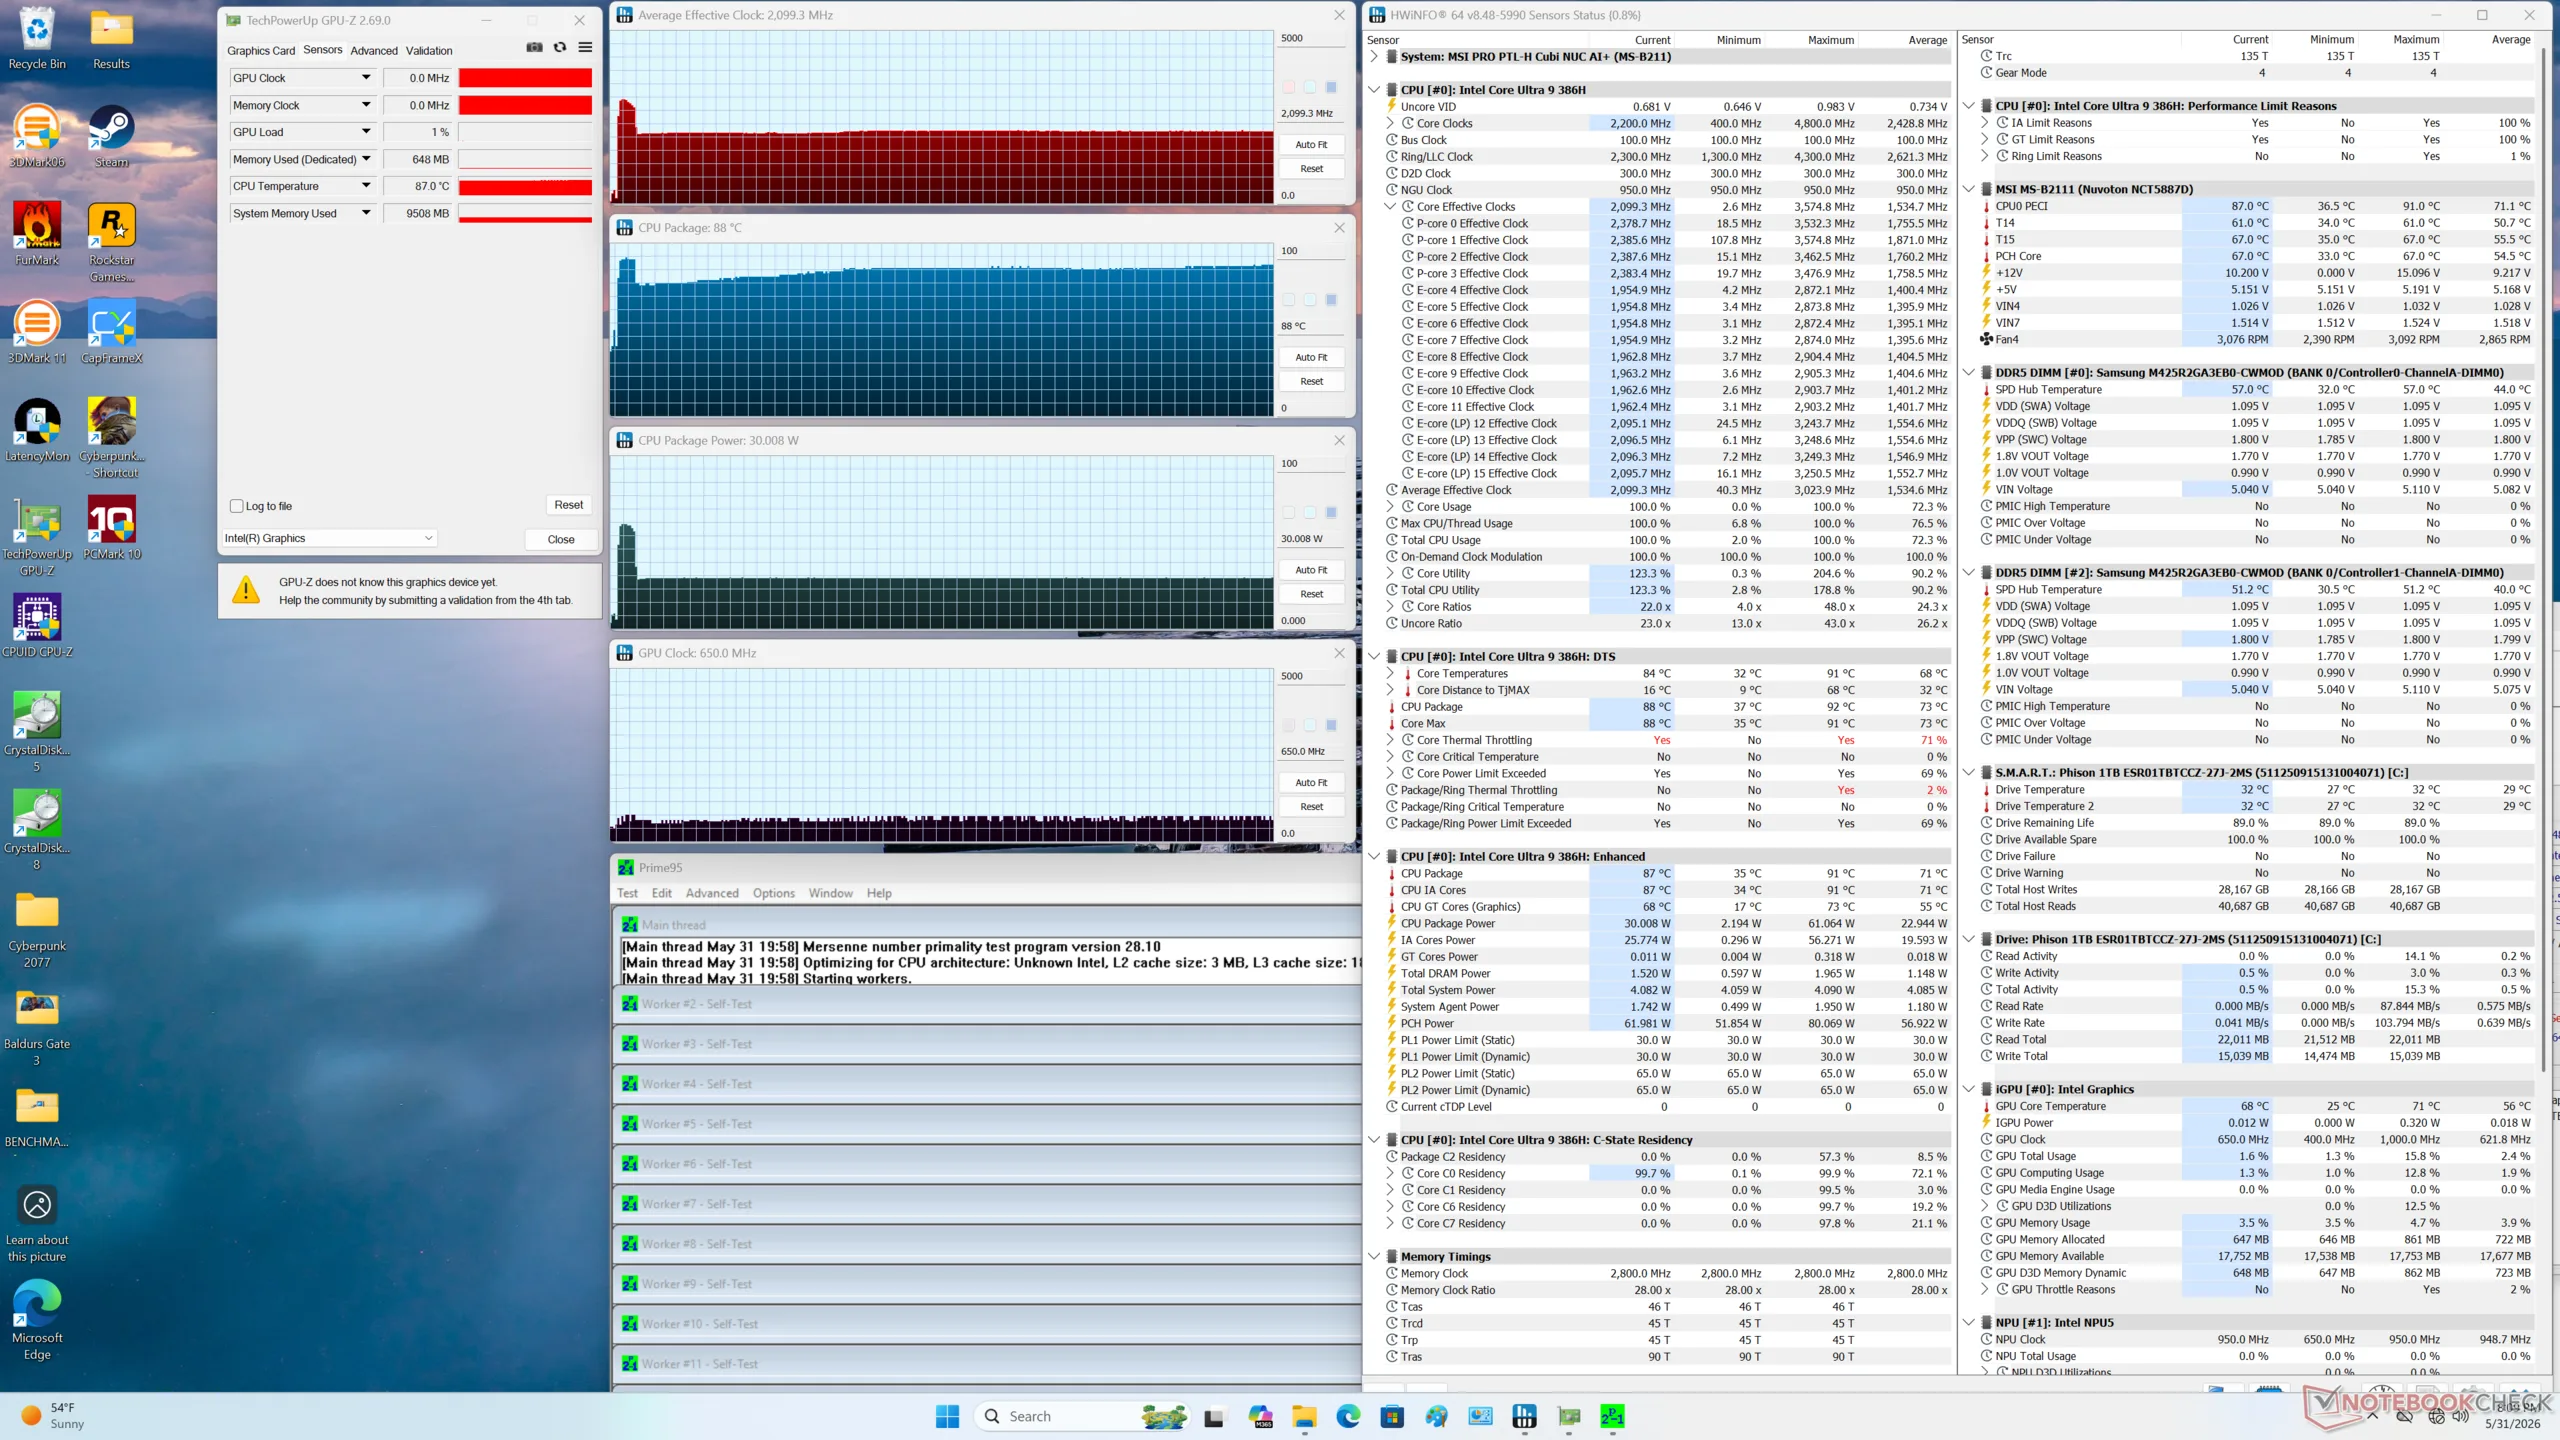
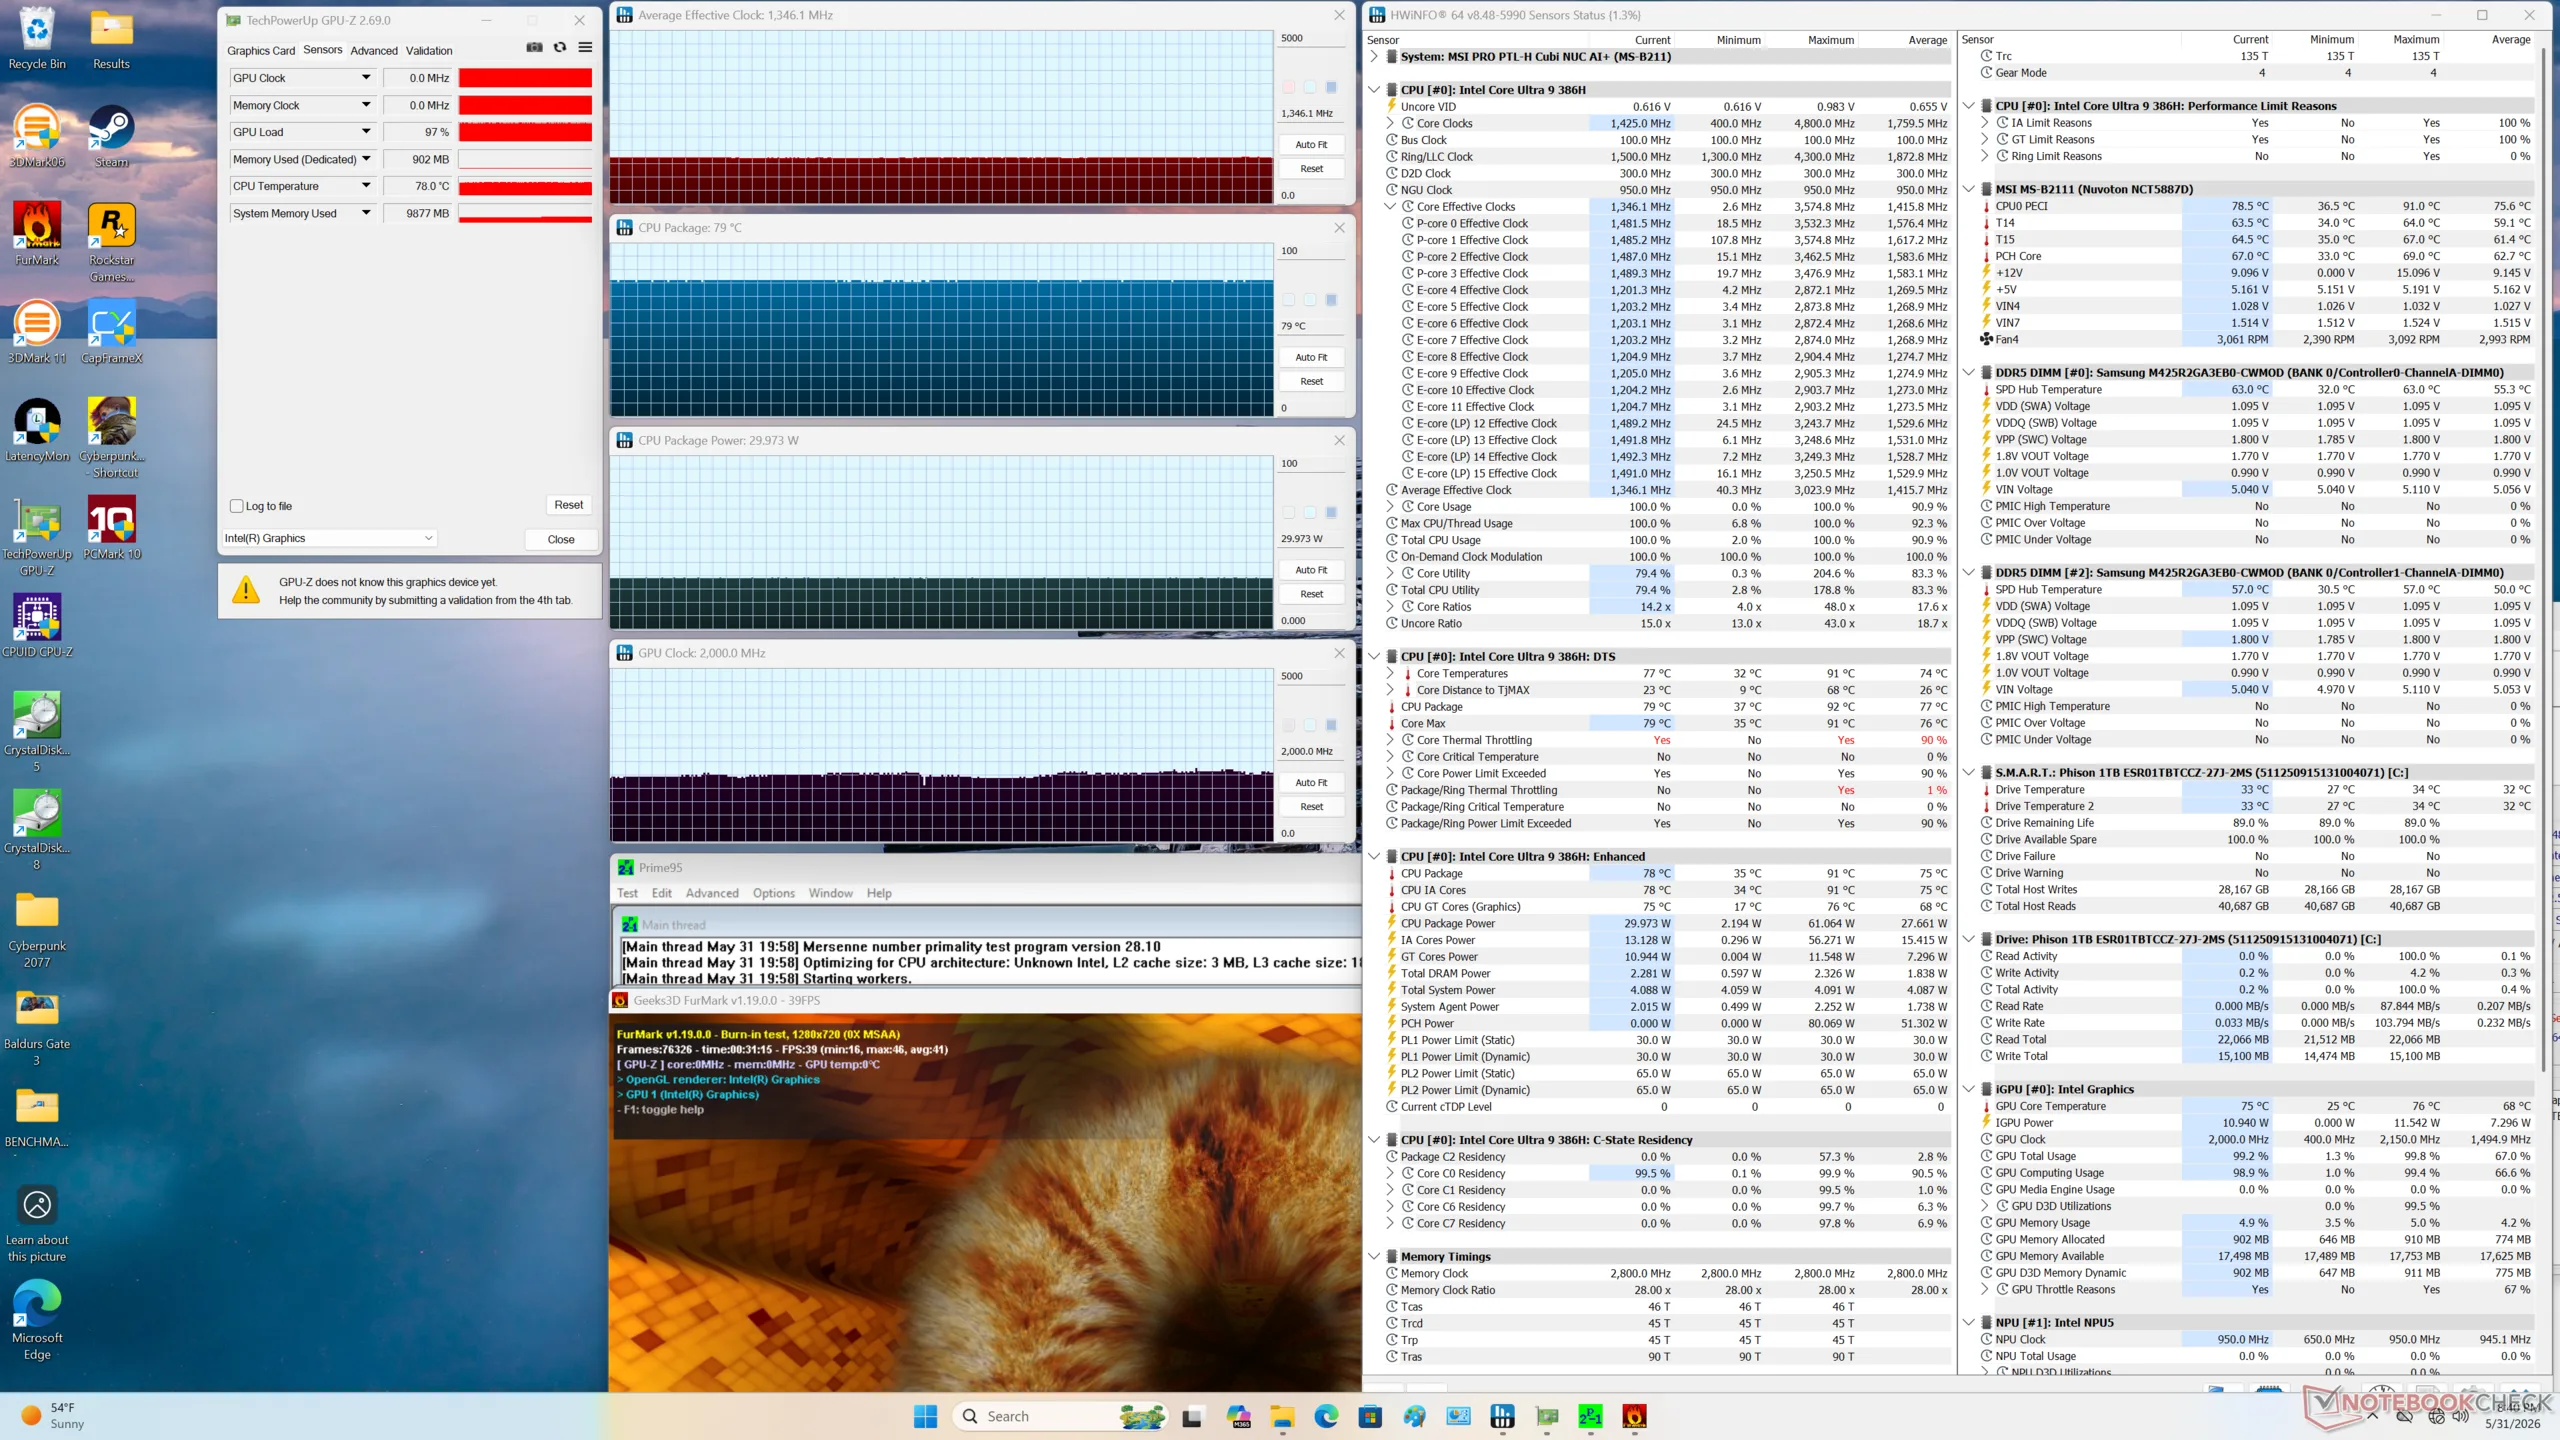
| Horloge moyenne du CPU (GHz) | Horloge du GPU (MHz) | Température moyenne du CPU (°C) | |
| Système au repos | -- | -- | 37 |
| Stress Prime95 | 2.1 | -- | 88 |
| Prime95 + FurMark Stress | 1.4 | 2000 | 79 |
| Cyberpunk 2077 Stress | 0.7 | 2500 | ~80 |
Gestion de l'énergie
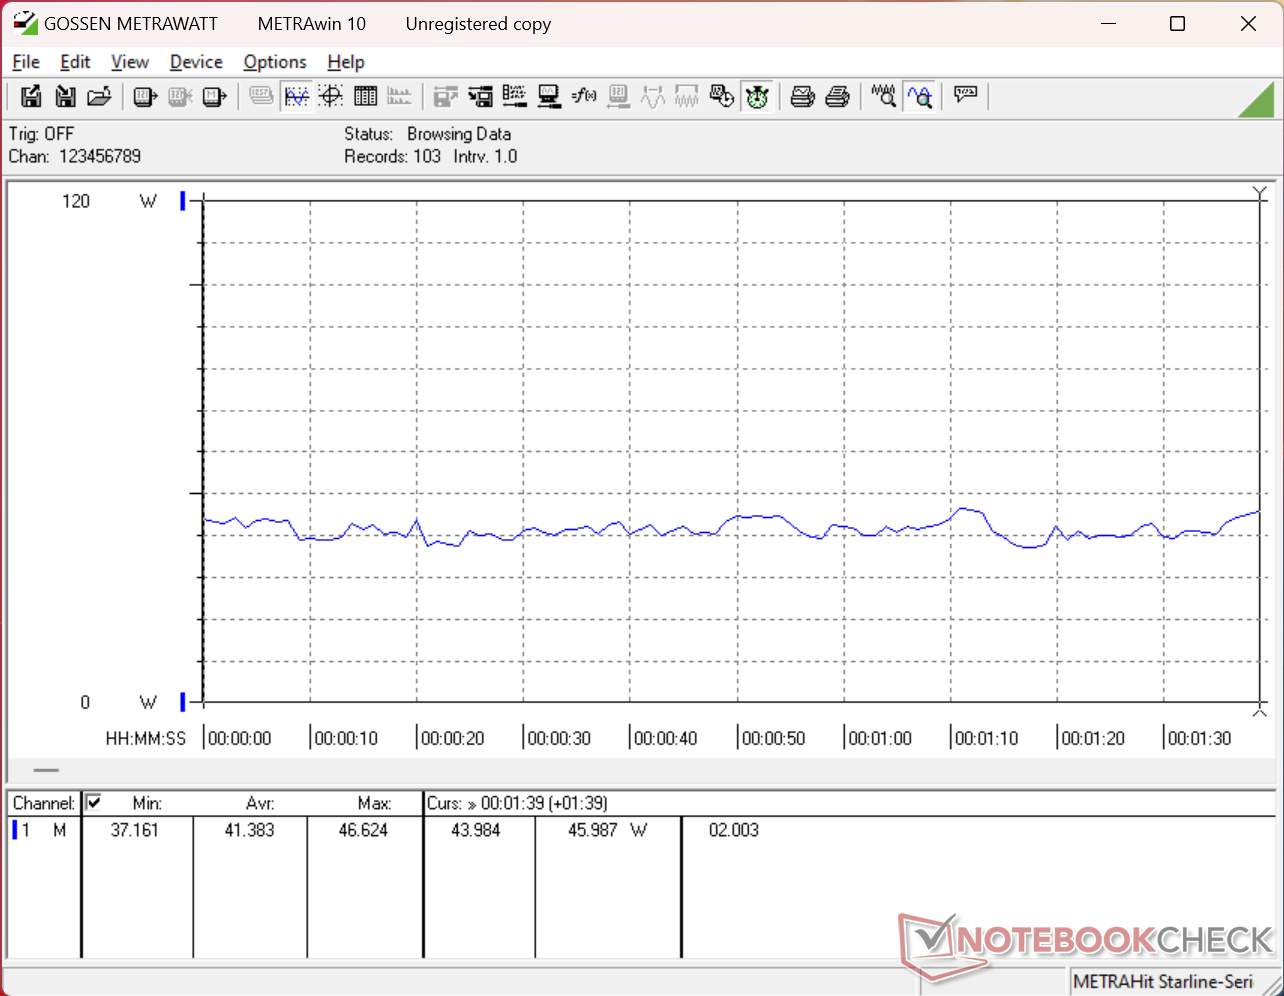
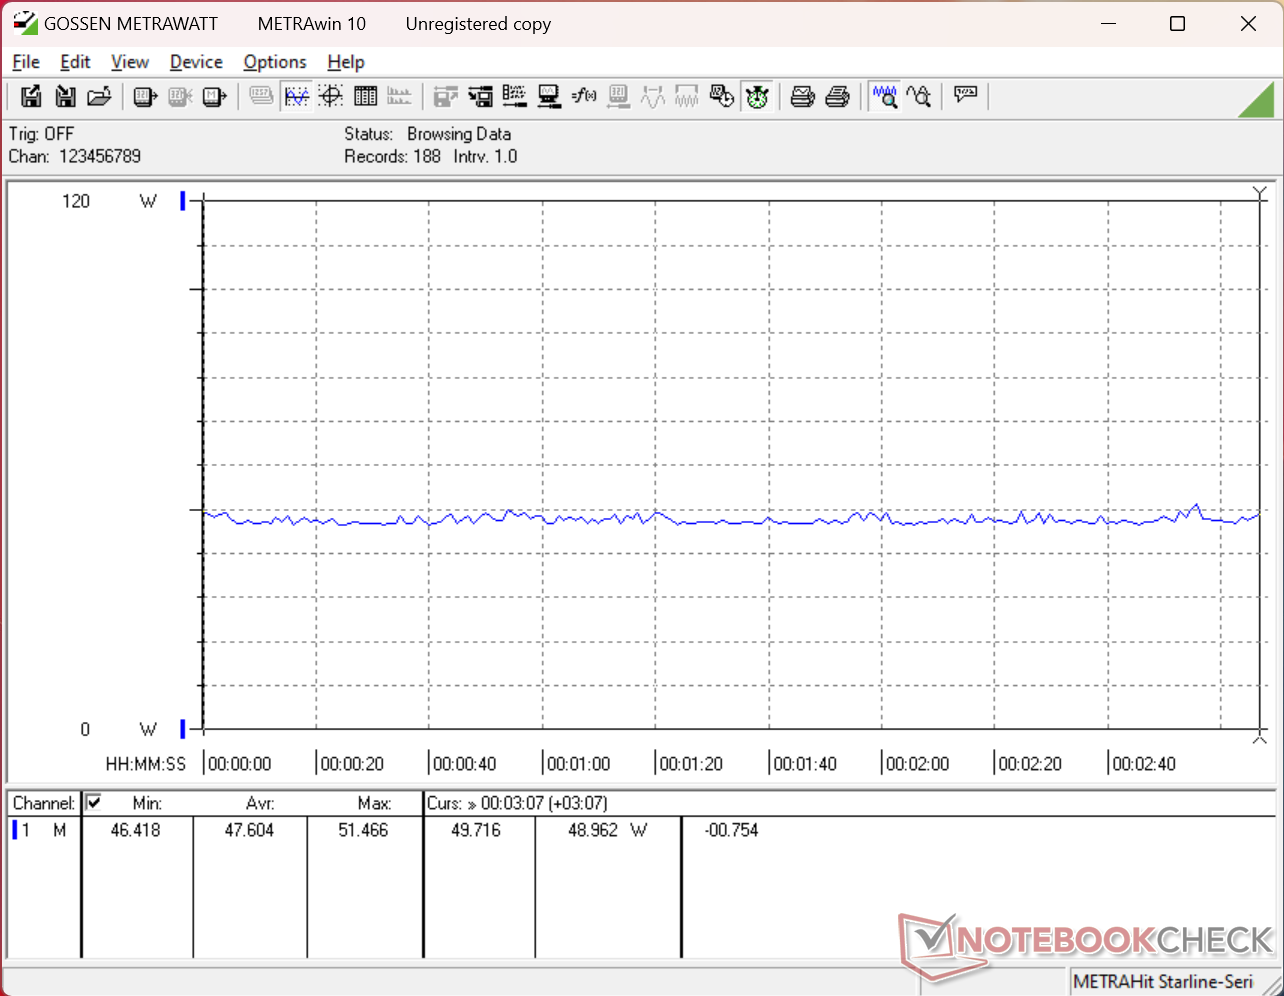
Consommation électrique
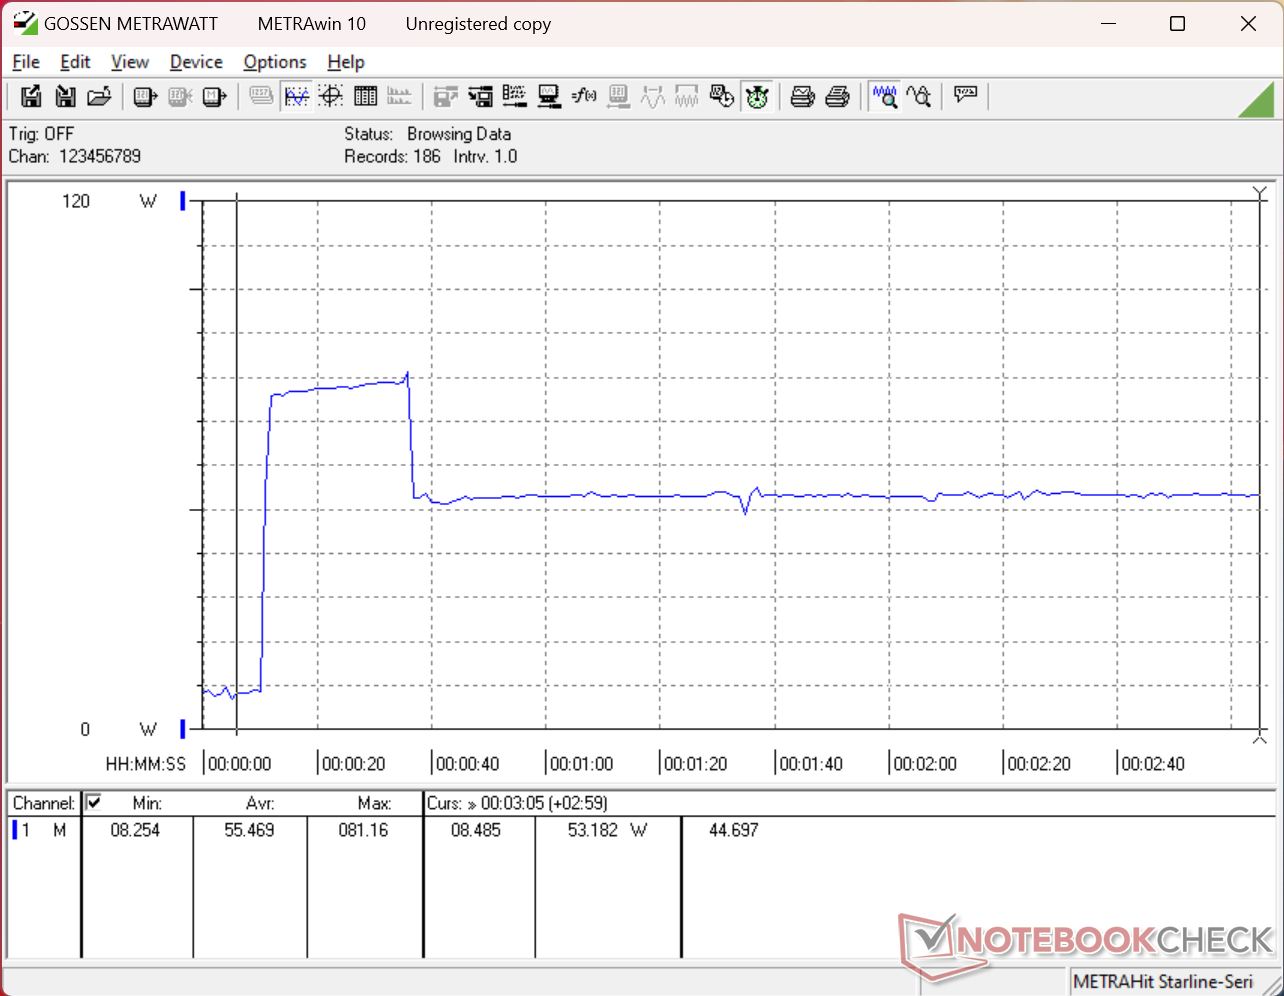
Le Cubi AI+ 3MG est nettement plus efficace que le Cubi AI+ 2MG de l'année dernière Cubi AI+ 2MG de l'année dernière, notamment en termes de performance par watt. Lors de l'exécution de Prime95, par exemple, la consommation se stabilise autour de 52 W, contre 49 W pour l'ancien modèle, malgré l'augmentation massive de 60 à 65 % des performances multithread. Les performances graphiques par watt ont également augmenté, mais dans des proportions bien moindres.
Notez que la consommation peut temporairement atteindre 98 W avant de redescendre en raison des limitations du CPU Turbo Boost. L'adaptateur secteur de 120 W (~13 x 6,9 x 2,5 cm) est plus que suffisant à cet égard, car le mini PC lui-même ne consomme en moyenne que 50 à 60 W lorsqu'il est en charge.
| Éteint/en veille | |
| Au repos | |
| Fortement sollicité |
|
Légende:
min: | |
| MSI Cubi NUC AI+ 3MG Ultra 9 386H, Intel Graphics 4 Xe3 PTL, Phison 1 TB ESR01TBTCCZ-27J, , x, | GMK NucBox K16 R7 7735HS, Radeon 680M, TWSC TSC3AN1T0-F6Q10S, , x, | GMK EVO-T1 Ultra 9 285H, Arc 140T, Crucial P3 Plus CT1000P3PSSD8, , x, | Geekom A5 Pro R5 7530U, Vega 7, Wodposit WPBSN4M8-1TGP, , x, | Asus NUC 15 Pro+ Ultra 9 285H, Arc 140T, Micron 3500 1TB MTFDKBA1T0TGD, , x, | MSI Cubi NUC AI+ 2MG Core Ultra 7 258V, Arc 140V, Phison 1 TB ESR01TBTCCZ-27J, , x, | MSI Cubi NUC 1M Core 7 150U, Iris Xe G7 96EUs, WD PC SN560 SDDPNQE-1T00, , x, | |
|---|---|---|---|---|---|---|---|
| Power Consumption | -10% | -27% | 42% | -12% | 20% | 8% | |
| Idle Minimum * (Watt) | 6.2 | 7.4 -19% | 6.1 2% | 3.2 48% | 3.9 37% | 2.9 53% | 6.4 -3% |
| Idle Average * (Watt) | 7.9 | 7.7 3% | 7.9 -0% | 4.3 46% | 6.1 23% | 5.7 28% | 8.3 -5% |
| Idle Maximum * (Watt) | 8.5 | 7.7 9% | 13.2 -55% | 5.1 40% | 8.2 4% | 10.2 -20% | 10.4 -22% |
| Load Average * (Watt) | 41.4 | 52 -26% | 60.7 -47% | 32.1 22% | 56.1 -36% | 38.7 7% | 38.5 7% |
| Cyberpunk 2077 ultra external monitor * (Watt) | 47.6 | 68 -43% | 67.4 -42% | 29.4 38% | 63.9 -34% | 41.1 14% | 36.1 24% |
| Load Maximum * (Watt) | 98 | 80.1 18% | 117.1 -19% | 43.5 56% | 160.6 -64% | 60 39% | 52.5 46% |
* ... Moindre est la valeur, meilleures sont les performances
Consommation électrique Cyberpunk / Stress Test
Consommation électrique du moniteur externe
Notebookcheck Rating
Le MSI Cubi NUC AI+ 3MG est l'un des plus petits mini PC que vous puissiez trouver avec un processeur Panther Lake Core Ultra 9. Cependant, quelques fonctionnalités manquantes l'empêchent d'être la solution ultime pour la vente au détail ou la bureautique.
MSI Cubi NUC AI+ 3MG
- 06/03/2026 v8
Allen Ngo
 Total Sustainability Score:
 Comparaison avec des concurrents potentiels
Image | Modèle | Prix | Poids | Épaisseur | Écran |
|---|---|---|---|---|---|
1. 76.9%  | MSI Cubi NUC AI+ 3MG Intel Core Ultra 9 386H ⎘ Intel Graphics 4 Xe3 Panther Lake iGPU ⎘ 32 Go Mémoire, 1000 Go SSD | Amazon: Prix de liste: 830 USD | 552 g | 37.5 mm | x |
2. 64.8%  | GMK NucBox K16 AMD Ryzen 7 7735HS ⎘ AMD Radeon 680M ⎘ 32 Go Mémoire, 1024 Go SSD | Amazon: Prix de liste: 650 USD | 567 g | 63 mm | x |
3. 75.4%  | GMK EVO-T1 Intel Core Ultra 9 285H ⎘ Intel Arc Graphics 140T ⎘ 64 Go Mémoire, 1024 Go SSD | Amazon: Prix de liste: 999€ | 946 g | 73.6 mm | x |
4. 72.6%  | Geekom A5 Pro AMD Ryzen 5 7530U ⎘ AMD Radeon RX Vega 7 ⎘ 16 Go Mémoire, 1024 Go SSD | Amazon: Prix de liste: 619€ | 423 g | 37 mm | x |
5. 77.5% 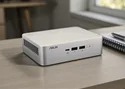 | Asus NUC 15 Pro+ Intel Core Ultra 9 285H ⎘ Intel Arc Graphics 140T ⎘ 32 Go Mémoire, 1024 Go SSD | Amazon: $1,642.00 Prix de liste: 991€ | 690 g | 42 mm | x |
6. 75.2% 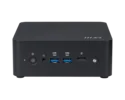 | MSI Cubi NUC AI+ 2MG Intel Core Ultra 7 258V ⎘ Intel Arc Graphics 140V ⎘ 32 Go Mémoire, 1000 Go SSD | Amazon: Prix de liste: 900 USD | 669 g | 50.1 mm | x |
7. 66.1%  | MSI Cubi NUC 1M Intel Core 7 150U ⎘ Intel Iris Xe Graphics G7 96EUs ⎘ 16 Go Mémoire, 1024 Go SSD | Amazon: Prix de liste: 950 USD | 660 g | 50.1 mm | x |
Transparency
La sélection des appareils à examiner est effectuée par notre équipe éditoriale. L'échantillon de test a été prêté à l'auteur par le fabricant ou le détaillant pour les besoins de cet examen. Le prêteur n'a pas eu d'influence sur cette évaluation et le fabricant n'a pas reçu de copie de cette évaluation avant sa publication. Il n'y avait aucune obligation de publier cet article. En tant que média indépendant, Notebookcheck n'est pas soumis à l'autorité des fabricants, des détaillants ou des éditeurs.
Voici comment Notebookcheck teste
Chaque année, Notebookcheck examine de manière indépendante des centaines d'ordinateurs portables et de smartphones en utilisant des procédures standardisées afin de garantir que tous les résultats sont comparables. Nous avons continuellement développé nos méthodes de test depuis environ 20 ans et avons établi des normes industrielles dans le processus. Dans nos laboratoires de test, des équipements de mesure de haute qualité sont utilisés par des techniciens et des rédacteurs expérimentés. Ces tests impliquent un processus de validation en plusieurs étapes. Notre système d'évaluation complexe repose sur des centaines de mesures et de points de référence bien fondés, ce qui garantit l'objectivité.
