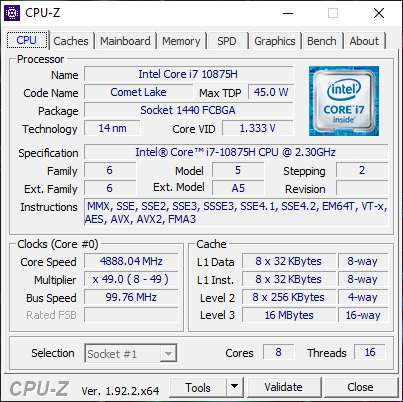
Test du Razer Blade 15 Modèle Avancé (i7-10875H, RTX 2070 Super Max-Q, FHD, 300 Hz) : le même, mais en plus puissant
Note | Date | Modèle | Poids | Épaisseur | Taille | Résolution | Prix |
|---|---|---|---|---|---|---|---|
| 86.9 % v7 (old) | 09/20 | Razer Blade 15 RTX 2070 Super Max-Q i7-10875H, GeForce RTX 2070 Super Max-Q | 2.1 kg | 17.8 mm | 15.60" | 1920x1080 | |
| 82.8 % v7 (old) | 05/20 | MSI GS66 Stealth 10SFS i9-10980HK, GeForce RTX 2070 Super Max-Q | 2.2 kg | 20 mm | 15.60" | 1920x1080 | |
| 81.3 % v7 (old) | 06/19 | Asus Zephyrus S GX502GW i7-9750H, GeForce RTX 2070 Mobile | 2.1 kg | 19 mm | 15.60" | 1920x1080 | |
| 84 % v7 (old) | 06/19 | Gigabyte Aero 15 Classic-XA i7-9750H, GeForce RTX 2070 Max-Q | 2.1 kg | 19 mm | 15.60" | 1920x1080 | |
| 84.8 % v7 (old) | 10/19 | Lenovo Legion Y740-15ICHg i7-9750H, GeForce RTX 2070 Max-Q | 2.3 kg | 25 mm | 15.60" | 1920x1080 | |
| 83 % v7 (old) | 09/20 | HP Envy 15-ep0098nr i7-10750H, GeForce RTX 2060 Max-Q | 2 kg | 19 mm | 15.60" | 3840x2160 |
| SD Card Reader | |
| average JPG Copy Test (av. of 3 runs) | |
| Razer Blade 15 RTX 2070 Super Max-Q (Toshiba Exceria Pro SDXC 64 GB UHS-II) | |
| Gigabyte Aero 15 Classic-XA (Toshiba Exceria Pro SDXC 64 GB UHS-II) | |
| HP Envy 15-ep0098nr (Toshiba Exceria Pro M501 UHS-II) | |
| maximum AS SSD Seq Read Test (1GB) | |
| Gigabyte Aero 15 Classic-XA (Toshiba Exceria Pro SDXC 64 GB UHS-II) | |
| Razer Blade 15 RTX 2070 Super Max-Q (Toshiba Exceria Pro SDXC 64 GB UHS-II) | |
| HP Envy 15-ep0098nr (Toshiba Exceria Pro M501 UHS-II) | |
| Networking | |
| iperf3 transmit AX12 | |
| MSI GS66 Stealth 10SFS | |
| HP Envy 15-ep0098nr | |
| Razer Blade 15 RTX 2070 Super Max-Q | |
| iperf3 receive AX12 | |
| HP Envy 15-ep0098nr | |
| Razer Blade 15 RTX 2070 Super Max-Q | |
| MSI GS66 Stealth 10SFS | |


| |||||||||||||||||||||||||
Homogénéité de la luminosité: 90 %
Valeur mesurée au centre, sur batterie: 345.4 cd/m²
Contraste: 1016:1 (Valeurs des noirs: 0.34 cd/m²)
ΔE ColorChecker Calman: 3.18 | ∀{0.5-29.43 Ø4.71}
calibrated: 1.77
ΔE Greyscale Calman: 3.8 | ∀{0.09-98 Ø4.96}
99% sRGB (Argyll 1.6.3 3D)
64.3% AdobeRGB 1998 (Argyll 1.6.3 3D)
70.5% AdobeRGB 1998 (Argyll 3D)
98.8% sRGB (Argyll 3D)
69.4% Display P3 (Argyll 3D)
Gamma: 2.15
CCT: 7109 K
| Razer Blade 15 RTX 2070 Super Max-Q AU Optronics B156HAN12.0, IPS, 15.6", 1920x1080 | MSI GS66 Stealth 10SFS AUO B156HAN12.0 (AUO328E), IPS, 15.6", 1920x1080 | Asus Zephyrus S GX502GW AU Optronics B156HAN08.2 (AUO82ED), IPS, 15.6", 1920x1080 | Gigabyte Aero 15 Classic-XA Sharp LQ156M1JW03 (SHP14C5), IGZO, 15.6", 1920x1080 | Lenovo Legion Y740-15ICHg BOE NV156FHM-N4J, IPS, 15.6", 1920x1080 | HP Envy 15-ep0098nr Samsung SDC4145, AMOLED, 15.6", 3840x2160 | |
|---|---|---|---|---|---|---|
| Display | 0% | -7% | -5% | -5% | 24% | |
| Display P3 Coverage (%) | 69.4 | 69.5 0% | 64.9 -6% | 65.3 -6% | 67.7 -2% | 88.5 28% |
| sRGB Coverage (%) | 98.8 | 99.6 1% | 91 -8% | 95.5 -3% | 91.6 -7% | 100 1% |
| AdobeRGB 1998 Coverage (%) | 70.5 | 70.8 0% | 65.9 -7% | 66.5 -6% | 67.1 -5% | 99.9 42% |
| Response Times | -179% | -68% | -208% | -260% | 71% | |
| Response Time Grey 50% / Grey 80% * (ms) | 3.2 ? | 14 ? -338% | 7.2 ? -125% | 15.2 ? -375% | 19 ? -494% | 0.8 ? 75% |
| Response Time Black / White * (ms) | 8 ? | 9.6 ? -20% | 8.8 ? -10% | 11.2 ? -40% | 10 ? -25% | 2.7 ? 66% |
| PWM Frequency (Hz) | 23580 ? | 242.7 ? | ||||
| Screen | 9% | -1% | 1% | 17% | -18% | |
| Brightness middle (cd/m²) | 345.4 | 316 -9% | 286 -17% | 266 -23% | 477 38% | 374.3 8% |
| Brightness (cd/m²) | 342 | 311 -9% | 275 -20% | 248 -27% | 431 26% | 379 11% |
| Brightness Distribution (%) | 90 | 92 2% | 90 0% | 89 -1% | 84 -7% | 91 1% |
| Black Level * (cd/m²) | 0.34 | 0.21 38% | 0.37 -9% | 0.31 9% | 0.175 49% | |
| Contrast (:1) | 1016 | 1505 48% | 773 -24% | 858 -16% | 2726 168% | |
| Colorchecker dE 2000 * | 3.18 | 3.03 5% | 2.19 31% | 2.78 13% | 4.17 -31% | 5.47 -72% |
| Colorchecker dE 2000 max. * | 6.57 | 7.32 -11% | 4.4 33% | 5.96 9% | 6.97 -6% | 8.22 -25% |
| Colorchecker dE 2000 calibrated * | 1.77 | 1.1 38% | 2.27 -28% | 0.91 49% | 2.51 -42% | 4.61 -160% |
| Greyscale dE 2000 * | 3.8 | 3.9 -3% | 2.2 42% | 3.58 6% | 3.49 8% | 2.3 39% |
| Gamma | 2.15 102% | 2.42 91% | 2.41 91% | 2.46 89% | 2.5 88% | 2.09 105% |
| CCT | 7109 91% | 7439 87% | 6405 101% | 7186 90% | 7076 92% | 6340 103% |
| Color Space (Percent of AdobeRGB 1998) (%) | 64.3 | 65 1% | 59 -8% | 62 -4% | 60 -7% | 87.8 37% |
| Color Space (Percent of sRGB) (%) | 99 | 100 1% | 91 -8% | 96 -3% | 91 -8% | 100 1% |
| Moyenne finale (programmes/paramètres) | -57% /
-16% | -25% /
-10% | -71% /
-26% | -83% /
-22% | 26% /
4% |
* ... Moindre est la valeur, meilleures sont les performances
Temps de réponse de l'écran
| ↔ Temps de réponse noir à blanc | ||
|---|---|---|
| 8 ms ... hausse ↗ et chute ↘ combinées | ↗ 4 ms hausse | 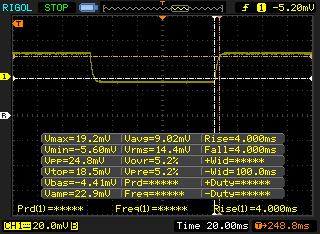 |
| ↘ 4 ms chute | ||
| L'écran montre de faibles temps de réponse, un bon écran pour jouer. En comparaison, tous les appareils testés affichent entre 0.1 (minimum) et 240 (maximum) ms. » 22 % des appareils testés affichent de meilleures performances. Cela signifie que les latences relevées sont meilleures que la moyenne (19.8 ms) de tous les appareils testés. | ||
| ↔ Temps de réponse gris 50% à gris 80% | ||
| 3.2 ms ... hausse ↗ et chute ↘ combinées | ↗ 1.4 ms hausse | 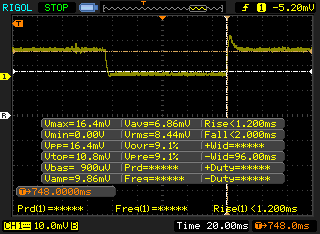 |
| ↘ 1.8 ms chute | ||
| L'écran montre de très faibles temps de réponse, parfait pour le jeu. En comparaison, tous les appareils testés affichent entre 0.165 (minimum) et 636 (maximum) ms. » 13 % des appareils testés affichent de meilleures performances. Cela signifie que les latences relevées sont meilleures que la moyenne (30.9 ms) de tous les appareils testés. | ||
Scintillement / MLI (Modulation de largeur d'impulsion)
| Scintillement / MLI (Modulation de largeur d'impulsion) non décelé | 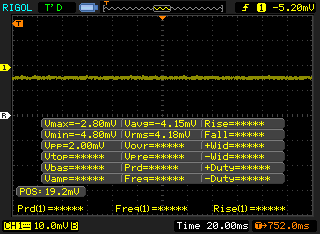 | ||
En comparaison, 52 % des appareils testés n'emploient pas MDI pour assombrir leur écran. Nous avons relevé une moyenne à 7741 (minimum : 5 - maximum : 343500) Hz dans le cas où une MDI était active. | |||
Cinebench R15: CPU Multi 64Bit | CPU Single 64Bit
Blender: v2.79 BMW27 CPU
7-Zip 18.03: 7z b 4 -mmt1 | 7z b 4
Geekbench 5.5: Single-Core | Multi-Core
HWBOT x265 Benchmark v2.2: 4k Preset
LibreOffice : 20 Documents To PDF
R Benchmark 2.5: Overall mean
| Cinebench R20 / CPU (Multi Core) | |
| MSI Bravo 15 A4DCR | |
| Asus ROG Strix Scar 15 G532LWS | |
| Eurocom Nightsky RX15 | |
| MSI GE65 Raider 9SF-049US | |
| Moyenne Intel Core i7-10875H (1986 - 4176, n=32) | |
| Alienware m15 R3 P87F | |
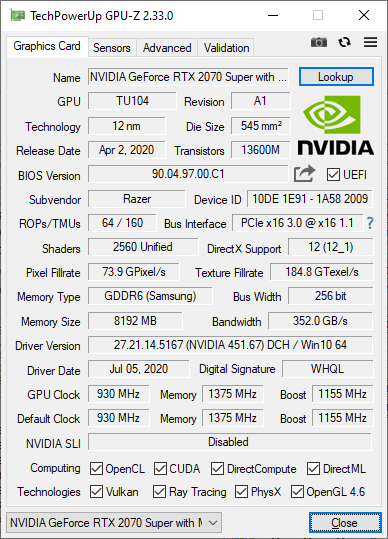
| Razer Blade 15 RTX 2070 Super Max-Q | |
| Maingear Vector 15 | |
| Dell G5 15 5590 | |
| Lenovo Legion 5 15IMH05H | |
| Cinebench R20 / CPU (Single Core) | |
| Asus ROG Strix Scar 15 G532LWS | |
| Razer Blade 15 RTX 2070 Super Max-Q | |
| Moyenne Intel Core i7-10875H (430 - 524, n=32) | |
| Eurocom Nightsky RX15 | |
| Alienware m15 R3 P87F | |
| MSI Bravo 15 A4DCR | |
| MSI GE65 Raider 9SF-049US | |
| Lenovo Legion 5 15IMH05H | |
| Maingear Vector 15 | |
| Dell G5 15 5590 | |
| Cinebench R15 / CPU Multi 64Bit | |
| Eurocom Nightsky RX15 | |
| MSI Bravo 15 A4DCR | |
| Asus ROG Strix Scar 15 G532LWS | |
| MSI GE65 Raider 9SF-049US | |
| Moyenne Intel Core i7-10875H (1003 - 1833, n=38) | |
| Razer Blade 15 RTX 2070 Super Max-Q | |
| Alienware m15 R3 P87F | |
| Maingear Vector 15 | |
| Dell G5 15 5590 | |
| Lenovo Legion 5 15IMH05H | |
| Cinebench R15 / CPU Single 64Bit | |
| Asus ROG Strix Scar 15 G532LWS | |
| Moyenne Intel Core i7-10875H (190 - 220, n=37) | |
| Eurocom Nightsky RX15 | |
| Razer Blade 15 RTX 2070 Super Max-Q | |
| Alienware m15 R3 P87F | |
| MSI GE65 Raider 9SF-049US | |
| Lenovo Legion 5 15IMH05H | |
| Maingear Vector 15 | |
| MSI Bravo 15 A4DCR | |
| Dell G5 15 5590 | |
| Blender / v2.79 BMW27 CPU | |
| Eurocom Nightsky RX15 | |
| Lenovo Legion 5 15IMH05H | |
| Razer Blade 15 RTX 2070 Super Max-Q | |
| Moyenne Intel Core i7-10875H (259 - 535, n=30) | |
| Alienware m15 R3 P87F | |
| MSI Bravo 15 A4DCR | |
| Asus ROG Strix Scar 15 G532LWS | |
| 7-Zip 18.03 / 7z b 4 -mmt1 | |
| Asus ROG Strix Scar 15 G532LWS | |
| Eurocom Nightsky RX15 | |
| Moyenne Intel Core i7-10875H (5071 - 5780, n=31) | |
| Razer Blade 15 RTX 2070 Super Max-Q | |
| Lenovo Legion 5 15IMH05H | |
| MSI Bravo 15 A4DCR | |
| Alienware m15 R3 P87F | |
| 7-Zip 18.03 / 7z b 4 | |
| Asus ROG Strix Scar 15 G532LWS | |
| MSI Bravo 15 A4DCR | |
| Eurocom Nightsky RX15 | |
| Moyenne Intel Core i7-10875H (29844 - 49562, n=31) | |
| Razer Blade 15 RTX 2070 Super Max-Q | |
| Alienware m15 R3 P87F | |
| Lenovo Legion 5 15IMH05H | |
| Geekbench 5.5 / Single-Core | |
| Asus ROG Strix Scar 15 G532LWS | |
| Moyenne Intel Core i7-10875H (1233 - 1371, n=29) | |
| Razer Blade 15 RTX 2070 Super Max-Q | |
| Alienware m15 R3 P87F | |
| Lenovo Legion 5 15IMH05H | |
| MSI Bravo 15 A4DCR | |
| Geekbench 5.5 / Multi-Core | |
| Asus ROG Strix Scar 15 G532LWS | |
| Moyenne Intel Core i7-10875H (5715 - 8620, n=29) | |
| MSI Bravo 15 A4DCR | |
| Razer Blade 15 RTX 2070 Super Max-Q | |
| Alienware m15 R3 P87F | |
| Lenovo Legion 5 15IMH05H | |
| HWBOT x265 Benchmark v2.2 / 4k Preset | |
| Asus ROG Strix Scar 15 G532LWS | |
| Eurocom Nightsky RX15 | |
| MSI Bravo 15 A4DCR | |
| Moyenne Intel Core i7-10875H (7.27 - 14.1, n=27) | |
| Alienware m15 R3 P87F | |
| Razer Blade 15 RTX 2070 Super Max-Q | |
| Lenovo Legion 5 15IMH05H | |
| LibreOffice / 20 Documents To PDF | |
| MSI Bravo 15 A4DCR | |
| Alienware m15 R3 P87F | |
| Lenovo Legion 5 15IMH05H | |
| Moyenne Intel Core i7-10875H (30.2 - 84.3, n=30) | |
| Asus ROG Strix Scar 15 G532LWS | |
| Razer Blade 15 RTX 2070 Super Max-Q | |
| R Benchmark 2.5 / Overall mean | |
| Alienware m15 R3 P87F | |
| Lenovo Legion 5 15IMH05H | |
| MSI Bravo 15 A4DCR | |
| Razer Blade 15 RTX 2070 Super Max-Q | |
| Moyenne Intel Core i7-10875H (0.546 - 0.662, n=29) | |
| Asus ROG Strix Scar 15 G532LWS | |
* ... Moindre est la valeur, meilleures sont les performances
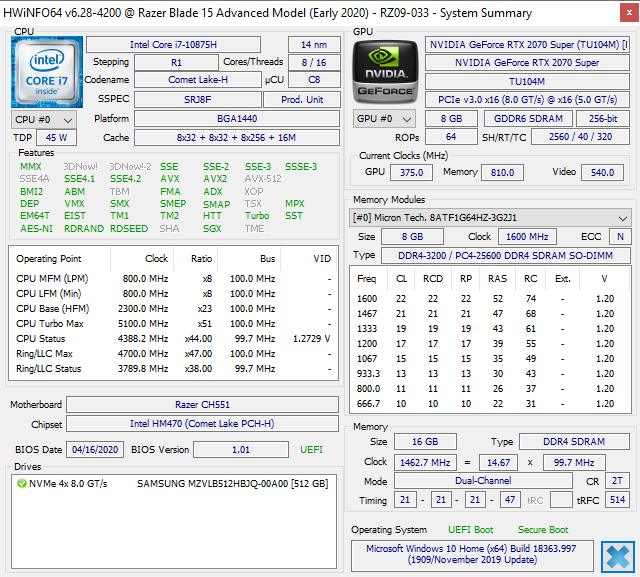
| PCMark 8 Home Score Accelerated v2 | 5840 points | |
| PCMark 8 Work Score Accelerated v2 | 6825 points | |
| PCMark 10 Score | 6739 points | |
Aide | ||
| DPC Latencies / LatencyMon - interrupt to process latency (max), Web, Youtube, Prime95 | |
| Aorus 15G XB | |
| MSI GS66 Stealth 10SFS | |
| Razer Blade 15 RTX 2070 Super Max-Q | |
| Asus ROG Strix Scar 15 G532LWS | |
| Alienware m15 R3 P87F | |
| Razer Blade 15 RTX 2080 Super Max-Q | |
| Lenovo Legion 5 15IMH05H | |
| Eluktronics RP-15 | |
* ... Moindre est la valeur, meilleures sont les performances
| Razer Blade 15 RTX 2070 Super Max-Q Samsung SSD PM981a MZVLB512HBJQ | MSI GS66 Stealth 10SFS Samsung SSD PM981 MZVLB1T0HALR | Asus Zephyrus S GX502GW 2x Intel SSD 660p SSDPEKNW512G8 (RAID 0) | Gigabyte Aero 15 Classic-XA Intel SSD 760p SSDPEKKW512G8 | Lenovo Legion Y740-15ICHg WDC PC SN520 SDAPMUW-128G | |
|---|---|---|---|---|---|
| AS SSD | 0% | -17% | -12% | -51% | |
| Seq Read (MB/s) | 1957 | 1065 -46% | 2506 28% | 2517 29% | 1372 -30% |
| Seq Write (MB/s) | 2092 | 2360 13% | 1712 -18% | 924 -56% | 746 -64% |
| 4K Read (MB/s) | 50.2 | 48.09 -4% | 48.32 -4% | 59.1 18% | 35.42 -29% |
| 4K Write (MB/s) | 96.5 | 110.7 15% | 103.6 7% | 126.5 31% | 99.9 4% |
| 4K-64 Read (MB/s) | 1594 | 1635 3% | 624 -61% | 876 -45% | 302.1 -81% |
| 4K-64 Write (MB/s) | 2005 | 1829 -9% | 1253 -38% | 922 -54% | 191.4 -90% |
| Access Time Read * (ms) | 0.057 | 0.071 -25% | 0.08 -40% | 0.042 26% | 0.132 -132% |
| Access Time Write * (ms) | 0.112 | 0.034 70% | 0.04 64% | 0.065 42% | 0.037 67% |
| Score Read (Points) | 1840 | 1790 -3% | 923 -50% | 1186 -36% | 475 -74% |
| Score Write (Points) | 2310 | 2176 -6% | 1528 -34% | 1141 -51% | 366 -84% |
| Score Total (Points) | 5103 | 4950 -3% | 2896 -43% | 2870 -44% | 1065 -79% |
| Copy ISO MB/s (MB/s) | 1793 | 2086 16% | 1062 -41% | ||
| Copy Program MB/s (MB/s) | 573 | 454.2 -21% | 426 -26% | ||
| Copy Game MB/s (MB/s) | 1418 | 1141 -20% | 650 -54% | ||
| CrystalDiskMark 5.2 / 6 | -7% | -19% | -14% | -47% | |
| Write 4K (MB/s) | 139.8 | 131.3 -6% | 97 -31% | 115.5 -17% | 134.2 -4% |
| Read 4K (MB/s) | 48.62 | 45.84 -6% | 49.58 2% | 58 19% | 37.72 -22% |
| Write Seq (MB/s) | 2260 | 2370 5% | 1838 -19% | 1555 -31% | 389.2 -83% |
| Read Seq (MB/s) | 2135 | 1509 -29% | 2421 13% | 2590 21% | 1030 -52% |
| Write 4K Q32T1 (MB/s) | 499.3 | 481.5 -4% | 326.9 -35% | 369.3 -26% | 238.9 -52% |
| Read 4K Q32T1 (MB/s) | 552 | 560 1% | 372.9 -32% | 441.7 -20% | 343.9 -38% |
| Write Seq Q32T1 (MB/s) | 2960 | 2392 -19% | 1894 -36% | 1547 -48% | 789 -73% |
| Read Seq Q32T1 (MB/s) | 3269 | 3232 -1% | 2828 -13% | 2969 -9% | 1502 -54% |
| Write 4K Q8T8 (MB/s) | 293.4 | ||||
| Read 4K Q8T8 (MB/s) | 405.8 | ||||
| Moyenne finale (programmes/paramètres) | -4% /
-3% | -18% /
-18% | -13% /
-13% | -49% /
-50% |
* ... Moindre est la valeur, meilleures sont les performances

Disk Throttling: DiskSpd Read Loop, Queue Depth 8
| 3DMark 11 Performance | 23678 points | |
| 3DMark Cloud Gate Standard Score | 48815 points | |
| 3DMark Fire Strike Score | 17915 points | |
| 3DMark Time Spy Score | 8052 points | |
Aide | ||
| Bas | Moyen | Élevé | Ultra | |
|---|---|---|---|---|
| The Witcher 3 (2015) | 348.3 | 235.4 | 141.4 | 74 |
| Dota 2 Reborn (2015) | 144 | 132 | 127 | 120 |
| Final Fantasy XV Benchmark (2018) | 162 | 110 | 83.7 | |
| X-Plane 11.11 (2018) | 121 | 109 | 90 |
| Razer Blade 15 RTX 2070 Super Max-Q GeForce RTX 2070 Super Max-Q, i7-10875H, Samsung SSD PM981a MZVLB512HBJQ | MSI GS66 Stealth 10SFS GeForce RTX 2070 Super Max-Q, i9-10980HK, Samsung SSD PM981 MZVLB1T0HALR | Asus Zephyrus S GX502GW GeForce RTX 2070 Mobile, i7-9750H, 2x Intel SSD 660p SSDPEKNW512G8 (RAID 0) | Gigabyte Aero 15 Classic-XA GeForce RTX 2070 Max-Q, i7-9750H, Intel SSD 760p SSDPEKKW512G8 | Lenovo Legion Y740-15ICHg GeForce RTX 2070 Max-Q, i7-9750H, WDC PC SN520 SDAPMUW-128G | Razer Blade 15 RTX 2080 Super Max-Q GeForce RTX 2080 Super Max-Q, i7-10875H, Samsung PM981a MZVLB1T0HBLR | |
|---|---|---|---|---|---|---|
| Noise | -16% | -16% | -15% | -3% | -4% | |
| arrêt / environnement * (dB) | 27 | 30 -11% | 30 -11% | 30 -11% | 30 -11% | 30.1 -11% |
| Idle Minimum * (dB) | 27 | 32 -19% | 31 -15% | 31 -15% | 31.3 -16% | 30.1 -11% |
| Idle Average * (dB) | 27 | 34 -26% | 33 -22% | 34 -26% | 31.3 -16% | 30.1 -11% |
| Idle Maximum * (dB) | 27 | 39 -44% | 38 -41% | 39 -44% | 31.3 -16% | 30.1 -11% |
| Load Average * (dB) | 44.7 | 53 -19% | 50 -12% | 46 -3% | 42 6% | 46.8 -5% |
| Witcher 3 ultra * (dB) | 51.2 | 48 6% | 53 -4% | 53 -4% | 42.1 18% | 48.4 5% |
| Load Maximum * (dB) | 54 | 53 2% | 56 -4% | 55 -2% | 46.5 14% | 46 15% |
* ... Moindre est la valeur, meilleures sont les performances
Degré de la nuisance sonore
| Au repos |
| 27 / 27 / 27 dB(A) |
| Fortement sollicité |
| 44.7 / 54 dB(A) |
 | ||
30 dB silencieux 40 dB(A) audible 50 dB(A) bruyant |
||
min: | ||
(-) La température maximale du côté supérieur est de 50 °C / 122 F, par rapport à la moyenne de 40.4 °C / 105 F, allant de 21.2 à 68.8 °C pour la classe Gaming.
(-) Le fond chauffe jusqu'à un maximum de 52.2 °C / 126 F, contre une moyenne de 43.2 °C / 110 F
(±) En utilisation inactive, la température moyenne du côté supérieur est de 33.3 °C / 92 F, par rapport à la moyenne du dispositif de 33.9 °C / 93 F.
(-) En jouant à The Witcher 3, la température moyenne du côté supérieur est de 40 °C / 104 F, alors que la moyenne de l'appareil est de 33.9 °C / 93 F.
(±) Les repose-poignets et le pavé tactile peuvent devenir très chauds au toucher, avec un maximum de 38 °C / 100.4# F.
(-) La température moyenne de la zone de l'appui-paume de dispositifs similaires était de 28.8 °C / 83.8 F (-9.2 °C / #-16.6 F).
Razer Blade 15 RTX 2070 Super Max-Q analyse audio
(+) | les haut-parleurs peuvent jouer relativement fort (87.1# dB)
Basses 100 - 315 Hz
(-) | presque aucune basse - en moyenne 16.2% plus bas que la médiane
(±) | la linéarité des basses est moyenne (9.4% delta à la fréquence précédente)
Médiums 400 - 2000 Hz
(±) | médiane supérieure - en moyenne 5.7% supérieure à la médiane
(+) | les médiums sont linéaires (4.8% delta à la fréquence précédente)
Aiguës 2 - 16 kHz
(+) | des sommets équilibrés - à seulement 3.6% de la médiane
(+) | les aigus sont linéaires (3.2% delta à la fréquence précédente)
Globalement 100 - 16 000 Hz
(±) | la linéarité du son global est moyenne (15.5% de différence avec la médiane)
Par rapport à la même classe
» 35% de tous les appareils testés de cette catégorie étaient meilleurs, 7% similaires, 58% pires
» Le meilleur avait un delta de 6%, la moyenne était de 18%, le pire était de 132%.
Par rapport à tous les appareils testés
» 23% de tous les appareils testés étaient meilleurs, 4% similaires, 73% pires
» Le meilleur avait un delta de 4%, la moyenne était de 23%, le pire était de 134%.
Apple MacBook 12 (Early 2016) 1.1 GHz analyse audio
(+) | les haut-parleurs peuvent jouer relativement fort (83.6# dB)
Basses 100 - 315 Hz
(±) | basse réduite - en moyenne 11.3% inférieure à la médiane
(±) | la linéarité des basses est moyenne (14.2% delta à la fréquence précédente)
Médiums 400 - 2000 Hz
(+) | médiane équilibrée - seulement 2.4% de la médiane
(+) | les médiums sont linéaires (5.5% delta à la fréquence précédente)
Aiguës 2 - 16 kHz
(+) | des sommets équilibrés - à seulement 2% de la médiane
(+) | les aigus sont linéaires (4.5% delta à la fréquence précédente)
Globalement 100 - 16 000 Hz
(+) | le son global est linéaire (10.2% différence à la médiane)
Par rapport à la même classe
» 7% de tous les appareils testés de cette catégorie étaient meilleurs, 2% similaires, 90% pires
» Le meilleur avait un delta de 5%, la moyenne était de 18%, le pire était de 53%.
Par rapport à tous les appareils testés
» 5% de tous les appareils testés étaient meilleurs, 1% similaires, 94% pires
» Le meilleur avait un delta de 4%, la moyenne était de 23%, le pire était de 134%.
| Éteint/en veille | |
| Au repos | |
| Fortement sollicité |
|
Légende:
min: | |
| Razer Blade 15 RTX 2070 Super Max-Q i7-10875H, GeForce RTX 2070 Super Max-Q, Samsung SSD PM981a MZVLB512HBJQ, IPS, 1920x1080, 15.6" | MSI GS66 Stealth 10SFS i9-10980HK, GeForce RTX 2070 Super Max-Q, Samsung SSD PM981 MZVLB1T0HALR, IPS, 1920x1080, 15.6" | Asus Zephyrus S GX502GW i7-9750H, GeForce RTX 2070 Mobile, 2x Intel SSD 660p SSDPEKNW512G8 (RAID 0), IPS, 1920x1080, 15.6" | Gigabyte Aero 15 Classic-XA i7-9750H, GeForce RTX 2070 Max-Q, Intel SSD 760p SSDPEKKW512G8, IGZO, 1920x1080, 15.6" | Lenovo Legion Y740-15ICHg i7-9750H, GeForce RTX 2070 Max-Q, WDC PC SN520 SDAPMUW-128G, IPS, 1920x1080, 15.6" | Razer Blade 15 RTX 2080 Super Max-Q i7-10875H, GeForce RTX 2080 Super Max-Q, Samsung PM981a MZVLB1T0HBLR, IPS, 1920x1080, 15.6" | |
|---|---|---|---|---|---|---|
| Power Consumption | 11% | -17% | -2% | -2% | 24% | |
| Idle Minimum * (Watt) | 14.3 | 13 9% | 24 -68% | 21 -47% | 22.2 -55% | 10.6 26% |
| Idle Average * (Watt) | 22.3 | 16 28% | 27 -21% | 23 -3% | 24.9 -12% | 13.1 41% |
| Idle Maximum * (Watt) | 36.9 | 27 27% | 33 11% | 32 13% | 30.6 17% | 15.8 57% |
| Load Average * (Watt) | 118.4 | 109 8% | 129 -9% | 97 18% | 101 15% | 131 -11% |
| Witcher 3 ultra * (Watt) | 153.7 | 155 -1% | 176 -15% | 148 4% | 143 7% | 146 5% |
| Load Maximum * (Watt) | 220.8 | 236 -7% | 216 2% | 213 4% | 186 16% | 169 23% |
* ... Moindre est la valeur, meilleures sont les performances
| Razer Blade 15 RTX 2070 Super Max-Q i7-10875H, GeForce RTX 2070 Super Max-Q, 80 Wh | MSI GS66 Stealth 10SFS i9-10980HK, GeForce RTX 2070 Super Max-Q, 99.99 Wh | Asus Zephyrus S GX502GW i7-9750H, GeForce RTX 2070 Mobile, 76 Wh | Gigabyte Aero 15 Classic-XA i7-9750H, GeForce RTX 2070 Max-Q, 94.24 Wh | Lenovo Legion Y740-15ICHg i7-9750H, GeForce RTX 2070 Max-Q, 57 Wh | HP Envy 15-ep0098nr i7-10750H, GeForce RTX 2060 Max-Q, 83 Wh | |
|---|---|---|---|---|---|---|
| Autonomie de la batterie | -3% | -41% | 11% | -52% | -5% | |
| WiFi v1.3 (h) | 6.3 | 6.1 -3% | 3.7 -41% | 7 11% | 3 -52% | 6 -5% |
| Reader / Idle (h) | 8.4 | 5.9 | 9.1 | 15 | ||
| Load (h) | 1.7 | 1 | 3 | 1.6 |
Points positifs
Points négatifs
Passer d'une GeForce RTX 2070 Super Max-Q à une GeForce RTX 2080 Super Max-Q permettra un gain de performances d'environ 15 %, sans impacter l'autonomie, le bruit du ventilateur, la consommation ou les températures. La différence de prix est d'environ 400 €, si bien qu'il faudra décider si ce gain de puissance graphique vaut l'investissement sur la version moins chère GeForce RTX 2070 Super Max-Q.
Au final, la GeForce RTX 2070 Super Max-Q est à peu près similaire à une GeForce RTX 2060 de bureau, mais dans un châssis de portable. Cela en fait l'un des PC portables ultrafins les plus performants du moment en ce qui concerne les performances et l'allure, malgré la présence des mêmes défauts que précédemment. Ceux qui ne voudront pas se ruiner avec le dernier Blade 15, la version GeForce RTX 2070 Super Max-Q n'est pas vraiment différente de l'ancienne et moins chère version GeForce RTX 2070 Max-Q.
L’intégralité de cette critique est disponible en anglais en suivant ce lien.
Razer Blade 15 RTX 2070 Super Max-Q
- 08/19/2020 v7 (old)
Allen Ngo
Price comparison
