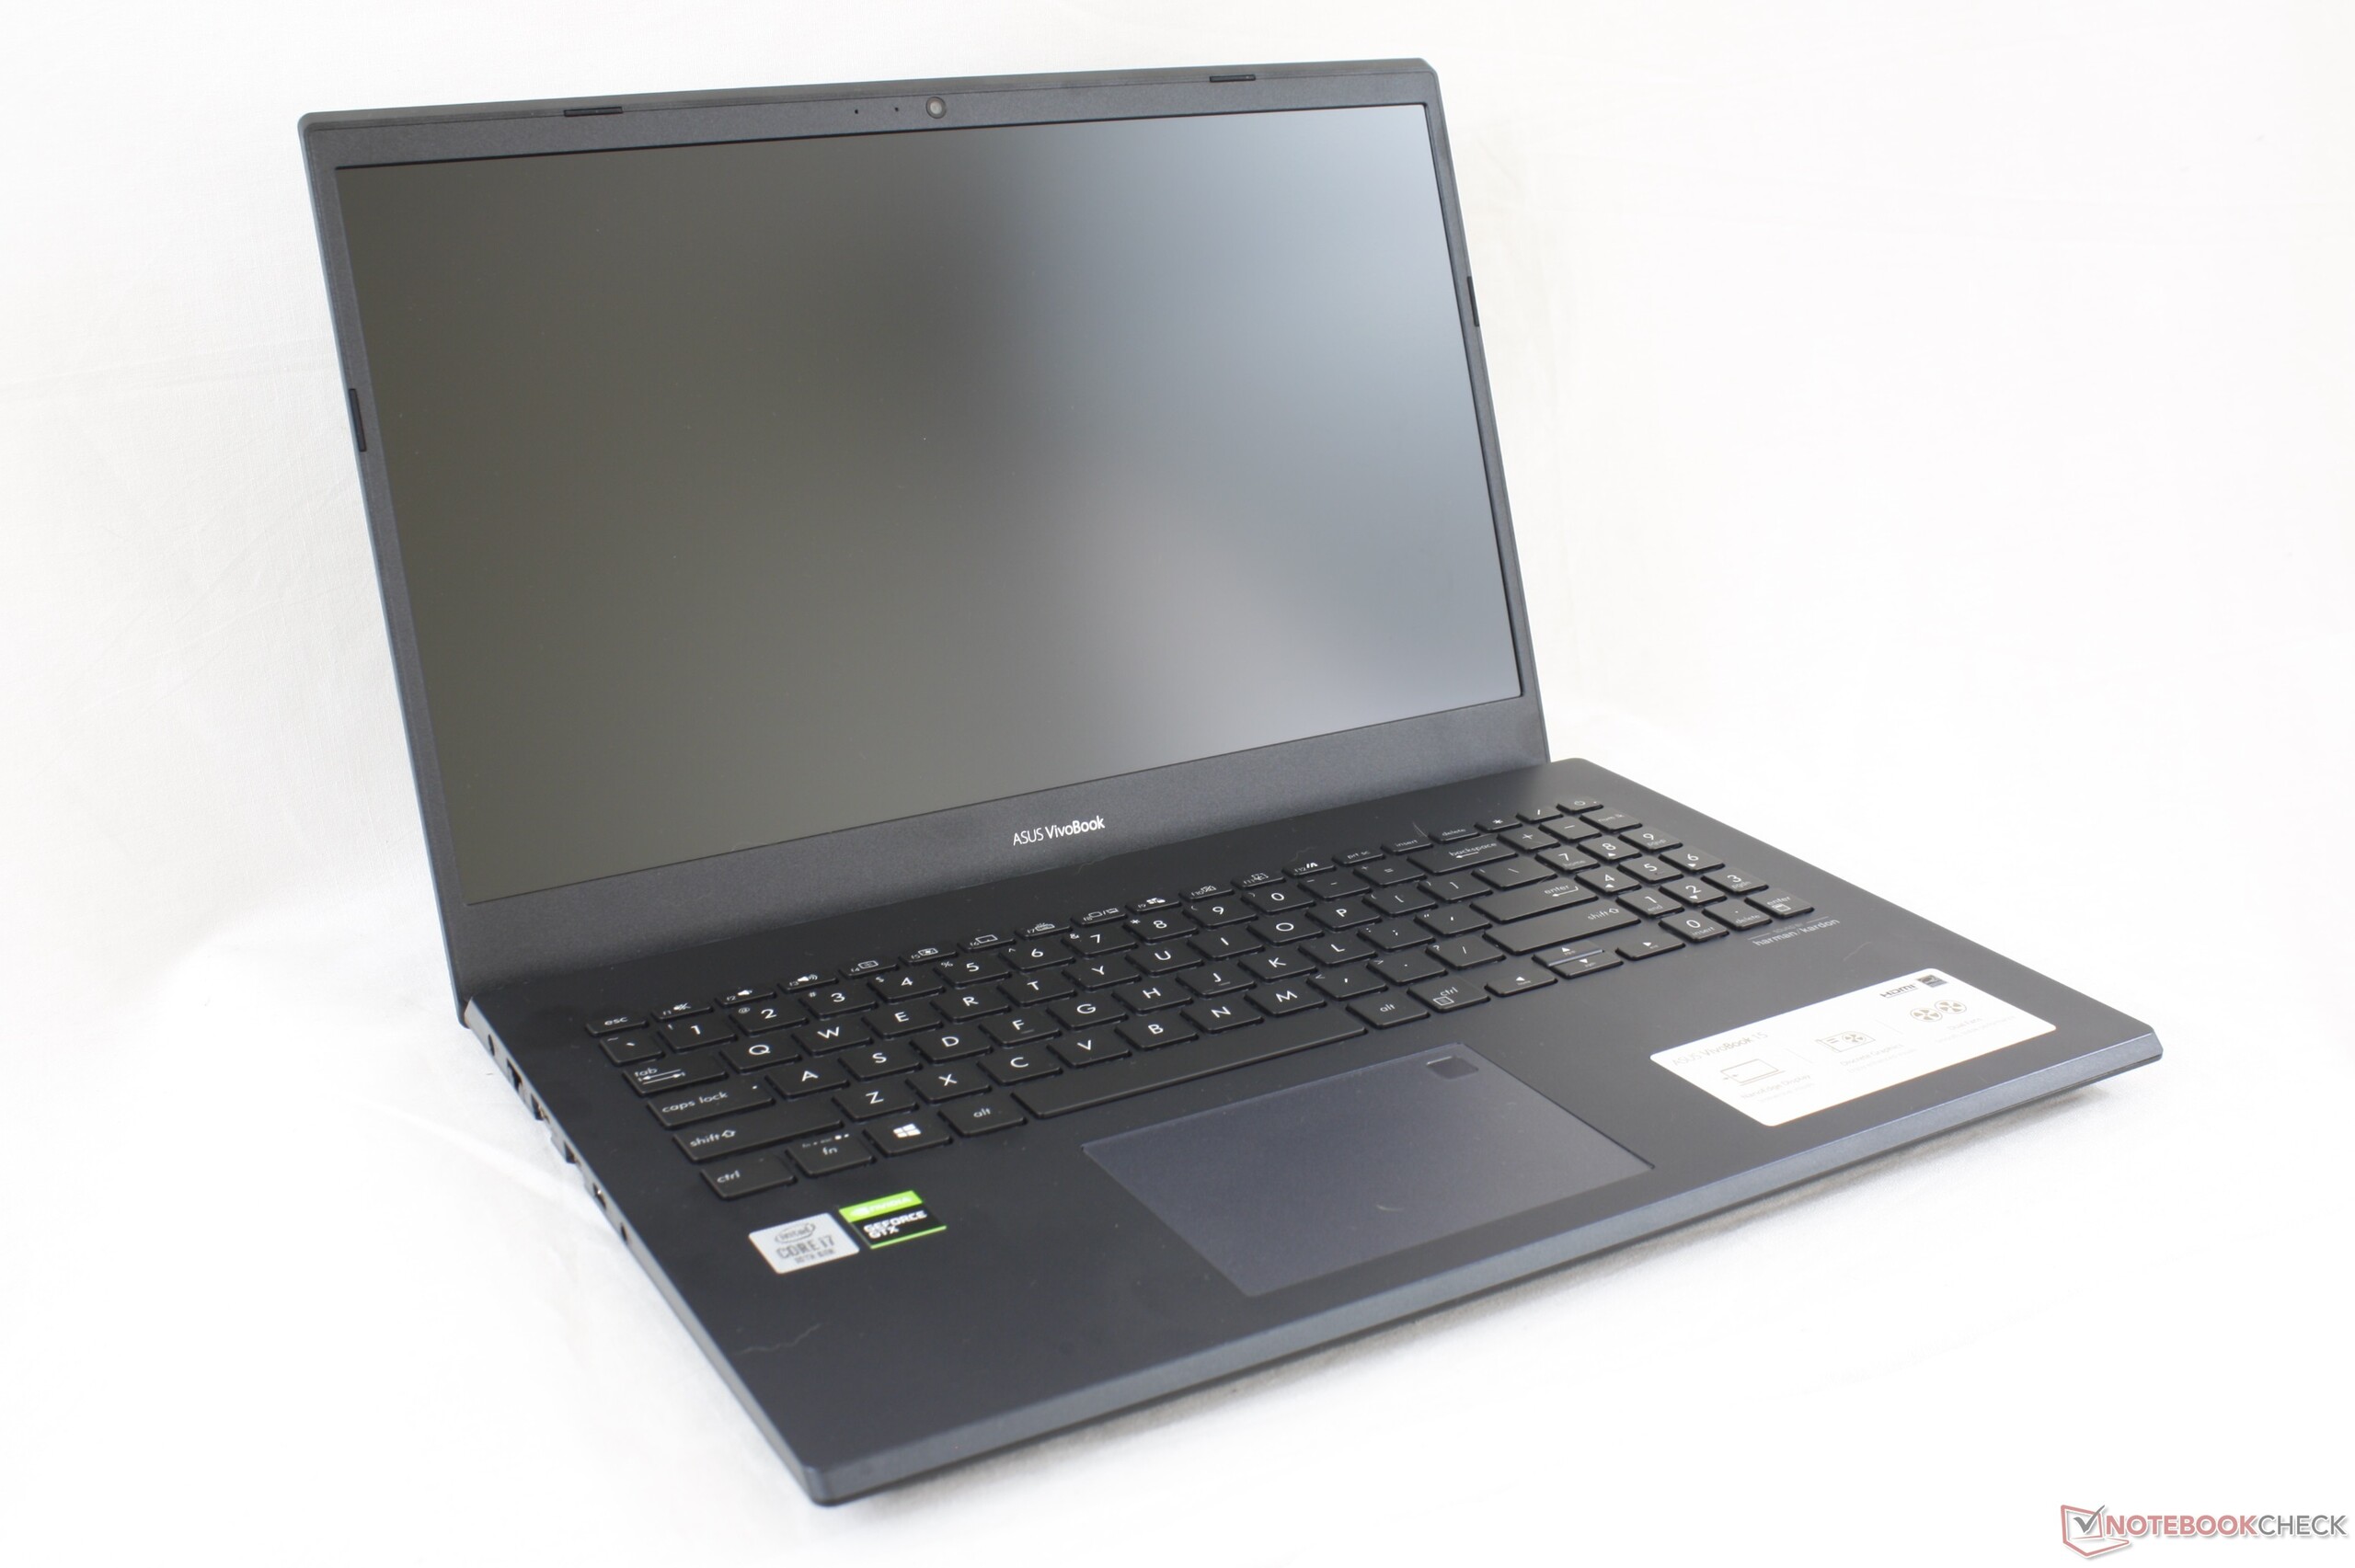
Test de l'Asus VivoBook 15 K571LI (i7-10750H, GTX 1650 Ti, FHD, 120 Hz) : PC portable hybride jeu et multimédia
Note | Date | Modèle | Poids | Épaisseur | Taille | Résolution | Prix |
|---|---|---|---|---|---|---|---|
| 78.6 % v7 (old) | 09/20 | Asus VivoBook 15 K571LI-PB71 i7-10750H, GeForce GTX 1650 Ti Mobile | 2.1 kg | 21.9 mm | 15.60" | 1920x1080 | |
| 83 % v7 (old) | 09/20 | HP Envy 15-ep0098nr i7-10750H, GeForce RTX 2060 Max-Q | 2 kg | 19 mm | 15.60" | 3840x2160 | |
| 81.5 % v7 (old) | 05/20 | Acer Aspire 5 A515-54G i5-10210U, GeForce MX250 | 1.7 kg | 17.9 mm | 15.60" | 1920x1080 | |
| 85.2 % v7 (old) | 04/20 | Asus ZenBook 15 UX534FTC-A8190T i7-10510U, GeForce GTX 1650 Max-Q | 1.6 kg | 18.9 mm | 15.60" | 1920x1080 | |
| 81.4 % v7 (old) | 02/20 | Lenovo Ideapad S540-15IML i5-10210U, GeForce MX250 | 1.9 kg | 17 mm | 15.60" | 1920x1080 | |
| 79.7 % v6 (old) | 08/19 | Dell Inspiron 15 5000 5585 R7 3700U, Vega 10 | 1.8 kg | 19.5 mm | 15.60" | 1920x1080 |
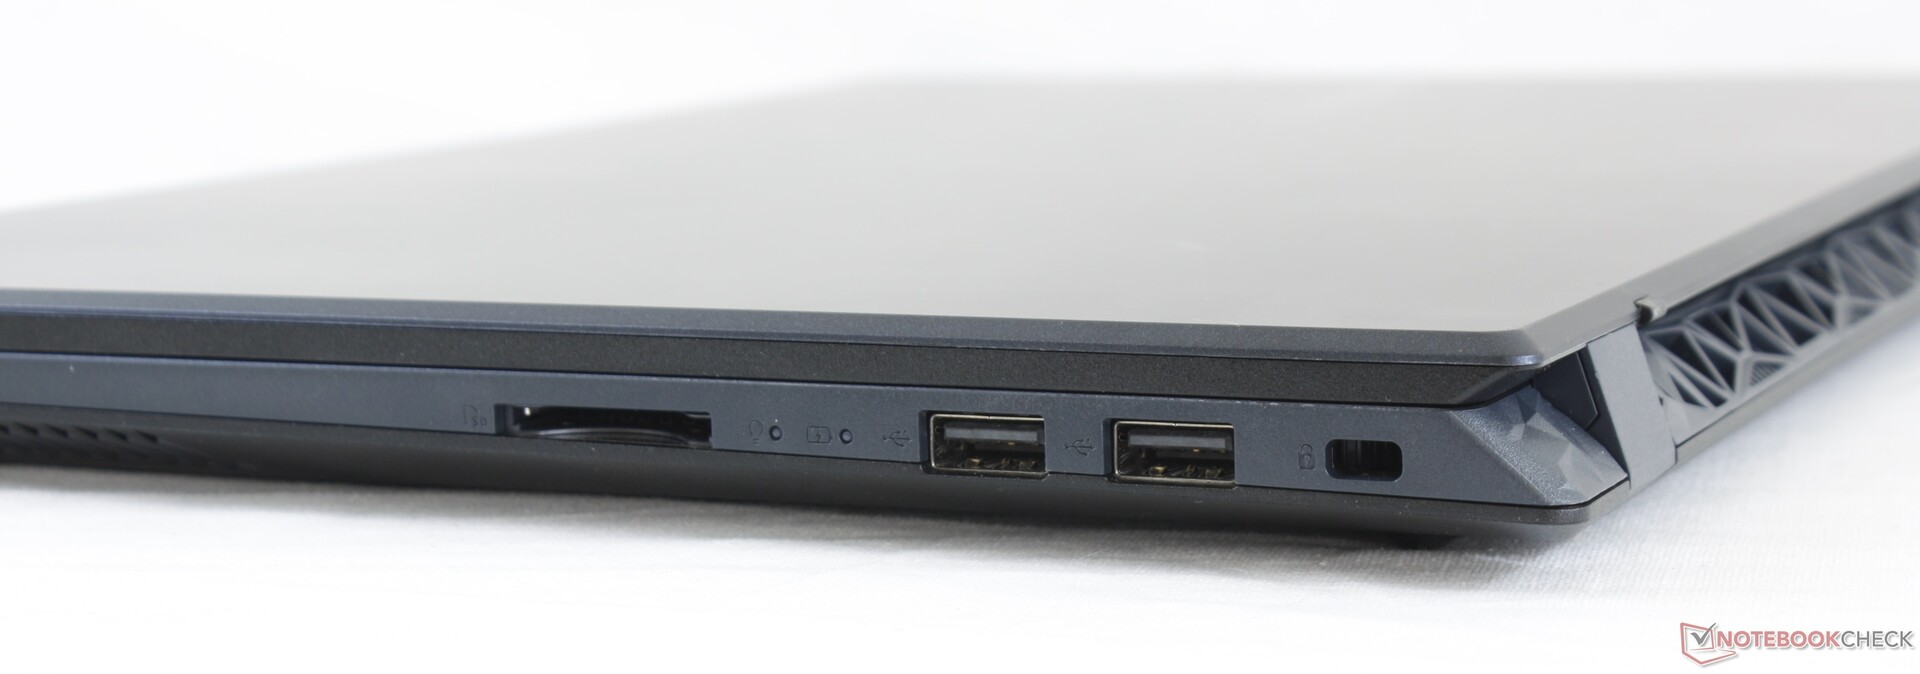
| SD Card Reader | |
| average JPG Copy Test (av. of 3 runs) | |
| Lenovo Ideapad S540-15IML (Toshiba Exceria Pro SDXC 64 GB UHS-II) | |
| HP Envy 15-ep0098nr (Toshiba Exceria Pro M501 UHS-II) | |
| Dell Inspiron 15 5000 5585 (Toshiba Exceria Pro SDXC 64 GB UHS-II) | |
| Asus VivoBook 15 K571LI-PB71 (Toshiba Exceria Pro SDXC 64 GB UHS-II) | |
| maximum AS SSD Seq Read Test (1GB) | |
| HP Envy 15-ep0098nr (Toshiba Exceria Pro M501 UHS-II) | |
| Lenovo Ideapad S540-15IML (Toshiba Exceria Pro SDXC 64 GB UHS-II) | |
| Dell Inspiron 15 5000 5585 (Toshiba Exceria Pro SDXC 64 GB UHS-II) | |
| Asus VivoBook 15 K571LI-PB71 (Toshiba Exceria Pro SDXC 64 GB UHS-II) | |


| |||||||||||||||||||||||||
Homogénéité de la luminosité: 87 %
Valeur mesurée au centre, sur batterie: 263.9 cd/m²
Contraste: 1015:1 (Valeurs des noirs: 0.26 cd/m²)
ΔE ColorChecker Calman: 5.56 | ∀{0.5-29.43 Ø4.73}
calibrated: 4.3
ΔE Greyscale Calman: 5.8 | ∀{0.09-98 Ø4.97}
60.1% sRGB (Argyll 1.6.3 3D)
38.2% AdobeRGB 1998 (Argyll 1.6.3 3D)
41.56% AdobeRGB 1998 (Argyll 3D)
60.4% sRGB (Argyll 3D)
40.2% Display P3 (Argyll 3D)
Gamma: 2.16
CCT: 7828 K
| Asus VivoBook 15 K571LI-PB71 Panda LM156LF-GL03, IPS, 15.6", 1920x1080 | HP Envy 15-ep0098nr Samsung SDC4145, AMOLED, 15.6", 3840x2160 | Acer Aspire 5 A515-54G LG Display LP156WFC SPD1, IPS, 15.6", 1920x1080 | Asus ZenBook 15 UX534FTC-A8190T BOE CQ NV156FHM-N63, IPS, 15.6", 1920x1080 | Lenovo Ideapad S540-15IML BOEhydis NV156FHM-N61 (BOE06FB), IPS, 15.6", 1920x1080 | Dell Inspiron 15 5000 5585 LG Philips 156WFC, IPS, 15.6", 1920x1080 | |
|---|---|---|---|---|---|---|
| Display | 109% | -16% | 52% | 54% | -7% | |
| Display P3 Coverage (%) | 40.2 | 88.5 120% | 33.78 -16% | 65 62% | 66.8 66% | 37.31 -7% |
| sRGB Coverage (%) | 60.4 | 100 66% | 50.8 -16% | 86.2 43% | 86.5 43% | 56.2 -7% |
| AdobeRGB 1998 Coverage (%) | 41.56 | 99.9 140% | 34.9 -16% | 62.9 51% | 63.2 52% | 38.55 -7% |
| Response Times | 93% | -16% | -46% | -60% | -7% | |
| Response Time Grey 50% / Grey 80% * (ms) | 28.4 ? | 0.8 ? 97% | 36 ? -27% | 45 ? -58% | 49.6 ? -75% | 28.4 ? -0% |
| Response Time Black / White * (ms) | 24 ? | 2.7 ? 89% | 25 ? -4% | 32 ? -33% | 34.8 ? -45% | 27.2 ? -13% |
| PWM Frequency (Hz) | 242.7 ? | 202 ? | ||||
| Screen | 45% | 6% | 28% | 25% | -1% | |
| Brightness middle (cd/m²) | 263.9 | 374.3 42% | 248 -6% | 299 13% | 299 13% | 253.6 -4% |
| Brightness (cd/m²) | 246 | 379 54% | 238 -3% | 280 14% | 278 13% | 227 -8% |
| Brightness Distribution (%) | 87 | 91 5% | 86 -1% | 89 2% | 87 0% | 84 -3% |
| Black Level * (cd/m²) | 0.26 | 0.23 12% | 0.21 19% | 0.25 4% | 0.27 -4% | |
| Contrast (:1) | 1015 | 1078 6% | 1424 40% | 1196 18% | 939 -7% | |
| Colorchecker dE 2000 * | 5.56 | 5.47 2% | 5.05 9% | 4.76 14% | 4.32 22% | 6.05 -9% |
| Colorchecker dE 2000 max. * | 16.11 | 8.22 49% | 14.34 11% | 9 44% | 9.3 42% | 14.03 13% |
| Colorchecker dE 2000 calibrated * | 4.3 | 4.61 -7% | 4.76 -11% | 2.58 40% | 4.97 -16% | |
| Greyscale dE 2000 * | 5.8 | 2.3 60% | 1.37 76% | 3.53 39% | 4.21 27% | 3.2 45% |
| Gamma | 2.16 102% | 2.09 105% | 2.4 92% | 2.3 96% | 2.39 92% | 2 110% |
| CCT | 7828 83% | 6340 103% | 6592 99% | 7228 90% | 6799 96% | 6820 95% |
| Color Space (Percent of AdobeRGB 1998) (%) | 38.2 | 87.8 130% | 32 -16% | 56 47% | 57 49% | 35.5 -7% |
| Color Space (Percent of sRGB) (%) | 60.1 | 100 66% | 51 -15% | 86 43% | 86 43% | 55.6 -7% |
| Moyenne finale (programmes/paramètres) | 82% /
65% | -9% /
-1% | 11% /
23% | 6% /
20% | -5% /
-3% |
* ... Moindre est la valeur, meilleures sont les performances
Temps de réponse de l'écran
| ↔ Temps de réponse noir à blanc | ||
|---|---|---|
| 24 ms ... hausse ↗ et chute ↘ combinées | ↗ 13.2 ms hausse | 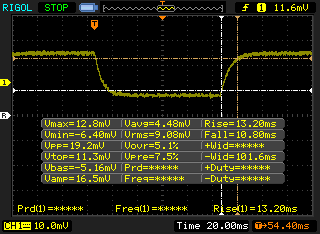 |
| ↘ 10.8 ms chute | ||
| L'écran montre de bons temps de réponse, mais insuffisant pour du jeu compétitif. En comparaison, tous les appareils testés affichent entre 0.1 (minimum) et 240 (maximum) ms. » 54 % des appareils testés affichent de meilleures performances. Cela signifie que les latences relevées sont moins bonnes que la moyenne (19.9 ms) de tous les appareils testés. | ||
| ↔ Temps de réponse gris 50% à gris 80% | ||
| 28.4 ms ... hausse ↗ et chute ↘ combinées | ↗ 16.8 ms hausse | 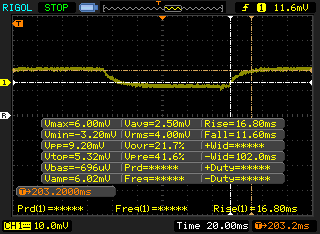 |
| ↘ 11.6 ms chute | ||
| L'écran souffre de latences relativement élevées, insuffisant pour le jeu. En comparaison, tous les appareils testés affichent entre 0.165 (minimum) et 636 (maximum) ms. » 38 % des appareils testés affichent de meilleures performances. Cela signifie que les latences relevées sont similaires à la moyenne (31.1 ms) de tous les appareils testés. | ||
Scintillement / MLI (Modulation de largeur d'impulsion)
| Scintillement / MLI (Modulation de largeur d'impulsion) non décelé | 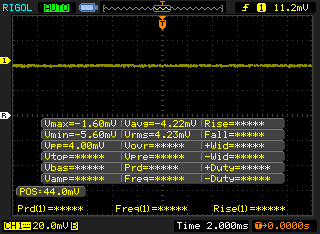 | ||
En comparaison, 52 % des appareils testés n'emploient pas MDI pour assombrir leur écran. Nous avons relevé une moyenne à 7794 (minimum : 5 - maximum : 343500) Hz dans le cas où une MDI était active. | |||
Cinebench R15: CPU Multi 64Bit | CPU Single 64Bit
Blender: v2.79 BMW27 CPU
7-Zip 18.03: 7z b 4 -mmt1 | 7z b 4
Geekbench 5.5: Single-Core | Multi-Core
HWBOT x265 Benchmark v2.2: 4k Preset
LibreOffice : 20 Documents To PDF
R Benchmark 2.5: Overall mean
| Cinebench R20 / CPU (Single Core) | |
| Dell XPS 15 9500 Core i7 4K UHD | |
| Asus ROG Strix Scar 15 G532LWS | |
| Dell G5 15 SE 5505 P89F | |
| Moyenne Intel Core i7-10750H (431 - 504, n=43) | |
| Asus VivoBook 15 K571LI-PB71 | |
| Asus ZenBook 15 UX534FTC-A8190T | |
| Lenovo IdeaPad S740-15IRH | |
| Dell XPS 15 9500 Core i5 | |
| HP Pavilion Gaming 15-ec1206ng | |
| Dell G5 15 5590-PCNJJ | |
| Blender / v2.79 BMW27 CPU | |
| Dell XPS 15 9500 Core i5 | |
| Asus VivoBook 15 K571LI-PB71 | |
| Moyenne Intel Core i7-10750H (322 - 587, n=43) | |
| Dell XPS 15 9500 Core i7 4K UHD | |
| HP Pavilion Gaming 15-ec1206ng | |
| Asus ROG Strix Scar 15 G532LWS | |
| Dell G5 15 SE 5505 P89F | |
| 7-Zip 18.03 / 7z b 4 -mmt1 | |
| Asus ROG Strix Scar 15 G532LWS | |
| Dell XPS 15 9500 Core i7 4K UHD | |
| Asus VivoBook 15 K571LI-PB71 | |
| Moyenne Intel Core i7-10750H (4504 - 5470, n=43) | |
| Dell XPS 15 9500 Core i5 | |
| Dell G5 15 SE 5505 P89F | |
| HP Pavilion Gaming 15-ec1206ng | |
| 7-Zip 18.03 / 7z b 4 | |
| Dell G5 15 SE 5505 P89F | |
| Asus ROG Strix Scar 15 G532LWS | |
| HP Pavilion Gaming 15-ec1206ng | |
| Dell XPS 15 9500 Core i7 4K UHD | |
| Moyenne Intel Core i7-10750H (26040 - 37345, n=43) | |
| Asus VivoBook 15 K571LI-PB71 | |
| Dell XPS 15 9500 Core i5 | |
| Geekbench 5.5 / Single-Core | |
| Asus ROG Strix Scar 15 G532LWS | |
| Dell XPS 15 9500 Core i7 4K UHD | |
| Asus VivoBook 15 K571LI-PB71 | |
| Moyenne Intel Core i7-10750H (1114 - 1333, n=43) | |
| Asus ZenBook 15 UX534FTC-A8190T | |
| Dell XPS 15 9500 Core i5 | |
| Dell G5 15 SE 5505 P89F | |
| HP Pavilion Gaming 15-ec1206ng | |
| Geekbench 5.5 / Multi-Core | |
| Asus ROG Strix Scar 15 G532LWS | |
| Dell XPS 15 9500 Core i7 4K UHD | |
| Dell G5 15 SE 5505 P89F | |
| Asus VivoBook 15 K571LI-PB71 | |
| Moyenne Intel Core i7-10750H (4443 - 6674, n=43) | |
| HP Pavilion Gaming 15-ec1206ng | |
| Asus ZenBook 15 UX534FTC-A8190T | |
| Dell XPS 15 9500 Core i5 | |
| HWBOT x265 Benchmark v2.2 / 4k Preset | |
| Asus ROG Strix Scar 15 G532LWS | |
| Dell G5 15 SE 5505 P89F | |
| HP Pavilion Gaming 15-ec1206ng | |
| Dell XPS 15 9500 Core i7 4K UHD | |
| Moyenne Intel Core i7-10750H (5.54 - 11.6, n=43) | |
| Asus VivoBook 15 K571LI-PB71 | |
| Dell XPS 15 9500 Core i5 | |
| LibreOffice / 20 Documents To PDF | |
| HP Pavilion Gaming 15-ec1206ng | |
| Dell G5 15 SE 5505 P89F | |
| Dell XPS 15 9500 Core i5 | |
| Moyenne Intel Core i7-10750H (43.1 - 99.2, n=43) | |
| Dell XPS 15 9500 Core i7 4K UHD | |
| Asus ROG Strix Scar 15 G532LWS | |
| Asus VivoBook 15 K571LI-PB71 | |
| R Benchmark 2.5 / Overall mean | |
| Dell XPS 15 9500 Core i5 | |
| Moyenne Intel Core i7-10750H (0.578 - 0.708, n=42) | |
| HP Pavilion Gaming 15-ec1206ng | |
| Asus VivoBook 15 K571LI-PB71 | |
| Dell XPS 15 9500 Core i7 4K UHD | |
| Dell G5 15 SE 5505 P89F | |
| Asus ROG Strix Scar 15 G532LWS | |
* ... Moindre est la valeur, meilleures sont les performances
| PCMark 8 Home Score Accelerated v2 | 4090 points | |
| PCMark 8 Work Score Accelerated v2 | 5343 points | |
| PCMark 10 Score | 4837 points | |
Aide | ||
| DPC Latencies / LatencyMon - interrupt to process latency (max), Web, Youtube, Prime95 | |
| Dell XPS 15 9500 Core i7 4K UHD | |
| HP Envy 15-ep0098nr | |
| Dell G5 15 SE 5505 P89F | |
| Dell XPS 15 9500 Core i5 | |
| Asus ROG Strix Scar 15 G532LWS | |
| Asus ROG Strix G15 G512LI | |
| Asus VivoBook 15 K571LI-PB71 | |
| HP Pavilion Gaming 15-ec1206ng | |
| Acer Nitro 5 AN517-52-77DS | |
* ... Moindre est la valeur, meilleures sont les performances
| Asus VivoBook 15 K571LI-PB71 Mushkin Helix-L 1TB MKNSSDHL1TB-08 | HP Envy 15-ep0098nr Intel Optane Memory H10 with Solid State Storage 32GB + 512GB HBRPEKNX0202A(L/H) | Acer Aspire 5 A515-54G Kingston RBUSNS8154P3512GJ1 | Asus ZenBook 15 UX534FTC-A8190T Samsung SSD PM981 MZVLB1T0HALR | Lenovo Ideapad S540-15IML Samsung SSD PM981a MZVLB512HBJQ | Dell Inspiron 15 5000 5585 WDC PC SN520 SDAPNUW-512G | |
|---|---|---|---|---|---|---|
| AS SSD | -5% | 31% | 63% | 119% | -0% | |
| Seq Read (MB/s) | 1323 | 1005 -24% | 1405 6% | 2643 100% | 2642 100% | 398.9 -70% |
| Seq Write (MB/s) | 1572 | 436.8 -72% | 953 -39% | 1533 -2% | 2433 55% | 884 -44% |
| 4K Read (MB/s) | 38.09 | 51.5 35% | 54 42% | 49.12 29% | 58 52% | 34.54 -9% |
| 4K Write (MB/s) | 127.4 | 88 -31% | 93 -27% | 134.7 6% | 145.3 14% | 82.1 -36% |
| 4K-64 Read (MB/s) | 812 | 517 -36% | 959 18% | 1028 27% | 1431 76% | 647 -20% |
| 4K-64 Write (MB/s) | 276 | 839 204% | 772 180% | 1353 390% | 1753 535% | 985 257% |
| Access Time Read * (ms) | 0.035 | 0.088 -151% | 0.051 -46% | 0.033 6% | 0.072 -106% | 0.072 -106% |
| Access Time Write * (ms) | 0.411 | 0.151 63% | 0.044 89% | 0.028 93% | 0.027 93% | 0.047 89% |
| Score Read (Points) | 983 | 669 -32% | 1153 17% | 1342 37% | 1753 78% | 721 -27% |
| Score Write (Points) | 561 | 970 73% | 961 71% | 1641 193% | 2142 282% | 1155 106% |
| Score Total (Points) | 2066 | 1972 -5% | 2695 30% | 3622 75% | 4790 132% | 2279 10% |
| Copy ISO MB/s (MB/s) | 2846 | 1173 -59% | 2226 -22% | 862 -70% | ||
| Copy Program MB/s (MB/s) | 728 | 769 6% | 506 -30% | 457 -37% | ||
| Copy Game MB/s (MB/s) | 1610 | 1045 -35% | 1230 -24% | 902 -44% | ||
| CrystalDiskMark 5.2 / 6 | -5% | -27% | 15% | 11% | -43% | |
| Write 4K (MB/s) | 169.7 | 100.2 -41% | 100.4 -41% | 138.1 -19% | 170.7 1% | 105.9 -38% |
| Read 4K (MB/s) | 53.2 | 112.8 112% | 47.16 -11% | 45.89 -14% | 49.51 -7% | 36.56 -31% |
| Write Seq (MB/s) | 1679 | 537 -68% | 993 -41% | 2147 28% | 1156 -31% | 1165 -31% |
| Read Seq (MB/s) | 1698 | 1270 -25% | 1176 -31% | 2188 29% | 1136 -33% | 423.2 -75% |
| Write 4K Q32T1 (MB/s) | 450.7 | 480.6 7% | 354.7 -21% | 427.8 -5% | 420.5 -7% | 332.1 -26% |
| Read 4K Q32T1 (MB/s) | 577 | 364.9 -37% | 473 -18% | 404 -30% | 527 -9% | 229.3 -60% |
| Write Seq Q32T1 (MB/s) | 1657 | 1224 -26% | 1034 -38% | 2396 45% | 2984 80% | 1460 -12% |
| Read Seq Q32T1 (MB/s) | 1851 | 2635 42% | 1635 -12% | 3454 87% | 3550 92% | 472.5 -74% |
| Moyenne finale (programmes/paramètres) | -5% /
-5% | 2% /
7% | 39% /
45% | 65% /
74% | -22% /
-16% |
* ... Moindre est la valeur, meilleures sont les performances

Disk Throttling: DiskSpd Read Loop, Queue Depth 8
| 3DMark 11 Performance | 12523 points | |
| 3DMark Cloud Gate Standard Score | 29531 points | |
| 3DMark Fire Strike Score | 8903 points | |
| 3DMark Time Spy Score | 3801 points | |
Aide | ||
| Final Fantasy XV Benchmark | |
| 1280x720 Lite Quality | |
| MSI RTX 2060 Gaming Z 6G | |
| HP Envy 15-ep0098nr | |
| Asus VivoBook 15 K571LI-PB71 | |
| MSI Alpha 15 A3DDK-034 | |
| 1920x1080 Standard Quality | |
| MSI RTX 2060 Gaming Z 6G | |
| HP Envy 15-ep0098nr | |
| MSI Alpha 15 A3DDK-034 | |
| Asus VivoBook 15 K571LI-PB71 | |
| 1920x1080 High Quality | |
| MSI RTX 2060 Gaming Z 6G | |
| HP Envy 15-ep0098nr | |
| Asus VivoBook 15 K571LI-PB71 | |
| MSI Alpha 15 A3DDK-034 | |
| Bas | Moyen | Élevé | Ultra | |
|---|---|---|---|---|
| The Witcher 3 (2015) | 199.3 | 126.6 | 74.5 | 38.8 |
| Dota 2 Reborn (2015) | 138 | 124 | 115 | 109 |
| Final Fantasy XV Benchmark (2018) | 104 | 54.9 | 39.3 | |
| X-Plane 11.11 (2018) | 95.6 | 80.5 | 71 |
| Asus VivoBook 15 K571LI-PB71 GeForce GTX 1650 Ti Mobile, i7-10750H, Mushkin Helix-L 1TB MKNSSDHL1TB-08 | HP Envy 15-ep0098nr GeForce RTX 2060 Max-Q, i7-10750H, Intel Optane Memory H10 with Solid State Storage 32GB + 512GB HBRPEKNX0202A(L/H) | Acer Aspire 5 A515-54G GeForce MX250, i5-10210U, Kingston RBUSNS8154P3512GJ1 | Asus ZenBook 15 UX534FTC-A8190T GeForce GTX 1650 Max-Q, i7-10510U, Samsung SSD PM981 MZVLB1T0HALR | Lenovo Ideapad S540-15IML GeForce MX250, i5-10210U, Samsung SSD PM981a MZVLB512HBJQ | Dell Inspiron 15 5000 5585 Vega 10, R7 3700U, WDC PC SN520 SDAPNUW-512G | |
|---|---|---|---|---|---|---|
| Noise | -8% | 7% | 9% | 1% | 11% | |
| arrêt / environnement * (dB) | 25.7 | 26.4 -3% | 29.8 -16% | 30.3 -18% | 30 -17% | 28.3 -10% |
| Idle Minimum * (dB) | 31.9 | 32.2 -1% | 29.8 7% | 30.3 5% | 30 6% | 28.3 11% |
| Idle Average * (dB) | 31.9 | 32.2 -1% | 29.8 7% | 30.3 5% | 32 -0% | 28.3 11% |
| Idle Maximum * (dB) | 31.9 | 32.2 -1% | 29.8 7% | 30.9 3% | 37 -16% | 28.3 11% |
| Load Average * (dB) | 44.2 | 48.3 -9% | 37.3 16% | 31.3 29% | 41 7% | 31.4 29% |
| Witcher 3 ultra * (dB) | 43.9 | 53.7 -22% | 38.1 13% | 39 11% | 41.4 6% | |
| Load Maximum * (dB) | 50.7 | 58.8 -16% | 40.1 21% | 38.2 25% | 42 17% | 41.4 18% |
* ... Moindre est la valeur, meilleures sont les performances
Degré de la nuisance sonore
| Au repos |
| 31.9 / 31.9 / 31.9 dB(A) |
| Fortement sollicité |
| 44.2 / 50.7 dB(A) |
 | ||
30 dB silencieux 40 dB(A) audible 50 dB(A) bruyant |
||
min: | ||
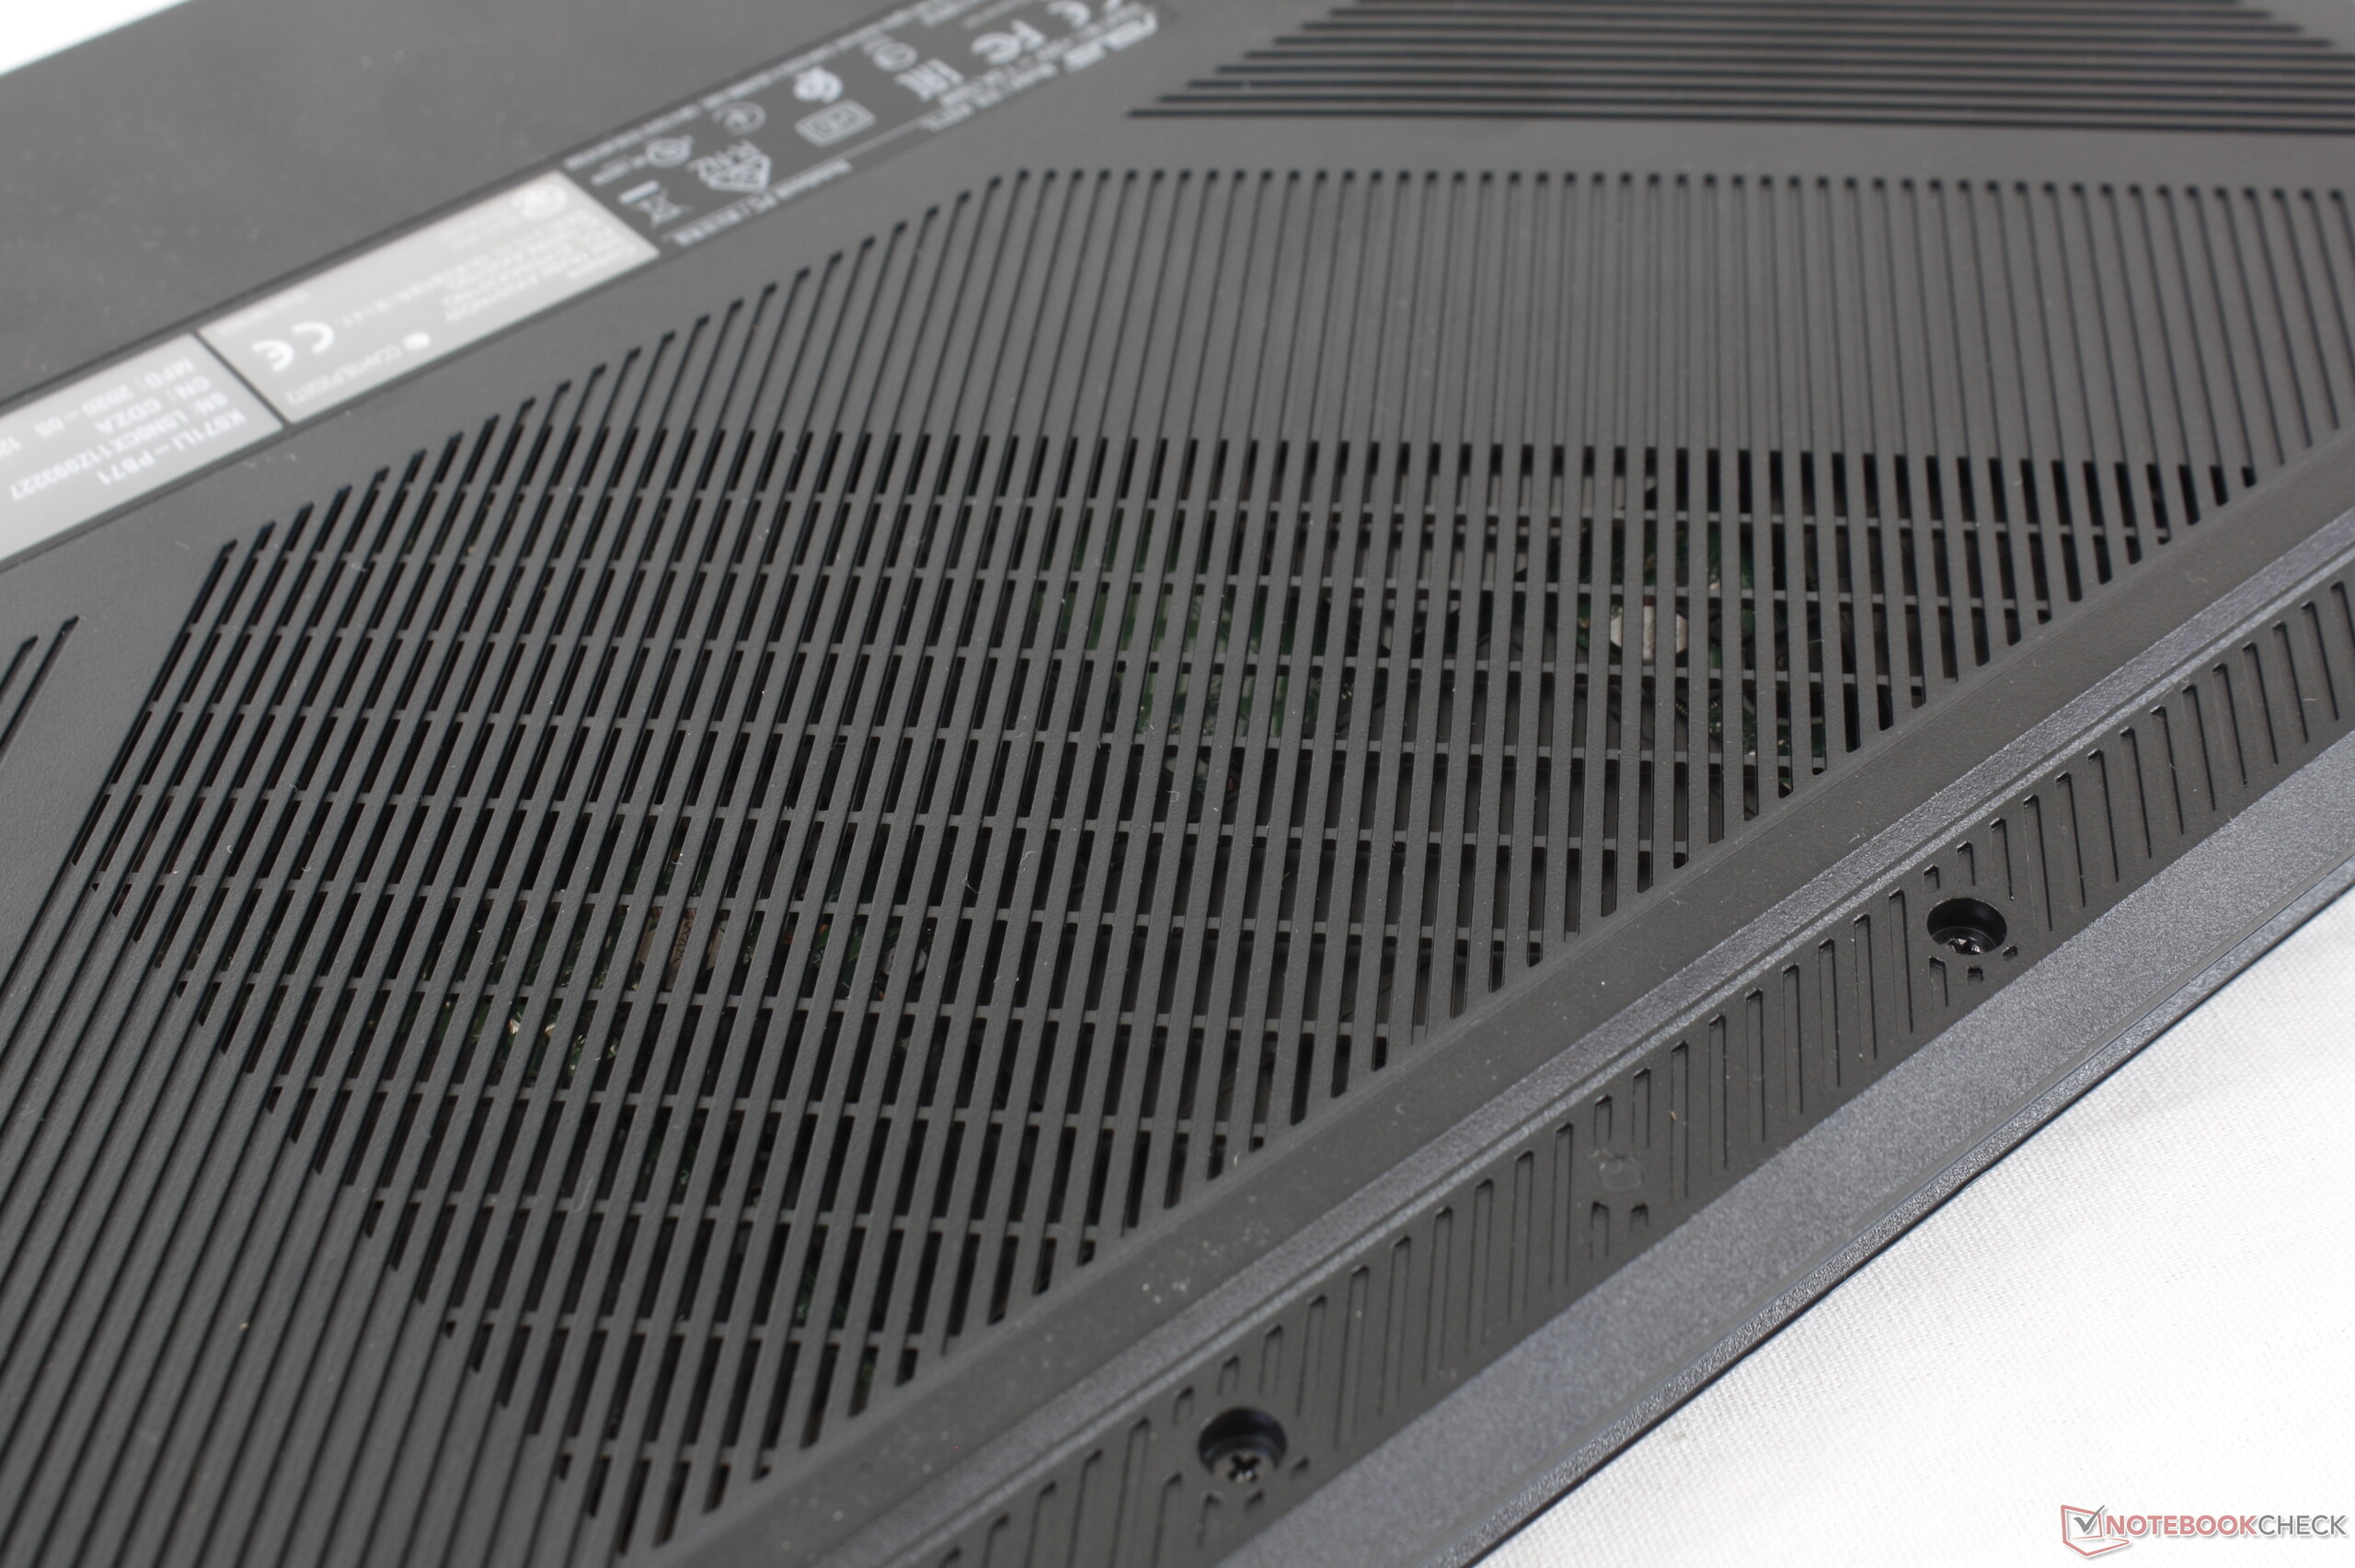
(-) La température maximale du côté supérieur est de 53 °C / 127 F, par rapport à la moyenne de 36.8 °C / 98 F, allant de 21 à 71 °C pour la classe Multimedia.
(-) Le fond chauffe jusqu'à un maximum de 72 °C / 162 F, contre une moyenne de 39.1 °C / 102 F
(+) En utilisation inactive, la température moyenne du côté supérieur est de 28.9 °C / 84 F, par rapport à la moyenne du dispositif de 31.3 °C / 88 F.
(±) En jouant à The Witcher 3, la température moyenne du côté supérieur est de 34.7 °C / 94 F, alors que la moyenne de l'appareil est de 31.3 °C / 88 F.
(+) Les repose-poignets et le pavé tactile sont plus froids que la température de la peau avec un maximum de 30 °C / 86 F et sont donc froids au toucher.
(±) La température moyenne de la zone de l'appui-paume de dispositifs similaires était de 28.7 °C / 83.7 F (-1.3 °C / #-2.3 F).
Asus VivoBook 15 K571LI-PB71 analyse audio
(±) | le niveau sonore du haut-parleur est moyen mais bon (78.7# dB)
Basses 100 - 315 Hz
(-) | presque aucune basse - en moyenne 20.1% plus bas que la médiane
(±) | la linéarité des basses est moyenne (14.6% delta à la fréquence précédente)
Médiums 400 - 2000 Hz
(±) | médiane supérieure - en moyenne 5% supérieure à la médiane
(+) | les médiums sont linéaires (3.9% delta à la fréquence précédente)
Aiguës 2 - 16 kHz
(+) | des sommets équilibrés - à seulement 1.1% de la médiane
(+) | les aigus sont linéaires (3.4% delta à la fréquence précédente)
Globalement 100 - 16 000 Hz
(±) | la linéarité du son global est moyenne (17.8% de différence avec la médiane)
Par rapport à la même classe
» 52% de tous les appareils testés de cette catégorie étaient meilleurs, 7% similaires, 41% pires
» Le meilleur avait un delta de 5%, la moyenne était de 17%, le pire était de 45%.
Par rapport à tous les appareils testés
» 36% de tous les appareils testés étaient meilleurs, 8% similaires, 56% pires
» Le meilleur avait un delta de 4%, la moyenne était de 24%, le pire était de 134%.
Apple MacBook 12 (Early 2016) 1.1 GHz analyse audio
(+) | les haut-parleurs peuvent jouer relativement fort (83.6# dB)
Basses 100 - 315 Hz
(±) | basse réduite - en moyenne 11.3% inférieure à la médiane
(±) | la linéarité des basses est moyenne (14.2% delta à la fréquence précédente)
Médiums 400 - 2000 Hz
(+) | médiane équilibrée - seulement 2.4% de la médiane
(+) | les médiums sont linéaires (5.5% delta à la fréquence précédente)
Aiguës 2 - 16 kHz
(+) | des sommets équilibrés - à seulement 2% de la médiane
(+) | les aigus sont linéaires (4.5% delta à la fréquence précédente)
Globalement 100 - 16 000 Hz
(+) | le son global est linéaire (10.2% différence à la médiane)
Par rapport à la même classe
» 7% de tous les appareils testés de cette catégorie étaient meilleurs, 2% similaires, 91% pires
» Le meilleur avait un delta de 5%, la moyenne était de 18%, le pire était de 53%.
Par rapport à tous les appareils testés
» 5% de tous les appareils testés étaient meilleurs, 1% similaires, 94% pires
» Le meilleur avait un delta de 4%, la moyenne était de 24%, le pire était de 134%.
| Éteint/en veille | |
| Au repos | |
| Fortement sollicité |
|
Légende:
min: | |
| Asus VivoBook 15 K571LI-PB71 i7-10750H, GeForce GTX 1650 Ti Mobile, Mushkin Helix-L 1TB MKNSSDHL1TB-08, IPS, 1920x1080, 15.6" | HP Envy 15-ep0098nr i7-10750H, GeForce RTX 2060 Max-Q, Intel Optane Memory H10 with Solid State Storage 32GB + 512GB HBRPEKNX0202A(L/H), AMOLED, 3840x2160, 15.6" | Acer Aspire 5 A515-54G i5-10210U, GeForce MX250, Kingston RBUSNS8154P3512GJ1, IPS, 1920x1080, 15.6" | Asus ZenBook 15 UX534FTC-A8190T i7-10510U, GeForce GTX 1650 Max-Q, Samsung SSD PM981 MZVLB1T0HALR, IPS, 1920x1080, 15.6" | Lenovo Ideapad S540-15IML i5-10210U, GeForce MX250, Samsung SSD PM981a MZVLB512HBJQ, IPS, 1920x1080, 15.6" | Dell Inspiron 15 5000 5585 R7 3700U, Vega 10, WDC PC SN520 SDAPNUW-512G, IPS, 1920x1080, 15.6" | |
|---|---|---|---|---|---|---|
| Power Consumption | -23% | 52% | 40% | 42% | 55% | |
| Idle Minimum * (Watt) | 6.4 | 9.2 -44% | 3.4 47% | 2.8 56% | 5 22% | 4.2 34% |
| Idle Average * (Watt) | 10.6 | 14.5 -37% | 6.4 40% | 7.7 27% | 7 34% | 6.8 36% |
| Idle Maximum * (Watt) | 18.4 | 18 2% | 9.2 50% | 9.4 49% | 10 46% | 7 62% |
| Load Average * (Watt) | 103.7 | 110.9 -7% | 38 63% | 57 45% | 64 38% | 36.5 65% |
| Witcher 3 ultra * (Watt) | 99.1 | 125.5 -27% | 62 37% | 44 56% | 37.9 62% | |
| Load Maximum * (Watt) | 154.9 | 194.6 -26% | 59 62% | 116 25% | 67 57% | 44 72% |
* ... Moindre est la valeur, meilleures sont les performances
| Asus VivoBook 15 K571LI-PB71 i7-10750H, GeForce GTX 1650 Ti Mobile, 42 Wh | HP Envy 15-ep0098nr i7-10750H, GeForce RTX 2060 Max-Q, 83 Wh | Acer Aspire 5 A515-54G i5-10210U, GeForce MX250, 48 Wh | Asus ZenBook 15 UX534FTC-A8190T i7-10510U, GeForce GTX 1650 Max-Q, 71 Wh | Lenovo Ideapad S540-15IML i5-10210U, GeForce MX250, 70 Wh | Dell Inspiron 15 5000 5585 R7 3700U, Vega 10, 42 Wh | |
|---|---|---|---|---|---|---|
| Autonomie de la batterie | 62% | 141% | 190% | 160% | 62% | |
| Reader / Idle (h) | 10.2 | 15 47% | 27.2 167% | 30.2 196% | 14.3 40% | |
| WiFi v1.3 (h) | 3.7 | 6 62% | 8.9 141% | 12.4 235% | 12.1 227% | 7 89% |
| Load (h) | 0.9 | 1.6 78% | 2.4 167% | 1.4 56% | 1.4 56% |
Points positifs
Points négatifs
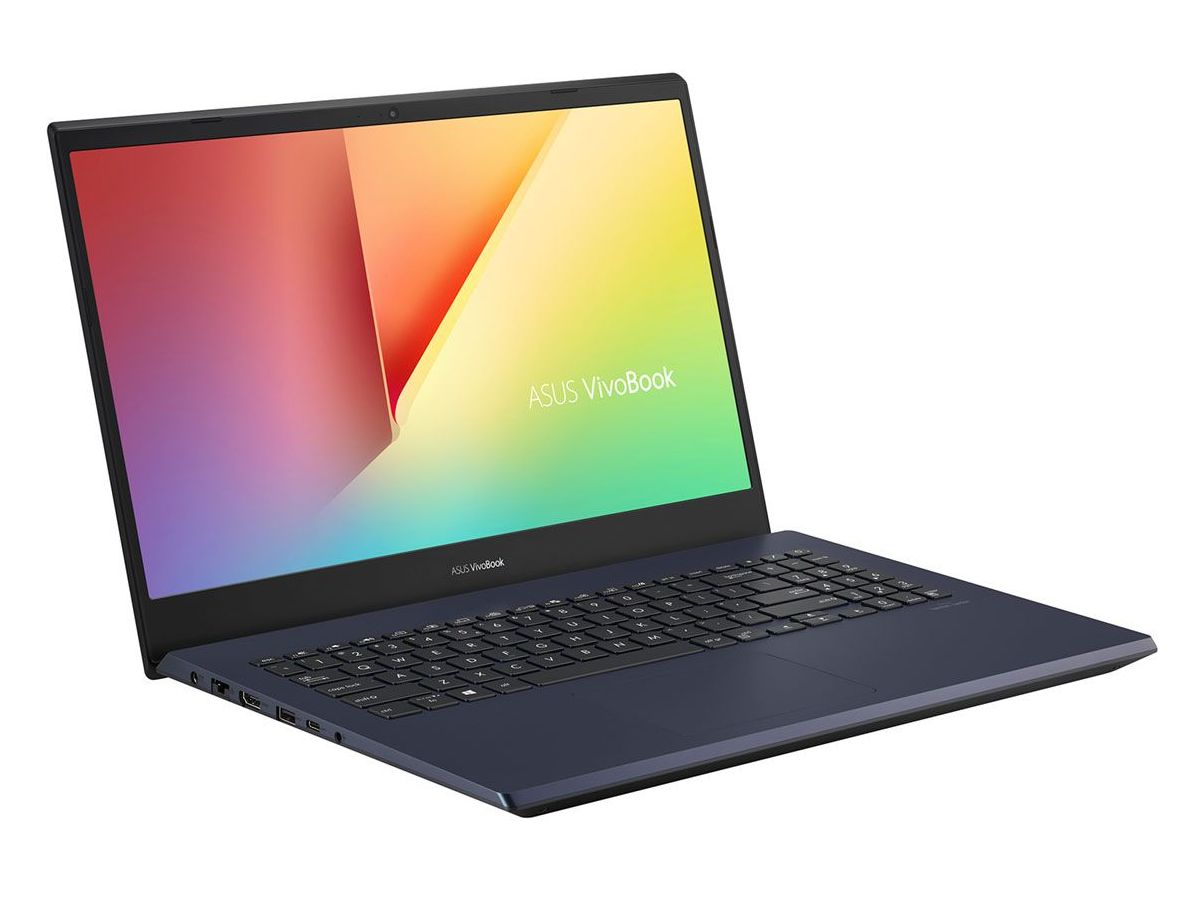

Le VivoBook 15 K571 est idéal pour les étudiants qui veulent un PC portable abordable pour le jeu et le travail, et qui soit également plutôt portable. Il est puissant pour sa taille et son poids, et s'avère être une solution intermédiaire entre un ultrabook classique et un PC de jeu d'entrée de gamme. Et peu de portables dans cette gamme de prix sont équipés d'un écran 120 Hz.
Ceux qui n'ont pas besoin d'un processeur Core de série H ou d'un GPU GTX 1650 Ti devraient plutôt regarder du côté du ZenBook. L'autonomie, le niveau sonore et les températures sont ici tout juste moyens, à cause des exigences du processeur.
Nous recommandons de choisir attentivement l'écran. Asus propose d'autres versions : 1080p 120 Hz à 45 % NTSC, 1080p 60 Hz à 45 % NTSC, ou 1080p 60 Hz à 72 NTSC. Le 1080p120 à 45 % NTSC sera le meilleur pour le jeu, même au vu des temps de réponse du noir au blanc moyens. Pour l'édition et le travail graphique, le 1080p60 Hz à 72 % NTSC sera le meilleur pour des couleurs plus profondes.
L'Asus VivoBook 15 K571 n'excelle nulle part, mais s'équilibre bien à cheval entre machine multimédia et de jeu, surtout au vu de son prix réduit.
L’intégralité de cette critique est disponible en anglais en suivant ce lien.
Asus VivoBook 15 K571LI-PB71
- 09/13/2020 v7 (old)
Allen Ngo
Price comparison
