Test de l'Uniwell Technology GM7AG8N : boîtier de refroidissement liquide plus silencieux que prévu
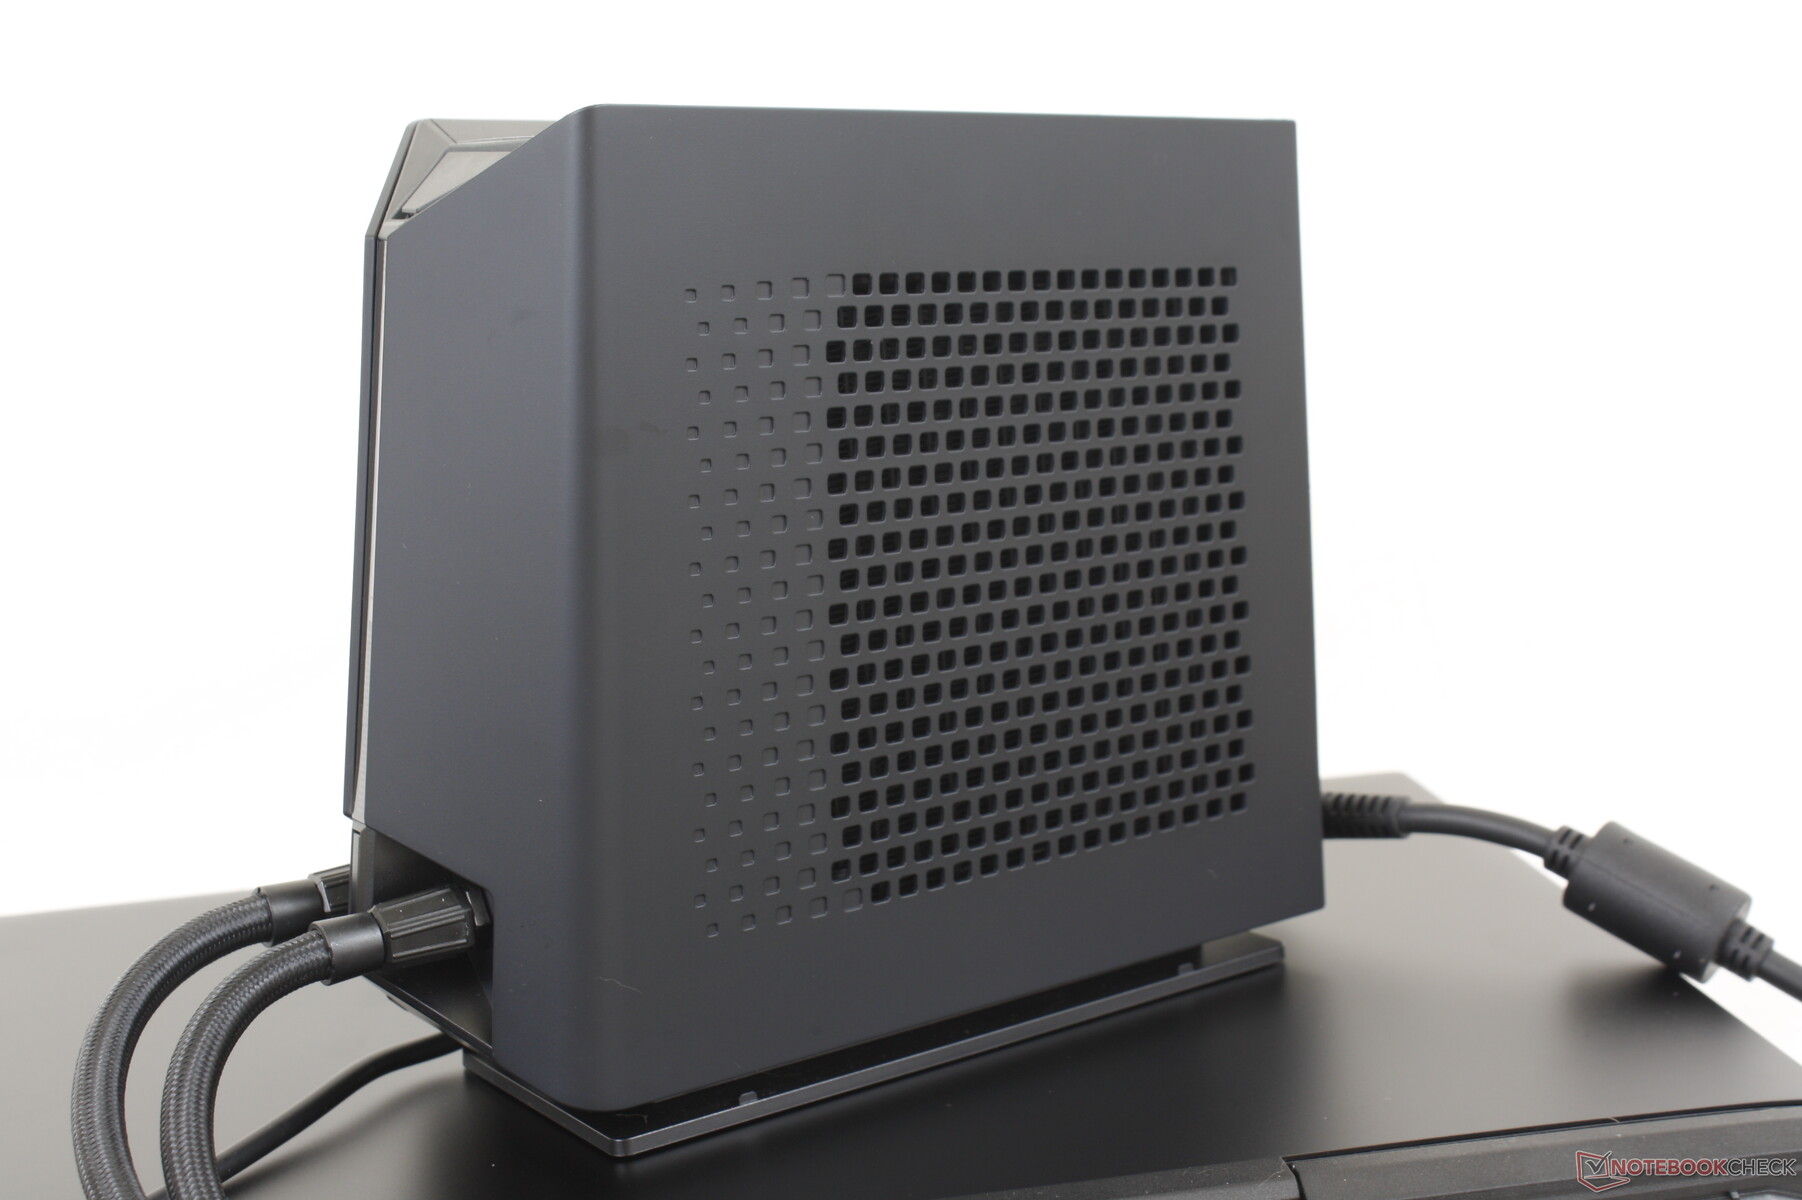
Après avoir testé letongfang GM5AG8W de 15,6 pouces refroidi par eau de Schenker, nous sommes maintenant prêts à tester le Tongfang GM7AG8N de 17 pouces refroidi par eau, offert par Uniwell Technology. Les stations de refroidissement externes peuvent être considérées comme une solution extrême aux exigences de refroidissement élevées des nouveaux processeurs et GPU mobiles. Alors que les ordinateurs de bureau ont le luxe d'avoir de l'espace, les ordinateurs portables de jeu doivent intégrer des processeurs de plus en plus rapides dans des facteurs de forme de plus en plus fins chaque année.
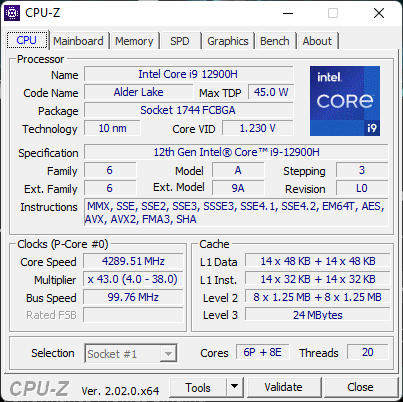
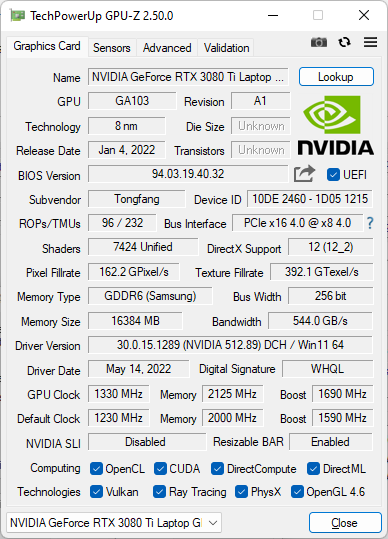
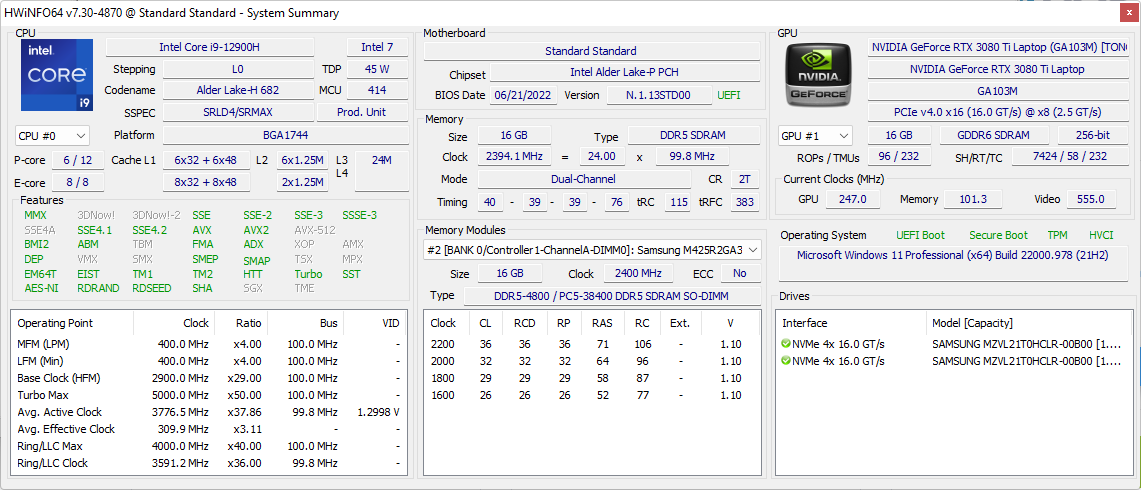
GeForce Notre unité de test est équipée du CPU Core i9-12900H de 12e génération, d'un GPU RTX 3080 Ti de 175 W avec MUX, d'un écran IPS 240 Hz 1600p de 17 pouces et d'un clavier mécanique Cherry MX intégré. Le modèle n'est pas encore largement disponible au moment de la publication.
Le GM7AG8N d'Uniwell Technology est en concurrence directe avec des ordinateurs portables de jeu de 17 pouces plus traditionnels comme le Razer Blade 17 Test du Razer Blade 17 (début 2022) : portable de jeu 4k élégant avec un écran lumineux , Asus ROG Zephyrus S17, MSI Stealth GS77, ou le Gigabyte Aorus 17X Test de l'Aorus 17X XES : PC portable de jeu avec i9-12900HX et des performances de pointe . Cependant, l'Uniwell est un facteur de forme 16:10 alors que la plupart des autres alternatives de 17 pouces sont toujours 16:9. Le boîtier de refroidissement est le même que sur le Schenker GM5AG8W et nous vous recommandons de consulter nos avis existants ici et ici pour plus de détails sur la façon de configurer le refroidisseur externe.
Plus de commentaires sur Uniwell Technology :
Comparaison avec les concurrents potentiels
Note | Date | Modèle | Poids | Épaisseur | Taille | Résolution | Prix |
|---|---|---|---|---|---|---|---|
| 88.1 % v7 (old) | 10/22 | Uniwell Technology GM7AG8N Liquid Cooling Box i9-12900H, GeForce RTX 3080 Ti Laptop GPU | 2.7 kg | 27.6 mm | 17.00" | 2560x1600 | |
| 88.3 % v7 (old) | 08/22 | MSI Titan GT77 12UHS i9-12900HX, GeForce RTX 3080 Ti Laptop GPU | 3.3 kg | 23 mm | 17.30" | 1920x1080 | |
| 83.7 % v7 (old) | 08/22 | Aorus 17X XES i9-12900HX, GeForce RTX 3070 Ti Laptop GPU | 2.7 kg | 30 mm | 17.30" | 1920x1080 | |
| 89.9 % v7 (old) | 07/22 | Razer Blade 17 Early 2022 i9-12900H, GeForce RTX 3080 Ti Laptop GPU | 2.8 kg | 19.9 mm | 17.30" | 3840x2160 | |
| 87.2 % v7 (old) | 04/22 | MSI Stealth GS77 12UHS-083US i7-12700H, GeForce RTX 3080 Ti Laptop GPU | 2.9 kg | 20.8 mm | 17.30" | 2560x1440 | |
| 90.1 % v7 (old) | 07/21 | Asus ROG Zephyrus S17 GX703HSD i9-11900H, GeForce RTX 3080 Laptop GPU | 2.8 kg | 19.9 mm | 17.30" | 2560x1440 |
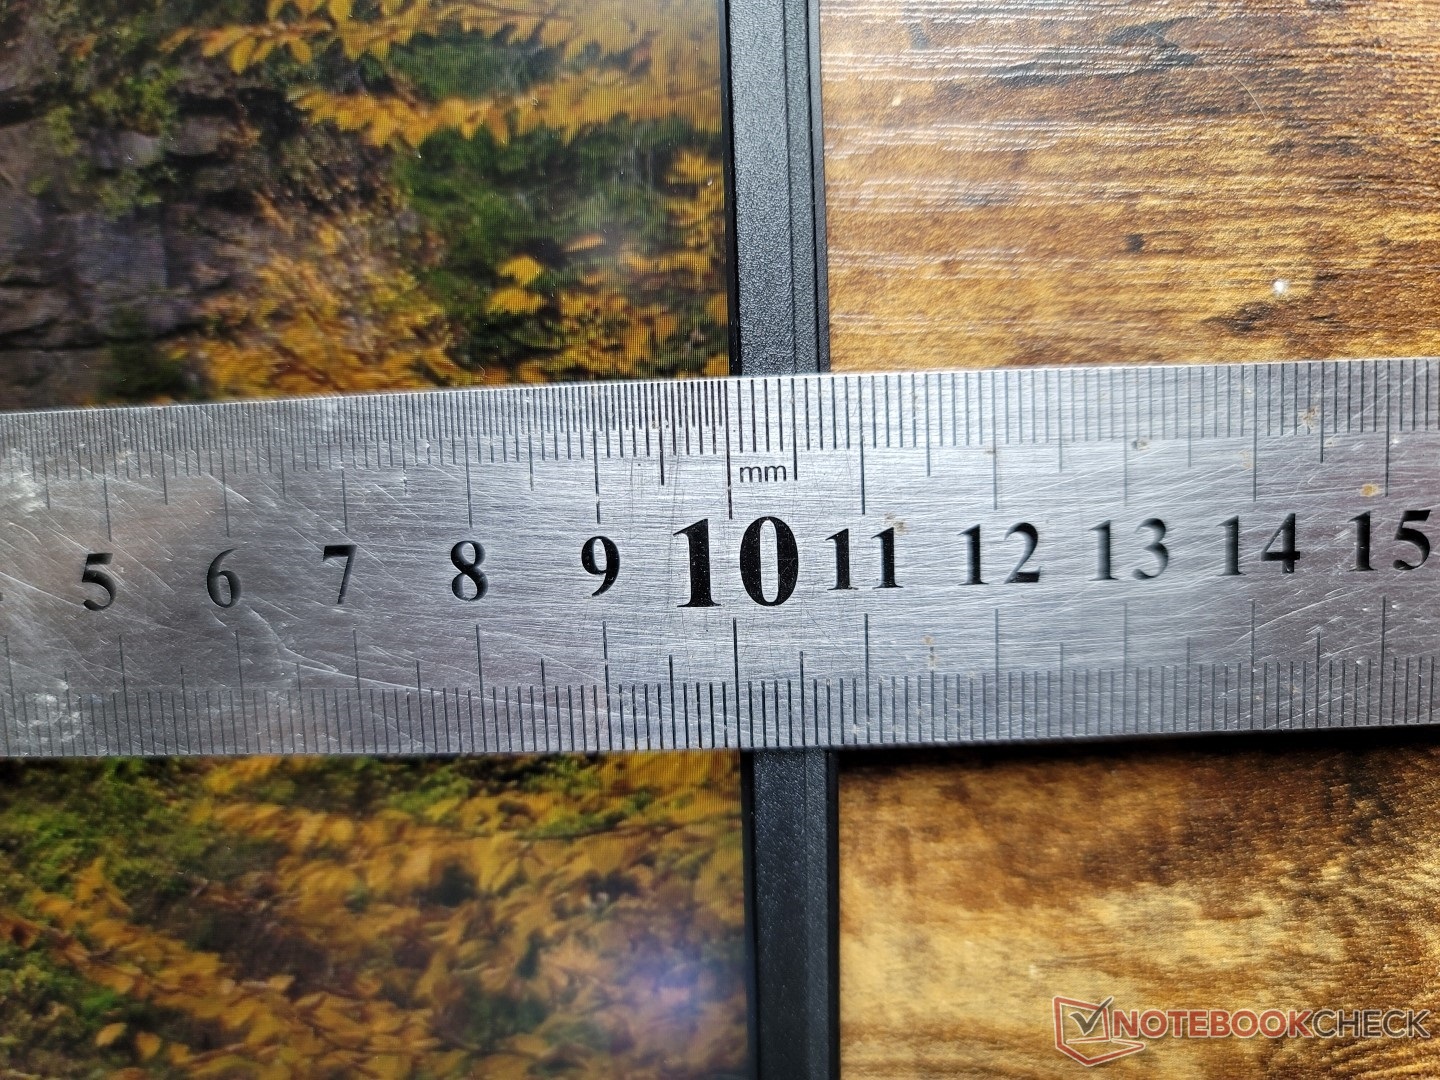
Cas - Un énorme aimant à empreintes digitales
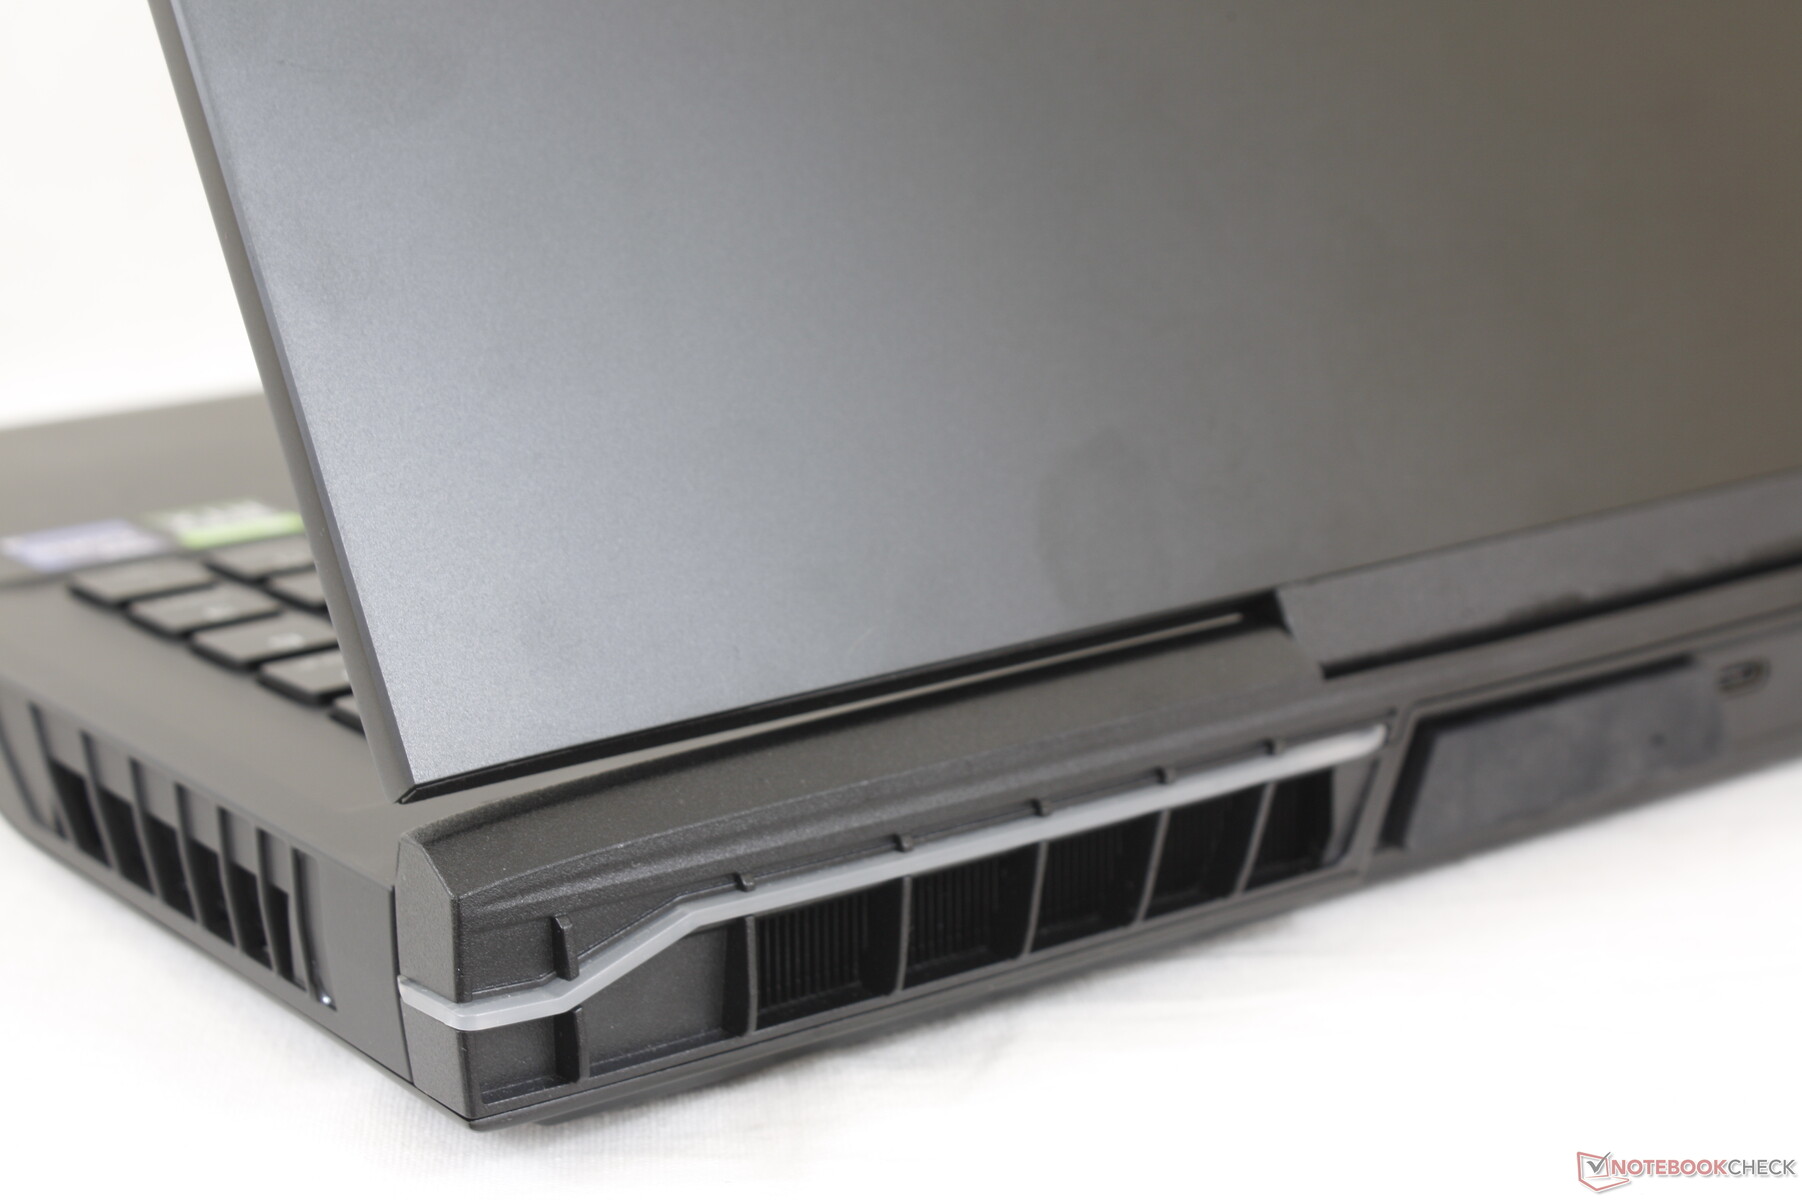
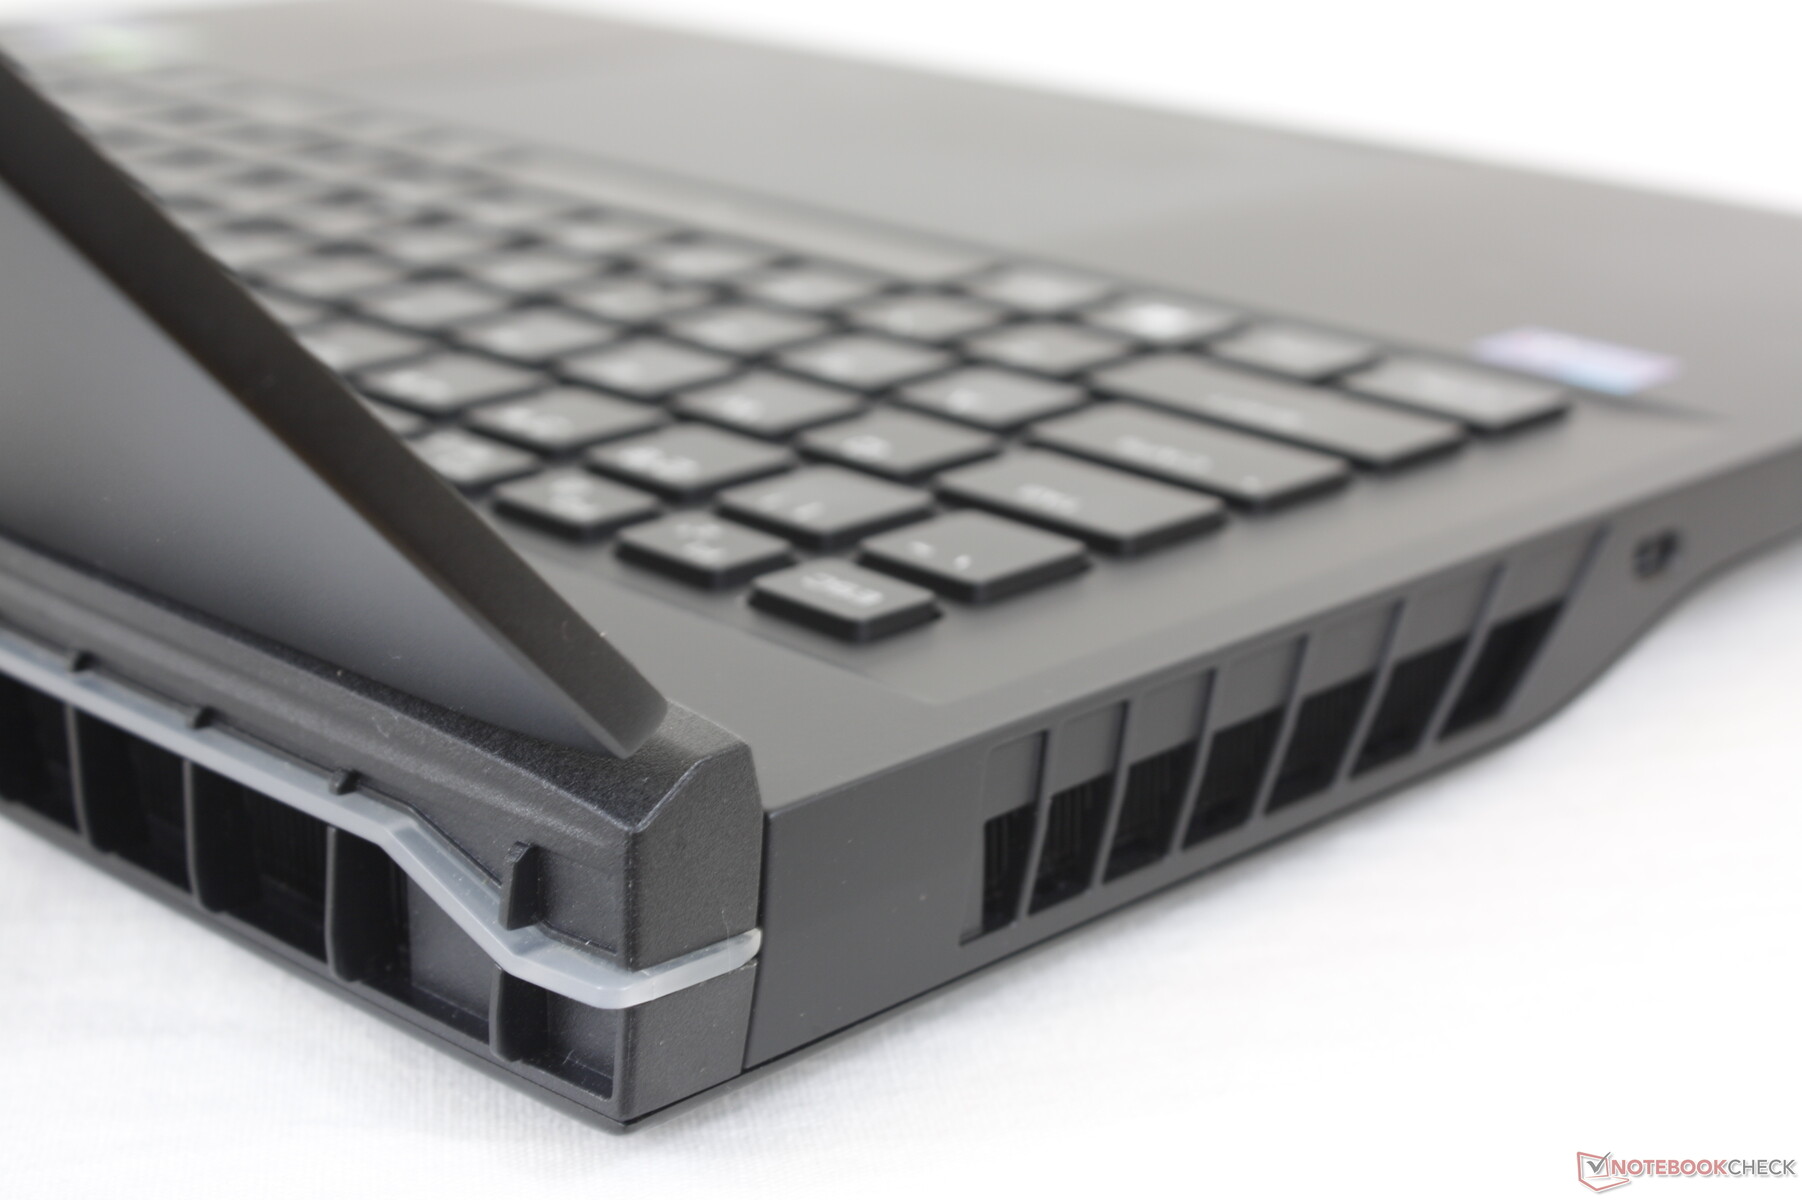
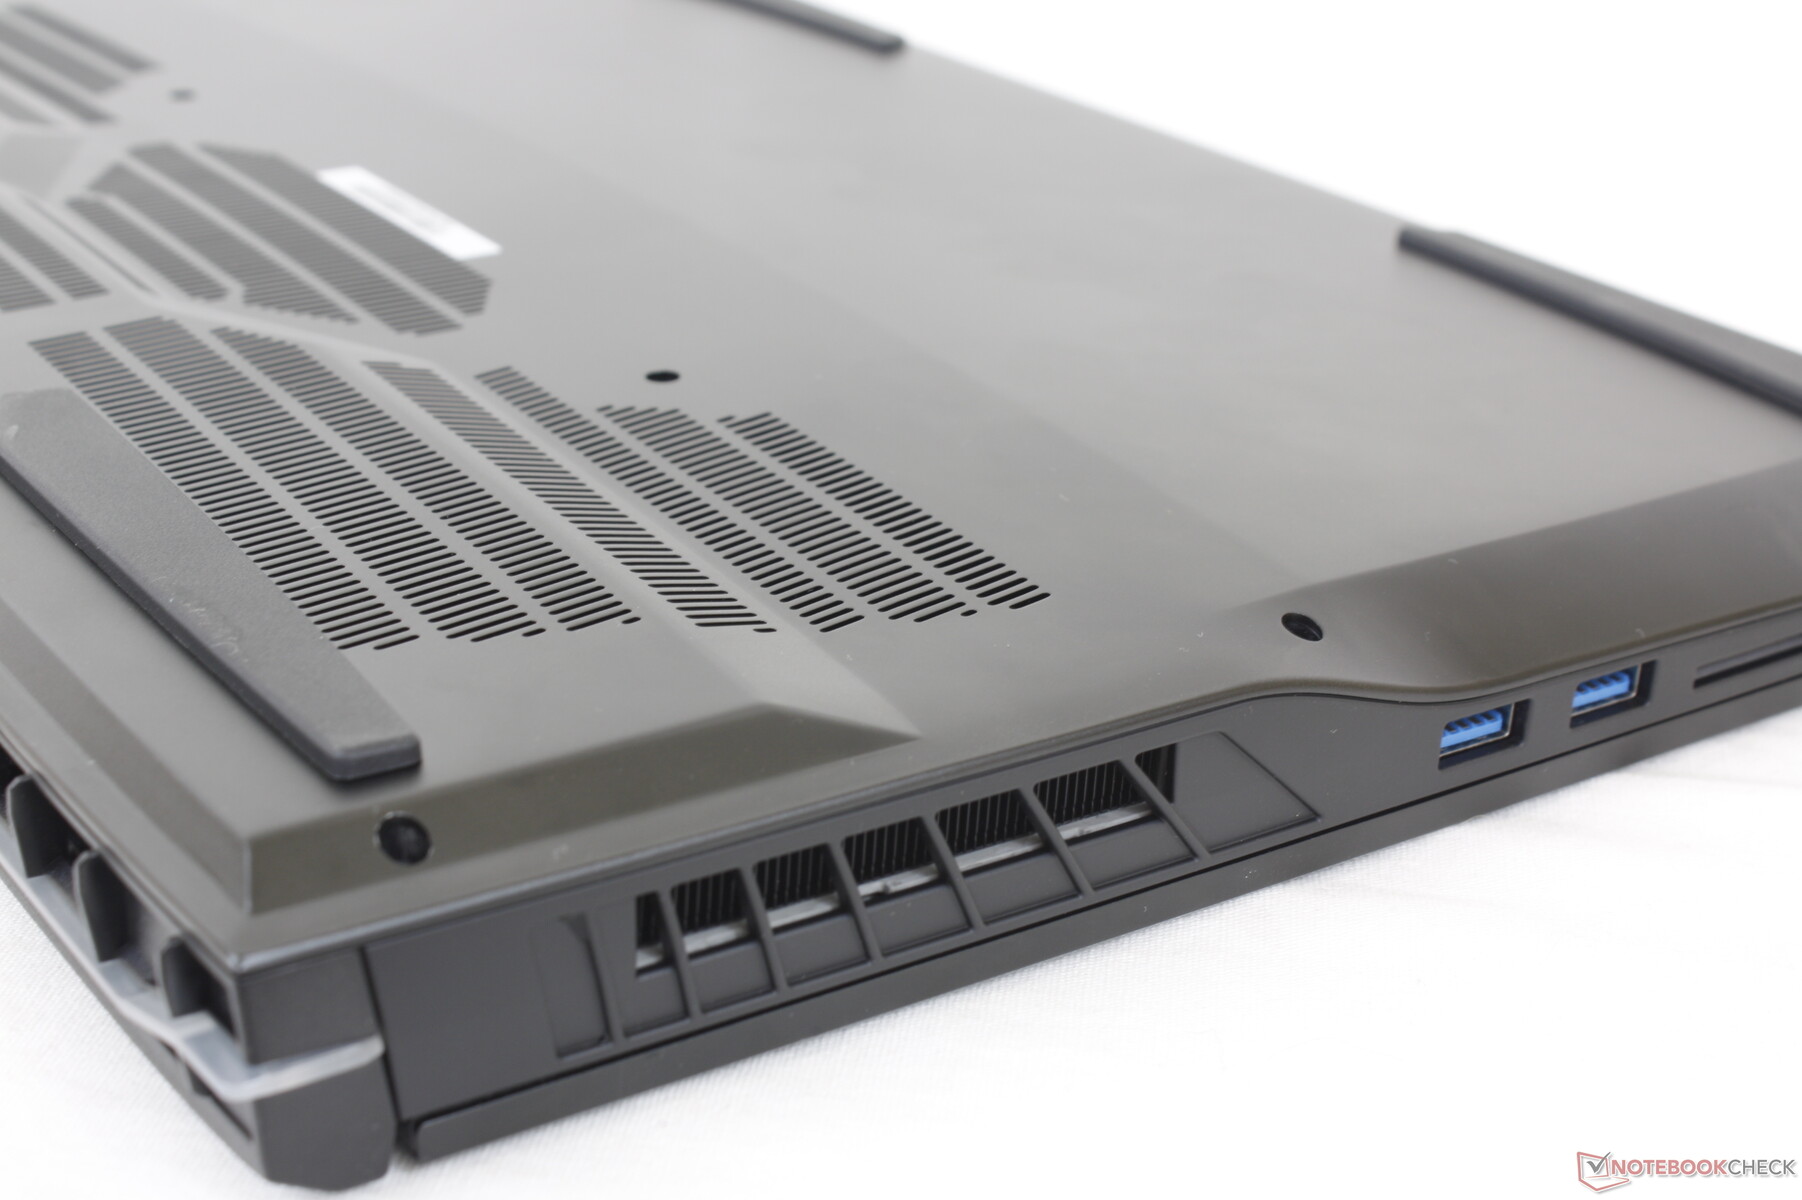
Le GM7AG8N de 17 pouces d'Uniwell Technology partage des caractéristiques similaires à celles du GM5AG8W de 15,6 pouces, puisque tous deux prennent en charge le même boîtier de refroidissement à eau externe. Néanmoins, les deux modèles sont très différents en ce qui concerne la conception du clavier et de la plaque inférieure. Alors que le GM5AG8W intègre un clavier biseauté avec de nombreuses grilles de ventilation sur le fond, le GM7AG8N dispose d'un clavier chiclet avec des évents redessinés. Le GM7AG8N a une barre de LED à l'arrière tandis que le GM5AG8W en a une à l'avant
La rigidité du châssis est excellente pour la base et le clavier. Si l'on tente de tordre la base ou d'appliquer une pression sur le centre du clavier, on obtient une flexion minimale et aucun craquement. Les charnières et le couvercle sont également solides, mais ils sont légèrement plus flexibles que sur la série Razer Blade 17.
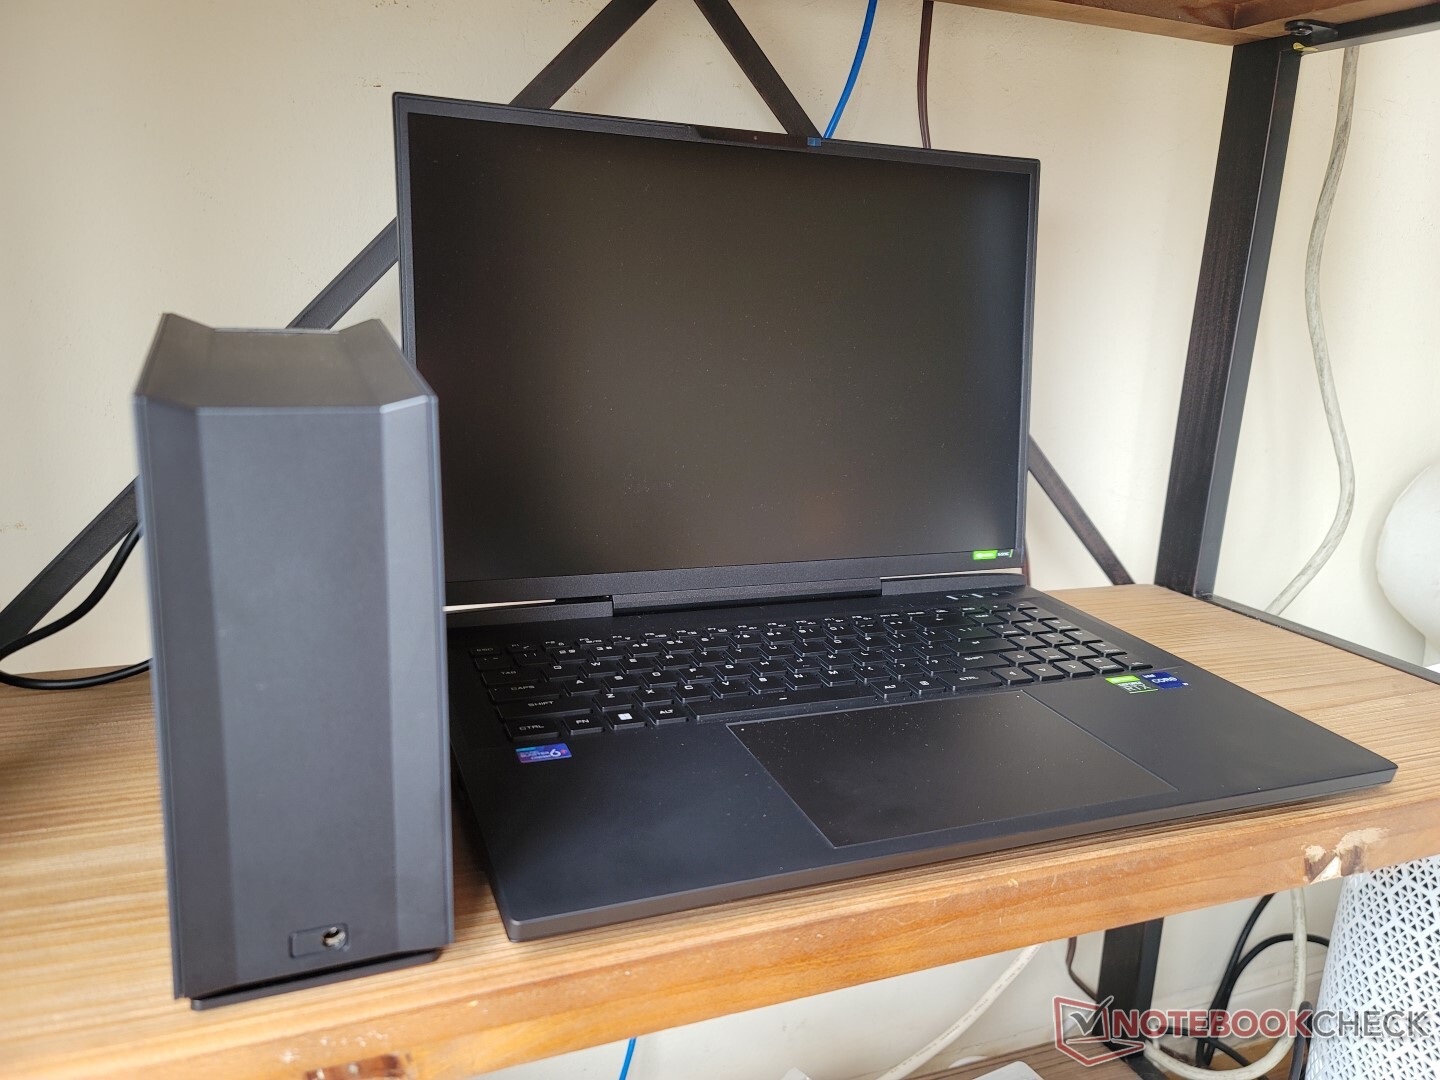
L'Uniwell est plus épais et plus long que la plupart des autres ordinateurs portables de jeu de 17 pouces, mais son poids est à peu près le même. Son empreinte légèrement plus carrée peut être attribuée à son rapport d'aspect 16:10, ce qui est peu commun pour un ordinateur portable de jeu de cette taille. Le poids total est heureusement dans la moyenne de la catégorie avant de prendre en compte le boîtier de refroidissement externe
- Poids de l'ordinateur portable : 2749 g
- Poids de l'adaptateur secteur : 1057 g
- Boîtier de refroidissement externe avec tubes d'eau (sans eau) : 1160 g
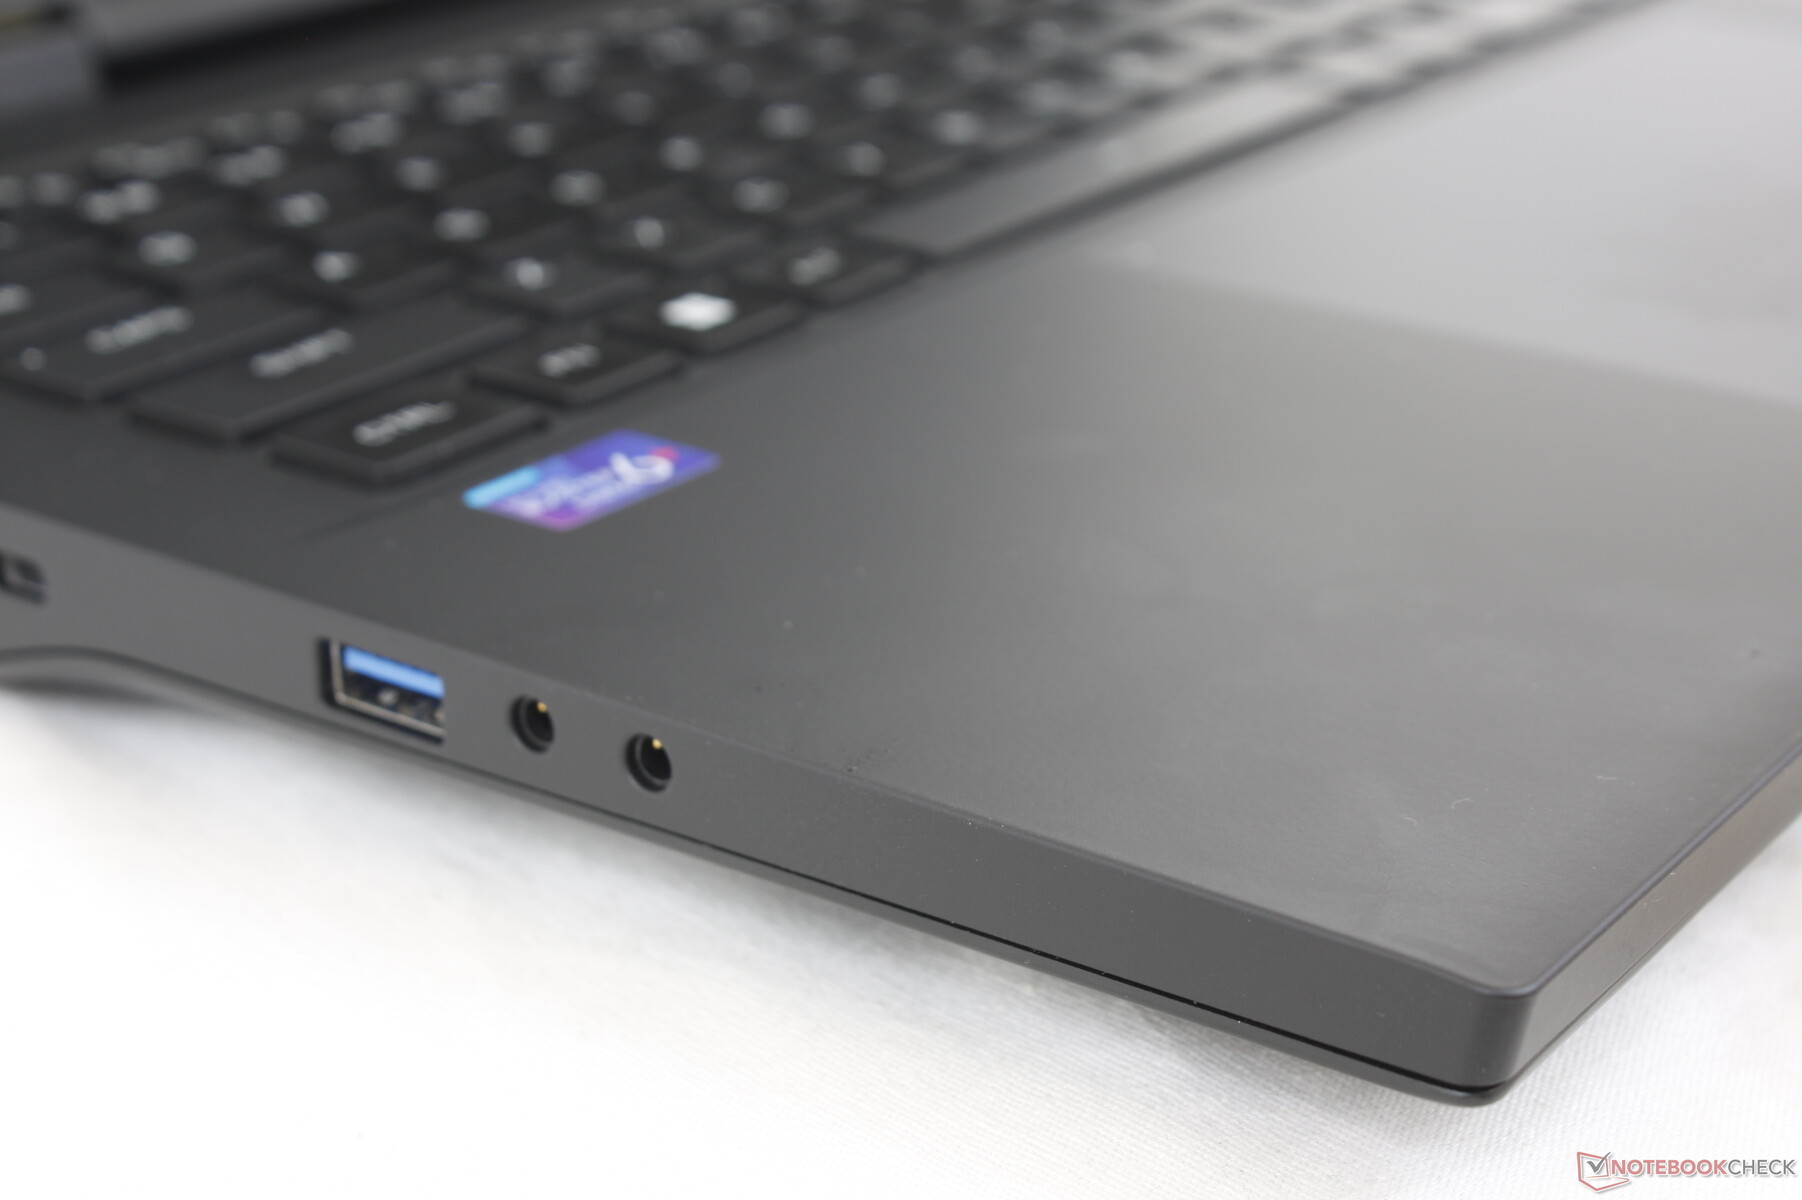
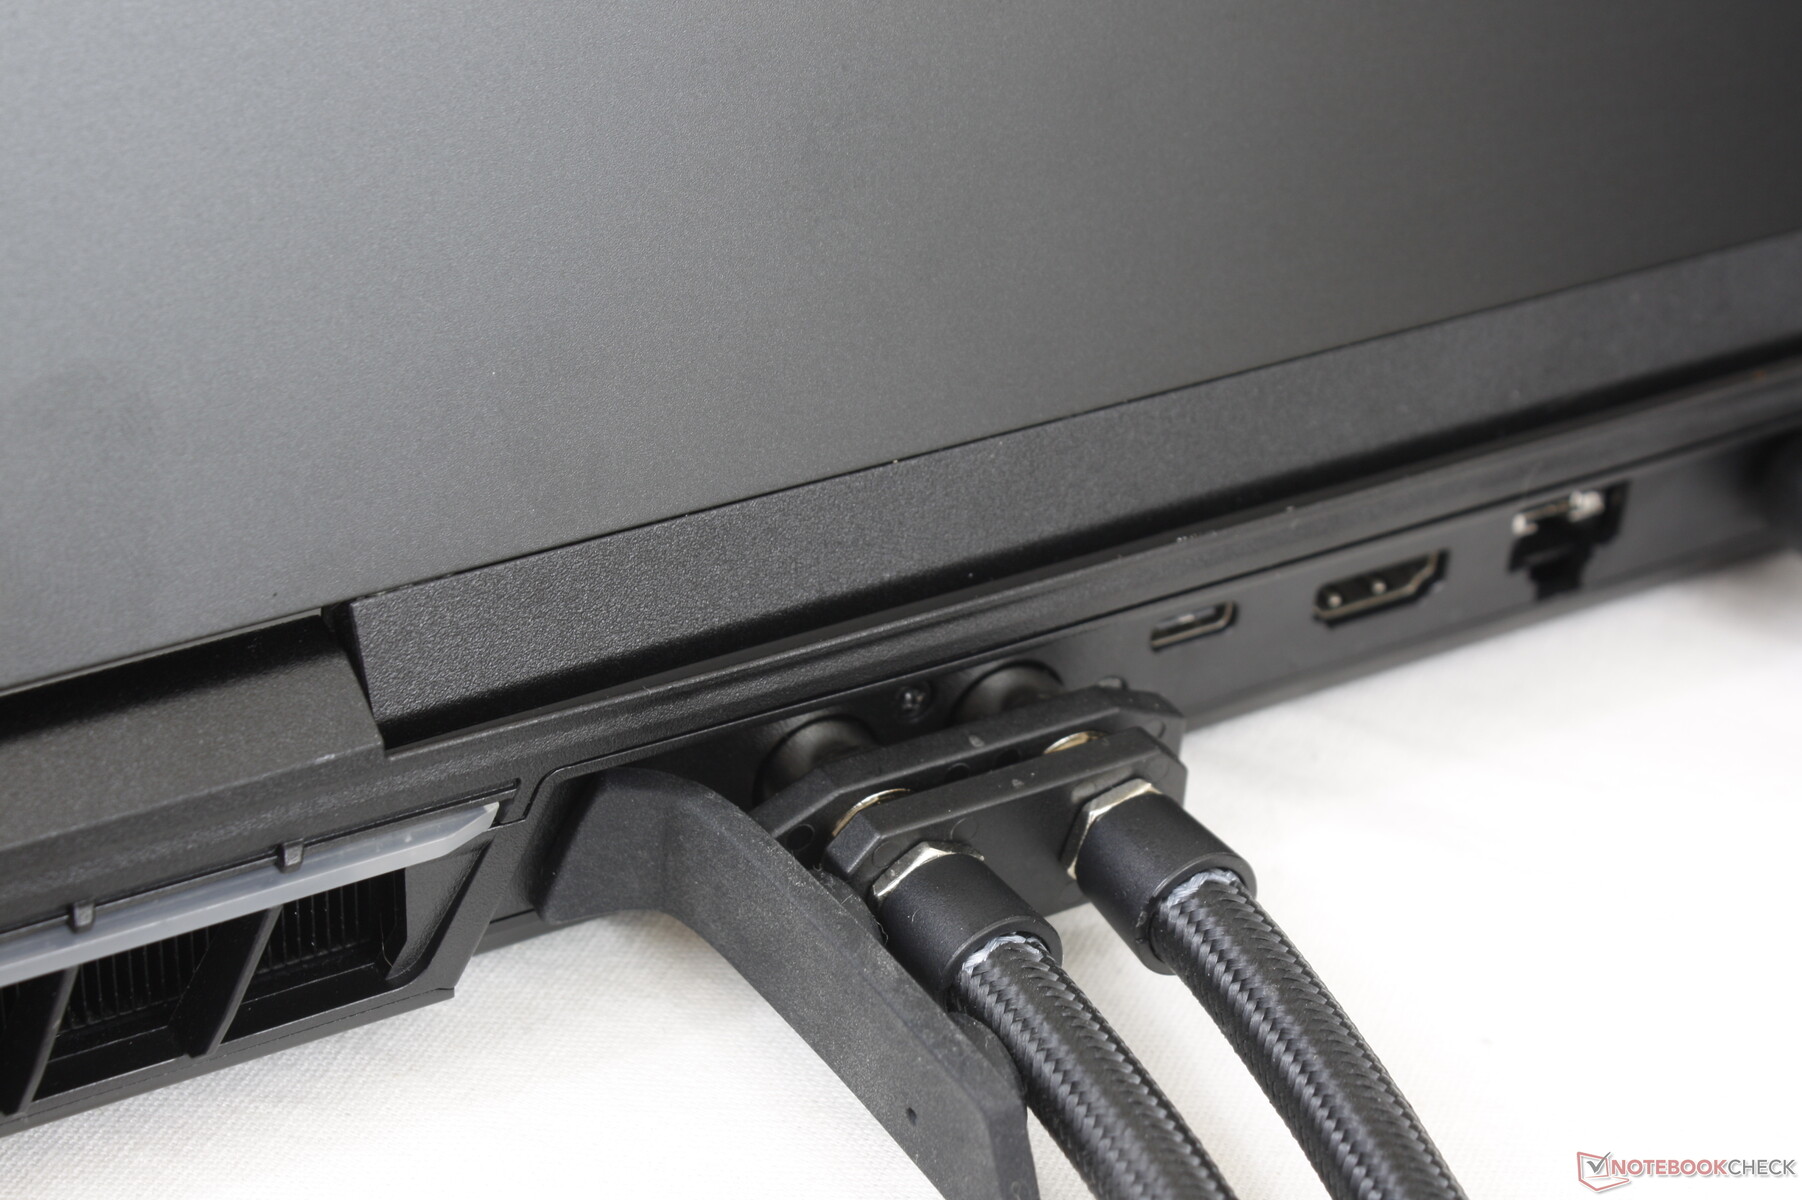
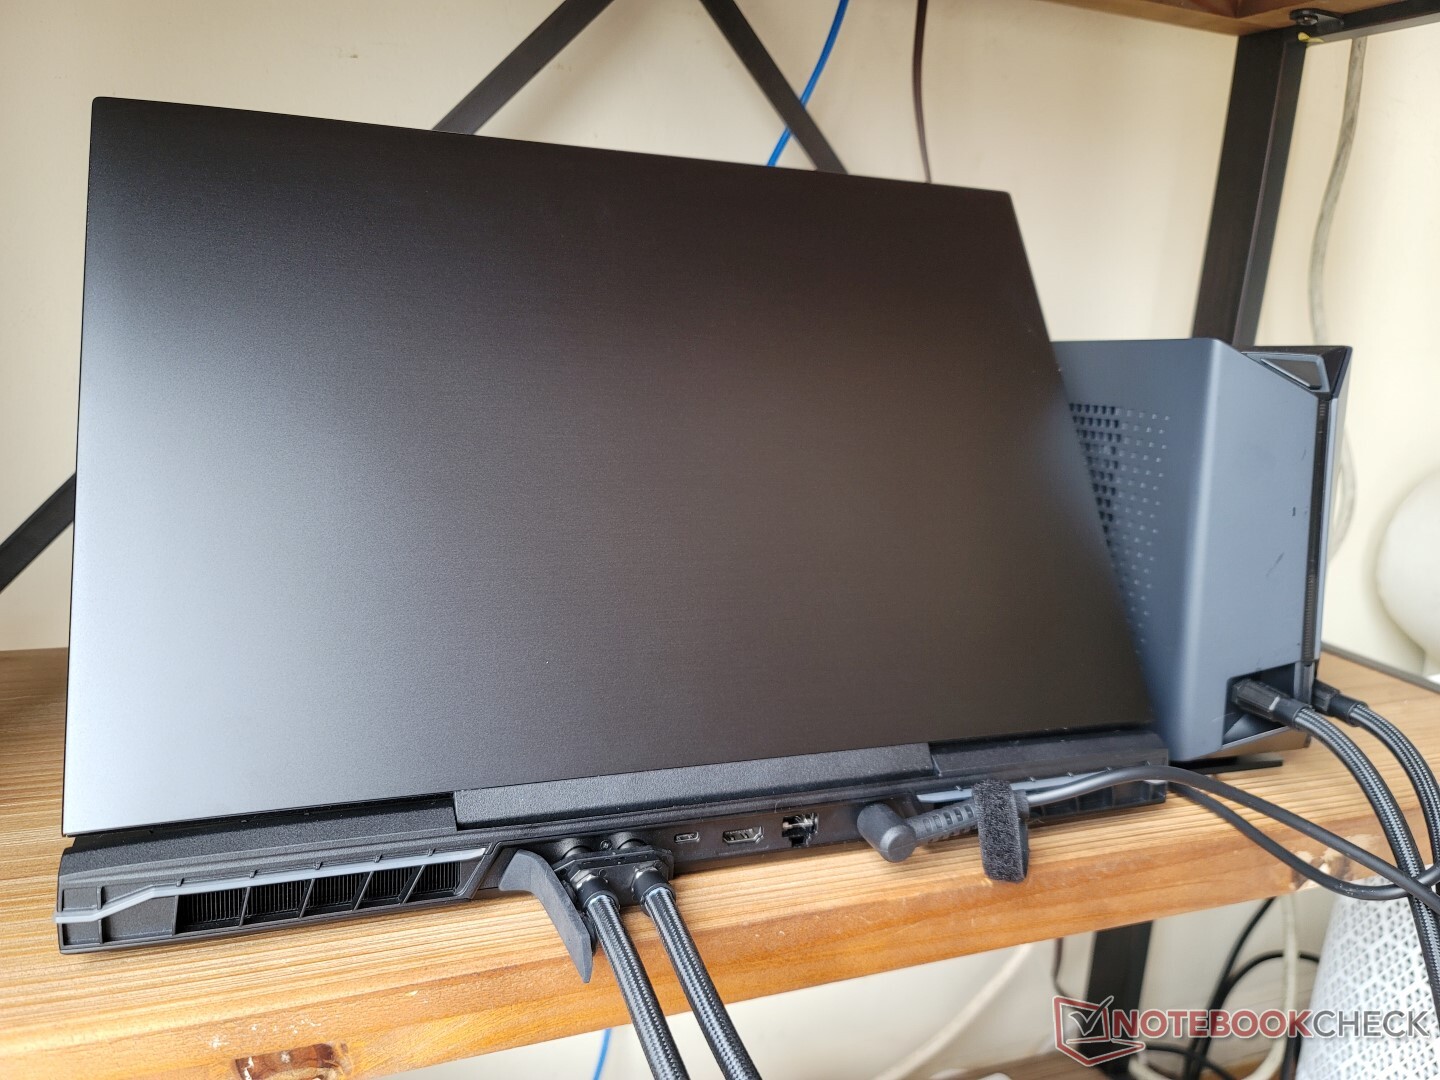
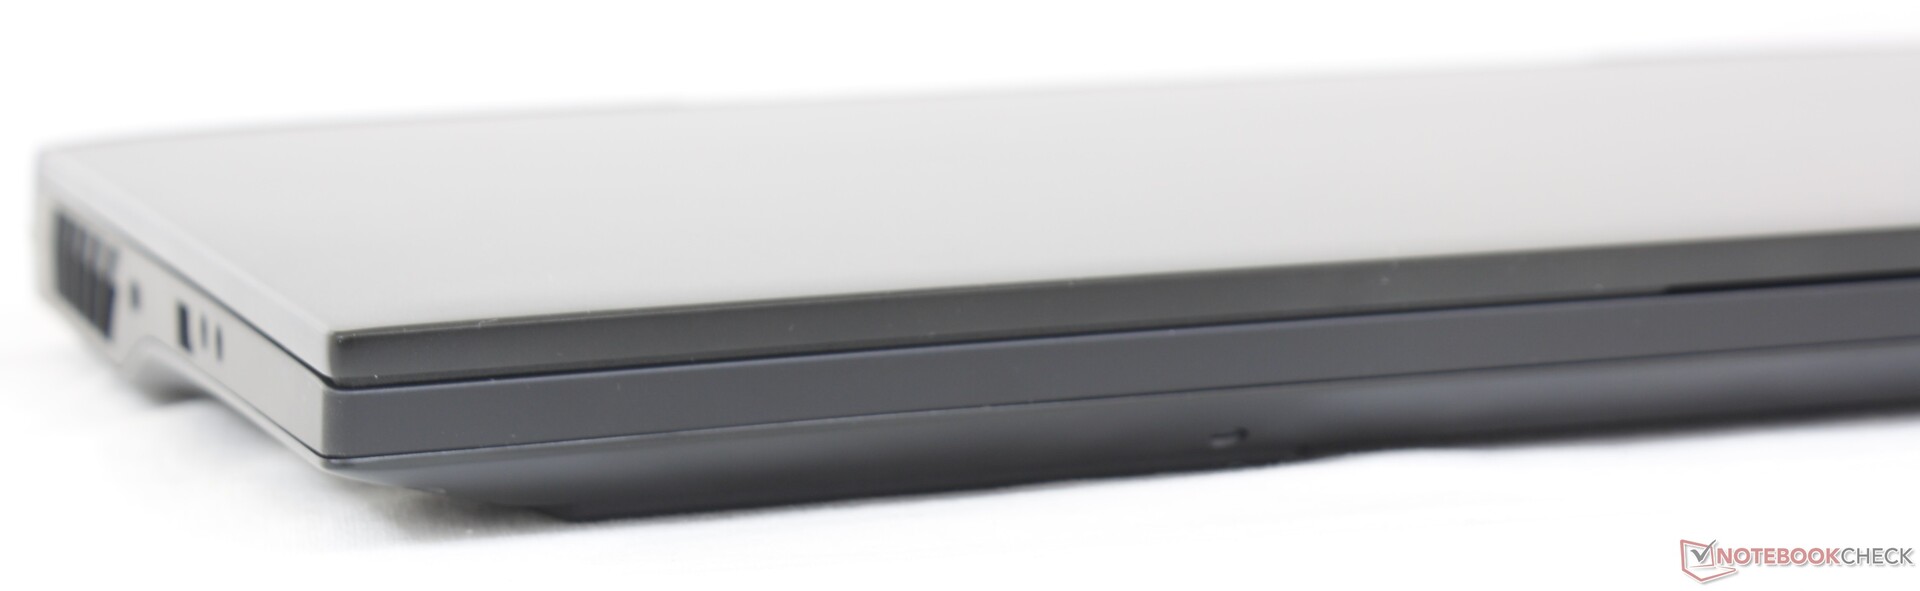
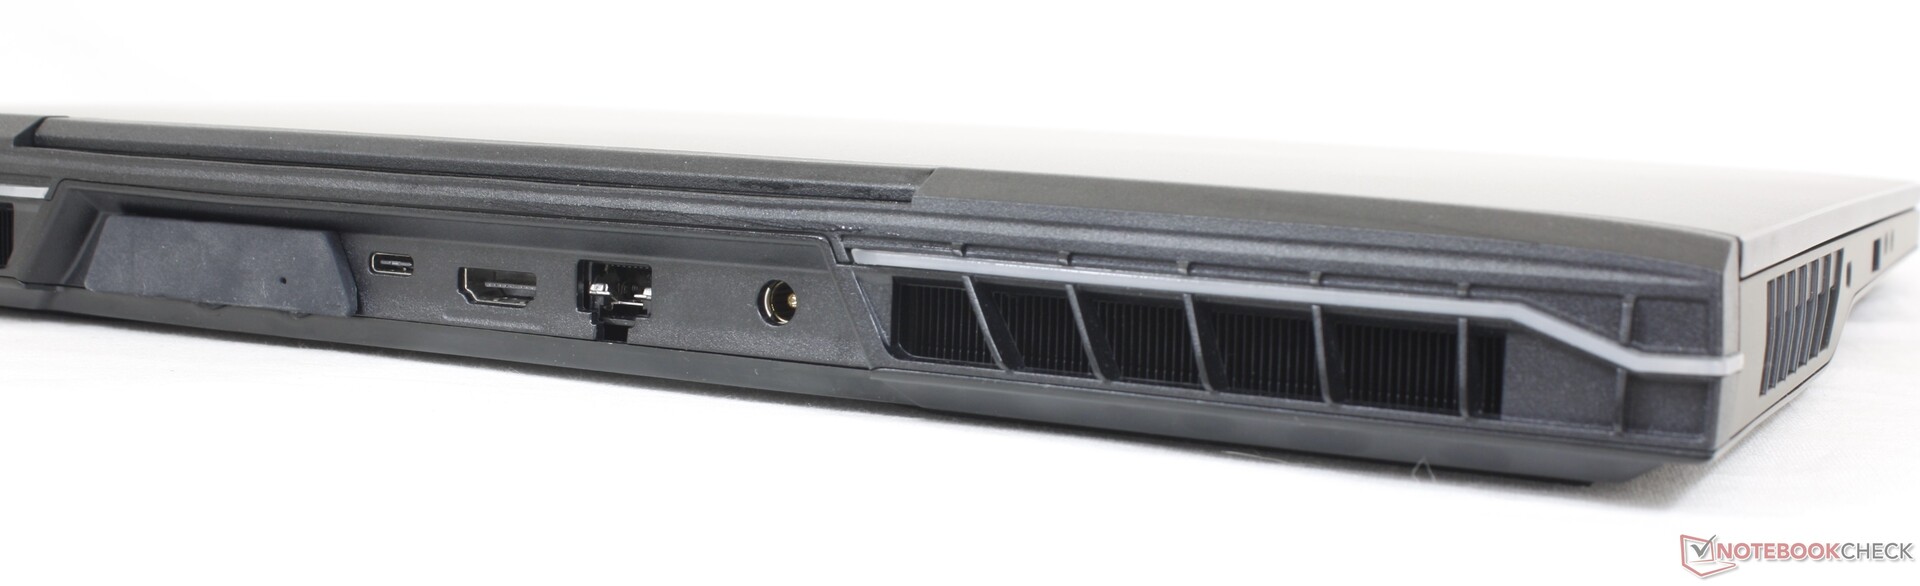
Connectivité - Support Thunderbolt 4
Les options de port et le positionnement sont identiques à ceux du Schenker XMG Neo 15 E22 de 15,6 pouces, même si notre Uniwell a un facteur de forme plus grand de 17 pouces. Nous aimerions voir des ports USB-C supplémentaires à l'avenir, car le port unique nous semble limitatif.
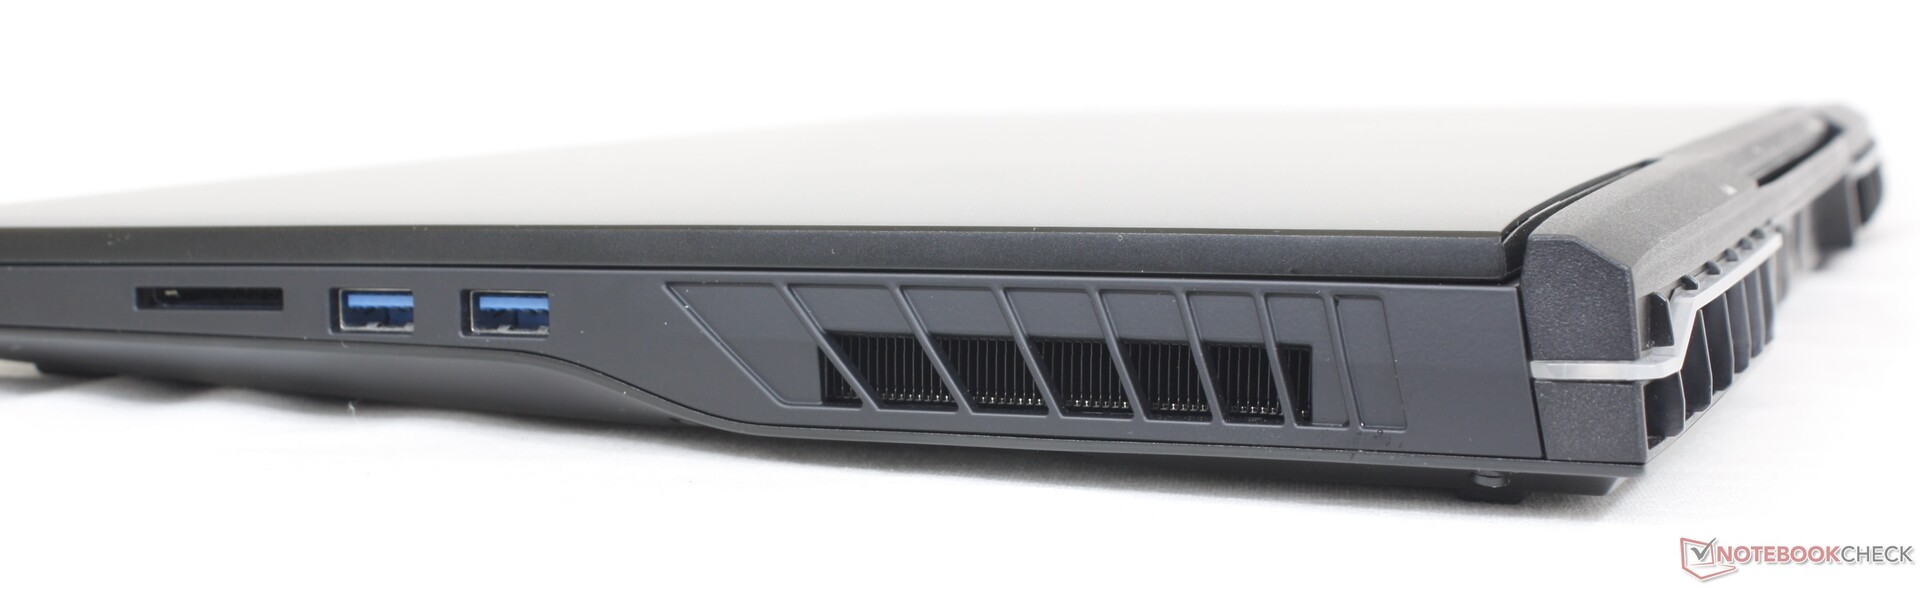
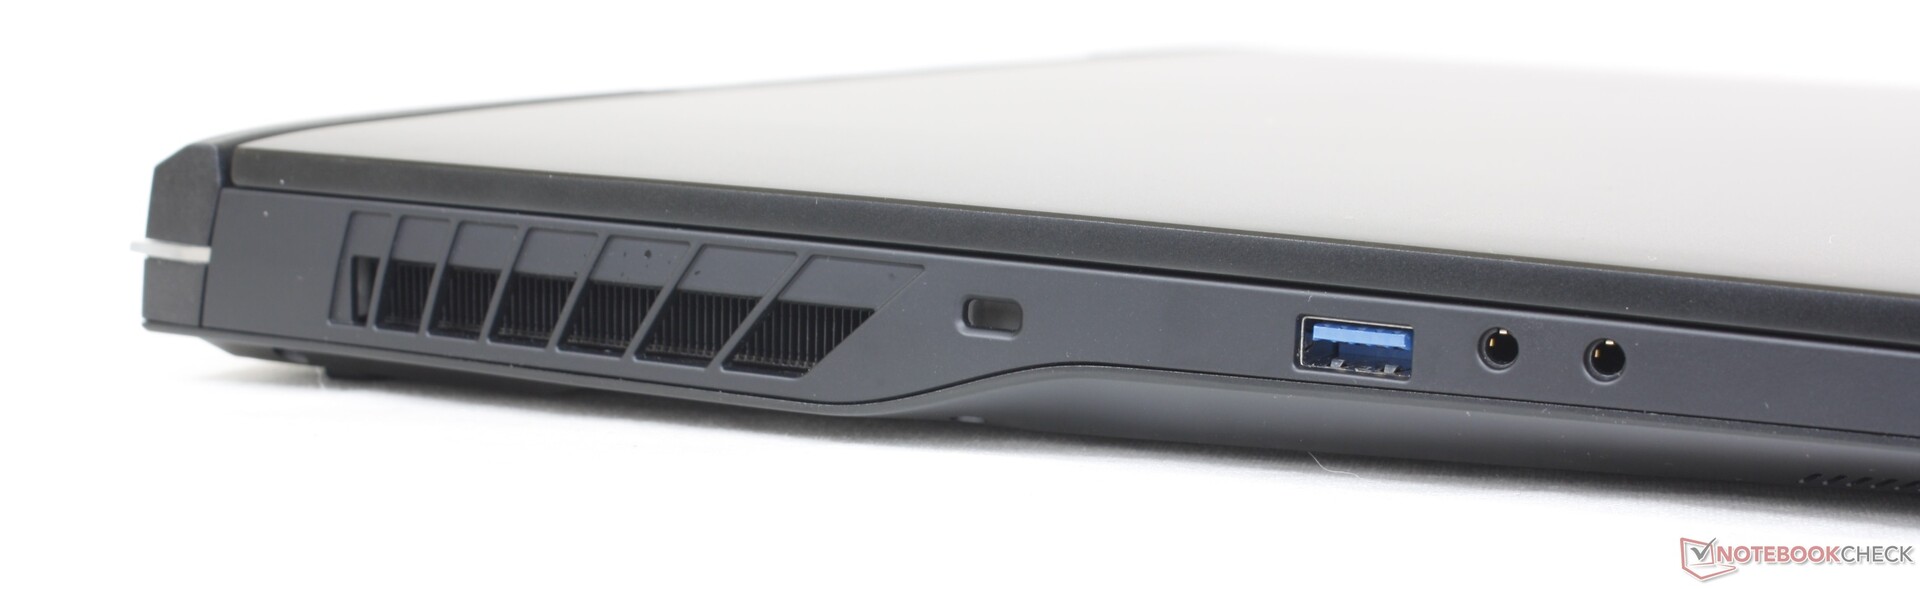
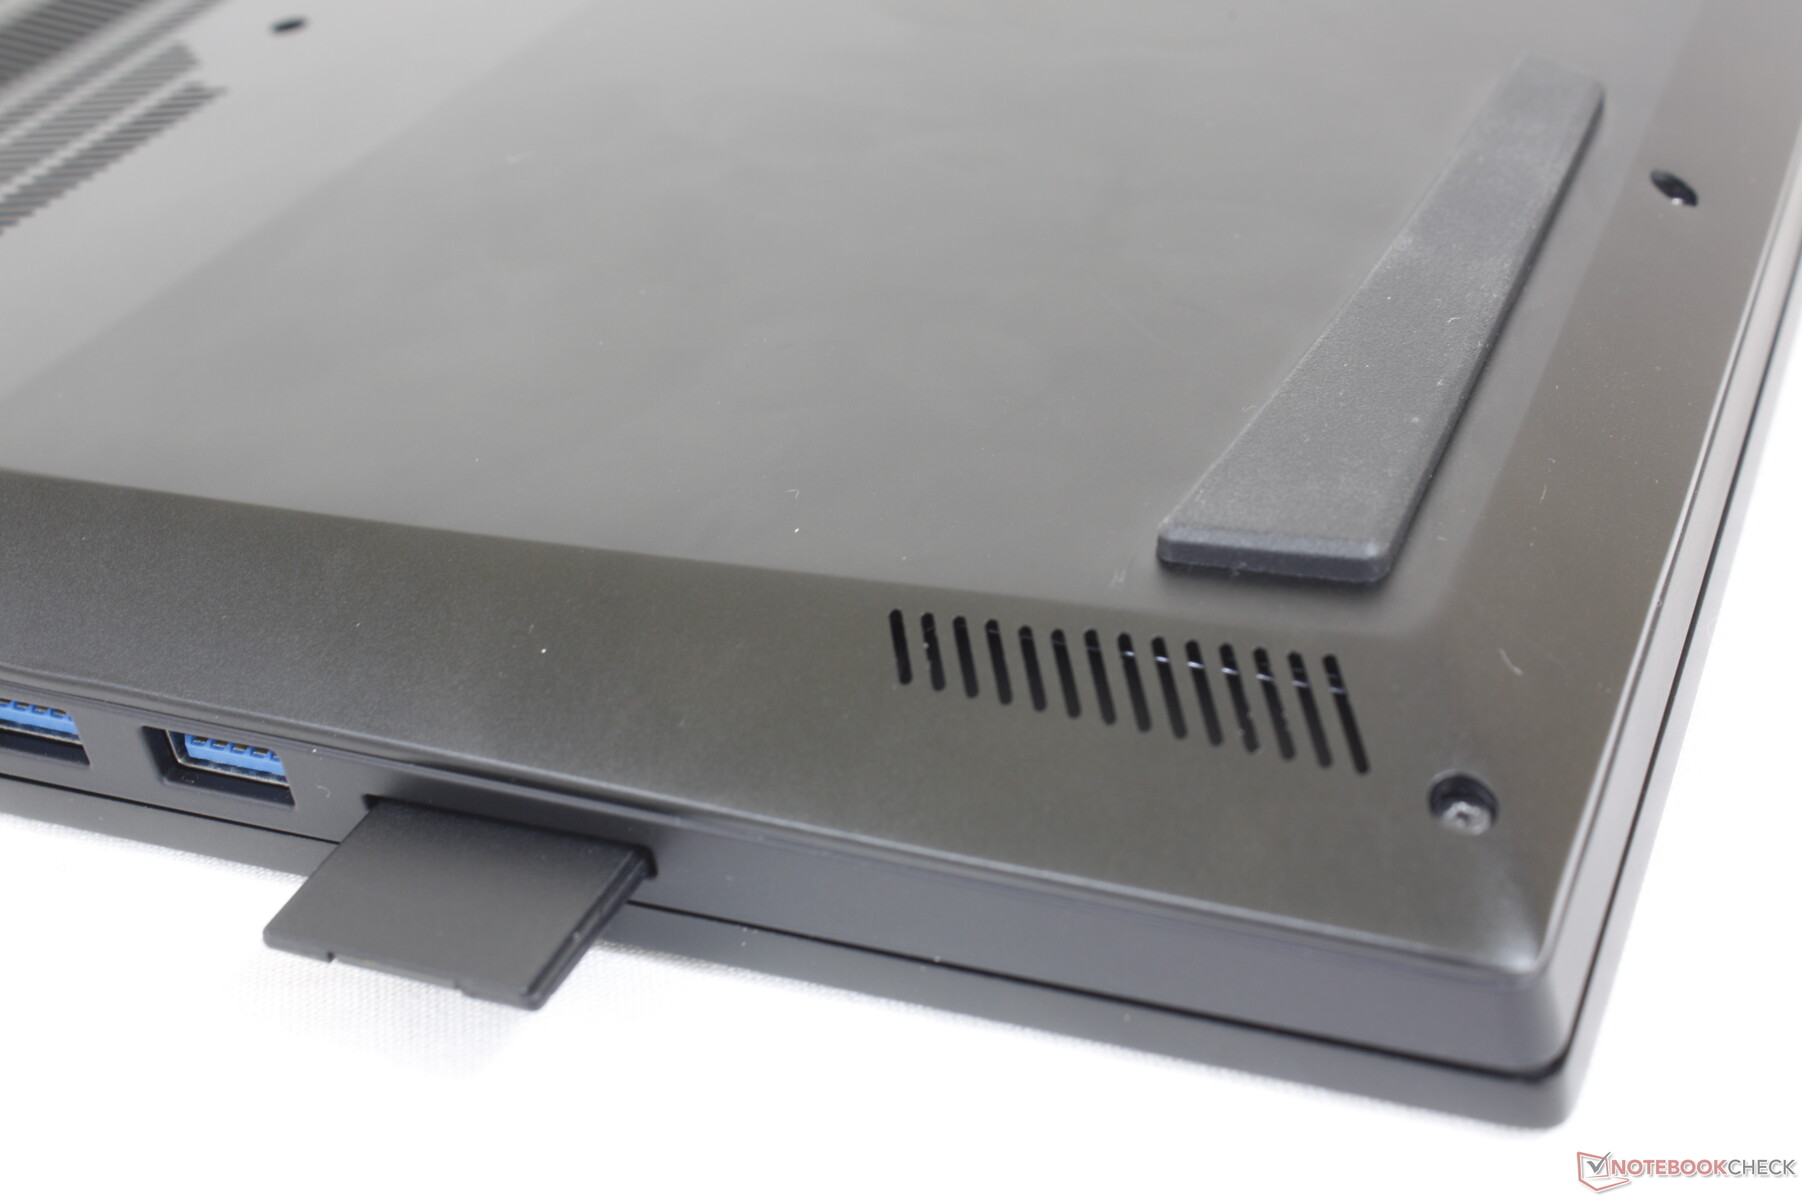
Lecteur de carte SD
Les taux de transfert avec le lecteur de cartes intégré sont deux fois moins élevés que ceux de l'Asus Zephyrus S17 Asus Zephyrus S17 ou du Razer Blade 17. Cela ne devrait pas être un problème pour la plupart des utilisateurs, à part ceux qui comptent beaucoup sur le transfert de gros fichiers via les cartes SD.
| SD Card Reader | |
| average JPG Copy Test (av. of 3 runs) | |
| Asus ROG Zephyrus S17 GX703HSD | |
| Razer Blade 17 Early 2022 (AV PRO microSD 128 GB V60) | |
| Uniwell Technology GM7AG8N Liquid Cooling Box (AV PRO microSD 128 GB V60) | |
| MSI Stealth GS77 12UHS-083US (AV Pro V60) | |
| MSI Titan GT77 12UHS (AV PRO microSD 128 GB V60) | |
| maximum AS SSD Seq Read Test (1GB) | |
| Asus ROG Zephyrus S17 GX703HSD | |
| Uniwell Technology GM7AG8N Liquid Cooling Box (AV PRO microSD 128 GB V60) | |
| MSI Titan GT77 12UHS (AV PRO microSD 128 GB V60) | |
| MSI Stealth GS77 12UHS-083US (AV Pro V60) | |
Communication
Il est un peu décevant de ne pas voir le Wi-Fi 6E inclus compte tenu du prix élevé de l'ordinateur portable. Néanmoins, le Wi-Fi 6 est plus que suffisant pour la plupart des utilisateurs, car le Wi-Fi 6E est rarement meilleur dans la plupart des scénarios du monde réel.
| Networking | |
| iperf3 transmit AX12 | |
| MSI Stealth GS77 12UHS-083US | |
| Asus ROG Zephyrus S17 GX703HSD | |
| iperf3 receive AX12 | |
| MSI Stealth GS77 12UHS-083US | |
| Asus ROG Zephyrus S17 GX703HSD | |
| iperf3 receive AXE11000 6GHz | |
| Aorus 17X XES | |
| MSI Titan GT77 12UHS | |
| iperf3 receive AXE11000 | |
| MSI Titan GT77 12UHS | |
| Razer Blade 17 Early 2022 | |
| Uniwell Technology GM7AG8N Liquid Cooling Box | |
| iperf3 transmit AXE11000 6GHz | |
| Aorus 17X XES | |
| MSI Titan GT77 12UHS | |
| iperf3 transmit AXE11000 | |
| MSI Titan GT77 12UHS | |
| Uniwell Technology GM7AG8N Liquid Cooling Box | |
Webcam
L'appareil photo de 2 mégapixels offre des couleurs médiocres, même selon les normes déjà faibles des webcams. L'infrarouge est pris en charge, mais il n'y a pas d'obturateur de confidentialité.


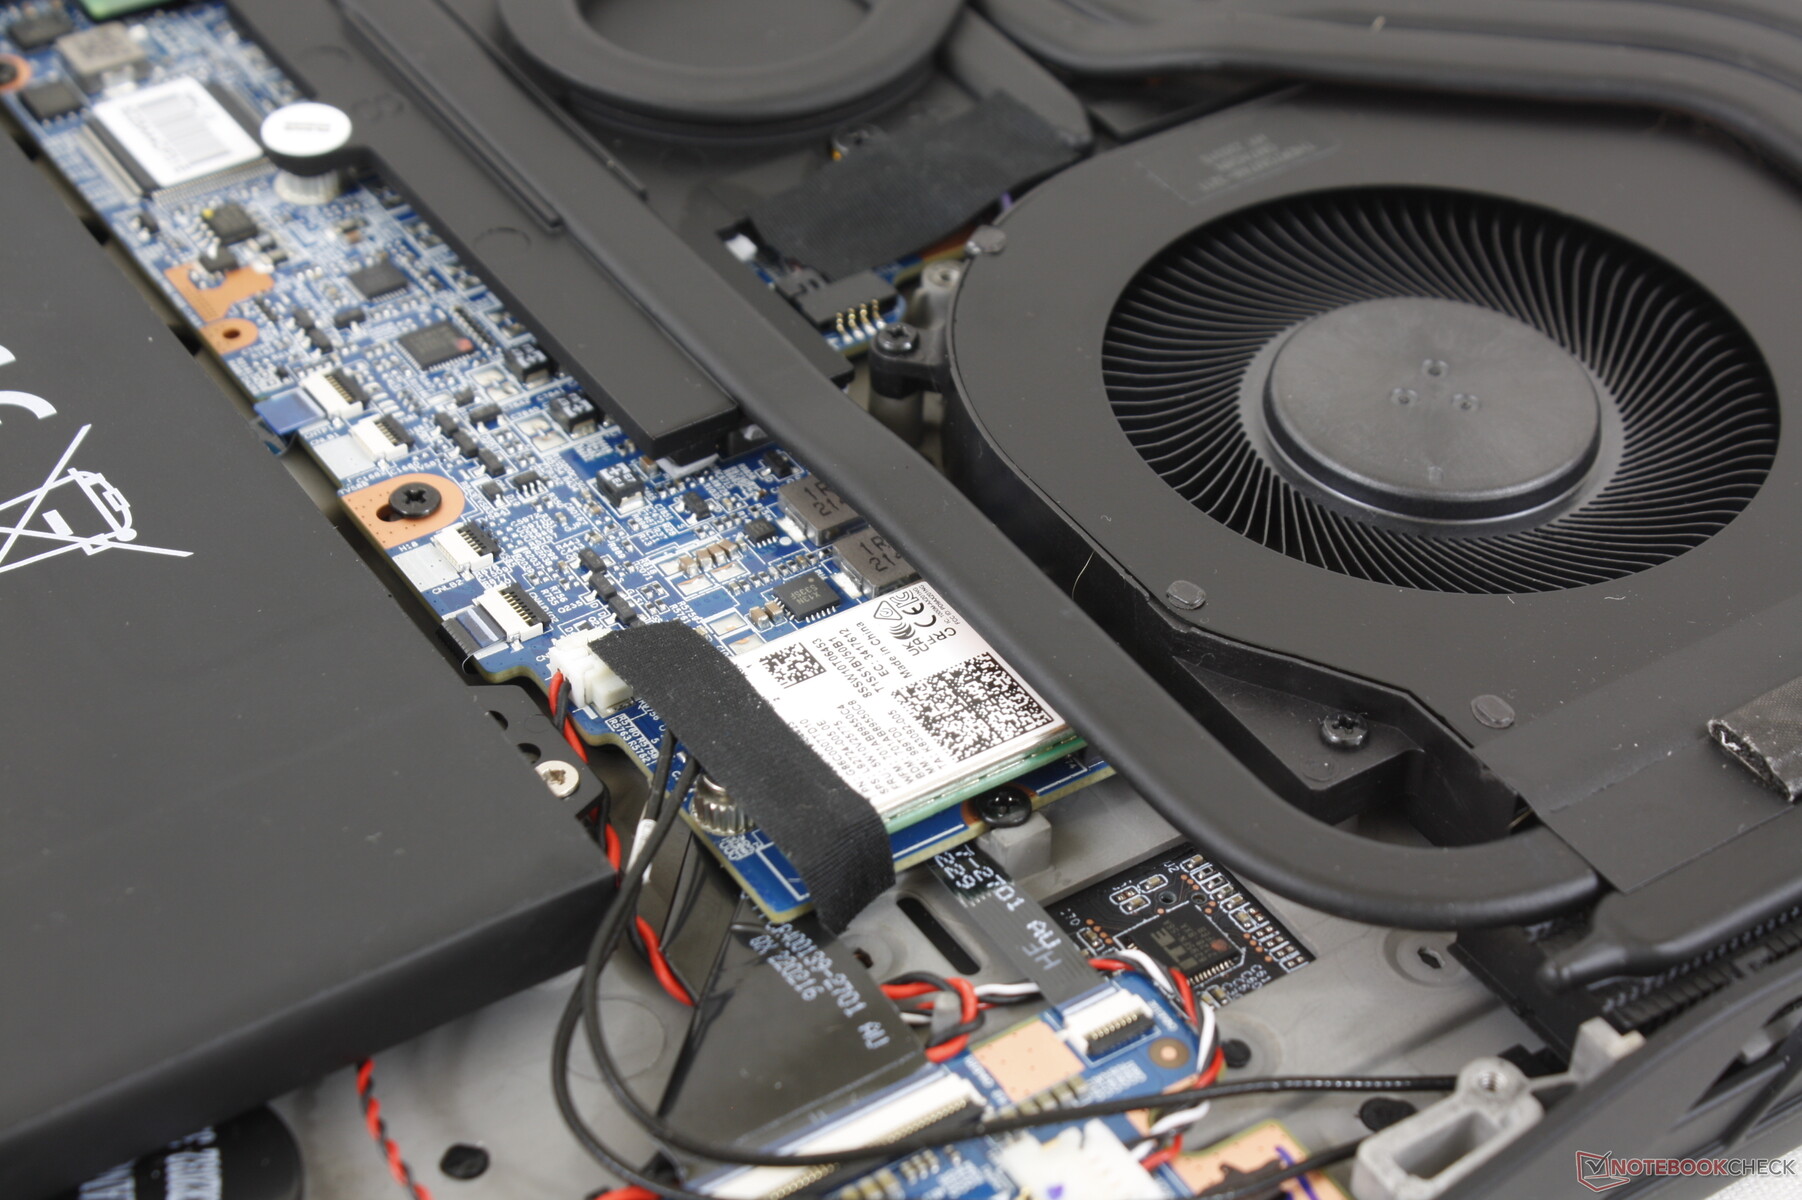
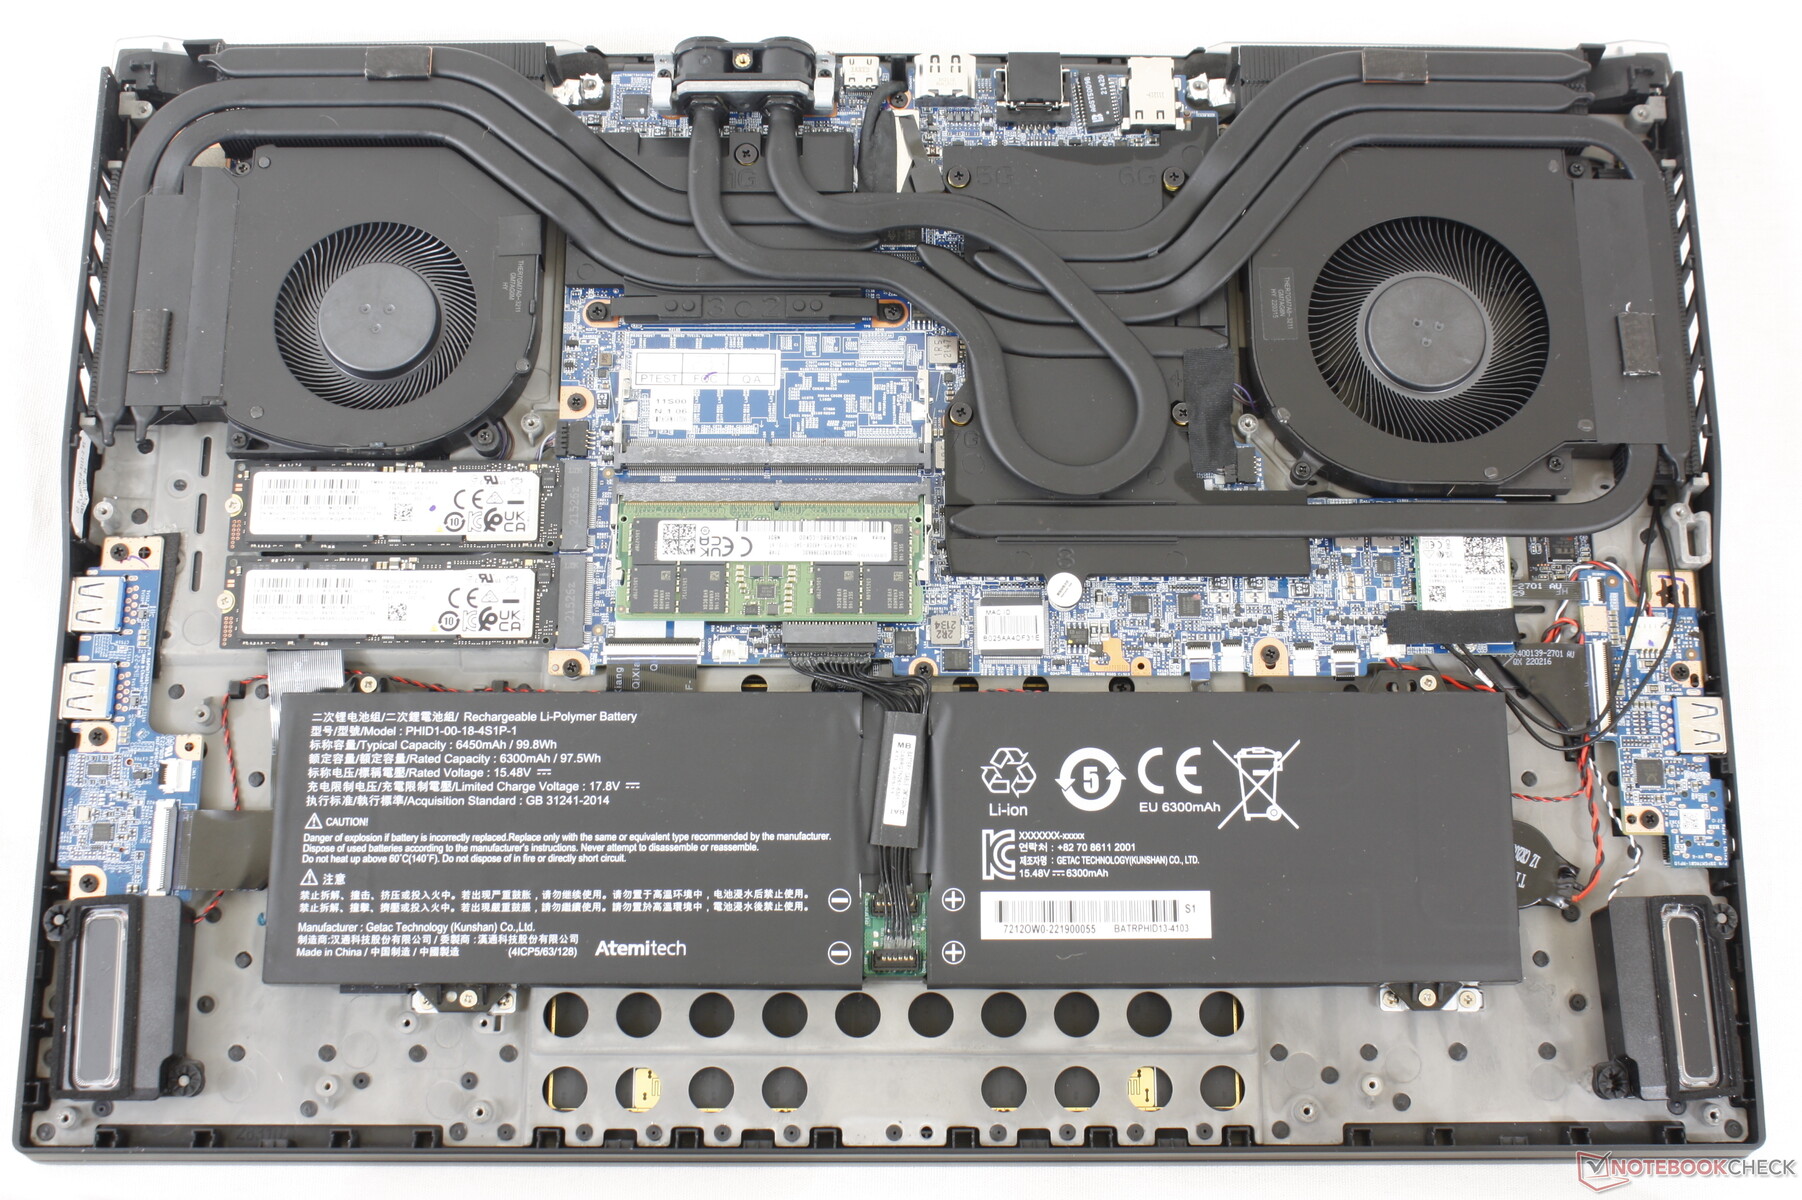
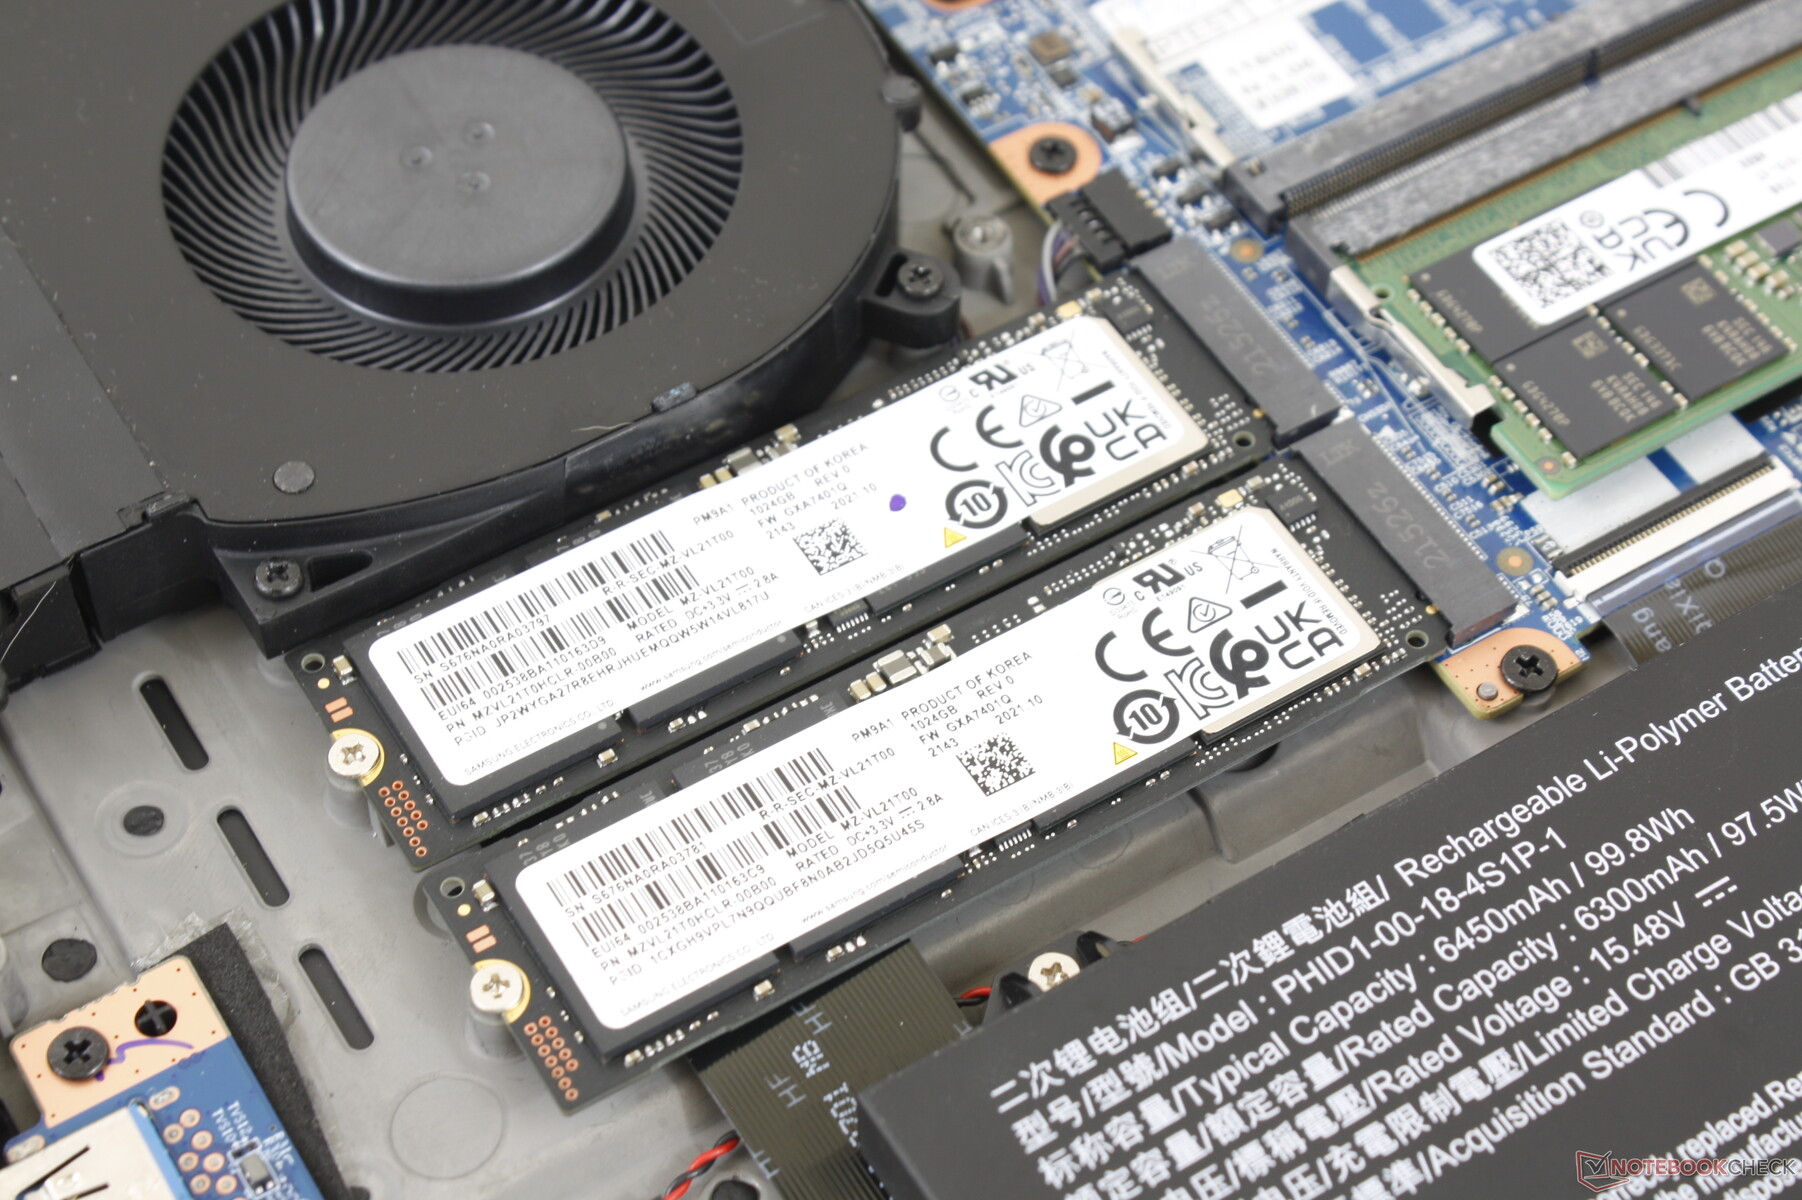
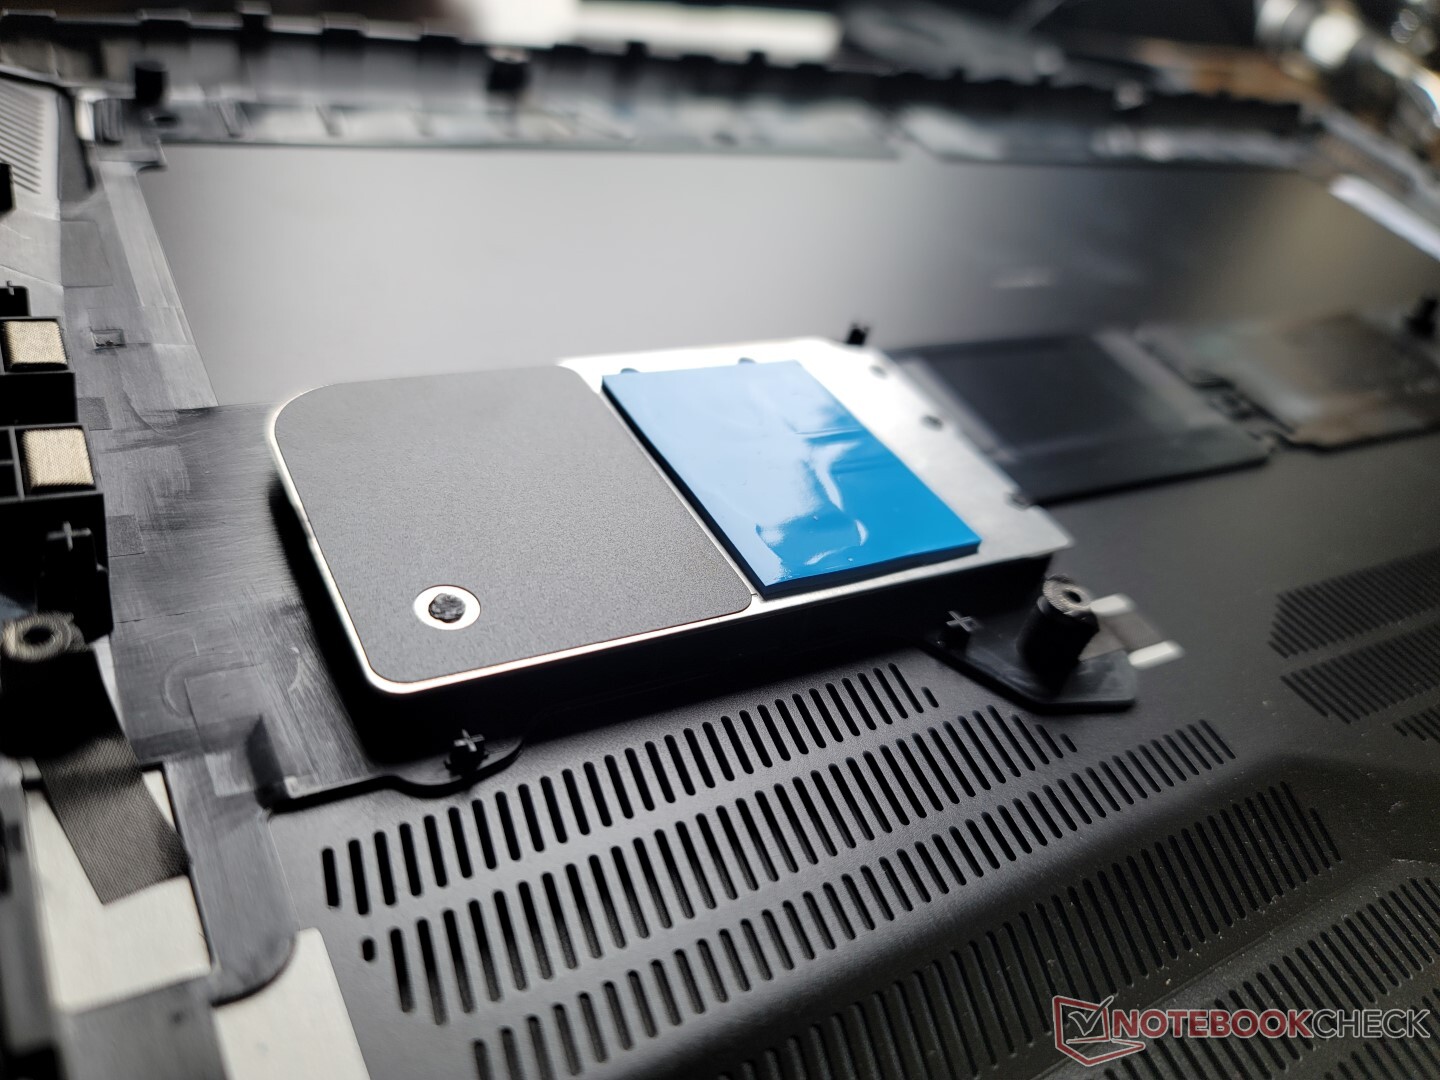
Maintenance
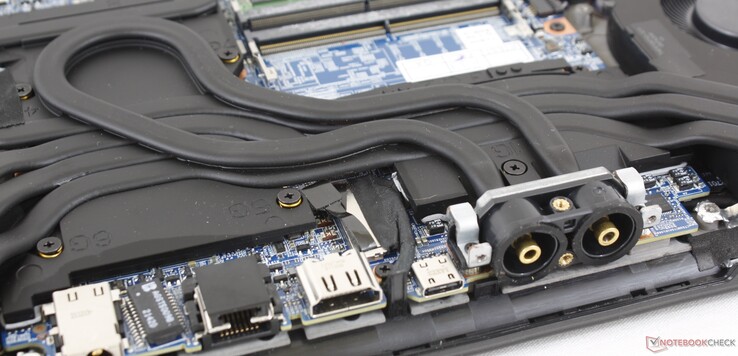
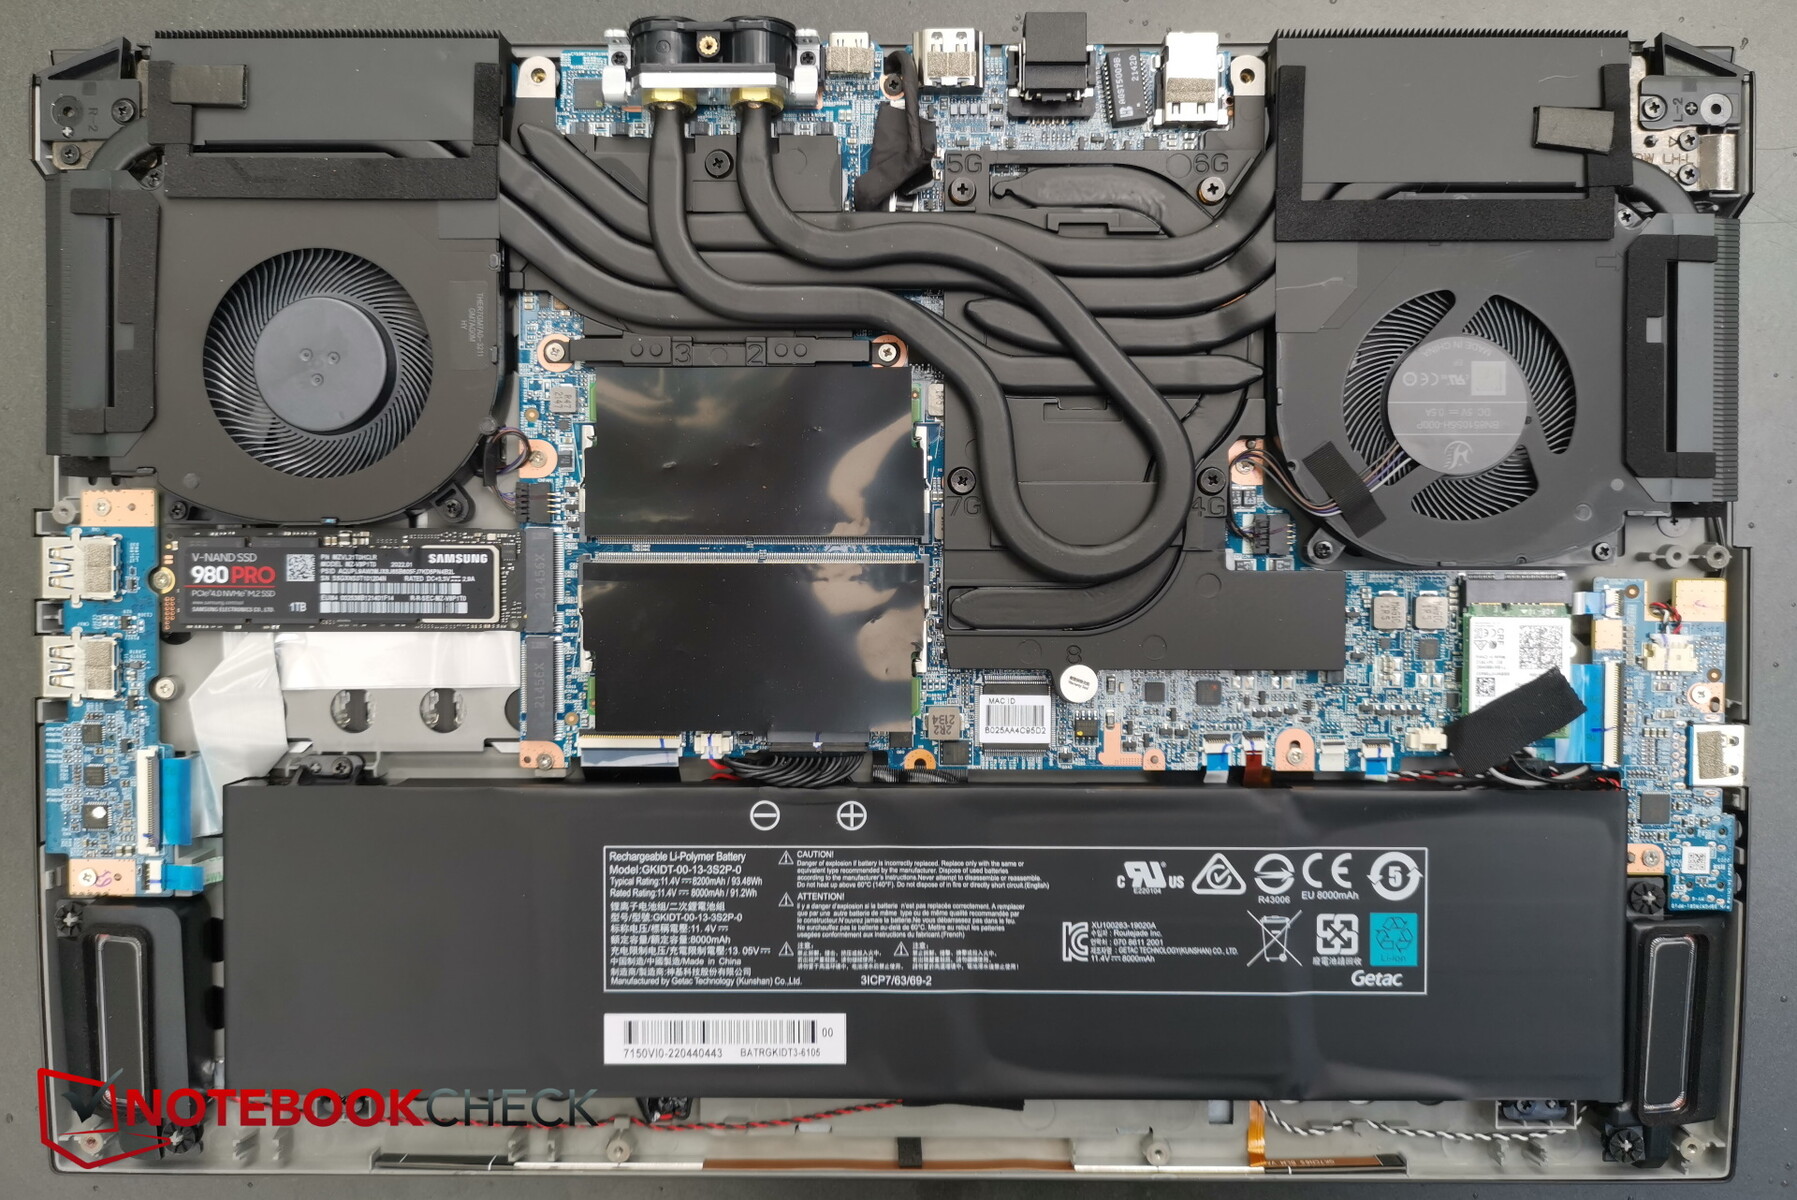
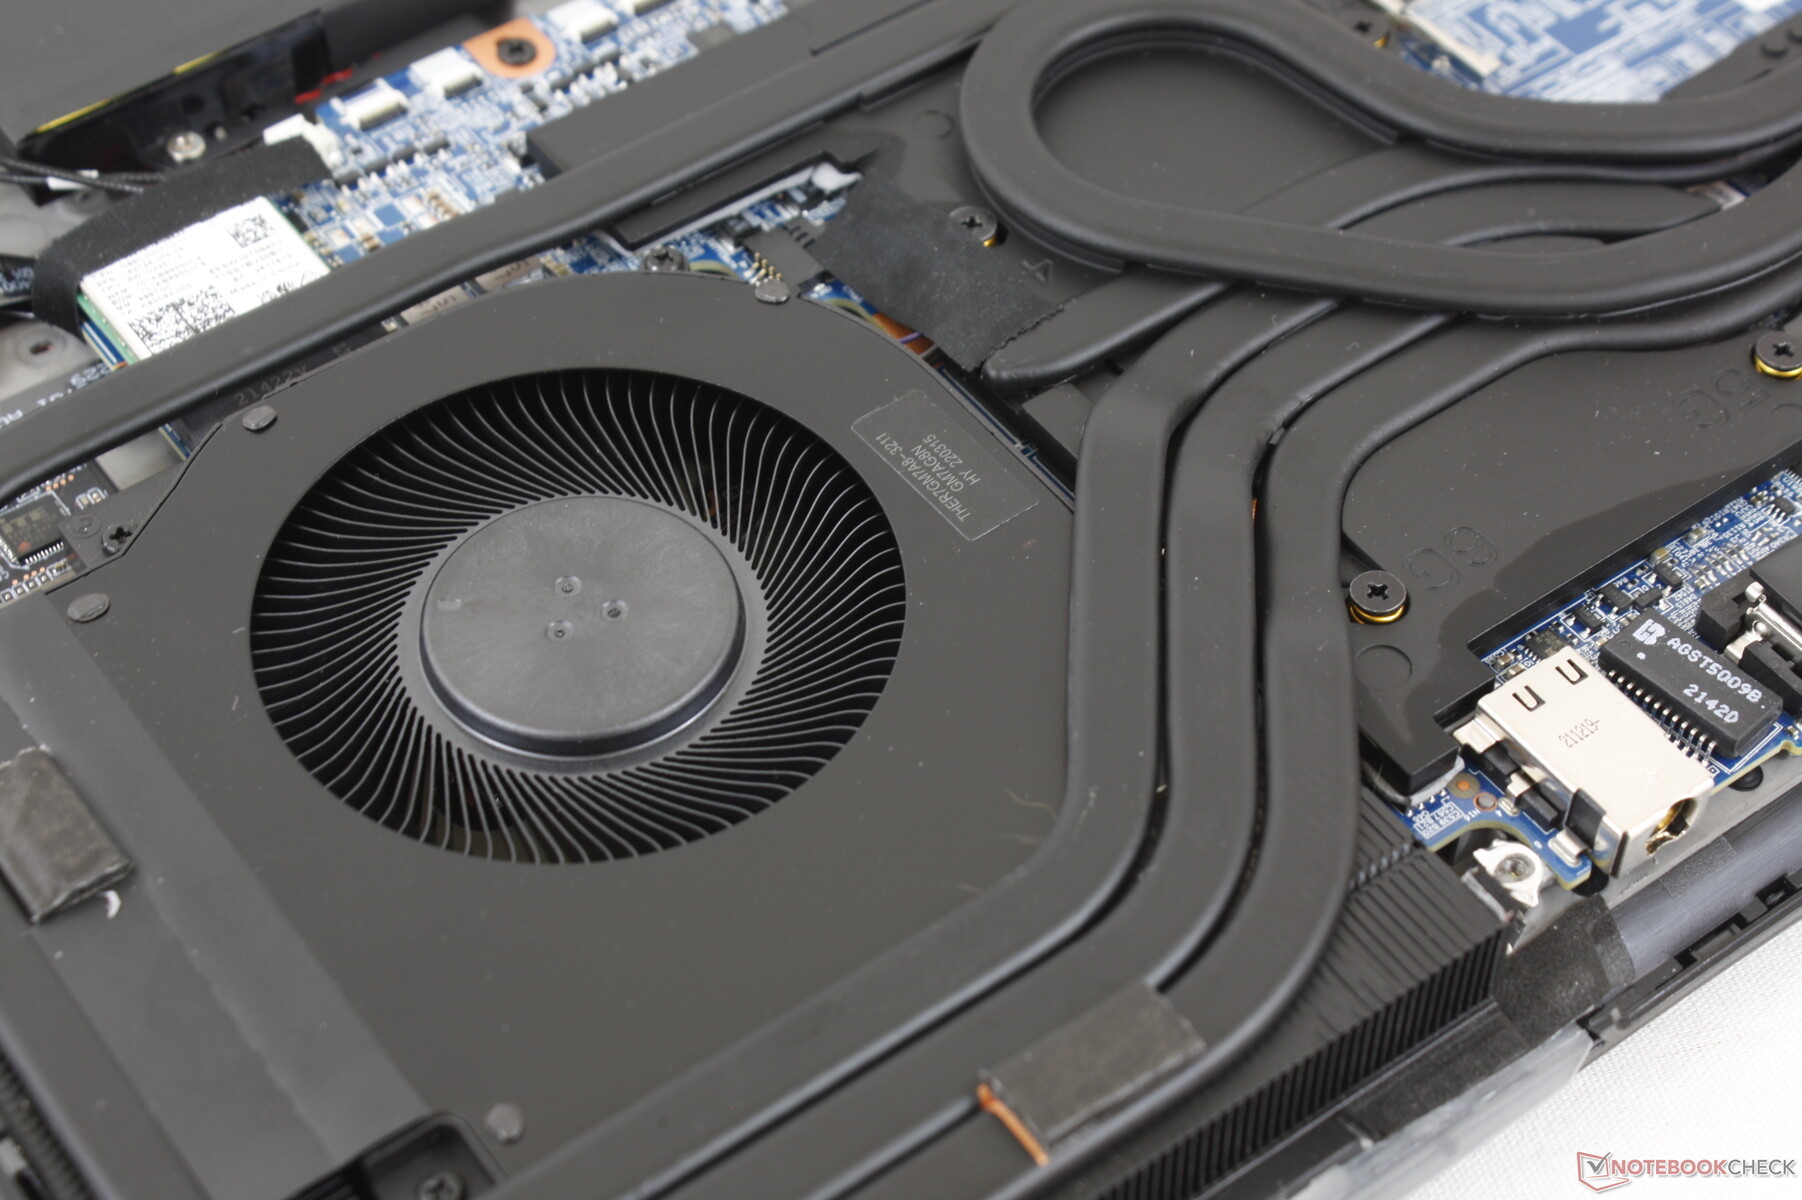
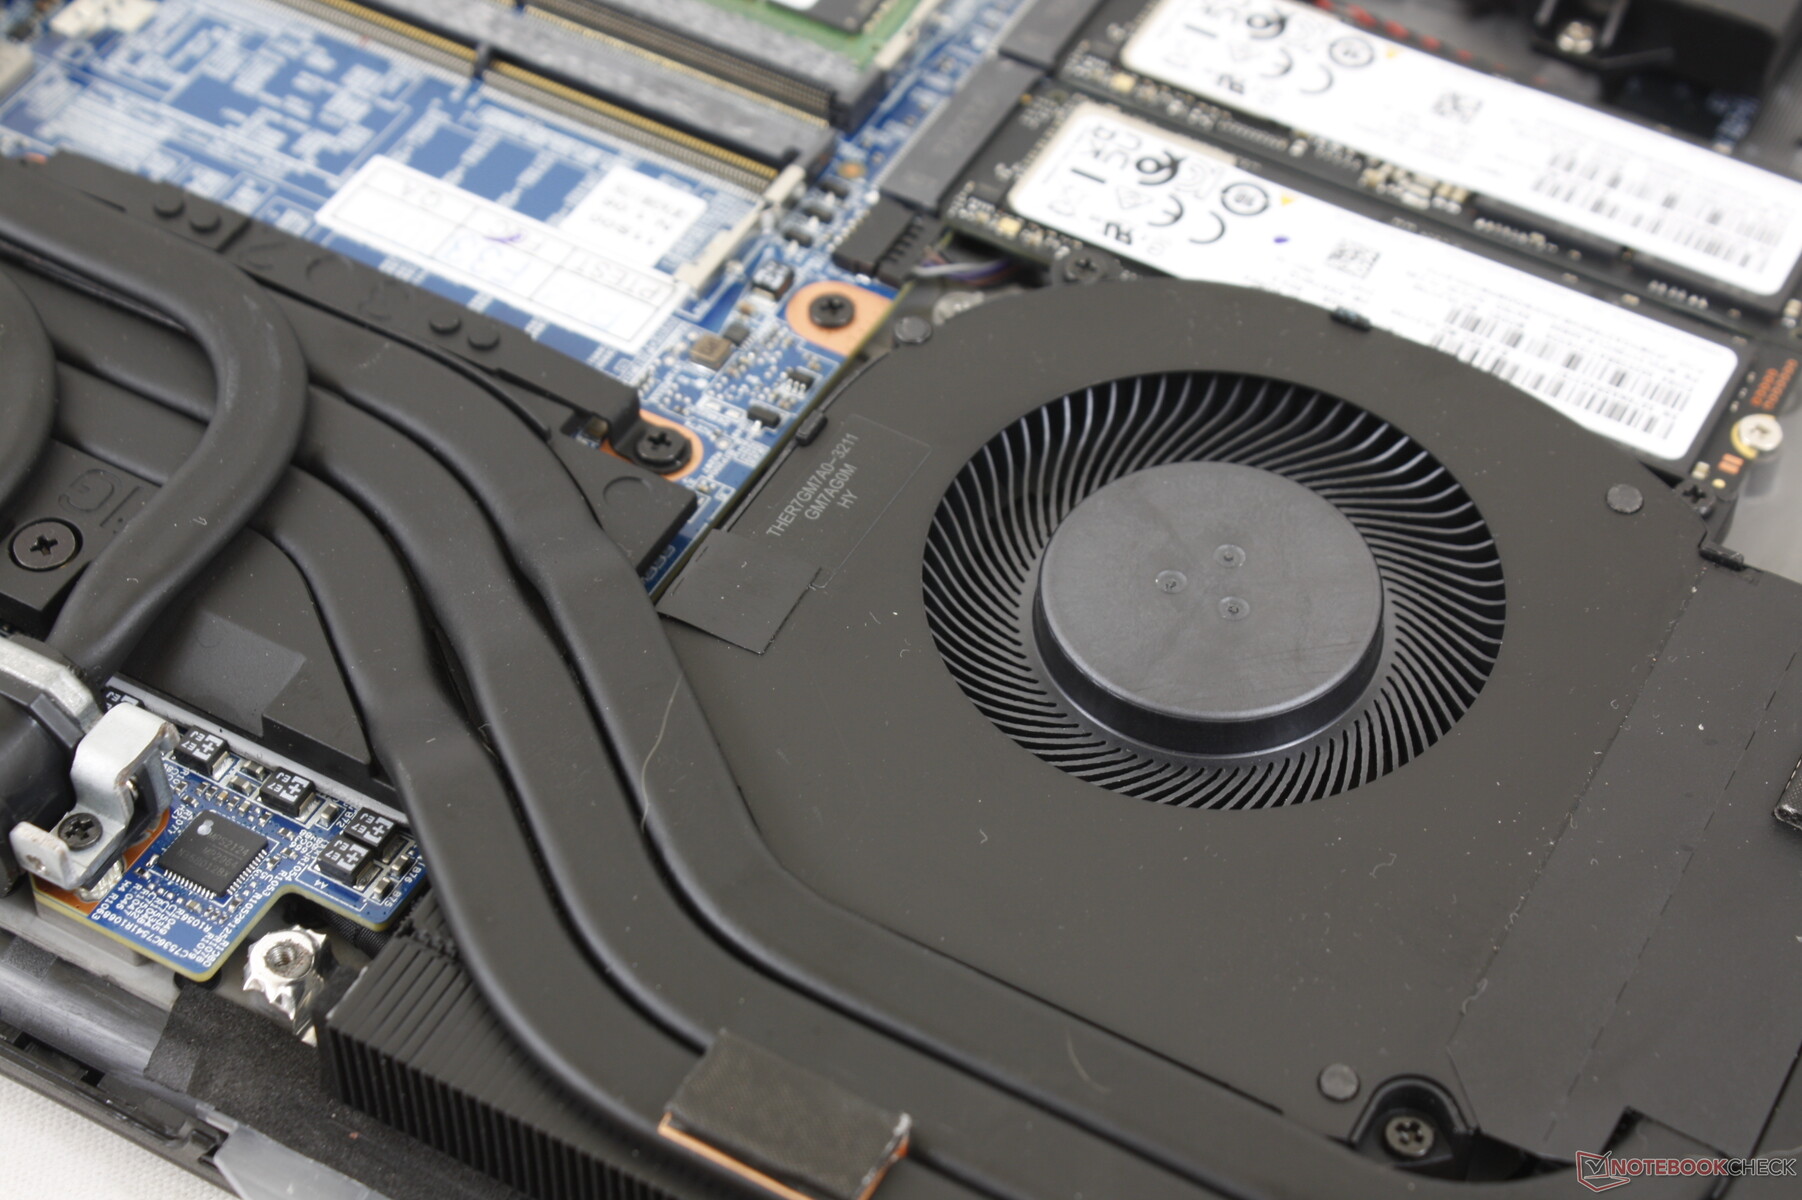
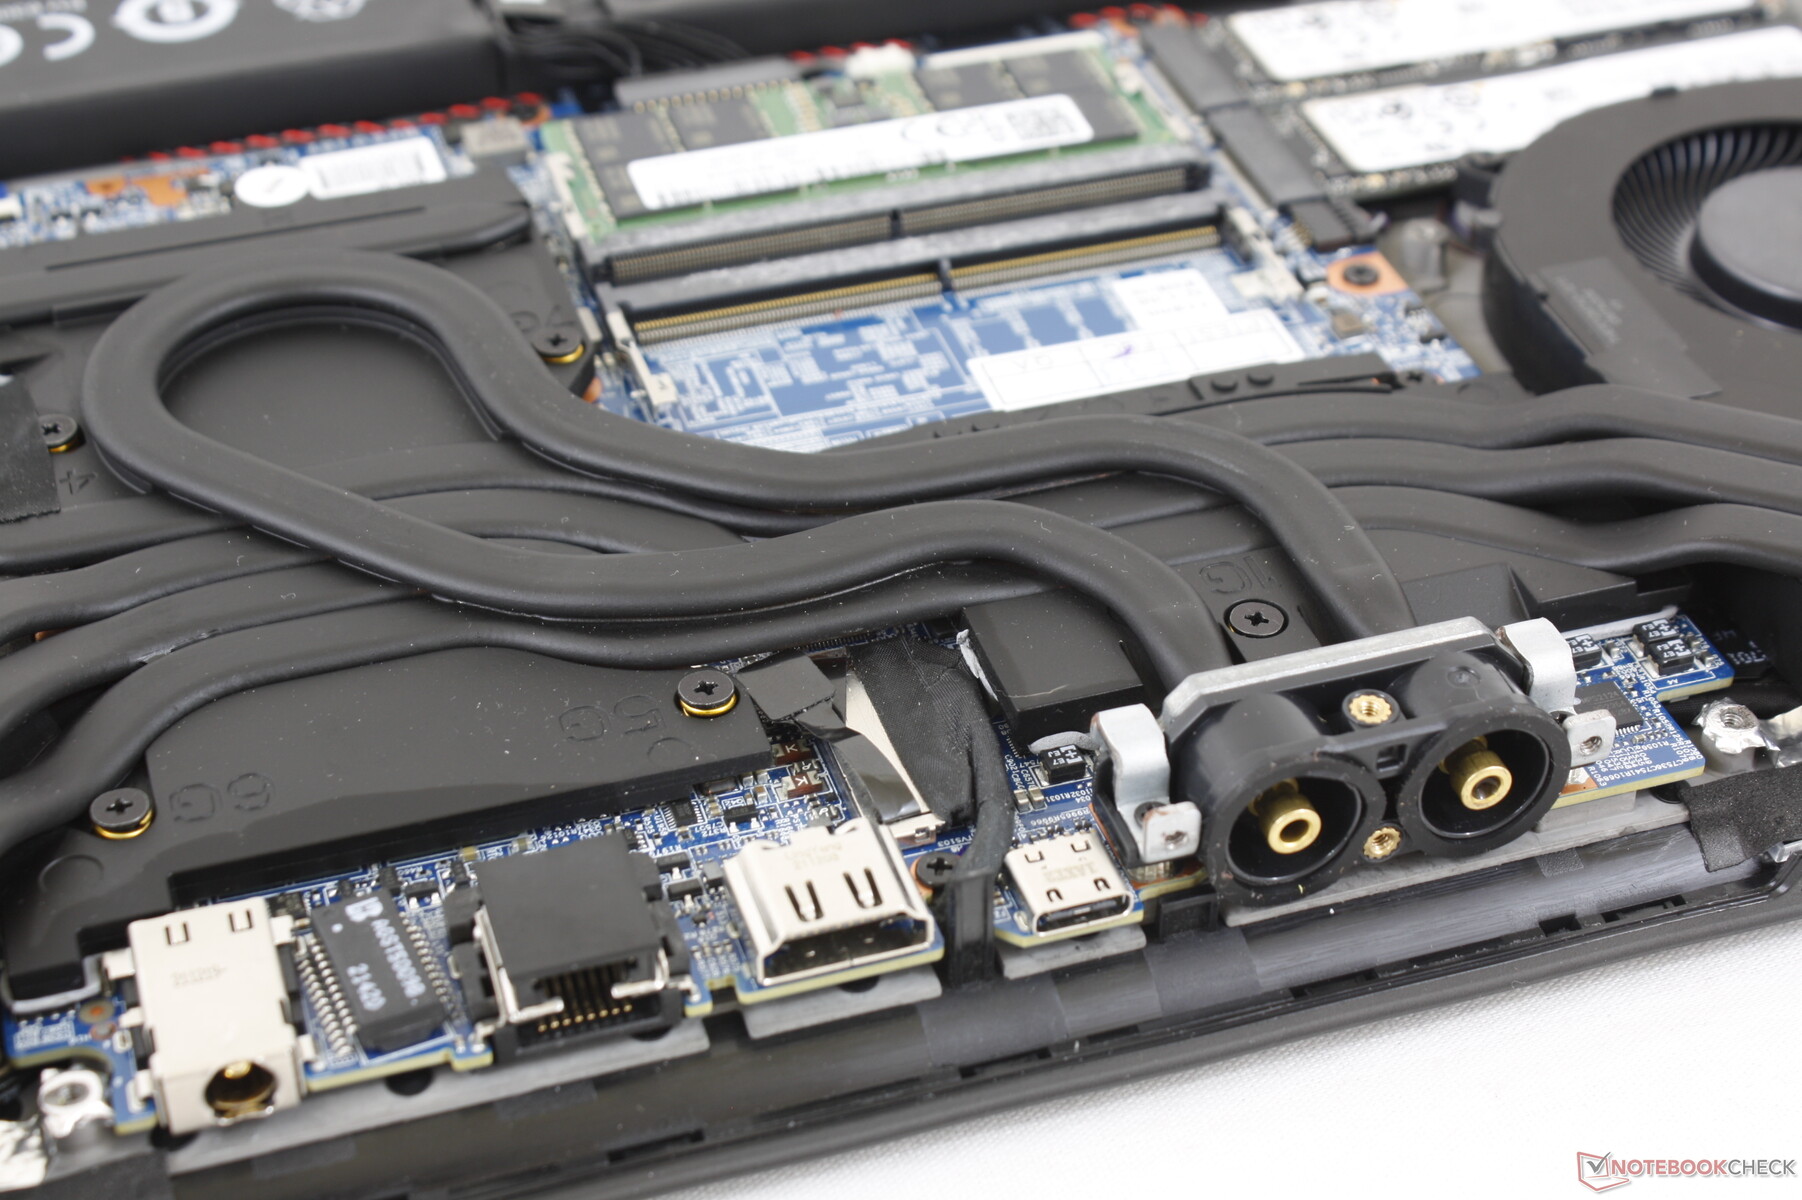
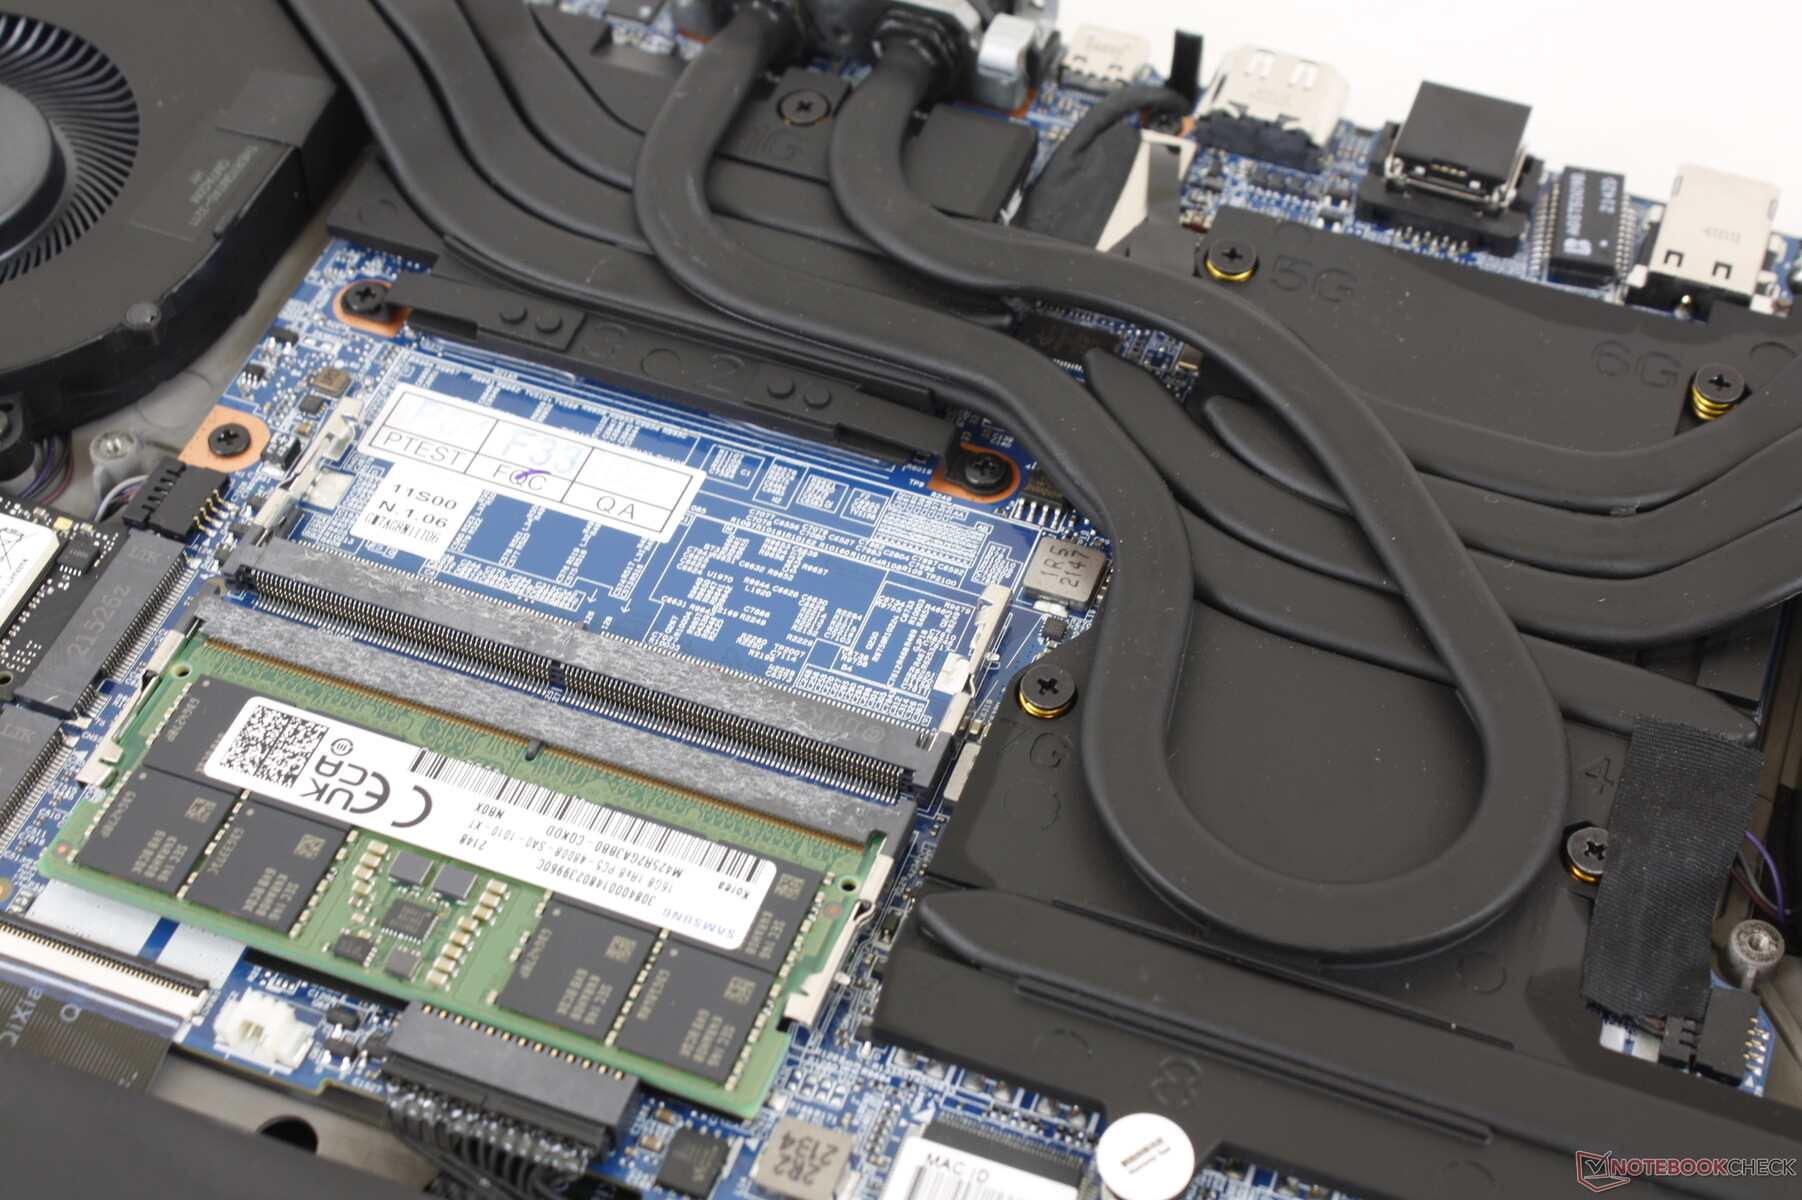
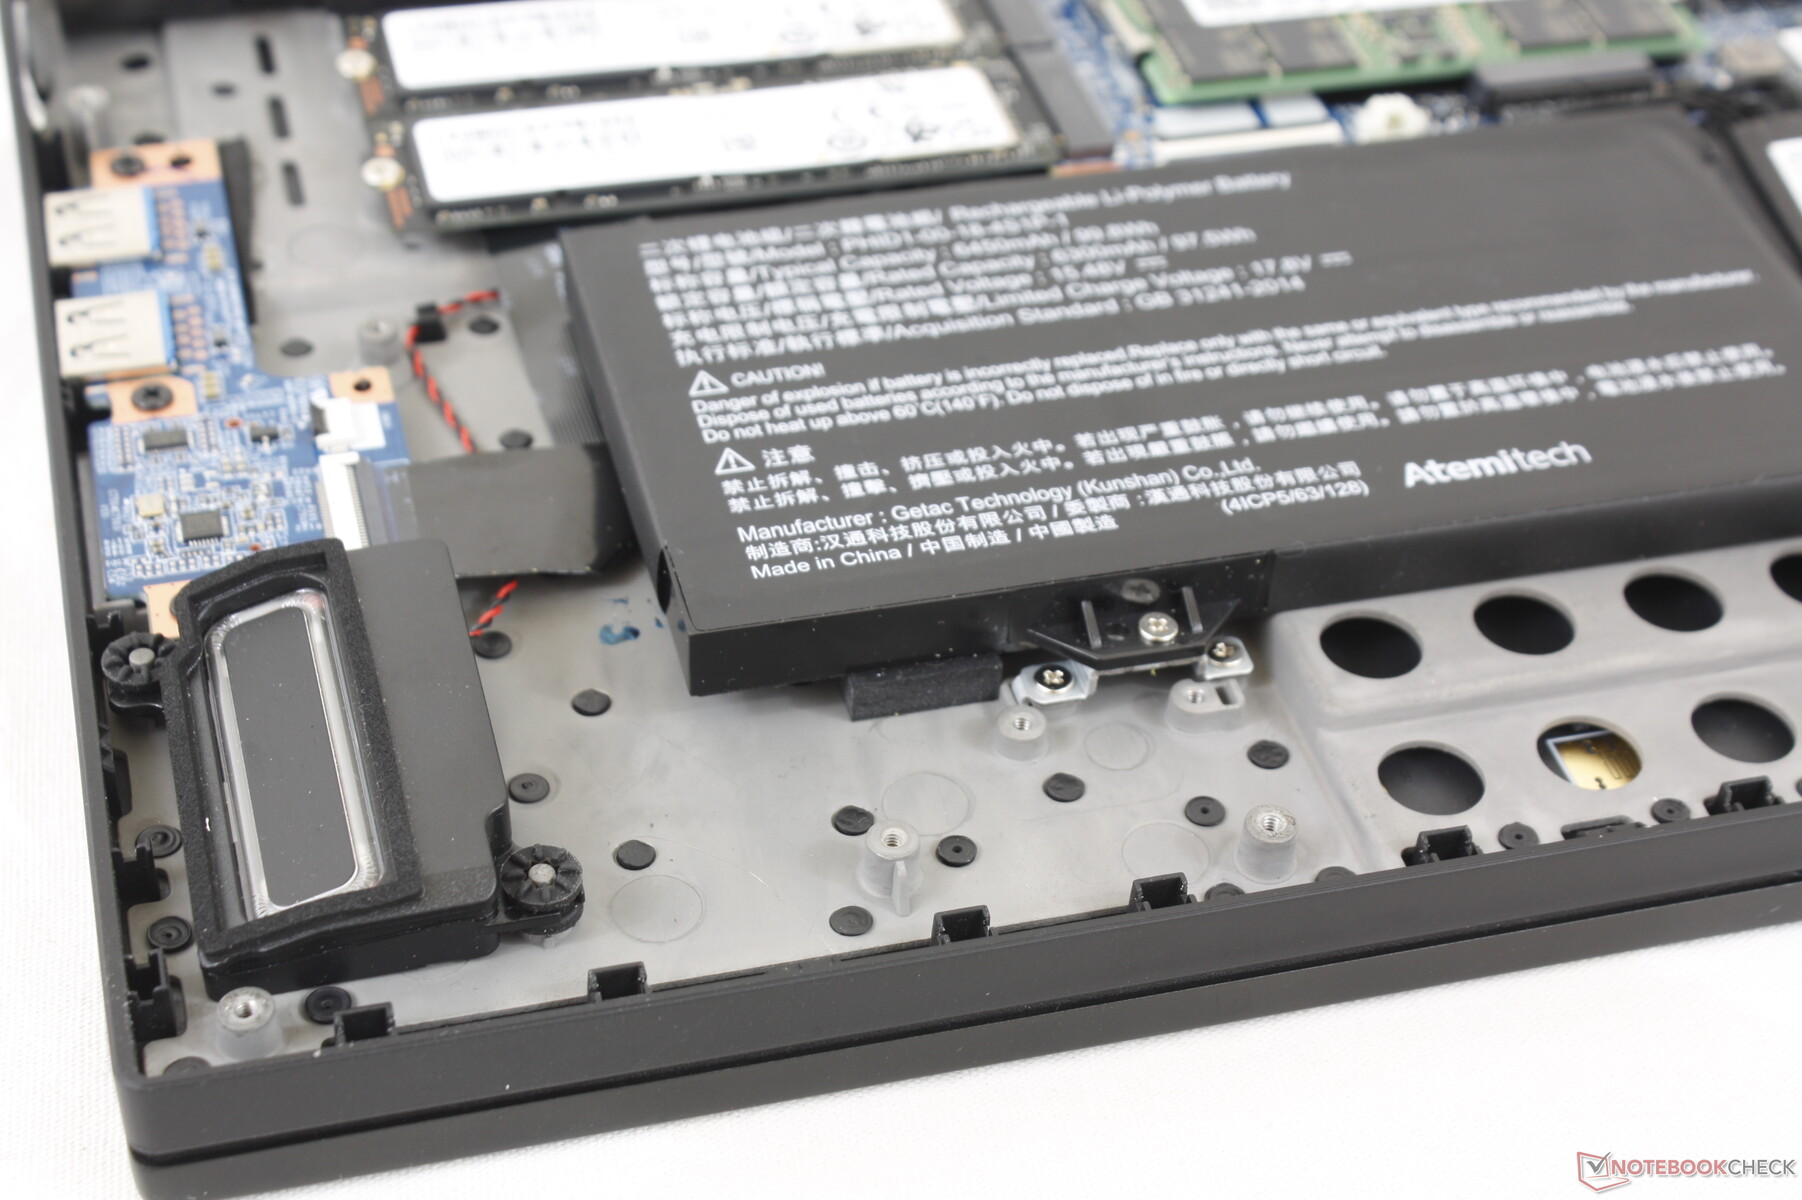
Le panneau inférieur se détache facilement après avoir retiré plusieurs vis Philips, ce qui permet de mettre à niveau la RAM ou le SSD. La carte mère présente de nombreuses similitudes avec la GM5AG8W, mais avec de légers changements au niveau de la solution de refroidissement, comme le montrent les images de comparaison ci-dessous.
Accessoires et garantie
Le boîtier de refroidissement externe comprend deux bouchons de vidange, deux tubes d'eau, deux bouchons d'eau et un manuel d'utilisation en plus de l'adaptateur secteur habituel.
La garantie limitée standard d'un an s'applique si l'appareil est acheté aux États-Unis.
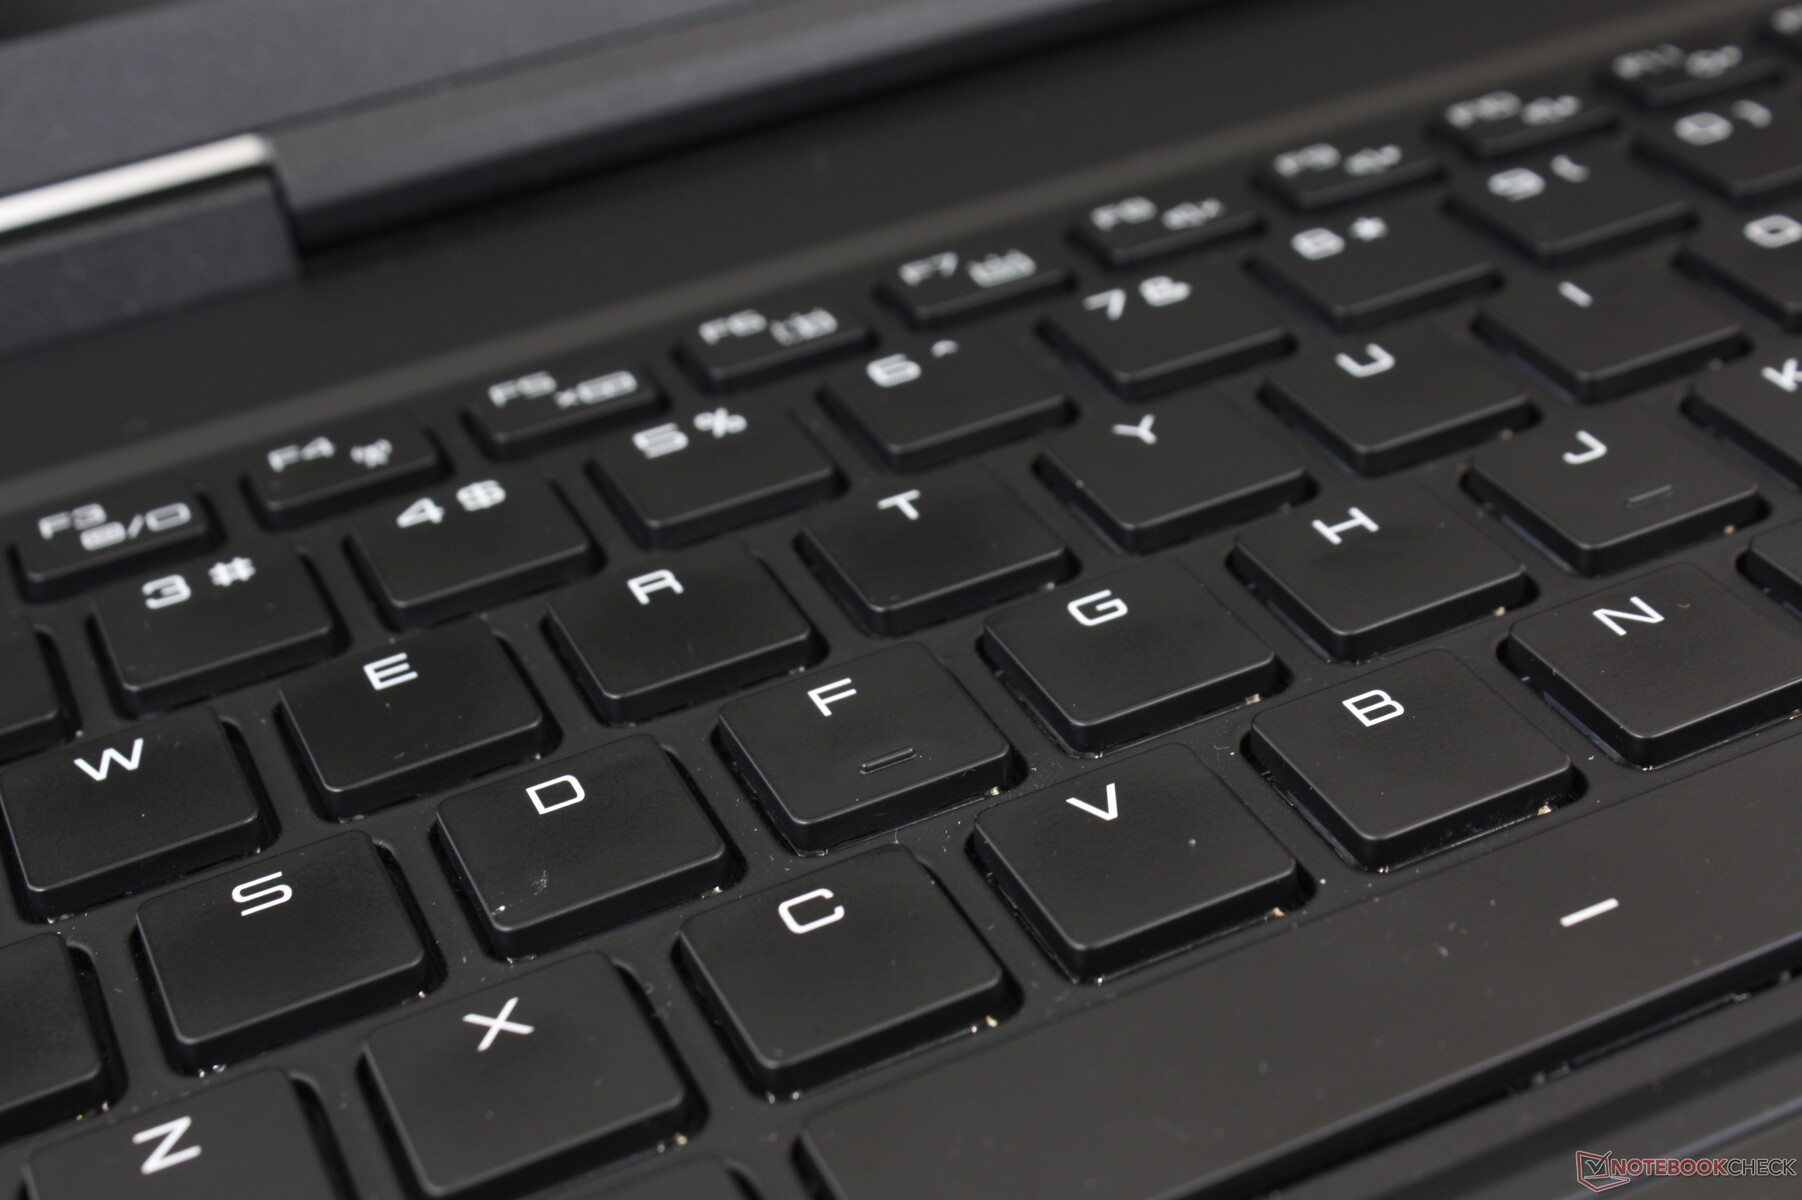
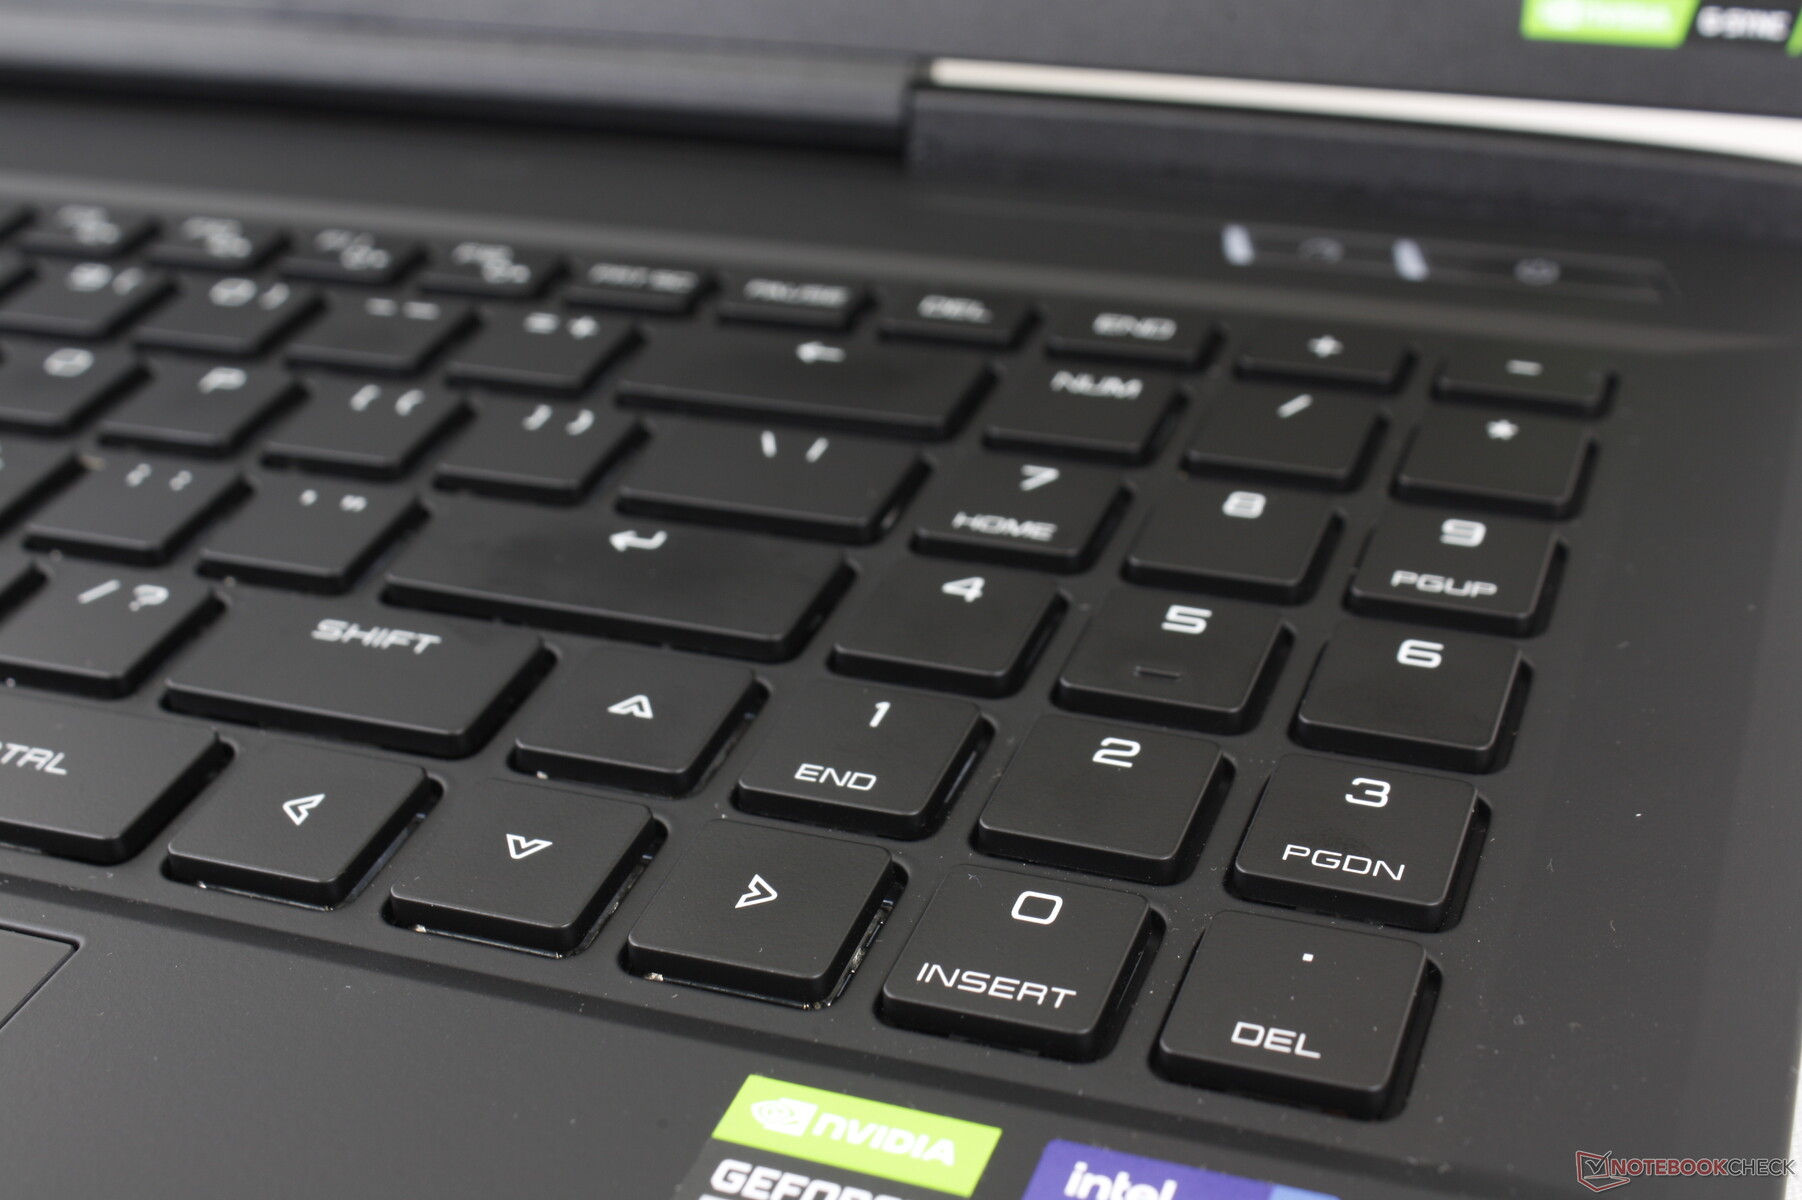
Périphériques d'entrée - Bruyants et cliquables
Clavier
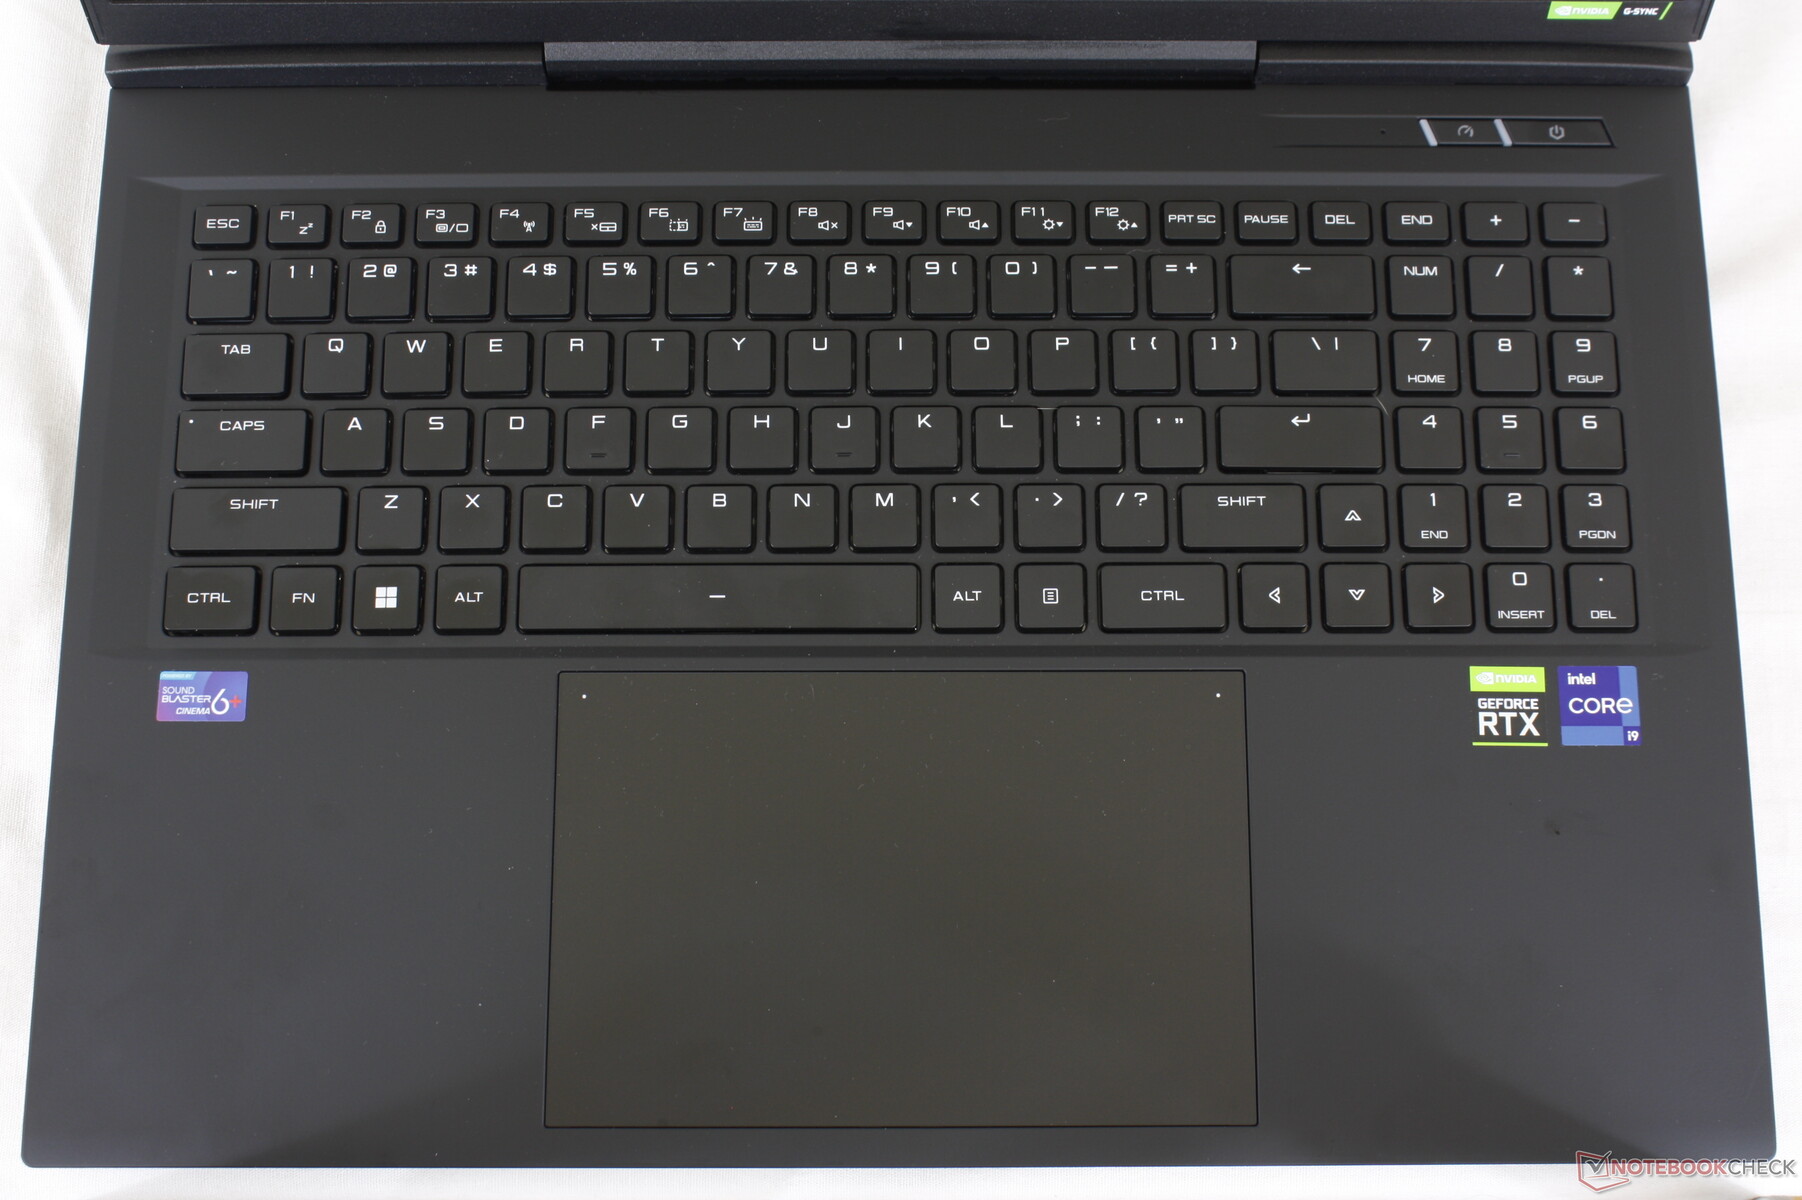
Le clavier RVB par touche est différent de celui duXMG Neo 15 E22 même si les deux ordinateurs portables partagent les mêmes ports. Les touches Cherry MX de notre Uniwell offrent une course nettement plus longue, un retour plus net et un bruit beaucoup plus fort que sur la plupart des autres ordinateurs portables. Vous éviterez d'utiliser ce portable dans les salles de classe, les conférences ou les bibliothèques en raison de son bruit
Un aspect ennuyeux que nous avons remarqué est que les touches du pavé numérique sont plus douces et plus silencieuses que les touches principales du clavier QWERTY et que le retour n'est pas uniforme sur toutes les touches. Il est difficile de taper entre les mots et les chiffres car le retour d'information est très différent d'une touche à l'autre.
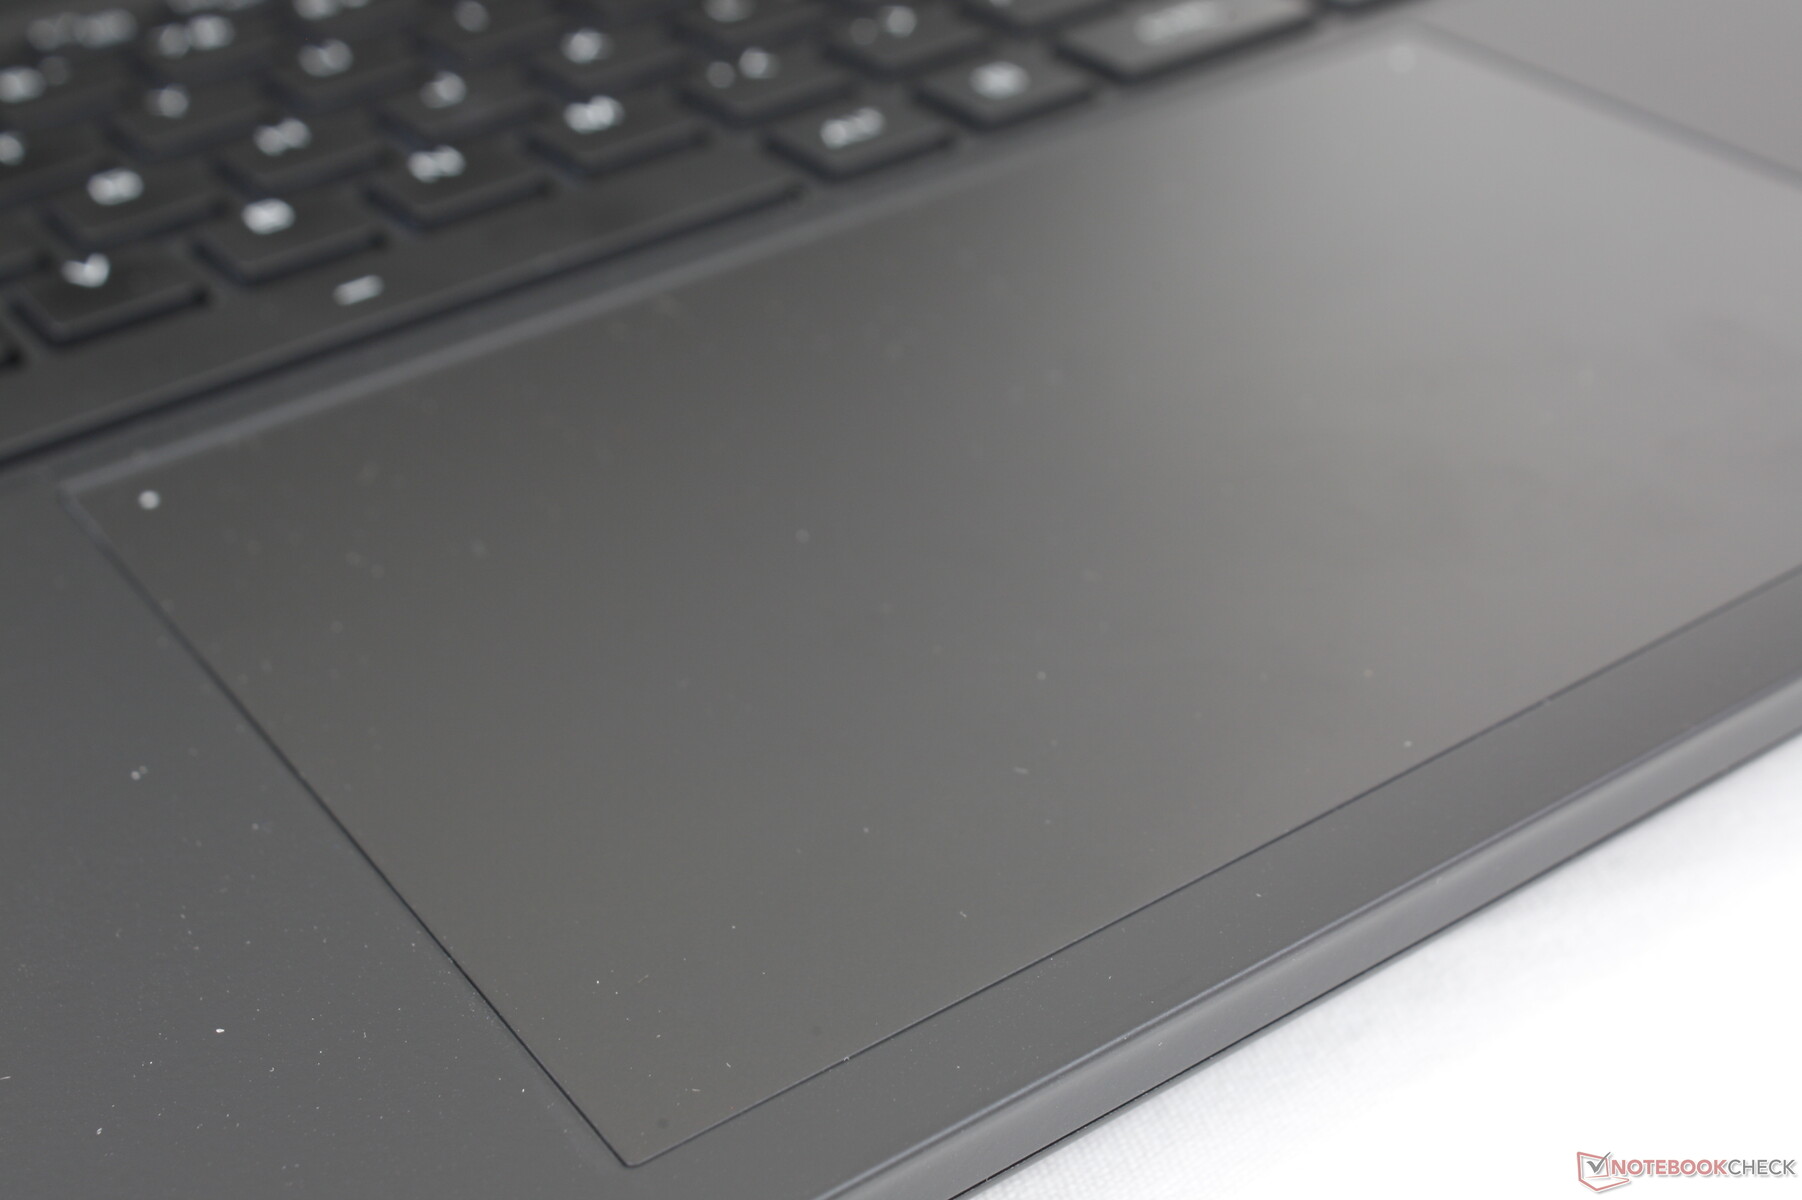
Pavé tactile
Le clickpad surdimensionné est encore plus grand que le clickpad déjà grand du MSI GS77 (15,5 x 10 cm contre 13,2 x 8,2 cm). Sa surface est légèrement caoutchoutée pour une glisse très douce à des vitesses moyennes à élevées, avec seulement un peu de collage à des vitesses plus lentes.
Le retour d'information lors du clic sur le pavé tactile est plus ferme que sur le grand pavé tactile du XPS 17 Test du Dell XPS 17 9720 : le PC portable multimédia haut de gamme commence à accuser son âge pour une sensation plus satisfaisante. Il est cependant plus bruyant, mais nous ne pensons pas que ce soit un gros problème puisque les touches mécaniques sont déjà assez bruyantes de toute façon.
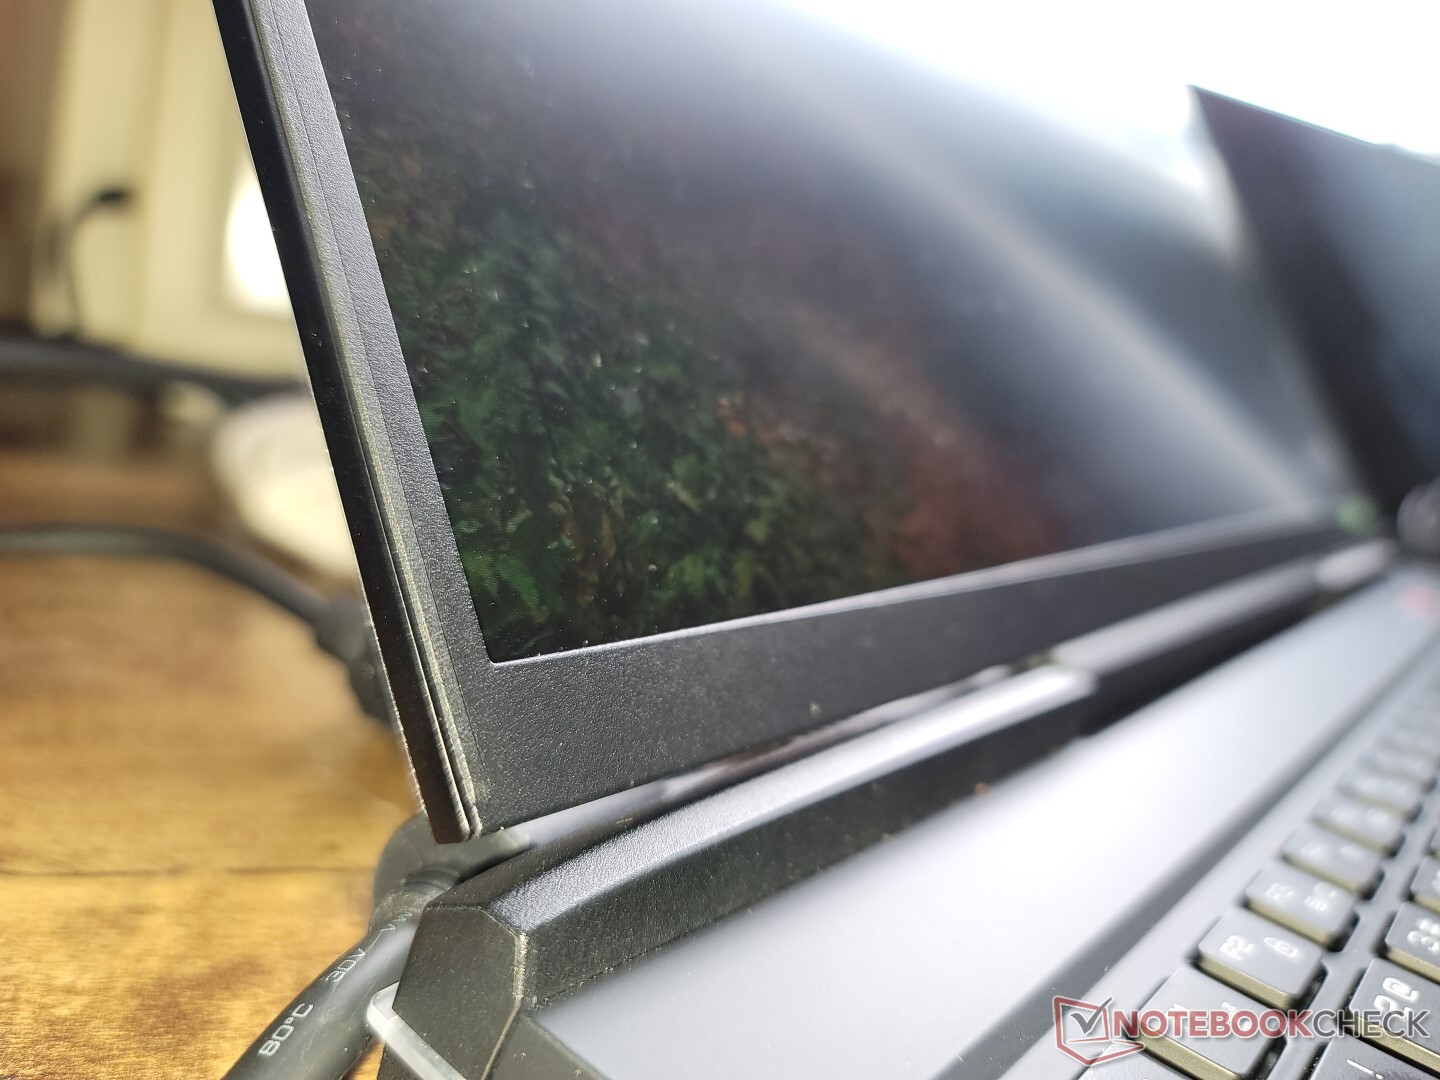
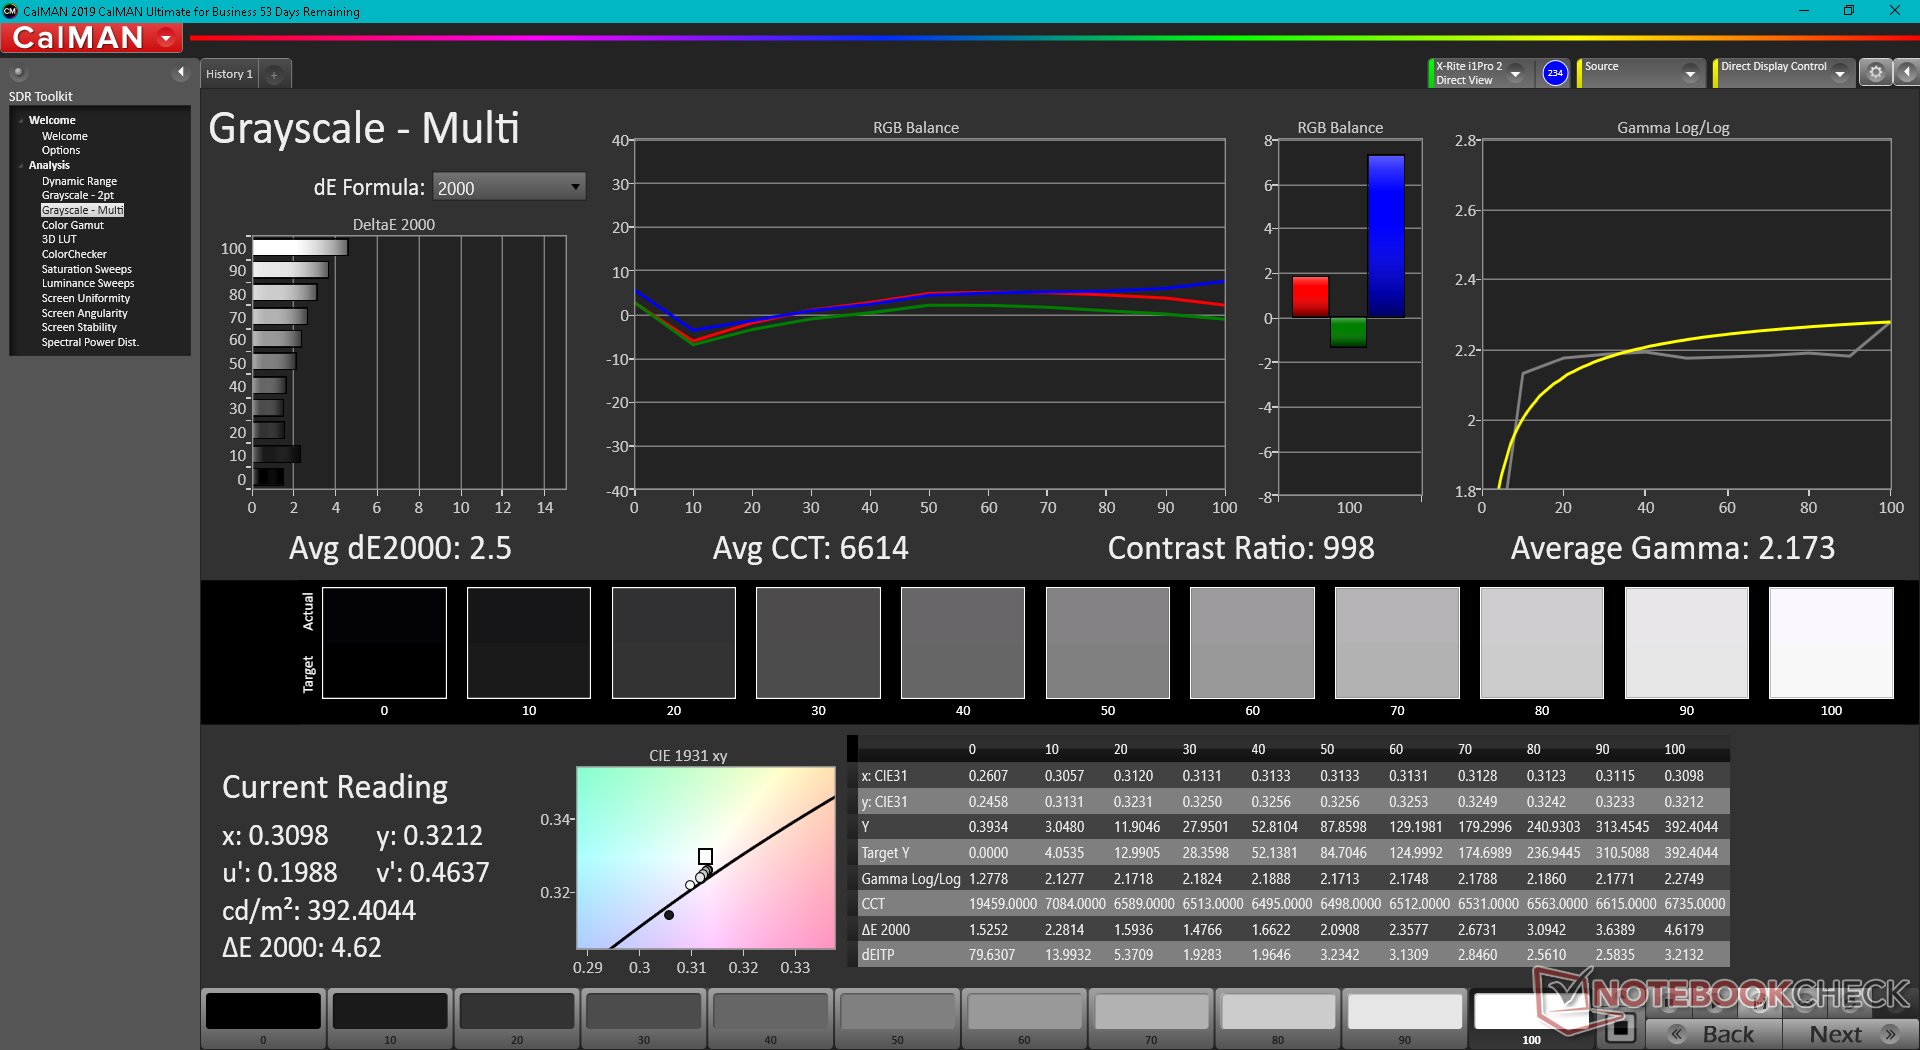
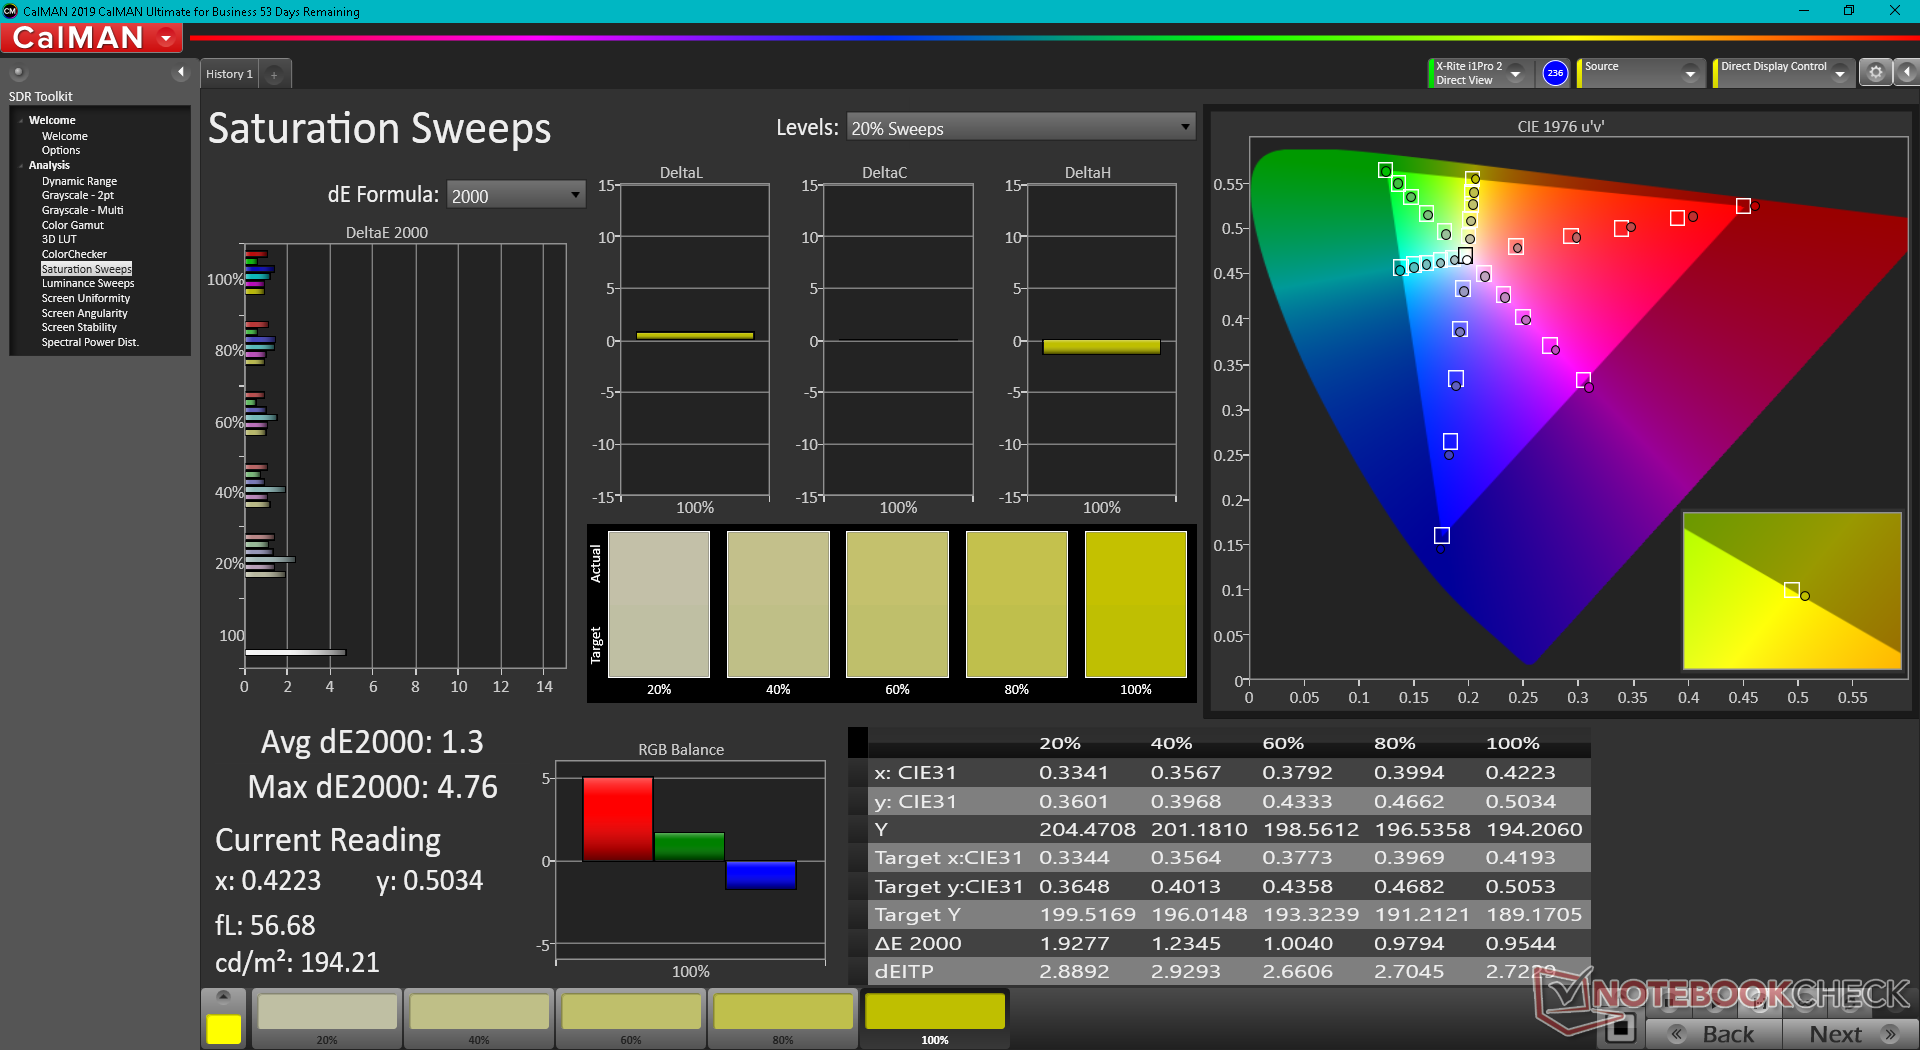
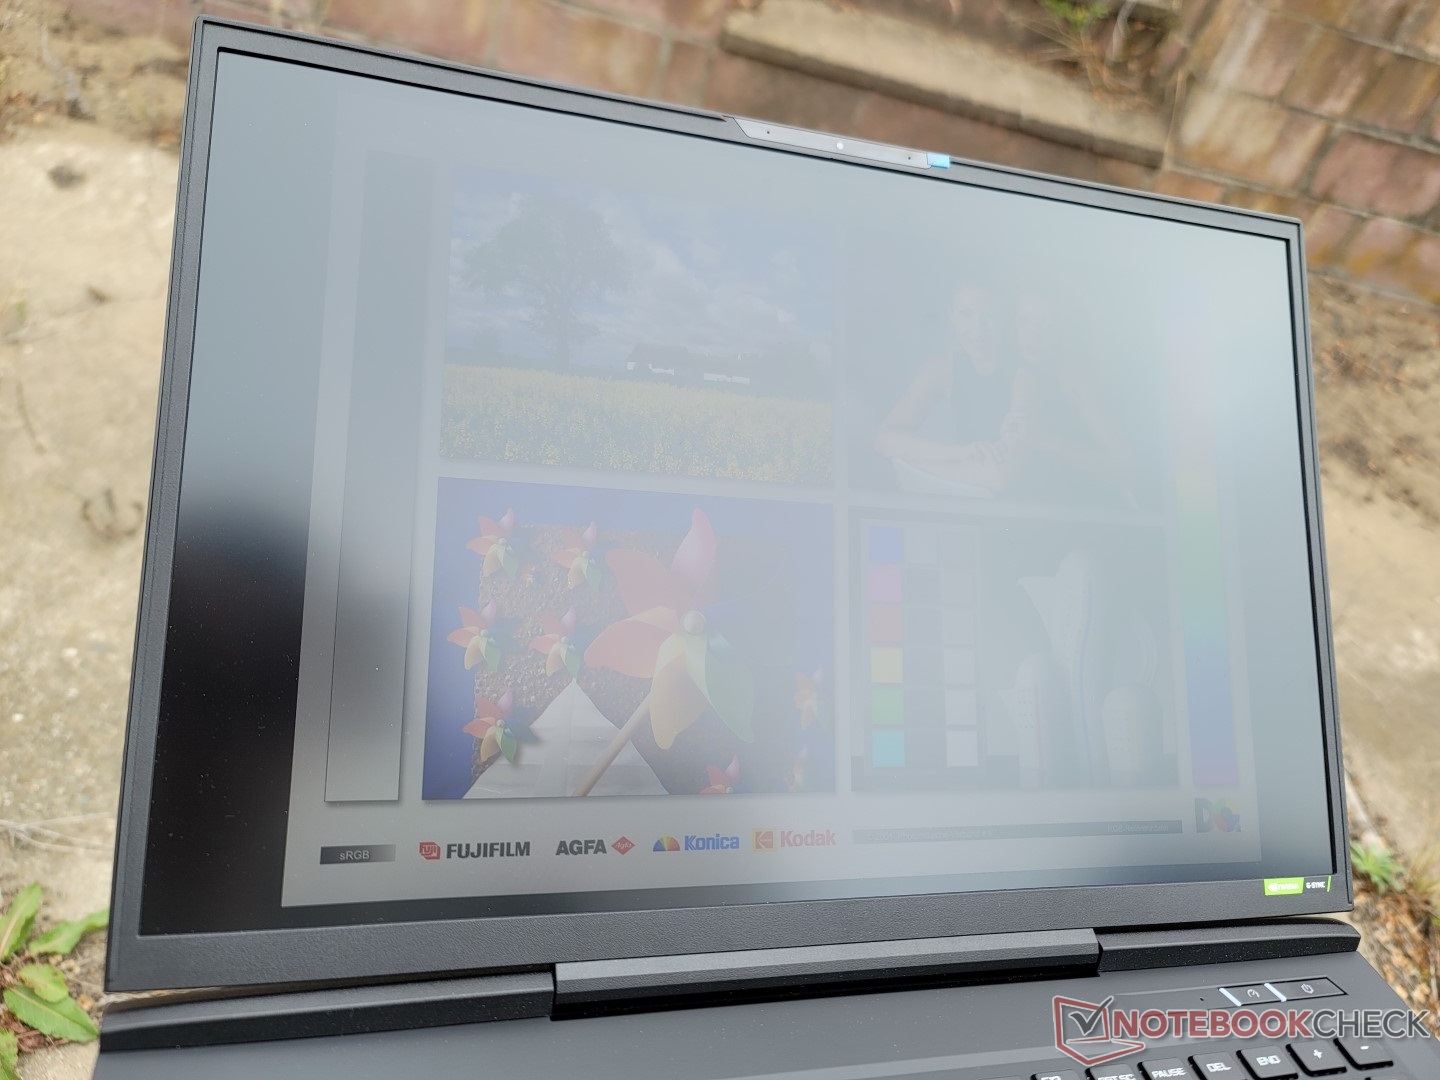
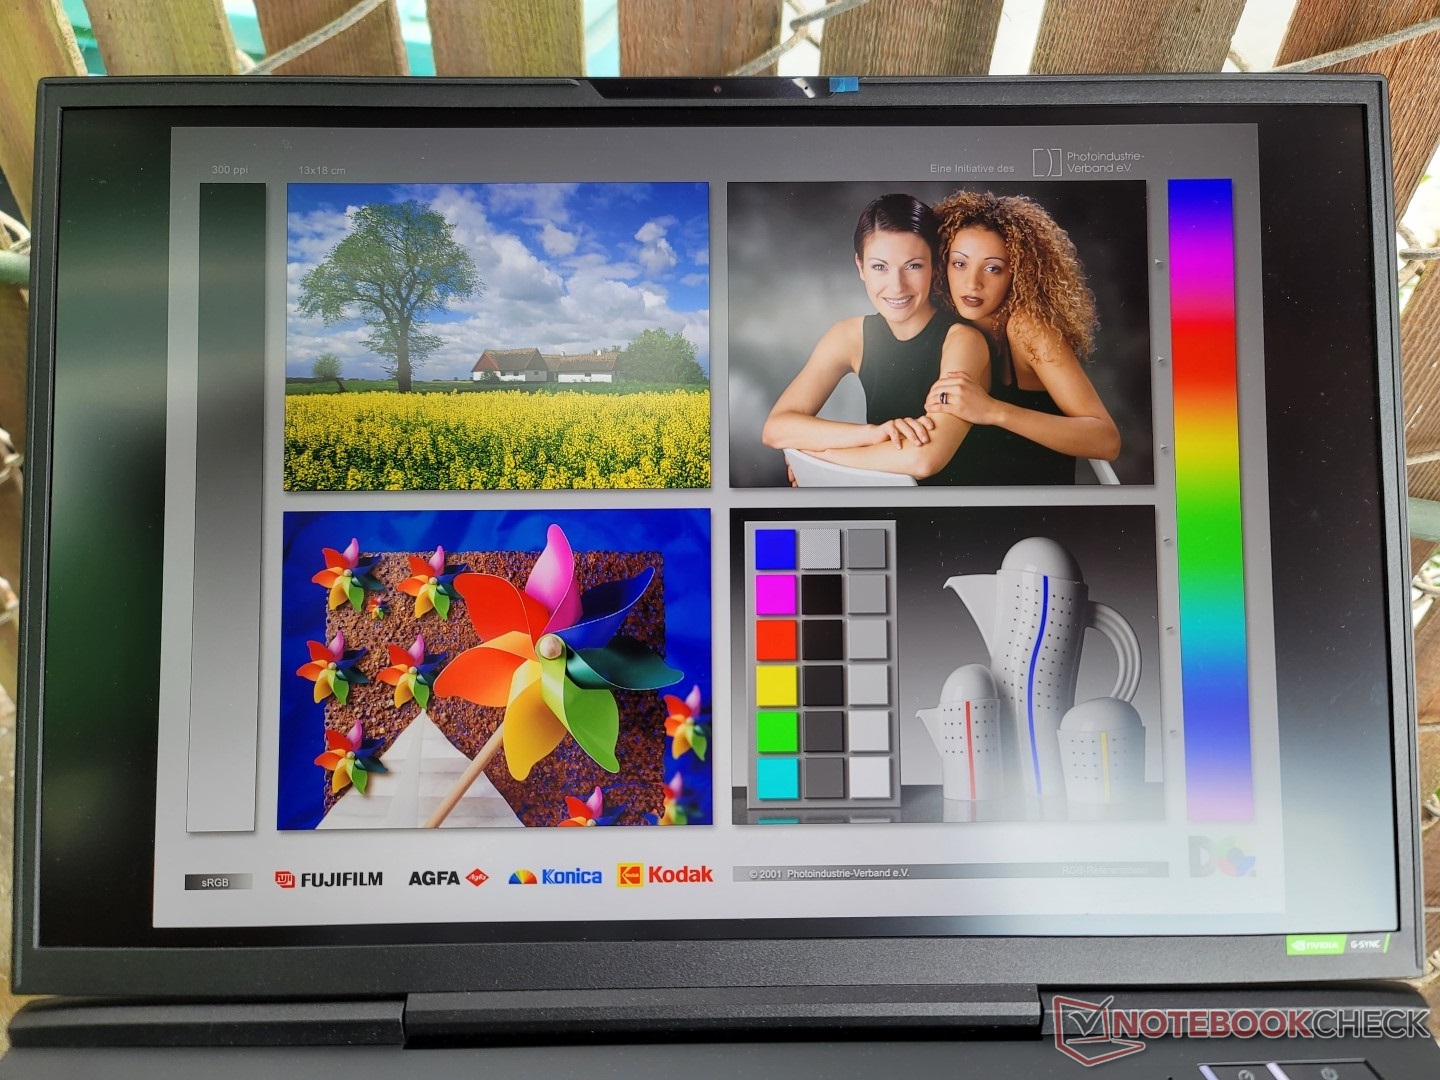
Affichage - Optimisé pour les jeux en 1440p
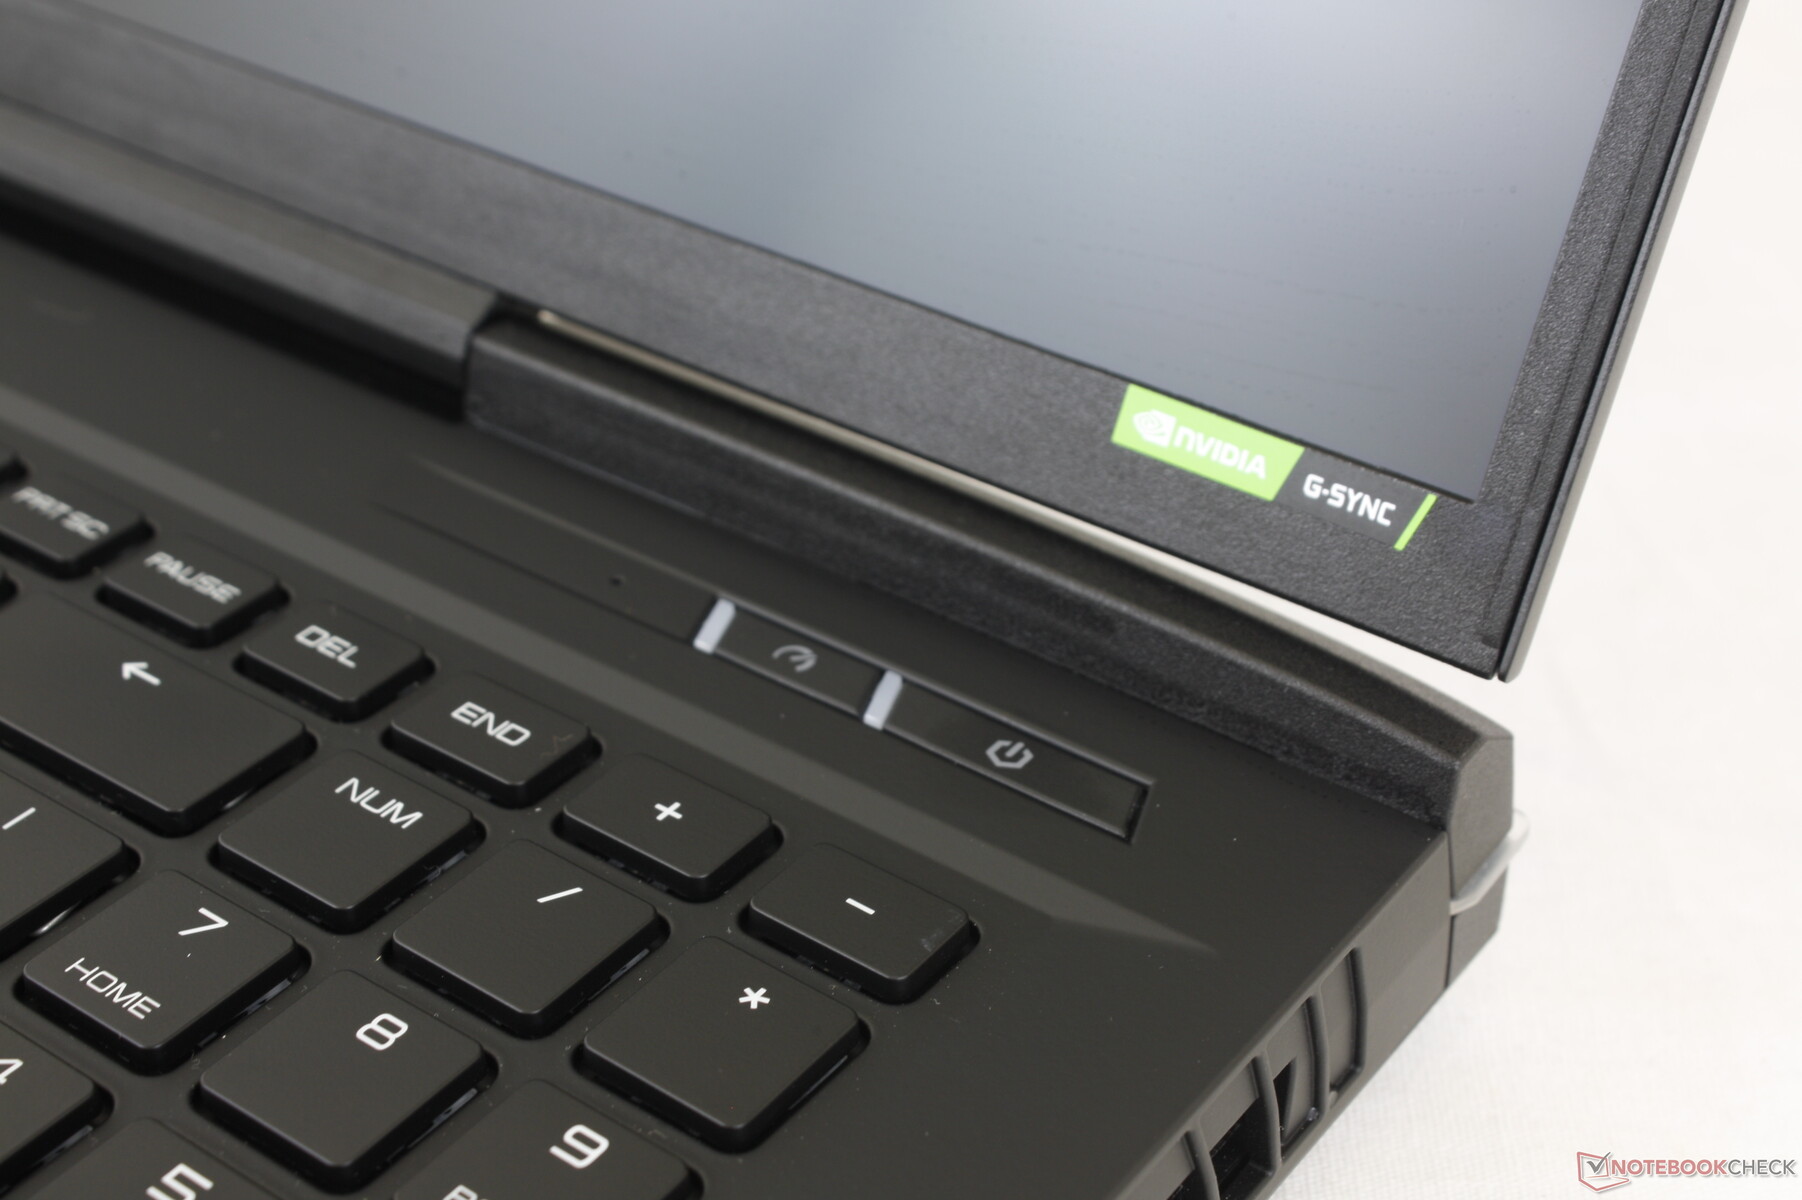
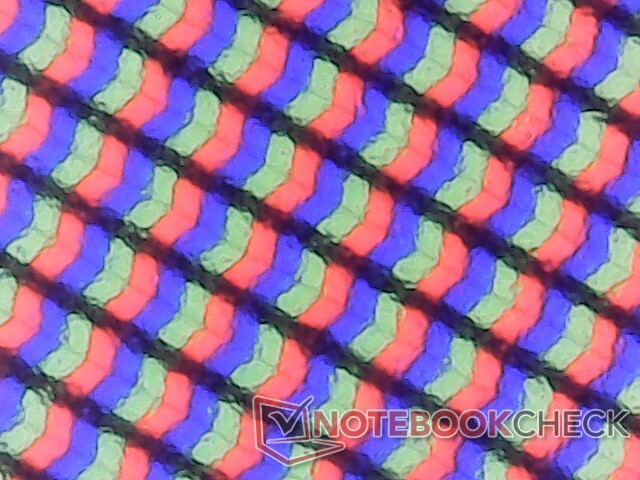
La dalle BOE NE170QDM-NZ1 de notre unité de test Uniwell est la première à apparaître dans notre base de données. Cette dalle IPS compatible G-Sync offre une couverture sRGB complète, des temps de réponse rapides, un bon contraste, une fréquence de rafraîchissement rapide de 240 Hz et un rétroéclairage relativement lumineux de 400 nits pour être digne d'une machine de jeu pour passionnés. Cependant, la plupart des autres ordinateurs portables de jeu comme le Razer Blade 17 ont des options supplémentaires comme le 4K ou l'OLED, qui ne sont pas disponibles sur l'Uniwell.
| |||||||||||||||||||||||||
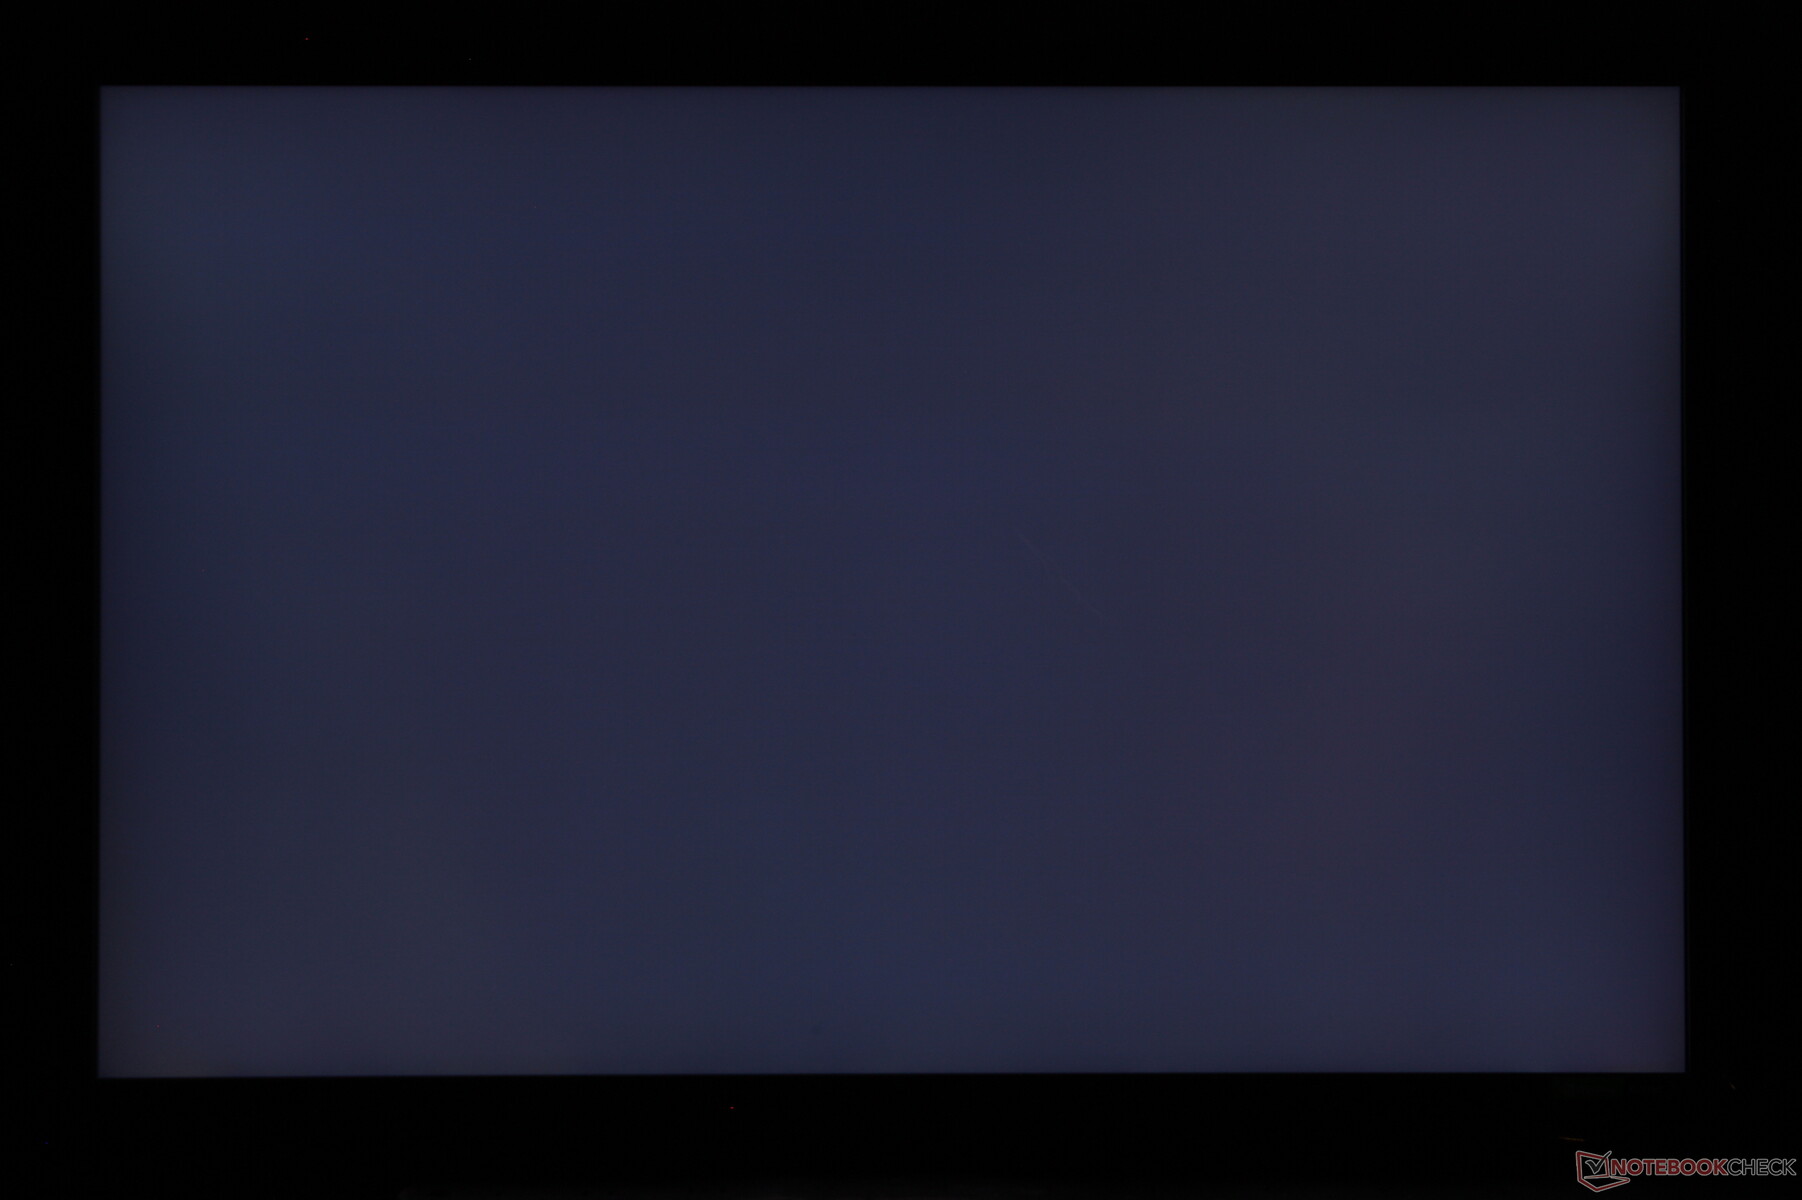
Homogénéité de la luminosité: 91 %
Valeur mesurée au centre, sur batterie: 392.5 cd/m²
Contraste: 872:1 (Valeurs des noirs: 0.45 cd/m²)
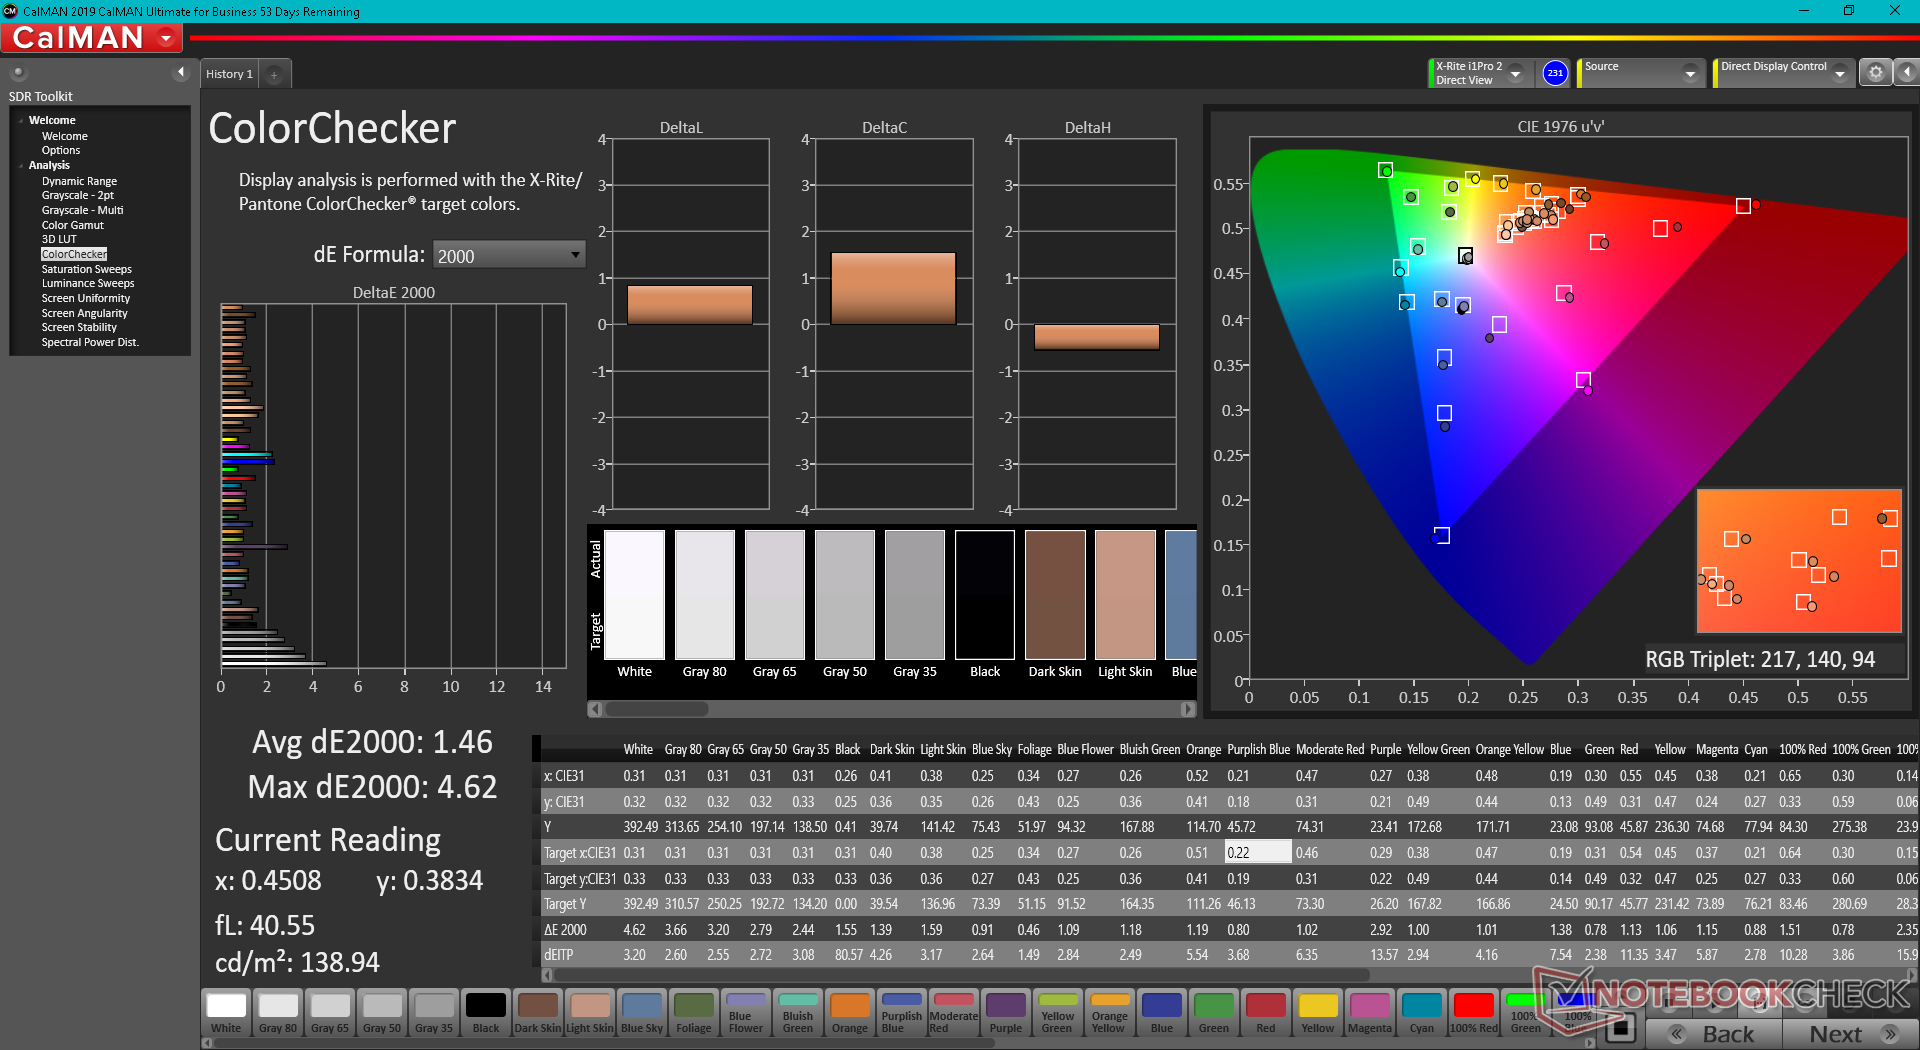
ΔE ColorChecker Calman: 1.46 | ∀{0.5-29.43 Ø4.71}
calibrated: 0.38
ΔE Greyscale Calman: 2.5 | ∀{0.09-98 Ø4.96}
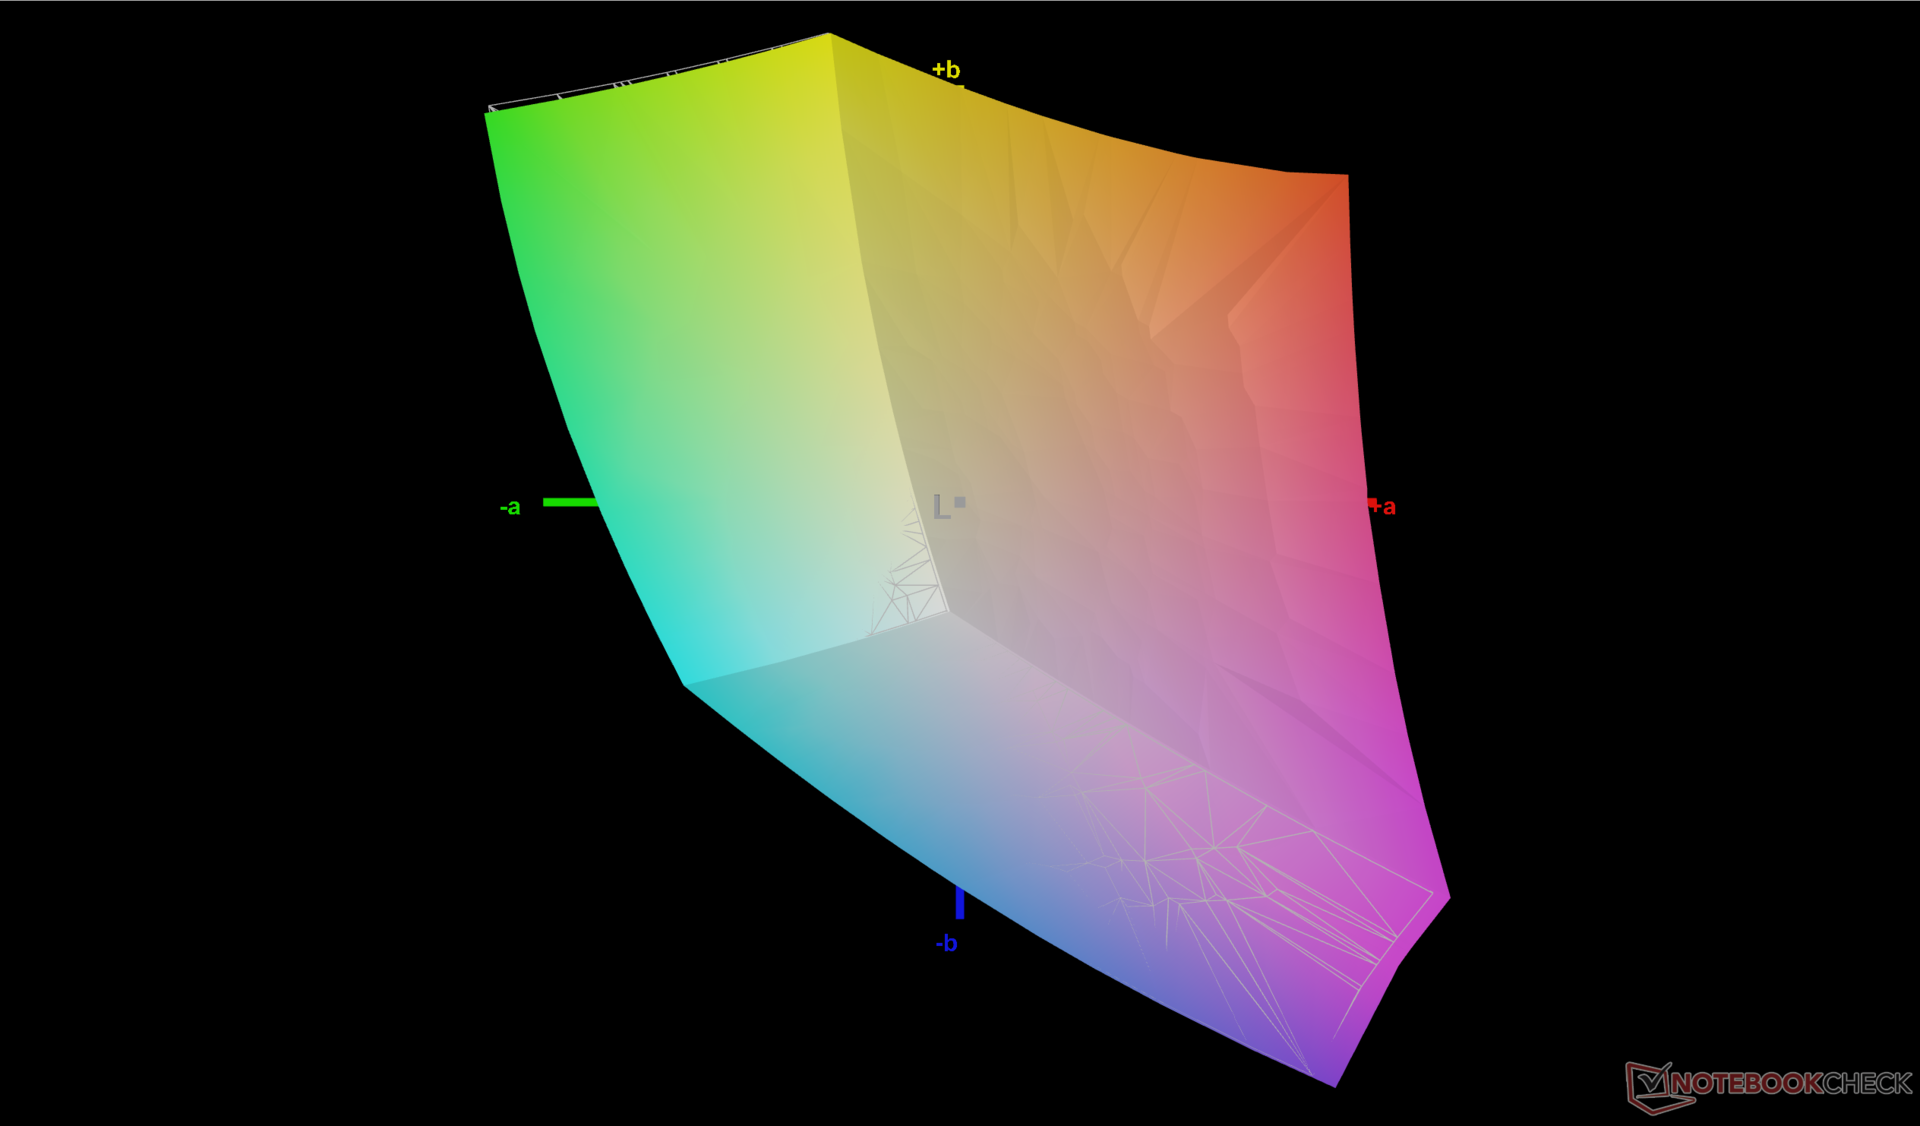
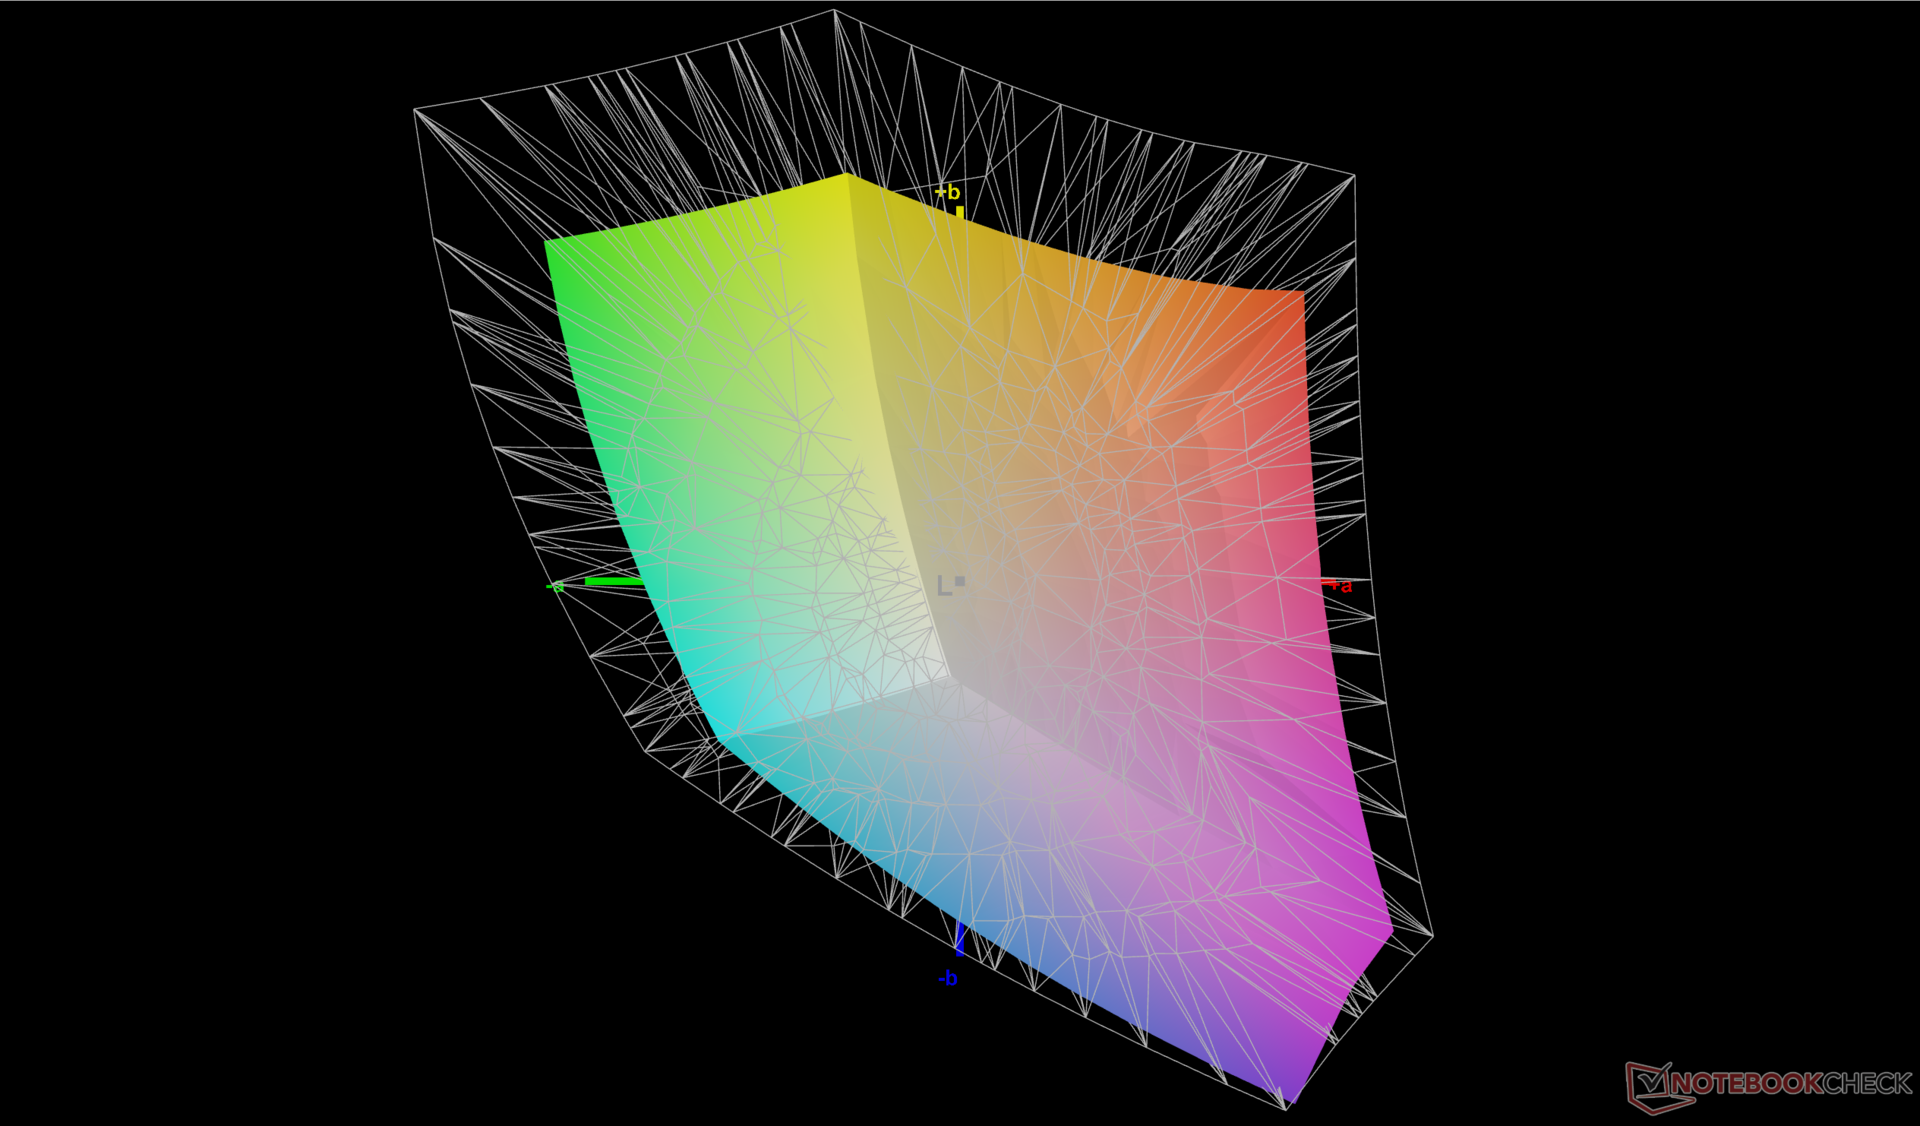
69.8% AdobeRGB 1998 (Argyll 3D)
99.7% sRGB (Argyll 3D)
69.1% Display P3 (Argyll 3D)
Gamma: 2.17
CCT: 6614 K
| Uniwell Technology GM7AG8N Liquid Cooling Box BOE NE170QDM-NZ1, IPS, 2560x1600, 17" | MSI Titan GT77 12UHS Sharp SHP1544 LQ173M1JW08, IPS-Level, 1920x1080, 17.3" | Aorus 17X XES Sharp SHP1563, IPS, 1920x1080, 17.3" | Razer Blade 17 Early 2022 AU Optronics B173ZAN06.9, IPS, 3840x2160, 17.3" | MSI Stealth GS77 12UHS-083US BOE NE173QHM-NZ1, IPS, 2560x1440, 17.3" | Asus ROG Zephyrus S17 GX703HSD BOE099D (BOE CQ NE173QHM-NY3), IPS, 2560x1440, 17.3" | |
|---|---|---|---|---|---|---|
| Display | 2% | 1% | 23% | 21% | 19% | |
| Display P3 Coverage (%) | 69.1 | 70.8 2% | 70.1 1% | 99.4 44% | 96.2 39% | 94.2 36% |
| sRGB Coverage (%) | 99.7 | 98.9 -1% | 99.9 0% | 100 0% | 99.7 0% | 98.7 -1% |
| AdobeRGB 1998 Coverage (%) | 69.8 | 73 5% | 71.9 3% | 87.3 25% | 85.8 23% | 84.4 21% |
| Response Times | 63% | 59% | 44% | -31% | 43% | |
| Response Time Grey 50% / Grey 80% * (ms) | 12.8 ? | 3.03 ? 76% | 3.4 ? 73% | 7.5 ? 41% | 17.6 ? -38% | 4.8 63% |
| Response Time Black / White * (ms) | 10.4 ? | 5.28 ? 49% | 5.8 ? 44% | 5.6 ? 46% | 12.8 ? -23% | 8 23% |
| PWM Frequency (Hz) | ||||||
| Screen | -55% | -74% | 11% | -47% | -62% | |
| Brightness middle (cd/m²) | 392.5 | 280 -29% | 278 -29% | 503 28% | 334.8 -15% | 322 -18% |
| Brightness (cd/m²) | 392 | 275 -30% | 273 -30% | 486 24% | 305 -22% | 288 -27% |
| Brightness Distribution (%) | 91 | 79 -13% | 79 -13% | 84 -8% | 79 -13% | 72 -21% |
| Black Level * (cd/m²) | 0.45 | 0.4 11% | 0.26 42% | 0.44 2% | 0.34 24% | 0.3 33% |
| Contrast (:1) | 872 | 700 -20% | 1069 23% | 1143 31% | 985 13% | 1073 23% |
| Colorchecker dE 2000 * | 1.46 | 2.1 -44% | 3.96 -171% | 1.08 26% | 4.1 -181% | 3.05 -109% |
| Colorchecker dE 2000 max. * | 4.62 | 5.83 -26% | 10.78 -133% | 4.54 2% | 7.28 -58% | 5.23 -13% |
| Colorchecker dE 2000 calibrated * | 0.38 | 1.58 -316% | 1.07 -182% | 0.6 -58% | 1.92 -405% | |
| Greyscale dE 2000 * | 2.5 | 3.3 -32% | 6.8 -172% | 1.3 48% | 5.6 -124% | 3.11 -24% |
| Gamma | 2.17 101% | 2.13 103% | 2.224 99% | 2.151 102% | 2.16 102% | 2.13 103% |
| CCT | 6614 98% | 7060 92% | 7651 85% | 6541 99% | 6314 103% | 6553 99% |
| Color Space (Percent of AdobeRGB 1998) (%) | 84 | |||||
| Color Space (Percent of sRGB) (%) | 99 | |||||
| Moyenne finale (programmes/paramètres) | 3% /
-26% | -5% /
-39% | 26% /
18% | -19% /
-29% | 0% /
-30% |
* ... Moindre est la valeur, meilleures sont les performances
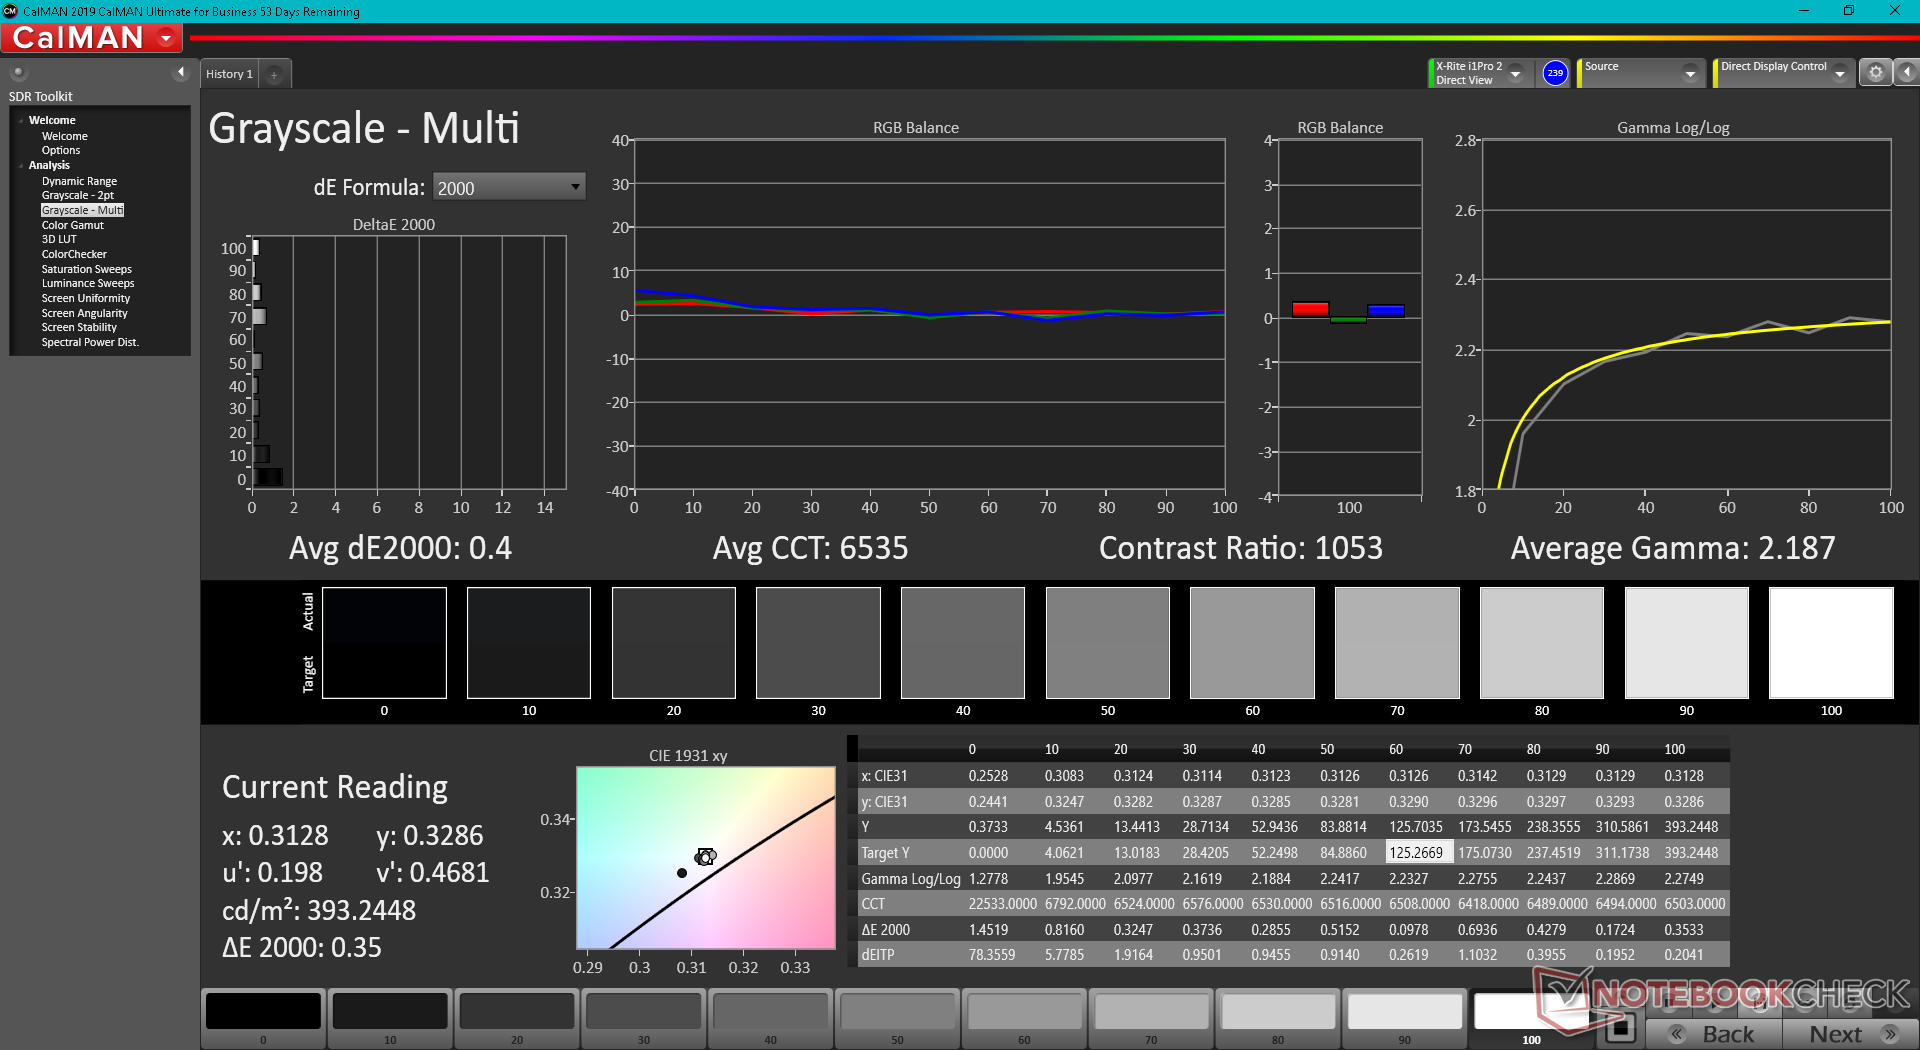
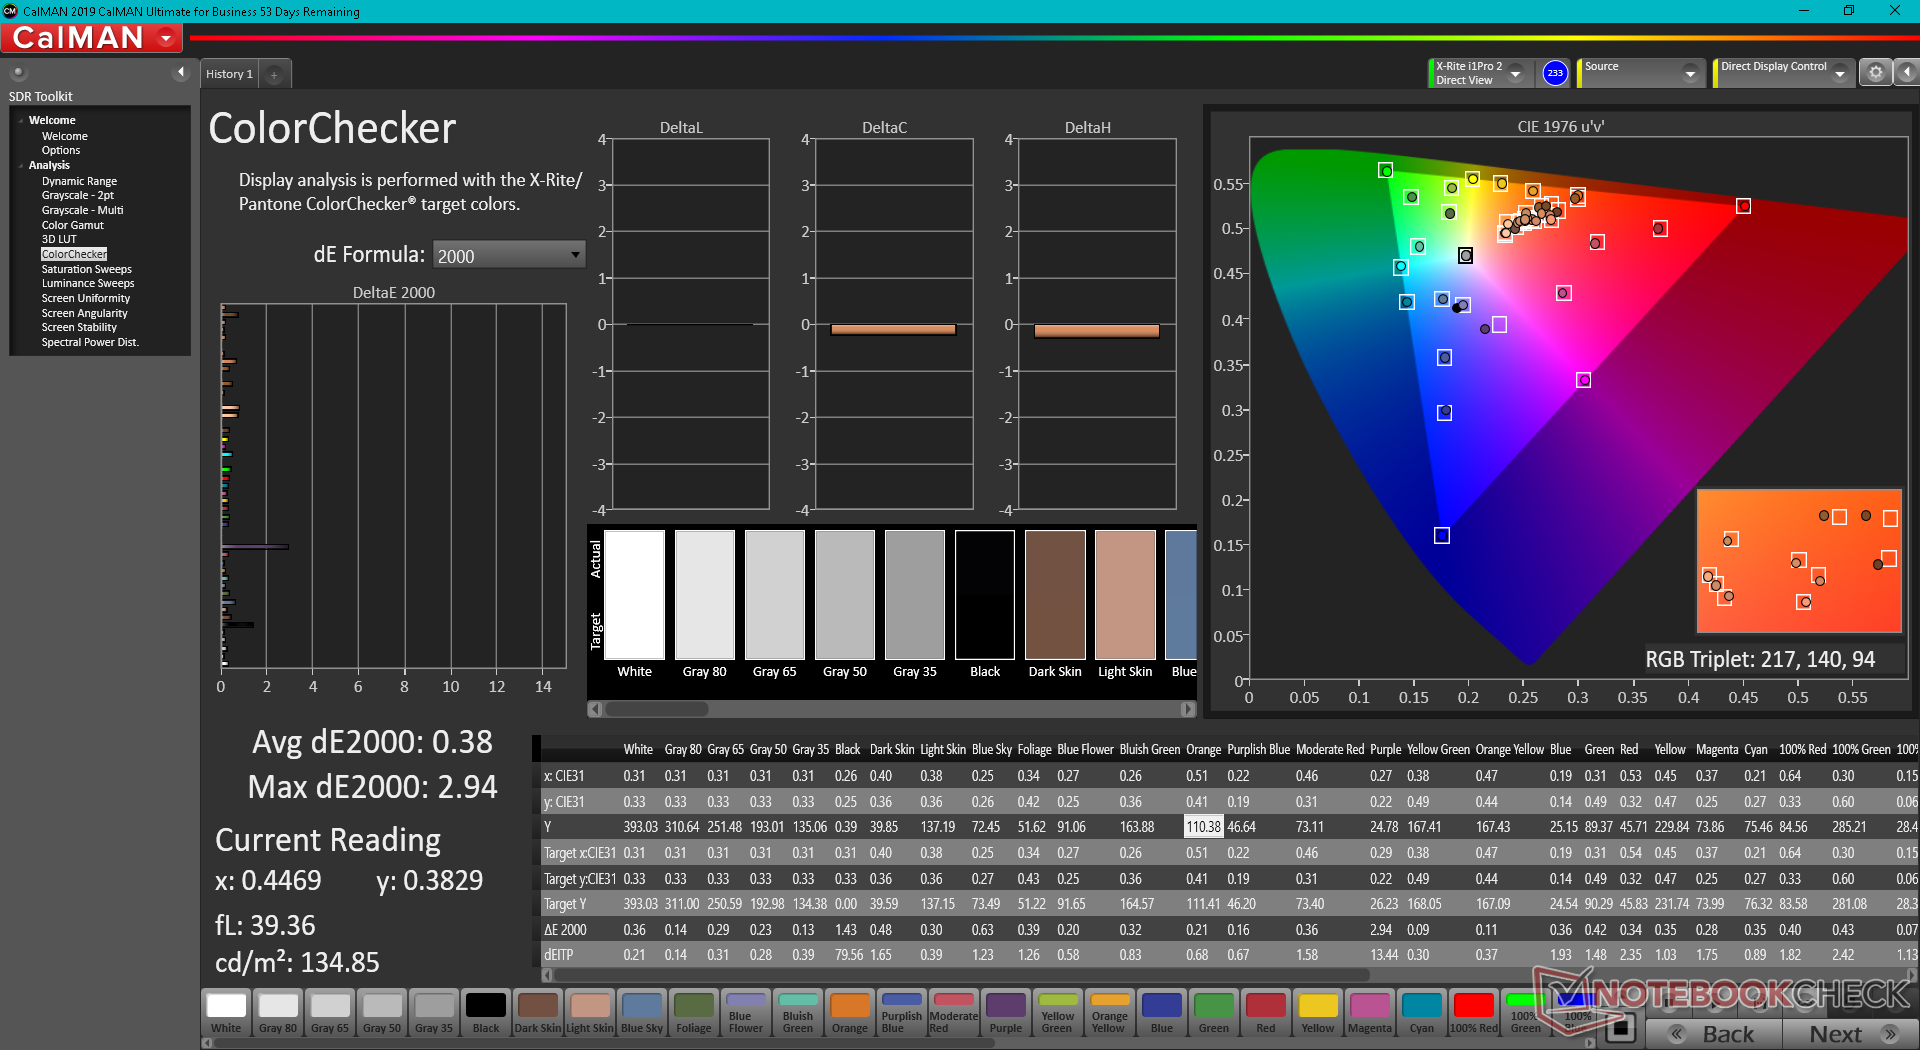
L'écran est déjà bien calibré, comme le montrent les résultats de CalMAN ci-dessous. Si l'on tente de le calibrer davantage avec notre colorimètre X-Rite, les valeurs DeltaE moyennes des niveaux de gris et des couleurs s'améliorent à peine, pour atteindre respectivement 0,4 et 0,38.

Temps de réponse de l'écran
| ↔ Temps de réponse noir à blanc | ||
|---|---|---|
| 10.4 ms ... hausse ↗ et chute ↘ combinées | ↗ 6 ms hausse | 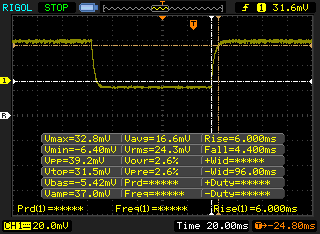 |
| ↘ 4.4 ms chute | ||
| L'écran montre de bons temps de réponse, mais insuffisant pour du jeu compétitif. En comparaison, tous les appareils testés affichent entre 0.1 (minimum) et 240 (maximum) ms. » 28 % des appareils testés affichent de meilleures performances. Cela signifie que les latences relevées sont meilleures que la moyenne (19.8 ms) de tous les appareils testés. | ||
| ↔ Temps de réponse gris 50% à gris 80% | ||
| 12.8 ms ... hausse ↗ et chute ↘ combinées | ↗ 6 ms hausse | 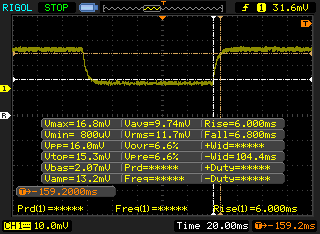 |
| ↘ 6.8 ms chute | ||
| L'écran montre de bons temps de réponse, mais insuffisant pour du jeu compétitif. En comparaison, tous les appareils testés affichent entre 0.165 (minimum) et 636 (maximum) ms. » 26 % des appareils testés affichent de meilleures performances. Cela signifie que les latences relevées sont meilleures que la moyenne (30.9 ms) de tous les appareils testés. | ||
Scintillement / MLI (Modulation de largeur d'impulsion)
| Scintillement / MLI (Modulation de largeur d'impulsion) non décelé | 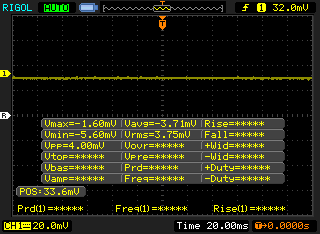 | ||
En comparaison, 52 % des appareils testés n'emploient pas MDI pour assombrir leur écran. Nous avons relevé une moyenne à 7744 (minimum : 5 - maximum : 343500) Hz dans le cas où une MDI était active. | |||
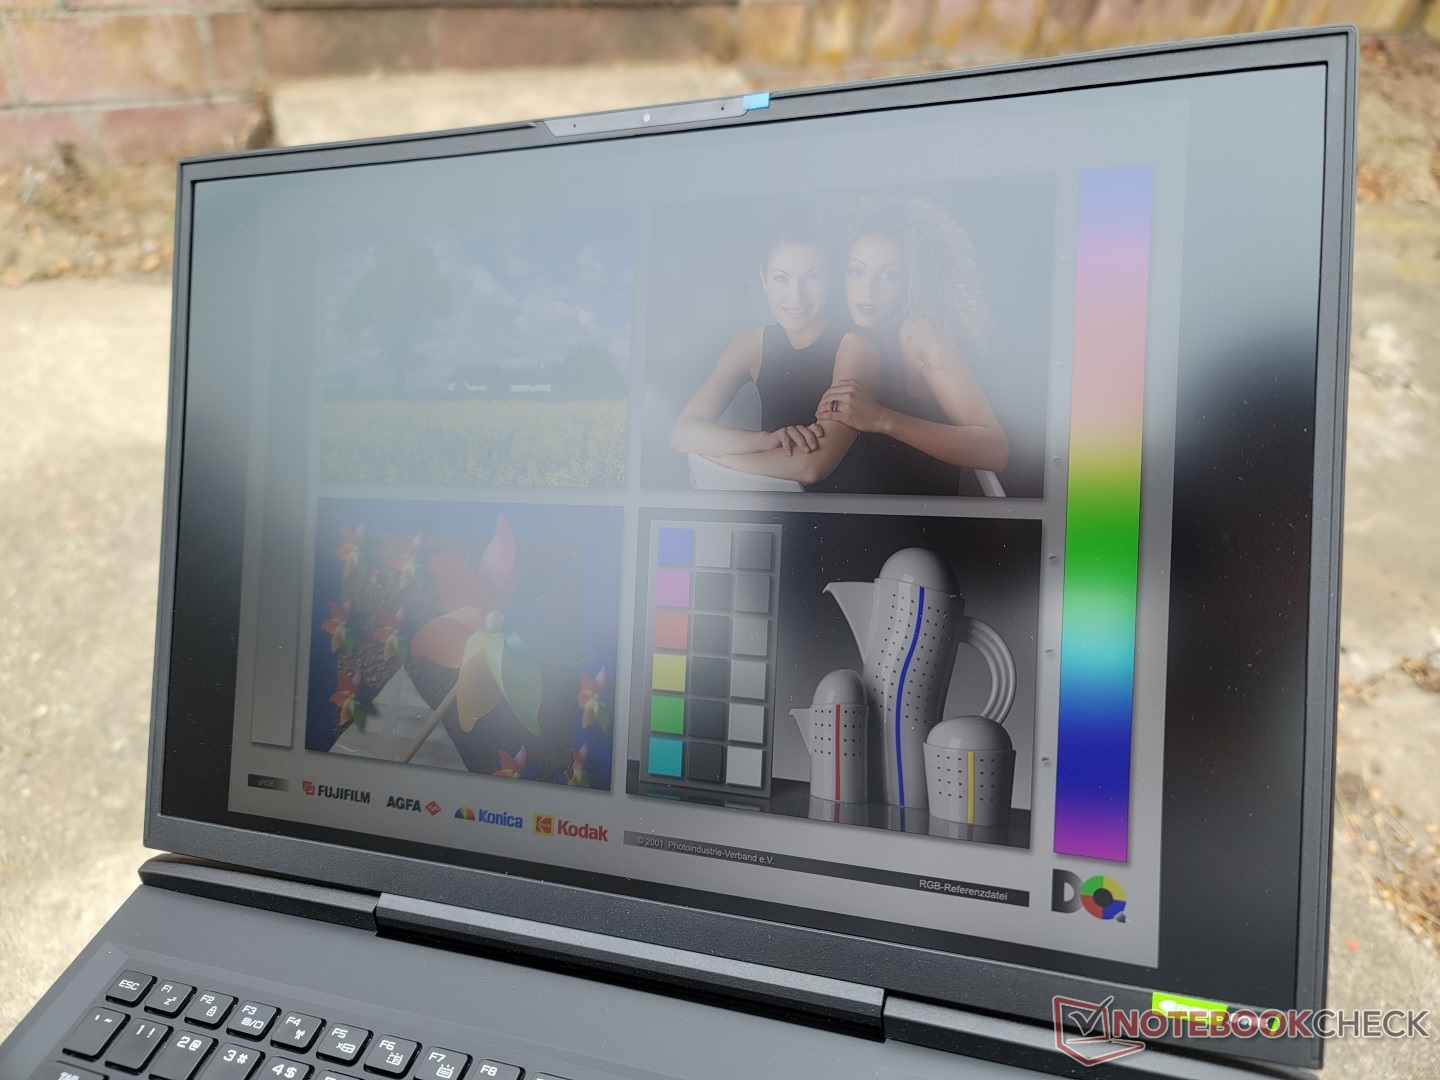
La visibilité extérieure est décente si elle est à l'ombre. Le rétroéclairage de 400 nits est plus lumineux que sur la plupart des autres ordinateurs portables de jeu comme le Aorus 17X ou l'Asus Zephyrus S17 où 300 nits sont courants.
Performances - sans restriction
Conditions d'essai
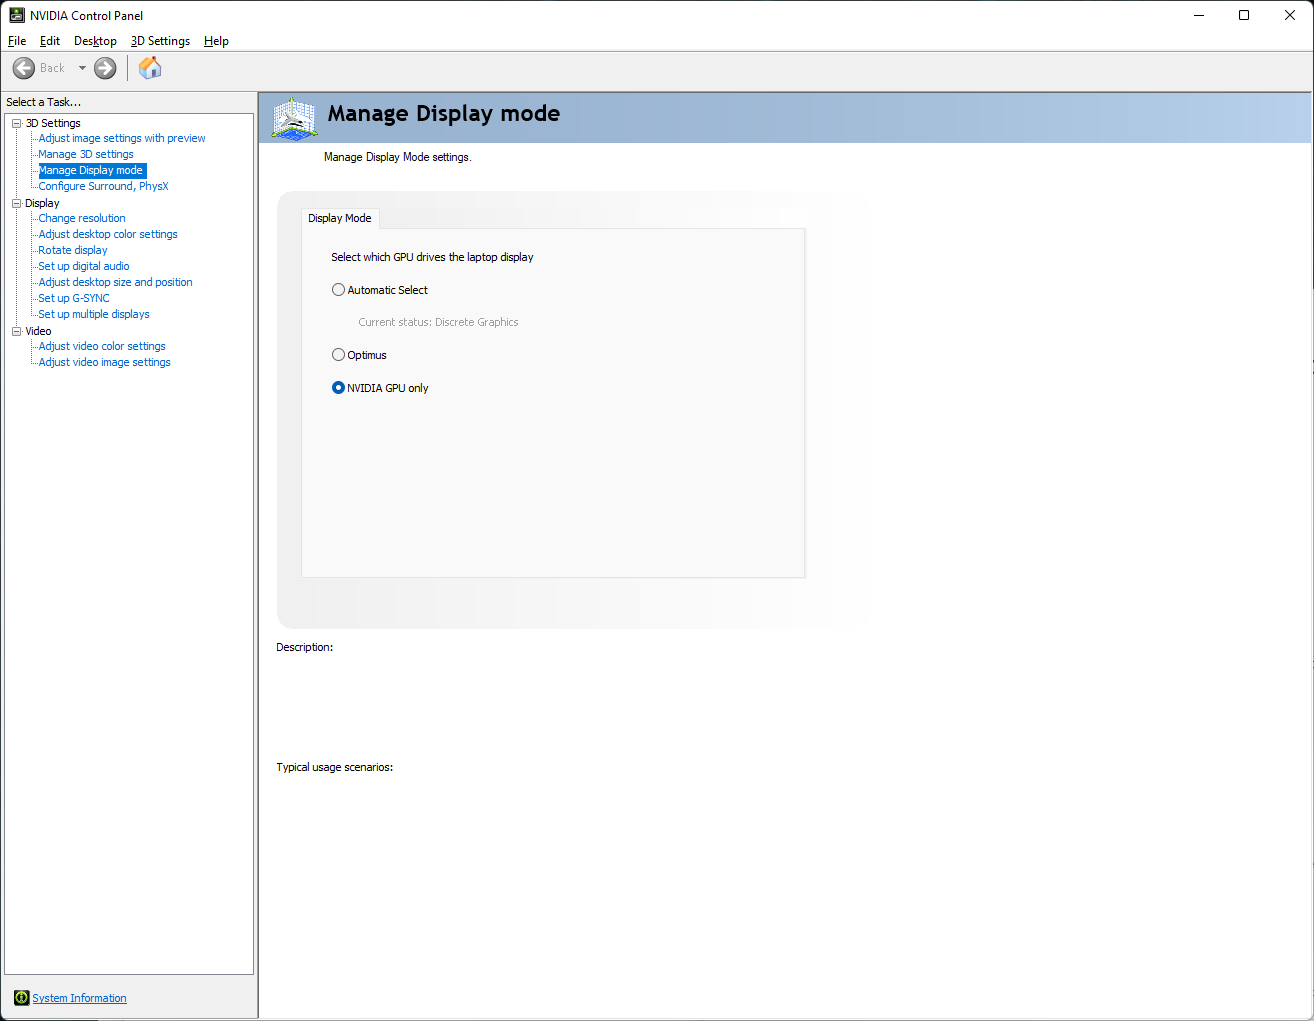
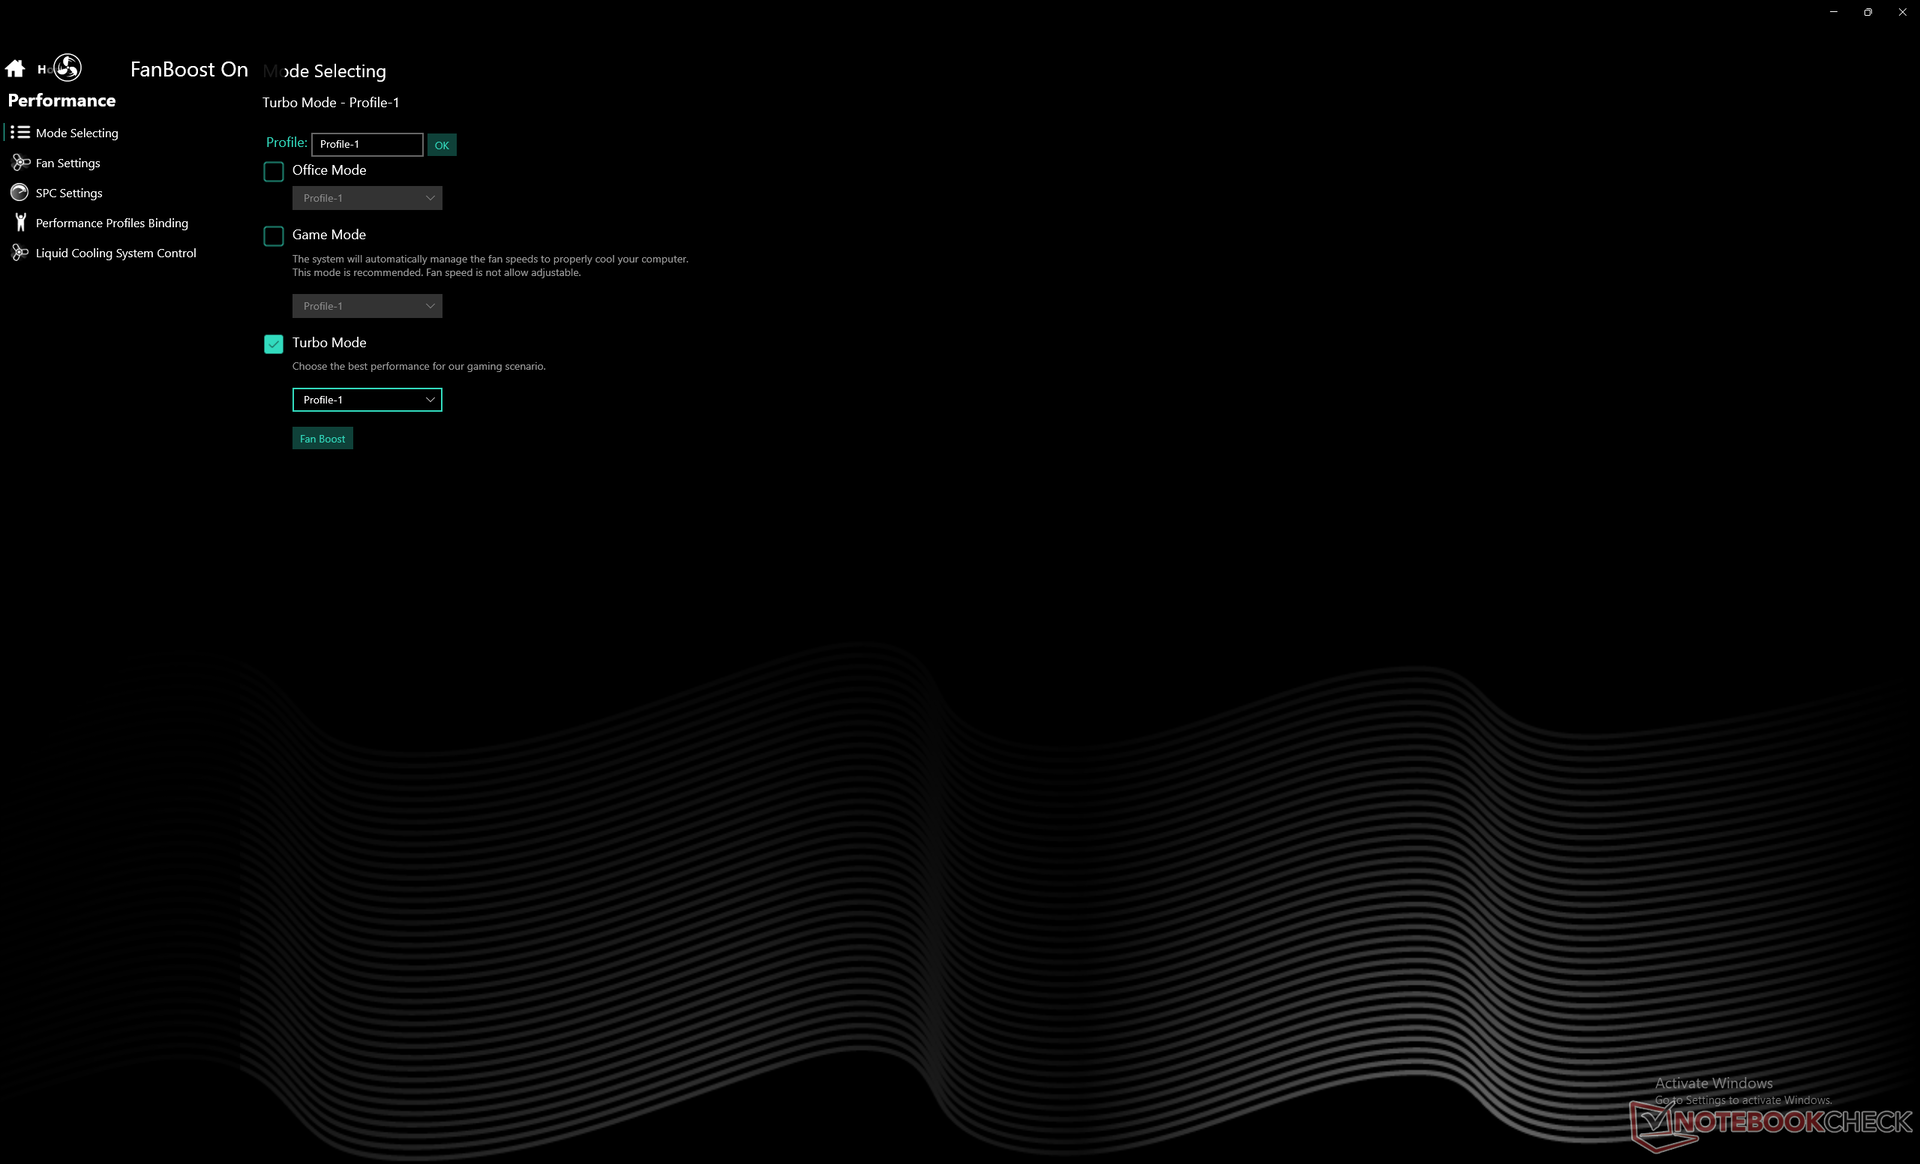
Sauf indication contraire, tous les tests et benchmarks ci-dessous ont été réalisés avec le boîtier de refroidissement externe connecté et actif. Nous nous sommes également assurés de régler Windows sur Performance, de désactiver Optimus en faveur de MUX, et de régler le logiciel Control Center sur "Fan Boost".
Le boîtier de refroidissement dispose de trois réglages de niveau sonore : Quieter, Quiet, et Balanced. La dénomination ne trompe personne, cependant, car ces trois paramètres peuvent être traduits en Low, Medium et Loudest. Nous avons réglé notre cooling box sur "Balanced" pour les besoins du test. N'oubliez pas que le boîtier de refroidissement ne fonctionne pas sur batterie.
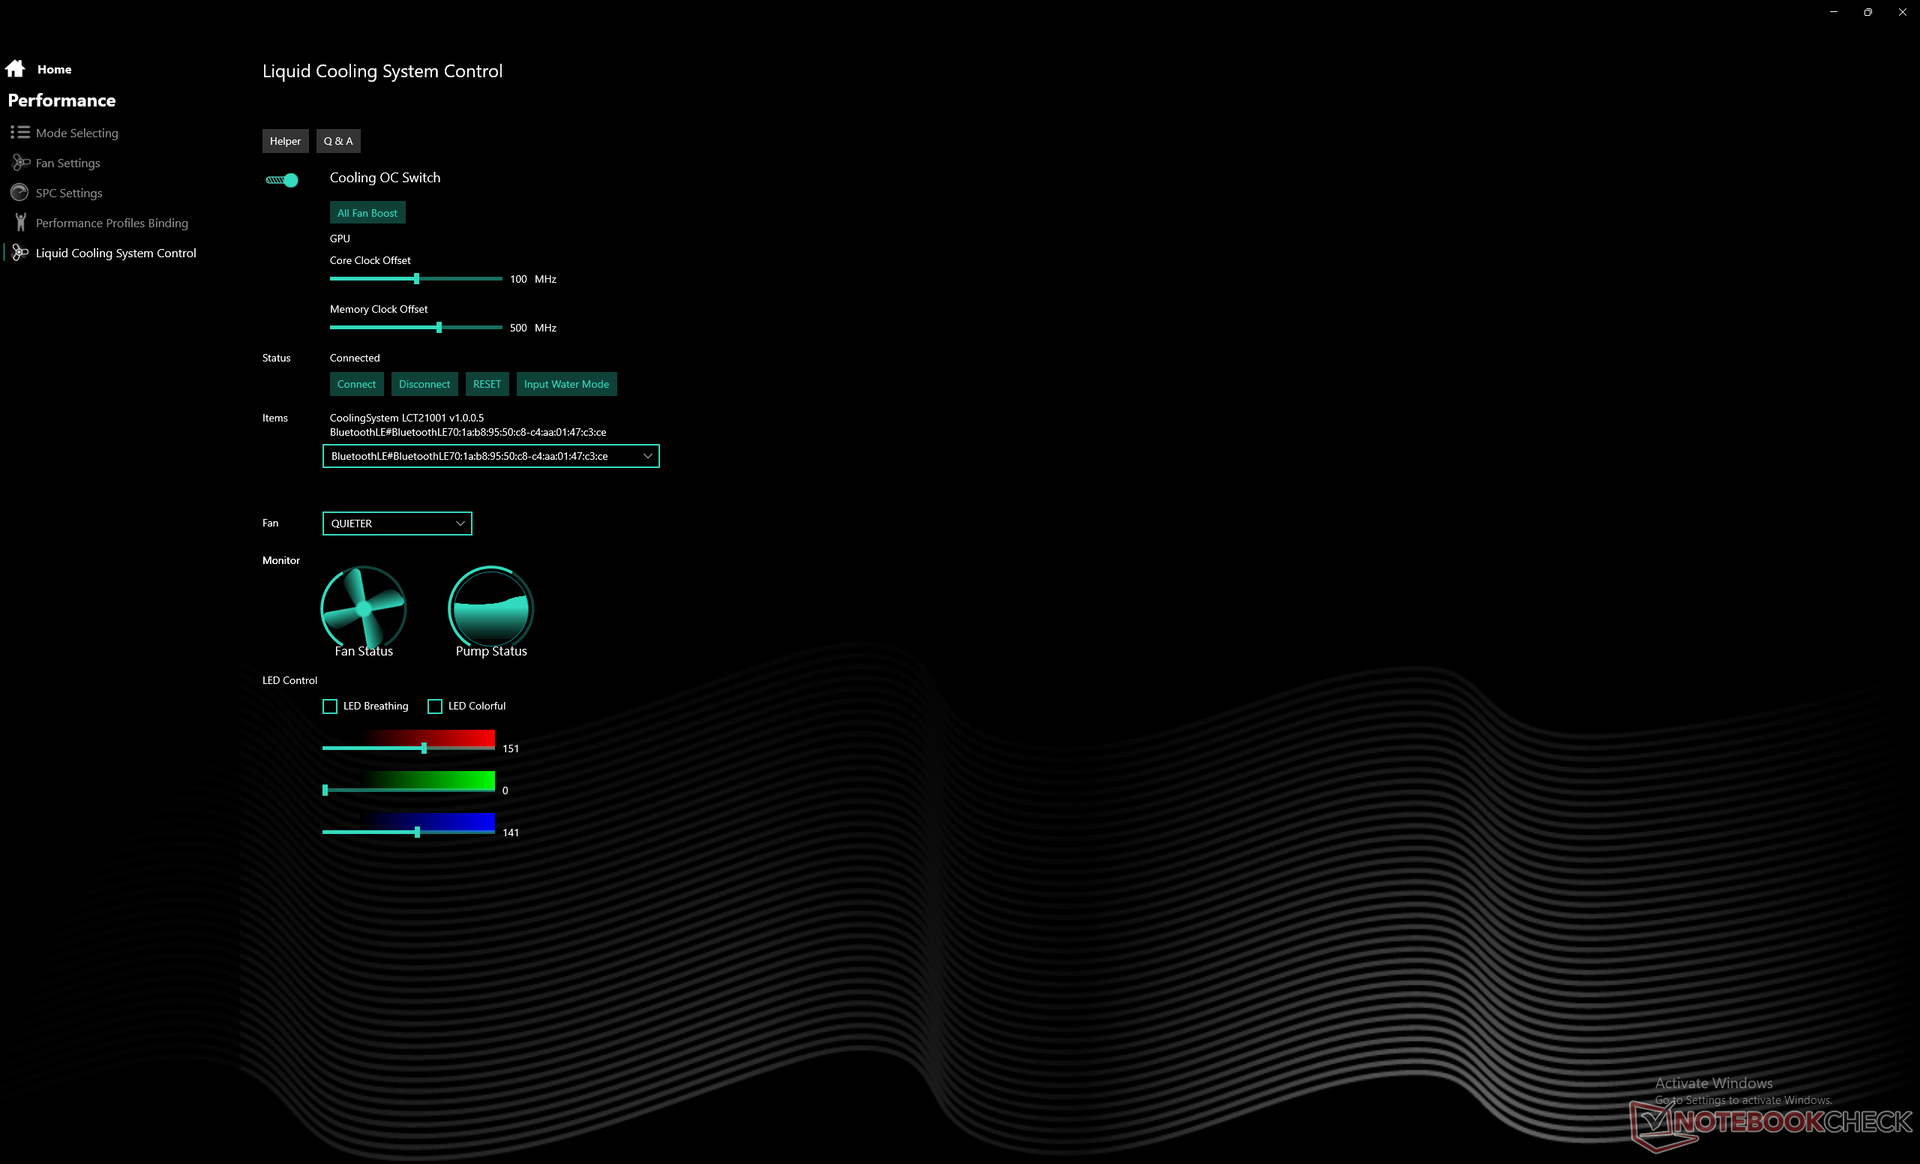
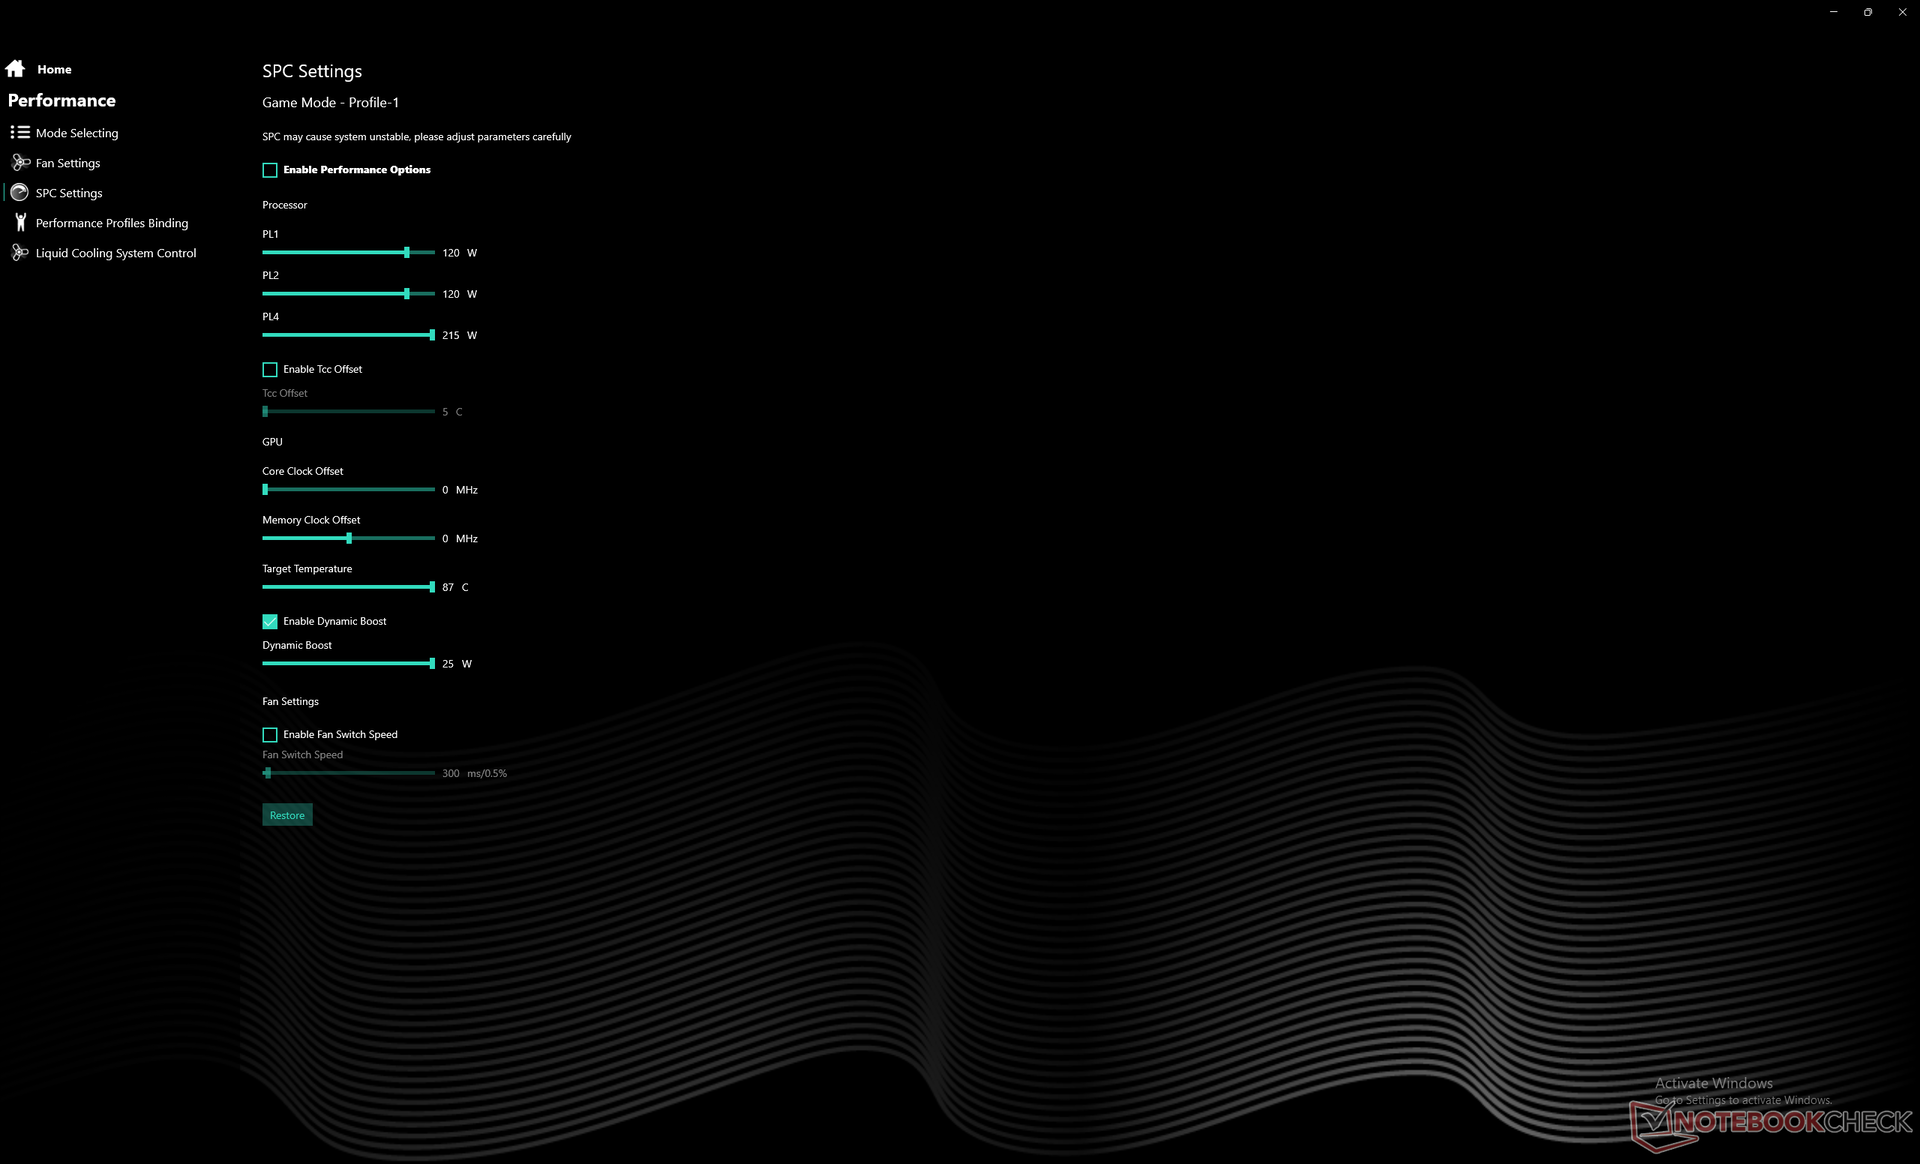
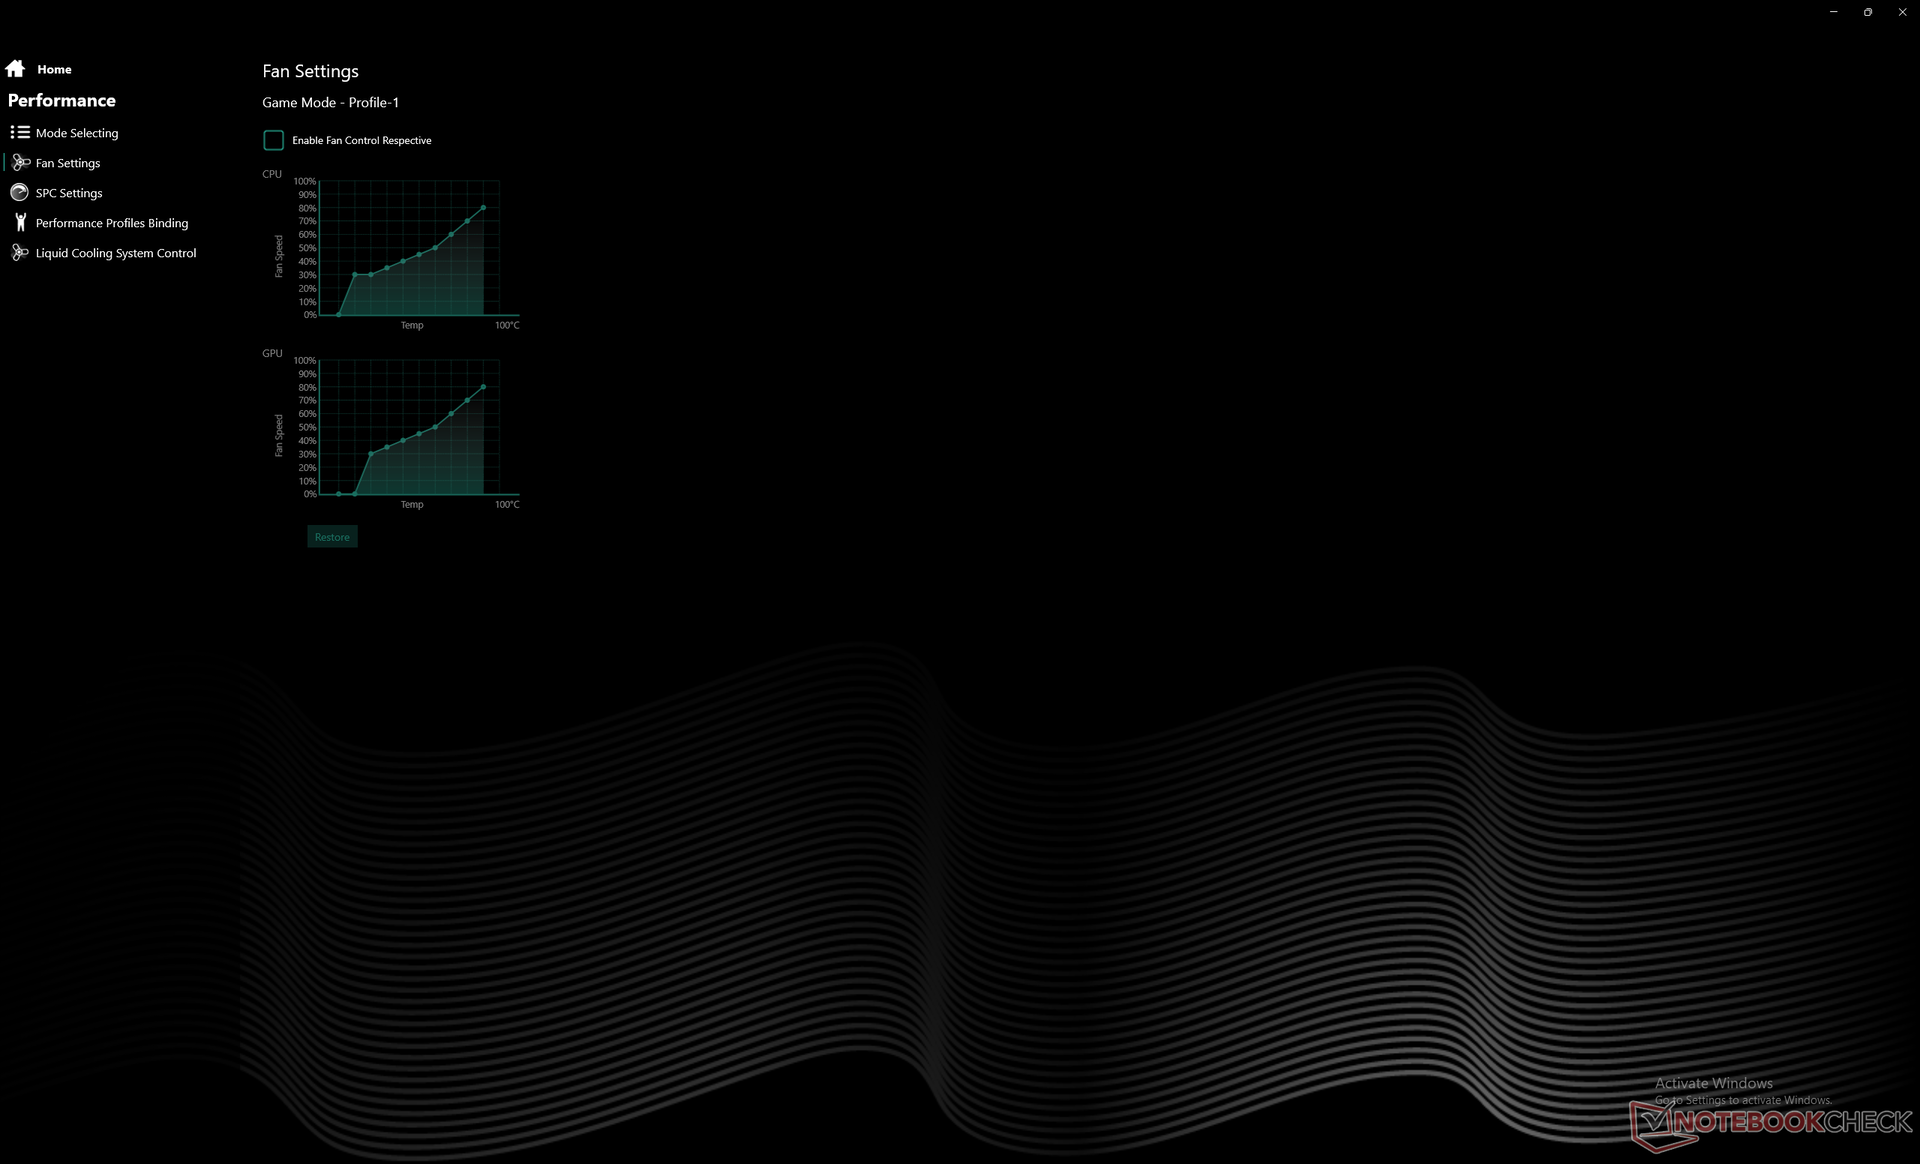
Il est fortement recommandé aux propriétaires de se familiariser avec le logiciel Control Center préinstallé, car il s'agit du centre de contrôle de l'ordinateur portable. Tout, des performances à l'éclairage, en passant par le contrôle des ventilateurs et l'overclocking, est contrôlé ici, comme le montrent les captures d'écran ci-dessous. Nos paramètres d'overclocking sont les paramètres par défaut de l'ordinateur portable tel qu'il est livré.
Processeur
Les performances du processeur sont meilleures que prévu, avec des résultats de 15 à 25 % plus rapides que la moyenne des ordinateurs portables de notre base de données équipés du même Core i9-12900H. En fait, ce modèle Uniwell est le portable Core i9-12900H le plus rapide que nous ayons testé jusqu'à présent.
La durabilité des performances est également excellente, comme on peut l'attendre de tout ordinateur portable de jeu décent, en particulier de celui qui est refroidi par eau.
Cinebench R15 Multi Loop
Cinebench R20: CPU (Multi Core) | CPU (Single Core)
Cinebench R23: Multi Core | Single Core
Cinebench R15: CPU Multi 64Bit | CPU Single 64Bit
Blender: v2.79 BMW27 CPU
7-Zip 18.03: 7z b 4 | 7z b 4 -mmt1
Geekbench 5.5: Multi-Core | Single-Core
HWBOT x265 Benchmark v2.2: 4k Preset
LibreOffice : 20 Documents To PDF
R Benchmark 2.5: Overall mean
* ... Moindre est la valeur, meilleures sont les performances
AIDA64: FP32 Ray-Trace | FPU Julia | CPU SHA3 | CPU Queen | FPU SinJulia | FPU Mandel | CPU AES | CPU ZLib | FP64 Ray-Trace | CPU PhotoWorxx
| Performance rating | |
| MSI Titan GT77 12UHS | |
| Uniwell Technology GM7AG8N Liquid Cooling Box | |
| Aorus 17X XES | |
| Moyenne Intel Core i9-12900H | |
| MSI Stealth GS77 12UHS-083US | |
| Razer Blade 17 Early 2022 | |
| Asus ROG Zephyrus S17 GX703HSD -9! | |
| AIDA64 / FP32 Ray-Trace | |
| MSI Titan GT77 12UHS | |
| Uniwell Technology GM7AG8N Liquid Cooling Box | |
| Aorus 17X XES | |
| Moyenne Intel Core i9-12900H (4074 - 18289, n=29) | |
| MSI Stealth GS77 12UHS-083US | |
| Razer Blade 17 Early 2022 | |
| AIDA64 / FPU Julia | |
| MSI Titan GT77 12UHS | |
| Uniwell Technology GM7AG8N Liquid Cooling Box | |
| Aorus 17X XES | |
| Moyenne Intel Core i9-12900H (22307 - 93236, n=29) | |
| MSI Stealth GS77 12UHS-083US | |
| Razer Blade 17 Early 2022 | |
| AIDA64 / CPU SHA3 | |
| MSI Titan GT77 12UHS | |
| Uniwell Technology GM7AG8N Liquid Cooling Box | |
| Aorus 17X XES | |
| MSI Stealth GS77 12UHS-083US | |
| Moyenne Intel Core i9-12900H (1378 - 4215, n=29) | |
| Razer Blade 17 Early 2022 | |
| AIDA64 / CPU Queen | |
| Uniwell Technology GM7AG8N Liquid Cooling Box | |
| Aorus 17X XES | |
| MSI Titan GT77 12UHS | |
| Moyenne Intel Core i9-12900H (78172 - 111241, n=28) | |
| MSI Stealth GS77 12UHS-083US | |
| Razer Blade 17 Early 2022 | |
| AIDA64 / FPU SinJulia | |
| MSI Titan GT77 12UHS | |
| Aorus 17X XES | |
| Uniwell Technology GM7AG8N Liquid Cooling Box | |
| MSI Stealth GS77 12UHS-083US | |
| Moyenne Intel Core i9-12900H (5709 - 10410, n=29) | |
| Razer Blade 17 Early 2022 | |
| AIDA64 / FPU Mandel | |
| MSI Titan GT77 12UHS | |
| Uniwell Technology GM7AG8N Liquid Cooling Box | |
| Aorus 17X XES | |
| Moyenne Intel Core i9-12900H (11257 - 45581, n=29) | |
| MSI Stealth GS77 12UHS-083US | |
| Razer Blade 17 Early 2022 | |
| AIDA64 / CPU AES | |
| MSI Titan GT77 12UHS | |
| Aorus 17X XES | |
| MSI Stealth GS77 12UHS-083US | |
| Uniwell Technology GM7AG8N Liquid Cooling Box | |
| Moyenne Intel Core i9-12900H (31935 - 151546, n=29) | |
| Razer Blade 17 Early 2022 | |
| AIDA64 / CPU ZLib | |
| MSI Titan GT77 12UHS | |
| Uniwell Technology GM7AG8N Liquid Cooling Box | |
| MSI Stealth GS77 12UHS-083US | |
| Aorus 17X XES | |
| Moyenne Intel Core i9-12900H (449 - 1193, n=29) | |
| Razer Blade 17 Early 2022 | |
| Asus ROG Zephyrus S17 GX703HSD | |
| AIDA64 / FP64 Ray-Trace | |
| MSI Titan GT77 12UHS | |
| Uniwell Technology GM7AG8N Liquid Cooling Box | |
| Aorus 17X XES | |
| Moyenne Intel Core i9-12900H (2235 - 10511, n=29) | |
| MSI Stealth GS77 12UHS-083US | |
| Razer Blade 17 Early 2022 | |
| AIDA64 / CPU PhotoWorxx | |
| MSI Titan GT77 12UHS | |
| Aorus 17X XES | |
| MSI Stealth GS77 12UHS-083US | |
| Razer Blade 17 Early 2022 | |
| Moyenne Intel Core i9-12900H (20960 - 48269, n=30) | |
| Uniwell Technology GM7AG8N Liquid Cooling Box | |
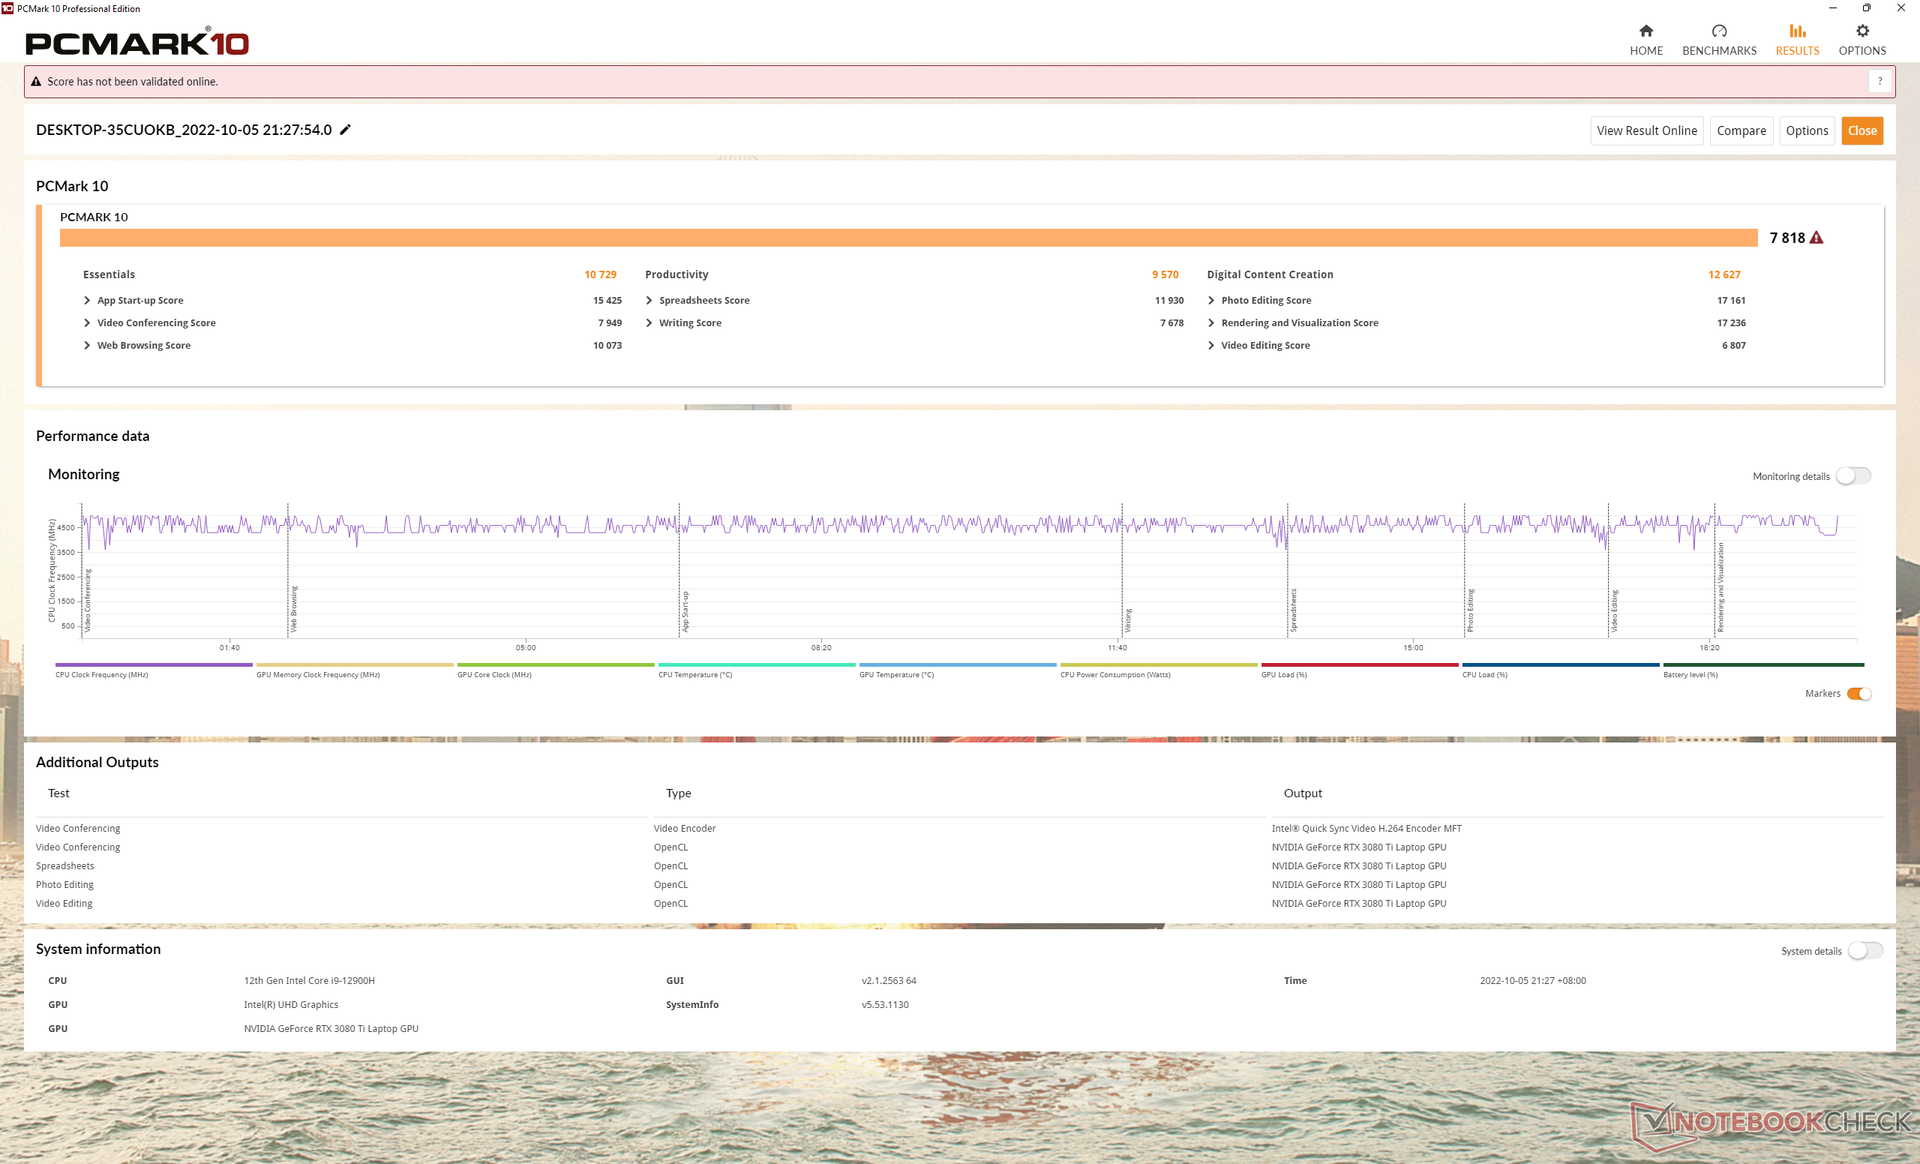
Performance du système
Les résultats de PCMark 10 sont comparables à ceux d'autres ordinateurs portables équipés du même processeur et de la même carte graphique, comme l'Alienware x15 R2 P111F.Alienware x15 R2 P111F ou le Razer Blade 17 Early 2022.
CrossMark: Overall | Productivity | Creativity | Responsiveness
| PCMark 10 / Score | |
| MSI Titan GT77 12UHS | |
| Aorus 17X XES | |
| Uniwell Technology GM7AG8N Liquid Cooling Box | |
| Moyenne Intel Core i9-12900H, NVIDIA GeForce RTX 3080 Ti Laptop GPU (7139 - 8083, n=6) | |
| MSI Stealth GS77 12UHS-083US | |
| Asus ROG Zephyrus S17 GX703HSD | |
| Razer Blade 17 Early 2022 | |
| PCMark 10 / Essentials | |
| MSI Titan GT77 12UHS | |
| Moyenne Intel Core i9-12900H, NVIDIA GeForce RTX 3080 Ti Laptop GPU (10254 - 11178, n=6) | |
| Uniwell Technology GM7AG8N Liquid Cooling Box | |
| Asus ROG Zephyrus S17 GX703HSD | |
| Aorus 17X XES | |
| MSI Stealth GS77 12UHS-083US | |
| Razer Blade 17 Early 2022 | |
| PCMark 10 / Productivity | |
| Aorus 17X XES | |
| MSI Titan GT77 12UHS | |
| Moyenne Intel Core i9-12900H, NVIDIA GeForce RTX 3080 Ti Laptop GPU (9102 - 11186, n=6) | |
| Uniwell Technology GM7AG8N Liquid Cooling Box | |
| MSI Stealth GS77 12UHS-083US | |
| Asus ROG Zephyrus S17 GX703HSD | |
| Razer Blade 17 Early 2022 | |
| PCMark 10 / Digital Content Creation | |
| MSI Titan GT77 12UHS | |
| Uniwell Technology GM7AG8N Liquid Cooling Box | |
| Aorus 17X XES | |
| Moyenne Intel Core i9-12900H, NVIDIA GeForce RTX 3080 Ti Laptop GPU (9847 - 12627, n=6) | |
| MSI Stealth GS77 12UHS-083US | |
| Razer Blade 17 Early 2022 | |
| Asus ROG Zephyrus S17 GX703HSD | |
| CrossMark / Overall | |
| Aorus 17X XES | |
| MSI Titan GT77 12UHS | |
| Moyenne Intel Core i9-12900H, NVIDIA GeForce RTX 3080 Ti Laptop GPU (1696 - 1965, n=3) | |
| Razer Blade 17 Early 2022 | |
| Uniwell Technology GM7AG8N Liquid Cooling Box | |
| CrossMark / Productivity | |
| Aorus 17X XES | |
| MSI Titan GT77 12UHS | |
| Moyenne Intel Core i9-12900H, NVIDIA GeForce RTX 3080 Ti Laptop GPU (1622 - 1870, n=3) | |
| Razer Blade 17 Early 2022 | |
| Uniwell Technology GM7AG8N Liquid Cooling Box | |
| CrossMark / Creativity | |
| Aorus 17X XES | |
| MSI Titan GT77 12UHS | |
| Moyenne Intel Core i9-12900H, NVIDIA GeForce RTX 3080 Ti Laptop GPU (1855 - 2135, n=3) | |
| Razer Blade 17 Early 2022 | |
| Uniwell Technology GM7AG8N Liquid Cooling Box | |
| CrossMark / Responsiveness | |
| Aorus 17X XES | |
| MSI Titan GT77 12UHS | |
| Razer Blade 17 Early 2022 | |
| Moyenne Intel Core i9-12900H, NVIDIA GeForce RTX 3080 Ti Laptop GPU (1483 - 1777, n=3) | |
| Uniwell Technology GM7AG8N Liquid Cooling Box | |
| PCMark 10 Score | 7818 points | |
Aide | ||
| AIDA64 / Memory Copy | |
| MSI Titan GT77 12UHS | |
| Aorus 17X XES | |
| MSI Stealth GS77 12UHS-083US | |
| Razer Blade 17 Early 2022 | |
| Moyenne Intel Core i9-12900H (34438 - 74264, n=29) | |
| Uniwell Technology GM7AG8N Liquid Cooling Box | |
| AIDA64 / Memory Read | |
| Aorus 17X XES | |
| MSI Stealth GS77 12UHS-083US | |
| Razer Blade 17 Early 2022 | |
| MSI Titan GT77 12UHS | |
| Moyenne Intel Core i9-12900H (36365 - 74642, n=29) | |
| Uniwell Technology GM7AG8N Liquid Cooling Box | |
| AIDA64 / Memory Write | |
| MSI Stealth GS77 12UHS-083US | |
| MSI Titan GT77 12UHS | |
| Aorus 17X XES | |
| Moyenne Intel Core i9-12900H (32276 - 67858, n=29) | |
| Razer Blade 17 Early 2022 | |
| Uniwell Technology GM7AG8N Liquid Cooling Box | |
| AIDA64 / Memory Latency | |
| MSI Stealth GS77 12UHS-083US | |
| Uniwell Technology GM7AG8N Liquid Cooling Box | |
| MSI Titan GT77 12UHS | |
| Aorus 17X XES | |
| Moyenne Intel Core i9-12900H (74.7 - 118.1, n=28) | |
| Asus ROG Zephyrus S17 GX703HSD | |
* ... Moindre est la valeur, meilleures sont les performances
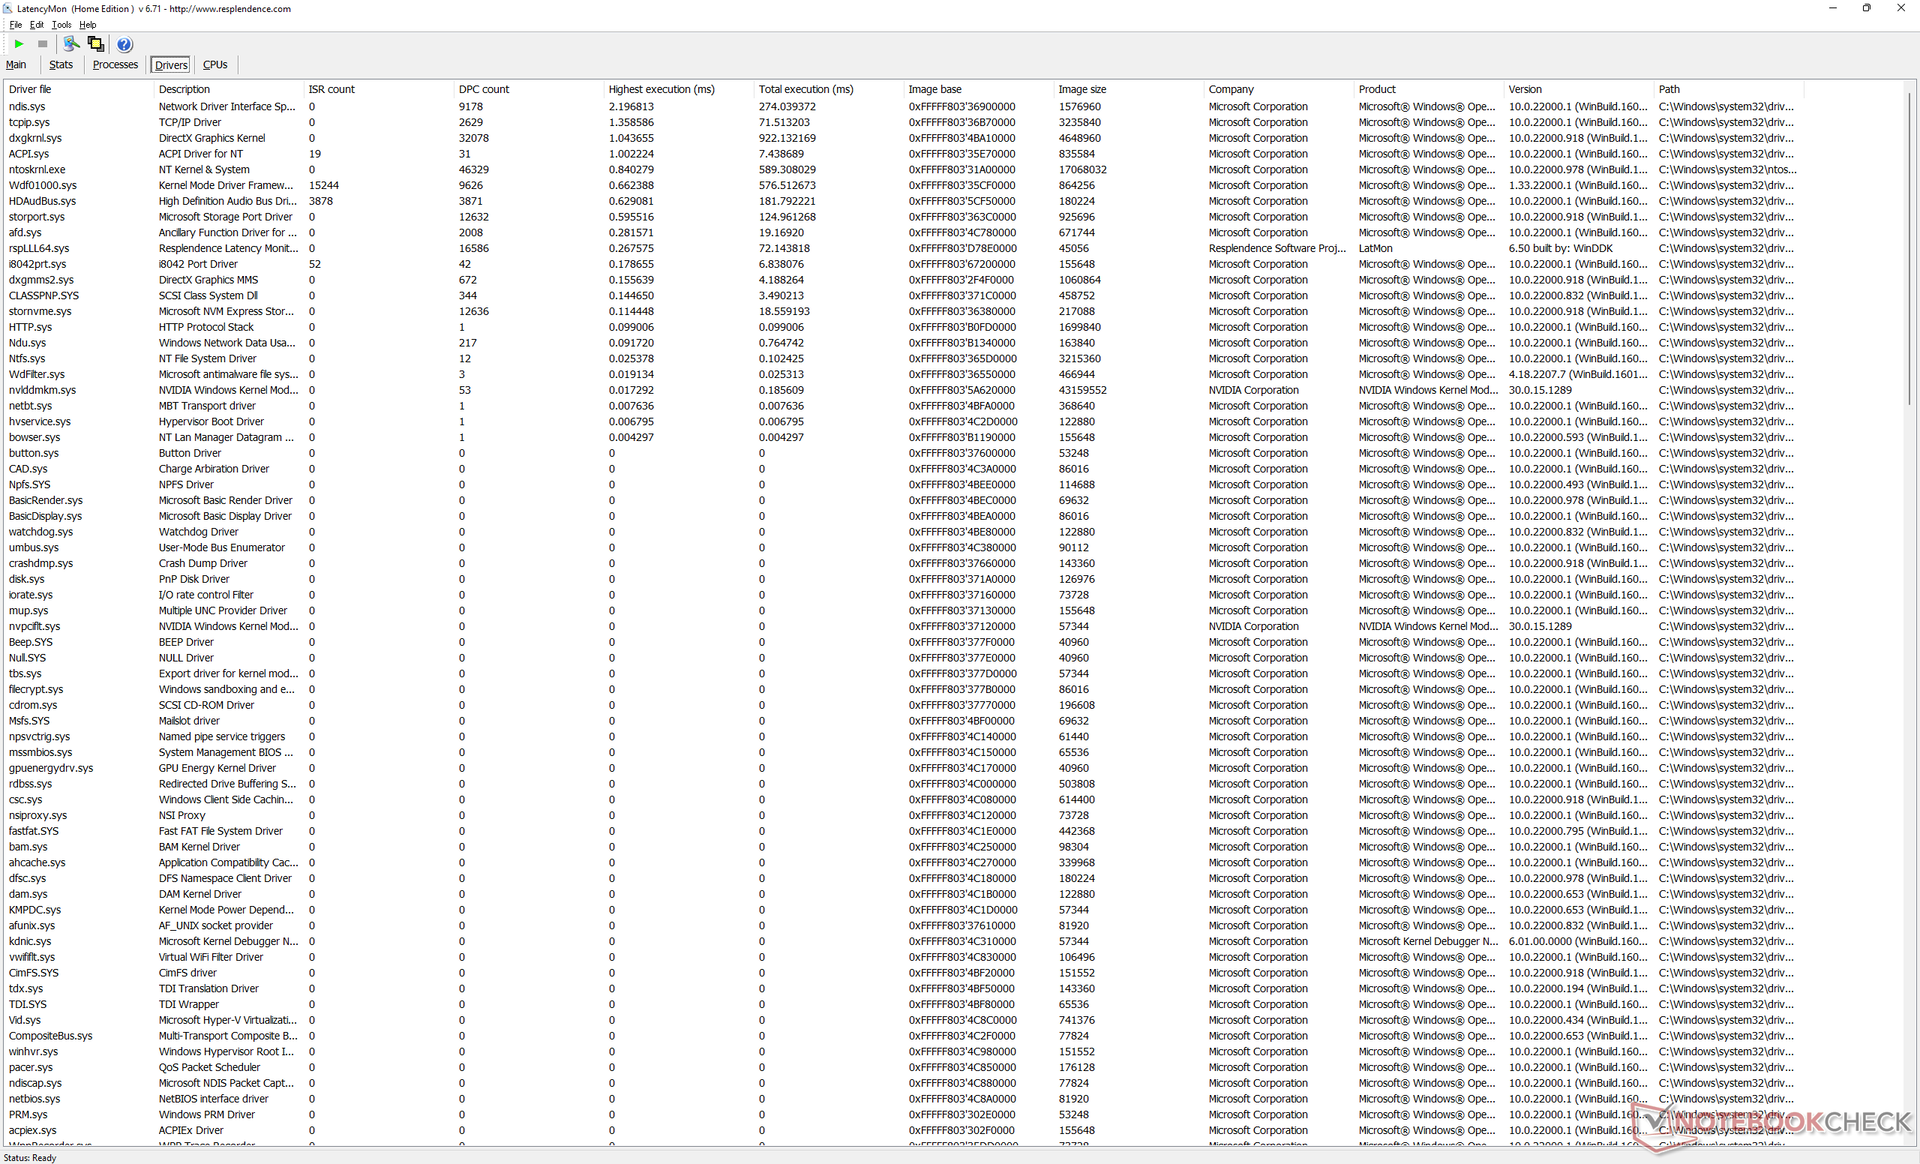
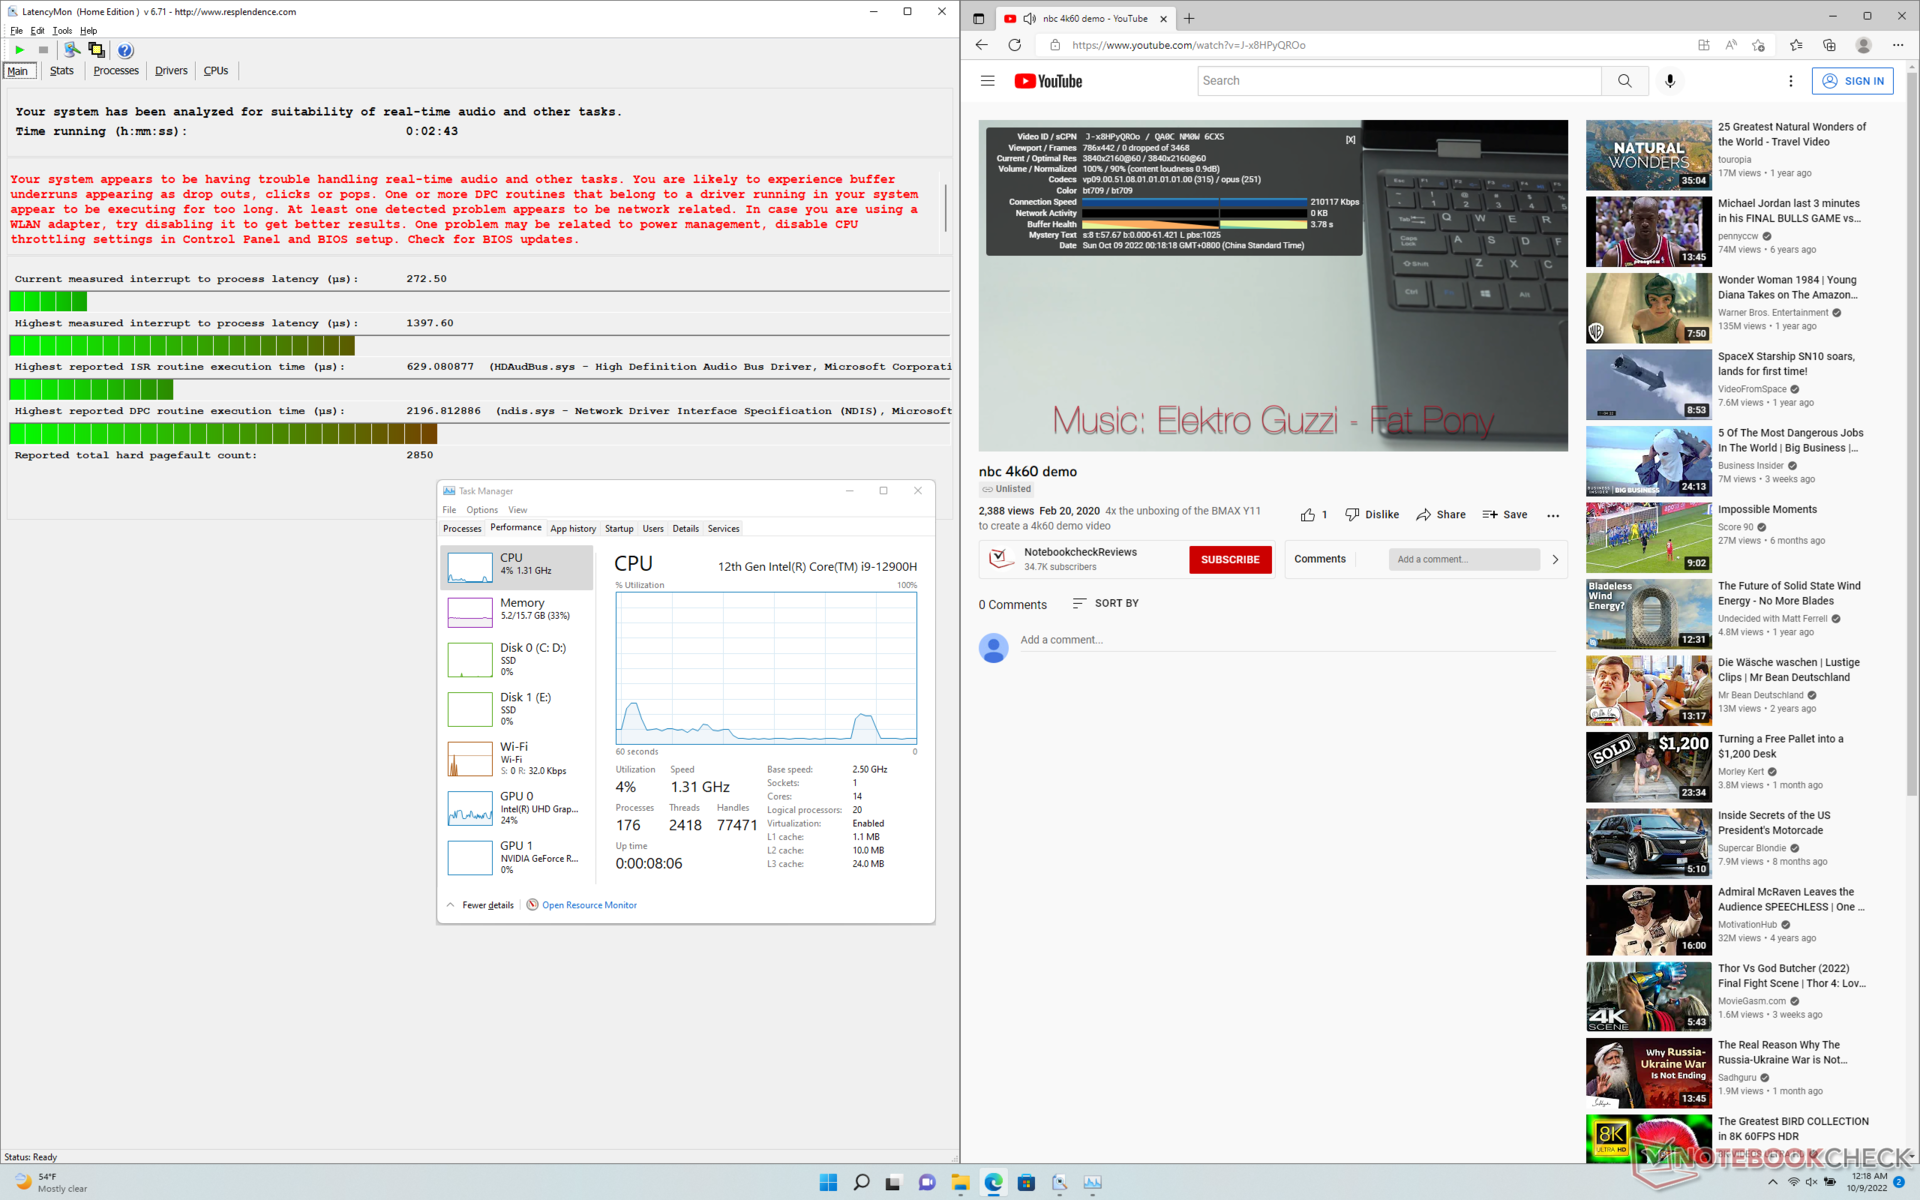
Latence DPC
LatencyMon révèle des problèmes de DPC lors de l'ouverture de plusieurs onglets de navigateur de notre page d'accueil. la lecture de vidéos 4K60 est par ailleurs parfaite, sans aucune perte d'images.
| DPC Latencies / LatencyMon - interrupt to process latency (max), Web, Youtube, Prime95 | |
| MSI Stealth GS77 12UHS-083US | |
| Asus ROG Zephyrus S17 GX703HSD | |
| Uniwell Technology GM7AG8N Liquid Cooling Box | |
| Aorus 17X XES | |
| Razer Blade 17 Early 2022 | |
* ... Moindre est la valeur, meilleures sont les performances
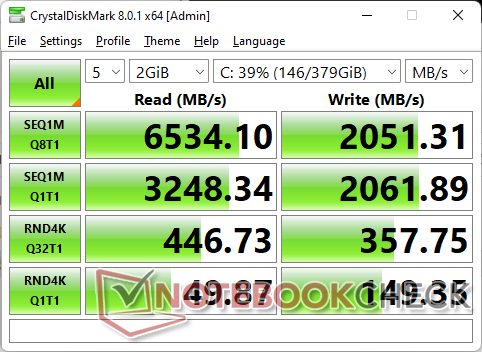
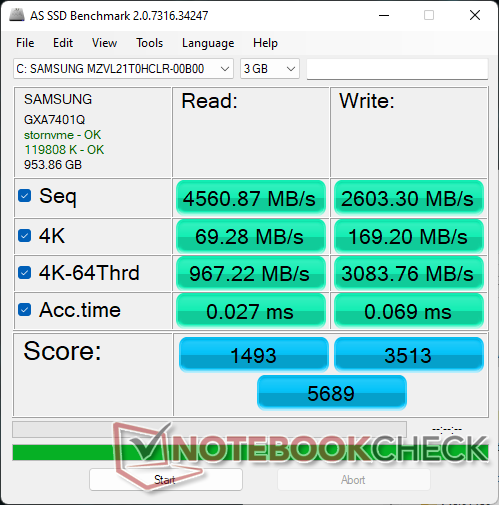
Périphériques de stockage - Support 2x M.2 2280 PCIe4 x4
Notre unité de test est équipée du mêmeSamsung PM9A1 MZVL21T0HCLR PCIe4 x4 SSD que l'on trouve dans de nombreux autres ordinateurs portables de jeu haut de gamme comme le MSI Titan GT77. Cependant, le disque présente des problèmes de performance lorsqu'il est sollicité, malgré le fait qu'un dissipateur thermique soit inclus. En exécutant DiskSpd en boucle, les taux de lecture commencent à être très élevés à ~6500 MB/s avant de chuter rapidement à ~1400 MB/s comme le montre notre graphique ci-dessous. Ceci pourrait être un bug potentiel du système.

| Drive Performance rating - Percent | |
| Asus ROG Zephyrus S17 GX703HSD | |
| Aorus 17X XES | |
| MSI Titan GT77 12UHS | |
| Razer Blade 17 Early 2022 | |
| MSI Stealth GS77 12UHS-083US | |
| Uniwell Technology GM7AG8N Liquid Cooling Box | |
* ... Moindre est la valeur, meilleures sont les performances
Disk Throttling: DiskSpd Read Loop, Queue Depth 8
Performances du GPU - GPU Full Fat 175 W TGP
Les performances graphiques sont environ 5 à 15 % plus rapides que celles de l'ordinateur portable moyen de notre base de données équipé de la même technologie GeForce RTX 3080 Ti GPU. Le GPU est capable de fonctionner encore plus vite si les utilisateurs décident de l'overclocker au-delà des paramètres du fabricant
Il est intéressant de noter que les performances graphiques ne sont pas réduites si le boîtier de refroidissement est utilisé avec son niveau de ventilation le plus bas. En faisant fonctionner Fire Strike en mode "le plus silencieux", on obtient des scores physiques et graphiques de 31443 et 31311 points, respectivement, contre 30601 et 30959 points en mode "équilibré". Ceci est particulièrement important car cela signifie que vous n'avez pas besoin de faire fonctionner le système à ses paramètres de ventilation maximum si vous n'avez pas l'intention d'overclocker le GPU.
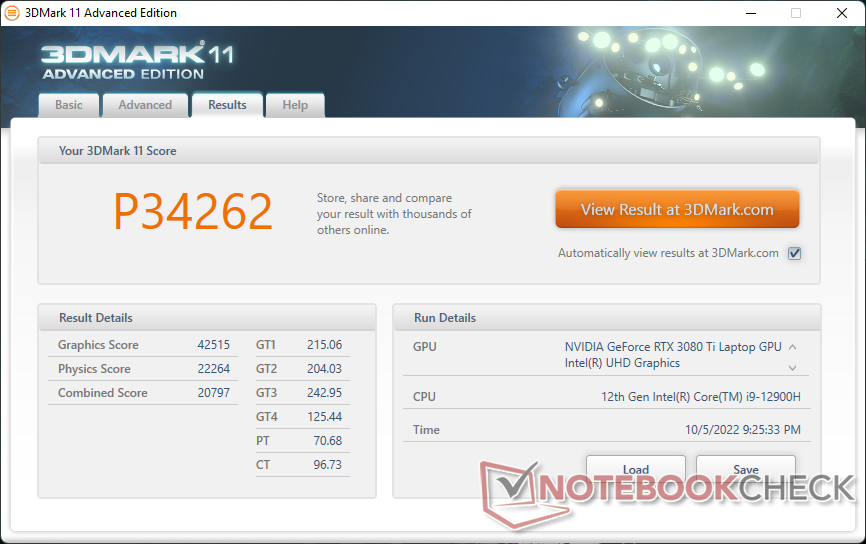
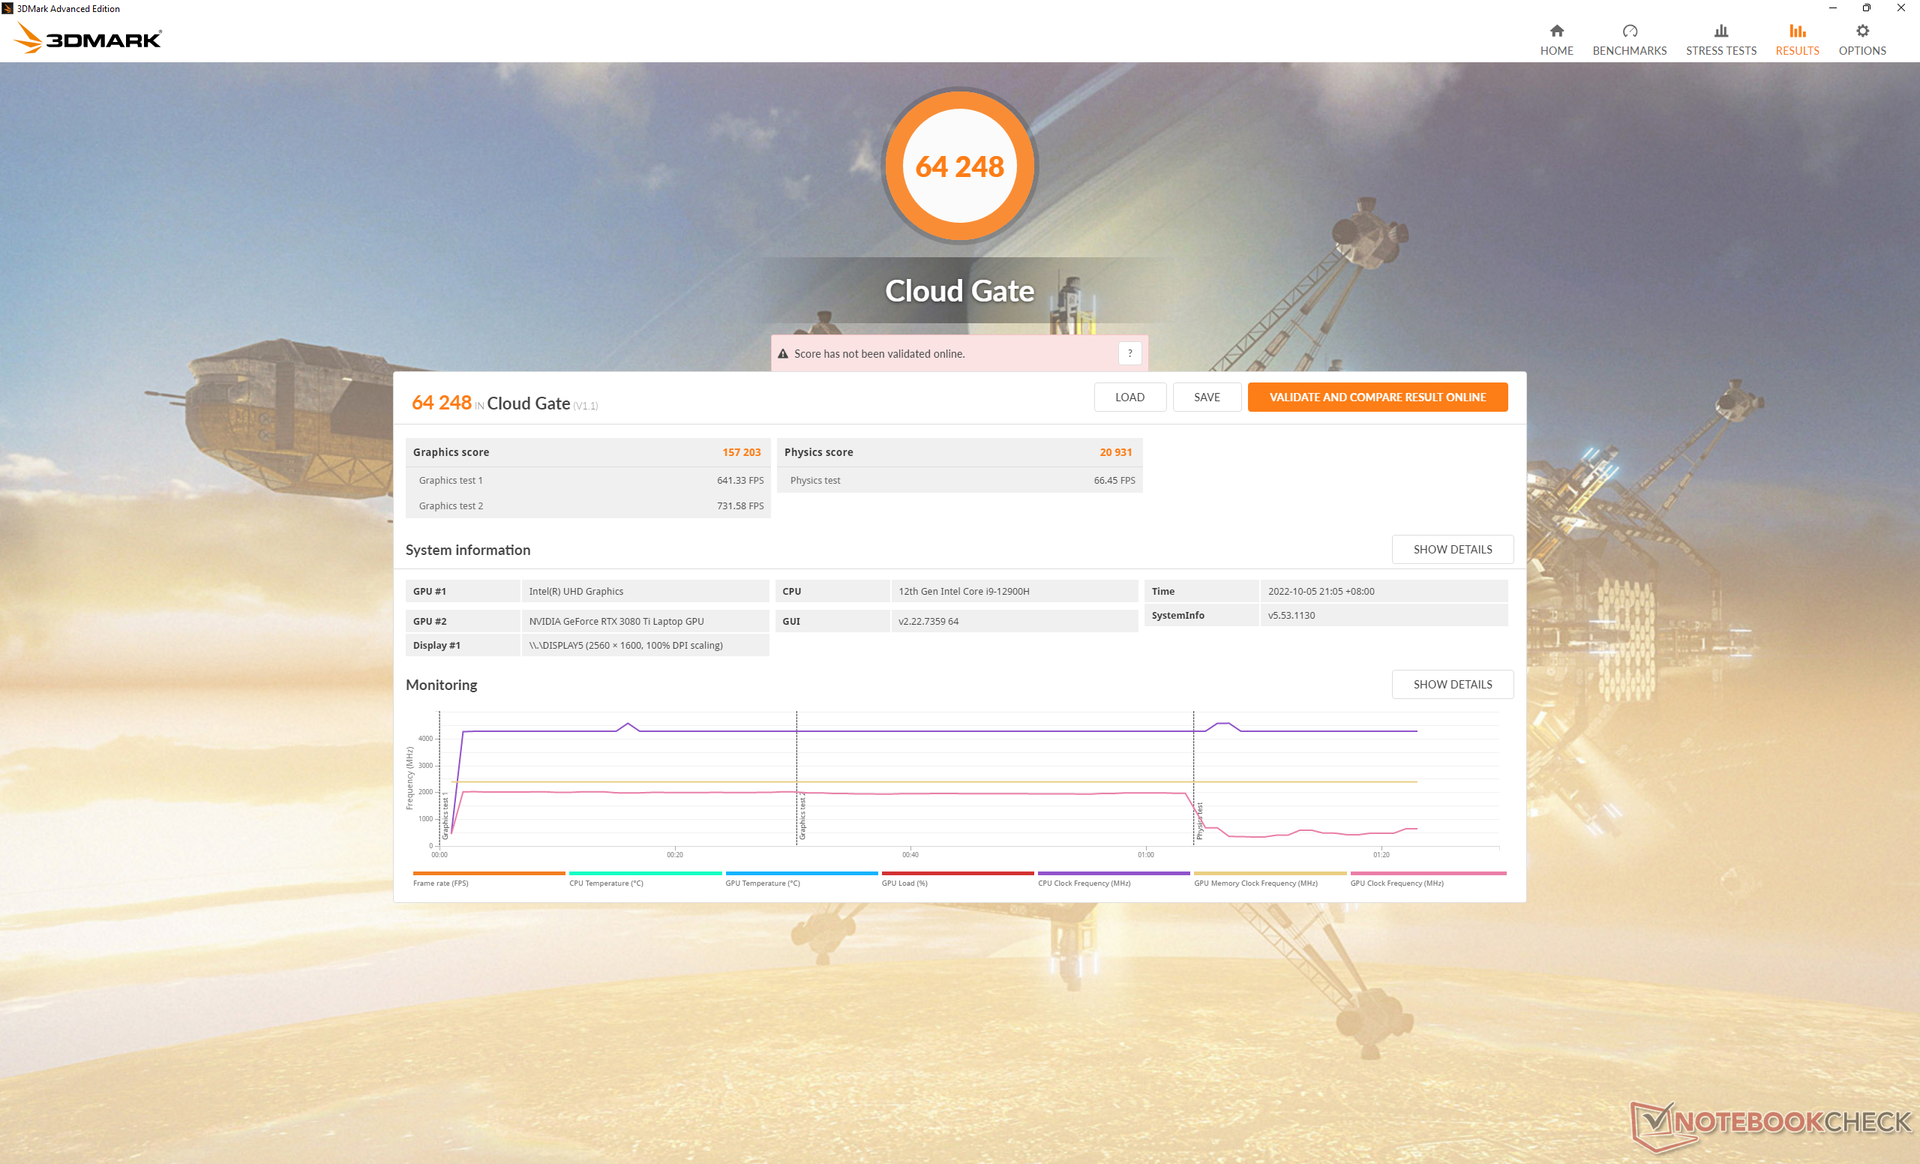
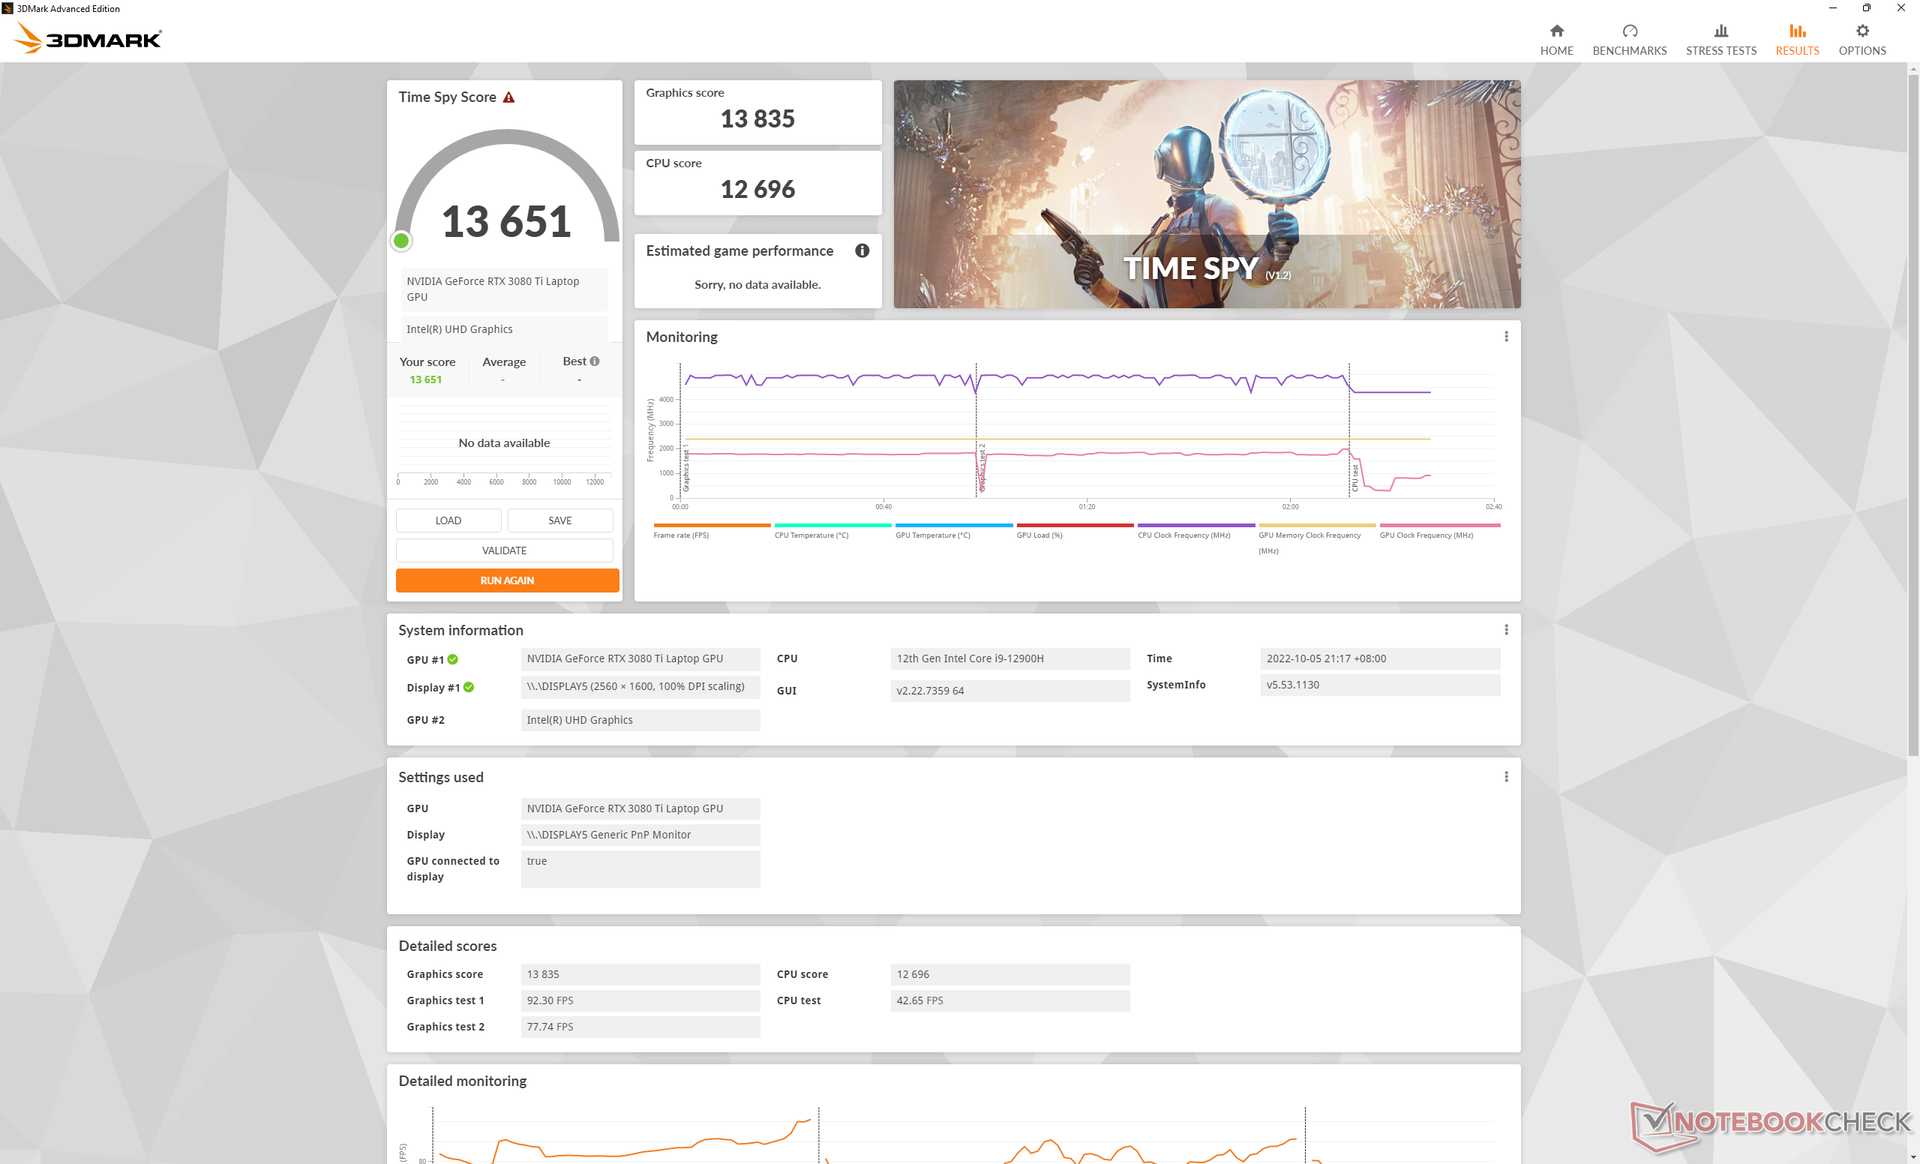
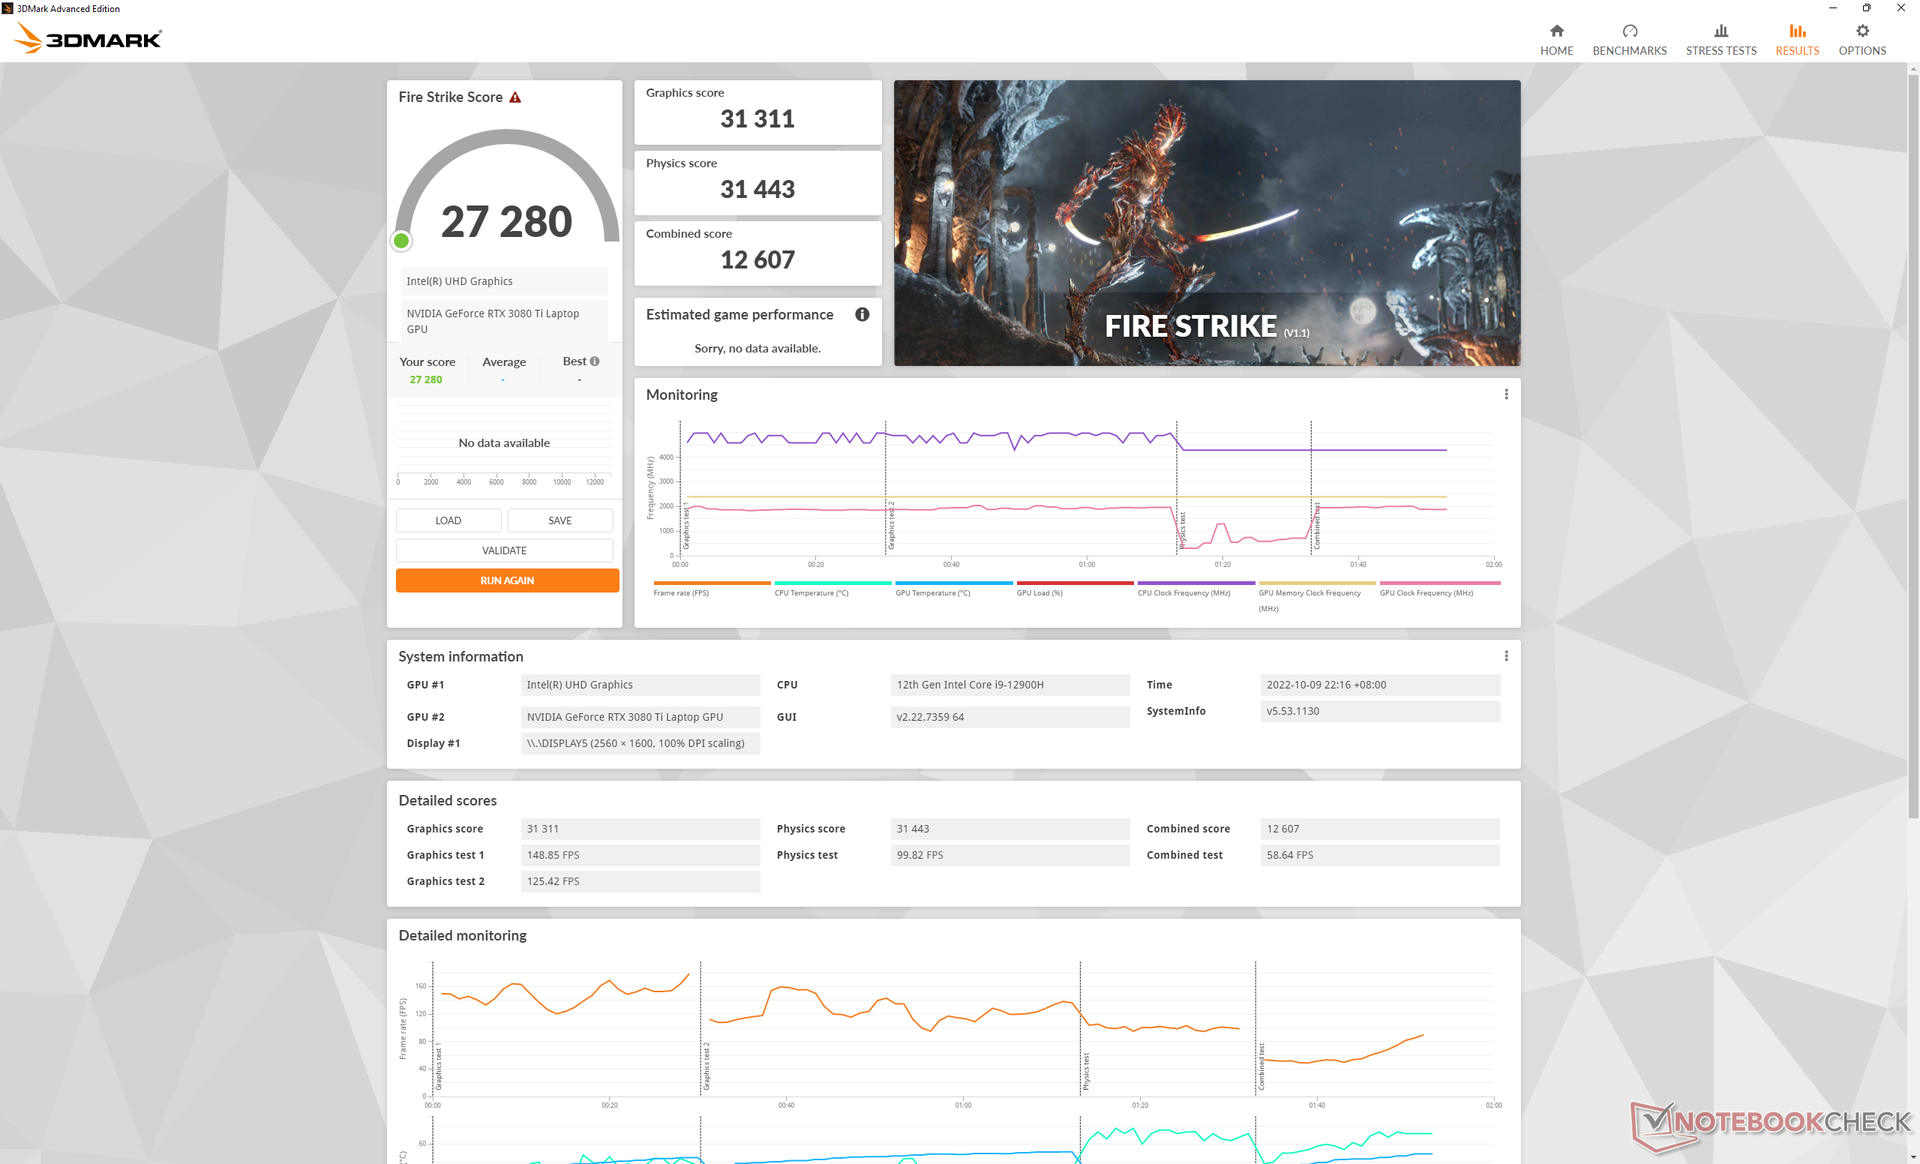

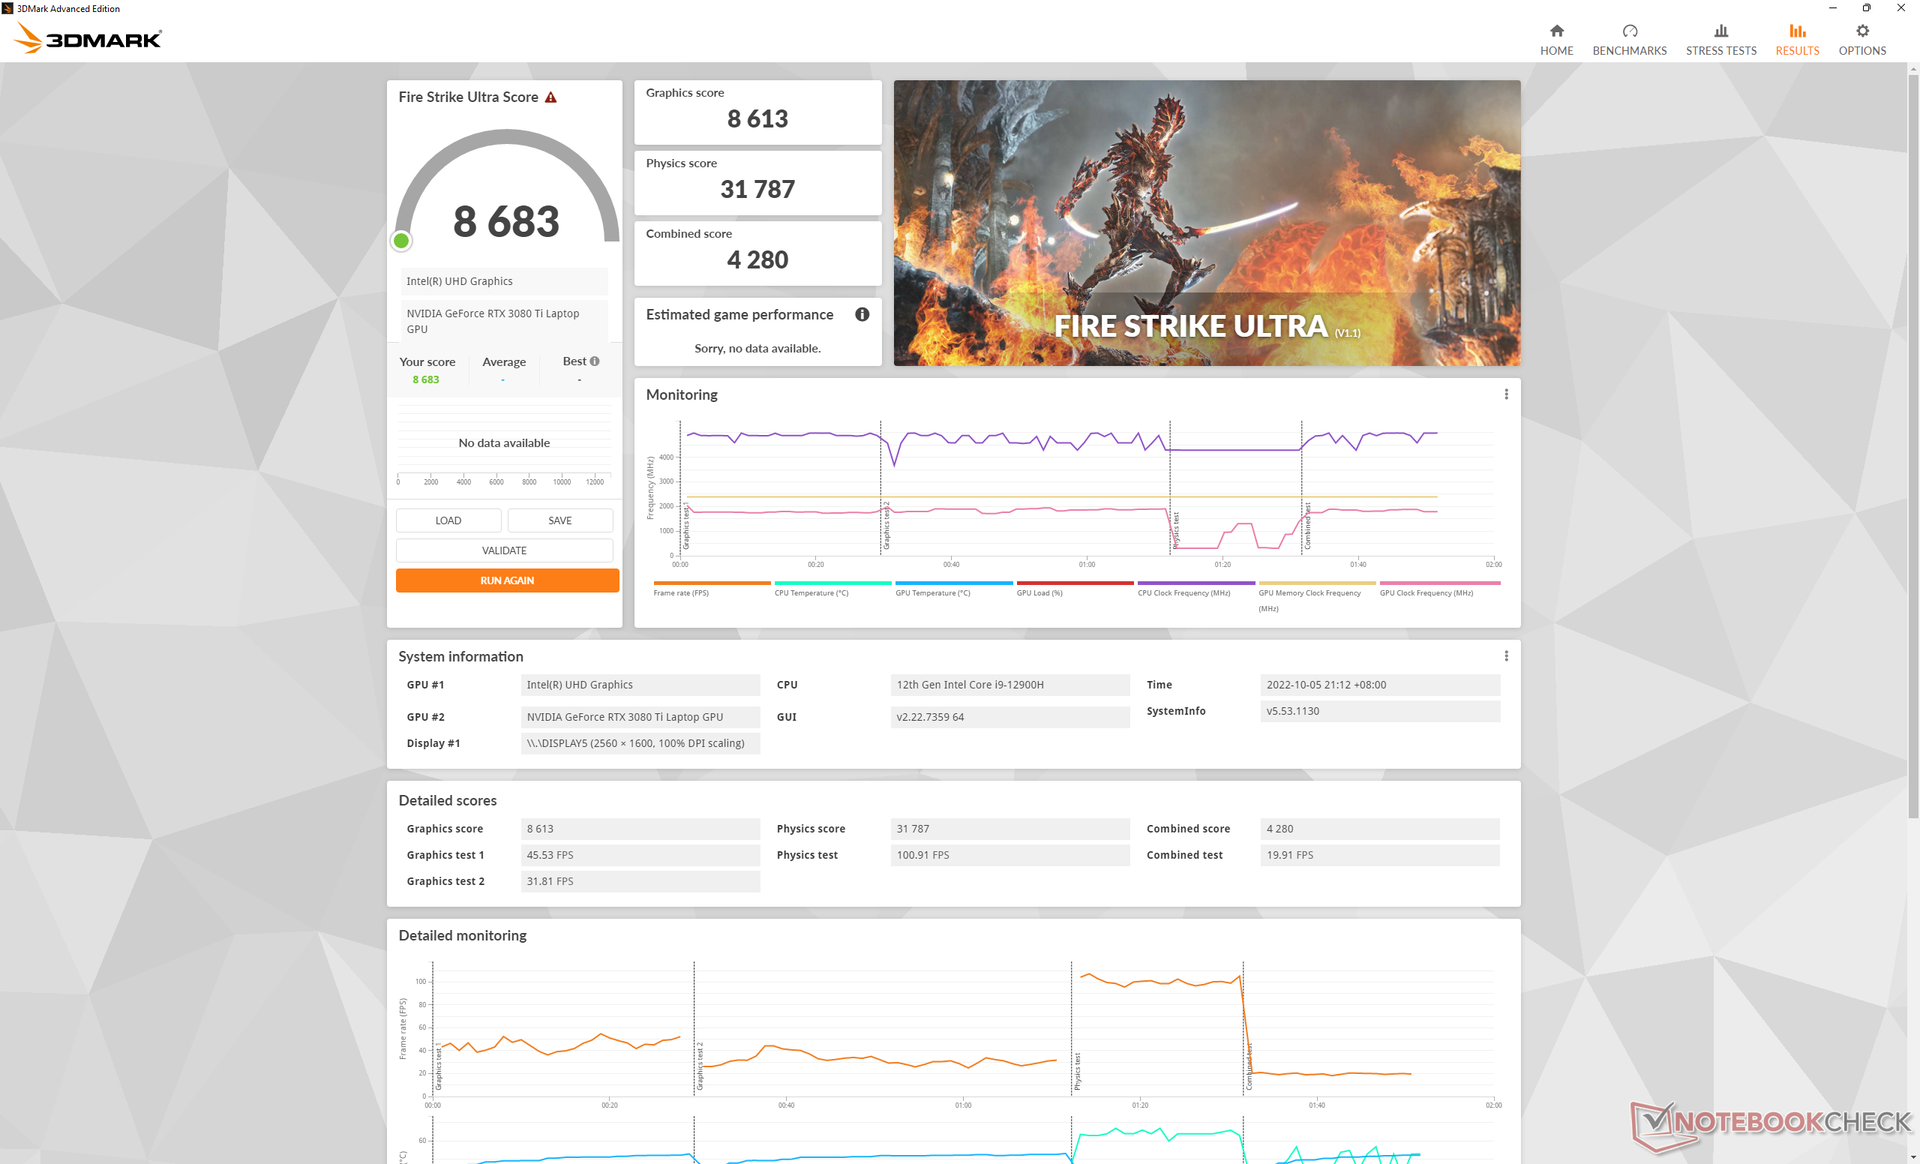
| 3DMark 11 Performance | 34262 points | |
| 3DMark Cloud Gate Standard Score | 64248 points | |
| 3DMark Fire Strike Score | 27342 points | |
| 3DMark Time Spy Score | 13651 points | |
Aide | ||
| Blender | |
| v3.3 Classroom OPTIX/RTX | |
| Aorus 17X XES | |
| MSI Titan GT77 12UHS | |
| Uniwell Technology GM7AG8N Liquid Cooling Box | |
| v3.3 Classroom CUDA | |
| Aorus 17X XES | |
| Uniwell Technology GM7AG8N Liquid Cooling Box | |
| MSI Titan GT77 12UHS | |
| v3.3 Classroom CPU | |
| Aorus 17X XES | |
| Uniwell Technology GM7AG8N Liquid Cooling Box | |
| MSI Titan GT77 12UHS | |
* ... Moindre est la valeur, meilleures sont les performances
Witcher 3 FPS Chart
| Bas | Moyen | Élevé | Ultra | QHD | |
|---|---|---|---|---|---|
| GTA V (2015) | 184.8 | 181.6 | 177.3 | 123.3 | 112.6 |
| The Witcher 3 (2015) | 464.9 | 366.2 | 257.5 | 127.2 | |
| Dota 2 Reborn (2015) | 171.3 | 158.9 | 152.3 | 145.3 | |
| Final Fantasy XV Benchmark (2018) | 188.7 | 164.4 | 122.7 | 97 | |
| X-Plane 11.11 (2018) | 149.2 | 133.8 | 106.2 | ||
| Strange Brigade (2018) | 448 | 311 | 255 | 224 | 166.8 |
| Cyberpunk 2077 1.6 (2022) | 144.9 | 140.1 | 115.8 | 96.7 | 63.3 |
Émissions
Bruit du système
Comme nous l'avons mentionné précédemment, le boîtier de refroidissement dispose de trois modes de ventilation : Quieter, Quietest, et Balanced. Le bruit du ventilateur en mode "Quietest" est déjà assez fort à 41,6 dB(A), ce qui est aussi fort que la plupart des Ultrabooks lorsqu'ils fonctionnent à haute charge. En passant au mode "Quiet" et "Balanced", le bruit du ventilateur passe respectivement à 44,2 dB(A) et 45,8 dB(A). Nous vous recommandons de placer le boîtier de refroidissement le plus loin possible de votre siège pour réduire les niveaux sonores.
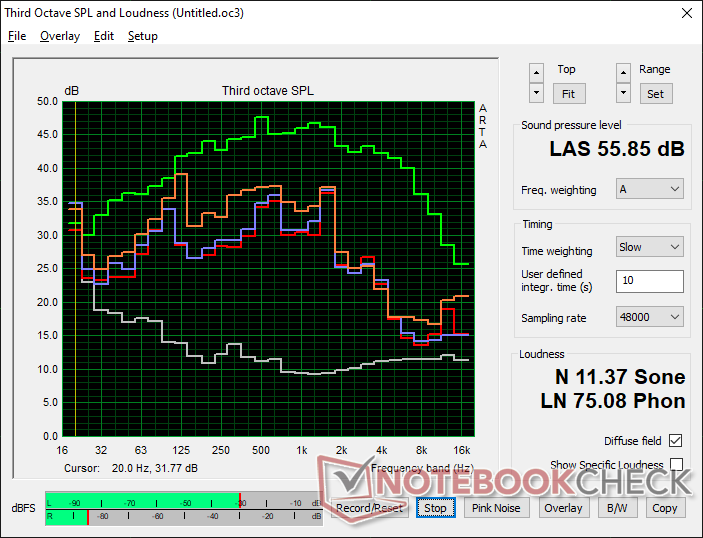
Il existe un quatrième profil d'alimentation dans le logiciel Control Center appelé "Fan Boost" qui fait fonctionner les ventilateurs internes à leur régime maximal. Lorsque le mode "Fan Boost" et le mode "Balanced" du boîtier de refroidissement sont tous deux actifs, le bruit global du système peut atteindre 55,9 dB(A), ce qui est en fait très similaire à celui de la plupart des ordinateurs portables de jeu 17 pouces "ordinaires" sans solution de refroidissement externe.
Ce qui est intéressant ici, c'est qu'il n'est pas nécessaire d'activer Fan Boost ou de régler le boîtier de refroidissement à son niveau le plus élevé pour faire fonctionner le CPU ou le GPU à des vitesses standard. En revanche, la plupart des autres ordinateurs portables de jeu comme l'Asus Zephyrus S17 ou le Razer Blade 17 exigent que les utilisateurs activent le mode Turbo, sinon le TGP sera étranglé lors des jeux. Cela signifie que les propriétaires d'Uniwell peuvent faire fonctionner le boîtier de refroidissement dans son mode "le plus silencieux" de 41,6 dB(A) pour des performances de jeu RTX 3080 Ti supérieures à la moyenne, alors que la plupart des autres ordinateurs portables de jeu doivent supporter un bruit de ventilateur de 50 dB(A) ou plus juste pour se rapprocher des performances de l'Uniwell. En bref, le boîtier de refroidissement est capable d'effectuer presque tout le travail de refroidissement, même en jouant avec les réglages de ventilateur les plus silencieux, sans avoir besoin d'accélérer le CPU ou le GPU.
Degré de la nuisance sonore
| Au repos |
| 41.6 / 42.1 / 42.1 dB(A) |
| Fortement sollicité |
| 42.2 / 55.9 dB(A) |
 | ||
30 dB silencieux 40 dB(A) audible 50 dB(A) bruyant |
||
min: | ||
| Uniwell Technology GM7AG8N Liquid Cooling Box GeForce RTX 3080 Ti Laptop GPU, i9-12900H, Samsung PM9A1 MZVL21T0HCLR | MSI Titan GT77 12UHS GeForce RTX 3080 Ti Laptop GPU, i9-12900HX, Samsung PM9A1 MZVL21T0HCLR | Aorus 17X XES GeForce RTX 3070 Ti Laptop GPU, i9-12900HX, Gigabyte AG470S1TB-SI B10 | Razer Blade 17 Early 2022 GeForce RTX 3080 Ti Laptop GPU, i9-12900H, Samsung PM9A1 MZVL21T0HCLR | MSI Stealth GS77 12UHS-083US GeForce RTX 3080 Ti Laptop GPU, i7-12700H, Micron 3400 1TB MTFDKBA1T0TFH | Asus ROG Zephyrus S17 GX703HSD GeForce RTX 3080 Laptop GPU, i9-11900H, Samsung PM9A1 MZVL22T0HBLB | |
|---|---|---|---|---|---|---|
| Noise | 17% | 5% | 12% | 19% | 23% | |
| arrêt / environnement * (dB) | 22.8 | 21.9 4% | 26 -14% | 26 -14% | 24.5 -7% | 23 -1% |
| Idle Minimum * (dB) | 41.6 | 24.53 41% | 28 33% | 26 37% | 24.5 41% | 23 45% |
| Idle Average * (dB) | 42.1 | 24.53 42% | 32 24% | 27 36% | 24.5 42% | 23 45% |
| Idle Maximum * (dB) | 42.1 | 24.53 42% | 38 10% | 32 24% | 30.8 27% | 23 45% |
| Load Average * (dB) | 42.2 | 46.25 -10% | 53 -26% | 50 -18% | 34.6 18% | 41 3% |
| Witcher 3 ultra * (dB) | 55.9 | 56.86 -2% | 54 3% | 51 9% | 46.2 17% | 45 19% |
| Load Maximum * (dB) | 55.9 | 54.25 3% | 55 2% | 51 9% | 56.8 -2% | 52 7% |
* ... Moindre est la valeur, meilleures sont les performances
Température - Garder la tête froide
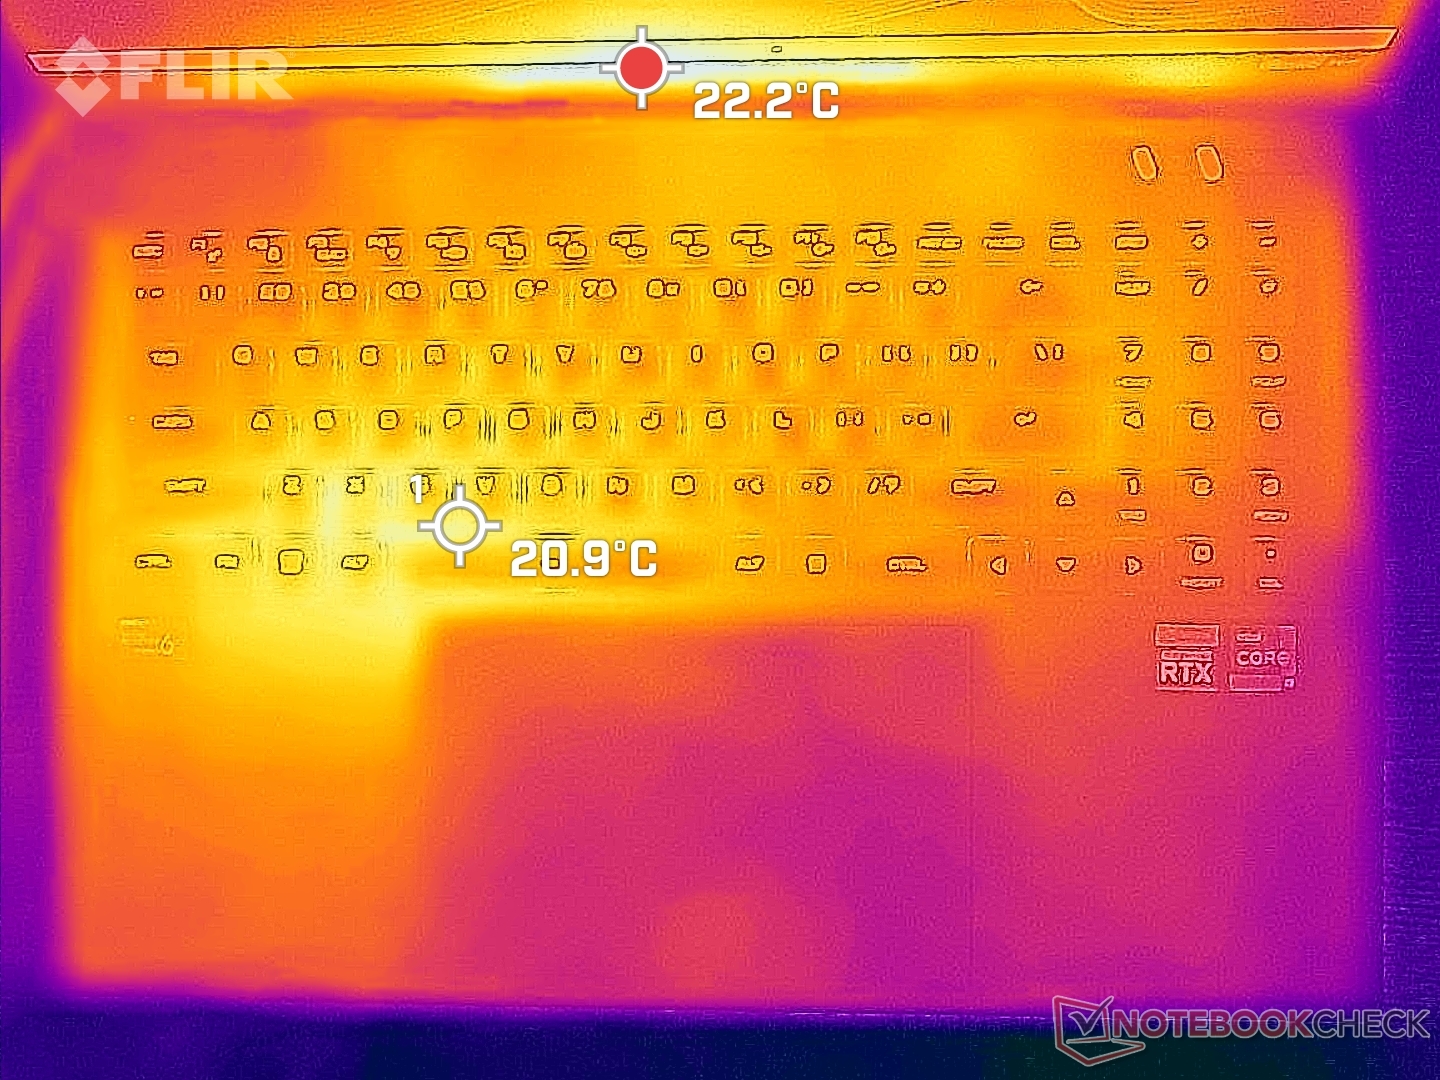
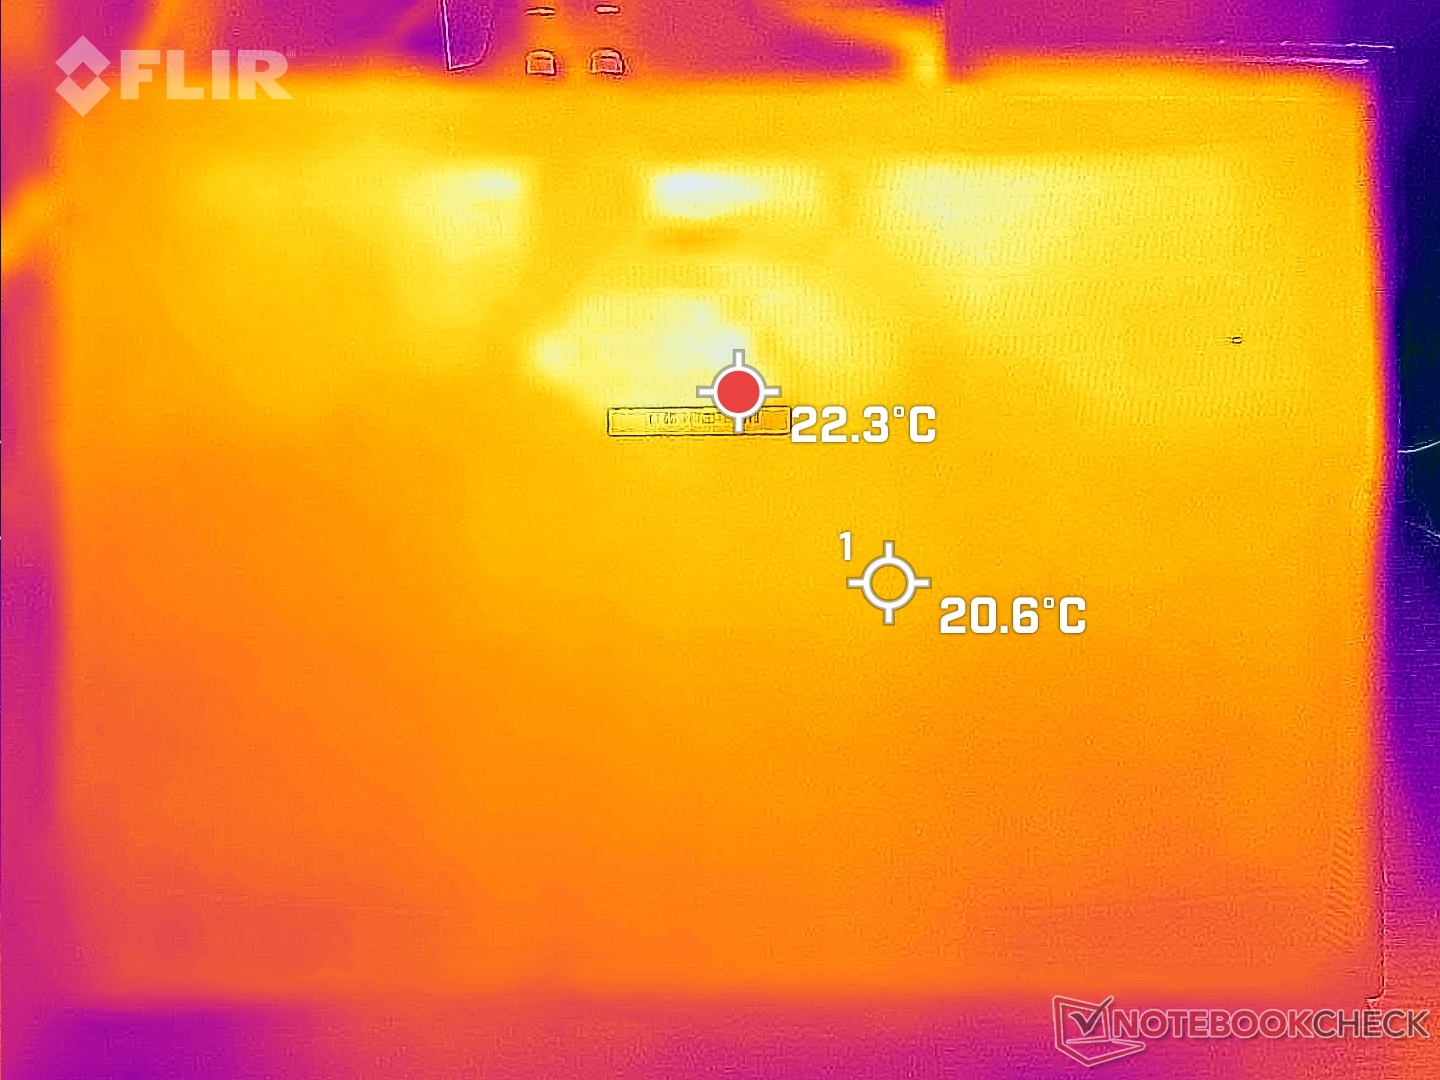
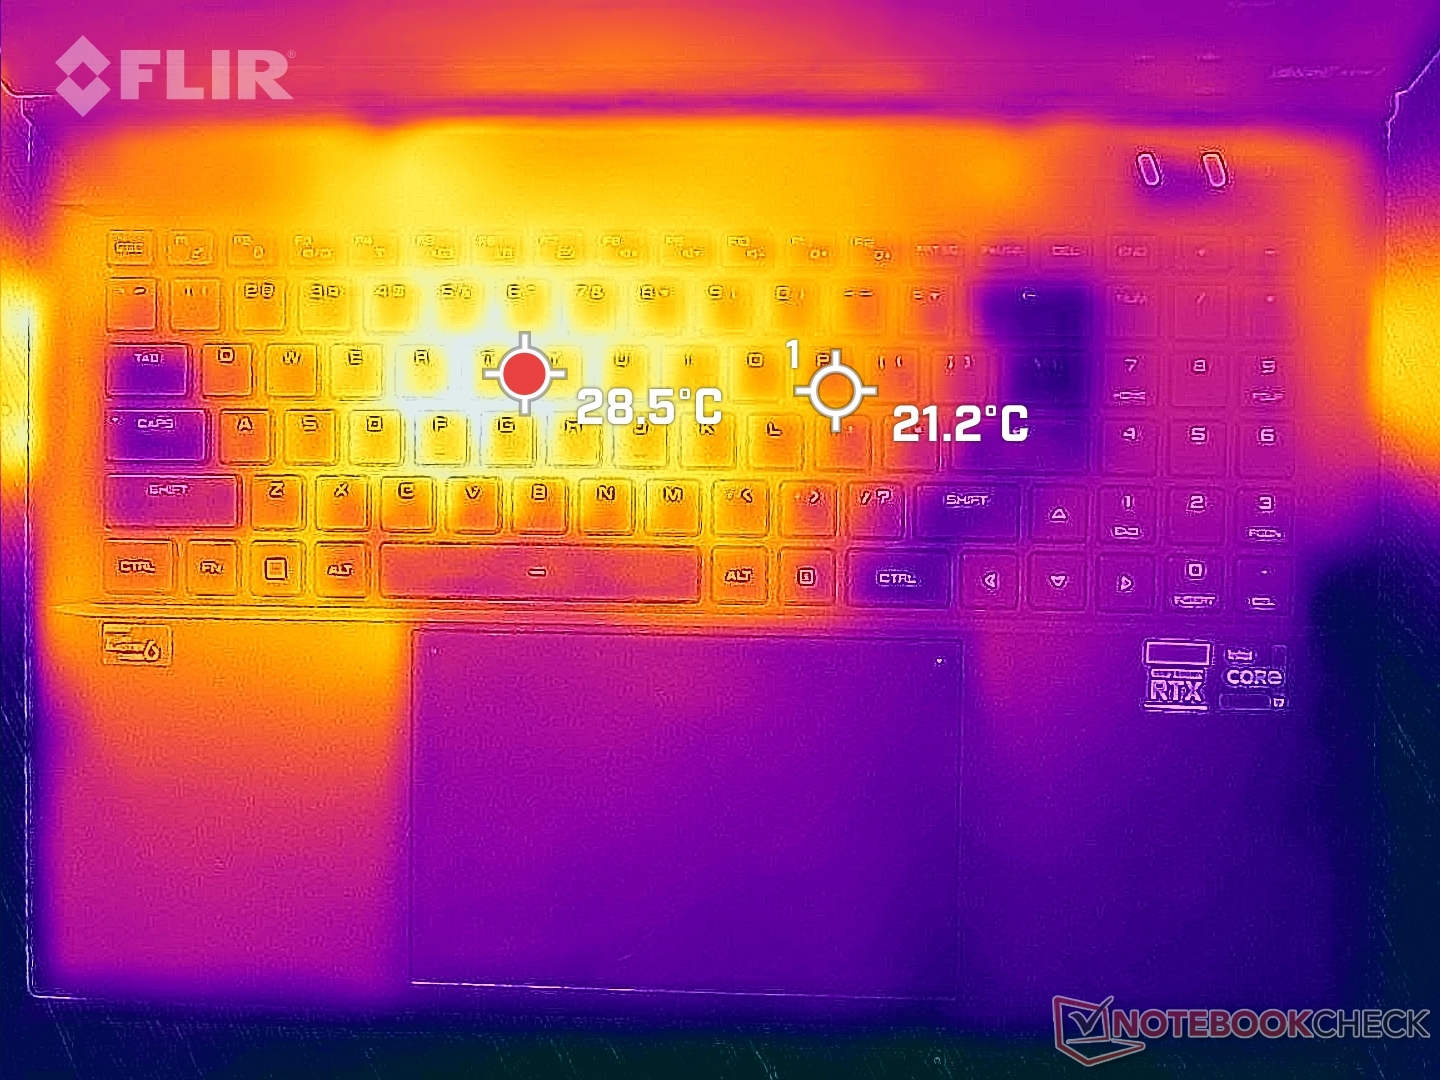
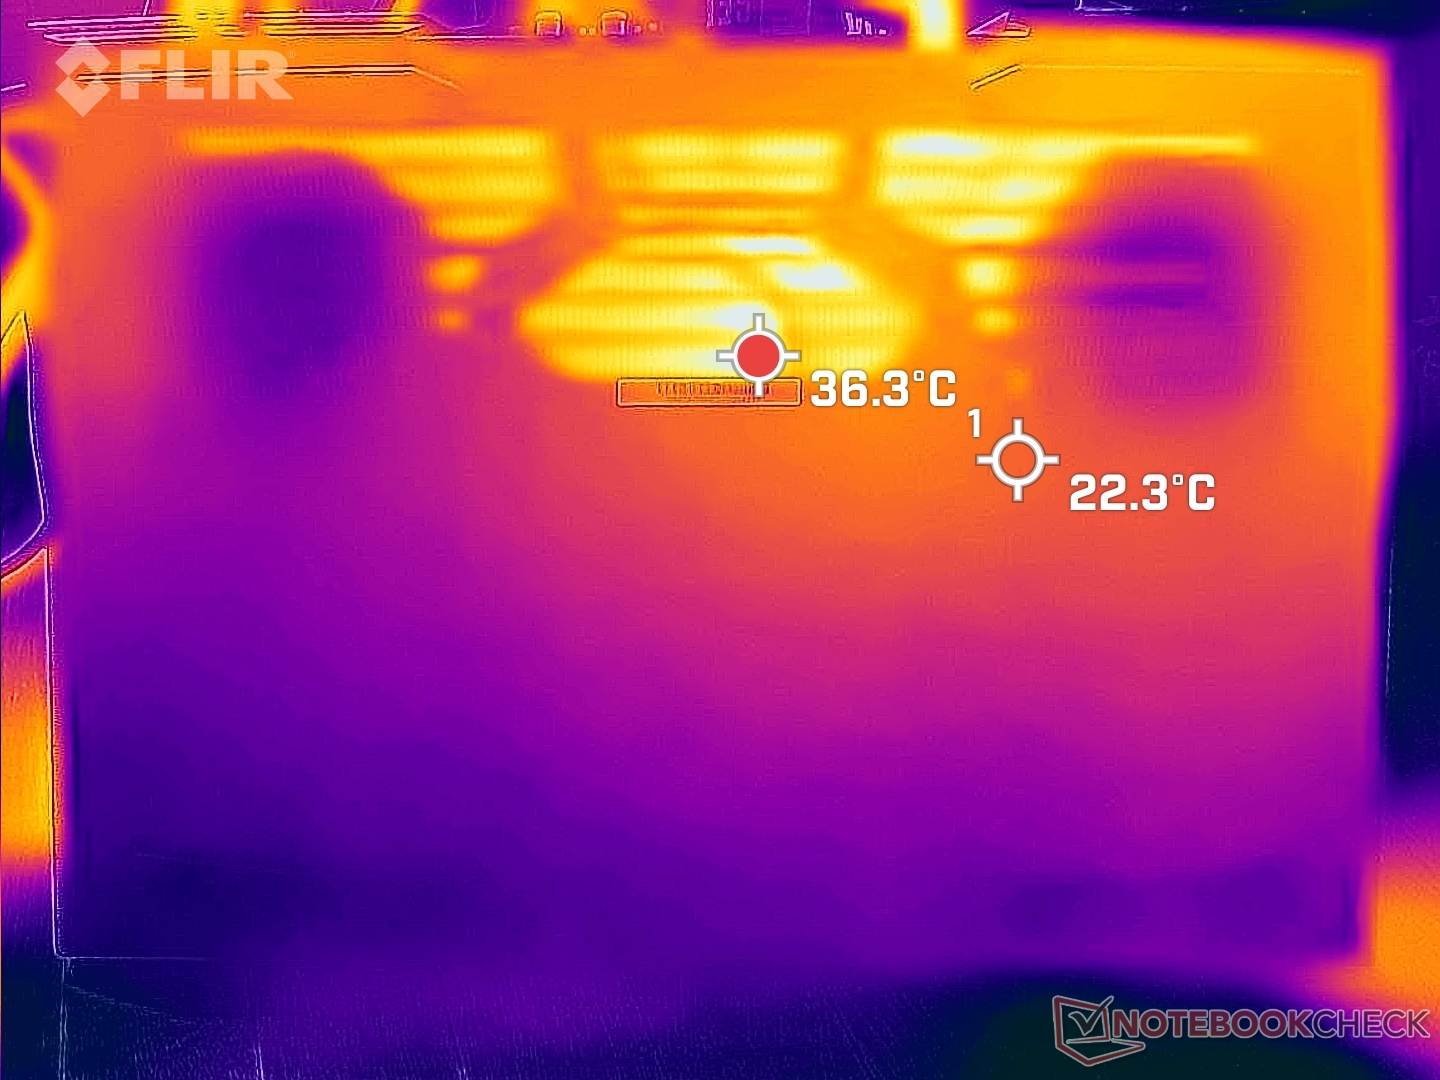
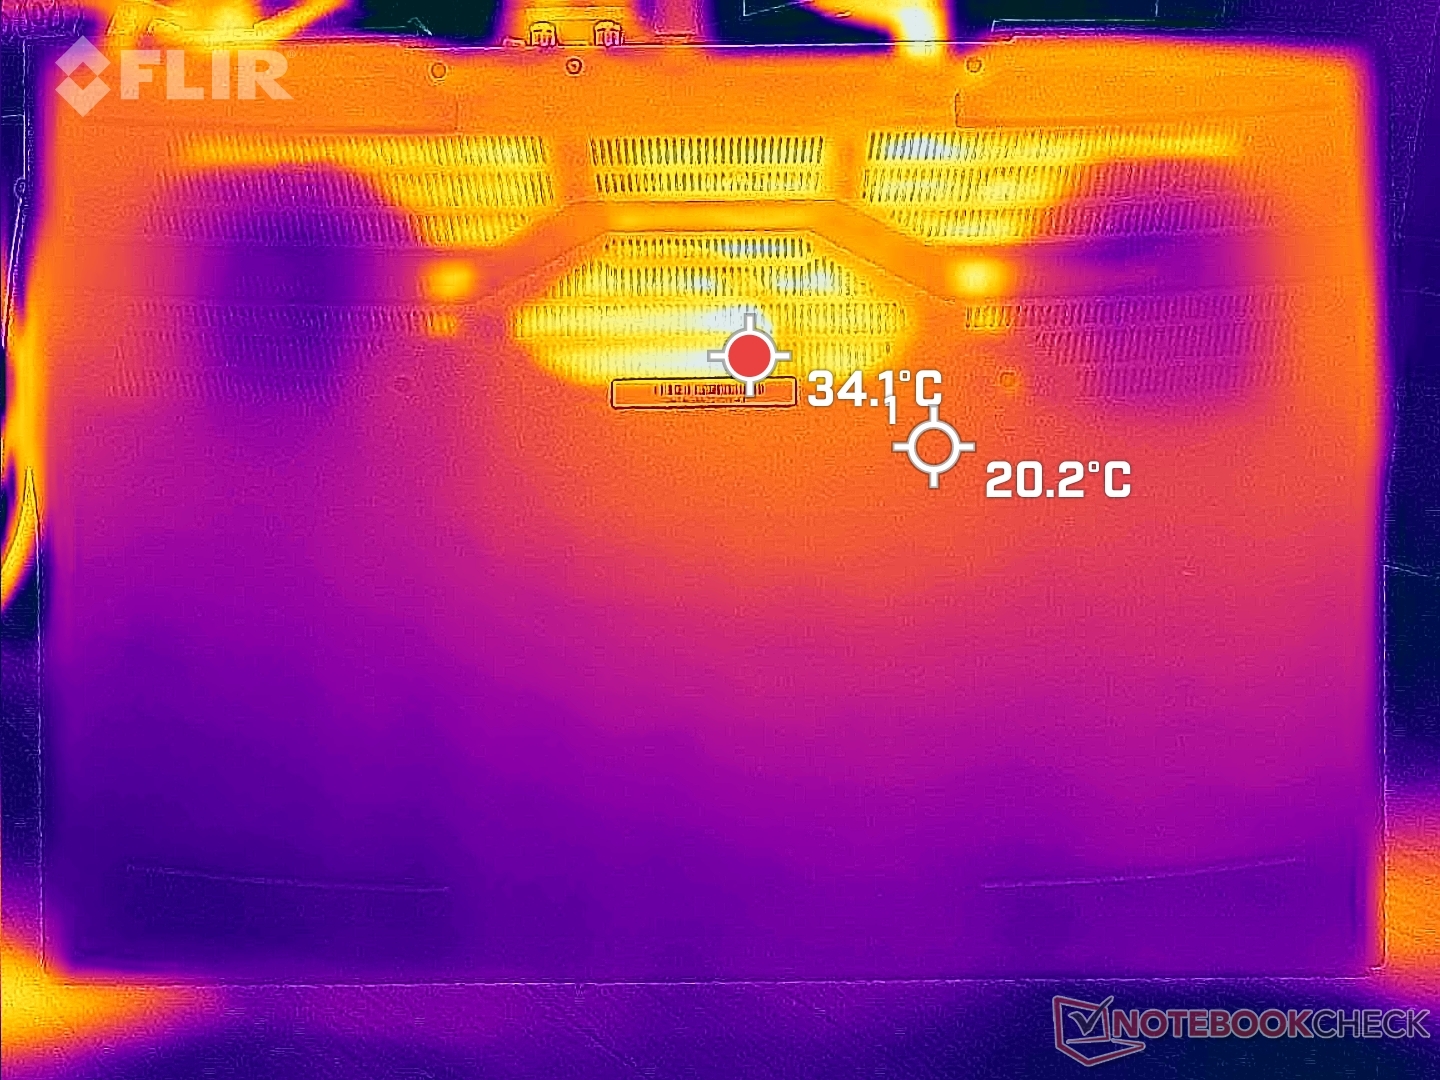
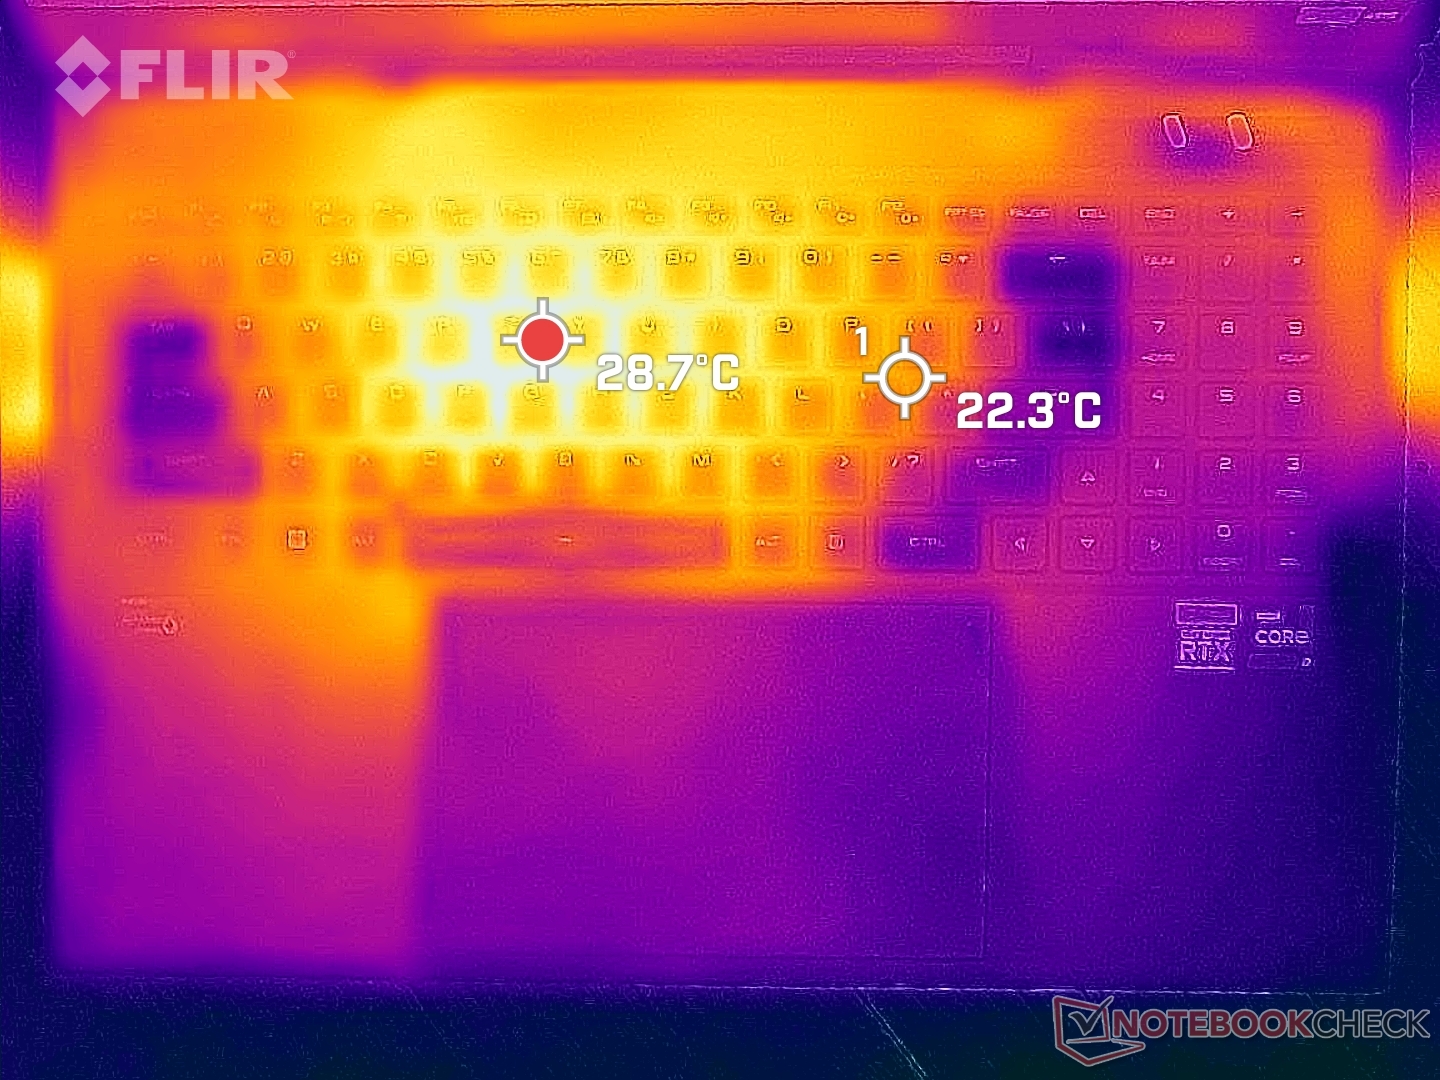
Les températures de surface sont les plus basses que nous ayons jamais enregistrées sur un ordinateur portable de jeu. Lorsqu'ils sont soumis à une utilisation à 100 % du CPU et du GPU, les points chauds du haut et du bas n'atteignent que 32 C et 30 C, respectivement, contre 50 C à 60+ C sur les ordinateurs portables de jeux MSI Stealth GS77. L'augmentation moyenne de la température n'est que d'environ 3°C par rapport à l'état de repos. Le boîtier de refroidissement est remarquable en termes de maintien des températures.
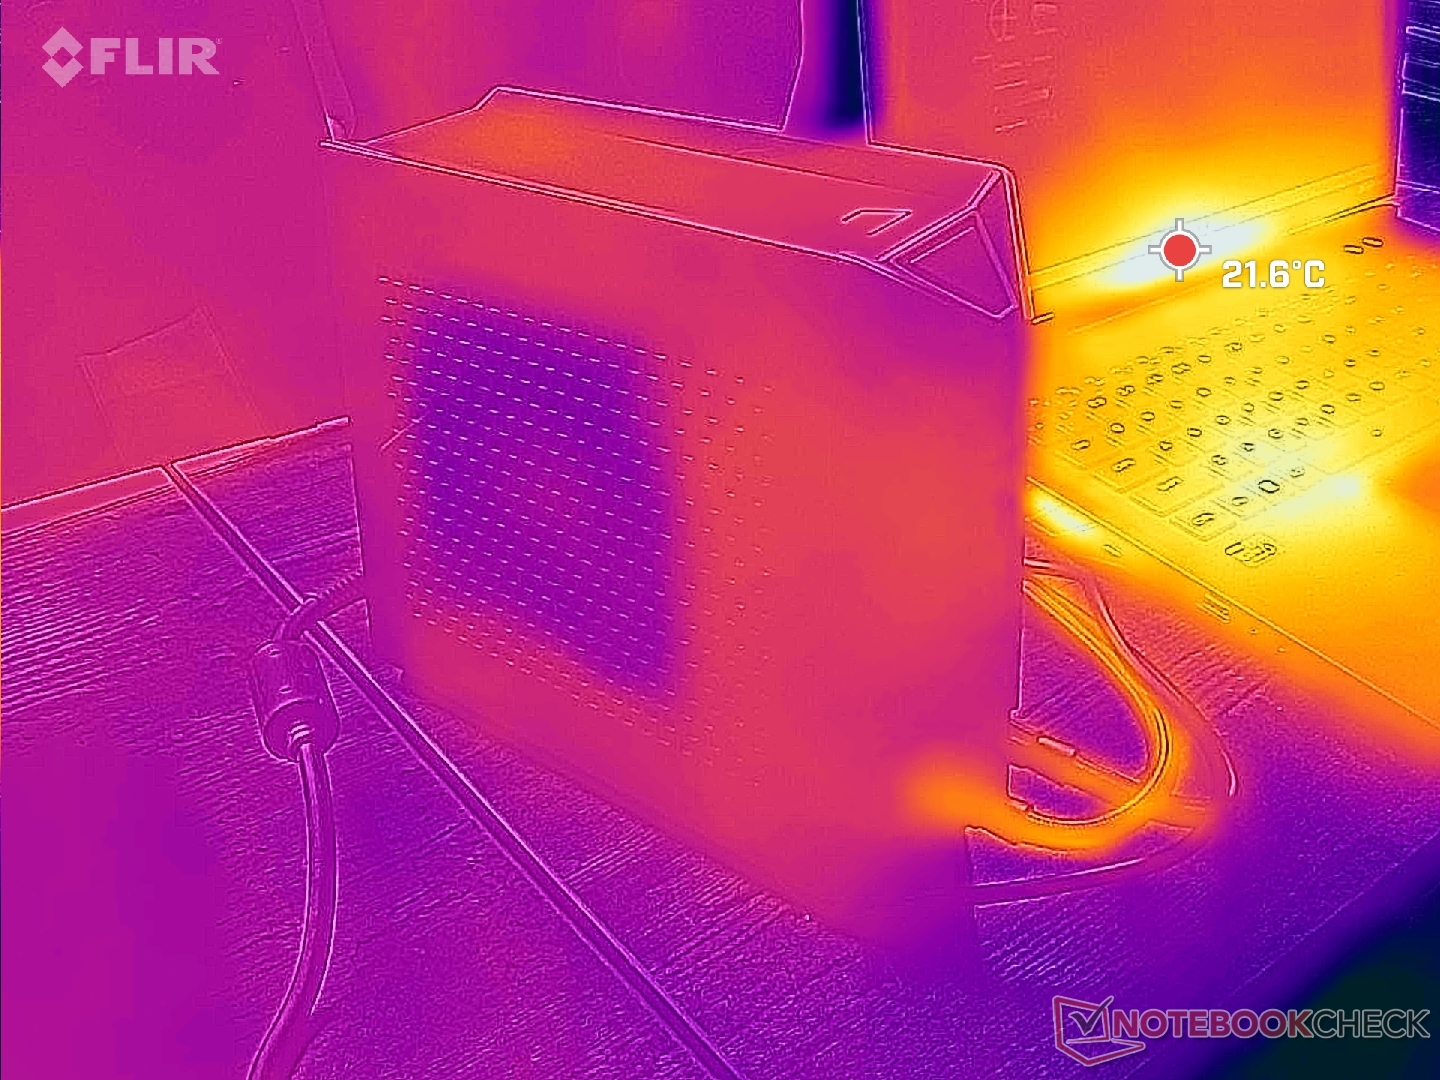
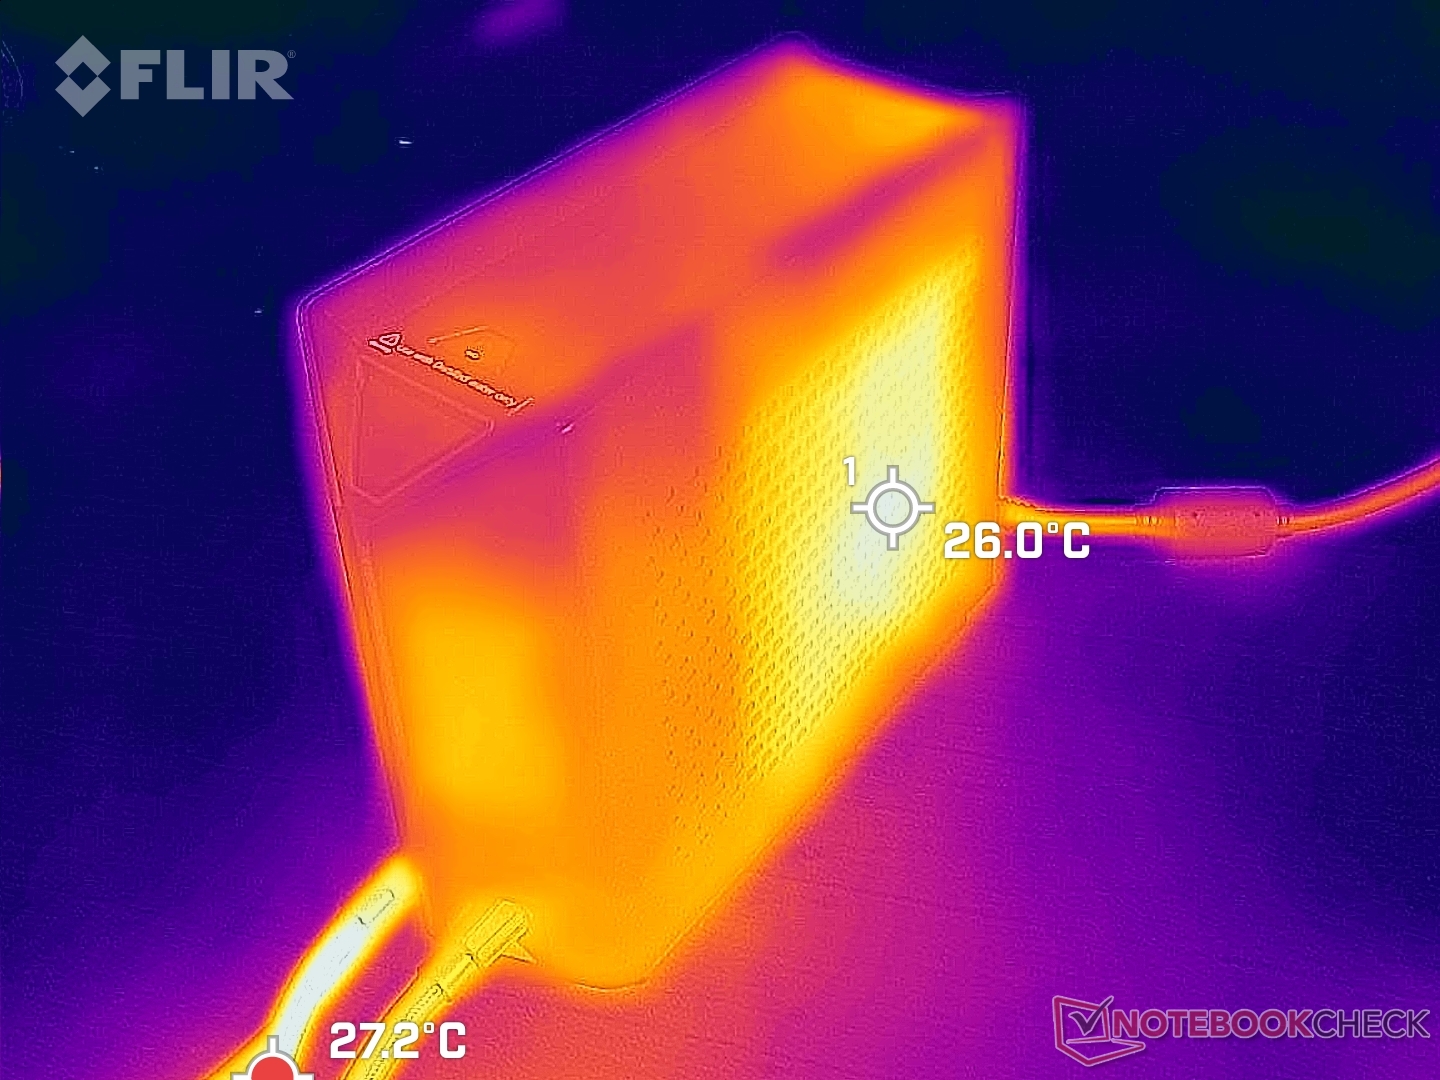
(+) La température maximale du côté supérieur est de 32 °C / 90 F, par rapport à la moyenne de 40.4 °C / 105 F, allant de 21.2 à 68.8 °C pour la classe Gaming.
(+) Le fond chauffe jusqu'à un maximum de 30 °C / 86 F, contre une moyenne de 43.2 °C / 110 F
(+) En utilisation inactive, la température moyenne du côté supérieur est de 24.5 °C / 76 F, par rapport à la moyenne du dispositif de 33.9 °C / 93 F.
(+) En jouant à The Witcher 3, la température moyenne du côté supérieur est de 27.2 °C / 81 F, alors que la moyenne de l'appareil est de 33.9 °C / 93 F.
(+) Les repose-poignets et le pavé tactile sont plus froids que la température de la peau avec un maximum de 25.2 °C / 77.4 F et sont donc froids au toucher.
(+) La température moyenne de la zone de l'appui-paume de dispositifs similaires était de 28.8 °C / 83.8 F (+3.6 °C / #6.4 F).
| Uniwell Technology GM7AG8N Liquid Cooling Box Intel Core i9-12900H, NVIDIA GeForce RTX 3080 Ti Laptop GPU | MSI Titan GT77 12UHS Intel Core i9-12900HX, NVIDIA GeForce RTX 3080 Ti Laptop GPU | Aorus 17X XES Intel Core i9-12900HX, NVIDIA GeForce RTX 3070 Ti Laptop GPU | Razer Blade 17 Early 2022 Intel Core i9-12900H, NVIDIA GeForce RTX 3080 Ti Laptop GPU | MSI Stealth GS77 12UHS-083US Intel Core i7-12700H, NVIDIA GeForce RTX 3080 Ti Laptop GPU | Asus ROG Zephyrus S17 GX703HSD Intel Core i9-11900H, NVIDIA GeForce RTX 3080 Laptop GPU | |
|---|---|---|---|---|---|---|
| Heat | -47% | -65% | -58% | -55% | -59% | |
| Maximum Upper Side * (°C) | 32 | 40.8 -27% | 54 -69% | 50 -56% | 50.6 -58% | 59 -84% |
| Maximum Bottom * (°C) | 30 | 52.4 -75% | 58 -93% | 56 -87% | 59.6 -99% | 53 -77% |
| Idle Upper Side * (°C) | 26.4 | 34.6 -31% | 37 -40% | 36 -36% | 30 -14% | 35 -33% |
| Idle Bottom * (°C) | 25 | 38.4 -54% | 39 -56% | 38 -52% | 37.4 -50% | 35 -40% |
* ... Moindre est la valeur, meilleures sont les performances
Test de stress - Beaucoup d'espace pour l'overclocking
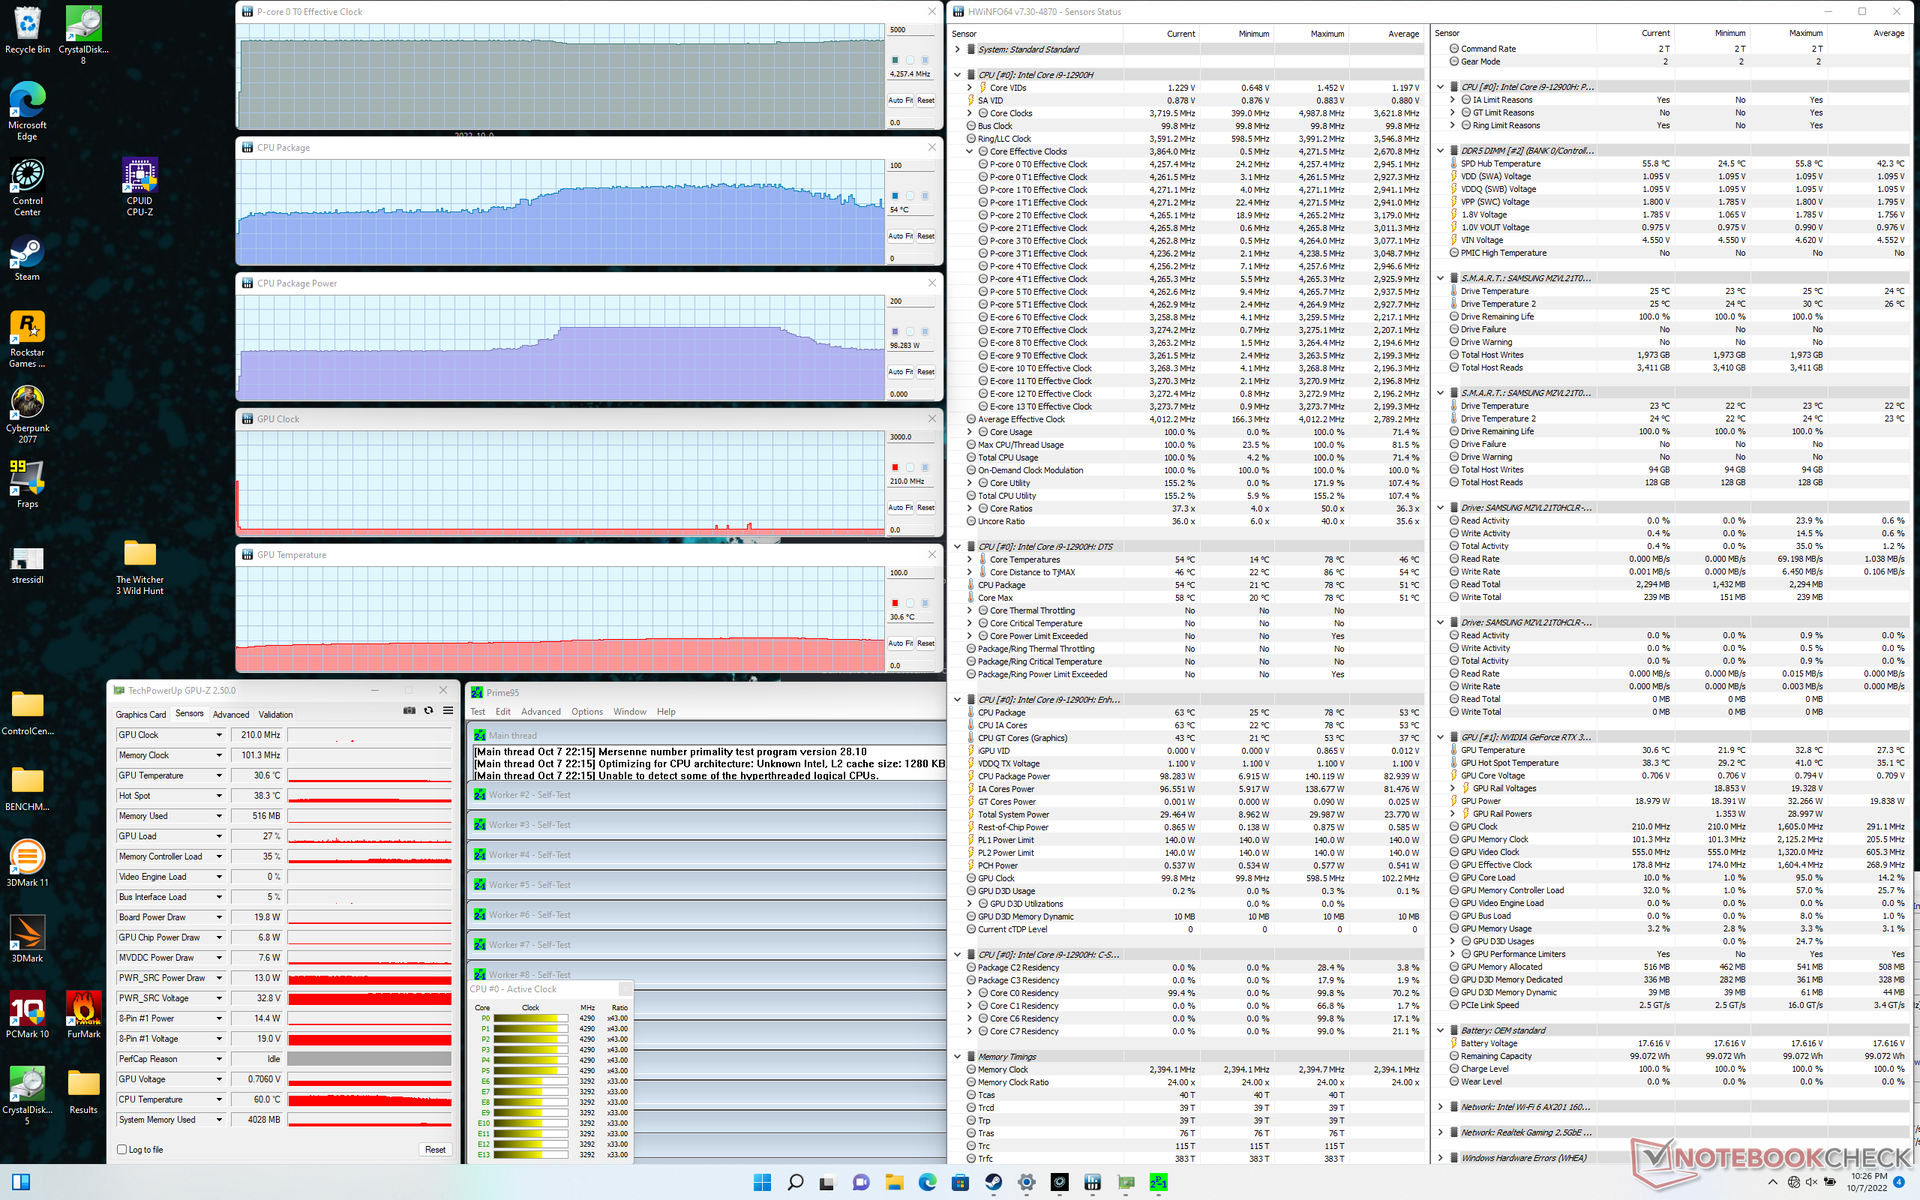
Le système n'a aucun problème à maintenir une fréquence d'horloge Turbo Boost élevée de 4,3 GHz lorsque le boîtier de refroidissement et les ventilateurs internes sont réglés à leur maximum respectif. Le CPU se stabilise à une fréquence d'horloge élevée de 4,3 GHz, une température basse de 54°C et une consommation élevée de 98W lors du test Prime95. En exécutant ce même test Prime95 sur le MSI Vector GP66 avec le même processeur, la fréquence d'horloge du cœur est plus lente, la température du cœur est plus élevée et la consommation d'énergie est plus faible, soit 3,0 GHz, 90 C et 70 W, respectivement.
La température et la consommation d'énergie lors de l'exécution de Prime95 pouvaient parfois atteindre 78°C et 140W, respectivement, sans que cela n'ait d'impact sur les fréquences d'horloge. Nous ne savons pas exactement pourquoi cela se produit, mais c'est tout de même remarquable
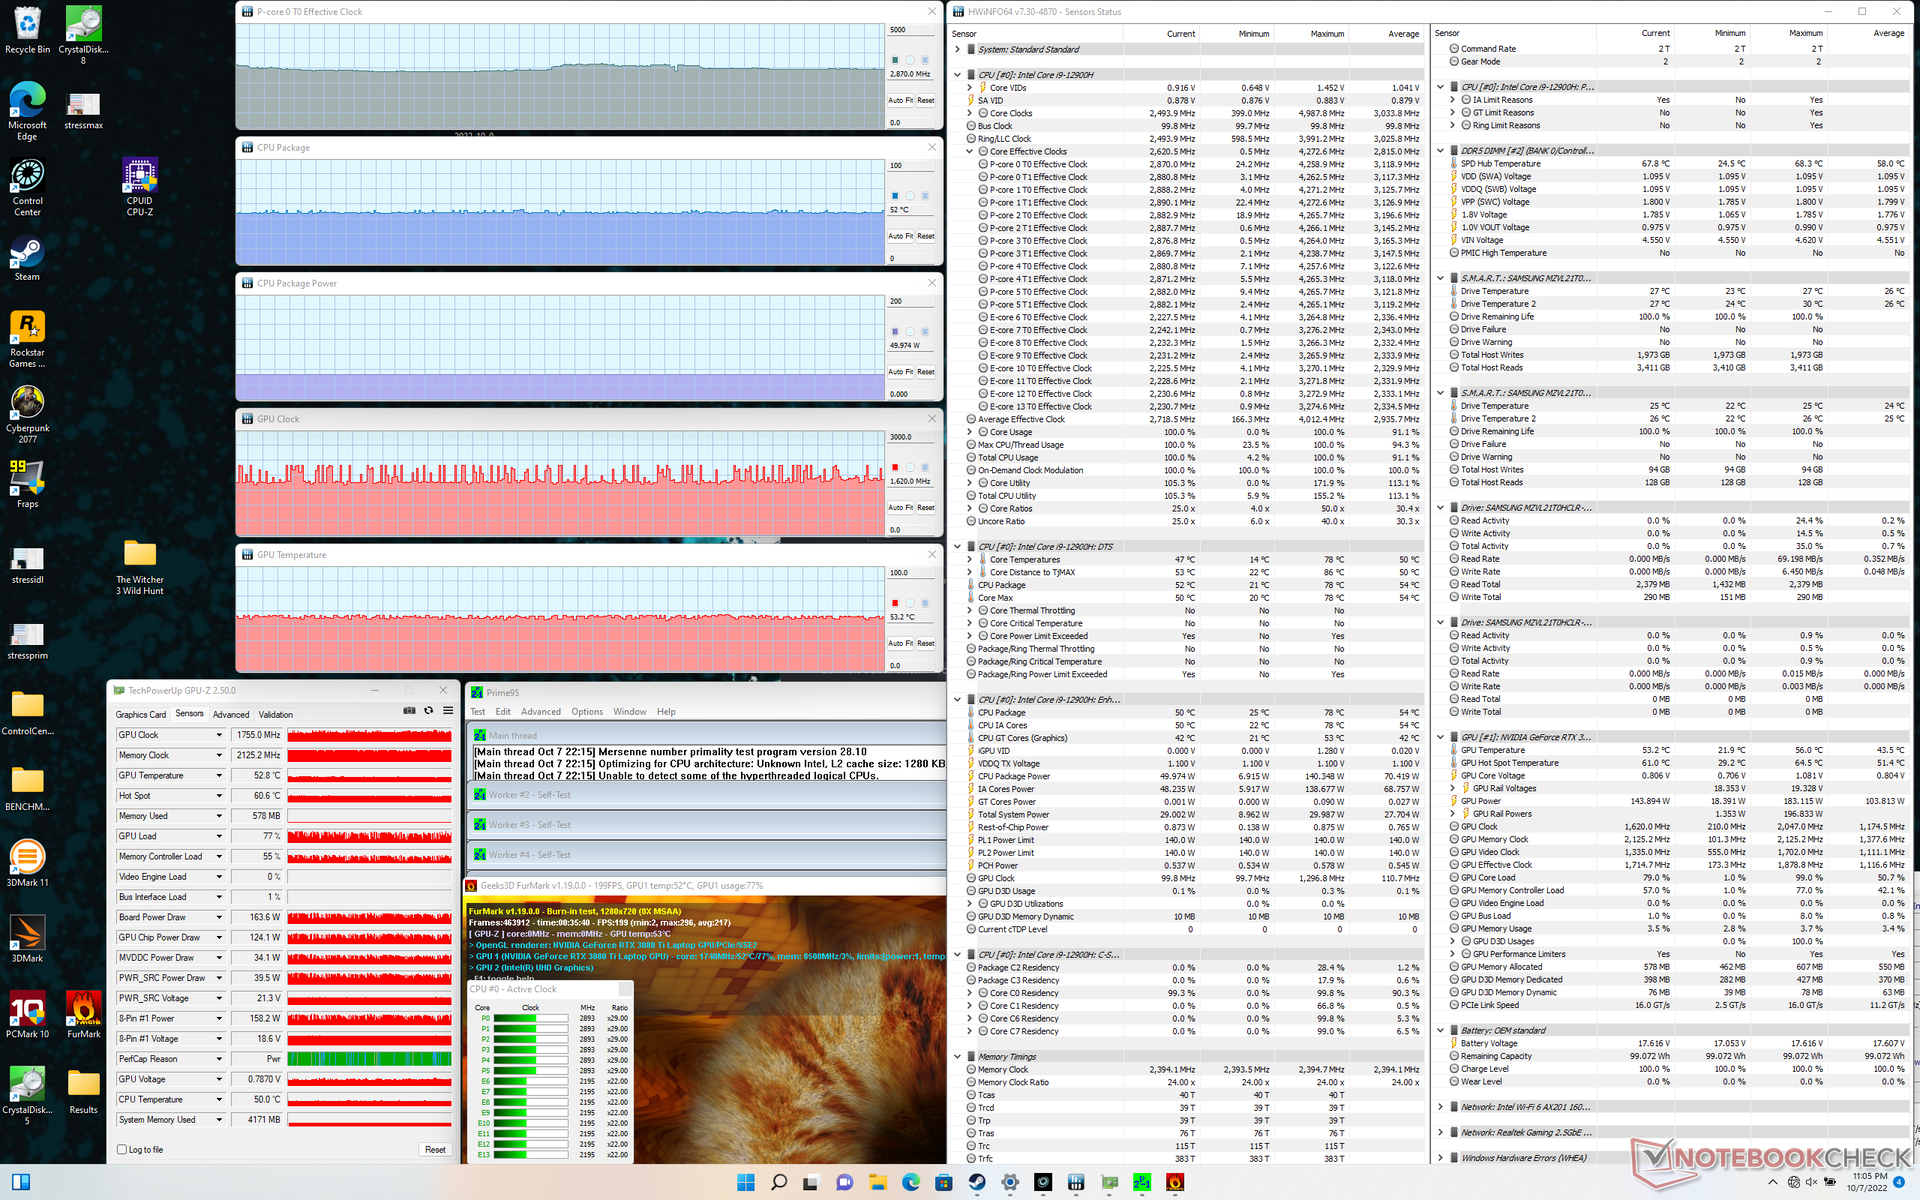
Le GPU se stabiliserait à 1890 MHz, 2125 MHz VRAM, 55 C, et 163 W (contre son TGP nominal de 175 W) lors de l'exécution du test Prime95 Witcher 3. En répétant ce test sur le MSI GS77 avec le même GPU 3080 Ti, on obtiendrait une fréquence d'horloge plus lente de 1432 MHz et un VRAM à 1750 MHz, une température plus chaude de 75 C et une consommation d'énergie plus faible de 105 W. Les avantages d'un boîtier de refroidissement à eau externe sont très clairs à cet égard.
L'utilisation sur batterie limite les performances comme on pouvait s'y attendre. Un test Fire Strike sur batteries donne des scores de physique et de graphisme de seulement 11276 et 4393 points, respectivement, contre 30601 et 30959 points sur secteur.
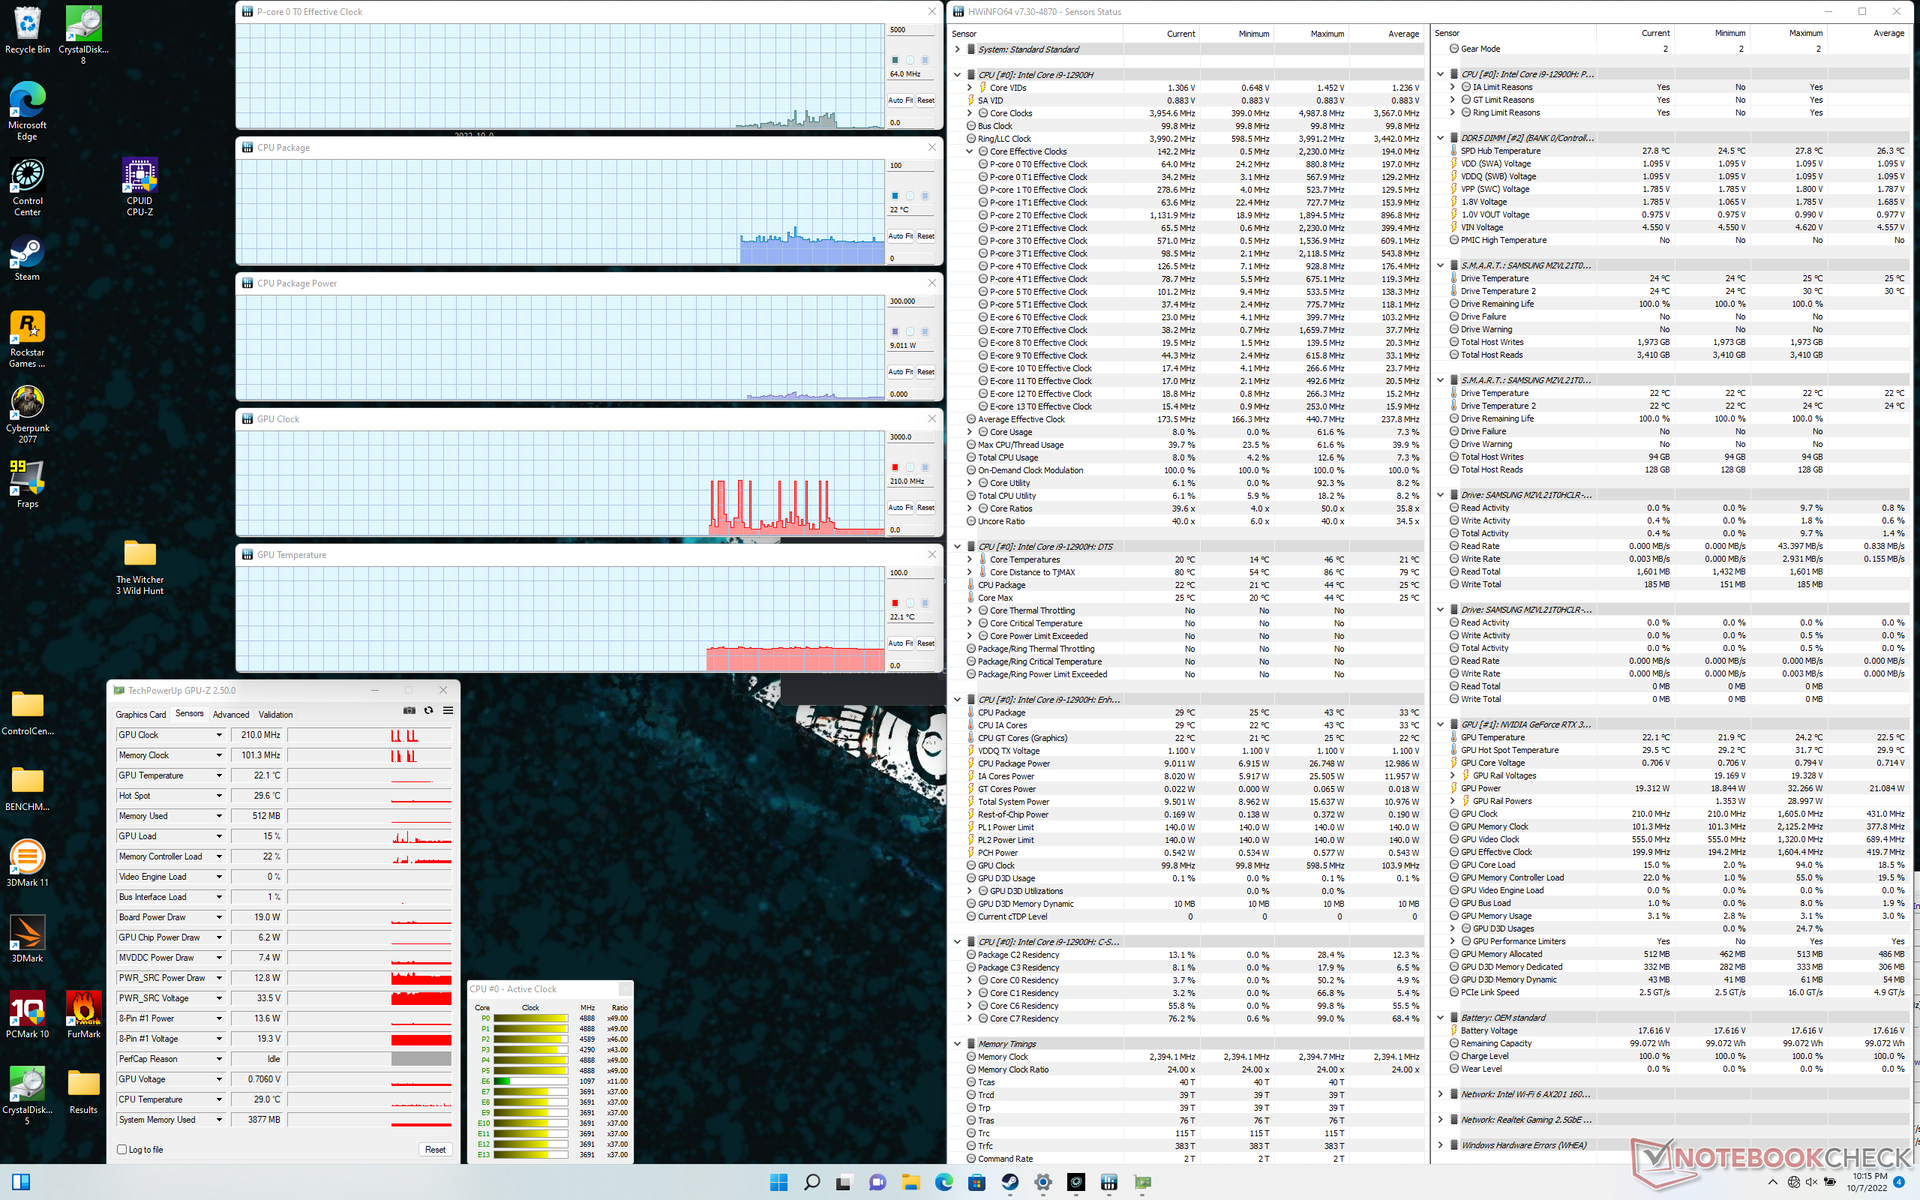
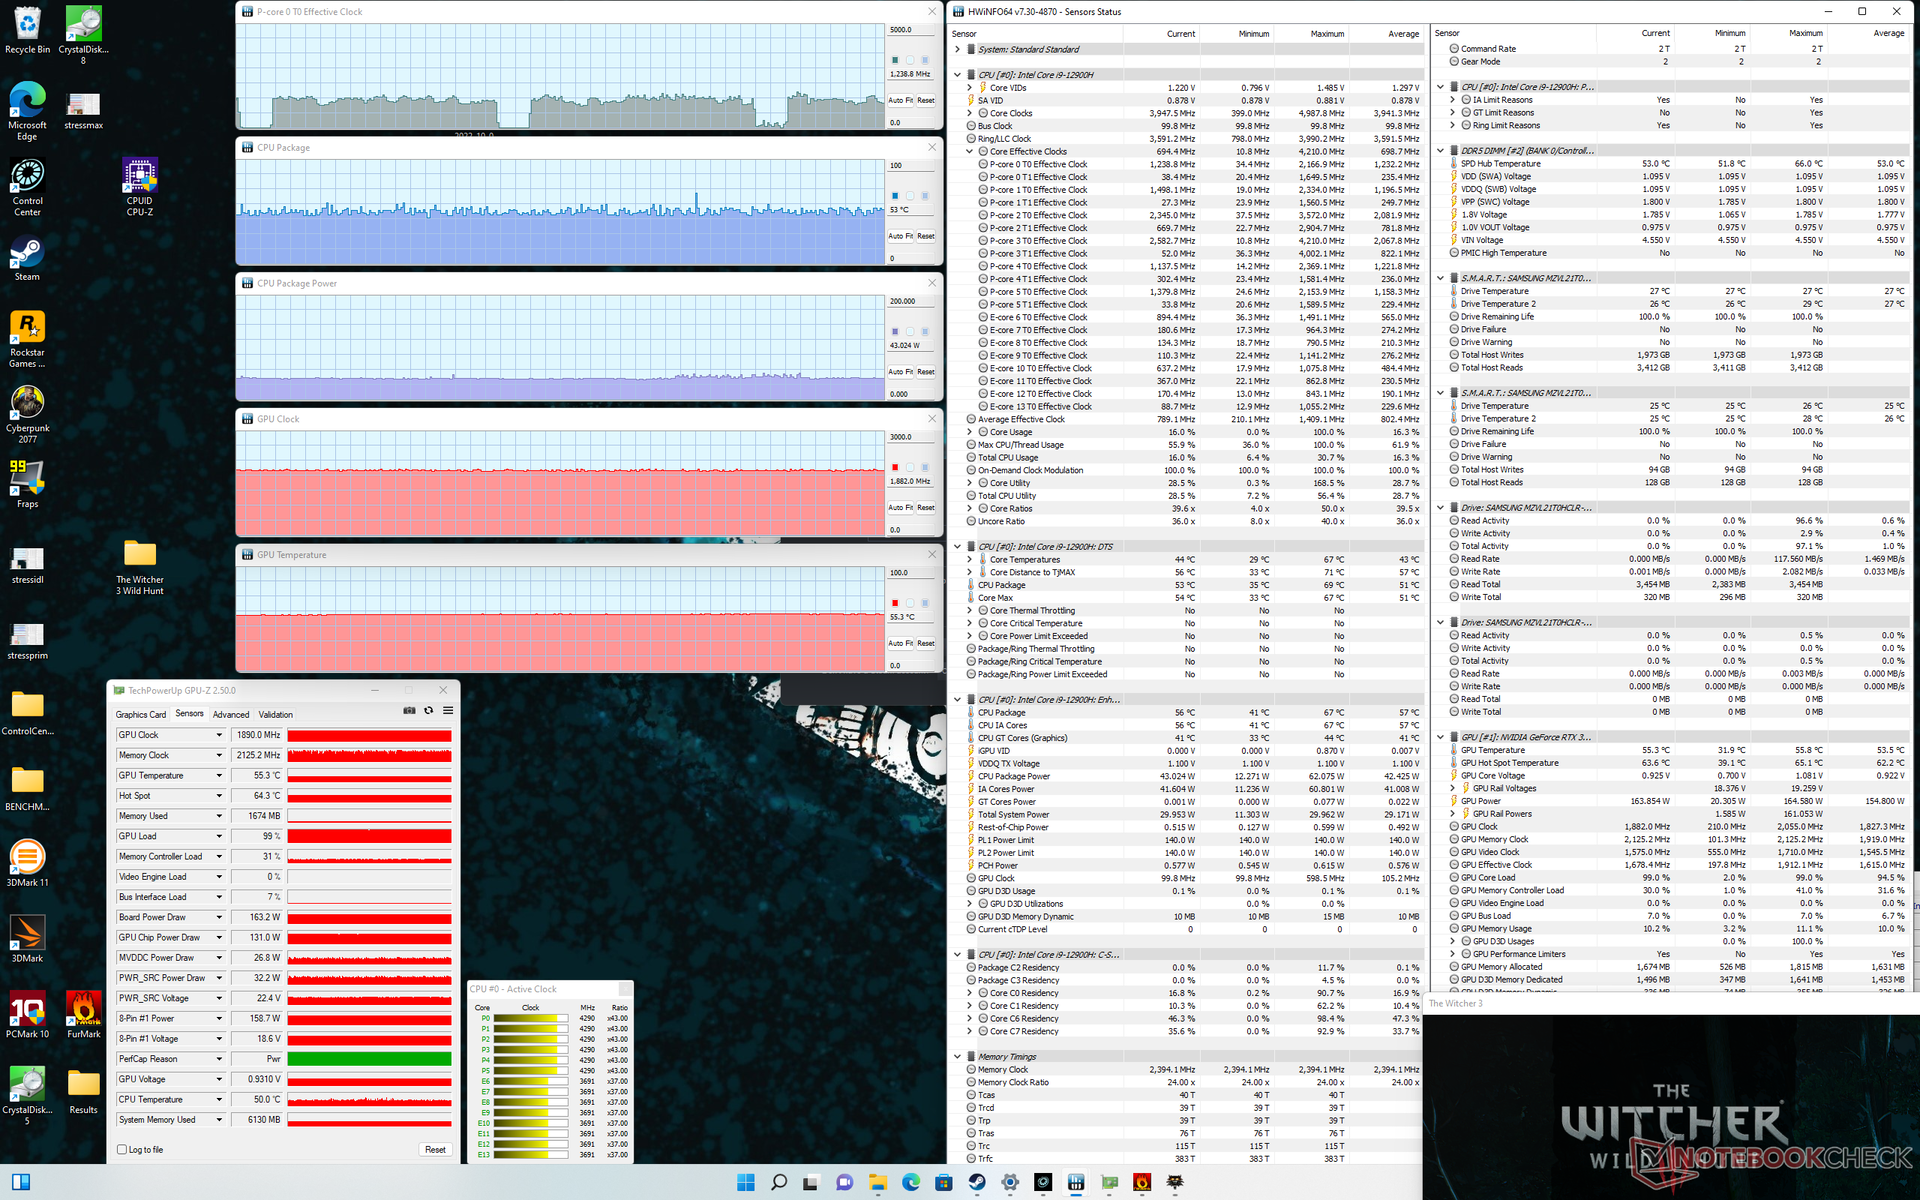
| Fréquence du CPU (GHz) | Fréquence du GPU (MHz) | Température moyenne du CPU (°C) | Température moyenne du GPU (°C) | |
| Système au repos | -- | -- | 22 | 22 |
| Prime95 Stress | 4.3 | -- | 54 | 31 |
| Prime95 + FurMark Stress | 2.9 | ~1755 | 52 | 53 |
| Witcher 3 Stress | ~1.3 | 1890 | 53 | 55 |
Haut-parleurs
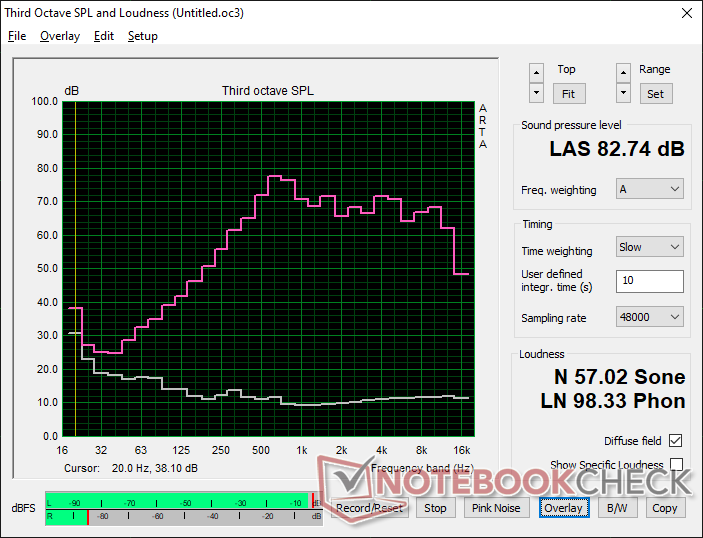
Uniwell Technology GM7AG8N Liquid Cooling Box analyse audio
(+) | les haut-parleurs peuvent jouer relativement fort (82.7# dB)
Basses 100 - 315 Hz
(-) | presque aucune basse - en moyenne 17.5% plus bas que la médiane
(±) | la linéarité des basses est moyenne (8% delta à la fréquence précédente)
Médiums 400 - 2000 Hz
(±) | médiane supérieure - en moyenne 5% supérieure à la médiane
(±) | la linéarité des médiums est moyenne (7.8% delta à la fréquence précédente)
Aiguës 2 - 16 kHz
(+) | des sommets équilibrés - à seulement 2.2% de la médiane
(+) | les aigus sont linéaires (5.5% delta à la fréquence précédente)
Globalement 100 - 16 000 Hz
(±) | la linéarité du son global est moyenne (15.1% de différence avec la médiane)
Par rapport à la même classe
» 32% de tous les appareils testés de cette catégorie étaient meilleurs, 6% similaires, 61% pires
» Le meilleur avait un delta de 6%, la moyenne était de 18%, le pire était de 132%.
Par rapport à tous les appareils testés
» 21% de tous les appareils testés étaient meilleurs, 4% similaires, 75% pires
» Le meilleur avait un delta de 4%, la moyenne était de 23%, le pire était de 134%.
Apple MacBook Pro 16 2021 M1 Pro analyse audio
(+) | les haut-parleurs peuvent jouer relativement fort (84.7# dB)
Basses 100 - 315 Hz
(+) | bonne basse - seulement 3.8% loin de la médiane
(+) | les basses sont linéaires (5.2% delta à la fréquence précédente)
Médiums 400 - 2000 Hz
(+) | médiane équilibrée - seulement 1.3% de la médiane
(+) | les médiums sont linéaires (2.1% delta à la fréquence précédente)
Aiguës 2 - 16 kHz
(+) | des sommets équilibrés - à seulement 1.9% de la médiane
(+) | les aigus sont linéaires (2.7% delta à la fréquence précédente)
Globalement 100 - 16 000 Hz
(+) | le son global est linéaire (4.6% différence à la médiane)
Par rapport à la même classe
» 0% de tous les appareils testés de cette catégorie étaient meilleurs, 0% similaires, 100% pires
» Le meilleur avait un delta de 5%, la moyenne était de 17%, le pire était de 45%.
Par rapport à tous les appareils testés
» 0% de tous les appareils testés étaient meilleurs, 0% similaires, 100% pires
» Le meilleur avait un delta de 4%, la moyenne était de 23%, le pire était de 134%.
Gestion de l'énergie
Consommation d'énergie - Oups !
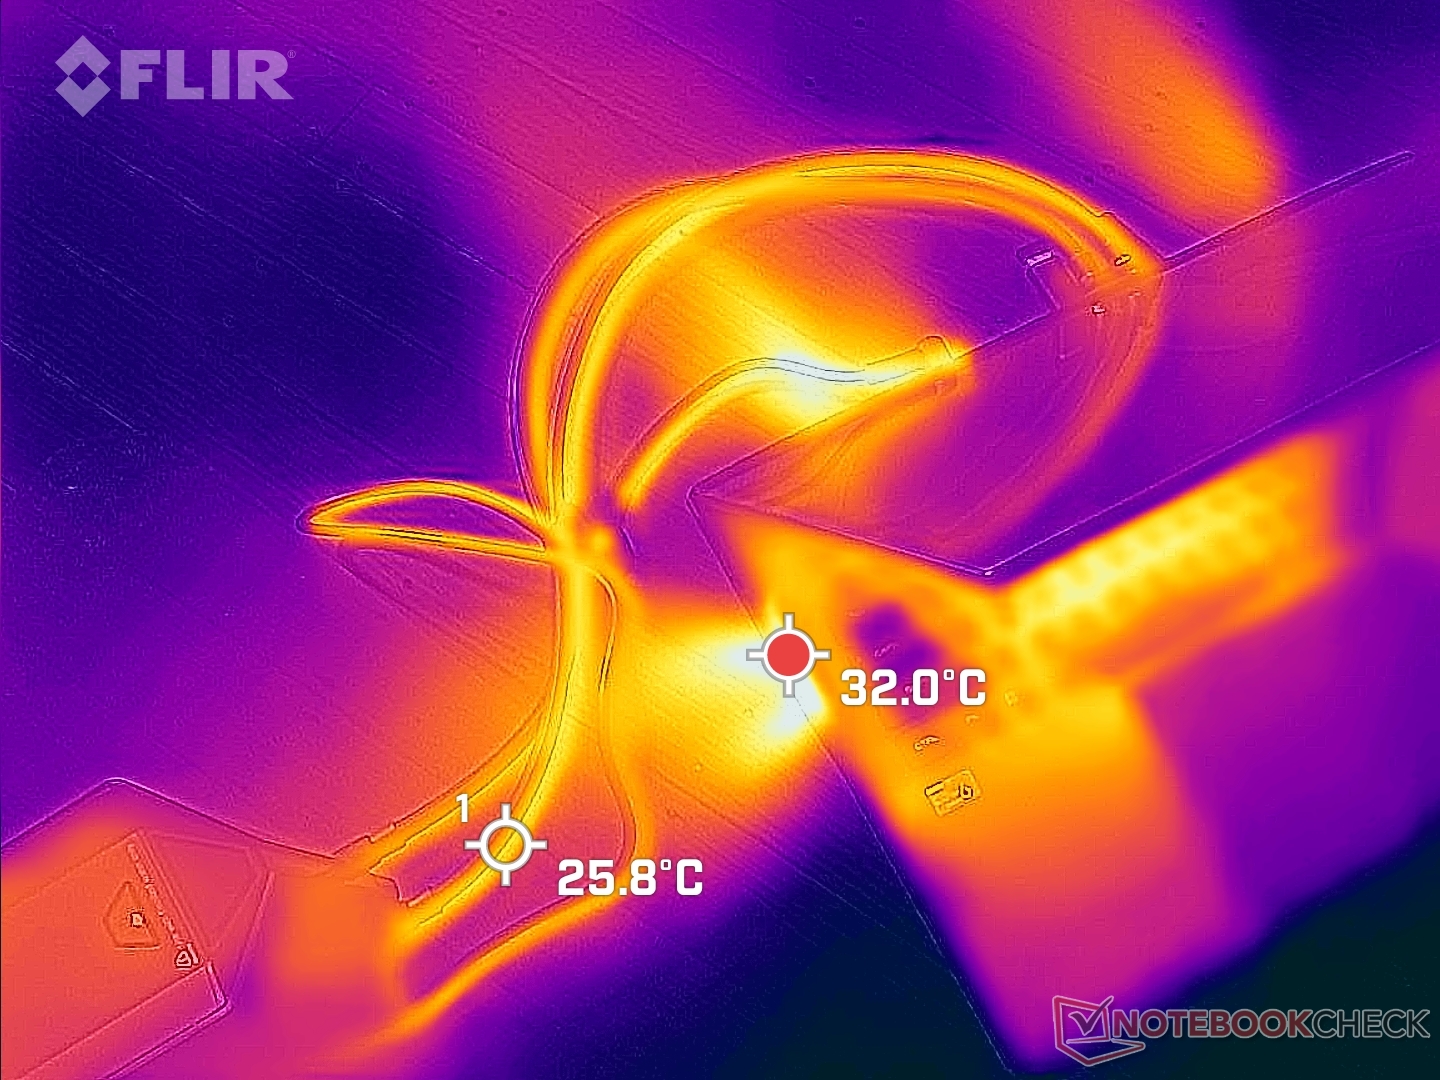
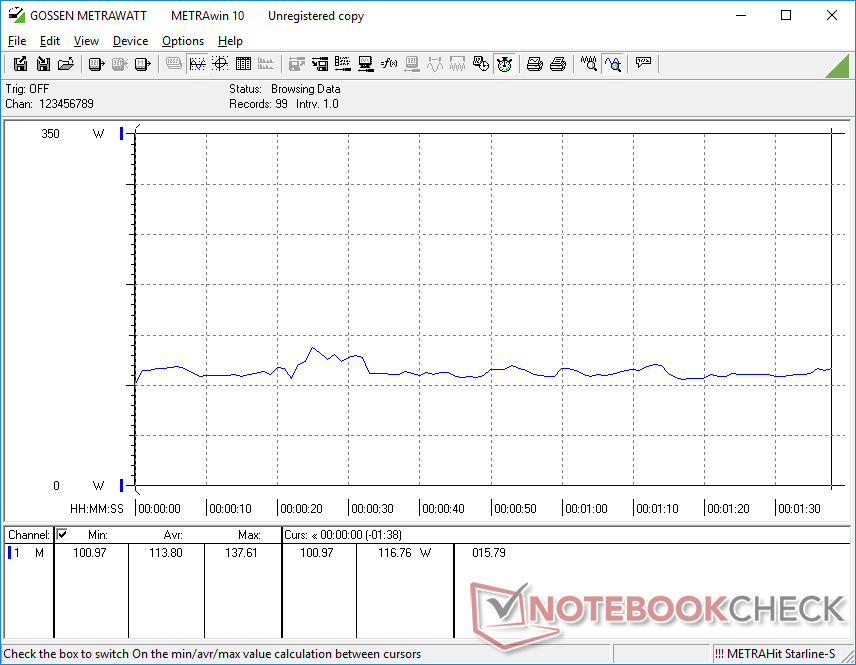
La marche au ralenti sur le bureau avec les réglages de luminosité et de profil d'alimentation les plus bas et avec le boîtier de refroidissement déconnecté ne consomme que 14 W sur la prise. En revanche, le fonctionnement au ralenti sur le bureau avec la luminosité et les paramètres de profil d'alimentation les plus élevés et avec le boîtier de refroidissement actif consomme près de 44 W, contre ~35 W ou moins sur l'ordinateur de bureau.Asus ROG Zephyrus S17 ou le Razer Blade 17. Vous voudrez peut-être éteindre le boîtier de refroidissement s'il n'est pas utilisé pour économiser sur les factures d'électricité
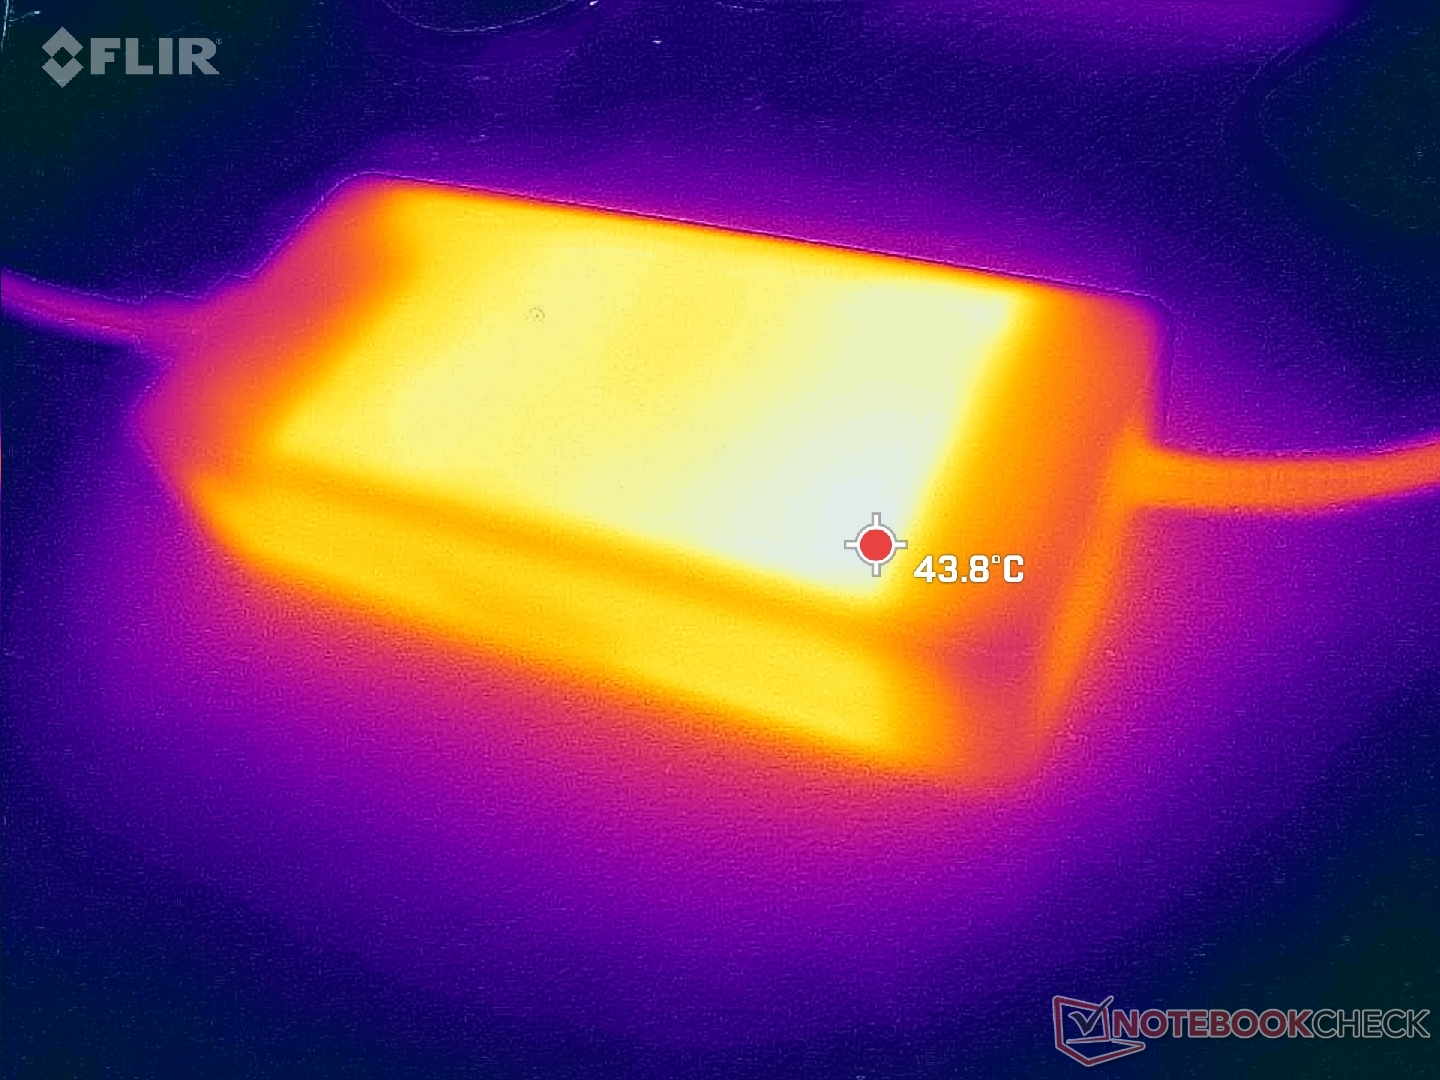
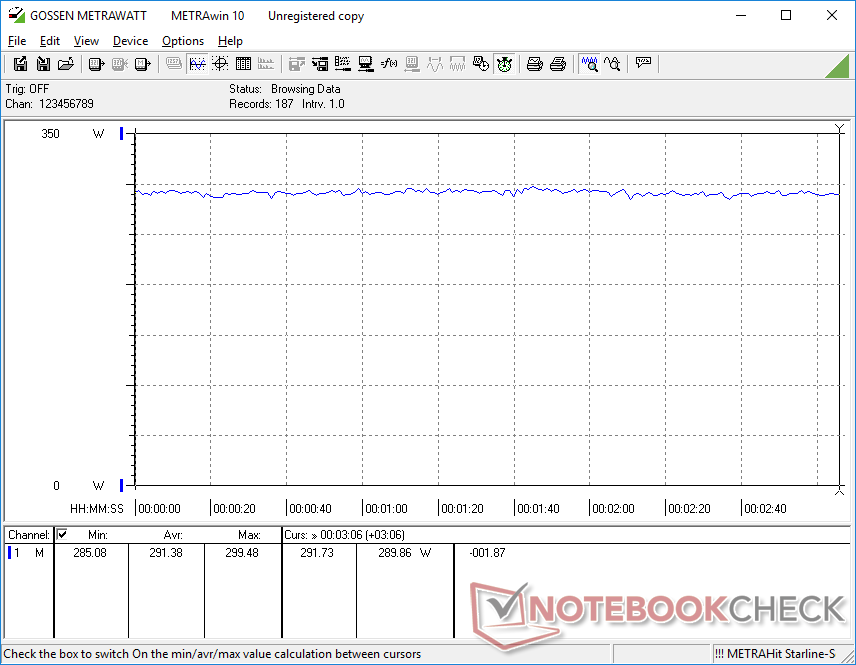
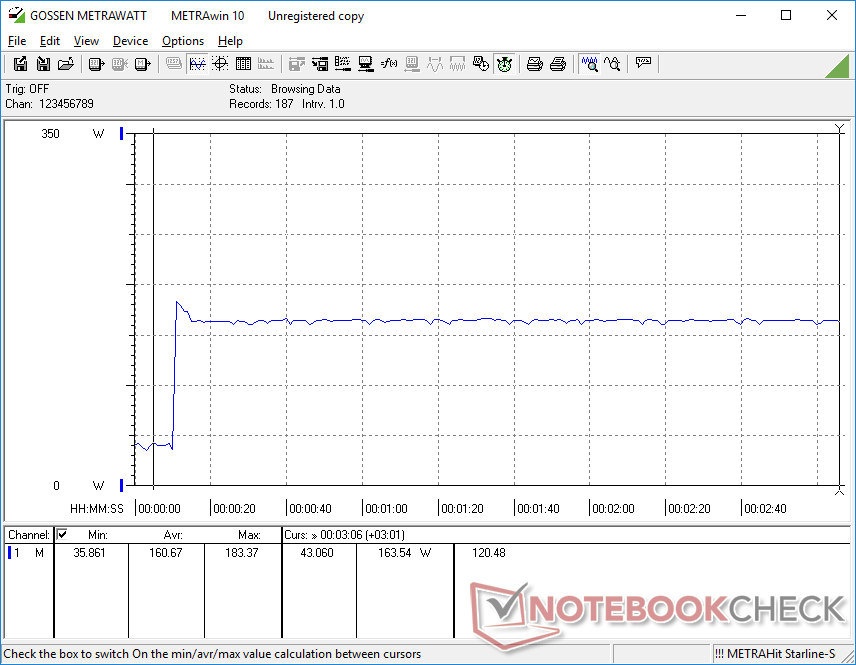
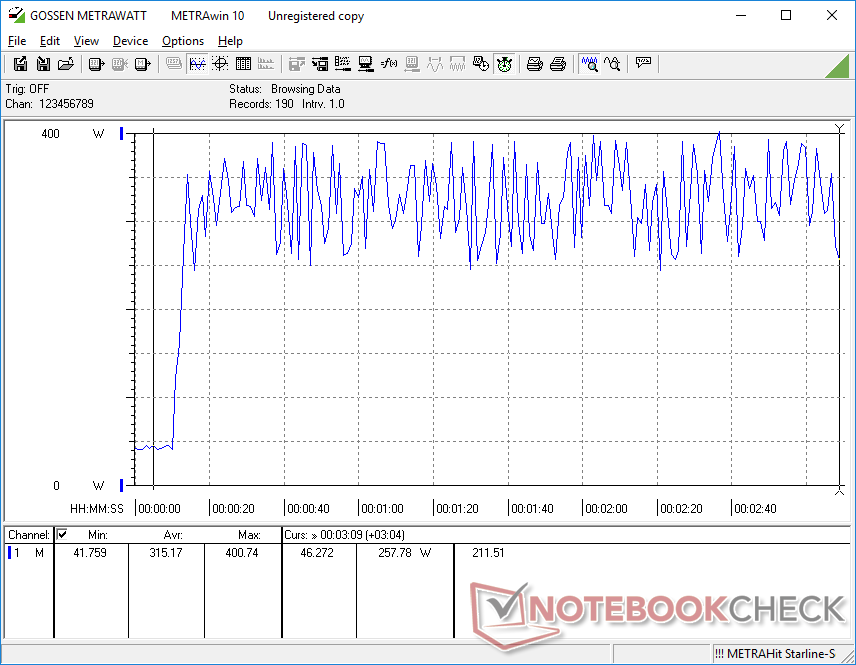
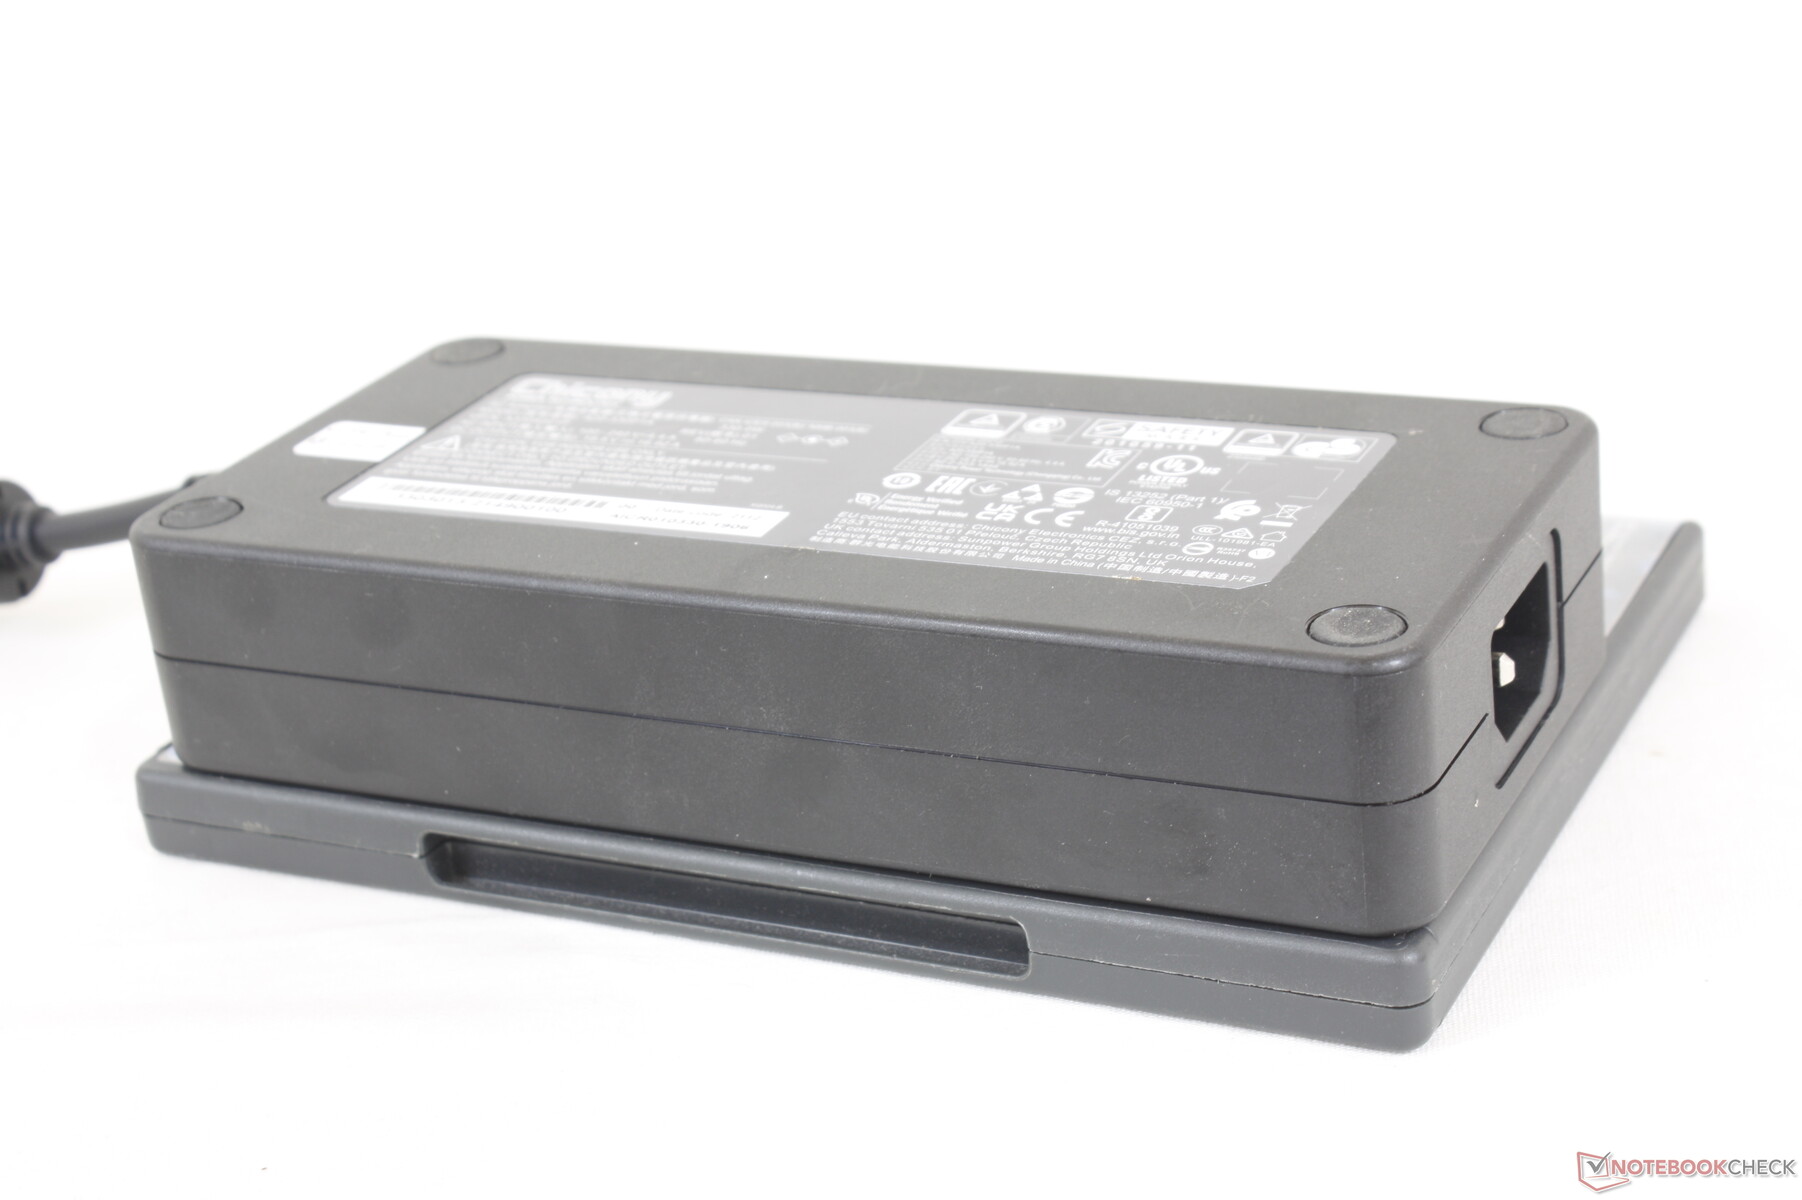
Le gros adaptateur secteur (~18,5 x 8,5 x 3,5 cm) est prévu pour 330 W. En fonctionnement, il consomme déjà 291 W, ce qui est significatif Witcher 3 consomme déjà 291 W, ce qui est nettement supérieur à la plupart des autres ordinateurs portables, y compris même l'énorme MSI Titan GT77, de près de 15 %. Si le CPU et le GPU sont tous deux utilisés à 100 %, la consommation d'énergie peut varier entre 250 et 400 W, comme le montrent les graphiques ci-dessous. L'adaptateur secteur de 330 W fourni est suffisant pour les jeux, mais il faut évidemment plus de puissance si vous avez l'intention de faire tourner le CPU et le GPU à leur maximum respectif.
| Éteint/en veille | |
| Au repos | |
| Fortement sollicité |
|
Légende:
min: | |
| Uniwell Technology GM7AG8N Liquid Cooling Box i9-12900H, GeForce RTX 3080 Ti Laptop GPU, Samsung PM9A1 MZVL21T0HCLR, IPS, 2560x1600, 17" | MSI Titan GT77 12UHS i9-12900HX, GeForce RTX 3080 Ti Laptop GPU, Samsung PM9A1 MZVL21T0HCLR, IPS-Level, 1920x1080, 17.3" | Aorus 17X XES i9-12900HX, GeForce RTX 3070 Ti Laptop GPU, Gigabyte AG470S1TB-SI B10, IPS, 1920x1080, 17.3" | Razer Blade 17 Early 2022 i9-12900H, GeForce RTX 3080 Ti Laptop GPU, Samsung PM9A1 MZVL21T0HCLR, IPS, 3840x2160, 17.3" | MSI Stealth GS77 12UHS-083US i7-12700H, GeForce RTX 3080 Ti Laptop GPU, Micron 3400 1TB MTFDKBA1T0TFH, IPS, 2560x1440, 17.3" | Asus ROG Zephyrus S17 GX703HSD i9-11900H, GeForce RTX 3080 Laptop GPU, Samsung PM9A1 MZVL22T0HBLB, IPS, 2560x1440, 17.3" | |
|---|---|---|---|---|---|---|
| Power Consumption | -10% | 5% | 15% | 22% | 14% | |
| Idle Minimum * (Watt) | 13.7 | 30.21 -121% | 18 -31% | 17 -24% | 20 -46% | 21.7 -58% |
| Idle Average * (Watt) | 38 | 32.42 15% | 28 26% | 23 39% | 21.4 44% | 27 29% |
| Idle Maximum * (Watt) | 43.4 | 33.7 22% | 36 17% | 34 22% | 27 38% | 33 24% |
| Load Average * (Watt) | 113.8 | 125.09 -10% | 153 -34% | 120 -5% | 100.5 12% | 108 5% |
| Witcher 3 ultra * (Watt) | 291 | 256 12% | 221 24% | 229 21% | 165 43% | 195 33% |
| Load Maximum * (Watt) | 400.8 | 321.88 20% | 290 28% | 243 39% | 247.1 38% | 210 48% |
* ... Moindre est la valeur, meilleures sont les performances
Power Consumption Witcher 3 / Stresstest
Power Consumption external Monitor
Autonomie de la batterie - Pas mal en fait
La capacité de la batterie est similaire à celle du MSI Stealth GS77 avec 99 Wh. Les durées d'exécution globales sont similaires à celles du MSI GT77 malgré leurs différences de taille.
L'USB-PD n'est pas pris en charge et l'ordinateur portable ne peut donc pas être chargé via l'USB-C.
| Uniwell Technology GM7AG8N Liquid Cooling Box i9-12900H, GeForce RTX 3080 Ti Laptop GPU, 99 Wh | MSI Titan GT77 12UHS i9-12900HX, GeForce RTX 3080 Ti Laptop GPU, 99.9 Wh | Aorus 17X XES i9-12900HX, GeForce RTX 3070 Ti Laptop GPU, 99 Wh | Razer Blade 17 Early 2022 i9-12900H, GeForce RTX 3080 Ti Laptop GPU, 82 Wh | MSI Stealth GS77 12UHS-083US i7-12700H, GeForce RTX 3080 Ti Laptop GPU, 99 Wh | Asus ROG Zephyrus S17 GX703HSD i9-11900H, GeForce RTX 3080 Laptop GPU, 90 Wh | |
|---|---|---|---|---|---|---|
| Autonomie de la batterie | -7% | -25% | -19% | 0% | 38% | |
| Reader / Idle (h) | 8.7 | 7.1 -18% | 10.8 24% | |||
| WiFi v1.3 (h) | 7 | 6.9 -1% | 4.4 -37% | 3.8 -46% | 6.2 -11% | 7.5 7% |
| Load (h) | 1.6 | 1.4 -13% | 1.4 -13% | 1.7 6% | 1.4 -13% | 2.7 69% |
| H.264 (h) | 7.2 | 3.8 | 4.8 | 7.2 | ||
| Witcher 3 ultra (h) | 1.5 | 1 |
Points positifs
Points négatifs
Verdict : ça marche vraiment
Une pompe à eau externe est une solution insensée pour refroidir un ordinateur portable de jeu. Non seulement elle est encombrante avec ses câbles et ses tubes, mais elle rend aussi le transport très compliqué. Elle ancre essentiellement l'ordinateur portable sur le bureau et décourage les déplacements encore plus qu'une station d'accueil eGPU.
Le boîtier de refroidissement liquide est destiné à un marché d'ordinateurs portables relativement petit, mais ses performances et son bruit relativement faible sont néanmoins impressionnants et meilleurs que prévu. Il doit cependant faire face à des défis de taille face à la montée en puissance du marché des eGPU.
Les résultats, cependant, sont difficiles à ignorer. Les performances globales sont plus rapides que celles de la plupart des autres ordinateurs portables équipés du même CPU Core i9-12900H et du même GPU RTX 3080 Ti, même lorsque l'Uniwell et le boîtier de refroidissement sont réglés au plus bas. Il est capable de fonctionner sensiblement plus silencieusement que les ordinateurs portables de jeu traditionnels sans avoir besoin de réduire les performances, ce qui n'est pas le cas de la plupart des autres ordinateurs portables de jeu.
Les résultats sont tout aussi impressionnants lorsque le système est réglé sur ses paramètres de ventilation maximum. Les températures centrales stables d'environ 55°C sont inférieures de plus de 30°C à celles de la plupart des portables de jeu ultrafins et constituent la température la plus basse que nous ayons vue dans cette catégorie. Cela laisse beaucoup de marge d'overclocking pour les enthousiastes s'ils sont prêts à tolérer le bruit plus fort du ventilateur.
Prix et disponibilité
Nom du prix et de la disponibilité du modèle testé, le cas échéant en écartant les variantes d'équipement pertinentes. Lien affil à un magasin de la liste dans la fenêtre de lien.
Uniwell Technology GM7AG8N Liquid Cooling Box
- 10/13/2022 v7 (old)
Allen Ngo
Price comparison

