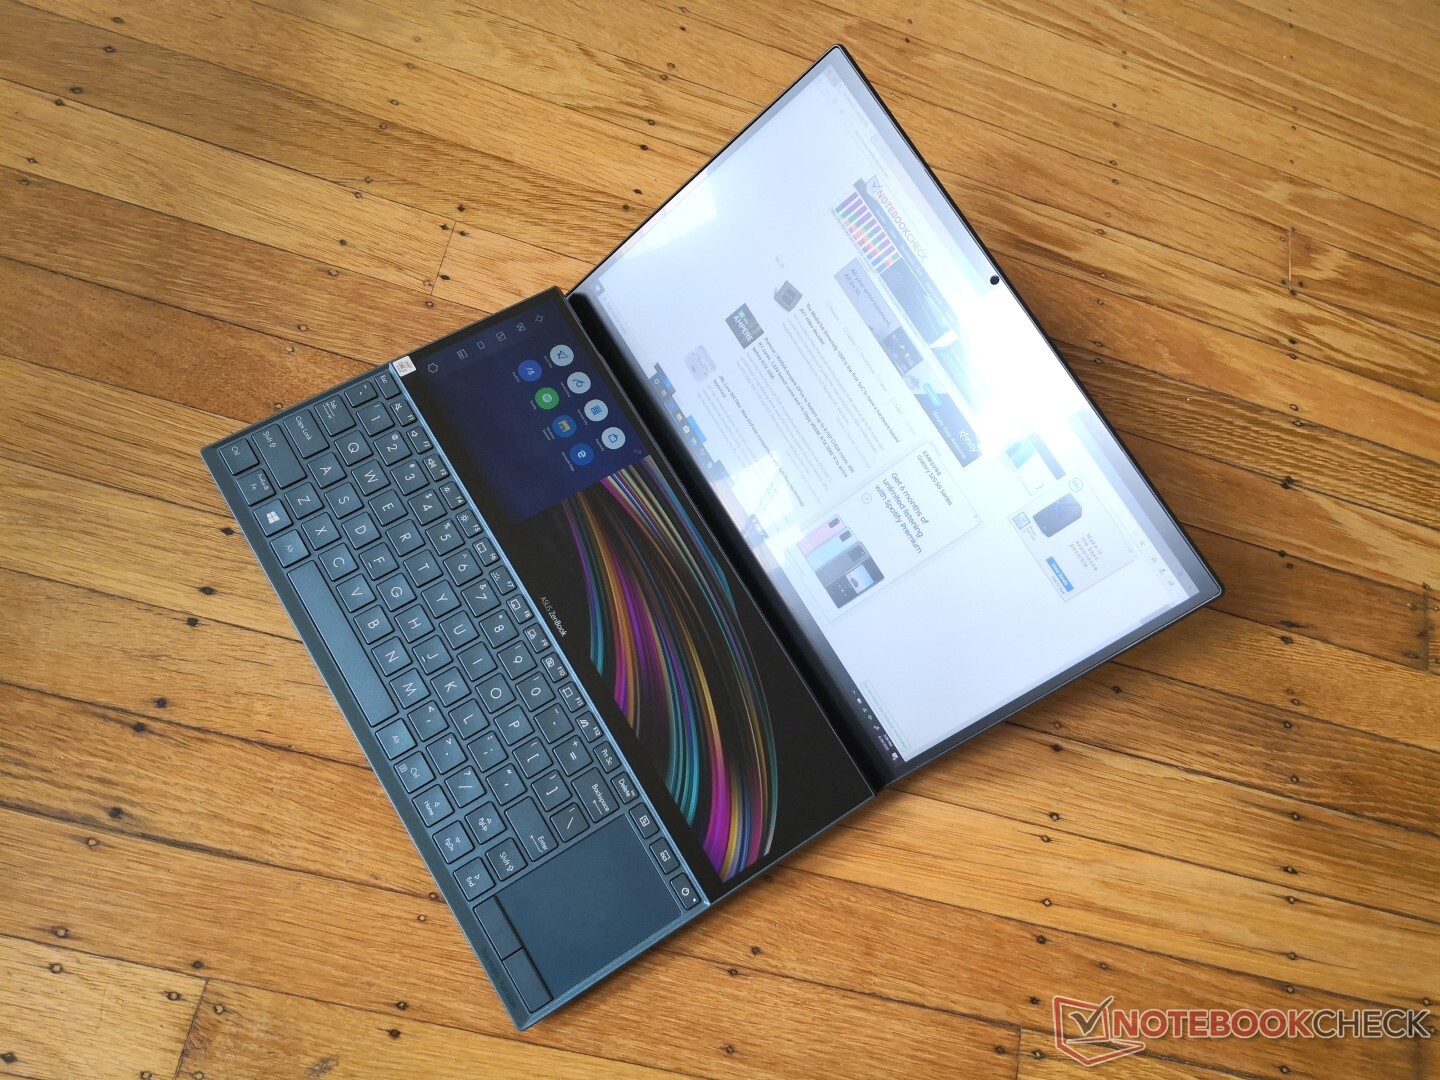
Test de l'Asus ZenBook Duo UX481 (i7-10510U, MX250, FHD) : comme l'Apple Touch Bar, mais en mieux
Note | Date | Modèle | Poids | Épaisseur | Taille | Résolution | Prix |
|---|---|---|---|---|---|---|---|
| 82.7 % v7 (old) | 05/20 | Asus ZenBook Duo UX481FL i7-10510U, GeForce MX250 | 1.8 kg | 19 mm | 14.00" | 1920x1080 | |
| 84.2 % v7 (old) | 03/20 | MSI Prestige 14 A10SC-009 i7-10710U, GeForce GTX 1650 Max-Q | 1.3 kg | 16 mm | 14.00" | 3840x2160 | |
| 85 % v6 (old) | 09/19 | Lenovo IdeaPad S940-14IWL i7-8565U, UHD Graphics 620 | 1.2 kg | 12 mm | 14.00" | 3840x2160 | |
| 84 % v7 (old) | 03/20 | Microsoft Surface Laptop 3 13 Core i5-1035G7 i5-1035G7, Iris Plus Graphics G7 (Ice Lake 64 EU) | 1.3 kg | 14.5 mm | 13.50" | 2256x1504 | |
| 81.2 % v7 (old) | 02/20 | Asus ZenBook 14 UM431DA-AM020T R7 3700U, Vega 10 | 1.4 kg | 16 mm | 14.00" | 1920x1080 |
| SD Card Reader | |
| average JPG Copy Test (av. of 3 runs) | |
| MSI Prestige 14 A10SC-009 (Toshiba Exceria Pro M501 microSDXC 64GB) | |
| Dell XPS 13 9300 Core i7-1065G7 (Toshiba Exceria Pro M501 64 GB UHS-II) | |
| Asus ZenBook Duo UX481FL (Toshiba Exceria Pro M501 microSDXC 64GB) | |
| Asus ZenBook 14 UM431DA-AM020T (Toshiba Exceria Pro SDXC 64 GB UHS-II) | |
| maximum AS SSD Seq Read Test (1GB) | |
| Dell XPS 13 9300 Core i7-1065G7 (Toshiba Exceria Pro M501 64 GB UHS-II) | |
| MSI Prestige 14 A10SC-009 (Toshiba Exceria Pro M501 microSDXC 64GB) | |
| Asus ZenBook Duo UX481FL (Toshiba Exceria Pro M501 microSDXC 64GB) | |
| Asus ZenBook 14 UM431DA-AM020T (Toshiba Exceria Pro SDXC 64 GB UHS-II) | |


| |||||||||||||||||||||||||
Homogénéité de la luminosité: 89 %
Valeur mesurée au centre, sur batterie: 301 cd/m²
Contraste: 717:1 (Valeurs des noirs: 0.42 cd/m²)
ΔE ColorChecker Calman: 1.01 | ∀{0.5-29.43 Ø4.72}
calibrated: 0.97
ΔE Greyscale Calman: 2.2 | ∀{0.09-98 Ø4.97}
99.5% sRGB (Argyll 1.6.3 3D)
63.2% AdobeRGB 1998 (Argyll 1.6.3 3D)
68.9% AdobeRGB 1998 (Argyll 3D)
99.5% sRGB (Argyll 3D)
67.1% Display P3 (Argyll 3D)
Gamma: 2.19
CCT: 6605 K
| Asus ZenBook Duo UX481FL Chi Mei N140HCE-EN2, IPS, 14", 1920x1080 | Asus ZenBook 14 UM431DA-AM020T CEC PA LM140LF-3L03, IPS, 14", 1920x1080 | Huawei Matebook X Pro i5 Tianma XM, IPS, 13.9", 3000x2000 | Lenovo IdeaPad S940-14IWL B140ZAN01.3, IPS, 14", 3840x2160 | Lenovo ThinkPad X1 Carbon G7 20R1-000YUS BOE NV140QUM-N53, IPS, 14", 3840x2160 | MSI Prestige 14 A10SC-009 IPS, 14", 3840x2160 | |
|---|---|---|---|---|---|---|
| Display | -3% | -3% | 16% | 15% | ||
| Display P3 Coverage (%) | 67.1 | 66.7 -1% | 65.9 -2% | 87.5 30% | 83 24% | |
| sRGB Coverage (%) | 99.5 | 92.3 -7% | 95.2 -4% | 99.7 0% | 99.7 0% | |
| AdobeRGB 1998 Coverage (%) | 68.9 | 67.5 -2% | 67.6 -2% | 81.1 18% | 83.1 21% | |
| Response Times | -9% | -15% | -54% | -42% | -59% | |
| Response Time Grey 50% / Grey 80% * (ms) | 31.2 ? | 36 ? -15% | 40.4 ? -29% | 57.2 ? -83% | 49.2 ? -58% | 55 ? -76% |
| Response Time Black / White * (ms) | 25.6 ? | 26 ? -2% | 25.6 ? -0% | 32 ? -25% | 32.2 ? -26% | 36 ? -41% |
| PWM Frequency (Hz) | 24750 ? | 44 ? | 201.6 ? | |||
| Screen | -124% | -34% | -57% | -103% | 16% | |
| Brightness middle (cd/m²) | 301 | 253 -16% | 442.7 47% | 594.5 98% | 532 77% | 567 88% |
| Brightness (cd/m²) | 285 | 245 -14% | 428 50% | 536 88% | 513 80% | 516 81% |
| Brightness Distribution (%) | 89 | 78 -12% | 84 -6% | 83 -7% | 90 1% | 86 -3% |
| Black Level * (cd/m²) | 0.42 | 0.225 46% | 0.31 26% | 0.43 -2% | 0.41 2% | 0.445 -6% |
| Contrast (:1) | 717 | 1124 57% | 1428 99% | 1383 93% | 1298 81% | 1274 78% |
| Colorchecker dE 2000 * | 1.01 | 8.89 -780% | 2.24 -122% | 4.87 -382% | 6.88 -581% | 1.55 -53% |
| Colorchecker dE 2000 max. * | 3.42 | 4.56 -33% | 7.19 -110% | 7.9 -131% | 12.65 -270% | 5.14 -50% |
| Colorchecker dE 2000 calibrated * | 0.97 | 4.9 -405% | 1.11 -14% | 2.83 -192% | 2.52 -160% | 1.24 -28% |
| Greyscale dE 2000 * | 2.2 | 6.33 -188% | 9.7 -341% | 6.7 -205% | 10.5 -377% | 1.48 33% |
| Gamma | 2.19 100% | 2.52 87% | 1.42 155% | 2.091 105% | 1.98 111% | 2.19 100% |
| CCT | 6605 98% | 6745 96% | 6227 104% | 6891 94% | 7394 88% | 6741 96% |
| Color Space (Percent of AdobeRGB 1998) (%) | 63.2 | 60 -5% | 61.6 -3% | 72 14% | 74.1 17% | |
| Color Space (Percent of sRGB) (%) | 99.5 | 91 -9% | 95 -5% | 100 1% | 99.7 0% | |
| Moyenne finale (programmes/paramètres) | -45% /
-87% | -17% /
-26% | -32% /
-43% | -43% /
-73% | -22% /
2% |
* ... Moindre est la valeur, meilleures sont les performances
Temps de réponse de l'écran
| ↔ Temps de réponse noir à blanc | ||
|---|---|---|
| 25.6 ms ... hausse ↗ et chute ↘ combinées | ↗ 14.8 ms hausse | 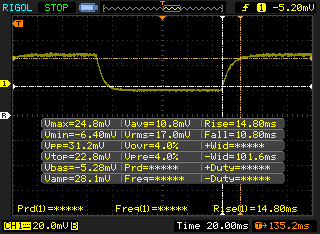 |
| ↘ 10.8 ms chute | ||
| L'écran souffre de latences relativement élevées, insuffisant pour le jeu. En comparaison, tous les appareils testés affichent entre 0.1 (minimum) et 240 (maximum) ms. » 61 % des appareils testés affichent de meilleures performances. Cela signifie que les latences relevées sont moins bonnes que la moyenne (19.8 ms) de tous les appareils testés. | ||
| ↔ Temps de réponse gris 50% à gris 80% | ||
| 31.2 ms ... hausse ↗ et chute ↘ combinées | ↗ 15.6 ms hausse | 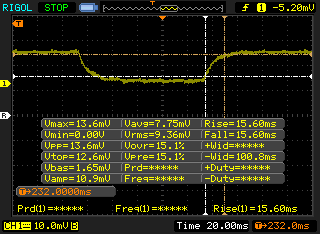 |
| ↘ 15.6 ms chute | ||
| L'écran souffre de latences très élevées, à éviter pour le jeu. En comparaison, tous les appareils testés affichent entre 0.165 (minimum) et 636 (maximum) ms. » 42 % des appareils testés affichent de meilleures performances. Cela signifie que les latences relevées sont similaires à la moyenne (31 ms) de tous les appareils testés. | ||
Scintillement / MLI (Modulation de largeur d'impulsion)
| Scintillement / MLI (Modulation de largeur d'impulsion) décelé | 24750 Hz | ≤ 29 Niveau de luminosité | 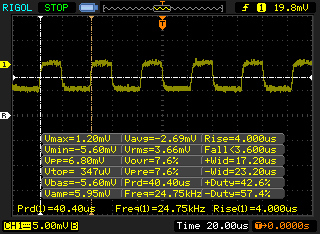 |
Le rétroéclairage de l'écran scintille à la fréquence de 24750 Hz (certainement du fait de l'utilisation d'une MDI - Modulation de largeur d'impulsion) à un niveau de luminosité inférieur ou égal à 29 % . Aucun scintillement ne devrait être perceptible au-dessus de cette valeur. La fréquence de rafraîchissement de 24750 Hz est élevée, la grande majorité des utilisateurs ne devrait pas percevoir de scintillements et être sujette à une fatigue oculaire accrue. En comparaison, 52 % des appareils testés n'emploient pas MDI pour assombrir leur écran. Nous avons relevé une moyenne à 7753 (minimum : 5 - maximum : 343500) Hz dans le cas où une MDI était active. | |||
Cinebench R15: CPU Single 64Bit | CPU Multi 64Bit
Blender: v2.79 BMW27 CPU
7-Zip 18.03: 7z b 4 -mmt1 | 7z b 4
Geekbench 5.5: Single-Core | Multi-Core
HWBOT x265 Benchmark v2.2: 4k Preset
LibreOffice : 20 Documents To PDF
R Benchmark 2.5: Overall mean
| Blender / v2.79 BMW27 CPU | |
| HP Elite Dragonfly-8MK79EA | |
| Moyenne Intel Core i7-10510U (628 - 1051, n=31) | |
| Asus ZenBook Duo UX481FL | |
| Microsoft Surface Laptop 3 13 Core i5-1035G7 | |
| Dell XPS 13 7390 Core i7-10710U | |
| 7-Zip 18.03 / 7z b 4 -mmt1 | |
| Asus ZenBook Duo UX481FL | |
| Moyenne Intel Core i7-10510U (3747 - 4981, n=31) | |
| Dell XPS 13 7390 Core i7-10710U | |
| Microsoft Surface Laptop 3 13 Core i5-1035G7 | |
| HP Elite Dragonfly-8MK79EA | |
| 7-Zip 18.03 / 7z b 4 | |
| Dell XPS 13 7390 Core i7-10710U | |
| Asus ZenBook Duo UX481FL | |
| Microsoft Surface Laptop 3 13 Core i5-1035G7 | |
| Moyenne Intel Core i7-10510U (12196 - 21298, n=31) | |
| HP Elite Dragonfly-8MK79EA | |
| Geekbench 5.5 / Single-Core | |
| Asus ZenBook Duo UX481FL | |
| Moyenne Intel Core i7-10510U (977 - 1287, n=31) | |
| Geekbench 5.5 / Multi-Core | |
| Asus ZenBook Duo UX481FL | |
| Moyenne Intel Core i7-10510U (2474 - 4484, n=31) | |
| HWBOT x265 Benchmark v2.2 / 4k Preset | |
| Dell XPS 13 7390 Core i7-10710U | |
| Asus ZenBook Duo UX481FL | |
| Moyenne Intel Core i7-10510U (3.41 - 6.04, n=31) | |
| Microsoft Surface Laptop 3 13 Core i5-1035G7 | |
| HP Elite Dragonfly-8MK79EA | |
| LibreOffice / 20 Documents To PDF | |
| Asus ZenBook Duo UX481FL | |
| Moyenne Intel Core i7-10510U (50.7 - 77.8, n=27) | |
| R Benchmark 2.5 / Overall mean | |
| Asus ZenBook Duo UX481FL | |
| Moyenne Intel Core i7-10510U (0.637 - 0.81, n=28) | |
* ... Moindre est la valeur, meilleures sont les performances
| PCMark 8 Home Score Accelerated v2 | 3747 points | |
| PCMark 8 Work Score Accelerated v2 | 5266 points | |
| PCMark 10 Score | 4246 points | |
Aide | ||
| DPC Latencies / LatencyMon - interrupt to process latency (max), Web, Youtube, Prime95 | |
| Asus ZenBook Duo UX481FL | |
* ... Moindre est la valeur, meilleures sont les performances
| Asus ZenBook Duo UX481FL Intel SSD 660p 1TB SSDPEKNW010T8 | Asus ZenBook 14 UM431DA-AM020T SK hynix BC501 HFM512GDHTNG-8310A | Huawei Matebook X Pro i5 Samsung PM961 MZVLW256HEHP | Lenovo ThinkPad X1 Carbon G7 20R1-000YUS WDC PC SN730 SDBPNTY-512G | MSI Prestige 14 A10SC-009 Samsung SSD PM981 MZVLB1T0HALR | |
|---|---|---|---|---|---|
| AS SSD | 0% | 3% | 14% | 74% | |
| Seq Read (MB/s) | 1237 | 1417 15% | 2416 95% | 1786 44% | 2300 86% |
| Seq Write (MB/s) | 1069 | 781 -27% | 1170 9% | 1259 18% | 2051 92% |
| 4K Read (MB/s) | 52.1 | 37.03 -29% | 48.33 -7% | 45.86 -12% | 46.23 -11% |
| 4K Write (MB/s) | 134.7 | 80.1 -41% | 103.1 -23% | 147.9 10% | 84.6 -37% |
| 4K-64 Read (MB/s) | 585 | 740 26% | 1039 78% | 885 51% | 1552 165% |
| 4K-64 Write (MB/s) | 854 | 748 -12% | 399.6 -53% | 950 11% | 1789 109% |
| Access Time Read * (ms) | 0.05 | 0.047 6% | 0.058 -16% | 0.058 -16% | 0.049 2% |
| Access Time Write * (ms) | 0.117 | 0.045 62% | 0.036 69% | 0.074 37% | 0.045 62% |
| Score Read (Points) | 761 | 918 21% | 1329 75% | 1110 46% | 1828 140% |
| Score Write (Points) | 1095 | 906 -17% | 620 -43% | 1224 12% | 2079 90% |
| Score Total (Points) | 2255 | 2270 1% | 2575 14% | 2885 28% | 4831 114% |
| Copy ISO MB/s (MB/s) | 1714 | 739 -57% | 1384 -19% | ||
| Copy Program MB/s (MB/s) | 511 | 312.3 -39% | 525 3% | ||
| Copy Game MB/s (MB/s) | 1187 | 486.3 -59% | 1008 -15% | ||
| CrystalDiskMark 5.2 / 6 | -32% | -17% | 24% | 20% | |
| Write 4K (MB/s) | 140.7 | 118.8 -16% | 116.5 -17% | 151.5 8% | 163.8 16% |
| Read 4K (MB/s) | 55.6 | 41.62 -25% | 42.18 -24% | 45.83 -18% | 48.6 -13% |
| Write Seq (MB/s) | 1415 | 796 -44% | 1079 -24% | 2060 46% | 2269 60% |
| Read Seq (MB/s) | 1516 | 1101 -27% | 1030 -32% | 1973 30% | 1963 29% |
| Write 4K Q32T1 (MB/s) | 474.5 | 234.7 -51% | 225.7 -52% | 489.8 3% | 289.8 -39% |
| Read 4K Q32T1 (MB/s) | 403.4 | 313.8 -22% | 302.9 -25% | 386.2 -4% | 373.6 -7% |
| Write Seq Q32T1 (MB/s) | 1796 | 842 -53% | 1174 -35% | 2703 51% | 2395 33% |
| Read Seq Q32T1 (MB/s) | 1913 | 1645 -14% | 3394 77% | 3376 76% | 3479 82% |
| Moyenne finale (programmes/paramètres) | -16% /
-13% | -7% /
-4% | 19% /
18% | 47% /
51% |
* ... Moindre est la valeur, meilleures sont les performances

| 3DMark | |
| 1280x720 Cloud Gate Standard Graphics | |
| Dell G5 15 5587 | |
| Asus ZenBook 15 UX534FTC-A8190T | |
| Asus ZenBook Flip 15 UX563FD-A1027T | |
| Moyenne NVIDIA GeForce MX250 (13805 - 23863, n=25) | |
| Dell Inspiron 15 5000 5585 | |
| Asus ZenBook Duo UX481FL | |
| Asus Zenbook 14 UX433FN-A6023T | |
| Lenovo Yoga C940-14IIL 81Q9 | |
| Asus VivoBook 15 X510UQ-BQ534T | |
| 1920x1080 Fire Strike Graphics | |
| Dell G5 15 5587 | |
| Asus ZenBook 15 UX534FTC-A8190T | |
| Asus ZenBook Flip 15 UX563FD-A1027T | |
| Moyenne NVIDIA GeForce MX250 (2939 - 3885, n=29) | |
| Dell Inspiron 15 5000 5585 | |
| Lenovo Yoga C940-14IIL 81Q9 | |
| Asus ZenBook Duo UX481FL | |
| Asus Zenbook 14 UX433FN-A6023T | |
| Asus VivoBook 15 X510UQ-BQ534T | |
| 2560x1440 Time Spy Graphics | |
| Dell G5 15 5587 | |
| Asus ZenBook 15 UX534FTC-A8190T | |
| Asus ZenBook Flip 15 UX563FD-A1027T | |
| Moyenne NVIDIA GeForce MX250 (881 - 1169, n=22) | |
| Asus ZenBook Duo UX481FL | |
| Asus Zenbook 14 UX433FN-A6023T | |
| Dell Inspiron 15 5000 5585 | |
| Lenovo Yoga C940-14IIL 81Q9 | |
| Asus VivoBook 15 X510UQ-BQ534T | |
| 3DMark 11 | |
| 1280x720 Performance GPU | |
| Dell G5 15 5587 | |
| Asus ZenBook 15 UX534FTC-A8190T | |
| Asus ZenBook Flip 15 UX563FD-A1027T | |
| Lenovo Yoga C940-14IIL 81Q9 | |
| Moyenne NVIDIA GeForce MX250 (3585 - 4942, n=29) | |
| Dell Inspiron 15 5000 5585 | |
| Asus ZenBook Duo UX481FL | |
| Asus Zenbook 14 UX433FN-A6023T | |
| Asus VivoBook 15 X510UQ-BQ534T | |
| 1280x720 Performance Combined | |
| Dell G5 15 5587 | |
| Asus ZenBook 15 UX534FTC-A8190T | |
| Asus ZenBook Flip 15 UX563FD-A1027T | |
| Moyenne NVIDIA GeForce MX250 (3532 - 4638, n=29) | |
| Lenovo Yoga C940-14IIL 81Q9 | |
| Asus ZenBook Duo UX481FL | |
| Asus Zenbook 14 UX433FN-A6023T | |
| Dell Inspiron 15 5000 5585 | |
| Asus VivoBook 15 X510UQ-BQ534T | |
| 3DMark 11 Performance | 3991 points | |
| 3DMark Cloud Gate Standard Score | 12710 points | |
| 3DMark Fire Strike Score | 2758 points | |
| 3DMark Time Spy Score | 995 points | |
Aide | ||
| Bas | Moyen | Élevé | Ultra | |
|---|---|---|---|---|
| The Witcher 3 (2015) | 58.3 | 33.8 | 18 | 9.8 |
| Dota 2 Reborn (2015) | 114 | 102 | 62.3 | 56 |
| X-Plane 11.11 (2018) | 64.8 | 45.5 | 42.5 |
| Asus ZenBook Duo UX481FL GeForce MX250, i7-10510U, Intel SSD 660p 1TB SSDPEKNW010T8 | Asus ZenBook 14 UM431DA-AM020T Vega 10, R7 3700U, SK hynix BC501 HFM512GDHTNG-8310A | Huawei Matebook X Pro i5 GeForce MX150, i5-8250U, Samsung PM961 MZVLW256HEHP | MSI Prestige 14 A10SC-009 GeForce GTX 1650 Max-Q, i7-10710U, Samsung SSD PM981 MZVLB1T0HALR | Asus Zenbook 14 UX433FN-A6023T GeForce MX150, i7-8565U, Intel SSD 660p SSDPEKNW512G8 | |
|---|---|---|---|---|---|
| Noise | 1% | -3% | -7% | -5% | |
| arrêt / environnement * (dB) | 28.3 | 29.8 -5% | 27.9 1% | 30.3 -7% | 30.7 -8% |
| Idle Minimum * (dB) | 28.3 | 28 1% | 27.9 1% | 30.3 -7% | 30.7 -8% |
| Idle Average * (dB) | 28.3 | 28 1% | 27.9 1% | 30.3 -7% | 30.7 -8% |
| Idle Maximum * (dB) | 28.3 | 28 1% | 27.9 1% | 30.3 -7% | 30.7 -8% |
| Load Average * (dB) | 39.1 | 36.8 6% | 36.2 7% | 40.2 -3% | 38.8 1% |
| Witcher 3 ultra * (dB) | 39.1 | 45 -15% | |||
| Load Maximum * (dB) | 39.1 | 39 -0% | 45.2 -16% | 43.5 -11% | 39.3 -1% |
* ... Moindre est la valeur, meilleures sont les performances
Degré de la nuisance sonore
| Au repos |
| 28.3 / 28.3 / 28.3 dB(A) |
| Fortement sollicité |
| 39.1 / 39.1 dB(A) |
 | ||
30 dB silencieux 40 dB(A) audible 50 dB(A) bruyant |
||
min: | ||
(+) La température maximale du côté supérieur est de 38.4 °C / 101 F, par rapport à la moyenne de 36.8 °C / 98 F, allant de 21 à 71 °C pour la classe Multimedia.
(-) Le fond chauffe jusqu'à un maximum de 48 °C / 118 F, contre une moyenne de 39.1 °C / 102 F
(+) En utilisation inactive, la température moyenne du côté supérieur est de 27.8 °C / 82 F, par rapport à la moyenne du dispositif de 31.3 °C / 88 F.
(±) En jouant à The Witcher 3, la température moyenne du côté supérieur est de 32.6 °C / 91 F, alors que la moyenne de l'appareil est de 31.3 °C / 88 F.
(+) Les repose-poignets et le pavé tactile sont plus froids que la température de la peau avec un maximum de 28 °C / 82.4 F et sont donc froids au toucher.
(±) La température moyenne de la zone de l'appui-paume de dispositifs similaires était de 28.7 °C / 83.7 F (+0.7 °C / #1.3 F).
Asus ZenBook Duo UX481FL analyse audio
(±) | le niveau sonore du haut-parleur est moyen mais bon (78.7# dB)
Basses 100 - 315 Hz
(±) | basse réduite - en moyenne 9.8% inférieure à la médiane
(-) | les basses ne sont pas linéaires (16.6% delta à la fréquence précédente)
Médiums 400 - 2000 Hz
(±) | médiane supérieure - en moyenne 5.5% supérieure à la médiane
(+) | les médiums sont linéaires (6.1% delta à la fréquence précédente)
Aiguës 2 - 16 kHz
(+) | des sommets équilibrés - à seulement 1.9% de la médiane
(+) | les aigus sont linéaires (4.7% delta à la fréquence précédente)
Globalement 100 - 16 000 Hz
(±) | la linéarité du son global est moyenne (18.9% de différence avec la médiane)
Par rapport à la même classe
» 59% de tous les appareils testés de cette catégorie étaient meilleurs, 7% similaires, 33% pires
» Le meilleur avait un delta de 5%, la moyenne était de 17%, le pire était de 45%.
Par rapport à tous les appareils testés
» 44% de tous les appareils testés étaient meilleurs, 8% similaires, 48% pires
» Le meilleur avait un delta de 4%, la moyenne était de 23%, le pire était de 134%.
Apple MacBook 12 (Early 2016) 1.1 GHz analyse audio
(+) | les haut-parleurs peuvent jouer relativement fort (83.6# dB)
Basses 100 - 315 Hz
(±) | basse réduite - en moyenne 11.3% inférieure à la médiane
(±) | la linéarité des basses est moyenne (14.2% delta à la fréquence précédente)
Médiums 400 - 2000 Hz
(+) | médiane équilibrée - seulement 2.4% de la médiane
(+) | les médiums sont linéaires (5.5% delta à la fréquence précédente)
Aiguës 2 - 16 kHz
(+) | des sommets équilibrés - à seulement 2% de la médiane
(+) | les aigus sont linéaires (4.5% delta à la fréquence précédente)
Globalement 100 - 16 000 Hz
(+) | le son global est linéaire (10.2% différence à la médiane)
Par rapport à la même classe
» 7% de tous les appareils testés de cette catégorie étaient meilleurs, 2% similaires, 91% pires
» Le meilleur avait un delta de 5%, la moyenne était de 18%, le pire était de 53%.
Par rapport à tous les appareils testés
» 5% de tous les appareils testés étaient meilleurs, 1% similaires, 94% pires
» Le meilleur avait un delta de 4%, la moyenne était de 23%, le pire était de 134%.
| Éteint/en veille | |
| Au repos | |
| Fortement sollicité |
|
Légende:
min: | |
| Asus ZenBook Duo UX481FL i7-10510U, GeForce MX250, Intel SSD 660p 1TB SSDPEKNW010T8, IPS, 1920x1080, 14" | Asus ZenBook 14 UM431DA-AM020T R7 3700U, Vega 10, SK hynix BC501 HFM512GDHTNG-8310A, IPS, 1920x1080, 14" | Huawei Matebook X Pro i5 i5-8250U, GeForce MX150, Samsung PM961 MZVLW256HEHP, IPS, 3000x2000, 13.9" | Lenovo ThinkPad X1 Carbon G7 20R1-000YUS i7-10510U, UHD Graphics 620, WDC PC SN730 SDBPNTY-512G, IPS, 3840x2160, 14" | MSI Prestige 14 A10SC-009 i7-10710U, GeForce GTX 1650 Max-Q, Samsung SSD PM981 MZVLB1T0HALR, IPS, 3840x2160, 14" | Lenovo IdeaPad S940-14IWL i7-8565U, UHD Graphics 620, Samsung SSD PM981 MZVLB512HAJQ, IPS, 3840x2160, 14" | |
|---|---|---|---|---|---|---|
| Power Consumption | 17% | -1% | -4% | -26% | -4% | |
| Idle Minimum * (Watt) | 3.5 | 3.6 -3% | 3.5 -0% | 3.5 -0% | 5.2 -49% | 5.2 -49% |
| Idle Average * (Watt) | 10 | 7.2 28% | 8.9 11% | 10.8 -8% | 12.2 -22% | 10.2 -2% |
| Idle Maximum * (Watt) | 11 | 10.8 2% | 12.3 -12% | 12.5 -14% | 14.3 -30% | 11.9 -8% |
| Load Average * (Watt) | 53 | 38 28% | 54.2 -2% | 47.2 11% | 67 -26% | 42.1 21% |
| Witcher 3 ultra * (Watt) | 35.6 | 42.4 -19% | ||||
| Load Maximum * (Watt) | 63.6 | 45.2 29% | 52.1 18% | 68.8 -8% | 67 -5% | 53.6 16% |
* ... Moindre est la valeur, meilleures sont les performances
| Asus ZenBook Duo UX481FL i7-10510U, GeForce MX250, 70 Wh | Asus ZenBook 14 UM431DA-AM020T R7 3700U, Vega 10, 47 Wh | Huawei Matebook X Pro i5 i5-8250U, GeForce MX150, 57.4 Wh | Lenovo ThinkPad X1 Carbon G7 20R1-000YUS i7-10510U, UHD Graphics 620, 51 Wh | MSI Prestige 14 A10SC-009 i7-10710U, GeForce GTX 1650 Max-Q, 52 Wh | Lenovo IdeaPad S940-14IWL i7-8565U, UHD Graphics 620, 52 Wh | |
|---|---|---|---|---|---|---|
| Autonomie de la batterie | -30% | -16% | 5% | -45% | -54% | |
| Reader / Idle (h) | 22.1 | 17.8 -19% | 20.7 -6% | 9.9 -55% | 8.4 -62% | |
| WiFi v1.3 (h) | 9.5 | 6.7 -29% | 9.3 -2% | 10 5% | 5.9 -38% | 5 -47% |
| Load (h) | 3.7 | 2.1 -43% | 2.2 -41% | 2.1 -43% | 1.7 -54% |
Points positifs
Points négatifs
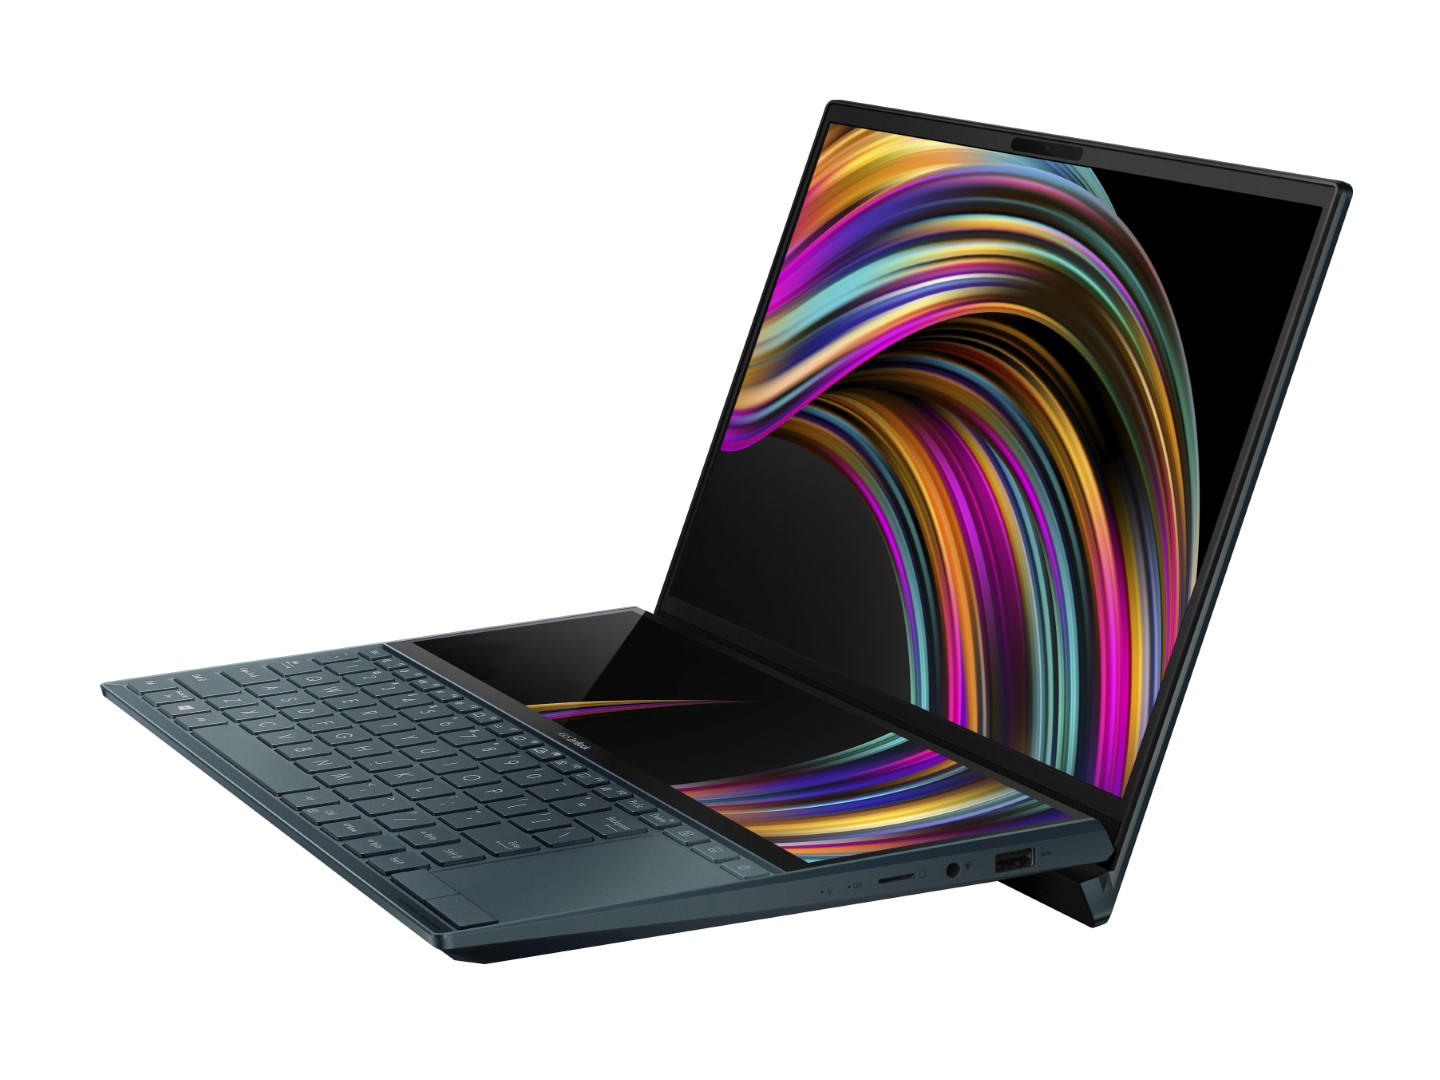
Comme n’importe quel utilisateur peut en attester, avoir deux écrans plutôt qu’un peut vraiment améliorer la productivité, et le ZenBook Duo ne fait que confirmer cela. Il est difficile de revenir à un seul écran une fois que l’on est habitué à l’espace permis par deux écrans, et c’est là l’avantage principal sur lequel Asus compte avec le ZenBook Duo.
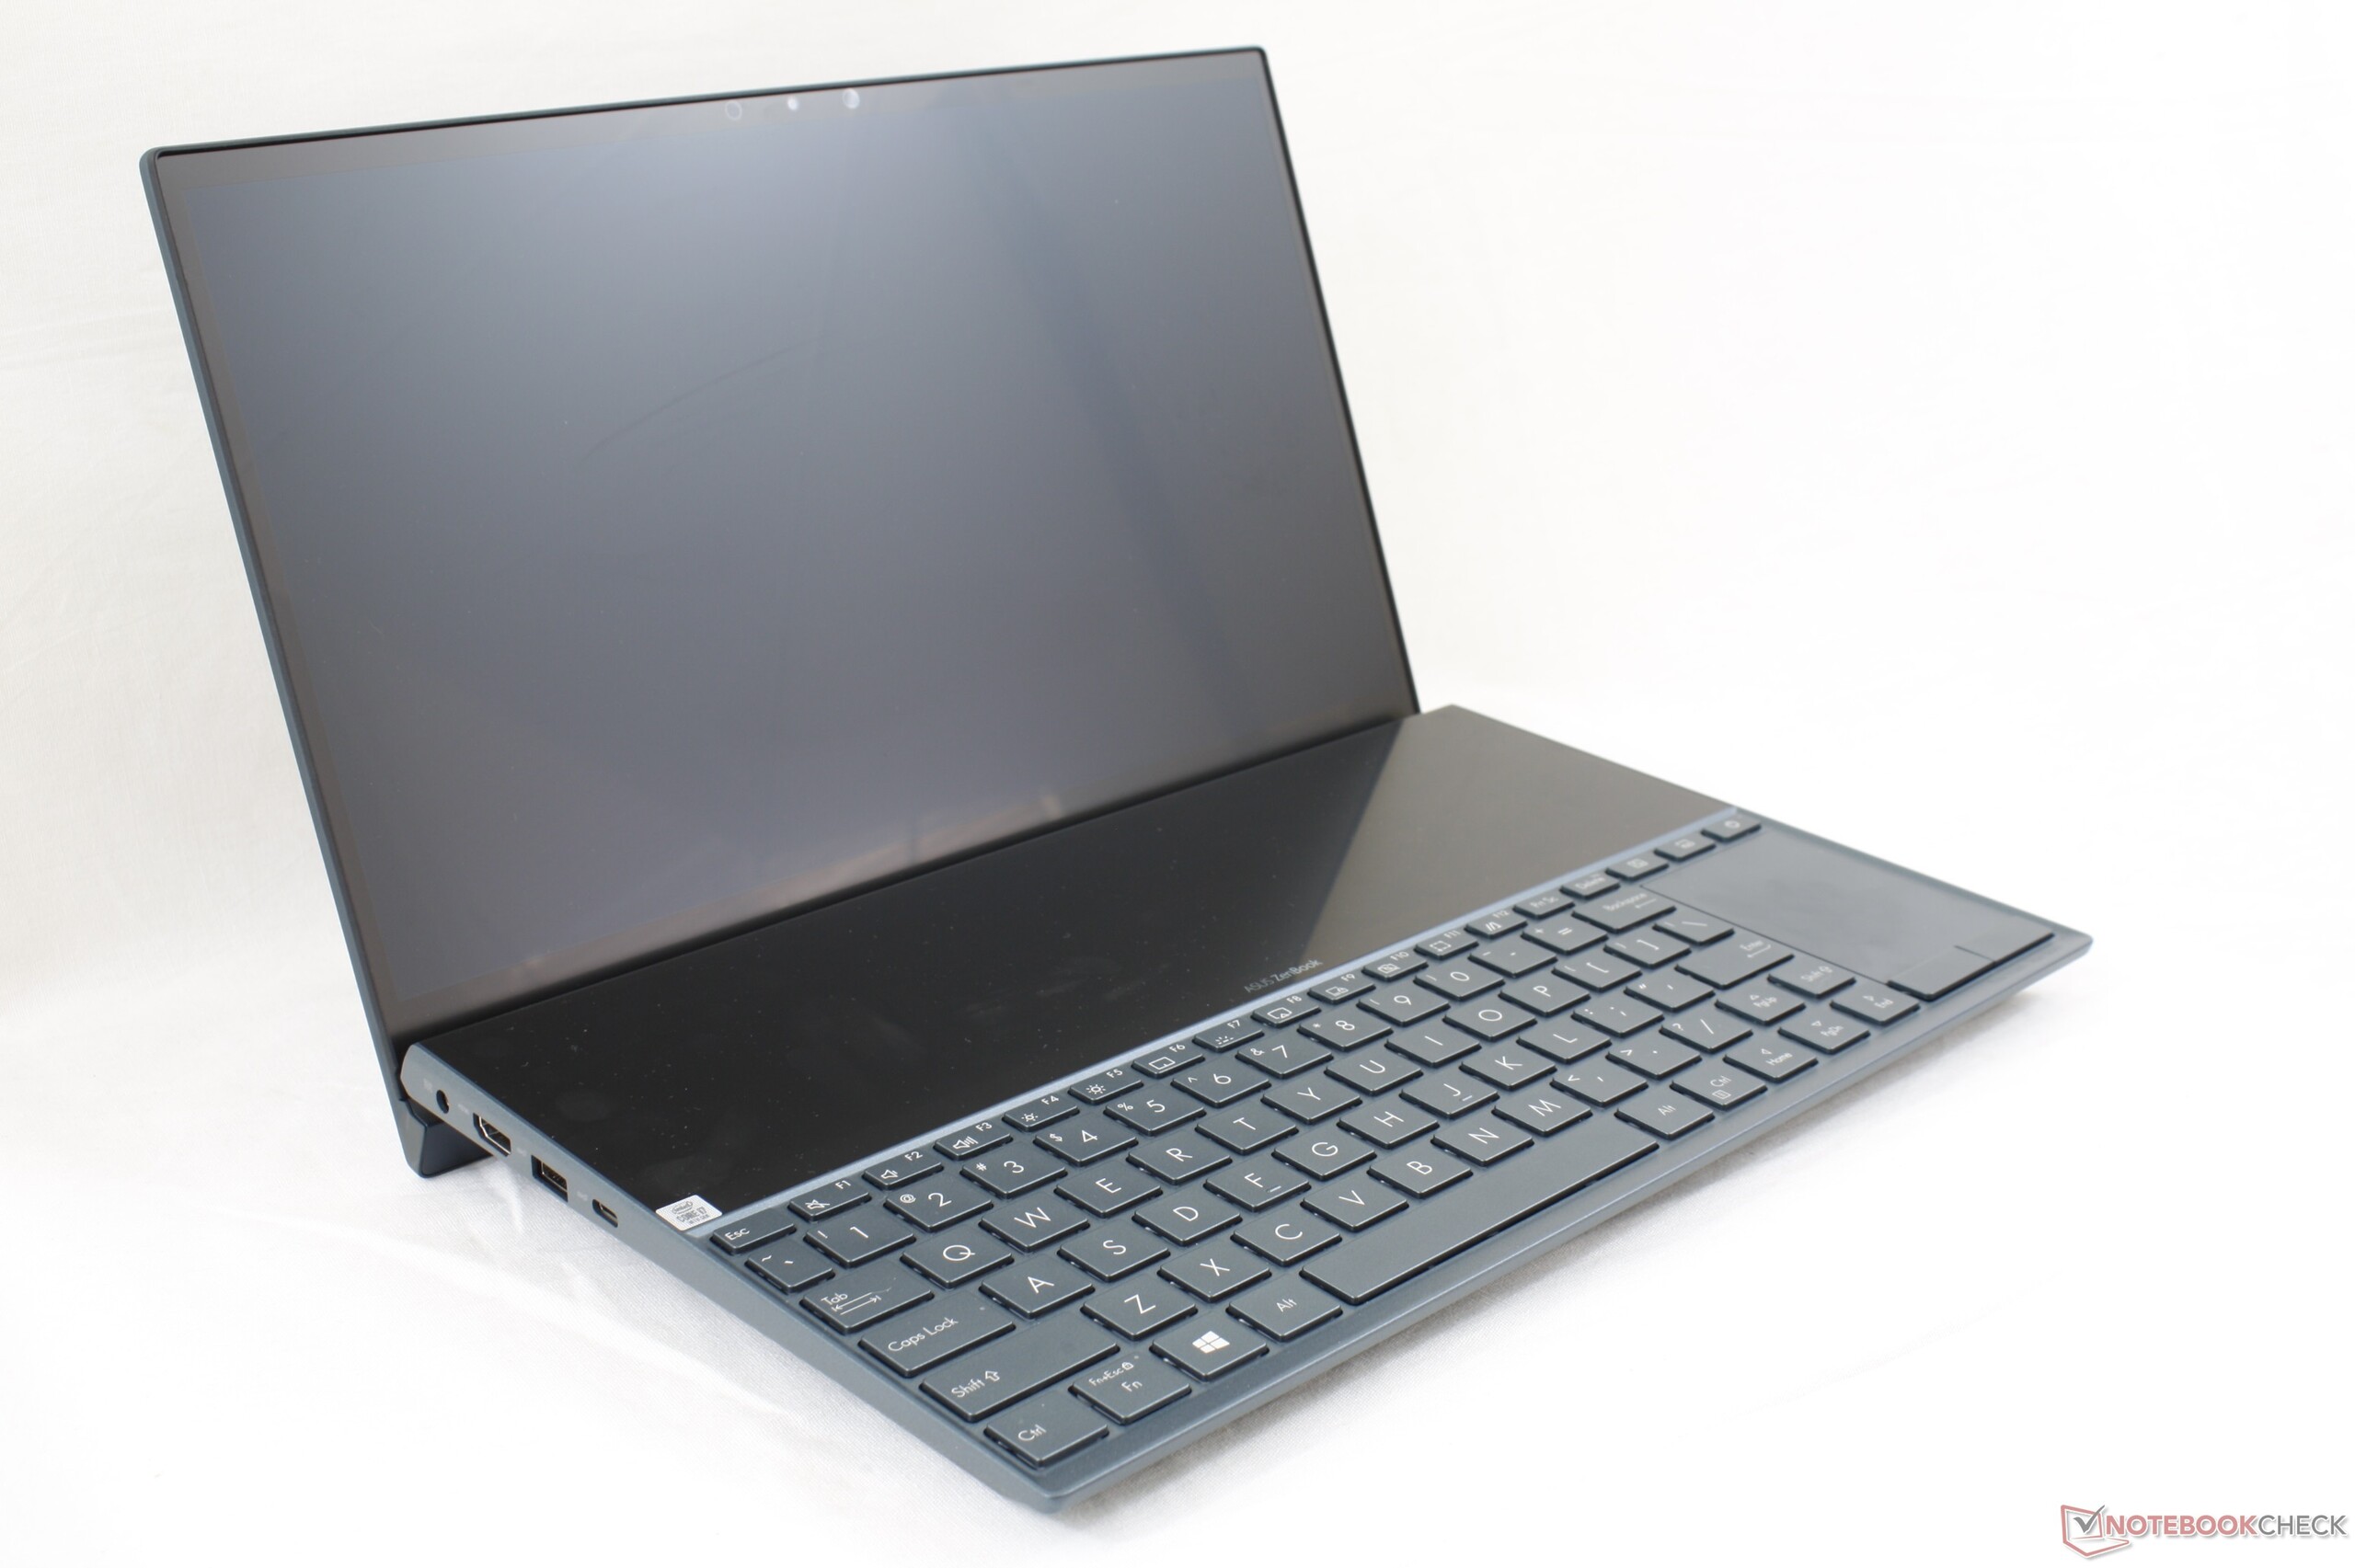
Mais sur un portable, il faudra accepter des compromis. Premièrement, le poids est le principal défaut du portable, qui est de plusieurs centaines de grammes plus lourd qu’un ZenBook 14 classique. Deuxièmement, les couleurs sur le second écran ne sont pas aussi vives que celles de l’écran principal, certifié Pantone. Troisièmement, l’angle de vision élevé entre l’utilisateur et le deuxième écran accentue les reflets et réduit la luminosité apparente, sauf en cas de luminosité ambiante optimale. Quatrièmement, le positionnement inhabituel du clavier nécessite un apprentissage, surtout si l’espace est réduit. Et cinquièmement, les écrans ne sont pas très bons pour les déplacements, malgré le format compact 14 pouces et l’autonomie spécialement bonne. L’OLED aurait potentiellement corrigé tous ces problèmes, mais une telle approche aurait significativement augmenté les prix.
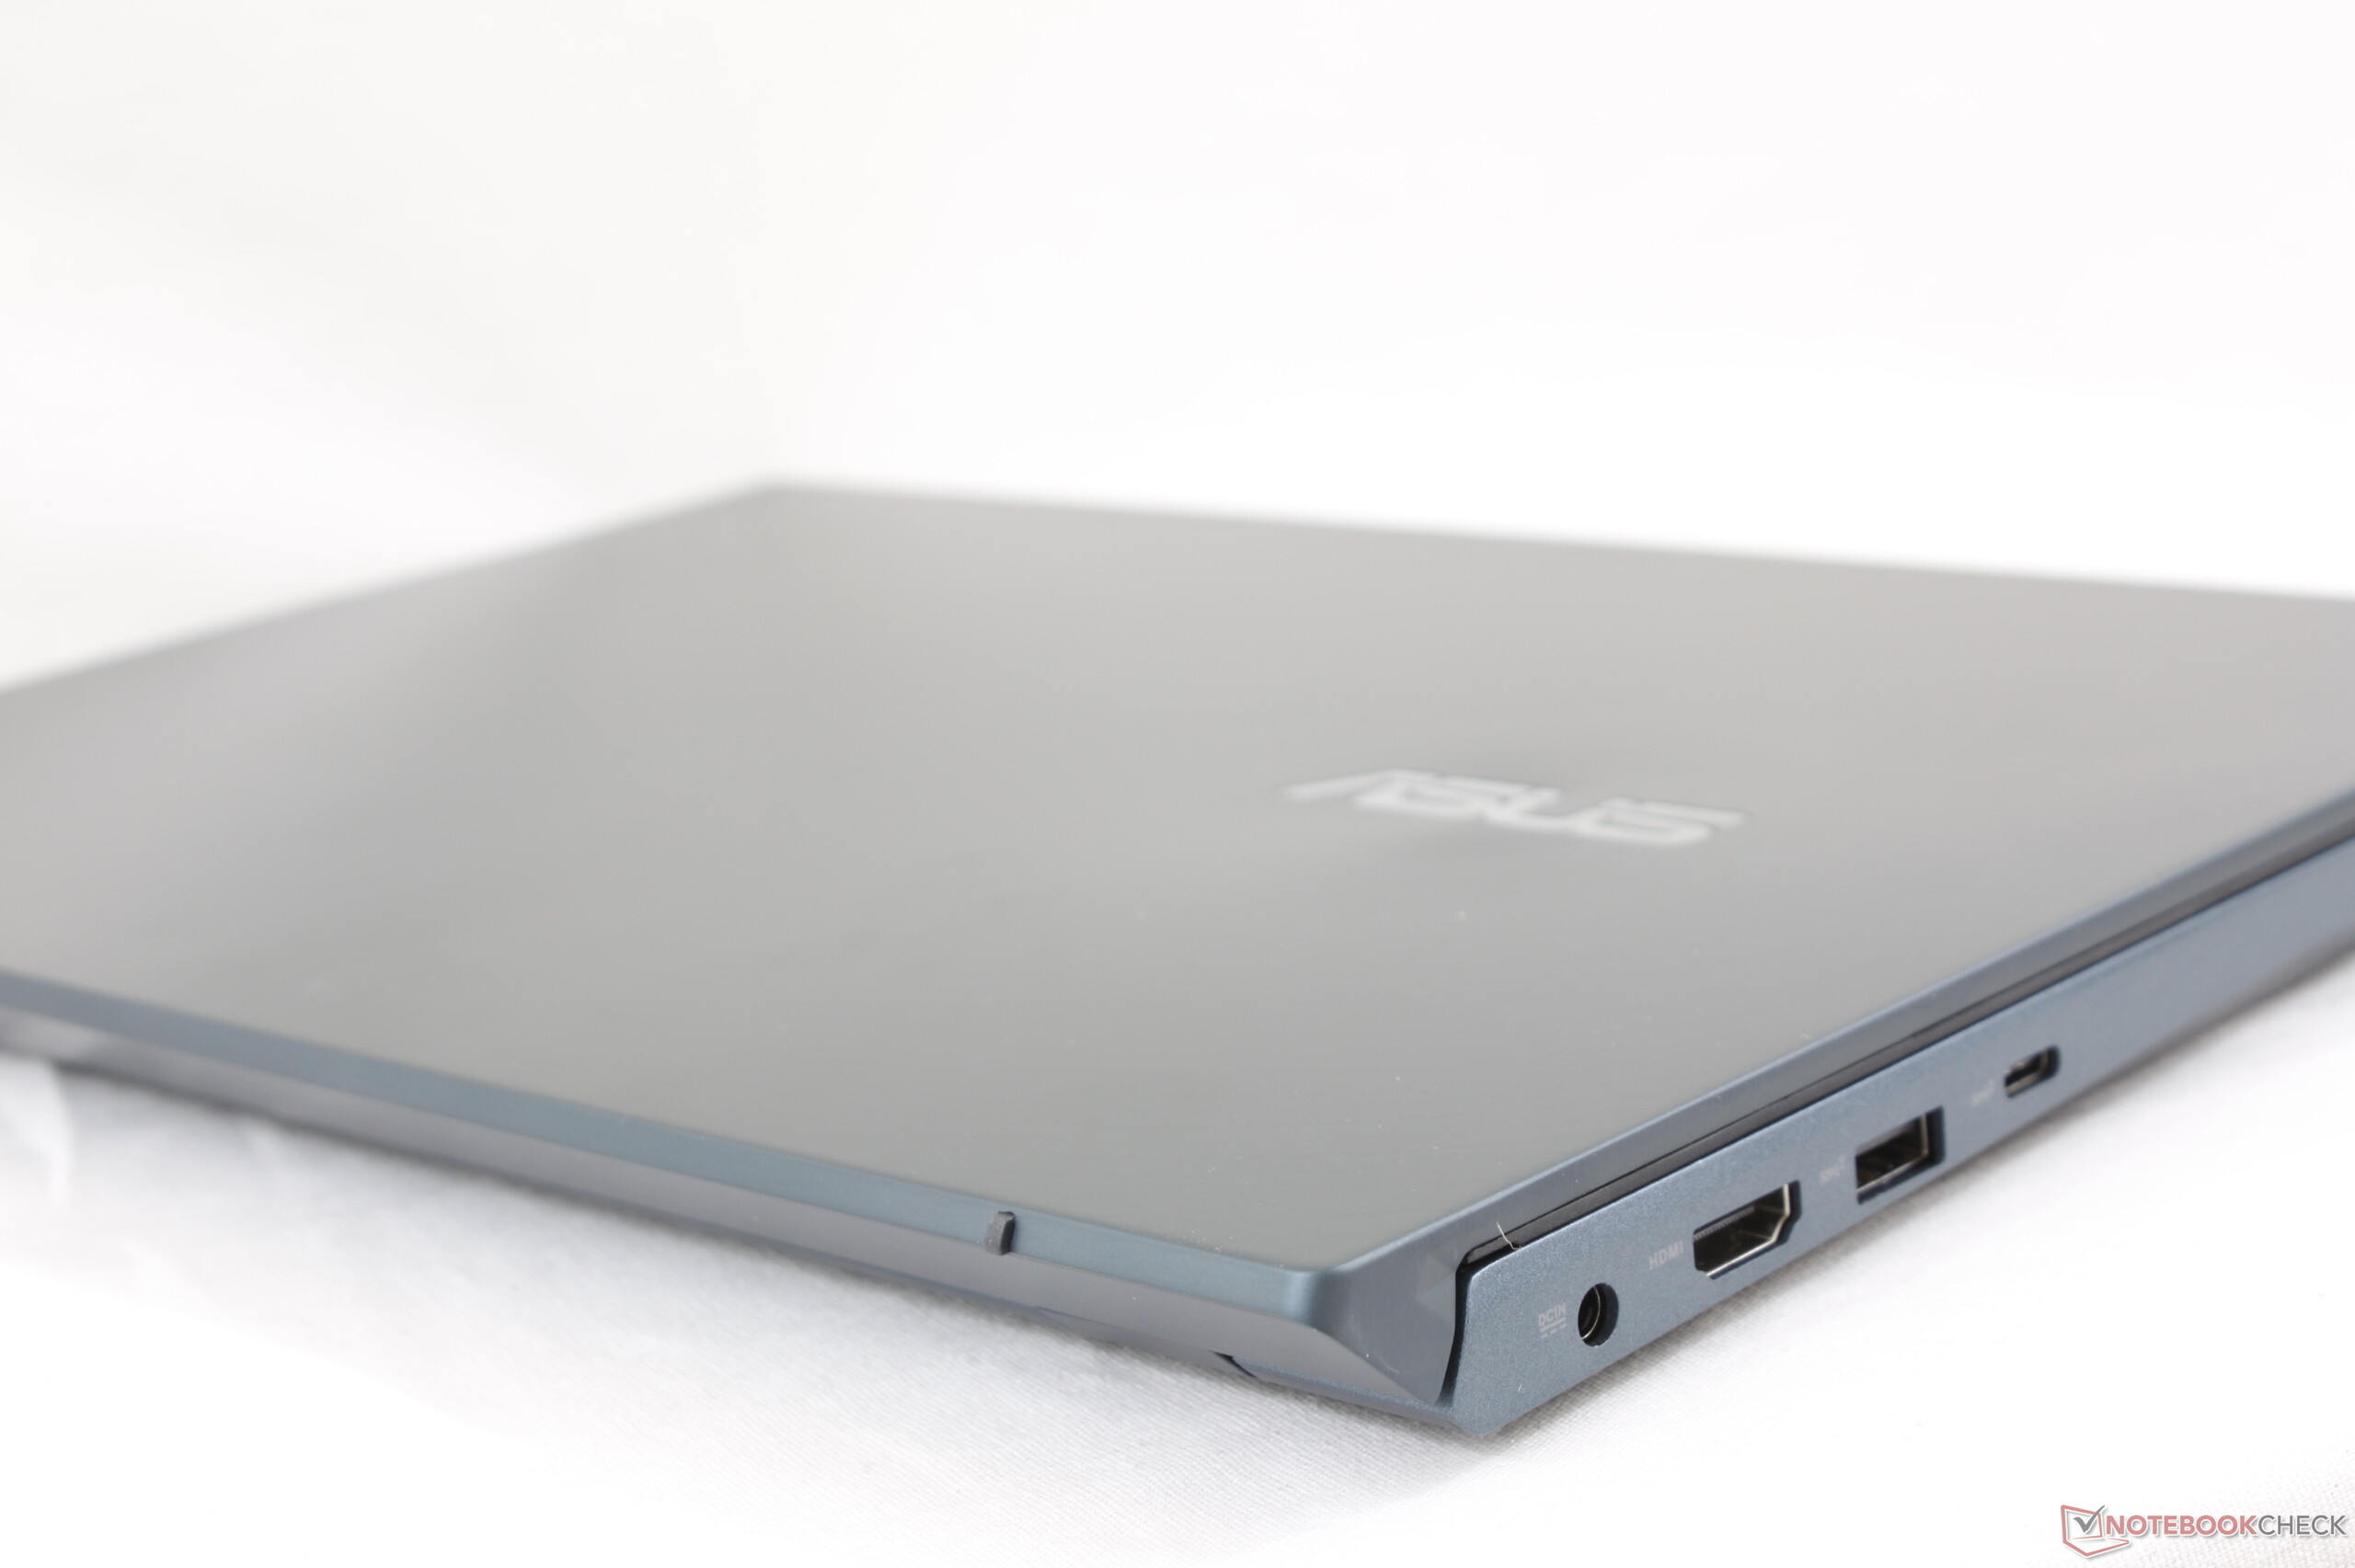
Il y a quelques autres fonctionnalités absentes, que nous aimerions avoir sur les prochaines versions. Un cache de webcam physique et la possibilité de charge via USB C par exemple, qui ne sont pas disponibles ici alors qu’ils sont maintenant communs parmi les autres PC portables haut de gammes.
Si les défaut énumérés ne vous gênent ou que vous pensez pouvoir vous y faire, alors le ZenBook Duo et son deuxième écran seront un délice pour le multitâche.
L’Asus ZenBook Duo est à son avantage dans un environnement à l’éclairage contrôlé et avec une souris, afin de de maximiser la visibilité et l’ergonomie du deuxième écran. Les nomades qui ont besoin de beaucoup de place à l’écran seront séduits par le ZenBook Duo. Mais si vous avez de la place sur votre bureau, alors un ZenBook 14 classique et un bon écran externe seront encore plus efficaces.
L’intégralité de cette critique est disponible en anglais en suivant ce lien.
Asus ZenBook Duo UX481FL
- 05/01/2020 v7 (old)
Allen Ngo
Price comparison
