
Notebookcheck Logo
Teaser

Test du MSI Stealth 16 AI B3WH : moitié gamer, moitié créateur, totalement professionnel

Pour les gamers qui travaillent au bureau.

Contrairement aux derniers modèles Razer Blade 16 ou Lenovo Yoga Pro 9 16, le MSI Stealth 16 de 2026 est doté d’une mémoire vive remplaçable pouvant atteindre 128 Go, ce qui en fait un monstre du multitâche pour le jeu vidéo, le montage vidéo, l’IA et bien plus encore.
Allen Ngo, 👁 Allen Ngo (traduit par DeepL / Ninh Duy) Publié 🇺🇸 🇳🇱 ...
Laptop / Notebook Gaming Geforce MSI

Verdict — Un Prestige 16 surboosté à bien des égards

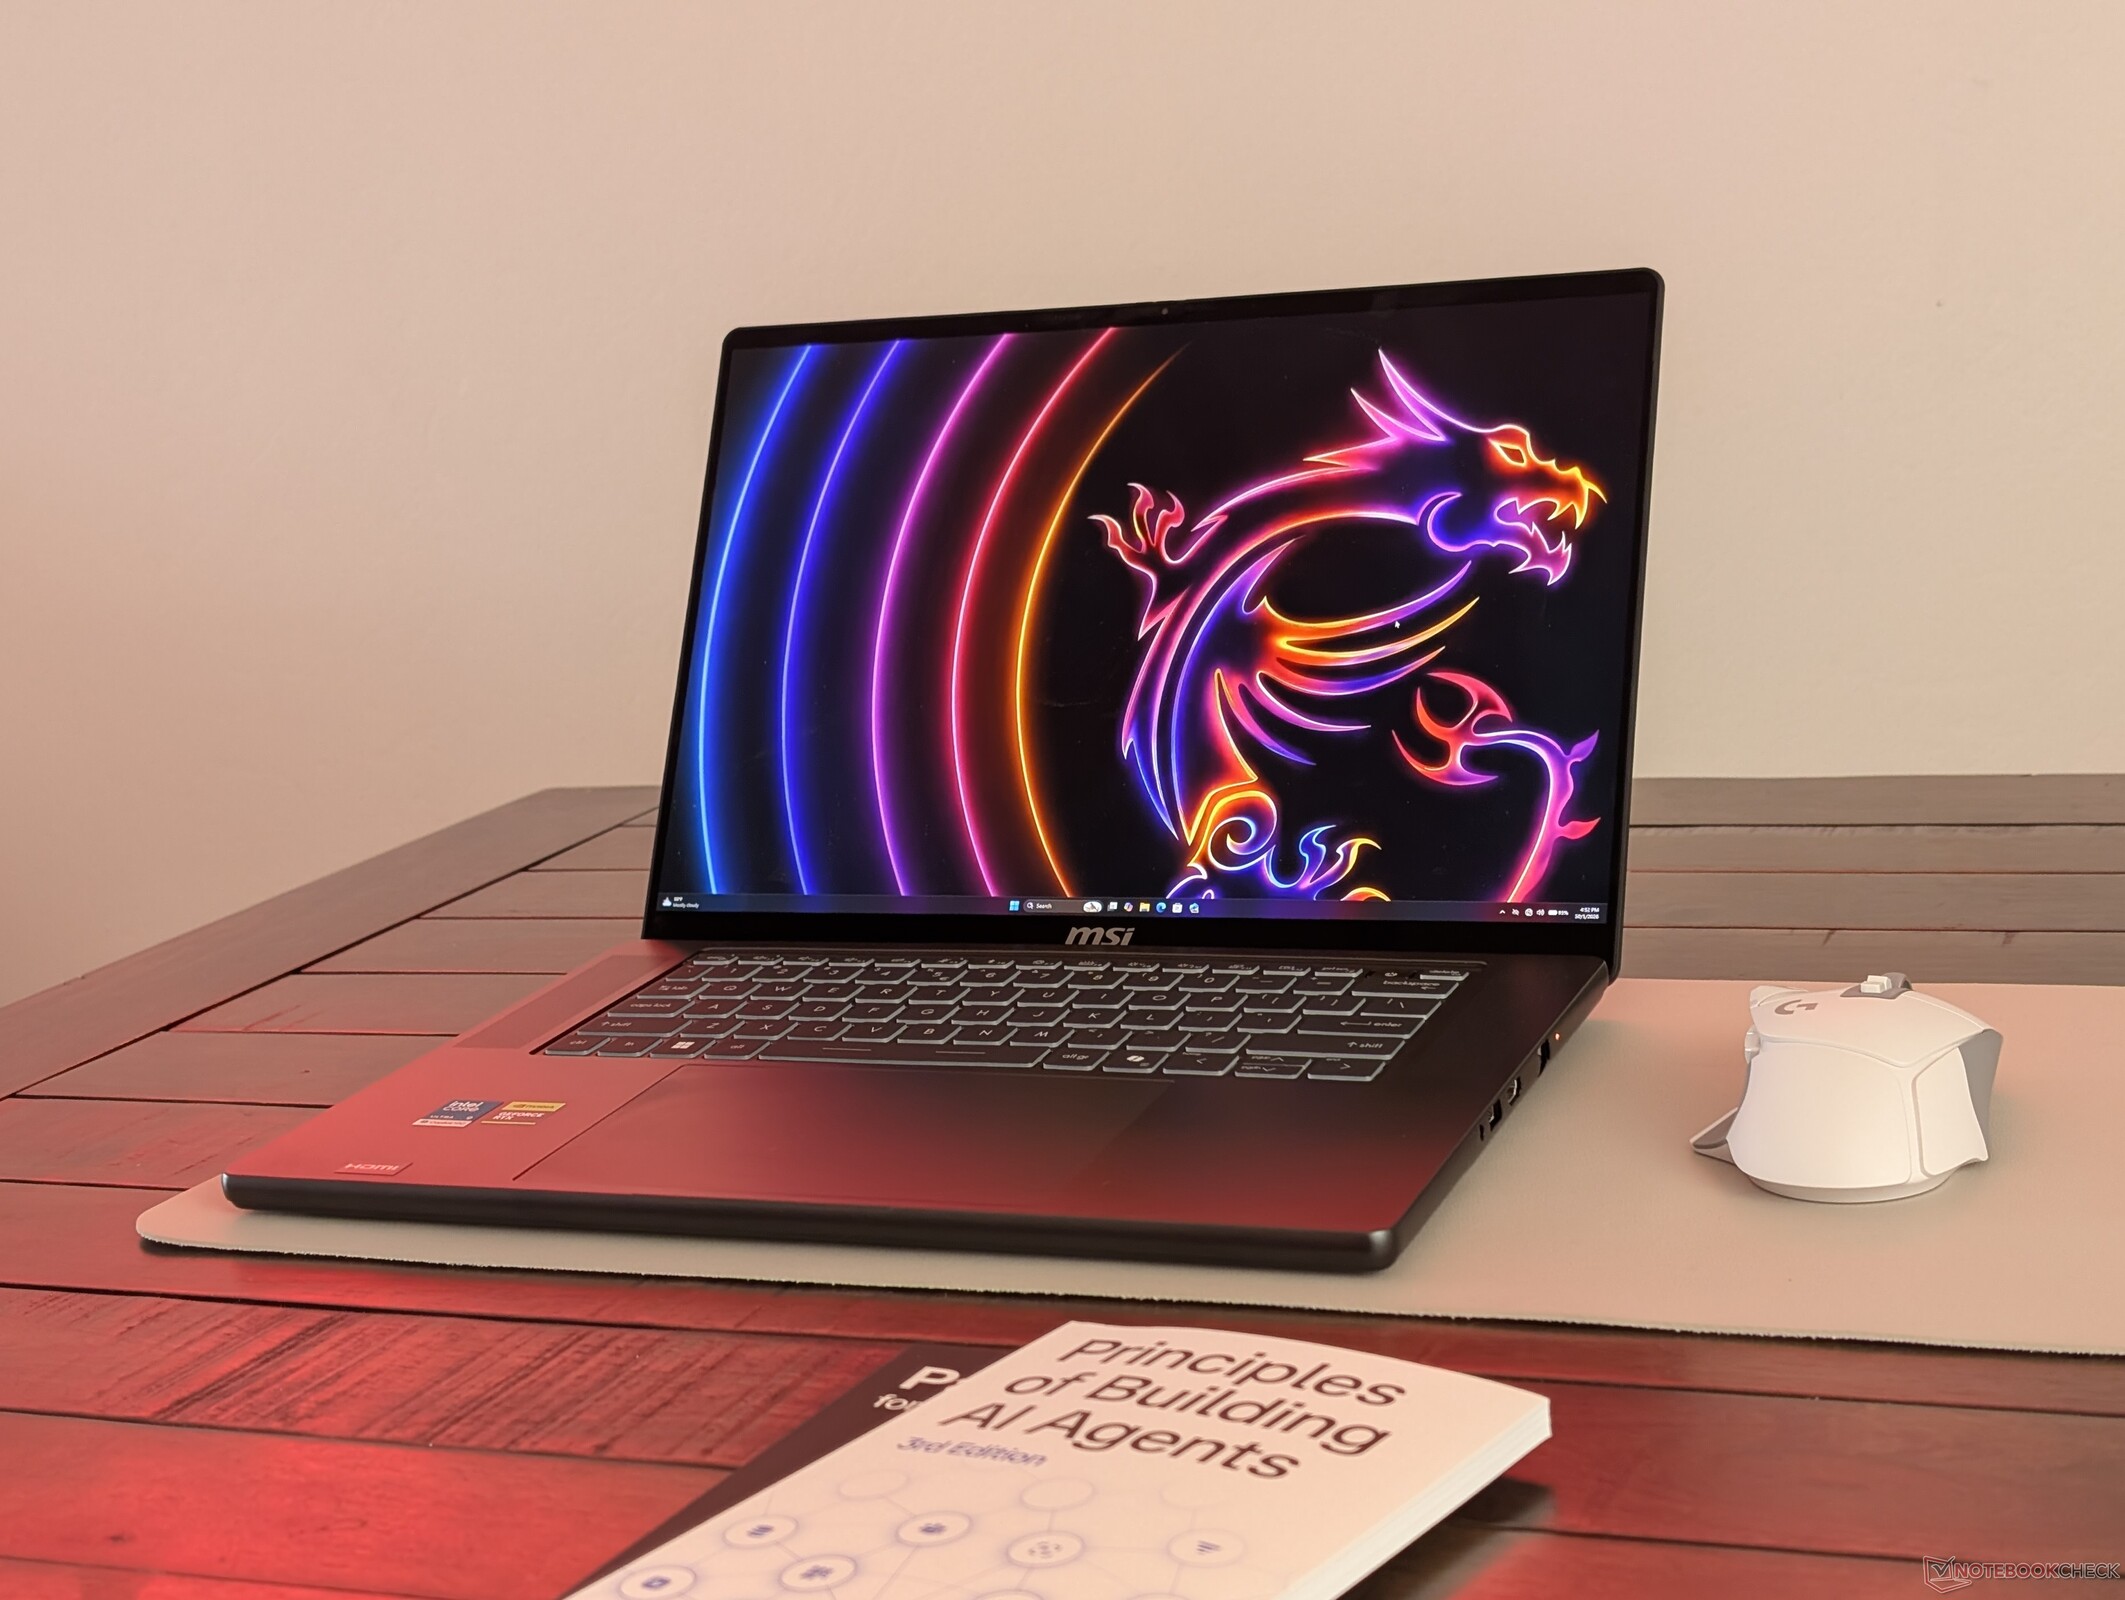
Le Stealth 16 AI 2026 peut être décrit au mieux comme un Prestige 16 survitaminé, doté de la puissance d’un ordinateur portable de jeu traditionnel. Les utilisateurs qui recherchent de meilleures performances que celles offertes par la gamme Prestige actuelle pour le jeu, la création de contenu ou les charges de travail agentiques locales trouveront dans le Stealth 16 un excellent choix, d’autant plus qu’il prend en charge une carte graphique GeForce RTX 5080 dédiée et jusqu’à 128 Go de mémoire amovible. Le nouveau design extérieur s’éloigne peut-être des racines gaming de la gamme Stealth, mais il est néanmoins plus élégant et plus robuste au toucher.

L’approche hybride entre ordinateur portable de jeu et station de travail présente quelques inconvénients. Plus particulièrement, le modèle MSI est dépourvu de certaines fonctionnalités que l’on trouve couramment sur la plupart des ordinateurs portables de jeu ou prosumer, comme G-Sync, un écran tactile ou Advanced Optimus, malgré la puissance de son matériel. Les haut-parleurs sont relativement faibles compte tenu de la taille de l’appareil, tandis que le clavier a été optimisé pour la frappe au détriment du jeu. Pour que le GPU fonctionne à son TGP annoncé de 125 W, le système doit également être réglé en mode Apex, qui est sans surprise le mode le plus bruyant.

Les alternatives comme le Razer Blade 16 sont légèrement plus lourdes et offrent un choix de ports supérieur ainsi que des fonctionnalités supplémentaires axées sur le jeu, notamment un plafond TGP plus élevé de 160 W, mais sa mémoire non évolutive constitue sans doute un obstacle rédhibitoire pour de nombreux professionnels.

Points positifs

+ écran OLED de haute qualité avec prise en charge de DisplayHDR600
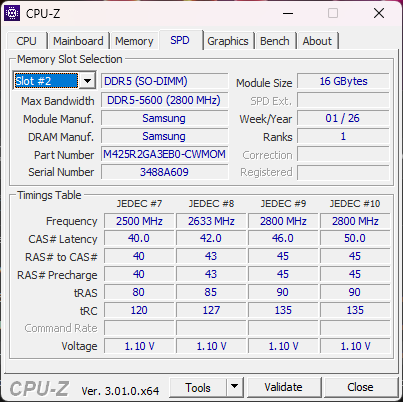
+ 2 SSD M.2 et 2 modules DDR5 SODIMM évolutifs
+ longue autonomie pour un ordinateur portable performant
+ conception plus robuste, pensée pour les professionnels
+ clickpad spacieux

Points négatifs

- les haut-parleurs intégrés pourraient être plus puissants
- plus de pavé numérique ; touches fléchées plus petites
- un mode de performance de trop
- l’emplacement des ports pourrait être mieux pensé
- pas de G-Sync ni d’écran tactile

Prix et disponibilité

Le MSI Stealth 16 AI B3WH testé est désormais en vente sur Amazon au prix de 3 100 $.

Amazon: Request rate limit exceeded. Learn more: https://affiliate-program.amazon.com/creatorsapi/docs/en-us/concepts/api-rates

La série ultrafine MSI Stealth a vu le jour comme un véritable ordinateur portable de jeu dès 2014. Depuis, la série a évolué pour intégrer des caractéristiques à la fois dédiées au jeu et à la création, afin d’attirer un public plus large de créateurs de contenu. Le dernier Stealth 16 de 2026 est donc un modèle hybride qui allie des fonctionnalités de la gamme gaming de MSI à celles de la série Prestige, destinée aux professionnels.

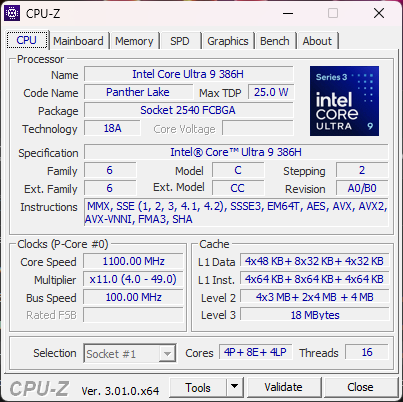
Notre unité de test est une configuration intermédiaire équipée d’un processeur Panther Lake Core Ultra 9 386H, d’un GPU GeForce RTX 5070 Ti de 125 W et d’un écran OLED 1600p240, pour environ 3 100 $. Les configurations inférieures et supérieures peuvent intégrer une RTX 5060 ou une RTX 5080, respectivement, mais l’écran OLED reste le même quelle que soit l’option choisie.

Parmi les concurrents de cette catégorie figurent d’autres ordinateurs portables de jeu ultrafins ou des ordinateurs portables de création axés sur les performances, comme le Razer Blade 16, l’Asus ZenBook 16 ou la série Lenovo Yoga Pro.

Autres tests de produits MSI :

Spécifications

MSI Stealth 16 AI B3WH (Stealth 16 Gamme)
Processeur
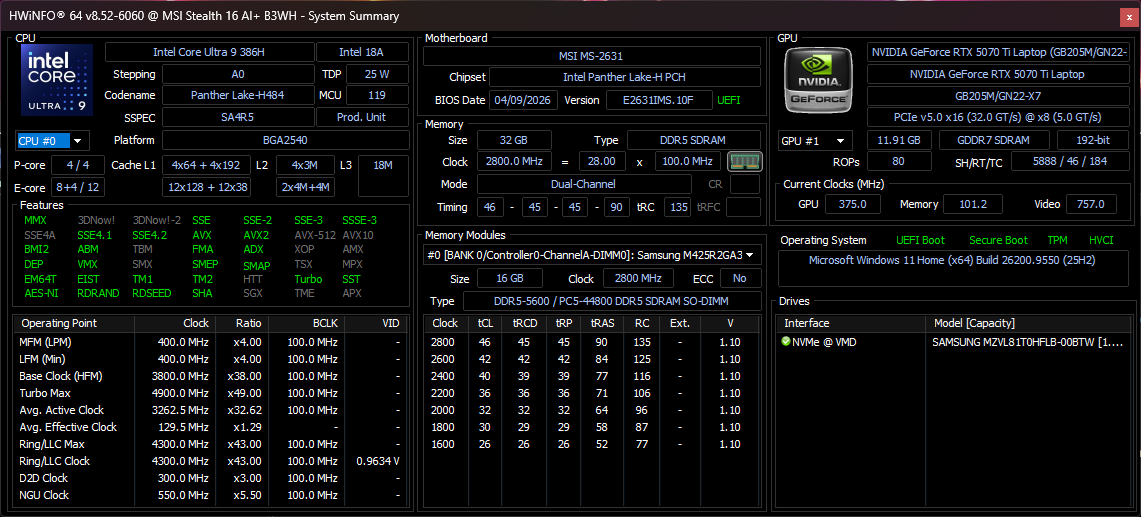
Intel Core Ultra 9 386H 16c/16t, 4 x 4.9 GHz Intel Cougar Cove P-Core, 8 x 3.9 GHz Intel Darkmont E-Core, 4 x 3.5 GHz Intel Darkmont LP E-Core, 97 W PL2 / Short Burst, 88 W PL1 / Sustained, Panther Lake
Carte graphique
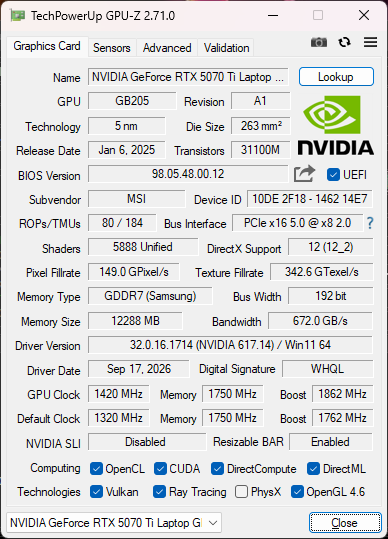
NVIDIA GeForce RTX 5070 Ti Laptop - 12 Go VRAM, Processeur: 1862 MHz, RAM: 1750 MHz, 125 W TDP, GDDR7, 617.14, Optimus
Mémoire
32 Go 
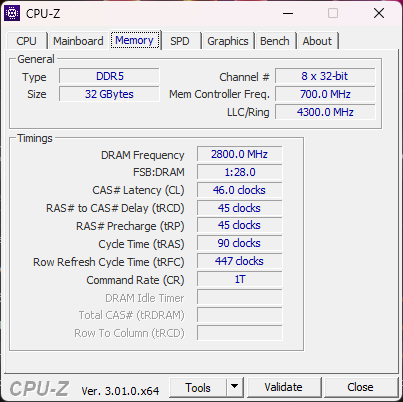
, DDR5-5600, Dual-Channel, 46-45-45-90
Écran
16.00 pouces 16:10, 2560 x 1600 pixel 189 PPP, Samsung ATNA60DL07-0, OLED, DisplayHDR600, brillant: oui, HDR, 240 Hz
Carte mère
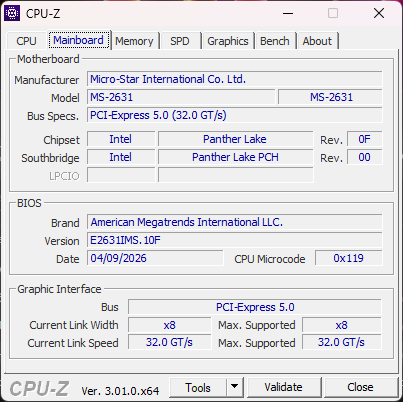
Intel Panther Lake-H PCH
Disque dur
Samsung PM9C1b MZVL81T0HFLB-00BTW, 1000 Go 
Carte son
Intel Panther Lake-H PCH - High Definition Audio - AVS (Audio, Voice, Speech)
Connexions
2 USB 3.1 Gen2, 2 USB4 40 Gbps, 2 Thunderbolt 4, USB-C Power Delivery (PD), 1 HDMI, 2 DisplayPort, Connectique audio: 3.5 mm combo, 1 Lecteur d'empreintes digitales
Réseau
Realtek RTL8125 2.5GBe Family Ethernet Controller (10/100/1000/2500MBit/s), Intel Wi-Fi 7 BE213 160MHz ( be = Wi-Fi 7), Bluetooth 6
Taille
Hauteur x Largeur x Profondeur (en mm): 19.99 x 354 x 246
Batterie
90 Wh Lithium-Polymère, 4-cell
Système d'exploitation
Microsoft Windows 11 Home
Appareil photo
Webcam: 1080p30, IR + privacy shutter
Appareil photo primaire: 2.1 MPix
Fonctionnalités additionnelles
Haut-parleurs: 2x 2 W tweeters, 2x 2 W subwoofers, Clavier: Chiclet, Rétroéclairage du clavier: oui, MSI Center, App Player, True Color, 12 Mois Garantie
Poids
2.033 kg, Alimentation: 740 g
Prix
3100 USD
Amazon
Remarque : le fabricant peut utiliser des composants provenant de différents fournisseurs, notamment des panneaux d'affichage, des lecteurs ou des clés USB ayant des spécifications similaires.


Case

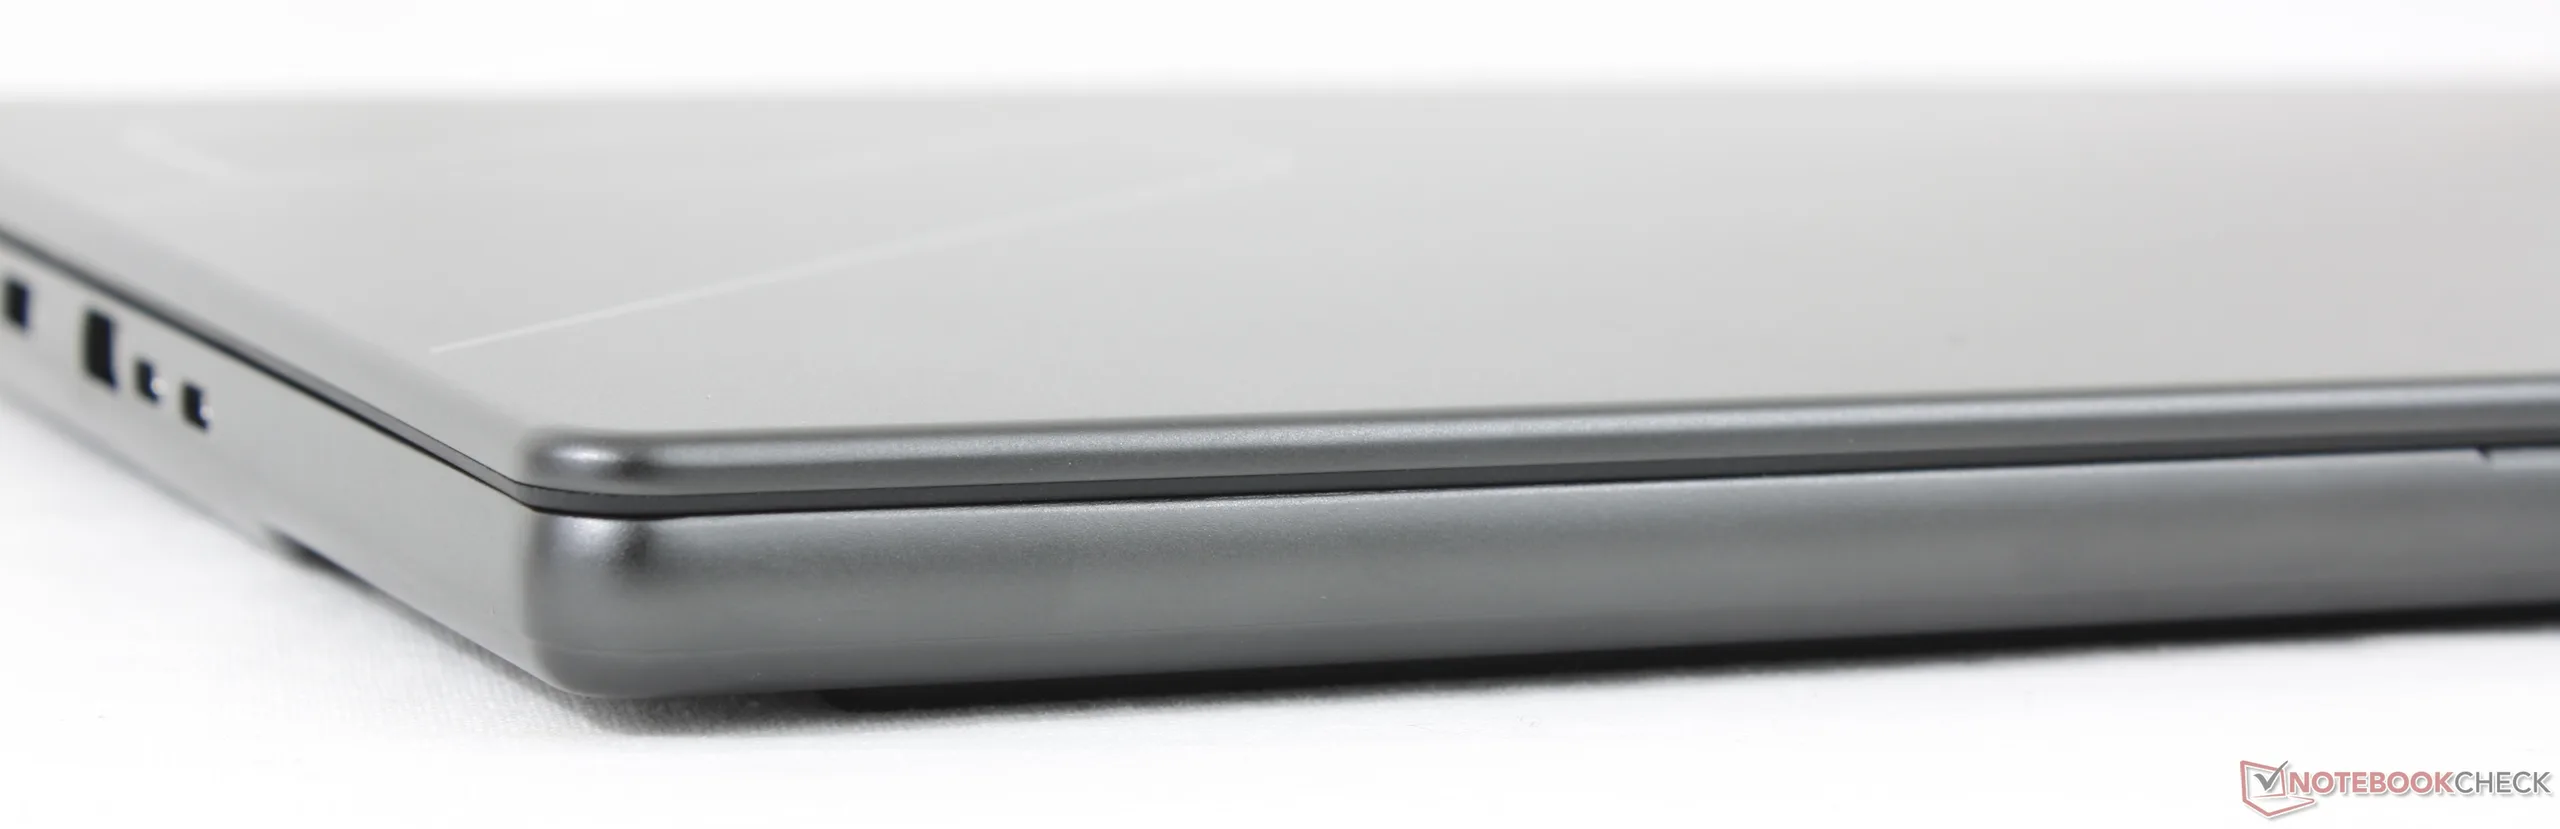
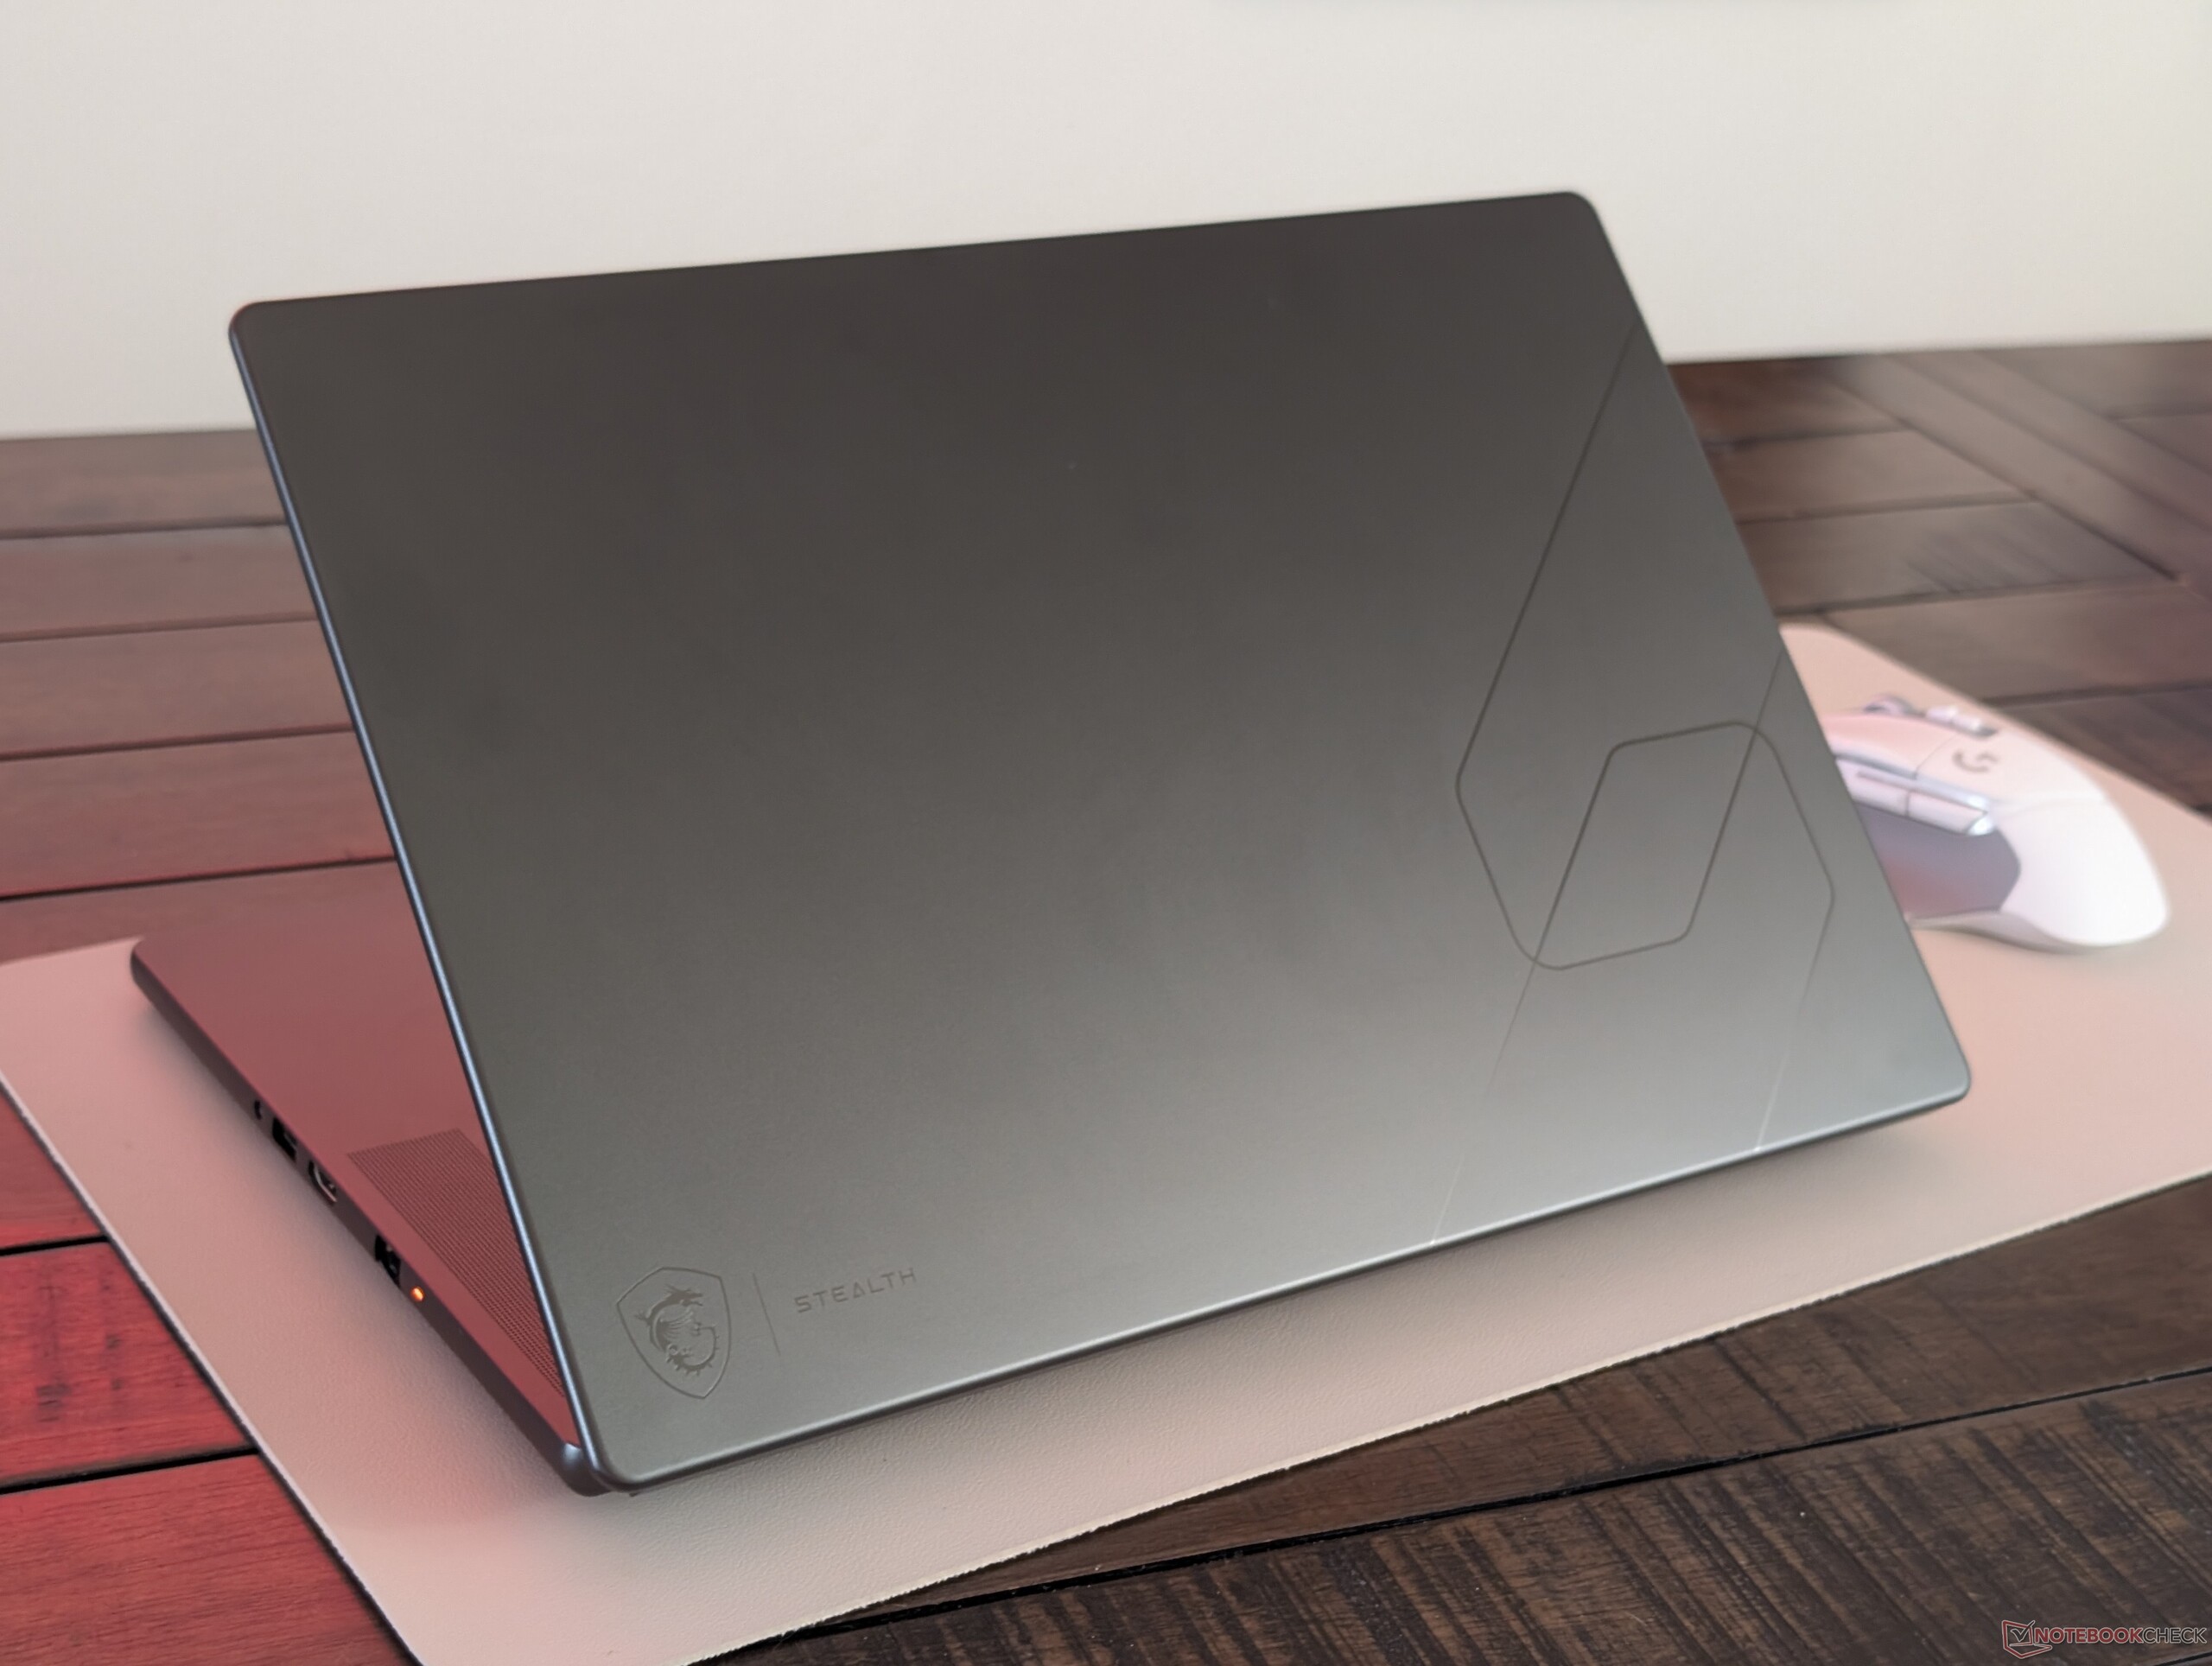
The gray all-aluminum alloy chassis contrasts the gaming-centric darker tones of the previous generation Stealth design. It can easily be mistaken as a Prestige laptop or mobile workstation in professional environments.

Surfaces feel thicker and stronger than the 2023 Stealth 16 albeit with slightly more flexing than a 2025 Razer Blade 16. Note that while the hinges are slightly stiffer than the outgoing design, maximum lid angle has been reduced from 180 degrees down to just 140 degrees.
Comparaison des tailles

❌
357 mm 255 mm 24.5 mm 2.3 kg361.4 mm 254.2 mm 16.9 mm 1.8 kg356 mm 260 mm 19.95 mm 2 kg354 mm 246 mm 19.99 mm 2 kg355 mm 250.5 mm 17.4 mm 2.1 kg354 mm 246 mm 17.9 mm 1.9 kg297 mm 210 mm 1 mm 5.7 g

Connectivité

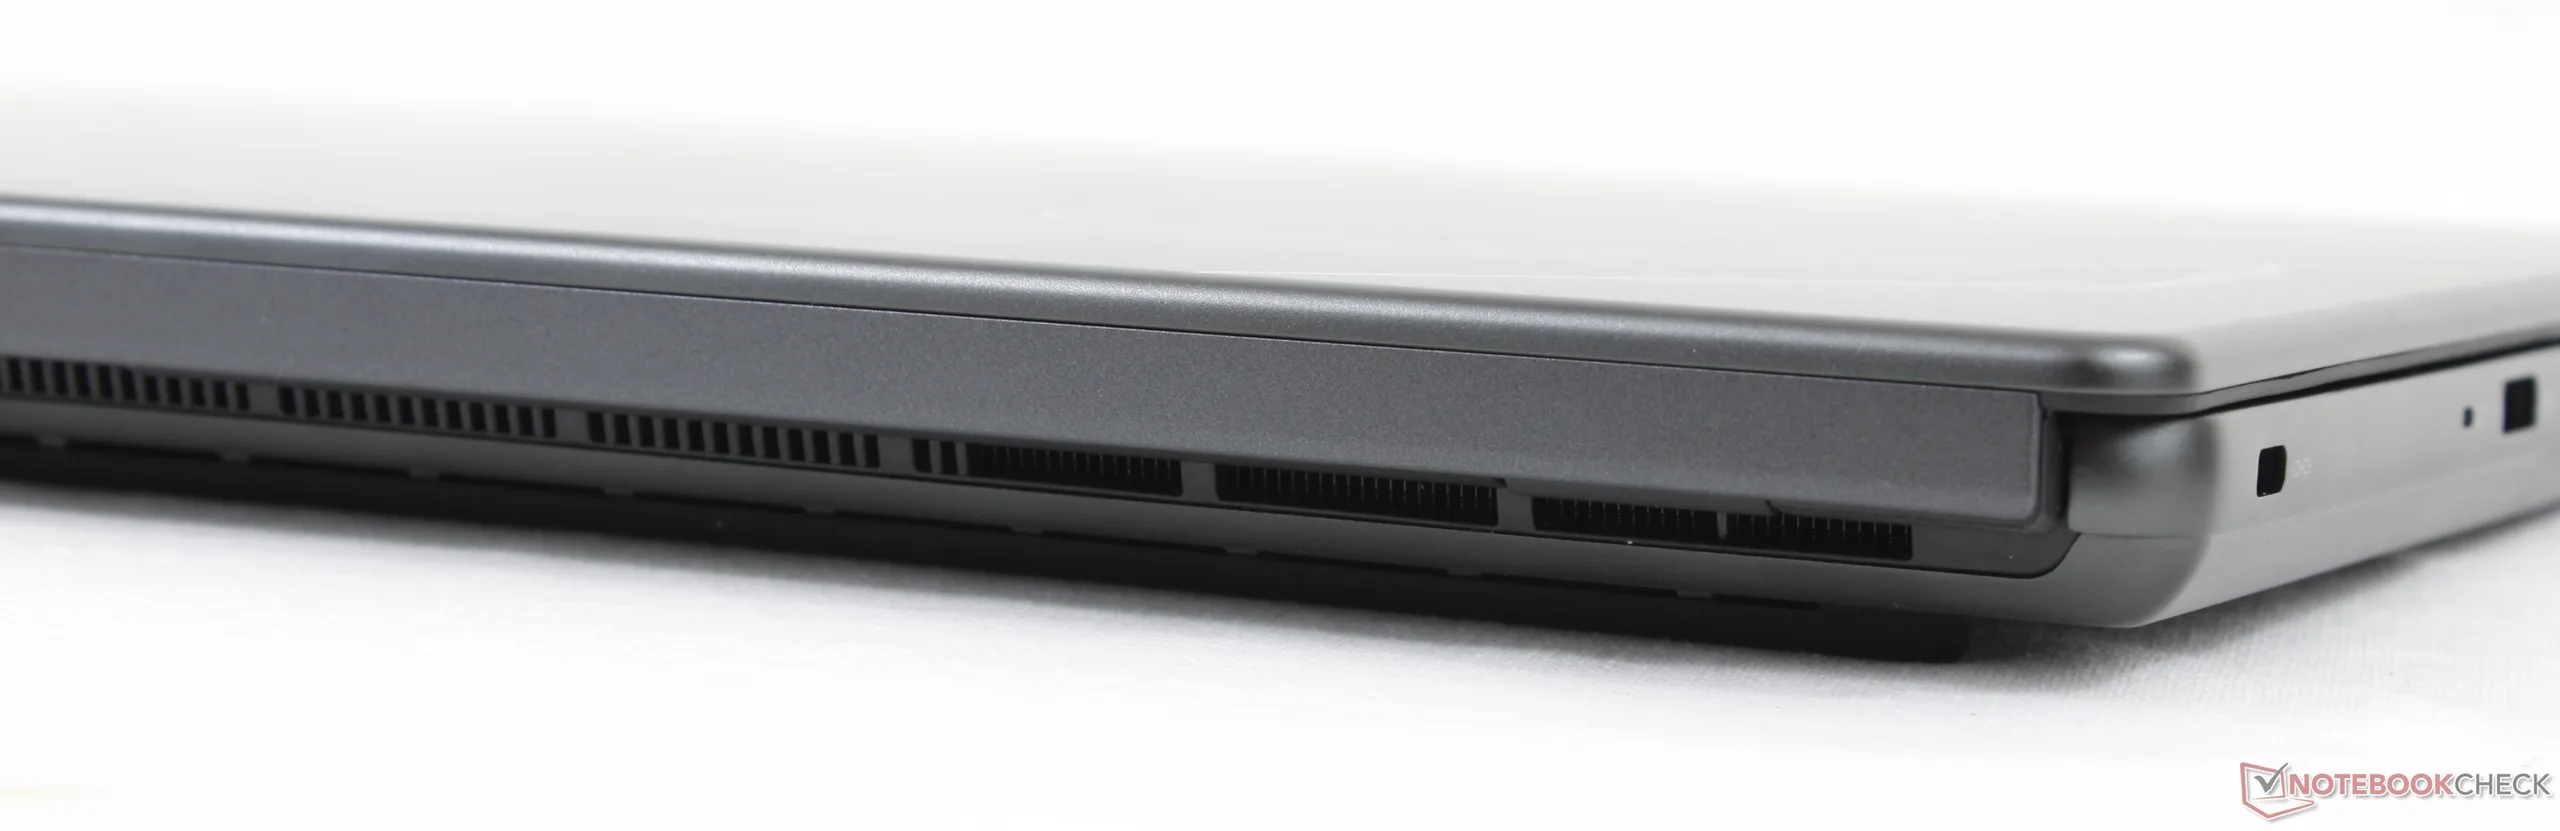
Avant : aucun port
Avant : aucun port
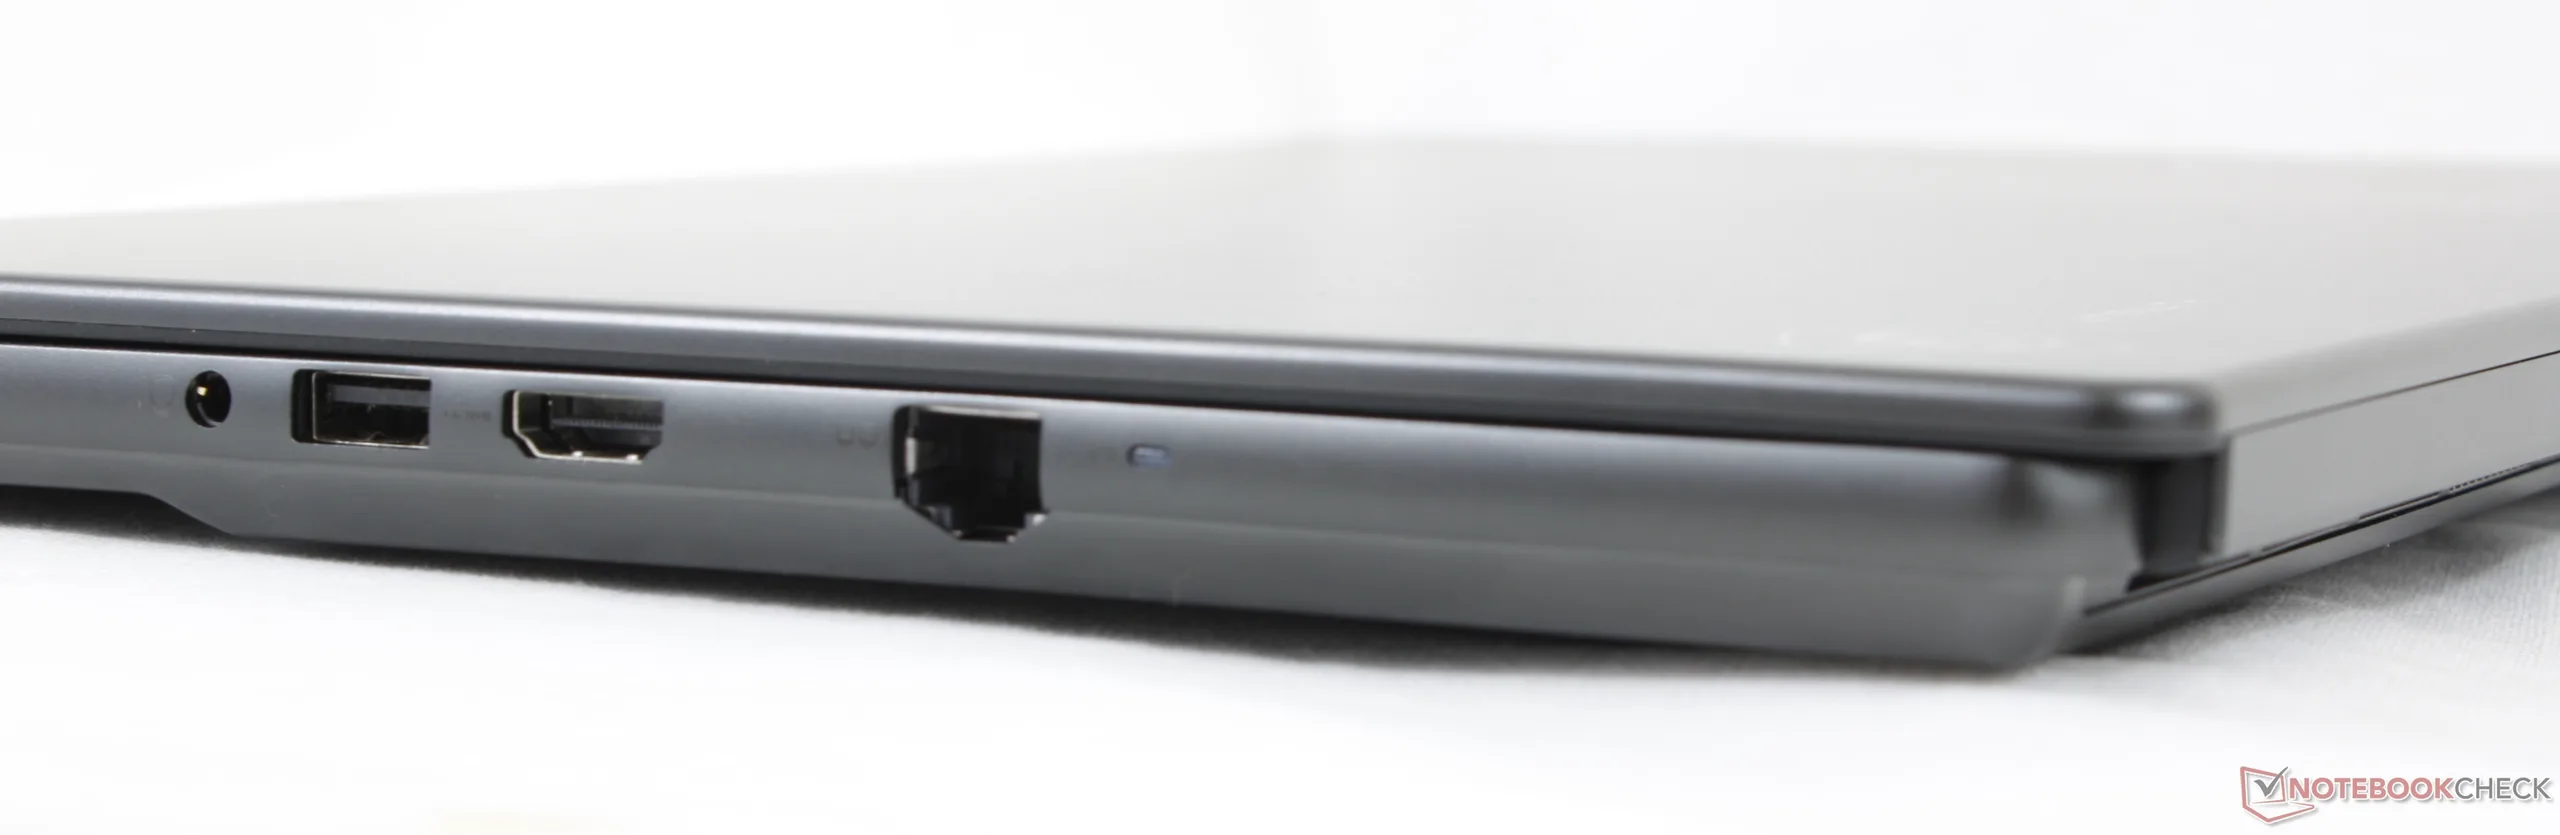
À droite : prise casque 3,5 mm, USB-A 3.2 Gen. 2, HDMI 2.1, RJ-45 (2,5 Gbps)
Arrière : aucun port
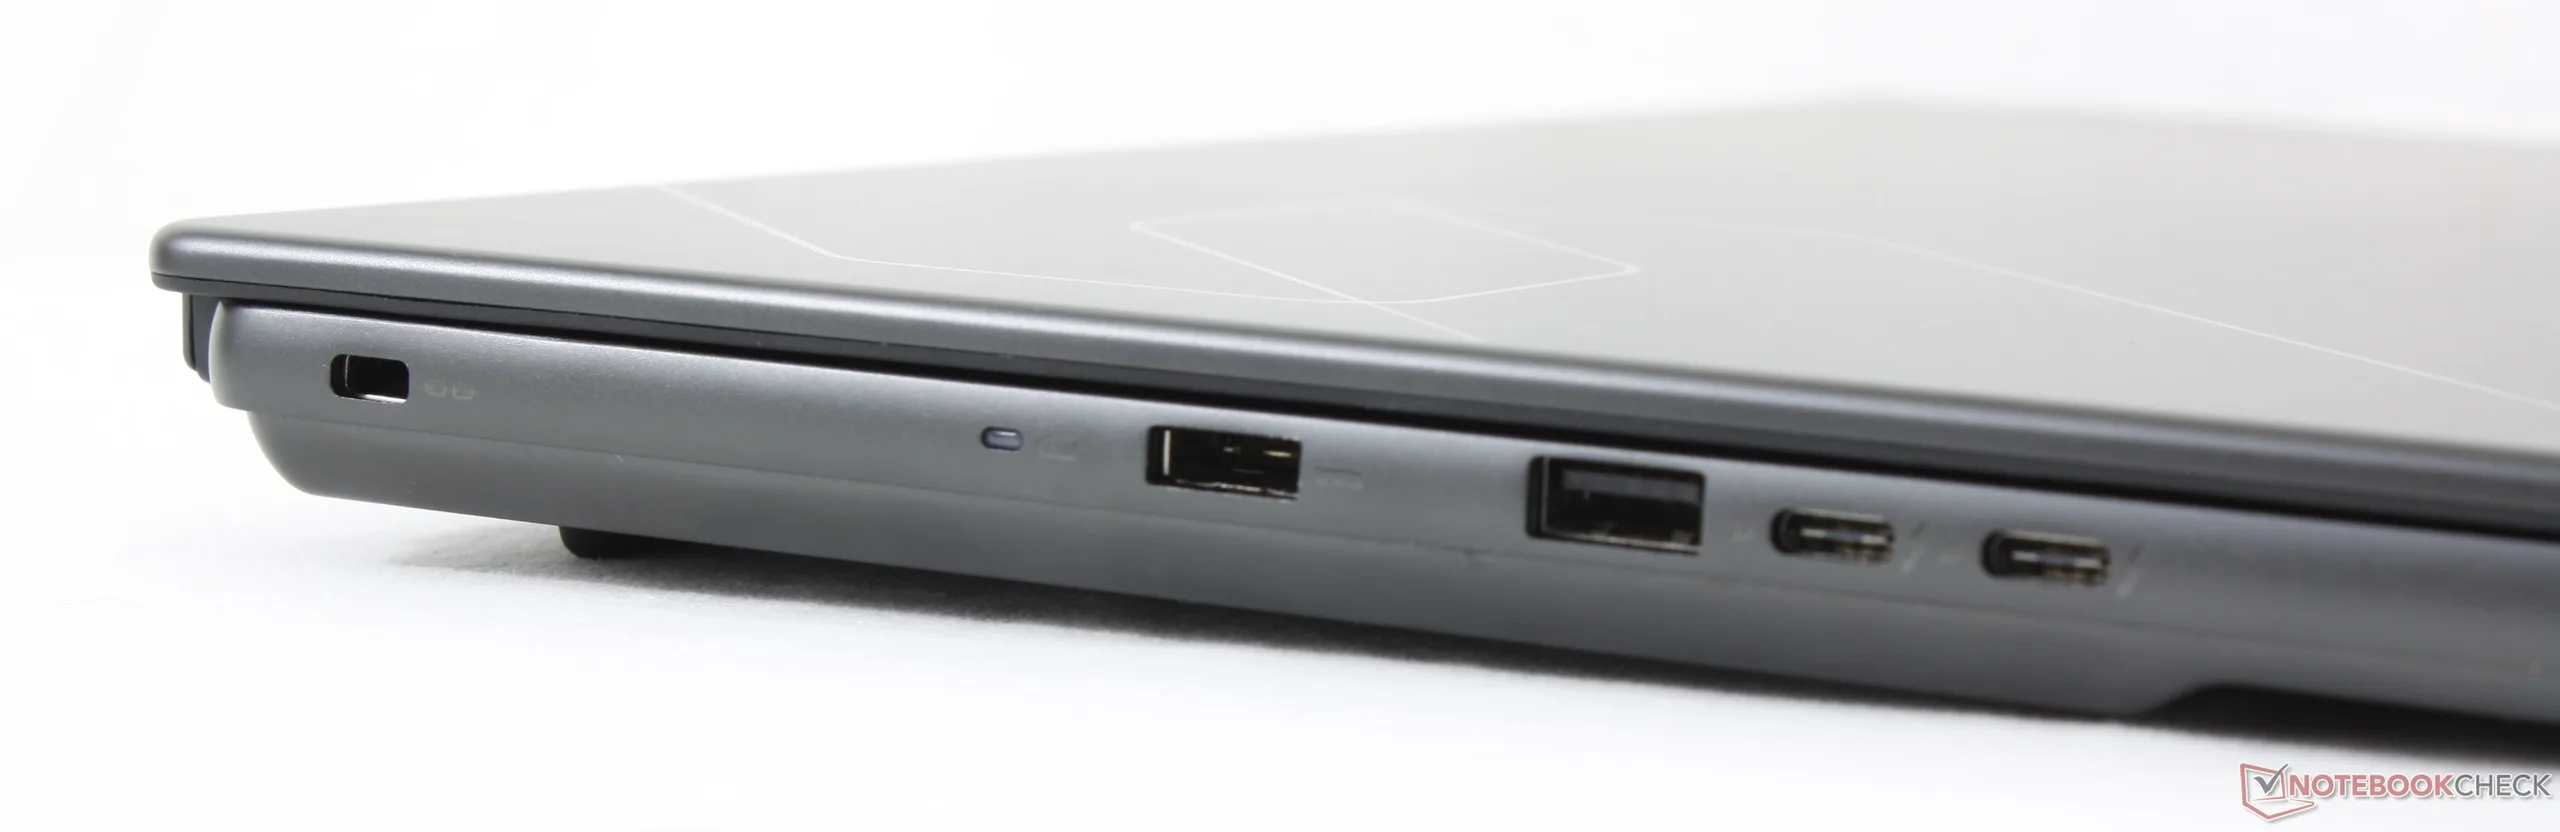
Gauche : verrou Kensington, adaptateur secteur, USB-A 3.2 Gen. 2, 2x USB-C Thunderbolt 4 avec DisplayPort 2.1 + Power Delivery 3.0

Communication

Networking
iperf3 transmit Wi-Fi6/7 RT-BE96U
Asus ROG Zephyrus G16 GU606AW
Intel Wi-Fi 7 BE211 320MHz
2341 (1210min - 2548max) MBit/s +9%
MSI Stealth 16 AI B3WH
Intel Wi-Fi 7 BE213 160MHz
2147 (1998min - 2242max) MBit/s
Aorus Master 16 AM6J
Realtek 8922AE WiFi 7 PCI-E NIC
718 (672min - 755max) MBit/s -67%
iperf3 receive Wi-Fi6/7 RT-BE96U
Asus ROG Zephyrus G16 GU606AW
Intel Wi-Fi 7 BE211 320MHz
1998 (1004min - 2049max) MBit/s +1%
MSI Stealth 16 AI B3WH
Intel Wi-Fi 7 BE213 160MHz
1980 (1639min - 2107max) MBit/s
Aorus Master 16 AM6J
Realtek 8922AE WiFi 7 PCI-E NIC
1642 (1406min - 1855max) MBit/s -17%
iperf3 receive AXE11000 6GHz
Razer Blade 16 Core Ultra 9 386H
Intel Wi-Fi 7 BE213 160MHz
1736 (1708min - 1755max) MBit/s
MSI Stealth 16 Studio A13VG
Killer Wi-Fi 6E AX1675i 160MHz Wireless Network Adapter
1446 (731min - 1469max) MBit/s
iperf3 transmit AXE11000 6GHz
MSI Stealth 16 Studio A13VG
Killer Wi-Fi 6E AX1675i 160MHz Wireless Network Adapter
1612 (1573min - 1655max) MBit/s
Razer Blade 16 Core Ultra 9 386H
Intel Wi-Fi 7 BE213 160MHz
1597 (1410min - 1661max) MBit/s
01002003004005006007008009001000110012001300140015001600170018001900200021002200Tooltip
MSI Stealth 16 AI B3WH; iperf3 transmit Wi-Fi6/7 RT-BE96U; iperf 3.1.3: Ø2147 (1998-2242) MBit/s
MSI Stealth 16 AI B3WH; iperf3 receive Wi-Fi6/7 RT-BE96U; iperf 3.1.3: Ø1980 (1639-2107) MBit/s

Webcam

ColorChecker
8.3 ∆E
12.2 ∆E
19.2 ∆E
22.4 ∆E
21 ∆E
12.6 ∆E
11 ∆E
17.1 ∆E
20 ∆E
21.9 ∆E
12.4 ∆E
13 ∆E
2.5 ∆E
14.3 ∆E
26 ∆E
13.4 ∆E
20.6 ∆E
18.4 ∆E
6.9 ∆E
7 ∆E
12.9 ∆E
17.4 ∆E
15.1 ∆E
1.4 ∆E
ColorChecker MSI Stealth 16 AI B3WH: 14.45 ∆E min: 1.43 - max: 25.96 ∆E

Maintenance

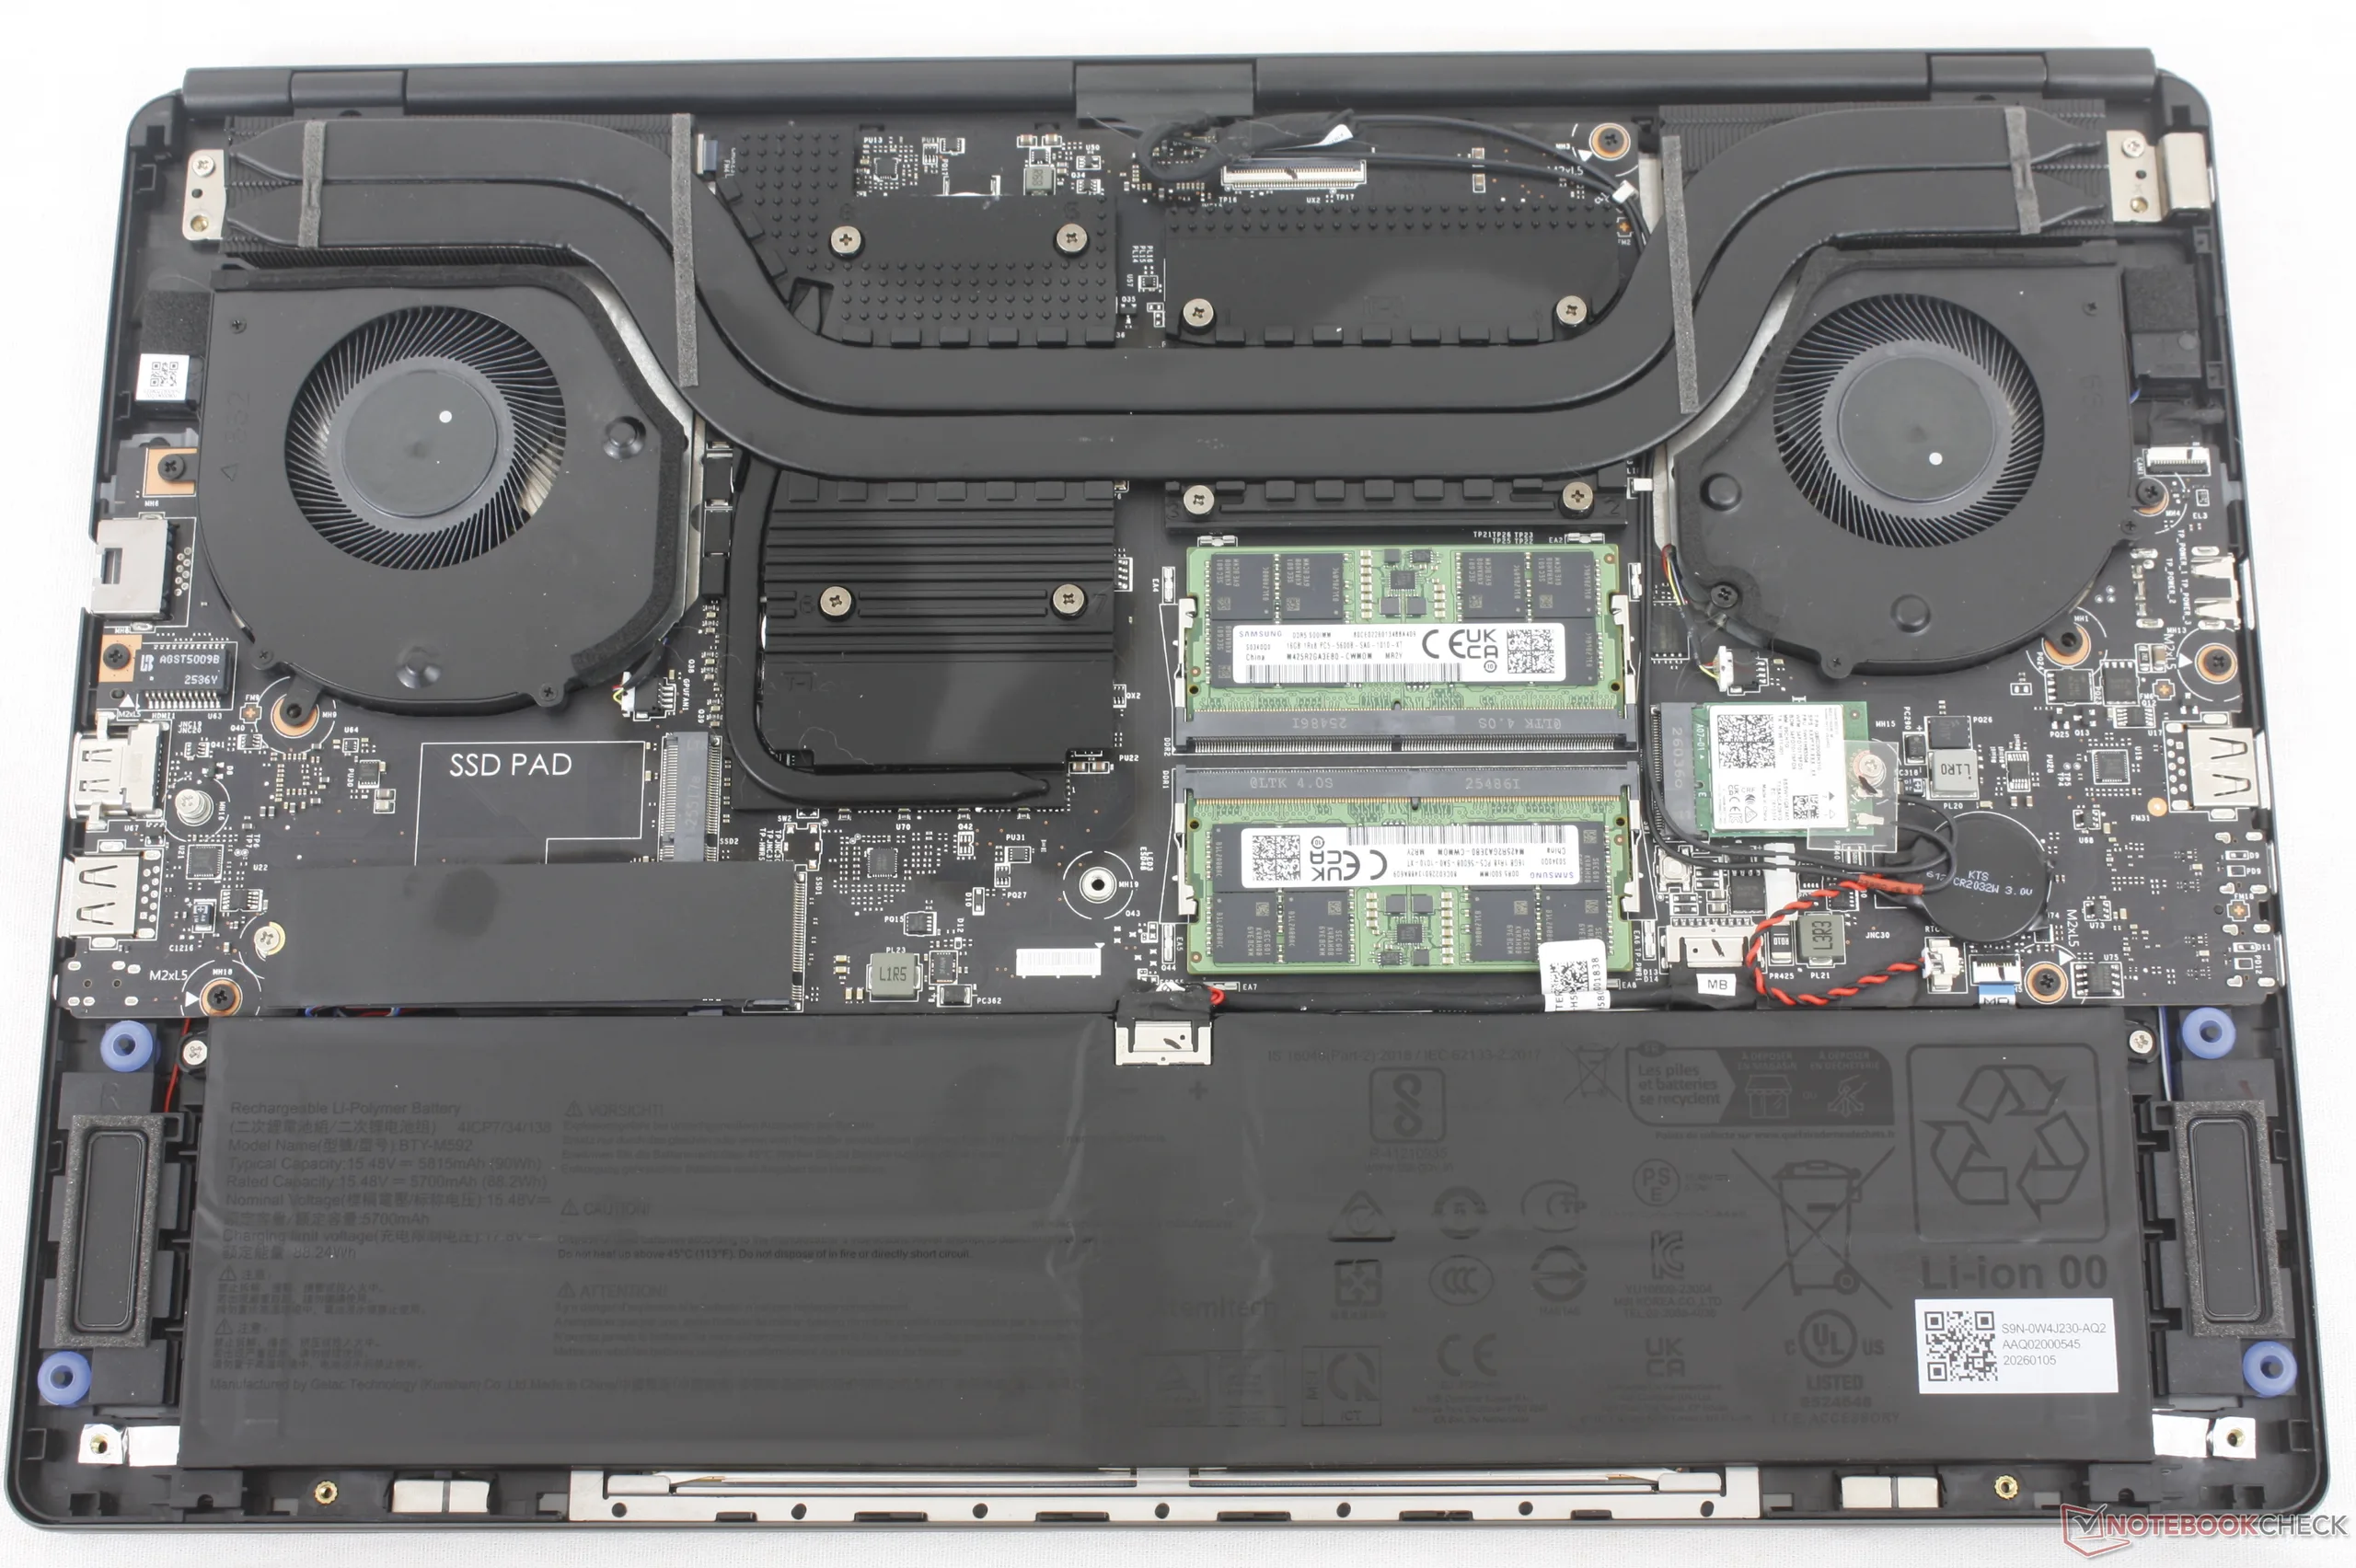
Le Stealth 16 2026 prend en charge jusqu’à deux SSD NVMe 2280 PCIe4 x4 et deux modules DDR5 SODIMM
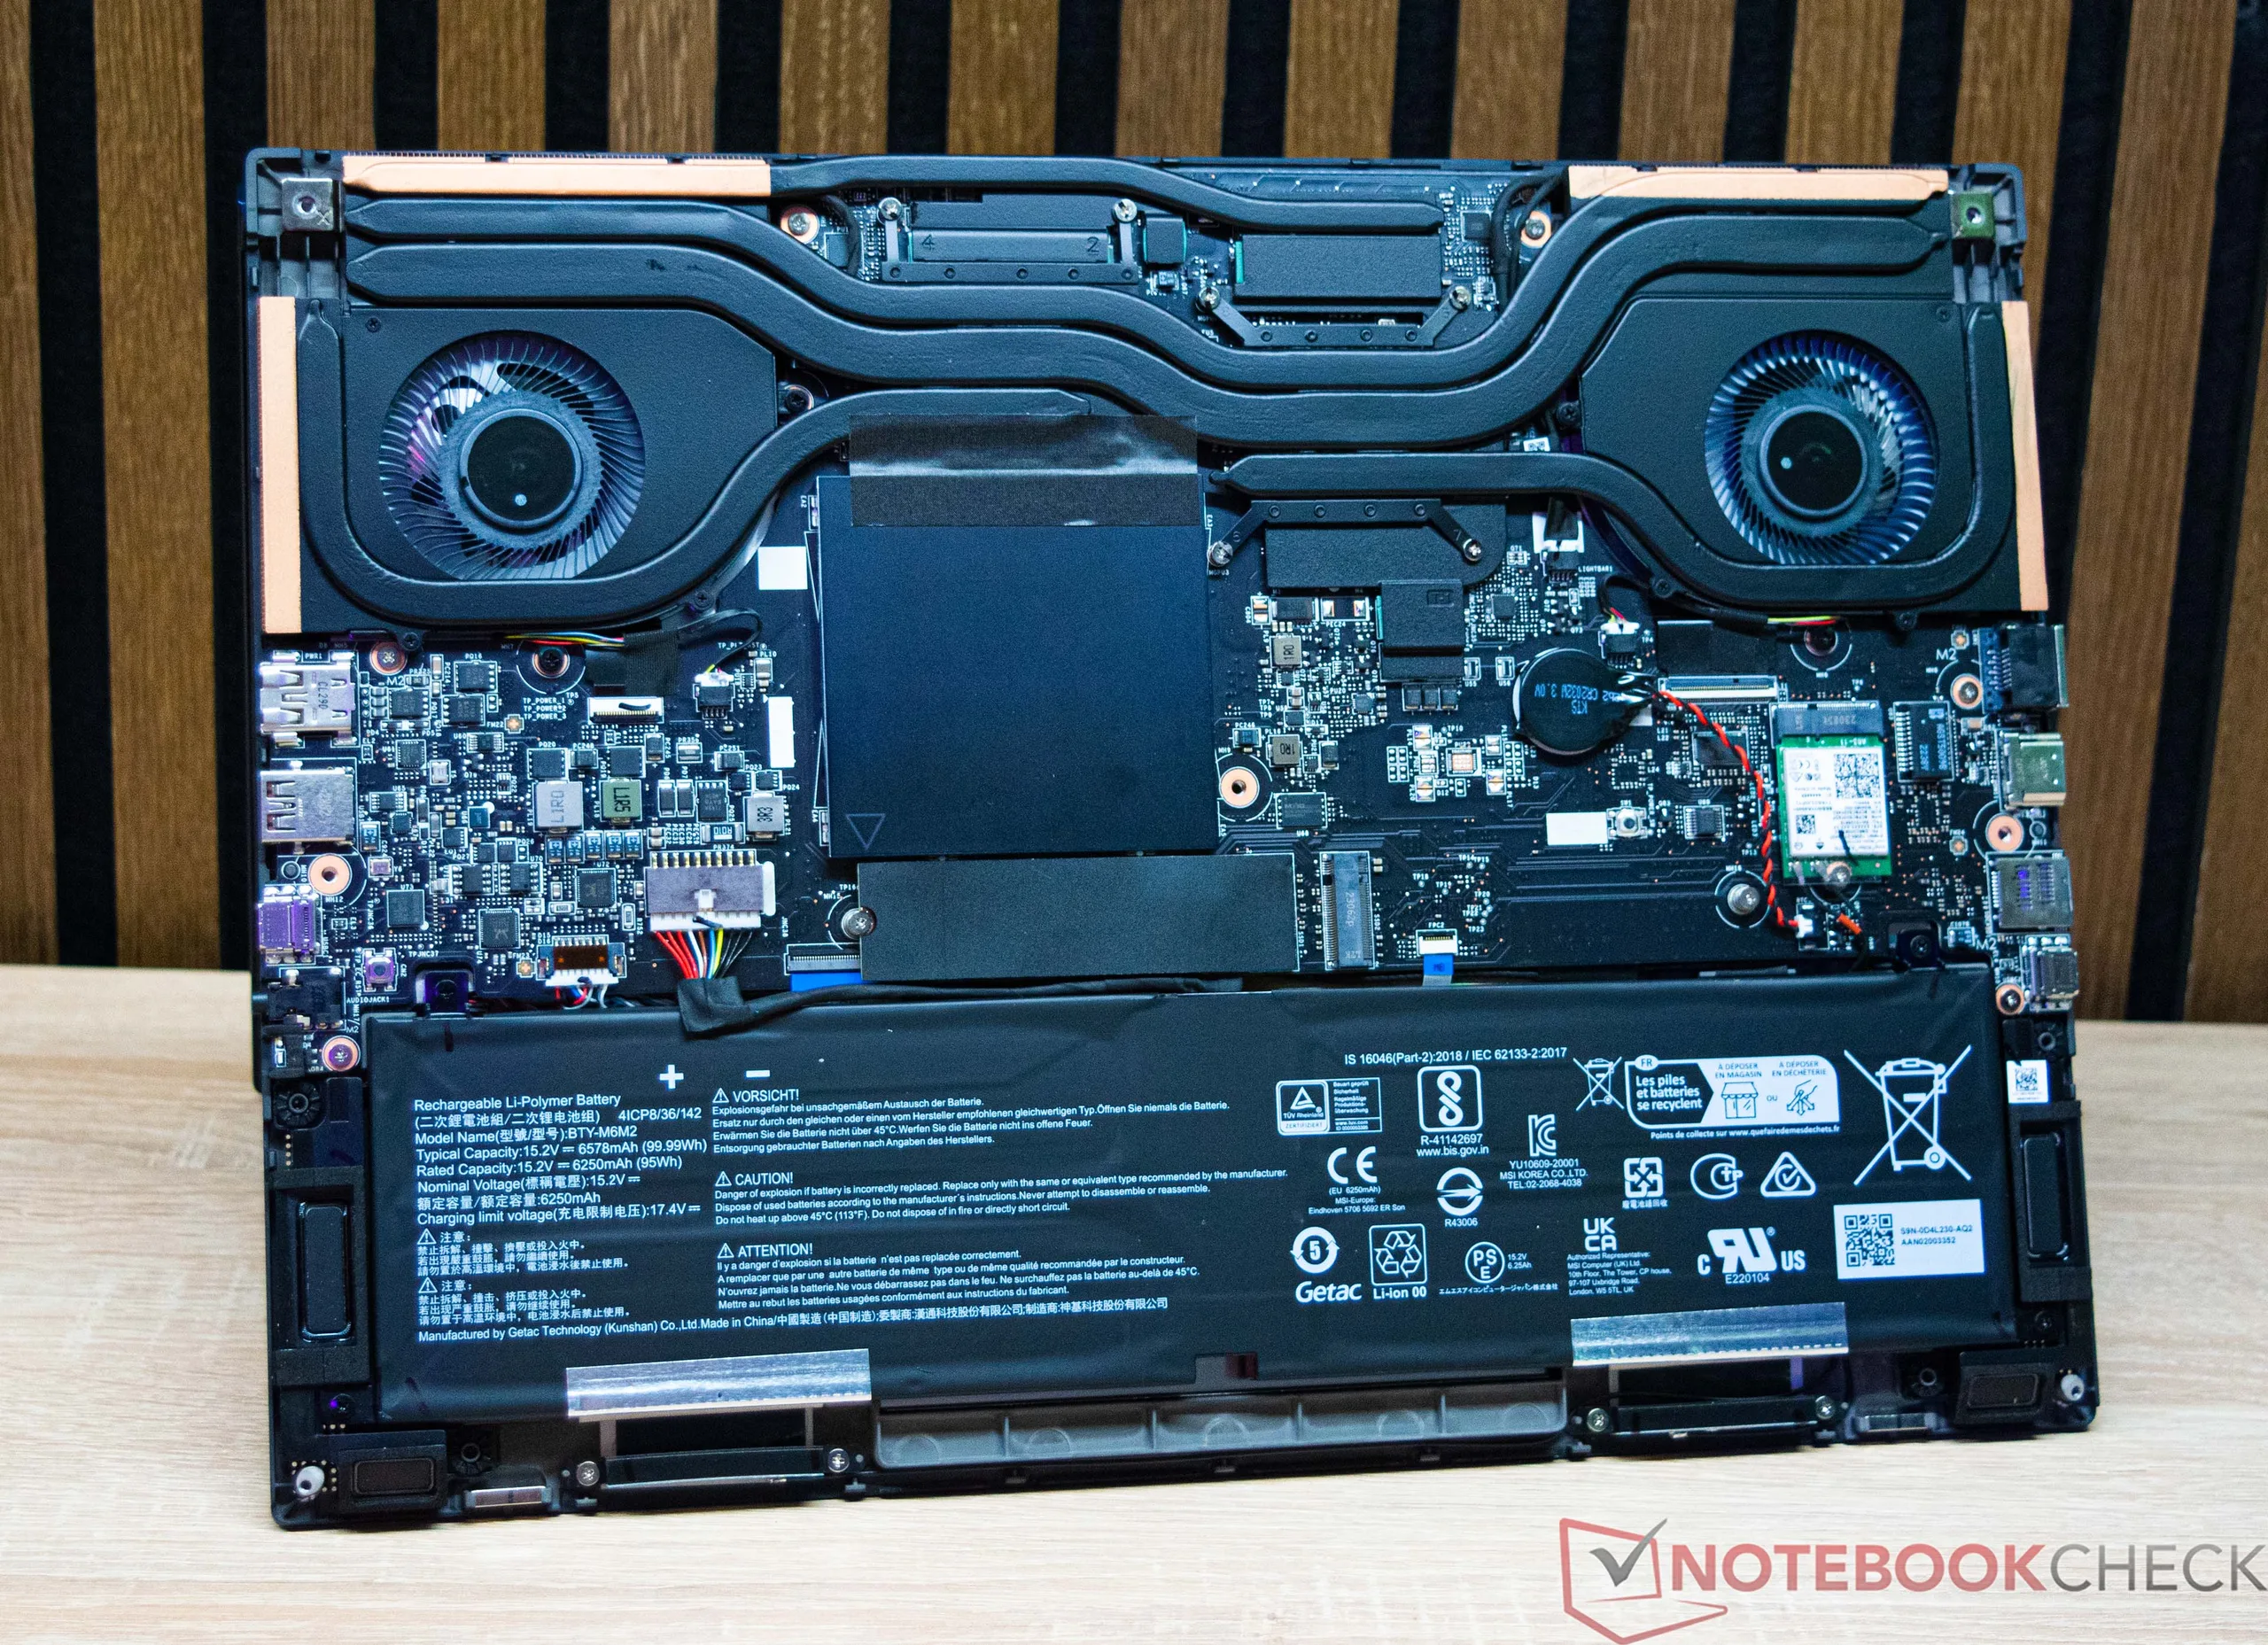
Stealth 16 2023 à titre de comparaison

Périphériques d’entrée

Pour correspondre à l’orientation plus professionnelle de la gamme Stealth, ce modèle reprend le clavier du Prestige 16 plutôt que celui d’un modèle davantage axé sur le gaming comme le Crosshair 16. L’éclairage RGB à quatre zones est pris en charge.
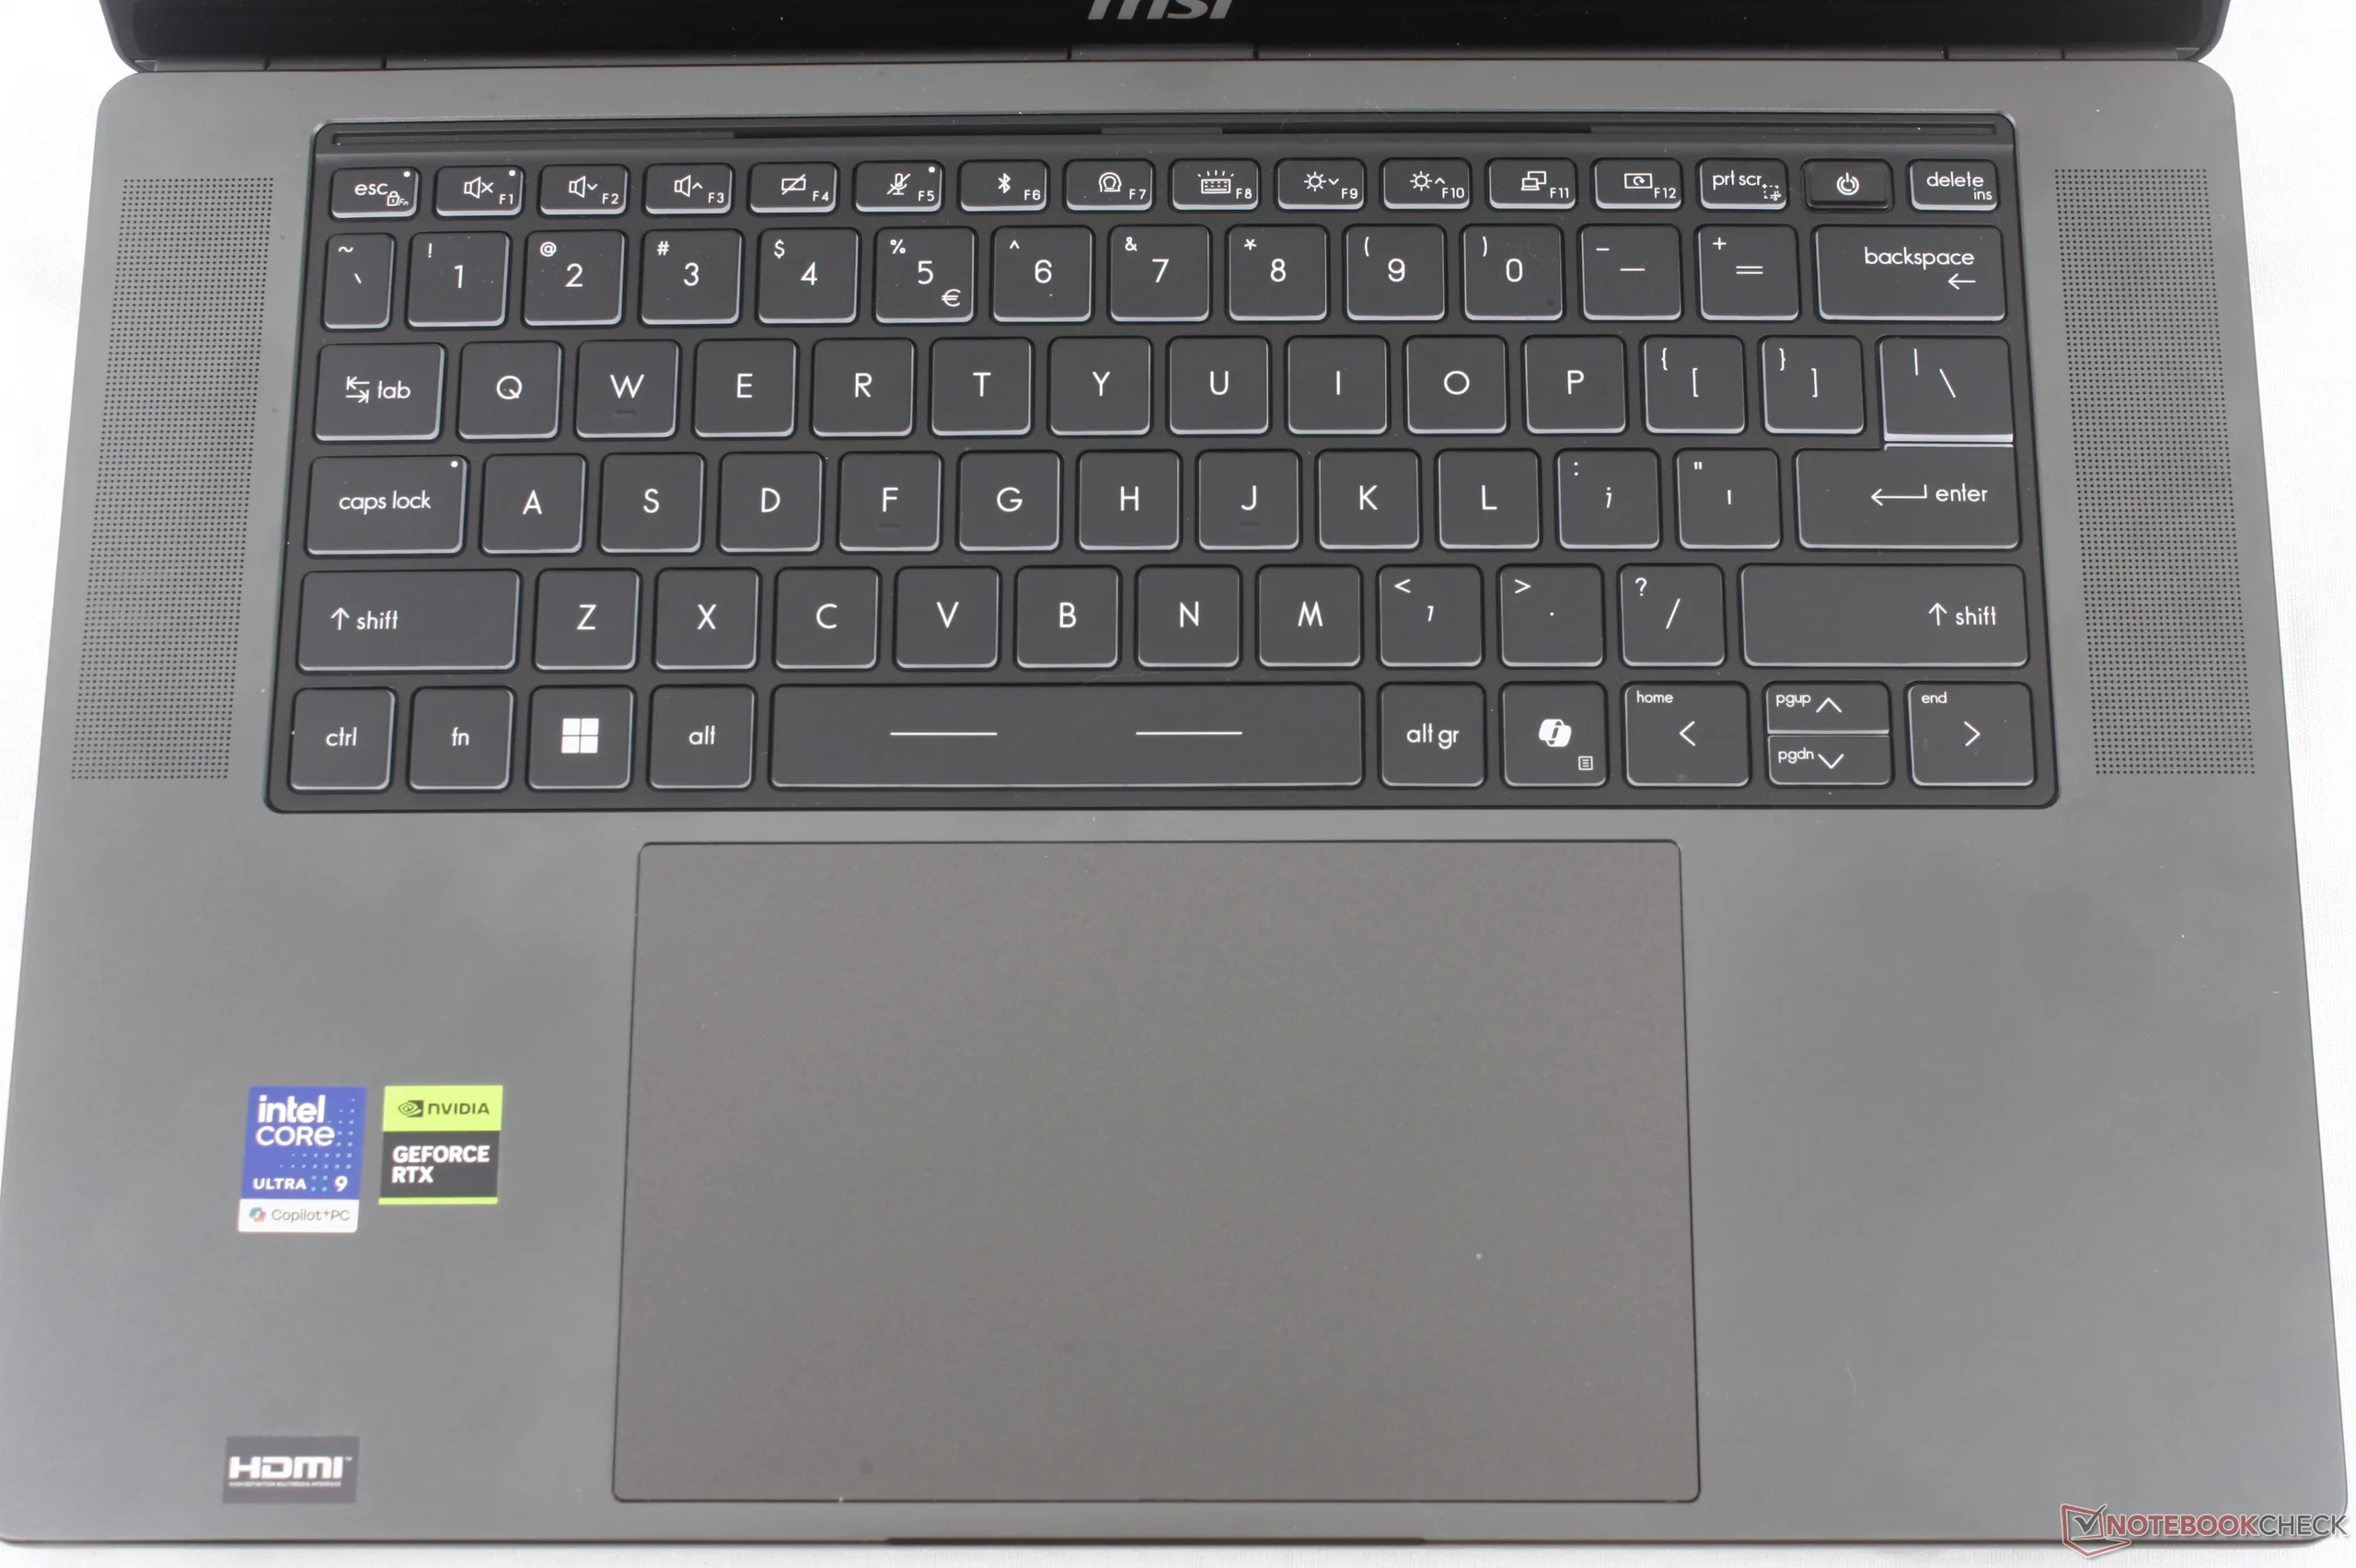
Le clickpad a considérablement gagné en taille, passant de 13,1 × 8,2 cm sur le Stealth 16 de 2023 à 16,1 × 10 cm sur cette dernière version.

Affichage

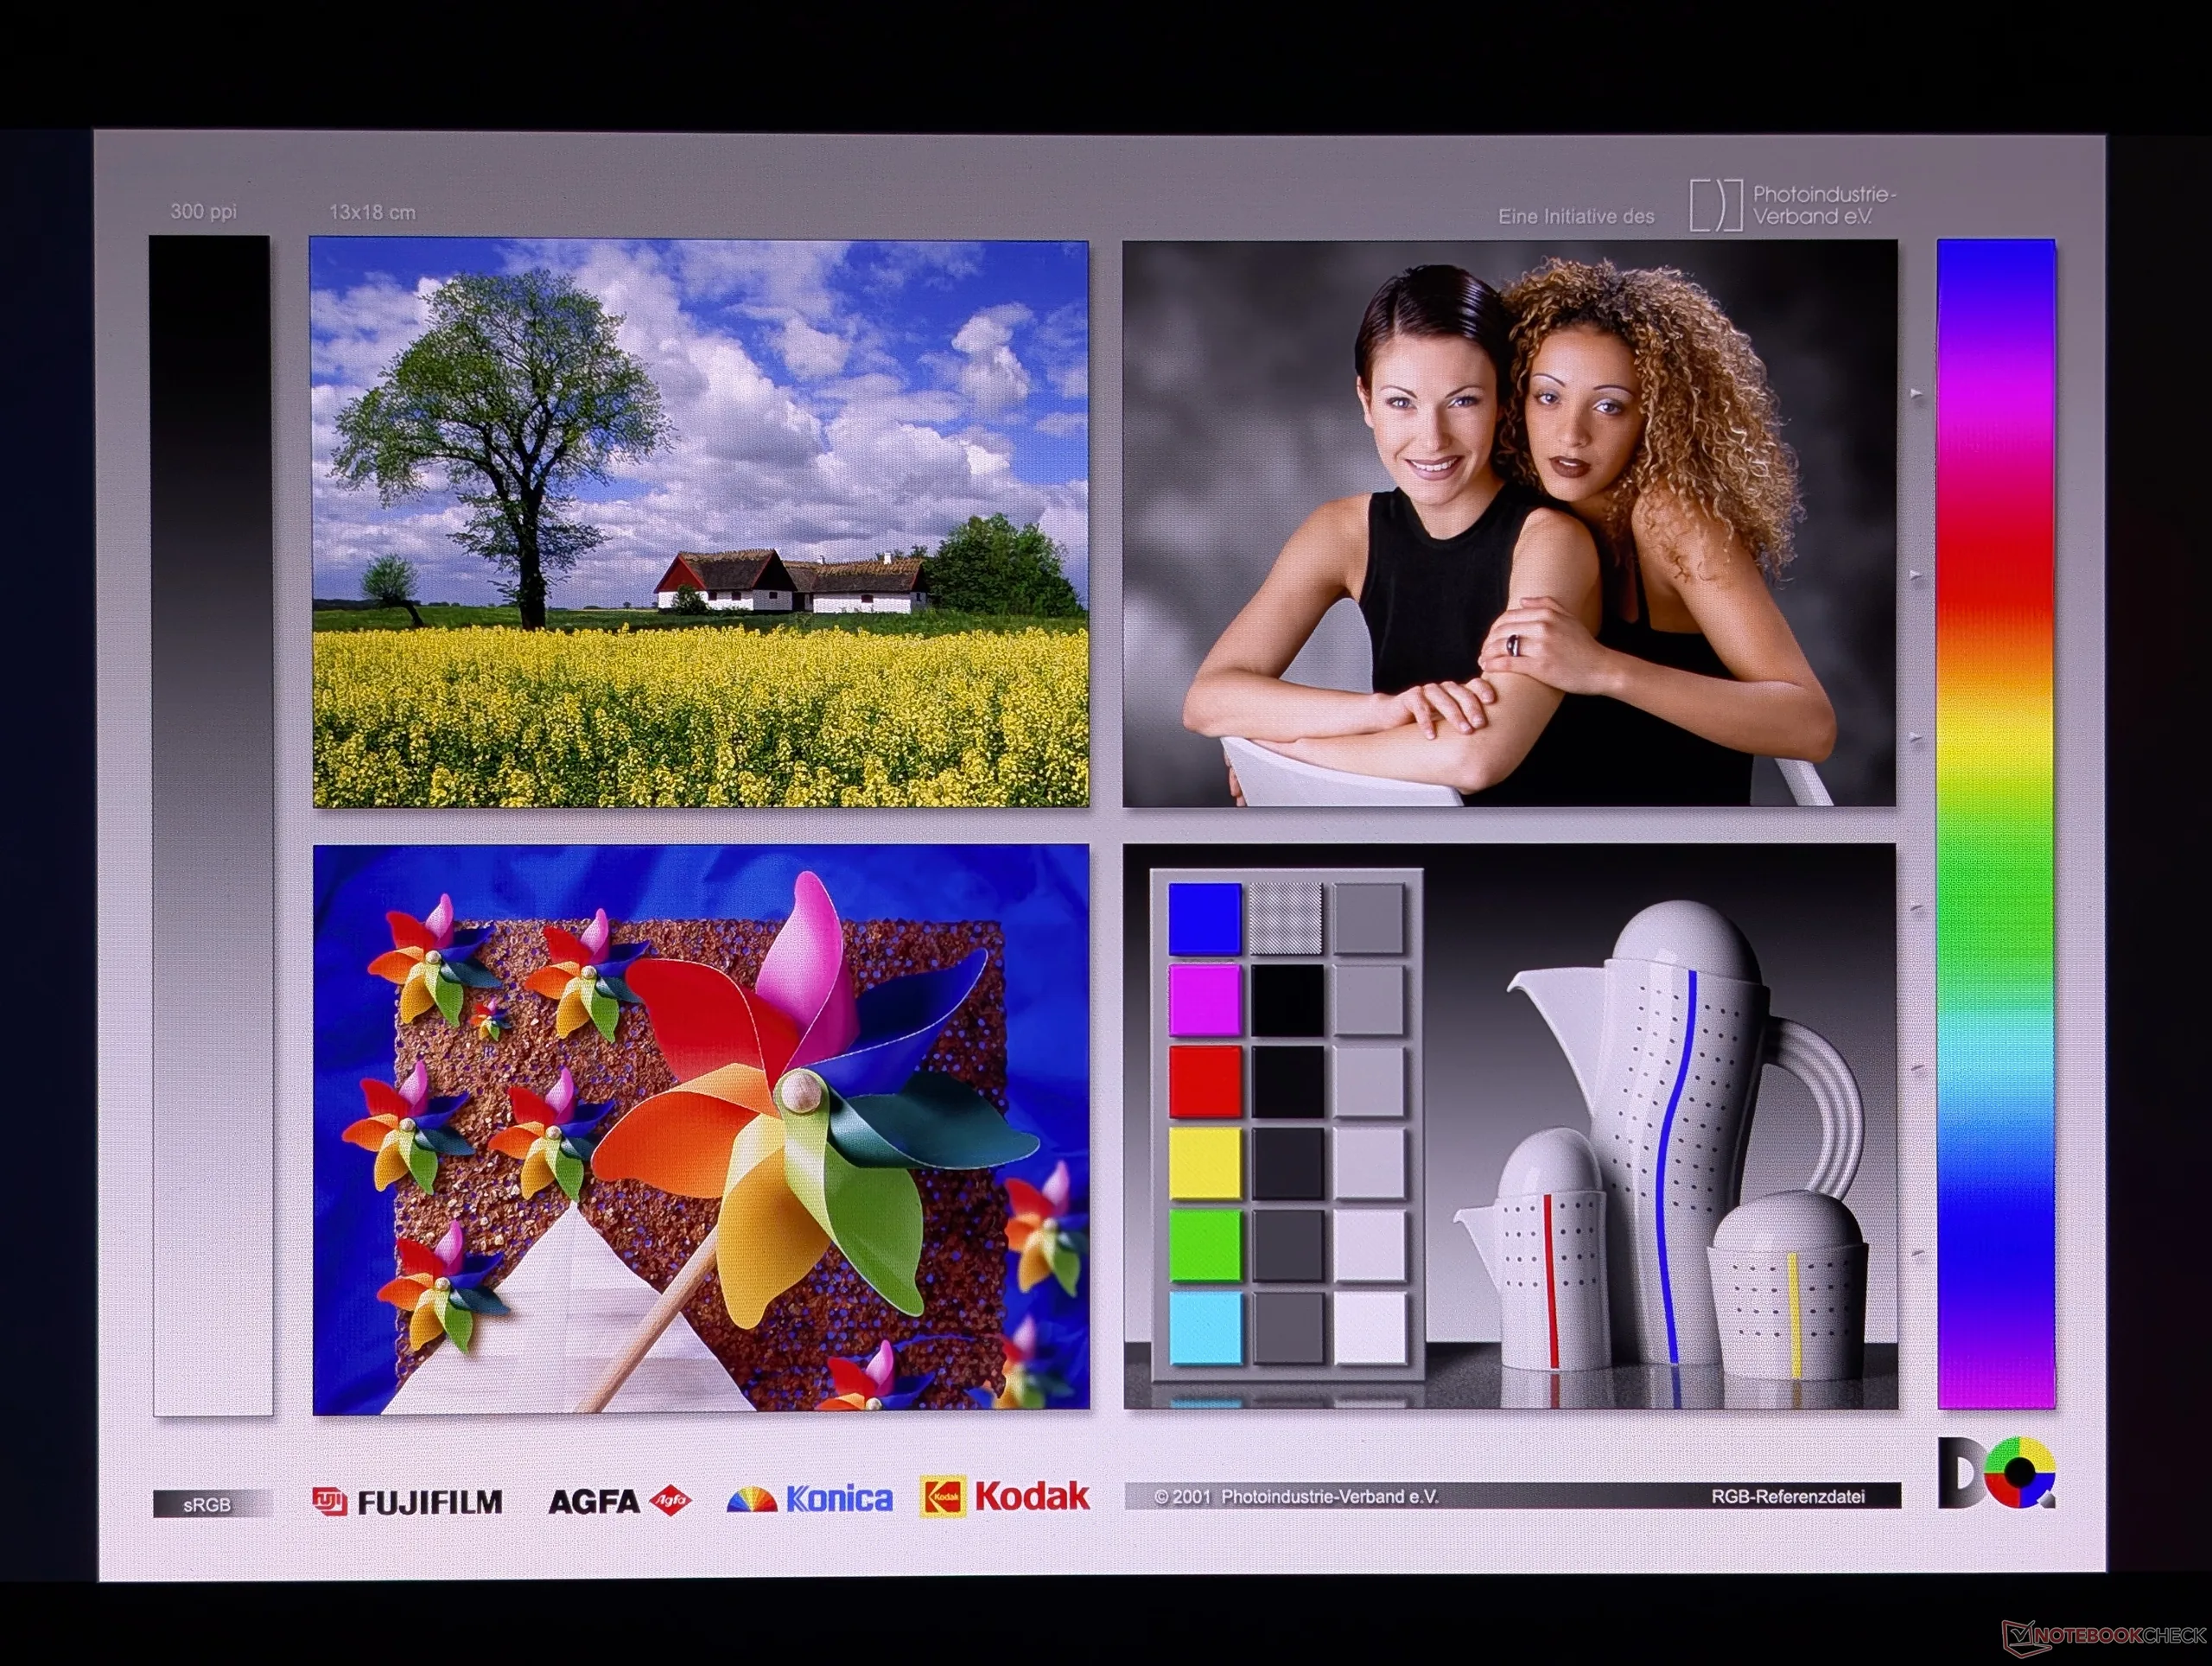
Matrice de pixels RVB nette provenant de la superposition brillante

L’écran OLED QHD+ de 240 Hz est similaire aux dalles disponibles sur les derniers Razer Blade 16 ou Asus ROG Zephyrus G16. Toutefois, gardez à l’esprit qu’il ne prend pas en charge G-Sync ni Advanced Optimus, et que le système doit donc redémarrer lors du passage entre les modes dGPU, iGPU et MSHybrid.

La luminosité maximale atteint 634 nits en mode HDR, conformément à la norme DisplayHDR600. En mode SDR, elle peut atteindre 385 nits.

390
cd/m²
387.5
cd/m²
385
cd/m²
390.9
cd/m²
384.8
cd/m²
384.6
cd/m²
393.7
cd/m²
391.4
cd/m²
389.8
cd/m²
Homogénéité de la luminosité
Samsung ATNA60DL07-0 testé avec X-Rite i1Pro 3
Maximum: 393.7 cd/m² (Nits) Moyenne: 388.6 cd/m² Minimum: 4.34 cd/m²
Homogénéité de la luminosité: 98 %
Valeur mesurée au centre, sur batterie: 384.8 cd/m²
Contraste: ∞:1 (Valeurs des noirs: 0 cd/m²)
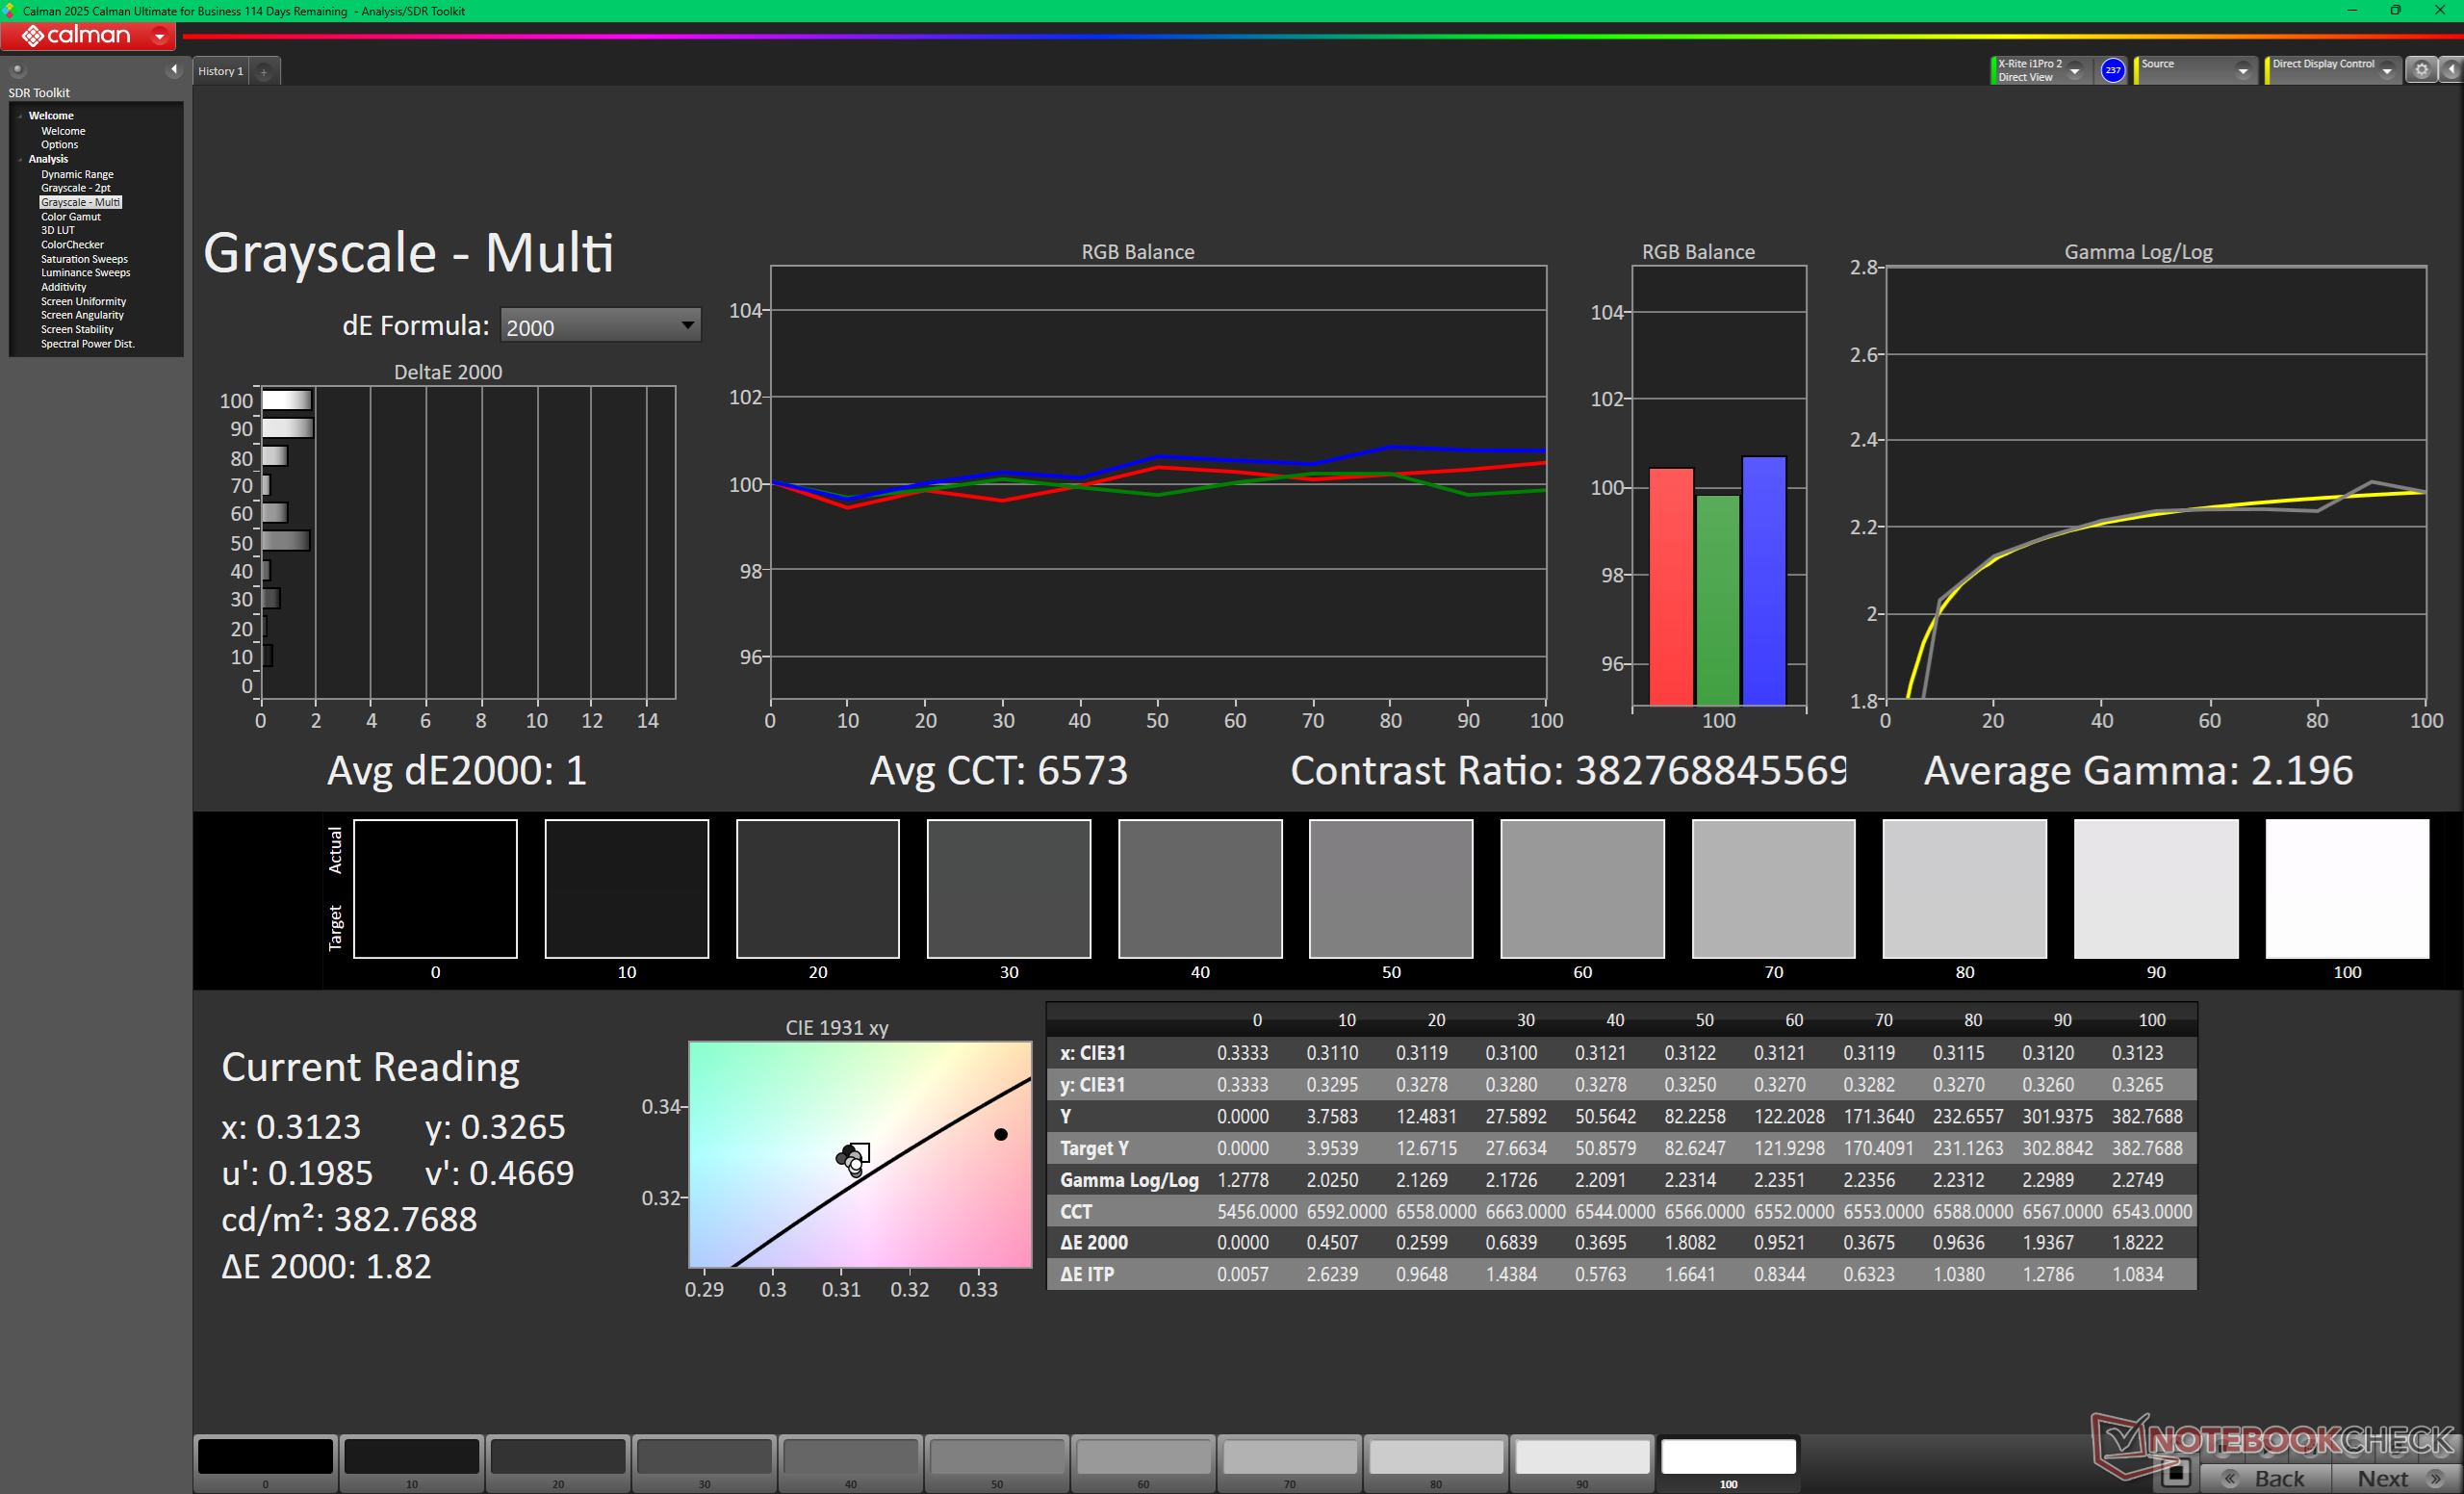
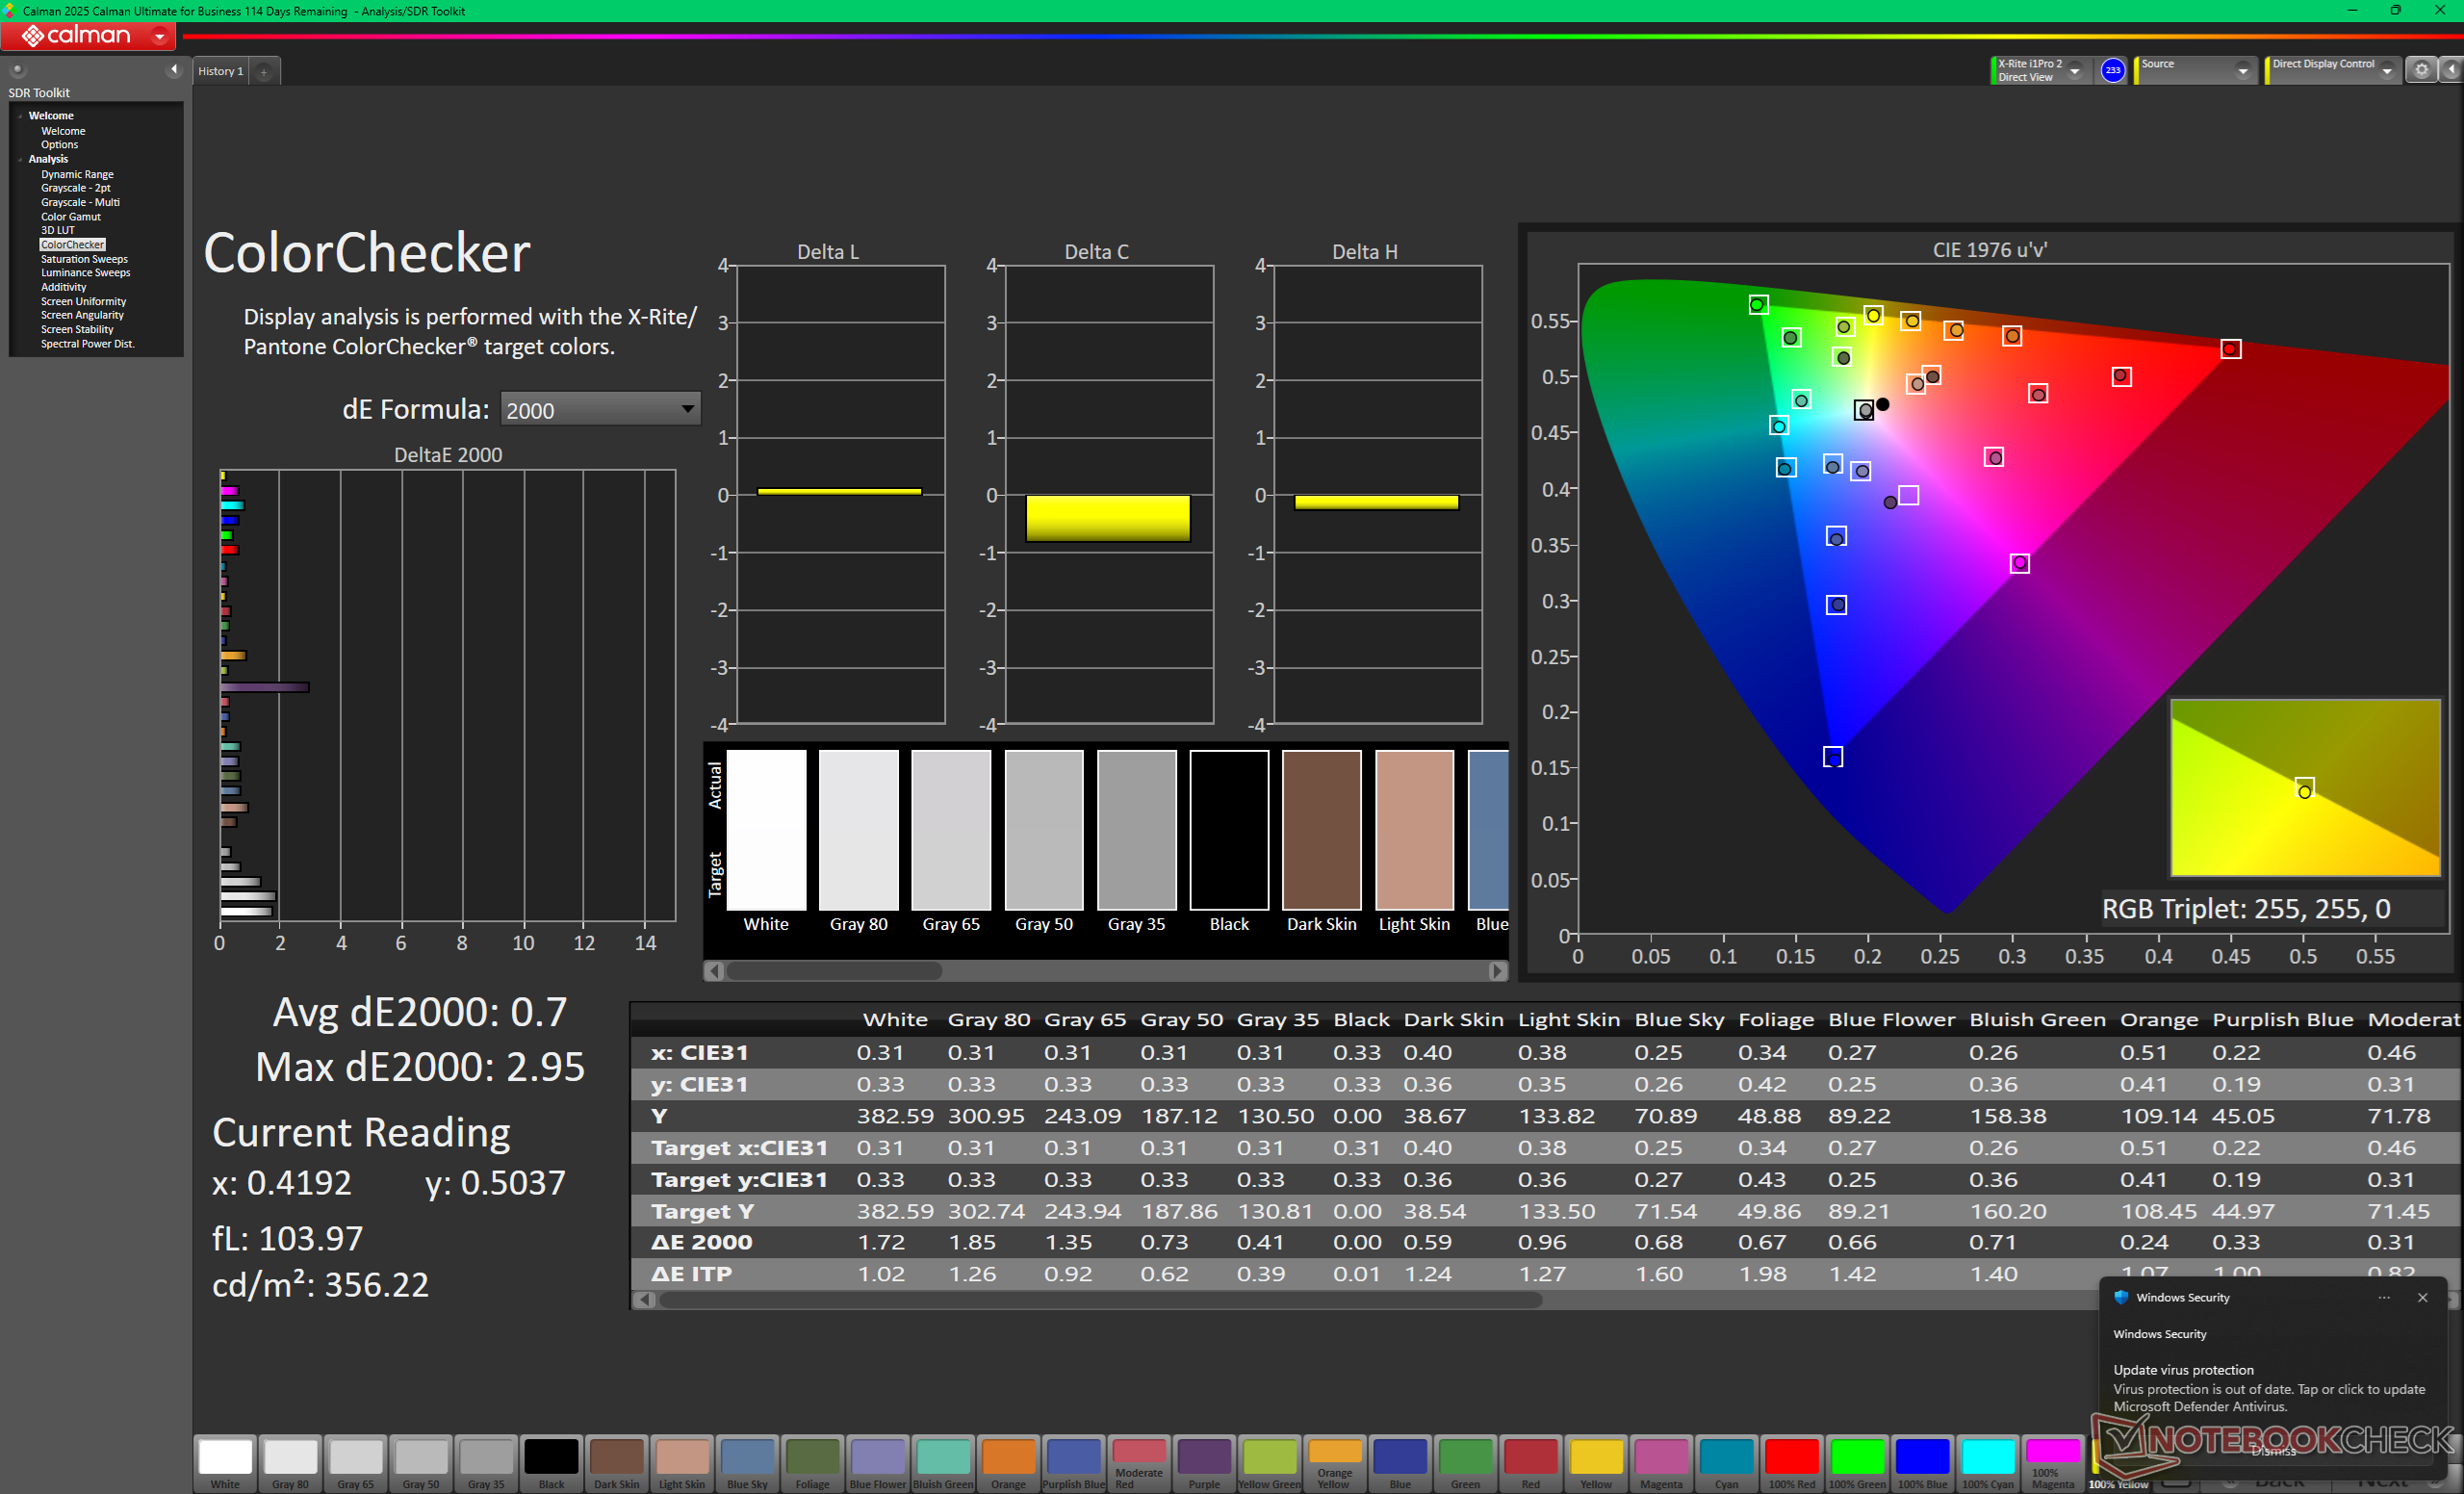
ΔE ColorChecker Calman: 0.7 | ∀{0.5-29.43 Ø4.69}
calibrated: 0.44
ΔE Greyscale Calman: 1 | ∀{0.09-98 Ø4.94}
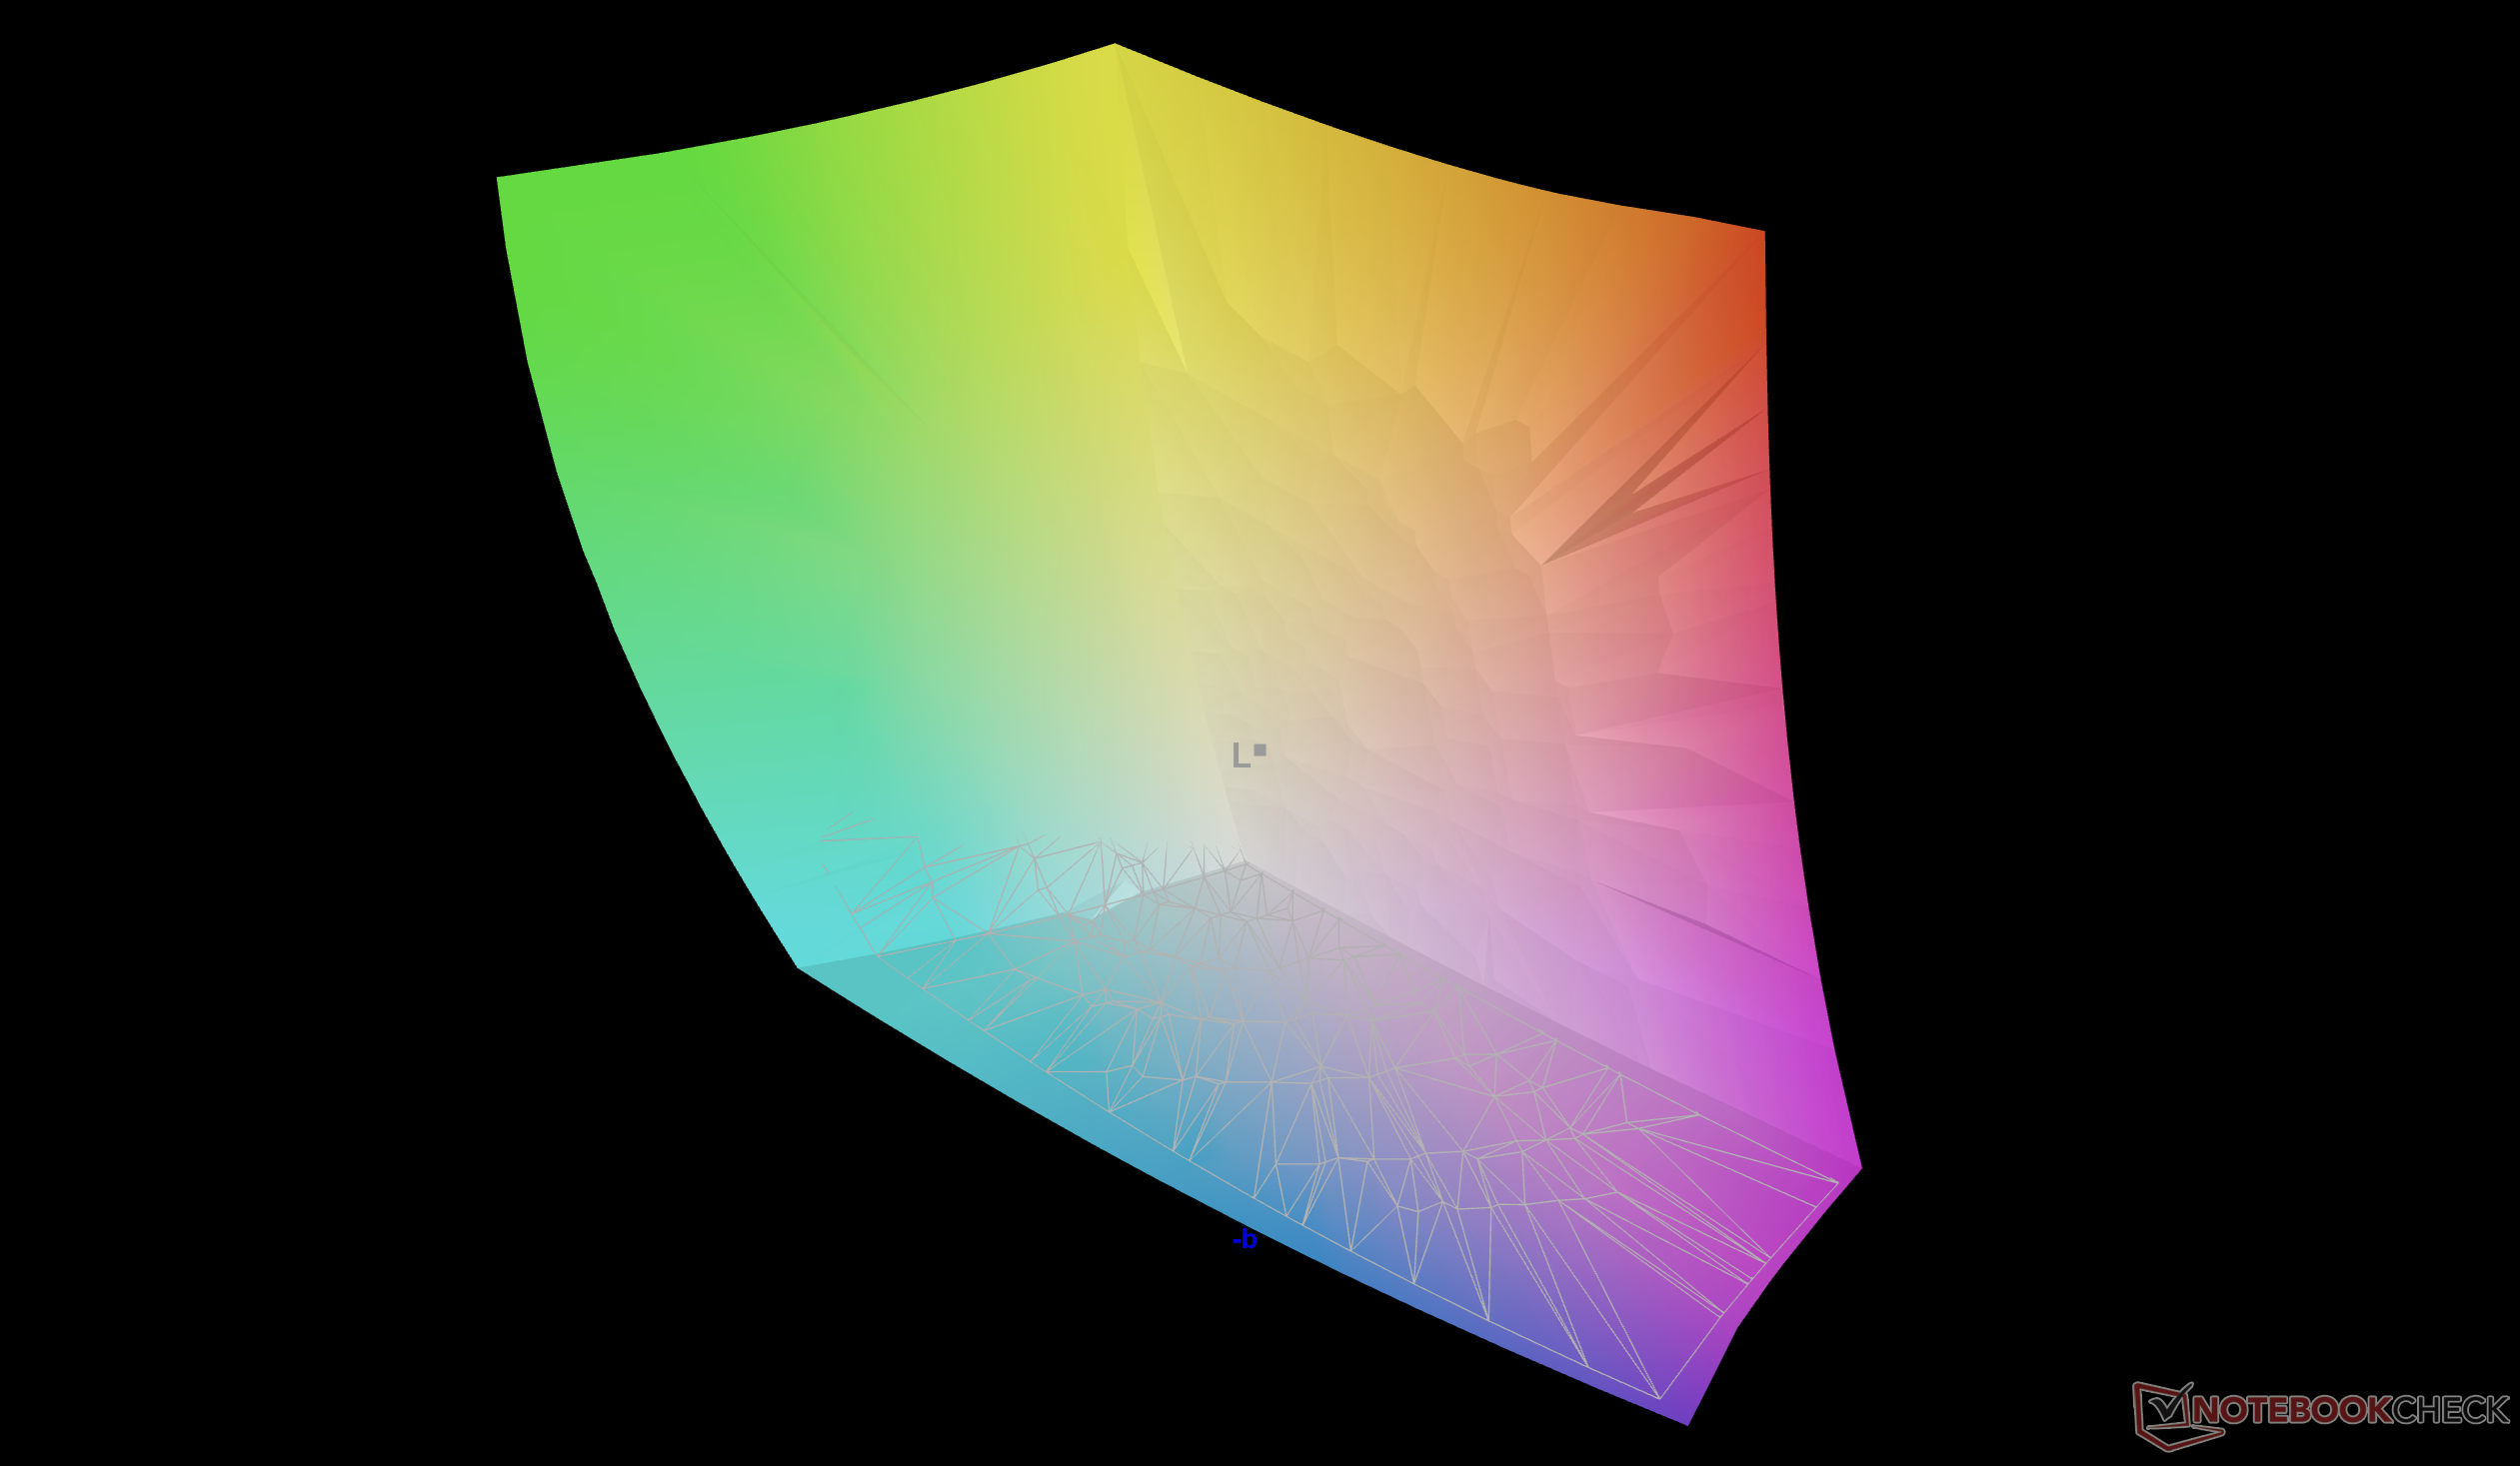
97.8% AdobeRGB 1998 (Argyll 3D)
100% sRGB (Argyll 3D)
99.5% Display P3 (Argyll 3D)
Gamma: 2.2
CCT: 6573 K
MSI Stealth 16 AI B3WH
Samsung ATNA60DL07-0, OLED, 2560x1600, 16", 240 Hz
MSI Stealth 16 Studio A13VG
AUO26A9, IPS, 2560x1600, 16", 240 Hz
Razer Blade 16 Core Ultra 9 386H
Samsung ATNA60HU06-0, OLED, 2560x1600, 16", 240 Hz
Lenovo Legion 7 16 AGP11
ATNA60HU02-0, OLED, 2560x1600, 16", 240 Hz
Aorus Master 16 AM6J
Samsung ATNA60HU02-0, OLED, 2560x1600, 16", 240 Hz
Asus ROG Zephyrus G16 GU606AW
ATNA60HU06-0, OLED, 2560x1600, 16", 240 Hz
Display
-5%
-1%
-3%
-5%
-8%
HDR Peak Brightness (cd/m²)
1138
Display P3 Coverage (%)
99.5
96.4
-3%
99.7
0%
99.2
0%
95.9
-4%
91.7
-8%
sRGB Coverage (%)
100
99.7
0%
100
0%
100
0%
100
0%
97.5
-2%
AdobeRGB 1998 Coverage (%)
97.8
84.8
-13%
93.5
-4%
90.2
-8%
88.2
-10%
84.8
-13%
Response Times
-1267%
2%
-131%
-4%
-73%
Response Time Grey 50% / Grey 80% * (ms)
0.29 ?(0.15, 0.14)
4.4 ?(2.2, 2.2)
-1417%
0.28 ?(0.15, 0.13)
3%
1.41 ?(0.7, 0.71)
-386%
0.371 ?(0.289, 0.082)
-28%
0.81 ?(0.7, 0.11)
-179%
Response Time Black / White * (ms)
0.46 ?(0.22, 0.24)
5.6 ?(2.2, 3.4)
-1117%
0.4 ?(0.2, 0.2)
13%
0.25 ?(0.13, 0.12)
46%
0.206 ?(0.112, 0.094)
55%
0.22 ?(0.12, 0.1)
52%
PWM Frequency (Hz)
960.2
1441
1440 ?(90)
1158 ?(99)
1440 ?(95)
PWM Amplitude * (%)
29
32
-10%
44
-52%
40
-38%
56
-93%
Screen
-201%
-55%
-122%
-139%
-32%
Brightness middle (cd/m²)
384.8
424
10%
462.2
20%
499
30%
468
22%
512
33%
Brightness (cd/m²)
389
411
6%
465
20%
502
29%
467
20%
515
32%
Brightness Distribution (%)
98
88
-10%
97
-1%
98
0%
96
-2%
98
0%
Black Level * (cd/m²)
0.37
0.02
0.03
0.01
Colorchecker dE 2000 *
0.7
3.04
-334%
3.03
-333%
2.5
-257%
4
-471%
1.5
-114%
Colorchecker dE 2000 max. *
2.95
7.5
-154%
5.84
-98%
7.8
-164%
6.59
-123%
3.4
-15%
Colorchecker dE 2000 calibrated *
0.44
3.04
-591%
0.6
-36%
Greyscale dE 2000 *
1
4.34
-334%
0.6
40%
4.7
-370%
3.8
-280%
2.3
-130%
Gamma
2.2 100%
2.32 95%
2.2 100%
2.21 100%
2.597 85%
2.16 102%
CCT
6573 99%
6952 93%
6452 101%
6715 97%
6626 98%
6589 99%
Contrast (:1)
1146
24950
15600
51200
Moyenne finale (programmes/paramètres)
-491% / -330%
-18% / -30%
-85% / -94%
-49% / -72%
-38% / -36%

* ... Moindre est la valeur, meilleures sont les performances
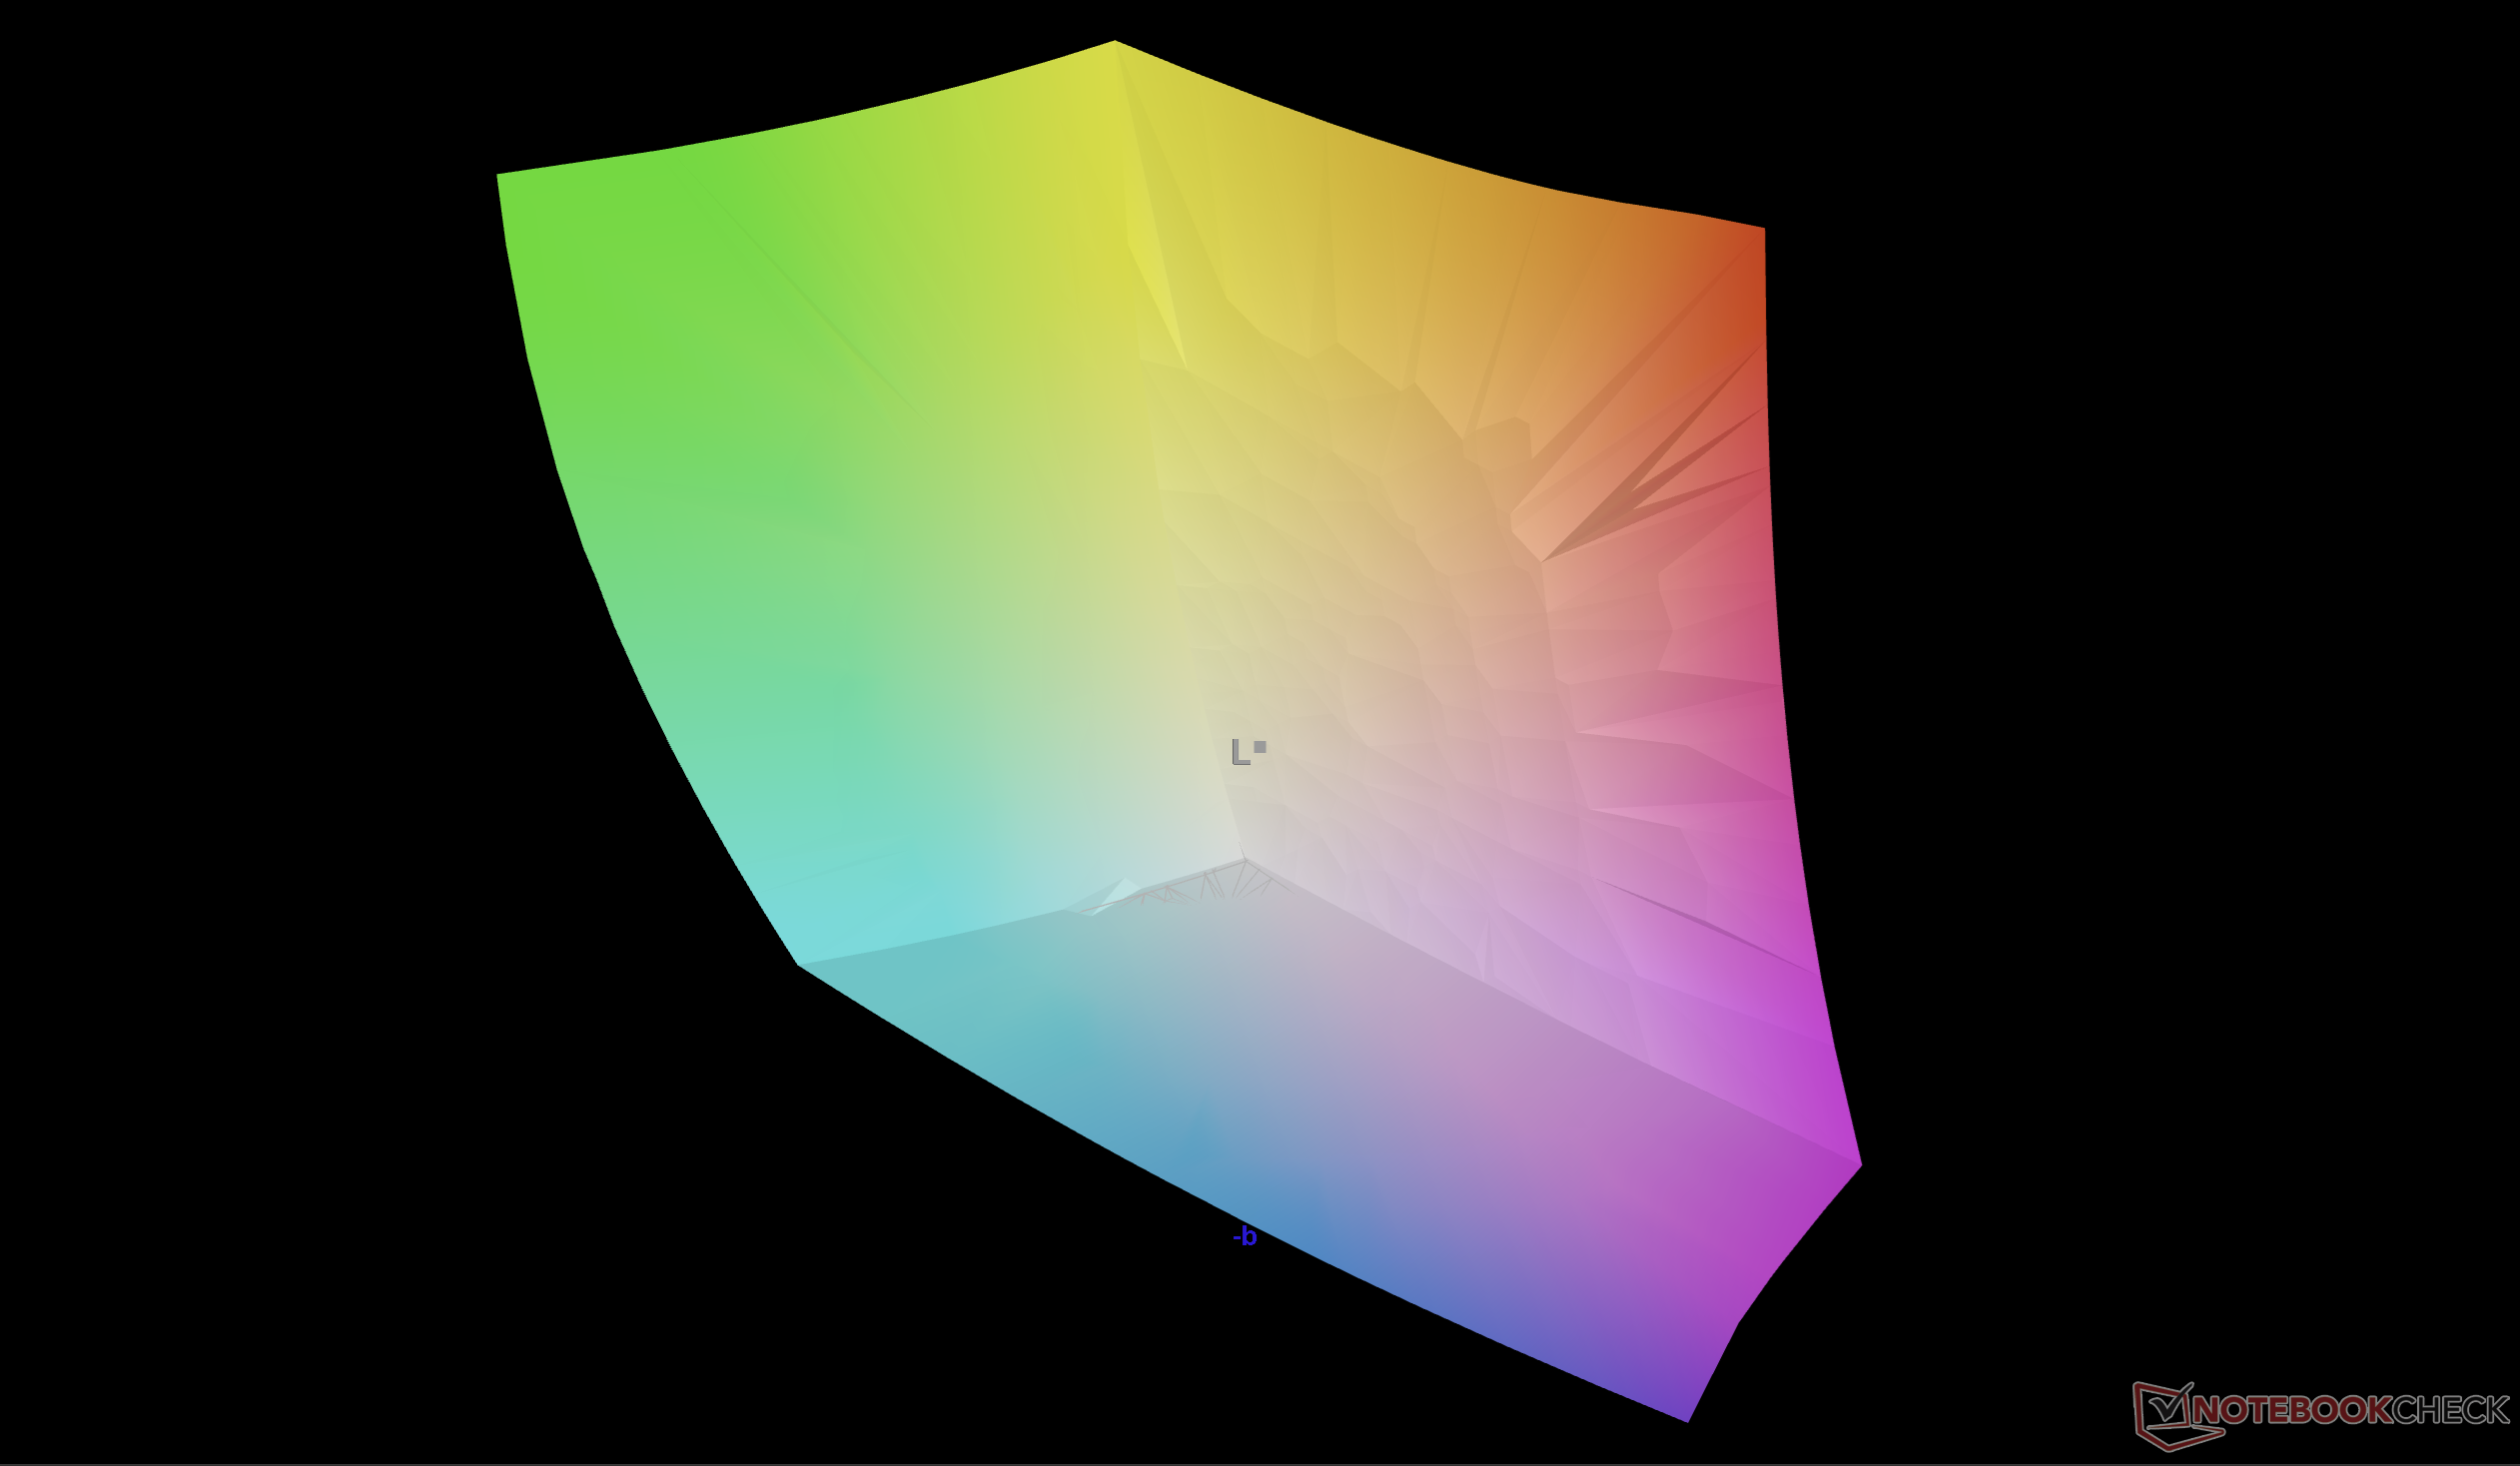
par rapport au sRGB
par rapport au sRGB
contre P3
contre P3
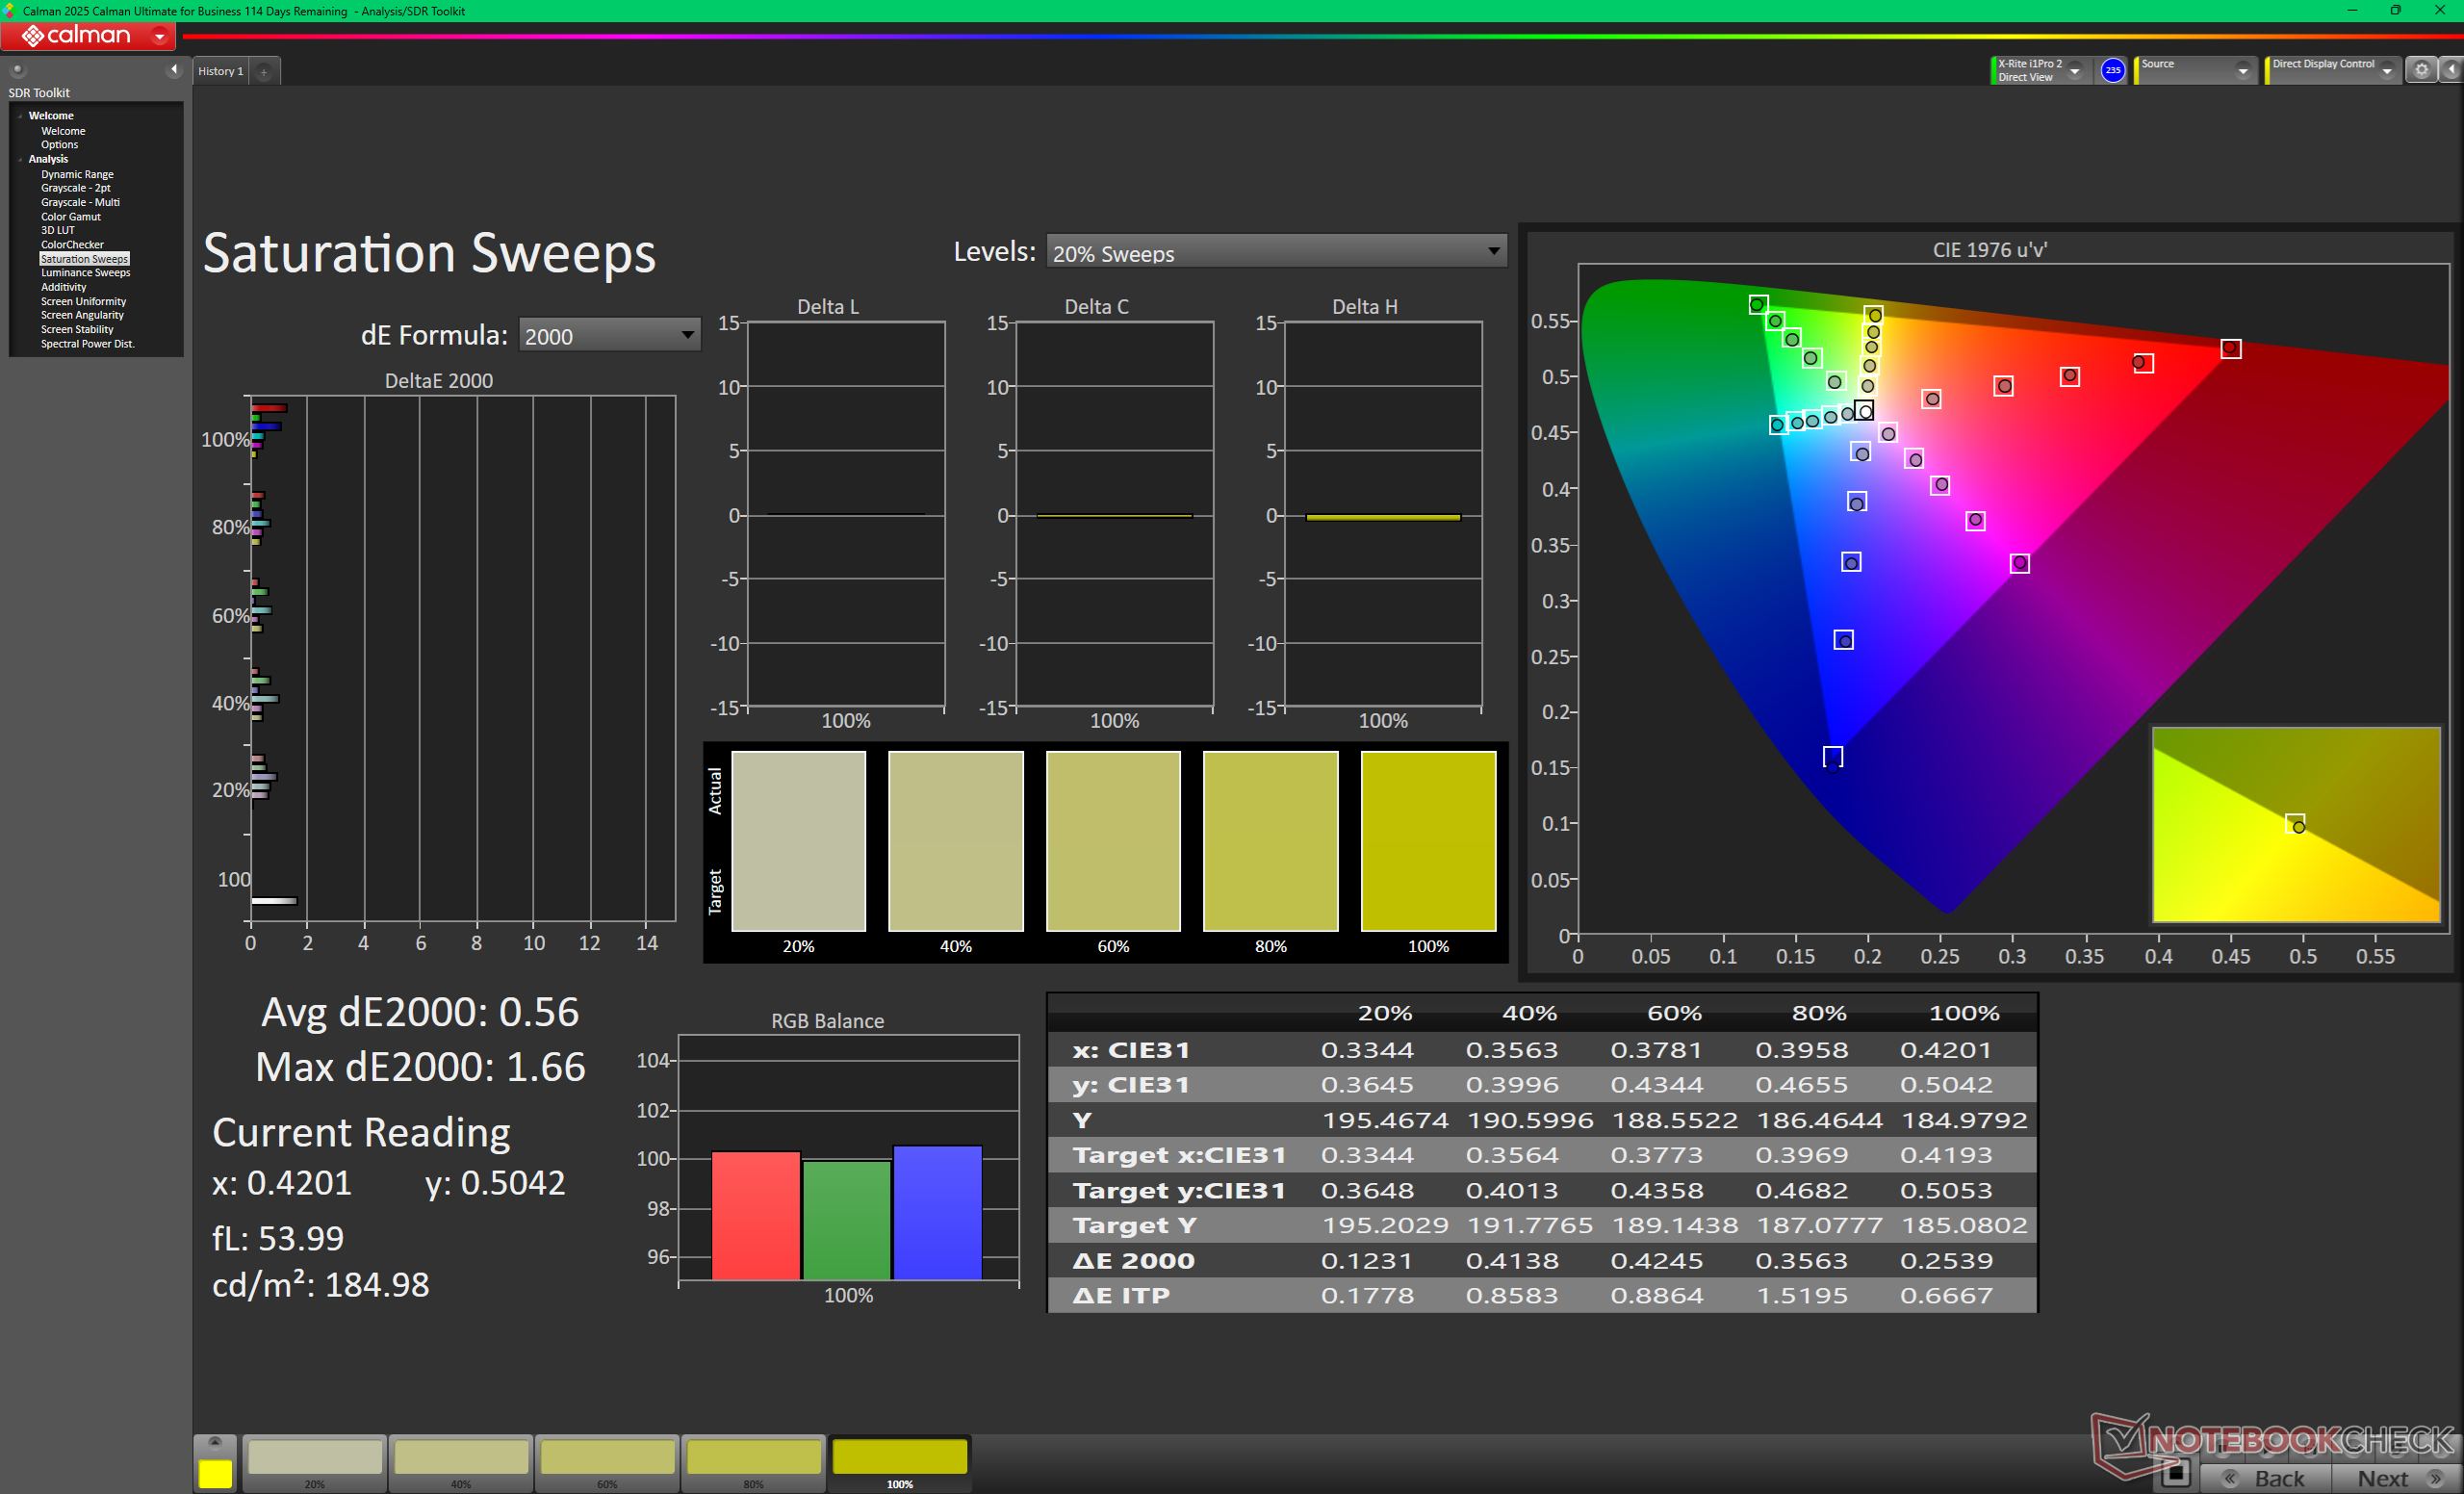
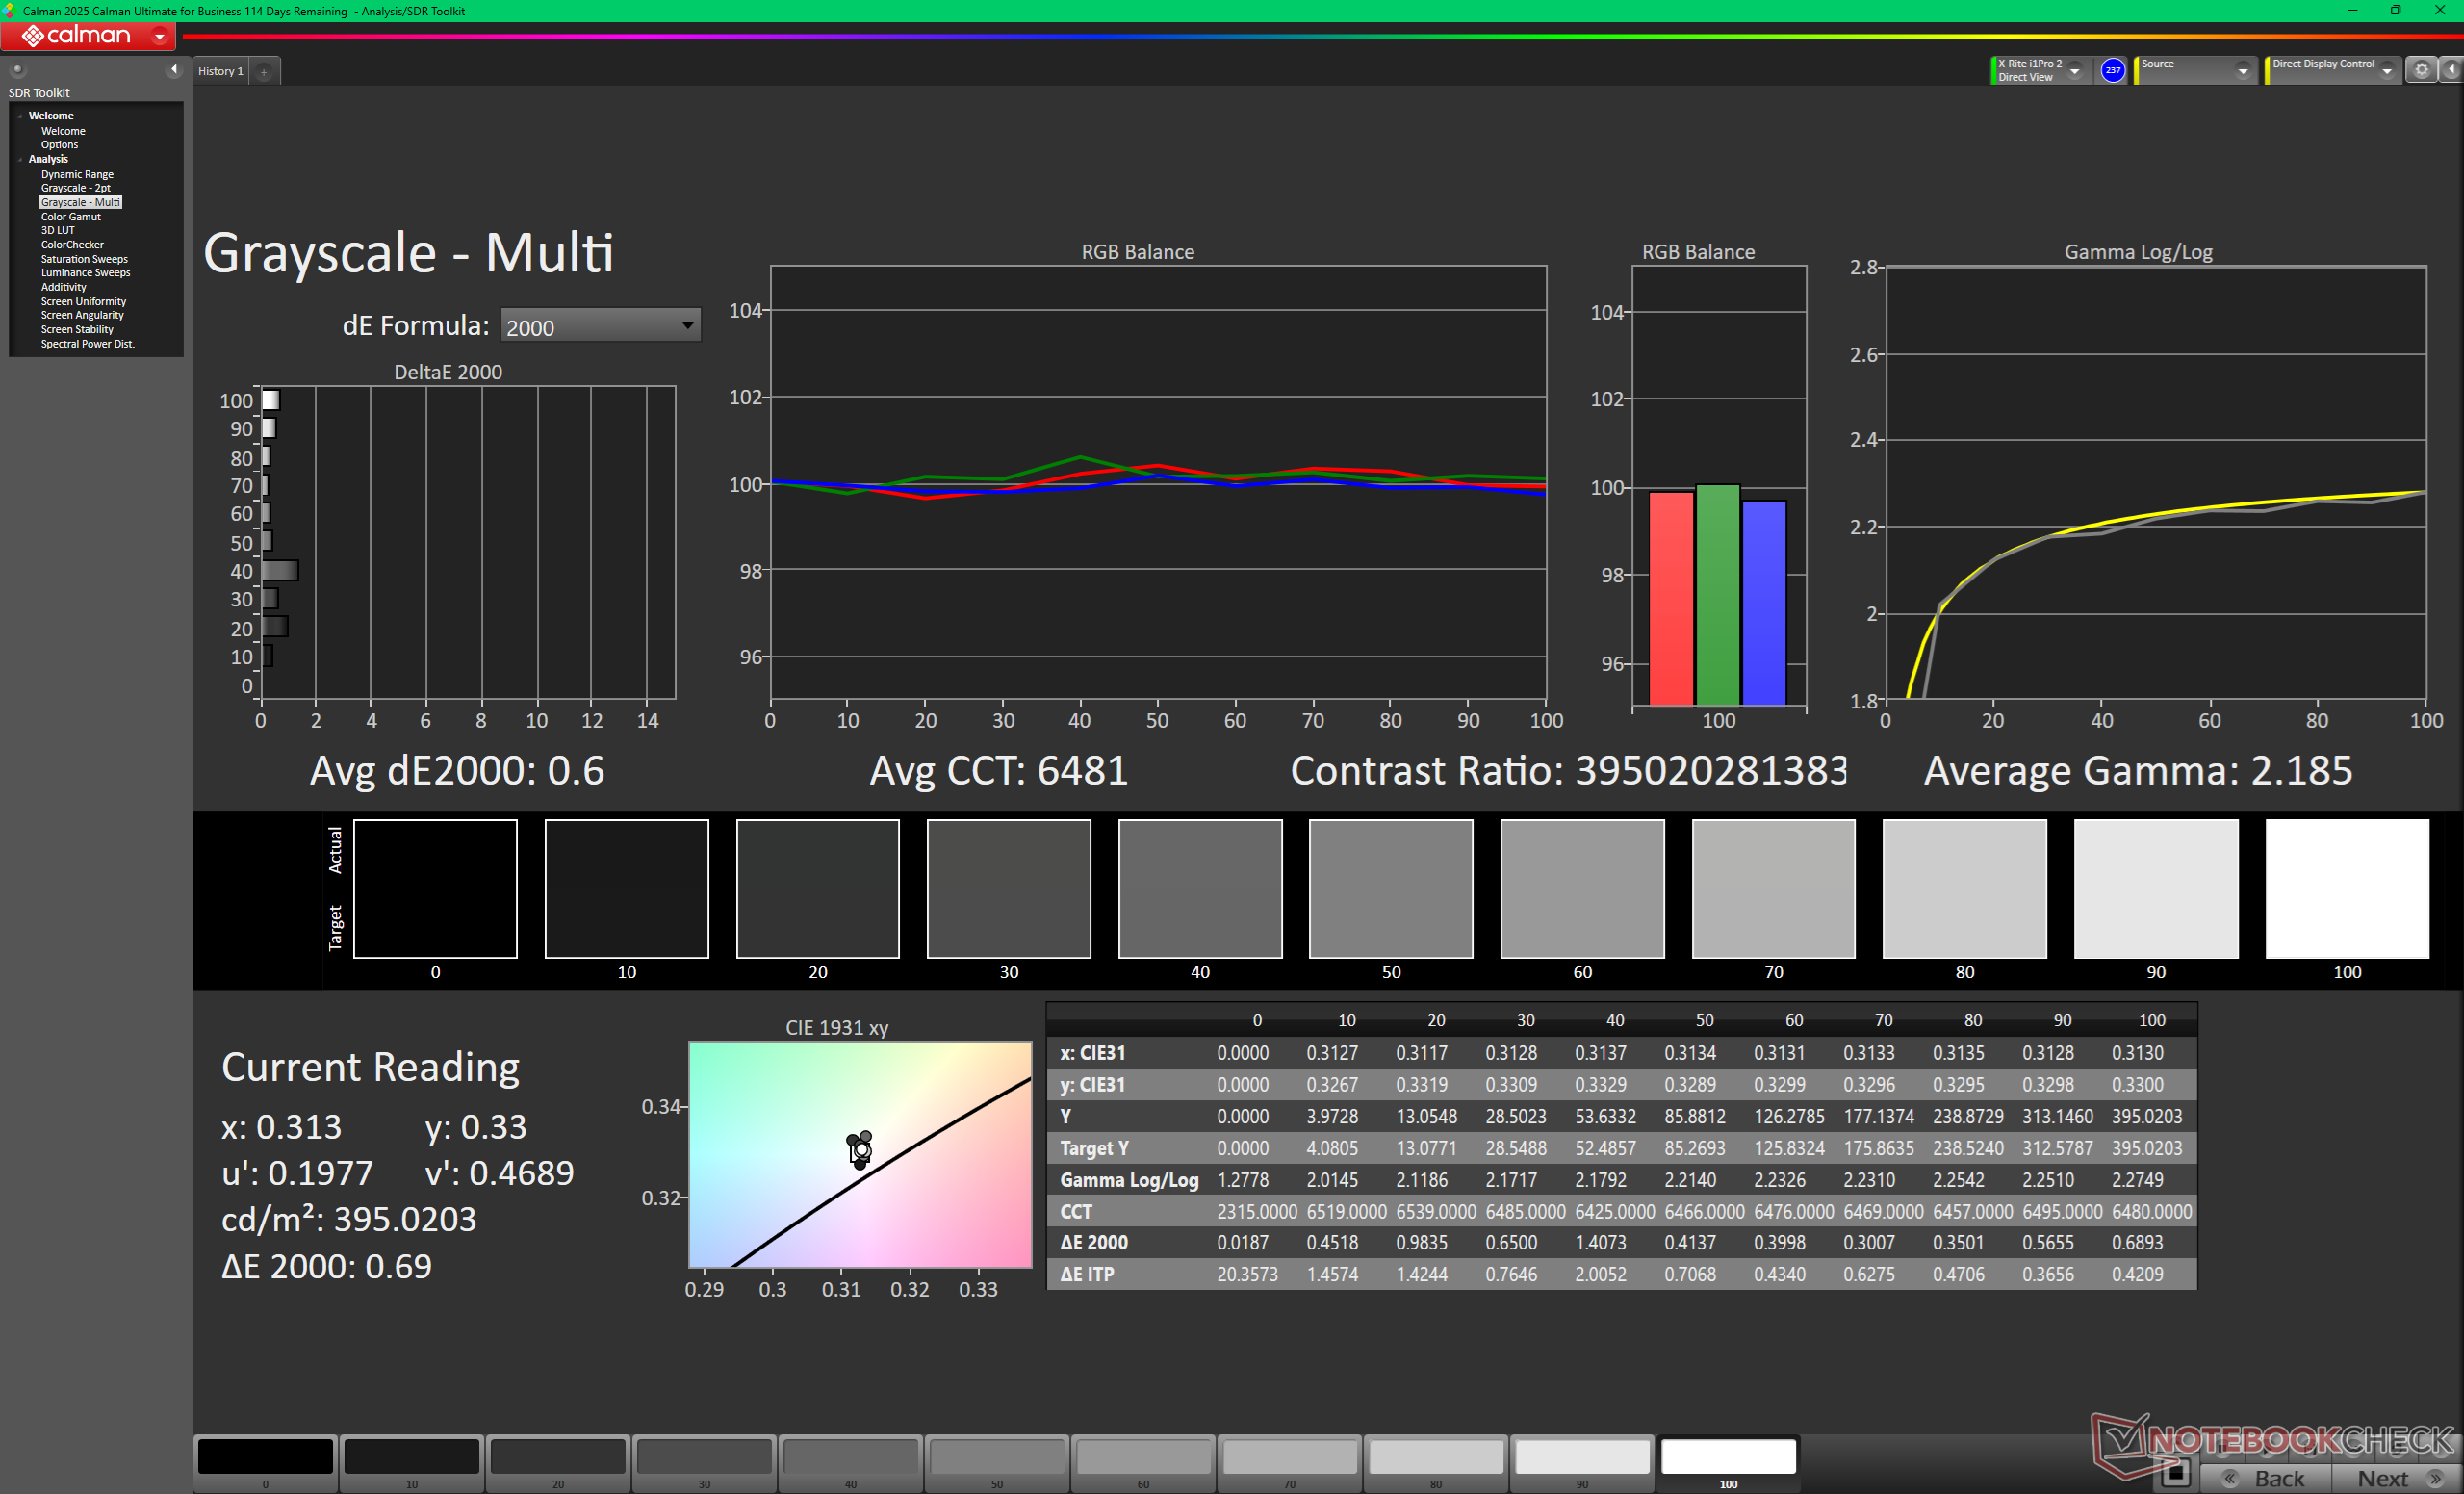
Niveaux de gris avant étalonnage (sRGB)
Balayages de saturation avant calibration (sRGB)
ColorChecker avant étalonnage (sRGB)
Niveaux de gris après étalonnage
Balayages de saturation après étalonnage
ColorChecker après étalonnage

Temps de réponse de l'écran

ℹ
Le temps de réponse d'un écran mesure la rapidité à laquelle l'écran est capable de changer une couleur pour une autre. Un temps de réponse élevé se traduit par une image floutée pour les objets en mouvement. Les joueurs bénéficieront de faibles latences d'affichage en jeu.
   ↔    Temps de réponse noir à blanc
0.46 ms ... hausse ↗ et chute ↘ combinées↗ 0.22 ms hausse
↘ 0.24 ms chute
L'écran montre de très faibles temps de réponse, parfait pour le jeu.
En comparaison, tous les appareils testés affichent entre 0.1 (minimum) et 240 (maximum) ms. » 1 % des appareils testés affichent de meilleures performances.
Cela signifie que les latences relevées sont meilleures que la moyenne (19.7 ms) de tous les appareils testés.
   ↔    Temps de réponse gris 50% à gris 80%
0.29 ms ... hausse ↗ et chute ↘ combinées↗ 0.15 ms hausse
↘ 0.14 ms chute
L'écran montre de très faibles temps de réponse, parfait pour le jeu.
En comparaison, tous les appareils testés affichent entre 0.13 (minimum) et 636 (maximum) ms. » 0 % des appareils testés affichent de meilleures performances.
Cela signifie que les latences relevées sont meilleures que la moyenne (30.7 ms) de tous les appareils testés.

Scintillement / MLI (Modulation de largeur d'impulsion)

ℹ
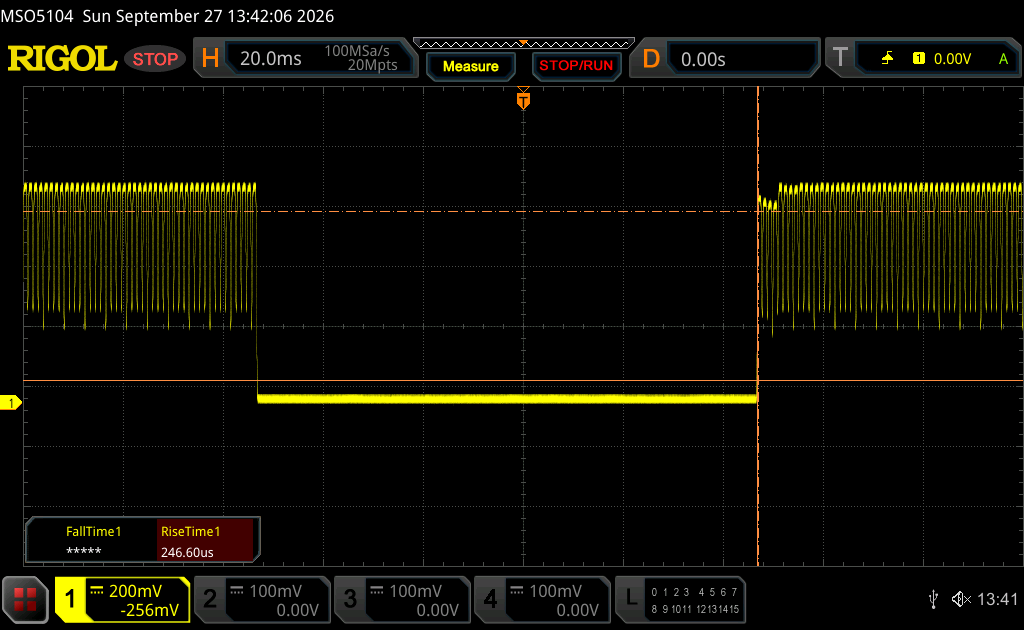
Afin d'abaisser la luminosité de l'écran, certains ordinateurs portables font varier très rapidement le rétroéclairage entre éteint et allumé. La fréquence à laquelle le rétroéclairage s'éteint et se rallume est normalement fixée à une valeur qui permet de rendre la variation indétectable à l'œil nu? Si la fréquence est trop basse, certaines personnes peuvent être sujettes à une fatigue oculaire, des maux de tête ou même percevoir les variations.
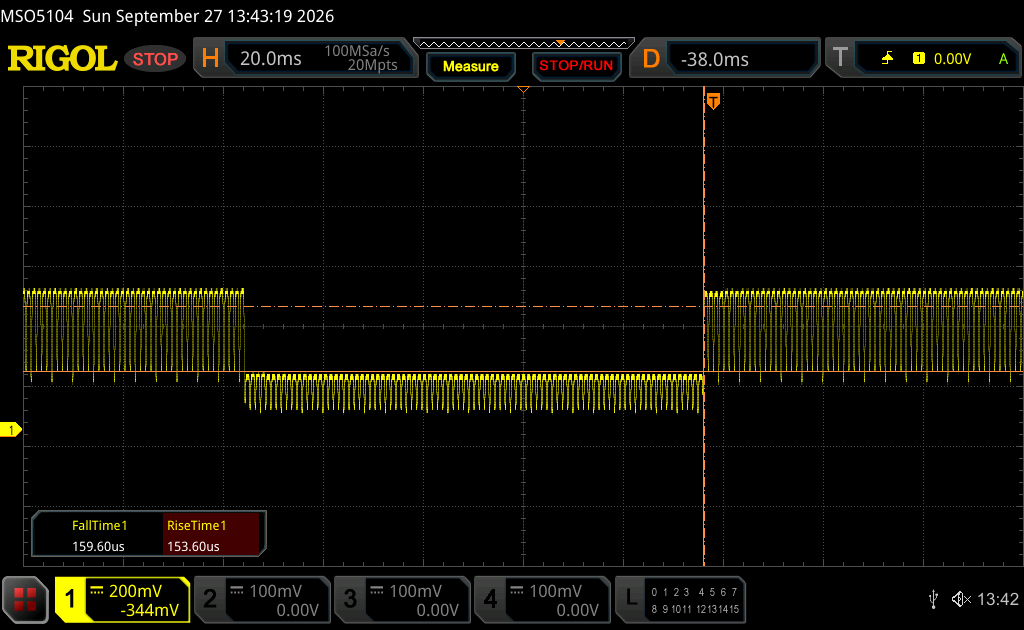
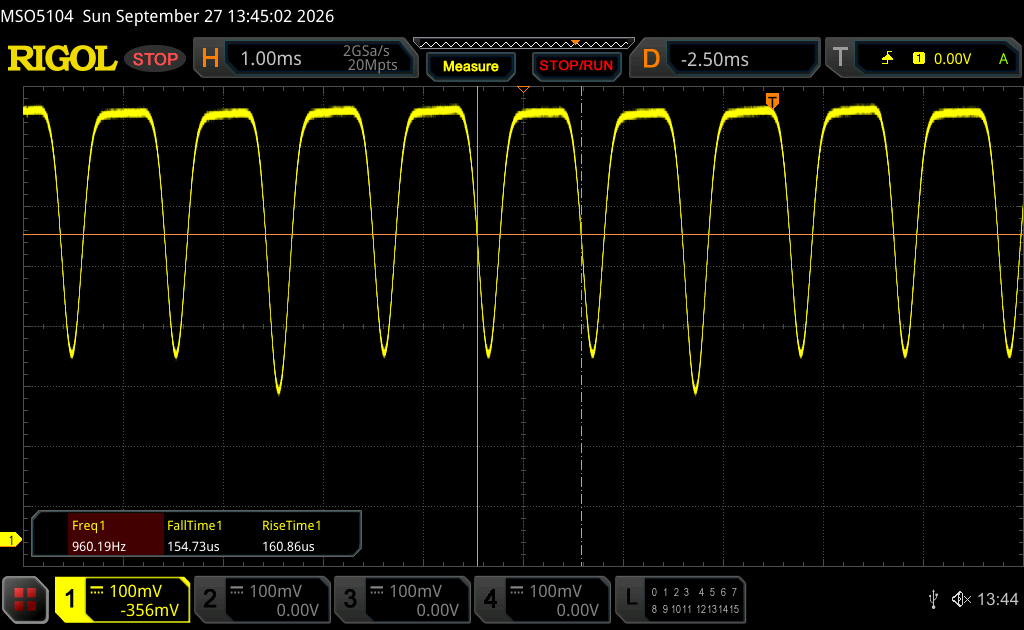
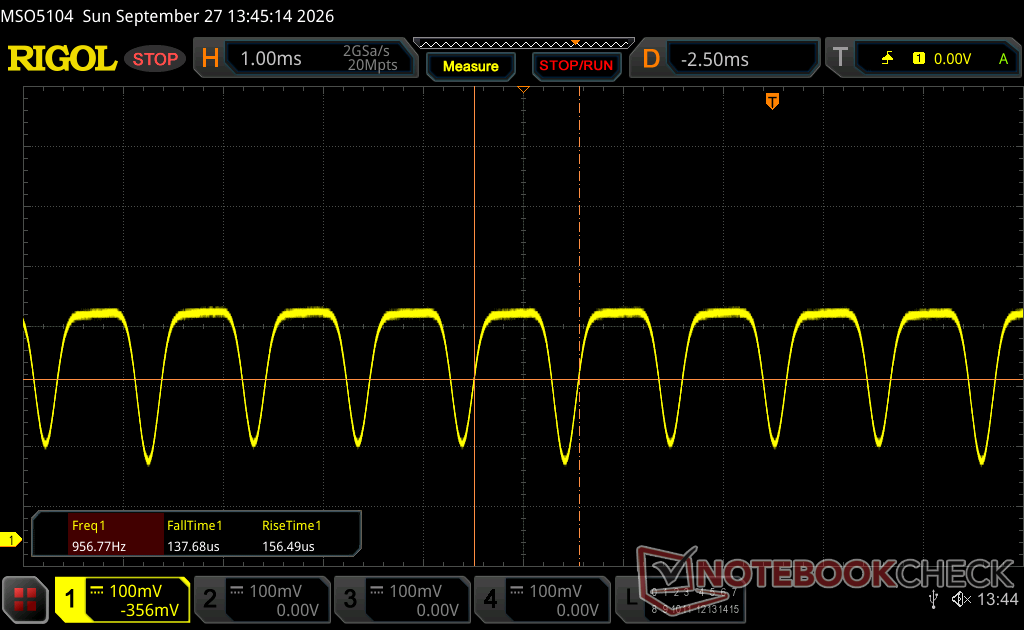
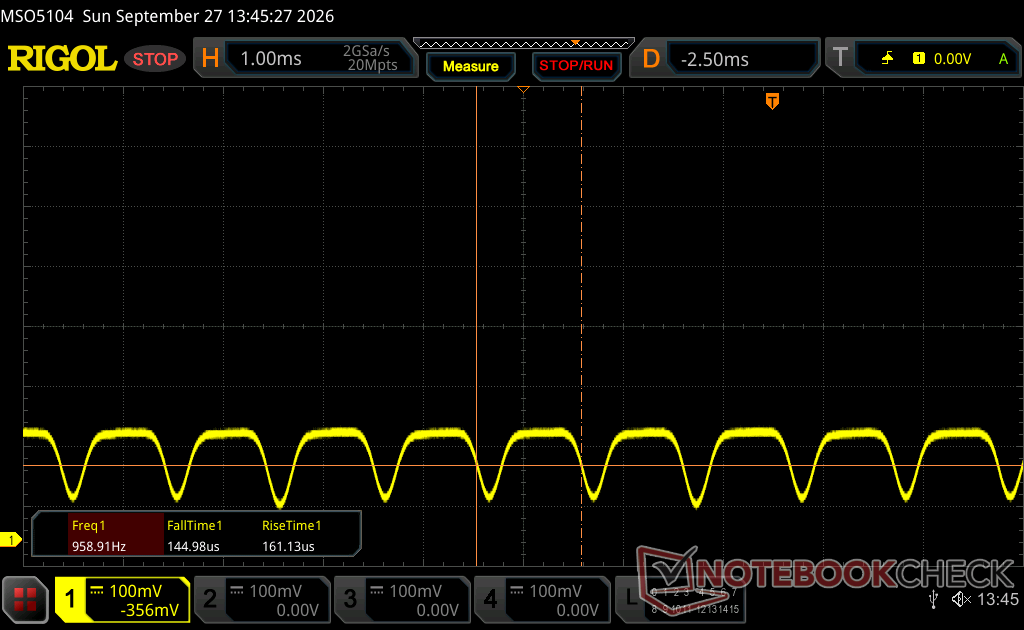
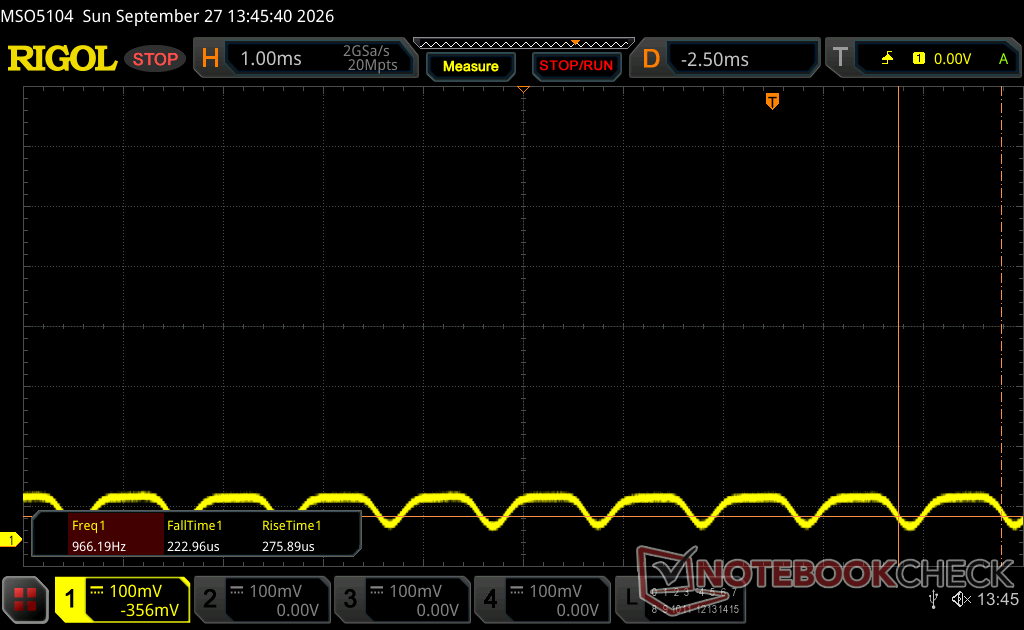
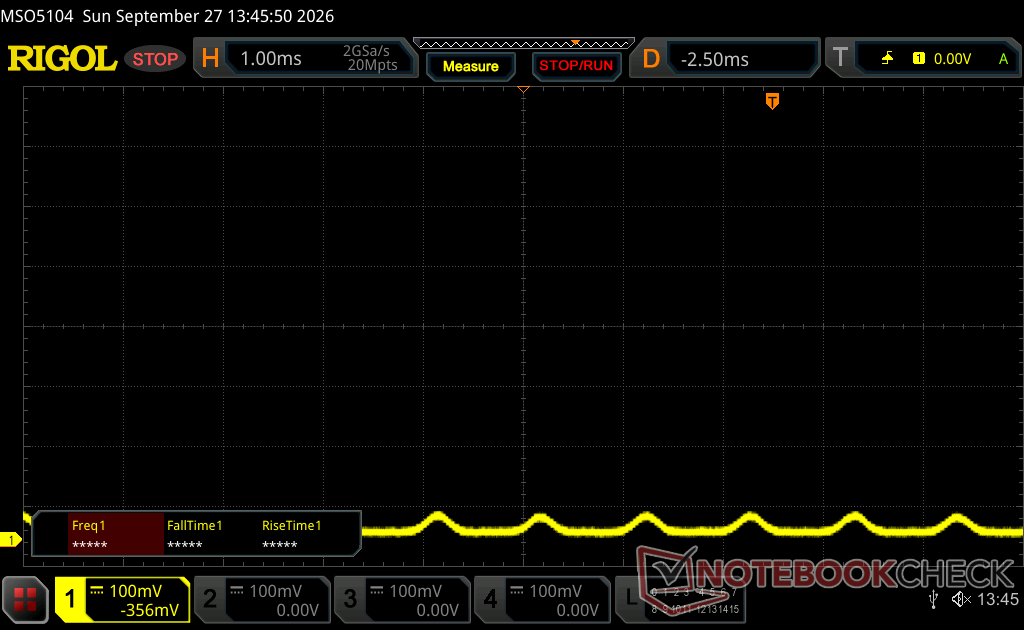
Scintillement / MLI (Modulation de largeur d'impulsion) décelé 960.2 Hz
Amplitude: 29 %

Le rétroéclairage de l'écran scintille à la fréquence de 960.2 Hz (certainement du fait de l'utilisation d'une MDI - Modulation de largeur d'impulsion) .

La fréquence de rafraîchissement de 960.2 Hz est élevée, la grande majorité des utilisateurs ne devrait pas percevoir de scintillements et être sujette à une fatigue oculaire accrue.

En comparaison, 52 % des appareils testés n'emploient pas MDI pour assombrir leur écran. Nous avons relevé une moyenne à 7614 (minimum : 5 - maximum : 343500) Hz dans le cas où une MDI était active.

Luminosité à 100 %
Luminosité à 100 %
75 % de luminosité
75 % de luminosité
Luminosité à 50 %
Luminosité à 50 %
Luminosité à 25 %
Luminosité à 25 %
Luminosité à 0 %
Luminosité à 0 %
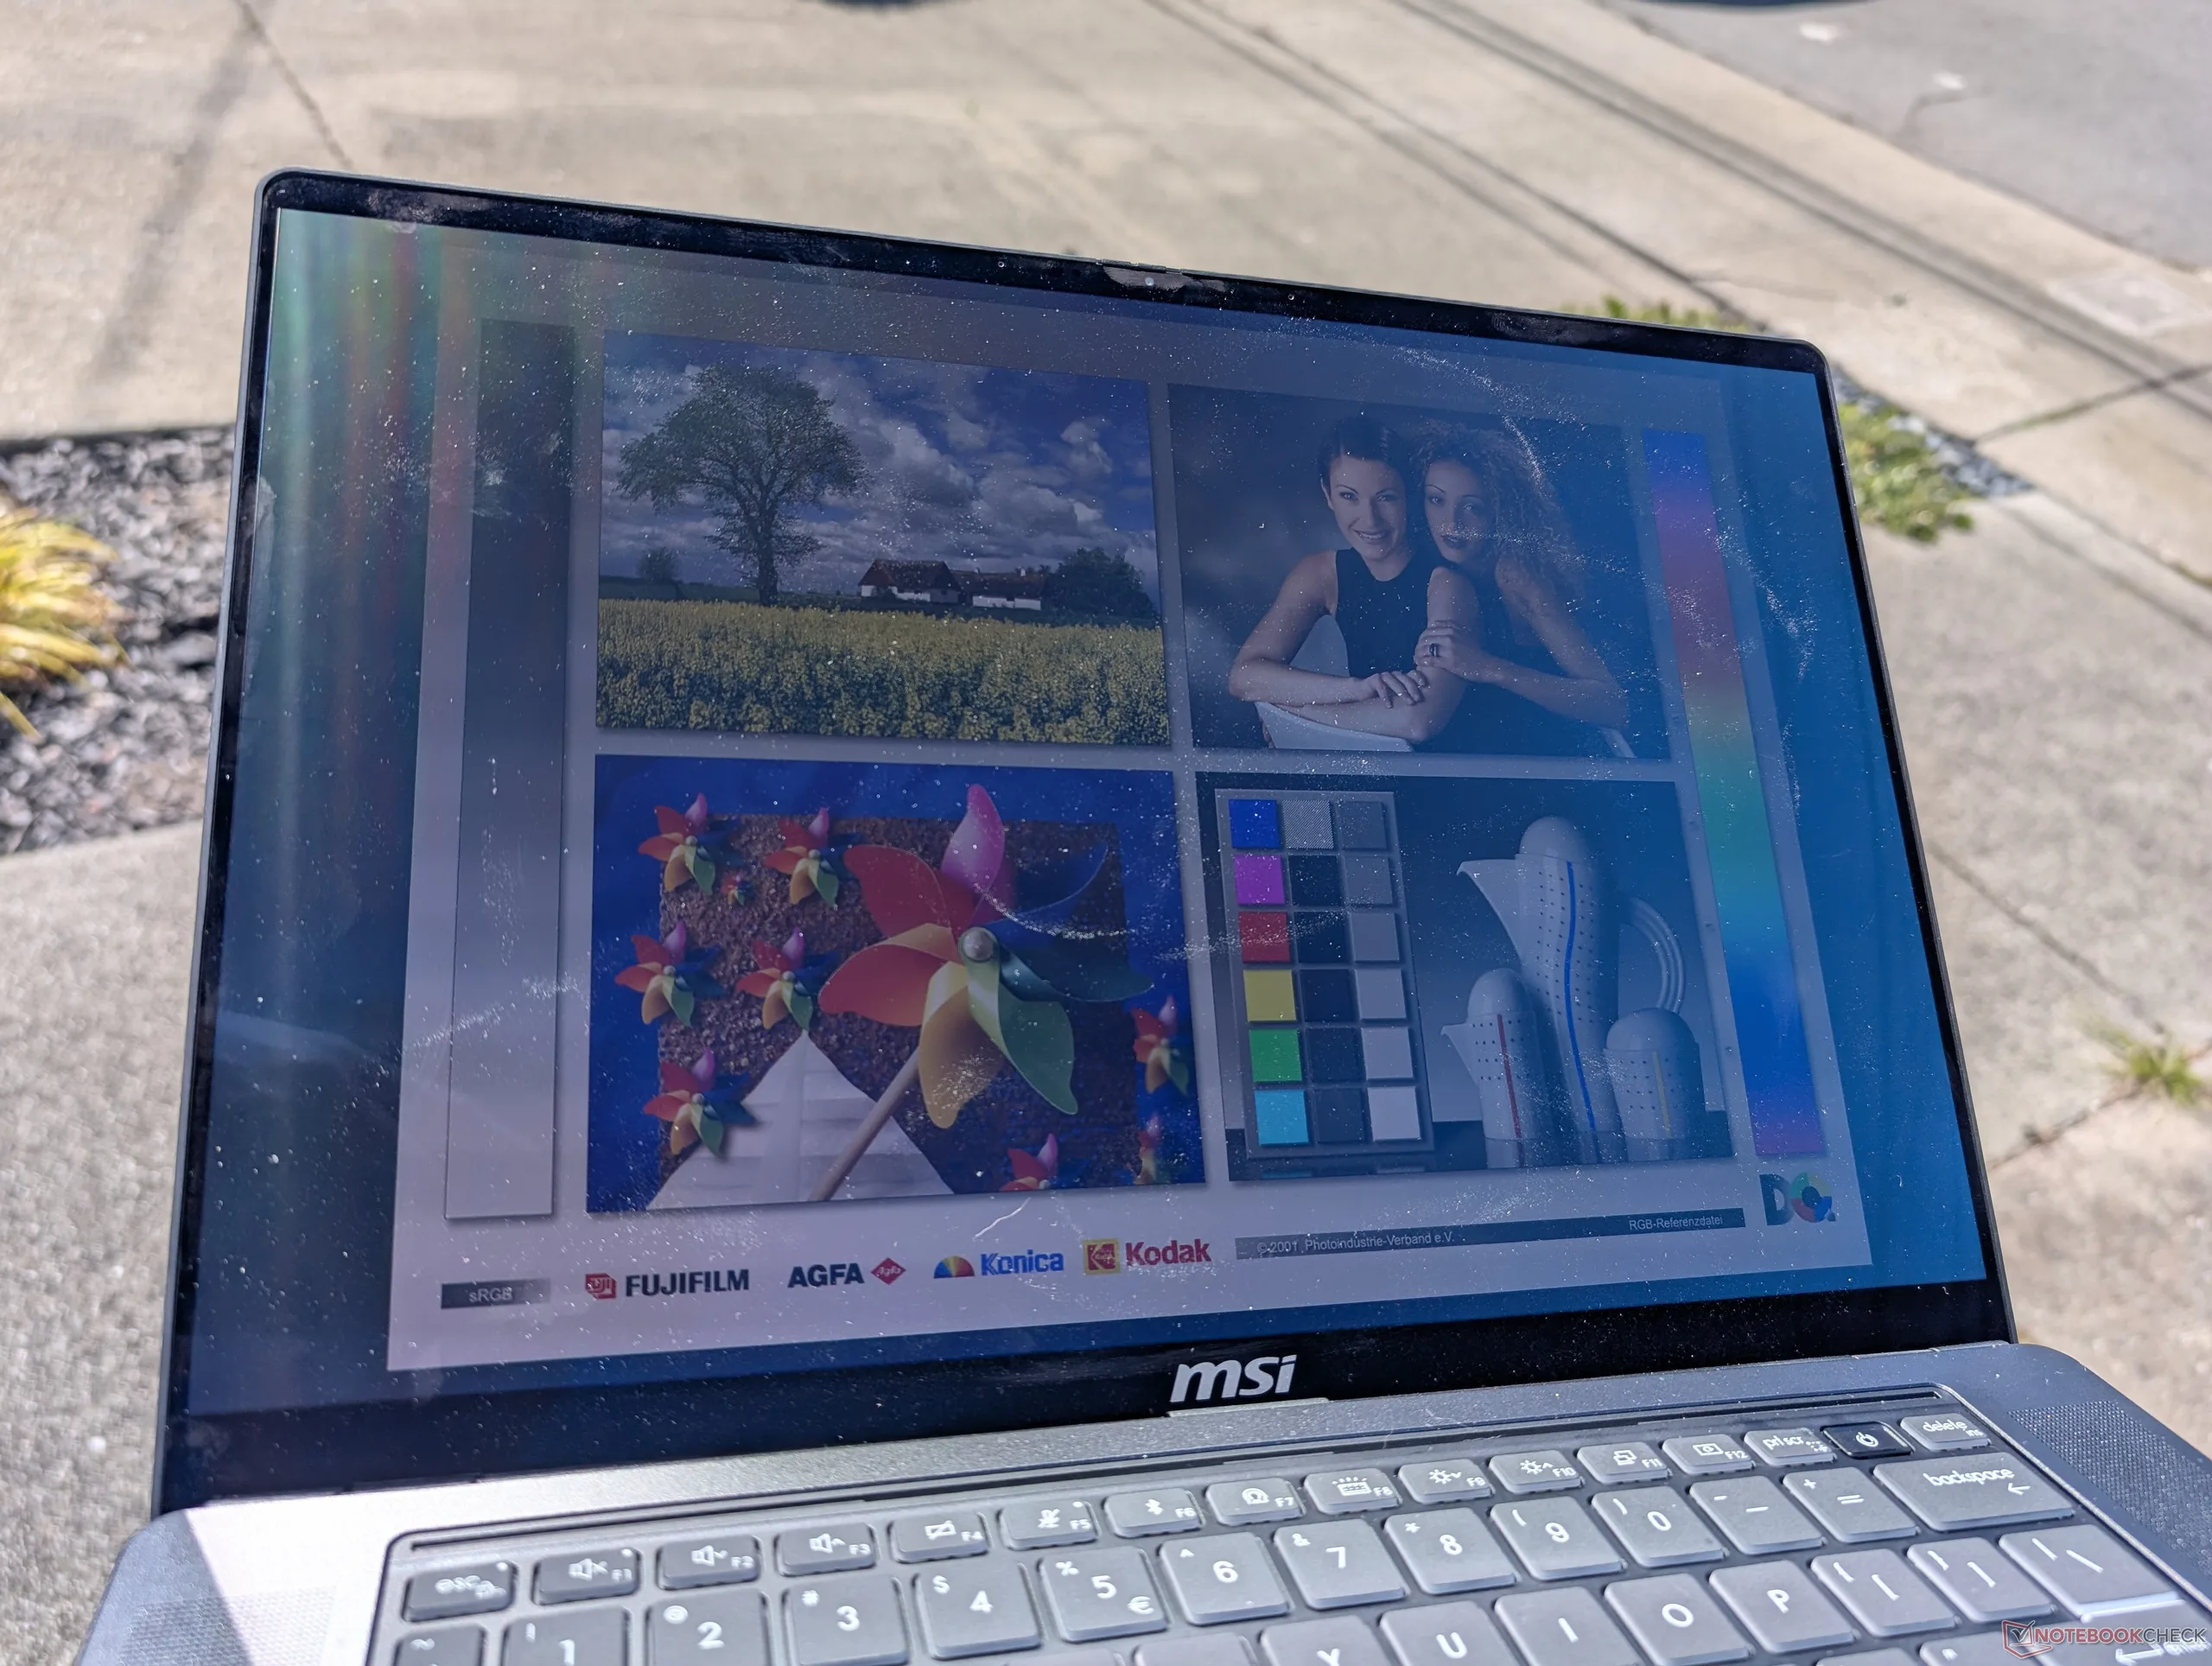
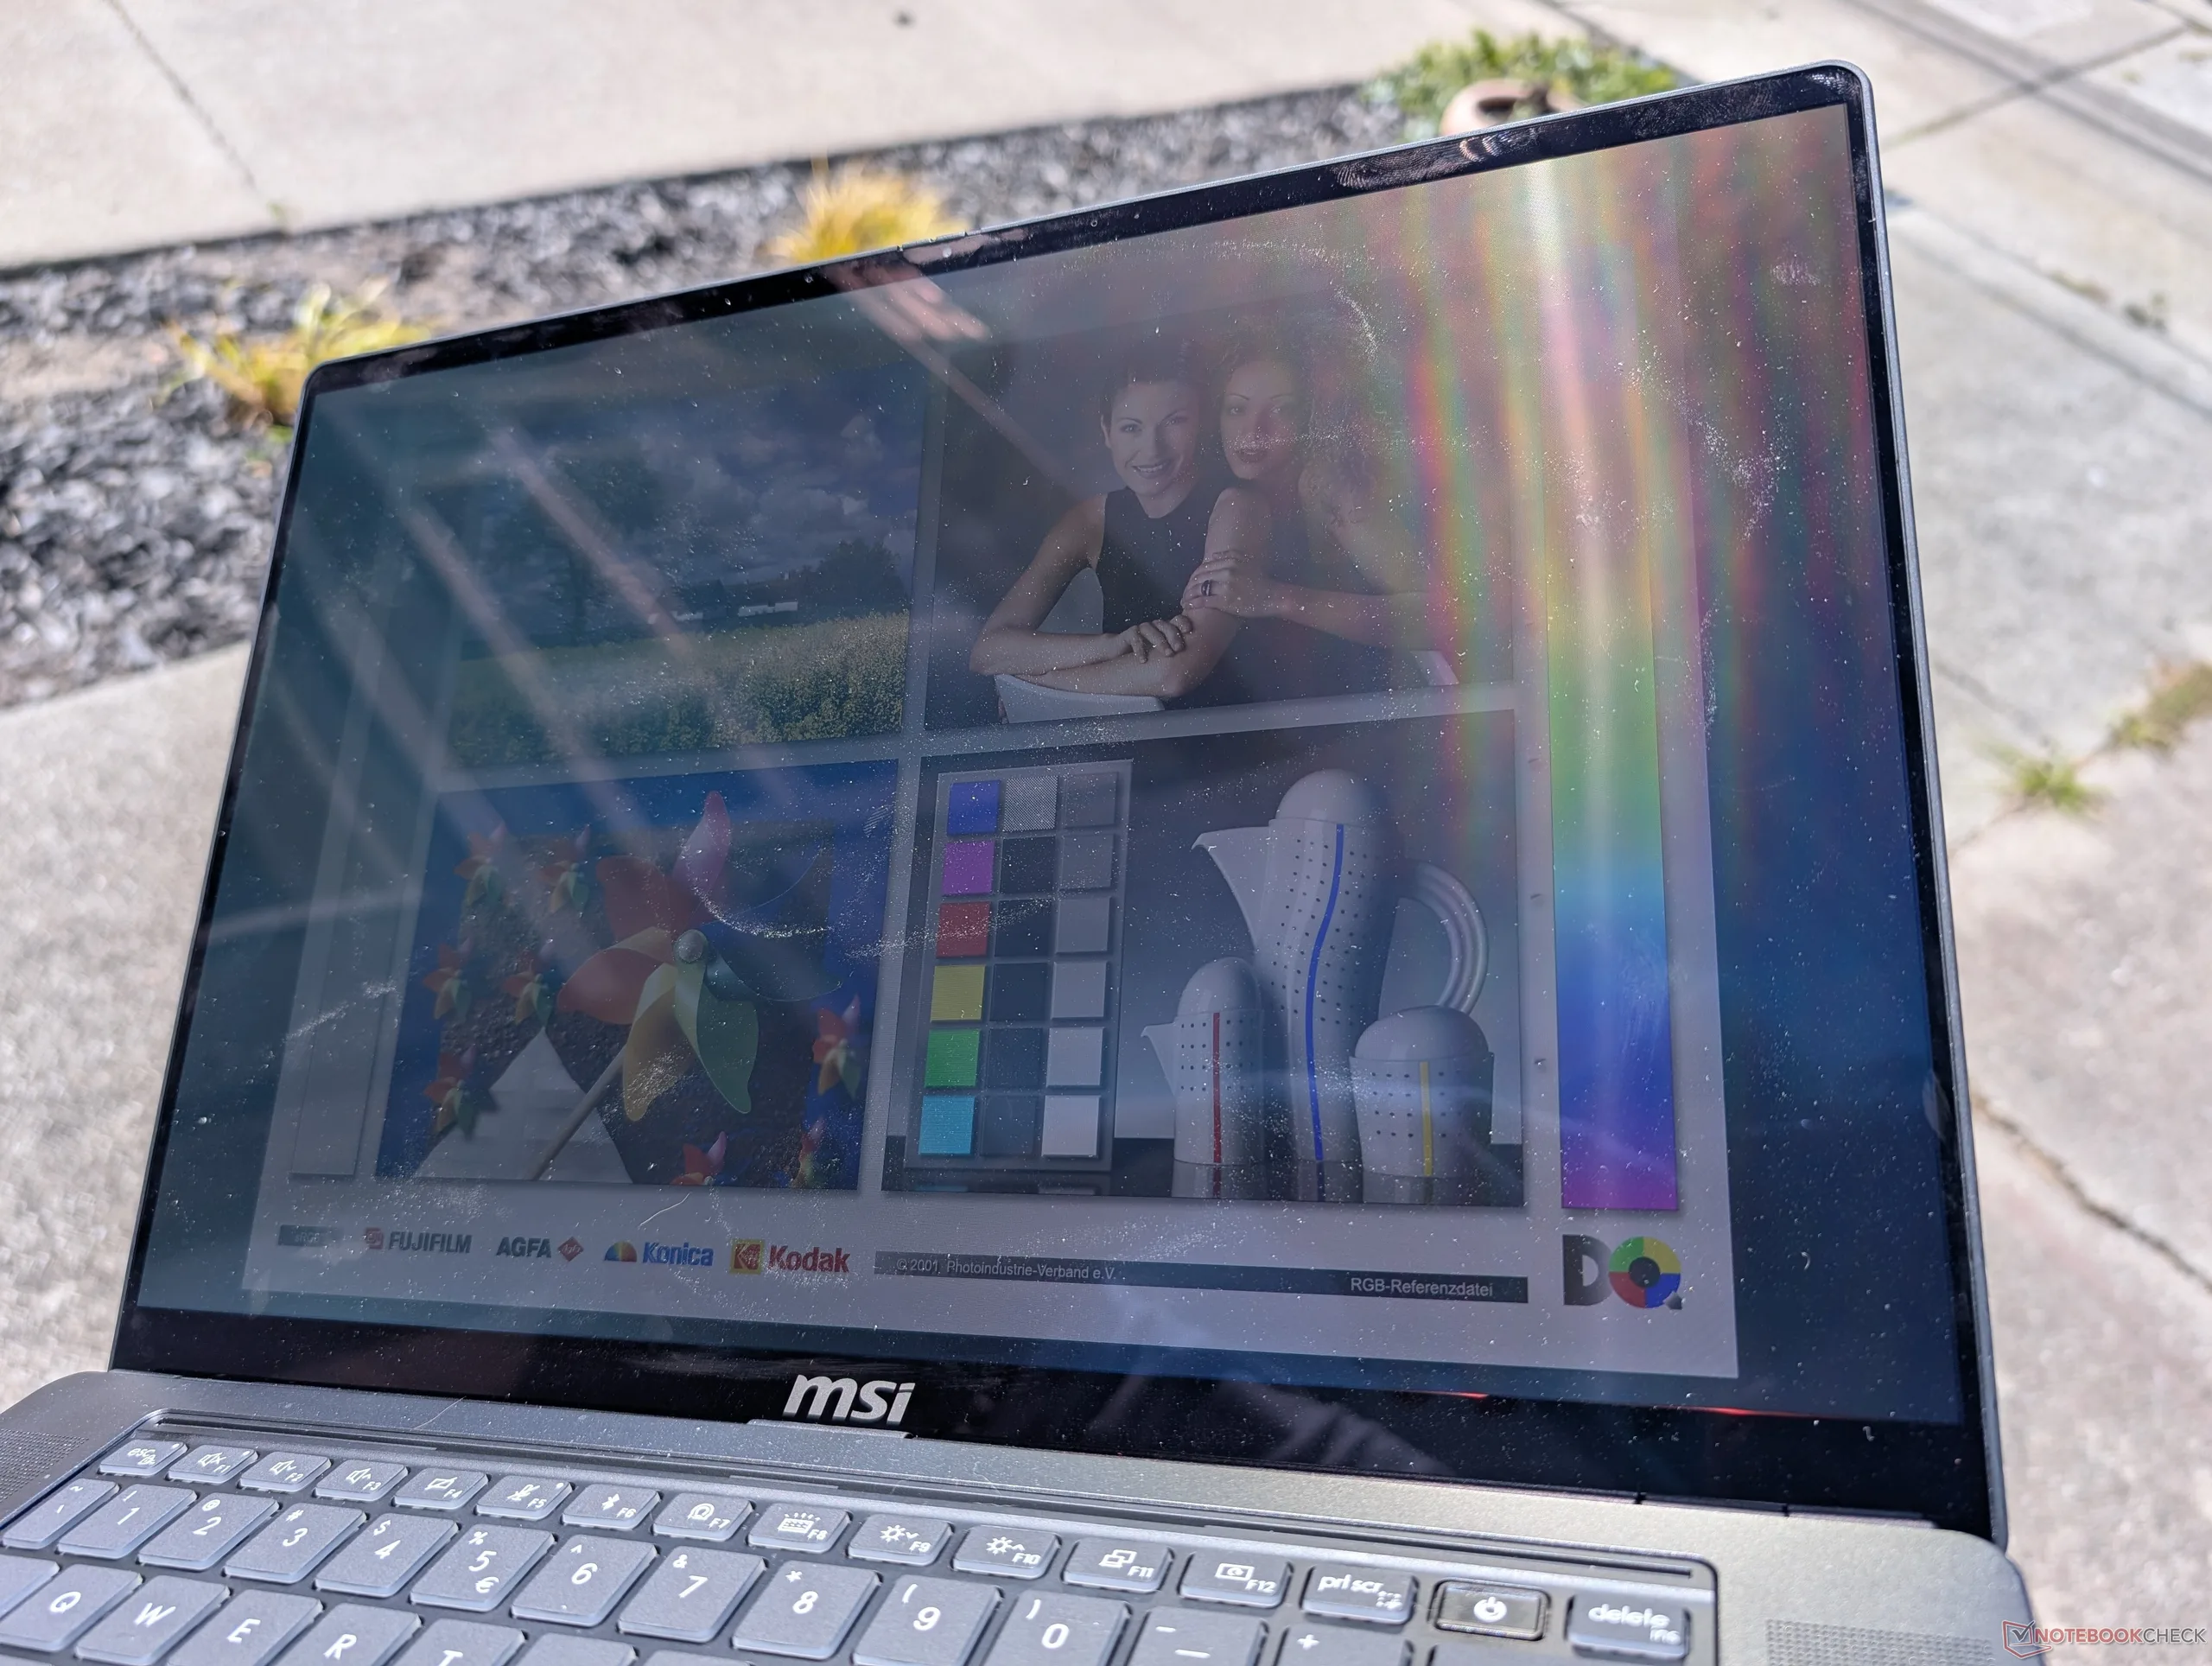
À l’extérieur, en plein soleil
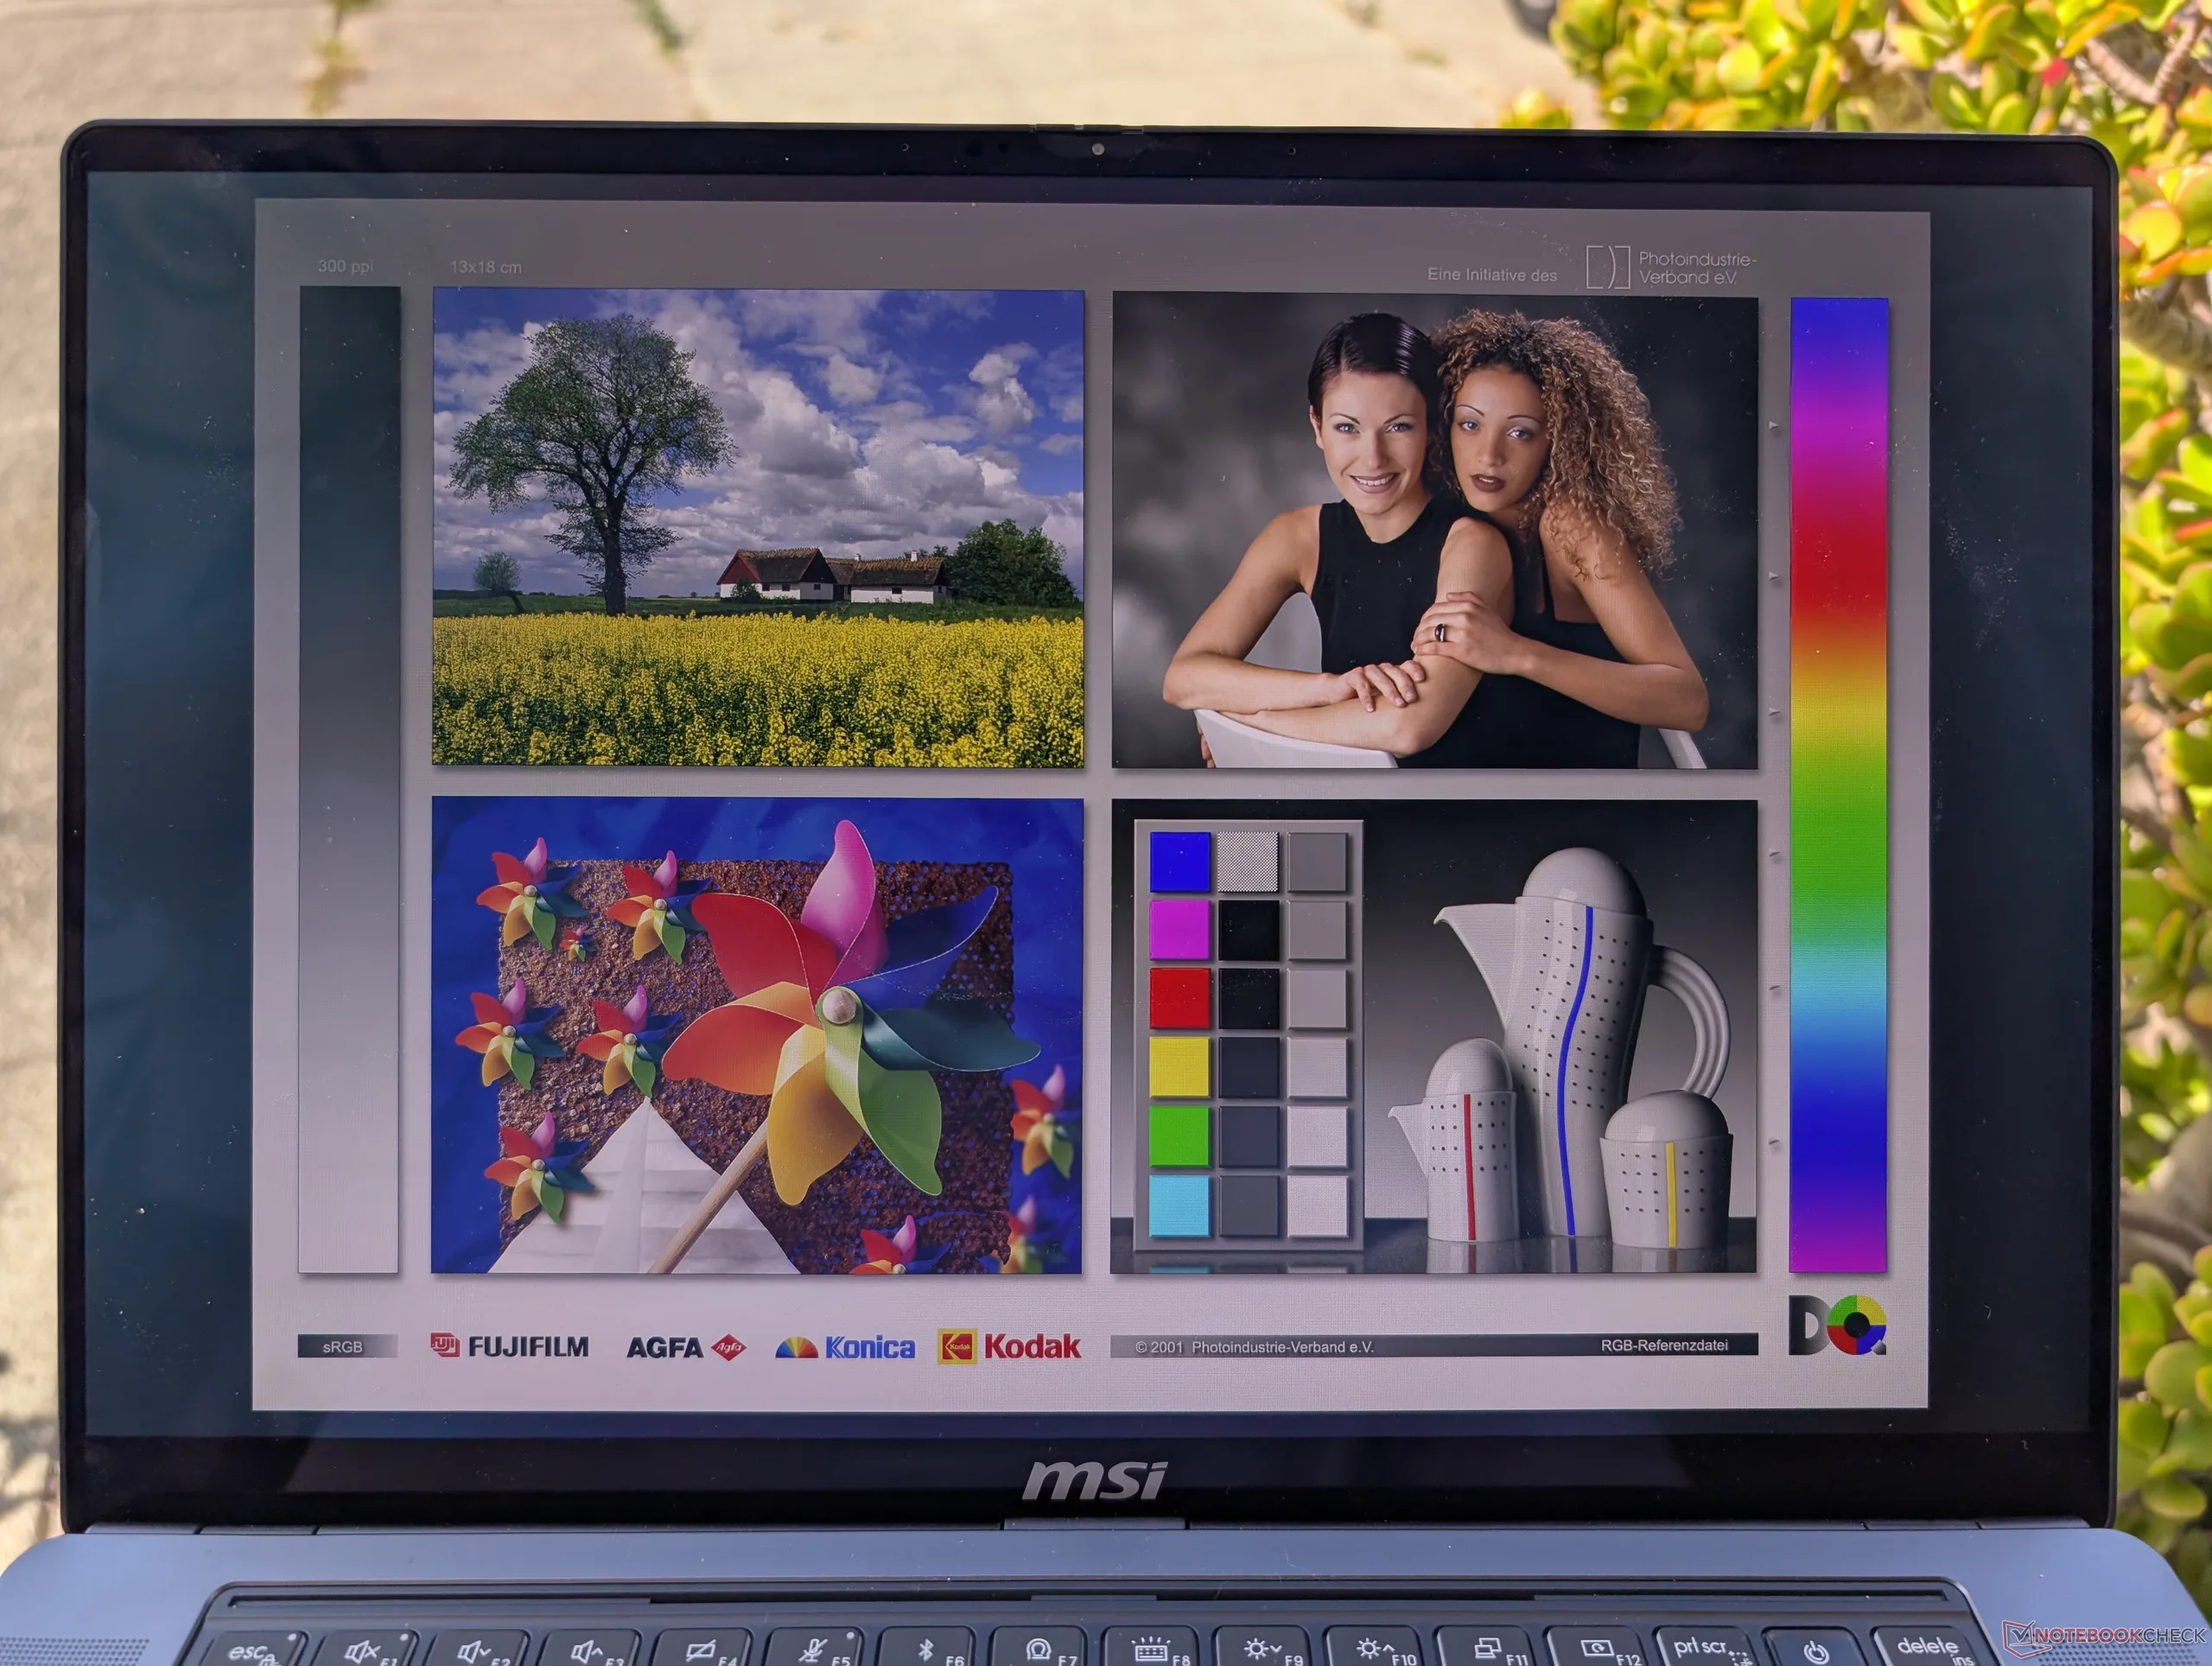
À l’extérieur, à l’ombre
En plein air, sous la lumière directe du soleil
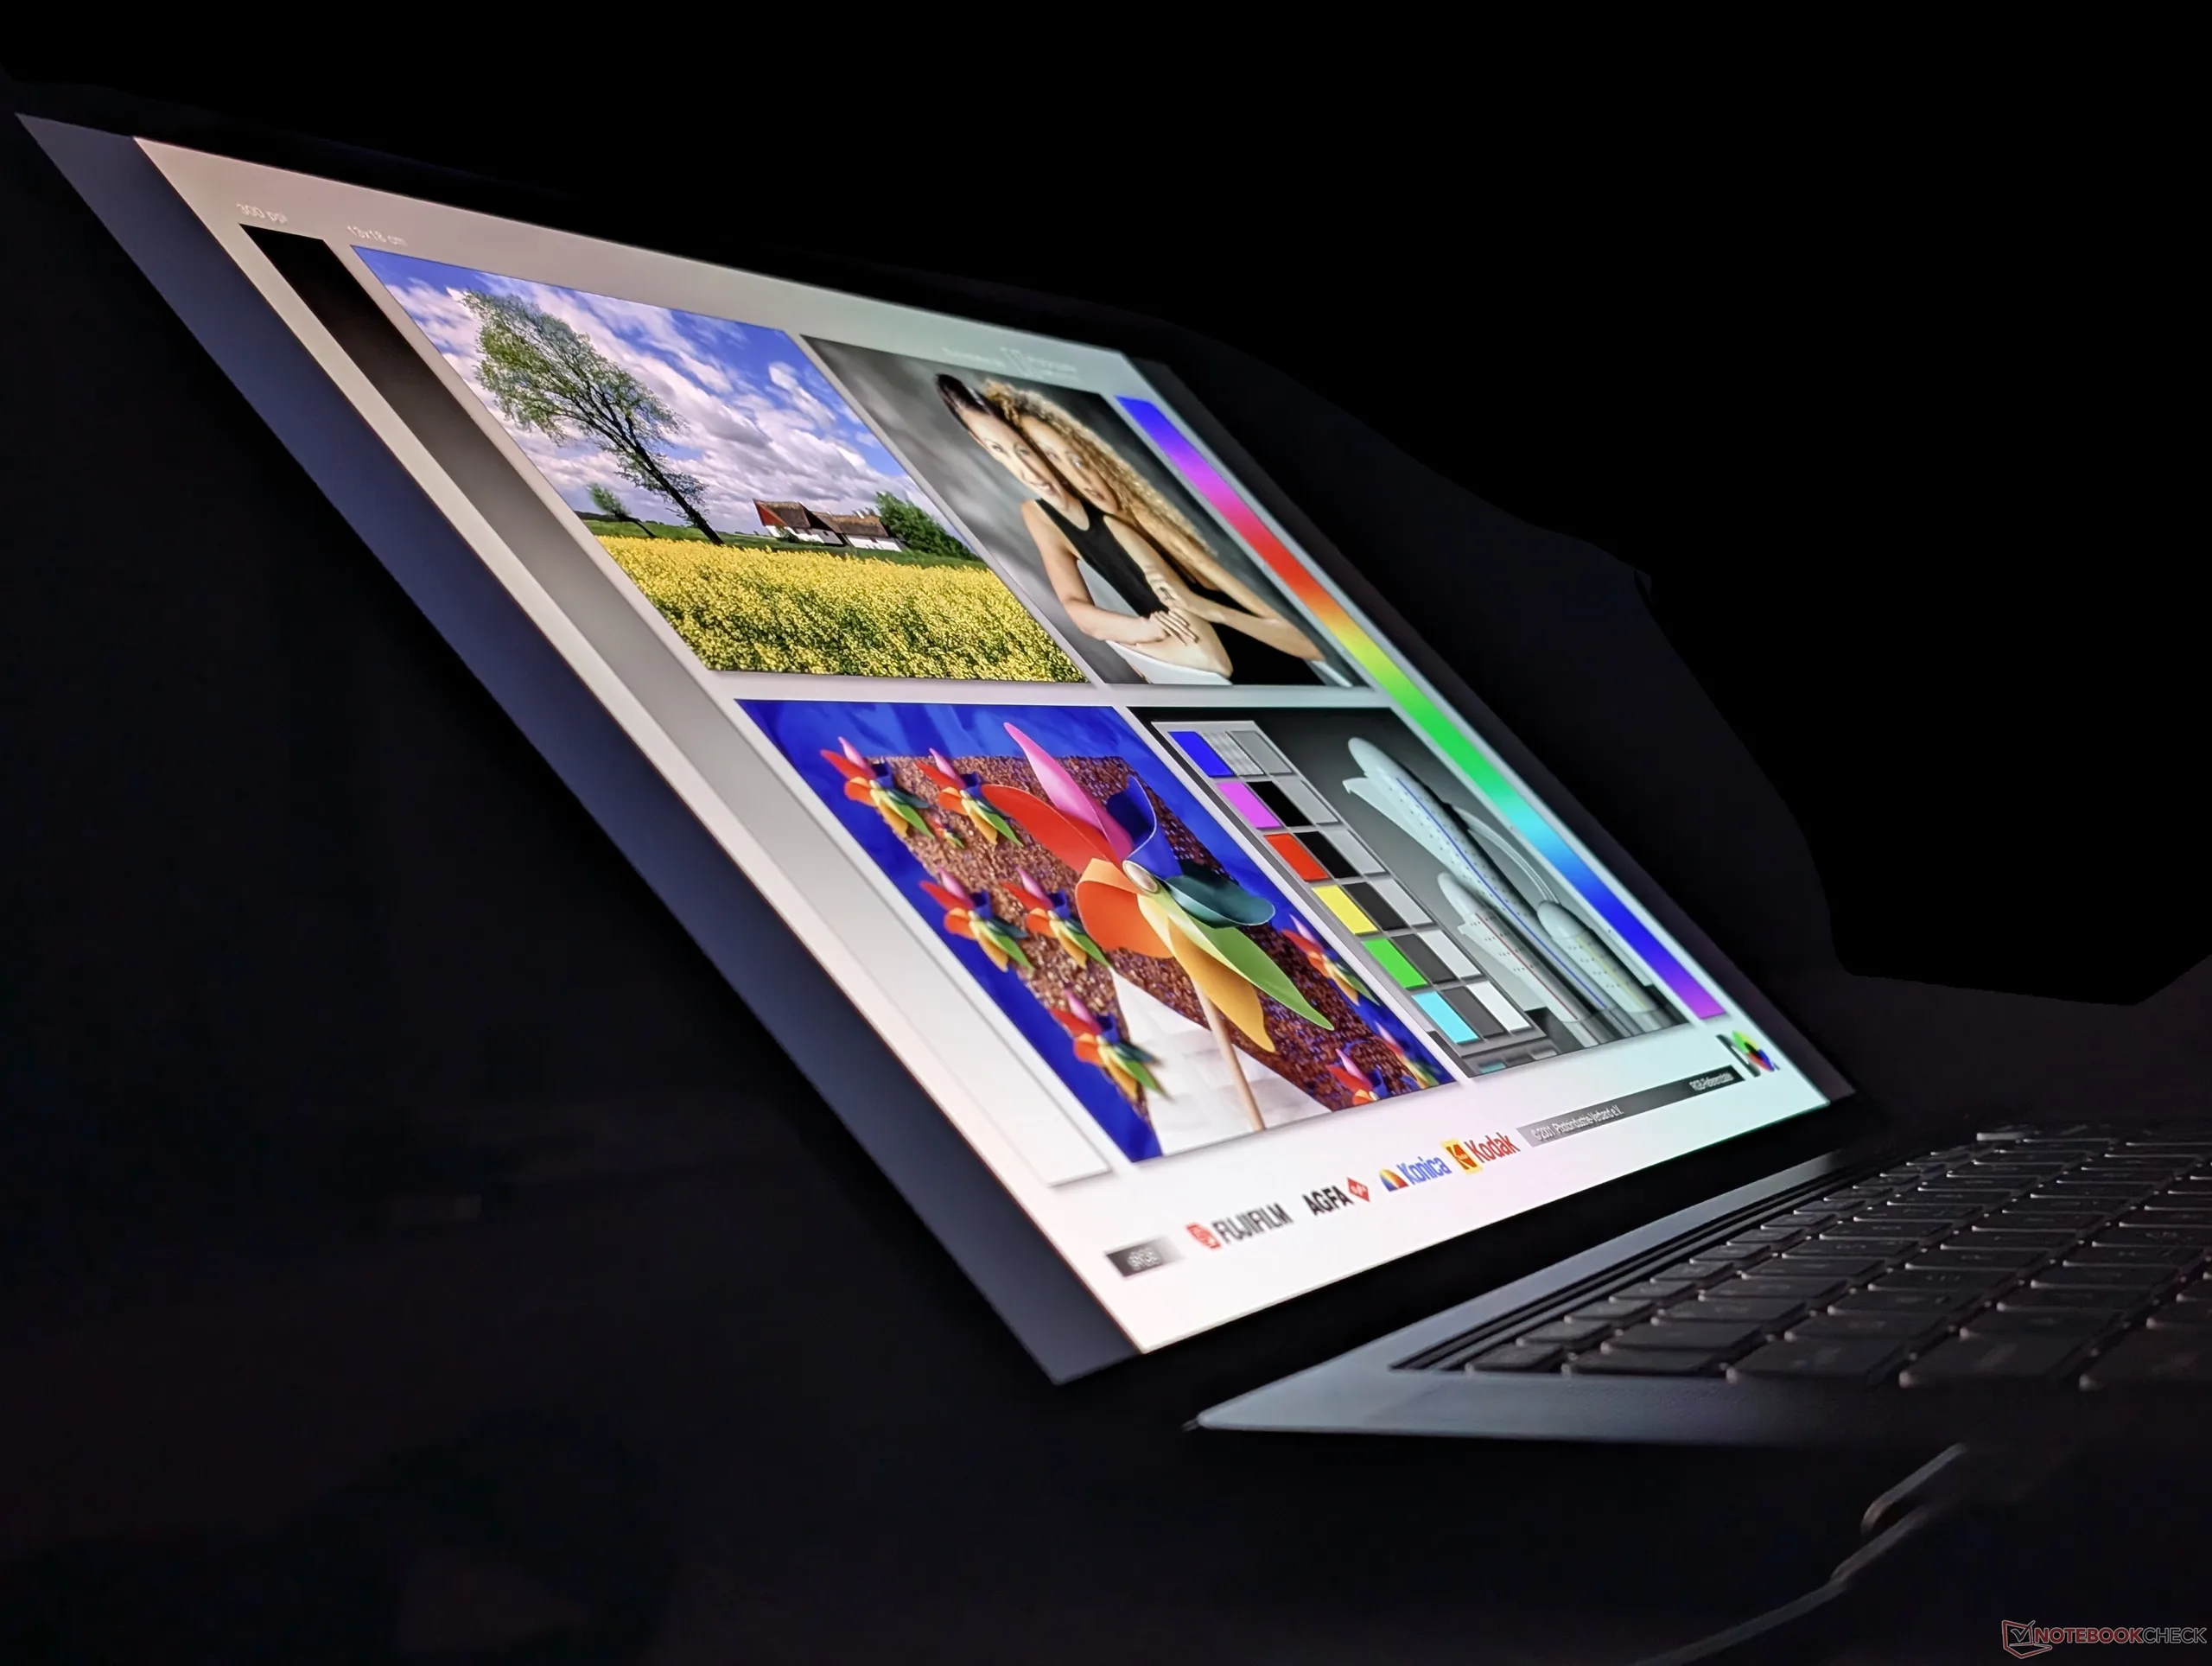
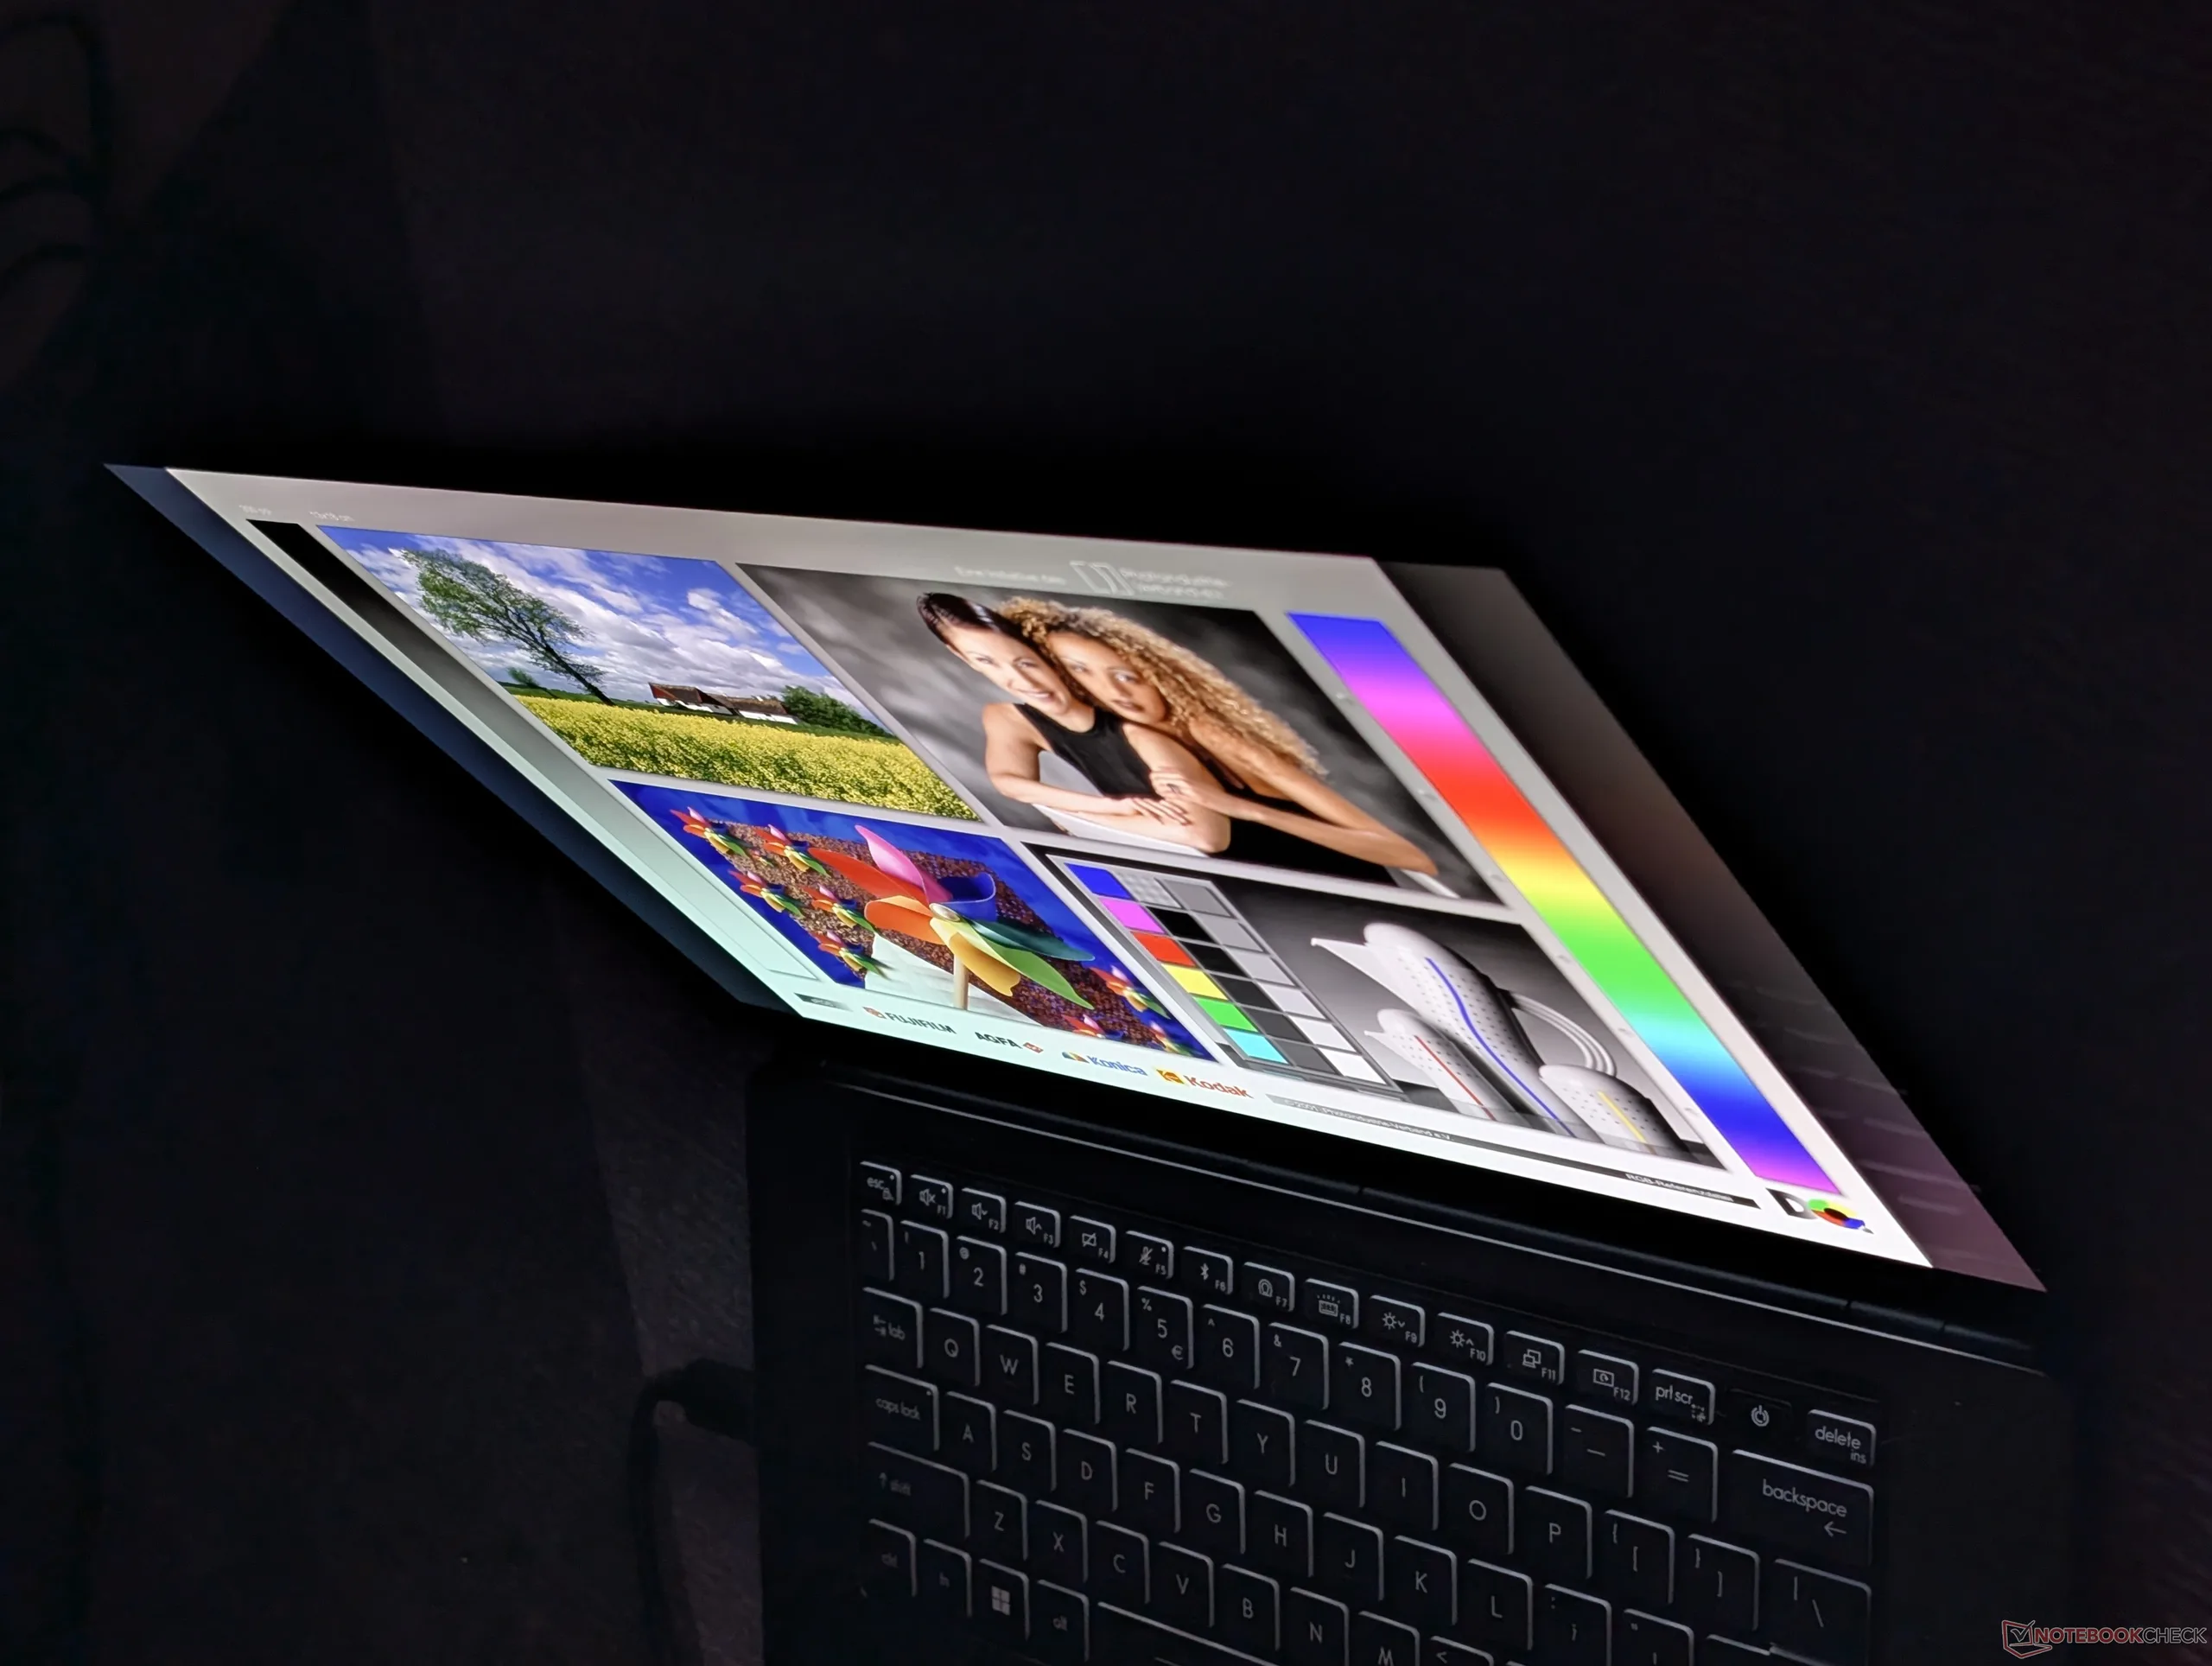
Angles de vision OLED étendus

Performance

Conditions de test

Nous avons réglé MSI Center sur le mode graphique dédié et le mode Performance, avec Apex activé, avant d’exécuter les tests de performances ci-dessous. Il s’agissait également des paramètres par défaut à la réception de notre appareil de test.

Performances du processeur

Les performances brutes du processeur avec le Core Ultra 9 386H sont à peu près comparables à celles du Ryzen AI 9 HX 470. 

Cinebench R15 en boucle multicœur

012525037550062575087510001125125013751500162517501875200021252250237525002625275028753000312532503375350036253750387540004125425043754500462547504875500051255250537555005625575058756000Tooltip
MSI Stealth 16 AI B3WH Intel Core Ultra 9 386H: Ø3222 (3176.62-3317.02) Points
MSI Stealth 16 Studio A13VG Intel Core i7-13700H: Ø2552 (2375.16-3030.99) Points
Razer Blade 16 Core Ultra 9 386H Intel Core Ultra 9 386H: Ø2941 (2806.23-3172.09) Points
Lenovo Legion 7 16 AGP11 AMD Ryzen AI 9 HX 470: Ø3496 (3345.88-3542.33) Points
Aorus Master 16 AM6J AMD Ryzen 9 9955HX3D: Ø5951 (5802.15-6067.96) Points
Asus ROG Zephyrus G16 GU606AW Intel Core Ultra 9 386H: Ø3281 (3216.99-3316.47) Points
CPU Performance rating: Percent
Cinebench 2024: CPU Multi Core | CPU Single Core
Cinebench 2026: CPU Multi
Cinebench R23: Multi Core | Single Core
Cinebench R20: CPU (Multi Core) | CPU (Single Core)
Cinebench R15: CPU Multi 64Bit | CPU Single 64Bit
Blender: v2.79 BMW27 CPU
7-Zip 18.03: 7z b 4 | 7z b 4 -mmt1
Geekbench 6.7: Multi-Core | Single-Core
Geekbench 5.5: Multi-Core | Single-Core
HWBOT x265 Benchmark v2.2: 4k Preset
LibreOffice : 20 Documents To PDF
R Benchmark 2.5: Overall mean
CPU Performance rating
Aorus Master 16 AM6J -1!
AMD Ryzen 9 9955HX3D
87.6 pt
HP Omen Max 16-ah1932nr
Intel Core Ultra 9 290HX Plus
87 pt
MSI Crosshair A16 HX E8WGK
AMD Ryzen 9 8940HX
78.9 pt
Lenovo Legion Pro 5 16IRX9 -3!
Intel Core i9-14900HX
76.7 pt
Razer Blade 16 Core Ultra 9 386H
Intel Core Ultra 9 386H
66.9 pt
Schenker XMG Core 16 M25 -1!
AMD Ryzen AI 9 HX 370
66.5 pt
Lenovo Legion 7 16 AGP11
AMD Ryzen AI 9 HX 470
66.4 pt
MSI Stealth 16 AI B3WH -2!
Intel Core Ultra 9 386H
64.9 pt
Moyenne Intel Core Ultra 9 386H
 
64.1 pt
Lenovo Legion Slim 5 16APH8 -5!
AMD Ryzen 7 7840HS
56.4 pt
MSI Stealth 16 Studio A13VG -5!
Intel Core i7-13700H
56.1 pt
Asus ROG Zephyrus M16 GU603H -7!
Intel Core i9-11900H
42.7 pt
Cinebench 2024 / CPU Multi Core
HP Omen Max 16-ah1932nr
Intel Core Ultra 9 290HX Plus
2096 Points +70%
Aorus Master 16 AM6J
AMD Ryzen 9 9955HX3D
2090 Points +70%
MSI Crosshair A16 HX E8WGK
AMD Ryzen 9 8940HX
1736 Points +41%
Schenker XMG Core 16 M25
AMD Ryzen AI 9 HX 370
1299 Points +5%
Lenovo Legion 7 16 AGP11
AMD Ryzen AI 9 HX 470
1241 Points +1%
MSI Stealth 16 AI B3WH
Intel Core Ultra 9 386H
1233 Points
Razer Blade 16 Core Ultra 9 386H
Intel Core Ultra 9 386H
1172 Points -5%
Moyenne Intel Core Ultra 9 386H
  (873 - 1271, n=10)
1142 Points -7%
Cinebench 2024 / CPU Single Core
HP Omen Max 16-ah1932nr
Intel Core Ultra 9 290HX Plus
137.5 Points +12%
Aorus Master 16 AM6J
AMD Ryzen 9 9955HX3D
130 Points +6%
Razer Blade 16 Core Ultra 9 386H
Intel Core Ultra 9 386H
126.8 Points +3%
MSI Stealth 16 AI B3WH
Intel Core Ultra 9 386H
122.8 Points
Moyenne Intel Core Ultra 9 386H
  (118.1 - 126.8, n=10)
122.5 Points 0%
Lenovo Legion 7 16 AGP11
AMD Ryzen AI 9 HX 470
119.1 Points -3%
Schenker XMG Core 16 M25
AMD Ryzen AI 9 HX 370
118.4 Points -4%
MSI Crosshair A16 HX E8WGK
AMD Ryzen 9 8940HX
113.2 Points -8%
Cinebench 2026 / CPU Multi
HP Omen Max 16-ah1932nr
Intel Core Ultra 9 290HX Plus
8490 Points +71%
MSI Crosshair A16 HX E8WGK
AMD Ryzen 9 8940HX
7138 Points +44%
Lenovo Legion 7 16 AGP11
AMD Ryzen AI 9 HX 470
5087 Points +3%
MSI Stealth 16 AI B3WH
Intel Core Ultra 9 386H
4951 Points
Moyenne Intel Core Ultra 9 386H
  (3799 - 5151, n=6)
4779 Points -3%
Razer Blade 16 Core Ultra 9 386H
Intel Core Ultra 9 386H
4730 Points -4%
Cinebench R23 / Multi Core
HP Omen Max 16-ah1932nr
Intel Core Ultra 9 290HX Plus
38242 (36217.9min - 38242.1max) Points +73%
Aorus Master 16 AM6J
AMD Ryzen 9 9955HX3D
37459 Points +70%
MSI Crosshair A16 HX E8WGK
AMD Ryzen 9 8940HX
32745 (32277.9min - 32745.3max) Points +48%
Lenovo Legion Pro 5 16IRX9
Intel Core i9-14900HX
29686 (26317.7min - 29686max) Points +34%
Lenovo Legion 7 16 AGP11
AMD Ryzen AI 9 HX 470
23946 Points +8%
Schenker XMG Core 16 M25
AMD Ryzen AI 9 HX 370
22187 Points 0%
MSI Stealth 16 AI B3WH
Intel Core Ultra 9 386H
22084 (21312.9min - 22083.8max) Points
Razer Blade 16 Core Ultra 9 386H
Intel Core Ultra 9 386H
20750 (18849.5min - 20749.6max) Points -6%
MSI Stealth 16 Studio A13VG
Intel Core i7-13700H
20034 Points -9%
Moyenne Intel Core Ultra 9 386H
  (12144 - 22084, n=10)
19585 Points -11%
Lenovo Legion Slim 5 16APH8
AMD Ryzen 7 7840HS
17088 (16600.7min - 17088.2max) Points -23%
Cinebench R23 / Single Core
HP Omen Max 16-ah1932nr
Intel Core Ultra 9 290HX Plus
2231 Points +6%
Aorus Master 16 AM6J
AMD Ryzen 9 9955HX3D
2150 Points +2%
Lenovo Legion Pro 5 16IRX9
Intel Core i9-14900HX
2122 Points +1%
MSI Stealth 16 AI B3WH
Intel Core Ultra 9 386H
2111 Points
Razer Blade 16 Core Ultra 9 386H
Intel Core Ultra 9 386H
2087 Points -1%
Moyenne Intel Core Ultra 9 386H
  (2010 - 2123, n=10)
2073 Points -2%
Lenovo Legion 7 16 AGP11
AMD Ryzen AI 9 HX 470
2061 Points -2%
Schenker XMG Core 16 M25
AMD Ryzen AI 9 HX 370
2019 Points -4%
MSI Crosshair A16 HX E8WGK
AMD Ryzen 9 8940HX
1886 Points -11%
MSI Stealth 16 Studio A13VG
Intel Core i7-13700H
1854 Points -12%
Lenovo Legion Slim 5 16APH8
AMD Ryzen 7 7840HS
1793 Points -15%
Cinebench R20 / CPU (Multi Core)
Aorus Master 16 AM6J
AMD Ryzen 9 9955HX3D
14793 Points +75%
HP Omen Max 16-ah1932nr
Intel Core Ultra 9 290HX Plus
14722 Points +74%
MSI Crosshair A16 HX E8WGK
AMD Ryzen 9 8940HX
12785 Points +51%
Lenovo Legion Pro 5 16IRX9
Intel Core i9-14900HX
11319 Points +34%
Lenovo Legion 7 16 AGP11
AMD Ryzen AI 9 HX 470
9225 Points +9%
Schenker XMG Core 16 M25
AMD Ryzen AI 9 HX 370
8504 Points +1%
MSI Stealth 16 AI B3WH
Intel Core Ultra 9 386H
8447 Points
Razer Blade 16 Core Ultra 9 386H
Intel Core Ultra 9 386H
8162 Points -3%
MSI Stealth 16 Studio A13VG
Intel Core i7-13700H
7674 Points -9%
Moyenne Intel Core Ultra 9 386H
  (4757 - 8447, n=10)
7657 Points -9%
Lenovo Legion Slim 5 16APH8
AMD Ryzen 7 7840HS
6674 Points -21%
Asus ROG Zephyrus M16 GU603H
Intel Core i9-11900H
5160 Points -39%
Cinebench R20 / CPU (Single Core)
HP Omen Max 16-ah1932nr
Intel Core Ultra 9 290HX Plus
840 Points +4%
Lenovo Legion Pro 5 16IRX9
Intel Core i9-14900HX
812 Points +1%
Lenovo Legion 7 16 AGP11
AMD Ryzen AI 9 HX 470
806 Points 0%
MSI Stealth 16 AI B3WH
Intel Core Ultra 9 386H
806 Points
Schenker XMG Core 16 M25
AMD Ryzen AI 9 HX 370
795 Points -1%
Razer Blade 16 Core Ultra 9 386H
Intel Core Ultra 9 386H
795 Points -1%
Aorus Master 16 AM6J
AMD Ryzen 9 9955HX3D
790 Points -2%
Moyenne Intel Core Ultra 9 386H
  (762 - 806, n=10)
789 Points -2%
MSI Crosshair A16 HX E8WGK
AMD Ryzen 9 8940HX
736 Points -9%
MSI Stealth 16 Studio A13VG
Intel Core i7-13700H
719 Points -11%
Lenovo Legion Slim 5 16APH8
AMD Ryzen 7 7840HS
698 Points -13%
Asus ROG Zephyrus M16 GU603H
Intel Core i9-11900H
603 Points -25%
Cinebench R15 / CPU Multi 64Bit
Aorus Master 16 AM6J
AMD Ryzen 9 9955HX3D
6068 (5802.15min - 6067.96max) Points +83%
HP Omen Max 16-ah1932nr
Intel Core Ultra 9 290HX Plus
5628 (5175.31min - 5628.25max) Points +70%
MSI Crosshair A16 HX E8WGK
AMD Ryzen 9 8940HX
5355 (5233.55min - 5355.47max) Points +61%
Lenovo Legion Pro 5 16IRX9
Intel Core i9-14900HX
4591 (4151.1min - 4590.84max) Points +38%
Schenker XMG Core 16 M25
AMD Ryzen AI 9 HX 370
3543 (3290.01min - 3542.96max) Points +7%
Lenovo Legion 7 16 AGP11
AMD Ryzen AI 9 HX 470
3542 (3345.88min - 3542.33max) Points +7%
MSI Stealth 16 AI B3WH
Intel Core Ultra 9 386H
3317 (3176.62min - 3317.02max) Points
Razer Blade 16 Core Ultra 9 386H
Intel Core Ultra 9 386H
3172 (2806.23min - 3172.09max) Points -4%
Moyenne Intel Core Ultra 9 386H
  (2197 - 3347, n=10)
3097 Points -7%
MSI Stealth 16 Studio A13VG
Intel Core i7-13700H
2854 Points -14%
Lenovo Legion Slim 5 16APH8
AMD Ryzen 7 7840HS
2706 (2627.26min - 2706.36max) Points -18%
Asus ROG Zephyrus M16 GU603H
Intel Core i9-11900H
2211 (1875.21min - 2210.56max) Points -33%
Cinebench R15 / CPU Single 64Bit
Aorus Master 16 AM6J
AMD Ryzen 9 9955HX3D
331 Points +4%
MSI Stealth 16 AI B3WH
Intel Core Ultra 9 386H
319 Points
Razer Blade 16 Core Ultra 9 386H
Intel Core Ultra 9 386H
313 Points -2%
HP Omen Max 16-ah1932nr
Intel Core Ultra 9 290HX Plus
303 Points -5%
MSI Crosshair A16 HX E8WGK
AMD Ryzen 9 8940HX
301 Points -6%
Moyenne Intel Core Ultra 9 386H
  (249 - 319, n=10)
300 Points -6%
Lenovo Legion Pro 5 16IRX9
Intel Core i9-14900HX
299 Points -6%
Lenovo Legion Slim 5 16APH8
AMD Ryzen 7 7840HS
280 Points -12%
MSI Stealth 16 Studio A13VG
Intel Core i7-13700H
273 Points -14%
Asus ROG Zephyrus M16 GU603H
Intel Core i9-11900H
236 Points -26%
Lenovo Legion 7 16 AGP11
AMD Ryzen AI 9 HX 470
192.7 Points -40%
Schenker XMG Core 16 M25
AMD Ryzen AI 9 HX 370
188.8 Points -41%
Blender / v2.79 BMW27 CPU
Asus ROG Zephyrus M16 GU603H
Intel Core i9-11900H
243 Seconds * -54%
Lenovo Legion Slim 5 16APH8
AMD Ryzen 7 7840HS
185 Seconds * -17%
Moyenne Intel Core Ultra 9 386H
  (156 - 299, n=10)
183.3 Seconds * -16%
Razer Blade 16 Core Ultra 9 386H
Intel Core Ultra 9 386H
171 Seconds * -8%
MSI Stealth 16 Studio A13VG
Intel Core i7-13700H
169 Seconds * -7%
MSI Stealth 16 AI B3WH
Intel Core Ultra 9 386H
158 Seconds *
Lenovo Legion 7 16 AGP11
AMD Ryzen AI 9 HX 470
140 Seconds * +11%
Schenker XMG Core 16 M25
AMD Ryzen AI 9 HX 370
139 Seconds * +12%
Lenovo Legion Pro 5 16IRX9
Intel Core i9-14900HX
113 Seconds * +28%
MSI Crosshair A16 HX E8WGK
AMD Ryzen 9 8940HX
96 Seconds * +39%
HP Omen Max 16-ah1932nr
Intel Core Ultra 9 290HX Plus
92 Seconds * +42%
Aorus Master 16 AM6J
AMD Ryzen 9 9955HX3D
82 Seconds * +48%
7-Zip 18.03 / 7z b 4
Aorus Master 16 AM6J
AMD Ryzen 9 9955HX3D
145000 MIPS +111%
MSI Crosshair A16 HX E8WGK
AMD Ryzen 9 8940HX
137645 MIPS +101%
Lenovo Legion Pro 5 16IRX9
Intel Core i9-14900HX
115585 MIPS +68%
HP Omen Max 16-ah1932nr
Intel Core Ultra 9 290HX Plus
103072 MIPS +50%
Schenker XMG Core 16 M25
AMD Ryzen AI 9 HX 370
84735 MIPS +23%
Lenovo Legion 7 16 AGP11
AMD Ryzen AI 9 HX 470
83161 MIPS +21%
MSI Stealth 16 Studio A13VG
Intel Core i7-13700H
76344 MIPS +11%
Razer Blade 16 Core Ultra 9 386H
Intel Core Ultra 9 386H
71655 MIPS +4%
Lenovo Legion Slim 5 16APH8
AMD Ryzen 7 7840HS
68815 MIPS 0%
MSI Stealth 16 AI B3WH
Intel Core Ultra 9 386H
68649 MIPS
Moyenne Intel Core Ultra 9 386H
  (44980 - 72882, n=10)
66189 MIPS -4%
Asus ROG Zephyrus M16 GU603H
Intel Core i9-11900H
54156 MIPS -21%
7-Zip 18.03 / 7z b 4 -mmt1
Aorus Master 16 AM6J
AMD Ryzen 9 9955HX3D
7382 MIPS +21%
MSI Crosshair A16 HX E8WGK
AMD Ryzen 9 8940HX
7220 MIPS +18%
HP Omen Max 16-ah1932nr
Intel Core Ultra 9 290HX Plus
6802 MIPS +11%
Lenovo Legion Pro 5 16IRX9
Intel Core i9-14900HX
6776 MIPS +11%
Lenovo Legion Slim 5 16APH8
AMD Ryzen 7 7840HS
6516 MIPS +7%
Schenker XMG Core 16 M25
AMD Ryzen AI 9 HX 370
6487 MIPS +6%
Razer Blade 16 Core Ultra 9 386H
Intel Core Ultra 9 386H
6367 MIPS +4%
Lenovo Legion 7 16 AGP11
AMD Ryzen AI 9 HX 470
6244 MIPS +2%
Moyenne Intel Core Ultra 9 386H
  (5488 - 6493, n=10)
6167 MIPS +1%
MSI Stealth 16 Studio A13VG
Intel Core i7-13700H
6125 MIPS 0%
MSI Stealth 16 AI B3WH
Intel Core Ultra 9 386H
6114 MIPS
Asus ROG Zephyrus M16 GU603H
Intel Core i9-11900H
5582 MIPS -9%
Geekbench 6.7 / Multi-Core
HP Omen Max 16-ah1932nr
Intel Core Ultra 9 290HX Plus
20585 Points
Aorus Master 16 AM6J
AMD Ryzen 9 9955HX3D
20023 Points
Lenovo Legion Pro 5 16IRX9
Intel Core i9-14900HX
18126 Points
Razer Blade 16 Core Ultra 9 386H
Intel Core Ultra 9 386H
16903 Points
MSI Crosshair A16 HX E8WGK
AMD Ryzen 9 8940HX
16483 Points
Schenker XMG Core 16 M25
AMD Ryzen AI 9 HX 370
16311 Points
Moyenne Intel Core Ultra 9 386H
  (13776 - 17405, n=11)
16298 Points
Lenovo Legion 7 16 AGP11
AMD Ryzen AI 9 HX 470
16116 Points
Geekbench 6.7 / Single-Core
Aorus Master 16 AM6J
AMD Ryzen 9 9955HX3D
3203 Points
HP Omen Max 16-ah1932nr
Intel Core Ultra 9 290HX Plus
3100 Points
Lenovo Legion 7 16 AGP11
AMD Ryzen AI 9 HX 470
2958 Points
Schenker XMG Core 16 M25
AMD Ryzen AI 9 HX 370
2930 Points
Lenovo Legion Pro 5 16IRX9
Intel Core i9-14900HX
2889 Points
Razer Blade 16 Core Ultra 9 386H
Intel Core Ultra 9 386H
2886 Points
Moyenne Intel Core Ultra 9 386H
  (2778 - 2947, n=11)
2876 Points
MSI Crosshair A16 HX E8WGK
AMD Ryzen 9 8940HX
2839 Points
Geekbench 5.5 / Multi-Core
HP Omen Max 16-ah1932nr
Intel Core Ultra 9 290HX Plus
24695 Points +59%
Aorus Master 16 AM6J
AMD Ryzen 9 9955HX3D
23661 Points +52%
Lenovo Legion Pro 5 16IRX9
Intel Core i9-14900HX
21299 Points +37%
MSI Crosshair A16 HX E8WGK
AMD Ryzen 9 8940HX
19054 Points +23%
Razer Blade 16 Core Ultra 9 386H
Intel Core Ultra 9 386H
17017 Points +9%
Schenker XMG Core 16 M25
AMD Ryzen AI 9 HX 370
16322 Points +5%
Moyenne Intel Core Ultra 9 386H
  (13098 - 17557, n=9)
16194 Points +4%
Lenovo Legion 7 16 AGP11
AMD Ryzen AI 9 HX 470
16002 Points +3%
MSI Stealth 16 AI B3WH
Intel Core Ultra 9 386H
15541 Points
MSI Stealth 16 Studio A13VG
Intel Core i7-13700H
13239 Points -15%
Lenovo Legion Slim 5 16APH8
AMD Ryzen 7 7840HS
11651 Points -25%
Asus ROG Zephyrus M16 GU603H
Intel Core i9-11900H
9663 Points -38%
Geekbench 5.5 / Single-Core
Aorus Master 16 AM6J
AMD Ryzen 9 9955HX3D
2406 Points +16%
HP Omen Max 16-ah1932nr
Intel Core Ultra 9 290HX Plus
2251 Points +9%
Lenovo Legion 7 16 AGP11
AMD Ryzen AI 9 HX 470
2178 Points +5%
Razer Blade 16 Core Ultra 9 386H
Intel Core Ultra 9 386H
2109 Points +2%
Moyenne Intel Core Ultra 9 386H
  (1992 - 2162, n=9)
2099 Points +1%
Schenker XMG Core 16 M25
AMD Ryzen AI 9 HX 370
2076 Points 0%
MSI Stealth 16 AI B3WH
Intel Core Ultra 9 386H
2070 Points
Lenovo Legion Pro 5 16IRX9
Intel Core i9-14900HX
2046 Points -1%
MSI Crosshair A16 HX E8WGK
AMD Ryzen 9 8940HX
2025 Points -2%
Lenovo Legion Slim 5 16APH8
AMD Ryzen 7 7840HS
1989 Points -4%
MSI Stealth 16 Studio A13VG
Intel Core i7-13700H
1829 Points -12%
Asus ROG Zephyrus M16 GU603H
Intel Core i9-11900H
1624 Points -22%
HWBOT x265 Benchmark v2.2 / 4k Preset
Aorus Master 16 AM6J
AMD Ryzen 9 9955HX3D
43 fps +75%
MSI Crosshair A16 HX E8WGK
AMD Ryzen 9 8940HX
35.7 fps +45%
HP Omen Max 16-ah1932nr
Intel Core Ultra 9 290HX Plus
32.6 fps +33%
Lenovo Legion Pro 5 16IRX9
Intel Core i9-14900HX
30.1 fps +22%
Lenovo Legion 7 16 AGP11
AMD Ryzen AI 9 HX 470
28.5 fps +16%
Schenker XMG Core 16 M25
AMD Ryzen AI 9 HX 370
28.4 fps +15%
MSI Stealth 16 AI B3WH
Intel Core Ultra 9 386H
24.6 fps
Razer Blade 16 Core Ultra 9 386H
Intel Core Ultra 9 386H
24.5 fps 0%
Moyenne Intel Core Ultra 9 386H
  (13.2 - 25.8, n=10)
22.8 fps -7%
Lenovo Legion Slim 5 16APH8
AMD Ryzen 7 7840HS
21.8 fps -11%
MSI Stealth 16 Studio A13VG
Intel Core i7-13700H
19.7 fps -20%
Asus ROG Zephyrus M16 GU603H
Intel Core i9-11900H
15 fps -39%
LibreOffice / 20 Documents To PDF
Aorus Master 16 AM6J
AMD Ryzen 9 9955HX3D
71.8 s * -81%
MSI Stealth 16 Studio A13VG
Intel Core i7-13700H
54.6 s * -38%
Lenovo Legion 7 16 AGP11
AMD Ryzen AI 9 HX 470
53.8 s * -36%
Schenker XMG Core 16 M25
AMD Ryzen AI 9 HX 370
52.1 s * -32%
Moyenne Intel Core Ultra 9 386H
  (38.5 - 56.1, n=10)
45.7 s * -15%
MSI Crosshair A16 HX E8WGK
AMD Ryzen 9 8940HX
43.6 s * -10%
Lenovo Legion Pro 5 16IRX9
Intel Core i9-14900HX
40.7 s * -3%
Asus ROG Zephyrus M16 GU603H
Intel Core i9-11900H
40.5 s * -2%
MSI Stealth 16 AI B3WH
Intel Core Ultra 9 386H
39.6 s *
Razer Blade 16 Core Ultra 9 386H
Intel Core Ultra 9 386H
38.5 s * +3%
Lenovo Legion Slim 5 16APH8
AMD Ryzen 7 7840HS
38.3 s * +3%
HP Omen Max 16-ah1932nr
Intel Core Ultra 9 290HX Plus
37 s * +7%
R Benchmark 2.5 / Overall mean
Asus ROG Zephyrus M16 GU603H
Intel Core i9-11900H
0.544 sec * -31%
MSI Stealth 16 Studio A13VG
Intel Core i7-13700H
0.4498 sec * -8%
Lenovo Legion Slim 5 16APH8
AMD Ryzen 7 7840HS
0.4336 sec * -5%
MSI Crosshair A16 HX E8WGK
AMD Ryzen 9 8940HX
0.4286 sec * -3%
Moyenne Intel Core Ultra 9 386H
  (0.4055 - 0.4384, n=10)
0.4231 sec * -2%
Lenovo Legion 7 16 AGP11
AMD Ryzen AI 9 HX 470
0.4157 sec * -0%
MSI Stealth 16 AI B3WH
Intel Core Ultra 9 386H
0.4148 sec *
Razer Blade 16 Core Ultra 9 386H
Intel Core Ultra 9 386H
0.4096 sec * +1%
Schenker XMG Core 16 M25
AMD Ryzen AI 9 HX 370
0.3974 sec * +4%
Lenovo Legion Pro 5 16IRX9
Intel Core i9-14900HX
0.3917 sec * +6%
HP Omen Max 16-ah1932nr
Intel Core Ultra 9 290HX Plus
0.3899 sec * +6%
Aorus Master 16 AM6J
AMD Ryzen 9 9955HX3D
0.3566 sec * +14%

* ... Moindre est la valeur, meilleures sont les performances
Cinebench R15 CPU Multi 64Bit
3317 Points
Cinebench R15 OpenGL 64Bit
258 fps
Cinebench R15 Ref. Match 64Bit
99.6 %
Cinebench R15 CPU Single 64Bit
319 Points
Cinebench R20 CPU (Single Core)
806 Points
Cinebench R20 CPU (Multi Core)
8447 Points
Cinebench R23 Single Core
2111 Points
Cinebench R23 Multi Core
22084 Points
Cinebench 2024 CPU Single Core
122.8 Points
Cinebench 2024 CPU Multi Core
1233 Points
Cinebench 2026 CPU Multi
4951 Points
Cinebench 2026 CPU Single Thread
507 Points
Aide
Performance rating
Aorus Master 16 AM6J -1!
AMD Ryzen 9 9955HX3D, GeForce RTX 5080 Laptop
94.9 pt
Lenovo Legion 7 16 AGP11 -1!
AMD Ryzen AI 9 HX 470, GeForce RTX 5060 Laptop
52.6 pt
MSI Stealth 16 Studio A13VG -1!
Intel Core i7-13700H, GeForce RTX 4070 Laptop GPU
41 pt
Asus ROG Zephyrus G16 GU606AW -1!
Intel Core Ultra 9 386H, GeForce RTX 5080 Laptop
40.8 pt
Razer Blade 16 Core Ultra 9 386H -1!
Intel Core Ultra 9 386H, GeForce RTX 5090 Laptop
40.7 pt
MSI Stealth 16 AI B3WH -1!
Intel Core Ultra 9 386H, GeForce RTX 5070 Ti Laptop
37 pt
Moyenne Intel Core Ultra 9 386H -1!
 
36.7 pt
AIDA64 / FP32 Ray-Trace
Aorus Master 16 AM6J
AMD Ryzen 9 9955HX3D, GeForce RTX 5080 Laptop (v8.20.8100)
81070 KRay/s +277%
Lenovo Legion 7 16 AGP11
AMD Ryzen AI 9 HX 470, GeForce RTX 5060 Laptop (v8.20.8100)
38491 KRay/s +79%
Asus ROG Zephyrus G16 GU606AW
Intel Core Ultra 9 386H, GeForce RTX 5080 Laptop (v8.20.8100)
21921 KRay/s +2%
MSI Stealth 16 AI B3WH
Intel Core Ultra 9 386H, GeForce RTX 5070 Ti Laptop (v8.20.8100)
21481 KRay/s
Razer Blade 16 Core Ultra 9 386H
Intel Core Ultra 9 386H, GeForce RTX 5090 Laptop (v8.20.8100)
20588 KRay/s -4%
Moyenne Intel Core Ultra 9 386H
  (10001 - 21921, n=10)
18779 KRay/s -13%
MSI Stealth 16 Studio A13VG
Intel Core i7-13700H, GeForce RTX 4070 Laptop GPU (v6.85.6300)
17934 KRay/s -17%
AIDA64 / FPU Julia
Aorus Master 16 AM6J
AMD Ryzen 9 9955HX3D, GeForce RTX 5080 Laptop (v8.20.8100)
372155 Points +240%
Lenovo Legion 7 16 AGP11
AMD Ryzen AI 9 HX 470, GeForce RTX 5060 Laptop (v8.20.8100)
146502 Points +34%
Asus ROG Zephyrus G16 GU606AW
Intel Core Ultra 9 386H, GeForce RTX 5080 Laptop (v8.20.8100)
112784 Points +3%
Razer Blade 16 Core Ultra 9 386H
Intel Core Ultra 9 386H, GeForce RTX 5090 Laptop (v8.20.8100)
110173 Points +1%
MSI Stealth 16 AI B3WH
Intel Core Ultra 9 386H, GeForce RTX 5070 Ti Laptop (v8.20.8100)
109571 Points
Moyenne Intel Core Ultra 9 386H
  (53370 - 113595, n=10)
98600 Points -10%
MSI Stealth 16 Studio A13VG
Intel Core i7-13700H, GeForce RTX 4070 Laptop GPU (v6.85.6300)
81656 Points -25%
AIDA64 / CPU SHA3
Aorus Master 16 AM6J
AMD Ryzen 9 9955HX3D, GeForce RTX 5080 Laptop (v8.20.8100)
9630 MB/s +78%
Lenovo Legion 7 16 AGP11
AMD Ryzen AI 9 HX 470, GeForce RTX 5060 Laptop (v8.20.8100)
5821 MB/s +8%
Razer Blade 16 Core Ultra 9 386H
Intel Core Ultra 9 386H, GeForce RTX 5090 Laptop (v8.20.8100)
5516 MB/s +2%
Asus ROG Zephyrus G16 GU606AW
Intel Core Ultra 9 386H, GeForce RTX 5080 Laptop (v8.20.8100)
5508 MB/s +2%
MSI Stealth 16 AI B3WH
Intel Core Ultra 9 386H, GeForce RTX 5070 Ti Laptop (v8.20.8100)
5407 MB/s
Moyenne Intel Core Ultra 9 386H
  (2776 - 5604, n=10)
4908 MB/s -9%
MSI Stealth 16 Studio A13VG
Intel Core i7-13700H, GeForce RTX 4070 Laptop GPU (v6.85.6300)
4080 MB/s -25%
AIDA64 / CPU Queen
MSI Stealth 16 Studio A13VG
Intel Core i7-13700H, GeForce RTX 4070 Laptop GPU (v6.85.6300)
105597 Points
AIDA64 / FPU SinJulia
Aorus Master 16 AM6J
AMD Ryzen 9 9955HX3D, GeForce RTX 5080 Laptop (v8.20.8100)
32252 Points +340%
Lenovo Legion 7 16 AGP11
AMD Ryzen AI 9 HX 470, GeForce RTX 5060 Laptop (v8.20.8100)
19201 Points +162%
MSI Stealth 16 Studio A13VG
Intel Core i7-13700H, GeForce RTX 4070 Laptop GPU (v6.85.6300)
11050 Points +51%
Asus ROG Zephyrus G16 GU606AW
Intel Core Ultra 9 386H, GeForce RTX 5080 Laptop (v8.20.8100)
7333 Points 0%
MSI Stealth 16 AI B3WH
Intel Core Ultra 9 386H, GeForce RTX 5070 Ti Laptop (v8.20.8100)
7322 Points
Razer Blade 16 Core Ultra 9 386H
Intel Core Ultra 9 386H, GeForce RTX 5090 Laptop (v8.20.8100)
7267 Points -1%
Moyenne Intel Core Ultra 9 386H
  (5314 - 7333, n=10)
6947 Points -5%
AIDA64 / FPU Mandel
Aorus Master 16 AM6J
AMD Ryzen 9 9955HX3D, GeForce RTX 5080 Laptop (v8.20.8100)
196829 Points +236%
Lenovo Legion 7 16 AGP11
AMD Ryzen AI 9 HX 470, GeForce RTX 5060 Laptop (v8.20.8100)
74636 Points +27%
Asus ROG Zephyrus G16 GU606AW
Intel Core Ultra 9 386H, GeForce RTX 5080 Laptop (v8.20.8100)
61540 Points +5%
MSI Stealth 16 AI B3WH
Intel Core Ultra 9 386H, GeForce RTX 5070 Ti Laptop (v8.20.8100)
58598 Points
Razer Blade 16 Core Ultra 9 386H
Intel Core Ultra 9 386H, GeForce RTX 5090 Laptop (v8.20.8100)
58275 Points -1%
Moyenne Intel Core Ultra 9 386H
  (28414 - 61578, n=10)
52659 Points -10%
MSI Stealth 16 Studio A13VG
Intel Core i7-13700H, GeForce RTX 4070 Laptop GPU (v6.85.6300)
44154 Points -25%
AIDA64 / CPU AES
Aorus Master 16 AM6J
AMD Ryzen 9 9955HX3D, GeForce RTX 5080 Laptop (v8.20.8100)
160619 MB/s +128%
Lenovo Legion 7 16 AGP11
AMD Ryzen AI 9 HX 470, GeForce RTX 5060 Laptop (v8.20.8100)
117375 MB/s +67%
MSI Stealth 16 Studio A13VG
Intel Core i7-13700H, GeForce RTX 4070 Laptop GPU (v6.85.6300)
81504 MB/s +16%
Asus ROG Zephyrus G16 GU606AW
Intel Core Ultra 9 386H, GeForce RTX 5080 Laptop (v8.20.8100)
70454 MB/s 0%
Razer Blade 16 Core Ultra 9 386H
Intel Core Ultra 9 386H, GeForce RTX 5090 Laptop (v8.20.8100)
70408 MB/s 0%
MSI Stealth 16 AI B3WH
Intel Core Ultra 9 386H, GeForce RTX 5070 Ti Laptop (v8.20.8100)
70307 MB/s
Moyenne Intel Core Ultra 9 386H
  (46362 - 72112, n=10)
65978 MB/s -6%
AIDA64 / CPU ZLib
Aorus Master 16 AM6J
AMD Ryzen 9 9955HX3D, GeForce RTX 5080 Laptop (v8.20.8100)
2436 MB/s +91%
Lenovo Legion 7 16 AGP11
AMD Ryzen AI 9 HX 470, GeForce RTX 5060 Laptop (v8.20.8100)
1549 MB/s +22%
MSI Stealth 16 AI B3WH
Intel Core Ultra 9 386H, GeForce RTX 5070 Ti Laptop (v8.20.8100)
1273 MB/s
Razer Blade 16 Core Ultra 9 386H
Intel Core Ultra 9 386H, GeForce RTX 5090 Laptop (v8.20.8100)
1271 MB/s 0%
Asus ROG Zephyrus G16 GU606AW
Intel Core Ultra 9 386H, GeForce RTX 5080 Laptop (v8.20.8100)
1267 MB/s 0%
Moyenne Intel Core Ultra 9 386H
  (669 - 1273, n=10)
1152 MB/s -10%
MSI Stealth 16 Studio A13VG
Intel Core i7-13700H, GeForce RTX 4070 Laptop GPU (v6.85.6300)
1032 MB/s -19%
AIDA64 / FP64 Ray-Trace
Aorus Master 16 AM6J
AMD Ryzen 9 9955HX3D, GeForce RTX 5080 Laptop (v8.20.8100)
43081 KRay/s +277%
Lenovo Legion 7 16 AGP11
AMD Ryzen AI 9 HX 470, GeForce RTX 5060 Laptop (v8.20.8100)
19610 KRay/s +72%
Asus ROG Zephyrus G16 GU606AW
Intel Core Ultra 9 386H, GeForce RTX 5080 Laptop (v8.20.8100)
11672 KRay/s +2%
MSI Stealth 16 AI B3WH
Intel Core Ultra 9 386H, GeForce RTX 5070 Ti Laptop (v8.20.8100)
11432 KRay/s
Razer Blade 16 Core Ultra 9 386H
Intel Core Ultra 9 386H, GeForce RTX 5090 Laptop (v8.20.8100)
10023 KRay/s -12%
Moyenne Intel Core Ultra 9 386H
  (5138 - 11672, n=10)
9814 KRay/s -14%
MSI Stealth 16 Studio A13VG
Intel Core i7-13700H, GeForce RTX 4070 Laptop GPU (v6.85.6300)
9680 KRay/s -15%
AIDA64 / CPU PhotoWorxx
Razer Blade 16 Core Ultra 9 386H
Intel Core Ultra 9 386H, GeForce RTX 5090 Laptop (v8.20.8100)
89891 MPixel/s +65%
Asus ROG Zephyrus G16 GU606AW
Intel Core Ultra 9 386H, GeForce RTX 5080 Laptop (v8.20.8100)
84002 MPixel/s +54%
Moyenne Intel Core Ultra 9 386H
  (54042 - 89891, n=10)
76111 MPixel/s +40%
MSI Stealth 16 AI B3WH
Intel Core Ultra 9 386H, GeForce RTX 5070 Ti Laptop (v8.20.8100)
54493 MPixel/s
Lenovo Legion 7 16 AGP11
AMD Ryzen AI 9 HX 470, GeForce RTX 5060 Laptop (v8.20.8100)
54302 MPixel/s 0%
MSI Stealth 16 Studio A13VG
Intel Core i7-13700H, GeForce RTX 4070 Laptop GPU (v6.85.6300)
46114 MPixel/s -15%
Aorus Master 16 AM6J
AMD Ryzen 9 9955HX3D, GeForce RTX 5080 Laptop (v8.20.8100)
44266 MPixel/s -19%
AIDA64 / CPU CheckMate
Aorus Master 16 AM6J
AMD Ryzen 9 9955HX3D, GeForce RTX 5080 Laptop (v8.20.8100)
20751 MP/s +341%
Lenovo Legion 7 16 AGP11
AMD Ryzen AI 9 HX 470, GeForce RTX 5060 Laptop (v8.20.8100)
8080 MP/s +72%
Asus ROG Zephyrus G16 GU606AW
Intel Core Ultra 9 386H, GeForce RTX 5080 Laptop (v8.20.8100)
4839 MP/s +3%
Razer Blade 16 Core Ultra 9 386H
Intel Core Ultra 9 386H, GeForce RTX 5090 Laptop (v8.20.8100)
4811 MP/s +2%
MSI Stealth 16 AI B3WH
Intel Core Ultra 9 386H, GeForce RTX 5070 Ti Laptop (v8.20.8100)
4708 MP/s
Moyenne Intel Core Ultra 9 386H
  (4051 - 4858, n=9)
4645 MP/s -1%

Performances du système

PCMark 10 Standard
PCMark 10 Standard
Performance rating
Razer Blade 16 Core Ultra 9 386H
GeForce RTX 5090 Laptop, Ultra 9 386H, Lexar NM790 2TB
91.1 pt
Aorus Master 16 AM6J -3!
GeForce RTX 5080 Laptop, R9 9955HX3D, Samsung PM9C1b MZVL81T0HFLB-00BTW
90.3 pt
Asus ROG Zephyrus G16 GU606AW
GeForce RTX 5080 Laptop, Ultra 9 386H, Samsung PM9C1b MZVL82T0HBL1
88.7 pt
MSI Stealth 16 AI B3WH
GeForce RTX 5070 Ti Laptop, Ultra 9 386H, Samsung PM9C1b MZVL81T0HFLB-00BTW
86.6 pt
Moyenne Intel Core Ultra 9 386H, NVIDIA GeForce RTX 5070 Ti Laptop
 
84.6 pt
Lenovo Legion 7 16 AGP11 -3!
GeForce RTX 5060 Laptop, Ryzen AI 9 HX 470, Lenovo UMIS AM541 1TB
76.8 pt
MSI Stealth 16 Studio A13VG -3!
GeForce RTX 4070 Laptop GPU, i7-13700H, Micron 3400 2TB MTFDKBA2T0TFH
71 pt
PCMark 10 / Score
Aorus Master 16 AM6J
GeForce RTX 5080 Laptop, R9 9955HX3D, Samsung PM9C1b MZVL81T0HFLB-00BTW
10636 Points +4%
MSI Stealth 16 AI B3WH
GeForce RTX 5070 Ti Laptop, Ultra 9 386H, Samsung PM9C1b MZVL81T0HFLB-00BTW
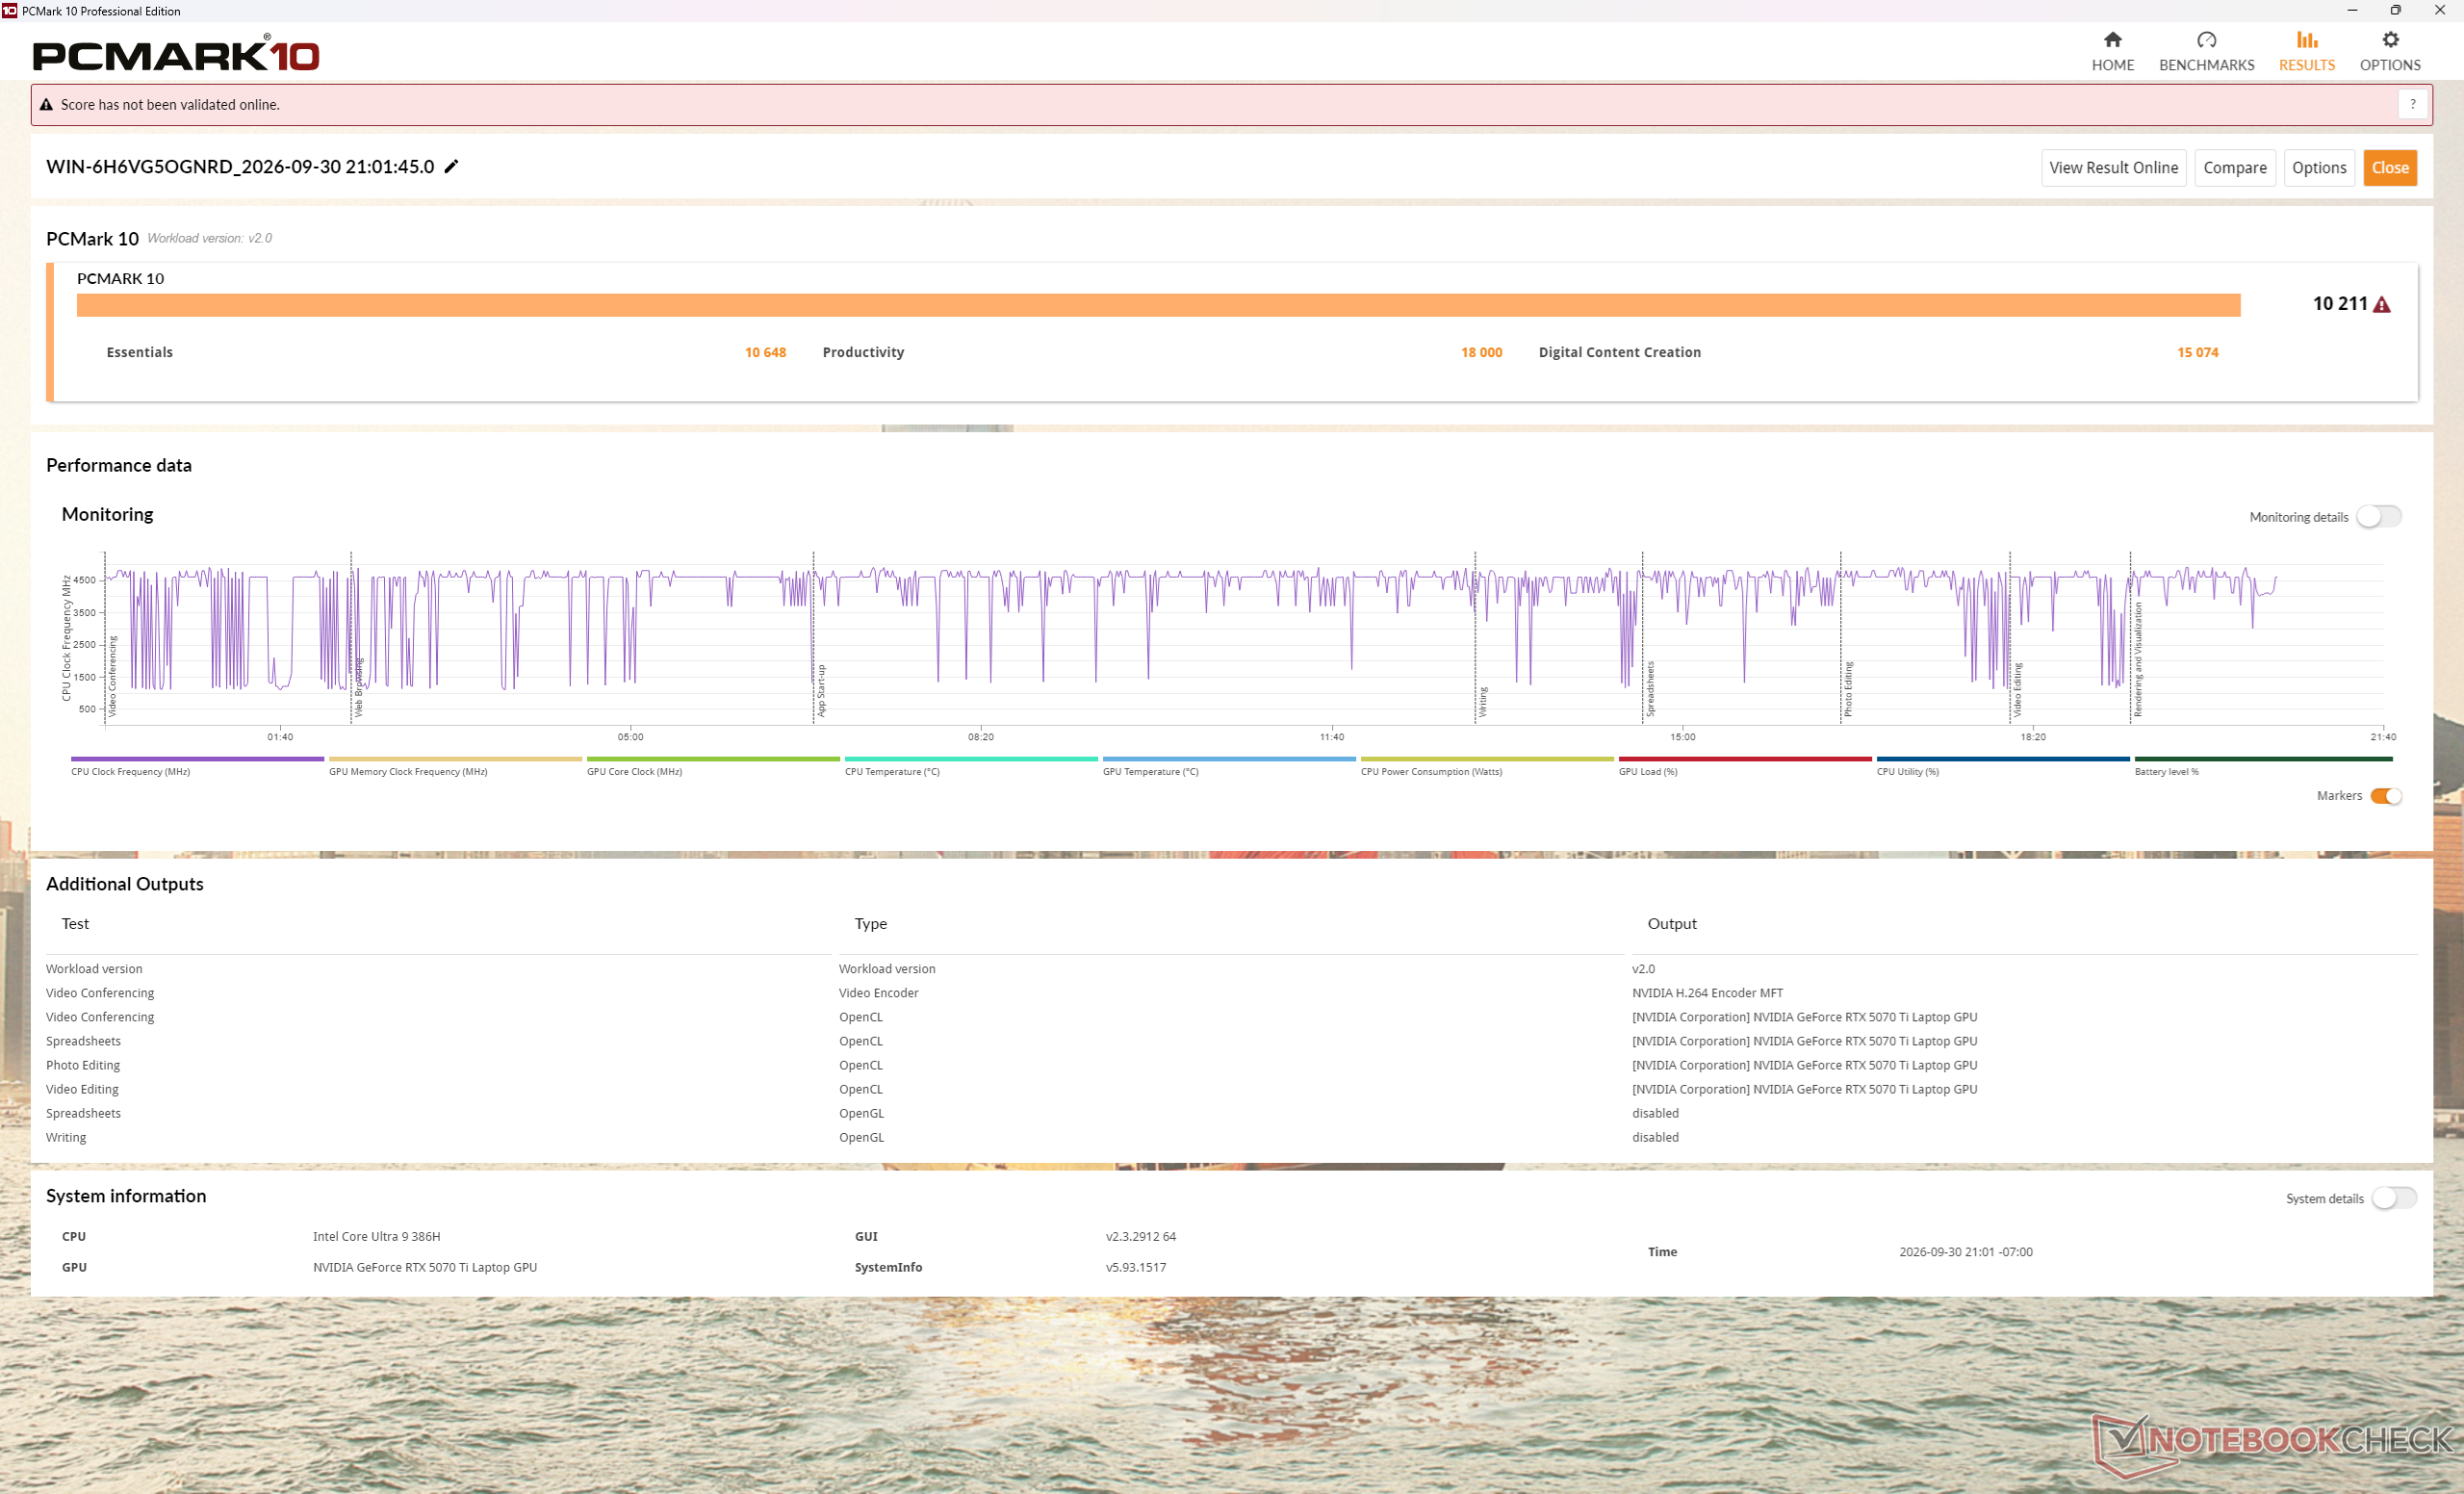
10211 Points
Razer Blade 16 Core Ultra 9 386H
GeForce RTX 5090 Laptop, Ultra 9 386H, Lexar NM790 2TB
10164 Points 0%
Asus ROG Zephyrus G16 GU606AW
GeForce RTX 5080 Laptop, Ultra 9 386H, Samsung PM9C1b MZVL82T0HBL1
9827 Points -4%
Moyenne Intel Core Ultra 9 386H, NVIDIA GeForce RTX 5070 Ti Laptop
  (9049 - 10211, n=2)
9630 Points -6%
Lenovo Legion 7 16 AGP11
GeForce RTX 5060 Laptop, Ryzen AI 9 HX 470, Lenovo UMIS AM541 1TB
9485 Points -7%
MSI Stealth 16 Studio A13VG
GeForce RTX 4070 Laptop GPU, i7-13700H, Micron 3400 2TB MTFDKBA2T0TFH
7329 Points -28%
PCMark 10 / Essentials
Aorus Master 16 AM6J
GeForce RTX 5080 Laptop, R9 9955HX3D, Samsung PM9C1b MZVL81T0HFLB-00BTW
11564 Points +9%
Razer Blade 16 Core Ultra 9 386H
GeForce RTX 5090 Laptop, Ultra 9 386H, Lexar NM790 2TB
10840 Points +2%
MSI Stealth 16 AI B3WH
GeForce RTX 5070 Ti Laptop, Ultra 9 386H, Samsung PM9C1b MZVL81T0HFLB-00BTW
10648 Points
MSI Stealth 16 Studio A13VG
GeForce RTX 4070 Laptop GPU, i7-13700H, Micron 3400 2TB MTFDKBA2T0TFH
10491 Points -1%
Lenovo Legion 7 16 AGP11
GeForce RTX 5060 Laptop, Ryzen AI 9 HX 470, Lenovo UMIS AM541 1TB
10430 Points -2%
Moyenne Intel Core Ultra 9 386H, NVIDIA GeForce RTX 5070 Ti Laptop
  (10068 - 10648, n=2)
10358 Points -3%
Asus ROG Zephyrus G16 GU606AW
GeForce RTX 5080 Laptop, Ultra 9 386H, Samsung PM9C1b MZVL82T0HBL1
10124 Points -5%
PCMark 10 / Productivity
Aorus Master 16 AM6J
GeForce RTX 5080 Laptop, R9 9955HX3D, Samsung PM9C1b MZVL81T0HFLB-00BTW
19653 Points +9%
MSI Stealth 16 AI B3WH
GeForce RTX 5070 Ti Laptop, Ultra 9 386H, Samsung PM9C1b MZVL81T0HFLB-00BTW
18000 Points
Asus ROG Zephyrus G16 GU606AW
GeForce RTX 5080 Laptop, Ultra 9 386H, Samsung PM9C1b MZVL82T0HBL1
16800 Points -7%
Razer Blade 16 Core Ultra 9 386H
GeForce RTX 5090 Laptop, Ultra 9 386H, Lexar NM790 2TB
16063 Points -11%
Lenovo Legion 7 16 AGP11
GeForce RTX 5060 Laptop, Ryzen AI 9 HX 470, Lenovo UMIS AM541 1TB
15691 Points -13%
Moyenne Intel Core Ultra 9 386H, NVIDIA GeForce RTX 5070 Ti Laptop
  (13132 - 18000, n=2)
15566 Points -14%
MSI Stealth 16 Studio A13VG
GeForce RTX 4070 Laptop GPU, i7-13700H, Micron 3400 2TB MTFDKBA2T0TFH
9376 Points -48%
PCMark 10 / Digital Content Creation
Razer Blade 16 Core Ultra 9 386H
GeForce RTX 5090 Laptop, Ultra 9 386H, Lexar NM790 2TB
16364 Points +9%
Asus ROG Zephyrus G16 GU606AW
GeForce RTX 5080 Laptop, Ultra 9 386H, Samsung PM9C1b MZVL82T0HBL1
15144 Points 0%
Moyenne Intel Core Ultra 9 386H, NVIDIA GeForce RTX 5070 Ti Laptop
  (15074 - 15207, n=2)
15141 Points 0%
MSI Stealth 16 AI B3WH
GeForce RTX 5070 Ti Laptop, Ultra 9 386H, Samsung PM9C1b MZVL81T0HFLB-00BTW
15074 Points
Aorus Master 16 AM6J
GeForce RTX 5080 Laptop, R9 9955HX3D, Samsung PM9C1b MZVL81T0HFLB-00BTW
14368 Points -5%
Lenovo Legion 7 16 AGP11
GeForce RTX 5060 Laptop, Ryzen AI 9 HX 470, Lenovo UMIS AM541 1TB
14151 Points -6%
MSI Stealth 16 Studio A13VG
GeForce RTX 4070 Laptop GPU, i7-13700H, Micron 3400 2TB MTFDKBA2T0TFH
10860 Points -28%
CrossMark / Overall
Razer Blade 16 Core Ultra 9 386H
GeForce RTX 5090 Laptop, Ultra 9 386H, Lexar NM790 2TB
2185 Points +6%
Asus ROG Zephyrus G16 GU606AW
GeForce RTX 5080 Laptop, Ultra 9 386H, Samsung PM9C1b MZVL82T0HBL1
2180 Points +6%
Aorus Master 16 AM6J
GeForce RTX 5080 Laptop, R9 9955HX3D, Samsung PM9C1b MZVL81T0HFLB-00BTW
2126 Points +3%
MSI Stealth 16 AI B3WH
GeForce RTX 5070 Ti Laptop, Ultra 9 386H, Samsung PM9C1b MZVL81T0HFLB-00BTW
2061 Points
Moyenne Intel Core Ultra 9 386H, NVIDIA GeForce RTX 5070 Ti Laptop
  (2029 - 2061, n=2)
2045 Points -1%
MSI Stealth 16 Studio A13VG
GeForce RTX 4070 Laptop GPU, i7-13700H, Micron 3400 2TB MTFDKBA2T0TFH
1789 Points -13%
Lenovo Legion 7 16 AGP11
GeForce RTX 5060 Laptop, Ryzen AI 9 HX 470, Lenovo UMIS AM541 1TB
1570 Points -24%
CrossMark / Productivity
Asus ROG Zephyrus G16 GU606AW
GeForce RTX 5080 Laptop, Ultra 9 386H, Samsung PM9C1b MZVL82T0HBL1
1977 Points +3%
Razer Blade 16 Core Ultra 9 386H
GeForce RTX 5090 Laptop, Ultra 9 386H, Lexar NM790 2TB
1972 Points +2%
MSI Stealth 16 AI B3WH
GeForce RTX 5070 Ti Laptop, Ultra 9 386H, Samsung PM9C1b MZVL81T0HFLB-00BTW
1926 Points
Aorus Master 16 AM6J
GeForce RTX 5080 Laptop, R9 9955HX3D, Samsung PM9C1b MZVL81T0HFLB-00BTW
1914 Points -1%
Moyenne Intel Core Ultra 9 386H, NVIDIA GeForce RTX 5070 Ti Laptop
  (1802 - 1926, n=2)
1864 Points -3%
MSI Stealth 16 Studio A13VG
GeForce RTX 4070 Laptop GPU, i7-13700H, Micron 3400 2TB MTFDKBA2T0TFH
1705 Points -11%
Lenovo Legion 7 16 AGP11
GeForce RTX 5060 Laptop, Ryzen AI 9 HX 470, Lenovo UMIS AM541 1TB
1430 Points -26%
CrossMark / Creativity
Razer Blade 16 Core Ultra 9 386H
GeForce RTX 5090 Laptop, Ultra 9 386H, Lexar NM790 2TB
2558 Points +11%
Asus ROG Zephyrus G16 GU606AW
GeForce RTX 5080 Laptop, Ultra 9 386H, Samsung PM9C1b MZVL82T0HBL1
2558 Points +11%
Aorus Master 16 AM6J
GeForce RTX 5080 Laptop, R9 9955HX3D, Samsung PM9C1b MZVL81T0HFLB-00BTW
2547 Points +11%
Moyenne Intel Core Ultra 9 386H, NVIDIA GeForce RTX 5070 Ti Laptop
  (2300 - 2404, n=2)
2352 Points +2%
MSI Stealth 16 AI B3WH
GeForce RTX 5070 Ti Laptop, Ultra 9 386H, Samsung PM9C1b MZVL81T0HFLB-00BTW
2300 Points
MSI Stealth 16 Studio A13VG
GeForce RTX 4070 Laptop GPU, i7-13700H, Micron 3400 2TB MTFDKBA2T0TFH
1936 Points -16%
Lenovo Legion 7 16 AGP11
GeForce RTX 5060 Laptop, Ryzen AI 9 HX 470, Lenovo UMIS AM541 1TB
1764 Points -23%
CrossMark / Responsiveness
Razer Blade 16 Core Ultra 9 386H
GeForce RTX 5090 Laptop, Ultra 9 386H, Lexar NM790 2TB
1854 Points +2%
MSI Stealth 16 AI B3WH
GeForce RTX 5070 Ti Laptop, Ultra 9 386H, Samsung PM9C1b MZVL81T0HFLB-00BTW
1818 Points
Asus ROG Zephyrus G16 GU606AW
GeForce RTX 5080 Laptop, Ultra 9 386H, Samsung PM9C1b MZVL82T0HBL1
1810 Points 0%
Moyenne Intel Core Ultra 9 386H, NVIDIA GeForce RTX 5070 Ti Laptop
  (1745 - 1818, n=2)
1782 Points -2%
Aorus Master 16 AM6J
GeForce RTX 5080 Laptop, R9 9955HX3D, Samsung PM9C1b MZVL81T0HFLB-00BTW
1691 Points -7%
MSI Stealth 16 Studio A13VG
GeForce RTX 4070 Laptop GPU, i7-13700H, Micron 3400 2TB MTFDKBA2T0TFH
1635 Points -10%
Lenovo Legion 7 16 AGP11
GeForce RTX 5060 Laptop, Ryzen AI 9 HX 470, Lenovo UMIS AM541 1TB
1463 Points -20%
WebXPRT 3 / Overall
Aorus Master 16 AM6J
GeForce RTX 5080 Laptop, R9 9955HX3D, Samsung PM9C1b MZVL81T0HFLB-00BTW
335 Points +2%
Lenovo Legion 7 16 AGP11
GeForce RTX 5060 Laptop, Ryzen AI 9 HX 470, Lenovo UMIS AM541 1TB
329 Points +1%
MSI Stealth 16 AI B3WH
GeForce RTX 5070 Ti Laptop, Ultra 9 386H, Samsung PM9C1b MZVL81T0HFLB-00BTW
327 Points
Razer Blade 16 Core Ultra 9 386H
GeForce RTX 5090 Laptop, Ultra 9 386H, Lexar NM790 2TB
325 Points -1%
Moyenne Intel Core Ultra 9 386H, NVIDIA GeForce RTX 5070 Ti Laptop
  (309 - 327, n=2)
318 Points -3%
Asus ROG Zephyrus G16 GU606AW
GeForce RTX 5080 Laptop, Ultra 9 386H, Samsung PM9C1b MZVL82T0HBL1
313 Points -4%
MSI Stealth 16 Studio A13VG
GeForce RTX 4070 Laptop GPU, i7-13700H, Micron 3400 2TB MTFDKBA2T0TFH
297 Points -9%
WebXPRT 4 / Overall
Aorus Master 16 AM6J
GeForce RTX 5080 Laptop, R9 9955HX3D, Samsung PM9C1b MZVL81T0HFLB-00BTW
309 Points +2%
MSI Stealth 16 AI B3WH
GeForce RTX 5070 Ti Laptop, Ultra 9 386H, Samsung PM9C1b MZVL81T0HFLB-00BTW
304 Points
Razer Blade 16 Core Ultra 9 386H
GeForce RTX 5090 Laptop, Ultra 9 386H, Lexar NM790 2TB
301 Points -1%
Asus ROG Zephyrus G16 GU606AW
GeForce RTX 5080 Laptop, Ultra 9 386H, Samsung PM9C1b MZVL82T0HBL1
300 Points -1%
Moyenne Intel Core Ultra 9 386H, NVIDIA GeForce RTX 5070 Ti Laptop
  (292 - 304, n=2)
298 Points -2%
Lenovo Legion 7 16 AGP11
GeForce RTX 5060 Laptop, Ryzen AI 9 HX 470, Lenovo UMIS AM541 1TB
282.5 Points -7%
MSI Stealth 16 Studio A13VG
GeForce RTX 4070 Laptop GPU, i7-13700H, Micron 3400 2TB MTFDKBA2T0TFH
268 Points -12%
Mozilla Kraken 1.1 / Total
MSI Stealth 16 Studio A13VG
GeForce RTX 4070 Laptop GPU, i7-13700H, Micron 3400 2TB MTFDKBA2T0TFH
509 ms * -13%
Asus ROG Zephyrus G16 GU606AW
GeForce RTX 5080 Laptop, Ultra 9 386H, Samsung PM9C1b MZVL82T0HBL1
457 ms * -2%
Asus ROG Zephyrus G16 GU606AW
GeForce RTX 5080 Laptop, Ultra 9 386H, Samsung PM9C1b MZVL82T0HBL1
442 ms * +2%
Razer Blade 16 Core Ultra 9 386H
GeForce RTX 5090 Laptop, Ultra 9 386H, Lexar NM790 2TB
456 ms * -1%
Moyenne Intel Core Ultra 9 386H, NVIDIA GeForce RTX 5070 Ti Laptop
  (450 - 461, n=2)
456 ms * -1%
MSI Stealth 16 AI B3WH
GeForce RTX 5070 Ti Laptop, Ultra 9 386H, Samsung PM9C1b MZVL81T0HFLB-00BTW
450 ms *
Lenovo Legion 7 16 AGP11
GeForce RTX 5060 Laptop, Ryzen AI 9 HX 470, Lenovo UMIS AM541 1TB
422 ms * +6%
Aorus Master 16 AM6J
GeForce RTX 5080 Laptop, R9 9955HX3D, Samsung PM9C1b MZVL81T0HFLB-00BTW
405 ms * +10%
Geekbench AI / Quantized GPU 1.7
Razer Blade 16 Core Ultra 9 386H
GeForce RTX 5090 Laptop, Ultra 9 386H, Lexar NM790 2TB
19400 Points +15%
Asus ROG Zephyrus G16 GU606AW
GeForce RTX 5080 Laptop, Ultra 9 386H, Samsung PM9C1b MZVL82T0HBL1
19062 Points +13%
Moyenne Intel Core Ultra 9 386H, NVIDIA GeForce RTX 5070 Ti Laptop
  (16823 - 16842, n=2)
16833 Points 0%
MSI Stealth 16 AI B3WH
GeForce RTX 5070 Ti Laptop, Ultra 9 386H, Samsung PM9C1b MZVL81T0HFLB-00BTW
16823 Points
Geekbench AI / Half Precision GPU 1.7
Razer Blade 16 Core Ultra 9 386H
GeForce RTX 5090 Laptop, Ultra 9 386H, Lexar NM790 2TB
42258 Points +17%
Asus ROG Zephyrus G16 GU606AW
GeForce RTX 5080 Laptop, Ultra 9 386H, Samsung PM9C1b MZVL82T0HBL1
40285 Points +12%
Moyenne Intel Core Ultra 9 386H, NVIDIA GeForce RTX 5070 Ti Laptop
  (36110 - 37148, n=2)
36629 Points +1%
MSI Stealth 16 AI B3WH
GeForce RTX 5070 Ti Laptop, Ultra 9 386H, Samsung PM9C1b MZVL81T0HFLB-00BTW
36110 Points
Geekbench AI / Single Precision GPU 1.7
Razer Blade 16 Core Ultra 9 386H
GeForce RTX 5090 Laptop, Ultra 9 386H, Lexar NM790 2TB
26380 Points +24%
Asus ROG Zephyrus G16 GU606AW
GeForce RTX 5080 Laptop, Ultra 9 386H, Samsung PM9C1b MZVL82T0HBL1
24018 Points +13%
Moyenne Intel Core Ultra 9 386H, NVIDIA GeForce RTX 5070 Ti Laptop
  (21236 - 21341, n=2)
21289 Points 0%
MSI Stealth 16 AI B3WH
GeForce RTX 5070 Ti Laptop, Ultra 9 386H, Samsung PM9C1b MZVL81T0HFLB-00BTW
21236 Points

* ... Moindre est la valeur, meilleures sont les performances
PCMark 10 Score
10211 points
Aide
AIDA64 / Memory Copy
Razer Blade 16 Core Ultra 9 386H
Intel Core Ultra 9 386H, GeForce RTX 5090 Laptop
129946 MB/s +60%
Asus ROG Zephyrus G16 GU606AW
Intel Core Ultra 9 386H, GeForce RTX 5080 Laptop
118166 MB/s +45%
Moyenne Intel Core Ultra 9 386H
  (75437 - 129946, n=10)
109277 MB/s +34%
Lenovo Legion 7 16 AGP11
AMD Ryzen AI 9 HX 470, GeForce RTX 5060 Laptop
86767 MB/s +7%
MSI Stealth 16 AI B3WH
Intel Core Ultra 9 386H, GeForce RTX 5070 Ti Laptop
81326 MB/s
MSI Stealth 16 Studio A13VG
Intel Core i7-13700H, GeForce RTX 4070 Laptop GPU
69289 MB/s -15%
Aorus Master 16 AM6J
AMD Ryzen 9 9955HX3D, GeForce RTX 5080 Laptop
63173 MB/s -22%
AIDA64 / Memory Read
Razer Blade 16 Core Ultra 9 386H
Intel Core Ultra 9 386H, GeForce RTX 5090 Laptop
118858 MB/s +43%
Asus ROG Zephyrus G16 GU606AW
Intel Core Ultra 9 386H, GeForce RTX 5080 Laptop
112707 MB/s +35%
Moyenne Intel Core Ultra 9 386H
  (81021 - 118858, n=10)
103803 MB/s +25%
Lenovo Legion 7 16 AGP11
AMD Ryzen AI 9 HX 470, GeForce RTX 5060 Laptop
93860 MB/s +13%
MSI Stealth 16 AI B3WH
Intel Core Ultra 9 386H, GeForce RTX 5070 Ti Laptop
83346 MB/s
MSI Stealth 16 Studio A13VG
Intel Core i7-13700H, GeForce RTX 4070 Laptop GPU
73950 MB/s -11%
Aorus Master 16 AM6J
AMD Ryzen 9 9955HX3D, GeForce RTX 5080 Laptop
66539 MB/s -20%
AIDA64 / Memory Write
Razer Blade 16 Core Ultra 9 386H
Intel Core Ultra 9 386H, GeForce RTX 5090 Laptop
135096 MB/s +73%
Asus ROG Zephyrus G16 GU606AW
Intel Core Ultra 9 386H, GeForce RTX 5080 Laptop
120757 MB/s +54%
Lenovo Legion 7 16 AGP11
AMD Ryzen AI 9 HX 470, GeForce RTX 5060 Laptop
118364 MB/s +51%
Moyenne Intel Core Ultra 9 386H
  (75959 - 135096, n=10)
110651 MB/s +41%
MSI Stealth 16 AI B3WH
Intel Core Ultra 9 386H, GeForce RTX 5070 Ti Laptop
78270 MB/s
MSI Stealth 16 Studio A13VG
Intel Core i7-13700H, GeForce RTX 4070 Laptop GPU
71464 MB/s -9%
Aorus Master 16 AM6J
AMD Ryzen 9 9955HX3D, GeForce RTX 5080 Laptop
69431 MB/s -11%
AIDA64 / Memory Latency
MSI Stealth 16 AI B3WH
Intel Core Ultra 9 386H, GeForce RTX 5070 Ti Laptop
118.6 ns *
Lenovo Legion 7 16 AGP11
AMD Ryzen AI 9 HX 470, GeForce RTX 5060 Laptop
104.1 ns * +12%
Aorus Master 16 AM6J
AMD Ryzen 9 9955HX3D, GeForce RTX 5080 Laptop
100.4 ns * +15%
Moyenne Intel Core Ultra 9 386H
  (87.2 - 118.6, n=10)
98.2 ns * +17%
Asus ROG Zephyrus G16 GU606AW
Intel Core Ultra 9 386H, GeForce RTX 5080 Laptop
90 ns * +24%
MSI Stealth 16 Studio A13VG
Intel Core i7-13700H, GeForce RTX 4070 Laptop GPU
87.6 ns * +26%
Razer Blade 16 Core Ultra 9 386H
Intel Core Ultra 9 386H, GeForce RTX 5090 Laptop
87.2 ns * +26%

* ... Moindre est la valeur, meilleures sont les performances
Latence DPC

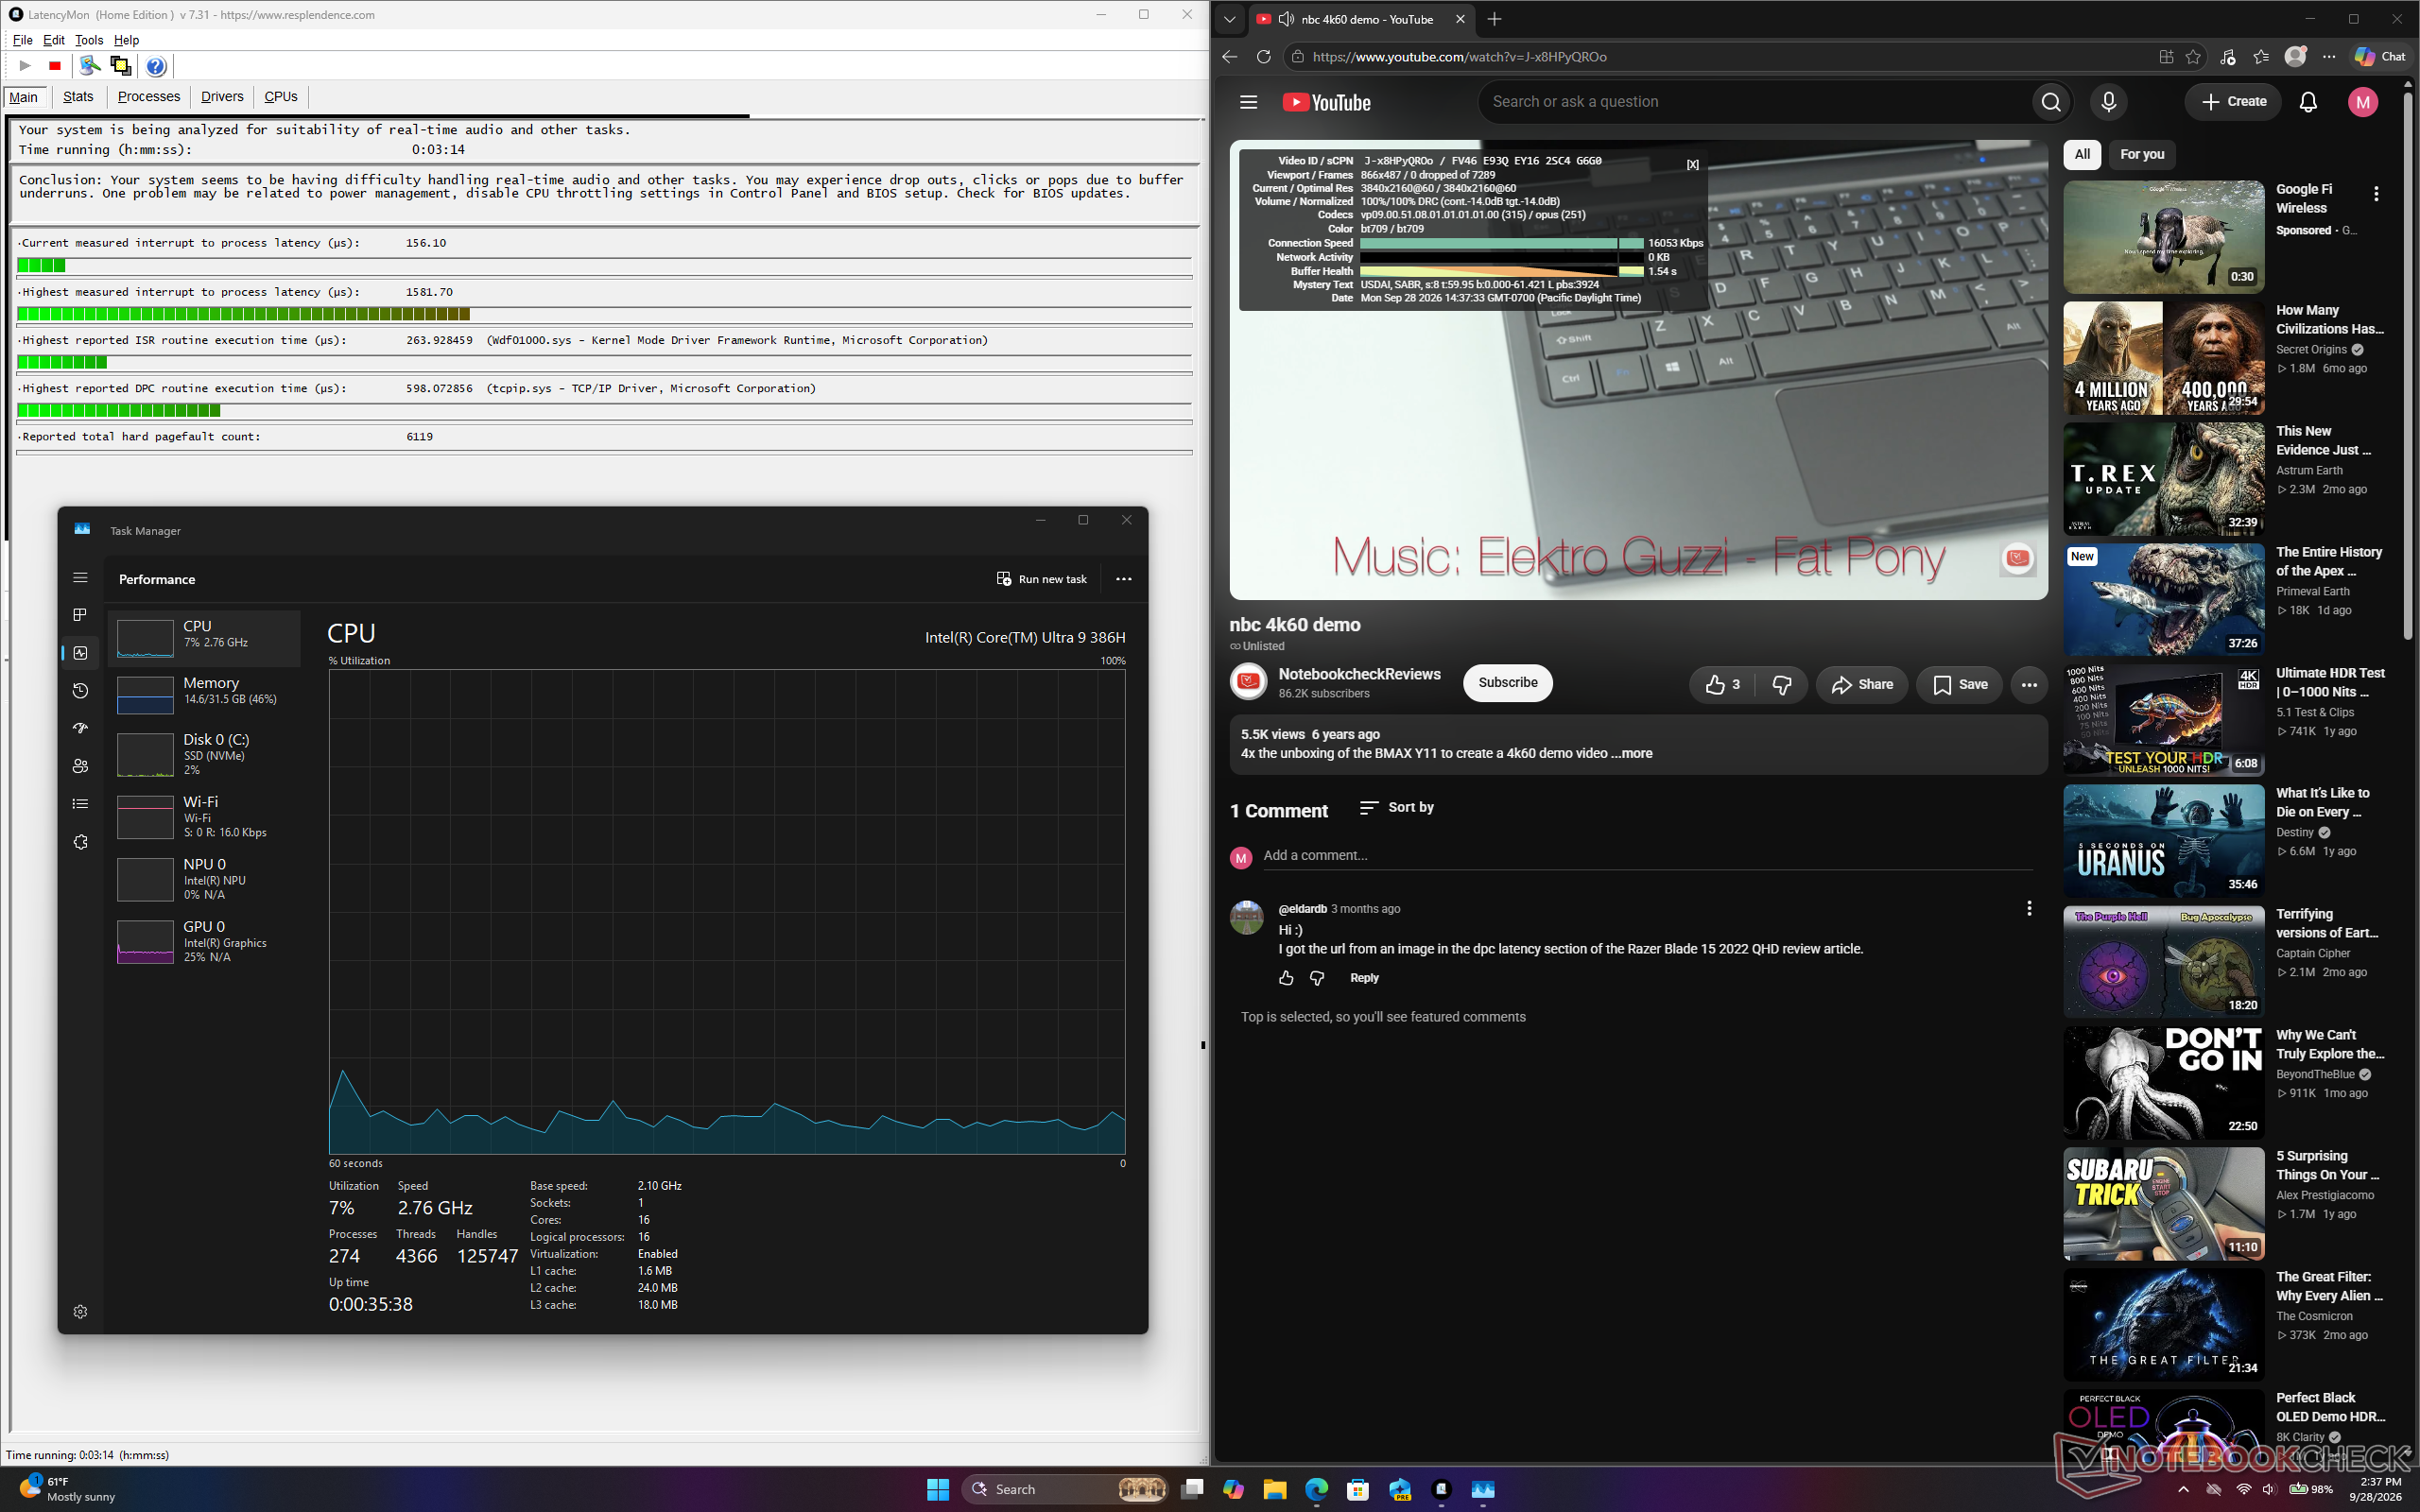
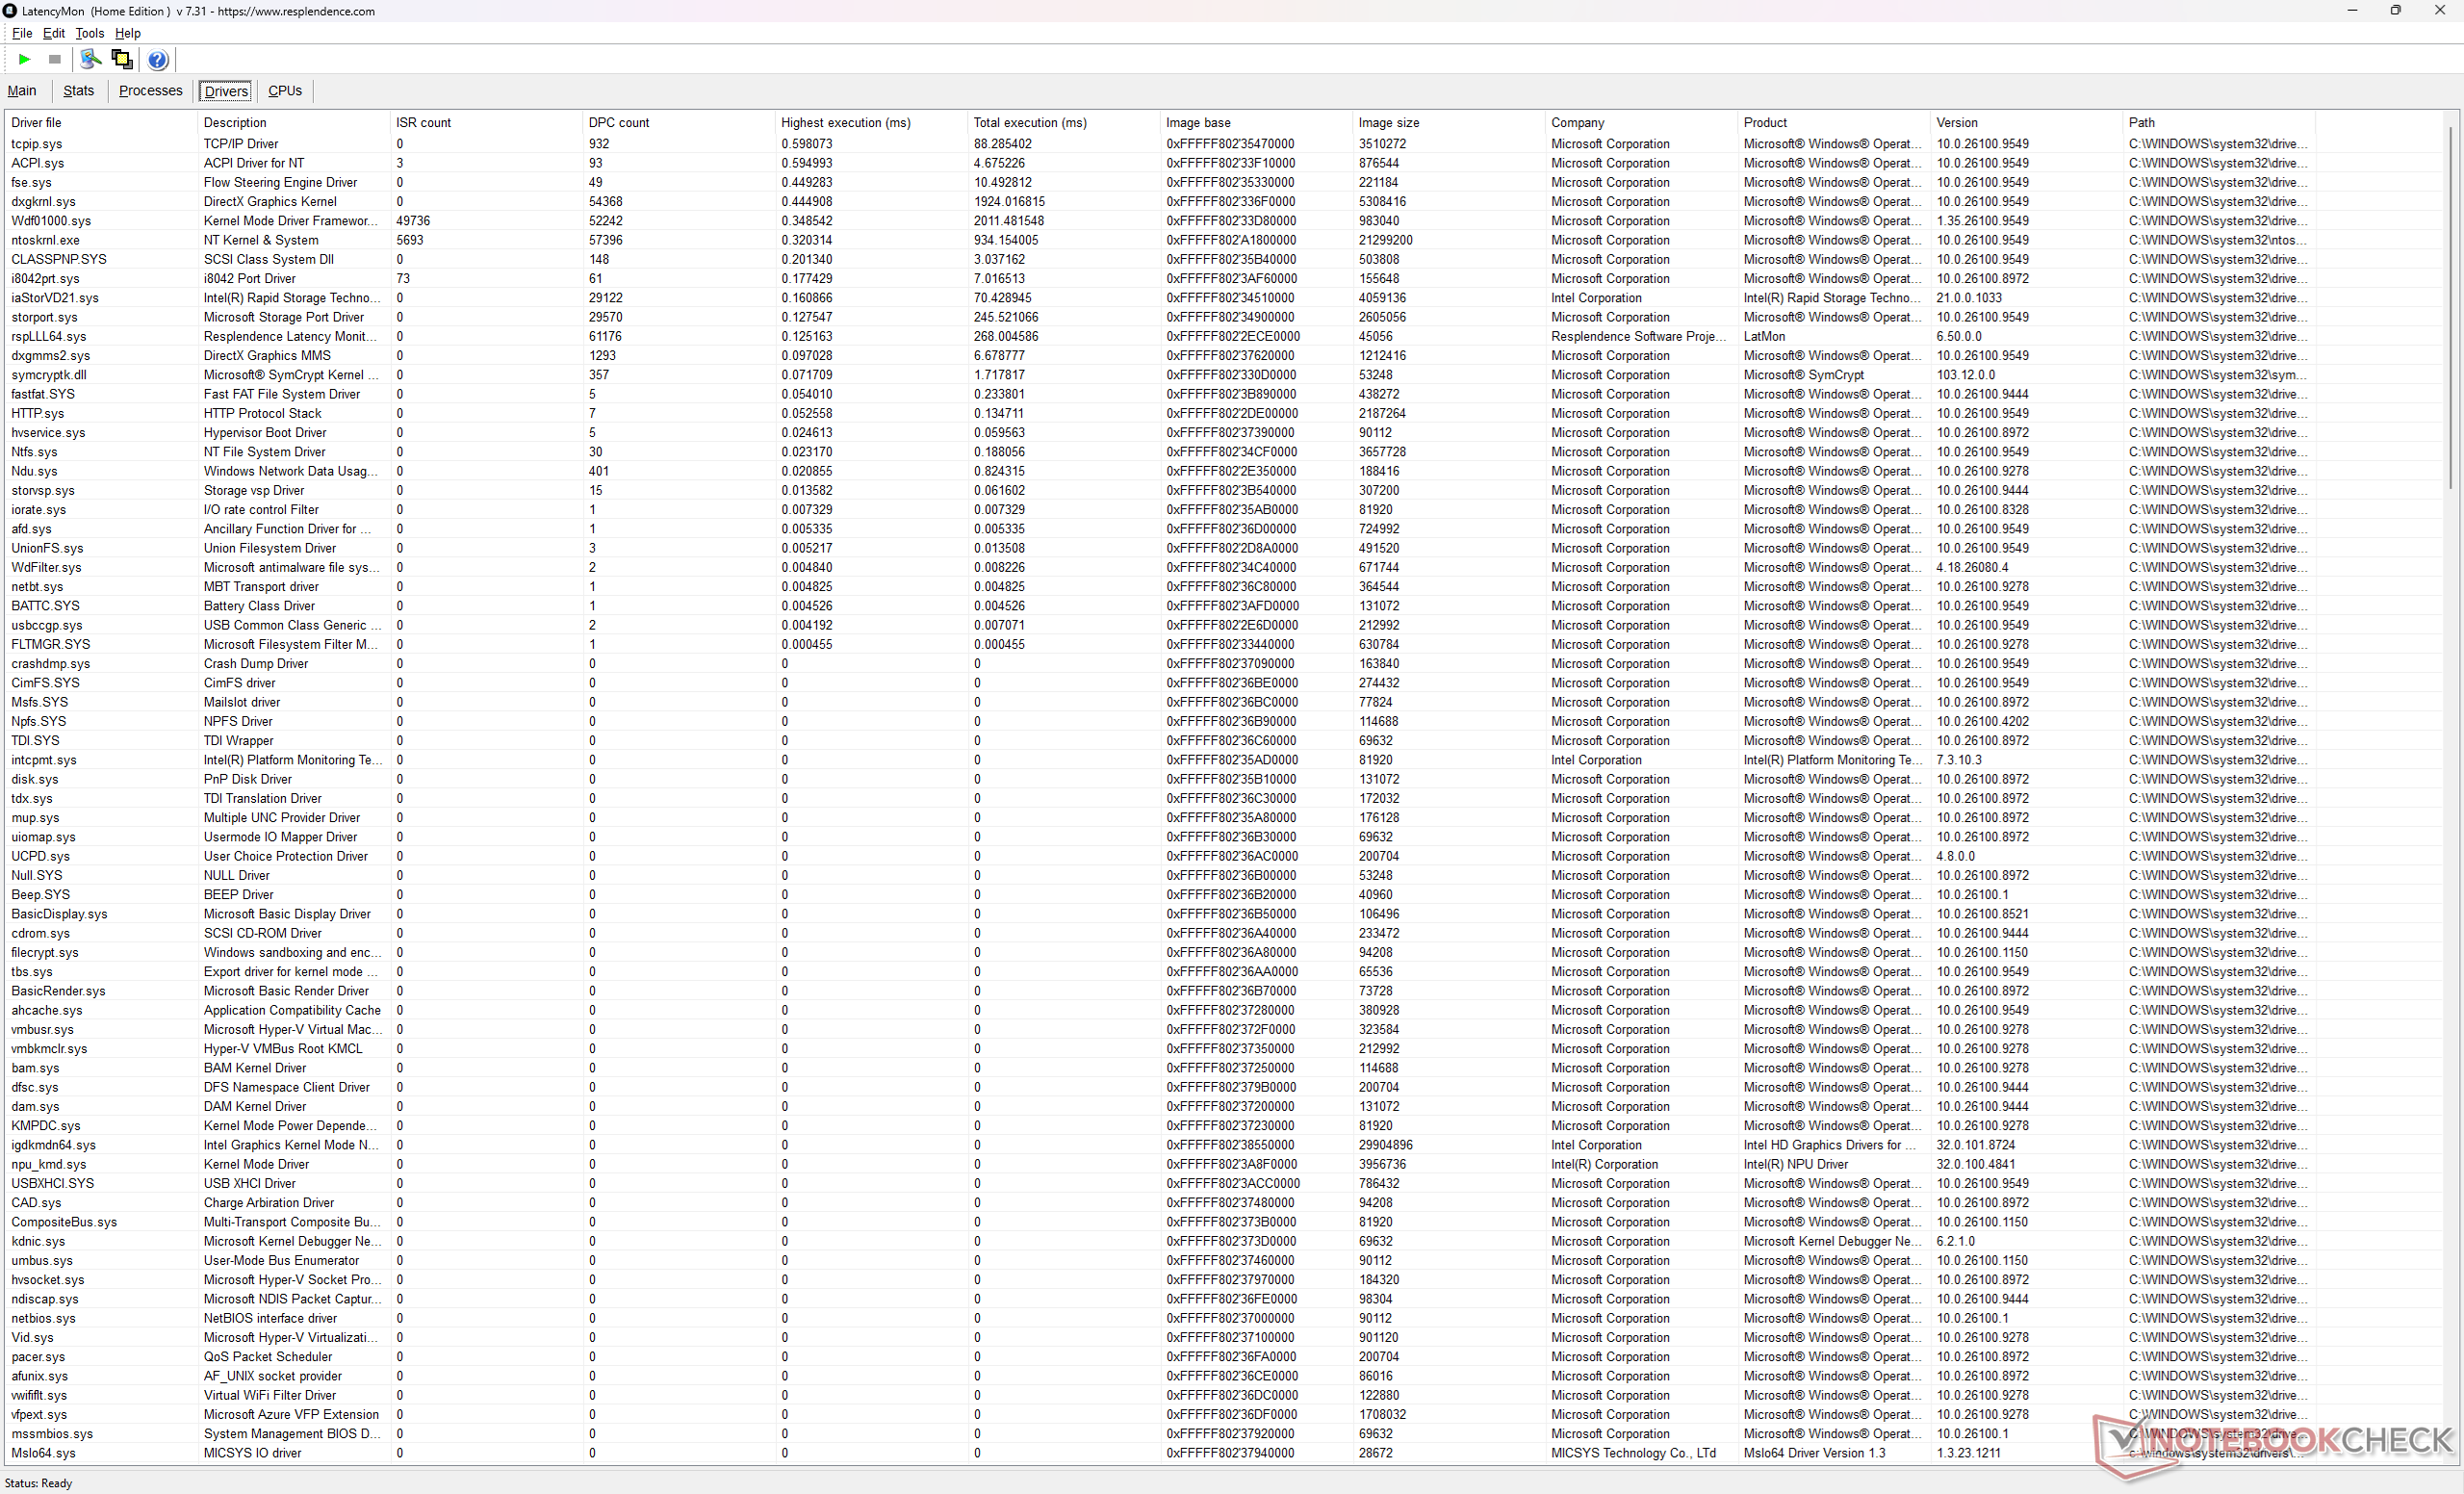
LatencyMon ne signale que de légers problèmes de DPC et aucune image perdue pendant la lecture vidéo en 4K à 60 i/s.
Liste des chauffeurs
DPC Latencies / LatencyMon - interrupt to process latency (max), Web, Youtube, Prime95
MSI Stealth 16 Studio A13VG
GeForce RTX 4070 Laptop GPU, i7-13700H, Micron 3400 2TB MTFDKBA2T0TFH
18226.8 μs * -1052%
Lenovo Legion 7 16 AGP11
GeForce RTX 5060 Laptop, Ryzen AI 9 HX 470, Lenovo UMIS AM541 1TB
7645.7 μs * -383%
Razer Blade 16 Core Ultra 9 386H
GeForce RTX 5090 Laptop, Ultra 9 386H, Lexar NM790 2TB
1826.3 μs * -15%
MSI Stealth 16 AI B3WH
GeForce RTX 5070 Ti Laptop, Ultra 9 386H, Samsung PM9C1b MZVL81T0HFLB-00BTW
1581.7 μs *
Asus ROG Zephyrus G16 GU606AW
GeForce RTX 5080 Laptop, Ultra 9 386H, Samsung PM9C1b MZVL82T0HBL1
365.8 μs * +77%

* ... Moindre est la valeur, meilleures sont les performances
Périphériques de stockage

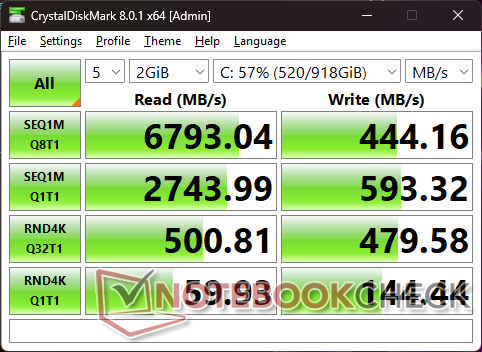
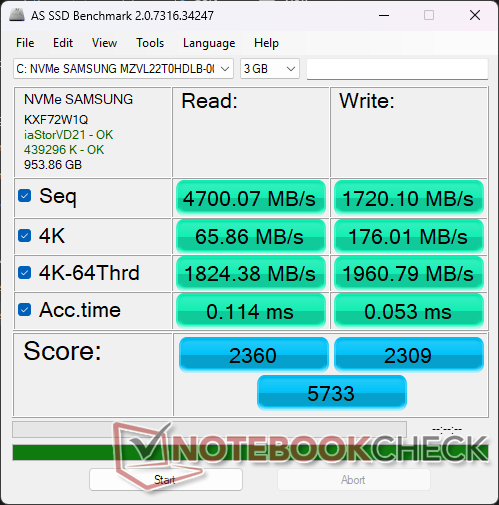
Le Samsung PM9C1b de notre système ne présente pas les problèmes de limitation des performances que nous avons rencontrés sur le Stealth 16 de 2023.

CDM 8
CDM 8
AS SSD
AS SSD
Samsung PM9C1b MZVL81T0HFLB-00BTW
CDM 5/6 Read Seq Q32T1: 7001 MB/s
CDM 5/6 Write Seq Q32T1: 5415 MB/s
CDM 5/6 Read 4K Q32T1: 511.6 MB/s
CDM 5/6 Write 4K Q32T1: 580.2 MB/s
CDM 5 Read Seq: 2611 MB/s
CDM 5 Write Seq: 734.5 MB/s
CDM 5/6 Read 4K: 67.31 MB/s
CDM 5/6 Write 4K: 127.9 MB/s
Drive Performance rating - Percent
Aorus Master 16 AM6J
Samsung PM9C1b MZVL81T0HFLB-00BTW
88.9 pt
MSI Stealth 16 Studio A13VG
Micron 3400 2TB MTFDKBA2T0TFH
87.2 pt
Lenovo Legion 7 16 AGP11
Lenovo UMIS AM541 1TB
81.3 pt
Asus ROG Zephyrus G16 GU606AW
Samsung PM9C1b MZVL82T0HBL1
78.7 pt
MSI Stealth 16 AI B3WH
Samsung PM9C1b MZVL81T0HFLB-00BTW
67.6 pt
Razer Blade 16 Core Ultra 9 386H
Lexar NM790 2TB
56.6 pt
DiskSpd
seq read
Lenovo Legion 7 16 AGP11
Lenovo UMIS AM541 1TB
3703 (3682.83min - 3703.01max) MB/s +73%
Aorus Master 16 AM6J
Samsung PM9C1b MZVL81T0HFLB-00BTW
3378 (3230.45min - 3378.26max) MB/s +57%
MSI Stealth 16 Studio A13VG
Micron 3400 2TB MTFDKBA2T0TFH
3349 (938.07min - 3349.15max) MB/s +56%
Asus ROG Zephyrus G16 GU606AW
Samsung PM9C1b MZVL82T0HBL1
3085 (3064.52min - 3085max) MB/s +44%
Razer Blade 16 Core Ultra 9 386H
Lexar NM790 2TB
2184 (2156.5min - 2184.39max) MB/s +2%
MSI Stealth 16 AI B3WH
Samsung PM9C1b MZVL81T0HFLB-00BTW
2145 (1598.45min - 2144.66max) MB/s
seq write
MSI Stealth 16 Studio A13VG
Micron 3400 2TB MTFDKBA2T0TFH
4485 (775.32min - 4484.81max) MB/s +131%
Aorus Master 16 AM6J
Samsung PM9C1b MZVL81T0HFLB-00BTW
3491 (3110.85min - 3490.71max) MB/s +80%
Lenovo Legion 7 16 AGP11
Lenovo UMIS AM541 1TB
3446 (2891.25min - 3446.25max) MB/s +77%
Razer Blade 16 Core Ultra 9 386H
Lexar NM790 2TB
3302 (1890.37min - 3302.39max) MB/s +70%
Asus ROG Zephyrus G16 GU606AW
Samsung PM9C1b MZVL82T0HBL1
2775 (2677.43min - 2774.74max) MB/s +43%
MSI Stealth 16 AI B3WH
Samsung PM9C1b MZVL81T0HFLB-00BTW
1943 (1502.96min - 1942.59max) MB/s
seq q8 t1 read
MSI Stealth 16 AI B3WH
Samsung PM9C1b MZVL81T0HFLB-00BTW
7078 (5389.68min - 7077.89max) MB/s
Asus ROG Zephyrus G16 GU606AW
Samsung PM9C1b MZVL82T0HBL1
7068 (5262.59min - 7067.7max) MB/s 0%
Razer Blade 16 Core Ultra 9 386H
Lexar NM790 2TB
6991 (6203.59min - 6991.49max) MB/s -1%
Lenovo Legion 7 16 AGP11
Lenovo UMIS AM541 1TB
6510 (5026.26min - 6509.54max) MB/s -8%
MSI Stealth 16 Studio A13VG
Micron 3400 2TB MTFDKBA2T0TFH
6460 (6020.84min - 6459.94max) MB/s -9%
Aorus Master 16 AM6J
Samsung PM9C1b MZVL81T0HFLB-00BTW
5597 (4952.59min - 5597.43max) MB/s -21%
seq q8 t1 write
Razer Blade 16 Core Ultra 9 386H
Lexar NM790 2TB
6384 (2633.81min - 6383.97max) MB/s +12%
Asus ROG Zephyrus G16 GU606AW
Samsung PM9C1b MZVL82T0HBL1
5755 (5615.64min - 5755max) MB/s +1%
MSI Stealth 16 AI B3WH
Samsung PM9C1b MZVL81T0HFLB-00BTW
5692 (1799.95min - 5692.24max) MB/s
MSI Stealth 16 Studio A13VG
Micron 3400 2TB MTFDKBA2T0TFH
4803 (4344.79min - 4802.73max) MB/s -16%
Aorus Master 16 AM6J
Samsung PM9C1b MZVL81T0HFLB-00BTW
3705 (3255.83min - 3704.62max) MB/s -35%
Lenovo Legion 7 16 AGP11
Lenovo UMIS AM541 1TB
3485 (3346.01min - 3484.63max) MB/s -39%
4k q1 t1 read
Aorus Master 16 AM6J
Samsung PM9C1b MZVL81T0HFLB-00BTW
77.4 (74.48min - 77.41max) MB/s +6%
Asus ROG Zephyrus G16 GU606AW
Samsung PM9C1b MZVL82T0HBL1
73.3 (72.62min - 73.28max) MB/s 0%
MSI Stealth 16 AI B3WH
Samsung PM9C1b MZVL81T0HFLB-00BTW
73.2 (72.71min - 73.2max) MB/s
MSI Stealth 16 Studio A13VG
Micron 3400 2TB MTFDKBA2T0TFH
67.9 (64.79min - 67.93max) MB/s -7%
Lenovo Legion 7 16 AGP11
Lenovo UMIS AM541 1TB
65.7 (64.97min - 65.69max) MB/s -10%
Razer Blade 16 Core Ultra 9 386H
Lexar NM790 2TB
60.5 (59.31min - 60.47max) MB/s -17%
4k q1 t1 write
MSI Stealth 16 Studio A13VG
Micron 3400 2TB MTFDKBA2T0TFH
253 (250.9min - 252.85max) MB/s +22%
Lenovo Legion 7 16 AGP11
Lenovo UMIS AM541 1TB
248 (245.65min - 248.33max) MB/s +20%
Aorus Master 16 AM6J
Samsung PM9C1b MZVL81T0HFLB-00BTW
226 (220.4min - 226.16max) MB/s +9%
MSI Stealth 16 AI B3WH
Samsung PM9C1b MZVL81T0HFLB-00BTW
207 (157.18min - 206.55max) MB/s
Razer Blade 16 Core Ultra 9 386H
Lexar NM790 2TB
192.1 (191.3min - 192.14max) MB/s -7%
Asus ROG Zephyrus G16 GU606AW
Samsung PM9C1b MZVL82T0HBL1
170.6 (169.75min - 170.57max) MB/s -18%
4k q32 t16 read
Aorus Master 16 AM6J
Samsung PM9C1b MZVL81T0HFLB-00BTW
4063 (4026.11min - 4063.09max) MB/s +43%
Asus ROG Zephyrus G16 GU606AW
Samsung PM9C1b MZVL82T0HBL1
3084 (3064.93min - 3084.36max) MB/s +8%
MSI Stealth 16 Studio A13VG
Micron 3400 2TB MTFDKBA2T0TFH
3013 (755.04min - 3013.06max) MB/s +6%
MSI Stealth 16 AI B3WH
Samsung PM9C1b MZVL81T0HFLB-00BTW
2851 (2824.97min - 2851.18max) MB/s
Lenovo Legion 7 16 AGP11
Lenovo UMIS AM541 1TB
1925 (1917.76min - 1925.46max) MB/s -32%
Razer Blade 16 Core Ultra 9 386H
Lexar NM790 2TB
886 (853.99min - 885.71max) MB/s -69%
4k q32 t16 write
MSI Stealth 16 Studio A13VG
Micron 3400 2TB MTFDKBA2T0TFH
2736 (1172min - 2736.15max) MB/s +22%
Aorus Master 16 AM6J
Samsung PM9C1b MZVL81T0HFLB-00BTW
2590 (2147.15min - 2589.9max) MB/s +16%
MSI Stealth 16 AI B3WH
Samsung PM9C1b MZVL81T0HFLB-00BTW
2238 (2173.54min - 2237.9max) MB/s
Asus ROG Zephyrus G16 GU606AW
Samsung PM9C1b MZVL82T0HBL1
2193 (2143.73min - 2192.91max) MB/s -2%
Lenovo Legion 7 16 AGP11
Lenovo UMIS AM541 1TB
1848 (1263.19min - 1848.28max) MB/s -17%
Razer Blade 16 Core Ultra 9 386H
Lexar NM790 2TB
504 (484.83min - 503.6max) MB/s -77%
AS SSD
Score Total
Aorus Master 16 AM6J
Samsung PM9C1b MZVL81T0HFLB-00BTW
9344 Points +63%
MSI Stealth 16 Studio A13VG
Micron 3400 2TB MTFDKBA2T0TFH
7774 Points +36%
Asus ROG Zephyrus G16 GU606AW
Samsung PM9C1b MZVL82T0HBL1
7687 Points +34%
Lenovo Legion 7 16 AGP11
Lenovo UMIS AM541 1TB
7527 Points +31%
MSI Stealth 16 AI B3WH
Samsung PM9C1b MZVL81T0HFLB-00BTW
5733 Points
Razer Blade 16 Core Ultra 9 386H
Lexar NM790 2TB
4107 Points -28%
Score Read
Aorus Master 16 AM6J
Samsung PM9C1b MZVL81T0HFLB-00BTW
3427 Points +45%
MSI Stealth 16 Studio A13VG
Micron 3400 2TB MTFDKBA2T0TFH
2959 Points +25%
Asus ROG Zephyrus G16 GU606AW
Samsung PM9C1b MZVL82T0HBL1
2957 Points +25%
Lenovo Legion 7 16 AGP11
Lenovo UMIS AM541 1TB
2608 Points +11%
MSI Stealth 16 AI B3WH
Samsung PM9C1b MZVL81T0HFLB-00BTW
2360 Points
Razer Blade 16 Core Ultra 9 386H
Lexar NM790 2TB
1379 Points -42%
Score Write
Aorus Master 16 AM6J
Samsung PM9C1b MZVL81T0HFLB-00BTW
4249 Points +84%
Lenovo Legion 7 16 AGP11
Lenovo UMIS AM541 1TB
3606 Points +56%
MSI Stealth 16 Studio A13VG
Micron 3400 2TB MTFDKBA2T0TFH
3331 Points +44%
Asus ROG Zephyrus G16 GU606AW
Samsung PM9C1b MZVL82T0HBL1
3314 Points +44%
MSI Stealth 16 AI B3WH
Samsung PM9C1b MZVL81T0HFLB-00BTW
2309 Points
Razer Blade 16 Core Ultra 9 386H
Lexar NM790 2TB
2100 Points -9%
Seq Read
Aorus Master 16 AM6J
Samsung PM9C1b MZVL81T0HFLB-00BTW
5721.12 MB/s +22%
Lenovo Legion 7 16 AGP11
Lenovo UMIS AM541 1TB
5701 MB/s +21%
Asus ROG Zephyrus G16 GU606AW
Samsung PM9C1b MZVL82T0HBL1
5510 MB/s +17%
MSI Stealth 16 Studio A13VG
Micron 3400 2TB MTFDKBA2T0TFH
5126 MB/s +9%
Razer Blade 16 Core Ultra 9 386H
Lexar NM790 2TB
4970.9 MB/s +6%
MSI Stealth 16 AI B3WH
Samsung PM9C1b MZVL81T0HFLB-00BTW
4700.07 MB/s
Seq Write
Lenovo Legion 7 16 AGP11
Lenovo UMIS AM541 1TB
5115 MB/s +197%
MSI Stealth 16 Studio A13VG
Micron 3400 2TB MTFDKBA2T0TFH
4546 MB/s +164%
Aorus Master 16 AM6J
Samsung PM9C1b MZVL81T0HFLB-00BTW
4108.74 MB/s +139%
Asus ROG Zephyrus G16 GU606AW
Samsung PM9C1b MZVL82T0HBL1
3602 MB/s +109%
Razer Blade 16 Core Ultra 9 386H
Lexar NM790 2TB
3179.74 MB/s +85%
MSI Stealth 16 AI B3WH
Samsung PM9C1b MZVL81T0HFLB-00BTW
1720.1 MB/s
4K Read
Lenovo Legion 7 16 AGP11
Lenovo UMIS AM541 1TB
74.7 MB/s +13%
Aorus Master 16 AM6J
Samsung PM9C1b MZVL81T0HFLB-00BTW
70.8 MB/s +8%
MSI Stealth 16 Studio A13VG
Micron 3400 2TB MTFDKBA2T0TFH
67.7 MB/s +3%
Asus ROG Zephyrus G16 GU606AW
Samsung PM9C1b MZVL82T0HBL1
67.2 MB/s +2%
MSI Stealth 16 AI B3WH
Samsung PM9C1b MZVL81T0HFLB-00BTW
65.86 MB/s
Razer Blade 16 Core Ultra 9 386H
Lexar NM790 2TB
56.96 MB/s -14%
4K Write
Lenovo Legion 7 16 AGP11
Lenovo UMIS AM541 1TB
221 MB/s +26%
MSI Stealth 16 Studio A13VG
Micron 3400 2TB MTFDKBA2T0TFH
207 MB/s +18%
Aorus Master 16 AM6J
Samsung PM9C1b MZVL81T0HFLB-00BTW
206.42 MB/s +17%
MSI Stealth 16 AI B3WH
Samsung PM9C1b MZVL81T0HFLB-00BTW
176.01 MB/s
Asus ROG Zephyrus G16 GU606AW
Samsung PM9C1b MZVL82T0HBL1
173.8 MB/s -1%
Razer Blade 16 Core Ultra 9 386H
Lexar NM790 2TB
155.96 MB/s -11%
4K-64 Read
Aorus Master 16 AM6J
Samsung PM9C1b MZVL81T0HFLB-00BTW
2784.09 MB/s +53%
MSI Stealth 16 Studio A13VG
Micron 3400 2TB MTFDKBA2T0TFH
2378 MB/s +30%
Asus ROG Zephyrus G16 GU606AW
Samsung PM9C1b MZVL82T0HBL1
2339 MB/s +28%
Lenovo Legion 7 16 AGP11
Lenovo UMIS AM541 1TB
1964 MB/s +8%
MSI Stealth 16 AI B3WH
Samsung PM9C1b MZVL81T0HFLB-00BTW
1824.38 MB/s
Razer Blade 16 Core Ultra 9 386H
Lexar NM790 2TB
824.7 MB/s -55%
4K-64 Write
Aorus Master 16 AM6J
Samsung PM9C1b MZVL81T0HFLB-00BTW
3631.52 MB/s +85%
Lenovo Legion 7 16 AGP11
Lenovo UMIS AM541 1TB
2873 MB/s +47%
Asus ROG Zephyrus G16 GU606AW
Samsung PM9C1b MZVL82T0HBL1
2780 MB/s +42%
MSI Stealth 16 Studio A13VG
Micron 3400 2TB MTFDKBA2T0TFH
2669 MB/s +36%
MSI Stealth 16 AI B3WH
Samsung PM9C1b MZVL81T0HFLB-00BTW
1960.79 MB/s
Razer Blade 16 Core Ultra 9 386H
Lexar NM790 2TB
1625.98 MB/s -17%
Access Time Read
MSI Stealth 16 AI B3WH
Samsung PM9C1b MZVL81T0HFLB-00BTW
0.114 ms *
Asus ROG Zephyrus G16 GU606AW
Samsung PM9C1b MZVL82T0HBL1
0.103 ms * +10%
Aorus Master 16 AM6J
Samsung PM9C1b MZVL81T0HFLB-00BTW
0.068 ms * +40%
Lenovo Legion 7 16 AGP11
Lenovo UMIS AM541 1TB
0.067 ms * +41%
Razer Blade 16 Core Ultra 9 386H
Lexar NM790 2TB
0.062 ms * +46%
MSI Stealth 16 Studio A13VG
Micron 3400 2TB MTFDKBA2T0TFH
0.027 ms * +76%
Access Time Write
Razer Blade 16 Core Ultra 9 386H
Lexar NM790 2TB
0.231 ms * -336%
MSI Stealth 16 AI B3WH
Samsung PM9C1b MZVL81T0HFLB-00BTW
0.053 ms *
Asus ROG Zephyrus G16 GU606AW
Samsung PM9C1b MZVL82T0HBL1
0.023 ms * +57%
Aorus Master 16 AM6J
Samsung PM9C1b MZVL81T0HFLB-00BTW
0.021 ms * +60%
MSI Stealth 16 Studio A13VG
Micron 3400 2TB MTFDKBA2T0TFH
0.02 ms * +62%
Lenovo Legion 7 16 AGP11
Lenovo UMIS AM541 1TB
0.019 ms * +64%

* ... Moindre est la valeur, meilleures sont les performances
Bridage du disque : boucle de lecture DiskSpd, profondeur de file d’attente 8

0145290435580725870101511601305145015951740188520302175232024652610275529003045319033353480362537703915406042054350449546404785493050755220536555105655580059456090623563806525667068156960Tooltip
MSI Stealth 16 AI B3WH Samsung PM9C1b MZVL81T0HFLB-00BTW; diskspd 2.0.17 f: Ø7081 (6318.66-7102.48) MB/s
MSI Stealth 16 Studio A13VG Micron 3400 2TB MTFDKBA2T0TFH: Ø1946 (1623.72-6448.85) MB/s

Performances du GPU

Comparé à un ordinateur portable équipé d’une RTX 5070 classique, les utilisateurs peuvent s’attendre à un gain de performances de 15 à 20 % avec la RTX 5070 Ti de 125 W du Stealth 16. Notez toutefois qu’un ordinateur de bureau équipé de la même RTX 5070 Ti serait tout de même presque 70 % plus rapide.

Profil d’alimentationScore graphiqueScore physiqueScore combiné (Time Spy)
Mode Performances avec Apex et CoolerBoost activés170901455916655
Mode Performances avec Apex activé16726 (-2%)14266 (-2%)16304 (-2%)
Mode Performances16508 (-3%)14690 (+1%)16207 (-3%)
Mode équilibré14186 (-17%)12209 (-16%)13849 (-17%)
Frappe de feu
Frappe de feu
Time Spy
Time Spy
Port Royal
Port Royal
Voie rapide
Voie rapide
3DMark Performance rating - Percent
KFA2 GeForce RTX 5070 Ti HoF Gaming
NVIDIA GeForce RTX 5070 Ti, AMD Ryzen 7 9800X3D
99.4 pt
Razer Blade 16 Core Ultra 9 386H
NVIDIA GeForce RTX 5090 Laptop, Intel Core Ultra 9 386H
70.4 pt
Aorus Master 16 AM6J -2!
NVIDIA GeForce RTX 5080 Laptop, AMD Ryzen 9 9955HX3D
70.1 pt
Moyenne NVIDIA GeForce RTX 5070 Ti Laptop
 
59.5 pt
MSI Stealth 16 AI B3WH
NVIDIA GeForce RTX 5070 Ti Laptop, Intel Core Ultra 9 386H
58.9 pt
MSI Crosshair A16 HX E8WGK
NVIDIA GeForce RTX 5070 Laptop, AMD Ryzen 9 8940HX
50.1 pt
MSI Stealth 16 Studio A13VG -2!
NVIDIA GeForce RTX 4070 Laptop GPU, Intel Core i7-13700H
44.9 pt
Lenovo Legion 7 16 AGP11
NVIDIA GeForce RTX 5060 Laptop, AMD Ryzen AI 9 HX 470
42.4 pt
Lenovo Legion Slim 5 16APH8 -1!
NVIDIA GeForce RTX 4060 Laptop GPU, AMD Ryzen 7 7840HS
32.5 pt
Asus ROG Zephyrus M16 GU603H -2!
NVIDIA GeForce RTX 3070 Laptop GPU, Intel Core i9-11900H
23.1 pt
3DMark 11 - 1280x720 Performance GPU
KFA2 GeForce RTX 5070 Ti HoF Gaming
NVIDIA GeForce RTX 5070 Ti, AMD Ryzen 7 9800X3D
84914 Points +52%
Aorus Master 16 AM6J
NVIDIA GeForce RTX 5080 Laptop, AMD Ryzen 9 9955HX3D
61571 Points +10%
MSI Stealth 16 AI B3WH
NVIDIA GeForce RTX 5070 Ti Laptop, Intel Core Ultra 9 386H
55888 Points
Moyenne NVIDIA GeForce RTX 5070 Ti Laptop
  (49092 - 61651, n=16)
55548 Points -1%
MSI Crosshair A16 HX E8WGK
NVIDIA GeForce RTX 5070 Laptop, AMD Ryzen 9 8940HX
45691 Points -18%
MSI Stealth 16 Studio A13VG
NVIDIA GeForce RTX 4070 Laptop GPU, Intel Core i7-13700H
41302 Points -26%
Lenovo Legion 7 16 AGP11
NVIDIA GeForce RTX 5060 Laptop, AMD Ryzen AI 9 HX 470
41285 Points -26%
Lenovo Legion Slim 5 16APH8
NVIDIA GeForce RTX 4060 Laptop GPU, AMD Ryzen 7 7840HS
31864 Points -43%
Razer Blade 16 Core Ultra 9 386H
NVIDIA GeForce RTX 5090 Laptop, Intel Core Ultra 9 386H
26378 Points -53%
Asus ROG Zephyrus M16 GU603H
NVIDIA GeForce RTX 3070 Laptop GPU, Intel Core i9-11900H
20039 Points -64%
3DMark
1920x1080 Fire Strike Graphics
KFA2 GeForce RTX 5070 Ti HoF Gaming
NVIDIA GeForce RTX 5070 Ti, AMD Ryzen 7 9800X3D
70373 Points +62%
Razer Blade 16 Core Ultra 9 386H
NVIDIA GeForce RTX 5090 Laptop, Intel Core Ultra 9 386H
52405 Points +21%
Aorus Master 16 AM6J
NVIDIA GeForce RTX 5080 Laptop, AMD Ryzen 9 9955HX3D
46816 Points +8%
MSI Stealth 16 AI B3WH
NVIDIA GeForce RTX 5070 Ti Laptop, Intel Core Ultra 9 386H
43346 Points
Moyenne NVIDIA GeForce RTX 5070 Ti Laptop
  (36184 - 47933, n=17)
43231 Points 0%
MSI Crosshair A16 HX E8WGK
NVIDIA GeForce RTX 5070 Laptop, AMD Ryzen 9 8940HX
38954 Points -10%
Lenovo Legion 7 16 AGP11
NVIDIA GeForce RTX 5060 Laptop, AMD Ryzen AI 9 HX 470
32851 Points -24%
MSI Stealth 16 Studio A13VG
NVIDIA GeForce RTX 4070 Laptop GPU, Intel Core i7-13700H
30051 Points -31%
Lenovo Legion Slim 5 16APH8
NVIDIA GeForce RTX 4060 Laptop GPU, AMD Ryzen 7 7840HS
23418 Points -46%
Asus ROG Zephyrus M16 GU603H
NVIDIA GeForce RTX 3070 Laptop GPU, Intel Core i9-11900H
16628 Points -62%
2560x1440 Time Spy Graphics
KFA2 GeForce RTX 5070 Ti HoF Gaming
NVIDIA GeForce RTX 5070 Ti, AMD Ryzen 7 9800X3D
27607 Points +65%
Razer Blade 16 Core Ultra 9 386H
NVIDIA GeForce RTX 5090 Laptop, Intel Core Ultra 9 386H
23470 Points +40%
Aorus Master 16 AM6J
NVIDIA GeForce RTX 5080 Laptop, AMD Ryzen 9 9955HX3D
19673 Points +18%
MSI Stealth 16 AI B3WH
NVIDIA GeForce RTX 5070 Ti Laptop, Intel Core Ultra 9 386H
16726 Points
Moyenne NVIDIA GeForce RTX 5070 Ti Laptop
  (14615 - 17981, n=17)
16566 Points -1%
MSI Crosshair A16 HX E8WGK
NVIDIA GeForce RTX 5070 Laptop, AMD Ryzen 9 8940HX
14118 Points -16%
Lenovo Legion 7 16 AGP11
NVIDIA GeForce RTX 5060 Laptop, AMD Ryzen AI 9 HX 470
12071 Points -28%
MSI Stealth 16 Studio A13VG
NVIDIA GeForce RTX 4070 Laptop GPU, Intel Core i7-13700H
11955 Points -29%
Lenovo Legion Slim 5 16APH8
NVIDIA GeForce RTX 4060 Laptop GPU, AMD Ryzen 7 7840HS
8873 Points -47%
Asus ROG Zephyrus M16 GU603H
NVIDIA GeForce RTX 3070 Laptop GPU, Intel Core i9-11900H
6059 Points -64%
2560x1440 Speed Way Score
KFA2 GeForce RTX 5070 Ti HoF Gaming
NVIDIA GeForce RTX 5070 Ti, AMD Ryzen 7 9800X3D
7772 Points +85%
Razer Blade 16 Core Ultra 9 386H
NVIDIA GeForce RTX 5090 Laptop, Intel Core Ultra 9 386H
6189 Points +47%
Moyenne NVIDIA GeForce RTX 5070 Ti Laptop
  (4135 - 4695, n=9)
4476 Points +6%
MSI Stealth 16 AI B3WH
NVIDIA GeForce RTX 5070 Ti Laptop, Intel Core Ultra 9 386H
4212 Points
MSI Crosshair A16 HX E8WGK
NVIDIA GeForce RTX 5070 Laptop, AMD Ryzen 9 8940HX
3682 Points -13%
Lenovo Legion 7 16 AGP11
NVIDIA GeForce RTX 5060 Laptop, AMD Ryzen AI 9 HX 470
2892 Points -31%
Lenovo Legion Slim 5 16APH8
NVIDIA GeForce RTX 4060 Laptop GPU, AMD Ryzen 7 7840HS
2118 Points -50%
Steel Nomad Score
KFA2 GeForce RTX 5070 Ti HoF Gaming
NVIDIA GeForce RTX 5070 Ti, AMD Ryzen 7 9800X3D
7249 Points +92%
KFA2 GeForce RTX 5070 Ti HoF Gaming
NVIDIA GeForce RTX 5070 Ti, AMD Ryzen 7 9800X3D
6825 Points +81%
Razer Blade 16 Core Ultra 9 386H
NVIDIA GeForce RTX 5090 Laptop, Intel Core Ultra 9 386H
5915 Points +56%
Moyenne NVIDIA GeForce RTX 5070 Ti Laptop
  (3420 - 4283, n=13)
3859 Points +2%
MSI Stealth 16 AI B3WH
NVIDIA GeForce RTX 5070 Ti Laptop, Intel Core Ultra 9 386H
3781 Points
MSI Crosshair A16 HX E8WGK
NVIDIA GeForce RTX 5070 Laptop, AMD Ryzen 9 8940HX
3087 Points -18%
Lenovo Legion 7 16 AGP11
NVIDIA GeForce RTX 5060 Laptop, AMD Ryzen AI 9 HX 470
2605 Points -31%
3DMark 11 Performance
39497 points
3DMark Cloud Gate Standard Score
54298 points
3DMark Fire Strike Score
29948 points
3DMark Time Spy Score
16304 points
3DMark Steel Nomad Score
3781 points
Aide
Blender
v3.3 Classroom OPTIX/RTX
MSI Stealth 16 Studio A13VG
NVIDIA GeForce RTX 4070 Laptop GPU, Intel Core i7-13700H
24 Seconds * -71%
Lenovo Legion Slim 5 16APH8
NVIDIA GeForce RTX 4060 Laptop GPU, AMD Ryzen 7 7840HS
22 Seconds * -57%
Lenovo Legion 7 16 AGP11
NVIDIA GeForce RTX 5060 Laptop, AMD Ryzen AI 9 HX 470
21 Seconds * -50%
MSI Crosshair A16 HX E8WGK
NVIDIA GeForce RTX 5070 Laptop, AMD Ryzen 9 8940HX
17 Seconds * -21%
Moyenne NVIDIA GeForce RTX 5070 Ti Laptop
  (13 - 19, n=15)
15.5 Seconds * -11%
Aorus Master 16 AM6J
NVIDIA GeForce RTX 5080 Laptop, AMD Ryzen 9 9955HX3D
14 Seconds * -0%
MSI Stealth 16 AI B3WH
NVIDIA GeForce RTX 5070 Ti Laptop, Intel Core Ultra 9 386H
14 Seconds *
KFA2 GeForce RTX 5070 Ti HoF Gaming
NVIDIA GeForce RTX 5070 Ti, AMD Ryzen 7 9800X3D
11 Seconds * +21%
Razer Blade 16 Core Ultra 9 386H
NVIDIA GeForce RTX 5090 Laptop, Intel Core Ultra 9 386H
10 Seconds * +29%
v3.3 Classroom CUDA
Lenovo Legion Slim 5 16APH8
NVIDIA GeForce RTX 4060 Laptop GPU, AMD Ryzen 7 7840HS
44 Seconds * -76%
Lenovo Legion 7 16 AGP11
NVIDIA GeForce RTX 5060 Laptop, AMD Ryzen AI 9 HX 470
41 Seconds * -64%
MSI Stealth 16 Studio A13VG
NVIDIA GeForce RTX 4070 Laptop GPU, Intel Core i7-13700H
36 Seconds * -44%
MSI Crosshair A16 HX E8WGK
NVIDIA GeForce RTX 5070 Laptop, AMD Ryzen 9 8940HX
30 Seconds * -20%
Moyenne NVIDIA GeForce RTX 5070 Ti Laptop
  (24 - 33, n=15)
26.1 Seconds * -4%
MSI Stealth 16 AI B3WH
NVIDIA GeForce RTX 5070 Ti Laptop, Intel Core Ultra 9 386H
25 Seconds *
Aorus Master 16 AM6J
NVIDIA GeForce RTX 5080 Laptop, AMD Ryzen 9 9955HX3D
22 Seconds * +12%
KFA2 GeForce RTX 5070 Ti HoF Gaming
NVIDIA GeForce RTX 5070 Ti, AMD Ryzen 7 9800X3D
17 Seconds * +32%
Razer Blade 16 Core Ultra 9 386H
NVIDIA GeForce RTX 5090 Laptop, Intel Core Ultra 9 386H
17 Seconds * +32%
v3.3 Classroom CPU
MSI Stealth 16 Studio A13VG
NVIDIA GeForce RTX 4070 Laptop GPU, Intel Core i7-13700H
299 Seconds * -19%
Lenovo Legion Slim 5 16APH8
NVIDIA GeForce RTX 4060 Laptop GPU, AMD Ryzen 7 7840HS
298 Seconds * -18%
Razer Blade 16 Core Ultra 9 386H
NVIDIA GeForce RTX 5090 Laptop, Intel Core Ultra 9 386H
282 Seconds * -12%
MSI Stealth 16 AI B3WH
NVIDIA GeForce RTX 5070 Ti Laptop, Intel Core Ultra 9 386H
252 Seconds *
Lenovo Legion 7 16 AGP11
NVIDIA GeForce RTX 5060 Laptop, AMD Ryzen AI 9 HX 470
210 Seconds * +17%
Moyenne NVIDIA GeForce RTX 5070 Ti Laptop
  (122 - 361, n=15)
201 Seconds * +20%
MSI Crosshair A16 HX E8WGK
NVIDIA GeForce RTX 5070 Laptop, AMD Ryzen 9 8940HX
150 Seconds * +40%
Aorus Master 16 AM6J
NVIDIA GeForce RTX 5080 Laptop, AMD Ryzen 9 9955HX3D
124 Seconds * +51%
v4.3 Barbershop CPU
Razer Blade 16 Core Ultra 9 386H
NVIDIA GeForce RTX 5090 Laptop, Intel Core Ultra 9 386H
1400 Seconds * -10%
MSI Stealth 16 AI B3WH
NVIDIA GeForce RTX 5070 Ti Laptop, Intel Core Ultra 9 386H
1269 Seconds *
Lenovo Legion 7 16 AGP11
NVIDIA GeForce RTX 5060 Laptop, AMD Ryzen AI 9 HX 470
1119 Seconds * +12%
Moyenne NVIDIA GeForce RTX 5070 Ti Laptop
  (628 - 1269, n=5)
914 Seconds * +28%
MSI Crosshair A16 HX E8WGK
NVIDIA GeForce RTX 5070 Laptop, AMD Ryzen 9 8940HX
716 Seconds * +44%
v4.3 Barbershop OPTIX
MSI Crosshair A16 HX E8WGK
NVIDIA GeForce RTX 5070 Laptop, AMD Ryzen 9 8940HX
86 Seconds * -18%
MSI Stealth 16 AI B3WH
NVIDIA GeForce RTX 5070 Ti Laptop, Intel Core Ultra 9 386H
73 Seconds *
Moyenne NVIDIA GeForce RTX 5070 Ti Laptop
  (67 - 75, n=5)
71.2 Seconds * +2%
KFA2 GeForce RTX 5070 Ti HoF Gaming
NVIDIA GeForce RTX 5070 Ti, AMD Ryzen 7 9800X3D
49 Seconds * +33%
Razer Blade 16 Core Ultra 9 386H
NVIDIA GeForce RTX 5090 Laptop, Intel Core Ultra 9 386H
49 Seconds * +33%

* ... Moindre est la valeur, meilleures sont les performances
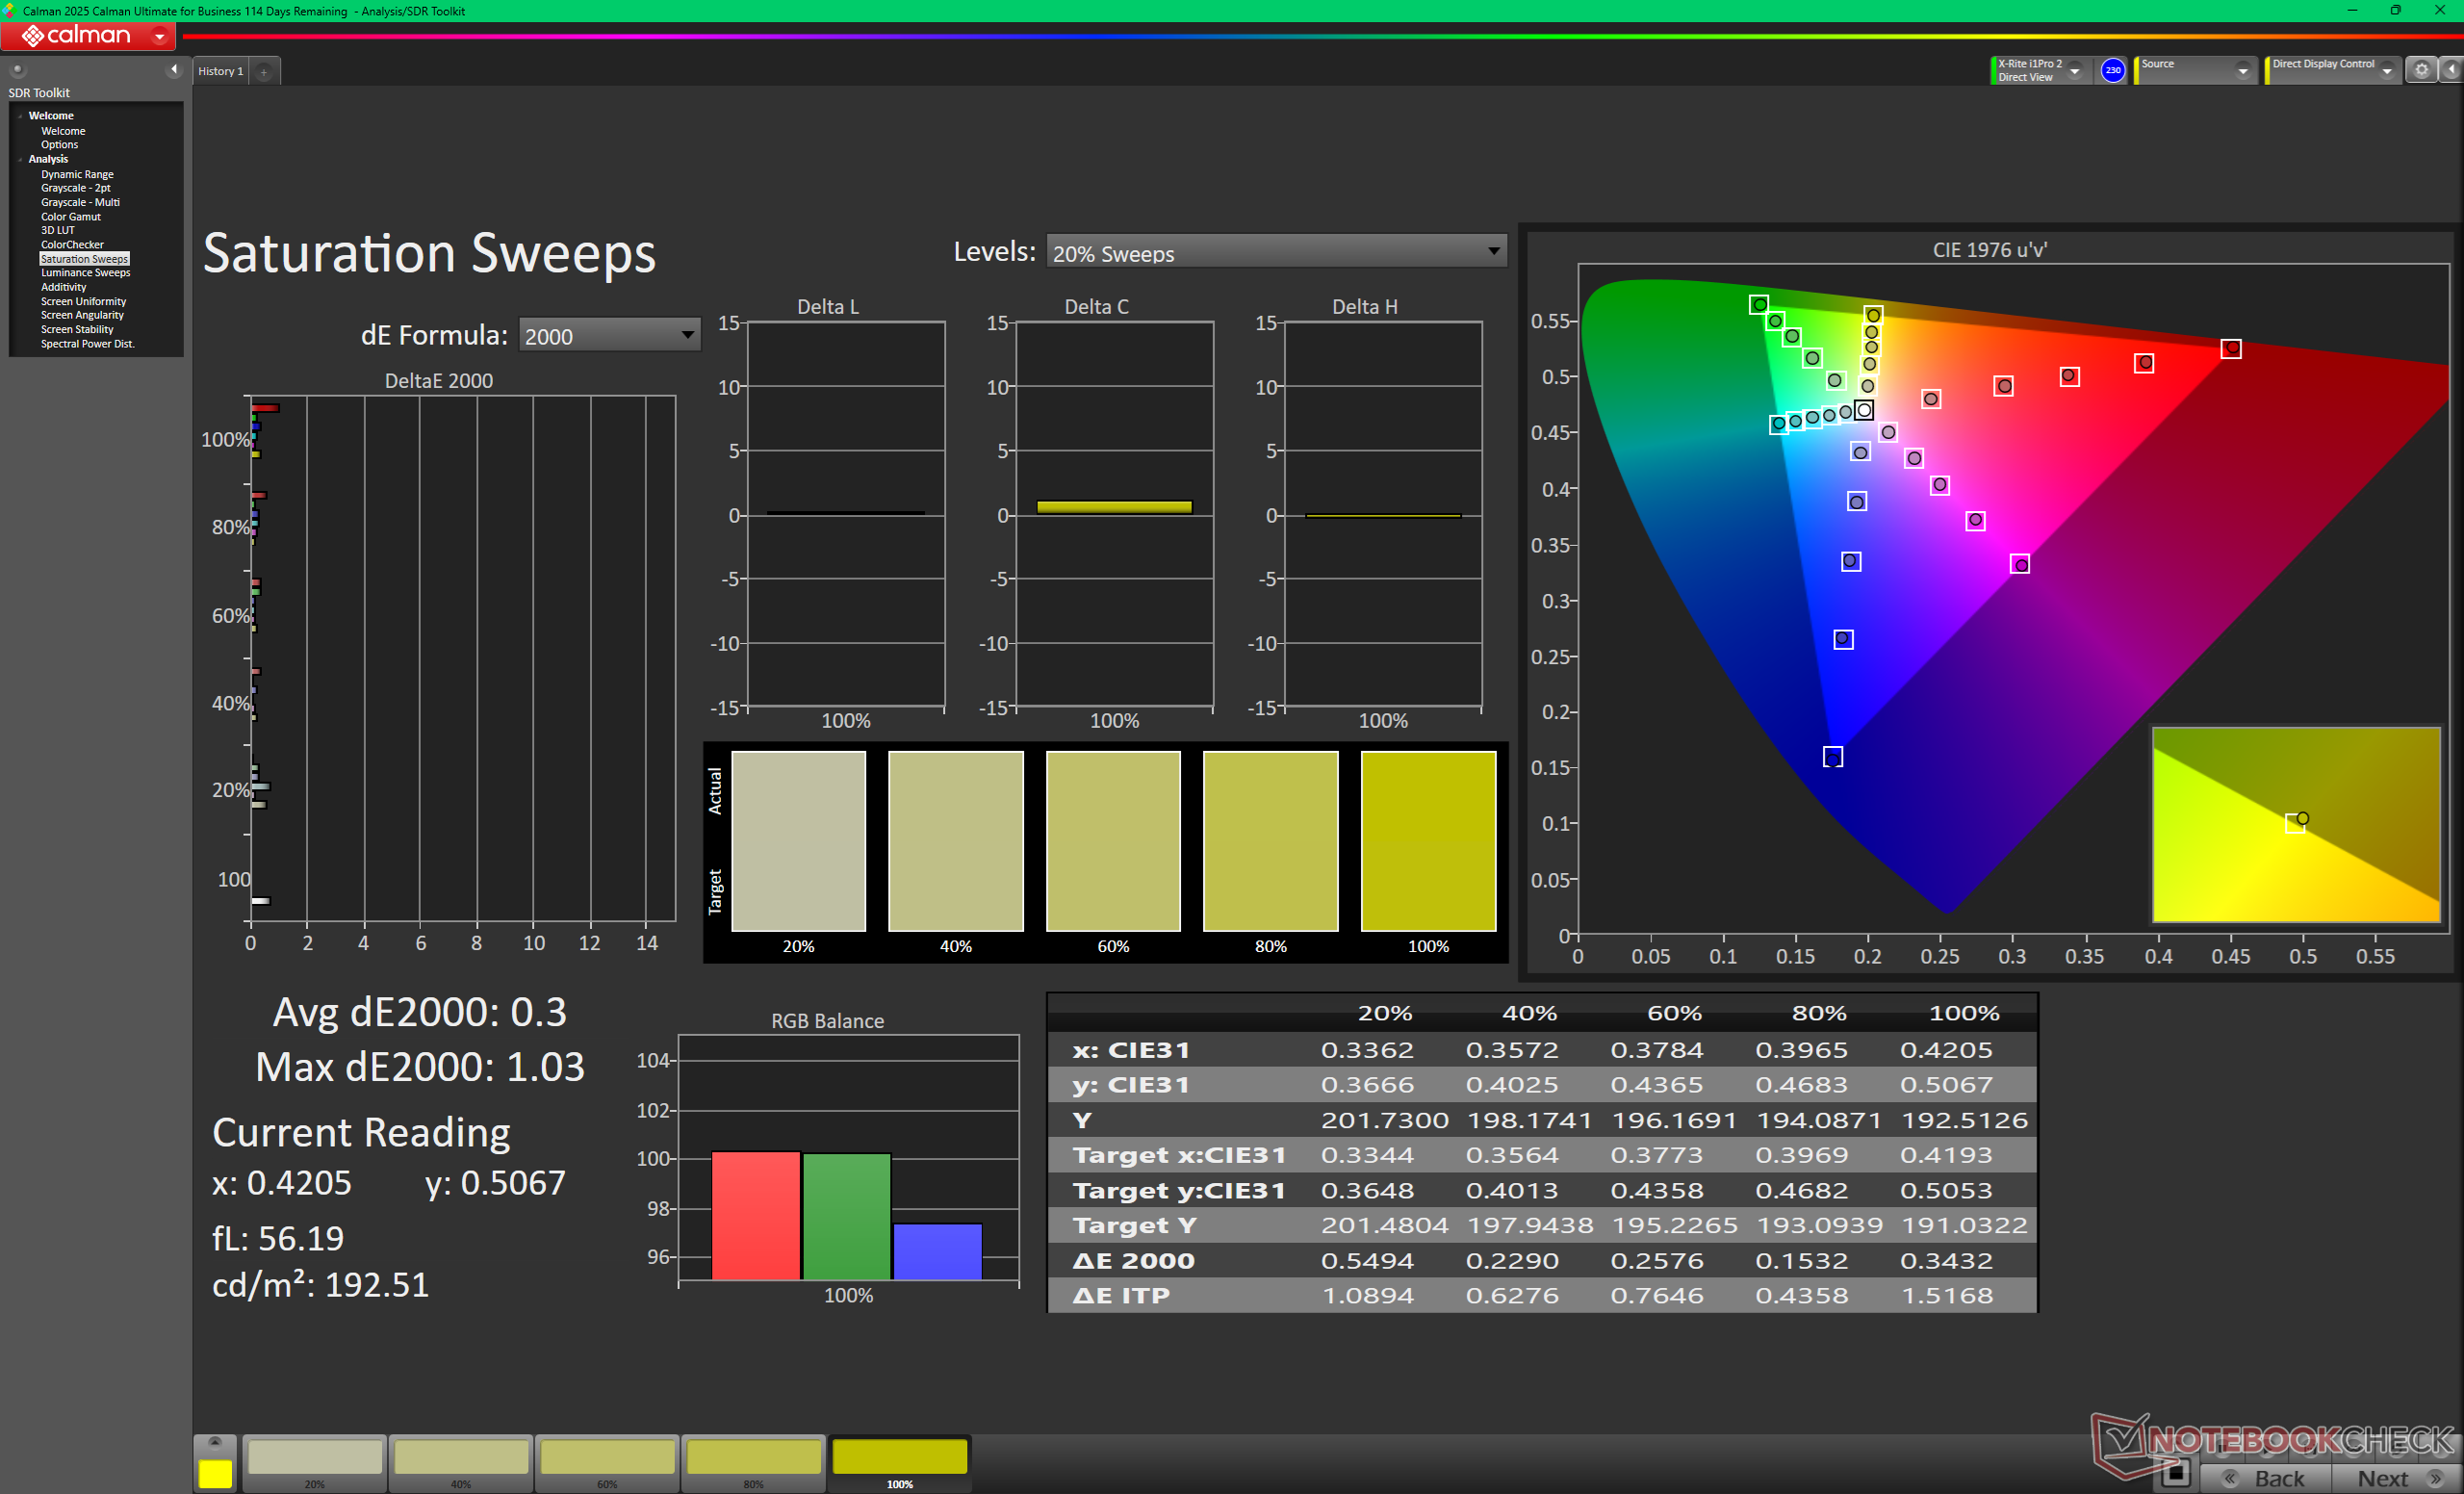
Performance rating - Percent
Aorus Master 16 AM6J -3!
AMD Ryzen 9 9955HX3D, NVIDIA GeForce RTX 5080 Laptop
96.7 pt
Razer Blade 16 Core Ultra 9 386H
Intel Core Ultra 9 386H, NVIDIA GeForce RTX 5090 Laptop
85.2 pt
Asus ROG Zephyrus G16 GU606AW
Intel Core Ultra 9 386H, NVIDIA GeForce RTX 5080 Laptop
80.3 pt
MSI Stealth 16 AI B3WH
Intel Core Ultra 9 386H, NVIDIA GeForce RTX 5070 Ti Laptop
76.7 pt
MSI Stealth 16 Studio A13VG -2!
Intel Core i7-13700H, NVIDIA GeForce RTX 4070 Laptop GPU
69.4 pt
Lenovo Legion 7 16 AGP11
AMD Ryzen AI 9 HX 470, NVIDIA GeForce RTX 5060 Laptop
65.5 pt
Cyberpunk 2077 - 1920x1080 Ultra Preset (FSR off)
Aorus Master 16 AM6J
AMD Ryzen 9 9955HX3D, NVIDIA GeForce RTX 5080 Laptop
144.5 (116min) fps +22%
Razer Blade 16 Core Ultra 9 386H
Intel Core Ultra 9 386H, NVIDIA GeForce RTX 5090 Laptop
139.5 (100.7min, 89.2P1) fps +18%
MSI Stealth 16 AI B3WH
Intel Core Ultra 9 386H, NVIDIA GeForce RTX 5070 Ti Laptop
118.7 (95.9min, 86P1) fps
Asus ROG Zephyrus G16 GU606AW
Intel Core Ultra 9 386H, NVIDIA GeForce RTX 5080 Laptop
114.2 (84.9min) fps -4%
Lenovo Legion 7 16 AGP11
AMD Ryzen AI 9 HX 470, NVIDIA GeForce RTX 5060 Laptop
90.5 (72.4min) fps -24%
Baldur's Gate 3 - 1920x1080 Ultra Preset AA:T
Razer Blade 16 Core Ultra 9 386H
Intel Core Ultra 9 386H, NVIDIA GeForce RTX 5090 Laptop
202 (12.2min, 112.6P0.1, 152.7P1) fps +31%
Aorus Master 16 AM6J
AMD Ryzen 9 9955HX3D, NVIDIA GeForce RTX 5080 Laptop
175 (65min) fps +13%
Asus ROG Zephyrus G16 GU606AW
Intel Core Ultra 9 386H, NVIDIA GeForce RTX 5080 Laptop
154.7 (87.8min, 112.2P0.1, 126.7P1) fps 0%
MSI Stealth 16 AI B3WH
Intel Core Ultra 9 386H, NVIDIA GeForce RTX 5070 Ti Laptop
154.5 (86.8min, 104.7P0.1, 124.9P1) fps
Lenovo Legion 7 16 AGP11
AMD Ryzen AI 9 HX 470, NVIDIA GeForce RTX 5060 Laptop
112.2 (90.4min, 93.5P0.1, 101.2P1) fps -27%
GTA V - 1920x1080 Highest AA:4xMSAA + FX AF:16x
Asus ROG Zephyrus G16 GU606AW
Intel Core Ultra 9 386H, NVIDIA GeForce RTX 5080 Laptop
141.8 (3.44min, 100P1) fps +8%
MSI Stealth 16 AI B3WH
Intel Core Ultra 9 386H, NVIDIA GeForce RTX 5070 Ti Laptop
131.8 (5.08min, 90.9P1) fps
Lenovo Legion 7 16 AGP11
AMD Ryzen AI 9 HX 470, NVIDIA GeForce RTX 5060 Laptop
129.7 (4.27min, 90.9P1) fps -2%
MSI Stealth 16 Studio A13VG
Intel Core i7-13700H, NVIDIA GeForce RTX 4070 Laptop GPU
119.7 (4.54min, 76.9P1) fps -9%
Razer Blade 16 Core Ultra 9 386H
Intel Core Ultra 9 386H, NVIDIA GeForce RTX 5090 Laptop
102.9 (8.02min, 55.6P1) fps -22%
Final Fantasy XV Benchmark - 1920x1080 High Quality
Razer Blade 16 Core Ultra 9 386H
Intel Core Ultra 9 386H, NVIDIA GeForce RTX 5090 Laptop
175.5 fps +17%
Asus ROG Zephyrus G16 GU606AW
Intel Core Ultra 9 386H, NVIDIA GeForce RTX 5080 Laptop
153.9 fps +2%
MSI Stealth 16 AI B3WH
Intel Core Ultra 9 386H, NVIDIA GeForce RTX 5070 Ti Laptop
150.3 fps
Lenovo Legion 7 16 AGP11
AMD Ryzen AI 9 HX 470, NVIDIA GeForce RTX 5060 Laptop
121.7 fps -19%
MSI Stealth 16 Studio A13VG
Intel Core i7-13700H, NVIDIA GeForce RTX 4070 Laptop GPU
115 fps -23%
Strange Brigade - 1920x1080 ultra AA:ultra AF:16
Razer Blade 16 Core Ultra 9 386H
Intel Core Ultra 9 386H, NVIDIA GeForce RTX 5090 Laptop
326 (72.8min, 230P1) fps +15%
Asus ROG Zephyrus G16 GU606AW
Intel Core Ultra 9 386H, NVIDIA GeForce RTX 5080 Laptop
300 (171.8min, 213P1) fps +6%
MSI Stealth 16 AI B3WH
Intel Core Ultra 9 386H, NVIDIA GeForce RTX 5070 Ti Laptop
284 (174.7min, 201P1) fps
Lenovo Legion 7 16 AGP11
AMD Ryzen AI 9 HX 470, NVIDIA GeForce RTX 5060 Laptop
223 (114.1min, 165.2P1) fps -21%
MSI Stealth 16 Studio A13VG
Intel Core i7-13700H, NVIDIA GeForce RTX 4070 Laptop GPU
200 (31.2min, 147.4P1) fps -30%
Dota 2 Reborn - 1920x1080 ultra (3/3) best looking
Aorus Master 16 AM6J
AMD Ryzen 9 9955HX3D, NVIDIA GeForce RTX 5080 Laptop
252 (201.5min) fps +80%
MSI Stealth 16 Studio A13VG
Intel Core i7-13700H, NVIDIA GeForce RTX 4070 Laptop GPU
154.7 (131.1min) fps +11%
Razer Blade 16 Core Ultra 9 386H
Intel Core Ultra 9 386H, NVIDIA GeForce RTX 5090 Laptop
153.8 (132.8min) fps +10%
Lenovo Legion 7 16 AGP11
AMD Ryzen AI 9 HX 470, NVIDIA GeForce RTX 5060 Laptop
147.8 (124.9min) fps +6%
Asus ROG Zephyrus G16 GU606AW
Intel Core Ultra 9 386H, NVIDIA GeForce RTX 5080 Laptop
146.4 (125.8min) fps +5%
MSI Stealth 16 AI B3WH
Intel Core Ultra 9 386H, NVIDIA GeForce RTX 5070 Ti Laptop
140 (120.7min) fps
X-Plane 11.11 - 1920x1080 high (fps_test=3)
Aorus Master 16 AM6J
AMD Ryzen 9 9955HX3D, NVIDIA GeForce RTX 5080 Laptop
148.5 fps +75%
MSI Stealth 16 Studio A13VG
Intel Core i7-13700H, NVIDIA GeForce RTX 4070 Laptop GPU
110.2 fps +30%
Asus ROG Zephyrus G16 GU606AW
Intel Core Ultra 9 386H, NVIDIA GeForce RTX 5080 Laptop
101.9 fps +20%
Razer Blade 16 Core Ultra 9 386H
Intel Core Ultra 9 386H, NVIDIA GeForce RTX 5090 Laptop
98.5 fps +16%
MSI Stealth 16 AI B3WH
Intel Core Ultra 9 386H, NVIDIA GeForce RTX 5070 Ti Laptop
84.9 fps
Lenovo Legion 7 16 AGP11
AMD Ryzen AI 9 HX 470, NVIDIA GeForce RTX 5060 Laptop
78.4 fps -8%
Black Myth: Wukong
1920x1080 cinematic TSR 100
KFA2 GeForce RTX 5070 Ti HoF Gaming
AMD Ryzen 7 9800X3D, NVIDIA GeForce RTX 5070 Ti
67 fps +68%
Razer Blade 16 Core Ultra 9 386H
Intel Core Ultra 9 386H, NVIDIA GeForce RTX 5090 Laptop
57 (47min) fps +43%
MSI Stealth 16 AI B3WH
Intel Core Ultra 9 386H, NVIDIA GeForce RTX 5070 Ti Laptop
40 (14min) fps
2560x1440 cinematic TSR 100
KFA2 GeForce RTX 5070 Ti HoF Gaming
AMD Ryzen 7 9800X3D, NVIDIA GeForce RTX 5070 Ti
52 fps +68%
Razer Blade 16 Core Ultra 9 386H
Intel Core Ultra 9 386H, NVIDIA GeForce RTX 5090 Laptop
43 (38min) fps +39%
MSI Stealth 16 AI B3WH
Intel Core Ultra 9 386H, NVIDIA GeForce RTX 5070 Ti Laptop
31 (26min) fps
3840x2160 cinematic TSR 100
KFA2 GeForce RTX 5070 Ti HoF Gaming
AMD Ryzen 7 9800X3D, NVIDIA GeForce RTX 5070 Ti
32 fps +78%
Razer Blade 16 Core Ultra 9 386H
Intel Core Ultra 9 386H, NVIDIA GeForce RTX 5090 Laptop
26 (21min) fps +44%
MSI Stealth 16 AI B3WH
Intel Core Ultra 9 386H, NVIDIA GeForce RTX 5070 Ti Laptop
18 (14min) fps
2560x1440 cinematic DLSS 68
KFA2 GeForce RTX 5070 Ti HoF Gaming
AMD Ryzen 7 9800X3D, NVIDIA GeForce RTX 5070 Ti
73 fps +62%
Razer Blade 16 Core Ultra 9 386H
Intel Core Ultra 9 386H, NVIDIA GeForce RTX 5090 Laptop
64 (47min) fps +42%
MSI Stealth 16 AI B3WH
Intel Core Ultra 9 386H, NVIDIA GeForce RTX 5070 Ti Laptop
45 (38min) fps
3840x2160 cinematic DLSS 68
KFA2 GeForce RTX 5070 Ti HoF Gaming
AMD Ryzen 7 9800X3D, NVIDIA GeForce RTX 5070 Ti
53 fps +71%
Razer Blade 16 Core Ultra 9 386H
Intel Core Ultra 9 386H, NVIDIA GeForce RTX 5090 Laptop
45 (38min) fps +45%
MSI Stealth 16 AI B3WH
Intel Core Ultra 9 386H, NVIDIA GeForce RTX 5070 Ti Laptop
31 (27min) fps
3840x2160 cinematic RT: Very High DLSS 68 FG
KFA2 GeForce RTX 5070 Ti HoF Gaming
AMD Ryzen 7 9800X3D, NVIDIA GeForce RTX 5070 Ti
51 fps +82%
Razer Blade 16 Core Ultra 9 386H
Intel Core Ultra 9 386H, NVIDIA GeForce RTX 5090 Laptop
45 (38min) fps +61%
MSI Stealth 16 AI B3WH
Intel Core Ultra 9 386H, NVIDIA GeForce RTX 5070 Ti Laptop
28 (26min) fps
2560x1440 cinematic RT: Very High DLSS 68 FG
KFA2 GeForce RTX 5070 Ti HoF Gaming
AMD Ryzen 7 9800X3D, NVIDIA GeForce RTX 5070 Ti
89 fps +89%
Razer Blade 16 Core Ultra 9 386H
Intel Core Ultra 9 386H, NVIDIA GeForce RTX 5090 Laptop
81 (58min) fps +72%
MSI Stealth 16 AI B3WH
Intel Core Ultra 9 386H, NVIDIA GeForce RTX 5070 Ti Laptop
47 (38min) fps
3840x2160 cinematic RT: Very High
Razer Blade 16 Core Ultra 9 386H
Intel Core Ultra 9 386H, NVIDIA GeForce RTX 5090 Laptop
13 (10min) fps +63%
MSI Stealth 16 AI B3WH
Intel Core Ultra 9 386H, NVIDIA GeForce RTX 5070 Ti Laptop
8 (7min) fps
GTA V
3840x2160 Highest AA:4xMSAA + FX AF:16x
Razer Blade 16 Core Ultra 9 386H
Intel Core Ultra 9 386H, NVIDIA GeForce RTX 5090 Laptop
107.5 (3.67min, 76.9P1) fps +44%
MSI Stealth 16 AI B3WH
Intel Core Ultra 9 386H, NVIDIA GeForce RTX 5070 Ti Laptop
74.4 (20.2min, 55.6P1) fps
Lenovo Legion Slim 5 16APH8
AMD Ryzen 7 7840HS, NVIDIA GeForce RTX 4060 Laptop GPU
38.1 (14.2min, 27P1) fps -49%
3840x2160 High/On (Advanced Graphics Off) AA:FX AF:8x
Razer Blade 16 Core Ultra 9 386H
Intel Core Ultra 9 386H, NVIDIA GeForce RTX 5090 Laptop
178.6 (3.08min, 125P1) fps +32%
MSI Stealth 16 AI B3WH
Intel Core Ultra 9 386H, NVIDIA GeForce RTX 5070 Ti Laptop
135.2 (10.4min, 100P1) fps
Lenovo Legion Slim 5 16APH8
AMD Ryzen 7 7840HS, NVIDIA GeForce RTX 4060 Laptop GPU
76.3 (21min, 55.6P1) fps -44%
Final Fantasy XV Benchmark
1920x1080 High Quality
KFA2 GeForce RTX 5070 Ti HoF Gaming
AMD Ryzen 7 9800X3D, NVIDIA GeForce RTX 5070 Ti
232 fps +54%
Razer Blade 16 Core Ultra 9 386H
Intel Core Ultra 9 386H, NVIDIA GeForce RTX 5090 Laptop
175.5 fps +17%
MSI Stealth 16 AI B3WH
Intel Core Ultra 9 386H, NVIDIA GeForce RTX 5070 Ti Laptop
150.3 fps
MSI Crosshair A16 HX E8WGK
AMD Ryzen 9 8940HX, NVIDIA GeForce RTX 5070 Laptop
140 fps -7%
Lenovo Legion 7 16 AGP11
AMD Ryzen AI 9 HX 470, NVIDIA GeForce RTX 5060 Laptop
121.7 fps -19%
MSI Stealth 16 Studio A13VG
Intel Core i7-13700H, NVIDIA GeForce RTX 4070 Laptop GPU
115 fps -23%
Lenovo Legion Slim 5 16APH8
AMD Ryzen 7 7840HS, NVIDIA GeForce RTX 4060 Laptop GPU
94.3 fps -37%
Asus ROG Zephyrus M16 GU603H
Intel Core i9-11900H, NVIDIA GeForce RTX 3070 Laptop GPU
65.7 fps -56%
2560x1440 High Quality
KFA2 GeForce RTX 5070 Ti HoF Gaming
AMD Ryzen 7 9800X3D, NVIDIA GeForce RTX 5070 Ti
193.1 fps +63%
Razer Blade 16 Core Ultra 9 386H
Intel Core Ultra 9 386H, NVIDIA GeForce RTX 5090 Laptop
154.1 fps +30%
MSI Stealth 16 AI B3WH
Intel Core Ultra 9 386H, NVIDIA GeForce RTX 5070 Ti Laptop
118.8 fps
MSI Crosshair A16 HX E8WGK
AMD Ryzen 9 8940HX, NVIDIA GeForce RTX 5070 Laptop
102 fps -14%
Lenovo Legion 7 16 AGP11
AMD Ryzen AI 9 HX 470, NVIDIA GeForce RTX 5060 Laptop
89.2 fps -25%
MSI Stealth 16 Studio A13VG
Intel Core i7-13700H, NVIDIA GeForce RTX 4070 Laptop GPU
83.8 fps -29%
Lenovo Legion Slim 5 16APH8
AMD Ryzen 7 7840HS, NVIDIA GeForce RTX 4060 Laptop GPU
67.7 fps -43%
Asus ROG Zephyrus M16 GU603H
Intel Core i9-11900H, NVIDIA GeForce RTX 3070 Laptop GPU
49.1 fps -59%
3840x2160 High Quality
KFA2 GeForce RTX 5070 Ti HoF Gaming
AMD Ryzen 7 9800X3D, NVIDIA GeForce RTX 5070 Ti
118.1 fps +80%
Razer Blade 16 Core Ultra 9 386H
Intel Core Ultra 9 386H, NVIDIA GeForce RTX 5090 Laptop
95.5 fps +45%
MSI Stealth 16 AI B3WH
Intel Core Ultra 9 386H, NVIDIA GeForce RTX 5070 Ti Laptop
65.7 fps
Lenovo Legion Slim 5 16APH8
AMD Ryzen 7 7840HS, NVIDIA GeForce RTX 4060 Laptop GPU
37.6 fps -43%
X-Plane 11.11 - 3840x2160 high (fps_test=3)
KFA2 GeForce RTX 5070 Ti HoF Gaming
AMD Ryzen 7 9800X3D, NVIDIA GeForce RTX 5070 Ti
150.5 fps +109%
Razer Blade 16 Core Ultra 9 386H
Intel Core Ultra 9 386H, NVIDIA GeForce RTX 5090 Laptop
84.6 fps +18%
MSI Stealth 16 AI B3WH
Intel Core Ultra 9 386H, NVIDIA GeForce RTX 5070 Ti Laptop
71.9 fps
Lenovo Legion Slim 5 16APH8
AMD Ryzen 7 7840HS, NVIDIA GeForce RTX 4060 Laptop GPU
70.9 fps -1%
Strange Brigade
1920x1080 ultra AA:ultra AF:16
Razer Blade 16 Core Ultra 9 386H
Intel Core Ultra 9 386H, NVIDIA GeForce RTX 5090 Laptop
326 (72.8min, 230P1) fps +15%
MSI Stealth 16 AI B3WH
Intel Core Ultra 9 386H, NVIDIA GeForce RTX 5070 Ti Laptop
284 (174.7min, 201P1) fps
MSI Crosshair A16 HX E8WGK
AMD Ryzen 9 8940HX, NVIDIA GeForce RTX 5070 Laptop
258 (159.7min, 195.8P1) fps -9%
Lenovo Legion 7 16 AGP11
AMD Ryzen AI 9 HX 470, NVIDIA GeForce RTX 5060 Laptop
223 (114.1min, 165.2P1) fps -21%
MSI Stealth 16 Studio A13VG
Intel Core i7-13700H, NVIDIA GeForce RTX 4070 Laptop GPU
200 (31.2min, 147.4P1) fps -30%
Lenovo Legion Slim 5 16APH8
AMD Ryzen 7 7840HS, NVIDIA GeForce RTX 4060 Laptop GPU
168.2 (38.3min, 126.4P1) fps -41%
Asus ROG Zephyrus M16 GU603H
Intel Core i9-11900H, NVIDIA GeForce RTX 3070 Laptop GPU
105 (66.4min, 72.1P1) fps -63%
2560x1440 ultra AA:ultra AF:16
Razer Blade 16 Core Ultra 9 386H
Intel Core Ultra 9 386H, NVIDIA GeForce RTX 5090 Laptop
310 (68.5min, 220P1) fps +50%
MSI Stealth 16 AI B3WH
Intel Core Ultra 9 386H, NVIDIA GeForce RTX 5070 Ti Laptop
207 (141.1min, 158.8P1) fps
MSI Crosshair A16 HX E8WGK
AMD Ryzen 9 8940HX, NVIDIA GeForce RTX 5070 Laptop
170.4 (127.2min, 139P1) fps -18%
Lenovo Legion 7 16 AGP11
AMD Ryzen AI 9 HX 470, NVIDIA GeForce RTX 5060 Laptop
155.2 (116.7min, 126.8P1) fps -25%
MSI Stealth 16 Studio A13VG
Intel Core i7-13700H, NVIDIA GeForce RTX 4070 Laptop GPU
132 (23min, 107.4P1) fps -36%
Lenovo Legion Slim 5 16APH8
AMD Ryzen 7 7840HS, NVIDIA GeForce RTX 4060 Laptop GPU
115.1 (28.9min, 94.1P1) fps -44%
Asus ROG Zephyrus M16 GU603H
Intel Core i9-11900H, NVIDIA GeForce RTX 3070 Laptop GPU
82.3 (25.9min, 58.7P1) fps -60%
3840x2160 ultra AA:ultra AF:16
Razer Blade 16 Core Ultra 9 386H
Intel Core Ultra 9 386H, NVIDIA GeForce RTX 5090 Laptop
174.9 (59.8min, 146.3P1) fps +55%
MSI Stealth 16 AI B3WH
Intel Core Ultra 9 386H, NVIDIA GeForce RTX 5070 Ti Laptop
112.7 (88.1min, 95.4P1) fps
Lenovo Legion Slim 5 16APH8
AMD Ryzen 7 7840HS, NVIDIA GeForce RTX 4060 Laptop GPU
61.8 (32.2min, 53.3P1) fps -45%
Baldur's Gate 3
1920x1080 Ultra Preset AA:T
KFA2 GeForce RTX 5070 Ti HoF Gaming
AMD Ryzen 7 9800X3D, NVIDIA GeForce RTX 5070 Ti
234 (199.9min, 205P0.1, 215P1) fps +51%
Razer Blade 16 Core Ultra 9 386H
Intel Core Ultra 9 386H, NVIDIA GeForce RTX 5090 Laptop
202 (12.2min, 112.6P0.1, 152.7P1) fps +31%
Aorus Master 16 AM6J
AMD Ryzen 9 9955HX3D, NVIDIA GeForce RTX 5080 Laptop
175 (65min) fps +13%
MSI Stealth 16 AI B3WH
Intel Core Ultra 9 386H, NVIDIA GeForce RTX 5070 Ti Laptop
154.5 (86.8min, 104.7P0.1, 124.9P1) fps
MSI Crosshair A16 HX E8WGK
AMD Ryzen 9 8940HX, NVIDIA GeForce RTX 5070 Laptop
133.2 (79.7min, 79.7P0.1, 79.9P1) fps -14%
Lenovo Legion 7 16 AGP11
AMD Ryzen AI 9 HX 470, NVIDIA GeForce RTX 5060 Laptop
112.2 (90.4min, 93.5P0.1, 101.2P1) fps -27%
2560x1440 Ultra Preset + Quality DLSS
KFA2 GeForce RTX 5070 Ti HoF Gaming
AMD Ryzen 7 9800X3D, NVIDIA GeForce RTX 5070 Ti
234 (172.7min, 204P0.1, 213P1) fps +54%
Razer Blade 16 Core Ultra 9 386H
Intel Core Ultra 9 386H, NVIDIA GeForce RTX 5090 Laptop
199.8 (14.6min, 122P0.1, 150.7P1) fps +32%
MSI Stealth 16 AI B3WH
Intel Core Ultra 9 386H, NVIDIA GeForce RTX 5070 Ti Laptop
151.9 (123.8min, 124.8P0.1, 130.1P1) fps
MSI Crosshair A16 HX E8WGK
AMD Ryzen 9 8940HX, NVIDIA GeForce RTX 5070 Laptop
129.6 (79.7min, 79.7P0.1, 79.9P1) fps -15%
2560x1440 Ultra Preset AA:T
KFA2 GeForce RTX 5070 Ti HoF Gaming
AMD Ryzen 7 9800X3D, NVIDIA GeForce RTX 5070 Ti
175.8 (153.6min, 156.7P0.1, 160.9P1) fps +69%
Razer Blade 16 Core Ultra 9 386H
Intel Core Ultra 9 386H, NVIDIA GeForce RTX 5090 Laptop
157.3 (113.3min, 121.2P0.1, 137.3P1) fps +52%
Aorus Master 16 AM6J
AMD Ryzen 9 9955HX3D, NVIDIA GeForce RTX 5080 Laptop
123 (79min) fps +18%
MSI Stealth 16 AI B3WH
Intel Core Ultra 9 386H, NVIDIA GeForce RTX 5070 Ti Laptop
103.8 (33.8min, 86.7P0.1, 88.5P1) fps
MSI Crosshair A16 HX E8WGK
AMD Ryzen 9 8940HX, NVIDIA GeForce RTX 5070 Laptop
90.3 (60min, 60P0.1, 79.6P1) fps -13%
Lenovo Legion 7 16 AGP11
AMD Ryzen AI 9 HX 470, NVIDIA GeForce RTX 5060 Laptop
76.4 (65.3min, 66.4P0.1, 68.8P1) fps -26%
3840x2160 Ultra Preset + Quality DLSS
KFA2 GeForce RTX 5070 Ti HoF Gaming
AMD Ryzen 7 9800X3D, NVIDIA GeForce RTX 5070 Ti
151.7 (134.6min, 137.5P0.1, 141.7P1) fps +63%
Razer Blade 16 Core Ultra 9 386H
Intel Core Ultra 9 386H, NVIDIA GeForce RTX 5090 Laptop
134.9 (106.5min, 113P0.1, 123.8P1) fps +45%
MSI Stealth 16 AI B3WH
Intel Core Ultra 9 386H, NVIDIA GeForce RTX 5070 Ti Laptop
92.8 (75.6min, 78.6P0.1, 80.5P1) fps
Cyberpunk 2077
1920x1080 Ultra Preset (FSR off)
KFA2 GeForce RTX 5070 Ti HoF Gaming
AMD Ryzen 7 9800X3D, NVIDIA GeForce RTX 5070 Ti
202 (163.6min) fps +70%
Aorus Master 16 AM6J
AMD Ryzen 9 9955HX3D, NVIDIA GeForce RTX 5080 Laptop
144.5 (116min) fps +22%
Razer Blade 16 Core Ultra 9 386H
Intel Core Ultra 9 386H, NVIDIA GeForce RTX 5090 Laptop
139.5 (100.7min, 89.2P1) fps +18%
MSI Stealth 16 AI B3WH
Intel Core Ultra 9 386H, NVIDIA GeForce RTX 5070 Ti Laptop
118.7 (95.9min, 86P1) fps
MSI Crosshair A16 HX E8WGK
AMD Ryzen 9 8940HX, NVIDIA GeForce RTX 5070 Laptop
112.1 (90.9min, 85.1P1) fps -6%
Lenovo Legion 7 16 AGP11
AMD Ryzen AI 9 HX 470, NVIDIA GeForce RTX 5060 Laptop
90.5 (72.4min) fps -24%
1920x1080 Ray Tracing Ultra Preset (DLSS off)
Razer Blade 16 Core Ultra 9 386H
Intel Core Ultra 9 386H, NVIDIA GeForce RTX 5090 Laptop
72.5 (61.9min, 56.4P1) fps +32%
MSI Stealth 16 AI B3WH
Intel Core Ultra 9 386H, NVIDIA GeForce RTX 5070 Ti Laptop
55.1 (48.5min, 45.8P1) fps
MSI Crosshair A16 HX E8WGK
AMD Ryzen 9 8940HX, NVIDIA GeForce RTX 5070 Laptop
48.5 (42.4min, 40.5P1) fps -12%
3840x2160 Ray Tracing Overdrive Preset + DLSS 4 Transformer Quality + Frame Generation MFG 4x
KFA2 GeForce RTX 5070 Ti HoF Gaming
AMD Ryzen 7 9800X3D, NVIDIA GeForce RTX 5070 Ti
113.2 (100.4min) fps +81%
Razer Blade 16 Core Ultra 9 386H
Intel Core Ultra 9 386H, NVIDIA GeForce RTX 5090 Laptop
89.9 (81.3min) fps +44%
MSI Stealth 16 AI B3WH
Intel Core Ultra 9 386H, NVIDIA GeForce RTX 5070 Ti Laptop
62.4 (55.8min) fps
3840x2160 Ray Tracing Overdrive Preset + DLSS 4 Transformer Quality + Frame Generation (M)FG 2x
KFA2 GeForce RTX 5070 Ti HoF Gaming
AMD Ryzen 7 9800X3D, NVIDIA GeForce RTX 5070 Ti
61 (52.9min) fps +80%
Razer Blade 16 Core Ultra 9 386H
Intel Core Ultra 9 386H, NVIDIA GeForce RTX 5090 Laptop
49.1 (44.2min) fps +45%
MSI Stealth 16 AI B3WH
Intel Core Ultra 9 386H, NVIDIA GeForce RTX 5070 Ti Laptop
33.8 (29.1min) fps
3840x2160 Ray Tracing Overdrive Preset + DLSS 4 Transformer Quality (no FG)
KFA2 GeForce RTX 5070 Ti HoF Gaming
AMD Ryzen 7 9800X3D, NVIDIA GeForce RTX 5070 Ti
33.9 (28.4min) fps +78%
Razer Blade 16 Core Ultra 9 386H
Intel Core Ultra 9 386H, NVIDIA GeForce RTX 5090 Laptop
28 (24min, 22.7P1) fps +47%
MSI Stealth 16 AI B3WH
Intel Core Ultra 9 386H, NVIDIA GeForce RTX 5070 Ti Laptop
19 (16.7min, 16.1P1) fps
3840x2160 Ray Tracing Overdrive Preset (no DLSS, no FG)
KFA2 GeForce RTX 5070 Ti HoF Gaming
AMD Ryzen 7 9800X3D, NVIDIA GeForce RTX 5070 Ti
16.4 (13.3min) fps +93%
Razer Blade 16 Core Ultra 9 386H
Intel Core Ultra 9 386H, NVIDIA GeForce RTX 5090 Laptop
13.3 (11.3min, 10.9P1) fps +57%
MSI Stealth 16 AI B3WH
Intel Core Ultra 9 386H, NVIDIA GeForce RTX 5070 Ti Laptop
8.49 (7.54min, 7.12P1) fps
2560x1440 Ultra Preset DLSS4 quality no FG
KFA2 GeForce RTX 5070 Ti HoF Gaming
AMD Ryzen 7 9800X3D, NVIDIA GeForce RTX 5070 Ti
151.5 (130.4min) fps +71%
Razer Blade 16 Core Ultra 9 386H
Intel Core Ultra 9 386H, NVIDIA GeForce RTX 5090 Laptop
116.6 (94.5min, 85.9P1) fps +32%
MSI Stealth 16 AI B3WH
Intel Core Ultra 9 386H, NVIDIA GeForce RTX 5070 Ti Laptop
88.4 (74.8min, 71.1P1) fps
MSI Crosshair A16 HX E8WGK
AMD Ryzen 9 8940HX, NVIDIA GeForce RTX 5070 Laptop
81.9 (71.5min, 67.2P1) fps -7%
Lenovo Legion 7 16 AGP11
AMD Ryzen AI 9 HX 470, NVIDIA GeForce RTX 5060 Laptop
66.7 (57.2min) fps -25%
2560x1440 Ultra Preset (FSR off)
KFA2 GeForce RTX 5070 Ti HoF Gaming
AMD Ryzen 7 9800X3D, NVIDIA GeForce RTX 5070 Ti
133.2 (110.7min) fps +78%
Razer Blade 16 Core Ultra 9 386H
Intel Core Ultra 9 386H, NVIDIA GeForce RTX 5090 Laptop
105.8 (84.1min, 74.9P1) fps +41%
Aorus Master 16 AM6J
AMD Ryzen 9 9955HX3D, NVIDIA GeForce RTX 5080 Laptop
99.8 (84min) fps +33%
MSI Stealth 16 AI B3WH
Intel Core Ultra 9 386H, NVIDIA GeForce RTX 5070 Ti Laptop
75 (63.2min, 61.3P1) fps
MSI Crosshair A16 HX E8WGK
AMD Ryzen 9 8940HX, NVIDIA GeForce RTX 5070 Laptop
68.8 (58.4min, 56.1P1) fps -8%
Lenovo Legion 7 16 AGP11
AMD Ryzen AI 9 HX 470, NVIDIA GeForce RTX 5060 Laptop
56.2 (47.6min) fps -25%
F1 24
1920x1080 Ultra High Preset AA:T AF:16x
KFA2 GeForce RTX 5070 Ti HoF Gaming
AMD Ryzen 7 9800X3D, NVIDIA GeForce RTX 5070 Ti
172.4 (114min, 130P1) fps +64%
Razer Blade 16 Core Ultra 9 386H
Intel Core Ultra 9 386H, NVIDIA GeForce RTX 5090 Laptop
132.3 (59min, 70P1) fps +26%
MSI Stealth 16 AI B3WH
Intel Core Ultra 9 386H, NVIDIA GeForce RTX 5070 Ti Laptop
105.2 (59min, 73P1) fps
MSI Crosshair A16 HX E8WGK
AMD Ryzen 9 8940HX, NVIDIA GeForce RTX 5070 Laptop
94.7 (68min, 75P1) fps -10%
Lenovo Legion 7 16 AGP11
AMD Ryzen AI 9 HX 470, NVIDIA GeForce RTX 5060 Laptop
74.3 (51min, 59P1) fps -29%
2560x1440 Ultra High Preset AA:T AF:16x
KFA2 GeForce RTX 5070 Ti HoF Gaming
AMD Ryzen 7 9800X3D, NVIDIA GeForce RTX 5070 Ti
116.5 (91min, 94P1) fps +78%
Razer Blade 16 Core Ultra 9 386H
Intel Core Ultra 9 386H, NVIDIA GeForce RTX 5090 Laptop
94.7 (57min, 67P1) fps +45%
MSI Stealth 16 AI B3WH
Intel Core Ultra 9 386H, NVIDIA GeForce RTX 5070 Ti Laptop
65.3 (53min, 53P1) fps
MSI Crosshair A16 HX E8WGK
AMD Ryzen 9 8940HX, NVIDIA GeForce RTX 5070 Laptop
59.3 (47min, 47P1) fps -9%
Lenovo Legion 7 16 AGP11
AMD Ryzen AI 9 HX 470, NVIDIA GeForce RTX 5060 Laptop
47.2 (38min, 38P1) fps -28%
3840x2160 Ultra High Preset AA:T AF:16x
KFA2 GeForce RTX 5070 Ti HoF Gaming
AMD Ryzen 7 9800X3D, NVIDIA GeForce RTX 5070 Ti
59.3 (49min, 49P1) fps +76%
Razer Blade 16 Core Ultra 9 386H
Intel Core Ultra 9 386H, NVIDIA GeForce RTX 5090 Laptop
48.4 (36min, 39P1) fps +44%
MSI Stealth 16 AI B3WH
Intel Core Ultra 9 386H, NVIDIA GeForce RTX 5070 Ti Laptop
33.7 (28min, 28P1) fps
3840x2160 Ultra High Preset + Quality DLSS AF:16x
KFA2 GeForce RTX 5070 Ti HoF Gaming
AMD Ryzen 7 9800X3D, NVIDIA GeForce RTX 5070 Ti
99.4 (80min, 81P1) fps +79%
Razer Blade 16 Core Ultra 9 386H
Intel Core Ultra 9 386H, NVIDIA GeForce RTX 5090 Laptop
81 (56min, 65P1) fps +46%
MSI Stealth 16 AI B3WH
Intel Core Ultra 9 386H, NVIDIA GeForce RTX 5070 Ti Laptop
55.6 (46min, 46P1) fps
2560x1440 Ultra High Preset + Quality DLSS AF:16x
KFA2 GeForce RTX 5070 Ti HoF Gaming
AMD Ryzen 7 9800X3D, NVIDIA GeForce RTX 5070 Ti
175 (108min, 130P1) fps +71%
Razer Blade 16 Core Ultra 9 386H
Intel Core Ultra 9 386H, NVIDIA GeForce RTX 5090 Laptop
132.8 (57min, 72P1) fps +30%
MSI Stealth 16 AI B3WH
Intel Core Ultra 9 386H, NVIDIA GeForce RTX 5070 Ti Laptop
102.4 (58min, 71P1) fps
MSI Crosshair A16 HX E8WGK
AMD Ryzen 9 8940HX, NVIDIA GeForce RTX 5070 Laptop
93.1 (65min, 71P1) fps -9%
Lenovo Legion 7 16 AGP11
AMD Ryzen AI 9 HX 470, NVIDIA GeForce RTX 5060 Laptop
74.5 (51min, 58P1) fps -27%

Graphique des FPS en réglages ultra pour Cyberpunk 2077

05101520253035404550556065707580859095100105110Tooltip
MSI Stealth 16 AI B3WH Ultra 9 386H, GeForce RTX 5070 Ti Laptop: Ø104.7 (97.8-107.3) fps
Alienware 16X Aurora Core Ultra 9 290HX Plus Ultra 9 290HX Plus, GeForce RTX 5070 Ti Laptop: Ø105 (99.7-113) fps
BasMoyenÉlevéUltraQHD DLSSQHD4K DLSS4K
GTA V (2015) 131.8 127.2 135.2
Dota 2 Reborn (2015) 170.2 152.5 148.5 140 132
Final Fantasy XV Benchmark (2018) 215 196 150.3 118.8 65.7
X-Plane 11.11 (2018) 108.8 98.9 84.9 71.9
Strange Brigade (2018) 284 207 112.7
Baldur's Gate 3 (2023) 154.5 151.9 103.8 92.8 55.6
Cyberpunk 2077 (2023) 144.9 131.4 118.7 88.4 75 42.1 33.2
F1 24 (2024) 238 105.2 102.4 65.3 55.6 33.7
Black Myth: Wukong (2024) 71 40 45 31 31 18

Émissions

Bruit du système

Le bruit des ventilateurs atteint tout juste 28 dB(A), sur un bruit de fond de 23 dB(A), lors d’une simple navigation Web ou du streaming vidéo. Sinon, il s’élève en moyenne à 47,1 dB(A), 50,8 dB(A), 52,3 dB(A) et 56,7 dB(A) en jeu, respectivement en mode Balanced, en mode Performance avec Apex inactif, en mode Performance avec Apex actif, et en mode Performance avec Apex et CoolerBoost actifs. Une plage de 50 à 55 dB(A) est courante sur la plupart des ordinateurs portables de jeu ultrafins.

Profil sonore du ventilateur (Blanc : Arrière-plan, Rouge : Système au repos, Bleu:3DMark 11, Orange : Cyberpunk 2077, Vert : test de résistance Prime95+FurMark)

Degré de la nuisance sonore

Au repos
23.4 / 23.4 / 27.4 dB(A)
Fortement sollicité
37.8 / 56.7 dB(A)
  red to green bar
 
 
30 dB
silencieux
40 dB(A)
audible
50 dB(A)
bruyant
 
min: dark, med: mid, max: light   Earthworks M23R, Arta (à 15 cm de distance)   bruit ambiant: 23.4 dB(A)
dB(A) 0102030405060708090Deep BassMiddle BassHigh BassLower RangeMidsHigher MidsLower HighsMid HighsUpper HighsSuper Highs2032.835.736.136.339.42525.724.32525.728.63122.521.623.525.525.54023.223.220.220.322.35025.72522.921.525.26324.924.12122.327.18036.726.723.222.52910028.227.323.420.633.312525.521.618.116.627.716027.821.115.913.830.220029.422.314.514.731.525033.924.71515.935.831533.625.817.818.337.540034.2251312.537.650037.327.211.31240.863036.627.511.411.840.58003926.610.310.342100041.128.39.89.544.9125041.527.79.69.445.3160043.228.59.59.847.1200043.427.810.110.248.2250043.227.410.110.547.831504023.610.910.845.2400039.424.811.211.344.8500038.220.811.511.743.2630037.116.411.811.740.9800033.516.111.711.939.81000029.416.611.611.836.91250024.81311.511.532.71600020.613.610.810.928.4SPL52.337.823.323.456.7N8.12.70.50.510.8median 36.6median 24.8median 11.5median 11.7median 40.5Delta5.84.42.21.75.9hearing rangehide median Fan NoiseMSI Stealth 16 AI B3WH
MSI Stealth 16 AI B3WH
Ultra 9 386H, GeForce RTX 5070 Ti Laptop
MSI Stealth 16 Studio A13VG
i7-13700H, GeForce RTX 4070 Laptop GPU
Razer Blade 16 Core Ultra 9 386H
Ultra 9 386H, GeForce RTX 5090 Laptop
Lenovo Legion 7 16 AGP11
Ryzen AI 9 HX 470, GeForce RTX 5060 Laptop
Aorus Master 16 AM6J
R9 9955HX3D, GeForce RTX 5080 Laptop
Asus ROG Zephyrus G16 GU606AW
Ultra 9 386H, GeForce RTX 5080 Laptop
Noise
3%
-4%
0%
-22%
-17%
arrêt / environnement * (dB)
23.4
24
-3%
23.1
1%
24.5
-5%
25
-7%
24.4
-4%
Idle Minimum * (dB)
23.4
24
-3%
23.4
-0%
24.5
-5%
28
-20%
32.8
-40%
Idle Average * (dB)
23.4
24
-3%
25.4
-9%
24.5
-5%
29
-24%
32.8
-40%
Idle Maximum * (dB)
27.4
24
12%
29.3
-7%
27.1
1%
35
-28%
32.8
-20%
Load Average * (dB)
37.8
34.81
8%
42.6
-13%
34.6
8%
58
-53%
42.6
-13%
Cyberpunk 2077 ultra * (dB)
52.3
53.6
-2%
53
-1%
59
-13%
54.8
-5%
Load Maximum * (dB)
56.7
51.57
9%
53.7
5%
53
7%
60
-6%
54.8
3%
Witcher 3 ultra * (dB)
44.05

* ... Moindre est la valeur, meilleures sont les performances
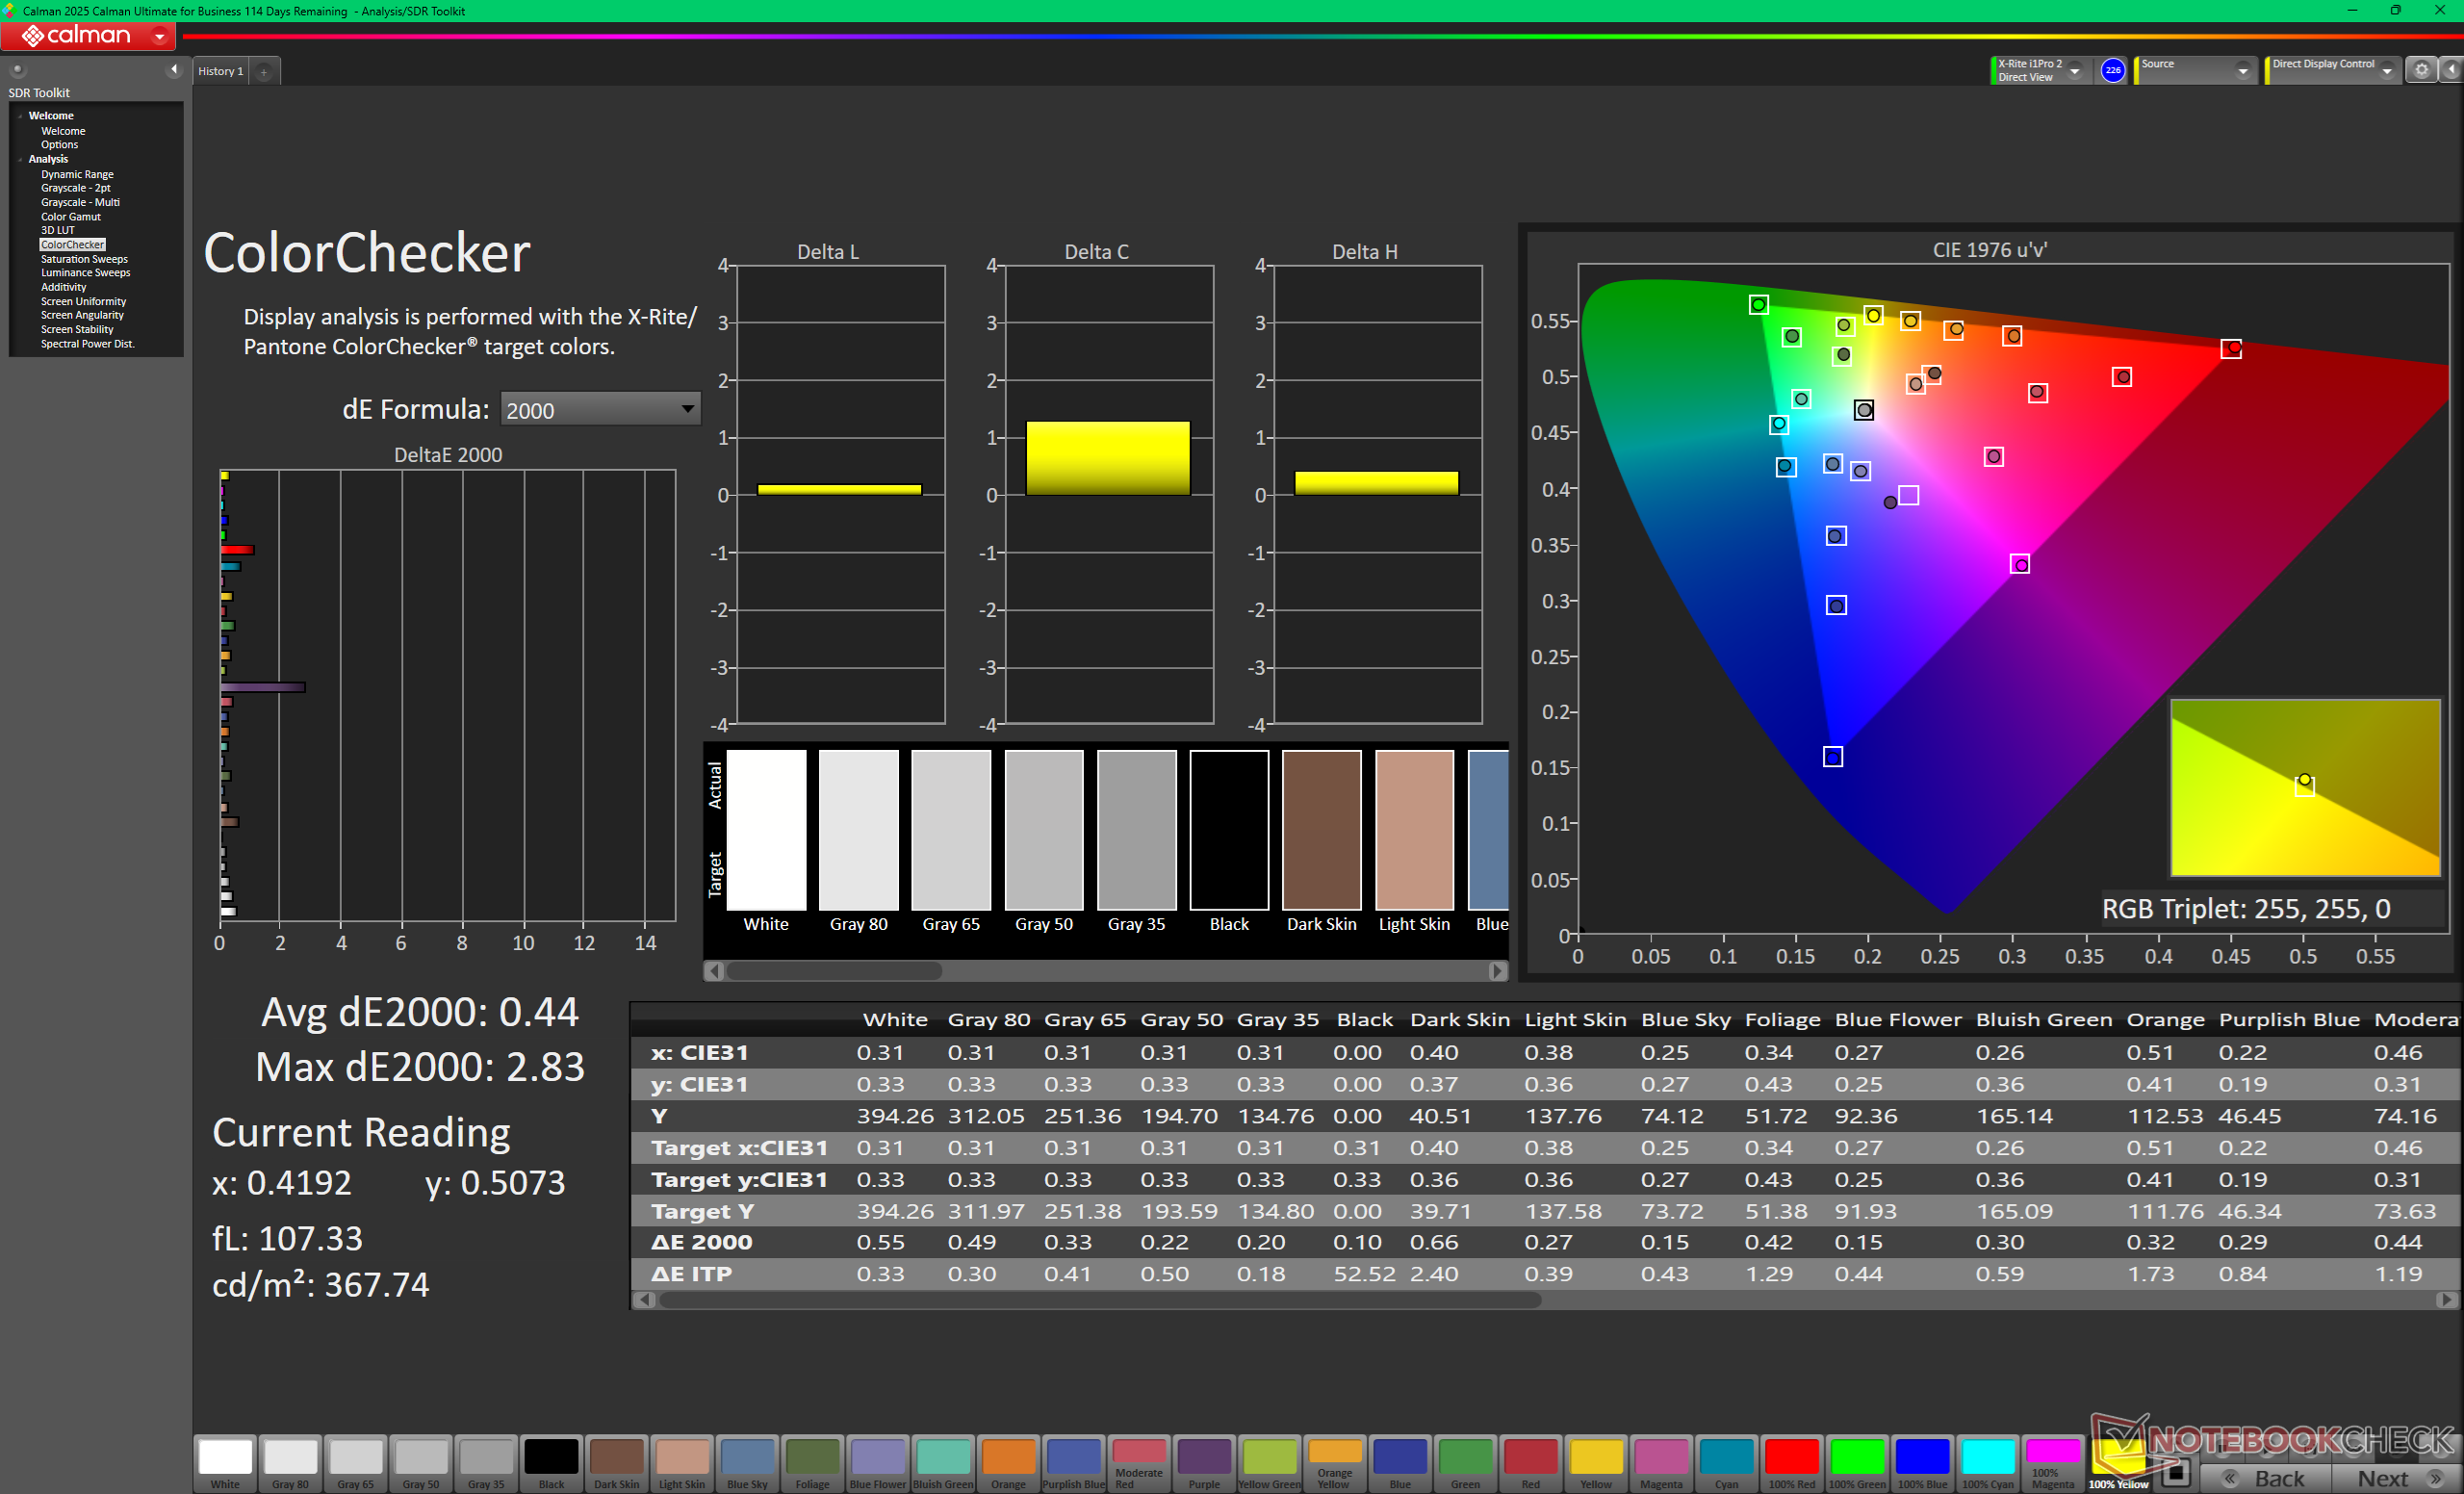
Température

Le centre du clavier et la moitié supérieure du pavé tactile peuvent devenir beaucoup plus chauds que sur la plupart des autres ordinateurs portables pendant les sessions de jeu. Les touches WASD, essentielles, restent toutefois beaucoup plus fraîches.
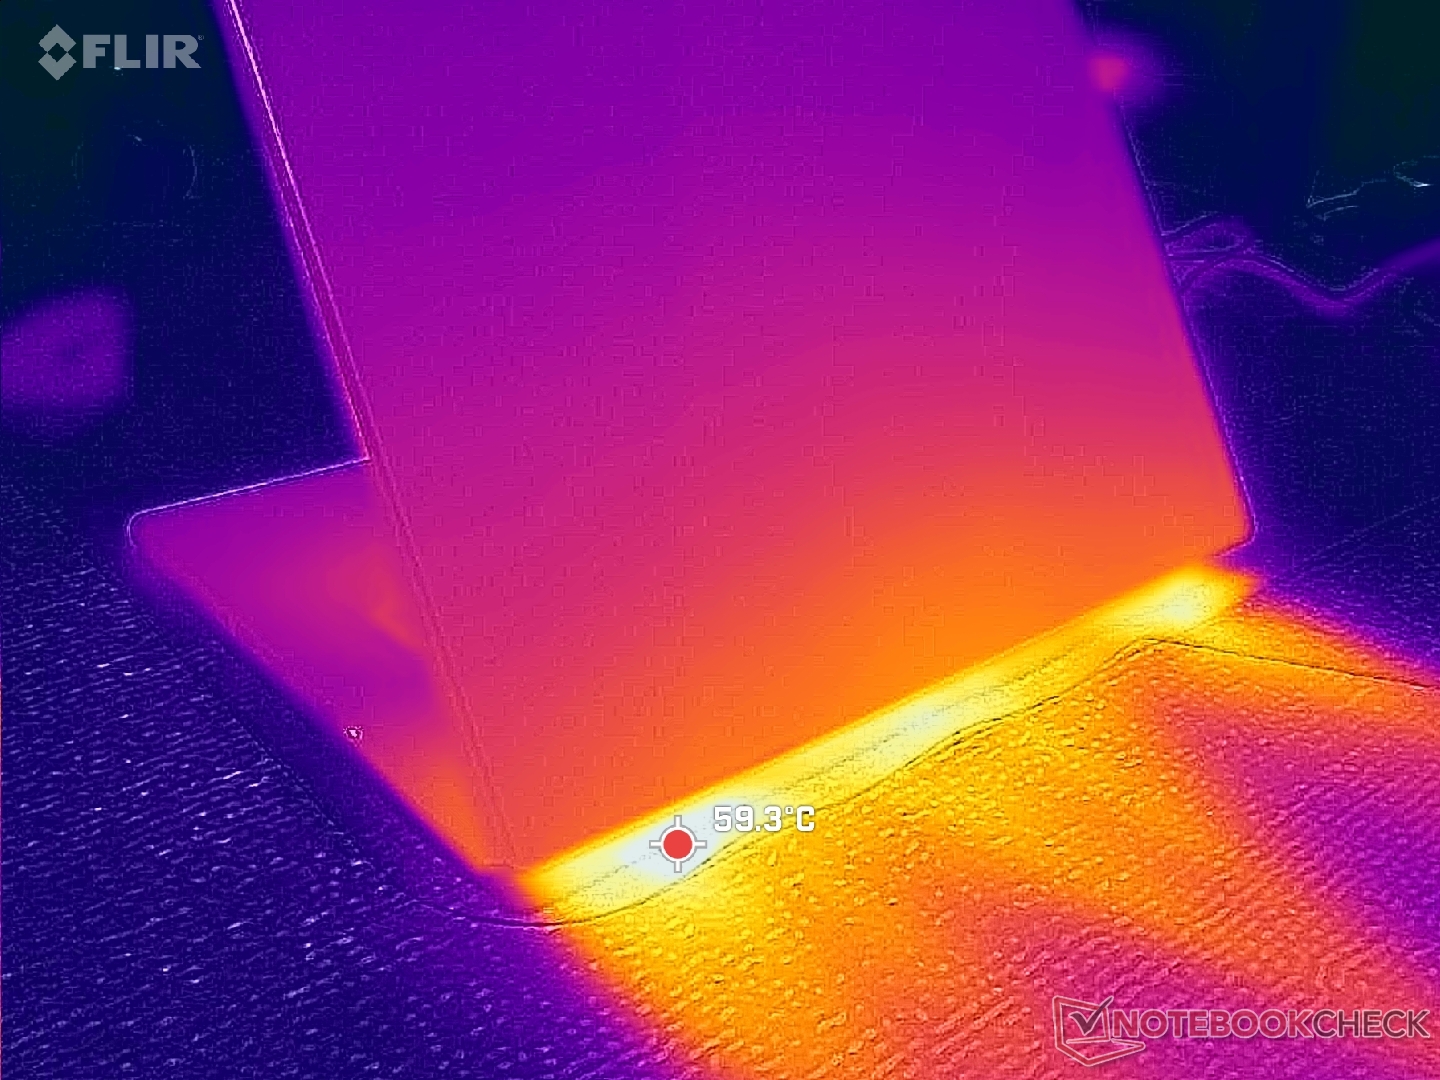
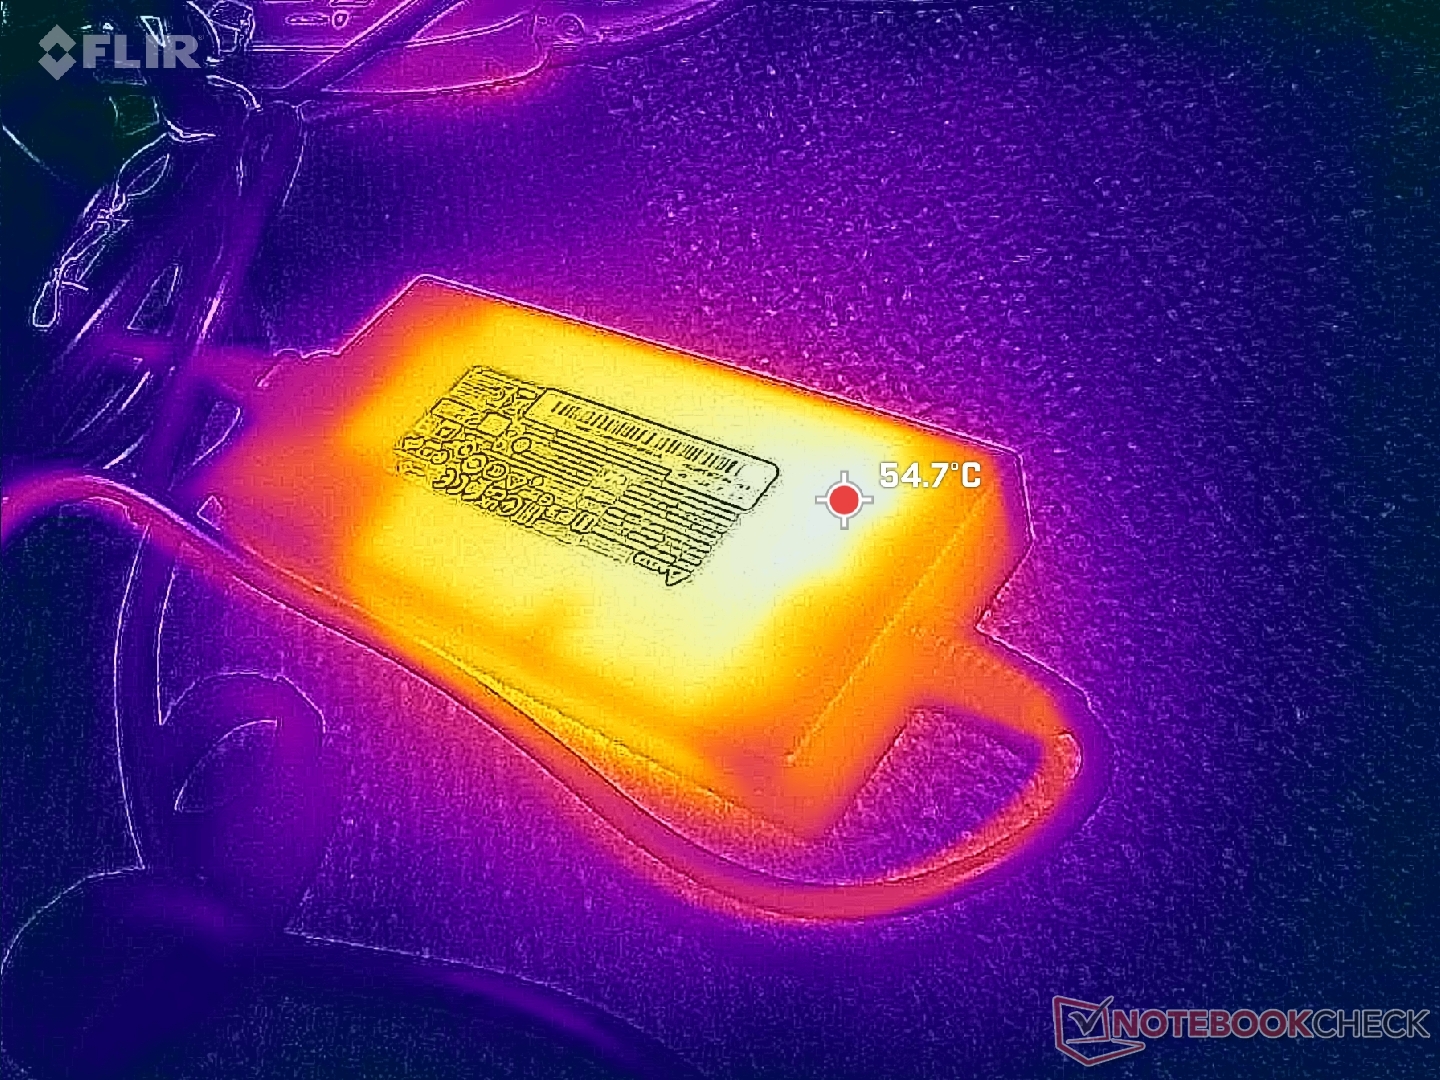
Échappement arrière
Échappement arrière
L’adaptateur secteur dépasse 55 °C en jeu
33.6 °C38.8 °C33 °C
32 °C34.6 °C32.2 °C
34.2 °C37.4 °C30 °C
Maximum: 38.8 °C
Moyenne: 34 °C
26.6 °C38.6 °C36.4 °C
28.8 °C33.8 °C33 °C
28.6 °C30.2 °C29.4 °C
Maximum: 38.6 °C
Moyenne: 31.7 °C
Alimentation (valeur maximale)  52 °C | Température ambiante de la pièce 23 °C | Fluke 62 Mini IR Thermometer
(±) La température moyenne de la face supérieure sous charge maximale est de 34 °C / 93 F, par rapport à la moyenne de 33.9 °C / 93 F pour les appareils de la classe Gaming.
(+) La température maximale du côté supérieur est de 38.8 °C / 102 F, par rapport à la moyenne de 40.4 °C / 105 F, allant de 21.2 à 68.8 °C pour la classe Gaming.
(+) Le fond chauffe jusqu'à un maximum de 38.6 °C / 101 F, contre une moyenne de 43.2 °C / 110 F
(+) En utilisation inactive, la température moyenne du côté supérieur est de 29.5 °C / 85 F, par rapport à la moyenne du dispositif de 33.9 °C / 93 F.
(±) 3: The average temperature for the upper side is 36.3 °C / 97 F, compared to the average of 33.9 °C / 93 F for the class Gaming.
(±) Les repose-poignets et le pavé tactile peuvent devenir très chauds au toucher, avec un maximum de 39.4 °C / 102.9# F.
(-) La température moyenne de la zone de l'appui-paume de dispositifs similaires était de 28.8 °C / 83.8 F (-10.6 °C / #-19.1 F).
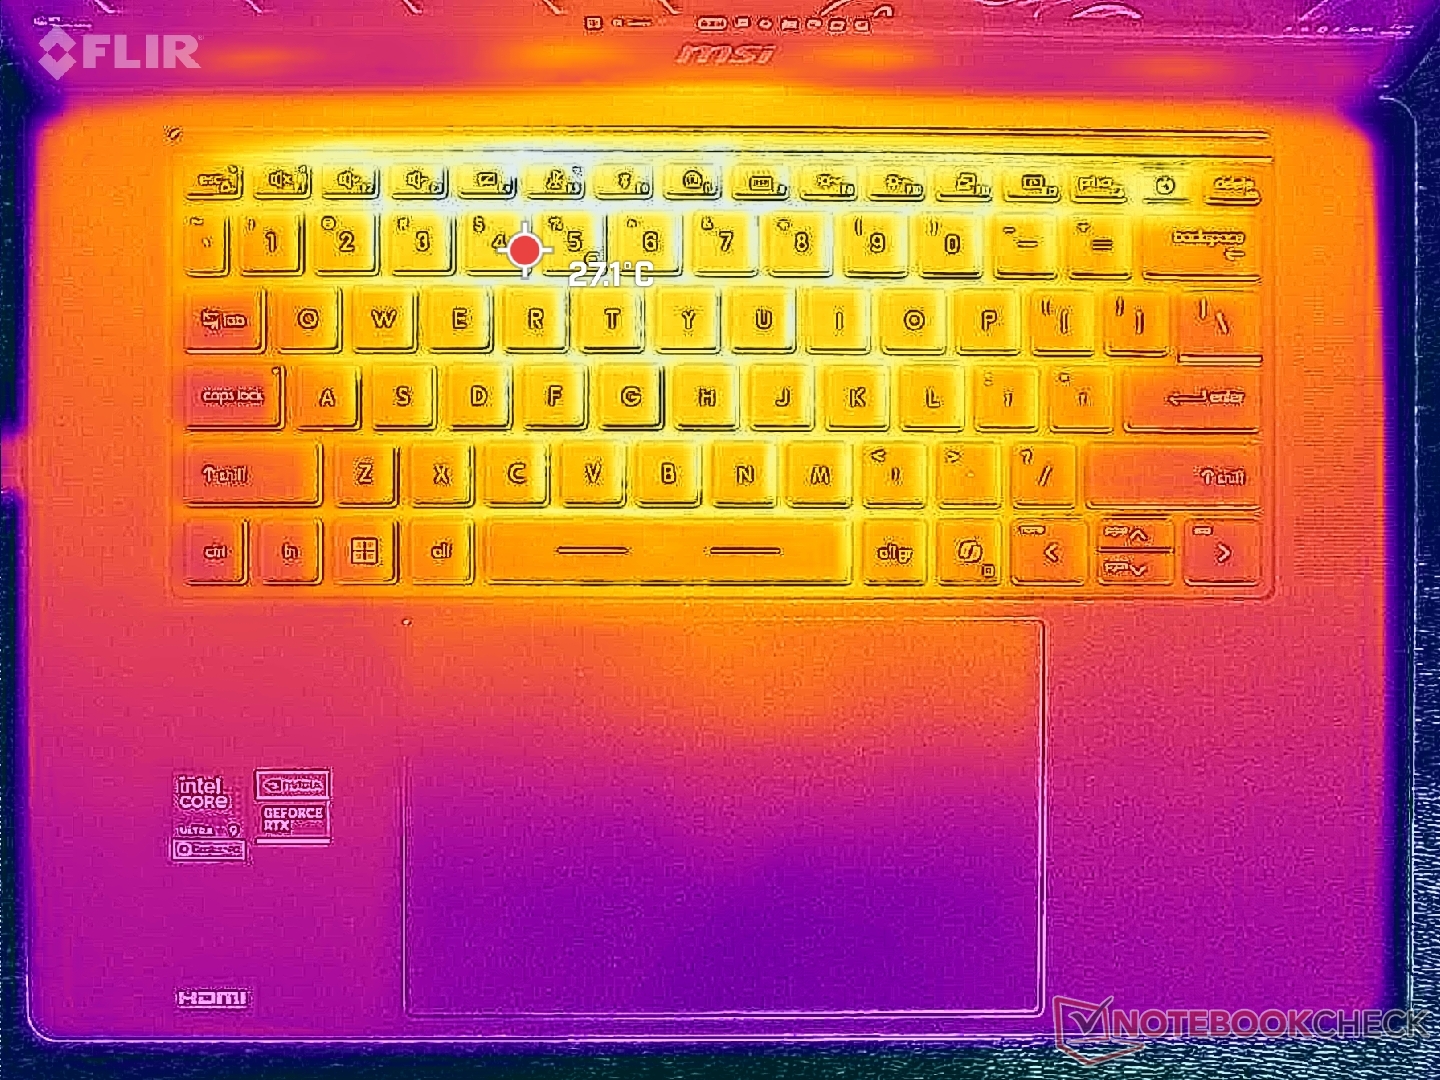
Système inactif (couvercle C)
Système inactif (capot D)
Stress de Cyberpunk 2077 (couverture C)
Cyberpunk 2077 stress (reprise par D)
Test de stress Prime95+FurMark (capot C)
Test de stress Prime95+FurMark (capot D)
MSI Stealth 16 AI B3WH
Ultra 9 386H, GeForce RTX 5070 Ti Laptop
MSI Stealth 16 Studio A13VG
i7-13700H, GeForce RTX 4070 Laptop GPU
Razer Blade 16 Core Ultra 9 386H
Ultra 9 386H, GeForce RTX 5090 Laptop
Lenovo Legion 7 16 AGP11
Ryzen AI 9 HX 470, GeForce RTX 5060 Laptop
Aorus Master 16 AM6J
R9 9955HX3D, GeForce RTX 5080 Laptop
Asus ROG Zephyrus G16 GU606AW
Ultra 9 386H, GeForce RTX 5080 Laptop
Heat
-33%
-13%
-2%
-32%
-8%
Maximum Upper Side * (°C)
38.8
60
-55%
45.6
-18%
44.9
-16%
50
-29%
46.3
-19%
Maximum Bottom * (°C)
38.6
61
-58%
47
-22%
50.5
-31%
52
-35%
45.9
-19%
Idle Upper Side * (°C)
32.6
38.2
-17%
35.2
-8%
27.3
16%
32.1
2%
Idle Bottom * (°C)
36.6
37.7
-3%
37.6
-3%
27.5
25%
34.5
6%

* ... Moindre est la valeur, meilleures sont les performances

Test de résistance
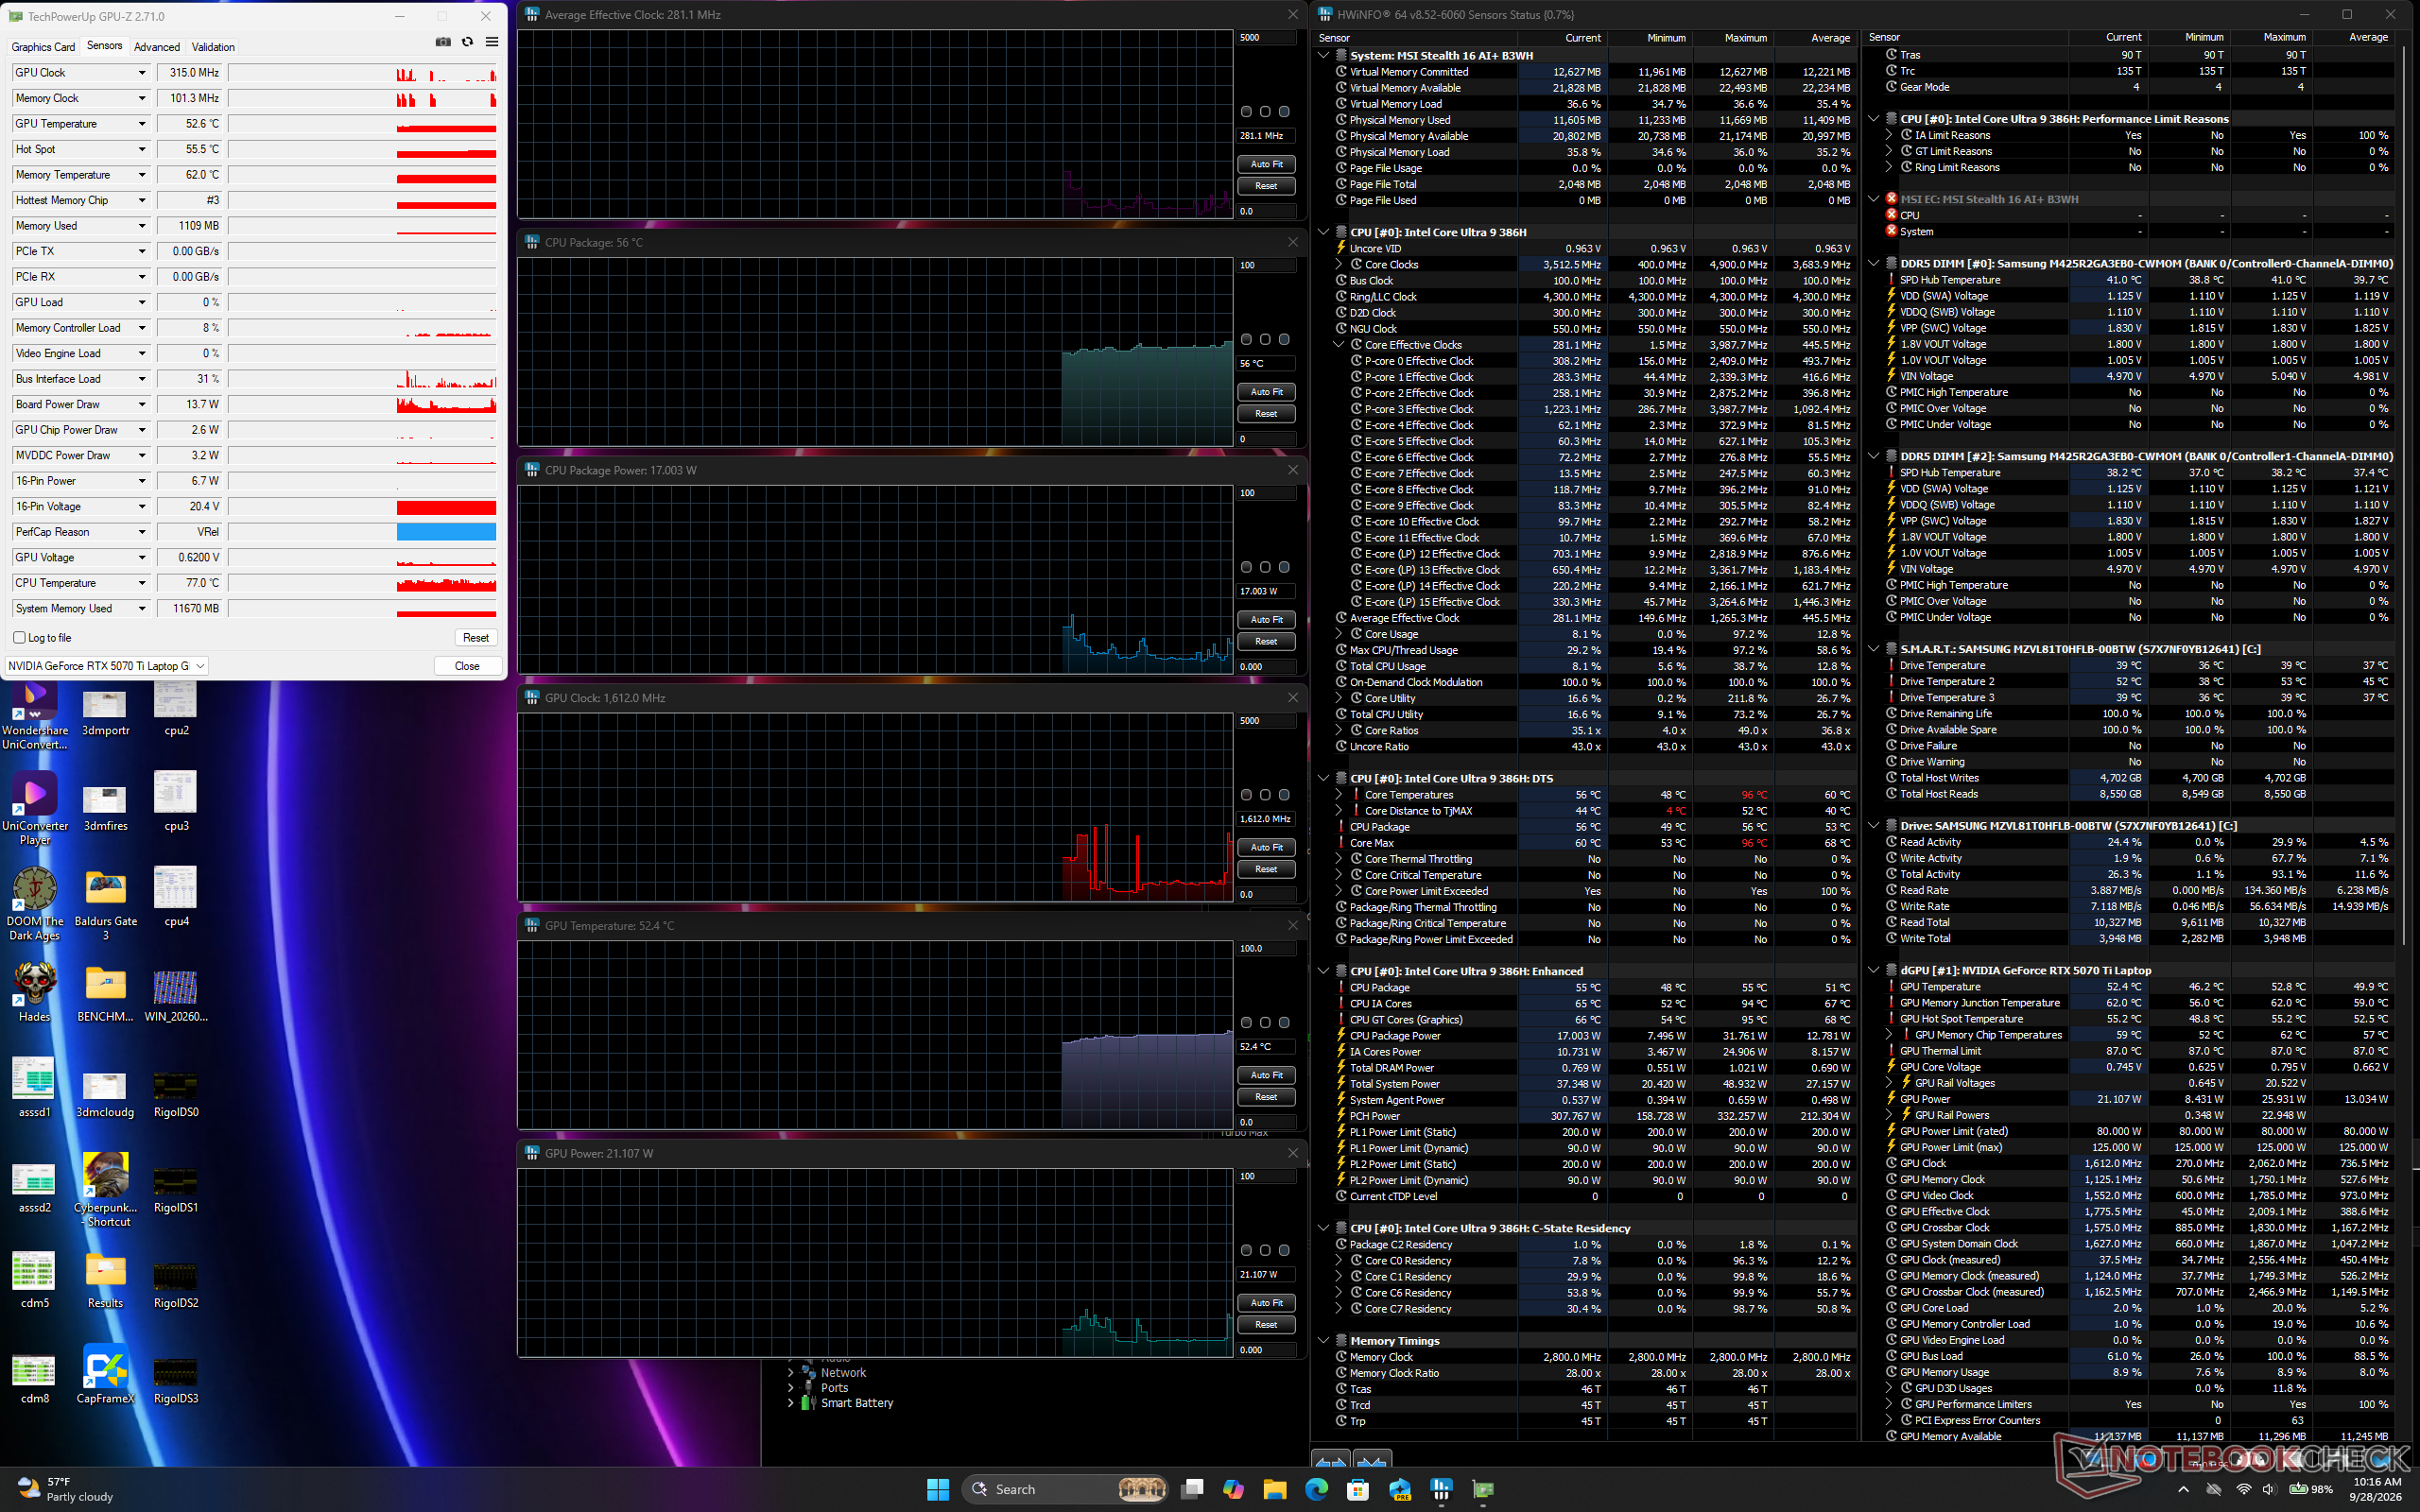
Système inactif
Système inactif

Le CPU se stabiliserait à 3,6 GHz, 57 °C et 88 W lors de l’exécution du test de résistance Prime95.

Le TGP serait en moyenne de 79 W, 96 W et 123 W lors de l’exécution de Cyberpunk 2077 en mode Équilibré, en mode Performance avec Apex désactivé et en mode Performance avec Apex activé, respectivement. La fonctionnalité Apex doit donc être activée pour atteindre le plafond TGP annoncé de 125 W. Notez que les performances n’augmenteront pas de façon notable si les options Apex et Coolerboost sont toutes deux activées.
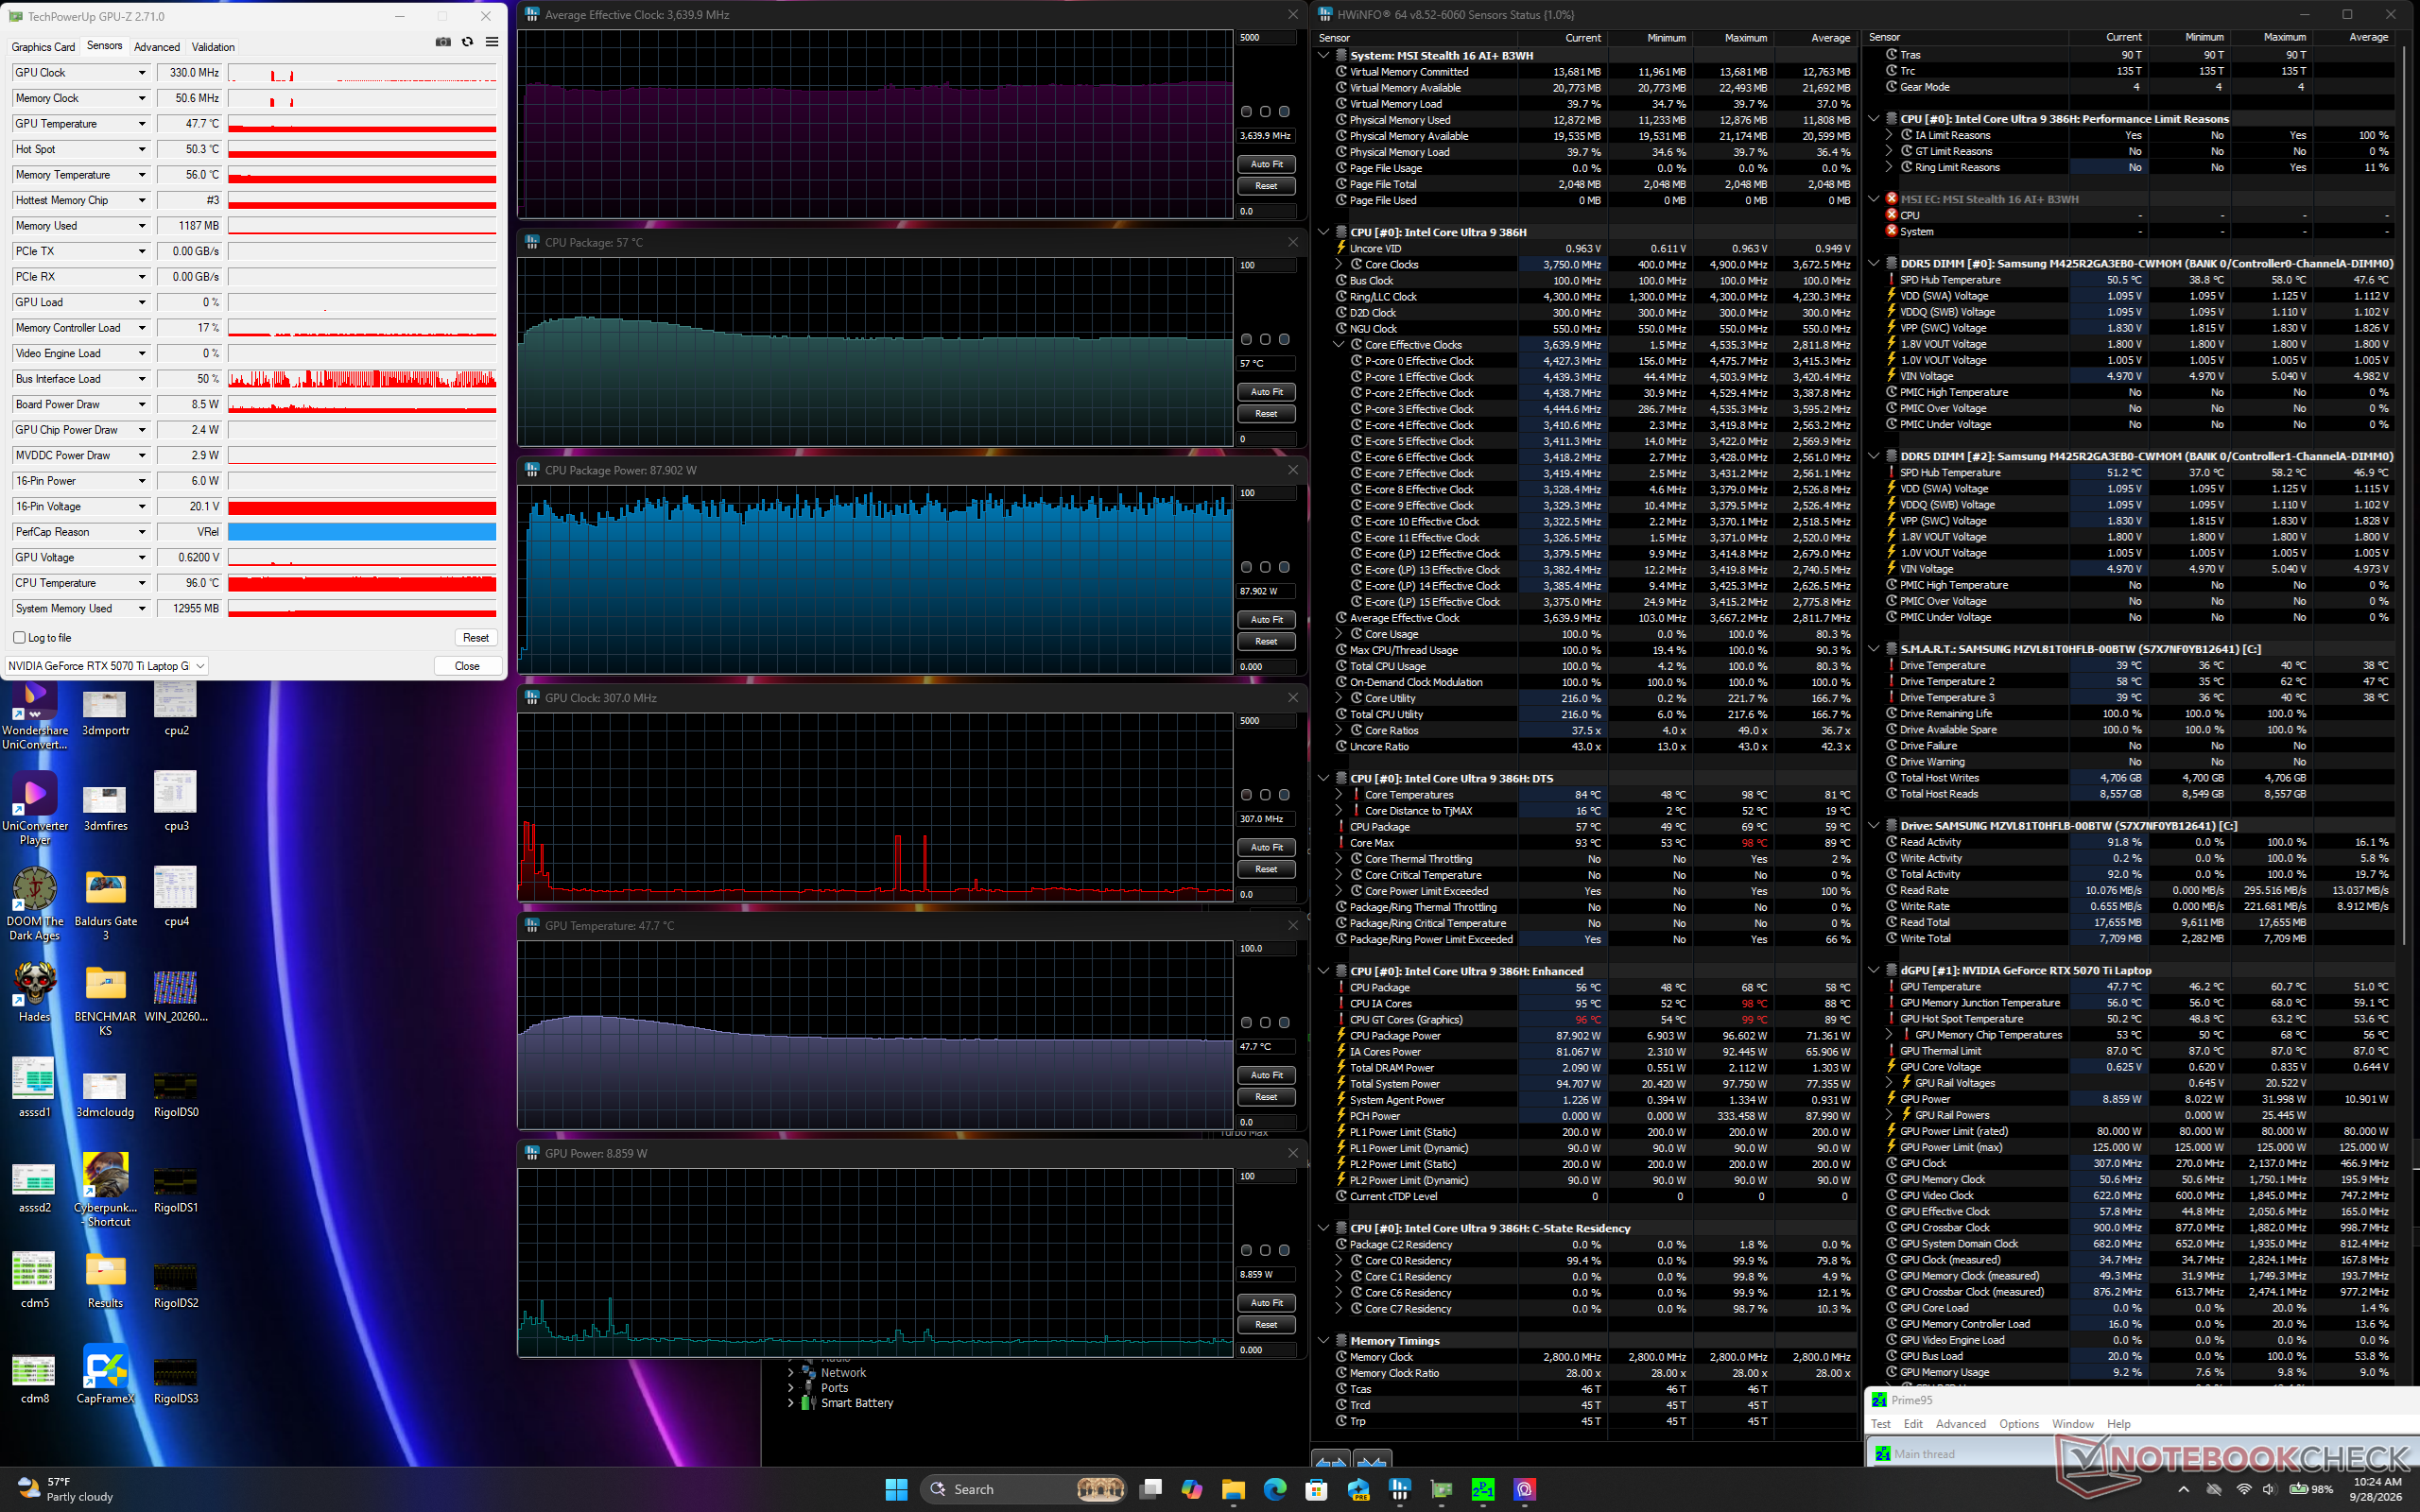
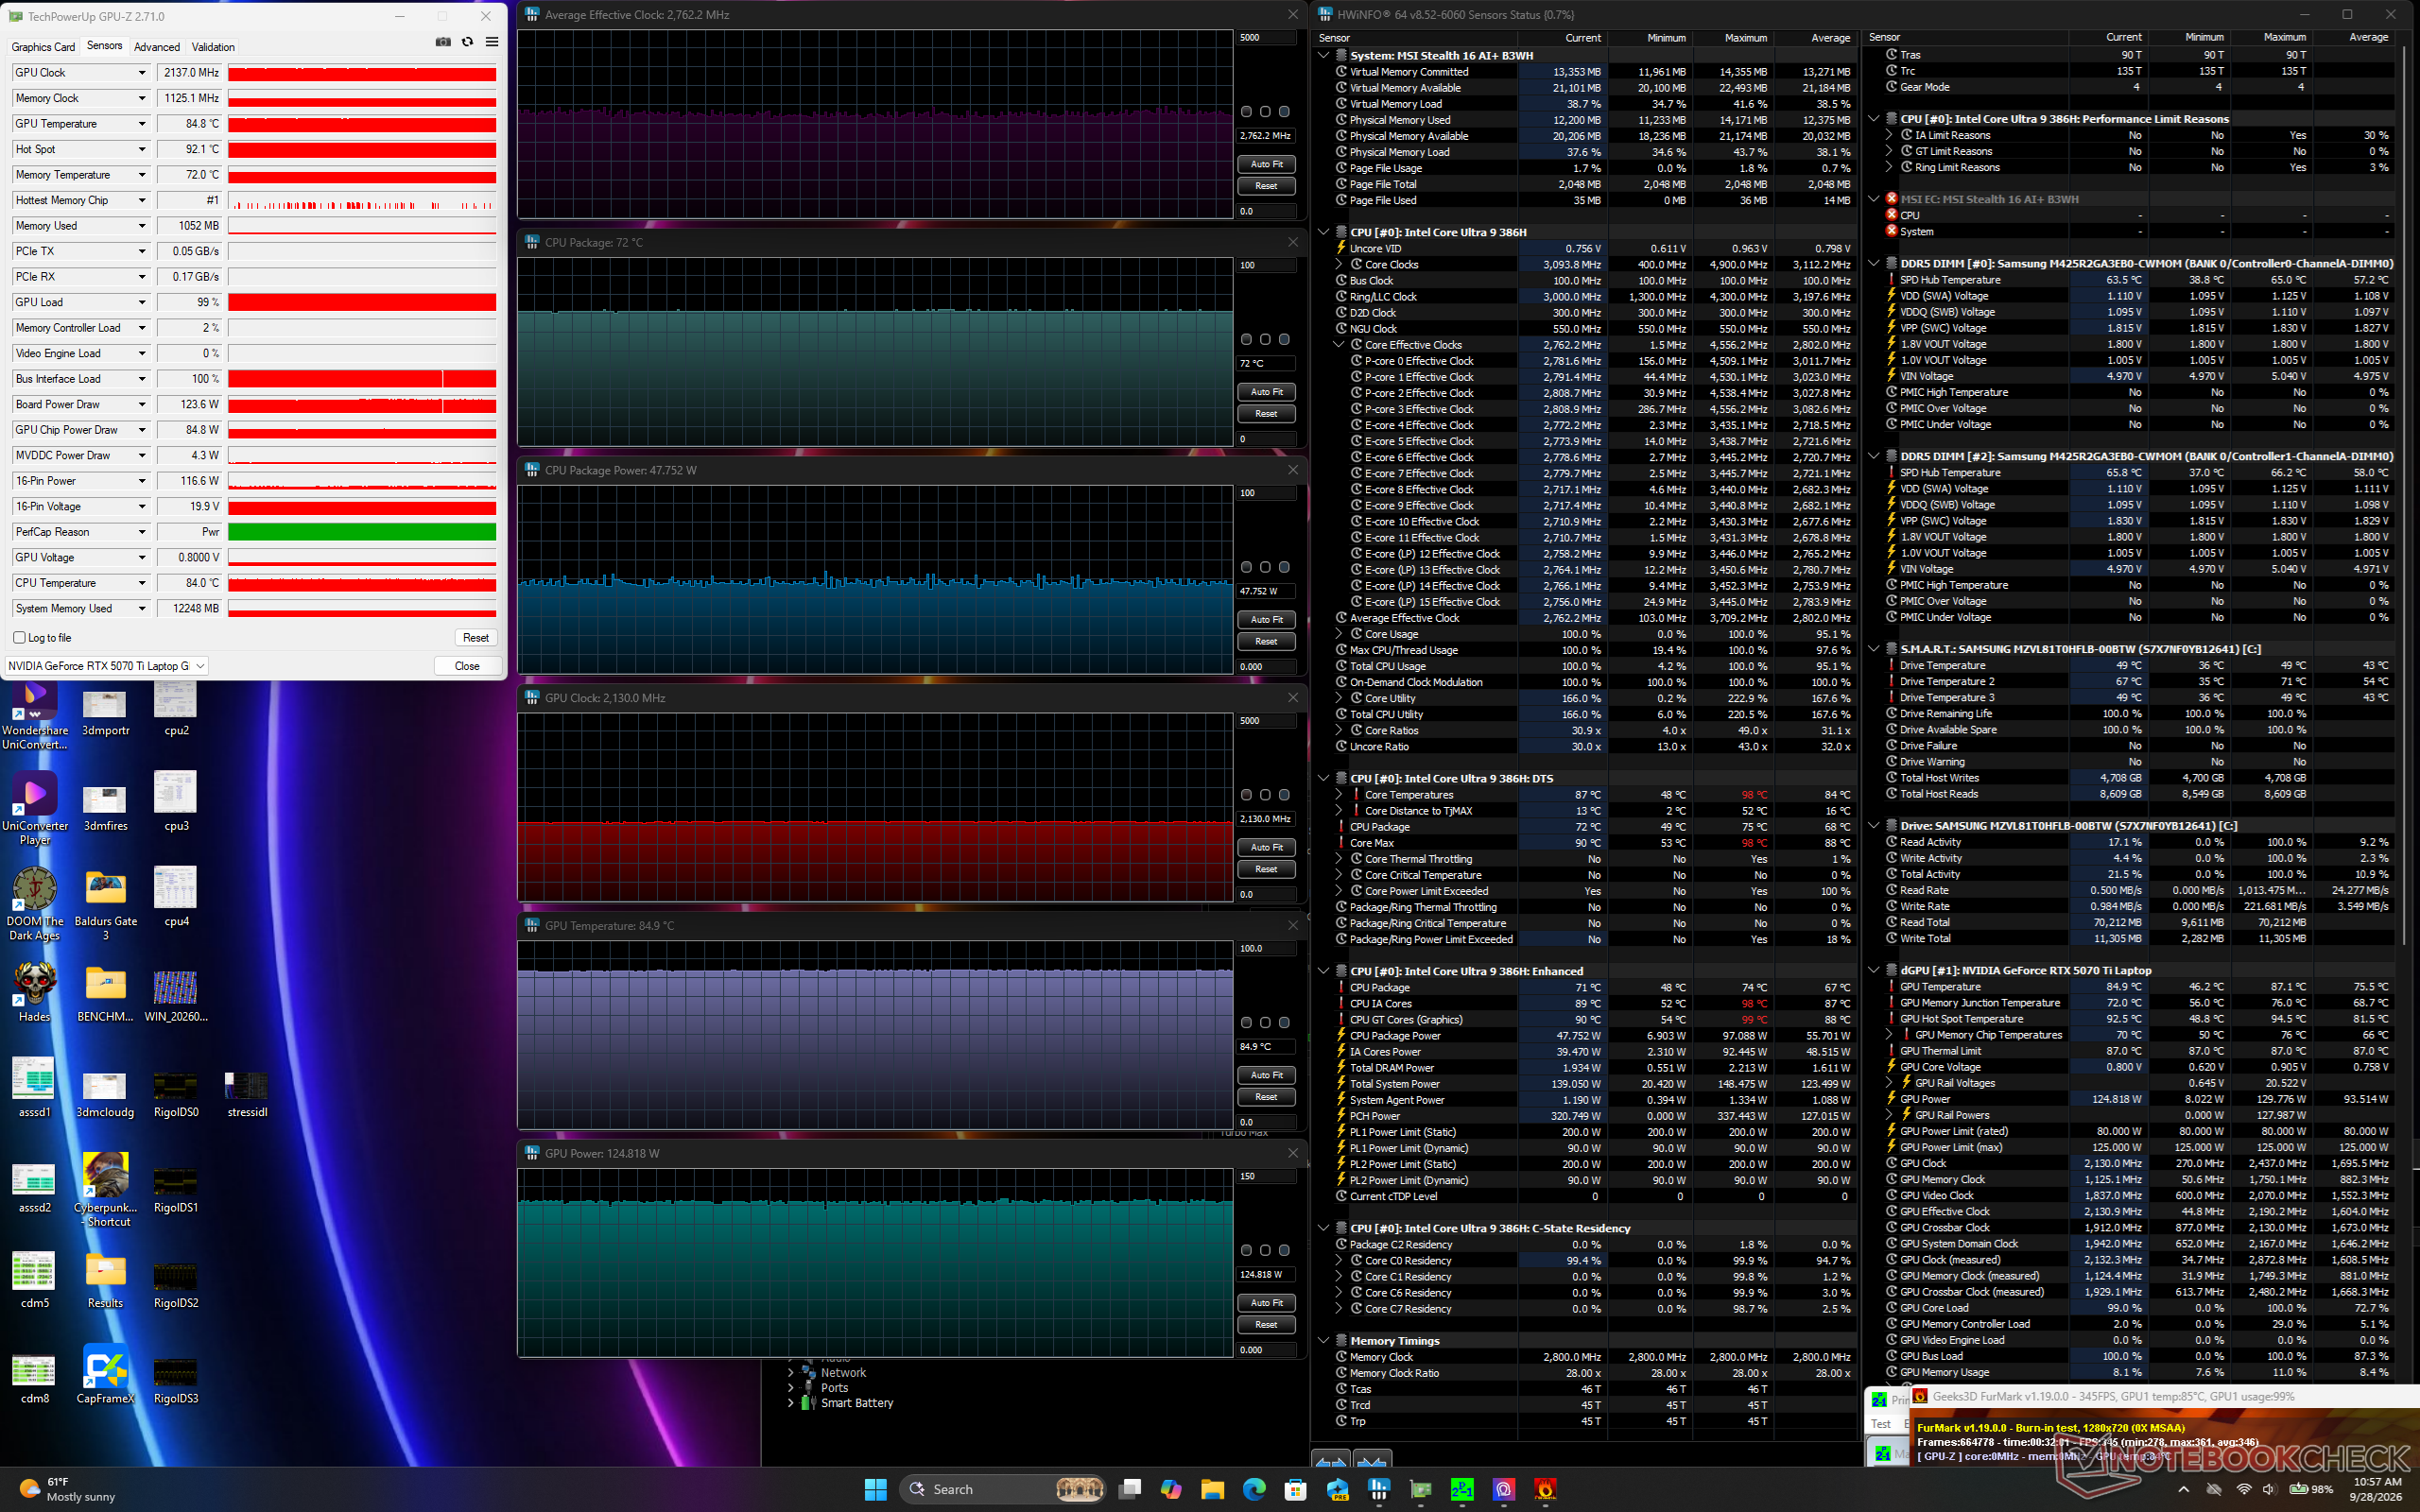
Test de stress Prime95
Test de stress Prime95+FurMark
Test de stress de Cyberpunk 2077 (mode équilibré)
Test de stress de Cyberpunk 2077 (mode Performance, Apex désactivé, CoolerBoost désactivé)
Test de stress de Cyberpunk 2077 (mode Performance, Apex activé, CoolerBoost désactivé)
Test de stress de Cyberpunk 2077 (mode Performance, Apex activé, CoolerBoost activé)
Fréquence d’horloge du CPU (GHz) Fréquence du GPU (MHz) Température moyenne du CPU (°C) Température moyenne du GPU (°C)
Système inactif -- 270 56 52
Test de stress Prime95 3.6 -- 57 48
Test de stress Prime95 + FurMark 2.8 2130 72 85
Test de charge Cyberpunk 2077 (mode équilibré) 2.2 1935 67 74
Test de stress de Cyberpunk 2077 (mode Performance, Apex désactivé, CoolerBoost désactivé) 2.5 2167 70 77
Stress de Cyberpunk 2077 (mode Performance, Apex activé, CoolerBoost désactivé) 2.6 2512 74 86
Test de stress Cyberpunk 2077 (mode Performance, Apex activé, CoolerBoost activé) 2.5 2437 73 85

Intervenants

Malgré ses quatre haut-parleurs, le volume maximal et la restitution des basses sont décevants pour un ordinateur portable de jeu.
dB(A) 0102030405060708090Deep BassMiddle BassHigh BassLower RangeMidsHigher MidsLower HighsMid HighsUpper HighsSuper Highs2036.134.2252523.73123.519.54020.220.15022.921632122.58023.227.510023.43612518.142.816015.950.620014.553.32501557.731517.860.54001365.350011.37063011.472.280010.372.810009.870.112509.66916009.570.4200010.169.8250010.170.9315010.971.6400011.267.1500011.563.8630011.867.1800011.7661000011.662.71250011.5611600010.860.2SPL23.381.4N0.552.7median 11.5median 66Delta2.2726.325.821.422.12624.925.127.622.532.523.448.72655.818.860.922.167.2267019.372.317.674.217.774.319.575.31571.711.871.311.27410.574.21072.710.17210.67210.97511.374.811.671.71269.71269.612.371.112.669.61270.111.269.824.784.70.666.6median 12median 71.73.42.2hearing rangehide median Pink NoiseMSI Stealth 16 AI B3WHApple MacBook Pro 16 2021 M1 Pro
Diagramme de fréquence (les cases peuvent être cochées et décochées pour comparer les appareils)
MSI Stealth 16 AI B3WH analyse audio

(±) | le niveau sonore du haut-parleur est moyen mais bon (81.4# dB)
Basses 100 - 315 Hz
(-) | presque aucune basse - en moyenne 15.8% plus bas que la médiane
(±) | la linéarité des basses est moyenne (10.1% delta à la fréquence précédente)
Médiums 400 - 2000 Hz
(+) | médiane équilibrée - seulement 4.1% de la médiane
(+) | les médiums sont linéaires (4.2% delta à la fréquence précédente)
Aiguës 2 - 16 kHz
(+) | des sommets équilibrés - à seulement 2.6% de la médiane
(+) | les aigus sont linéaires (4.5% delta à la fréquence précédente)
Globalement 100 - 16 000 Hz
(+) | le son global est linéaire (13.6% différence à la médiane)
Par rapport à la même classe
» 21% de tous les appareils testés de cette catégorie étaient meilleurs, 7% similaires, 72% pires
» Le meilleur avait un delta de 6%, la moyenne était de 18%, le pire était de 132%.
Par rapport à tous les appareils testés
» 15% de tous les appareils testés étaient meilleurs, 4% similaires, 81% pires
» Le meilleur avait un delta de 4%, la moyenne était de 23%, le pire était de 136%.

Apple MacBook Pro 16 2021 M1 Pro analyse audio

(+) | les haut-parleurs peuvent jouer relativement fort (84.7# dB)
Basses 100 - 315 Hz
(+) | bonne basse - seulement 3.8% loin de la médiane
(+) | les basses sont linéaires (5.2% delta à la fréquence précédente)
Médiums 400 - 2000 Hz
(+) | médiane équilibrée - seulement 1.3% de la médiane
(+) | les médiums sont linéaires (2.1% delta à la fréquence précédente)
Aiguës 2 - 16 kHz
(+) | des sommets équilibrés - à seulement 1.9% de la médiane
(+) | les aigus sont linéaires (2.7% delta à la fréquence précédente)
Globalement 100 - 16 000 Hz
(+) | le son global est linéaire (4.6% différence à la médiane)
Par rapport à la même classe
» 0% de tous les appareils testés de cette catégorie étaient meilleurs, 0% similaires, 100% pires
» Le meilleur avait un delta de 5%, la moyenne était de 17%, le pire était de 45%.
Par rapport à tous les appareils testés
» 0% de tous les appareils testés étaient meilleurs, 0% similaires, 100% pires
» Le meilleur avait un delta de 4%, la moyenne était de 23%, le pire était de 136%.

Gestion de l’énergie

Consommation électrique

À environ 210 W en jeu, le Stealth16 se situe dans la moyenne des ordinateurs portables gaming équipés d’un GPU RTX. Le système est nettement plus efficace que le Crosshair A16 HX à base d’AMD, qui est équipé du RTX 5070, moins puissant.
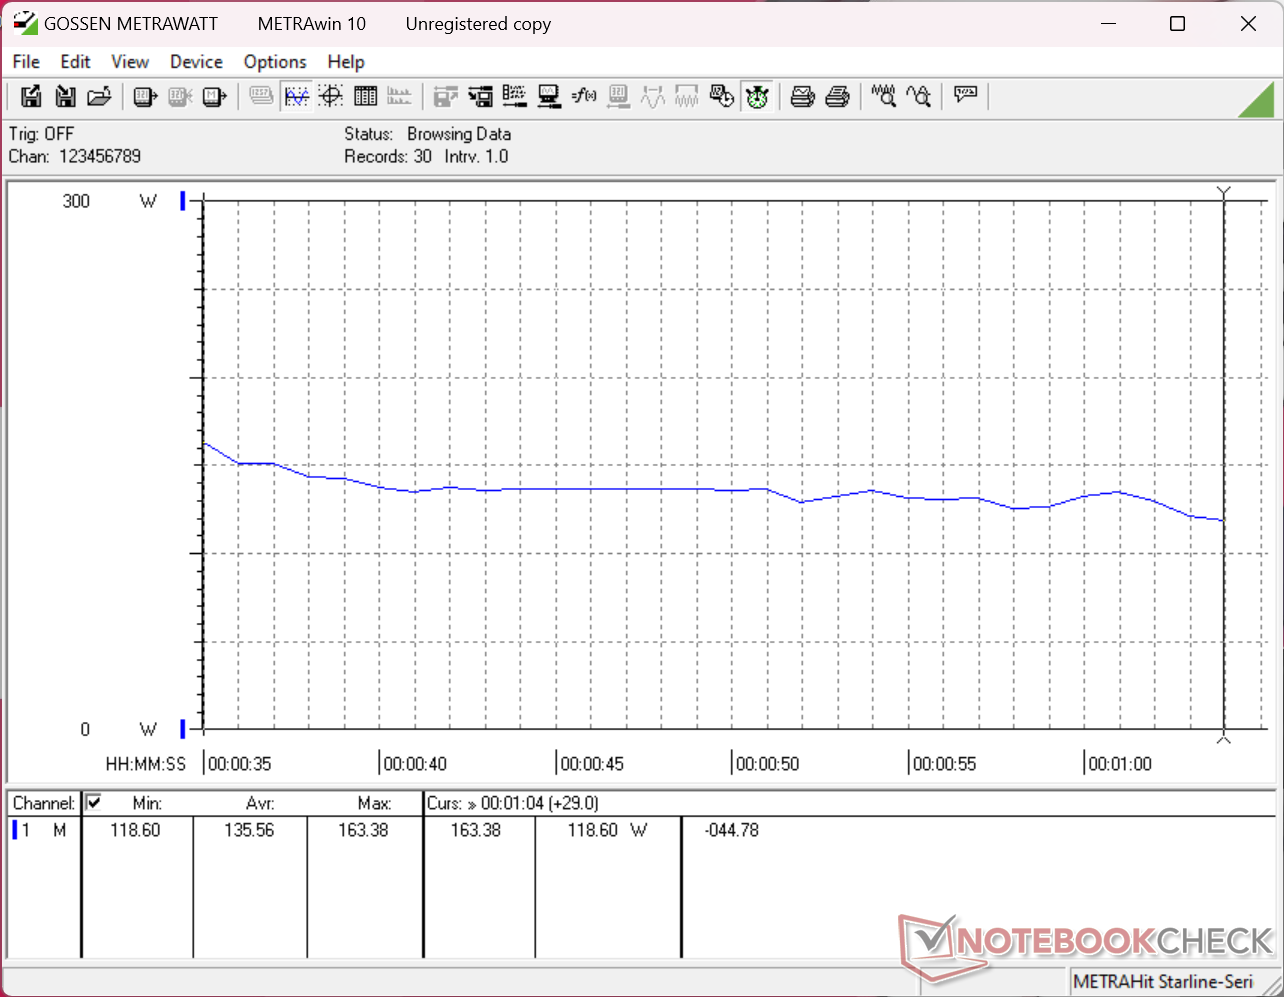
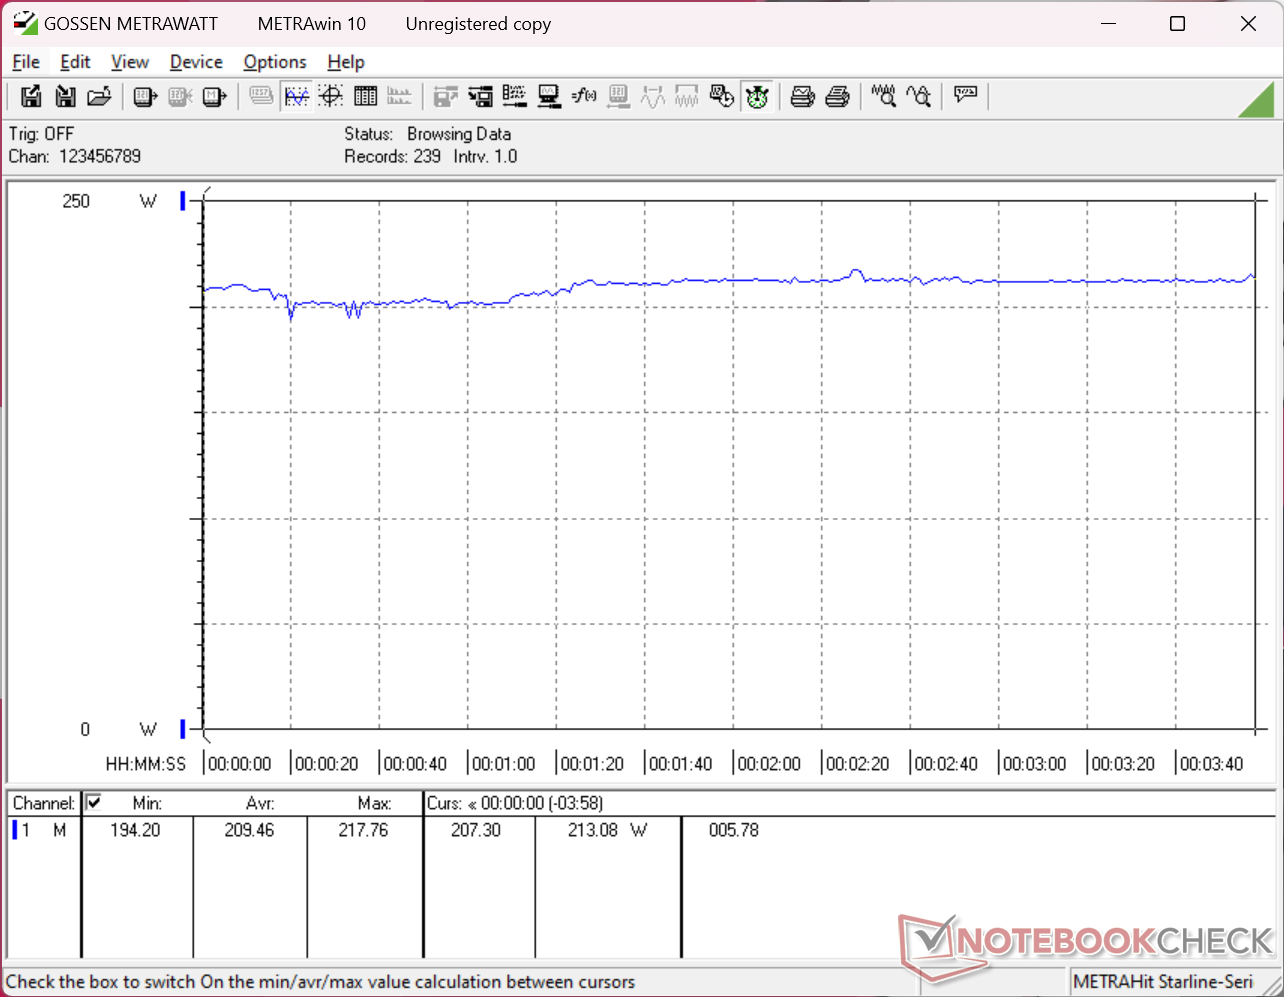
Consommation sous 3DMark 11
Consommation de Cyberpunk 2077 en 1080p Ultra
La consommation atteindrait un pic de 147 W au lancement du test de stress Prime95.
Test de stress Prime95+FurMark lancé à 10 s.
Consommation énergétique
Éteint/en veilledarklight 0.09 / 2.1 Watts
Au reposdarkmidlight 6.5 / 7.8 / 24.5 Watts
Fortement sollicité midlight 135.6 / 284.3 Watts
 color bar
Légende: min: dark, med: mid, max: light        Metrahit Energy
MSI Stealth 16 AI B3WH
Ultra 9 386H, GeForce RTX 5070 Ti Laptop, Samsung PM9C1b MZVL81T0HFLB-00BTW, OLED, 2560x1600, 16"
MSI Stealth 16 Studio A13VG
i7-13700H, GeForce RTX 4070 Laptop GPU, Micron 3400 2TB MTFDKBA2T0TFH, IPS, 2560x1600, 16"
Razer Blade 16 Core Ultra 9 386H
Ultra 9 386H, GeForce RTX 5090 Laptop, Lexar NM790 2TB, OLED, 2560x1600, 16"
Lenovo Legion 7 16 AGP11
Ryzen AI 9 HX 470, GeForce RTX 5060 Laptop, Lenovo UMIS AM541 1TB, OLED, 2560x1600, 16"
Aorus Master 16 AM6J
R9 9955HX3D, GeForce RTX 5080 Laptop, Samsung PM9C1b MZVL81T0HFLB-00BTW, OLED, 2560x1600, 16"
Asus ROG Zephyrus G16 GU606AW
Ultra 9 386H, GeForce RTX 5080 Laptop, Samsung PM9C1b MZVL82T0HBL1, OLED, 2560x1600, 16"
Power Consumption
-25%
-22%
23%
-46%
-1%
Idle Minimum * (Watt)
6.5
11
-69%
4.4
32%
5.7
12%
14.4
-122%
7.8
-20%
Idle Average * (Watt)
7.8
18
-131%
22.3
-186%
8.7
-12%
16.8
-115%
13.3
-71%
Idle Maximum * (Watt)
24.5
19
22%
30.4
-24%
9.1
63%
19.3
21%
13.6
44%
Load Average * (Watt)
135.6
91
33%
110.7
18%
88.7
35%
151
-11%
122.9
9%
Cyberpunk 2077 ultra external monitor * (Watt)
212
216
-2%
156.9
26%
188.1
11%
Cyberpunk 2077 ultra * (Watt)
209
216
-3%
160.3
23%
272
-30%
190
9%
Load Maximum * (Watt)
284.3
228
20%
251.3
12%
234.9
17%
338
-19%
245.6
14%
Witcher 3 ultra * (Watt)
130

* ... Moindre est la valeur, meilleures sont les performances

Consommation électrique Cyberpunk / test de stress

0102030405060708090100110120130140150160170180190200210220230240250260270280Tooltip
MSI Stealth 16 AI B3WH Ultra 9 386H, GeForce RTX 5070 Ti Laptop; 1280x720 Prime95 28.10 and Furmark 1.25: Ø220 (205-284) Watt
Razer Blade 16 Core Ultra 9 386H Ultra 9 386H, GeForce RTX 5090 Laptop; 1280x720 Prime95 28.10 and Furmark 1.25: Ø161.4 (125.9-251) Watt
MSI Stealth 16 AI B3WH Ultra 9 386H, GeForce RTX 5070 Ti Laptop; Idle 150cd/m2: Ø7 (4.98-13.5) Watt
Razer Blade 16 Core Ultra 9 386H Ultra 9 386H, GeForce RTX 5090 Laptop; Idle 150cd/m2: Ø5.15 (0.0006-6.38) Watt
MSI Stealth 16 AI B3WH Ultra 9 386H, GeForce RTX 5070 Ti Laptop; Cyberpunk 2077 FHD ultra no FSR 150cd: Ø209 (194.2-218) Watt
Razer Blade 16 Core Ultra 9 386H Ultra 9 386H, GeForce RTX 5090 Laptop; Cyberpunk 2077 FHD ultra no FSR 150cd: Ø216 (205-221) Watt

Consommation électrique du moniteur externe

05101520253035404550556065707580859095100105110115120125130135140145150155160165170175180185190195200205210215220Tooltip
MSI Stealth 16 AI B3WH Ultra 9 386H, GeForce RTX 5070 Ti Laptop; Prime95 V2810 Stress (external Monitor): Ø138 (126.8-146.7) Watt
Razer Blade 16 Core Ultra 9 386H Ultra 9 386H, GeForce RTX 5090 Laptop; Prime95 V2810 Stress (external Monitor): Ø104.6 (91.3-134.1) Watt
Razer Blade 16 Core Ultra 9 386H Ultra 9 386H, GeForce RTX 5090 Laptop; Cinebench R15 Multi (external Monitor): Ø104.8 (103.4-105.8) Watt
MSI Stealth 16 AI B3WH Ultra 9 386H, GeForce RTX 5070 Ti Laptop; Cinebench R23 Multi (external Monitor): Ø107.7 (99.2-110.7) Watt
Razer Blade 16 Core Ultra 9 386H Ultra 9 386H, GeForce RTX 5090 Laptop; Cinebench R23 Multi (external Monitor): Ø120.7 (117.1-122.7) Watt
MSI Stealth 16 AI B3WH Ultra 9 386H, GeForce RTX 5070 Ti Laptop; 1280x720 FurMark 1.19 GPU Stress Test (external Monitor): Ø151.9 (133.4-179.5) Watt
Razer Blade 16 Core Ultra 9 386H Ultra 9 386H, GeForce RTX 5090 Laptop; 1280x720 FurMark 1.19 GPU Stress Test (external Monitor): Ø206 (179.6-214) Watt
MSI Stealth 16 AI B3WH Ultra 9 386H, GeForce RTX 5070 Ti Laptop; Idle 1min (external Monitor): Ø6.49 (4.8-9.09) Watt
Razer Blade 16 Core Ultra 9 386H Ultra 9 386H, GeForce RTX 5090 Laptop; Idle 1min (external Monitor): Ø4.54 (0.00227-6.34) Watt
MSI Stealth 16 AI B3WH Ultra 9 386H, GeForce RTX 5070 Ti Laptop; Cyberpunk 2077 FHD ultra no FSR (external Monitor): Ø212 (208-215) Watt
Razer Blade 16 Core Ultra 9 386H Ultra 9 386H, GeForce RTX 5090 Laptop; Cyberpunk 2077 FHD ultra no FSR (external Monitor): Ø216 (201-223) Watt

Autonomie de la batterie

L’autonomie en WLAN est encore plus longue que celle que nous avons mesurée sur le Stealth 16 de 2023, malgré une capacité de batterie inférieure de 10 %. Veillez toutefois à régler le système en mode iGPU pour prolonger l’autonomie.

Autonomie
WiFi Websurfing
9h 16min
MSI Stealth 16 AI B3WH
Ultra 9 386H, GeForce RTX 5070 Ti Laptop, 90 Wh
MSI Stealth 16 Studio A13VG
i7-13700H, GeForce RTX 4070 Laptop GPU, 99.9 Wh
Razer Blade 16 Core Ultra 9 386H
Ultra 9 386H, GeForce RTX 5090 Laptop, 90 Wh
Lenovo Legion 7 16 AGP11
Ryzen AI 9 HX 470, GeForce RTX 5060 Laptop, 84 Wh
Aorus Master 16 AM6J
R9 9955HX3D, GeForce RTX 5080 Laptop, 99 Wh
Asus ROG Zephyrus G16 GU606AW
Ultra 9 386H, GeForce RTX 5080 Laptop, 90 Wh
Autonomie de la batterie
-16%
26%
-1%
-44%
33%
WiFi v1.3 (h)
9.3
7.8
-16%
11.7
26%
9.2
-1%
5.2
-44%
12.4
33%
Reader / Idle (h)
11
H.264 (h)
7.7
Load (h)
2.4

Note de Notebookcheck

Un ordinateur portable de jeu doté d’un habillage Prestige, conçu pour les environnements professionnels et les tâches gourmandes en RAM.

MSI Stealth 16 AI B3WH - 10/03/2026 v8
Allen Ngo

Châssis
88 / 98 → 89%
Clavier
89%
Dispositif de pointage
92%
Connectivité
73 / 80 → 92%
Poids
63 / 10-68 → 91%
Autonomie
87 / 95 → 91%
Écran
88%
Performances en jeu
91%
Performances dans les applications
90%
AI Performance
96%
Chauffe
90 / 95 → 95%
Nuisance sonore
69 / 90 → 77%
Audio
78%
Appareil photo
36 / 75 → 47%
Moyenne
66%
88%
Gaming - Moyenne compensée
CO2 Emissions
No Data
Materials
0%
Packaging
75%
Power Use
80%
Repairability
40%
Software Updates
22.3%
Recycle Logo Total Sustainability Score: 36.2%

Comparaison des concurrents potentiels

Image
Modèle
Prix
Poids
Épaisseur
Écran
1.
87.7%
MSI Stealth 16 AI B3WH
Intel Core Ultra 9 386H ⎘
NVIDIA GeForce RTX 5070 Ti Laptop ⎘
32 Go Mémoire, 1000 Go SSD
Prix de liste: 3100 USD2 kg19.99 mm16.00"
2560x1600
189 PPI
OLED
2.
88.8% v7 (old)
MSI Stealth 16 Studio A13VG
Intel Core i7-13700H ⎘
NVIDIA GeForce RTX 4070 Laptop GPU ⎘
32 Go Mémoire, 2048 Go SSD
Amazon:
1. $1,583.99
MSI Stealth 16 Studio A13VG-...
2. $71.99
BTY-M6M2 Battery For MSI Ste...
3. $3,099.99
msi Stealth 16 AI+ 16” 240...
Prix de liste: 3100 EUR
2 kg19.95 mm16.00"
2560x1600
189 PPI
IPS
3.
87.7%
Razer Blade 16 Core Ultra 9 386H
Intel Core Ultra 9 386H ⎘
NVIDIA GeForce RTX 5090 Laptop ⎘
32 Go Mémoire, 2048 Go SSD
Amazon:
1. $4,699.99
Razer Blade 16 (2026) Gaming...
2. $3,499.99
Razer Blade 16 (2026) Gaming...
3. $3,999.99
Razer Blade 16 Gaming Laptop...
Prix de liste: 4900 USD
2.1 kg17.4 mm16.00"
2560x1600
189 PPI
OLED
4.
86.4%
Lenovo Legion 7 16 AGP11
AMD Ryzen AI 9 HX 470 ⎘
NVIDIA GeForce RTX 5060 Laptop ⎘
32 Go Mémoire, 1024 Go SSD
Prix de liste: 2500€1.8 kg16.9 mm16.00"
2560x1600
189 PPI
OLED
5.
83.5%
Aorus Master 16 AM6J
AMD Ryzen 9 9955HX3D ⎘
NVIDIA GeForce RTX 5080 Laptop ⎘
32 Go Mémoire, 1000 Go SSD
Amazon:
1. $3,399.99
GIGABYTE - AORUS Master 16 G...
2. $4,415.99
GIGABYTE - AORUS Master 16 G...
3. $4,799.00
GIGABYTE AORUS Master 16 Gam...
2.3 kg24.5 mm16.00"
2560x1600
189 PPI
OLED
6.
90.4%
Asus ROG Zephyrus G16 GU606AW
Intel Core Ultra 9 386H ⎘
NVIDIA GeForce RTX 5080 Laptop ⎘
64 Go Mémoire, 2048 Go SSD
Prix de liste: 5400€1.9 kg17.9 mm16.00"
2560x1600
189 PPI
OLED

Transparency

La sélection des appareils à examiner est effectuée par notre équipe éditoriale. L'échantillon de test a été prêté à l'auteur par le fabricant ou le détaillant pour les besoins de cet examen. Le prêteur n'a pas eu d'influence sur cette évaluation et le fabricant n'a pas reçu de copie de cette évaluation avant sa publication. Il n'y avait aucune obligation de publier cet article. En tant que média indépendant, Notebookcheck n'est pas soumis à l'autorité des fabricants, des détaillants ou des éditeurs.

Voici comment Notebookcheck teste

Chaque année, Notebookcheck examine de manière indépendante des centaines d'ordinateurs portables et de smartphones en utilisant des procédures standardisées afin de garantir que tous les résultats sont comparables. Nous avons continuellement développé nos méthodes de test depuis environ 20 ans et avons établi des normes industrielles dans le processus. Dans nos laboratoires de test, des équipements de mesure de haute qualité sont utilisés par des techniciens et des rédacteurs expérimentés. Ces tests impliquent un processus de validation en plusieurs étapes. Notre système d'évaluation complexe repose sur des centaines de mesures et de points de référence bien fondés, ce qui garantit l'objectivité.
Google LogoAdd as a preferred source on Google
Mail Logo
> Revues et rapports de ordinateurs portatifs et smartphones, ordiphones > Critiques > Test du MSI Stealth 16 AI B3WH : moitié gamer, moitié créateur, totalement professionnel
Allen Ngo, 2026-10- 4 (Update: 2026-10- 4)