Verdict — Des performances brutes avec un minimum de confort
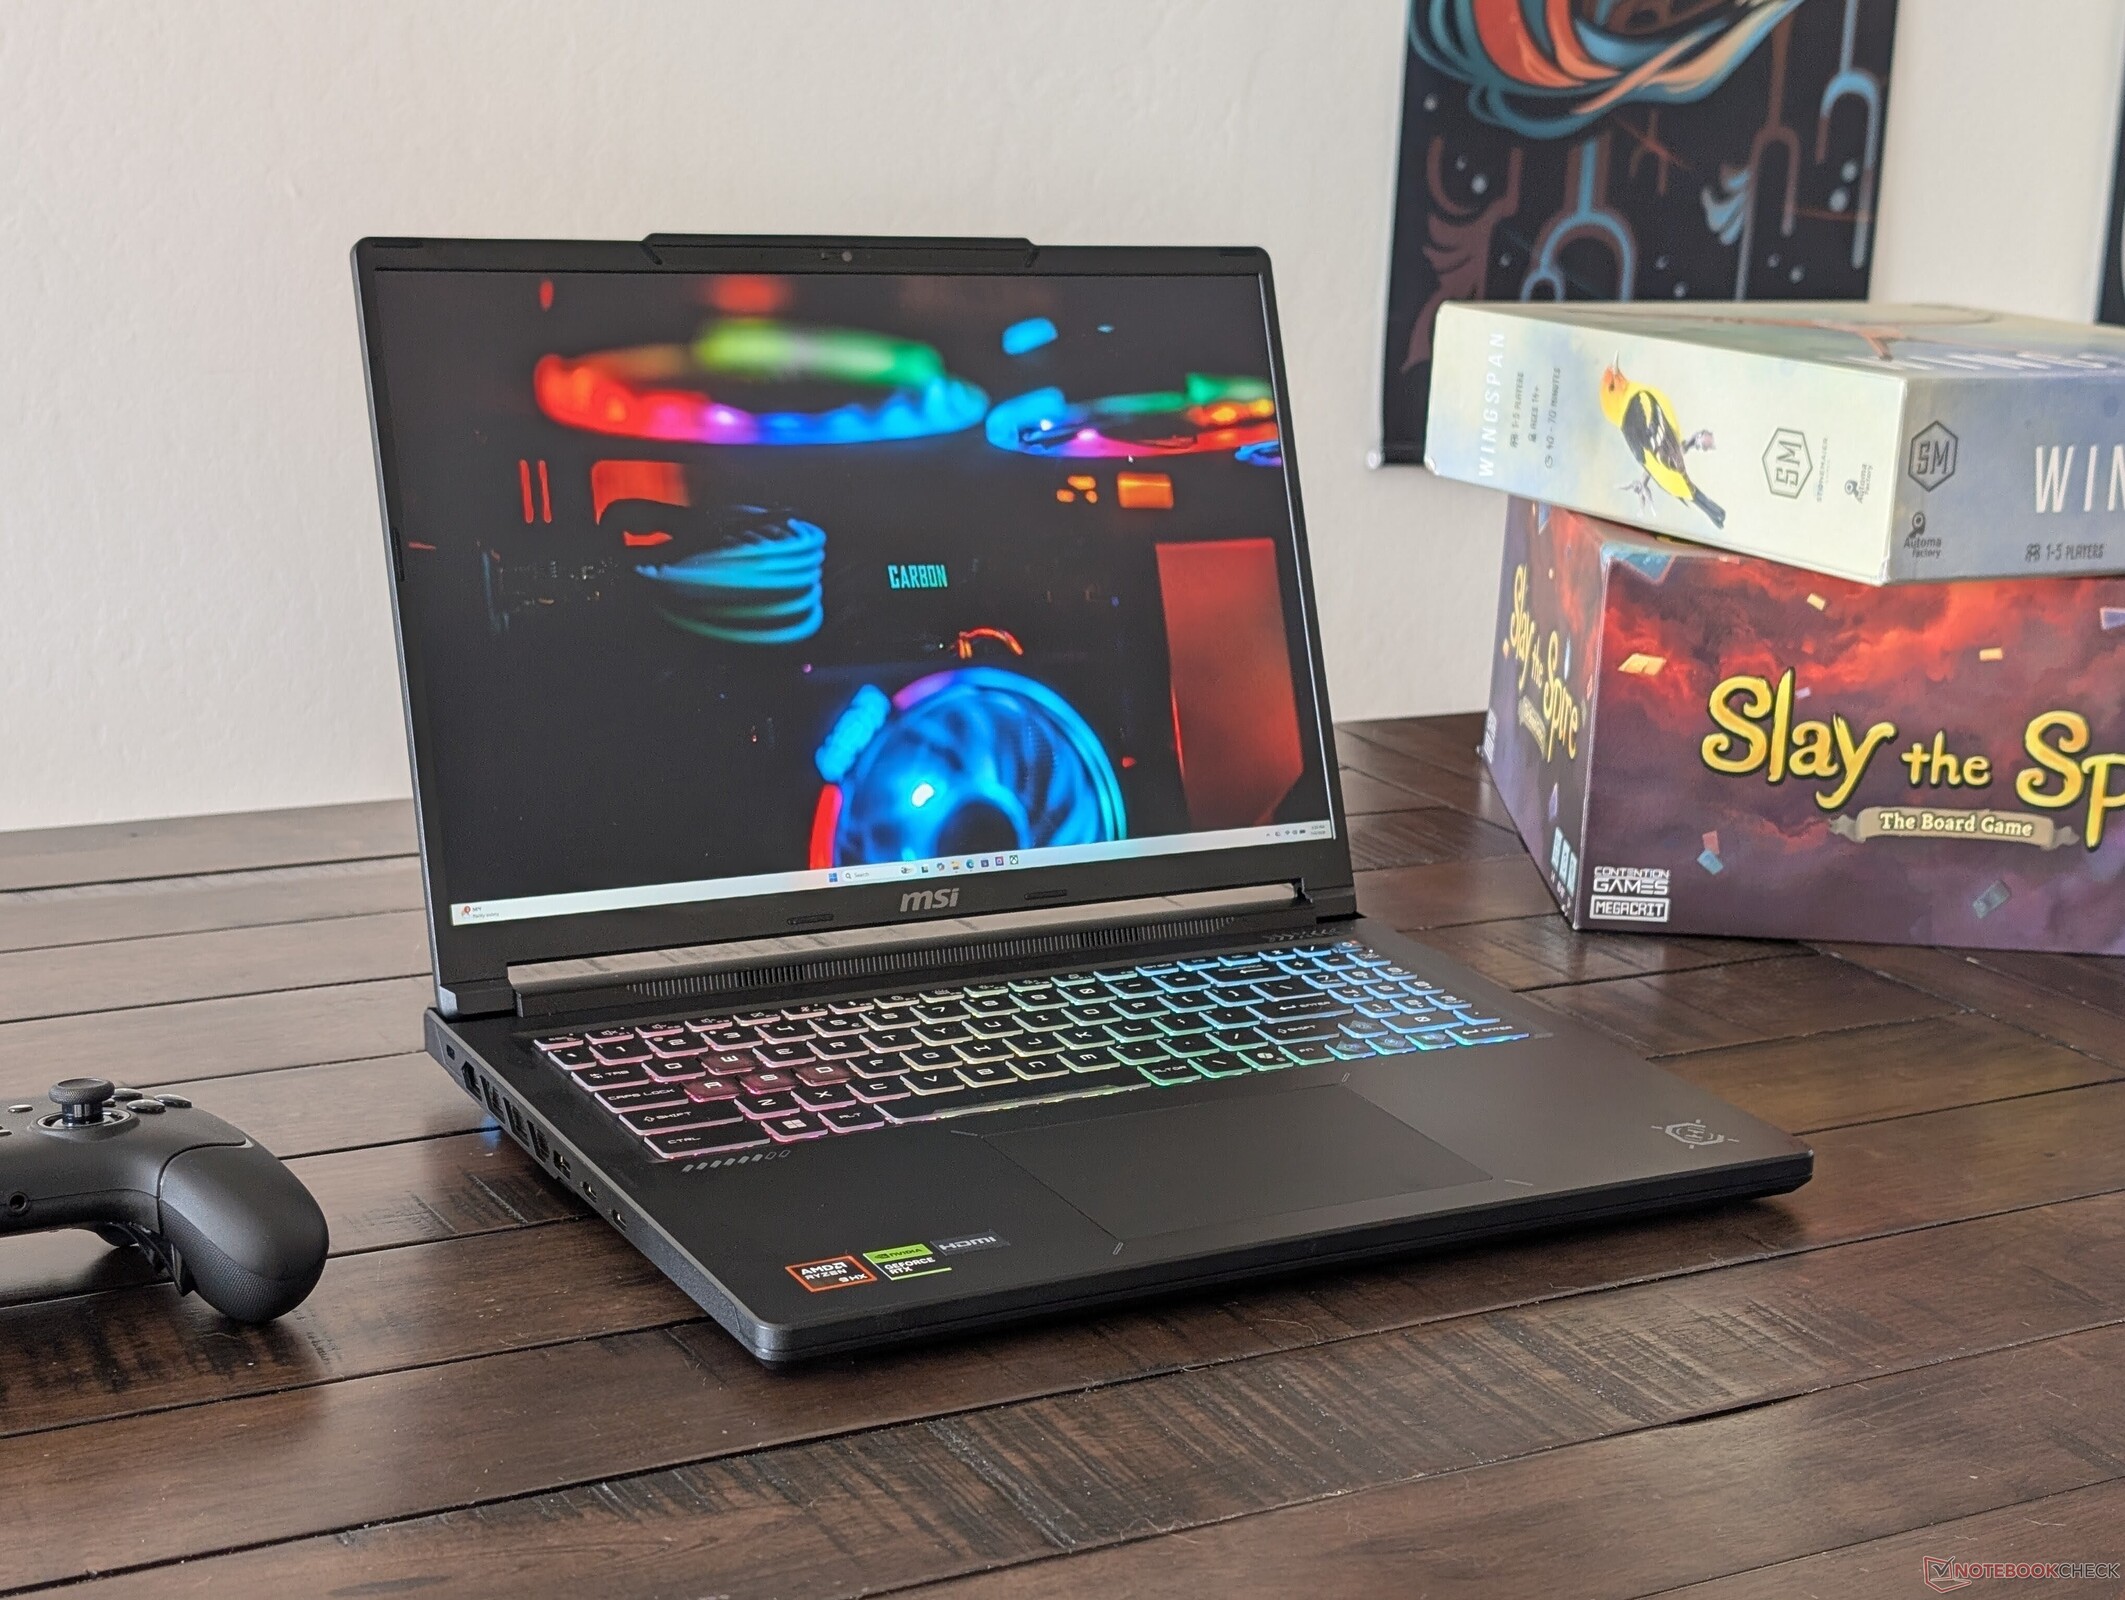
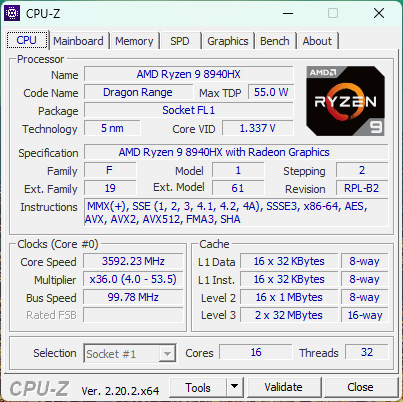
Le Crosshair A16 HX se distingue par ses performances, en particulier pour un ordinateur portable de jeu de milieu de gamme équipé d'un processeur AMD ou d'une carte graphique NVIDIA. Bien qu'il fonctionne sur une plateforme Zen 4 plus ancienne, le Ryzen 9 8940HX surpasse le plus récent Ryzen AI 9 470 Zen 5, tout en se situant à seulement 5 à 10 % du plus onéreux Intel Core Ultra 9 275HX. Les améliorations apportées au châssis constituent également un pas dans la bonne direction, puisque le système offre davantage de ports, un pavé tactile plus grand et un design légèrement plus fin et plus léger que le Crosshair 16 HX basé sur Intel, ce qui facilite son transport.
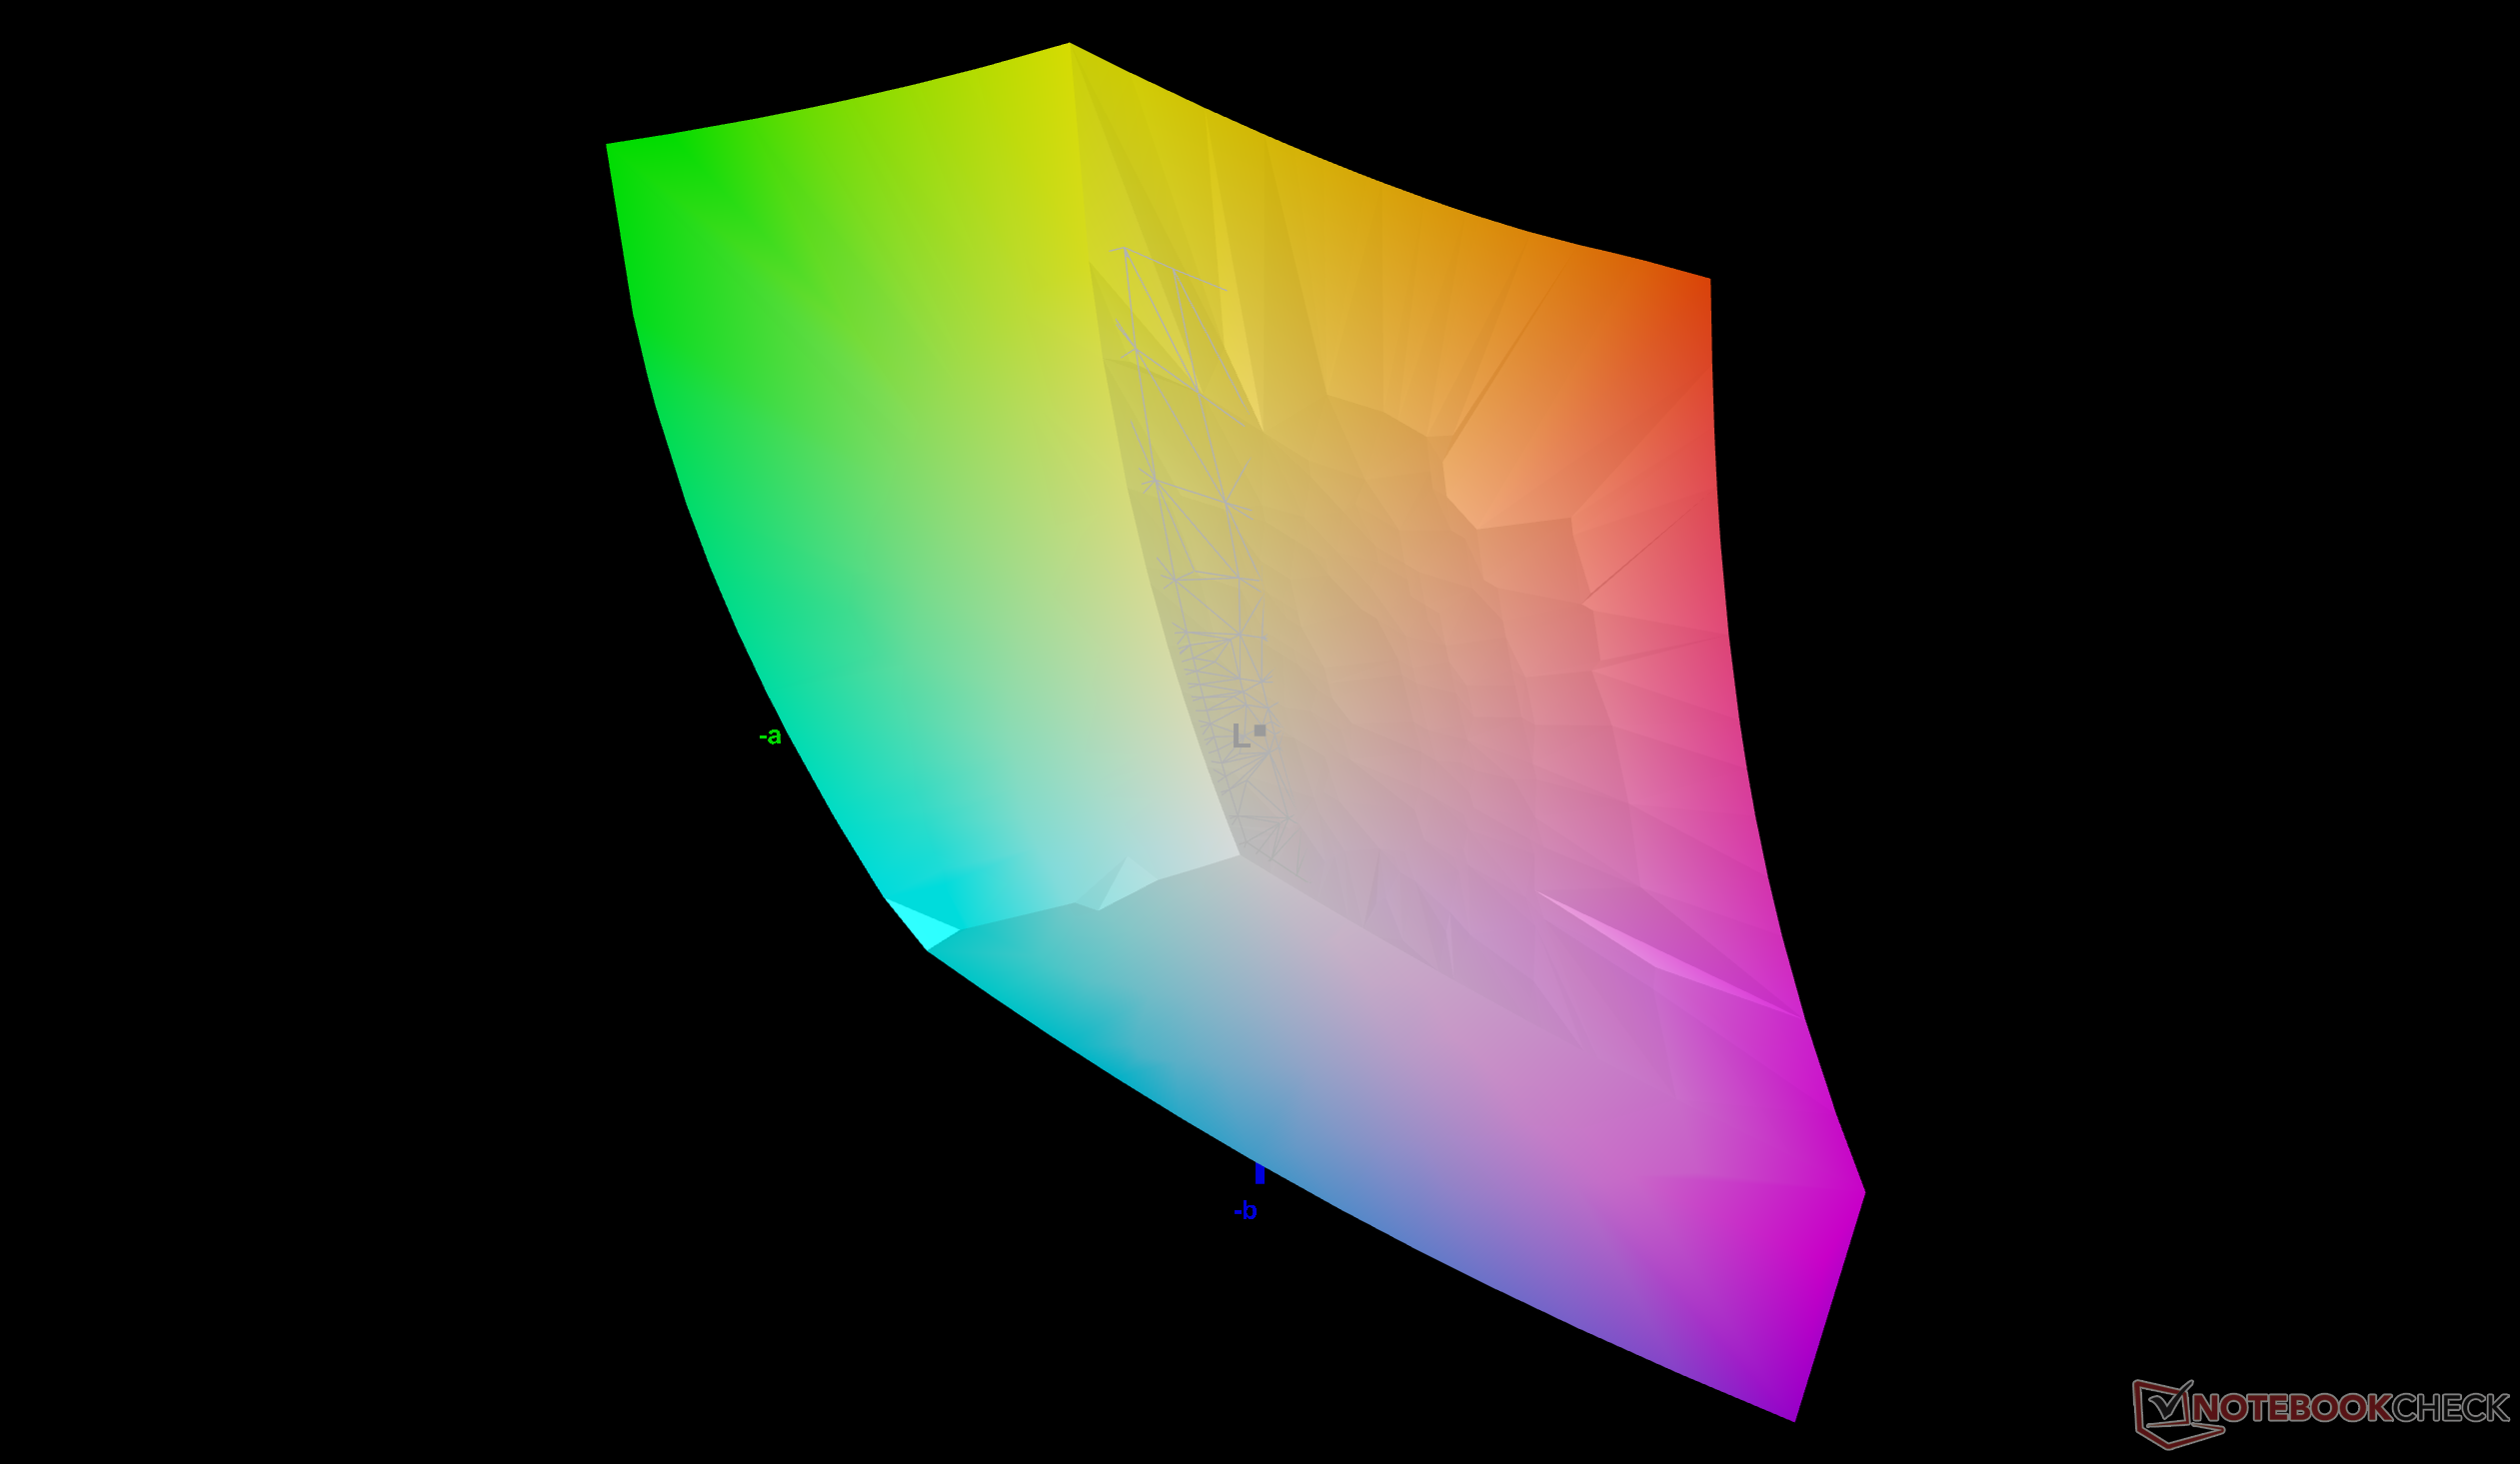
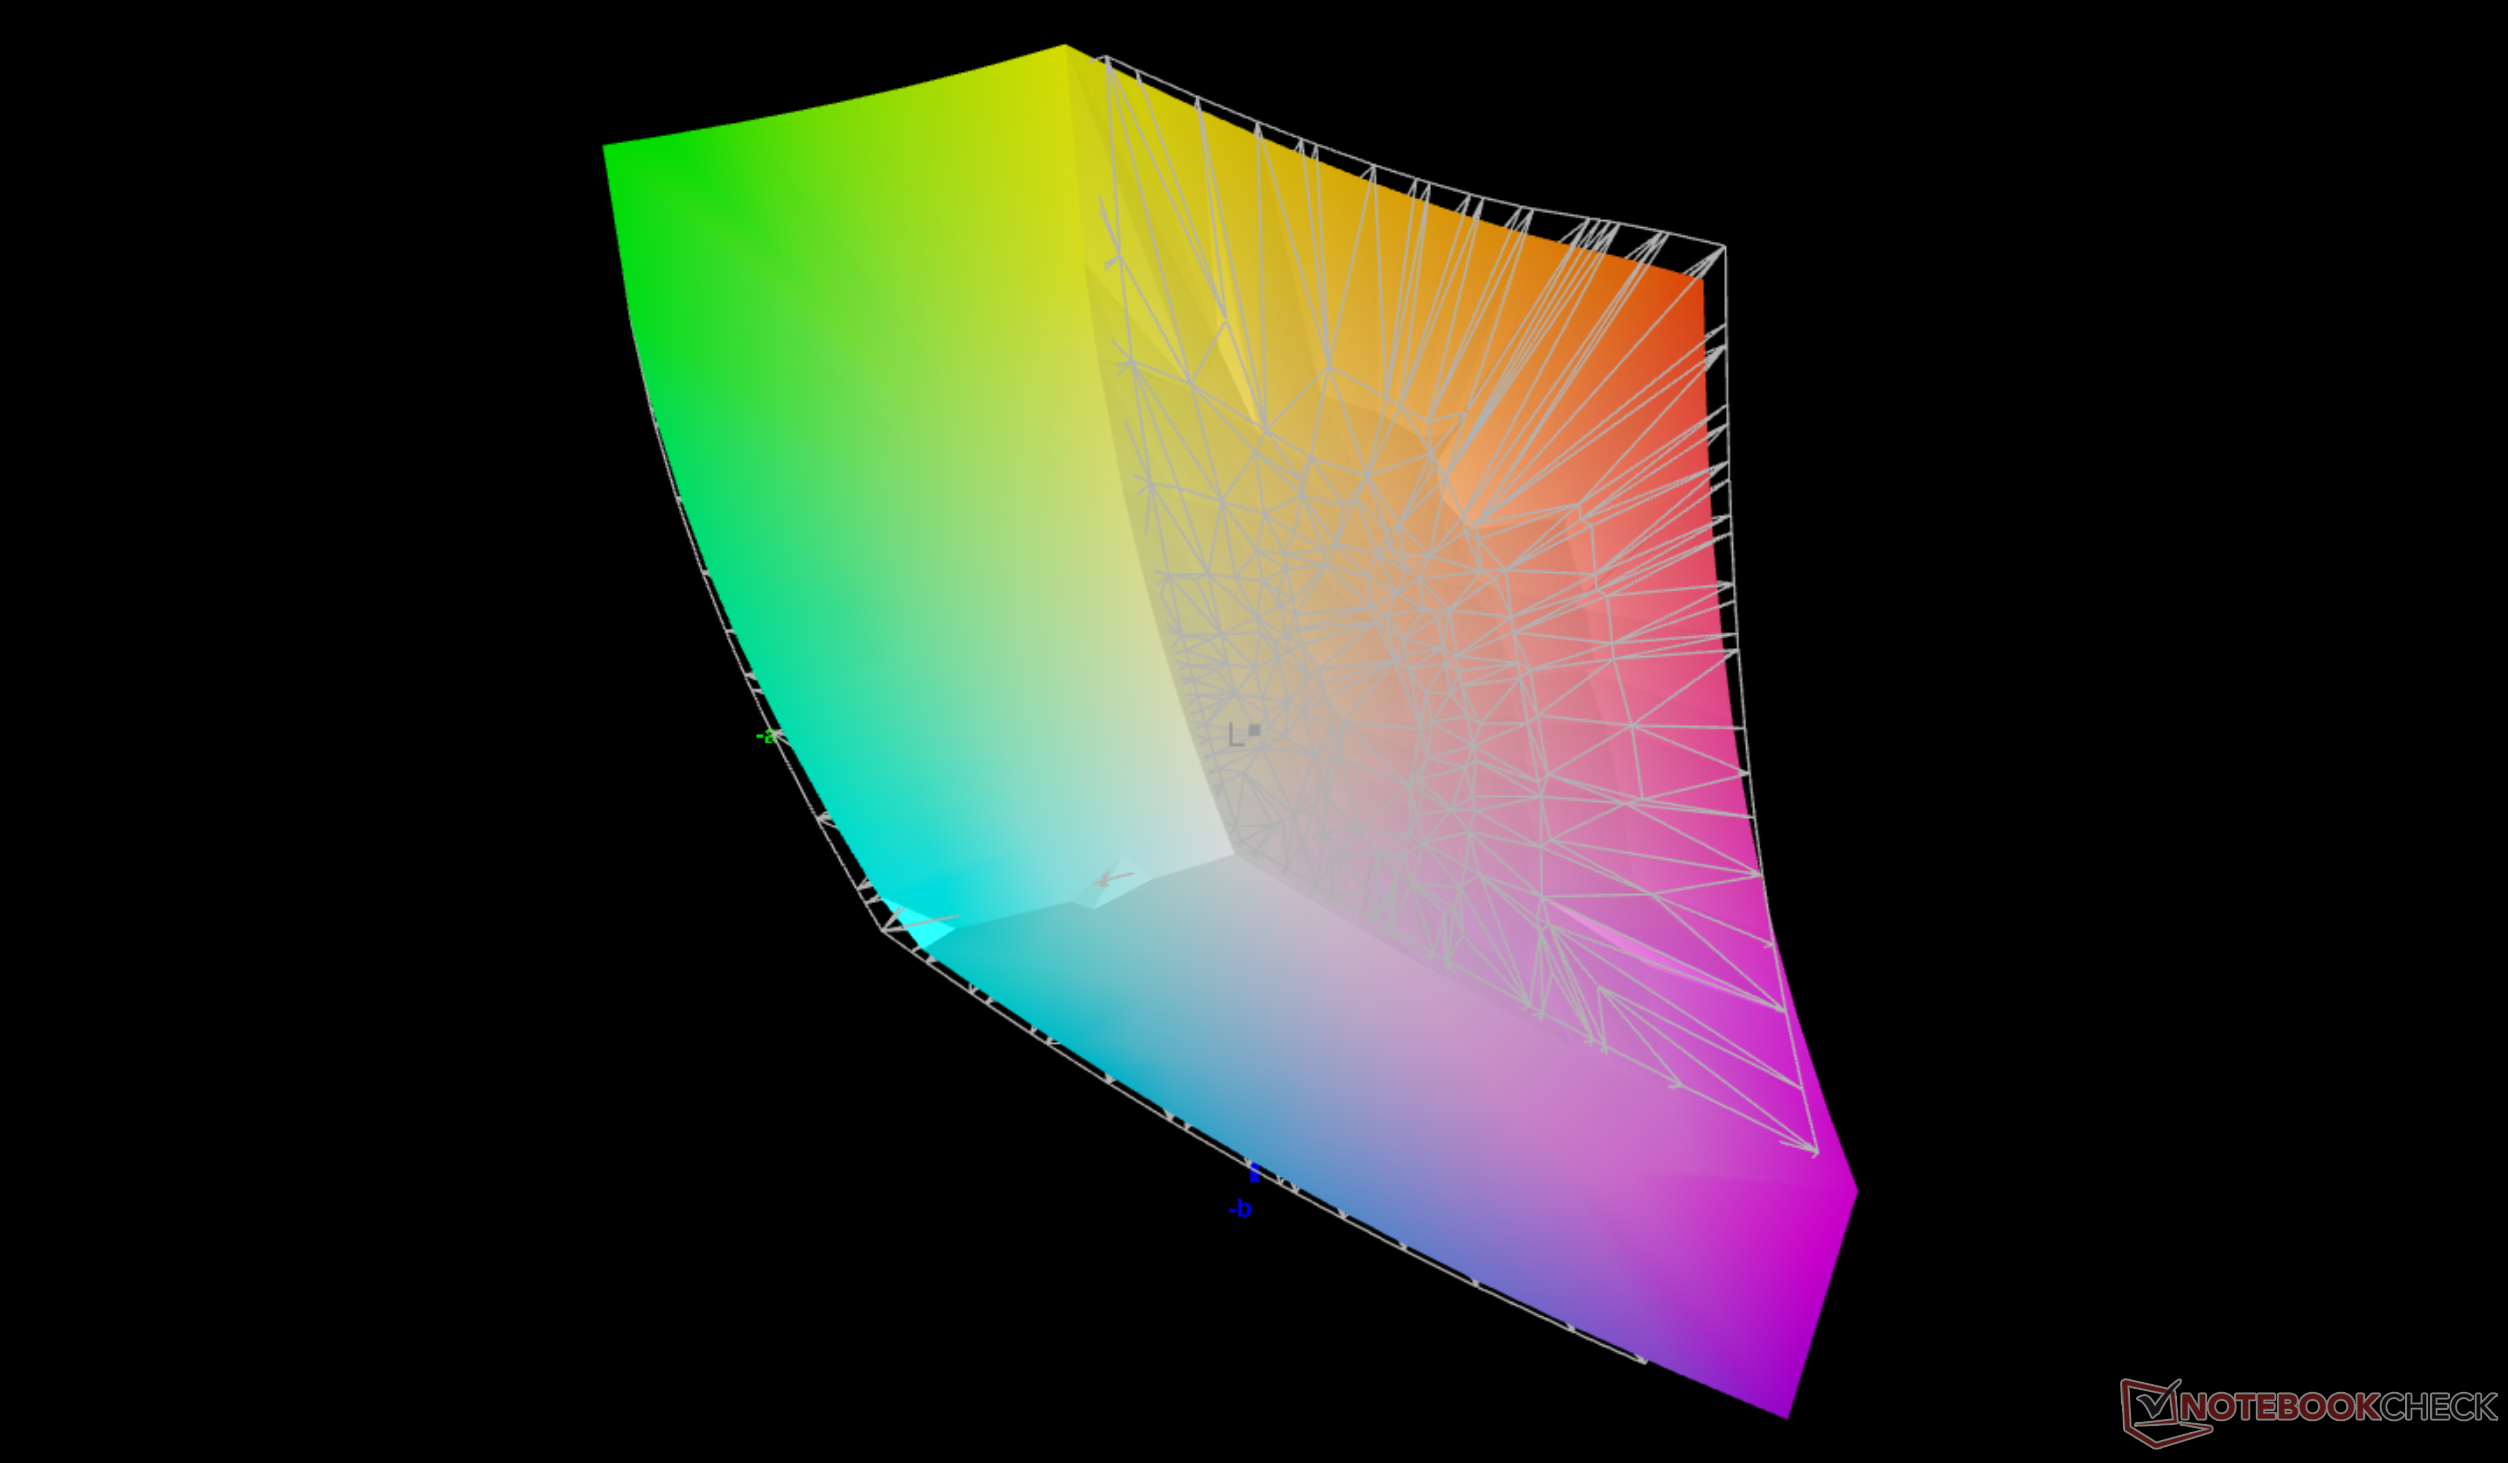
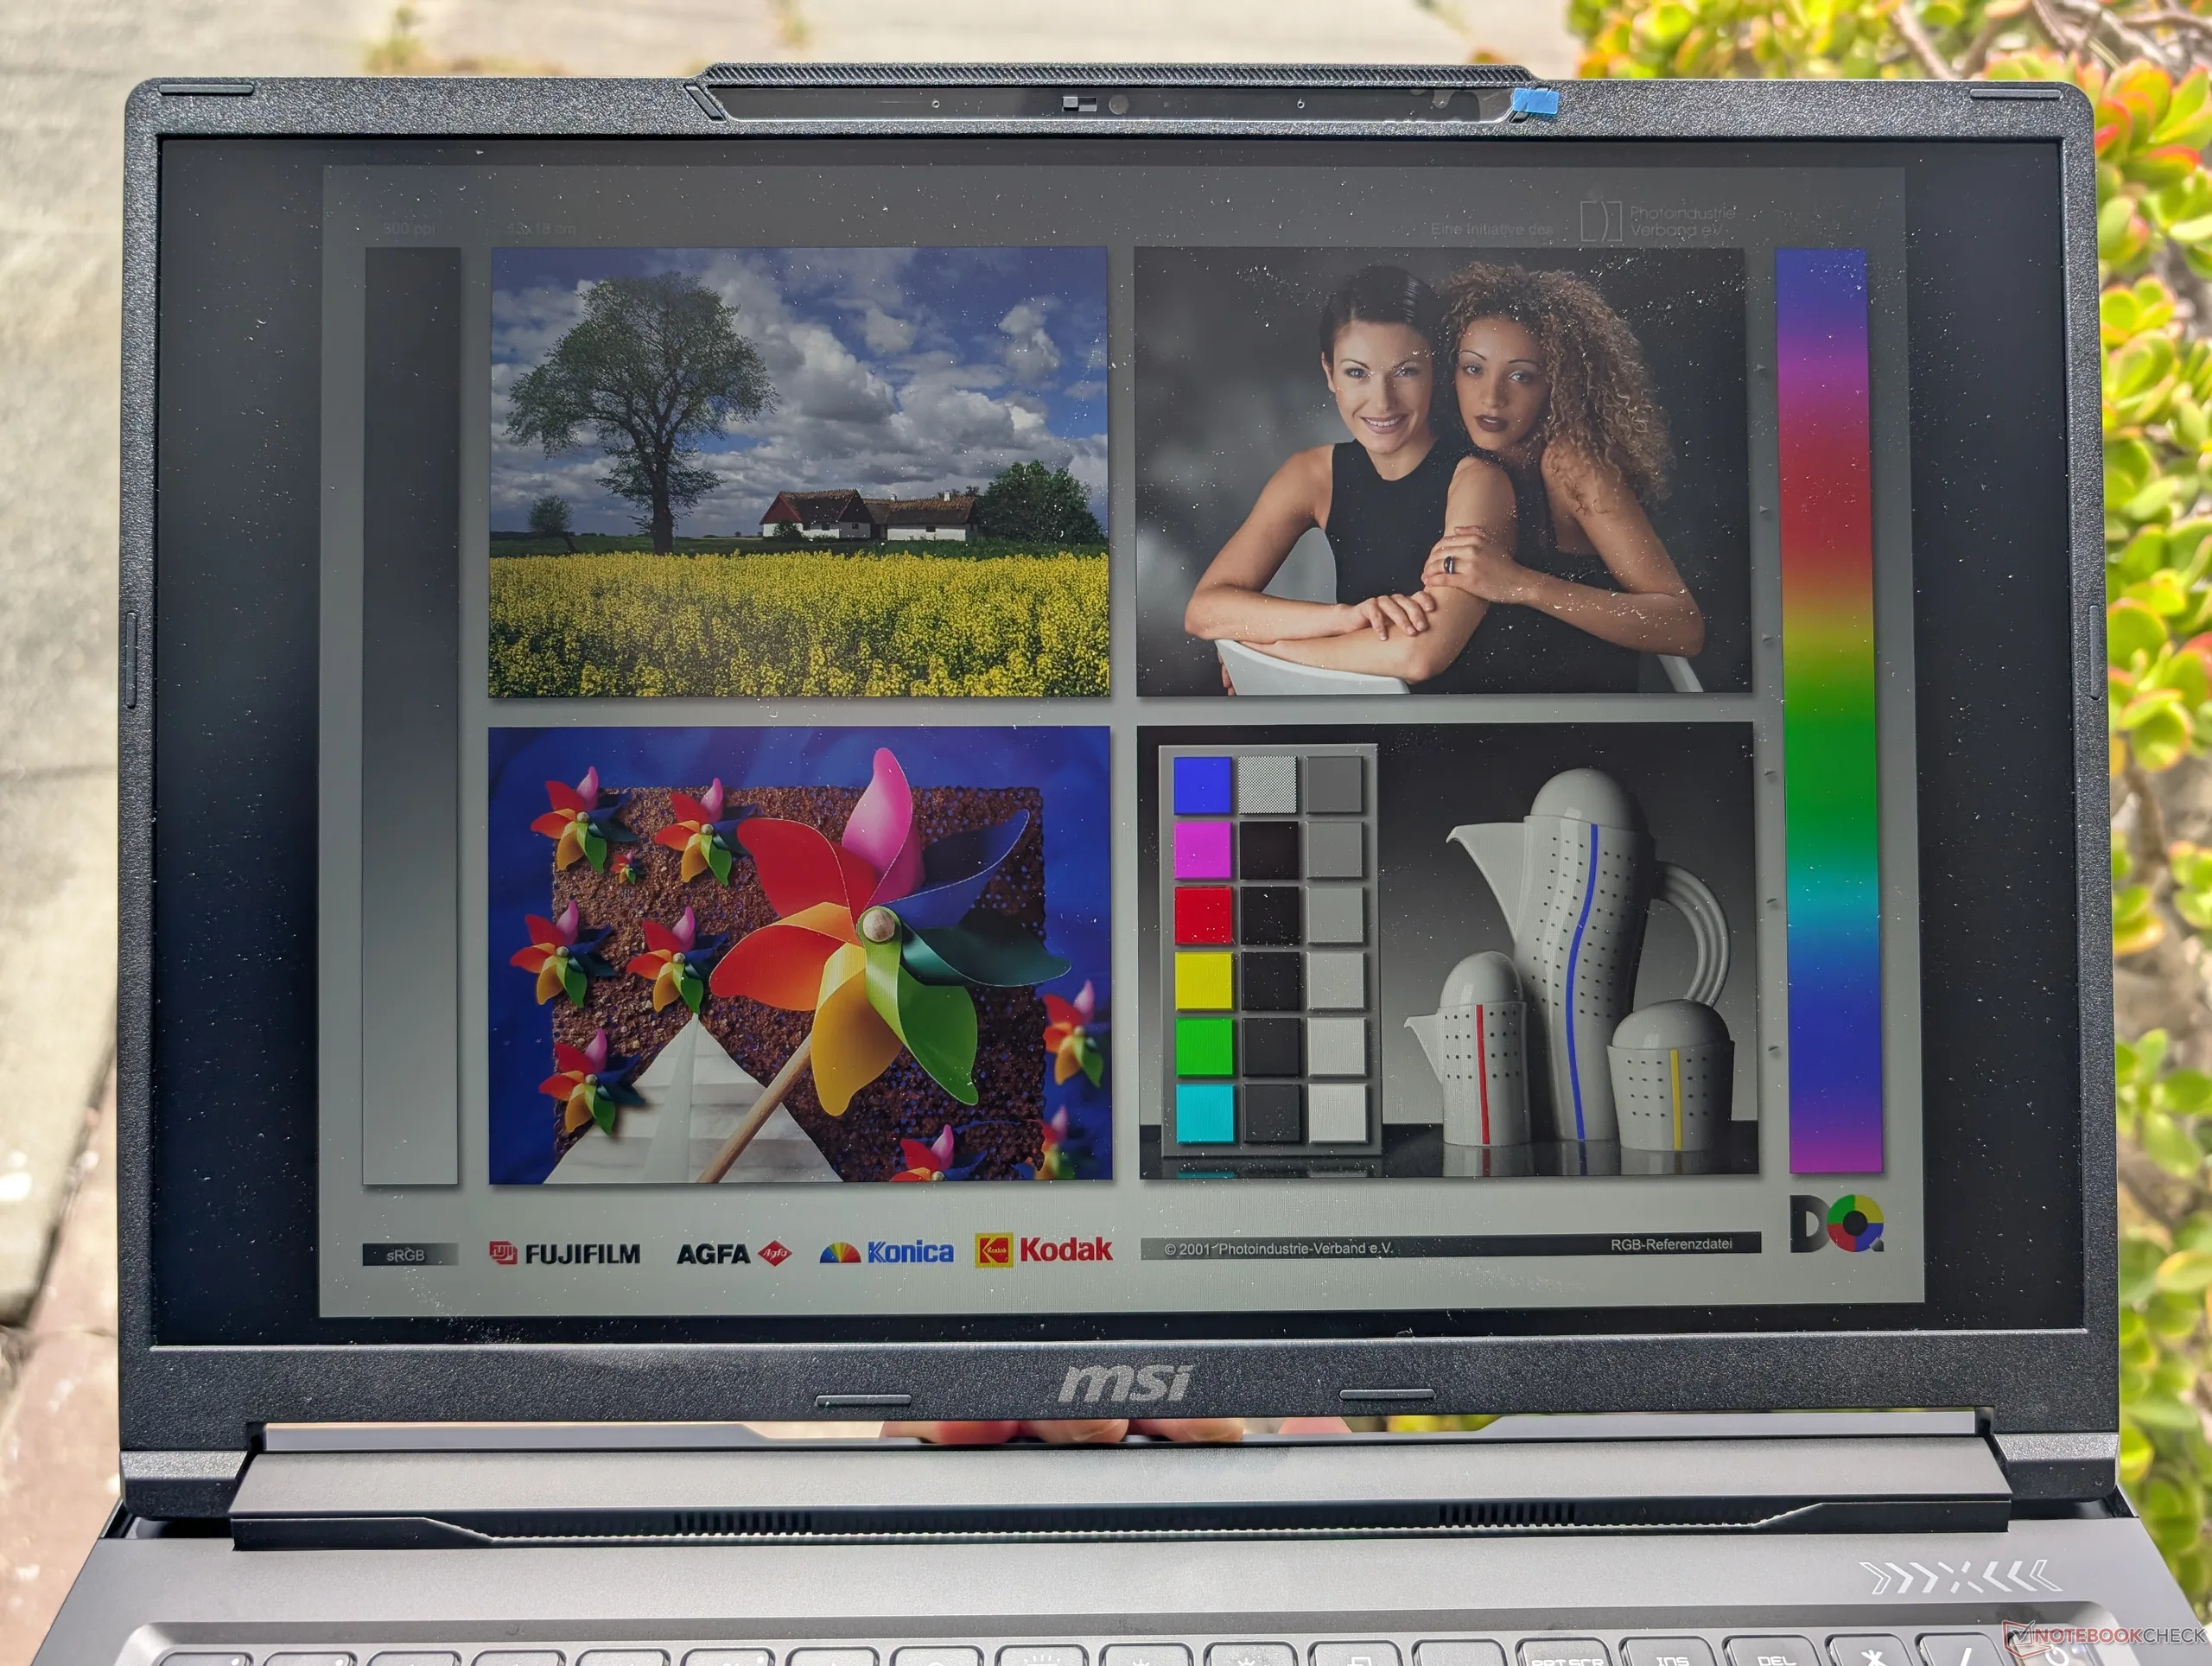
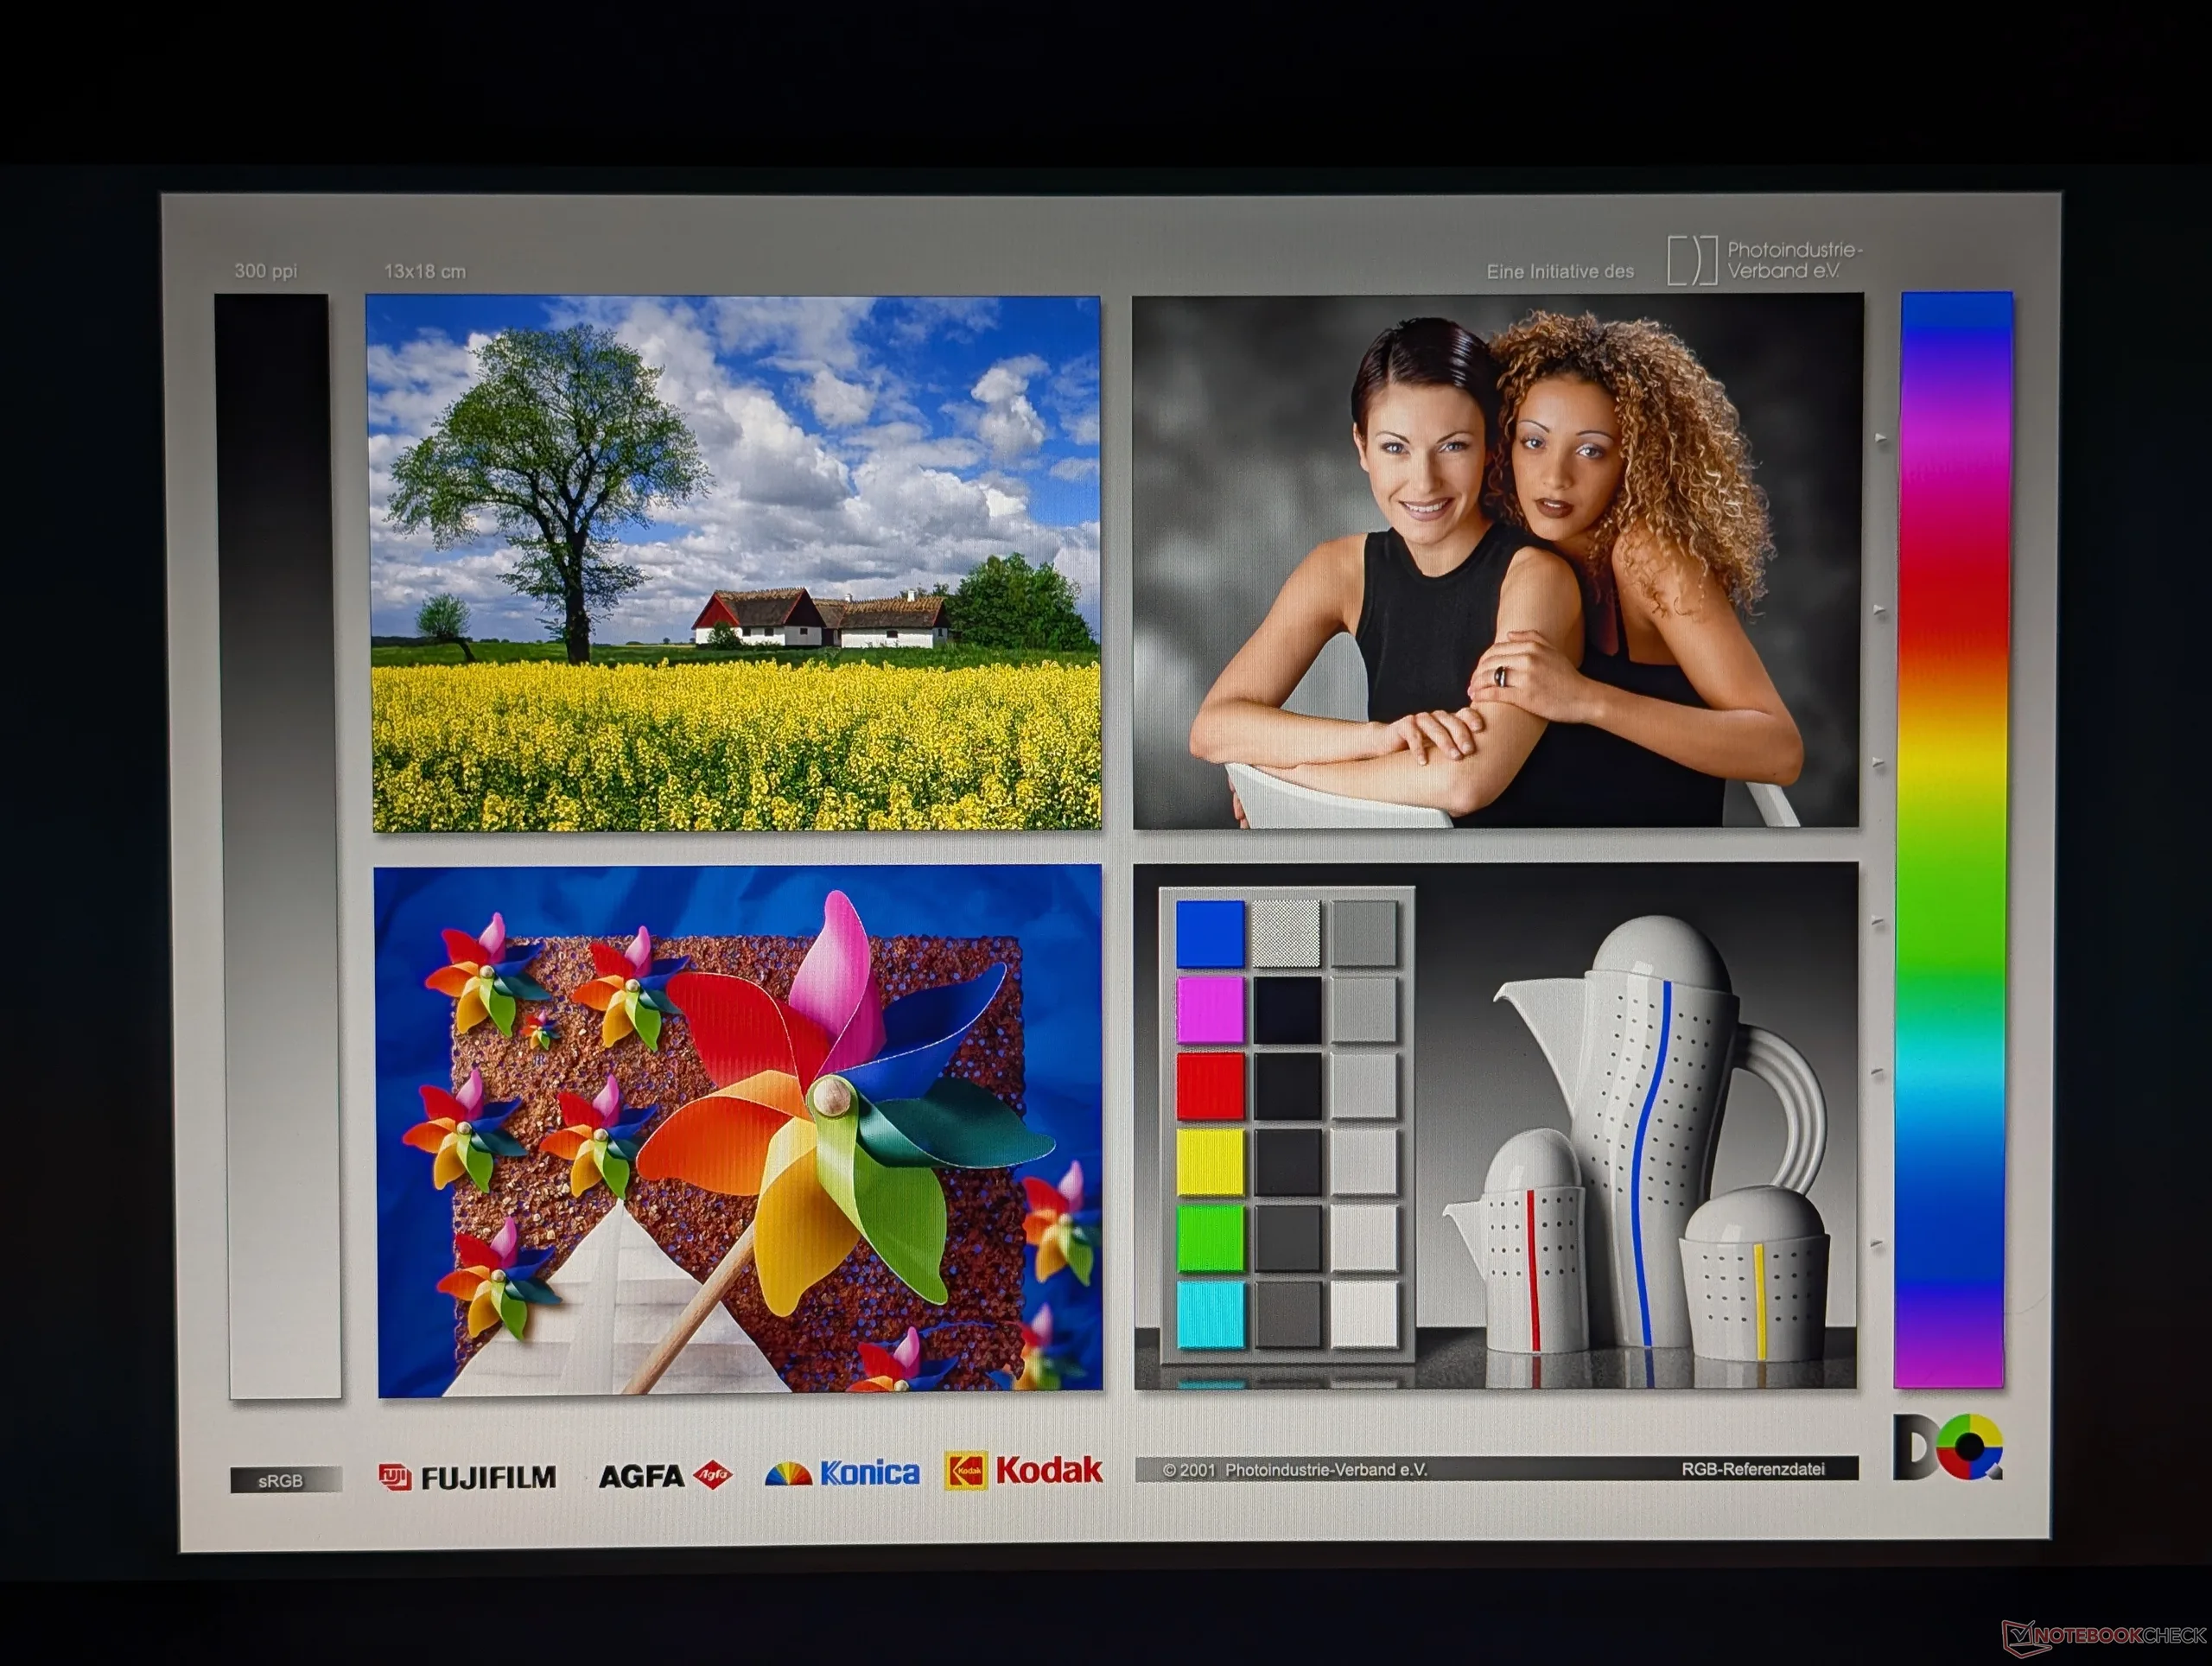
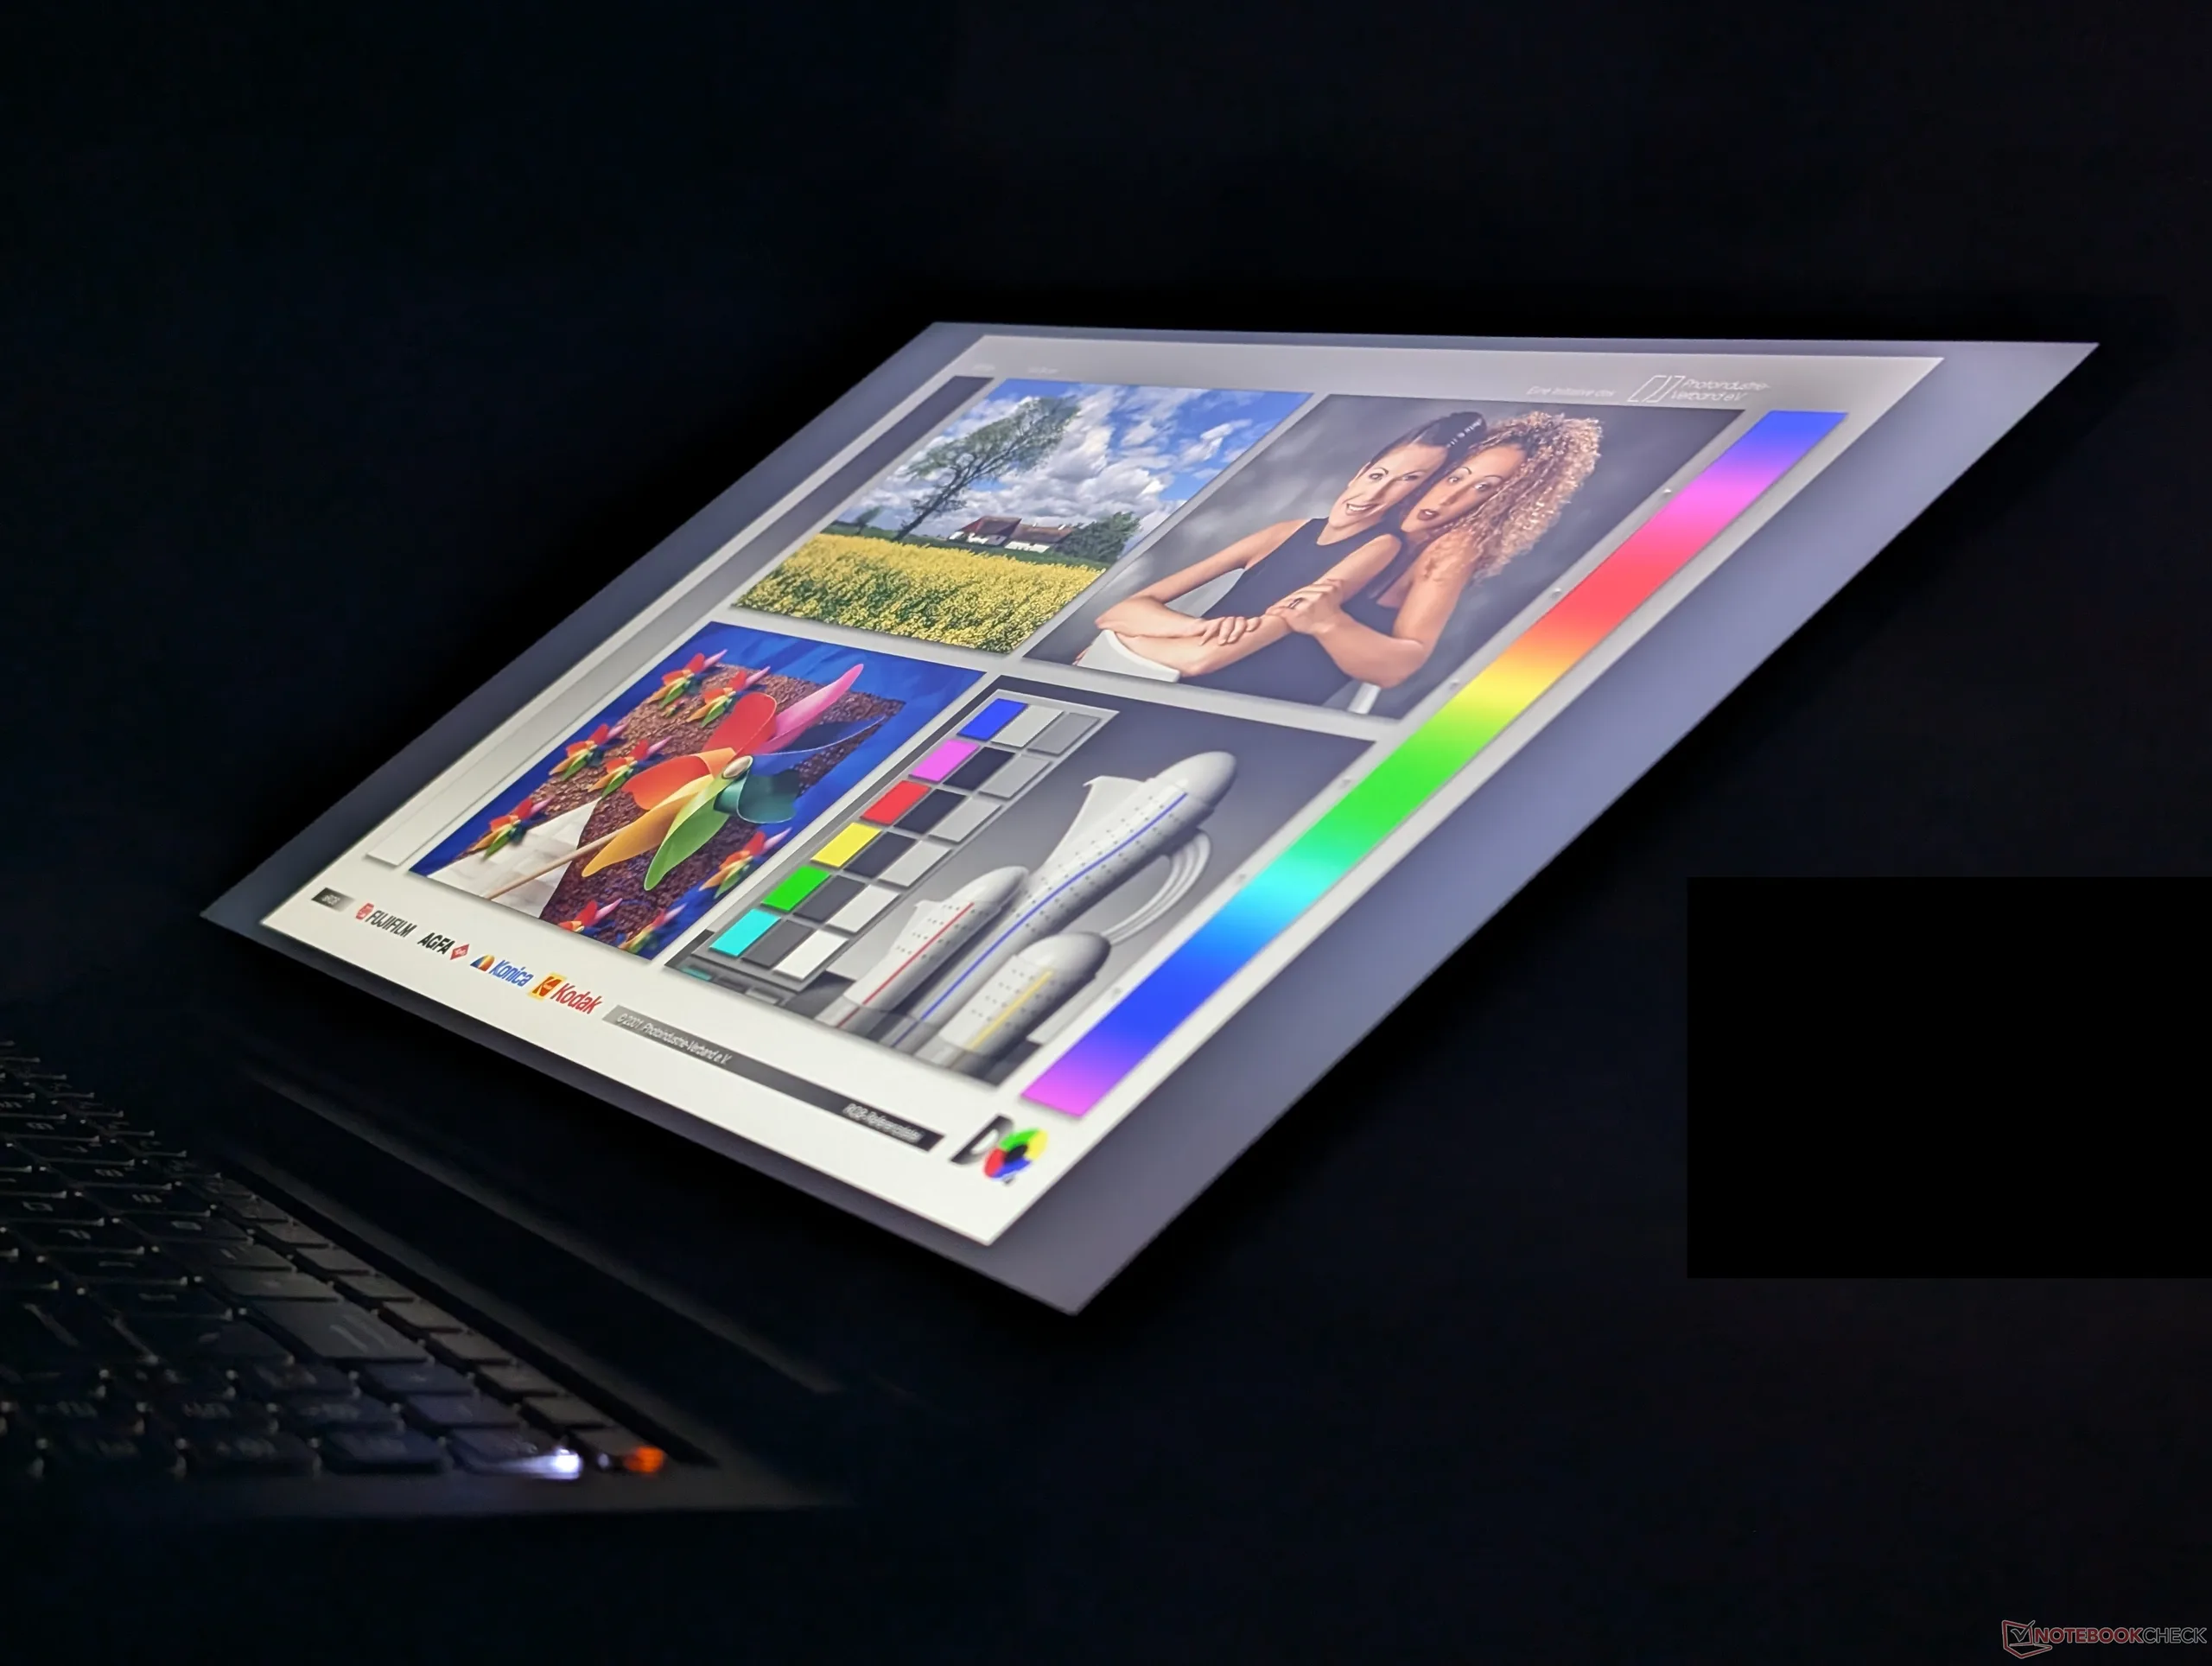
L'écran IPS 1600p240, couvrant 95 % de la gamme de couleurs P3, mérite également d'être mentionné. Nous apprécions le fait que toutes les configurations actuelles soient équipées de la même dalle de haute qualité, y compris la version d'entrée de gamme avec la RTX 5060 ; les acheteurs n'ont donc pas à s'inquiéter de se retrouver avec des options de gamme NTSC à seulement 45 %.
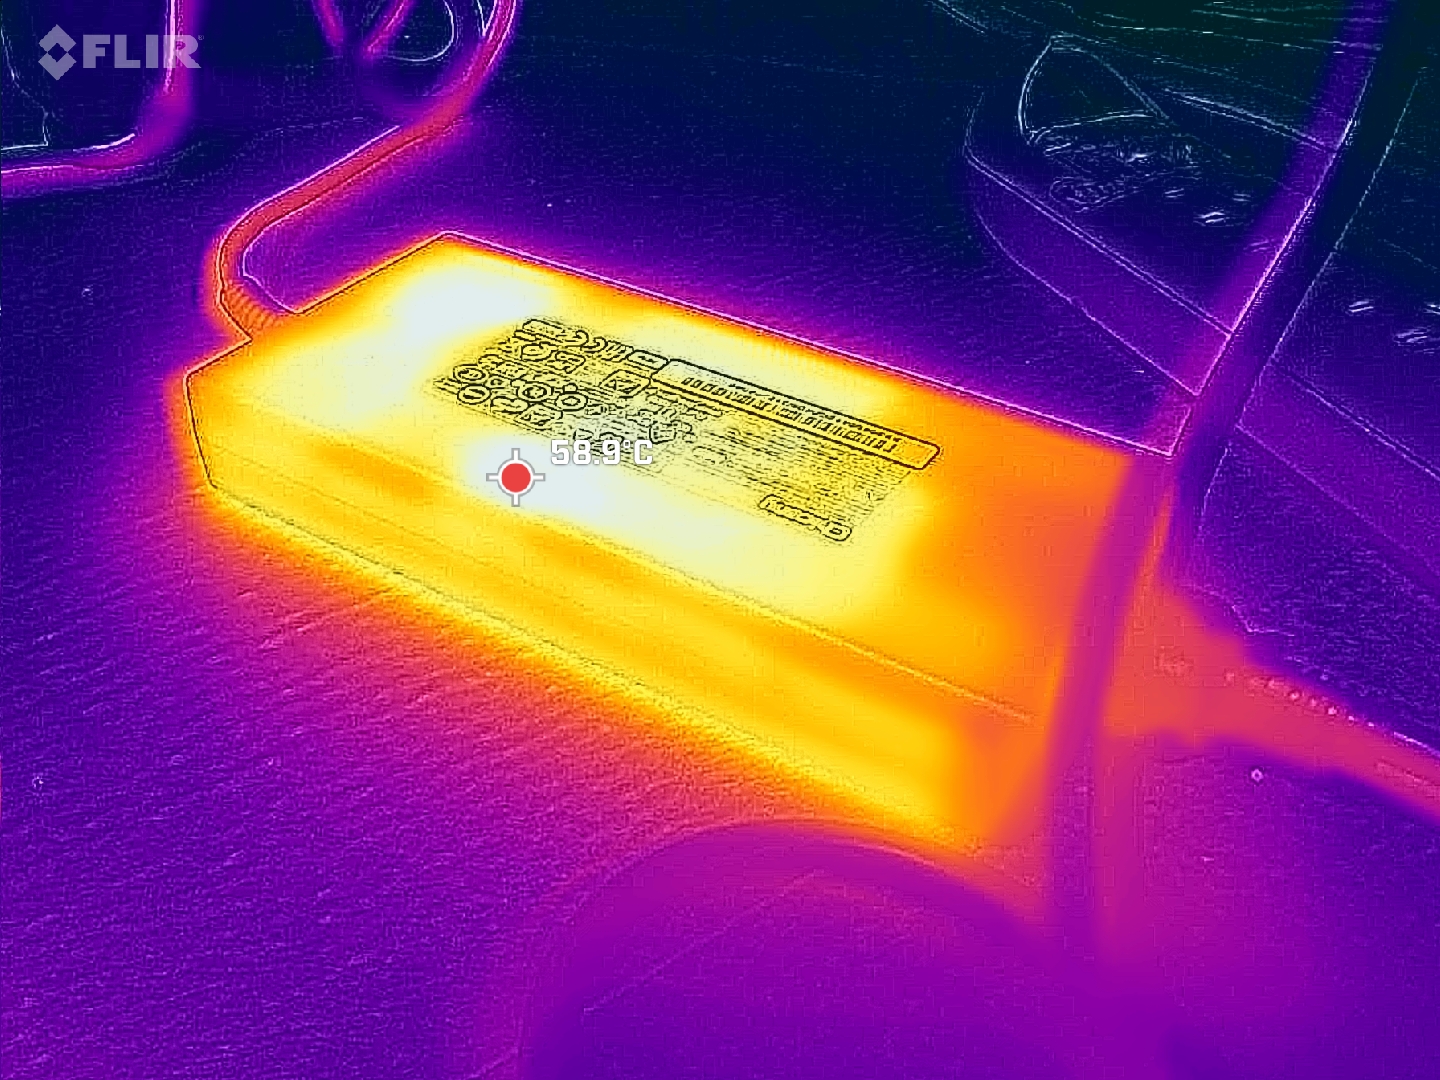
Bien que les améliorations apportées aux performances et au châssis soient remarquables, le Crosshair A16 HX reste un modèle d'entrée de gamme, et les compromis sont donc perceptibles. Le châssis en plastique mat, en particulier, est très sensible aux traces de doigts, tandis que la mauvaise qualité des haut-parleurs, l’absence de G-Sync, d’Advanced Optimus, de HDR et d’éclairage RVB par touche viennent gâcher l’expérience de jeu globale. L'adaptateur secteur de 240 W semble un peu trop petit, car cet ordinateur portable gourmand en énergie consomme déjà en moyenne près de 250 W en jeu, ce qui entraîne une forte élévation de la température de l'adaptateur et, de manière générale, une autonomie réduite.
Points positifs
Points négatifs
Prix et disponibilité
La configuration testée avec la RTX 5070 est désormais disponible sur Amazon au prix de 2 700$.
Le Crosshair A16 HX est la version AMD du modèle basé sur Intel Crosshair 16 HX. Il existe toutefois plusieurs différences entre ces deux modèles, tant au niveau de la conception que des caractéristiques techniques. La gamme Crosshair regroupe certains des ordinateurs portables de jeu les plus abordables de MSI, contrairement aux gammes Raider ou Titan, plus onéreuses.
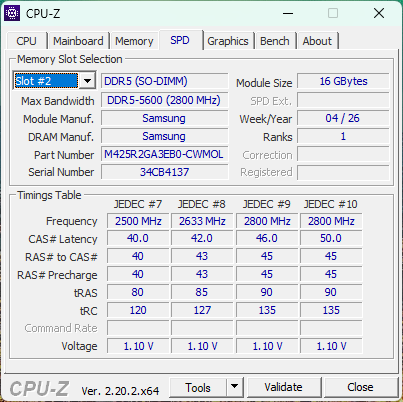
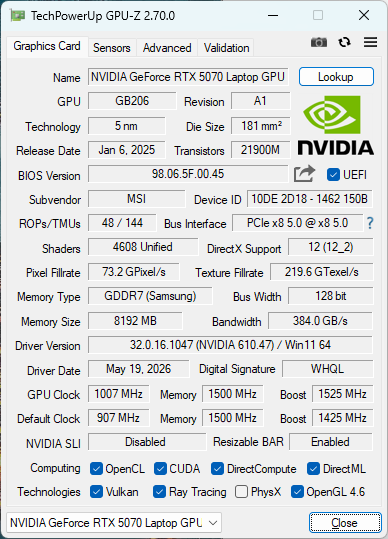
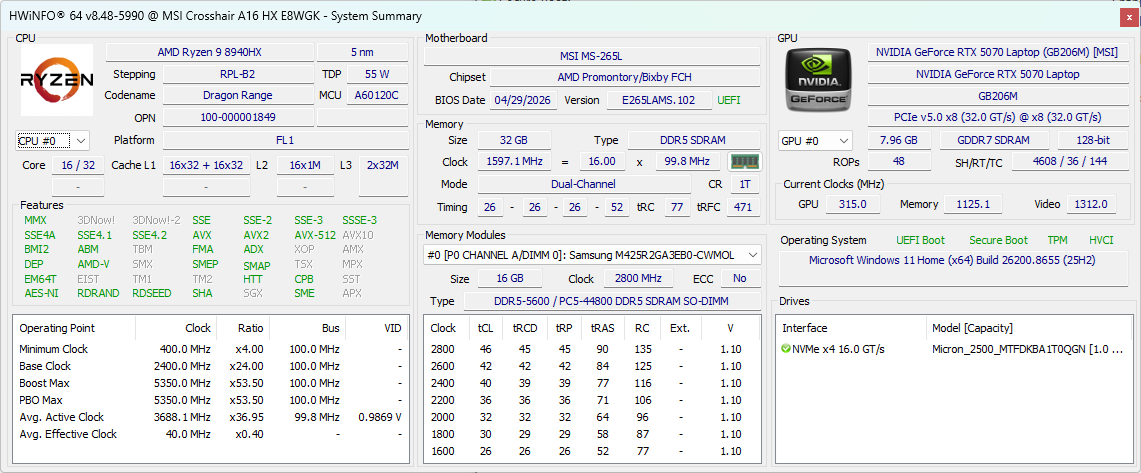
Notre modèle de test est une configuration haut de gamme équipée d’un processeur Ryzen 9 8940HX Zen 4, d’une carte graphique RTX 5070 d’ GeForce s de 115 W et d’un écran IPS 1600p, pour un prix d’environ 2 700 $. Les modèles d’entrée de gamme sont quant à eux équipés de la RTX 5060, mais toutes les configurations sont dotées du même écran IPS.
Parmi les alternatives, on trouve d’autres ordinateurs portables de jeu abordables ou de milieu de gamme, comme le série Asus TUF, Alienware 16 Auroraou l’ Acer Nitro V 16.
Autres avis sur MSI :
Caractéristiques techniques
Affaire
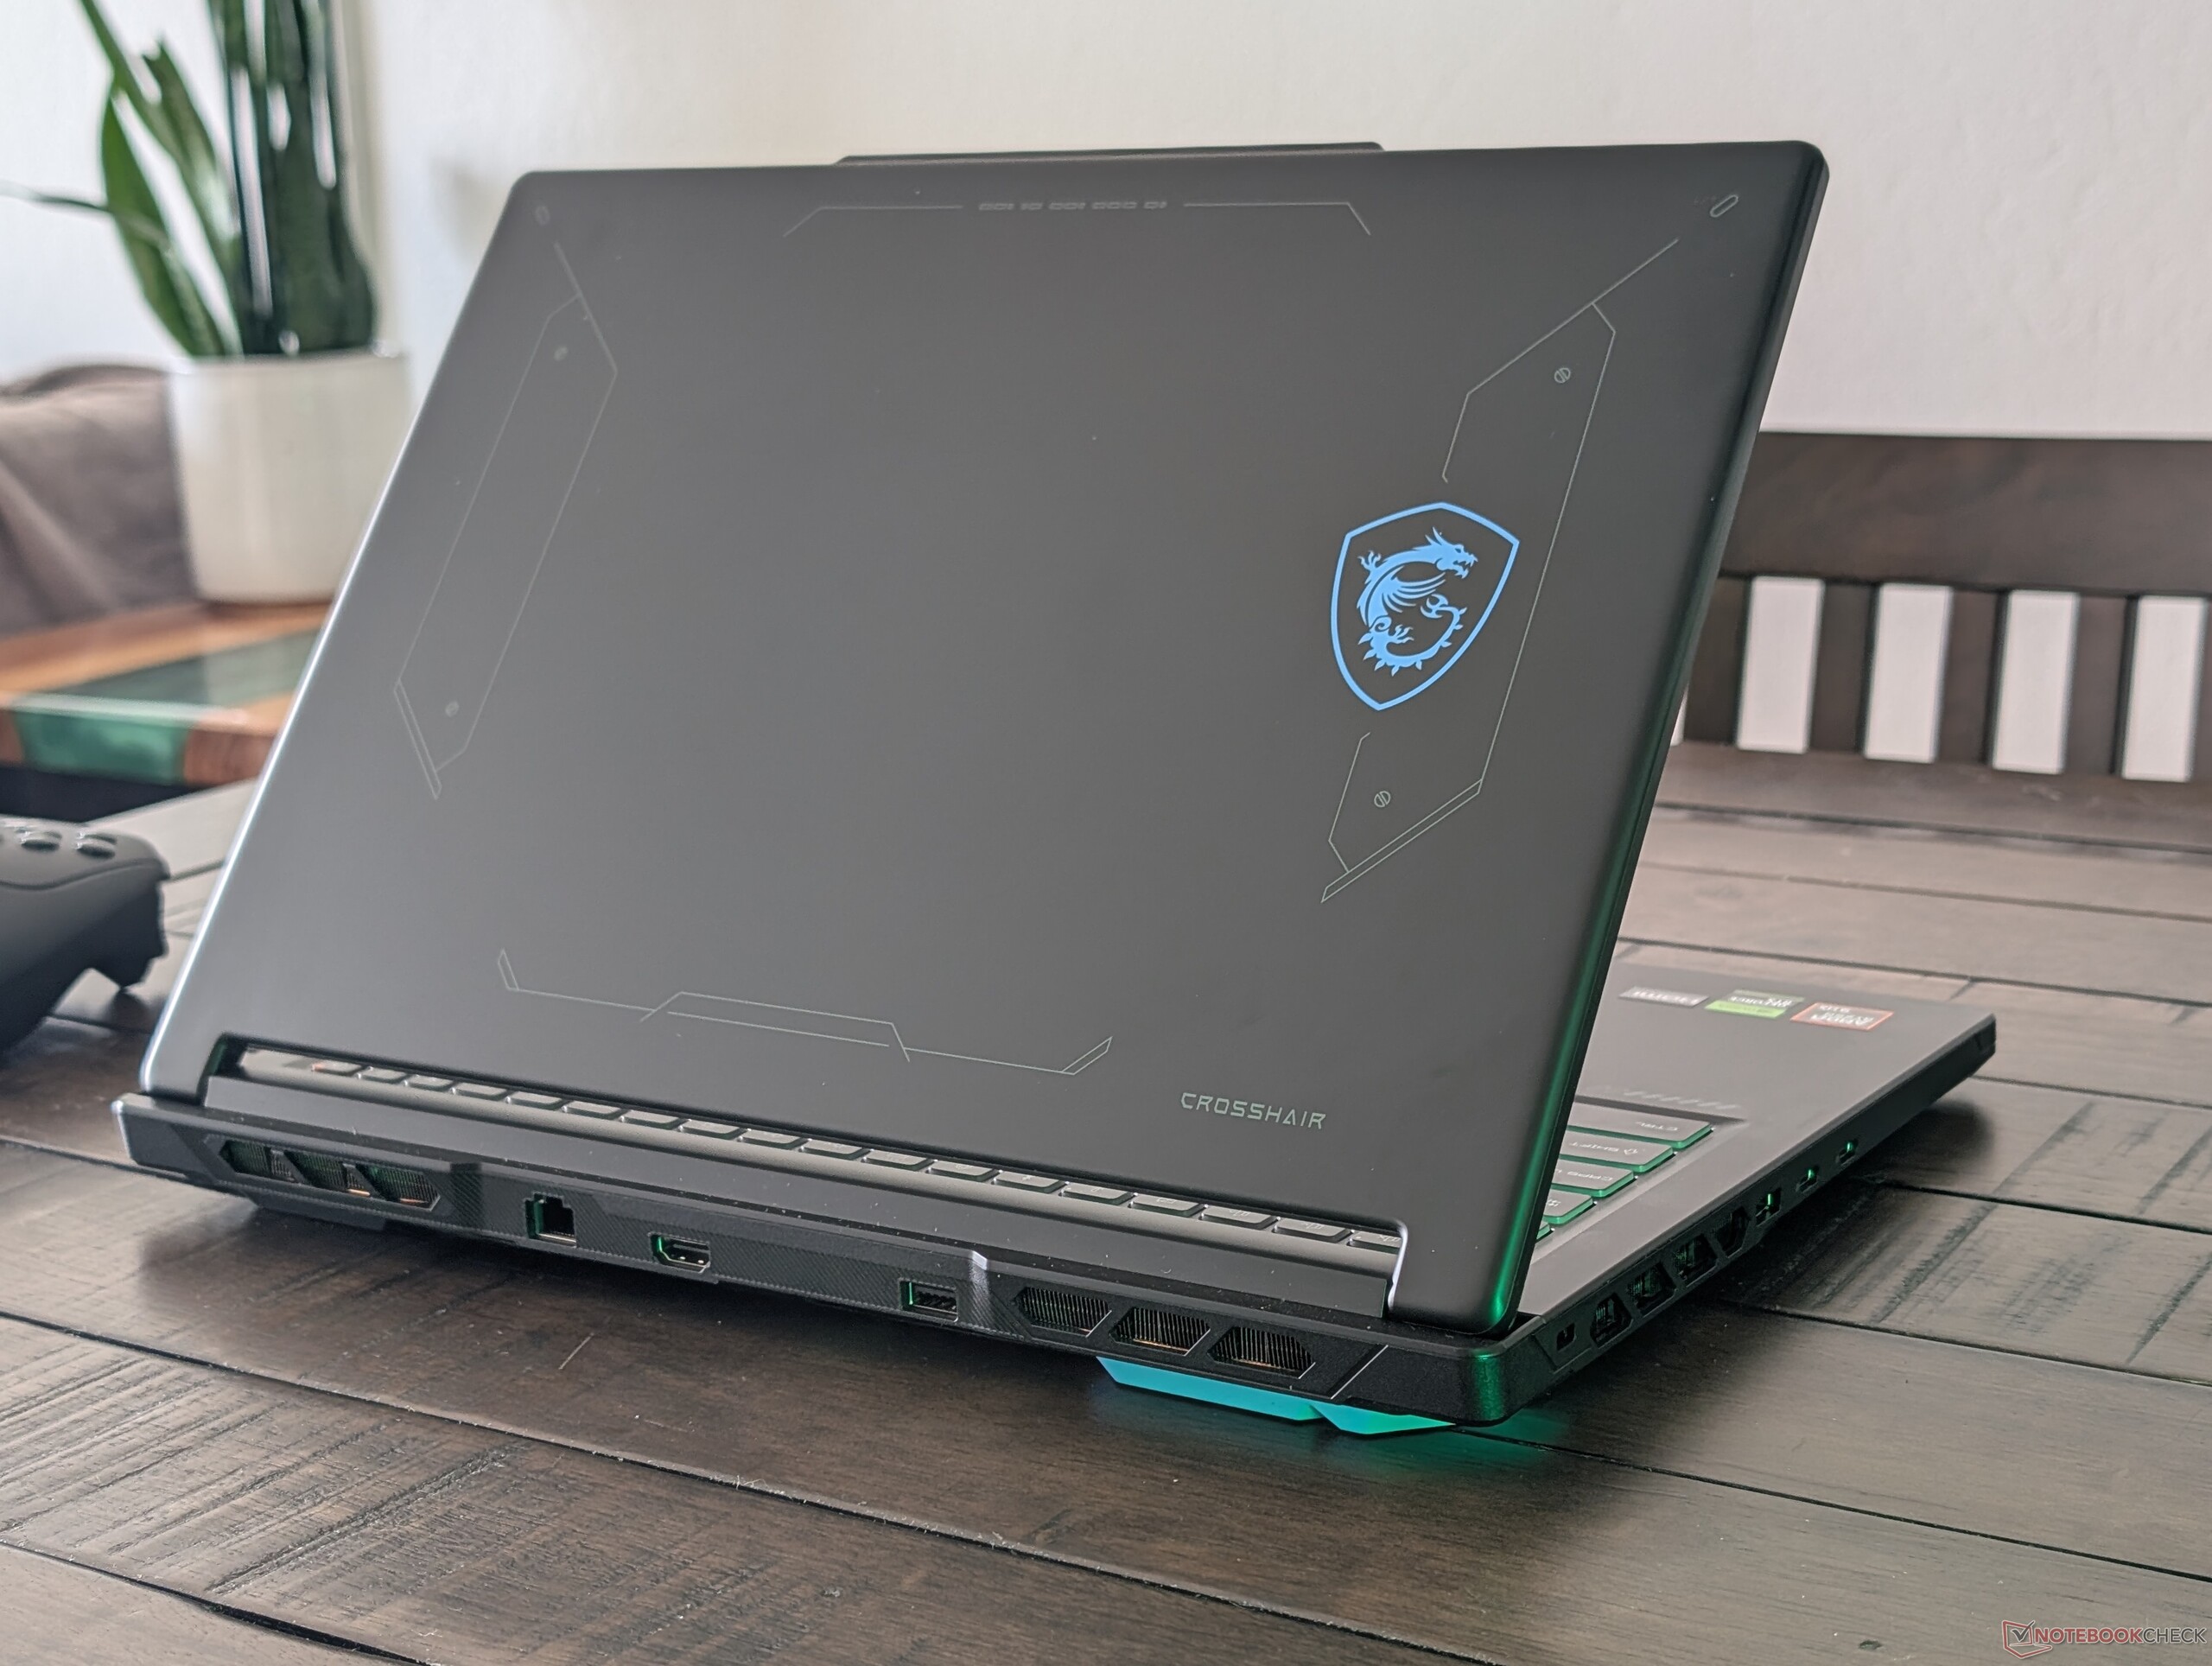
Le châssis est principalement en plastique noir mat et ne comporte aucun éclairage RVB superflu, afin de réduire les coûts. Les charnières de l'écran permettent une ouverture maximale d'environ 150 degrés.
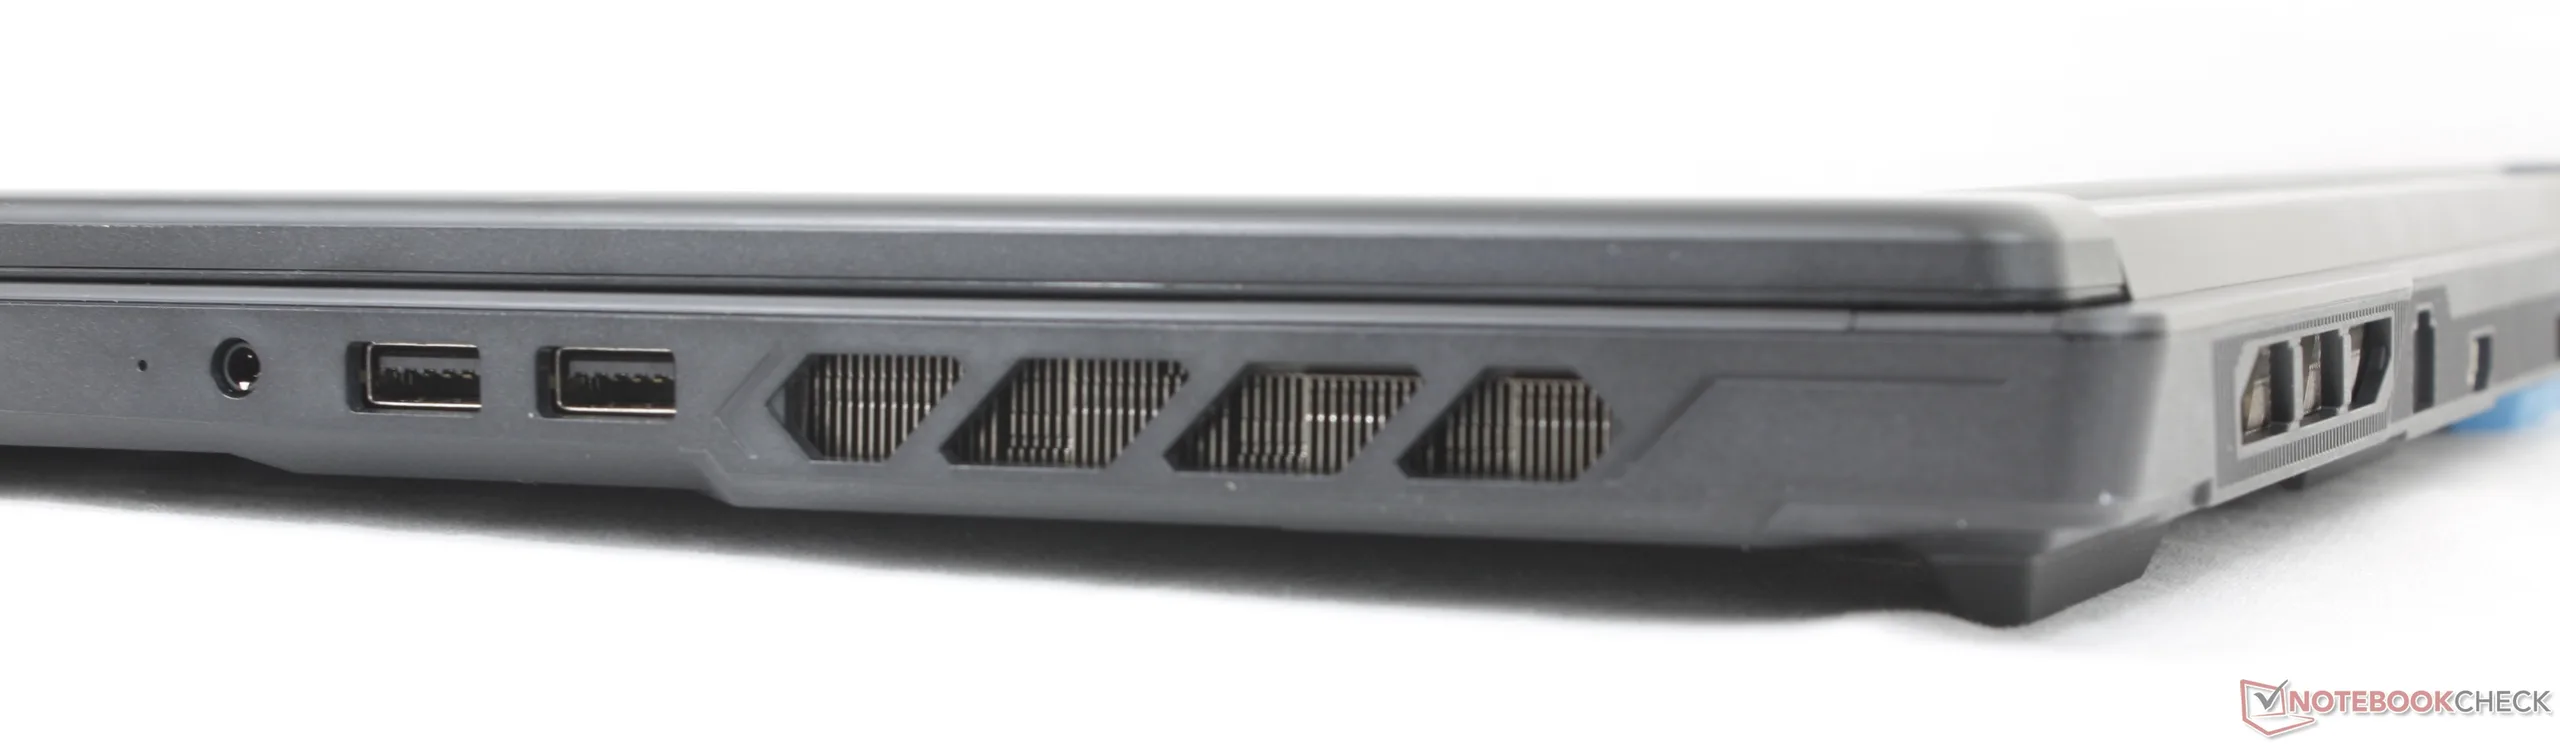
Connectivité
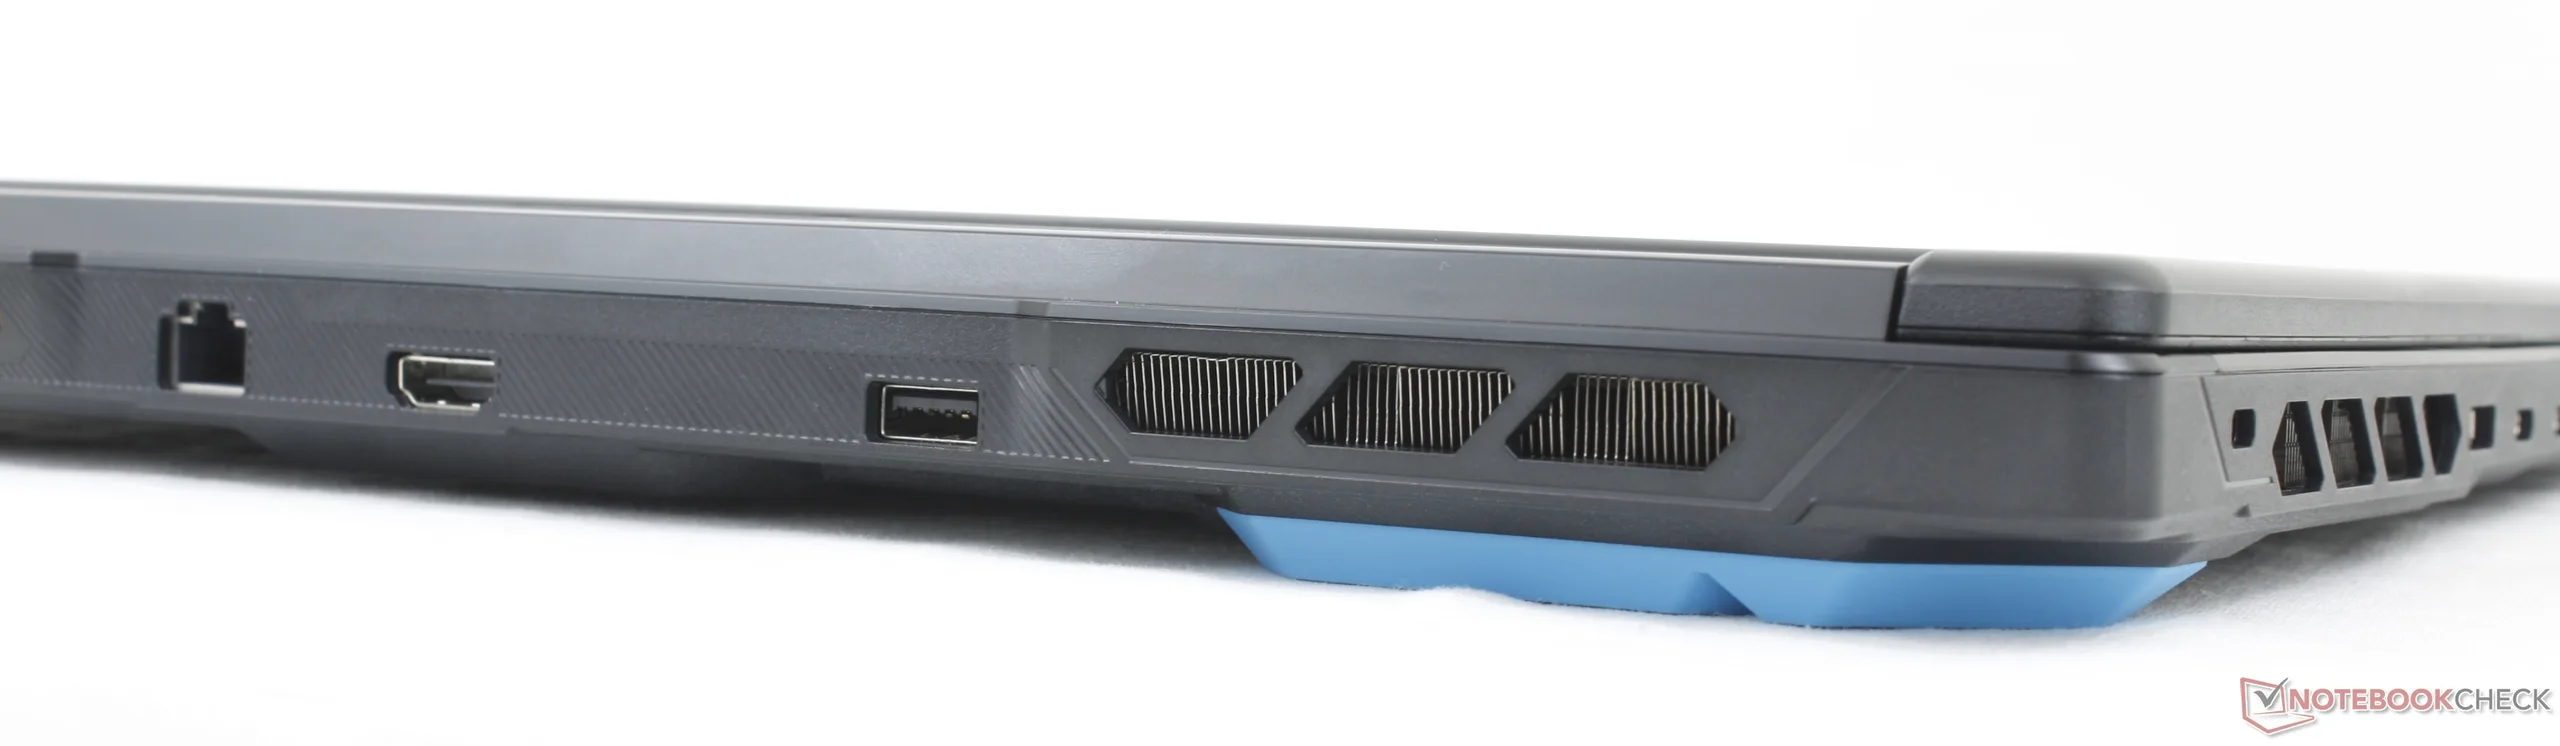
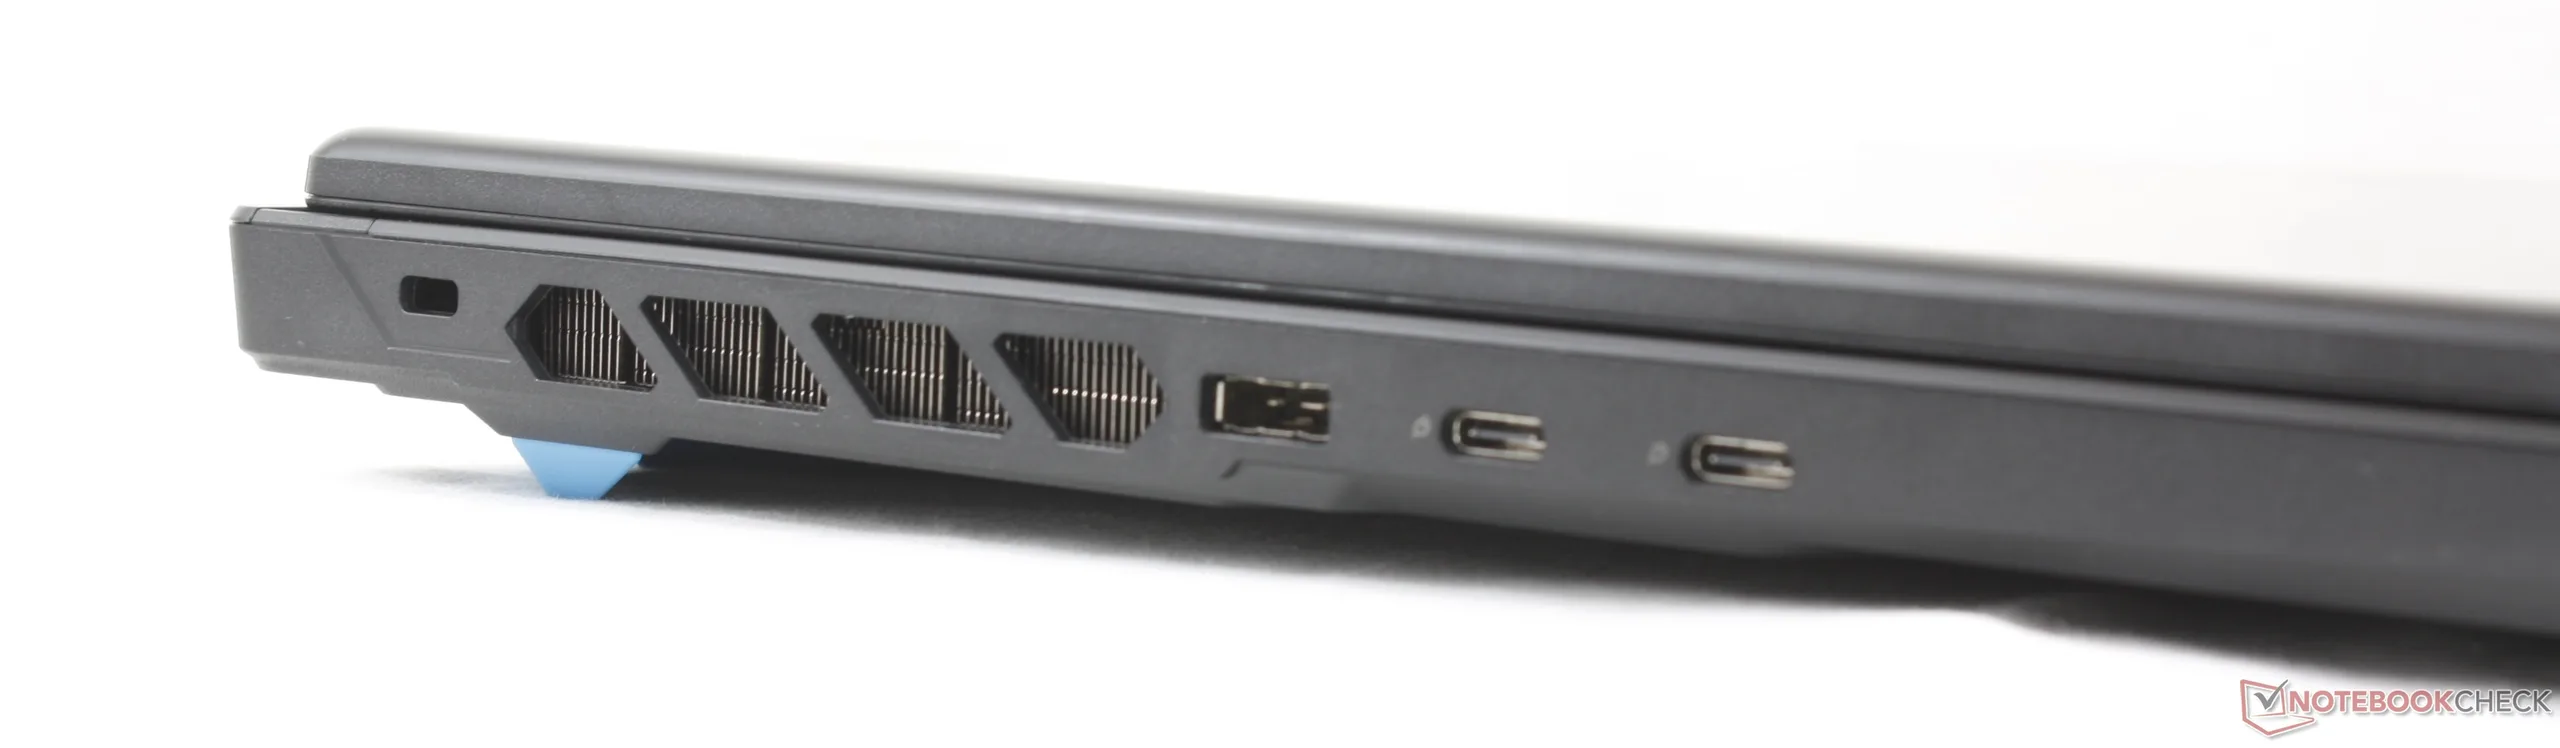
Communication
Webcam


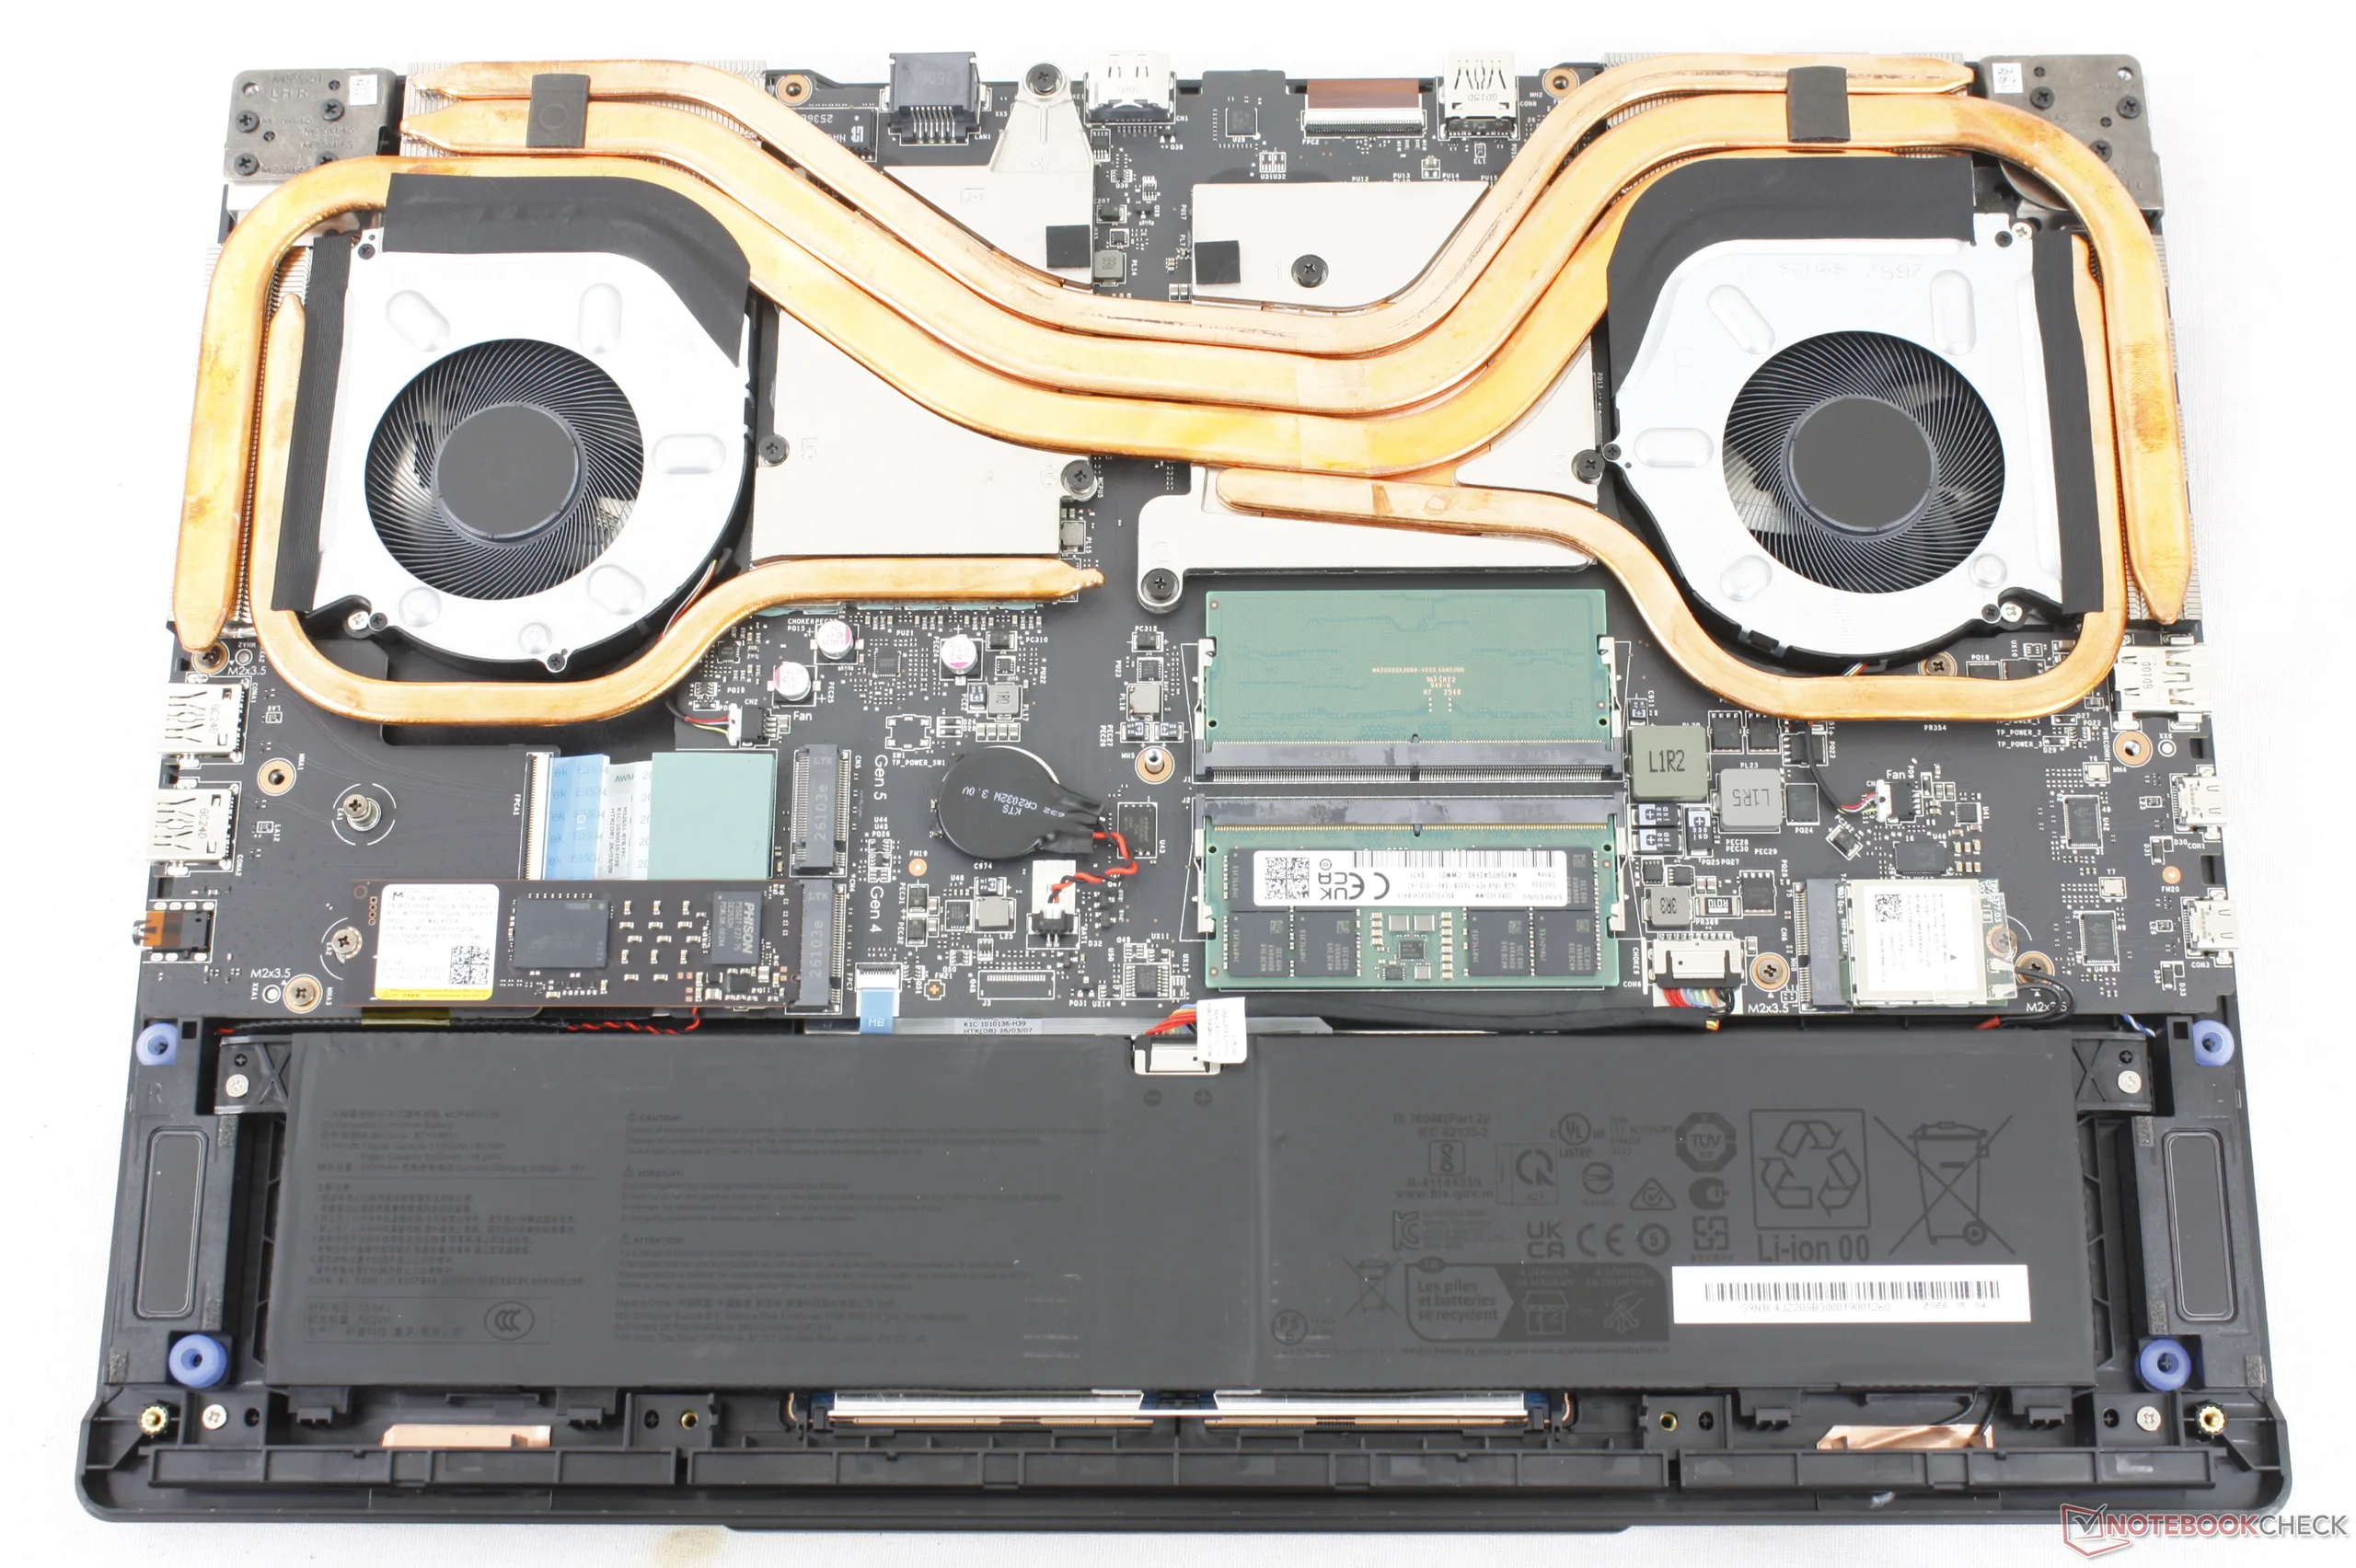
Maintenance

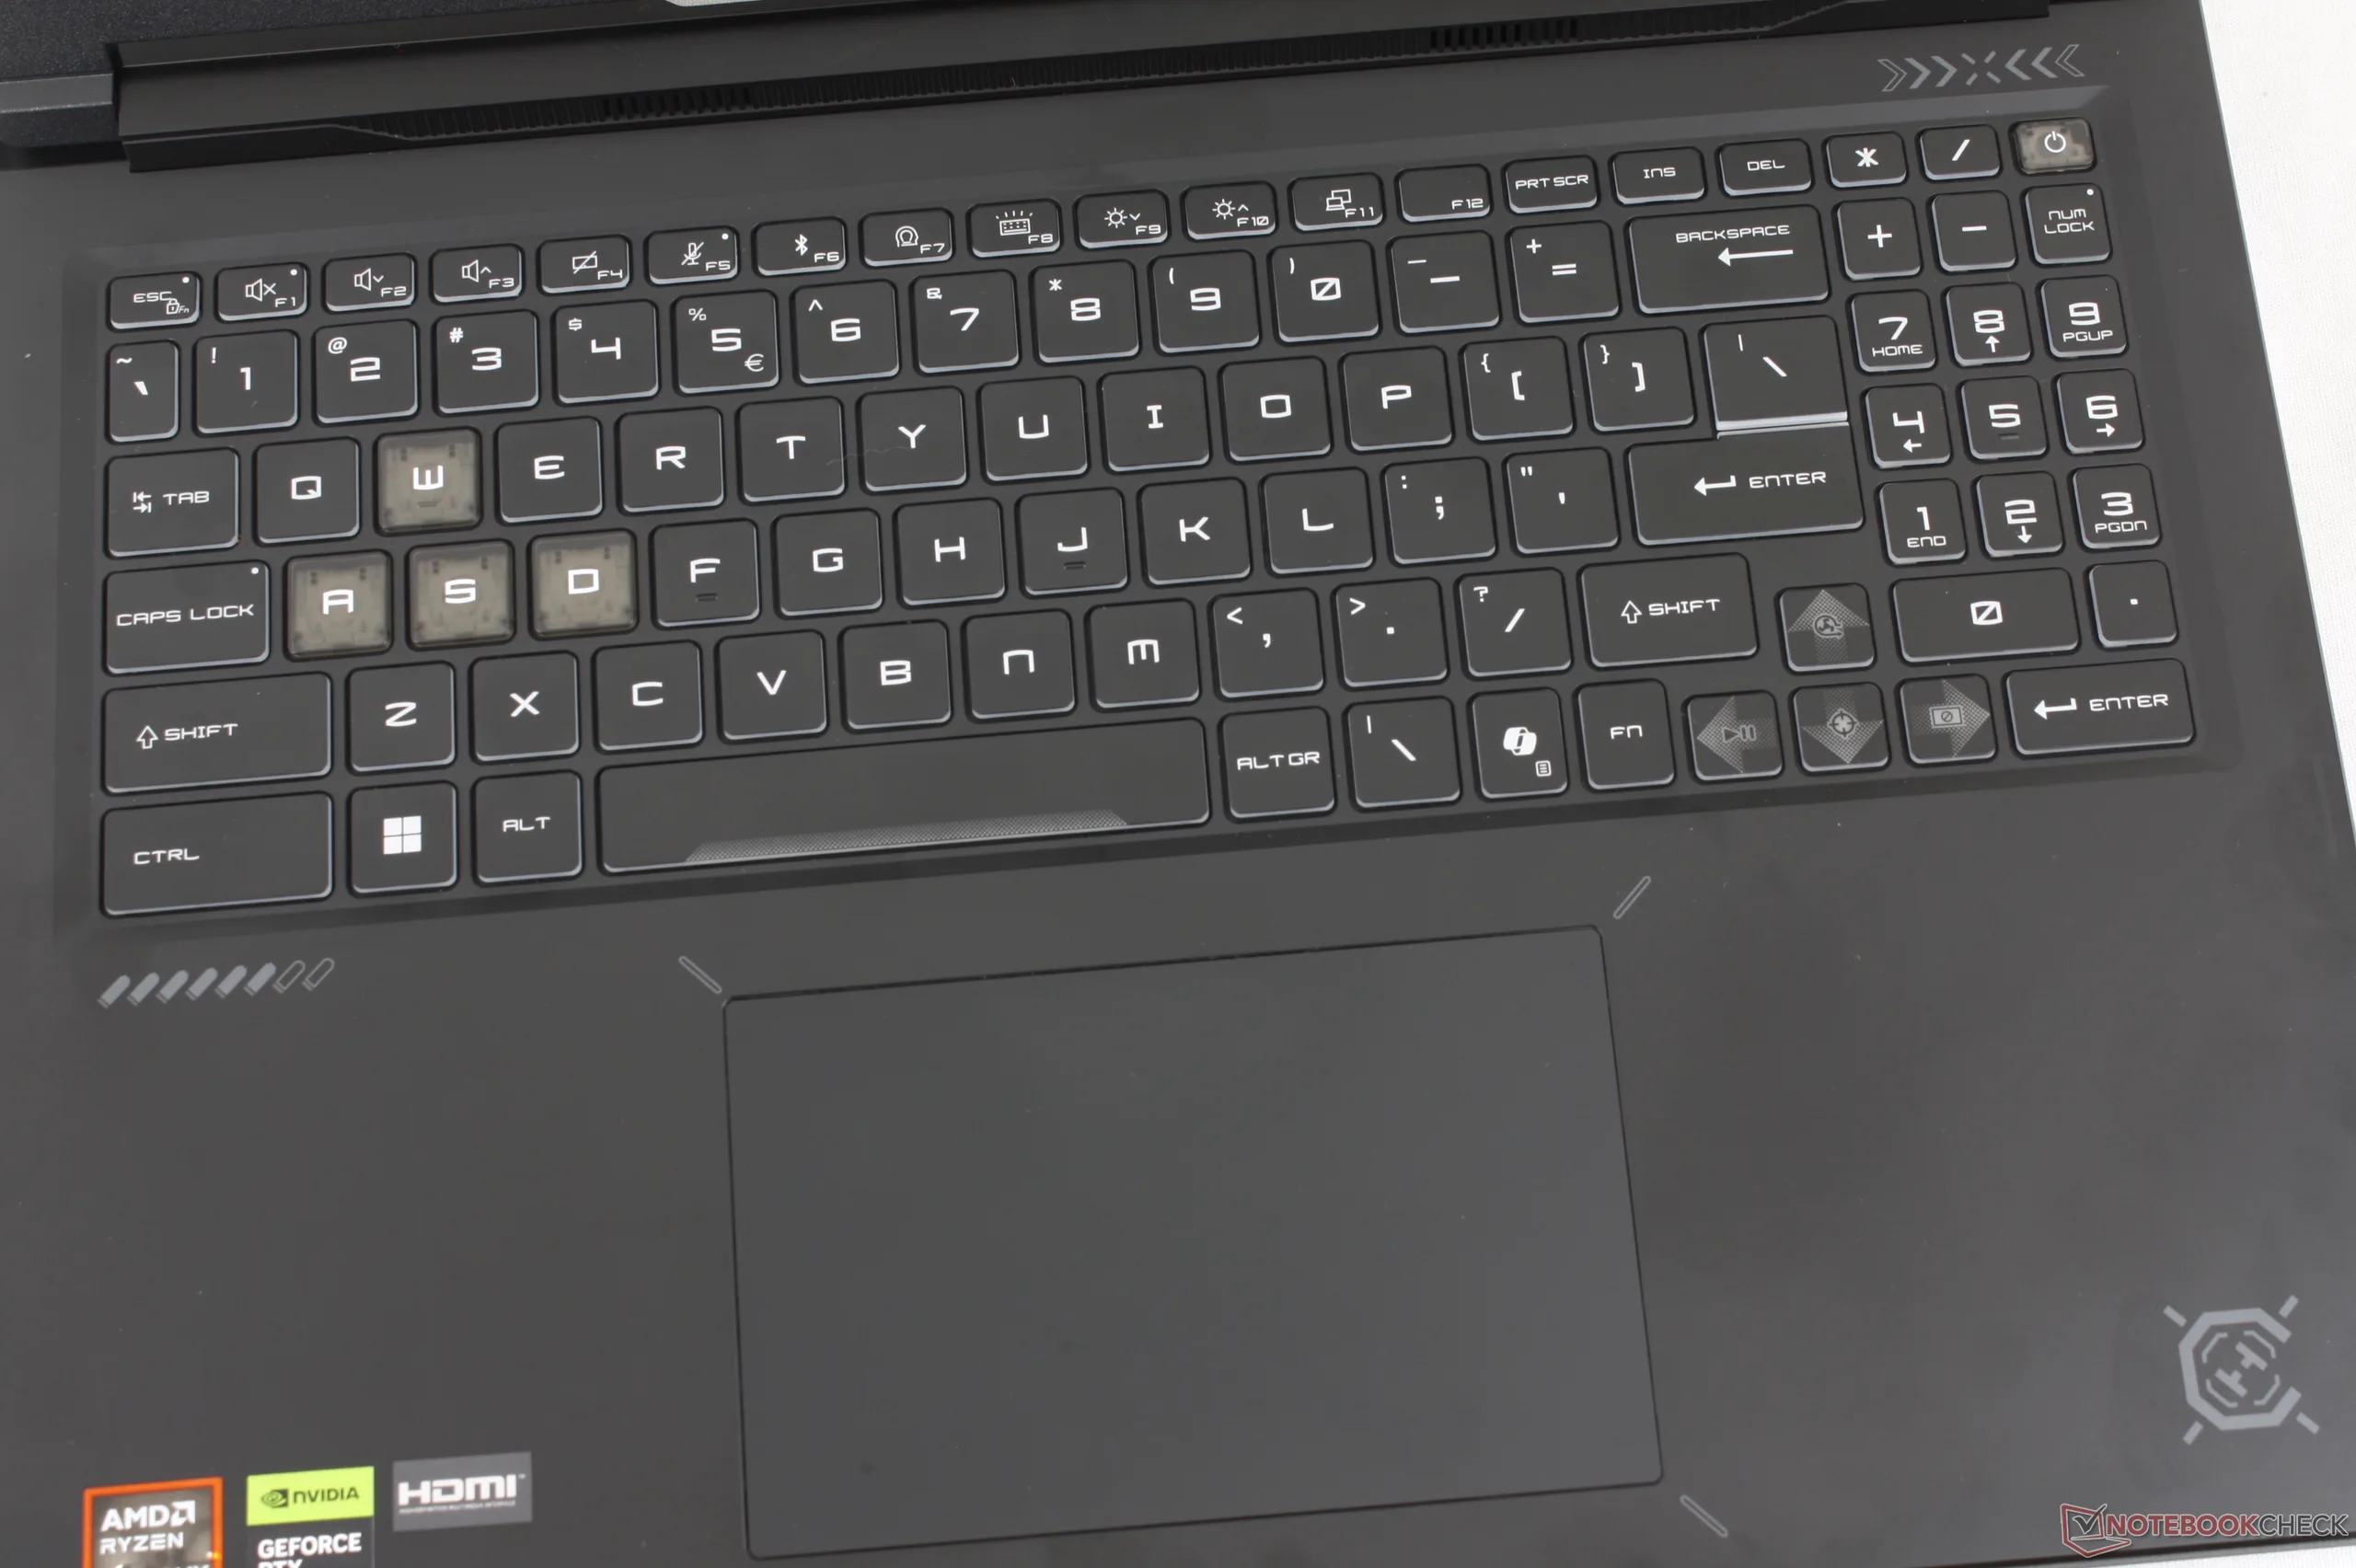
Périphériques de saisie
Affichage
Ce modèle utilise la même dalle IPS B160QAN02.3 d'AU Optronics que celle équipant le Crosshair 16 HX AI à processeur Intel.


| |||||||||||||||||||||||||
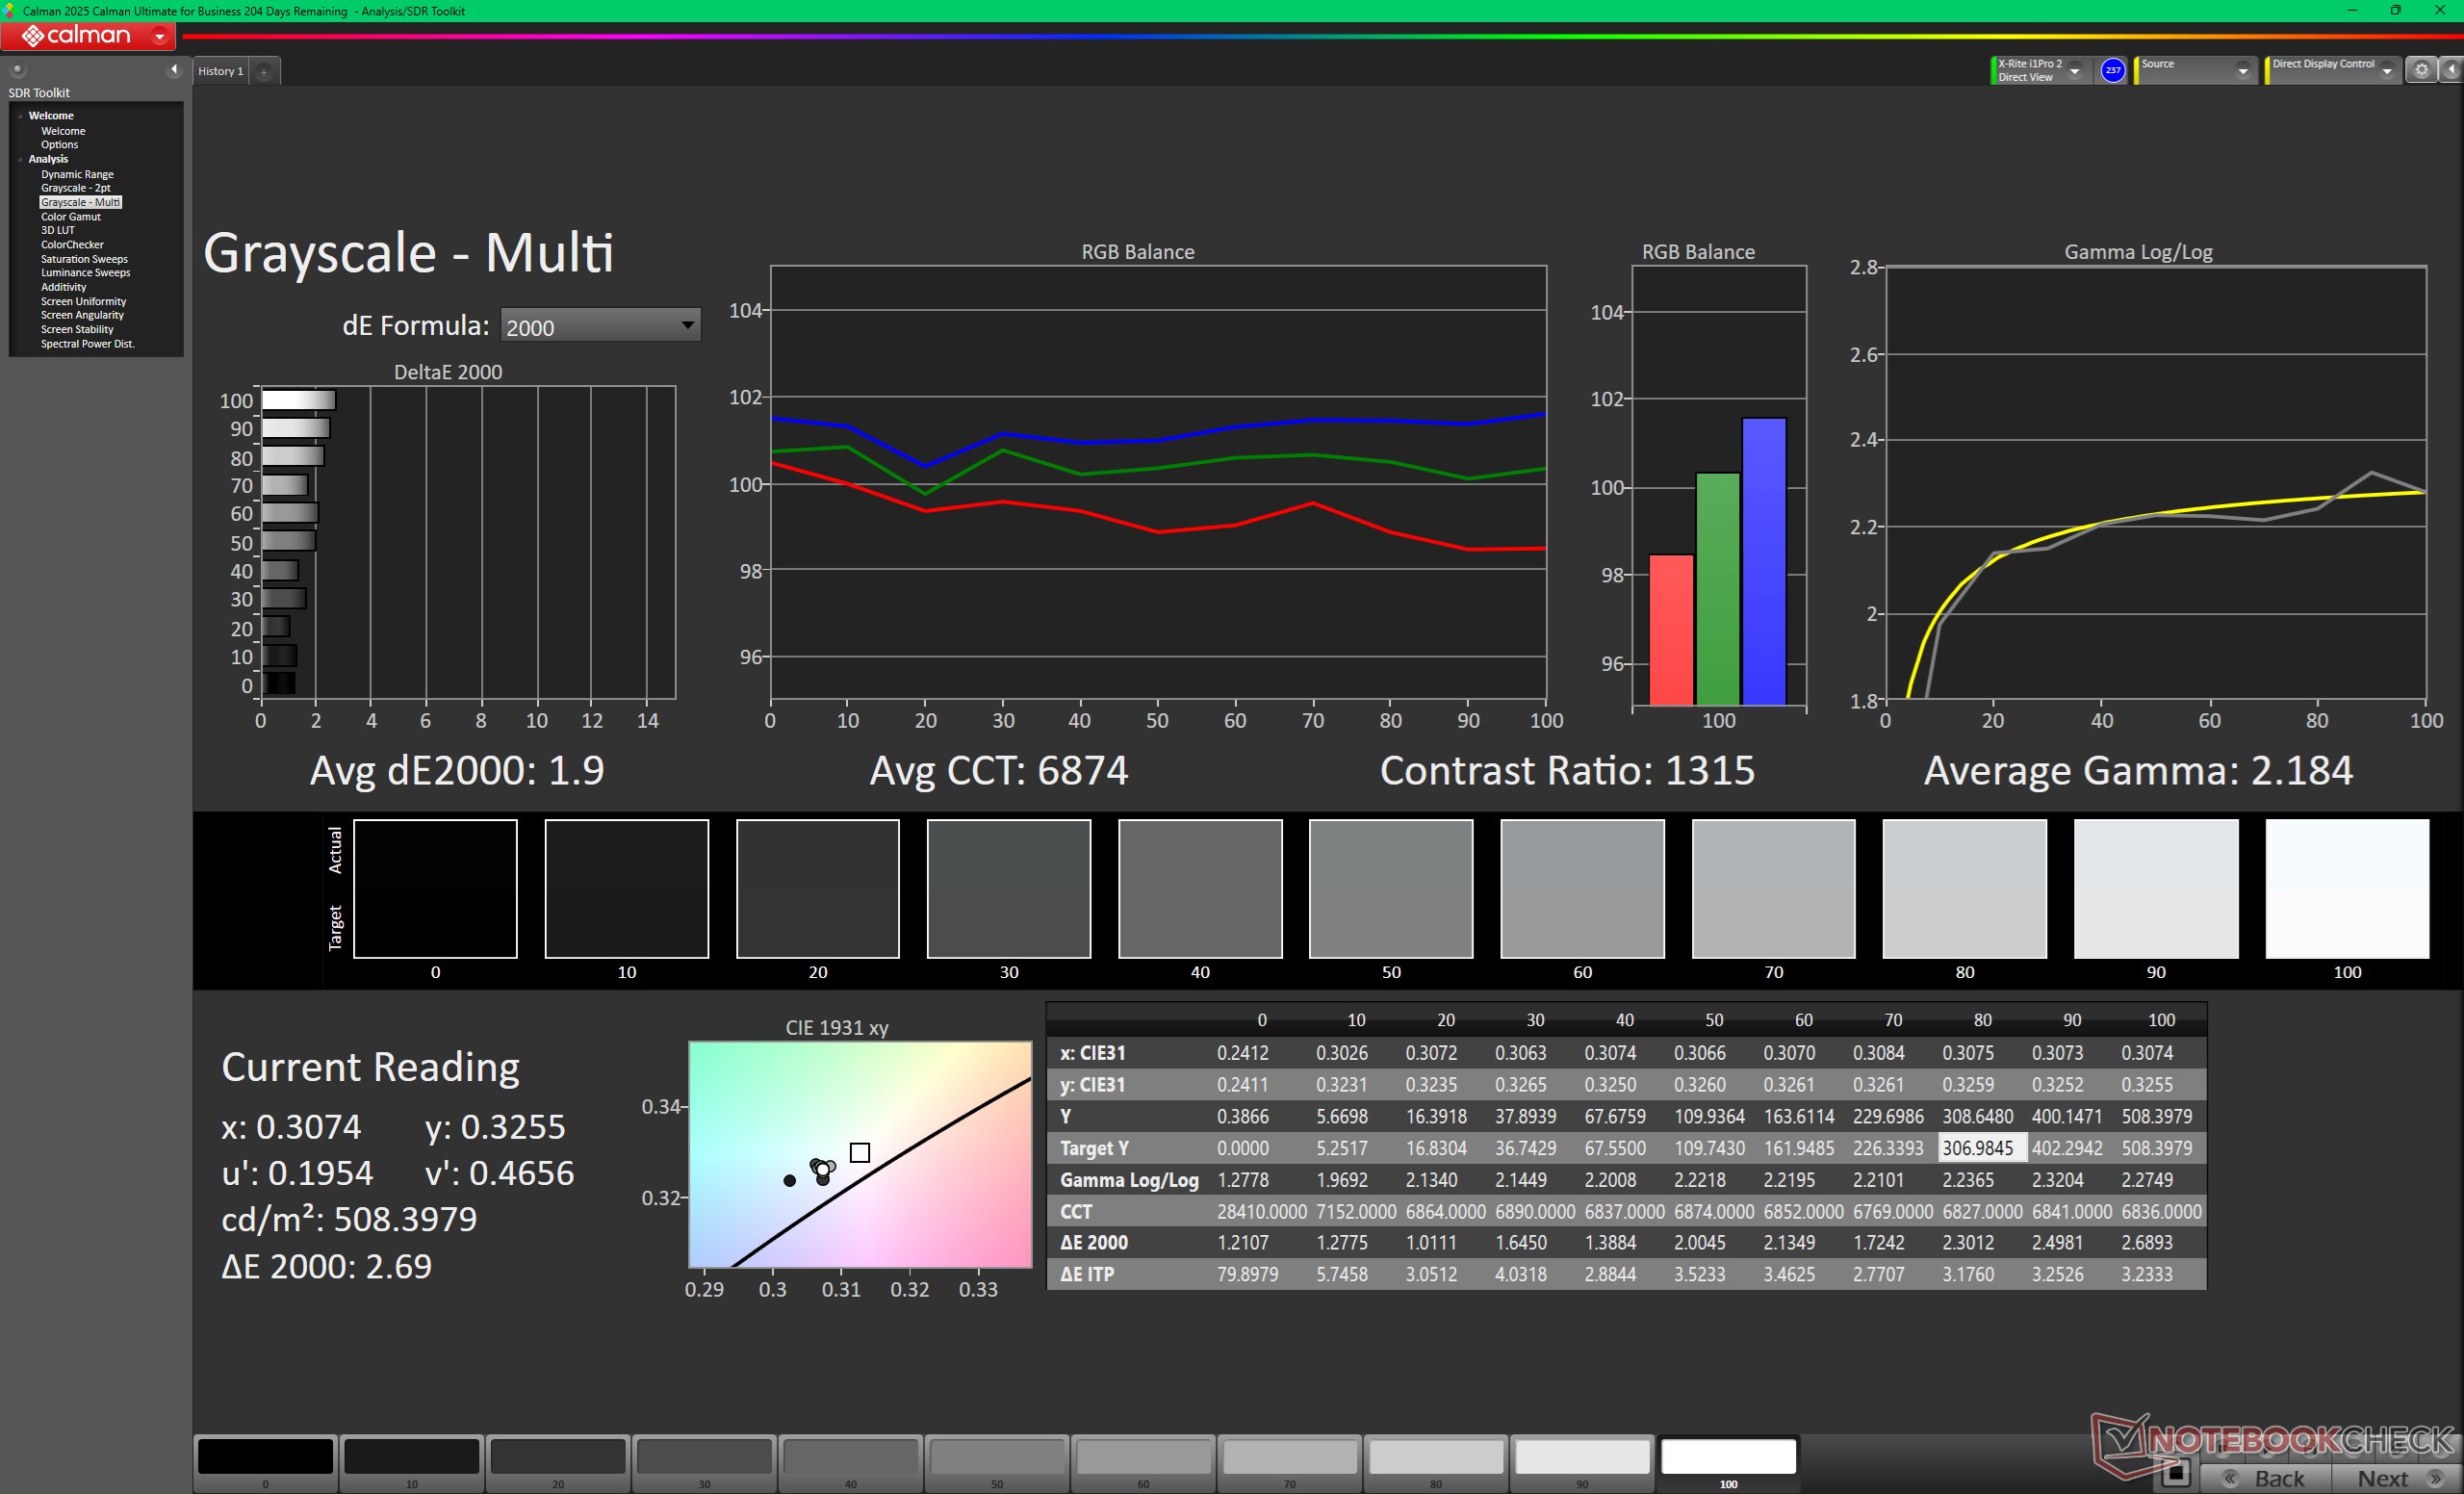
Homogénéité de la luminosité: 89 %
Valeur mesurée au centre, sur batterie: 512.4 cd/m²
Contraste: 1314:1 (Valeurs des noirs: 0.39 cd/m²)
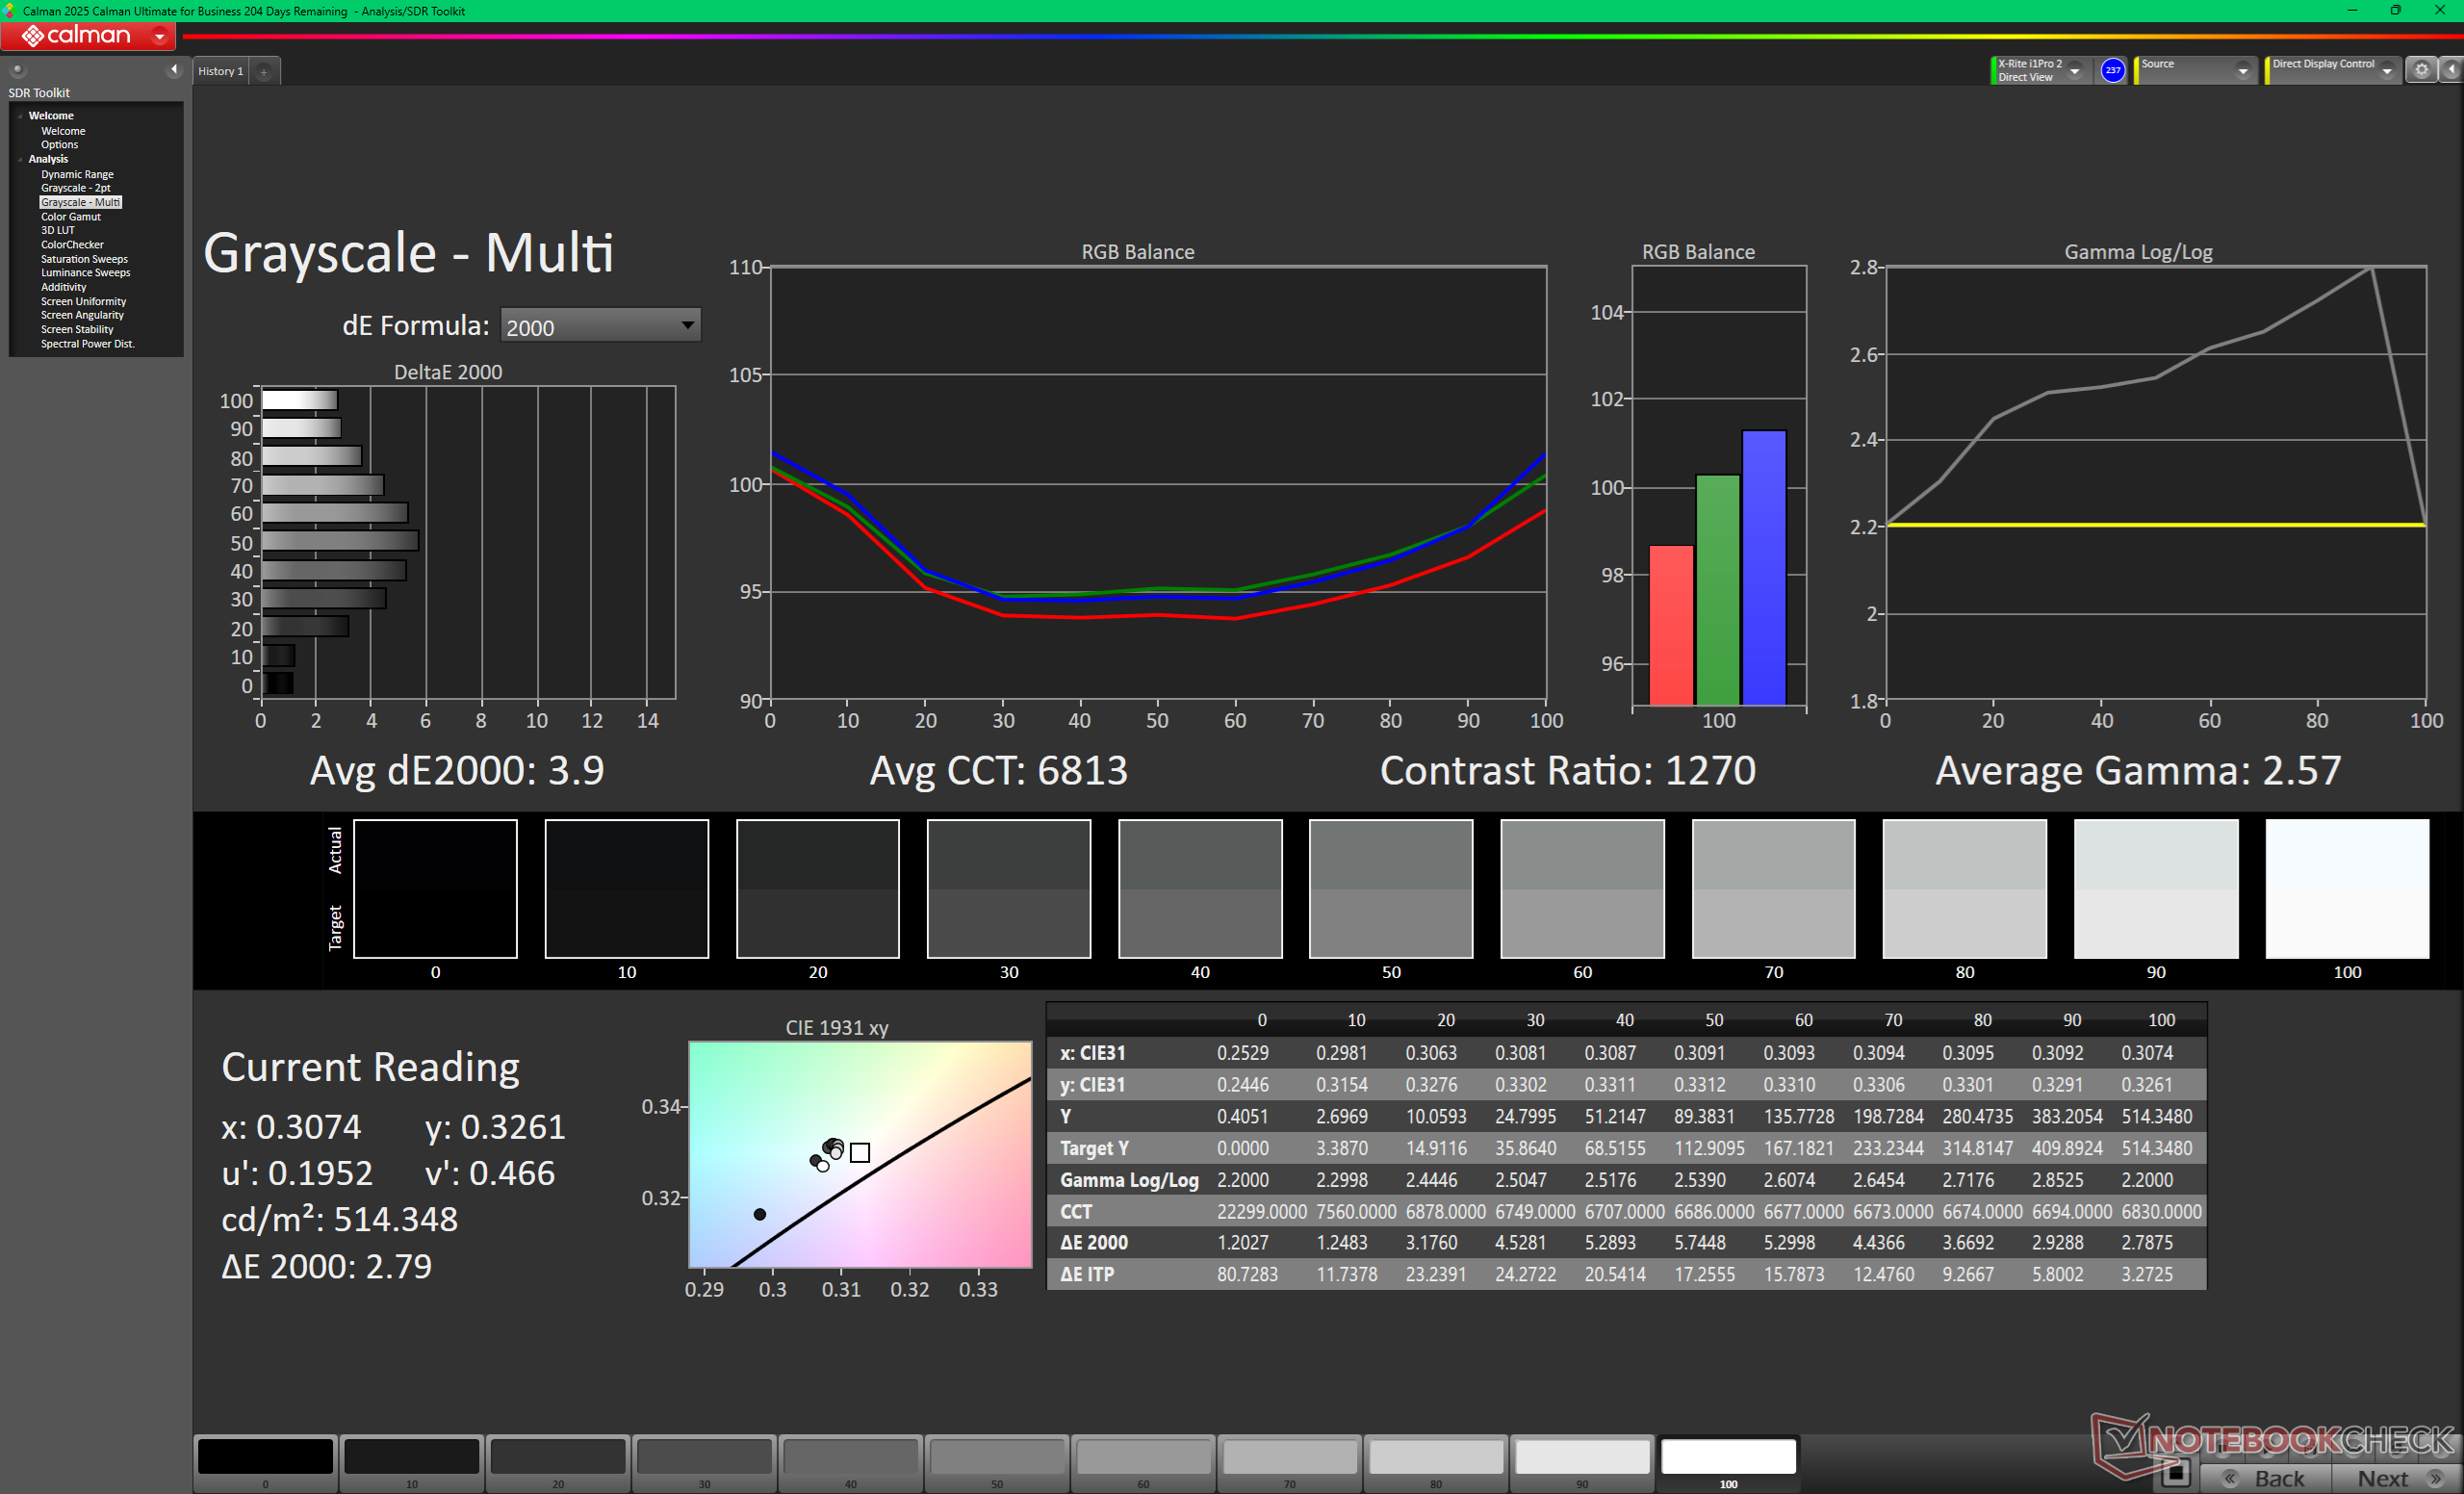
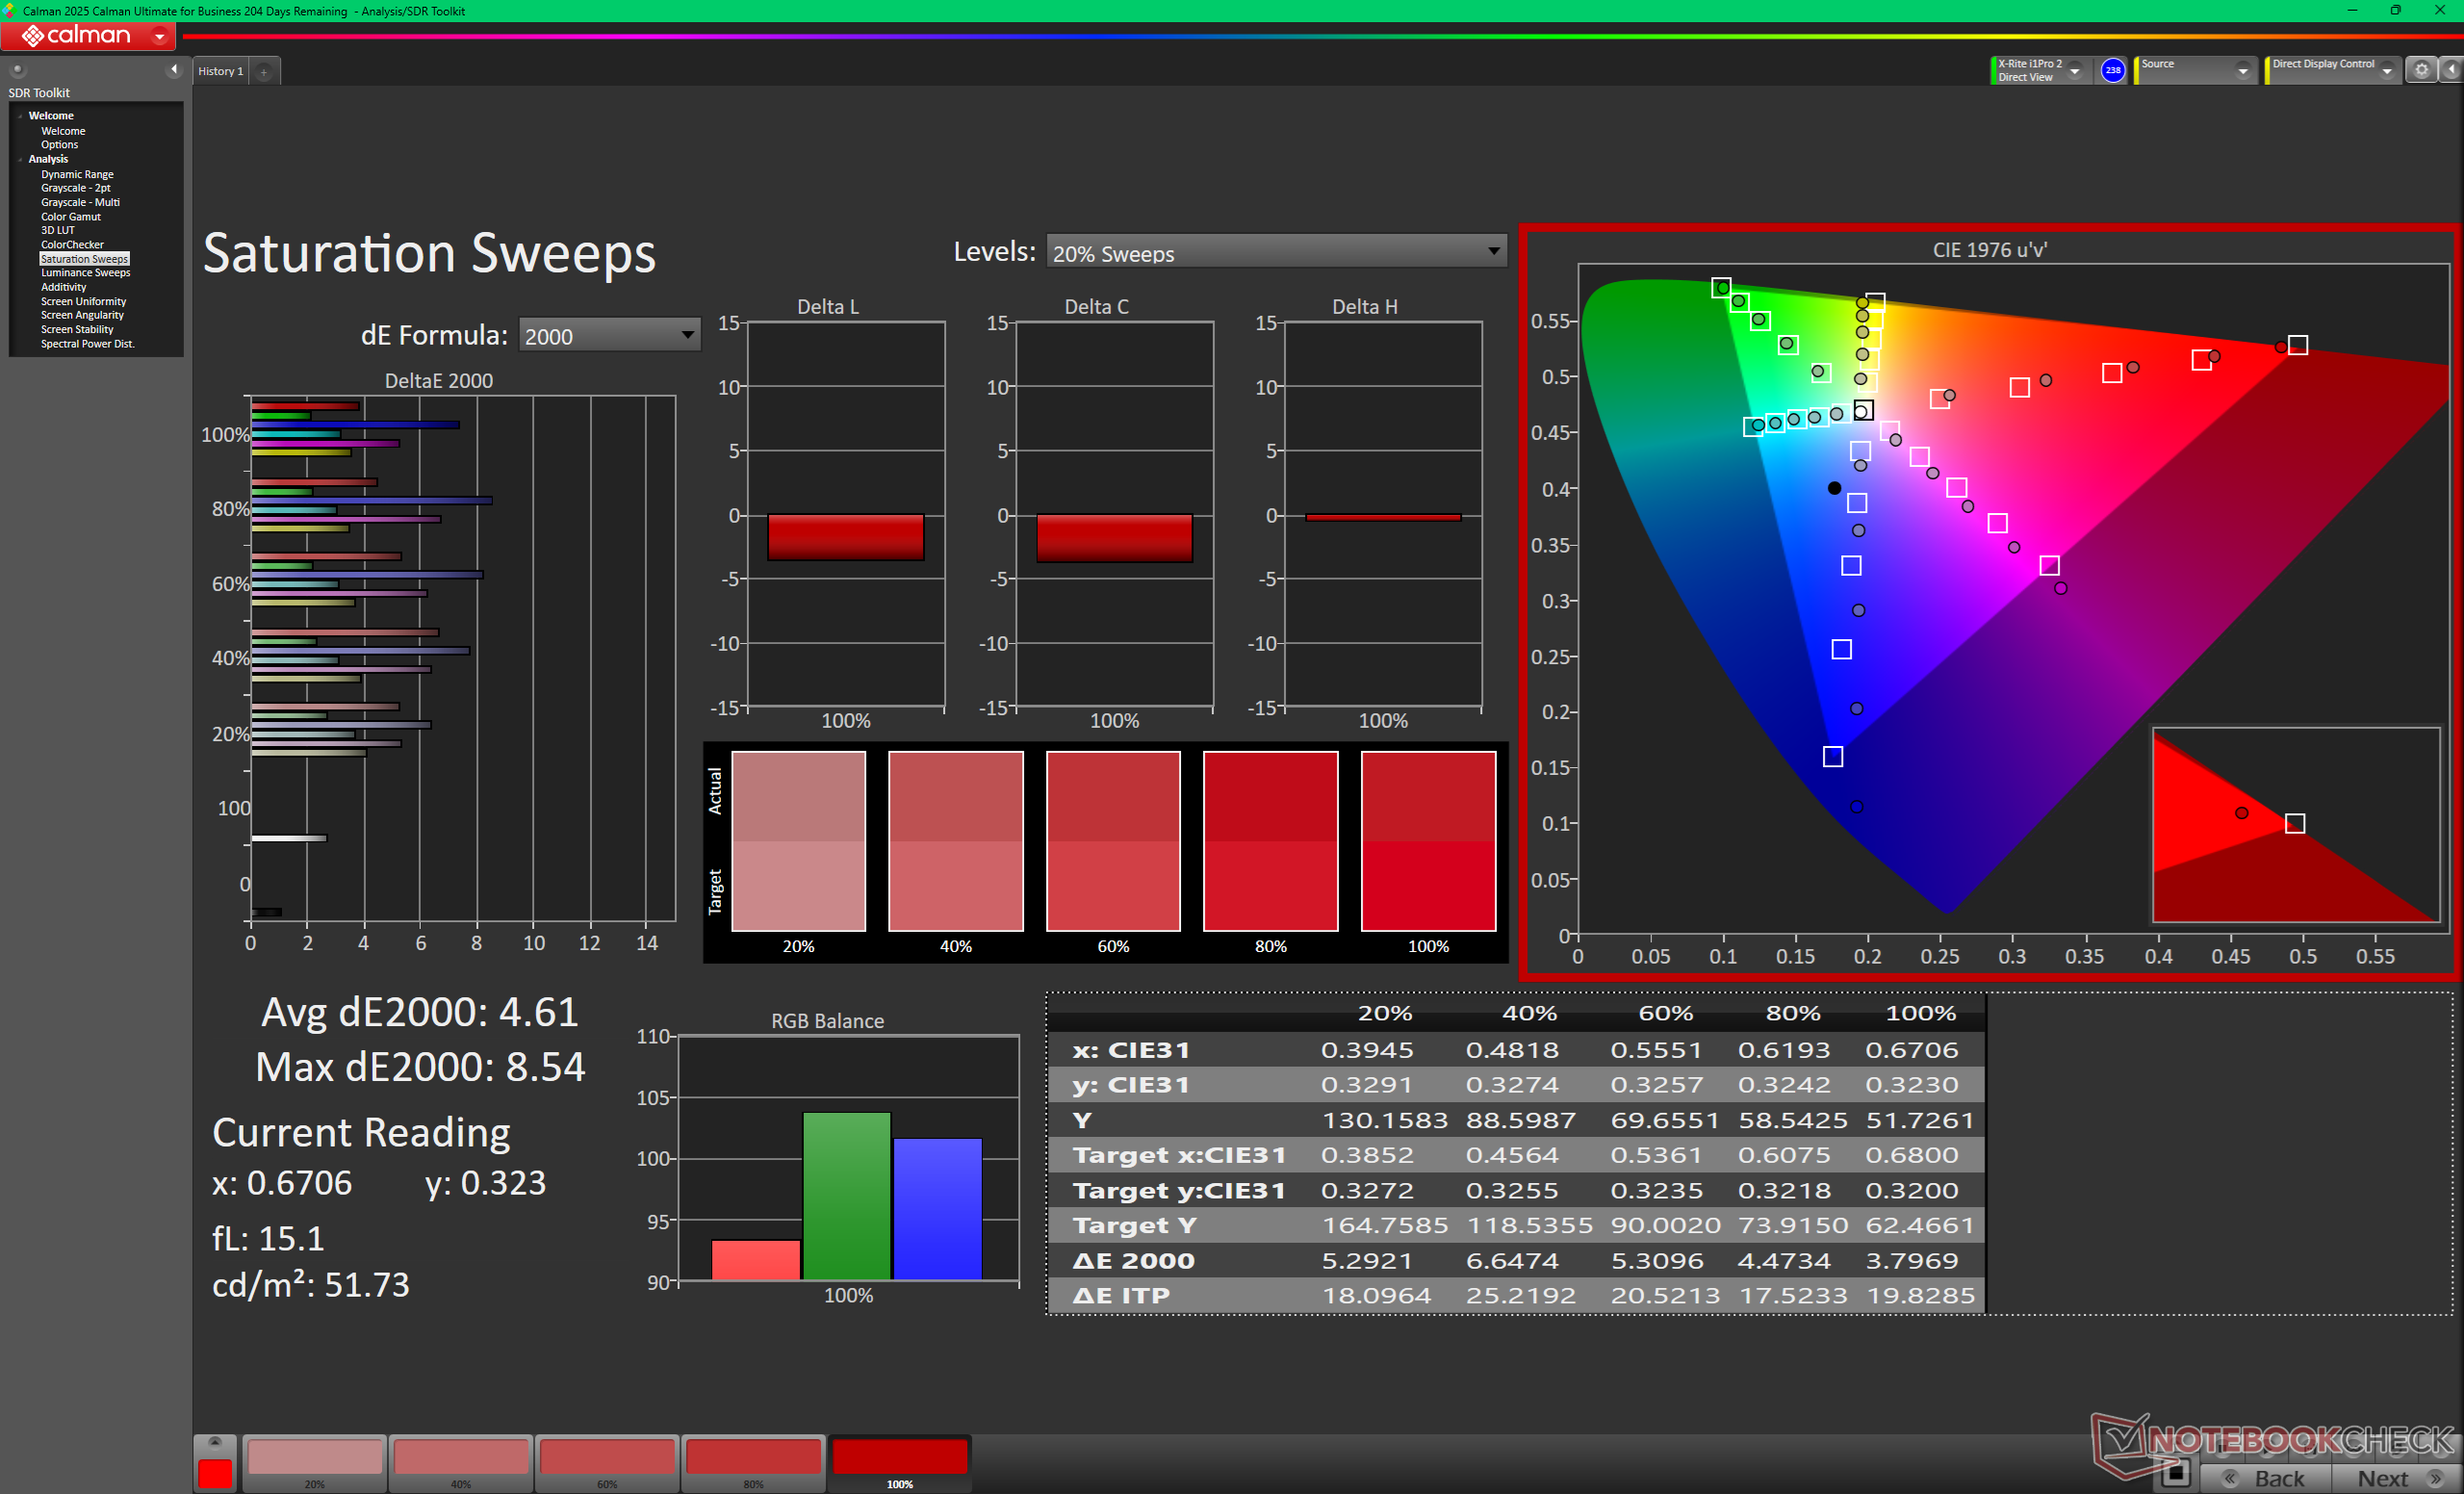
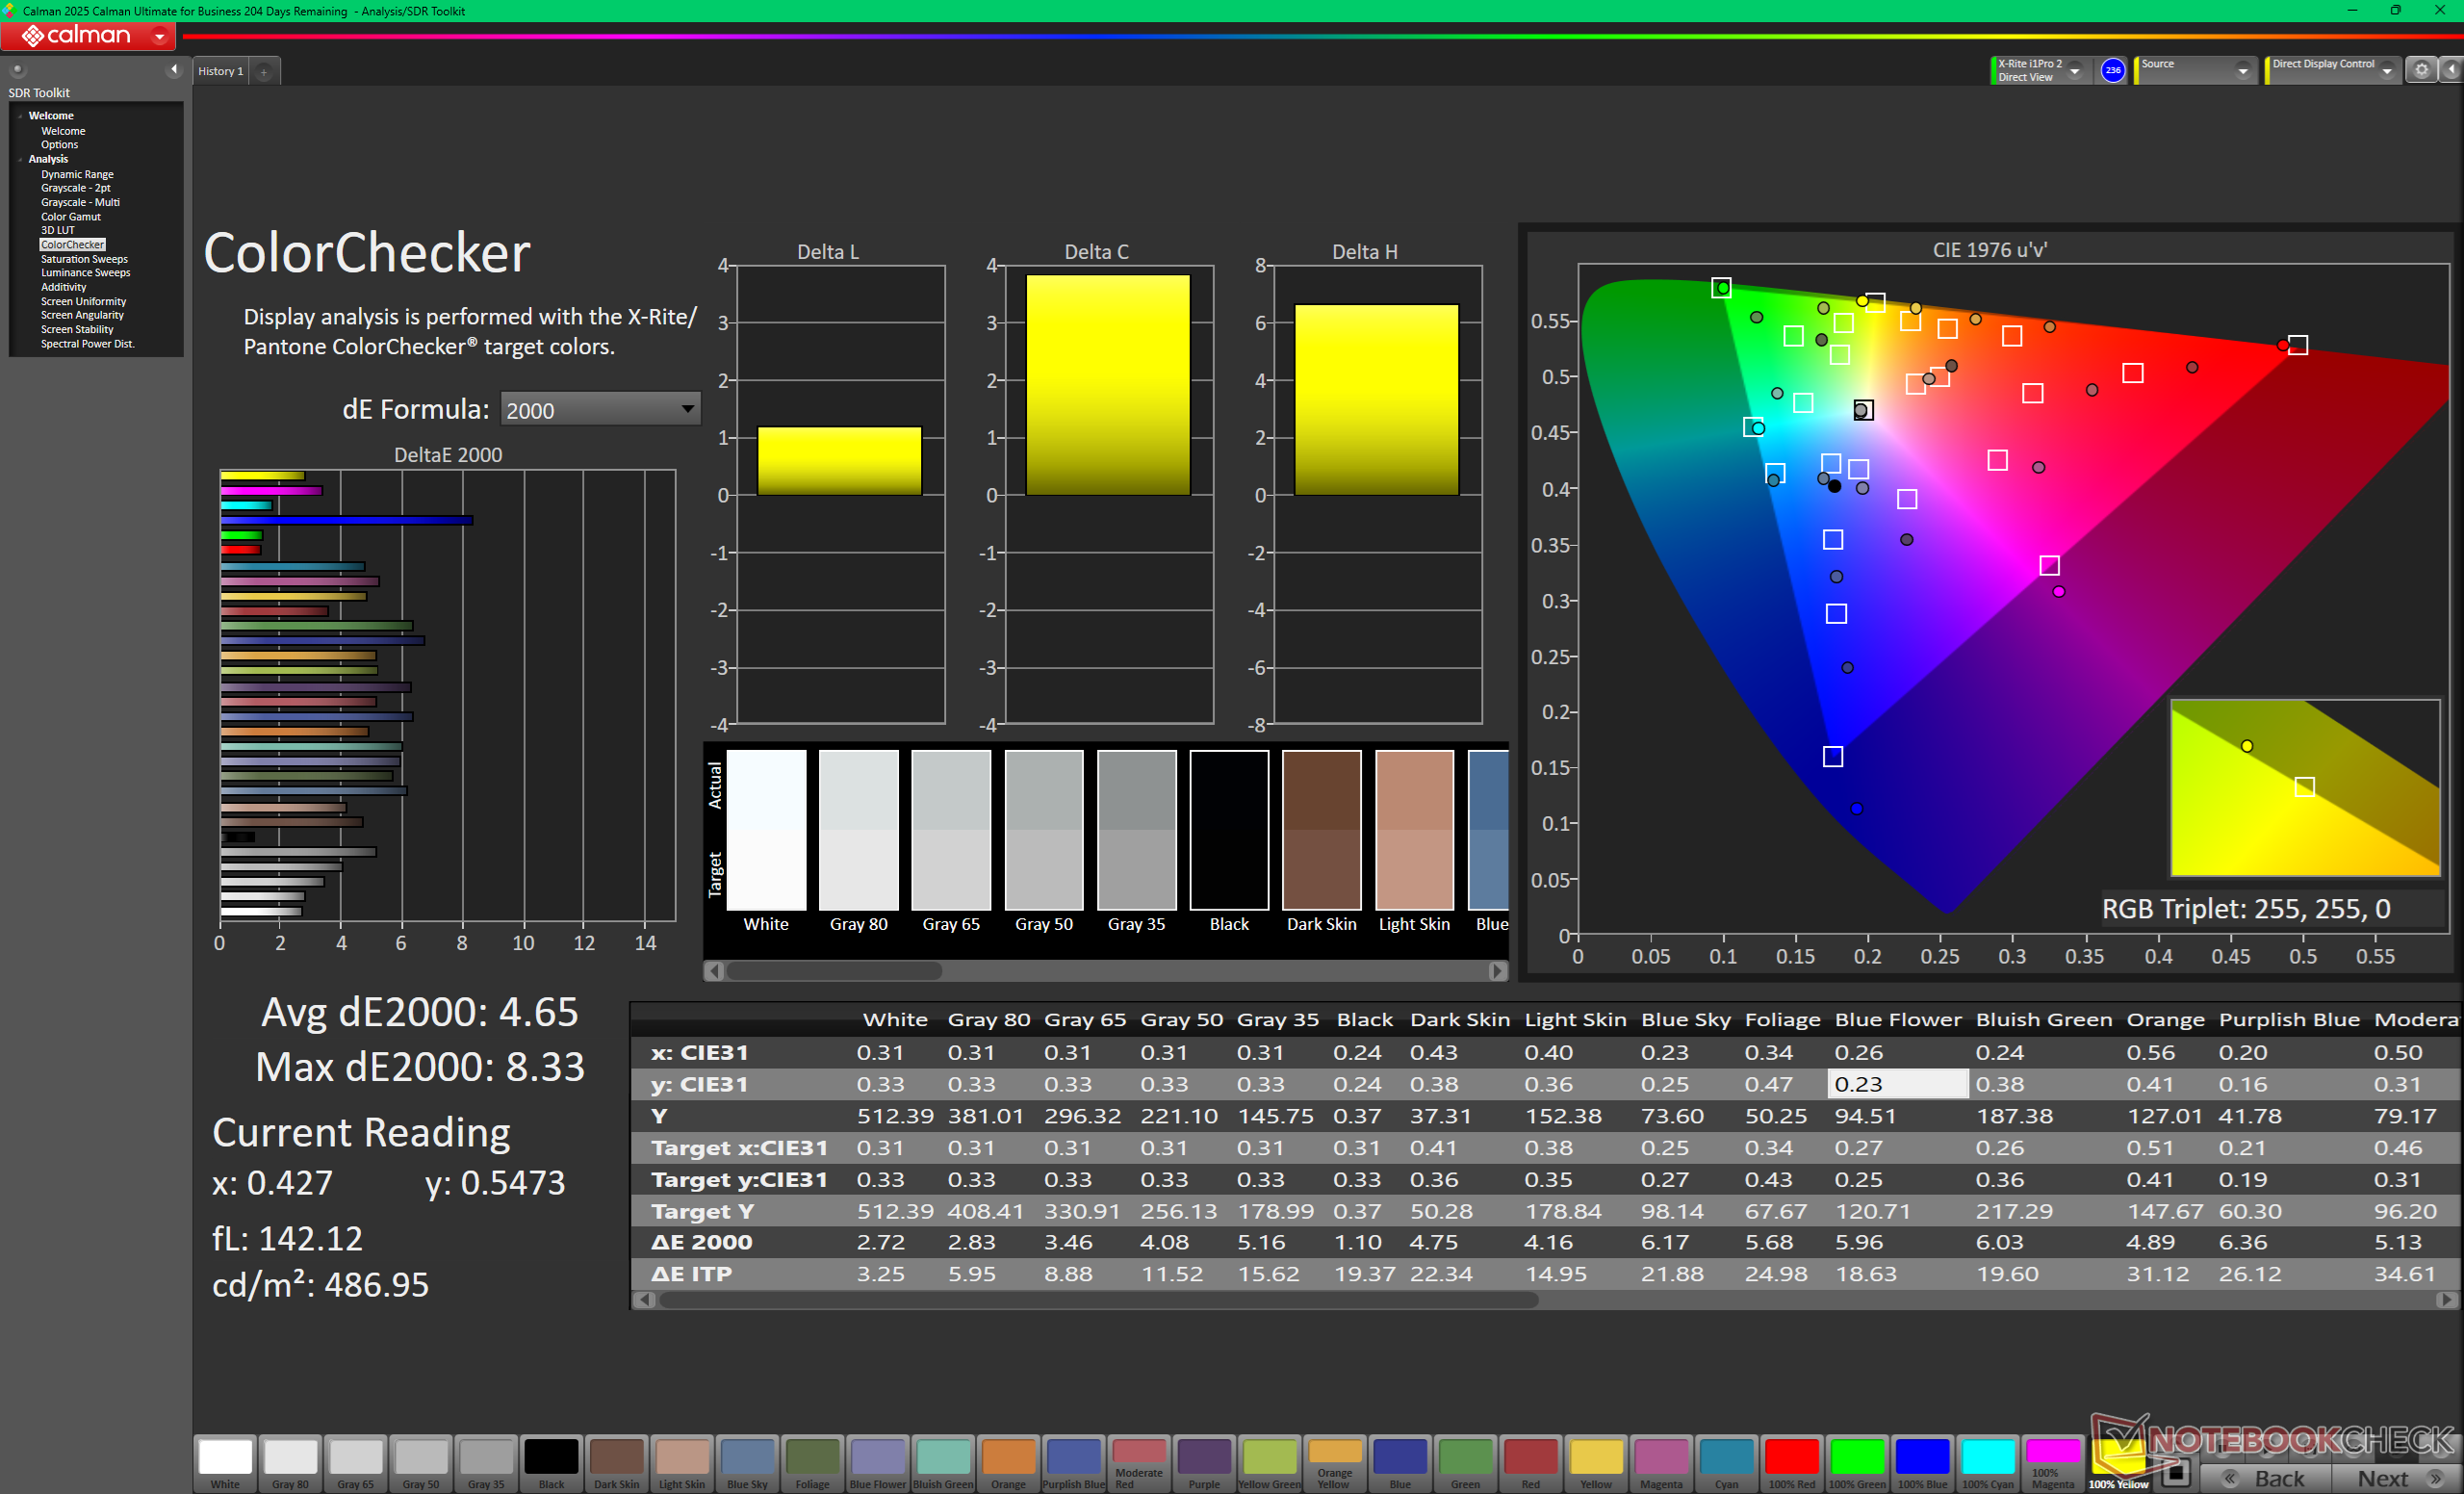
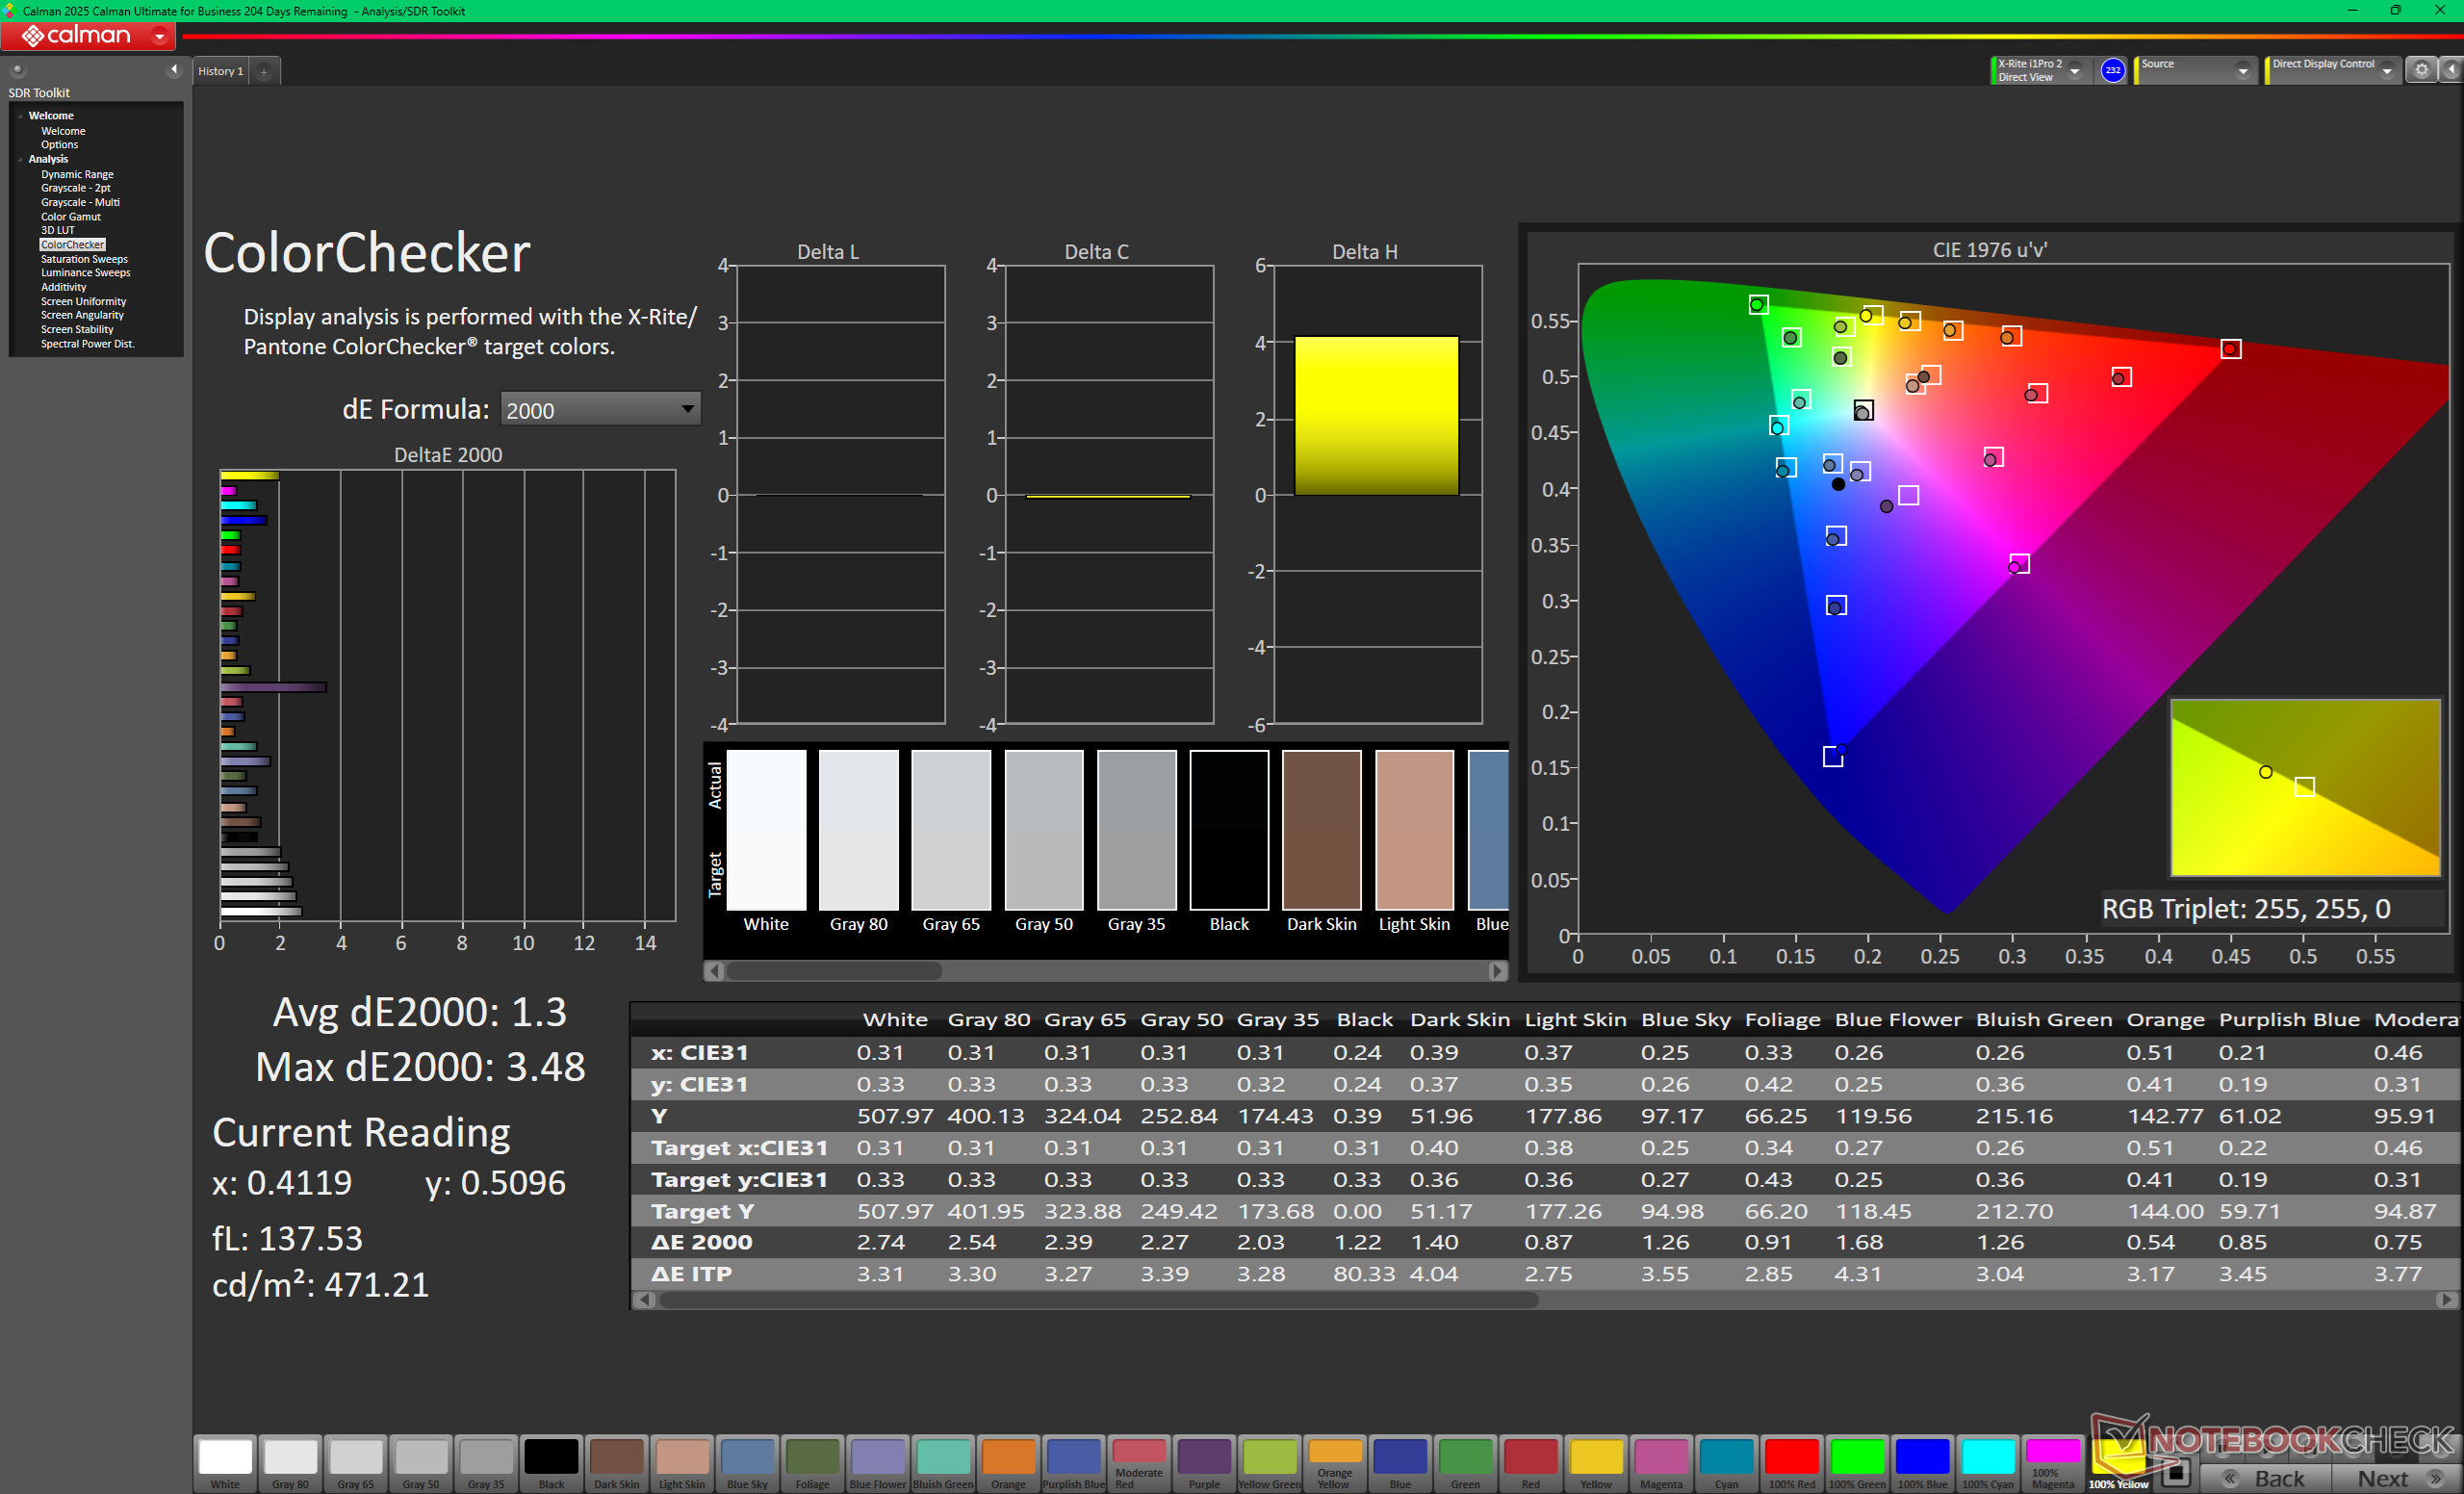
ΔE ColorChecker Calman: 4.65 | ∀{0.5-29.43 Ø4.72}
calibrated: 1.3
ΔE Greyscale Calman: 3.9 | ∀{0.09-98 Ø4.97}
83.1% AdobeRGB 1998 (Argyll 3D)
99.6% sRGB (Argyll 3D)
94.9% Display P3 (Argyll 3D)
Gamma: 2.57
CCT: 6813 K
| MSI Crosshair A16 HX E8WGK AU Optronics B160QAN02.3, IPS, 2560x1600, 16", 240 Hz | MSI Crosshair 16 HX AI D2XWGKG AUO B160QAN02.3, IPS, 2560x1600, 16", 240 Hz | Alienware 16X Aurora Core Ultra 9 290HX Plus Samsung 160HU05, OLED, 2560x1600, 16", 240 Hz | Lenovo Legion 7 16 AGP11 ATNA60HU02-0, OLED, 2560x1600, 16", 240 Hz | Gigabyte Gaming A16 Pro GA6DH (Core 7 240H, RTX 5070 Ti) BOE0D86 (NS160QDM-NY3), IPS, 2560x1600, 16", 165 Hz | Acer Predator Helios Neo 16S AI PHN16S-71-94L9 Samsung ATNA60DL03-0, OLED, 2560x1600, 16", 240 Hz | |
|---|---|---|---|---|---|---|
| Display | 1% | 6% | 5% | -13% | 7% | |
| Display P3 Coverage (%) | 94.9 | 95.5 1% | 99.6 5% | 99.2 5% | 72.5 -24% | 99.9 5% |
| sRGB Coverage (%) | 99.6 | 99.7 0% | 100 0% | 100 0% | 99.3 0% | 100 0% |
| AdobeRGB 1998 Coverage (%) | 83.1 | 83.9 1% | 93.9 13% | 90.2 9% | 70.4 -15% | 96.5 16% |
| Response Times | 19% | 94% | 82% | -7% | 96% | |
| Response Time Grey 50% / Grey 80% * (ms) | 4.2 ? | 3.59 ? 15% | 0.29 ? 93% | 1.41 ? 66% | 6.8 ? -62% | 0.2 ? 95% |
| Response Time Black / White * (ms) | 9.2 ? | 7.09 ? 23% | 0.45 ? 95% | 0.25 ? 97% | 4.8 ? 48% | 0.25 ? 97% |
| PWM Frequency (Hz) | 1439.8 ? | 1440 ? | 960 | |||
| PWM Amplitude * (%) | 29 | 44 | 50 | |||
| Screen | -24% | 15% | 242% | 18% | 97% | |
| Brightness middle (cd/m²) | 512.4 | 472 -8% | 380.5 -26% | 499 -3% | 517 1% | 390 -24% |
| Brightness (cd/m²) | 476 | 438 -8% | 384 -19% | 502 5% | 490 3% | 394 -17% |
| Brightness Distribution (%) | 89 | 88 -1% | 98 10% | 98 10% | 92 3% | 98 10% |
| Black Level * (cd/m²) | 0.39 | 0.4 -3% | 0.02 95% | 0.39 -0% | 0.04 90% | |
| Contrast (:1) | 1314 | 1180 -10% | 24950 1799% | 1326 1% | 9750 642% | |
| Colorchecker dE 2000 * | 4.65 | 6.07 -31% | 3.27 30% | 2.5 46% | 1.62 65% | 1.61 65% |
| Colorchecker dE 2000 max. * | 8.33 | 9.76 -17% | 6.31 24% | 7.8 6% | 3.52 58% | 3.49 58% |
| Colorchecker dE 2000 calibrated * | 1.3 | 2.25 -73% | 1.1 15% | 1.62 -25% | 1.59 -22% | |
| Greyscale dE 2000 * | 3.9 | 6.4 -64% | 1 74% | 4.7 -21% | 1.85 53% | 1.2 69% |
| Gamma | 2.57 86% | 2.52 87% | 2.23 99% | 2.21 100% | 2.36 93% | 2.235 98% |
| CCT | 6813 95% | 7987 81% | 6410 101% | 6715 97% | 6596 99% | 6580 99% |
| Moyenne finale (programmes/paramètres) | -1% /
-13% | 38% /
26% | 110% /
163% | -1% /
8% | 67% /
77% |
* ... Moindre est la valeur, meilleures sont les performances
Temps de réponse de l'écran
| ↔ Temps de réponse noir à blanc | ||
|---|---|---|
| 9.2 ms ... hausse ↗ et chute ↘ combinées | ↗ 4.9 ms hausse | 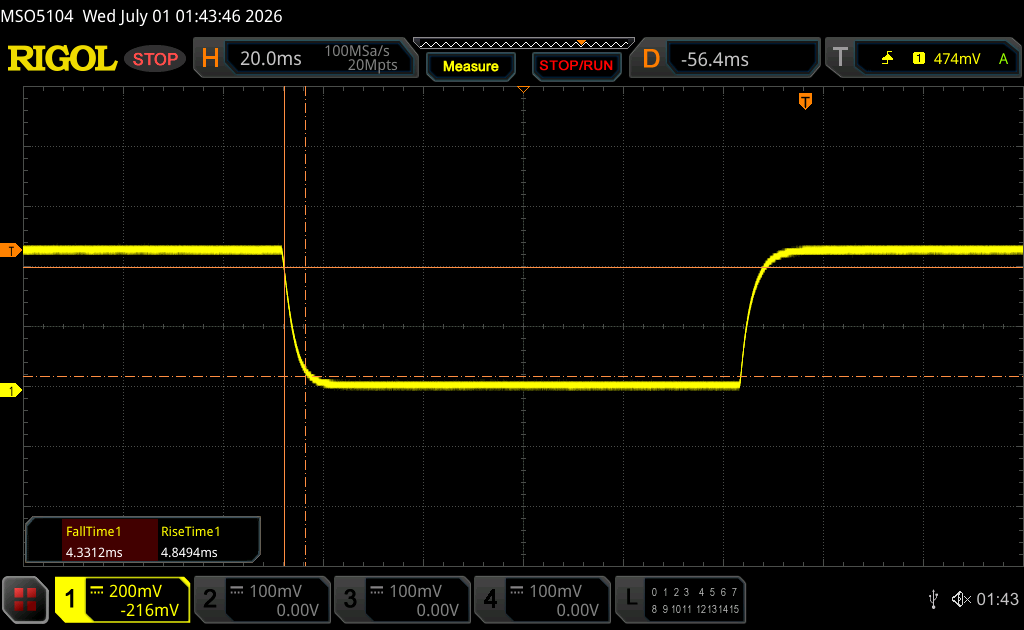 |
| ↘ 4.3 ms chute | ||
| L'écran montre de faibles temps de réponse, un bon écran pour jouer. En comparaison, tous les appareils testés affichent entre 0.1 (minimum) et 240 (maximum) ms. » 26 % des appareils testés affichent de meilleures performances. Cela signifie que les latences relevées sont meilleures que la moyenne (19.8 ms) de tous les appareils testés. | ||
| ↔ Temps de réponse gris 50% à gris 80% | ||
| 4.2 ms ... hausse ↗ et chute ↘ combinées | ↗ 1.8 ms hausse | 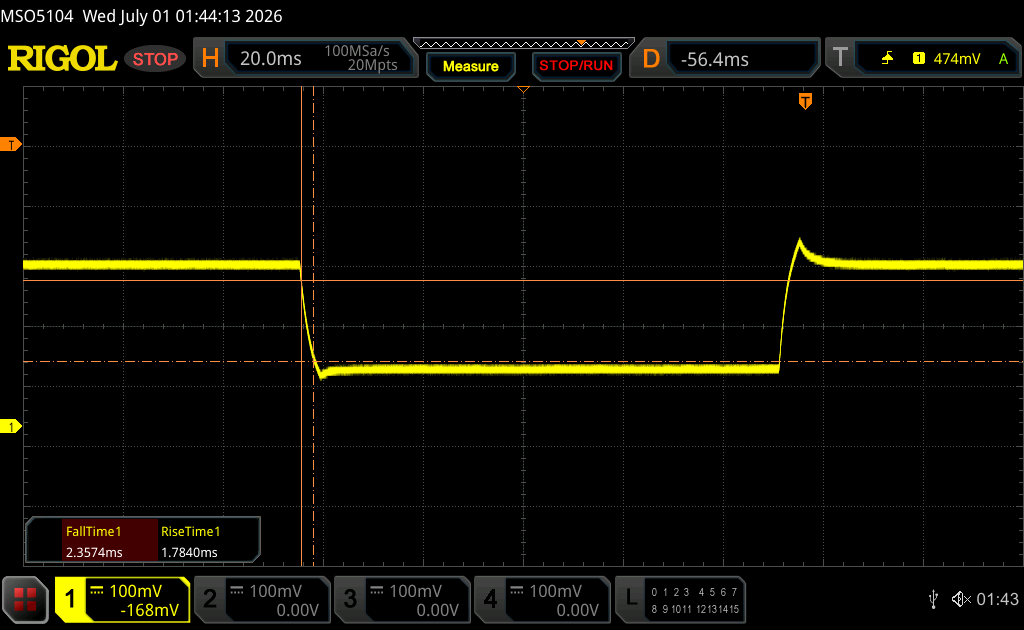 |
| ↘ 2.4 ms chute | ||
| L'écran montre de très faibles temps de réponse, parfait pour le jeu. En comparaison, tous les appareils testés affichent entre 0.165 (minimum) et 636 (maximum) ms. » 16 % des appareils testés affichent de meilleures performances. Cela signifie que les latences relevées sont meilleures que la moyenne (31 ms) de tous les appareils testés. | ||
Scintillement / MLI (Modulation de largeur d'impulsion)
| Scintillement / MLI (Modulation de largeur d'impulsion) non décelé | 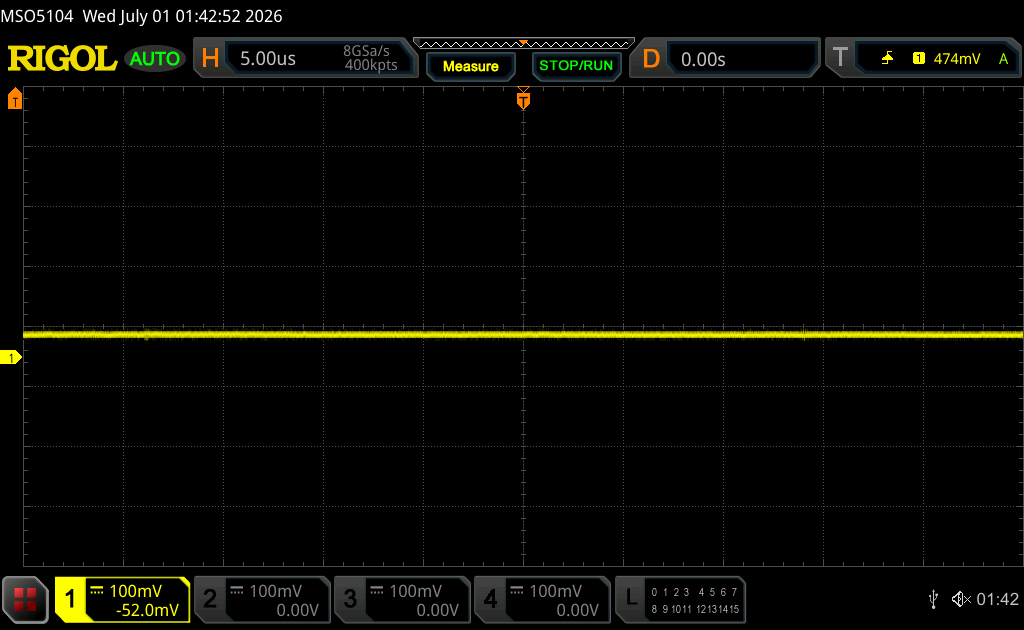 | ||
En comparaison, 52 % des appareils testés n'emploient pas MDI pour assombrir leur écran. Nous avons relevé une moyenne à 7772 (minimum : 5 - maximum : 343500) Hz dans le cas où une MDI était active. | |||
Performances
Conditions d'essai
Le système est préréglé en mode « Performance », le mode « Apex » étant activé. Nous avons également configuré le système en mode « dGPU » avant d'exécuter les tests de performance ci-dessous.
Performances du processeur
Cinebench R15 Multi Loop
Cinebench R23: Multi Core | Single Core
Cinebench R20: CPU (Multi Core) | CPU (Single Core)
Cinebench R15: CPU Multi 64Bit | CPU Single 64Bit
Blender: v2.79 BMW27 CPU
7-Zip 18.03: 7z b 4 | 7z b 4 -mmt1
Geekbench 6.7: Multi-Core | Single-Core
Geekbench 5.5: Multi-Core | Single-Core
HWBOT x265 Benchmark v2.2: 4k Preset
LibreOffice : 20 Documents To PDF
R Benchmark 2.5: Overall mean
* ... Moindre est la valeur, meilleures sont les performances
AIDA64: FP32 Ray-Trace | FPU Julia | CPU SHA3 | CPU Queen | FPU SinJulia | FPU Mandel | CPU AES | CPU ZLib | FP64 Ray-Trace | CPU PhotoWorxx | CPU CheckMate
| Performance rating | |
| MSI Crosshair A16 HX E8WGK -1! | |
| Moyenne AMD Ryzen 9 8940HX | |
| Alienware 16X Aurora Core Ultra 9 290HX Plus -1! | |
| MSI Crosshair 16 HX AI D2XWGKG -1! | |
| Lenovo Legion 7 16 AGP11 -1! | |
| Acer Predator Helios Neo 16S AI PHN16S-71-94L9 -1! | |
| Gigabyte Gaming A16 Pro GA6DH (Core 7 240H, RTX 5070 Ti) -1! | |
| AIDA64 / FP32 Ray-Trace | |
| MSI Crosshair A16 HX E8WGK (v8.20.8100) | |
| Moyenne AMD Ryzen 9 8940HX (43311 - 53747, n=3) | |
| Lenovo Legion 7 16 AGP11 (v8.20.8100) | |
| MSI Crosshair 16 HX AI D2XWGKG (v6.92.6600) | |
| Alienware 16X Aurora Core Ultra 9 290HX Plus (v8.20.8100) | |
| Acer Predator Helios Neo 16S AI PHN16S-71-94L9 (v6.92.6600) | |
| Gigabyte Gaming A16 Pro GA6DH (Core 7 240H, RTX 5070 Ti) (v8.20.8100) | |
| AIDA64 / FPU Julia | |
| MSI Crosshair A16 HX E8WGK (v8.20.8100) | |
| Moyenne AMD Ryzen 9 8940HX (171374 - 218716, n=3) | |
| MSI Crosshair 16 HX AI D2XWGKG (v6.92.6600) | |
| Alienware 16X Aurora Core Ultra 9 290HX Plus (v8.20.8100) | |
| Lenovo Legion 7 16 AGP11 (v8.20.8100) | |
| Acer Predator Helios Neo 16S AI PHN16S-71-94L9 (v6.92.6600) | |
| Gigabyte Gaming A16 Pro GA6DH (Core 7 240H, RTX 5070 Ti) (v8.20.8100) | |
| AIDA64 / CPU SHA3 | |
| MSI Crosshair A16 HX E8WGK (v8.20.8100) | |
| Moyenne AMD Ryzen 9 8940HX (7988 - 9427, n=3) | |
| MSI Crosshair 16 HX AI D2XWGKG (v6.92.6600) | |
| Alienware 16X Aurora Core Ultra 9 290HX Plus (v8.20.8100) | |
| Acer Predator Helios Neo 16S AI PHN16S-71-94L9 (v6.92.6600) | |
| Lenovo Legion 7 16 AGP11 (v8.20.8100) | |
| Gigabyte Gaming A16 Pro GA6DH (Core 7 240H, RTX 5070 Ti) (v8.20.8100) | |
| AIDA64 / CPU Queen | |
| Moyenne AMD Ryzen 9 8940HX (169334 - 172010, n=2) | |
| MSI Crosshair 16 HX AI D2XWGKG (v6.92.6600) | |
| Acer Predator Helios Neo 16S AI PHN16S-71-94L9 (v6.92.6600) | |
| AIDA64 / FPU SinJulia | |
| MSI Crosshair A16 HX E8WGK (v8.20.8100) | |
| Moyenne AMD Ryzen 9 8940HX (26855 - 29886, n=3) | |
| Lenovo Legion 7 16 AGP11 (v8.20.8100) | |
| Alienware 16X Aurora Core Ultra 9 290HX Plus (v8.20.8100) | |
| MSI Crosshair 16 HX AI D2XWGKG (v6.92.6600) | |
| Acer Predator Helios Neo 16S AI PHN16S-71-94L9 (v6.92.6600) | |
| Gigabyte Gaming A16 Pro GA6DH (Core 7 240H, RTX 5070 Ti) (v8.20.8100) | |
| AIDA64 / FPU Mandel | |
| MSI Crosshair A16 HX E8WGK (v8.20.8100) | |
| Moyenne AMD Ryzen 9 8940HX (90684 - 117231, n=3) | |
| MSI Crosshair 16 HX AI D2XWGKG (v6.92.6600) | |
| Alienware 16X Aurora Core Ultra 9 290HX Plus (v8.20.8100) | |
| Lenovo Legion 7 16 AGP11 (v8.20.8100) | |
| Acer Predator Helios Neo 16S AI PHN16S-71-94L9 (v6.92.6600) | |
| Gigabyte Gaming A16 Pro GA6DH (Core 7 240H, RTX 5070 Ti) (v8.20.8100) | |
| AIDA64 / CPU AES | |
| MSI Crosshair A16 HX E8WGK (v8.20.8100) | |
| Moyenne AMD Ryzen 9 8940HX (150768 - 175214, n=3) | |
| Alienware 16X Aurora Core Ultra 9 290HX Plus (v8.20.8100) | |
| MSI Crosshair 16 HX AI D2XWGKG (v6.92.6600) | |
| Lenovo Legion 7 16 AGP11 (v8.20.8100) | |
| Acer Predator Helios Neo 16S AI PHN16S-71-94L9 (v6.92.6600) | |
| Gigabyte Gaming A16 Pro GA6DH (Core 7 240H, RTX 5070 Ti) (v8.20.8100) | |
| AIDA64 / CPU ZLib | |
| MSI Crosshair A16 HX E8WGK (v8.20.8100) | |
| Moyenne AMD Ryzen 9 8940HX (1784 - 2122, n=3) | |
| MSI Crosshair 16 HX AI D2XWGKG (v6.92.6600) | |
| Alienware 16X Aurora Core Ultra 9 290HX Plus (v8.20.8100) | |
| Acer Predator Helios Neo 16S AI PHN16S-71-94L9 (v6.92.6600) | |
| Lenovo Legion 7 16 AGP11 (v8.20.8100) | |
| Gigabyte Gaming A16 Pro GA6DH (Core 7 240H, RTX 5070 Ti) (v8.20.8100) | |
| AIDA64 / FP64 Ray-Trace | |
| MSI Crosshair A16 HX E8WGK (v8.20.8100) | |
| Moyenne AMD Ryzen 9 8940HX (23193 - 28773, n=3) | |
| Lenovo Legion 7 16 AGP11 (v8.20.8100) | |
| MSI Crosshair 16 HX AI D2XWGKG (v6.92.6600) | |
| Alienware 16X Aurora Core Ultra 9 290HX Plus (v8.20.8100) | |
| Acer Predator Helios Neo 16S AI PHN16S-71-94L9 (v6.92.6600) | |
| Gigabyte Gaming A16 Pro GA6DH (Core 7 240H, RTX 5070 Ti) (v8.20.8100) | |
| AIDA64 / CPU PhotoWorxx | |
| Lenovo Legion 7 16 AGP11 (v8.20.8100) | |
| Acer Predator Helios Neo 16S AI PHN16S-71-94L9 (v6.92.6600) | |
| Alienware 16X Aurora Core Ultra 9 290HX Plus (v8.20.8100) | |
| Gigabyte Gaming A16 Pro GA6DH (Core 7 240H, RTX 5070 Ti) (v8.20.8100) | |
| MSI Crosshair 16 HX AI D2XWGKG (v6.92.6600) | |
| MSI Crosshair A16 HX E8WGK (v8.20.8100) | |
| Moyenne AMD Ryzen 9 8940HX (18283 - 35274, n=3) | |
| AIDA64 / CPU CheckMate | |
| MSI Crosshair A16 HX E8WGK (v8.20.8100) | |
| Moyenne AMD Ryzen 9 8940HX (n=1) | |
| Lenovo Legion 7 16 AGP11 (v8.20.8100) | |
| Alienware 16X Aurora Core Ultra 9 290HX Plus (v8.20.8100) | |
| Gigabyte Gaming A16 Pro GA6DH (Core 7 240H, RTX 5070 Ti) (v8.20.8100) | |
Performances du système
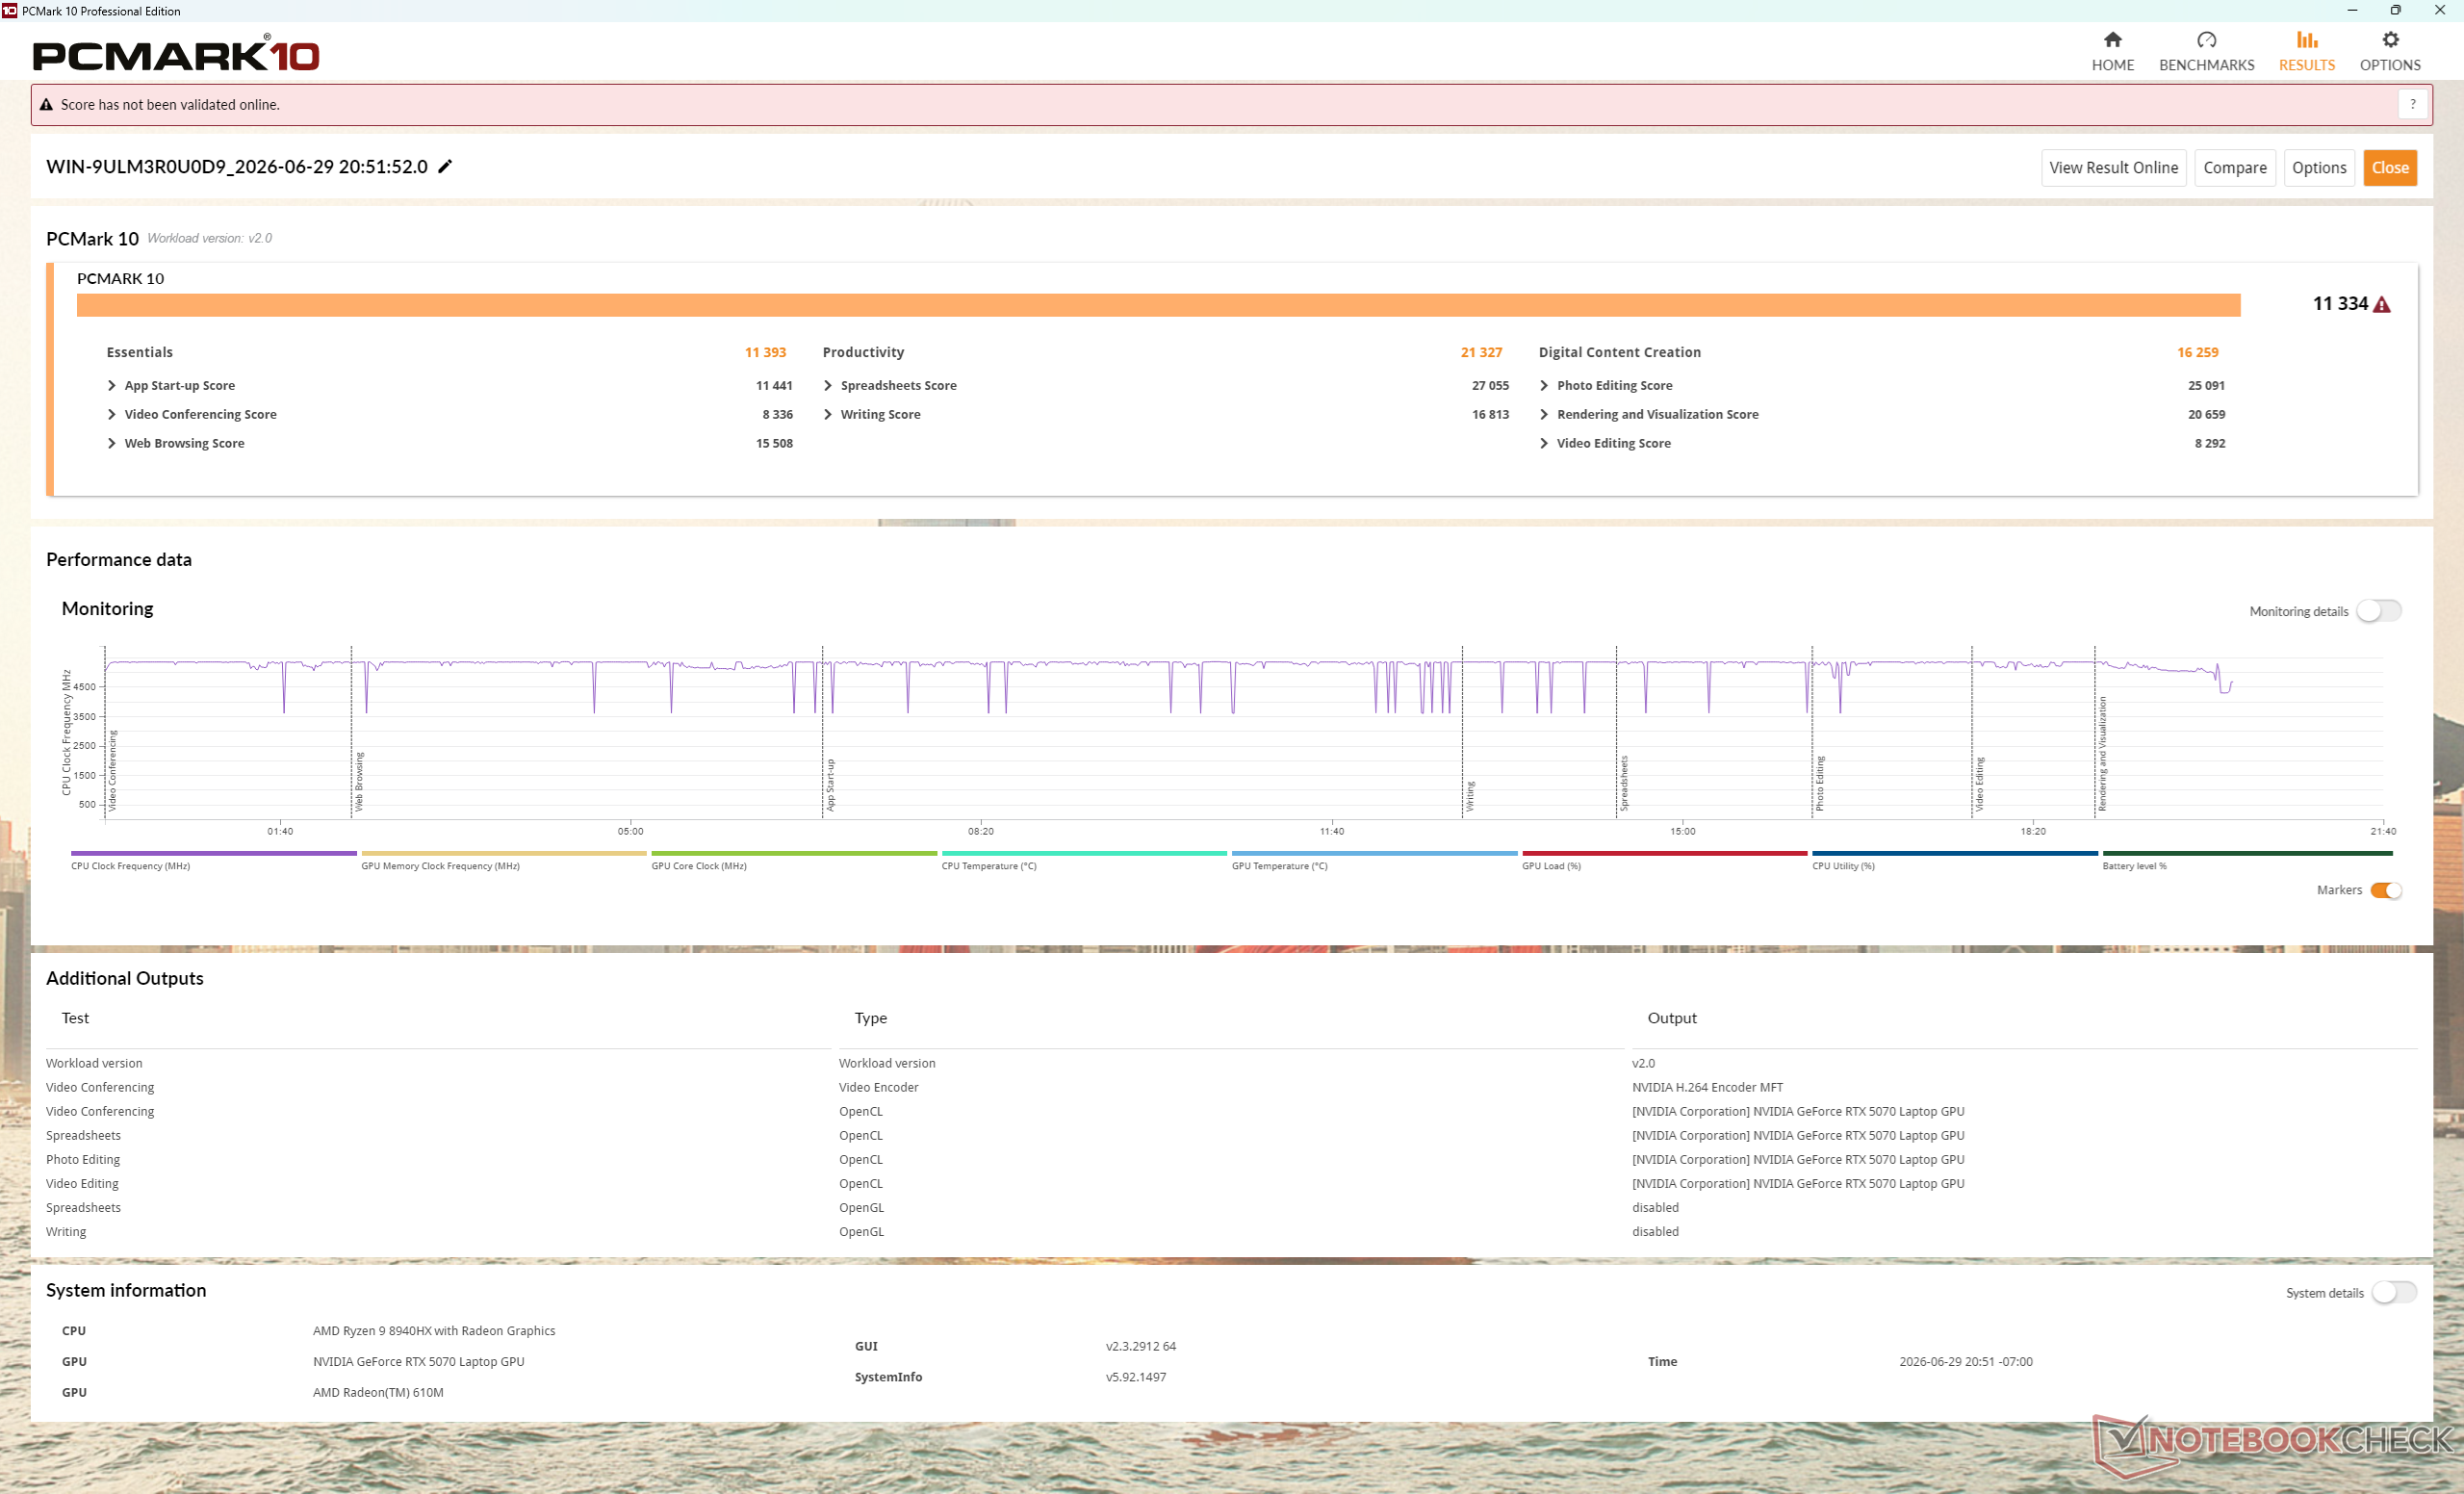
PCMark 10: Score | Essentials | Productivity | Digital Content Creation
CrossMark: Overall | Productivity | Creativity | Responsiveness
WebXPRT 3: Overall
WebXPRT 4: Overall
Mozilla Kraken 1.1: Total
Geekbench AI: Quantized GPU 1.7 | Half Precision GPU 1.7 | Single Precision GPU 1.7
| Performance rating | |
| Alienware 16X Aurora Core Ultra 9 290HX Plus | |
| MSI Crosshair A16 HX E8WGK | |
| Moyenne AMD Ryzen 9 8940HX, NVIDIA GeForce RTX 5070 Laptop | |
| MSI Crosshair 16 HX AI D2XWGKG | |
| Acer Predator Helios Neo 16S AI PHN16S-71-94L9 -3! | |
| Lenovo Legion 7 16 AGP11 -3! | |
| Gigabyte Gaming A16 Pro GA6DH (Core 7 240H, RTX 5070 Ti) | |
| PCMark 10 / Score | |
| MSI Crosshair A16 HX E8WGK | |
| Alienware 16X Aurora Core Ultra 9 290HX Plus | |
| Moyenne AMD Ryzen 9 8940HX, NVIDIA GeForce RTX 5070 Laptop (8106 - 11334, n=2) | |
| Lenovo Legion 7 16 AGP11 | |
| Gigabyte Gaming A16 Pro GA6DH (Core 7 240H, RTX 5070 Ti) | |
| Acer Predator Helios Neo 16S AI PHN16S-71-94L9 | |
| MSI Crosshair 16 HX AI D2XWGKG | |
| PCMark 10 / Essentials | |
| Alienware 16X Aurora Core Ultra 9 290HX Plus | |
| MSI Crosshair A16 HX E8WGK | |
| Moyenne AMD Ryzen 9 8940HX, NVIDIA GeForce RTX 5070 Laptop (11371 - 11393, n=2) | |
| Acer Predator Helios Neo 16S AI PHN16S-71-94L9 | |
| MSI Crosshair 16 HX AI D2XWGKG | |
| Lenovo Legion 7 16 AGP11 | |
| Gigabyte Gaming A16 Pro GA6DH (Core 7 240H, RTX 5070 Ti) | |
| PCMark 10 / Productivity | |
| MSI Crosshair A16 HX E8WGK | |
| Alienware 16X Aurora Core Ultra 9 290HX Plus | |
| Lenovo Legion 7 16 AGP11 | |
| Moyenne AMD Ryzen 9 8940HX, NVIDIA GeForce RTX 5070 Laptop (9492 - 21327, n=2) | |
| Gigabyte Gaming A16 Pro GA6DH (Core 7 240H, RTX 5070 Ti) | |
| Acer Predator Helios Neo 16S AI PHN16S-71-94L9 | |
| MSI Crosshair 16 HX AI D2XWGKG | |
| PCMark 10 / Digital Content Creation | |
| Alienware 16X Aurora Core Ultra 9 290HX Plus | |
| MSI Crosshair 16 HX AI D2XWGKG | |
| MSI Crosshair A16 HX E8WGK | |
| Moyenne AMD Ryzen 9 8940HX, NVIDIA GeForce RTX 5070 Laptop (13392 - 16259, n=2) | |
| Acer Predator Helios Neo 16S AI PHN16S-71-94L9 | |
| Lenovo Legion 7 16 AGP11 | |
| Gigabyte Gaming A16 Pro GA6DH (Core 7 240H, RTX 5070 Ti) | |
| CrossMark / Overall | |
| Alienware 16X Aurora Core Ultra 9 290HX Plus | |
| Acer Predator Helios Neo 16S AI PHN16S-71-94L9 | |
| MSI Crosshair 16 HX AI D2XWGKG | |
| MSI Crosshair A16 HX E8WGK | |
| Moyenne AMD Ryzen 9 8940HX, NVIDIA GeForce RTX 5070 Laptop (1977 - 2011, n=2) | |
| Gigabyte Gaming A16 Pro GA6DH (Core 7 240H, RTX 5070 Ti) | |
| Lenovo Legion 7 16 AGP11 | |
| CrossMark / Productivity | |
| Alienware 16X Aurora Core Ultra 9 290HX Plus | |
| MSI Crosshair 16 HX AI D2XWGKG | |
| Acer Predator Helios Neo 16S AI PHN16S-71-94L9 | |
| MSI Crosshair A16 HX E8WGK | |
| Moyenne AMD Ryzen 9 8940HX, NVIDIA GeForce RTX 5070 Laptop (1844 - 1869, n=2) | |
| Gigabyte Gaming A16 Pro GA6DH (Core 7 240H, RTX 5070 Ti) | |
| Lenovo Legion 7 16 AGP11 | |
| CrossMark / Creativity | |
| Alienware 16X Aurora Core Ultra 9 290HX Plus | |
| Acer Predator Helios Neo 16S AI PHN16S-71-94L9 | |
| MSI Crosshair 16 HX AI D2XWGKG | |
| MSI Crosshair A16 HX E8WGK | |
| Moyenne AMD Ryzen 9 8940HX, NVIDIA GeForce RTX 5070 Laptop (2225 - 2298, n=2) | |
| Gigabyte Gaming A16 Pro GA6DH (Core 7 240H, RTX 5070 Ti) | |
| Lenovo Legion 7 16 AGP11 | |
| CrossMark / Responsiveness | |
| Alienware 16X Aurora Core Ultra 9 290HX Plus | |
| MSI Crosshair 16 HX AI D2XWGKG | |
| Acer Predator Helios Neo 16S AI PHN16S-71-94L9 | |
| Moyenne AMD Ryzen 9 8940HX, NVIDIA GeForce RTX 5070 Laptop (1680 - 1709, n=2) | |
| MSI Crosshair A16 HX E8WGK | |
| Gigabyte Gaming A16 Pro GA6DH (Core 7 240H, RTX 5070 Ti) | |
| Lenovo Legion 7 16 AGP11 | |
| WebXPRT 3 / Overall | |
| Alienware 16X Aurora Core Ultra 9 290HX Plus | |
| MSI Crosshair 16 HX AI D2XWGKG | |
| Lenovo Legion 7 16 AGP11 | |
| Acer Predator Helios Neo 16S AI PHN16S-71-94L9 | |
| MSI Crosshair A16 HX E8WGK | |
| Moyenne AMD Ryzen 9 8940HX, NVIDIA GeForce RTX 5070 Laptop (274 - 322, n=2) | |
| Gigabyte Gaming A16 Pro GA6DH (Core 7 240H, RTX 5070 Ti) | |
| WebXPRT 4 / Overall | |
| Alienware 16X Aurora Core Ultra 9 290HX Plus | |
| MSI Crosshair 16 HX AI D2XWGKG | |
| Acer Predator Helios Neo 16S AI PHN16S-71-94L9 | |
| MSI Crosshair A16 HX E8WGK | |
| Lenovo Legion 7 16 AGP11 | |
| Moyenne AMD Ryzen 9 8940HX, NVIDIA GeForce RTX 5070 Laptop (230 - 283, n=2) | |
| Gigabyte Gaming A16 Pro GA6DH (Core 7 240H, RTX 5070 Ti) | |
| Mozilla Kraken 1.1 / Total | |
| Gigabyte Gaming A16 Pro GA6DH (Core 7 240H, RTX 5070 Ti) | |
| Moyenne AMD Ryzen 9 8940HX, NVIDIA GeForce RTX 5070 Laptop (474 - 507, n=2) | |
| MSI Crosshair A16 HX E8WGK | |
| Lenovo Legion 7 16 AGP11 | |
| Acer Predator Helios Neo 16S AI PHN16S-71-94L9 | |
| MSI Crosshair 16 HX AI D2XWGKG | |
| Alienware 16X Aurora Core Ultra 9 290HX Plus | |
| Geekbench AI / Quantized GPU 1.7 | |
| Alienware 16X Aurora Core Ultra 9 290HX Plus | |
| MSI Crosshair A16 HX E8WGK | |
| Moyenne AMD Ryzen 9 8940HX, NVIDIA GeForce RTX 5070 Laptop (n=1) | |
| MSI Crosshair 16 HX AI D2XWGKG | |
| Gigabyte Gaming A16 Pro GA6DH (Core 7 240H, RTX 5070 Ti) | |
| Geekbench AI / Half Precision GPU 1.7 | |
| MSI Crosshair A16 HX E8WGK | |
| Moyenne AMD Ryzen 9 8940HX, NVIDIA GeForce RTX 5070 Laptop (n=1) | |
| Alienware 16X Aurora Core Ultra 9 290HX Plus | |
| MSI Crosshair 16 HX AI D2XWGKG | |
| Gigabyte Gaming A16 Pro GA6DH (Core 7 240H, RTX 5070 Ti) | |
| Geekbench AI / Single Precision GPU 1.7 | |
| Alienware 16X Aurora Core Ultra 9 290HX Plus | |
| MSI Crosshair A16 HX E8WGK | |
| Moyenne AMD Ryzen 9 8940HX, NVIDIA GeForce RTX 5070 Laptop (n=1) | |
| MSI Crosshair 16 HX AI D2XWGKG | |
| Gigabyte Gaming A16 Pro GA6DH (Core 7 240H, RTX 5070 Ti) | |
* ... Moindre est la valeur, meilleures sont les performances
| PCMark 10 Score | 11334 points | |
Aide | ||
* ... Moindre est la valeur, meilleures sont les performances
Latence DPC
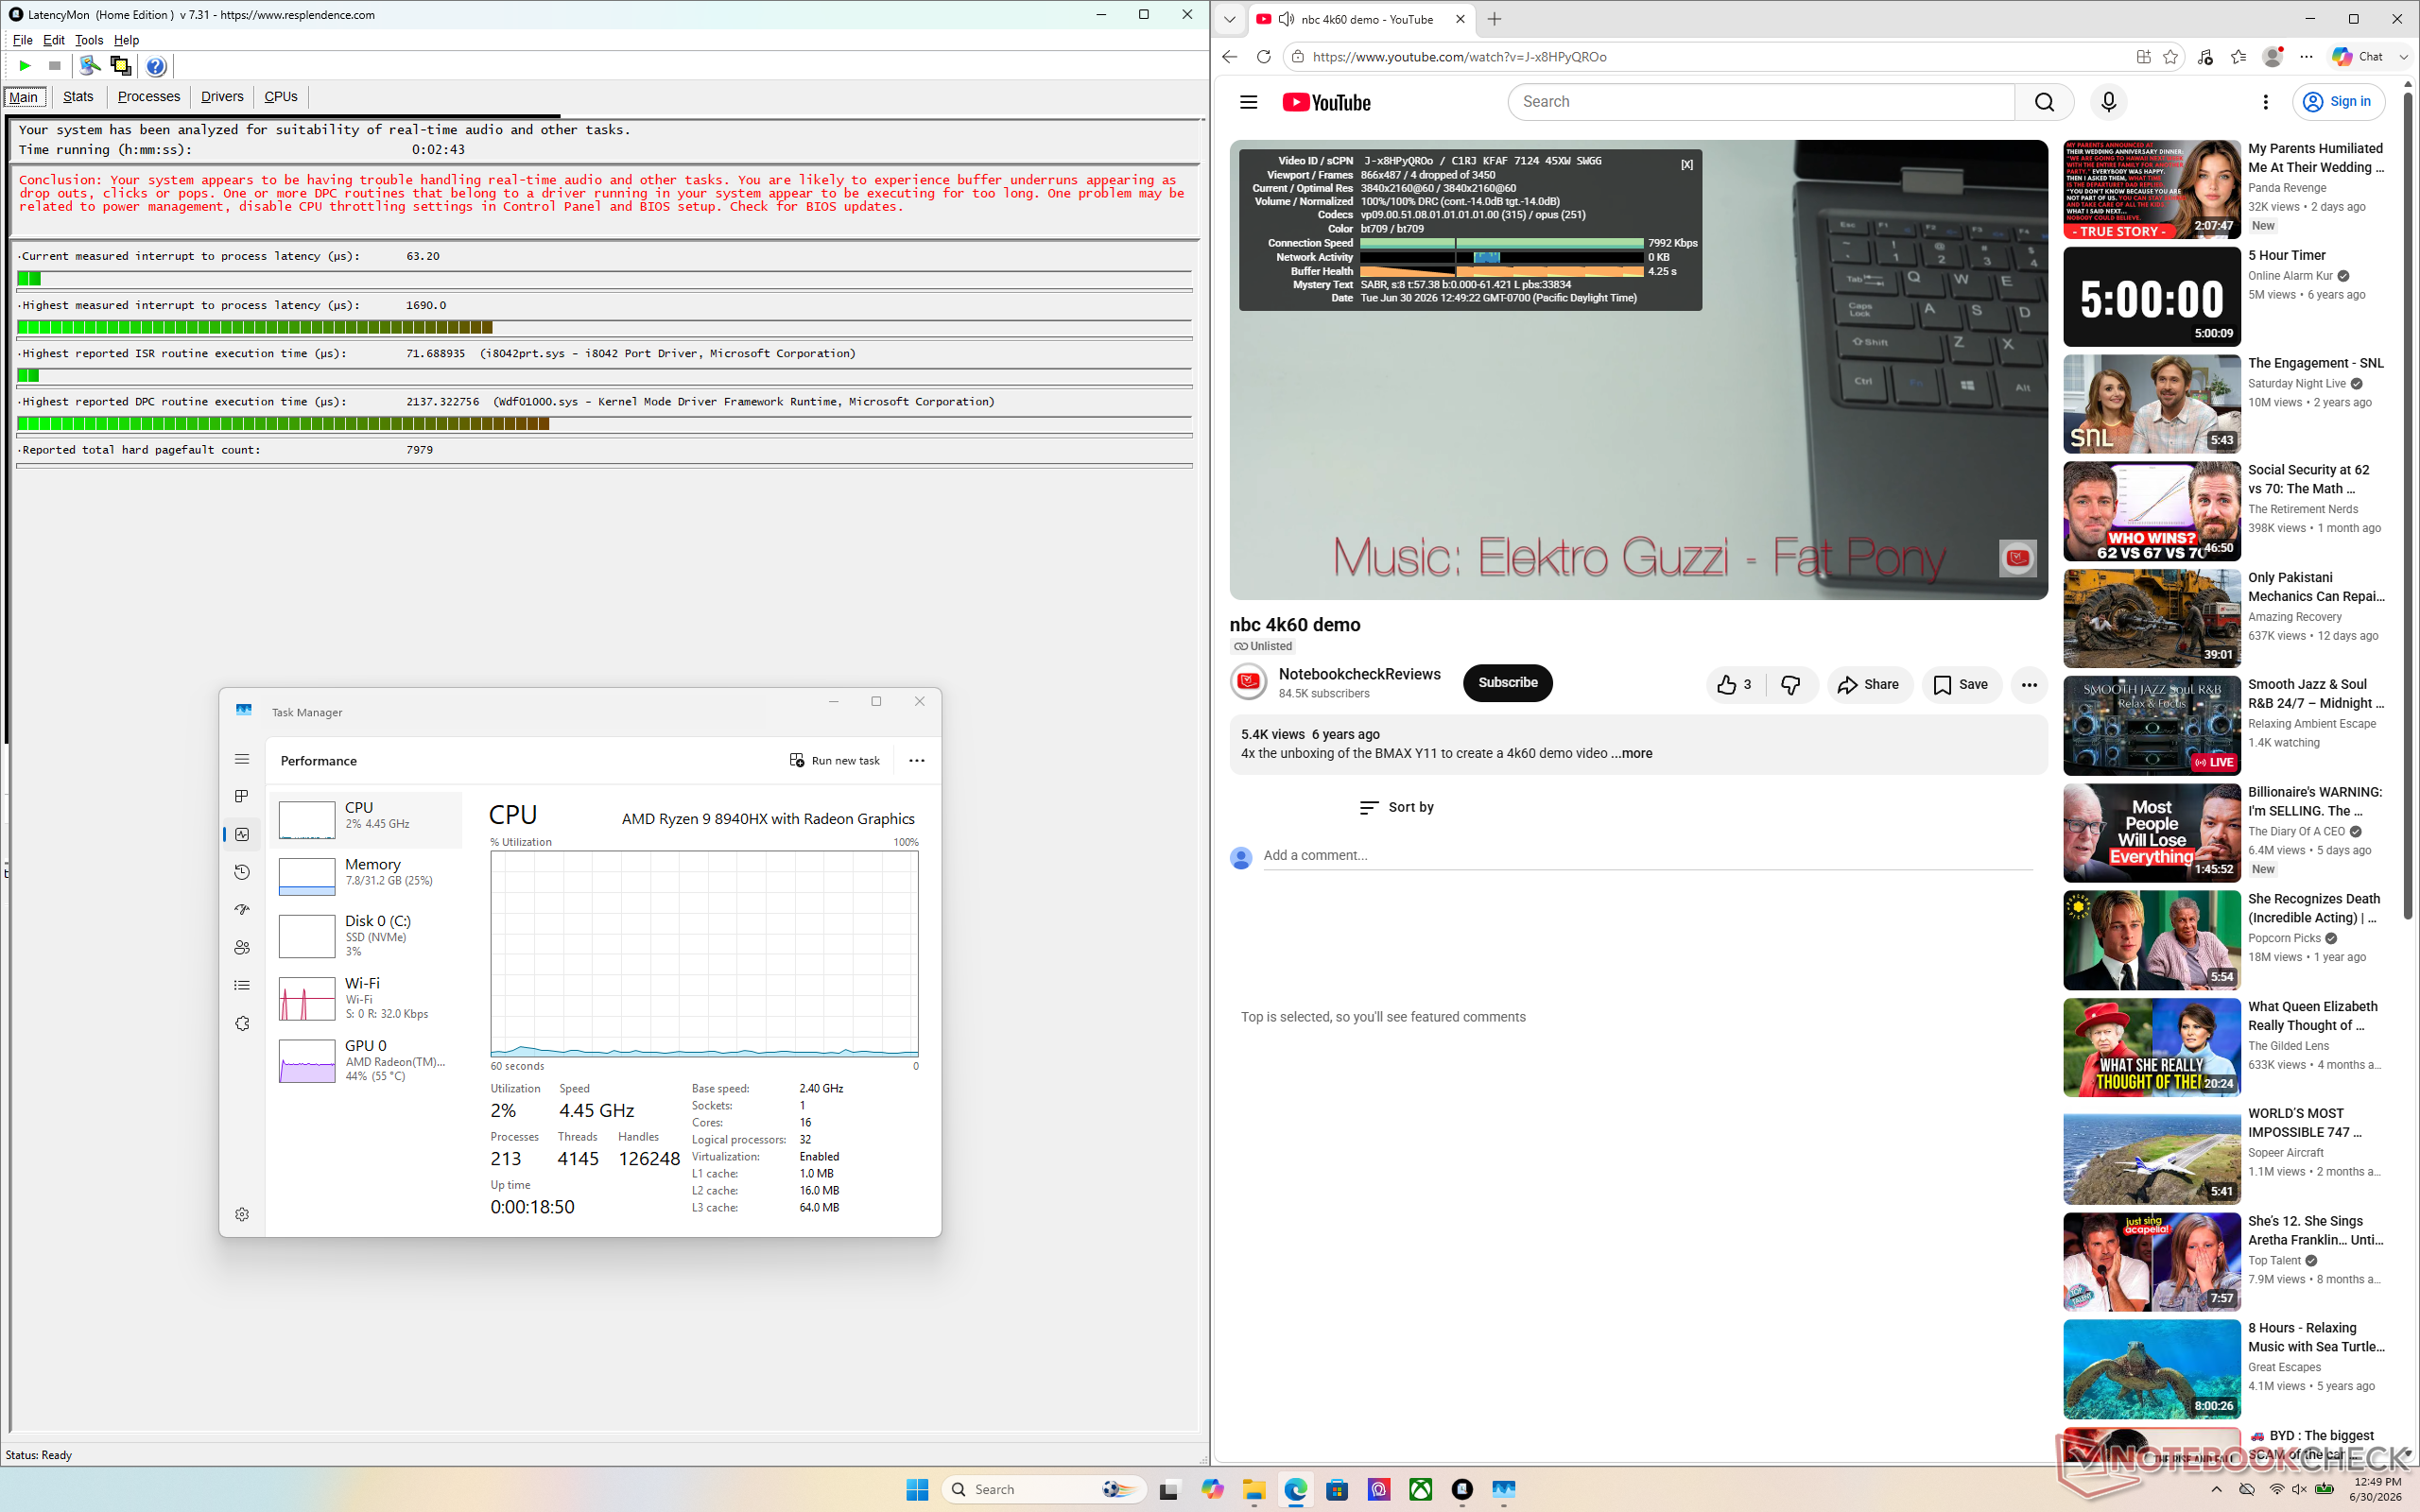
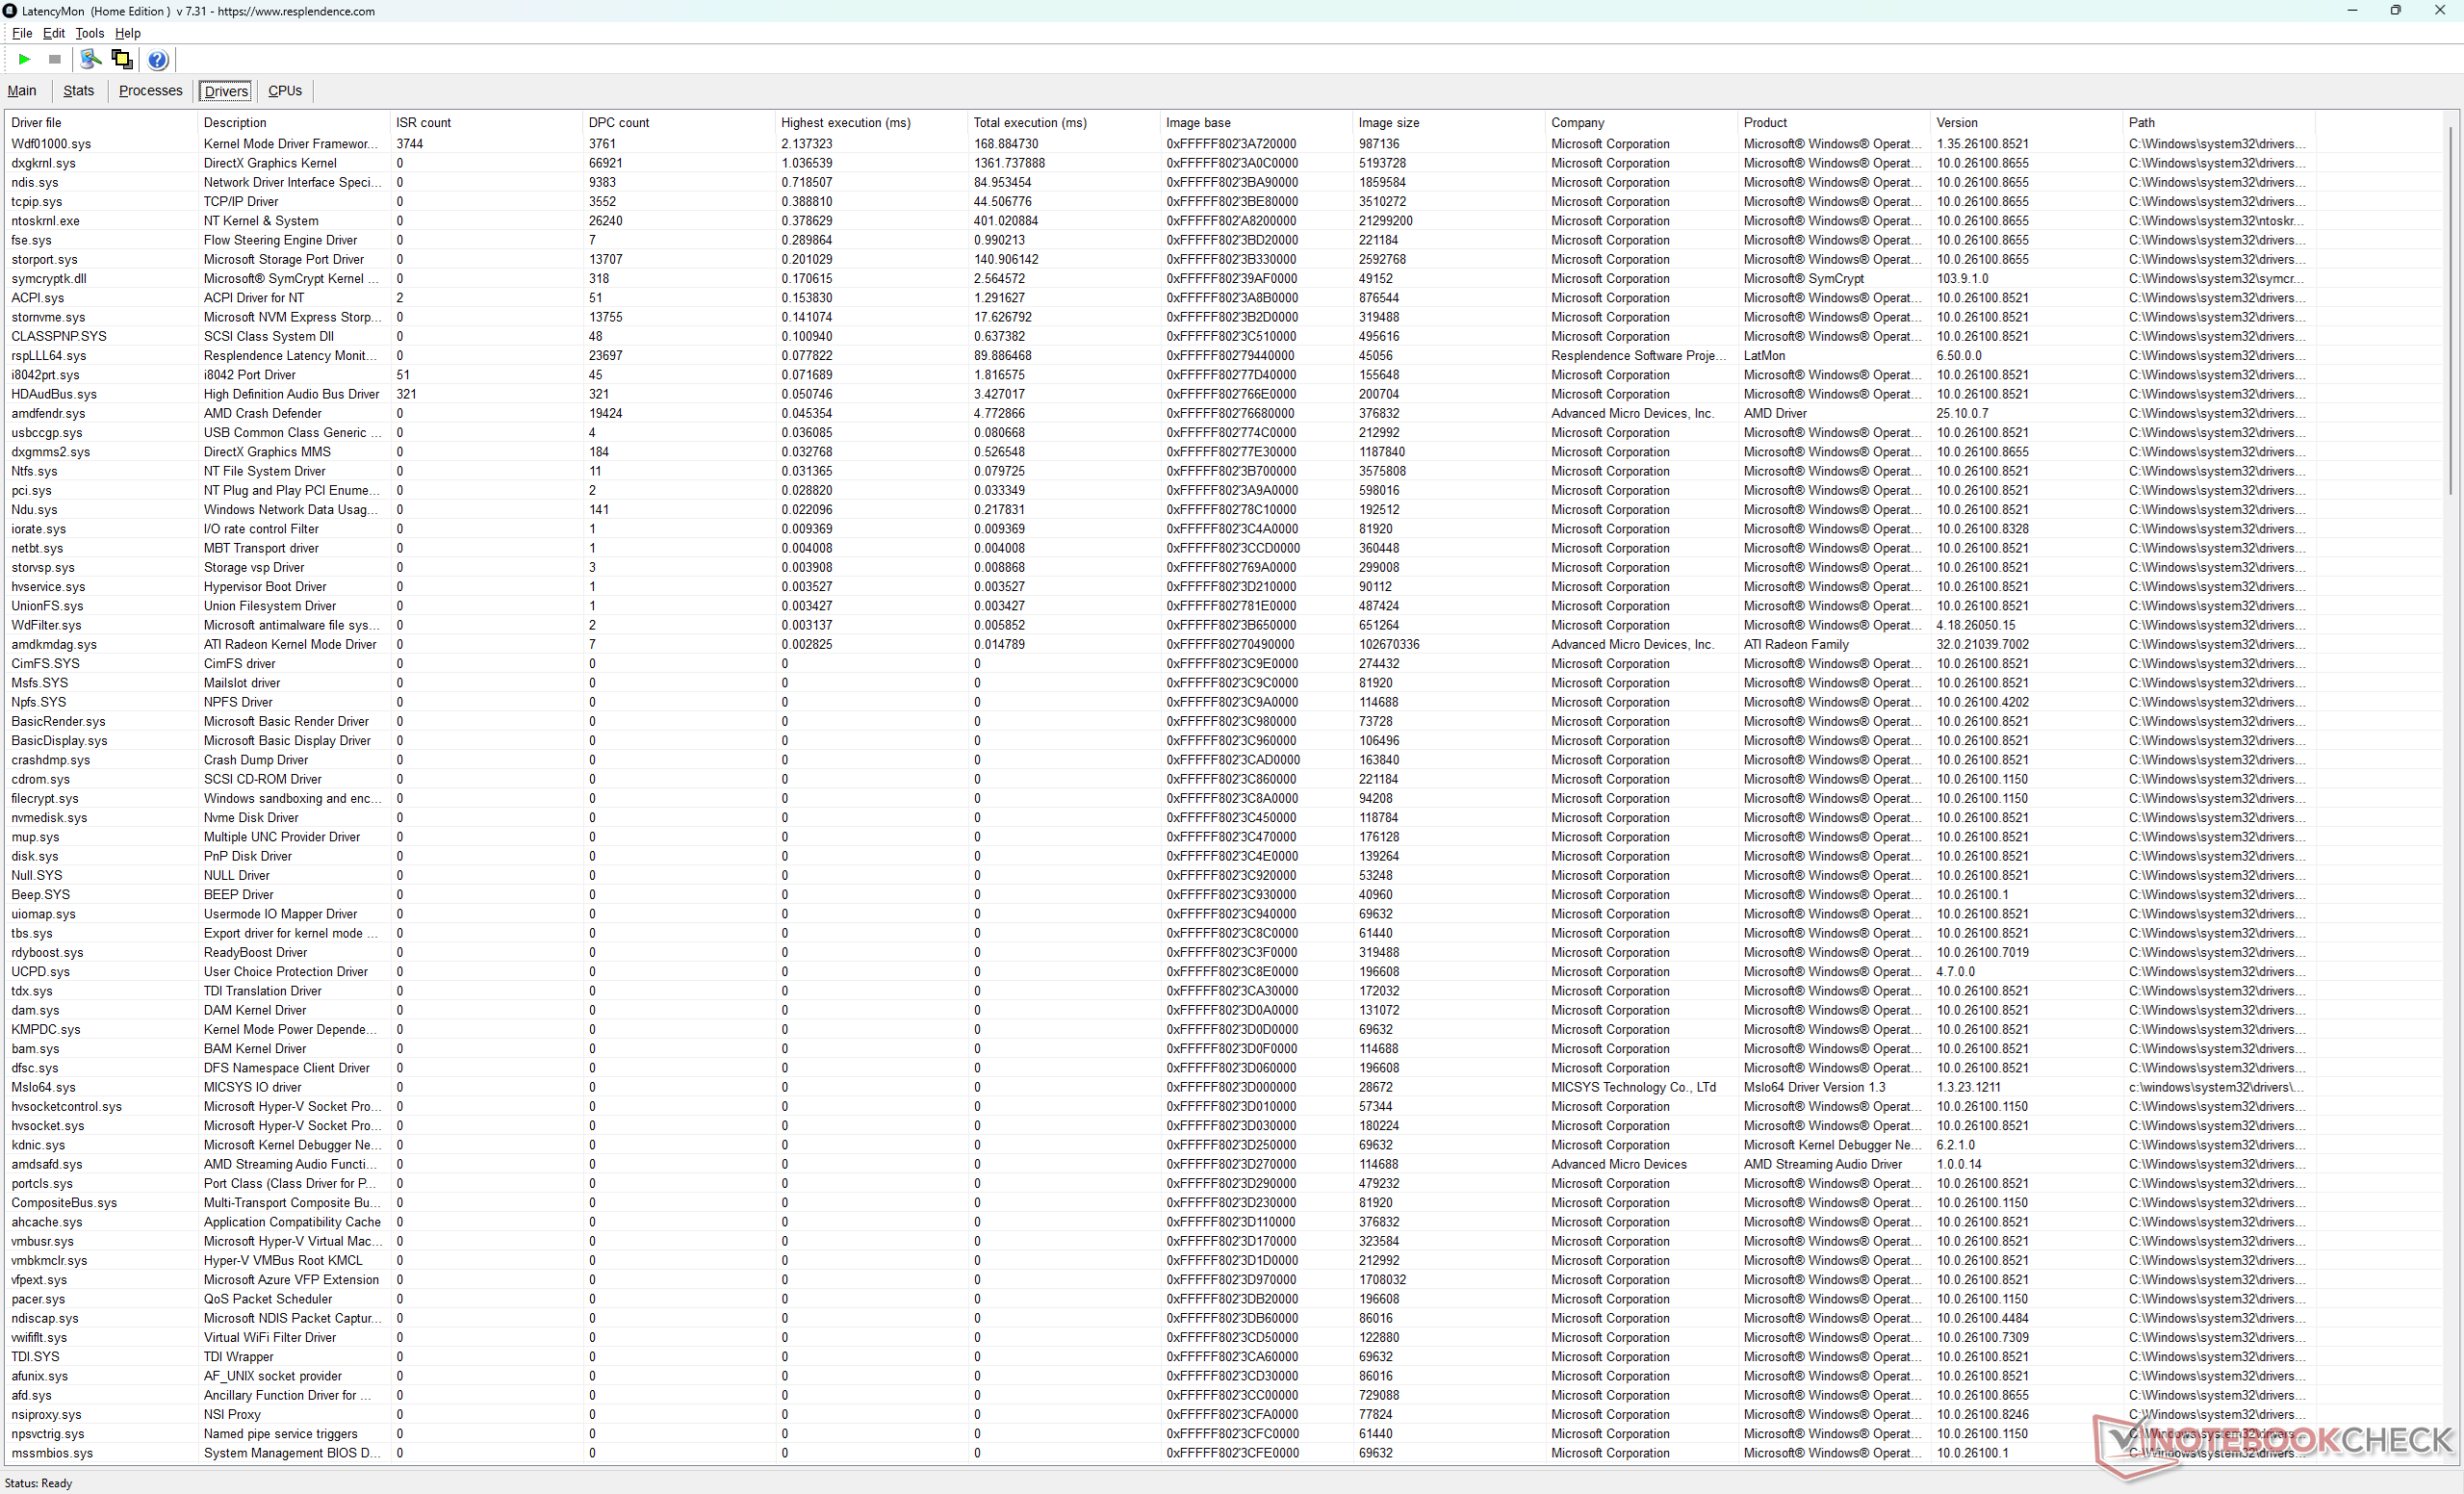
| DPC Latencies / LatencyMon - interrupt to process latency (max), Web, Youtube, Prime95 | |
| Lenovo Legion 7 16 AGP11 | |
| Gigabyte Gaming A16 Pro GA6DH (Core 7 240H, RTX 5070 Ti) | |
| Alienware 16X Aurora Core Ultra 9 290HX Plus | |
| Acer Predator Helios Neo 16S AI PHN16S-71-94L9 | |
| MSI Crosshair A16 HX E8WGK | |
| MSI Crosshair 16 HX AI D2XWGKG | |
* ... Moindre est la valeur, meilleures sont les performances
Périphériques de stockage
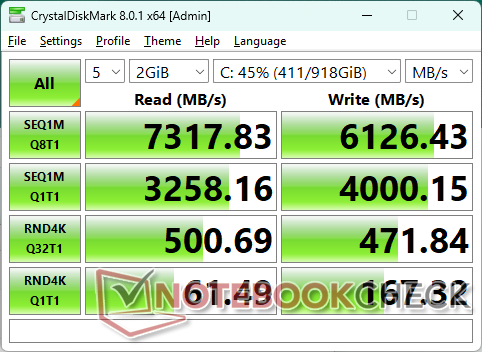
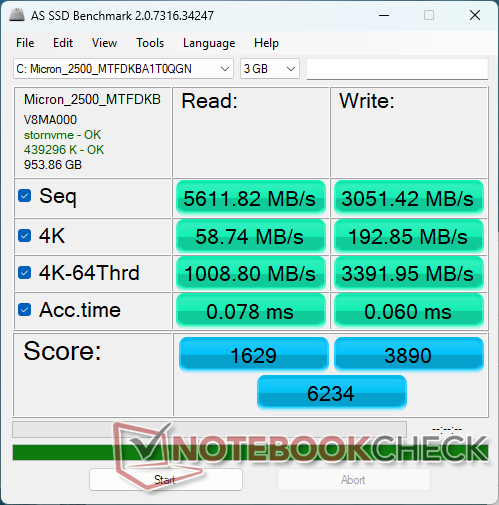

* ... Moindre est la valeur, meilleures sont les performances
Limitation du disque : boucle de lecture DiskSpd, profondeur de file d'attente 8
Performances du GPU
| Profil de puissance | Score graphique | Score de physique | Score combiné |
| Mode Performance, Cooler Boost activé, Apex activé | 14 087 | 13 104 | 13 930 |
| Mode Performance, Cooler Boost désactivé, Apex activé | 14 118 (-0 %) | 13 154 (-0 %) | 13 964 (-0 %) |
| Mode Performance, Cooler Boost désactivé, Apex désactivé | 13 991 (-1 %) | 13 109 (-0 %) | 13 851 (-0 %) |
| Mode Équilibré | 13 451 (-5 %) | 12 174 (-7 %) | 13 242 (-5 %) |
| Alimentation par batterie | 4 400 (-69 %) | 6 518 (-50 %) | 4 625 (-67 %) |
| 3DMark 11 Performance | 37786 points | |
| 3DMark Cloud Gate Standard Score | 71413 points | |
| 3DMark Fire Strike Score | 35205 points | |
| 3DMark Time Spy Score | 13964 points | |
| 3DMark Steel Nomad Score | 3087 points | |
Aide | ||
* ... Moindre est la valeur, meilleures sont les performances
| Final Fantasy XV Benchmark - 1920x1080 High Quality | |
| Alienware 16X Aurora Core Ultra 9 290HX Plus | |
| MSI Crosshair 16 HX AI D2XWGKG | |
| MSI Crosshair A16 HX E8WGK | |
| Lenovo Legion 7 16 AGP11 | |
| Gigabyte Gaming A16 Pro GA6DH (Core 7 240H, RTX 5070 Ti) | |
| Strange Brigade - 1920x1080 ultra AA:ultra AF:16 | |
| Alienware 16X Aurora Core Ultra 9 290HX Plus | |
| Gigabyte Gaming A16 Pro GA6DH (Core 7 240H, RTX 5070 Ti) | |
| MSI Crosshair 16 HX AI D2XWGKG | |
| MSI Crosshair A16 HX E8WGK | |
| Lenovo Legion 7 16 AGP11 | |
Tableau des FPS en mode « Ultra » de Cyberpunk 2077
| Bas | Moyen | Élevé | Ultra | QHD DLSS | QHD | |
|---|---|---|---|---|---|---|
| GTA V (2015) | 187.6 | 186.6 | 184.6 | 152.6 | 129.7 | |
| Dota 2 Reborn (2015) | 240 | 208 | 199.1 | 183.3 | ||
| Final Fantasy XV Benchmark (2018) | 229 | 187.8 | 140 | 102 | ||
| X-Plane 11.11 (2018) | 141.9 | 131.5 | 104.8 | |||
| Strange Brigade (2018) | 502 | 369 | 305 | 258 | 170.4 | |
| Baldur's Gate 3 (2023) | 239 | 183.9 | 154.6 | 133.2 | 129.6 | 90.3 |
| Cyberpunk 2077 (2023) | 173.8 | 149 | 124.8 | 112.1 | 81.9 | 68.8 |
| F1 24 (2024) | 345 | 336 | 269 | 94.7 | 93.1 | 59.3 |
Émissions
Bruit du système
Degré de la nuisance sonore
| Au repos |
| 29.1 / 29.1 / 29.1 dB(A) |
| Fortement sollicité |
| 41.7 / 59 dB(A) |
 | ||
30 dB silencieux 40 dB(A) audible 50 dB(A) bruyant |
||
min: | ||
| MSI Crosshair A16 HX E8WGK R9 8940HX, GeForce RTX 5070 Laptop | MSI Crosshair 16 HX AI D2XWGKG Ultra 9 275HX, GeForce RTX 5070 Laptop | Alienware 16X Aurora Core Ultra 9 290HX Plus Ultra 9 290HX Plus, GeForce RTX 5070 Ti Laptop | Lenovo Legion 7 16 AGP11 Ryzen AI 9 HX 470, GeForce RTX 5060 Laptop | Gigabyte Gaming A16 Pro GA6DH (Core 7 240H, RTX 5070 Ti) Core 7 240H, GeForce RTX 5070 Ti Laptop | Acer Predator Helios Neo 16S AI PHN16S-71-94L9 Ultra 9 275HX, GeForce RTX 5070 Ti Laptop | |
|---|---|---|---|---|---|---|
| Noise | -2% | 3% | 10% | 11% | -2% | |
| arrêt / environnement * (dB) | 23.4 | 25.56 -9% | 23.4 -0% | 24.5 -5% | 23 2% | 24 -3% |
| Idle Minimum * (dB) | 29.1 | 28.3 3% | 23.8 18% | 24.5 16% | 23 21% | 24 18% |
| Idle Average * (dB) | 29.1 | 28.3 3% | 23.8 18% | 24.5 16% | 24.35 16% | 30 -3% |
| Idle Maximum * (dB) | 29.1 | 28.3 3% | 31.4 -8% | 27.1 7% | 24.35 16% | 35 -20% |
| Load Average * (dB) | 41.7 | 50.26 -21% | 48.7 -17% | 34.6 17% | 34.77 17% | 53 -27% |
| Cyberpunk 2077 ultra * (dB) | 58.7 | 57.8 2% | 51.5 12% | 53 10% | 56.18 4% | 52 11% |
| Load Maximum * (dB) | 59 | 57.95 2% | 59.8 -1% | 53 10% | 56.43 4% | 54 8% |
* ... Moindre est la valeur, meilleures sont les performances
Température
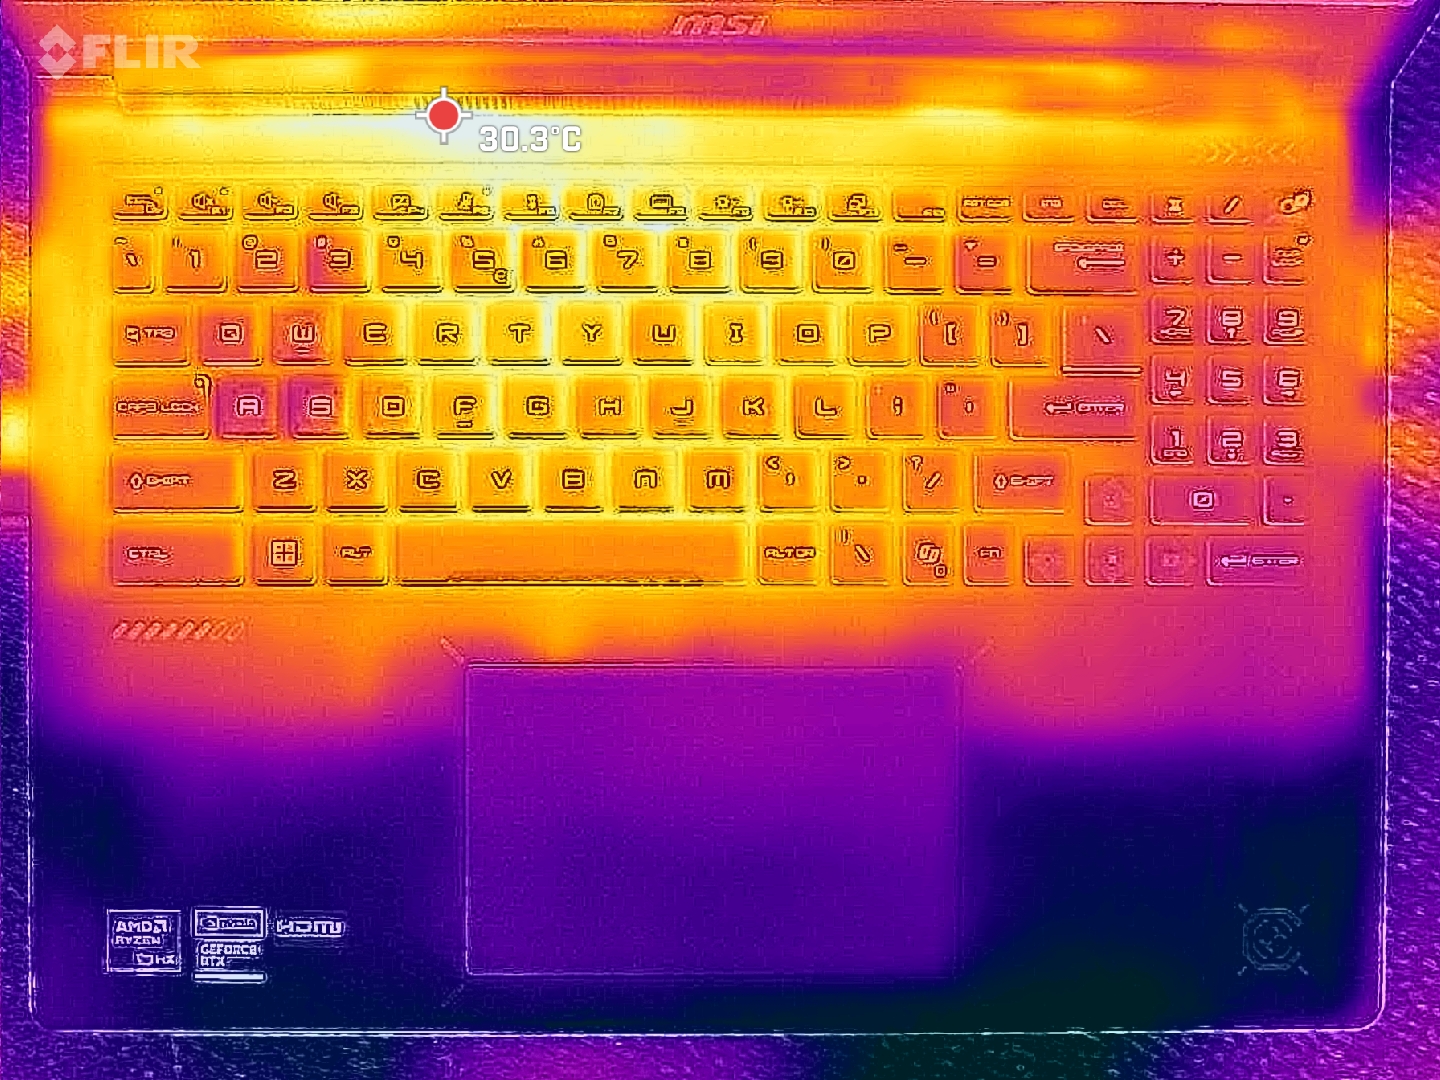
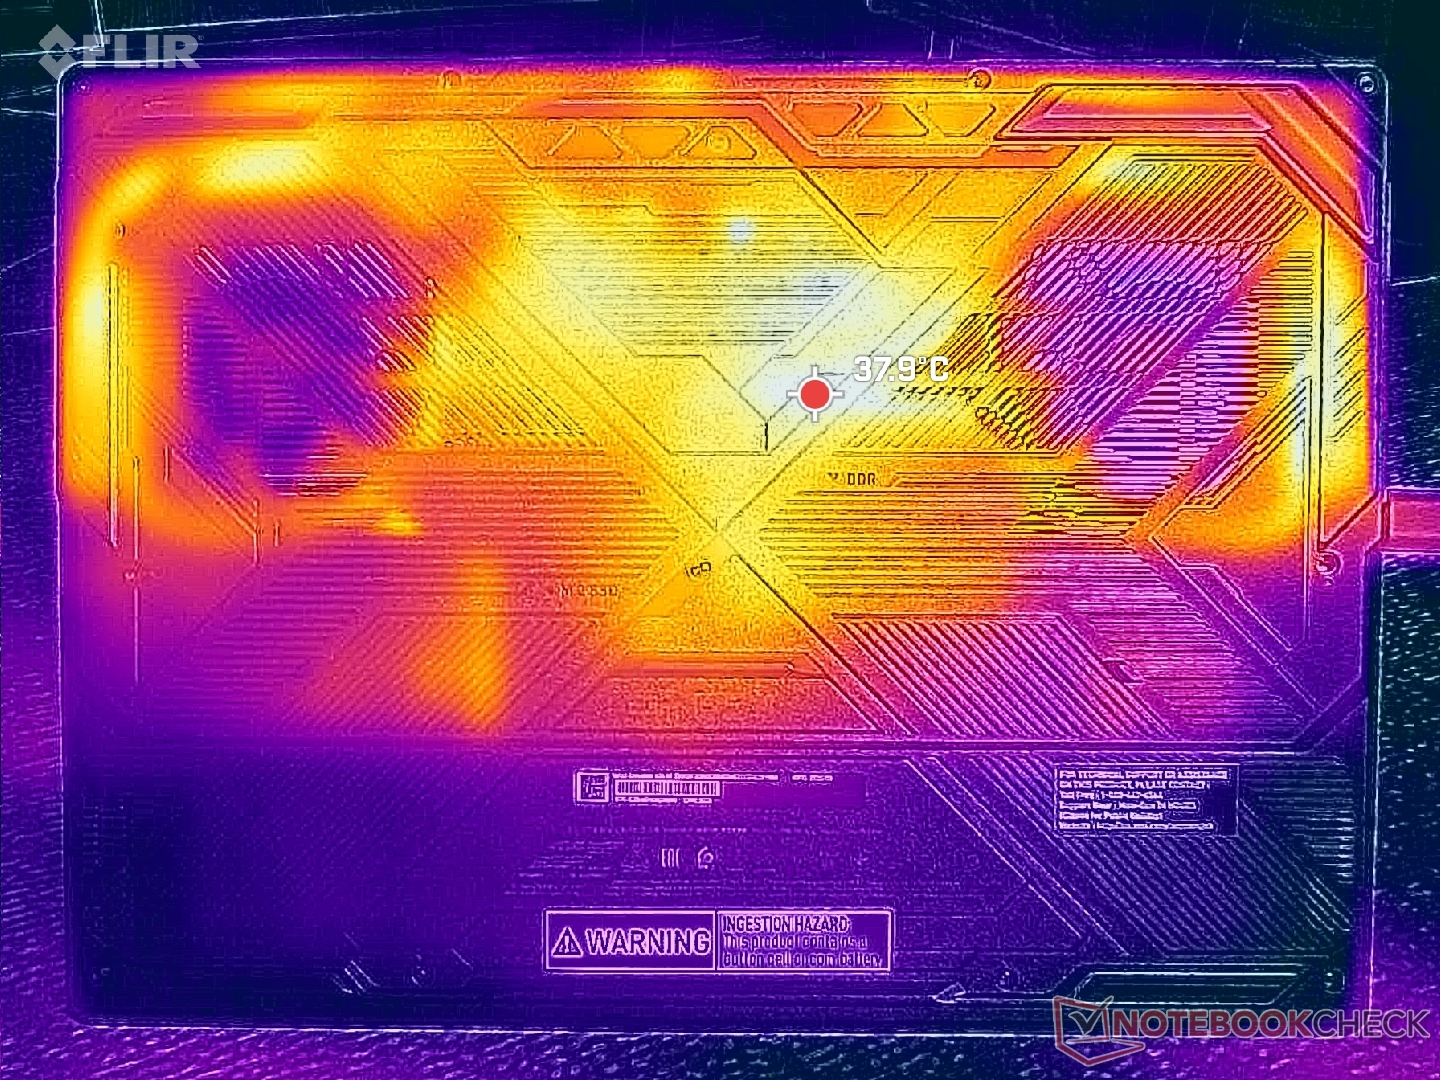
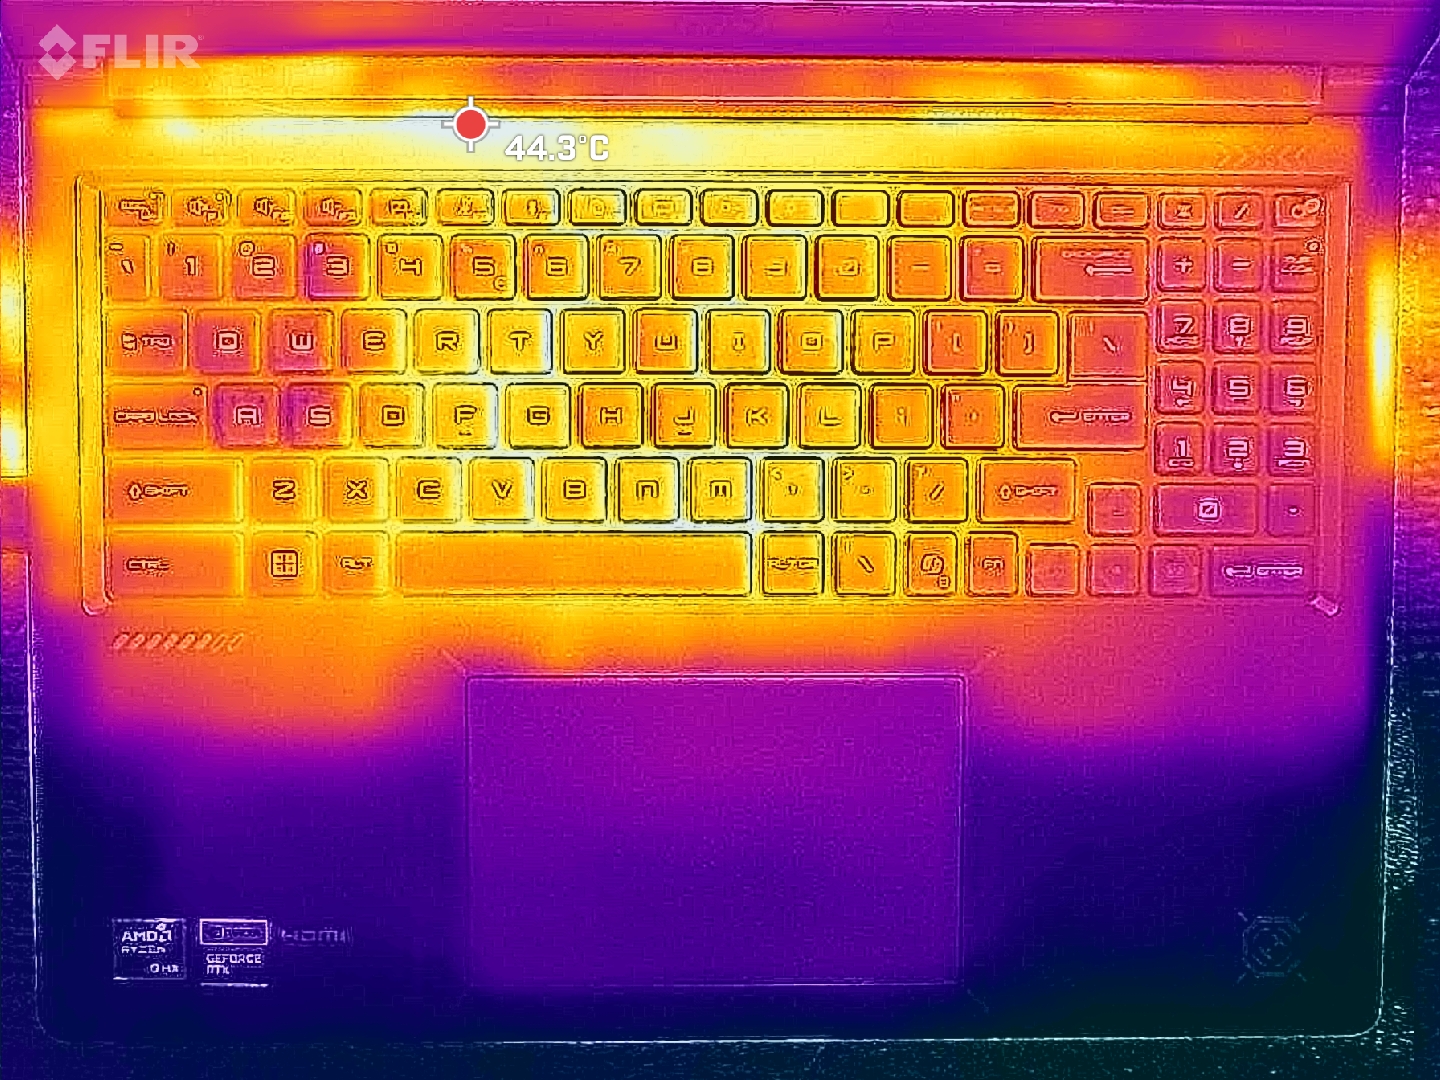
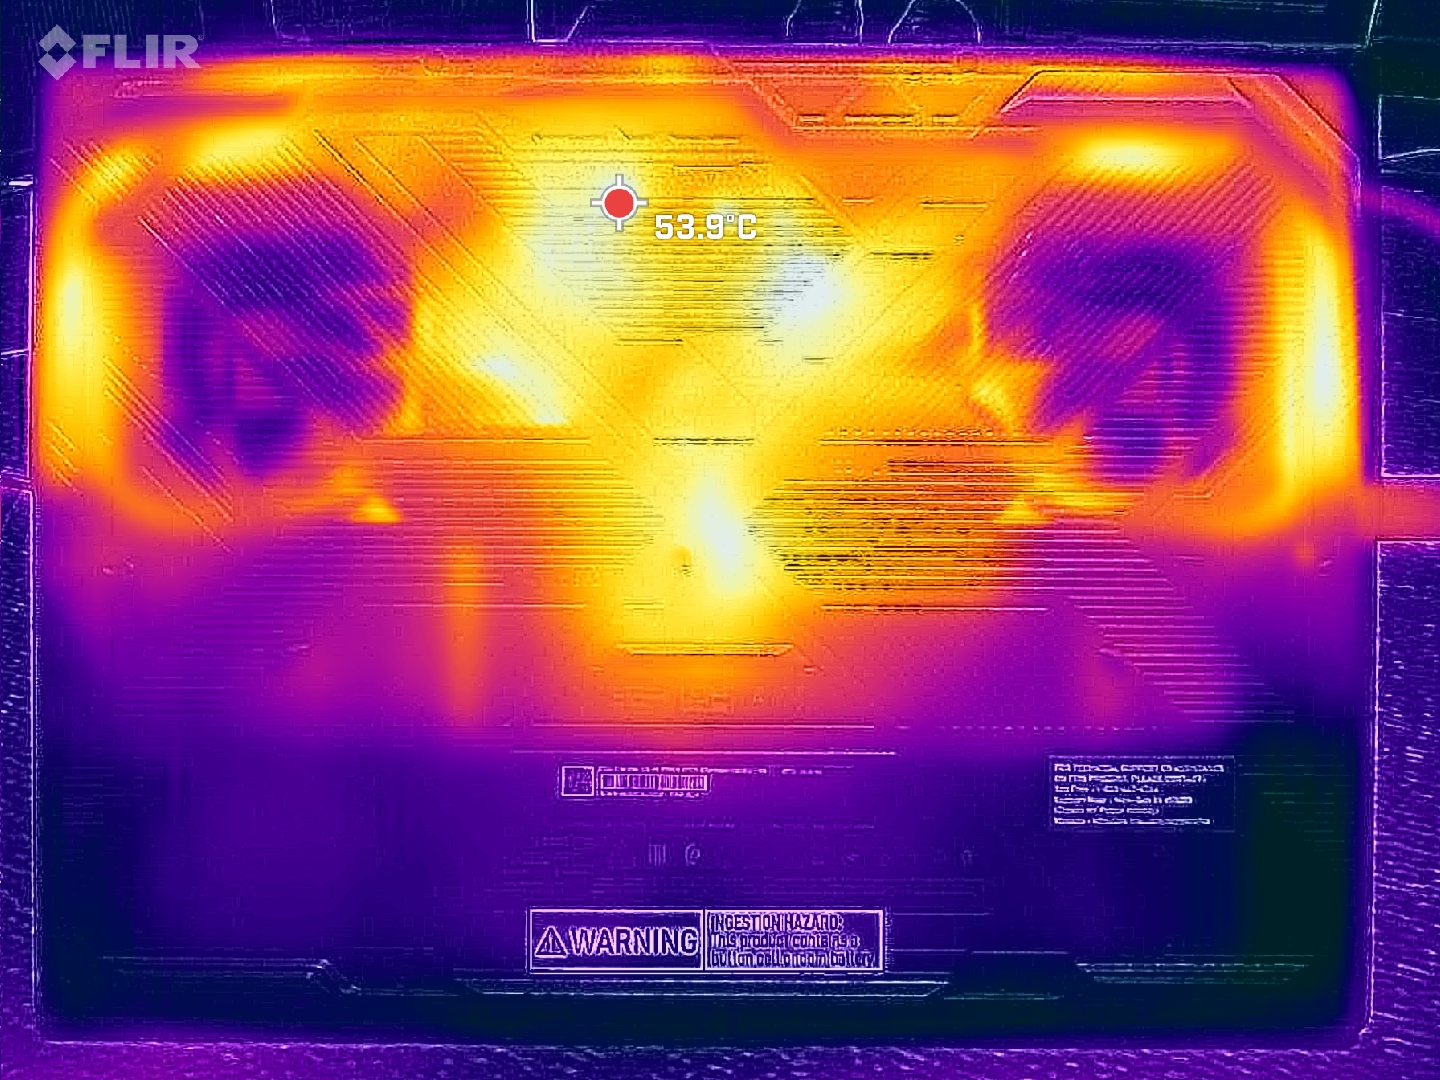
(±) La température maximale du côté supérieur est de 41.8 °C / 107 F, par rapport à la moyenne de 40.4 °C / 105 F, allant de 21.2 à 68.8 °C pour la classe Gaming.
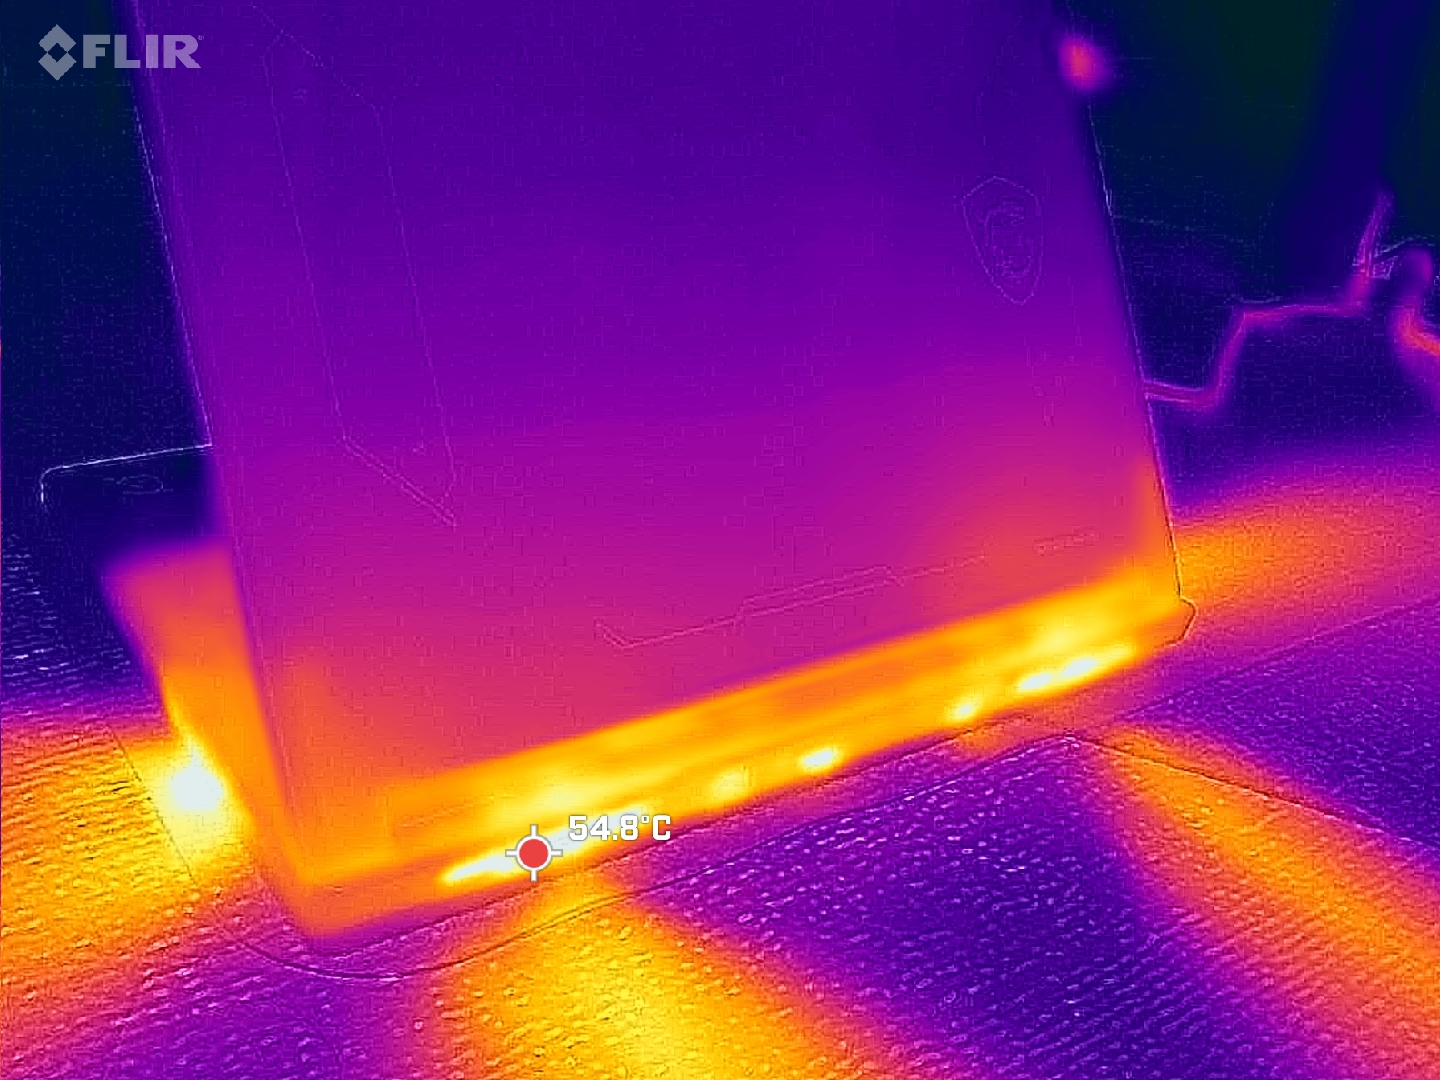
(-) Le fond chauffe jusqu'à un maximum de 50.6 °C / 123 F, contre une moyenne de 43.2 °C / 110 F
(+) En utilisation inactive, la température moyenne du côté supérieur est de 26.2 °C / 79 F, par rapport à la moyenne du dispositif de 33.9 °C / 93 F.
(+) Les repose-poignets et le pavé tactile sont plus froids que la température de la peau avec un maximum de 31.6 °C / 88.9 F et sont donc froids au toucher.
(-) La température moyenne de la zone de l'appui-paume de dispositifs similaires était de 28.8 °C / 83.8 F (-2.8 °C / #-5.1 F).
| MSI Crosshair A16 HX E8WGK R9 8940HX, GeForce RTX 5070 Laptop | MSI Crosshair 16 HX AI D2XWGKG Ultra 9 275HX, GeForce RTX 5070 Laptop | Alienware 16X Aurora Core Ultra 9 290HX Plus Ultra 9 290HX Plus, GeForce RTX 5070 Ti Laptop | Lenovo Legion 7 16 AGP11 Ryzen AI 9 HX 470, GeForce RTX 5060 Laptop | Gigabyte Gaming A16 Pro GA6DH (Core 7 240H, RTX 5070 Ti) Core 7 240H, GeForce RTX 5070 Ti Laptop | Acer Predator Helios Neo 16S AI PHN16S-71-94L9 Ultra 9 275HX, GeForce RTX 5070 Ti Laptop | |
|---|---|---|---|---|---|---|
| Heat | 7% | 10% | 7% | -2% | 2% | |
| Maximum Upper Side * (°C) | 41.8 | 44.8 -7% | 48.2 -15% | 44.9 -7% | 42 -0% | 47 -12% |
| Maximum Bottom * (°C) | 50.6 | 43.4 14% | 41 19% | 50.5 -0% | 49 3% | 55 -9% |
| Idle Upper Side * (°C) | 30.8 | 31.2 -1% | 28.2 8% | 27.3 11% | 34 -10% | 28 9% |
| Idle Bottom * (°C) | 36 | 28.8 20% | 26.2 27% | 27.5 24% | 36 -0% | 29 19% |
* ... Moindre est la valeur, meilleures sont les performances
Test de résistance
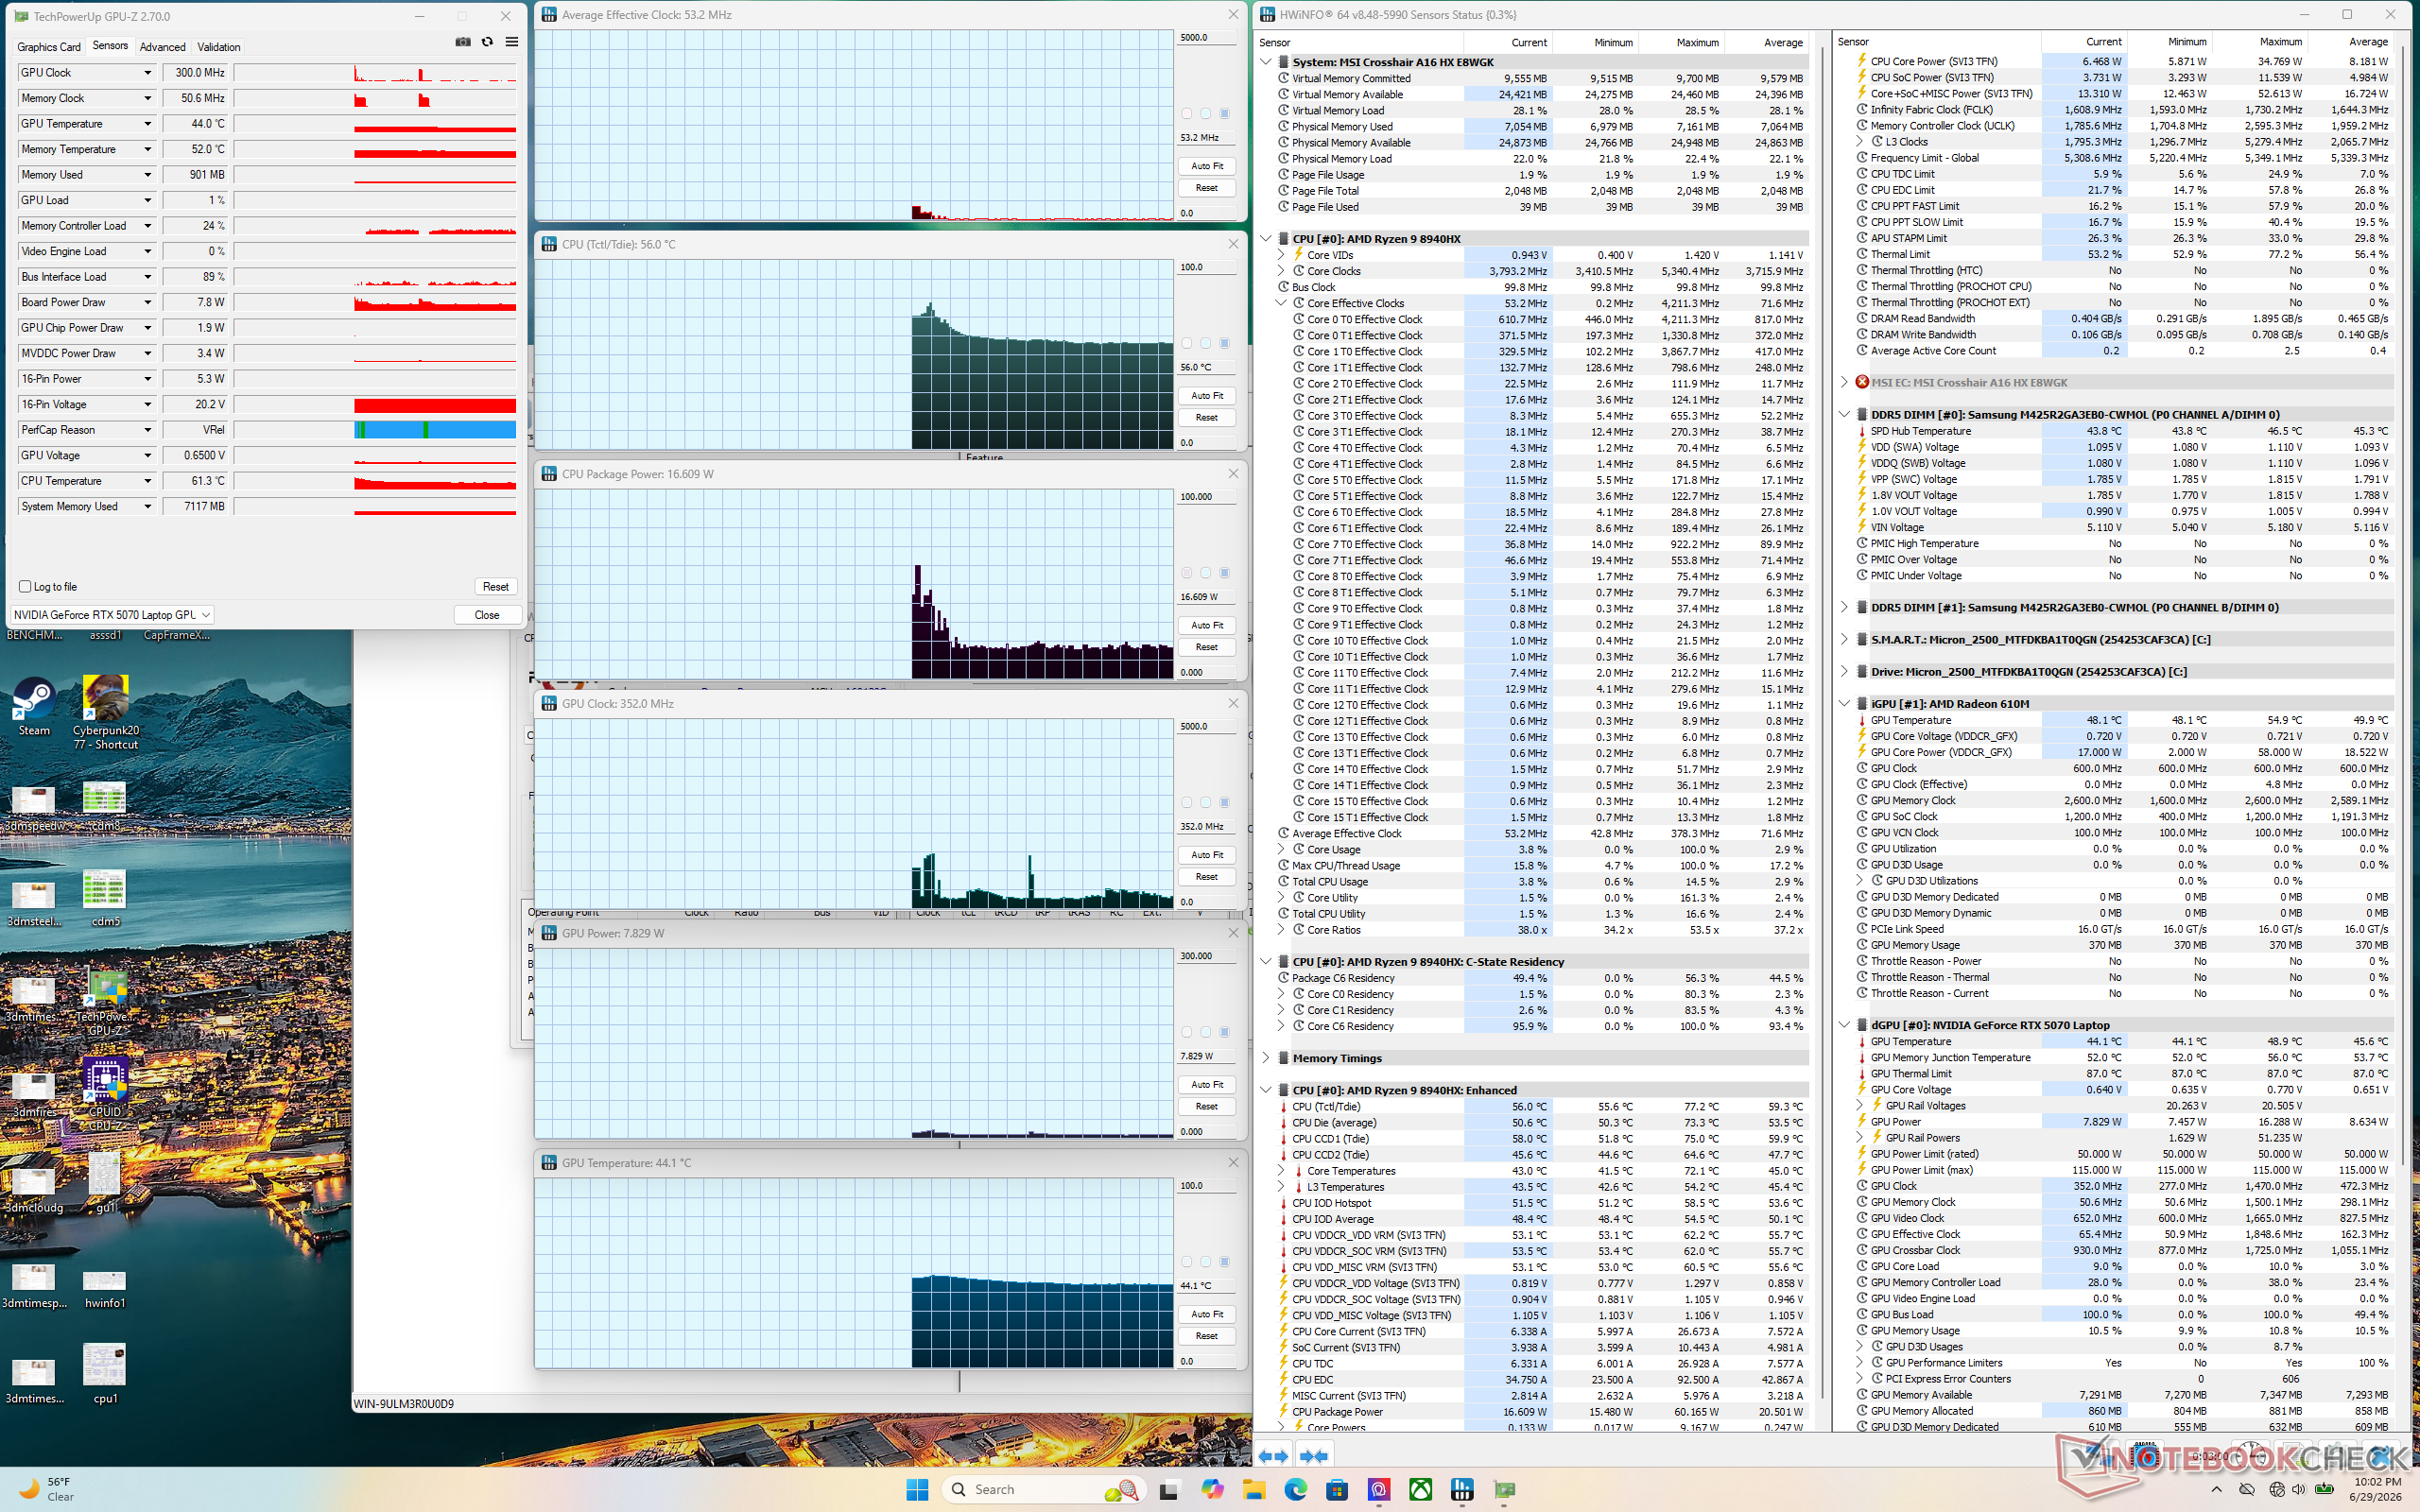
Les températures du processeur et de la carte graphique en mode « Performance » se situaient en moyenne respectivement entre le milieu et le bas des 80. Les températures des cœurs étaient inférieures de quelques degrés Celsius en mode « Équilibré », mais la TGP moyenne passait de 113 W à 99 W, au détriment des performances graphiques.
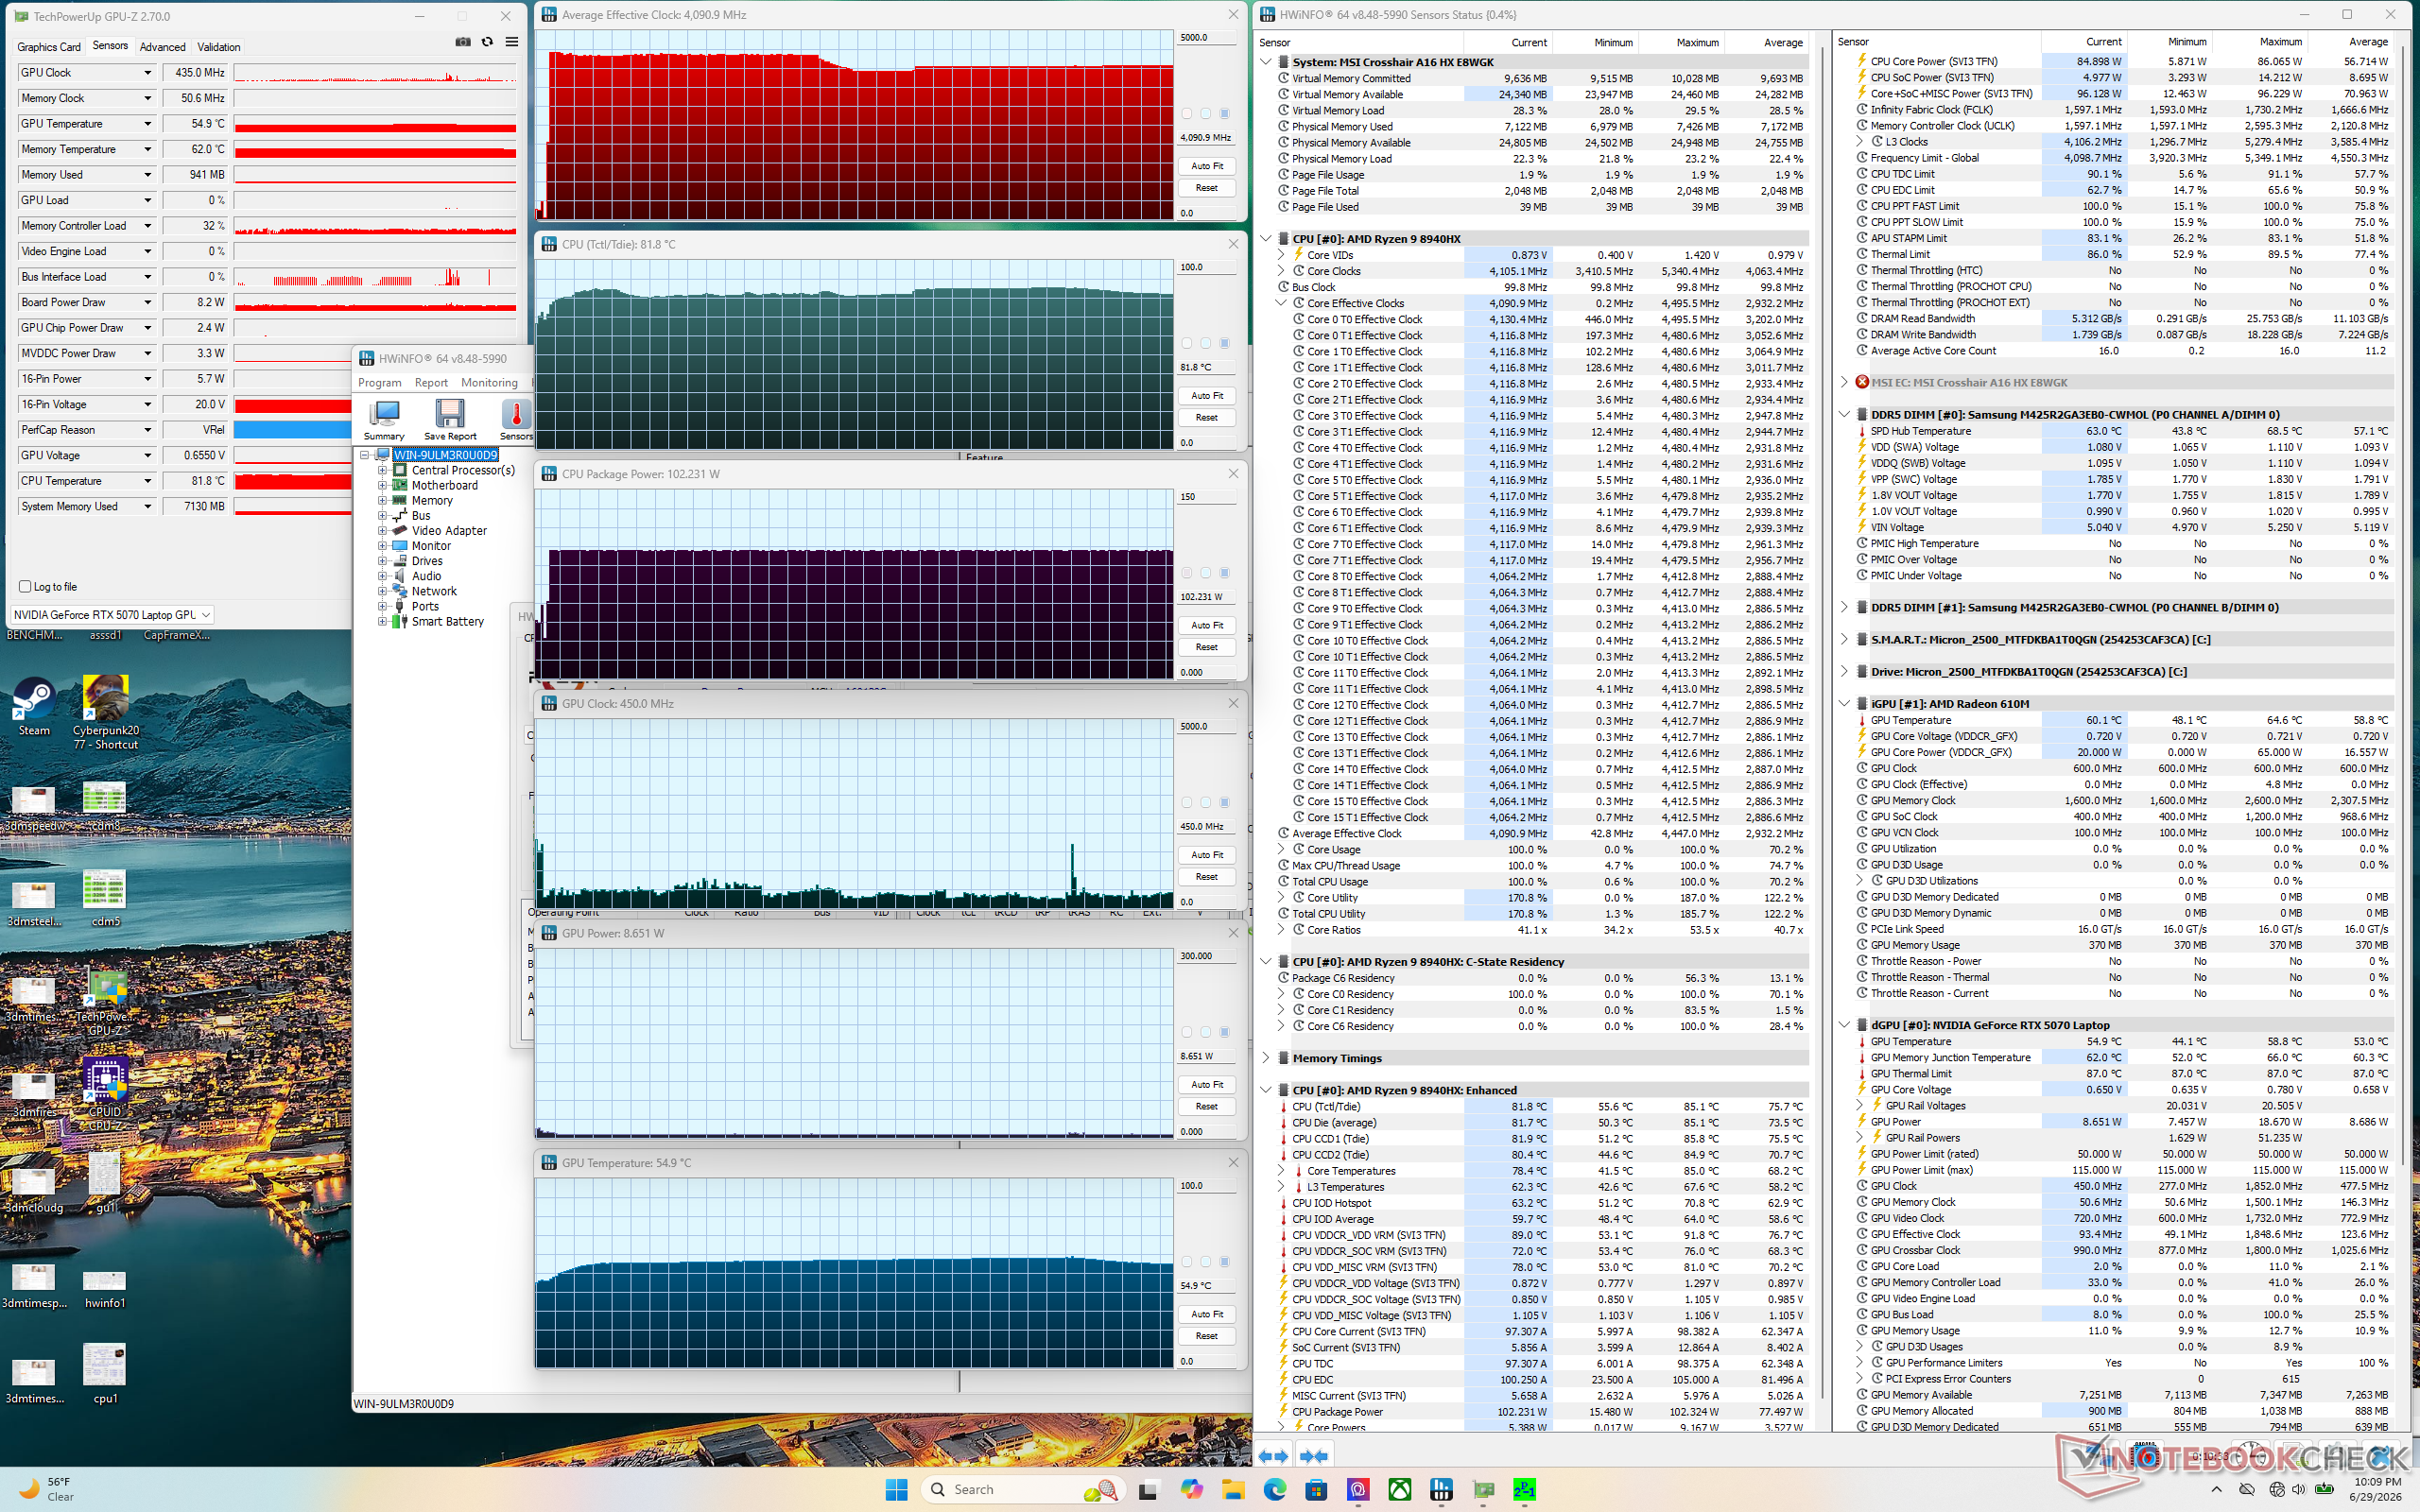
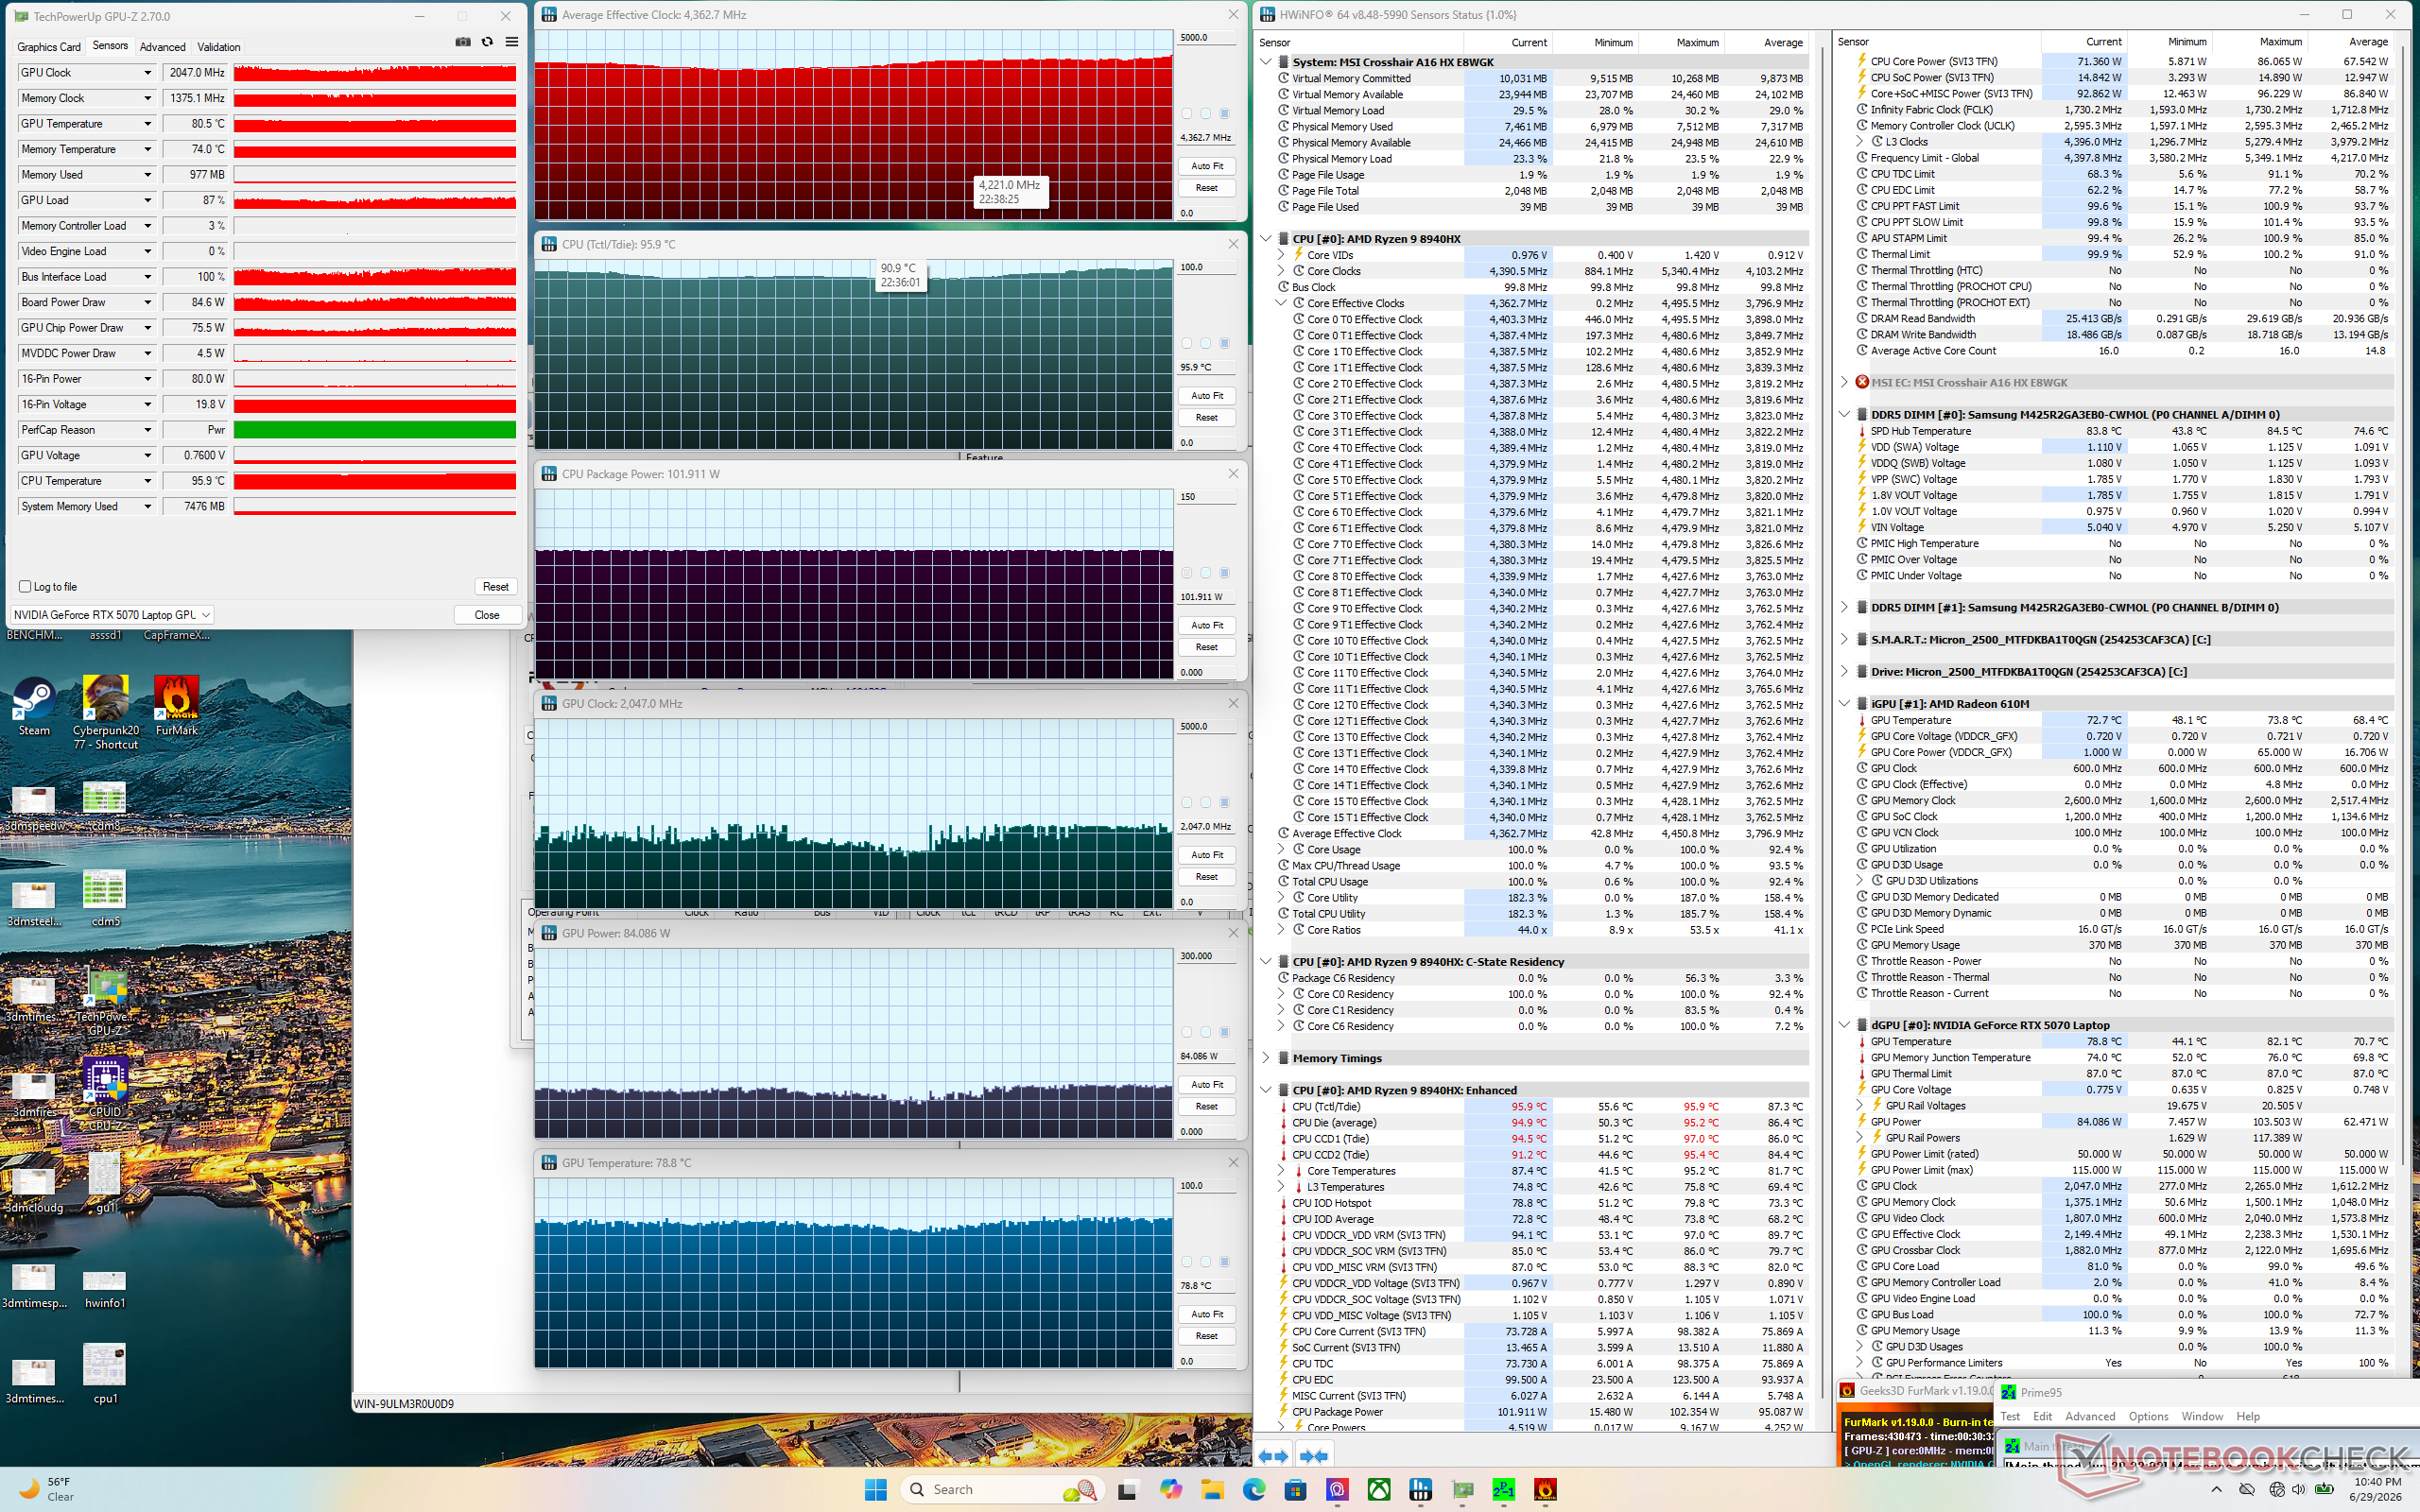
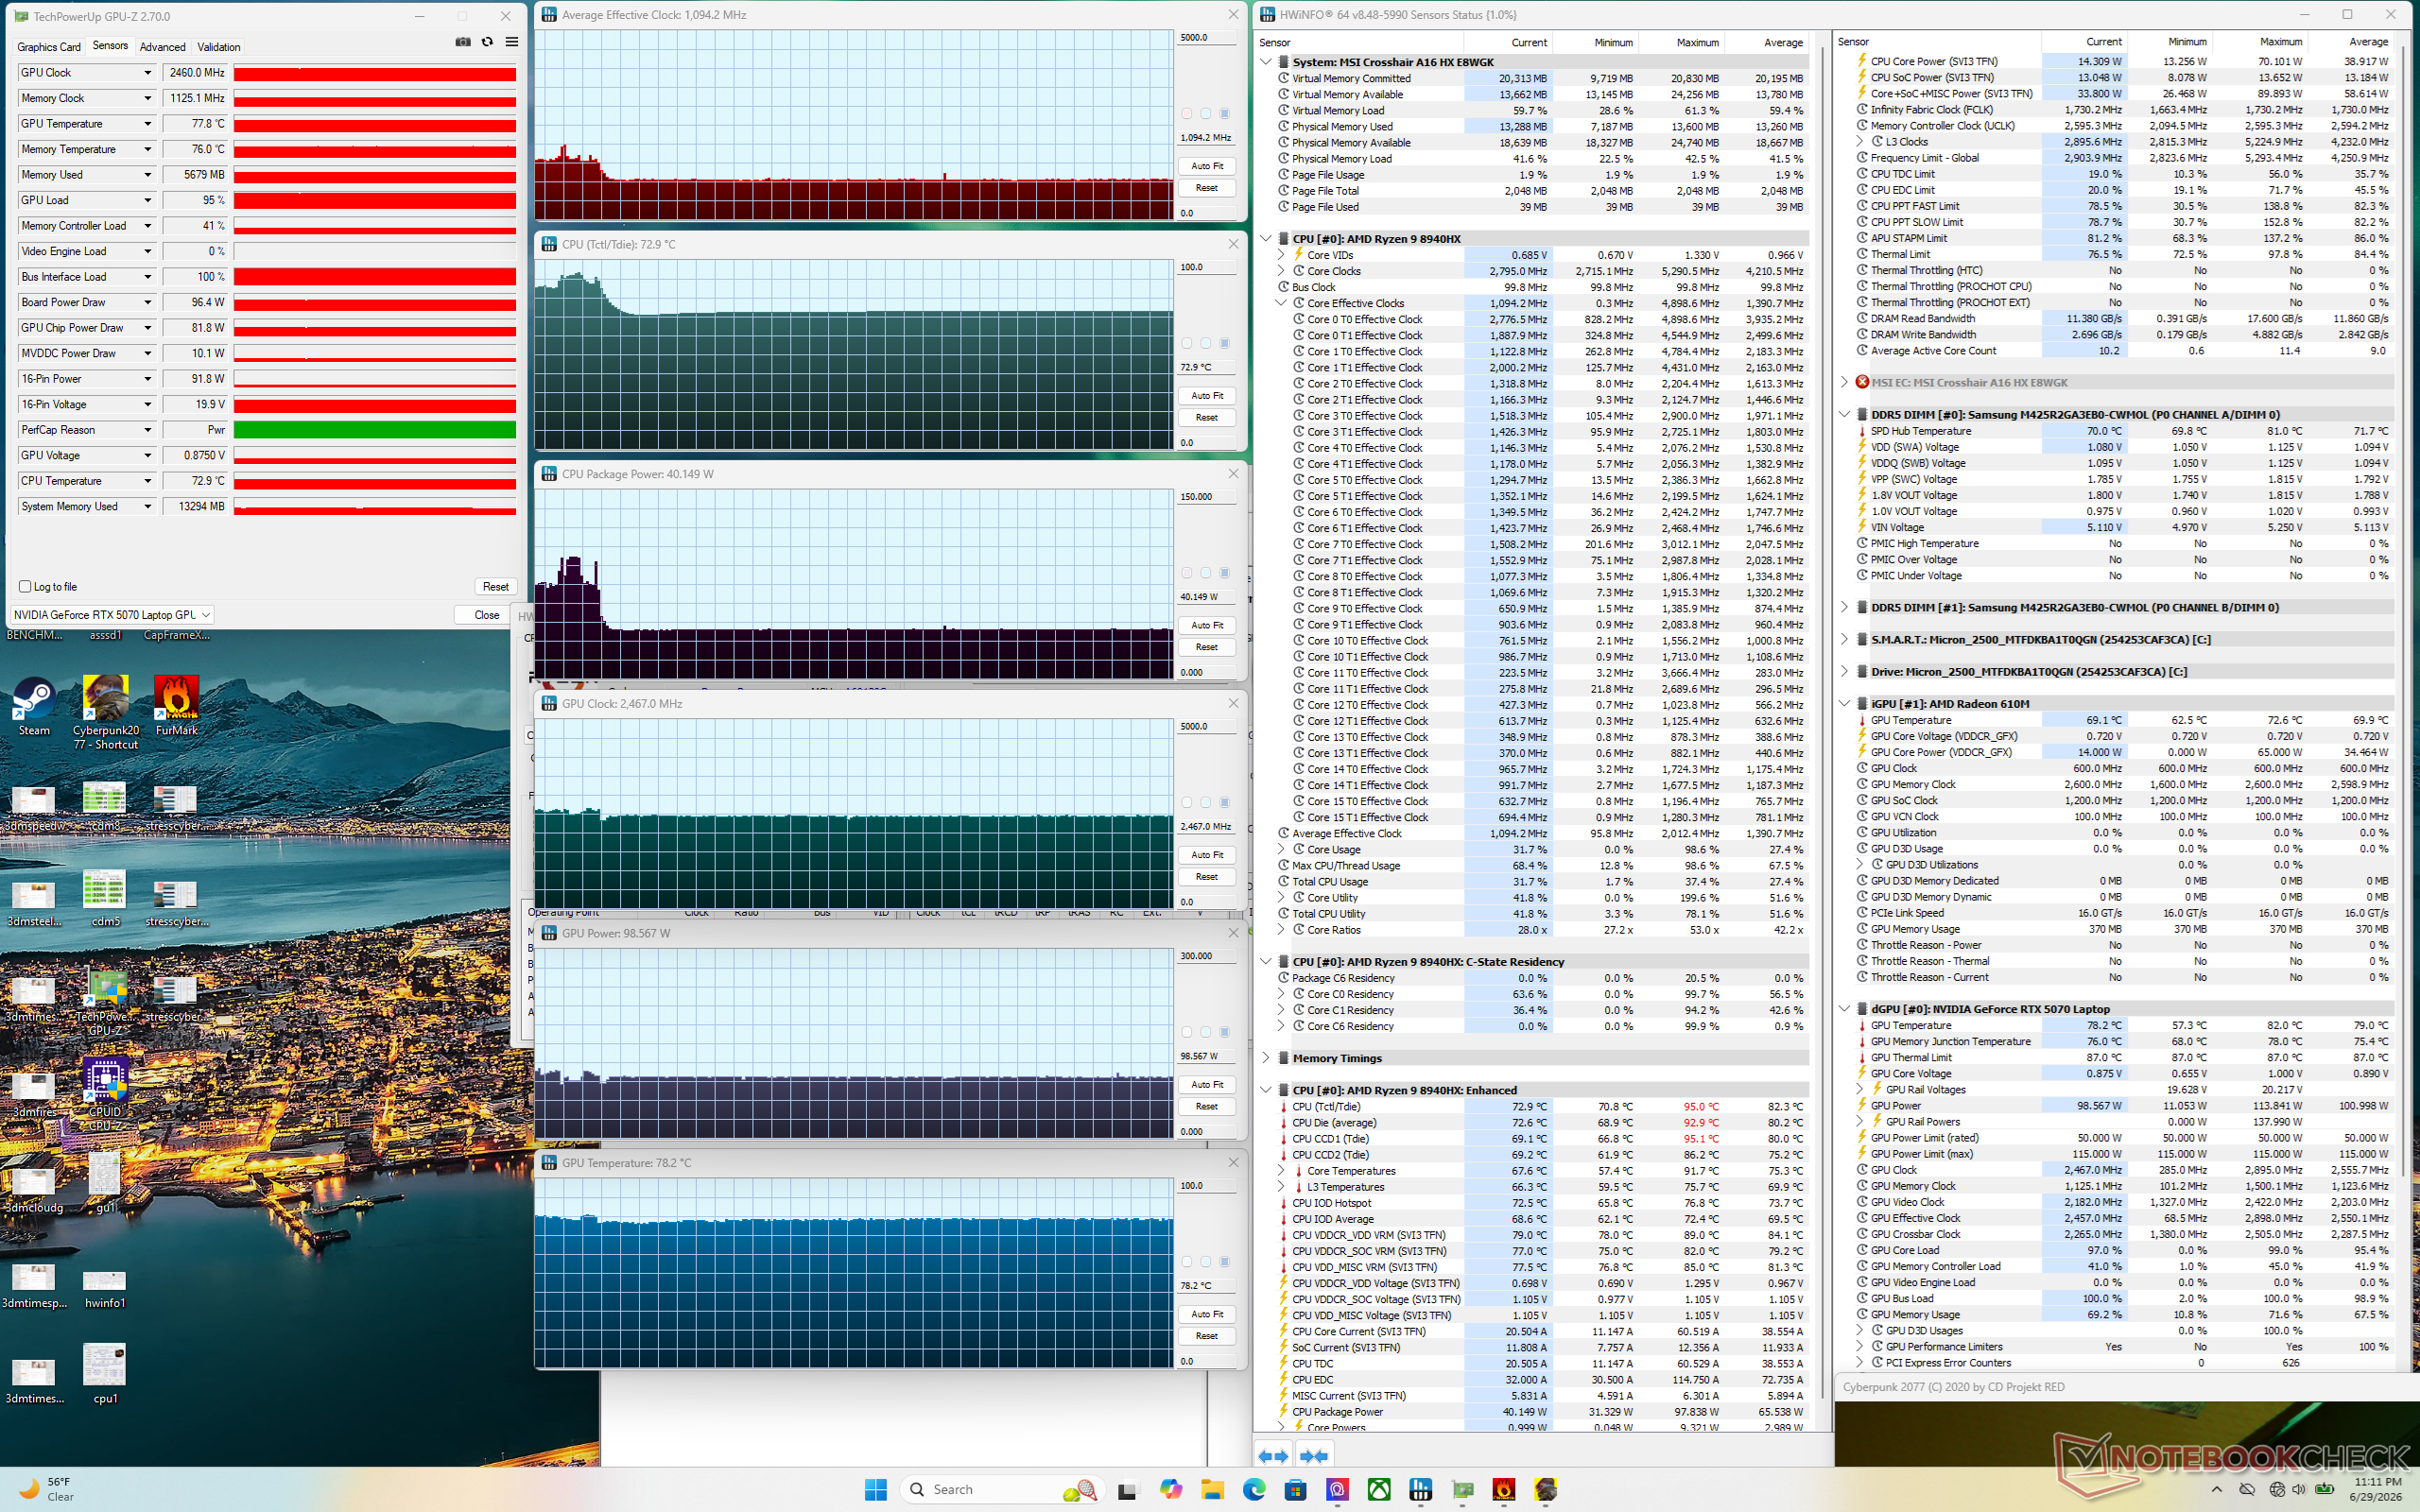

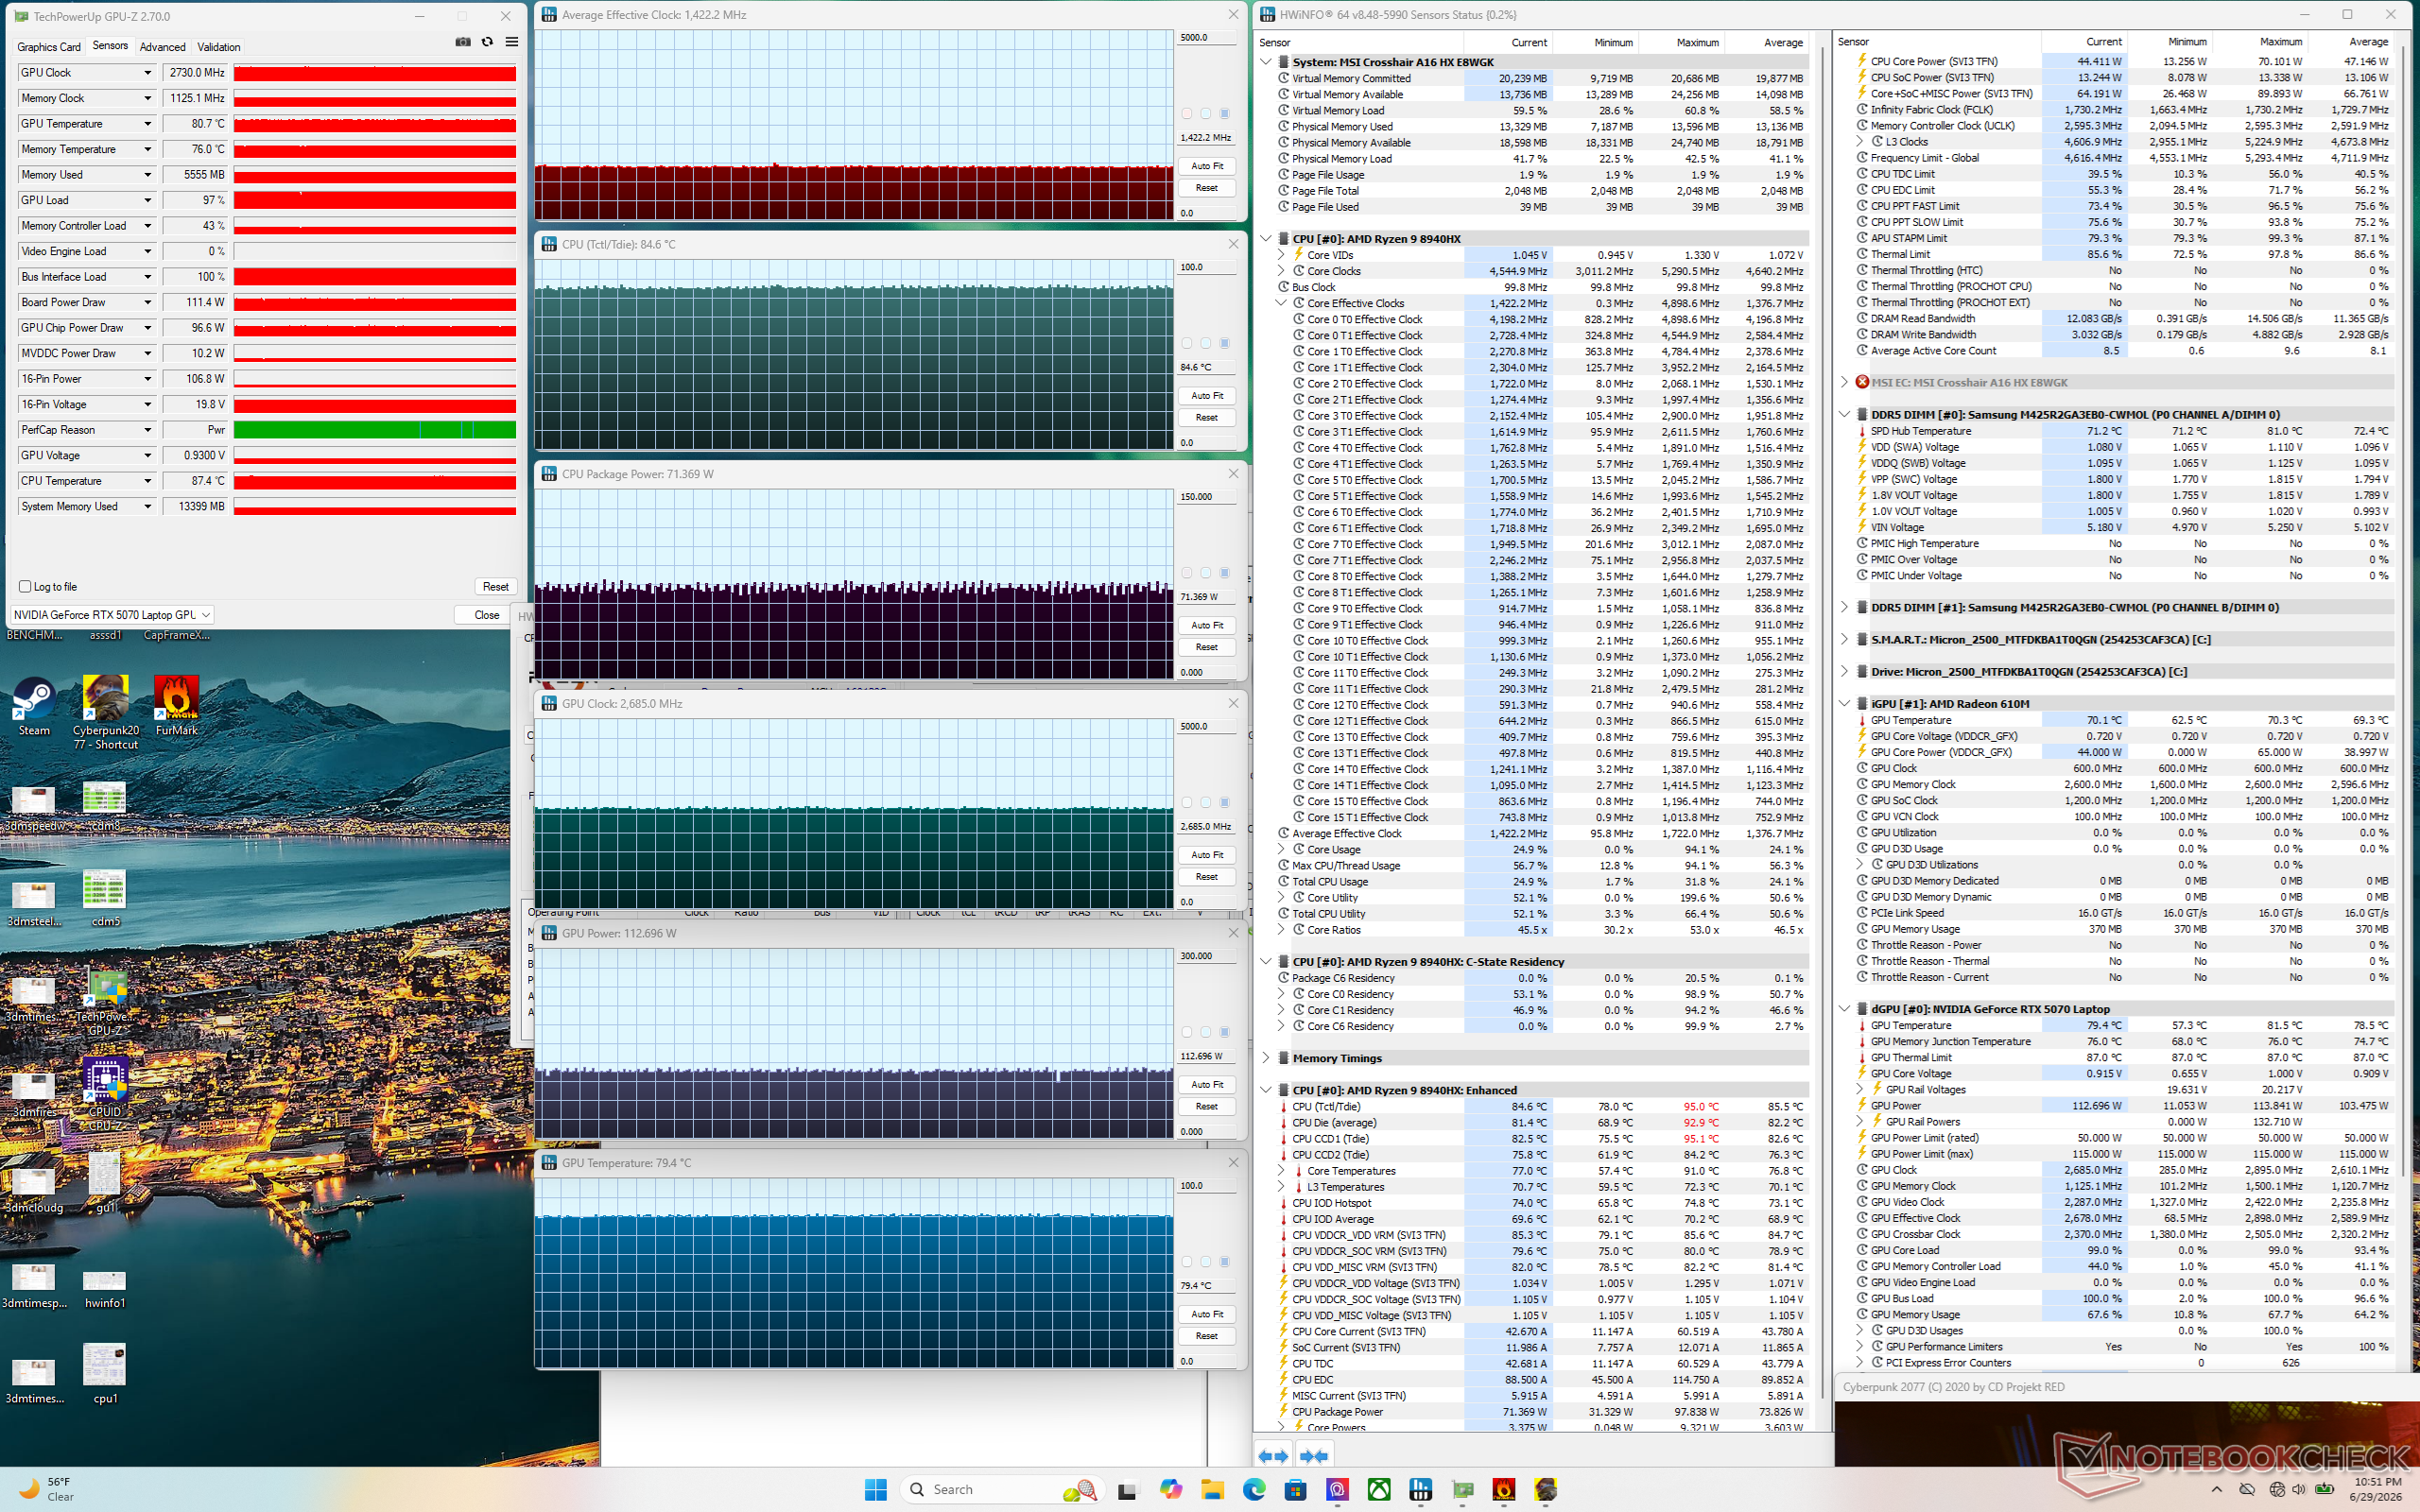
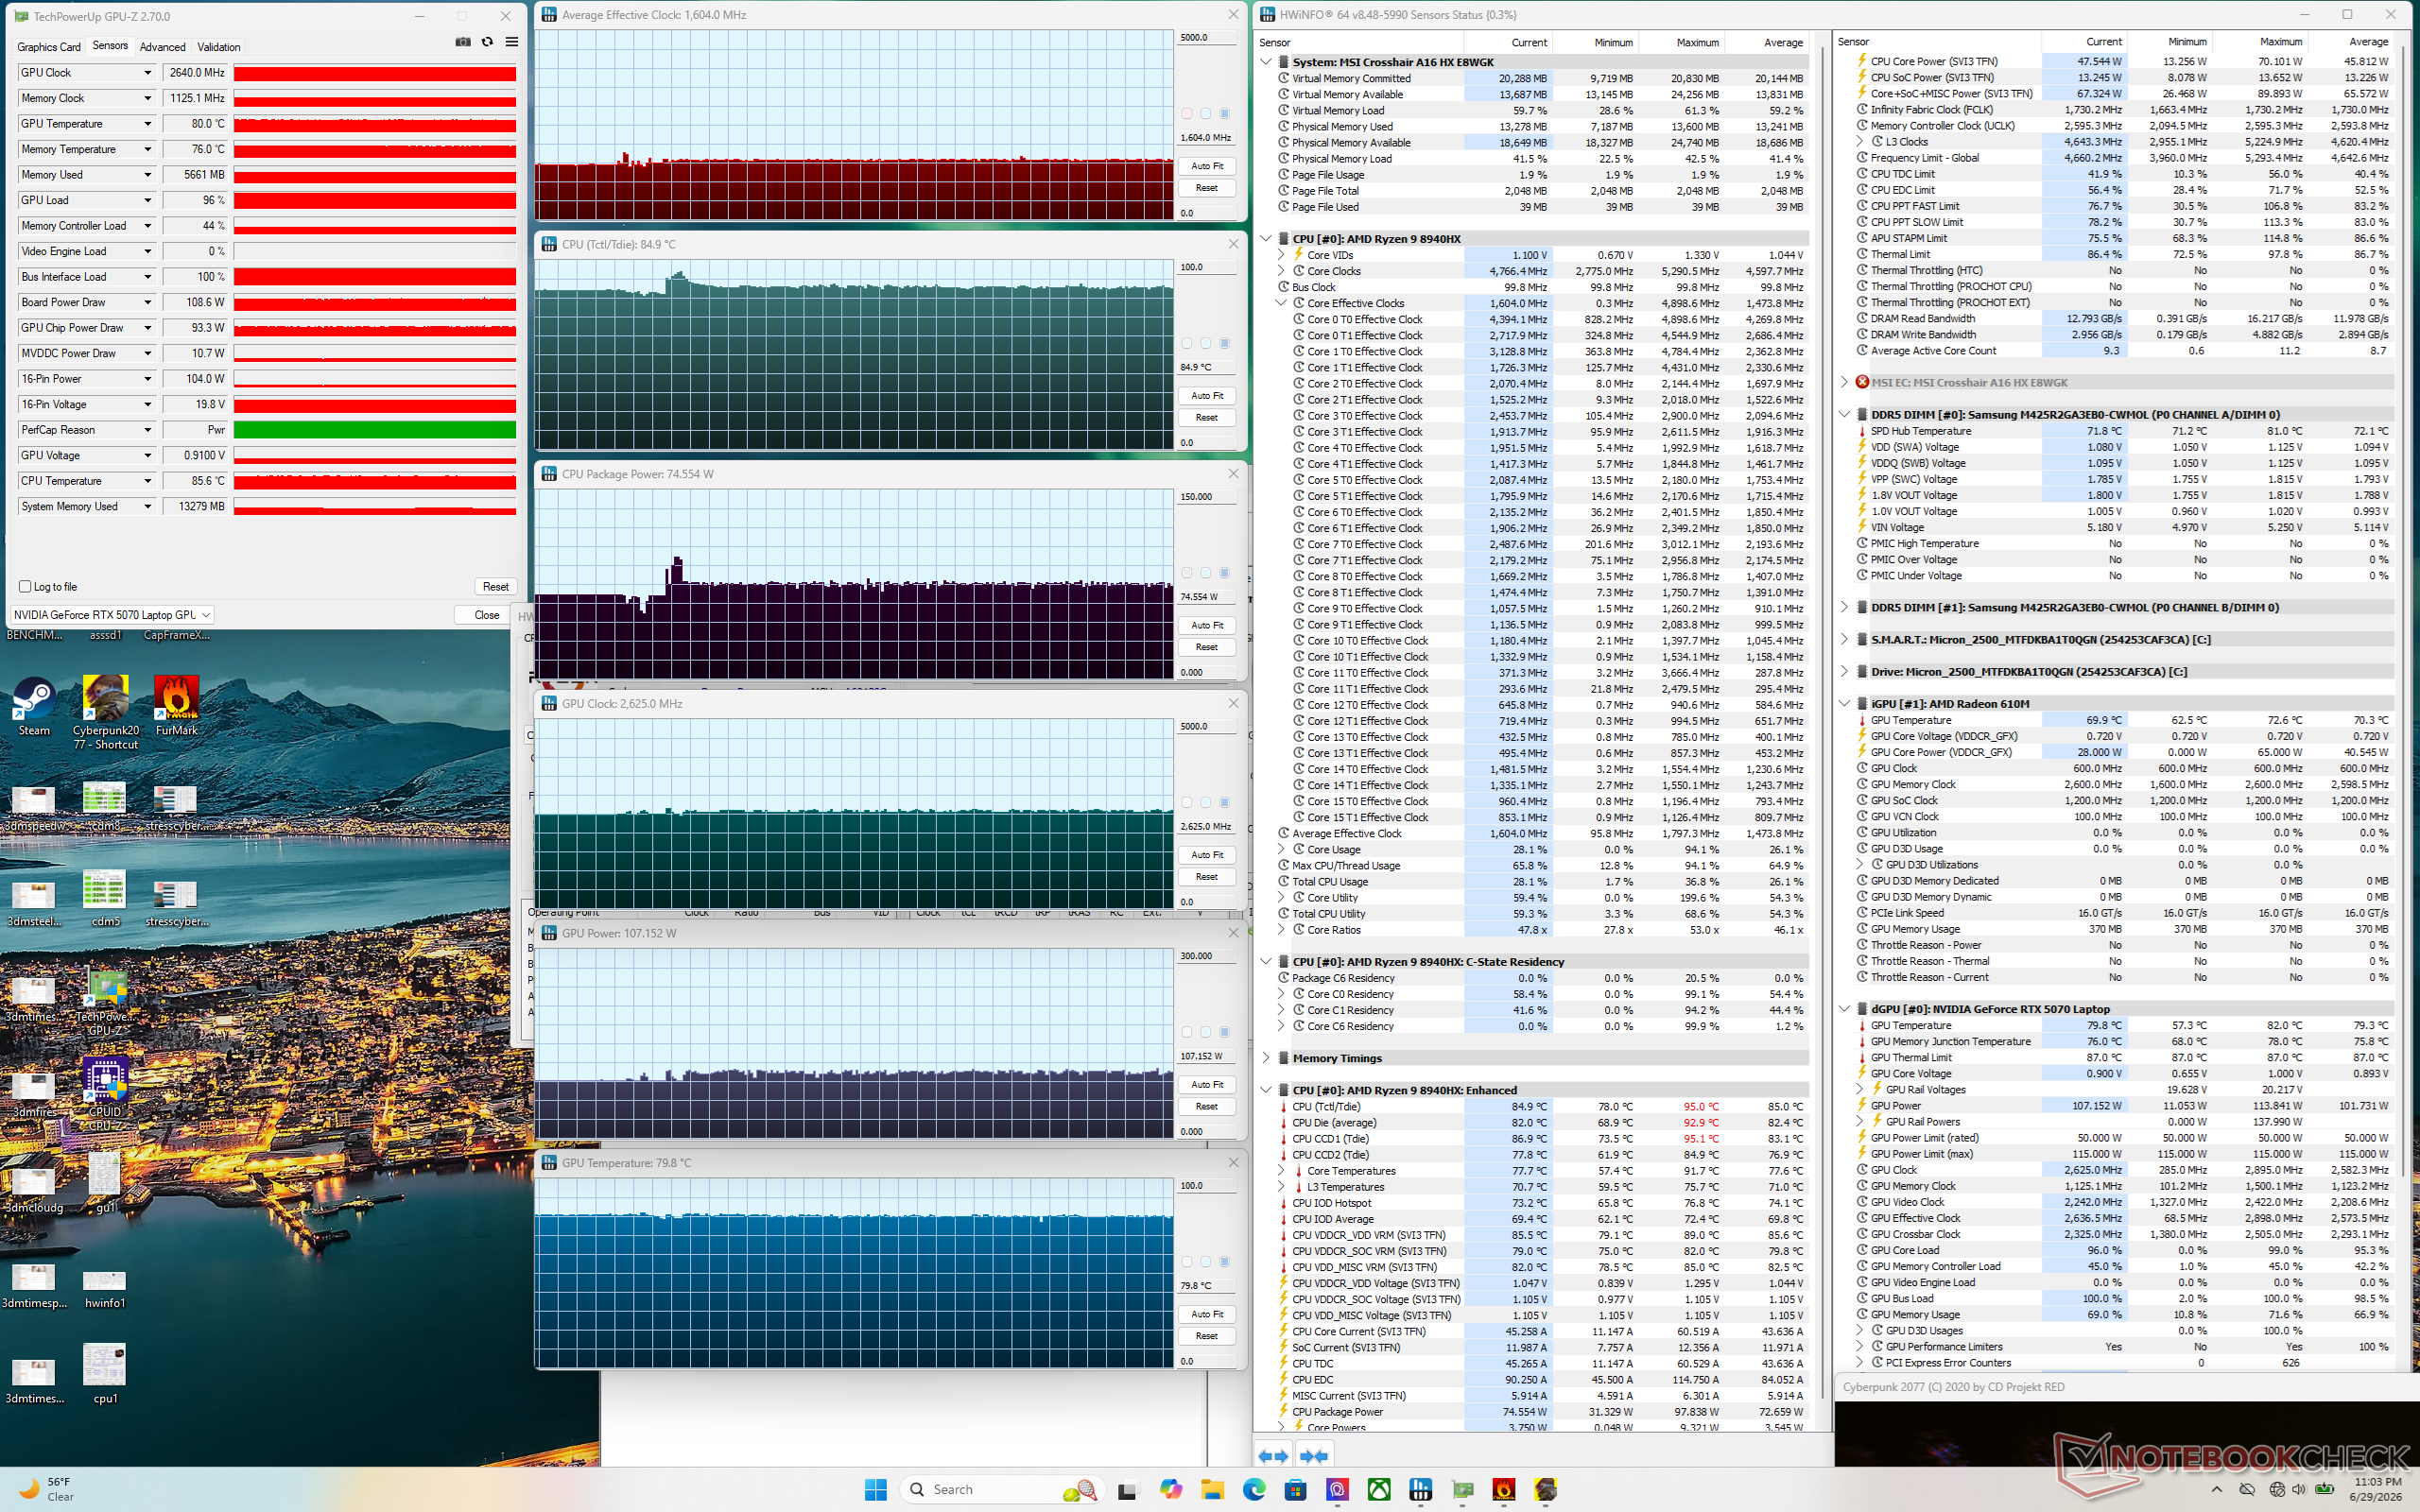
| Fréquence moyenne du processeur (GHz) | Fréquence du GPU (MHz) | Température moyenne du processeur (°C) | Température moyenne du GPU (°C) | |
| Système au repos | -- | -- | 56 | 44 |
| Stress Prime95 | 4,1 | -- | 82 | 55 |
| Stress Prime95 + FurMark | 4,4 | ~2047 | 96 | 79 |
| Stress Cyberpunk 2077 (mode Équilibré) | 1,1 | 2467 | 73 | 78 |
| Cyberpunk 2077 – Test de charge (Apex désactivé, mode Performance) | 1,5 | 2512 | 84 | 81 |
| Cyberpunk 2077 – Test de charge (Apex activé, mode Performance) | 1,4 | 2685 | 85 | 79 |
| Cyberpunk 2077 en charge maximale (Apex activé, mode Cooler Boost) | 1,6 | 2 625 | 85 | 80 |
Intervenants
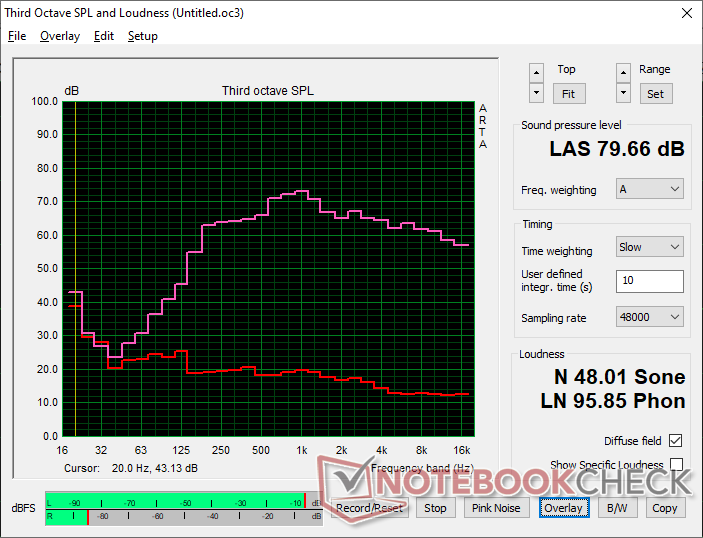
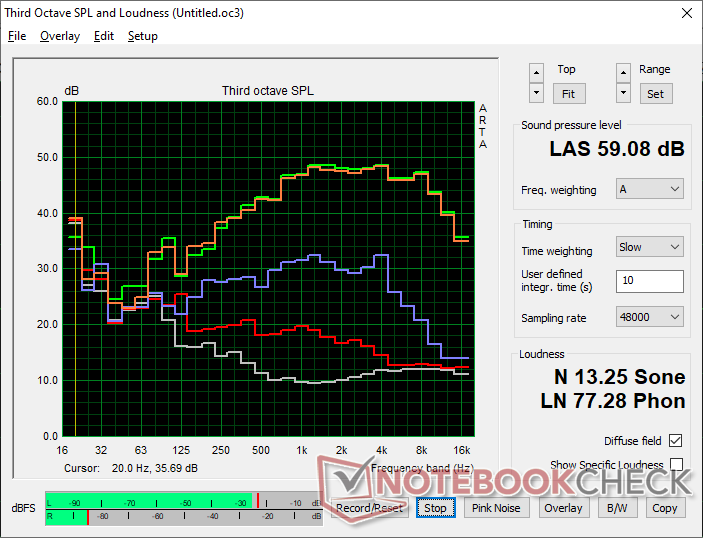
MSI Crosshair A16 HX E8WGK analyse audio
(±) | le niveau sonore du haut-parleur est moyen mais bon (79.7# dB)
Basses 100 - 315 Hz
(±) | basse réduite - en moyenne 8.8% inférieure à la médiane
(±) | la linéarité des basses est moyenne (10% delta à la fréquence précédente)
Médiums 400 - 2000 Hz
(+) | médiane équilibrée - seulement 4.5% de la médiane
(+) | les médiums sont linéaires (4.6% delta à la fréquence précédente)
Aiguës 2 - 16 kHz
(+) | des sommets équilibrés - à seulement 1.7% de la médiane
(+) | les aigus sont linéaires (3.6% delta à la fréquence précédente)
Globalement 100 - 16 000 Hz
(+) | le son global est linéaire (12.7% différence à la médiane)
Par rapport à la même classe
» 16% de tous les appareils testés de cette catégorie étaient meilleurs, 4% similaires, 80% pires
» Le meilleur avait un delta de 6%, la moyenne était de 18%, le pire était de 132%.
Par rapport à tous les appareils testés
» 12% de tous les appareils testés étaient meilleurs, 3% similaires, 86% pires
» Le meilleur avait un delta de 4%, la moyenne était de 24%, le pire était de 134%.
Apple MacBook Pro 16 2021 M1 Pro analyse audio
(+) | les haut-parleurs peuvent jouer relativement fort (84.7# dB)
Basses 100 - 315 Hz
(+) | bonne basse - seulement 3.8% loin de la médiane
(+) | les basses sont linéaires (5.2% delta à la fréquence précédente)
Médiums 400 - 2000 Hz
(+) | médiane équilibrée - seulement 1.3% de la médiane
(+) | les médiums sont linéaires (2.1% delta à la fréquence précédente)
Aiguës 2 - 16 kHz
(+) | des sommets équilibrés - à seulement 1.9% de la médiane
(+) | les aigus sont linéaires (2.7% delta à la fréquence précédente)
Globalement 100 - 16 000 Hz
(+) | le son global est linéaire (4.6% différence à la médiane)
Par rapport à la même classe
» 0% de tous les appareils testés de cette catégorie étaient meilleurs, 0% similaires, 100% pires
» Le meilleur avait un delta de 5%, la moyenne était de 17%, le pire était de 45%.
Par rapport à tous les appareils testés
» 0% de tous les appareils testés étaient meilleurs, 0% similaires, 100% pires
» Le meilleur avait un delta de 4%, la moyenne était de 24%, le pire était de 134%.
Gestion de l'énergie
Consommation électrique
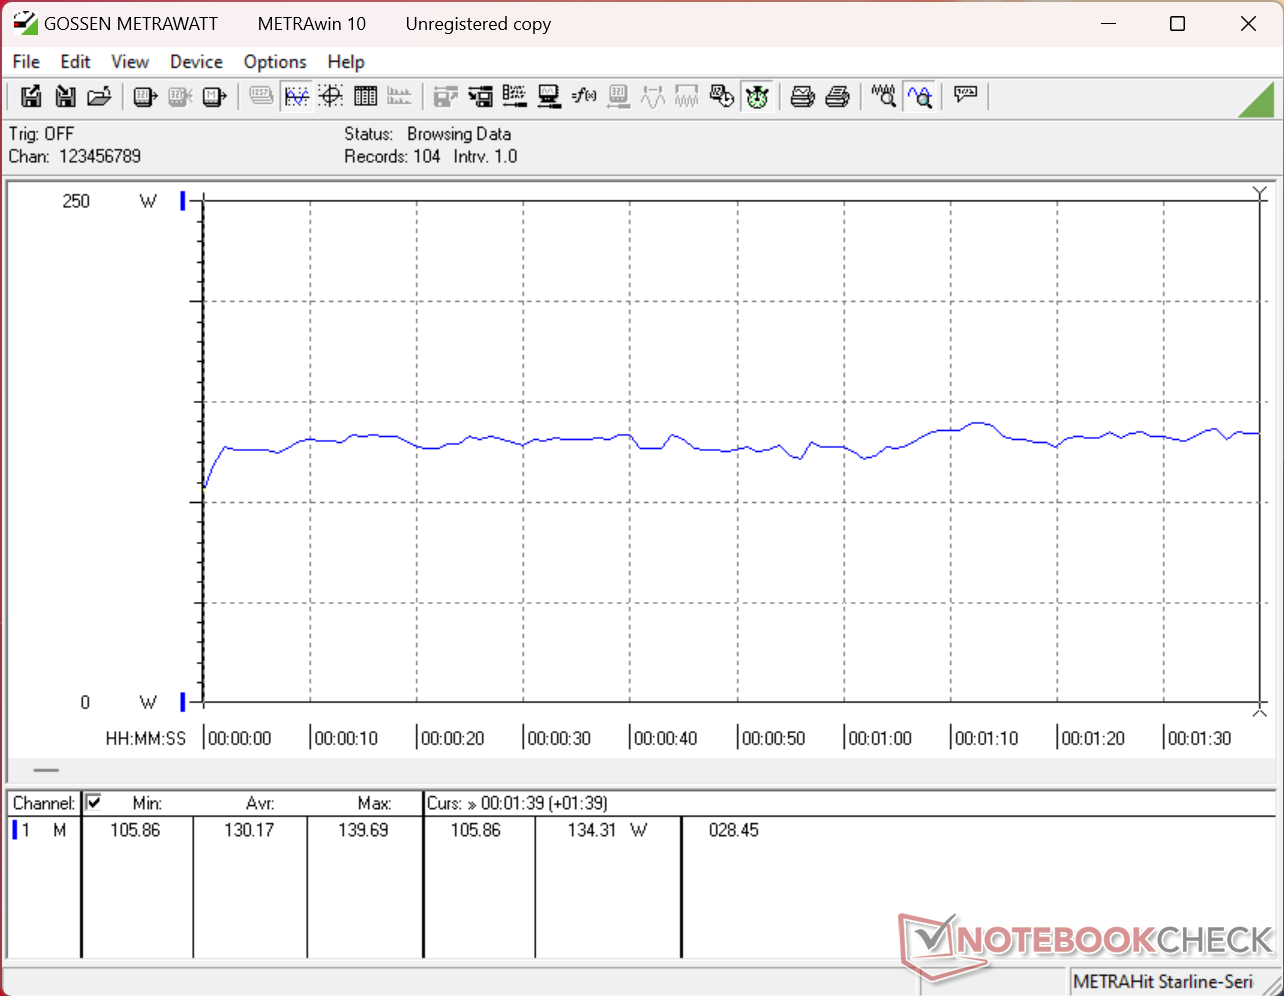
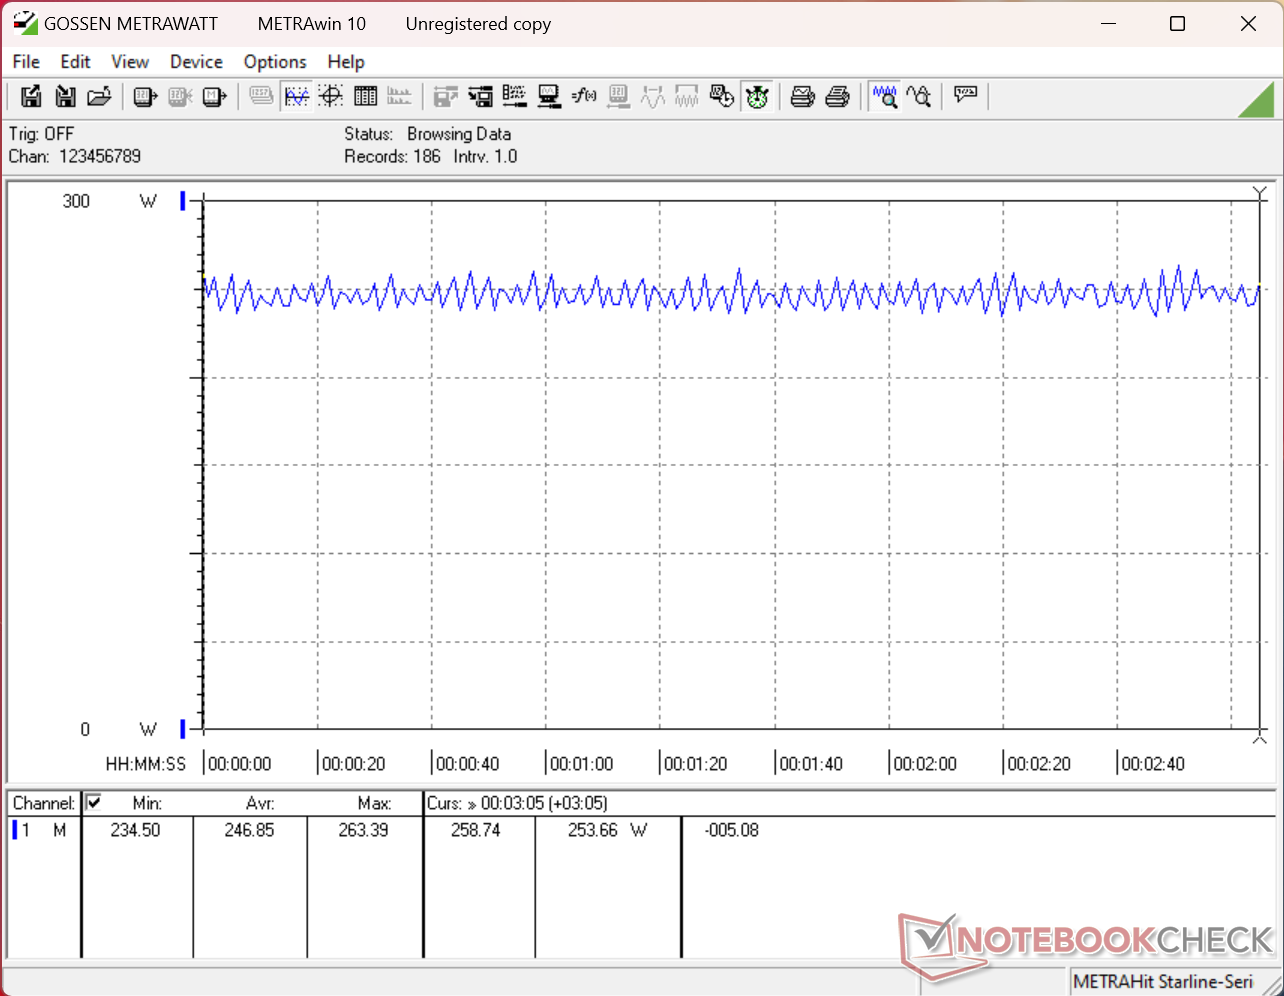
| Éteint/en veille | |
| Au repos | |
| Fortement sollicité |
|
Légende:
min: | |
| MSI Crosshair A16 HX E8WGK R9 8940HX, GeForce RTX 5070 Laptop, Micron 2500 1TB MTFDKBA1T0QGN, IPS, 2560x1600, 16" | MSI Crosshair 16 HX AI D2XWGKG Ultra 9 275HX, GeForce RTX 5070 Laptop, Micron 2500 1TB MTFDKBA1T0QGN, IPS, 2560x1600, 16" | Alienware 16X Aurora Core Ultra 9 290HX Plus Ultra 9 290HX Plus, GeForce RTX 5070 Ti Laptop, , OLED, 2560x1600, 16" | Lenovo Legion 7 16 AGP11 Ryzen AI 9 HX 470, GeForce RTX 5060 Laptop, Lenovo UMIS AM541 1TB, OLED, 2560x1600, 16" | Gigabyte Gaming A16 Pro GA6DH (Core 7 240H, RTX 5070 Ti) Core 7 240H, GeForce RTX 5070 Ti Laptop, Samsung PM9C1b MZVL81T0HFLB-00BTW, IPS, 2560x1600, 16" | Acer Predator Helios Neo 16S AI PHN16S-71-94L9 Ultra 9 275HX, GeForce RTX 5070 Ti Laptop, Micron 3500 1TB MTFDKBA1T0TGD, OLED, 2560x1600, 16" | |
|---|---|---|---|---|---|---|
| Power Consumption | -25% | 22% | 42% | 3% | 37% | |
| Idle Minimum * (Watt) | 12.3 | 26.2 -113% | 6.9 44% | 5.7 54% | 21.5 -75% | 3.9 68% |
| Idle Average * (Watt) | 17.1 | 33.8 -98% | 8.1 53% | 8.7 49% | 28.3 -65% | 11 36% |
| Idle Maximum * (Watt) | 42.4 | 34 20% | 31 27% | 9.1 79% | 26.3 38% | 16.9 60% |
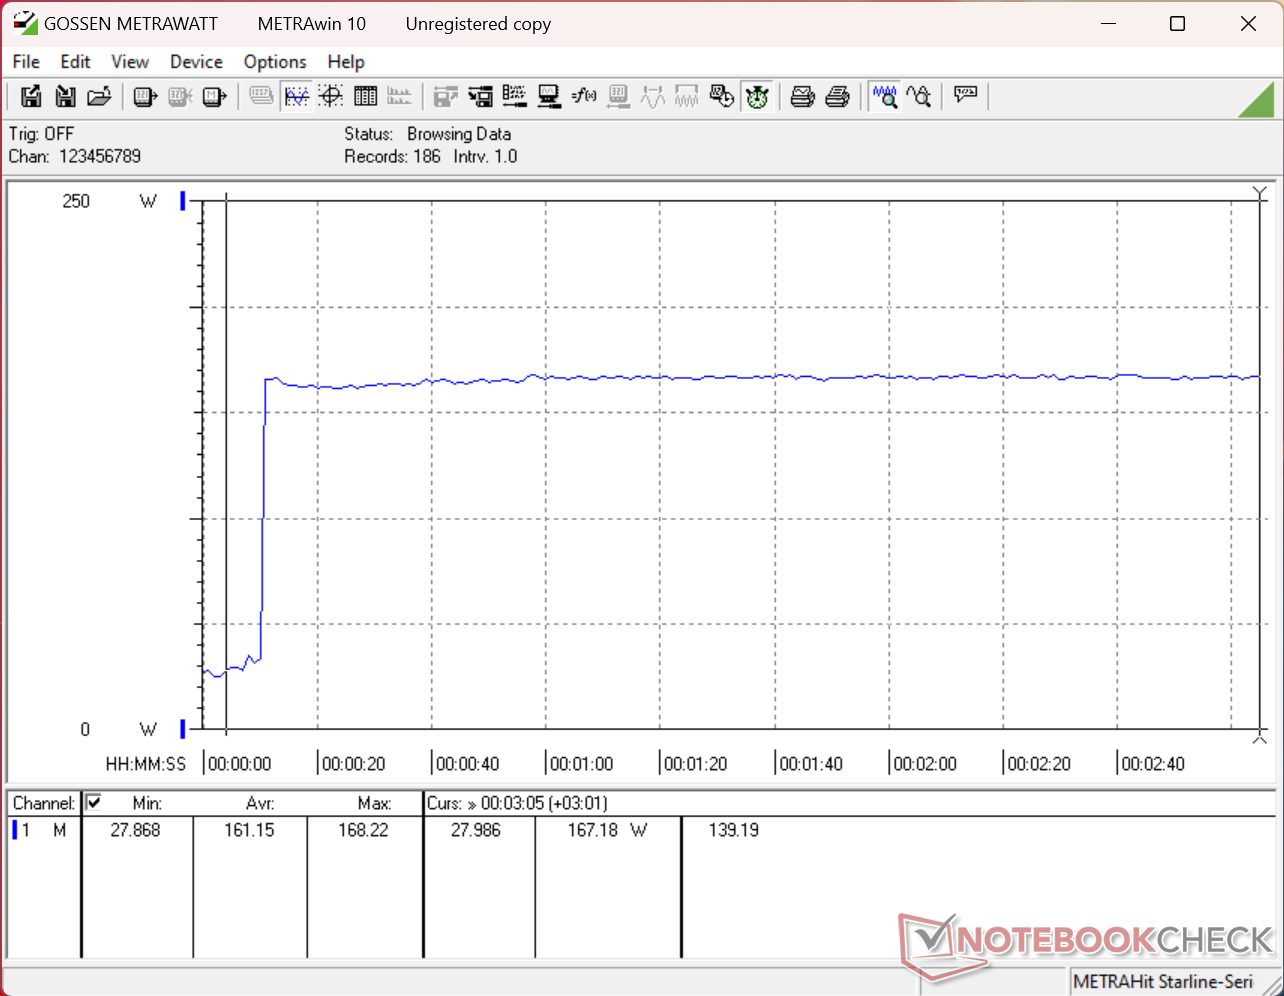
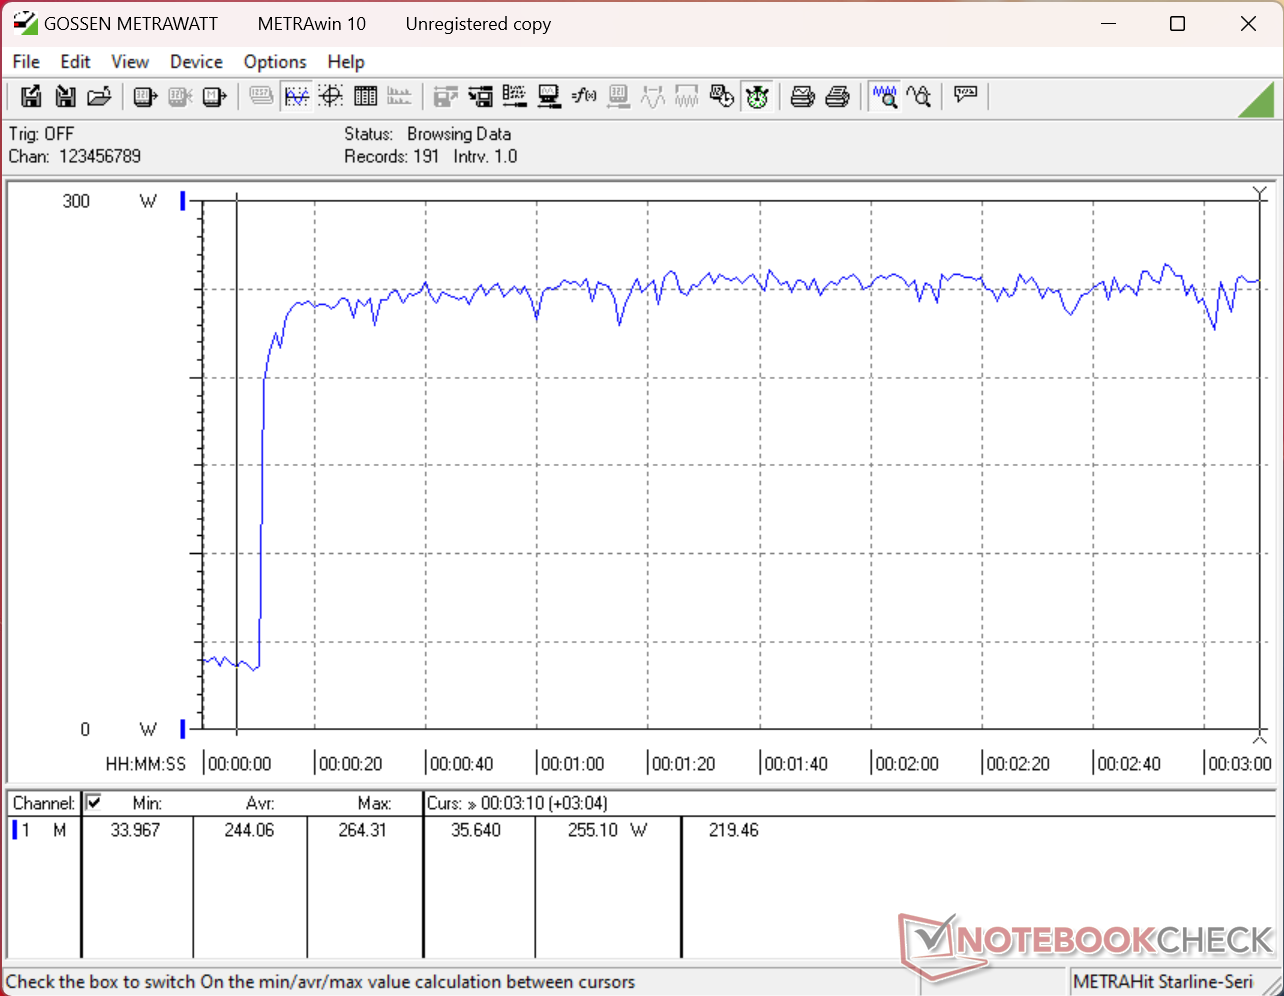
| Load Average * (Watt) | 130.2 | 112 14% | 131.6 -1% | 88.7 32% | 92.5 29% | 123 6% |
| Cyberpunk 2077 ultra * (Watt) | 246 | 224 9% | 198.3 19% | 160.3 35% | 165 33% | 152.7 38% |
| Cyberpunk 2077 ultra external monitor * (Watt) | 242 | 220 9% | 172.1 29% | 156.9 35% | 158 35% | 144.9 40% |
| Load Maximum * (Watt) | 264.3 | 315 -19% | 300.1 -14% | 234.9 11% | 195 26% | 229 13% |
* ... Moindre est la valeur, meilleures sont les performances
Consommation électrique : Cyberpunk / Test de charge
Consommation électrique du moniteur externe
Autonomie de la batterie
| MSI Crosshair A16 HX E8WGK R9 8940HX, GeForce RTX 5070 Laptop, 80 Wh | MSI Crosshair 16 HX AI D2XWGKG Ultra 9 275HX, GeForce RTX 5070 Laptop, 90 Wh | Alienware 16X Aurora Core Ultra 9 290HX Plus Ultra 9 290HX Plus, GeForce RTX 5070 Ti Laptop, 96 Wh | Lenovo Legion 7 16 AGP11 Ryzen AI 9 HX 470, GeForce RTX 5060 Laptop, 84 Wh | Gigabyte Gaming A16 Pro GA6DH (Core 7 240H, RTX 5070 Ti) Core 7 240H, GeForce RTX 5070 Ti Laptop, 76 Wh | Acer Predator Helios Neo 16S AI PHN16S-71-94L9 Ultra 9 275HX, GeForce RTX 5070 Ti Laptop, 76 Wh | |
|---|---|---|---|---|---|---|
| Autonomie de la batterie | 102% | 35% | 67% | 51% | -9% | |
| WiFi v1.3 (h) | 5.5 | 11.1 102% | 7.4 35% | 9.2 67% | 8.3 51% | 5 -9% |
| H.264 (h) | 14.2 |
Note attribuée par Notebookcheck
Le Crosshair A16 fait partie des ordinateurs portables de jeu les plus abordables de MSI ; il privilégie les performances et la qualité d'affichage au détriment des fonctionnalités secondaires ou haut de gamme afin de réduire les coûts.
MSI Crosshair A16 HX E8WGK
- 07/03/2026 v8
Allen Ngo
 Total Sustainability Score:
 Comparaison des concurrents potentiels
Image | Modèle | Prix | Poids | Épaisseur | Écran |
|---|---|---|---|---|---|
1. 82.5%  | MSI Crosshair A16 HX E8WGK AMD Ryzen 9 8940HX ⎘ NVIDIA GeForce RTX 5070 Laptop ⎘ 32 Go Mémoire, 1024 Go SSD | Amazon: $2,629.00 Prix de liste: 2700 USD | 2.3 kg | 25.55 mm | 16.00" 2560x1600 189 PPI IPS |
2. 81.9%  | MSI Crosshair 16 HX AI D2XWGKG Intel Core Ultra 9 275HX ⎘ NVIDIA GeForce RTX 5070 Laptop ⎘ 16 Go Mémoire, 1024 Go SSD | Amazon: Prix de liste: 2500 EUR | 2.5 kg | 27.9 mm | 16.00" 2560x1600 189 PPI IPS |
3. 85.9%  | Alienware 16X Aurora Core Ultra 9 290HX Plus Intel Core Ultra 9 290HX Plus ⎘ NVIDIA GeForce RTX 5070 Ti Laptop ⎘ 32 Go Mémoire | Amazon: Prix de liste: 3000 USD | 2.6 kg | 23.4 mm | 16.00" 2560x1600 189 PPI OLED |
4. 86.4%  | Lenovo Legion 7 16 AGP11 AMD Ryzen AI 9 HX 470 ⎘ NVIDIA GeForce RTX 5060 Laptop ⎘ 32 Go Mémoire, 1024 Go SSD | Amazon: Prix de liste: 2500€ | 1.8 kg | 16.9 mm | 16.00" 2560x1600 189 PPI OLED |
5. 81%  | Gigabyte Gaming A16 Pro GA6DH (Core 7 240H, RTX 5070 Ti) Intel Core 7 240H ⎘ NVIDIA GeForce RTX 5070 Ti Laptop ⎘ 32 Go Mémoire, 1000 Go SSD | Amazon: Prix de liste: 2300 Euro | 2.4 kg | 22.99 mm | 16.00" 2560x1600 189 PPI IPS |
6. 82%  | Acer Predator Helios Neo 16S AI PHN16S-71-94L9 Intel Core Ultra 9 275HX ⎘ NVIDIA GeForce RTX 5070 Ti Laptop ⎘ 32 Go Mémoire, 1024 Go SSD | Amazon: Prix de liste: 2400 EUR | 2.2 kg | 19.9 mm | 16.00" 2560x1600 189 PPI OLED |
Transparency
La sélection des appareils à examiner est effectuée par notre équipe éditoriale. L'échantillon de test a été prêté à l'auteur par le fabricant ou le détaillant pour les besoins de cet examen. Le prêteur n'a pas eu d'influence sur cette évaluation et le fabricant n'a pas reçu de copie de cette évaluation avant sa publication. Il n'y avait aucune obligation de publier cet article. En tant que média indépendant, Notebookcheck n'est pas soumis à l'autorité des fabricants, des détaillants ou des éditeurs.
Voici comment Notebookcheck teste
Chaque année, Notebookcheck examine de manière indépendante des centaines d'ordinateurs portables et de smartphones en utilisant des procédures standardisées afin de garantir que tous les résultats sont comparables. Nous avons continuellement développé nos méthodes de test depuis environ 20 ans et avons établi des normes industrielles dans le processus. Dans nos laboratoires de test, des équipements de mesure de haute qualité sont utilisés par des techniciens et des rédacteurs expérimentés. Ces tests impliquent un processus de validation en plusieurs étapes. Notre système d'évaluation complexe repose sur des centaines de mesures et de points de référence bien fondés, ce qui garantit l'objectivité.
