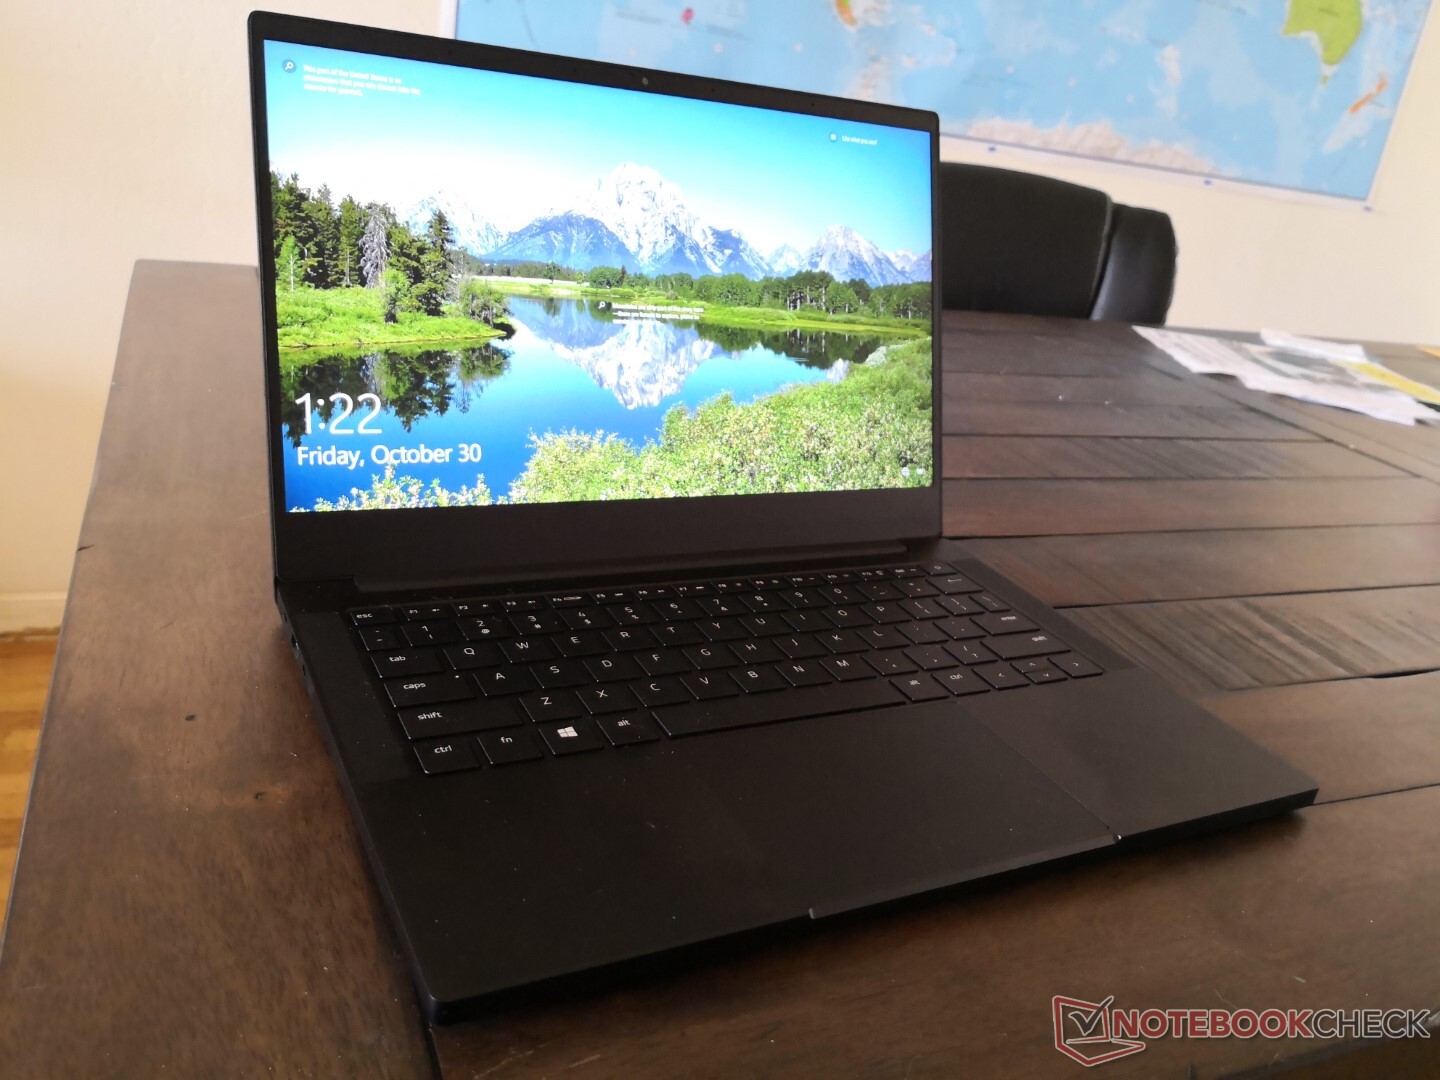
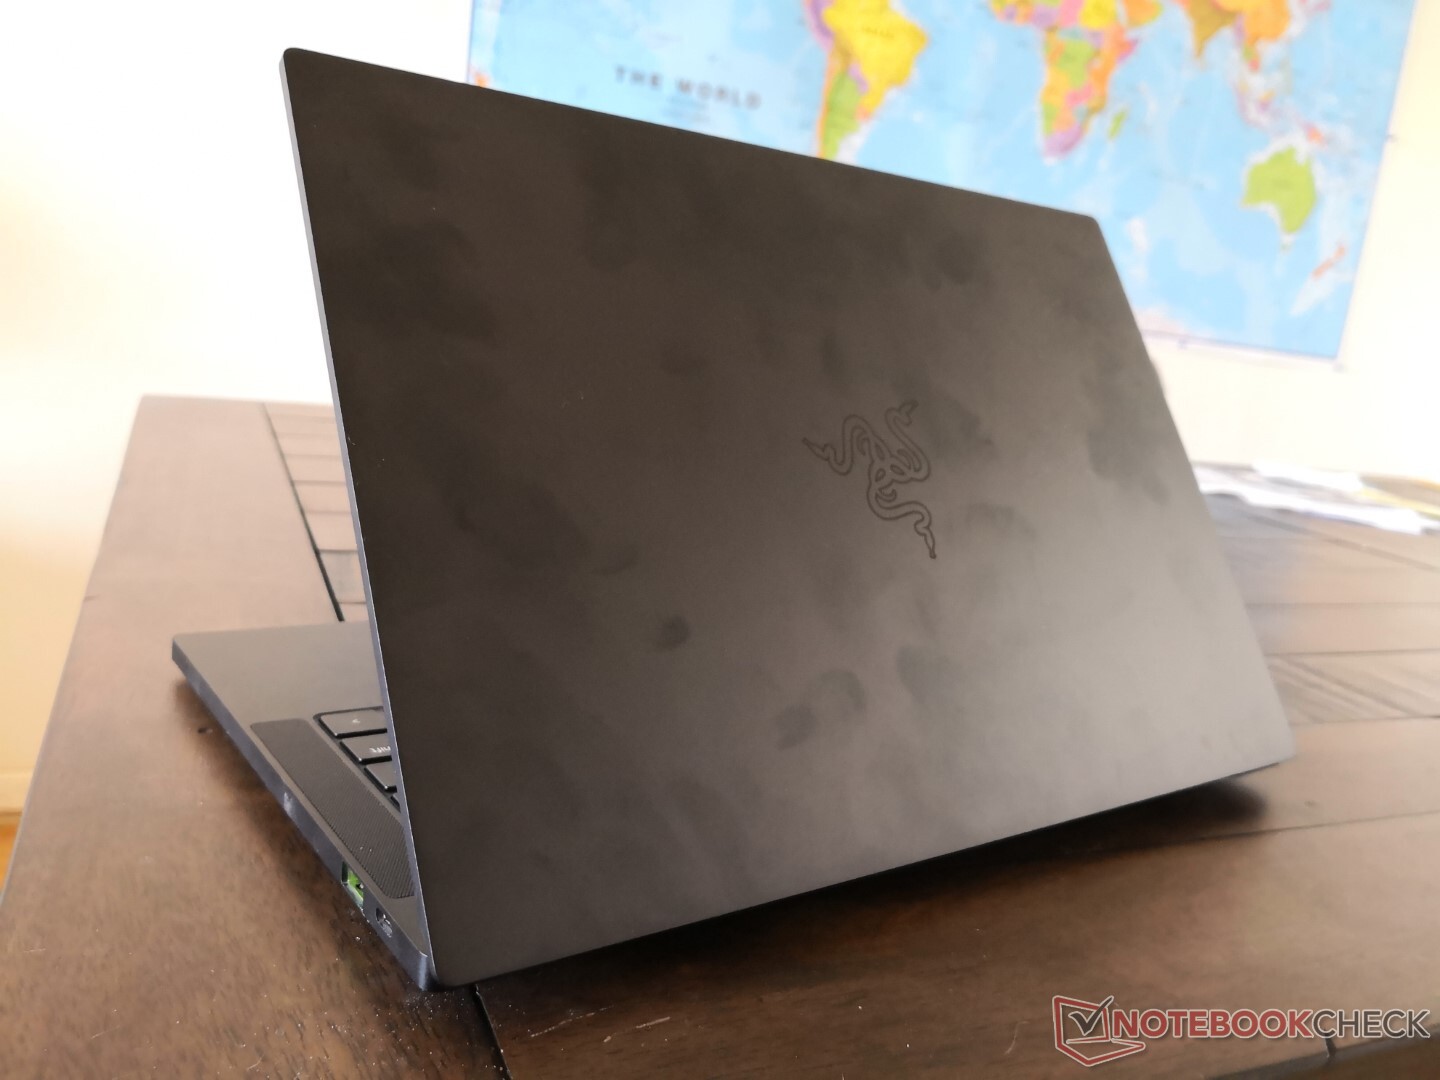
Test du Razer Blade Stealth Tiger Lake (i7-1165G7, GTX 1650 Ti Max-Q, FHD, 120 Hz) : un petit pas en avant
Note | Date | Modèle | Poids | Épaisseur | Taille | Résolution | Prix |
|---|---|---|---|---|---|---|---|
| 85.5 % v7 (old) | 11/20 | Razer Blade Stealth i7-1165G7 GTX 1650 Ti Max-Q i7-1165G7, GeForce GTX 1650 Ti Max-Q | 1.4 kg | 15.3 mm | 13.30" | 1920x1080 | |
| 84.8 % v7 (old) | 07/20 | Razer Blade Stealth Core i7 GTX 1650 Ti Max-Q 4K i7-1065G7, GeForce GTX 1650 Ti Max-Q | 1.5 kg | 15.3 mm | 13.30" | 3840x2160 | |
| 88.1 % v7 (old) | 11/20 | Dell XPS 13 9310 Core i7 FHD i7-1165G7, Iris Xe G7 96EUs | 1.3 kg | 14.8 mm | 13.40" | 1920x1200 | |
| 87.4 % v7 (old) | 07/20 | Huawei MateBook X Pro 2020 i7 i7-10510U, GeForce MX250 | 1.3 kg | 14.6 mm | 13.90" | 3000x2000 | |
| 85.1 % v7 (old) | 10/20 | Asus Zenbook S UX393JA i7-1065G7, Iris Plus Graphics G7 (Ice Lake 64 EU) | 1.4 kg | 15.7 mm | 13.90" | 3300x2200 | |
| 84.4 % v7 (old) | 11/20 | Lenovo Yoga Slim 7-14IIL05 i7-1065G7, GeForce MX350 | 1.4 kg | 14.9 mm | 14.00" | 1920x1080 |


| |||||||||||||||||||||||||
Homogénéité de la luminosité: 88 %
Valeur mesurée au centre, sur batterie: 356.8 cd/m²
Contraste: 1049:1 (Valeurs des noirs: 0.34 cd/m²)
ΔE ColorChecker Calman: 1.63 | ∀{0.5-29.43 Ø4.72}
calibrated: 1.08
ΔE Greyscale Calman: 3 | ∀{0.09-98 Ø4.97}
97.6% sRGB (Argyll 1.6.3 3D)
62% AdobeRGB 1998 (Argyll 1.6.3 3D)
67.1% AdobeRGB 1998 (Argyll 3D)
97.4% sRGB (Argyll 3D)
66% Display P3 (Argyll 3D)
Gamma: 2.23
CCT: 6434 K
| Razer Blade Stealth i7-1165G7 GTX 1650 Ti Max-Q Sharp LQ133M1JW46, IPS, 13.3", 1920x1080 | Razer Blade Stealth Core i7 GTX 1650 Ti Max-Q 4K AUO272B, IPS, 13.3", 3840x2160 | Dell XPS 13 9310 Core i7 FHD Sharp LQ134N1, IPS, 13.4", 1920x1200 | Huawei MateBook X Pro 2020 i7 JDI LPM139M422A, LTPS, 13.9", 3000x2000 | Asus Zenbook S UX393JA AU Optronics B139KAN01.0, IPS, 13.9", 3300x2200 | Lenovo Yoga Slim 7-14IIL05 N140HCG-EQ1, , 14", 1920x1080 | |
|---|---|---|---|---|---|---|
| Display | -4% | 6% | 2% | 27% | 1% | |
| Display P3 Coverage (%) | 66 | 63.7 -3% | 70.9 7% | 66.6 1% | 97.7 48% | 66.4 1% |
| sRGB Coverage (%) | 97.4 | 93.7 -4% | 99.1 2% | 99.4 2% | 99.8 2% | 98.8 1% |
| AdobeRGB 1998 Coverage (%) | 67.1 | 64.5 -4% | 72.9 9% | 68.6 2% | 87.9 31% | 68.4 2% |
| Response Times | 1% | 11% | 16% | -1% | 9% | |
| Response Time Grey 50% / Grey 80% * (ms) | 57.6 ? | 57.6 ? -0% | 52 ? 10% | 49.6 ? 14% | 56.4 ? 2% | 51.2 ? 11% |
| Response Time Black / White * (ms) | 37.6 ? | 37.2 ? 1% | 33.2 ? 12% | 30.8 ? 18% | 38.8 ? -3% | 35.2 ? 6% |
| PWM Frequency (Hz) | 2475 ? | 29070 ? | ||||
| Screen | -0% | -6% | 28% | -20% | 6% | |
| Brightness middle (cd/m²) | 356.8 | 467 31% | 543.3 52% | 557 56% | 444.1 24% | 289 -19% |
| Brightness (cd/m²) | 336 | 448 33% | 524 56% | 532 58% | 423 26% | 286 -15% |
| Brightness Distribution (%) | 88 | 92 5% | 92 5% | 87 -1% | 89 1% | 92 5% |
| Black Level * (cd/m²) | 0.34 | 0.39 -15% | 0.38 -12% | 0.33 3% | 0.37 -9% | 0.17 50% |
| Contrast (:1) | 1049 | 1197 14% | 1430 36% | 1688 61% | 1200 14% | 1700 62% |
| Colorchecker dE 2000 * | 1.63 | 2.1 -29% | 3.02 -85% | 1.4 14% | 2.94 -80% | 2.5 -53% |
| Colorchecker dE 2000 max. * | 5.03 | 5.1 -1% | 7.61 -51% | 2.5 50% | 7.37 -47% | 4.7 7% |
| Colorchecker dE 2000 calibrated * | 1.08 | 2.04 -89% | 1.23 -14% | 0.7 35% | 3.05 -182% | 0.6 44% |
| Greyscale dE 2000 * | 3 | 1.3 57% | 5 -67% | 2 33% | 2.9 3% | 3.4 -13% |
| Gamma | 2.23 99% | 2.26 97% | 2.02 109% | 2.14 103% | 2.1 105% | 1.98 111% |
| CCT | 6434 101% | 6501 100% | 6550 99% | 6689 97% | 6766 96% | 7005 93% |
| Color Space (Percent of AdobeRGB 1998) (%) | 62 | 59.5 -4% | 66.8 8% | 62.5 1% | 78.2 26% | 62.6 1% |
| Color Space (Percent of sRGB) (%) | 97.6 | 93.4 -4% | 99.6 2% | 99.5 2% | 99.8 2% | 98.9 1% |
| Moyenne finale (programmes/paramètres) | -1% /
-1% | 4% /
-2% | 15% /
22% | 2% /
-9% | 5% /
6% |
* ... Moindre est la valeur, meilleures sont les performances
Temps de réponse de l'écran
| ↔ Temps de réponse noir à blanc | ||
|---|---|---|
| 37.6 ms ... hausse ↗ et chute ↘ combinées | ↗ 20.4 ms hausse | 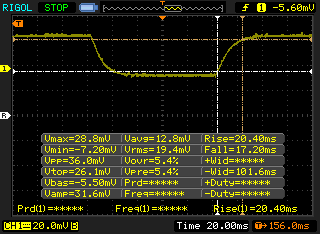 |
| ↘ 17.2 ms chute | ||
| L'écran souffre de latences très élevées, à éviter pour le jeu. En comparaison, tous les appareils testés affichent entre 0.1 (minimum) et 240 (maximum) ms. » 95 % des appareils testés affichent de meilleures performances. Cela signifie que les latences relevées sont moins bonnes que la moyenne (19.9 ms) de tous les appareils testés. | ||
| ↔ Temps de réponse gris 50% à gris 80% | ||
| 57.6 ms ... hausse ↗ et chute ↘ combinées | ↗ 26 ms hausse | 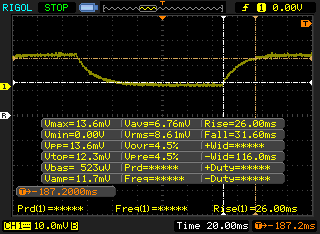 |
| ↘ 31.6 ms chute | ||
| L'écran souffre de latences très élevées, à éviter pour le jeu. En comparaison, tous les appareils testés affichent entre 0.165 (minimum) et 636 (maximum) ms. » 94 % des appareils testés affichent de meilleures performances. Cela signifie que les latences relevées sont moins bonnes que la moyenne (31.1 ms) de tous les appareils testés. | ||
Scintillement / MLI (Modulation de largeur d'impulsion)
| Scintillement / MLI (Modulation de largeur d'impulsion) non décelé | 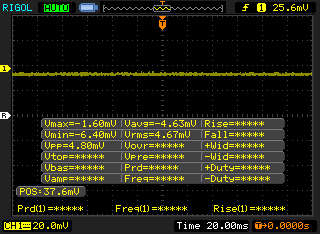 | ||
En comparaison, 52 % des appareils testés n'emploient pas MDI pour assombrir leur écran. Nous avons relevé une moyenne à 7784 (minimum : 5 - maximum : 343500) Hz dans le cas où une MDI était active. | |||
Cinebench R15: CPU Multi 64Bit | CPU Single 64Bit
Blender: v2.79 BMW27 CPU
7-Zip 18.03: 7z b 4 -mmt1 | 7z b 4
Geekbench 5.5: Single-Core | Multi-Core
HWBOT x265 Benchmark v2.2: 4k Preset
LibreOffice : 20 Documents To PDF
R Benchmark 2.5: Overall mean
| Blender / v2.79 BMW27 CPU | |
| Dell XPS 13 9300 i5 FHD | |
| Moyenne Intel Core i7-1165G7 (468 - 1138, n=80) | |
| Lenovo IdeaPad 5 14ARE05 | |
| Razer Blade Stealth i7-1165G7 GTX 1650 Ti Max-Q | |
| Acer Swift 3 SF314-42-R4XJ | |
| Lenovo Yoga Slim 7-14ARE | |
| 7-Zip 18.03 / 7z b 4 -mmt1 | |
| Razer Blade Stealth i7-1165G7 GTX 1650 Ti Max-Q | |
| Moyenne Intel Core i7-1165G7 (4478 - 5507, n=80) | |
| Lenovo Yoga Slim 7-14ARE | |
| Acer Swift 3 SF314-42-R4XJ | |
| Lenovo IdeaPad 5 14ARE05 | |
| Dell XPS 13 9300 i5 FHD | |
| Razer Blade Stealth Core i7 GTX 1650 Ti Max-Q 4K | |
| Geekbench 5.5 / Single-Core | |
| Razer Blade Stealth i7-1165G7 GTX 1650 Ti Max-Q | |
| Moyenne Intel Core i7-1165G7 (1302 - 1595, n=77) | |
| Dell XPS 13 9300 i5 FHD | |
| Razer Blade Stealth Core i7 GTX 1650 Ti Max-Q 4K | |
| Lenovo Yoga Slim 7-14ARE | |
| Lenovo Yoga Slim 7-14ARE | |
| Acer Swift 3 SF314-42-R4XJ | |
| Lenovo IdeaPad 5 14ARE05 | |
| HWBOT x265 Benchmark v2.2 / 4k Preset | |
| Lenovo Yoga Slim 7-14ARE | |
| Acer Swift 3 SF314-42-R4XJ | |
| Razer Blade Stealth i7-1165G7 GTX 1650 Ti Max-Q | |
| Lenovo IdeaPad 5 14ARE05 | |
| Moyenne Intel Core i7-1165G7 (1.39 - 8.47, n=80) | |
| Dell XPS 13 9300 i5 FHD | |
| LibreOffice / 20 Documents To PDF | |
| Razer Blade Stealth Core i7 GTX 1650 Ti Max-Q 4K | |
| Acer Swift 3 SF314-42-R4XJ | |
| Lenovo IdeaPad 5 14ARE05 | |
| Lenovo Yoga Slim 7-14ARE | |
| Moyenne Intel Core i7-1165G7 (21.5 - 88.1, n=78) | |
| Razer Blade Stealth i7-1165G7 GTX 1650 Ti Max-Q | |
| R Benchmark 2.5 / Overall mean | |
| Dell XPS 13 9300 i5 FHD | |
| Lenovo IdeaPad 5 14ARE05 | |
| Acer Swift 3 SF314-42-R4XJ | |
| Lenovo Yoga Slim 7-14ARE | |
| Moyenne Intel Core i7-1165G7 (0.552 - 1.002, n=80) | |
| Razer Blade Stealth i7-1165G7 GTX 1650 Ti Max-Q | |
* ... Moindre est la valeur, meilleures sont les performances
| PCMark 8 Home Score Accelerated v2 | 4410 points | |
| PCMark 8 Work Score Accelerated v2 | 5628 points | |
| PCMark 10 Score | 5549 points | |
Aide | ||
| DPC Latencies / LatencyMon - interrupt to process latency (max), Web, Youtube, Prime95 | |
| Razer Blade Stealth Core i7 GTX 1650 Ti Max-Q 4K | |
| Asus Zenbook S UX393JA | |
| Razer Blade Stealth i7-1165G7 GTX 1650 Ti Max-Q | |
| Dell XPS 13 9310 Core i7 FHD | |
| Lenovo Yoga Slim 7-14IIL05 | |
* ... Moindre est la valeur, meilleures sont les performances
| Razer Blade Stealth i7-1165G7 GTX 1650 Ti Max-Q Samsung SSD PM981a MZVLB512HBJQ | Razer Blade Stealth Core i7 GTX 1650 Ti Max-Q 4K Lite-On CA5-8D512 | Dell XPS 13 9310 Core i7 FHD Micron 2300 512GB MTFDHBA512TDV | Asus Zenbook S UX393JA Intel SSD 660p 1TB SSDPEKNW010T8 | Lenovo Yoga Slim 7-14IIL05 WDC PC SN730 SDBPNTY-512G | |
|---|---|---|---|---|---|
| AS SSD | -29% | -56% | -36% | -17% | |
| Seq Read (MB/s) | 2353 | 2220 -6% | 2091 -11% | 1405 -40% | 2703 15% |
| Seq Write (MB/s) | 1625 | 2006 23% | 1396 -14% | 1062 -35% | 1104 -32% |
| 4K Read (MB/s) | 57.5 | 51.4 -11% | 49.29 -14% | 50.8 -12% | 46.41 -19% |
| 4K Write (MB/s) | 189.3 | 119.2 -37% | 104.2 -45% | 124.9 -34% | 154.1 -19% |
| 4K-64 Read (MB/s) | 1169 | 740 -37% | 827 -29% | 590 -50% | 835 -29% |
| 4K-64 Write (MB/s) | 1778 | 968 -46% | 1636 -8% | 840 -53% | 1138 -36% |
| Access Time Read * (ms) | 0.05 | 0.051 -2% | 0.066 -32% | 0.041 18% | 0.058 -16% |
| Access Time Write * (ms) | 0.058 | 0.1 -72% | 0.365 -529% | 0.118 -103% | 0.028 52% |
| Score Read (Points) | 1462 | 1013 -31% | 1086 -26% | 781 -47% | 1151 -21% |
| Score Write (Points) | 2130 | 1288 -40% | 1880 -12% | 1071 -50% | 1402 -34% |
| Score Total (Points) | 4316 | 2822 -35% | 3499 -19% | 2251 -48% | 3073 -29% |
| Copy ISO MB/s (MB/s) | 2073 | 1881 -9% | 1544 -26% | 1459 -30% | 1626 -22% |
| Copy Program MB/s (MB/s) | 673 | 441.8 -34% | 613 -9% | 600 -11% | 568 -16% |
| Copy Game MB/s (MB/s) | 1568 | 505 -68% | 1451 -7% | 1411 -10% | 1151 -27% |
| CrystalDiskMark 5.2 / 6 | 7% | -8% | -22% | -5% | |
| Write 4K (MB/s) | 151.1 | 158.7 5% | 97.5 -35% | 129.5 -14% | 137 -9% |
| Read 4K (MB/s) | 35.78 | 58.2 63% | 50.9 42% | 54 51% | 48.71 36% |
| Write Seq (MB/s) | 2122 | 2219 5% | 1811 -15% | 1265 -40% | 1785 -16% |
| Read Seq (MB/s) | 2403 | 2444 2% | 1836 -24% | 1410 -41% | 2057 -14% |
| Write 4K Q32T1 (MB/s) | 528 | 475.9 -10% | 521 -1% | 420.3 -20% | 436.9 -17% |
| Read 4K Q32T1 (MB/s) | 430.2 | 509 18% | 357.5 -17% | 357.7 -17% | 389 -10% |
| Write Seq Q32T1 (MB/s) | 2986 | 2202 -26% | 2879 -4% | 1799 -40% | 2708 -9% |
| Read Seq Q32T1 (MB/s) | 3540 | 3372 -5% | 3204 -9% | 1616 -54% | 3426 -3% |
| Moyenne finale (programmes/paramètres) | -11% /
-16% | -32% /
-38% | -29% /
-31% | -11% /
-13% |
* ... Moindre est la valeur, meilleures sont les performances

Disk Throttling: DiskSpd Read Loop, Queue Depth 8
| 3DMark 11 Performance | 12174 points | |
| 3DMark Cloud Gate Standard Score | 26161 points | |
| 3DMark Fire Strike Score | 7996 points | |
| 3DMark Time Spy Score | 3443 points | |
Aide | ||
| Bas | Moyen | Élevé | Ultra | |
|---|---|---|---|---|
| GTA V (2015) | 171 | 164 | 91.5 | 45.4 |
| The Witcher 3 (2015) | 153 | 87.3 | 52.8 | 30.1 |
| Dota 2 Reborn (2015) | 147 | 129 | 121 | 110 |
| Final Fantasy XV Benchmark (2018) | 94 | 48.1 | 33.9 | |
| X-Plane 11.11 (2018) | 96.4 | 87.5 | 72.3 | |
| Strange Brigade (2018) | 196 | 81.5 | 65.6 | 55.2 |
| Total War: Three Kingdoms (2019) | 164.3 | 57.5 | 36 | 18.6 |
| Razer Blade Stealth i7-1165G7 GTX 1650 Ti Max-Q GeForce GTX 1650 Ti Max-Q, i7-1165G7, Samsung SSD PM981a MZVLB512HBJQ | Razer Blade Stealth Core i7 GTX 1650 Ti Max-Q 4K GeForce GTX 1650 Ti Max-Q, i7-1065G7, Lite-On CA5-8D512 | Dell XPS 13 9310 Core i7 FHD Iris Xe G7 96EUs, i7-1165G7, Micron 2300 512GB MTFDHBA512TDV | Huawei MateBook X Pro 2020 i7 GeForce MX250, i7-10510U, Samsung PM981a MZVLB1T0HBLR | Lenovo Yoga Slim 7-14IIL05 GeForce MX350, i7-1065G7, WDC PC SN730 SDBPNTY-512G | |
|---|---|---|---|---|---|
| Noise | -3% | 10% | -3% | -7% | |
| arrêt / environnement * (dB) | 25.3 | 28 -11% | 25.7 -2% | 29.6 -17% | 29.3 -16% |
| Idle Minimum * (dB) | 25.3 | 28 -11% | 25.7 -2% | 29.6 -17% | 29.3 -16% |
| Idle Average * (dB) | 25.3 | 28 -11% | 25.7 -2% | 29.6 -17% | 29.3 -16% |
| Idle Maximum * (dB) | 27 | 28 -4% | 25.9 4% | 30.3 -12% | 30.5 -13% |
| Load Average * (dB) | 47.9 | 39 19% | 26.2 45% | 38 21% | 41.5 13% |
| Witcher 3 ultra * (dB) | 38.4 | 42.7 -11% | 36.5 5% | 38 1% | 41.5 -8% |
| Load Maximum * (dB) | 45.9 | 43.7 5% | 36.6 20% | 38 17% | 41.5 10% |
* ... Moindre est la valeur, meilleures sont les performances
Degré de la nuisance sonore
| Au repos |
| 25.3 / 25.3 / 27 dB(A) |
| Fortement sollicité |
| 47.9 / 45.9 dB(A) |
 | ||
30 dB silencieux 40 dB(A) audible 50 dB(A) bruyant |
||
min: | ||
(±) La température maximale du côté supérieur est de 44 °C / 111 F, par rapport à la moyenne de 35.9 °C / 97 F, allant de 21.4 à 59 °C pour la classe Subnotebook.
(-) Le fond chauffe jusqu'à un maximum de 47.4 °C / 117 F, contre une moyenne de 39.2 °C / 103 F
(+) En utilisation inactive, la température moyenne du côté supérieur est de 30.2 °C / 86 F, par rapport à la moyenne du dispositif de 30.8 °C / 87 F.
(±) En jouant à The Witcher 3, la température moyenne du côté supérieur est de 32.4 °C / 90 F, alors que la moyenne de l'appareil est de 30.8 °C / 87 F.
(+) Les repose-poignets et le pavé tactile atteignent la température maximale de la peau (33 °C / 91.4 F) et ne sont donc pas chauds.
(-) La température moyenne de la zone de l'appui-paume de dispositifs similaires était de 28.2 °C / 82.8 F (-4.8 °C / #-8.6 F).
Razer Blade Stealth i7-1165G7 GTX 1650 Ti Max-Q analyse audio
(+) | les haut-parleurs peuvent jouer relativement fort (84.3# dB)
Basses 100 - 315 Hz
(-) | presque aucune basse - en moyenne 20.2% plus bas que la médiane
(±) | la linéarité des basses est moyenne (11.9% delta à la fréquence précédente)
Médiums 400 - 2000 Hz
(±) | médiane supérieure - en moyenne 5.9% supérieure à la médiane
(±) | la linéarité des médiums est moyenne (10.2% delta à la fréquence précédente)
Aiguës 2 - 16 kHz
(±) | sommets plus élevés - en moyenne 5.2% plus élevés que la médiane
(±) | la linéarité des aigus est moyenne (7.1% delta à la fréquence précédente)
Globalement 100 - 16 000 Hz
(±) | la linéarité du son global est moyenne (18.9% de différence avec la médiane)
Par rapport à la même classe
» 57% de tous les appareils testés de cette catégorie étaient meilleurs, 6% similaires, 36% pires
» Le meilleur avait un delta de 5%, la moyenne était de 18%, le pire était de 53%.
Par rapport à tous les appareils testés
» 44% de tous les appareils testés étaient meilleurs, 8% similaires, 48% pires
» Le meilleur avait un delta de 4%, la moyenne était de 24%, le pire était de 134%.
Apple MacBook 12 (Early 2016) 1.1 GHz analyse audio
(+) | les haut-parleurs peuvent jouer relativement fort (83.6# dB)
Basses 100 - 315 Hz
(±) | basse réduite - en moyenne 11.3% inférieure à la médiane
(±) | la linéarité des basses est moyenne (14.2% delta à la fréquence précédente)
Médiums 400 - 2000 Hz
(+) | médiane équilibrée - seulement 2.4% de la médiane
(+) | les médiums sont linéaires (5.5% delta à la fréquence précédente)
Aiguës 2 - 16 kHz
(+) | des sommets équilibrés - à seulement 2% de la médiane
(+) | les aigus sont linéaires (4.5% delta à la fréquence précédente)
Globalement 100 - 16 000 Hz
(+) | le son global est linéaire (10.2% différence à la médiane)
Par rapport à la même classe
» 7% de tous les appareils testés de cette catégorie étaient meilleurs, 2% similaires, 91% pires
» Le meilleur avait un delta de 5%, la moyenne était de 18%, le pire était de 53%.
Par rapport à tous les appareils testés
» 5% de tous les appareils testés étaient meilleurs, 1% similaires, 94% pires
» Le meilleur avait un delta de 4%, la moyenne était de 24%, le pire était de 134%.
| Éteint/en veille | |
| Au repos | |
| Fortement sollicité |
|
Légende:
min: | |
| Razer Blade Stealth i7-1165G7 GTX 1650 Ti Max-Q i7-1165G7, GeForce GTX 1650 Ti Max-Q, Samsung SSD PM981a MZVLB512HBJQ, IPS, 1920x1080, 13.3" | Razer Blade Stealth Core i7 GTX 1650 Ti Max-Q 4K i7-1065G7, GeForce GTX 1650 Ti Max-Q, Lite-On CA5-8D512, IPS, 3840x2160, 13.3" | Dell XPS 13 9310 Core i7 FHD i7-1165G7, Iris Xe G7 96EUs, Micron 2300 512GB MTFDHBA512TDV, IPS, 1920x1200, 13.4" | Huawei MateBook X Pro 2020 i7 i7-10510U, GeForce MX250, Samsung PM981a MZVLB1T0HBLR, LTPS, 3000x2000, 13.9" | Asus Zenbook S UX393JA i7-1065G7, Iris Plus Graphics G7 (Ice Lake 64 EU), Intel SSD 660p 1TB SSDPEKNW010T8, IPS, 3300x2200, 13.9" | Lenovo Yoga Slim 7-14IIL05 i7-1065G7, GeForce MX350, WDC PC SN730 SDBPNTY-512G, , 1920x1080, 14" | |
|---|---|---|---|---|---|---|
| Power Consumption | -22% | 36% | 12% | 26% | 21% | |
| Idle Minimum * (Watt) | 4 | 6 -50% | 3.9 2% | 4.3 -8% | 4.1 -2% | 3.7 7% |
| Idle Average * (Watt) | 6.3 | 10.9 -73% | 5.9 6% | 8.5 -35% | 7.5 -19% | 5.7 10% |
| Idle Maximum * (Watt) | 14.5 | 15.5 -7% | 6.3 57% | 12 17% | 8.5 41% | 8.2 43% |
| Load Average * (Watt) | 79.2 | 71.9 9% | 39.7 50% | 54.8 31% | 36.8 54% | 57.1 28% |
| Witcher 3 ultra * (Watt) | 68.2 | 72.9 -7% | 34.8 49% | 47.1 31% | 39.2 43% | 54 21% |
| Load Maximum * (Watt) | 99.4 | 100.5 -1% | 47.5 52% | 61.5 38% | 61.6 38% | 82.8 17% |
* ... Moindre est la valeur, meilleures sont les performances
| Razer Blade Stealth i7-1165G7 GTX 1650 Ti Max-Q i7-1165G7, GeForce GTX 1650 Ti Max-Q, 53.1 Wh | Razer Blade Stealth Core i7 GTX 1650 Ti Max-Q 4K i7-1065G7, GeForce GTX 1650 Ti Max-Q, 53.1 Wh | Dell XPS 13 9310 Core i7 FHD i7-1165G7, Iris Xe G7 96EUs, 52 Wh | Huawei MateBook X Pro 2020 i7 i7-10510U, GeForce MX250, 57.4 Wh | Asus Zenbook S UX393JA i7-1065G7, Iris Plus Graphics G7 (Ice Lake 64 EU), 67 Wh | Lenovo Yoga Slim 7-14IIL05 i7-1065G7, GeForce MX350, 61 Wh | |
|---|---|---|---|---|---|---|
| Autonomie de la batterie | -45% | 34% | 16% | 39% | 10% | |
| Reader / Idle (h) | 20.6 | 7.8 -62% | 30 46% | 38.4 86% | ||
| WiFi v1.3 (h) | 9 | 6.5 -28% | 11 22% | 10.4 16% | 8.3 -8% | 9.9 10% |
| Load (h) | 1.7 | 3.2 | 2.4 | 2.7 | 1.4 |
Warning: More than one pro / contra elements for this language found
Points positifs
Points négatifs
Un avantage certain de Tiger Lake est son gain énorme de performances graphiques sur l'Iris Plus G7 de l'an dernier. Même si cela ne suffit pas à transformer des PC portables en machines de jeu, il permet à des ultrabooks ultrafins comme le XPS 13 ou le HP Spectre 13 de faire tourner plutôt bien des jeux populaires comme DOTA 2, Rocket League ou Fortnite, injouables sur l'ancienne UHD Graphics 620.
Le Razer Blade Stealth est un cas à part, parce qu'il est équipé du GPU le plus puissant disponible dans un 13 pouces : la GeForce GTX 1650 Ti Max-Q. De ce fait, l'un des points forts de Tiger Lake est inutile, Razer ayant couplé le processeur avec une carte graphique Nvidia déjà puissante. Le léger gain de performances CPU d'une génération à l'autre est toujours bienvenu, mais la plupart des jeux dépendent avant tout de la carte graphique, si bien que le tain de performances multithread de 20 % ne permettra qu'un gain de quelques images dans la plupart des jeux. La principale exception ici est pour ceux qui pensent utiliser des réglages graphiques très bas pour mieux exploiter le taux de rafraîchissement de l'écran de 120 Hz, qui dépendent plus du processeur. Dans ce cas, la différence de performances de jeu entre le Blade Stealth Tiger Lake et la version Ice Lake 25 W sera conséquente, comme le montre notre test 720p DOTA 2. En revanche, les performances de jeu ne seront que très légèrement meilleures avec la résolution 1080p par défaut.
Cela signifie-t-il qu'il n'y a pas de vraie raison de choisir le Blade Stealth Tiger Lake plutôt que la version Ice Lake ? La plus grosse batterie est certainement intéressante, mais cela aurait été bien d'avoir d'autres évolutions comme l'Advanced Optimus pour avec G-Sync et Optimus simultanément, des claviers intégralement rétroéclairés pour les versions internationales, et même un vrai cache de webcam ou un lecteur d'empreintes digitales. La luminosité n'est pas au niveau des ultraportables classiques tels le XPS 13 ou le MacBook 13, et les temps de réponse du noir au blanc pourraient être meilleurs, pour des jeux comme Overwatch. C'est le meilleur Blade Stealth à ce jour, mais il doit encore faire mieux afin de remporter le titre d'ultraportable de jeu "ultime".
Ceux qui choisiront le Blade Stealt Ice Lake 25 W, plus ancien et moins cher, ne perdront pas grand chose, puisqu'il possède les mêmes écran 120 Hz et carte graphique GTX 1650 Ti Max-Q, pour une expérience de jeu presque identique. Ceux qui veulent le meilleur, alors la configuration Tiger Lake n'est que d'une centaine d'euros plus chère, et sans le non-sens de la distinction 15 / 25 W faite par Razer l'an dernier. La mise à jour Tiger Lake est en fin de compte une mise à jour mineure, comme le souligne la petite différence de prix entre les deux générations.
L’intégralité de cette critique est disponible en anglais en suivant ce lien.
Razer Blade Stealth i7-1165G7 GTX 1650 Ti Max-Q
- 10/31/2020 v7 (old)
Allen Ngo
Price comparison
