 Deutsch
 English
 Español
 Français
 Italiano
 Nederlands
 Polski
 Português
 Русский
 Türkçe
 Svenska
 Chinese
 Magyar
Test de l'Acer Predator Helios Neo 16 (2024) : PC portable de jeu RTX 4070 et écran DCI-P3

Avec le Predator Helios Neo 16, Acer ajoute un nouveau modèle au segment des ordinateurs portables de jeu de milieu de gamme. Le matériel correspond aux scénarios d'utilisation ciblés du jeu, du rendu et du streaming : un processeur Core i7-14700HX, a GeForce RTX 407032 Go de RAM, et un écran IPS lumineux avec des couleurs précises (DCI-P3) au format 16:10.
Bien que l'Helios ressemble à son prédécesseur, ils ne partagent pas exactement la même construction. Les concurrents comprennent d'autres ordinateurs portables tels que Aorus 16X 2024, Alienware m16 R2, HP Omen Transcend 16, Asus TUF Gaming A17 FA707XIet Lenovo Legion Pro 5 16IRX9.
Comparaison avec les concurrents potentiels
Note | Date | Modèle | Poids | Épaisseur | Taille | Résolution | Meilleur prix |
|---|---|---|---|---|---|---|---|
| 86.8 % | 05/24 | Acer Acer Predator Helios Neo 16 (2024) i7-14700HX, NVIDIA GeForce RTX 4070 Laptop GPU | 2.6 kg | 25.95 mm | 16.00" | 2560x1600 | |
| 87.4 % | 04/24 | Aorus 16X 2024 i9-14900HX, NVIDIA GeForce RTX 4070 Laptop GPU | 2.3 kg | 20 mm | 16.00" | 2560x1600 | |
| 90.2 % | 03/24 | Alienware m16 R2 Ultra 7 155H, NVIDIA GeForce RTX 4070 Laptop GPU | 2.5 kg | 23.5 mm | 16.00" | 2560x1600 | |
| 88.4 % | 02/24 | HP Omen Transcend 16-u1095ng i9-14900HX, NVIDIA GeForce RTX 4070 Laptop GPU | 2.3 kg | 20 mm | 16.00" | 2560x1600 | |
| 85.6 % | 01/24 | Asus TUF Gaming A17 FA707XI-NS94 R9 7940HS, NVIDIA GeForce RTX 4070 Laptop GPU | 2.5 kg | 25.4 mm | 17.30" | 1920x1080 | |
| 89.3 % | 04/24 | Lenovo Legion Pro 5 16IRX9 i9-14900HX, NVIDIA GeForce RTX 4070 Laptop GPU | 2.5 kg | 26.95 mm | 16.00" | 2560x1600 |
Boîtier - Acer utilise du plastique et de l'aluminium
L'étui est de bonne facture. Même si l'unité de base en plastique et le couvercle en aluminium peuvent être légèrement déformés, cela reste dans les limites du possible. La pression exercée sur l'arrière du couvercle de l'écran ne provoque pas d'artefacts d'image. Les charnières maintiennent fermement le couvercle en place, avec un angle d'ouverture maximal d'environ 150 degrés. Le couvercle peut être ouvert d'une seule main.
En ce qui concerne la couleur du boîtier, le noir domine et seuls les couvercles des ventilateurs à l'arrière sont d'un gris plus clair. L'éclairage du clavier et le logo Predator éclairé à l'arrière du couvercle ajoutent un peu de couleur.


Le Predator est le plus lourd et le plus grand des ordinateurs portables de 16 pouces de notre comparatif.
Équipement - Le Predator est équipé de Thunderbolt 4
L'équipement de connexion bien équilibré comprend trois ports USB-A (1x USB 3.2 Gen 1, 2x USB 3.2 Gen 2), deux ports USB-C (Thunderbolt 4 ; Power Delivery, DisplayPort) et trois ports vidéo (HDMI 2.1, 2x DP). Les connexions disponibles sont complétées par un port audio et un port Gigabit Ethernet (2,5 Gbit/s).
Les ports vidéo et d'alimentation sont placés à l'arrière de l'ordinateur portable, de sorte que les câbles correspondants passent à l'arrière et ne gênent pas. Acer a placé le reste des ports au centre des côtés droit et gauche, et les zones situées à côté des repose-poignets sont pratiquement dépourvues de câbles.


Lecteur de carte SD
Le lecteur de cartes de stockage microSD (carte de référence : AV PRO microSD 128 GB V60) fonctionne à un rythme lent, avec des taux de transfert maximaux de 20 Mo/s (transfert de 250 fichiers jpg de 5 Mo chacun) et de 25,8 Mo/s (copie de gros blocs de données), ce qui n'est plus du tout dans l'air du temps. Les concurrents font nettement mieux.
| SD Card Reader | |
| average JPG Copy Test (av. of 3 runs) | |
| Aorus 16X 2024 (AV PRO microSD 128 GB V60) | |
| Moyenne de la classe Gaming (19 - 202, n=97, 2 dernières années) | |
| Alienware m16 R2 (AV PRO microSD 128 GB V60) | |
| Acer Acer Predator Helios Neo 16 (2024) (AV PRO microSD 128 GB V60) | |
| maximum AS SSD Seq Read Test (1GB) | |
| Alienware m16 R2 (AV PRO microSD 128 GB V60) | |
| Aorus 16X 2024 (AV PRO microSD 128 GB V60) | |
| Moyenne de la classe Gaming (25.8 - 269, n=92, 2 dernières années) | |
| Acer Acer Predator Helios Neo 16 (2024) (AV PRO microSD 128 GB V60) | |
Communication
Dans des conditions optimales (pas d'appareils WLAN à proximité et distance réduite entre l'ordinateur portable et le PC serveur), l'ordinateur portable Acer atteint de très bons débits de données WiFi. La puce WiFi 6E (AX1675i alias Intel AX211) et le contrôleur Gigabit Ethernet (E3100G ; 2,5 Gbit/s) proviennent tous deux de Killer.
Webcam
La webcam de 2,1 mégapixels donne des résultats moyens, mais elle est au moins capable d'offrir une bonne précision des couleurs. Il n'y a pas de protection mécanique de l'objectif.
 NVIDIA GeForce RTX 4070 Laptop GPU, i7-14700HX, Samsung PM9A1a MZVL21T0HDLU")
 NVIDIA GeForce RTX 4070 Laptop GPU, i7-14700HX, Samsung PM9A1a MZVL21T0HDLU")
Accessoires
L'ordinateur portable ne contient pas d'autres accessoires que les documents habituels (manuel de démarrage rapide et informations sur la garantie).
Maintenance
Le retrait de la plaque inférieure permet d'accéder au SSD (PCIe 4, M.2-2280) et au deuxième emplacement SSD (PCIe 4, M.2-2280), au module WLAN, aux ventilateurs et à la batterie. La mémoire de travail et ses emplacements (tous deux occupés) sont cachés sous un couvercle supplémentaire vissé.


Garantie
Acer offre une garantie de deux ans (envoi en réparation) pour le portable de 16 pouces. Vous pouvez étendre la garantie à trois ans pour un supplément de ~100 euros (~108 $).
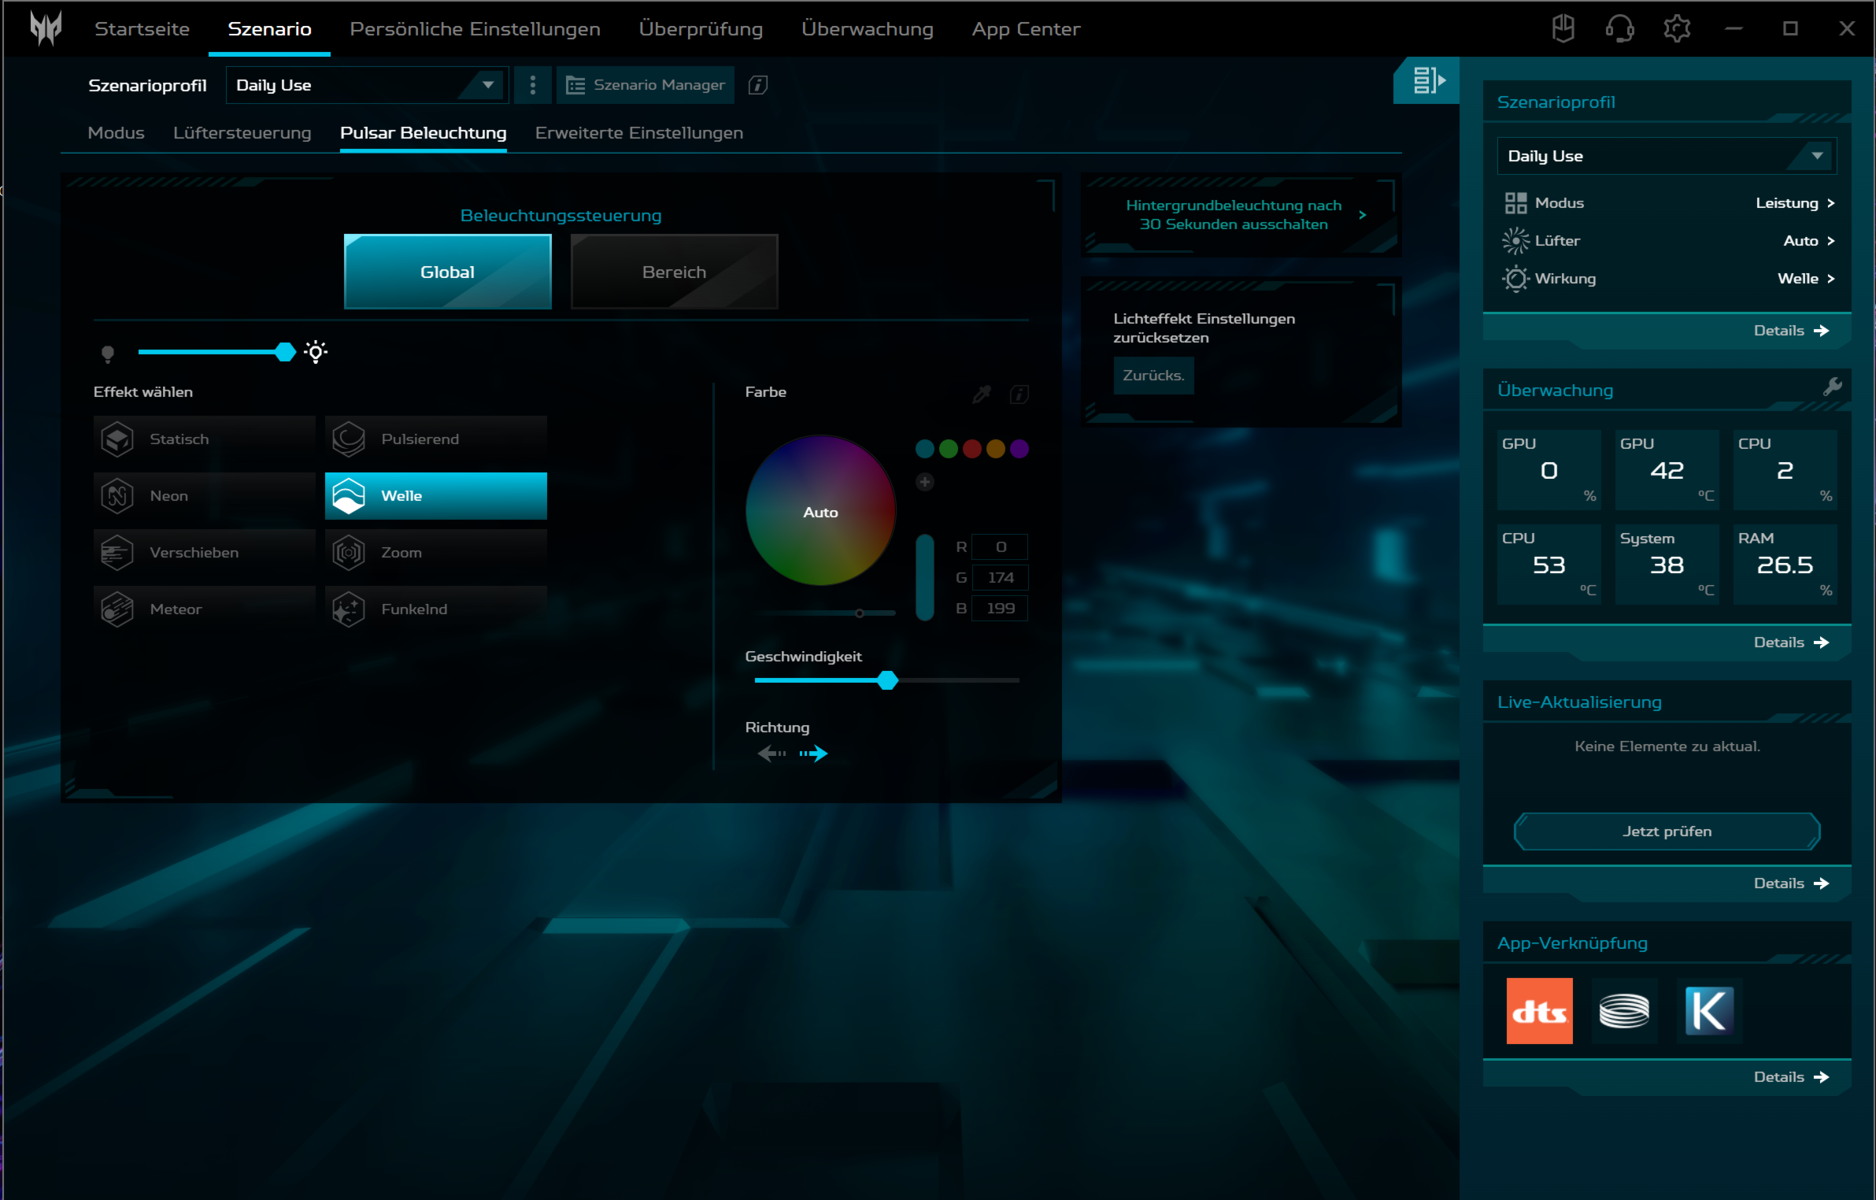
Périphériques d'entrée - Le clavier offre une illumination RGB
Clavier
Acer utilise un clavier chicklet moyen (avec éclairage RGB) qui convient aux tâches quotidiennes et ne se distingue ni positivement ni négativement. Ses touches lisses offrent une course courte, un point de pression clair et une résistance décente. Le clavier présente une légère flexion lors de la frappe, ce qui ne s'est pas avéré gênant. Le fait que les quatre touches fléchées soient de taille normale est un plus.
Pavé tactile
Le ClickPad multitouch (~12,6 x 8,3 cm, ~5 x 3,3 in) ne se démarque pas non plus de la masse. Il offre une course courte et un point de pression clair, permettant aux doigts de glisser facilement sur la surface lisse.

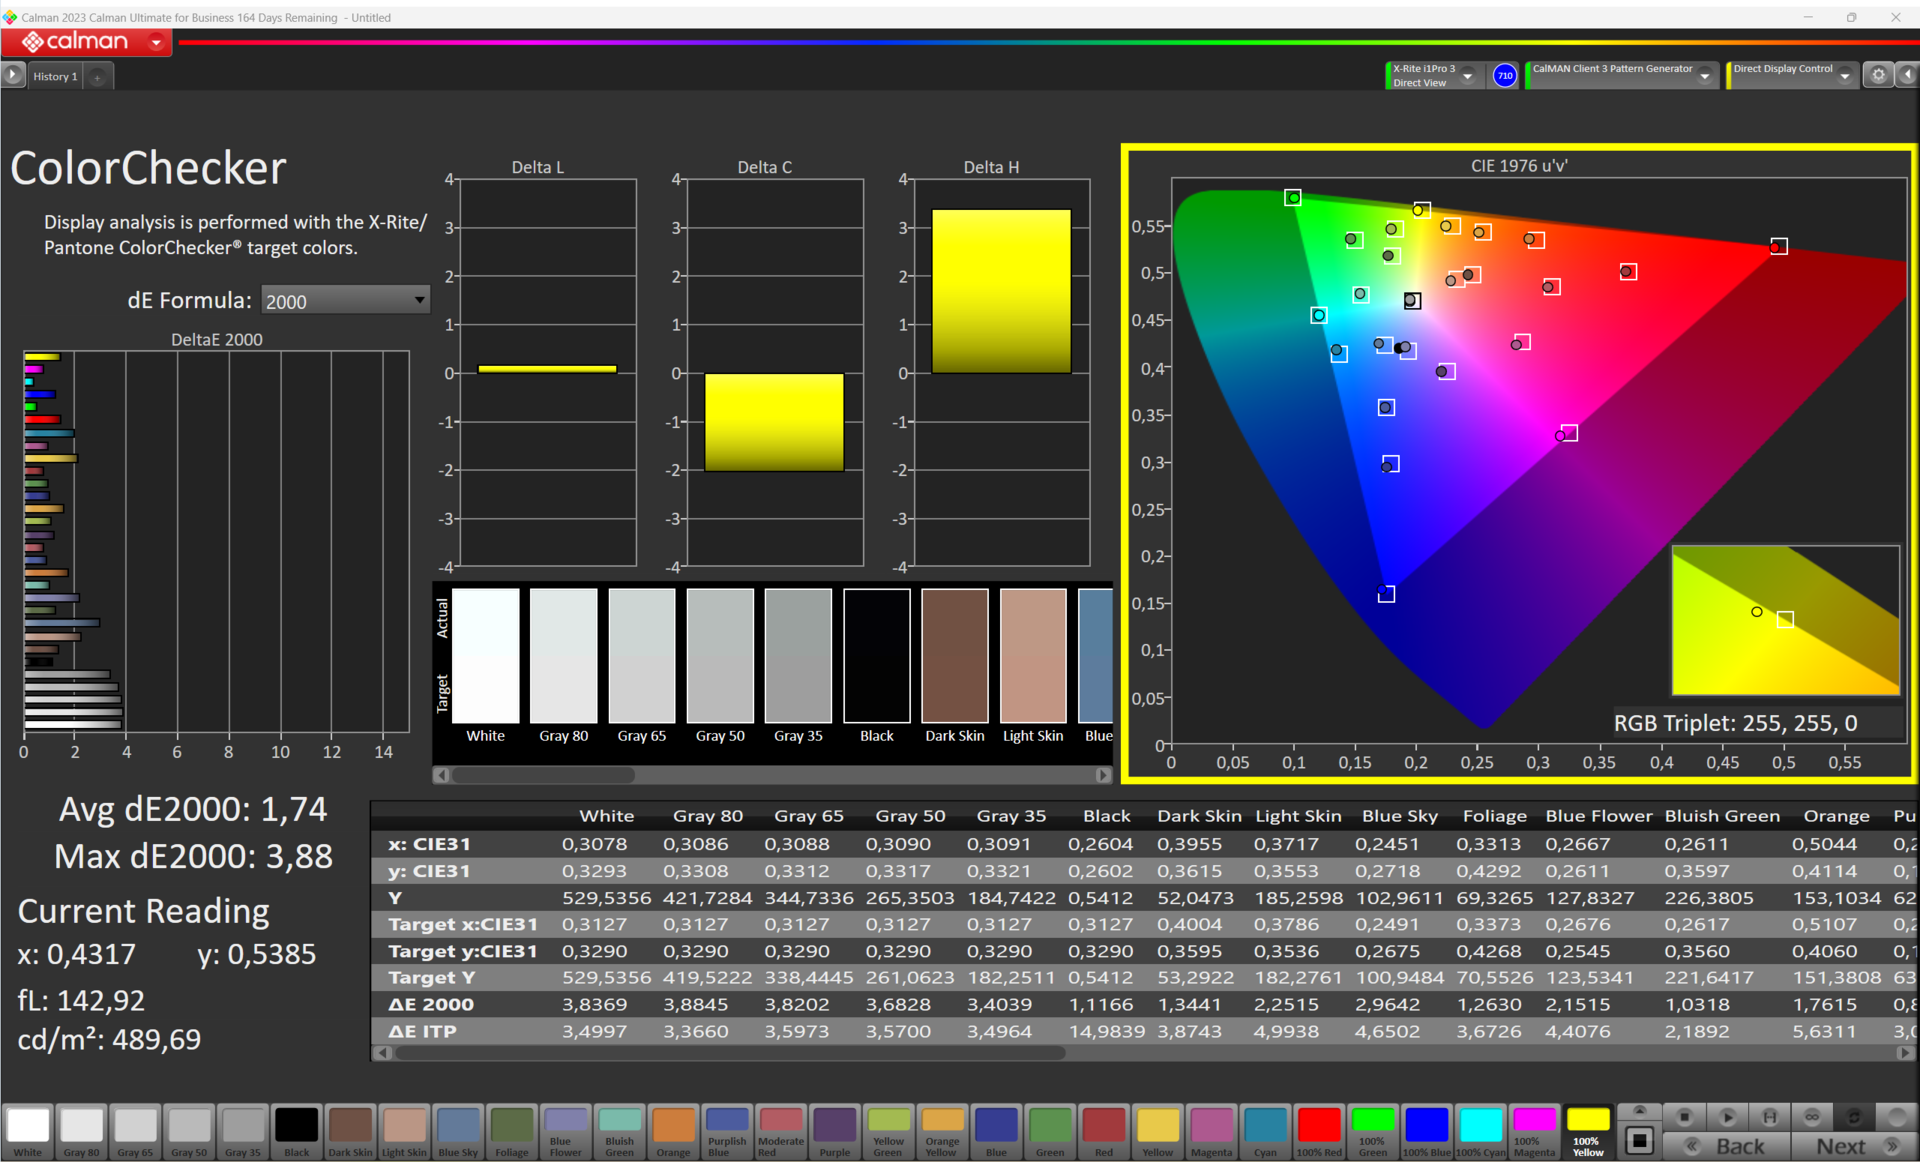
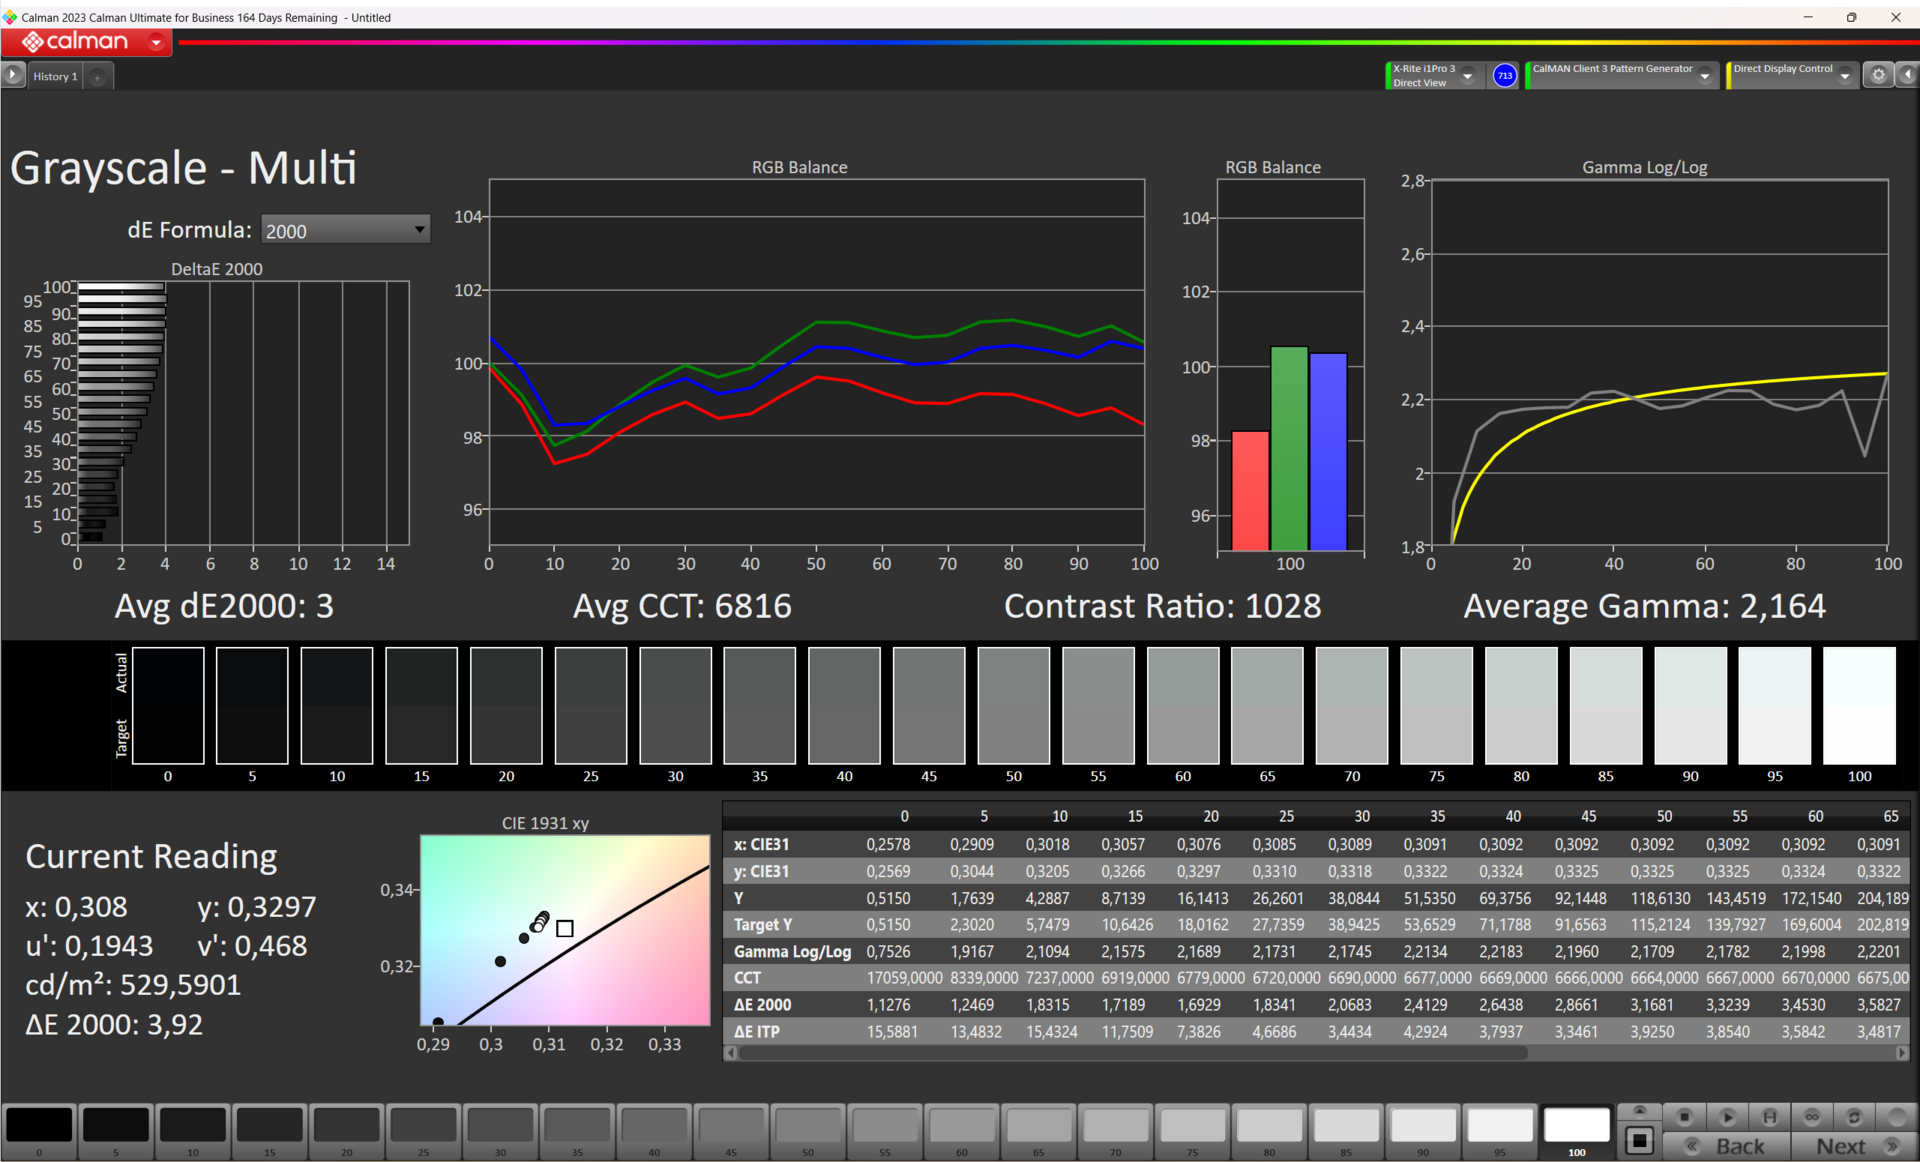
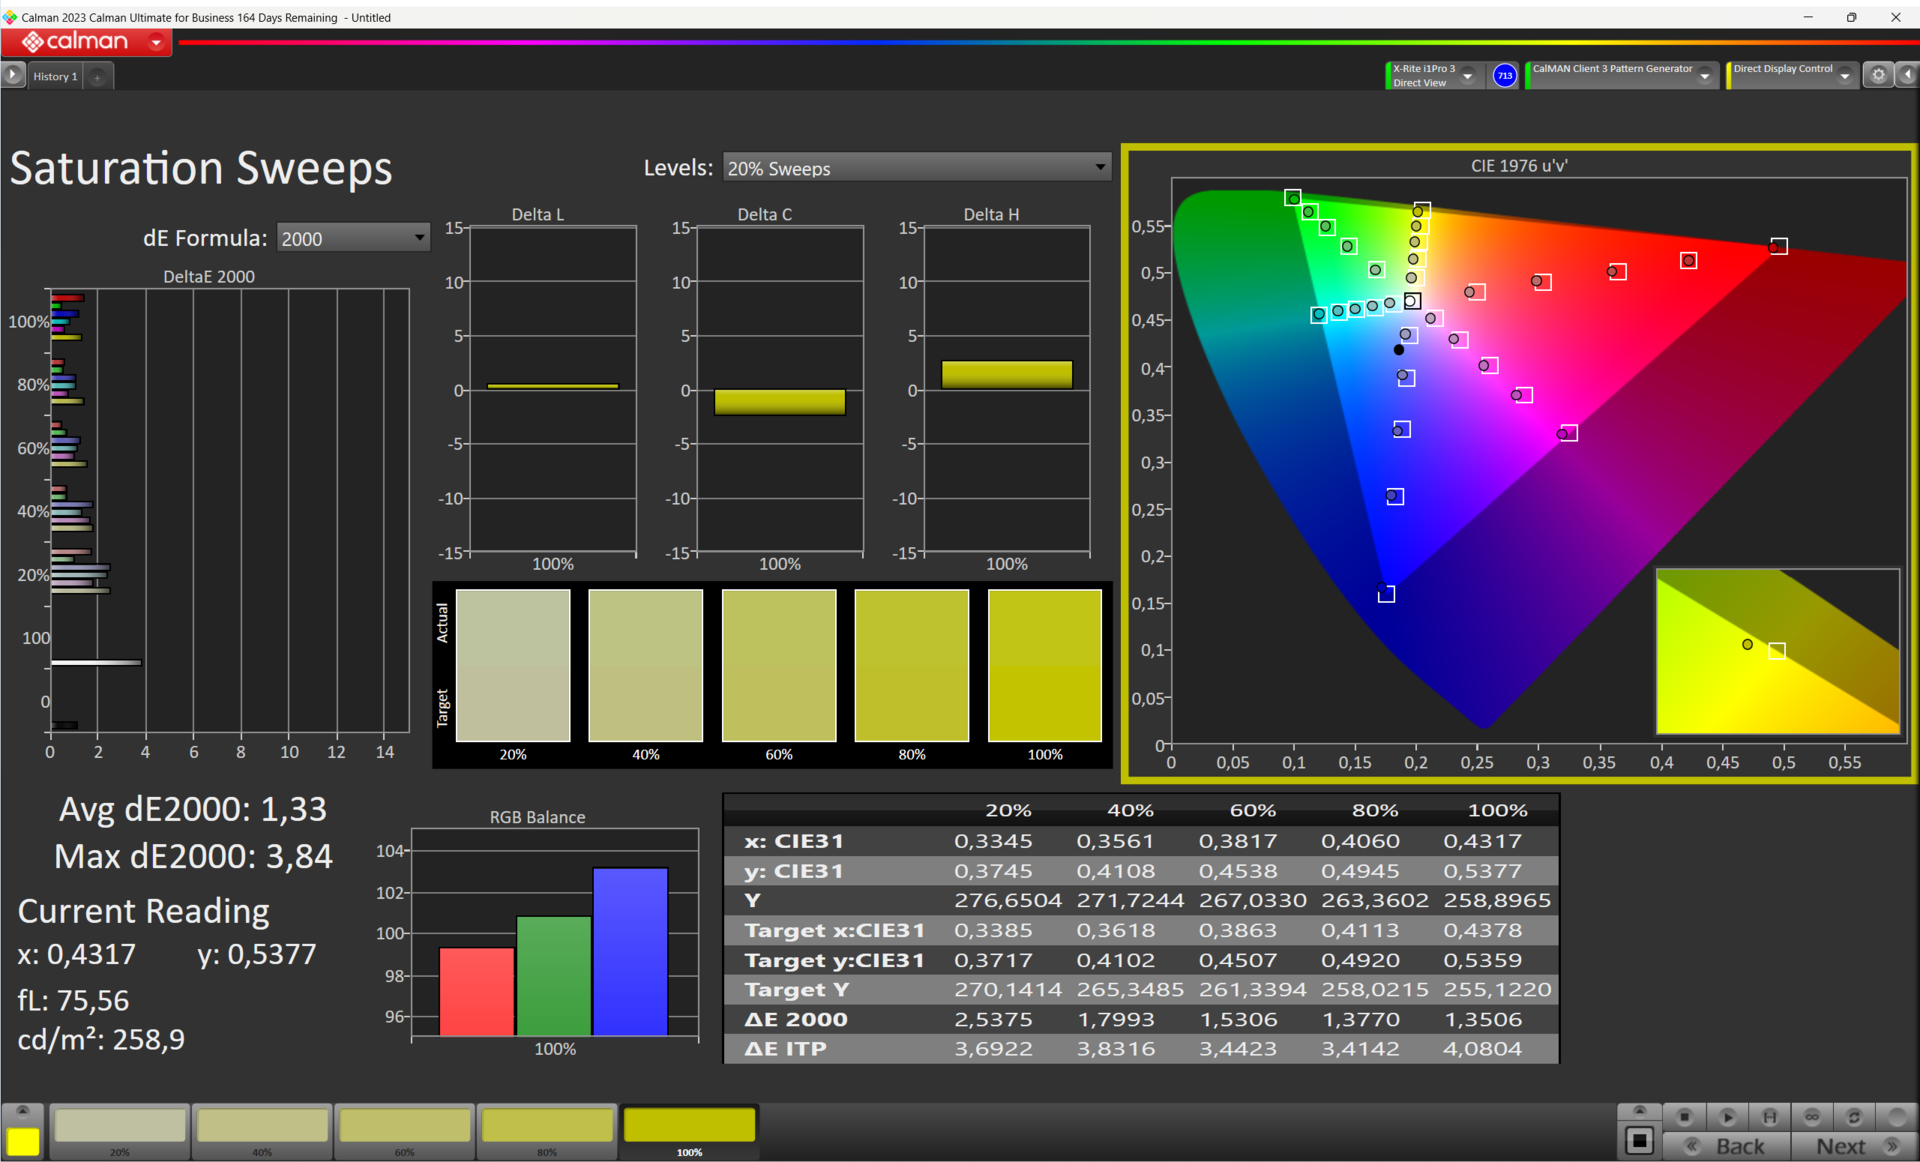
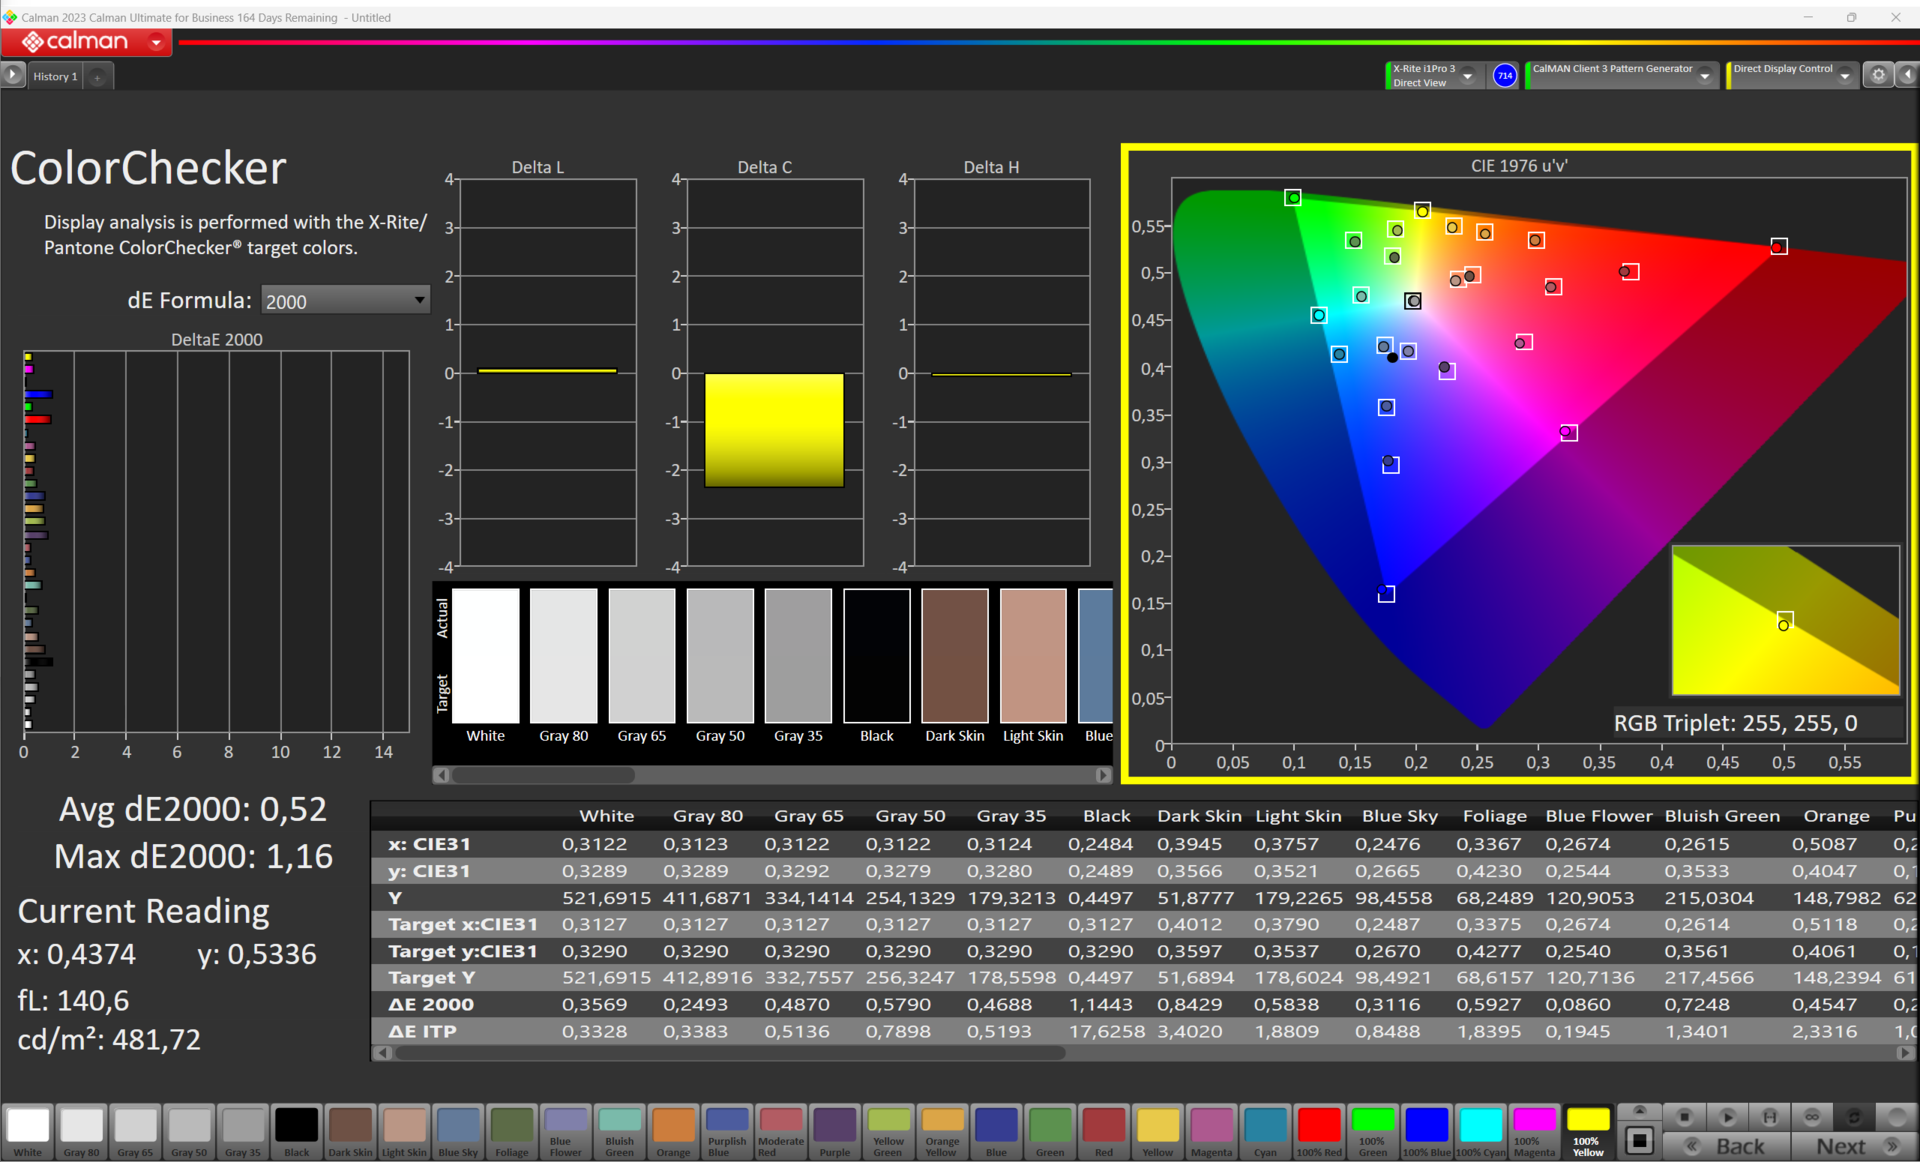
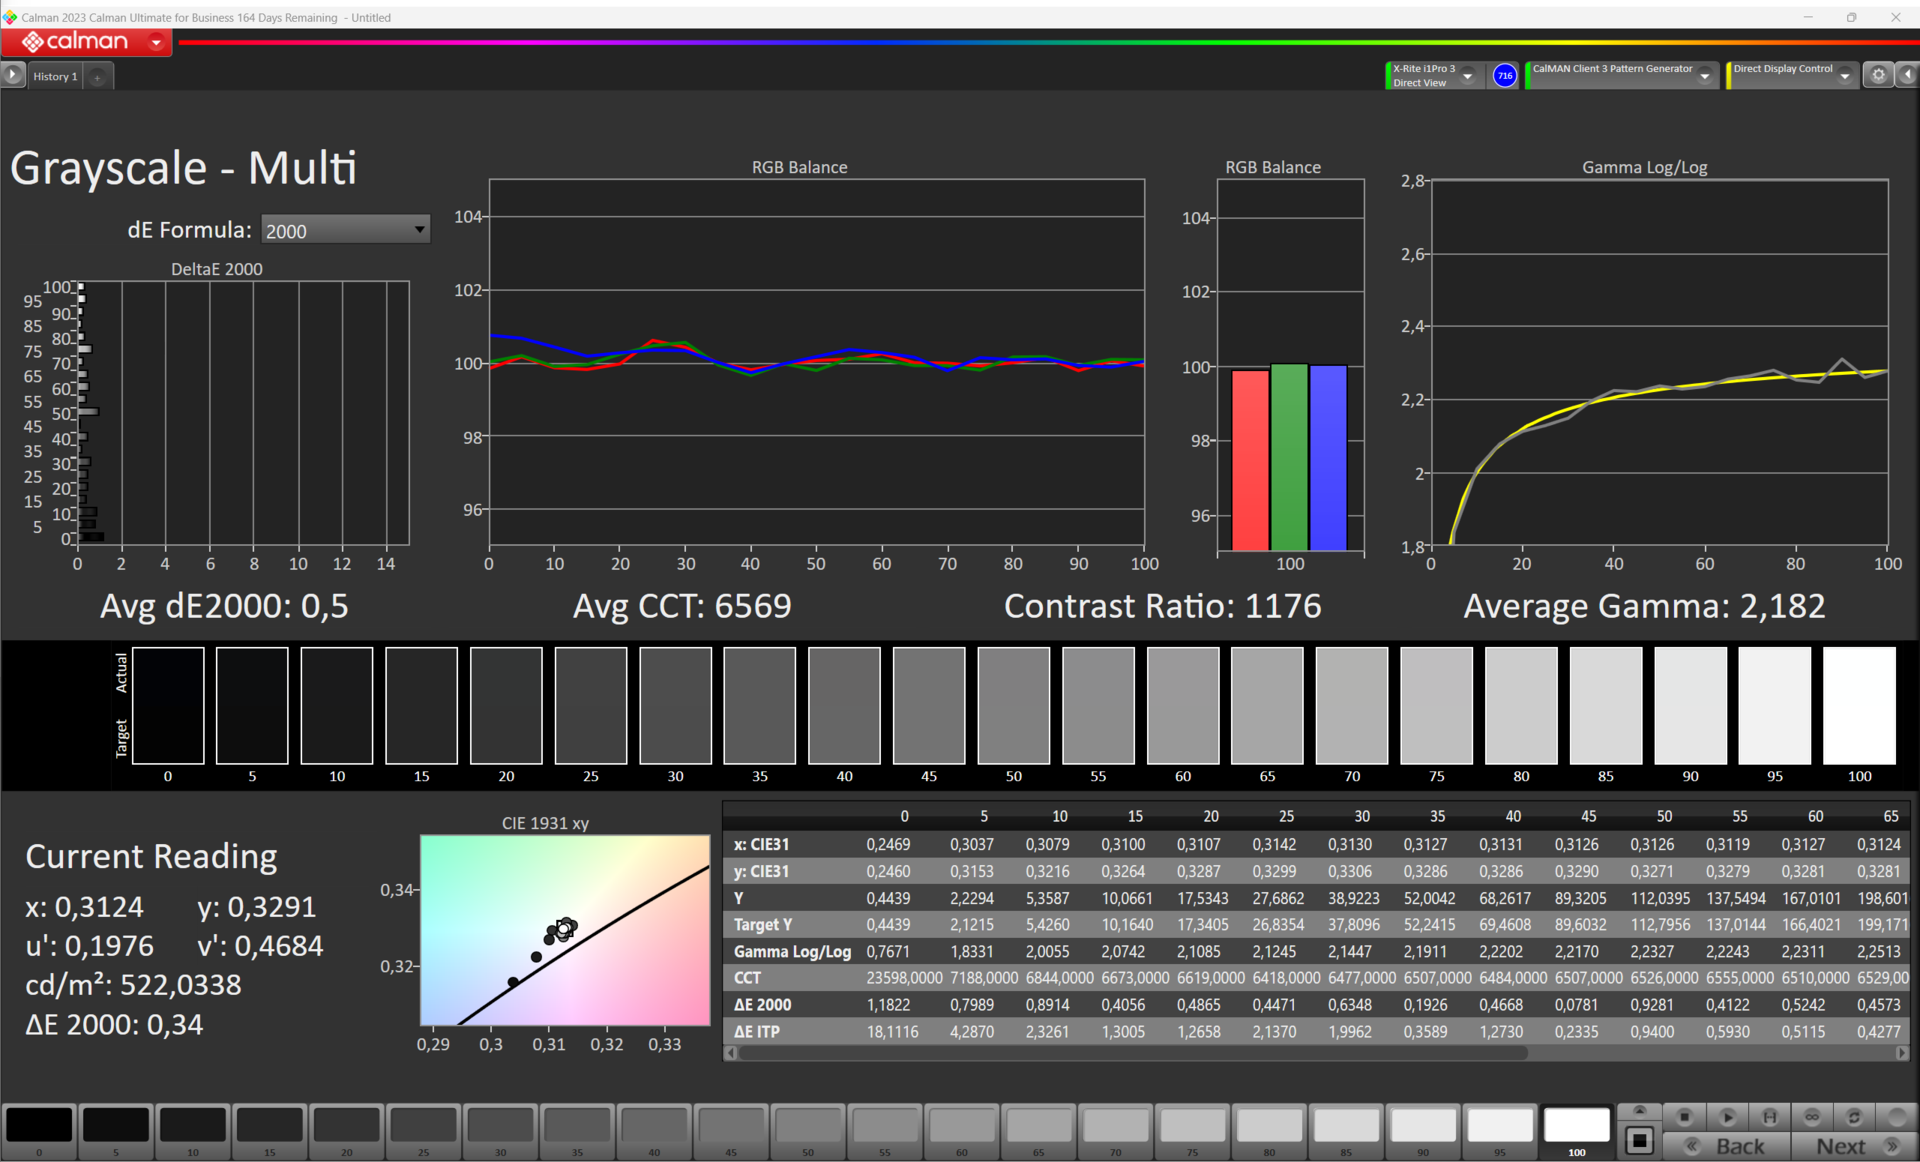
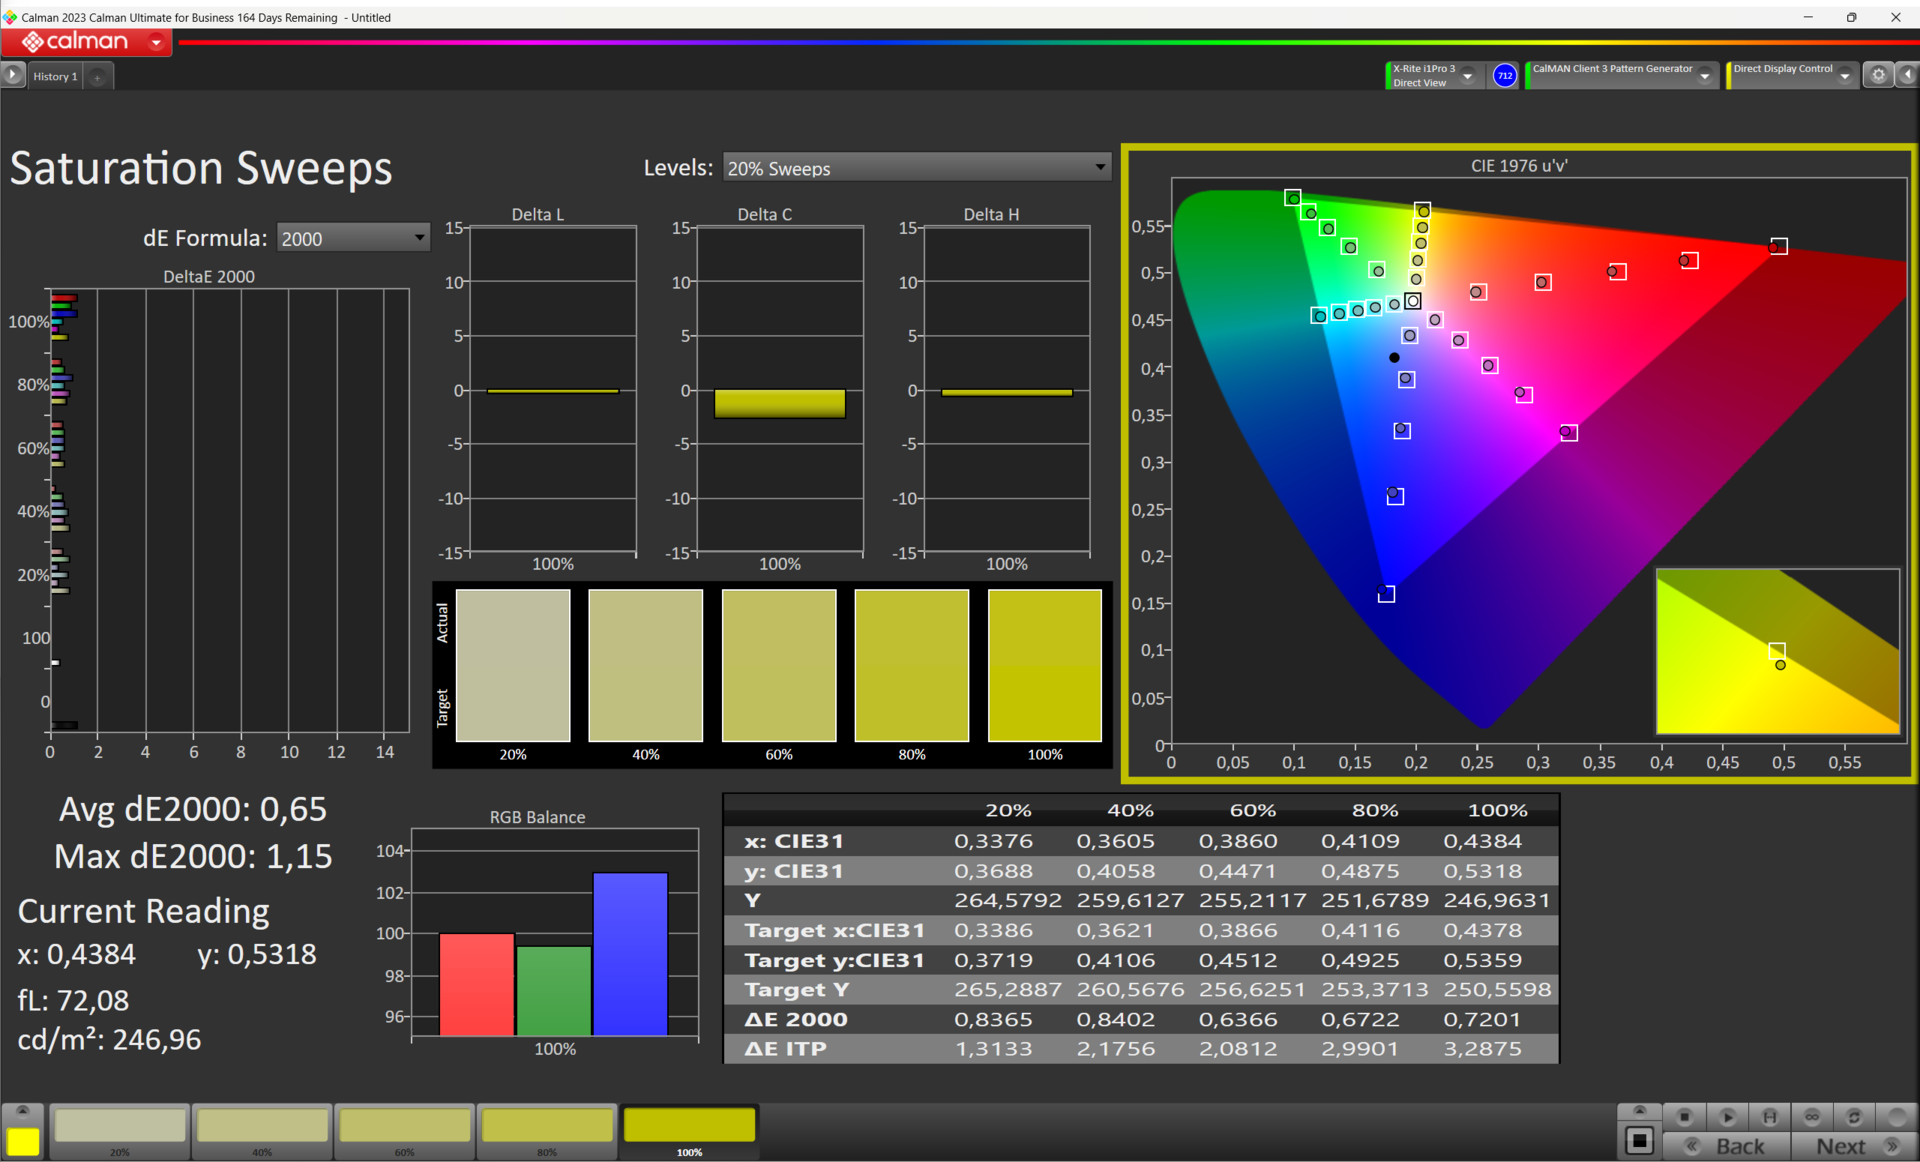
Affichage - Panneau WQXGA lumineux avec couverture DCI-P3
L'écran IPS de 16 pouces (2 560 x 1 600 pixels) au format convivial 16:10 se distingue par des angles de vision stables, l'absence de scintillement PWM, des temps de réponse courts, une surface mate et une luminosité élevée (>500 cd/m²). Cette dernière vous permet de lire le contenu de l'écran à l'extérieur, à condition que la lumière du soleil ne soit pas trop forte.
Acer utilise un écran 240 Hz et prend en charge la technologie G-Sync. Les taux de rafraîchissement de l'écran et du GPU sont ajustés dynamiquement pour permettre des images en mouvement aussi fluides que possible, en particulier dans les jeux.
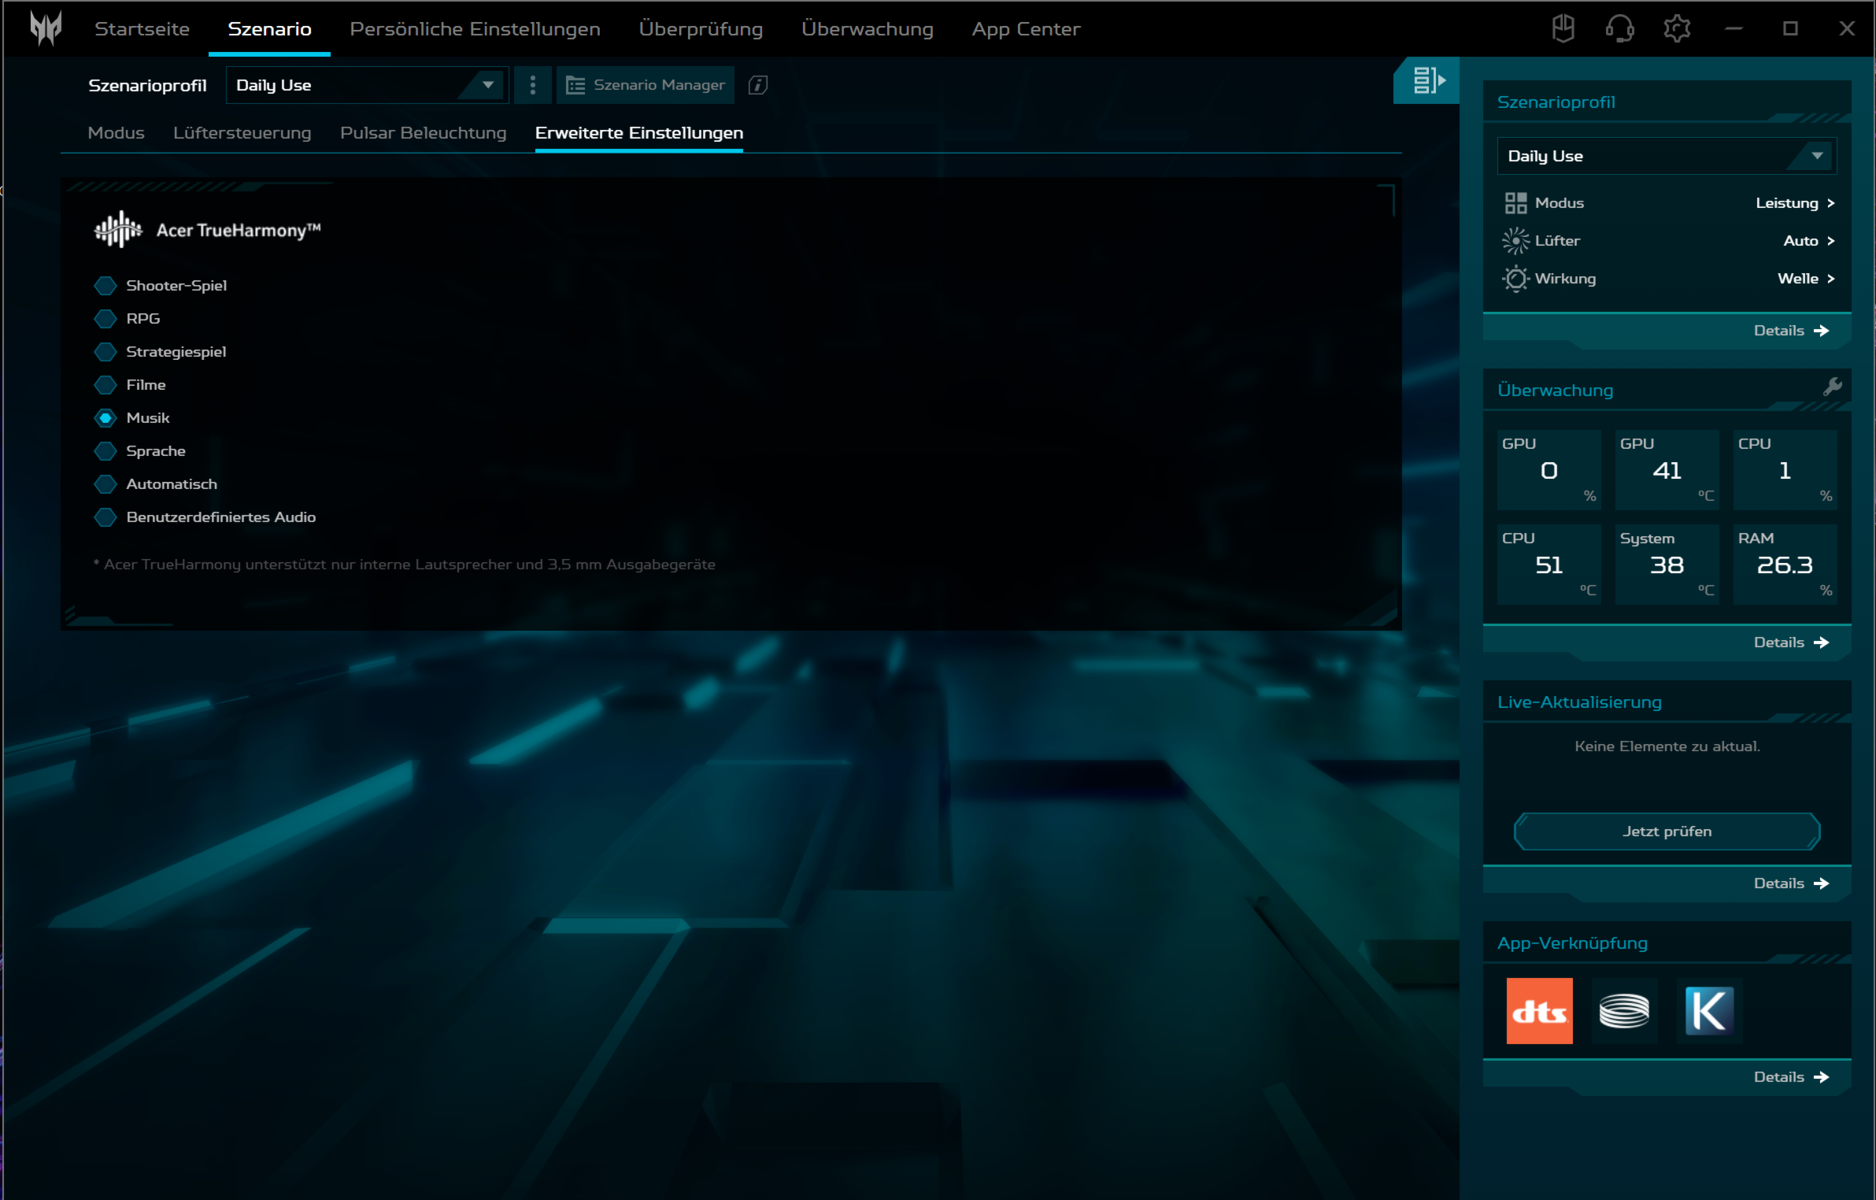
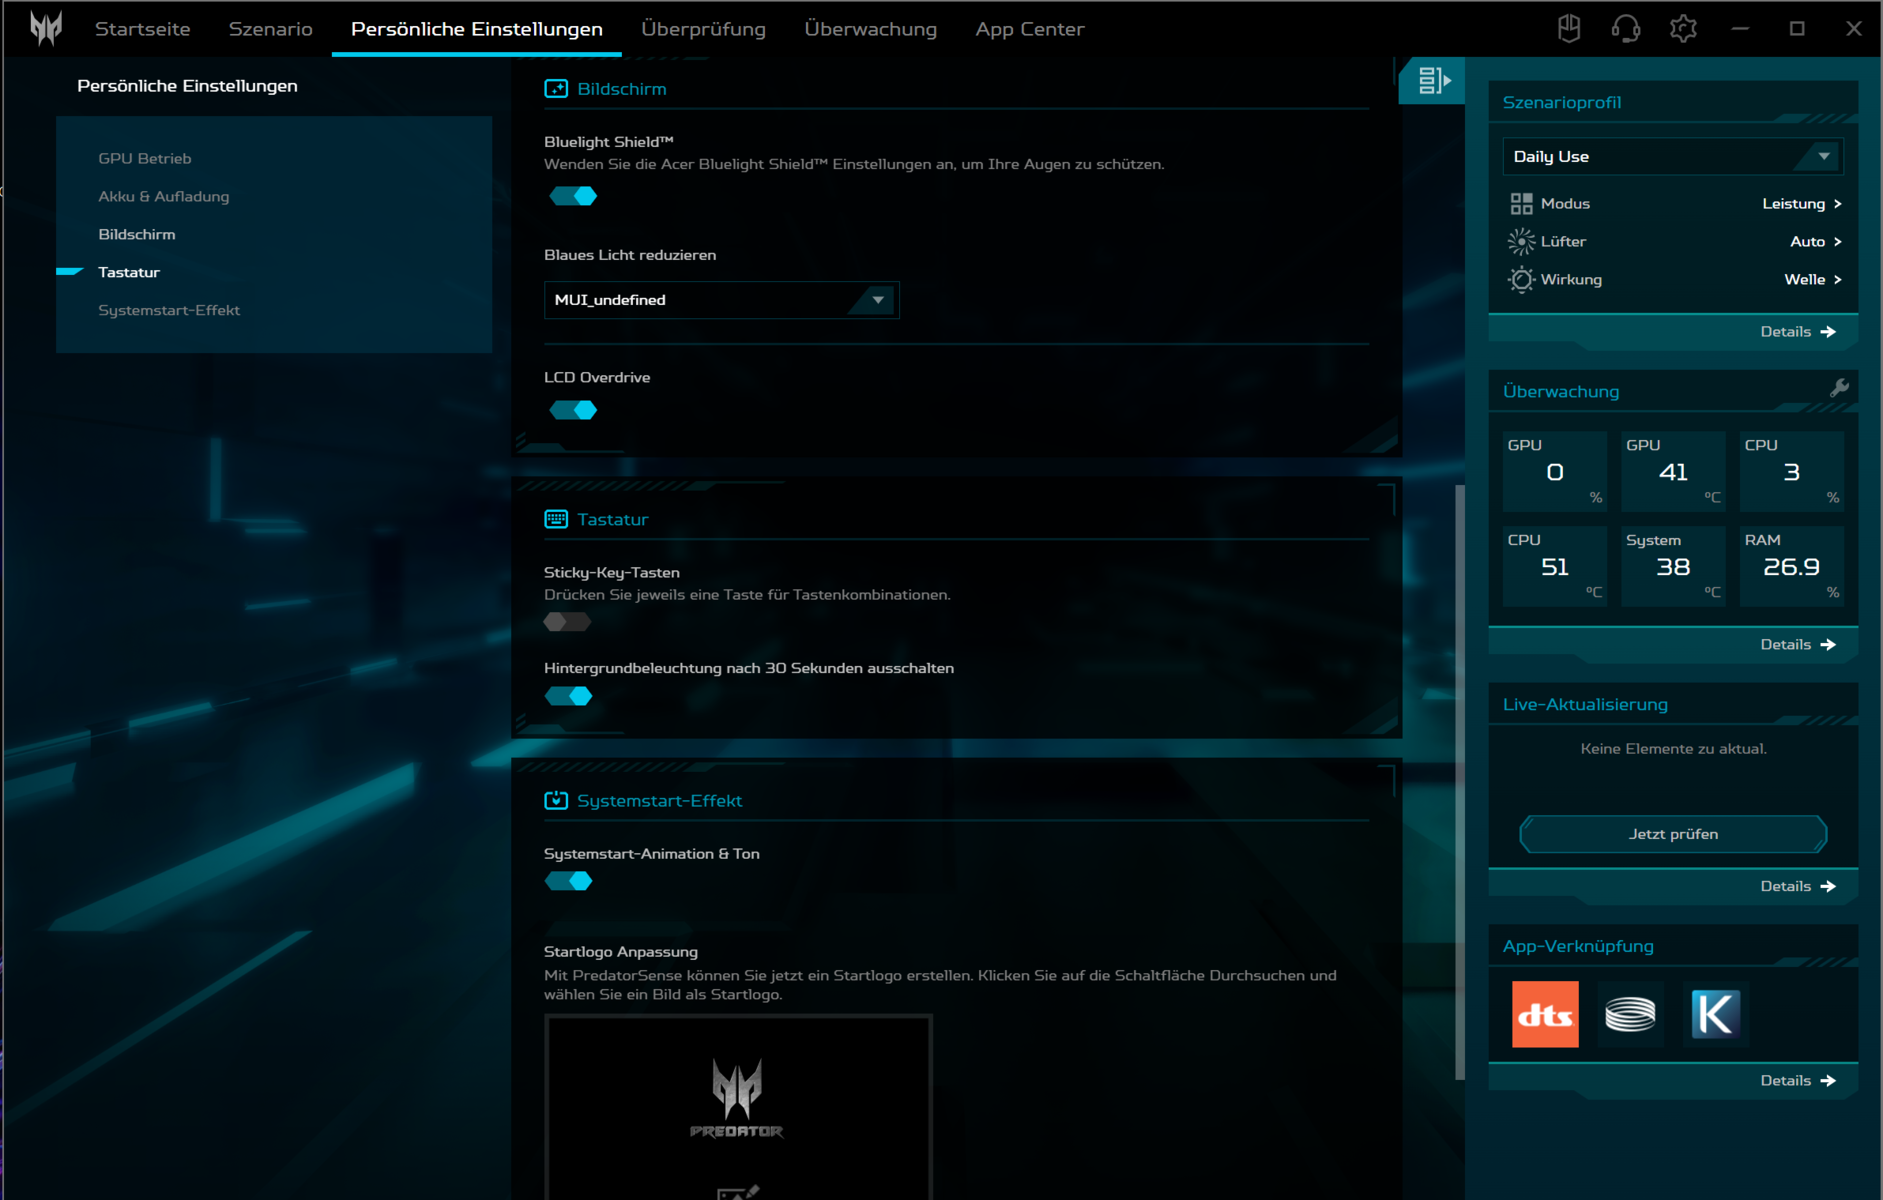
Notez que l'overdrive de l'écran LCD ne peut apparemment pas être désactivé. Les temps de réponse restent au même niveau, quelle que soit la position de l'interrupteur on/off dans le logiciel PredatorSense (centre de contrôle de l'ordinateur portable).


| |||||||||||||||||||||||||
Homogénéité de la luminosité: 85 %
Valeur mesurée au centre, sur batterie: 521 cd/m²
Contraste: 1184:1 (Valeurs des noirs: 0.44 cd/m²)
ΔE Color 1.74 | 0.5-29.43 Ø5, calibrated: 0.52
ΔE Greyscale 3 | 0.57-98 Ø5.3
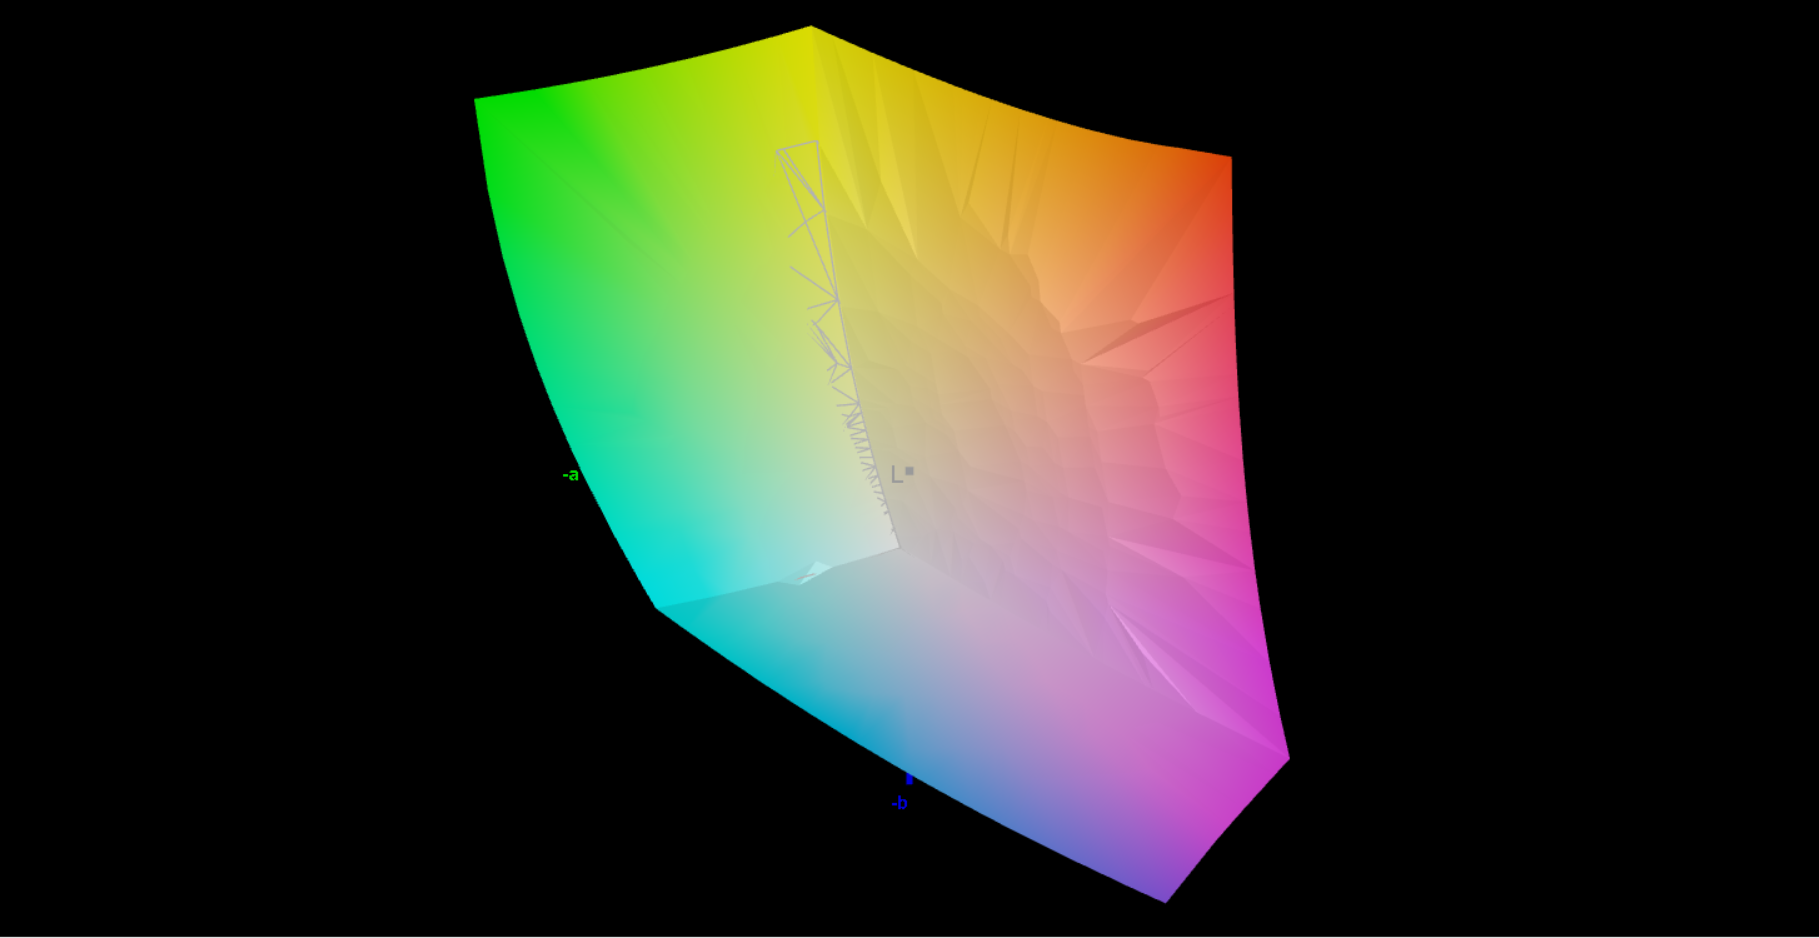
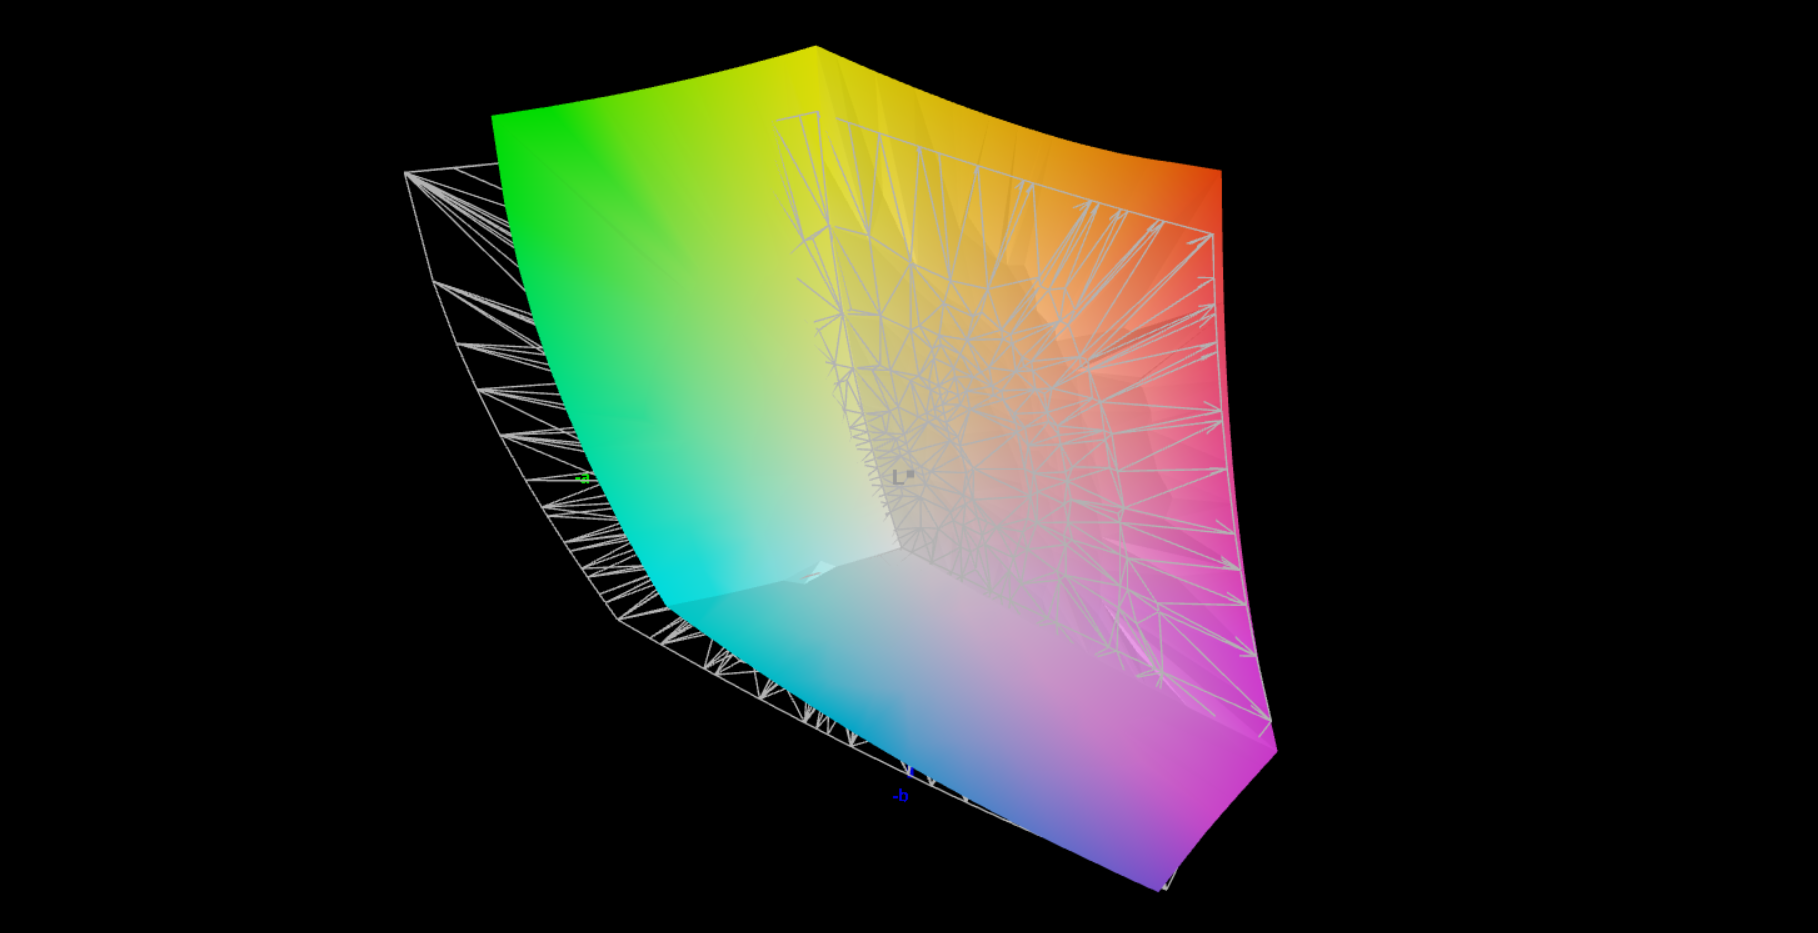
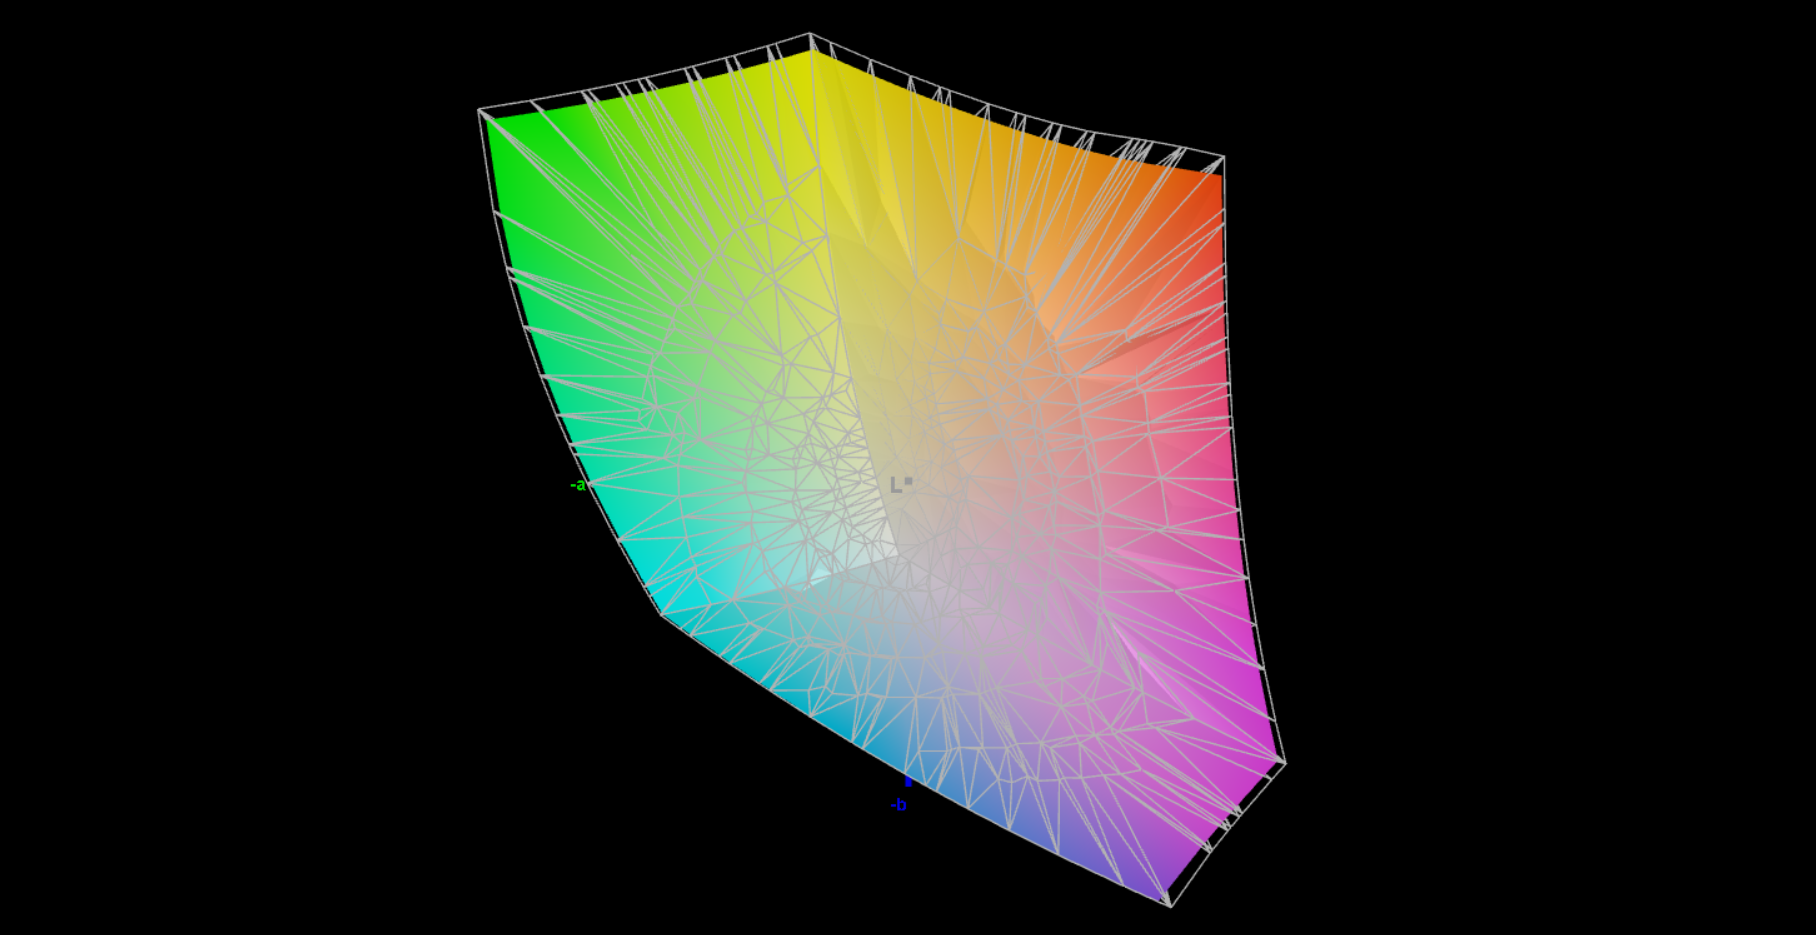
86.4% AdobeRGB 1998 (Argyll 2.2.0 3D)
99.8% sRGB (Argyll 2.2.0 3D)
95.9% Display P3 (Argyll 2.2.0 3D)
Gamma: 2.164
| Acer Acer Predator Helios Neo 16 (2024) Chi Mei N160GME-GTB, LED, 2560x1600, 16.00 | Aorus 16X 2024 BOE CQ NE160QDM-NY1, IPS, 2560x1600, 16.00 | Alienware m16 R2 BOE NE16NYH, IPS, 2560x1600, 16.00 | HP Omen Transcend 16-u1095ng ATNA60DL02-0 (SDC41A4), OLED, 2560x1600, 16.00 | Asus TUF Gaming A17 FA707XI-NS94 AU Optronics B173HAN04.9, IPS, 1920x1080, 17.30 | Lenovo Legion Pro 5 16IRX9 BOE NE160QDM-NYC, IPS, 2560x1600, 16.00 | |
|---|---|---|---|---|---|---|
| Display | -18% | -14% | 5% | -51% | -16% | |
| Display P3 Coverage | 95.9 | 67.2 -30% | 71 -26% | 99.8 4% | 39.7 -59% | 69.3 -28% |
| sRGB Coverage | 99.8 | 96.7 -3% | 100 0% | 100 0% | 59.1 -41% | 99.4 0% |
| AdobeRGB 1998 Coverage | 86.4 | 69.3 -20% | 71.4 -17% | 97 12% | 41 -53% | 70.1 -19% |
| Response Times | -6% | -7% | 97% | -443% | -70% | |
| Response Time Grey 50% / Grey 80% * | 5 ? | 7.5 ? -50% | 5.7 ? -14% | 0.2 ? 96% | 39 ? -680% | 11.9 ? -138% |
| Response Time Black / White * | 8.8 ? | 5.4 ? 39% | 8.7 ? 1% | 0.2 ? 98% | 26.9 ? -206% | 8.9 ? -1% |
| PWM Frequency | 120 ? | |||||
| Screen | -27% | -3% | 103% | -99% | 2% | |
| Brightness middle | 521 | 542 4% | 345.8 -34% | 390 -25% | 255.9 -51% | 384 -26% |
| Brightness | 506 | 504 0% | 337 -33% | 392 -23% | 248 -51% | 366 -28% |
| Brightness Distribution | 85 | 86 1% | 87 2% | 98 15% | 91 7% | 91 7% |
| Black Level * | 0.44 | 0.45 -2% | 0.3 32% | 0.02 95% | 0.21 52% | 0.35 20% |
| Contrast | 1184 | 1204 2% | 1153 -3% | 19500 1547% | 1219 3% | 1097 -7% |
| Colorchecker dE 2000 * | 1.74 | 2.73 -57% | 1.99 -14% | 1.94 -11% | 4.51 -159% | 0.97 44% |
| Colorchecker dE 2000 max. * | 3.88 | 5.29 -36% | 3.52 9% | 4.26 -10% | 20.77 -435% | 3.57 8% |
| Colorchecker dE 2000 calibrated * | 0.52 | 1.32 -154% | 0.62 -19% | 4.21 -710% | 1.82 -250% | 0.77 -48% |
| Greyscale dE 2000 * | 3 | 2.9 3% | 2.1 30% | 1.5 50% | 3.2 -7% | 1.5 50% |
| Gamma | 2.164 102% | 2.192 100% | 2.32 95% | 2.221 99% | 2.08 106% | 2.24 98% |
| CCT | 6816 95% | 6173 105% | 6369 102% | 6395 102% | 6054 107% | 6709 97% |
| Moyenne finale (programmes/paramètres) | -17% /
-22% | -8% /
-6% | 68% /
81% | -198% /
-138% | -28% /
-12% |
* ... Moindre est la valeur, meilleures sont les performances
L'écran est capable de couvrir entièrement ou presque les espaces colorimétriques sRGB et DCI-P3, ce qui n'est pas le cas de l'espace colorimétrique AdobeRGB. L'écran Predator offre donc une meilleure couverture de l'espace colorimétrique que les écrans de la plupart des concurrents. D'une manière générale, l'écran offre déjà une bonne reproduction des couleurs à la livraison, avec un écart de 1,7 (objectif : DeltaE < 3). Un étalonnage supplémentaire abaisse encore la valeur à 0,52, ce qui est très bien.
Vous pouvez télécharger et utiliser gratuitement notre profil de couleurs. Le lien se trouve dans la boîte d'information de l'écran.
Temps de réponse de l'écran
| ↔ Temps de réponse noir à blanc | ||
|---|---|---|
| 8.8 ms ... hausse ↗ et chute ↘ combinées | ↗ 4.7 ms hausse |  |
| ↘ 4.1 ms chute | ||
| L'écran montre de faibles temps de réponse, un bon écran pour jouer. En comparaison, tous les appareils testés affichent entre 0.1 (minimum) et 240 (maximum) ms. » 19 % des appareils testés affichent de meilleures performances. Cela signifie que les latences relevées sont meilleures que la moyenne (21.4 ms) de tous les appareils testés. | ||
| ↔ Temps de réponse gris 50% à gris 80% | ||
| 5 ms ... hausse ↗ et chute ↘ combinées | ↗ 2.5 ms hausse |  |
| ↘ 2.5 ms chute | ||
| L'écran montre de très faibles temps de réponse, parfait pour le jeu. En comparaison, tous les appareils testés affichent entre 0.2 (minimum) et 636 (maximum) ms. » 12 % des appareils testés affichent de meilleures performances. Cela signifie que les latences relevées sont meilleures que la moyenne (33.7 ms) de tous les appareils testés. | ||
Scintillement / MLI (Modulation de largeur d'impulsion)
| Scintillement / MLI (Modulation de largeur d'impulsion) non décelé |  | ||
En comparaison, 53 % des appareils testés n'emploient pas MDI pour assombrir leur écran. Nous avons relevé une moyenne à 17803 (minimum : 5 - maximum : 3846000) Hz dans le cas où une MDI était active. | |||
Performance - Beaucoup de puissance, grâce à Raptor Lake et Ada Lovelace
Le groupe d'utilisateurs cible de l'ordinateur portable 16 pouces d'Acer comprend les joueurs et les créateurs. L'ordinateur portable fonctionne avec Raptor Lake et Ada Lovelace. Au moment de ce test, le modèle de notre unité de test n'est pas encore disponible (en Allemagne), mais vous pouvez obtenir un modèle frère avec 16 au lieu de 32 Go de RAM pour près de 1 900 euros (~2 044 $). Le modèle le plus abordable de la série coûte environ 1 500 euros (~1 614 $).
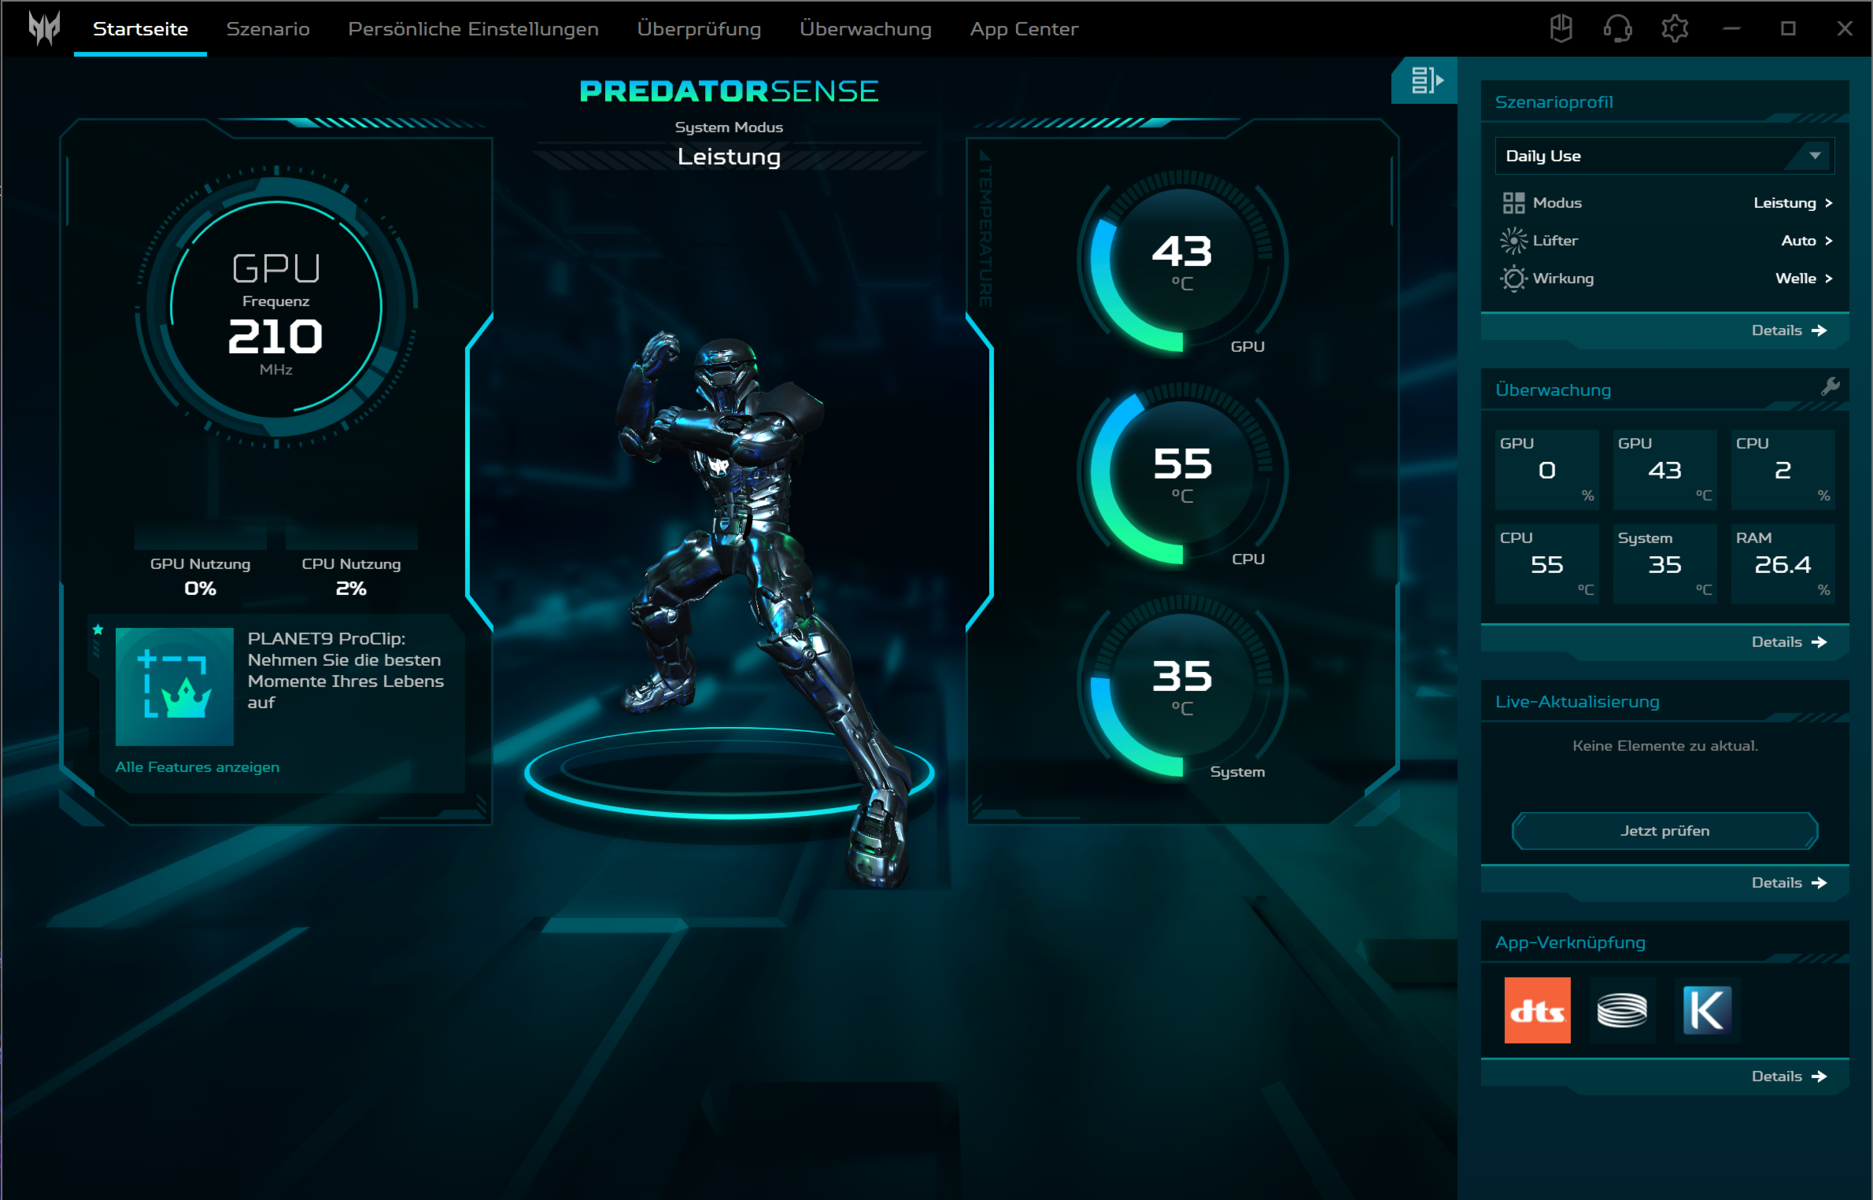
Conditions d'essai
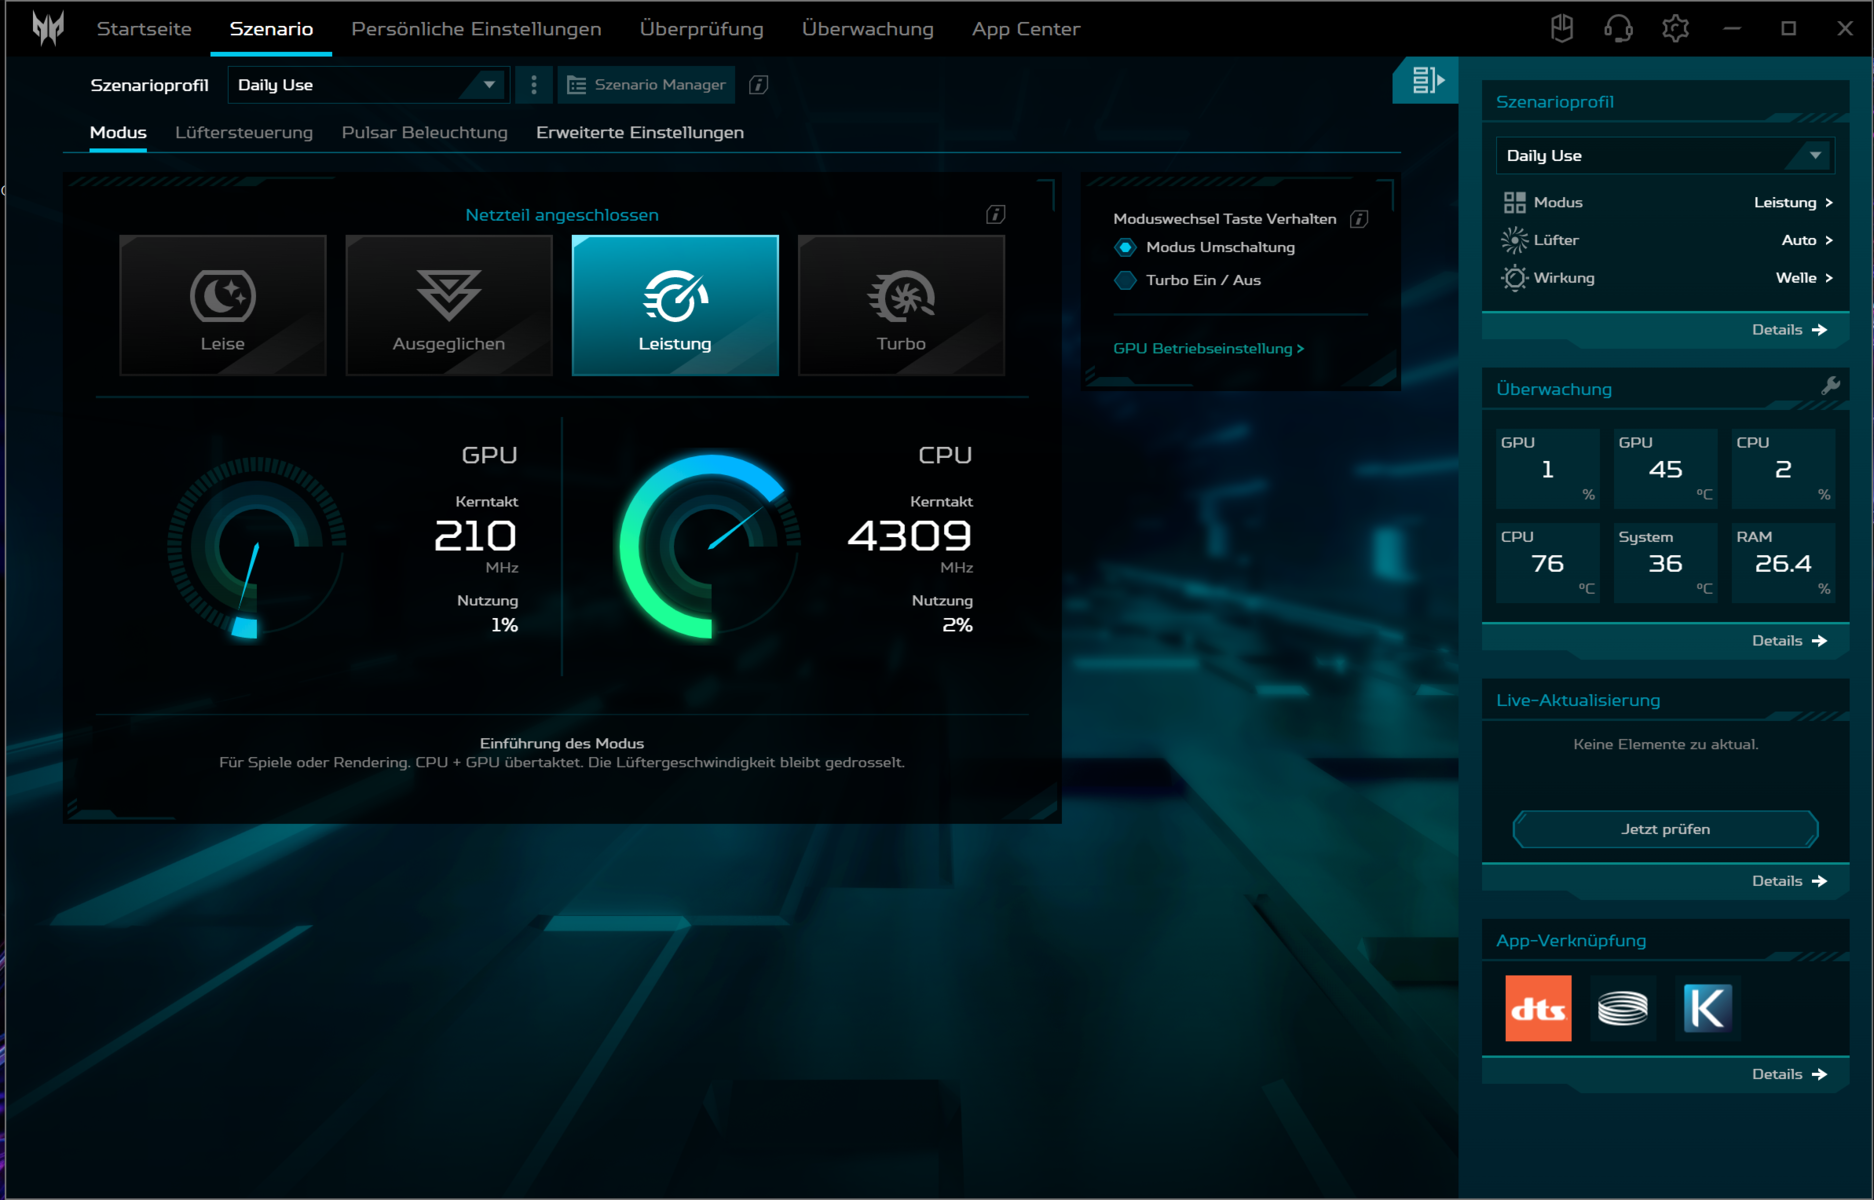
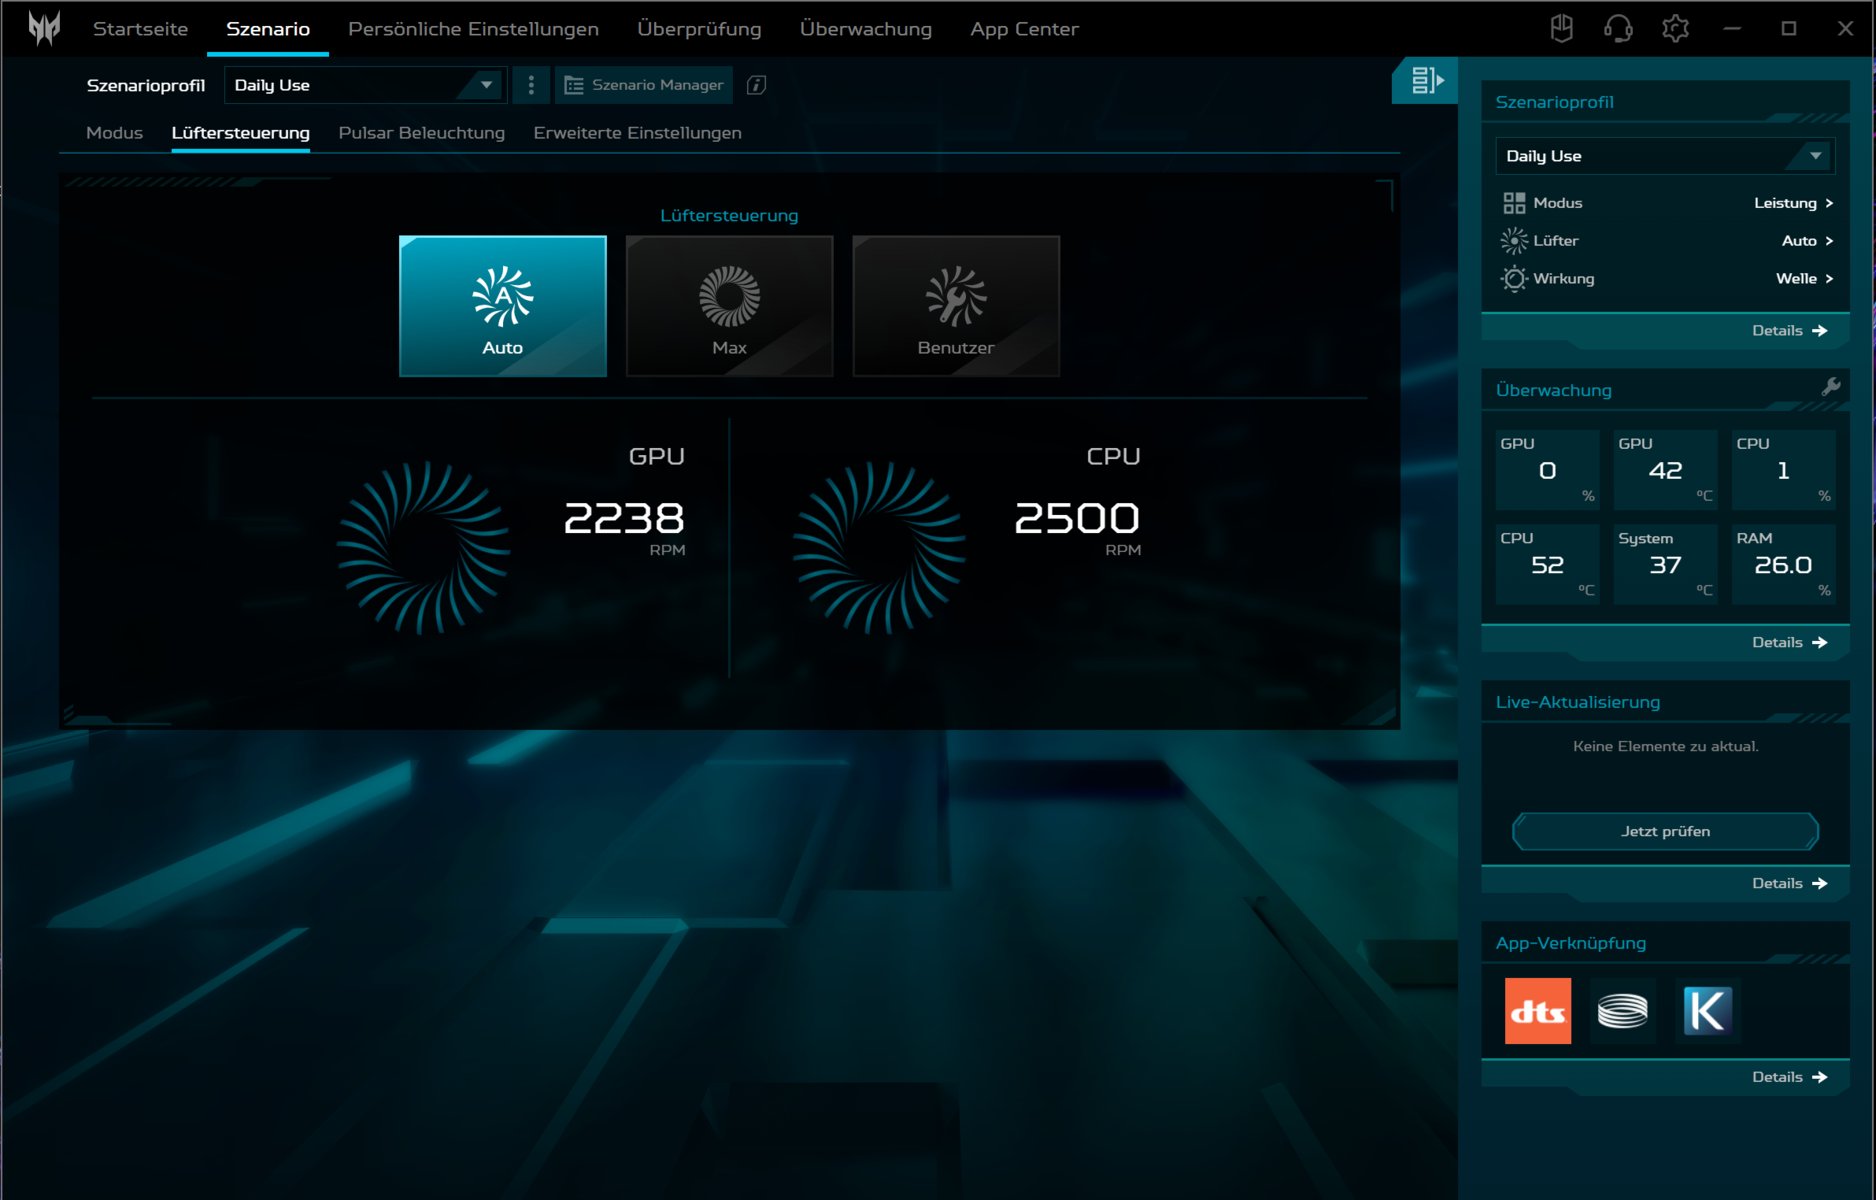
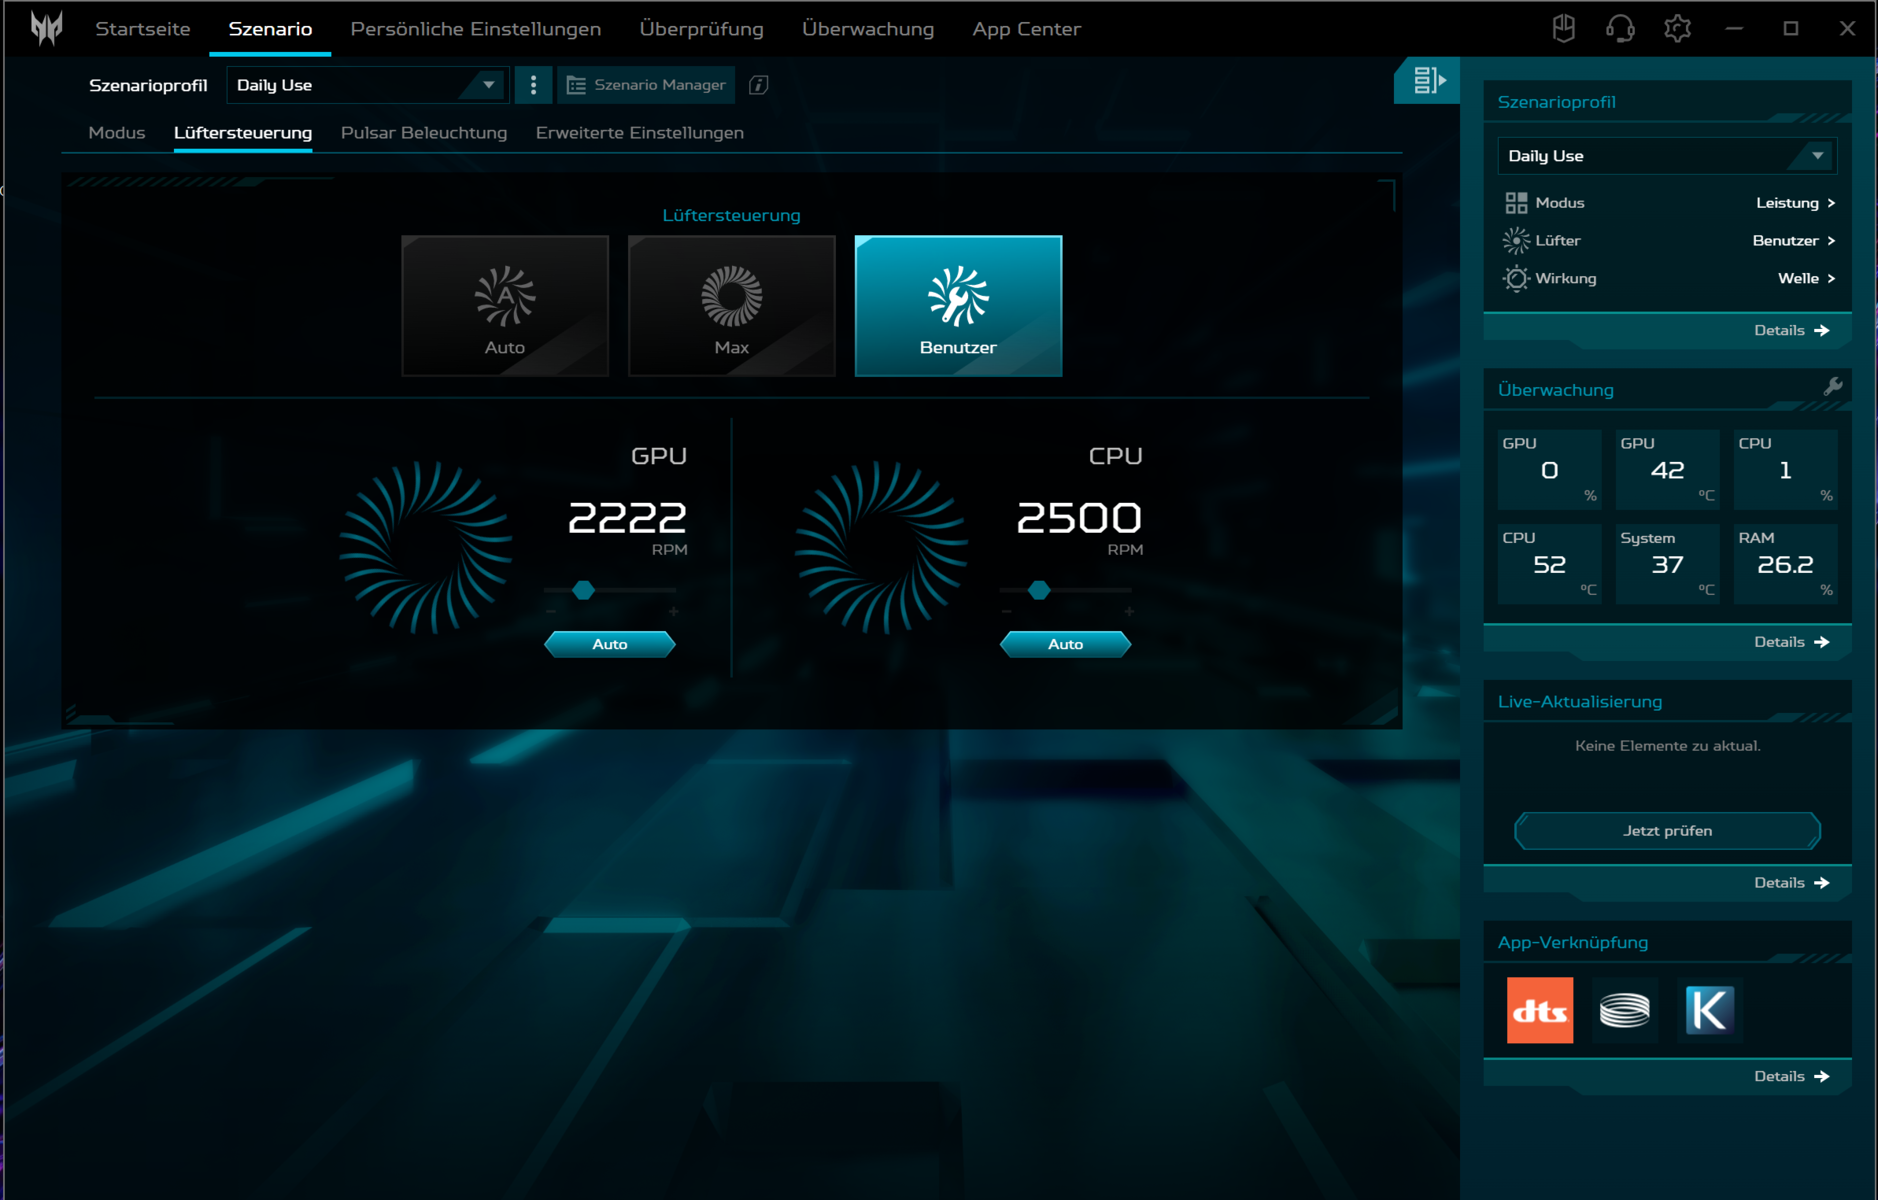
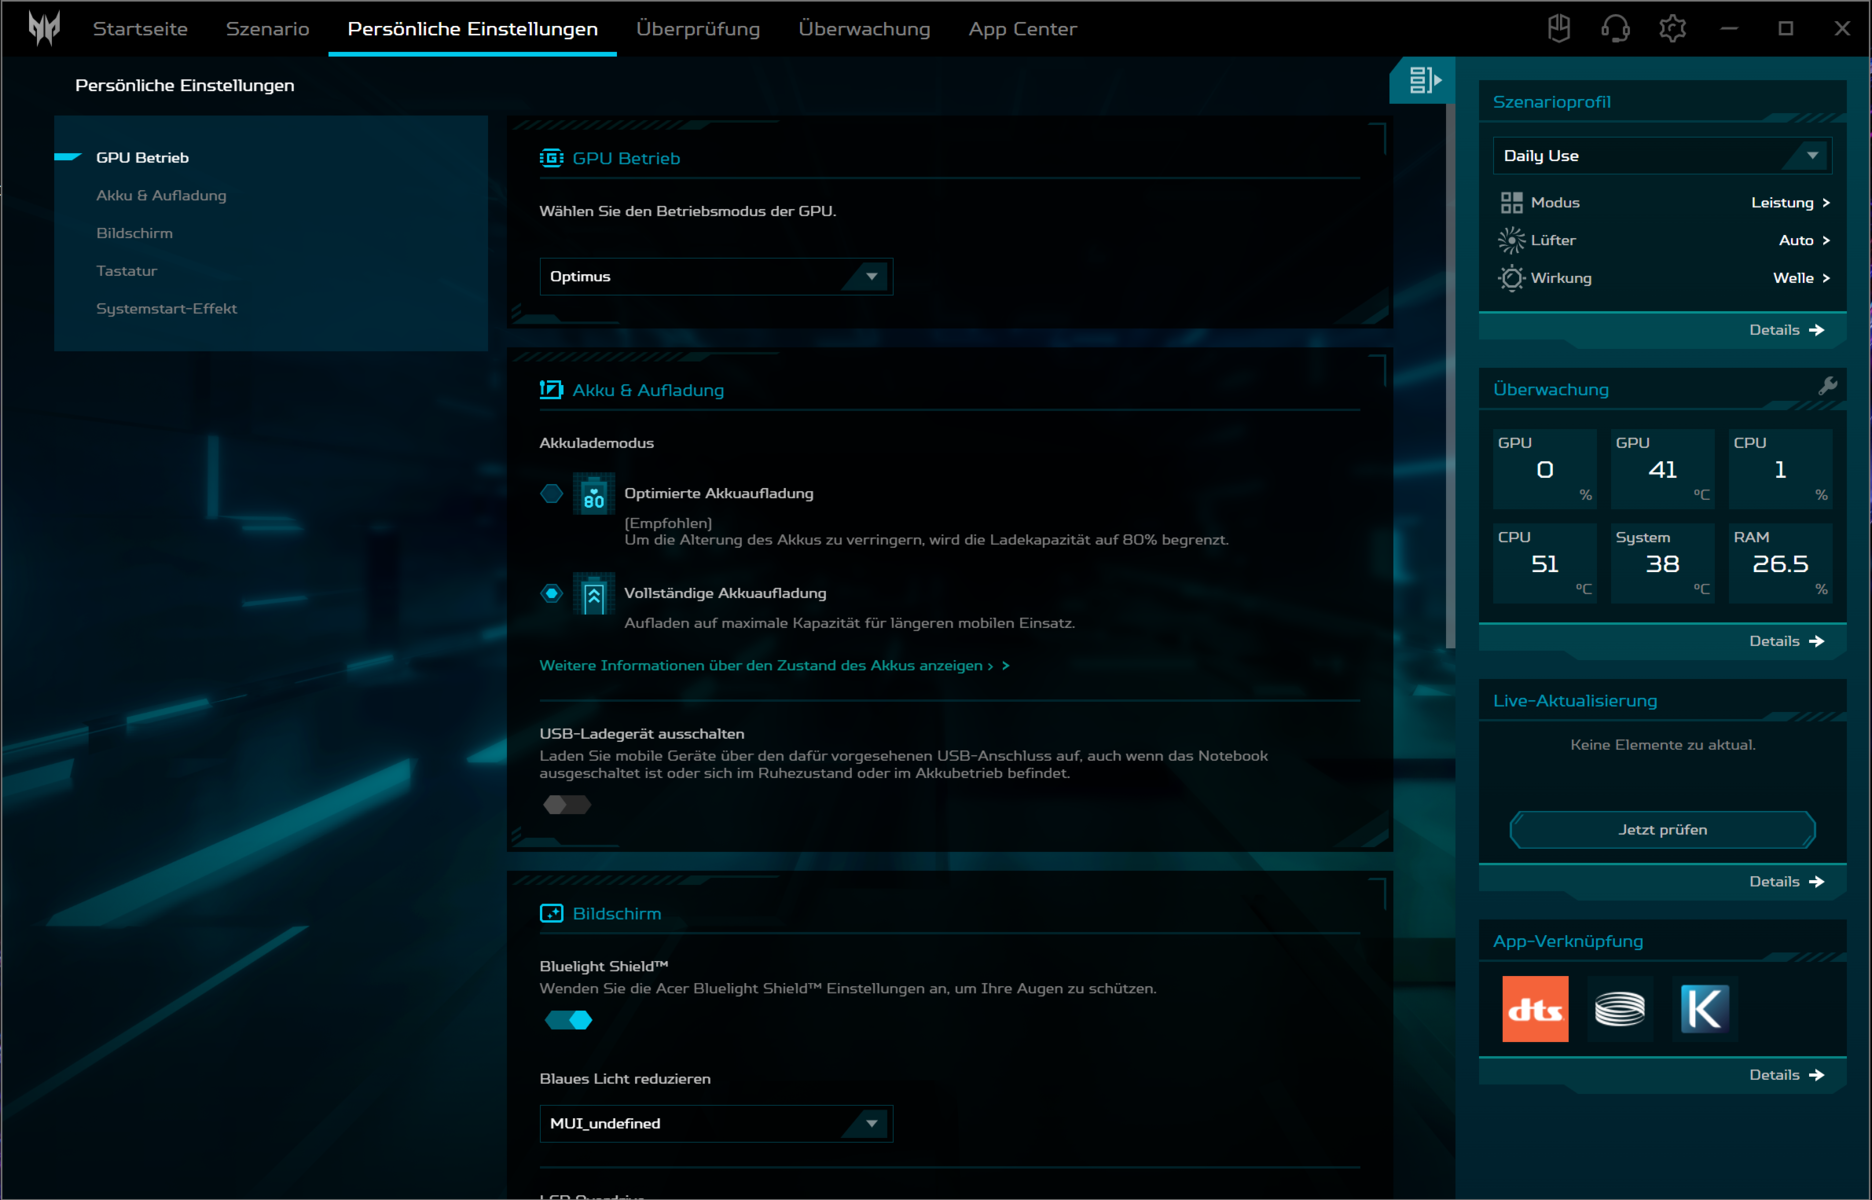
Le fabricant propose six modes différents - quatre pour le fonctionnement sur secteur et deux pour le fonctionnement sur batterie (voir tableau). Nous avons utilisé le mode "Performance" pour nos benchmarks et le mode "Eco" pour les tests sur batterie. Pour utiliser les modes "Turbo" ou "Performance", vous devez disposer d'un niveau de batterie d'au moins 40 %. Vous pouvez passer d'un mode à l'autre en appuyant sur une touche (au-dessus du clavier) ou en utilisant le logiciel PredatorSense (centre de contrôle de l'ordinateur portable), une LED indiquant le mode actuellement actif.
| Turbo | Performance | Équilibré | Silencieux | Équilibré (batterie) | Eco (batterie) | |
|---|---|---|---|---|---|---|
| Limite de puissance 1 (HWInfo) | 115 Watt | 95 Watt | 85 Watt | 55 Watt | 85 Watt | 85 Watt |
| Limite de puissance 2 (HWInfo) | 157 Watt | 157 Watt | 157 Watt | 157 Watt | 157 Watt | 157 Watt |
| Bruit max. Bruit | 55,8 dB(A) | 49,5 dB(A) | 45 dB(A) | - | - | - |
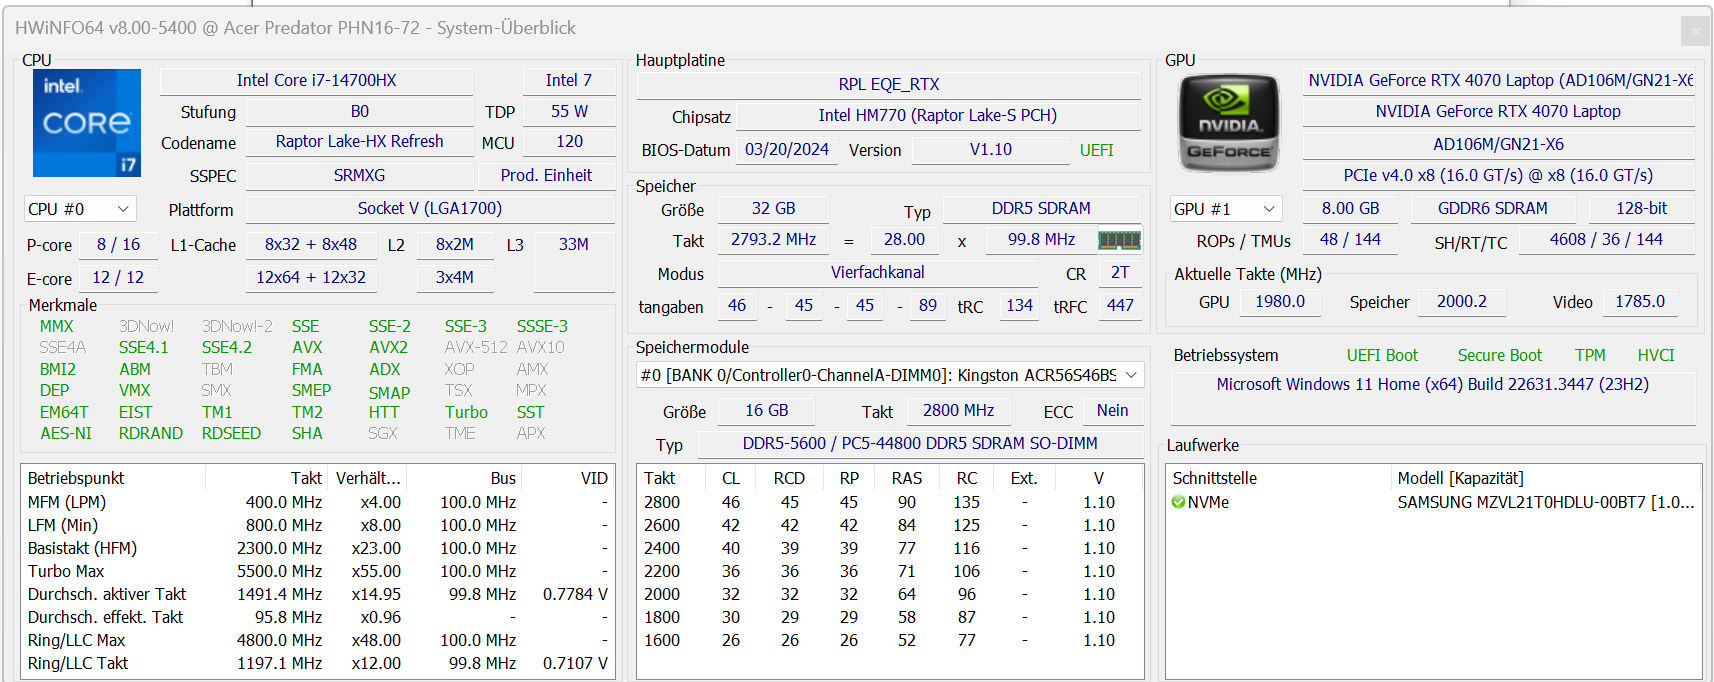
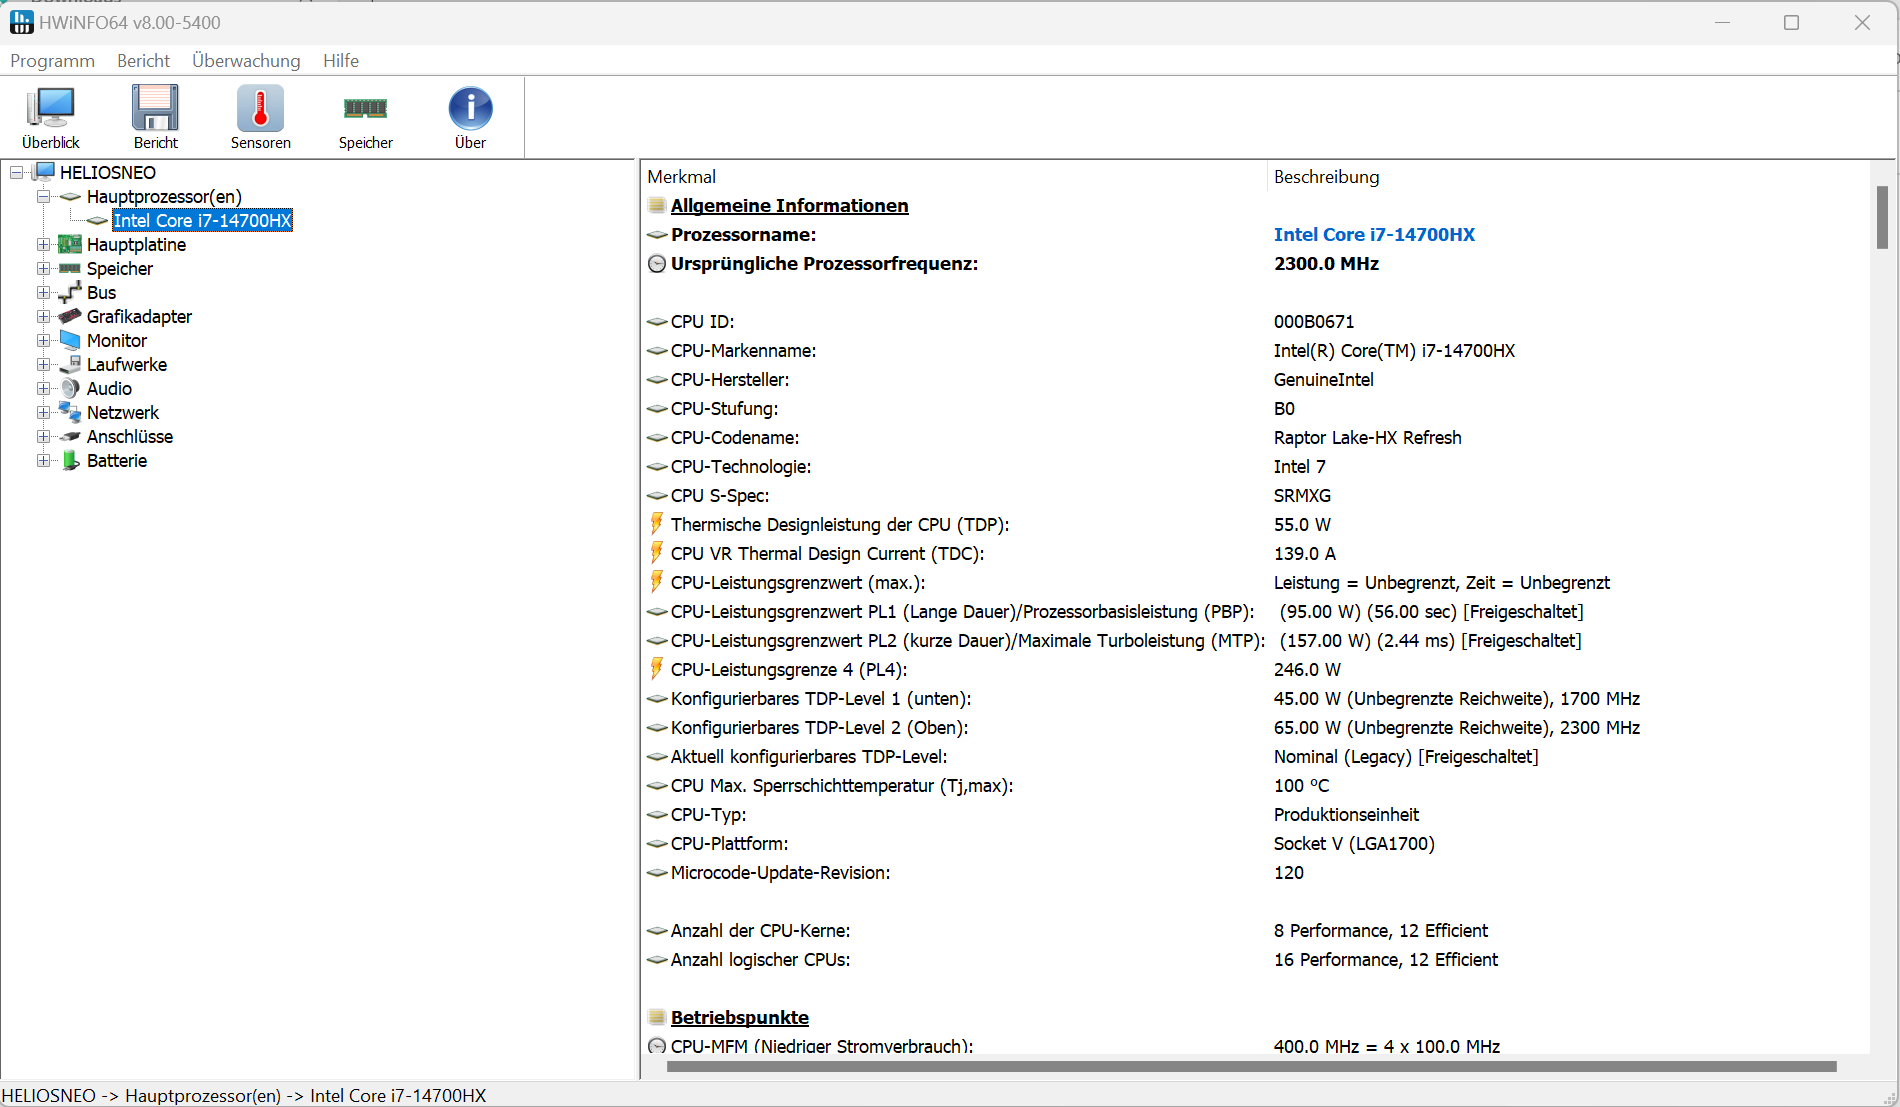
Processeur
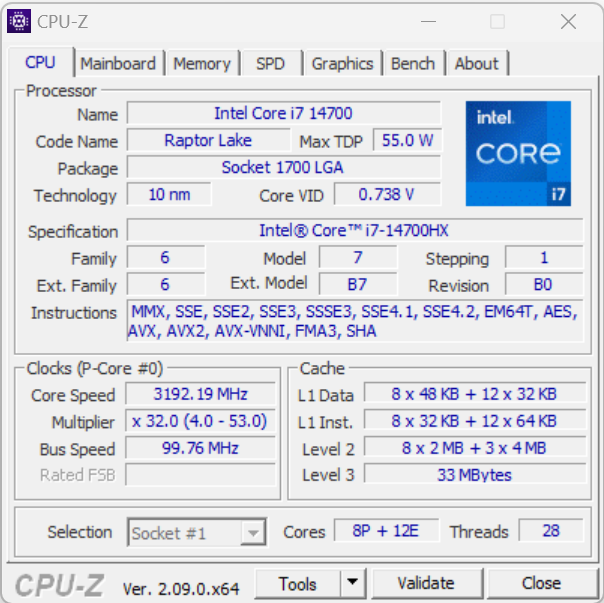
Les 20 cœurs (8P + 12E = 28 threads) du processeur Core i7-14700HX (Raptor Lake) atteignent des vitesses d'horloge maximales de 5,5 GHz (P) et 3,9 GHz (E) respectivement. La charge constante multithread (CB15 Loop) est gérée avec une vitesse d'horloge constante, indépendamment du profil de puissance sélectionné. Cependant, les différences s'avèrent plutôt faibles, seul le profil "Silent" réduisant les performances de manière significative.
Les résultats du benchmark sont légèrement décevants : Malgré les quatre cœurs de CPU supplémentaires et les vitesses d'horloge plus élevées, les performances multithread sont au même niveau que celles du Core i7-14650HX. Ce n'est qu'au niveau des performances monothématiques que le 14700HX est en mesure d'exploiter sa puissance nominale supplémentaire.


Cinebench R15 Multi Constant Load Test


| CPU Performance Rating - Percent | |
| Lenovo Legion Pro 5 16IRX9 | |
| Aorus 16X 2024 | |
| Acer Acer Predator Helios Neo 16 (2024) | |
| Acer Acer Predator Helios Neo 16 (2024) | |
| Lenovo Legion 5 16IRX G9 | |
| HP Omen Transcend 16-u1095ng | |
| Moyenne Intel Core i7-14700HX | |
| Moyenne de la classe Gaming | |
| Asus TUF Gaming A17 FA707XI-NS94 | |
| Alienware m16 R2 -1! | |
| Cinebench R20 | |
| CPU (Multi Core) | |
| Lenovo Legion Pro 5 16IRX9 | |
| Aorus 16X 2024 | |
| Acer Acer Predator Helios Neo 16 (2024) (Turbo) | |
| Lenovo Legion 5 16IRX G9 | |
| Moyenne Intel Core i7-14700HX (8361 - 9661, n=4) | |
| HP Omen Transcend 16-u1095ng | |
| Acer Acer Predator Helios Neo 16 (2024) | |
| Moyenne de la classe Gaming (930 - 13769, n=221, 2 dernières années) | |
| Alienware m16 R2 | |
| Asus TUF Gaming A17 FA707XI-NS94 | |
| CPU (Single Core) | |
| Aorus 16X 2024 | |
| HP Omen Transcend 16-u1095ng | |
| Acer Acer Predator Helios Neo 16 (2024) (Turbo) | |
| Lenovo Legion Pro 5 16IRX9 | |
| Acer Acer Predator Helios Neo 16 (2024) | |
| Lenovo Legion 5 16IRX G9 | |
| Moyenne Intel Core i7-14700HX (651 - 821, n=4) | |
| Asus TUF Gaming A17 FA707XI-NS94 | |
| Moyenne de la classe Gaming (169 - 855, n=221, 2 dernières années) | |
| Alienware m16 R2 | |
| Cinebench R15 | |
| CPU Multi 64Bit | |
| Lenovo Legion Pro 5 16IRX9 | |
| Aorus 16X 2024 | |
| HP Omen Transcend 16-u1095ng | |
| Acer Acer Predator Helios Neo 16 (2024) (Turbo) | |
| Lenovo Legion 5 16IRX G9 | |
| Moyenne Intel Core i7-14700HX (3455 - 3855, n=4) | |
| Acer Acer Predator Helios Neo 16 (2024) | |
| Moyenne de la classe Gaming (400 - 5663, n=226, 2 dernières années) | |
| Alienware m16 R2 | |
| Asus TUF Gaming A17 FA707XI-NS94 | |
| CPU Single 64Bit | |
| Aorus 16X 2024 | |
| Acer Acer Predator Helios Neo 16 (2024) (Turbo) | |
| Lenovo Legion Pro 5 16IRX9 | |
| HP Omen Transcend 16-u1095ng | |
| Acer Acer Predator Helios Neo 16 (2024) | |
| Asus TUF Gaming A17 FA707XI-NS94 | |
| Lenovo Legion 5 16IRX G9 | |
| Moyenne Intel Core i7-14700HX (238 - 304, n=4) | |
| Moyenne de la classe Gaming (79.2 - 318, n=225, 2 dernières années) | |
| Alienware m16 R2 | |
| Blender - v2.79 BMW27 CPU | |
| Moyenne de la classe Gaming (87 - 1259, n=218, 2 dernières années) | |
| Acer Acer Predator Helios Neo 16 (2024) (Turbo) | |
| Asus TUF Gaming A17 FA707XI-NS94 | |
| HP Omen Transcend 16-u1095ng | |
| Moyenne Intel Core i7-14700HX (137 - 184, n=4) | |
| Lenovo Legion 5 16IRX G9 | |
| Acer Acer Predator Helios Neo 16 (2024) | |
| Aorus 16X 2024 | |
| Lenovo Legion Pro 5 16IRX9 | |
| Geekbench 6.2 | |
| Multi-Core | |
| Lenovo Legion Pro 5 16IRX9 (6.2.1) | |
| Acer Acer Predator Helios Neo 16 (2024) (6.2.1, Turbo) | |
| Aorus 16X 2024 (6.2.1) | |
| Acer Acer Predator Helios Neo 16 (2024) (6.2.1) | |
| Moyenne Intel Core i7-14700HX (14807 - 17442, n=4) | |
| HP Omen Transcend 16-u1095ng (6.2.1) | |
| Lenovo Legion 5 16IRX G9 (6.2.1) | |
| Moyenne de la classe Gaming (5340 - 18590, n=80, 2 dernières années) | |
| Alienware m16 R2 (6.2.1) | |
| Asus TUF Gaming A17 FA707XI-NS94 (6.2.1) | |
| Single-Core | |
| Aorus 16X 2024 (6.2.1) | |
| Acer Acer Predator Helios Neo 16 (2024) (6.2.1) | |
| Acer Acer Predator Helios Neo 16 (2024) (6.2.1, Turbo) | |
| Lenovo Legion Pro 5 16IRX9 (6.2.1) | |
| HP Omen Transcend 16-u1095ng (6.2.1) | |
| Lenovo Legion 5 16IRX G9 (6.2.1) | |
| Asus TUF Gaming A17 FA707XI-NS94 (6.2.1) | |
| Moyenne Intel Core i7-14700HX (2378 - 2975, n=4) | |
| Moyenne de la classe Gaming (1599 - 3095, n=80, 2 dernières années) | |
| Alienware m16 R2 (6.2.1) | |
| HWBOT x265 Benchmark v2.2 - 4k Preset | |
| Lenovo Legion Pro 5 16IRX9 | |
| Aorus 16X 2024 | |
| Lenovo Legion 5 16IRX G9 | |
| Acer Acer Predator Helios Neo 16 (2024) (Turbo) | |
| Moyenne Intel Core i7-14700HX (22 - 26.9, n=4) | |
| Acer Acer Predator Helios Neo 16 (2024) | |
| HP Omen Transcend 16-u1095ng | |
| Asus TUF Gaming A17 FA707XI-NS94 | |
| Moyenne de la classe Gaming (3 - 37.6, n=221, 2 dernières années) | |
| Alienware m16 R2 | |
| LibreOffice - 20 Documents To PDF | |
| HP Omen Transcend 16-u1095ng (6.3.4.2) | |
| Alienware m16 R2 (6.3.4.2) | |
| Moyenne de la classe Gaming (32.8 - 332, n=217, 2 dernières années) | |
| Asus TUF Gaming A17 FA707XI-NS94 (6.3.4.2) | |
| Moyenne Intel Core i7-14700HX (41.9 - 55.3, n=4) | |
| Acer Acer Predator Helios Neo 16 (2024) (6.3.4.2, Turbo) | |
| Lenovo Legion 5 16IRX G9 (6.3.4.2) | |
| Acer Acer Predator Helios Neo 16 (2024) (6.3.4.2) | |
| Lenovo Legion Pro 5 16IRX9 (6.3.4.2) | |
| Aorus 16X 2024 (6.3.4.2) | |
| R Benchmark 2.5 - Overall mean | |
| Alienware m16 R2 | |
| Moyenne de la classe Gaming (0.3609 - 4.47, n=220, 2 dernières années) | |
| Moyenne Intel Core i7-14700HX (0.3821 - 0.4896, n=4) | |
| Asus TUF Gaming A17 FA707XI-NS94 | |
| Lenovo Legion 5 16IRX G9 | |
| Acer Acer Predator Helios Neo 16 (2024) (Turbo) | |
| HP Omen Transcend 16-u1095ng | |
| Lenovo Legion Pro 5 16IRX9 | |
| Acer Acer Predator Helios Neo 16 (2024) | |
| Aorus 16X 2024 | |
* ... Moindre est la valeur, meilleures sont les performances
AIDA64: FP32 Ray-Trace | FPU Julia | CPU SHA3 | CPU Queen | FPU SinJulia | FPU Mandel | CPU AES | CPU ZLib | FP64 Ray-Trace | CPU PhotoWorxx
| Performance Rating | |
| Lenovo Legion Pro 5 16IRX9 | |
| Aorus 16X 2024 | |
| Acer Acer Predator Helios Neo 16 (2024) | |
| Asus TUF Gaming A17 FA707XI-NS94 | |
| Acer Acer Predator Helios Neo 16 (2024) | |
| Moyenne Intel Core i7-14700HX | |
| Moyenne de la classe Gaming | |
| HP Omen Transcend 16-u1095ng | |
| Alienware m16 R2 | |
| AIDA64 / FP32 Ray-Trace | |
| Asus TUF Gaming A17 FA707XI-NS94 (v6.92.6600) | |
| Lenovo Legion Pro 5 16IRX9 (v6.92.6600) | |
| Acer Acer Predator Helios Neo 16 (2024) (v6.92.6600, Turbo) | |
| Aorus 16X 2024 (v6.92.6600) | |
| Acer Acer Predator Helios Neo 16 (2024) (v6.92.6600) | |
| Moyenne Intel Core i7-14700HX (16932 - 23179, n=4) | |
| Moyenne de la classe Gaming (3069 - 60169, n=216, 2 dernières années) | |
| Alienware m16 R2 (v6.92.6600) | |
| HP Omen Transcend 16-u1095ng (v6.92.6600) | |
| AIDA64 / FPU Julia | |
| Lenovo Legion Pro 5 16IRX9 (v6.92.6600) | |
| Asus TUF Gaming A17 FA707XI-NS94 (v6.92.6600) | |
| Aorus 16X 2024 (v6.92.6600) | |
| Acer Acer Predator Helios Neo 16 (2024) (v6.92.6600, Turbo) | |
| Acer Acer Predator Helios Neo 16 (2024) (v6.92.6600) | |
| Moyenne Intel Core i7-14700HX (86338 - 114710, n=4) | |
| Moyenne de la classe Gaming (18567 - 252486, n=216, 2 dernières années) | |
| Alienware m16 R2 (v6.92.6600) | |
| HP Omen Transcend 16-u1095ng (v6.92.6600) | |
| AIDA64 / CPU SHA3 | |
| Lenovo Legion Pro 5 16IRX9 (v6.92.6600) | |
| Aorus 16X 2024 (v6.92.6600) | |
| Acer Acer Predator Helios Neo 16 (2024) (v6.92.6600, Turbo) | |
| Asus TUF Gaming A17 FA707XI-NS94 (v6.92.6600) | |
| Acer Acer Predator Helios Neo 16 (2024) (v6.92.6600) | |
| Moyenne Intel Core i7-14700HX (4008 - 5484, n=4) | |
| Moyenne de la classe Gaming (629 - 10389, n=216, 2 dernières années) | |
| HP Omen Transcend 16-u1095ng (v6.92.6600) | |
| Alienware m16 R2 (v6.92.6600) | |
| AIDA64 / CPU Queen | |
| Acer Acer Predator Helios Neo 16 (2024) (v6.92.6600) | |
| Acer Acer Predator Helios Neo 16 (2024) (v6.92.6600, Turbo) | |
| Lenovo Legion Pro 5 16IRX9 (v6.92.6600) | |
| Moyenne Intel Core i7-14700HX (129836 - 150835, n=4) | |
| Aorus 16X 2024 (v6.92.6600) | |
| Asus TUF Gaming A17 FA707XI-NS94 (v6.92.6600) | |
| HP Omen Transcend 16-u1095ng (v6.92.6600) | |
| Moyenne de la classe Gaming (15371 - 200651, n=216, 2 dernières années) | |
| Alienware m16 R2 (v6.92.6600) | |
| AIDA64 / FPU SinJulia | |
| Asus TUF Gaming A17 FA707XI-NS94 (v6.92.6600) | |
| Lenovo Legion Pro 5 16IRX9 (v6.92.6600) | |
| Aorus 16X 2024 (v6.92.6600) | |
| Acer Acer Predator Helios Neo 16 (2024) (v6.92.6600, Turbo) | |
| Acer Acer Predator Helios Neo 16 (2024) (v6.92.6600) | |
| Moyenne Intel Core i7-14700HX (11704 - 13868, n=4) | |
| Moyenne de la classe Gaming (2137 - 32988, n=216, 2 dernières années) | |
| HP Omen Transcend 16-u1095ng (v6.92.6600) | |
| Alienware m16 R2 (v6.92.6600) | |
| AIDA64 / FPU Mandel | |
| Asus TUF Gaming A17 FA707XI-NS94 (v6.92.6600) | |
| Lenovo Legion Pro 5 16IRX9 (v6.92.6600) | |
| Acer Acer Predator Helios Neo 16 (2024) (v6.92.6600, Turbo) | |
| Aorus 16X 2024 (v6.92.6600) | |
| Acer Acer Predator Helios Neo 16 (2024) (v6.92.6600) | |
| Moyenne Intel Core i7-14700HX (42125 - 57996, n=4) | |
| Moyenne de la classe Gaming (10291 - 134044, n=216, 2 dernières années) | |
| Alienware m16 R2 (v6.92.6600) | |
| HP Omen Transcend 16-u1095ng (v6.92.6600) | |
| AIDA64 / CPU AES | |
| Lenovo Legion Pro 5 16IRX9 (v6.92.6600) | |
| Aorus 16X 2024 (v6.92.6600) | |
| Moyenne de la classe Gaming (19065 - 328679, n=216, 2 dernières années) | |
| Acer Acer Predator Helios Neo 16 (2024) (v6.92.6600, Turbo) | |
| Moyenne Intel Core i7-14700HX (82161 - 108043, n=4) | |
| Acer Acer Predator Helios Neo 16 (2024) (v6.92.6600) | |
| Asus TUF Gaming A17 FA707XI-NS94 (v6.92.6600) | |
| HP Omen Transcend 16-u1095ng (v6.92.6600) | |
| Alienware m16 R2 (v6.92.6600) | |
| AIDA64 / CPU ZLib | |
| Lenovo Legion Pro 5 16IRX9 (v6.92.6600) | |
| Aorus 16X 2024 (v6.92.6600) | |
| Acer Acer Predator Helios Neo 16 (2024) (v6.92.6600, Turbo) | |
| Acer Acer Predator Helios Neo 16 (2024) (v6.92.6600) | |
| Moyenne Intel Core i7-14700HX (1177 - 1633, n=4) | |
| HP Omen Transcend 16-u1095ng (v6.92.6600) | |
| Moyenne de la classe Gaming (150.9 - 2409, n=216, 2 dernières années) | |
| Alienware m16 R2 (v6.92.6600) | |
| Asus TUF Gaming A17 FA707XI-NS94 (v6.92.6600) | |
| AIDA64 / FP64 Ray-Trace | |
| Asus TUF Gaming A17 FA707XI-NS94 (v6.92.6600) | |
| Lenovo Legion Pro 5 16IRX9 (v6.92.6600) | |
| Acer Acer Predator Helios Neo 16 (2024) (v6.92.6600, Turbo) | |
| Aorus 16X 2024 (v6.92.6600) | |
| Acer Acer Predator Helios Neo 16 (2024) (v6.92.6600) | |
| Moyenne Intel Core i7-14700HX (9029 - 12676, n=4) | |
| Moyenne de la classe Gaming (1518 - 31796, n=216, 2 dernières années) | |
| Alienware m16 R2 (v6.92.6600) | |
| HP Omen Transcend 16-u1095ng (v6.92.6600) | |
| AIDA64 / CPU PhotoWorxx | |
| Lenovo Legion Pro 5 16IRX9 (v6.92.6600) | |
| HP Omen Transcend 16-u1095ng (v6.92.6600) | |
| Aorus 16X 2024 (v6.92.6600) | |
| Acer Acer Predator Helios Neo 16 (2024) (v6.92.6600, Turbo) | |
| Acer Acer Predator Helios Neo 16 (2024) (v6.92.6600) | |
| Moyenne Intel Core i7-14700HX (39446 - 47993, n=4) | |
| Alienware m16 R2 (v6.92.6600) | |
| Moyenne de la classe Gaming (10805 - 60161, n=217, 2 dernières années) | |
| Asus TUF Gaming A17 FA707XI-NS94 (v6.92.6600) | |
Performance du système
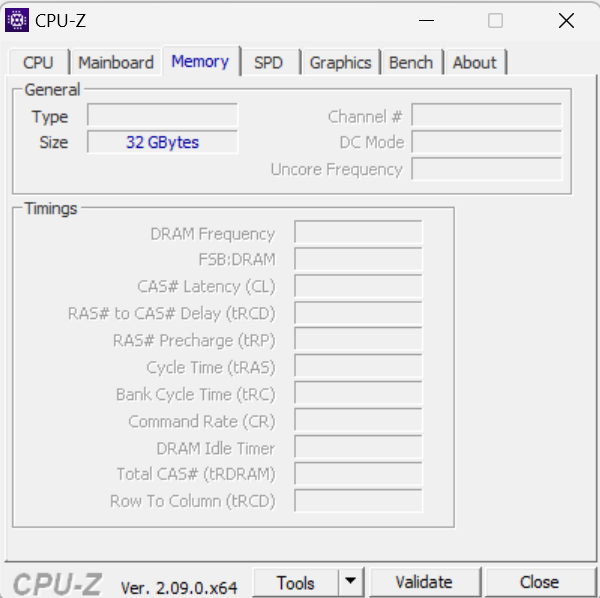
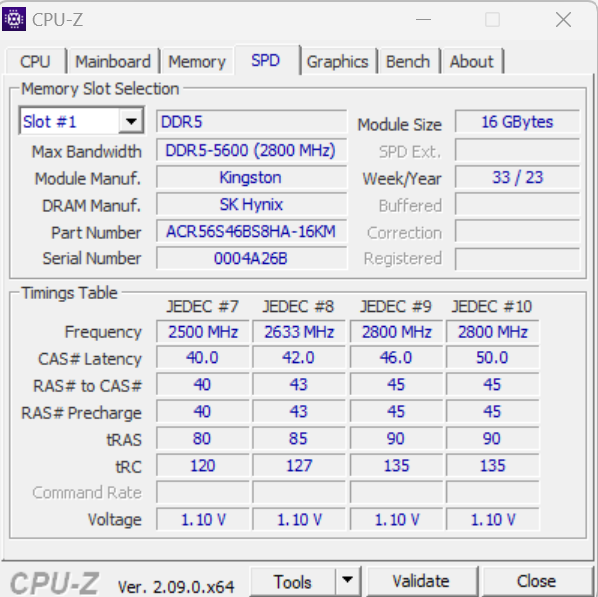
Le système, conçu pour des applications gourmandes en énergie telles que le rendu, le streaming et les jeux, fonctionne rapidement et en douceur. La mémoire de travail offre des taux de transfert qui se situent au niveau normal pour une RAM DDR5-5600.

CrossMark: Overall | Productivity | Creativity | Responsiveness
WebXPRT 3: Overall
WebXPRT 4: Overall
Mozilla Kraken 1.1: Total
| PCMark 10 / Score | |
| Lenovo Legion Pro 5 16IRX9 | |
| Aorus 16X 2024 | |
| Acer Acer Predator Helios Neo 16 (2024) | |
| Moyenne Intel Core i7-14700HX, NVIDIA GeForce RTX 4070 Laptop GPU () | |
| Asus TUF Gaming A17 FA707XI-NS94 | |
| HP Omen Transcend 16-u1095ng | |
| Alienware m16 R2 | |
| Moyenne de la classe Gaming (5235 - 9852, n=192, 2 dernières années) | |
| PCMark 10 / Essentials | |
| Acer Acer Predator Helios Neo 16 (2024) | |
| Moyenne Intel Core i7-14700HX, NVIDIA GeForce RTX 4070 Laptop GPU () | |
| Lenovo Legion Pro 5 16IRX9 | |
| Aorus 16X 2024 | |
| Asus TUF Gaming A17 FA707XI-NS94 | |
| Moyenne de la classe Gaming (8300 - 12334, n=191, 2 dernières années) | |
| HP Omen Transcend 16-u1095ng | |
| Alienware m16 R2 | |
| PCMark 10 / Productivity | |
| Aorus 16X 2024 | |
| Acer Acer Predator Helios Neo 16 (2024) | |
| Moyenne Intel Core i7-14700HX, NVIDIA GeForce RTX 4070 Laptop GPU () | |
| HP Omen Transcend 16-u1095ng | |
| Lenovo Legion Pro 5 16IRX9 | |
| Moyenne de la classe Gaming (6662 - 11833, n=191, 2 dernières années) | |
| Asus TUF Gaming A17 FA707XI-NS94 | |
| Alienware m16 R2 | |
| PCMark 10 / Digital Content Creation | |
| Lenovo Legion Pro 5 16IRX9 | |
| Asus TUF Gaming A17 FA707XI-NS94 | |
| Aorus 16X 2024 | |
| Alienware m16 R2 | |
| Acer Acer Predator Helios Neo 16 (2024) | |
| Moyenne Intel Core i7-14700HX, NVIDIA GeForce RTX 4070 Laptop GPU () | |
| HP Omen Transcend 16-u1095ng | |
| Moyenne de la classe Gaming (6462 - 18475, n=191, 2 dernières années) | |
| CrossMark / Overall | |
| Aorus 16X 2024 | |
| Acer Acer Predator Helios Neo 16 (2024) | |
| Moyenne Intel Core i7-14700HX, NVIDIA GeForce RTX 4070 Laptop GPU () | |
| Lenovo Legion Pro 5 16IRX9 | |
| Moyenne de la classe Gaming (1247 - 2334, n=165, 2 dernières années) | |
| Asus TUF Gaming A17 FA707XI-NS94 | |
| Alienware m16 R2 | |
| CrossMark / Productivity | |
| Aorus 16X 2024 | |
| Acer Acer Predator Helios Neo 16 (2024) | |
| Moyenne Intel Core i7-14700HX, NVIDIA GeForce RTX 4070 Laptop GPU () | |
| Lenovo Legion Pro 5 16IRX9 | |
| Moyenne de la classe Gaming (1299 - 2204, n=165, 2 dernières années) | |
| Asus TUF Gaming A17 FA707XI-NS94 | |
| Alienware m16 R2 | |
| CrossMark / Creativity | |
| Aorus 16X 2024 | |
| Acer Acer Predator Helios Neo 16 (2024) | |
| Moyenne Intel Core i7-14700HX, NVIDIA GeForce RTX 4070 Laptop GPU () | |
| Lenovo Legion Pro 5 16IRX9 | |
| Moyenne de la classe Gaming (1275 - 2514, n=165, 2 dernières années) | |
| Asus TUF Gaming A17 FA707XI-NS94 | |
| Alienware m16 R2 | |
| CrossMark / Responsiveness | |
| Aorus 16X 2024 | |
| Acer Acer Predator Helios Neo 16 (2024) | |
| Moyenne Intel Core i7-14700HX, NVIDIA GeForce RTX 4070 Laptop GPU () | |
| Lenovo Legion Pro 5 16IRX9 | |
| Moyenne de la classe Gaming (1030 - 2330, n=165, 2 dernières années) | |
| Alienware m16 R2 | |
| Asus TUF Gaming A17 FA707XI-NS94 | |
| WebXPRT 3 / Overall | |
| HP Omen Transcend 16-u1095ng | |
| Aorus 16X 2024 | |
| Acer Acer Predator Helios Neo 16 (2024) | |
| Moyenne Intel Core i7-14700HX, NVIDIA GeForce RTX 4070 Laptop GPU () | |
| Lenovo Legion Pro 5 16IRX9 | |
| Asus TUF Gaming A17 FA707XI-NS94 | |
| Moyenne de la classe Gaming (215 - 480, n=190, 2 dernières années) | |
| Alienware m16 R2 | |
| WebXPRT 4 / Overall | |
| Acer Acer Predator Helios Neo 16 (2024) | |
| Moyenne Intel Core i7-14700HX, NVIDIA GeForce RTX 4070 Laptop GPU () | |
| Lenovo Legion Pro 5 16IRX9 | |
| Asus TUF Gaming A17 FA707XI-NS94 | |
| Moyenne de la classe Gaming (157.9 - 328, n=165, 2 dernières années) | |
| Alienware m16 R2 | |
| Mozilla Kraken 1.1 / Total | |
| Alienware m16 R2 | |
| Moyenne de la classe Gaming (421 - 824, n=203, 2 dernières années) | |
| Asus TUF Gaming A17 FA707XI-NS94 | |
| Lenovo Legion Pro 5 16IRX9 | |
| Acer Acer Predator Helios Neo 16 (2024) | |
| Moyenne Intel Core i7-14700HX, NVIDIA GeForce RTX 4070 Laptop GPU () | |
| HP Omen Transcend 16-u1095ng | |
| Aorus 16X 2024 | |
* ... Moindre est la valeur, meilleures sont les performances
| PCMark 10 Score | 8302 points | |
Aide | ||
| AIDA64 / Memory Copy | |
| Lenovo Legion Pro 5 16IRX9 | |
| Aorus 16X 2024 | |
| HP Omen Transcend 16-u1095ng | |
| Acer Acer Predator Helios Neo 16 (2024) | |
| Moyenne Intel Core i7-14700HX (66599 - 77310, n=4) | |
| Alienware m16 R2 | |
| Moyenne de la classe Gaming (21842 - 92565, n=216, 2 dernières années) | |
| Asus TUF Gaming A17 FA707XI-NS94 | |
| AIDA64 / Memory Read | |
| Aorus 16X 2024 | |
| Lenovo Legion Pro 5 16IRX9 | |
| HP Omen Transcend 16-u1095ng | |
| Acer Acer Predator Helios Neo 16 (2024) | |
| Moyenne Intel Core i7-14700HX (81049 - 85314, n=4) | |
| Alienware m16 R2 | |
| Moyenne de la classe Gaming (23681 - 90647, n=216, 2 dernières années) | |
| Asus TUF Gaming A17 FA707XI-NS94 | |
| AIDA64 / Memory Write | |
| HP Omen Transcend 16-u1095ng | |
| Aorus 16X 2024 | |
| Lenovo Legion Pro 5 16IRX9 | |
| Asus TUF Gaming A17 FA707XI-NS94 | |
| Acer Acer Predator Helios Neo 16 (2024) | |
| Moyenne Intel Core i7-14700HX (64033 - 75654, n=4) | |
| Alienware m16 R2 | |
| Moyenne de la classe Gaming (21619 - 103259, n=216, 2 dernières années) | |
| AIDA64 / Memory Latency | |
| Alienware m16 R2 | |
| Asus TUF Gaming A17 FA707XI-NS94 | |
| Moyenne Intel Core i7-14700HX (85.3 - 96.4, n=4) | |
| Acer Acer Predator Helios Neo 16 (2024) | |
| Moyenne de la classe Gaming (59.5 - 152.5, n=212, 2 dernières années) | |
| HP Omen Transcend 16-u1095ng | |
| Lenovo Legion Pro 5 16IRX9 | |
| Aorus 16X 2024 | |
* ... Moindre est la valeur, meilleures sont les performances
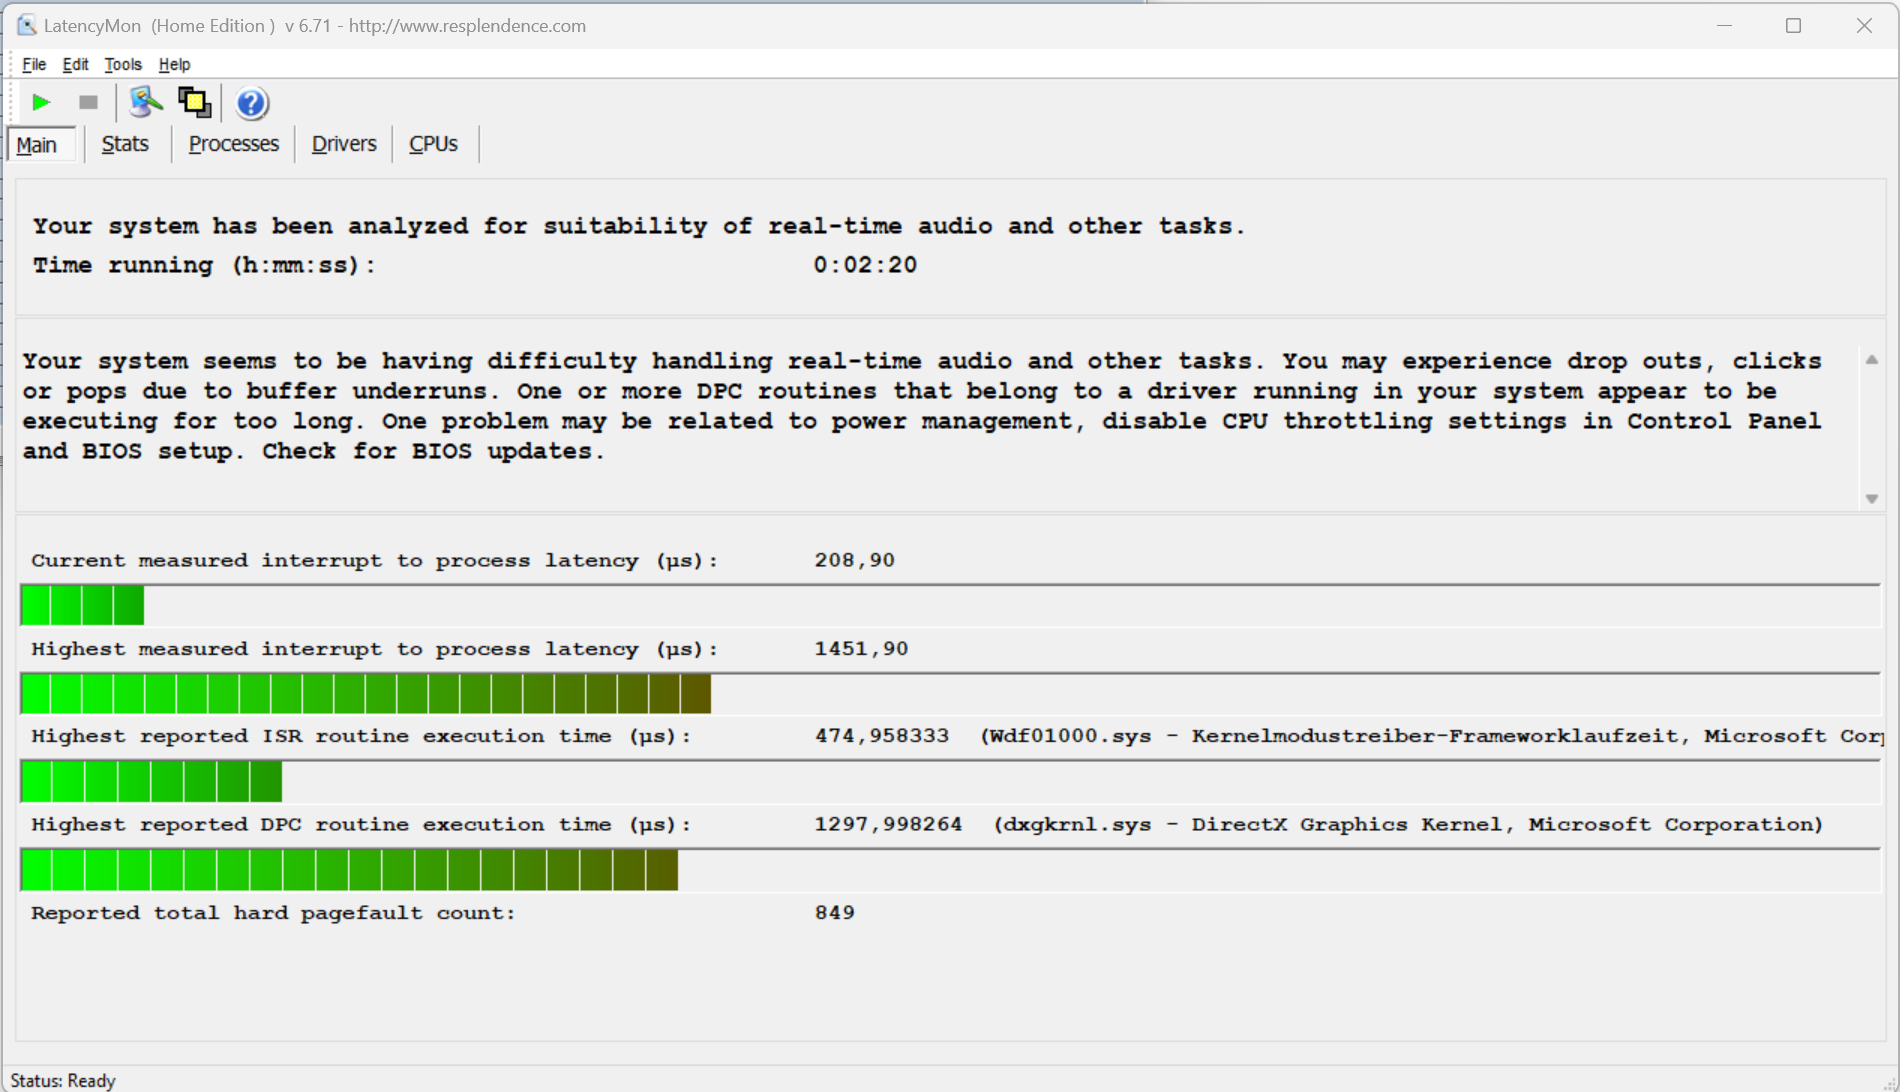
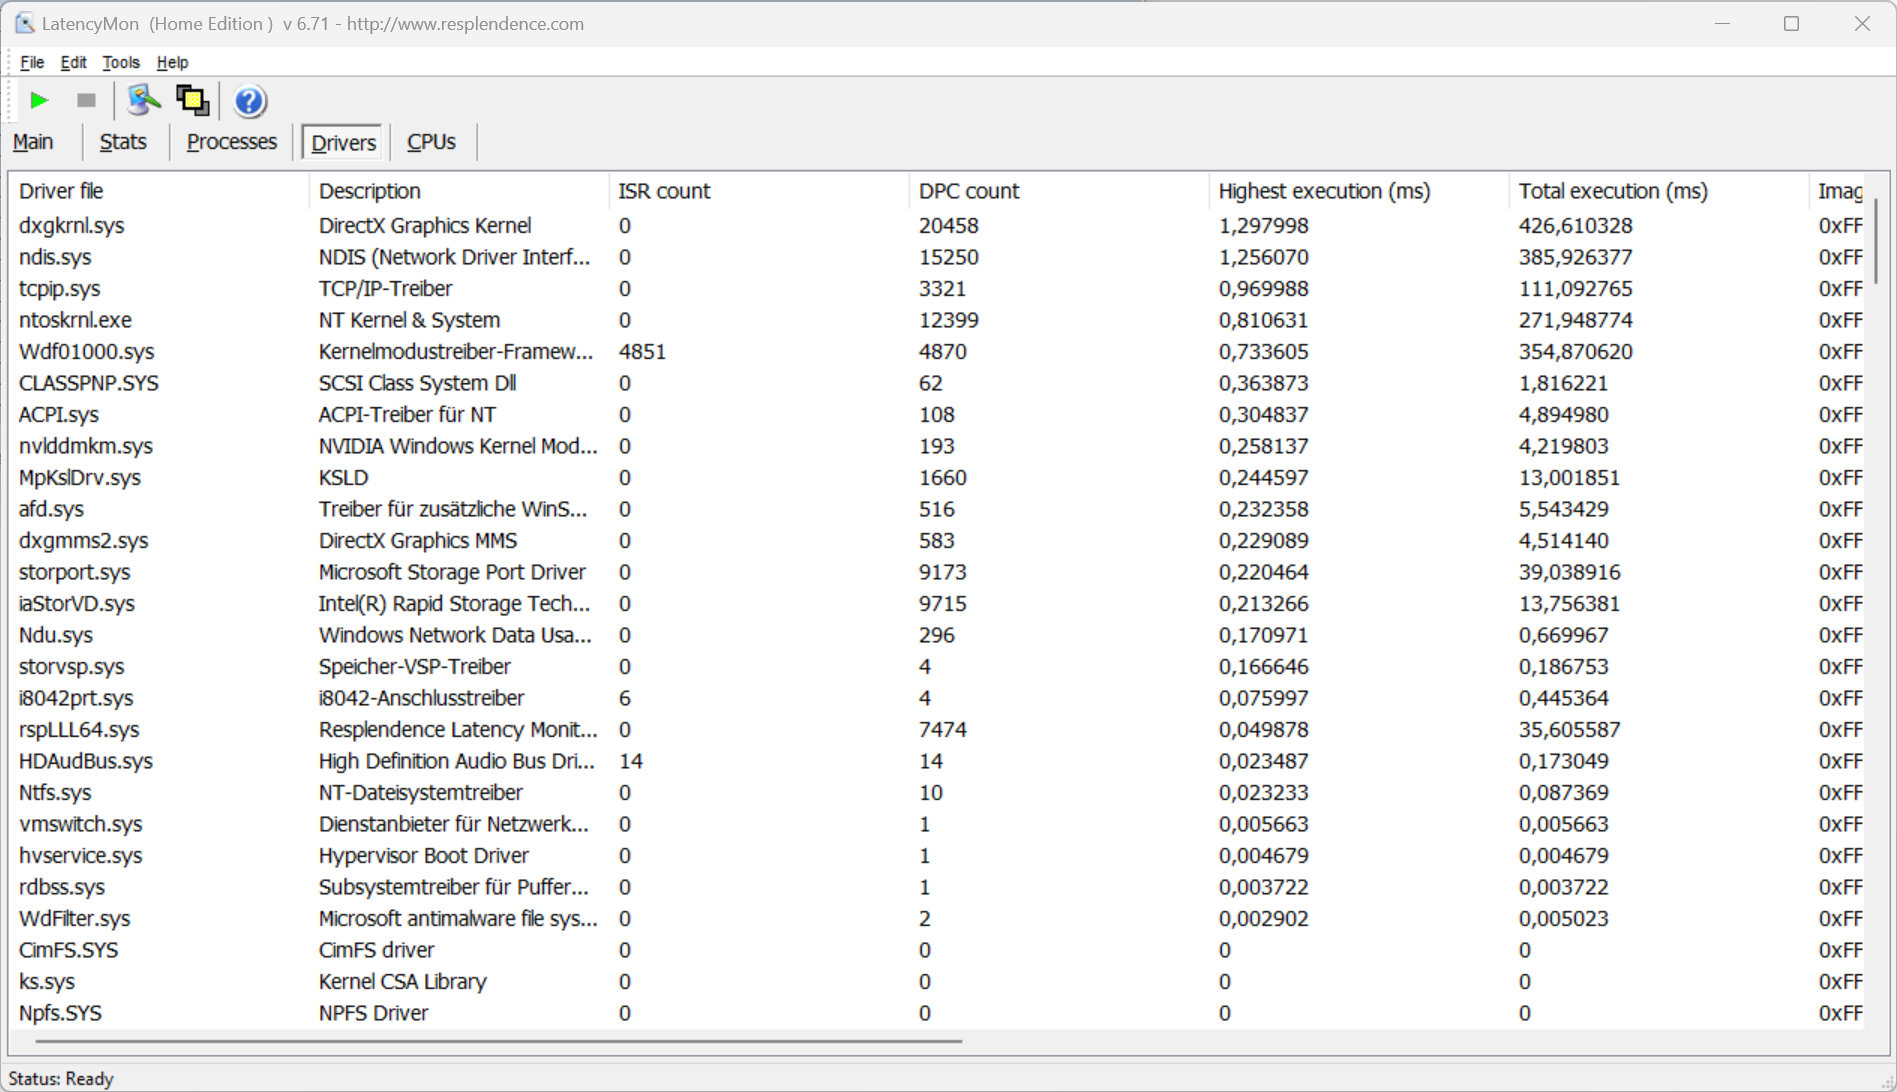
Latences DPC
Le système ne semble pas adapté au traitement vidéo et audio en temps réel, et Latency Monitor a révélé quelques comportements suspects lors de notre test (surf sur le web, lecture de vidéos 4k, charge élevée sur Prime95). Les prochaines mises à jour logicielles pourraient apporter des améliorations ou des latences encore plus mauvaises.
| DPC Latencies / LatencyMon - interrupt to process latency (max), Web, Youtube, Prime95 | |
| Alienware m16 R2 | |
| Asus TUF Gaming A17 FA707XI-NS94 | |
| HP Omen Transcend 16-u1095ng | |
| Acer Acer Predator Helios Neo 16 (2024) | |
| Aorus 16X 2024 | |
| Lenovo Legion Pro 5 16IRX9 | |
* ... Moindre est la valeur, meilleures sont les performances
Solution de stockage
Acer a équipé notre unité de test d'un SSD Samsung (1 TB, PCIe 4, M.2 2280) qui fournit d'excellents débits de données. Il est également positif qu'il n'y ait pas d'étranglement thermique pendant notre test. Le Predator est capable d'accepter un total de deux SSD.
Vous trouverez les mesures de tous les SSD et HDD que nous avons testés jusqu'à présent dans notre liste d'aperçu.


* ... Moindre est la valeur, meilleures sont les performances
Disk Throttling: DiskSpd Read Loop, Queue Depth 8
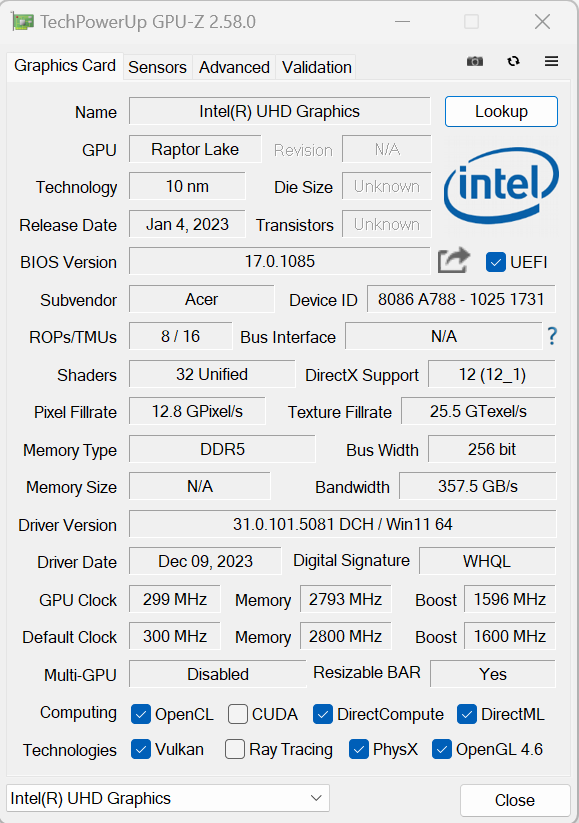
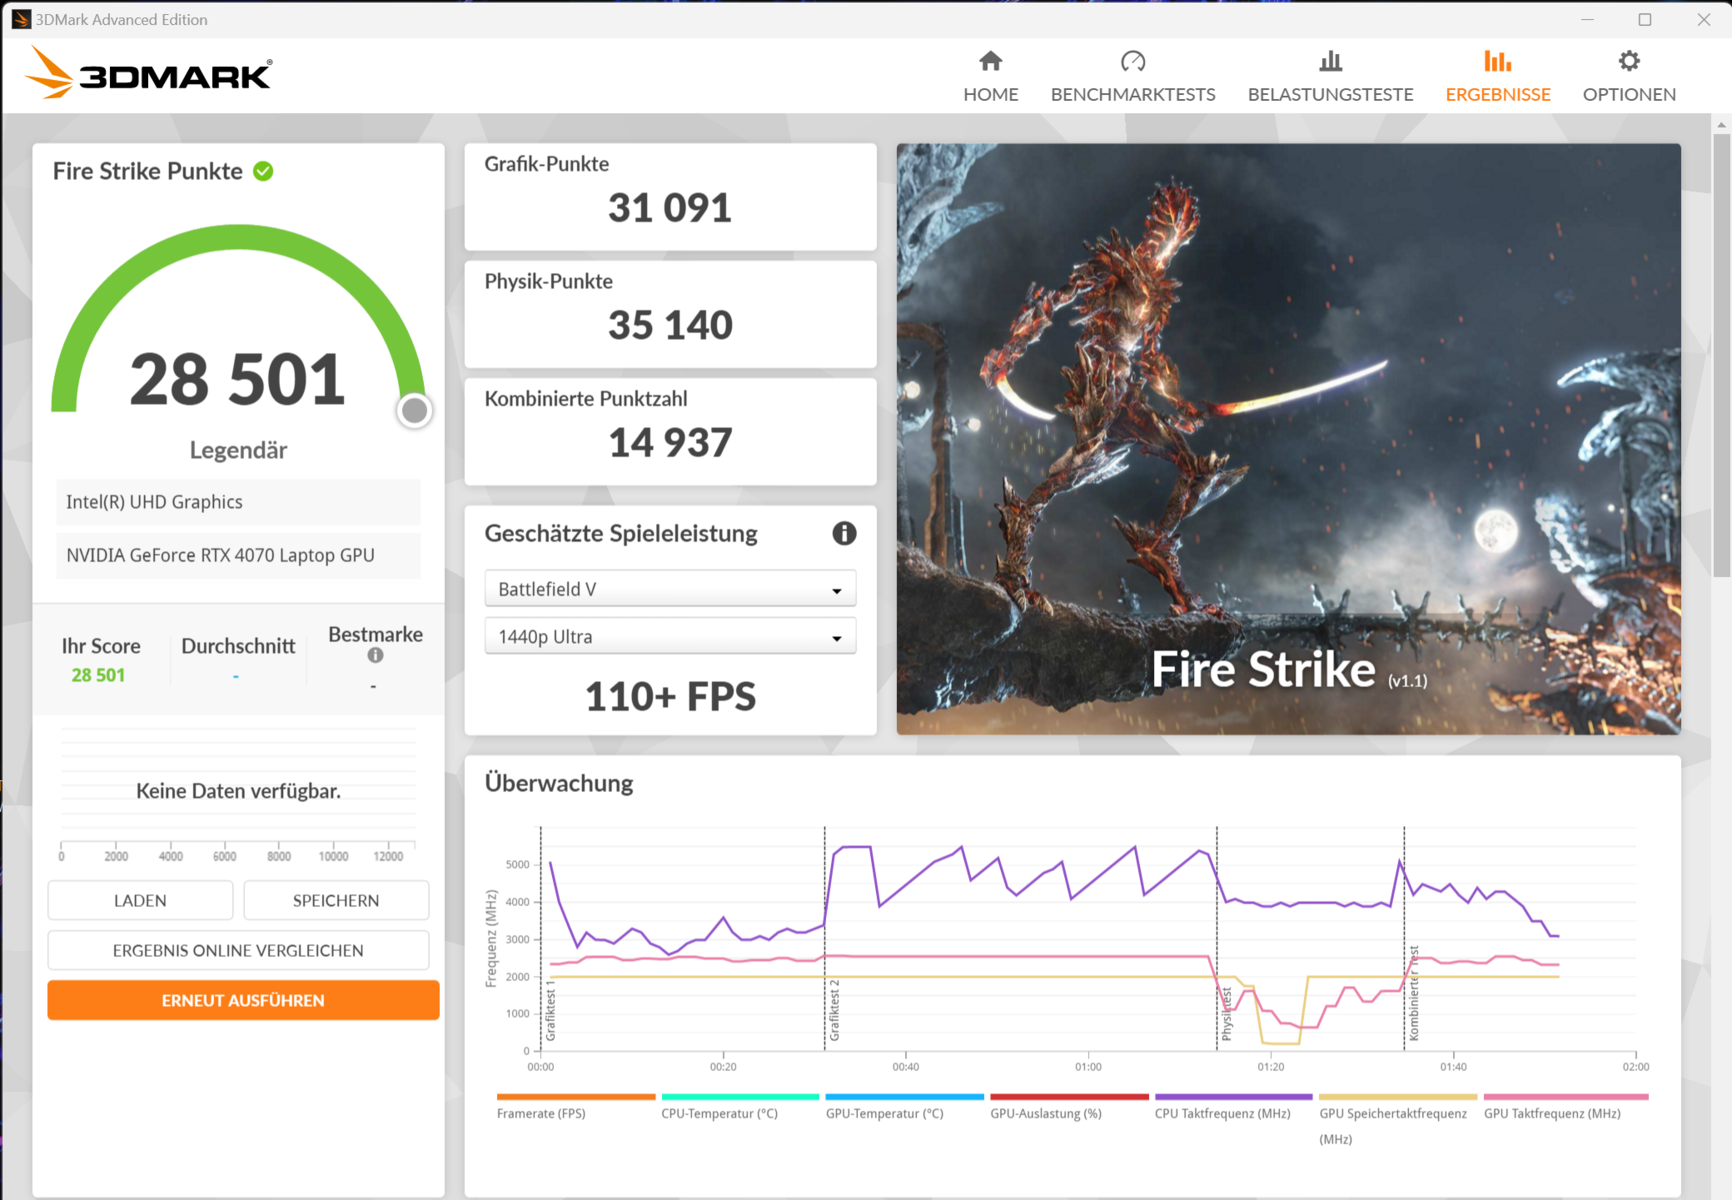
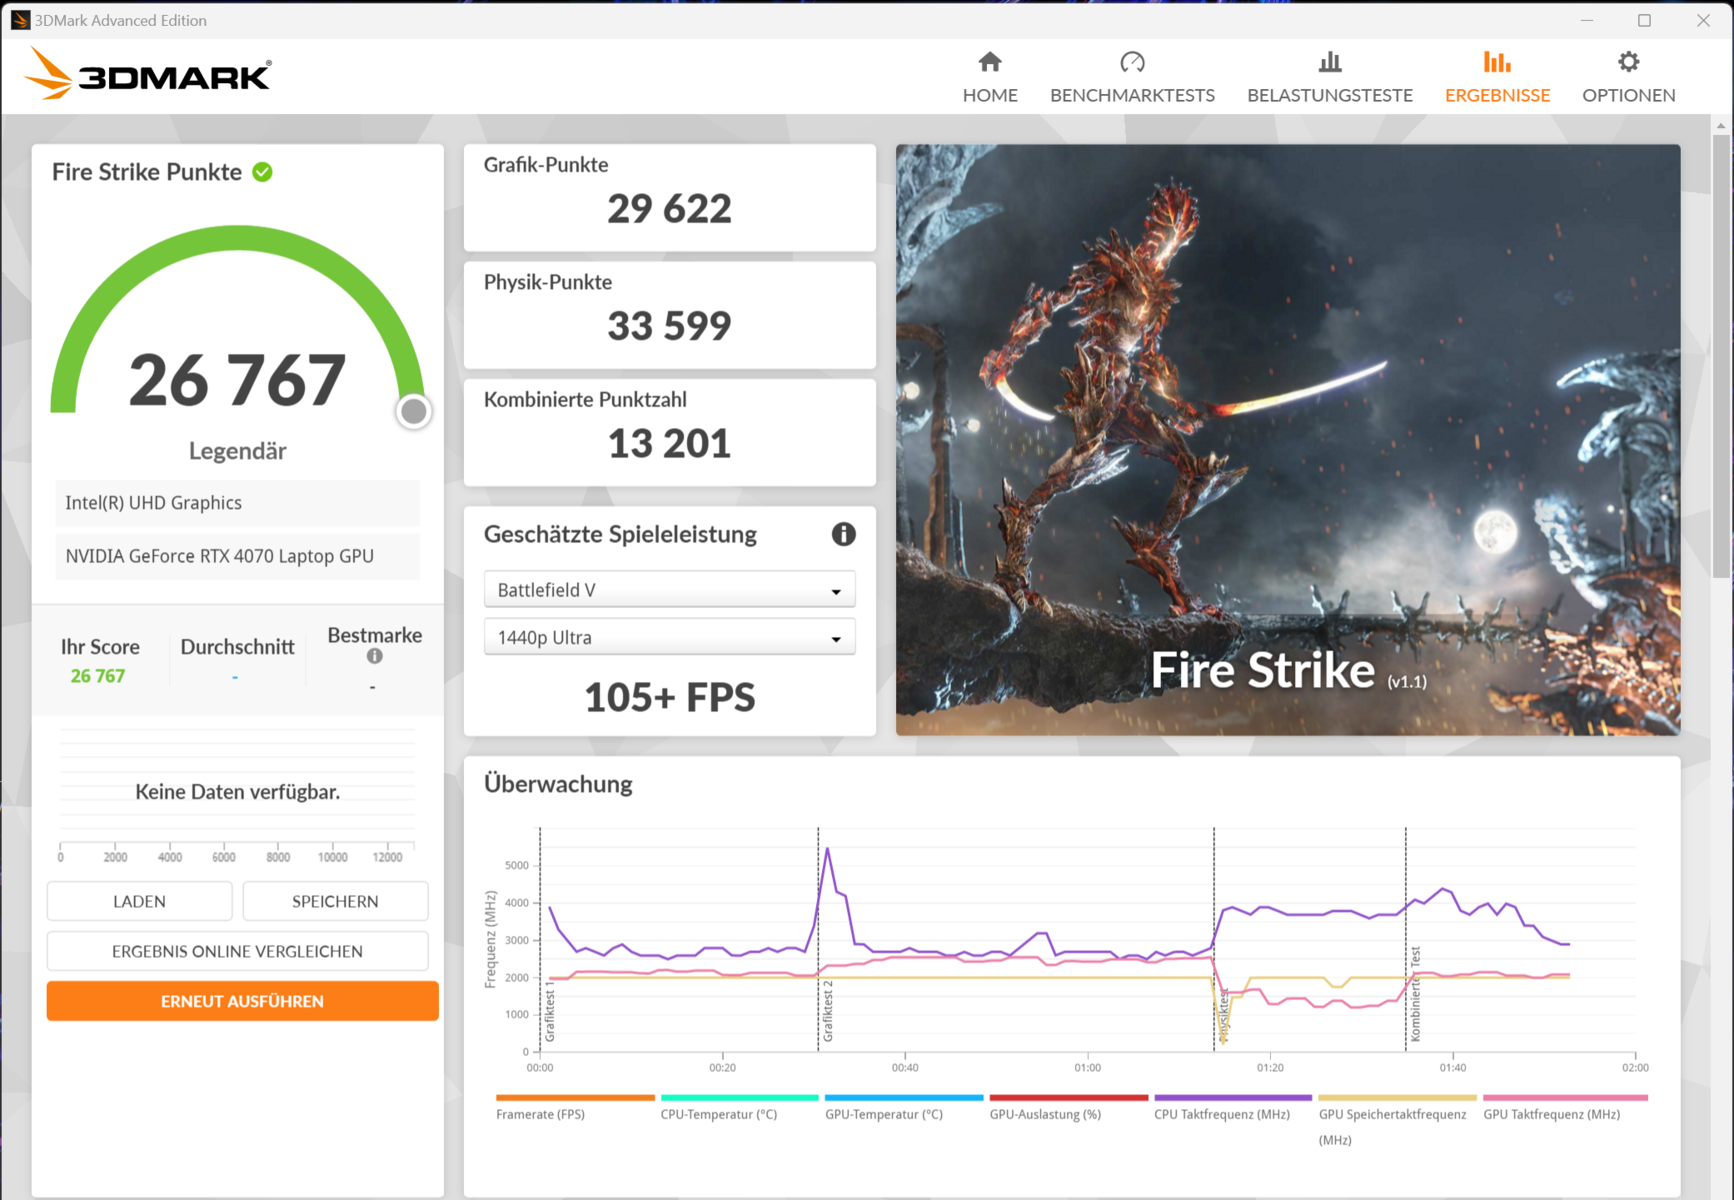
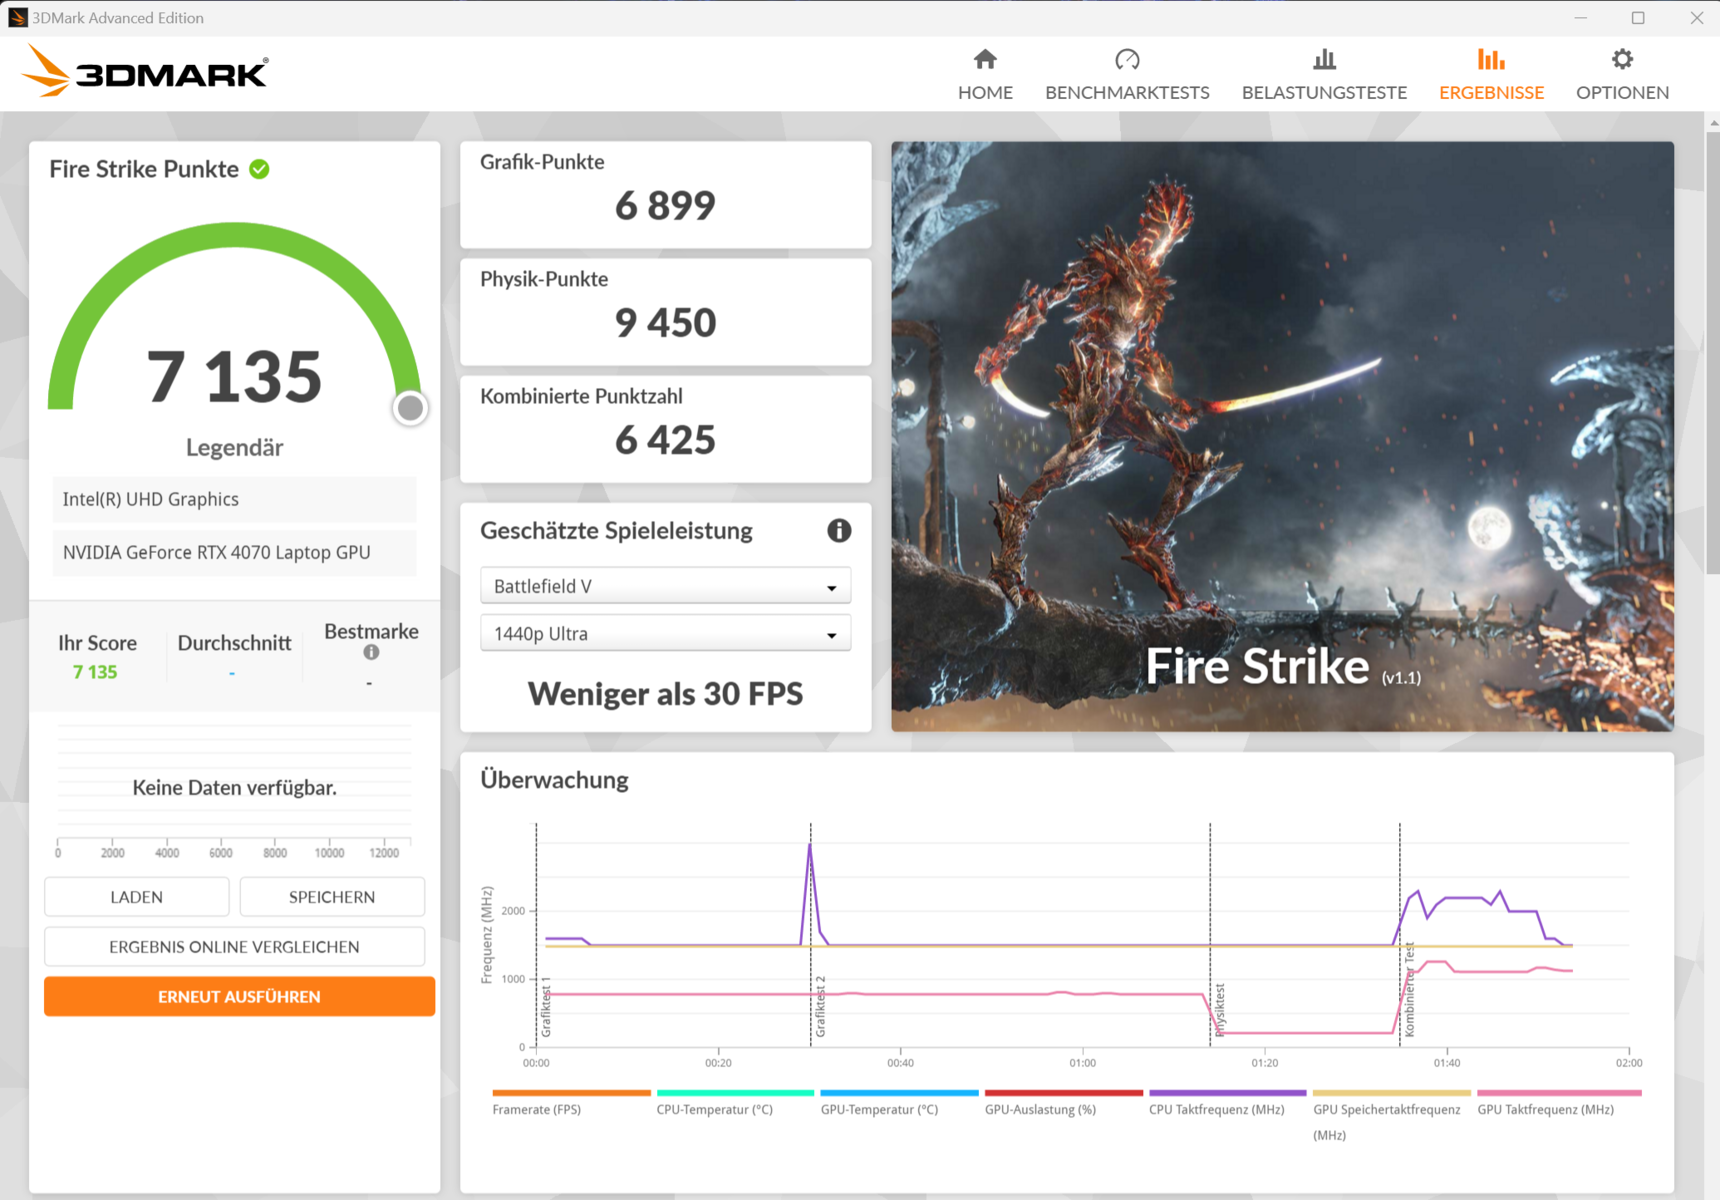
Carte graphique
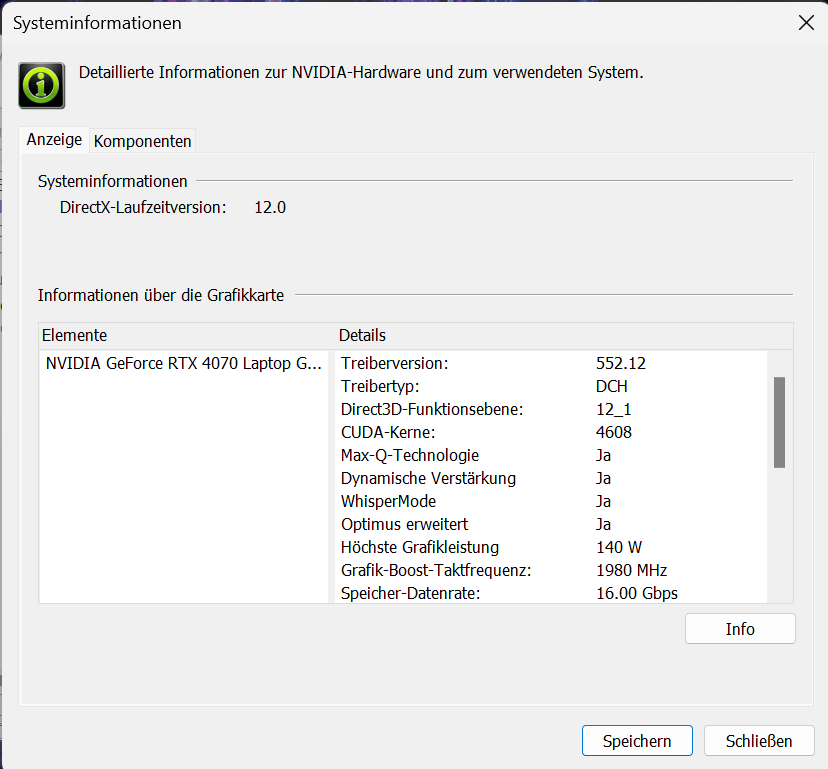
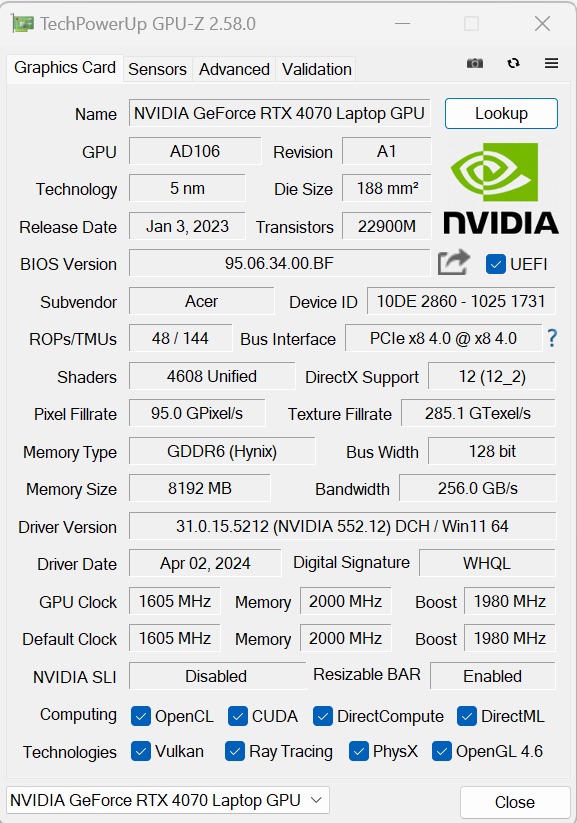
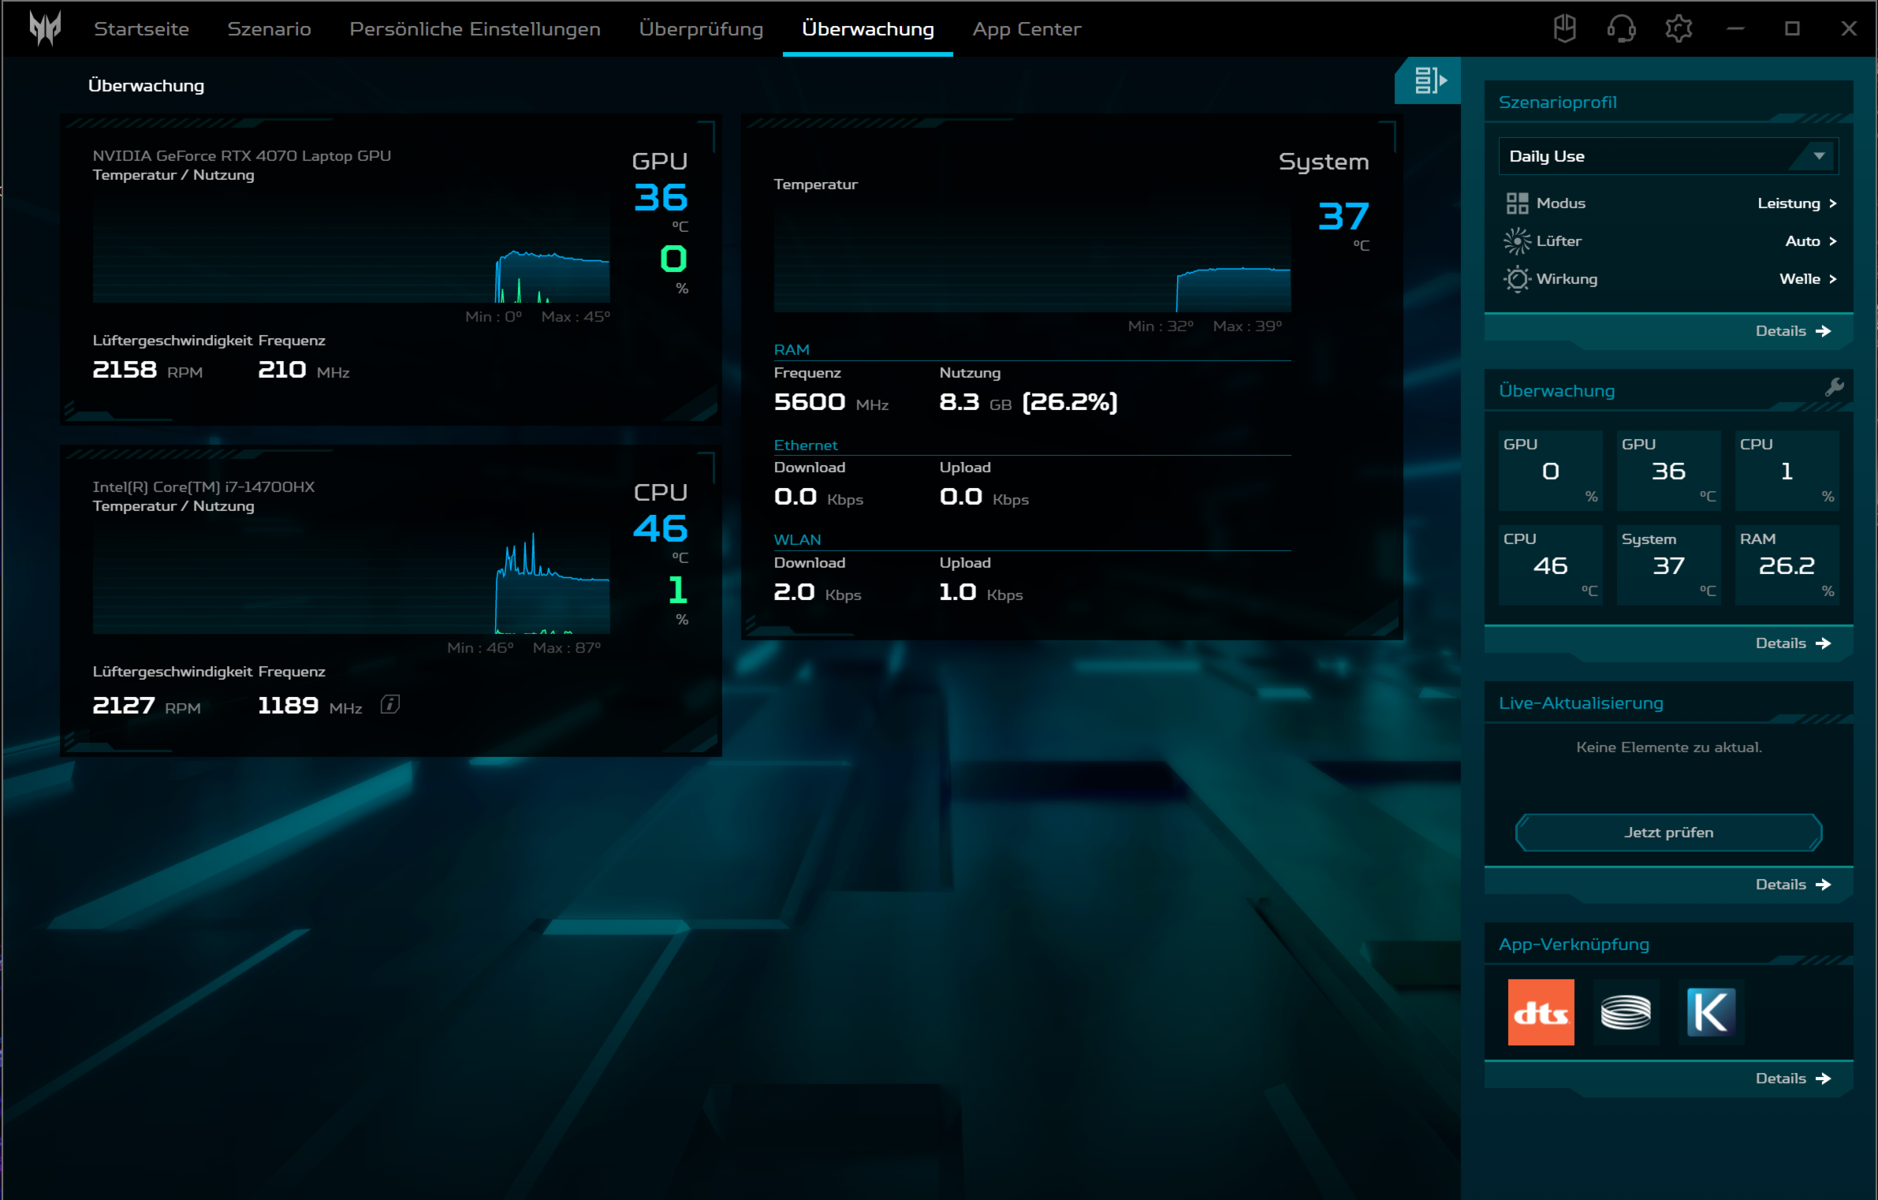
Acer accompagne le Core i7 d'une carte GeForce RTX 4070ce qui lui permet d'atteindre une puissance maximale de 140 watts, soit la valeur la plus élevée possible. Le GPU offre 4 608 shaders, un bus 128 bits et une mémoire GDDR6 rapide, bien que cette dernière soit un peu juste avec seulement 8 Go. Advanced Optimus est pris en charge. Les résultats du benchmark sont supérieurs à la moyenne des puces RTX-4070. La différence entre les modes "Performance" et "Turbo" est minime.

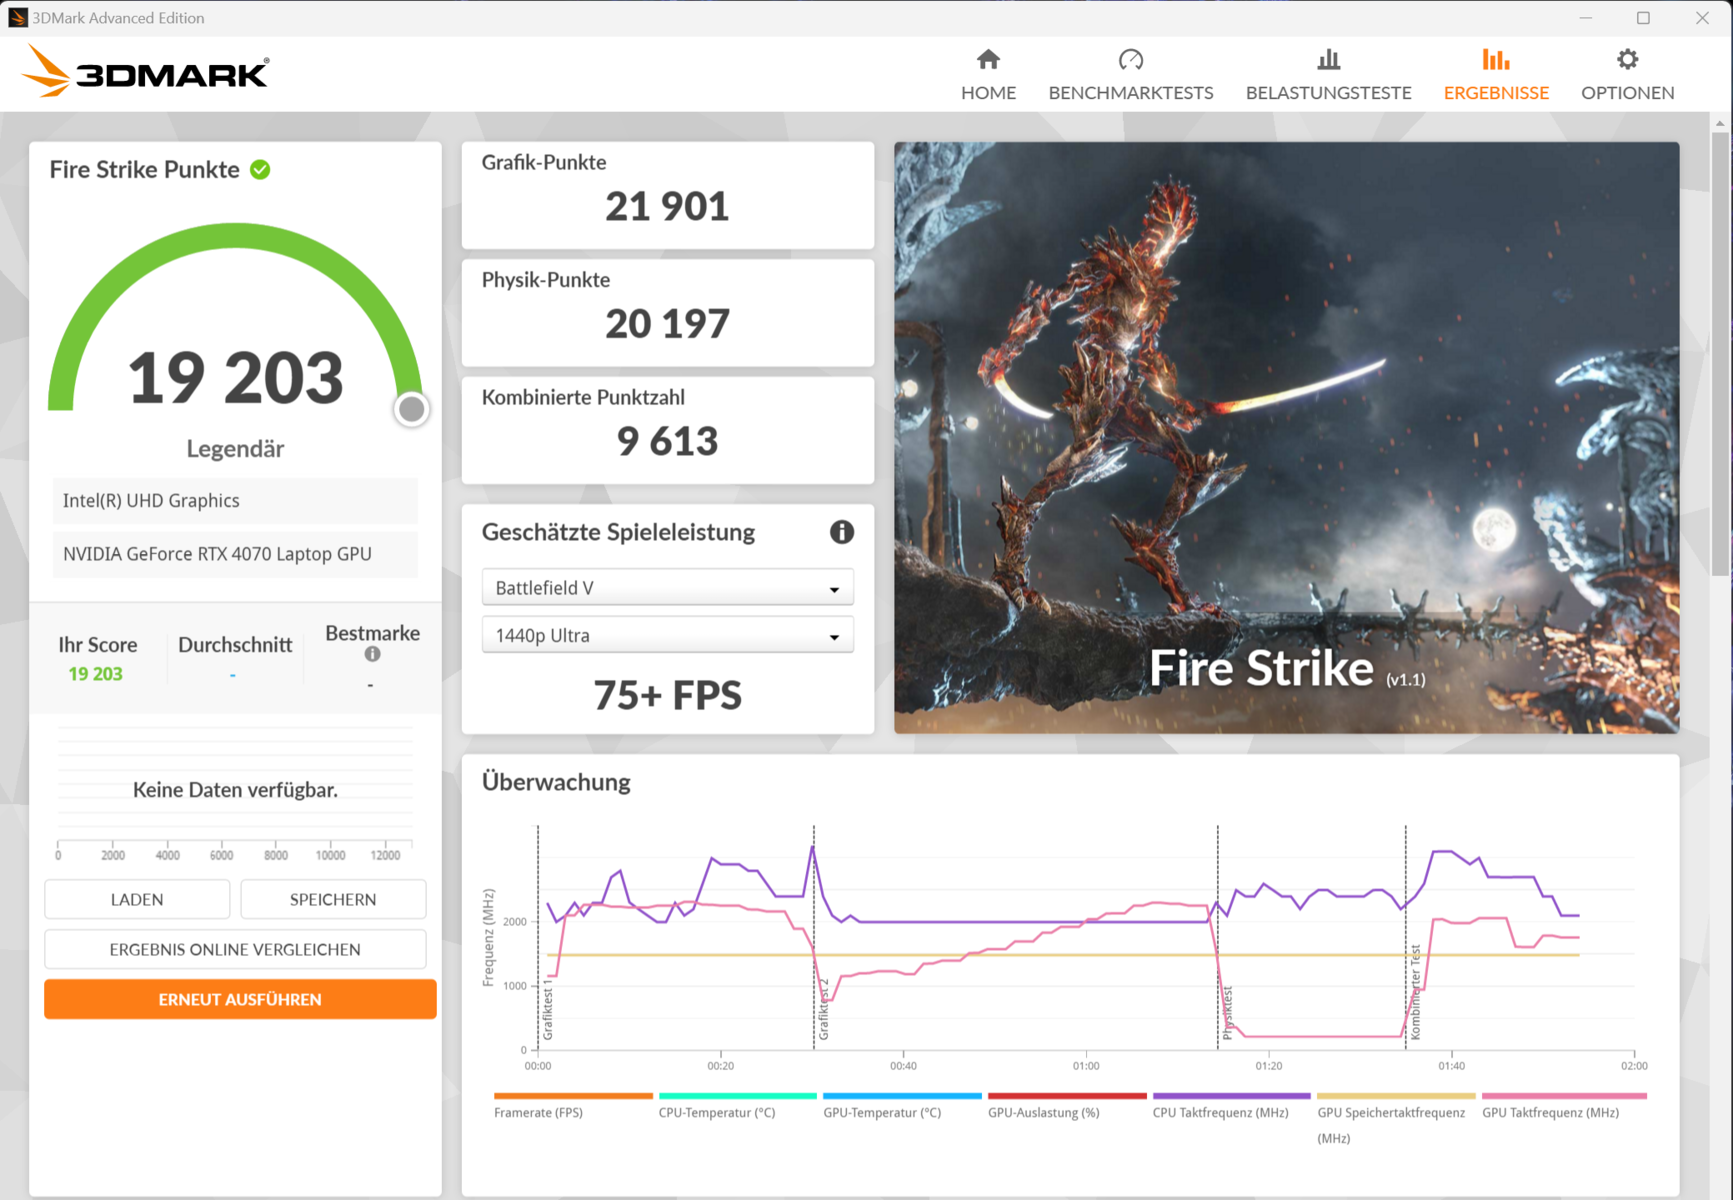
| 3DMark 06 Standard Score | 59935 points | |
| 3DMark 11 Performance | 36334 points | |
| 3DMark Fire Strike Score | 28501 points | |
| 3DMark Time Spy Score | 13309 points | |
Aide | ||
| Geekbench 5.5 | |
| OpenCL Score | |
| Aorus 16X 2024 | |
| Moyenne de la classe Gaming (5039 - 226512, n=224, 2 dernières années) | |
| Acer Acer Predator Helios Neo 16 (2024) (Turbo) | |
| HP Omen Transcend 16-u1095ng | |
| Asus TUF Gaming A17 FA707XI-NS94 | |
| Acer Acer Predator Helios Neo 16 (2024) | |
| Lenovo Legion Pro 5 16IRX9 | |
| Moyenne NVIDIA GeForce RTX 4070 Laptop GPU (17391 - 129366, n=49) | |
| Alienware m16 R2 | |
| Vulkan Score | |
| Acer Acer Predator Helios Neo 16 (2024) (Turbo) | |
| Aorus 16X 2024 | |
| Acer Acer Predator Helios Neo 16 (2024) | |
| Alienware m16 R2 | |
| Asus TUF Gaming A17 FA707XI-NS94 | |
| Lenovo Legion Pro 5 16IRX9 | |
| Moyenne de la classe Gaming (1952 - 160279, n=220, 2 dernières années) | |
| Moyenne NVIDIA GeForce RTX 4070 Laptop GPU (4898 - 93339, n=48) | |
| Geekbench 6.2 | |
| GPU OpenCL | |
| Acer Acer Predator Helios Neo 16 (2024) (6.2.1, Turbo) | |
| HP Omen Transcend 16-u1095ng (6.2.1) | |
| Aorus 16X 2024 (6.2.1) | |
| Acer Acer Predator Helios Neo 16 (2024) (6.2.1) | |
| Asus TUF Gaming A17 FA707XI-NS94 (6.2.1) | |
| Moyenne NVIDIA GeForce RTX 4070 Laptop GPU (101474 - 129836, n=26) | |
| Moyenne de la classe Gaming (4321 - 207373, n=80, 2 dernières années) | |
| Lenovo Legion Pro 5 16IRX9 (6.2.1) | |
| Alienware m16 R2 (6.2.1) | |
| GPU Vulkan | |
| Alienware m16 R2 (6.2.1) | |
| Asus TUF Gaming A17 FA707XI-NS94 (6.2.1) | |
| Lenovo Legion Pro 5 16IRX9 (6.2.1) | |
| Acer Acer Predator Helios Neo 16 (2024) (6.2.1, Turbo) | |
| Aorus 16X 2024 (6.2.1) | |
| Acer Acer Predator Helios Neo 16 (2024) (6.2.1) | |
| Moyenne de la classe Gaming (4286 - 196201, n=77, 2 dernières années) | |
| Moyenne NVIDIA GeForce RTX 4070 Laptop GPU (9035 - 120033, n=24) | |
| V-Ray Benchmark Next 4.10 | |
| GPU | |
| Lenovo Legion Pro 5 16IRX9 (v4.10.07 ) | |
| Acer Acer Predator Helios Neo 16 (2024) (v4.10.07, Turbo) | |
| Acer Acer Predator Helios Neo 16 (2024) (v4.10.07 ) | |
| Moyenne de la classe Gaming (54 - 1334, n=178, 2 dernières années) | |
| Moyenne NVIDIA GeForce RTX 4070 Laptop GPU (500 - 686, n=35) | |
| HP Omen Transcend 16-u1095ng (v4.10.07 ) | |
| Aorus 16X 2024 (v4.10.07 ) | |
| CPU | |
| Lenovo Legion Pro 5 16IRX9 (v4.10.07 ) | |
| Aorus 16X 2024 (v4.10.07 ) | |
| Acer Acer Predator Helios Neo 16 (2024) (v4.10.07, Turbo) | |
| Acer Acer Predator Helios Neo 16 (2024) (v4.10.07 ) | |
| HP Omen Transcend 16-u1095ng (v4.10.07 ) | |
| Moyenne NVIDIA GeForce RTX 4070 Laptop GPU (12638 - 35173, n=35) | |
| Moyenne de la classe Gaming (2741 - 37629, n=178, 2 dernières années) | |
* ... Moindre est la valeur, meilleures sont les performances
Performances des jeux
Le Predator est conçu pour les jeux en QHD avec des paramètres élevés à maximaux. DLSS 3 et la génération d'images permettraient des réglages maximaux avec raytracing dans des résolutions plus élevées, mais ce n'est le cas que pour les jeux avec le support correspondant. Comme les résultats des benchmarks synthétiques, les taux de rafraîchissement se situent également au-dessus de la moyenne pour la RTX-4070 ("Performance" et "Turbo").
| Performance Rating - Percent | |
| Lenovo Legion Pro 5 16IRX9 | |
| Acer Acer Predator Helios Neo 16 (2024) | |
| Acer Acer Predator Helios Neo 16 (2024) | |
| Aorus 16X 2024 | |
| HP Omen Transcend 16-u1095ng | |
| Alienware m16 R2 -1! | |
| Moyenne NVIDIA GeForce RTX 4070 Laptop GPU | |
| Moyenne de la classe Gaming | |
| Asus TUF Gaming A17 FA707XI-NS94 -1! | |
| The Witcher 3 - 1920x1080 Ultra Graphics & Postprocessing (HBAO+) | |
| Lenovo Legion Pro 5 16IRX9 | |
| Acer Acer Predator Helios Neo 16 (2024) (Turbo) | |
| Acer Acer Predator Helios Neo 16 (2024) | |
| Aorus 16X 2024 | |
| Alienware m16 R2 | |
| Asus TUF Gaming A17 FA707XI-NS94 | |
| Moyenne de la classe Gaming (8.61 - 216, n=216, 2 dernières années) | |
| HP Omen Transcend 16-u1095ng | |
| Moyenne NVIDIA GeForce RTX 4070 Laptop GPU (69.8 - 133.7, n=52) | |
| GTA V - 1920x1080 Highest Settings possible AA:4xMSAA + FX AF:16x | |
| Acer Acer Predator Helios Neo 16 (2024) (Turbo) | |
| Acer Acer Predator Helios Neo 16 (2024) | |
| Lenovo Legion Pro 5 16IRX9 | |
| HP Omen Transcend 16-u1095ng | |
| Moyenne NVIDIA GeForce RTX 4070 Laptop GPU (63.5 - 140.5, n=44) | |
| Moyenne de la classe Gaming (6.38 - 167.7, n=208, 2 dernières années) | |
| Aorus 16X 2024 | |
| Final Fantasy XV Benchmark - 1920x1080 High Quality | |
| Lenovo Legion Pro 5 16IRX9 (1.3) | |
| Acer Acer Predator Helios Neo 16 (2024) (1.3, Turbo) | |
| Acer Acer Predator Helios Neo 16 (2024) (1.3) | |
| Asus TUF Gaming A17 FA707XI-NS94 (1.3) | |
| Alienware m16 R2 (1.3) | |
| Moyenne NVIDIA GeForce RTX 4070 Laptop GPU (66 - 131.9, n=47) | |
| Moyenne de la classe Gaming (9.13 - 194.9, n=218, 2 dernières années) | |
| Aorus 16X 2024 (1.3) | |
| HP Omen Transcend 16-u1095ng (1.3) | |
| Strange Brigade - 1920x1080 ultra AA:ultra AF:16 | |
| Lenovo Legion Pro 5 16IRX9 (1.47.22.14 D3D12) | |
| Alienware m16 R2 (1.47.22.14 D3D12) | |
| Acer Acer Predator Helios Neo 16 (2024) (1.47.22.14 D3D12, Turbo) | |
| Asus TUF Gaming A17 FA707XI-NS94 (1.47.22.14 D3D12) | |
| Acer Acer Predator Helios Neo 16 (2024) (1.47.22.14 D3D12) | |
| Moyenne de la classe Gaming (14.6 - 421, n=215, 2 dernières années) | |
| Aorus 16X 2024 (1.47.22.14 D3D12) | |
| Moyenne NVIDIA GeForce RTX 4070 Laptop GPU (117.7 - 234, n=47) | |
| HP Omen Transcend 16-u1095ng (1.47.22.14 D3D12) | |
| Dota 2 Reborn - 1920x1080 ultra (3/3) best looking | |
| Lenovo Legion Pro 5 16IRX9 | |
| Acer Acer Predator Helios Neo 16 (2024) | |
| Aorus 16X 2024 | |
| Acer Acer Predator Helios Neo 16 (2024) (Turbo) | |
| HP Omen Transcend 16-u1095ng | |
| Moyenne NVIDIA GeForce RTX 4070 Laptop GPU (89.7 - 187.5, n=48) | |
| Moyenne de la classe Gaming (26.9 - 220, n=227, 2 dernières années) | |
| Alienware m16 R2 | |
| Asus TUF Gaming A17 FA707XI-NS94 | |
| X-Plane 11.11 - 1920x1080 high (fps_test=3) | |
| Lenovo Legion Pro 5 16IRX9 | |
| Aorus 16X 2024 | |
| Acer Acer Predator Helios Neo 16 (2024) | |
| Acer Acer Predator Helios Neo 16 (2024) (Turbo) | |
| HP Omen Transcend 16-u1095ng | |
| Moyenne NVIDIA GeForce RTX 4070 Laptop GPU (72.2 - 144.4, n=50) | |
| Moyenne de la classe Gaming (12.4 - 166.2, n=233, 2 dernières années) | |
| Alienware m16 R2 | |
| Asus TUF Gaming A17 FA707XI-NS94 | |
| Assassin's Creed Mirage | |
| 1920x1080 Ultra High Preset (Adaptive Quality Off) | |
| Acer Acer Predator Helios Neo 16 (2024) | |
| Moyenne NVIDIA GeForce RTX 4070 Laptop GPU (97 - 99, n=4) | |
| Moyenne de la classe Gaming (21 - 160, n=16, 2 dernières années) | |
| 2560x1440 Ultra High Preset (Adaptive Quality Off) | |
| Moyenne de la classe Gaming (44 - 136, n=11, 2 dernières années) | |
| Acer Acer Predator Helios Neo 16 (2024) | |
| Moyenne NVIDIA GeForce RTX 4070 Laptop GPU (74 - 80, n=4) | |
| Horizon Forbidden West | |
| 1920x1080 Very High Preset AA:T | |
| Acer Acer Predator Helios Neo 16 (2024) | |
| Aorus 16X 2024 | |
| Moyenne de la classe Gaming (30.2 - 103.5, n=5, 2 dernières années) | |
| Moyenne NVIDIA GeForce RTX 4070 Laptop GPU (53.2 - 76.7, n=6) | |
| 2560x1440 Very High Preset AA:T | |
| Acer Acer Predator Helios Neo 16 (2024) | |
| Aorus 16X 2024 | |
| Moyenne de la classe Gaming (24.1 - 83.7, n=5, 2 dernières années) | |
| Moyenne NVIDIA GeForce RTX 4070 Laptop GPU (40.3 - 59.1, n=6) | |
Nous évaluons la stabilité des taux de rafraîchissement en utilisant The Witcher 3, le jeu fonctionnant pendant environ une heure (paramètres maximaux, FHD). Le personnage du jeu n'est pas déplacé pendant cette période. Après environ 50 minutes, les taux d'images chutent de quelques points de pourcentage en mode "Performance". le mode "Turbo" permet de contrer ce comportement.
The Witcher 3 FPS Chart


| Bas | Moyen | Élevé | Ultra | QHD | |
| GTA V (2015) | 187.3 | 185.9 | 180.9 | 127.8 | 95.2 |
| The Witcher 3 (2015) | 556.7 | 390.1 | 234.9 | 127.2 | 93.1 |
| Dota 2 Reborn (2015) | 232 | 208 | 194.9 | 181.7 | |
| Final Fantasy XV Benchmark (2018) | 205 | 162.8 | 122.1 | 88.7 | |
| X-Plane 11.11 (2018) | 192.8 | 161.7 | 126.3 | ||
| Far Cry 5 (2018) | 187 | 134 | 122 | 123 | 113 |
| Strange Brigade (2018) | 490 | 305 | 244 | 213 | 138.7 |
| Baldur's Gate 3 (2023) | 163 | 135.5 | 119.1 | 117 | 82.8 |
| Cyberpunk 2077 2.0 Phantom Liberty (2023) | 110.2 | 106.3 | 96.4 | 83.3 | 51.7 |
| Assassin's Creed Mirage (2023) | 150 | 141 | 133 | 99 | 80 |
| Alan Wake 2 (2023) | 82.8 | 76.3 | 68.9 | 43.8 | |
| Horizon Forbidden West (2024) | 106.4 | 101.4 | 79.8 | 76.7 | 59.1 |
Émissions - L'ordinateur portable Acer produit beaucoup de bruit
Émissions sonores
Le bruit est l'un des principaux points faibles du Predator. Comme on peut s'y attendre pour sa catégorie, l'ordinateur portable produit beaucoup de bruit lorsqu'il est en charge. Mais même une faible charge (téléchargement d'un jeu) conduit à un fonctionnement audible du ventilateur, produisant des bruits de ronronnement. Ce comportement se manifeste non seulement dans les modes d'alimentation orientés vers la performance, mais aussi dans le profil "Silent". Il reste à voir si Acer sera en mesure d'ajuster ce comportement lors d'une prochaine mise à jour. Il est également possible que notre appareil de test soit défectueux.
Degré de la nuisance sonore
| Au repos |
| 27.8 / 32 / 29.6 dB(A) |
| Fortement sollicité |
| 45.2 / 55.8 dB(A) |
 | ||
30 dB silencieux 40 dB(A) audible 50 dB(A) bruyant |
||
min: | ||
| Acer Acer Predator Helios Neo 16 (2024) NVIDIA GeForce RTX 4070 Laptop GPU, i7-14700HX, Samsung PM9A1a MZVL21T0HDLU | Aorus 16X 2024 NVIDIA GeForce RTX 4070 Laptop GPU, i9-14900HX, Gigabyte AG450E1024-SI | Alienware m16 R2 NVIDIA GeForce RTX 4070 Laptop GPU, Ultra 7 155H, Samsung PM9A1 MZVL21T0HCLR | HP Omen Transcend 16-u1095ng NVIDIA GeForce RTX 4070 Laptop GPU, i9-14900HX, Kioxia XG8 KXG80ZNV1T02 | Asus TUF Gaming A17 FA707XI-NS94 NVIDIA GeForce RTX 4070 Laptop GPU, R9 7940HS, WD PC SN560 SDDPNQE-1T00 | Lenovo Legion Pro 5 16IRX9 NVIDIA GeForce RTX 4070 Laptop GPU, i9-14900HX, Samsung PM9A1 MZVL21T0HCLR | |
|---|---|---|---|---|---|---|
| Noise | -7% | 11% | 3% | 2% | 7% | |
| off / environment * | 25.2 | 26 -3% | 24.7 2% | 24 5% | 27.9 -11% | 23.9 5% |
| Idle Minimum * | 27.8 | 26 6% | 25.3 9% | 29 -4% | 28.5 -3% | 24.3 13% |
| Idle Average * | 32 | 32 -0% | 25.3 21% | 30 6% | 29.8 7% | 24.3 24% |
| Idle Maximum * | 29.6 | 38 -28% | 25.3 15% | 31 -5% | 29.8 -1% | 28.9 2% |
| Load Average * | 45.2 | 54 -19% | 31.7 30% | 45 -0% | 34.8 23% | 45.8 -1% |
| Load Maximum * | 55.8 | 55 1% | 62 -11% | 47 16% | 57.3 -3% | 56.6 -1% |
| Witcher 3 ultra * | 50 | 53.8 | 44 | 57.1 | 51 |
* ... Moindre est la valeur, meilleures sont les performances
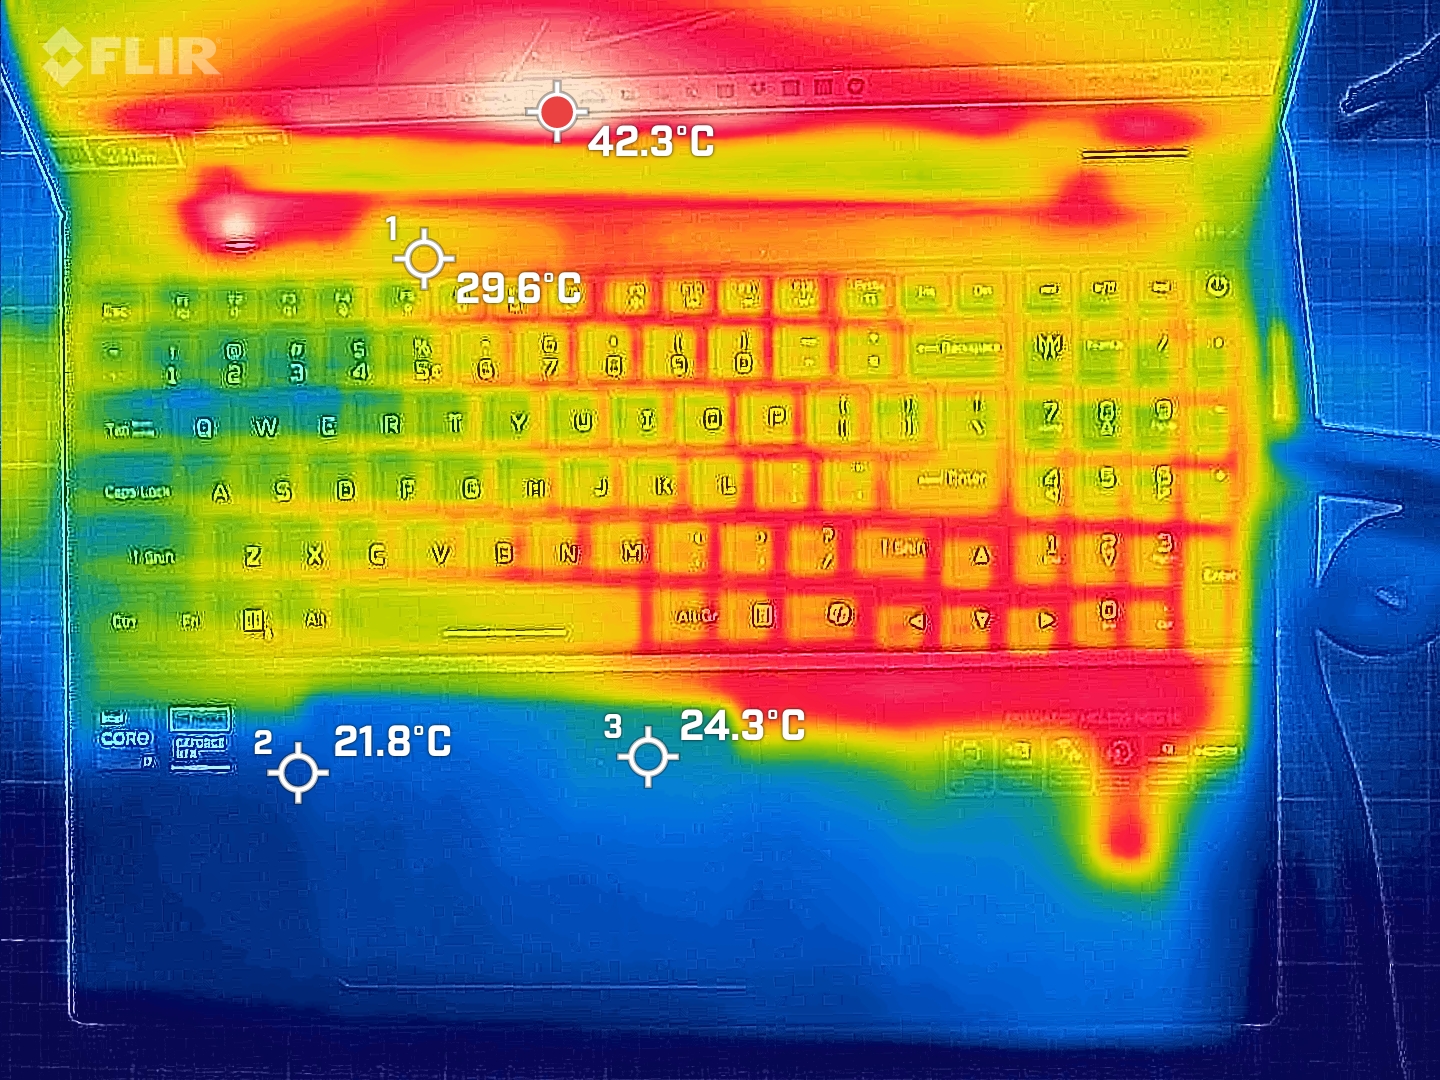
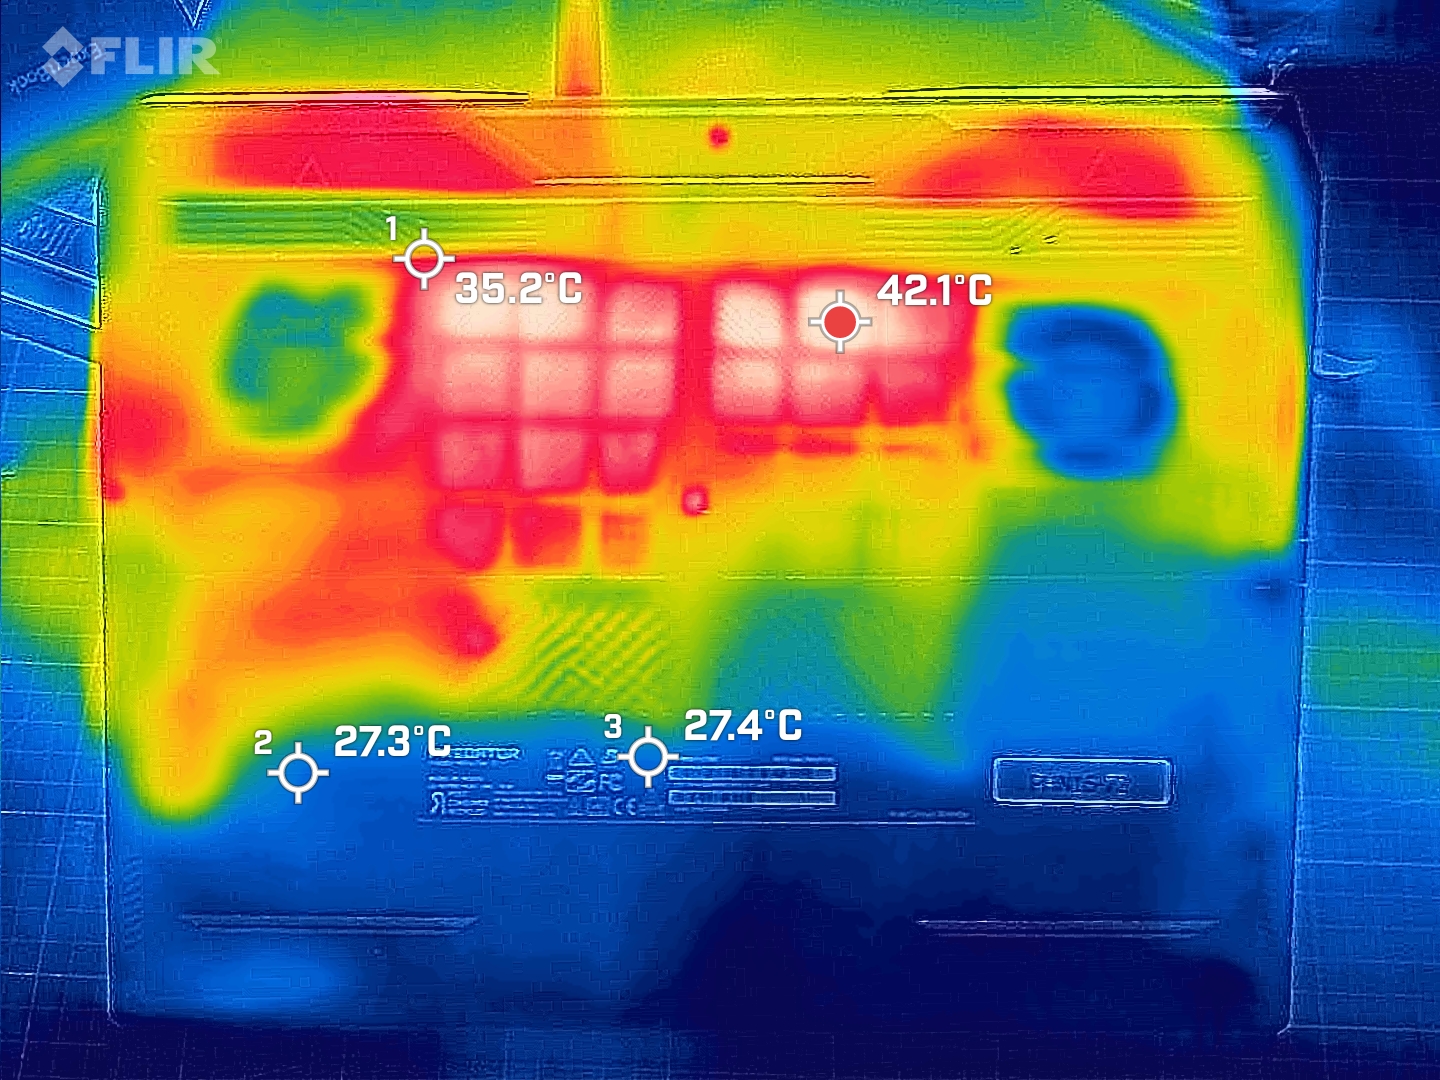
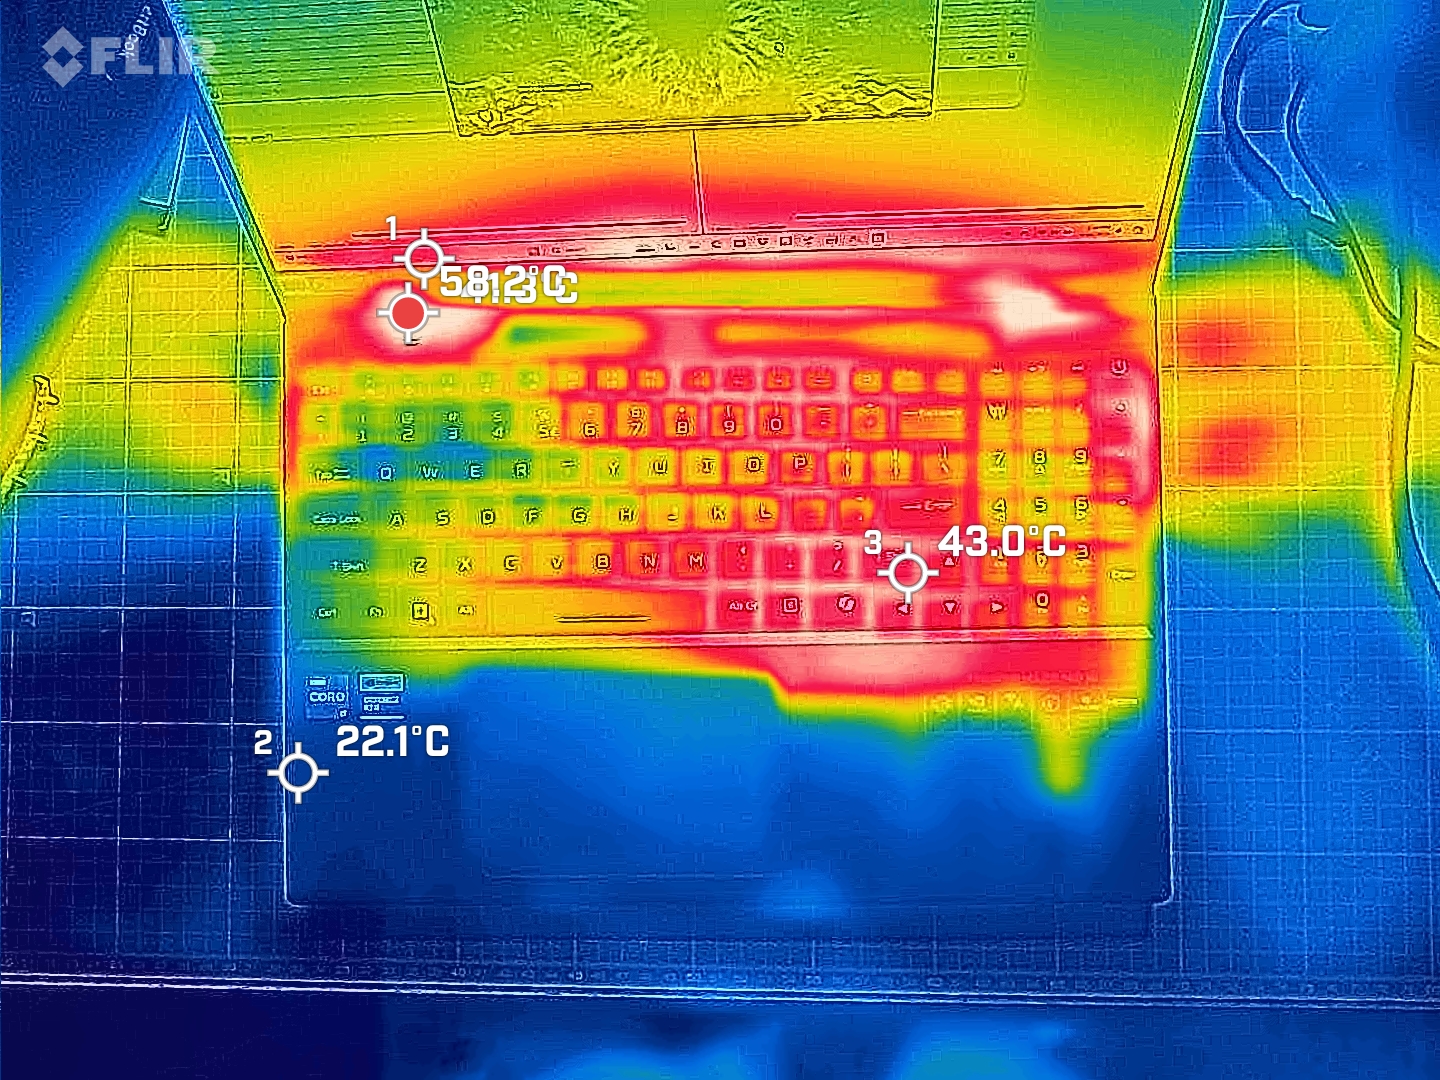
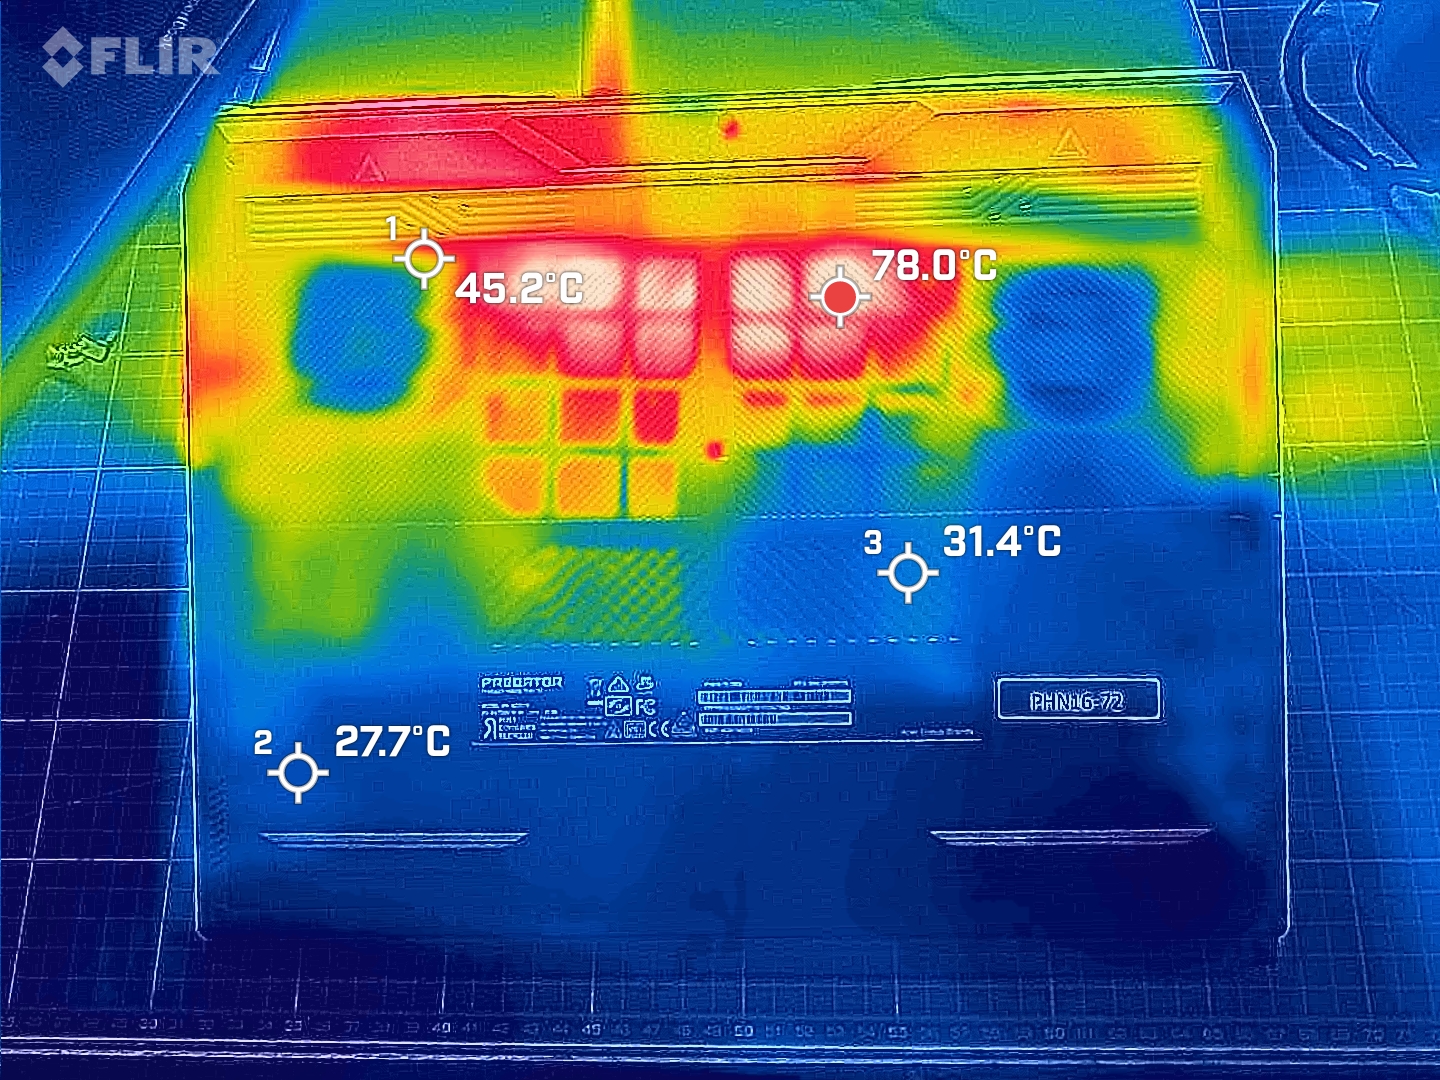
Températures

À pleine charge, l'ordinateur portable chauffe modérément en moyenne, mais l'échauffement peut être assez important à certains endroits. Toutefois, le fait que le repose-paume reste froid avec des valeurs inférieures à 20 °C (68 °F) est un avantage. En utilisation quotidienne (bureautique, Internet), les valeurs restent dans la fourchette verte.
(-) La température maximale du côté supérieur est de 58 °C / 136 F, par rapport à la moyenne de 40.4 °C / 105 F, allant de 21.2 à 68.8 °C pour la classe Gaming.
(-) Le fond chauffe jusqu'à un maximum de 45.2 °C / 113 F, contre une moyenne de 43.2 °C / 110 F
(+) En utilisation inactive, la température moyenne du côté supérieur est de 26.4 °C / 80 F, par rapport à la moyenne du dispositif de 33.8 °C / 93 F.
(+) Les repose-poignets et le pavé tactile sont plus froids que la température de la peau avec un maximum de 24.6 °C / 76.3 F et sont donc froids au toucher.
(+) La température moyenne de la zone de l'appui-paume de dispositifs similaires était de 28.9 °C / 84 F (+4.3 °C / #7.7 F).
| Acer Acer Predator Helios Neo 16 (2024) Intel Core i7-14700HX, NVIDIA GeForce RTX 4070 Laptop GPU | Aorus 16X 2024 Intel Core i9-14900HX, NVIDIA GeForce RTX 4070 Laptop GPU | Alienware m16 R2 Intel Core Ultra 7 155H, NVIDIA GeForce RTX 4070 Laptop GPU | HP Omen Transcend 16-u1095ng Intel Core i9-14900HX, NVIDIA GeForce RTX 4070 Laptop GPU | Asus TUF Gaming A17 FA707XI-NS94 AMD Ryzen 9 7940HS, NVIDIA GeForce RTX 4070 Laptop GPU | Lenovo Legion Pro 5 16IRX9 Intel Core i9-14900HX, NVIDIA GeForce RTX 4070 Laptop GPU | |
|---|---|---|---|---|---|---|
| Heat | 4% | -4% | 1% | 26% | -0% | |
| Maximum Upper Side * | 58 | 41 29% | 44.8 23% | 49 16% | 40 31% | 43.8 24% |
| Maximum Bottom * | 45.2 | 41 9% | 48 -6% | 63 -39% | 33.6 26% | 55.4 -23% |
| Idle Upper Side * | 31.1 | 37 -19% | 37.2 -20% | 30 4% | 26.6 14% | 32.8 -5% |
| Idle Bottom * | 37.2 | 38 -2% | 42 -13% | 29 22% | 24.4 34% | 36 3% |
* ... Moindre est la valeur, meilleures sont les performances
Test de stress
Notre scénario de test de stress extrême (avec Prime95 et FurMark fonctionnant en permanence) évalue la stabilité du système à pleine charge. Alors que le CPU et le GPU commencent le test avec des vitesses d'horloge élevées, les vitesses varient au cours du test.

Intervenants
Bien que les haut-parleurs stéréo puissent bénéficier de plus de basses, ils produisent un son décent.
Acer Acer Predator Helios Neo 16 (2024) analyse audio
(+) | les haut-parleurs peuvent jouer relativement fort (82.1# dB)
Bass 100 - 315 Hz
(-) | presque aucune basse - en moyenne 21.8% plus bas que la médiane
(±) | la linéarité des basses est moyenne (12% delta à la fréquence précédente)
Mids 400 - 2000 Hz
(±) | médiane supérieure - en moyenne 5.6% supérieure à la médiane
(±) | la linéarité des médiums est moyenne (10% delta à la fréquence précédente)
Aiguës 2 - 16 kHz
(+) | des sommets équilibrés - à seulement 2.4% de la médiane
(±) | la linéarité des aigus est moyenne (8.8% delta à la fréquence précédente)
Overall 100 - 16.000 Hz
(±) | la linéarité du son global est moyenne (17.5% de différence avec la médiane)
Par rapport à la même classe
» 45% de tous les appareils testés de cette catégorie étaient meilleurs, 12% similaires, 42% pires
» Le meilleur avait un delta de 6%, la moyenne était de 18%, le pire était de 132%.
Par rapport à tous les appareils testés
» 28% de tous les appareils testés étaient meilleurs, 8% similaires, 63% pires
» Le meilleur avait un delta de 4%, la moyenne était de 25%, le pire était de 134%.
Aorus 16X 2024 analyse audio
(+) | les haut-parleurs peuvent jouer relativement fort (85# dB)
Bass 100 - 315 Hz
(±) | basse réduite - en moyenne 8.5% inférieure à la médiane
(±) | la linéarité des basses est moyenne (8.3% delta à la fréquence précédente)
Mids 400 - 2000 Hz
(+) | médiane équilibrée - seulement 3.1% de la médiane
(+) | les médiums sont linéaires (5.8% delta à la fréquence précédente)
Aiguës 2 - 16 kHz
(+) | des sommets équilibrés - à seulement 2.5% de la médiane
(±) | la linéarité des aigus est moyenne (7% delta à la fréquence précédente)
Overall 100 - 16.000 Hz
(+) | le son global est linéaire (8.4% différence à la médiane)
Par rapport à la même classe
» 1% de tous les appareils testés de cette catégorie étaient meilleurs, 1% similaires, 98% pires
» Le meilleur avait un delta de 6%, la moyenne était de 18%, le pire était de 132%.
Par rapport à tous les appareils testés
» 1% de tous les appareils testés étaient meilleurs, 0% similaires, 98% pires
» Le meilleur avait un delta de 4%, la moyenne était de 25%, le pire était de 134%.
Gestion de l'énergie - Le Neo 16 n'offre qu'une faible autonomie
Consommation électrique
Que ce soit en mode veille ou sur batterie, l'ordinateur portable Acer affiche une consommation d'énergie accrue, supérieure à celle de ses concurrents. Sinon, la consommation se situe à des niveaux normaux pour le matériel utilisé. Alors qu'il fonctionne pendant notre test avec The Witcher 3 avec une consommation d'énergie constante, la consommation varie pendant la suite du test de stress. Le chargeur de 330 watts fournit une puissance suffisante.
| Éteint/en veille | |
| Au repos | |
| Fortement sollicité |
|
| Acer Acer Predator Helios Neo 16 (2024) i7-14700HX, NVIDIA GeForce RTX 4070 Laptop GPU, Samsung PM9A1a MZVL21T0HDLU, LED, 2560x1600, 16.00 | Aorus 16X 2024 i9-14900HX, NVIDIA GeForce RTX 4070 Laptop GPU, Gigabyte AG450E1024-SI, IPS, 2560x1600, 16.00 | Alienware m16 R2 Ultra 7 155H, NVIDIA GeForce RTX 4070 Laptop GPU, Samsung PM9A1 MZVL21T0HCLR, IPS, 2560x1600, 16.00 | HP Omen Transcend 16-u1095ng i9-14900HX, NVIDIA GeForce RTX 4070 Laptop GPU, Kioxia XG8 KXG80ZNV1T02, OLED, 2560x1600, 16.00 | Asus TUF Gaming A17 FA707XI-NS94 R9 7940HS, NVIDIA GeForce RTX 4070 Laptop GPU, WD PC SN560 SDDPNQE-1T00, IPS, 1920x1080, 17.30 | Moyenne NVIDIA GeForce RTX 4070 Laptop GPU | Moyenne de la classe Gaming | |
|---|---|---|---|---|---|---|---|
| Power Consumption | 12% | 21% | 18% | 28% | 28% | 18% | |
| Idle Minimum * | 26.7 | 13 51% | 8.1 70% | 10 63% | 6.2 77% | 12.1 ? 55% | 13.9 ? 48% |
| Idle Average * | 24.4 | 18 26% | 13 47% | 18 26% | 21.8 11% | 16.9 ? 31% | 19.2 ? 21% |
| Idle Maximum * | 32.7 | 35 -7% | 40.3 -23% | 32 2% | 22 33% | 24.1 ? 26% | 27.1 ? 17% |
| Load Average * | 122.1 | 138 -13% | 79 35% | 128 -5% | 59.2 52% | 99.5 ? 19% | 110.4 ? 10% |
| Witcher 3 ultra * | 190.6 | 172.6 9% | 188.1 1% | 148.4 22% | 189.7 -0% | ||
| Load Maximum * | 241 | 222 8% | 254.9 -6% | 242 -0% | 247.8 -3% | 220 ? 9% | 251 ? -4% |
* ... Moindre est la valeur, meilleures sont les performances
Power Consumption The Witcher 3 / Stress Test
Power Consumption With External Monitor
Autonomie de la batterie
L'autonomie de la batterie est globalement mauvaise : Les valeurs d'environ 4 heures dans notre test WiFi en chargeant des sites web via un script et le test vidéo en lisant le court métrage Big Buck Bunny (codage H.264, FHD) en boucle constante ne sont plus à la hauteur des normes actuelles. Avec des capacités de batterie comparables, les concurrents font preuve d'une endurance nettement supérieure. La consommation d'énergie élevée de l'Helios a un impact négatif à ce niveau. Les tests de durée de vie de la batterie ont été effectués avec Optimus activé.
| Acer Acer Predator Helios Neo 16 (2024) i7-14700HX, NVIDIA GeForce RTX 4070 Laptop GPU, 90.61 Wh | Aorus 16X 2024 i9-14900HX, NVIDIA GeForce RTX 4070 Laptop GPU, 99 Wh | Alienware m16 R2 Ultra 7 155H, NVIDIA GeForce RTX 4070 Laptop GPU, 90 Wh | HP Omen Transcend 16-u1095ng i9-14900HX, NVIDIA GeForce RTX 4070 Laptop GPU, 97 Wh | Asus TUF Gaming A17 FA707XI-NS94 R9 7940HS, NVIDIA GeForce RTX 4070 Laptop GPU, 90 Wh | Lenovo Legion Pro 5 16IRX9 i9-14900HX, NVIDIA GeForce RTX 4070 Laptop GPU, 80 Wh | Moyenne de la classe Gaming | |
|---|---|---|---|---|---|---|---|
| Autonomie de la batterie | 94% | 67% | 29% | 134% | 8% | 47% | |
| Reader / Idle | 356 | 753 112% | 758 113% | 1180 231% | 403 13% | 545 ? 53% | |
| H.264 | 242 | 541 124% | 397 ? 64% | ||||
| WiFi v1.3 | 227 | 481 112% | 483 113% | 292 29% | 548 141% | 290 28% | 369 ? 63% |
| Load | 79 | 100 27% | 60 -24% | 103 30% | 65 -18% | 84.8 ? 7% |
Points positifs
Points négatifs
Verdict - Un ordinateur portable puissant mais qui rencontre quelques problèmes

L'Helios Neo 16 s'adresse aux joueurs et aux créateurs et embarque le matériel correspondant : un processeur Core i7-14700HX, GeForce RTX 4070et un écran lumineux de 16 pouces (2560x1600 pixels, DCI-P3, G-Sync, 240 Hz) au format 16:10. Le CPU et le GPU sont capables de fonctionner à des vitesses d'horloge constamment élevées, et un SSD PCIe 4 rapide (1 TB) garantit des temps de chargement courts.
L'Acer Predator Helios Neo 16 offre une performance élevée et un bon niveau d'équipement, mais montre aussi quelques faiblesses.
Deux ports USB-C (Thunderbolt 4) facilitent l'intégration de l'ordinateur portable dans les environnements de travail existants, permettant également quelques options d'extension telles que l'utilisation d'un GPU externe ou d'une station d'accueil. Les deux ports sont capables d'émettre un signal DisplayPort et prennent également en charge Power Delivery.
La bonne impression initiale de l'ordinateur portable est ternie par la consommation d'énergie et les valeurs d'émission : En mode veille et à faible charge, les ventilateurs tournent trop et souvent à un régime trop élevé. Dans les mêmes conditions, la consommation d'énergie est également trop élevée, ce qui se traduit par une durée de vie de la batterie relativement faible. Acer pourra peut-être résoudre ces problèmes lors d'une prochaine mise à jour du BIOS. Nous ne pouvons pas non plus exclure un défaut dans notre unité de test, sinon nous ne pourrions pas en recommander l'achat.
Une alternative pourrait être l'Aorus 16X (2024) Aorus 16X (2024)qui offre des performances comparables mais une autonomie nettement supérieure.
Prix et disponibilité
Un modèle similaire à notre Predator Helios Neo 16 de test est disponible aux États-Unis sur la boutique en ligne d'Acer ( ) pour environ 1 700 $les modèles d'entrée de gamme de la série (Core i7-14650HX, GeForce RTX 4060, 16 Go de RAM, 1 TB SSD) sont disponibles à partir de 1 200 $. Certains modèles sont également disponibles sur Amazon à partir de ~1 000 $.
Acer Acer Predator Helios Neo 16 (2024)
-
04/29/2024 v7
Sascha Mölck
Transparency
The present review sample was made available to the author as a loan by the manufacturer or a shop for the purposes of review. The lender had no influence on this review, nor did the manufacturer receive a copy of this review before publication. There was no obligation to publish this review.
Pricecompare

