 Deutsch
 English
 Español
 Français
 Italiano
 Nederlands
 Polski
 Português
 Русский
 Türkçe
 Svenska
 Chinese
 Magyar
Test du XMG Fusion 15 (début 2024) : PC portable RTX 4070 compact pour joueurs et créatifs
Le XMG Fusion 15 (Early 24) - un ordinateur portable de 15,3 pouces pour les joueurs et les créateurs - est basé sur un barebone (GM5IX7A) du fabricant Tongfang. Raptor Lake, Ada Lovelace et 32 Go de RAM équipent l'ordinateur portable pour le streaming, le rendu et les jeux. La variante actuelle peut être achetée pour environ 2 500 dollars américains. Parmi les concurrents, on trouve des appareils tels que Aorus 16X (2024), Alienware m16 R2, HP Omen Transcend 16 et le Lenovo Legion Pro 5 16IRX9.
Comparaison avec les concurrents potentiels
Note | Date | Modèle | Poids | Épaisseur | Taille | Résolution | Meilleur prix |
|---|---|---|---|---|---|---|---|
| 88.9 % | 05/24 | SCHENKER XMG Fusion 15 (Early 24) i9-14900HX, NVIDIA GeForce RTX 4070 Laptop GPU | 2.1 kg | 21.9 mm | 15.30" | 2560x1600 | |
| 87.4 % | 04/24 | Aorus 16X 2024 i9-14900HX, NVIDIA GeForce RTX 4070 Laptop GPU | 2.3 kg | 20 mm | 16.00" | 2560x1600 | |
| 90.2 % | 03/24 | Alienware m16 R2 Ultra 7 155H, NVIDIA GeForce RTX 4070 Laptop GPU | 2.5 kg | 23.5 mm | 16.00" | 2560x1600 | |
| 88.4 % | 02/24 | HP Omen Transcend 16-u1095ng i9-14900HX, NVIDIA GeForce RTX 4070 Laptop GPU | 2.3 kg | 20 mm | 16.00" | 2560x1600 | |
| 89.3 % | 04/24 | Lenovo Legion Pro 5 16IRX9 i9-14900HX, NVIDIA GeForce RTX 4070 Laptop GPU | 2.5 kg | 26.95 mm | 16.00" | 2560x1600 |
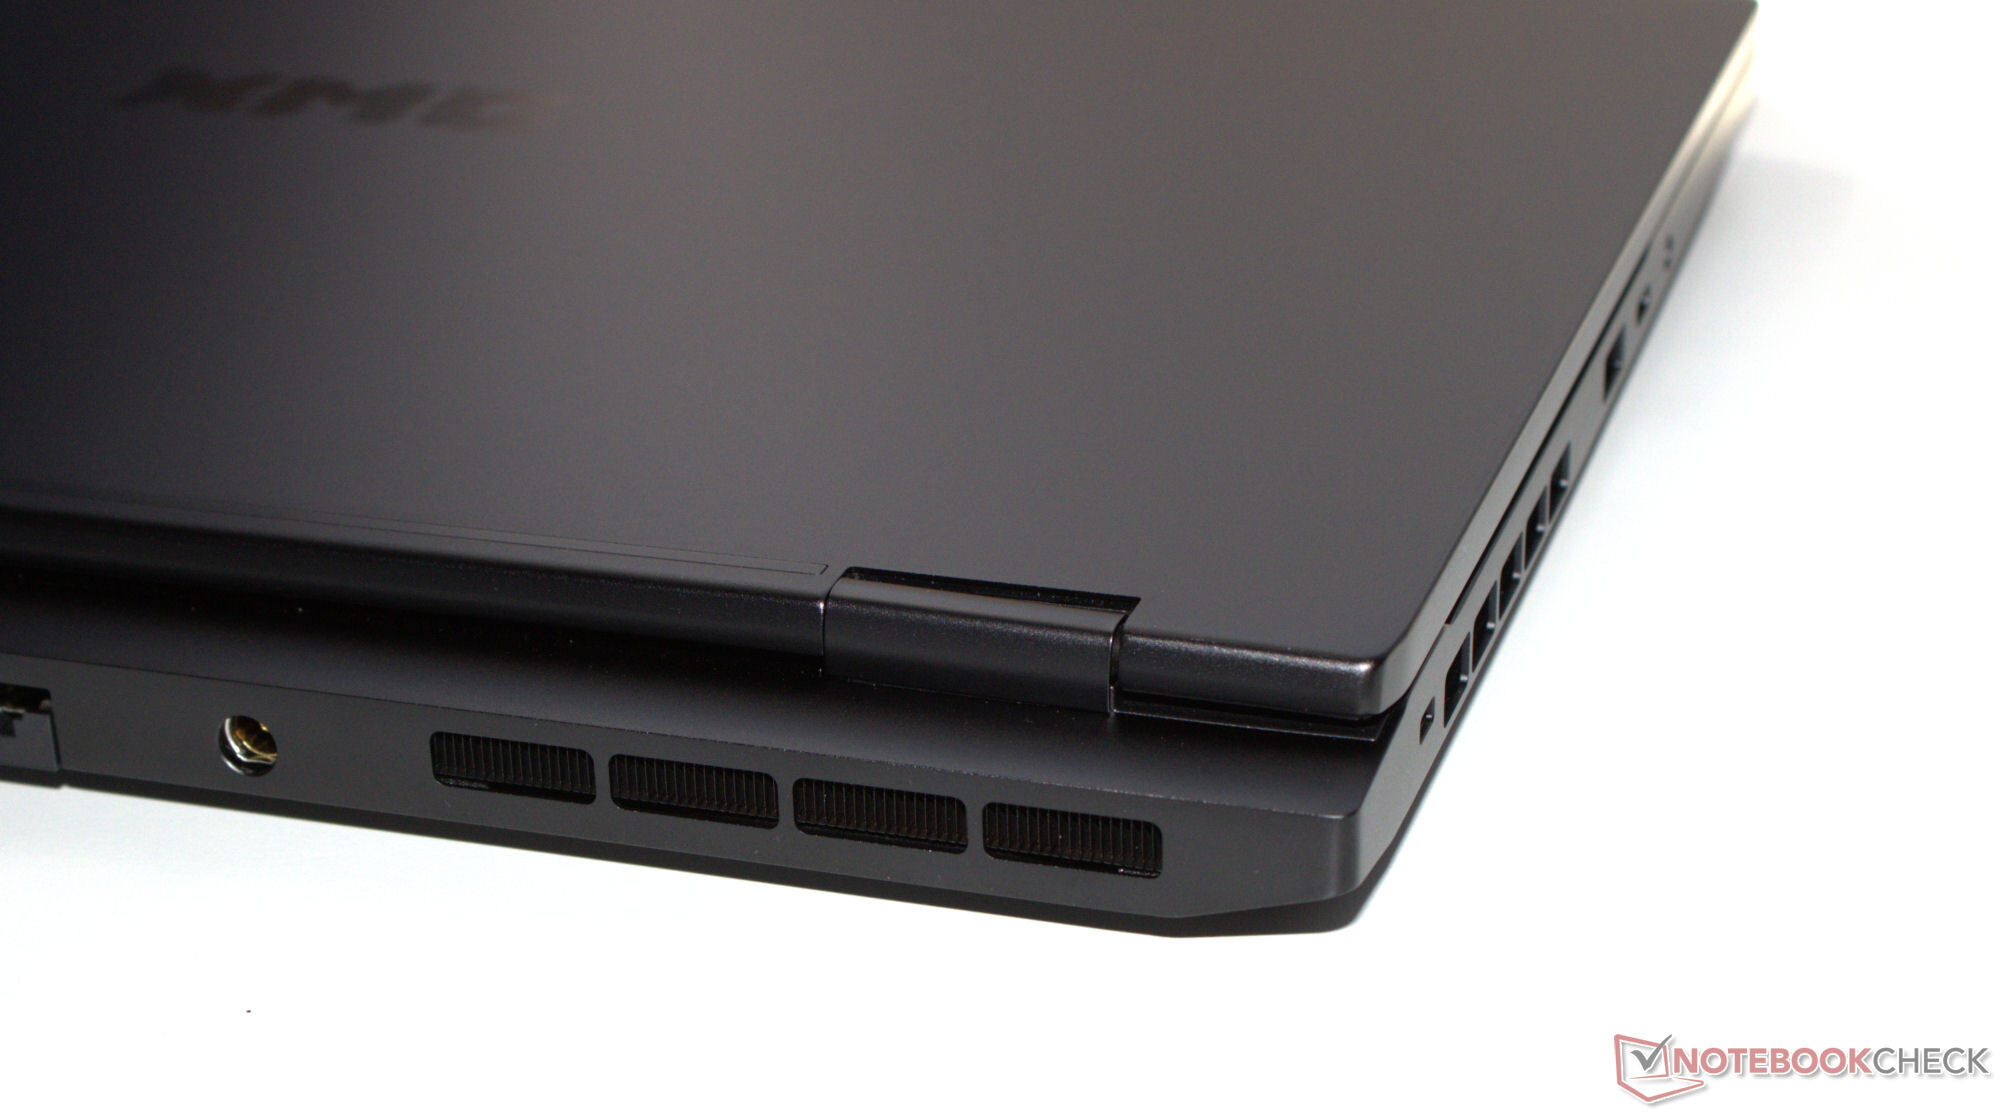
Boîtier - L'ordinateur portable XMG est doté d'un boîtier en aluminium
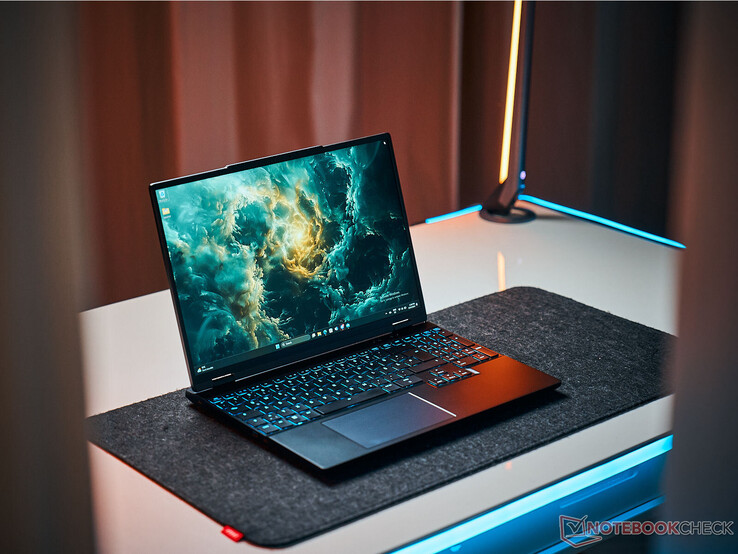
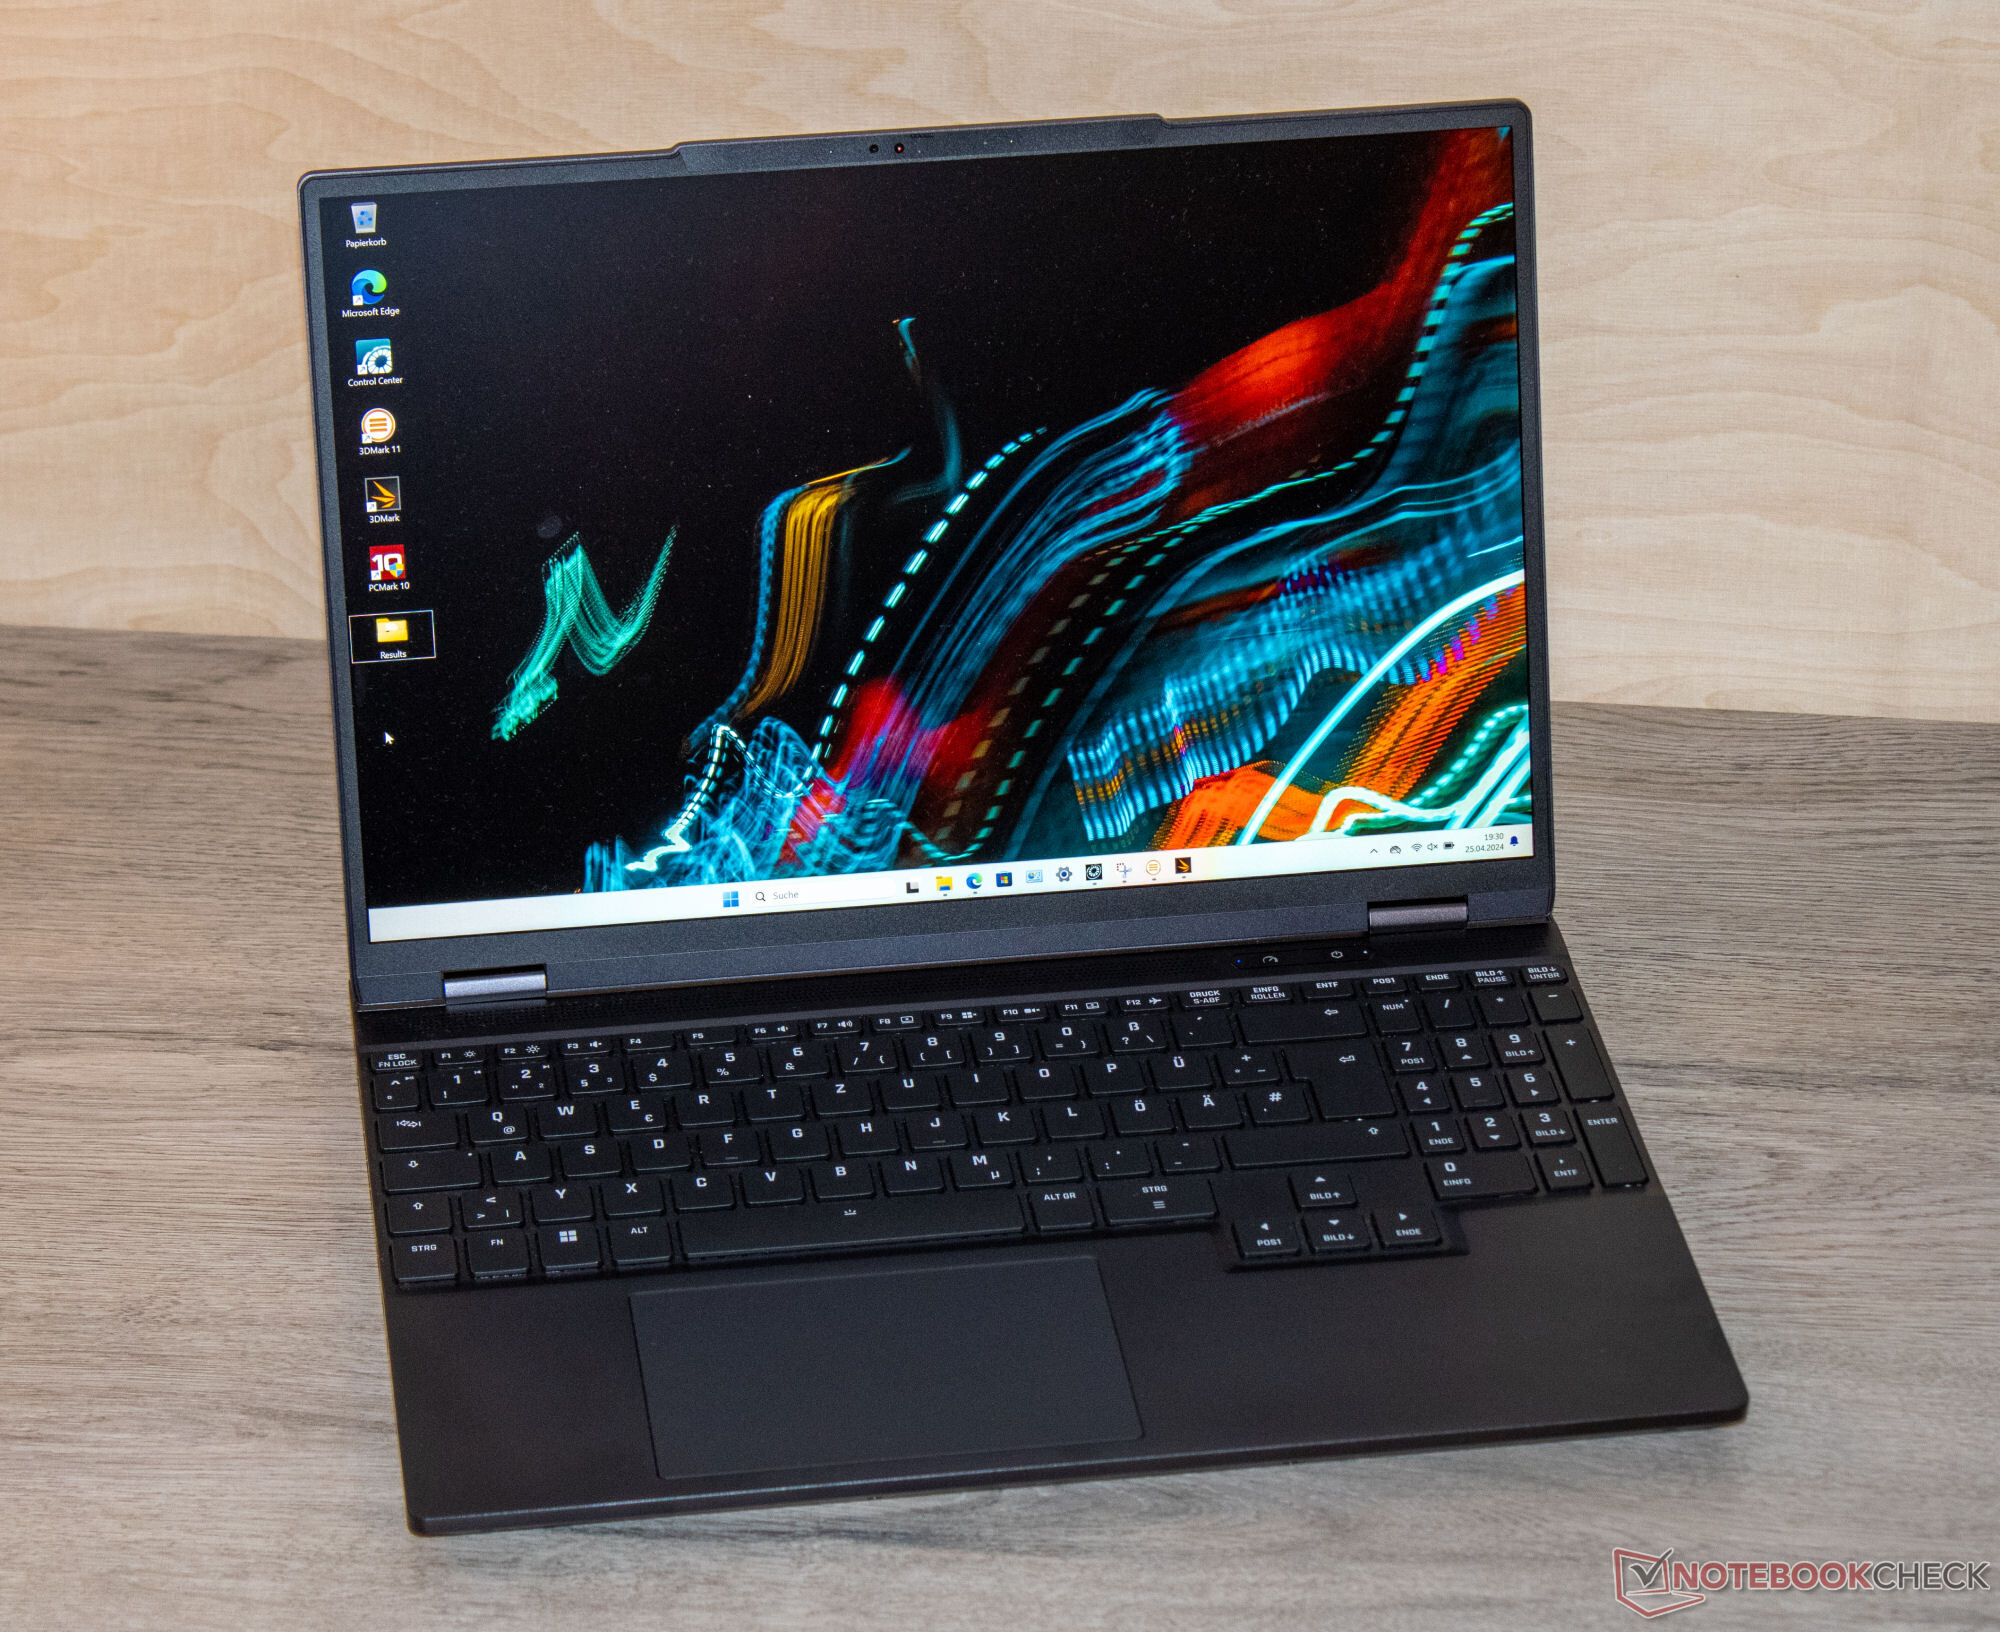
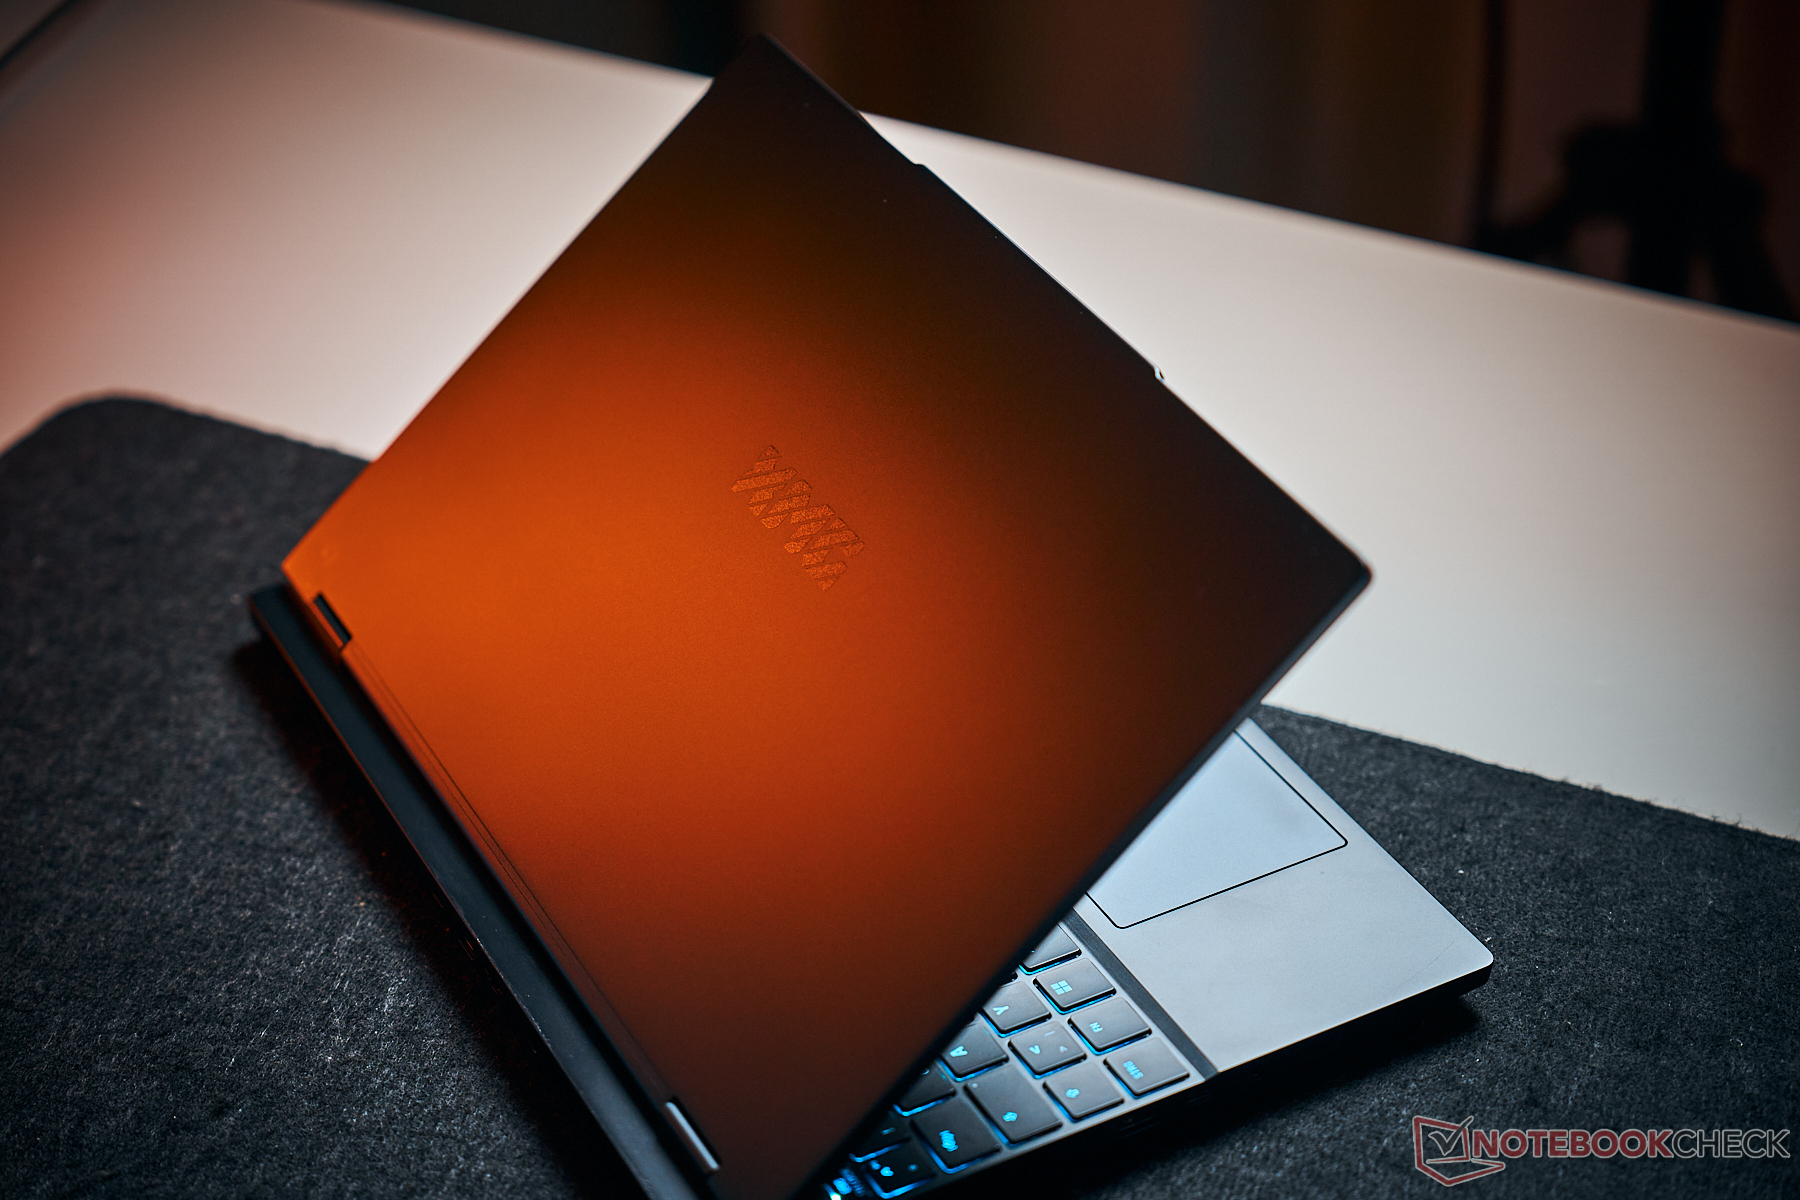
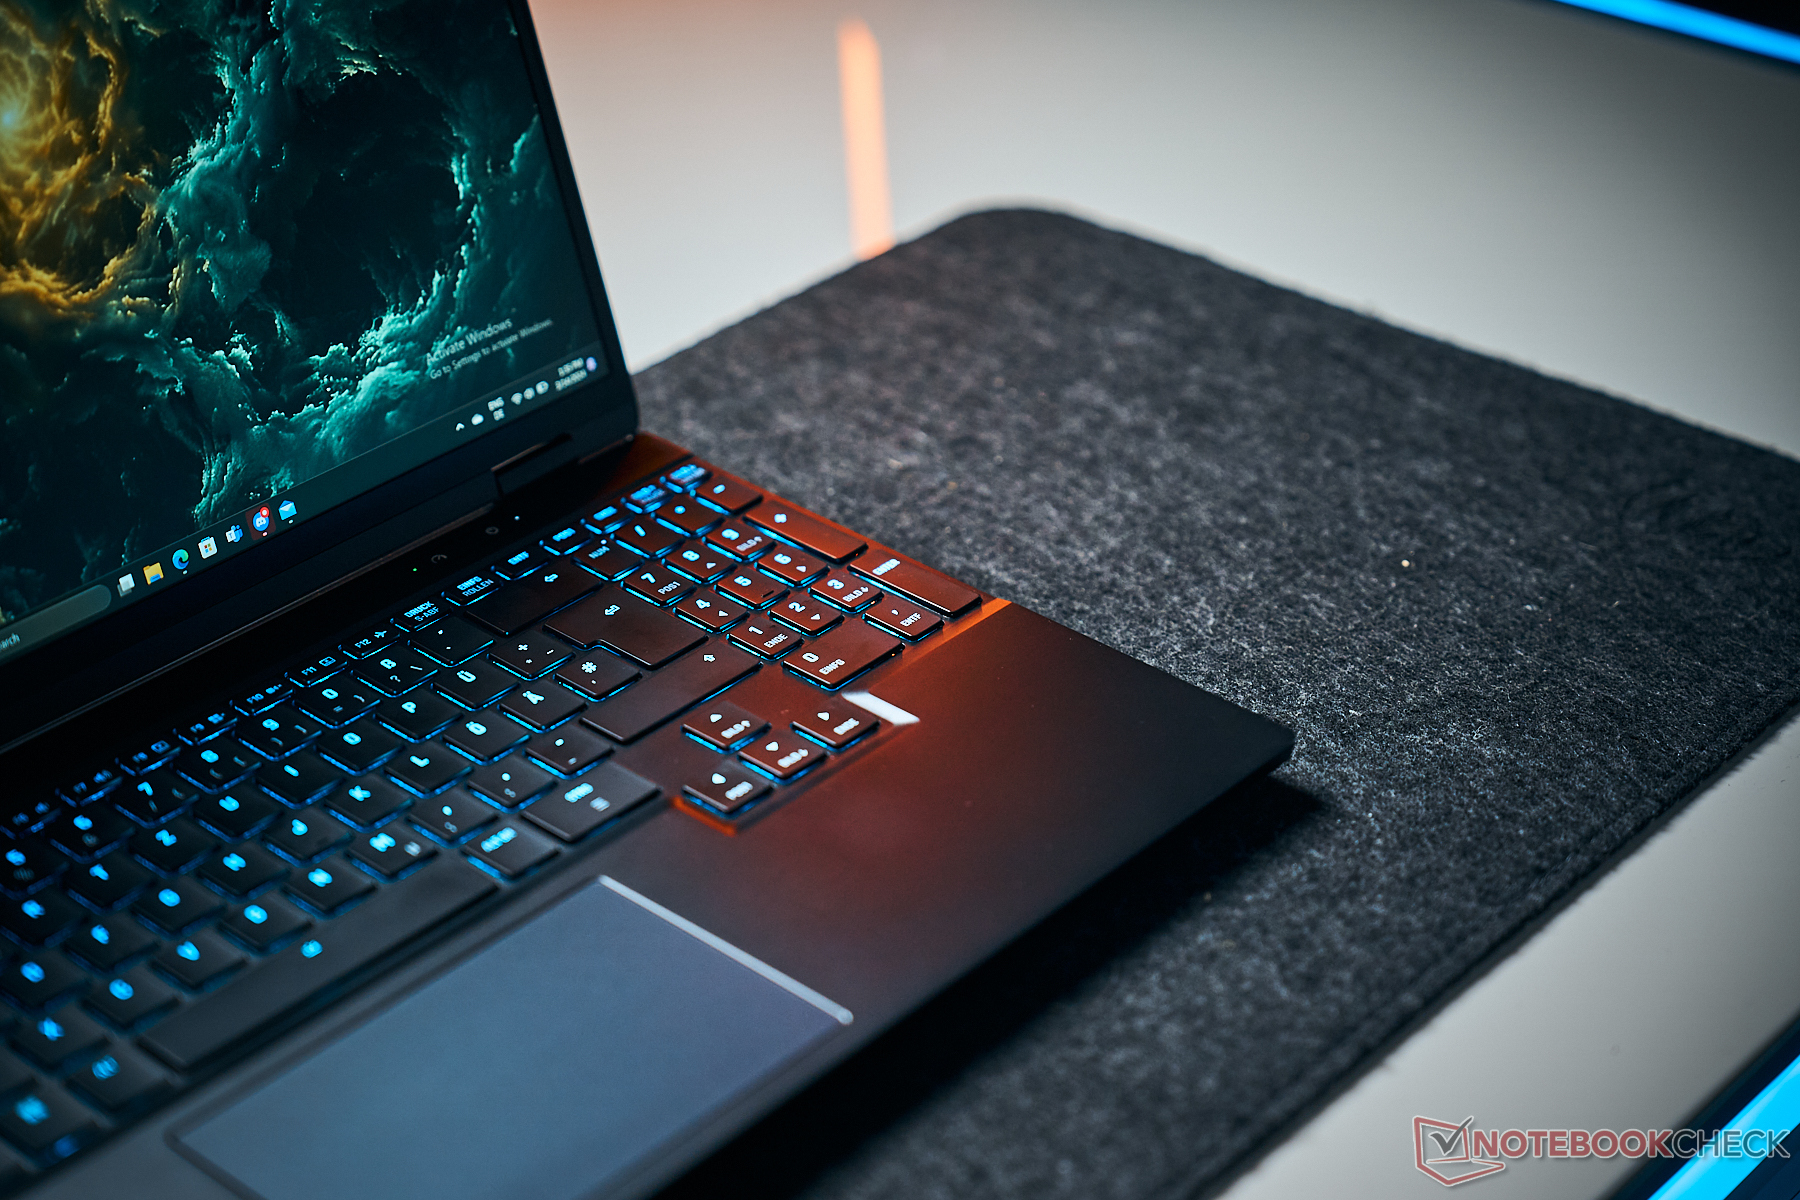
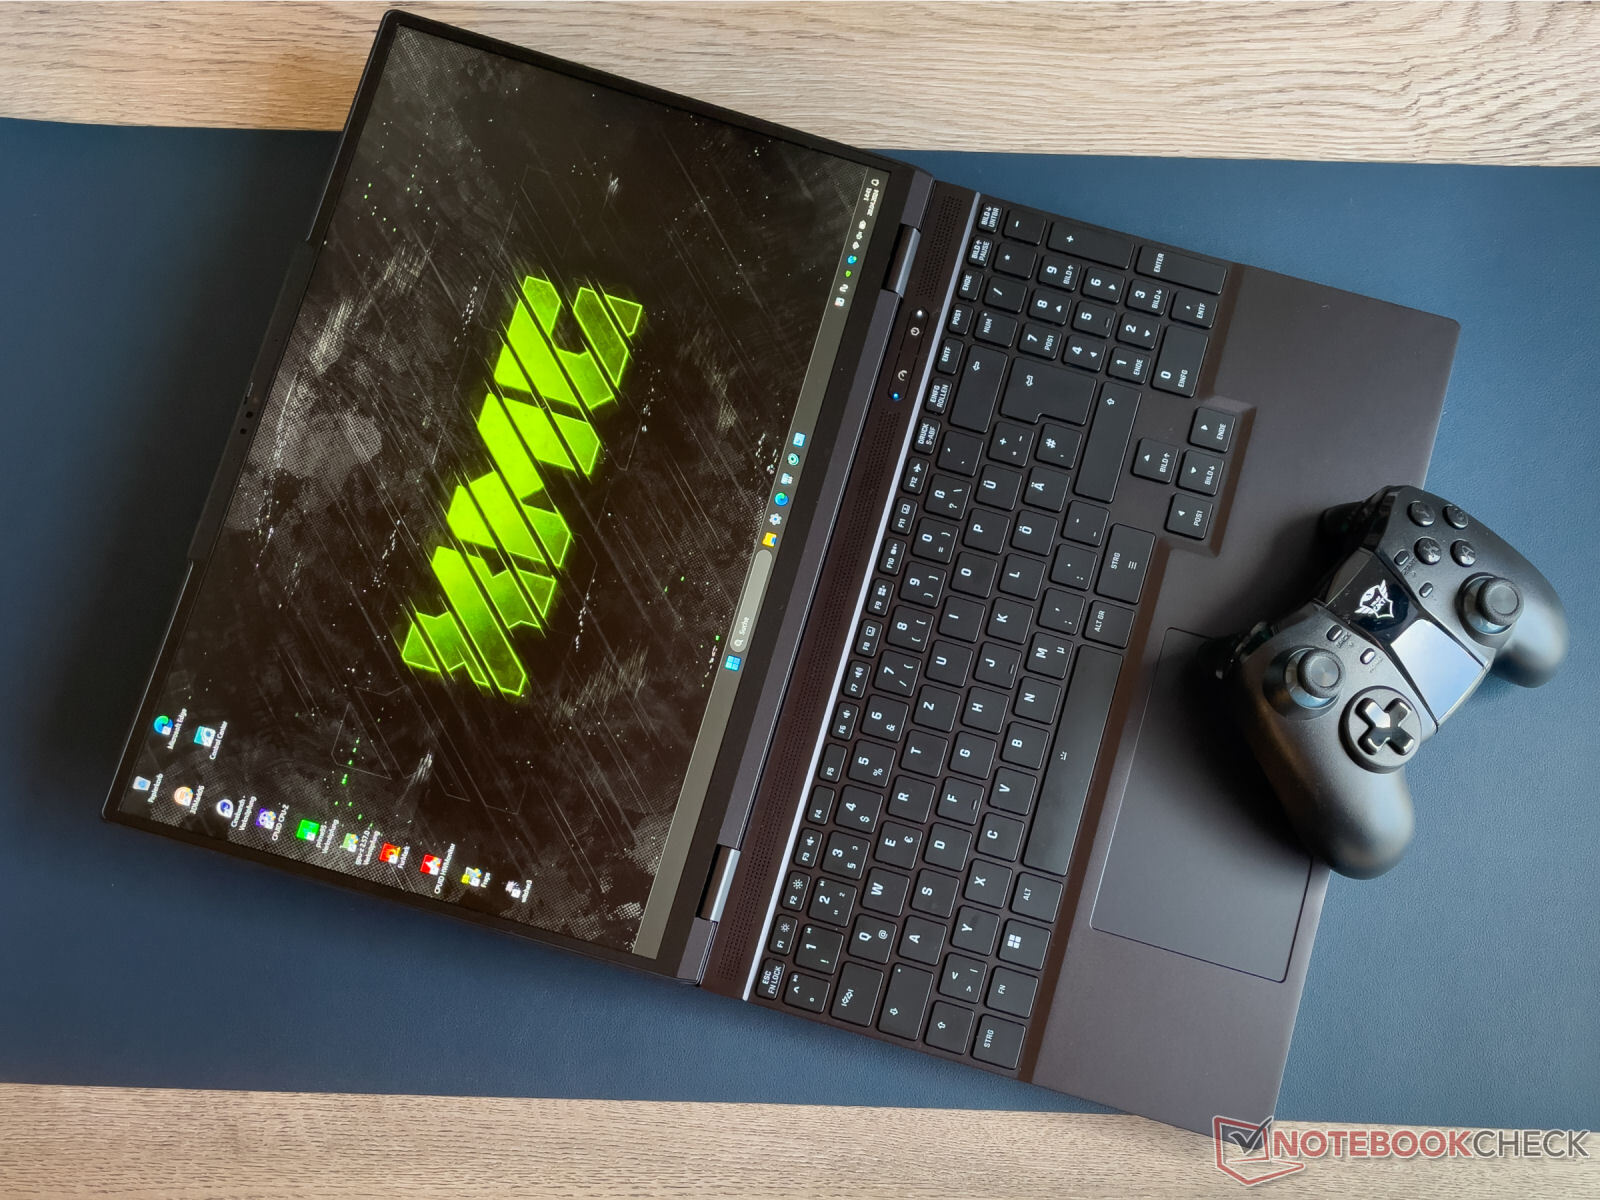
Schenker a opté pour un boîtier élégant en aluminium noir mat avec des surfaces lisses. L'ordinateur portable ne présente pas d'éléments de design accrocheurs ni de bandes LED, seul le rétroéclairage du clavier (RVB) donne un peu de couleur à l'appareil. L'ordinateur portable se distingue à peine dans les environnements professionnels.
Nous n'avons remarqué aucune protubérance matérielle et tous les interstices sont parfaitement alignés. L'unité de base et le couvercle peuvent être légèrement tordus, mais cela n'a rien d'extraordinaire. Une pression sur l'arrière du couvercle n'entraîne aucune modification de l'image. Les charnières rigides permettent un angle d'ouverture maximal de 180 degrés. Il est possible de l'ouvrir d'une seule main.
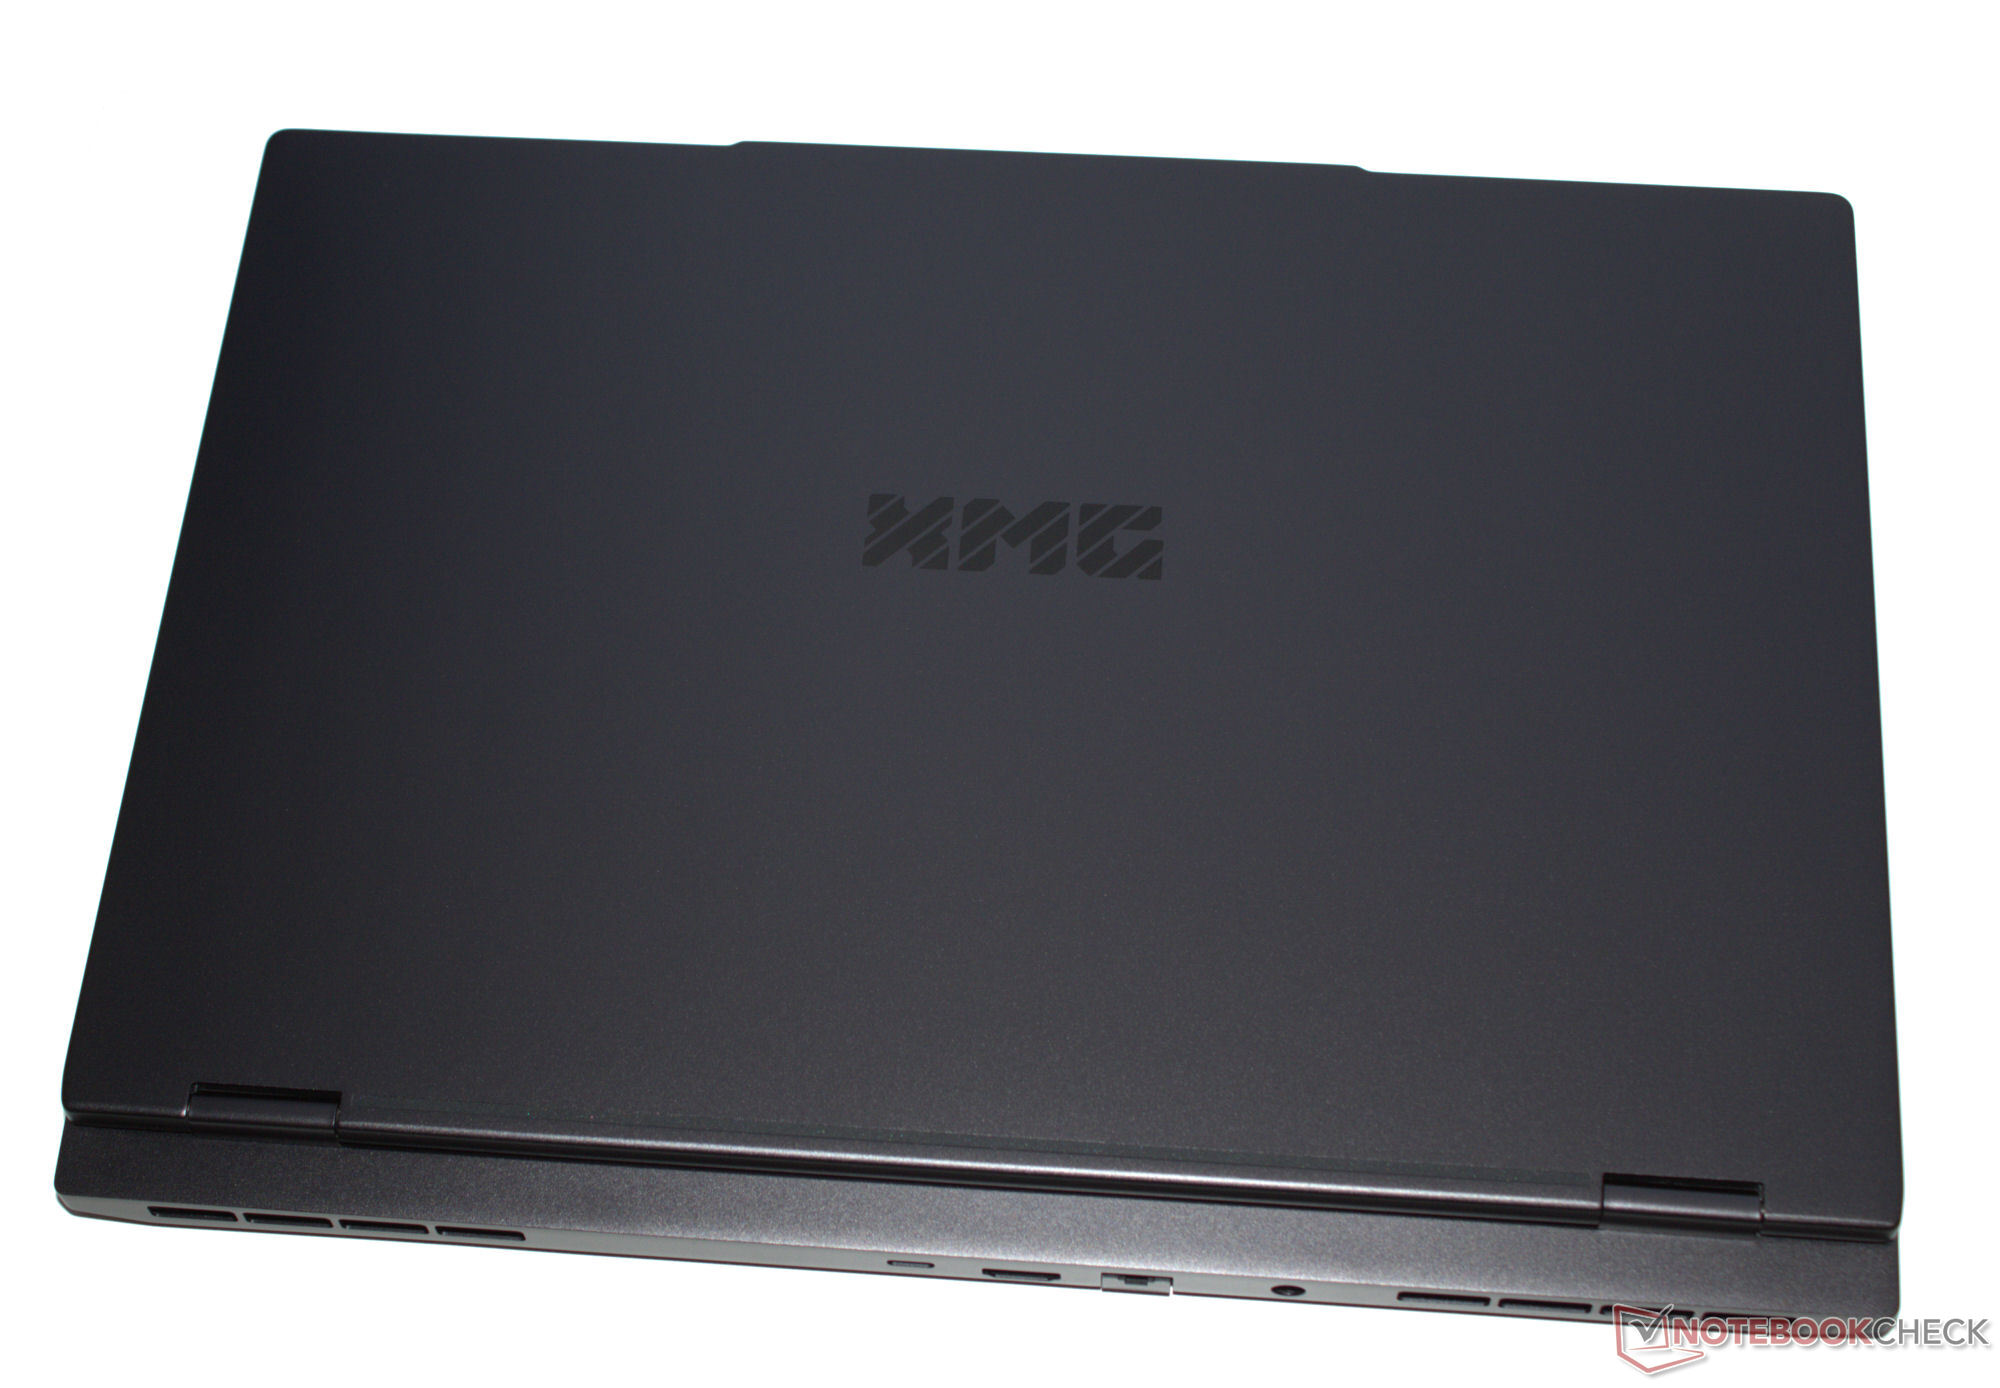
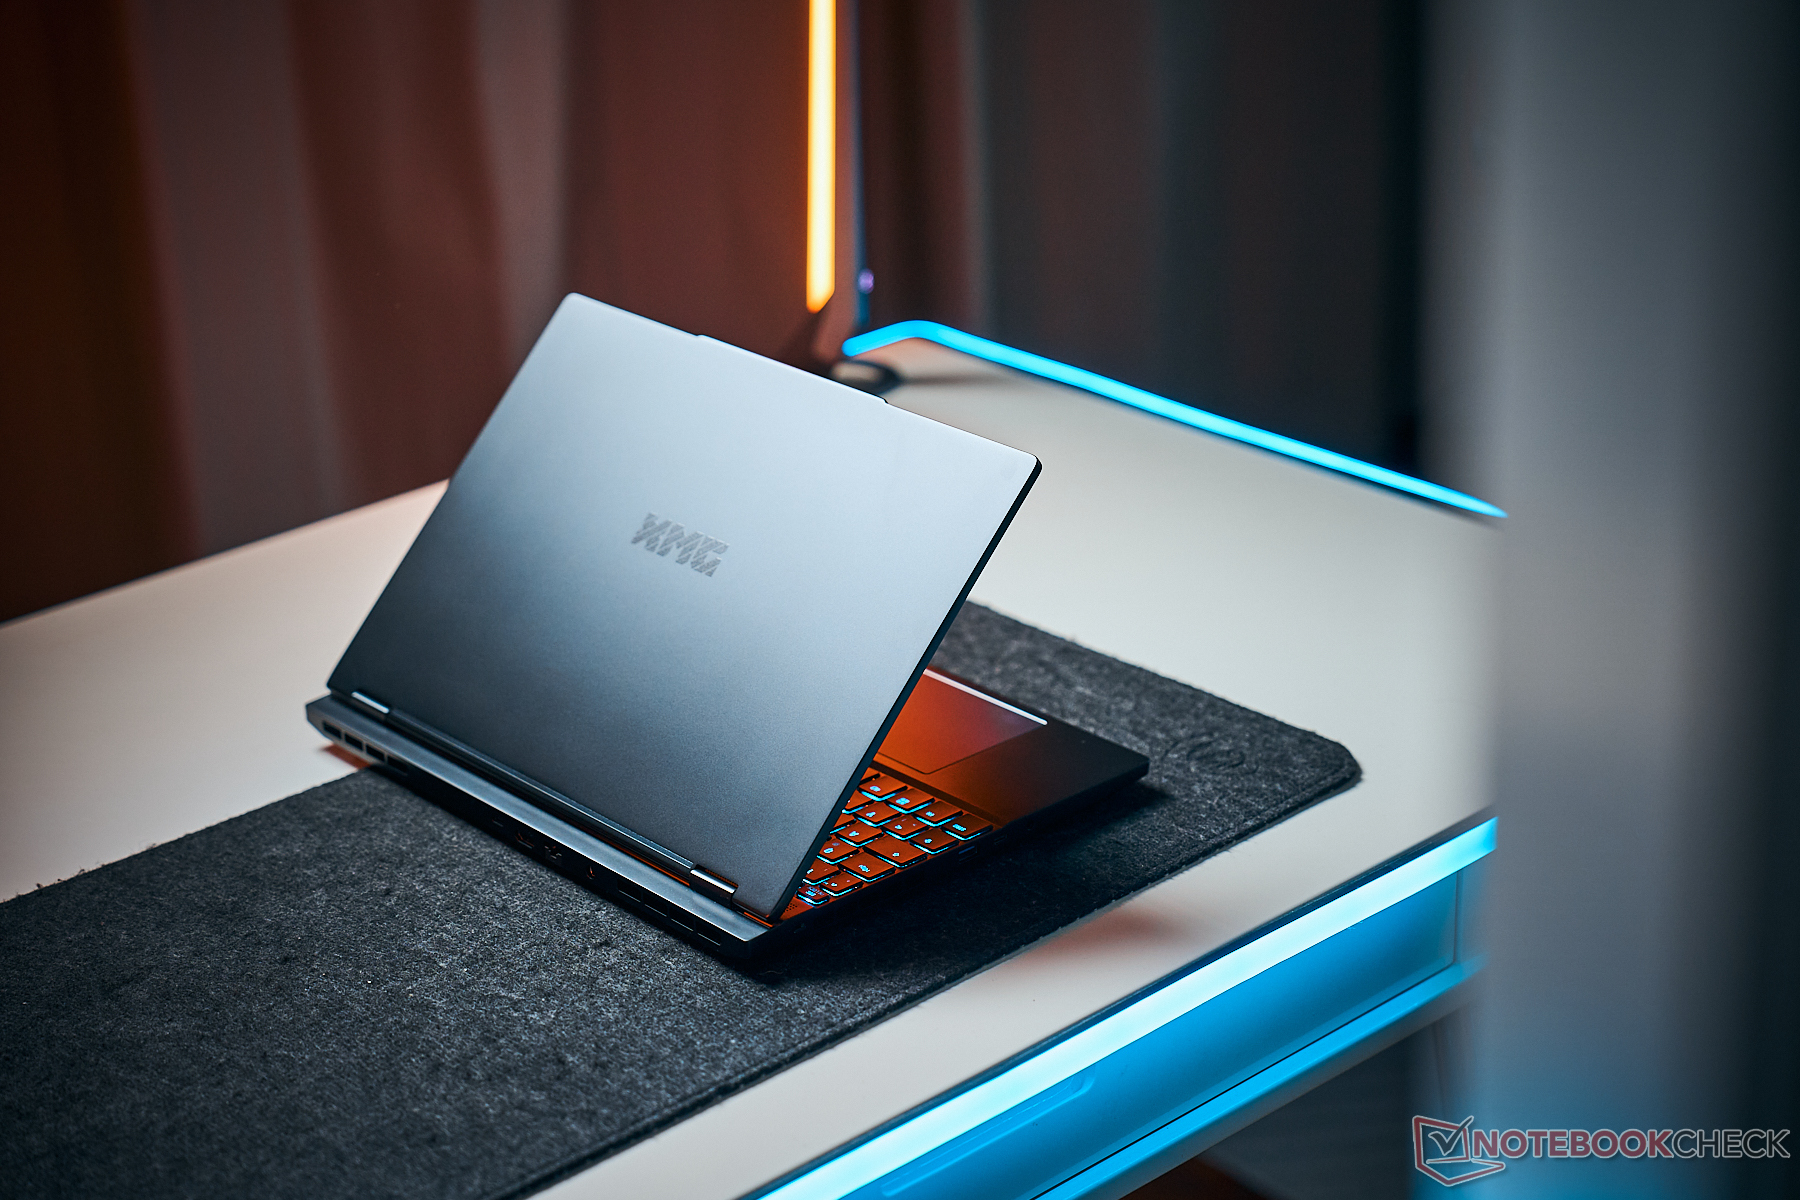
Ce n'est pas une surprise : Dans le champ de comparaison, le Fusion est l'appareil le plus compact - il est doté du plus petit écran. En même temps, il est aussi le plus léger de tous.
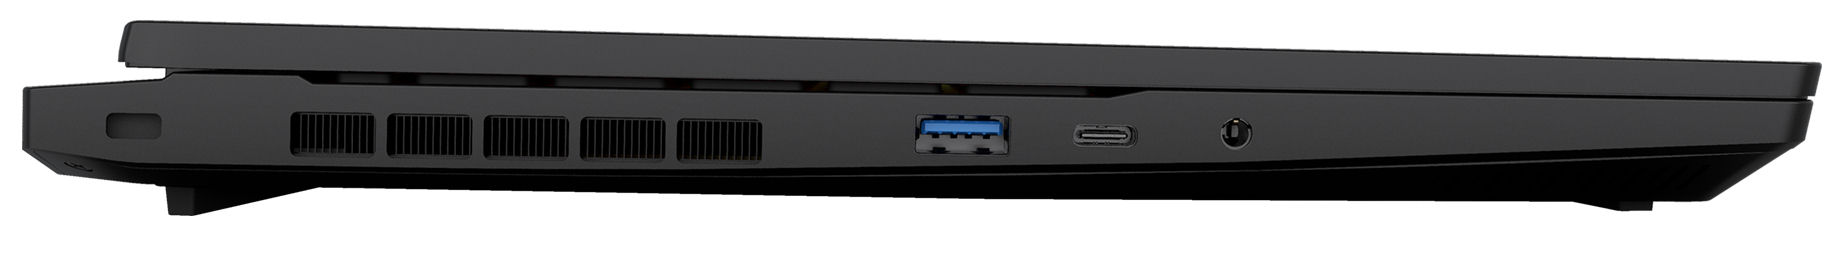
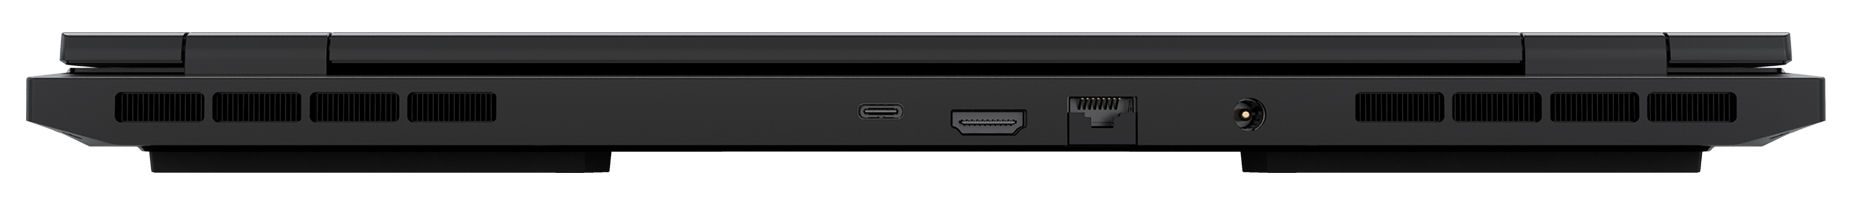
Connectivité - Le Fusion 15 avec Thunderbolt 4
Le Fusion dispose de trois ports USB-A (USB 3.2 Gen 1) et de deux ports USB-C (1x USB 3.2 Gen 1, 1x Thunderbolt 4). Le port TB4 prend en charge Power Delivery et peut émettre un signal DisplayPort. Au total, l'ordinateur portable dispose de deux sorties vidéo (1x HDMI, 1x DP). Une prise audio et un port Gigabit Ethernet complètent ses options de connectivité. Les sorties vidéo et la connexion d'alimentation sont situées à l'arrière de l'appareil. Les câbles correspondants sortent par l'arrière, de sorte qu'ils ne vous gênent pas.
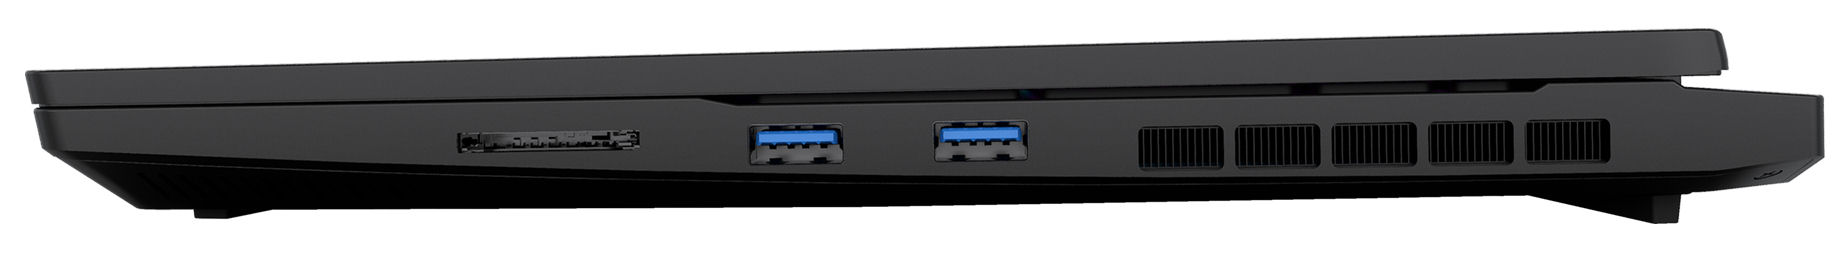
Lecteur de carte SD
Avec des taux de transfert de 81 MB/s (transfert de 250 images jpg de 5 MB chacune) et de 82 MB/s (copie de gros blocs de données), le lecteur de carte SD (carte de référence : AV PRO microSD 128 GB V60) est d'une vitesse moyenne. La concurrence propose largement des lecteurs plus rapides.
| SD Card Reader | |
| average JPG Copy Test (av. of 3 runs) | |
| Aorus 16X 2024 (AV PRO microSD 128 GB V60) | |
| Moyenne de la classe Gaming (19 - 202, n=97, 2 dernières années) | |
| SCHENKER XMG Fusion 15 (Early 24) (AV PRO microSD 128 GB V60) | |
| Alienware m16 R2 (AV PRO microSD 128 GB V60) | |
| maximum AS SSD Seq Read Test (1GB) | |
| Alienware m16 R2 (AV PRO microSD 128 GB V60) | |
| Aorus 16X 2024 (AV PRO microSD 128 GB V60) | |
| Moyenne de la classe Gaming (25.8 - 269, n=92, 2 dernières années) | |
| SCHENKER XMG Fusion 15 (Early 24) (AV PRO microSD 128 GB V60) | |
Communication
Le Fusion utilise une puce WiFi 6E (Intel AX211) qui, dans le meilleur des cas (pas d'appareils WiFi à proximité, courte distance entre l'ordinateur portable et le serveur), atteint de très bons débits de données. Les connexions filaires sont prises en charge par un contrôleur Gigabit Ethernet (YT6801) de Motorcomm, un fabricant que nous n'avions jamais rencontré auparavant.
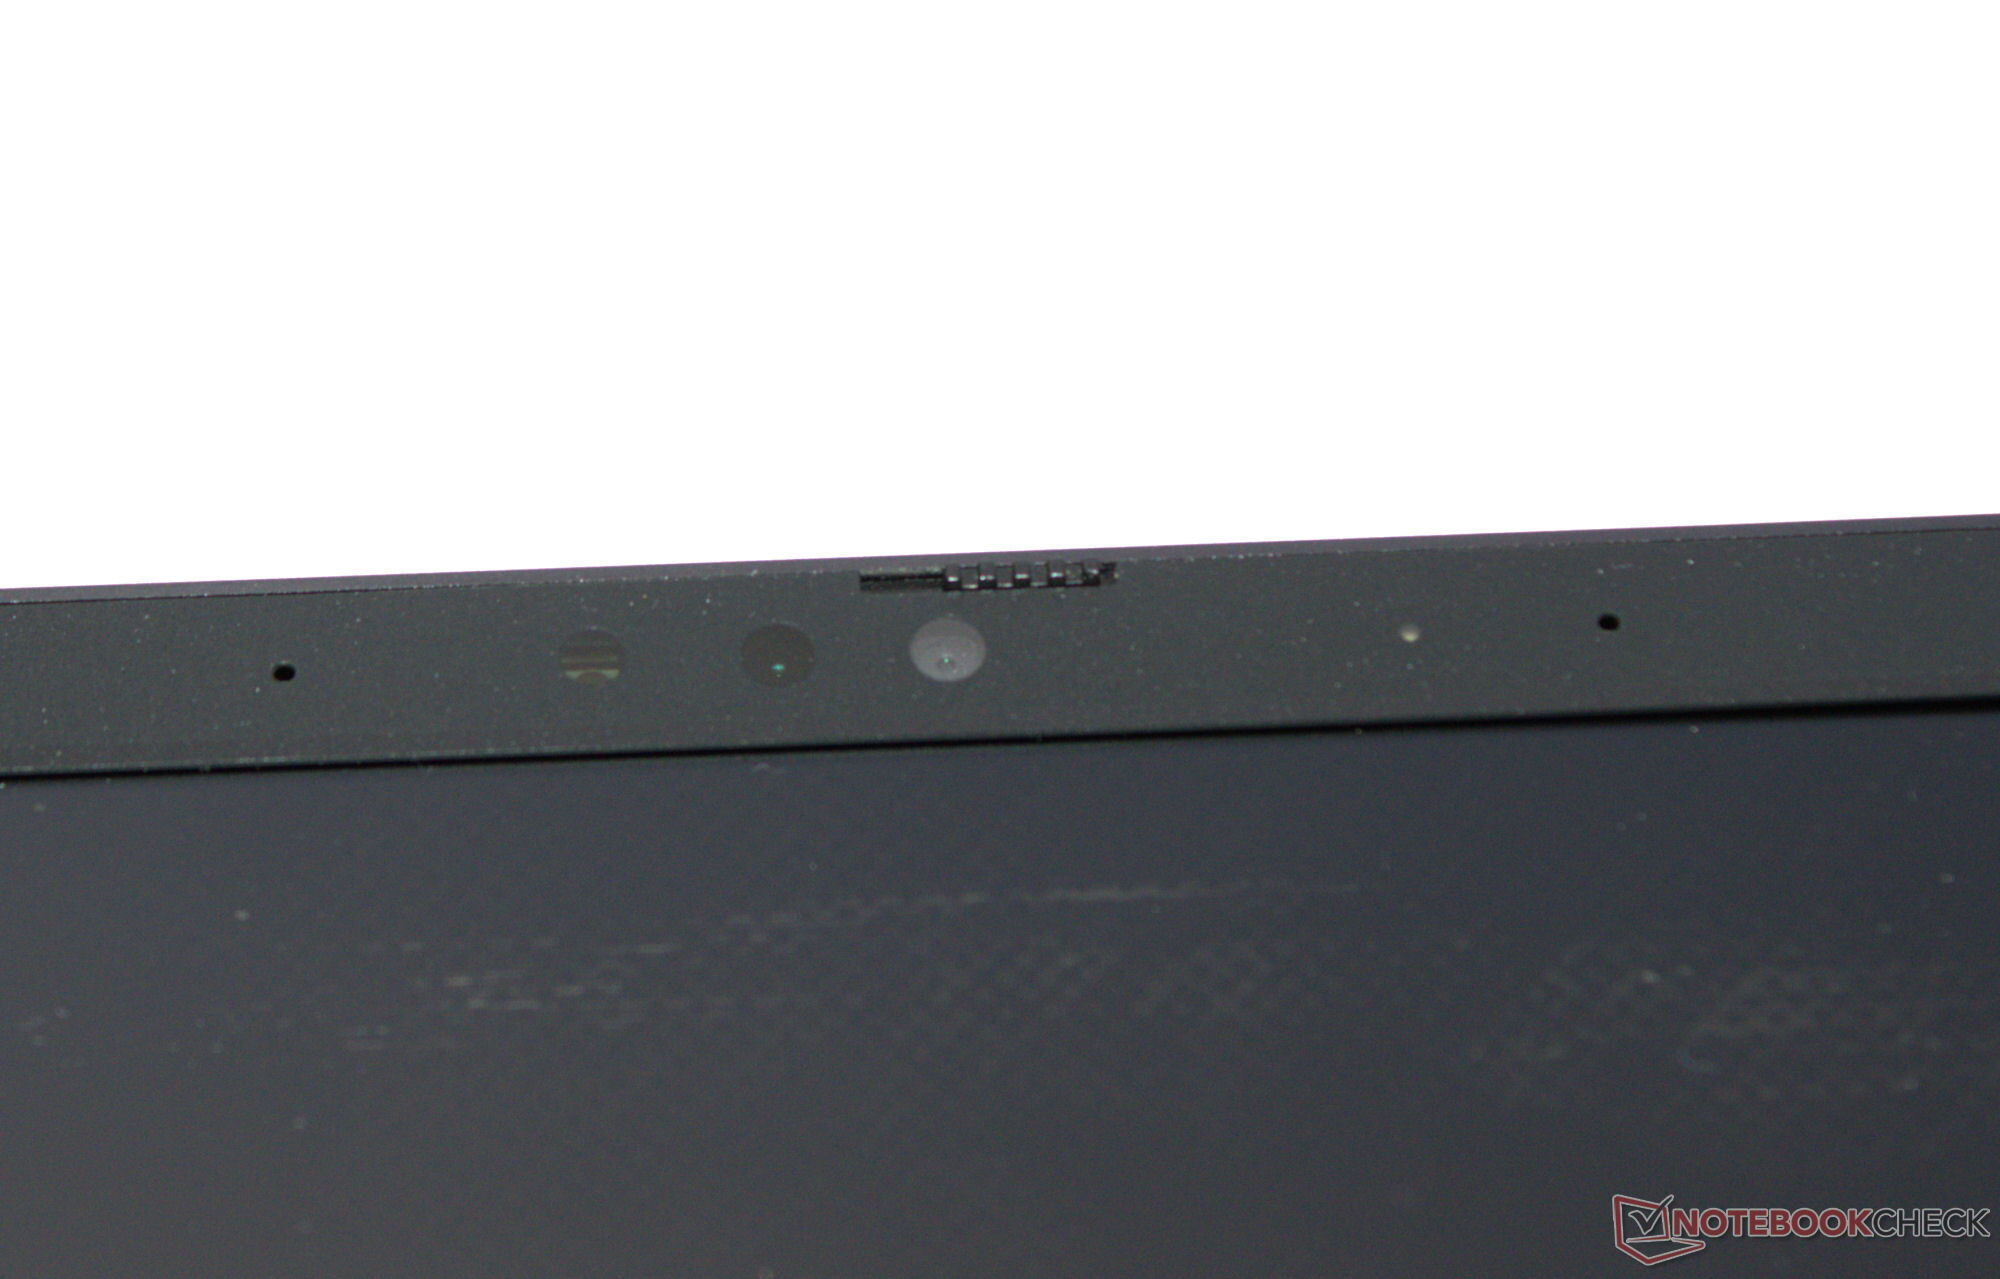
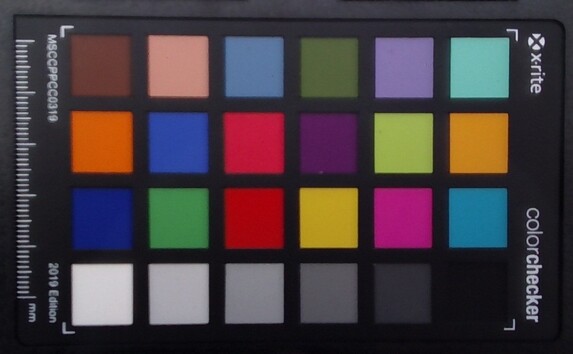
Webcam
Sa webcam (2,1 MP) est de qualité moyenne. Elle n'est pas à la hauteur en ce qui concerne la précision des couleurs : Avec un écart d'environ 9, la valeur cible (DeltaE<3) n'a pas été atteinte. Il prend toutefois en charge le système Windows Hello. De plus, il est équipé d'un couvercle mécanique.
 NVIDIA GeForce RTX 4070 Laptop GPU, i9-14900HX, Samsung 990 Pro 1 TB")
 NVIDIA GeForce RTX 4070 Laptop GPU, i9-14900HX, Samsung 990 Pro 1 TB")
Accessoires
L'ordinateur portable est livré avec une clé USB (pilote, manuels), des autocollants et un tapis de souris.
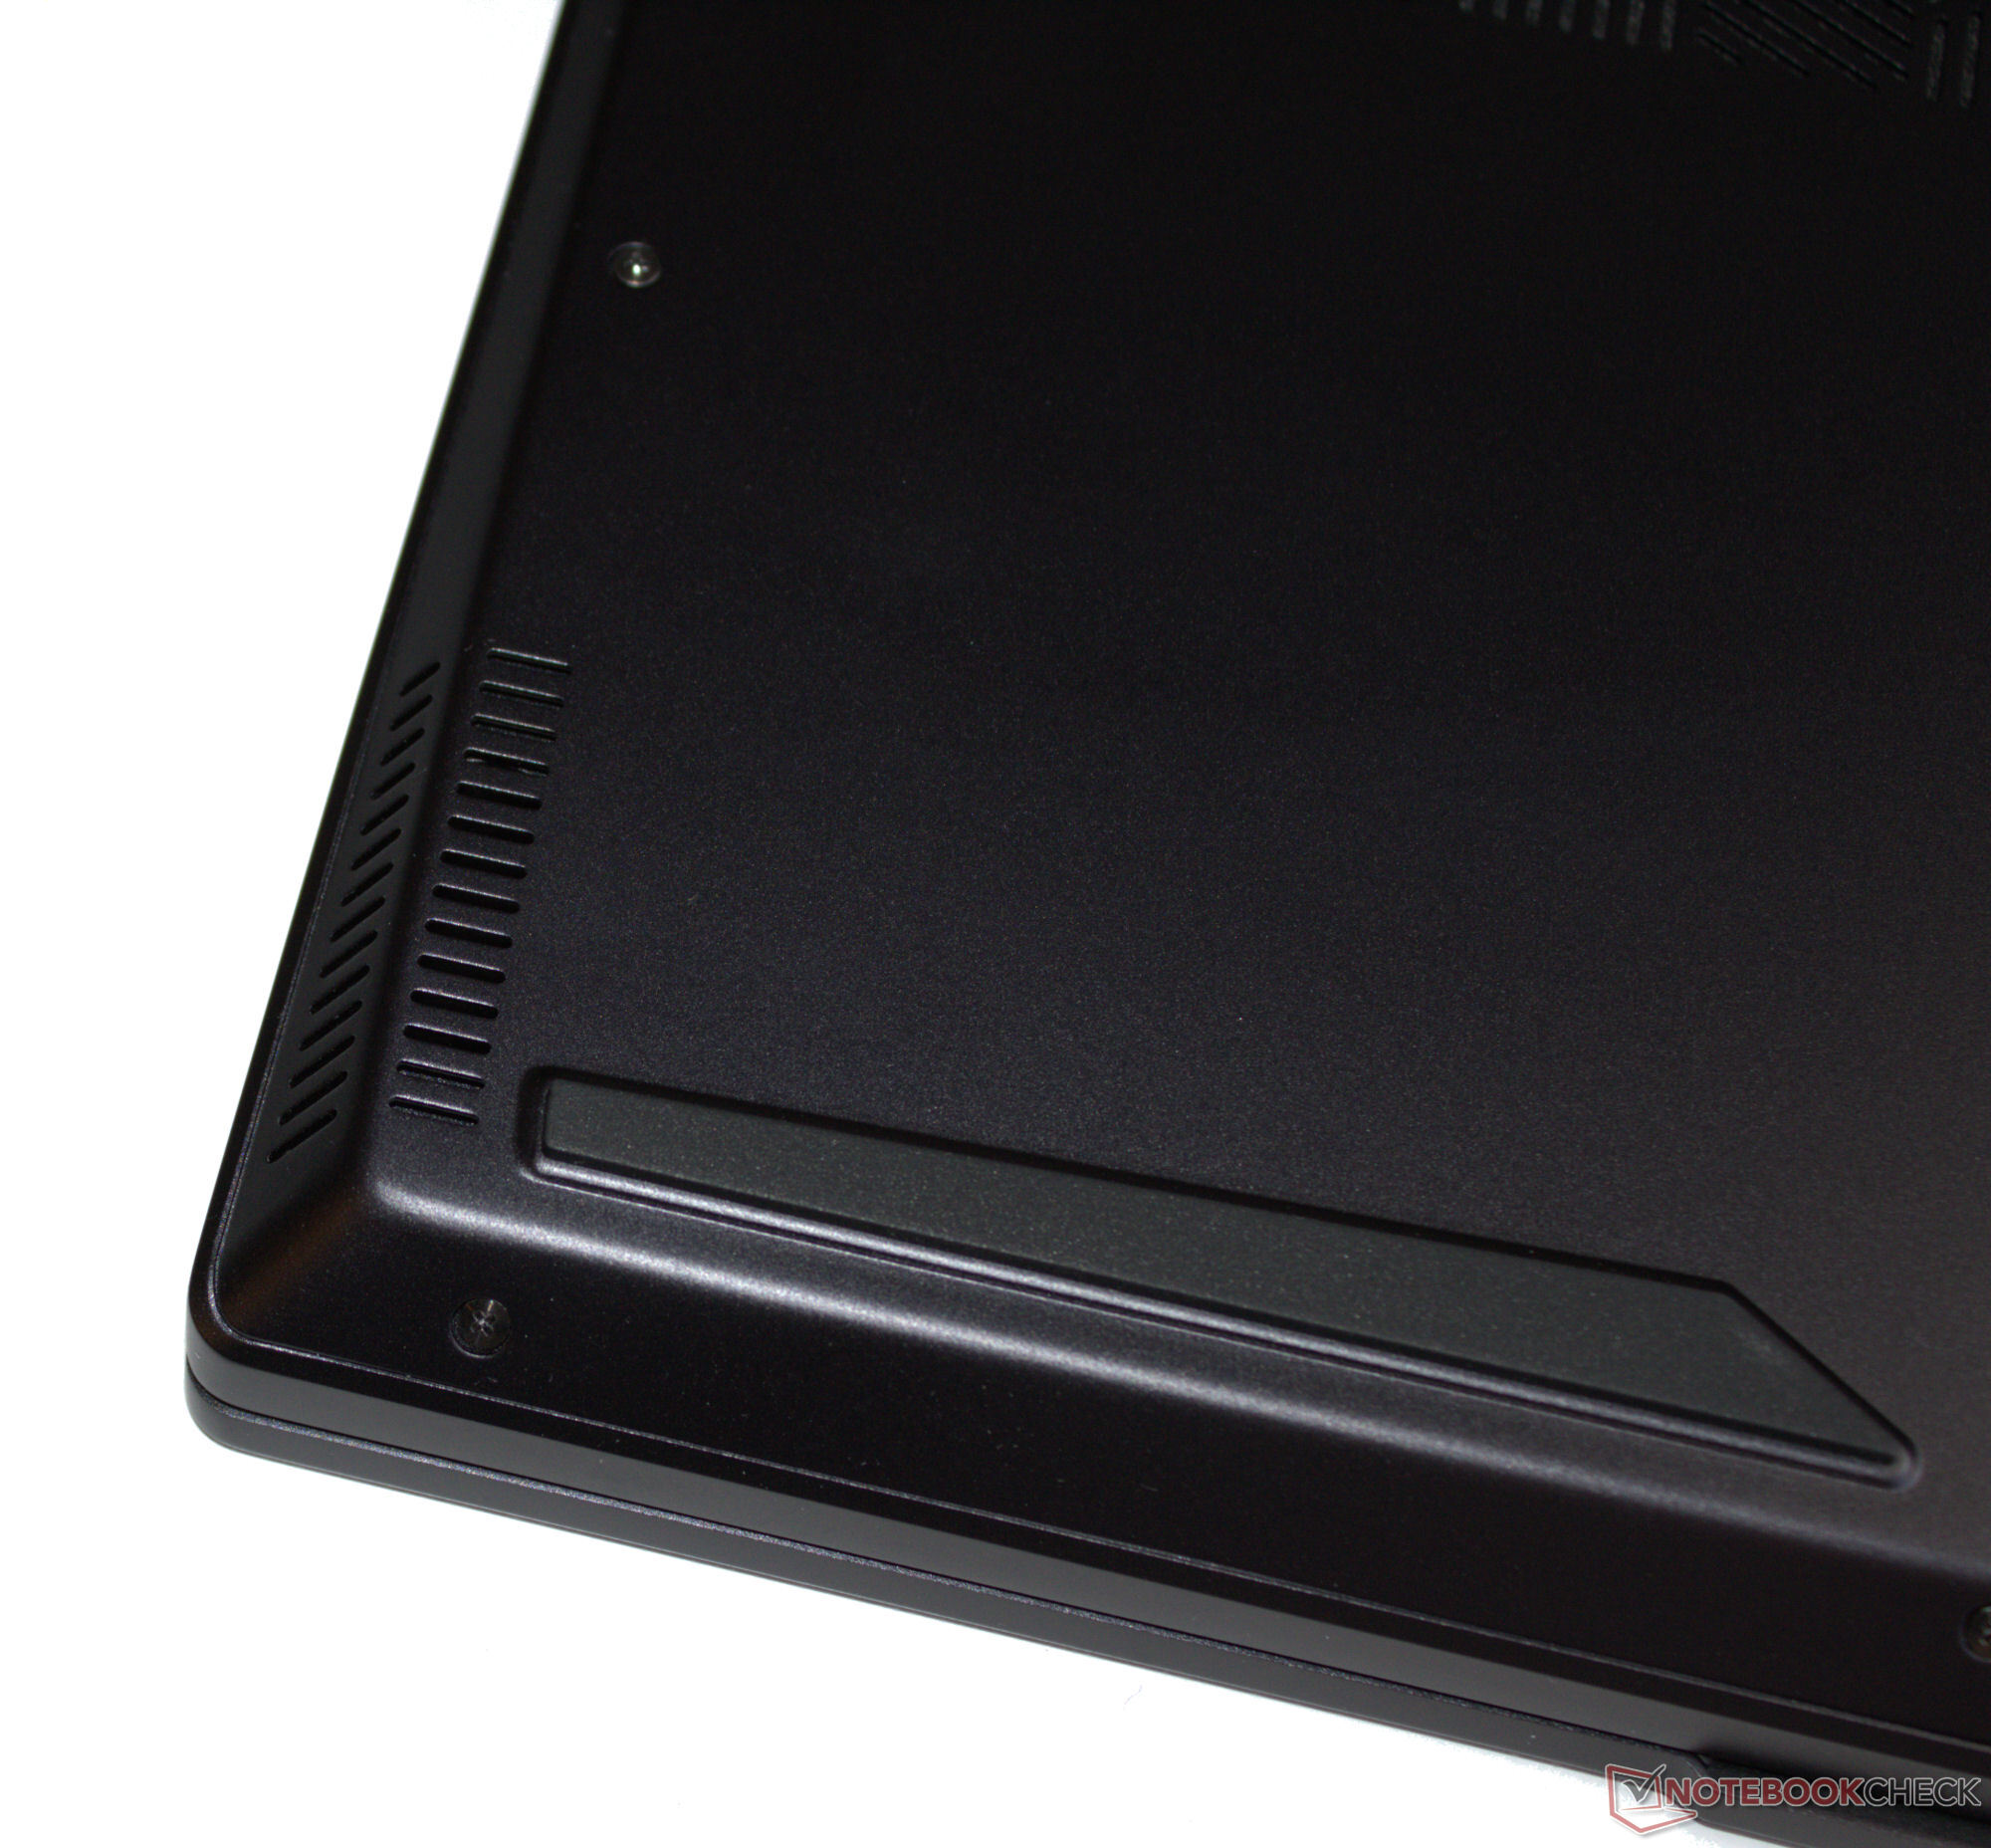
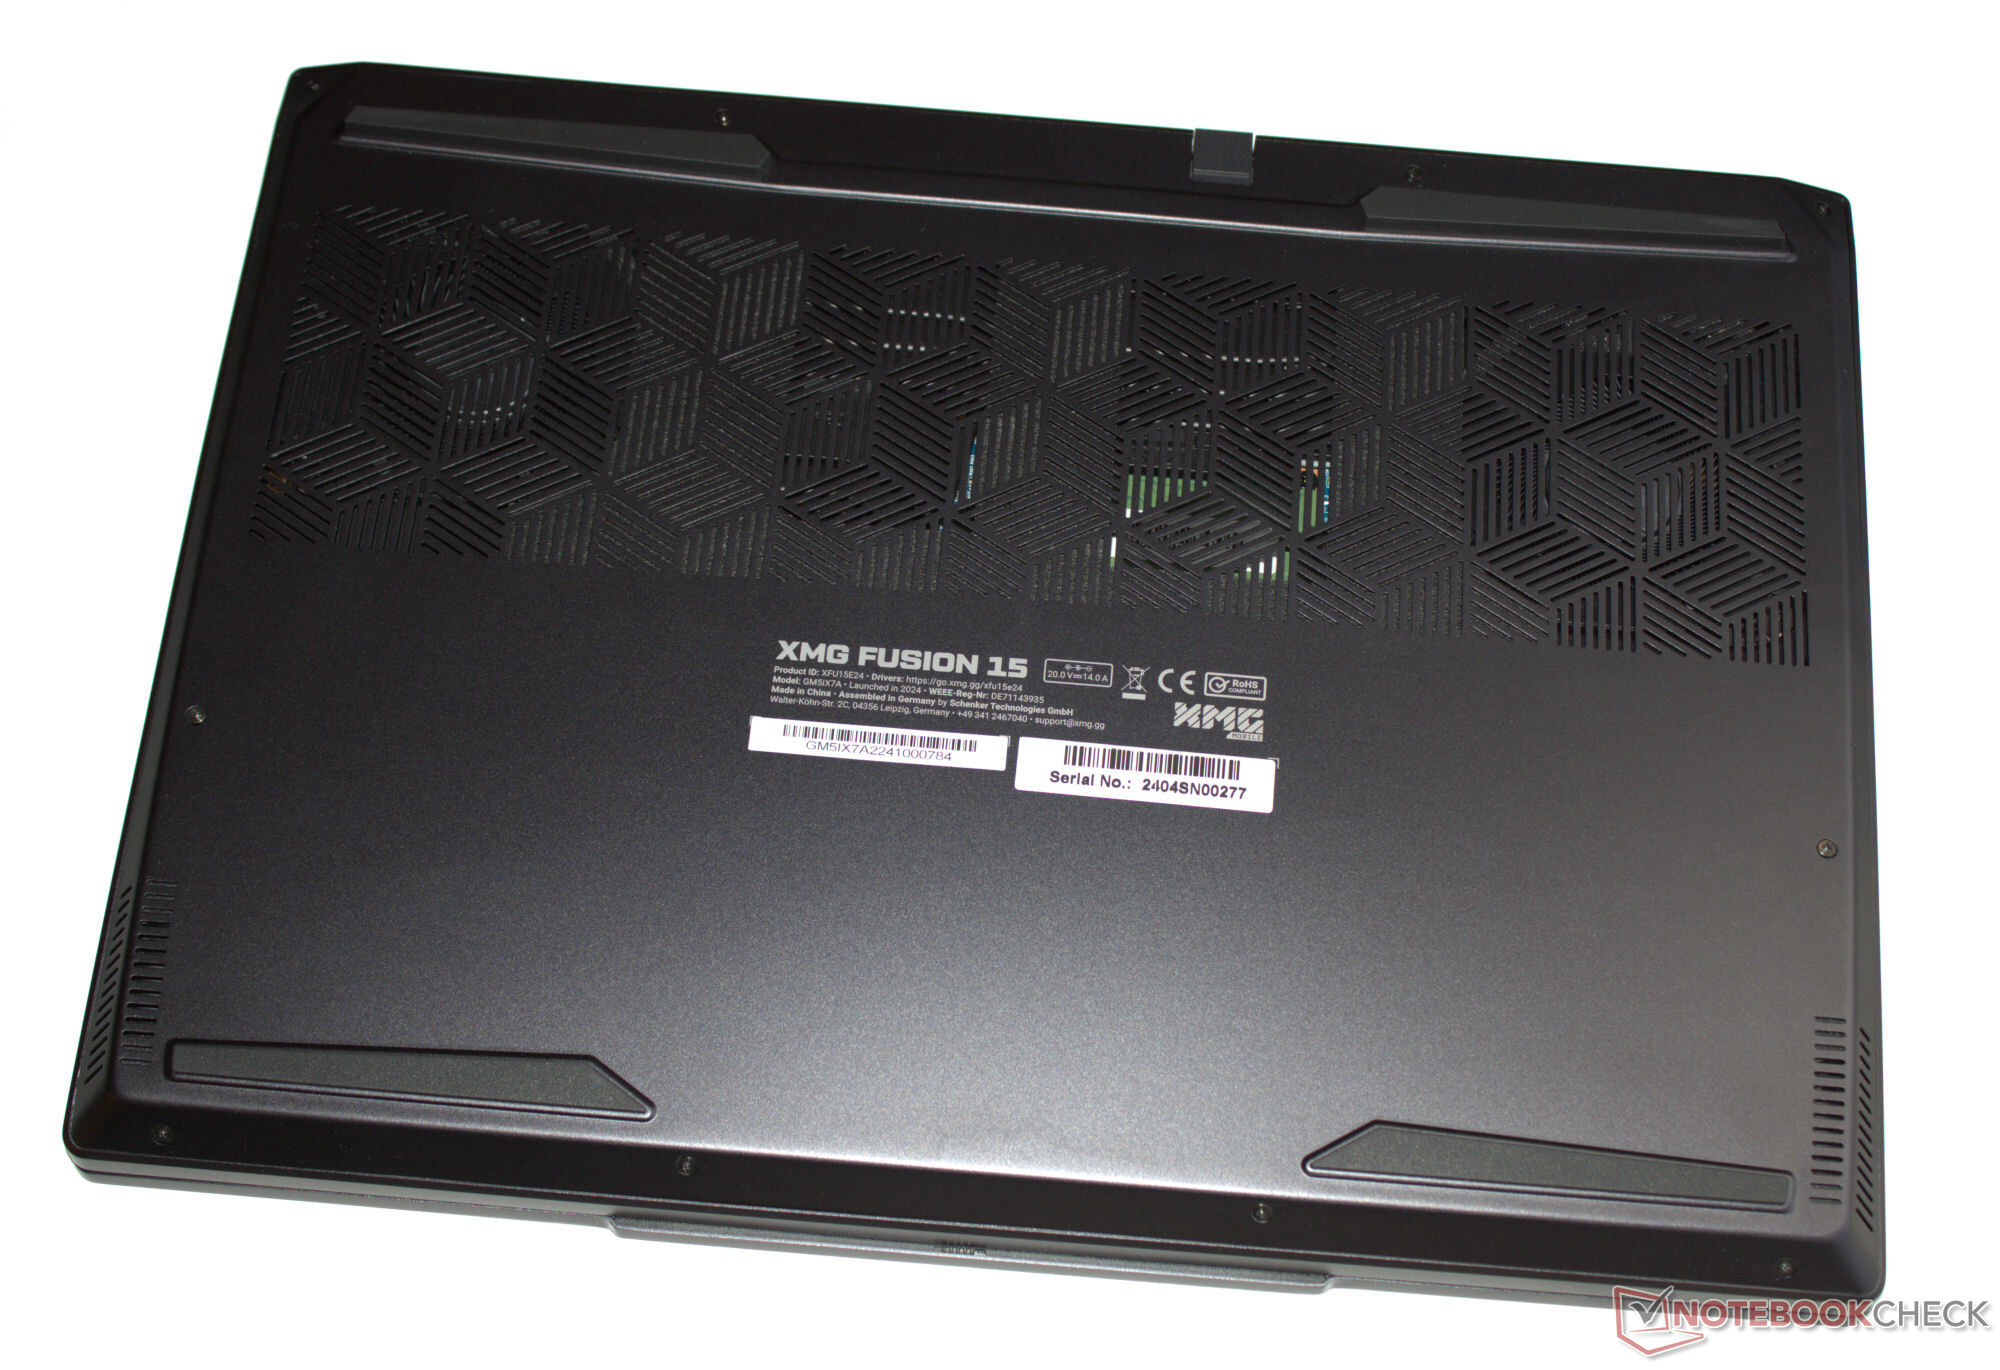
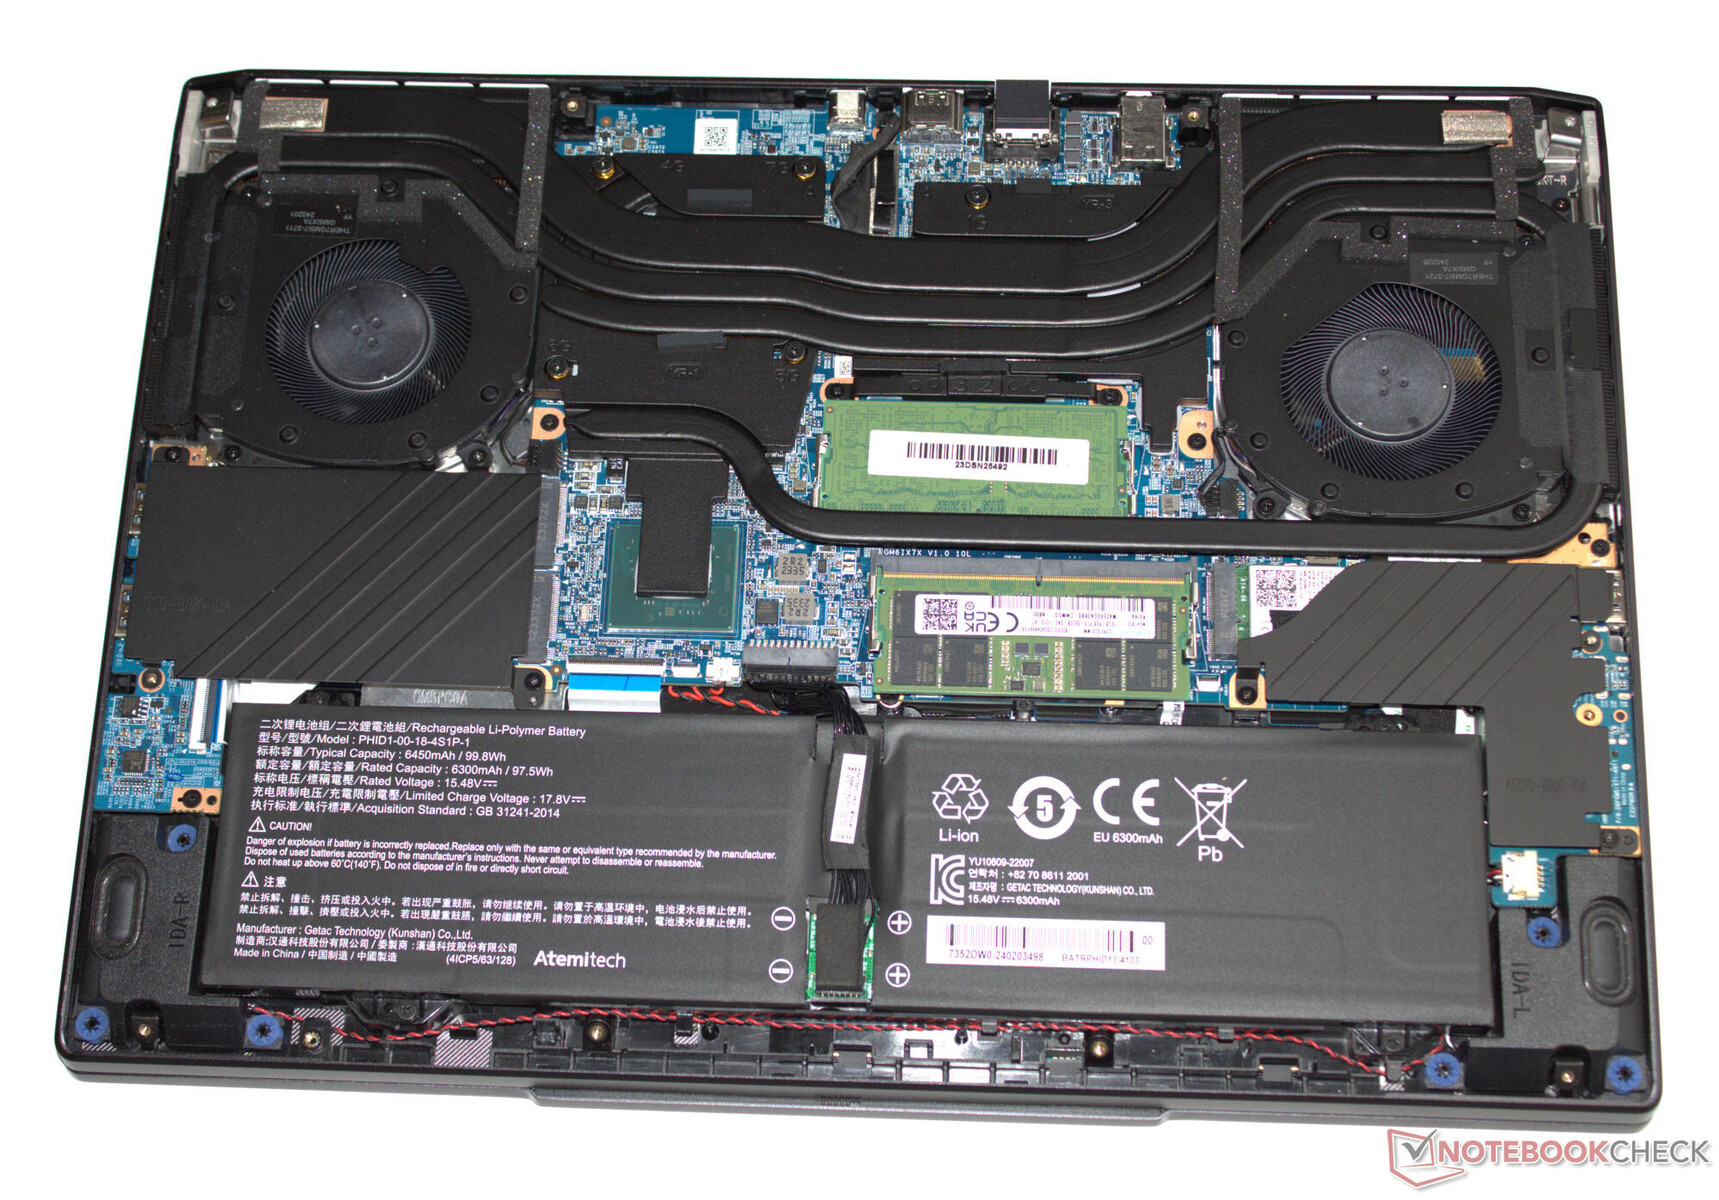
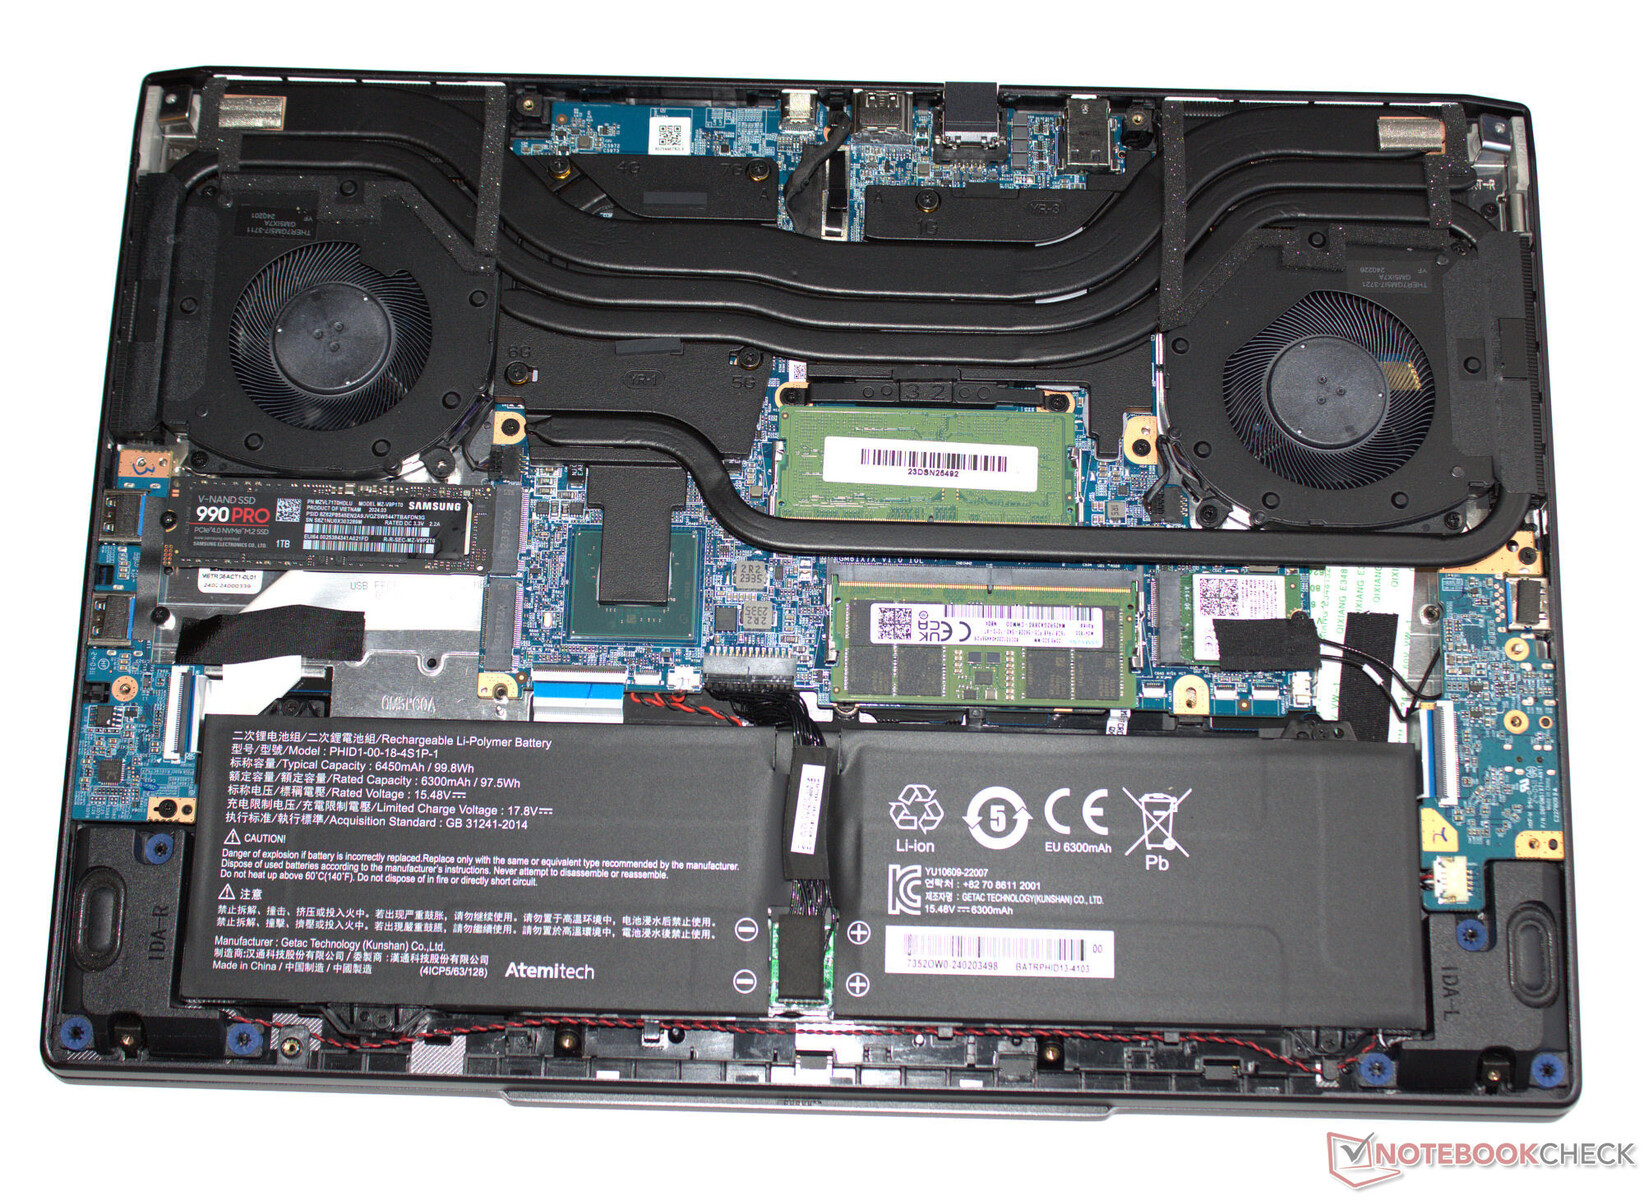
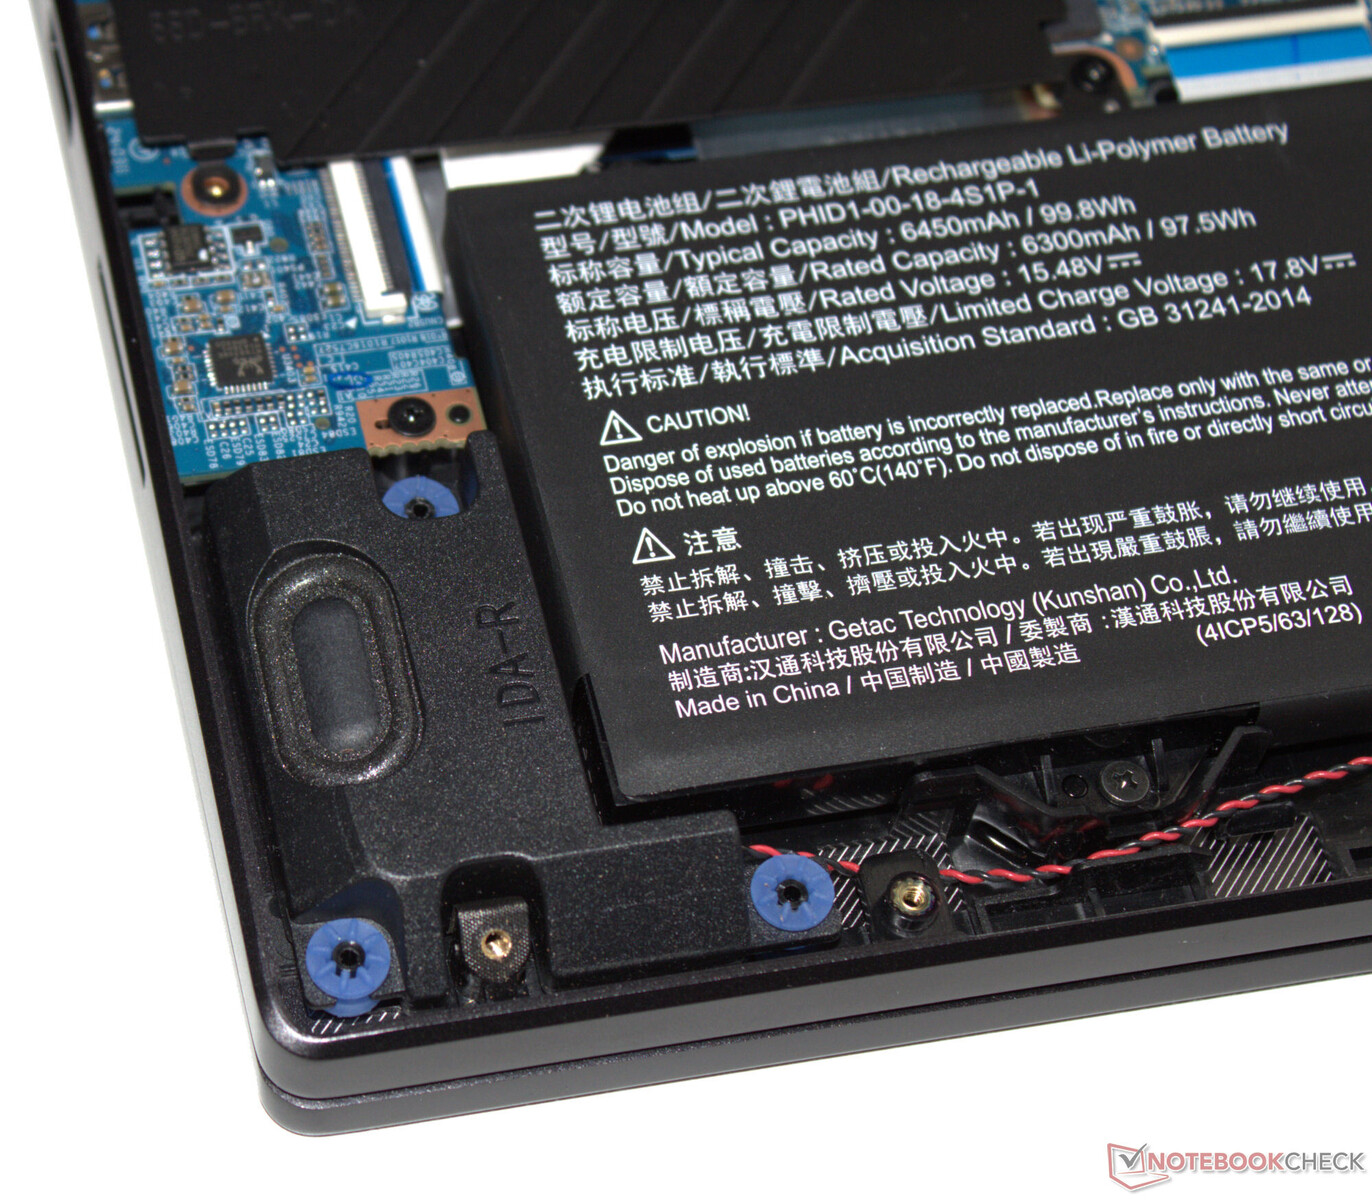
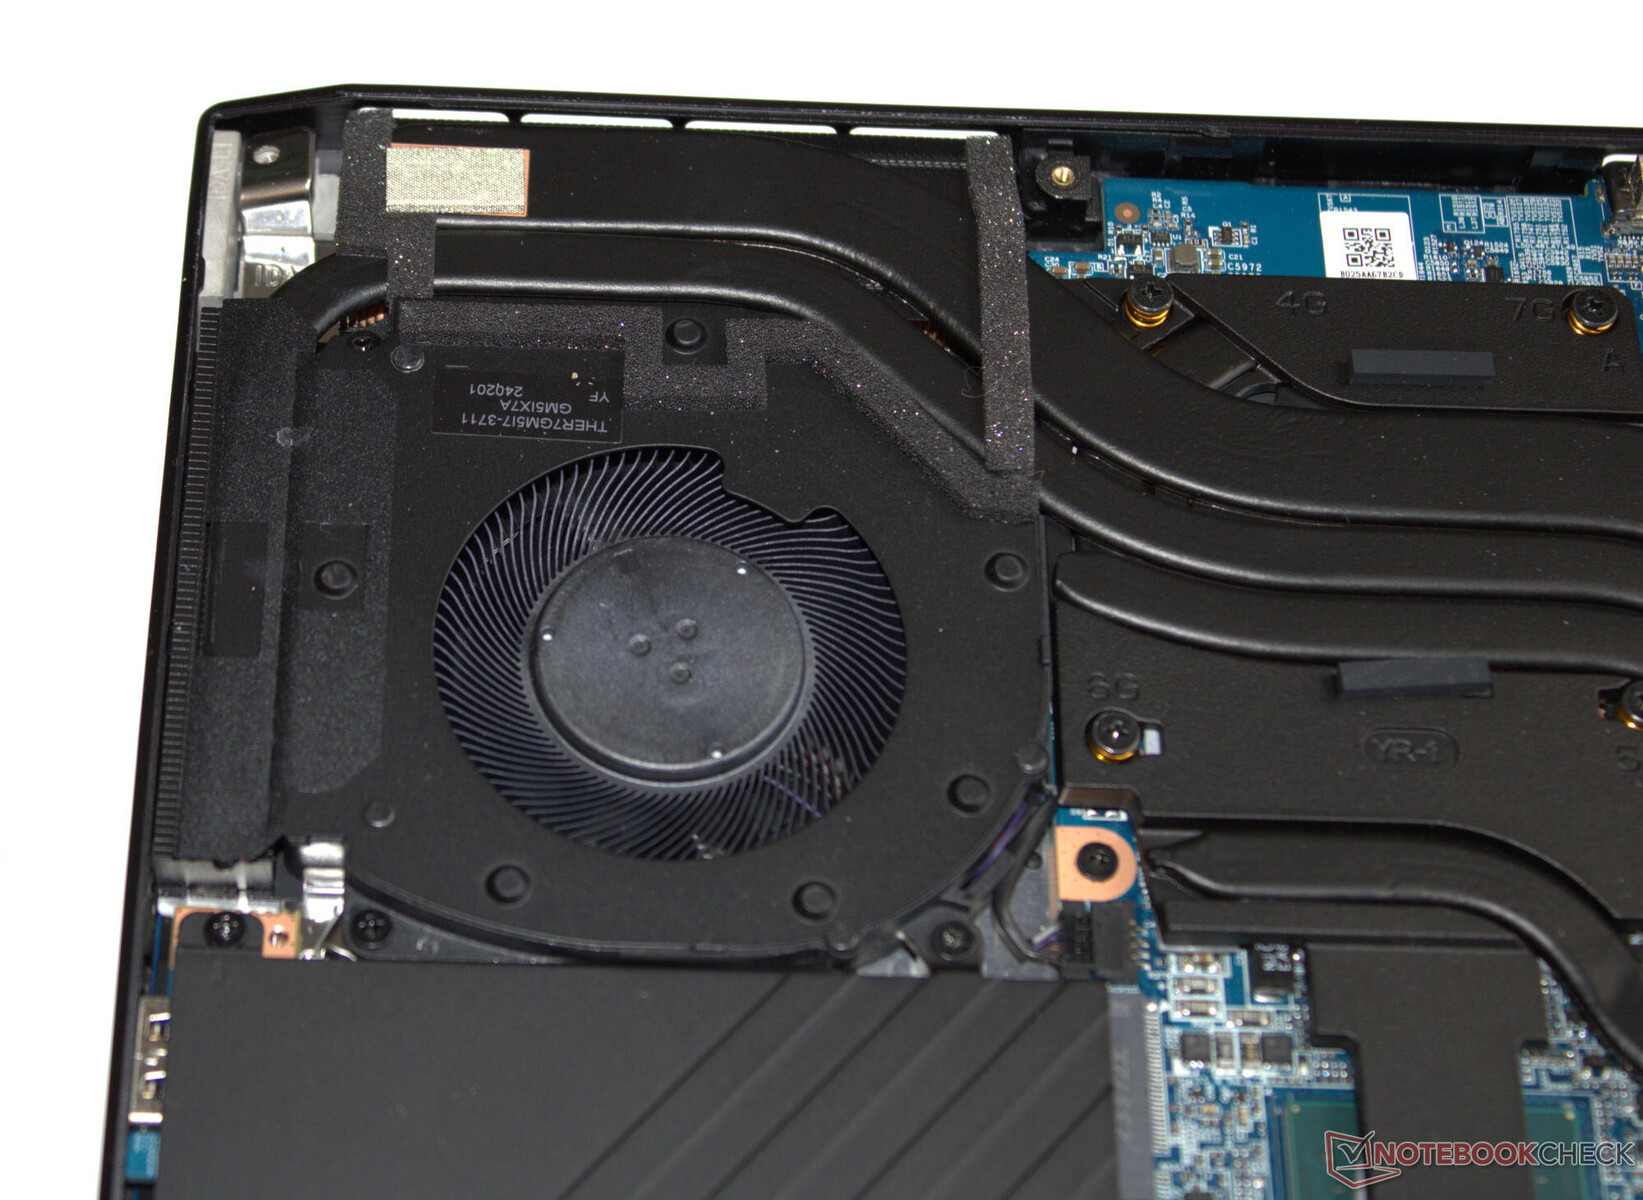
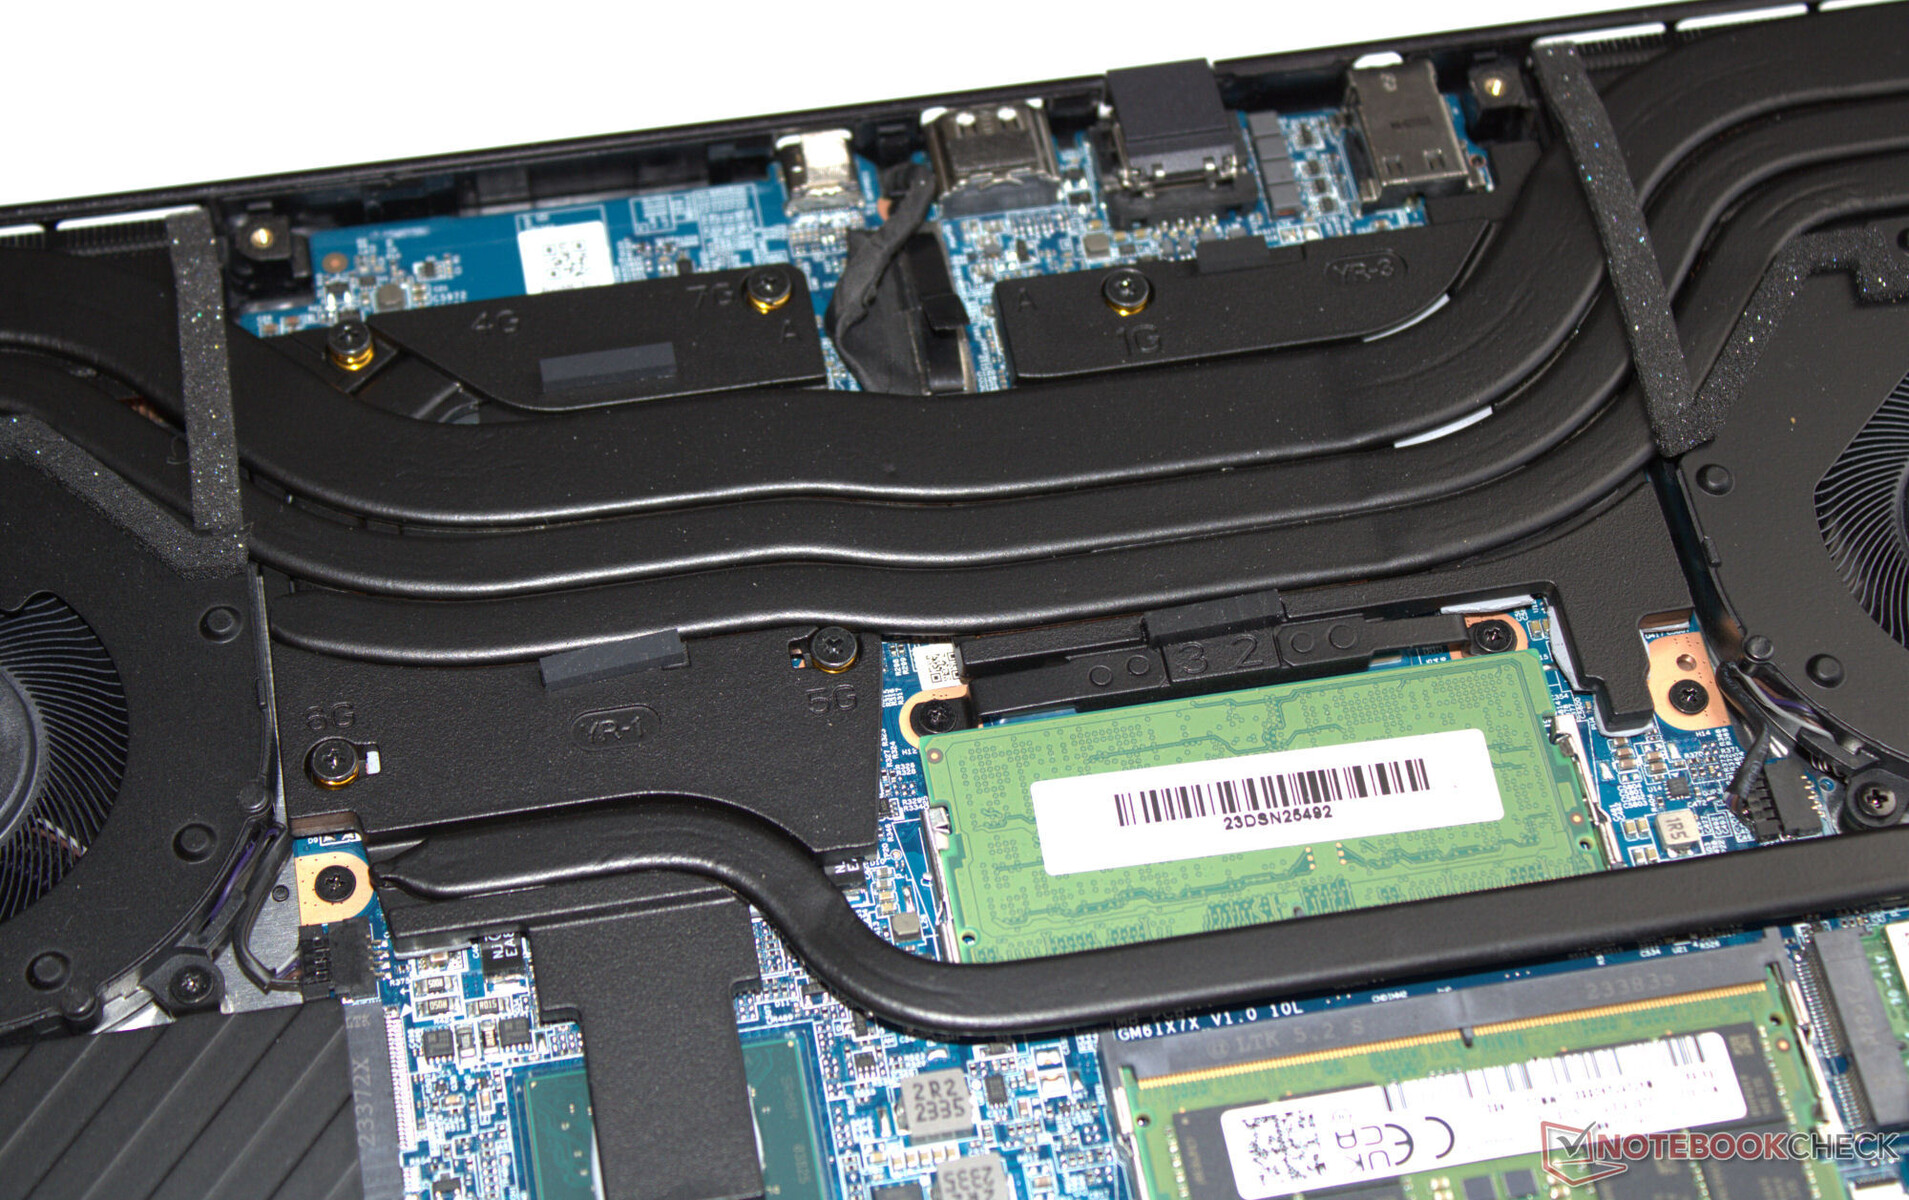
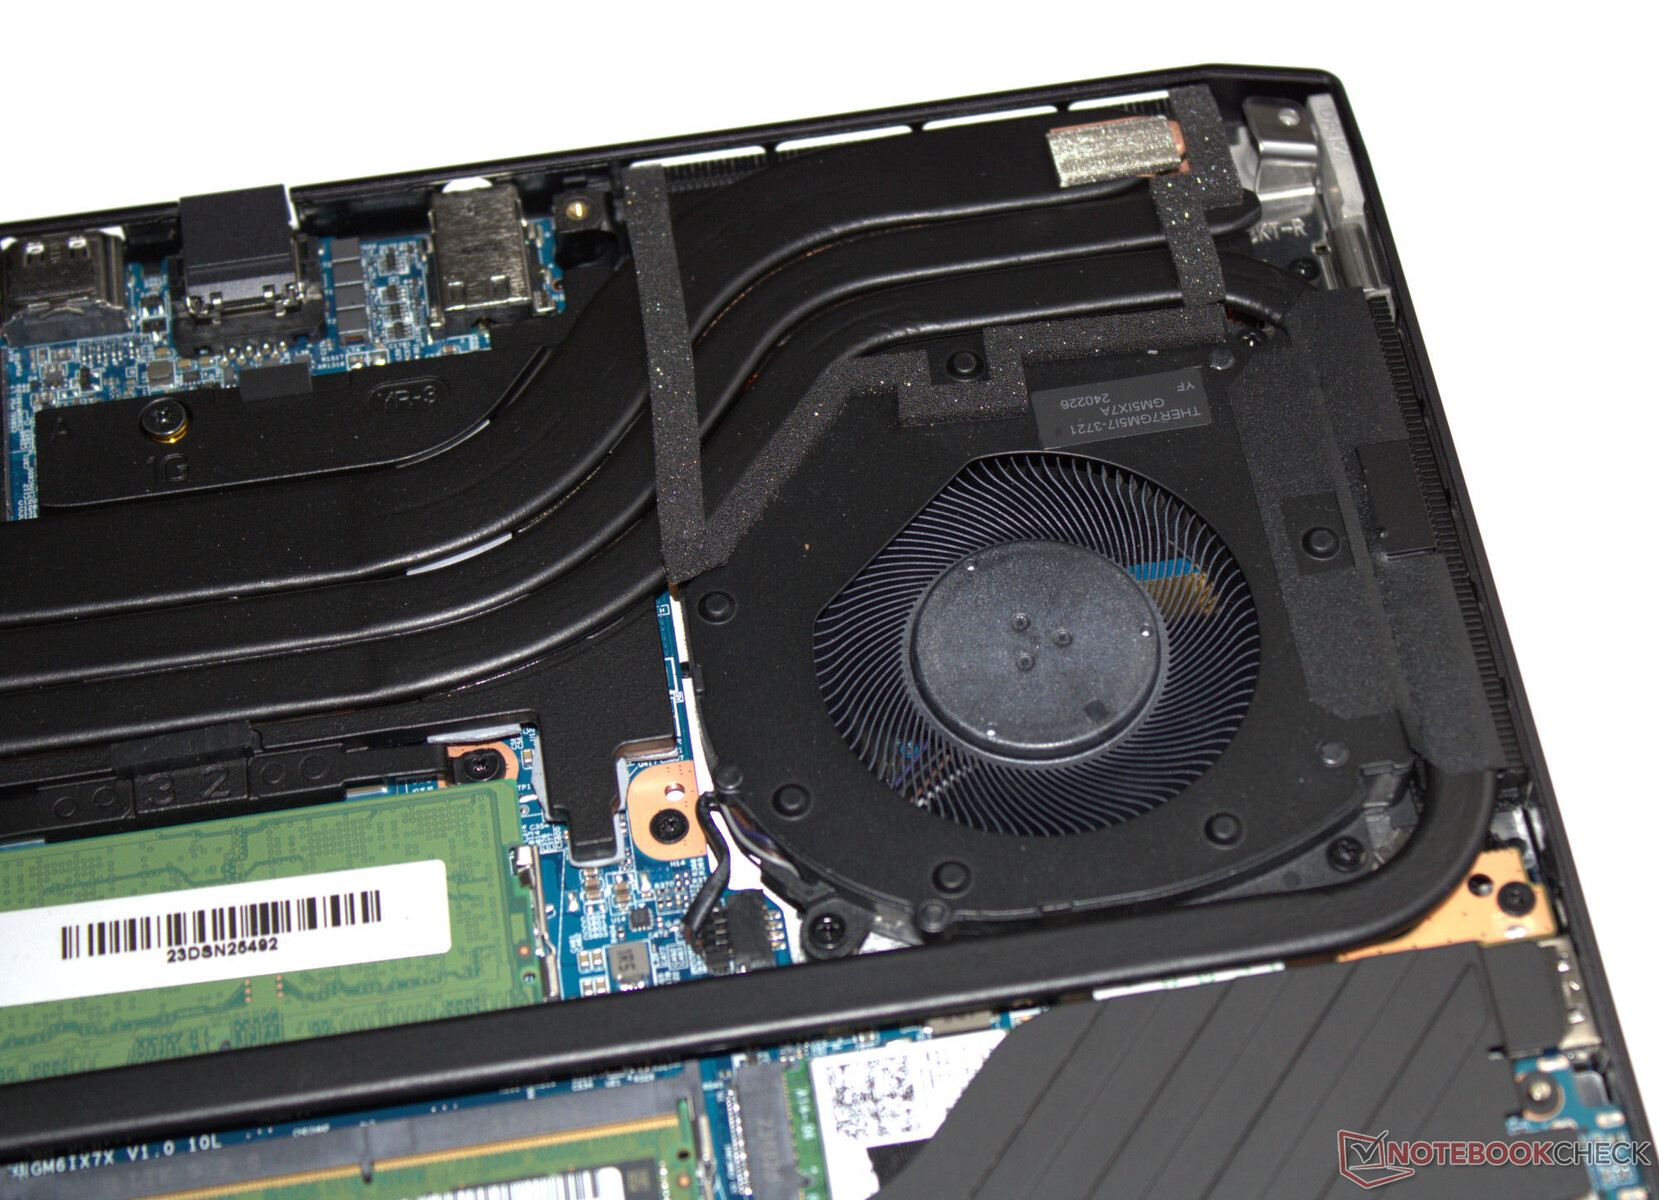
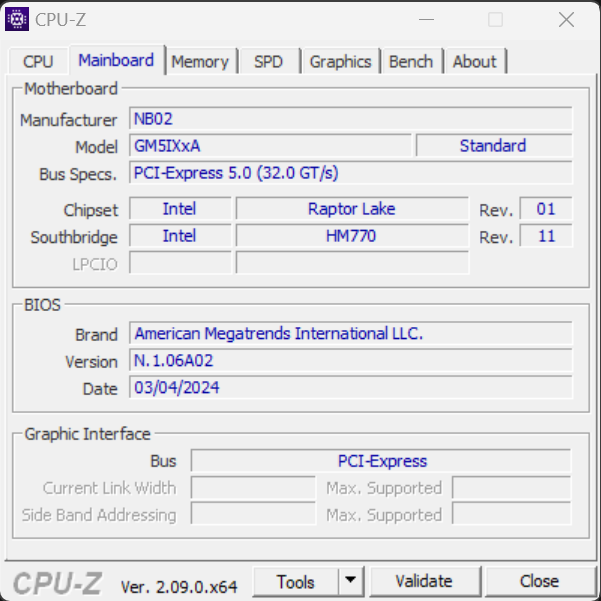
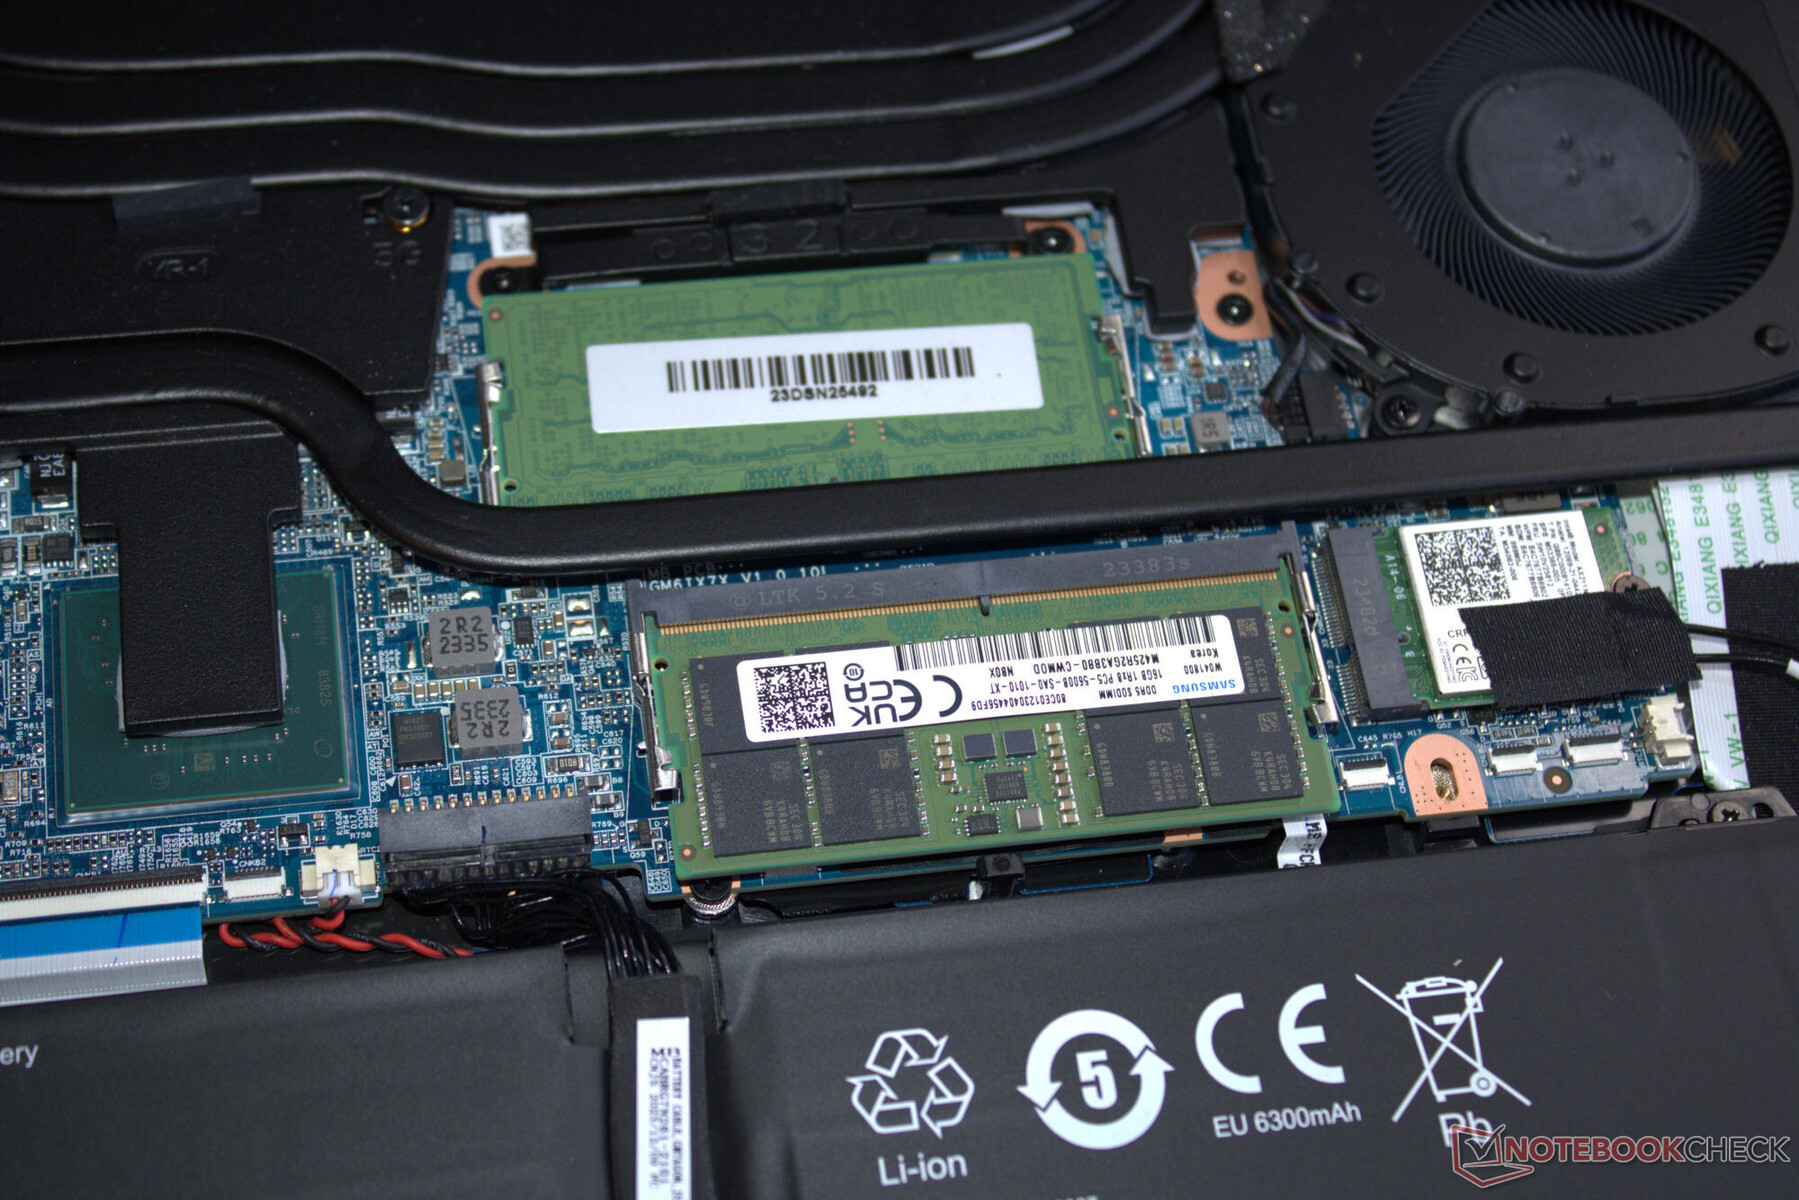
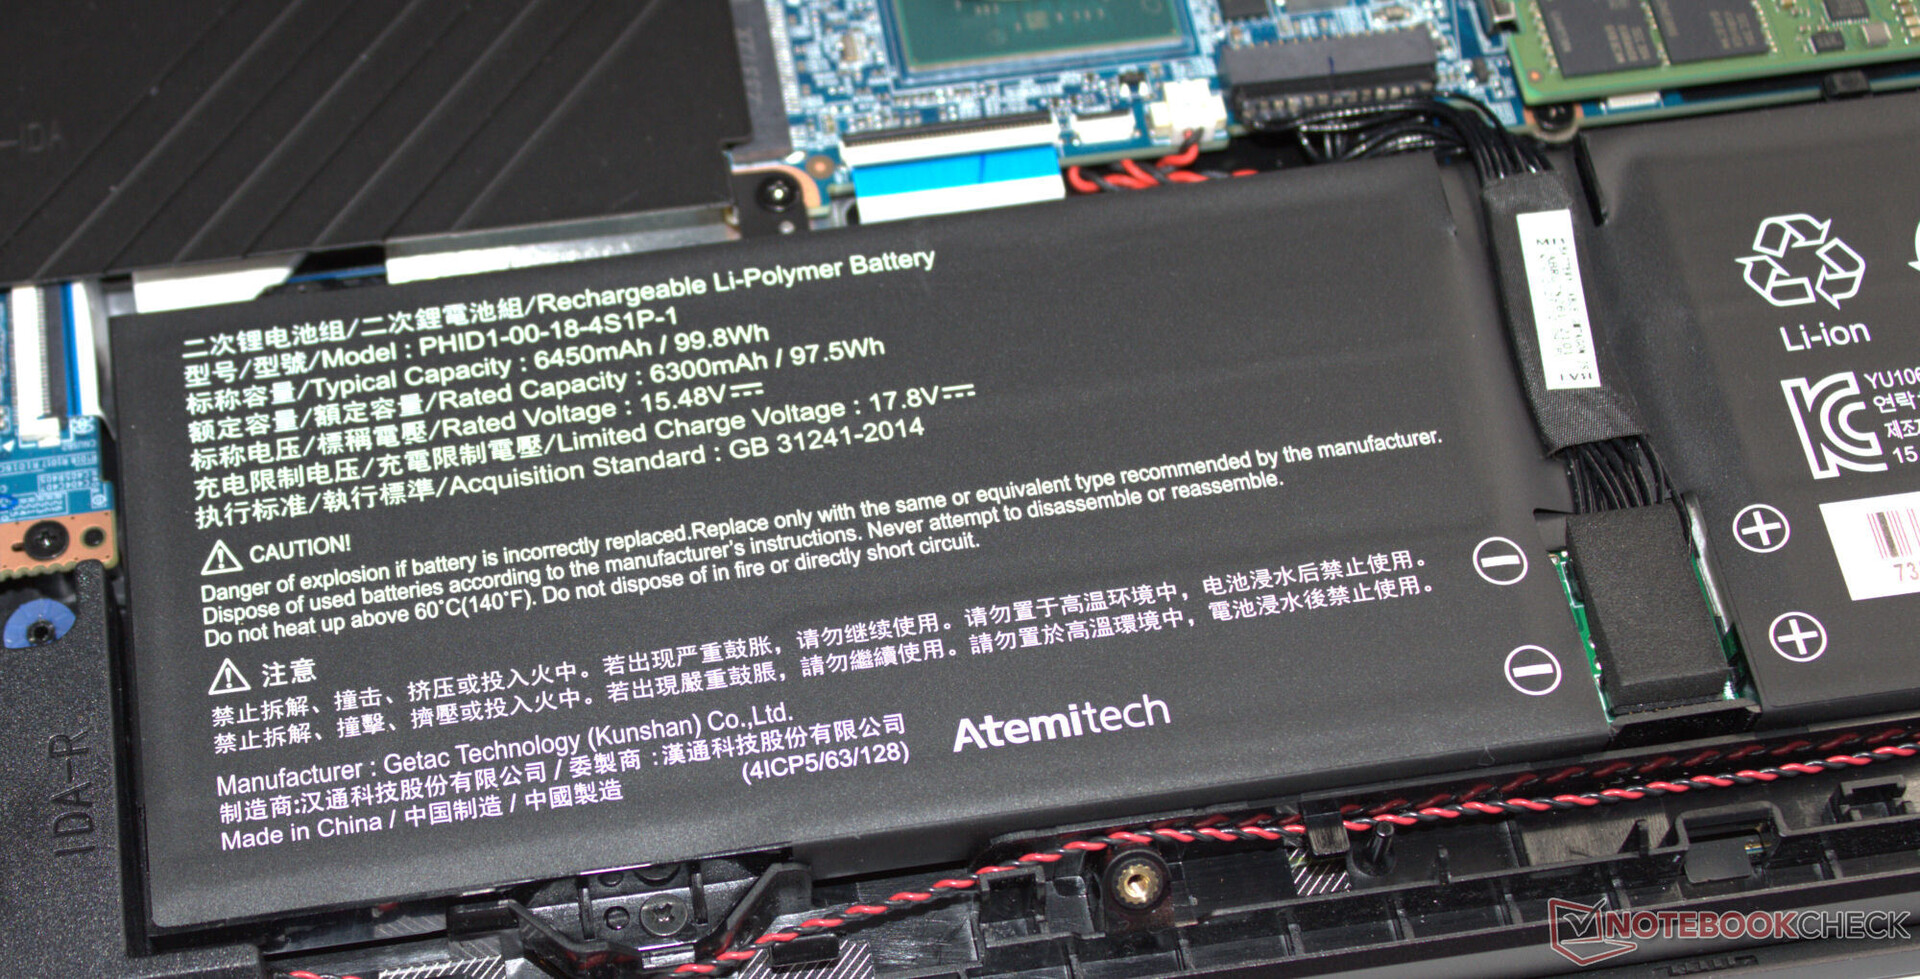
Maintenance
Après avoir retiré toutes les vis situées sous l'appareil, la partie inférieure du boîtier peut être retirée assez facilement - vous aurez peut-être besoin d'un plectre ou d'une spatule plate pour vous aider dans cette tâche. Vous pouvez ensuite accéder aux banques de RAM (toutes deux occupées), au SSD (PCIe 4, M.2-2280), au deuxième emplacement SSD (PCIe 4, M.2-2280), au module WLAN, aux ventilateurs, à la batterie du BIOS et à la batterie de l'ordinateur portable.
Garantie
L'appareil est couvert par une garantie de base de deux ans, qui comprend le service d'enlèvement et un service de réparation rapide de six mois (réparation dans les 48 heures). Vous pouvez étendre cette garantie à 36 mois moyennant des frais.
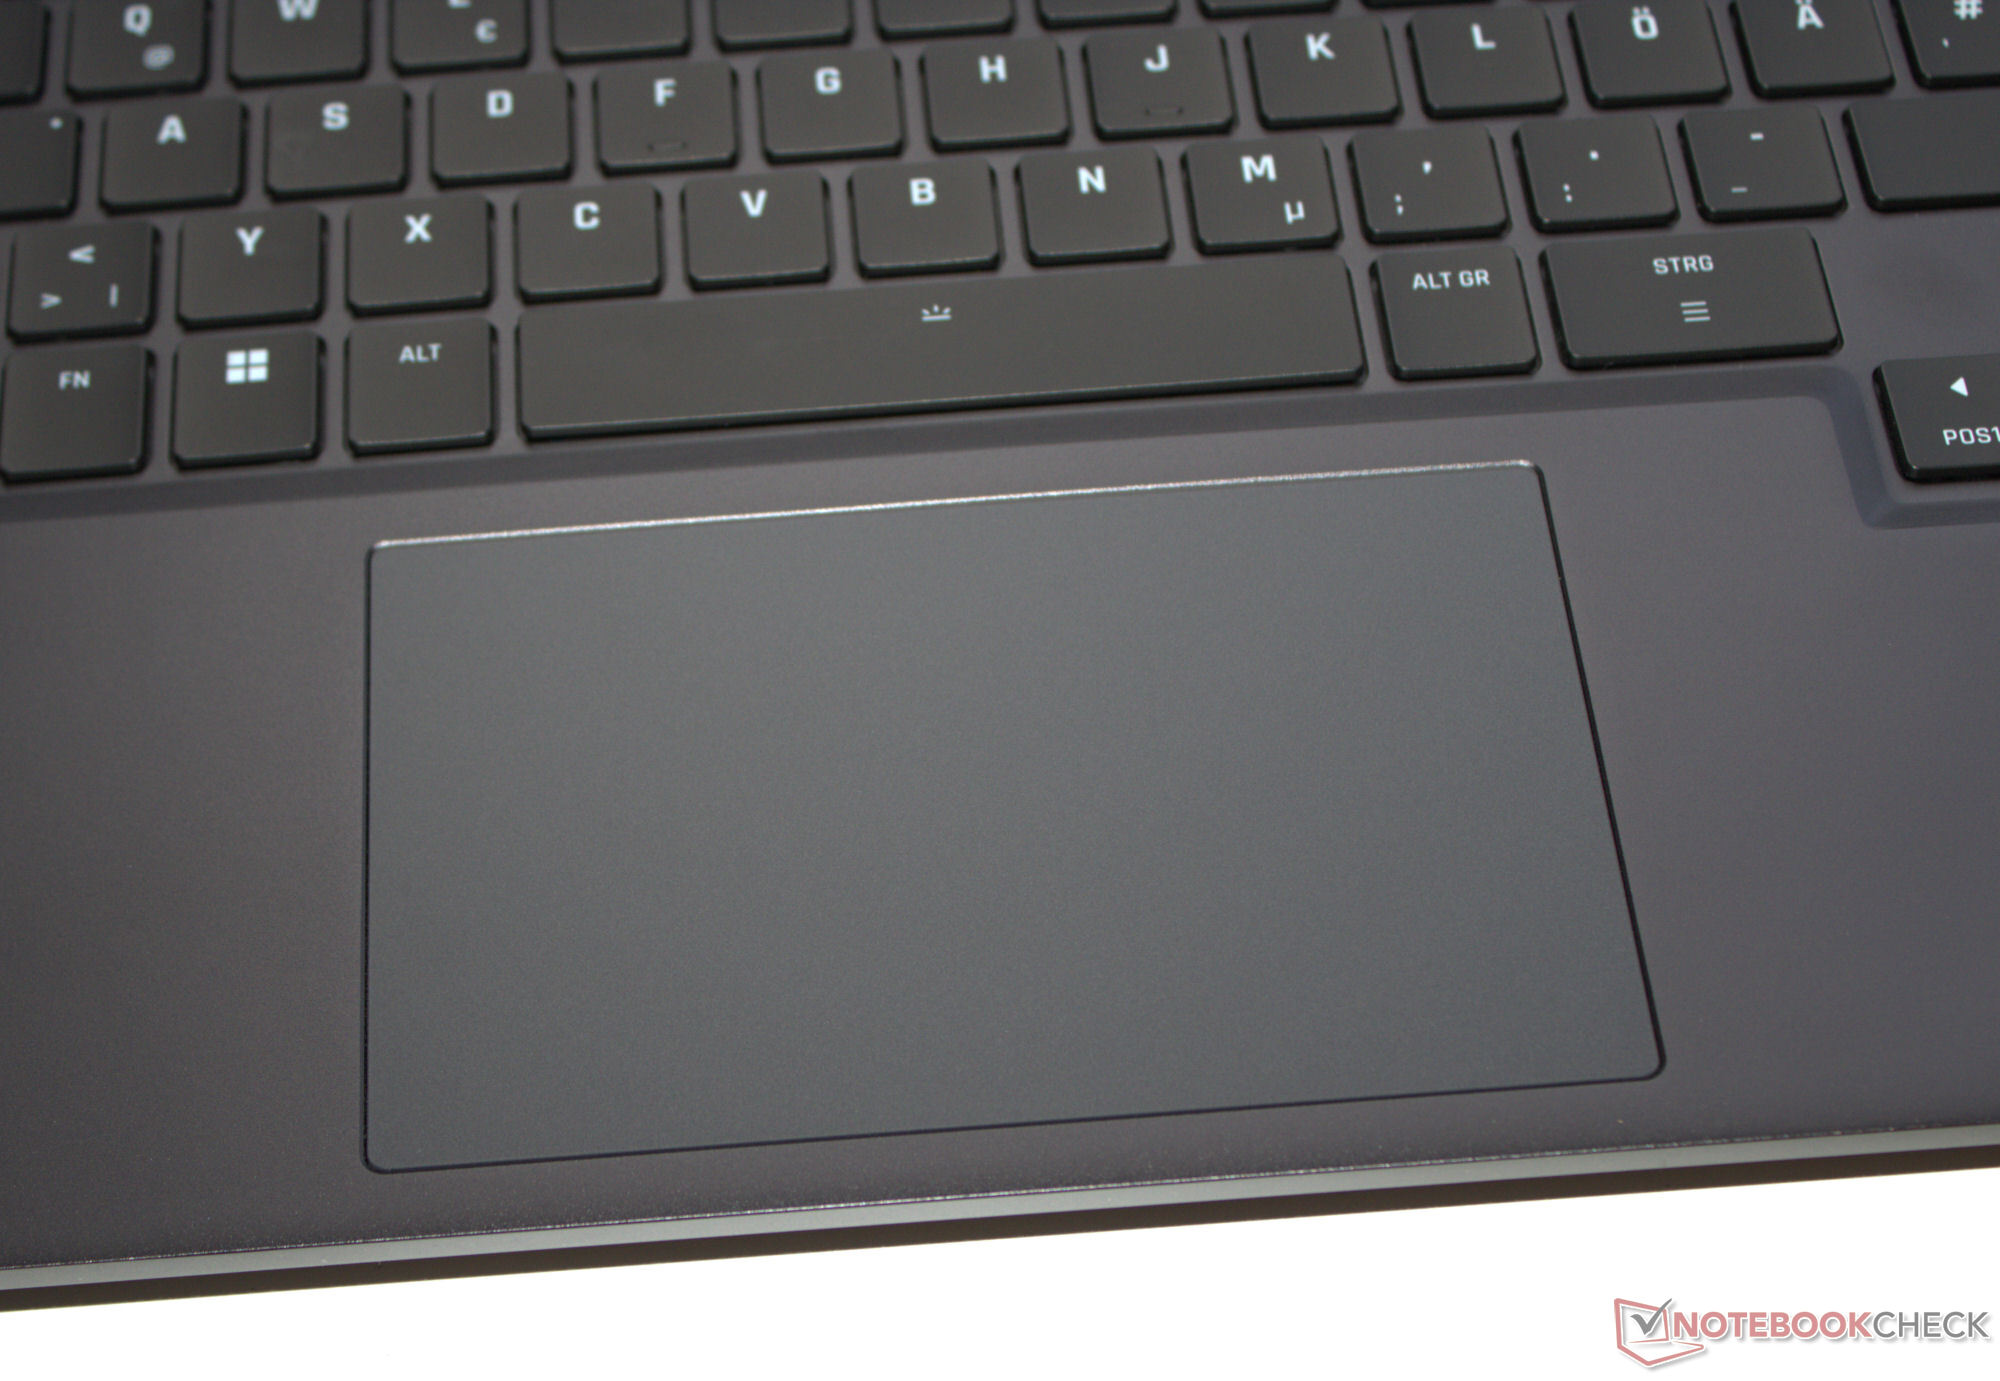
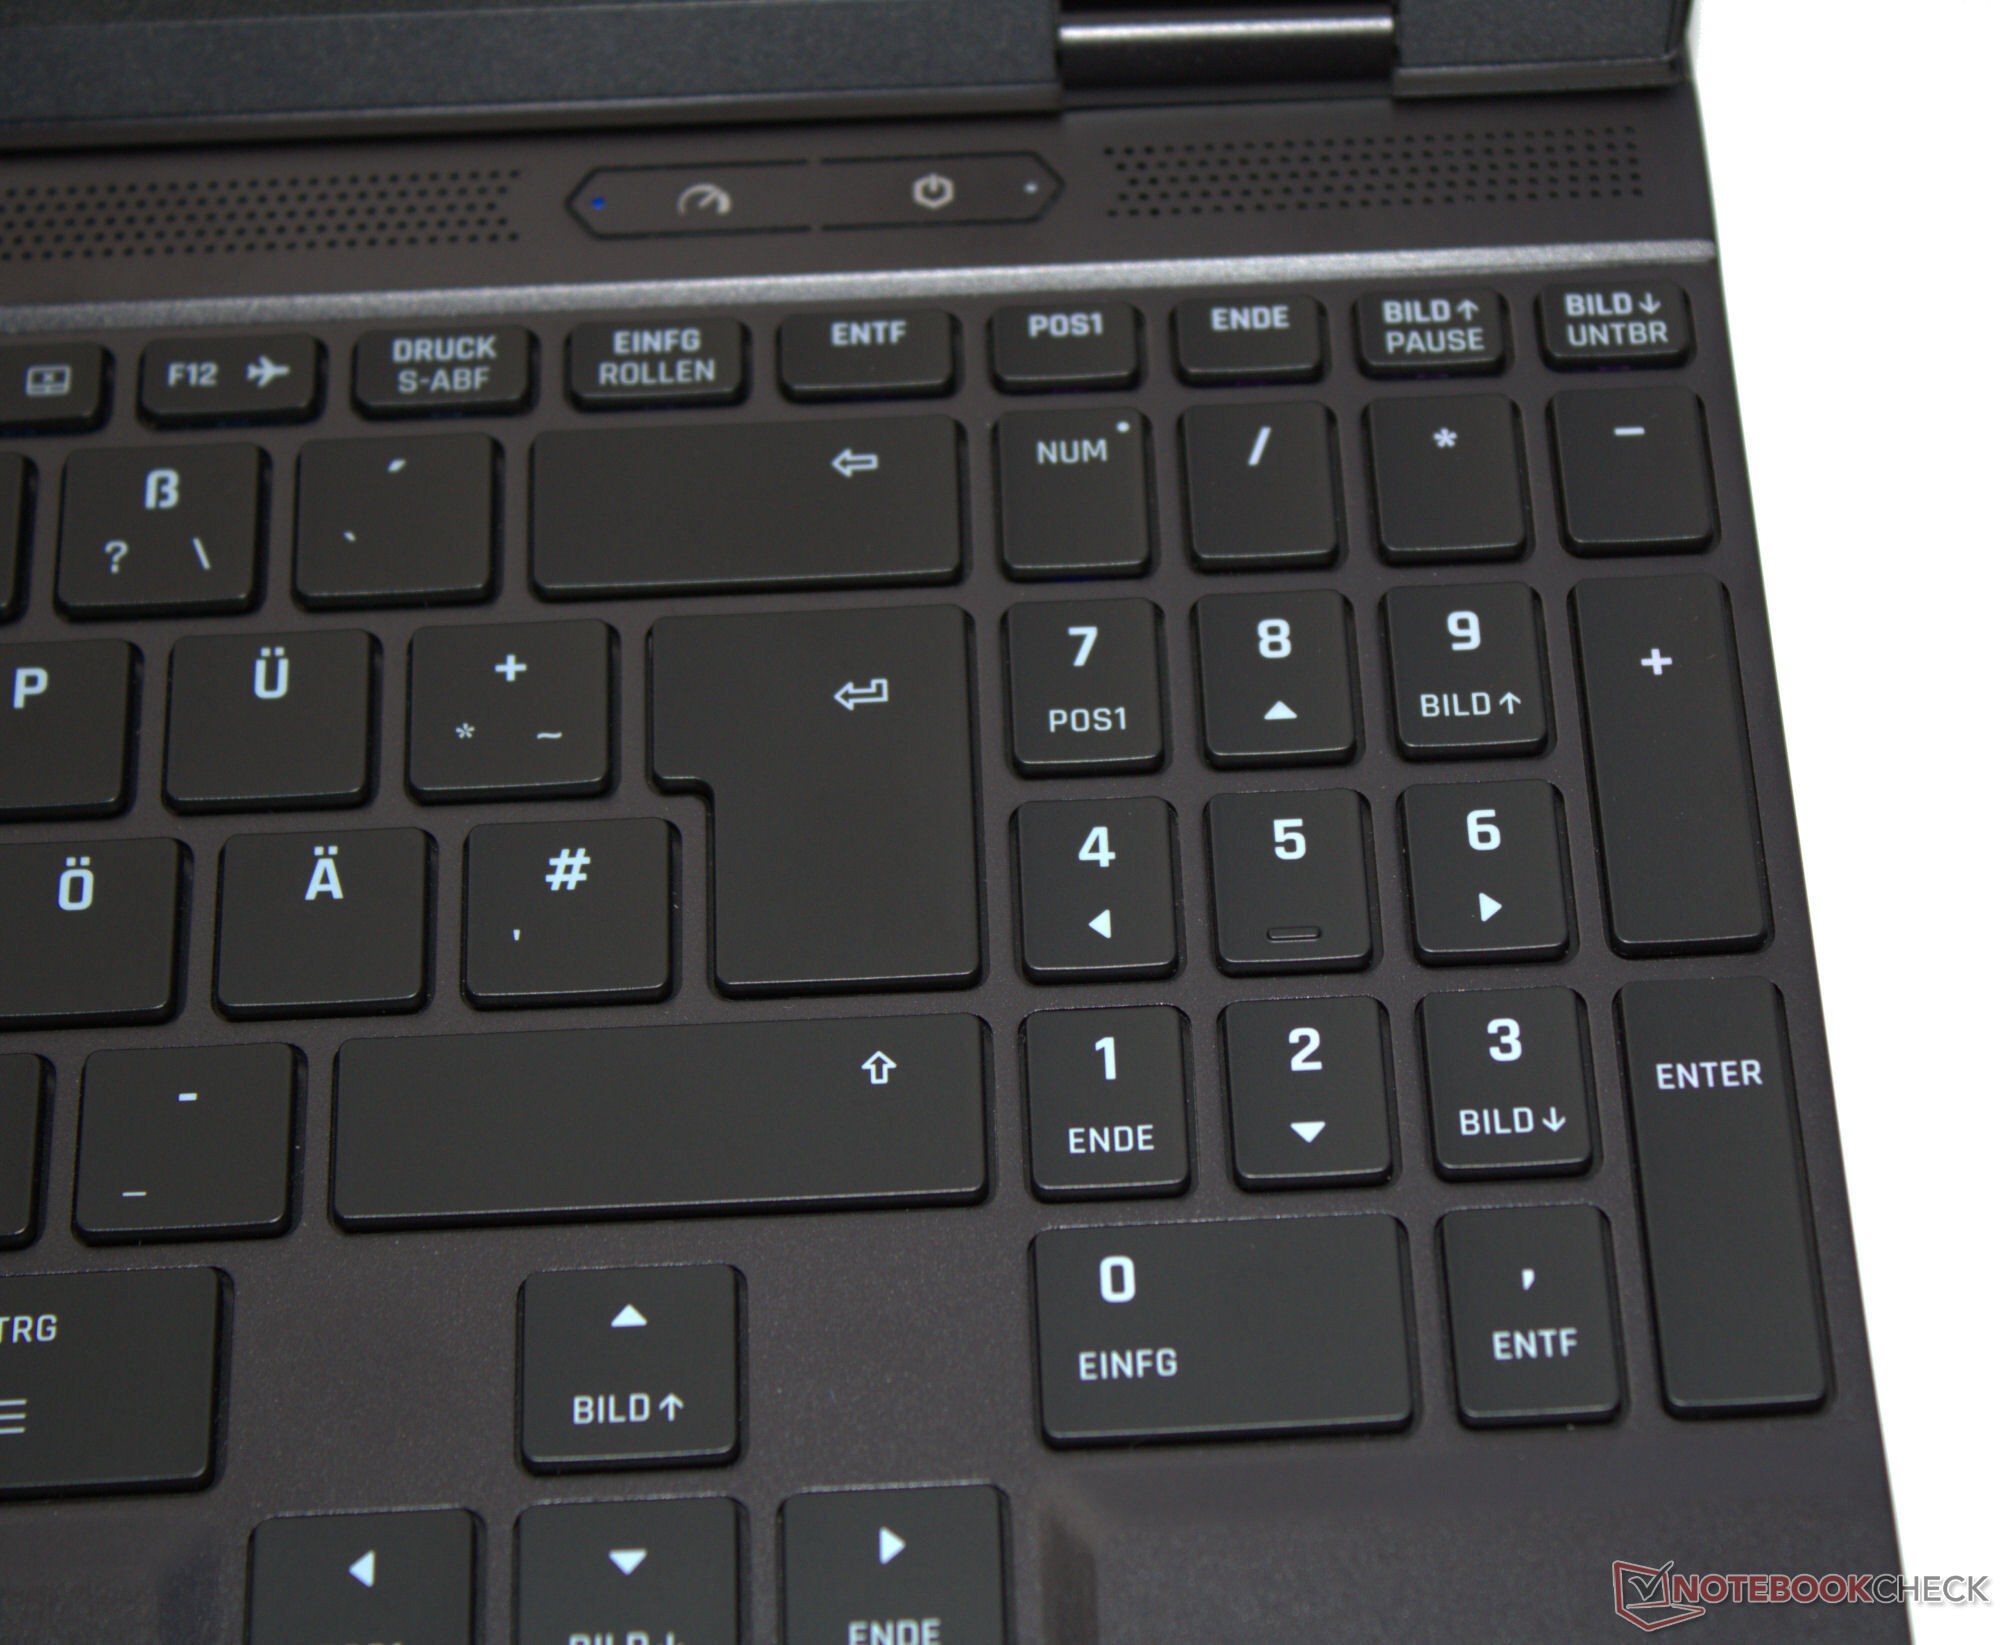
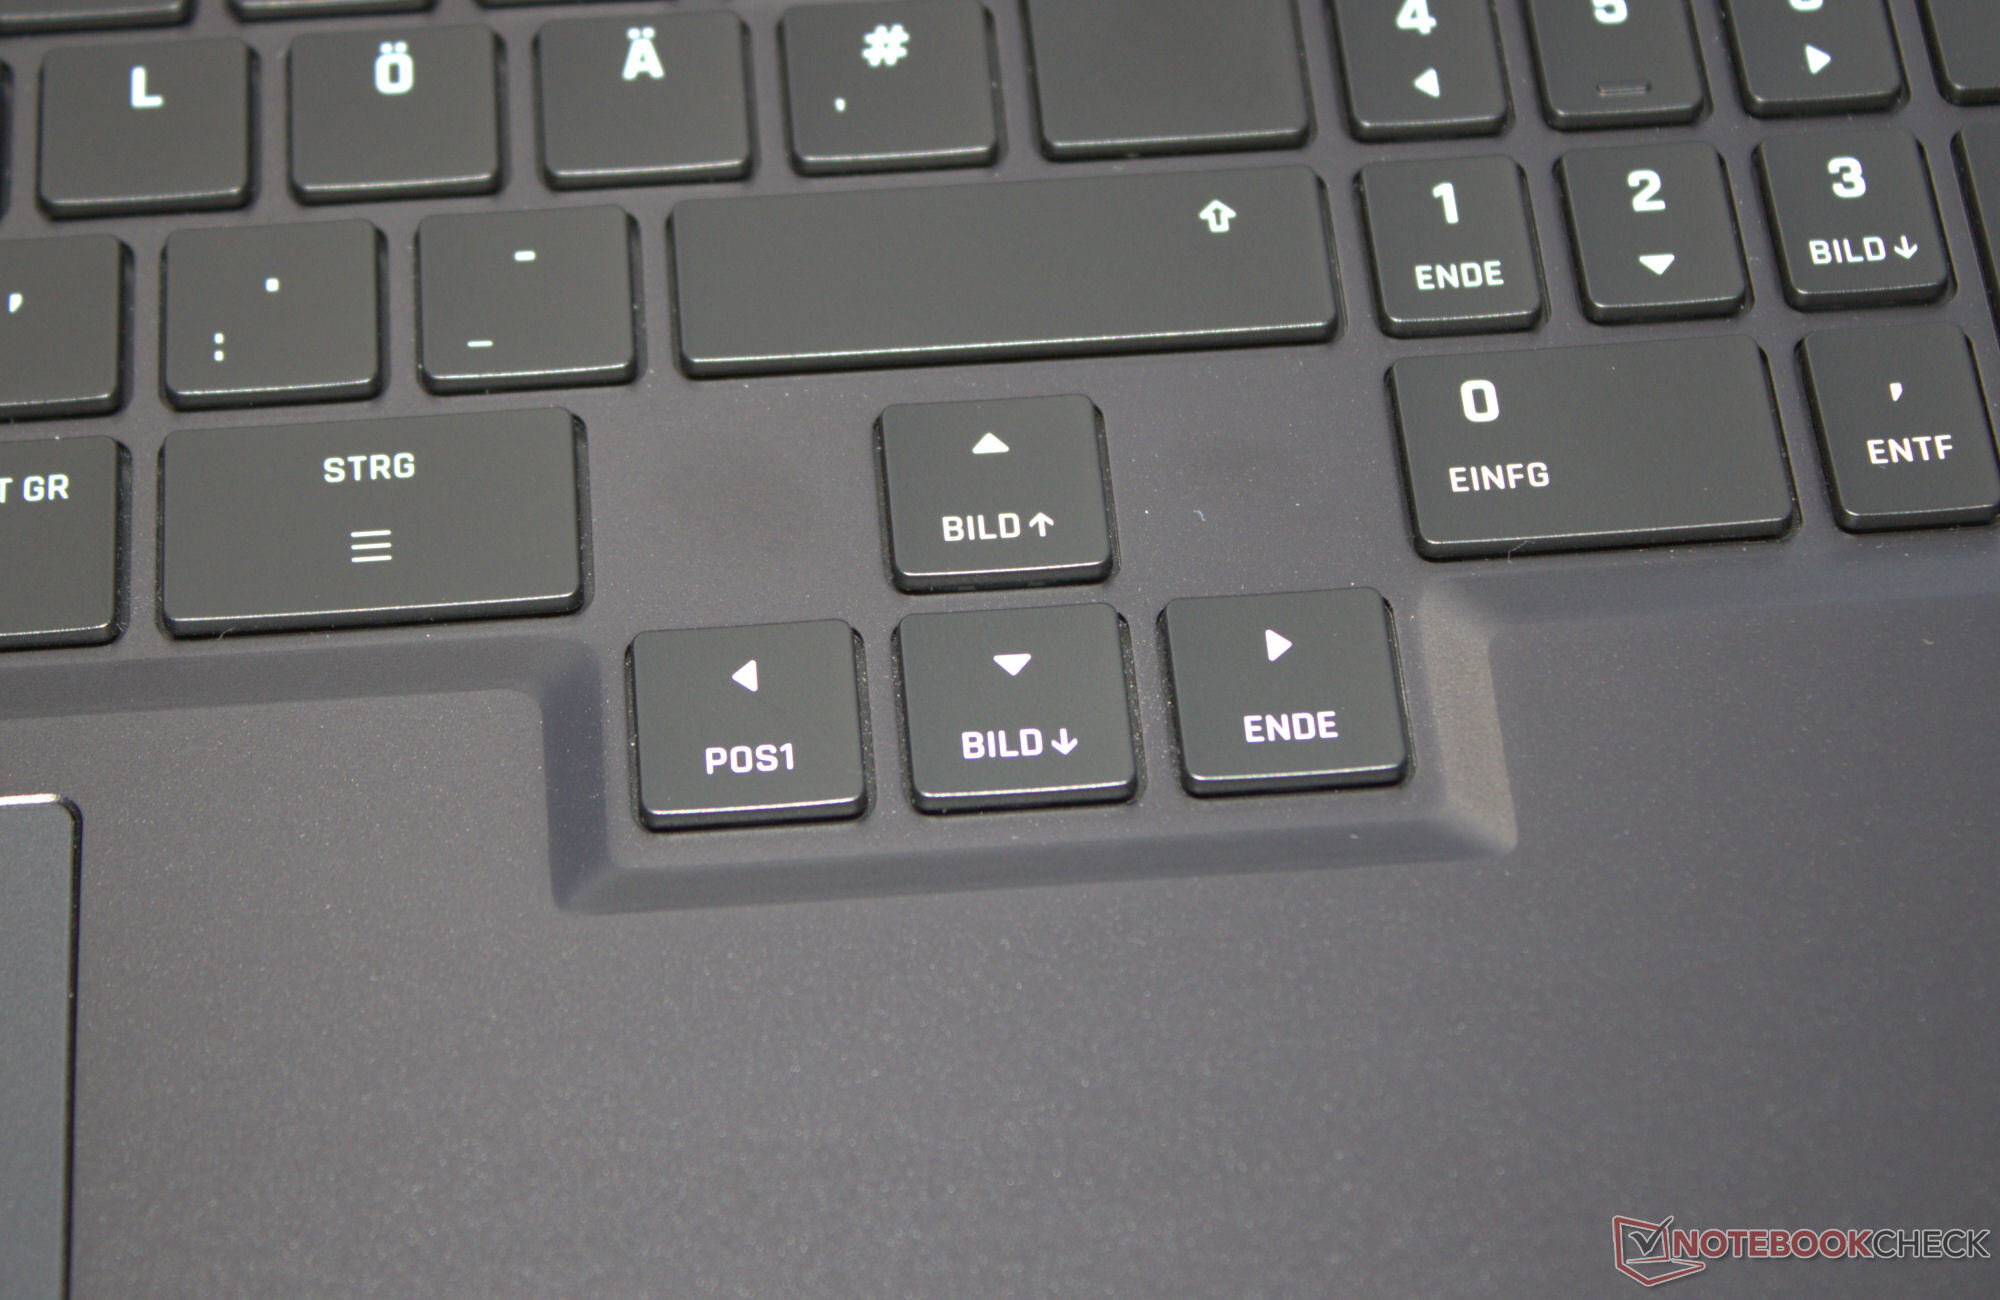
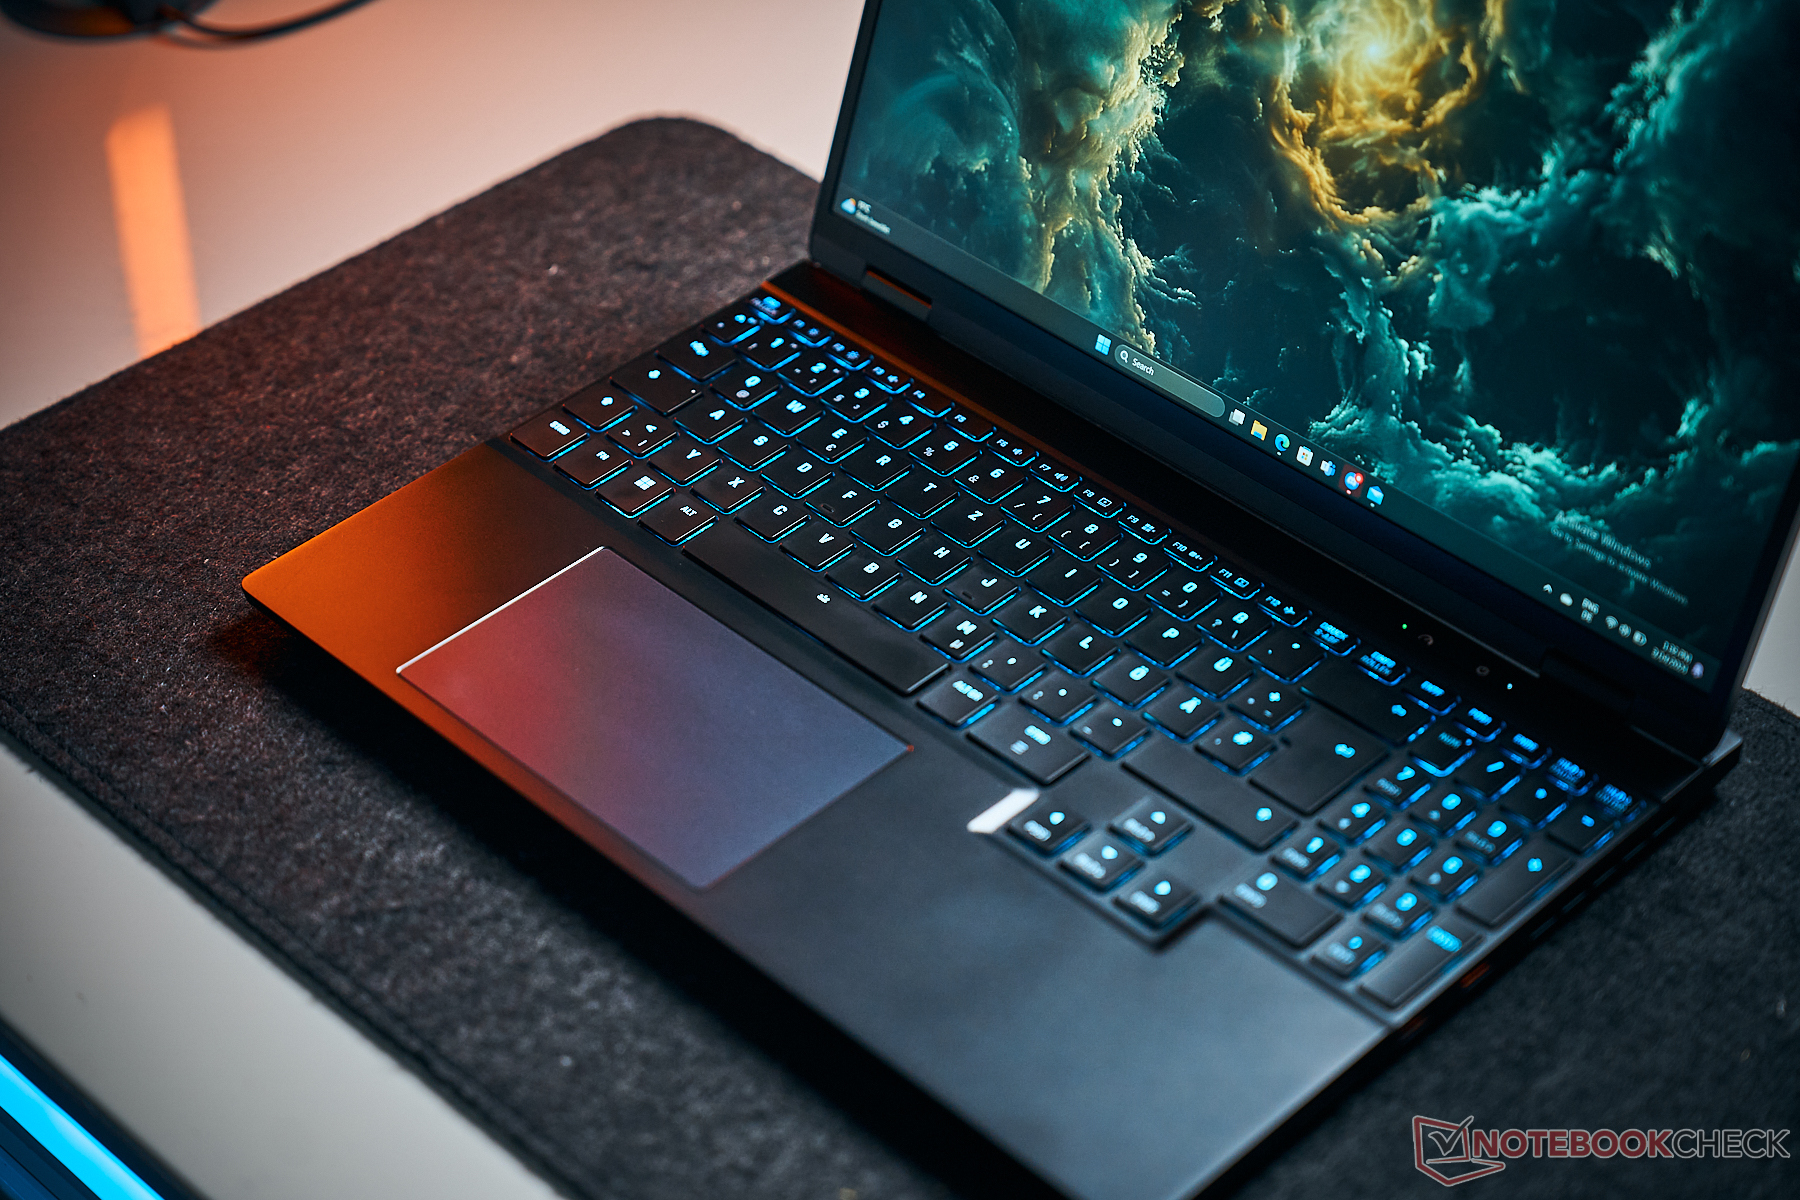
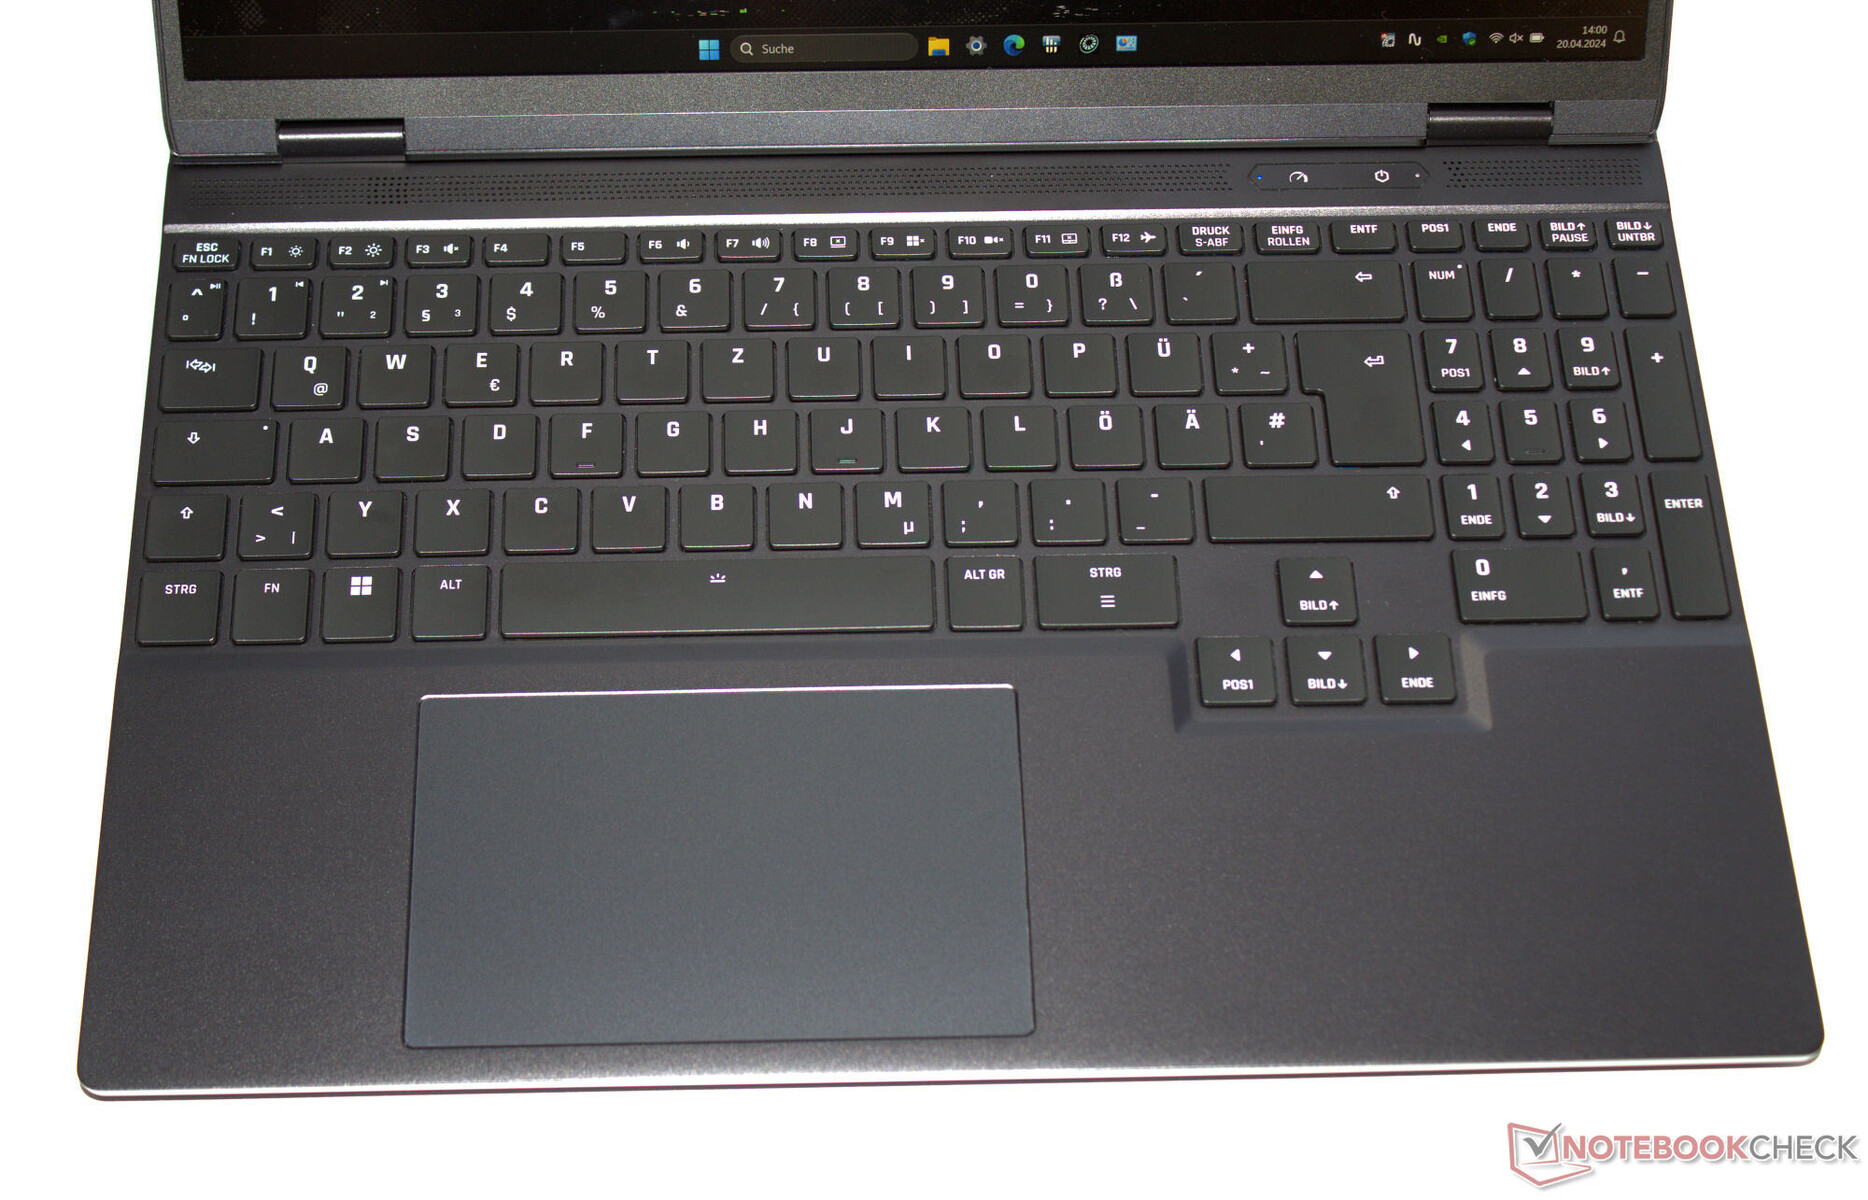
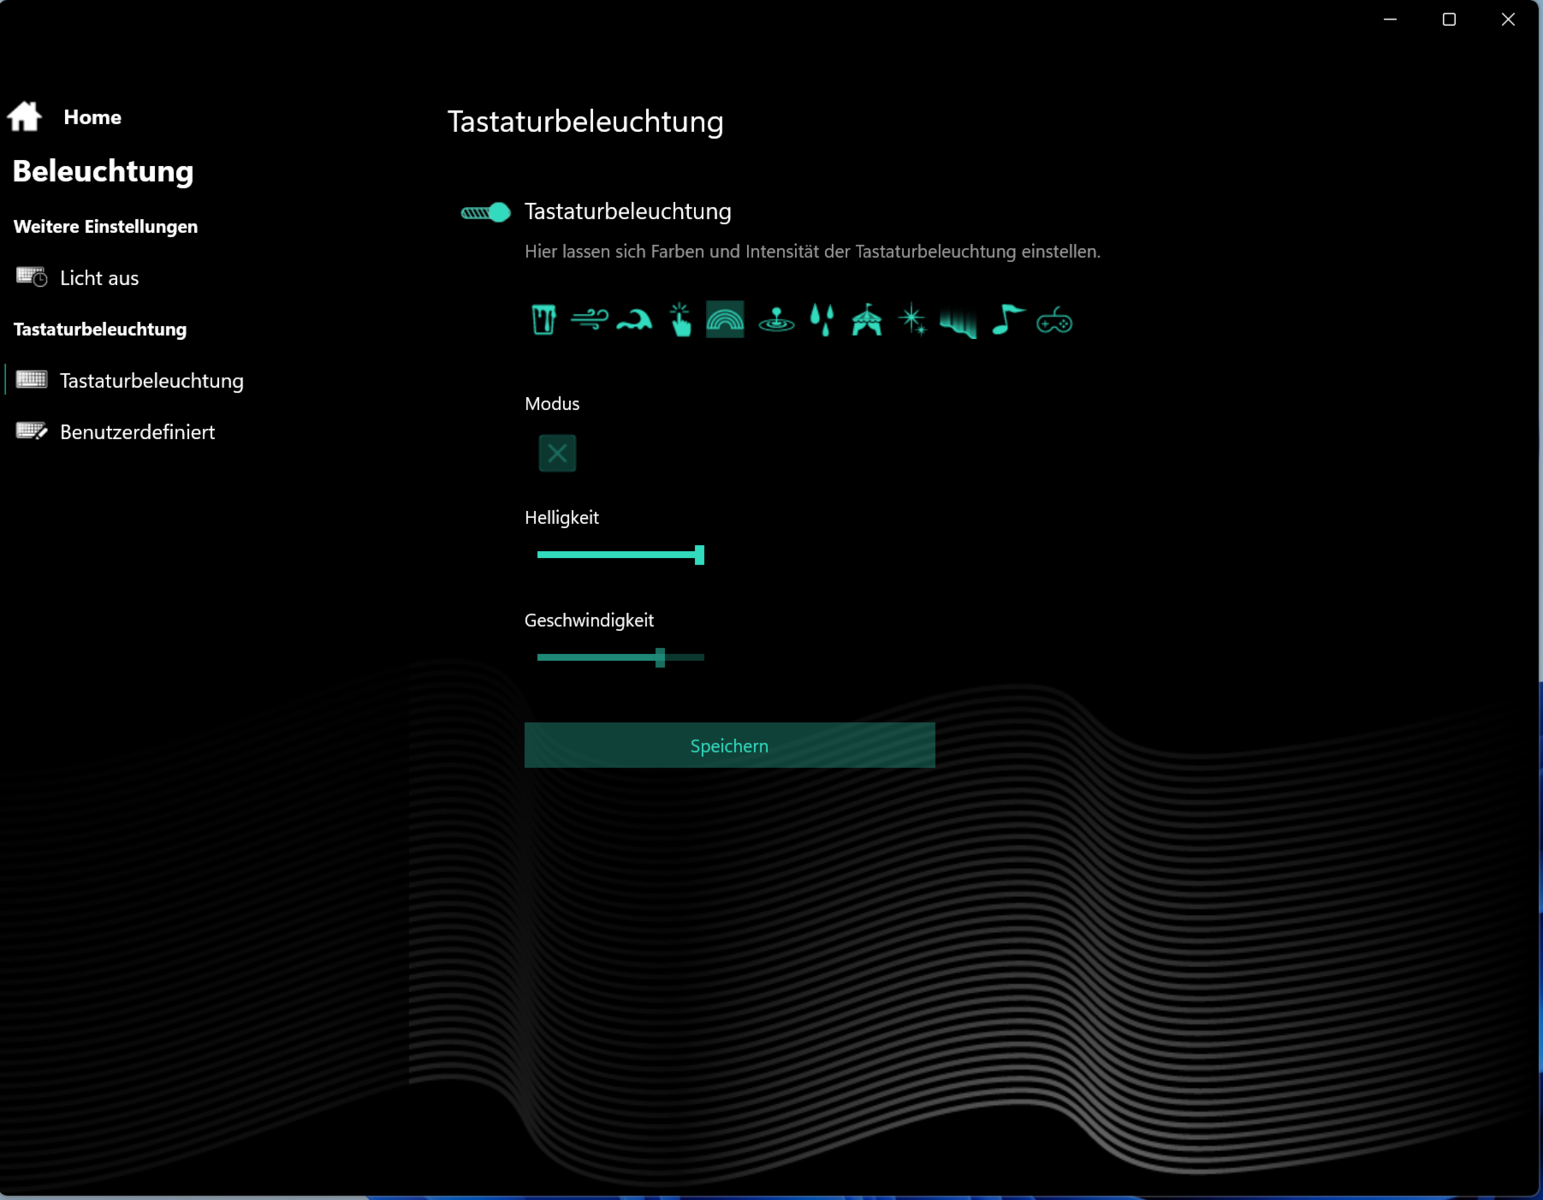
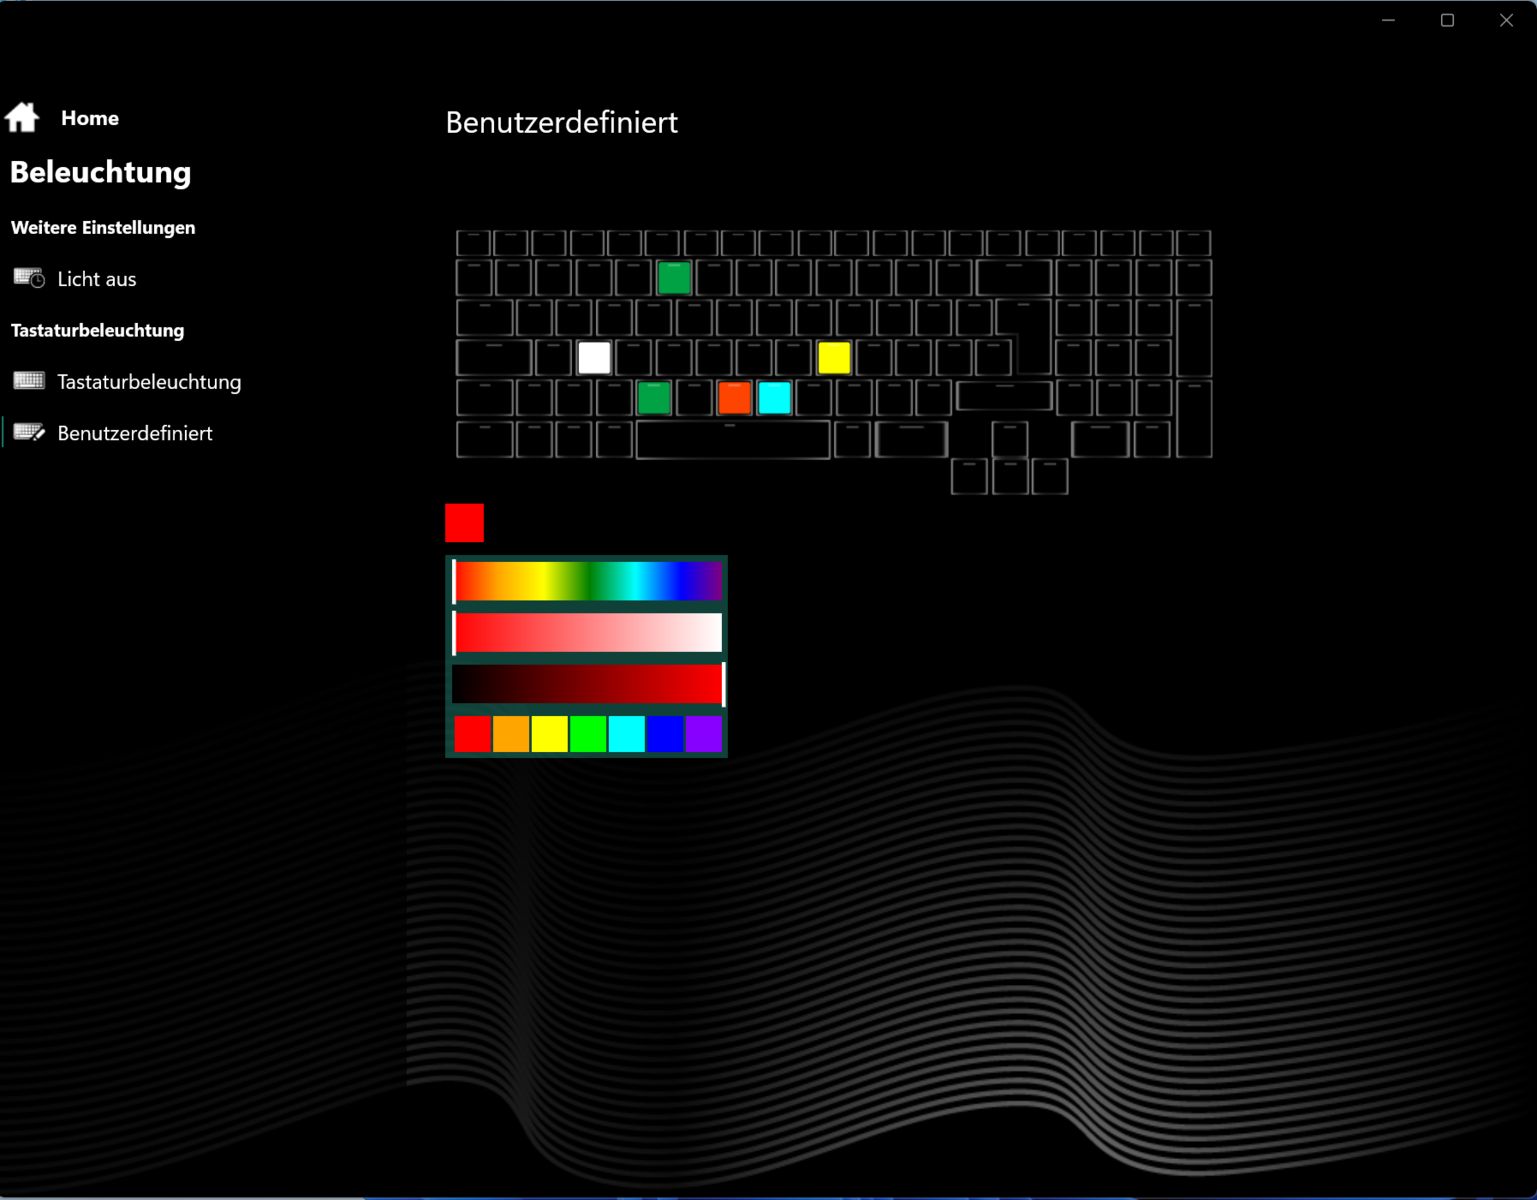
Périphériques d'entrée - Rétro-éclairage RGB à une touche
Clavier
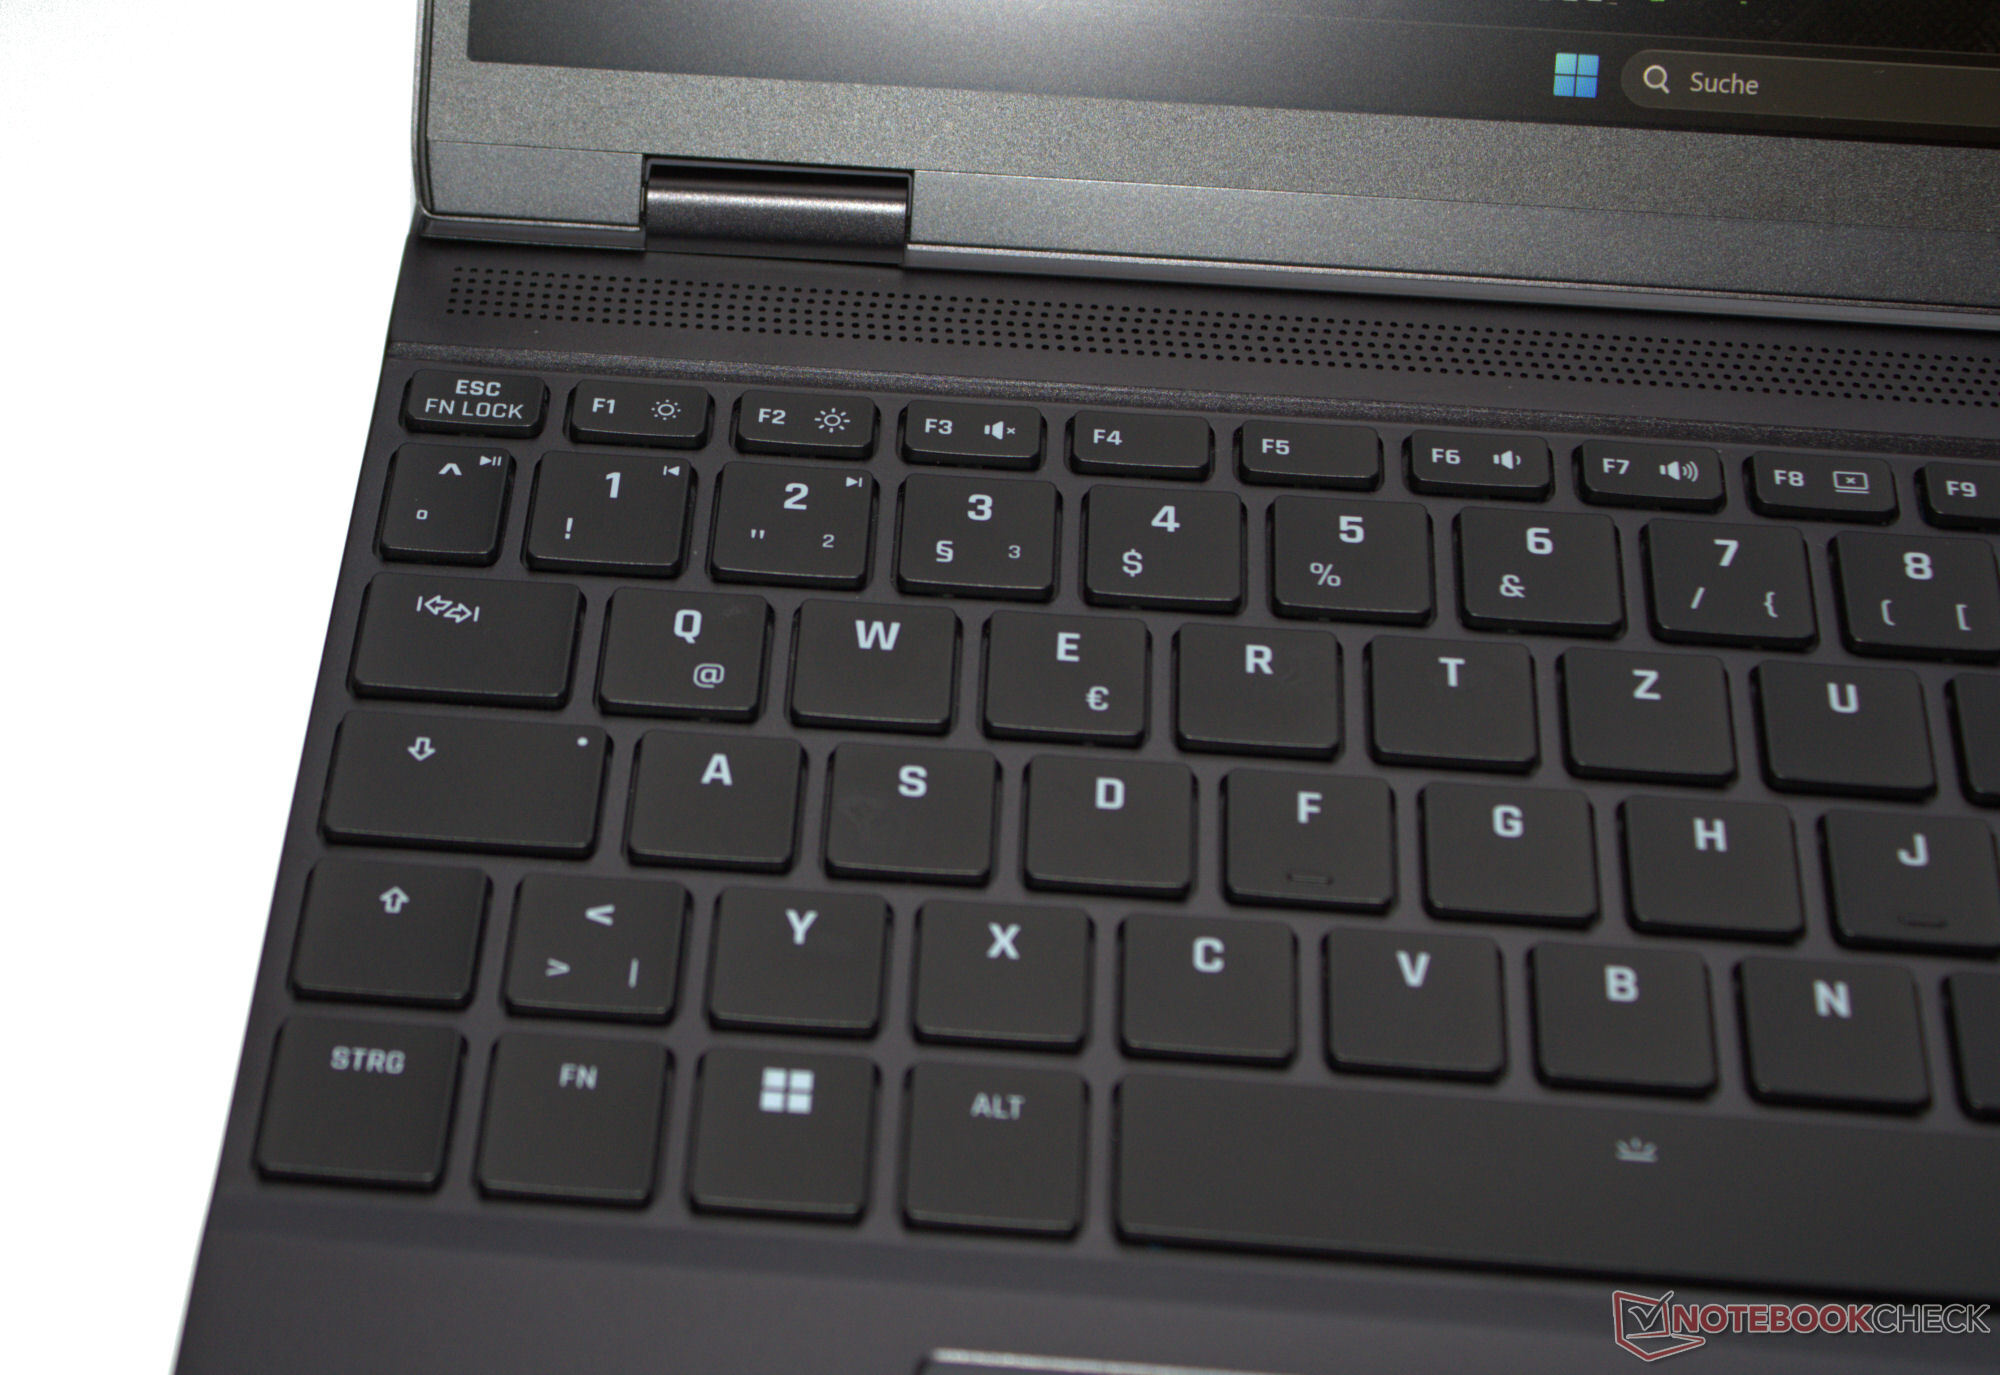
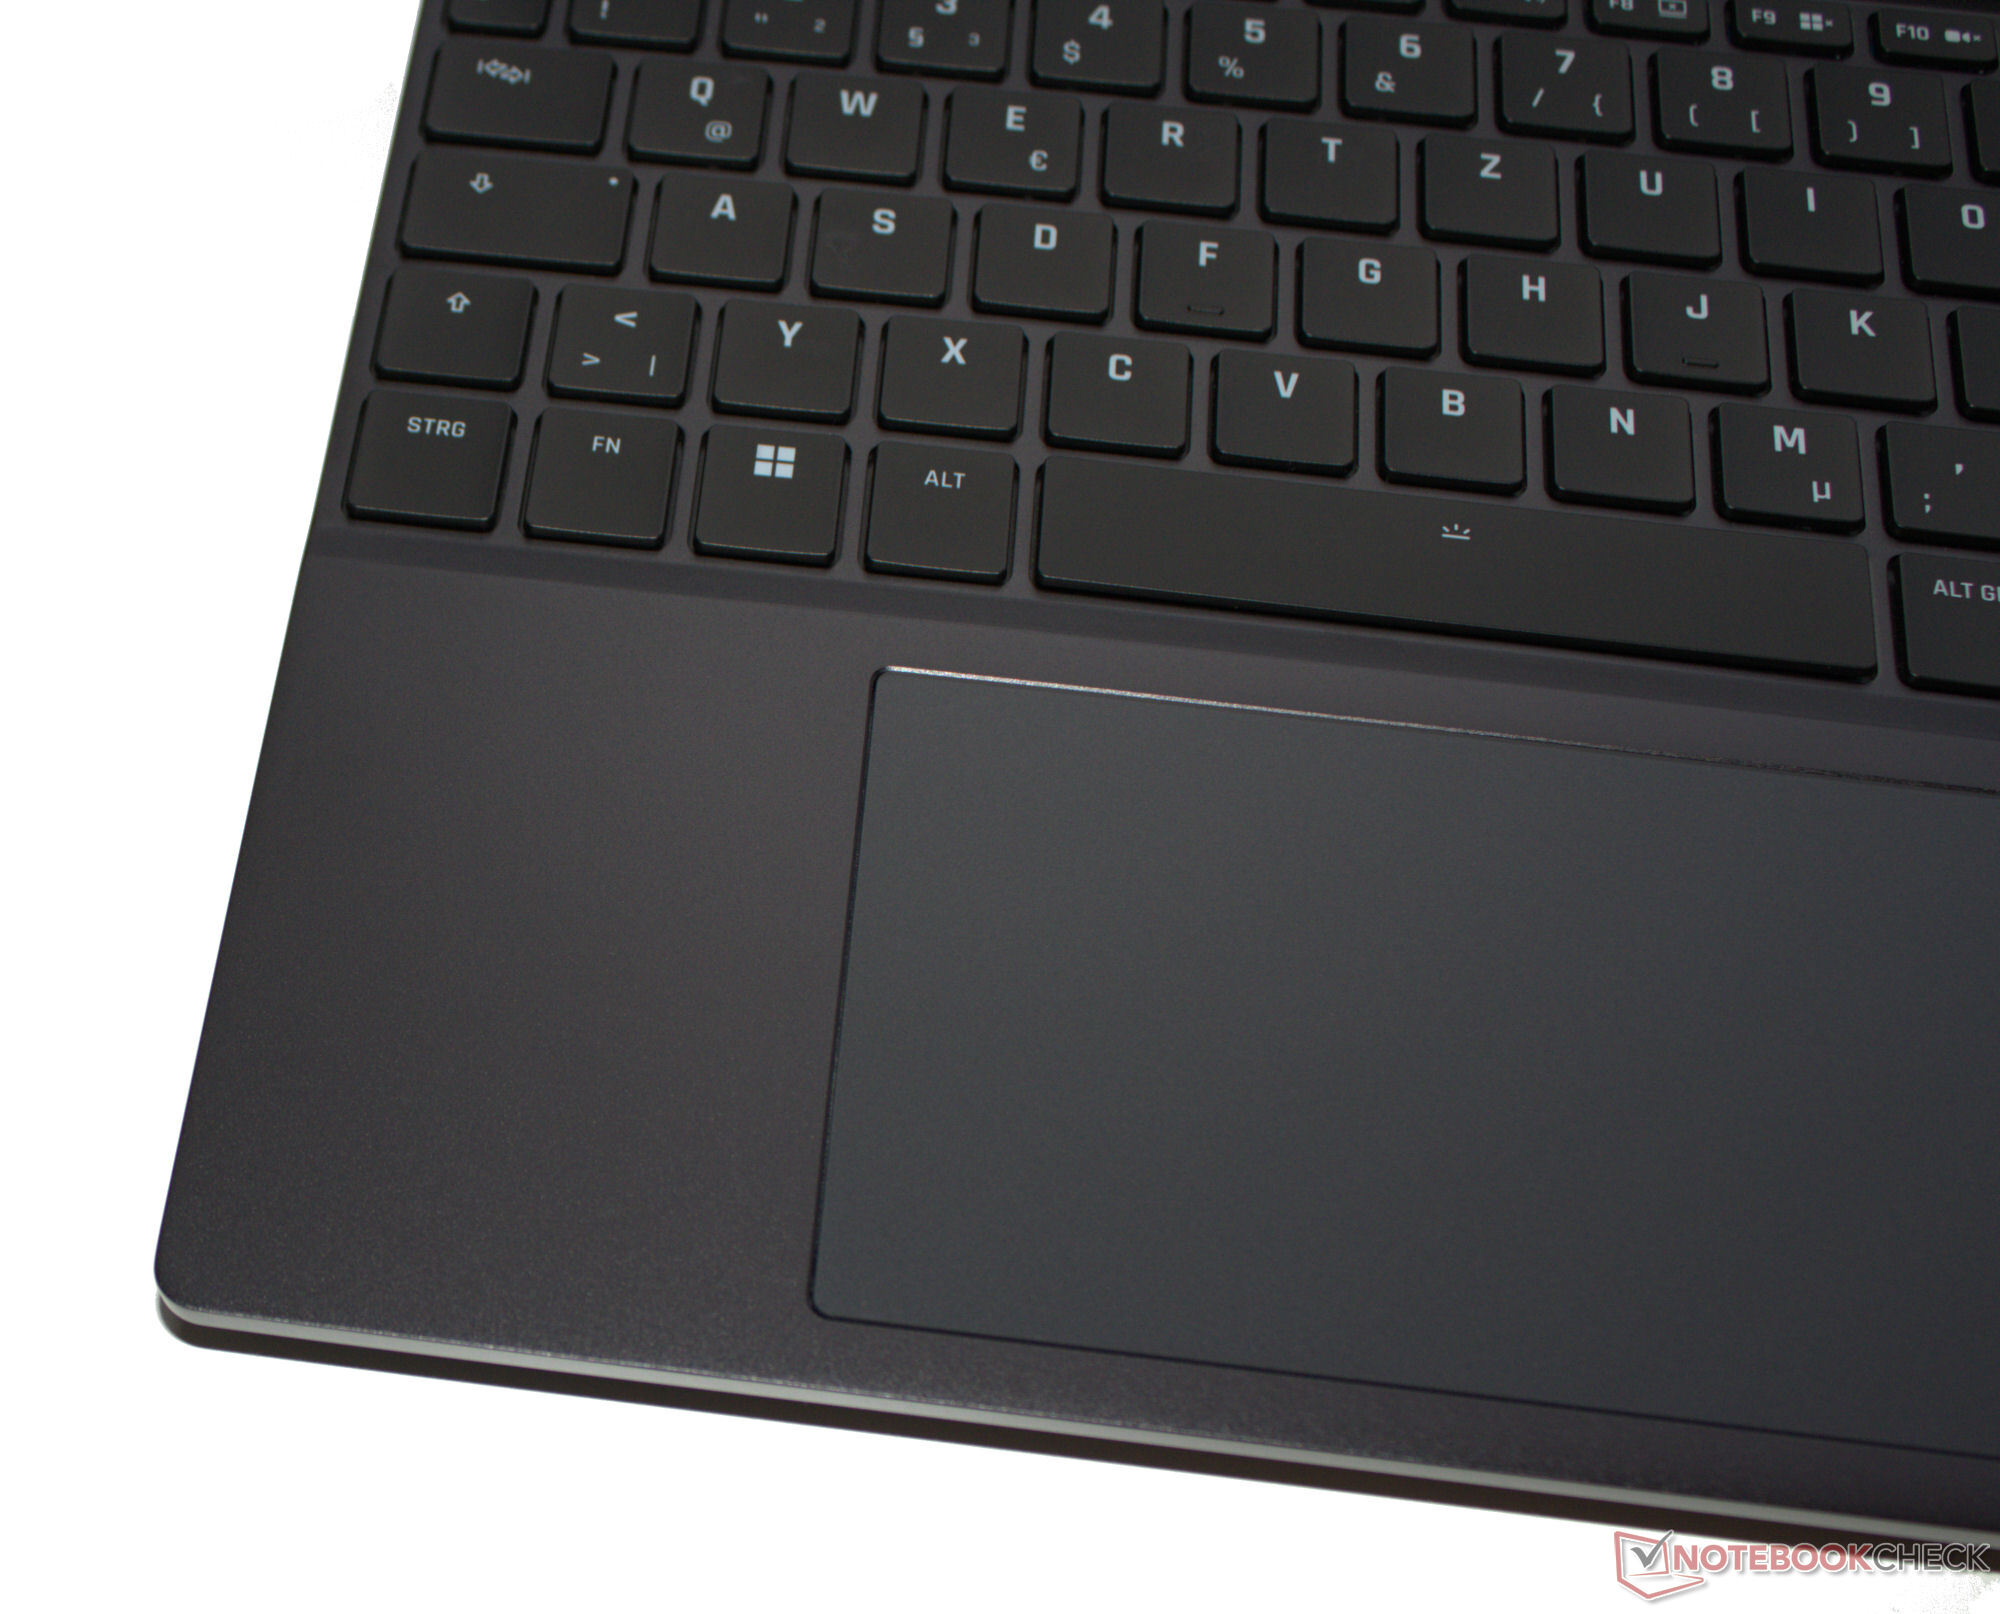
Les touches du clavier chiclet (rétroéclairage RGB à quatre niveaux) présentent une élévation moyenne et un point de pression clair. Leur résistance pourrait être un peu plus nette, mais c'est une question de goût. Le clavier cède légèrement lors de la frappe, mais ne s'est pas avéré gênant lors de notre test. Points positifs : Les quatre touches fléchées sont non seulement de taille normale, mais elles sont également séparées des autres touches.
Pavé tactile
Un pavé tactile multi-touch (environ 12,3 x 7,8 cm) remplace la souris et sa surface lisse facilite le glissement des doigts. Sa surface lisse facilite le glissement des doigts. Il est doté d'un ascenseur court et d'un point de pression clair.
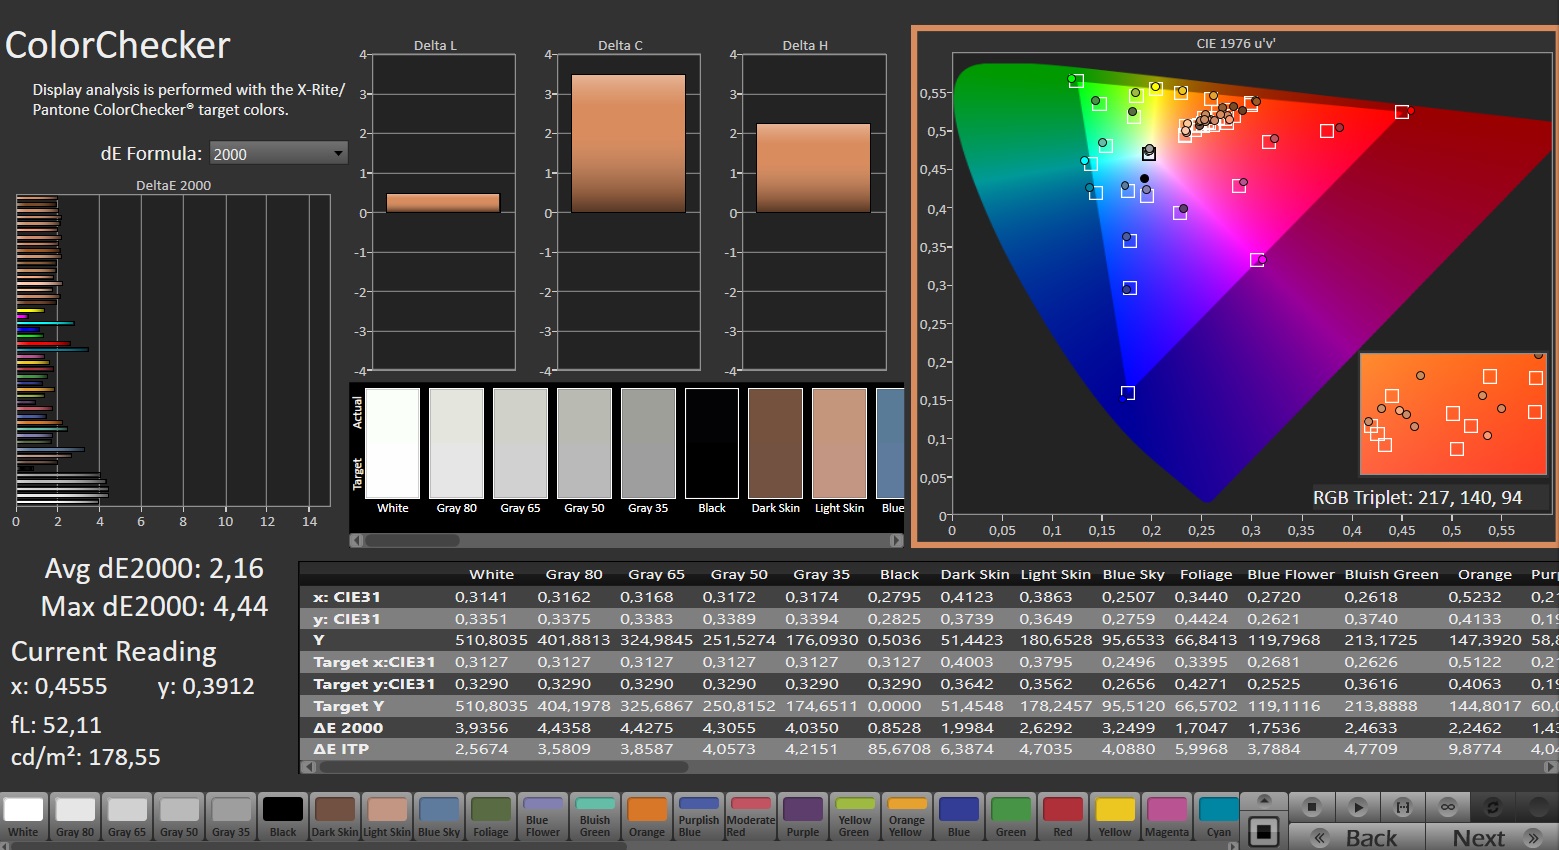
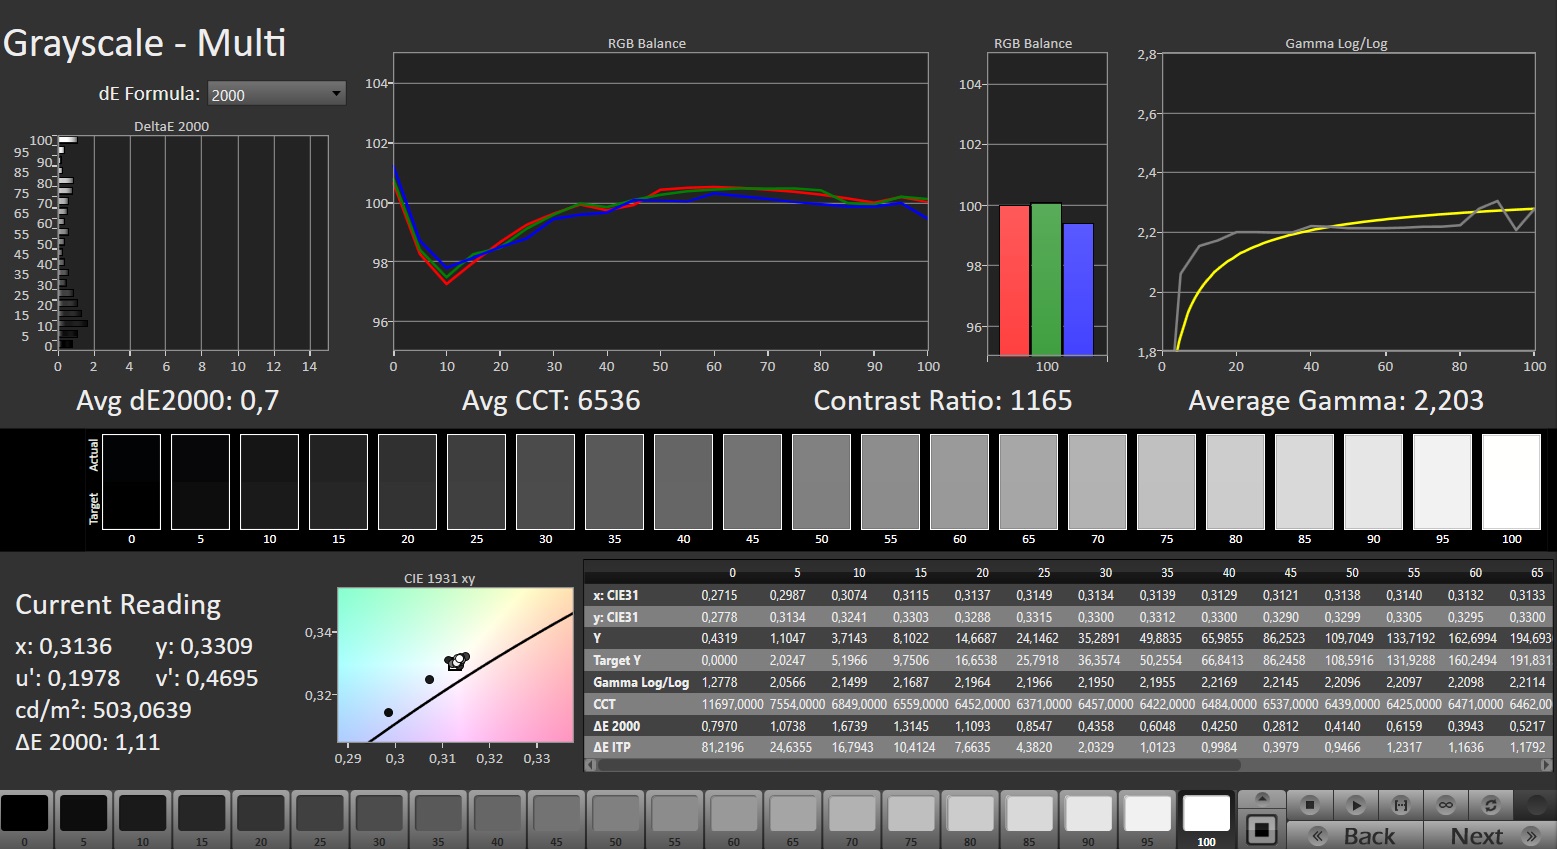
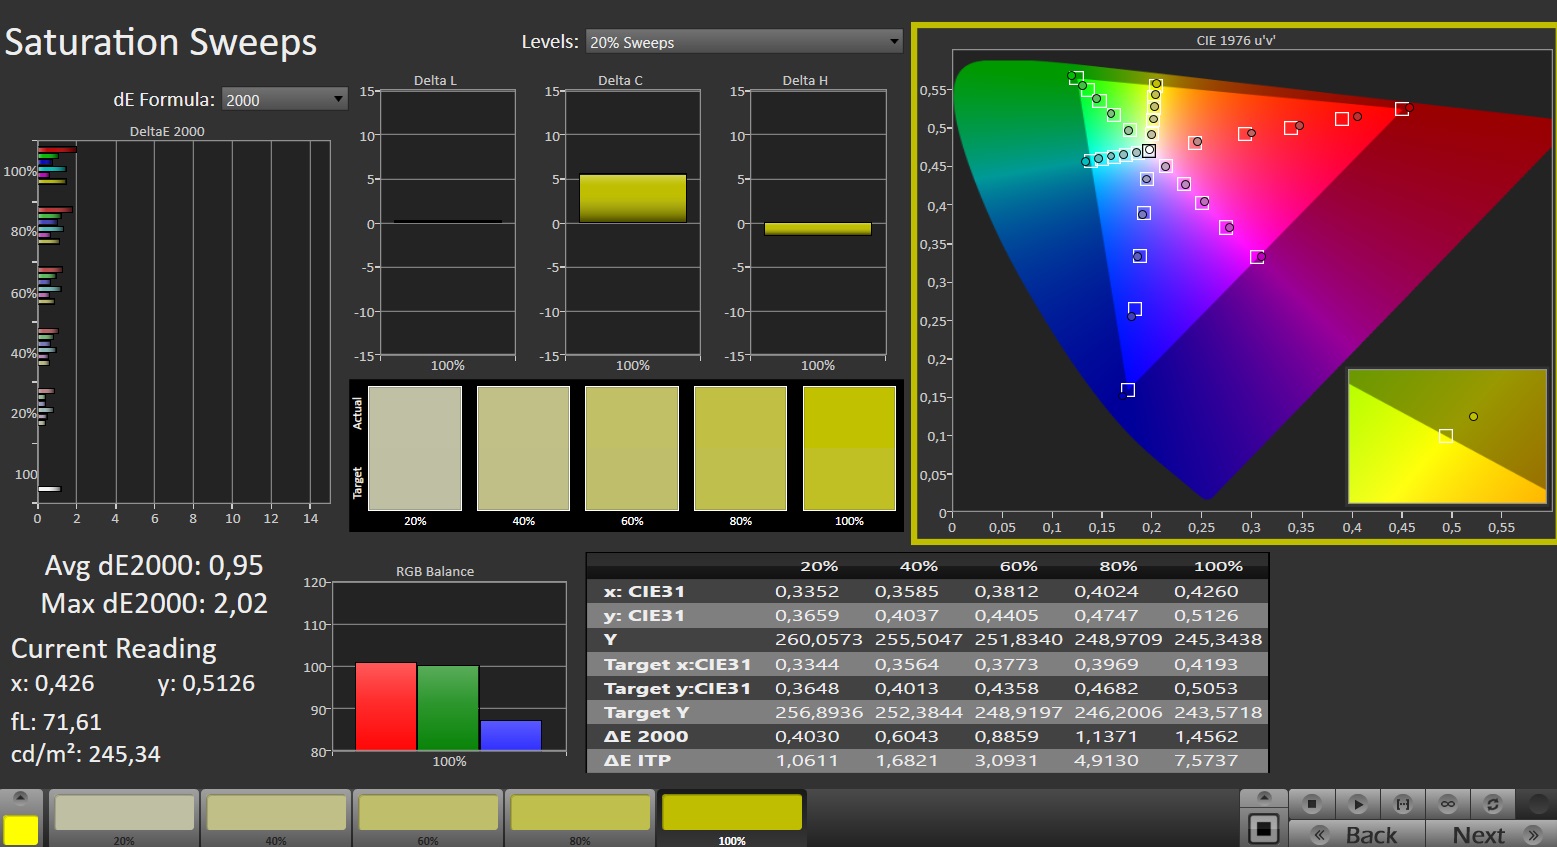
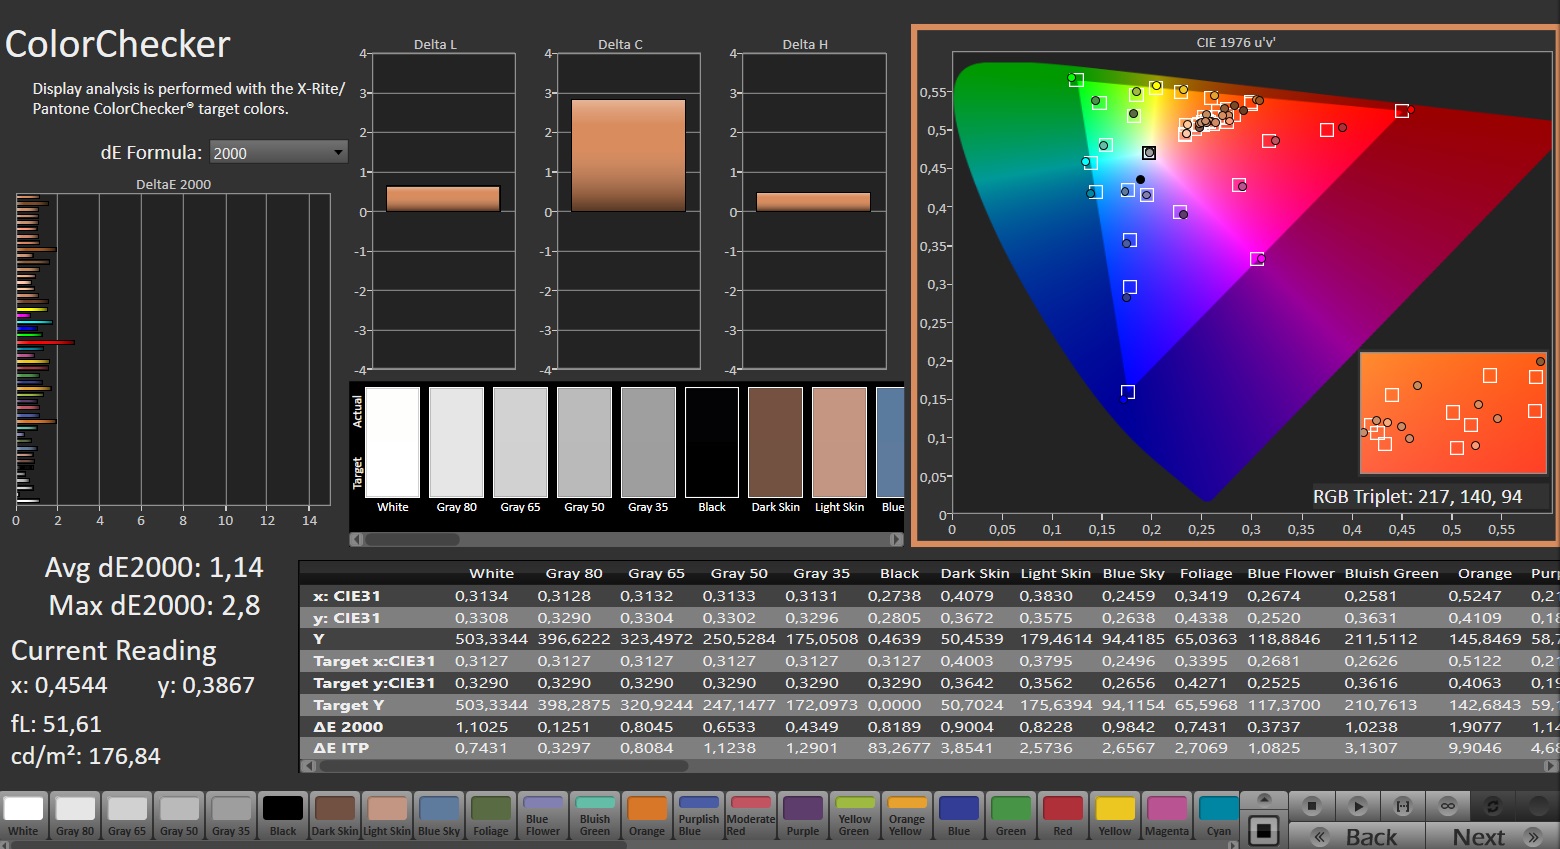
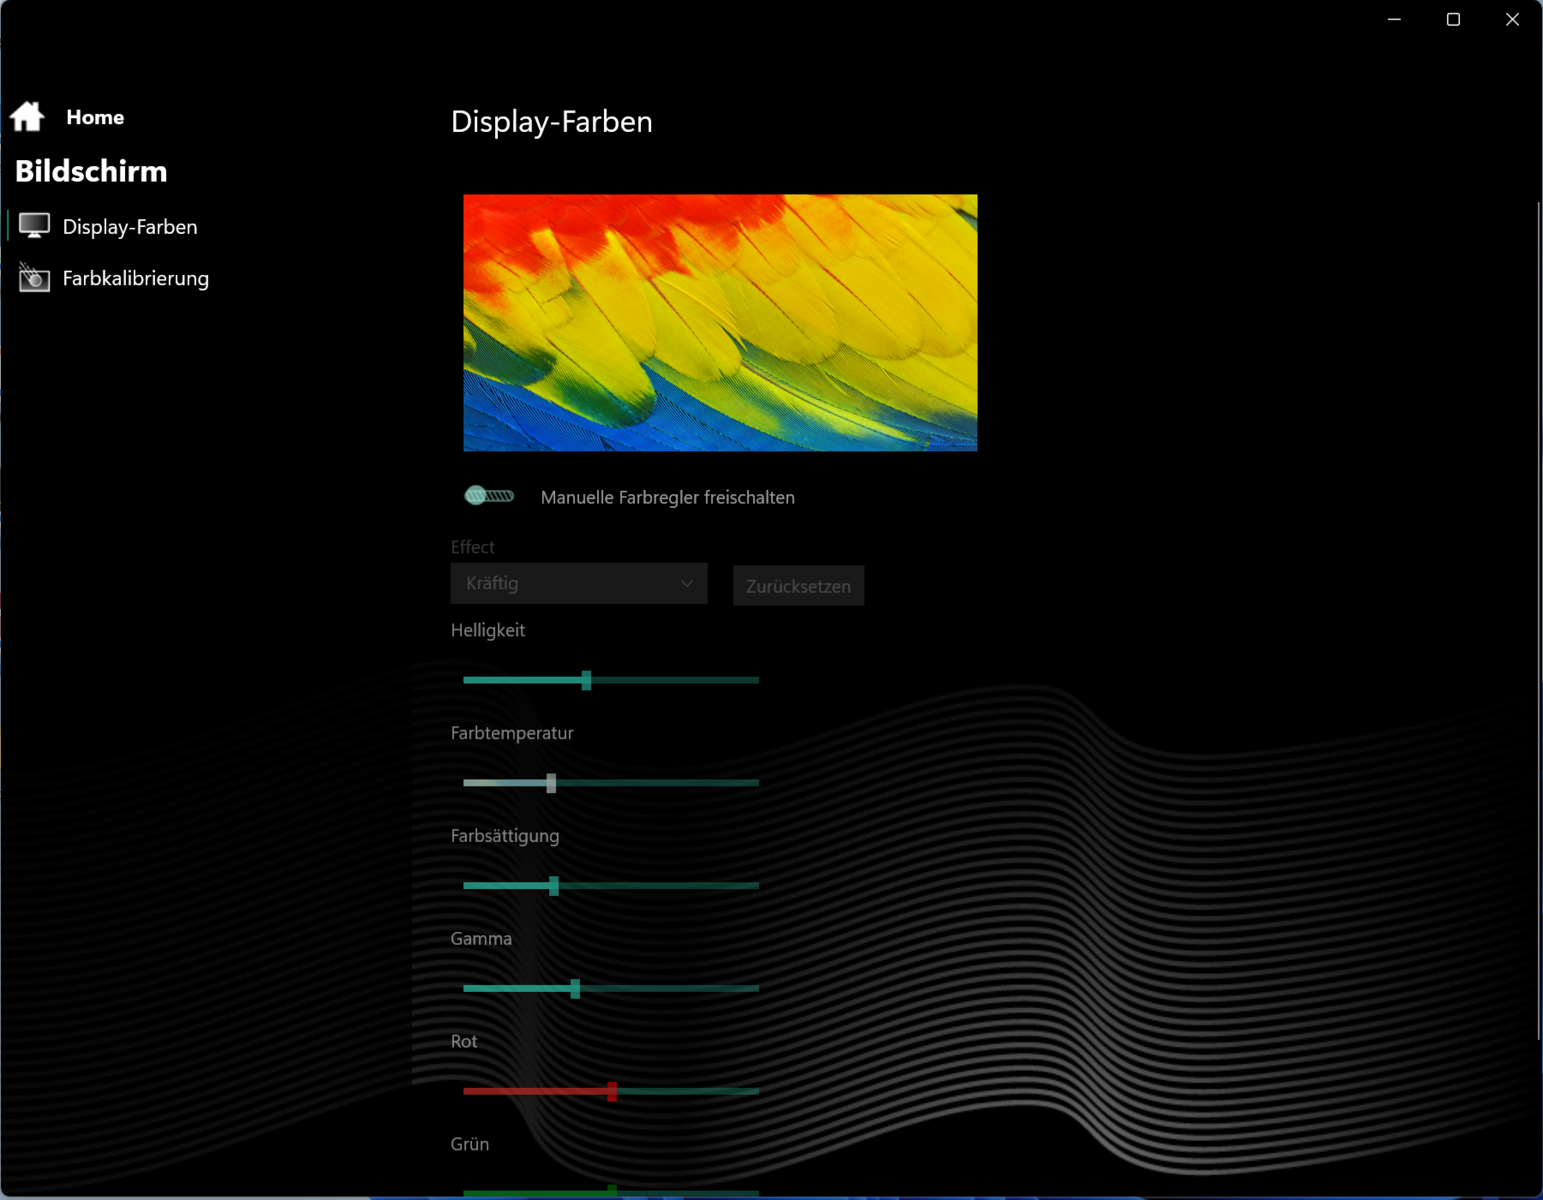
Écran - Panneau lumineux avec couverture sRGB
Schenker a équipé le Fusion d'un écran de 15,3 pouces (2 560 x 1 600 pixels) au format 16:10. L'écran mat de 240 Hz bénéficie de la synchronisation adaptative, de l'absence de scintillement PWM, de temps de réponse courts et d'une grande luminosité. D'autres écrans ne sont pas disponibles.

| |||||||||||||||||||||||||
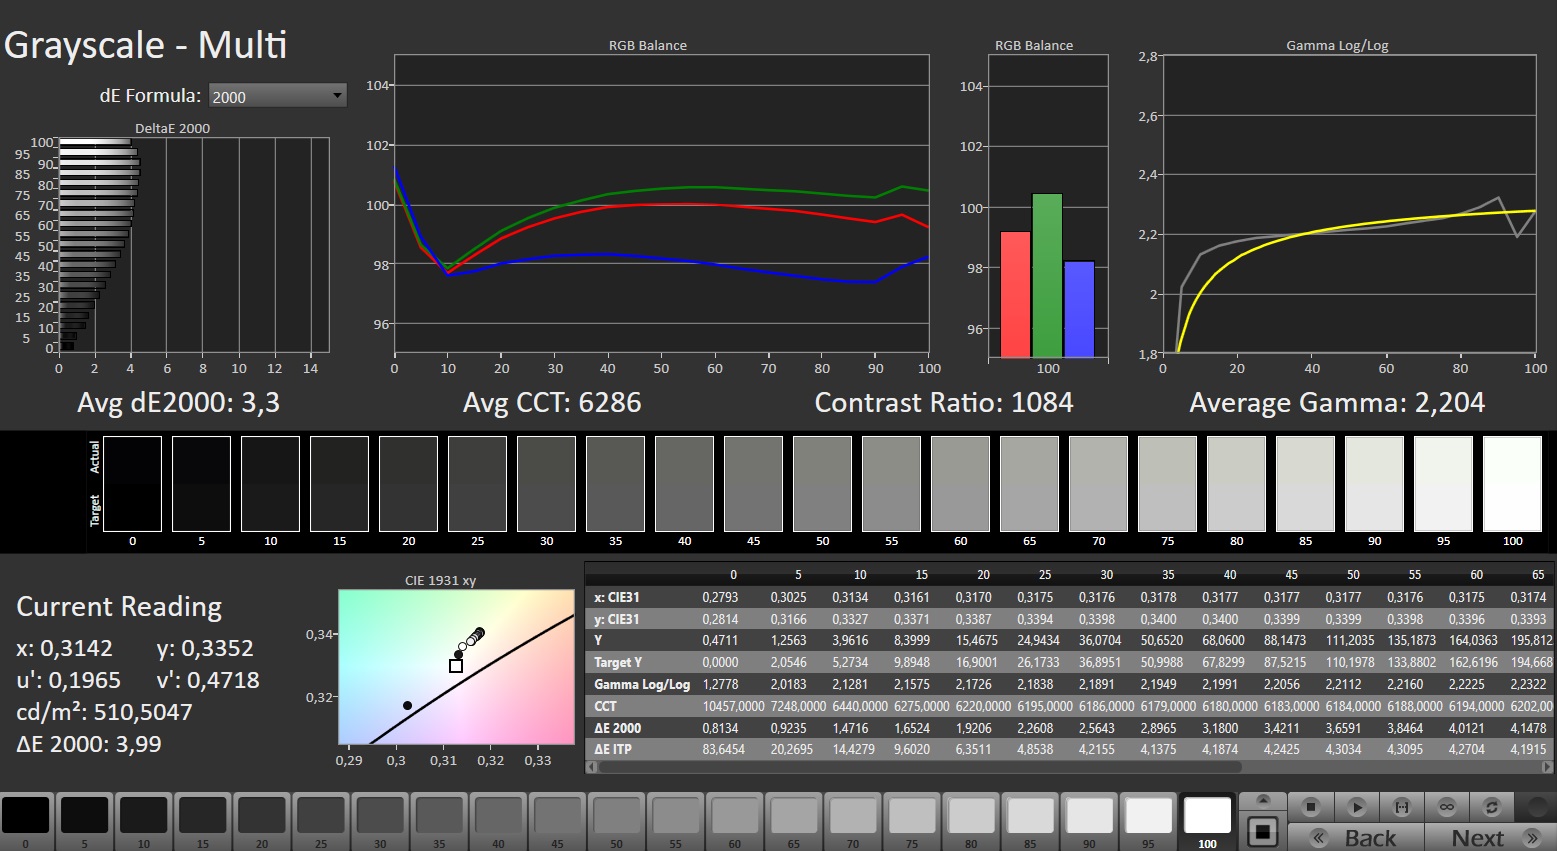
Homogénéité de la luminosité: 89 %
Valeur mesurée au centre, sur batterie: 491 cd/m²
Contraste: 1045:1 (Valeurs des noirs: 0.47 cd/m²)
ΔE Color 2.16 | 0.5-29.43 Ø5, calibrated: 1.14
ΔE Greyscale 3.3 | 0.57-98 Ø5.3
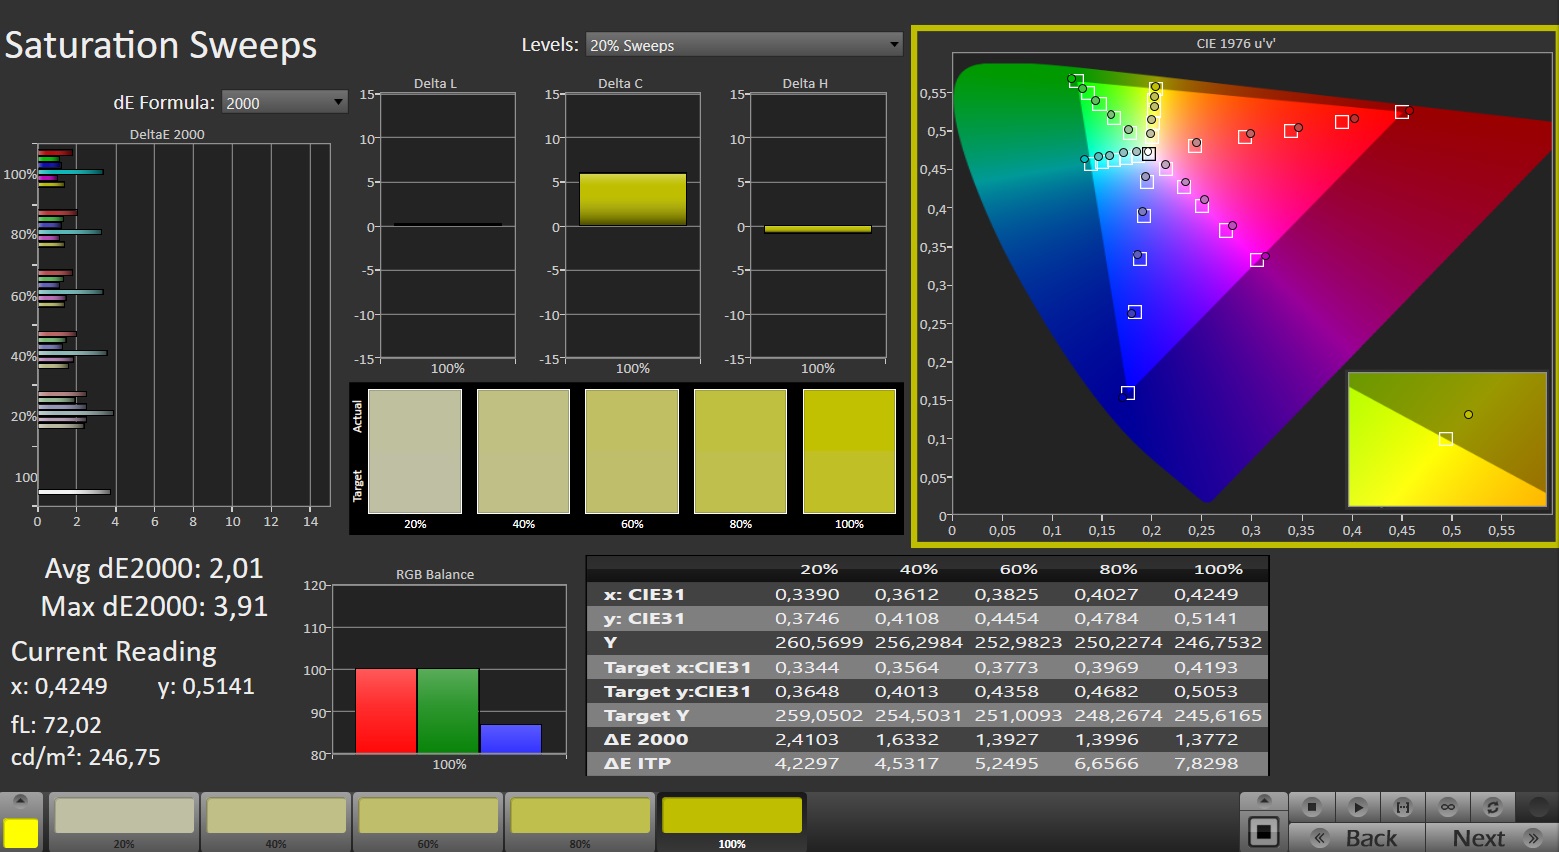
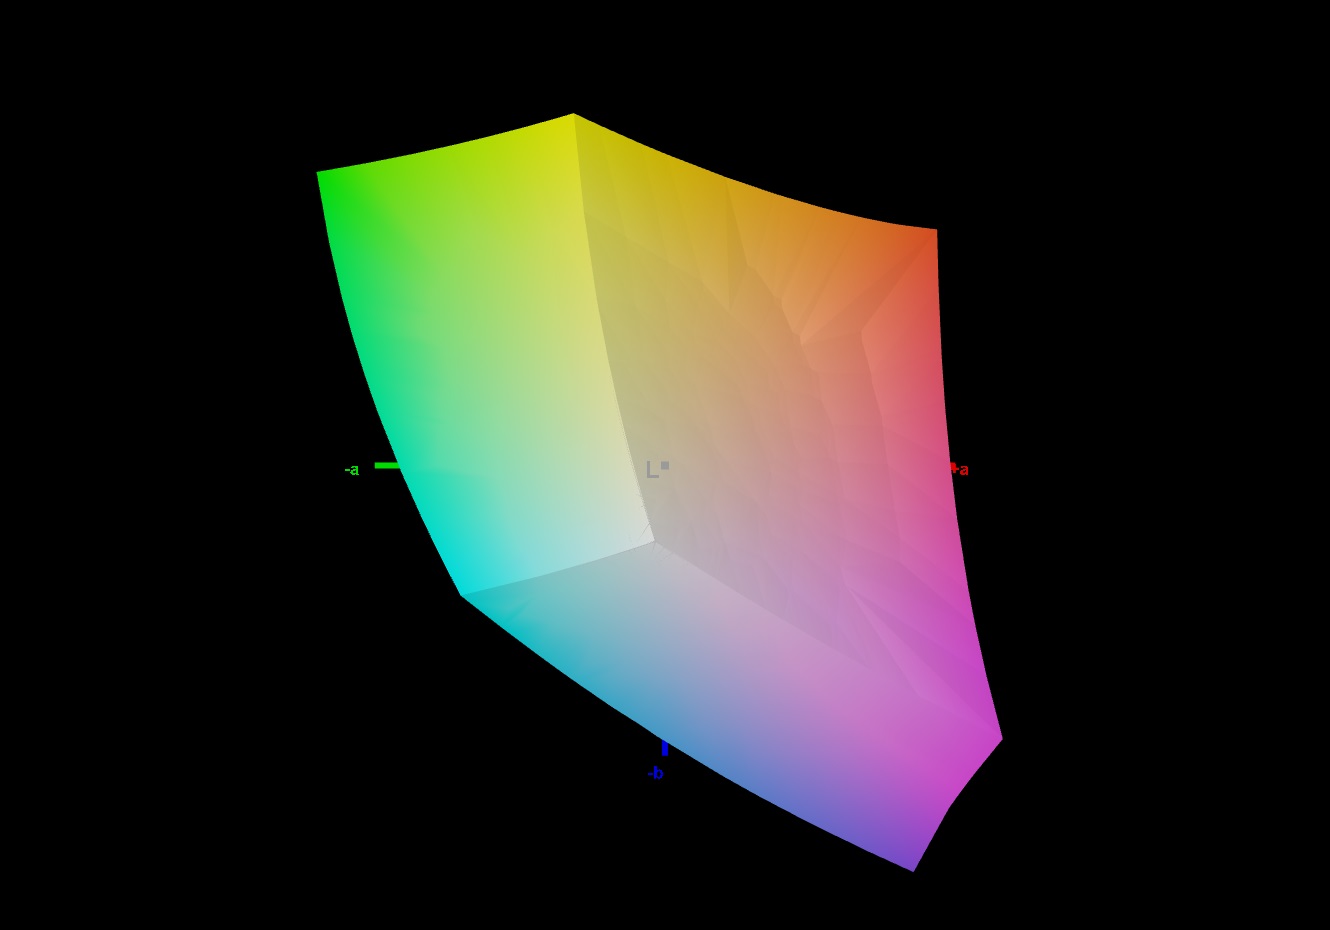
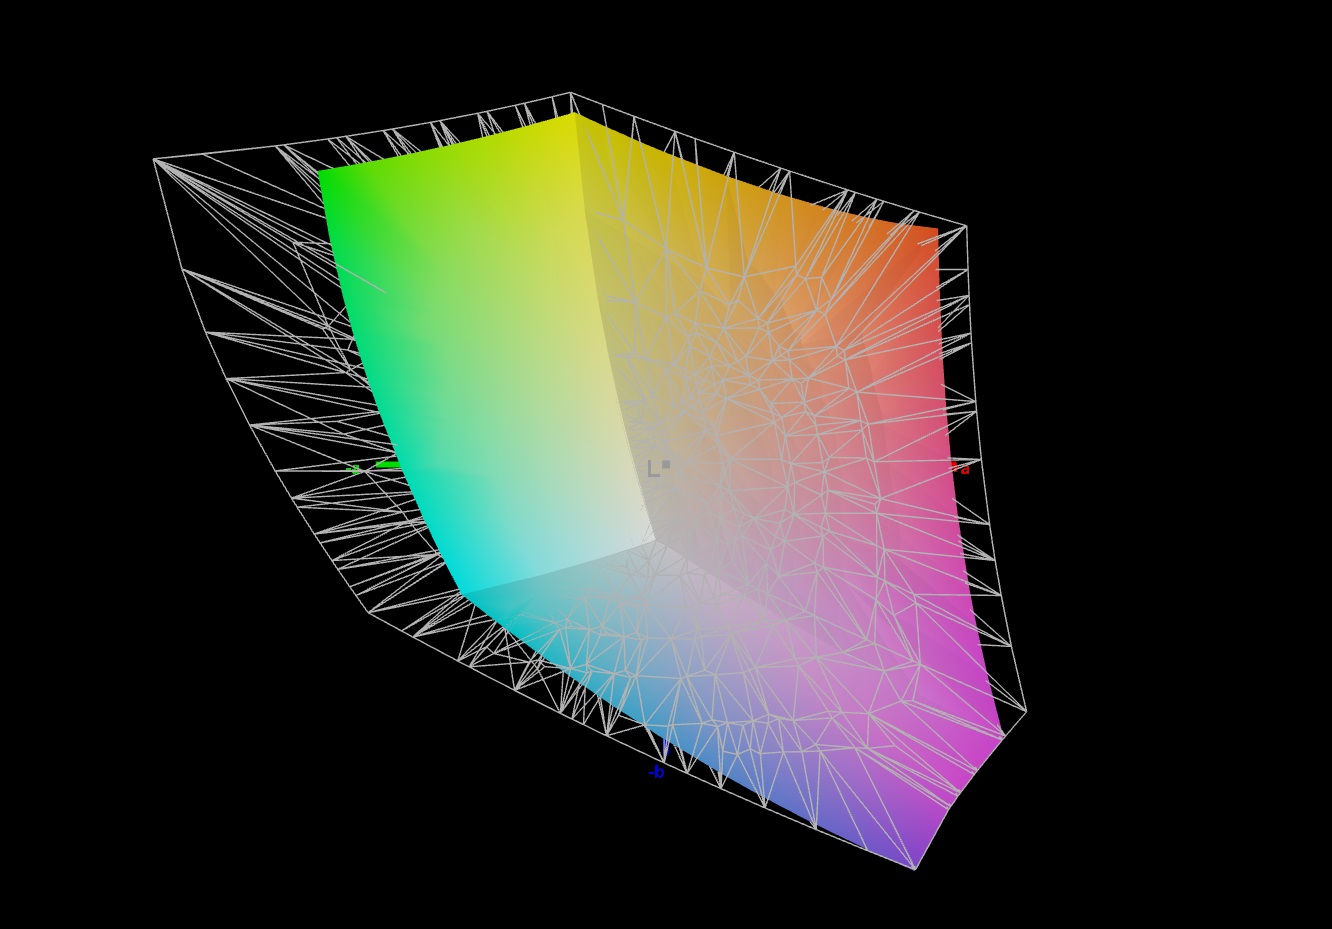
75% AdobeRGB 1998 (Argyll 2.2.0 3D)
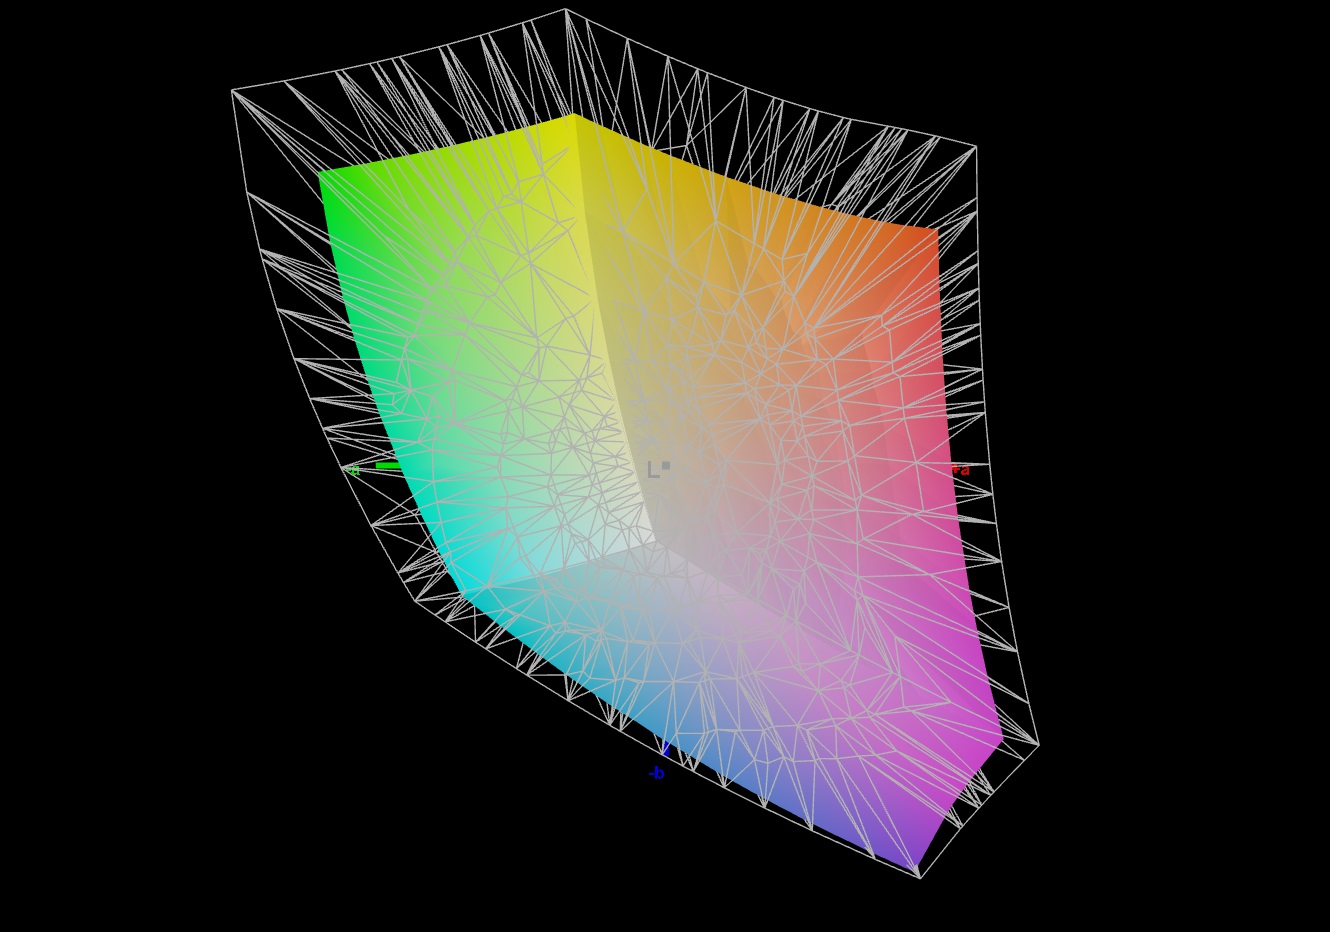
100% sRGB (Argyll 2.2.0 3D)
73.5% Display P3 (Argyll 2.2.0 3D)
Gamma: 2.204
| SCHENKER XMG Fusion 15 (Early 24) BOE NJ NE153QDM-NZ1, IPS, 2560x1600, 15.30 | Aorus 16X 2024 BOE CQ NE160QDM-NY1, IPS, 2560x1600, 16.00 | Alienware m16 R2 BOE NE16NYH, IPS, 2560x1600, 16.00 | HP Omen Transcend 16-u1095ng ATNA60DL02-0 (SDC41A4), OLED, 2560x1600, 16.00 | Lenovo Legion Pro 5 16IRX9 BOE NE160QDM-NYC, IPS, 2560x1600, 16.00 | |
|---|---|---|---|---|---|
| Display | -7% | -3% | 22% | -5% | |
| Display P3 Coverage | 73.5 | 67.2 -9% | 71 -3% | 99.8 36% | 69.3 -6% |
| sRGB Coverage | 100 | 96.7 -3% | 100 0% | 100 0% | 99.4 -1% |
| AdobeRGB 1998 Coverage | 75 | 69.3 -8% | 71.4 -5% | 97 29% | 70.1 -7% |
| Response Times | -27% | -41% | 96% | -105% | |
| Response Time Grey 50% / Grey 80% * | 5 ? | 7.5 ? -50% | 5.7 ? -14% | 0.2 ? 96% | 11.9 ? -138% |
| Response Time Black / White * | 5.2 ? | 5.4 ? -4% | 8.7 ? -67% | 0.2 ? 96% | 8.9 ? -71% |
| PWM Frequency | 120 ? | ||||
| Screen | -1% | 11% | 182% | 17% | |
| Brightness middle | 491 | 542 10% | 345.8 -30% | 390 -21% | 384 -22% |
| Brightness | 460 | 504 10% | 337 -27% | 392 -15% | 366 -20% |
| Brightness Distribution | 89 | 86 -3% | 87 -2% | 98 10% | 91 2% |
| Black Level * | 0.47 | 0.45 4% | 0.3 36% | 0.02 96% | 0.35 26% |
| Contrast | 1045 | 1204 15% | 1153 10% | 19500 1766% | 1097 5% |
| Colorchecker dE 2000 * | 2.16 | 2.73 -26% | 1.99 8% | 1.94 10% | 0.97 55% |
| Colorchecker dE 2000 max. * | 4.44 | 5.29 -19% | 3.52 21% | 4.26 4% | 3.57 20% |
| Colorchecker dE 2000 calibrated * | 1.14 | 1.32 -16% | 0.62 46% | 4.21 -269% | 0.77 32% |
| Greyscale dE 2000 * | 3.3 | 2.9 12% | 2.1 36% | 1.5 55% | 1.5 55% |
| Gamma | 2.204 100% | 2.192 100% | 2.32 95% | 2.221 99% | 2.24 98% |
| CCT | 6286 103% | 6173 105% | 6369 102% | 6395 102% | 6709 97% |
| Moyenne finale (programmes/paramètres) | -12% /
-6% | -11% /
1% | 100% /
135% | -31% /
-5% |
* ... Moindre est la valeur, meilleures sont les performances
L'écran présentait déjà une bonne représentation des couleurs dès sa sortie de la boîte : Avec un écart d'environ 2,2, la valeur cible (DeltaE < 3) a été atteinte. L'étalonnage de l'écran réduit l'écart à 1,14 et permet d'obtenir des tons gris plus équilibrés. L'écran est capable de couvrir complètement l'espace colorimétrique sRGB, mais pas les espaces colorimétriques AdobeRGB ou DCI P3. Ceci n'est pas différent de la plupart des écrans de ses concurrents.
Temps de réponse de l'écran
| ↔ Temps de réponse noir à blanc | ||
|---|---|---|
| 5.2 ms ... hausse ↗ et chute ↘ combinées | ↗ 1.5 ms hausse | 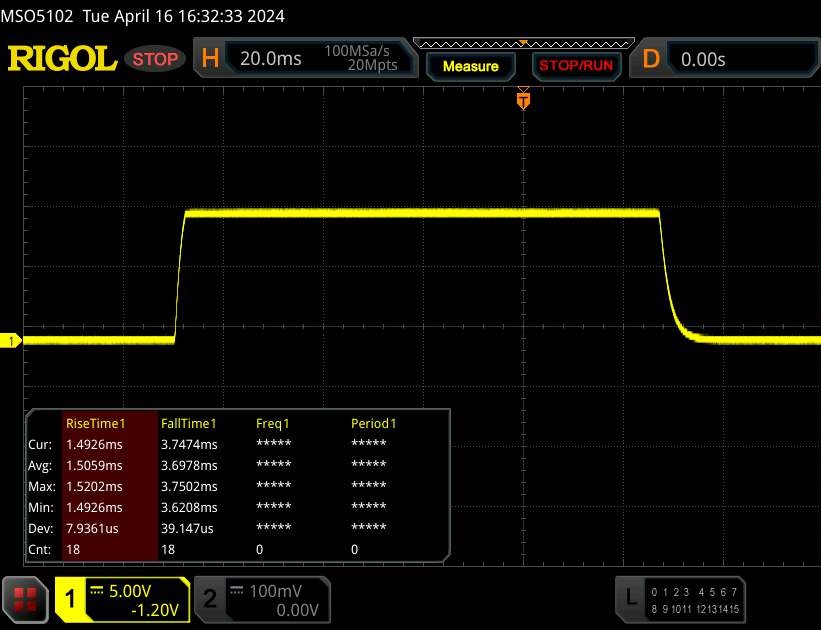 |
| ↘ 3.7 ms chute | ||
| L'écran montre de très faibles temps de réponse, parfait pour le jeu. En comparaison, tous les appareils testés affichent entre 0.1 (minimum) et 240 (maximum) ms. » 12 % des appareils testés affichent de meilleures performances. Cela signifie que les latences relevées sont meilleures que la moyenne (21.4 ms) de tous les appareils testés. | ||
| ↔ Temps de réponse gris 50% à gris 80% | ||
| 5 ms ... hausse ↗ et chute ↘ combinées | ↗ 2.3 ms hausse | 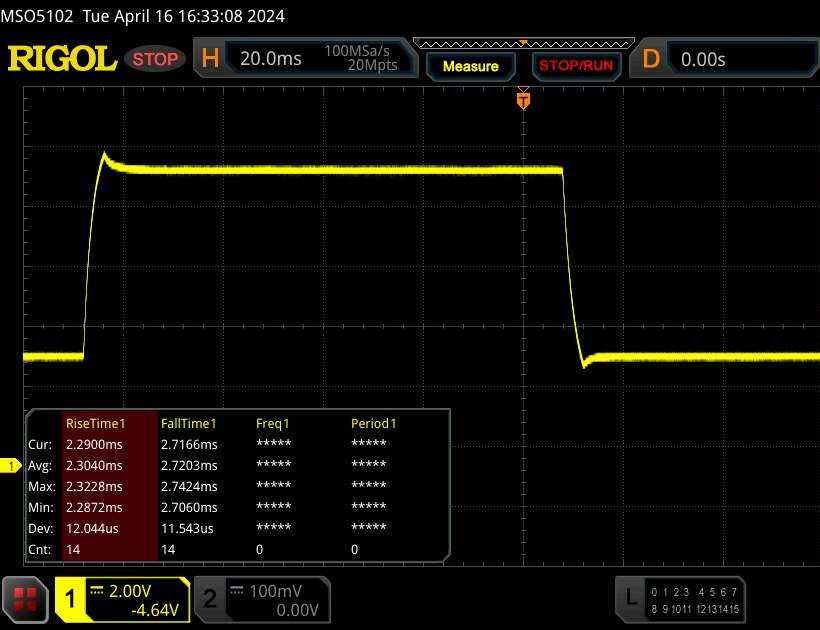 |
| ↘ 2.7 ms chute | ||
| L'écran montre de très faibles temps de réponse, parfait pour le jeu. En comparaison, tous les appareils testés affichent entre 0.2 (minimum) et 636 (maximum) ms. » 12 % des appareils testés affichent de meilleures performances. Cela signifie que les latences relevées sont meilleures que la moyenne (33.7 ms) de tous les appareils testés. | ||
Scintillement / MLI (Modulation de largeur d'impulsion)
| Scintillement / MLI (Modulation de largeur d'impulsion) non décelé |  | ||
En comparaison, 53 % des appareils testés n'emploient pas MDI pour assombrir leur écran. Nous avons relevé une moyenne à 17803 (minimum : 5 - maximum : 3846000) Hz dans le cas où une MDI était active. | |||
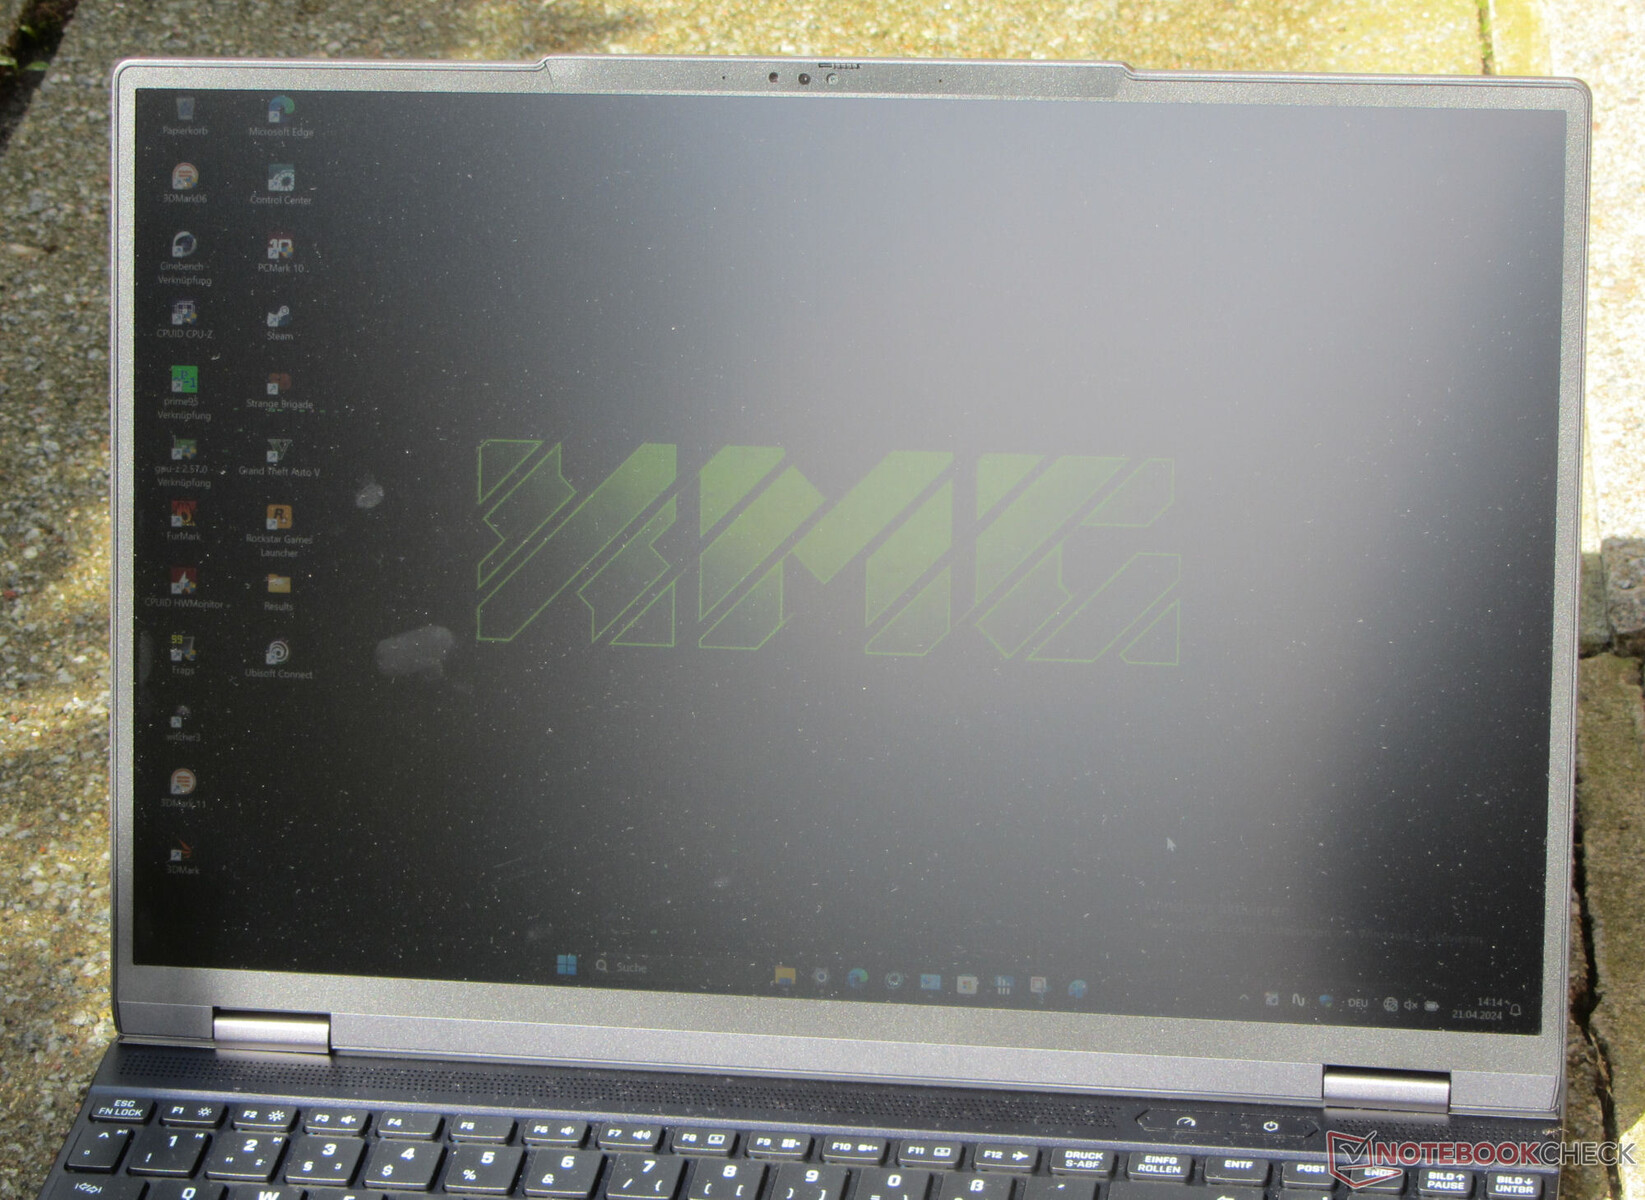
L'écran IPS de l'appareil, dont l'angle de vision est stable, reste lisible sous tous les angles. À l'extérieur, vous pouvez lire sur l'écran tant que le soleil ne brille pas trop fort.

Performance - Raptor Lake et Ada Lovelace alimentent l'ordinateur portable
Le puissant et compact XMG Fusion 15 (Early 24) s'adresse aux joueurs et aux créateurs. Raptor Lake et Ada Lovelace fournissent les performances nécessaires. L'ordinateur portable peut être configuré individuellement via la boutique en ligne Schenker. La variante actuelle coûte environ 2 500 dollars. Les modèles moins chers commencent à partir d'environ 1 700 dollars.
Conditions d'essai
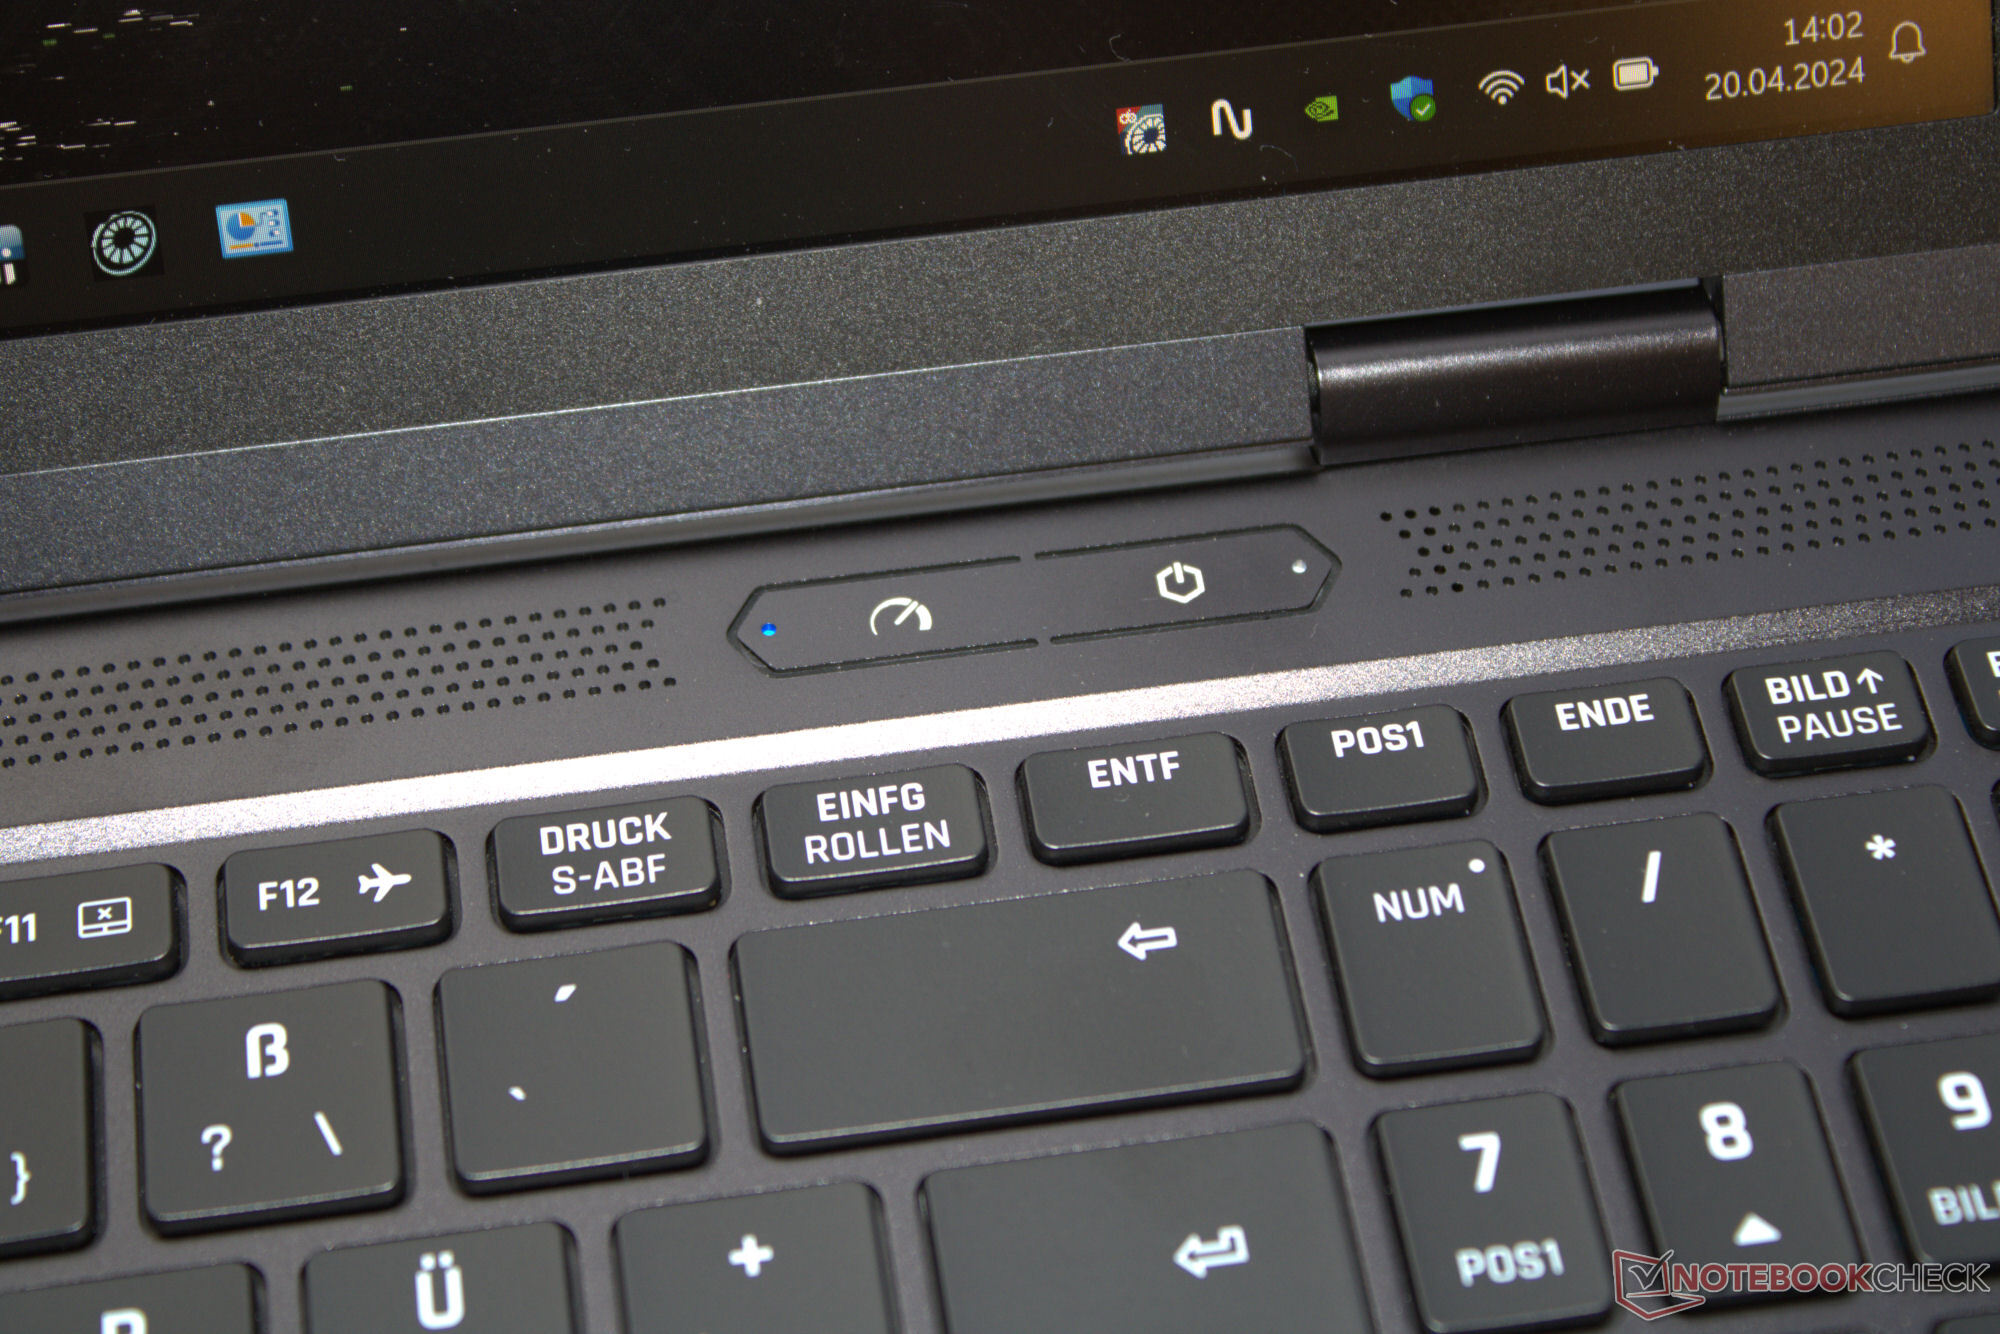
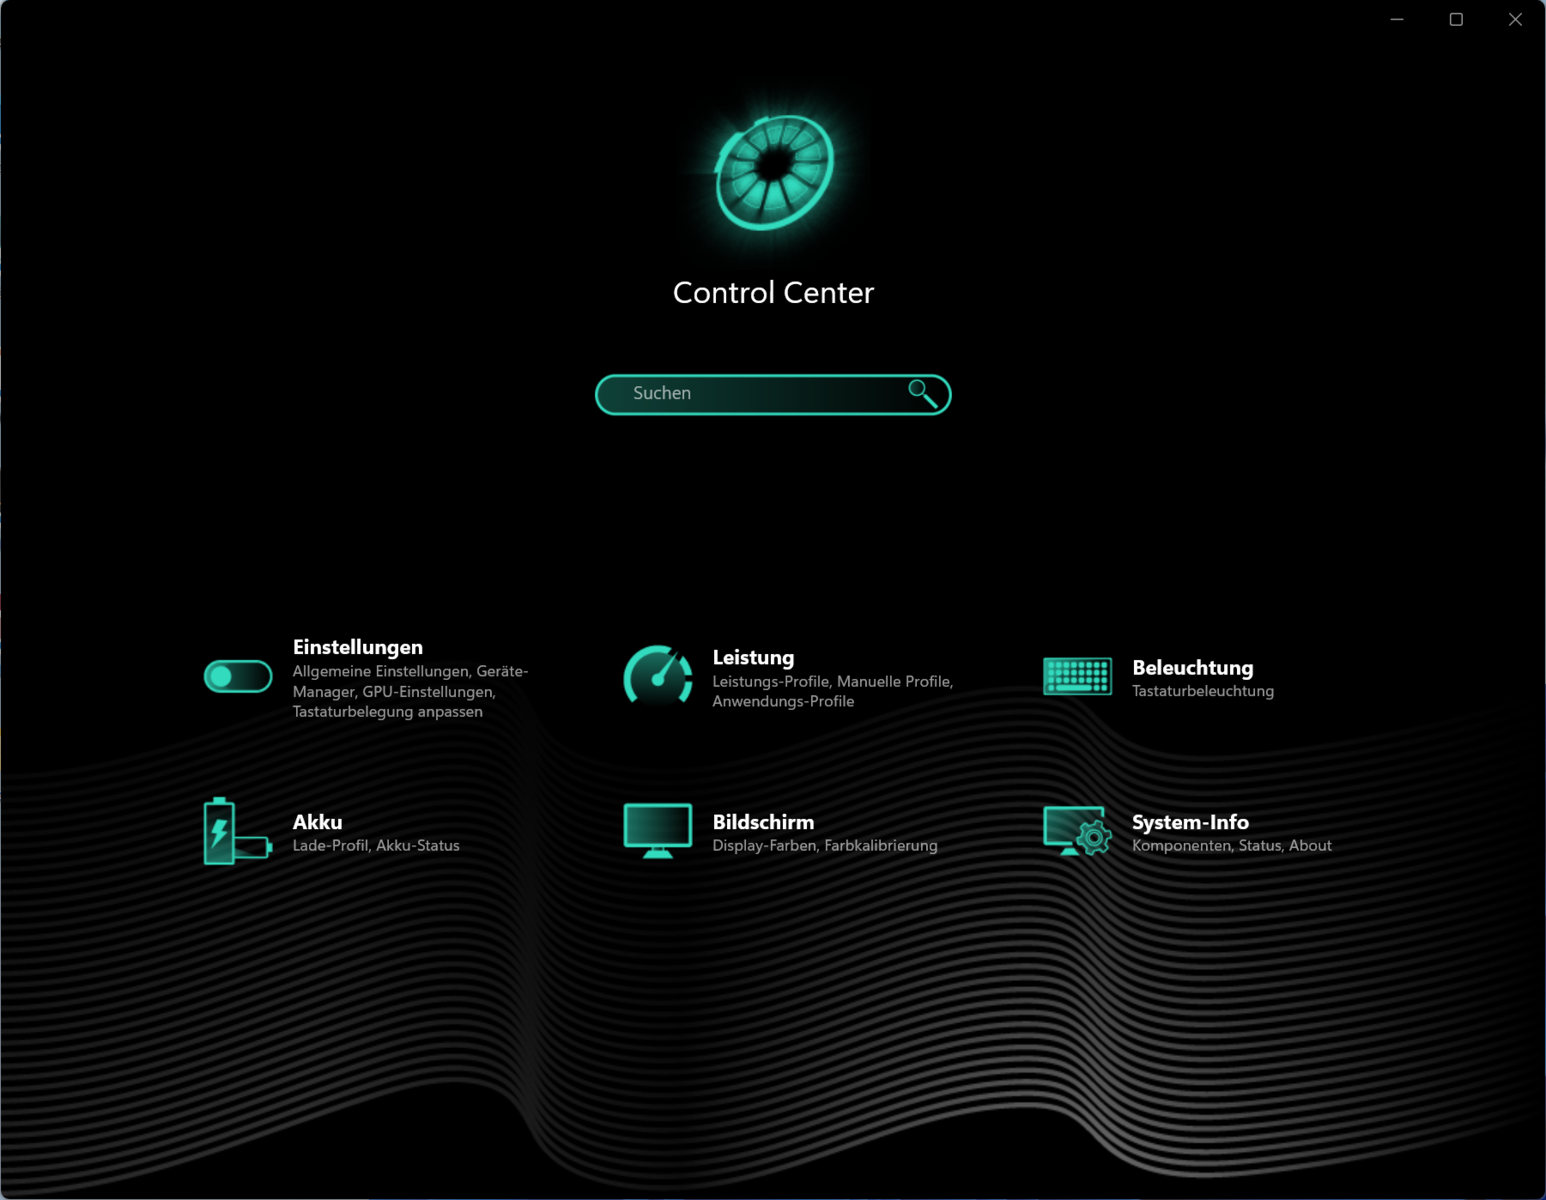
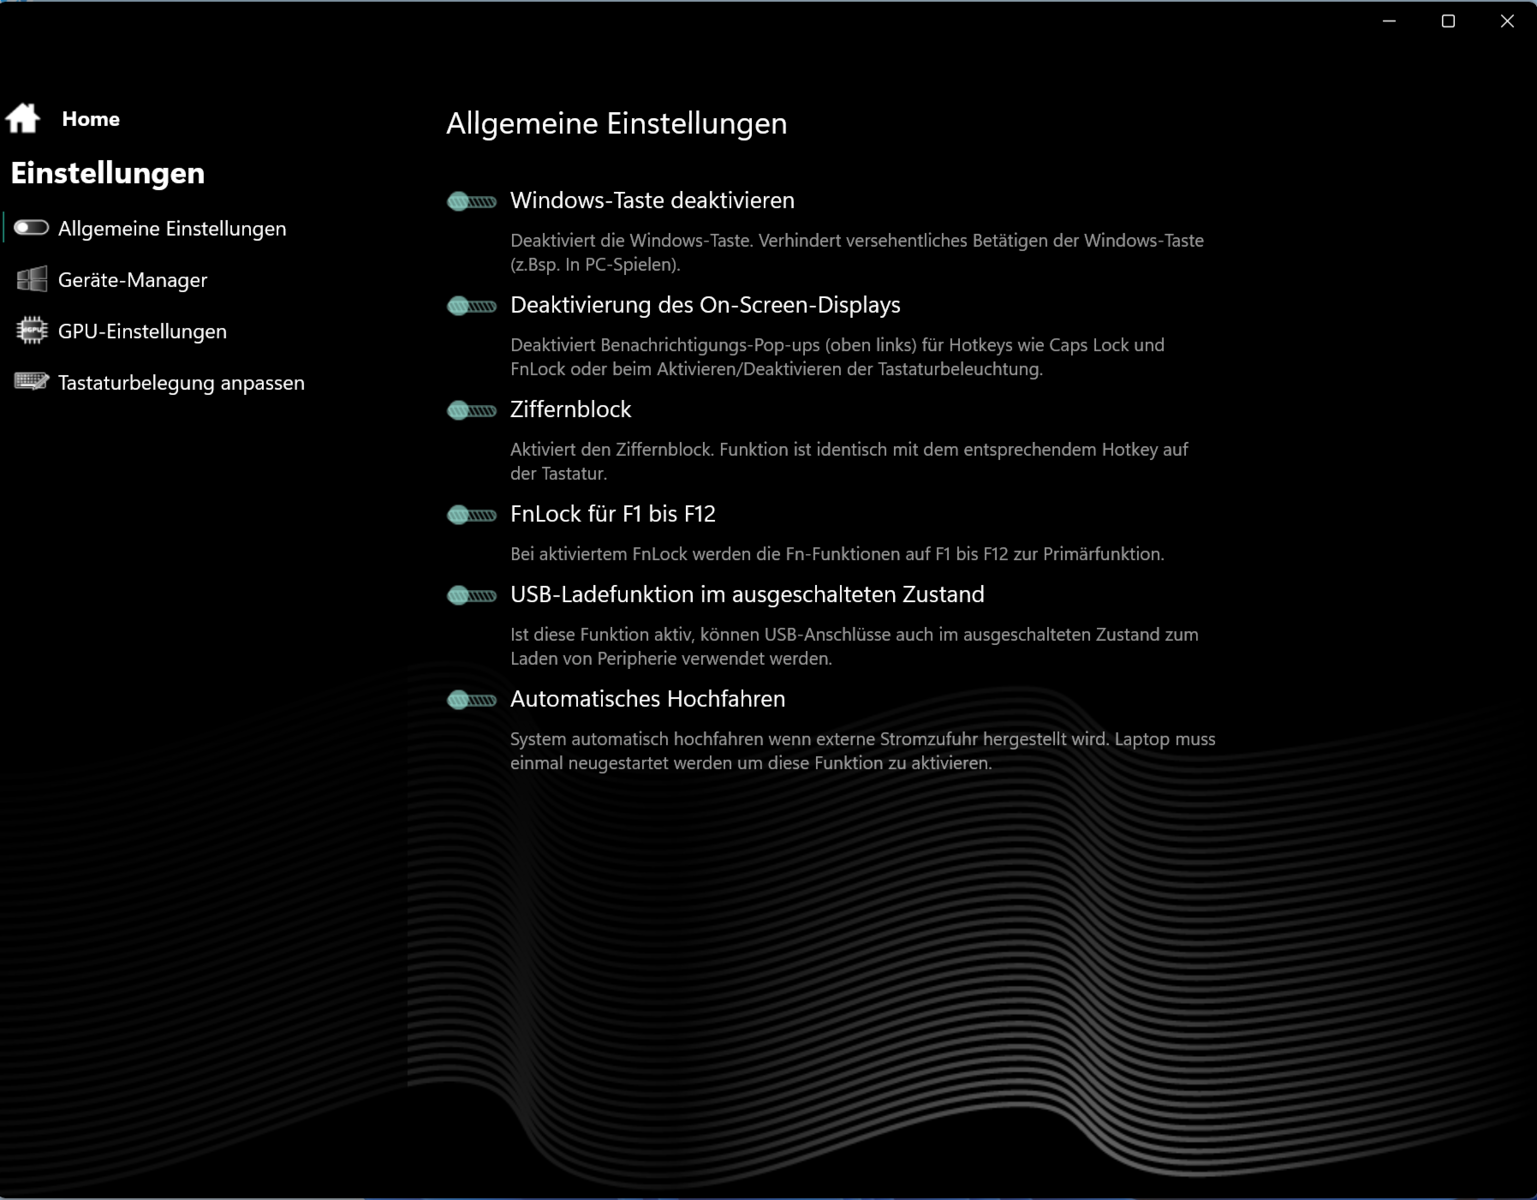
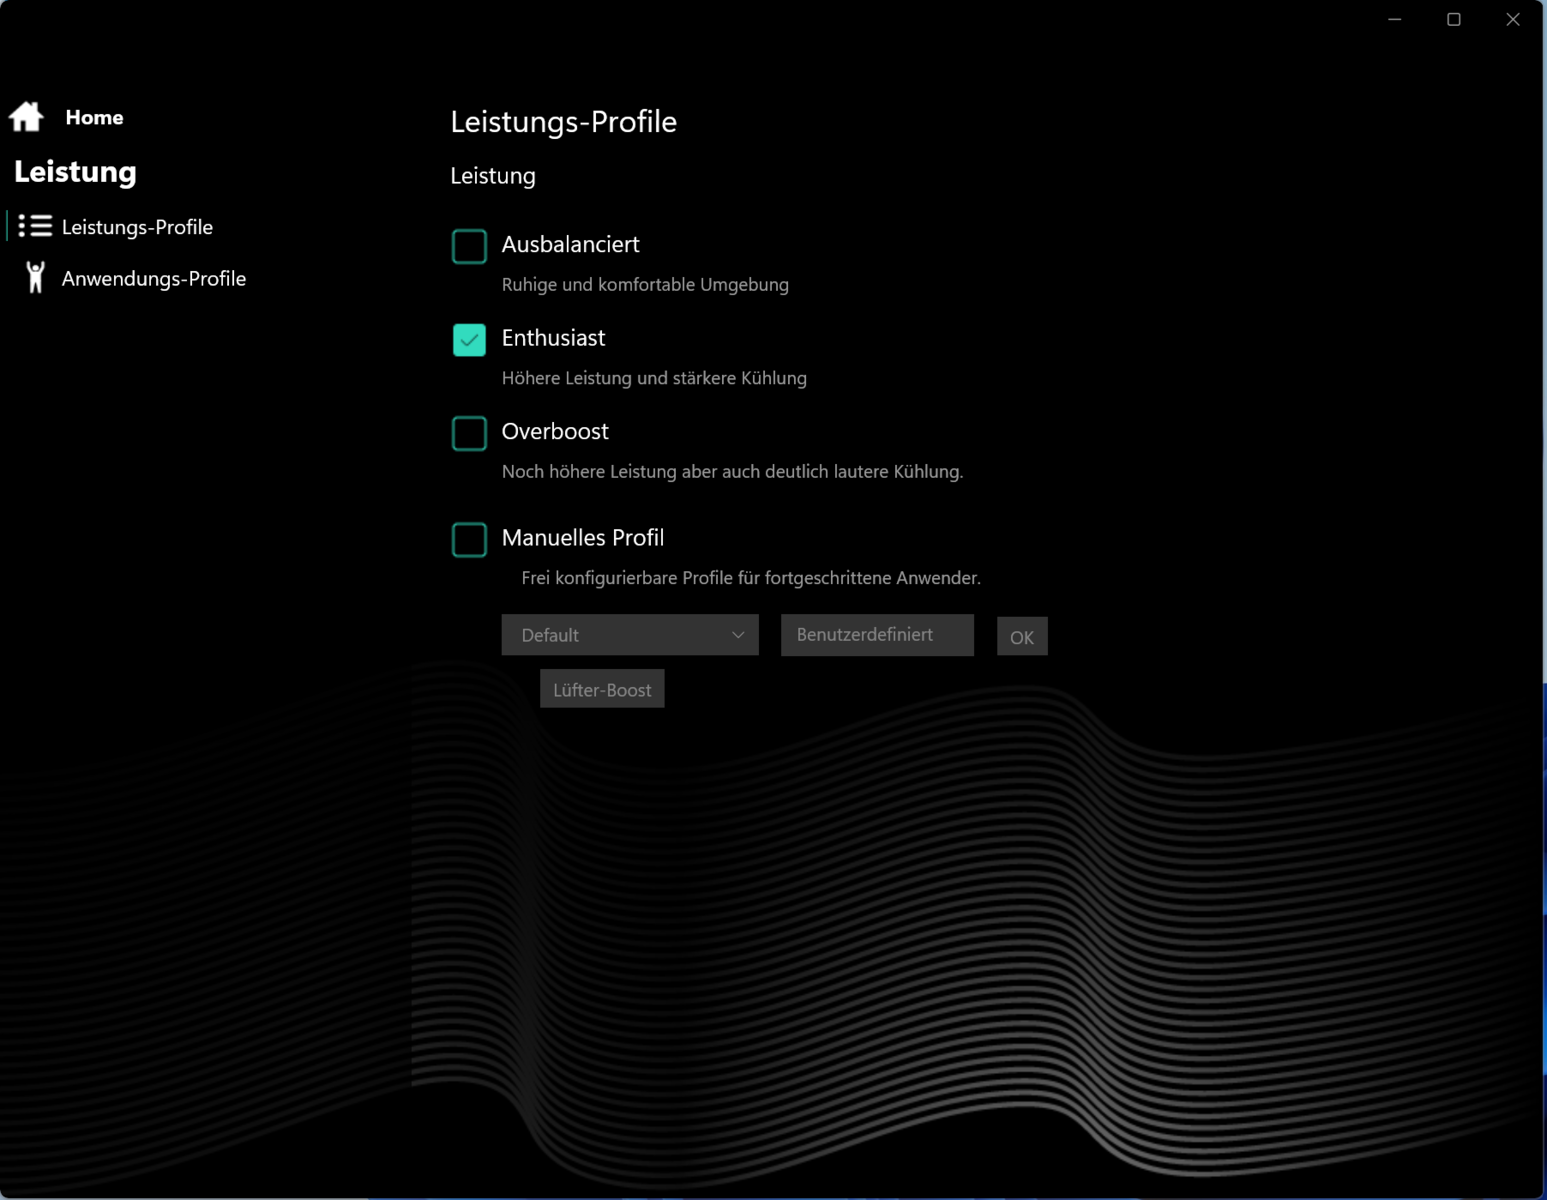
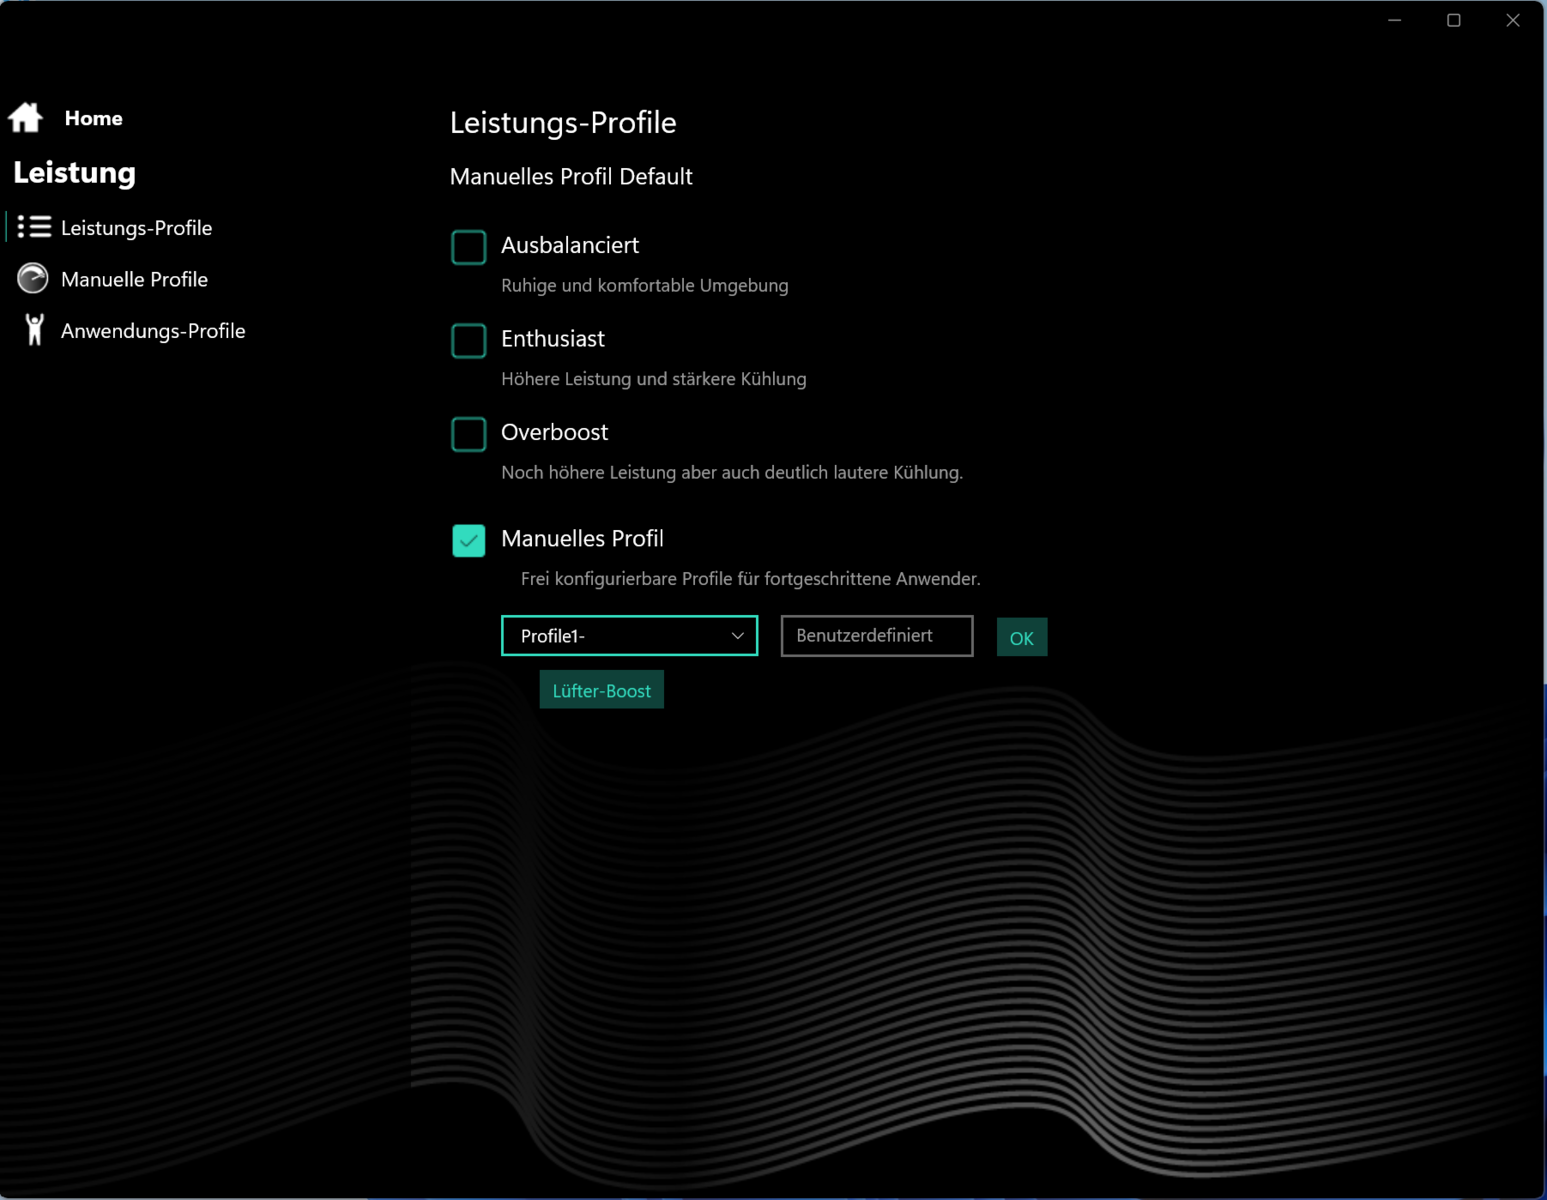
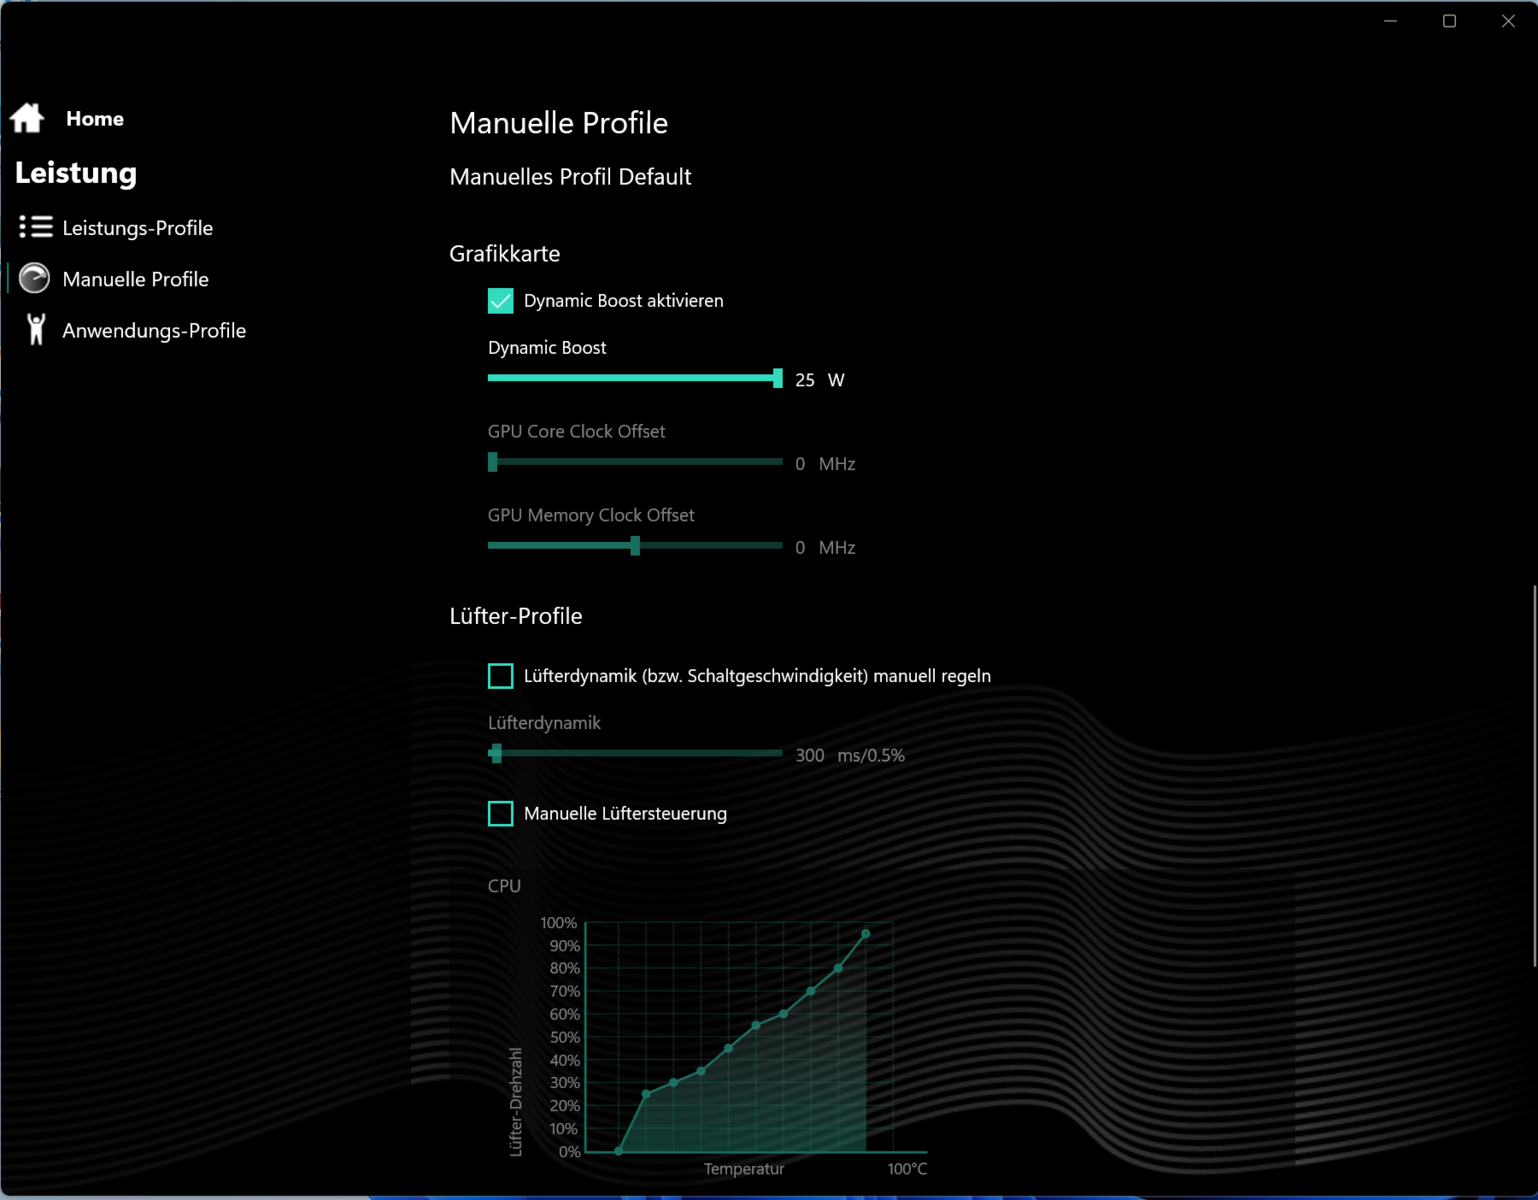
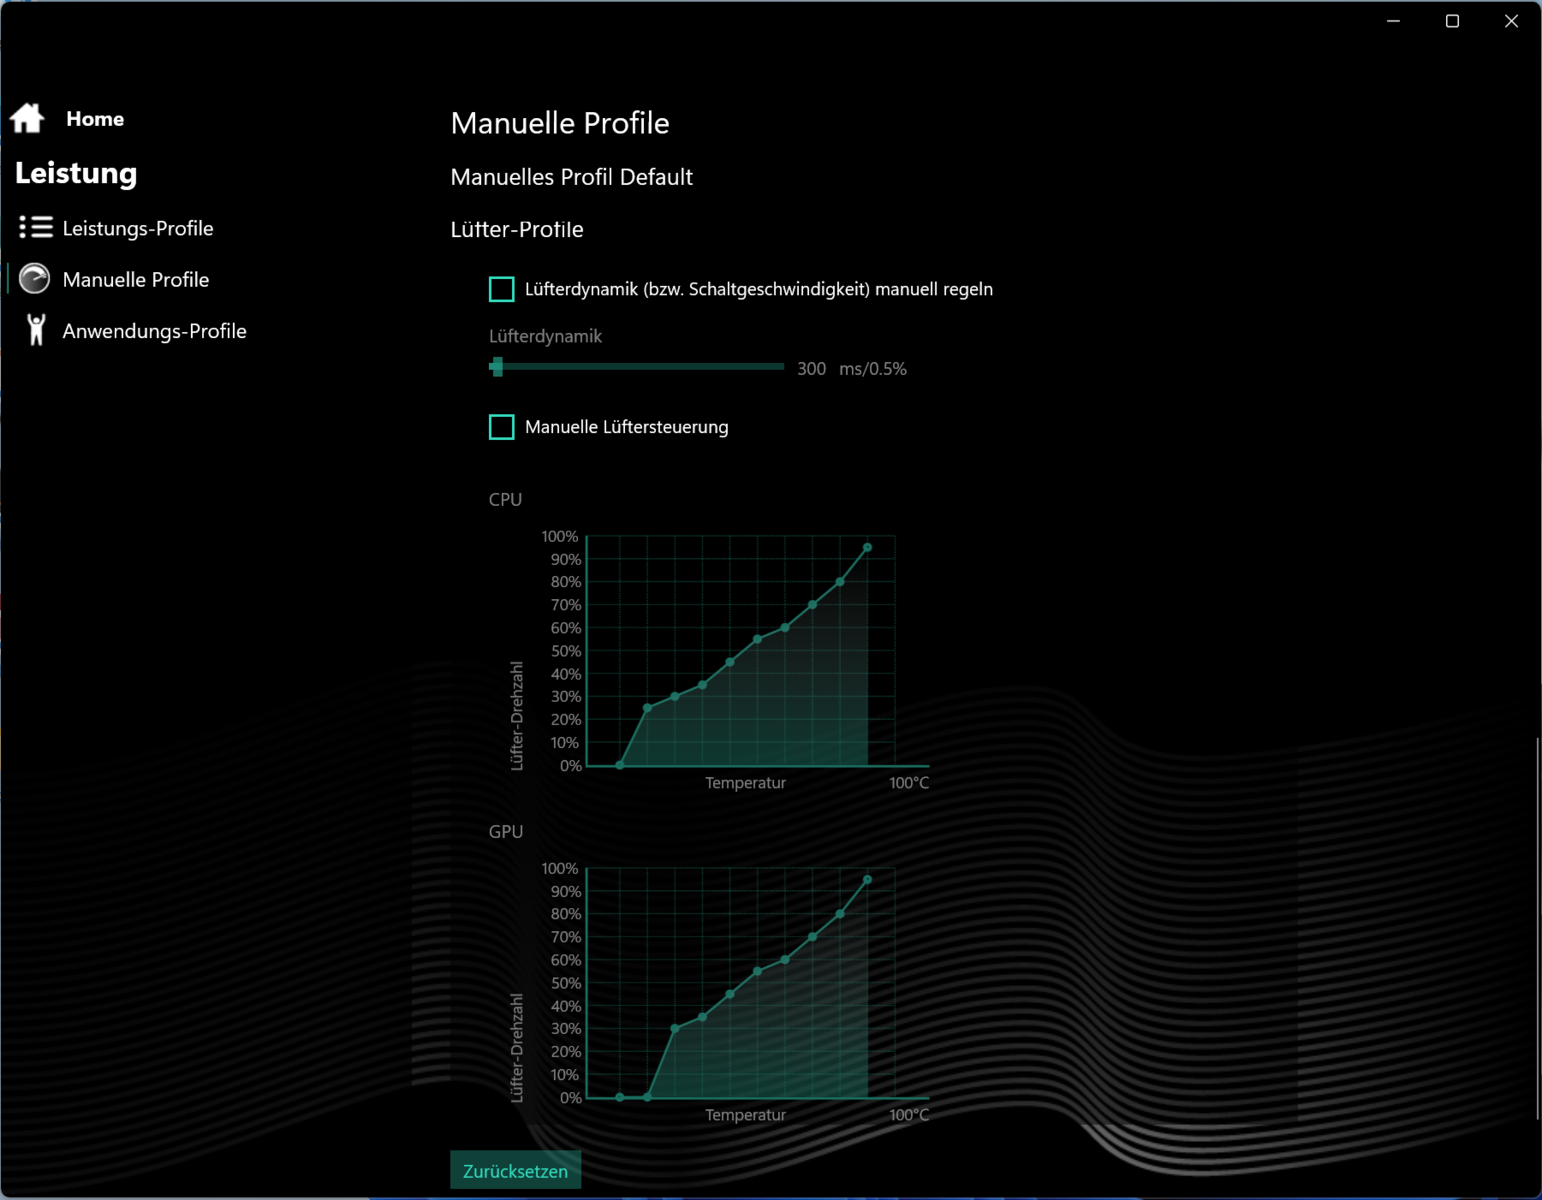
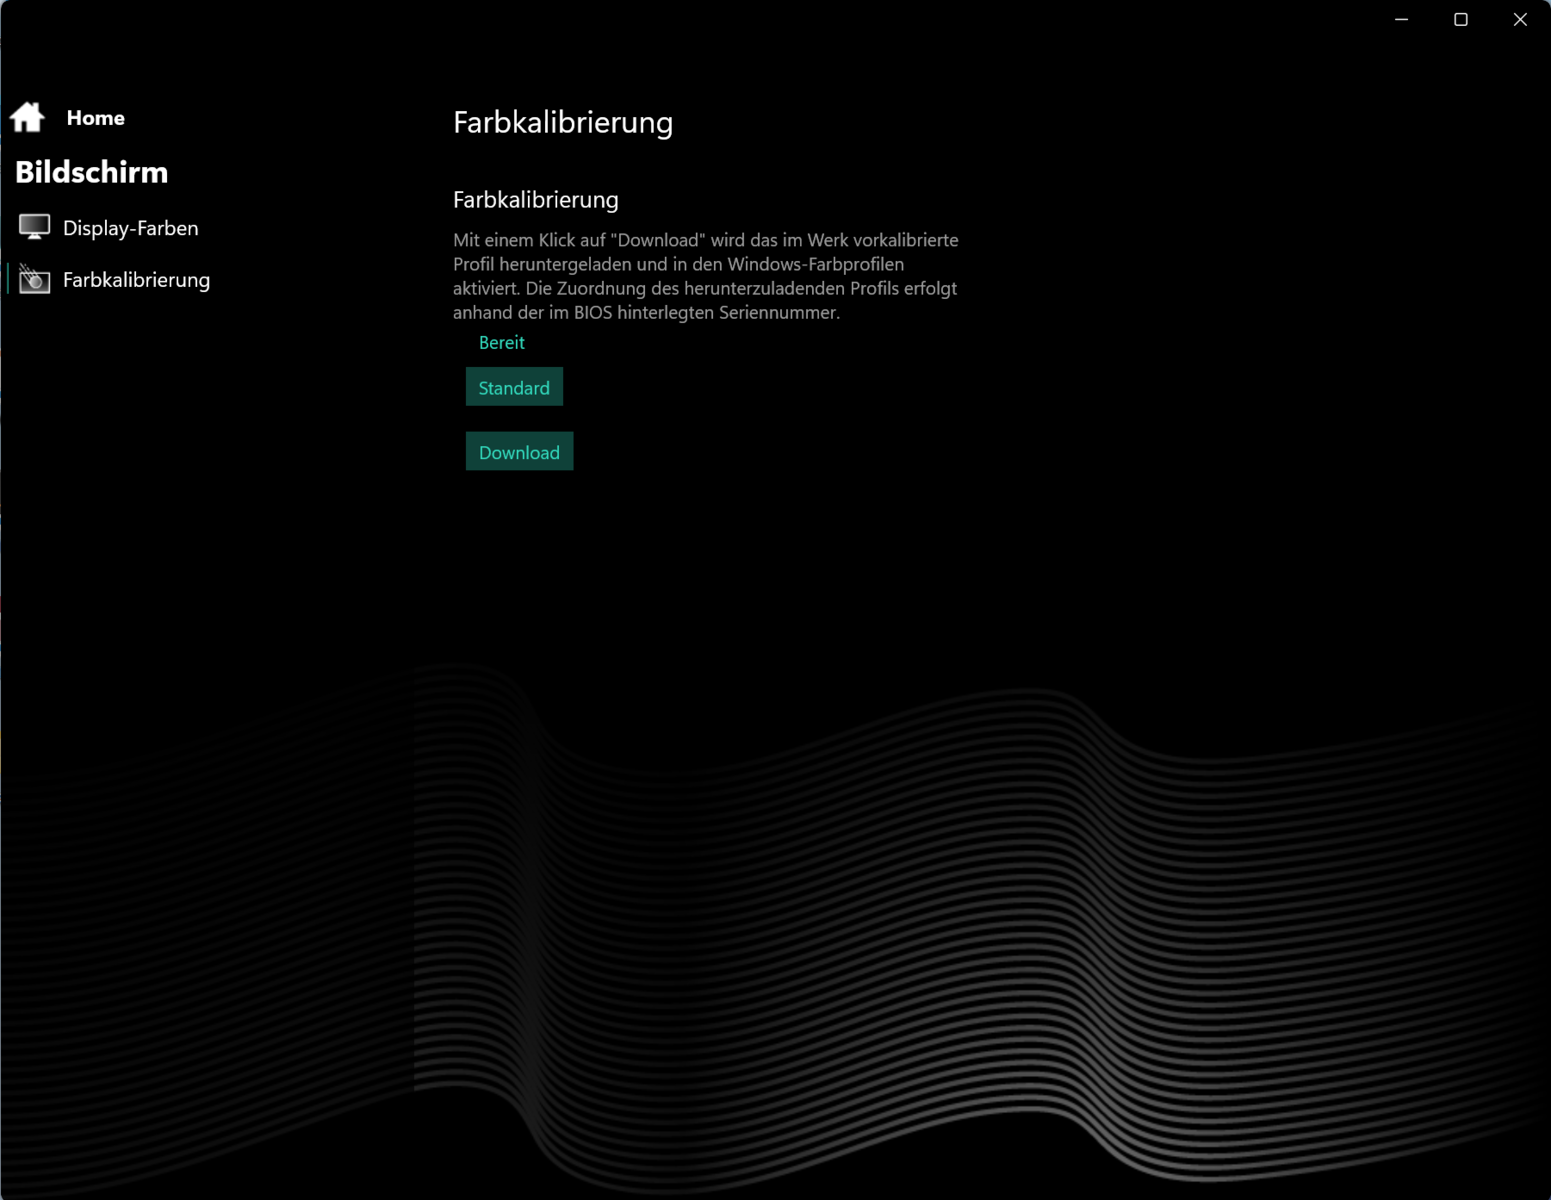
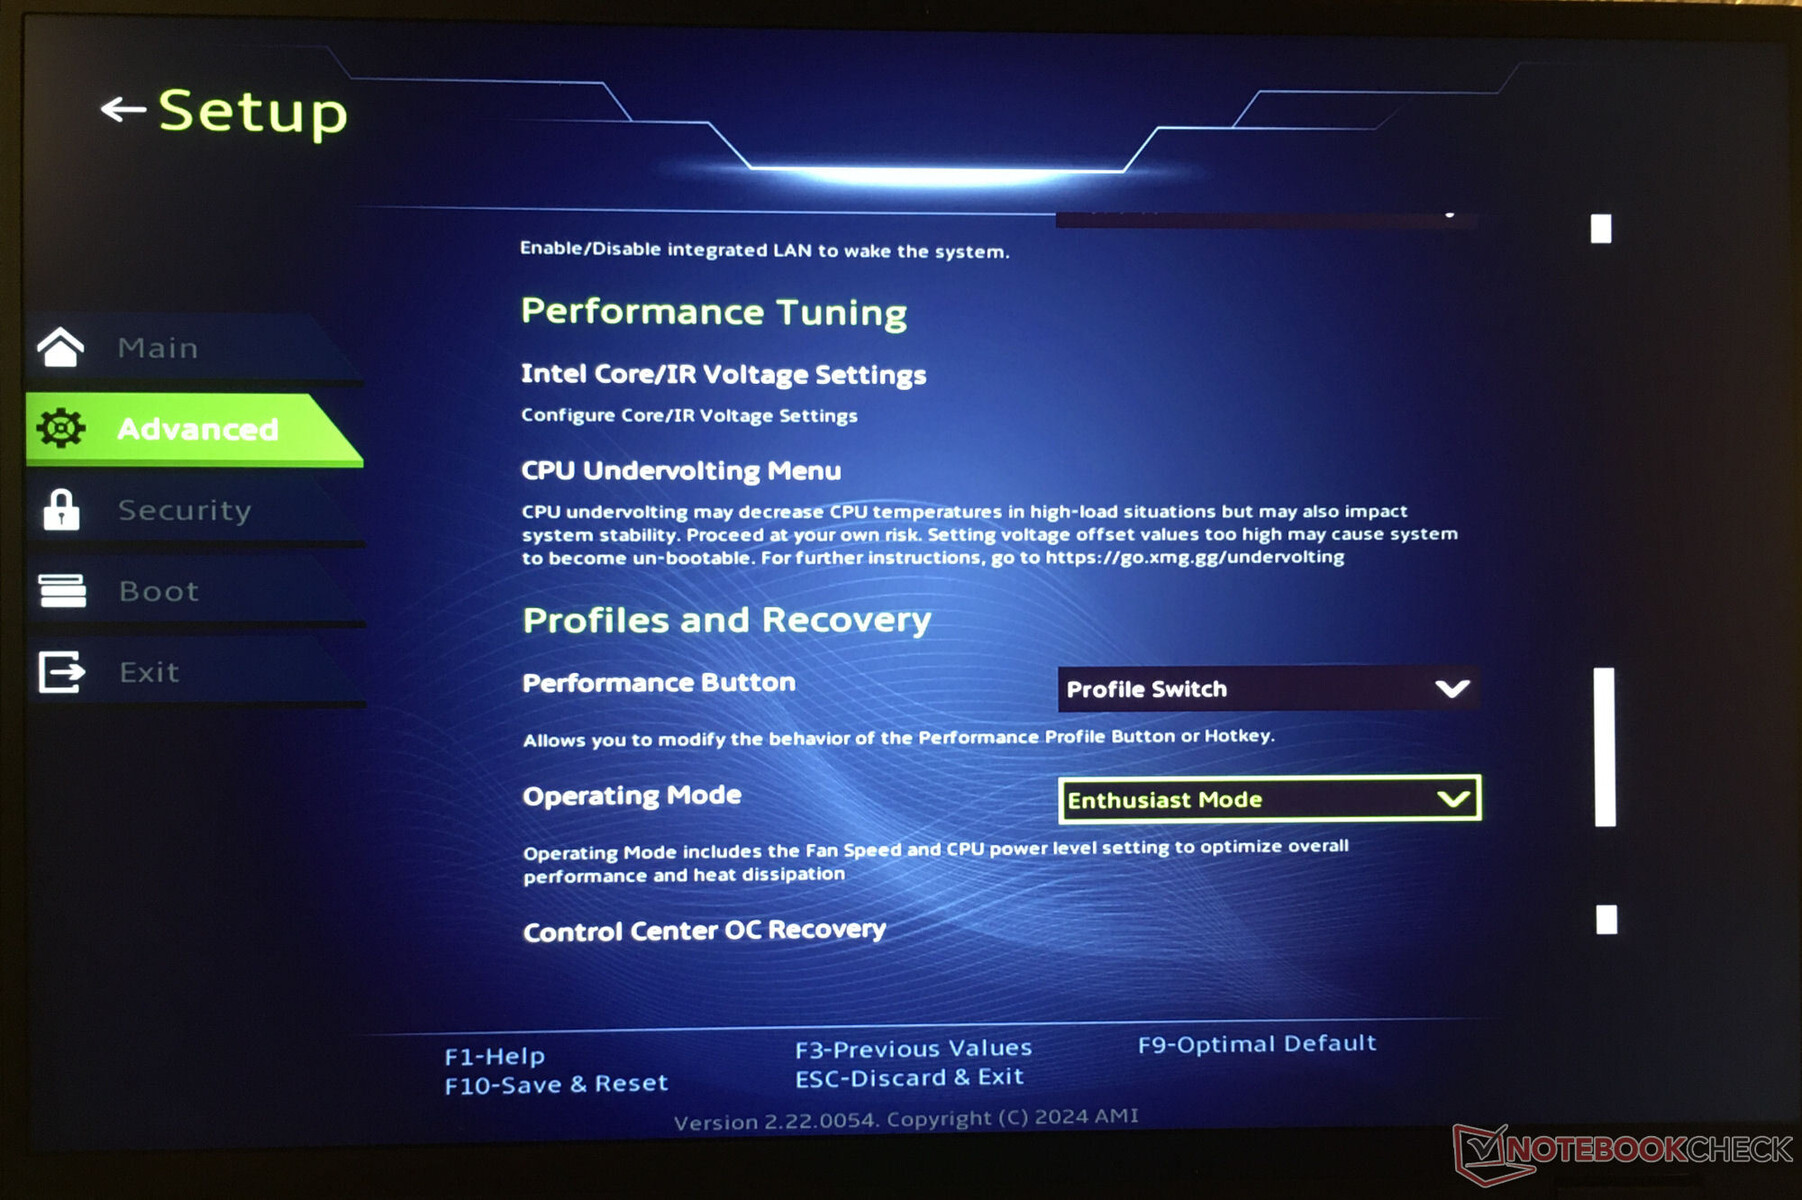
L'ordinateur portable offre trois modes de performance spécifiques au fabricant (voir tableau), entre lesquels vous pouvez basculer rapidement à l'aide d'un bouton séparé (à côté du bouton d'alimentation). Des profils individuels peuvent être créés à l'aide du logiciel Control Center préinstallé. Par exemple, les limites de puissance du CPU, le TGP du GPU et/ou les limites supérieures de température de l'appareil peuvent être ajustés.
Les modes Enthusiast (benchmarks) et Balanced (tests de batterie) ont été utilisés lors de notre test. Le mode GPU était réglé sur Hybride (= Optimus).
| Enthusiast | Overboost | Balanced | |
|---|---|---|---|
| Limite de puissance 1 (HWInfo) | 160 watts | 160 watts | 160 watts |
| Limite de puissance 2 (HWInfo) | 170 watts | 170 watts | 170 watts |
| Bruit (Witcher 3) | 51 dB(A) | 53 dB(A) | 39 dB(A) |
| Performance (Witcher 3) | 128 fps | 130 fps | 14-128 fps |

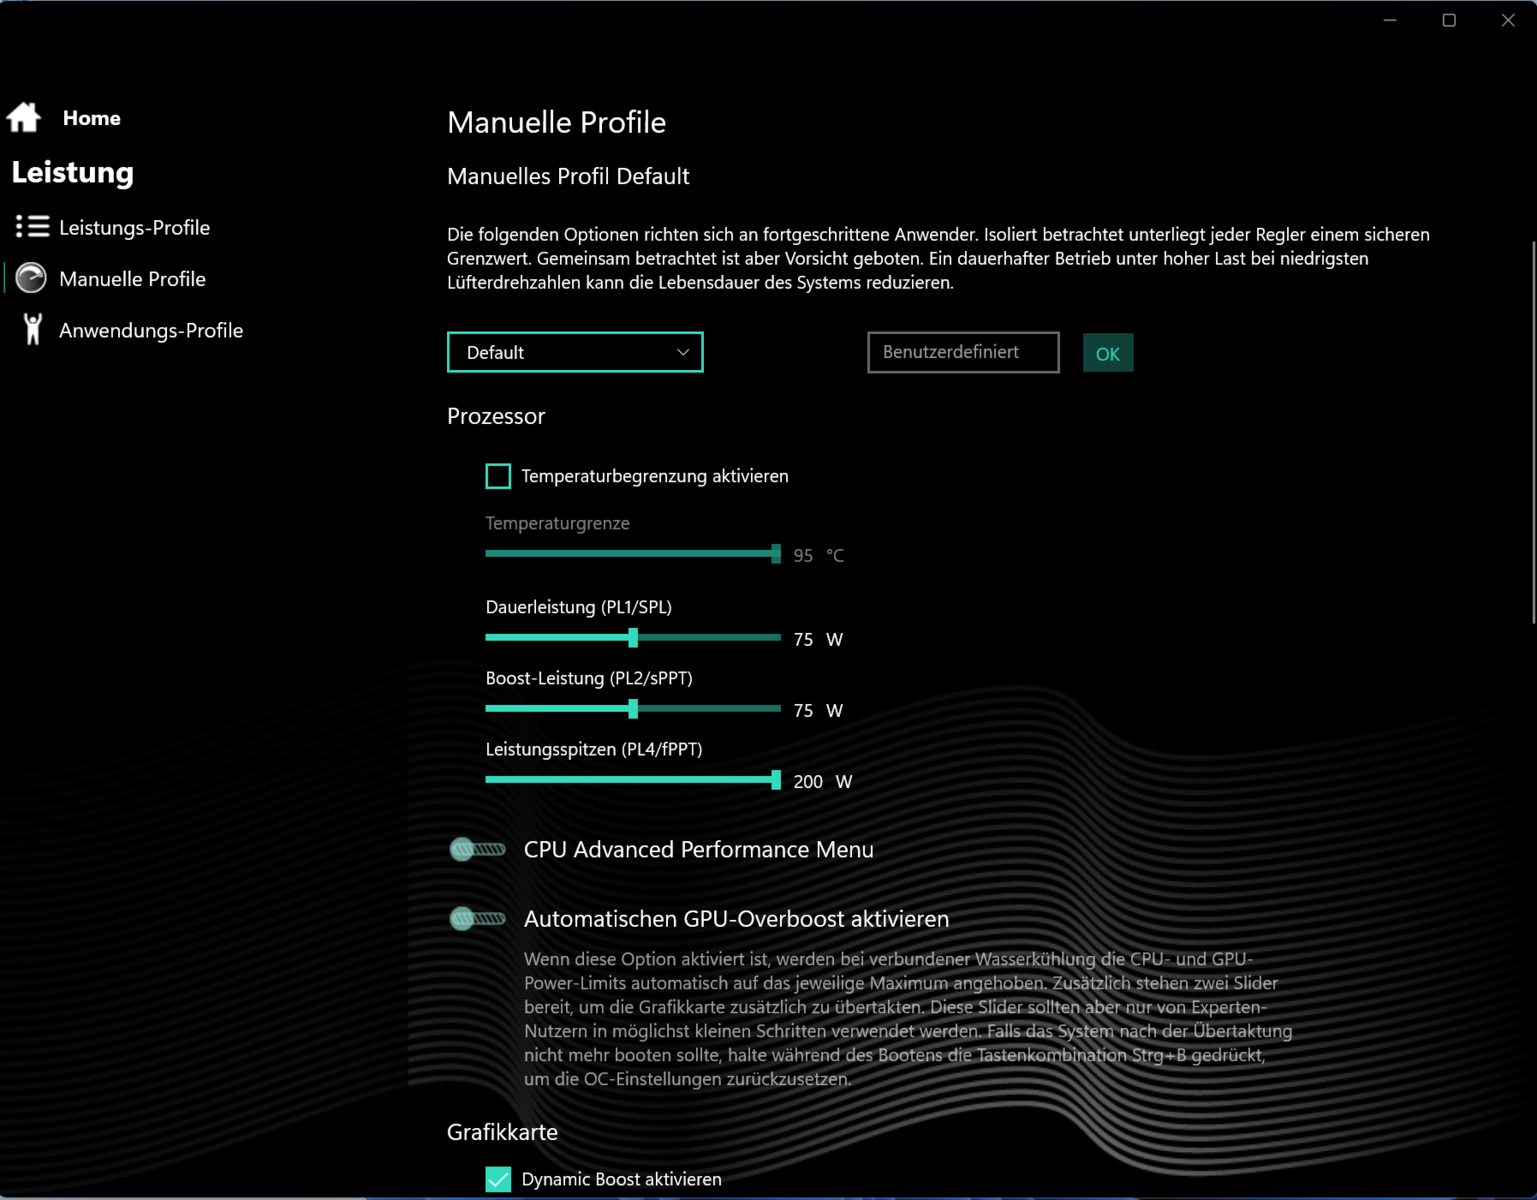
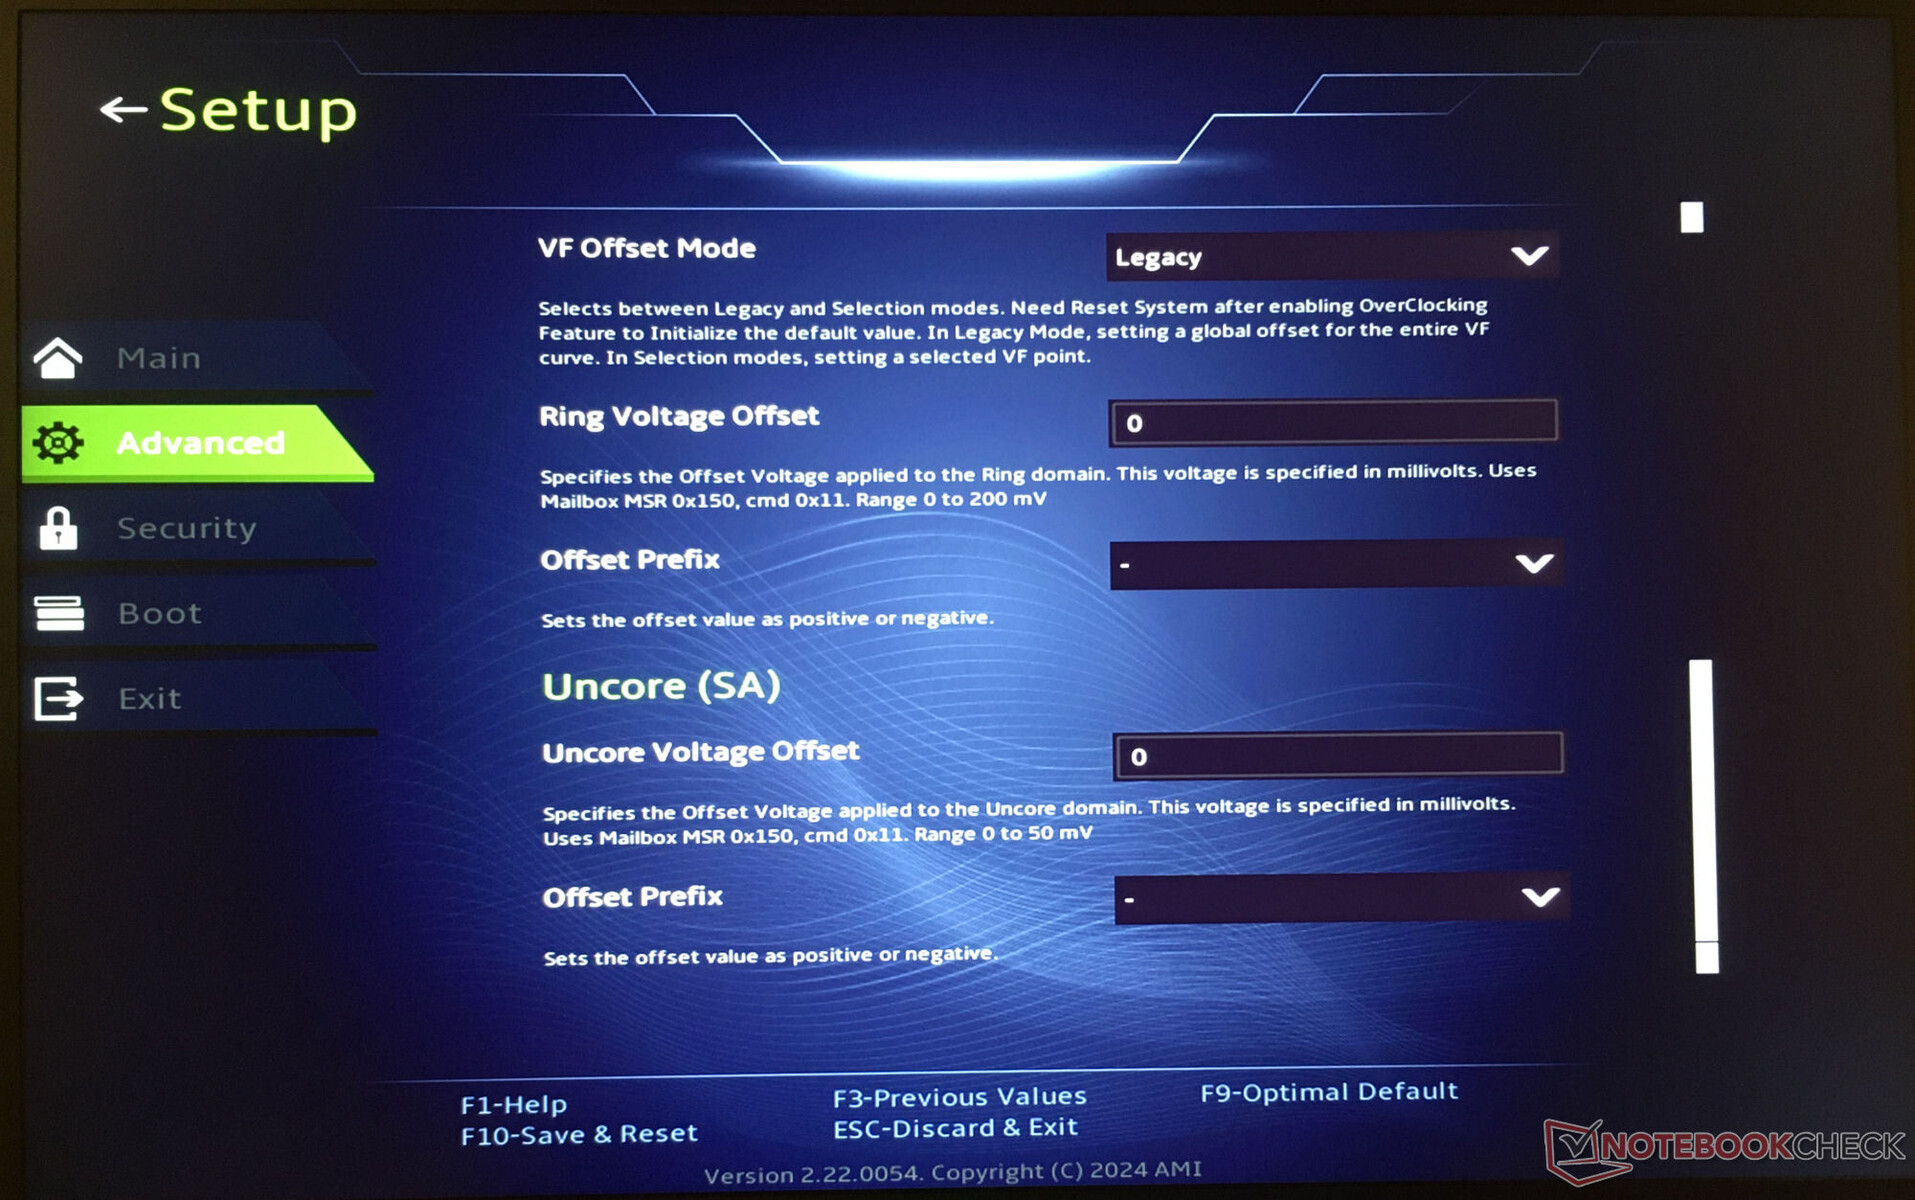
Sous-voltage
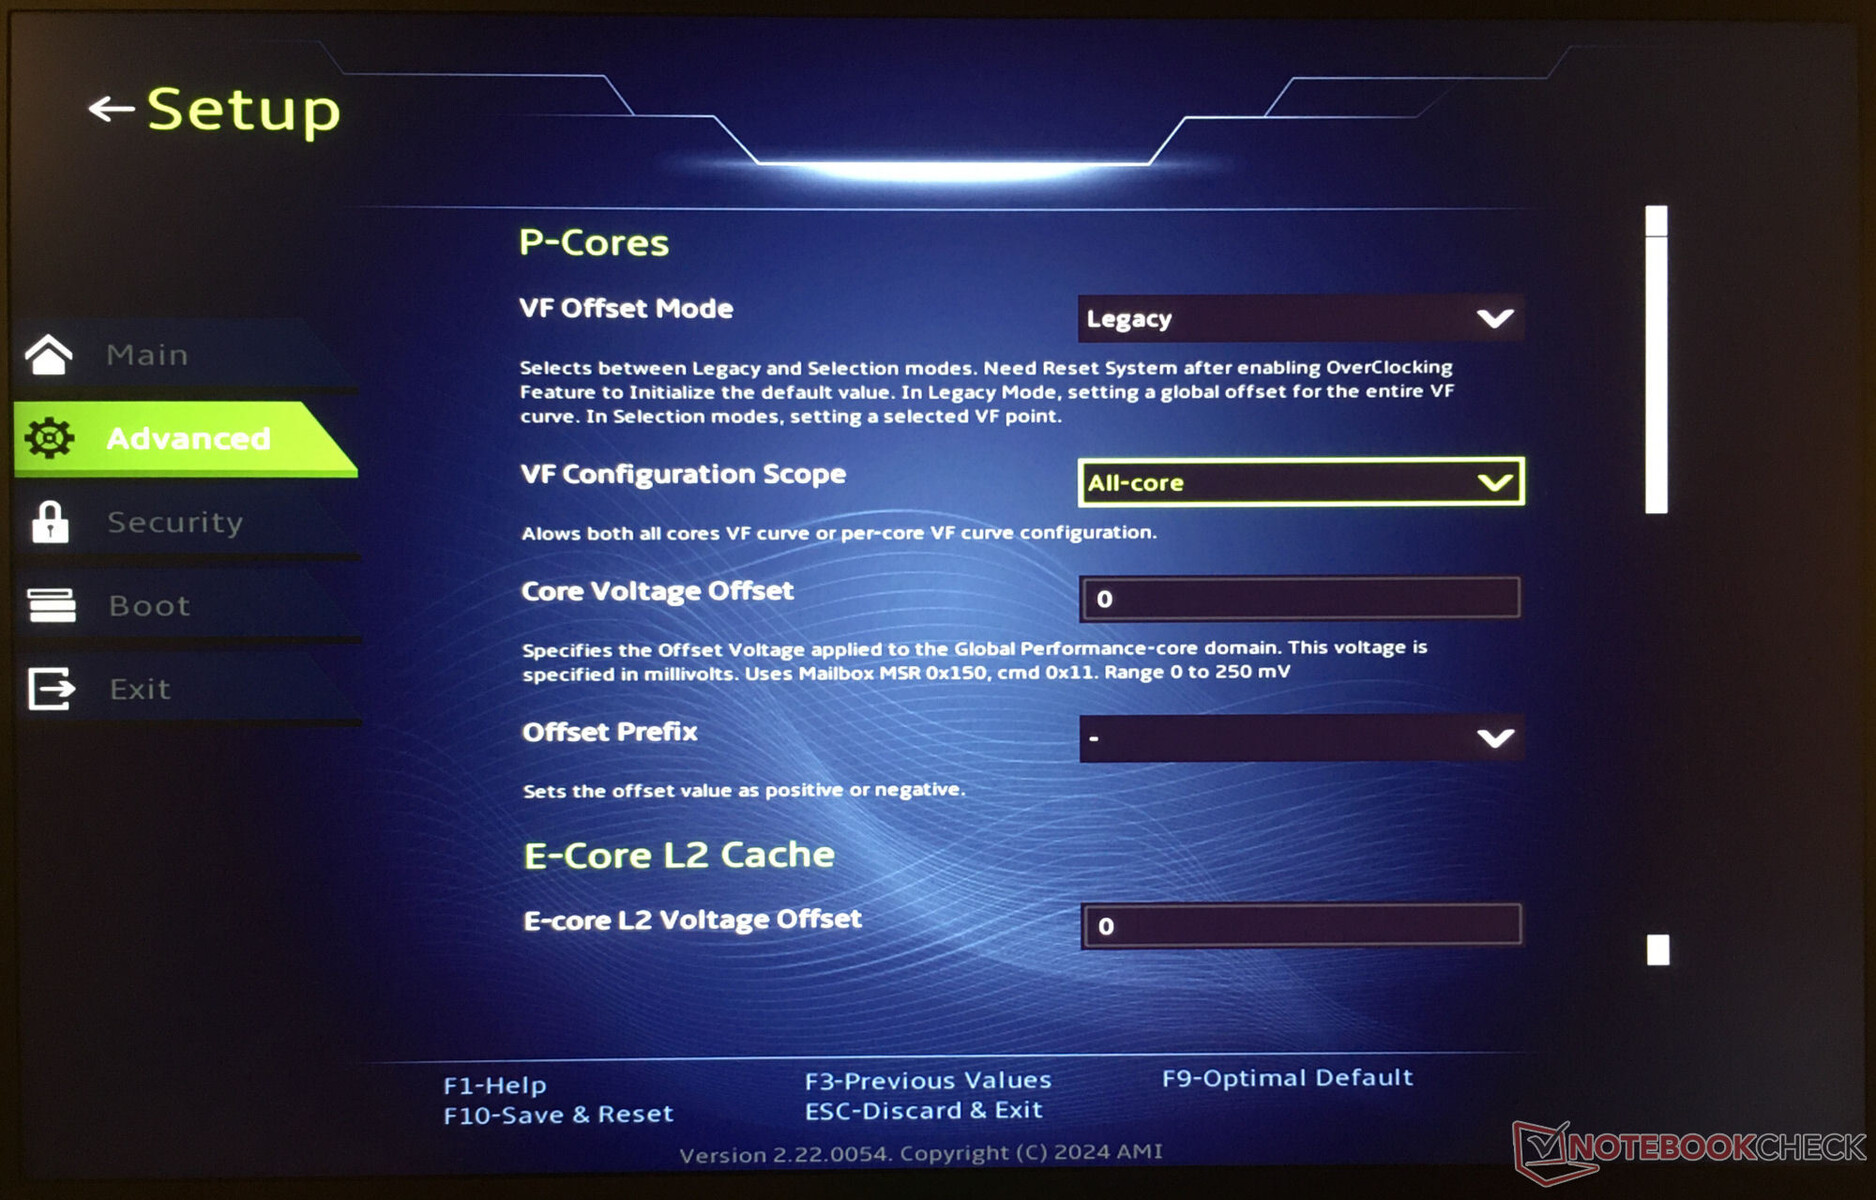
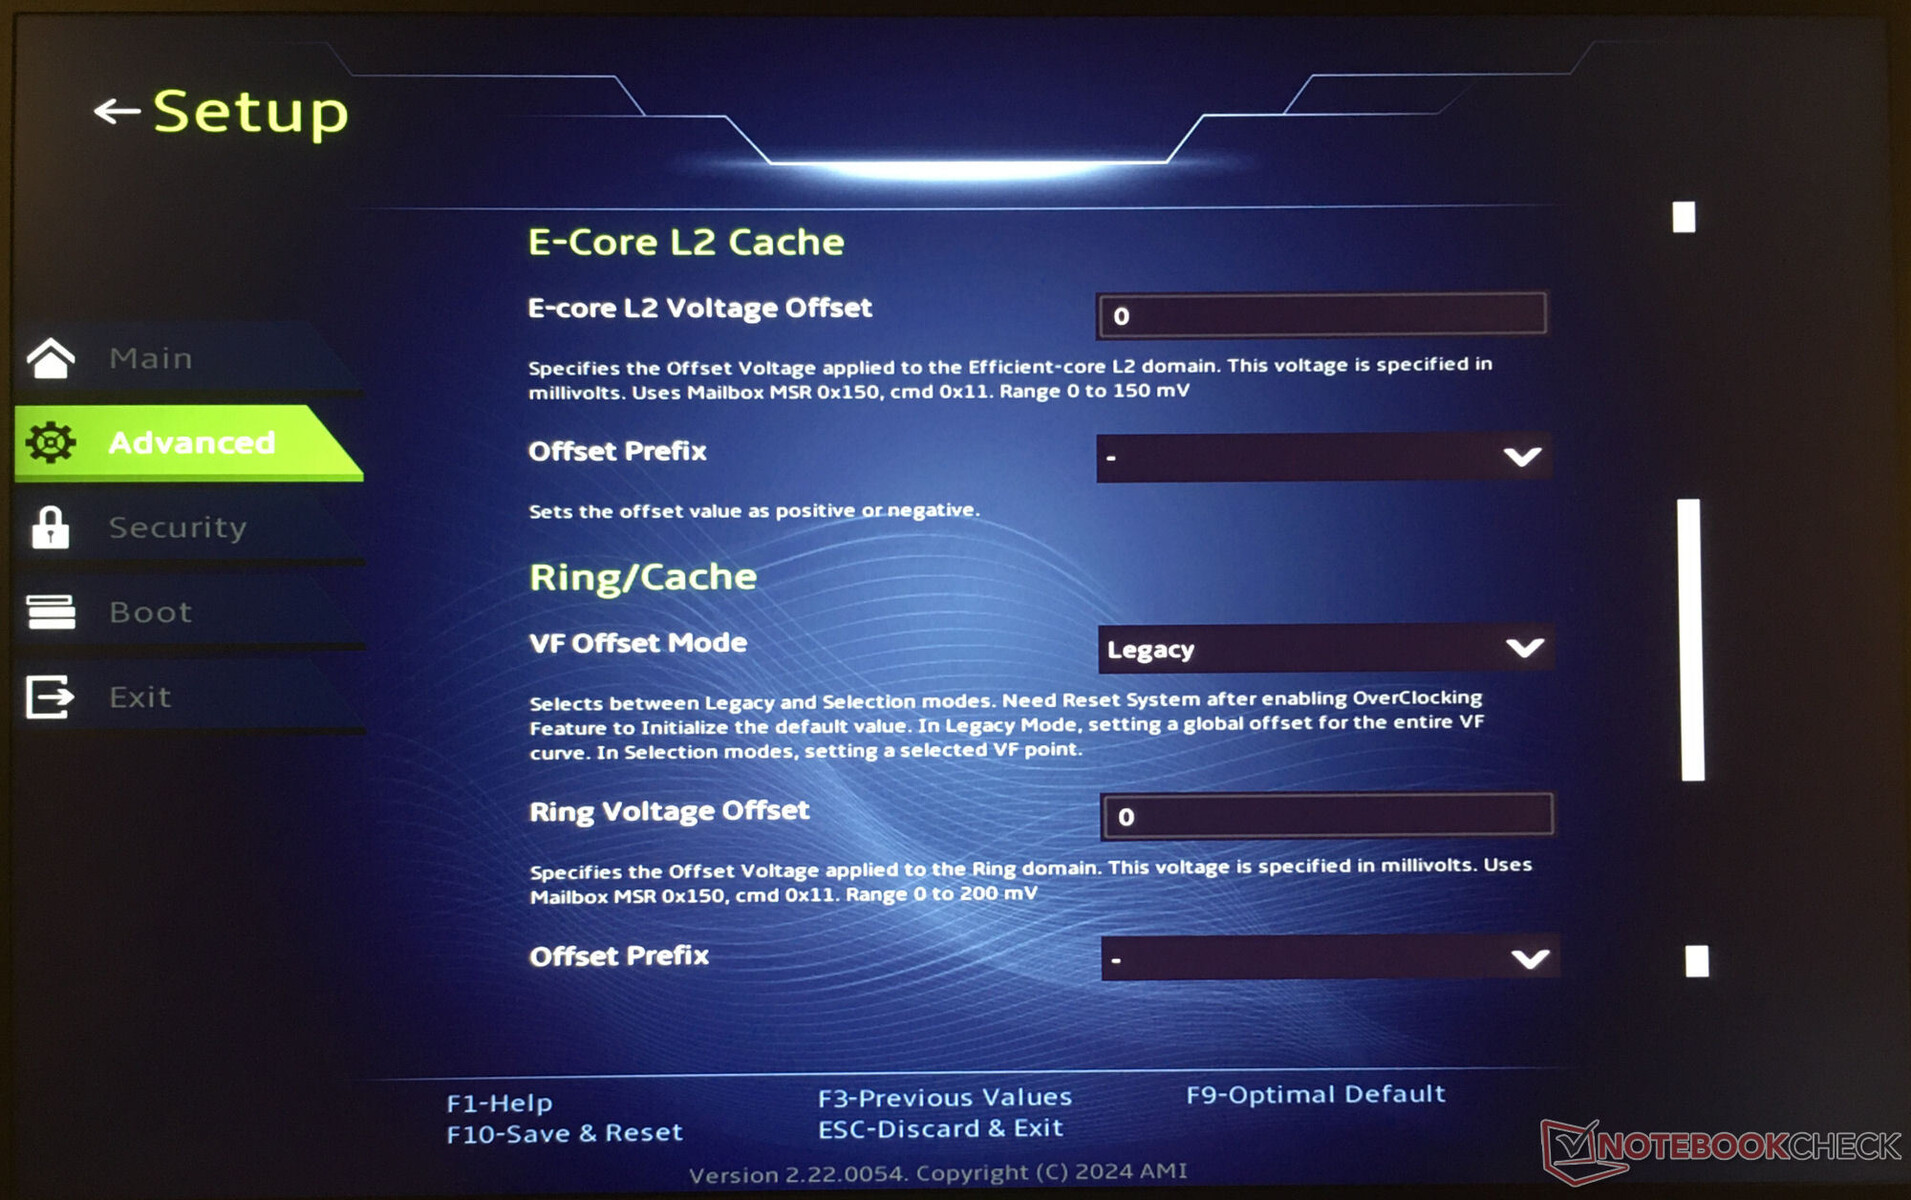
Le processeur peut fonctionner à des tensions inférieures à celles prévues par le fabricant (undervolting). Cela permet de réduire la consommation d'énergie et les émissions de chaleur de l'appareil. Mais attention : Un abaissement trop important de la tension peut conduire à un système instable ou défectueux. Dans ce cas, les modifications doivent être inversées - l'undervolting se fait à vos risques et périls.
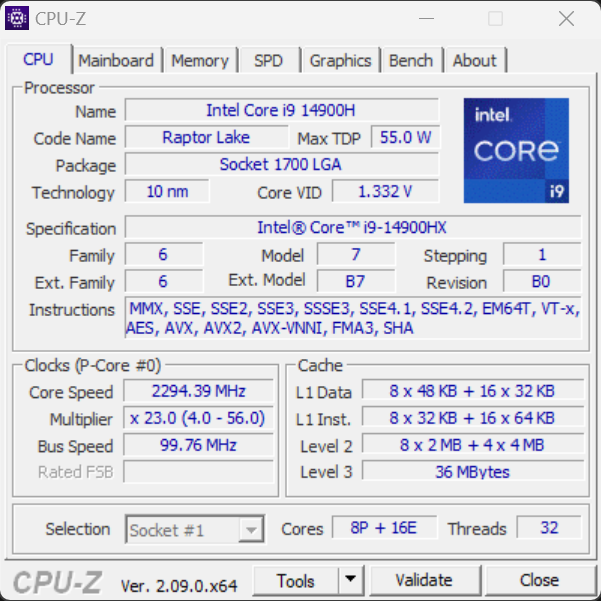
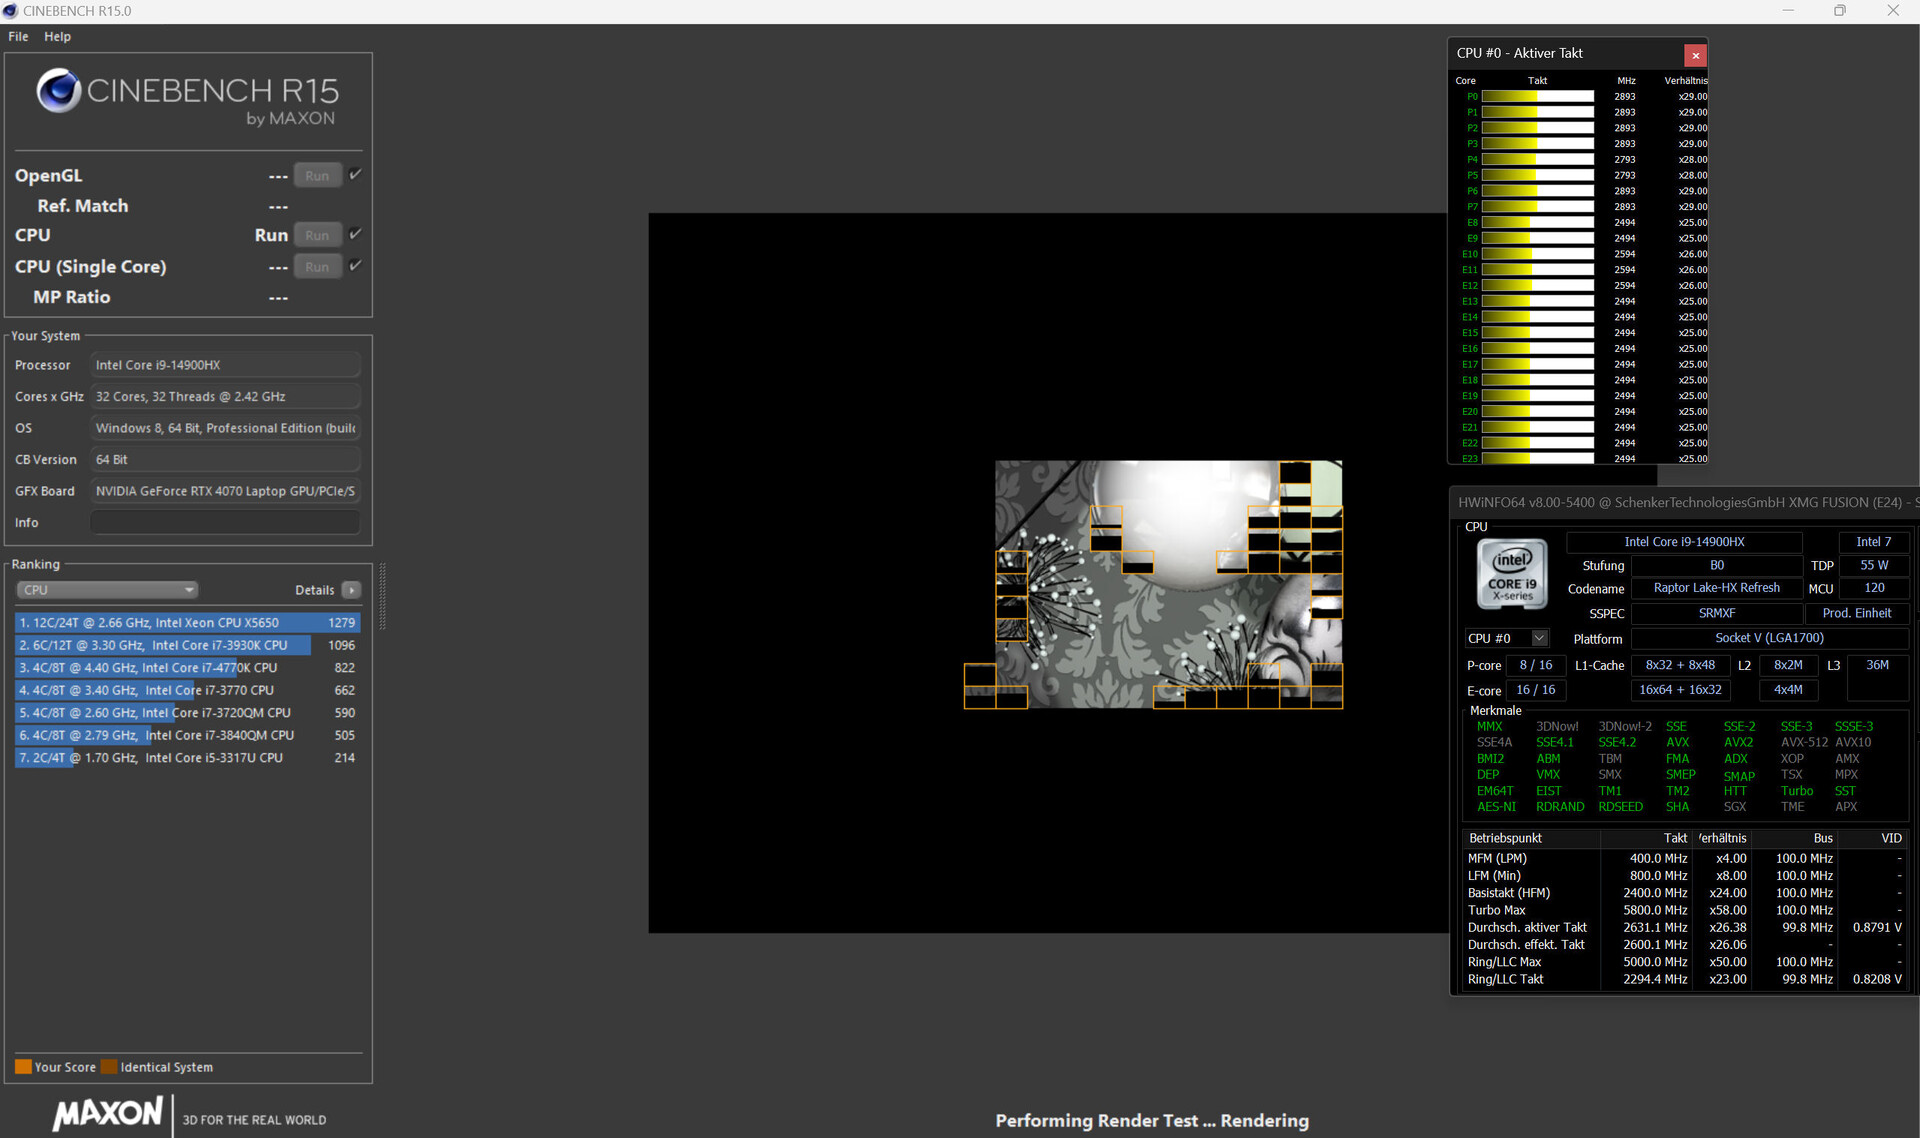
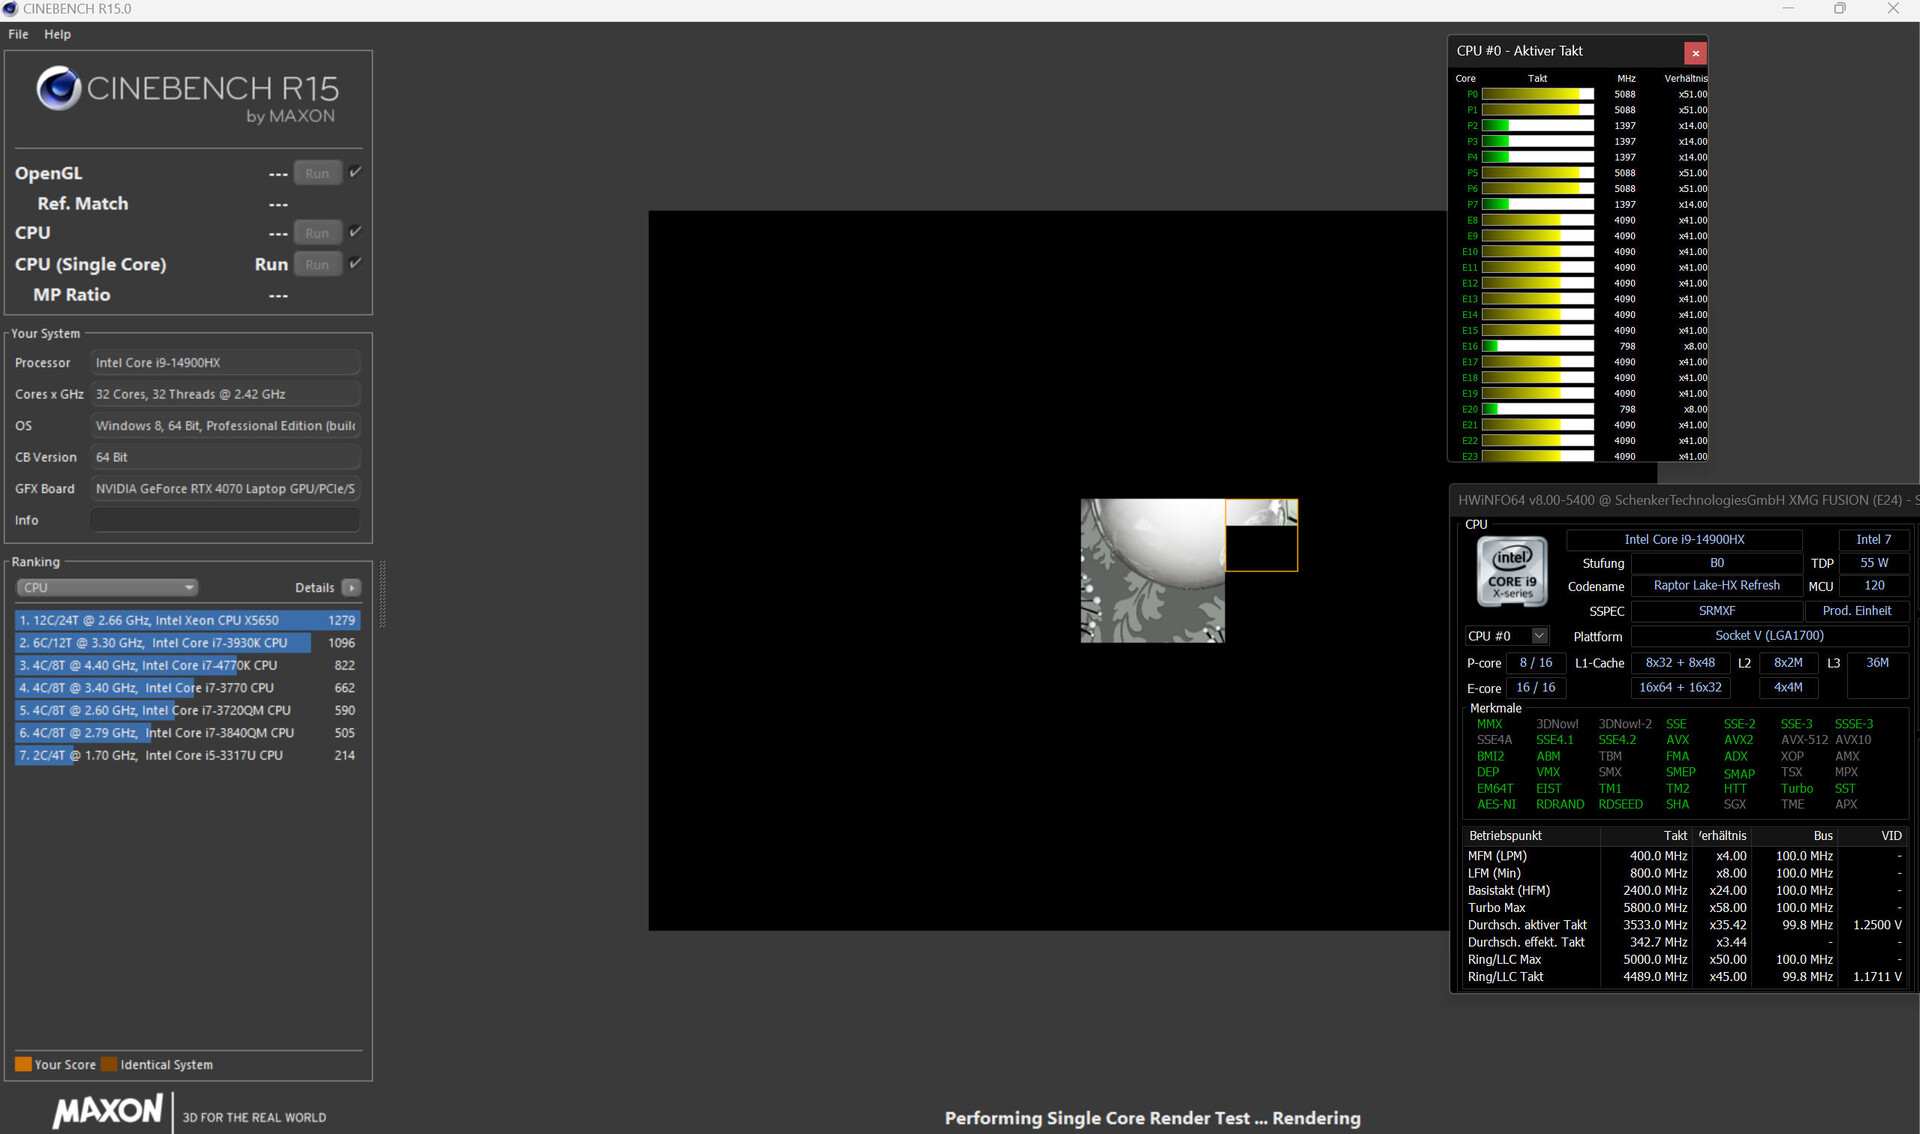
Processeur
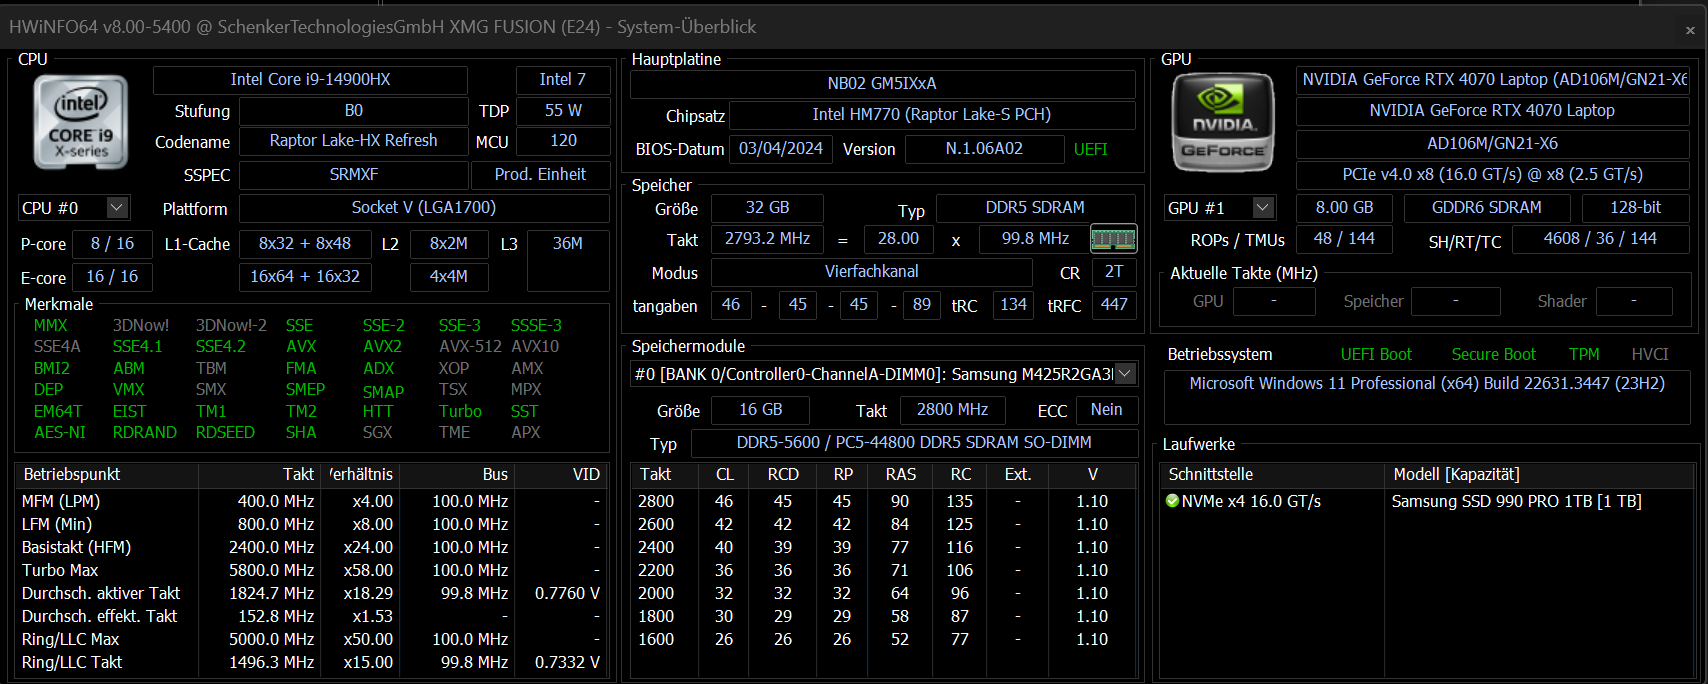
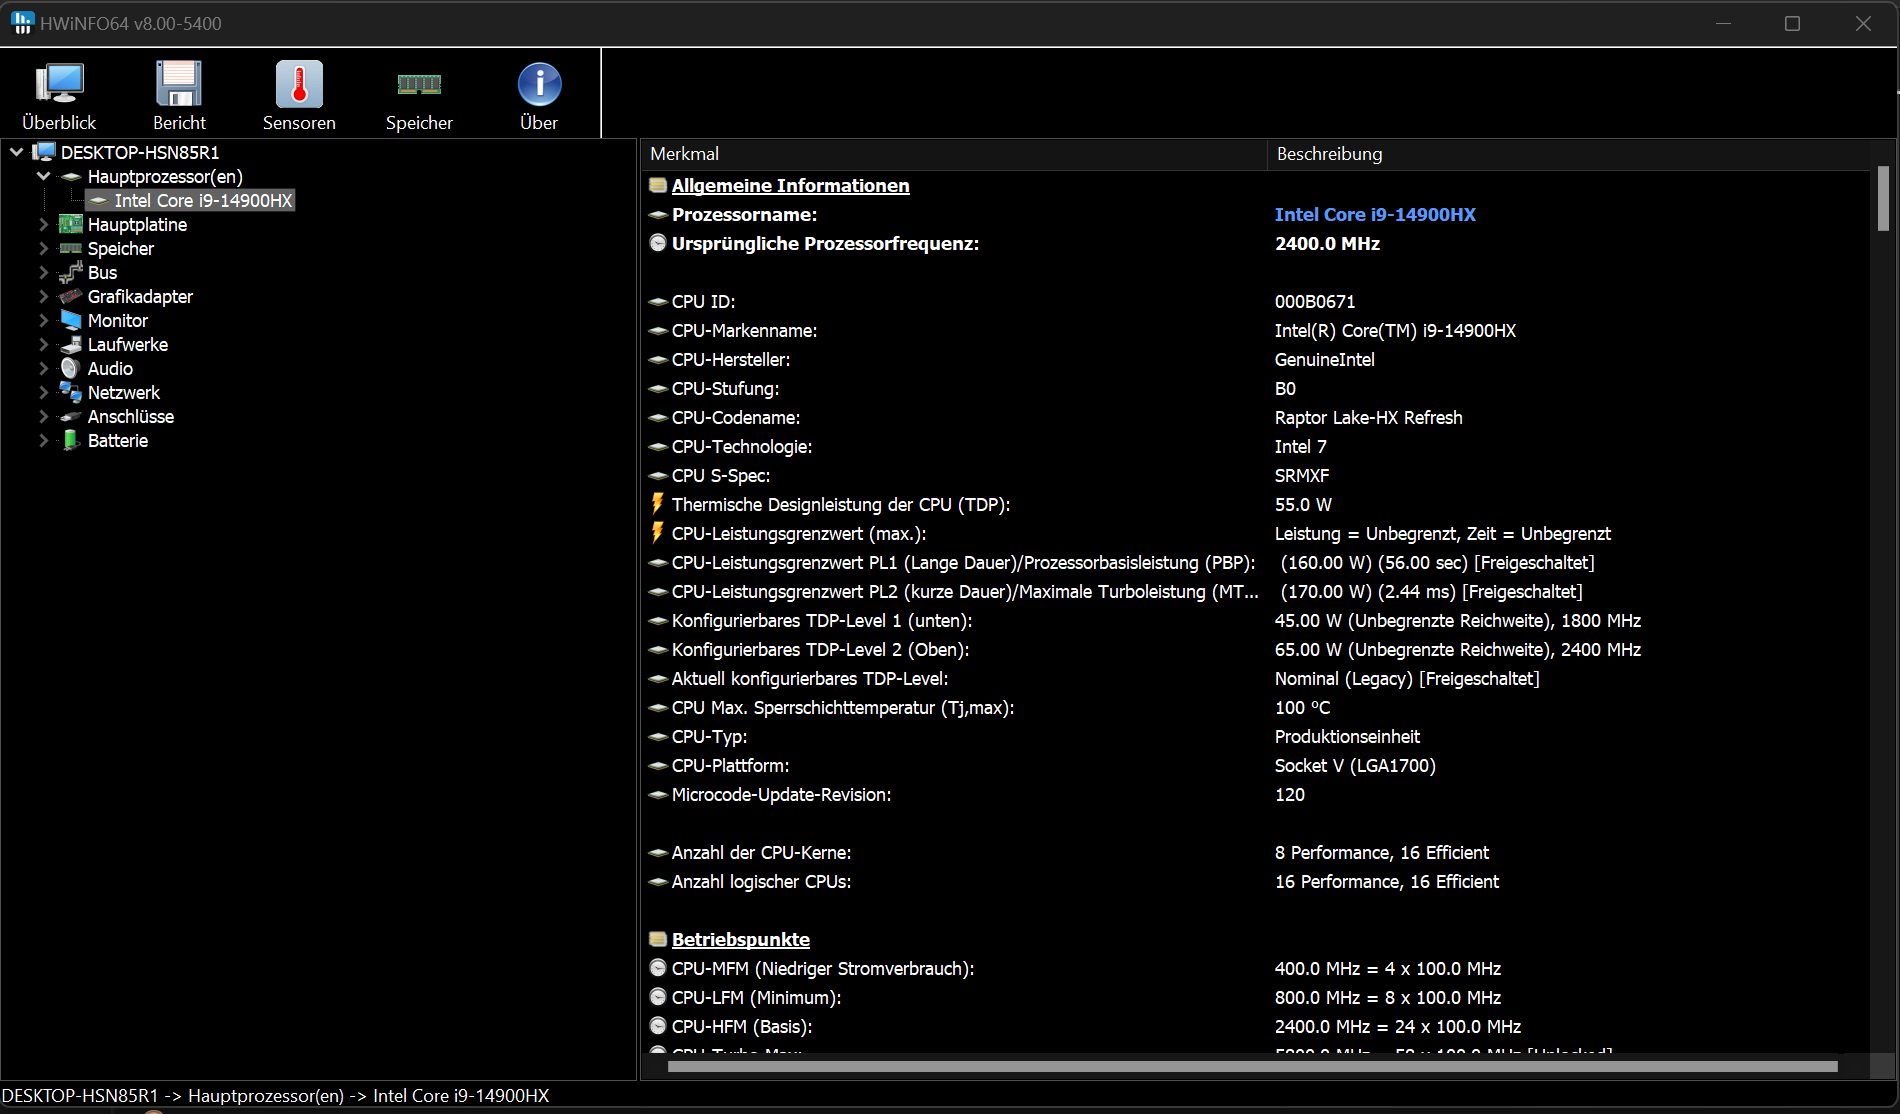
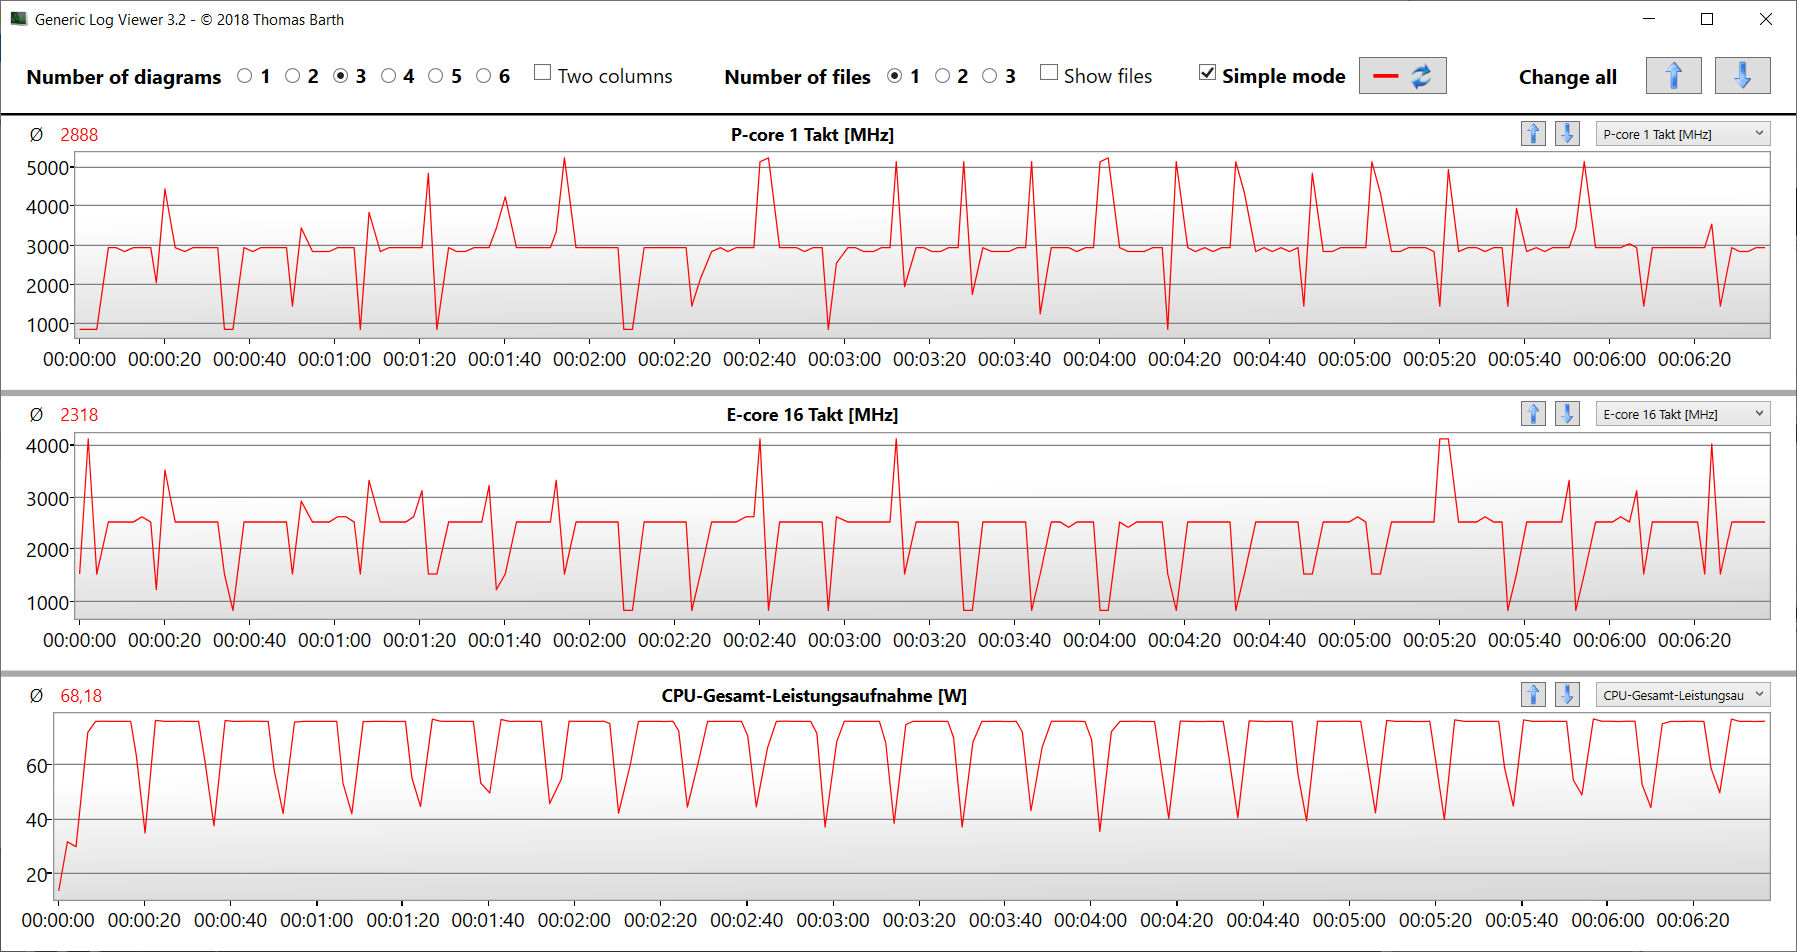
Le Core i9-14900HX (Raptor Lake) (8P + 16E = 32 threads) atteignent des fréquences maximales de 5,8 GHz (P) et de 4,1 GHz (E). La charge multithread permanente (CB15 Loop) se traduit par des fréquences d'horloge stables - le niveau dépend du mode d'alimentation sélectionné.
Enthusiast fournit des valeurs de référence inférieures à la moyenne du CPU, tandis qu'Overboost les augmente de manière significative au-dessus de la moyenne - cela s'applique principalement aux performances multithread du portable. Les performances de l'ordinateur en mode "single-thread" se situent à un niveau élevé et très similaire lorsque vous utilisez les trois profils.
Vous trouverez plus d'informations sur le Core i9 dans notre article d'analyseTest de l'Intel Raptor Lake-HX Refresh : Core i9-14900HX avec plus de performances à cœur unique .
Cinebench R15 Multi continuous test
| CPU Performance Rating - Percent | |
| SCHENKER XMG Fusion 15 (Early 24) | |
| Lenovo Legion Pro 5 16IRX9 | |
| Moyenne Intel Core i9-14900HX | |
| Aorus 16X 2024 | |
| SCHENKER XMG Fusion 15 (Early 24) | |
| HP Omen Transcend 16-u1095ng | |
| Moyenne de la classe Gaming | |
| Alienware m16 R2 -1! | |
| Cinebench R23 | |
| Multi Core | |
| SCHENKER XMG Fusion 15 (Early 24) (Overboost) | |
| Lenovo Legion Pro 5 16IRX9 | |
| Moyenne Intel Core i9-14900HX (20702 - 32996, n=23) | |
| Aorus 16X 2024 | |
| SCHENKER XMG Fusion 15 (Early 24) | |
| HP Omen Transcend 16-u1095ng | |
| Moyenne de la classe Gaming (2435 - 34613, n=223, 2 dernières années) | |
| Alienware m16 R2 | |
| Single Core | |
| SCHENKER XMG Fusion 15 (Early 24) (Overboost) | |
| Aorus 16X 2024 | |
| HP Omen Transcend 16-u1095ng | |
| Moyenne Intel Core i9-14900HX (2043 - 2235, n=23) | |
| Lenovo Legion Pro 5 16IRX9 | |
| SCHENKER XMG Fusion 15 (Early 24) | |
| Moyenne de la classe Gaming (527 - 2235, n=221, 2 dernières années) | |
| Alienware m16 R2 | |
| Cinebench R20 | |
| CPU (Multi Core) | |
| SCHENKER XMG Fusion 15 (Early 24) (Overboost) | |
| Lenovo Legion Pro 5 16IRX9 | |
| Moyenne Intel Core i9-14900HX (8427 - 12419, n=23) | |
| Aorus 16X 2024 | |
| SCHENKER XMG Fusion 15 (Early 24) | |
| HP Omen Transcend 16-u1095ng | |
| Moyenne de la classe Gaming (930 - 13769, n=221, 2 dernières années) | |
| Alienware m16 R2 | |
| CPU (Single Core) | |
| SCHENKER XMG Fusion 15 (Early 24) (Overboost) | |
| Aorus 16X 2024 | |
| HP Omen Transcend 16-u1095ng | |
| Moyenne Intel Core i9-14900HX (779 - 859, n=23) | |
| Lenovo Legion Pro 5 16IRX9 | |
| SCHENKER XMG Fusion 15 (Early 24) | |
| Moyenne de la classe Gaming (169 - 855, n=221, 2 dernières années) | |
| Alienware m16 R2 | |
| Cinebench R15 | |
| CPU Multi 64Bit | |
| Lenovo Legion Pro 5 16IRX9 | |
| SCHENKER XMG Fusion 15 (Early 24) (Overboost) | |
| Moyenne Intel Core i9-14900HX (3263 - 4875, n=23) | |
| Aorus 16X 2024 | |
| HP Omen Transcend 16-u1095ng | |
| SCHENKER XMG Fusion 15 (Early 24) | |
| Moyenne de la classe Gaming (400 - 5663, n=226, 2 dernières années) | |
| Alienware m16 R2 | |
| CPU Single 64Bit | |
| Aorus 16X 2024 | |
| SCHENKER XMG Fusion 15 (Early 24) (Overboost) | |
| Moyenne Intel Core i9-14900HX (287 - 320, n=23) | |
| Lenovo Legion Pro 5 16IRX9 | |
| HP Omen Transcend 16-u1095ng | |
| SCHENKER XMG Fusion 15 (Early 24) | |
| Moyenne de la classe Gaming (79.2 - 318, n=225, 2 dernières années) | |
| Alienware m16 R2 | |
| Blender - v2.79 BMW27 CPU | |
| Moyenne de la classe Gaming (87 - 1259, n=218, 2 dernières années) | |
| HP Omen Transcend 16-u1095ng | |
| SCHENKER XMG Fusion 15 (Early 24) | |
| Aorus 16X 2024 | |
| Moyenne Intel Core i9-14900HX (102 - 164, n=23) | |
| Lenovo Legion Pro 5 16IRX9 | |
| SCHENKER XMG Fusion 15 (Early 24) (Overboost) | |
| 7-Zip 18.03 | |
| 7z b 4 | |
| SCHENKER XMG Fusion 15 (Early 24) (Overboost) | |
| Lenovo Legion Pro 5 16IRX9 | |
| Moyenne Intel Core i9-14900HX (87555 - 127108, n=23) | |
| Aorus 16X 2024 | |
| SCHENKER XMG Fusion 15 (Early 24) | |
| HP Omen Transcend 16-u1095ng | |
| Moyenne de la classe Gaming (11386 - 140932, n=220, 2 dernières années) | |
| Alienware m16 R2 | |
| 7z b 4 -mmt1 | |
| SCHENKER XMG Fusion 15 (Early 24) | |
| SCHENKER XMG Fusion 15 (Early 24) (Overboost) | |
| Aorus 16X 2024 | |
| HP Omen Transcend 16-u1095ng | |
| Moyenne Intel Core i9-14900HX (6206 - 7508, n=23) | |
| Lenovo Legion Pro 5 16IRX9 | |
| Moyenne de la classe Gaming (2685 - 7581, n=220, 2 dernières années) | |
| Alienware m16 R2 | |
| Geekbench 6.2 | |
| Multi-Core | |
| Lenovo Legion Pro 5 16IRX9 (6.2.1) | |
| SCHENKER XMG Fusion 15 (Early 24) (6.2.1, Overboost) | |
| Moyenne Intel Core i9-14900HX (15849 - 18643, n=23) | |
| Aorus 16X 2024 (6.2.1) | |
| SCHENKER XMG Fusion 15 (Early 24) (6.2.1) | |
| HP Omen Transcend 16-u1095ng (6.2.1) | |
| Moyenne de la classe Gaming (5340 - 18590, n=80, 2 dernières années) | |
| Alienware m16 R2 (6.2.1) | |
| Single-Core | |
| SCHENKER XMG Fusion 15 (Early 24) (6.2.1) | |
| Aorus 16X 2024 (6.2.1) | |
| SCHENKER XMG Fusion 15 (Early 24) (6.2.1, Overboost) | |
| Moyenne Intel Core i9-14900HX (2800 - 3095, n=23) | |
| Lenovo Legion Pro 5 16IRX9 (6.2.1) | |
| HP Omen Transcend 16-u1095ng (6.2.1) | |
| Moyenne de la classe Gaming (1599 - 3095, n=80, 2 dernières années) | |
| Alienware m16 R2 (6.2.1) | |
| Geekbench 5.5 | |
| Multi-Core | |
| Lenovo Legion Pro 5 16IRX9 | |
| SCHENKER XMG Fusion 15 (Early 24) (Overboost) | |
| Aorus 16X 2024 | |
| Moyenne Intel Core i9-14900HX (8618 - 21606, n=23) | |
| HP Omen Transcend 16-u1095ng | |
| SCHENKER XMG Fusion 15 (Early 24) | |
| Moyenne de la classe Gaming (1946 - 22200, n=225, 2 dernières années) | |
| Alienware m16 R2 | |
| Single-Core | |
| Aorus 16X 2024 | |
| SCHENKER XMG Fusion 15 (Early 24) (Overboost) | |
| SCHENKER XMG Fusion 15 (Early 24) | |
| Moyenne Intel Core i9-14900HX (1669 - 2210, n=23) | |
| HP Omen Transcend 16-u1095ng | |
| Lenovo Legion Pro 5 16IRX9 | |
| Moyenne de la classe Gaming (158 - 2210, n=225, 2 dernières années) | |
| Alienware m16 R2 | |
| HWBOT x265 Benchmark v2.2 - 4k Preset | |
| SCHENKER XMG Fusion 15 (Early 24) (Overboost) | |
| Lenovo Legion Pro 5 16IRX9 | |
| Moyenne Intel Core i9-14900HX (22.7 - 34.4, n=23) | |
| Aorus 16X 2024 | |
| SCHENKER XMG Fusion 15 (Early 24) | |
| HP Omen Transcend 16-u1095ng | |
| Moyenne de la classe Gaming (3 - 37.6, n=221, 2 dernières années) | |
| Alienware m16 R2 | |
| LibreOffice - 20 Documents To PDF | |
| HP Omen Transcend 16-u1095ng (6.3.4.2) | |
| Alienware m16 R2 (6.3.4.2) | |
| Moyenne de la classe Gaming (32.8 - 332, n=217, 2 dernières années) | |
| Moyenne Intel Core i9-14900HX (33.9 - 85.1, n=23) | |
| Lenovo Legion Pro 5 16IRX9 (6.3.4.2) | |
| SCHENKER XMG Fusion 15 (Early 24) (6.3.4.2) | |
| Aorus 16X 2024 (6.3.4.2) | |
| SCHENKER XMG Fusion 15 (Early 24) (6.3.4.2, Overboost) | |
| R Benchmark 2.5 - Overall mean | |
| Alienware m16 R2 | |
| Moyenne de la classe Gaming (0.3609 - 4.47, n=220, 2 dernières années) | |
| HP Omen Transcend 16-u1095ng | |
| Lenovo Legion Pro 5 16IRX9 | |
| Moyenne Intel Core i9-14900HX (0.3609 - 0.4225, n=23) | |
| Aorus 16X 2024 | |
| SCHENKER XMG Fusion 15 (Early 24) (Overboost) | |
| SCHENKER XMG Fusion 15 (Early 24) | |
* ... Moindre est la valeur, meilleures sont les performances
AIDA64: FP32 Ray-Trace | FPU Julia | CPU SHA3 | CPU Queen | FPU SinJulia | FPU Mandel | CPU AES | CPU ZLib | FP64 Ray-Trace | CPU PhotoWorxx
| Performance Rating | |
| SCHENKER XMG Fusion 15 (Early 24) | |
| Lenovo Legion Pro 5 16IRX9 | |
| Moyenne Intel Core i9-14900HX | |
| Aorus 16X 2024 | |
| SCHENKER XMG Fusion 15 (Early 24) | |
| Moyenne de la classe Gaming | |
| HP Omen Transcend 16-u1095ng | |
| Alienware m16 R2 | |
| AIDA64 / FP32 Ray-Trace | |
| SCHENKER XMG Fusion 15 (Early 24) (v6.92.6600, Overboost) | |
| Moyenne Intel Core i9-14900HX (17244 - 29351, n=22) | |
| Lenovo Legion Pro 5 16IRX9 (v6.92.6600) | |
| Aorus 16X 2024 (v6.92.6600) | |
| SCHENKER XMG Fusion 15 (Early 24) (v6.92.6600) | |
| Moyenne de la classe Gaming (3069 - 60169, n=216, 2 dernières années) | |
| Alienware m16 R2 (v6.92.6600) | |
| HP Omen Transcend 16-u1095ng (v6.92.6600) | |
| AIDA64 / FPU Julia | |
| SCHENKER XMG Fusion 15 (Early 24) (v6.92.6600, Overboost) | |
| Lenovo Legion Pro 5 16IRX9 (v6.92.6600) | |
| Moyenne Intel Core i9-14900HX (88537 - 148888, n=22) | |
| Aorus 16X 2024 (v6.92.6600) | |
| SCHENKER XMG Fusion 15 (Early 24) (v6.92.6600) | |
| Moyenne de la classe Gaming (18567 - 252486, n=216, 2 dernières années) | |
| Alienware m16 R2 (v6.92.6600) | |
| HP Omen Transcend 16-u1095ng (v6.92.6600) | |
| AIDA64 / CPU SHA3 | |
| SCHENKER XMG Fusion 15 (Early 24) (v6.92.6600, Overboost) | |
| Lenovo Legion Pro 5 16IRX9 (v6.92.6600) | |
| Moyenne Intel Core i9-14900HX (4267 - 7229, n=22) | |
| Aorus 16X 2024 (v6.92.6600) | |
| SCHENKER XMG Fusion 15 (Early 24) (v6.92.6600) | |
| Moyenne de la classe Gaming (629 - 10389, n=216, 2 dernières années) | |
| HP Omen Transcend 16-u1095ng (v6.92.6600) | |
| Alienware m16 R2 (v6.92.6600) | |
| AIDA64 / CPU Queen | |
| Lenovo Legion Pro 5 16IRX9 (v6.92.6600) | |
| SCHENKER XMG Fusion 15 (Early 24) (v6.92.6600, Overboost) | |
| Aorus 16X 2024 (v6.92.6600) | |
| Moyenne Intel Core i9-14900HX (118405 - 148773, n=22) | |
| SCHENKER XMG Fusion 15 (Early 24) (v6.92.6600) | |
| HP Omen Transcend 16-u1095ng (v6.92.6600) | |
| Moyenne de la classe Gaming (15371 - 200651, n=216, 2 dernières années) | |
| Alienware m16 R2 (v6.92.6600) | |
| AIDA64 / FPU SinJulia | |
| SCHENKER XMG Fusion 15 (Early 24) (v6.92.6600, Overboost) | |
| Lenovo Legion Pro 5 16IRX9 (v6.92.6600) | |
| Moyenne Intel Core i9-14900HX (12217 - 18256, n=22) | |
| Aorus 16X 2024 (v6.92.6600) | |
| SCHENKER XMG Fusion 15 (Early 24) (v6.92.6600) | |
| Moyenne de la classe Gaming (2137 - 32988, n=216, 2 dernières années) | |
| HP Omen Transcend 16-u1095ng (v6.92.6600) | |
| Alienware m16 R2 (v6.92.6600) | |
| AIDA64 / FPU Mandel | |
| SCHENKER XMG Fusion 15 (Early 24) (v6.92.6600, Overboost) | |
| Lenovo Legion Pro 5 16IRX9 (v6.92.6600) | |
| Moyenne Intel Core i9-14900HX (43302 - 72594, n=22) | |
| Aorus 16X 2024 (v6.92.6600) | |
| SCHENKER XMG Fusion 15 (Early 24) (v6.92.6600) | |
| Moyenne de la classe Gaming (10291 - 134044, n=216, 2 dernières années) | |
| Alienware m16 R2 (v6.92.6600) | |
| HP Omen Transcend 16-u1095ng (v6.92.6600) | |
| AIDA64 / CPU AES | |
| SCHENKER XMG Fusion 15 (Early 24) (v6.92.6600, Overboost) | |
| SCHENKER XMG Fusion 15 (Early 24) (v6.92.6600) | |
| Moyenne Intel Core i9-14900HX (86964 - 241777, n=22) | |
| Lenovo Legion Pro 5 16IRX9 (v6.92.6600) | |
| Aorus 16X 2024 (v6.92.6600) | |
| Moyenne de la classe Gaming (19065 - 328679, n=216, 2 dernières années) | |
| HP Omen Transcend 16-u1095ng (v6.92.6600) | |
| Alienware m16 R2 (v6.92.6600) | |
| AIDA64 / CPU ZLib | |
| SCHENKER XMG Fusion 15 (Early 24) (v6.92.6600, Overboost) | |
| Lenovo Legion Pro 5 16IRX9 (v6.92.6600) | |
| Moyenne Intel Core i9-14900HX (1265 - 2149, n=22) | |
| Aorus 16X 2024 (v6.92.6600) | |
| SCHENKER XMG Fusion 15 (Early 24) (v6.92.6600) | |
| HP Omen Transcend 16-u1095ng (v6.92.6600) | |
| Moyenne de la classe Gaming (150.9 - 2409, n=216, 2 dernières années) | |
| Alienware m16 R2 (v6.92.6600) | |
| AIDA64 / FP64 Ray-Trace | |
| SCHENKER XMG Fusion 15 (Early 24) (v6.92.6600, Overboost) | |
| Lenovo Legion Pro 5 16IRX9 (v6.92.6600) | |
| Moyenne Intel Core i9-14900HX (9170 - 16128, n=22) | |
| Aorus 16X 2024 (v6.92.6600) | |
| SCHENKER XMG Fusion 15 (Early 24) (v6.92.6600) | |
| Moyenne de la classe Gaming (1518 - 31796, n=216, 2 dernières années) | |
| Alienware m16 R2 (v6.92.6600) | |
| HP Omen Transcend 16-u1095ng (v6.92.6600) | |
| AIDA64 / CPU PhotoWorxx | |
| Lenovo Legion Pro 5 16IRX9 (v6.92.6600) | |
| HP Omen Transcend 16-u1095ng (v6.92.6600) | |
| Aorus 16X 2024 (v6.92.6600) | |
| Moyenne Intel Core i9-14900HX (33960 - 51118, n=22) | |
| SCHENKER XMG Fusion 15 (Early 24) (v6.92.6600, Overboost) | |
| SCHENKER XMG Fusion 15 (Early 24) (v6.92.6600) | |
| Alienware m16 R2 (v6.92.6600) | |
| Moyenne de la classe Gaming (10805 - 60161, n=217, 2 dernières années) | |
Performance du système
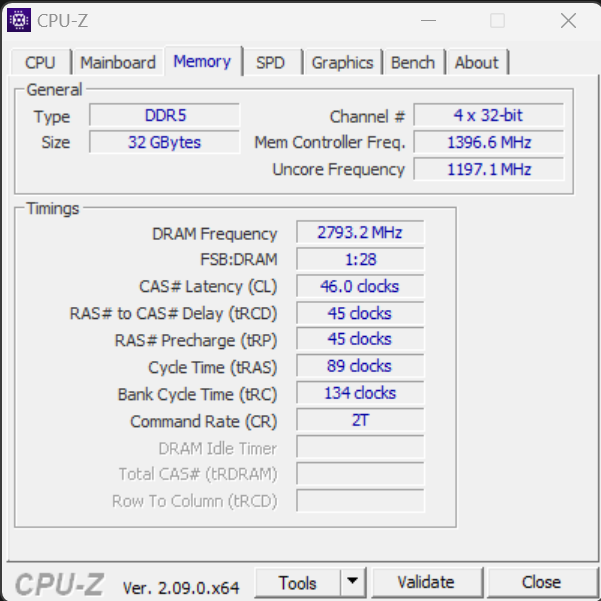
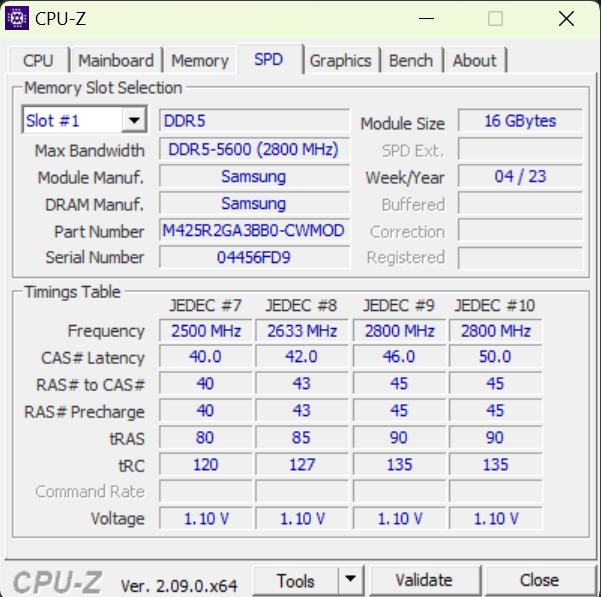
Le système, qui fonctionne en douceur, ne manque pas de puissance de calcul. Les jeux, le streaming et le rendu ne posent pas de problèmes majeurs à l'ordinateur portable. Les taux de transfert de la RAM se situent à un niveau normal pour une RAM DDR5-5600. Les résultats PCMark sont également bons.
CrossMark: Overall | Productivity | Creativity | Responsiveness
WebXPRT 3: Overall
WebXPRT 4: Overall
Mozilla Kraken 1.1: Total
| PCMark 10 / Score | |
| Lenovo Legion Pro 5 16IRX9 | |
| SCHENKER XMG Fusion 15 (Early 24) | |
| Aorus 16X 2024 | |
| Moyenne Intel Core i9-14900HX, NVIDIA GeForce RTX 4070 Laptop GPU (7866 - 8550, n=5) | |
| HP Omen Transcend 16-u1095ng | |
| Alienware m16 R2 | |
| Moyenne de la classe Gaming (5235 - 9852, n=192, 2 dernières années) | |
| PCMark 10 / Essentials | |
| SCHENKER XMG Fusion 15 (Early 24) | |
| Lenovo Legion Pro 5 16IRX9 | |
| Moyenne Intel Core i9-14900HX, NVIDIA GeForce RTX 4070 Laptop GPU (10621 - 11815, n=5) | |
| Aorus 16X 2024 | |
| Moyenne de la classe Gaming (8300 - 12334, n=191, 2 dernières années) | |
| HP Omen Transcend 16-u1095ng | |
| Alienware m16 R2 | |
| PCMark 10 / Productivity | |
| Aorus 16X 2024 | |
| SCHENKER XMG Fusion 15 (Early 24) | |
| Moyenne Intel Core i9-14900HX, NVIDIA GeForce RTX 4070 Laptop GPU (9701 - 11103, n=5) | |
| HP Omen Transcend 16-u1095ng | |
| Lenovo Legion Pro 5 16IRX9 | |
| Moyenne de la classe Gaming (6662 - 11833, n=191, 2 dernières années) | |
| Alienware m16 R2 | |
| PCMark 10 / Digital Content Creation | |
| Lenovo Legion Pro 5 16IRX9 | |
| Moyenne Intel Core i9-14900HX, NVIDIA GeForce RTX 4070 Laptop GPU (12114 - 14827, n=5) | |
| SCHENKER XMG Fusion 15 (Early 24) | |
| Aorus 16X 2024 | |
| Alienware m16 R2 | |
| HP Omen Transcend 16-u1095ng | |
| Moyenne de la classe Gaming (6462 - 18475, n=191, 2 dernières années) | |
| CrossMark / Overall | |
| Aorus 16X 2024 | |
| Moyenne Intel Core i9-14900HX, NVIDIA GeForce RTX 4070 Laptop GPU (2002 - 2312, n=4) | |
| SCHENKER XMG Fusion 15 (Early 24) | |
| Lenovo Legion Pro 5 16IRX9 | |
| Moyenne de la classe Gaming (1247 - 2334, n=165, 2 dernières années) | |
| Alienware m16 R2 | |
| CrossMark / Productivity | |
| Aorus 16X 2024 | |
| SCHENKER XMG Fusion 15 (Early 24) | |
| Moyenne Intel Core i9-14900HX, NVIDIA GeForce RTX 4070 Laptop GPU (1827 - 2191, n=4) | |
| Lenovo Legion Pro 5 16IRX9 | |
| Moyenne de la classe Gaming (1299 - 2204, n=165, 2 dernières années) | |
| Alienware m16 R2 | |
| CrossMark / Creativity | |
| Aorus 16X 2024 | |
| Moyenne Intel Core i9-14900HX, NVIDIA GeForce RTX 4070 Laptop GPU (2287 - 2458, n=4) | |
| SCHENKER XMG Fusion 15 (Early 24) | |
| Lenovo Legion Pro 5 16IRX9 | |
| Moyenne de la classe Gaming (1275 - 2514, n=165, 2 dernières années) | |
| Alienware m16 R2 | |
| CrossMark / Responsiveness | |
| Aorus 16X 2024 | |
| Moyenne Intel Core i9-14900HX, NVIDIA GeForce RTX 4070 Laptop GPU (1769 - 2330, n=4) | |
| SCHENKER XMG Fusion 15 (Early 24) | |
| Lenovo Legion Pro 5 16IRX9 | |
| Moyenne de la classe Gaming (1030 - 2330, n=165, 2 dernières années) | |
| Alienware m16 R2 | |
| WebXPRT 3 / Overall | |
| HP Omen Transcend 16-u1095ng | |
| SCHENKER XMG Fusion 15 (Early 24) | |
| Moyenne Intel Core i9-14900HX, NVIDIA GeForce RTX 4070 Laptop GPU (322 - 342, n=5) | |
| Aorus 16X 2024 | |
| Lenovo Legion Pro 5 16IRX9 | |
| Moyenne de la classe Gaming (215 - 480, n=190, 2 dernières années) | |
| Alienware m16 R2 | |
| WebXPRT 4 / Overall | |
| SCHENKER XMG Fusion 15 (Early 24) | |
| Moyenne Intel Core i9-14900HX, NVIDIA GeForce RTX 4070 Laptop GPU (291 - 301, n=3) | |
| Lenovo Legion Pro 5 16IRX9 | |
| Moyenne de la classe Gaming (157.9 - 328, n=165, 2 dernières années) | |
| Alienware m16 R2 | |
| Mozilla Kraken 1.1 / Total | |
| Alienware m16 R2 | |
| Moyenne de la classe Gaming (421 - 824, n=203, 2 dernières années) | |
| Lenovo Legion Pro 5 16IRX9 | |
| Moyenne Intel Core i9-14900HX, NVIDIA GeForce RTX 4070 Laptop GPU (431 - 449, n=5) | |
| HP Omen Transcend 16-u1095ng | |
| Aorus 16X 2024 | |
| SCHENKER XMG Fusion 15 (Early 24) | |
* ... Moindre est la valeur, meilleures sont les performances
| PCMark 10 Score | 8522 points | |
Aide | ||
| AIDA64 / Memory Copy | |
| Lenovo Legion Pro 5 16IRX9 | |
| Aorus 16X 2024 | |
| HP Omen Transcend 16-u1095ng | |
| SCHENKER XMG Fusion 15 (Early 24) | |
| Moyenne Intel Core i9-14900HX (56992 - 83392, n=22) | |
| Alienware m16 R2 | |
| Moyenne de la classe Gaming (21842 - 92565, n=216, 2 dernières années) | |
| AIDA64 / Memory Read | |
| Aorus 16X 2024 | |
| Lenovo Legion Pro 5 16IRX9 | |
| SCHENKER XMG Fusion 15 (Early 24) | |
| HP Omen Transcend 16-u1095ng | |
| Moyenne Intel Core i9-14900HX (54443 - 87507, n=22) | |
| Alienware m16 R2 | |
| Moyenne de la classe Gaming (23681 - 90647, n=216, 2 dernières années) | |
| AIDA64 / Memory Write | |
| HP Omen Transcend 16-u1095ng | |
| Aorus 16X 2024 | |
| Lenovo Legion Pro 5 16IRX9 | |
| Moyenne Intel Core i9-14900HX (51387 - 78199, n=22) | |
| SCHENKER XMG Fusion 15 (Early 24) | |
| Alienware m16 R2 | |
| Moyenne de la classe Gaming (21619 - 103259, n=216, 2 dernières années) | |
| AIDA64 / Memory Latency | |
| Alienware m16 R2 | |
| Moyenne de la classe Gaming (59.5 - 152.5, n=212, 2 dernières années) | |
| HP Omen Transcend 16-u1095ng | |
| Moyenne Intel Core i9-14900HX (79.7 - 105, n=22) | |
| Lenovo Legion Pro 5 16IRX9 | |
| SCHENKER XMG Fusion 15 (Early 24) | |
| Aorus 16X 2024 | |
* ... Moindre est la valeur, meilleures sont les performances
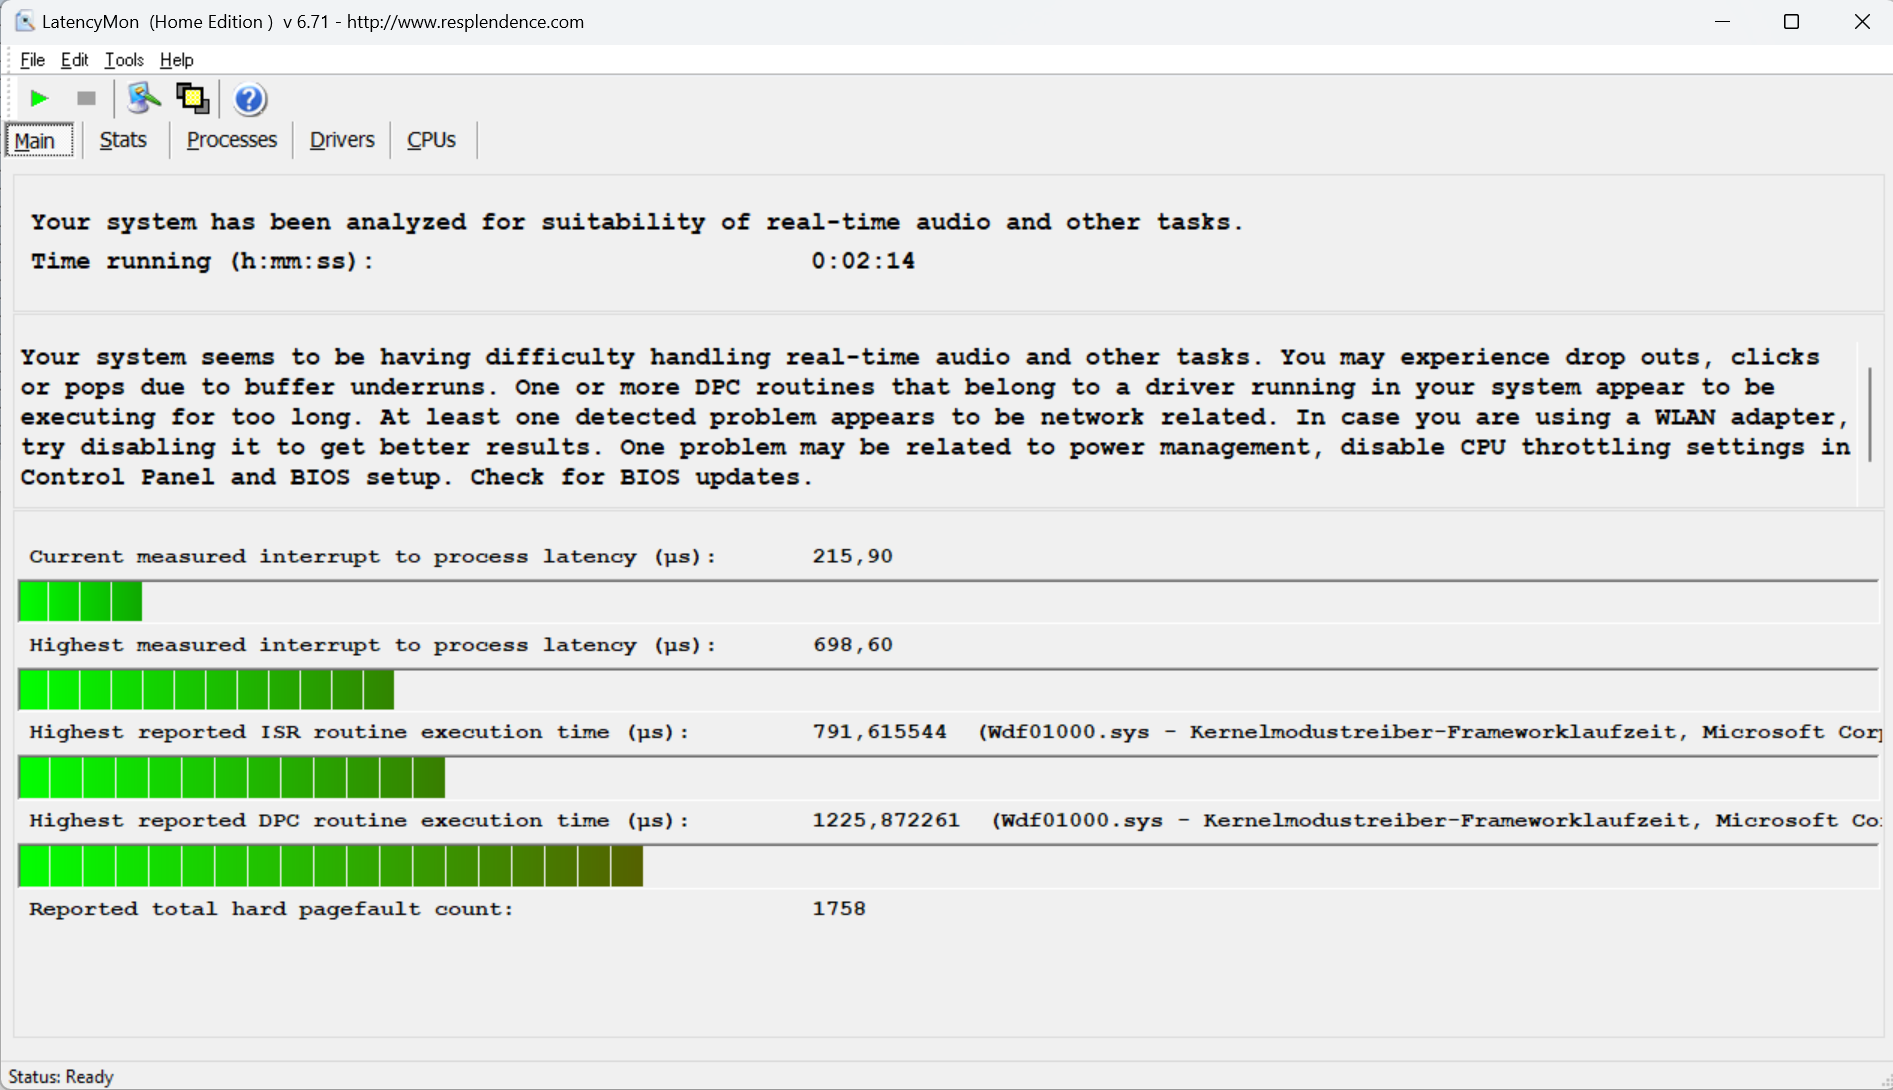
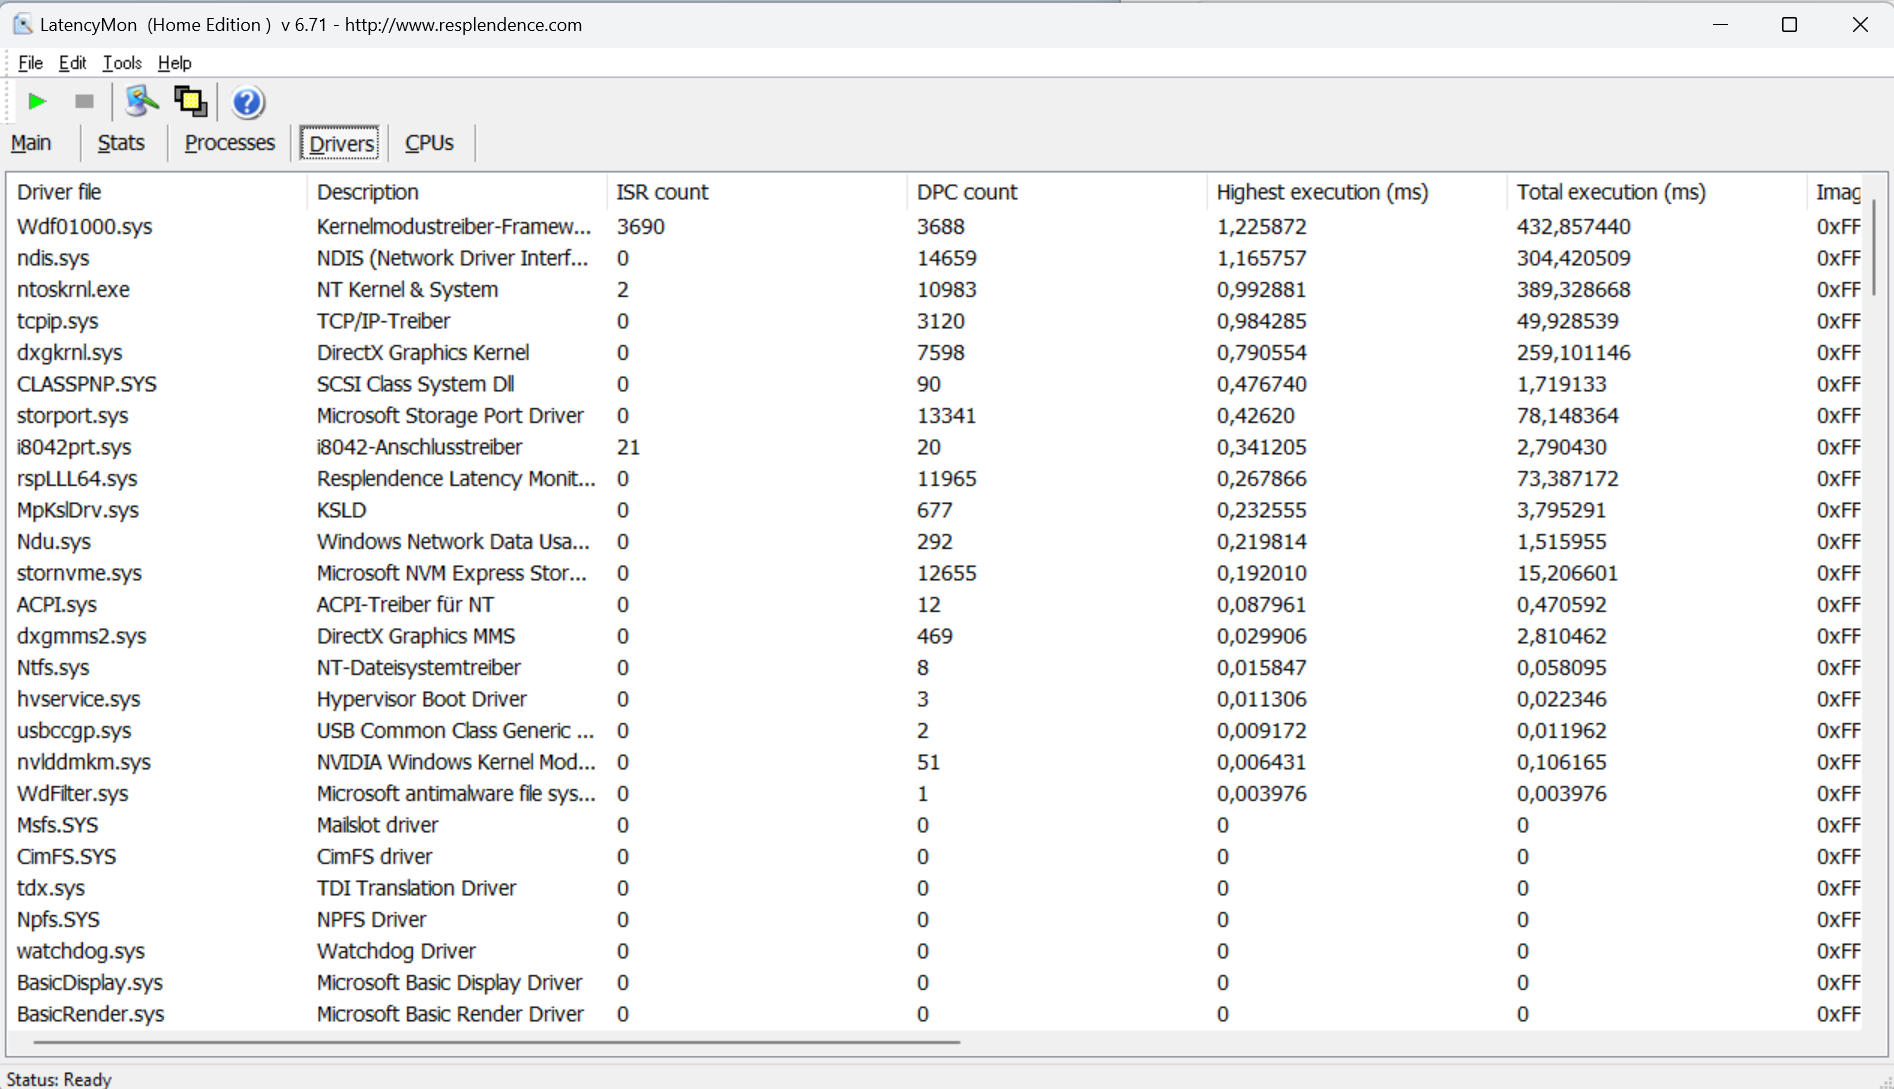
Latences DPC
Le test standardisé du moniteur de latence (navigation sur le web, lecture de vidéos 4k, charge élevée Prime95) a révélé quelques anomalies. Le système ne semble pas adapté à l'édition vidéo et audio en temps réel. Les futures mises à jour logicielles pourraient apporter des améliorations, voire des détériorations.
| DPC Latencies / LatencyMon - interrupt to process latency (max), Web, Youtube, Prime95 | |
| Alienware m16 R2 | |
| HP Omen Transcend 16-u1095ng | |
| Aorus 16X 2024 | |
| Lenovo Legion Pro 5 16IRX9 | |
| SCHENKER XMG Fusion 15 (Early 24) | |
* ... Moindre est la valeur, meilleures sont les performances
Dispositifs de stockage
Le Fusion peut accueillir un total de deux SSD PCIe-4 au format M.2-2280. Le RAID-0/1 est pris en charge. Le SSD Samsung (1 To) de notre appareil de test a fourni d'excellents débits de données. Point positif : Nous n'avons pas constaté d'étranglement thermique.


* ... Moindre est la valeur, meilleures sont les performances
Reading continuous performance: DiskSpd Read Loop, Queue Depth 8
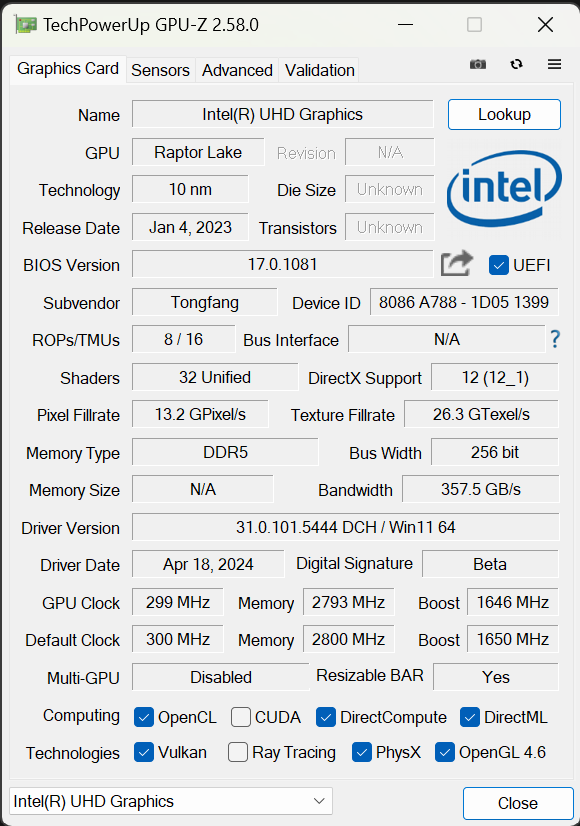
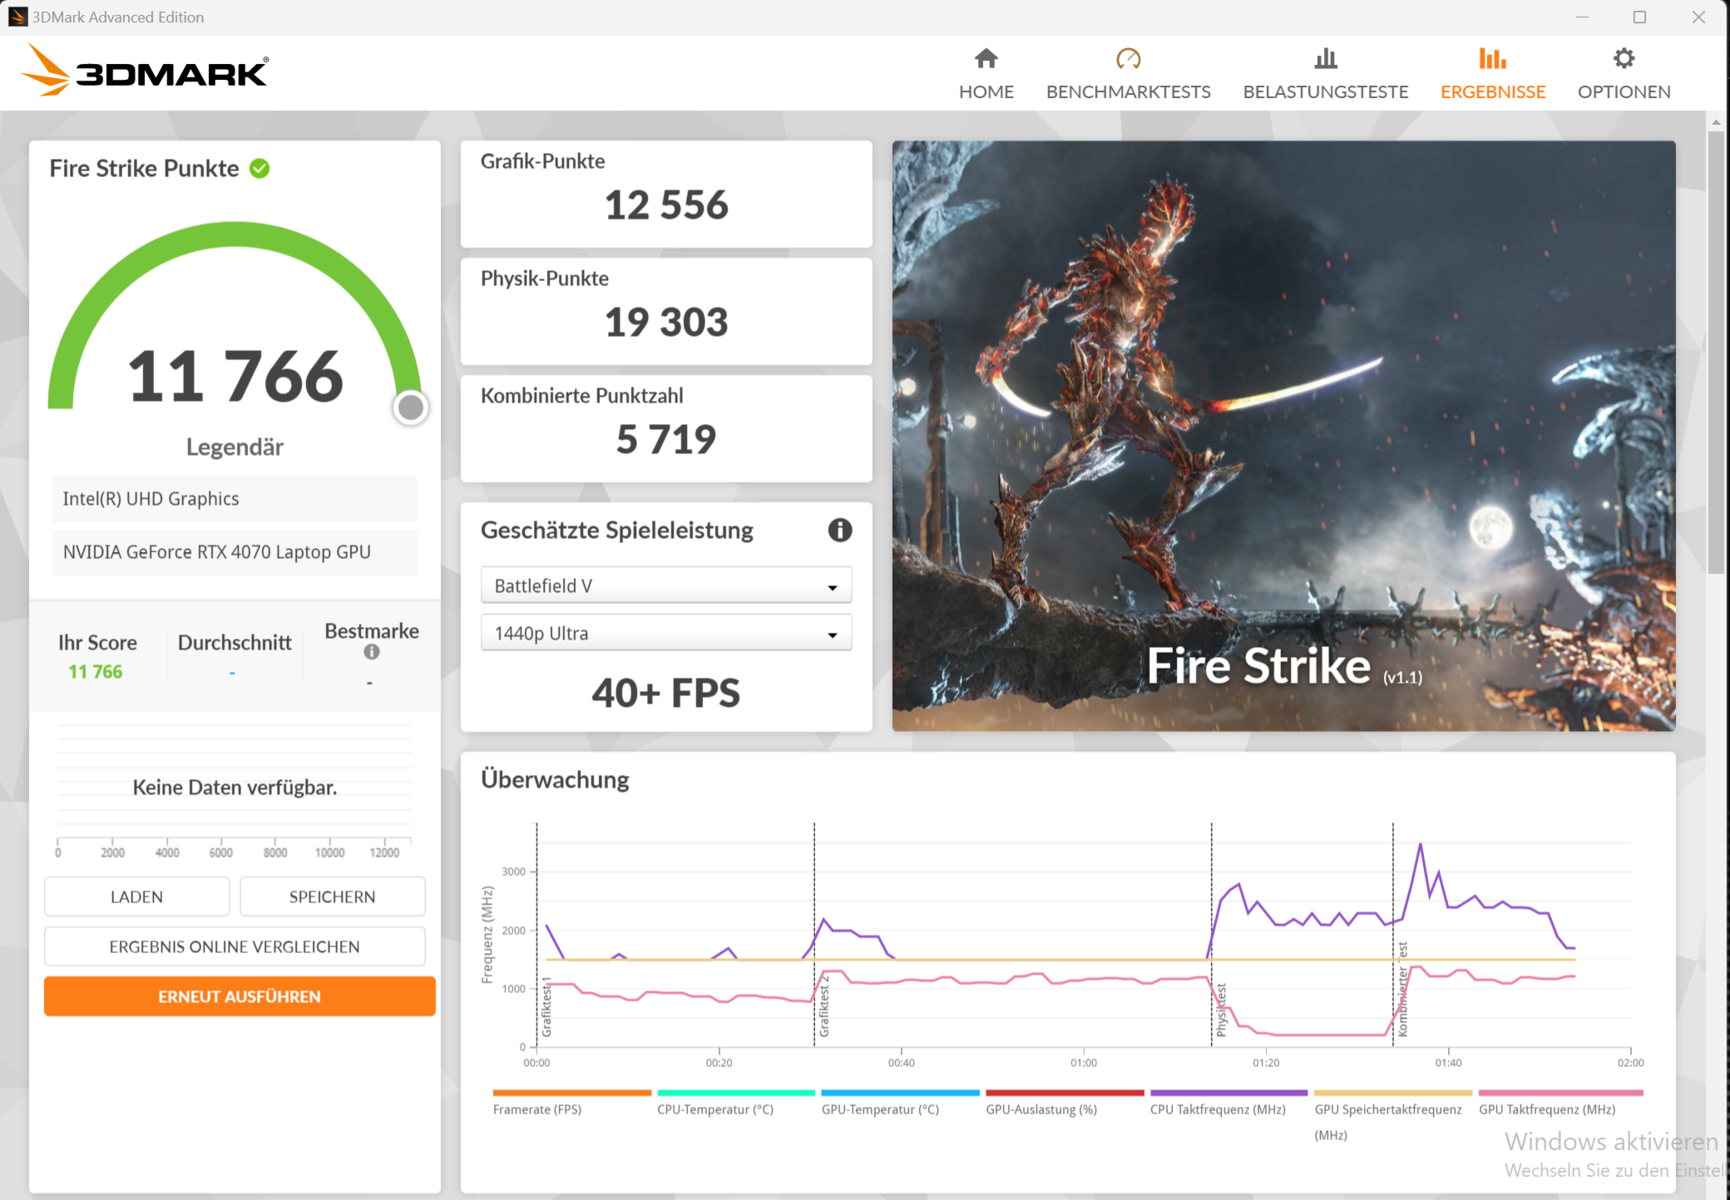
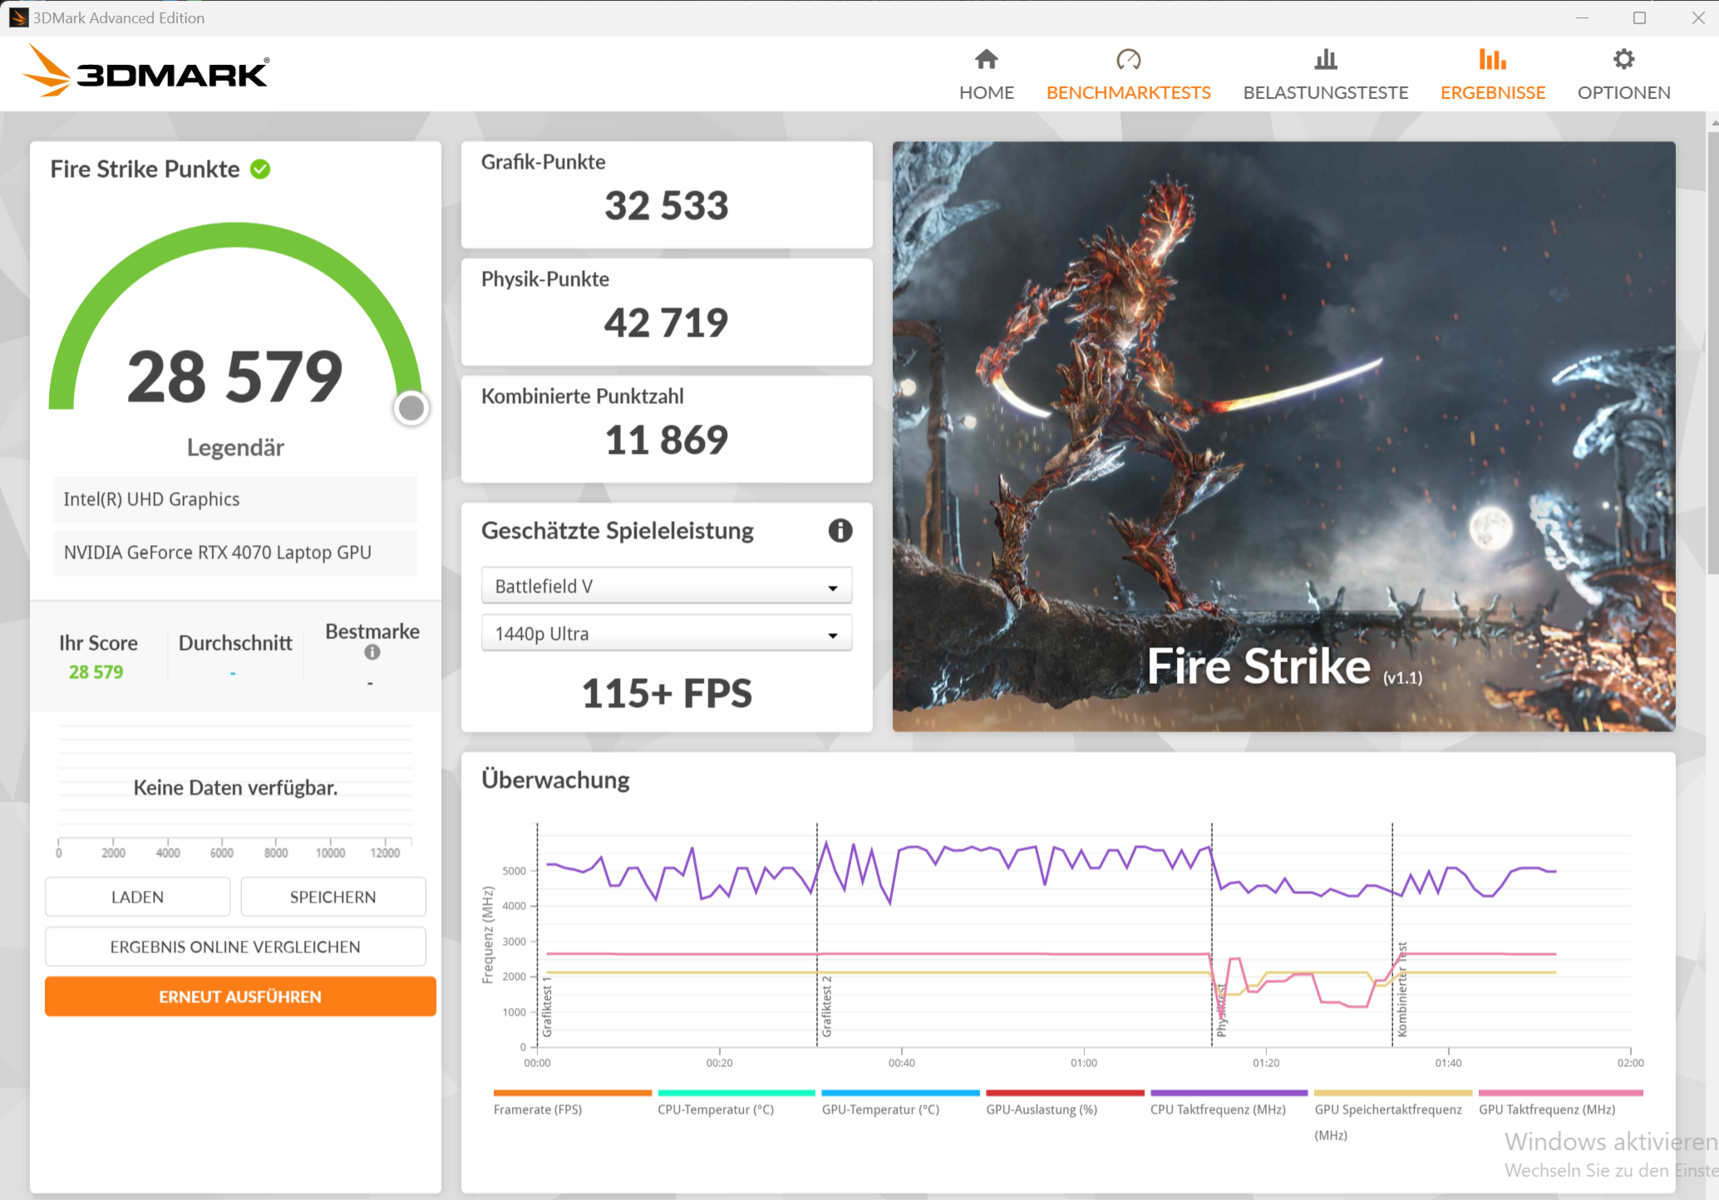
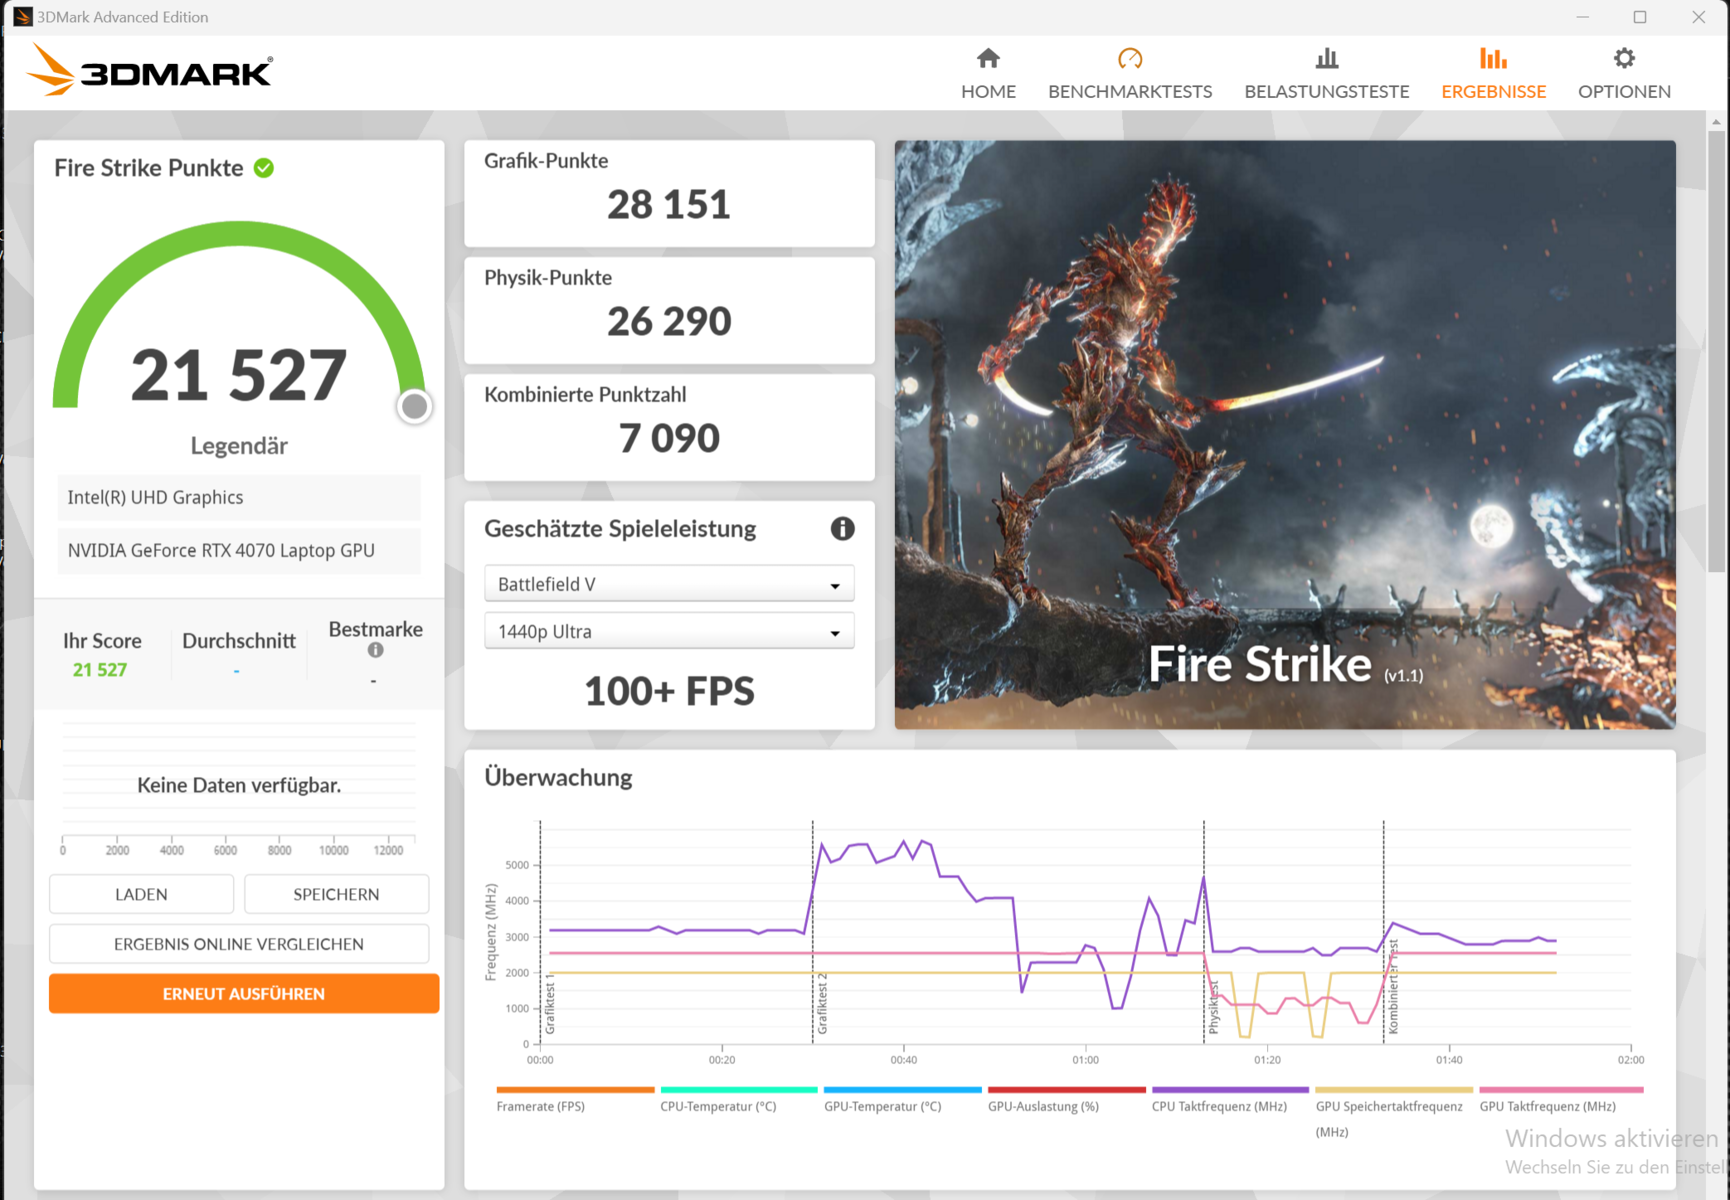
Carte graphique
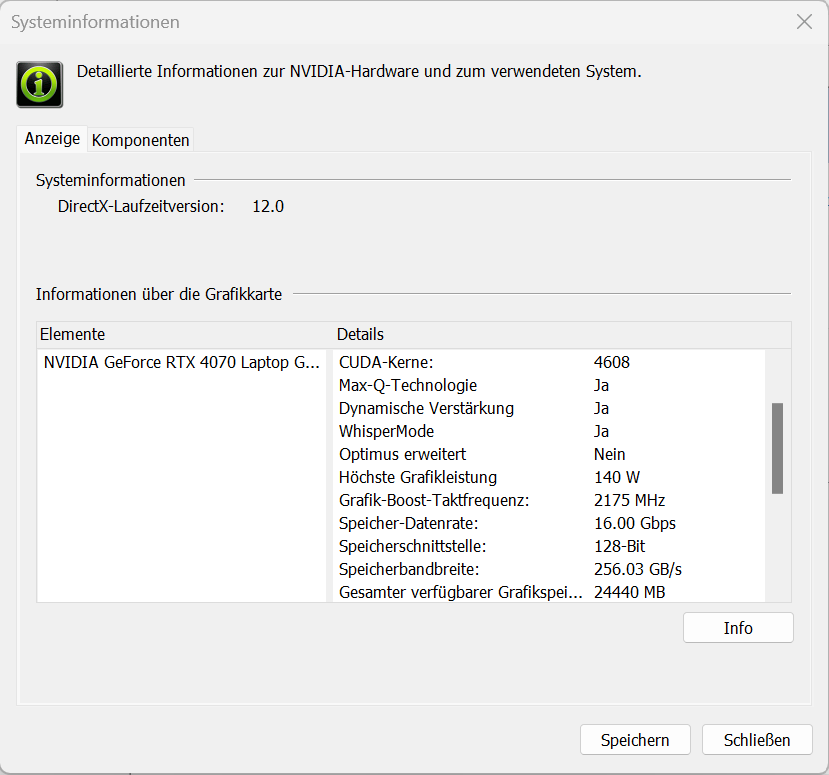
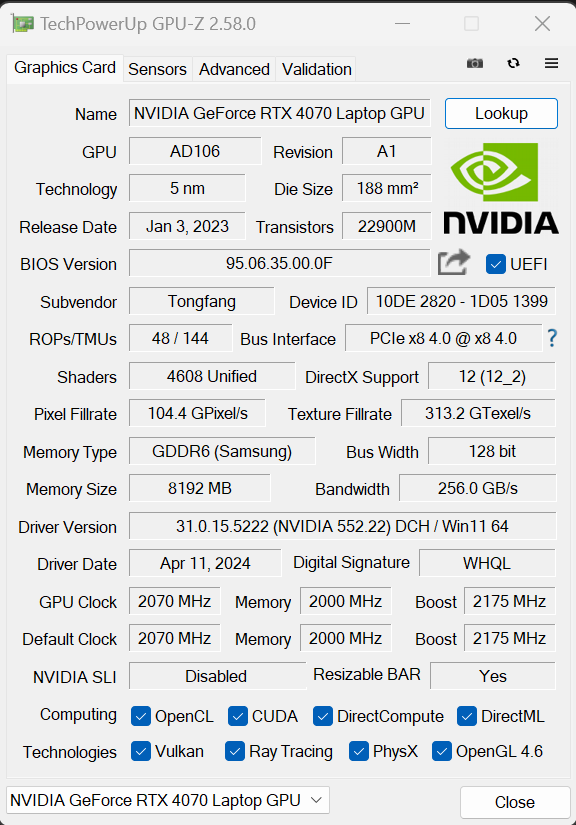
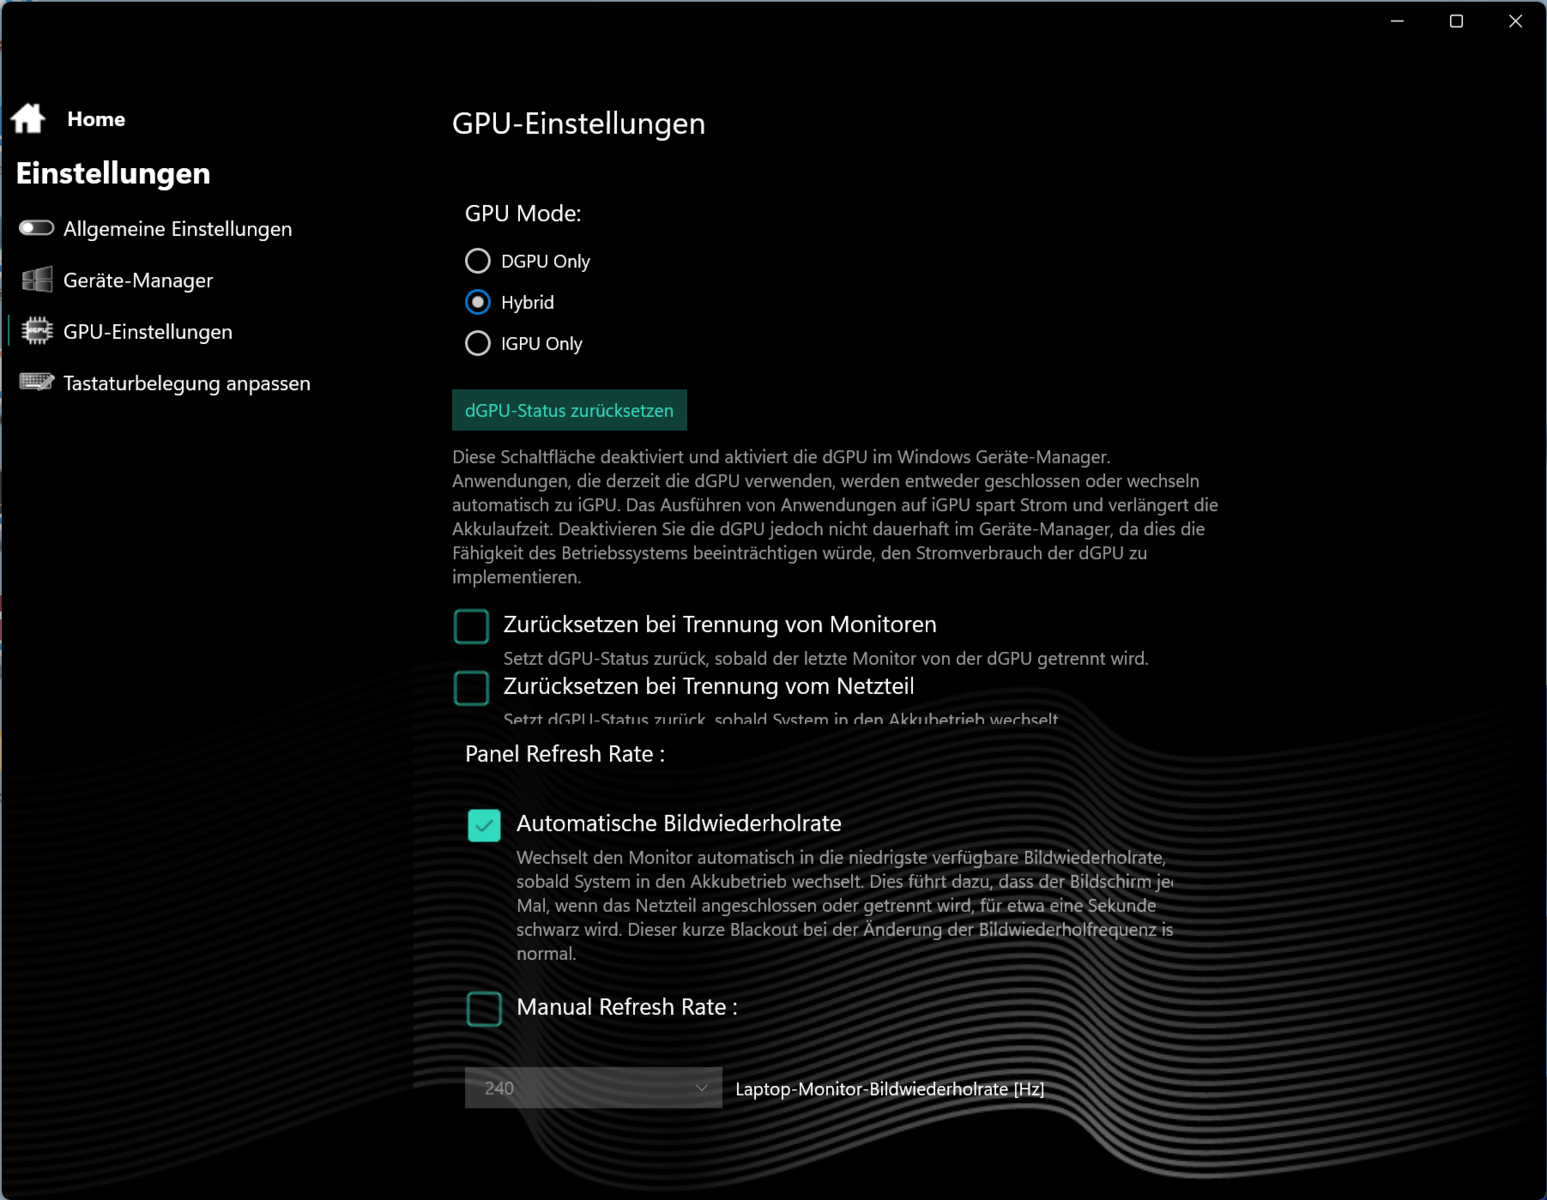
Schenker a permis à la GeForce RTX 4070 un TGP maximum de 140 watts (115 watts + 25 watts Dynamic Boost) - plus n'est pas recommandé par Nvidia. Le GPU a accès à 8 Go de VRAM (GDDR6) - un peu juste pour les exigences actuelles. Les benchmarks ont donné des résultats supérieurs à la moyenne de la RTX-4070(Enthusiast) et l'Overboost n'a donné qu'un petit avantage. Le passage du dGPU à l'Optimus nécessite un redémarrage.

| 3DMark Performance Rating - Percent | |
| SCHENKER XMG Fusion 15 (Early 24) | |
| Lenovo Legion Pro 5 16IRX9 | |
| SCHENKER XMG Fusion 15 (Early 24) | |
| Alienware m16 R2 | |
| Moyenne de la classe Gaming | |
| Aorus 16X 2024 | |
| Moyenne NVIDIA GeForce RTX 4070 Laptop GPU | |
| HP Omen Transcend 16-u1095ng | |
| 3DMark 11 - 1280x720 Performance GPU | |
| SCHENKER XMG Fusion 15 (Early 24) (Overboost) | |
| SCHENKER XMG Fusion 15 (Early 24) | |
| Lenovo Legion Pro 5 16IRX9 | |
| Alienware m16 R2 | |
| Aorus 16X 2024 | |
| Moyenne de la classe Gaming (1029 - 72070, n=220, 2 dernières années) | |
| Moyenne NVIDIA GeForce RTX 4070 Laptop GPU (24229 - 46434, n=50) | |
| HP Omen Transcend 16-u1095ng | |
| 3DMark | |
| 1920x1080 Fire Strike Graphics | |
| SCHENKER XMG Fusion 15 (Early 24) (Overboost) | |
| SCHENKER XMG Fusion 15 (Early 24) | |
| Lenovo Legion Pro 5 16IRX9 | |
| Alienware m16 R2 | |
| Moyenne de la classe Gaming (781 - 53059, n=225, 2 dernières années) | |
| Moyenne NVIDIA GeForce RTX 4070 Laptop GPU (16212 - 33451, n=50) | |
| Aorus 16X 2024 | |
| HP Omen Transcend 16-u1095ng | |
| 2560x1440 Time Spy Graphics | |
| SCHENKER XMG Fusion 15 (Early 24) (Overboost) | |
| Lenovo Legion Pro 5 16IRX9 | |
| Alienware m16 R2 | |
| SCHENKER XMG Fusion 15 (Early 24) | |
| Moyenne de la classe Gaming (224 - 22547, n=222, 2 dernières années) | |
| Aorus 16X 2024 | |
| Moyenne NVIDIA GeForce RTX 4070 Laptop GPU (6241 - 13391, n=49) | |
| HP Omen Transcend 16-u1095ng | |
| 3DMark 06 Standard Score | 63892 points | |
| 3DMark 11 Performance | 36008 points | |
| 3DMark Fire Strike Score | 26661 points | |
| 3DMark Time Spy Score | 13067 points | |
Aide | ||
| Geekbench 5.5 | |
| OpenCL Score | |
| SCHENKER XMG Fusion 15 (Early 24) | |
| SCHENKER XMG Fusion 15 (Early 24) (Overboost) | |
| Aorus 16X 2024 | |
| Moyenne de la classe Gaming (5039 - 226512, n=224, 2 dernières années) | |
| HP Omen Transcend 16-u1095ng | |
| Lenovo Legion Pro 5 16IRX9 | |
| Moyenne NVIDIA GeForce RTX 4070 Laptop GPU (17391 - 129366, n=49) | |
| Alienware m16 R2 | |
| Vulkan Score | |
| SCHENKER XMG Fusion 15 (Early 24) (Overboost) | |
| Aorus 16X 2024 | |
| SCHENKER XMG Fusion 15 (Early 24) | |
| Alienware m16 R2 | |
| Lenovo Legion Pro 5 16IRX9 | |
| Moyenne de la classe Gaming (1952 - 160279, n=220, 2 dernières années) | |
| Moyenne NVIDIA GeForce RTX 4070 Laptop GPU (4898 - 93339, n=48) | |
| Geekbench 6.2 | |
| GPU OpenCL | |
| SCHENKER XMG Fusion 15 (Early 24) (6.2.1) | |
| SCHENKER XMG Fusion 15 (Early 24) (6.2.1, Overboost) | |
| HP Omen Transcend 16-u1095ng (6.2.1) | |
| Aorus 16X 2024 (6.2.1) | |
| Moyenne NVIDIA GeForce RTX 4070 Laptop GPU (101474 - 129836, n=26) | |
| Moyenne de la classe Gaming (4321 - 207373, n=80, 2 dernières années) | |
| Lenovo Legion Pro 5 16IRX9 (6.2.1) | |
| Alienware m16 R2 (6.2.1) | |
| GPU Vulkan | |
| SCHENKER XMG Fusion 15 (Early 24) (6.2.1, Overboost) | |
| Alienware m16 R2 (6.2.1) | |
| Lenovo Legion Pro 5 16IRX9 (6.2.1) | |
| SCHENKER XMG Fusion 15 (Early 24) (6.2.1) | |
| Aorus 16X 2024 (6.2.1) | |
| Moyenne de la classe Gaming (4286 - 196201, n=77, 2 dernières années) | |
| Moyenne NVIDIA GeForce RTX 4070 Laptop GPU (9035 - 120033, n=24) | |
| V-Ray 5 Benchmark | |
| GPU RTX | |
| Moyenne de la classe Gaming (171 - 3824, n=122, 2 dernières années) | |
| Lenovo Legion Pro 5 16IRX9 (5.0.1) | |
| SCHENKER XMG Fusion 15 (Early 24) (5.0.1, Overboost) | |
| SCHENKER XMG Fusion 15 (Early 24) (5.0.1) | |
| Alienware m16 R2 (5.0.1) | |
| Aorus 16X 2024 (5.0.1) | |
| Moyenne NVIDIA GeForce RTX 4070 Laptop GPU (171 - 1872, n=28) | |
| GPU CUDA | |
| Moyenne de la classe Gaming (120 - 2797, n=126, 2 dernières années) | |
| Lenovo Legion Pro 5 16IRX9 (5.0.1) | |
| SCHENKER XMG Fusion 15 (Early 24) (5.0.1, Overboost) | |
| SCHENKER XMG Fusion 15 (Early 24) (5.0.1) | |
| Alienware m16 R2 (5.0.1) | |
| Aorus 16X 2024 (5.0.1) | |
| Moyenne NVIDIA GeForce RTX 4070 Laptop GPU (120 - 1333, n=28) | |
| CPU | |
| SCHENKER XMG Fusion 15 (Early 24) (5.0.1, Overboost) | |
| Lenovo Legion Pro 5 16IRX9 (5.0.1) | |
| Aorus 16X 2024 (5.0.1) | |
| SCHENKER XMG Fusion 15 (Early 24) (5.0.1) | |
| Moyenne NVIDIA GeForce RTX 4070 Laptop GPU (10005 - 20388, n=27) | |
| Moyenne de la classe Gaming (1690 - 26944, n=136, 2 dernières années) | |
| Alienware m16 R2 (5.0.1) | |
| V-Ray Benchmark Next 4.10 | |
| GPU | |
| Lenovo Legion Pro 5 16IRX9 (v4.10.07 ) | |
| SCHENKER XMG Fusion 15 (Early 24) (v4.10.07, Overboost) | |
| Moyenne de la classe Gaming (54 - 1334, n=178, 2 dernières années) | |
| Moyenne NVIDIA GeForce RTX 4070 Laptop GPU (500 - 686, n=35) | |
| SCHENKER XMG Fusion 15 (Early 24) (v4.10.07 ) | |
| HP Omen Transcend 16-u1095ng (v4.10.07 ) | |
| Aorus 16X 2024 (v4.10.07 ) | |
| CPU | |
| SCHENKER XMG Fusion 15 (Early 24) (v4.10.07, Overboost) | |
| Lenovo Legion Pro 5 16IRX9 (v4.10.07 ) | |
| Aorus 16X 2024 (v4.10.07 ) | |
| SCHENKER XMG Fusion 15 (Early 24) (v4.10.07 ) | |
| HP Omen Transcend 16-u1095ng (v4.10.07 ) | |
| Moyenne NVIDIA GeForce RTX 4070 Laptop GPU (12638 - 35173, n=35) | |
| Moyenne de la classe Gaming (2741 - 37629, n=178, 2 dernières années) | |
* ... Moindre est la valeur, meilleures sont les performances
Performances des jeux
Le matériel est conçu pour les jeux en QHD avec des paramètres élevés à maximaux. En utilisant DLSS 3 et Frame Generation, vous pouvez jouer à des jeux avec des résolutions plus élevées et des paramètres maximaux, y compris le ray tracing, mais uniquement avec des jeux qui prennent en charge ces fonctions. Nous avons noté des taux de rafraîchissement supérieurs à la moyenne de la RTX-4070(Enthusiast) et l'Overboost a donné un petit avantage.
| Performance Rating - Percent | |
| SCHENKER XMG Fusion 15 (Early 24) | |
| Lenovo Legion Pro 5 16IRX9 | |
| SCHENKER XMG Fusion 15 (Early 24) | |
| Aorus 16X 2024 | |
| Alienware m16 R2 -1! | |
| HP Omen Transcend 16-u1095ng | |
| Moyenne NVIDIA GeForce RTX 4070 Laptop GPU | |
| Moyenne de la classe Gaming | |
| The Witcher 3 - 1920x1080 Ultra Graphics & Postprocessing (HBAO+) | |
| Lenovo Legion Pro 5 16IRX9 | |
| SCHENKER XMG Fusion 15 (Early 24) (Overboost) | |
| SCHENKER XMG Fusion 15 (Early 24) | |
| Aorus 16X 2024 | |
| Alienware m16 R2 | |
| Moyenne de la classe Gaming (8.61 - 216, n=216, 2 dernières années) | |
| HP Omen Transcend 16-u1095ng | |
| Moyenne NVIDIA GeForce RTX 4070 Laptop GPU (69.8 - 133.7, n=52) | |
| GTA V - 1920x1080 Highest Settings possible AA:4xMSAA + FX AF:16x | |
| SCHENKER XMG Fusion 15 (Early 24) (Overboost) | |
| SCHENKER XMG Fusion 15 (Early 24) | |
| Lenovo Legion Pro 5 16IRX9 | |
| HP Omen Transcend 16-u1095ng | |
| Moyenne NVIDIA GeForce RTX 4070 Laptop GPU (63.5 - 140.5, n=44) | |
| Moyenne de la classe Gaming (6.38 - 167.7, n=208, 2 dernières années) | |
| Aorus 16X 2024 | |
| Final Fantasy XV Benchmark - 1920x1080 High Quality | |
| SCHENKER XMG Fusion 15 (Early 24) (1.3, Overboost) | |
| Lenovo Legion Pro 5 16IRX9 (1.3) | |
| SCHENKER XMG Fusion 15 (Early 24) (1.3) | |
| Alienware m16 R2 (1.3) | |
| Moyenne NVIDIA GeForce RTX 4070 Laptop GPU (66 - 131.9, n=47) | |
| Moyenne de la classe Gaming (9.13 - 194.9, n=218, 2 dernières années) | |
| Aorus 16X 2024 (1.3) | |
| HP Omen Transcend 16-u1095ng (1.3) | |
| Strange Brigade - 1920x1080 ultra AA:ultra AF:16 | |
| Lenovo Legion Pro 5 16IRX9 (1.47.22.14 D3D12) | |
| SCHENKER XMG Fusion 15 (Early 24) (1.47.22.14 D3D12, Overboost) | |
| Alienware m16 R2 (1.47.22.14 D3D12) | |
| SCHENKER XMG Fusion 15 (Early 24) (1.47.22.14 D3D12) | |
| Moyenne de la classe Gaming (14.6 - 421, n=215, 2 dernières années) | |
| Aorus 16X 2024 (1.47.22.14 D3D12) | |
| Moyenne NVIDIA GeForce RTX 4070 Laptop GPU (117.7 - 234, n=47) | |
| HP Omen Transcend 16-u1095ng (1.47.22.14 D3D12) | |
| Dota 2 Reborn - 1920x1080 ultra (3/3) best looking | |
| SCHENKER XMG Fusion 15 (Early 24) (Overboost) | |
| Lenovo Legion Pro 5 16IRX9 | |
| SCHENKER XMG Fusion 15 (Early 24) | |
| Aorus 16X 2024 | |
| HP Omen Transcend 16-u1095ng | |
| Moyenne NVIDIA GeForce RTX 4070 Laptop GPU (89.7 - 187.5, n=48) | |
| Moyenne de la classe Gaming (26.9 - 220, n=227, 2 dernières années) | |
| Alienware m16 R2 | |
| X-Plane 11.11 - 1920x1080 high (fps_test=3) | |
| SCHENKER XMG Fusion 15 (Early 24) (Overboost) | |
| Lenovo Legion Pro 5 16IRX9 | |
| SCHENKER XMG Fusion 15 (Early 24) | |
| Aorus 16X 2024 | |
| HP Omen Transcend 16-u1095ng | |
| Moyenne NVIDIA GeForce RTX 4070 Laptop GPU (72.2 - 144.4, n=50) | |
| Moyenne de la classe Gaming (12.4 - 166.2, n=233, 2 dernières années) | |
| Alienware m16 R2 | |
| The Witcher 3 v4.00 | |
| 1920x1080 Ultra Preset / On AA:FX | |
| Moyenne de la classe Gaming (25.7 - 150, n=17, 2 dernières années) | |
| SCHENKER XMG Fusion 15 (Early 24) | |
| Moyenne NVIDIA GeForce RTX 4070 Laptop GPU (85 - 86.5, n=2) | |
| 1920x1080 RT Ultra Preset / On AA:FX | |
| Moyenne de la classe Gaming (12.9 - 66, n=11, 2 dernières années) | |
| SCHENKER XMG Fusion 15 (Early 24) | |
| Moyenne NVIDIA GeForce RTX 4070 Laptop GPU (36 - 40.4, n=2) | |
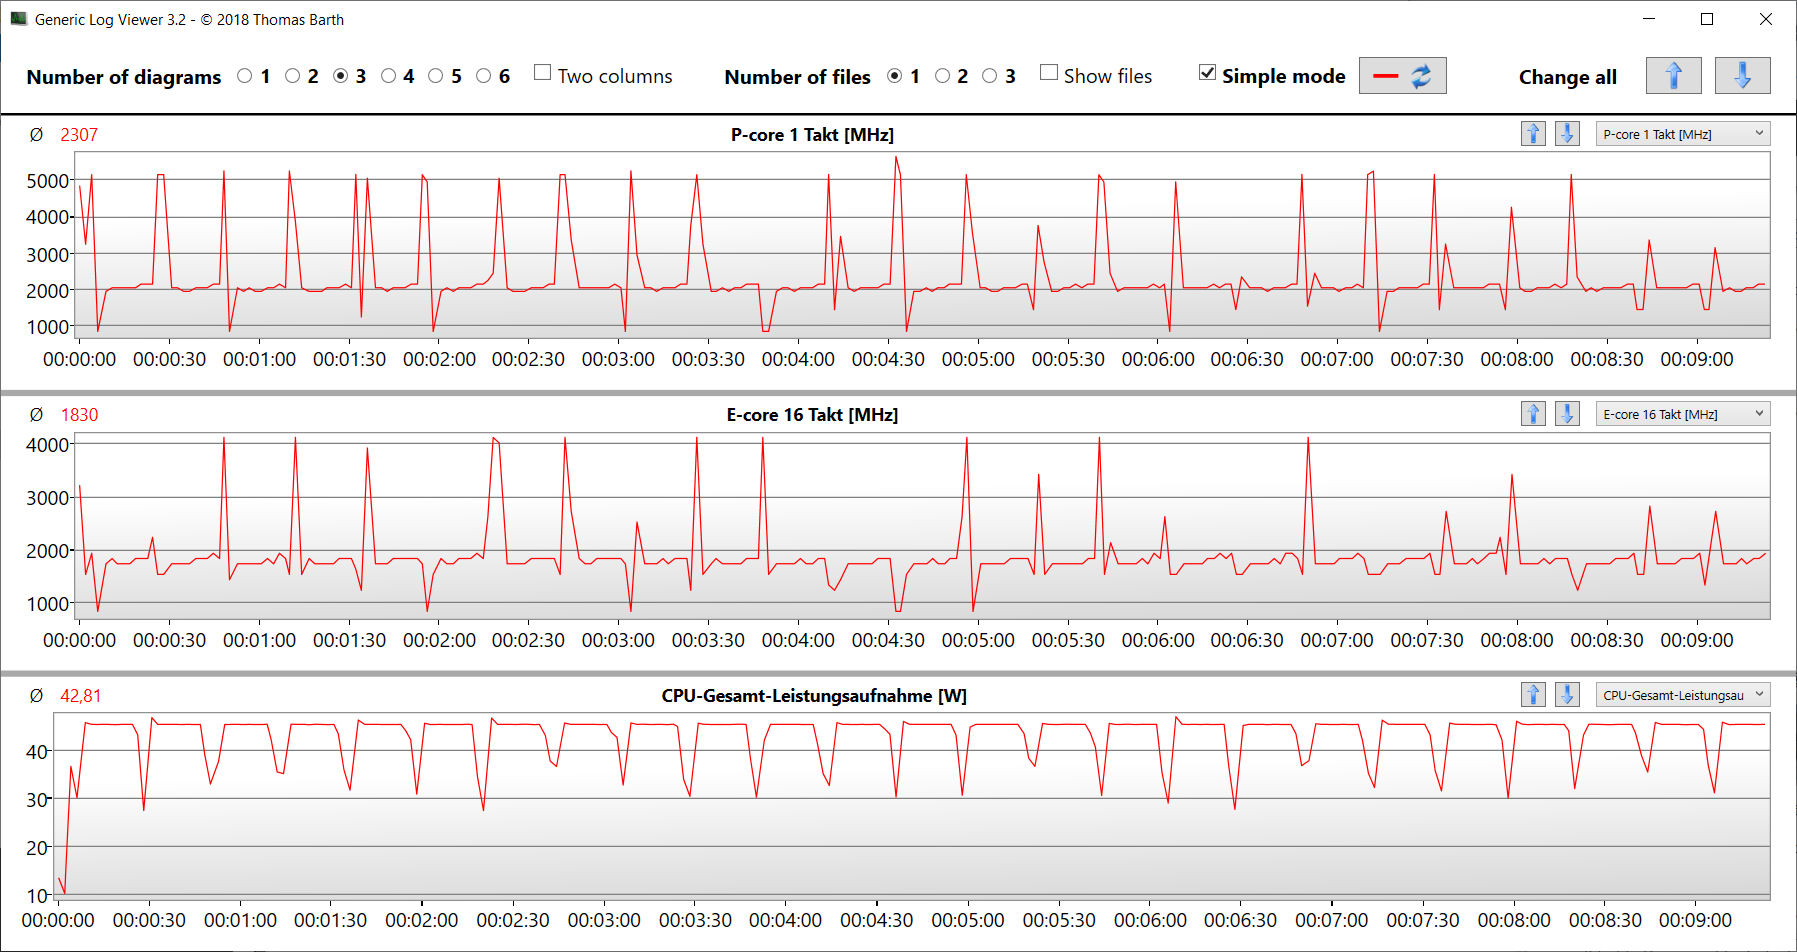
Afin de vérifier si les taux de rafraîchissement restent stables sur une longue période, nous avons laissé le jeu The Witcher 3 tourner pendant environ 60 minutes en Full HD et avec les paramètres réglés au maximum. Nous n'avons pas déplacé le personnage du jeu. Nous n'avons pas constaté d'effondrement du taux de rafraîchissement, mais il a baissé de quelques pour cent après environ 50 minutes(Enthusiast). Avec le profil Overboost activé, ce comportement ne s'est pas produit.
Witcher 3 FPS diagram
| Bas | Moyen | Élevé | Ultra | QHD | |
| GTA V (2015) | 187.8 | 187 | 186.4 | 137.6 | 98.2 |
| The Witcher 3 (2015) | 603.3 | 418.4 | 246.2 | 128 | 92.2 |
| Dota 2 Reborn (2015) | 234 | 207 | 196.5 | 182.1 | |
| Final Fantasy XV Benchmark (2018) | 226 | 175.5 | 124.6 | 90.5 | |
| X-Plane 11.11 (2018) | 205 | 173.3 | 136.9 | ||
| Far Cry 5 (2018) | 204 | 176 | 166 | 157 | 124 |
| Strange Brigade (2018) | 558 | 313 | 245 | 214 | 139.2 |
| The Witcher 3 v4.00 (2023) | 271 | 215 | 176.2 | 86.5 | |
| Baldur's Gate 3 (2023) | 157.2 | 121.2 | 106.1 | 105 | 82.1 |
| Cyberpunk 2077 2.0 Phantom Liberty (2023) | 156.6 | 124.5 | 103.6 | 87 | 52.6 |
| Alan Wake 2 (2023) | 74.3 | 71.4 | 70.1 | 42.8 | |
| Alone in the Dark (2024) | 222 | 209 | 196.5 | 126 | 76.6 |
| Dragon's Dogma 2 (2024) | 83.9 | 80 | 61.3 |
Emissions - L'ordinateur portable de Schenker chauffe beaucoup
Émissions sonores
En utilisation quotidienne et au ralenti, l'ordinateur portable est très silencieux. Bien que les ventilateurs soient activés en permanence (ils peuvent être désactivés via le BIOS), ils ne peuvent être entendus que dans un environnement très calme. En charge, les choses changent rapidement : Nous avons noté des émissions sonores allant jusqu'à 53 dB(A)(Enthusiast). En mode Overboost, les valeurs sont encore plus élevées. L'appareil fonctionne beaucoup plus silencieusement en mode équilibré, mais audétriment des performances.
Degré de la nuisance sonore
| Au repos |
| 27 / 28 / 33 dB(A) |
| Fortement sollicité |
| 52 / 53 dB(A) |
 | ||
30 dB silencieux 40 dB(A) audible 50 dB(A) bruyant |
||
min: | ||
| SCHENKER XMG Fusion 15 (Early 24) i9-14900HX, NVIDIA GeForce RTX 4070 Laptop GPU | Aorus 16X 2024 i9-14900HX, NVIDIA GeForce RTX 4070 Laptop GPU | Alienware m16 R2 Ultra 7 155H, NVIDIA GeForce RTX 4070 Laptop GPU | HP Omen Transcend 16-u1095ng i9-14900HX, NVIDIA GeForce RTX 4070 Laptop GPU | Lenovo Legion Pro 5 16IRX9 i9-14900HX, NVIDIA GeForce RTX 4070 Laptop GPU | |
|---|---|---|---|---|---|
| Noise | -5% | 8% | 5% | 6% | |
| off / environment * | 25 | 26 -4% | 24.7 1% | 24 4% | 23.9 4% |
| Idle Minimum * | 27 | 26 4% | 25.3 6% | 29 -7% | 24.3 10% |
| Idle Average * | 28 | 32 -14% | 25.3 10% | 30 -7% | 24.3 13% |
| Idle Maximum * | 33 | 38 -15% | 25.3 23% | 31 6% | 28.9 12% |
| Load Average * | 52 | 54 -4% | 31.7 39% | 45 13% | 45.8 12% |
| Witcher 3 ultra * | 51 | 50 2% | 53.8 -5% | 44 14% | 51 -0% |
| Load Maximum * | 53 | 55 -4% | 62 -17% | 47 11% | 56.6 -7% |
* ... Moindre est la valeur, meilleures sont les performances
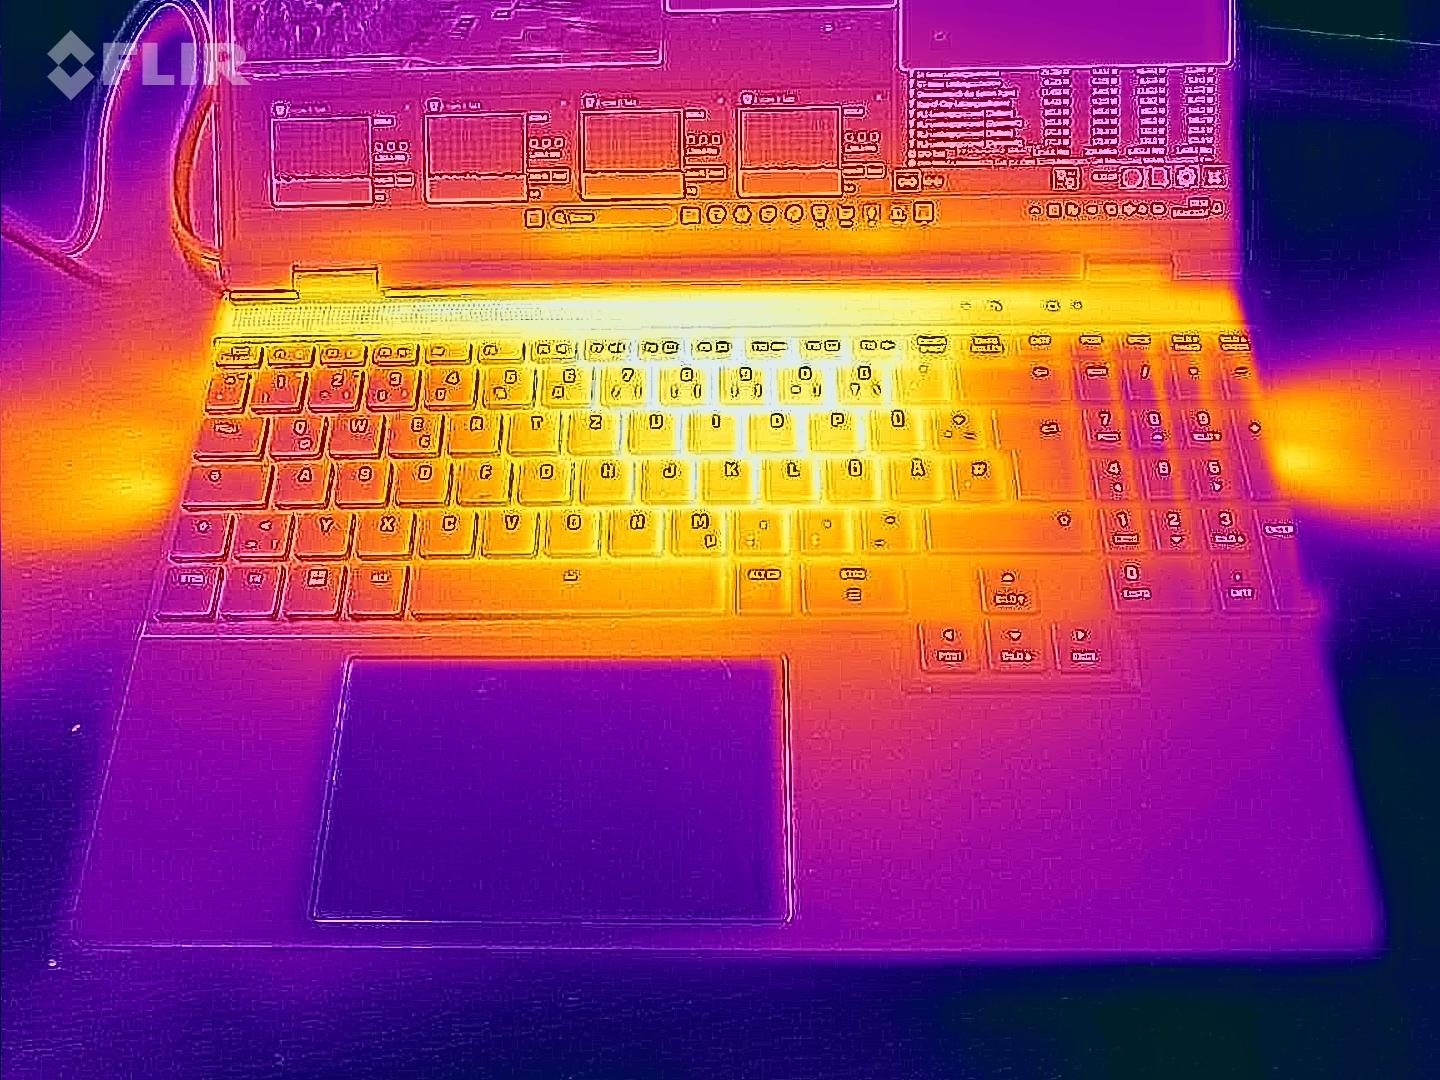
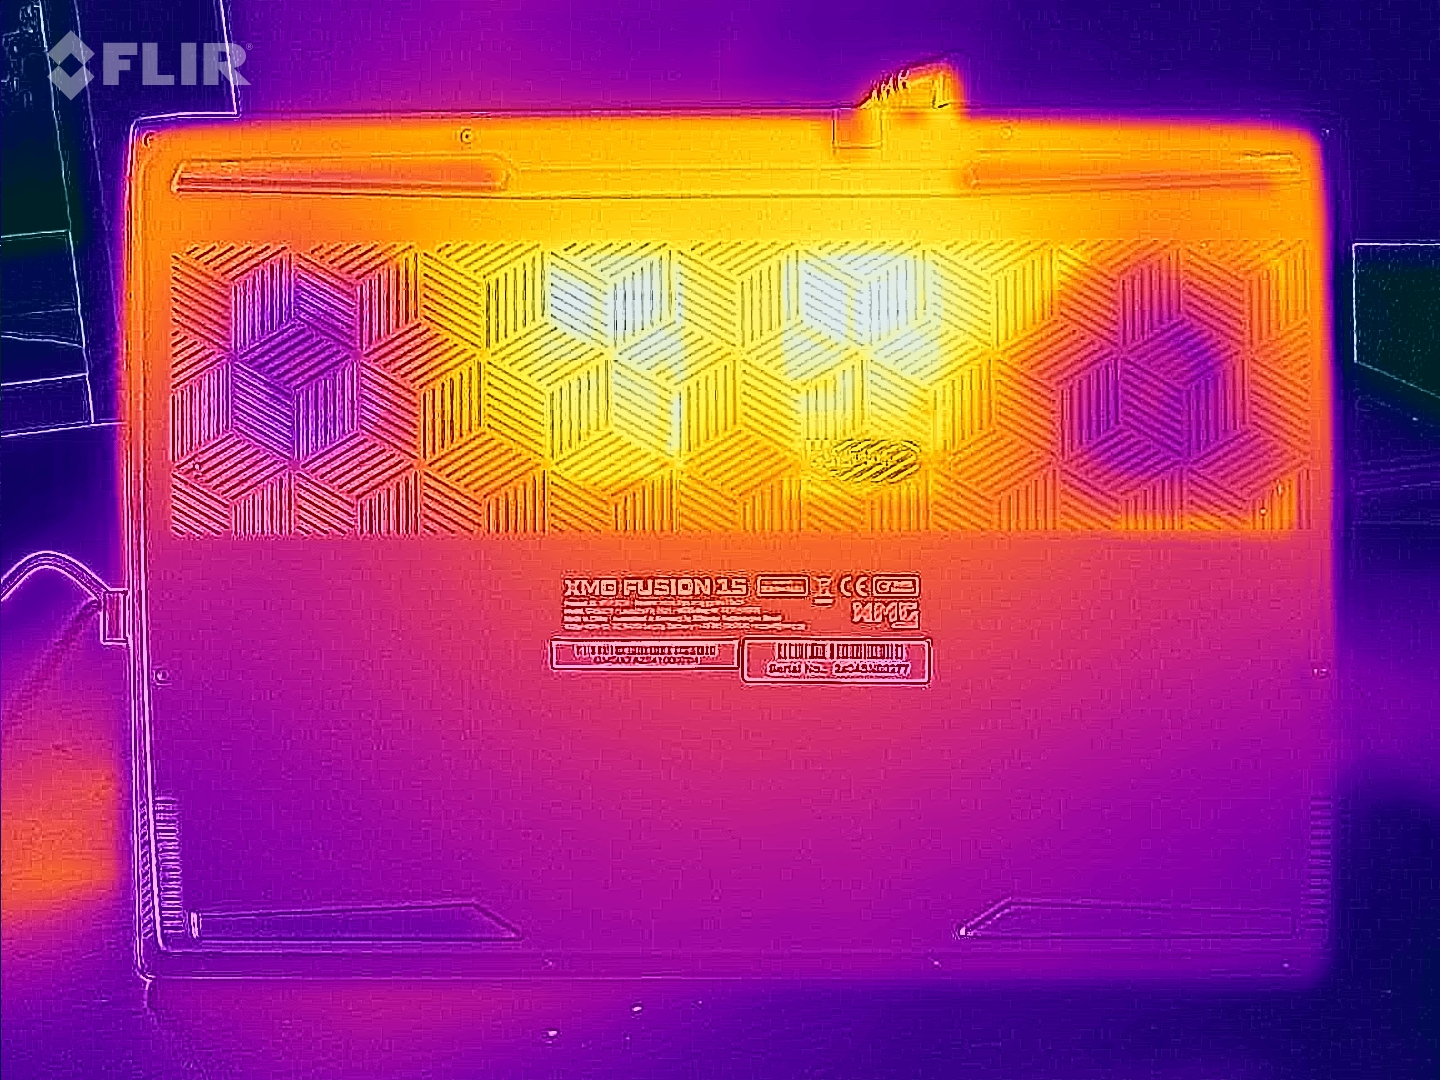
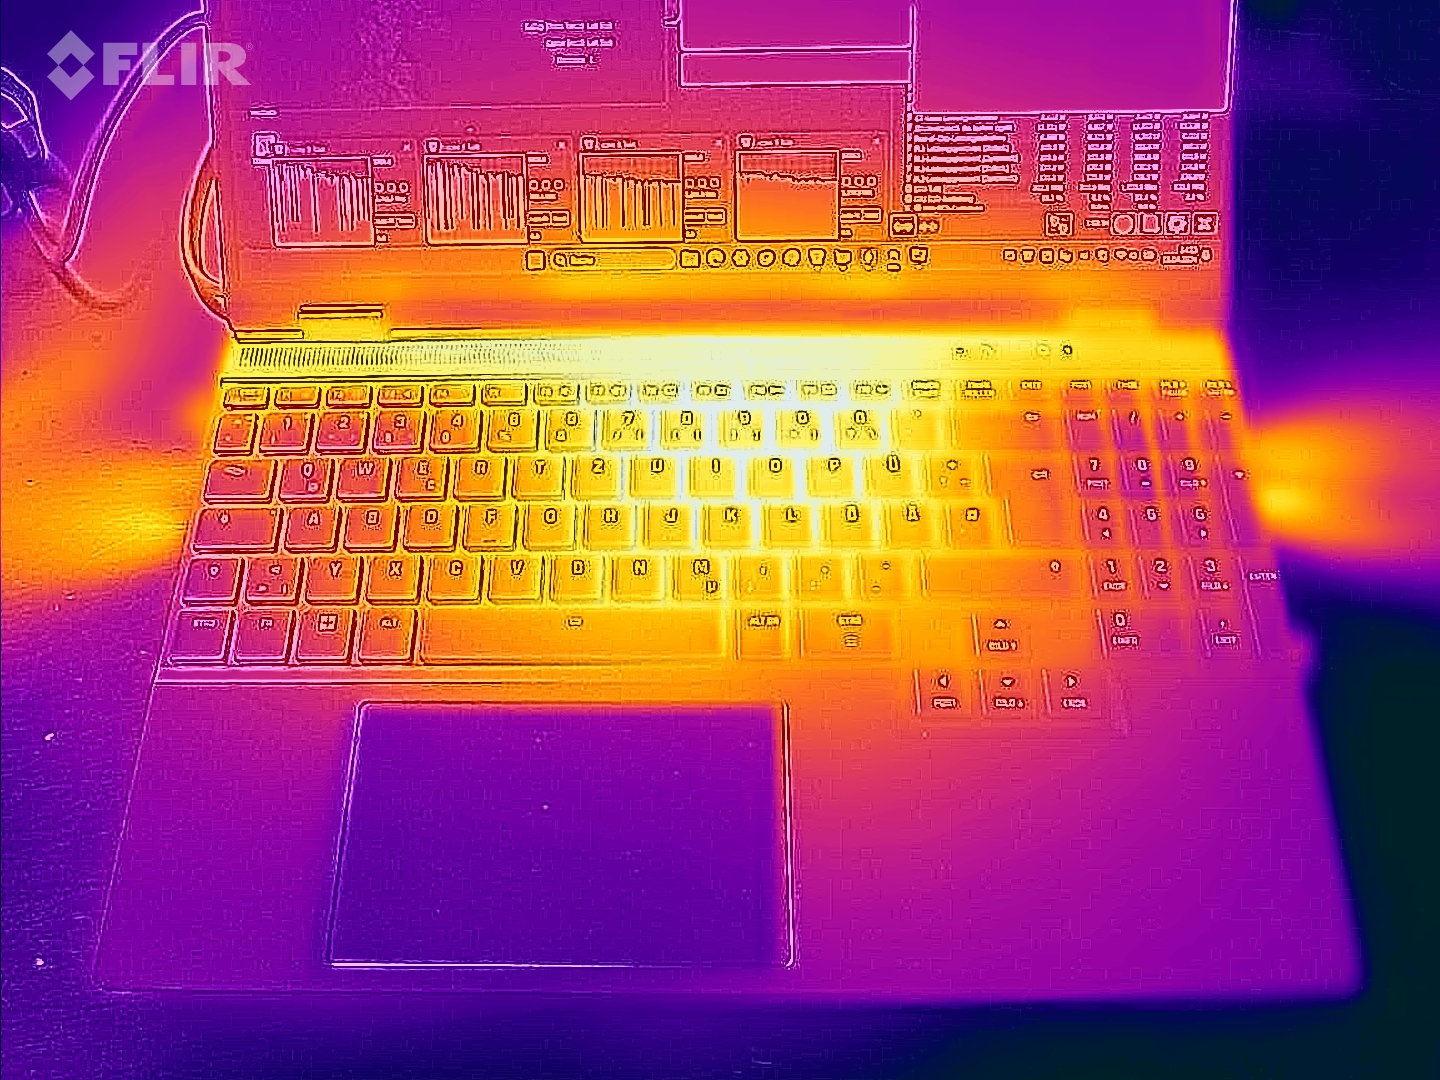
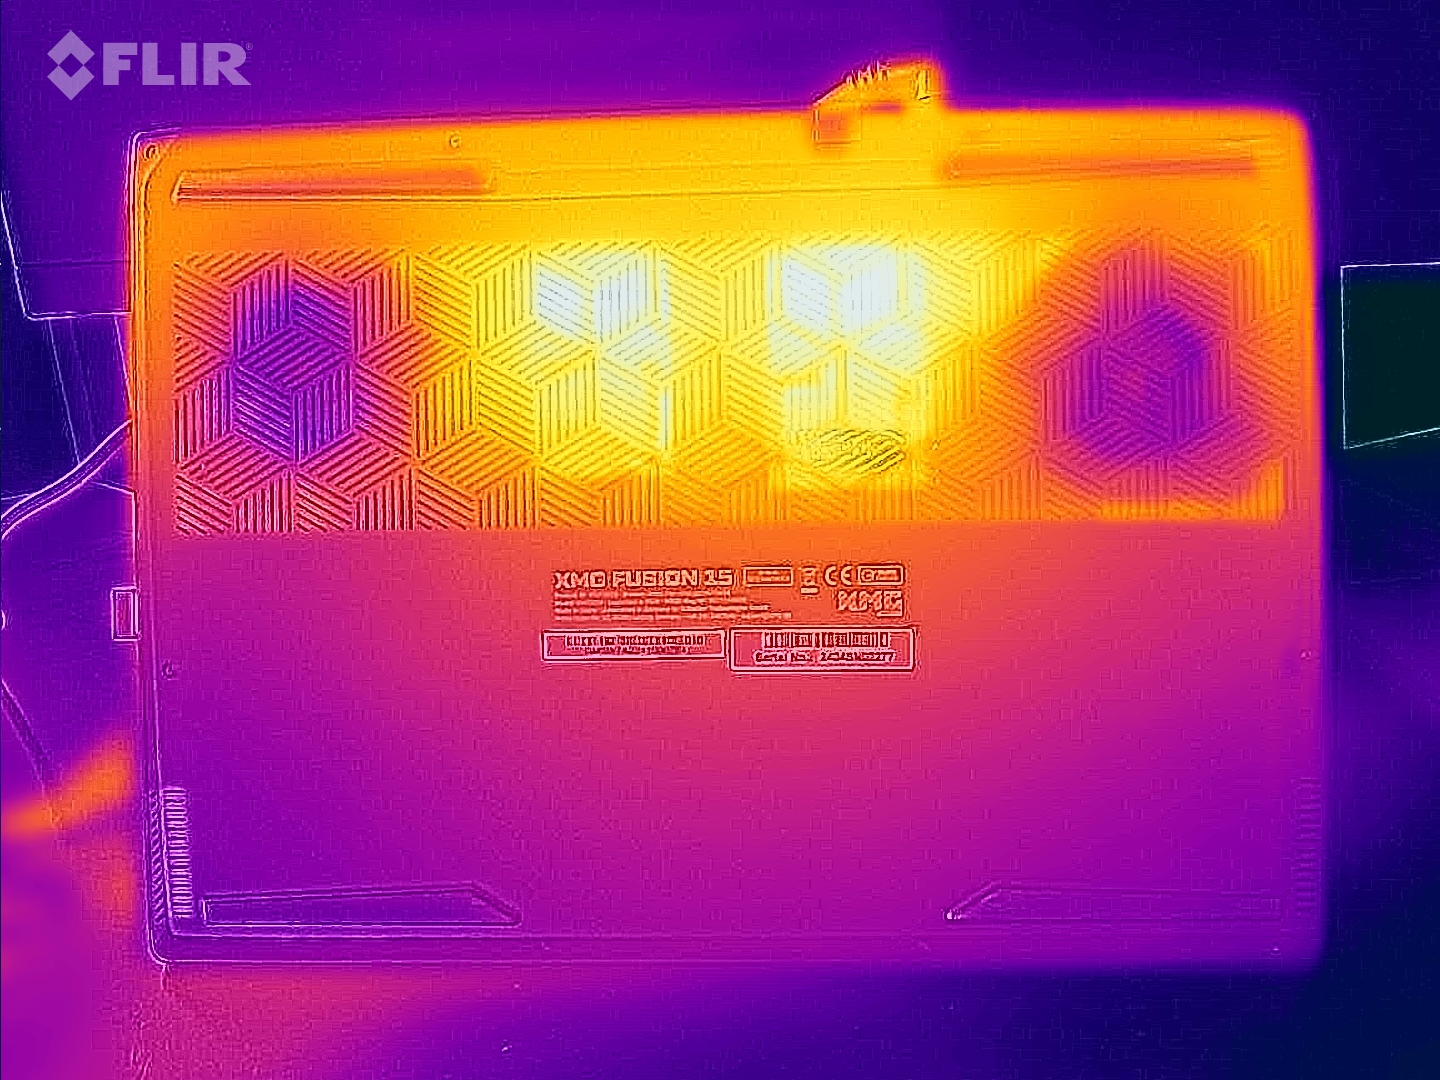
Température
Le test de stress et le test Witcher 3 ont conduit l'ordinateur portable à chauffer considérablement. Il a parfois atteint des valeurs supérieures à 50 degrés Celsius. En utilisation quotidienne (bureau, internet), les valeurs restent généralement dans la zone verte.
(-) La température maximale du côté supérieur est de 48 °C / 118 F, par rapport à la moyenne de 40.4 °C / 105 F, allant de 21.2 à 68.8 °C pour la classe Gaming.
(-) Le fond chauffe jusqu'à un maximum de 56 °C / 133 F, contre une moyenne de 43.2 °C / 110 F
(+) En utilisation inactive, la température moyenne du côté supérieur est de 26.6 °C / 80 F, par rapport à la moyenne du dispositif de 33.8 °C / 93 F.
(-) En jouant à The Witcher 3, la température moyenne du côté supérieur est de 40.4 °C / 105 F, alors que la moyenne de l'appareil est de 33.8 °C / 93 F.
(+) Les repose-poignets et le pavé tactile atteignent la température maximale de la peau (34 °C / 93.2 F) et ne sont donc pas chauds.
(-) La température moyenne de la zone de l'appui-paume de dispositifs similaires était de 28.9 °C / 84 F (-5.1 °C / #-9.2 F).
| SCHENKER XMG Fusion 15 (Early 24) Intel Core i9-14900HX, NVIDIA GeForce RTX 4070 Laptop GPU | Aorus 16X 2024 Intel Core i9-14900HX, NVIDIA GeForce RTX 4070 Laptop GPU | Alienware m16 R2 Intel Core Ultra 7 155H, NVIDIA GeForce RTX 4070 Laptop GPU | HP Omen Transcend 16-u1095ng Intel Core i9-14900HX, NVIDIA GeForce RTX 4070 Laptop GPU | Lenovo Legion Pro 5 16IRX9 Intel Core i9-14900HX, NVIDIA GeForce RTX 4070 Laptop GPU | |
|---|---|---|---|---|---|
| Heat | -5% | -14% | -6% | -8% | |
| Maximum Upper Side * | 48 | 41 15% | 44.8 7% | 49 -2% | 43.8 9% |
| Maximum Bottom * | 56 | 41 27% | 48 14% | 63 -13% | 55.4 1% |
| Idle Upper Side * | 28 | 37 -32% | 37.2 -33% | 30 -7% | 32.8 -17% |
| Idle Bottom * | 29 | 38 -31% | 42 -45% | 29 -0% | 36 -24% |
* ... Moindre est la valeur, meilleures sont les performances
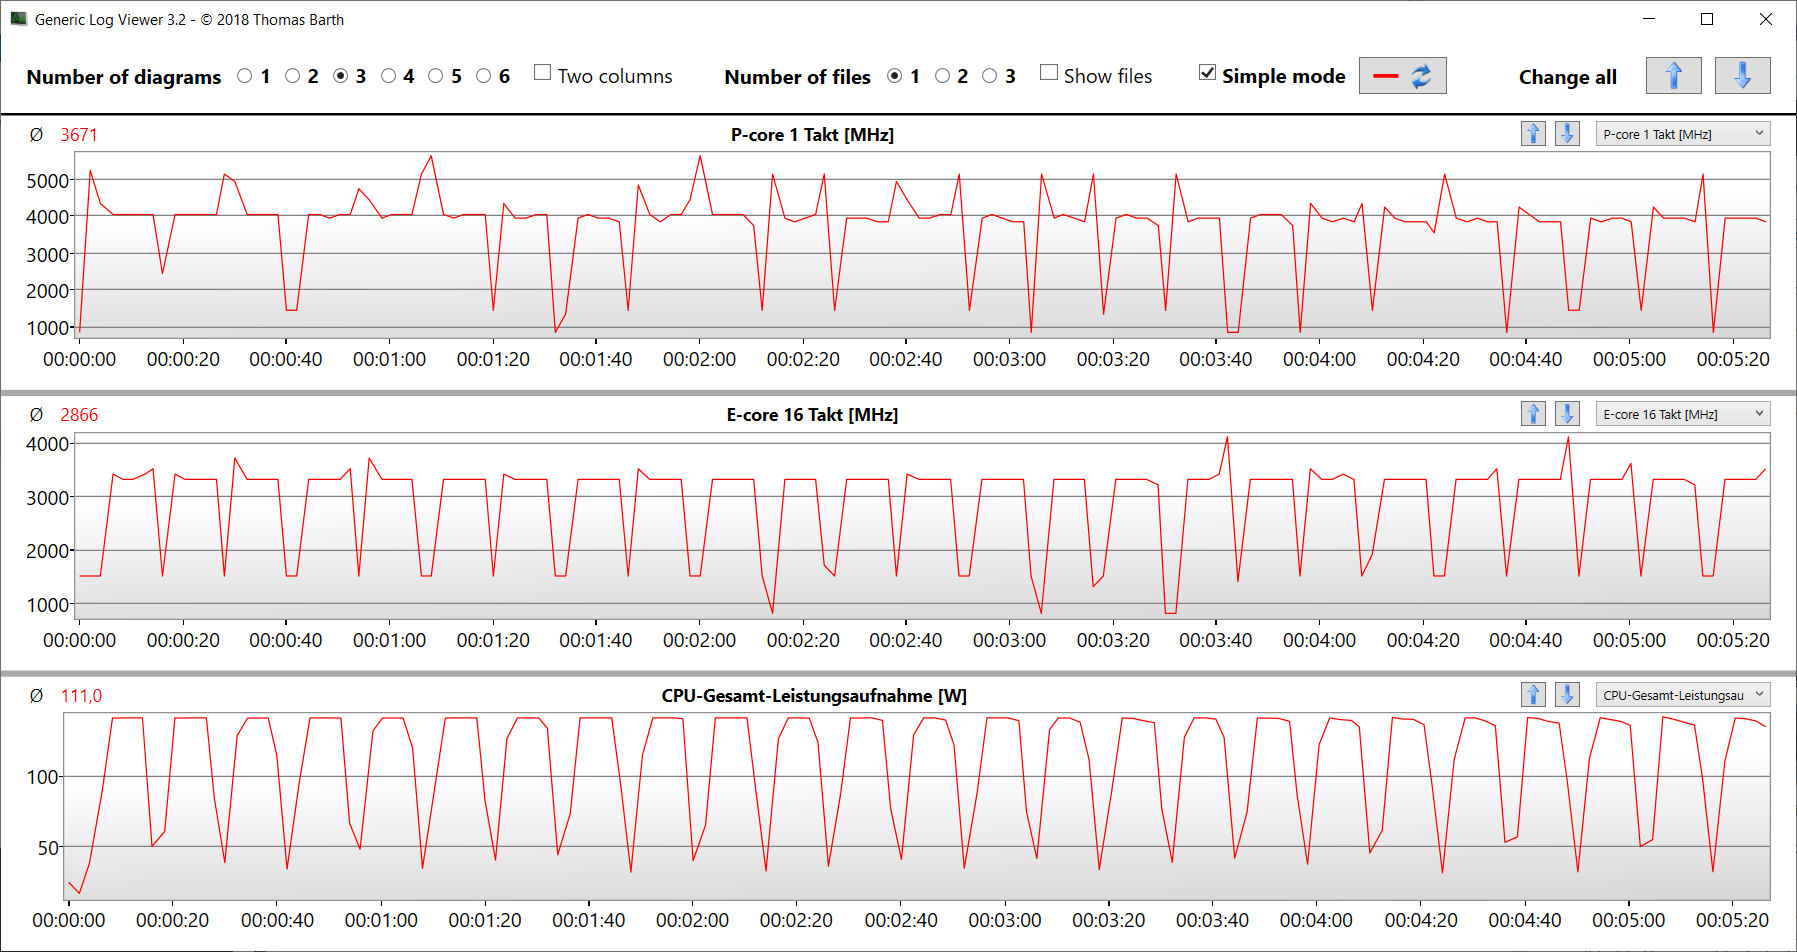
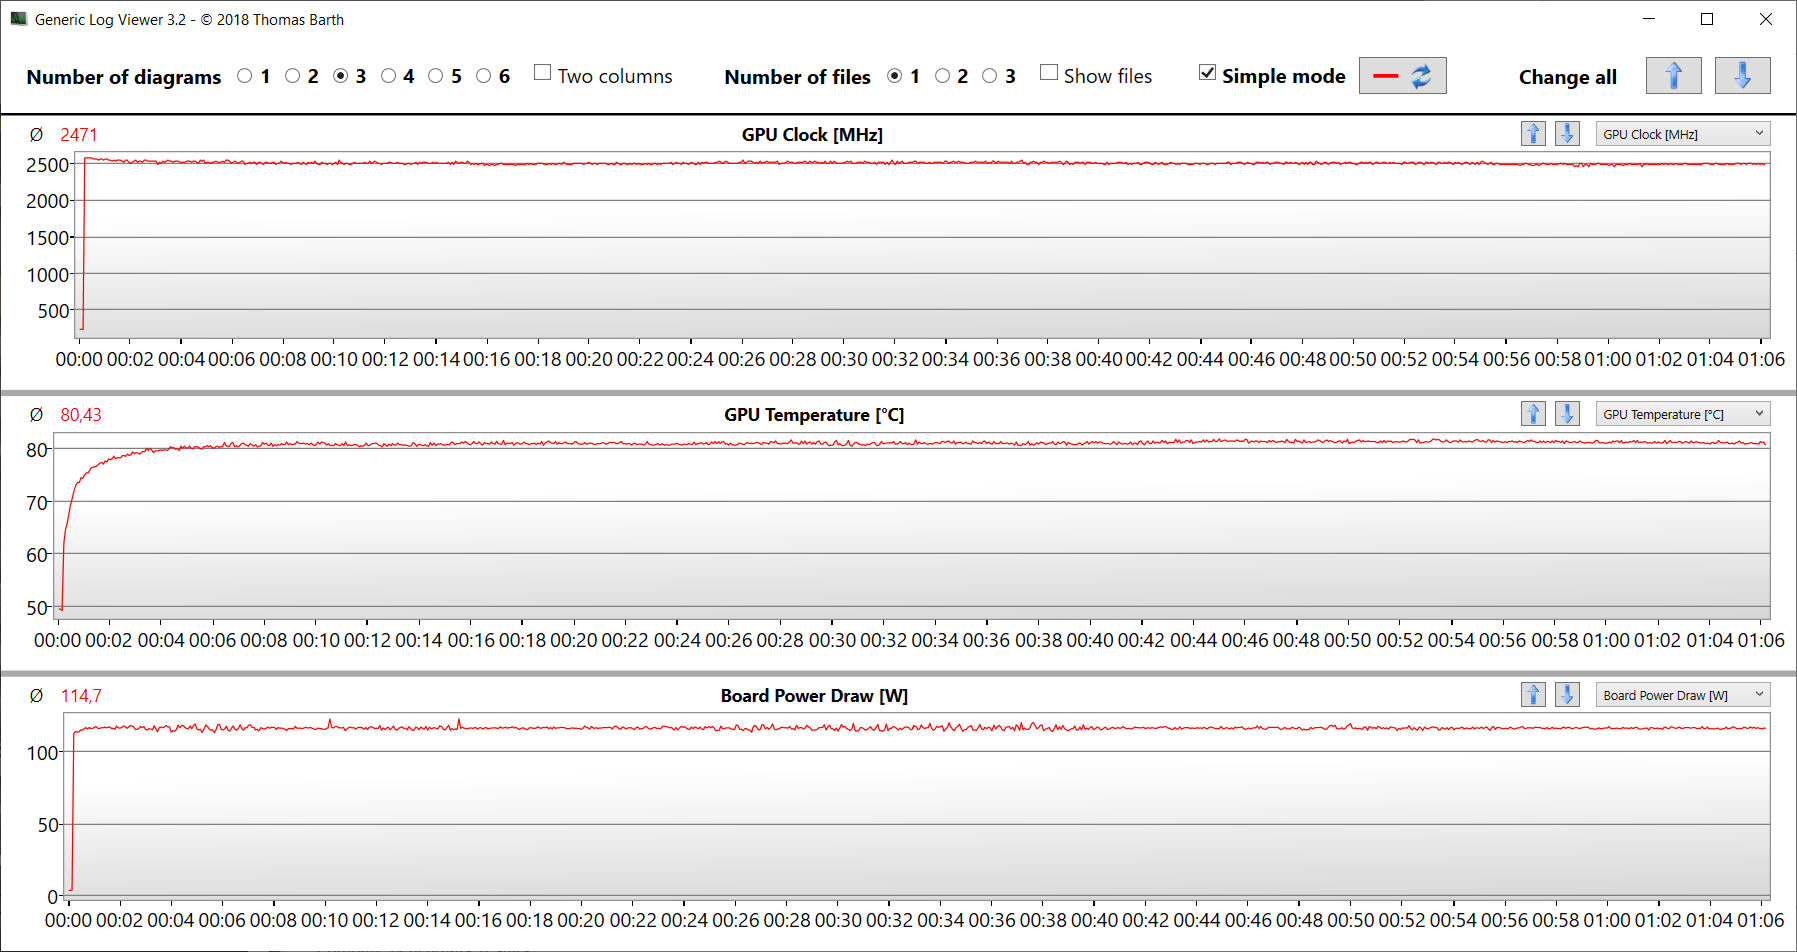
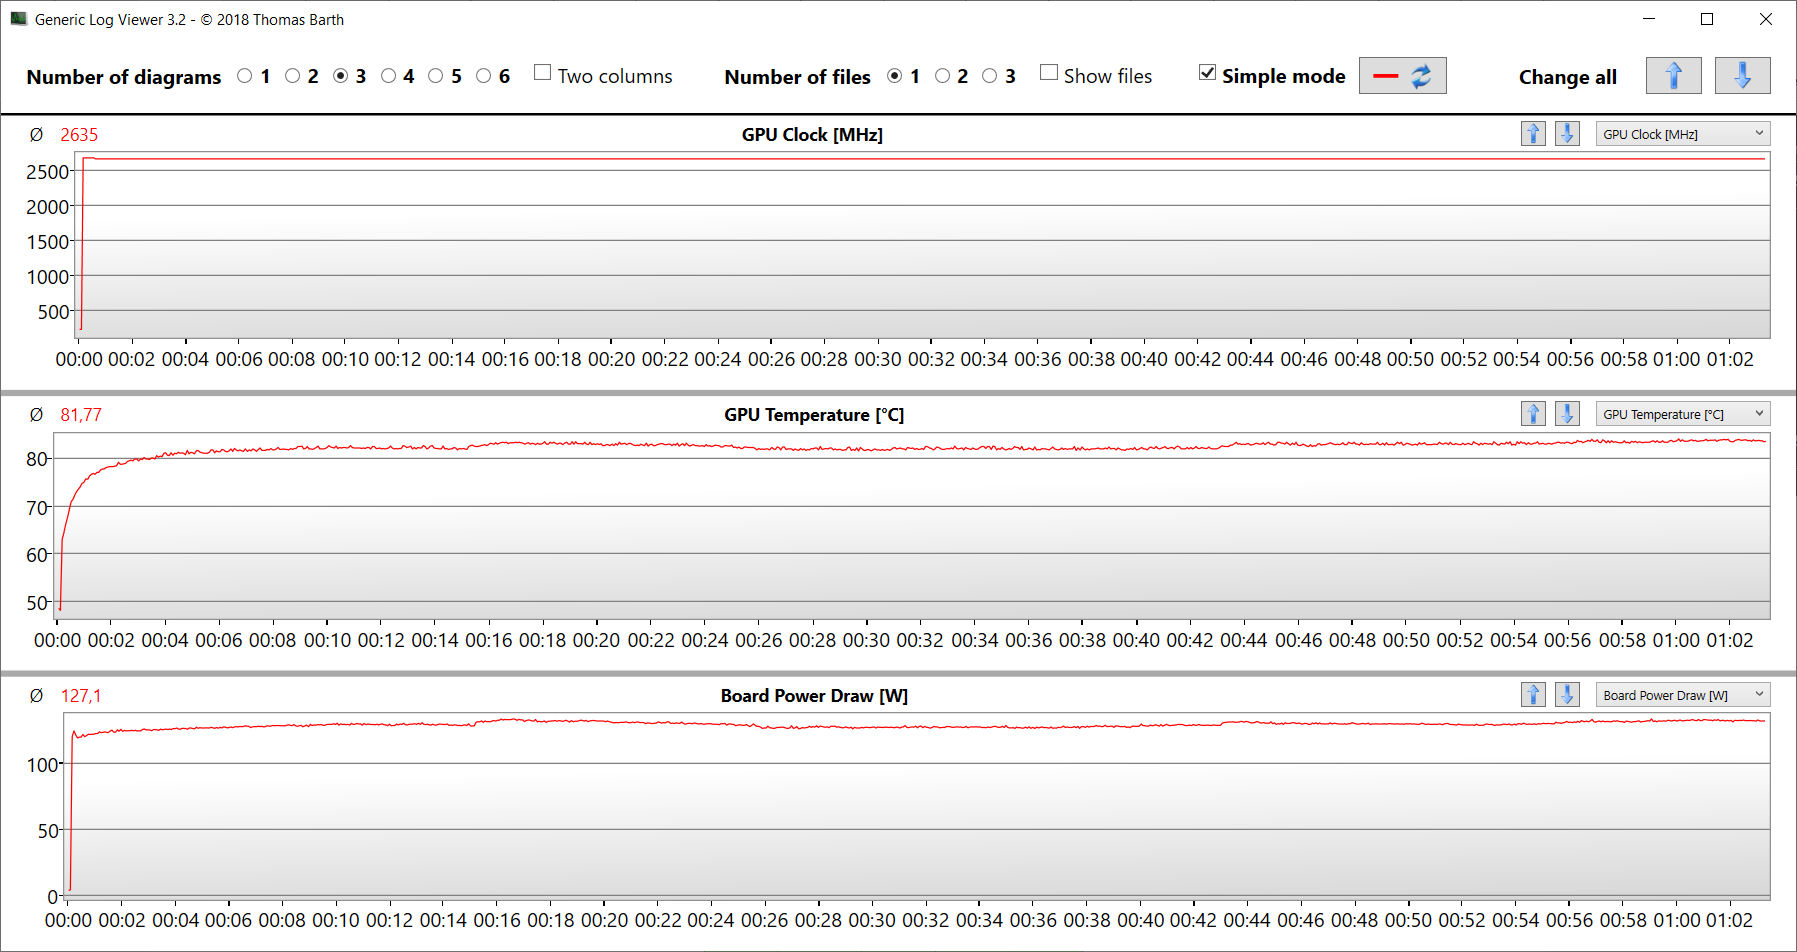
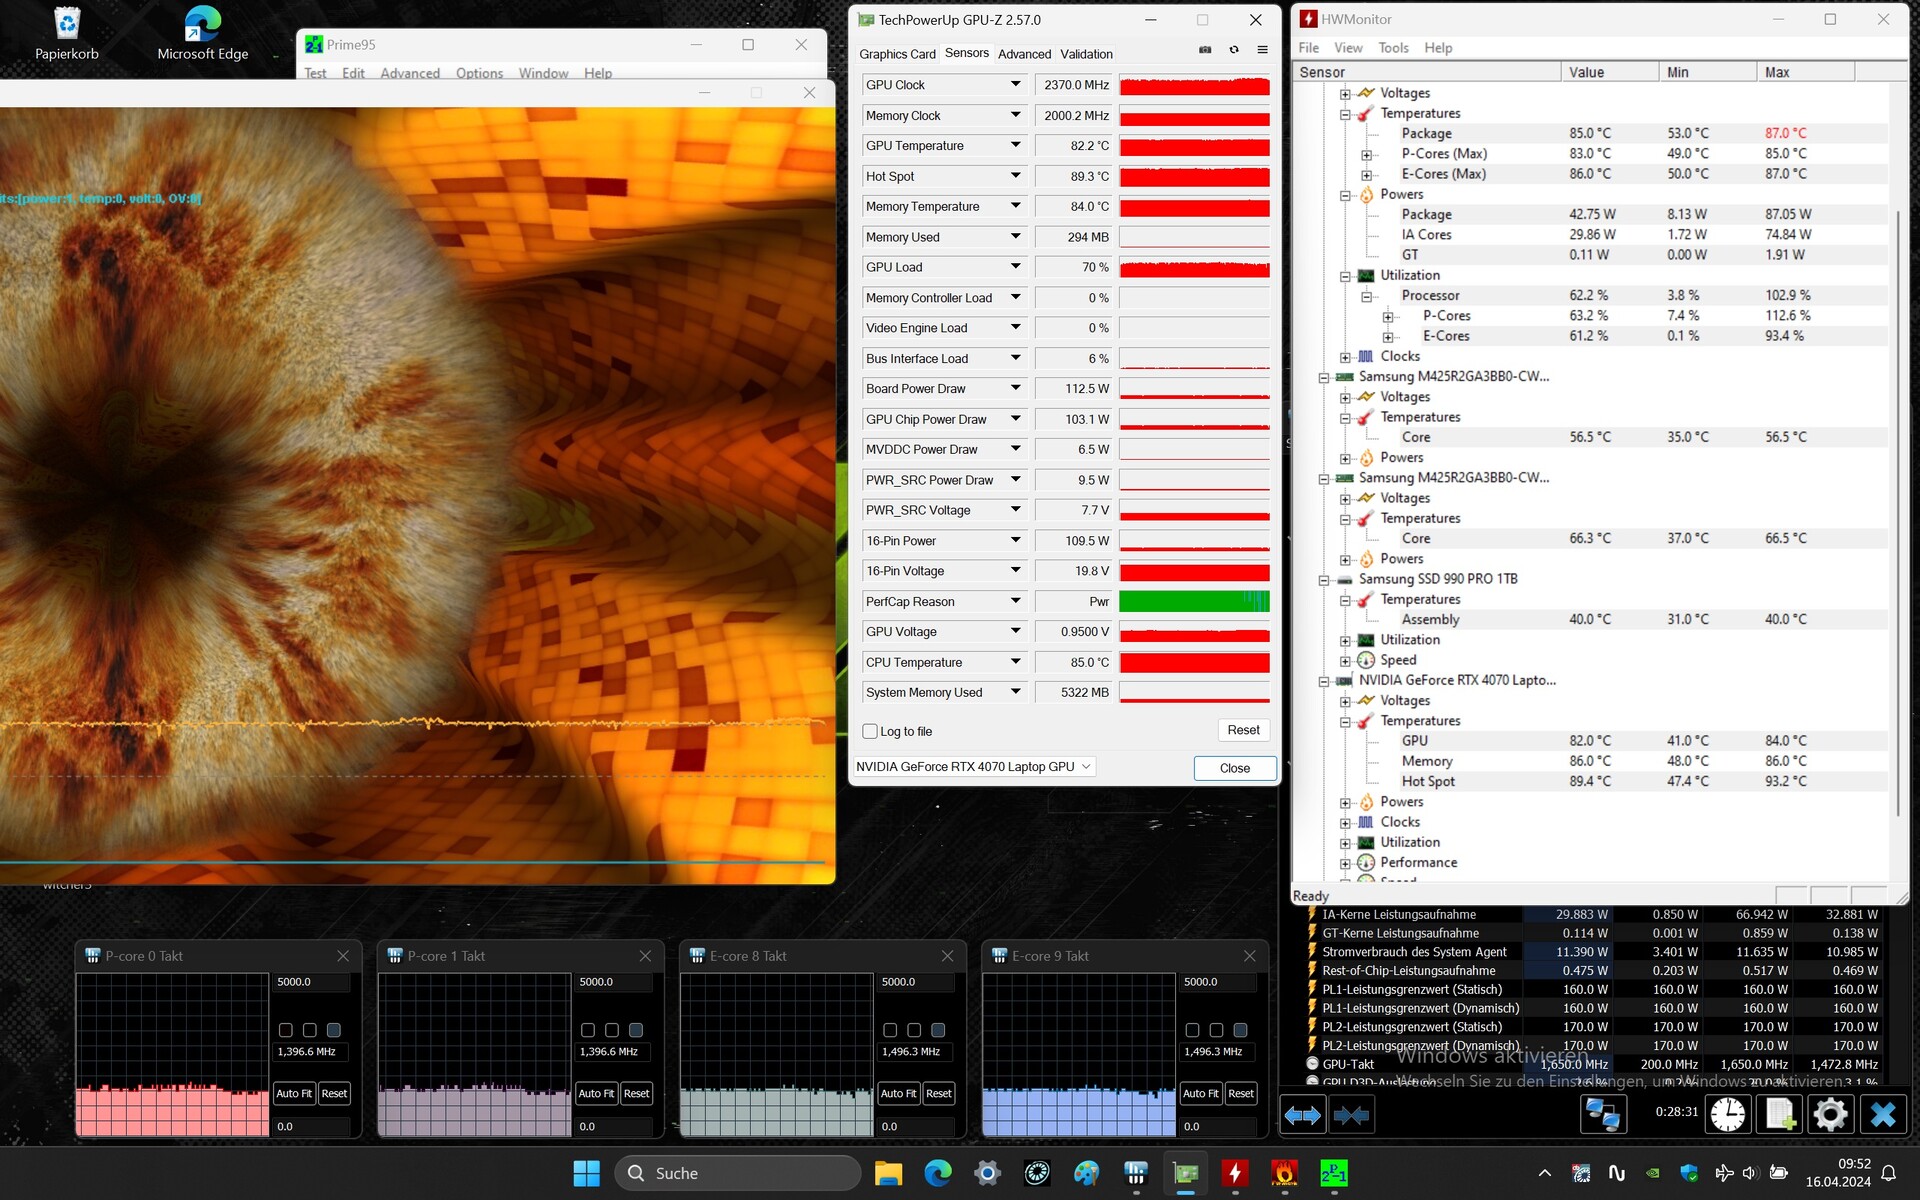
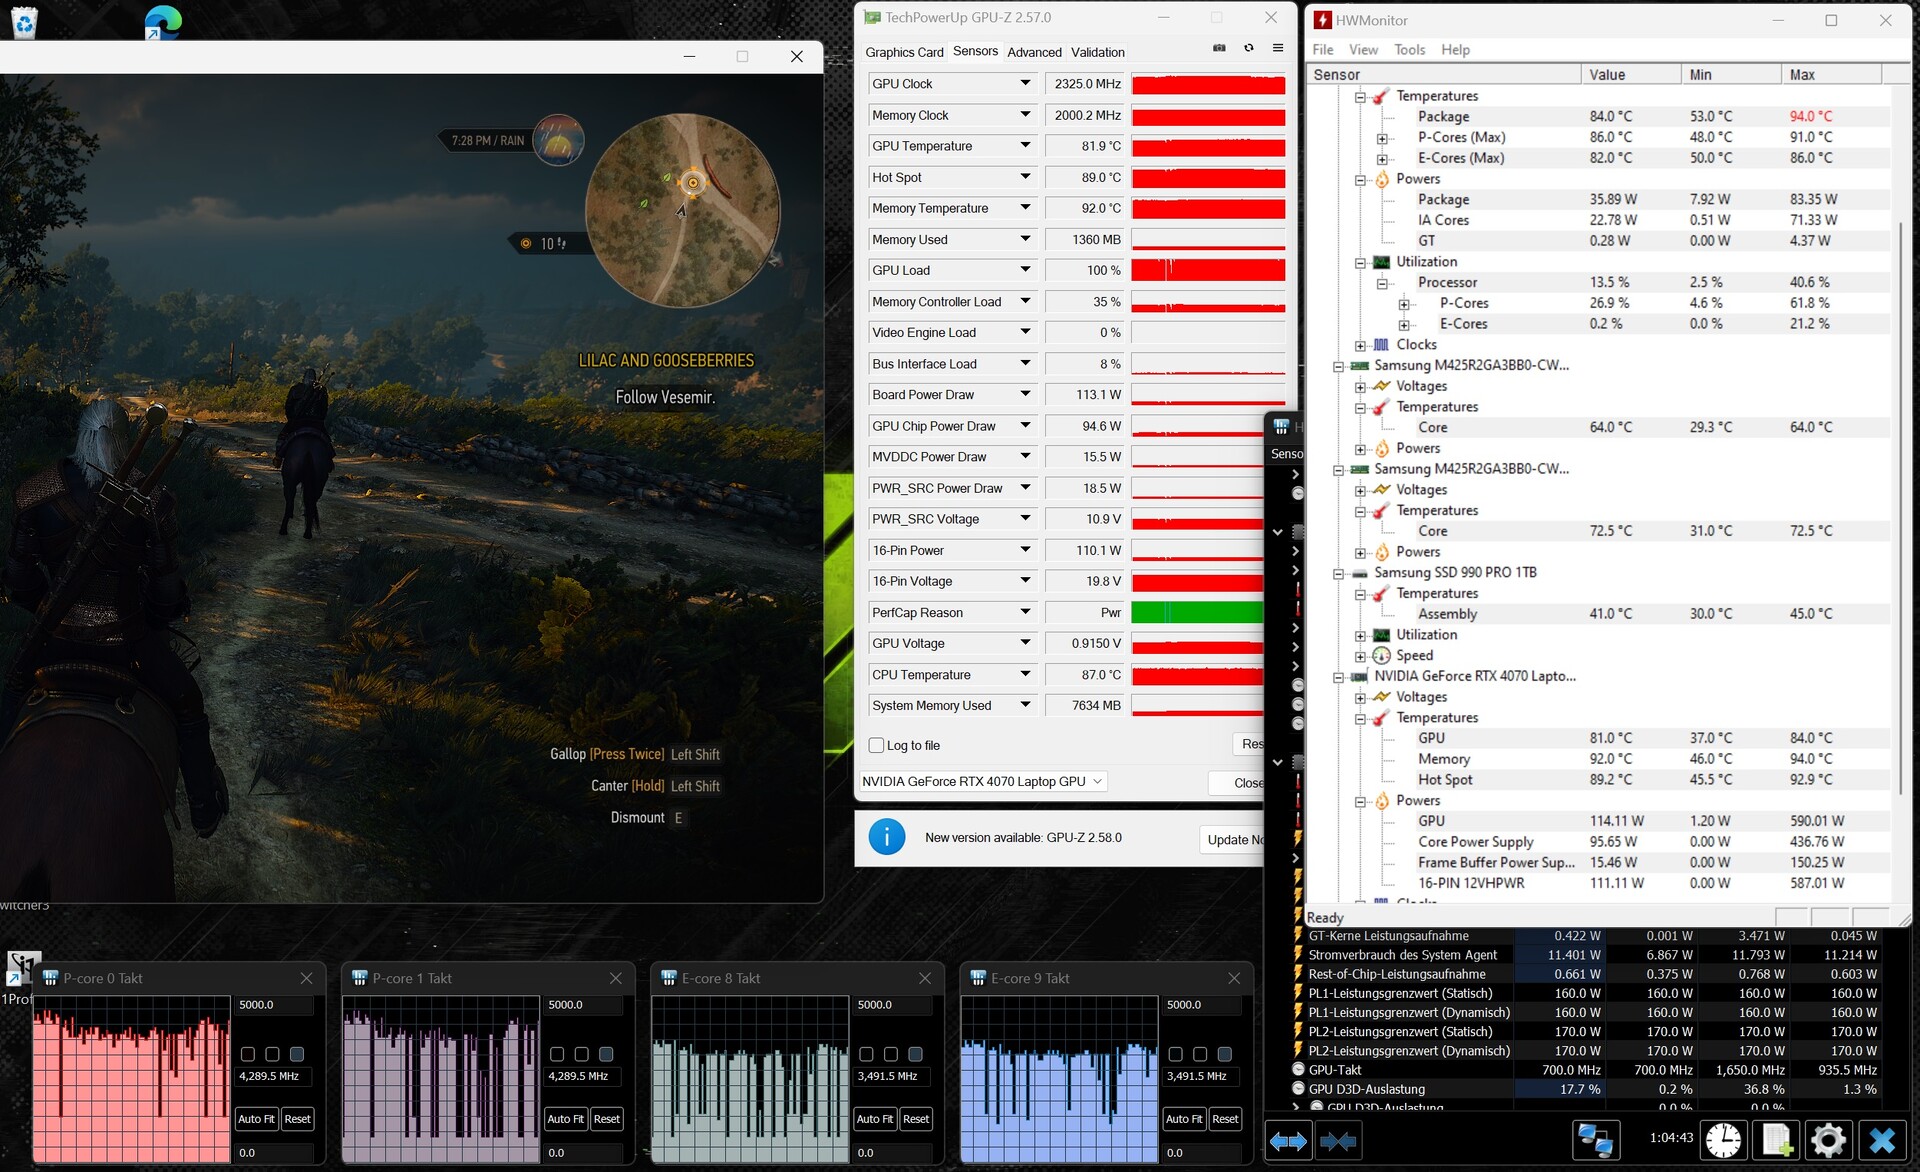
Épreuve d'effort
Le scénario extrême simulé par le test de stress (Prime95 et Furmark en fonctionnement continu) permet de vérifier la stabilité du système à pleine charge. L'horloge du processeur est passée lentement et continuellement de valeurs légèrement supérieures à la fréquence de base à des valeurs inférieures. Le cœur graphique a fonctionné à des vitesses élevées pendant toute la durée du test.
Intervenants
Les haut-parleurs stéréo de l'ordinateur portable produisent un son décent, mais ils manquent de basses. Vous obtiendrez un meilleur son en branchant un casque ou des haut-parleurs externes.
SCHENKER XMG Fusion 15 (Early 24) analyse audio
(+) | les haut-parleurs peuvent jouer relativement fort (85# dB)
Bass 100 - 315 Hz
(-) | presque aucune basse - en moyenne 15.8% plus bas que la médiane
(±) | la linéarité des basses est moyenne (12.5% delta à la fréquence précédente)
Mids 400 - 2000 Hz
(+) | médiane équilibrée - seulement 4.4% de la médiane
(+) | les médiums sont linéaires (5.9% delta à la fréquence précédente)
Aiguës 2 - 16 kHz
(+) | des sommets équilibrés - à seulement 2% de la médiane
(+) | les aigus sont linéaires (4.8% delta à la fréquence précédente)
Overall 100 - 16.000 Hz
(+) | le son global est linéaire (11.5% différence à la médiane)
Par rapport à la même classe
» 9% de tous les appareils testés de cette catégorie étaient meilleurs, 2% similaires, 89% pires
» Le meilleur avait un delta de 6%, la moyenne était de 18%, le pire était de 132%.
Par rapport à tous les appareils testés
» 6% de tous les appareils testés étaient meilleurs, 2% similaires, 93% pires
» Le meilleur avait un delta de 4%, la moyenne était de 25%, le pire était de 134%.
Aorus 16X 2024 analyse audio
(+) | les haut-parleurs peuvent jouer relativement fort (85# dB)
Bass 100 - 315 Hz
(±) | basse réduite - en moyenne 8.5% inférieure à la médiane
(±) | la linéarité des basses est moyenne (8.3% delta à la fréquence précédente)
Mids 400 - 2000 Hz
(+) | médiane équilibrée - seulement 3.1% de la médiane
(+) | les médiums sont linéaires (5.8% delta à la fréquence précédente)
Aiguës 2 - 16 kHz
(+) | des sommets équilibrés - à seulement 2.5% de la médiane
(±) | la linéarité des aigus est moyenne (7% delta à la fréquence précédente)
Overall 100 - 16.000 Hz
(+) | le son global est linéaire (8.4% différence à la médiane)
Par rapport à la même classe
» 1% de tous les appareils testés de cette catégorie étaient meilleurs, 1% similaires, 98% pires
» Le meilleur avait un delta de 6%, la moyenne était de 18%, le pire était de 132%.
Par rapport à tous les appareils testés
» 1% de tous les appareils testés étaient meilleurs, 0% similaires, 98% pires
» Le meilleur avait un delta de 4%, la moyenne était de 25%, le pire était de 134%.
Gestion de l'énergie - Le Fusion 15 offre de très bonnes durées d'utilisation
Consommation électrique
Sa consommation d'énergie est largement normale pour le matériel installé. Exception : Malgré une batterie entièrement chargée, nous avons mesuré une consommation d'énergie d'environ 20 watts lorsque l'ordinateur portable était éteint. Il s'agit probablement d'un bogue. Le Witcher 3 et le test de stress se sont déroulés avec des valeurs de consommation d'énergie en légère baisse. Le bloc d'alimentation (280 watts) est suffisamment puissant.
| Au repos | |
| Fortement sollicité |
|
| SCHENKER XMG Fusion 15 (Early 24) i9-14900HX, NVIDIA GeForce RTX 4070 Laptop GPU | Aorus 16X 2024 i9-14900HX, NVIDIA GeForce RTX 4070 Laptop GPU | Alienware m16 R2 Ultra 7 155H, NVIDIA GeForce RTX 4070 Laptop GPU | HP Omen Transcend 16-u1095ng i9-14900HX, NVIDIA GeForce RTX 4070 Laptop GPU | Moyenne de la classe Gaming | |
|---|---|---|---|---|---|
| Power Consumption | -21% | -3% | -10% | -22% | |
| Idle Minimum * | 8 | 13 -63% | 8.1 -1% | 10 -25% | 13.9 ? -74% |
| Idle Average * | 14 | 18 -29% | 13 7% | 18 -29% | 19.2 ? -37% |
| Idle Maximum * | 26 | 35 -35% | 40.3 -55% | 32 -23% | 27.1 ? -4% |
| Load Average * | 118 | 138 -17% | 79 33% | 128 -8% | 110.4 ? 6% |
| Witcher 3 ultra * | 192.7 | 172.6 10% | 188.1 2% | 148.4 23% | |
| Load Maximum * | 244 | 222 9% | 254.9 -4% | 242 1% | 251 ? -3% |
* ... Moindre est la valeur, meilleures sont les performances
Power consumption Witcher 3 / stress test
Power consumption with external monitor
Délais d'exécution
Lors de nos tests WiFi (chargement de sites web via un script) et vidéo (court métrage Big Buck Bunny (encodage H.264, FHD) en boucle), nous avons mesuré des durées d'exécution respectives de 8h00 et 10h02. Ce sont de très bonnes valeurs.
| SCHENKER XMG Fusion 15 (Early 24) i9-14900HX, NVIDIA GeForce RTX 4070 Laptop GPU, 99.8 Wh | Aorus 16X 2024 i9-14900HX, NVIDIA GeForce RTX 4070 Laptop GPU, 99 Wh | Alienware m16 R2 Ultra 7 155H, NVIDIA GeForce RTX 4070 Laptop GPU, 90 Wh | HP Omen Transcend 16-u1095ng i9-14900HX, NVIDIA GeForce RTX 4070 Laptop GPU, 97 Wh | Lenovo Legion Pro 5 16IRX9 i9-14900HX, NVIDIA GeForce RTX 4070 Laptop GPU, 80 Wh | Moyenne de la classe Gaming | |
|---|---|---|---|---|---|---|
| Autonomie de la batterie | -17% | -26% | -39% | -52% | -36% | |
| Reader / Idle | 911 | 753 -17% | 758 -17% | 403 -56% | 545 ? -40% | |
| H.264 | 602 | 541 -10% | 397 ? -34% | |||
| WiFi v1.3 | 480 | 481 0% | 483 1% | 292 -39% | 290 -40% | 369 ? -23% |
| Load | 164 | 100 -39% | 60 -63% | 65 -60% | 84.8 ? -48% |
Points positifs
Points négatifs
Verdict - Portable, puissant, persévérant
Les dimensions compactes et le faible poids (environ 2,1 kg) ne se font pas au détriment des performances matérielles. Le Core i9 et la GeForce RTX 4070 sont capables de travailler avec des fréquences d'horloge élevées et constantes. La fusion des performances et de la portabilité de l'ordinateur portable peut être considérée comme une réussite.
Le XMG Fusion 15 (Early 24) - un ordinateur portable puissant pour les joueurs et les créateurs.
L'ordinateur portable chauffe beaucoup lorsqu'il est sollicité et produit alors beaucoup de bruit. Pour des émissions plus modérées, il faut sacrifier un peu de puissance de calcul. Son écran de 15,3 pouces (2 560 x 1 600 pixels, IPS, 240 Hz, Adaptive Sync) au format 16:10 est globalement impressionnant. Sa luminosité élevée est remarquable.
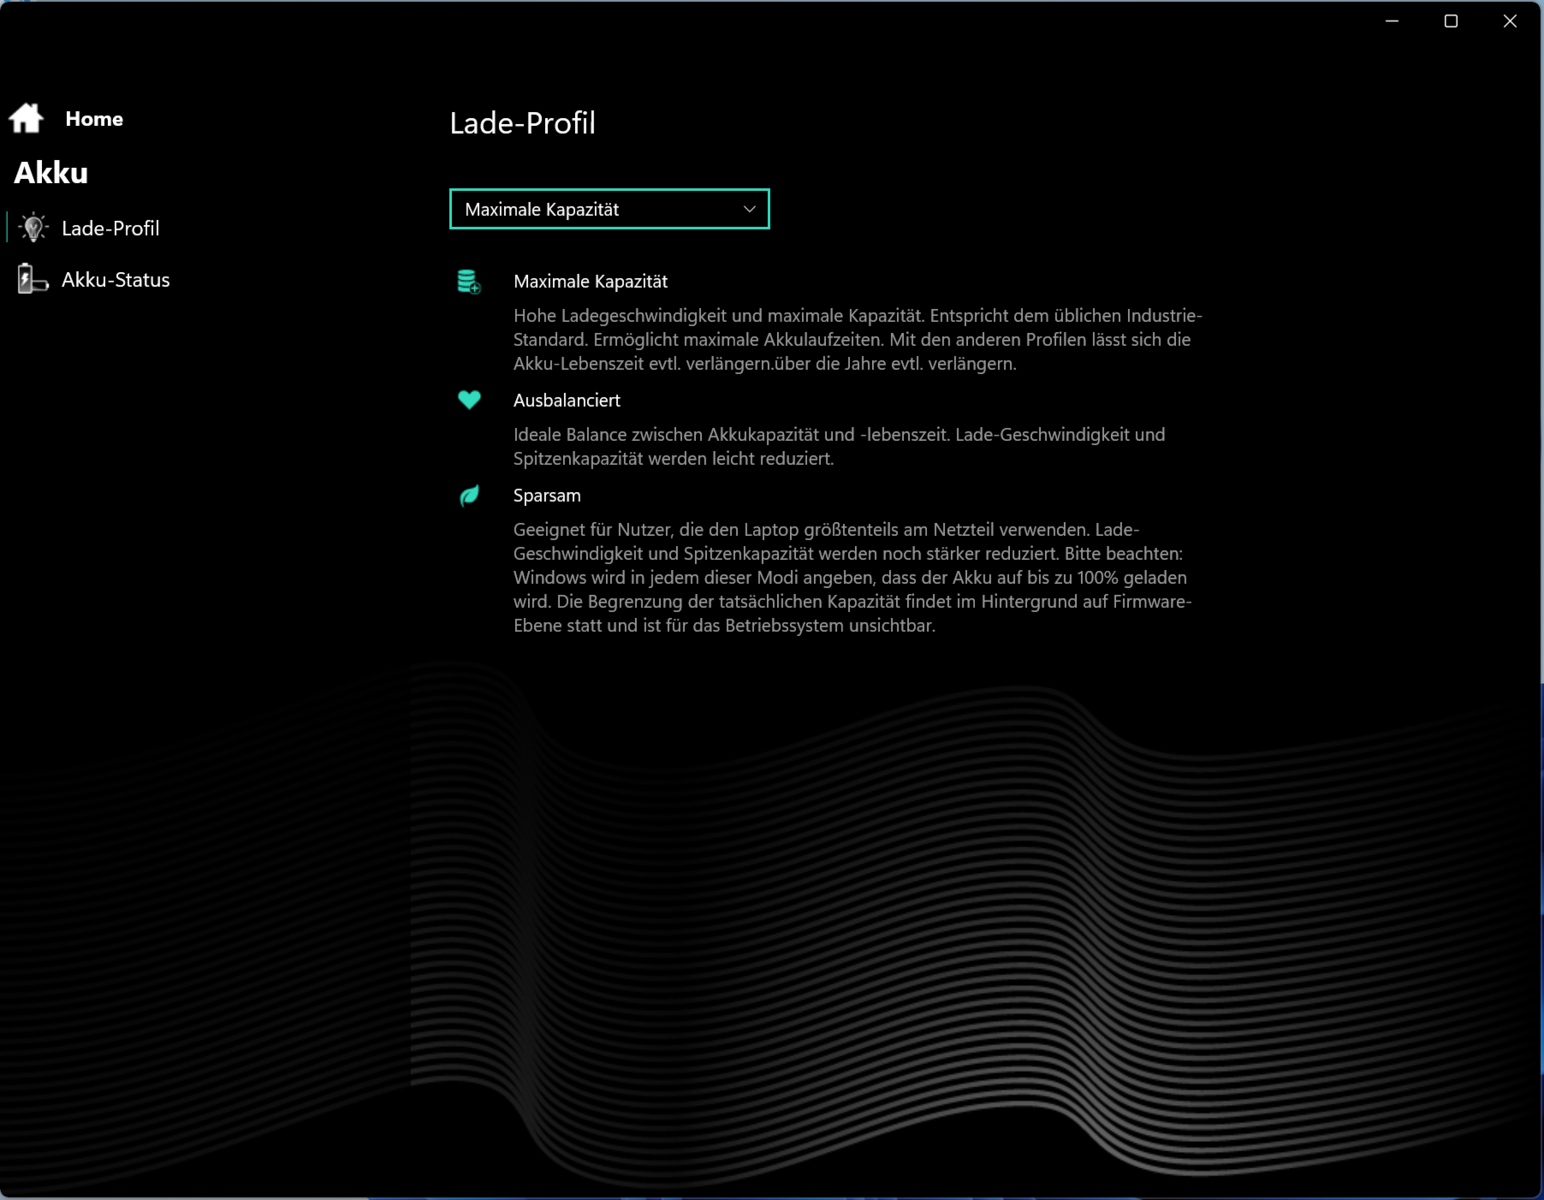
Une charge complète (99,8 Wh) suffit pour une autonomie pratique d'environ 8 à 10 heures - de très bonnes valeurs. Point positif : La batterie peut être chargée via une alimentation USB-C (min. 100 watts, 20 V) - le port TB4 de l'ordinateur portable prend en charge Power Delivery. Par conséquent, vous n'avez pas nécessairement besoin d'emporter en permanence le bloc d'alimentation propriétaire (280 watts).
Une alternative pourrait être le bloc d'alimentation Aorus 16X (2024). Cet ordinateur portable offre une puissance de calcul comparable ainsi que des durées d'exécution tout aussi bonnes.
Prix et disponibilité
Le XMG Fusion 15 (Early 24) peut être configuré et commandé directement via la boutique en ligne de Schenker. L'appareil de test actuel coûte environ 2 500 dollars. Les prix commencent à partir d'environ 1 700 dollars.
SCHENKER XMG Fusion 15 (Early 24)
-
05/01/2024 v7
Sascha Mölck
Transparency
The present review sample was made available to the author as a loan by the manufacturer or a shop for the purposes of review. The lender had no influence on this review, nor did the manufacturer receive a copy of this review before publication. There was no obligation to publish this review.
Pricecompare

