Test de l'Intel NUC11TNKi5 Pro Mini Tiger Canyon : le NUC Tiger Lake le plus petit

La famille NUC 11 se compose de trois grands modèles : le NUC 11 Pro Mini (NUC11TNK), le NUC 11 Performance (NUC11PAQ) et le NUC 11 Enthusiast (NUC11PHK) équipé de la technologie RTX GeForce. Chaque modèle est visuellement distinct, le Pro Mini étant le plus petit du groupe.
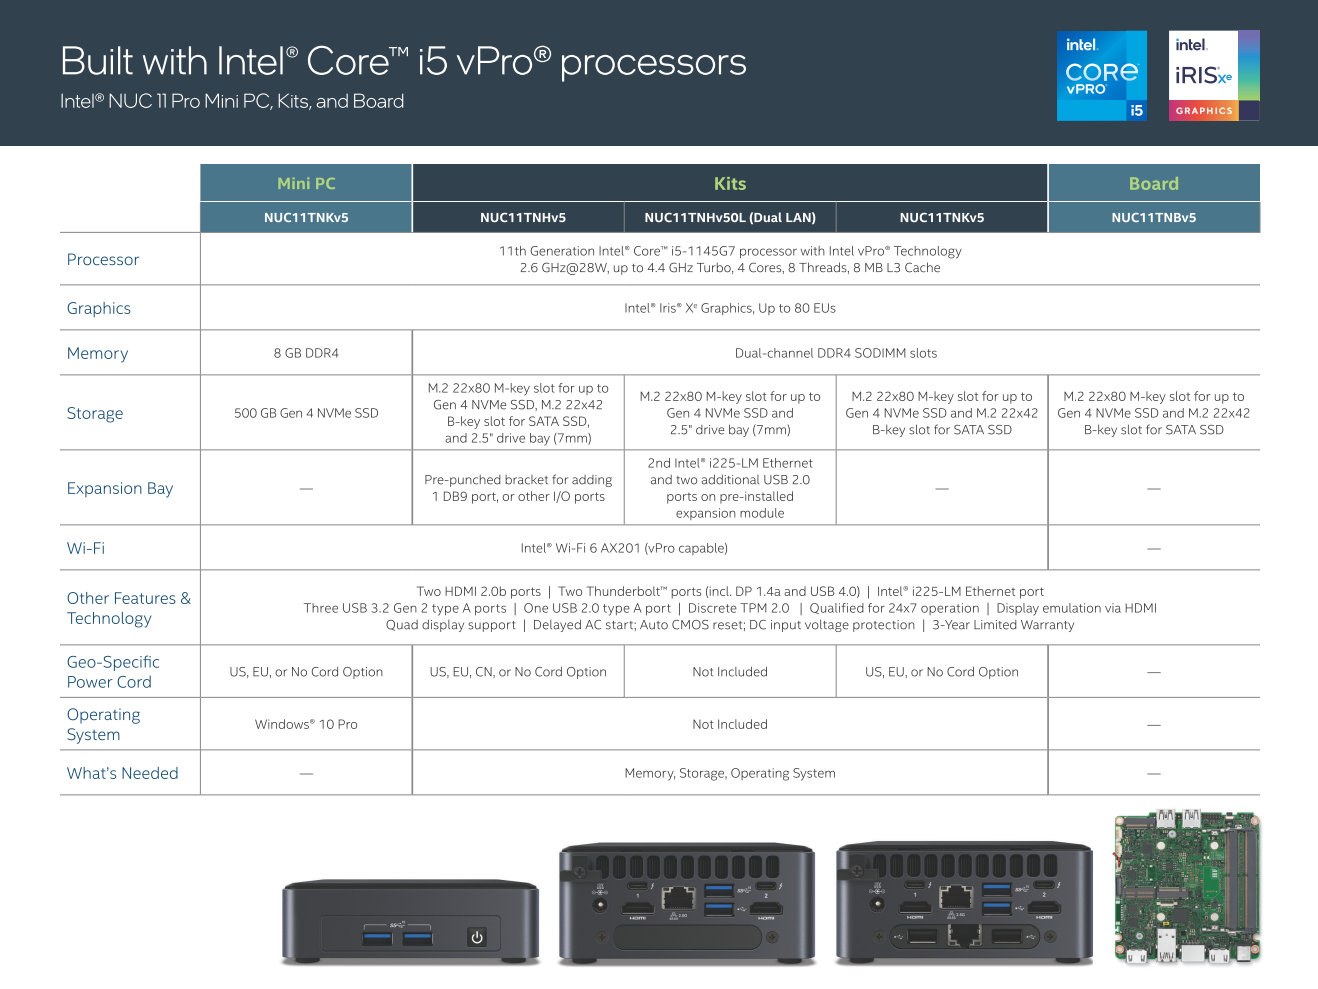
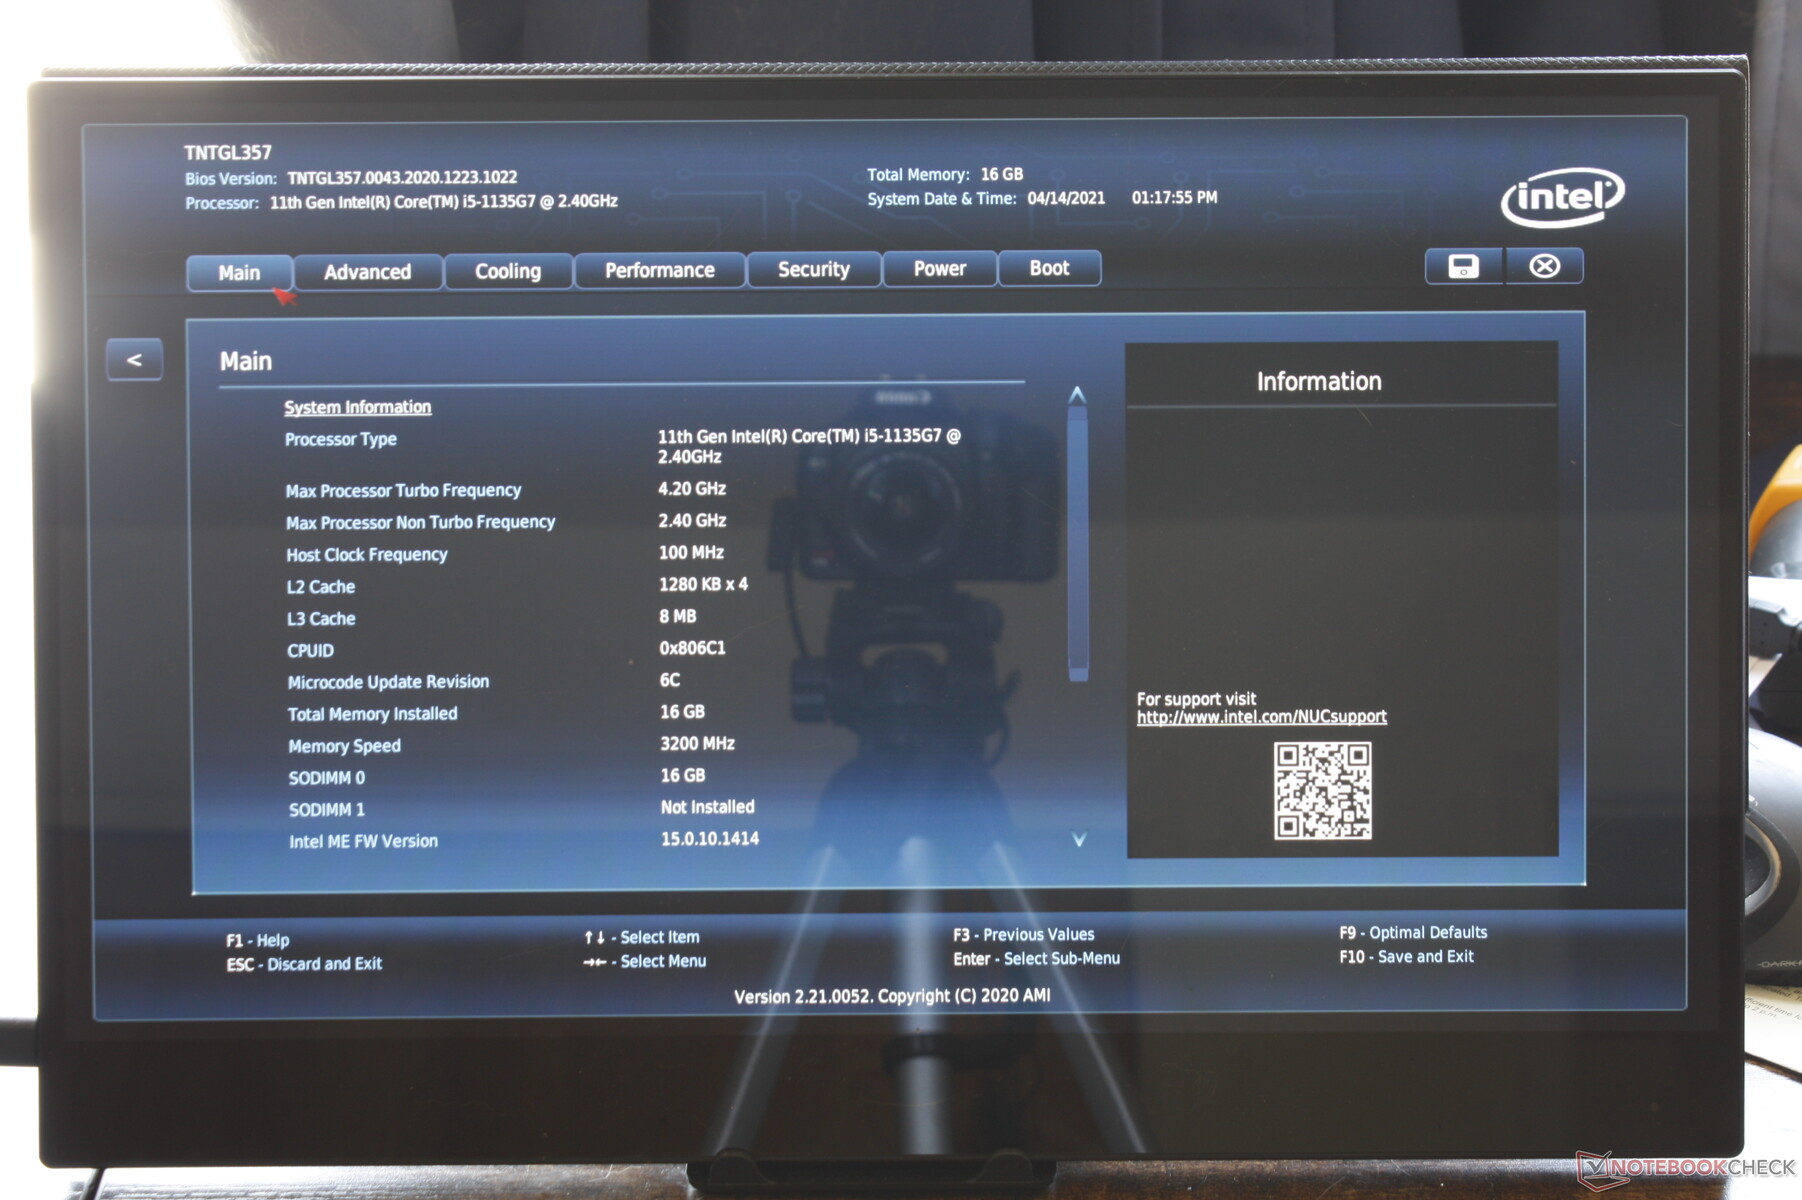
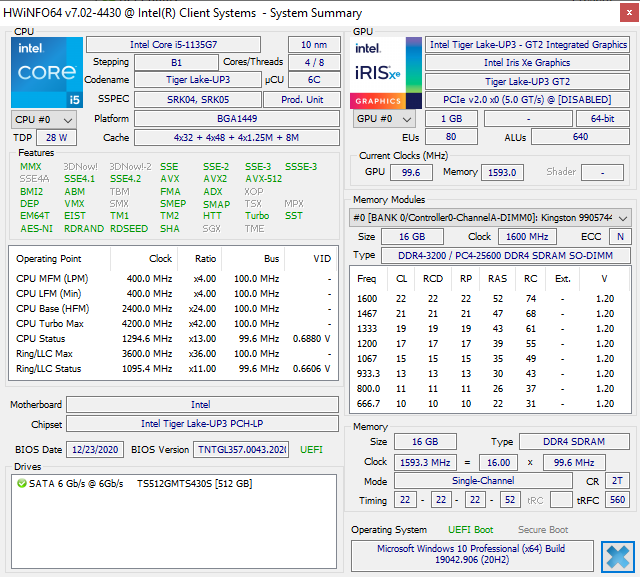
L'unité que nous testons ici est le NUC 11 Pro Mini. Nous passerons en revue le modèle Enthusiast dans les semaines à venir. Alors que les options Core i3, Core i7, RAM double canal et SSD NVMe sont disponibles, Intel a configuré le nôtre avec le CPU Core i5-1135G7, 16 Go de RAM simple canal et un SSD M.2 SATA III de 512 Go.
Les concurrents de la série Intel NUC n'ont cessé de croître au fil des ans. Les alternatives incluent le Zotac ZBox, Beelink SEi10, GMK NucBox 2et le Lenovo ThinkCentre Nano.
Plus de commentaires sur le NUC d'Intel :
potential competitors in comparison
Note | Date | Modèle | Poids | Épaisseur | Taille | Résolution | Prix |
|---|---|---|---|---|---|---|---|
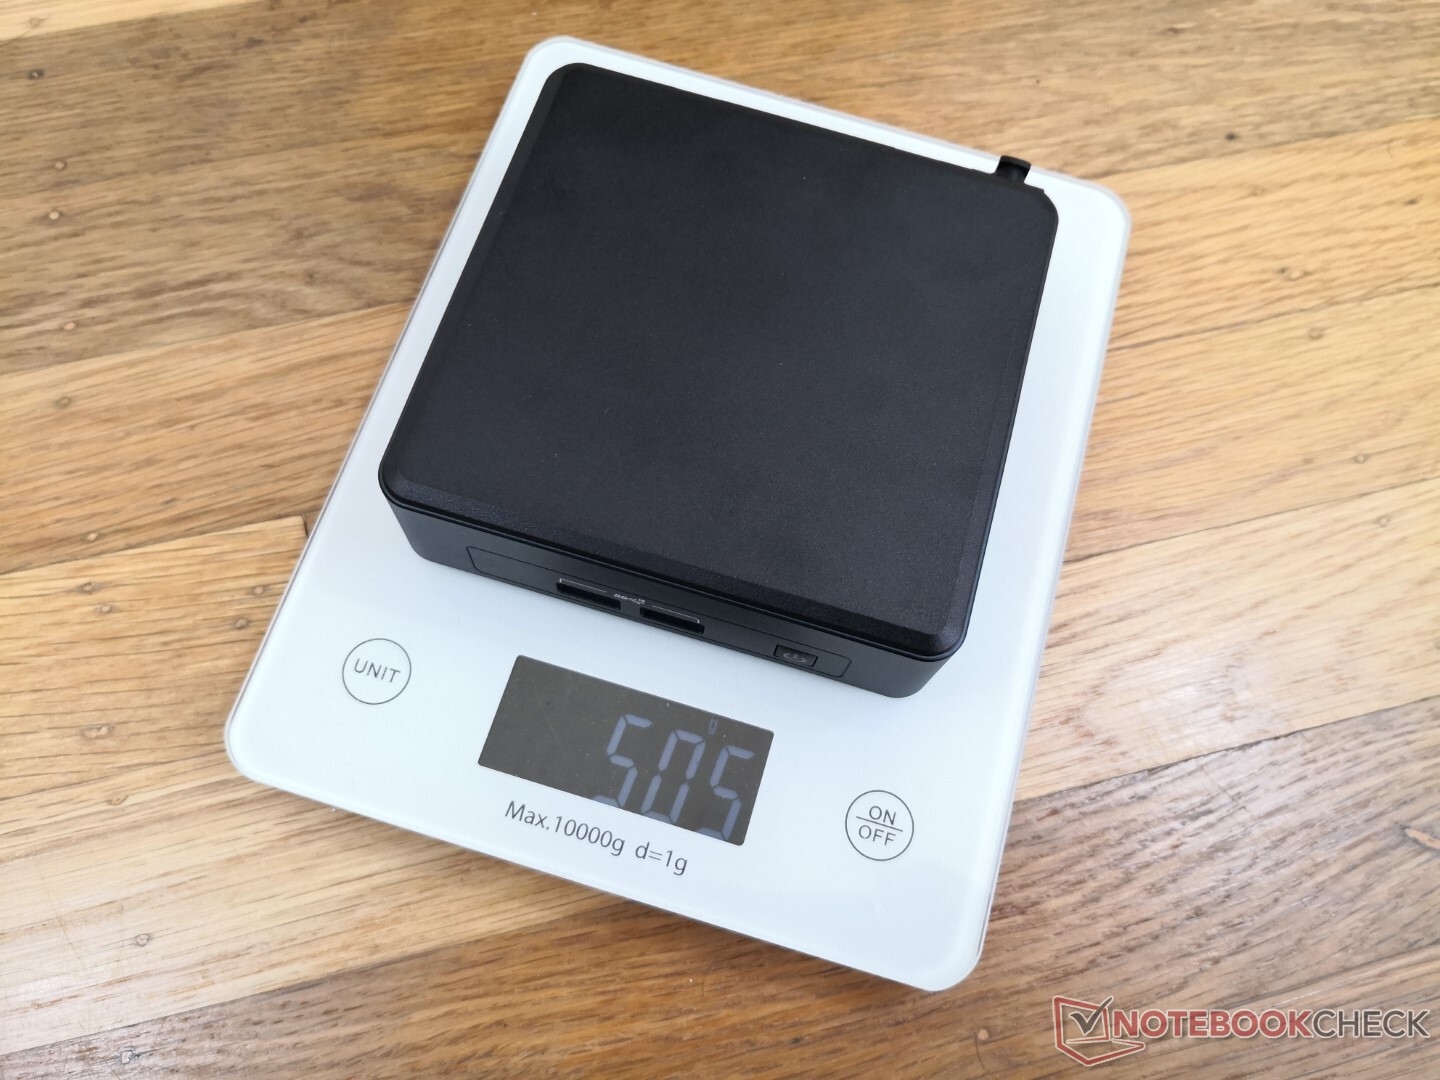
v (old) | 04/21 | Intel NUC11TNKi5 i5-1135G7, Iris Xe G7 80EUs | 504 g | 37 mm | x | ||
v (old) | 03/21 | GMK NucBox 2 i5-8259U, Iris Plus Graphics 655 | 430 g | 50 mm | x | ||
v (old) | 02/21 | Intel NUC11PAQi7 i7-1165G7, Iris Xe G7 96EUs | 647 g | 56 mm | x | ||
v (old) | 02/20 | Intel NUC10i5FNK i5-10210U, UHD Graphics 620 | 493 g | 36 mm | 0.00" | 0x0 | |
v (old) | Beelink SEi10 i3-1005G1, UHD Graphics G1 (Ice Lake 32 EU) | 350 g | 41 mm | x | |||
v (old) | Zotac ZBOX MI642 Nano i5-10210U, UHD Graphics 620 | 472 g | 51 mm | x |
Cas
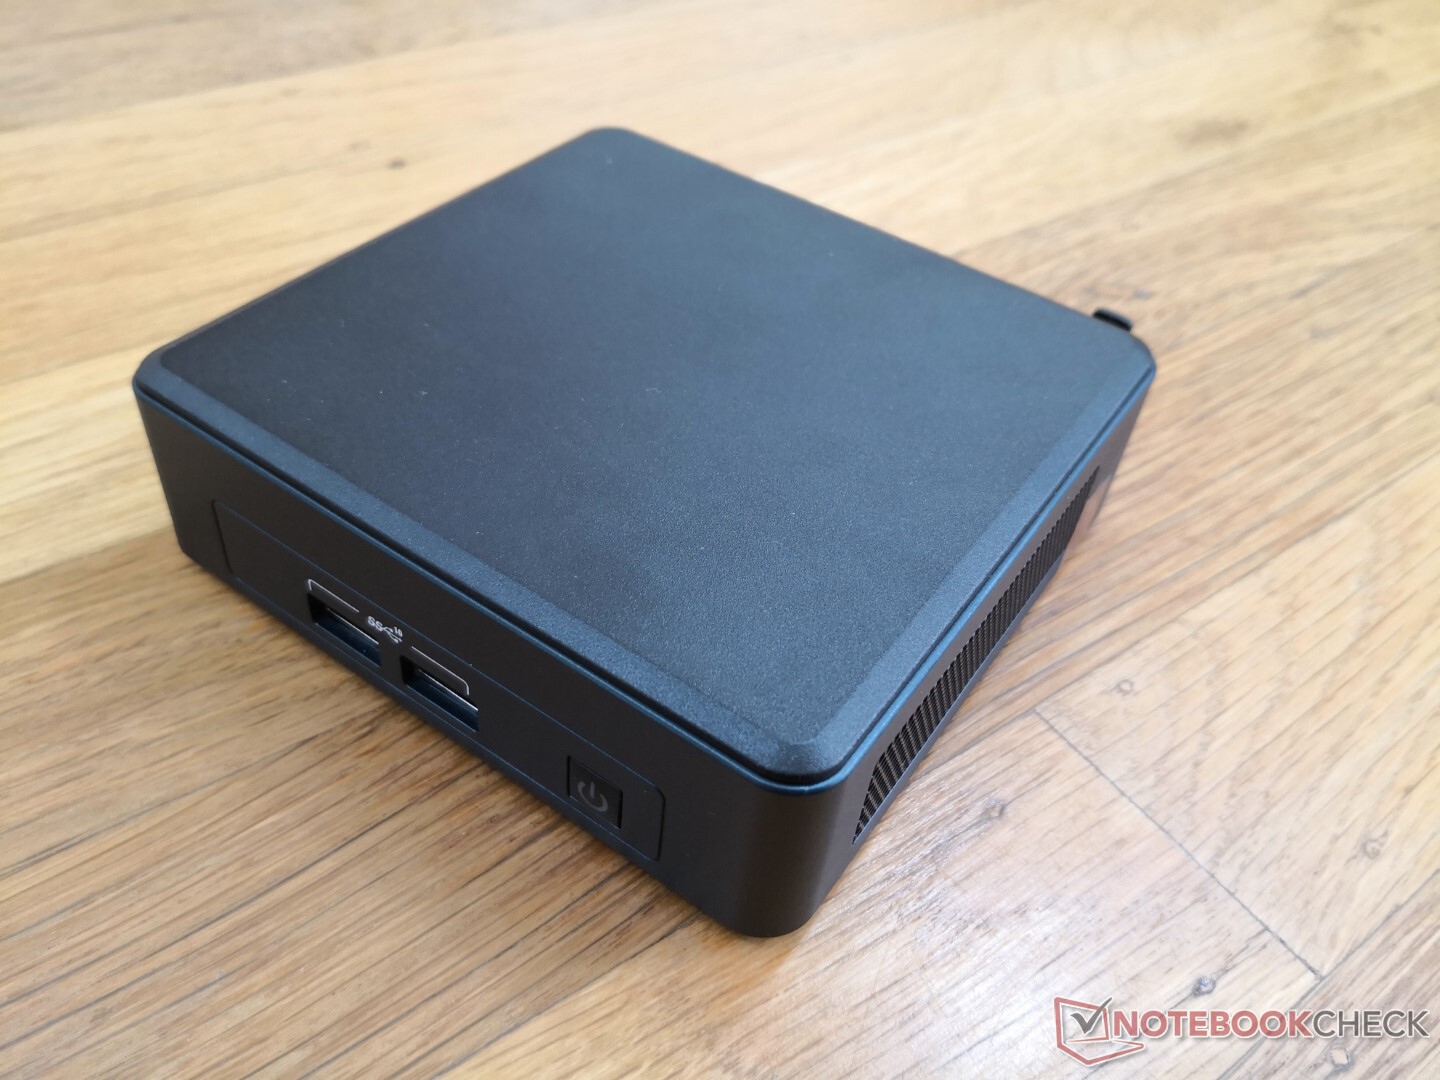
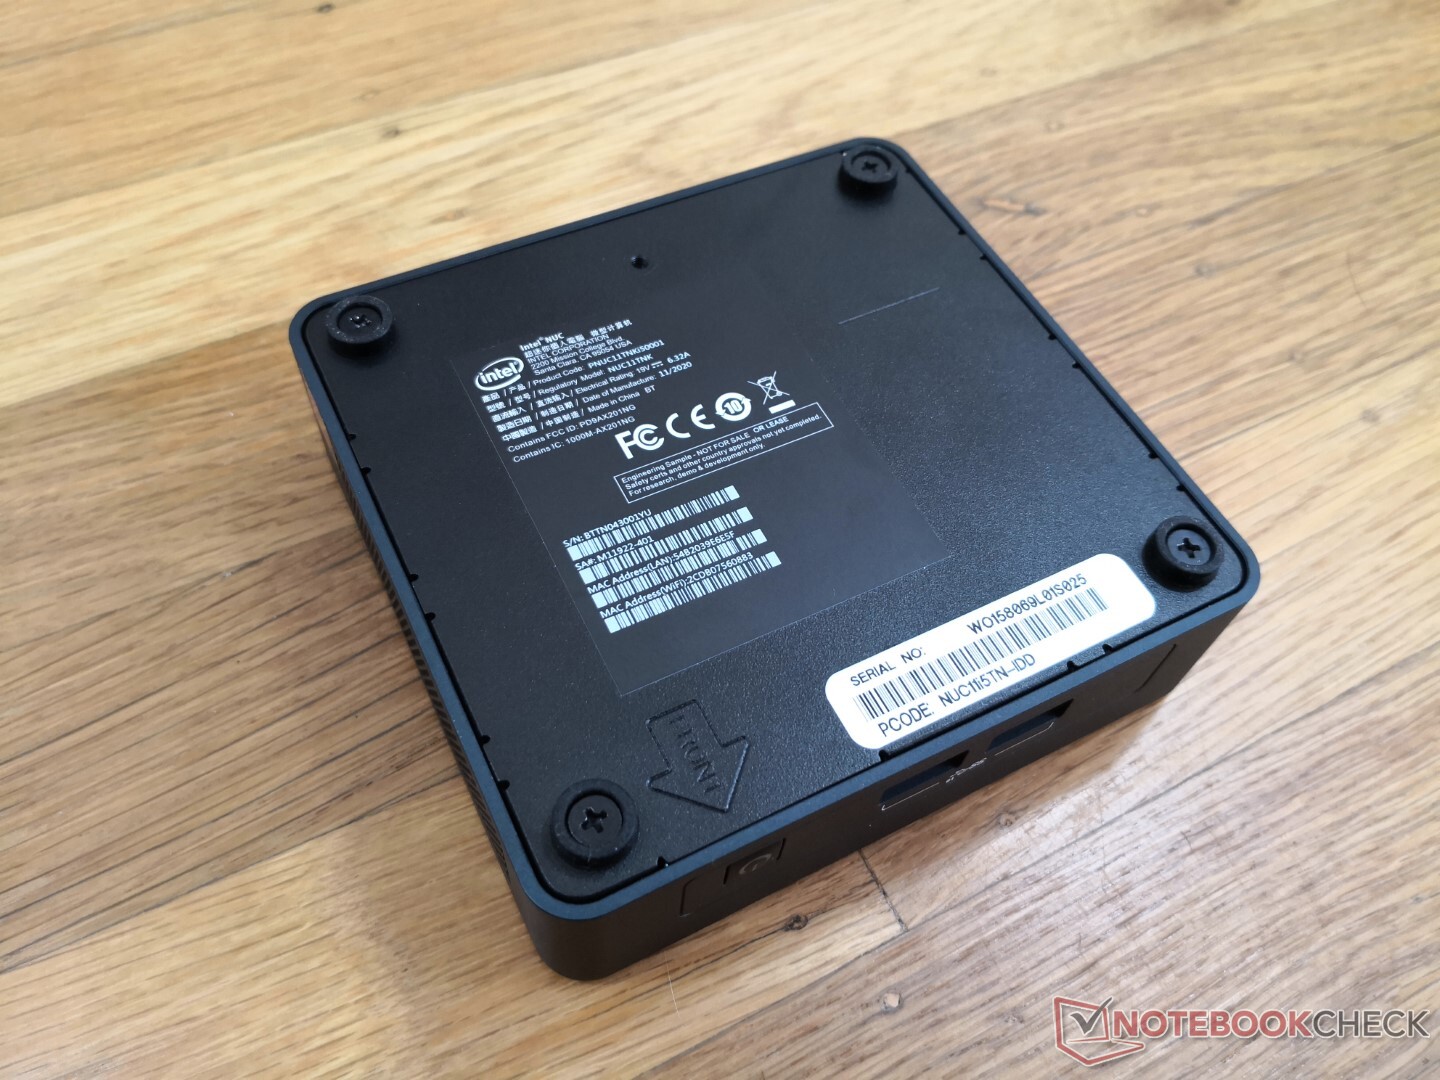
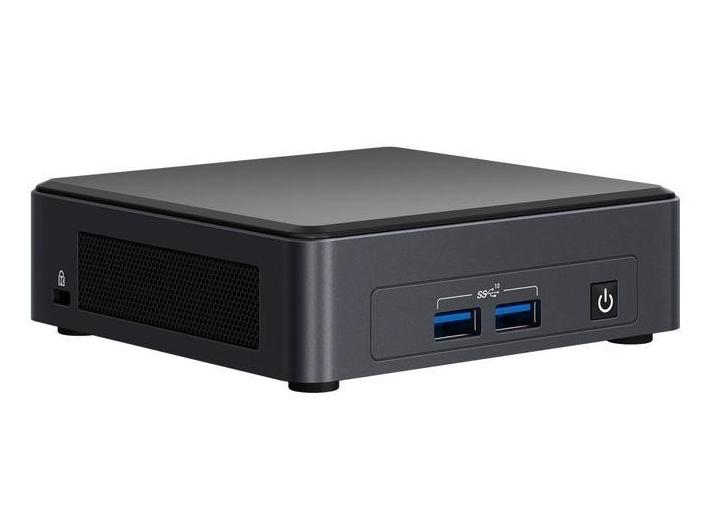
La longueur et la largeur sont identiques à celles du NUC 11 Performance, tandis que la hauteur est inférieure de 19 mm. La plaque supérieure en plastique est désormais mate et légèrement rugueuse, contrairement aux plaques lisses et brillantes des anciens NUC, ce qui devrait réduire l'accumulation d'empreintes digitales et les rayures disgracieuses.
Comme pour les autres Intel NUC, un arceau métallique interne est présent pour améliorer la rigidité et la qualité au prix d'un poids supplémentaire. C'est toujours une caractéristique distinctive du NUC par rapport à la plupart des autres mini PC.
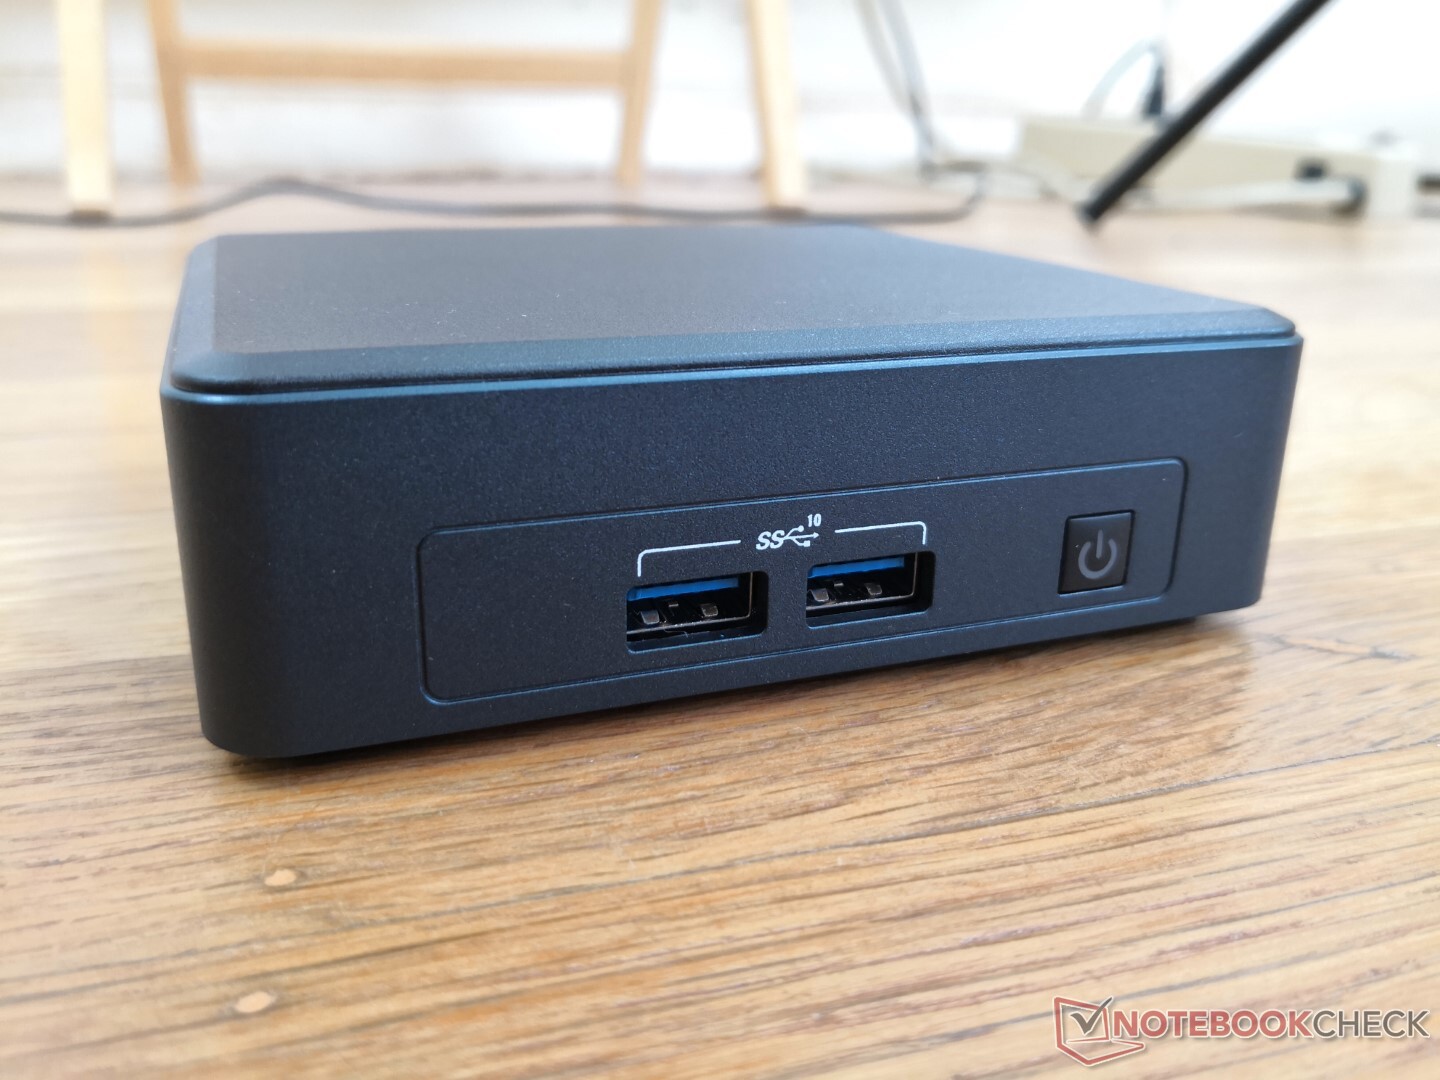
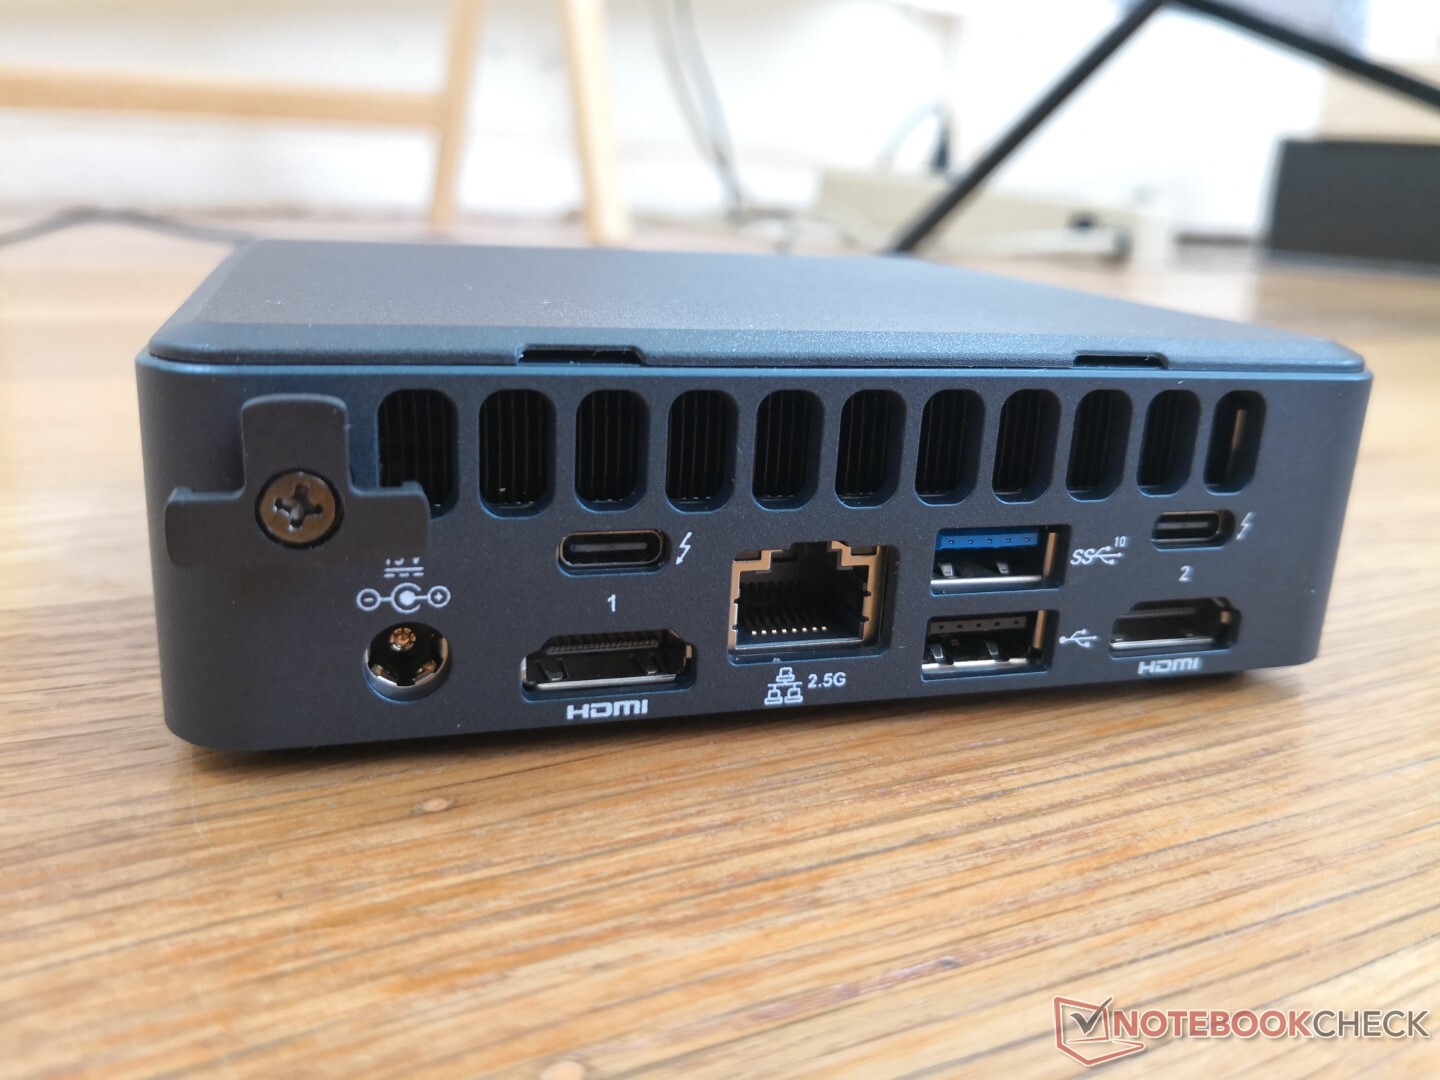
Connectivité
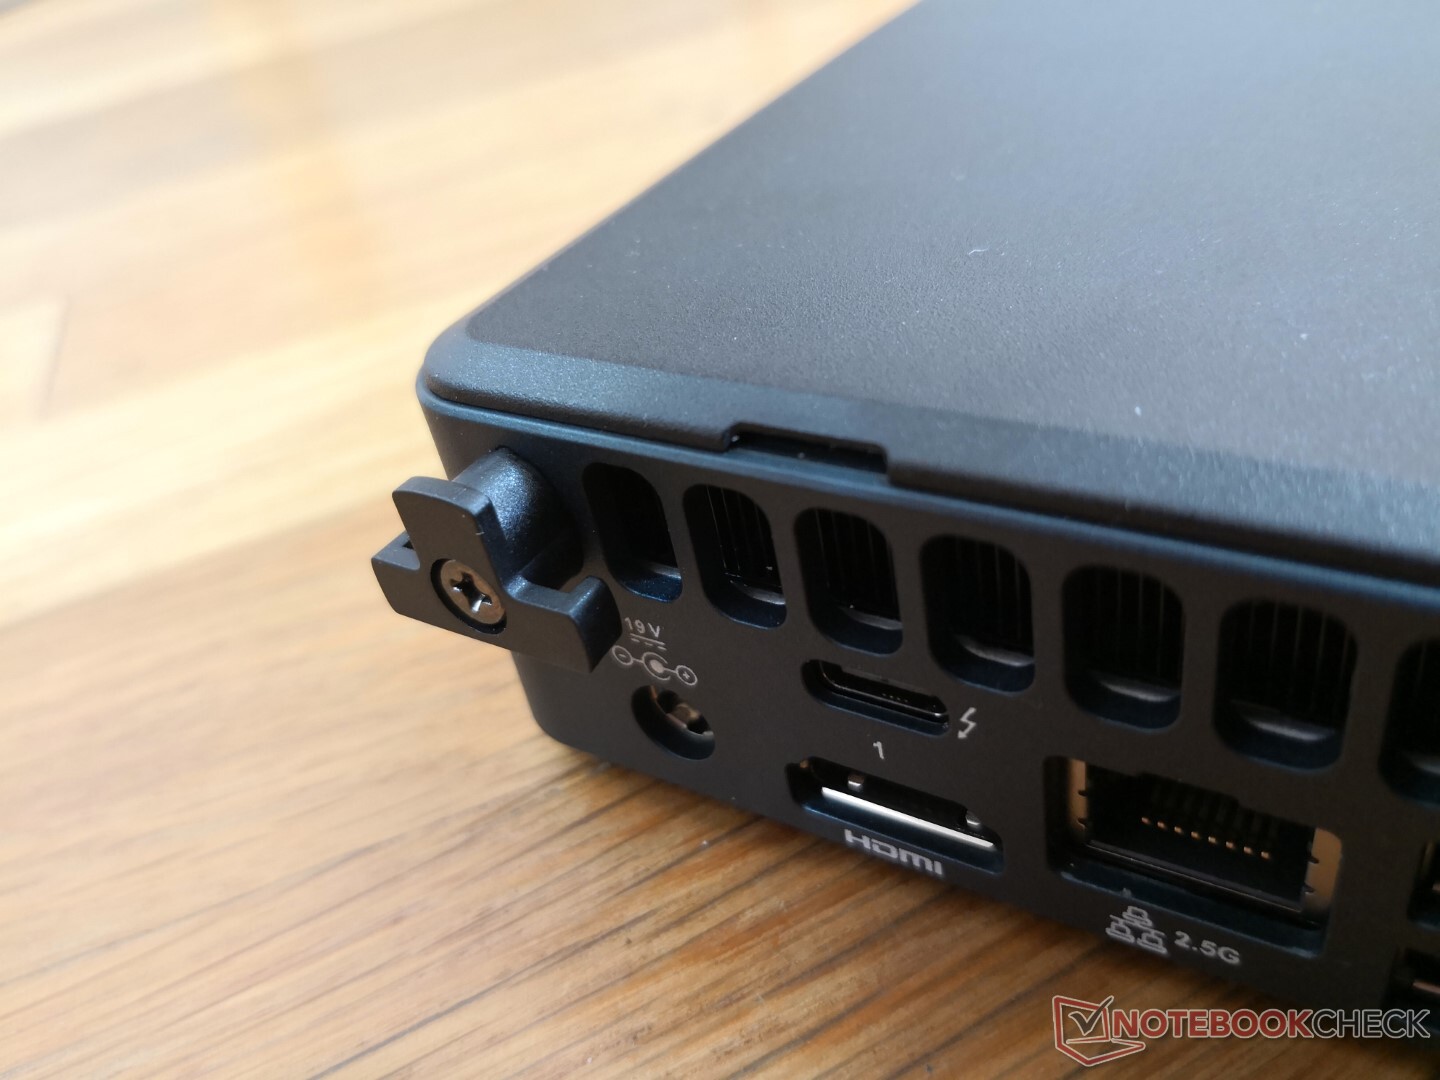
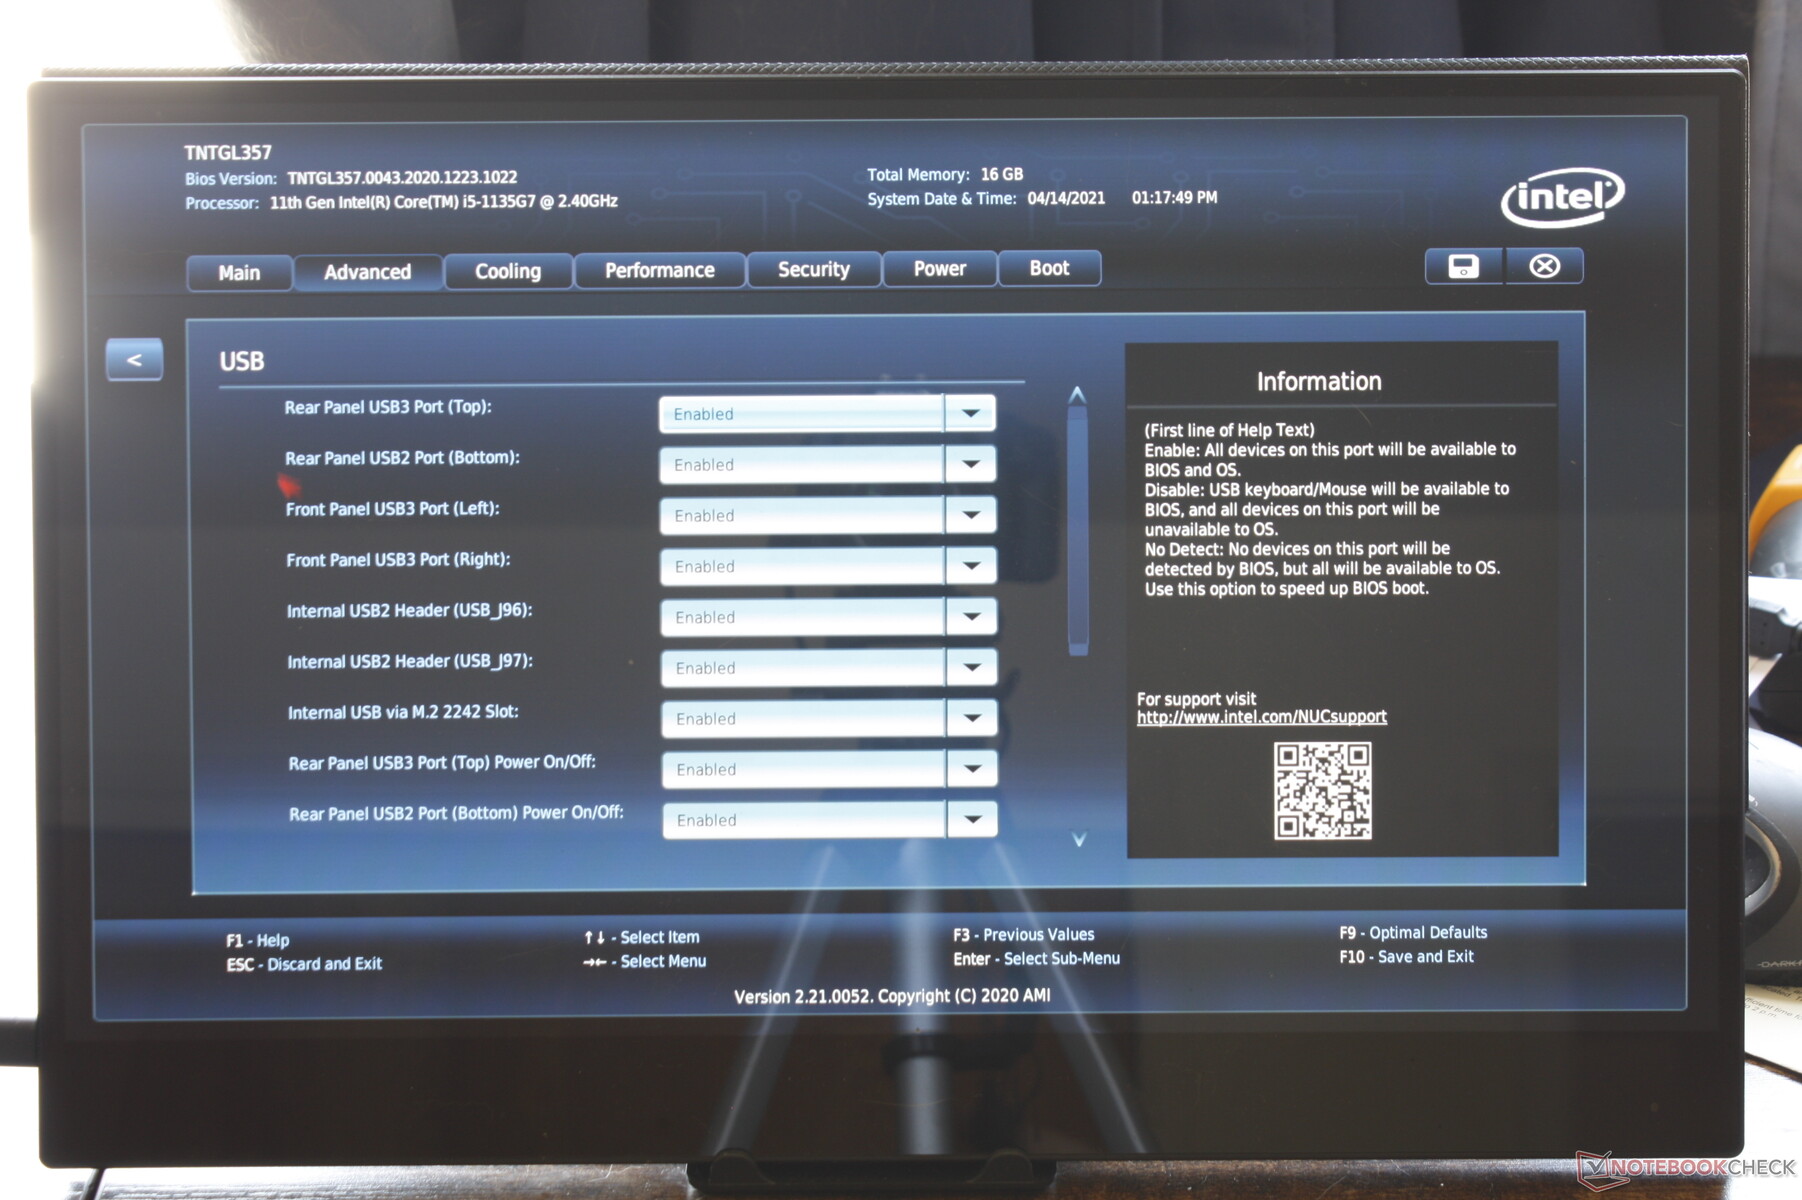
Presque tous les ports sont serrés le long de l'arrière, y compris le port Thunderbolt 3 et le port Thunderbolt 4. Malheureusement, le NUC ne peut pas être alimenté par des adaptateurs secteur USB-C et les propriétaires doivent donc utiliser le port de barillet secteur propriétaire inclus.
Communication
| Networking | |
| iperf3 transmit AX12 | |
| Intel NUC11TNKi5 | |
| Beelink SEi10 | |
| Intel NUC11PAQi7 | |
| GMK NucBox 2 | |
| iperf3 receive AX12 | |
| Intel NUC11TNKi5 | |
| Beelink SEi10 | |
| Intel NUC11PAQi7 | |
| GMK NucBox 2 | |
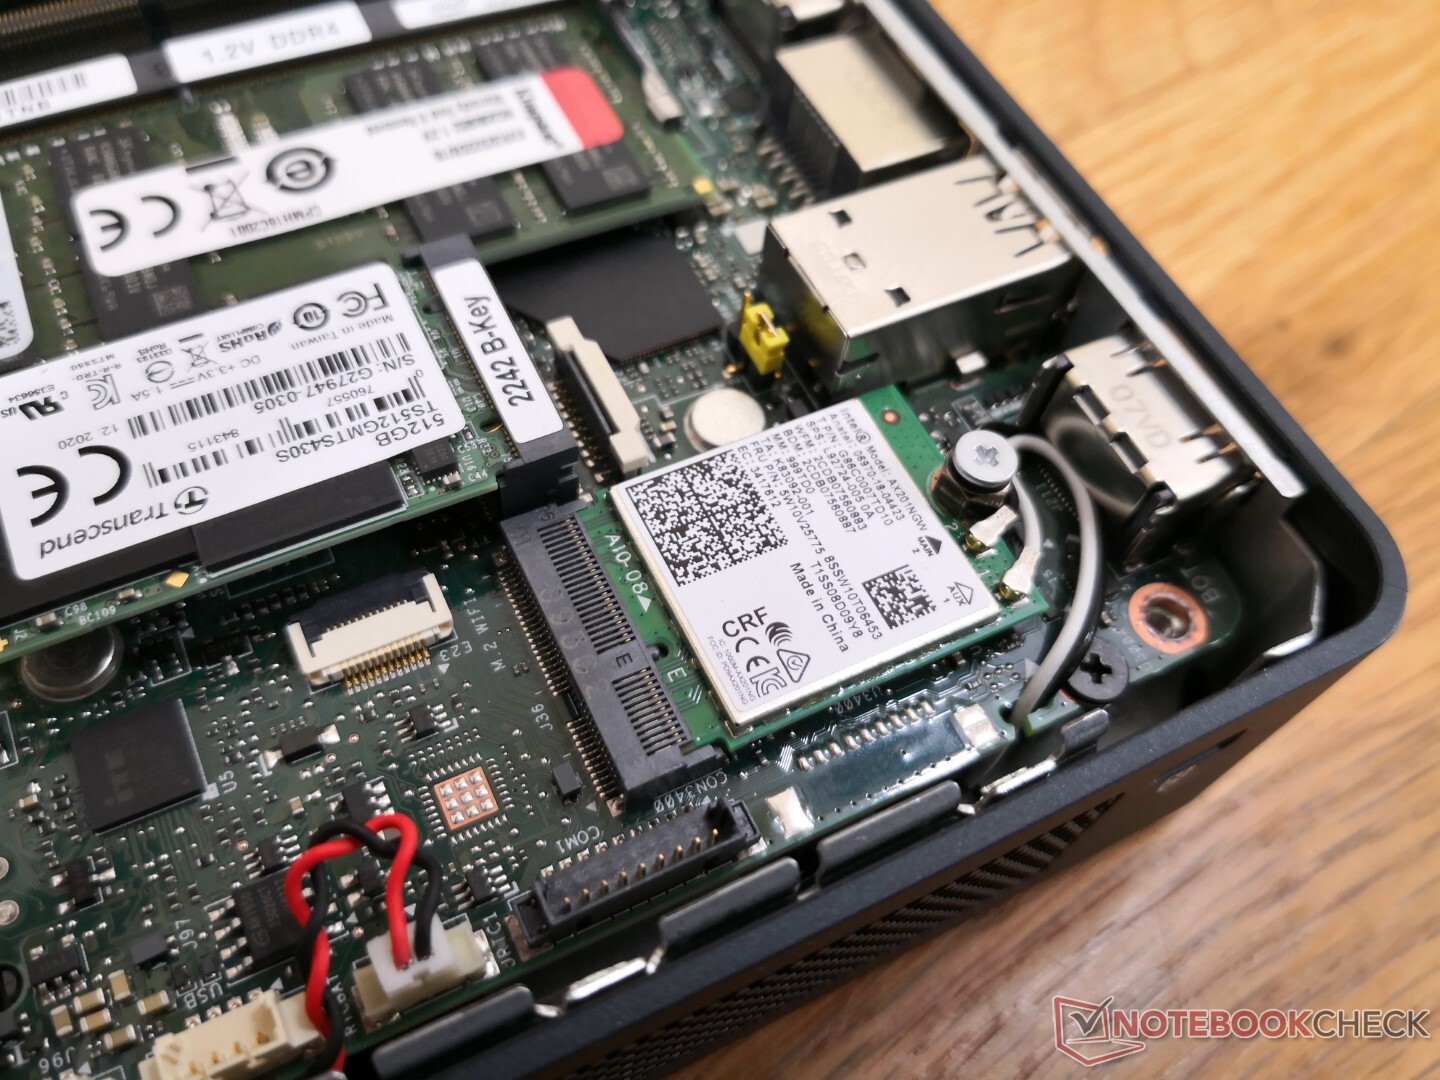
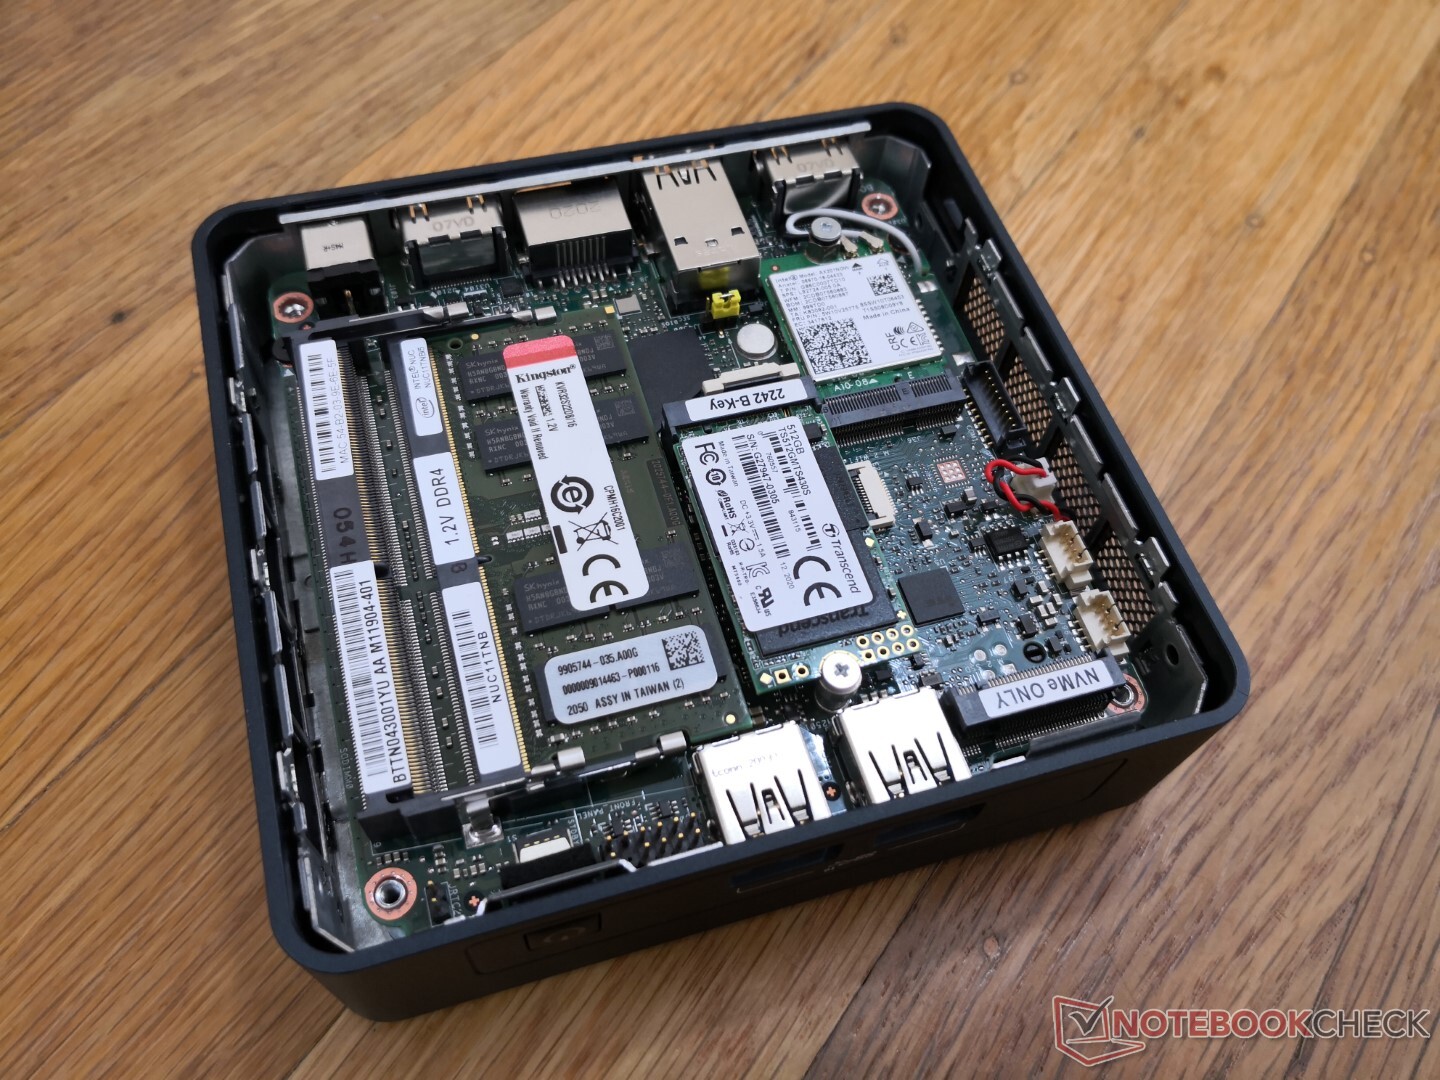
Maintenance
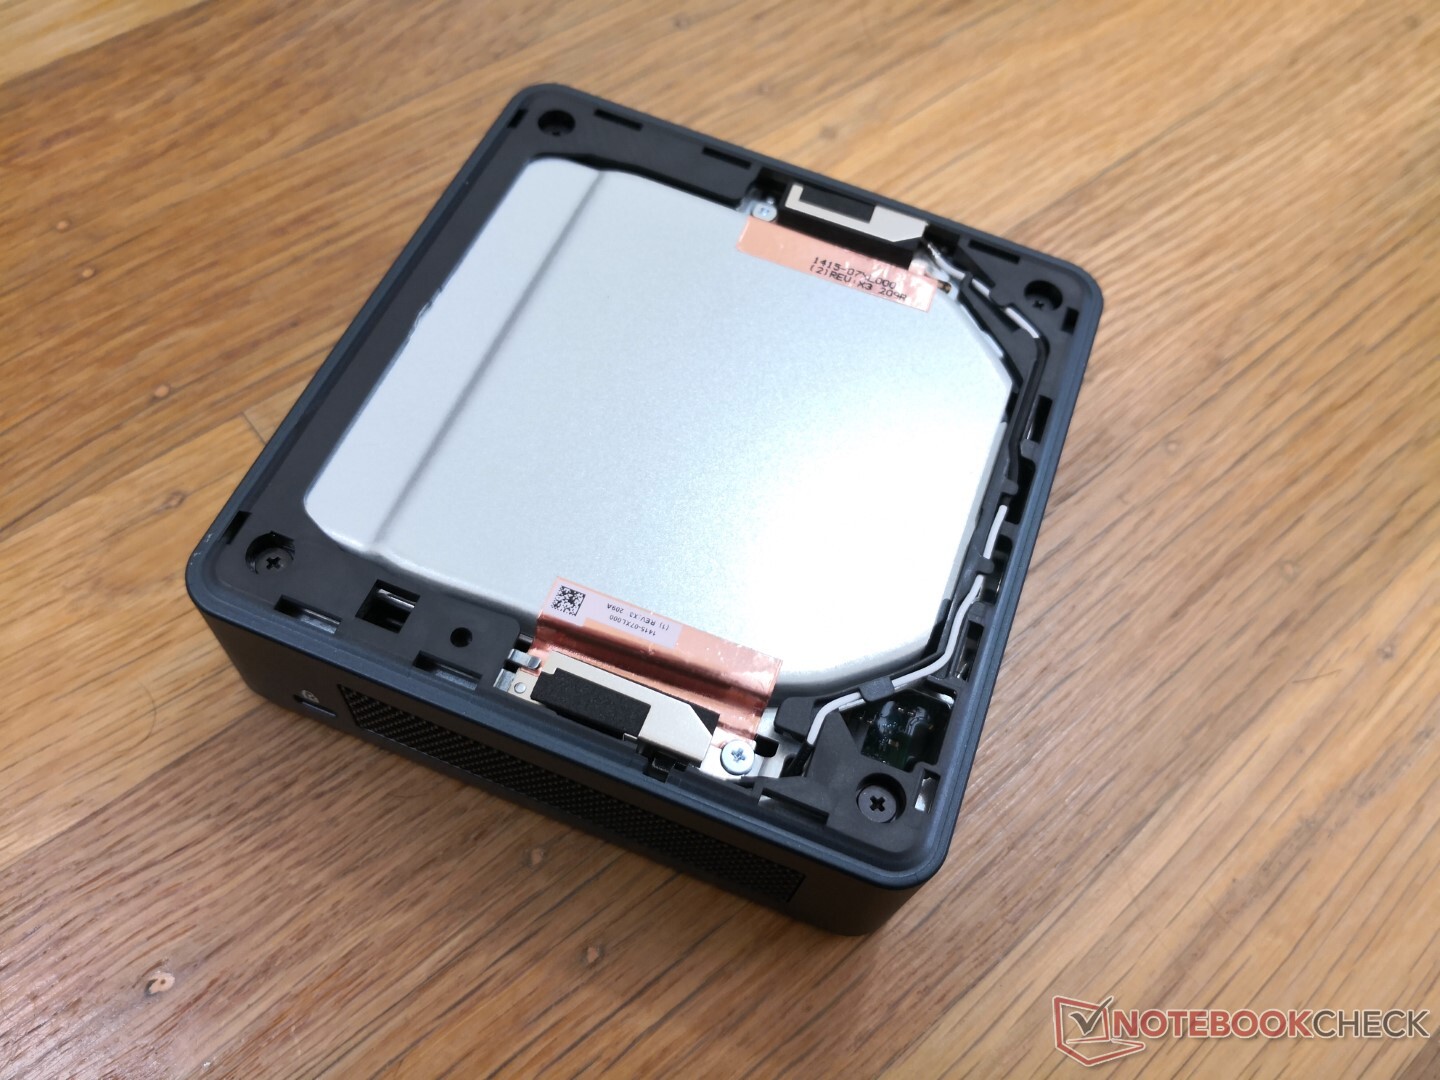
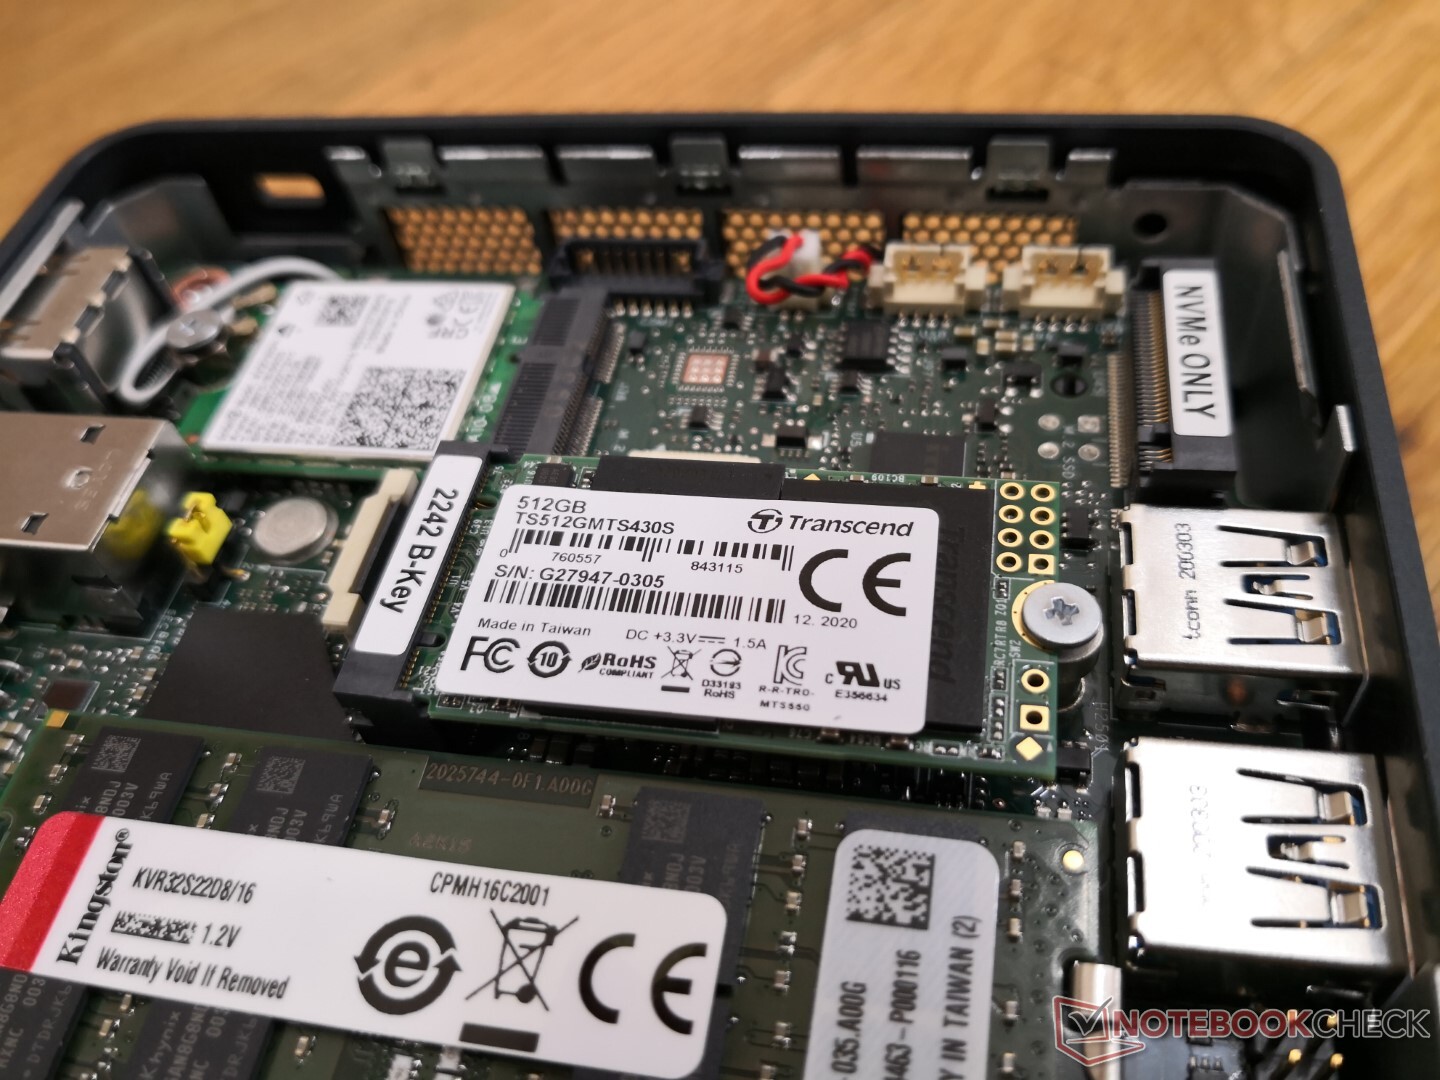
Le panneau inférieur s'enlève facilement pour exposer les composants évolutifs : 2x SODIMM, 2x M.2 storage (M.2 2242 SATA III, M.2 2280 PCIe 4), et le module WLAN amovible. Le SSD M.2 2280, plus long, serait placé au-dessus du module WLAN.
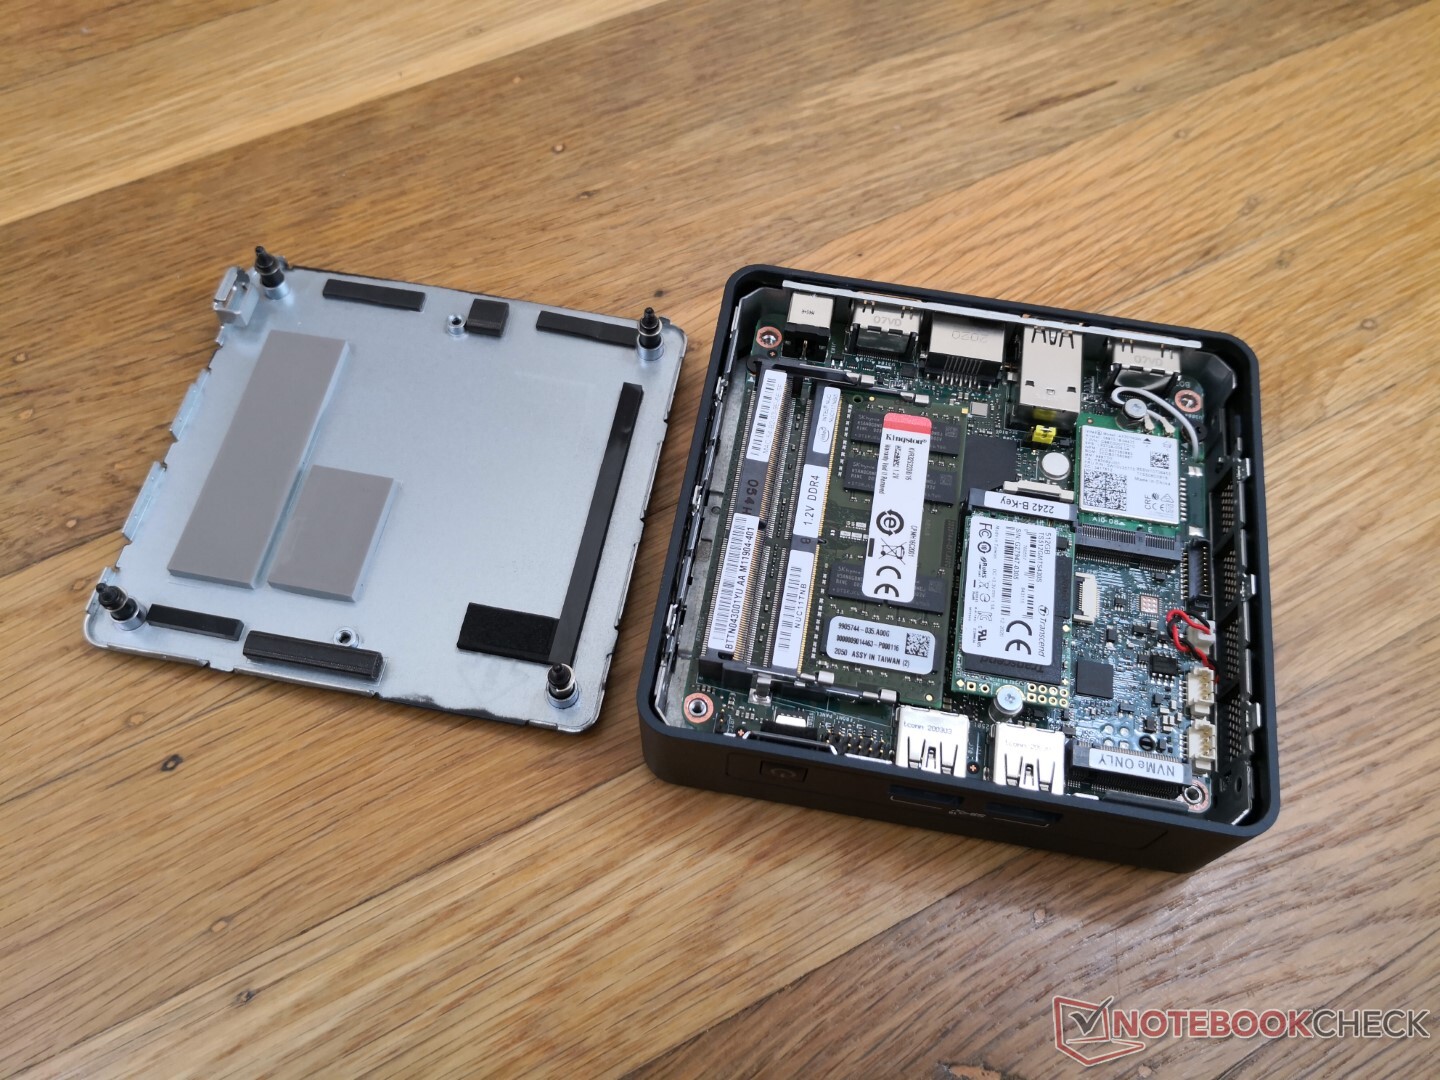
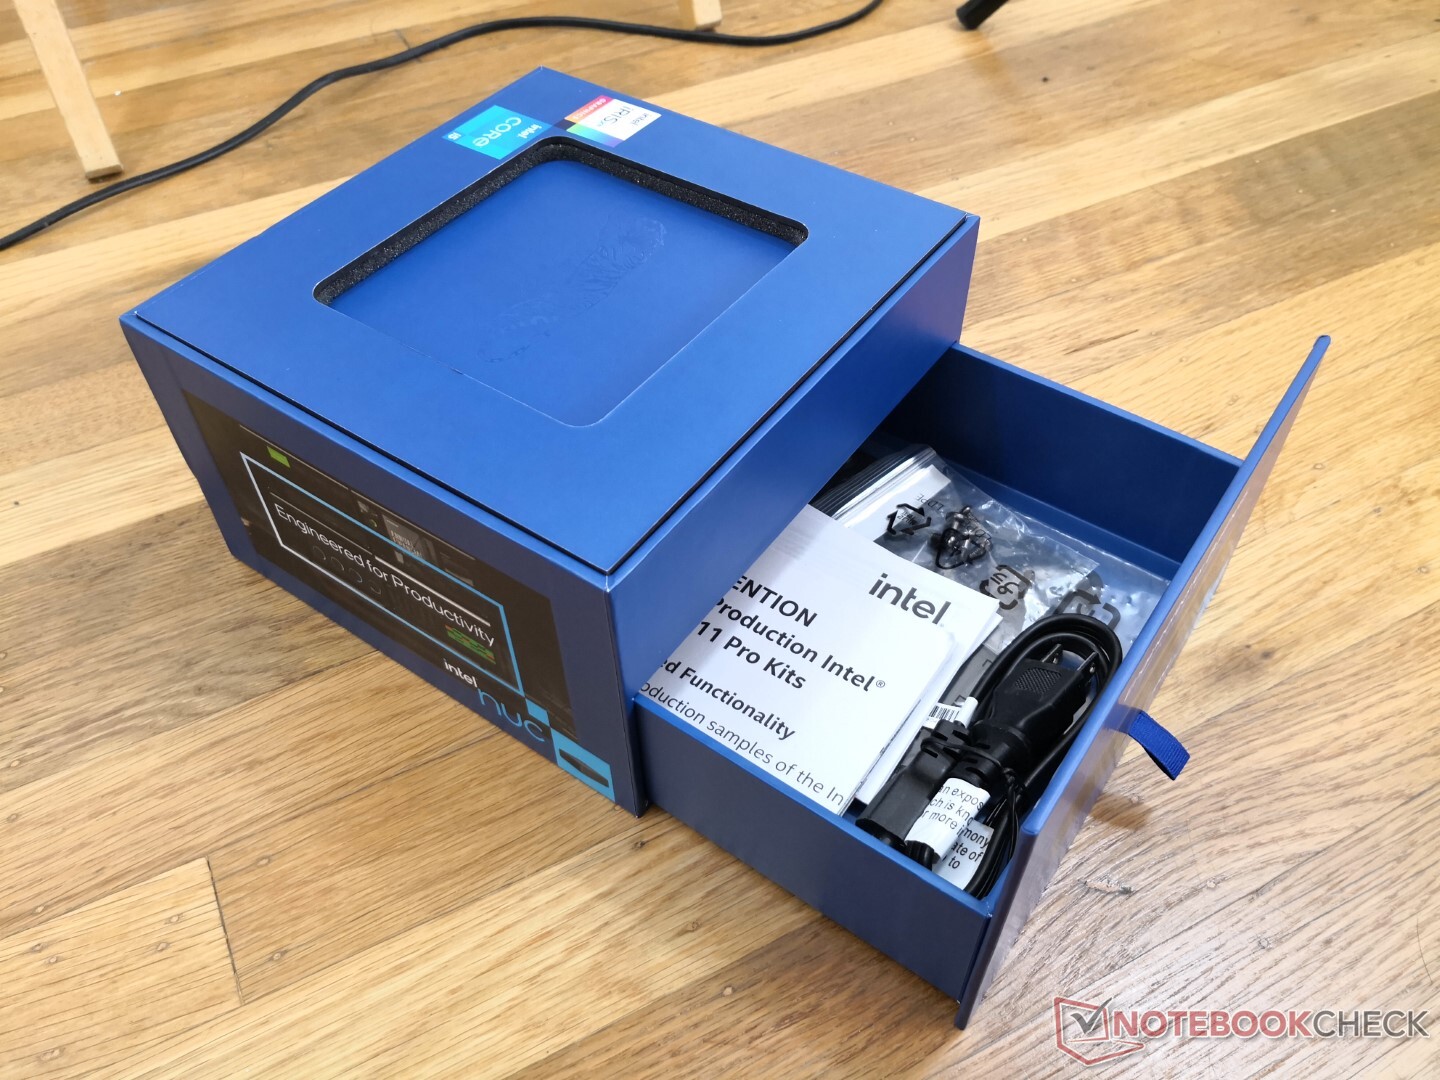
Accessoires et garantie
La boîte de détail comprend un support de montage VESA amovible et des vis supplémentaires. Une garantie fabricant limitée de trois ans est fournie en standard, soit deux ans de plus que la plupart des autres mini-PC.
Performance
Fidèle à son nom, chaque mini-PC de la série NUC11 est équipé d'un processeur Tiger Lake de 11e génération, allant du Core i3 de la série U au Core i7. Intel vPro est disponible sur le Core i5-1145G7 et i7-1185G7 tandis que les options non vPro sont les habituels i5-1135G7 et i7-1165G7. Tous sont équipés de la carte graphique Iris Xe, à l'exception du bas de gamme Core i3-1115G4.
Il n'y a pas d'options graphiques discrètes. Les utilisateurs voudront peut-être se tourner vers le NUC 11 Enthusiast si les performances graphiques sont une priorité.
Processeur
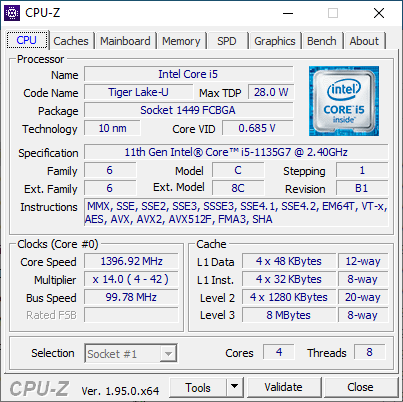
Les performances du CPU se situent à quelques points de pourcentage près de la moyenne Core i5-1135G7 Dans notre base de données. La mise à niveau vers le Core i7-1165G7, plus coûteux, peut améliorer les performances multithread de 25 à 35 %, d'après nos observations avec leNUC11PAQi7. Il convient de noter que le Core i5-1135G7 est capable de surpasser les performances du Core i7-8809G dans l'ancien Hades Canyon NUC8.
La durabilité des performances est meilleure que sur la Surface Pro 7 Plus qui est livré avec exactement le même CPU. L'exécution de CineBench R15 xT en boucle révèle que notre NUC11 maintient des scores beaucoup plus élevés dans le temps par rapport à la tablette de Microsoft.
Cinebench R15: CPU Multi 64Bit | CPU Single 64Bit
Blender: v2.79 BMW27 CPU
7-Zip 18.03: 7z b 4 -mmt1 | 7z b 4
Geekbench 5.5: Single-Core | Multi-Core
HWBOT x265 Benchmark v2.2: 4k Preset
LibreOffice : 20 Documents To PDF
R Benchmark 2.5: Overall mean
| Cinebench R20 / CPU (Multi Core) | |
| Lenovo Yoga Slim 7-14ARE | |
| Asus VivoBook Flip 14 TM420IA | |
| Lenovo IdeaPad S540-13ARE-82DL000YGE | |
| Intel NUC11PAQi7 | |
| Intel Hades Canyon NUC8i7HVK | |
| Intel NUC11TNKi5 | |
| Lenovo Yoga 9 14 ITL 4K | |
| Moyenne Intel Core i5-1135G7 (979 - 2382, n=62) | |
| Intel NUC10i5FNK | |
| Microsoft Surface Pro 7 Plus | |
| GMK NucBox 2 | |
| HP Envy 13-ba0001ng | |
| Zotac ZBOX MI642 Nano | |
| Beelink SEi10 | |
| Cinebench R20 / CPU (Single Core) | |
| Intel NUC11PAQi7 | |
| Lenovo Yoga 9 14 ITL 4K | |
| Moyenne Intel Core i5-1135G7 (375 - 527, n=62) | |
| Intel NUC11TNKi5 | |
| Microsoft Surface Pro 7 Plus | |
| Lenovo Yoga Slim 7-14ARE | |
| Asus VivoBook Flip 14 TM420IA | |
| Lenovo IdeaPad S540-13ARE-82DL000YGE | |
| HP Envy 13-ba0001ng | |
| Intel NUC10i5FNK | |
| Zotac ZBOX MI642 Nano | |
| Intel Hades Canyon NUC8i7HVK | |
| Beelink SEi10 | |
| GMK NucBox 2 | |
| Cinebench R15 / CPU Multi 64Bit | |
| Lenovo Yoga Slim 7-14ARE | |
| Lenovo IdeaPad S540-13ARE-82DL000YGE | |
| Asus VivoBook Flip 14 TM420IA | |
| Intel NUC11PAQi7 | |
| Lenovo Yoga 9 14 ITL 4K | |
| Intel Hades Canyon NUC8i7HVK | |
| Intel NUC11TNKi5 | |
| Moyenne Intel Core i5-1135G7 (431 - 941, n=65) | |
| Intel NUC10i5FNK | |
| Microsoft Surface Pro 7 Plus | |
| GMK NucBox 2 | |
| HP Envy 13-ba0001ng | |
| Zotac ZBOX MI642 Nano | |
| Beelink SEi10 | |
| Cinebench R15 / CPU Single 64Bit | |
| Intel NUC11PAQi7 | |
| Lenovo Yoga 9 14 ITL 4K | |
| Intel NUC11TNKi5 | |
| Moyenne Intel Core i5-1135G7 (141.4 - 205, n=61) | |
| Microsoft Surface Pro 7 Plus | |
| Lenovo Yoga Slim 7-14ARE | |
| Asus VivoBook Flip 14 TM420IA | |
| Intel Hades Canyon NUC8i7HVK | |
| HP Envy 13-ba0001ng | |
| Lenovo IdeaPad S540-13ARE-82DL000YGE | |
| Intel NUC10i5FNK | |
| Zotac ZBOX MI642 Nano | |
| Beelink SEi10 | |
| GMK NucBox 2 | |
| Blender / v2.79 BMW27 CPU | |
| Beelink SEi10 | |
| Zotac ZBOX MI642 Nano | |
| HP Envy 13-ba0001ng | |
| GMK NucBox 2 | |
| Microsoft Surface Pro 7 Plus | |
| Moyenne Intel Core i5-1135G7 (499 - 1044, n=60) | |
| Lenovo Yoga 9 14 ITL 4K | |
| Intel NUC11TNKi5 | |
| Intel NUC10i5FNK | |
| Intel Hades Canyon NUC8i7HVK | |
| Intel NUC11PAQi7 | |
| Asus VivoBook Flip 14 TM420IA | |
| Lenovo IdeaPad S540-13ARE-82DL000YGE | |
| Lenovo Yoga Slim 7-14ARE | |
| 7-Zip 18.03 / 7z b 4 -mmt1 | |
| Intel NUC11PAQi7 | |
| Lenovo Yoga 9 14 ITL 4K | |
| Intel NUC11TNKi5 | |
| HP Envy 13-ba0001ng | |
| Moyenne Intel Core i5-1135G7 (3924 - 4921, n=62) | |
| Lenovo Yoga Slim 7-14ARE | |
| Asus VivoBook Flip 14 TM420IA | |
| Microsoft Surface Pro 7 Plus | |
| Zotac ZBOX MI642 Nano | |
| Intel NUC10i5FNK | |
| Lenovo IdeaPad S540-13ARE-82DL000YGE | |
| Intel Hades Canyon NUC8i7HVK | |
| Beelink SEi10 | |
| GMK NucBox 2 | |
| 7-Zip 18.03 / 7z b 4 | |
| Lenovo Yoga Slim 7-14ARE | |
| Lenovo IdeaPad S540-13ARE-82DL000YGE | |
| Asus VivoBook Flip 14 TM420IA | |
| Intel NUC11PAQi7 | |
| Intel NUC11TNKi5 | |
| Microsoft Surface Pro 7 Plus | |
| Lenovo Yoga 9 14 ITL 4K | |
| Intel NUC10i5FNK | |
| Moyenne Intel Core i5-1135G7 (14745 - 24873, n=62) | |
| Intel Hades Canyon NUC8i7HVK | |
| GMK NucBox 2 | |
| Zotac ZBOX MI642 Nano | |
| HP Envy 13-ba0001ng | |
| Beelink SEi10 | |
| Geekbench 5.5 / Single-Core | |
| Intel NUC11PAQi7 | |
| Lenovo Yoga 9 14 ITL 4K | |
| Intel NUC11TNKi5 | |
| Moyenne Intel Core i5-1135G7 (1147 - 1428, n=58) | |
| Microsoft Surface Pro 7 Plus | |
| HP Envy 13-ba0001ng | |
| Asus VivoBook Flip 14 TM420IA | |
| Lenovo Yoga Slim 7-14ARE | |
| Lenovo Yoga Slim 7-14ARE | |
| Beelink SEi10 | |
| Zotac ZBOX MI642 Nano | |
| Lenovo IdeaPad S540-13ARE-82DL000YGE | |
| Intel NUC10i5FNK | |
| GMK NucBox 2 | |
| Geekbench 5.5 / Multi-Core | |
| Lenovo Yoga Slim 7-14ARE | |
| Lenovo Yoga Slim 7-14ARE | |
| Lenovo IdeaPad S540-13ARE-82DL000YGE | |
| Lenovo Yoga 9 14 ITL 4K | |
| Asus VivoBook Flip 14 TM420IA | |
| Intel NUC11PAQi7 | |
| Microsoft Surface Pro 7 Plus | |
| Moyenne Intel Core i5-1135G7 (3475 - 5472, n=58) | |
| Intel NUC11TNKi5 | |
| HP Envy 13-ba0001ng | |
| Intel NUC10i5FNK | |
| Zotac ZBOX MI642 Nano | |
| GMK NucBox 2 | |
| Beelink SEi10 | |
| HWBOT x265 Benchmark v2.2 / 4k Preset | |
| Lenovo Yoga Slim 7-14ARE | |
| Asus VivoBook Flip 14 TM420IA | |
| Lenovo IdeaPad S540-13ARE-82DL000YGE | |
| Intel NUC11PAQi7 | |
| Intel Hades Canyon NUC8i7HVK | |
| Intel NUC11TNKi5 | |
| Intel NUC10i5FNK | |
| Microsoft Surface Pro 7 Plus | |
| Moyenne Intel Core i5-1135G7 (3.57 - 7.6, n=57) | |
| Lenovo Yoga 9 14 ITL 4K | |
| GMK NucBox 2 | |
| HP Envy 13-ba0001ng | |
| Zotac ZBOX MI642 Nano | |
| Beelink SEi10 | |
| LibreOffice / 20 Documents To PDF | |
| Lenovo IdeaPad S540-13ARE-82DL000YGE | |
| Zotac ZBOX MI642 Nano | |
| GMK NucBox 2 | |
| Lenovo Yoga Slim 7-14ARE | |
| Microsoft Surface Pro 7 Plus | |
| Asus VivoBook Flip 14 TM420IA | |
| HP Envy 13-ba0001ng | |
| Beelink SEi10 | |
| Moyenne Intel Core i5-1135G7 (44.2 - 62.9, n=60) | |
| Lenovo Yoga 9 14 ITL 4K | |
| Intel NUC11TNKi5 | |
| Intel NUC11PAQi7 | |
| R Benchmark 2.5 / Overall mean | |
| GMK NucBox 2 | |
| Beelink SEi10 | |
| Intel NUC10i5FNK | |
| Zotac ZBOX MI642 Nano | |
| Microsoft Surface Pro 7 Plus | |
| HP Envy 13-ba0001ng | |
| Moyenne Intel Core i5-1135G7 (0.619 - 0.727, n=59) | |
| Lenovo IdeaPad S540-13ARE-82DL000YGE | |
| Intel NUC11TNKi5 | |
| Lenovo Yoga Slim 7-14ARE | |
| Asus VivoBook Flip 14 TM420IA | |
| Lenovo Yoga 9 14 ITL 4K | |
| Intel NUC11PAQi7 | |
Cinebench R15: CPU Multi 64Bit | CPU Single 64Bit
Blender: v2.79 BMW27 CPU
7-Zip 18.03: 7z b 4 -mmt1 | 7z b 4
Geekbench 5.5: Single-Core | Multi-Core
HWBOT x265 Benchmark v2.2: 4k Preset
LibreOffice : 20 Documents To PDF
R Benchmark 2.5: Overall mean
* ... Moindre est la valeur, meilleures sont les performances
Performance du système
| PCMark 10 | |
| Score | |
| Intel NUC11PAQi7 | |
| Moyenne Intel Core i5-1135G7, Intel Iris Xe Graphics G7 80EUs (4026 - 4952, n=53) | |
| Intel NUC11TNKi5 | |
| GMK NucBox 2 | |
| Intel NUC10i5FNK | |
| Zotac ZBOX MI642 Nano | |
| Beelink SEi10 | |
| Essentials | |
| Intel NUC11PAQi7 | |
| Moyenne Intel Core i5-1135G7, Intel Iris Xe Graphics G7 80EUs (8149 - 9917, n=53) | |
| Intel NUC11TNKi5 | |
| GMK NucBox 2 | |
| Intel NUC10i5FNK | |
| Zotac ZBOX MI642 Nano | |
| Beelink SEi10 | |
| Productivity | |
| Intel NUC11PAQi7 | |
| Intel NUC10i5FNK | |
| GMK NucBox 2 | |
| Zotac ZBOX MI642 Nano | |
| Moyenne Intel Core i5-1135G7, Intel Iris Xe Graphics G7 80EUs (5040 - 6619, n=53) | |
| Intel NUC11TNKi5 | |
| Beelink SEi10 | |
| Digital Content Creation | |
| Intel NUC11PAQi7 | |
| Moyenne Intel Core i5-1135G7, Intel Iris Xe Graphics G7 80EUs (3548 - 5255, n=53) | |
| Intel NUC11TNKi5 | |
| GMK NucBox 2 | |
| Intel NUC10i5FNK | |
| Zotac ZBOX MI642 Nano | |
| Beelink SEi10 | |
| PCMark 8 | |
| Home Score Accelerated v2 | |
| Moyenne Intel Core i5-1135G7, Intel Iris Xe Graphics G7 80EUs (3472 - 5032, n=11) | |
| Intel NUC11PAQi7 | |
| Intel NUC10i5FNK | |
| Zotac ZBOX MI642 Nano | |
| Beelink SEi10 | |
| Work Score Accelerated v2 | |
| Zotac ZBOX MI642 Nano | |
| Intel NUC10i5FNK | |
| Intel NUC11PAQi7 | |
| Moyenne Intel Core i5-1135G7, Intel Iris Xe Graphics G7 80EUs (2473 - 3214, n=11) | |
| Beelink SEi10 | |
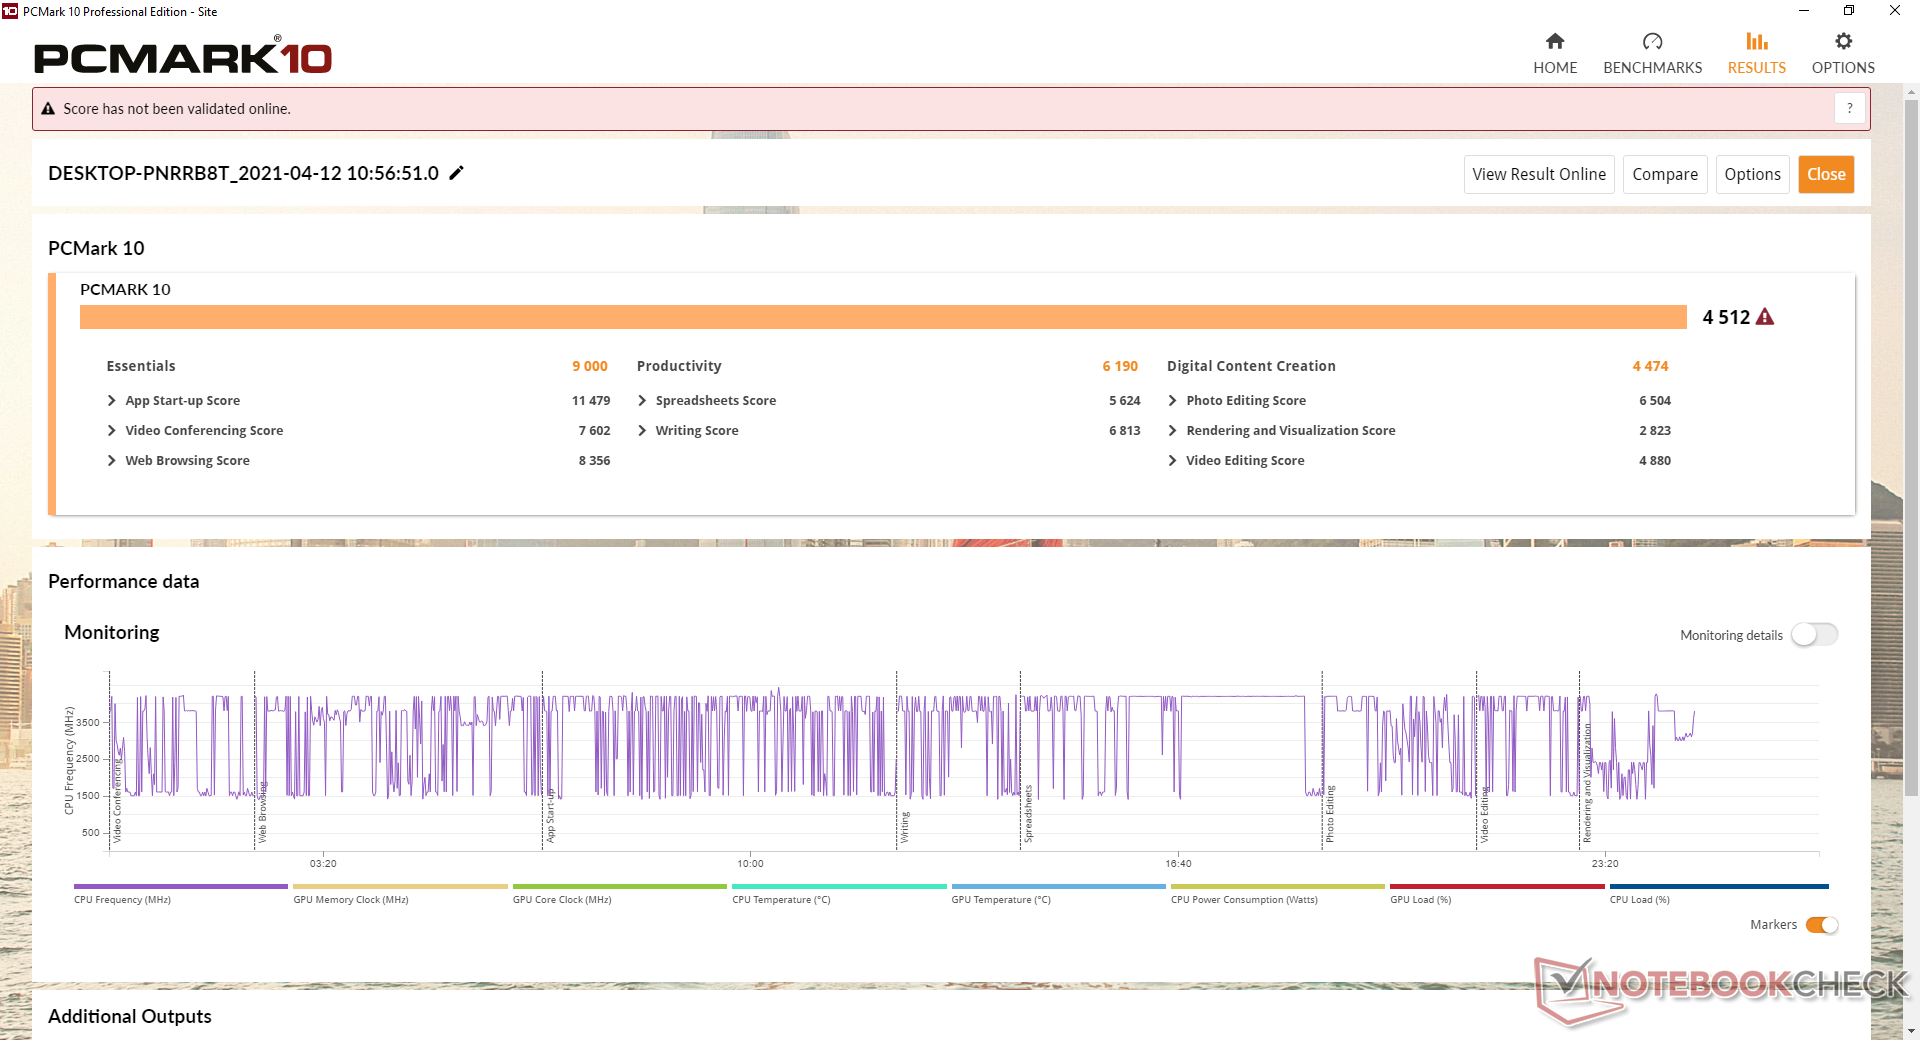
| PCMark 10 Score | 4512 points | |
Aide | ||
Latence DPC
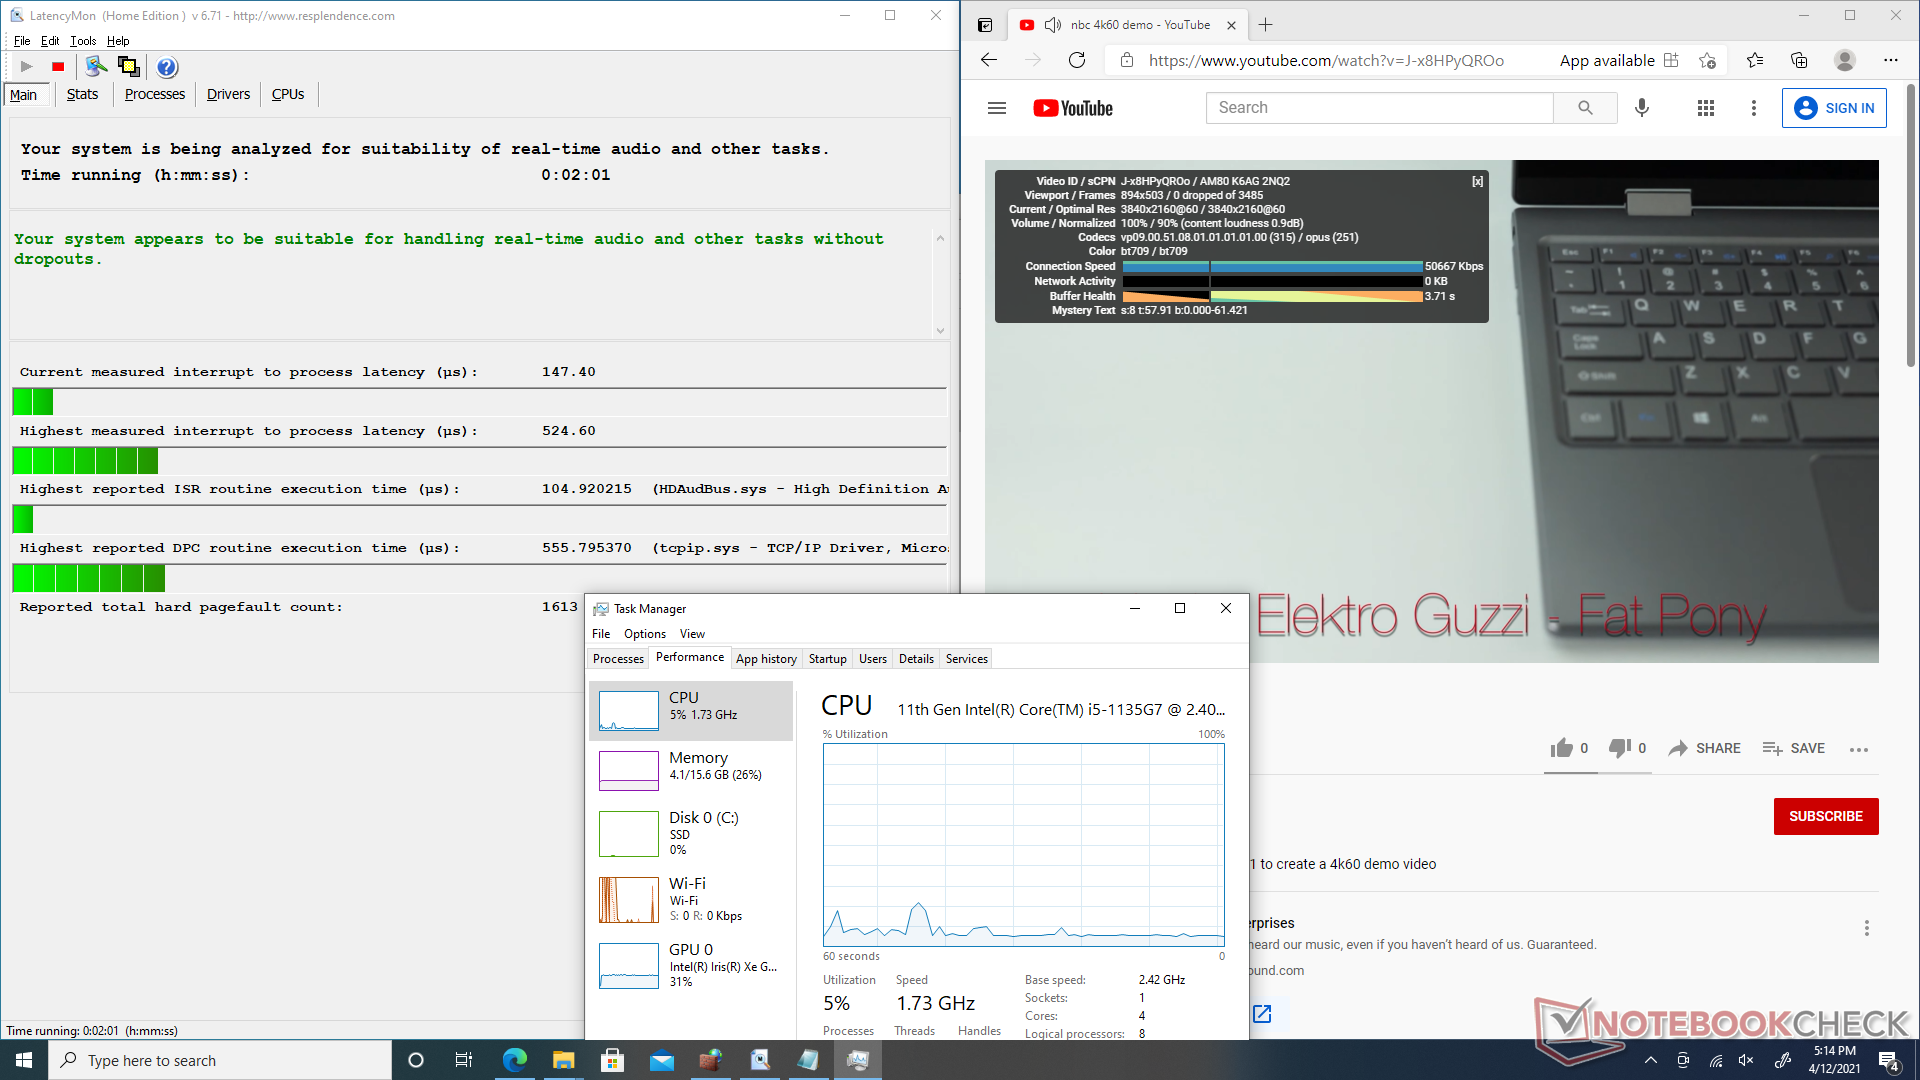
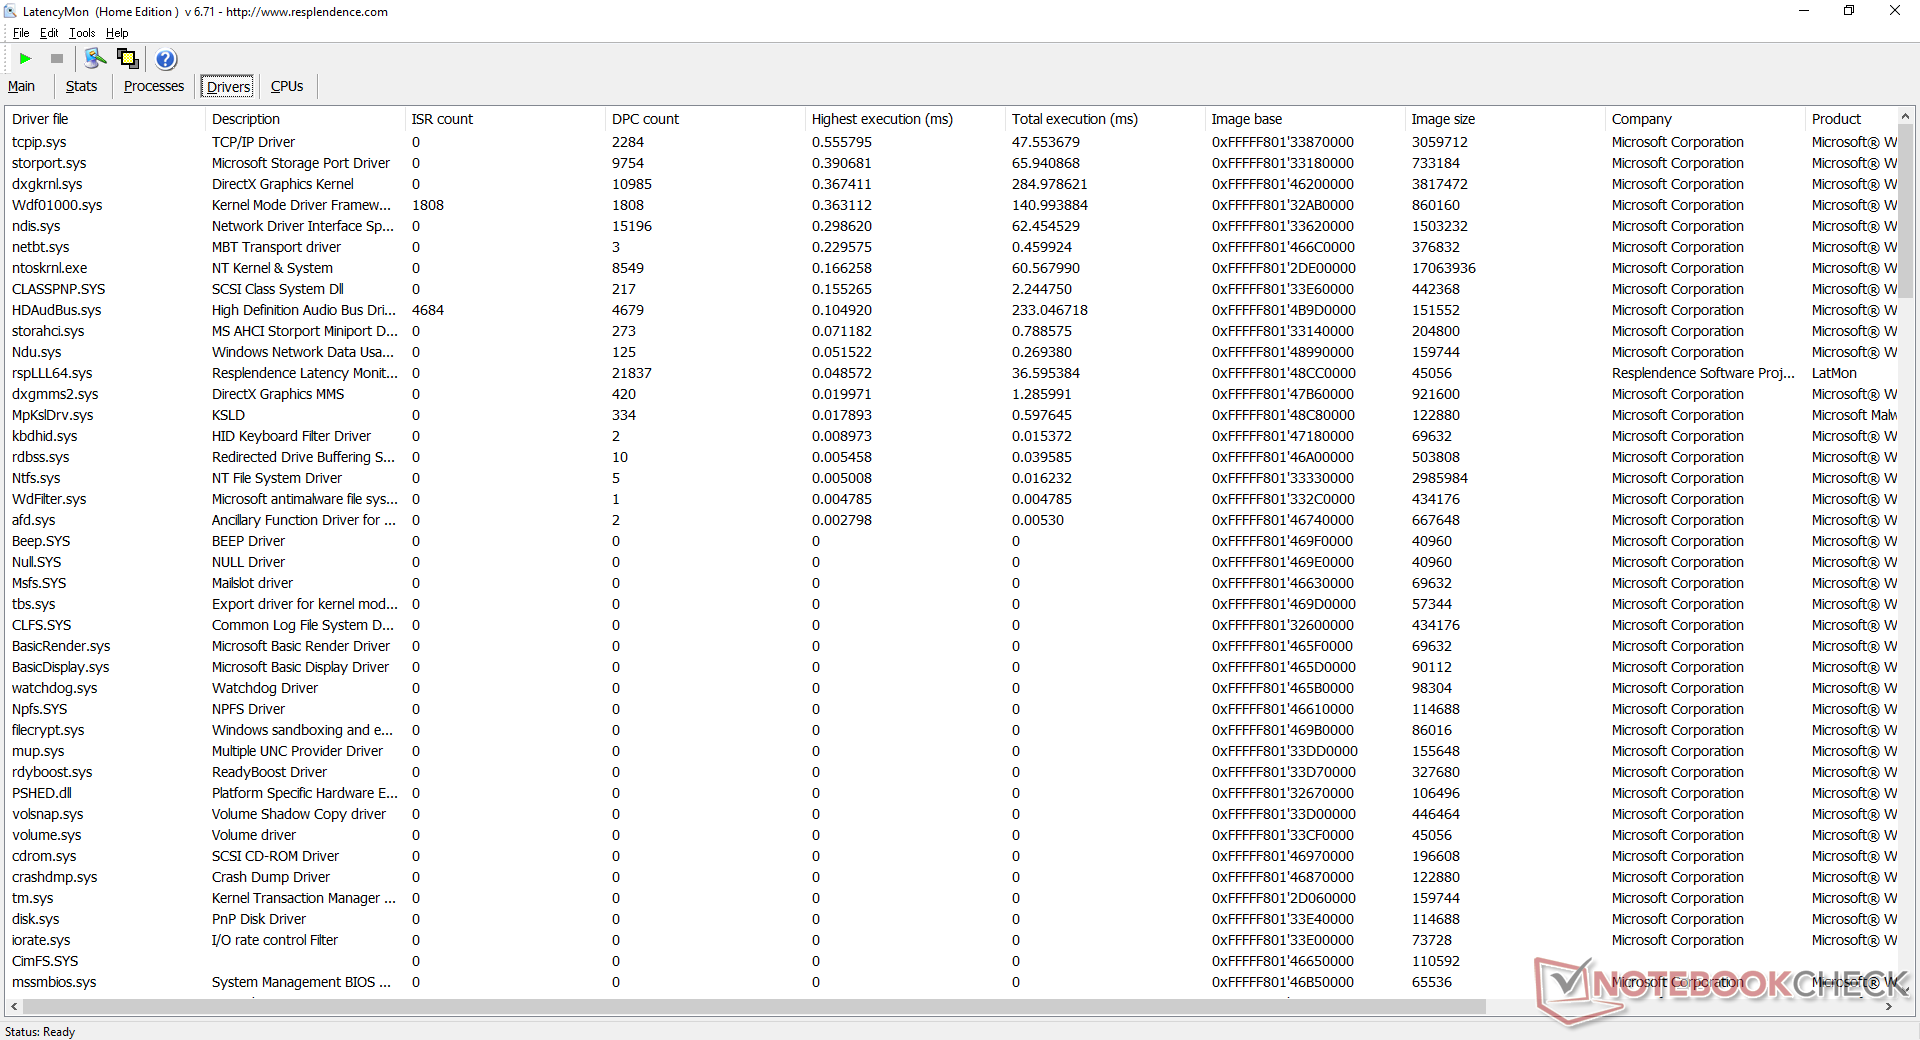
LatencyMon ne montre aucun problème de latence DPC lors de l'ouverture de plusieurs onglets sur notre page d'accueil. La lecture de vidéos 4K à 60 FPS est également fluide et ne présente aucune perte d'images pendant nos tests.
| DPC Latencies / LatencyMon - interrupt to process latency (max), Web, Youtube, Prime95 | |
| Beelink SEi10 | |
| GMK NucBox 2 | |
| Intel NUC11PAQi7 | |
| Intel NUC11TNKi5 | |
* ... Moindre est la valeur, meilleures sont les performances
Périphériques de stockage
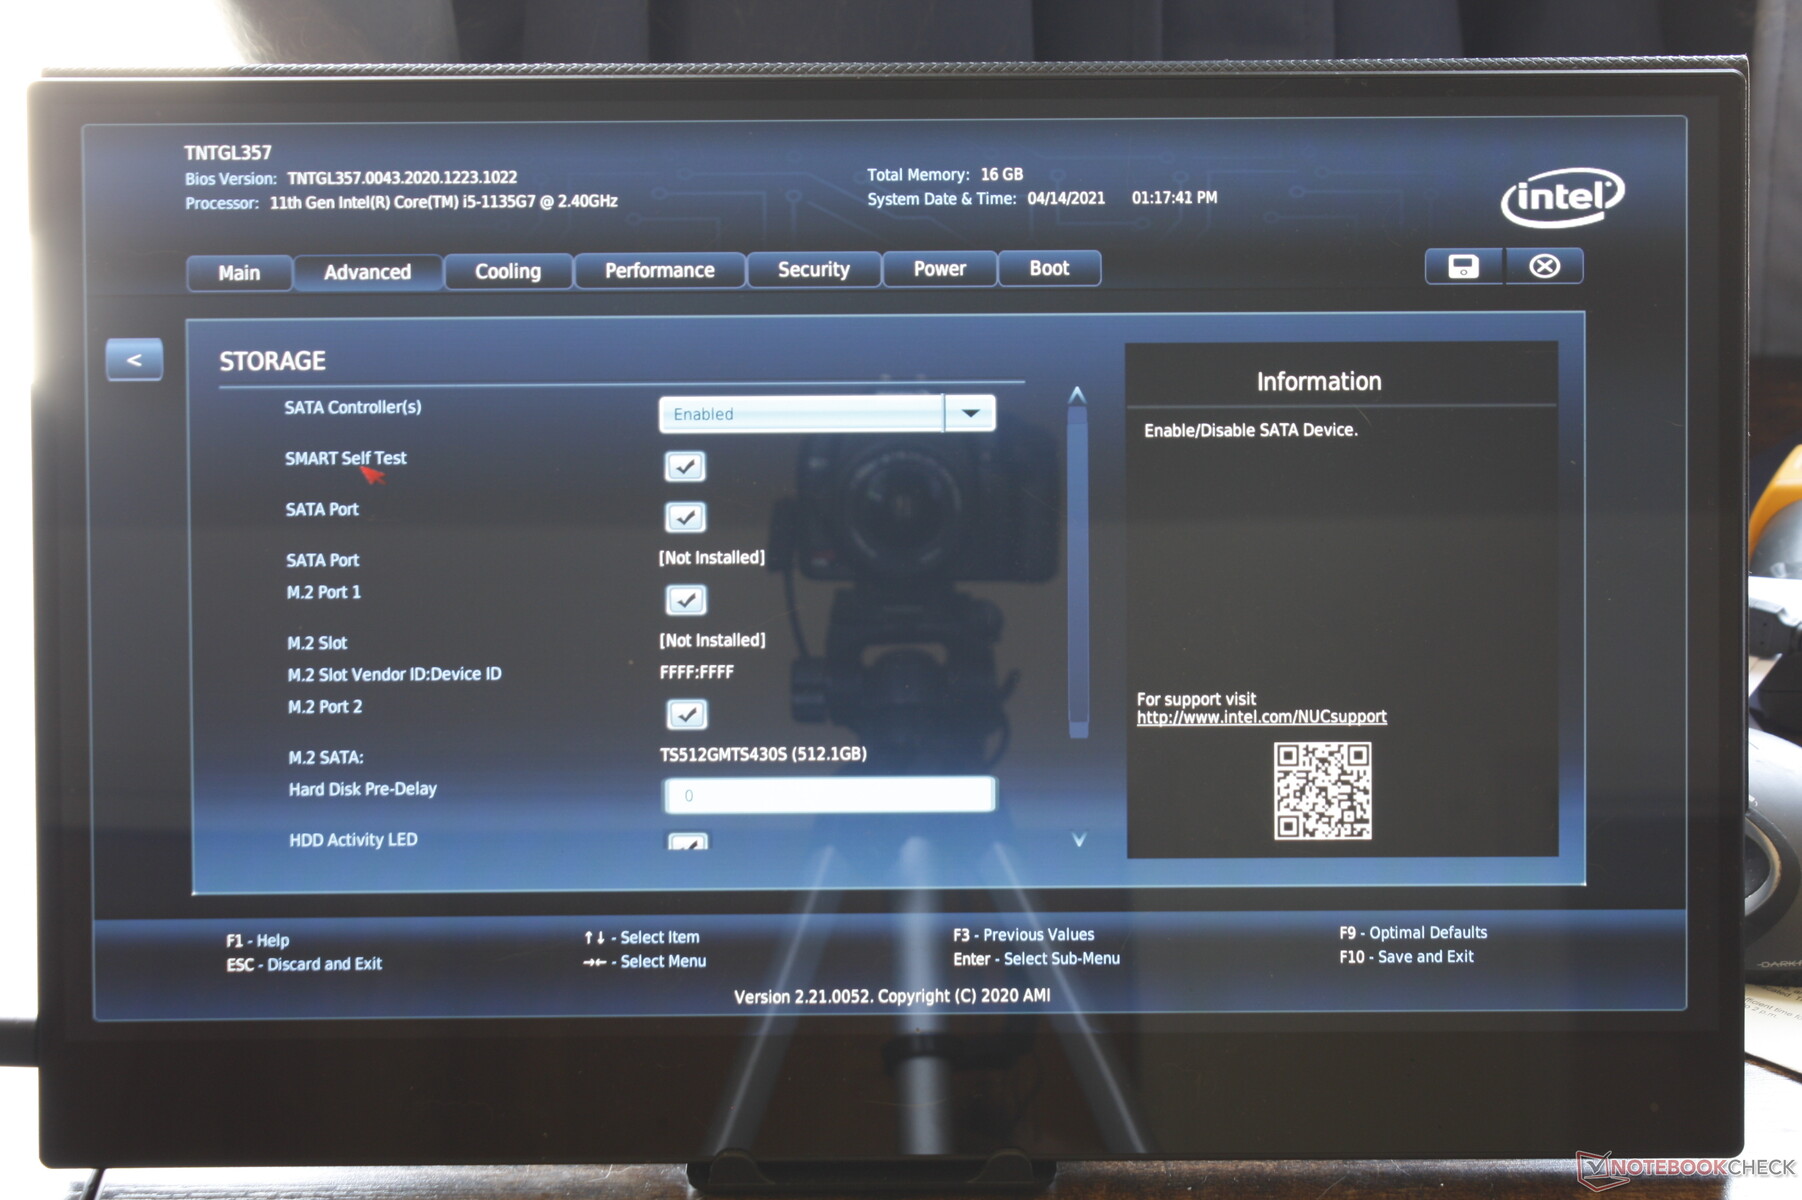
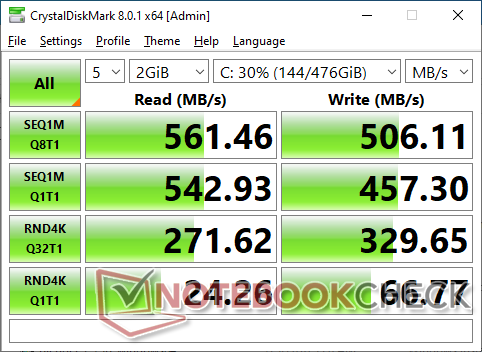
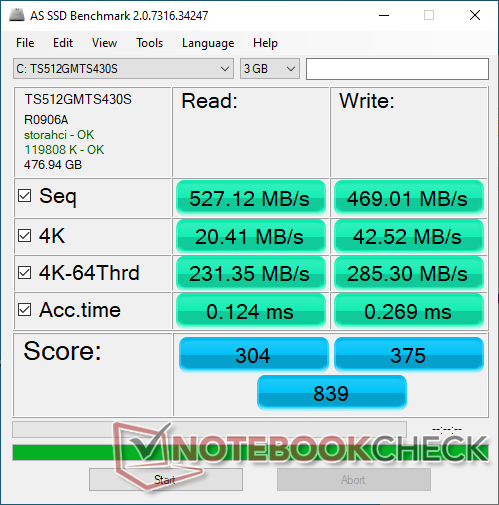
Le NUC 11 Pro Mini possède une configuration de stockage unique avec ses deux emplacements M.2 asymétriques. Un emplacement supporte uniquement 2242 SSD SATA III tandis que le second supporte jusqu'à 2280 disques PCIe 4.0. Le SSD SATA III Transcend de notre unité ne fait pas le poids face aux disques NVMe, mais les propriétaires peuvent facilement le mettre à niveau s'ils le souhaitent.
| Intel NUC11TNKi5 Transcend M.2 SSD 430S TS512GMTS430S | GMK NucBox 2 Netac S930E8/256GPN | Intel NUC11PAQi7 Samsung SSD 980 Pro 500GB MZ-V8P500BW | Beelink SEi10 Silicon Motion AZW 256G M.2280 NVMe 4X 200725 D | Zotac ZBOX MI642 Nano Western Digital WD Blue 3D WDBNCE5000PNC | |
|---|---|---|---|---|---|
| AS SSD | 91% | 434% | 17% | 18% | |
| Seq Read (MB/s) | 527 | 2069 293% | 3257 518% | 1111 111% | 507 -4% |
| Seq Write (MB/s) | 469 | 1203 157% | 3937 739% | 323.5 -31% | 413.8 -12% |
| 4K Read (MB/s) | 20.41 | 41.66 104% | 51.3 151% | 33.1 62% | 36.75 80% |
| 4K Write (MB/s) | 42.52 | 136.9 222% | 75.7 78% | 66.2 56% | 88.5 108% |
| 4K-64 Read (MB/s) | 231.4 | 366.3 58% | 2283 887% | 357.3 54% | 369.4 60% |
| 4K-64 Write (MB/s) | 285.3 | 340.5 19% | 2206 673% | 154.8 -46% | 193.7 -32% |
| Access Time Read * (ms) | 0.124 | 0.064 48% | 0.056 55% | 0.066 47% | 0.103 17% |
| Access Time Write * (ms) | 0.269 | 0.347 -29% | 0.154 43% | 0.616 -129% | 0.095 65% |
| Score Read (Points) | 304 | 615 102% | 2660 775% | 501 65% | 457 50% |
| Score Write (Points) | 375 | 598 59% | 2676 614% | 253 -33% | 324 -14% |
| Score Total (Points) | 839 | 1497 78% | 6725 702% | 983 17% | 1023 22% |
| Copy ISO MB/s (MB/s) | 490.9 | 1186 142% | 2030 314% | 1160 136% | 482.5 -2% |
| Copy Program MB/s (MB/s) | 415.9 | 428.6 3% | 883 112% | 121.1 -71% | 191.9 -54% |
| Copy Game MB/s (MB/s) | 352.3 | 435.7 24% | 1817 416% | 364.4 3% | 248.9 -29% |
| CrystalDiskMark 5.2 / 6 | 149% | 533% | 146% | 23% | |
| Write 4K (MB/s) | 65.9 | 178.4 171% | 244.6 271% | 203 208% | 105.9 61% |
| Read 4K (MB/s) | 24.27 | 61 151% | 80.4 231% | 63.2 160% | 39.15 61% |
| Write Seq (MB/s) | 456.4 | 1040 128% | 4094 797% | 1114 144% | |
| Read Seq (MB/s) | 542 | 1919 254% | 4099 656% | 1765 226% | |
| Write 4K Q32T1 (MB/s) | 331.3 | 417.7 26% | 715 116% | 423.9 28% | 320.5 -3% |
| Read 4K Q32T1 (MB/s) | 295 | 325.6 10% | 783 165% | 389.2 32% | 342.1 16% |
| Write Seq Q32T1 (MB/s) | 506 | 1144 126% | 5065 901% | 1104 118% | 514 2% |
| Read Seq Q32T1 (MB/s) | 562 | 2379 323% | 6884 1125% | 1990 254% | 554 -1% |
| Write 4K Q8T8 (MB/s) | 330.8 | ||||
| Read 4K Q8T8 (MB/s) | 391.8 | ||||
| Moyenne finale (programmes/paramètres) | 120% /
112% | 484% /
470% | 82% /
64% | 21% /
20% |
* ... Moindre est la valeur, meilleures sont les performances

Disk Throttling: DiskSpd Read Loop, Queue Depth 8
Performances du GPU
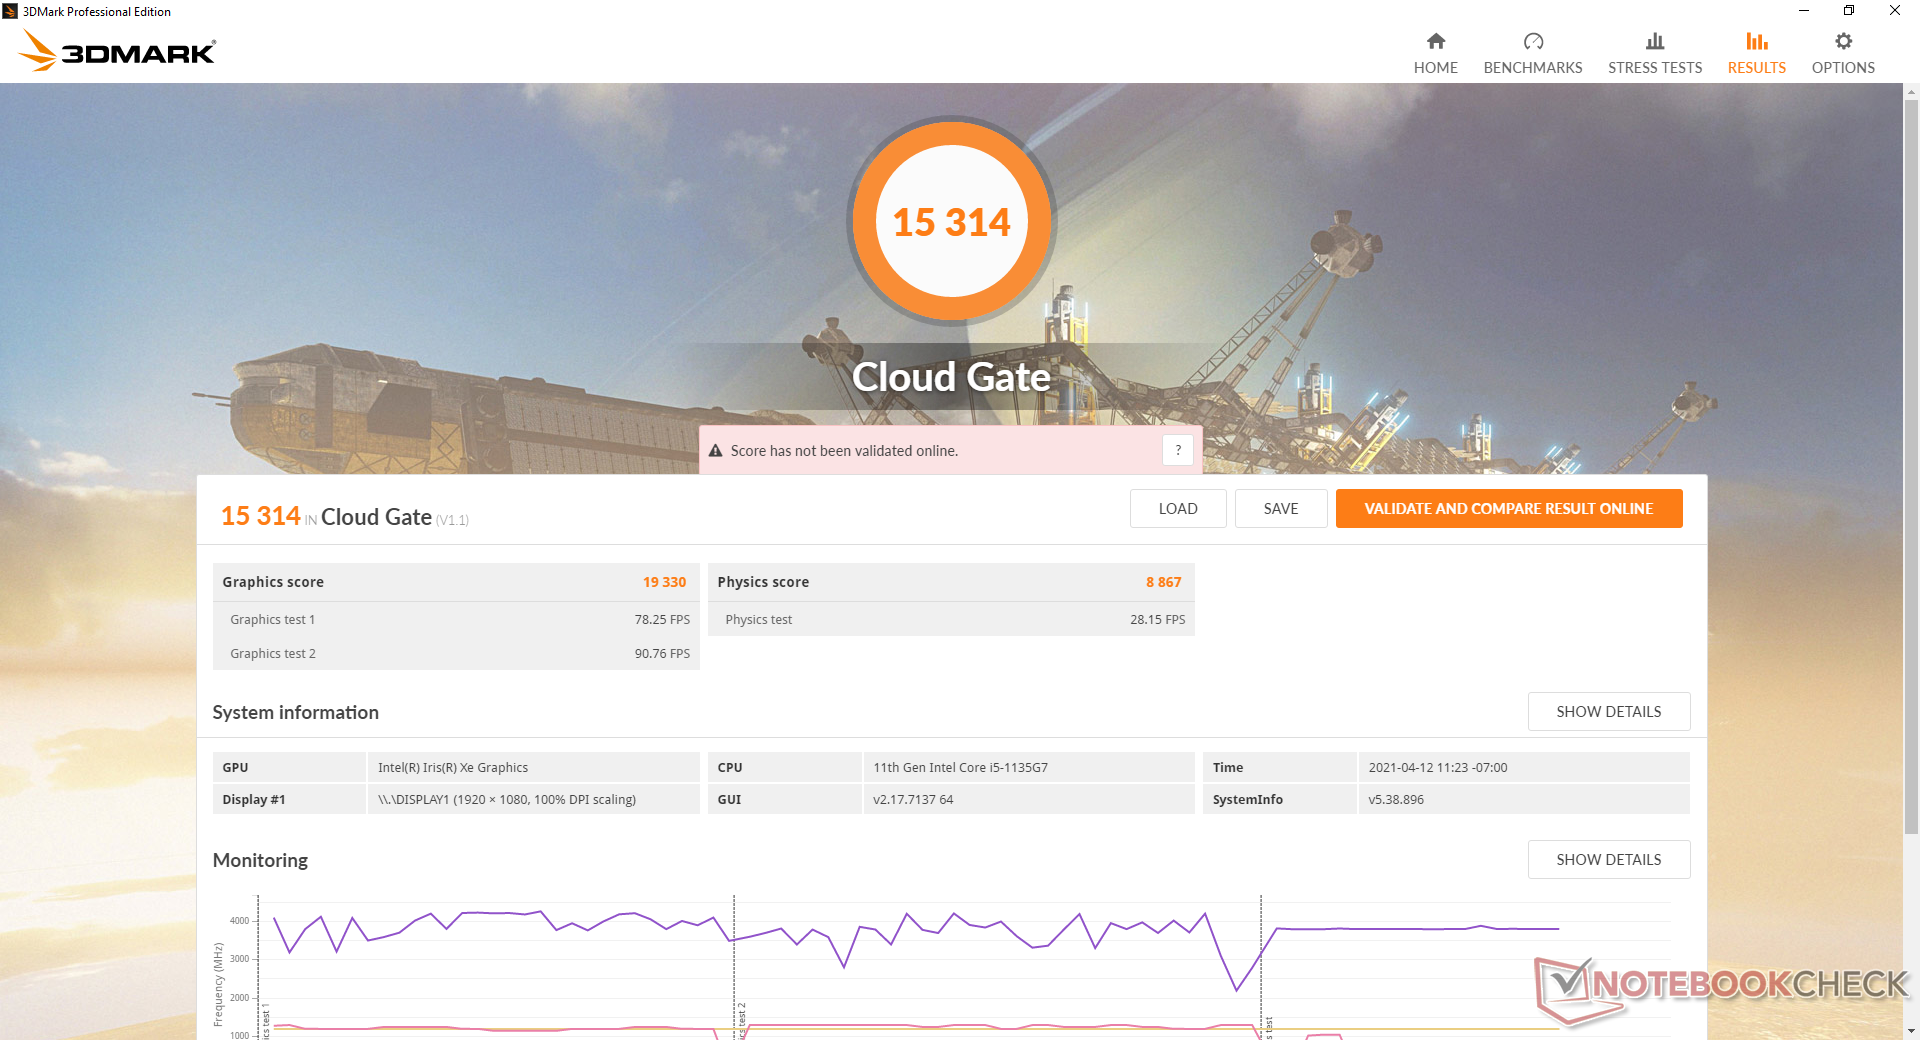
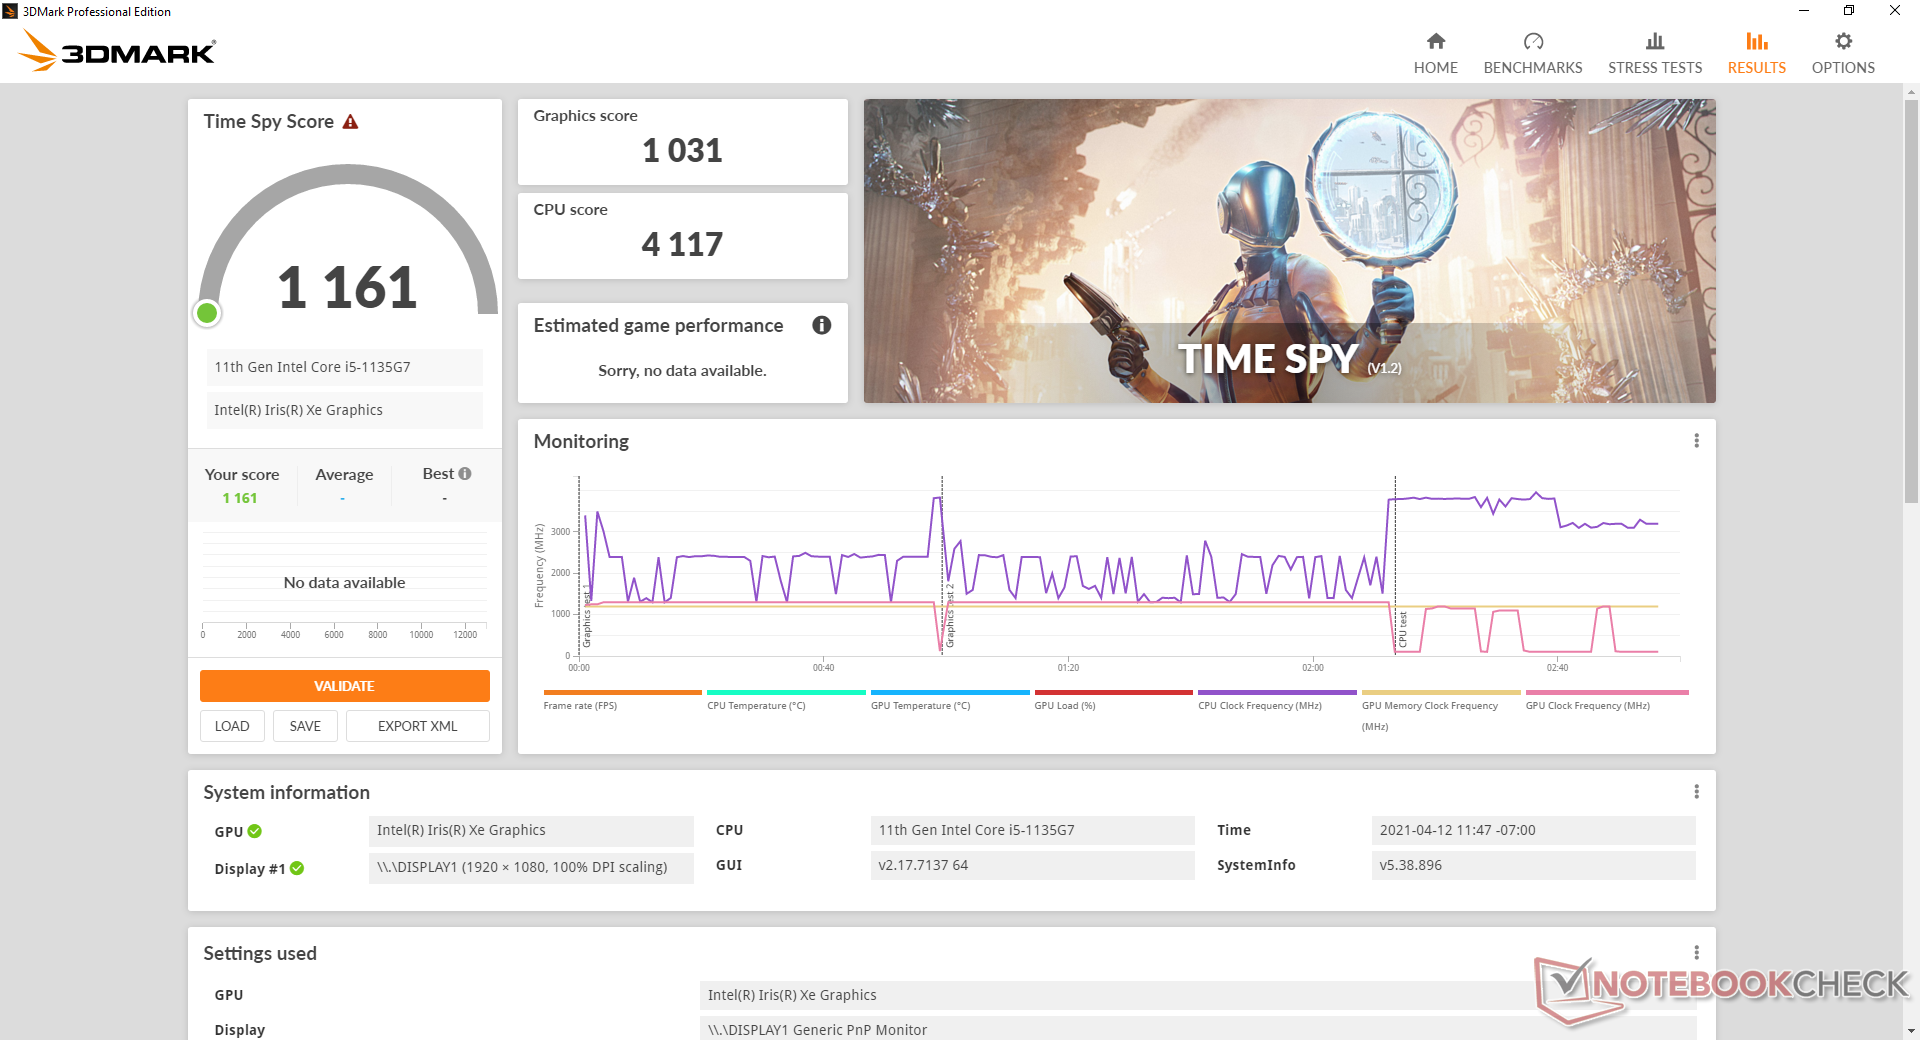
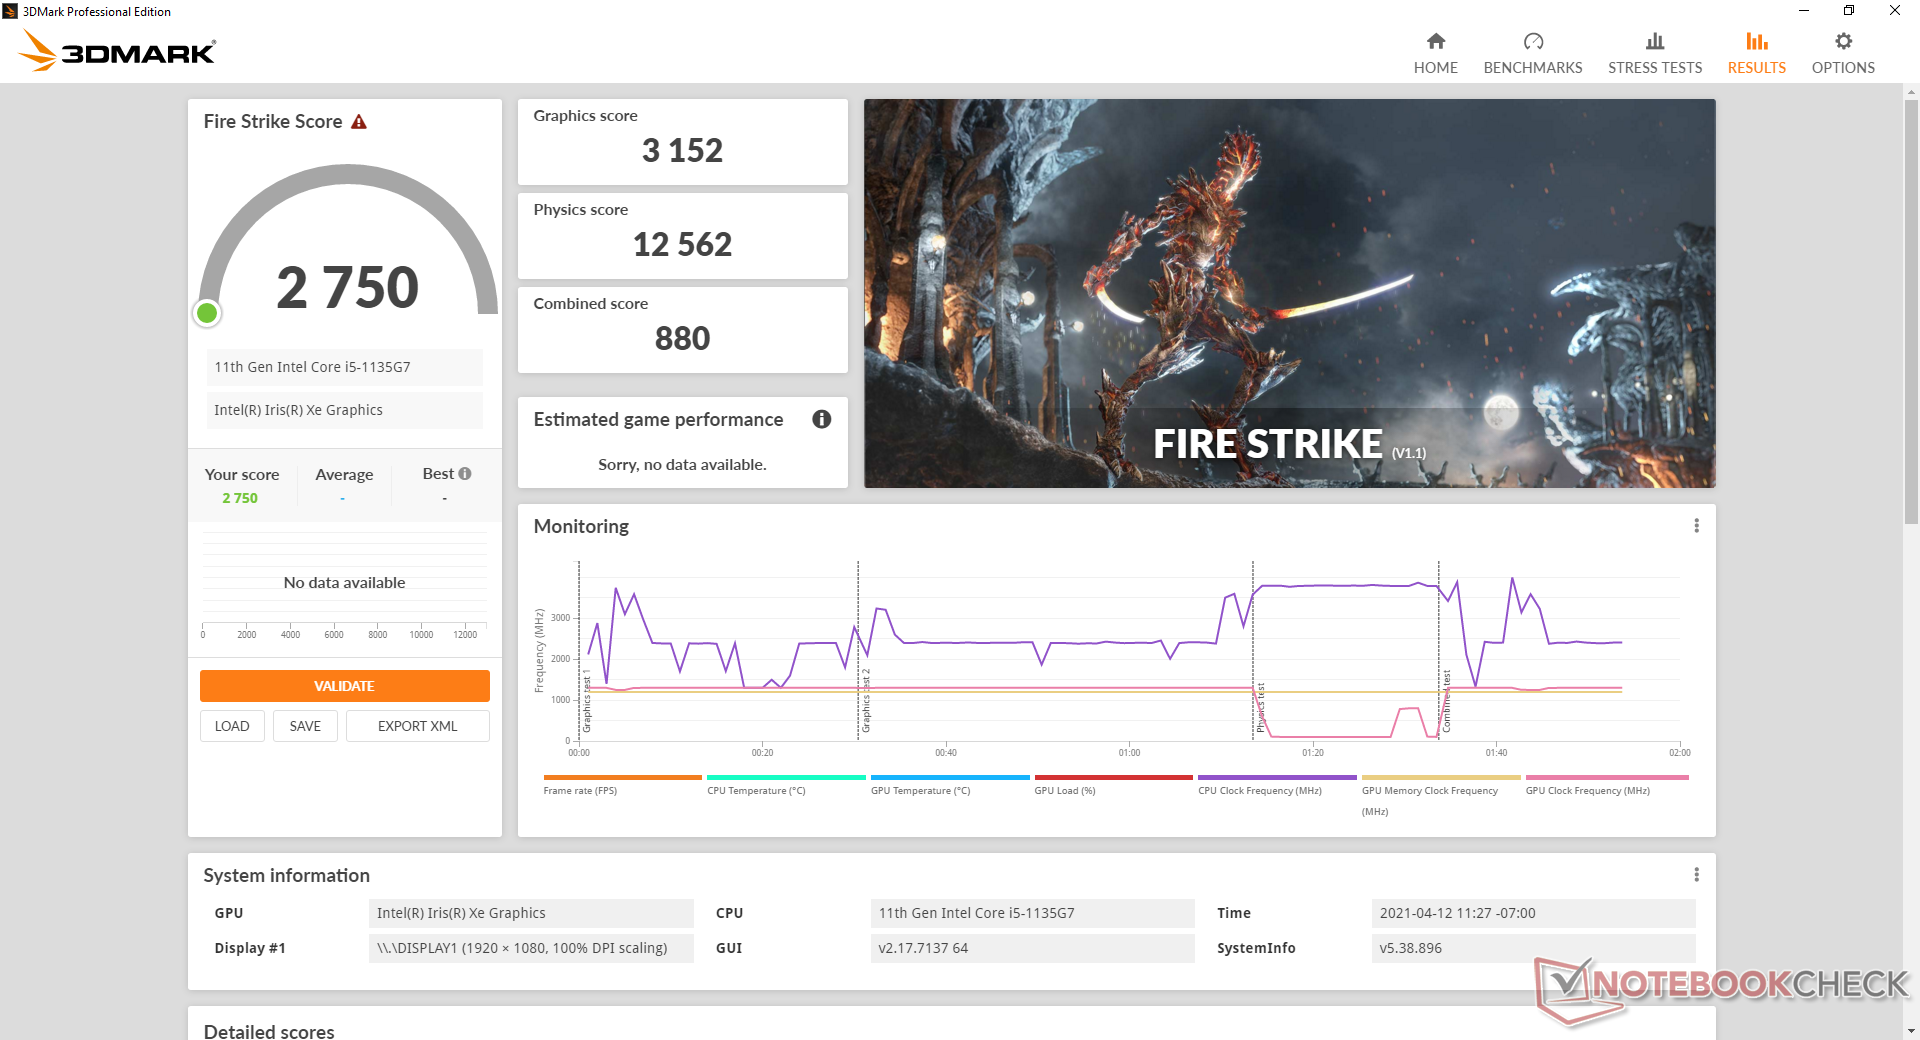
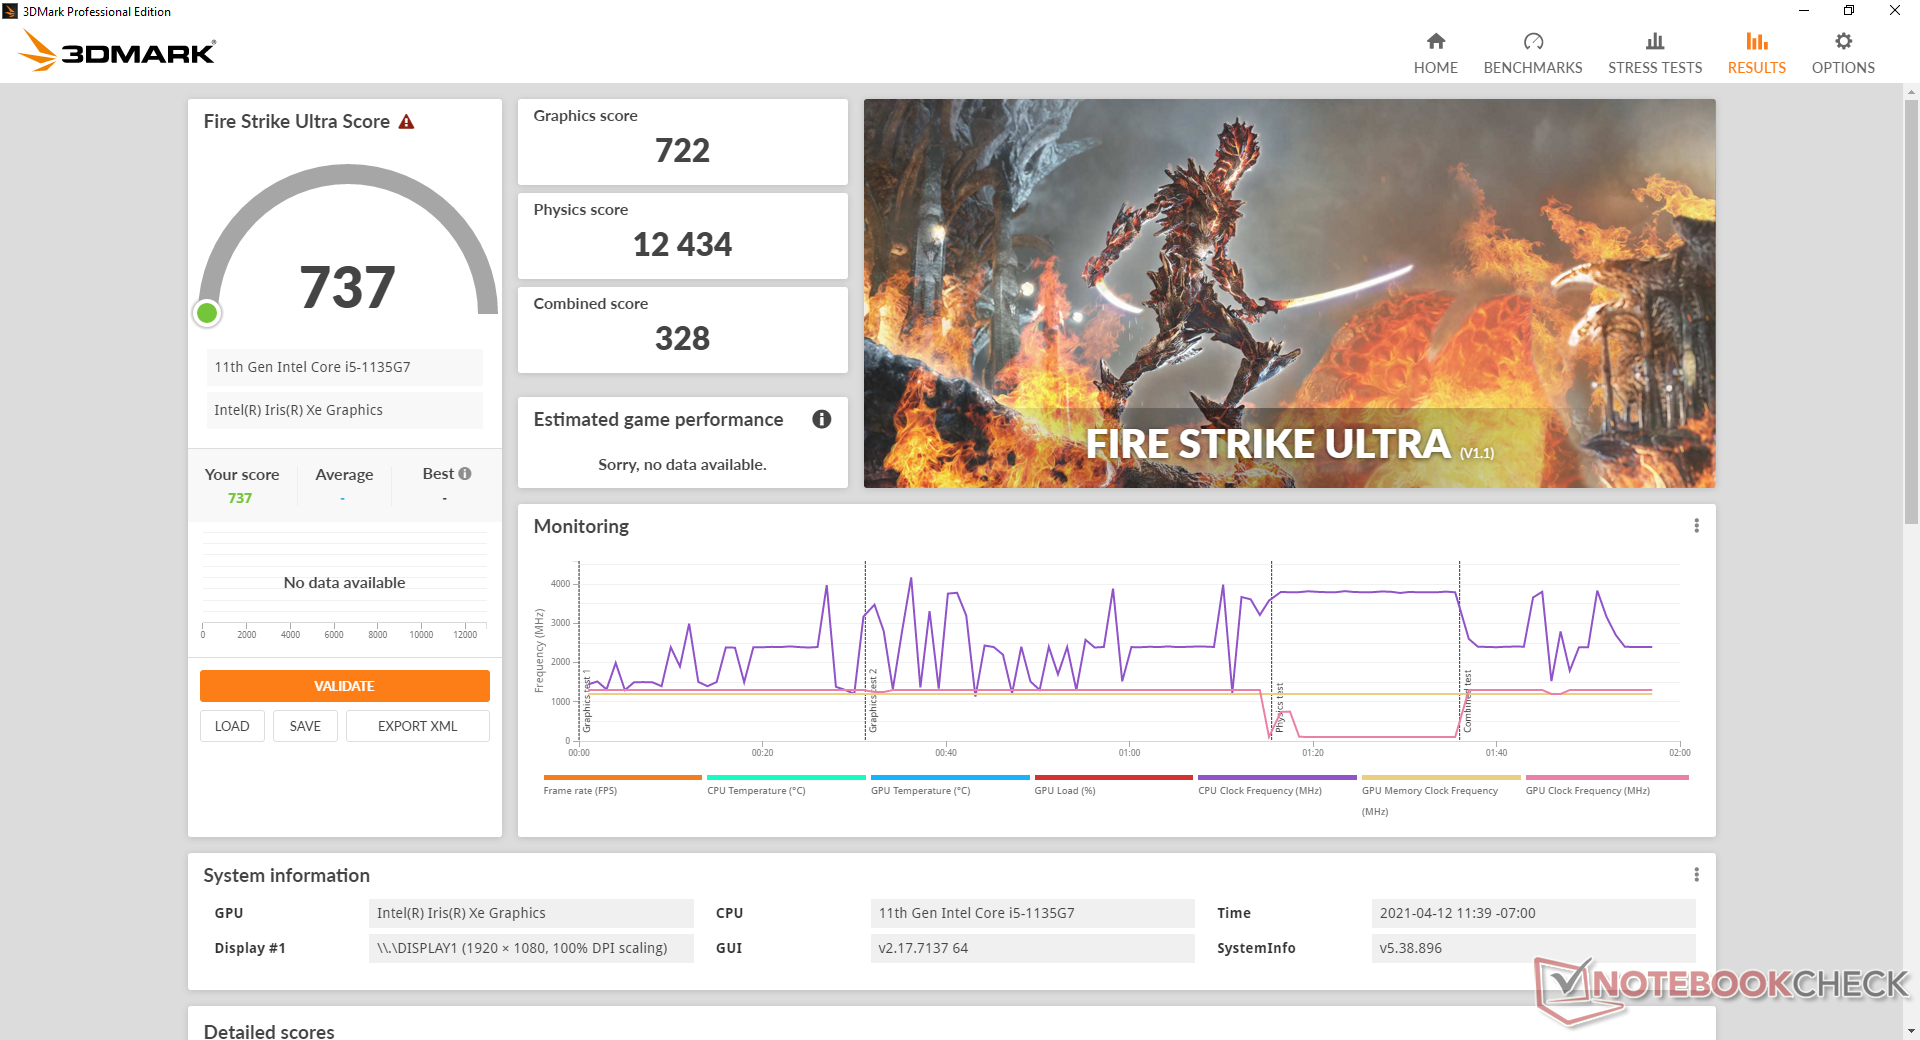
Les scores 3DMark sont environ 10 % plus lents que la moyenne.Iris Xe Graphics G7 80EUs dans notre base de données, probablement en raison de la configuration de la RAM à canal unique de notre unité de pré-production. La mise à niveau vers l'option Core i7-1165G7 avec l'Iris Xe Graphics G7 96EUs, plus rapide, est une bonne chose Iris Xe 96EUs plus rapide, les performances du GPU augmenteront d'au moins 30 %.
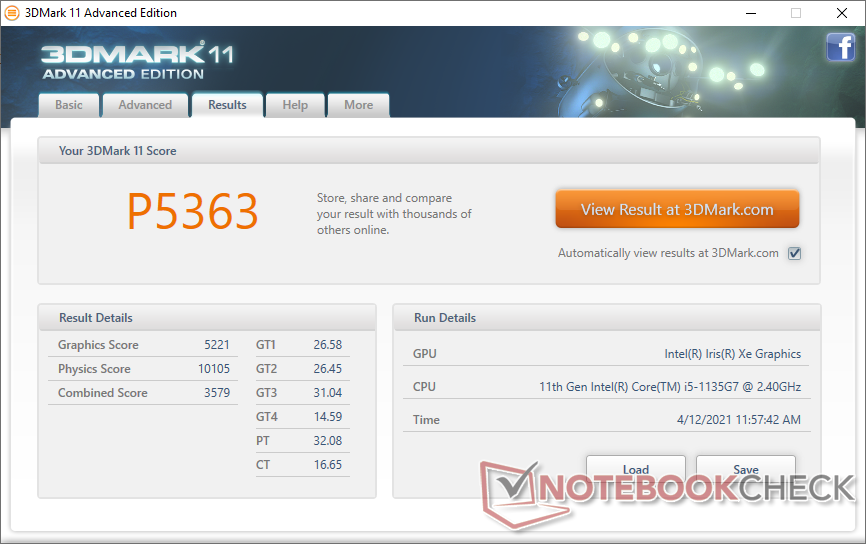
| 3DMark 11 Performance | 5363 points | |
| 3DMark Cloud Gate Standard Score | 15314 points | |
| 3DMark Fire Strike Score | 2750 points | |
| 3DMark Time Spy Score | 1161 points | |
Aide | ||
| Bas | Moyen | Élevé | Ultra | |
|---|---|---|---|---|
| The Witcher 3 (2015) | 59.8 | |||
| Dota 2 Reborn (2015) | 73.8 | 56 | 34.2 | 31.4 |
| Final Fantasy XV Benchmark (2018) | 26.8 | 13.7 | 10.5 | |
| X-Plane 11.11 (2018) | 37.1 | 27.3 | 29.1 |
Emissions
Bruit du système
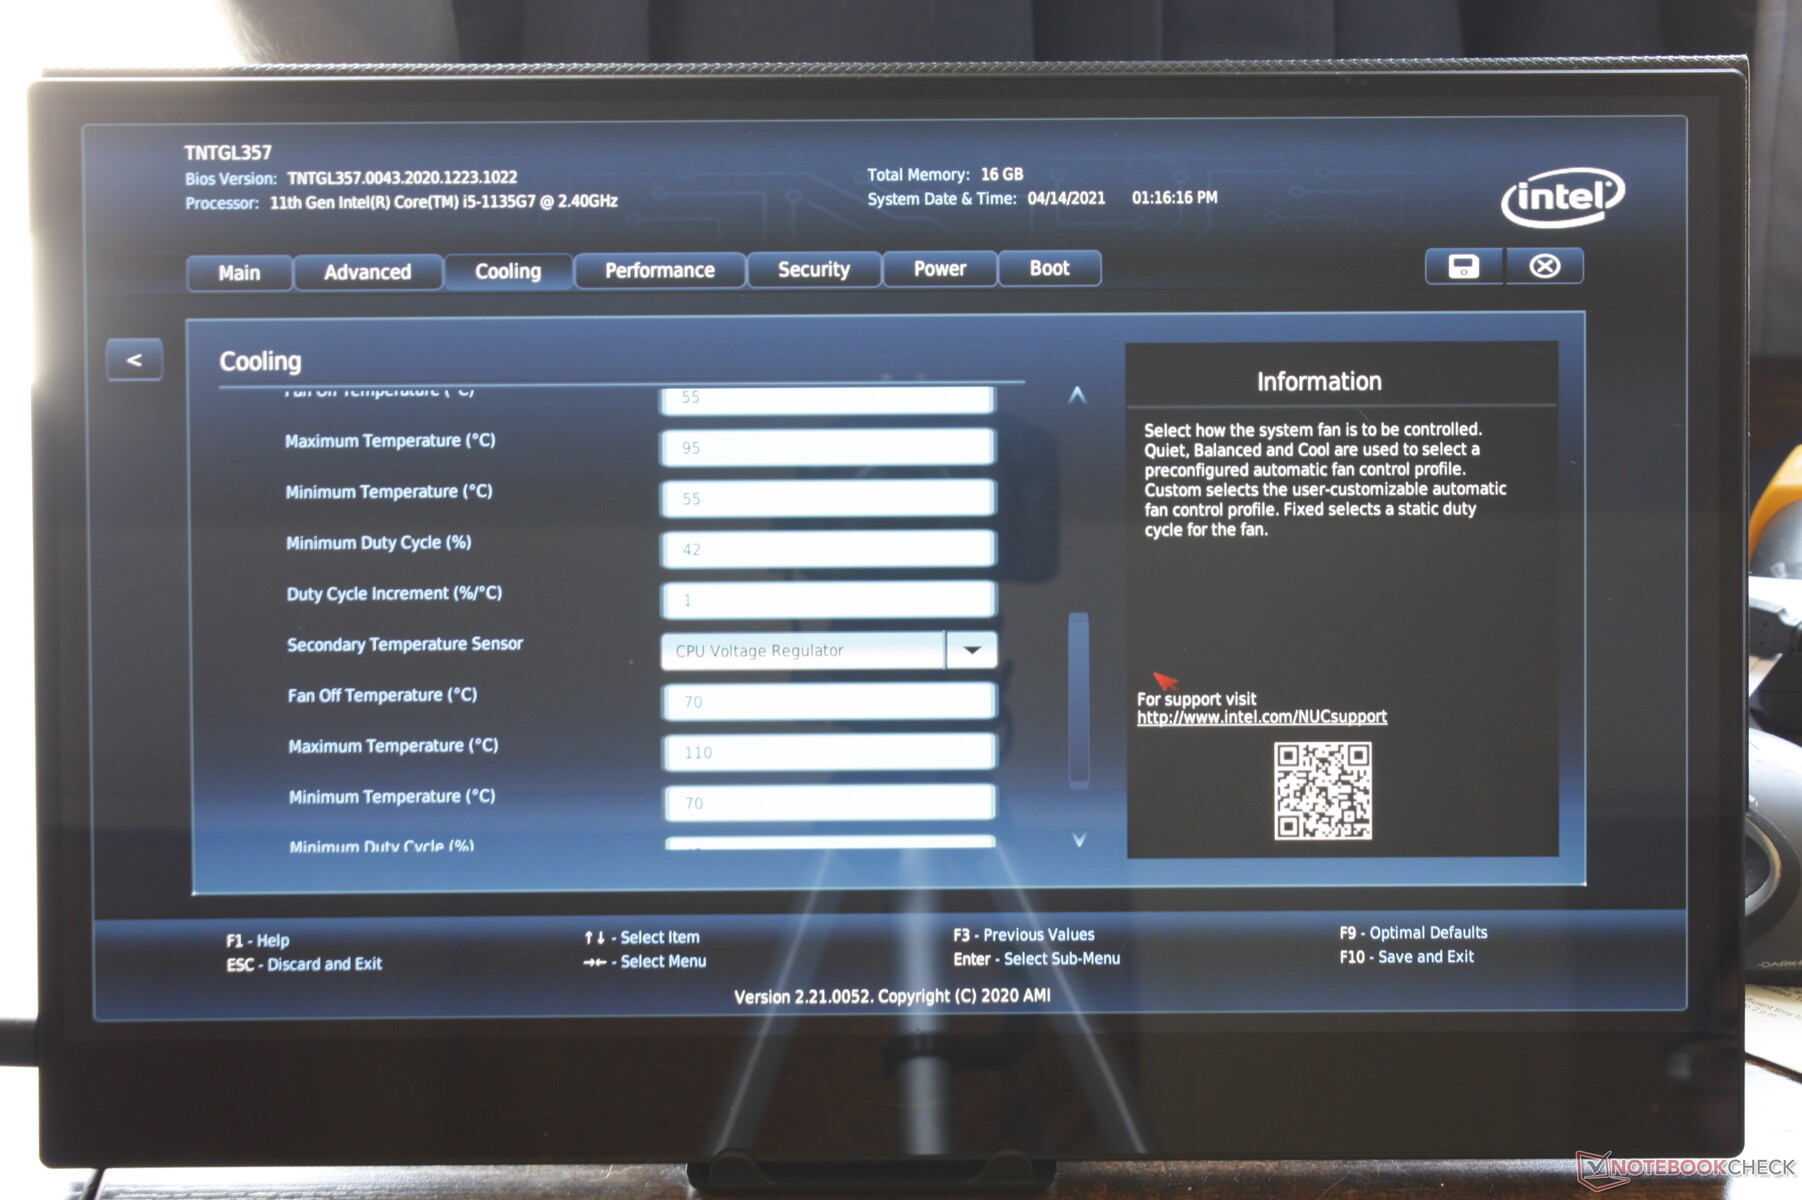
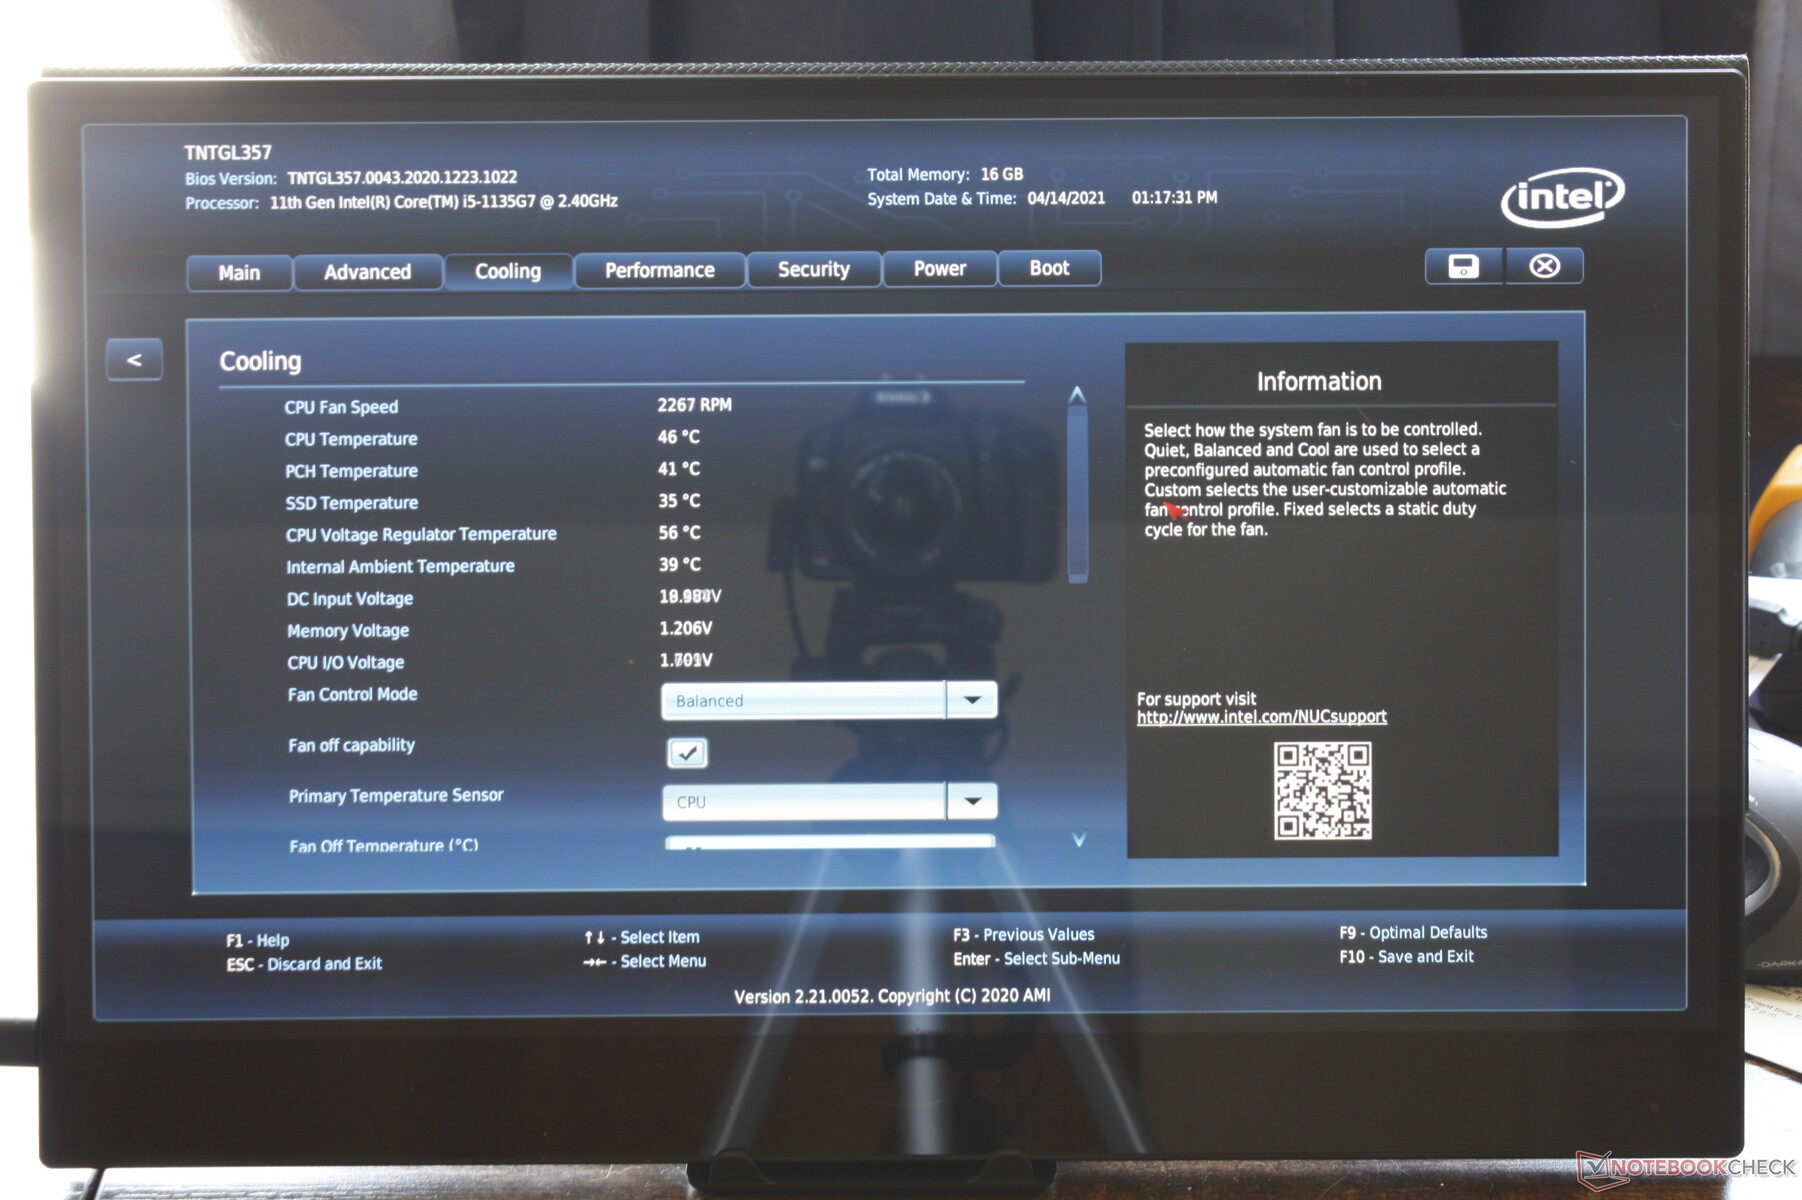
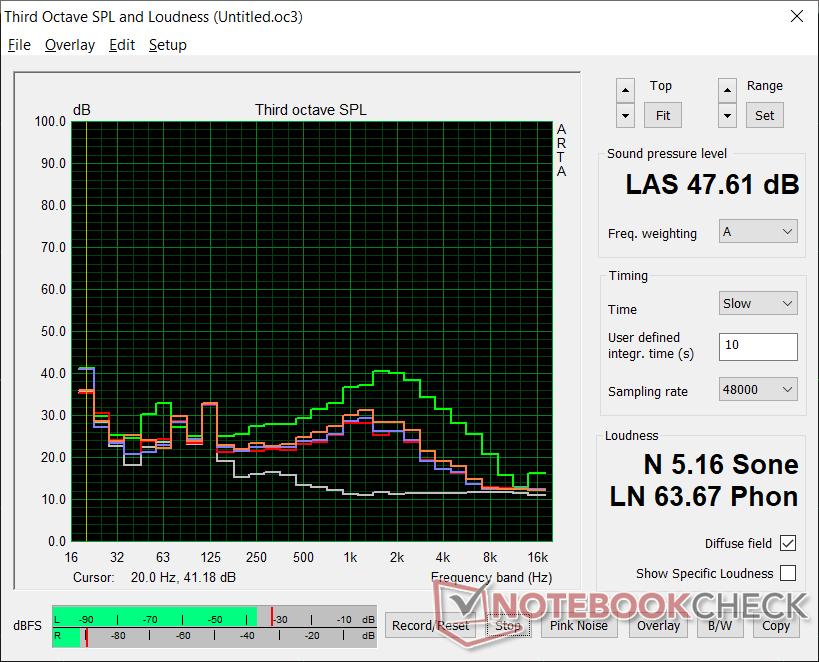
Le ventilateur interne tourne rarement au ralenti, même lorsque le système est au repos sur le bureau. Nous avons pu enregistrer un bruit de ventilateur constant de 35,6 dB(A) contre un arrière-plan silencieux de 24,8 dB(A) lors de la navigation sur Internet, ce qui est plus fort que la plupart des autres mini-PC dans des conditions similaires. Les changements de vitesse sont graduels et il n'y a donc pas de problèmes de pulsation, mais les utilisateurs doivent s'attendre à un bruit de ventilateur plus fort que la moyenne lorsqu'ils utilisent la plupart des charges. Le BIOS permet de définir des seuils de température plus spécifiques pour le contrôle du bruit du ventilateur.
| Intel NUC11TNKi5 | GMK NucBox 2 | Intel NUC11PAQi7 | Beelink SEi10 | Zotac ZBOX MI642 Nano | Intel NUC8i7BE | |
|---|---|---|---|---|---|---|
| Noise | 18% | 12% | 0% | 1% | 5% | |
| arrêt / environnement * (dB) | 24.8 | 25.6 -3% | 25.6 -3% | 27.5 -11% | 27.8 -12% | 28.7 -16% |
| Idle Minimum * (dB) | 35.6 | 25.7 28% | 25.6 28% | 30.9 13% | 27.8 22% | 28.7 19% |
| Idle Average * (dB) | 35.6 | 25.7 28% | 25.6 28% | 33.5 6% | 33.9 5% | 29.3 18% |
| Idle Maximum * (dB) | 35.6 | 25.7 28% | 25.6 28% | 33.5 6% | 33.9 5% | 31.8 11% |
| Load Average * (dB) | 36.2 | 35.3 2% | 33.6 7% | 38.5 -6% | 43.7 -21% | 39 -8% |
| Witcher 3 ultra * (dB) | 38 | 33.6 12% | 39 -3% | |||
| Load Maximum * (dB) | 47.6 | 35.1 26% | 54.5 -14% | 51.6 -8% | 43.7 8% | 41.4 13% |
* ... Moindre est la valeur, meilleures sont les performances
Degré de la nuisance sonore
| Au repos |
| 35.6 / 35.6 / 35.6 dB(A) |
| Fortement sollicité |
| 36.2 / 47.6 dB(A) |
 | ||
30 dB silencieux 40 dB(A) audible 50 dB(A) bruyant |
||
min: | ||
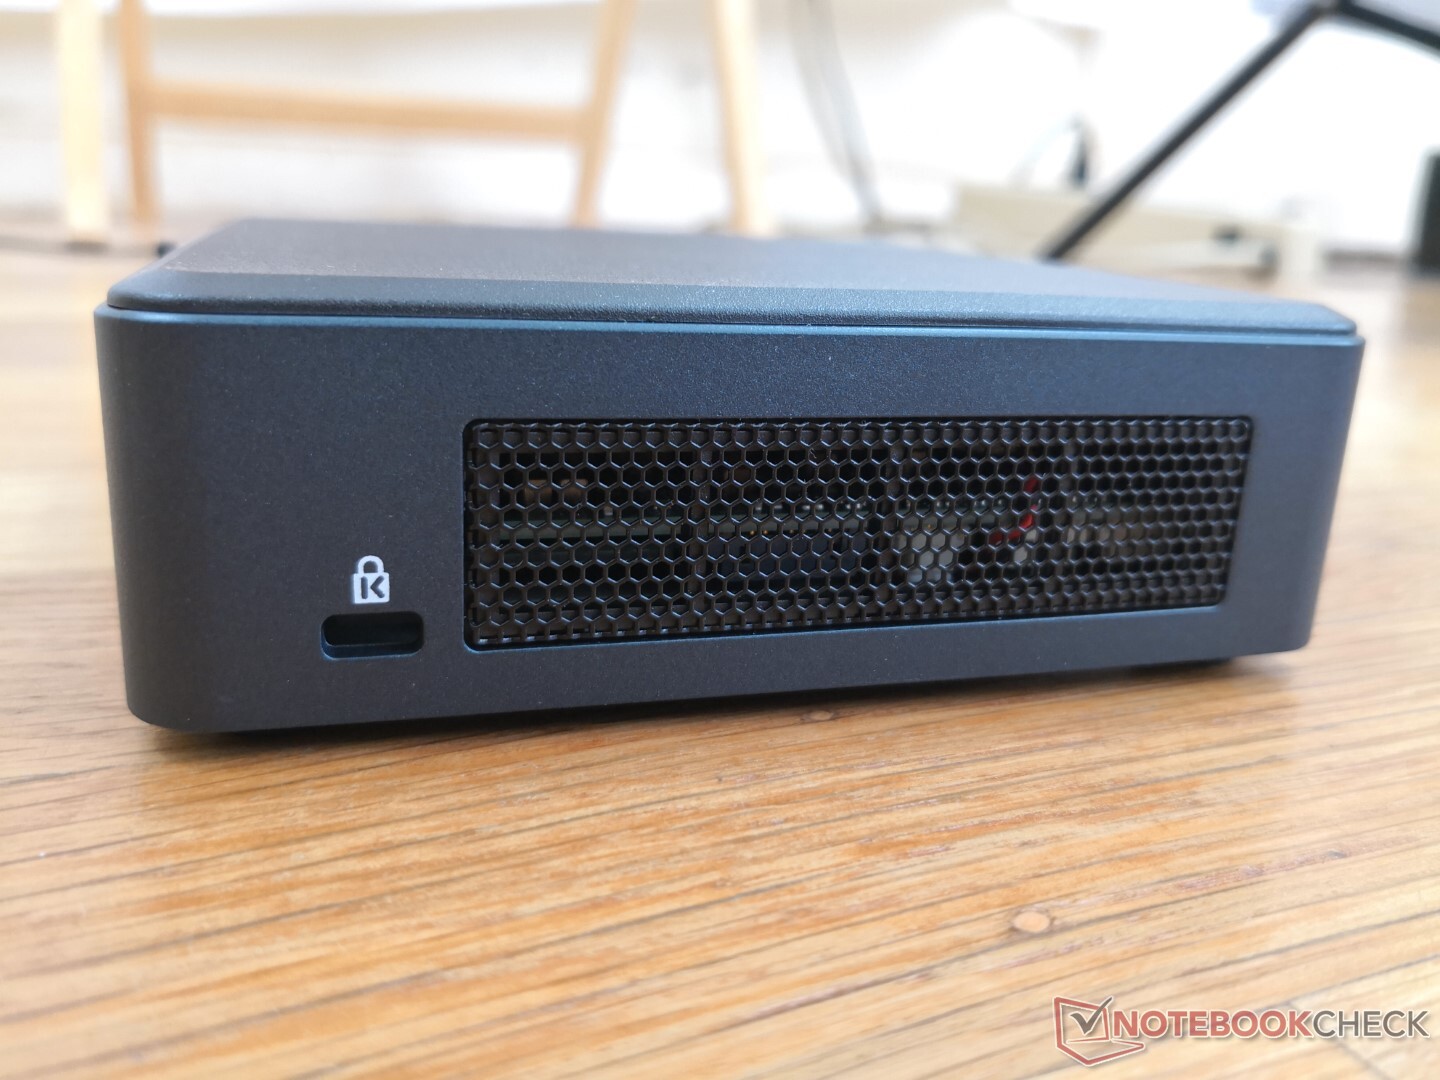
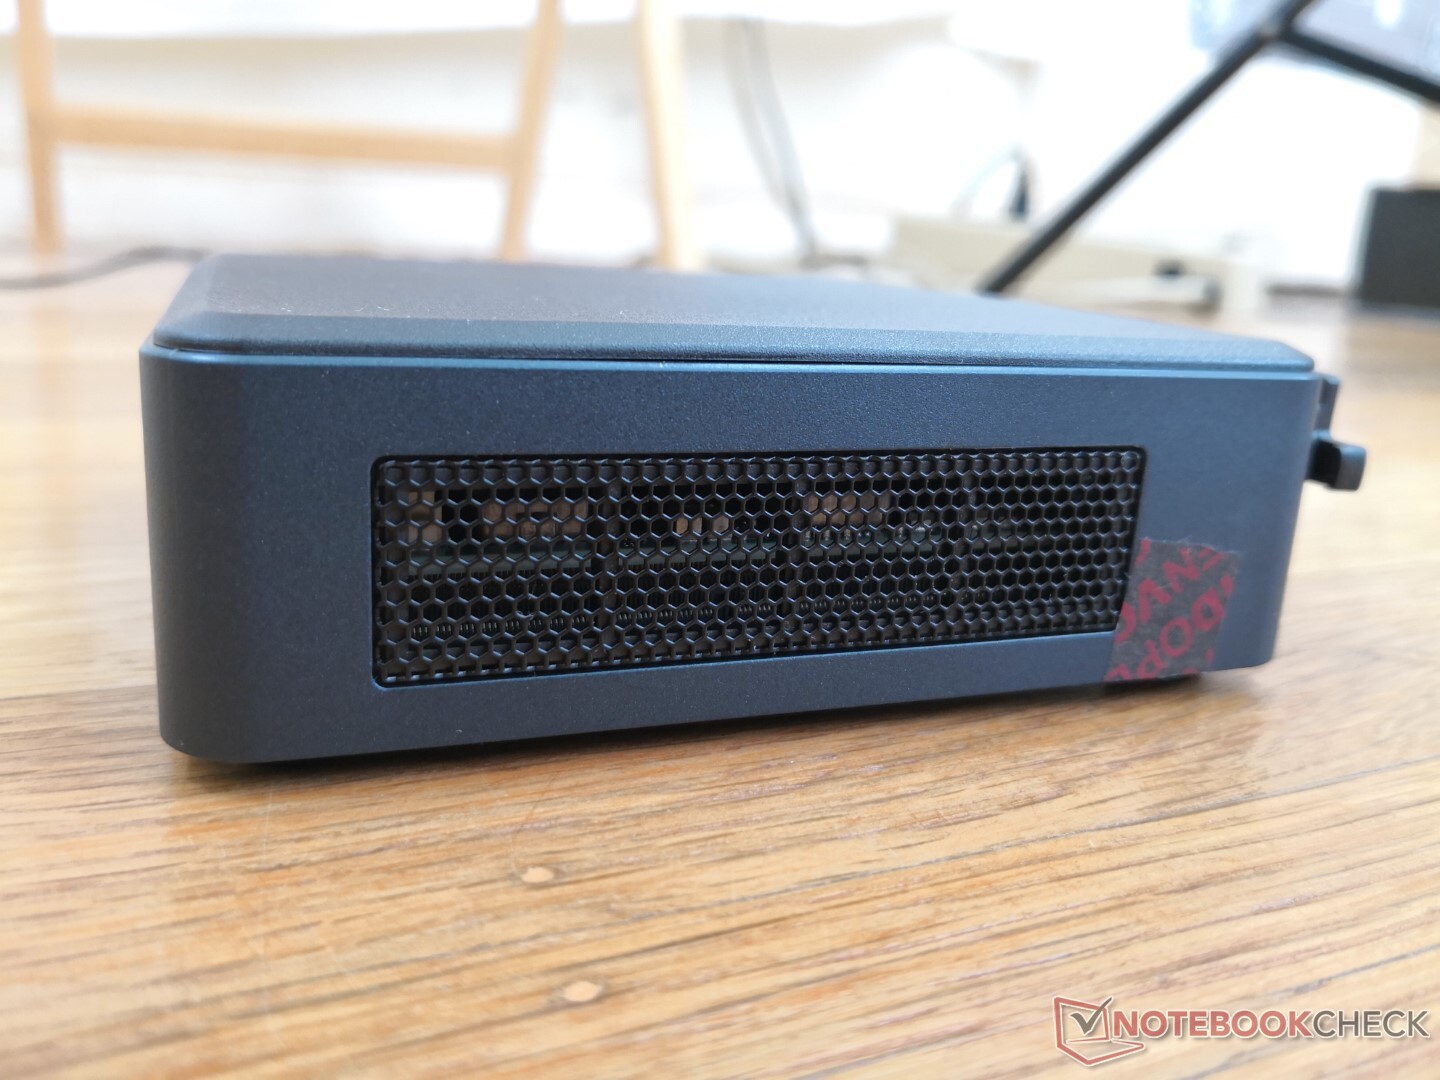
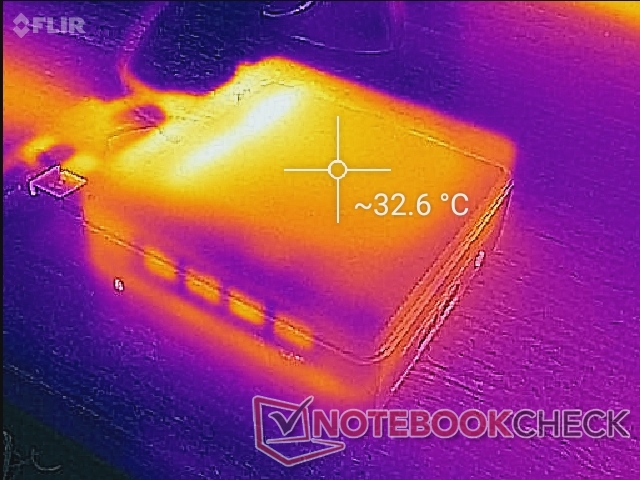
Température
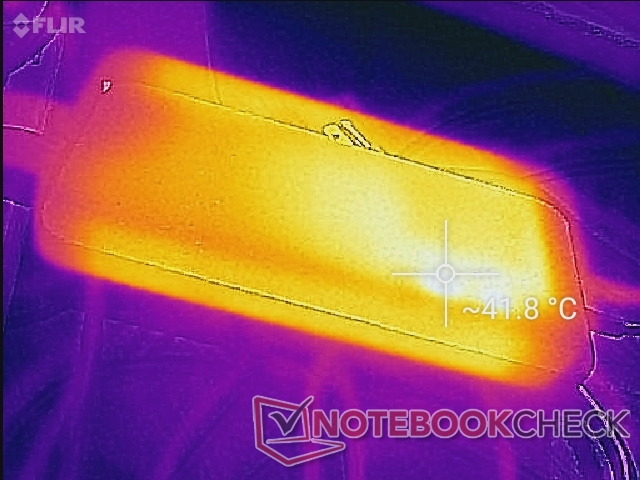
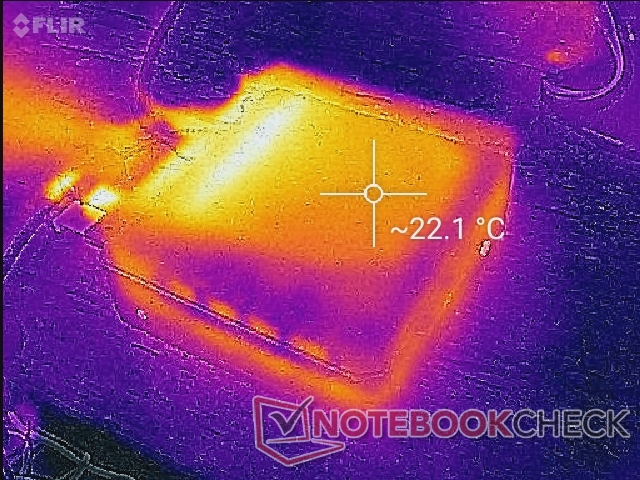
La température de surface varie entre 22 et 27 °C en mode veille et 43 °C en cas de charge de traitement extrême. L'air frais est tiré par les côtés, ce qui signifie que la ventilation sera partiellement bloquée si le NUC est positionné verticalement.
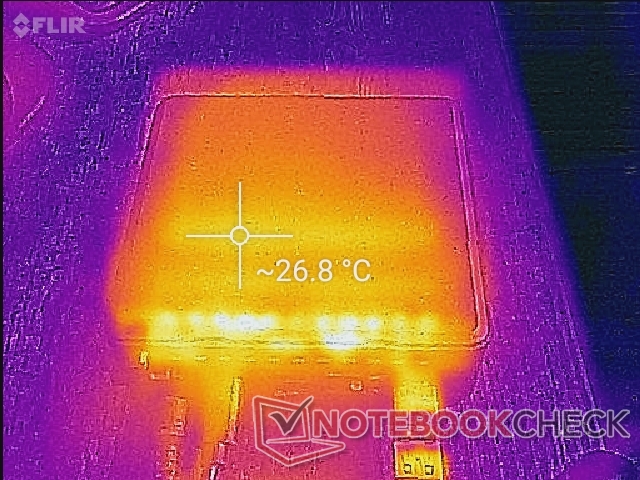
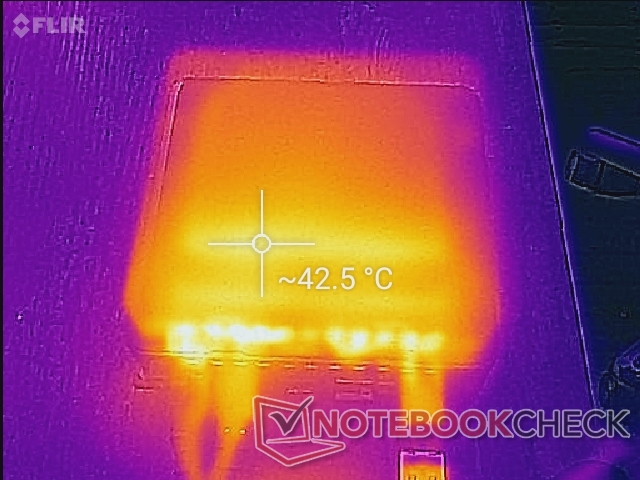
L'adaptateur secteur peut être aussi chaud que le mini PC lui-même, à 42°C, lorsqu'il est en charge.
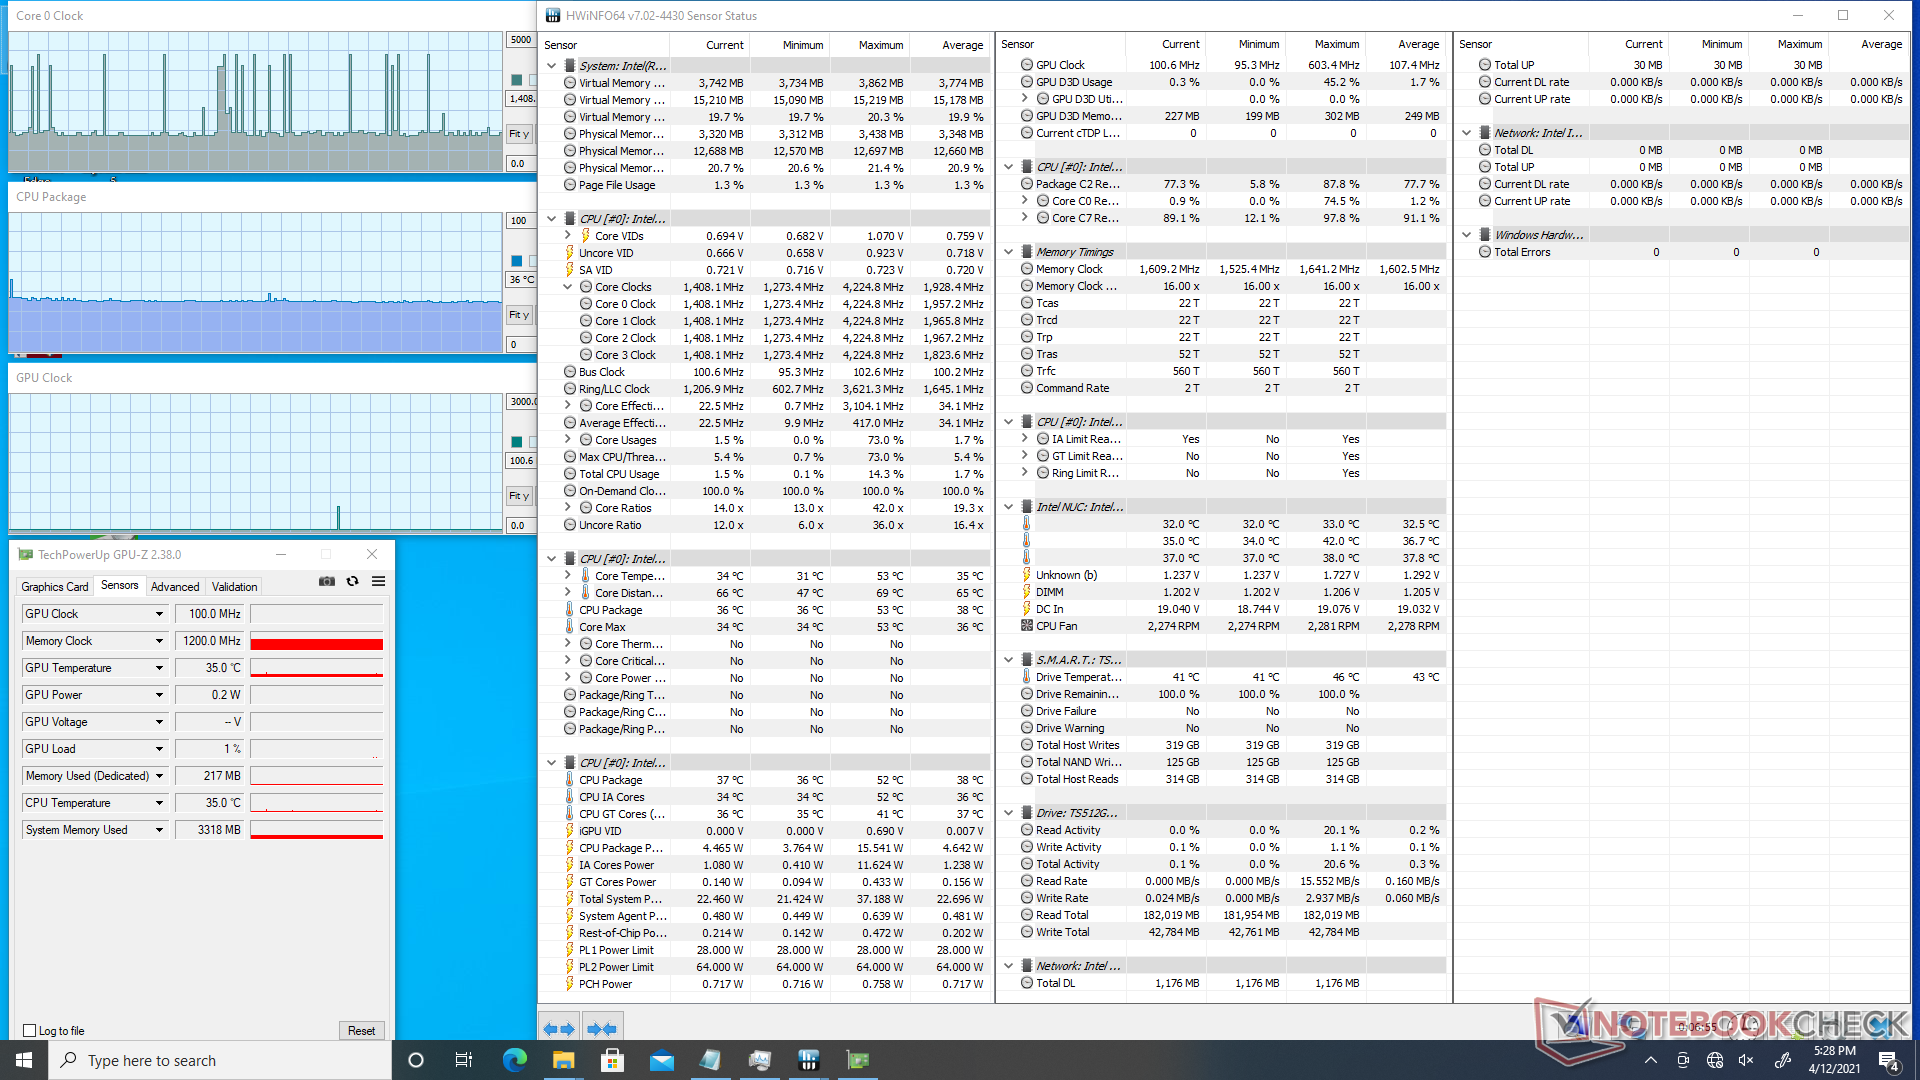
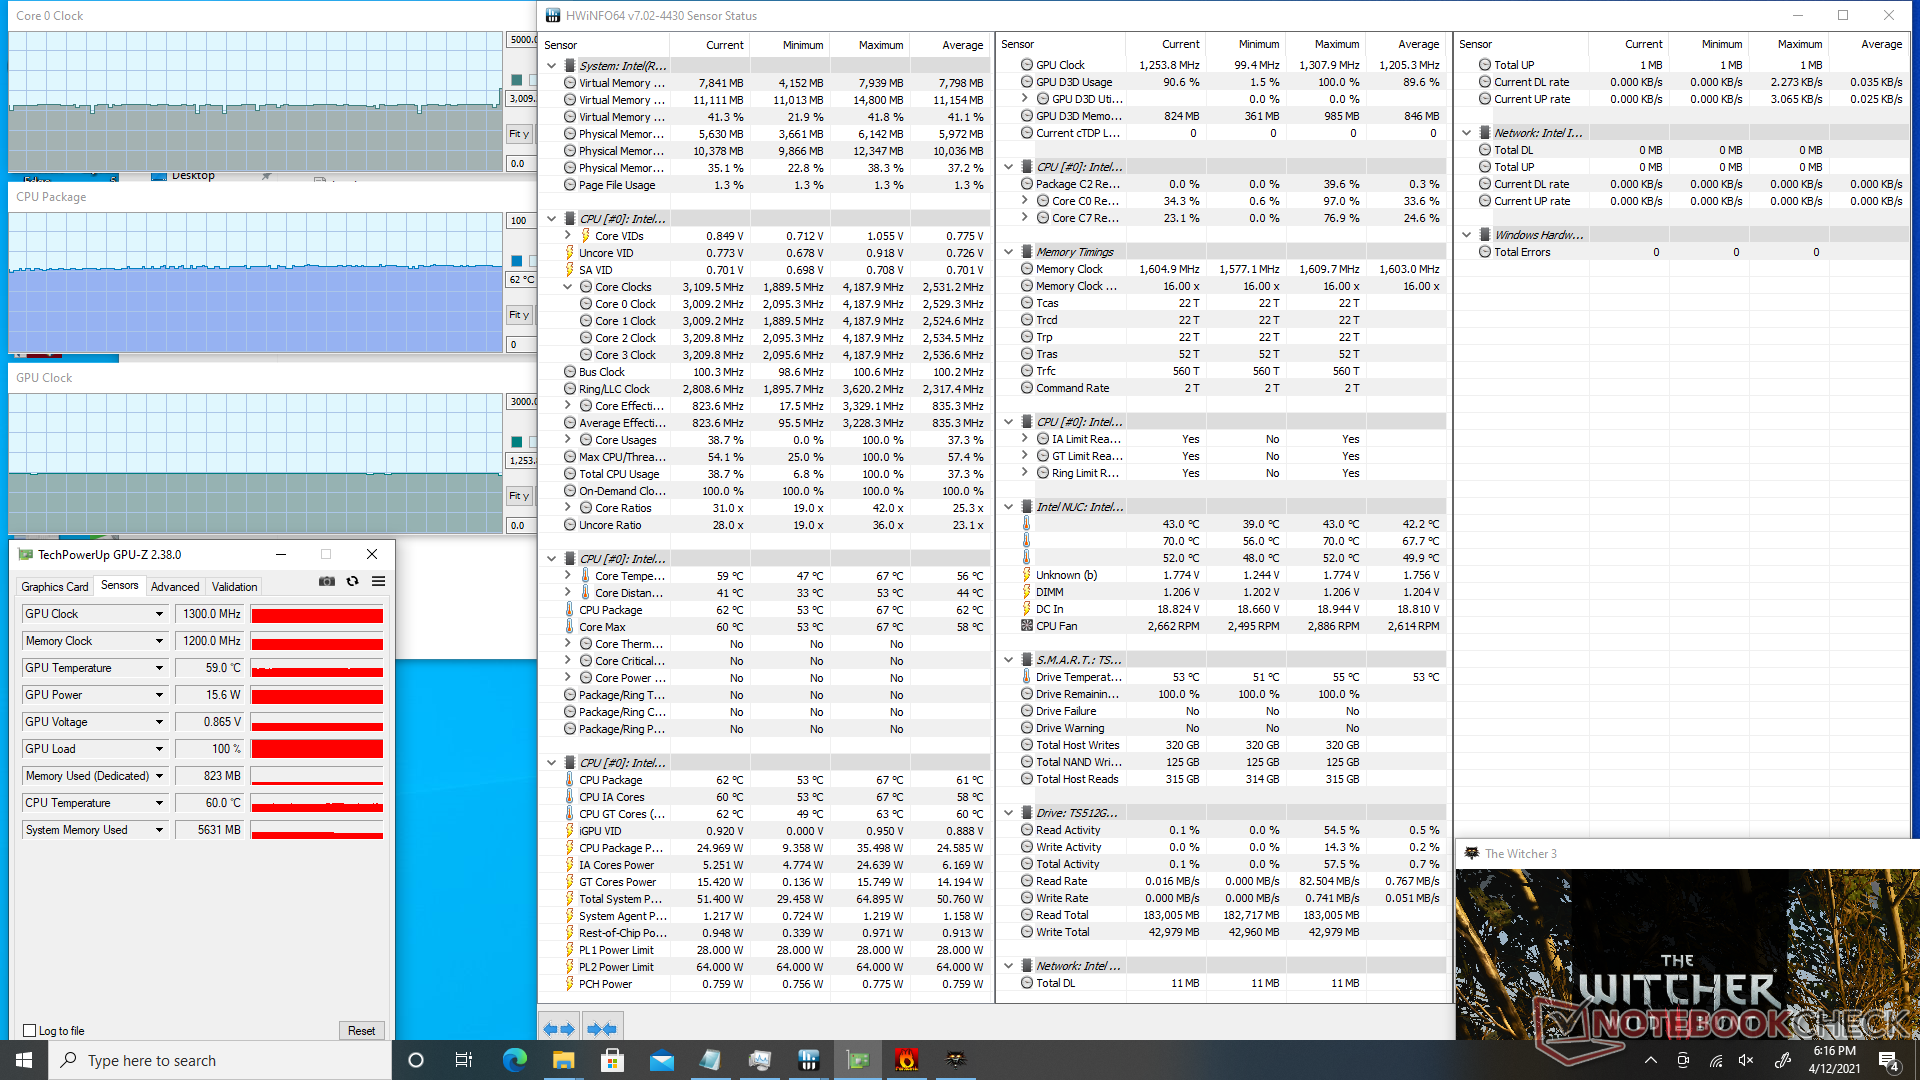
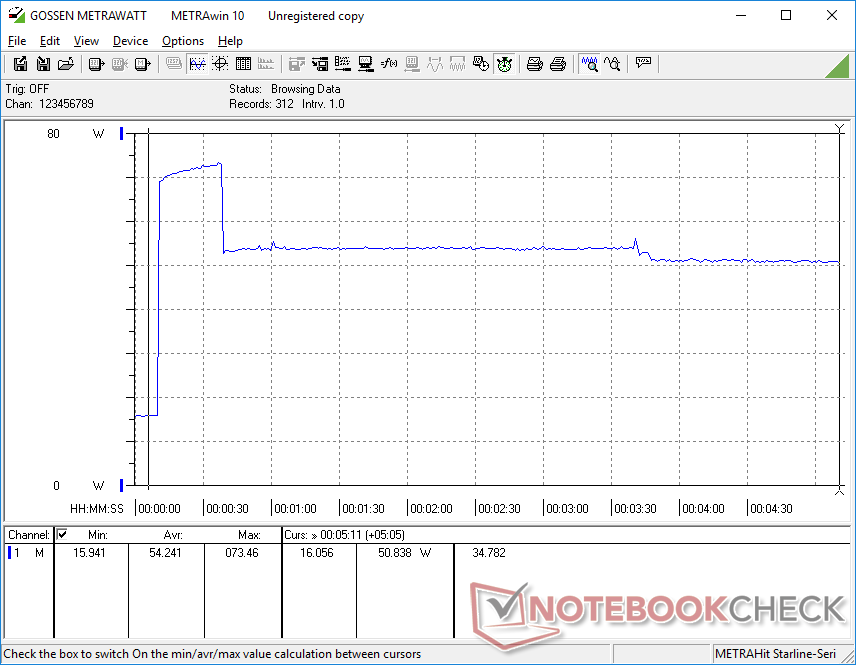
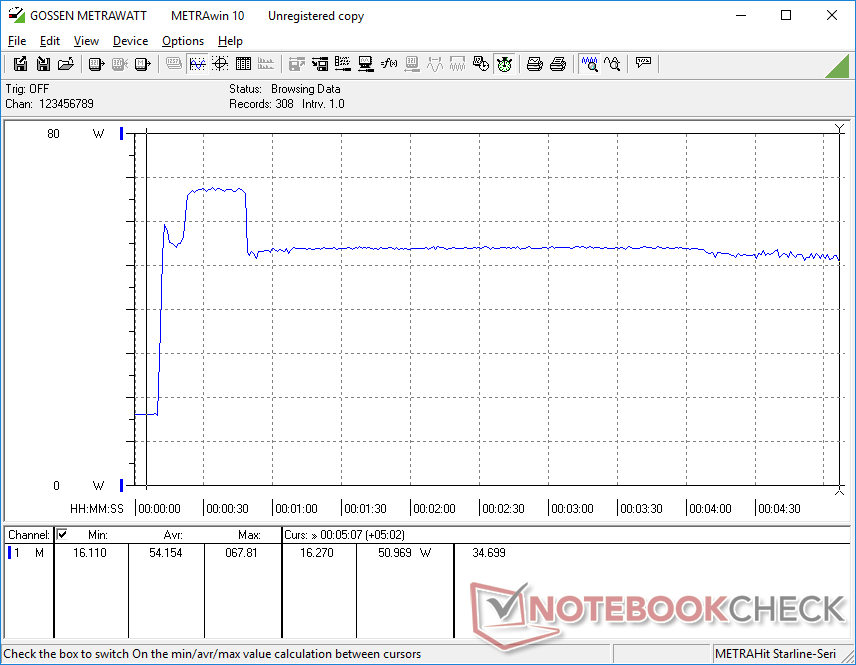
Test de stress
Lors de l'exécution de Prime95, le processeur passe à 3,7 GHz pendant environ 30 secondes jusqu'à ce qu'il atteigne une température centrale de 81 C. Ensuite, les fréquences d'horloge baissent régulièrement et se stabilisent dans la plage de 2,5 à 2,7 GHz afin de maintenir une température centrale plus fraîche de 70 C. La durabilité maximale du Turbo Boost n'est donc pas indéfinie, mais elle est au moins plus longue que celle de nombreux ordinateurs portables équipés du même processeur Core i5-1135G7. Le site Lenovo Yoga 7i 14par exemple, atteindrait 3,8 GHz pendant quelques secondes seulement avant de plafonner dans les mêmes conditions Prime95
Les utilisateurs peuvent s'attendre à ce que les températures du cœur oscillent entre 60 C et 70 C lors de l'exécution de charges exigeantes.
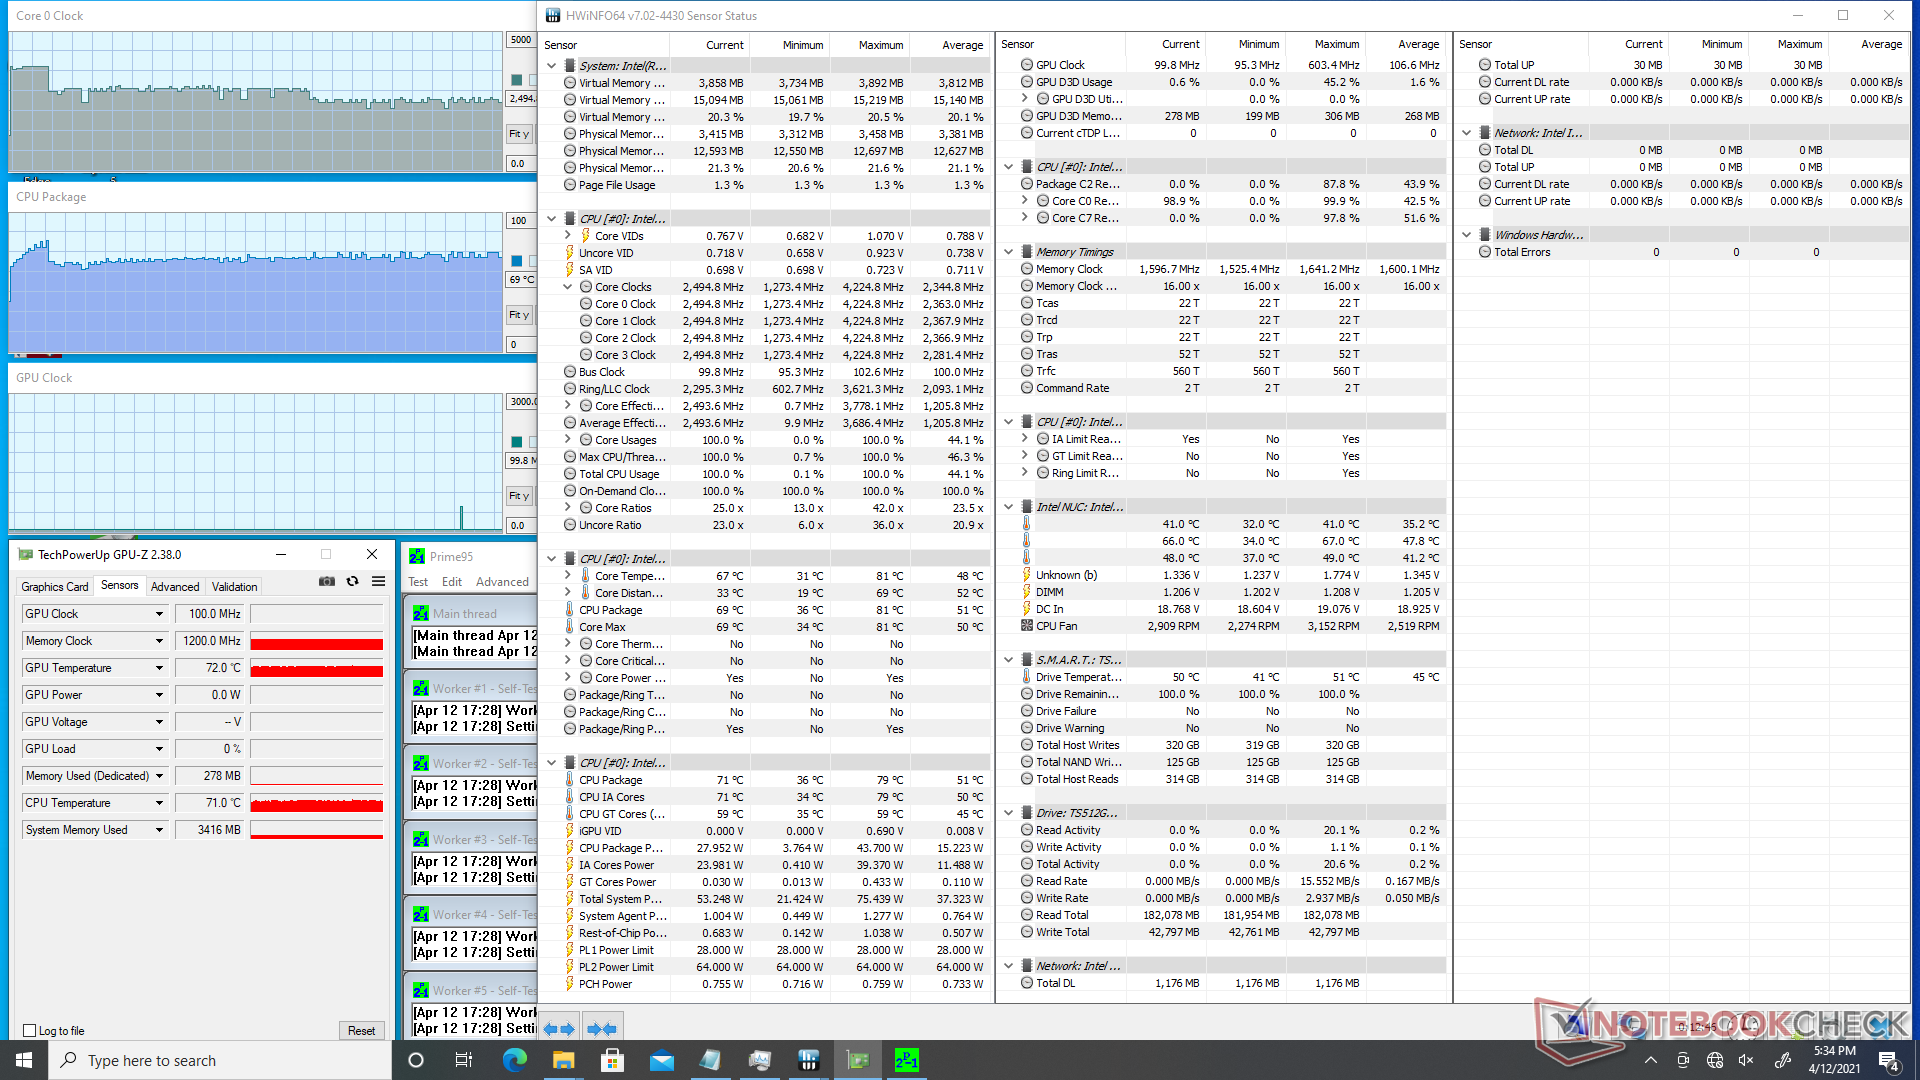
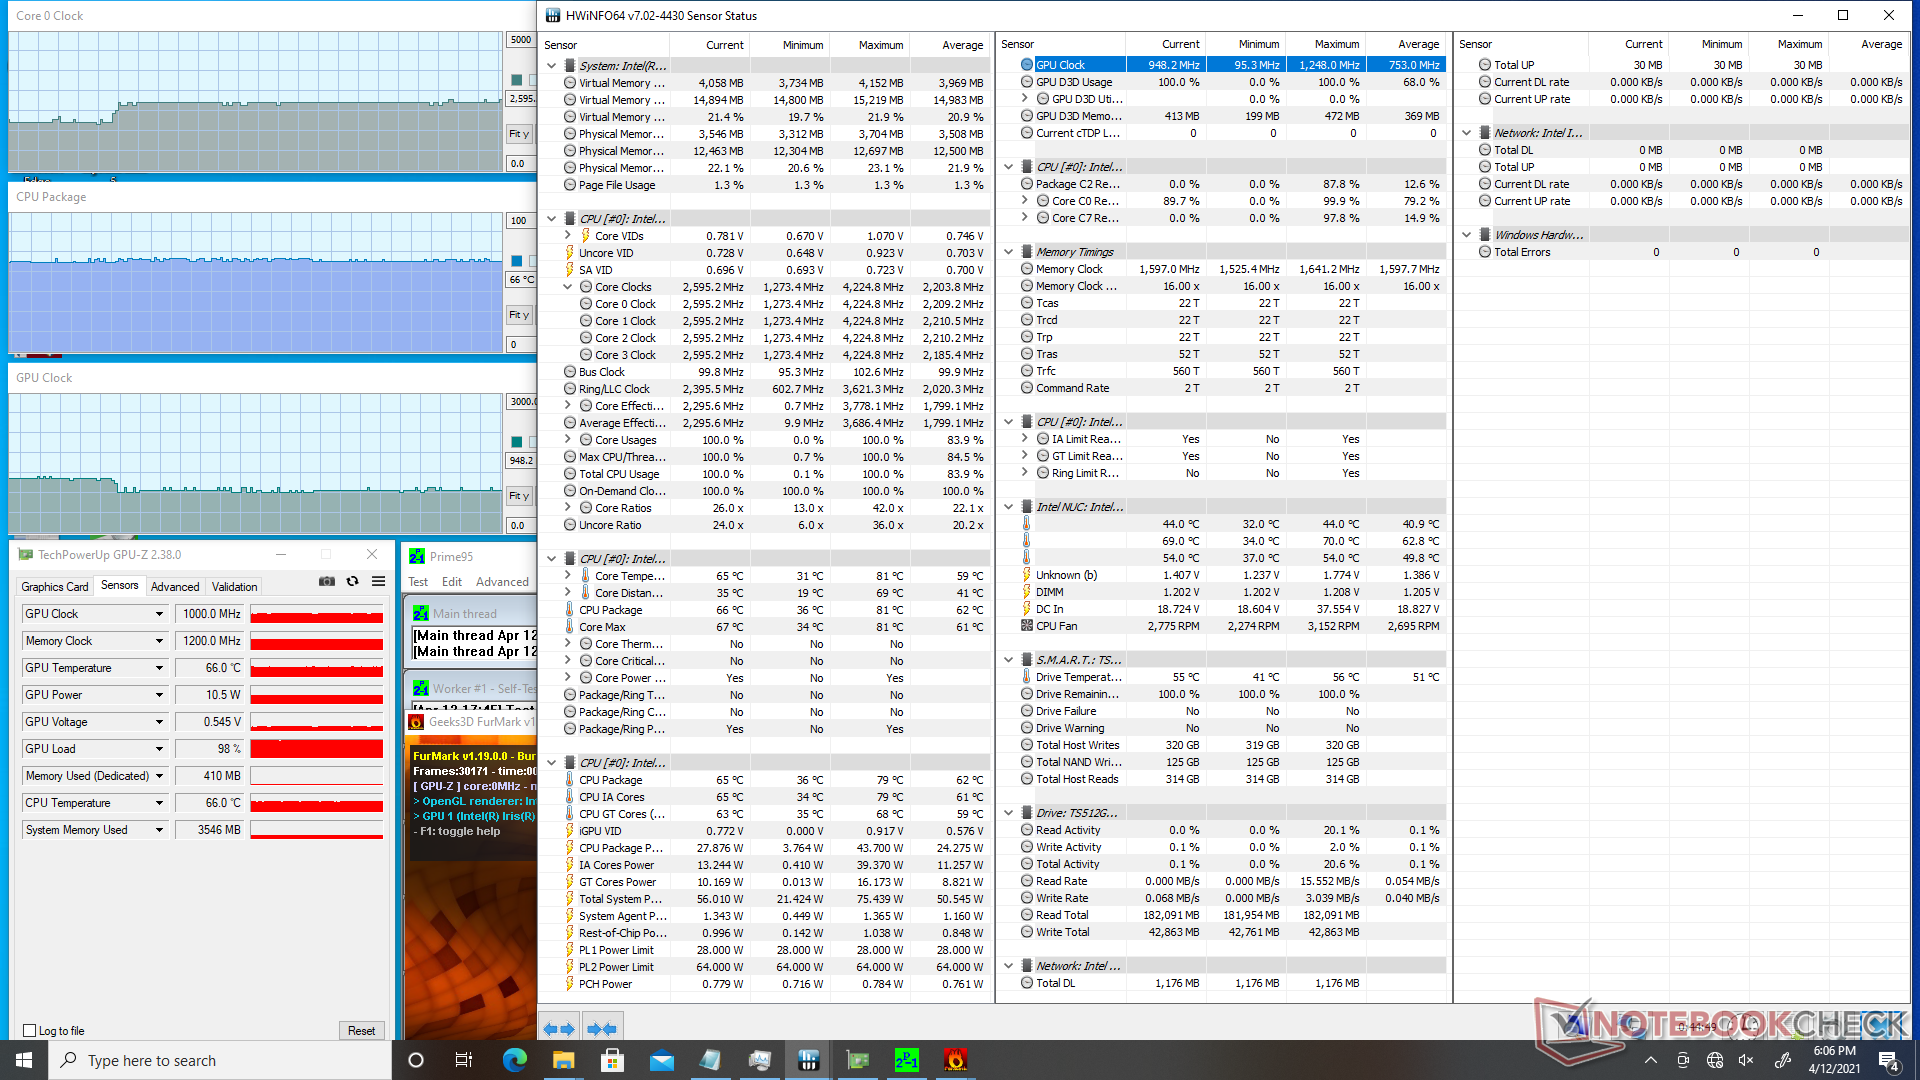
| Fréquence CPU(GHz) | Fréquence GPU(MHz) | Température CPUmoyenne(°C) |
| Système au repos | - | - |
| Prime95 Stress | 2.4 - 2.7 | -- |
| Prime95+ FurMark Stress | 1.8 - 2.6 | 950 - 1200 |
| Witcher 3 Stress | 2.4 | 1300 |
Energy Management
Consommation d'énergie
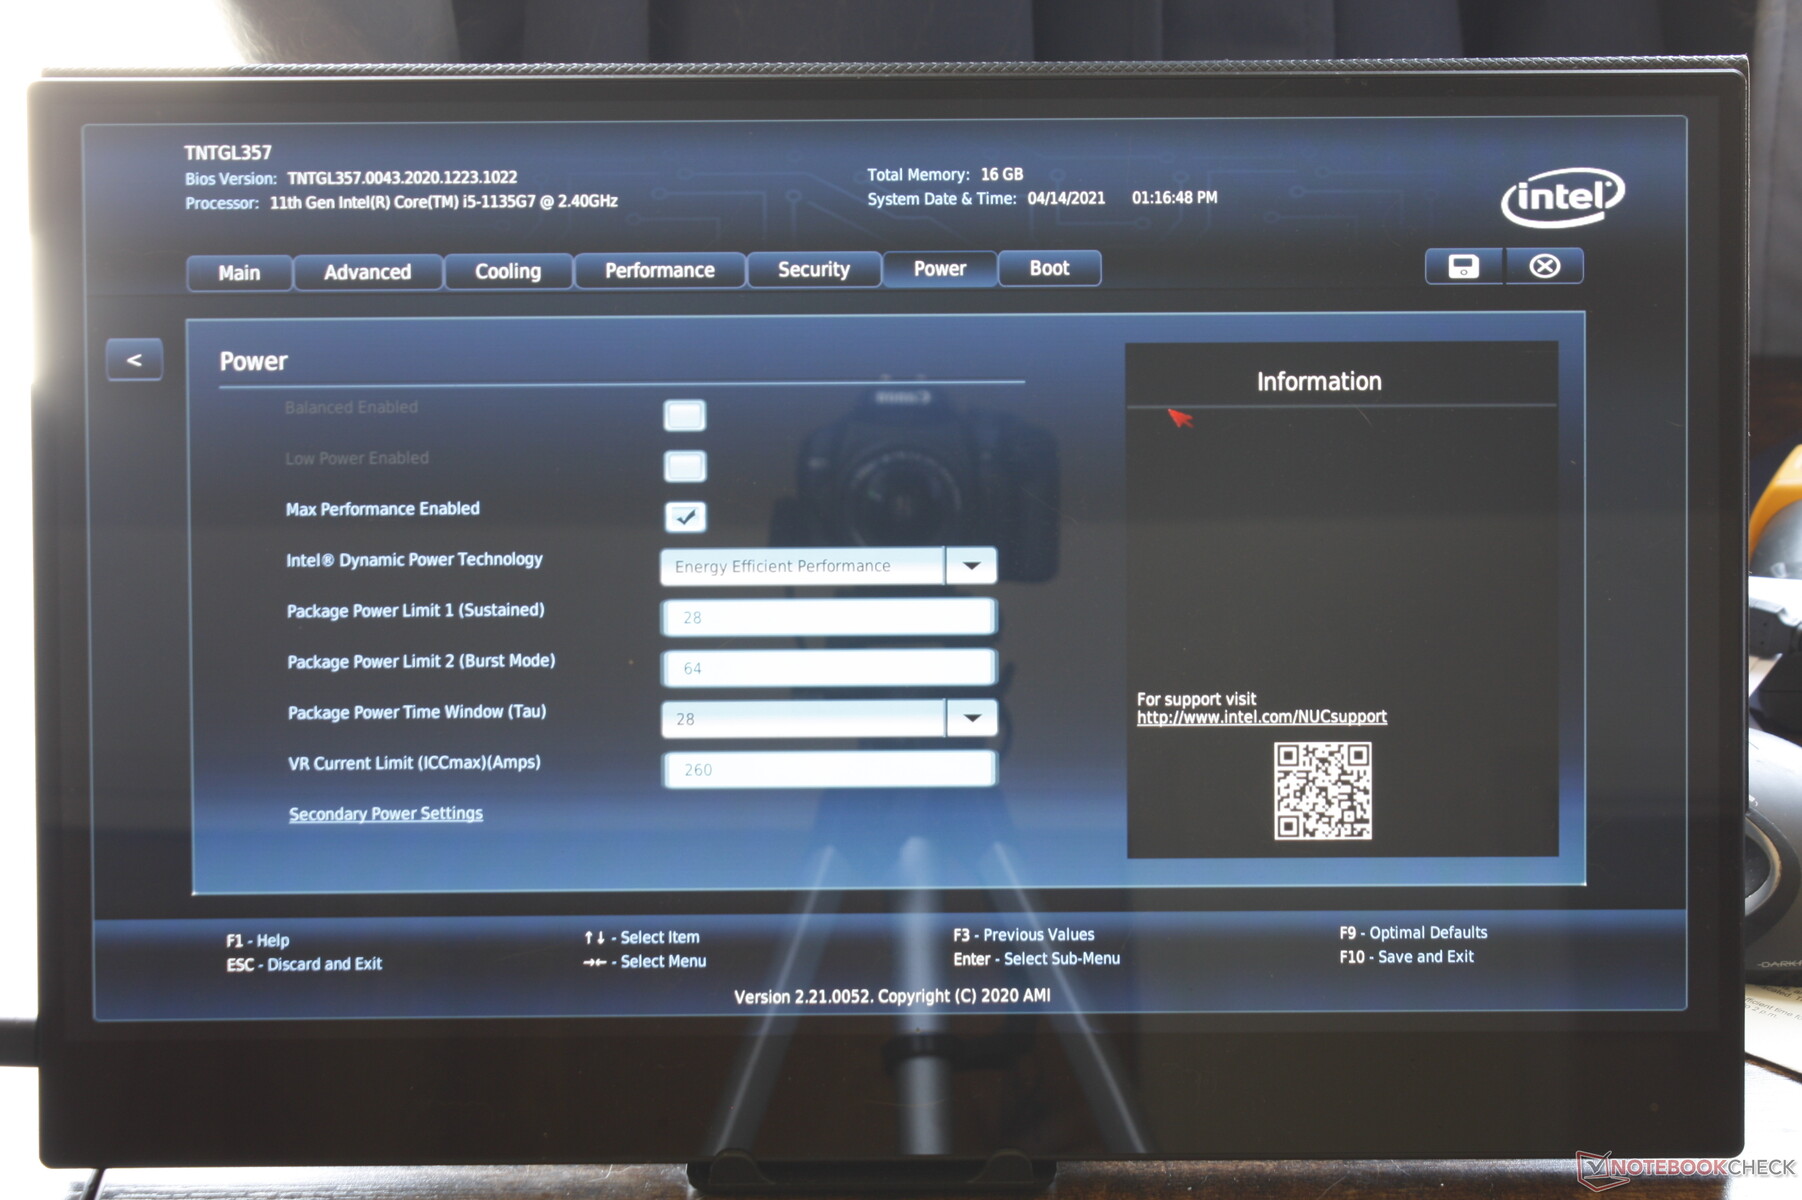
Le NUC11TNKi5 est systématiquement plus gourmand en énergie que le NUC11PAQi7, même si ce dernier est plus rapide et plus grand. Les charges de jeu consomment entre 40 W et 44 W, contre 31 W à 39 W pour le NUC11PAQi7. La consommation peut atteindre 74 W en cas de charges de traitement extrêmes, mais cette consommation n'est que temporaire en raison du Turbo Boost limité du système.
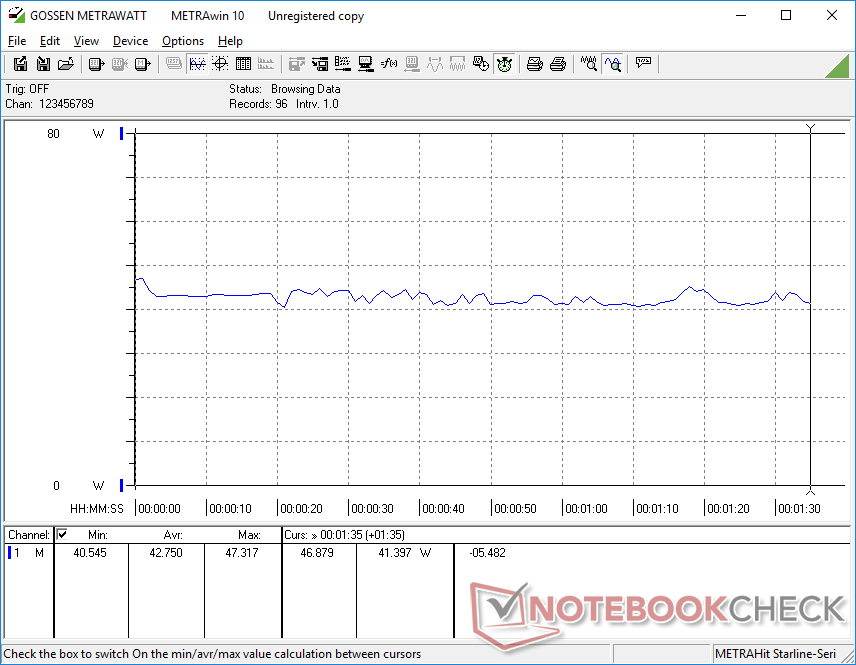
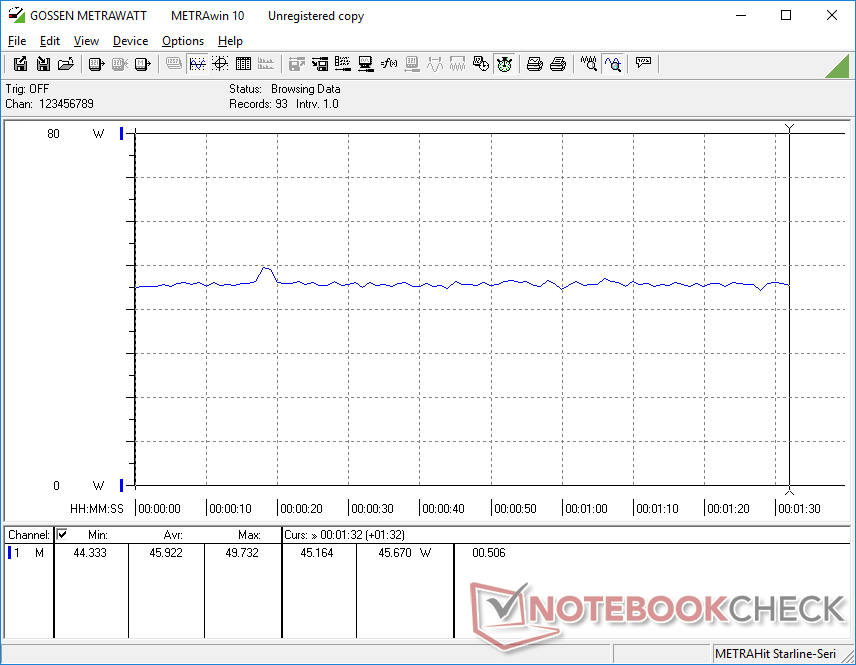
| Éteint/en veille | |
| Au repos | |
| Fortement sollicité |
|
Légende:
min: | |
| Intel NUC11TNKi5 | GMK NucBox 2 | Intel NUC11PAQi7 | Intel NUC10i5FNK | Beelink SEi10 | Zotac ZBOX MI642 Nano | |
|---|---|---|---|---|---|---|
| Power Consumption | 30% | 31% | -4% | 42% | 23% | |
| Idle Minimum * (Watt) | 11.5 | 6.1 47% | 5.6 51% | 6.3 45% | 8.9 23% | |
| Idle Average * (Watt) | 12.4 | 6.8 45% | 5.6 55% | 15.7 -27% | 6.6 47% | 9 27% |
| Idle Maximum * (Watt) | 12.9 | 7.3 43% | 6 53% | 6.7 48% | 9.9 23% | |
| Load Average * (Watt) | 40.7 | 46.3 -14% | 31.4 23% | 25.9 36% | 33 19% | |
| Witcher 3 ultra * (Watt) | 43.9 | 39 11% | ||||
| Load Maximum * (Watt) | 73.5 | 50.7 31% | 80.5 -10% | 58.6 20% | 46.7 36% | 58 21% |
* ... Moindre est la valeur, meilleures sont les performances
Points positifs
Points négatifs
Verdict
Le prix a toujours été une bataille difficile pour la série NUC. Le NUC11TNKi5 avec 4 Go de RAM, pas de système d'exploitation et pas de stockage se vend 670 $ US, contre 500 $ US pour le GMK NucBox 2 avec 8 Go de RAM, le système d'exploitation Windows 10 et un SSD NVMe de 256 Go. Encore moins cher, le Beelink SEi10 coûte 400 $ avec 8 Go de RAM, 256 Go de SSD NVMe et même un support Thunderbolt 3. Pour que le NUC 11 Pro en vaille vraiment la peine, les utilisateurs devront exploiter les performances relativement élevées du processeur et apprécier à la fois la garantie constructeur de trois ans et la qualité de construction solide. Sinon, les GMK ou Beelink susmentionnés fonctionneront tout aussi bien pour les environnements HTPC à faible puissance ou le streaming 4K.
Ce n'est pas exactement bon marché, mais les utilisateurs obtiennent un mini PC mince de première classe avec le dernier CPU de 11e génération et tous ses avantages en termes de performances.
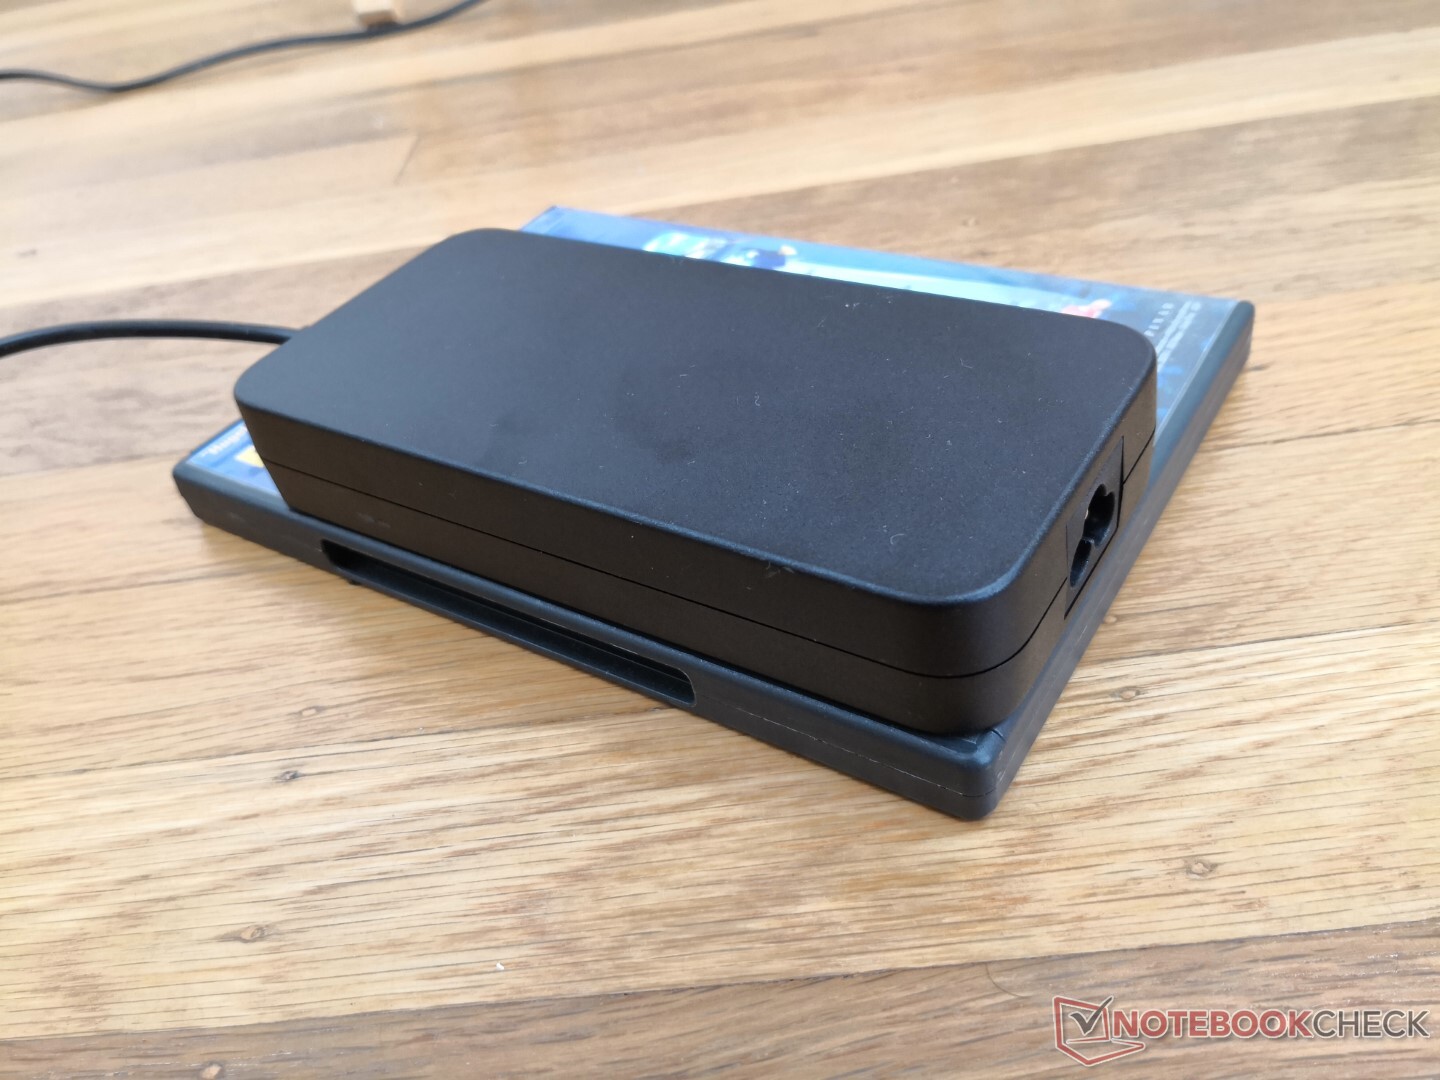
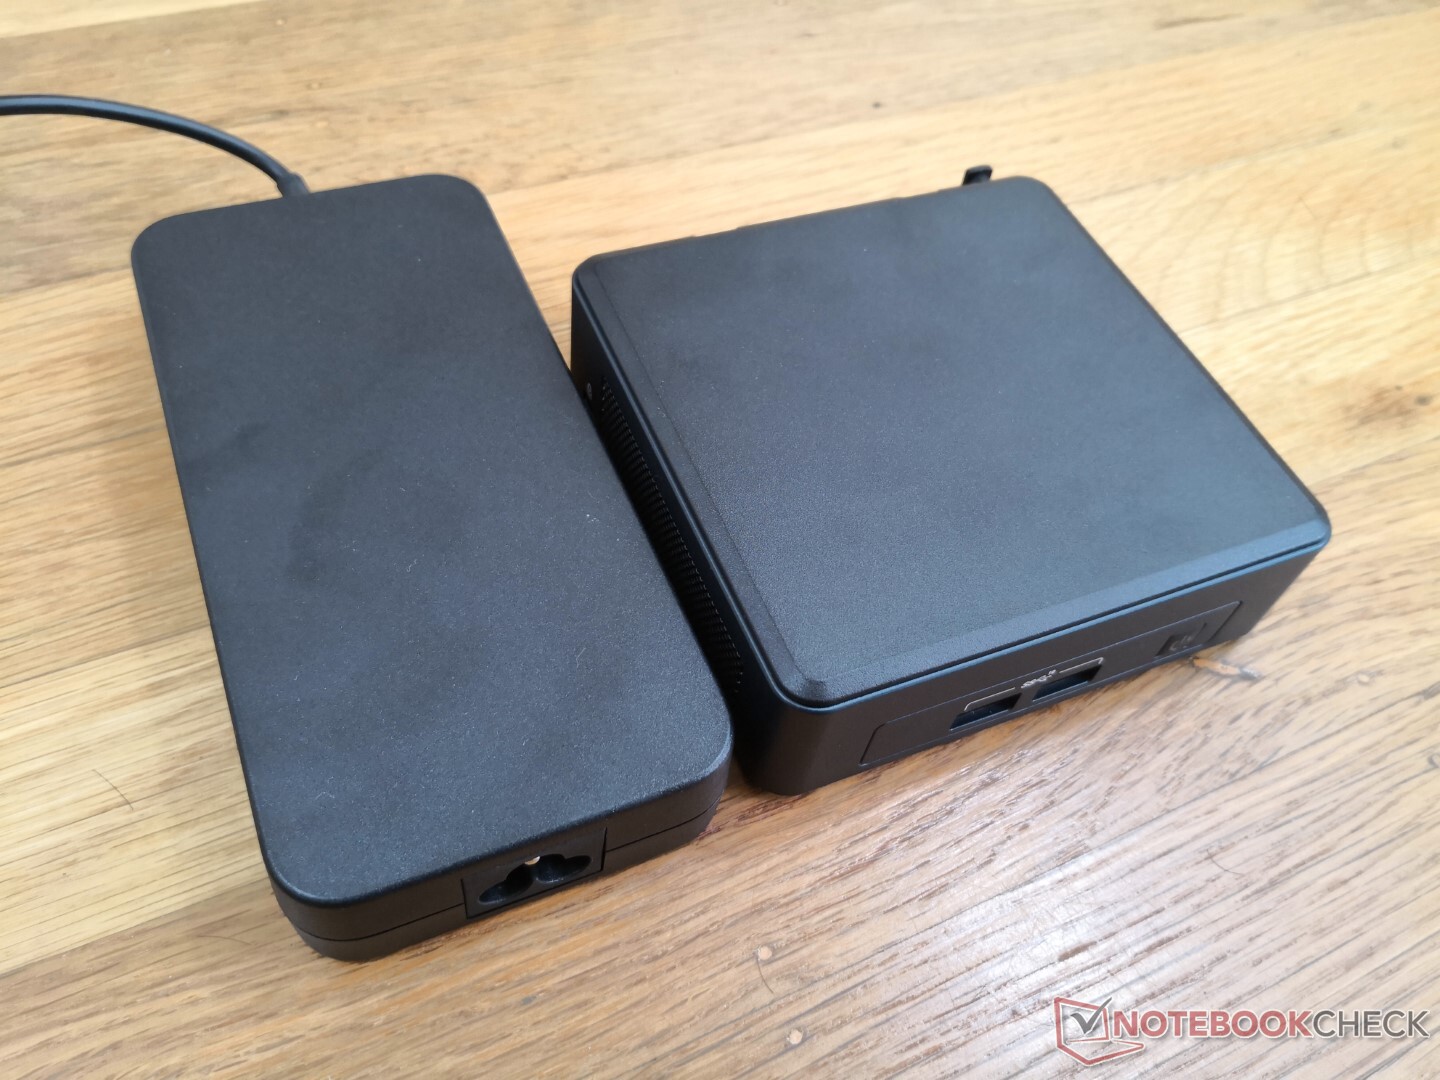
Pour l'inévitable "NUC 12 Pro", nous aimerions voir USB-C Power Delivery et un adaptateur secteur plus petit. L'USB-C PD permettrait aux adaptateurs secteur USB-C tiers de réduire la dépendance aux adaptateurs propriétaires d'Intel. L'adaptateur Intel surdimensionné de 120 W est aussi grand que l'adaptateur de l'ordinateur portable de jeu MSI GP66, ce qui est absurde pour un mini-PC alimenté par un Core U.
Prix et disponibilité
L'Intel NUC 11 Pro sera largement disponible dans les semaines qui suivront cet article. Au moins un détaillant en ligne a déjà expédié la configuration Core i7 du modèle est déjà en train de livrer la configuration Core i7 du modèle
Price comparison

