Test du MSI Bravo 15 B5DD : performances de la Radeon RX 5500M en berne au vu du prix
Le Bravo 15 B5DD de MSI est une mise à jour du Bravo 15 A4DCR de 2020. Bien que leurs noms puissent être assez similaires, le nouveau modèle porte un châssis redessiné avec des processeurs AMD plus récents tout en maintenant un prix bas attrayant de 700 à 900 dollars américains
Les SKU actuels sont équipés du processeur Ryzen 5 5600H ou Ryzen 7 5800H avec différents niveaux de stockage ou de RAM. Toutes les configurations sont équipées de la même dalle FHD 144 Hz et du même GPU Radeon RX 5500M, sans autres options
Les concurrents dans cet espace comprennent d'autres ordinateurs portables de jeu d'entrée de gamme de 15,6 pouces comme le Asus TUF Gaming F15, Lenovo Legion 5 15, La série Dell G15ou le HP Pavilion Gaming 15
Plus de commentaires sur MSI :
Potential Competitors in Comparison
Note | Date | Modèle | Poids | Épaisseur | Taille | Résolution | Prix |
|---|---|---|---|---|---|---|---|
| 78.2 % v7 (old) | 04/22 | MSI Bravo 15 B5DD-010US R5 5600H, Radeon RX 5500M | 2.3 kg | 24.95 mm | 15.60" | 1920x1080 | |
| 79.5 % v7 (old) | 08/20 | MSI Bravo 15 A4DCR R7 4800H, Radeon RX 5300M | 2 kg | 22 mm | 15.60" | 1920x1080 | |
| 87.2 % v7 (old) | 03/22 | Asus TUF Gaming F15 FX507ZM i7-12700H, GeForce RTX 3060 Laptop GPU | 2.1 kg | 24.95 mm | 15.60" | 1920x1080 | |
| 82.7 % v7 (old) | 10/21 | Dell G15 5515 R7 5800H, GeForce RTX 3050 Ti Laptop GPU | 2.4 kg | 24.9 mm | 15.60" | 1920x1080 | |
| 79.7 % v7 (old) | 03/22 | Lenovo Ideapad Gaming 3 15IHU-82K1002RGE i5-11300H, GeForce RTX 3050 Ti Laptop GPU | 2 kg | 24.2 mm | 15.60" | 1920x1080 | |
| 82.2 % v7 (old) | 08/21 | Acer Nitro 5 AN515-45-R1JH R7 5800H, GeForce RTX 3070 Laptop GPU | 2.3 kg | 23.9 mm | 15.60" | 2560x1440 |
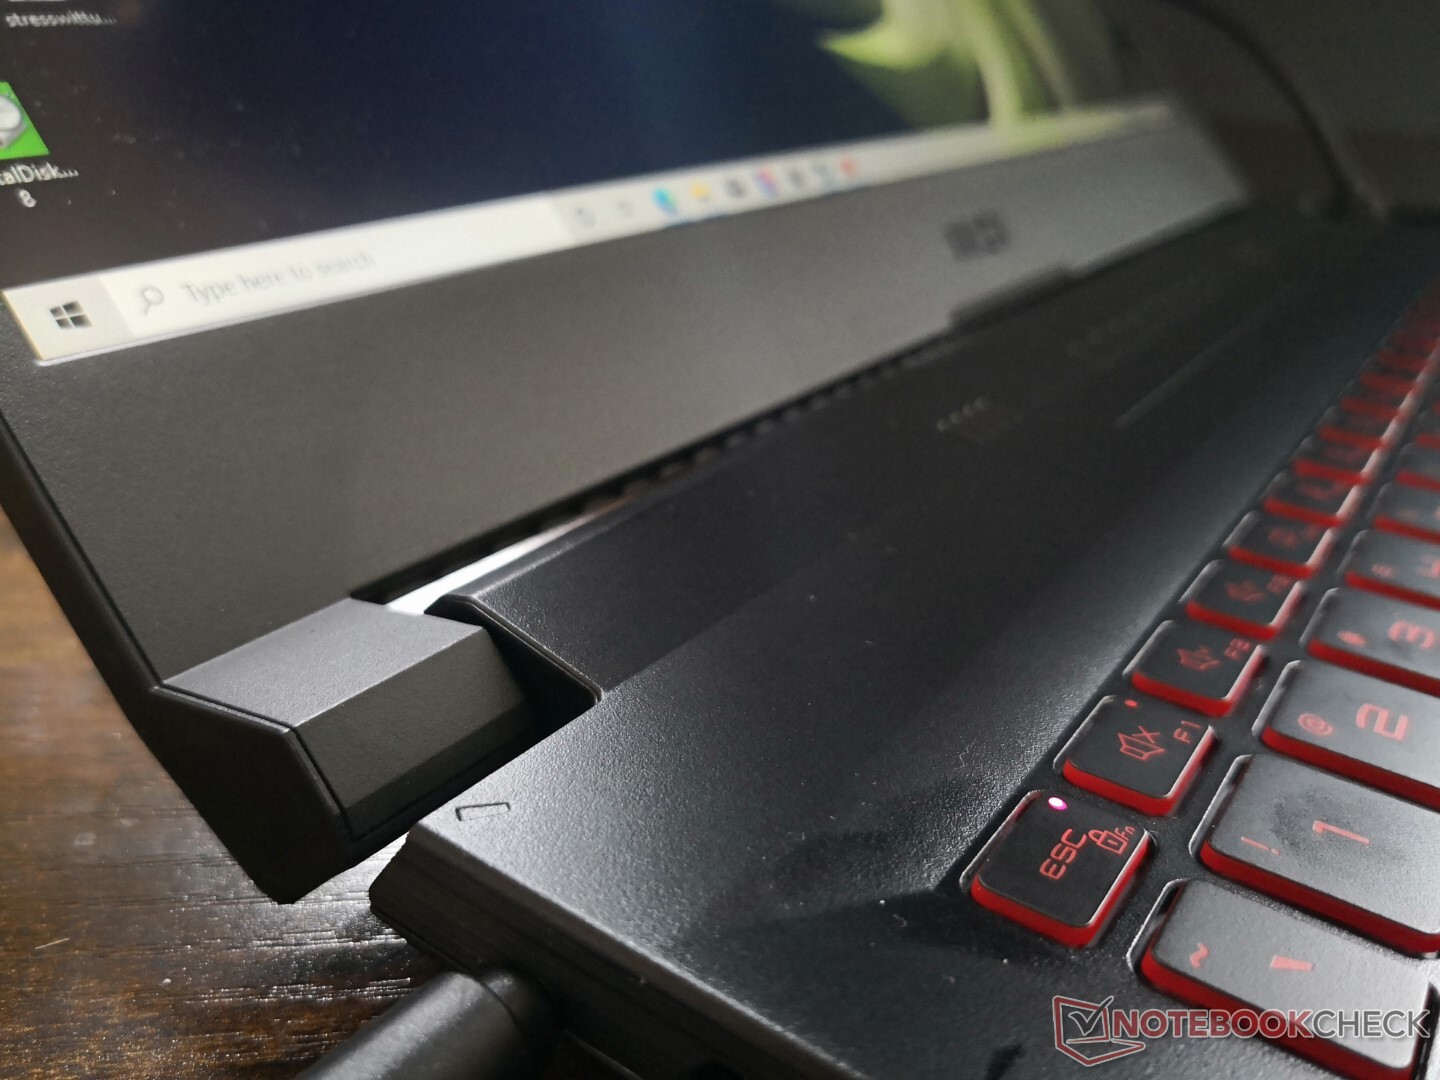
Cas - Du plastique partout
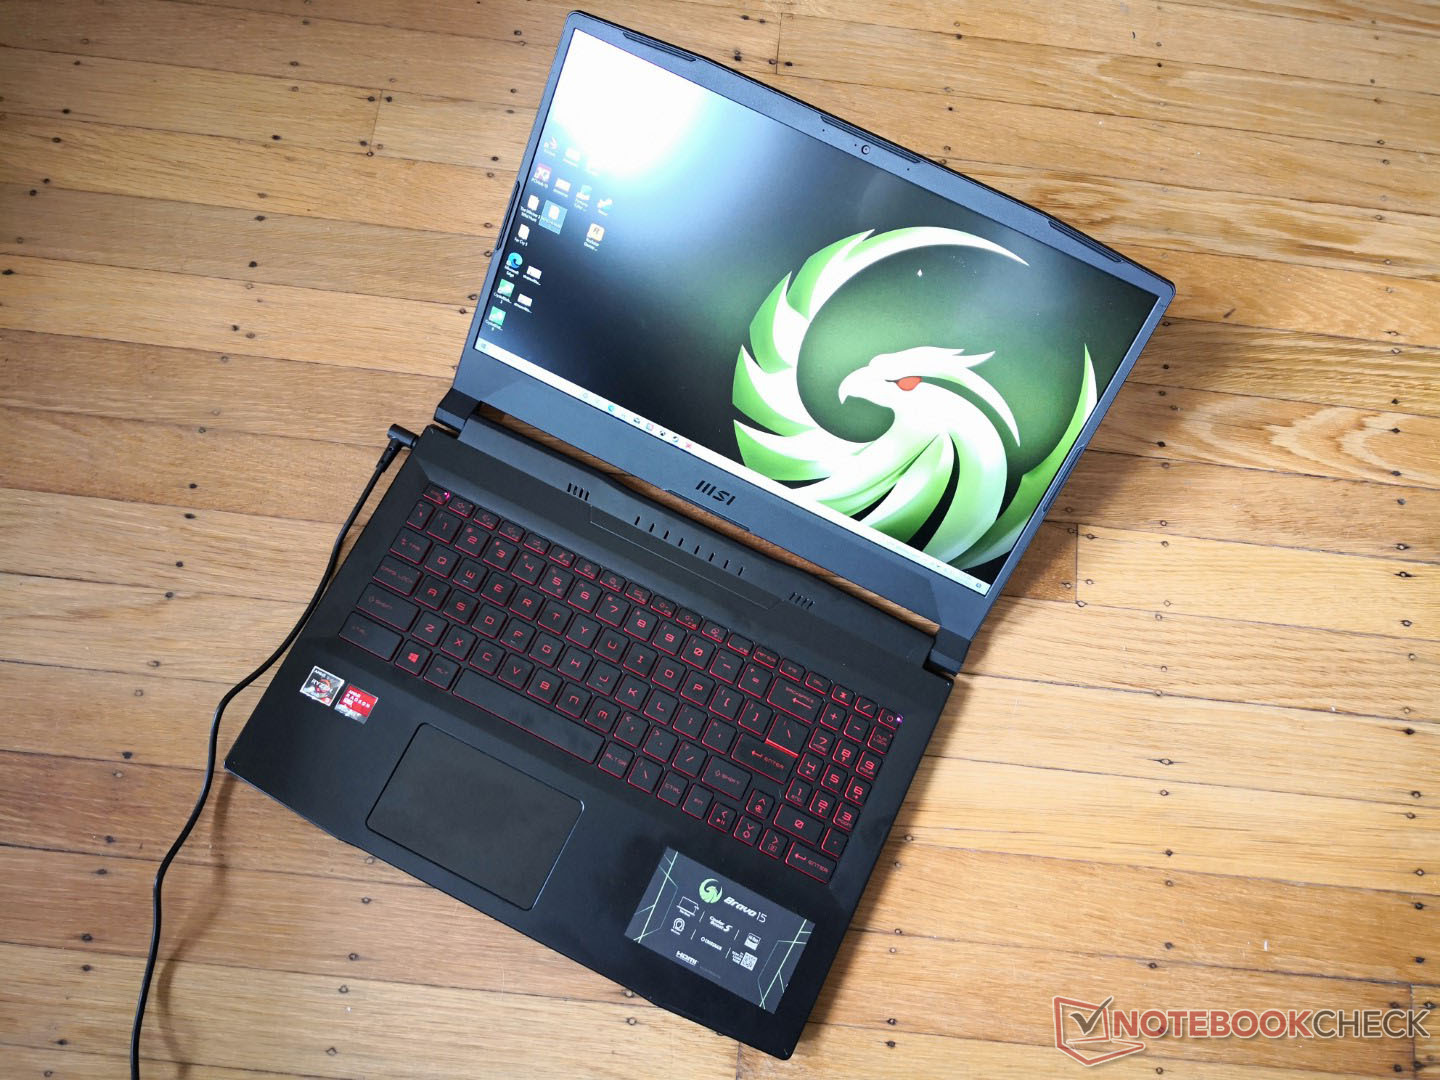
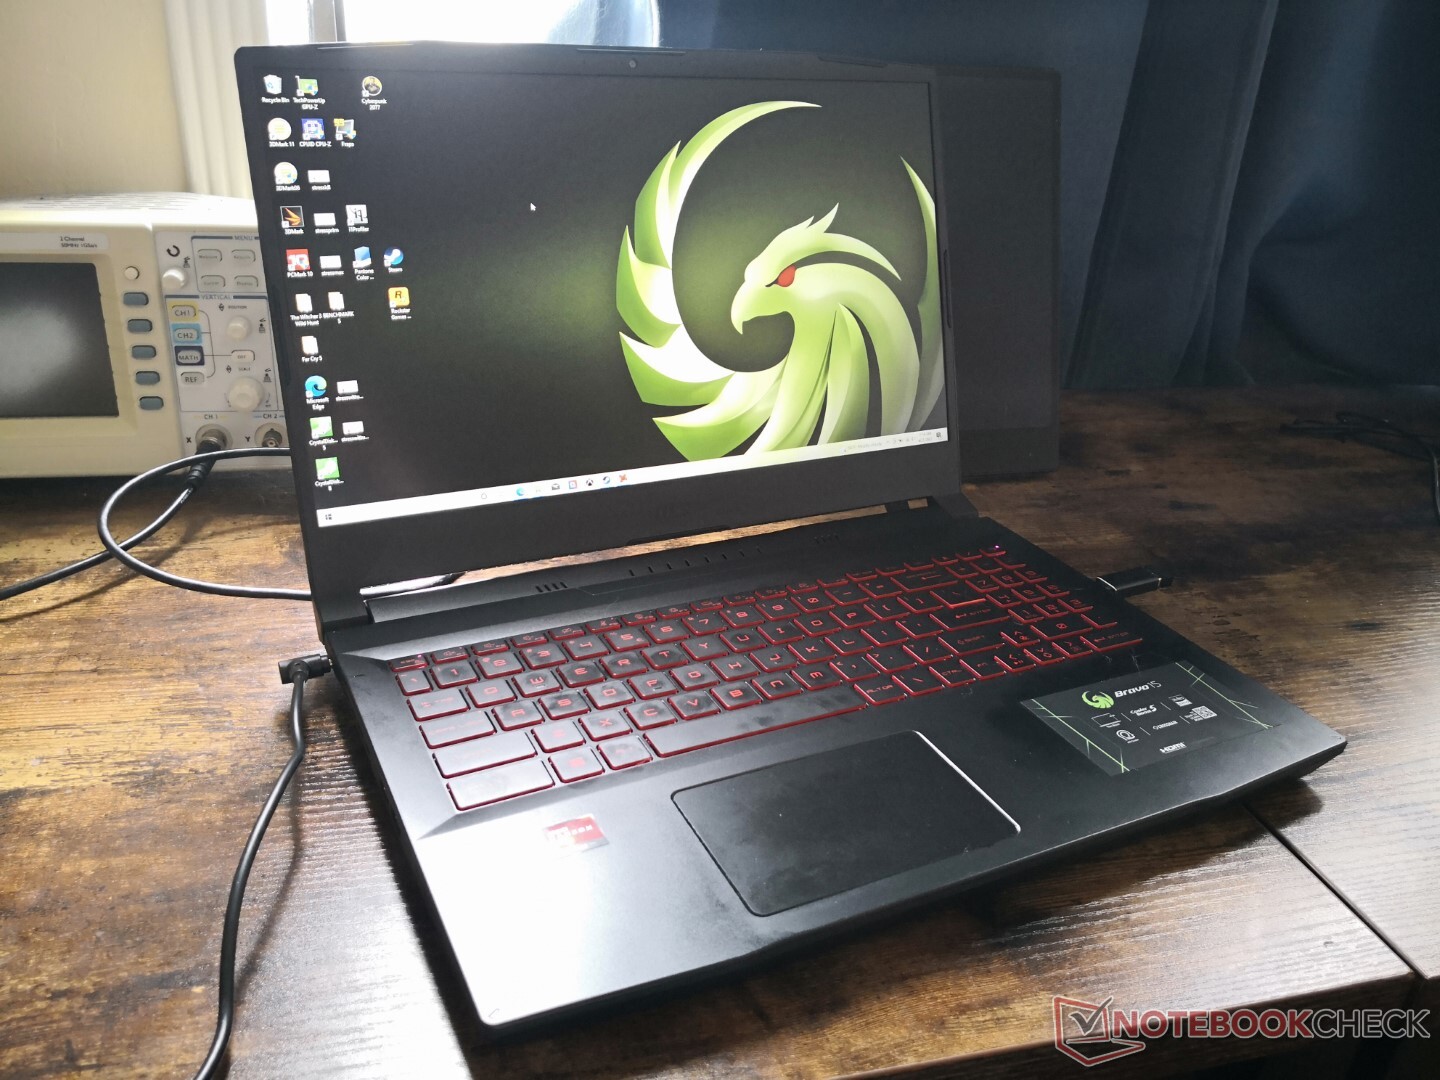
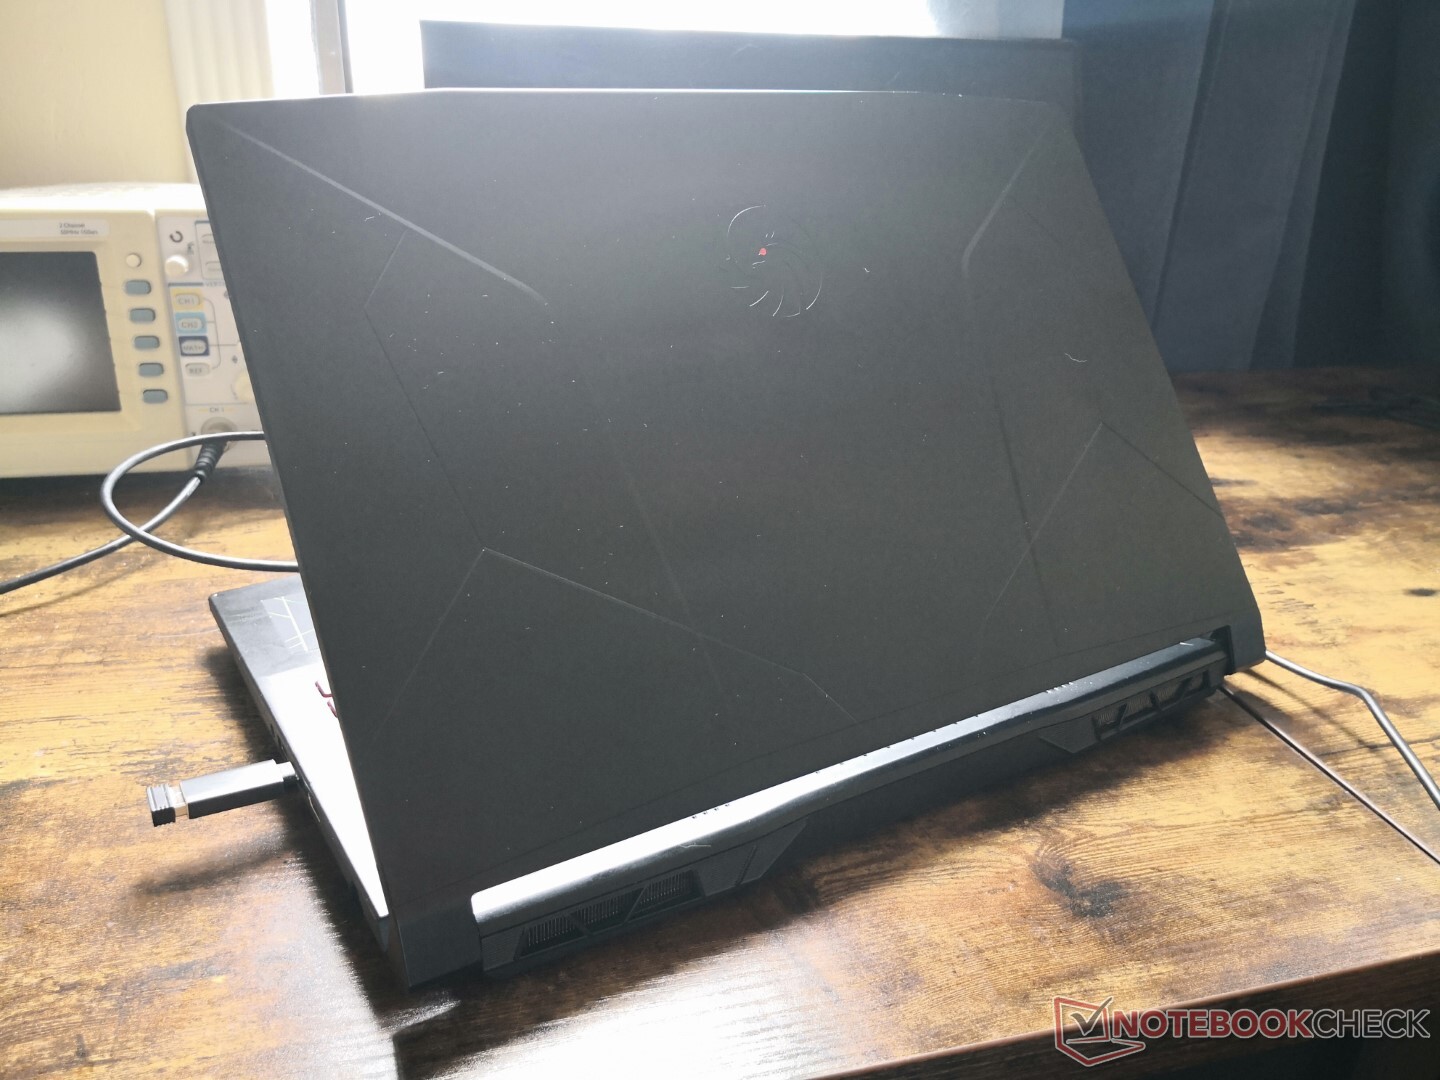
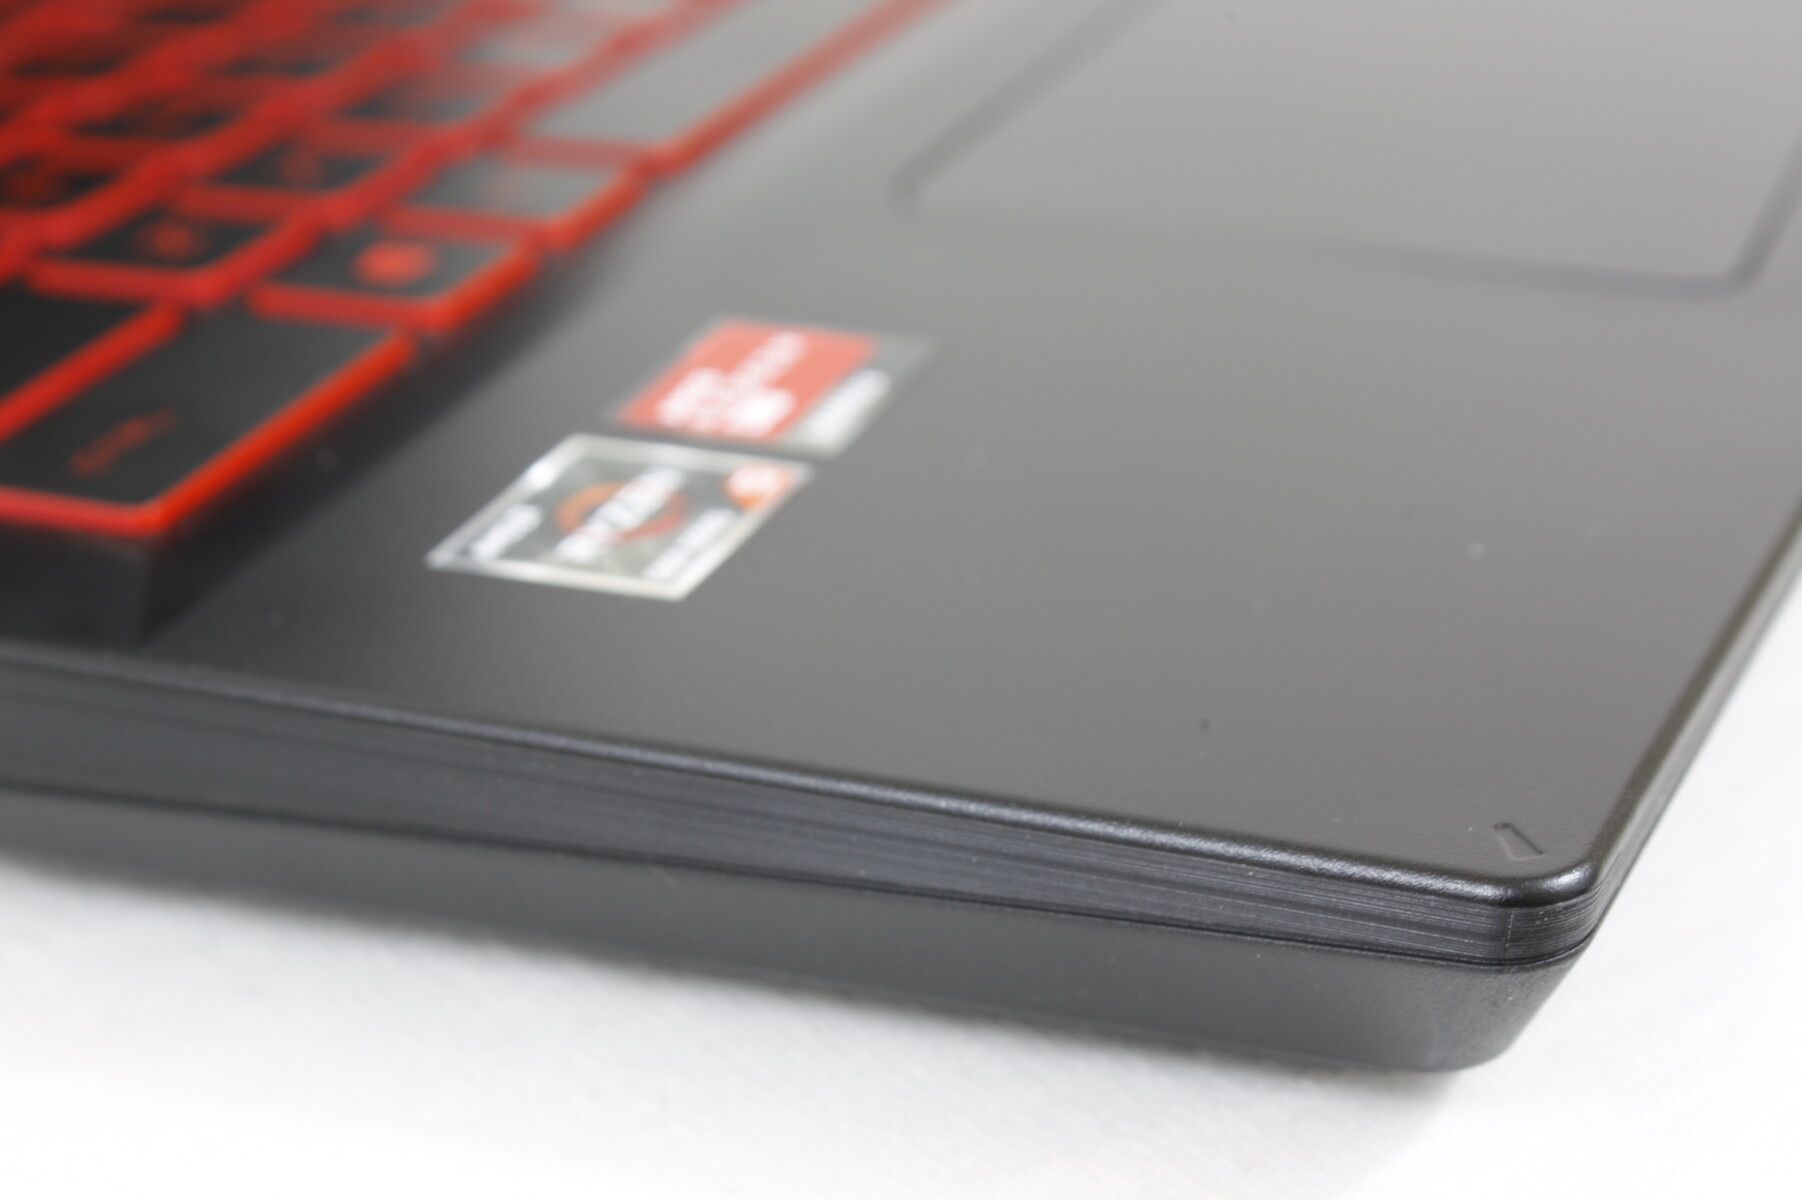
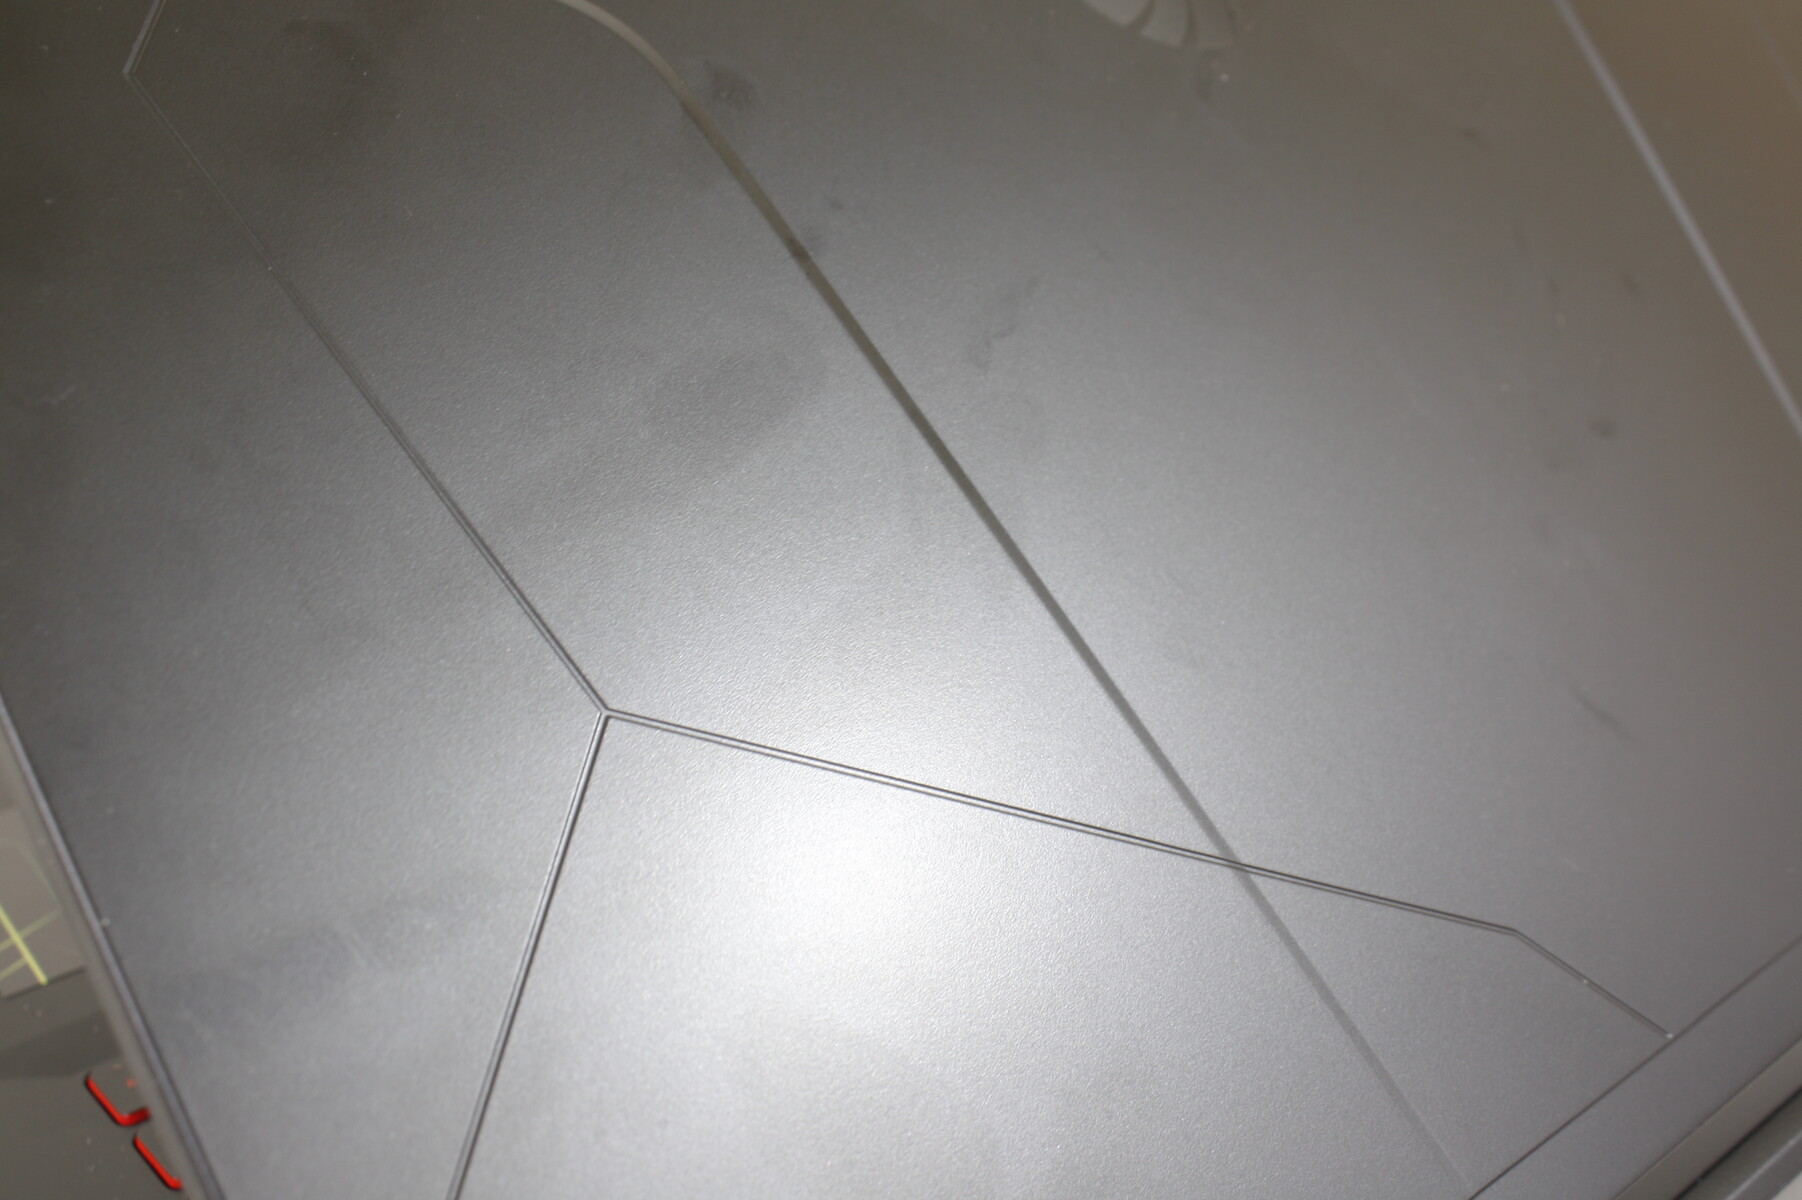
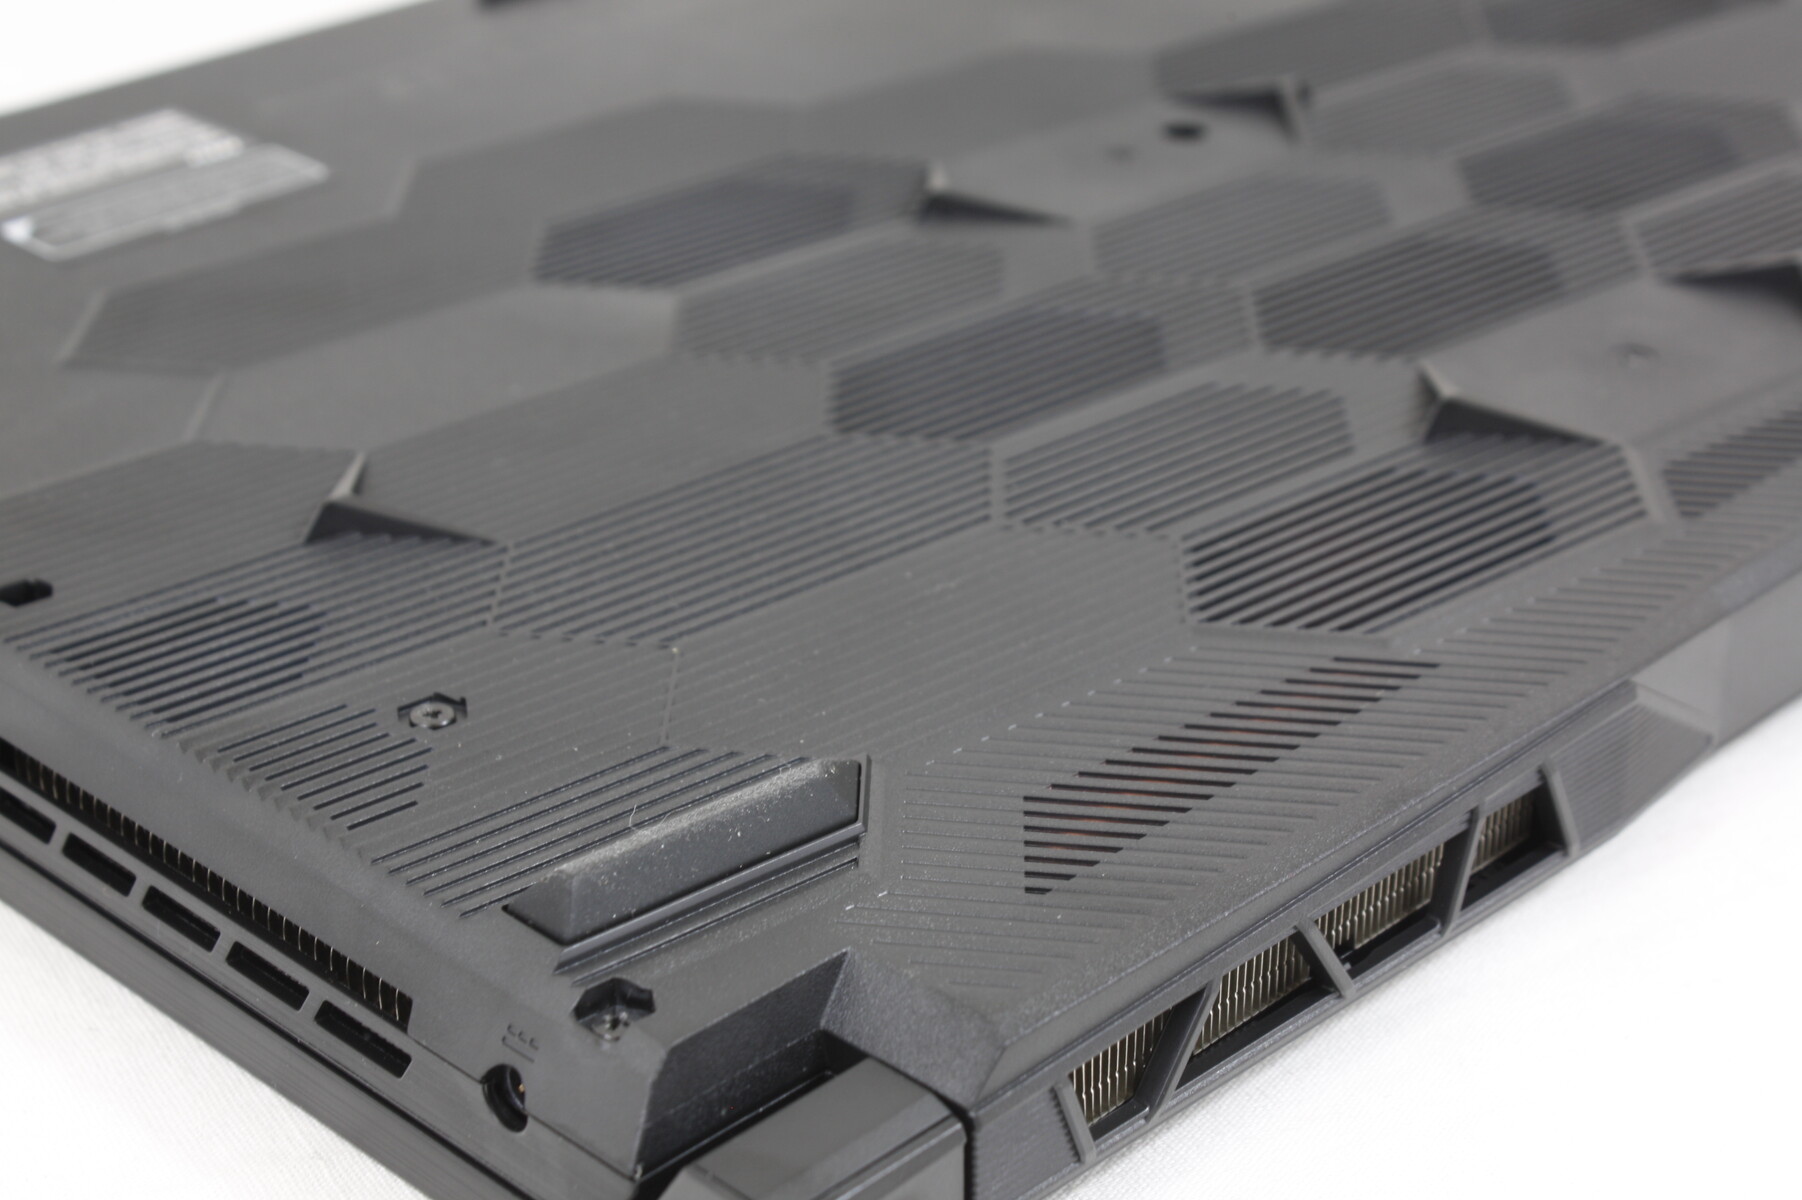
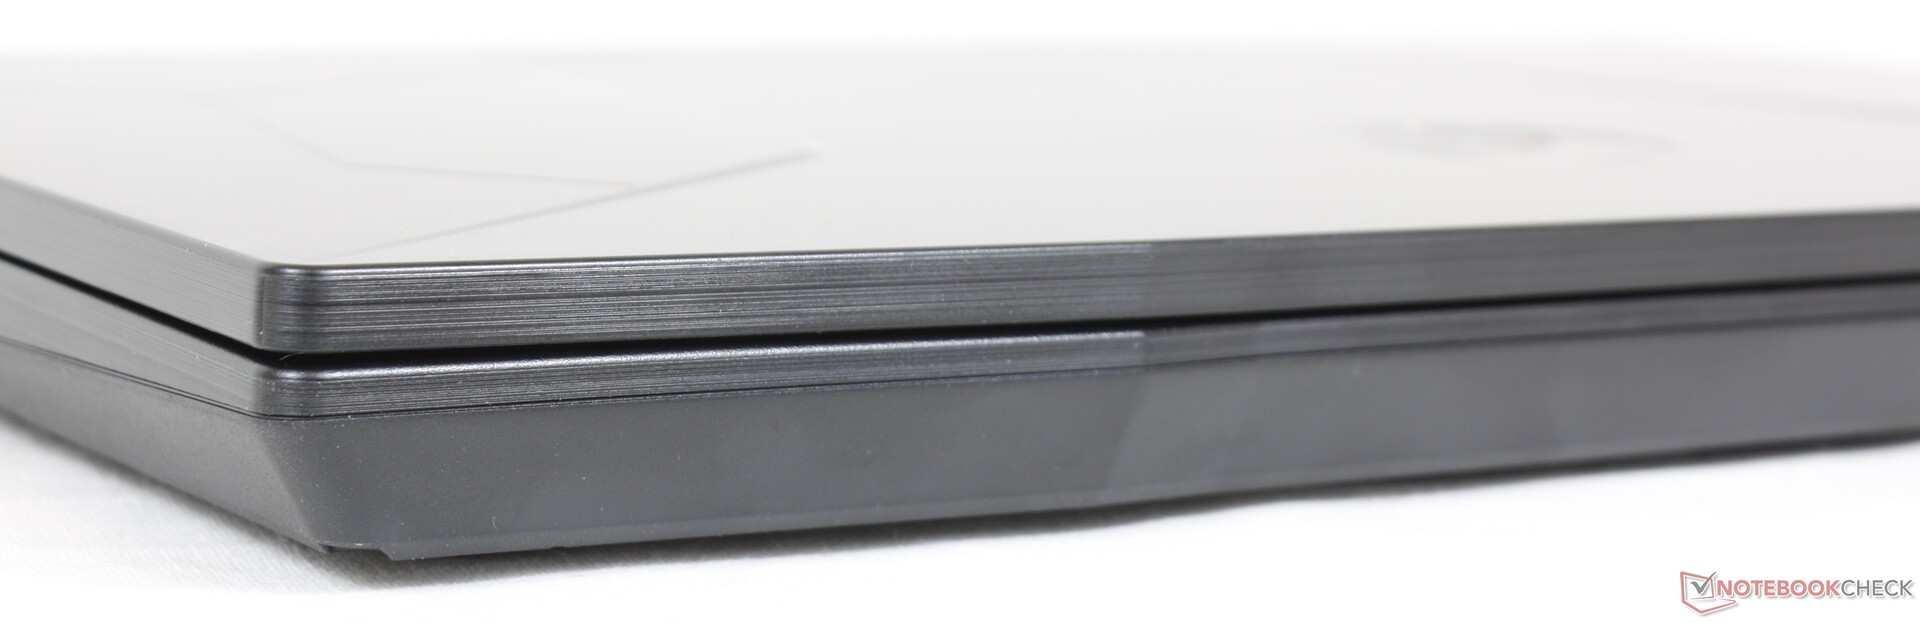
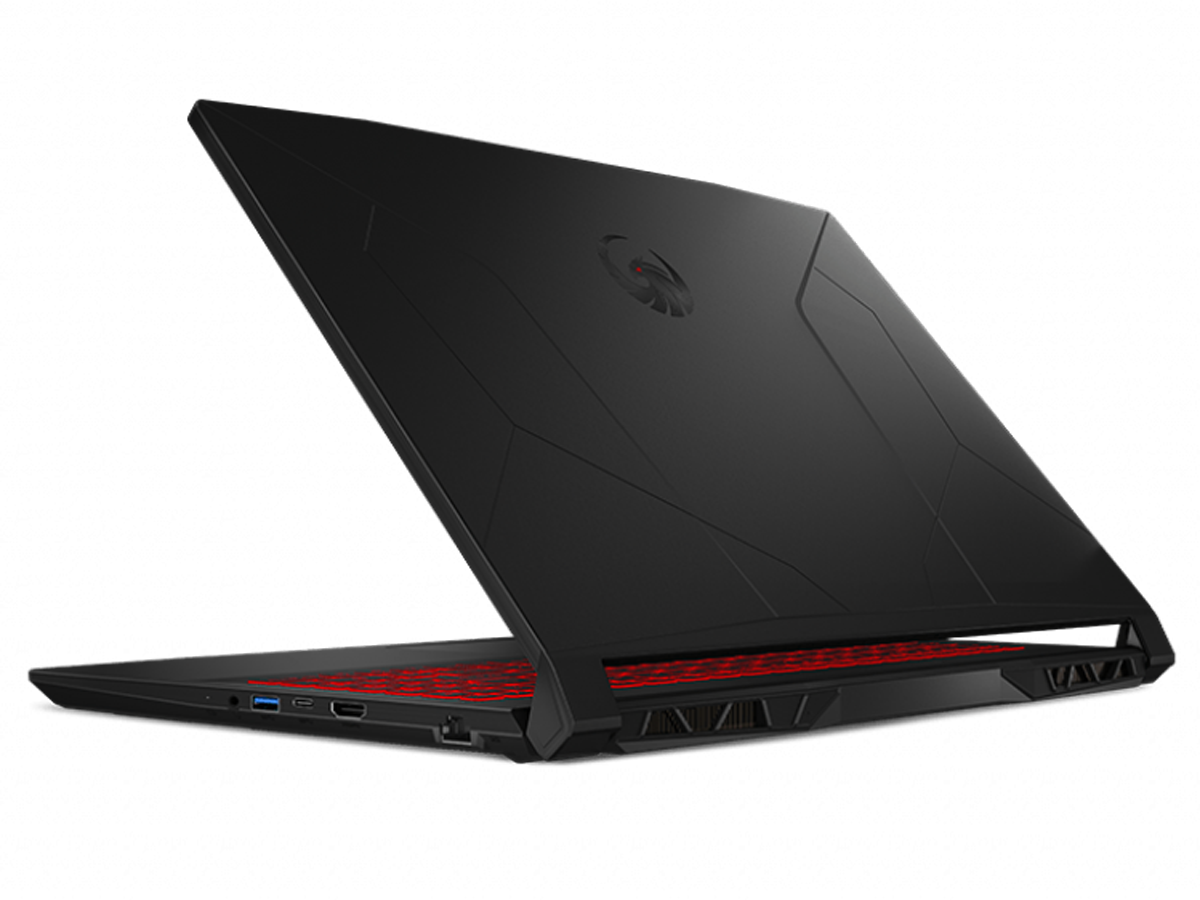
Alors que le Bravo 15 2020 avait un couvercle extérieur et une base en aluminium brossé, le dernier design du Bravo 15 est à l'inverse principalement en plastique mat. C'est un look plus terne qui ressemble à celui d'autres ordinateurs portables de jeu bon marché comme le Acer Nitro 5 ou Gigabyte G5. MSI réserve ses designs plus élégants et plus luxueux aux modèles haut de gamme des familles GE, GT ou GS, plus onéreuses.
La rigidité du châssis est forte pour un ordinateur portable de jeu bon marché. L'application d'une pression sur le centre du clavier ou le couvercle extérieur déforme légèrement leurs surfaces respectives, mais pas de façon inquiétante. Tenter de tordre le système n'entraîne pas non plus de grincement. Les charnières vacillent trop à notre goût lors de l'ajustement des angles, cependant, ce qui donne l'impression que le système est bon marché.
En termes de taille et de poids, le nouveau modèle Bravo 15 est plus grand et plus lourd (2,3 kg contre 2,0 kg) que son prédécesseur immédiat, comme le montre notre comparaison de taille ci-dessous. Les modèles concurrents comme le Lenovo Ideapad Gaming 3 15 ou le Asus TUF Gaming F15 FX507ZM sont plus légers et plus petits dans l'ensemble.
Connectivité - L'essentiel
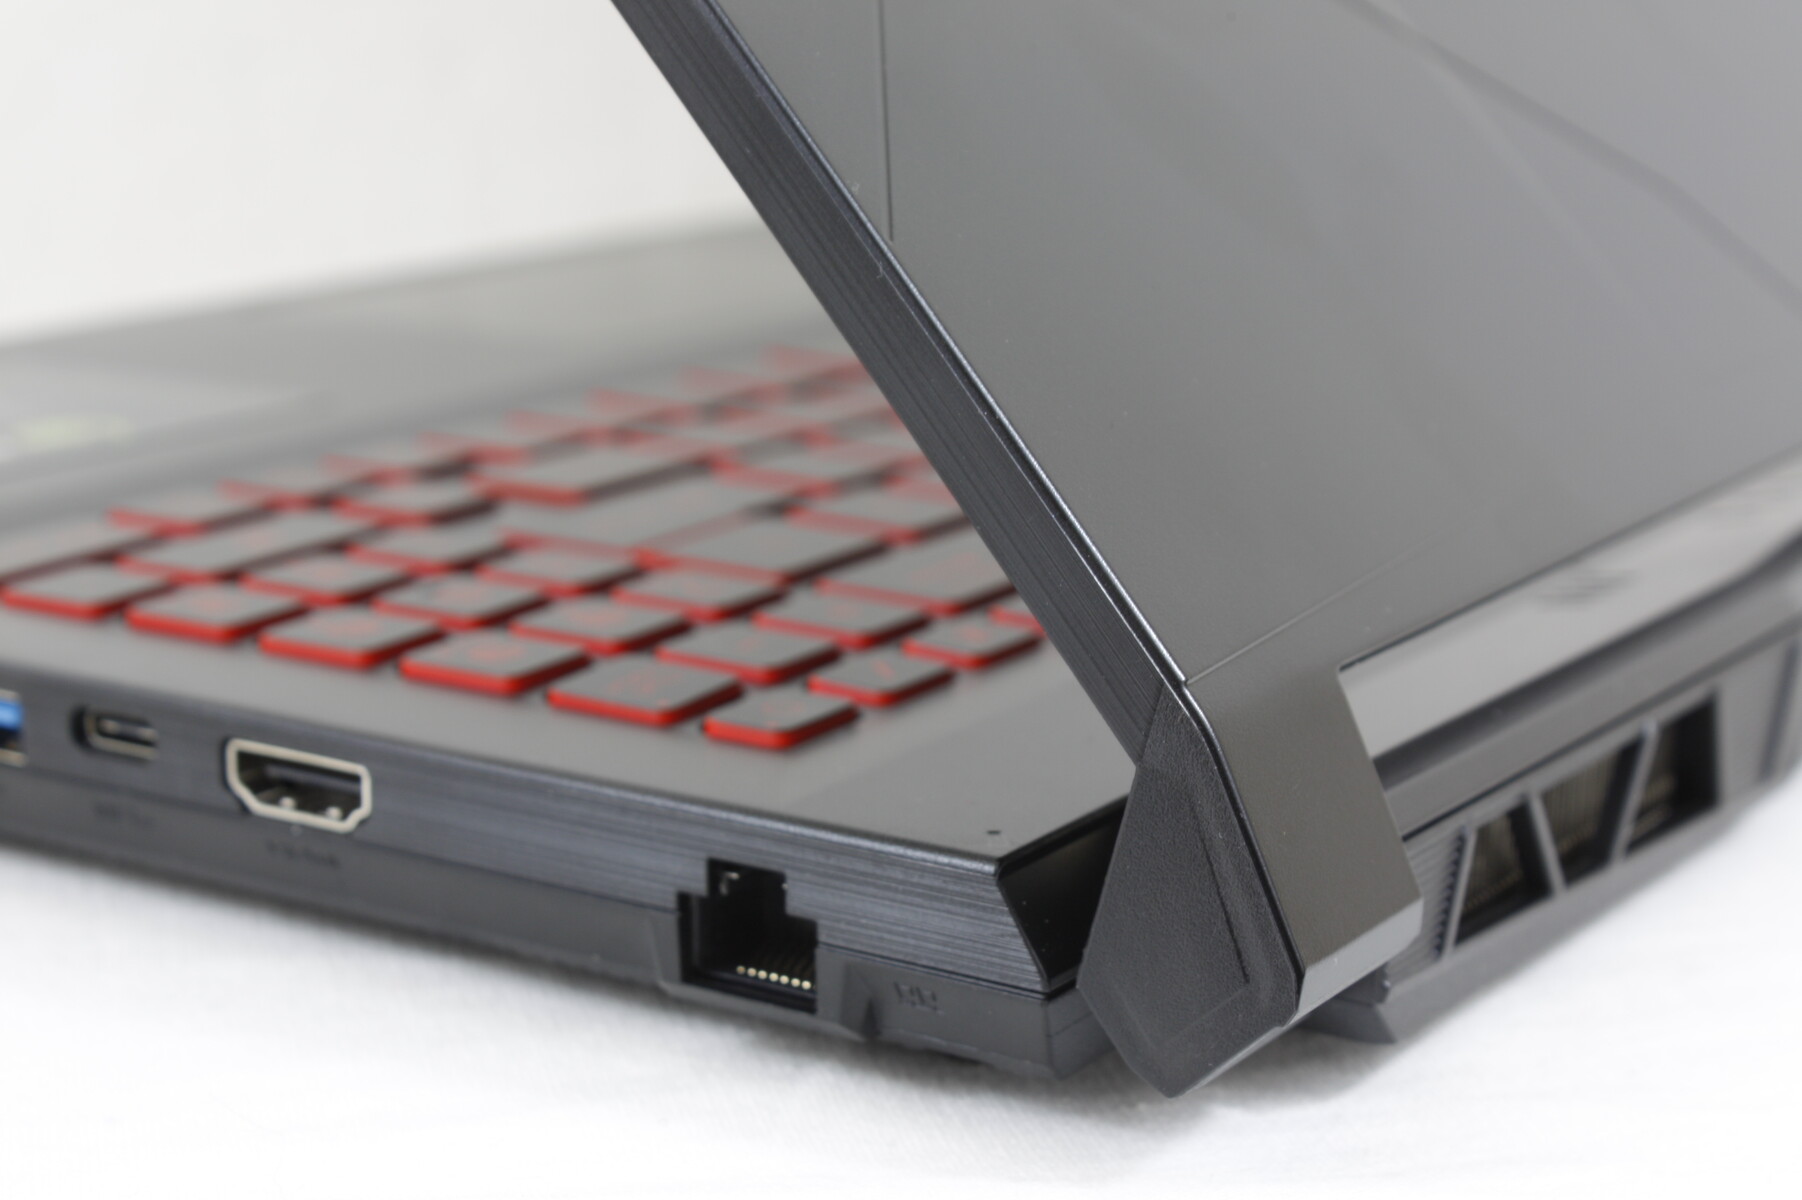
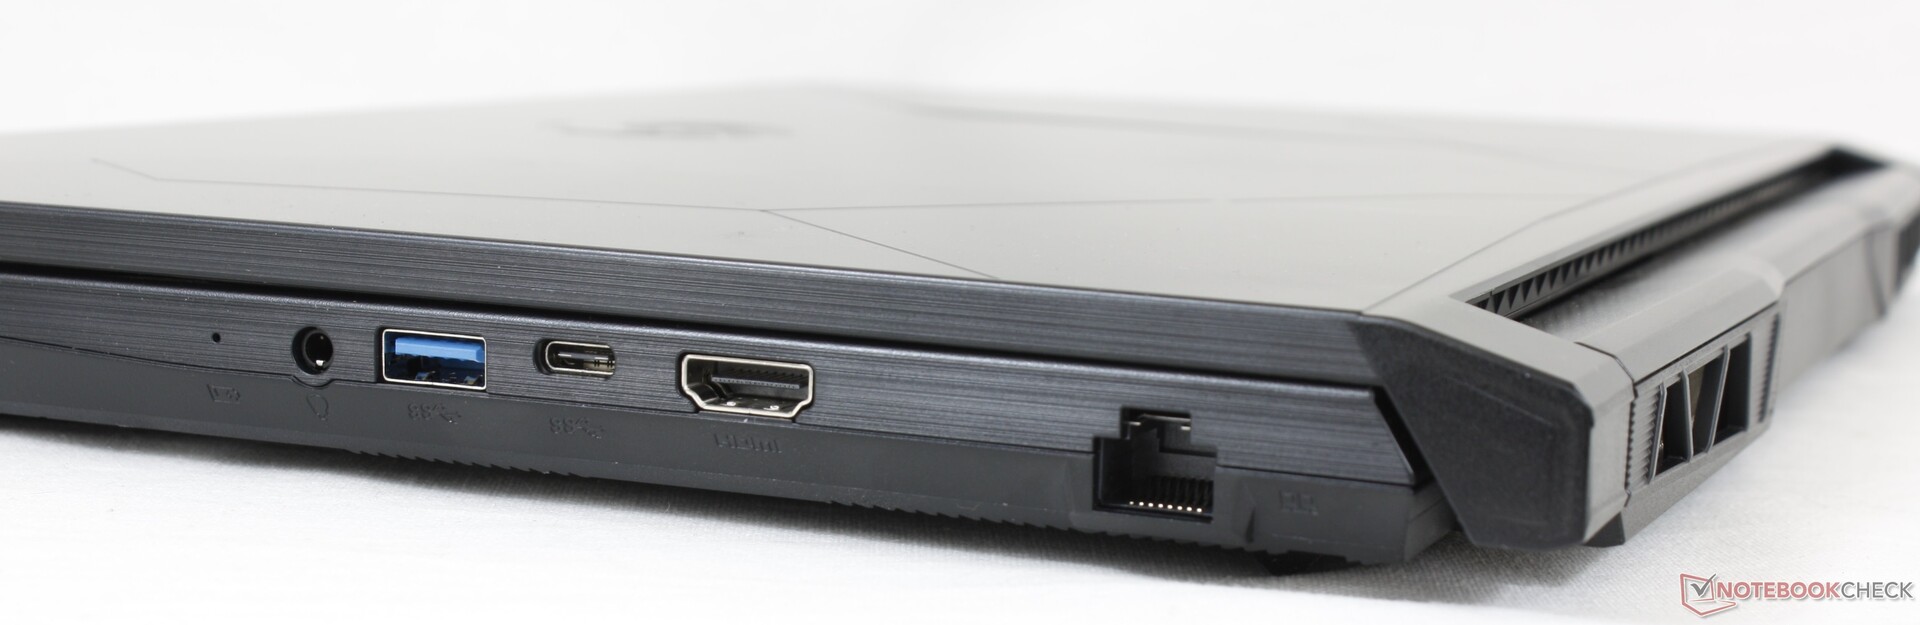
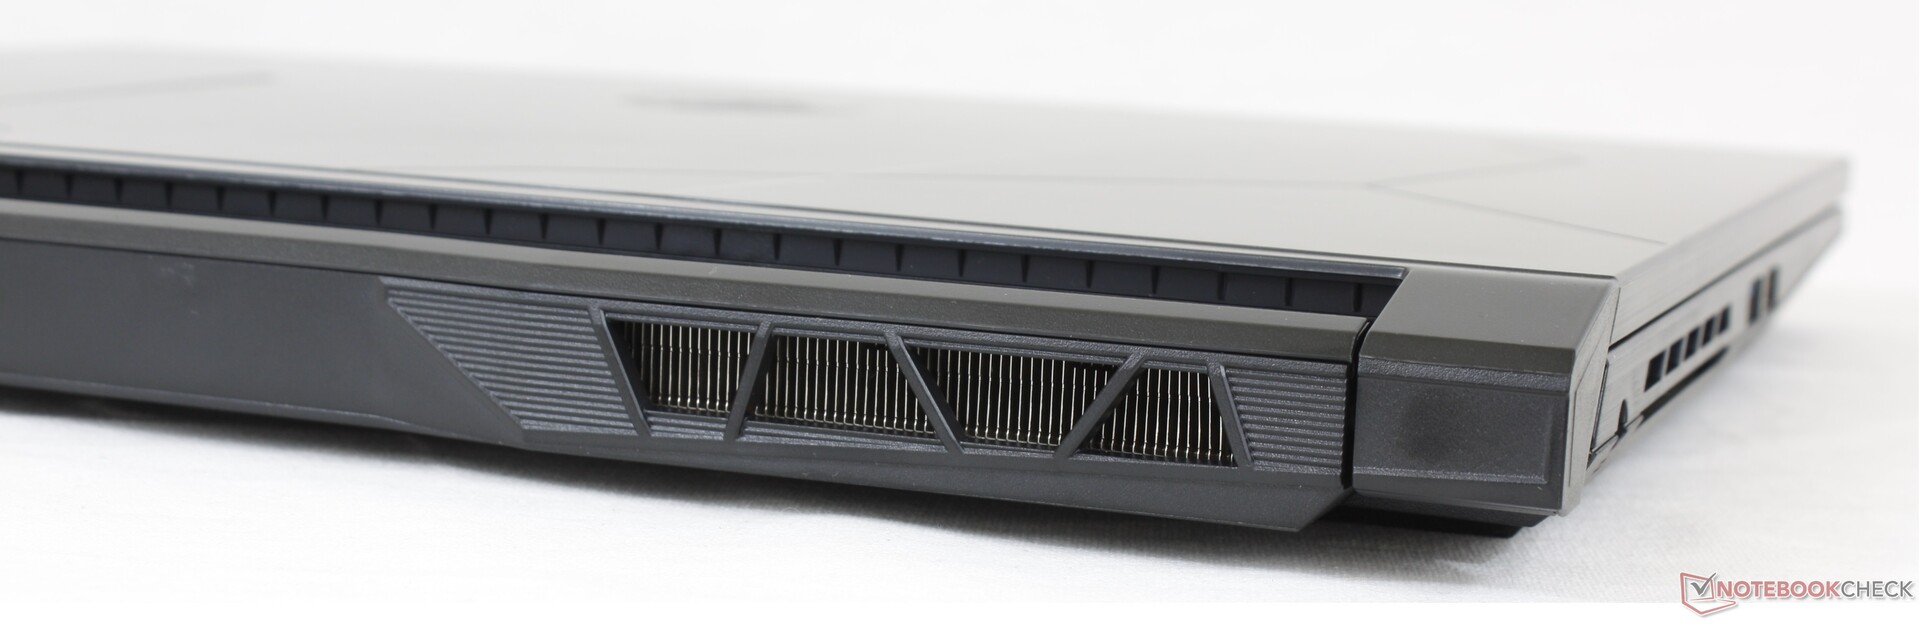
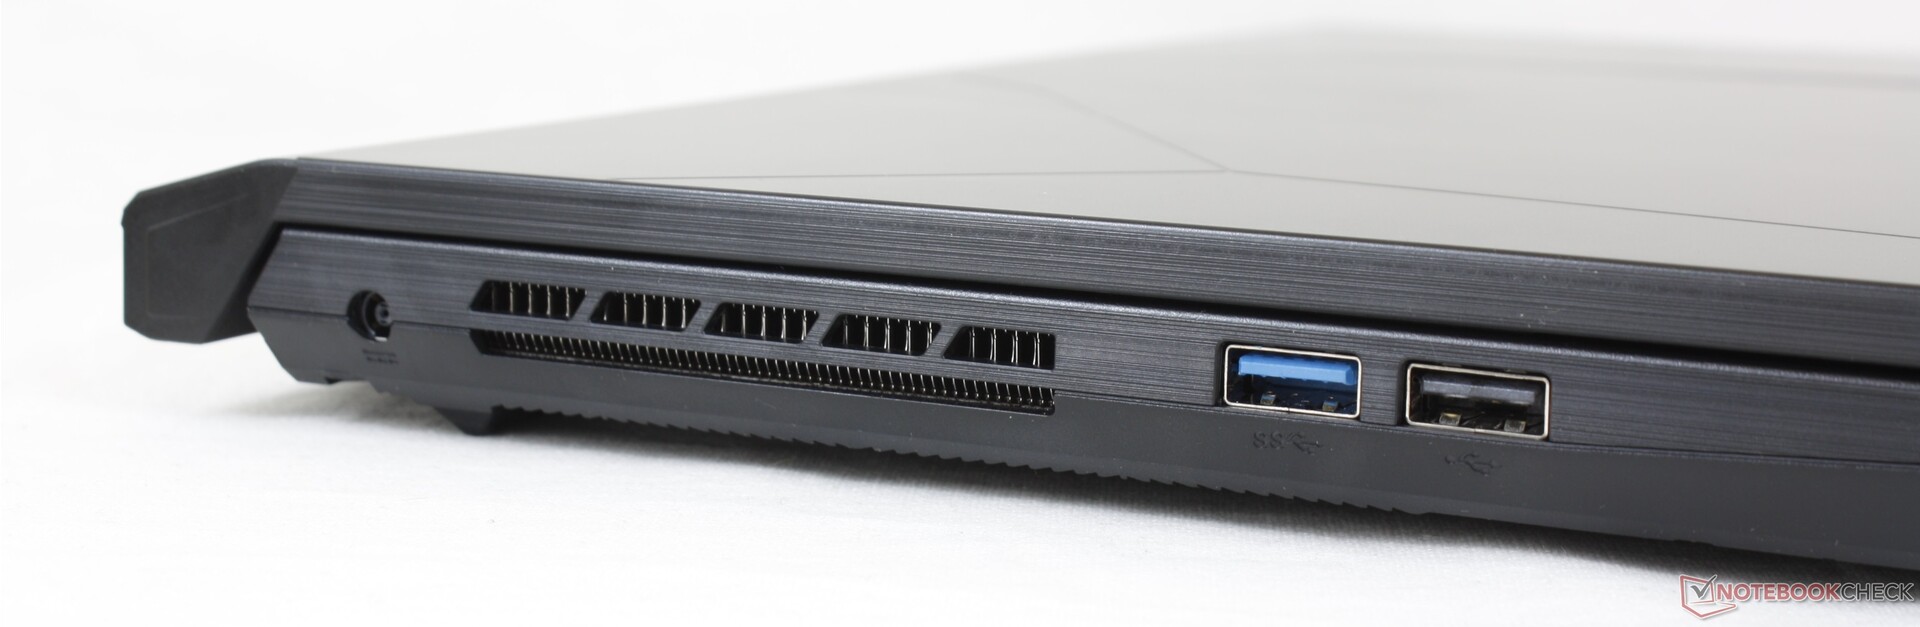
Les options et le positionnement des ports ont considérablement changé par rapport au Bravo 15 de 2020. Le verrou Kensington, par exemple, a disparu et l'un des ports USB-C a été remplacé par un troisième port USB-A. La plupart des autres ordinateurs portables de jeu ont tendance à avoir plusieurs ports USB-C au lieu d'un seul. La plupart des autres ordinateurs portables de jeu ont tendance à avoir plusieurs ports USB-C au lieu d'un seul, y compris sur la série concurrente Asus TUF FX507
N'oubliez pas que le port USB-C de ce modèle ne prend pas en charge la sortie DisplayPort, Power Delivery ou Thunderbolt.
Communication
Webcam
La webcam intégrée est le standard 720p sans prise en charge de Windows Hello. Les utilisateurs peuvent désactiver la caméra électroniquement via la touche F6.


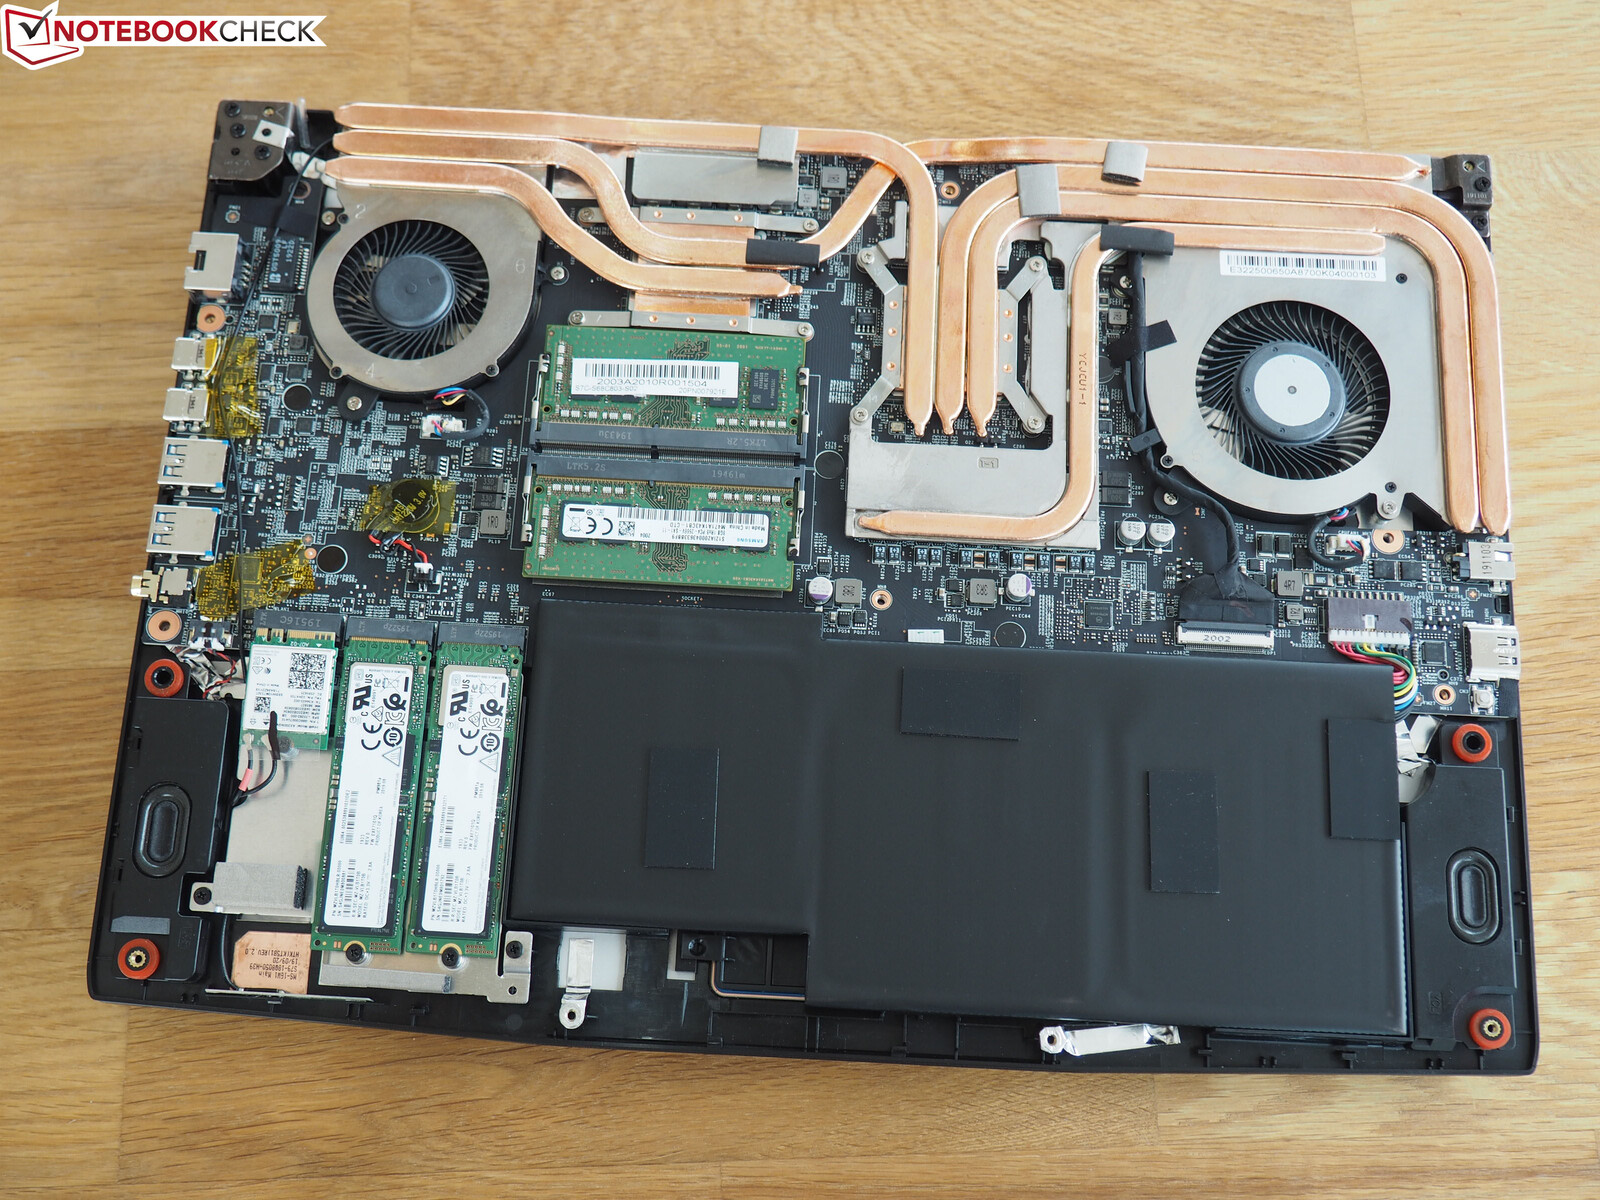
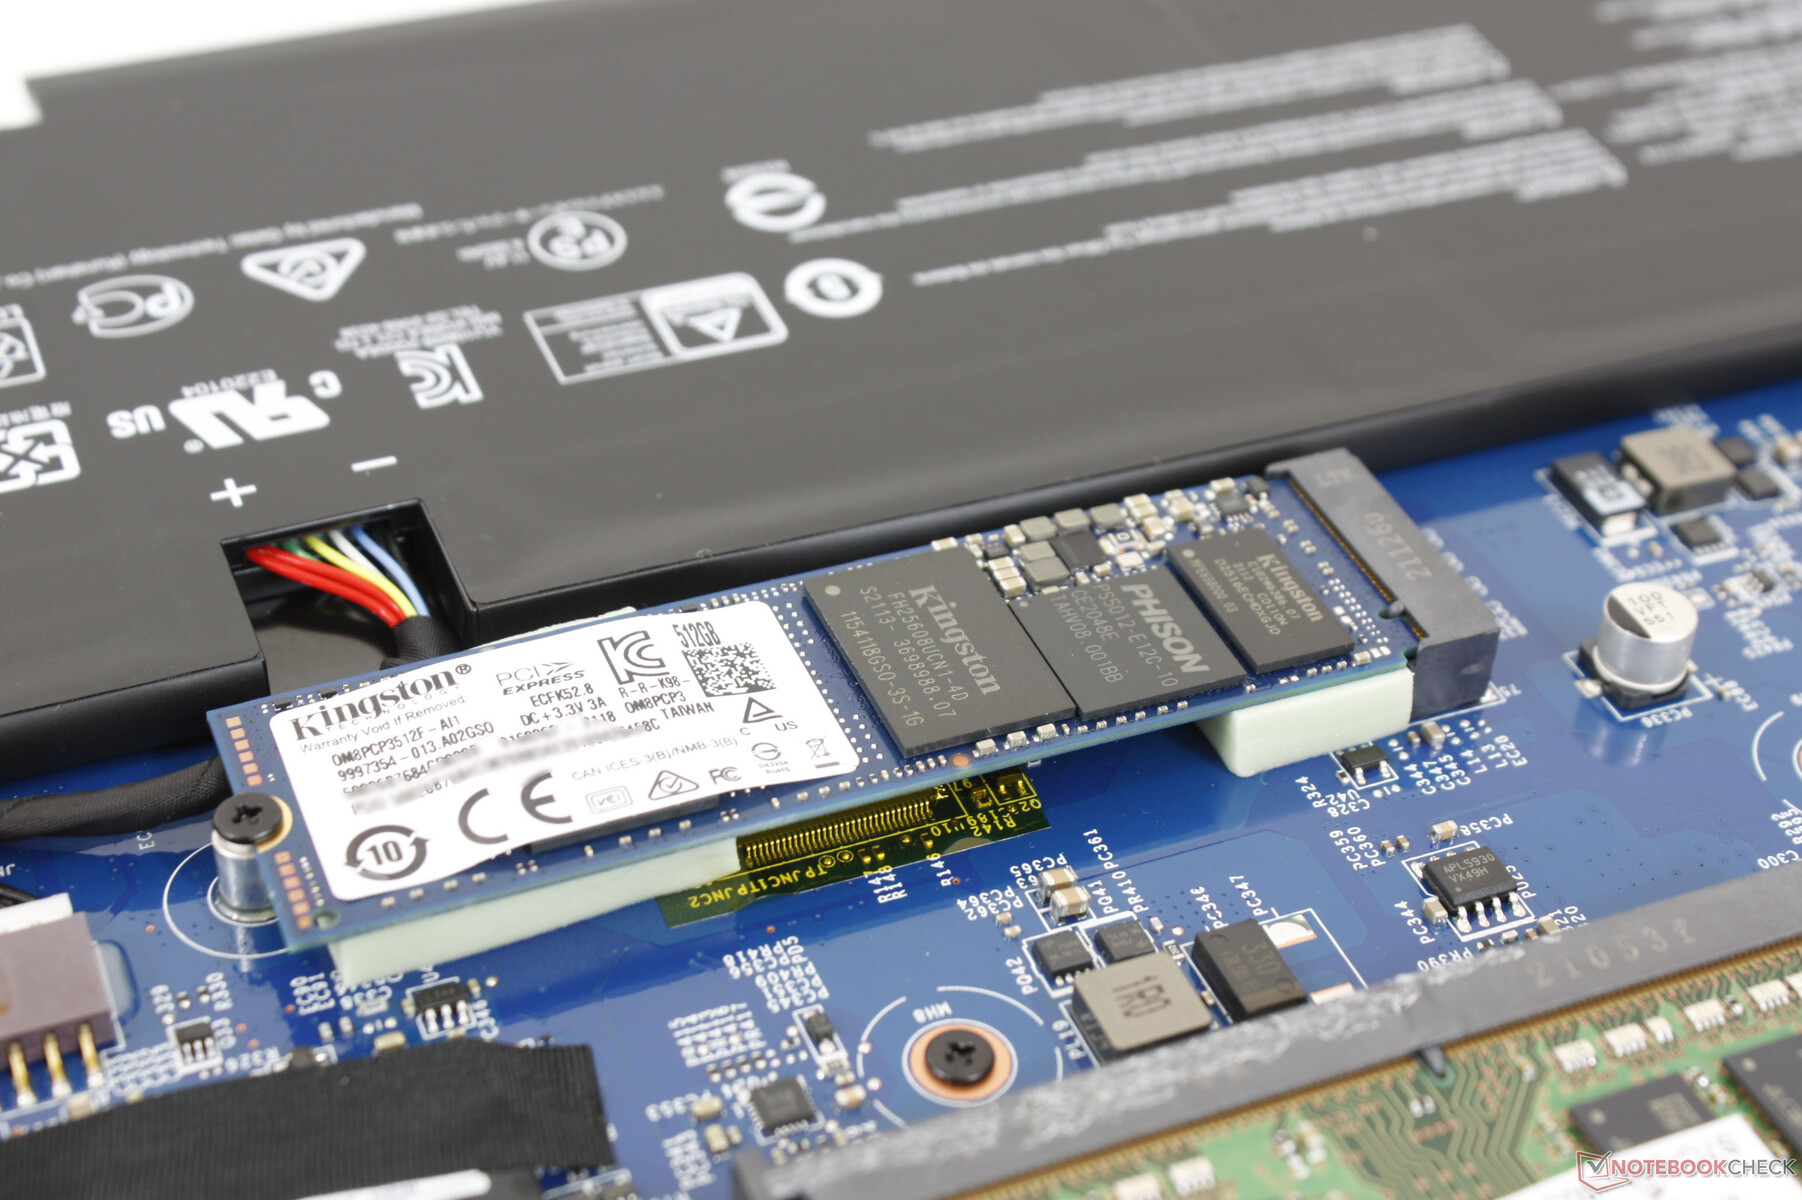
Maintenance
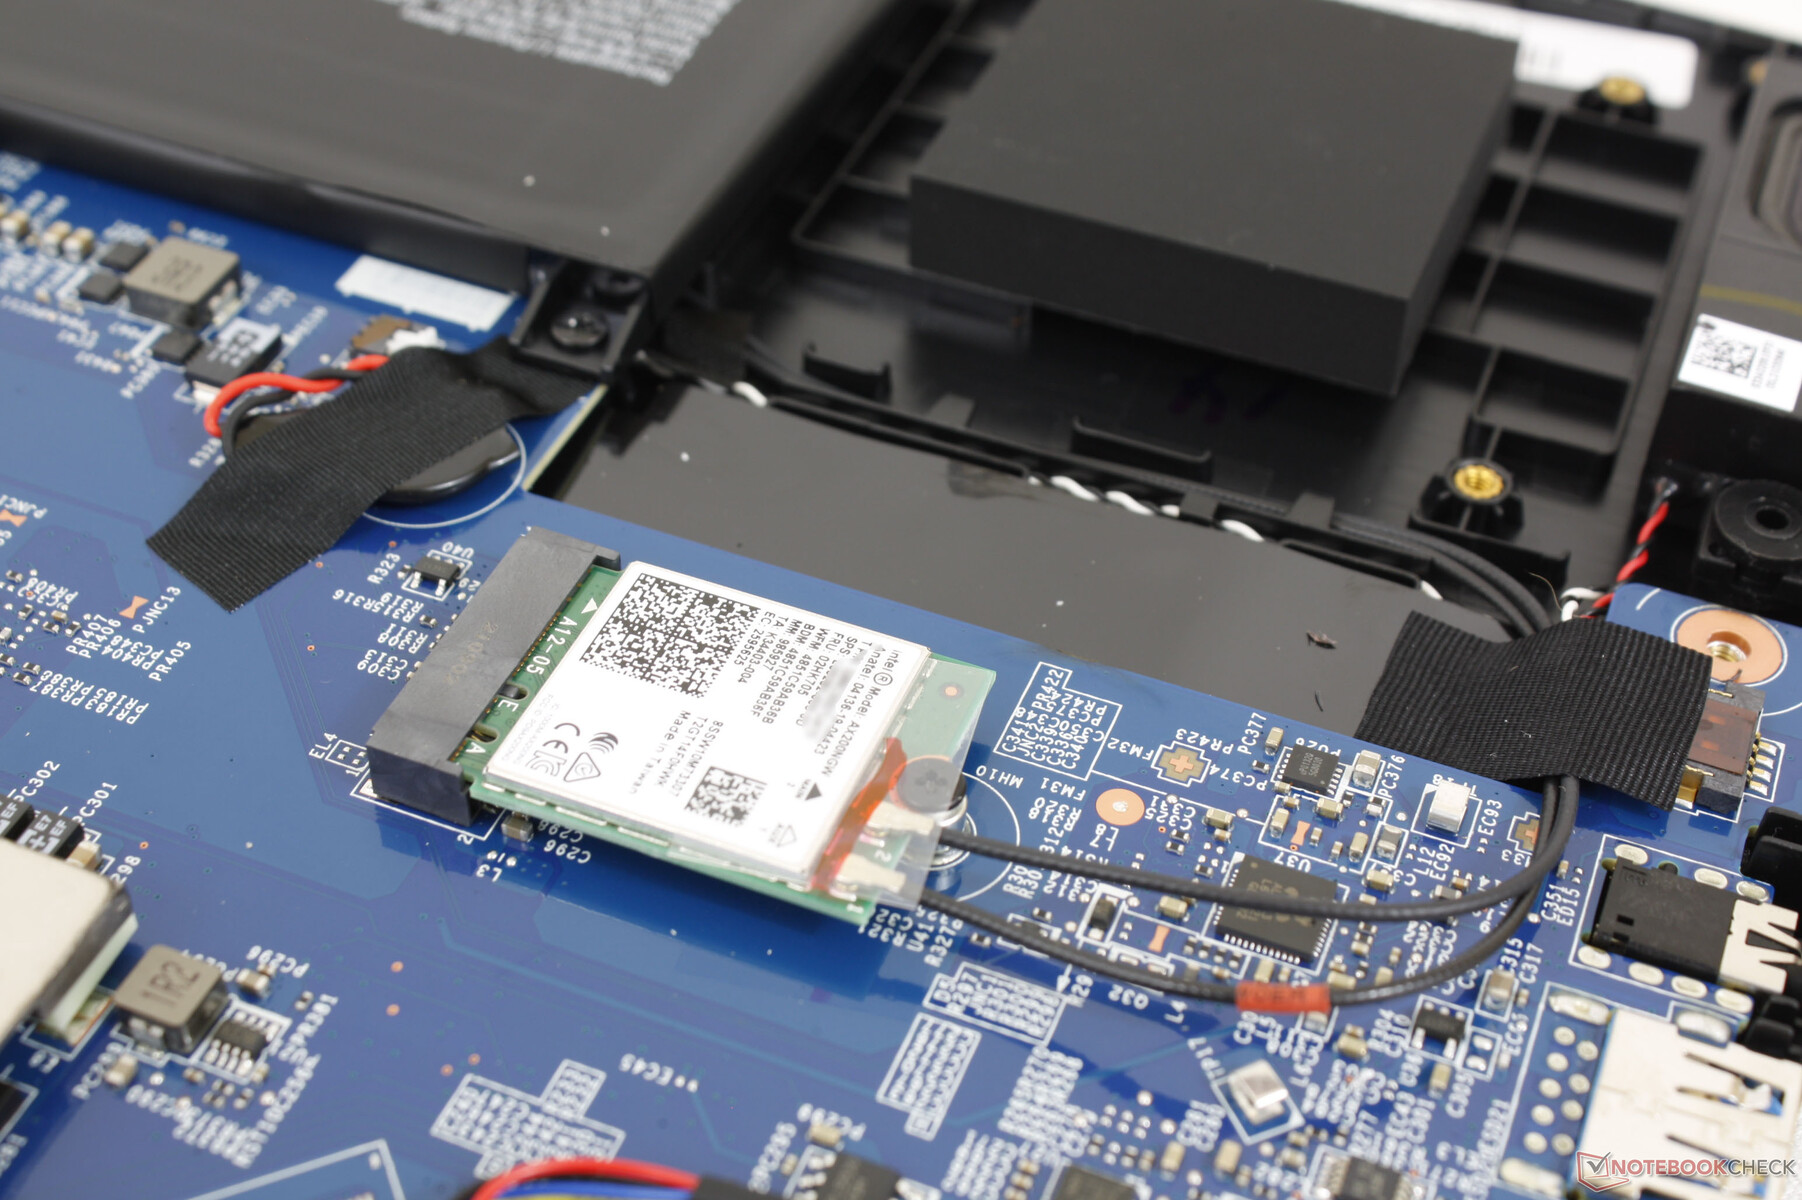
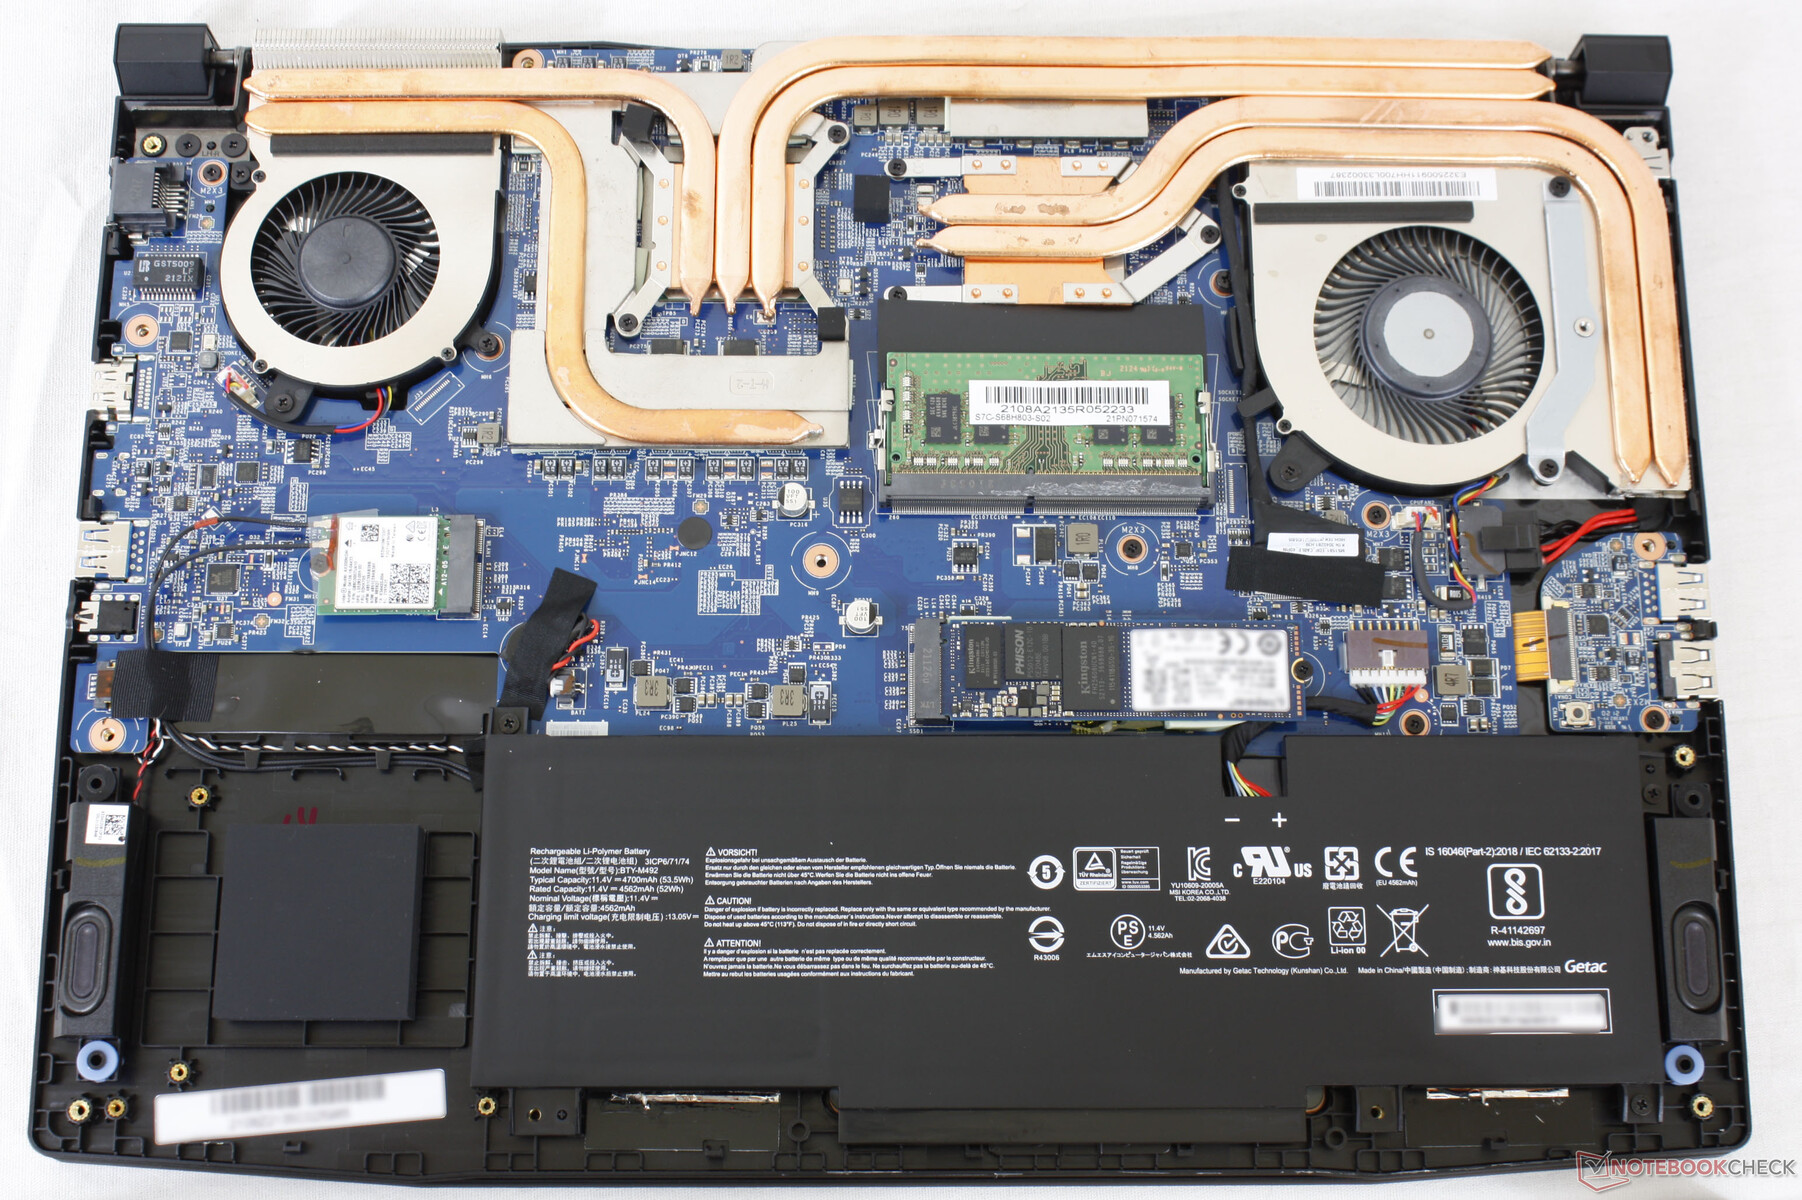
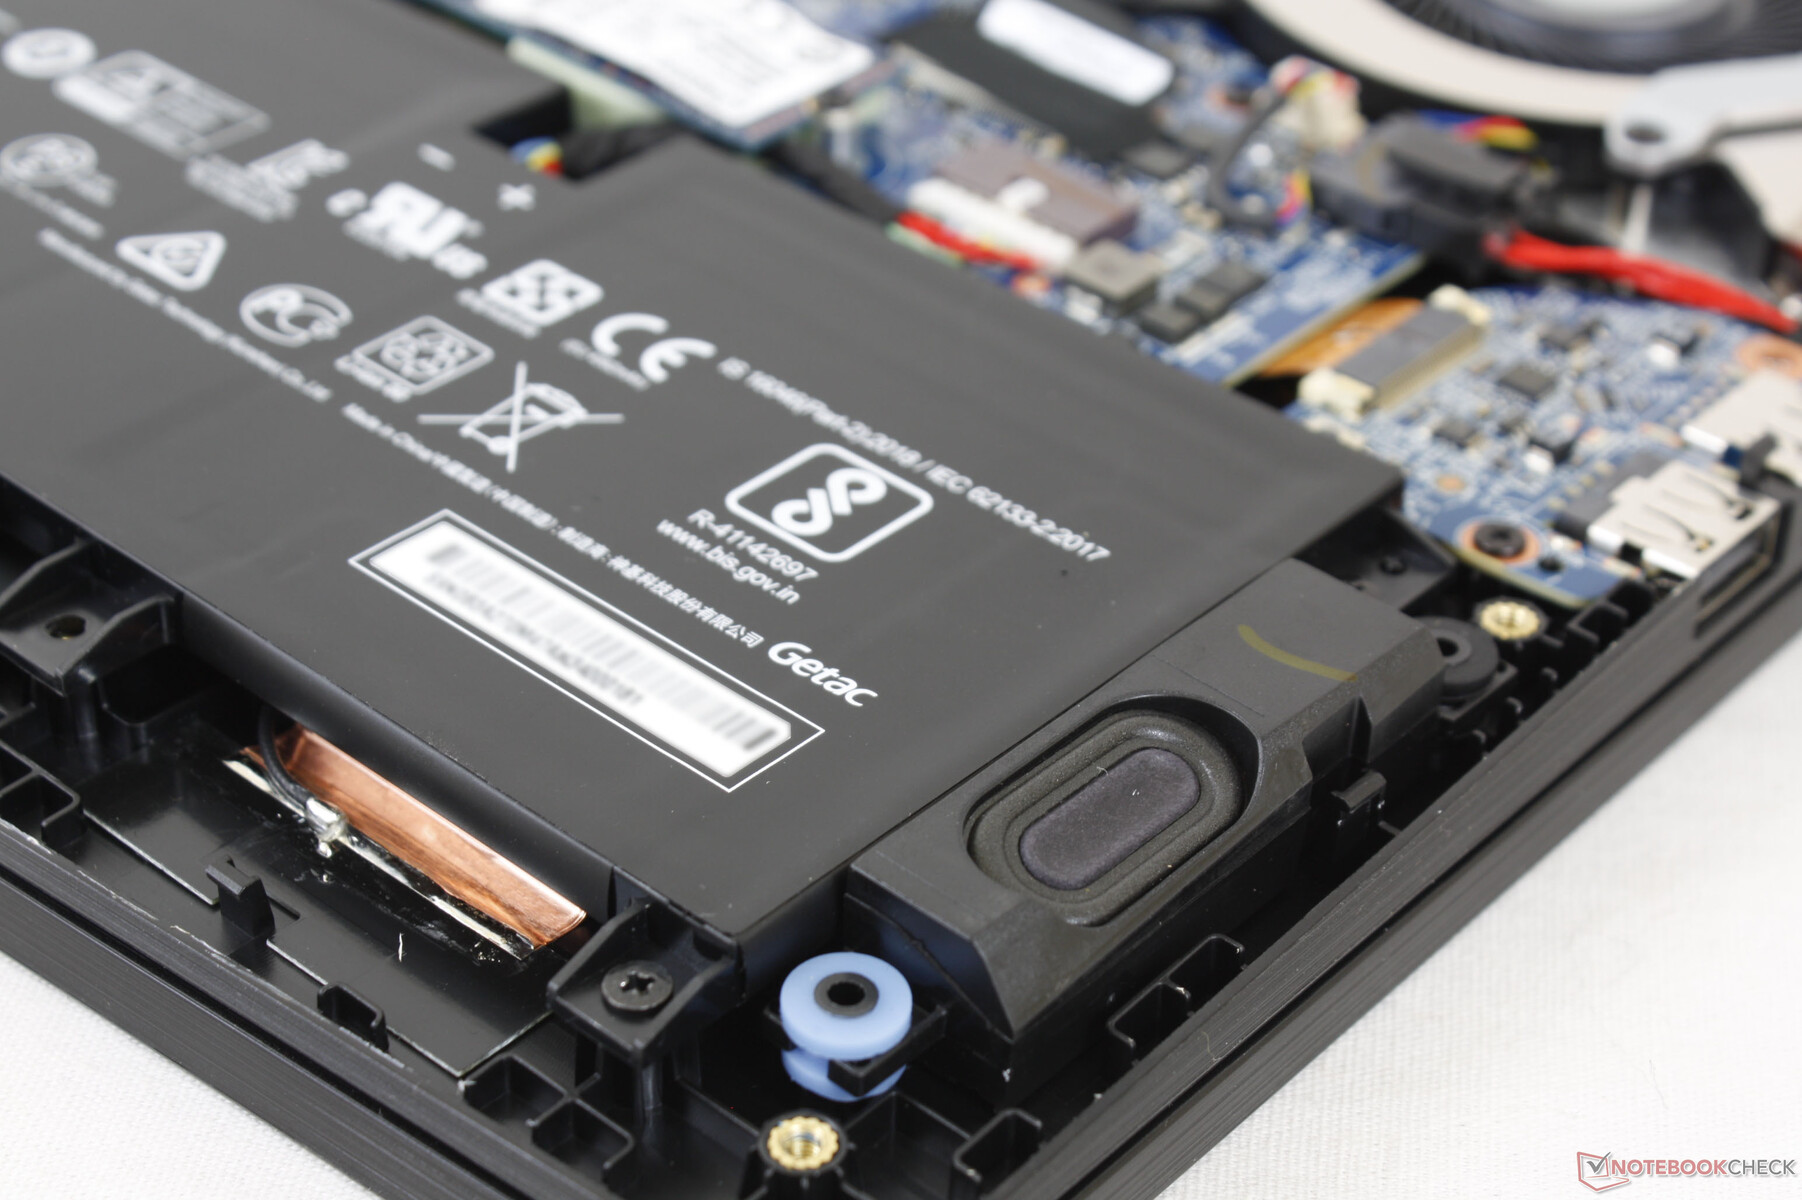
Le panneau inférieur est relativement facile à retirer avec un tournevis Philips et un bord tranchant. Notez qu'un autocollant "sceau d'usine" doit être brisé si vous voulez accéder aux internes.
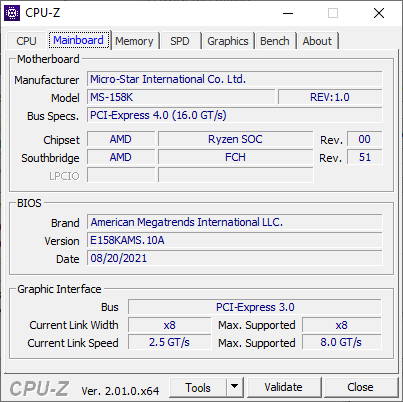
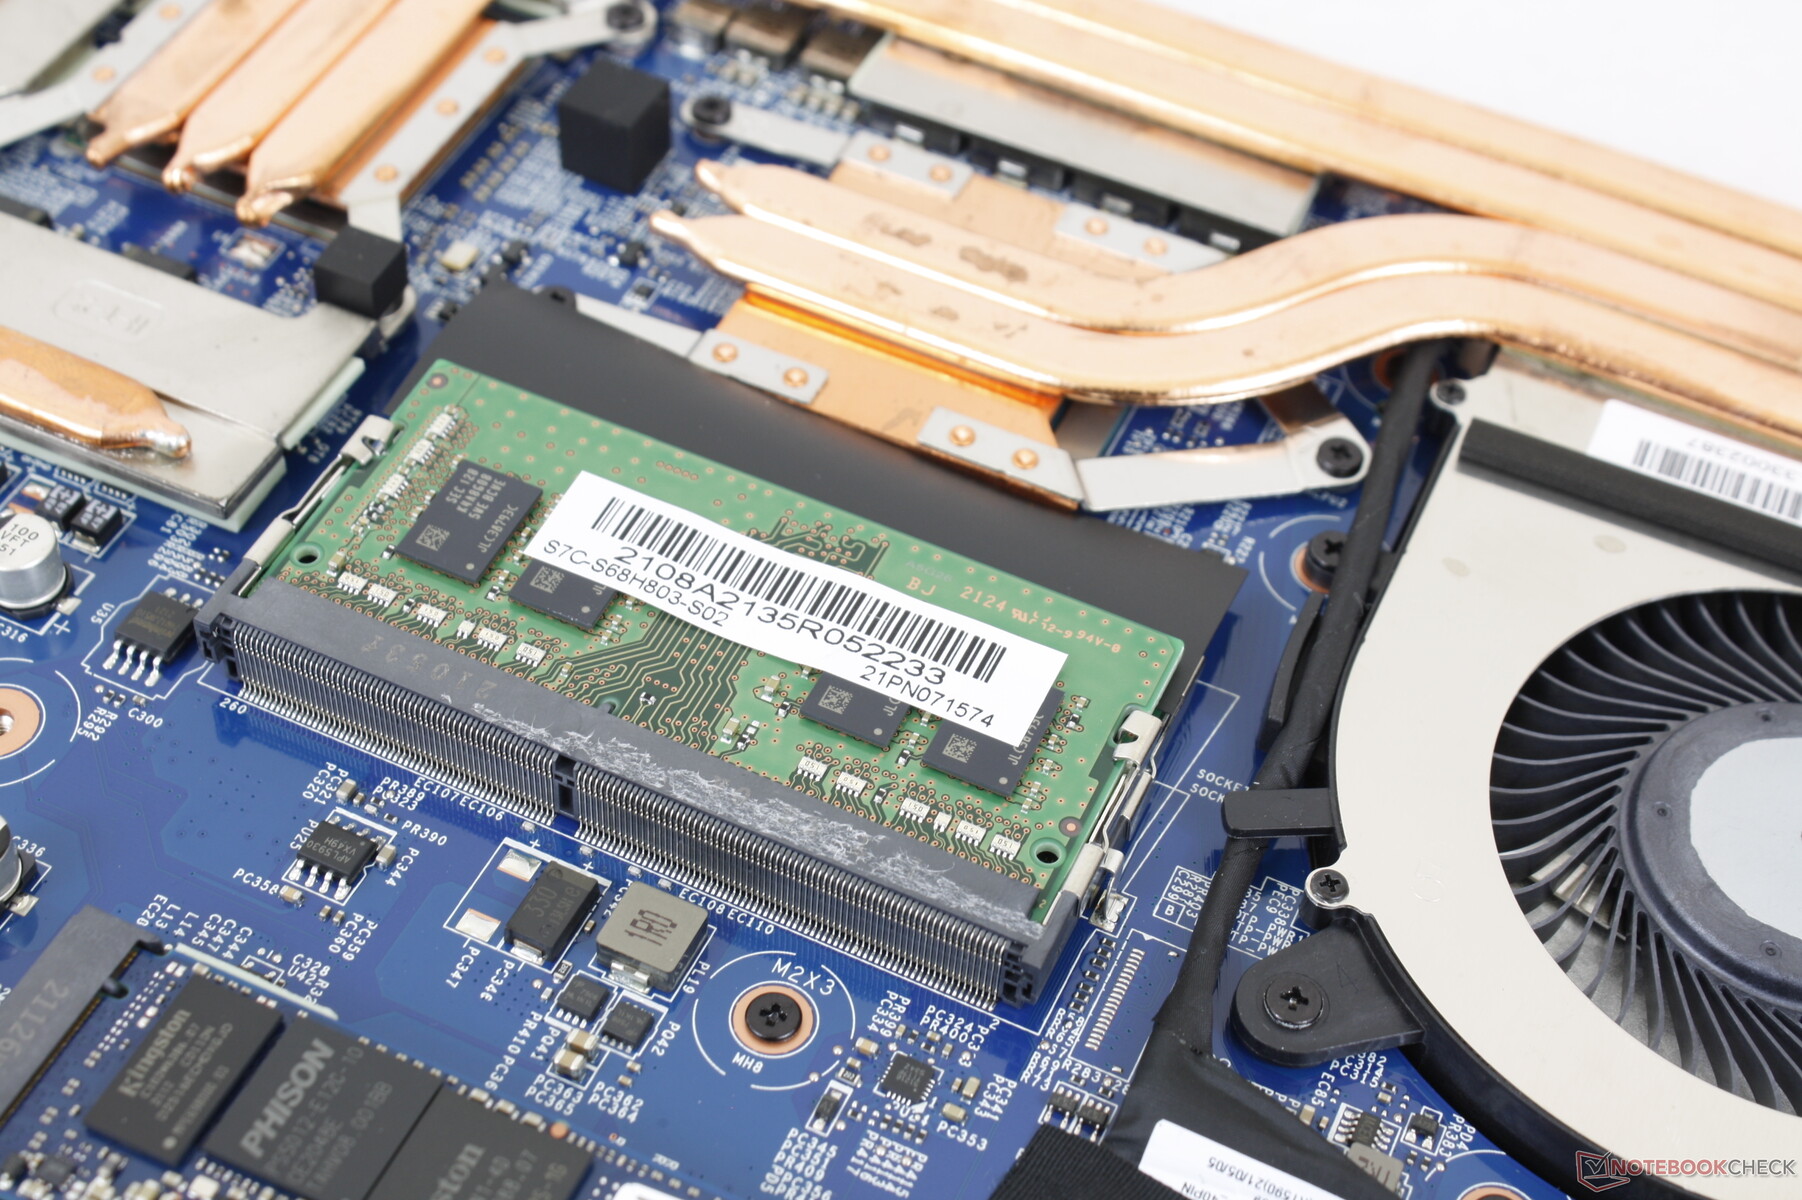
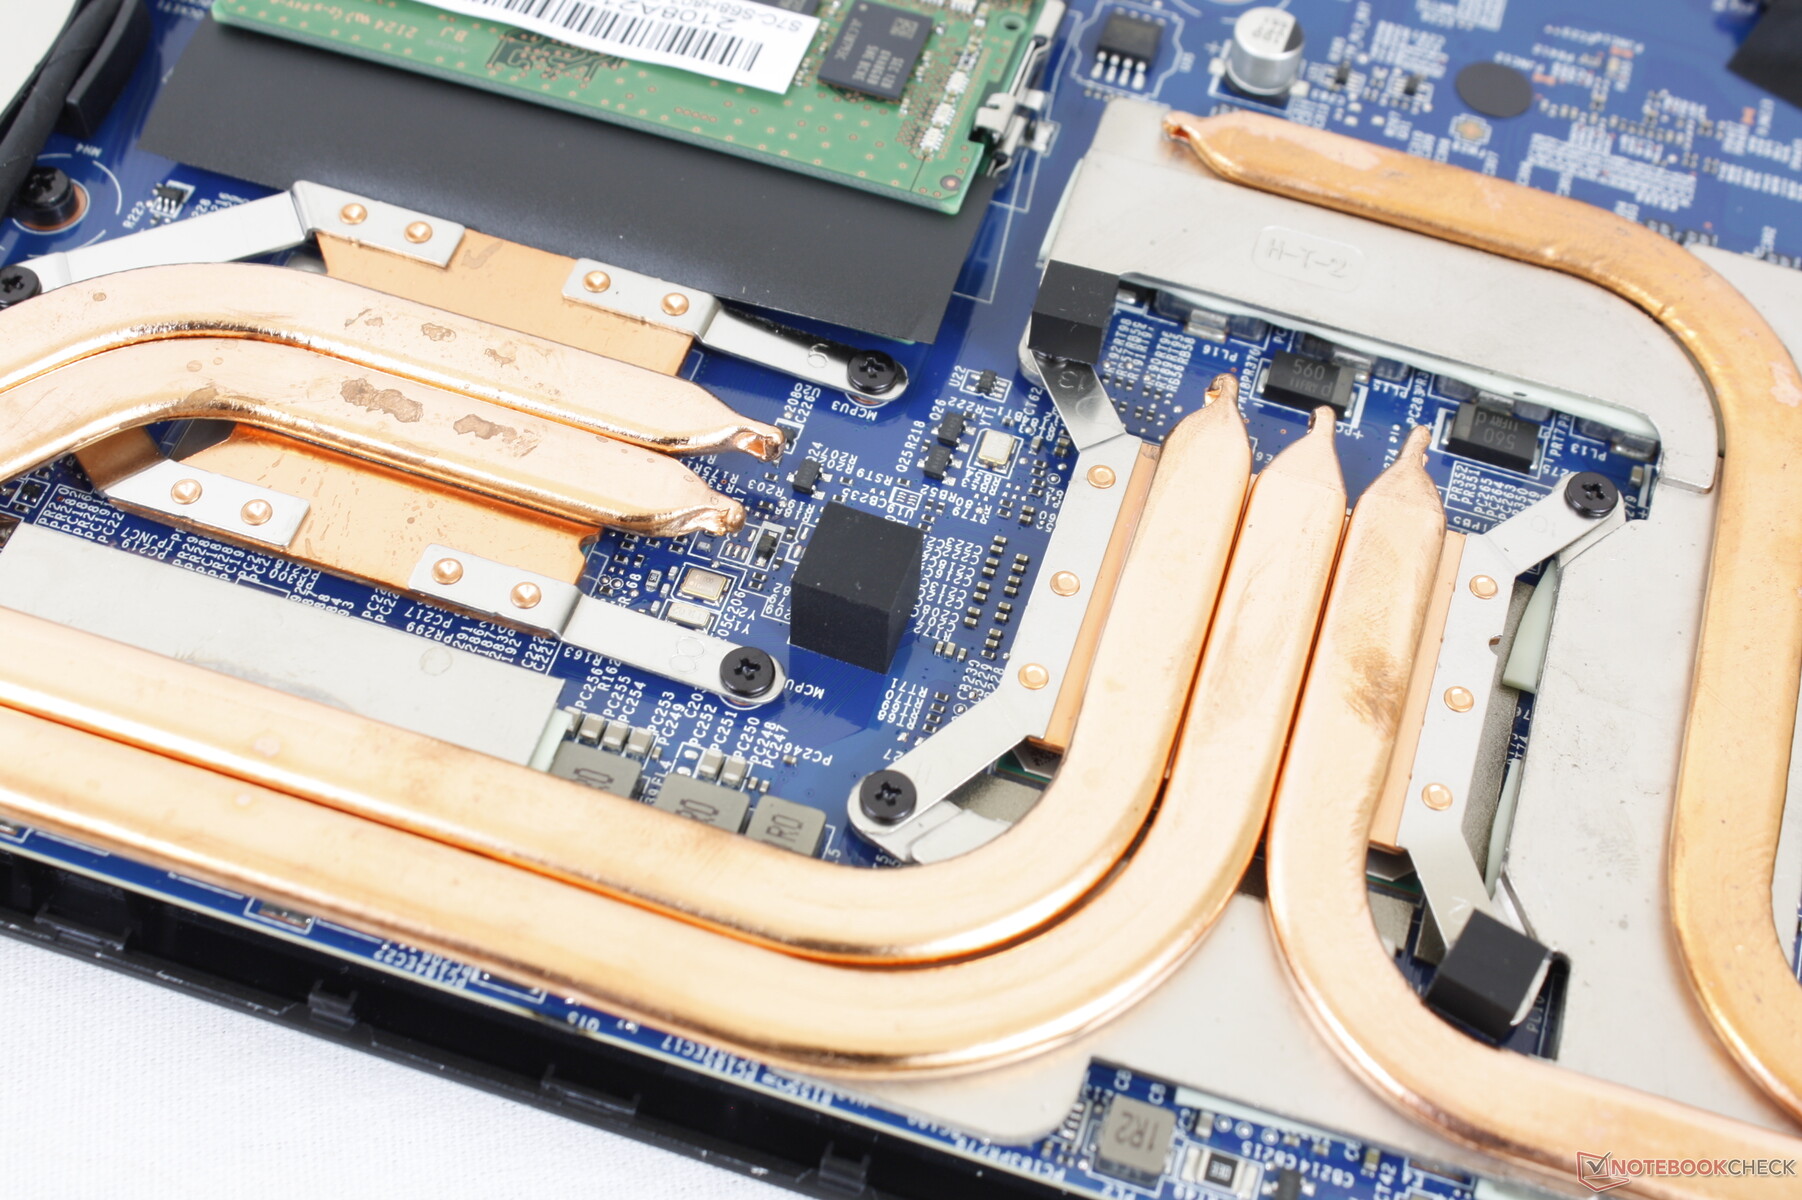
Une fois à l'intérieur, les utilisateurs auront un accès direct à 2 slots SODIMM, au module WLAN amovible et à un slot PCIe3 M.2 2280, ce qui est une baisse par rapport aux deux slots M.2 2280 du modèle Bravo 2020. MSI a effectué plusieurs changements de cartes mères cette année comme le montrent nos images de comparaison ci-dessous.
Accessoires et garantie
Il n'y a pas d'autres éléments dans la boîte, à part l'adaptateur secteur et les documents. La garantie limitée habituelle d'un an s'applique.
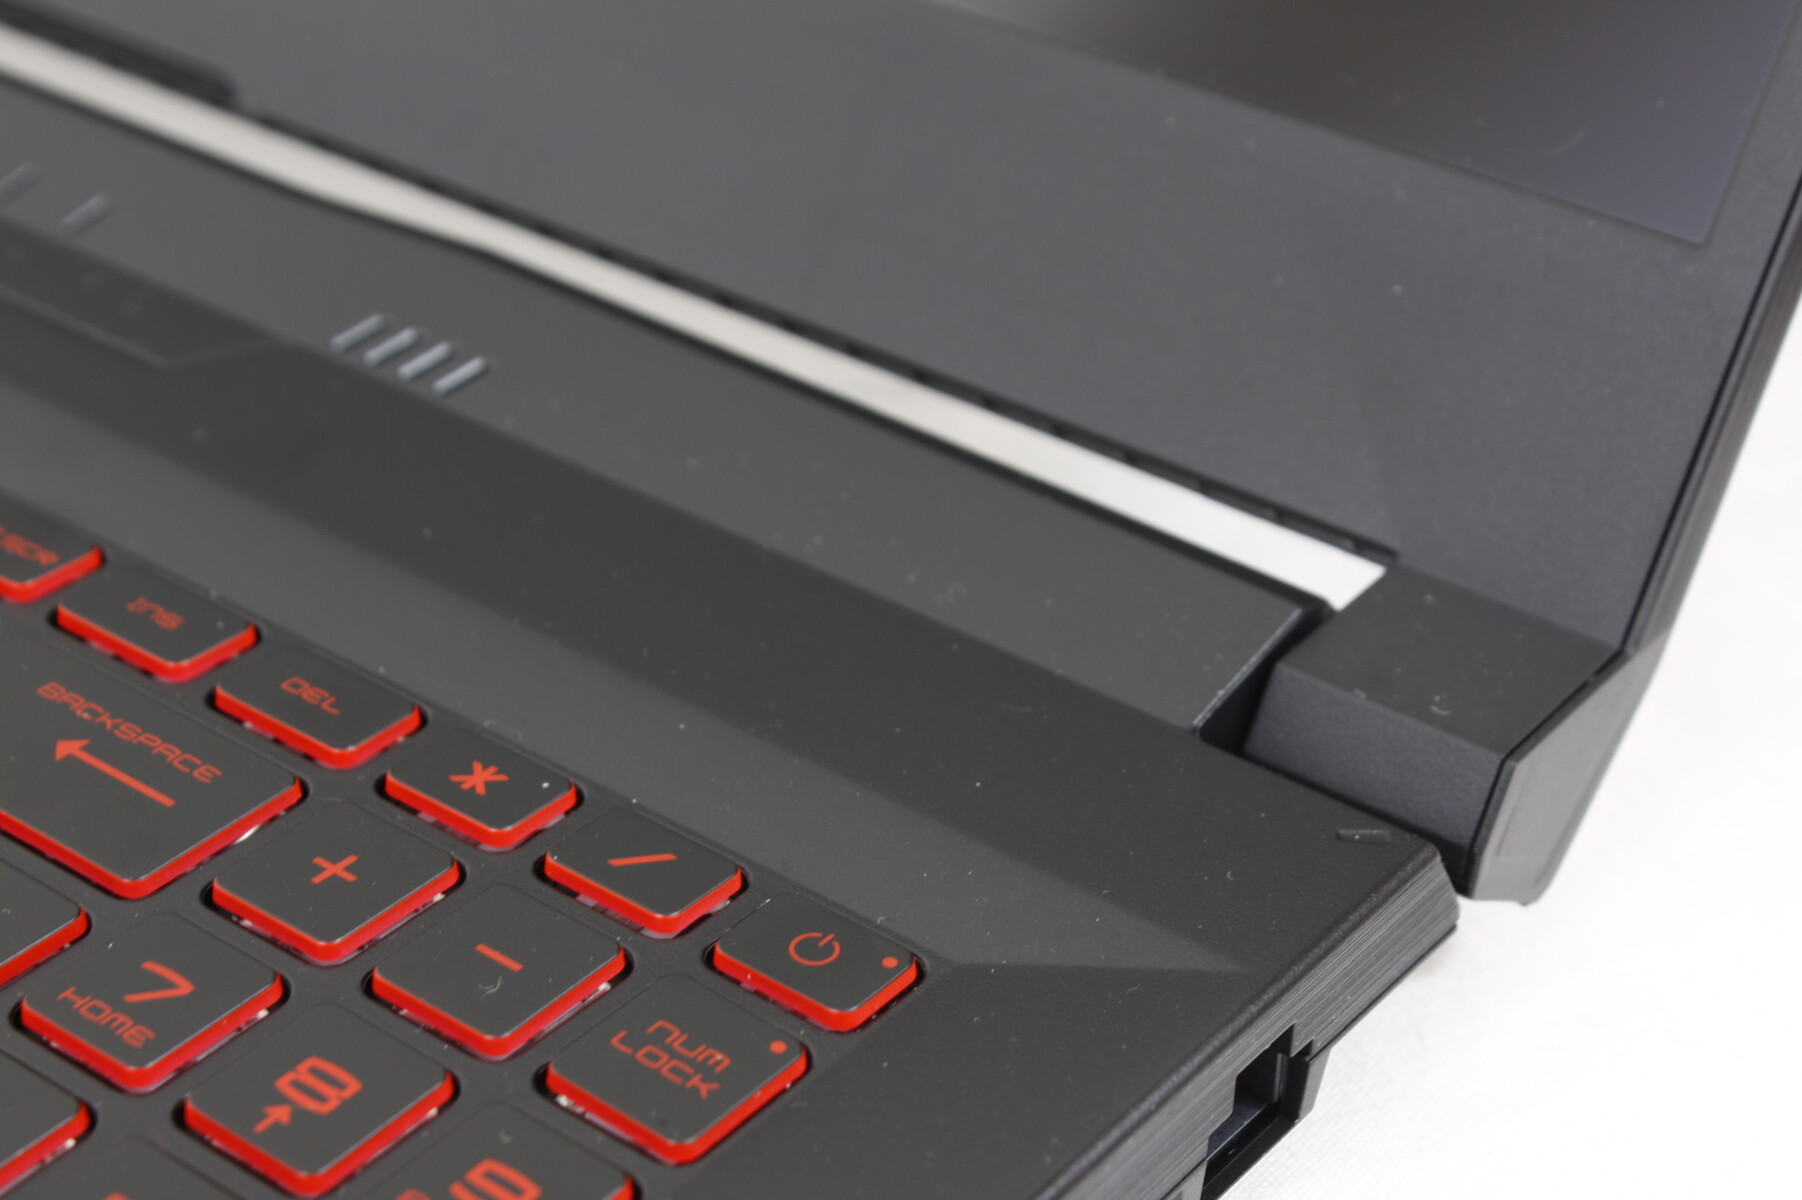
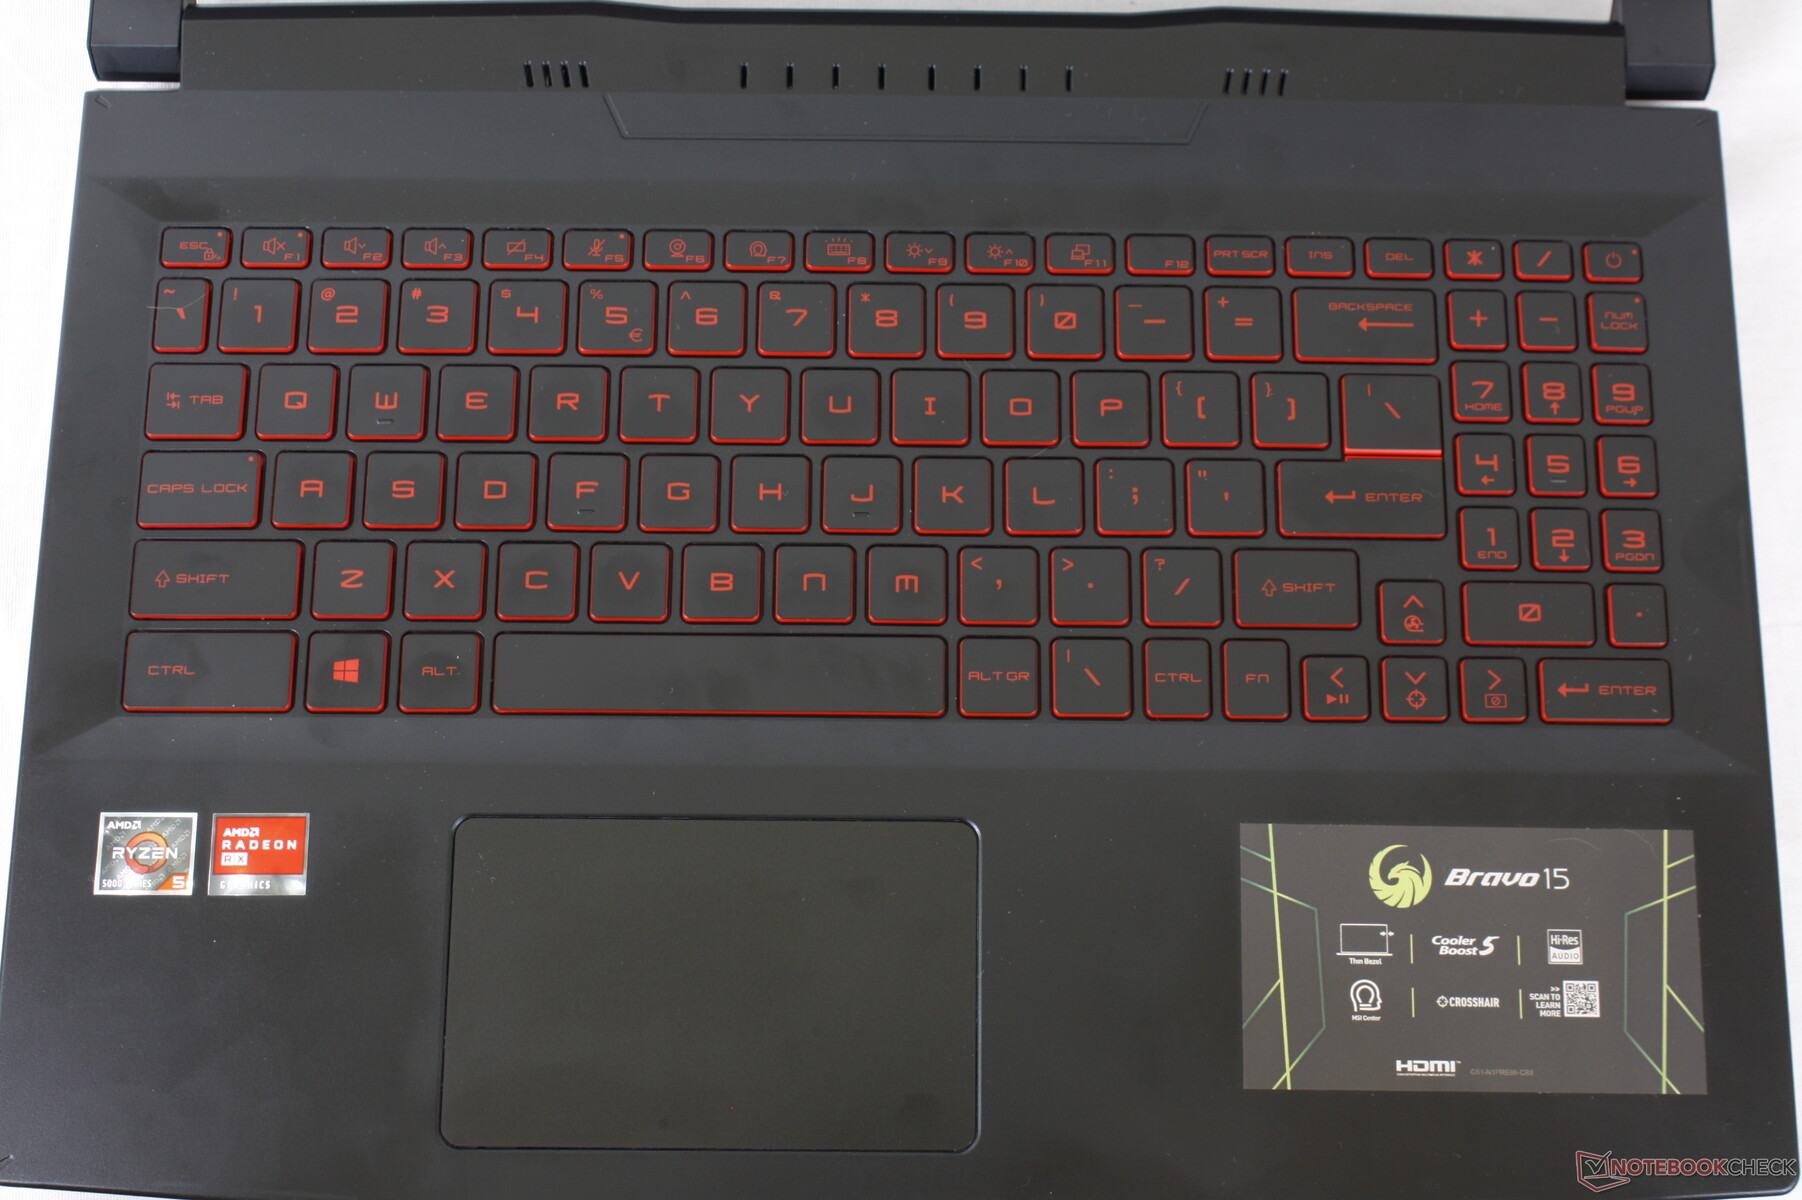
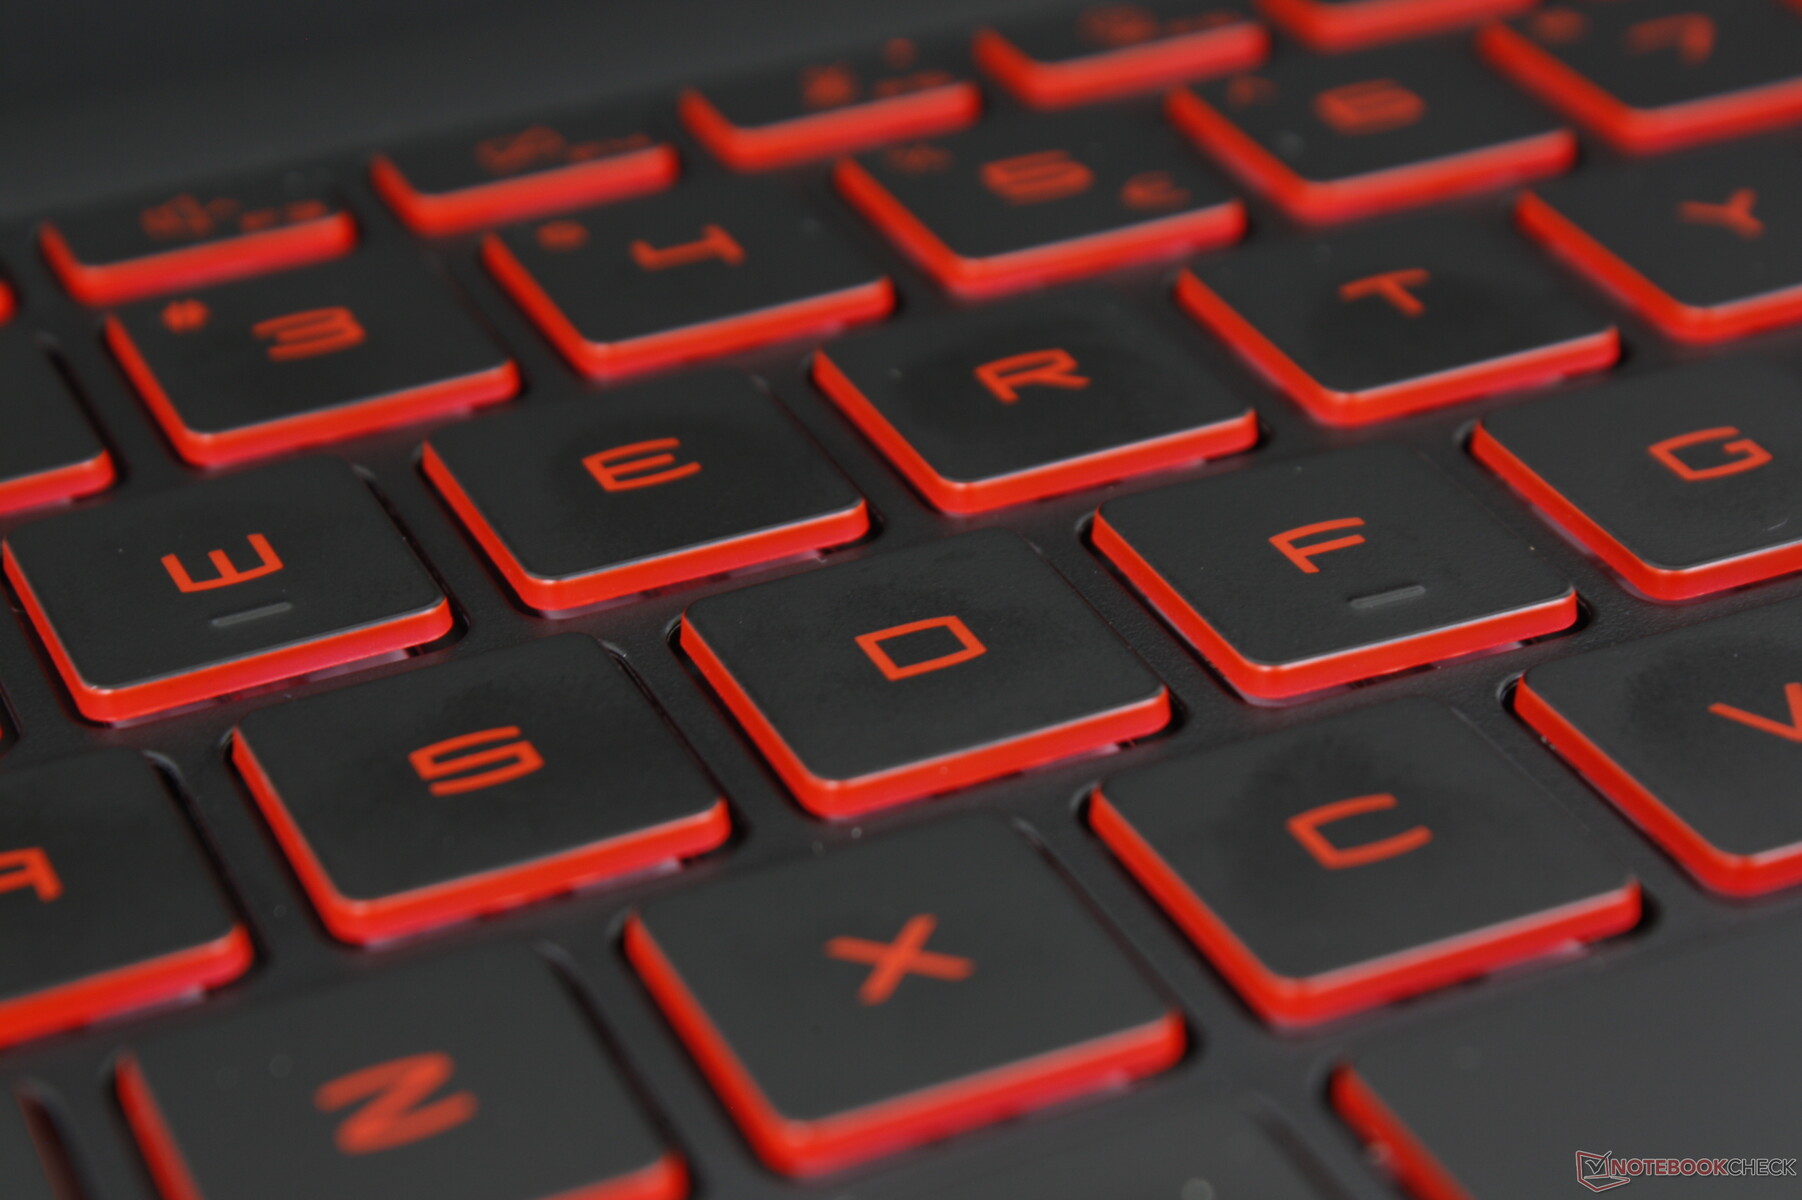
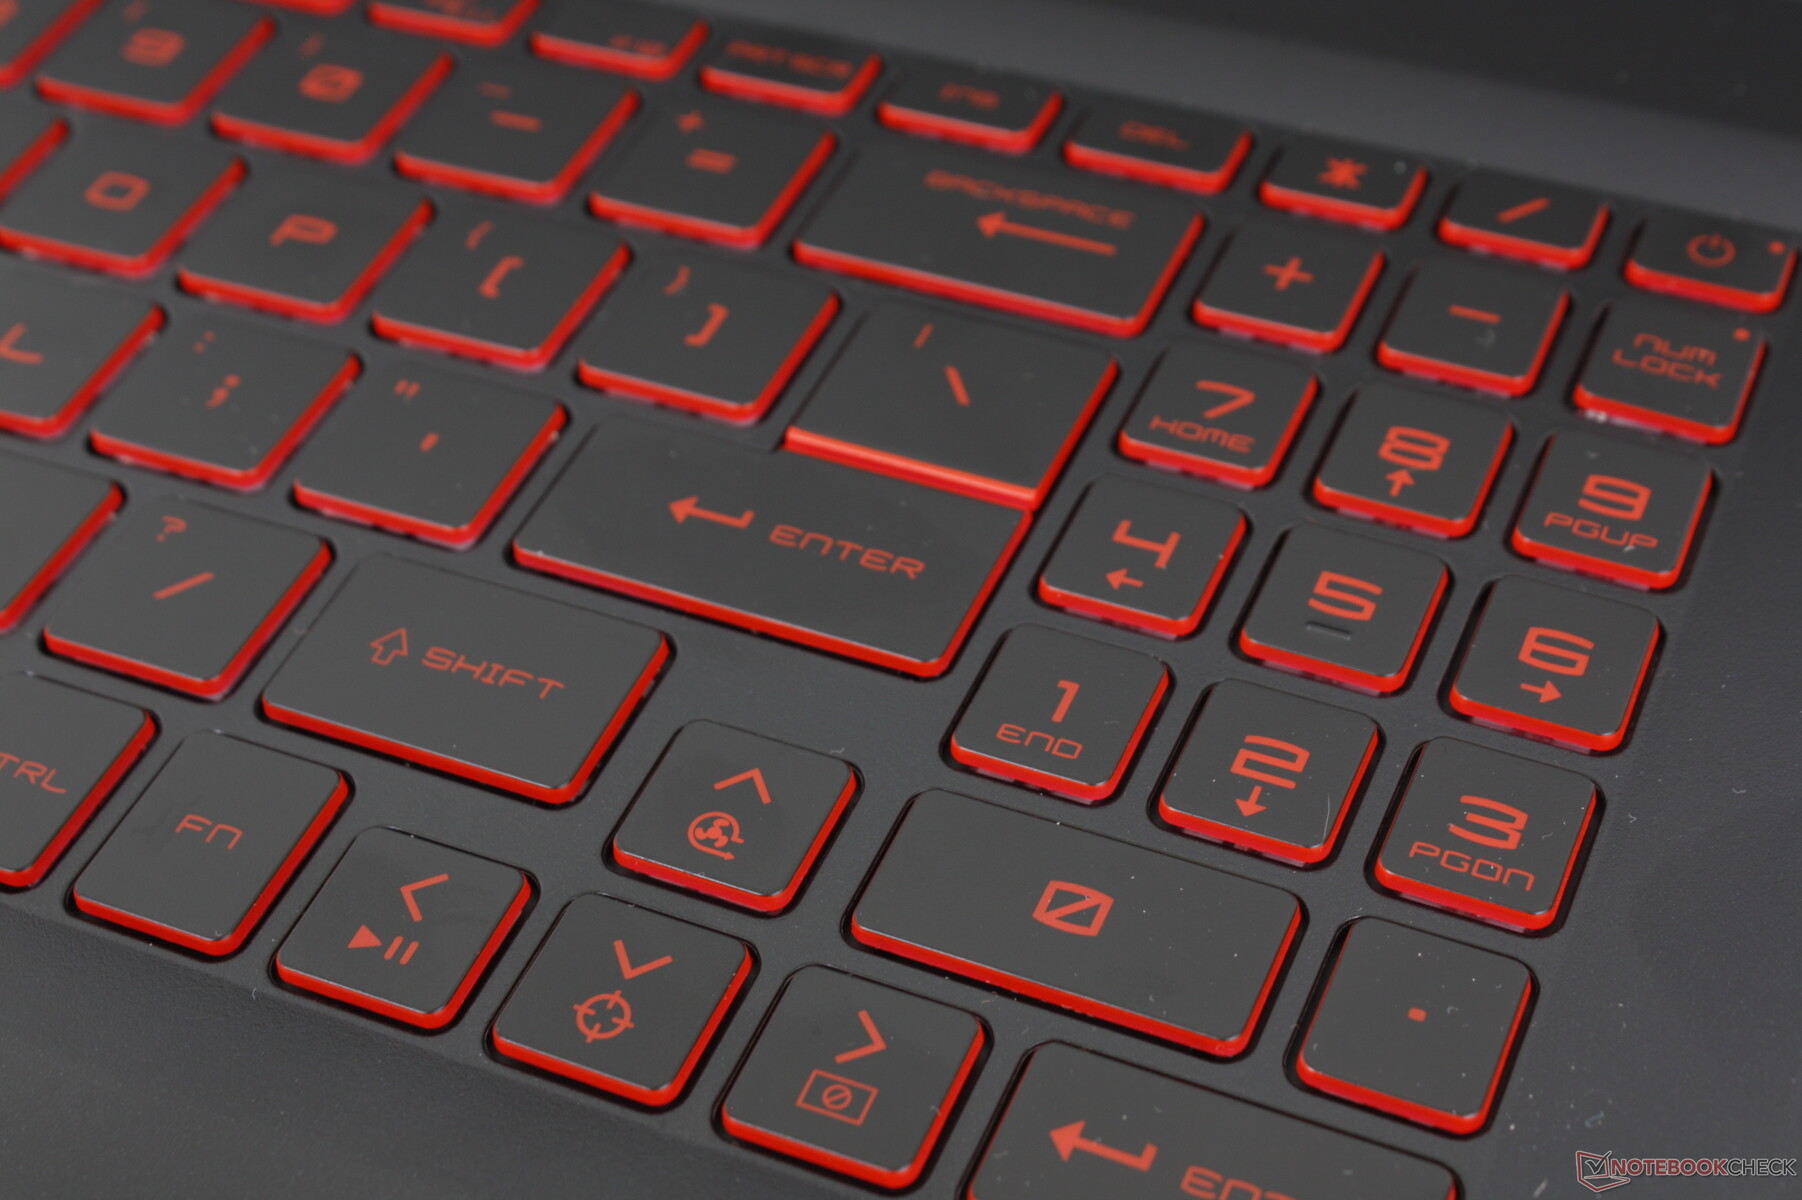
Périphériques d'entrée - Nouveau clavier, ancien pavé numérique
Clavier
Décrire le pavé tactile : caractéristiques de glissement, structure de la surface, taille, caractéristiques, par exemple, multi-touch, défilement, réactivité, précision, boutons du pavé tactile, autres remplacements de la souris, par exemple, trackpoint, ...
Un chapitre séparé décrivant l'écran tactile (réactivité, ...) pourrait être approprié pour les tablettes/convertibles.
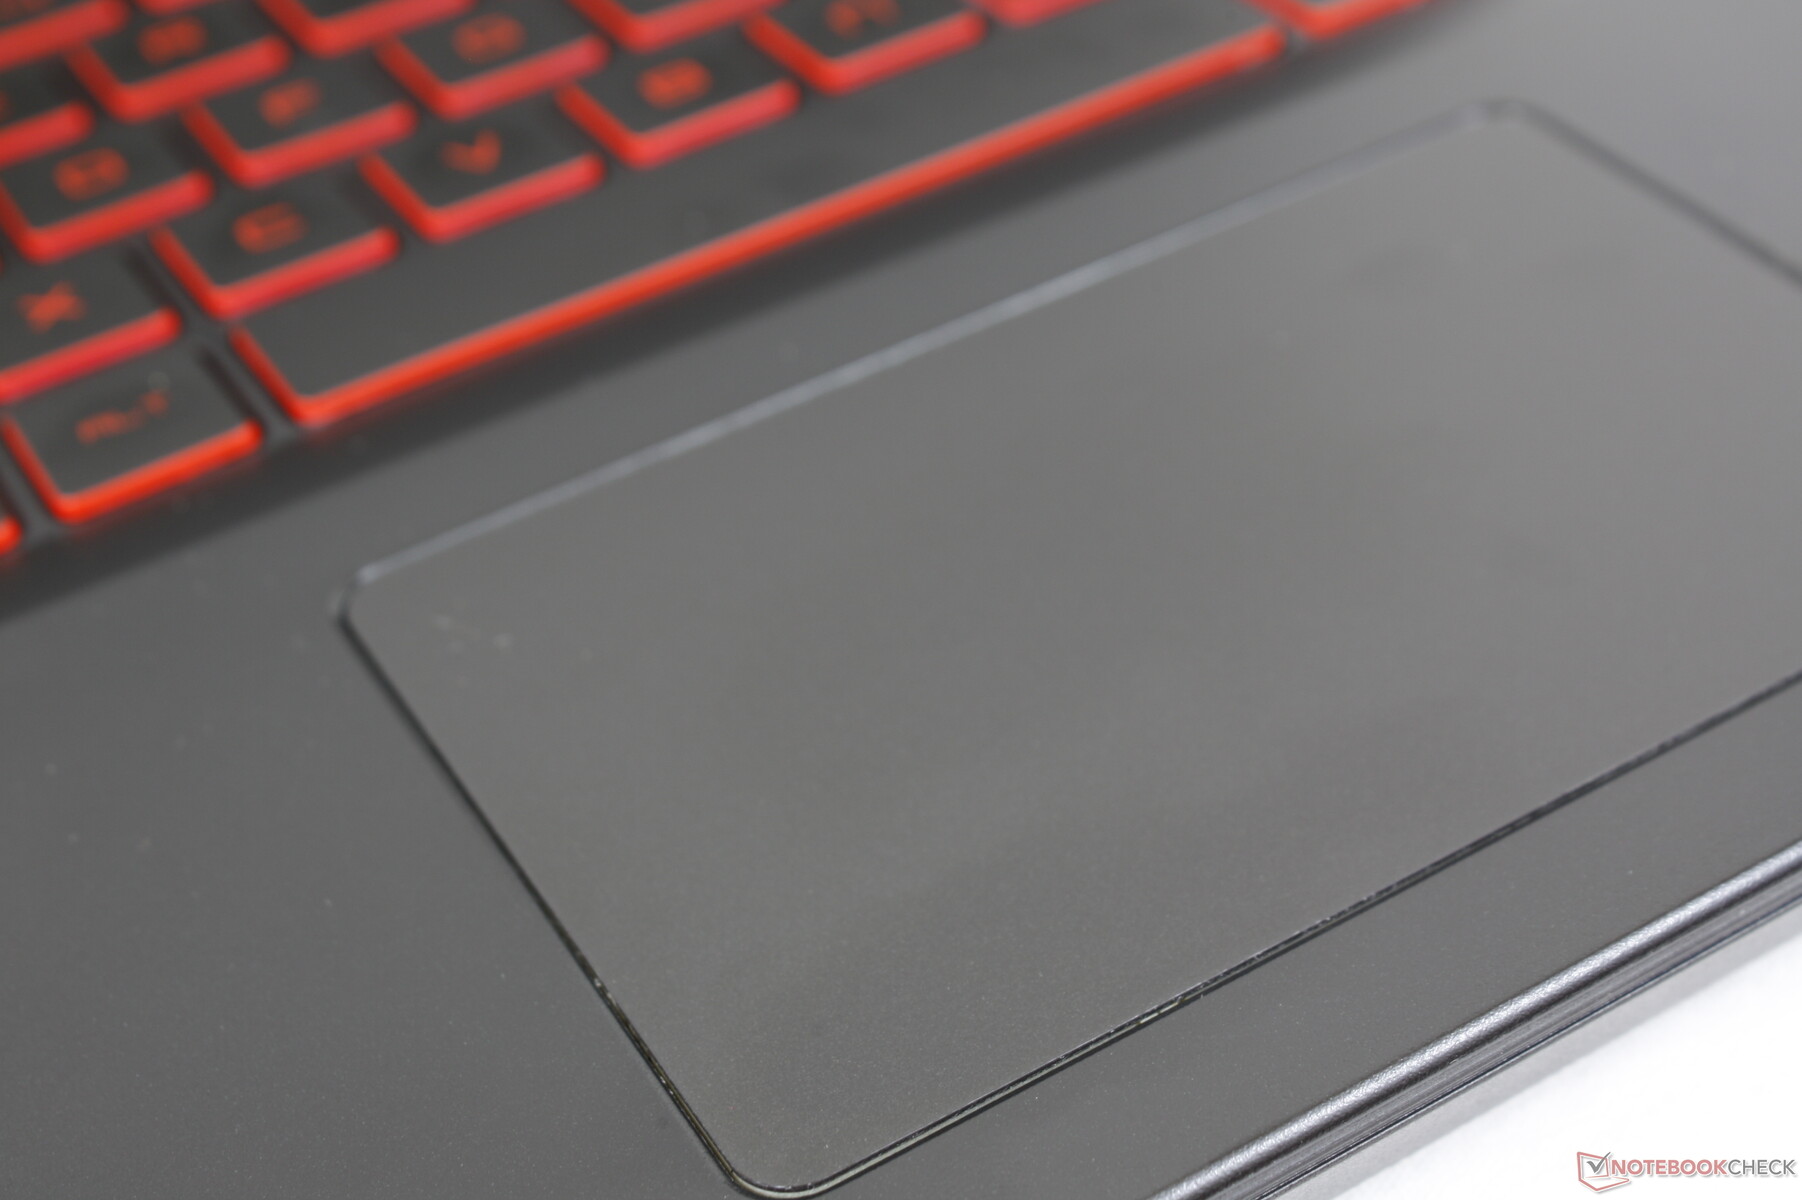
Pavé tactile
Le pavé tactile (10,5 x 6,5 cm) est de la même taille que celui du Bravo 15 de 2020. Il n'a malheureusement pas été amélioré en termes d'adhérence ou de retour d'information, que nous trouvions également médiocres sur l'ancien modèle. La glisse n'est pas très fluide car le doigt colle trop facilement tandis que le feedback est du côté spongieux lorsqu'on appuie dessus. Si MSI insiste pour ne pas augmenter la taille du clickpad, alors nous aimerions voir des boutons de souris dédiés pour faciliter les clics et les actions de drag-and-drop.
Affichage - FreeSync avec taux de rafraîchissement de 144 Hz
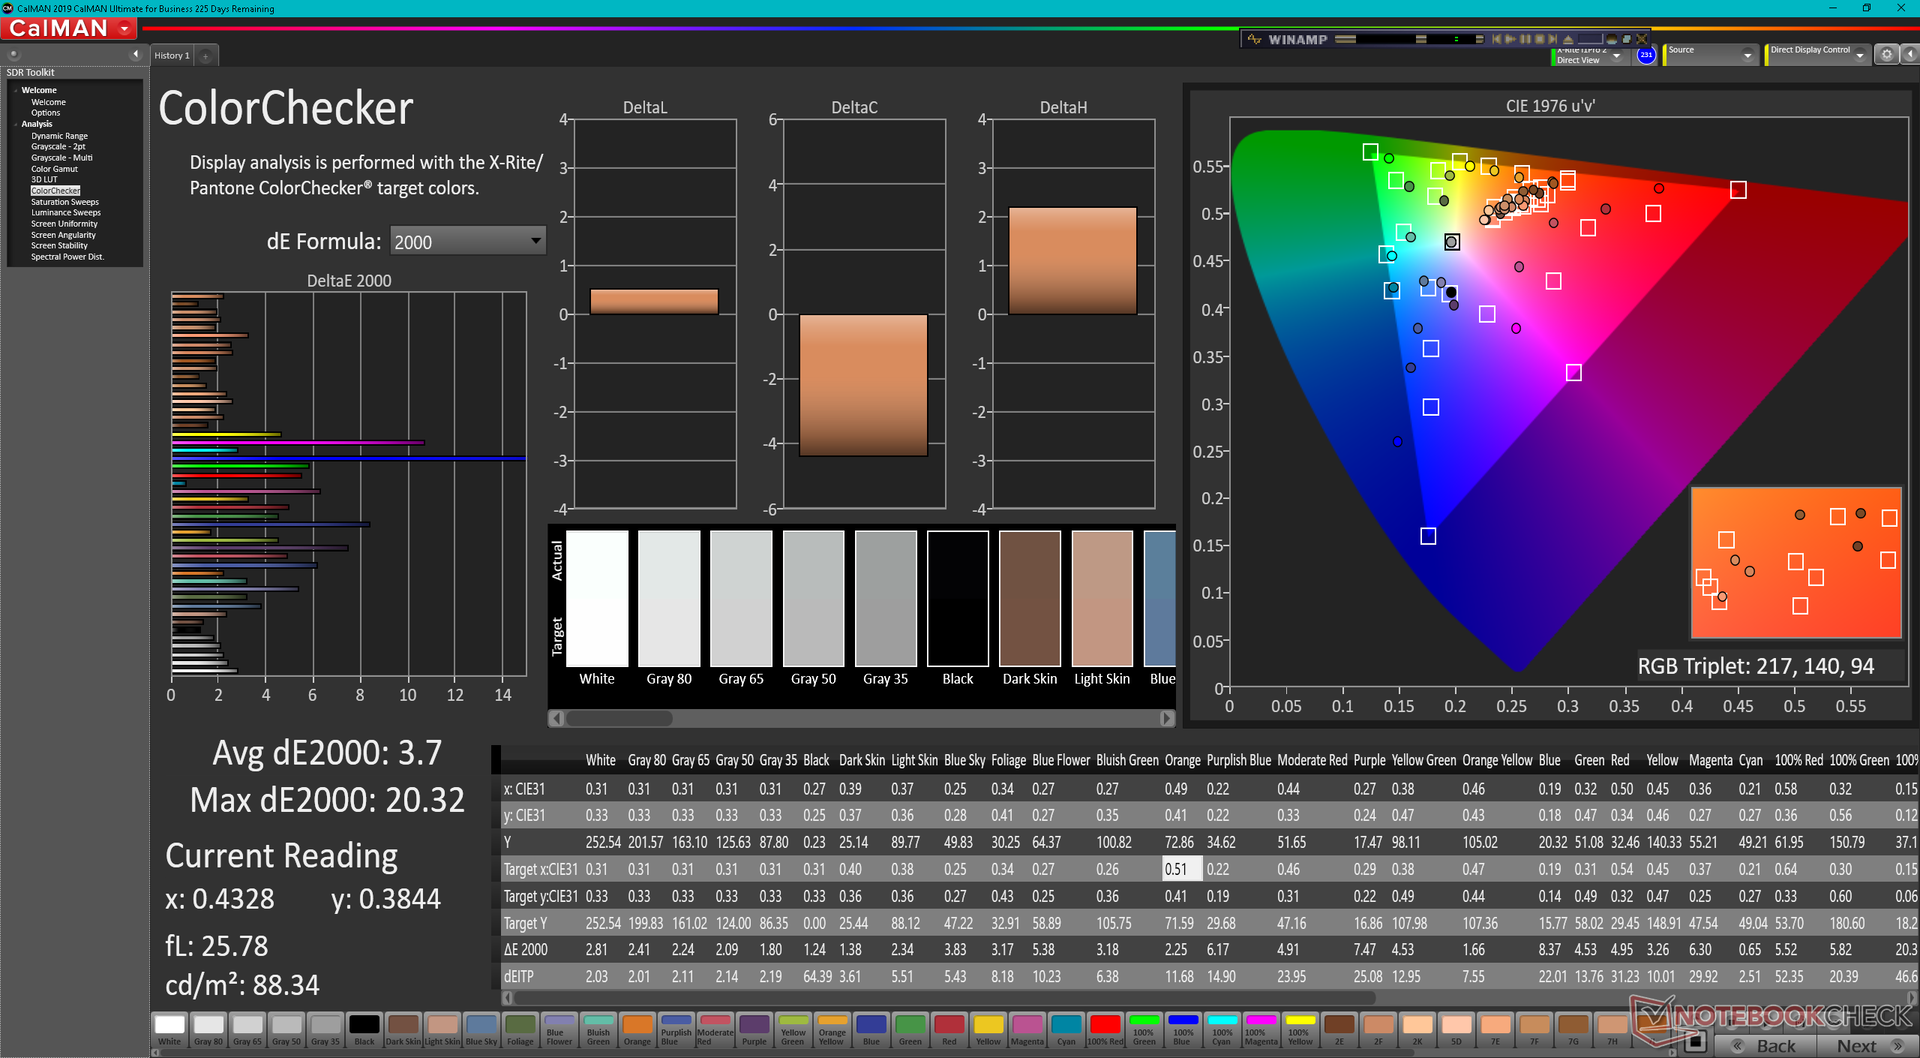
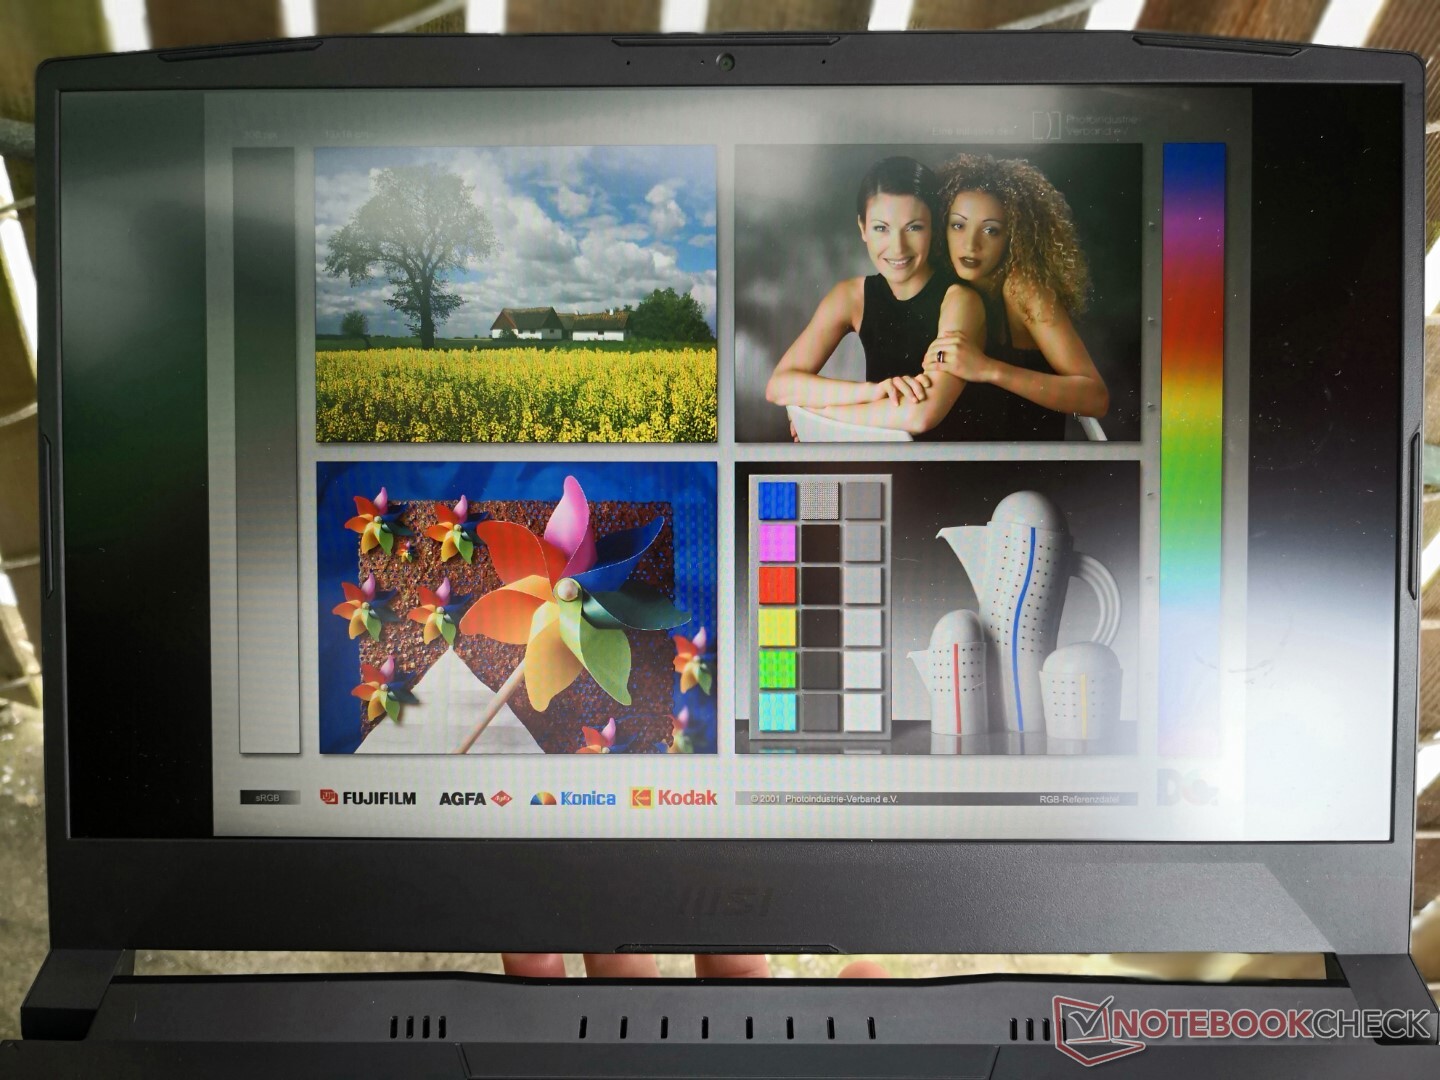
Notre unité de test Bravo 15 est équipée du même panneau IPS Chi Mei N156HRA-EA1 que l'on trouve sur le Nitro 5 AN515 d'Acer ou le TUF Gaming F15 FX506HM d'Asus. Cette dalle est remarquable pour son taux de rafraîchissement natif de 144 Hz et ses temps de réponse décents en noir et blanc et gris-gris, mais le gamut limité la rend inadaptée à la plupart des travaux d'édition graphique. Les résultats sont un déclassement par rapport au Bravo 15 de 2020 qui avait un panneau AU Optronics de meilleure qualité avec des temps de réponse plus rapides, de meilleures couleurs et un rétroéclairage plus lumineux.


| |||||||||||||||||||||||||
Homogénéité de la luminosité: 87 %
Valeur mesurée au centre, sur batterie: 265.1 cd/m²
Contraste: 757:1 (Valeurs des noirs: 0.35 cd/m²)
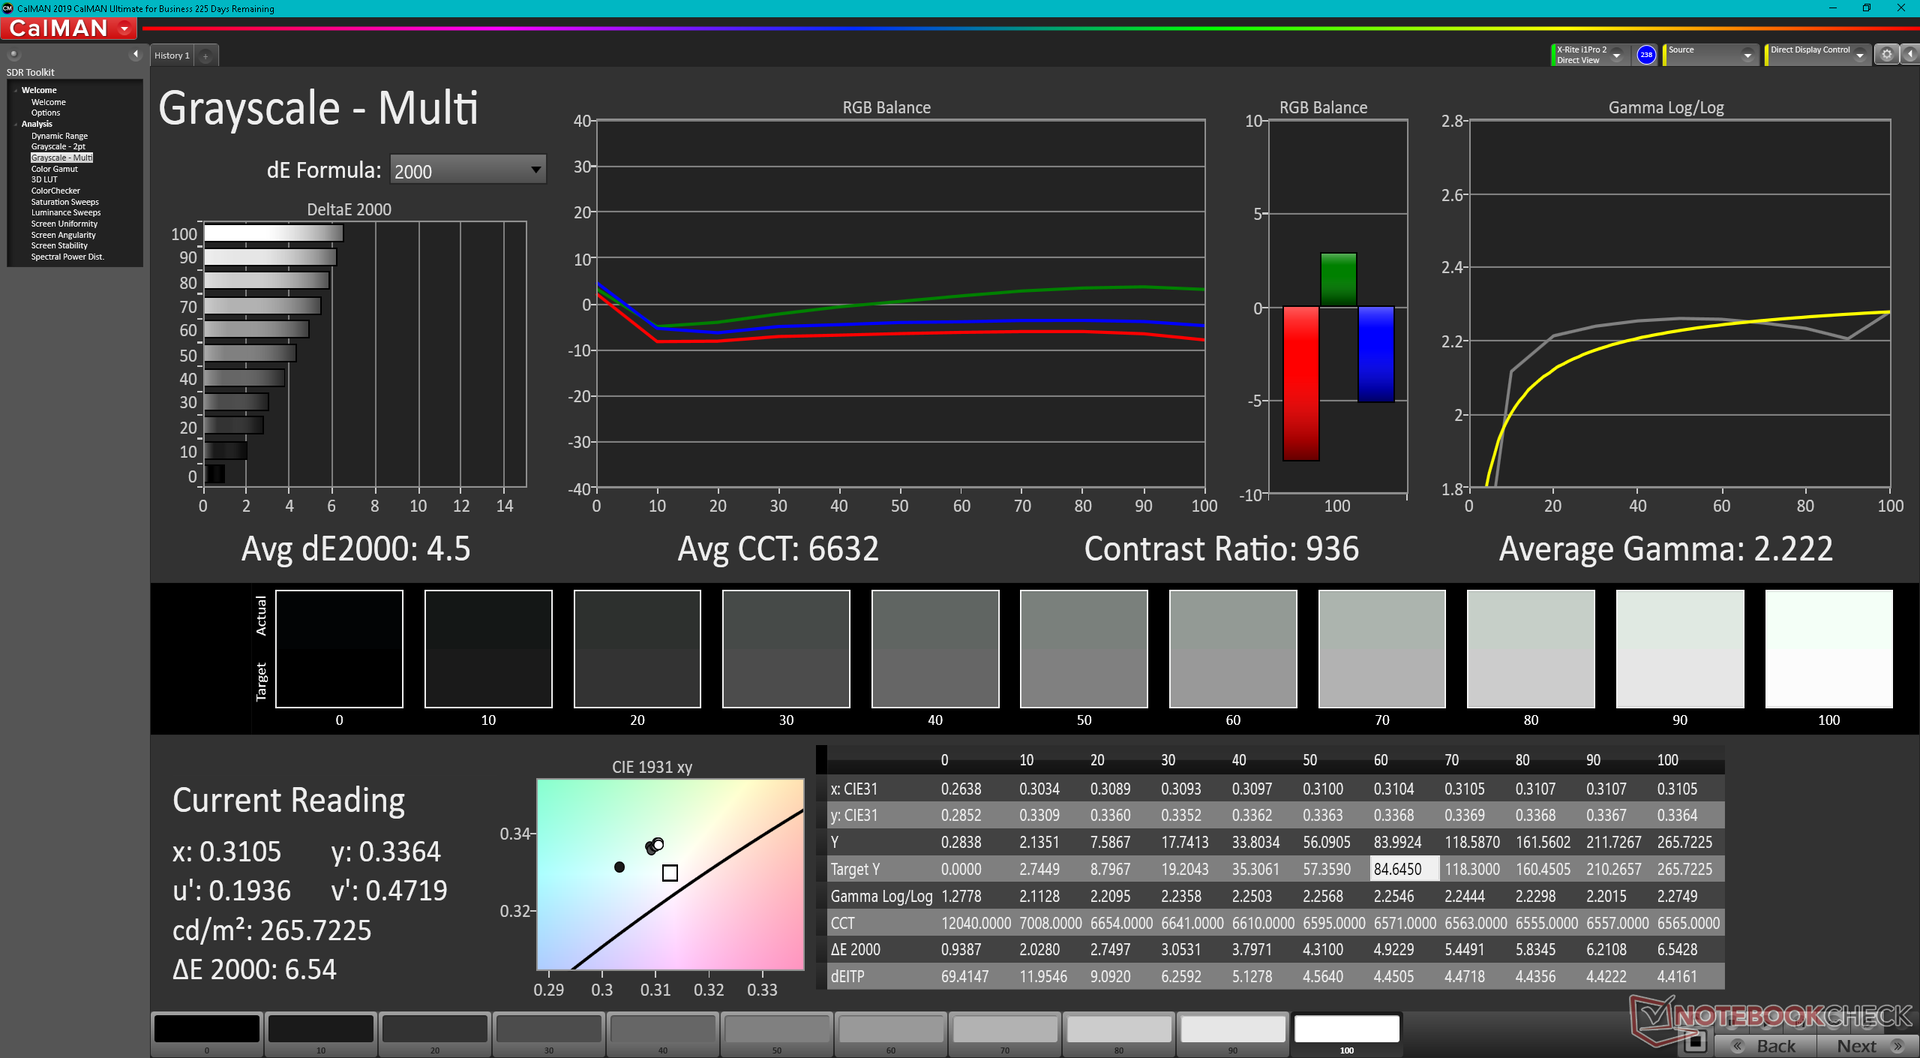
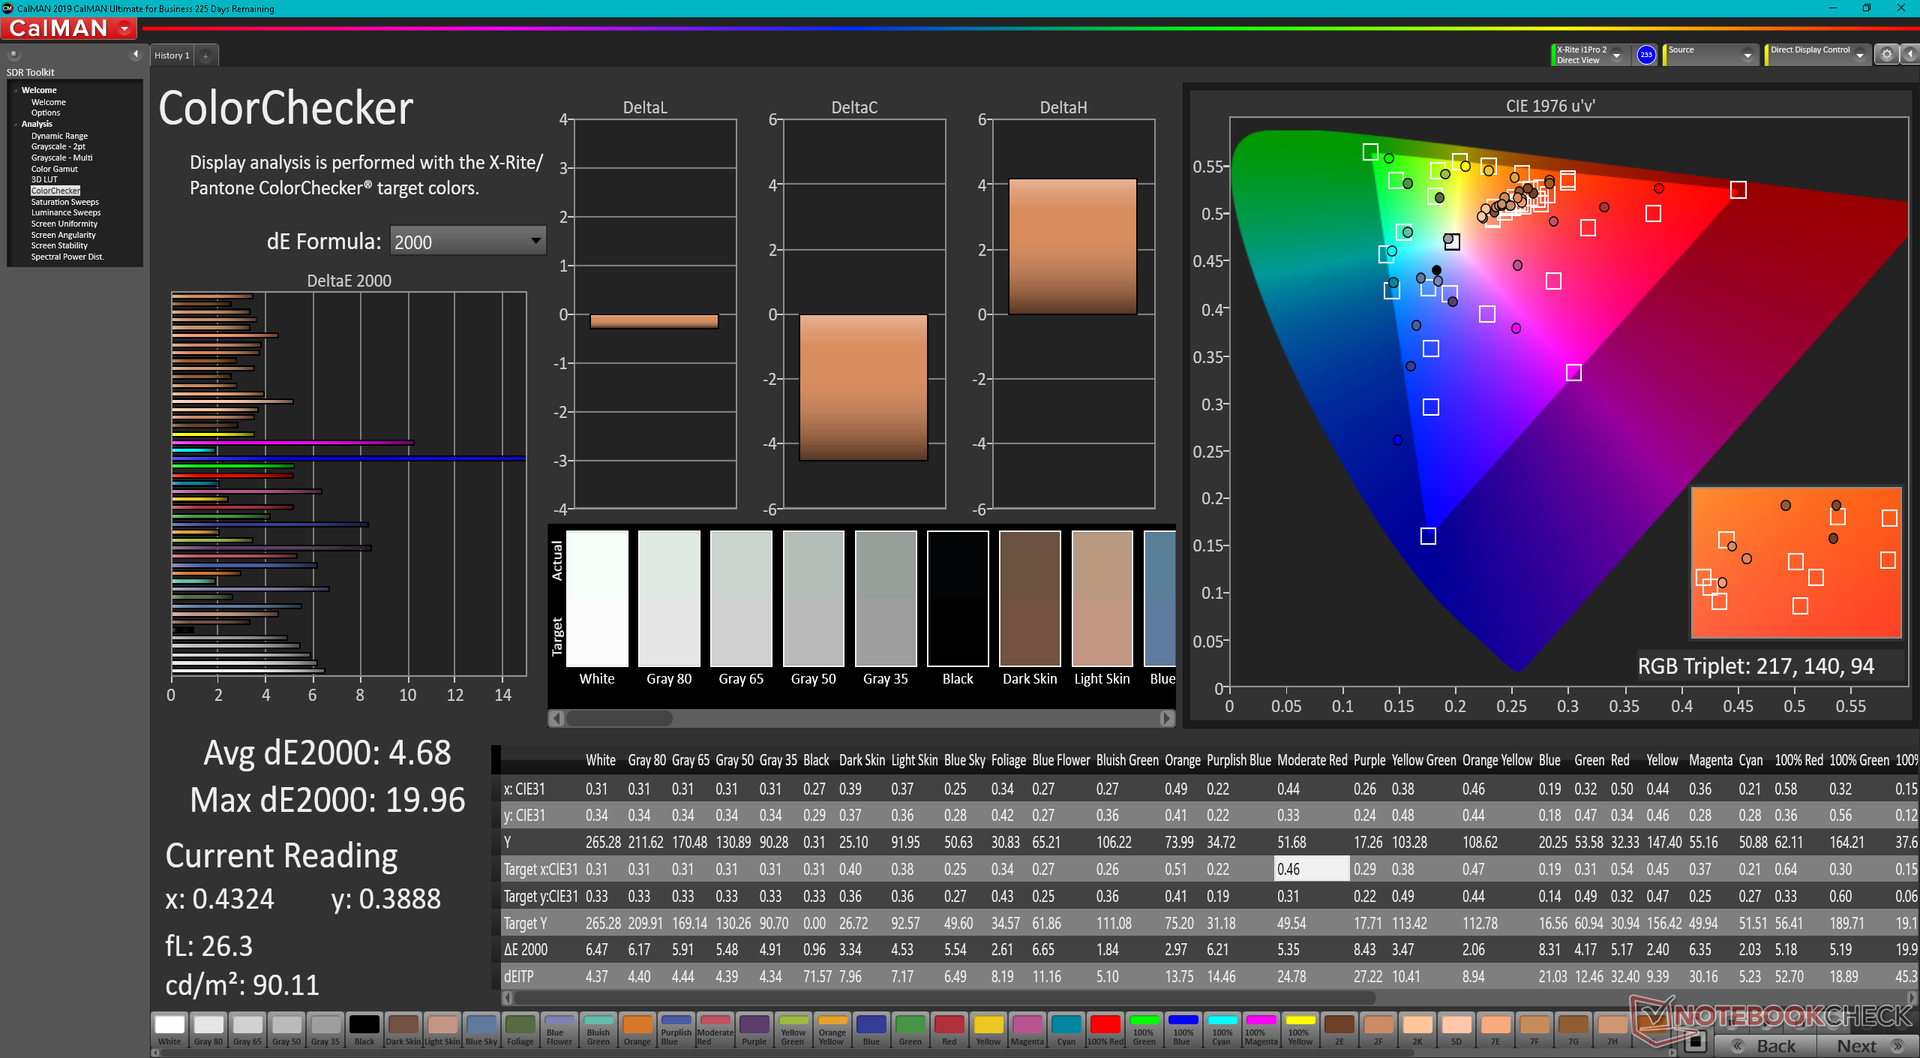
ΔE ColorChecker Calman: 4.68 | ∀{0.5-29.43 Ø4.73}
calibrated: 3.7
ΔE Greyscale Calman: 4.5 | ∀{0.09-98 Ø4.97}
43.6% AdobeRGB 1998 (Argyll 3D)
62.8% sRGB (Argyll 3D)
42.1% Display P3 (Argyll 3D)
Gamma: 2.22
CCT: 6632 K
| MSI Bravo 15 B5DD-010US Chi Mei N156HRA-EA1, IPS, 1920x1080, 15.6" | MSI Bravo 15 A4DCR AU Optronics B156HAN08.0 (AUO80ED), IPS-Level, 1920x1080, 15.6" | Asus TUF Gaming F15 FX507ZM TL156VDXP0101, IPS, 1920x1080, 15.6" | Dell G15 5515 BOE092A, IPS, 1920x1080, 15.6" | Lenovo Ideapad Gaming 3 15IHU-82K1002RGE LEN156FHD, IPS, 1920x1080, 15.6" | Acer Nitro 5 AN515-45-R1JH BOE BOE09B8, IPS, 2560x1440, 15.6" | |
|---|---|---|---|---|---|---|
| Display | 43% | 56% | -8% | -6% | 55% | |
| Display P3 Coverage (%) | 42.1 | 62 47% | 66.4 58% | 39.1 -7% | 39.7 -6% | 66.2 57% |
| sRGB Coverage (%) | 62.8 | 86.8 38% | 97 54% | 56.9 -9% | 59.6 -5% | 96.3 53% |
| AdobeRGB 1998 Coverage (%) | 43.6 | 62.7 44% | 68.5 57% | 40.4 -7% | 41.1 -6% | 67.1 54% |
| Response Times | 46% | 61% | 14% | -68% | 55% | |
| Response Time Grey 50% / Grey 80% * (ms) | 25.6 ? | 16 ? 37% | 5.6 ? 78% | 25.2 ? 2% | 46.4 ? -81% | 14 ? 45% |
| Response Time Black / White * (ms) | 22.8 ? | 10.4 ? 54% | 12.8 ? 44% | 16.8 ? 26% | 35.2 ? -54% | 8 ? 65% |
| PWM Frequency (Hz) | 200 ? | |||||
| Screen | 15% | 44% | -1% | 11% | 7% | |
| Brightness middle (cd/m²) | 265.1 | 311 17% | 353.7 33% | 278 5% | 307 16% | 349 32% |
| Brightness (cd/m²) | 245 | 313 28% | 340 39% | 262 7% | 292 19% | 304 24% |
| Brightness Distribution (%) | 87 | 88 1% | 89 2% | 83 -5% | 88 1% | 79 -9% |
| Black Level * (cd/m²) | 0.35 | 0.43 -23% | 0.34 3% | 0.36 -3% | 0.21 40% | 0.535 -53% |
| Contrast (:1) | 757 | 723 -4% | 1040 37% | 772 2% | 1462 93% | 652 -14% |
| Colorchecker dE 2000 * | 4.68 | 4.5 4% | 1.74 63% | 5.74 -23% | 5.9 -26% | 3.11 34% |
| Colorchecker dE 2000 max. * | 19.96 | 7.97 60% | 3.63 82% | 19.63 2% | 21.6 -8% | 9.57 52% |
| Colorchecker dE 2000 calibrated * | 3.7 | 2.65 28% | 0.5 86% | 4.7 -27% | 4.8 -30% | |
| Greyscale dE 2000 * | 4.5 | 3.3 27% | 2.1 53% | 3.1 31% | 4.9 -9% | 5 -11% |
| Gamma | 2.22 99% | 2.129 103% | 2.3 96% | 2.011 109% | 2.26 97% | 2.36 93% |
| CCT | 6632 98% | 7227 90% | 6257 104% | 6207 105% | 6504 100% | 6976 93% |
| Color Space (Percent of AdobeRGB 1998) (%) | 63 | |||||
| Color Space (Percent of sRGB) (%) | 86 | |||||
| Moyenne finale (programmes/paramètres) | 35% /
26% | 54% /
49% | 2% /
-0% | -21% /
-4% | 39% /
25% |
* ... Moindre est la valeur, meilleures sont les performances
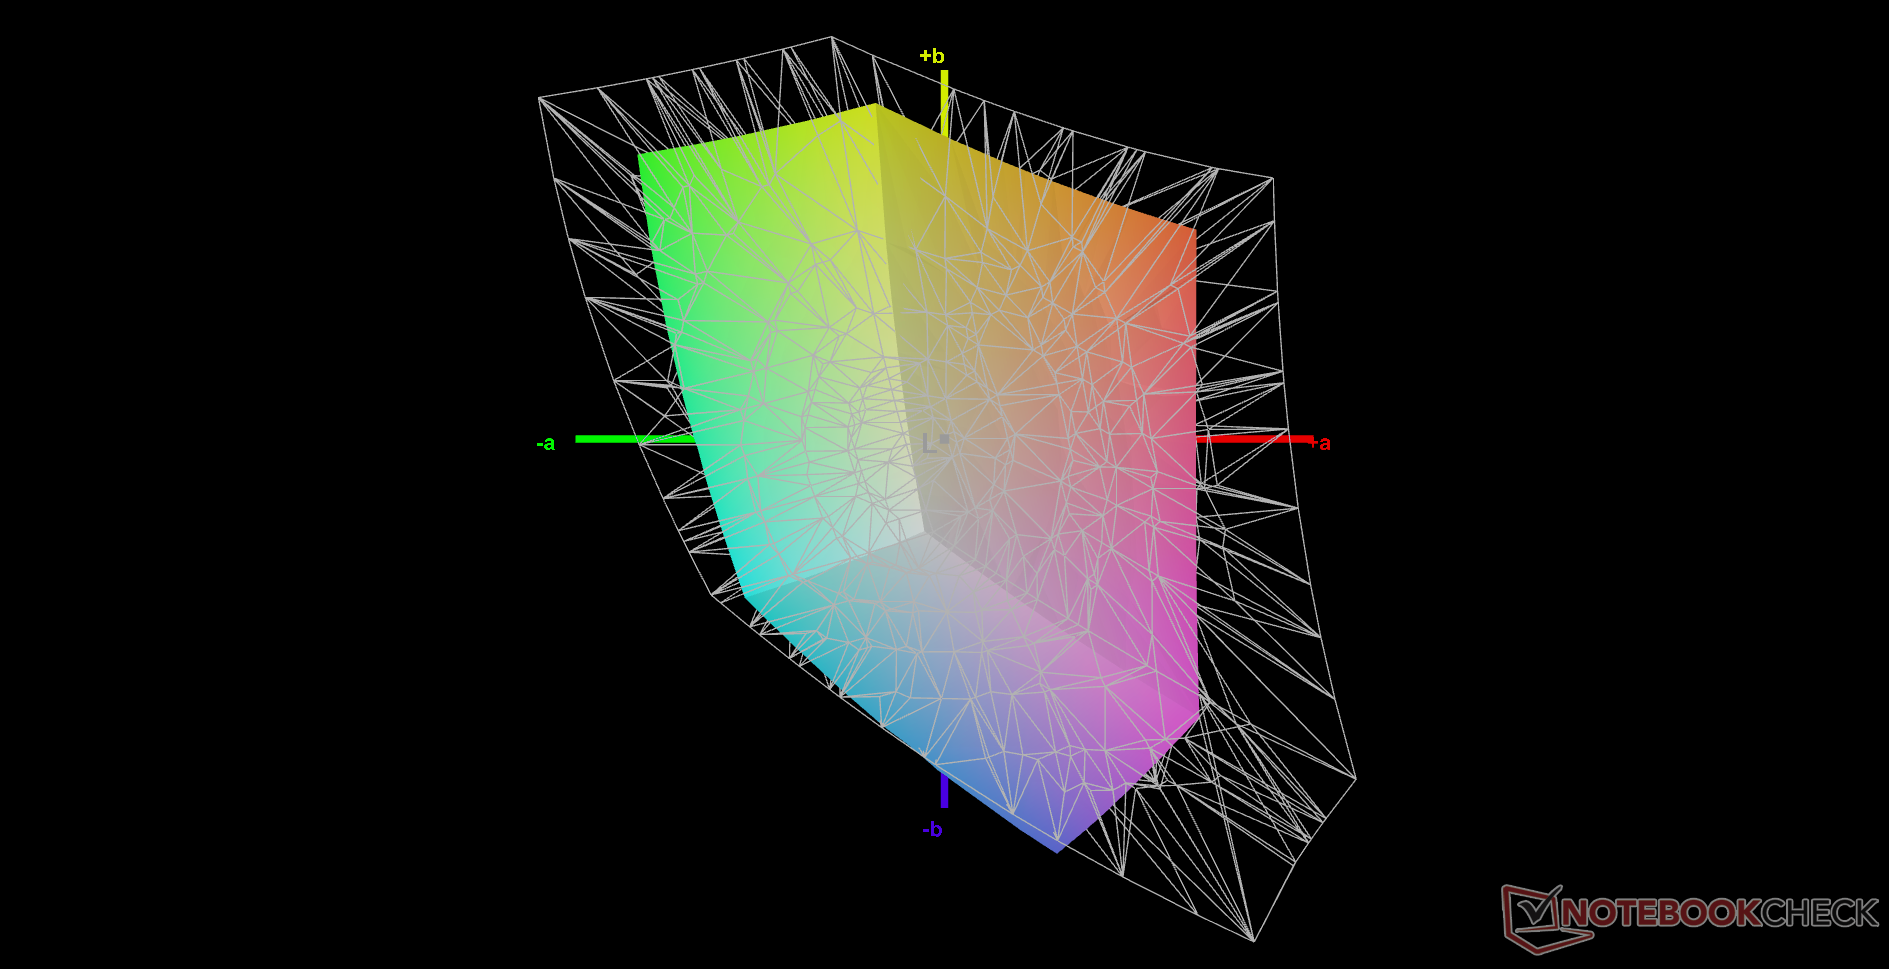
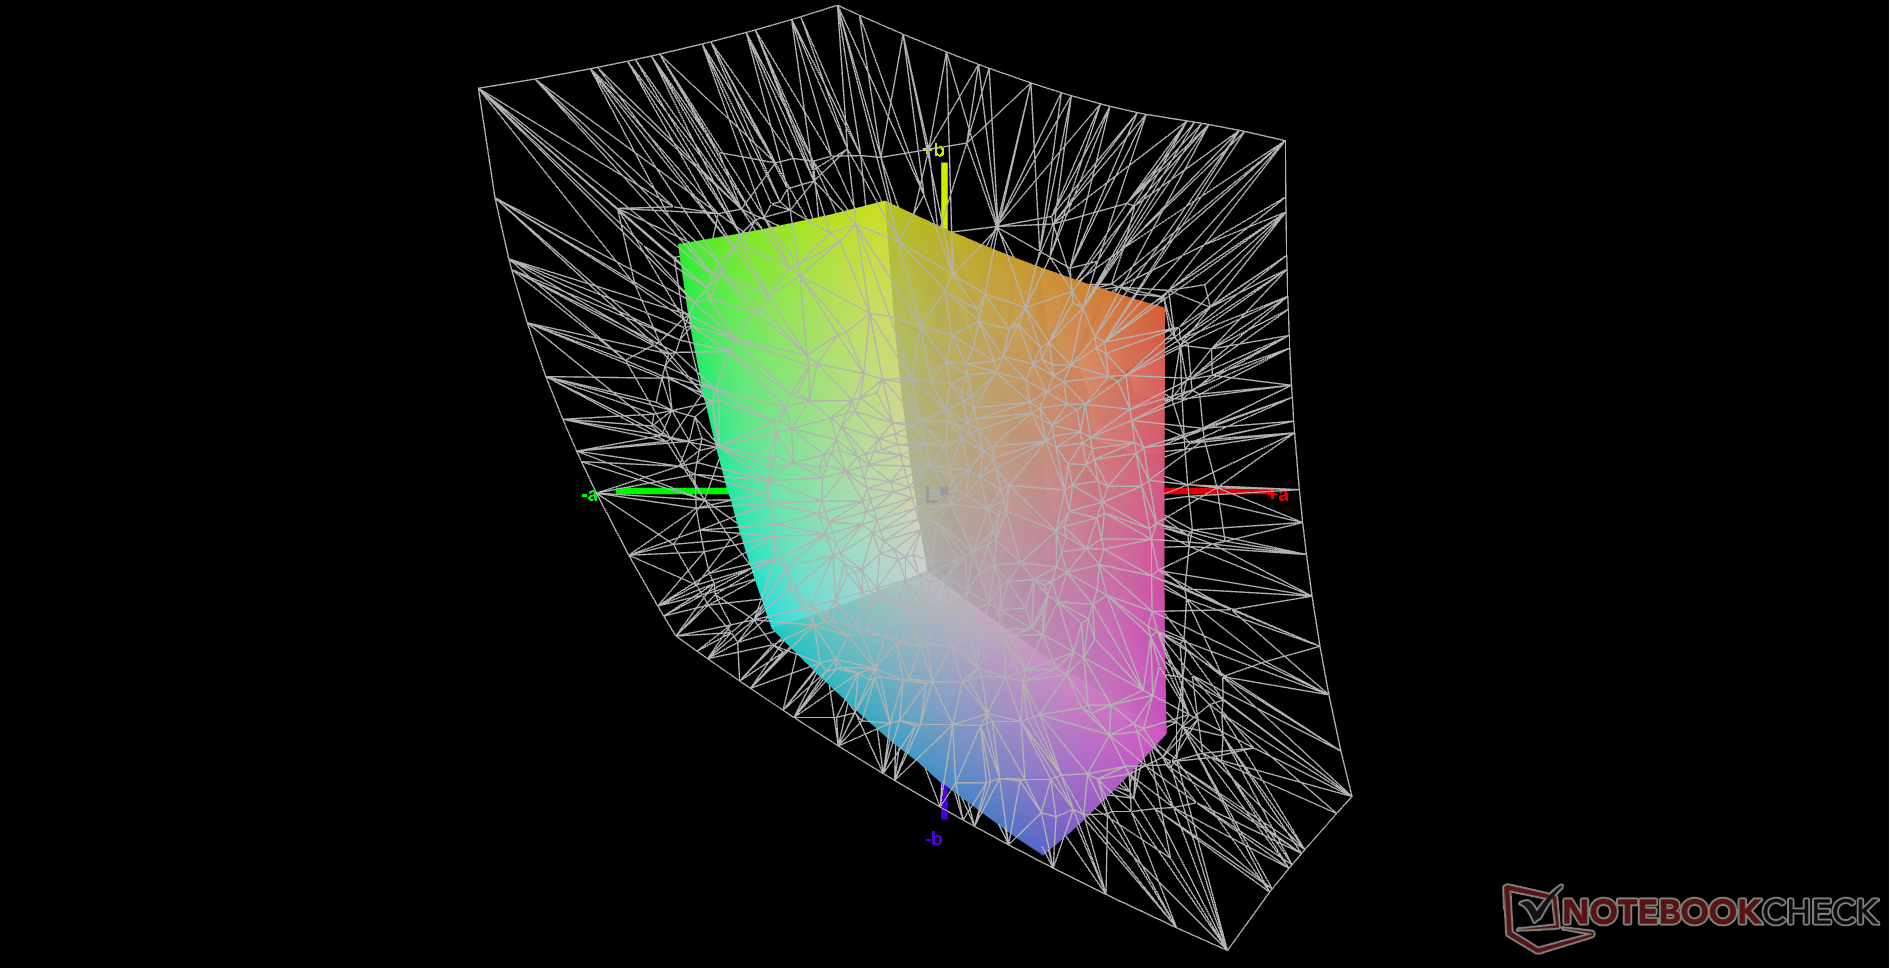
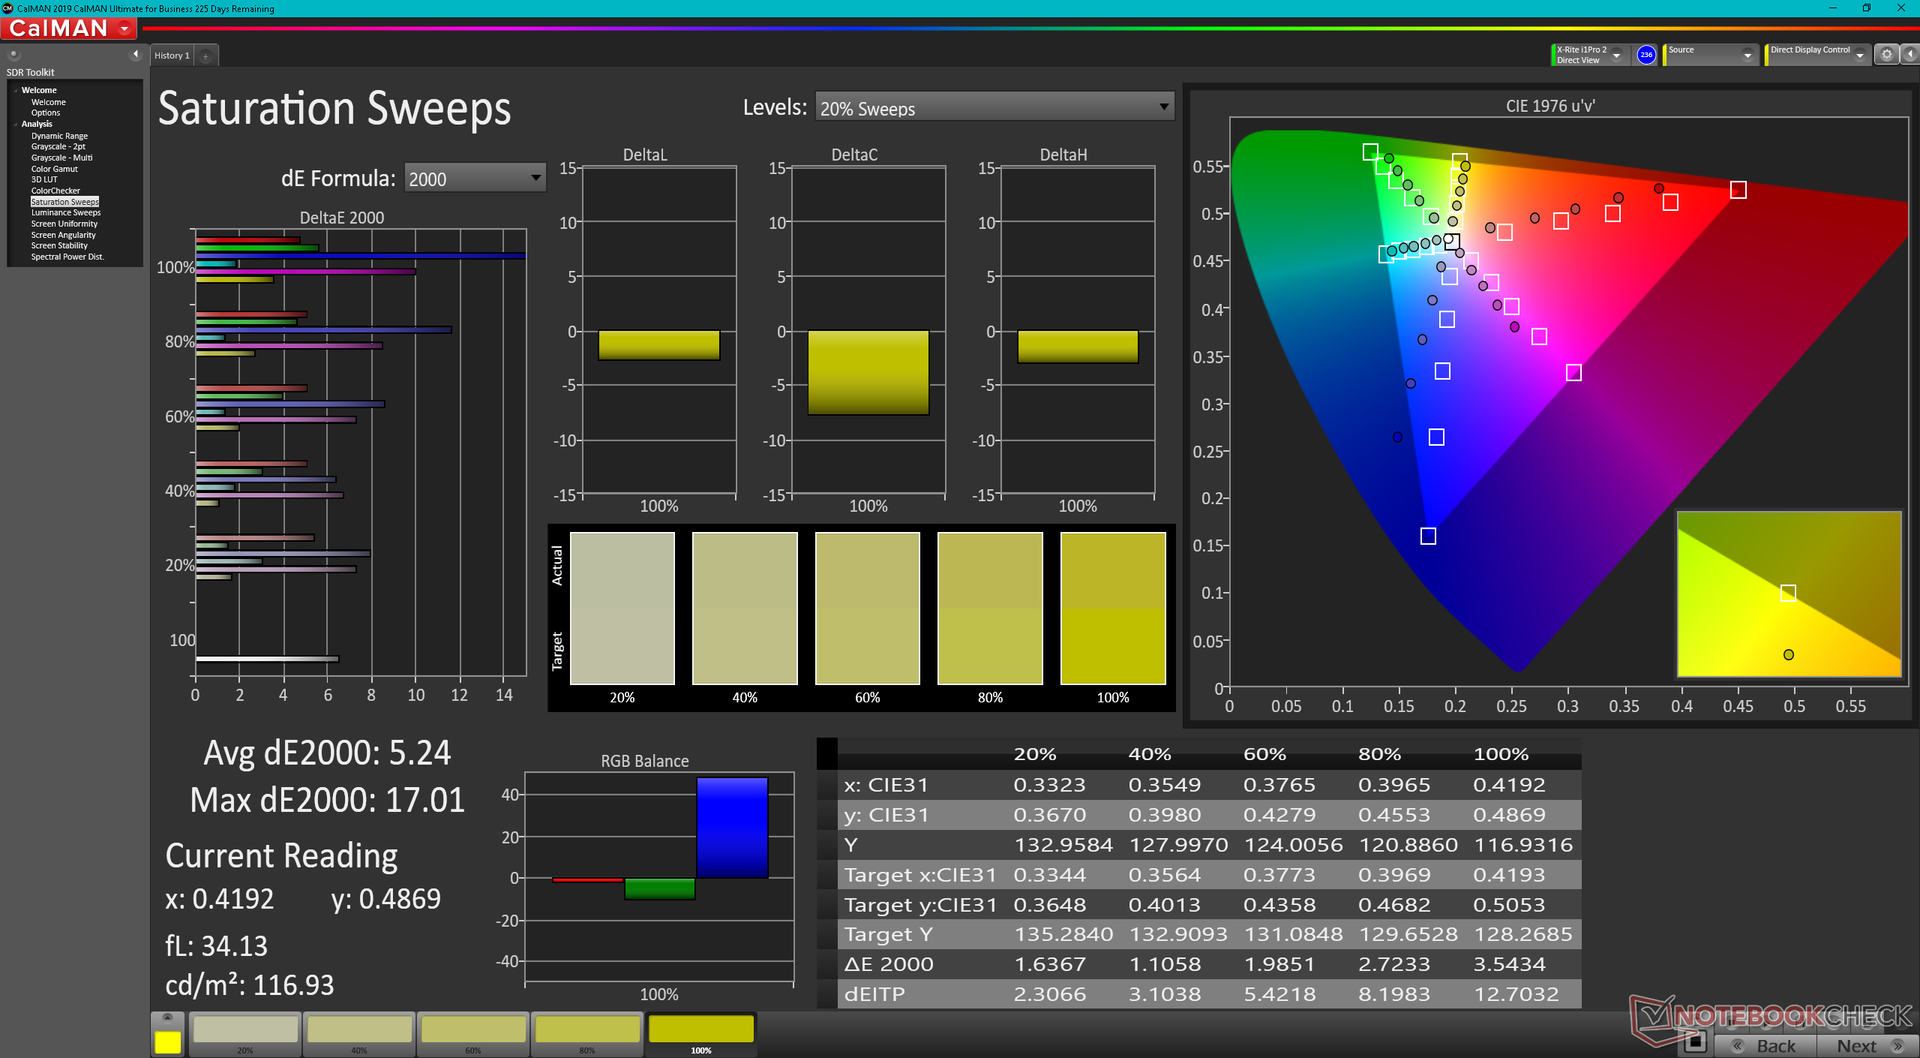
L'espace colorimétrique est étroit, avec seulement 63 % de sRGB, ce qui est une caractéristique commune des panneaux à bas prix. La plupart des ordinateurs portables de jeu de milieu de gamme ont des options pour une couverture sRGB complète alors que le nouveau Bravo 15 n'en a aucune. Il semble que MSI ait supprimé certaines options d'affichage haut de gamme cette fois-ci.
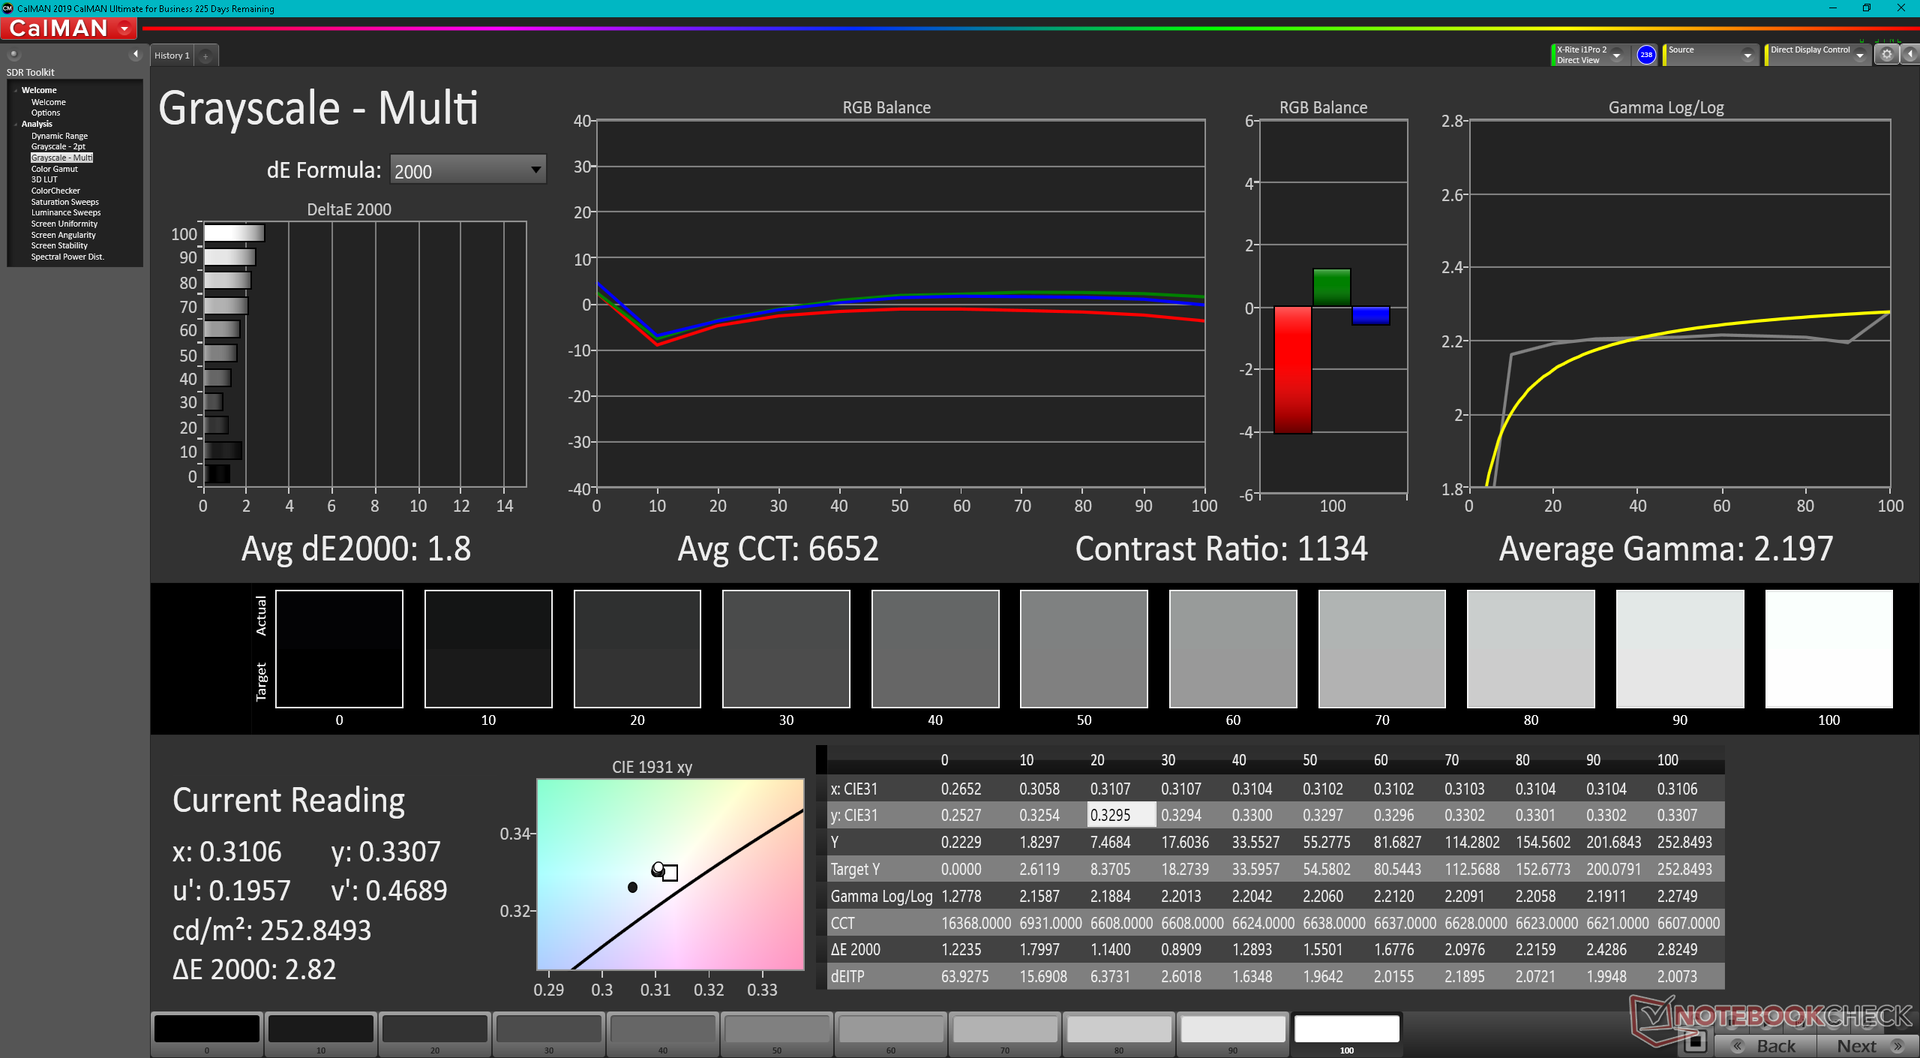
Les valeurs moyennes de DeltaE en niveaux de gris et en couleurs ne sont pas si mauvaises pour un ordinateur portable de jeu à petit budget, car les panneaux bon marché ont tendance à être trop froids par défaut. Nous sommes en mesure d'améliorer la précision encore plus avec notre colorimètre X-Rite (Grayscale DeltaE 4.5 -> 1.8, ColorChecker DeltaE 4.68 -> 3.7), mais les utilisateurs ne doivent pas s'attendre à quelque chose de significatif en raison du gamut limité mentionné ci-dessus.

Temps de réponse de l'écran
| ↔ Temps de réponse noir à blanc | ||
|---|---|---|
| 22.8 ms ... hausse ↗ et chute ↘ combinées | ↗ 13.2 ms hausse | 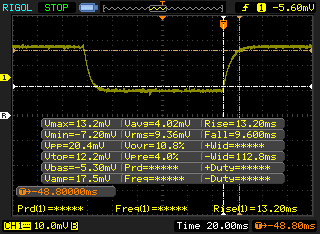 |
| ↘ 9.6 ms chute | ||
| L'écran montre de bons temps de réponse, mais insuffisant pour du jeu compétitif. En comparaison, tous les appareils testés affichent entre 0.1 (minimum) et 240 (maximum) ms. » 51 % des appareils testés affichent de meilleures performances. Cela signifie que les latences relevées sont moins bonnes que la moyenne (19.9 ms) de tous les appareils testés. | ||
| ↔ Temps de réponse gris 50% à gris 80% | ||
| 25.6 ms ... hausse ↗ et chute ↘ combinées | ↗ 14 ms hausse | 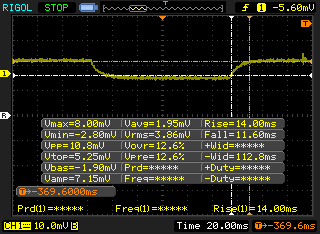 |
| ↘ 11.6 ms chute | ||
| L'écran souffre de latences relativement élevées, insuffisant pour le jeu. En comparaison, tous les appareils testés affichent entre 0.165 (minimum) et 636 (maximum) ms. » 36 % des appareils testés affichent de meilleures performances. Cela signifie que les latences relevées sont meilleures que la moyenne (31.1 ms) de tous les appareils testés. | ||
Scintillement / MLI (Modulation de largeur d'impulsion)
| Scintillement / MLI (Modulation de largeur d'impulsion) non décelé | 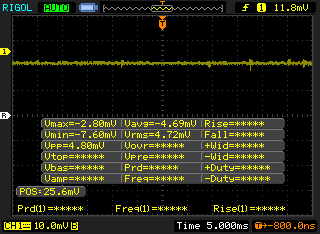 | ||
En comparaison, 52 % des appareils testés n'emploient pas MDI pour assombrir leur écran. Nous avons relevé une moyenne à 7798 (minimum : 5 - maximum : 343500) Hz dans le cas où une MDI était active. | |||
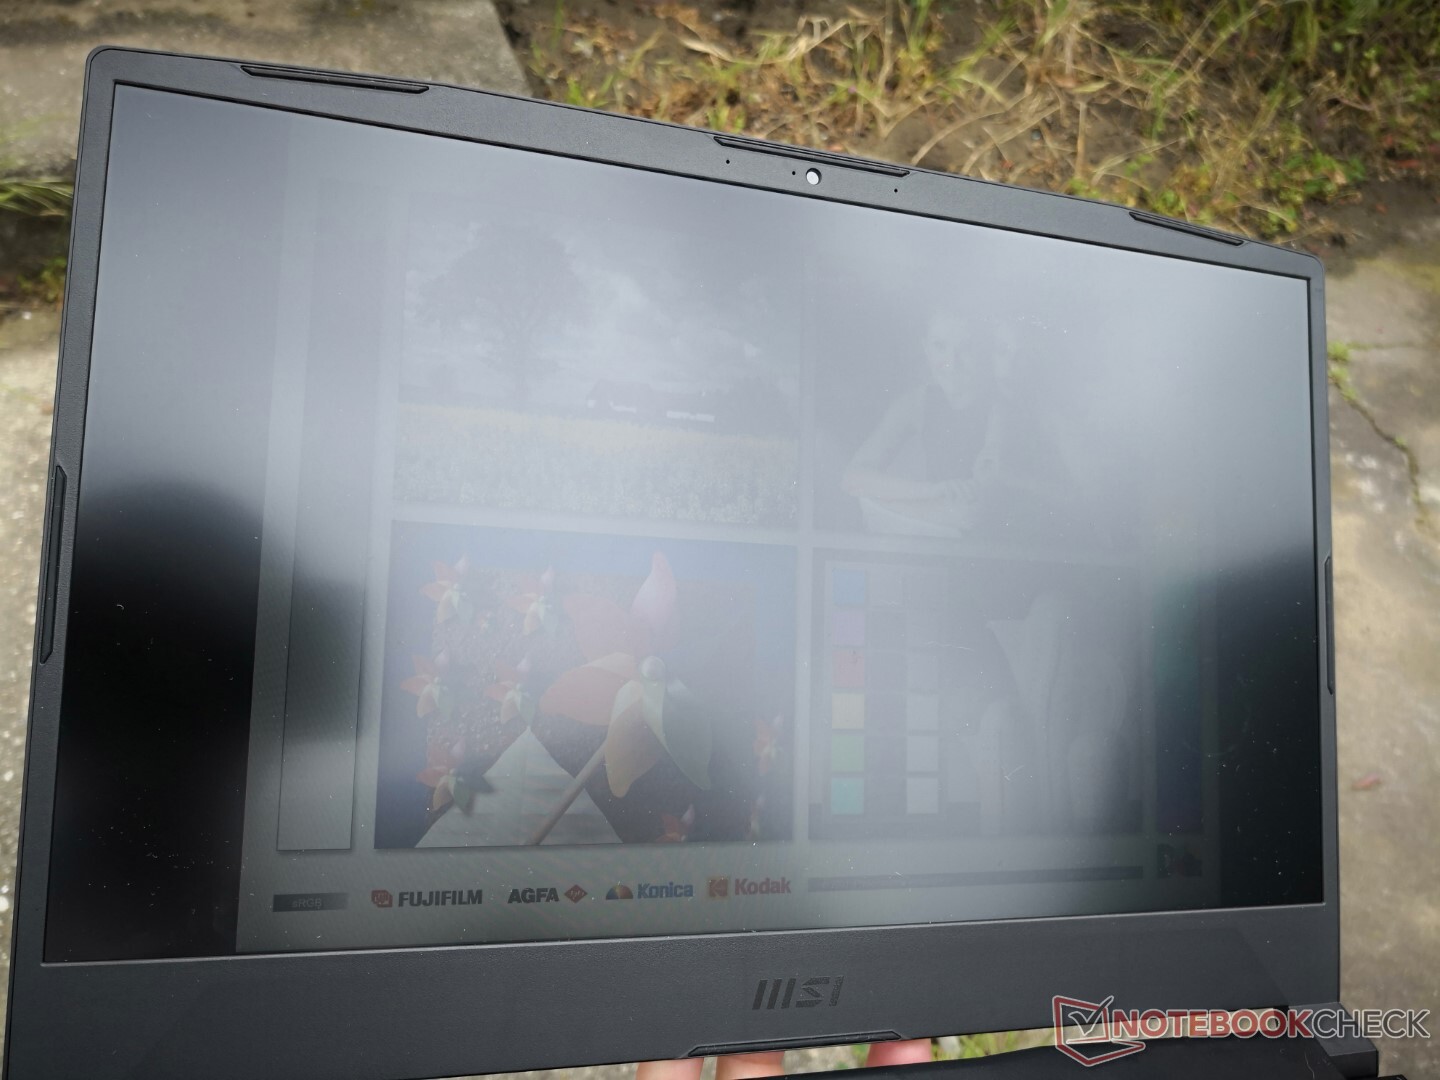
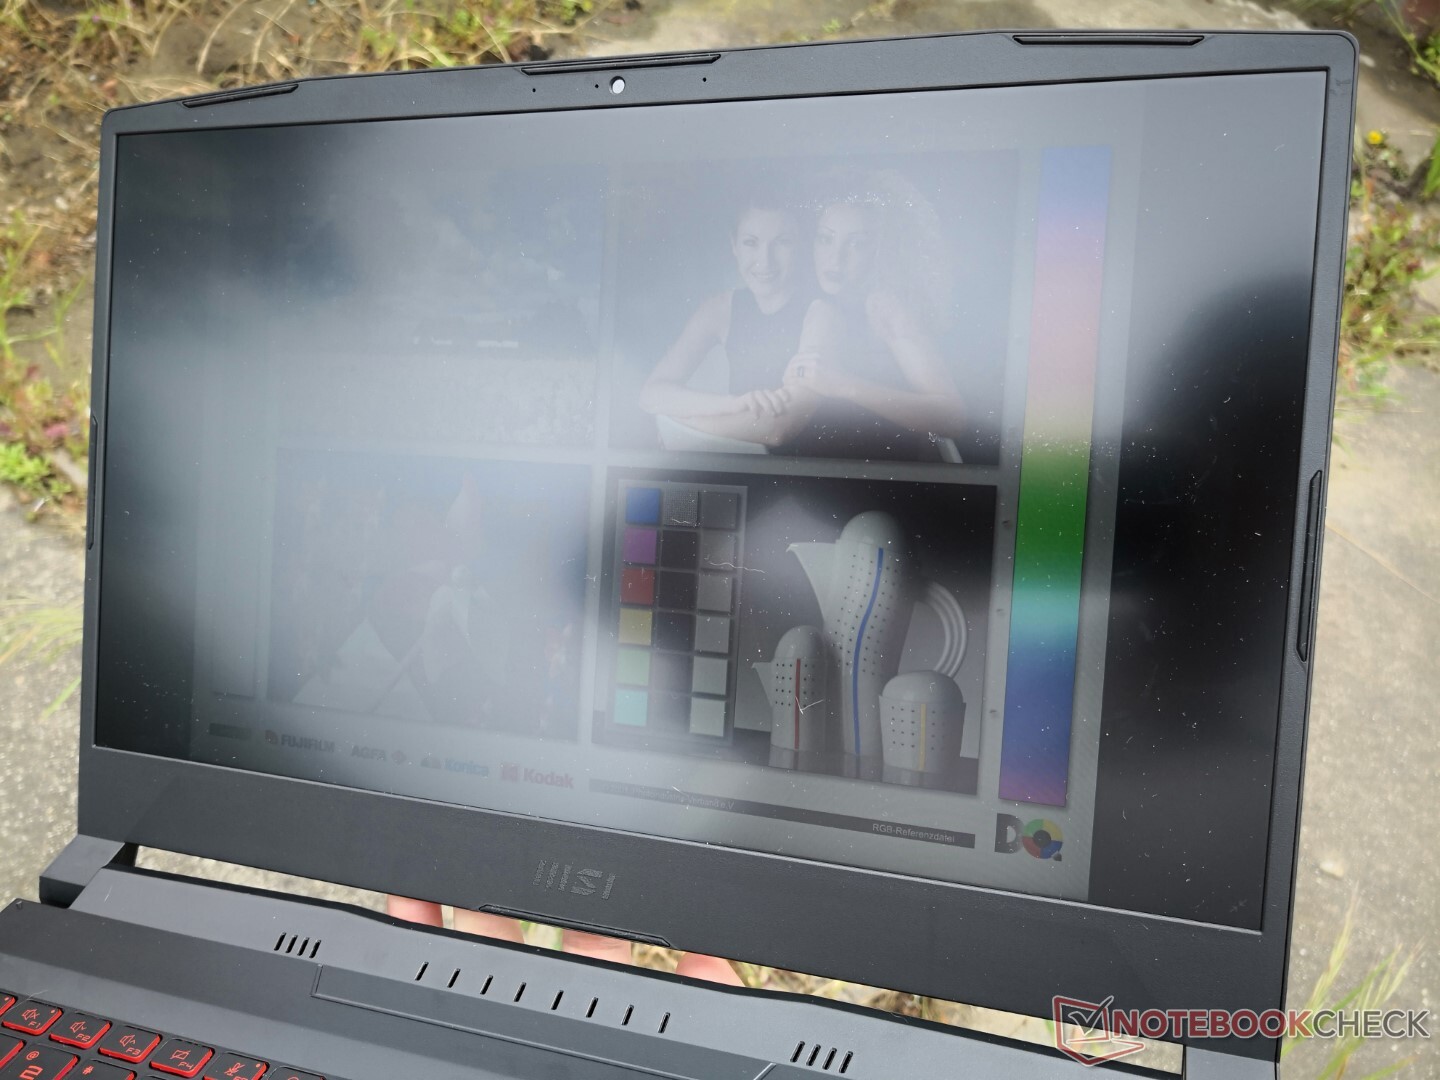
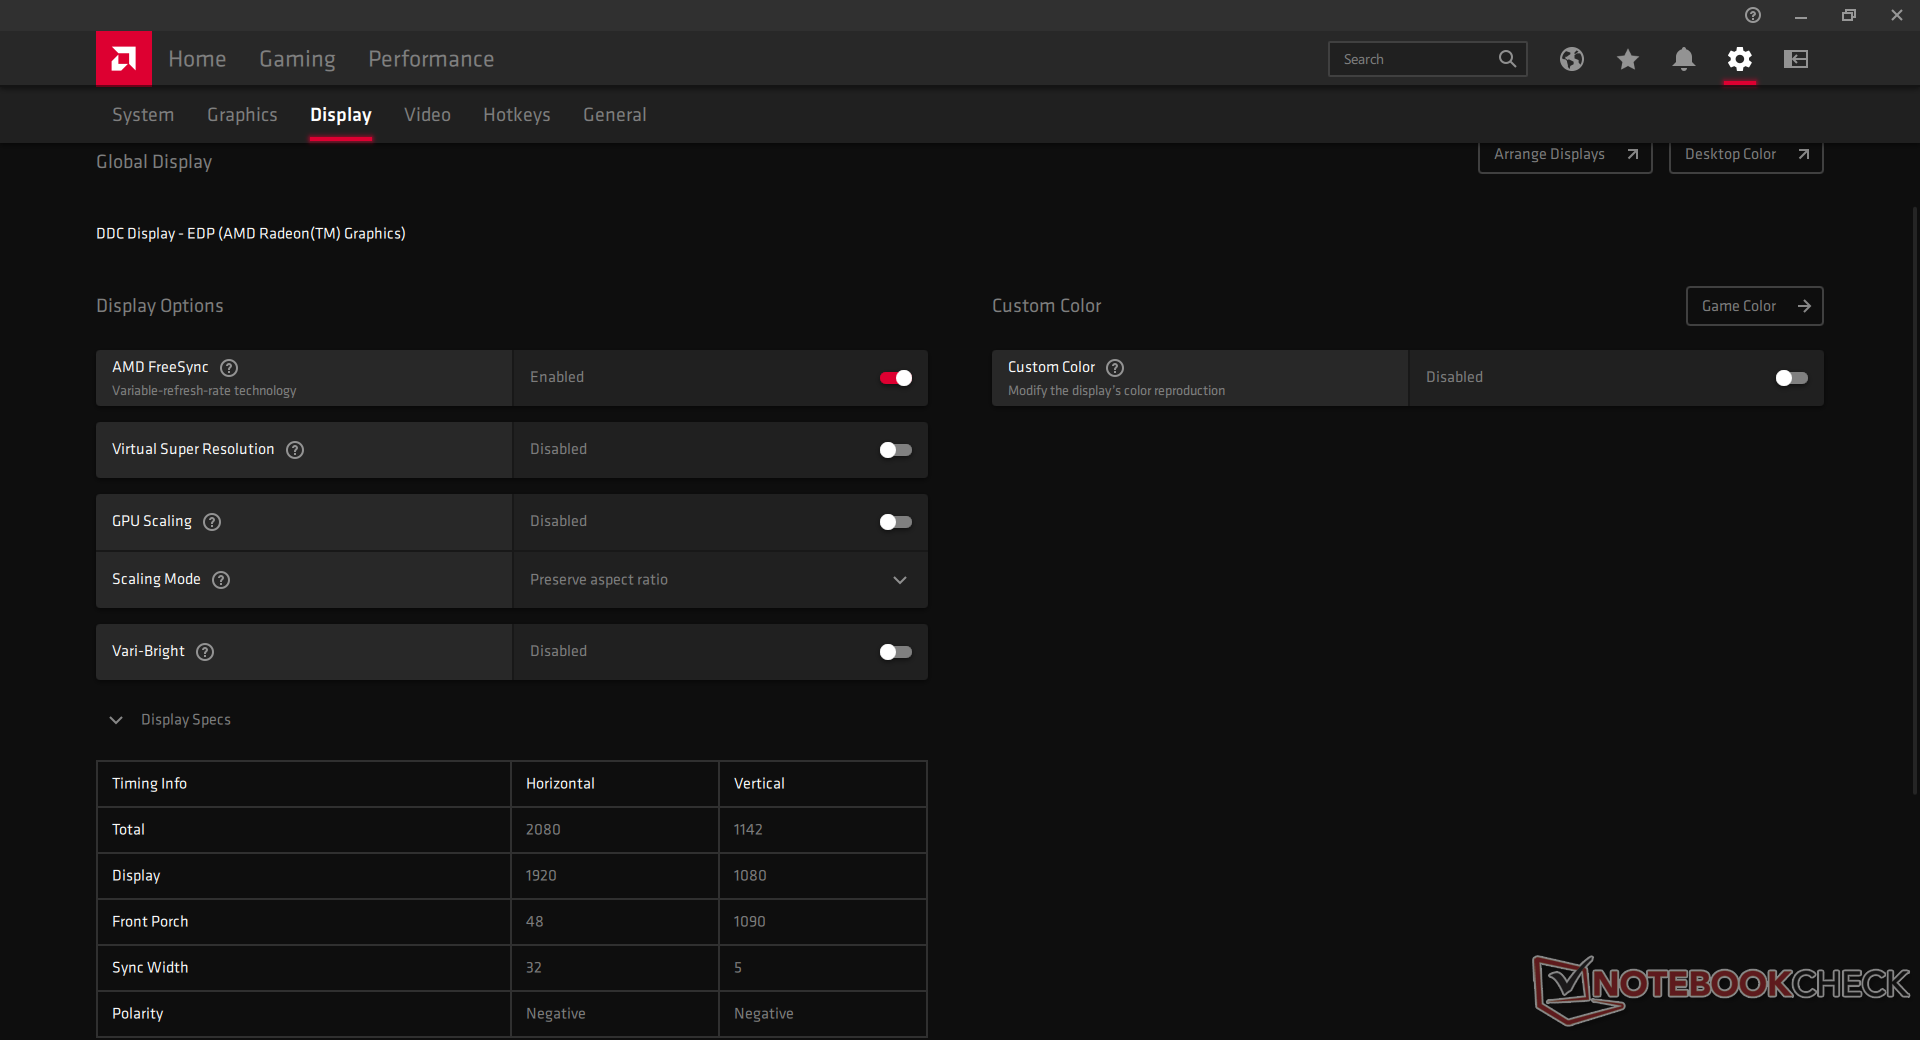
La visibilité extérieure est inférieure à la moyenne, car la plupart des écrans d'ordinateurs portables de jeu se situent autour de 300 nits, alors que l'écran de notre Bravo 15 de test plafonne à environ 250 nits en moyenne sur neuf quadrants. Les utilisateurs voudront peut-être désactiver la fonction Vari-Bright d'AMD, qui est activée par défaut, sinon la luminosité maximale baissera encore plus lorsque l'ordinateur fonctionnera sur batterie.

Performance
Conditions d'essai
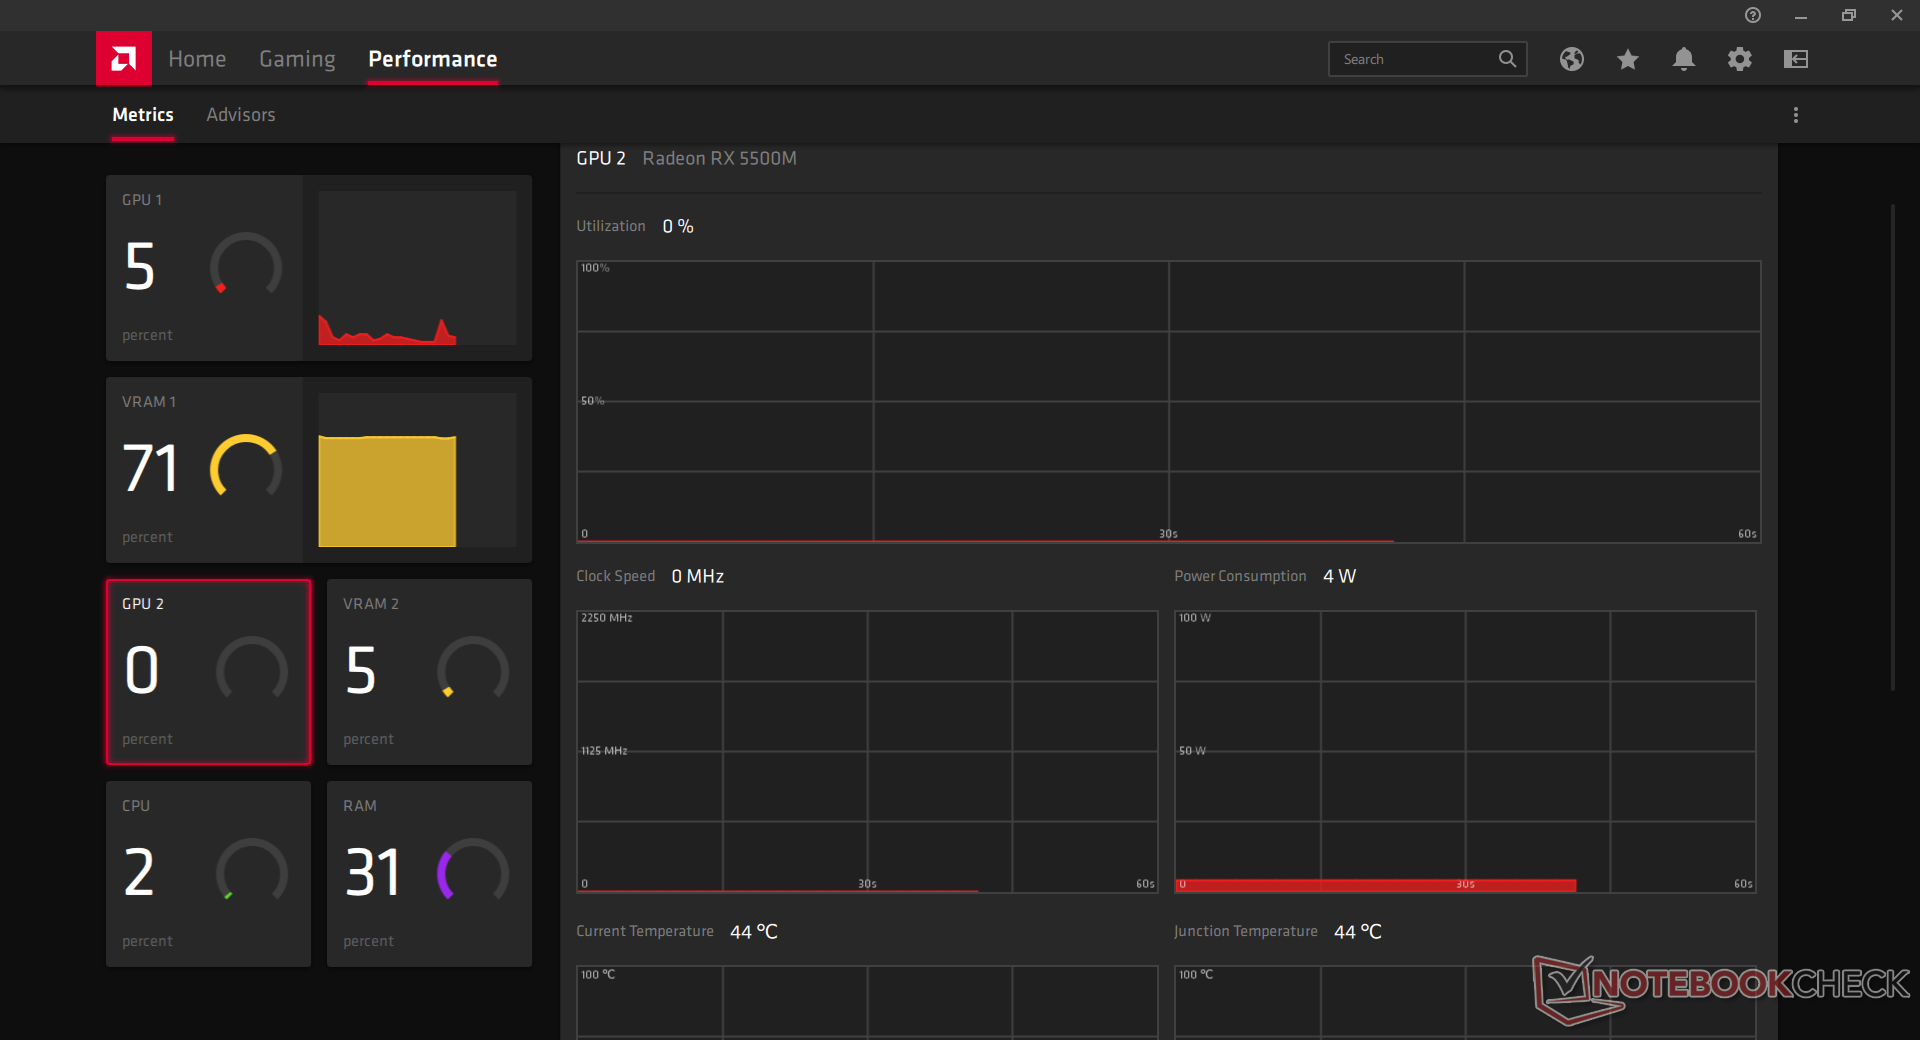
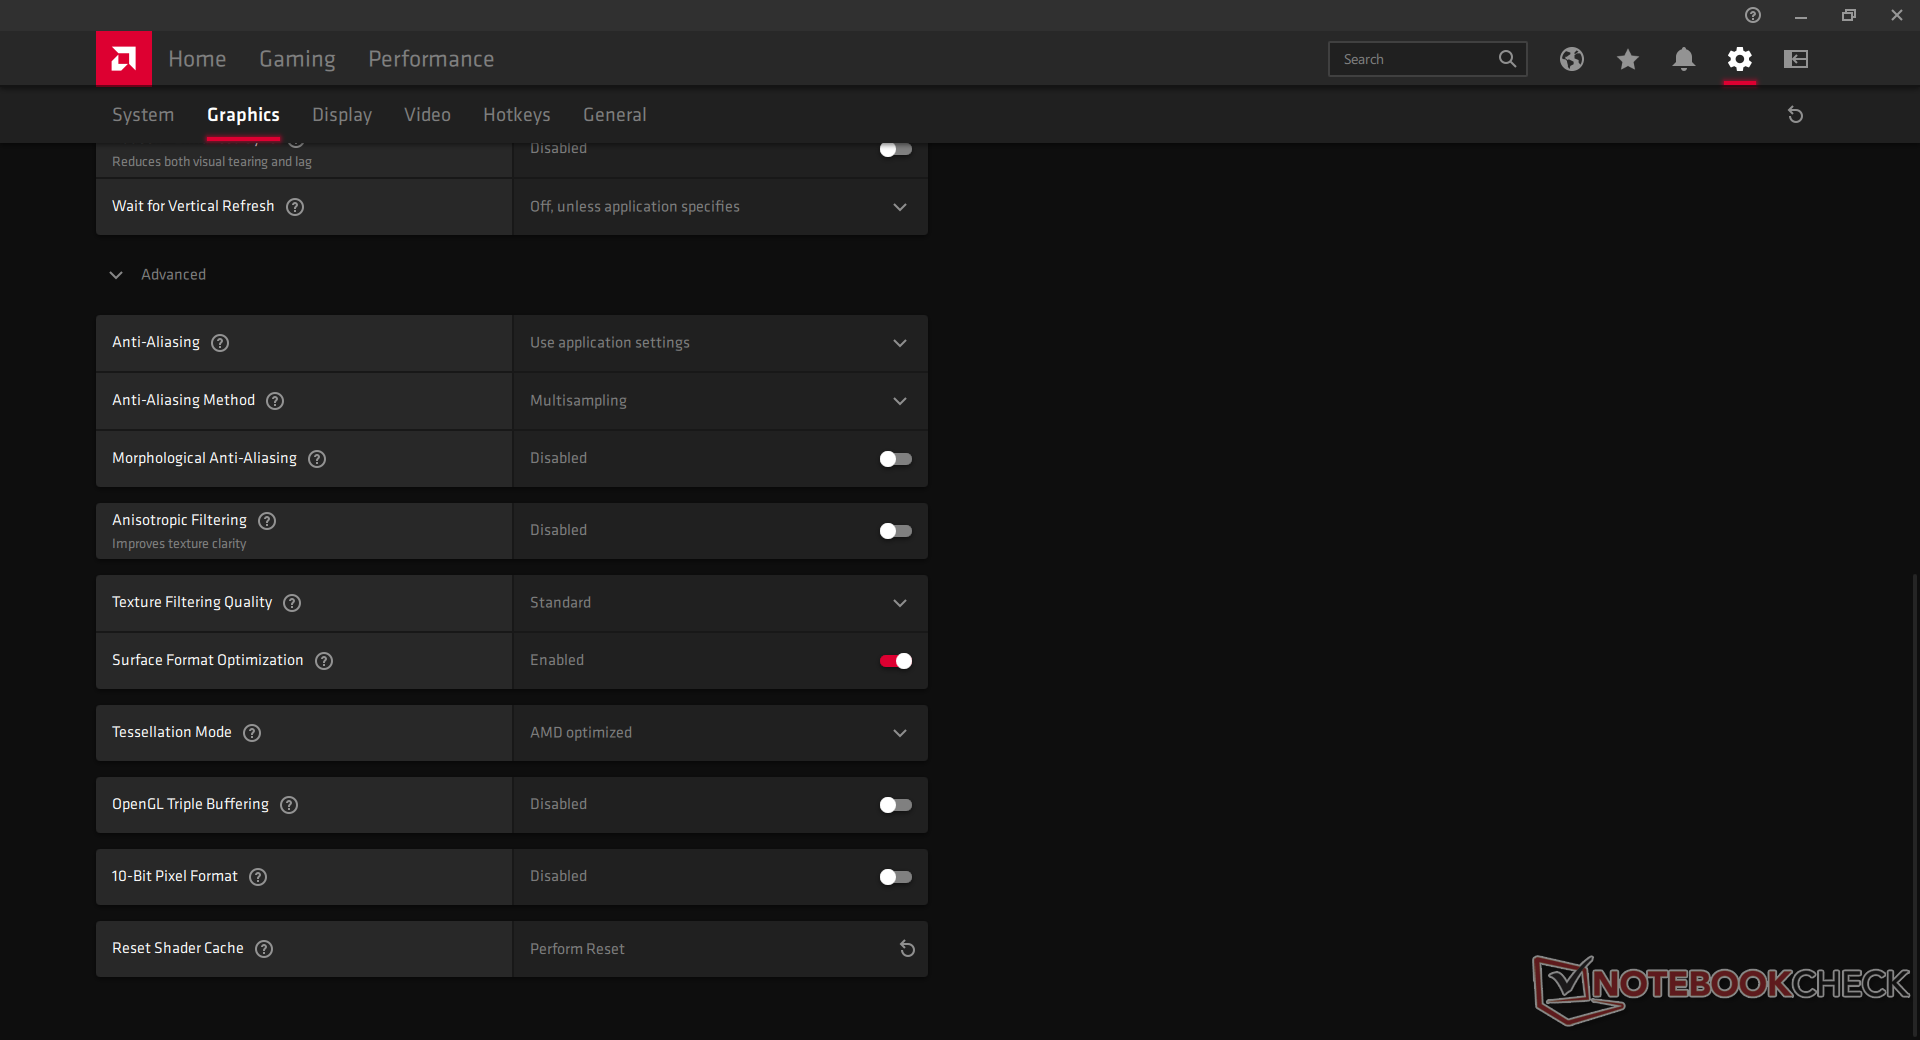
Notre appareil a été réglé en mode Performance Extrême via le logiciel préinstallé MSI Center avant d'exécuter les benchmarks ci-dessous. Il est fortement recommandé aux utilisateurs de se familiariser avec le MSI Center, le logiciel AMD Radeon et le logiciel Nahimic Companion, car les fonctions clés du système sont activées par ces applications spécifiques.
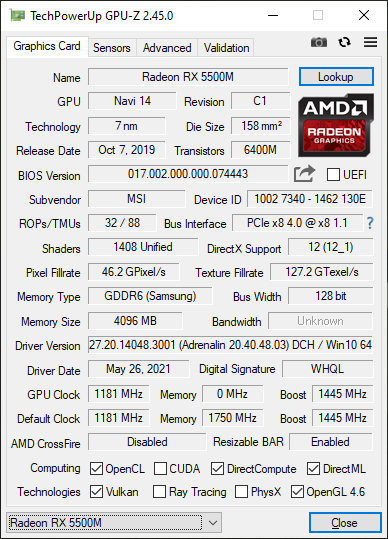
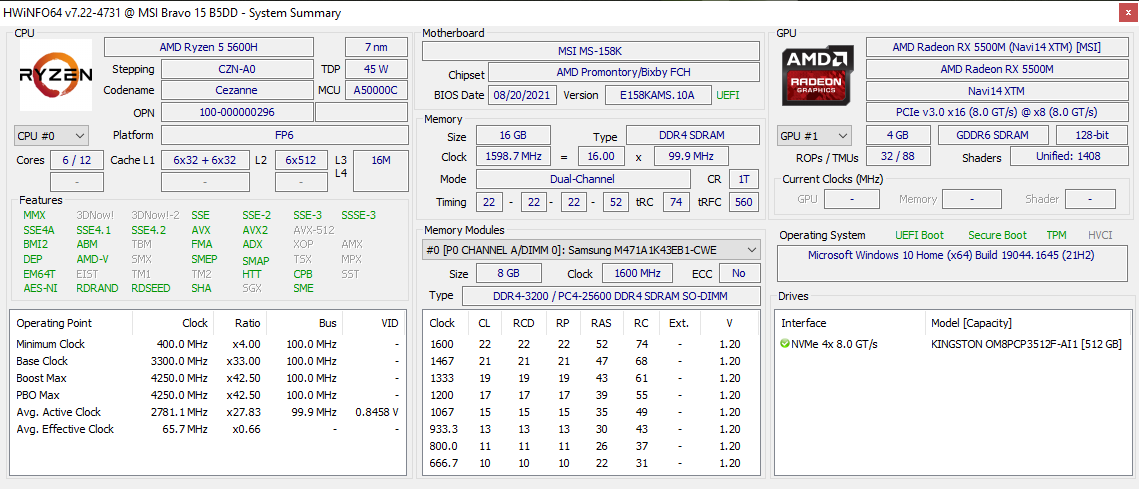
Les états par défaut du CPU PL sont réglés à 45 W selon l'outil Renoir Mobile Tuning tandis que le Radeon RX 5500M PPT est réglé à 65 W selon HWiNFO. Le TGP est ici conforme au GeForce GTX 1060 mobile qui était courant sur de nombreux ordinateurs portables de jeu depuis 2016.
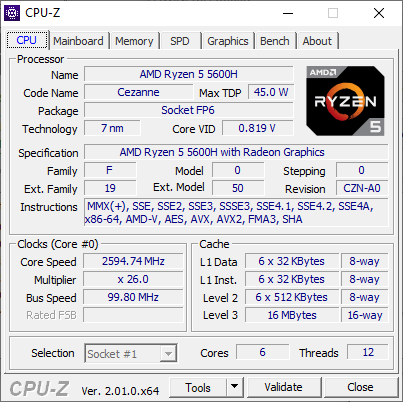
Processeur - Le CPU Ryzen est la vedette
Le saut du Ryzen 5 3550H au Ryzen 5 4600H était déjà significatif pour AMD. Ainsi, le saut du Ryzen 5 4600H au Ryzen 5 5600H tel que trouvé sur notre MSI est comparativement mineur. Le CPU n'est qu'environ 10 pour cent et 25 pour cent plus rapide que son prédécesseur immédiat dans les charges monofil et multi-fil, respectivement, ce qui est encore décent néanmoins pour un CPU de série H orienté budget. Les performances brutes en multithread sont systématiquement plus rapides que celles de n'importe quel processeur Intel Core i5 de 10e ou 11e génération avec lequel le Ryzen 5 5600H est en concurrence directe.
La durabilité des performances est excellente avec aucune fluctuation des fréquences d'horloge ou des creux dans le temps lors de l'exécution de CineBench R15 xT en boucle.
Cinebench R15 Multi Loop
Cinebench R23: Multi Core | Single Core
Cinebench R15: CPU Multi 64Bit | CPU Single 64Bit
Blender: v2.79 BMW27 CPU
7-Zip 18.03: 7z b 4 | 7z b 4 -mmt1
Geekbench 5.5: Multi-Core | Single-Core
HWBOT x265 Benchmark v2.2: 4k Preset
LibreOffice : 20 Documents To PDF
R Benchmark 2.5: Overall mean
Cinebench R23: Multi Core | Single Core
Cinebench R15: CPU Multi 64Bit | CPU Single 64Bit
Blender: v2.79 BMW27 CPU
7-Zip 18.03: 7z b 4 | 7z b 4 -mmt1
Geekbench 5.5: Multi-Core | Single-Core
HWBOT x265 Benchmark v2.2: 4k Preset
LibreOffice : 20 Documents To PDF
R Benchmark 2.5: Overall mean
* ... Moindre est la valeur, meilleures sont les performances
AIDA64: FP32 Ray-Trace | FPU Julia | CPU SHA3 | CPU Queen | FPU SinJulia | FPU Mandel | CPU AES | CPU ZLib | FP64 Ray-Trace | CPU PhotoWorxx
| Performance rating | |
| Acer Nitro 5 AN515-45-R1JH | |
| Dell G15 5515 | |
| MSI Bravo 15 A4DCR | |
| Asus TUF Gaming F15 FX507ZM | |
| MSI Bravo 15 B5DD-010US | |
| Moyenne AMD Ryzen 5 5600H | |
| Lenovo Ideapad Gaming 3 15IHU-82K1002RGE | |
| AIDA64 / FP32 Ray-Trace | |
| Dell G15 5515 | |
| Acer Nitro 5 AN515-45-R1JH | |
| MSI Bravo 15 A4DCR | |
| Moyenne AMD Ryzen 5 5600H (9181 - 12636, n=14) | |
| MSI Bravo 15 B5DD-010US | |
| Asus TUF Gaming F15 FX507ZM | |
| Lenovo Ideapad Gaming 3 15IHU-82K1002RGE | |
| AIDA64 / FPU Julia | |
| Acer Nitro 5 AN515-45-R1JH | |
| Dell G15 5515 | |
| Moyenne AMD Ryzen 5 5600H (51994 - 78250, n=14) | |
| MSI Bravo 15 B5DD-010US | |
| MSI Bravo 15 A4DCR | |
| Asus TUF Gaming F15 FX507ZM | |
| Lenovo Ideapad Gaming 3 15IHU-82K1002RGE | |
| AIDA64 / CPU SHA3 | |
| Asus TUF Gaming F15 FX507ZM | |
| Acer Nitro 5 AN515-45-R1JH | |
| Dell G15 5515 | |
| Moyenne AMD Ryzen 5 5600H (1587 - 2675, n=14) | |
| MSI Bravo 15 B5DD-010US | |
| Lenovo Ideapad Gaming 3 15IHU-82K1002RGE | |
| MSI Bravo 15 A4DCR | |
| AIDA64 / CPU Queen | |
| Asus TUF Gaming F15 FX507ZM | |
| Acer Nitro 5 AN515-45-R1JH | |
| MSI Bravo 15 A4DCR | |
| Dell G15 5515 | |
| MSI Bravo 15 B5DD-010US | |
| Moyenne AMD Ryzen 5 5600H (66699 - 77213, n=14) | |
| Lenovo Ideapad Gaming 3 15IHU-82K1002RGE | |
| AIDA64 / FPU SinJulia | |
| MSI Bravo 15 A4DCR | |
| Dell G15 5515 | |
| Acer Nitro 5 AN515-45-R1JH | |
| Asus TUF Gaming F15 FX507ZM | |
| MSI Bravo 15 B5DD-010US | |
| Moyenne AMD Ryzen 5 5600H (8340 - 9159, n=14) | |
| Lenovo Ideapad Gaming 3 15IHU-82K1002RGE | |
| AIDA64 / FPU Mandel | |
| Acer Nitro 5 AN515-45-R1JH | |
| Dell G15 5515 | |
| Moyenne AMD Ryzen 5 5600H (28268 - 43274, n=14) | |
| MSI Bravo 15 B5DD-010US | |
| MSI Bravo 15 A4DCR | |
| Asus TUF Gaming F15 FX507ZM | |
| Lenovo Ideapad Gaming 3 15IHU-82K1002RGE | |
| AIDA64 / CPU AES | |
| Acer Nitro 5 AN515-45-R1JH | |
| Dell G15 5515 | |
| MSI Bravo 15 B5DD-010US | |
| Moyenne AMD Ryzen 5 5600H (39852 - 98939, n=14) | |
| Lenovo Ideapad Gaming 3 15IHU-82K1002RGE | |
| Asus TUF Gaming F15 FX507ZM | |
| MSI Bravo 15 A4DCR | |
| AIDA64 / CPU ZLib | |
| Asus TUF Gaming F15 FX507ZM | |
| Acer Nitro 5 AN515-45-R1JH | |
| Dell G15 5515 | |
| MSI Bravo 15 A4DCR | |
| Moyenne AMD Ryzen 5 5600H (507 - 649, n=14) | |
| MSI Bravo 15 B5DD-010US | |
| Lenovo Ideapad Gaming 3 15IHU-82K1002RGE | |
| AIDA64 / FP64 Ray-Trace | |
| Acer Nitro 5 AN515-45-R1JH | |
| Dell G15 5515 | |
| MSI Bravo 15 A4DCR | |
| Moyenne AMD Ryzen 5 5600H (4811 - 6652, n=14) | |
| MSI Bravo 15 B5DD-010US | |
| Asus TUF Gaming F15 FX507ZM | |
| Lenovo Ideapad Gaming 3 15IHU-82K1002RGE | |
| AIDA64 / CPU PhotoWorxx | |
| Asus TUF Gaming F15 FX507ZM | |
| MSI Bravo 15 A4DCR | |
| MSI Bravo 15 B5DD-010US | |
| Moyenne AMD Ryzen 5 5600H (7419 - 24746, n=14) | |
| Dell G15 5515 | |
| Acer Nitro 5 AN515-45-R1JH | |
| Lenovo Ideapad Gaming 3 15IHU-82K1002RGE | |
Performance du système
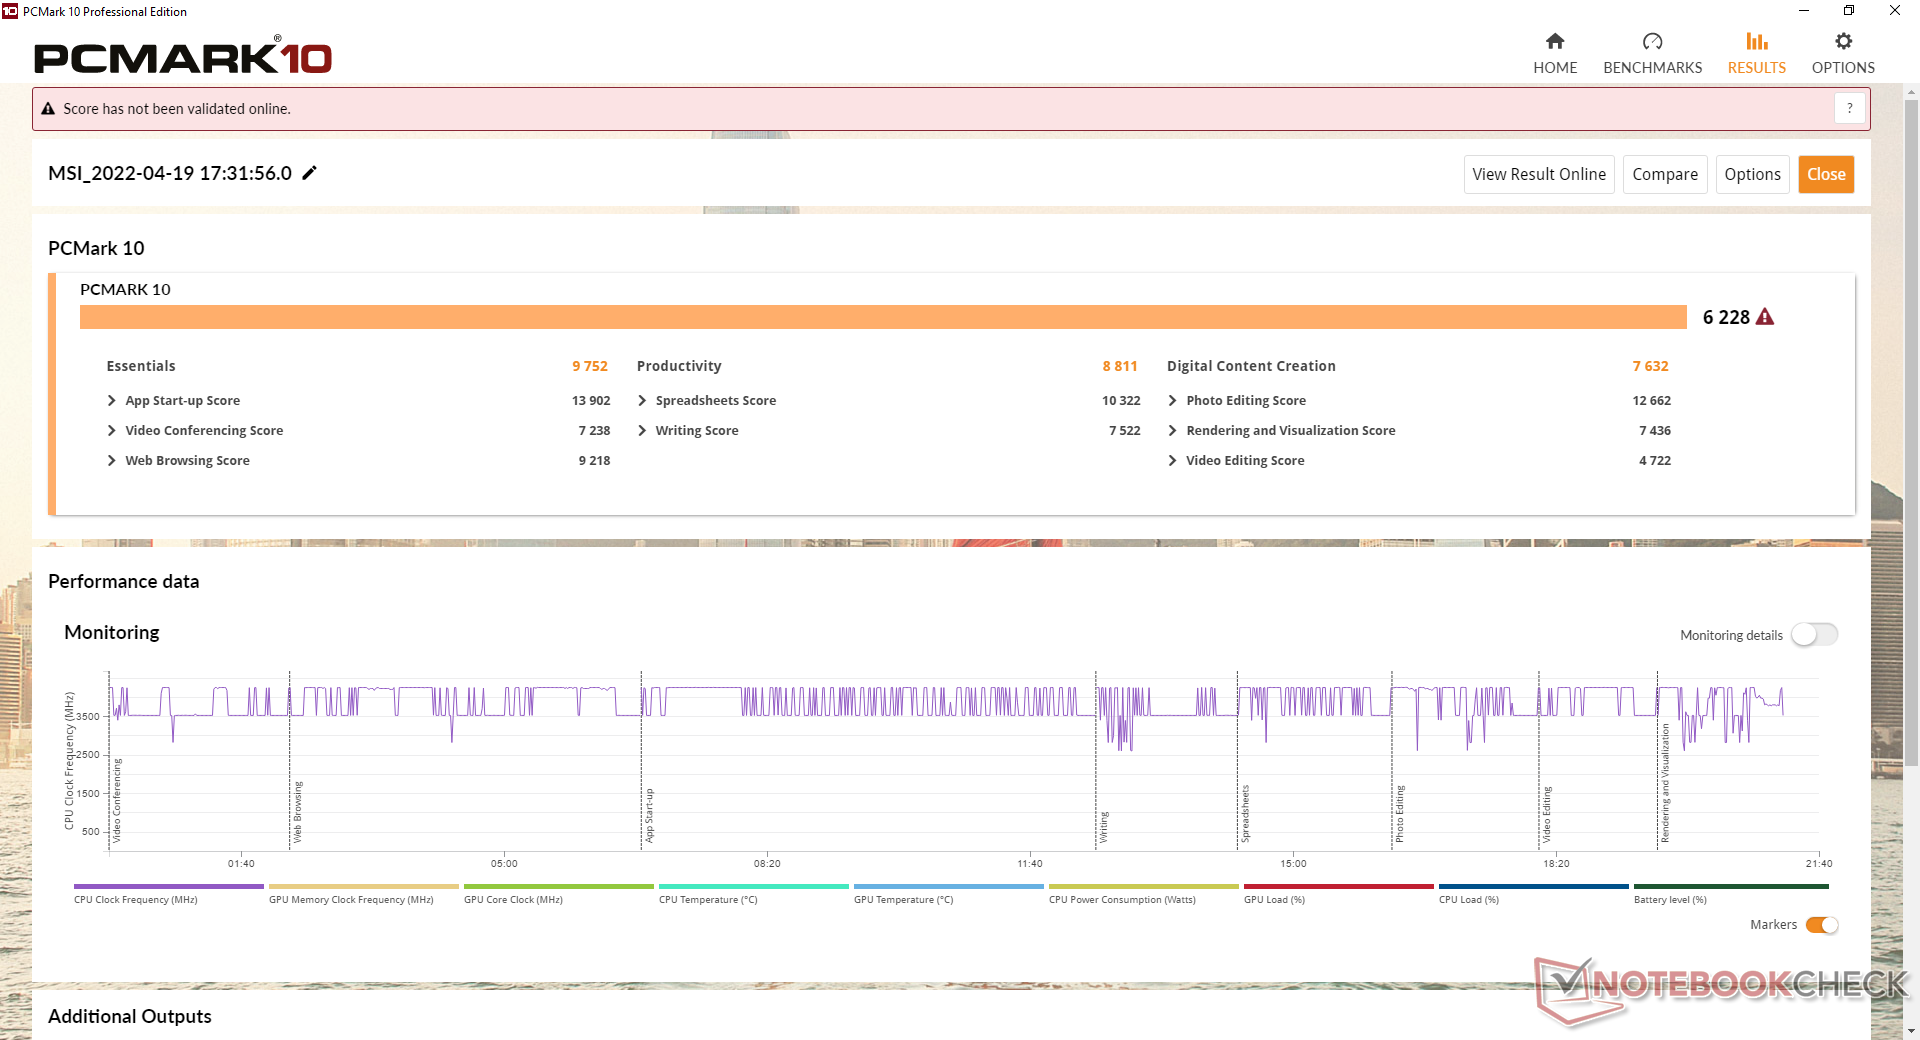
Les scores PCMark 10 sont comparables à ceux d'autres ordinateurs portables de jeu dotés de GPU d'entrée de gamme comme le Dell G15 5515. Les résultats sont une amélioration par rapport au MSI Bravo 15 2020, en particulier dans le sous-test Productivité.
CrossMark: Overall | Productivity | Creativity | Responsiveness
| PCMark 10 / Score | |
| Asus TUF Gaming F15 FX507ZM | |
| Acer Nitro 5 AN515-45-R1JH | |
| MSI Bravo 15 B5DD-010US | |
| Moyenne AMD Ryzen 5 5600H, AMD Radeon RX 5500M (n=1) | |
| Dell G15 5515 | |
| Lenovo Ideapad Gaming 3 15IHU-82K1002RGE | |
| MSI Bravo 15 A4DCR | |
| PCMark 10 / Essentials | |
| Asus TUF Gaming F15 FX507ZM | |
| Acer Nitro 5 AN515-45-R1JH | |
| MSI Bravo 15 A4DCR | |
| MSI Bravo 15 B5DD-010US | |
| Moyenne AMD Ryzen 5 5600H, AMD Radeon RX 5500M (n=1) | |
| Dell G15 5515 | |
| Lenovo Ideapad Gaming 3 15IHU-82K1002RGE | |
| PCMark 10 / Productivity | |
| Acer Nitro 5 AN515-45-R1JH | |
| Lenovo Ideapad Gaming 3 15IHU-82K1002RGE | |
| Asus TUF Gaming F15 FX507ZM | |
| MSI Bravo 15 B5DD-010US | |
| Moyenne AMD Ryzen 5 5600H, AMD Radeon RX 5500M (n=1) | |
| Dell G15 5515 | |
| MSI Bravo 15 A4DCR | |
| PCMark 10 / Digital Content Creation | |
| Asus TUF Gaming F15 FX507ZM | |
| Acer Nitro 5 AN515-45-R1JH | |
| MSI Bravo 15 B5DD-010US | |
| Moyenne AMD Ryzen 5 5600H, AMD Radeon RX 5500M (n=1) | |
| Dell G15 5515 | |
| MSI Bravo 15 A4DCR | |
| Lenovo Ideapad Gaming 3 15IHU-82K1002RGE | |
| CrossMark / Overall | |
| Lenovo Ideapad Gaming 3 15IHU-82K1002RGE | |
| CrossMark / Productivity | |
| Lenovo Ideapad Gaming 3 15IHU-82K1002RGE | |
| CrossMark / Creativity | |
| Lenovo Ideapad Gaming 3 15IHU-82K1002RGE | |
| CrossMark / Responsiveness | |
| Lenovo Ideapad Gaming 3 15IHU-82K1002RGE | |
| PCMark 10 Score | 6228 points | |
Aide | ||
| AIDA64 / Memory Copy | |
| Asus TUF Gaming F15 FX507ZM | |
| MSI Bravo 15 B5DD-010US | |
| Dell G15 5515 | |
| Acer Nitro 5 AN515-45-R1JH | |
| Moyenne AMD Ryzen 5 5600H (20549 - 42141, n=14) | |
| MSI Bravo 15 A4DCR | |
| Lenovo Ideapad Gaming 3 15IHU-82K1002RGE | |
| AIDA64 / Memory Read | |
| Asus TUF Gaming F15 FX507ZM | |
| MSI Bravo 15 B5DD-010US | |
| Dell G15 5515 | |
| Acer Nitro 5 AN515-45-R1JH | |
| Moyenne AMD Ryzen 5 5600H (22917 - 47595, n=14) | |
| MSI Bravo 15 A4DCR | |
| Lenovo Ideapad Gaming 3 15IHU-82K1002RGE | |
| AIDA64 / Memory Write | |
| Asus TUF Gaming F15 FX507ZM | |
| MSI Bravo 15 A4DCR | |
| MSI Bravo 15 B5DD-010US | |
| Moyenne AMD Ryzen 5 5600H (20226 - 44872, n=14) | |
| Dell G15 5515 | |
| Acer Nitro 5 AN515-45-R1JH | |
| Lenovo Ideapad Gaming 3 15IHU-82K1002RGE | |
| AIDA64 / Memory Latency | |
| MSI Bravo 15 A4DCR | |
| Lenovo Ideapad Gaming 3 15IHU-82K1002RGE | |
| Moyenne AMD Ryzen 5 5600H (75 - 89.1, n=14) | |
| Dell G15 5515 | |
| MSI Bravo 15 B5DD-010US | |
| Acer Nitro 5 AN515-45-R1JH | |
| Asus TUF Gaming F15 FX507ZM | |
* ... Moindre est la valeur, meilleures sont les performances
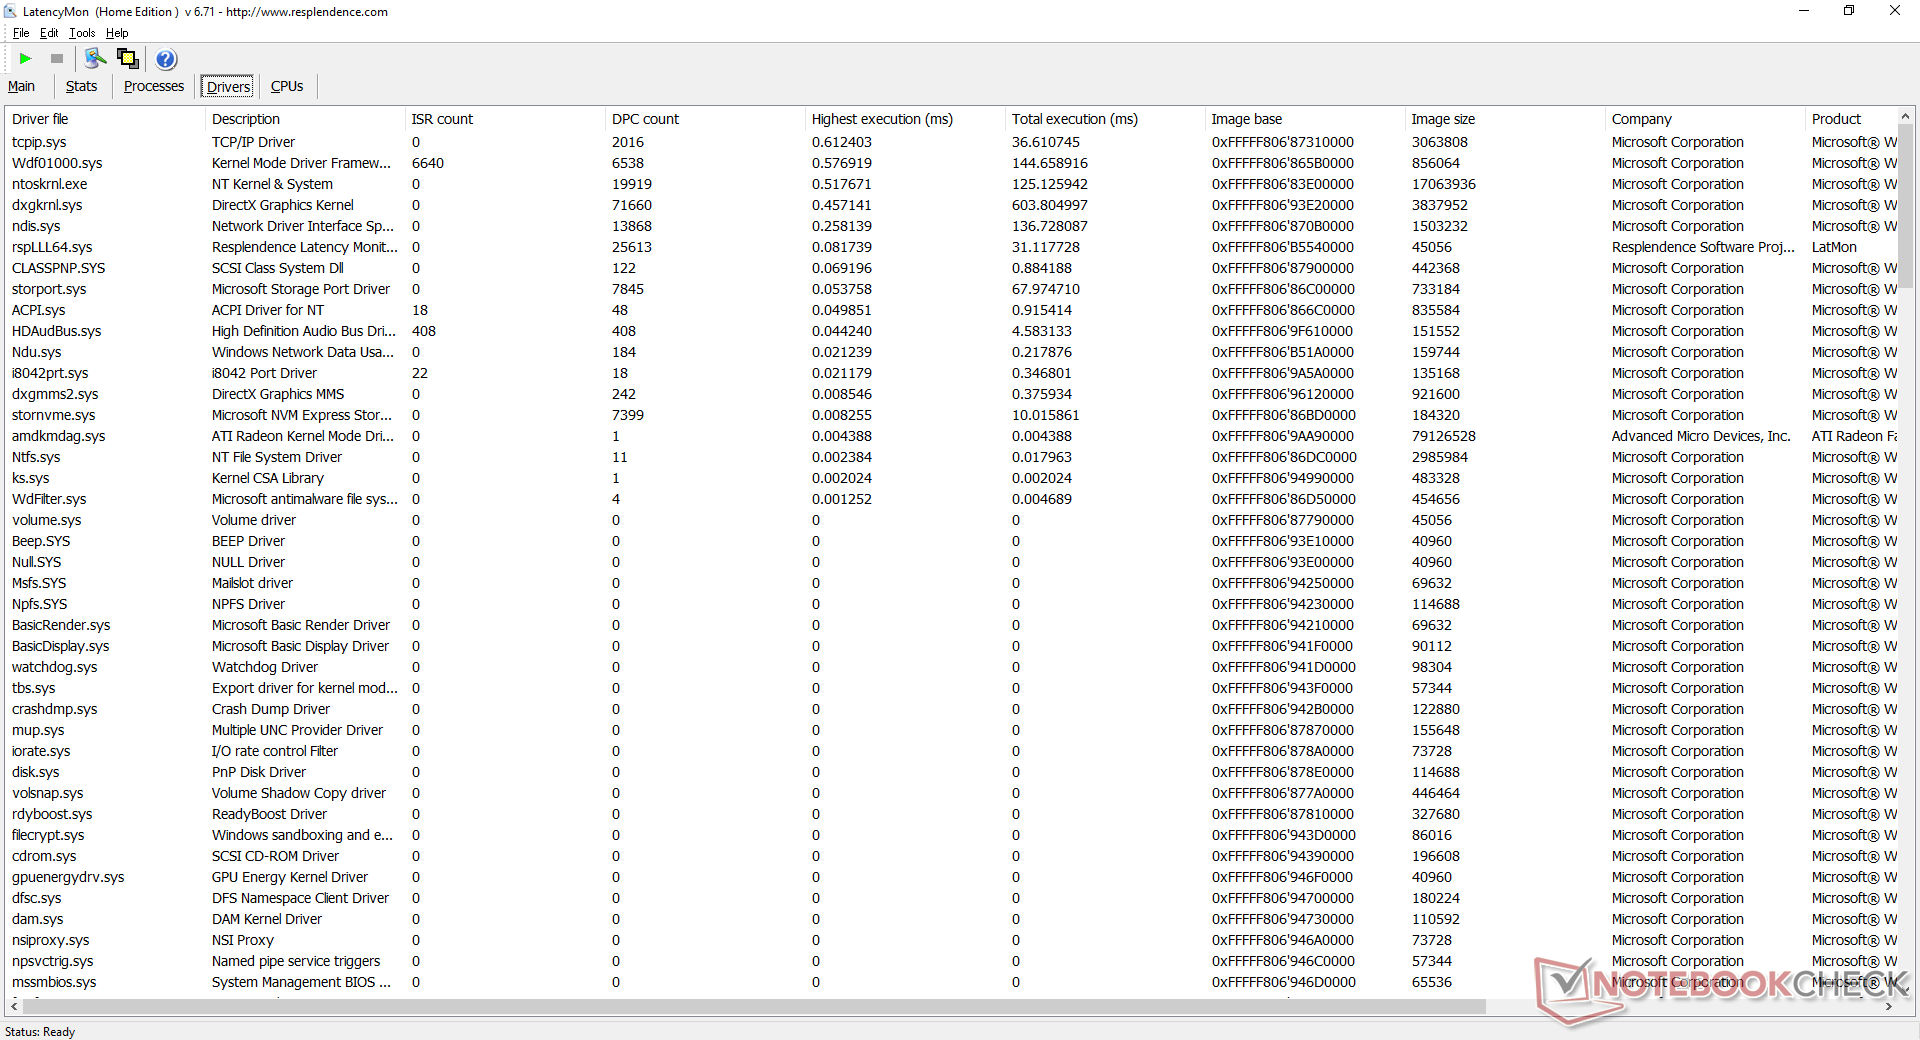
Latence DPC
Notez les monitorings dans notre test standardisé de latence. suivez les directives dans l'entrée de la page de benchmark ! - tout bon ou latence élevée observée ? pourrait être un problème pour le montage audio et vidéo en temps réel (pour la configuration logicielle/matérielle testée)
Ajoutez deux captures d'écran sous le centre (latencymon principal et onglet pilote).
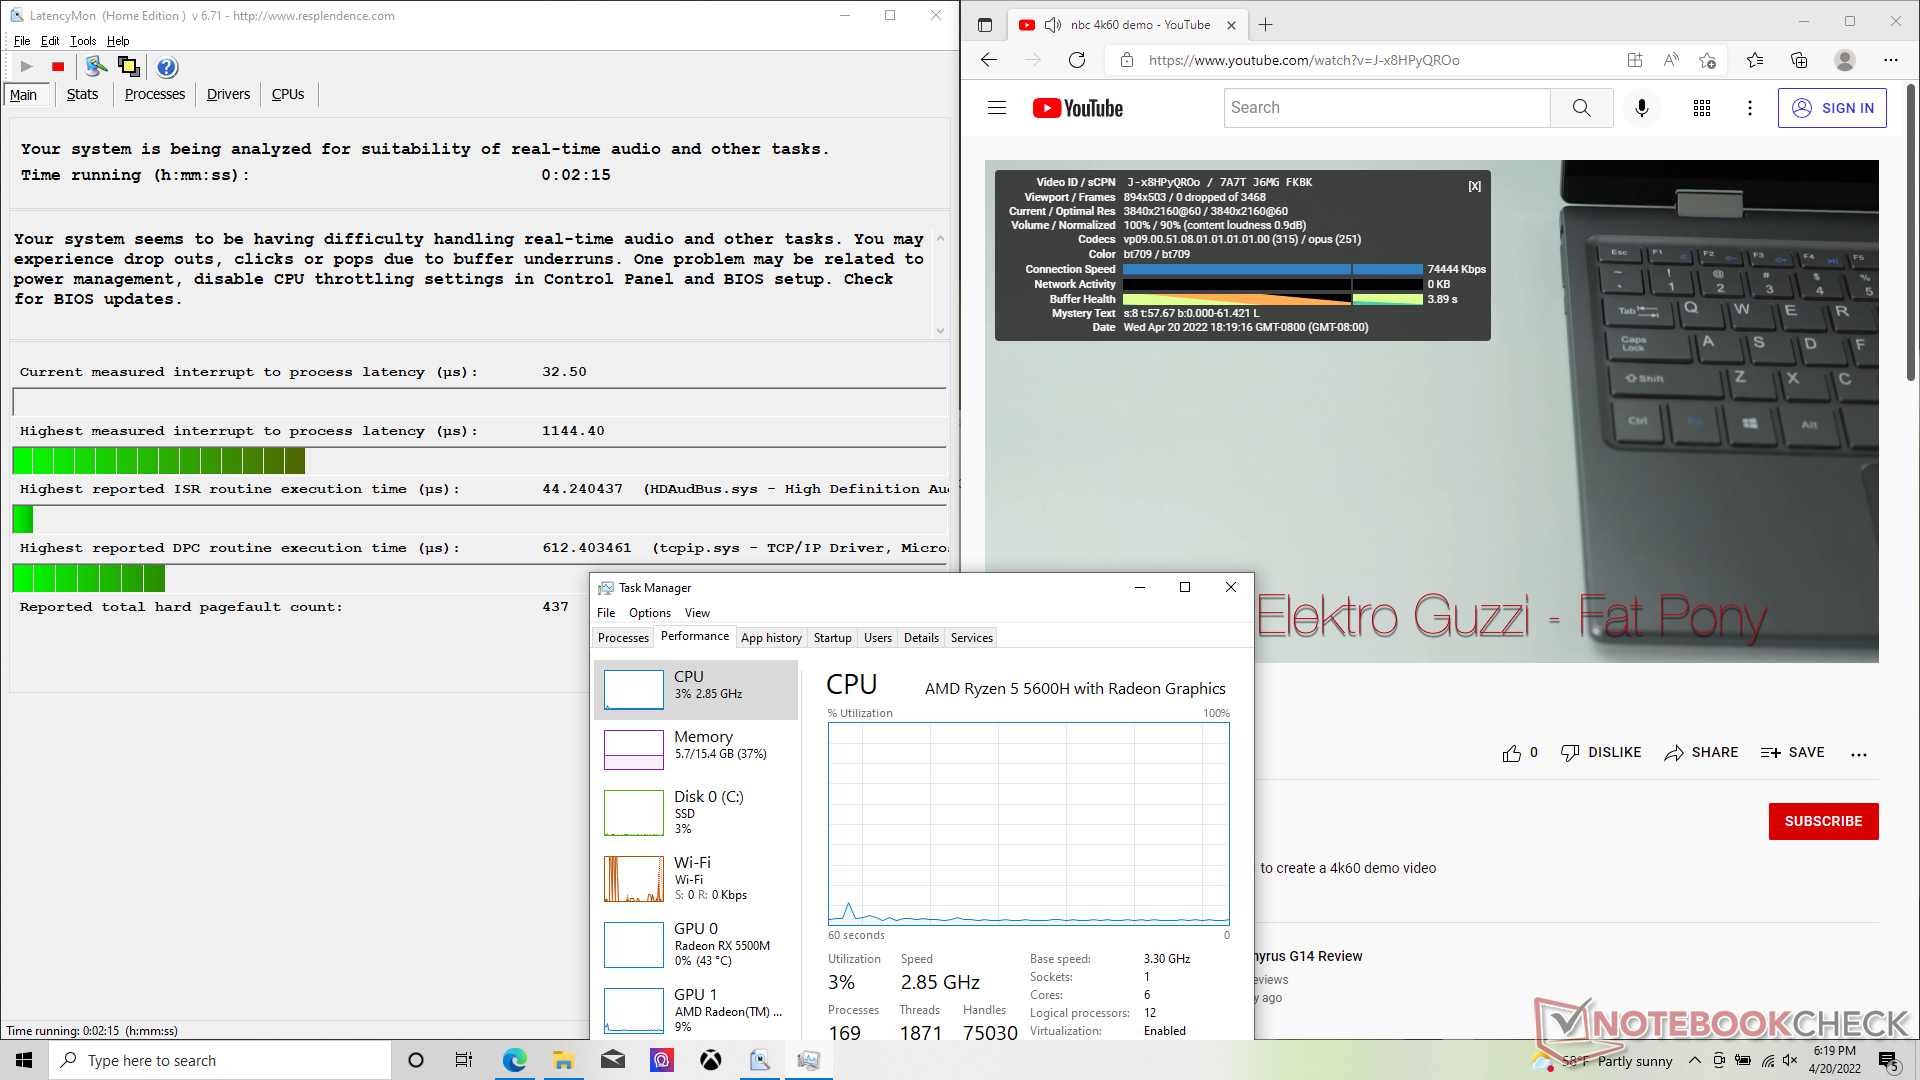
| DPC Latencies / LatencyMon - interrupt to process latency (max), Web, Youtube, Prime95 | |
| MSI Bravo 15 A4DCR | |
| MSI Bravo 15 B5DD-010US | |
| Lenovo Ideapad Gaming 3 15IHU-82K1002RGE | |
| Asus TUF Gaming F15 FX507ZM | |
| Dell G15 5515 | |
| Acer Nitro 5 AN515-45-R1JH | |
* ... Moindre est la valeur, meilleures sont les performances
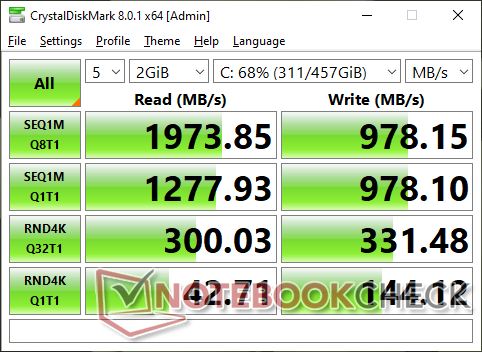
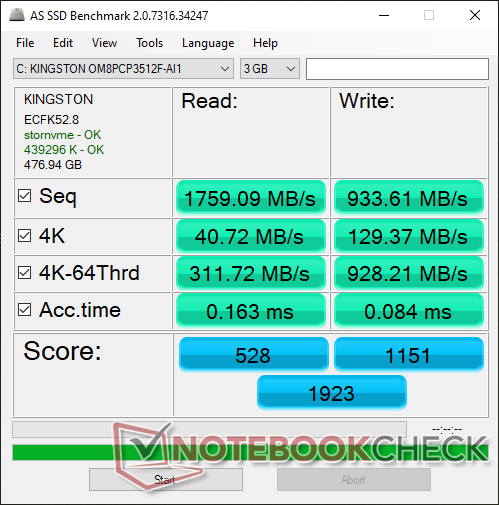
Dispositifs de stockage - jusqu'à un seul lecteur
Notre unité est configurée avec le disque dur SSD Kingston OM8PCP3512F PCIe3 NVMe de 512 Go offrant des taux de transfert allant jusqu'à 2000 Mo/s. Bien que les taux d'écriture soient environ deux fois moins rapides, ils reflètent néanmoins le niveau de prix budgétaire.

| Drive Performance rating - Percent | |
| Asus TUF Gaming F15 FX507ZM | |
| MSI Bravo 15 A4DCR | |
| Dell G15 5515 | |
| Lenovo Ideapad Gaming 3 15IHU-82K1002RGE | |
| Acer Nitro 5 AN515-45-R1JH -1! | |
| MSI Bravo 15 B5DD-010US | |
* ... Moindre est la valeur, meilleures sont les performances
Disk Throttling: DiskSpd Read Loop, Queue Depth 8
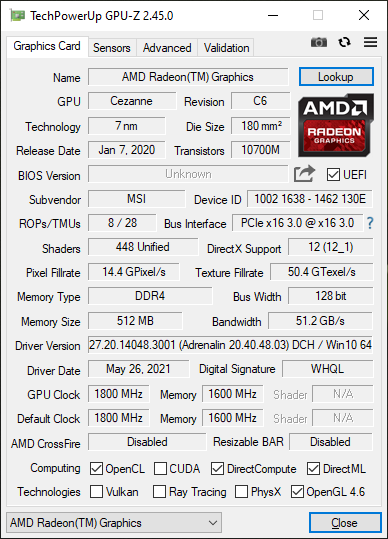
Performances du GPU - Radeon ancienne génération
Les performances graphiques se situent à quelques points de pourcentage près de celles de l'ancienne GeForce GTX 1060 mobile. Une mise à niveau vers une alternative Nvidia d'entrée de gamme comme la GTX 1660 Ti mobile ou la RTX 3050 Ti mobile peut augmenter les taux de trame de 40 à 60 %. Heureusement, l'écran interne prend en charge FreeSync, ce qui est très utile pour les GPU moins performants comme notre Radeon RX 5500M.
MSI ne propose pas d'option Radeon RX 5600M à ce jour, ce qui aurait permis d'améliorer les performances graphiques d'environ 40 % par rapport à notre RX 5500M.
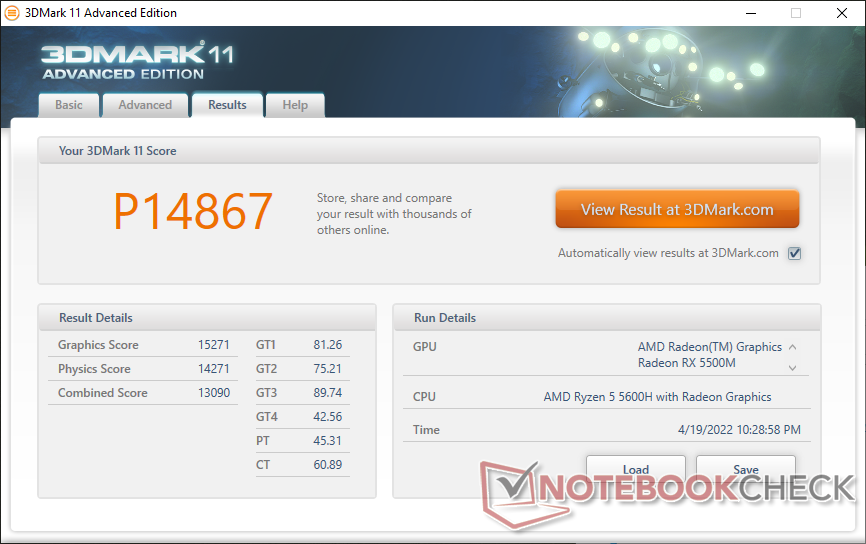
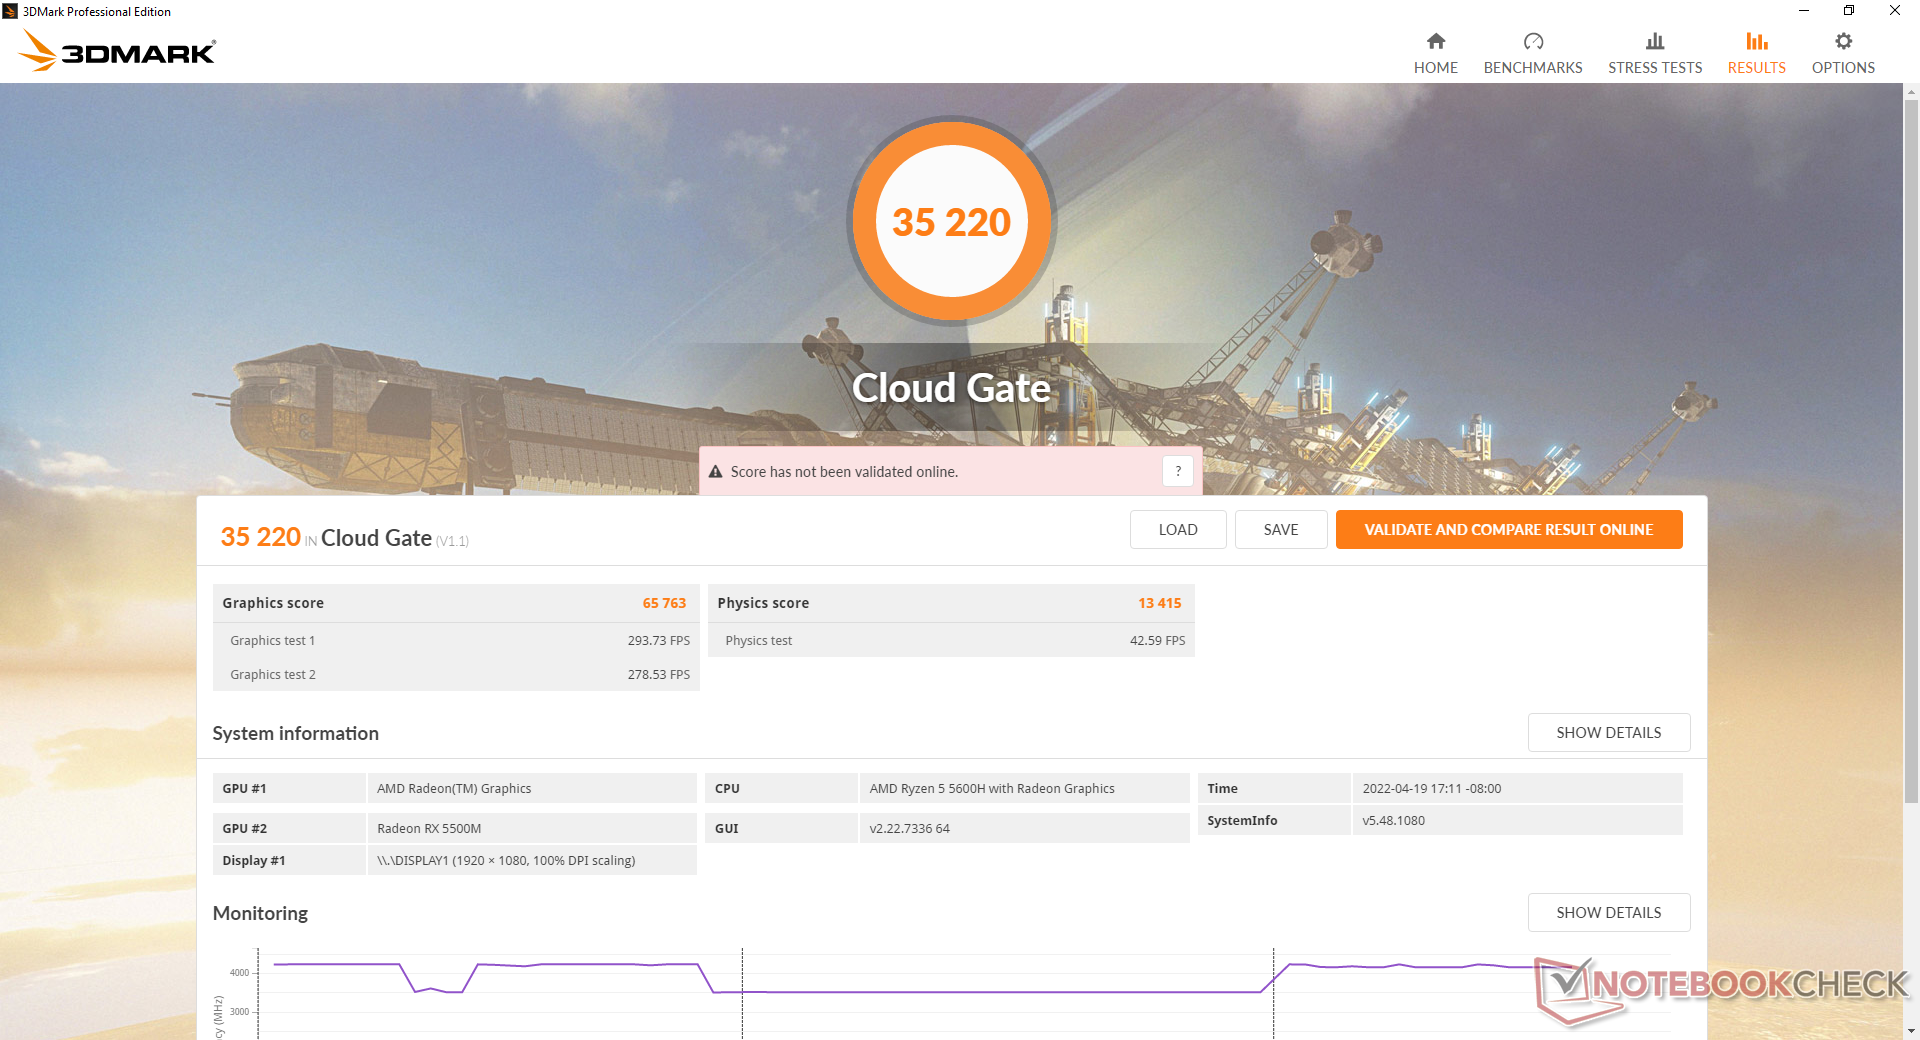
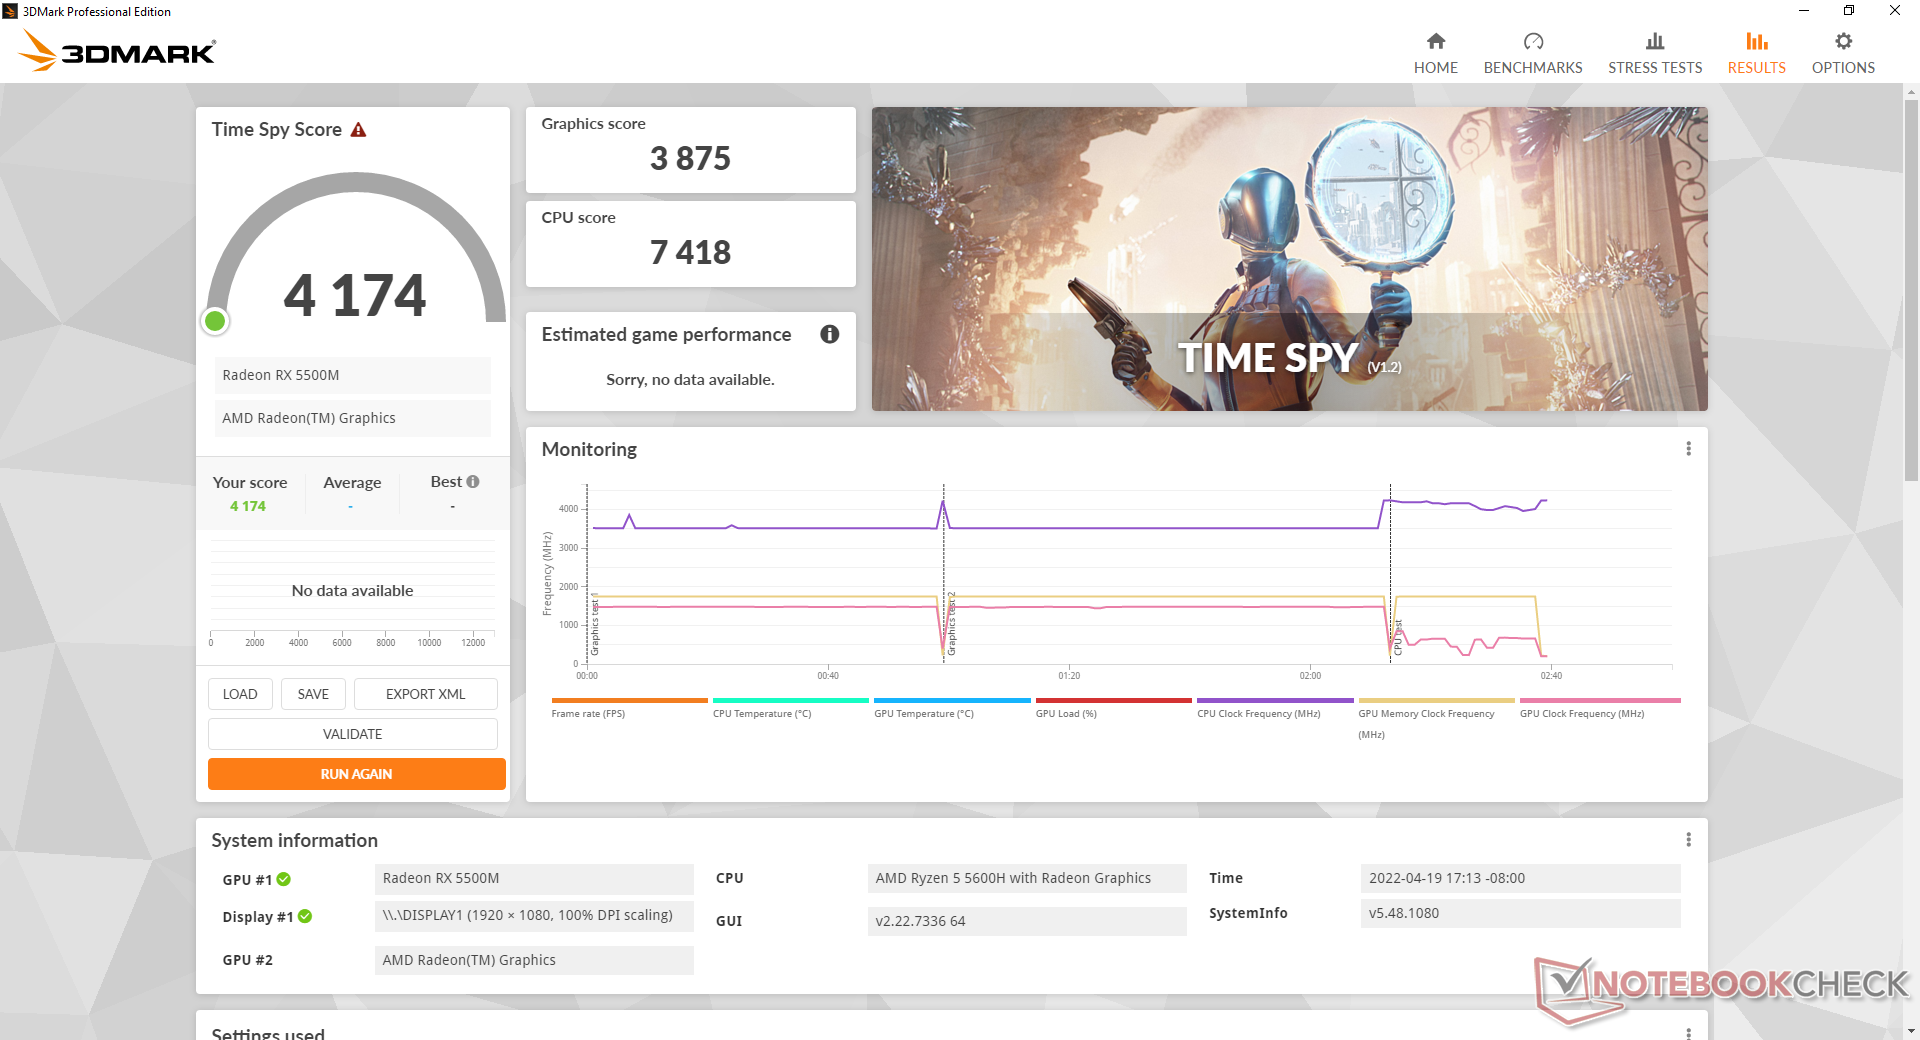
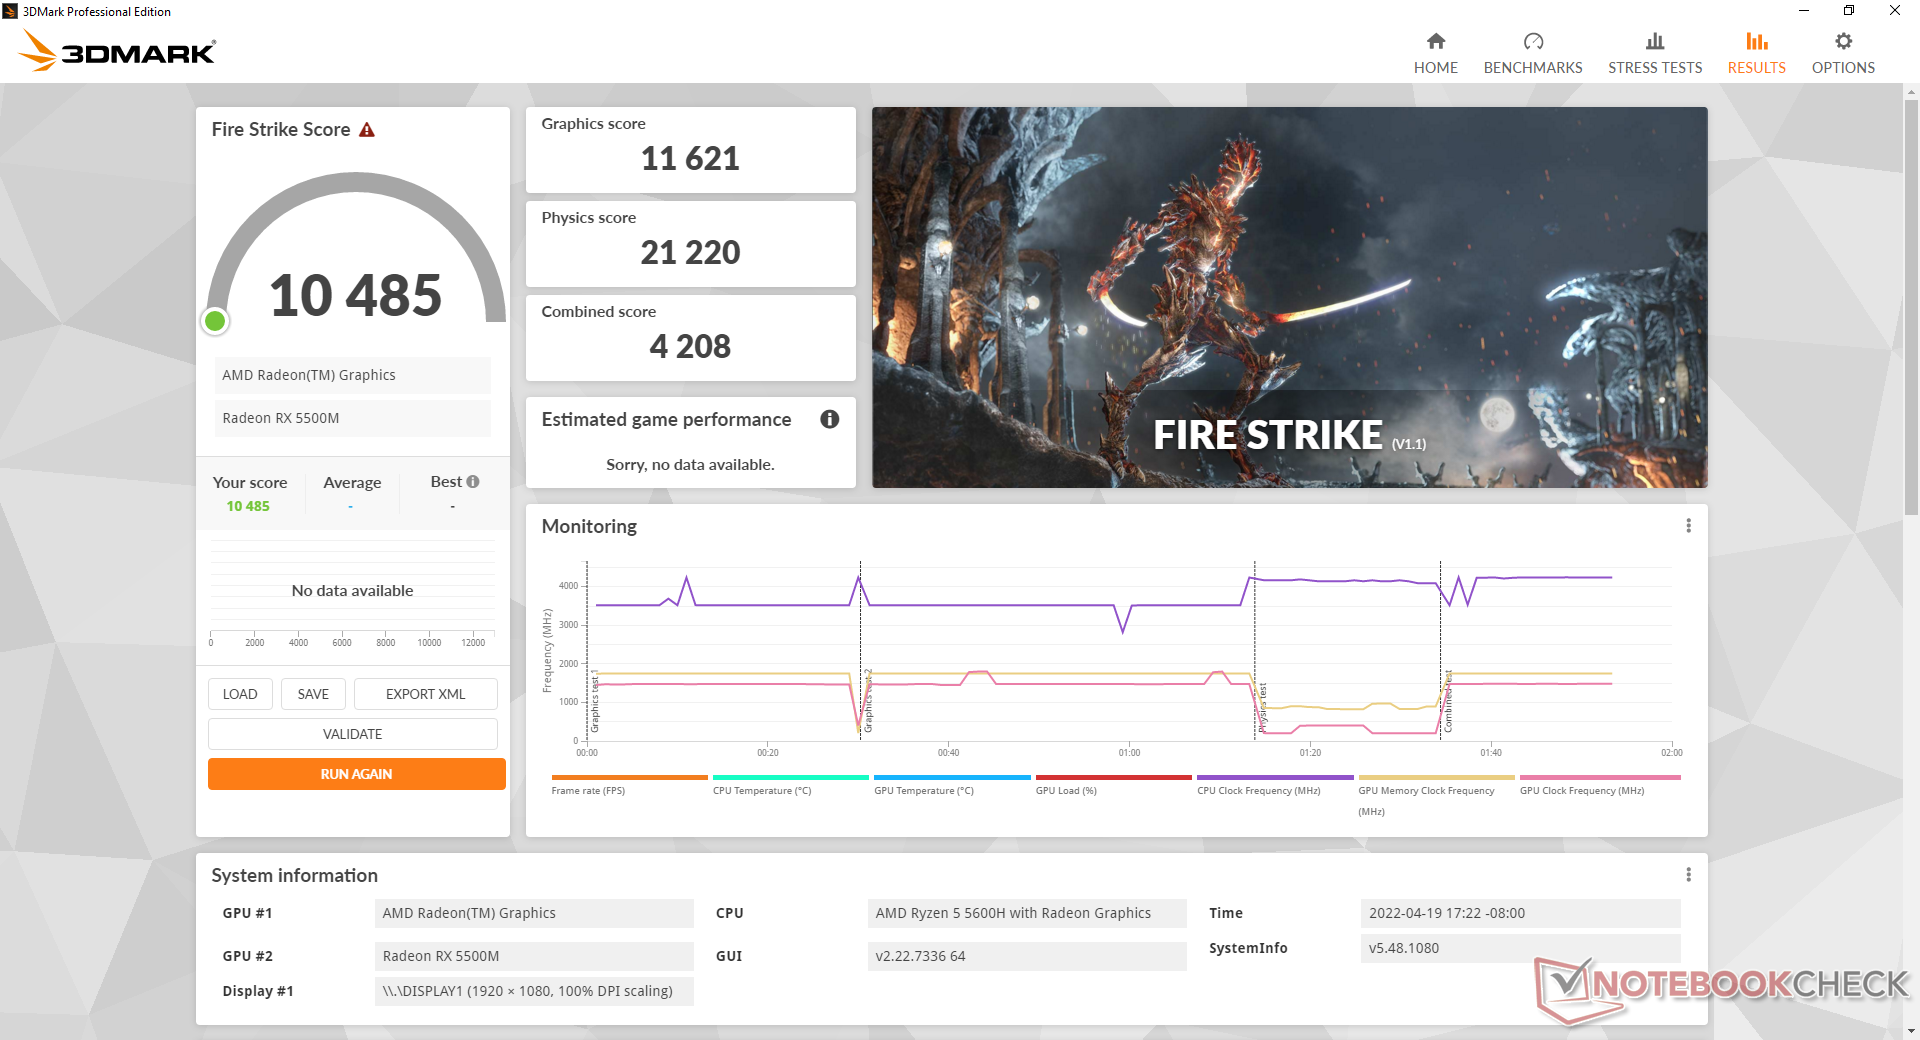
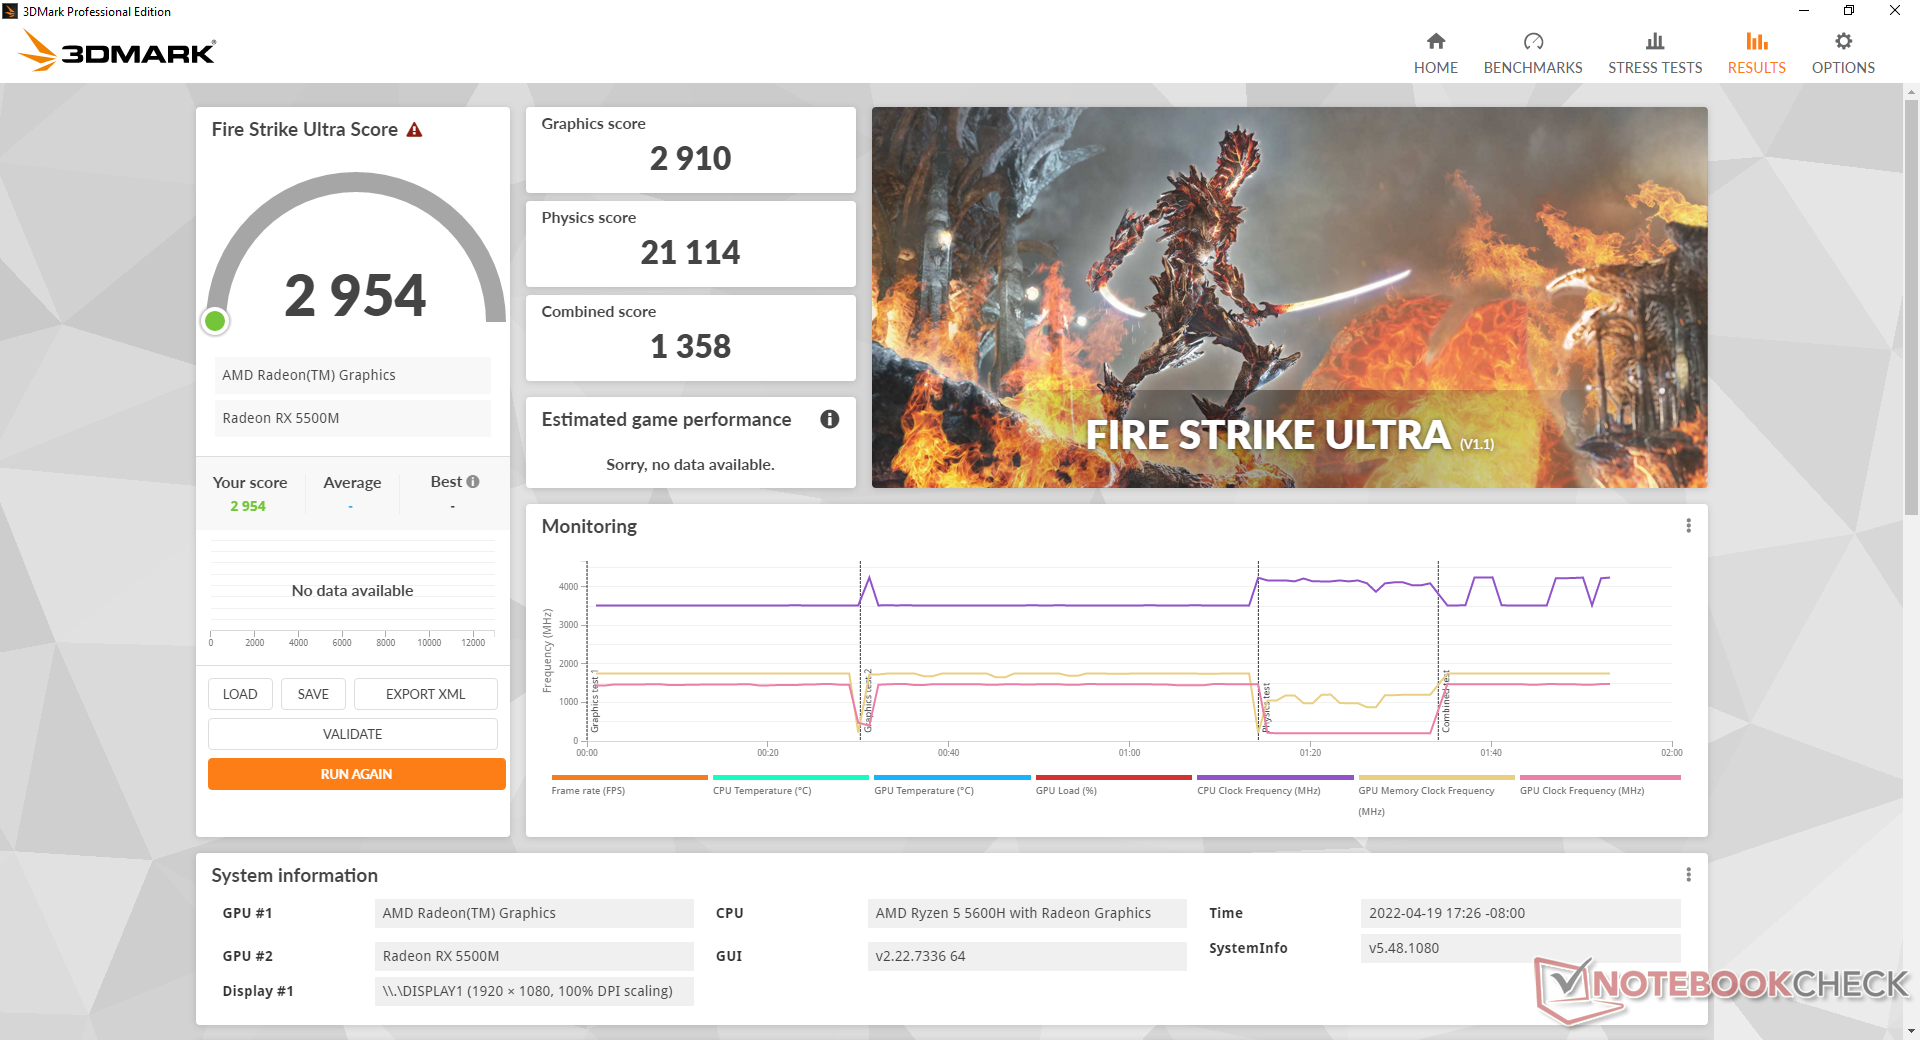
| 3DMark 11 Performance | 14867 points | |
| 3DMark Cloud Gate Standard Score | 35220 points | |
| 3DMark Fire Strike Score | 10485 points | |
| 3DMark Time Spy Score | 4174 points | |
Aide | ||
| Cyberpunk 2077 1.6 | |
| 1920x1080 Low Preset | |
| Lenovo Ideapad Gaming 3 15IHU-82K1002RGE | |
| Moyenne AMD Radeon RX 5500M (53.2 - 55.9, n=2) | |
| MSI Bravo 15 B5DD-010US | |
| 1920x1080 Medium Preset | |
| Lenovo Ideapad Gaming 3 15IHU-82K1002RGE | |
| Moyenne AMD Radeon RX 5500M (41.5 - 44.9, n=2) | |
| MSI Bravo 15 B5DD-010US | |
| 1920x1080 High Preset | |
| Lenovo Ideapad Gaming 3 15IHU-82K1002RGE | |
| Moyenne AMD Radeon RX 5500M (31.2 - 34.4, n=2) | |
| MSI Bravo 15 B5DD-010US | |
| 1920x1080 Ultra Preset | |
| Lenovo Ideapad Gaming 3 15IHU-82K1002RGE | |
| MSI Bravo 15 B5DD-010US | |
| Moyenne AMD Radeon RX 5500M (27.7 - 31.3, n=2) | |
Witcher 3 FPS Chart
| Bas | Moyen | Élevé | Ultra | |
|---|---|---|---|---|
| GTA V (2015) | 173.8 | 106.6 | 54.1 | |
| The Witcher 3 (2015) | 221.1 | 72.5 | 45.5 | |
| Dota 2 Reborn (2015) | 156.4 | 141.7 | 128.4 | 119.8 |
| Final Fantasy XV Benchmark (2018) | 113.2 | 58.6 | 39.2 | |
| X-Plane 11.11 (2018) | 55.4 | 41.9 | 36.5 | |
| Strange Brigade (2018) | 237 | 100.9 | 81.5 | 71.8 |
| Cyberpunk 2077 1.6 (2022) | 53.2 | 41.5 | 31.2 | 31.3 |
Emissions - Silencieux sous les bons réglages
Bruit du système
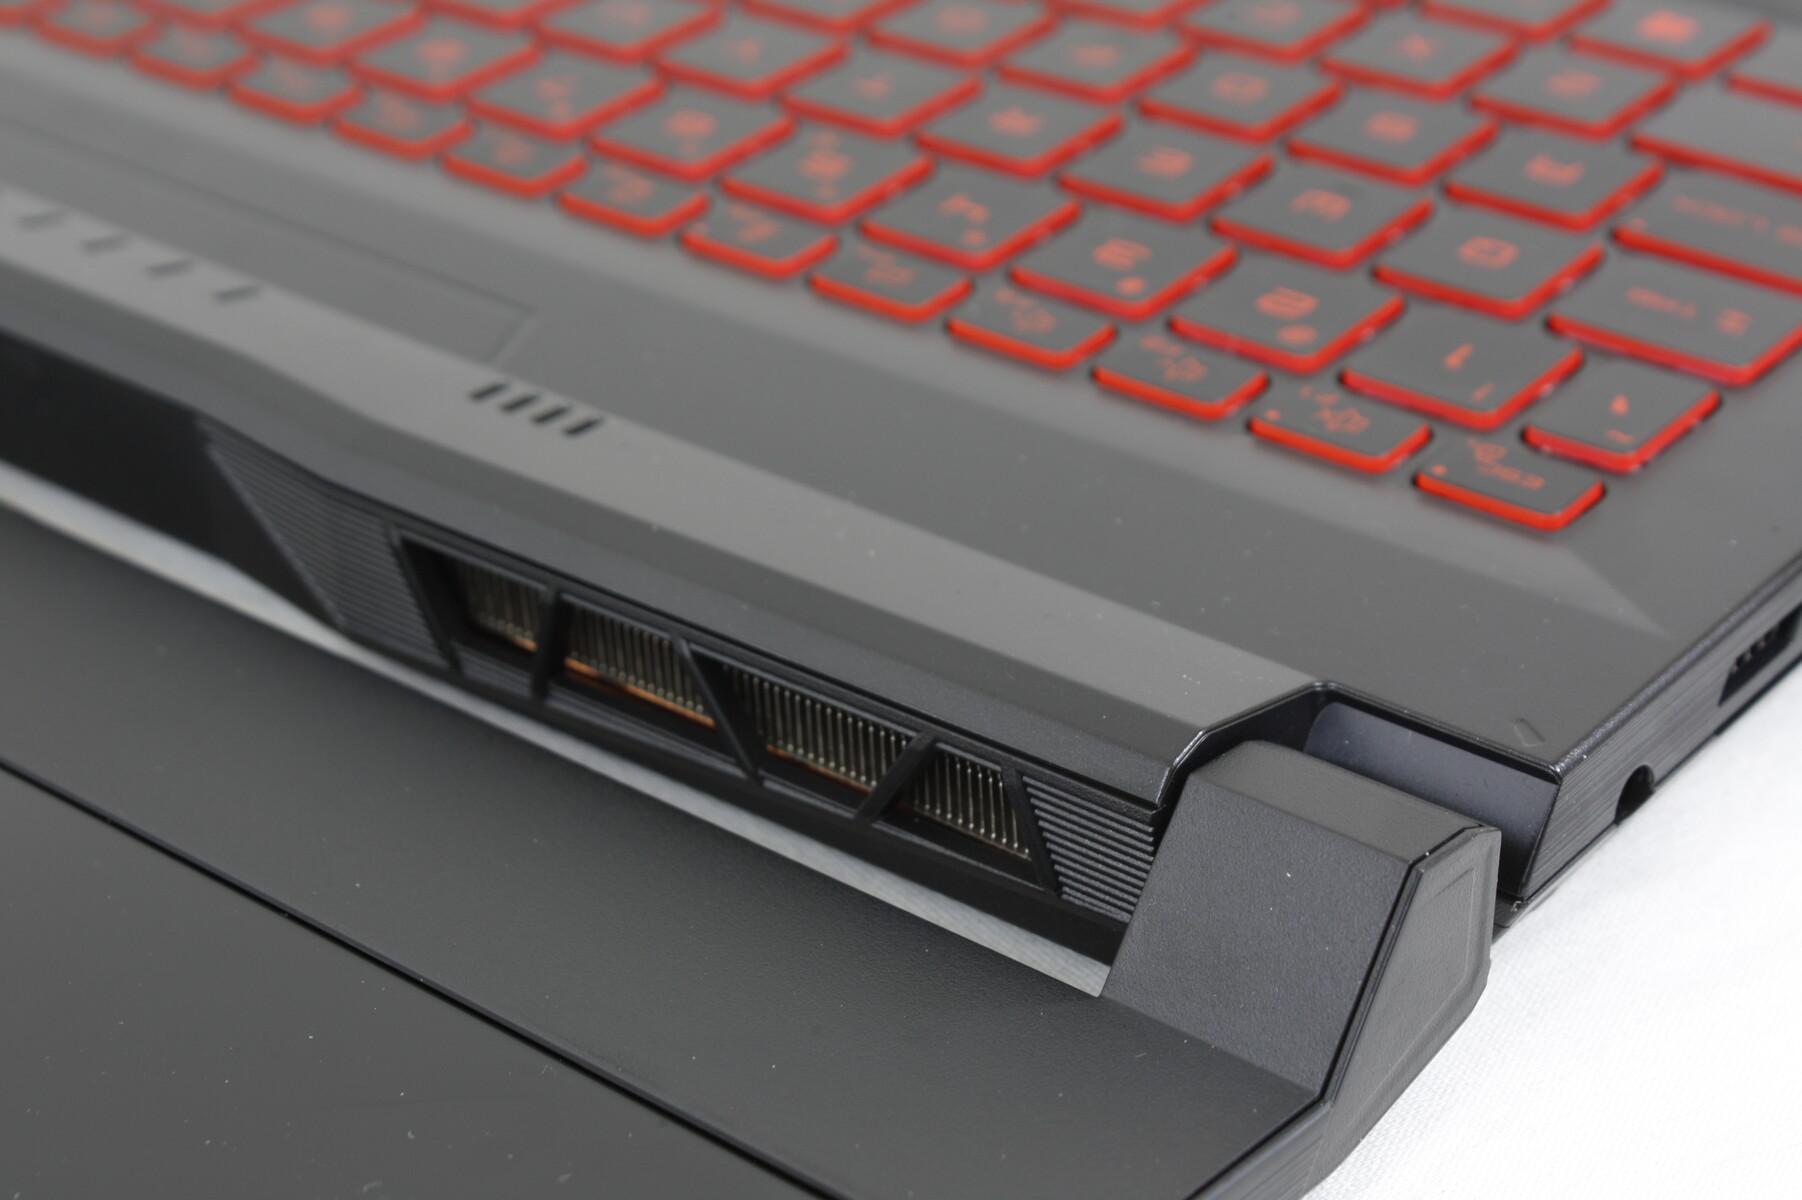
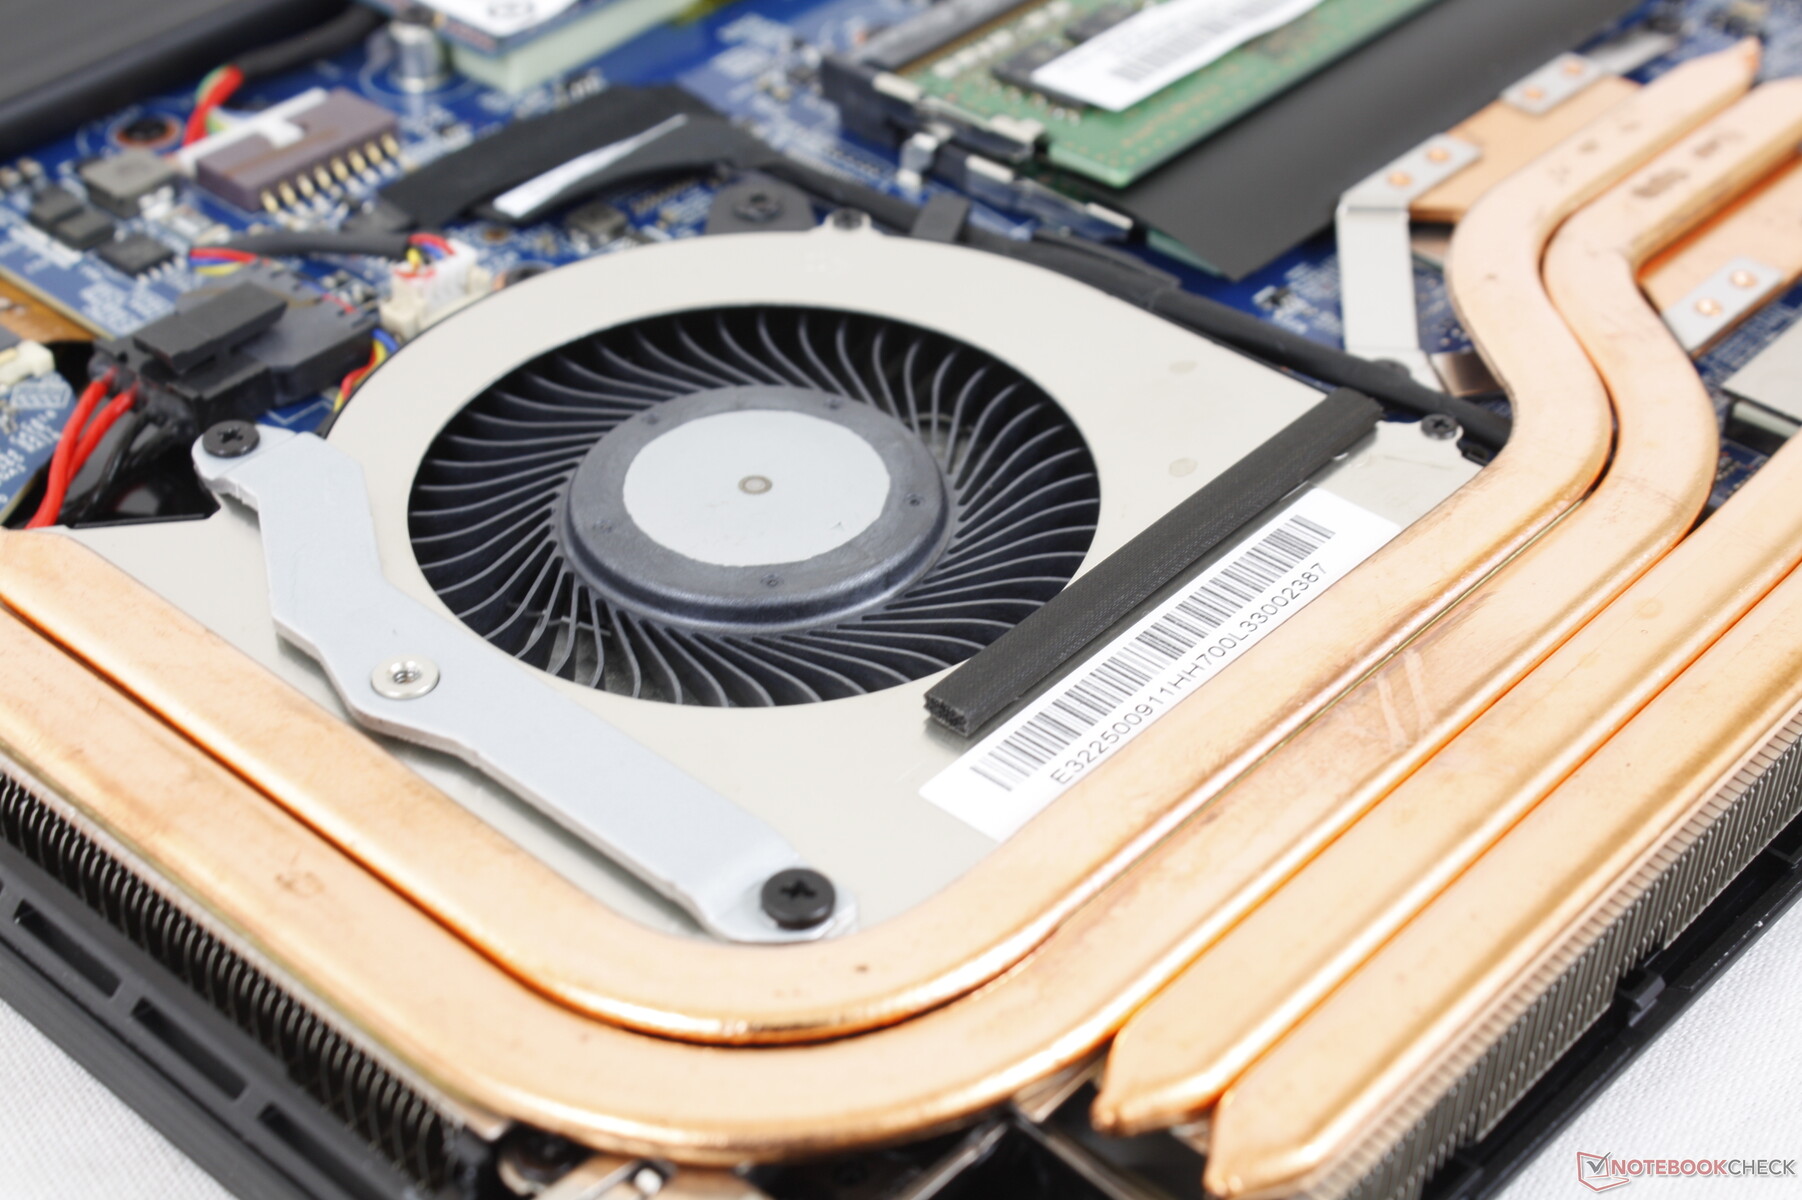
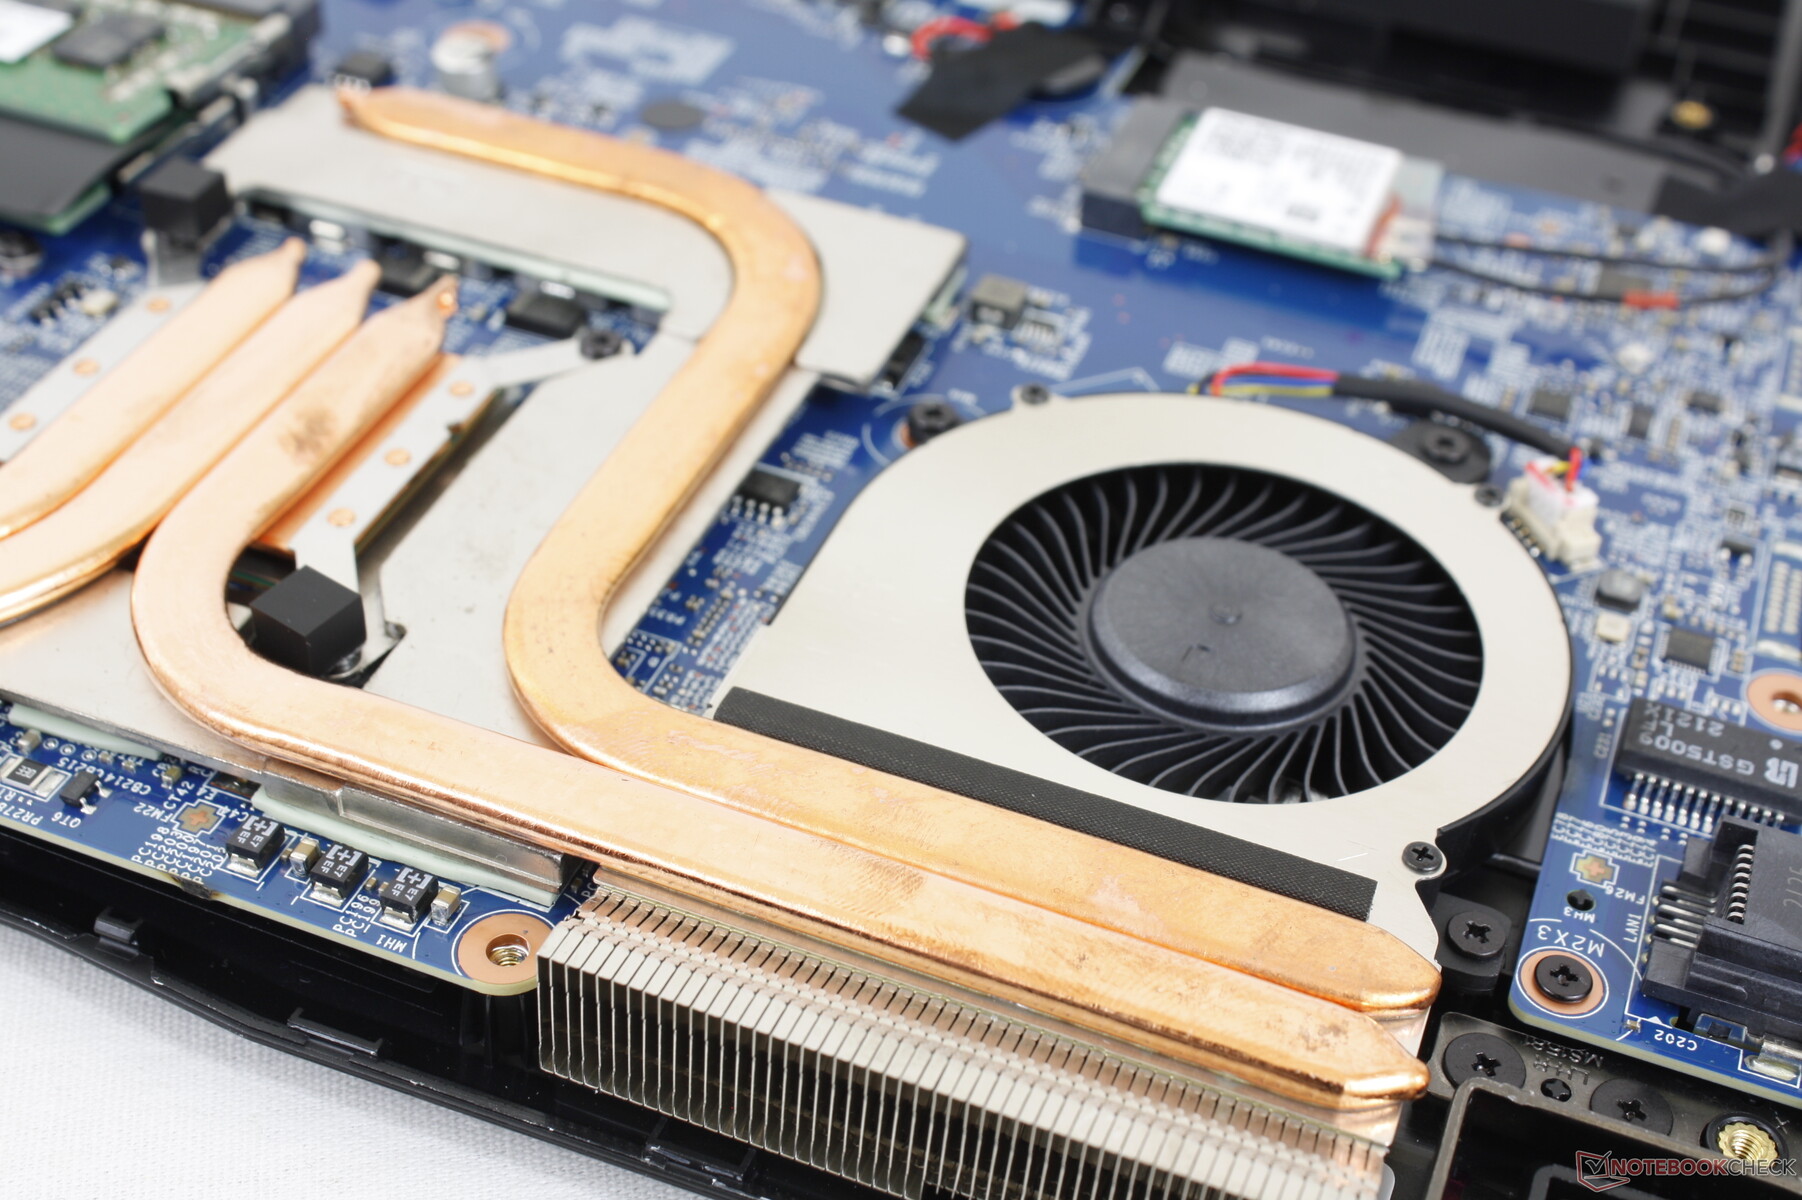
La solution de refroidissement se compose de deux ventilateurs asymétriques et de six caloducs en cuivre disposés différemment que sur l'ancien 2020 Bravo 15. Le bruit du ventilateur dépend fortement des profils d'alimentation du MSI Center : Super Battery, Silent, Balanced, Extreme Performance et Cooler Boost. S'ils sont réglés sur Silencieux ou moins, les ventilateurs restent très silencieux pour être presque inaudibles dans un environnement de bureau typique. En revanche, s'ils sont réglés sur Équilibré ou Performances extrêmes, les ventilateurs ont tendance à osciller autour de 32,8 dB(A) sur un fond silencieux de 24,5 dB(A), même en cas de faible charge comme la navigation ou le streaming vidéo. Le mode silencieux est donc à envisager pour les environnements sensibles au bruit.
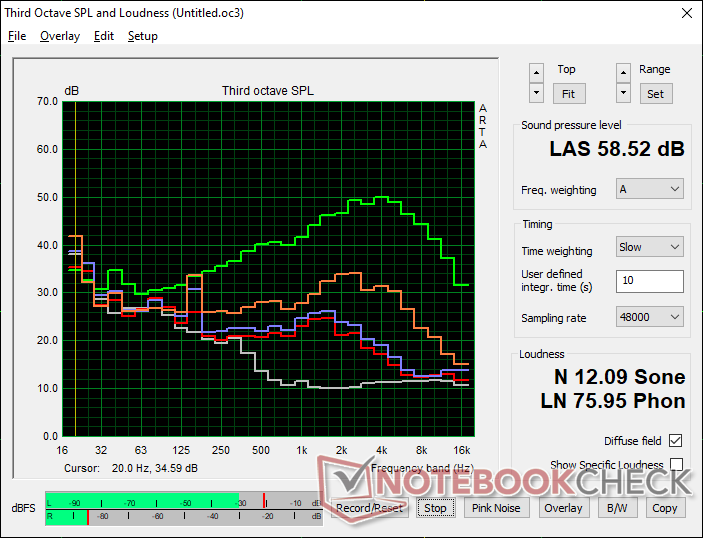
Lorsque vous jouez en mode Performances extrêmes, les ventilateurs ont tendance à se stabiliser à 42,5 dB(A) avec des impulsions peu fréquentes jusqu'à 49,4 dB(A). La gamme basse de 40 dB(A) est néanmoins plus silencieuse que celle de nombreux ordinateurs portables de jeu plus rapides comme le Asus TUF Gaming F15 FX507 ou l'Acer Nitro 5 AN515. L'activation du mode Cooler Boost fait passer le bruit du ventilateur à 58,5 dB(A), quelle que soit l'activité.
Degré de la nuisance sonore
| Au repos |
| 24.5 / 32.8 / 32.8 dB(A) |
| Fortement sollicité |
| 34.5 / 58.5 dB(A) |
 | ||
30 dB silencieux 40 dB(A) audible 50 dB(A) bruyant |
||
min: | ||
| MSI Bravo 15 B5DD-010US Radeon RX 5500M, R5 5600H, Kingston OM8PCP3512F-AB | MSI Bravo 15 A4DCR Radeon RX 5300M, R7 4800H, Samsung PM981a MZVLB1T0HBLR | Asus TUF Gaming F15 FX507ZM GeForce RTX 3060 Laptop GPU, i7-12700H, SK Hynix HFM001TD3JX013N | Dell G15 5515 GeForce RTX 3050 Ti Laptop GPU, R7 5800H, Samsung PM991a MZ9LQ512HBLU-00BD1 | Lenovo Ideapad Gaming 3 15IHU-82K1002RGE GeForce RTX 3050 Ti Laptop GPU, i5-11300H, Micron 2210 MTFDHBA512QFD | Acer Nitro 5 AN515-45-R1JH GeForce RTX 3070 Laptop GPU, R7 5800H, WDC PC SN530 SDBPNPZ-1T00 | |
|---|---|---|---|---|---|---|
| Noise | -16% | 4% | 2% | 3% | 1% | |
| arrêt / environnement * (dB) | 24.5 | 30 -22% | 23.2 5% | 24 2% | 23.9 2% | 25 -2% |
| Idle Minimum * (dB) | 24.5 | 31 -27% | 23.6 4% | 25 -2% | 23.9 2% | 25 -2% |
| Idle Average * (dB) | 32.8 | 32 2% | 23.6 28% | 26 21% | 26.8 18% | 25 24% |
| Idle Maximum * (dB) | 32.8 | 40 -22% | 25.4 23% | 30 9% | 26.8 18% | 32.2 2% |
| Load Average * (dB) | 34.5 | 48 -39% | 38 -10% | 44 -28% | 43.5 -26% | 45.8 -33% |
| Witcher 3 ultra * (dB) | 42.5 | 48 -13% | 54.1 -27% | 44 -4% | 43.5 -2% | |
| Load Maximum * (dB) | 58.5 | 54 8% | 57.2 2% | 48 18% | 53.1 9% | 49.1 16% |
* ... Moindre est la valeur, meilleures sont les performances
Température
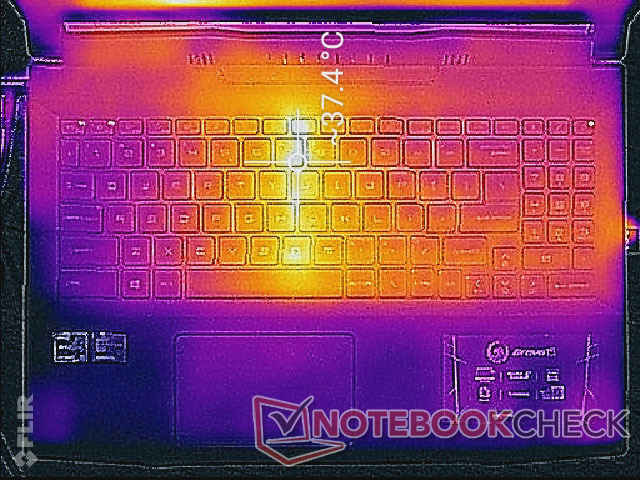
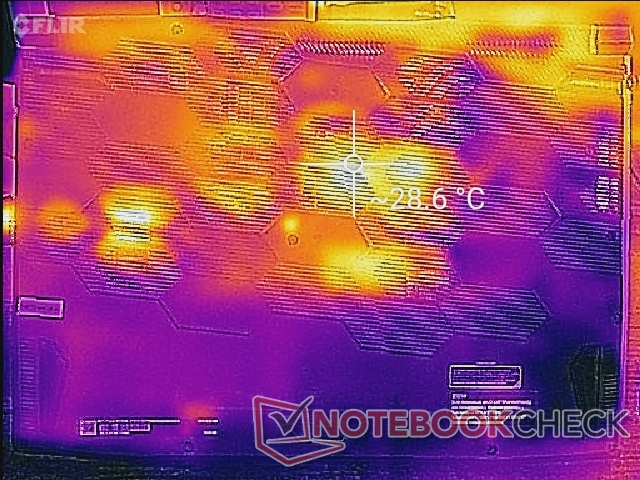
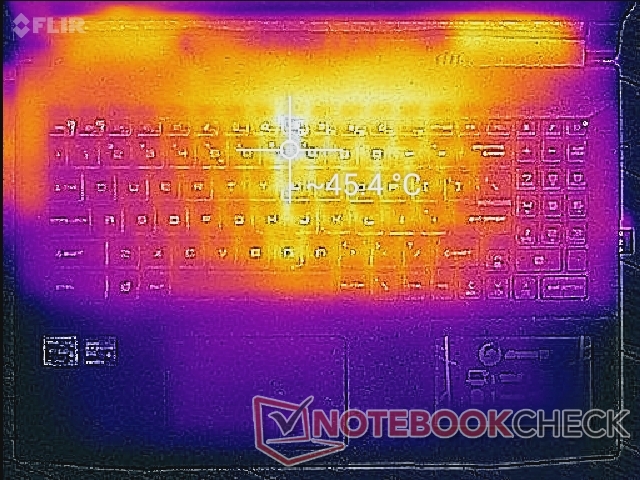
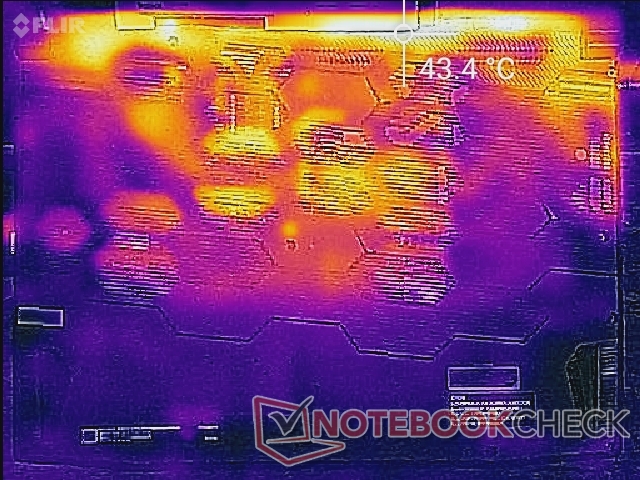
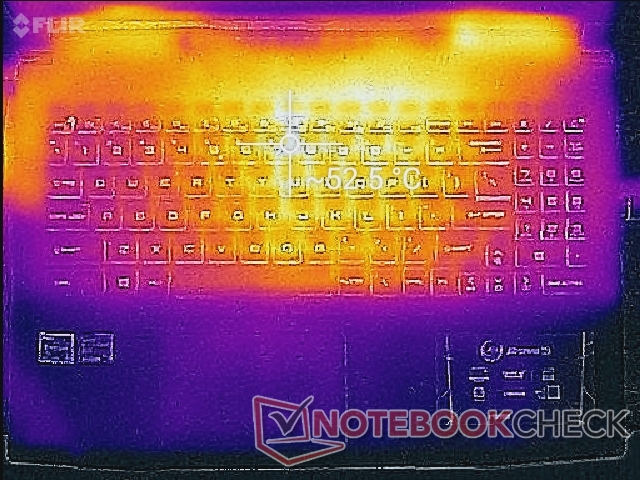
La majeure partie du châssis en plastique reste relativement froide au toucher, même lorsqu'elle est soumise à de lourdes charges, car il ne s'agit pas d'une conception métallique ultrafine. Les repose-poignets, les touches WASD et la zone du pavé numérique, par exemple, ne sont qu'à environ 30 °C lors des jeux. Les points chauds sont les plus proches du centre du clavier et du bord arrière, là où la peau ne risque pas de se toucher pendant de longues périodes d'utilisation. Les températures moyennes sont inférieures à celles que nous avons observées sur le Bravo 15 de 2020, notamment autour des touches WASD.
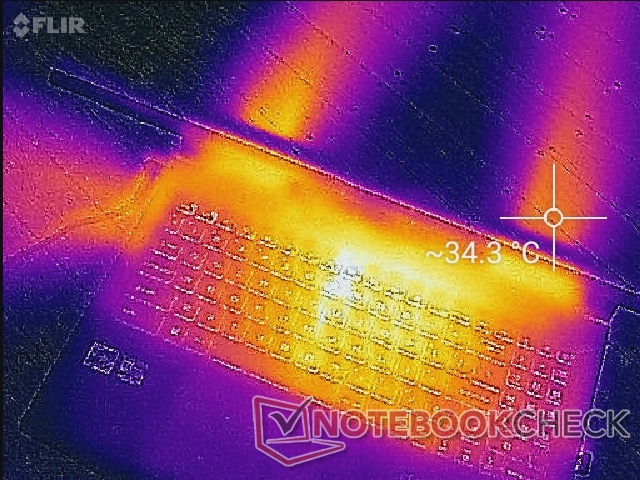
(-) La température maximale du côté supérieur est de 52.2 °C / 126 F, par rapport à la moyenne de 40.4 °C / 105 F, allant de 21.2 à 68.8 °C pour la classe Gaming.
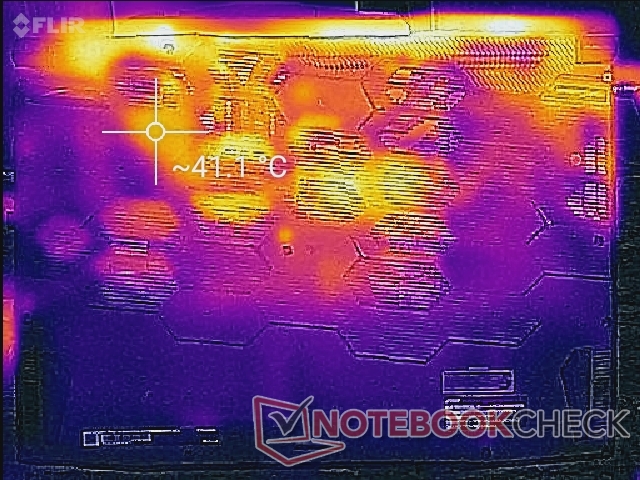
(-) Le fond chauffe jusqu'à un maximum de 48.6 °C / 119 F, contre une moyenne de 43.2 °C / 110 F
(+) En utilisation inactive, la température moyenne du côté supérieur est de 30 °C / 86 F, par rapport à la moyenne du dispositif de 33.9 °C / 93 F.
(+) En jouant à The Witcher 3, la température moyenne du côté supérieur est de 31.9 °C / 89 F, alors que la moyenne de l'appareil est de 33.9 °C / 93 F.
(+) Les repose-poignets et le pavé tactile sont plus froids que la température de la peau avec un maximum de 27.6 °C / 81.7 F et sont donc froids au toucher.
(±) La température moyenne de la zone de l'appui-paume de dispositifs similaires était de 28.8 °C / 83.8 F (+1.2 °C / #2.1 F).
| MSI Bravo 15 B5DD-010US AMD Ryzen 5 5600H, AMD Radeon RX 5500M | MSI Bravo 15 A4DCR AMD Ryzen 7 4800H, AMD Radeon RX 5300M | Asus TUF Gaming F15 FX507ZM Intel Core i7-12700H, NVIDIA GeForce RTX 3060 Laptop GPU | Dell G15 5515 AMD Ryzen 7 5800H, NVIDIA GeForce RTX 3050 Ti Laptop GPU | Lenovo Ideapad Gaming 3 15IHU-82K1002RGE Intel Core i5-11300H, NVIDIA GeForce RTX 3050 Ti Laptop GPU | Acer Nitro 5 AN515-45-R1JH AMD Ryzen 7 5800H, NVIDIA GeForce RTX 3070 Laptop GPU | |
|---|---|---|---|---|---|---|
| Heat | 3% | -6% | 11% | 14% | -3% | |
| Maximum Upper Side * (°C) | 52.2 | 51 2% | 44.4 15% | 50 4% | 43.2 17% | 53.2 -2% |
| Maximum Bottom * (°C) | 48.6 | 50 -3% | 48.8 -0% | 49 -1% | 47.9 1% | 58.2 -20% |
| Idle Upper Side * (°C) | 38 | 30 21% | 37.8 1% | 26 32% | 24.9 34% | 29.5 22% |
| Idle Bottom * (°C) | 28.4 | 31 -9% | 39.6 -39% | 26 8% | 27 5% | 31.2 -10% |
* ... Moindre est la valeur, meilleures sont les performances
Test de stress
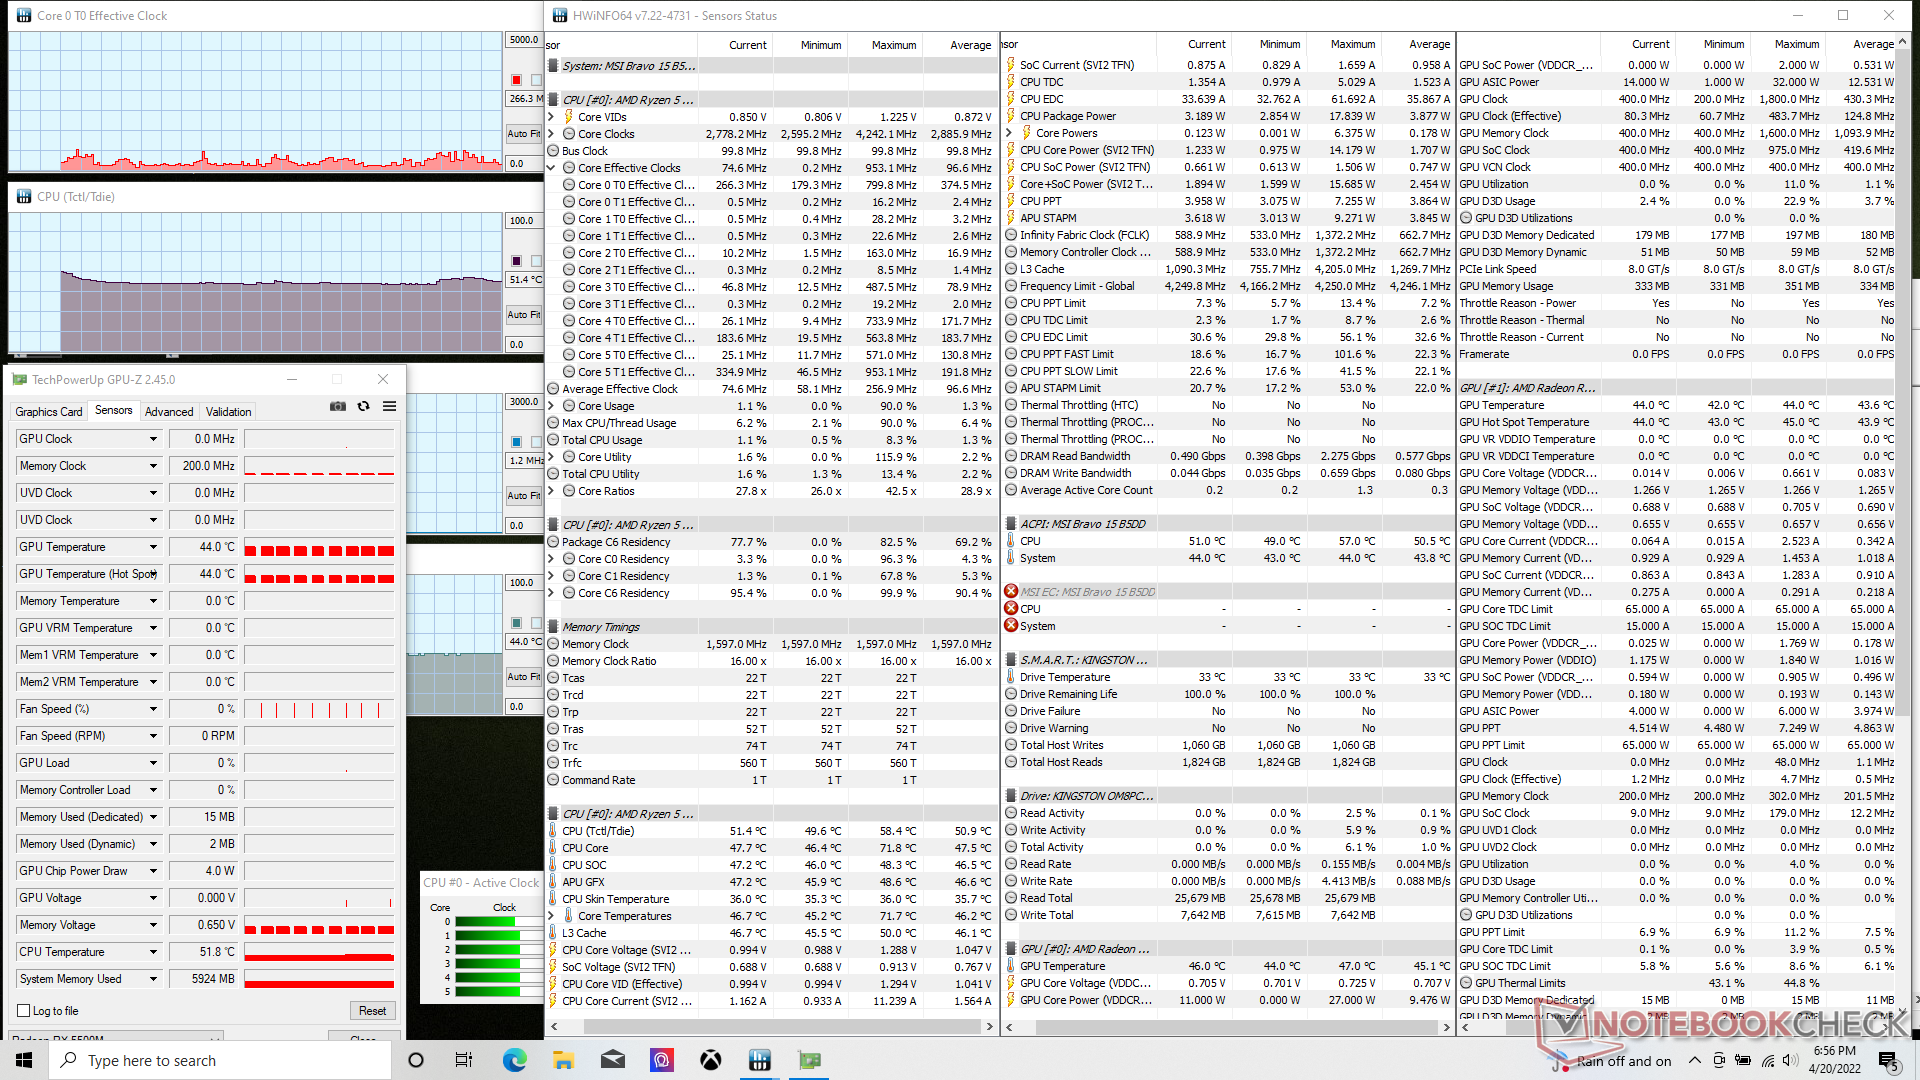
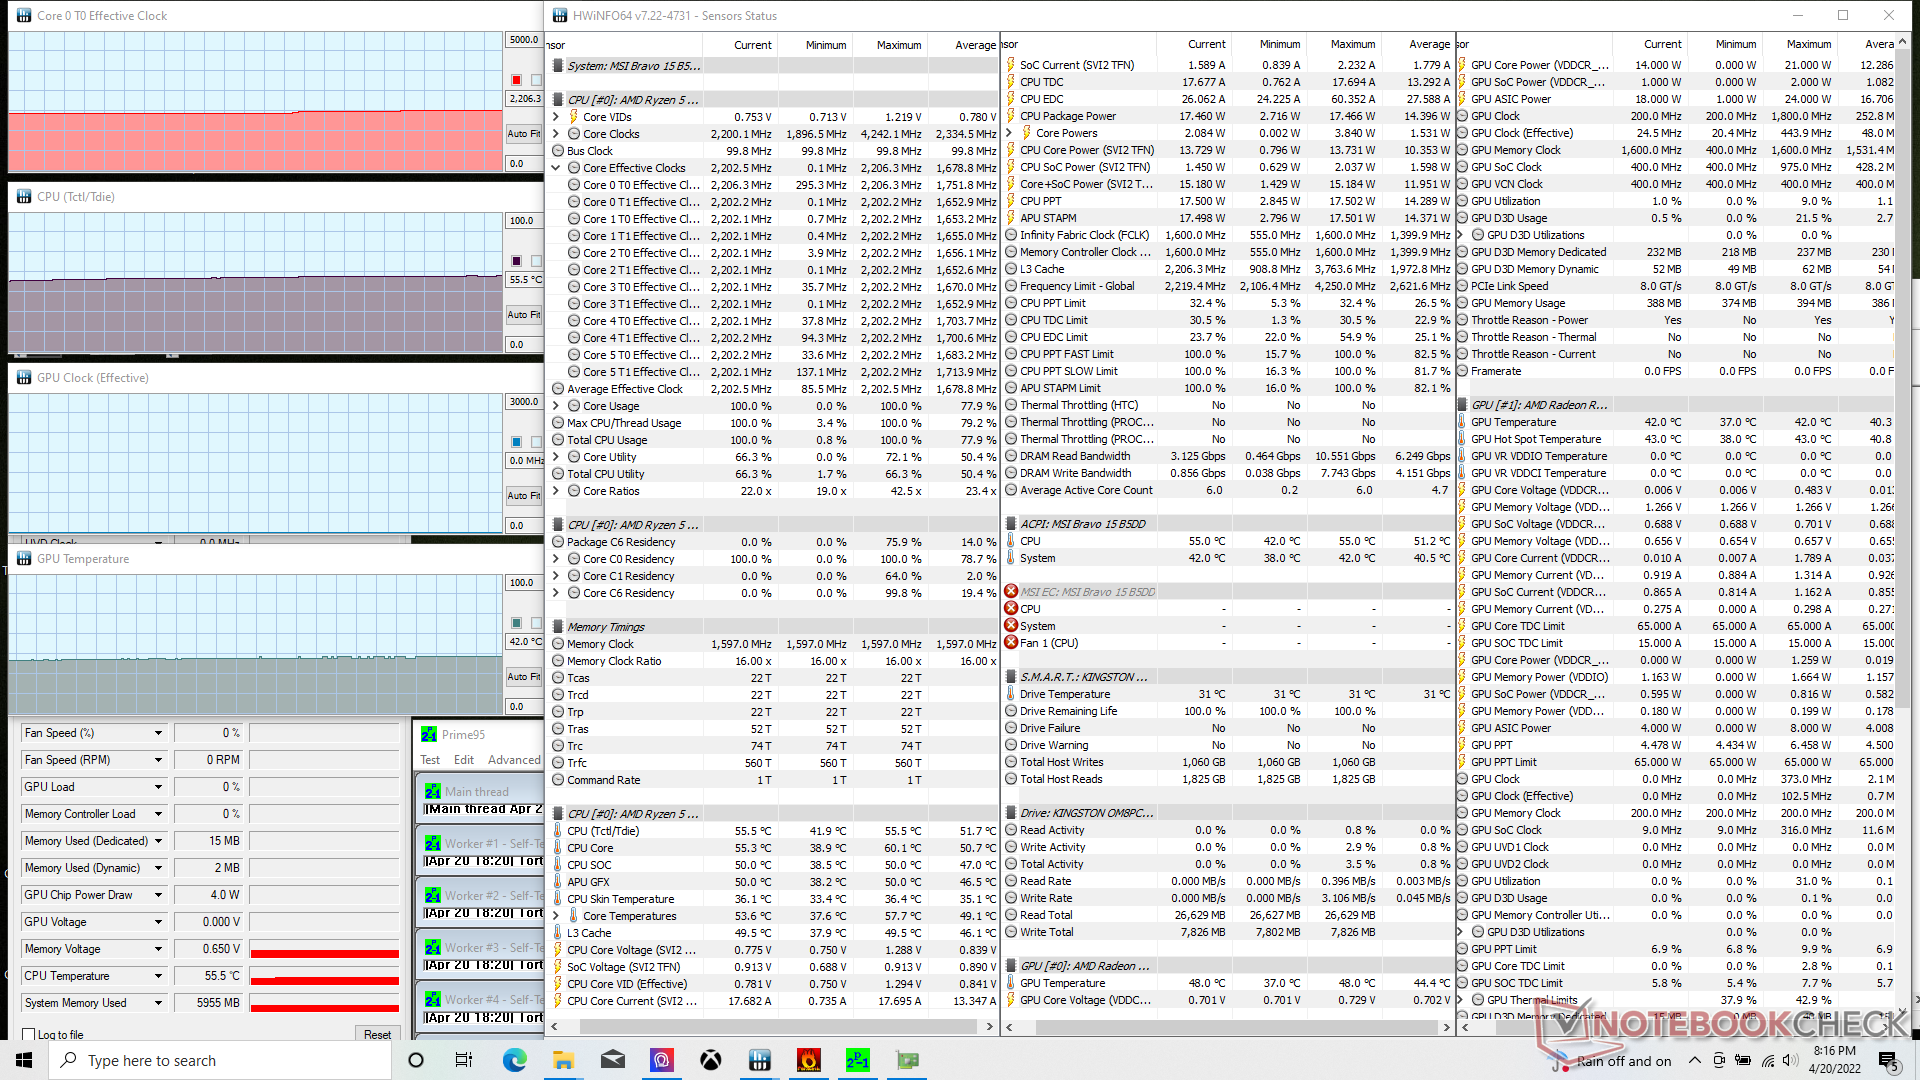
Les fréquences d'horloge du CPU se stabiliseraient à 2,2 GHz et 56 C lors de l'exécution de Prime95 en mode Performance extrême, contre 3,8 GHz et 95 C sur l'Asus ROG Strix Scar 15 G533QS équipé de Ryzen 9. Les températures du CPU et du GPU se stabilisent à 68°C et 75°C, respectivement, lors de l'exécution de Prime95 en mode Extreme Performance Witcher 3. En comparaison, le cœur du CPU et le GPU du Bravo 15 2020 se stabilisent respectivement à 77 C et 71 C. Les températures relativement basses, même sous de lourdes charges, sont courantes parmi les ordinateurs portables de jeu d'entrée de gamme tels que notre série Bravo 15.
L'activation de la fonction Cooler Boost (ou du mode ventilateur maximal) permet de réduire les températures du cœur sans nécessairement augmenter les performances du CPU ou du GPU, comme le montre le tableau ci-dessous, qui correspond à ce que nous avons observé sur d'autres ordinateurs portables de jeu MSI dotés de la même fonction Cooler Boost. Comme les températures sont déjà assez basses, la fonction peut être désactivée dans la plupart des cas.
Le fonctionnement sur batterie limite les performances. Sur le site Fire Strike, les scores physiques et graphiques sont respectivement de 16804 et 4552 points, contre 21220 et 11621 points sur secteur.
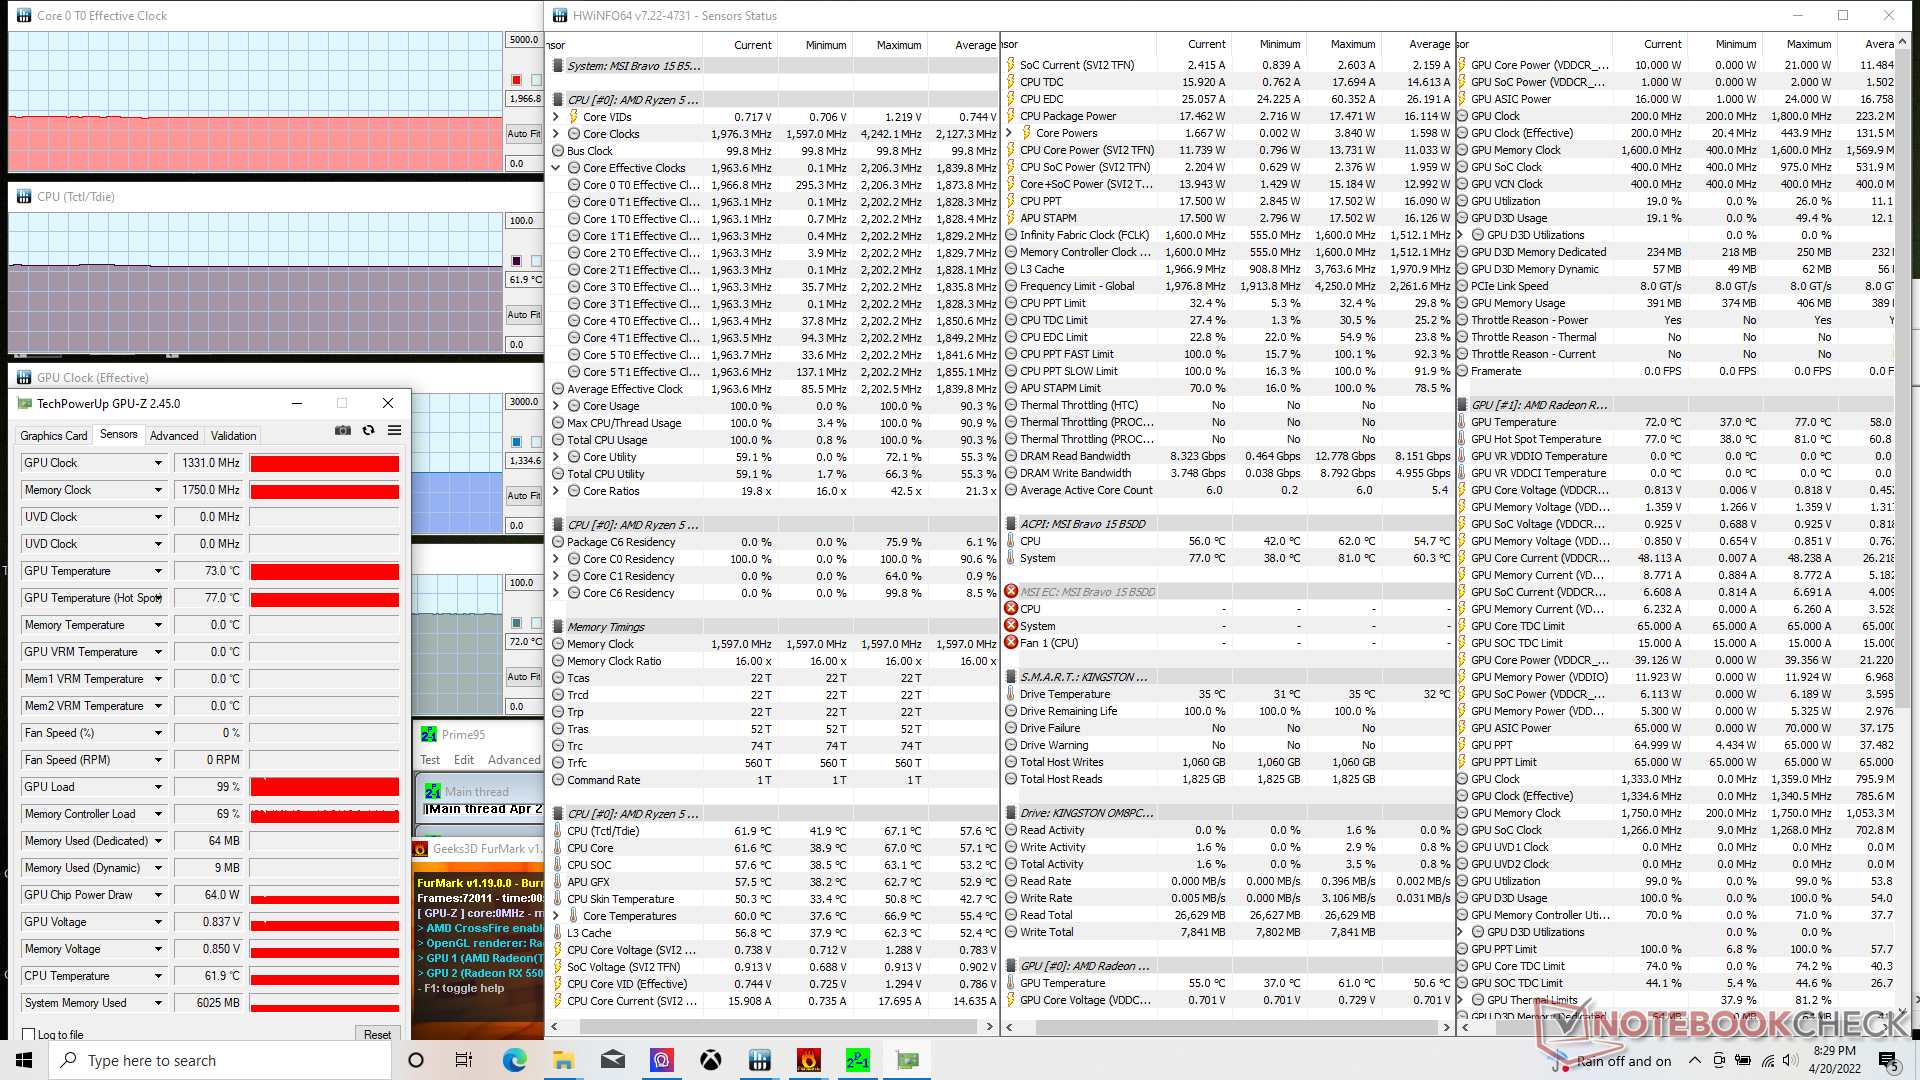
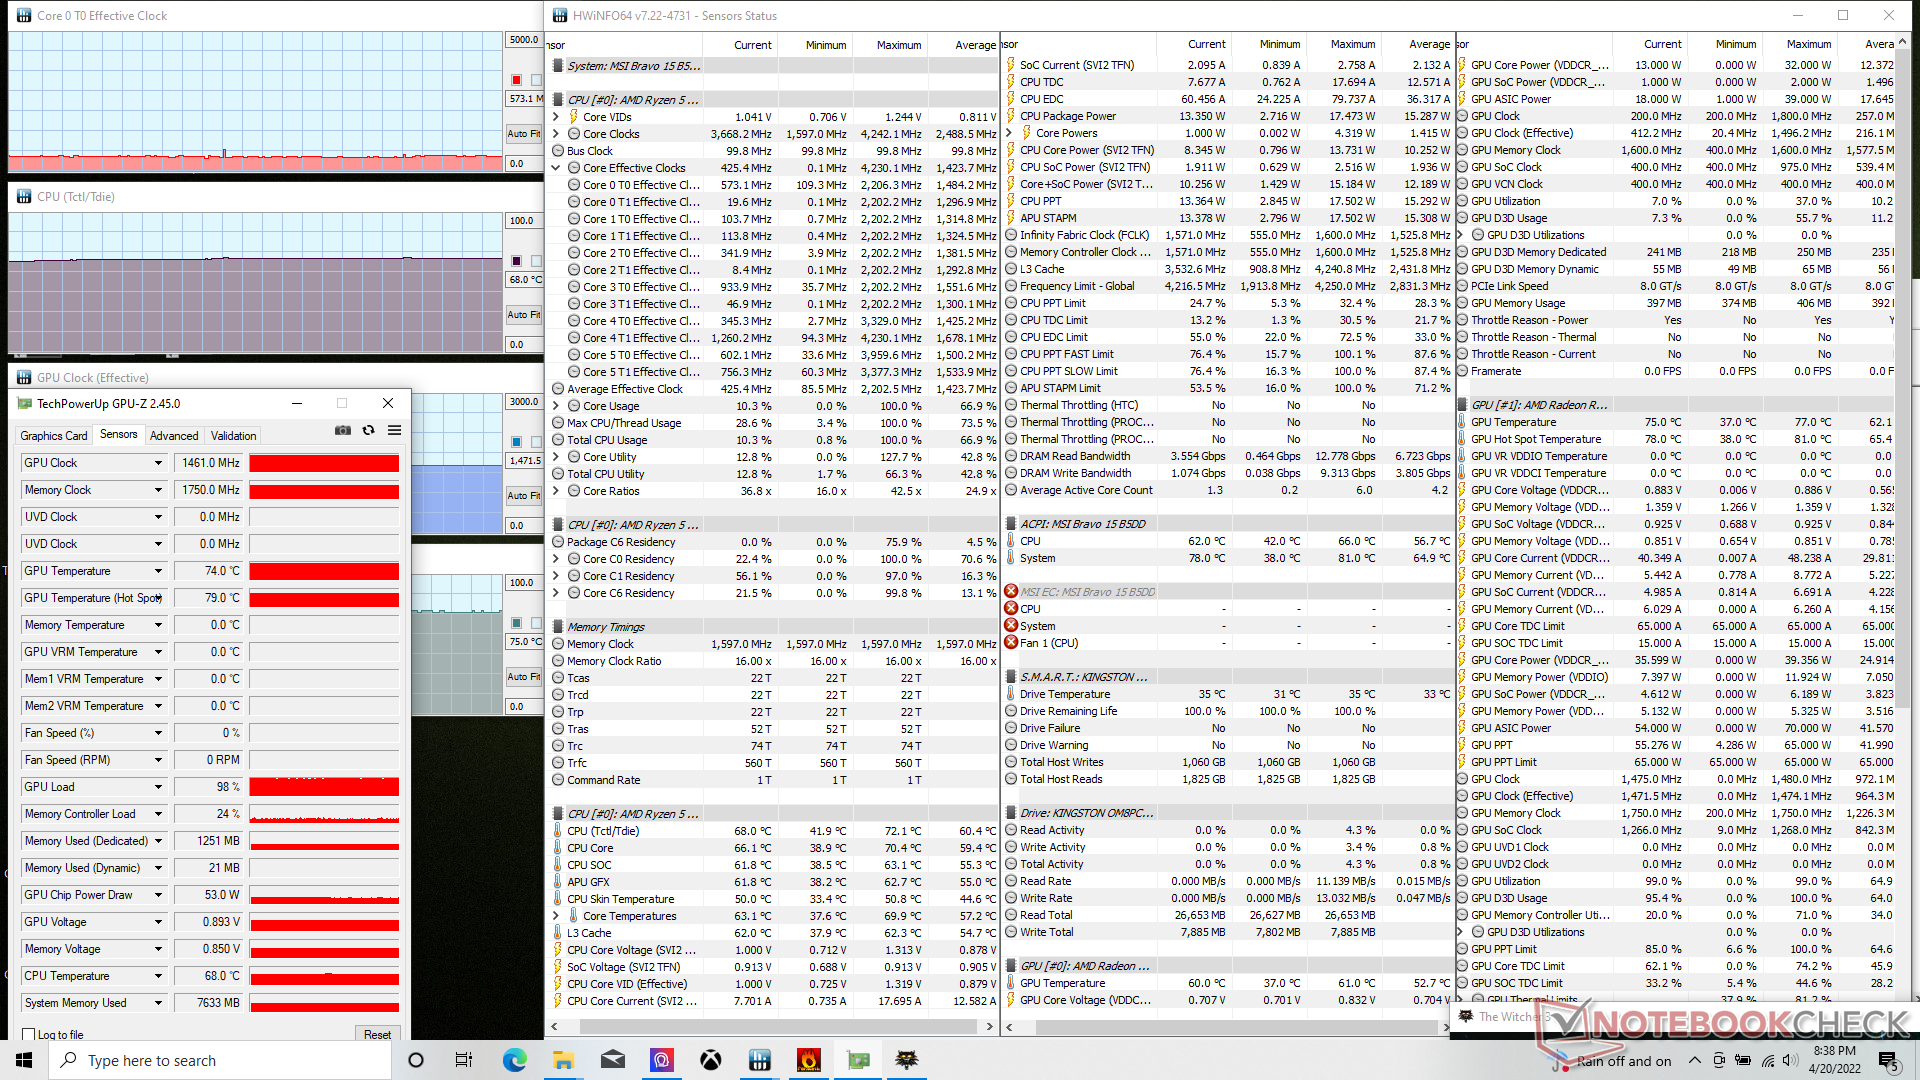
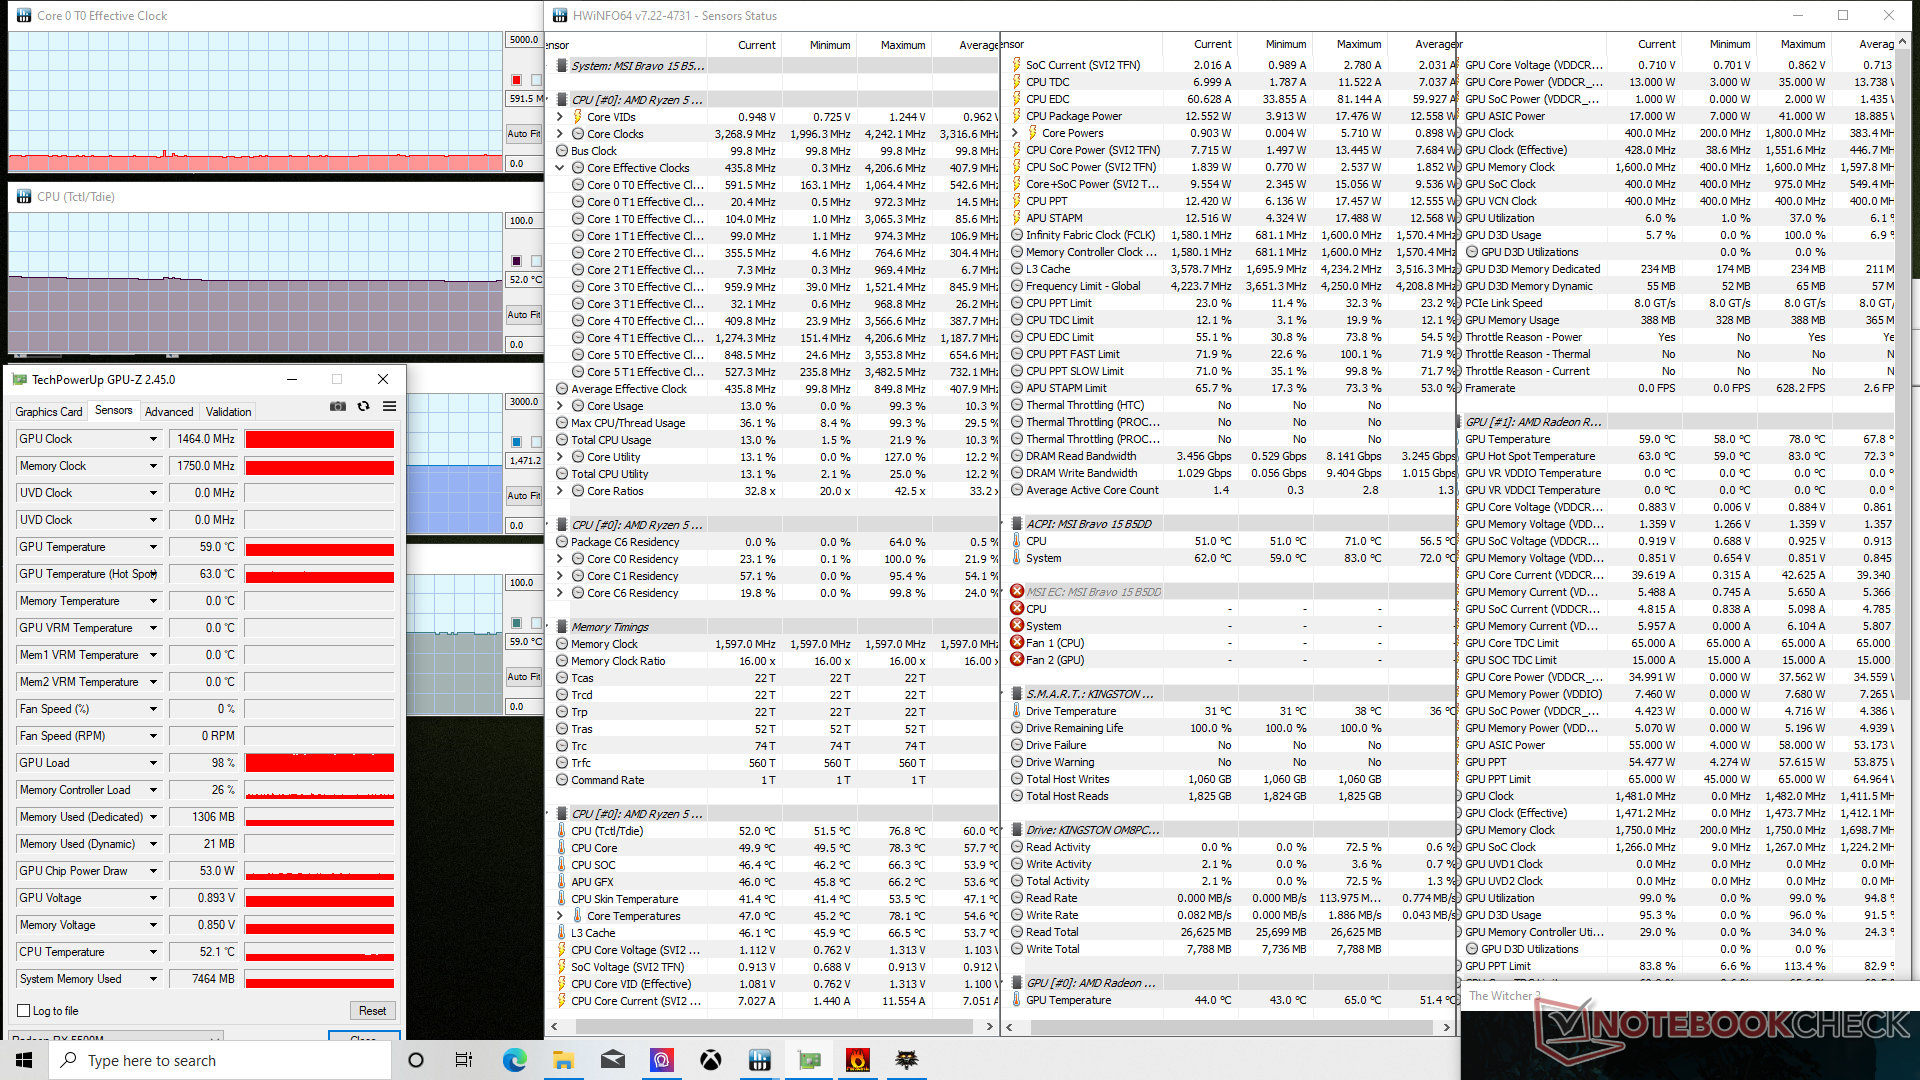
| Horloge CPU (GHz) | Horloge GPU (MHz) | Température CPU moyenne Tctl/Tdie (°C) | Température GPU moyenne (°C) | |
| Système au repos | -- | -- | 51 | 44 |
| Prime95 Stress | 2.2 | -- | 56 | 42 |
| Prime95 + FurMark Stress | 2.0 | 1331 | 62 | 72 |
| Witcher 3 Stress (Cooler Boost off) | 0.6 | 1461 | 68 | 75 |
| Witcher 3 Stress (Cooler Boost on) | 0.6 | 1464 | 52 | 59 |
Haut-parleurs
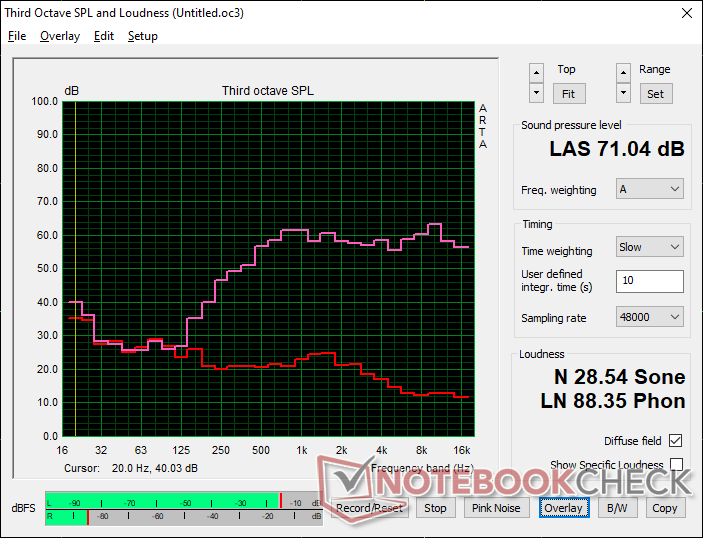
MSI Bravo 15 B5DD-010US analyse audio
(-) | haut-parleurs pas très forts (71 dB)
Basses 100 - 315 Hz
(-) | presque aucune basse - en moyenne 20.2% plus bas que la médiane
(±) | la linéarité des basses est moyenne (11.7% delta à la fréquence précédente)
Médiums 400 - 2000 Hz
(+) | médiane équilibrée - seulement 2.6% de la médiane
(+) | les médiums sont linéaires (6.8% delta à la fréquence précédente)
Aiguës 2 - 16 kHz
(+) | des sommets équilibrés - à seulement 1.9% de la médiane
(+) | les aigus sont linéaires (5.1% delta à la fréquence précédente)
Globalement 100 - 16 000 Hz
(±) | la linéarité du son global est moyenne (21.7% de différence avec la médiane)
Par rapport à la même classe
» 78% de tous les appareils testés de cette catégorie étaient meilleurs, 6% similaires, 17% pires
» Le meilleur avait un delta de 6%, la moyenne était de 18%, le pire était de 132%.
Par rapport à tous les appareils testés
» 61% de tous les appareils testés étaient meilleurs, 7% similaires, 31% pires
» Le meilleur avait un delta de 4%, la moyenne était de 24%, le pire était de 134%.
Apple MacBook Pro 16 2021 M1 Pro analyse audio
(+) | les haut-parleurs peuvent jouer relativement fort (84.7# dB)
Basses 100 - 315 Hz
(+) | bonne basse - seulement 3.8% loin de la médiane
(+) | les basses sont linéaires (5.2% delta à la fréquence précédente)
Médiums 400 - 2000 Hz
(+) | médiane équilibrée - seulement 1.3% de la médiane
(+) | les médiums sont linéaires (2.1% delta à la fréquence précédente)
Aiguës 2 - 16 kHz
(+) | des sommets équilibrés - à seulement 1.9% de la médiane
(+) | les aigus sont linéaires (2.7% delta à la fréquence précédente)
Globalement 100 - 16 000 Hz
(+) | le son global est linéaire (4.6% différence à la médiane)
Par rapport à la même classe
» 0% de tous les appareils testés de cette catégorie étaient meilleurs, 0% similaires, 100% pires
» Le meilleur avait un delta de 5%, la moyenne était de 17%, le pire était de 45%.
Par rapport à tous les appareils testés
» 0% de tous les appareils testés étaient meilleurs, 0% similaires, 100% pires
» Le meilleur avait un delta de 4%, la moyenne était de 24%, le pire était de 134%.
Gestion de l'énergie
Consommation d'énergie - Bon CPU, mauvais GPU
La consommation d'énergie lors de l'exécution de jeux ou d'autres charges plus élevées est presque identique à celle que nous avons enregistrée sur le 2020 Bravo 15 qui utilise un Ryzen 7 4800H d'ancienne génération et une Radeon RX 5300M plus lente. La performance par watt, cependant, est un sac mitigé. Bien que notre CPU Ryzen 5 5600H puisse offrir des performances multithread 60 % plus rapides que le Core i5-11300H concurrent pour une consommation d'énergie 12 % inférieure, notre Radeon RX5500M est environ 15 à 30 % plus lente que le GeForce RTX 3050 Ti concurrent tout en consommant 13 % moins d'énergie. En bref, le CPU d'AMD a un net avantage en termes de performance par watt par rapport à Intel, tandis que le GPU d'AMD a un net désavantage par rapport aux derniers GPU de Nvidia
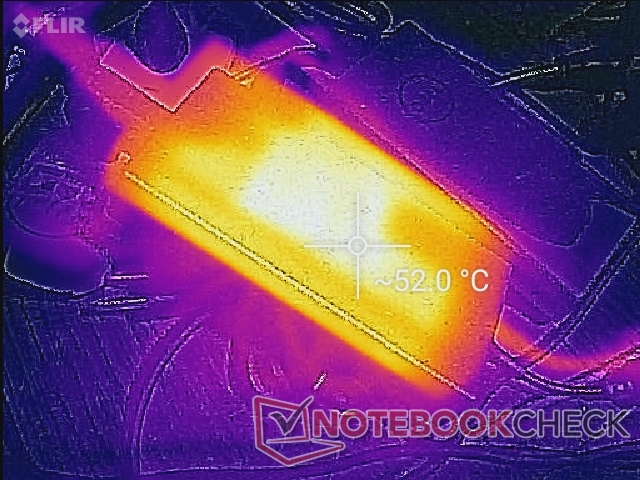
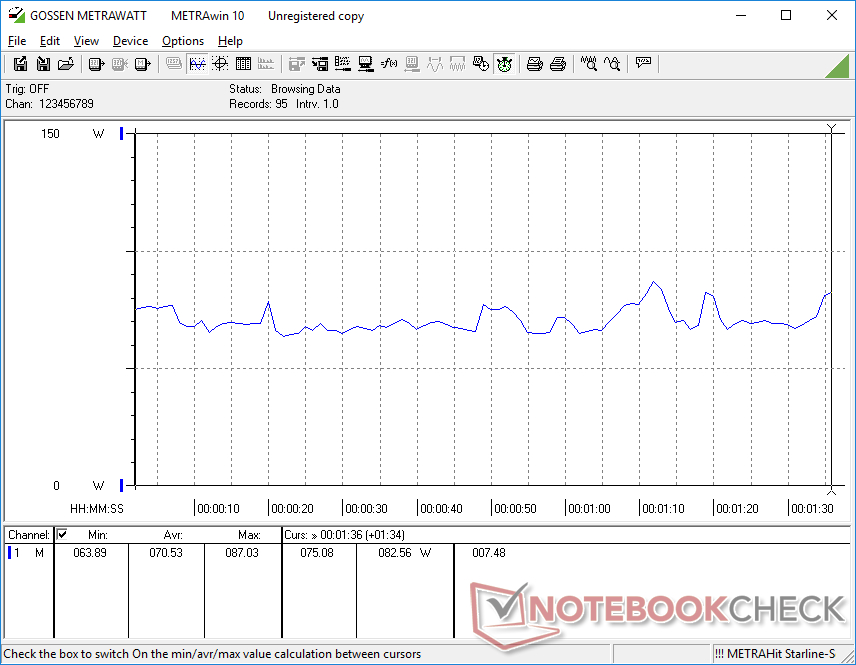
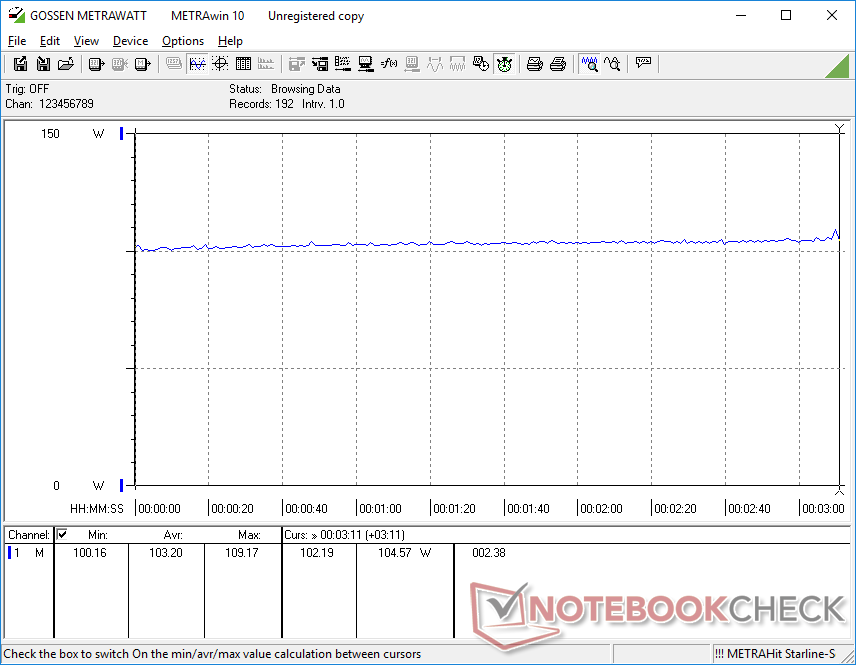
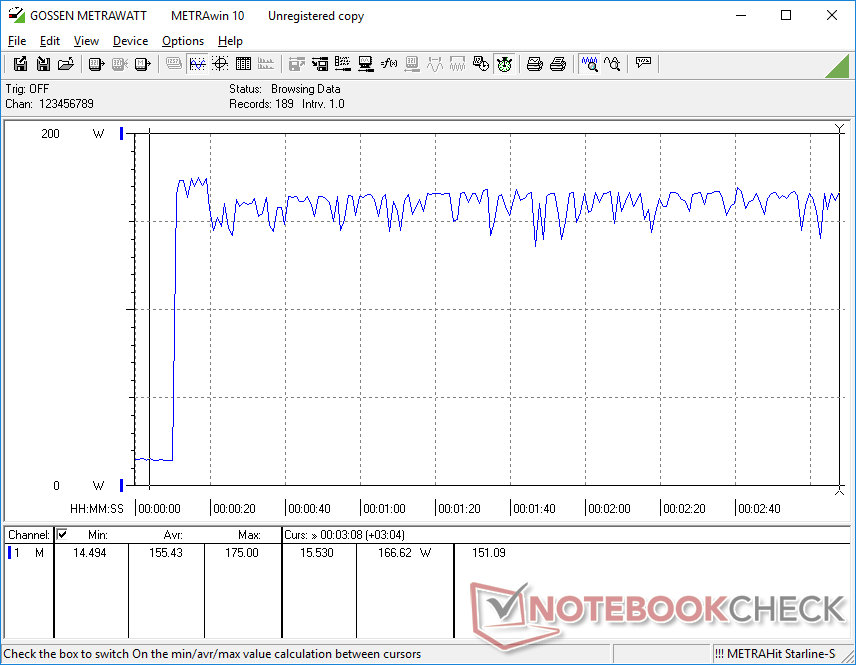
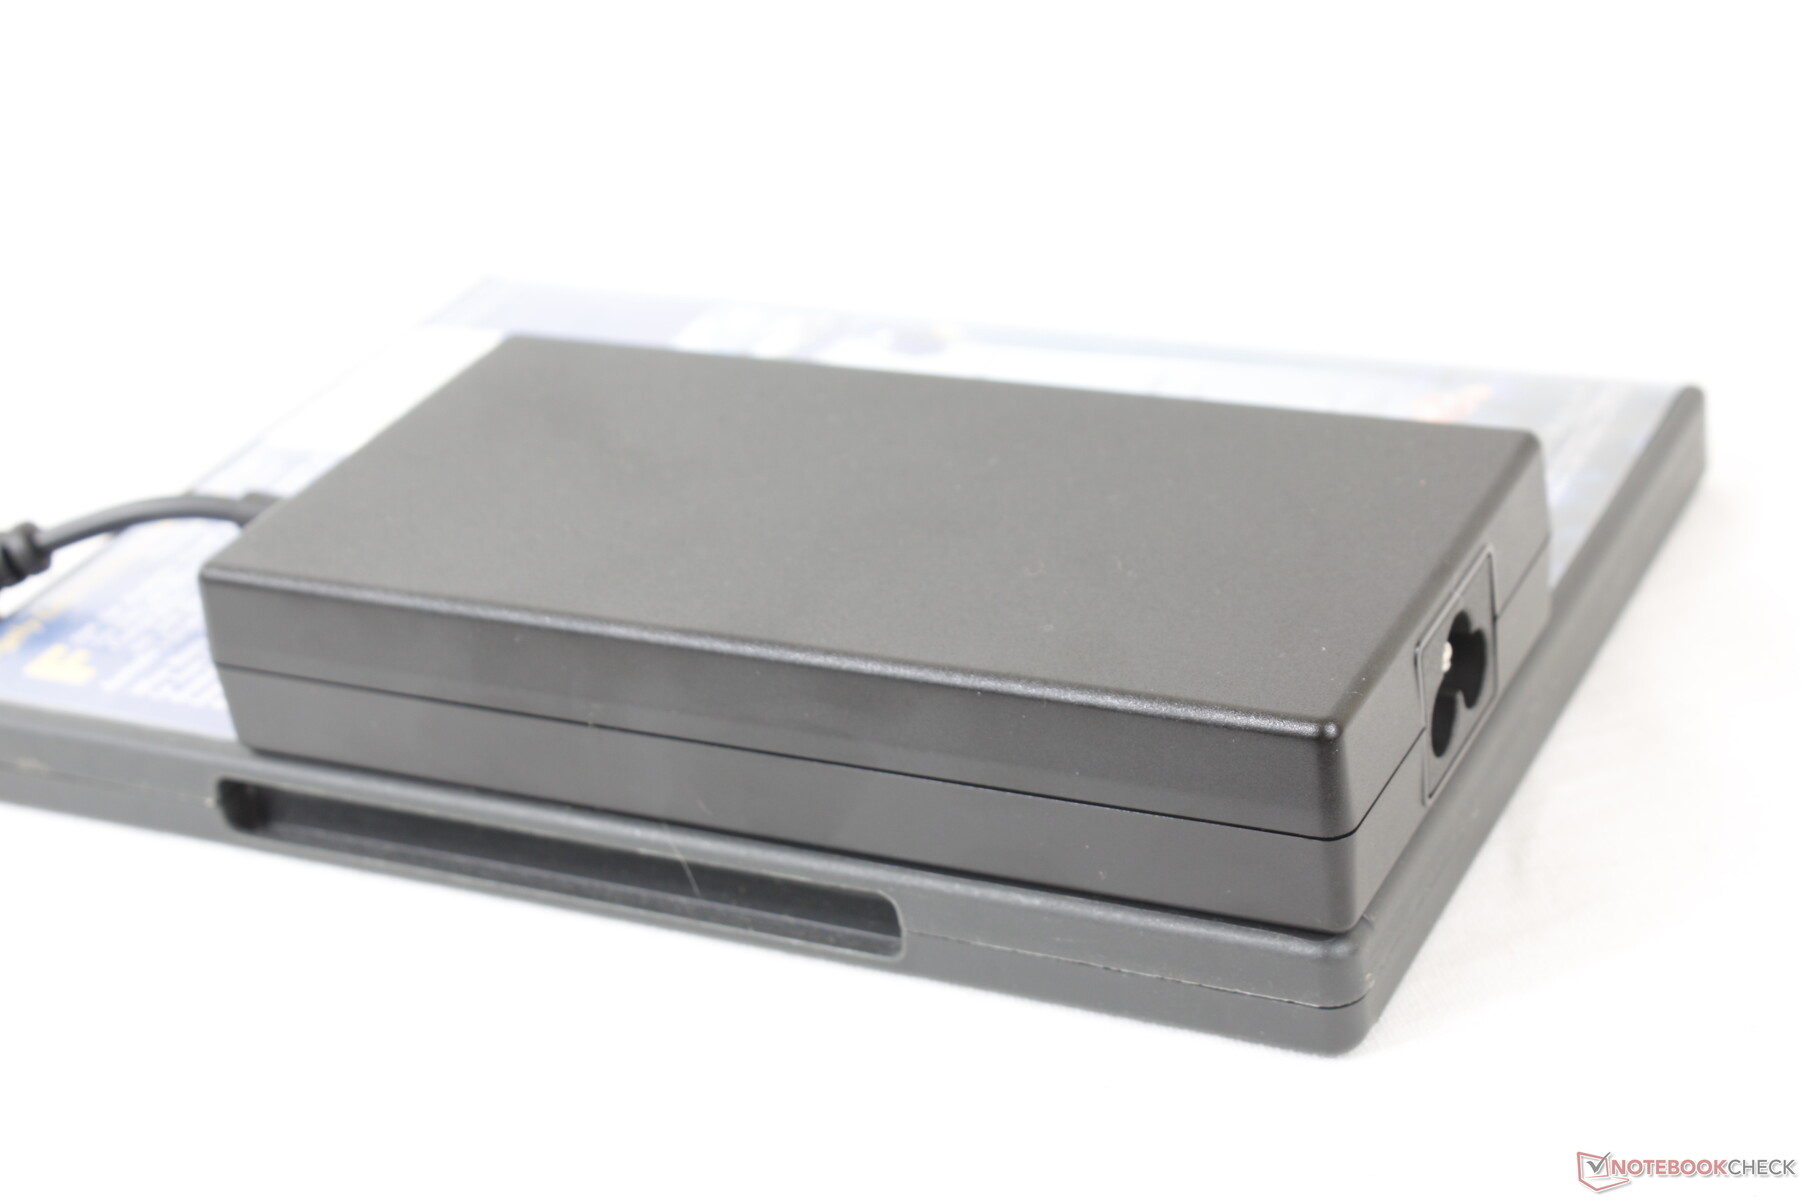
Nous avons pu enregistrer une consommation maximale de 175 W sur l'adaptateur secteur 150 W de taille moyenne (~13,6 x 6,6 x 2,9 cm) lorsque le CPU et le GPU sont utilisés à 100 %. Étant donné que le système peut demander plus d'énergie que ce pour quoi l'adaptateur secteur est conçu, il est possible que le modèle aurait pu bénéficier d'un adaptateur de plus grande capacité. Attendez-vous à ce que le taux de charge ralentisse considérablement lors de l'exécution de charges aussi extrêmes. Heureusement, les charges de jeu typiques consomment environ 100 W, ce qui est bien dans la plage de sortie nominale de l'adaptateur secteur.
| Éteint/en veille | |
| Au repos | |
| Fortement sollicité |
|
Légende:
min: | |
| MSI Bravo 15 B5DD-010US R5 5600H, Radeon RX 5500M, Kingston OM8PCP3512F-AB, IPS, 1920x1080, 15.6" | MSI Bravo 15 A4DCR R7 4800H, Radeon RX 5300M, Samsung PM981a MZVLB1T0HBLR, IPS-Level, 1920x1080, 15.6" | Asus TUF Gaming F15 FX507ZM i7-12700H, GeForce RTX 3060 Laptop GPU, SK Hynix HFM001TD3JX013N, IPS, 1920x1080, 15.6" | Dell G15 5515 R7 5800H, GeForce RTX 3050 Ti Laptop GPU, Samsung PM991a MZ9LQ512HBLU-00BD1, IPS, 1920x1080, 15.6" | Lenovo Ideapad Gaming 3 15IHU-82K1002RGE i5-11300H, GeForce RTX 3050 Ti Laptop GPU, Micron 2210 MTFDHBA512QFD, IPS, 1920x1080, 15.6" | Asus ROG Zephyrus M15 GU502LU-BI7N4 i7-10750H, GeForce GTX 1660 Ti Mobile, Intel SSD 660p SSDPEKNW512G8, IPS, 1920x1080, 15.6" | |
|---|---|---|---|---|---|---|
| Power Consumption | -39% | -51% | -17% | 5% | -71% | |
| Idle Minimum * (Watt) | 6.6 | 11 -67% | 6.3 5% | 5 24% | 4.9 26% | 10 -52% |
| Idle Average * (Watt) | 9.8 | 14 -43% | 9.8 -0% | 9 8% | 8.3 15% | 16.9 -72% |
| Idle Maximum * (Watt) | 10.8 | 25 -131% | 26.5 -145% | 20 -85% | 8.9 18% | 28.3 -162% |
| Load Average * (Watt) | 70.5 | 72 -2% | 103.8 -47% | 94 -33% | 81 -15% | 122.7 -74% |
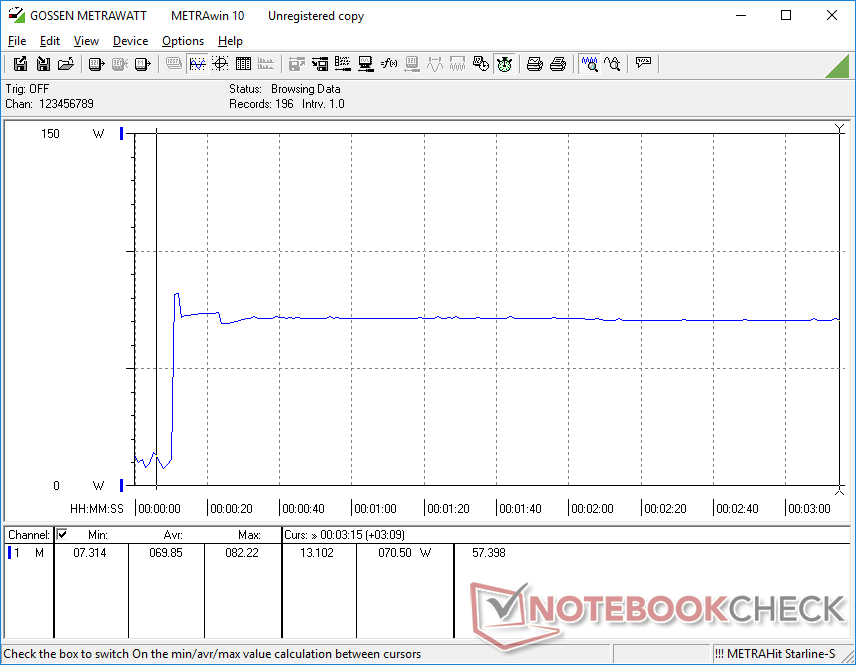
| Witcher 3 ultra * (Watt) | 103.2 | 100 3% | 189 -83% | 123 -19% | 119 -15% | 143.2 -39% |
| Load Maximum * (Watt) | 175 | 163 7% | 241.9 -38% | 172 2% | 172 2% | 224.1 -28% |
* ... Moindre est la valeur, meilleures sont les performances
Power Consumption Witcher 3 / Stresstest
Power Consumption external Monitor
Autonomie de la batterie - Décent pour un ordinateur portable de jeu
Les durées d'exécution sont en hausse, même si la capacité de la batterie n'a pas changé de manière significative par rapport au modèle Bravo de l'année dernière. Nous avons pu enregistrer un peu plus de 6 heures d'utilisation réelle du WLAN, soit environ 2 heures de plus que sur le modèle précédent.
Le chargement de la batterie vide à la pleine capacité est lent et dure presque 2,5 heures, alors que la plupart des autres ordinateurs portables ne prennent que 1,5 à 2 heures. Le modèle ne peut pas être rechargé via USB-C, contrairement aux séries plus coûteuses GS ou GT de MSI.
| MSI Bravo 15 B5DD-010US R5 5600H, Radeon RX 5500M, 53 Wh | MSI Bravo 15 A4DCR R7 4800H, Radeon RX 5300M, 51 Wh | Asus TUF Gaming F15 FX507ZM i7-12700H, GeForce RTX 3060 Laptop GPU, 90 Wh | Dell G15 5515 R7 5800H, GeForce RTX 3050 Ti Laptop GPU, 56 Wh | Lenovo Ideapad Gaming 3 15IHU-82K1002RGE i5-11300H, GeForce RTX 3050 Ti Laptop GPU, 45 Wh | Acer Nitro 5 AN515-45-R1JH R7 5800H, GeForce RTX 3070 Laptop GPU, 57.5 Wh | |
|---|---|---|---|---|---|---|
| Autonomie de la batterie | -21% | 19% | 41% | 8% | -3% | |
| Reader / Idle (h) | 9.2 | 7 -24% | 15.8 72% | 13.5 47% | 9.2 0% | |
| WiFi v1.3 (h) | 6.3 | 4.5 -29% | 4.8 -24% | 8 27% | 6.6 5% | 5.7 -10% |
| Load (h) | 1 | 0.9 -10% | 1.1 10% | 1.5 50% | 1.1 10% | 1 0% |
| H.264 (h) | 8.8 | 7.7 | 6.9 |
Points positifs
Points négatifs
Verdict - Celui qu'il faut éviter
Payer environ 800 dollars américains en 2022 pour un ordinateur portable de jeu qui est plus lent qu'une GeForce GTX 1060 de 2016 n'est tout simplement pas normal. Les options du processeur Zen 3 peuvent être excellentes, mais elles sont associées à un GPU Radeon RX 5500M si vieux que le système commencera à avoir des difficultés avec les jeux plus récents plus tôt que nous le souhaiterions.
Le Bravo 15 B5DD est un ordinateur portable de jeu 2022 avec un GPU de milieu de gamme de 2016. Le rapide processeur AMD Ryzen est bloqué par la vieillissante Radeon RX 5500M.
En ce qui concerne le reste de l'ordinateur portable, le fabricant a effectivement procédé à quelques dégradations notables par rapport au Bravo 15 de 2020. Le nouveau modèle ne prend désormais en charge qu'un seul SSD M.2 au lieu de deux, par exemple, aux côtés de moins de ports USB-C et d'aucune autre option d'affichage à choisir. Le fait que le nouveau design soit plus lourd et plus grand que l'ancien n'aide pas non plus
Nous pouvons au moins apprécier les températures de fonctionnement relativement fraîches et les bonnes performances du processeur pour le prix. Pour une meilleure expérience de jeu, cependant, vous en aurez bien plus pour votre argent avec d'autres ordinateurs portables de jeu à petit prix équipés de la technologie GeForce RTX 3050 ou même GeForce GTX 1660 Ti à la place.
Prix et disponibilité
MSI Bravo 15 B5DD-010US
- 04/23/2022 v7 (old)
Allen Ngo
Price comparison

