Test du Lenovo ThinkBook Plus Gen 3 : un booster de productivité ultra-large 21:10
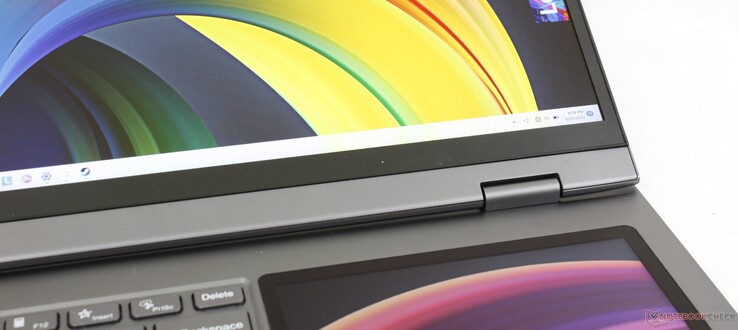
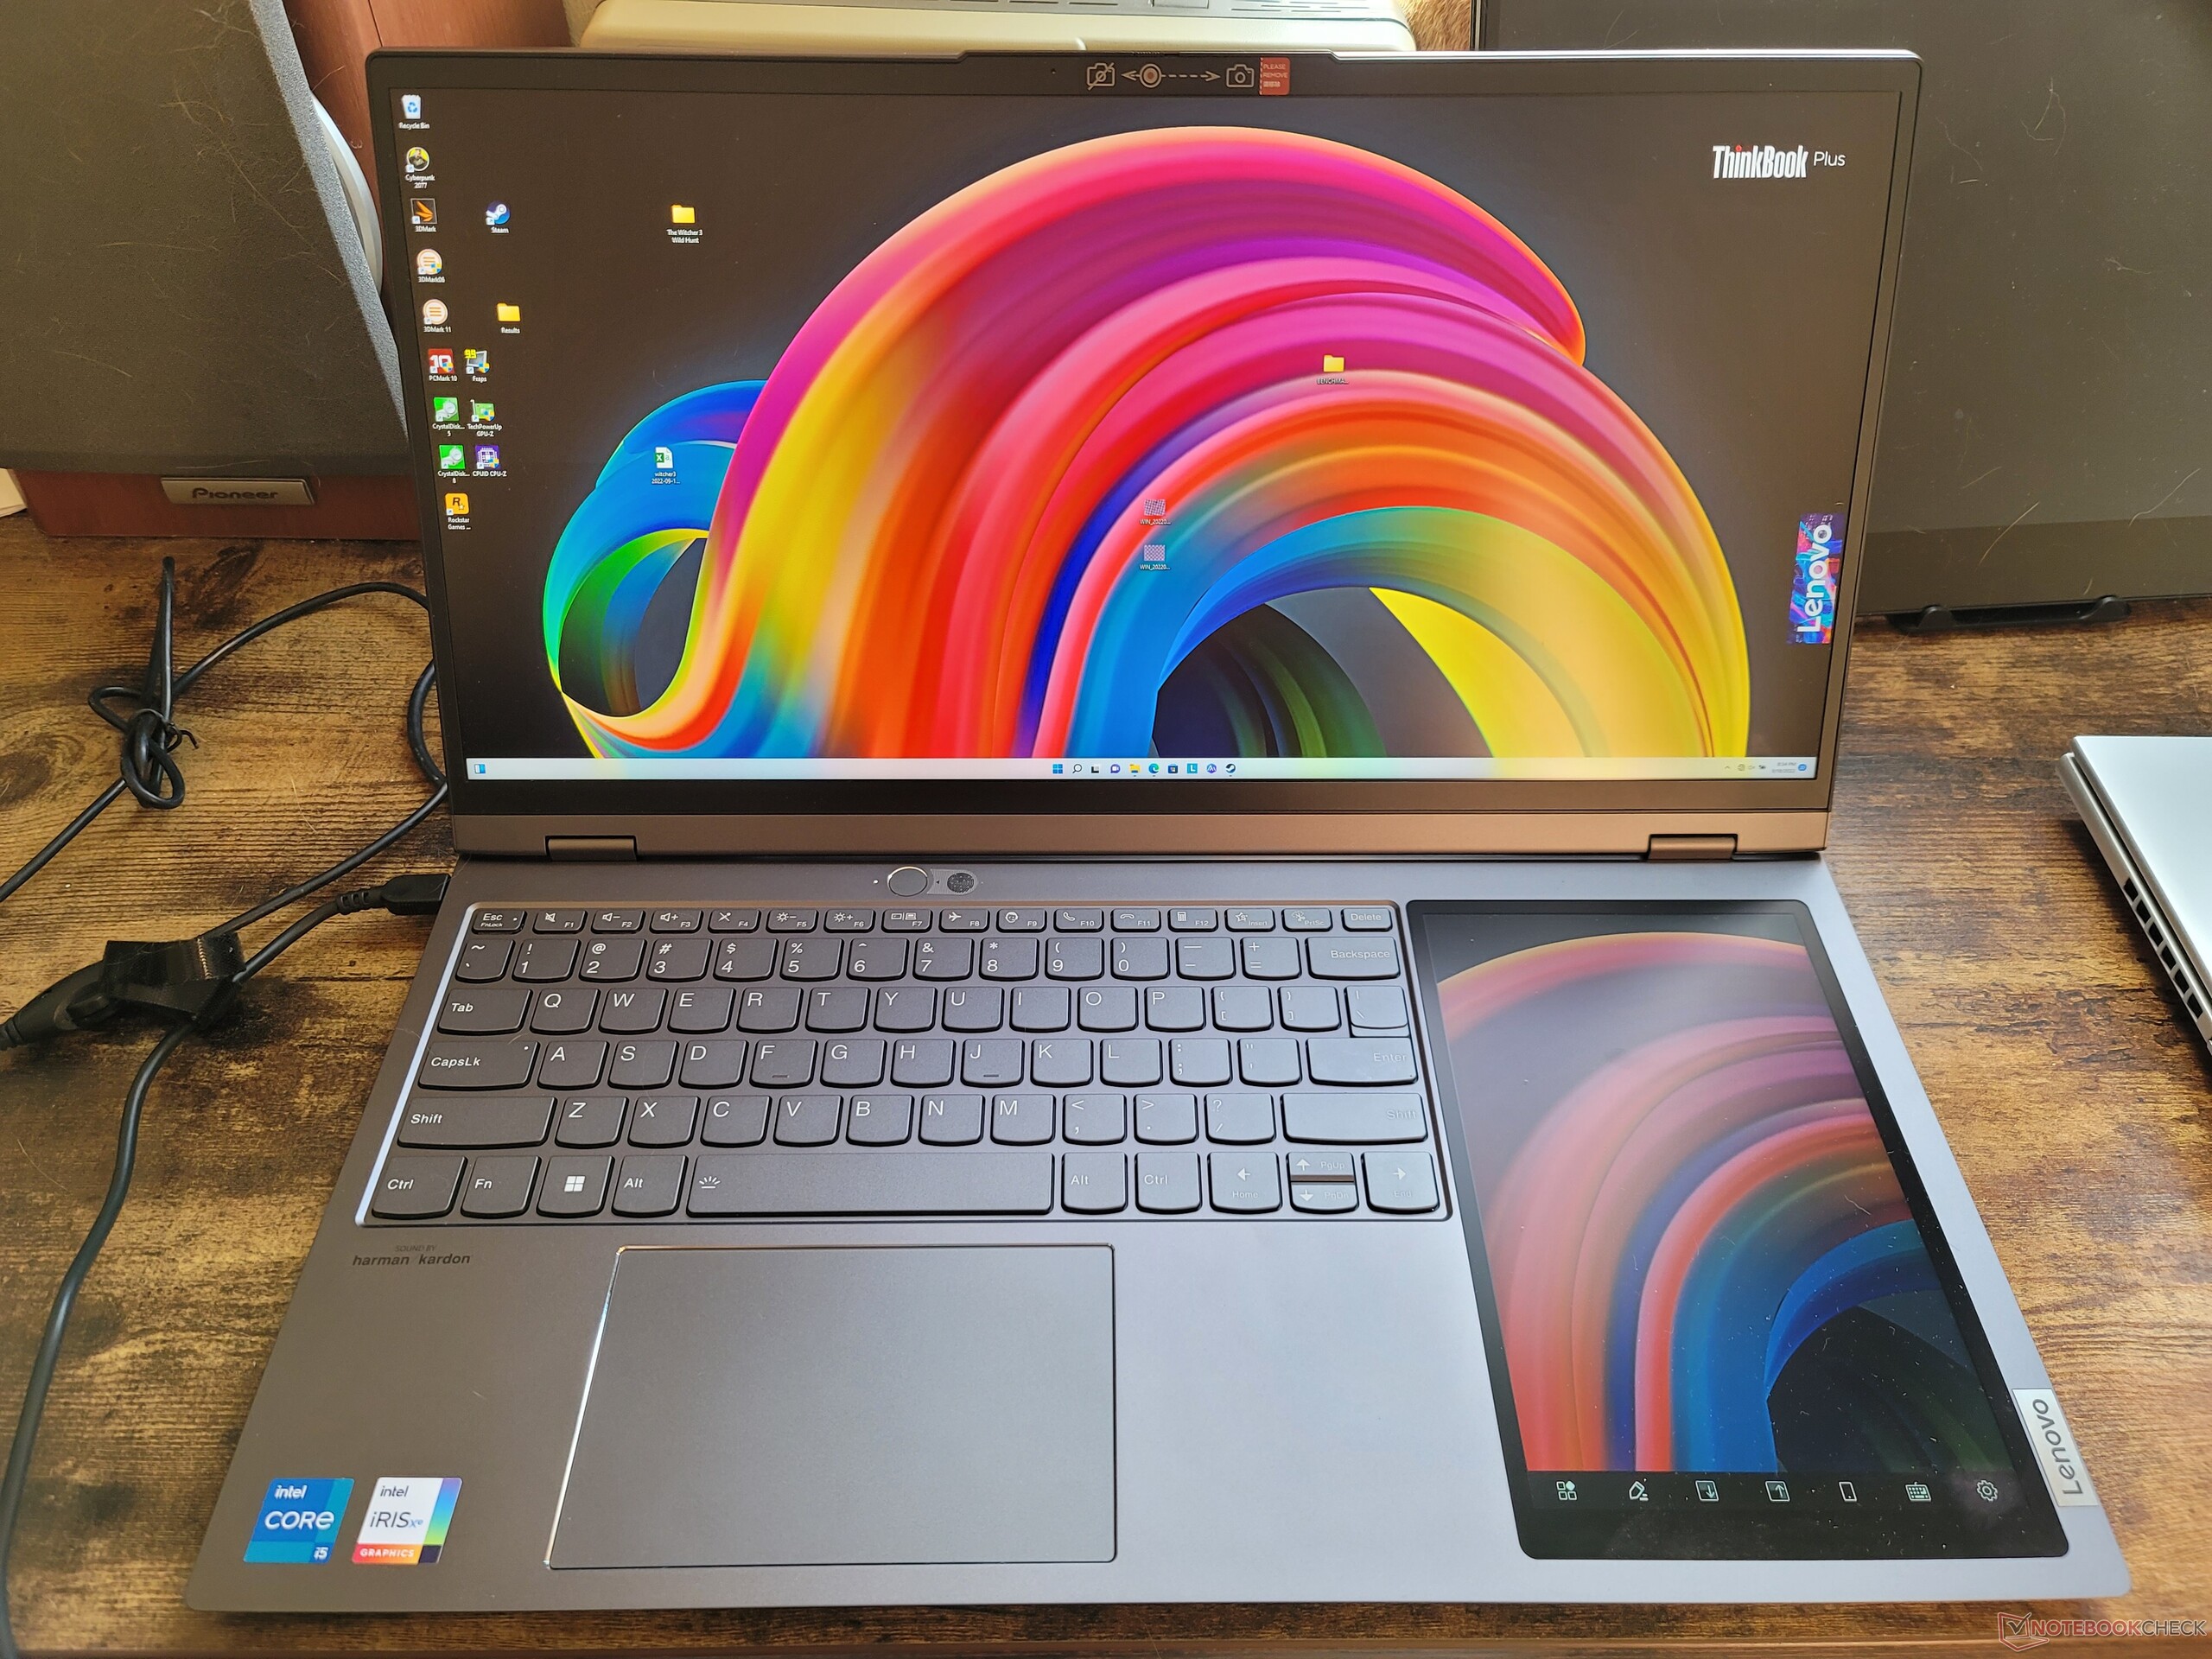
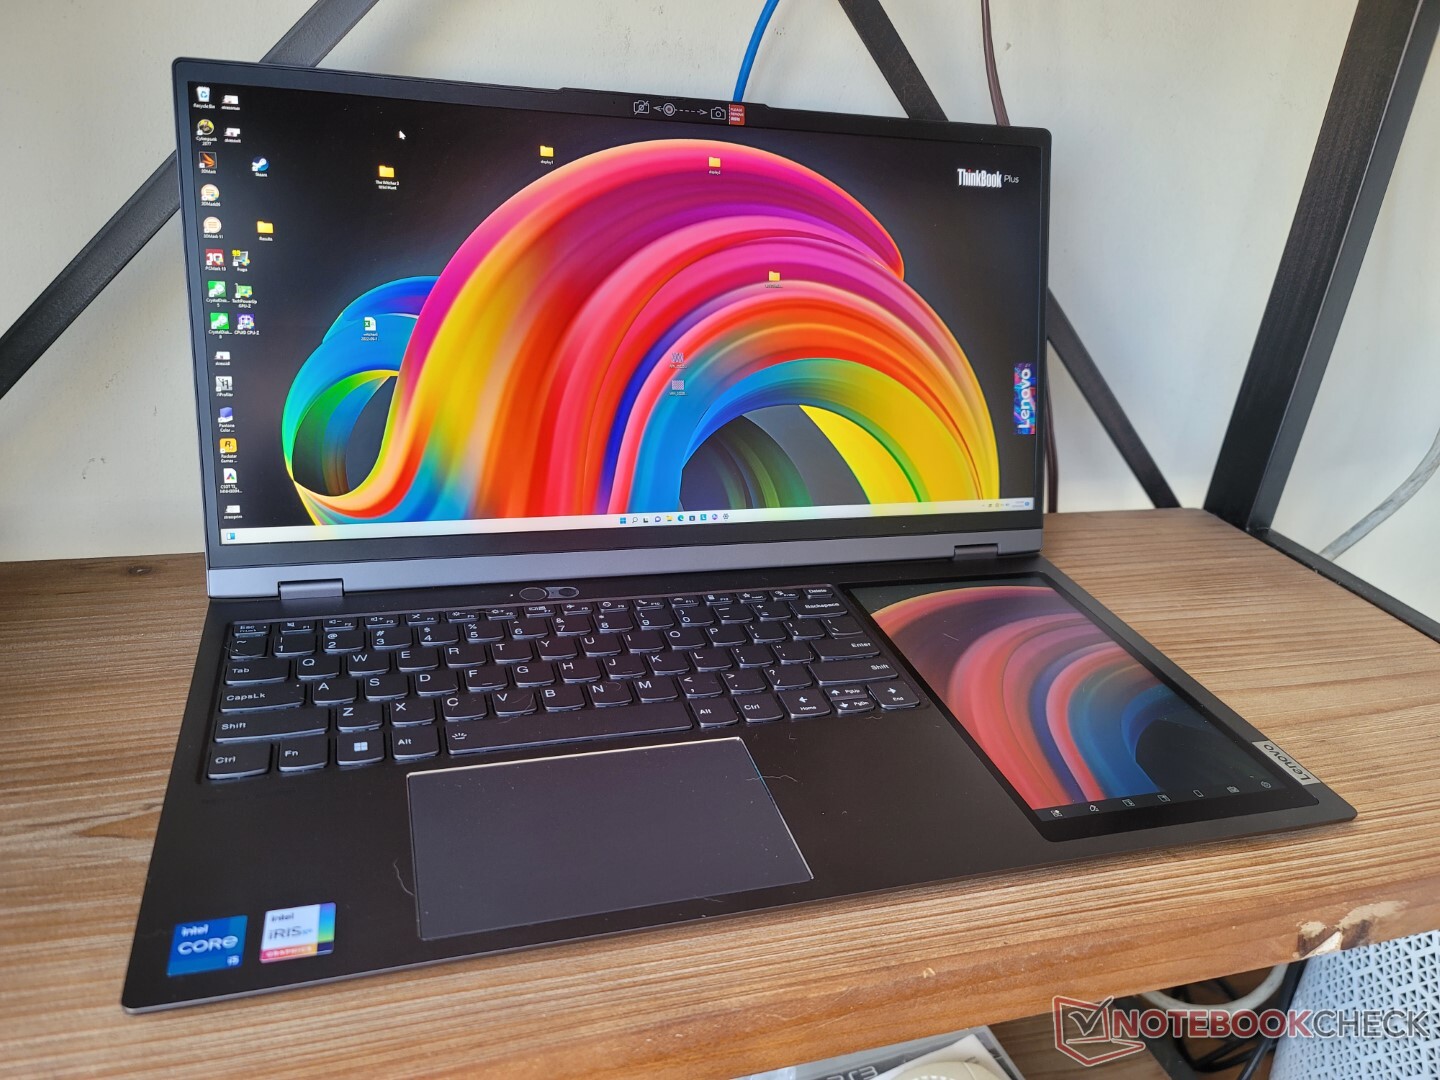
Le Lenovo ThinkBook Plus Gen 3 succède directement au ThinkBook Plus Gen 2. Bien que le nom seul ne suffise pas à le dire, le modèle Gen 3 est un changement significatif par rapport à son prédécesseur, et ce, à plus d'un titre que la plupart des autres ordinateurs portables. Alors que le modèle Gen 2 est un convertible 16:10 de 13,3 pouces avec un écran tactile E-Ink secondaire de 12 pouces, le modèle Gen 3 est un clamshell 21:10 de 17,3 pouces avec un écran tactile IPS secondaire de 8 pouces. Les deux modèles sont si différents que l'on pourrait discuter de la dénomination du modèle Gen 3 par rapport au Gen 2, car ils servent tous deux des objectifs très différents.
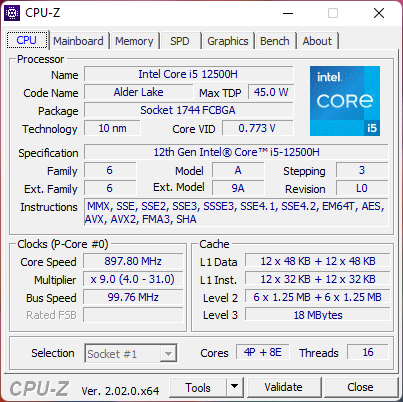
Notre configuration de test de la Gen 3 comprend le CPU Core i7-12700H de 12e génération avec 16 Go de RAM soudée et 512 Go de stockage PCIe4 pour environ 1600 USD. Un Core i5-12500H est disponible, mais toutes les options sont équipées exactement du même écran tactile IPS mat de 3072 x 1440, de l'écran tactile IPS secondaire de 8 pouces de 800 x 1280 et de la carte graphique Iris Xe intégrée.
Parmi les alternatives au ThinkBook Plus Gen 3, citons les modèles de 15 pouces suivants Série Asus ZenBook Pro Duo et d'autres ordinateurs portables de 17 pouces conçus pour les créateurs de contenu ou la productivité au bureau, comme leLG Gram 17 ou Dell XPS 17.
Plus de commentaires sur Lenovo :
Comparaison avec les concurrents potentiels
Note | Date | Modèle | Poids | Épaisseur | Taille | Résolution | Prix |
|---|---|---|---|---|---|---|---|
| 85.6 % v7 (old) | 09/22 | Lenovo ThinkBook Plus Gen3 i7-12700H, Iris Xe G7 96EUs | 2 kg | 17.9 mm | 17.30" | 3072x1440 | |
| 86.1 % v7 (old) | 10/21 | Lenovo ThinkBook Plus Gen2 Core i5 i5-1130G7, Iris Xe G7 80EUs | 1.2 kg | 13.9 mm | 13.30" | 2560x1600 | |
| 86.4 % v7 (old) | 06/20 | Asus ProArt StudioBook Pro 17 W700G3T i7-9750H, Quadro RTX 3000 Max-Q | 2.5 kg | 18.4 mm | 17.00" | 1920x1200 | |
| 87.3 % v7 (old) | 08/22 | LG Gram 17 (2022) i5-1240P, Iris Xe G7 80EUs | 1.4 kg | 17.7 mm | 17.00" | 2560x1600 | |
| 89.3 % v7 (old) | 06/22 | Dell XPS 17 9720 i7-12700H, GeForce RTX 3050 4GB Laptop GPU | 2.5 kg | 19.5 mm | 17.00" | 3840x2400 | |
| 88 % v7 (old) | 05/21 | Gigabyte Aero 17 HDR YD i9-11980HK, GeForce RTX 3080 Laptop GPU | 2.8 kg | 22 mm | 17.30" | 3840x2160 |
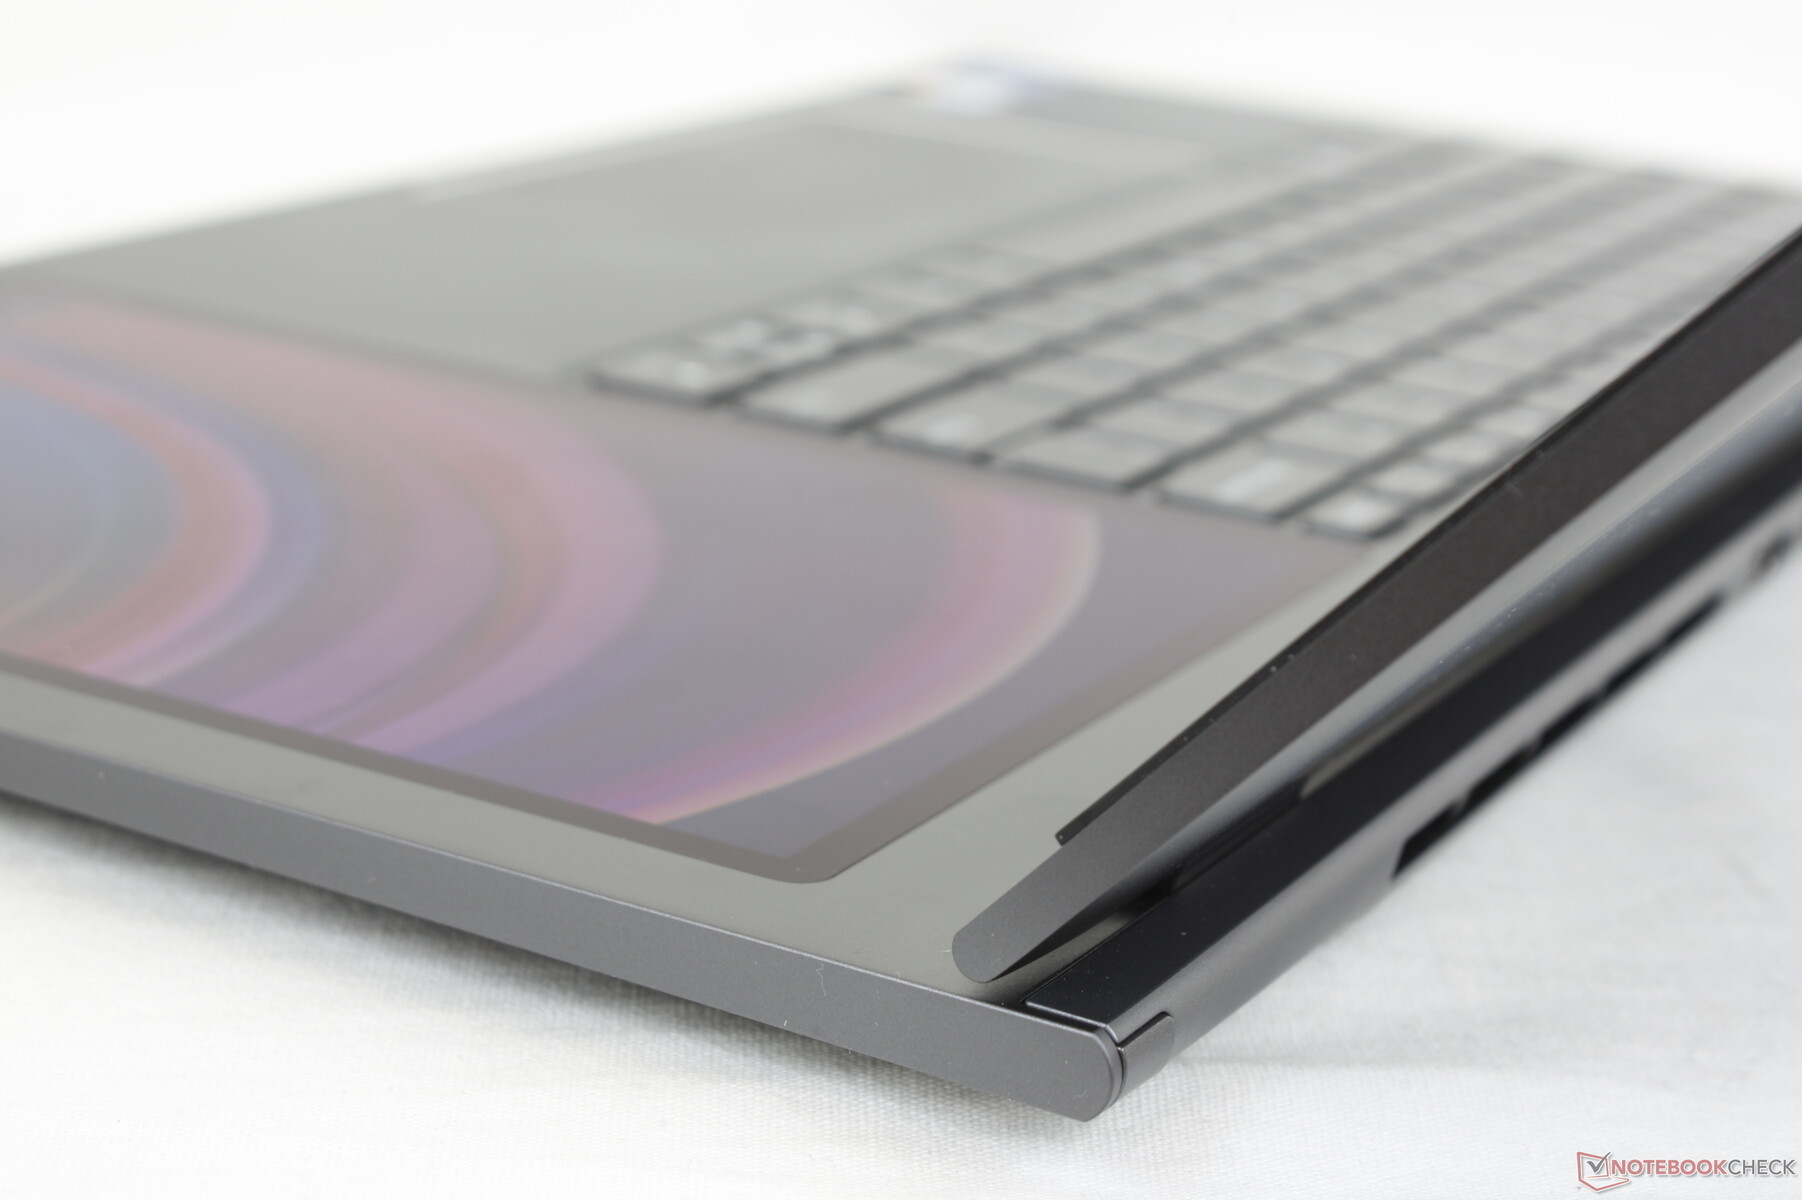
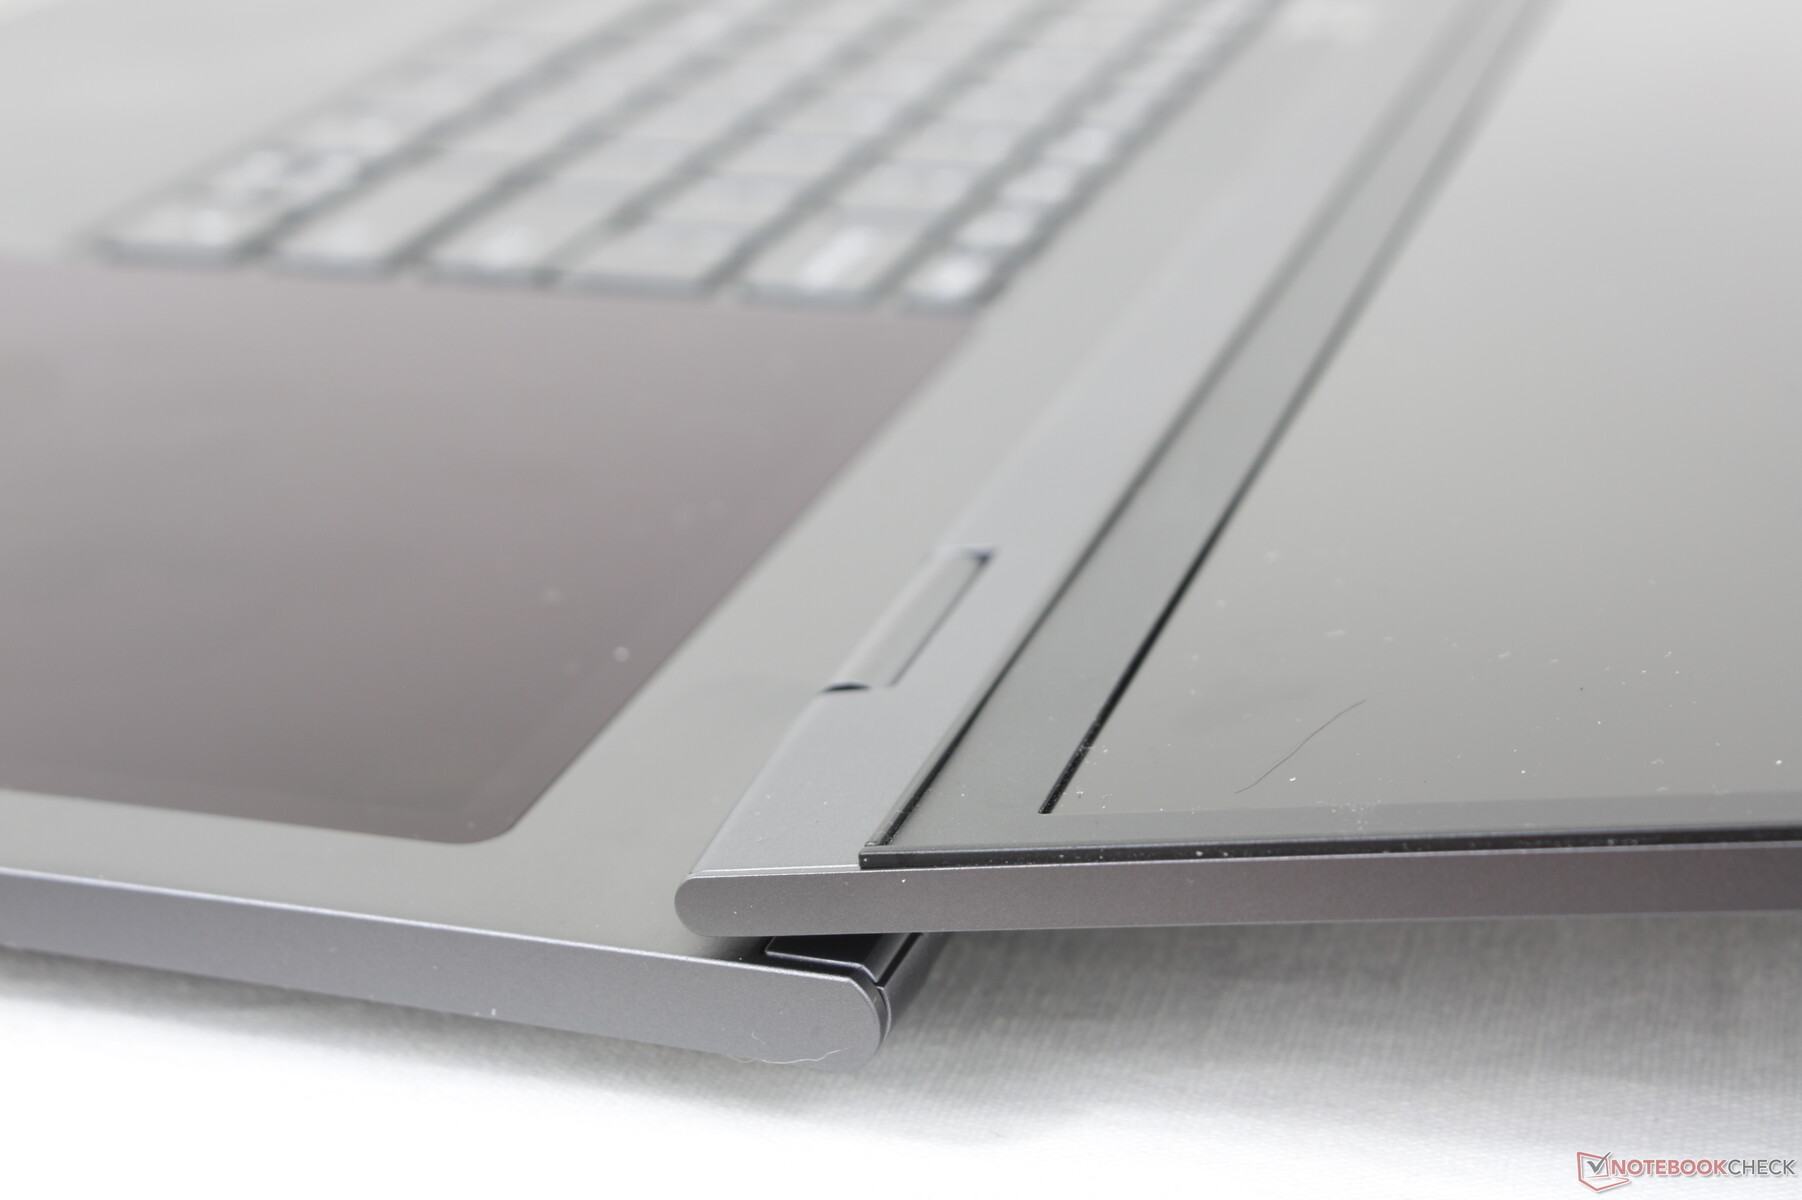
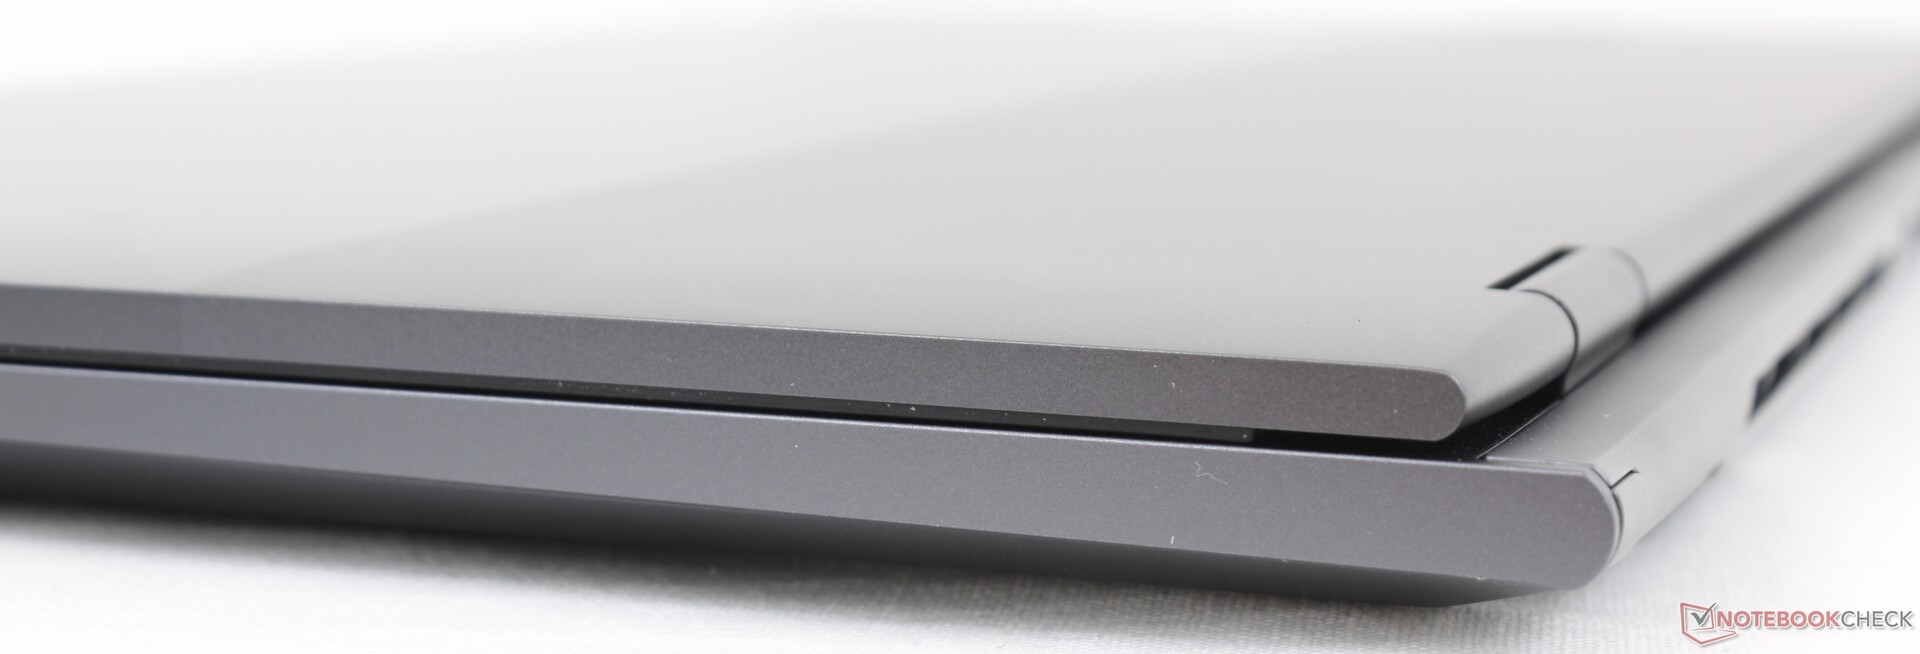
Cas - Long et mince
Le châssis partage les mêmes matériaux en alliage d'aluminium que sur d'autres modèles de ThinkBook, comme sur le récent ThinkBook 16 G4 Plus. Ainsi, si vous avez déjà tenu un modèle ThinkBook, les surfaces lisses gris foncé du ThinkBook Plus Gen 3 vous seront immédiatement familières. Le design vise les bureaux décontractés et les environnements de PME, entre les modèles Yoga centrés sur le consommateur et les modèles ThinkPad plus traditionnels.
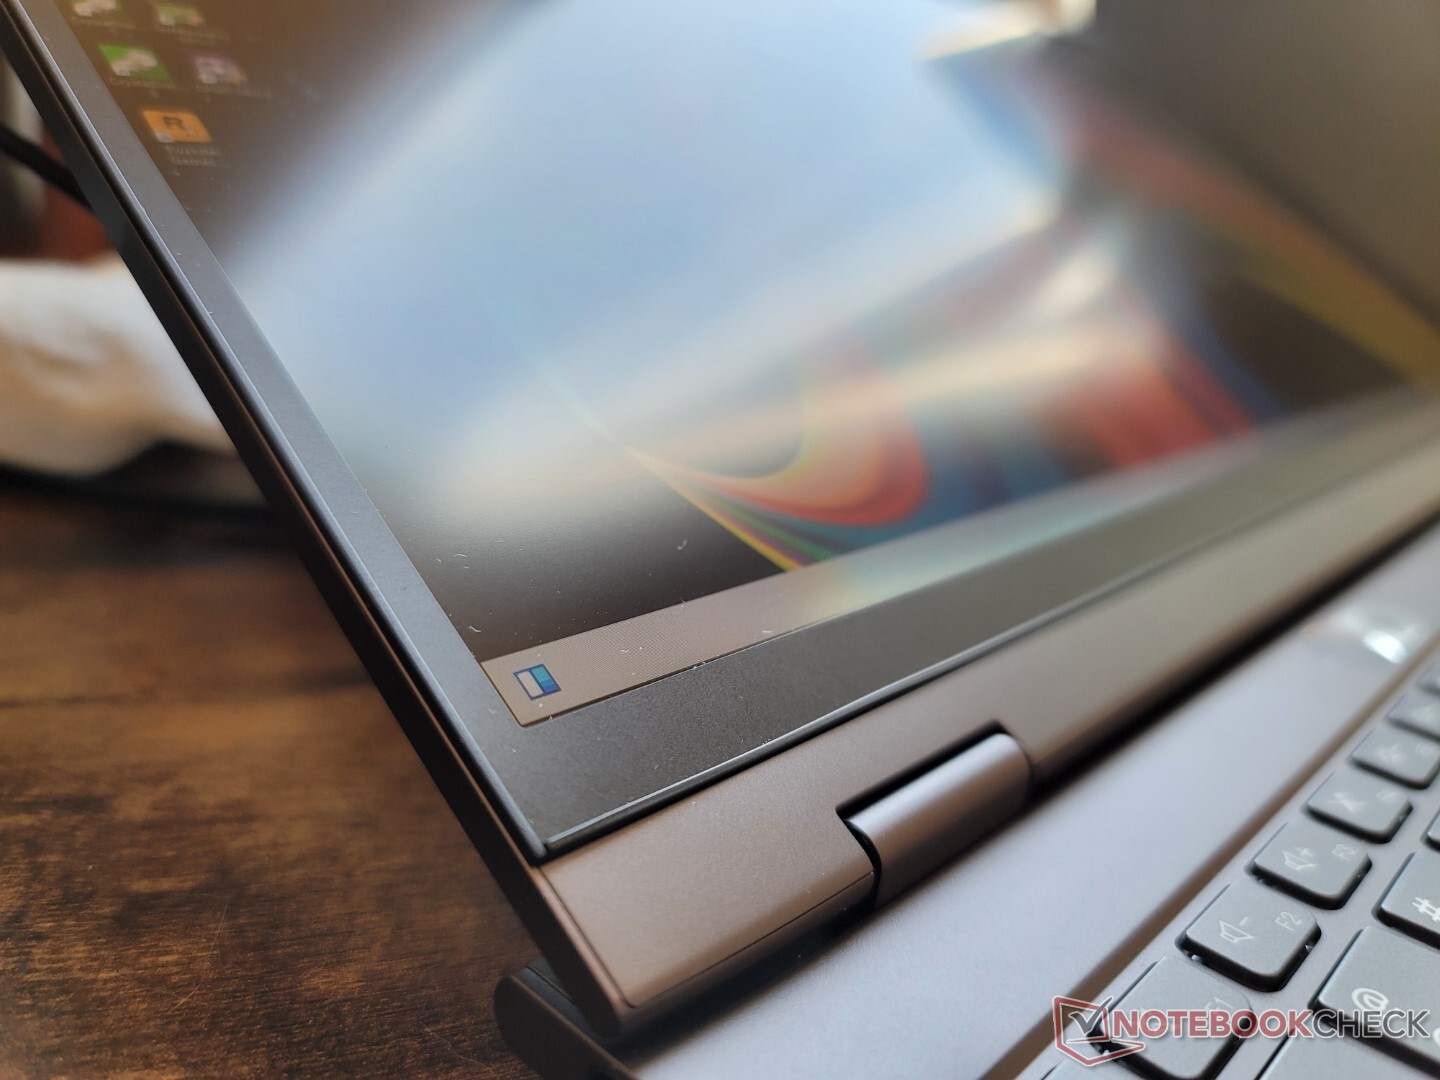
La qualité de fabrication est légèrement inférieure à celle d'un Yoga ou d'un ThinkPad série X de la série X. Le couvercle et la base sont un peu plus susceptibles de se tordre et de grincer, probablement en raison du format plus grand de 17,3 pouces et du squelette relativement fin. Les alternatives comme le ZenBook Duo ou le XPS 17 sont plus fermes et plus solides, surtout au niveau des charnières.
Le rapport d'aspect allongé a donné lieu à un châssis à la fois plus large et plus court que celui des autres ordinateurs portables de 17 pouces. Heureusement, il reste fin et léger par rapport à sa catégorie de taille. Le XPS 17, par exemple, pèse un demi-kilo de plus.
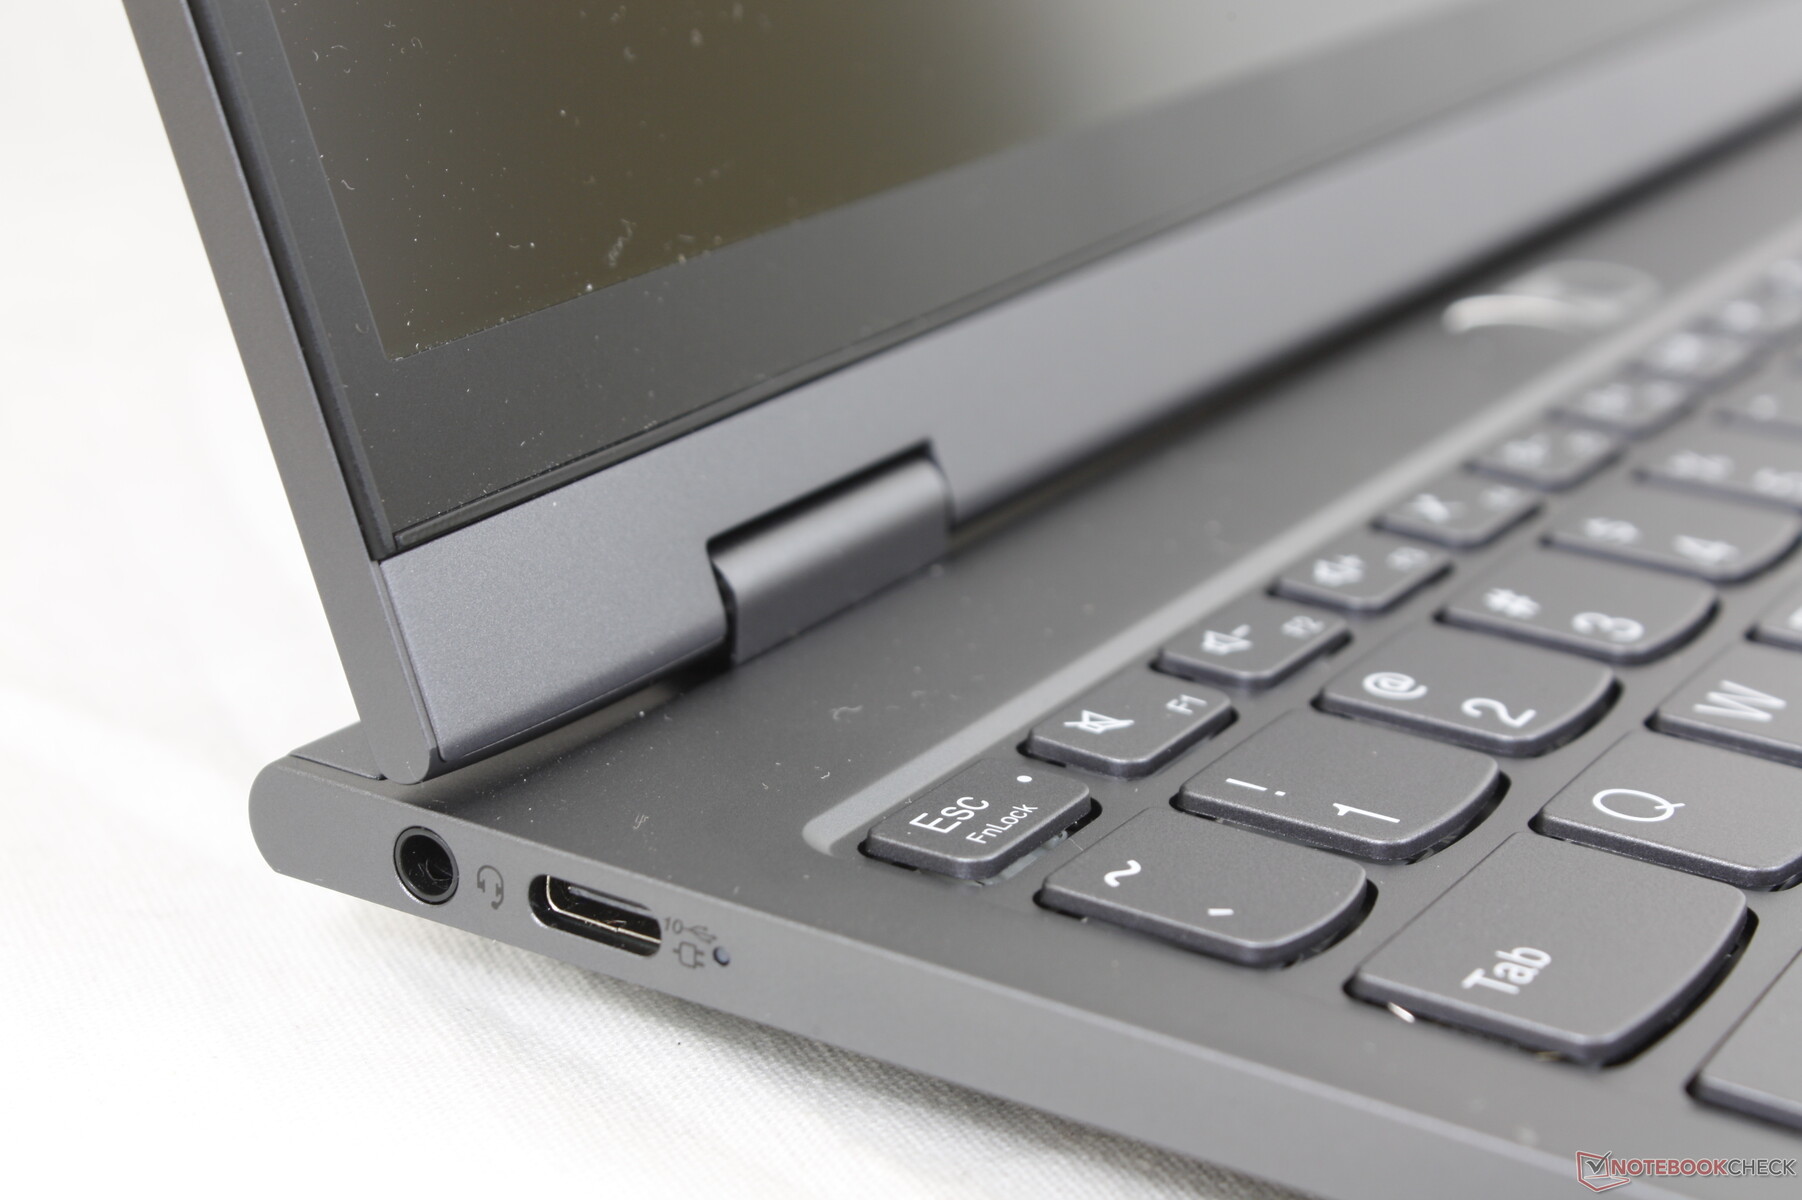
Connectivité - Support Thunderbolt 4
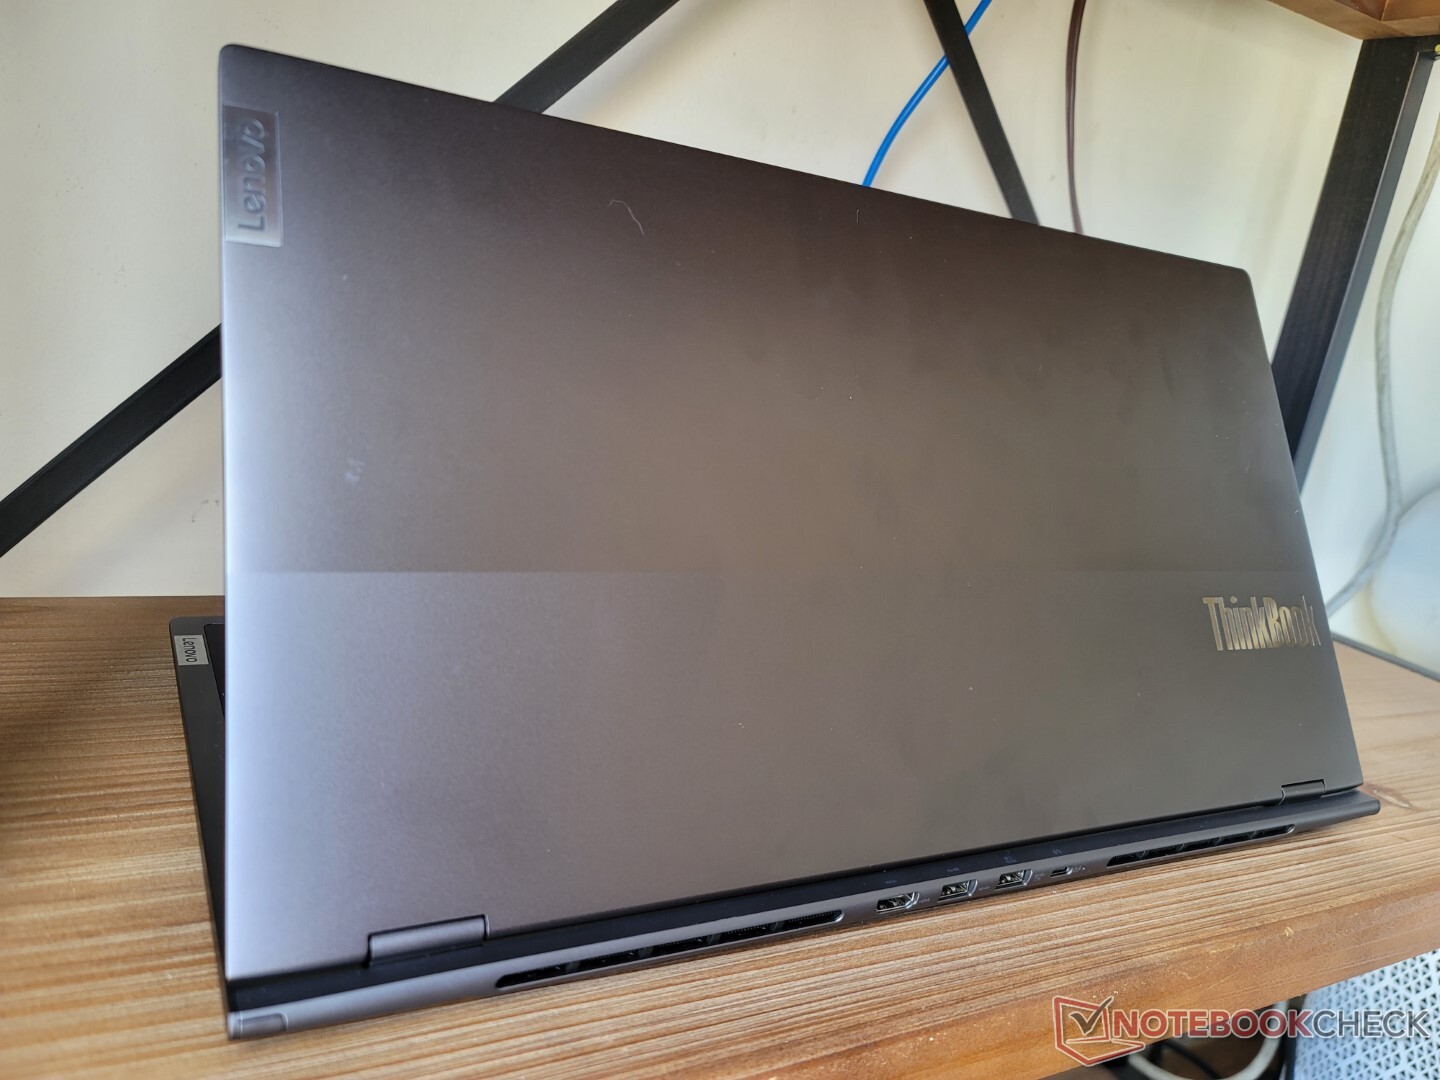
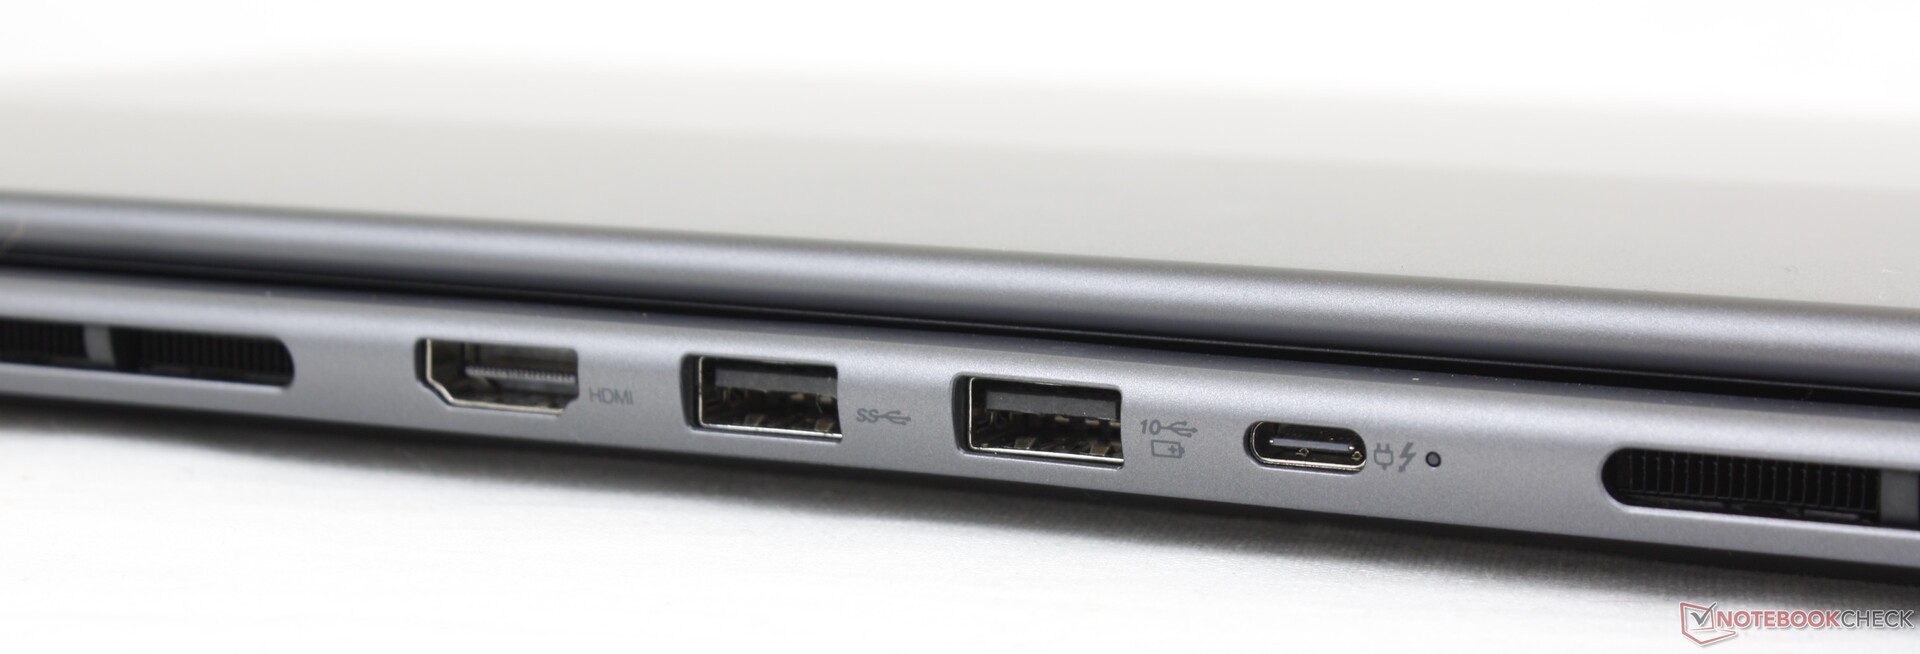
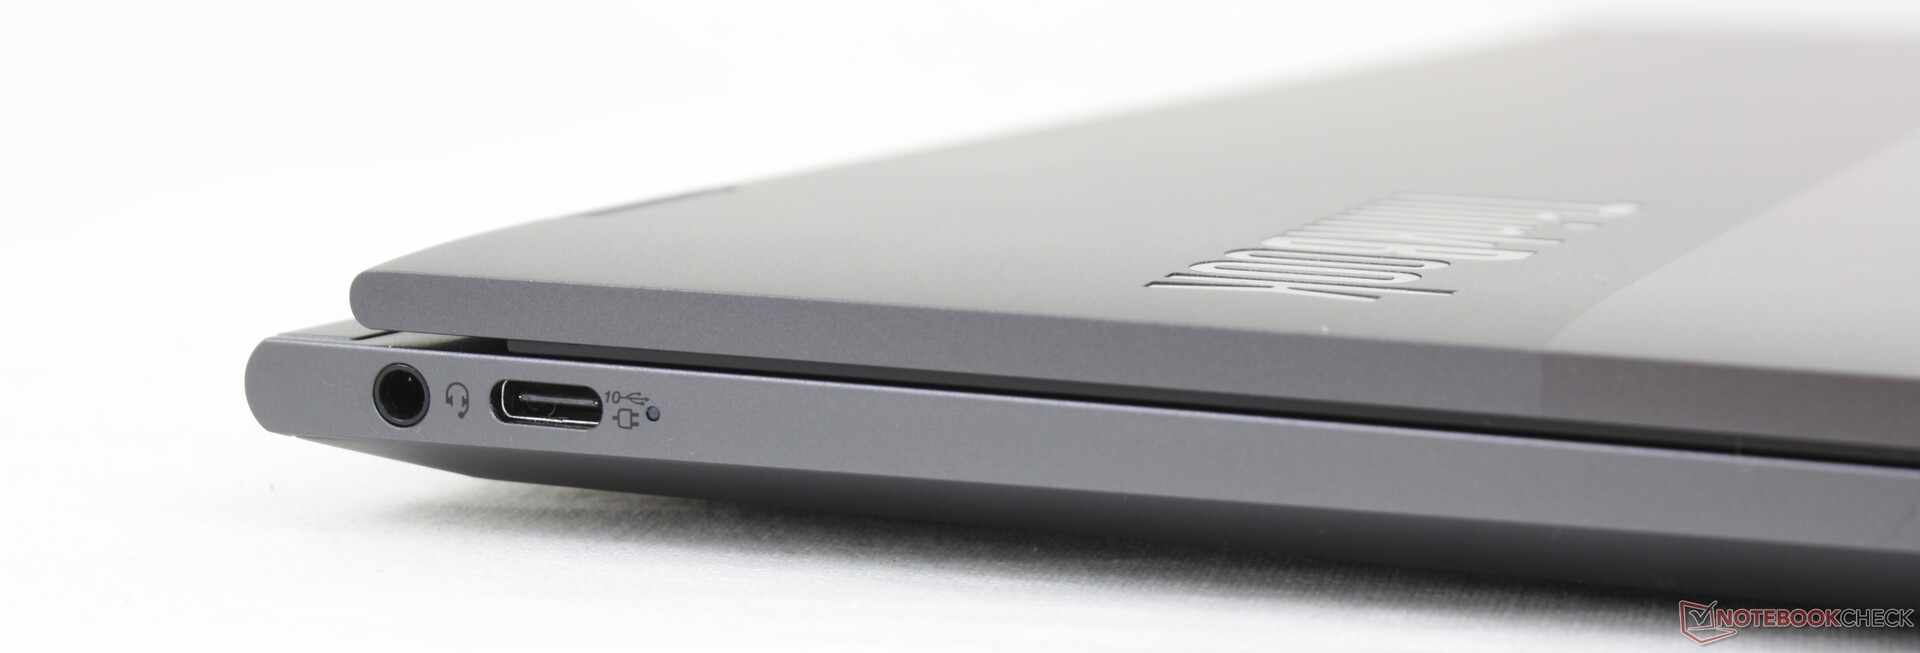
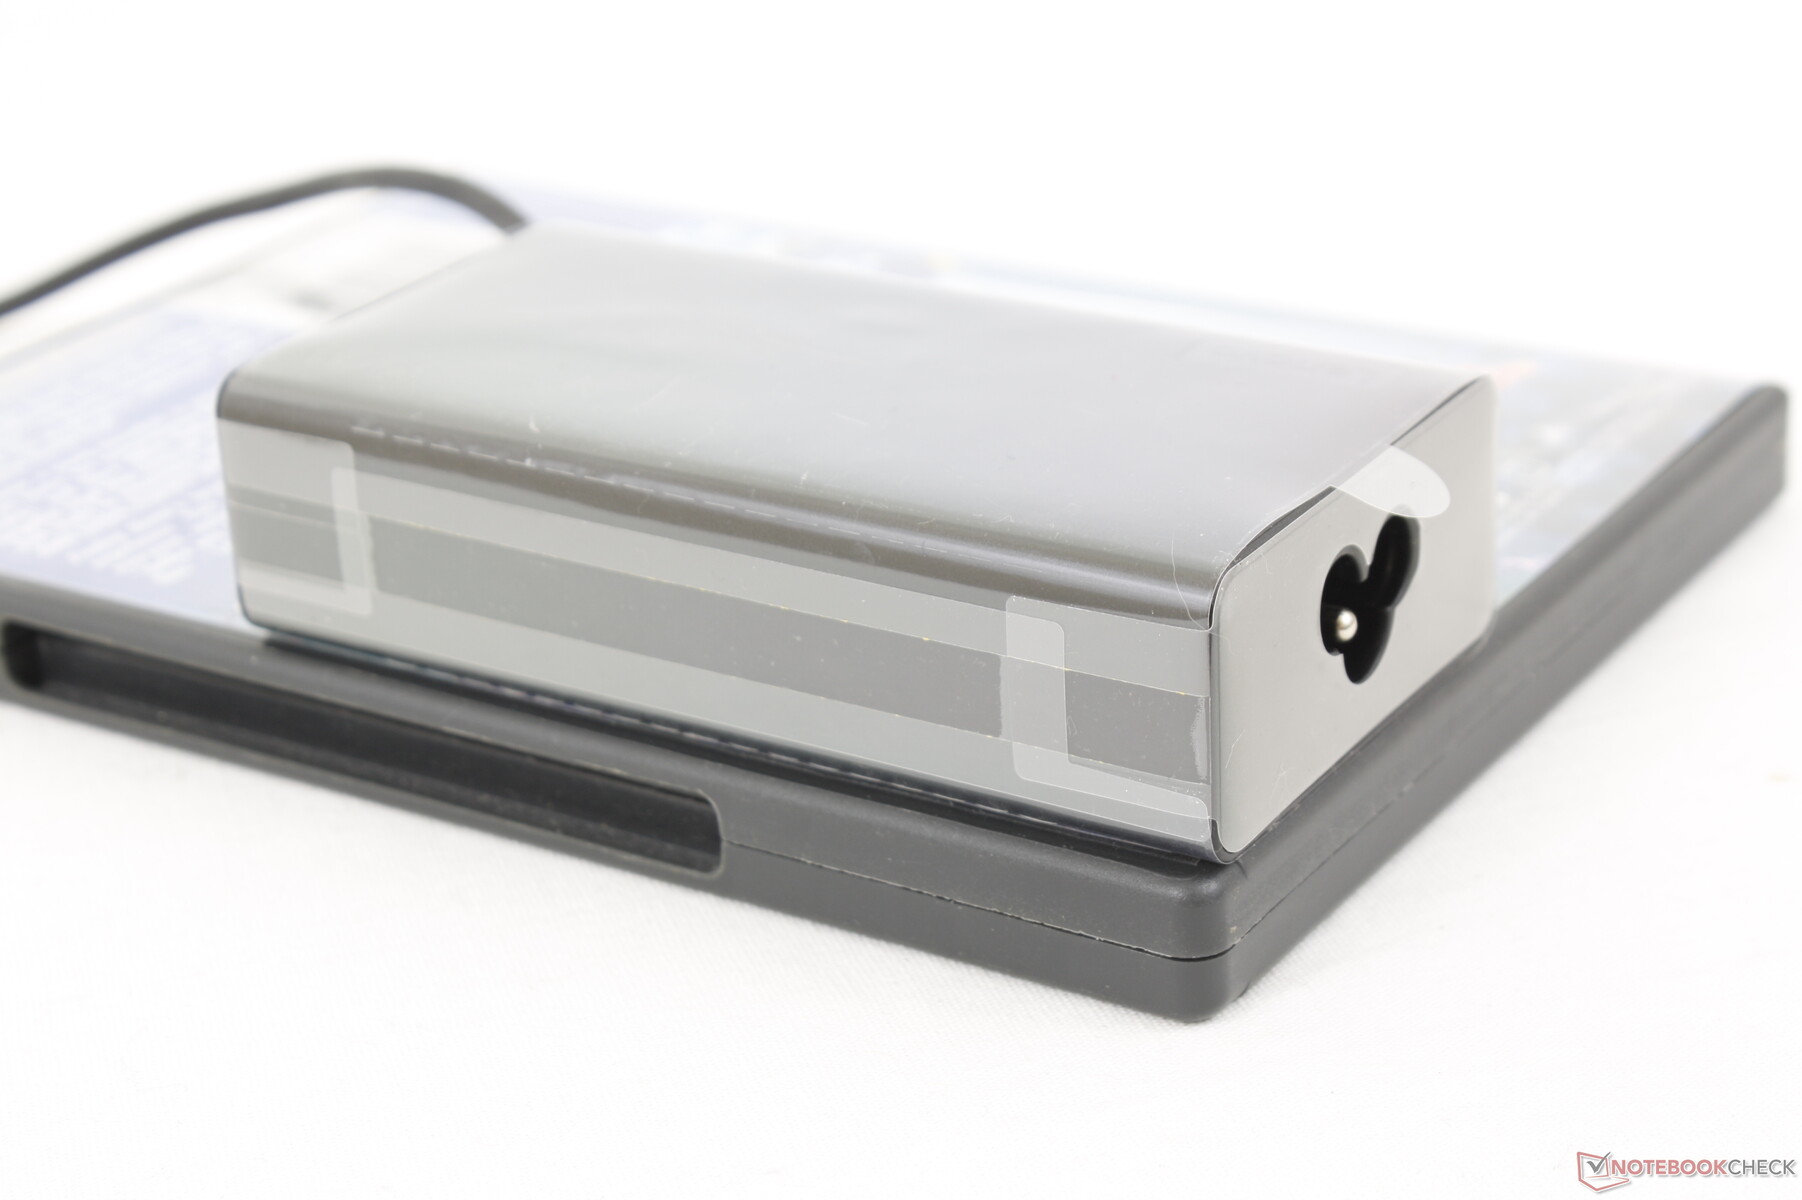
Ce serait un crime si le modèle Gen 3 était doté de moins de ports que le modèle de dernière génération, beaucoup plus petit. Le système intègre deux ports USB-C, comme son prédécesseur, ainsi que de nouveaux ports USB-A et HDMI à l'arrière, pour une plus grande variété d'options. Notez que seul un des deux ports USB-C est compatible avec Thunderbolt, mais l'un ou l'autre peut être utilisé pour la recharge ou DisplayPort.
Il n'y a pas de lecteur de carte SD, ce qui est un peu décevant compte tenu du grand facteur de forme et de l'accent mis sur les tâches de bureau/édition.
Communication
Un Intel AX211 est fourni en standard pour la connectivité Wi-Fi 6E et Bluetooth 5.2. Nous avons constaté des taux de transfert stables lorsqu'il était couplé à notre réseau 6 GHz.
| Networking | |
| iperf3 transmit AX12 | |
| Gigabyte Aero 17 HDR YD | |
| Asus ProArt StudioBook Pro 17 W700G3T | |
| Lenovo ThinkBook Plus Gen2 Core i5 | |
| iperf3 receive AX12 | |
| Asus ProArt StudioBook Pro 17 W700G3T | |
| Lenovo ThinkBook Plus Gen2 Core i5 | |
| Gigabyte Aero 17 HDR YD | |
| iperf3 receive AXE11000 6GHz | |
| Lenovo ThinkBook Plus Gen3 | |
| iperf3 receive AXE11000 | |
| LG Gram 17 (2022) | |
| Dell XPS 17 9720 | |
| iperf3 transmit AXE11000 6GHz | |
| Lenovo ThinkBook Plus Gen3 | |
| iperf3 transmit AXE11000 | |
| Dell XPS 17 9720 | |
| LG Gram 17 (2022) | |
Webcam
L'appareil photo de 2 mégapixels est plus précis que ceux de la série XPS, mais il n'est pas aussi bon que les appareils photo de 5 mégapixels de la plupart des nouveaux modèles HP de nombreux modèles HP plus récents. Un capteur infrarouge et un obturateur sont présents pour la prise en charge d'Allo et la confidentialité, respectivement.


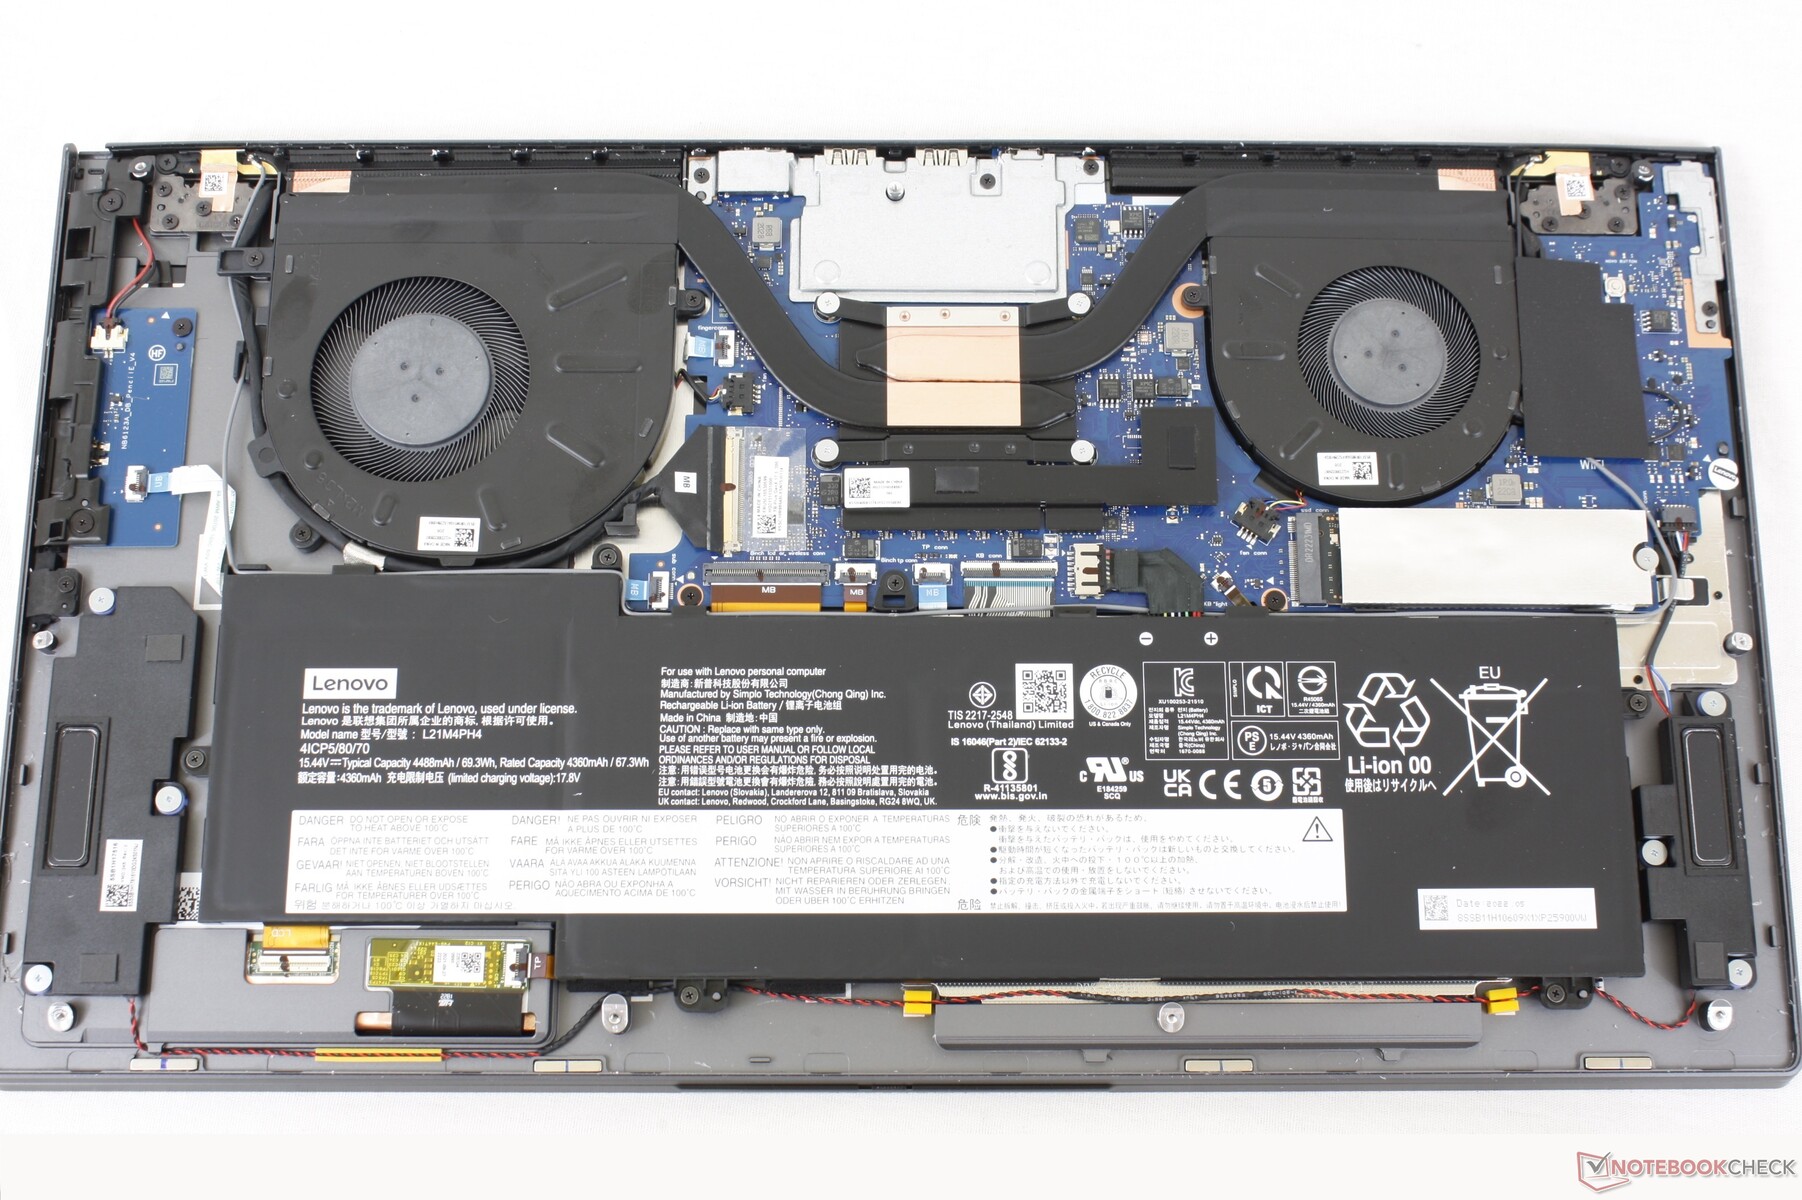
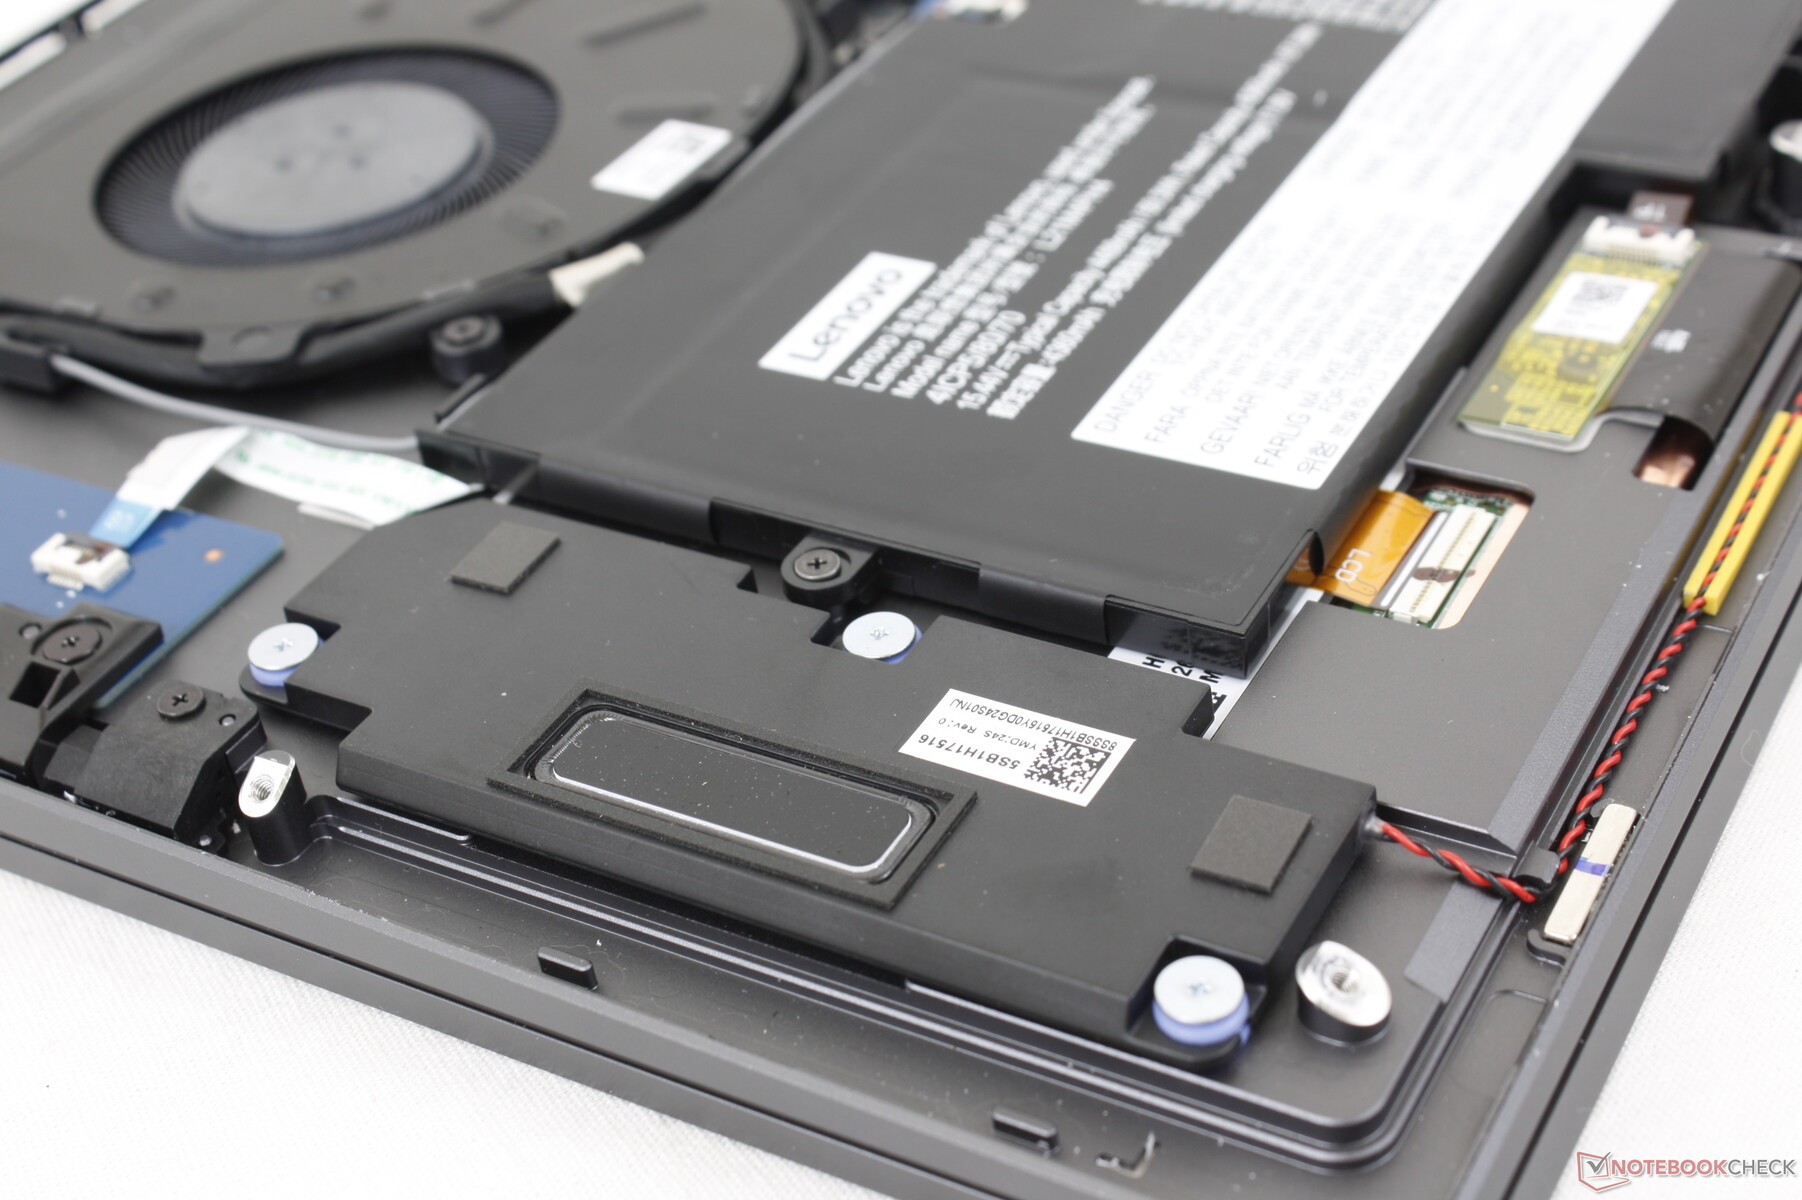
Maintenance
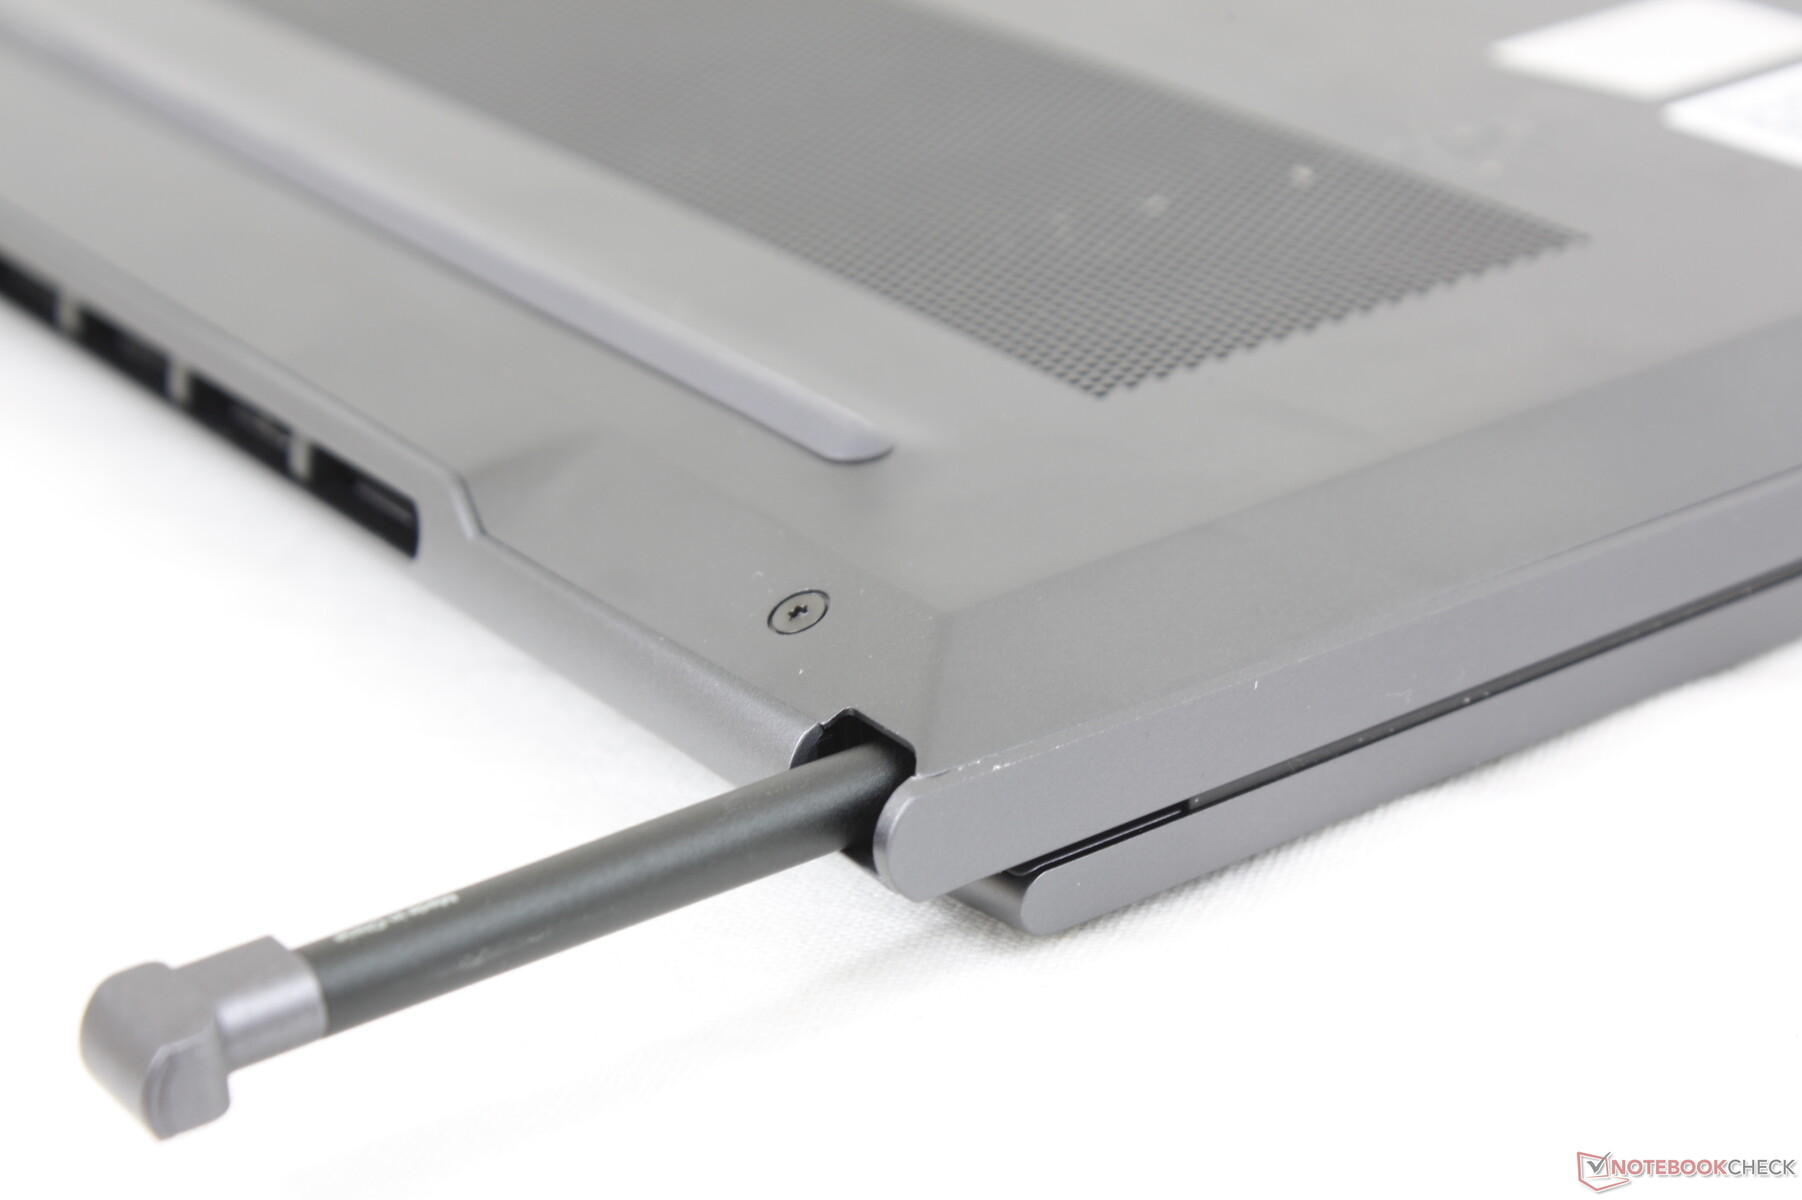
Le panneau inférieur est fixé par neuf vis Torx T5. Nous vous recommandons de retirer d'abord le stylo par l'arrière, puis d'utiliser cette ouverture pour détacher plus facilement le panneau de la base.
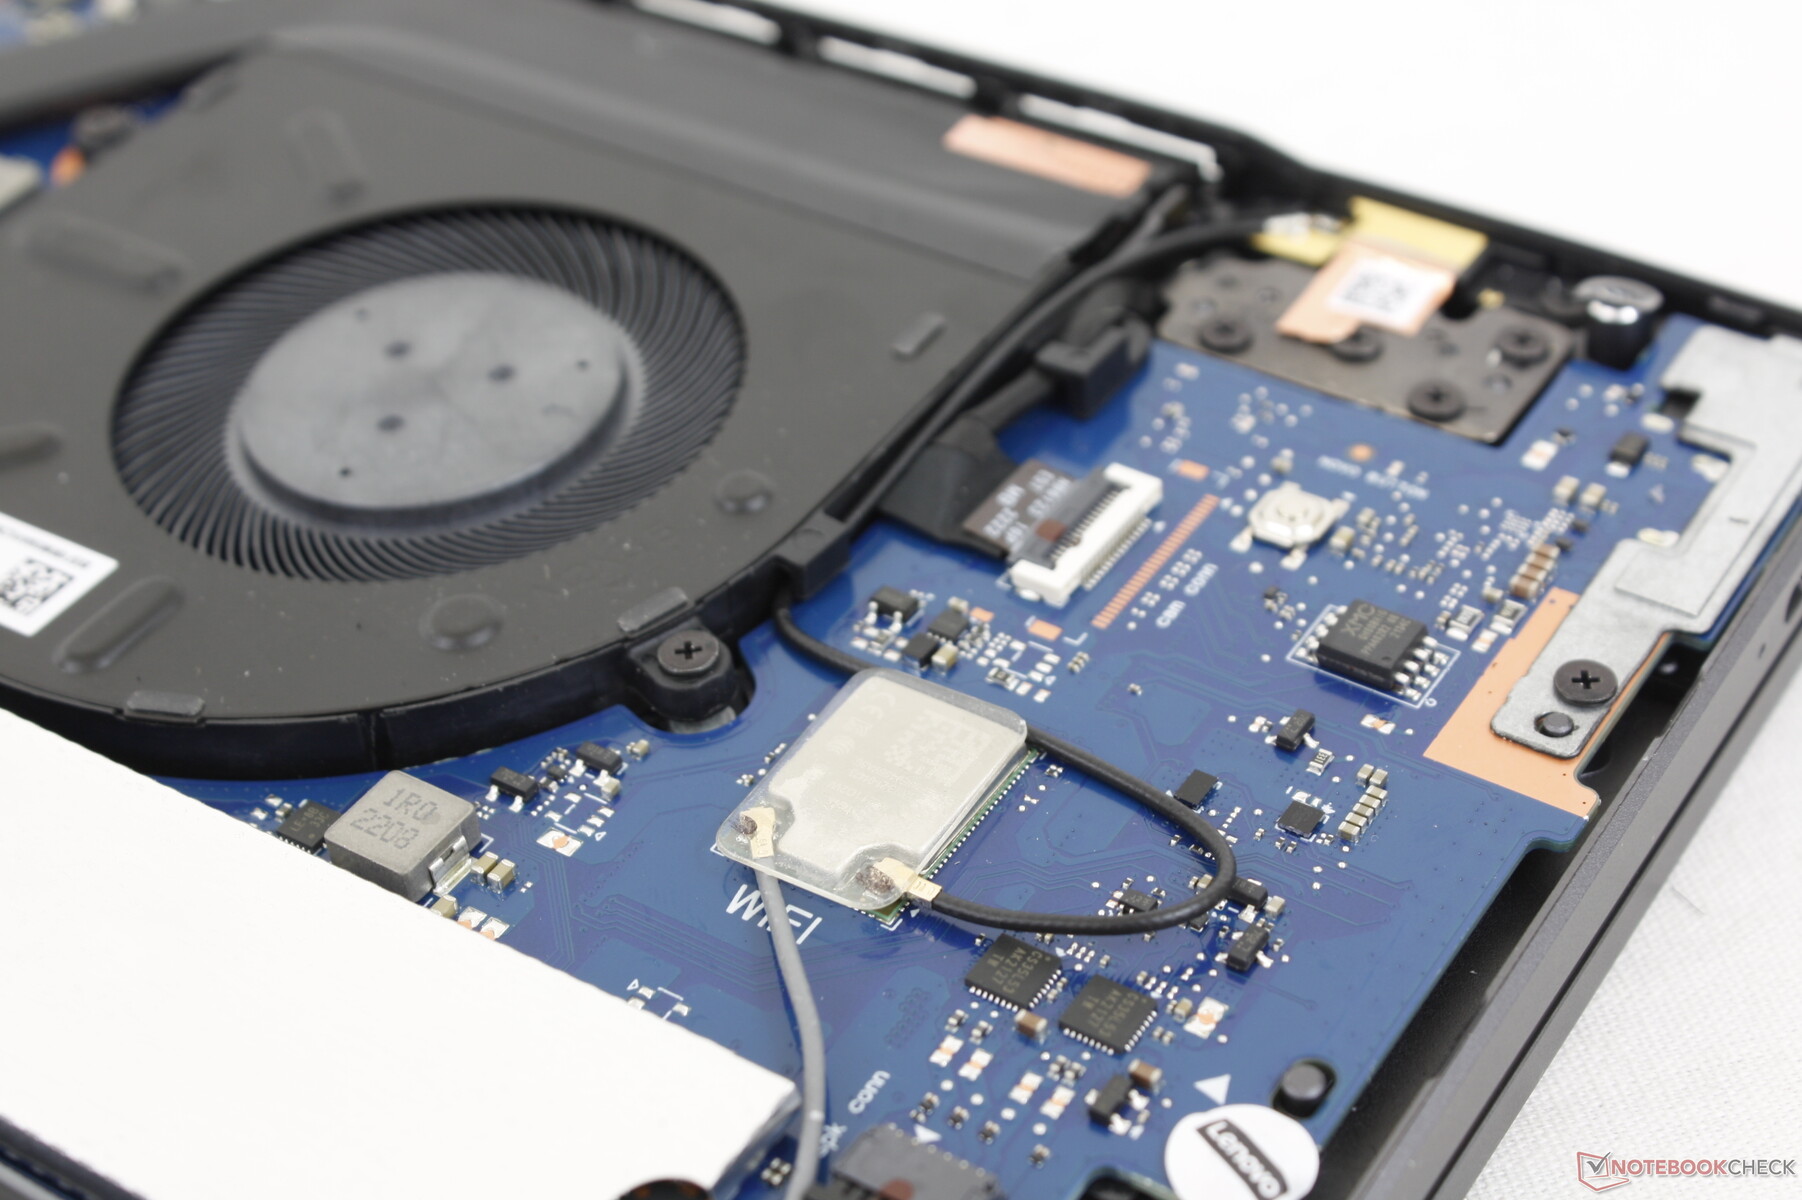
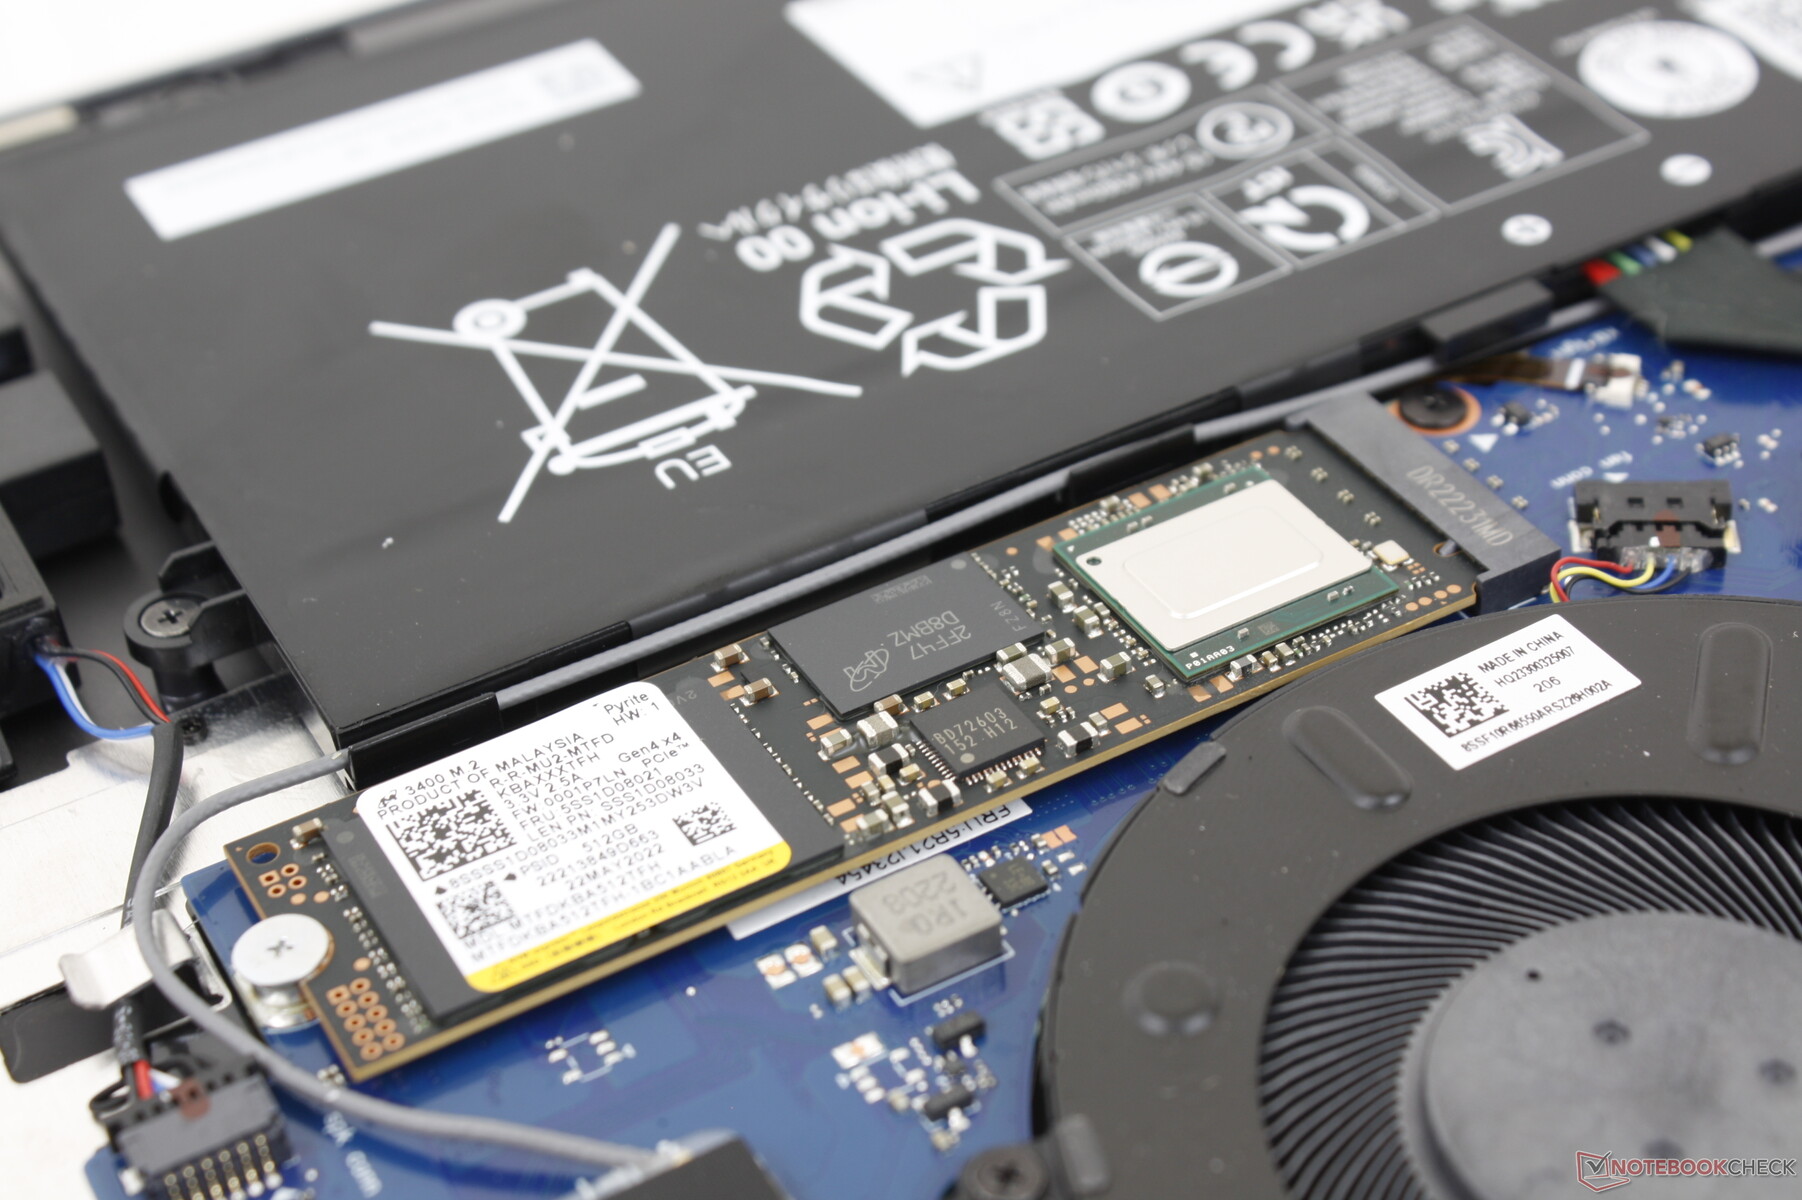
Il n'y a pas grand chose à mettre à niveau une fois à l'intérieur car les modules WLAN et RAM sont soudés.
Accessoires et garantie
Le système intègre un stylet actif, comme sur le modèle Gen 2 de l'année dernière. La garantie standard limitée d'un an du fabricant s'applique si l'achat est effectué aux États-Unis.
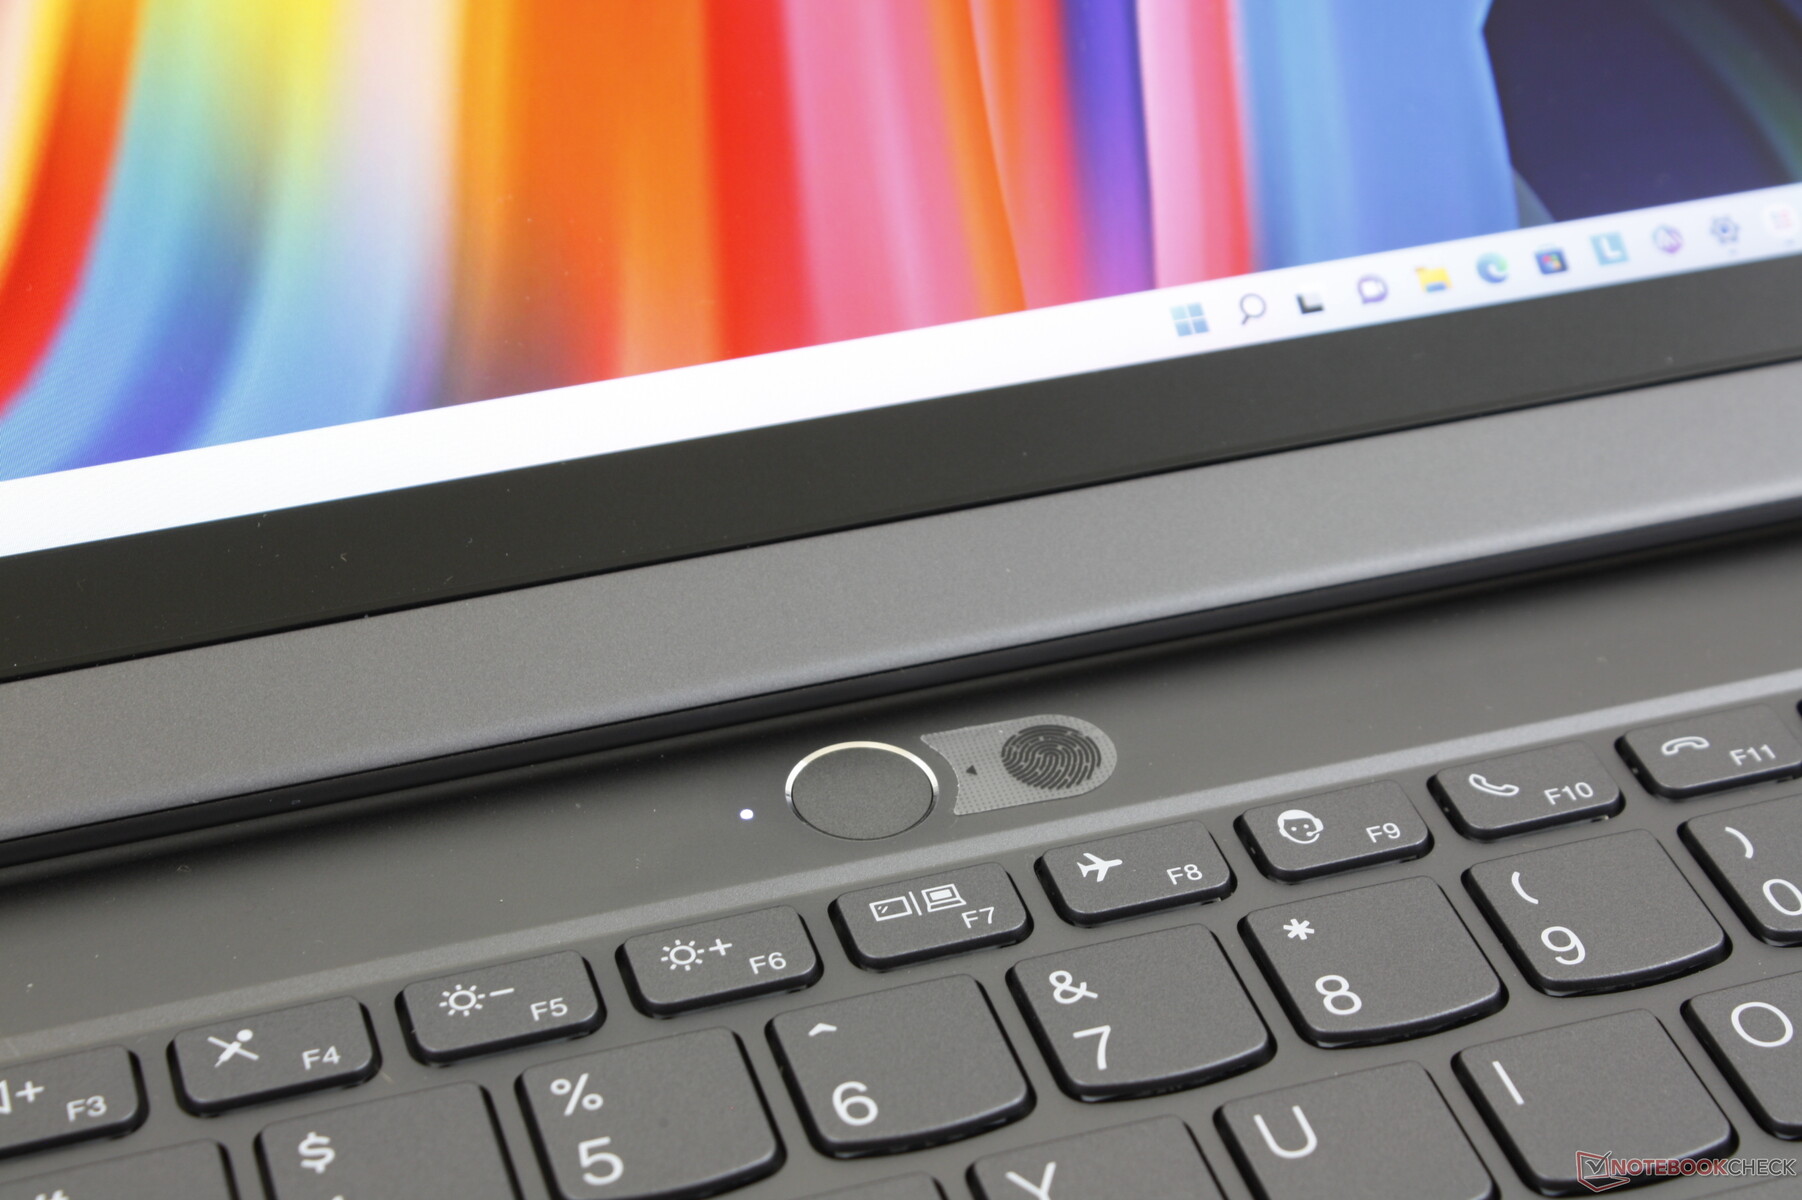
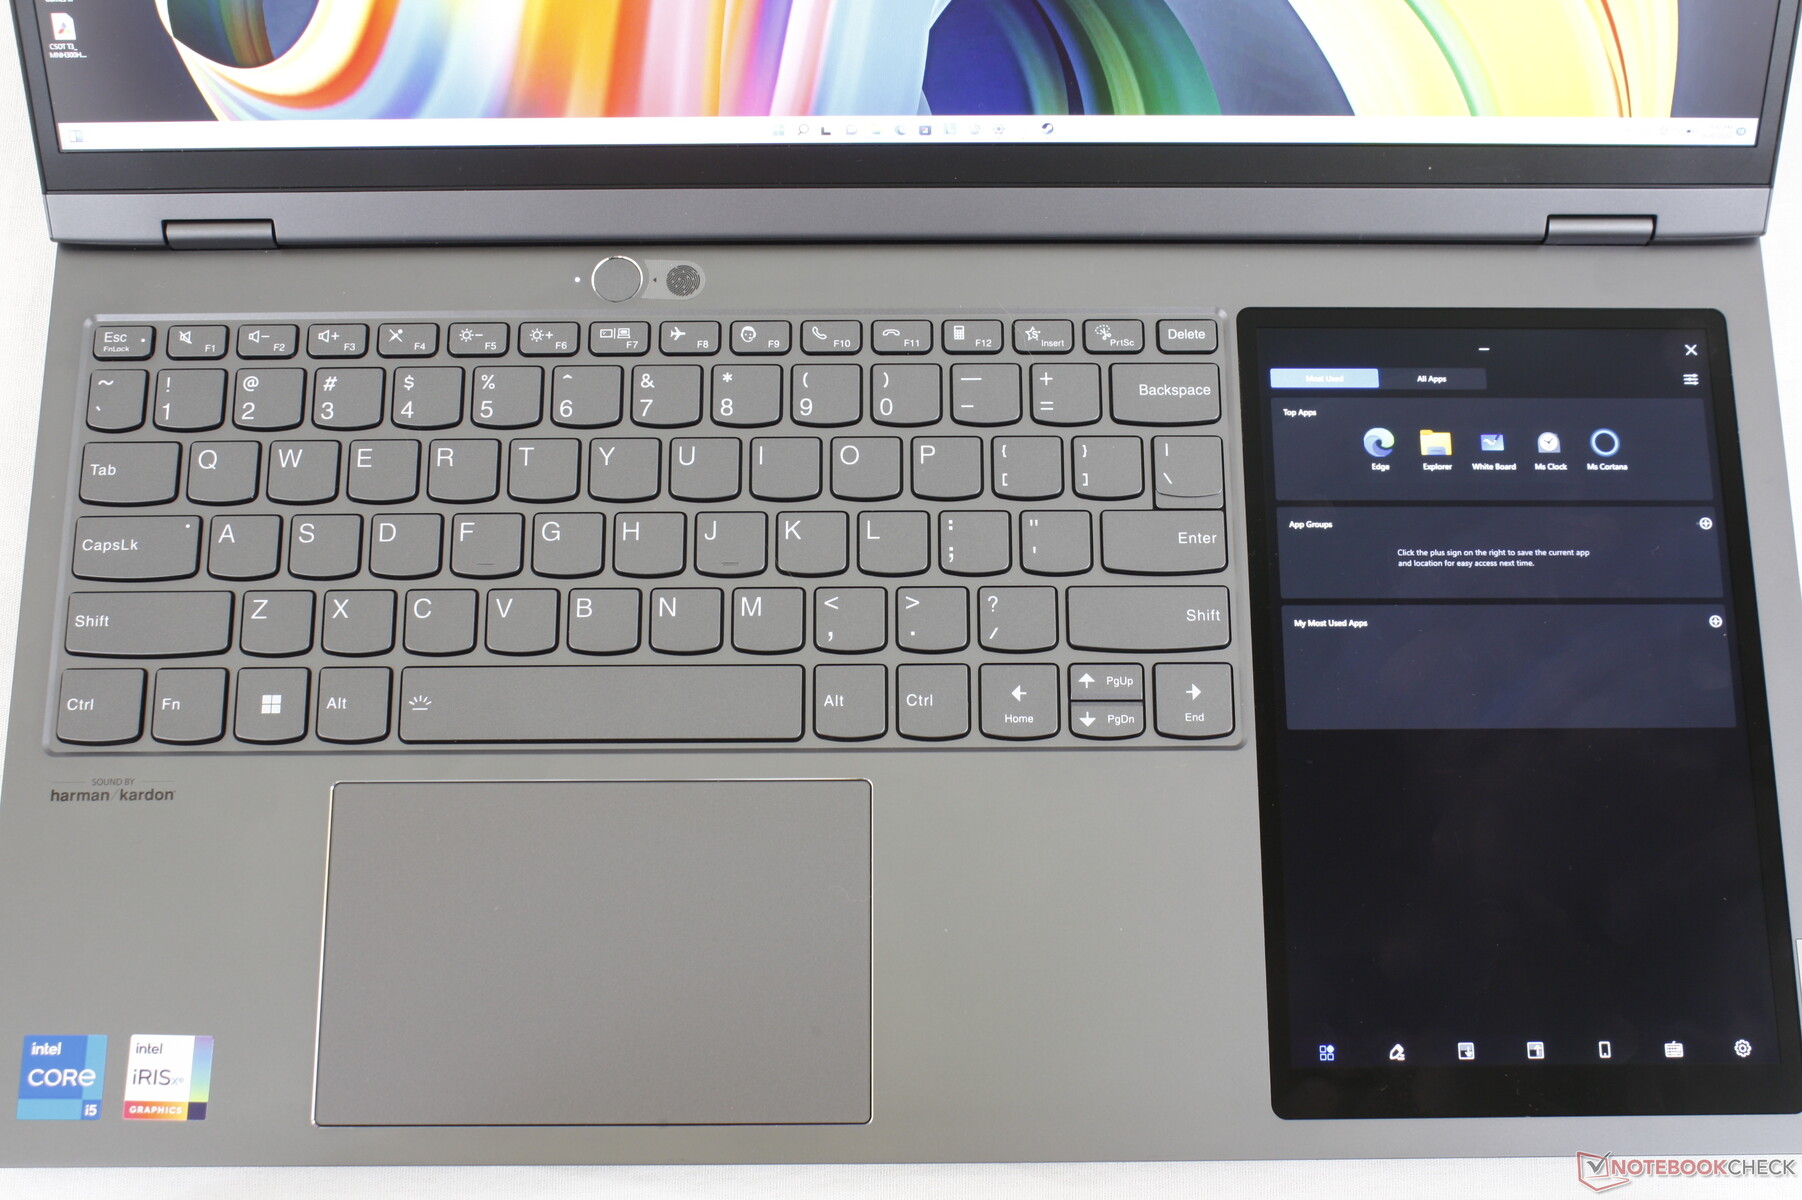
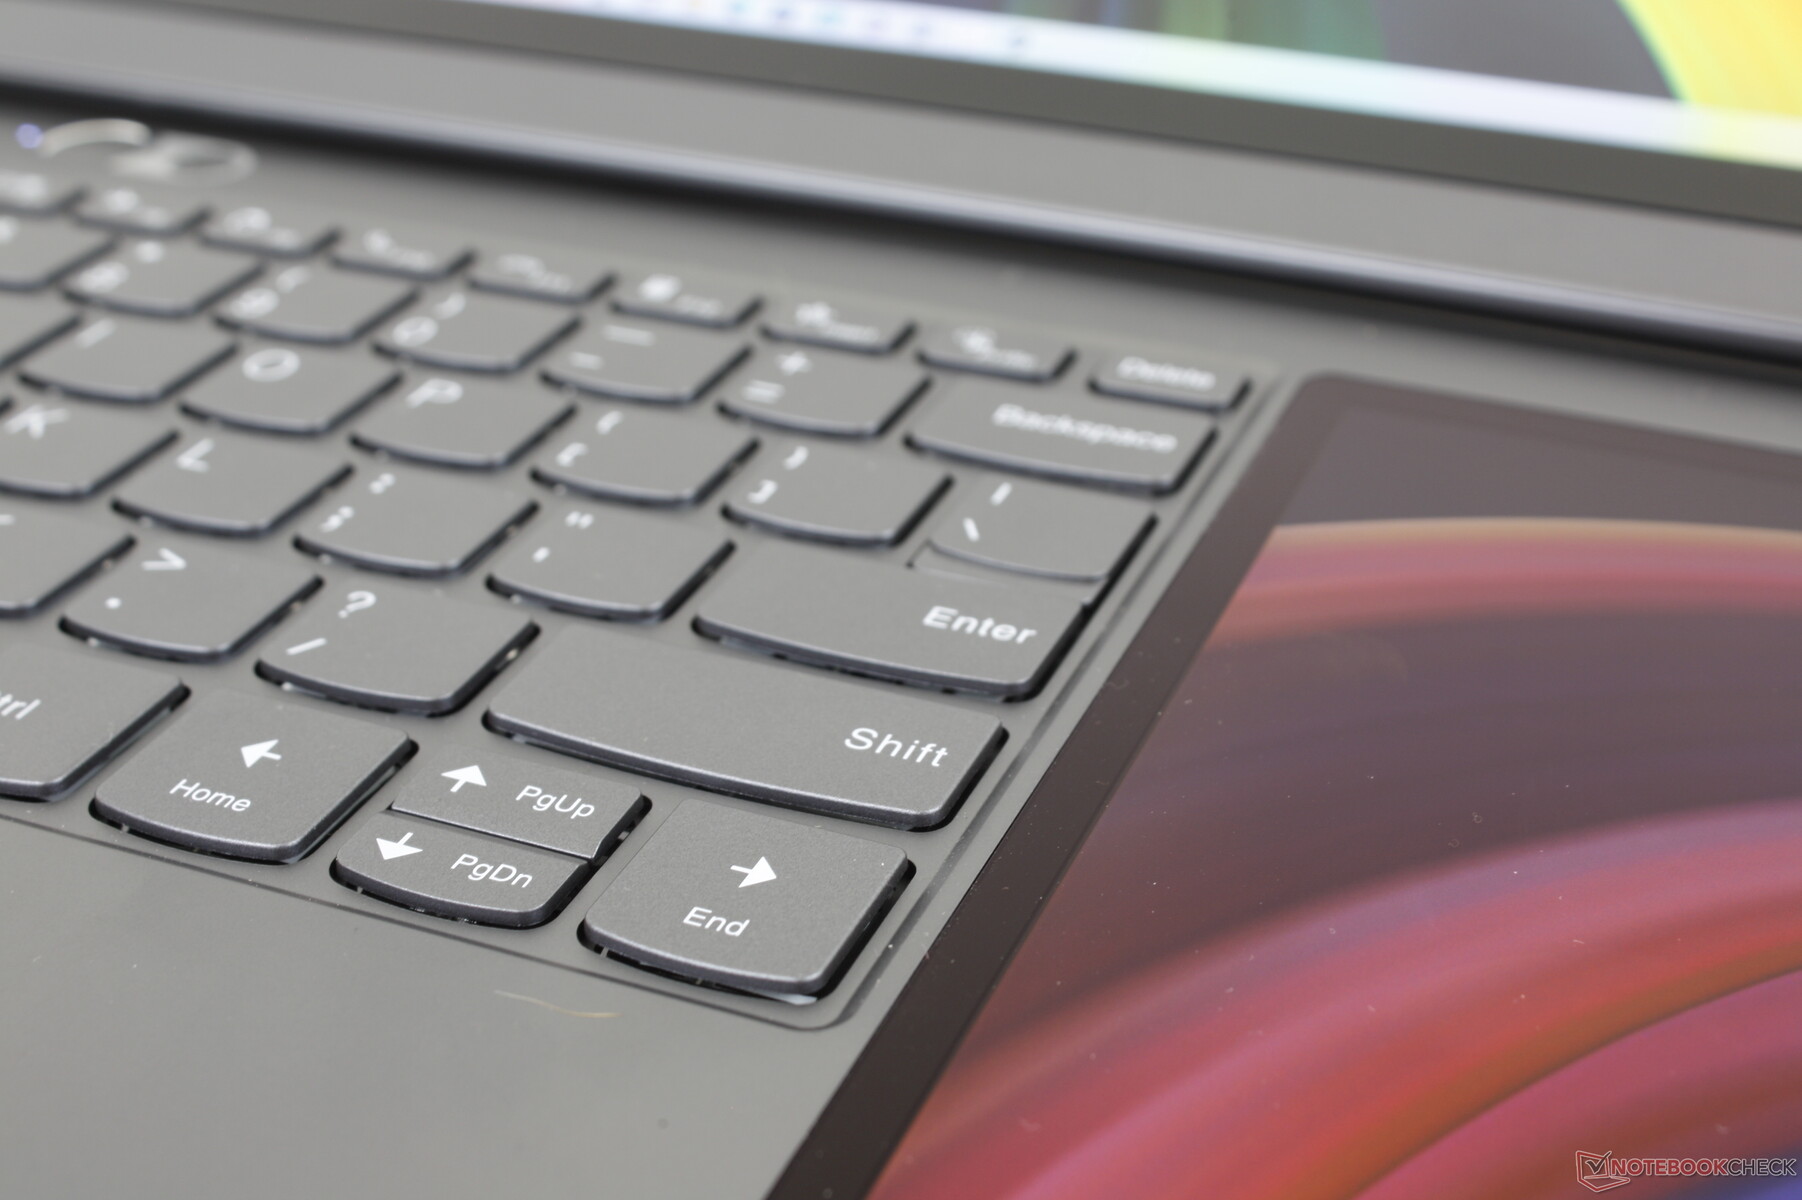
Périphériques d'entrée - Plateau de clavier spacieux
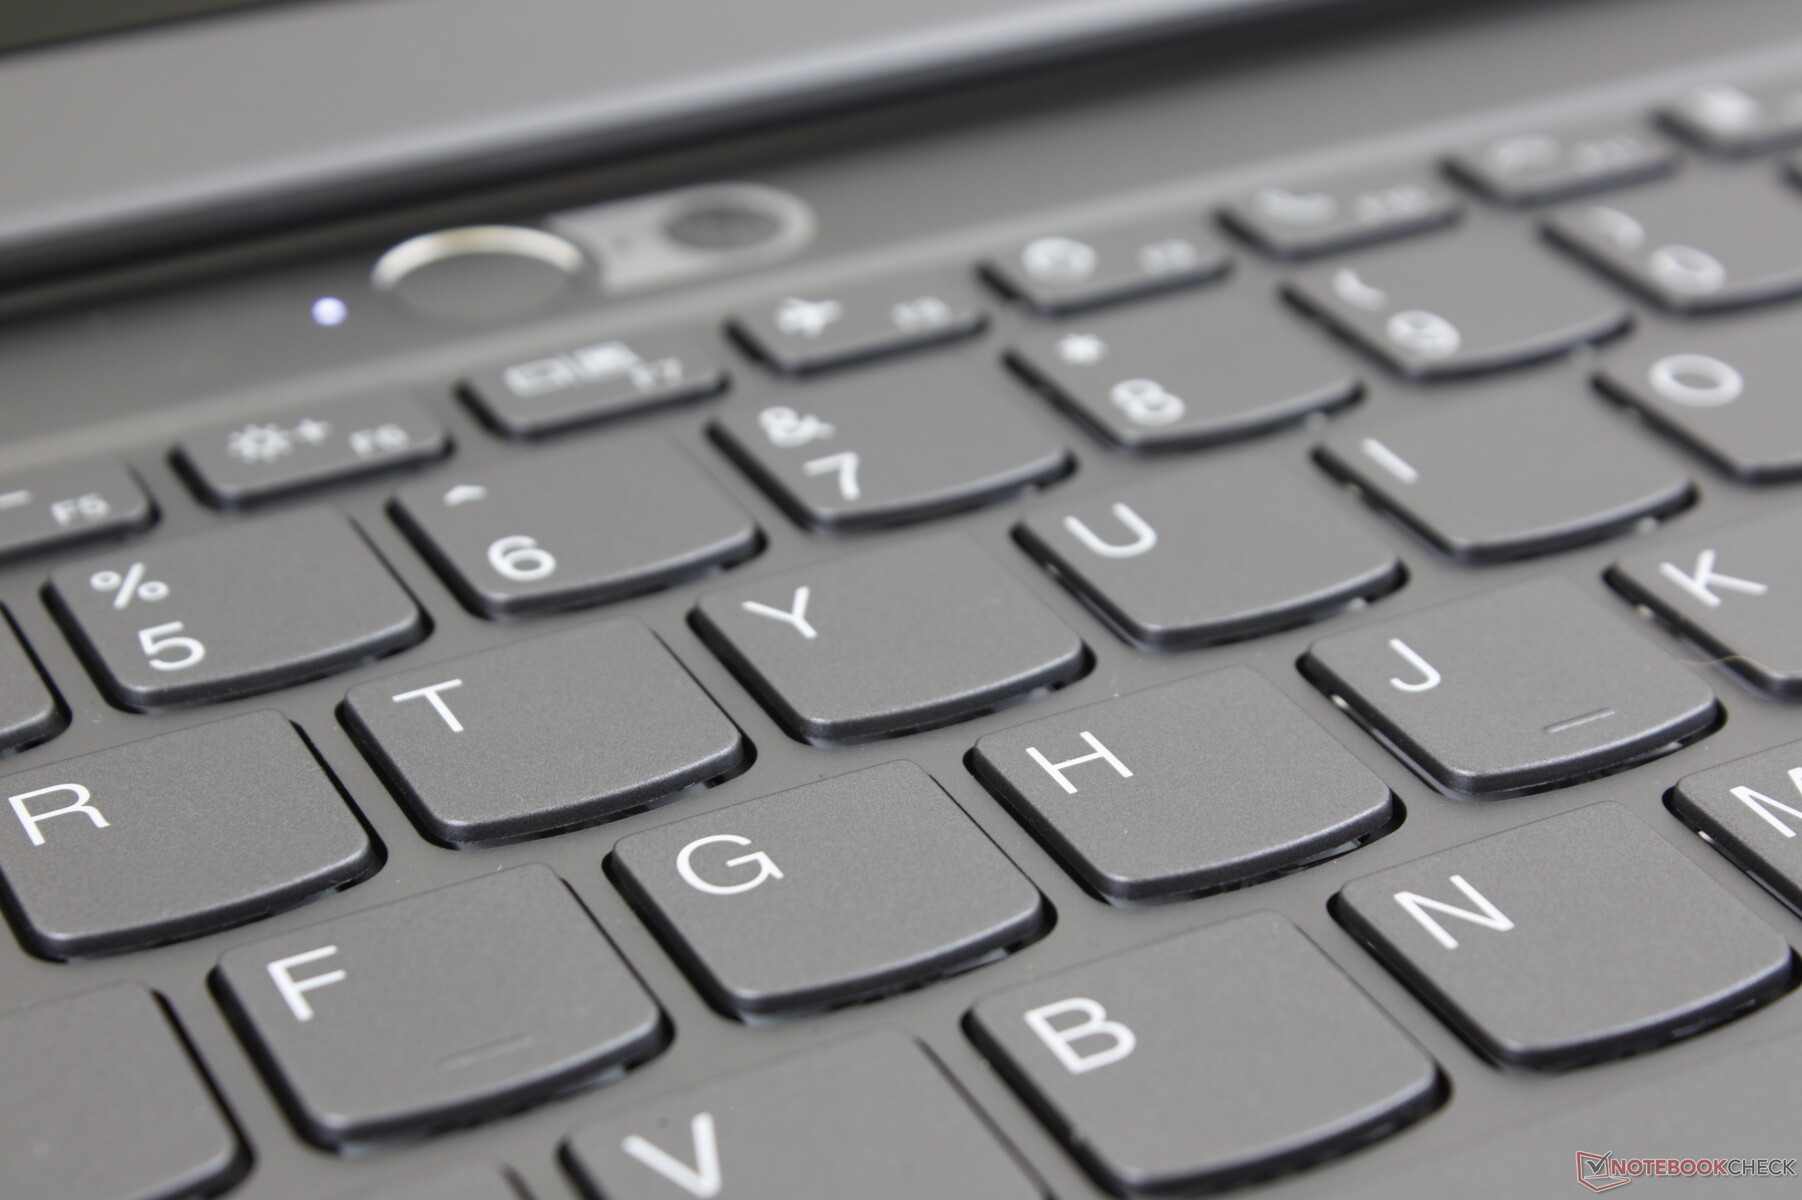
Clavier
L'expérience de frappe reste identique à celle des autres ordinateurs portables ThinkBook, notamment le ThinkBook 14 G4 malgré l'inclusion de l'écran tactile secondaire. L'encombrement plus important permet de disposer d'un pavé tactile, d'un écran tactile et d'un clavier relativement spacieux sur un seul ordinateur portable, alors qu'on peut se sentir à l'étroit sur un ZenBook 14 ou 15 pouces plus petit.
Les touches sont peu profondes et légères, ce qui n'est pas sans rappeler les claviers de nombreux modèles Yoga, IdeaPad ou Ultrabook de milieu de gamme. Les claviers des ThinkPad sont généralement plus fermes et ont une course plus longue en comparaison.
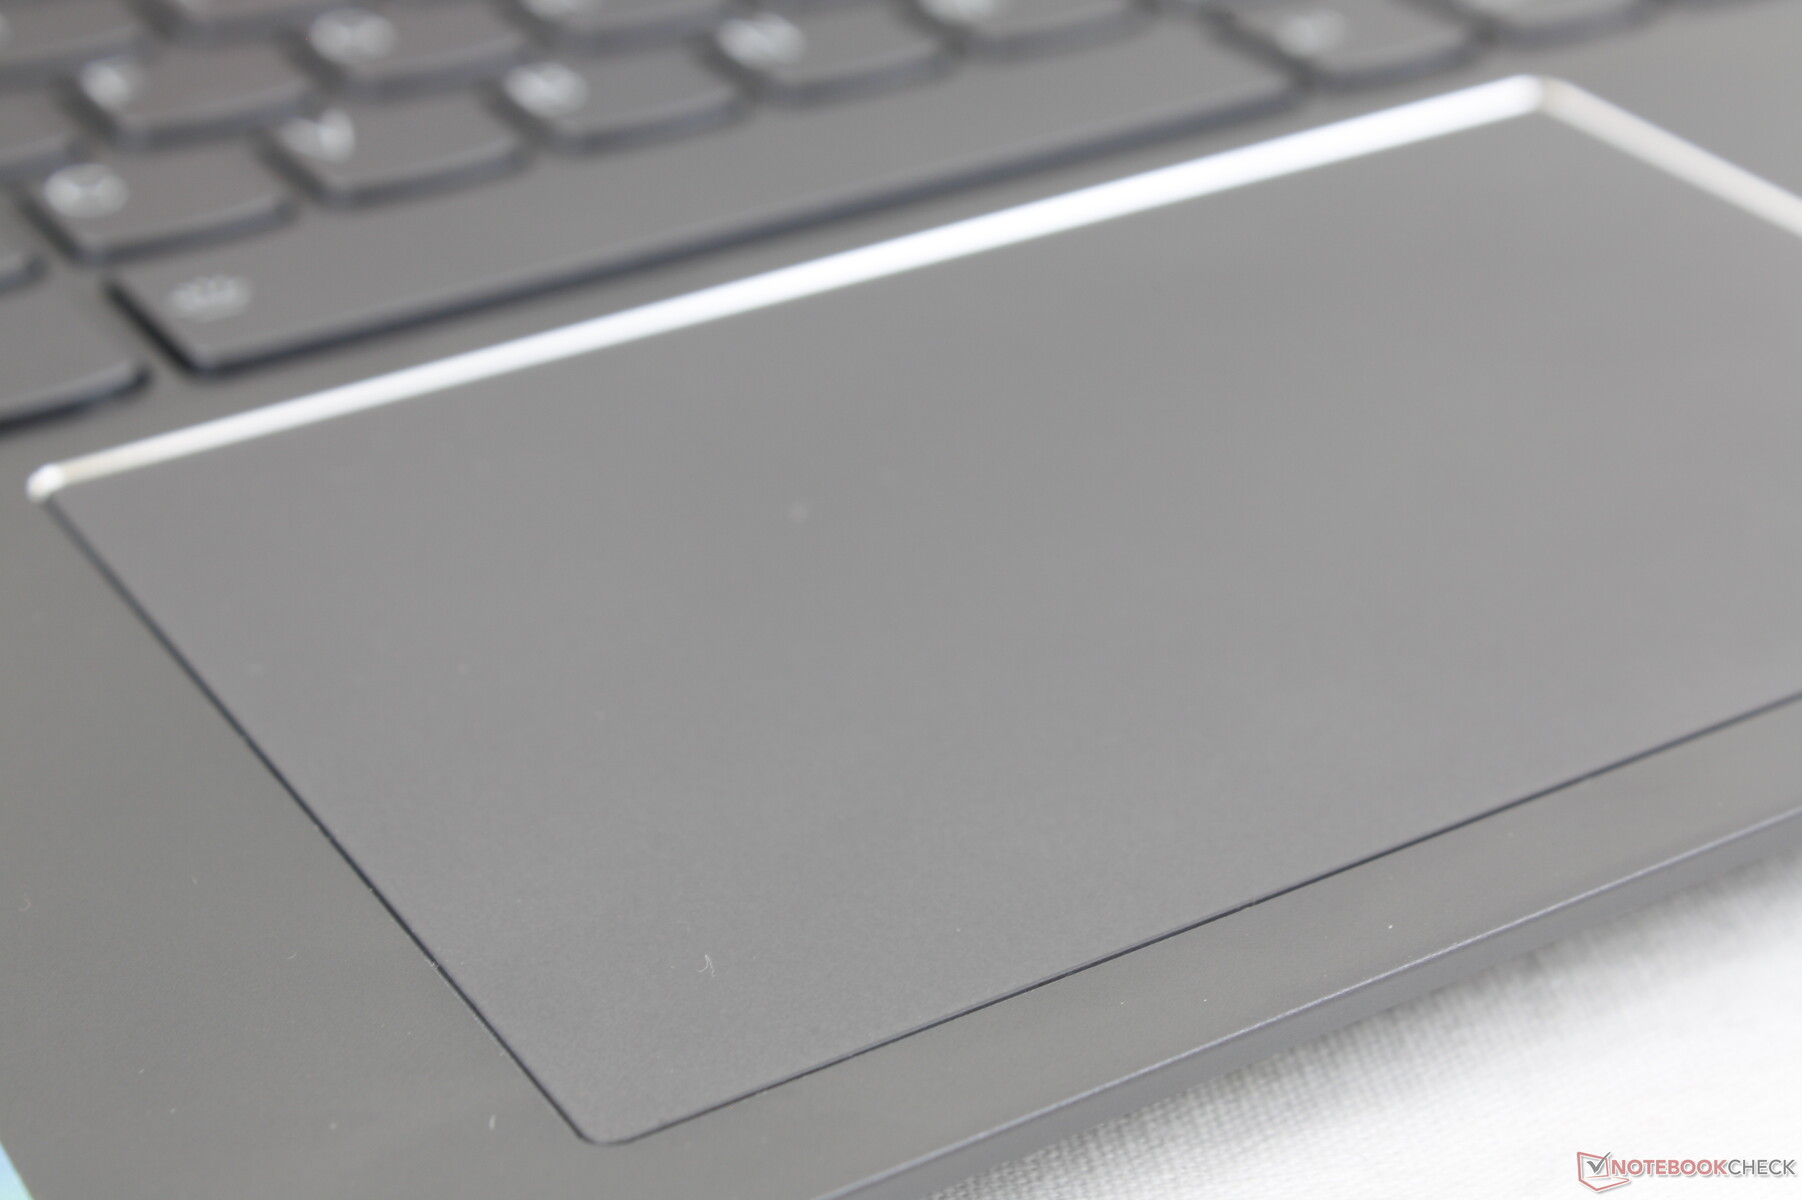
Pavé tactile
Le pavé tactile est d'une taille décente, contrairement à celui, minuscule, du ZenBook Duo UX481 (12 x 7,5 cm contre 5,5 x 7 cm). Le glissement est fluide et réactif, en partie grâce au taux de rafraîchissement natif de 120 Hz de l'écran principal. Les clics sur le pavé tactile sont fermes et accompagnés d'un clic auditif fort pour un retour satisfaisant.
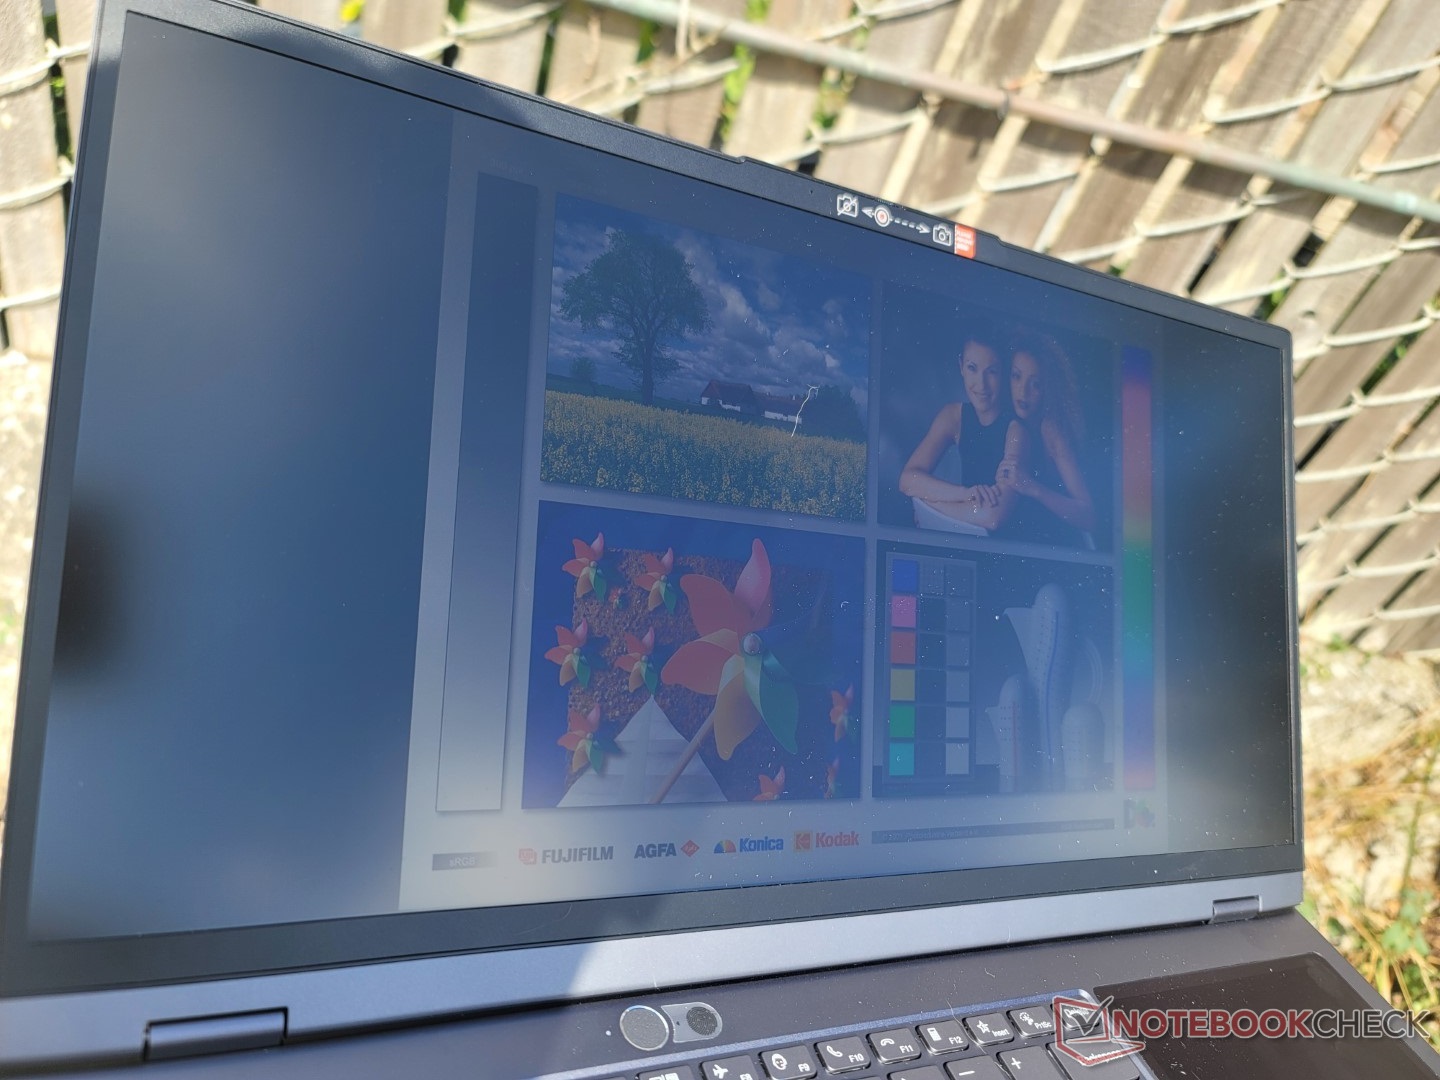
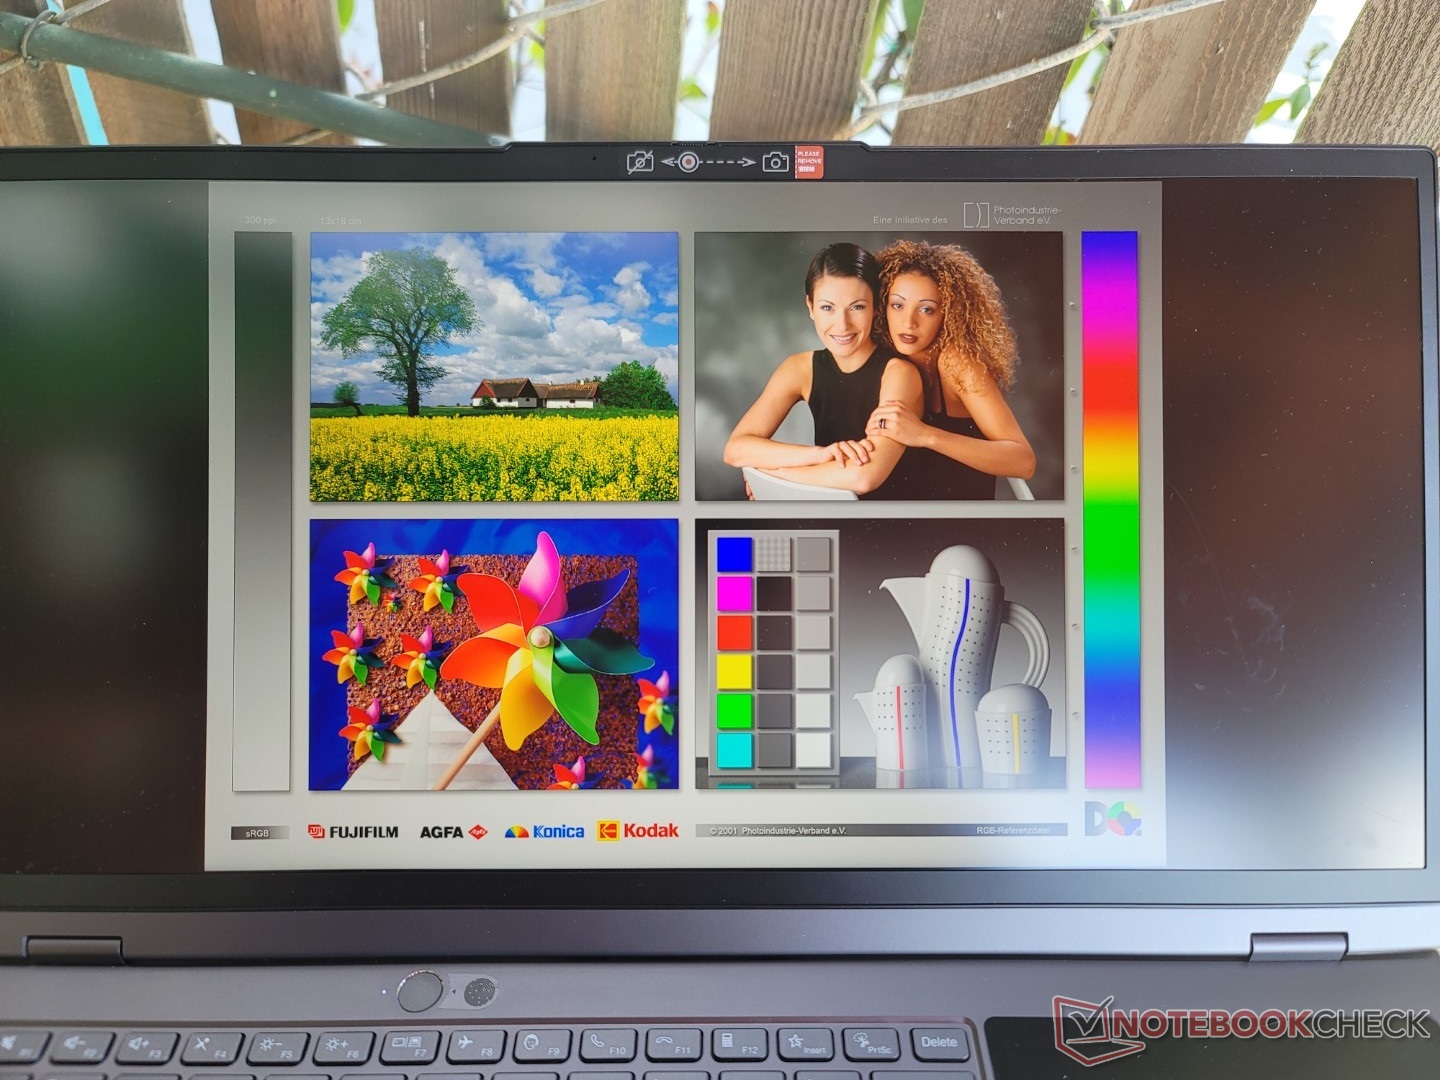
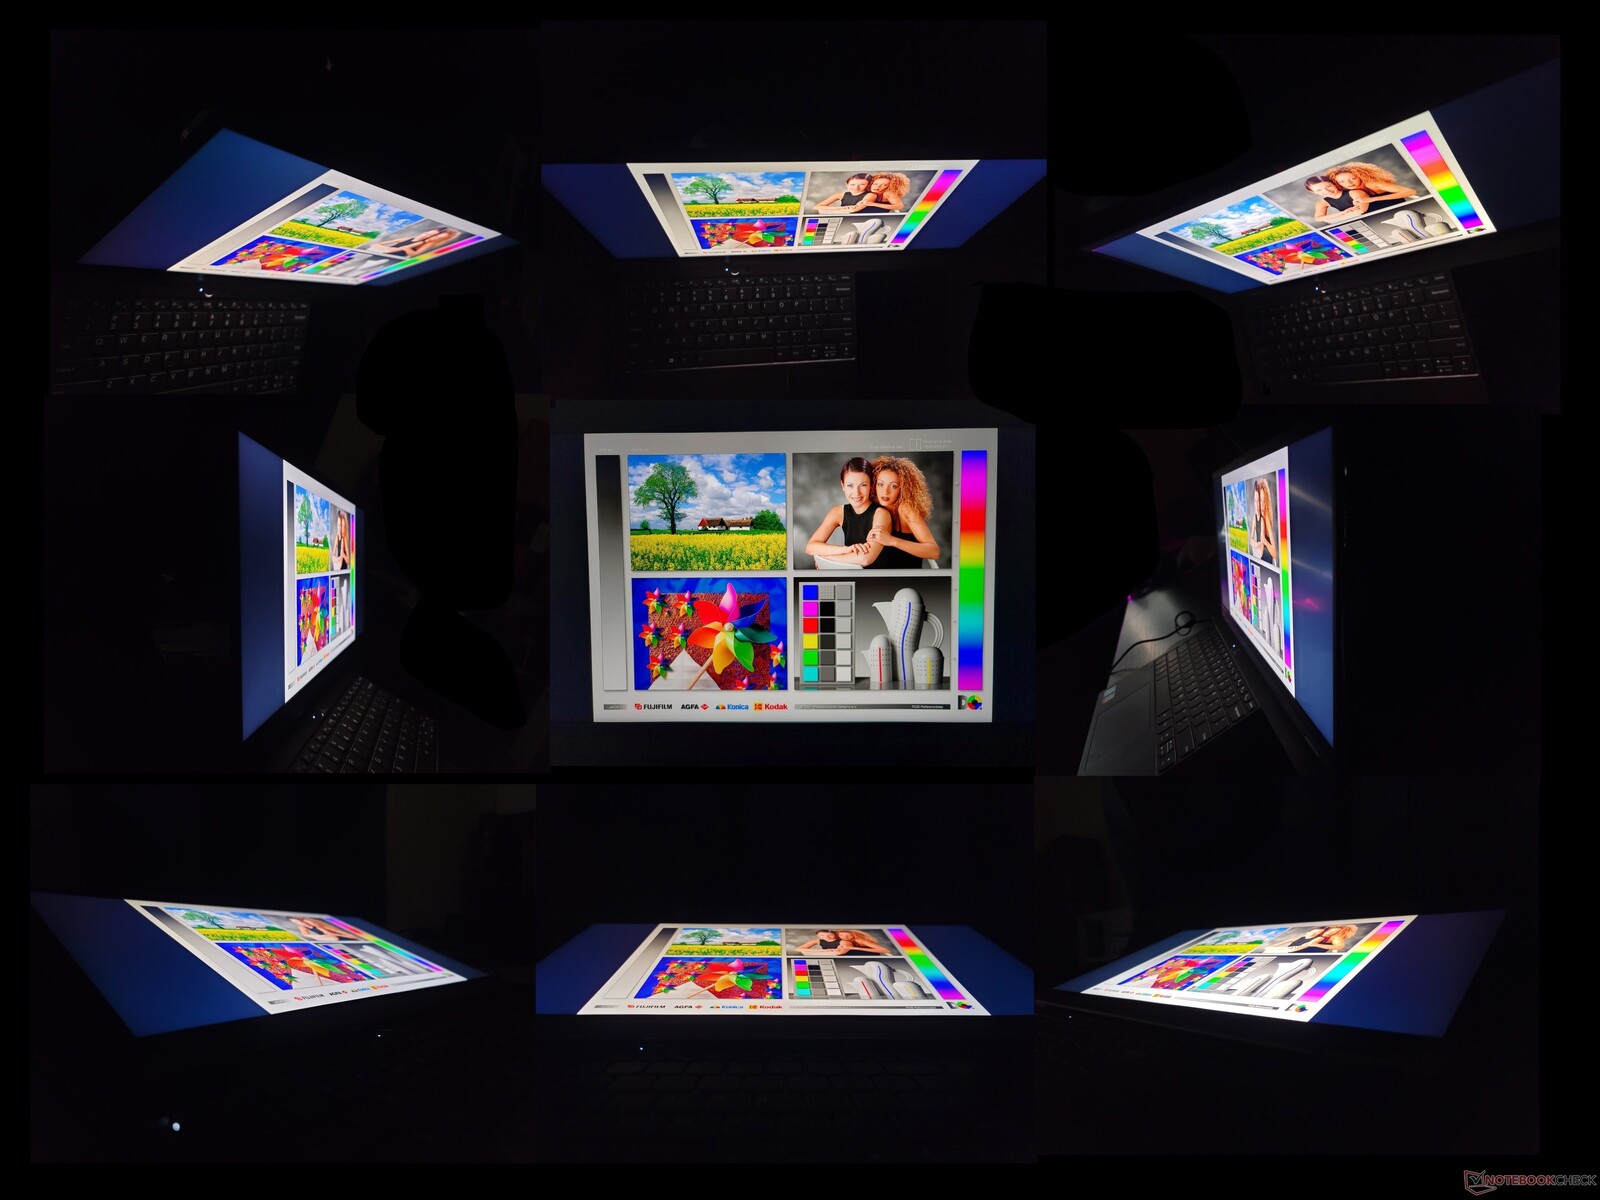
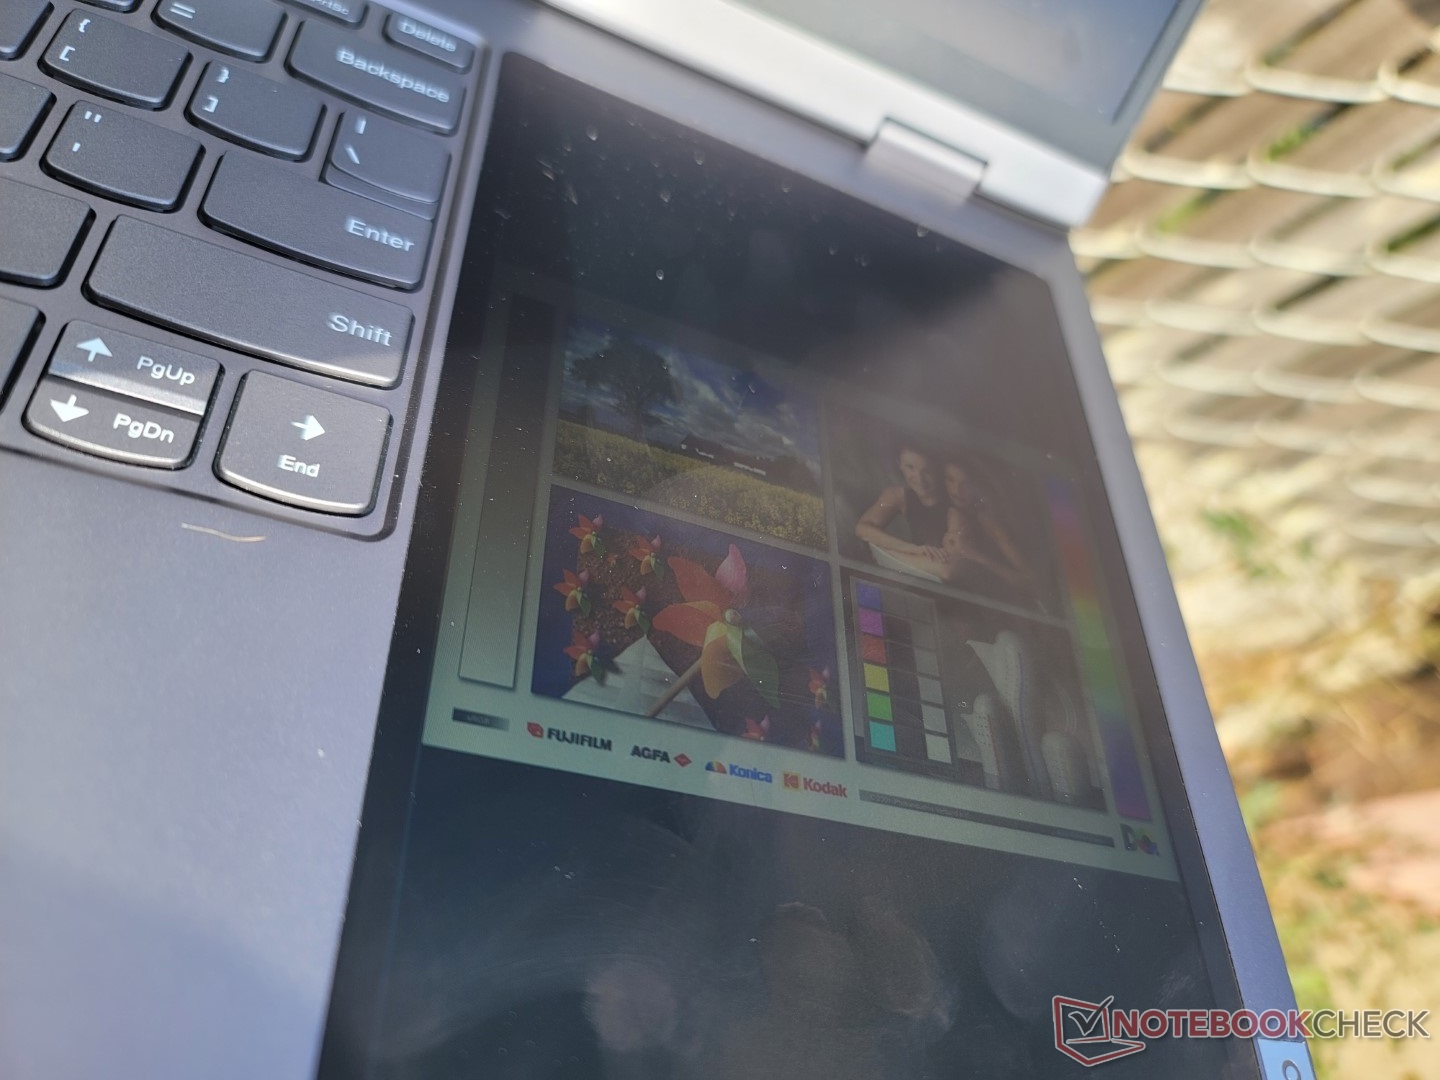
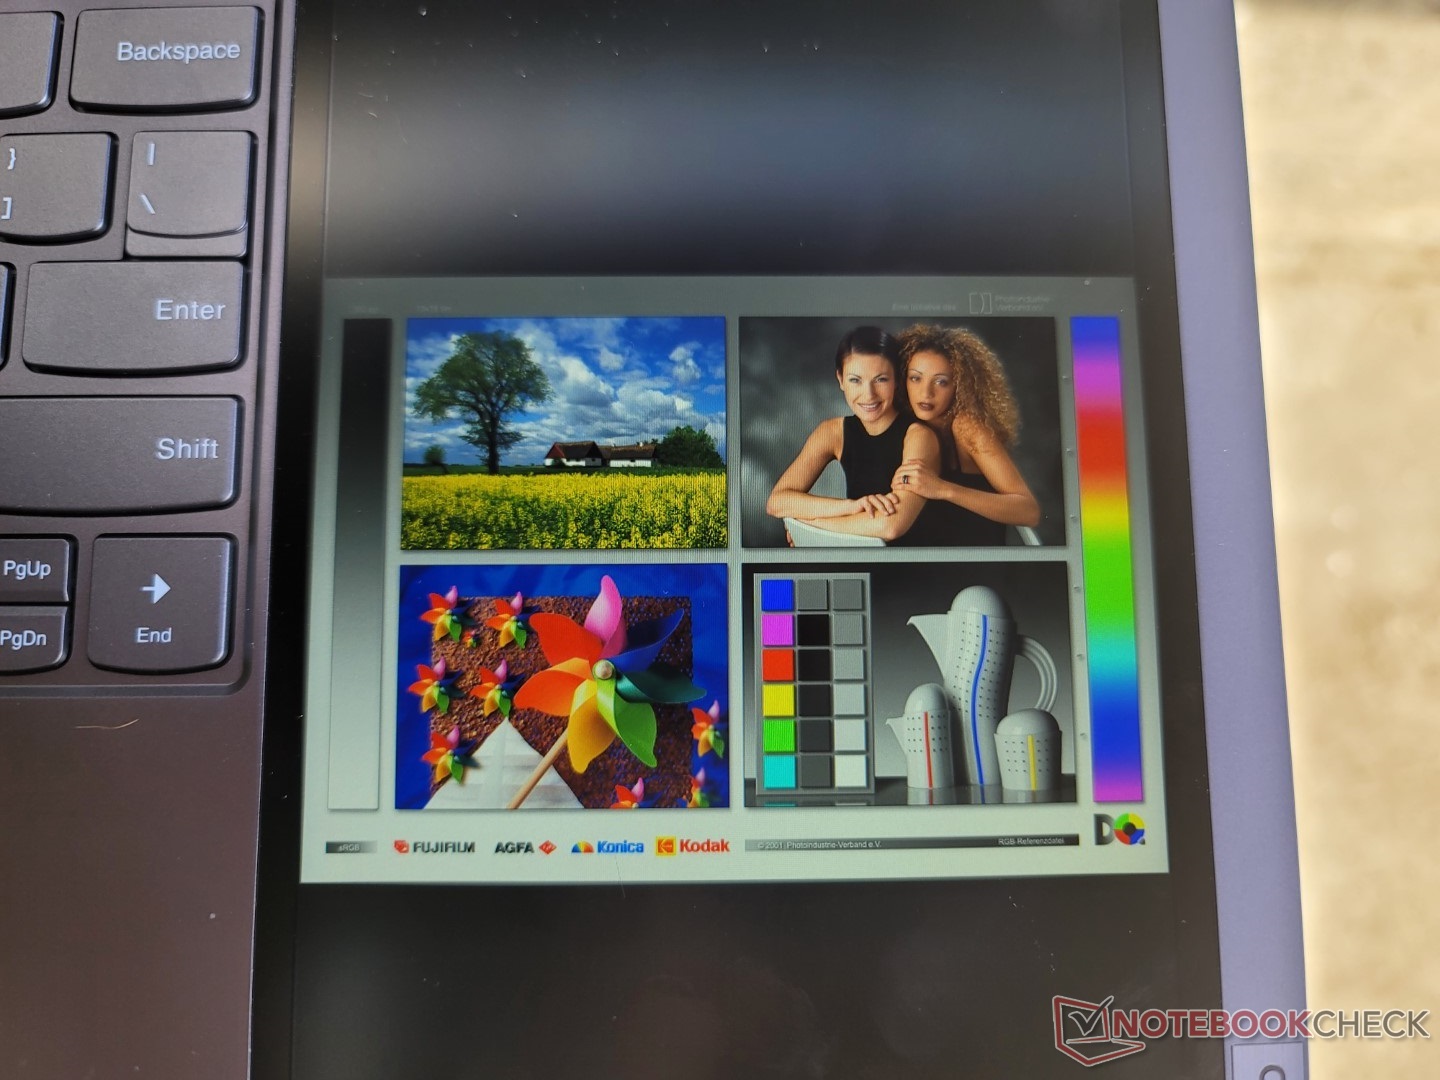
Écran principal - P3, 120 Hz, et IPS 21:10
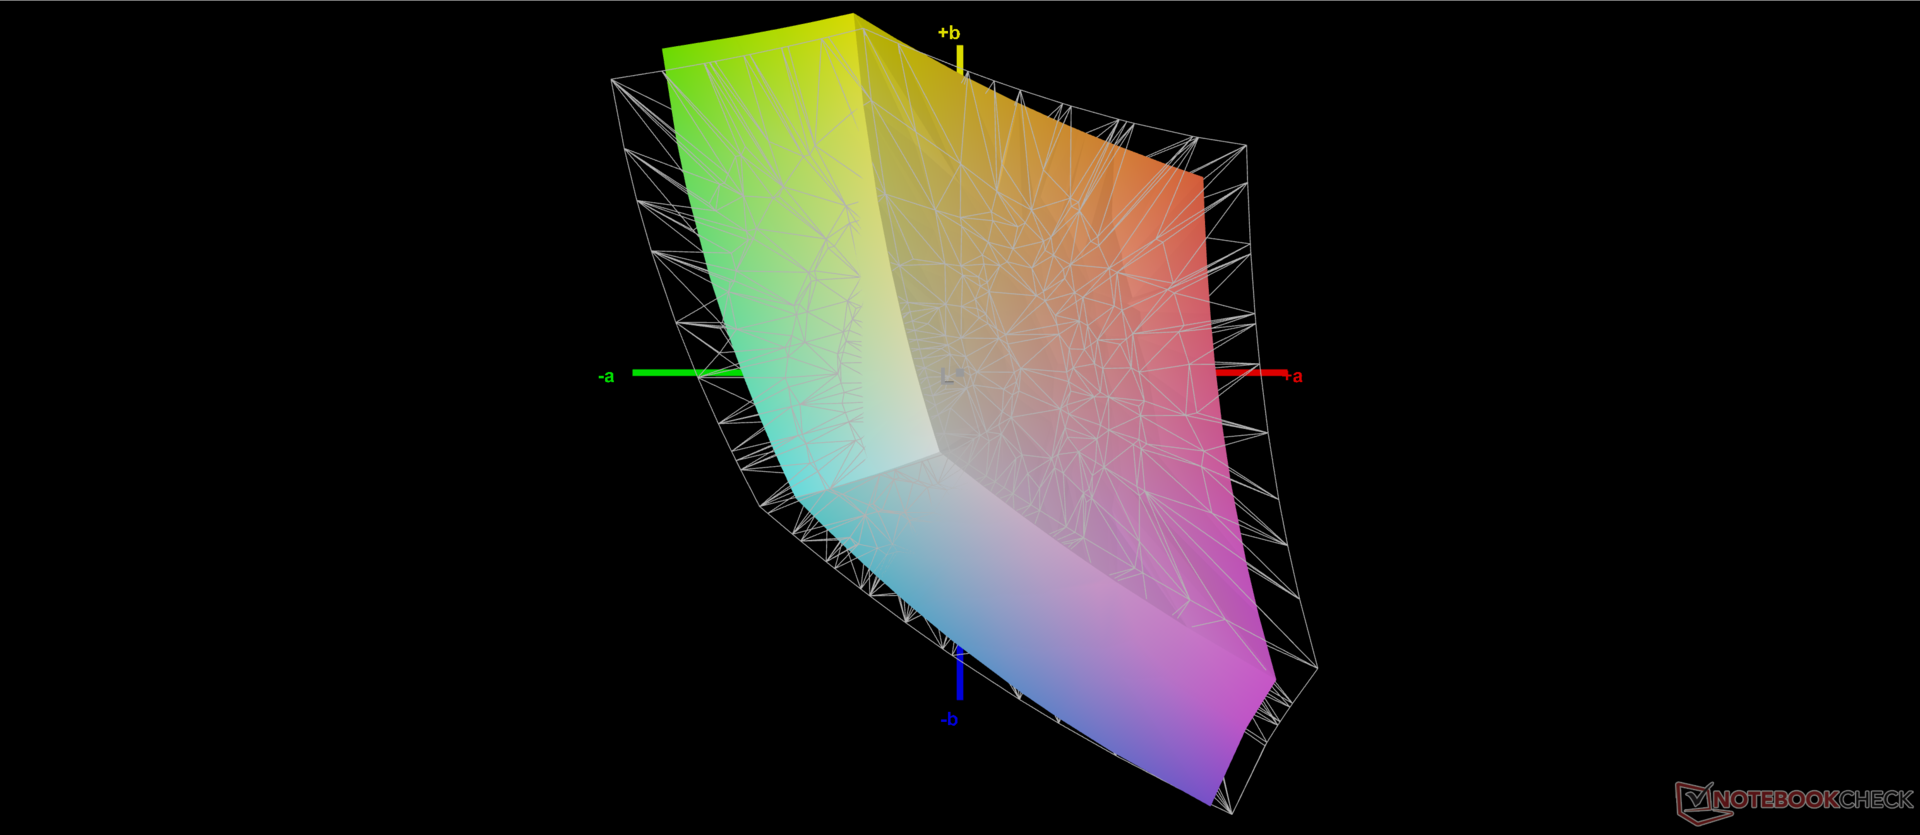
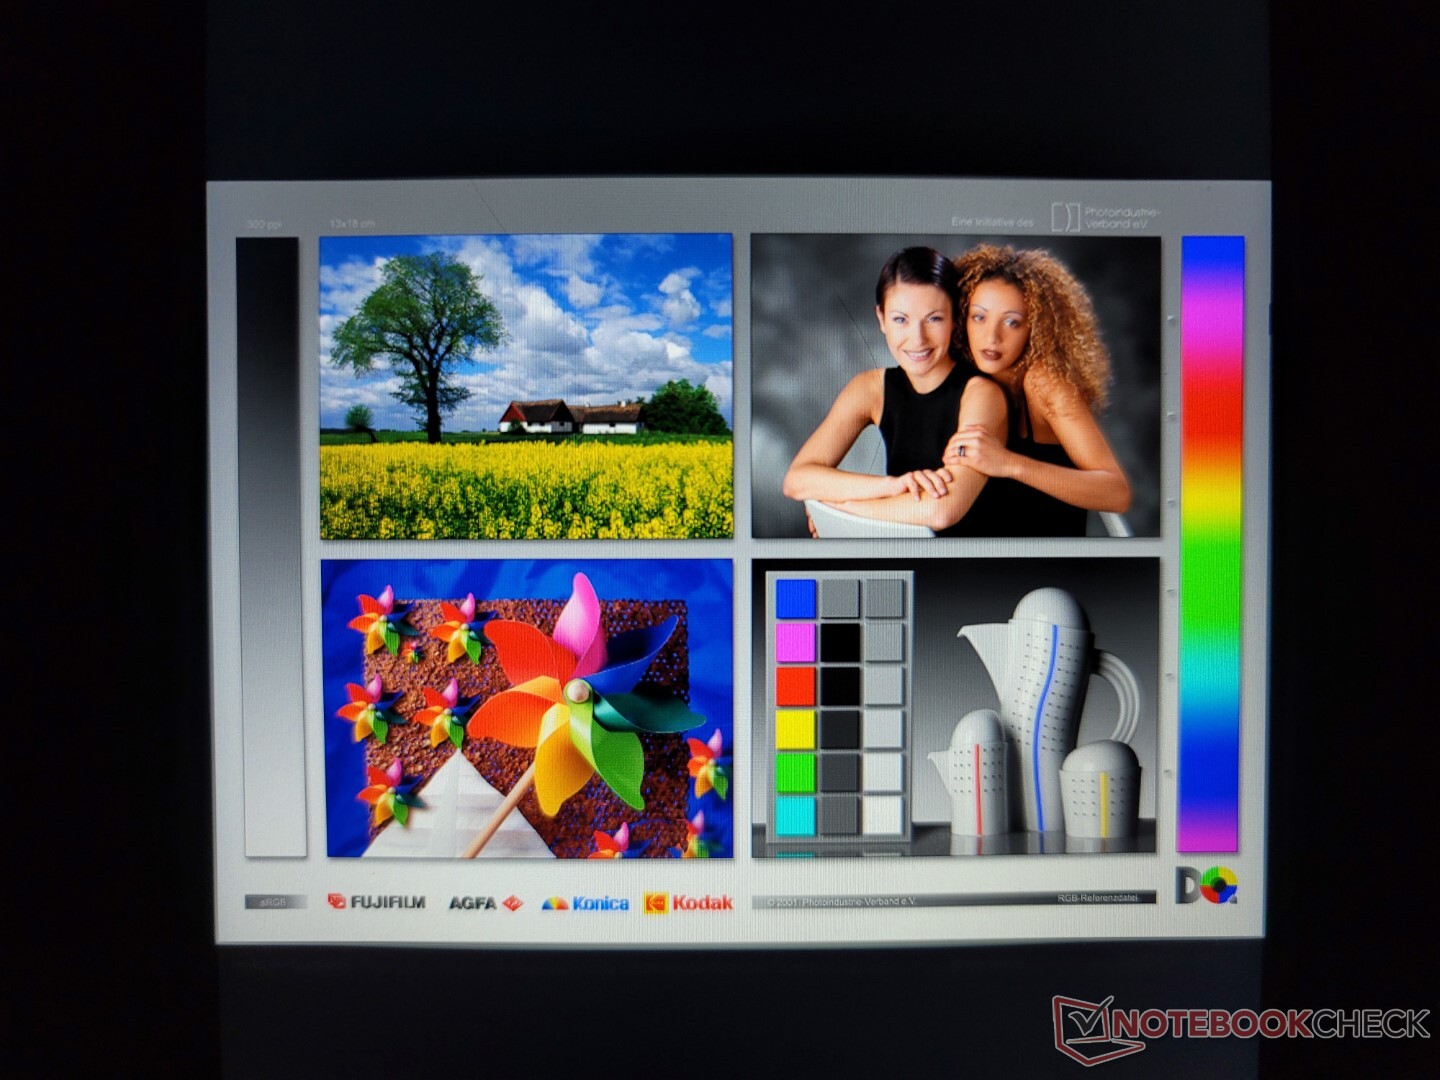
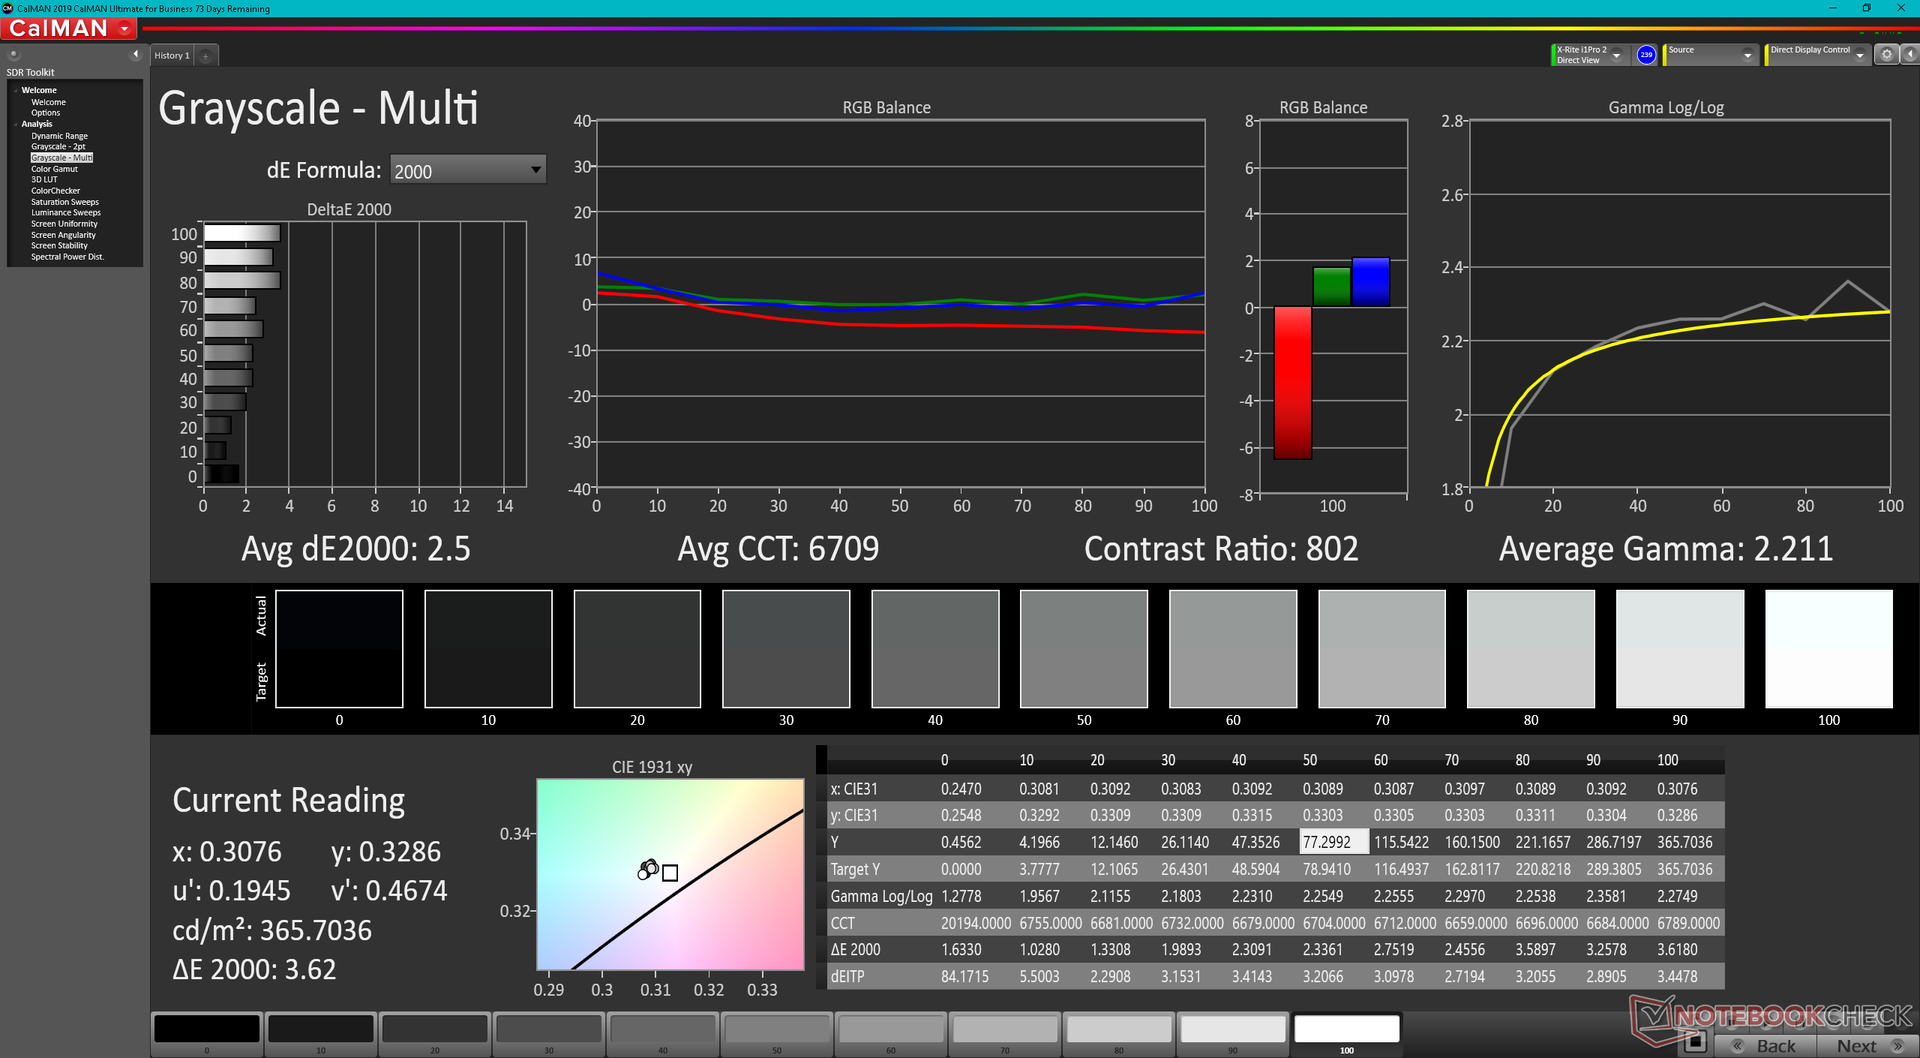
L'écran IPS principal est peut-être d'un format atypique, mais il présente les mêmes caractéristiques que la plupart des autres écrans IPS haut de gamme. Le taux de contraste de ~1000:1, les temps de réponse noir-blanc raisonnablement rapides, le taux de rafraîchissement natif de 120 Hz et la couverture des couleurs P3 de >95 % font de cet écran un outil étonnamment bon pour les graphiques, l'édition et tout ce qui se trouve entre les deux. Les couleurs et les temps de réponse en particulier sont respectivement plus profonds et plus rapides que ceux de l'écran du ThinkBook Plus Gen 2 tandis que la luminosité maximale reste à peu près la même.
| |||||||||||||||||||||||||
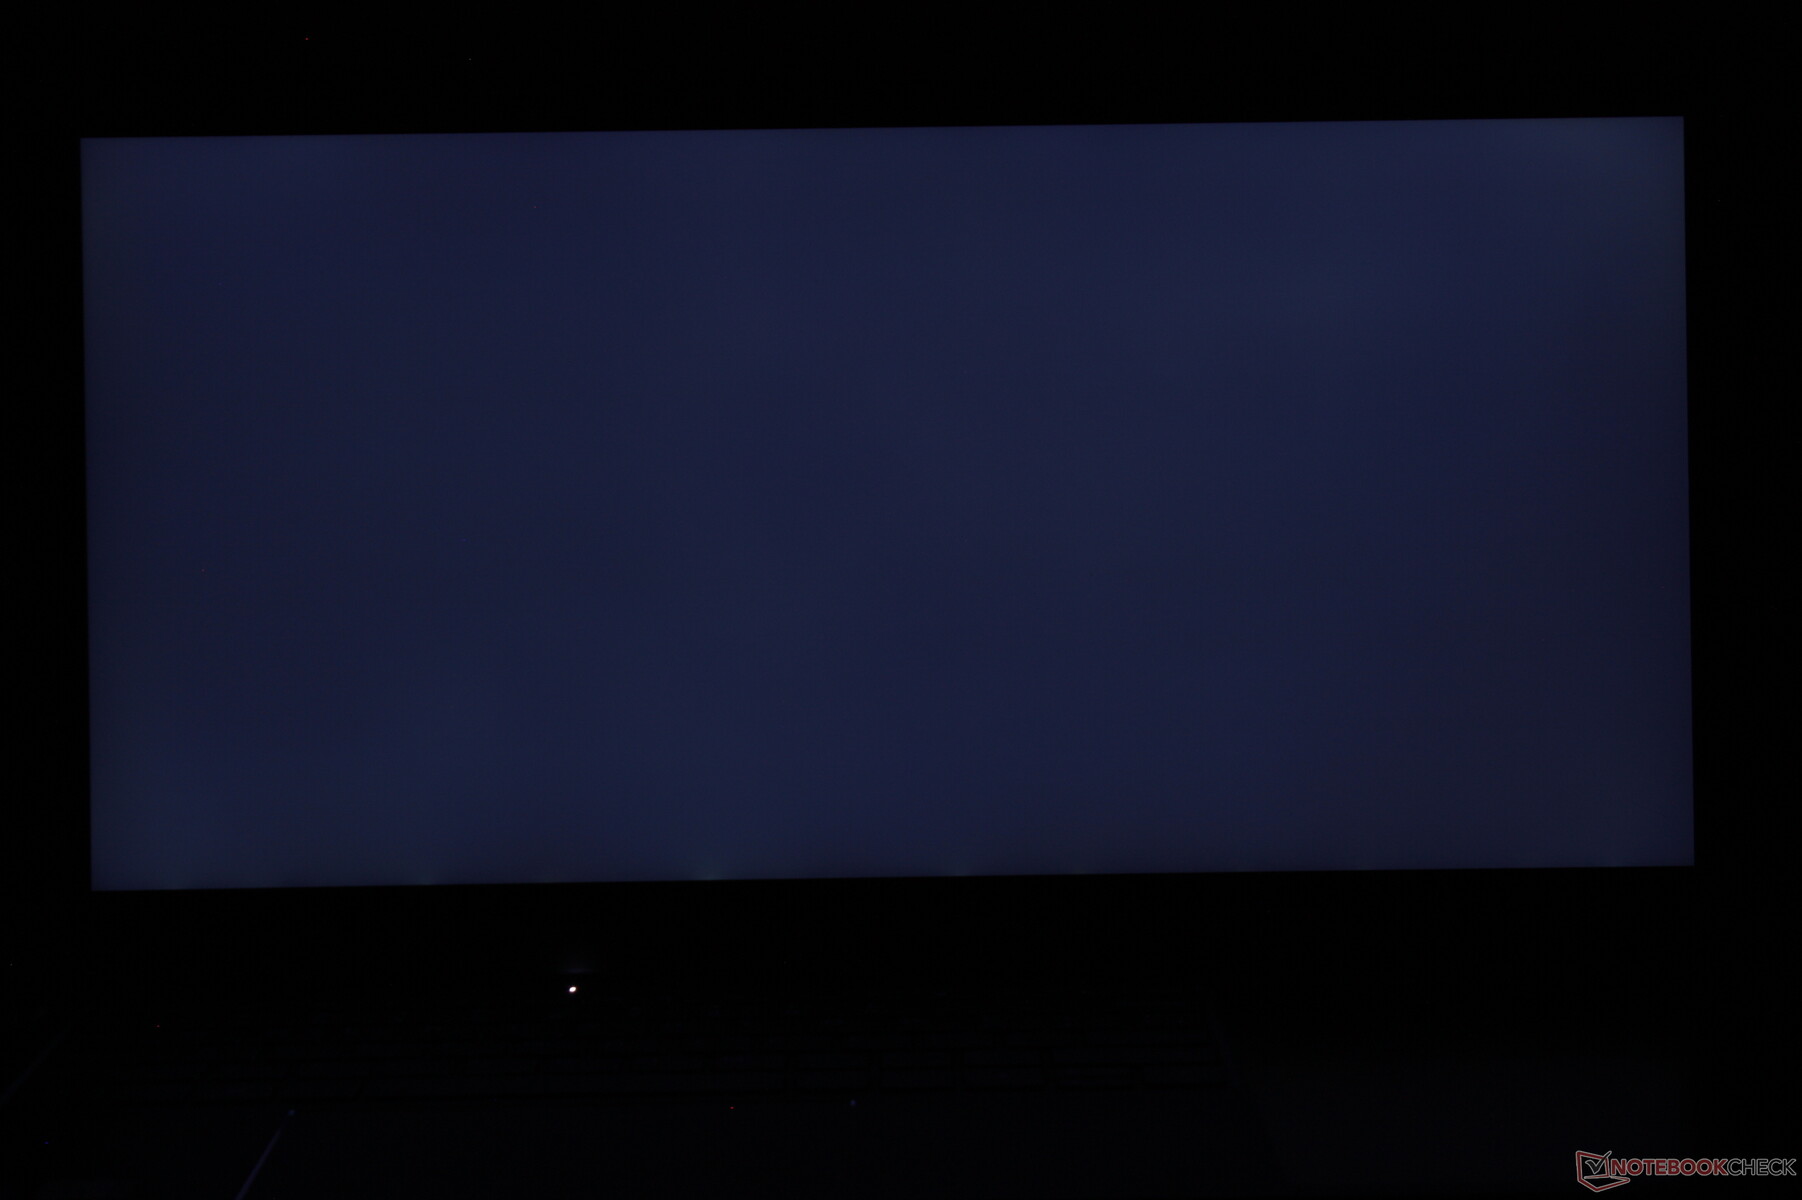
Homogénéité de la luminosité: 84 %
Valeur mesurée au centre, sur batterie: 405 cd/m²
Contraste: 1191:1 (Valeurs des noirs: 0.34 cd/m²)
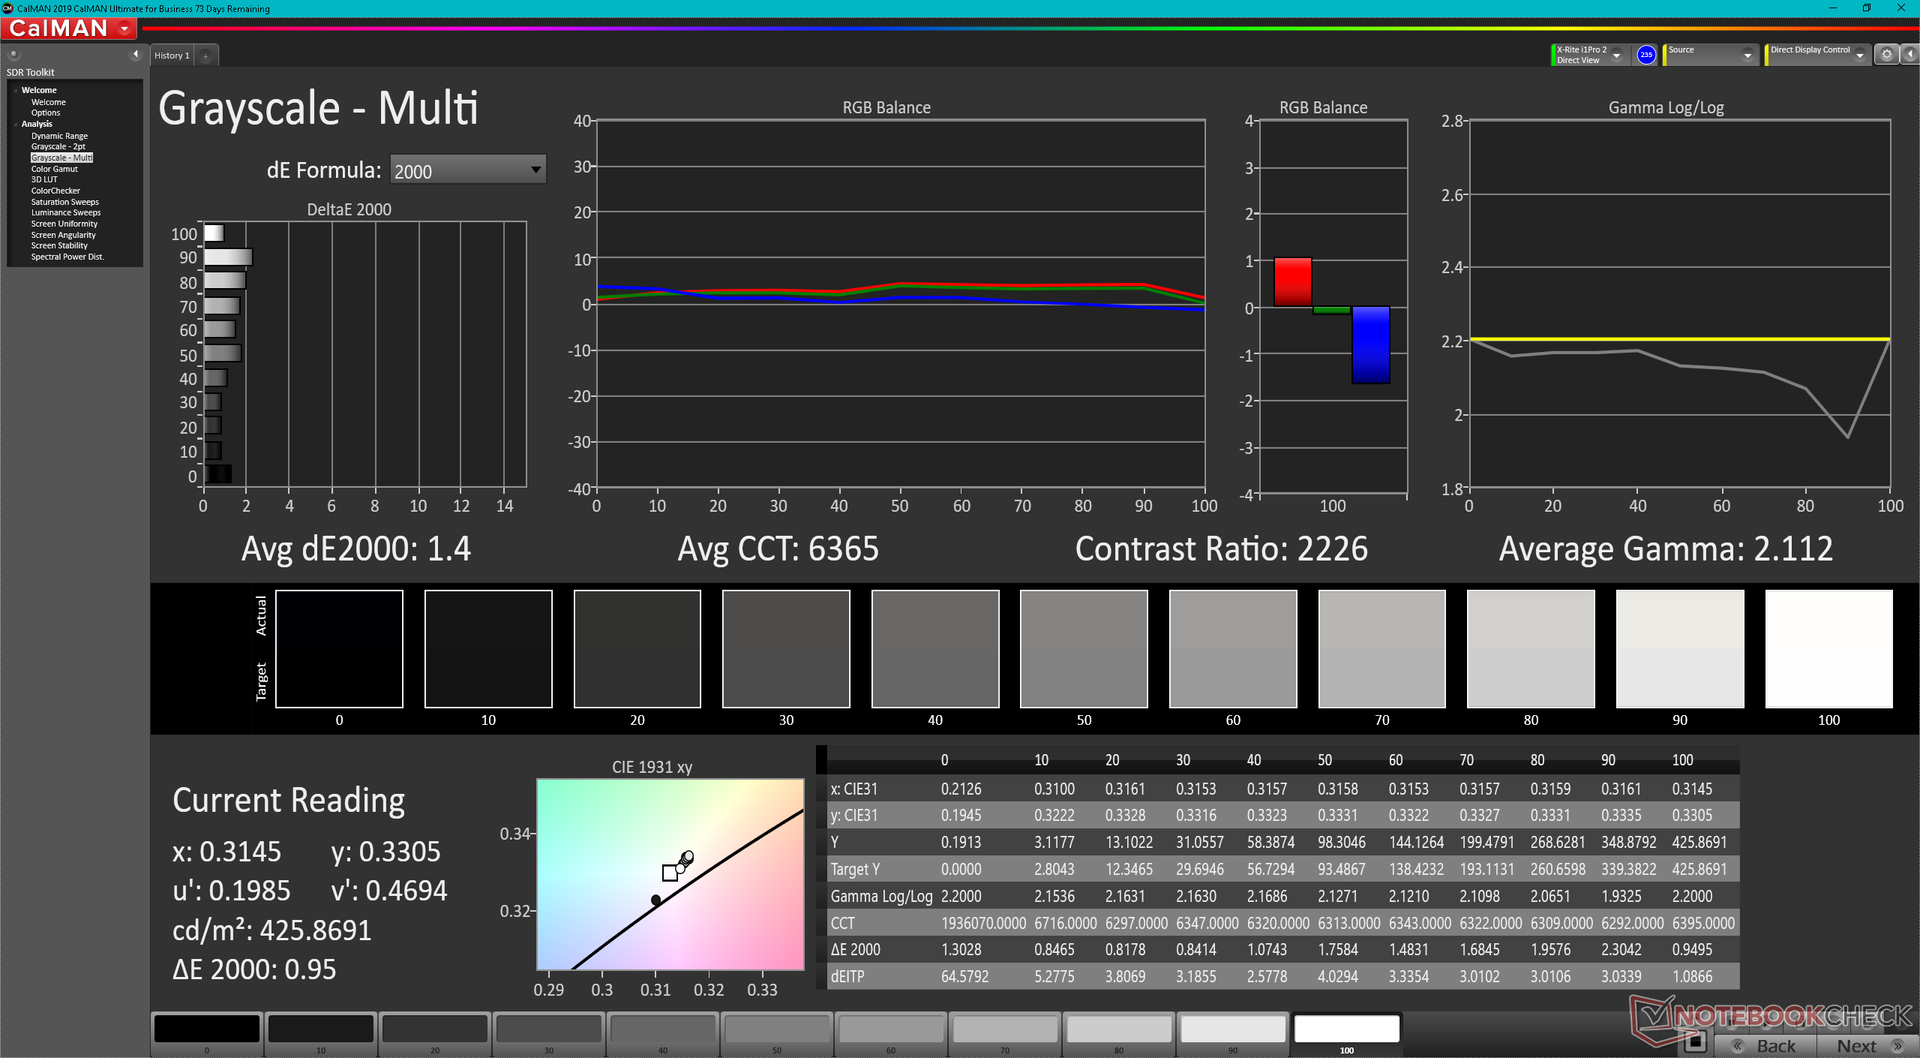
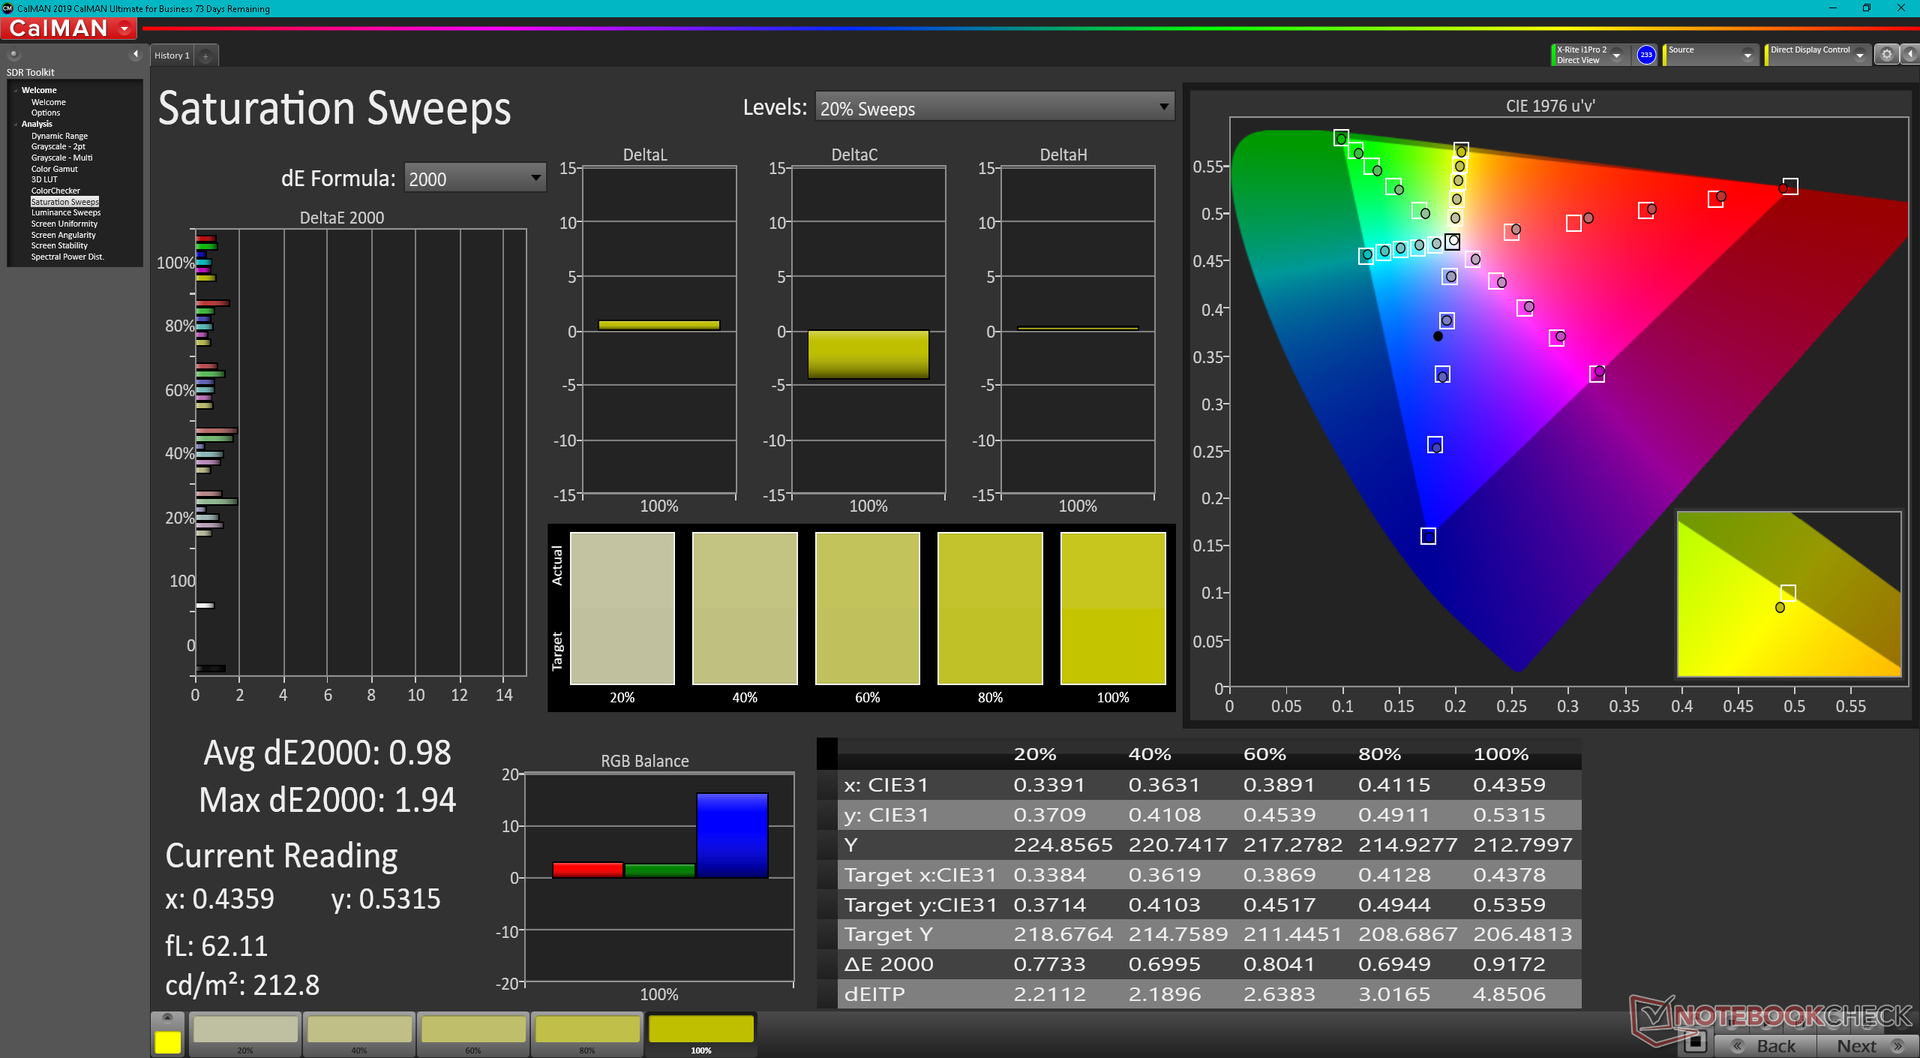
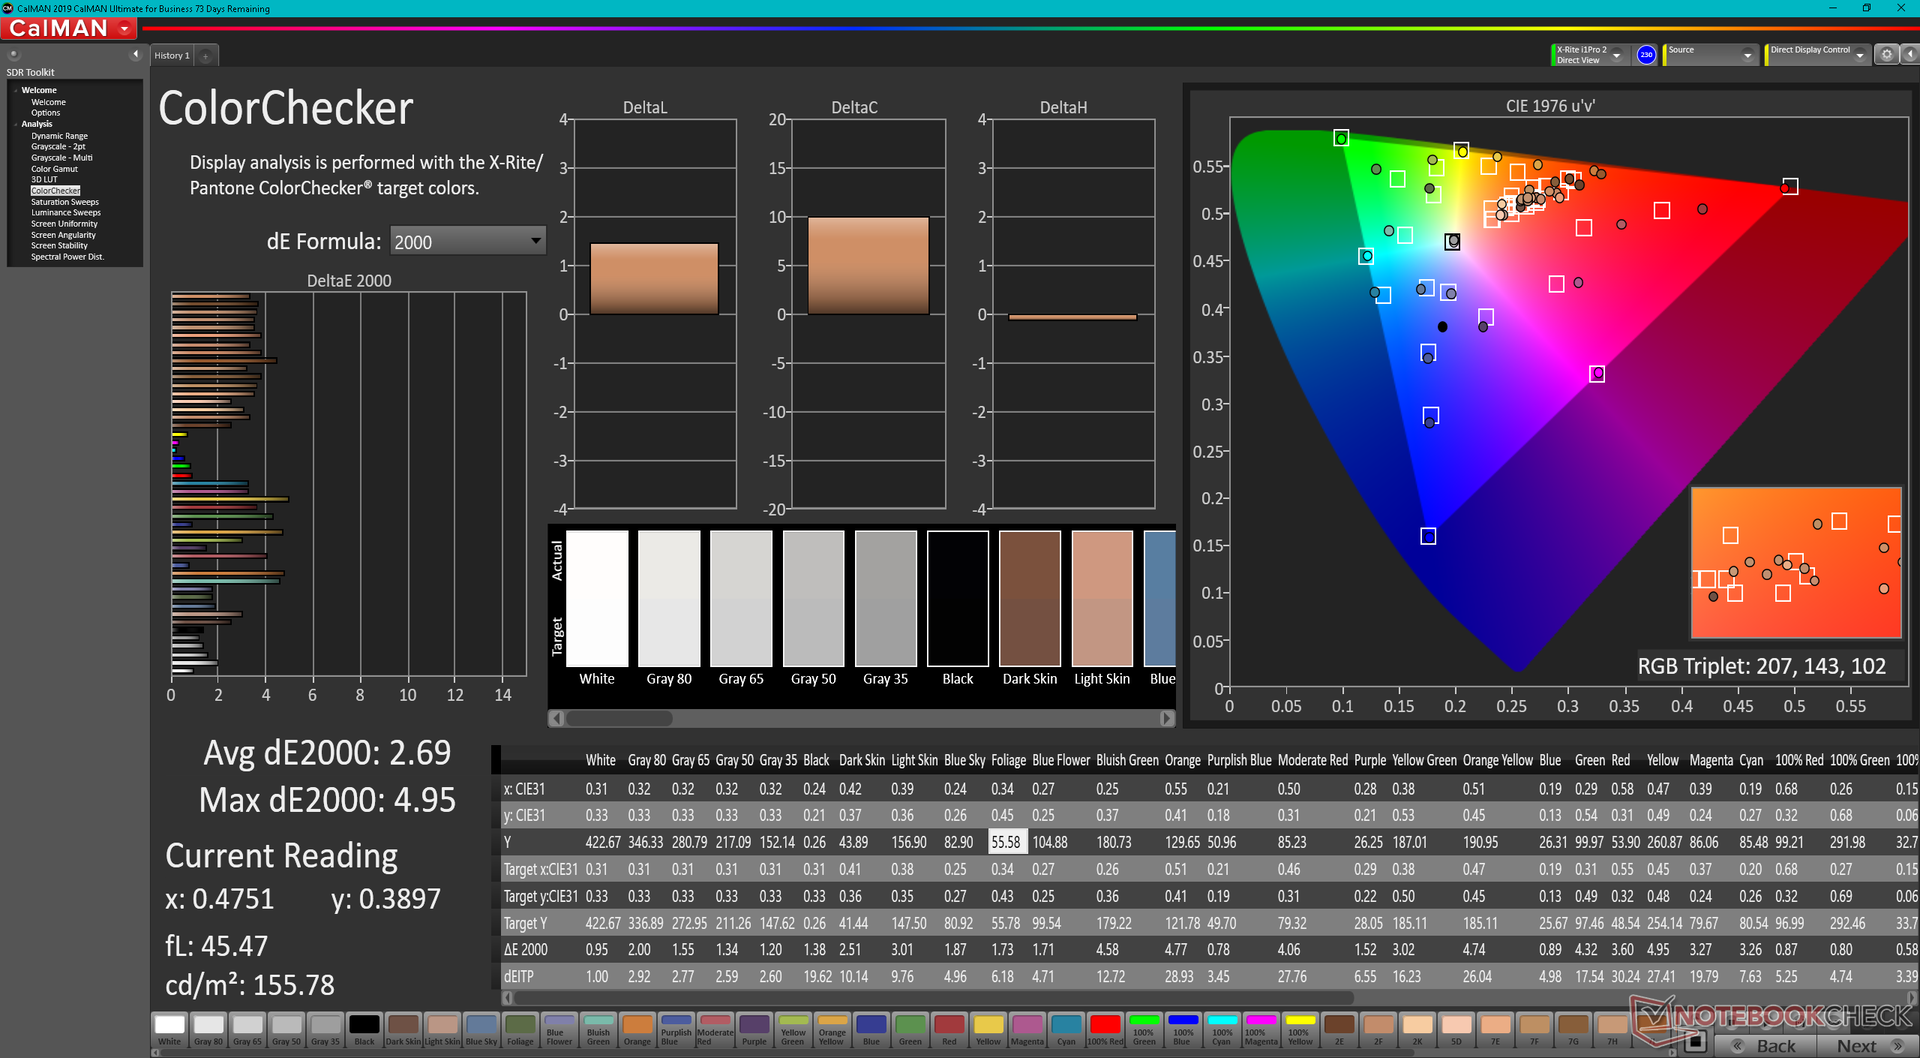
ΔE ColorChecker Calman: 2.69 | ∀{0.5-29.43 Ø4.71}
ΔE Greyscale Calman: 1.4 | ∀{0.09-98 Ø4.96}
87.8% AdobeRGB 1998 (Argyll 3D)
100% sRGB (Argyll 3D)
96.8% Display P3 (Argyll 3D)
Gamma: 2.1
CCT: 6365 K
| Lenovo ThinkBook Plus Gen3 MNH300HB1-1 CSOT T3, IPS, 3072x1440, 17.3" | Lenovo ThinkBook Plus Gen2 Core i5 CSOT T3 MND307DA1-5 (LCD), IPS, E-Ink, 2560x1600, 13.3" | Asus ProArt StudioBook Pro 17 W700G3T 170PUW1-A00, IPS, 1920x1200, 17" | LG Gram 17 (2022) LG Philips LP170WQ1-SPF2, IPS, 2560x1600, 17" | Dell XPS 17 9720 Sharp LQ170R1, IPS, 3840x2400, 17" | Gigabyte Aero 17 HDR YD AU Optronics AUO329B, IPS, 3840x2160, 17.3" | |
|---|---|---|---|---|---|---|
| Display | -16% | -2% | -0% | 4% | 1% | |
| Display P3 Coverage (%) | 96.8 | 70.1 -28% | 96.2 -1% | 98.1 1% | 94.8 -2% | 86.9 -10% |
| sRGB Coverage (%) | 100 | 98 -2% | 99.8 0% | 99.9 0% | 100 0% | 100 0% |
| AdobeRGB 1998 Coverage (%) | 87.8 | 72.2 -18% | 84.7 -4% | 85.9 -2% | 100 14% | 99.6 13% |
| Response Times | -44% | -45% | -28% | -64% | -56% | |
| Response Time Grey 50% / Grey 80% * (ms) | 28 ? | 42.8 ? -53% | 41.2 ? -47% | 46 ? -64% | 53.2 ? -90% | 52 ? -86% |
| Response Time Black / White * (ms) | 20.8 ? | 28 ? -35% | 29.6 ? -42% | 19 ? 9% | 28.4 ? -37% | 26 ? -25% |
| PWM Frequency (Hz) | 17990 ? | |||||
| Screen | -17% | 9% | -28% | -18% | 20% | |
| Brightness middle (cd/m²) | 405 | 404 0% | 323 -20% | 400 -1% | 438 8% | 488 20% |
| Brightness (cd/m²) | 389 | 388 0% | 308 -21% | 353 -9% | 411 6% | 467 20% |
| Brightness Distribution (%) | 84 | 94 12% | 88 5% | 81 -4% | 86 2% | 86 2% |
| Black Level * (cd/m²) | 0.34 | 0.24 29% | 0.36 -6% | 0.3 12% | 0.27 21% | 0.33 3% |
| Contrast (:1) | 1191 | 1683 41% | 897 -25% | 1333 12% | 1622 36% | 1479 24% |
| Colorchecker dE 2000 * | 2.69 | 3.1 -15% | 1.1 59% | 3.15 -17% | 2.5 7% | 1.23 54% |
| Colorchecker dE 2000 max. * | 4.95 | 6.9 -39% | 3.3 33% | 6.54 -32% | 6.3 -27% | 2.94 41% |
| Greyscale dE 2000 * | 1.4 | 3.7 -164% | 0.8 43% | 4 -186% | 4.2 -200% | 1.5 -7% |
| Gamma | 2.1 105% | 2.26 97% | 2.23 99% | 2.14 103% | 2.22 99% | 2.169 101% |
| CCT | 6365 102% | 5936 110% | 6479 100% | 7278 89% | 7034 92% | 6614 98% |
| Colorchecker dE 2000 calibrated * | 1.3 | 0.8 | 1.44 | 0.8 | 0.77 | |
| Color Space (Percent of AdobeRGB 1998) (%) | 75.7 | 99 | ||||
| Color Space (Percent of sRGB) (%) | 99.8 | 99 | ||||
| Moyenne finale (programmes/paramètres) | -26% /
-21% | -13% /
-2% | -19% /
-22% | -26% /
-20% | -12% /
4% |
* ... Moindre est la valeur, meilleures sont les performances
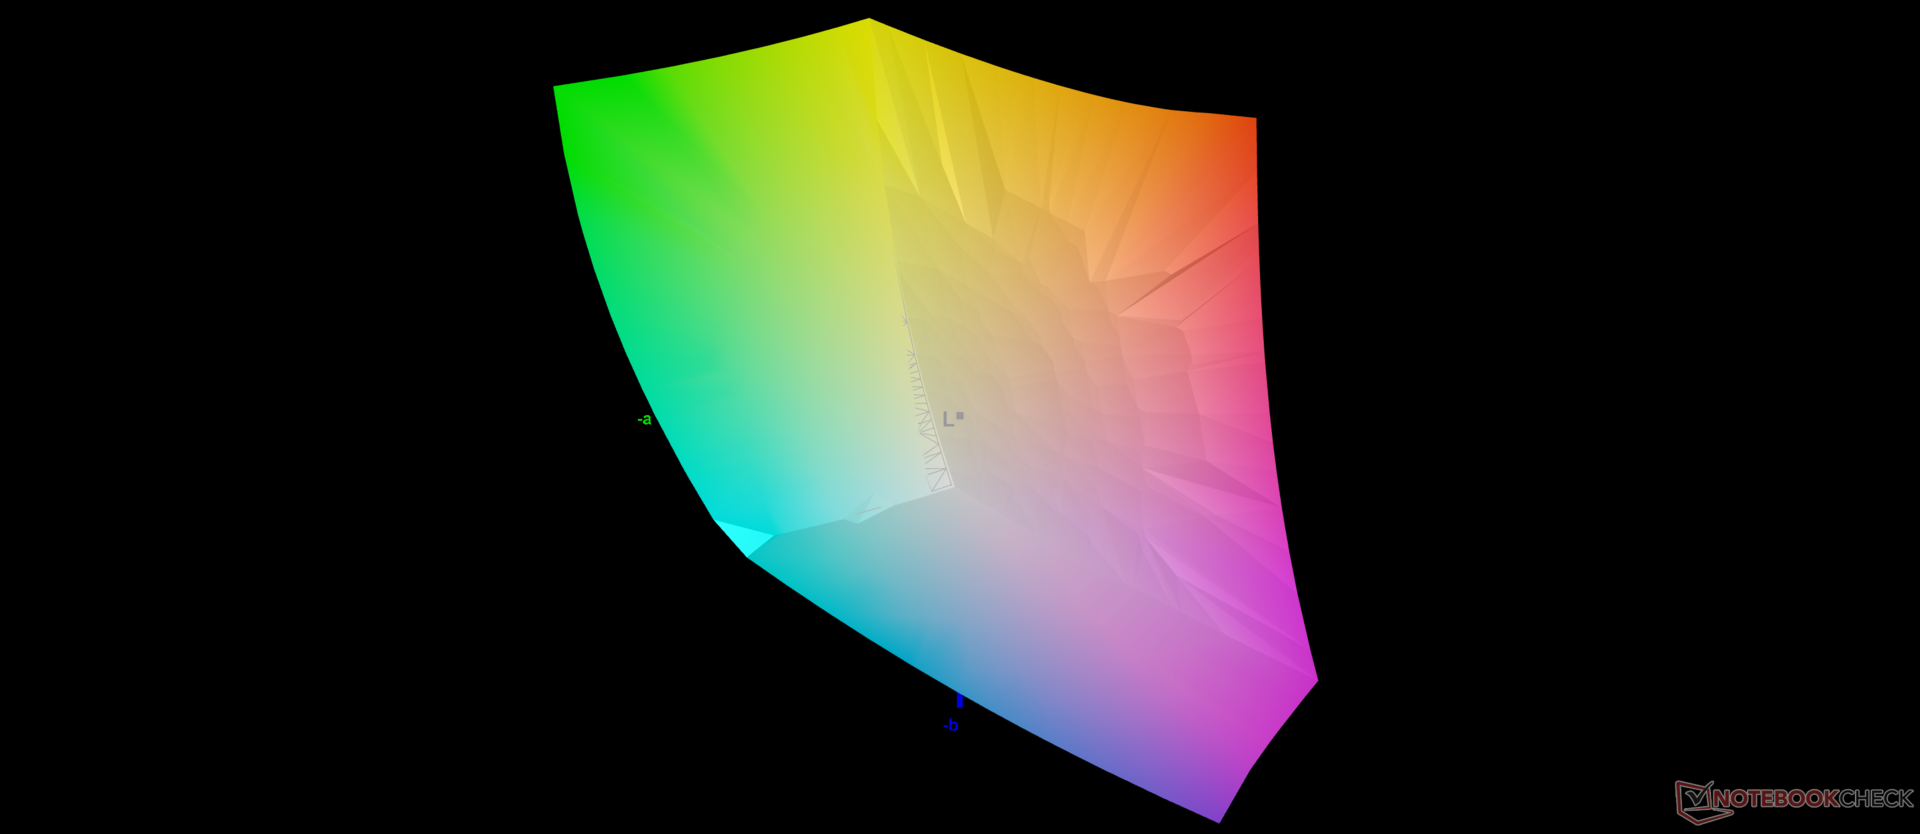
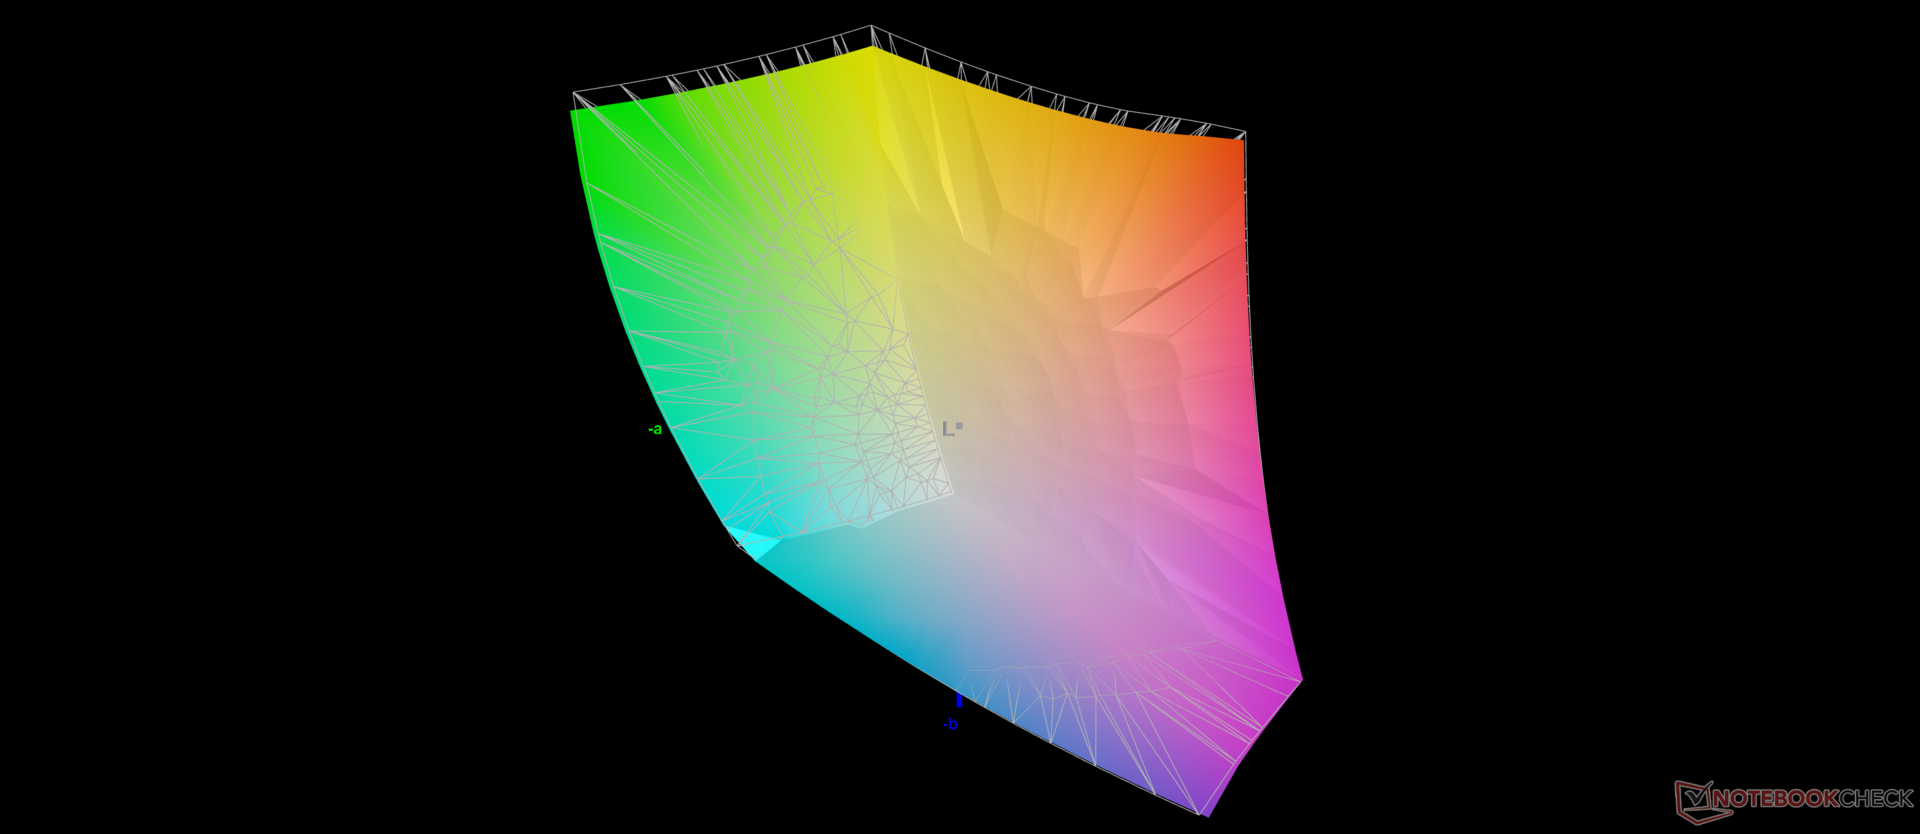
L'écran est bien calibré par rapport à la norme P3, avec des valeurs DeltaE moyennes pour les niveaux de gris et les couleurs de seulement 1,4 et 2,69, respectivement. Un étalonnage par l'utilisateur final n'est pas nécessaire.
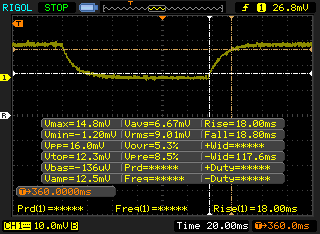
Temps de réponse de l'écran
| ↔ Temps de réponse noir à blanc | ||
|---|---|---|
| 20.8 ms ... hausse ↗ et chute ↘ combinées | ↗ 10.8 ms hausse | 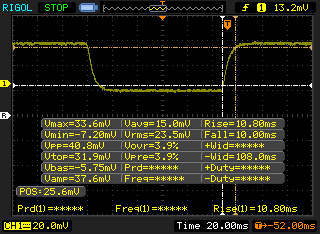 |
| ↘ 10 ms chute | ||
| L'écran montre de bons temps de réponse, mais insuffisant pour du jeu compétitif. En comparaison, tous les appareils testés affichent entre 0.1 (minimum) et 240 (maximum) ms. » 46 % des appareils testés affichent de meilleures performances. Cela signifie que les latences relevées sont similaires à la moyenne (19.8 ms) de tous les appareils testés. | ||
| ↔ Temps de réponse gris 50% à gris 80% | ||
| 28 ms ... hausse ↗ et chute ↘ combinées | ↗ 13.2 ms hausse | 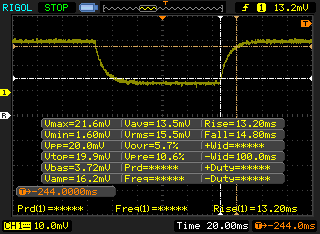 |
| ↘ 14.8 ms chute | ||
| L'écran souffre de latences relativement élevées, insuffisant pour le jeu. En comparaison, tous les appareils testés affichent entre 0.165 (minimum) et 636 (maximum) ms. » 38 % des appareils testés affichent de meilleures performances. Cela signifie que les latences relevées sont similaires à la moyenne (31 ms) de tous les appareils testés. | ||
Scintillement / MLI (Modulation de largeur d'impulsion)
| Scintillement / MLI (Modulation de largeur d'impulsion) non décelé | 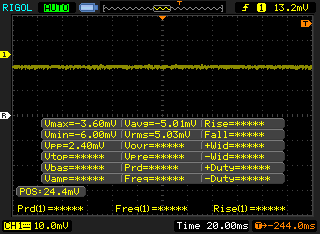 | ||
En comparaison, 52 % des appareils testés n'emploient pas MDI pour assombrir leur écran. Nous avons relevé une moyenne à 7754 (minimum : 5 - maximum : 343500) Hz dans le cas où une MDI était active. | |||
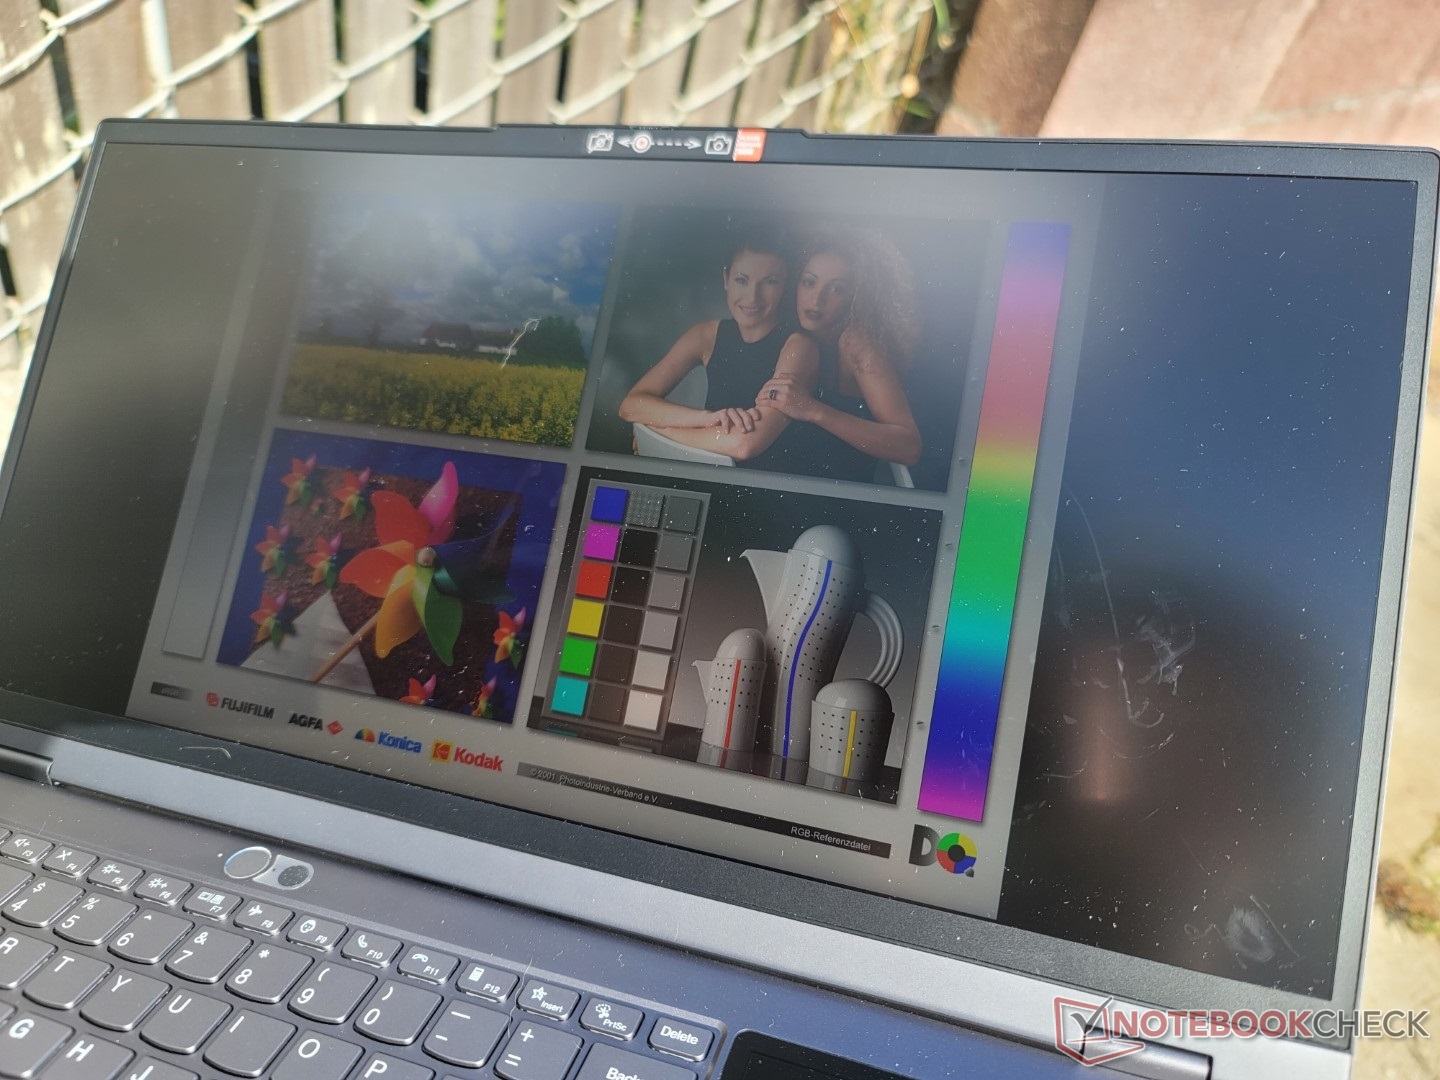
La visibilité extérieure est similaire à celle du LG Gram 17 ou XPS 17 car ils ont tous des niveaux de luminosité maximum similaires. Sur le Lenovo, cependant, les reflets sont plus visibles sur les côtés de l'écran en raison de son rapport d'aspect plus grand que la normale. Vous voudrez toujours travailler à l'ombre lorsque cela est possible pour maximiser la visibilité.
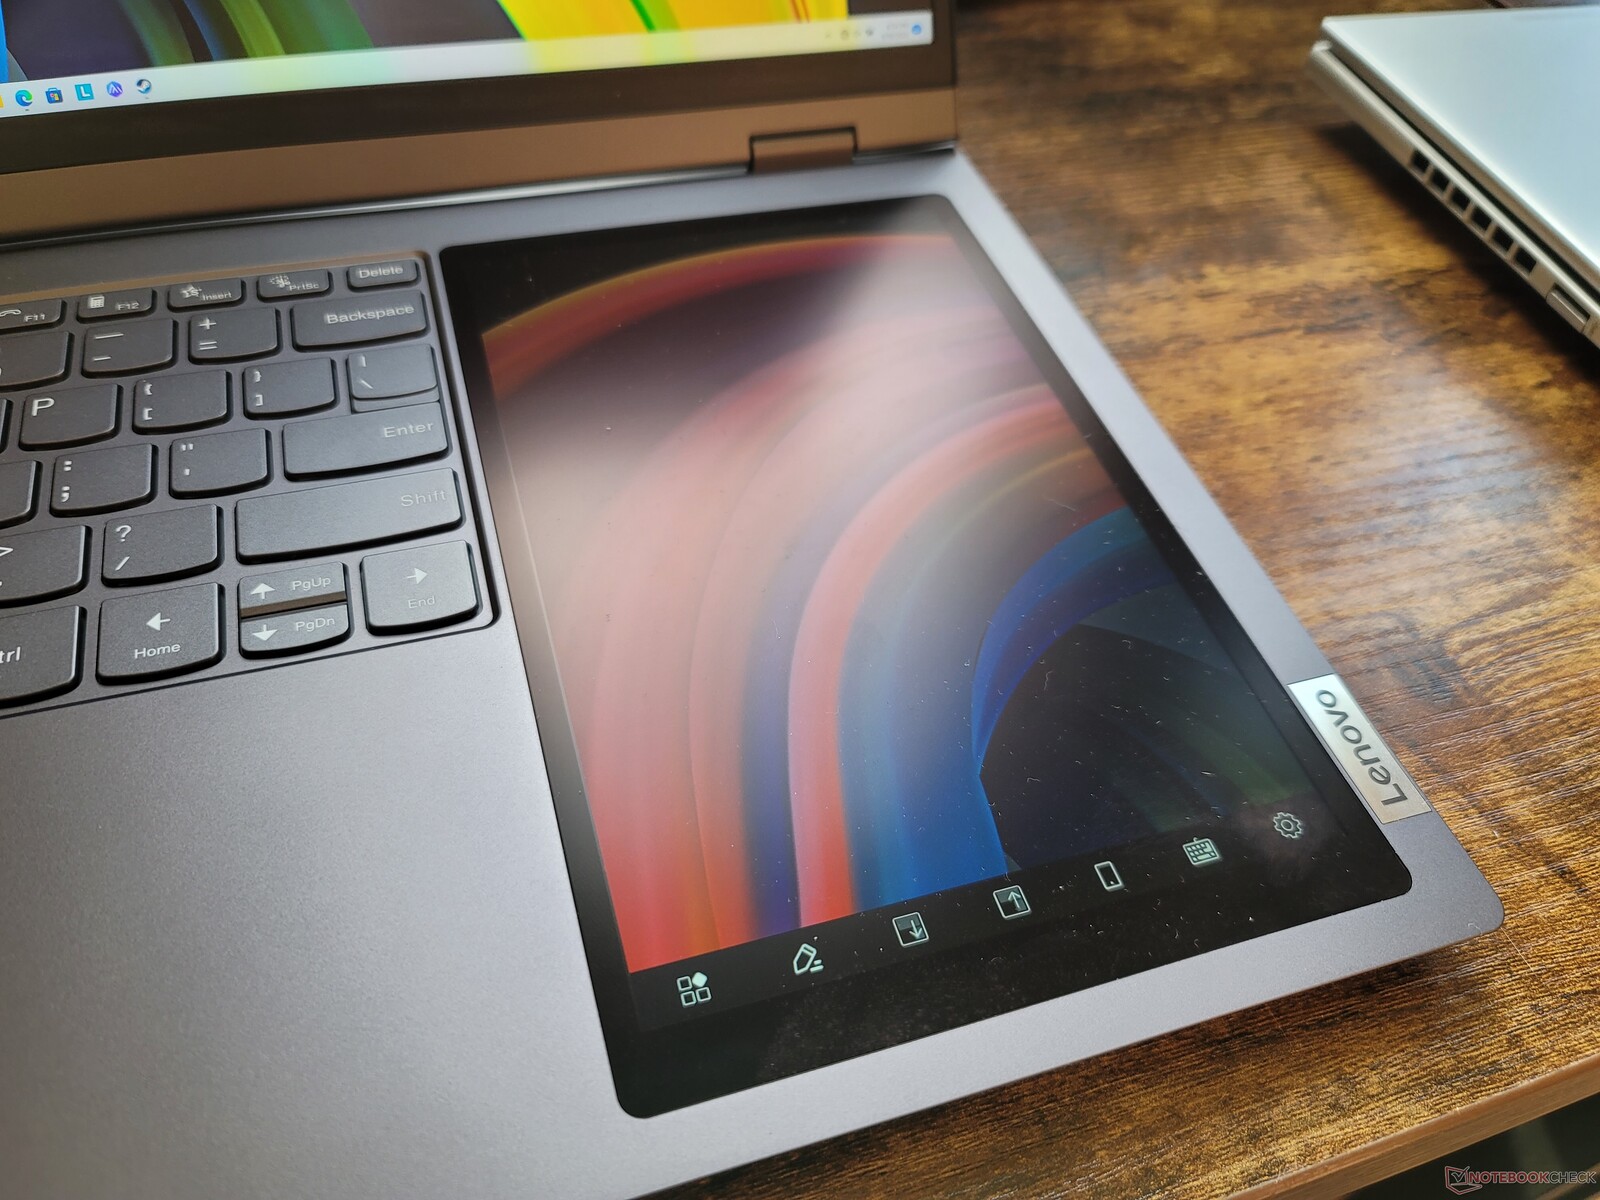
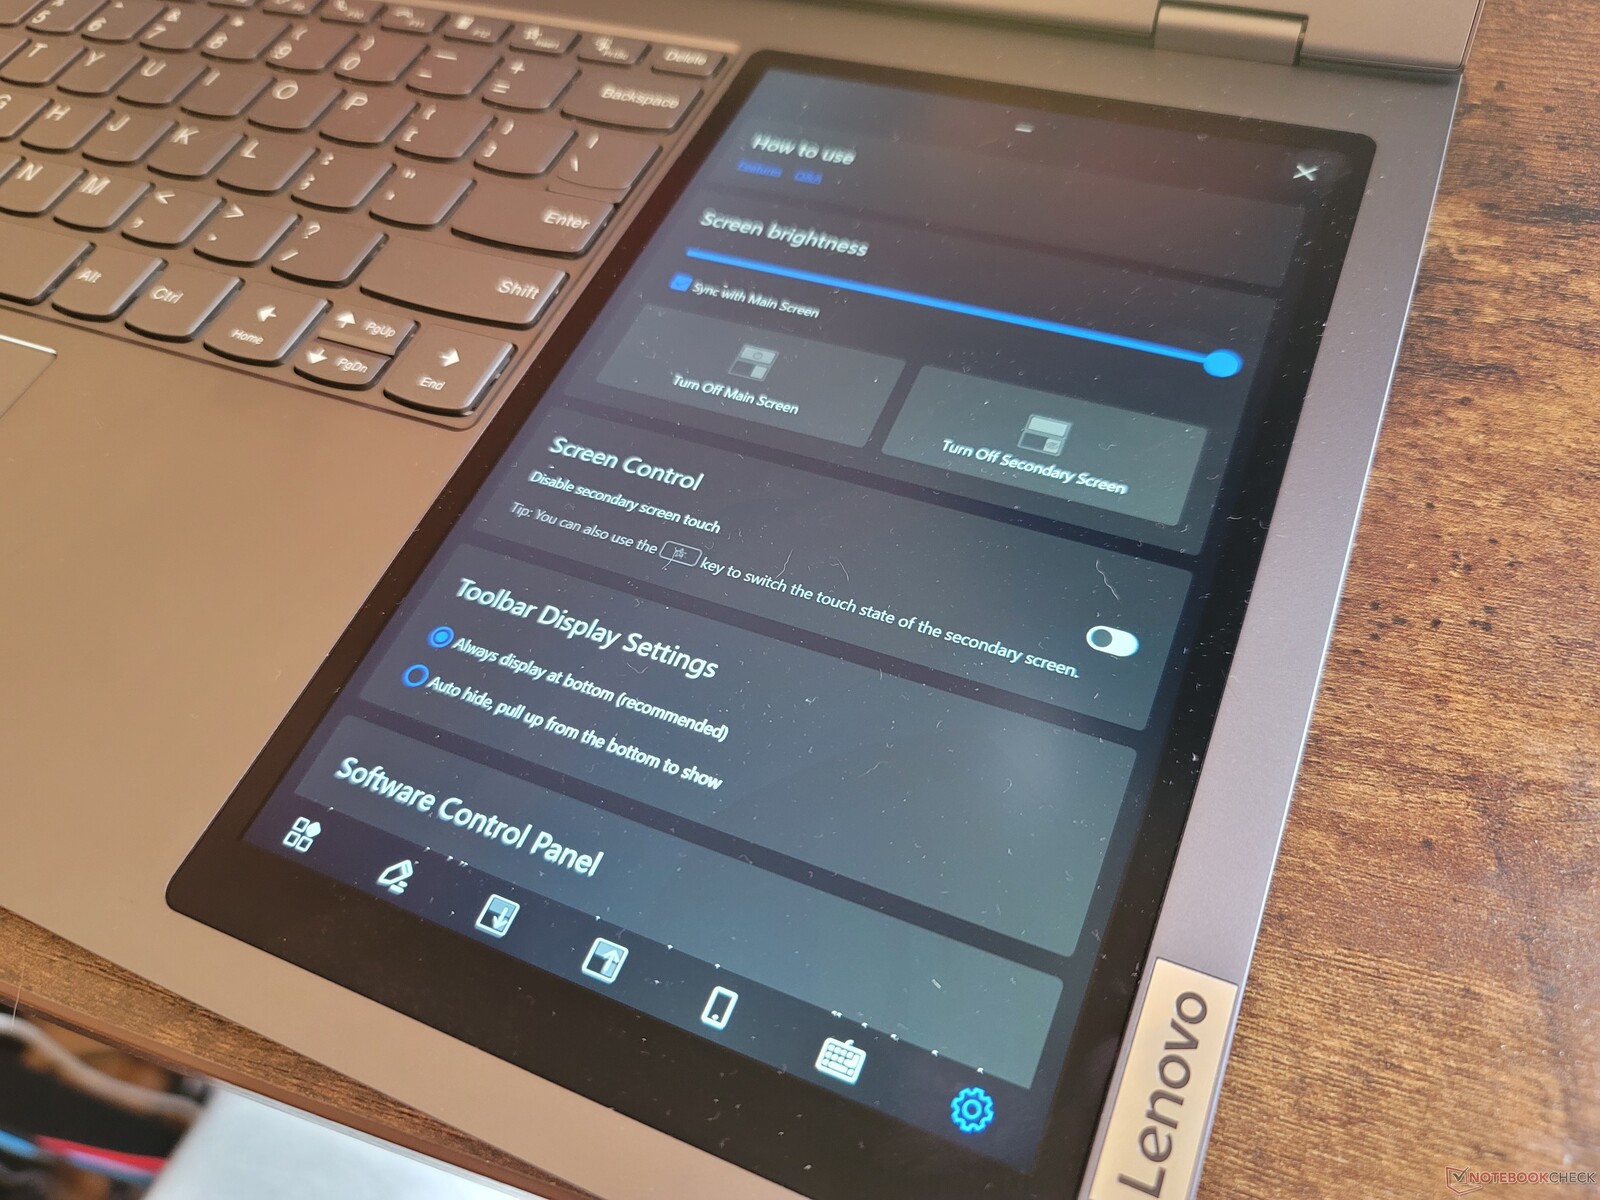
Écran secondaire : beaucoup d'espace d'écran supplémentaire
D'un point de vue utilitaire, l'écran secondaire fonctionne parfaitement et sans problème pour faire glisser différentes fenêtres vers l'écran principal. Son rapport d'aspect 10:16 en particulier fonctionne mieux pour une plus grande variété d'applications et de programmes par rapport aux écrans secondaires plus étroits de la série Asus ZenBook Duo.
L'écran est également doté de fonctions auxiliaires uniques que l'on ne trouve pas sur les modèles Asus. Par exemple, il existe des options pour synchroniser la luminosité avec l'écran principal ou pour refléter uniquement une partie spécifique de 800 x 1280 pixels de l'écran principal.
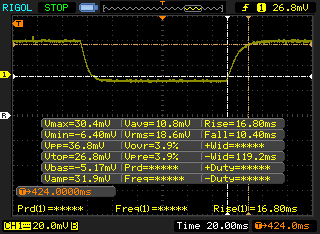
| écran tactile IPS secondaire de 8 pouces | Résolution 800 x 1280 |
|---|---|
| Taux de rafraîchissement | 60 Hz |
| Luminosité maximale | 393,6 nits |
| Temps de réponse du noir au blanc | 16,8 ms en montée, 10,4 ms en descente |
| Temps de réponse du gris au gris | 18,0 ms de montée, 18,8 ms de descente |
| Rapport de contraste | 579:1 |
| couverture sRGB | 80,6 pour cent |
| Gamma | 2,55 |
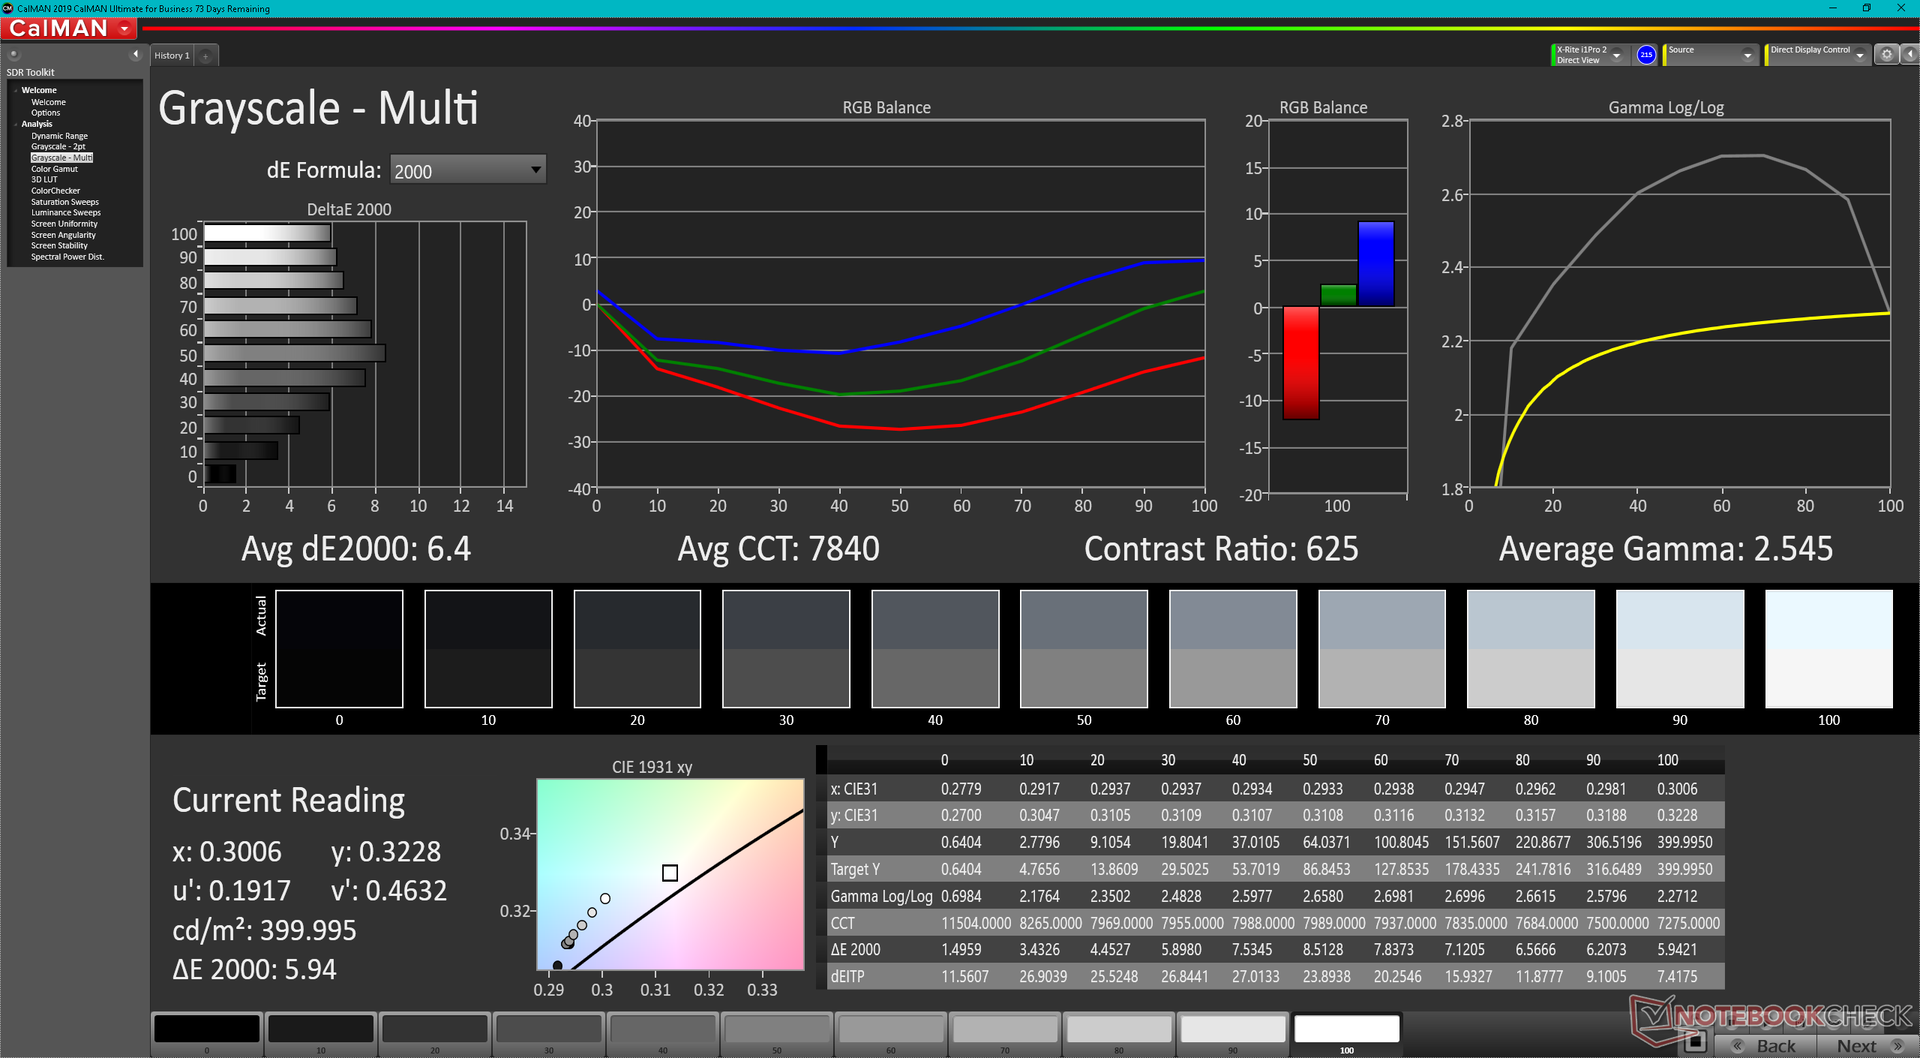
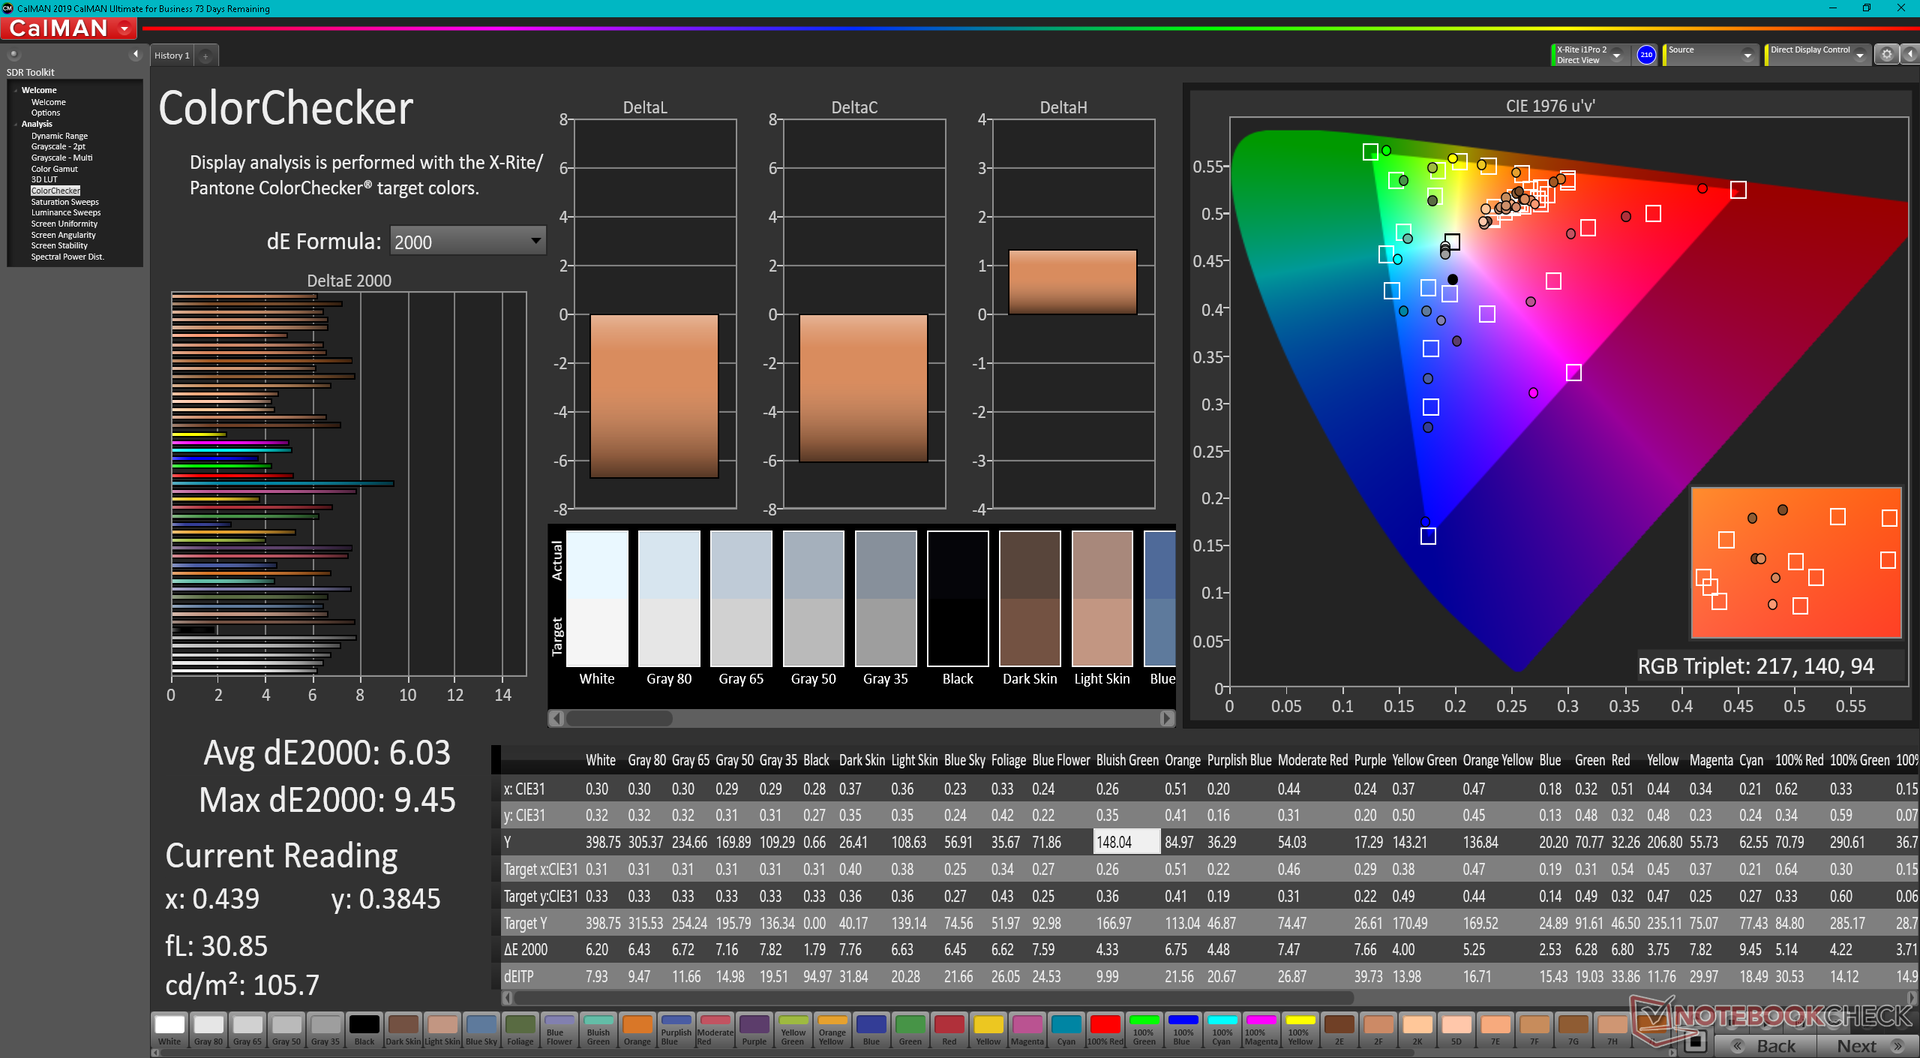
| CCT | 7840 |
| Moyenne des niveaux de gris DeltaE2000 | 6,4 |
| Colorchecker dE 2000 | 6.03 |
| Contrôleur de couleur dE 2000 Max | 9,45 |
Malheureusement, l'écran secondaire présente des inconvénients similaires à ceux de certains premiers modèles ZenBook Duo. Ses couleurs, sa fréquence de rafraîchissement, son taux de contraste, sa granularité et son angle de vision éblouissant, en particulier, sont tous nettement inférieurs à ceux de l'écran principal. La qualité d'image ressemble davantage à celle d'une tablette bon marché de 8 pouces Android qu'à celle d'un iPad ou d'une Samsung Galaxy Tab S. Si la reproduction de la qualité d'image 1:1 entre l'écran principal et l'écran secondaire est importante pour vos charges de travail, alors le double écran externe restera votre meilleure option
Nous avons également rencontré plusieurs bugs sur le second écran. Tout d'abord, sa luminosité n'était parfois pas synchronisée avec celle de l'écran principal. Deuxièmement, l'écran principal s'éteint souvent au réveil, ne laissant que le second écran allumé, même si les deux écrans étaient actifs avant d'entrer en mode veille. Troisièmement, l'écran réagit au toucher même s'il est désactivé par Windows, ce qui peut entraîner de nombreuses entrées accidentelles sur l'écran principal. Les utilisateurs doivent se souvenir d'appuyer manuellement sur la touche " S Star " (ou la touche " Insert ") du clavier pour activer la sensibilité au toucher. Enfin, de nombreuses entrées ne sont pas enregistrées sur le deuxième écran, ce qui peut devenir frustrant pendant l'utilisation. Bon nombre de ces fonctionnalités sont prometteuses, mais elles pourraient certainement bénéficier de plus de temps de développement.
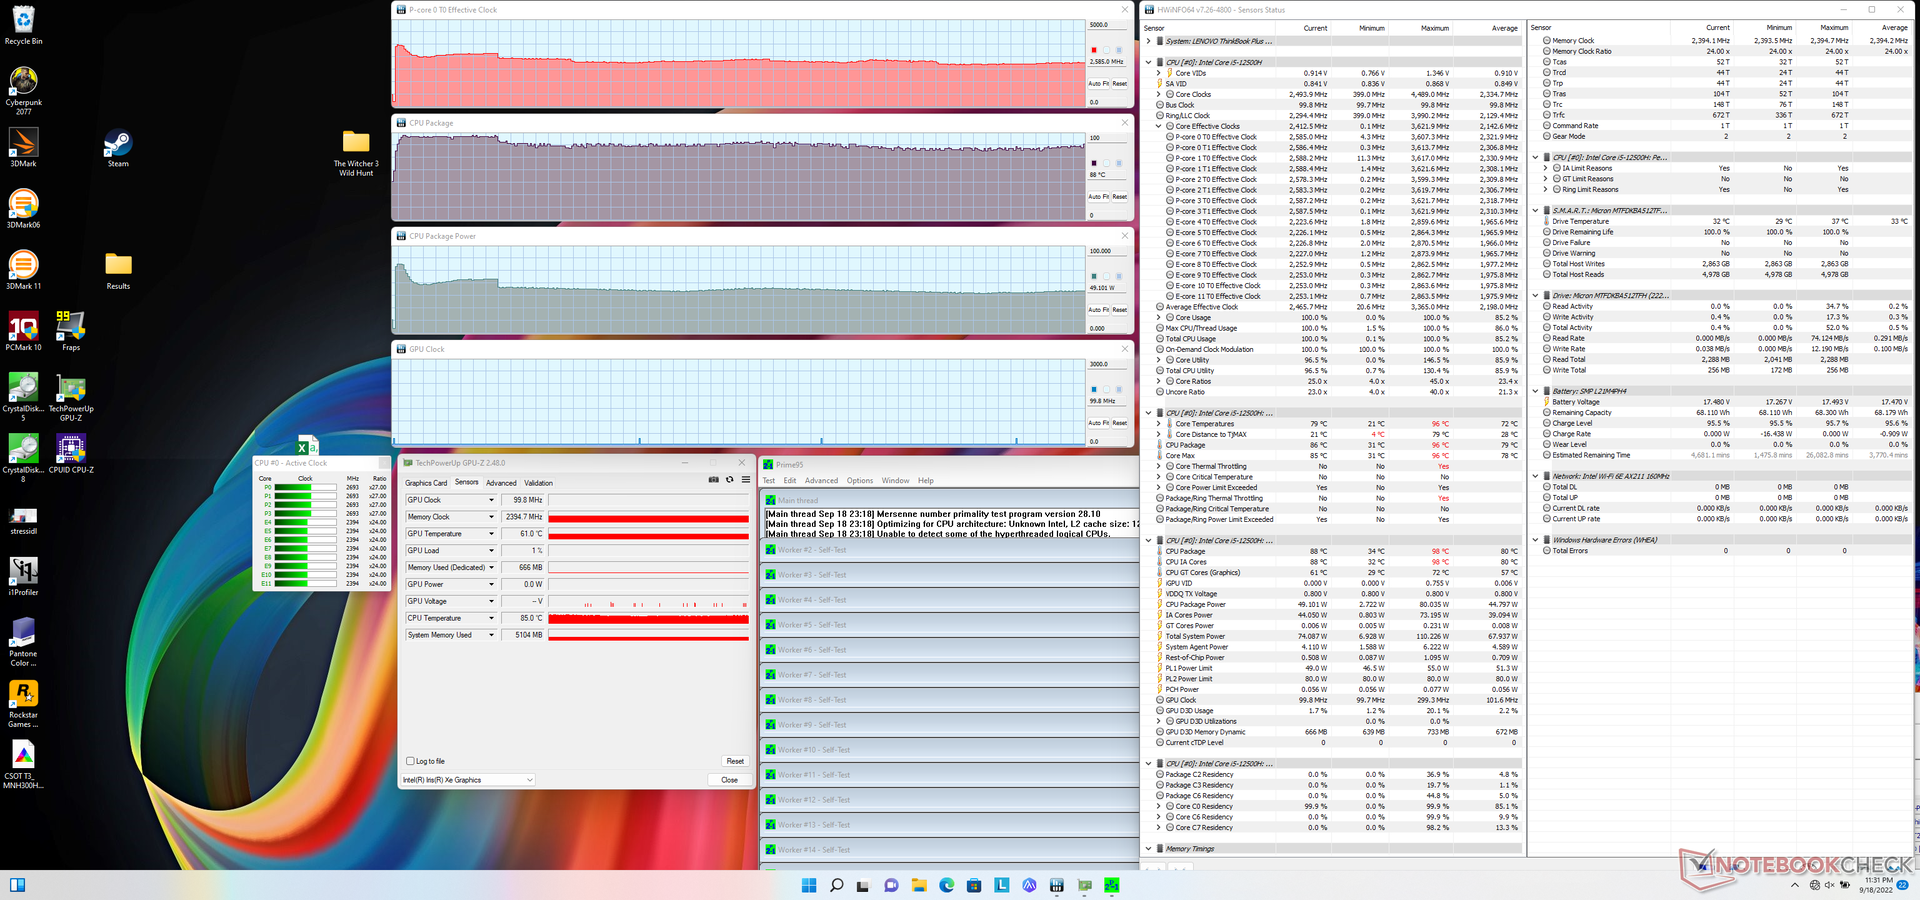
Performances - Intel 12e génération Alder Lake-H
Conditions d'essai
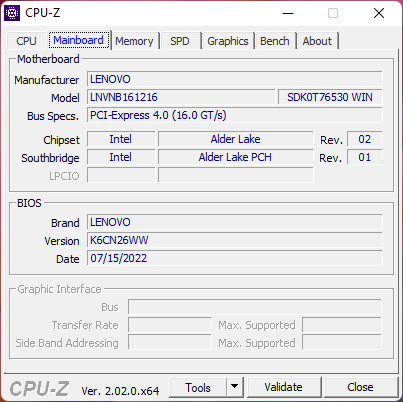
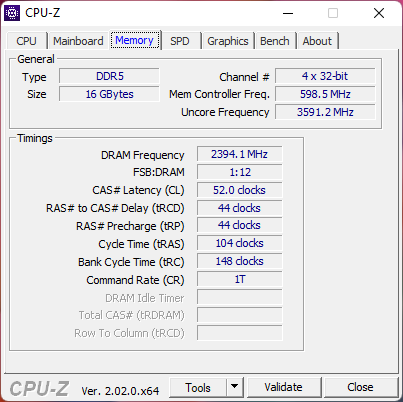
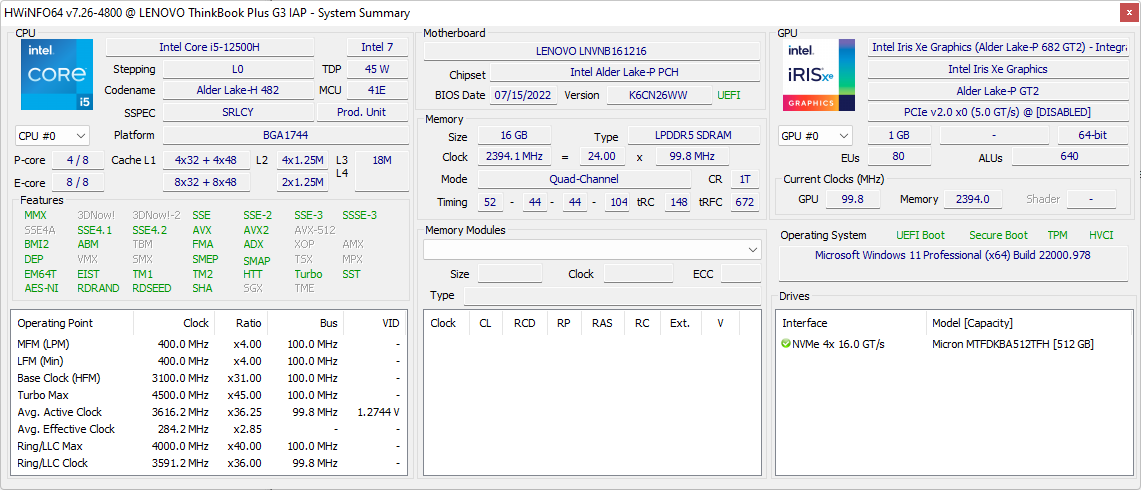
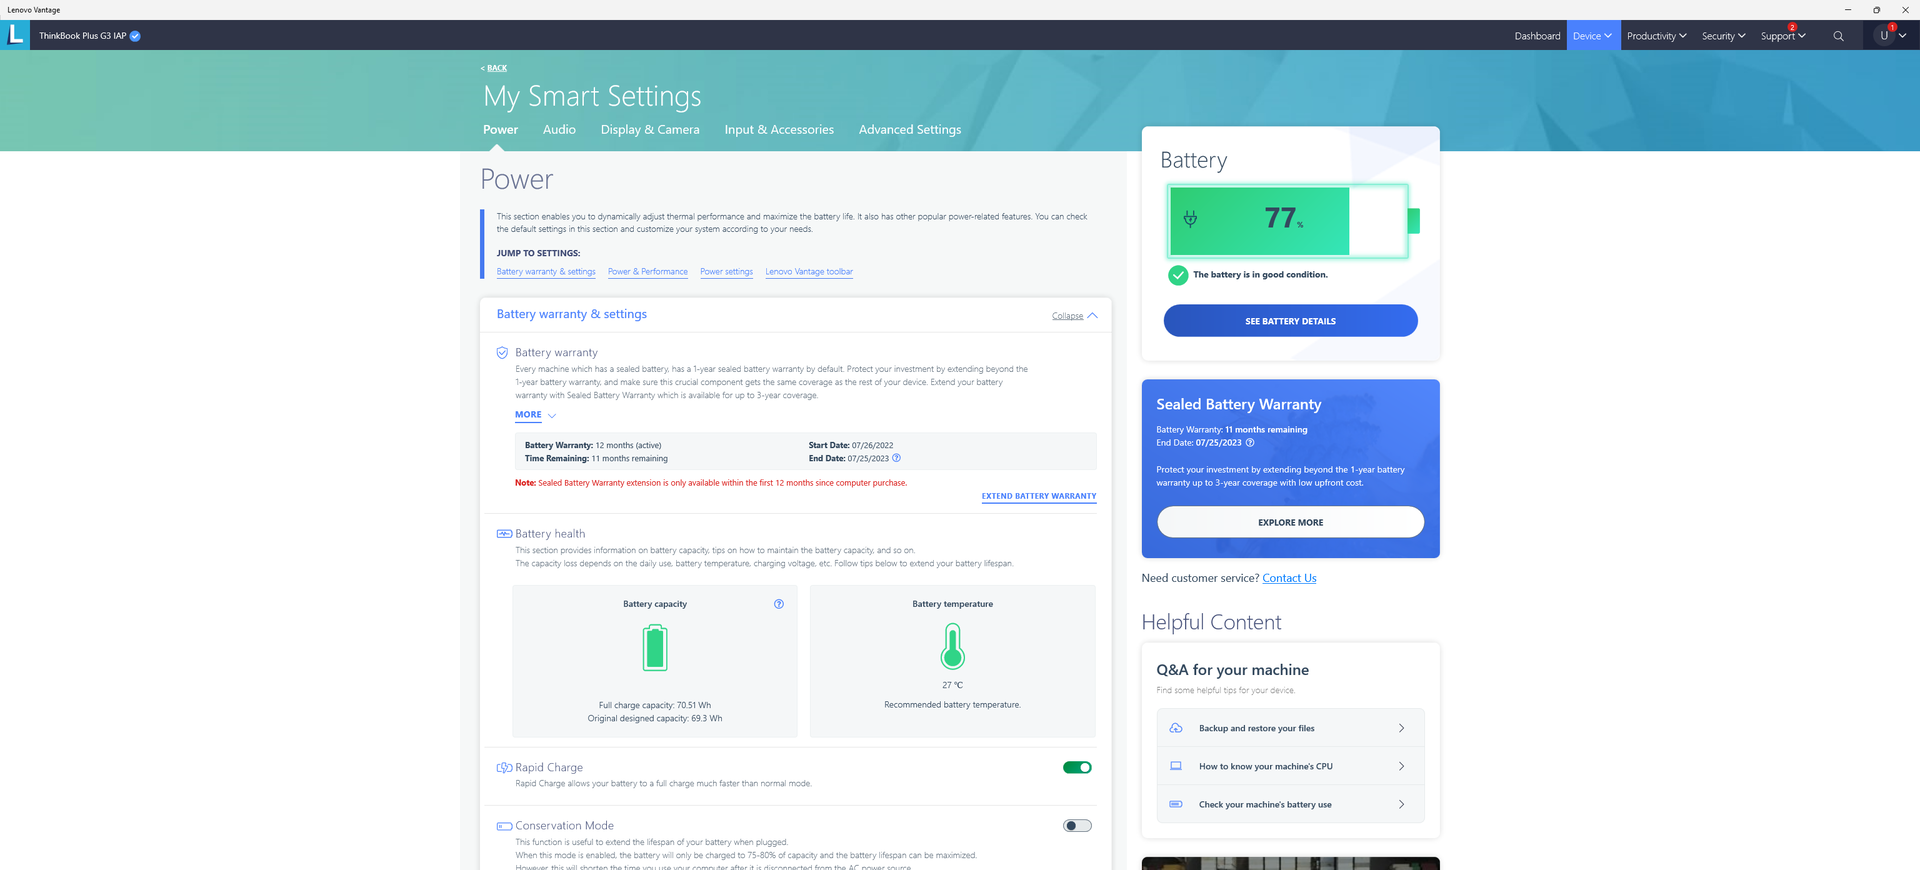
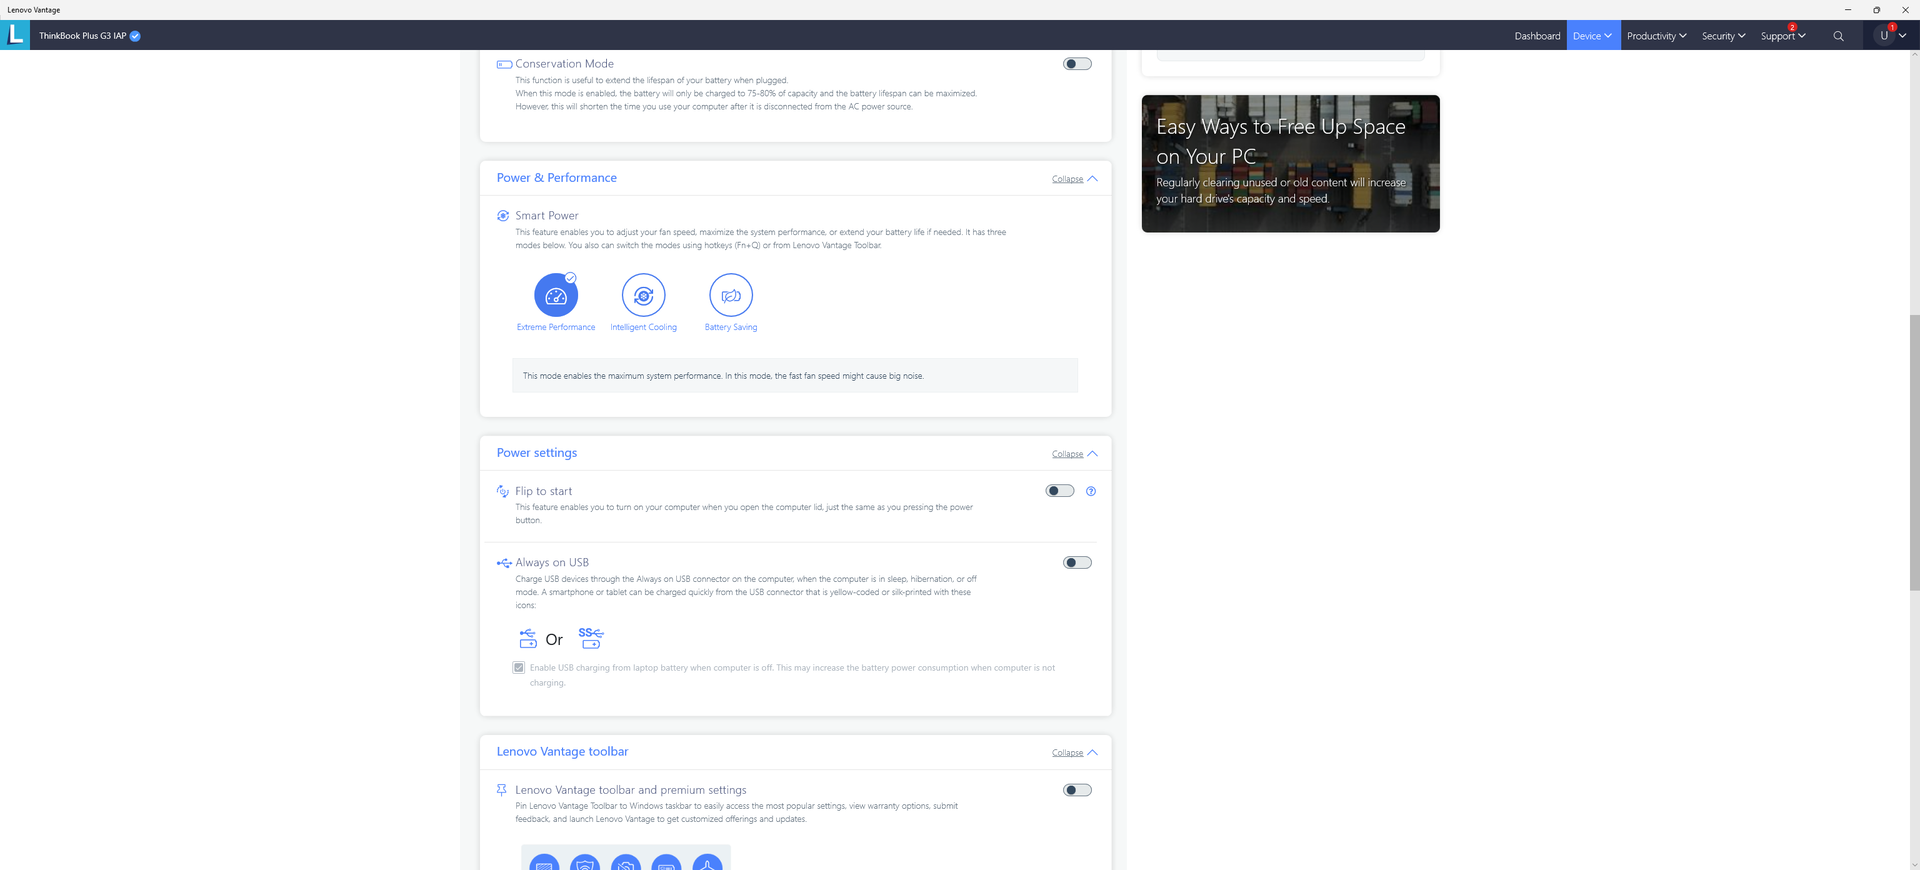
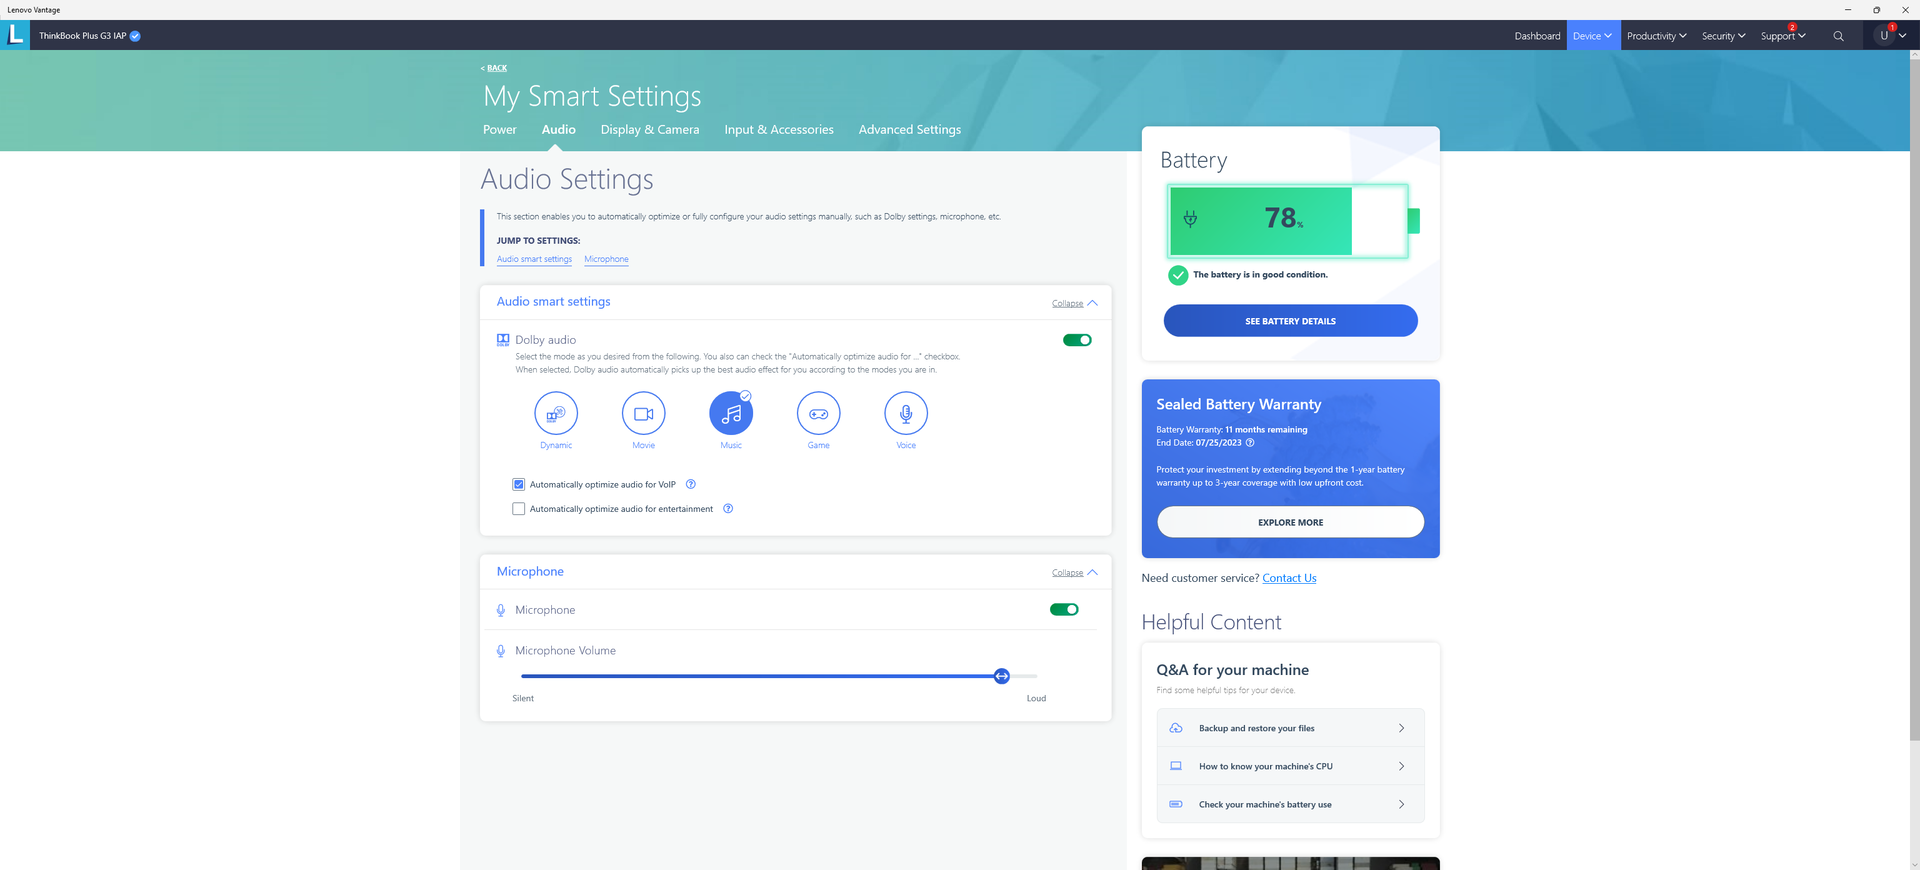
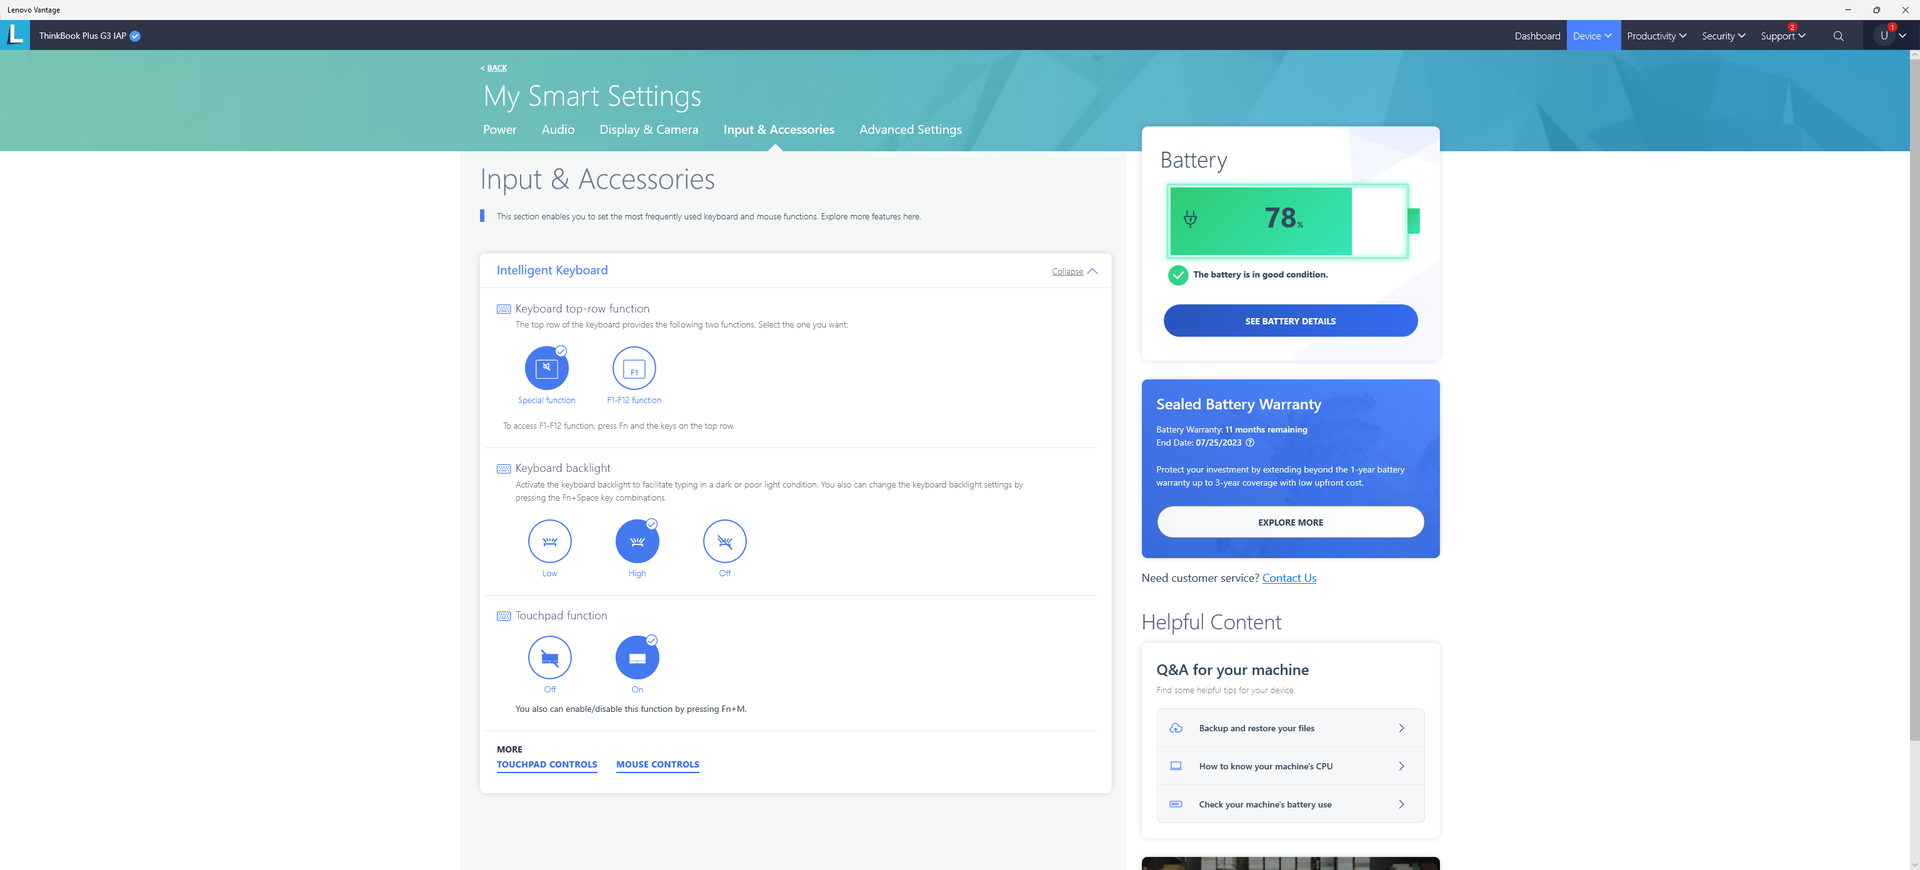
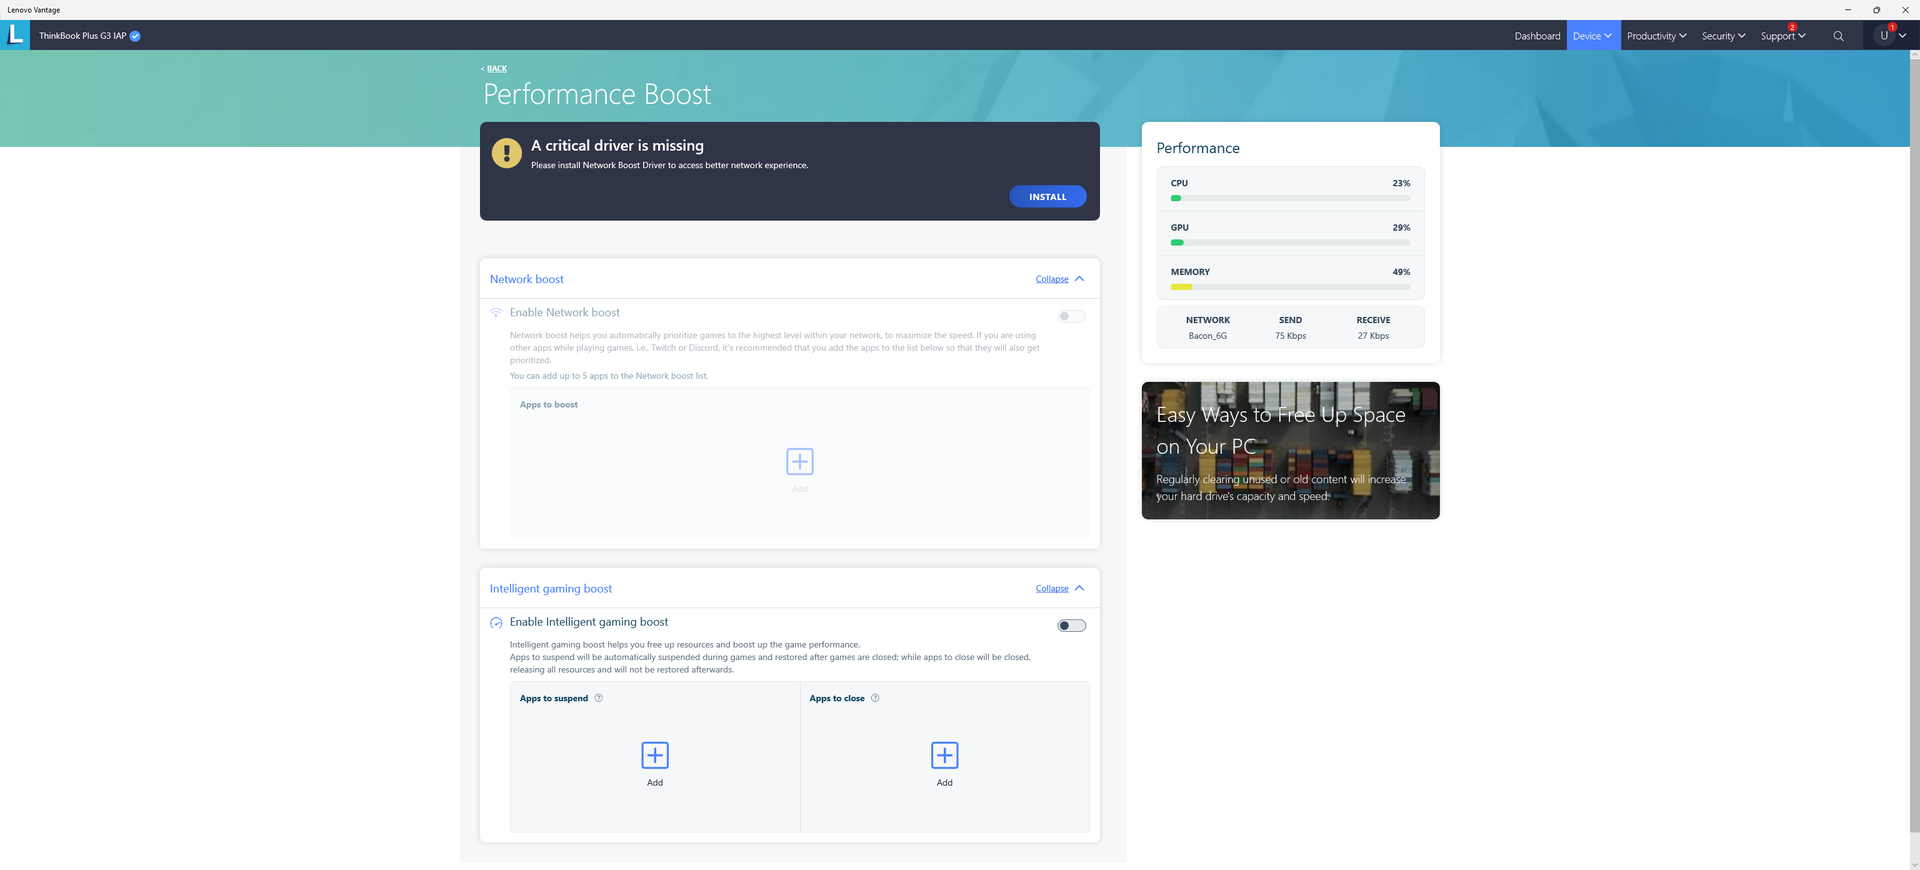
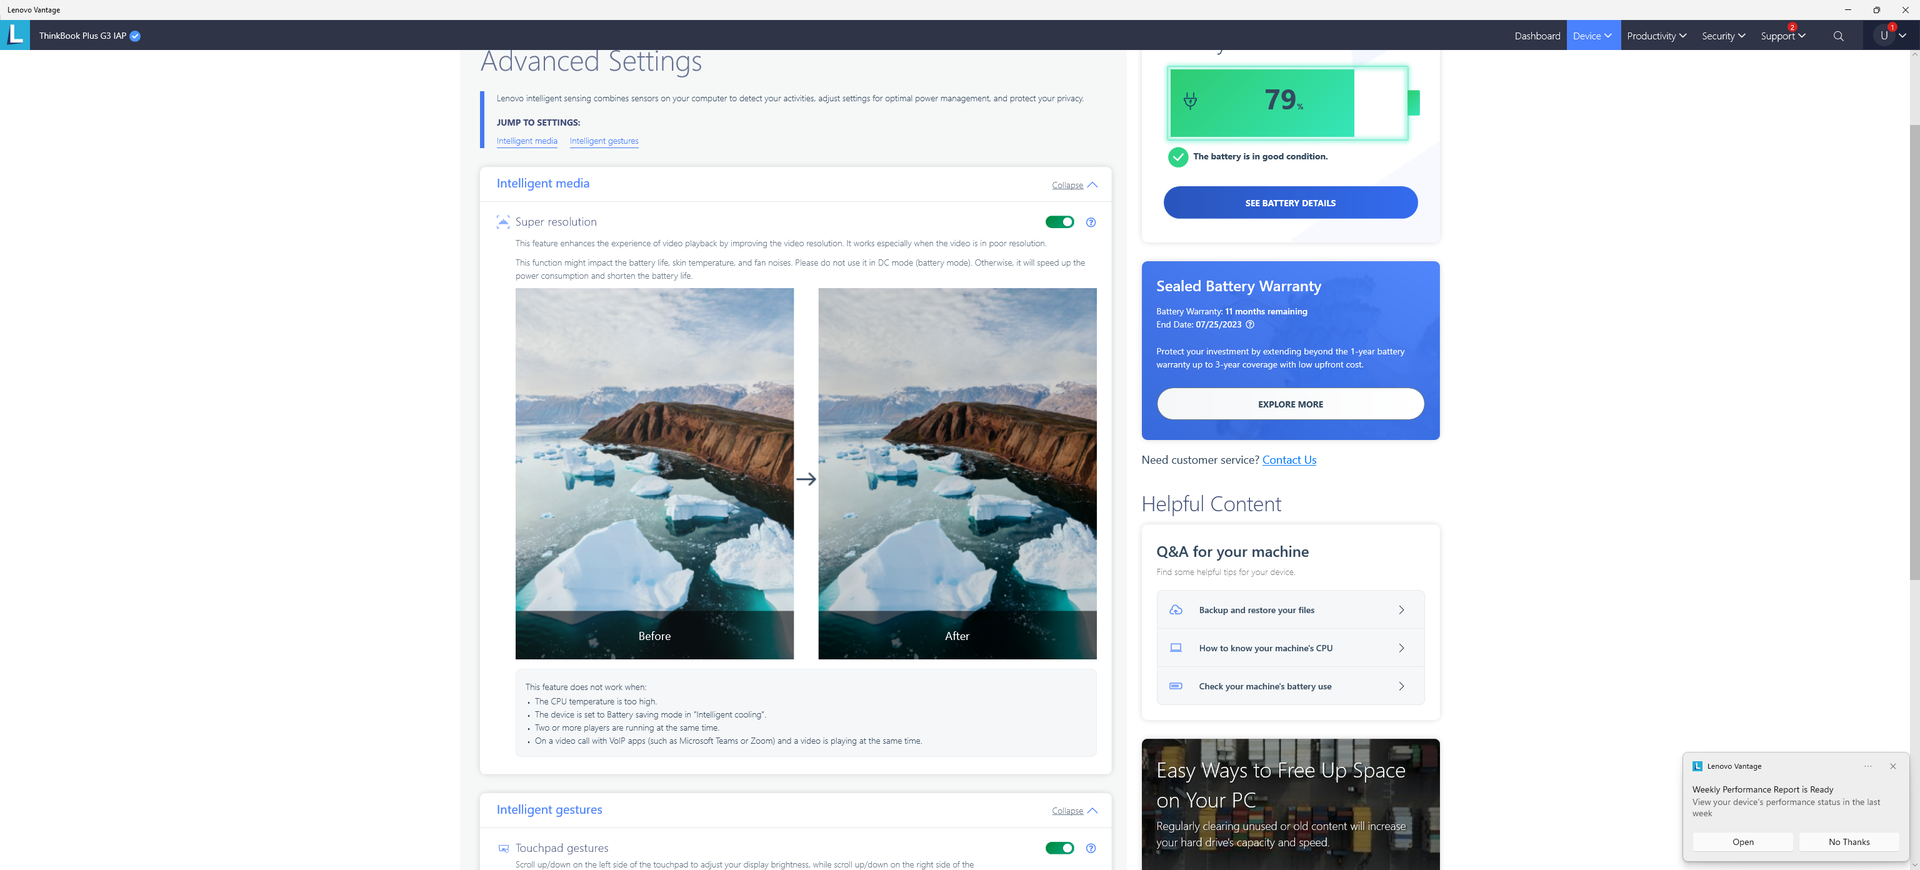
Nous avons réglé notre appareil en mode Performances extrêmes via Lenovo Vantage et en mode Performances via Windows avant d'exécuter l'un des benchmarks ci-dessous. Les propriétaires doivent se familiariser avec le logiciel Vantage préinstallé, car il s'agit du centre de contrôle des mises à jour, des performances et des fonctions auxiliaires de l'ordinateur portable. Les captures d'écran ci-dessous montrent certaines des fonctions disponibles sur le logiciel.
Processeur
Les performances du processeur sont de 20 à 25 % inférieures à celles de la moyenne des processeurs Core i7-12700H dans notre base de données. Le déficit de performance est suffisamment important pour que même les ordinateurs portables équipés du "plus lent" Core i5-12500H comme le Honor MagicBook 15 peuvent égaler ou dépasser les performances de notre Lenovo. Néanmoins, les performances du processeur sont toujours plus rapides que celles du Core i7-1260P ou Core i7-1165G7. L'avantage est particulièrement important par rapport auCore i5-1130G7 qui équipait le modèle ThinkBook Plus Gen 2 de l'année dernière.
Cinebench R15 Multi Loop
Cinebench R23: Multi Core | Single Core
Cinebench R15: CPU Multi 64Bit | CPU Single 64Bit
Blender: v2.79 BMW27 CPU
7-Zip 18.03: 7z b 4 | 7z b 4 -mmt1
Geekbench 5.5: Multi-Core | Single-Core
HWBOT x265 Benchmark v2.2: 4k Preset
LibreOffice : 20 Documents To PDF
R Benchmark 2.5: Overall mean
Cinebench R23: Multi Core | Single Core
Cinebench R15: CPU Multi 64Bit | CPU Single 64Bit
Blender: v2.79 BMW27 CPU
7-Zip 18.03: 7z b 4 | 7z b 4 -mmt1
Geekbench 5.5: Multi-Core | Single-Core
HWBOT x265 Benchmark v2.2: 4k Preset
LibreOffice : 20 Documents To PDF
R Benchmark 2.5: Overall mean
* ... Moindre est la valeur, meilleures sont les performances
AIDA64: FP32 Ray-Trace | FPU Julia | CPU SHA3 | CPU Queen | FPU SinJulia | FPU Mandel | CPU AES | CPU ZLib | FP64 Ray-Trace | CPU PhotoWorxx
| Performance rating | |
| Moyenne Intel Core i7-12700H | |
| Lenovo ThinkBook Plus Gen3 | |
| Dell XPS 17 9720 | |
| Asus ProArt StudioBook Pro 17 W700G3T | |
| LG Gram 17 (2022) | |
| Lenovo ThinkBook Plus Gen2 Core i5 | |
| Gigabyte Aero 17 HDR YD -9! | |
| AIDA64 / FP32 Ray-Trace | |
| Lenovo ThinkBook Plus Gen3 | |
| Moyenne Intel Core i7-12700H (2585 - 17957, n=64) | |
| Asus ProArt StudioBook Pro 17 W700G3T | |
| Dell XPS 17 9720 | |
| LG Gram 17 (2022) | |
| Lenovo ThinkBook Plus Gen2 Core i5 | |
| AIDA64 / FPU Julia | |
| Lenovo ThinkBook Plus Gen3 | |
| Moyenne Intel Core i7-12700H (12439 - 90760, n=64) | |
| Asus ProArt StudioBook Pro 17 W700G3T | |
| Dell XPS 17 9720 | |
| LG Gram 17 (2022) | |
| Lenovo ThinkBook Plus Gen2 Core i5 | |
| AIDA64 / CPU SHA3 | |
| Moyenne Intel Core i7-12700H (833 - 4242, n=64) | |
| Lenovo ThinkBook Plus Gen3 | |
| Dell XPS 17 9720 | |
| Asus ProArt StudioBook Pro 17 W700G3T | |
| Lenovo ThinkBook Plus Gen2 Core i5 | |
| LG Gram 17 (2022) | |
| AIDA64 / CPU Queen | |
| Dell XPS 17 9720 | |
| Moyenne Intel Core i7-12700H (57923 - 103202, n=63) | |
| Lenovo ThinkBook Plus Gen3 | |
| Asus ProArt StudioBook Pro 17 W700G3T | |
| LG Gram 17 (2022) | |
| Lenovo ThinkBook Plus Gen2 Core i5 | |
| AIDA64 / FPU SinJulia | |
| Moyenne Intel Core i7-12700H (3249 - 9939, n=64) | |
| Dell XPS 17 9720 | |
| Lenovo ThinkBook Plus Gen3 | |
| Asus ProArt StudioBook Pro 17 W700G3T | |
| LG Gram 17 (2022) | |
| Lenovo ThinkBook Plus Gen2 Core i5 | |
| AIDA64 / FPU Mandel | |
| Lenovo ThinkBook Plus Gen3 | |
| Moyenne Intel Core i7-12700H (7135 - 44760, n=64) | |
| Asus ProArt StudioBook Pro 17 W700G3T | |
| Dell XPS 17 9720 | |
| LG Gram 17 (2022) | |
| Lenovo ThinkBook Plus Gen2 Core i5 | |
| AIDA64 / CPU AES | |
| Moyenne Intel Core i7-12700H (31839 - 144360, n=64) | |
| Dell XPS 17 9720 | |
| Lenovo ThinkBook Plus Gen3 | |
| Lenovo ThinkBook Plus Gen2 Core i5 | |
| LG Gram 17 (2022) | |
| Asus ProArt StudioBook Pro 17 W700G3T | |
| AIDA64 / CPU ZLib | |
| Moyenne Intel Core i7-12700H (305 - 1171, n=64) | |
| Dell XPS 17 9720 | |
| Lenovo ThinkBook Plus Gen3 | |
| Asus ProArt StudioBook Pro 17 W700G3T | |
| LG Gram 17 (2022) | |
| Lenovo ThinkBook Plus Gen2 Core i5 | |
| Gigabyte Aero 17 HDR YD | |
| AIDA64 / FP64 Ray-Trace | |
| Lenovo ThinkBook Plus Gen3 | |
| Moyenne Intel Core i7-12700H (1437 - 9692, n=64) | |
| Asus ProArt StudioBook Pro 17 W700G3T | |
| Dell XPS 17 9720 | |
| LG Gram 17 (2022) | |
| Lenovo ThinkBook Plus Gen2 Core i5 | |
| AIDA64 / CPU PhotoWorxx | |
| Dell XPS 17 9720 | |
| Lenovo ThinkBook Plus Gen3 | |
| Lenovo ThinkBook Plus Gen2 Core i5 | |
| LG Gram 17 (2022) | |
| Moyenne Intel Core i7-12700H (12863 - 52207, n=64) | |
| Asus ProArt StudioBook Pro 17 W700G3T | |
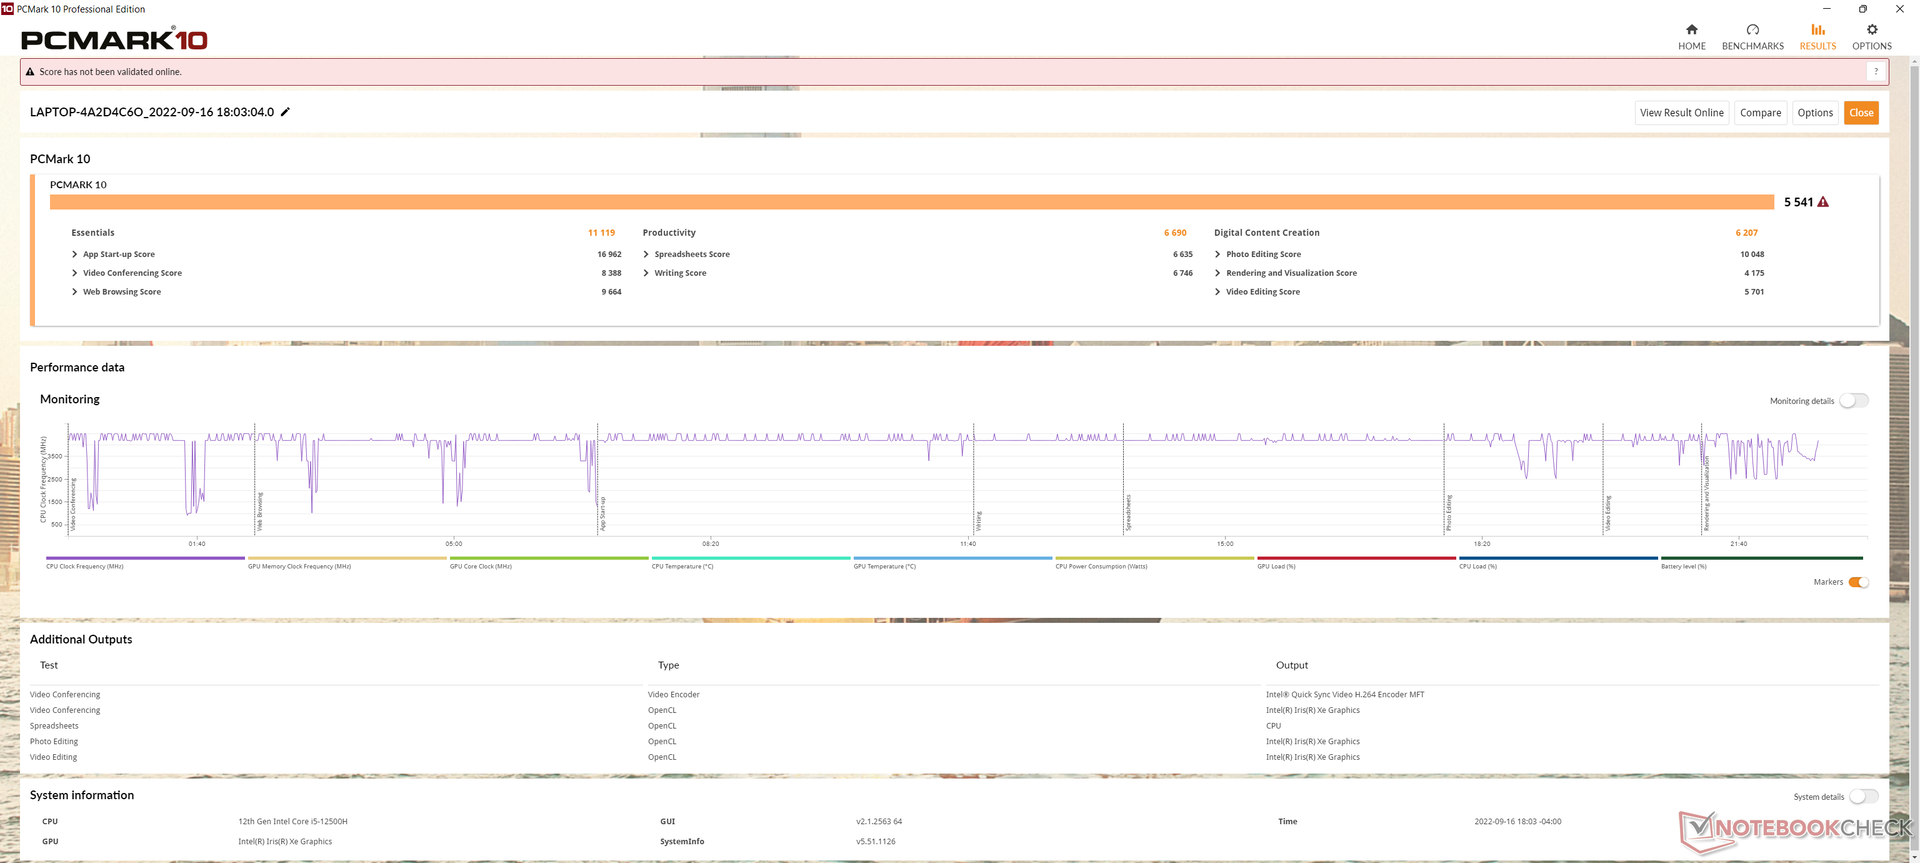
Performance du système
Les résultats de PCMark 10 sont supérieurs à ceux de nombreux ordinateurs portables équipés de processeurs Core U-series ou d'anciens processeurs H-series, tout en étant inférieurs à ceux équipés de GPU dédiés comme leXPS 17 9720.
CrossMark: Overall | Productivity | Creativity | Responsiveness
| PCMark 10 / Score | |
| Gigabyte Aero 17 HDR YD | |
| Dell XPS 17 9720 | |
| Moyenne Intel Core i7-12700H, Intel Iris Xe Graphics G7 96EUs (5541 - 6281, n=8) | |
| Lenovo ThinkBook Plus Gen3 | |
| LG Gram 17 (2022) | |
| Asus ProArt StudioBook Pro 17 W700G3T | |
| Lenovo ThinkBook Plus Gen2 Core i5 | |
| PCMark 10 / Essentials | |
| Lenovo ThinkBook Plus Gen3 | |
| Moyenne Intel Core i7-12700H, Intel Iris Xe Graphics G7 96EUs (9991 - 11699, n=8) | |
| Dell XPS 17 9720 | |
| Lenovo ThinkBook Plus Gen2 Core i5 | |
| Gigabyte Aero 17 HDR YD | |
| LG Gram 17 (2022) | |
| Asus ProArt StudioBook Pro 17 W700G3T | |
| PCMark 10 / Productivity | |
| Dell XPS 17 9720 | |
| Gigabyte Aero 17 HDR YD | |
| Asus ProArt StudioBook Pro 17 W700G3T | |
| Moyenne Intel Core i7-12700H, Intel Iris Xe Graphics G7 96EUs (6690 - 8038, n=8) | |
| Lenovo ThinkBook Plus Gen3 | |
| LG Gram 17 (2022) | |
| Lenovo ThinkBook Plus Gen2 Core i5 | |
| PCMark 10 / Digital Content Creation | |
| Gigabyte Aero 17 HDR YD | |
| Dell XPS 17 9720 | |
| Moyenne Intel Core i7-12700H, Intel Iris Xe Graphics G7 96EUs (6207 - 7401, n=8) | |
| Lenovo ThinkBook Plus Gen3 | |
| LG Gram 17 (2022) | |
| Asus ProArt StudioBook Pro 17 W700G3T | |
| Lenovo ThinkBook Plus Gen2 Core i5 | |
| CrossMark / Overall | |
| Dell XPS 17 9720 | |
| Moyenne Intel Core i7-12700H, Intel Iris Xe Graphics G7 96EUs (1492 - 1907, n=8) | |
| Lenovo ThinkBook Plus Gen3 | |
| LG Gram 17 (2022) | |
| CrossMark / Productivity | |
| Dell XPS 17 9720 | |
| Moyenne Intel Core i7-12700H, Intel Iris Xe Graphics G7 96EUs (1499 - 1832, n=8) | |
| Lenovo ThinkBook Plus Gen3 | |
| LG Gram 17 (2022) | |
| CrossMark / Creativity | |
| Dell XPS 17 9720 | |
| Lenovo ThinkBook Plus Gen3 | |
| Moyenne Intel Core i7-12700H, Intel Iris Xe Graphics G7 96EUs (1507 - 2016, n=8) | |
| LG Gram 17 (2022) | |
| CrossMark / Responsiveness | |
| Dell XPS 17 9720 | |
| Moyenne Intel Core i7-12700H, Intel Iris Xe Graphics G7 96EUs (1384 - 1831, n=8) | |
| LG Gram 17 (2022) | |
| Lenovo ThinkBook Plus Gen3 | |
| PCMark 10 Score | 5541 points | |
Aide | ||
| AIDA64 / Memory Copy | |
| Dell XPS 17 9720 | |
| Lenovo ThinkBook Plus Gen3 | |
| LG Gram 17 (2022) | |
| Lenovo ThinkBook Plus Gen2 Core i5 | |
| Moyenne Intel Core i7-12700H (25615 - 80511, n=64) | |
| Asus ProArt StudioBook Pro 17 W700G3T | |
| AIDA64 / Memory Read | |
| Lenovo ThinkBook Plus Gen3 | |
| Dell XPS 17 9720 | |
| LG Gram 17 (2022) | |
| Lenovo ThinkBook Plus Gen2 Core i5 | |
| Moyenne Intel Core i7-12700H (25586 - 79442, n=64) | |
| Asus ProArt StudioBook Pro 17 W700G3T | |
| AIDA64 / Memory Write | |
| Dell XPS 17 9720 | |
| Lenovo ThinkBook Plus Gen2 Core i5 | |
| LG Gram 17 (2022) | |
| Lenovo ThinkBook Plus Gen3 | |
| Moyenne Intel Core i7-12700H (23679 - 88660, n=64) | |
| Asus ProArt StudioBook Pro 17 W700G3T | |
| AIDA64 / Memory Latency | |
| Lenovo ThinkBook Plus Gen3 | |
| LG Gram 17 (2022) | |
| Lenovo ThinkBook Plus Gen2 Core i5 | |
| Dell XPS 17 9720 | |
| Moyenne Intel Core i7-12700H (76.2 - 133.9, n=62) | |
| Asus ProArt StudioBook Pro 17 W700G3T | |
| Gigabyte Aero 17 HDR YD | |
* ... Moindre est la valeur, meilleures sont les performances
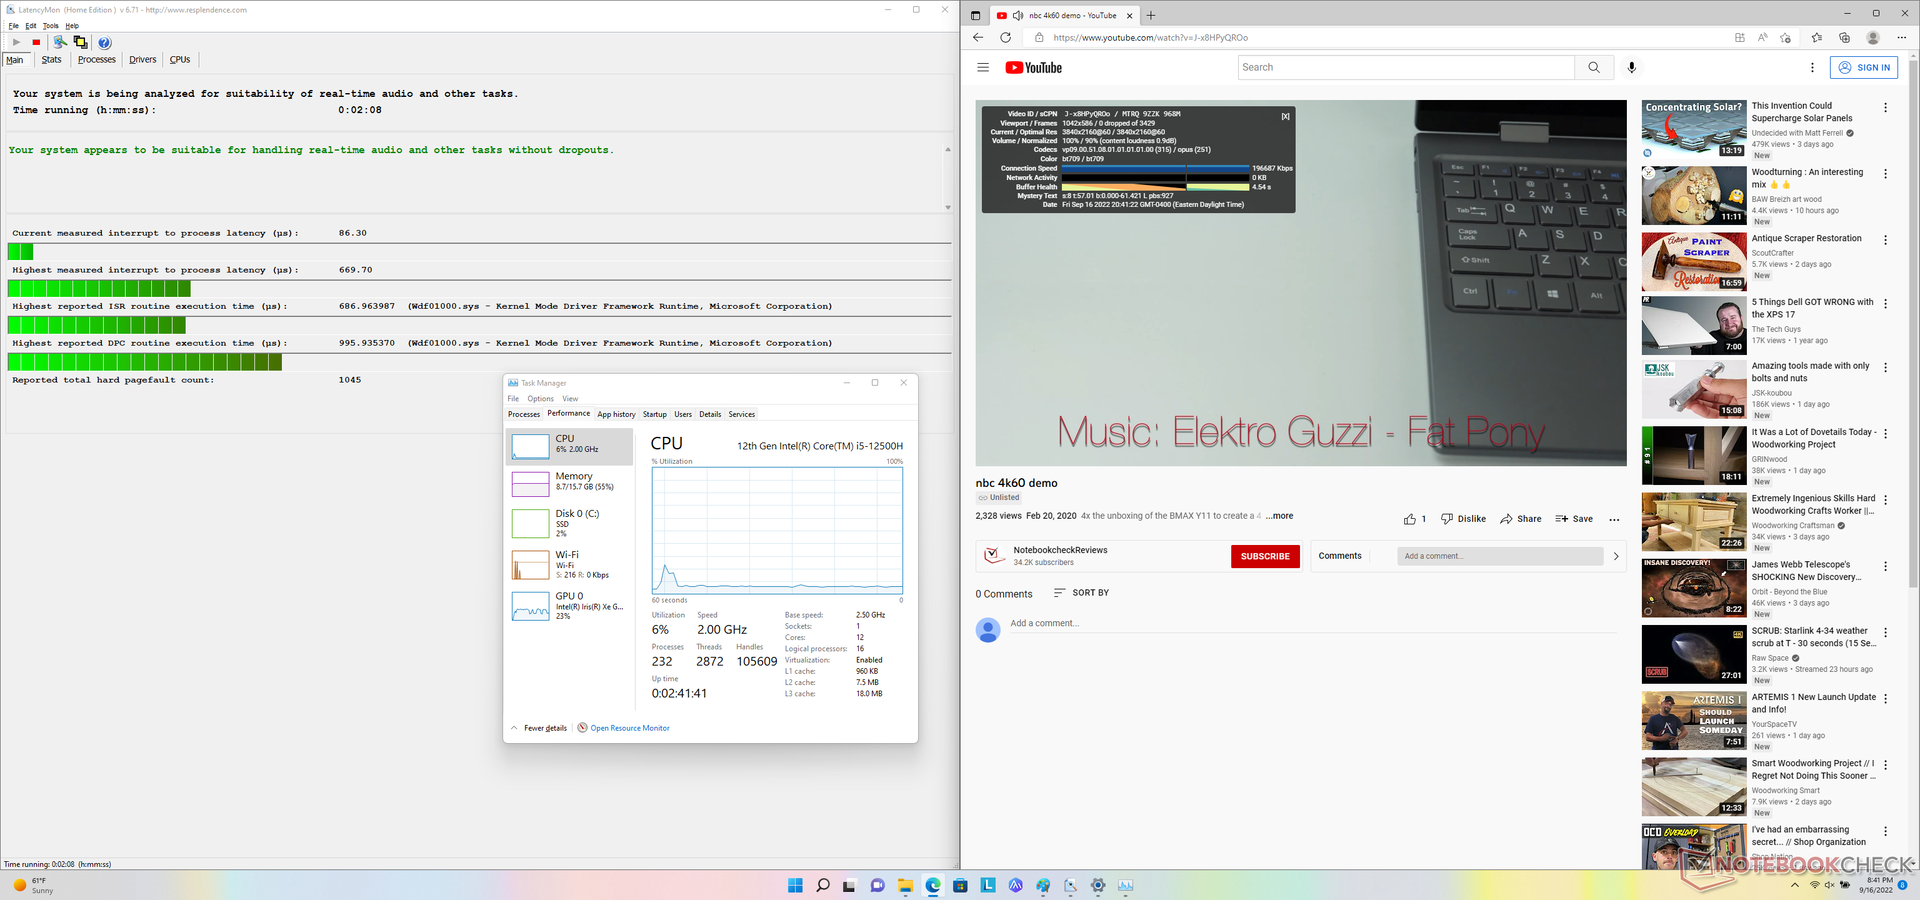
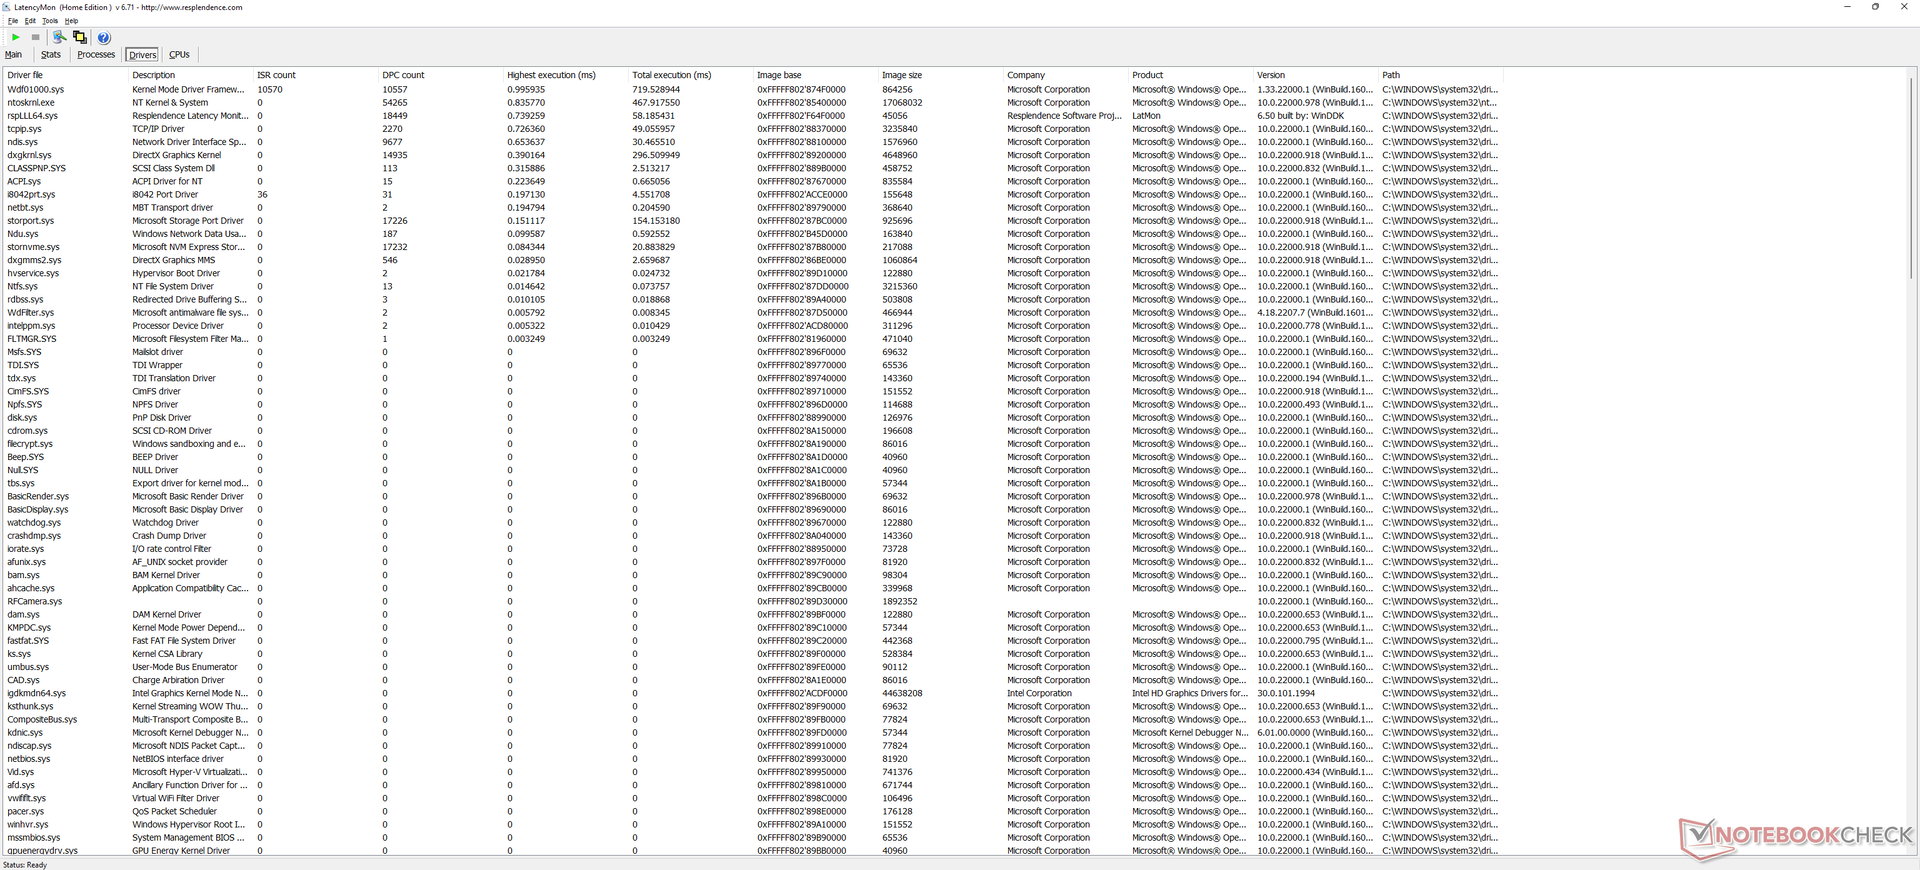
Latence DPC
LatencyMon ne révèle aucun problème majeur de CPD lors de l'ouverture de plusieurs onglets de navigateur de notre page d'accueil ou lors de l'exécution du stress Prime95 pendant 30 secondes. la lecture de vidéos 4K à 60 FPS est également parfaite, sans aucune perte d'images.
| DPC Latencies / LatencyMon - interrupt to process latency (max), Web, Youtube, Prime95 | |
| Gigabyte Aero 17 HDR YD | |
| Lenovo ThinkBook Plus Gen2 Core i5 | |
| Dell XPS 17 9720 | |
| Lenovo ThinkBook Plus Gen3 | |
| LG Gram 17 (2022) | |
* ... Moindre est la valeur, meilleures sont les performances
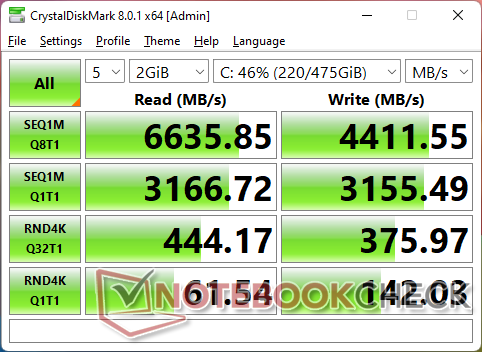
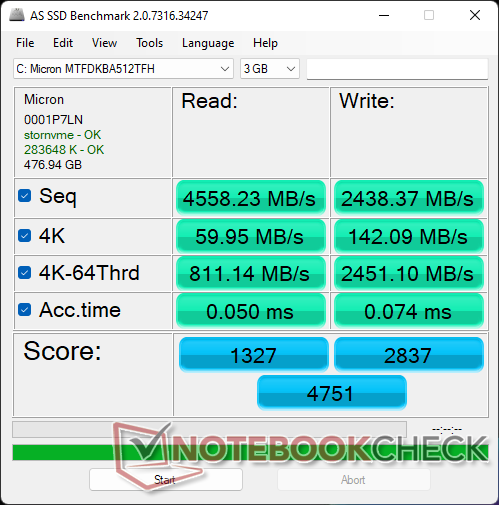
Périphériques de stockage
Notre unité de test est livrée avec le même disque dur de 512 GoMicron 3400 MTFDKBA512TFH Que l'on trouve sur le Dell XPS 17 9720. Bien qu'il ne soit pas aussi rapide que la série Samsung PM9A1, le disque ne présente aucun problème d'accélération et offre un niveau de performance constant, même lorsqu'il est sollicité.

| Drive Performance rating - Percent | |
| Gigabyte Aero 17 HDR YD | |
| LG Gram 17 (2022) | |
| Lenovo ThinkBook Plus Gen2 Core i5 | |
| Dell XPS 17 9720 | |
| Lenovo ThinkBook Plus Gen3 | |
| Asus ProArt StudioBook Pro 17 W700G3T | |
* ... Moindre est la valeur, meilleures sont les performances
Disk Throttling: DiskSpd Read Loop, Queue Depth 8
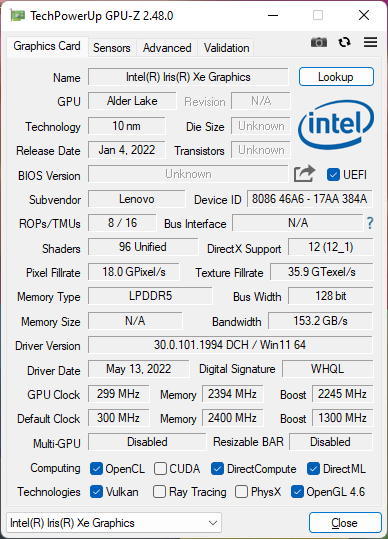
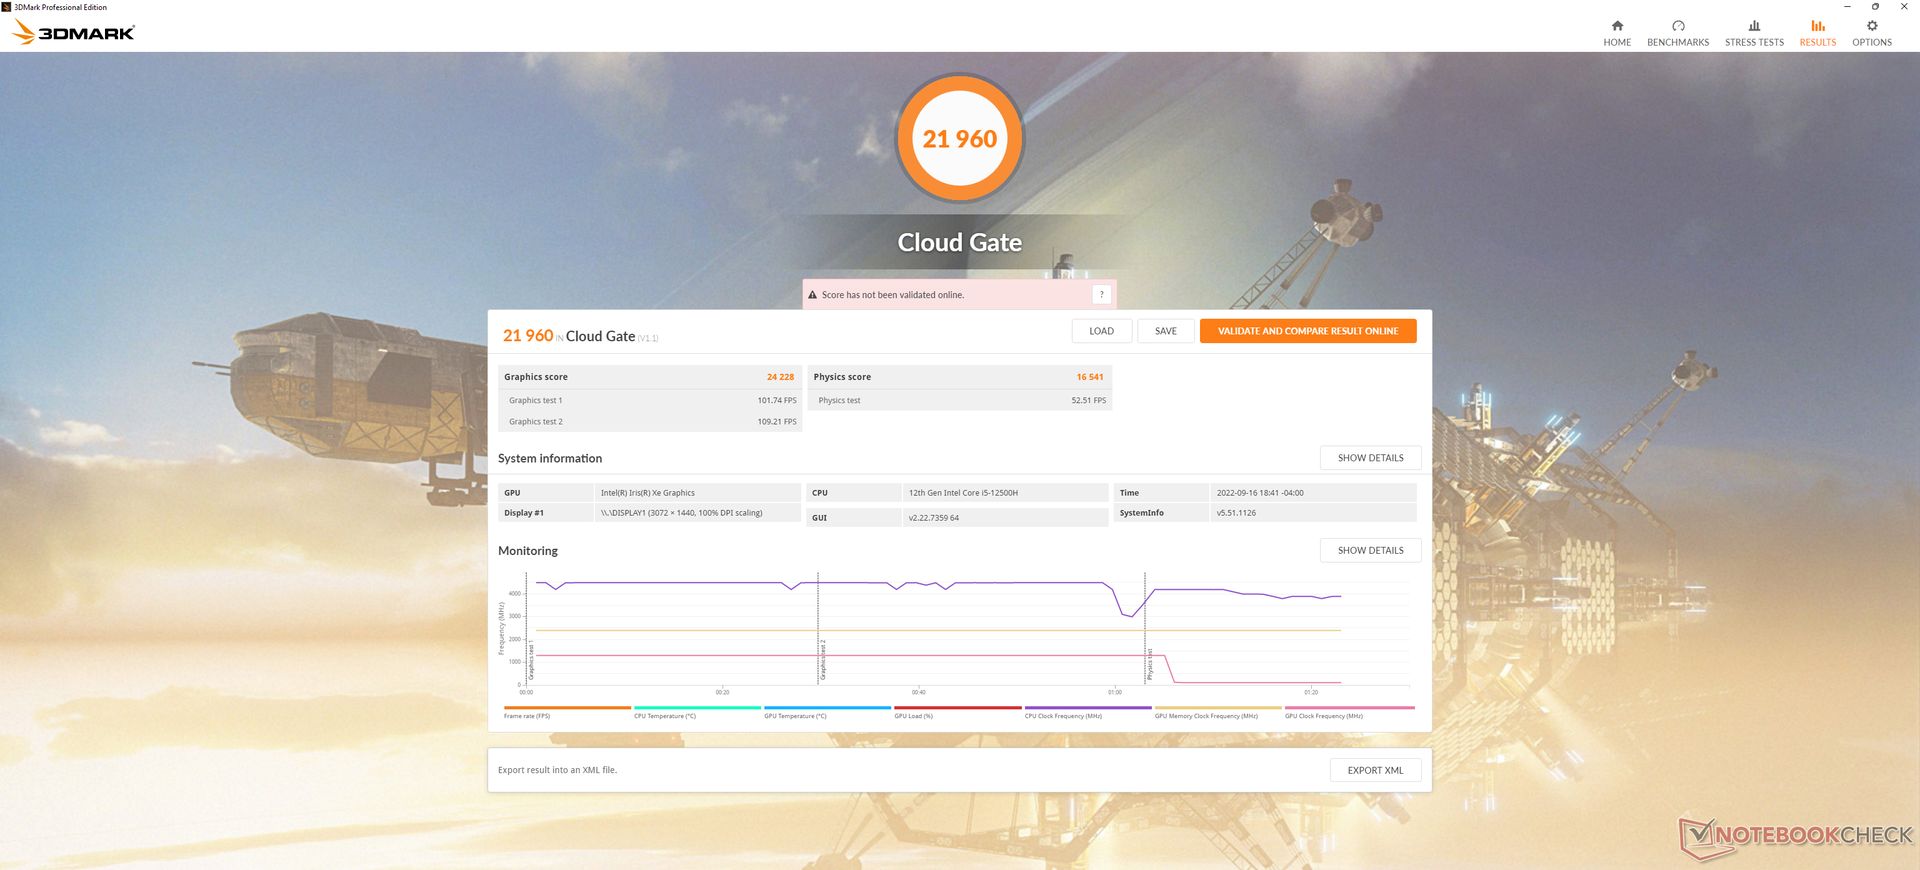
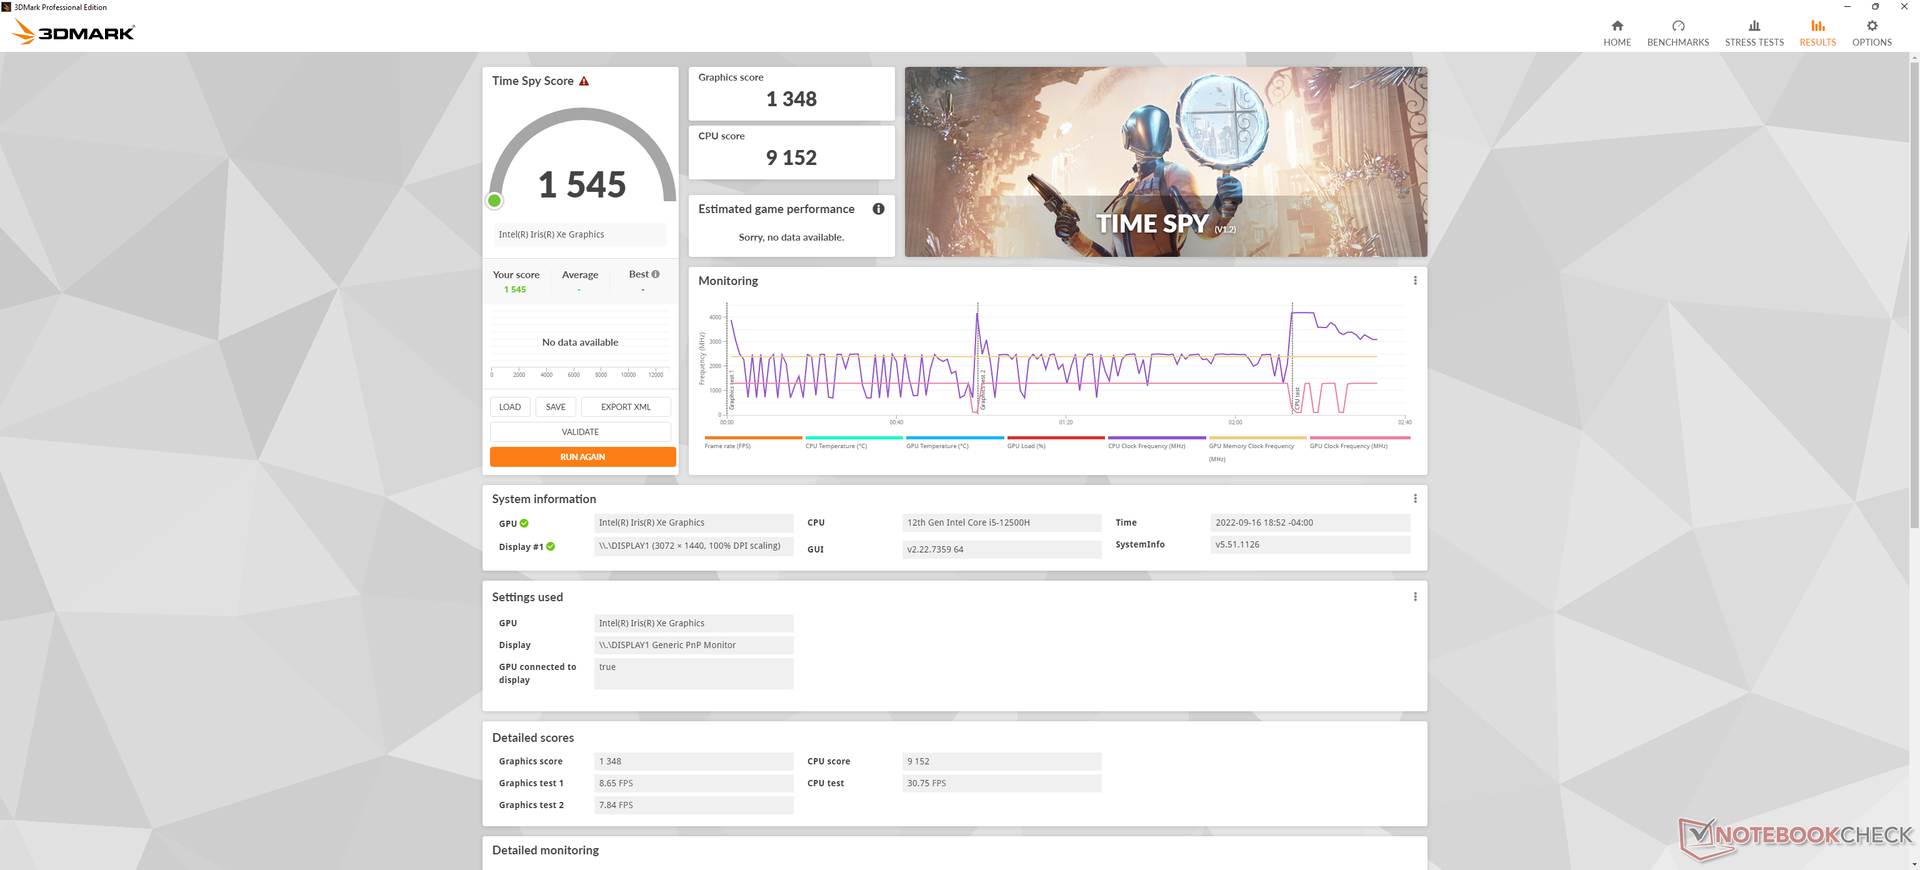
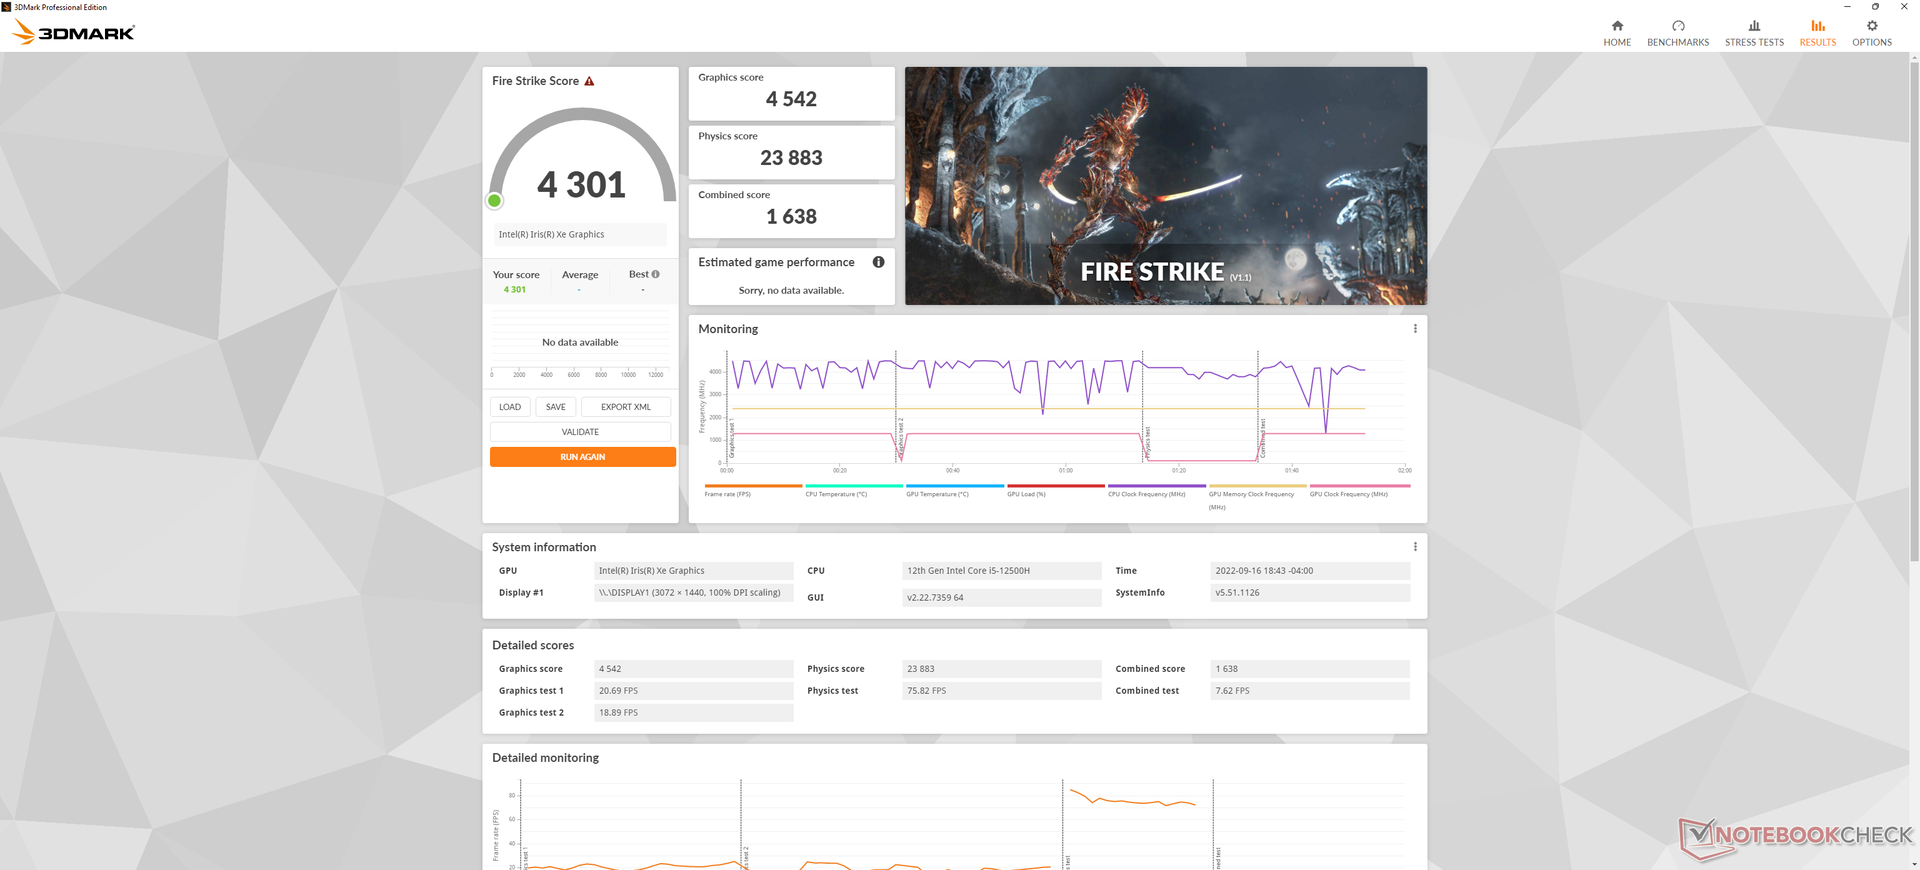
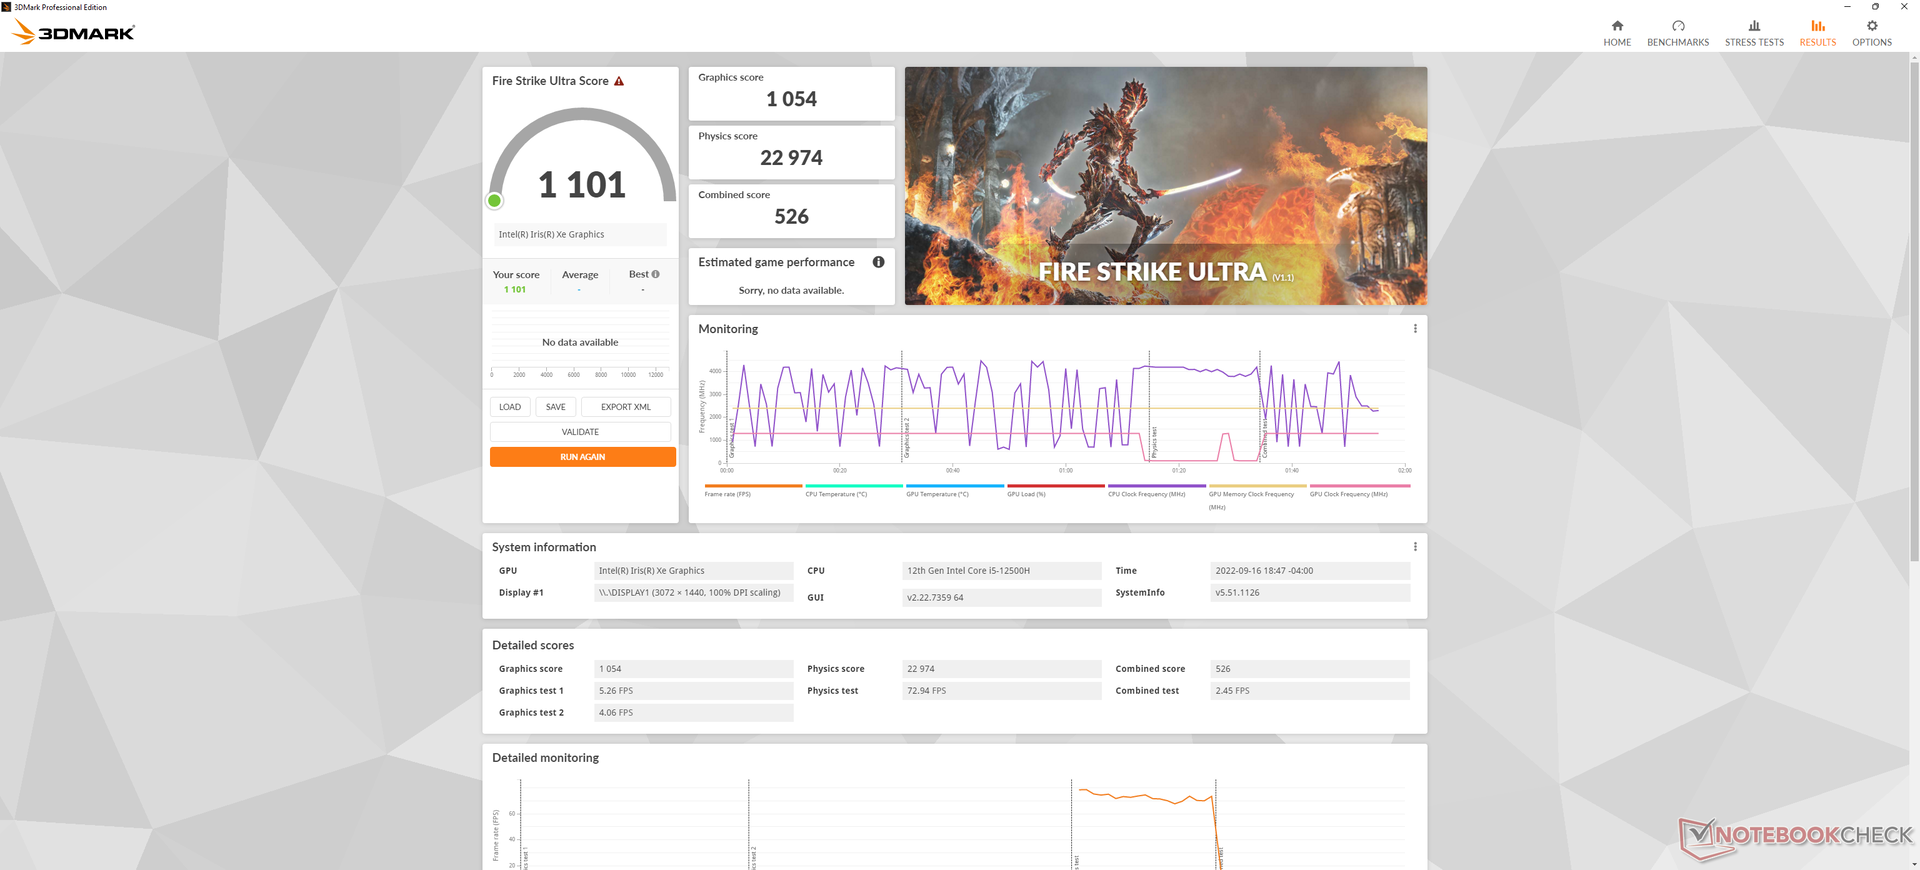
Performances du GPU - Iris Xe intégré uniquement
Les performances graphiques brutes sont inférieures de quelques points de pourcentage à celles de l'ordinateur portable moyen de notre base de données doté du même processeur intégré Iris Xe 96 EUs GPU. Il est dommage qu'il n'y ait pas d'options discrètes GeForce GTX/RTX ou même MX à choisir, ce qui aurait pu améliorer les performances graphiques de manière significative. La solution intégrée d'Intel est du côté plus lent si l'on considère la catégorie des grands 17 pouces.
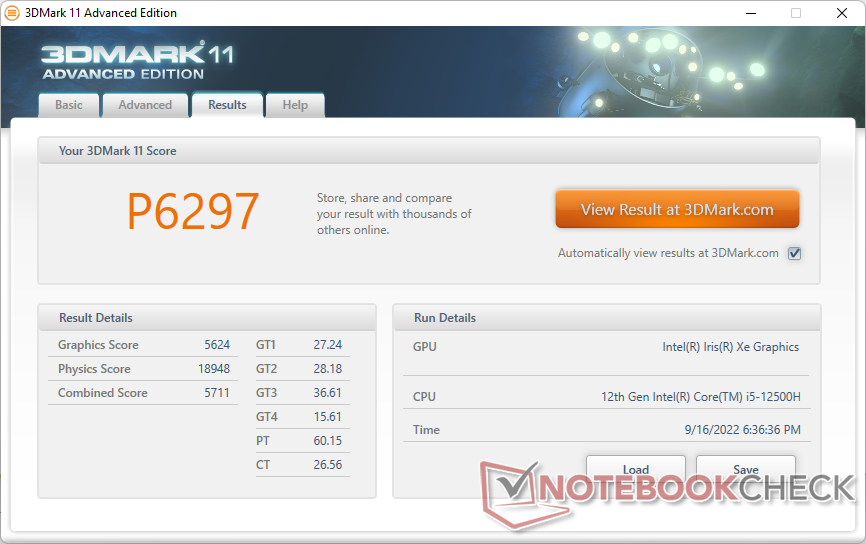
| 3DMark 11 Performance | 6297 points | |
| 3DMark Cloud Gate Standard Score | 21960 points | |
| 3DMark Fire Strike Score | 4301 points | |
| 3DMark Time Spy Score | 1545 points | |
Aide | ||
Witcher 3 FPS Chart
| Bas | Moyen | Élevé | Ultra | |
|---|---|---|---|---|
| GTA V (2015) | 100.1 | 60.9 | 20 | 8.96 |
| The Witcher 3 (2015) | 87.1 | 51.2 | 30.4 | 13.4 |
| Dota 2 Reborn (2015) | 126 | 94.1 | 48.6 | 44.9 |
| Final Fantasy XV Benchmark (2018) | 39 | 21.3 | 16.8 | |
| X-Plane 11.11 (2018) | 43.5 | 34 | 30.4 | |
| Strange Brigade (2018) | 74.6 | 32 | 25.5 | 20.2 |
| Cyberpunk 2077 1.6 (2022) | 16 | 13.4 | 10.6 | 8.6 |
Émissions
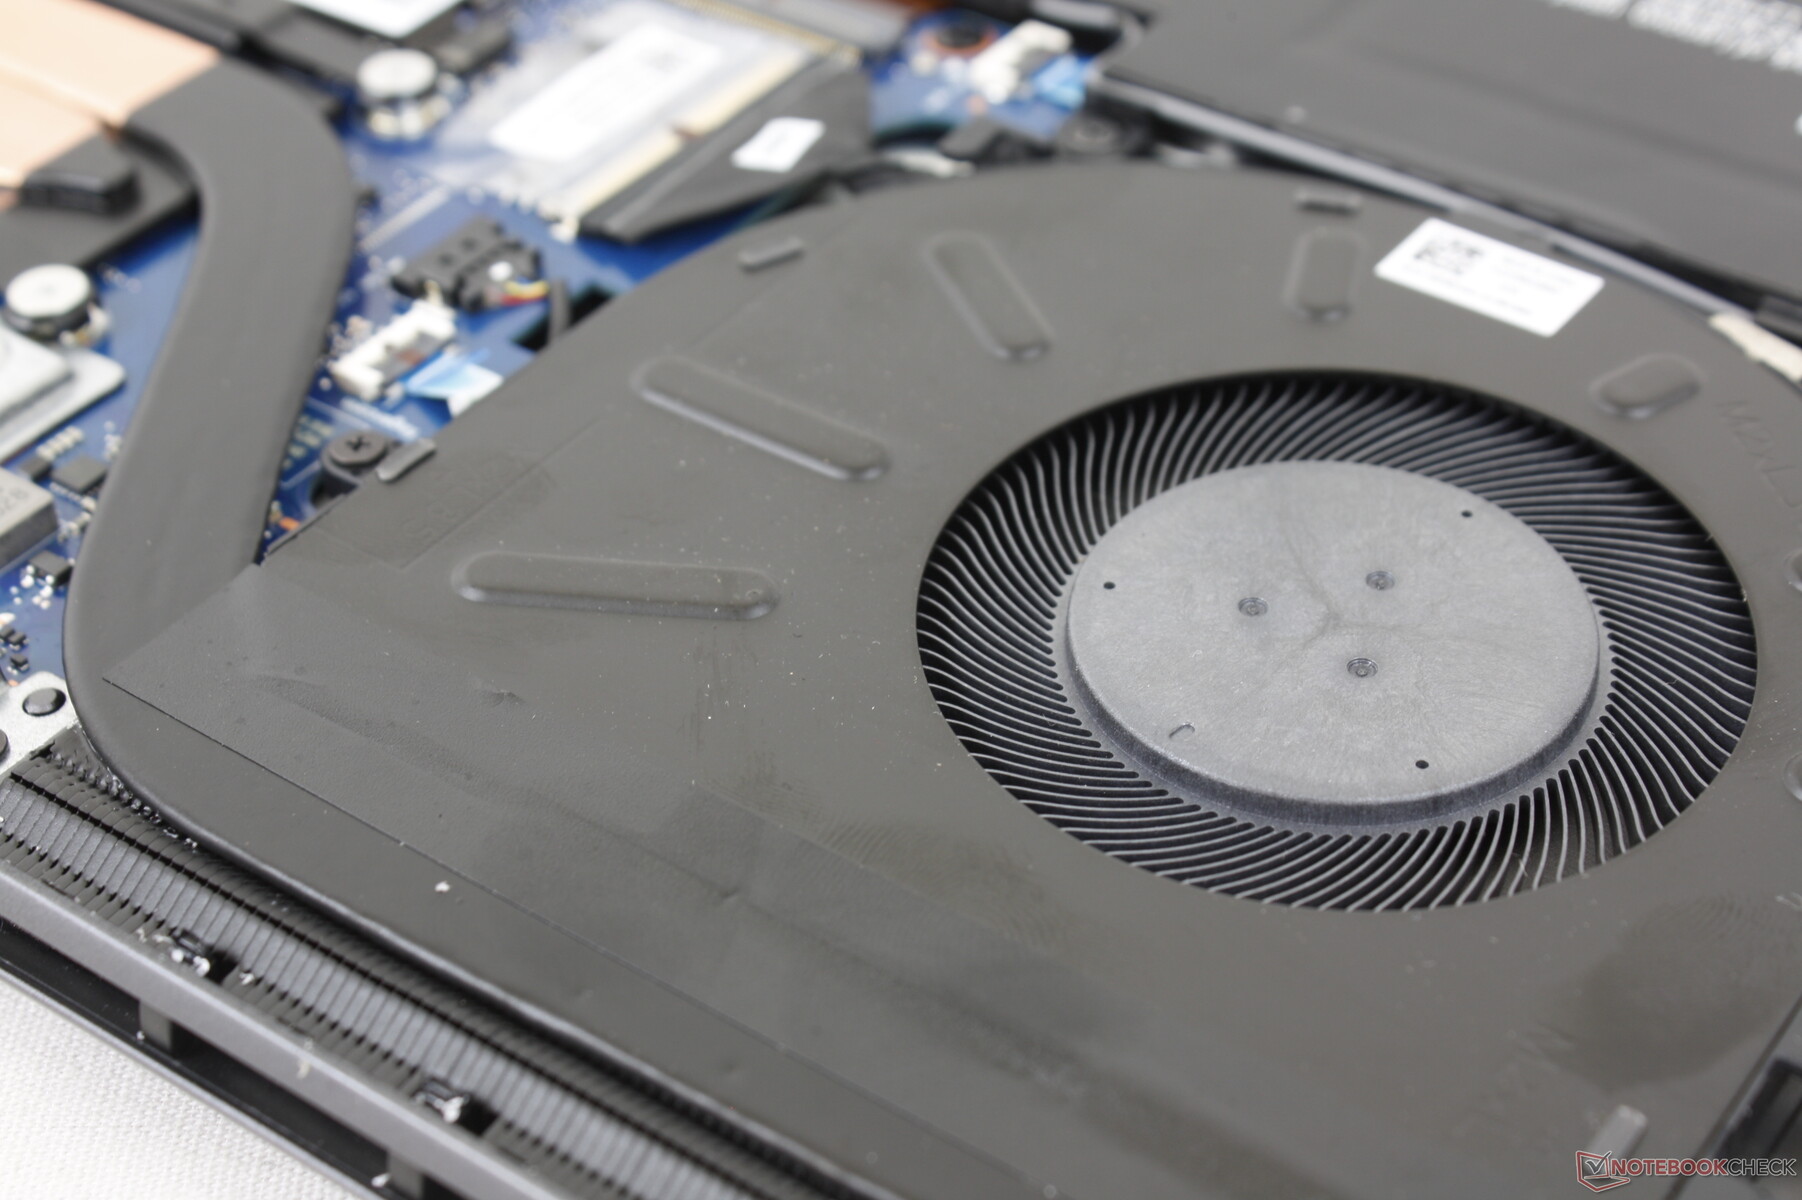
Bruit du système - Bruyant sous charge
Le bruit du ventilateur au ralenti sur le bureau varie entre 26 et 28 dB(A) selon le profil de puissance, contre un bruit de fond de 22,7 dB(A). Ainsi, les ventilateurs internes ne sont jamais vraiment silencieux dans la plupart des scénarios, ce qui est peut-être la conséquence de l'utilisation d'un CPU Core H-series au lieu de l'option Core U, plus lente mais plus efficace. Les ventilateurs ont tendance à pulser jusqu'à 35 dB(A) si l'on navigue sur le web ou si l'on fait du traitement de texte en mode Extreme Performance et nous recommandons donc le mode Balanced ou "Intelligent Cooling" pour les applications peu exigeantes.
L'exécution de charges plus élevées comme les jeux induit un bruit de ventilateur entre 39 et 43 dB(A), ce qui est beaucoup plus fort que sur le plus petit ThinkBook Plus Gen 2.
Degré de la nuisance sonore
| Au repos |
| 26.3 / 26.3 / 27.9 dB(A) |
| Fortement sollicité |
| 42.2 / 46.5 dB(A) |
 | ||
30 dB silencieux 40 dB(A) audible 50 dB(A) bruyant |
||
min: | ||
| Lenovo ThinkBook Plus Gen3 Iris Xe G7 96EUs, i7-12700H, Micron 3400 MTFDKBA512TFH 512GB | Lenovo ThinkBook Plus Gen2 Core i5 Iris Xe G7 80EUs, i5-1130G7, Samsung PM9A1 MZVL2512HCJQ | Asus ProArt StudioBook Pro 17 W700G3T Quadro RTX 3000 Max-Q, i7-9750H, Samsung SSD PM981 MZVLB1T0HALR | LG Gram 17 (2022) Iris Xe G7 80EUs, i5-1240P, Samsung PM9A1 MZVL2512HCJQ | Dell XPS 17 9720 GeForce RTX 3050 4GB Laptop GPU, i7-12700H, Micron 3400 MTFDKBA512TFH 512GB | Gigabyte Aero 17 HDR YD GeForce RTX 3080 Laptop GPU, i9-11980HK, Samsung PM9A1 MZVL2512HCJQ | |
|---|---|---|---|---|---|---|
| Noise | 6% | 2% | 6% | -1% | -21% | |
| arrêt / environnement * (dB) | 22.7 | 25.4 -12% | 29.4 -30% | 25.1 -11% | 24 -6% | 25 -10% |
| Idle Minimum * (dB) | 26.3 | 25.4 3% | 29.4 -12% | 25.12 4% | 24 9% | 30 -14% |
| Idle Average * (dB) | 26.3 | 27.4 -4% | 29.9 -14% | 25.15 4% | 24 9% | 32 -22% |
| Idle Maximum * (dB) | 27.9 | 32.2 -15% | 29.9 -7% | 26 7% | 24 14% | 41 -47% |
| Load Average * (dB) | 42.2 | 32.2 24% | 31.6 25% | 36.9 13% | 43.9 -4% | 43 -2% |
| Witcher 3 ultra * (dB) | 39.8 | 32.2 19% | 31.6 21% | 48.4 -22% | 51 -28% | |
| Load Maximum * (dB) | 46.5 | 34.5 26% | 31.6 32% | 37.2 20% | 48.4 -4% | 59 -27% |
* ... Moindre est la valeur, meilleures sont les performances
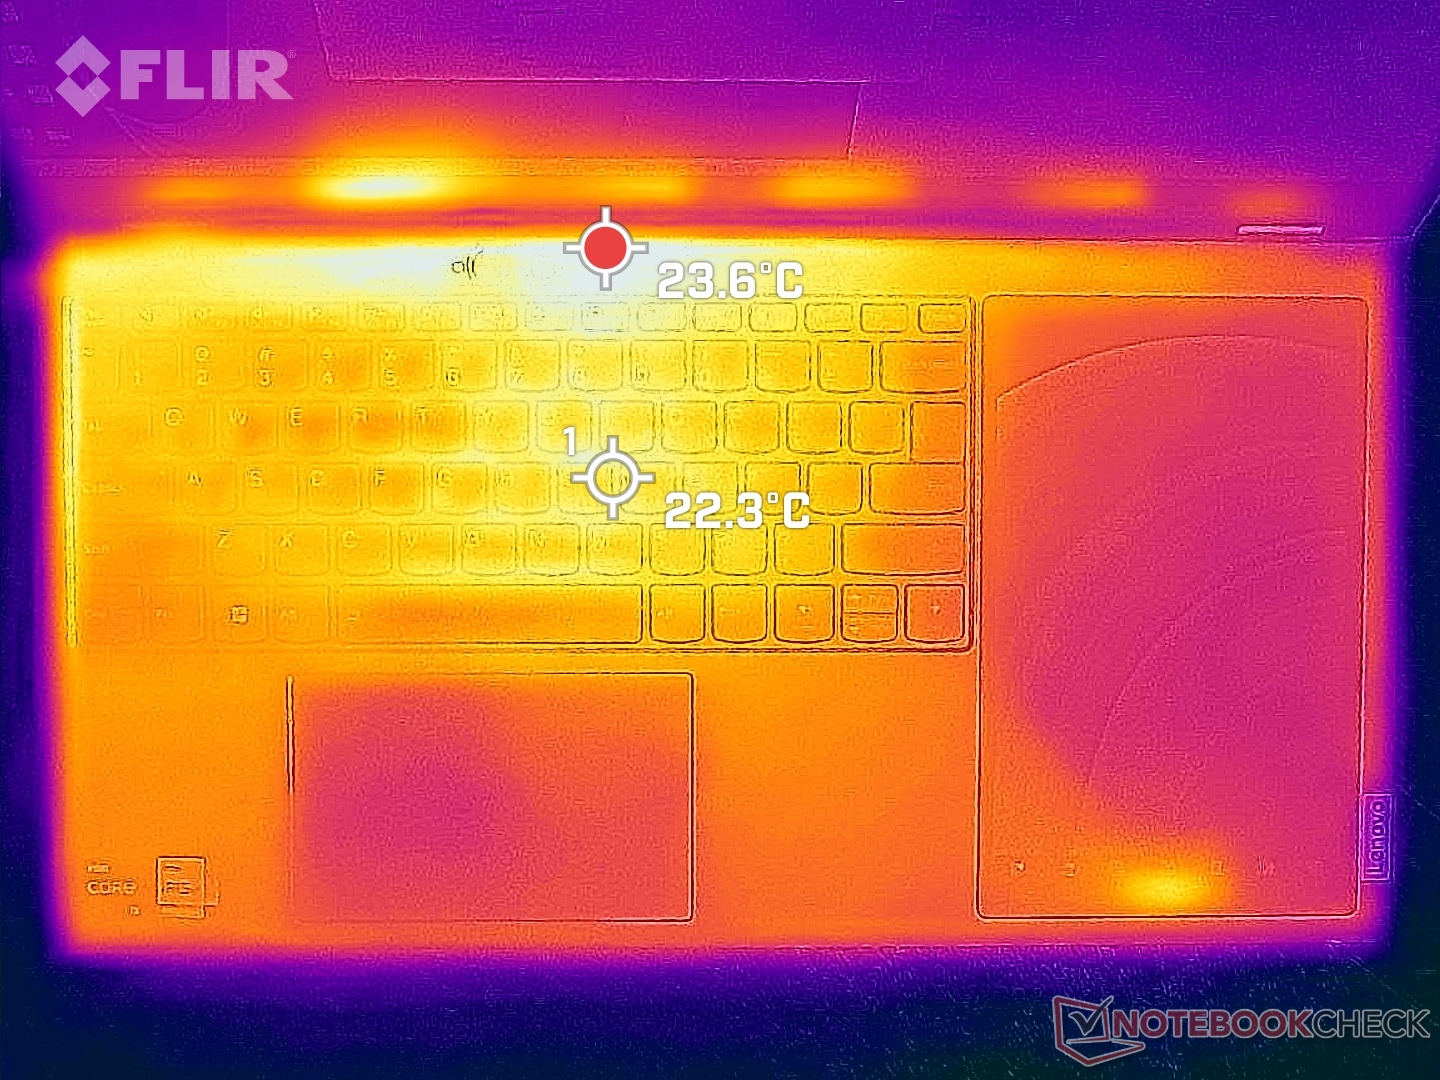
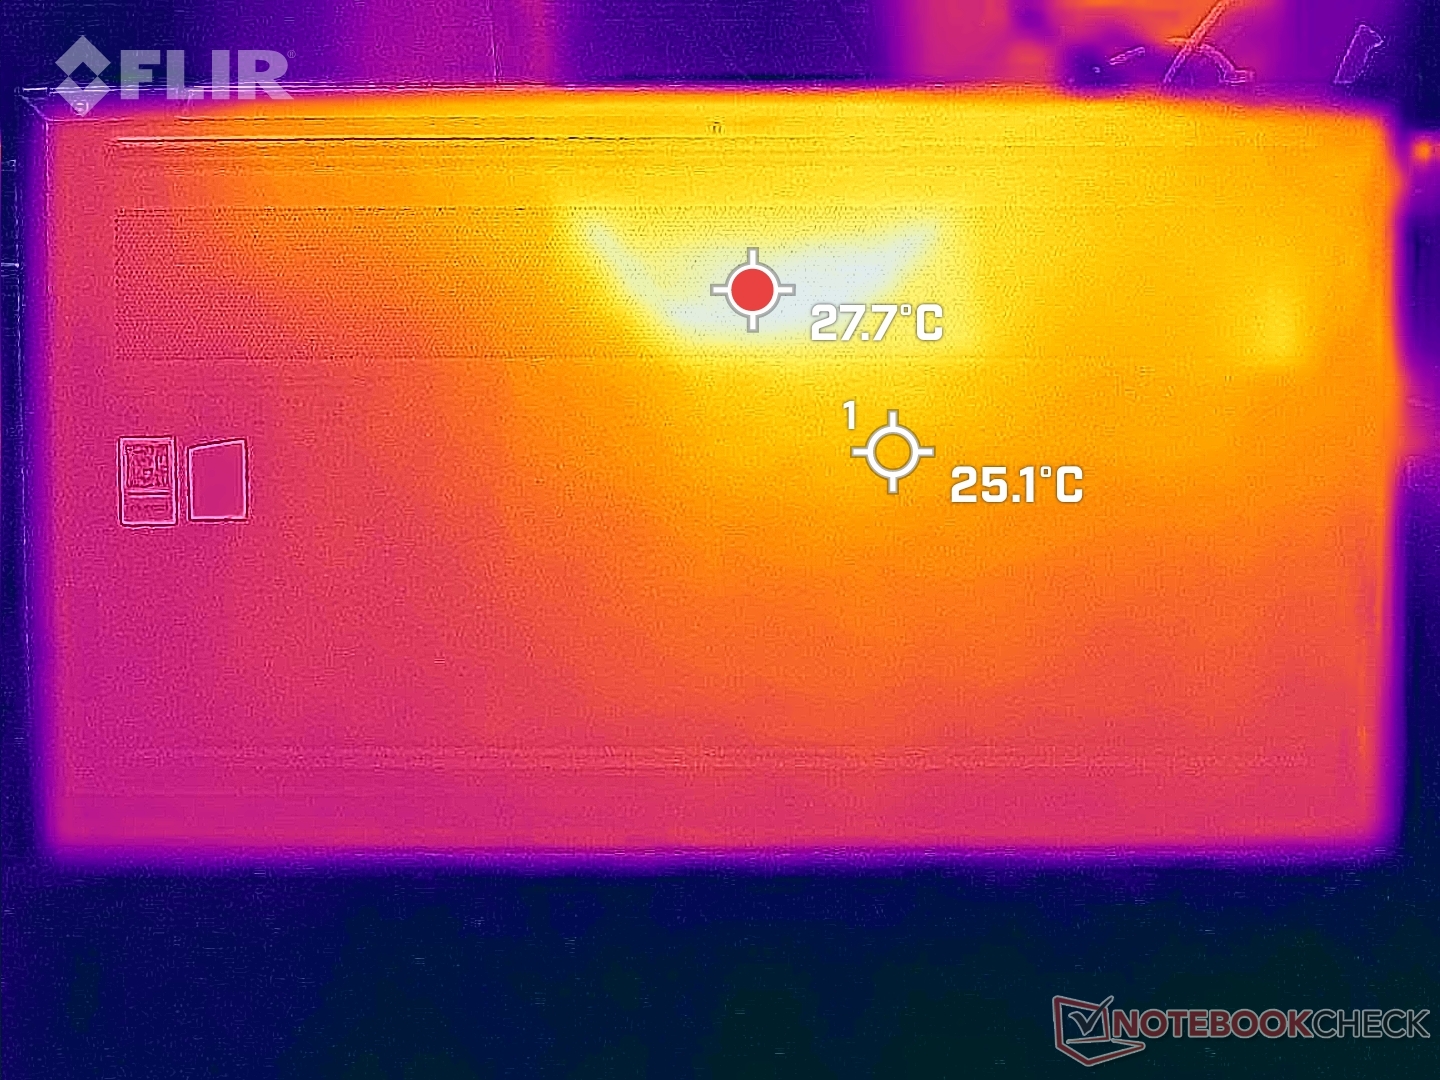
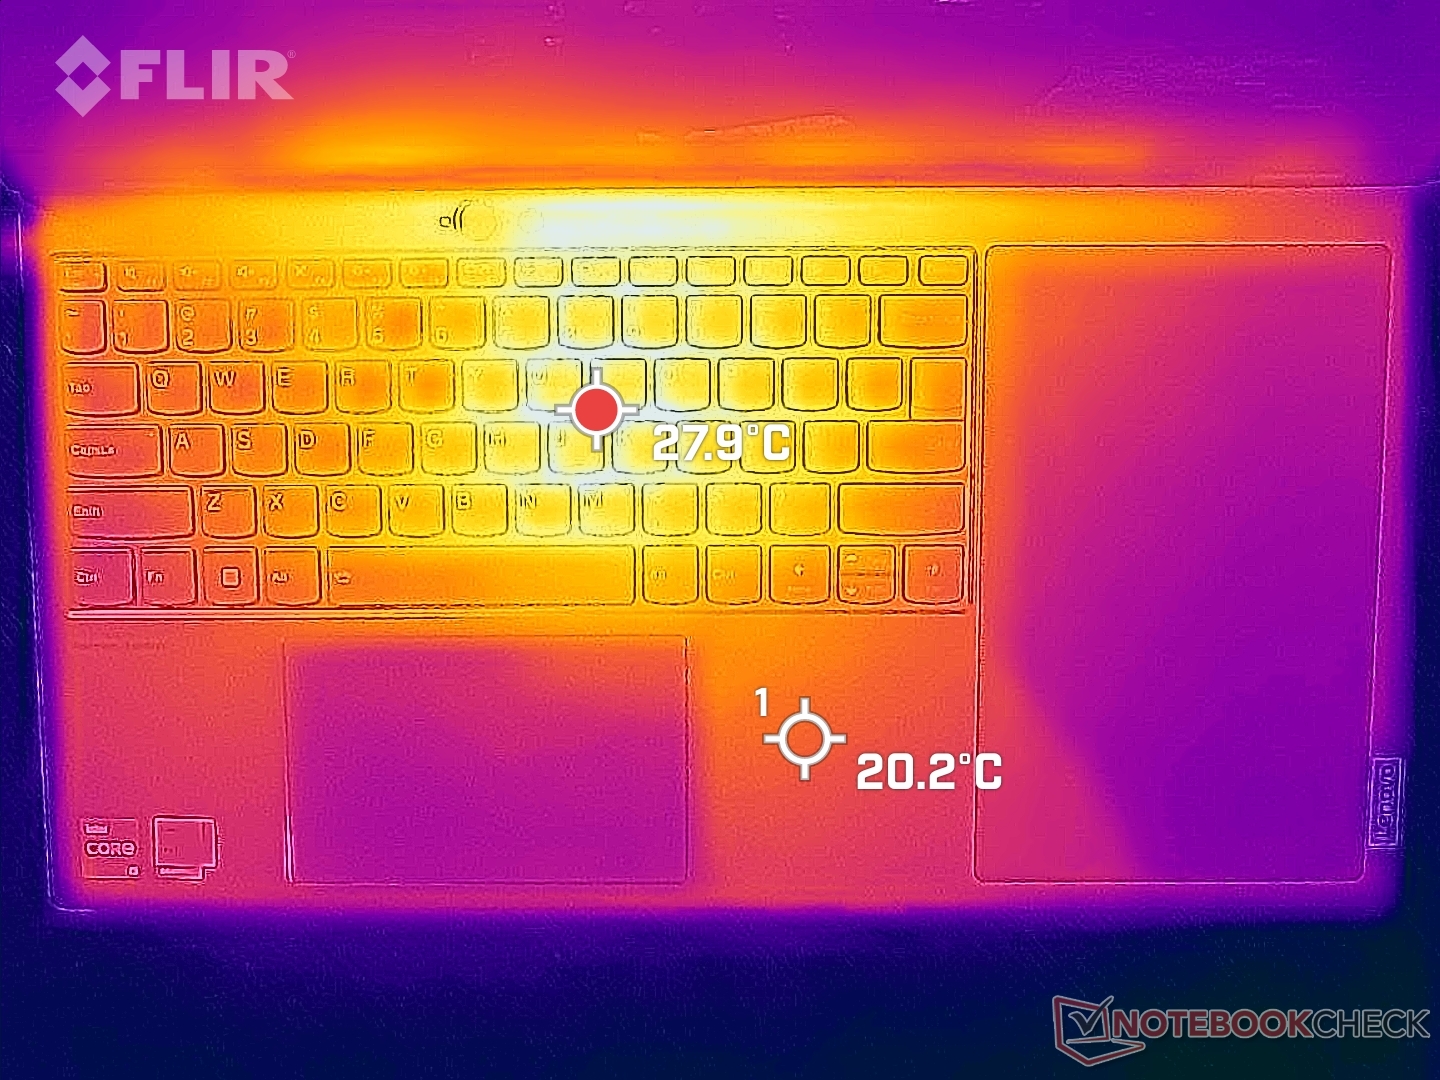
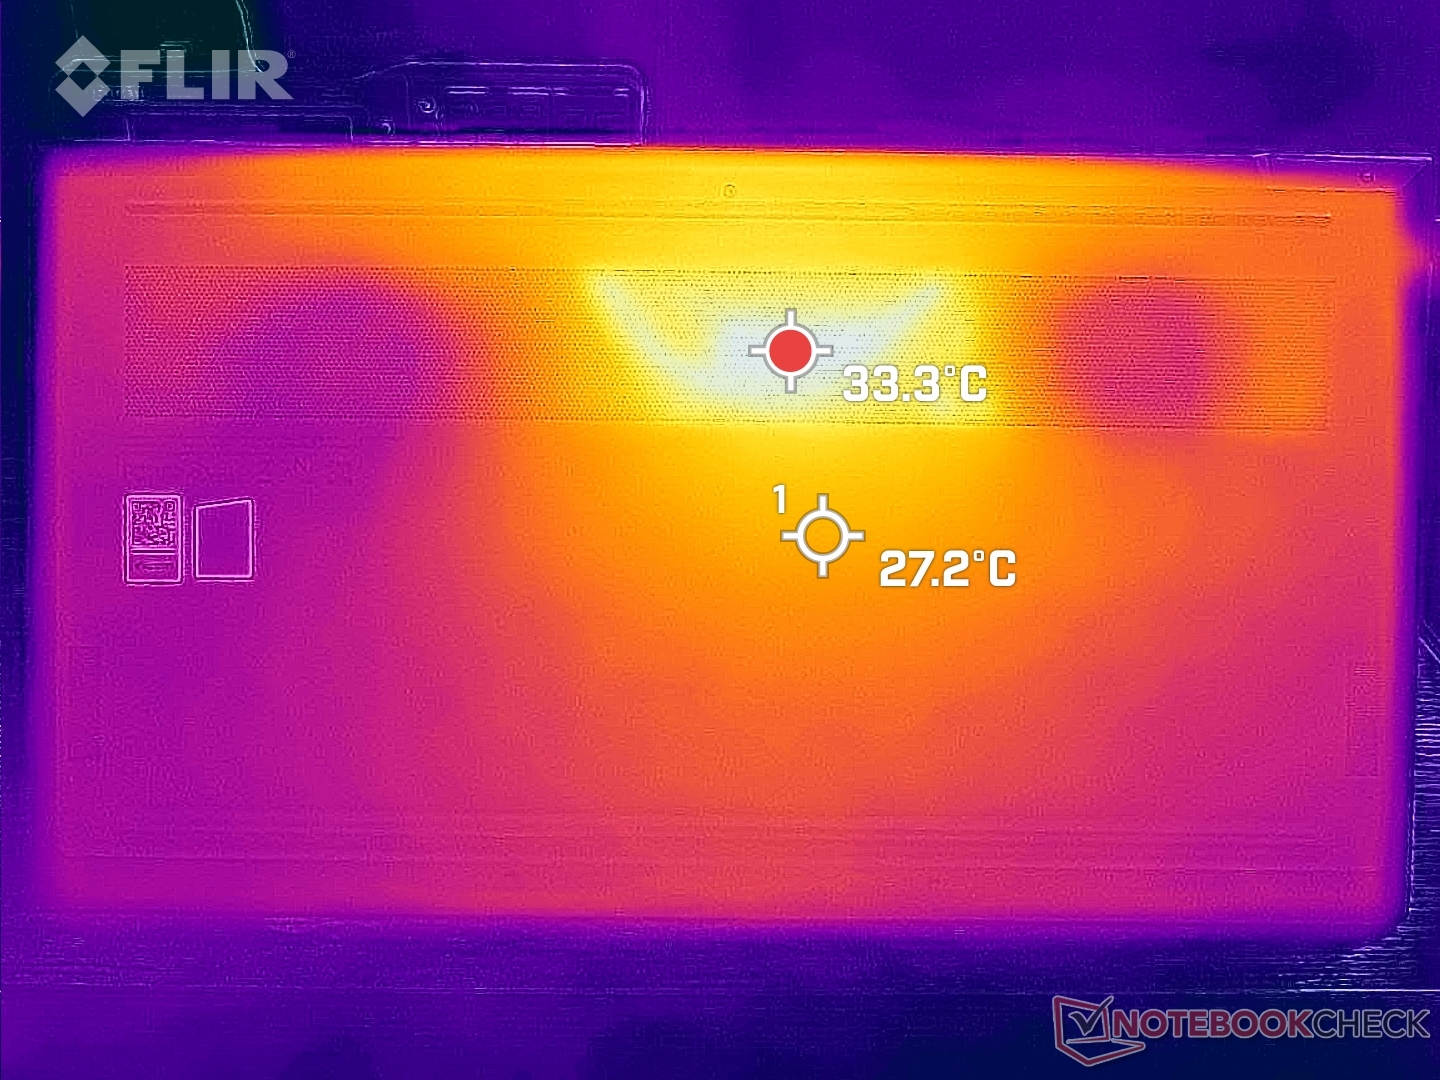
Température - Plutôt cool
Les températures de surface sont plus fraîches que prévu, même en cas de charges exigeantes. Les points chauds ne sont que d'environ 33 C sur le haut et le bas, respectivement, contre 50 C ou plus sur le LG Gram 17 dans des conditions similaires. La plus grande surface du large rapport d'aspect 21:10 a un effet positif sur le développement global de la température.
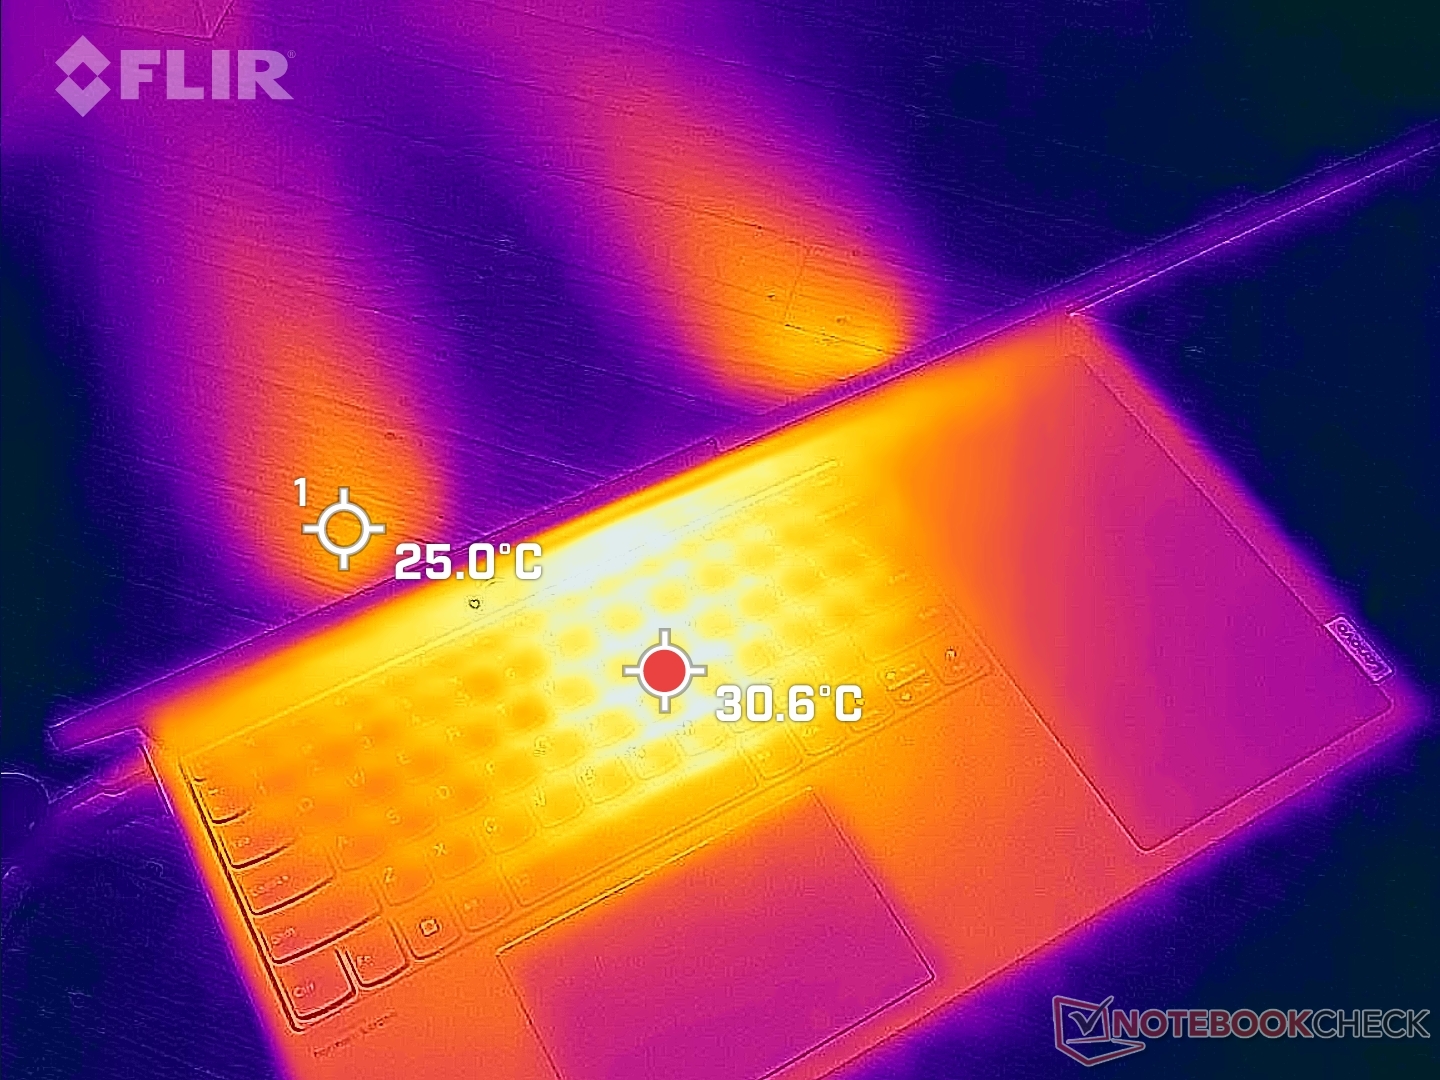
(+) La température maximale du côté supérieur est de 33.2 °C / 92 F, par rapport à la moyenne de 34.3 °C / 94 F, allant de 21.2 à 62.5 °C pour la classe Office.
(+) Le fond chauffe jusqu'à un maximum de 32.8 °C / 91 F, contre une moyenne de 36.8 °C / 98 F
(+) En utilisation inactive, la température moyenne du côté supérieur est de 27.2 °C / 81 F, par rapport à la moyenne du dispositif de 29.5 °C / 85 F.
(+) Les repose-poignets et le pavé tactile sont plus froids que la température de la peau avec un maximum de 26.4 °C / 79.5 F et sont donc froids au toucher.
(±) La température moyenne de la zone de l'appui-paume de dispositifs similaires était de 27.5 °C / 81.5 F (+1.1 °C / #2 F).
| Lenovo ThinkBook Plus Gen3 Intel Core i7-12700H, Intel Iris Xe Graphics G7 96EUs | Lenovo ThinkBook Plus Gen2 Core i5 Intel Core i5-1130G7, Intel Iris Xe Graphics G7 80EUs | Asus ProArt StudioBook Pro 17 W700G3T Intel Core i7-9750H, NVIDIA Quadro RTX 3000 Max-Q | LG Gram 17 (2022) Intel Core i5-1240P, Intel Iris Xe Graphics G7 80EUs | Dell XPS 17 9720 Intel Core i7-12700H, NVIDIA GeForce RTX 3050 4GB Laptop GPU | Gigabyte Aero 17 HDR YD Intel Core i9-11980HK, NVIDIA GeForce RTX 3080 Laptop GPU | |
|---|---|---|---|---|---|---|
| Heat | -17% | -12% | -30% | -13% | -32% | |
| Maximum Upper Side * (°C) | 33.2 | 42 -27% | 45.4 -37% | 50 -51% | 49.5 -49% | 44 -33% |
| Maximum Bottom * (°C) | 32.8 | 44.5 -36% | 53.7 -64% | 50 -52% | 38.4 -17% | 56 -71% |
| Idle Upper Side * (°C) | 29.8 | 29.8 -0% | 22.2 26% | 31.5 -6% | 28 6% | 32 -7% |
| Idle Bottom * (°C) | 30.4 | 31.9 -5% | 21.8 28% | 33.5 -10% | 27.8 9% | 35 -15% |
* ... Moindre est la valeur, meilleures sont les performances
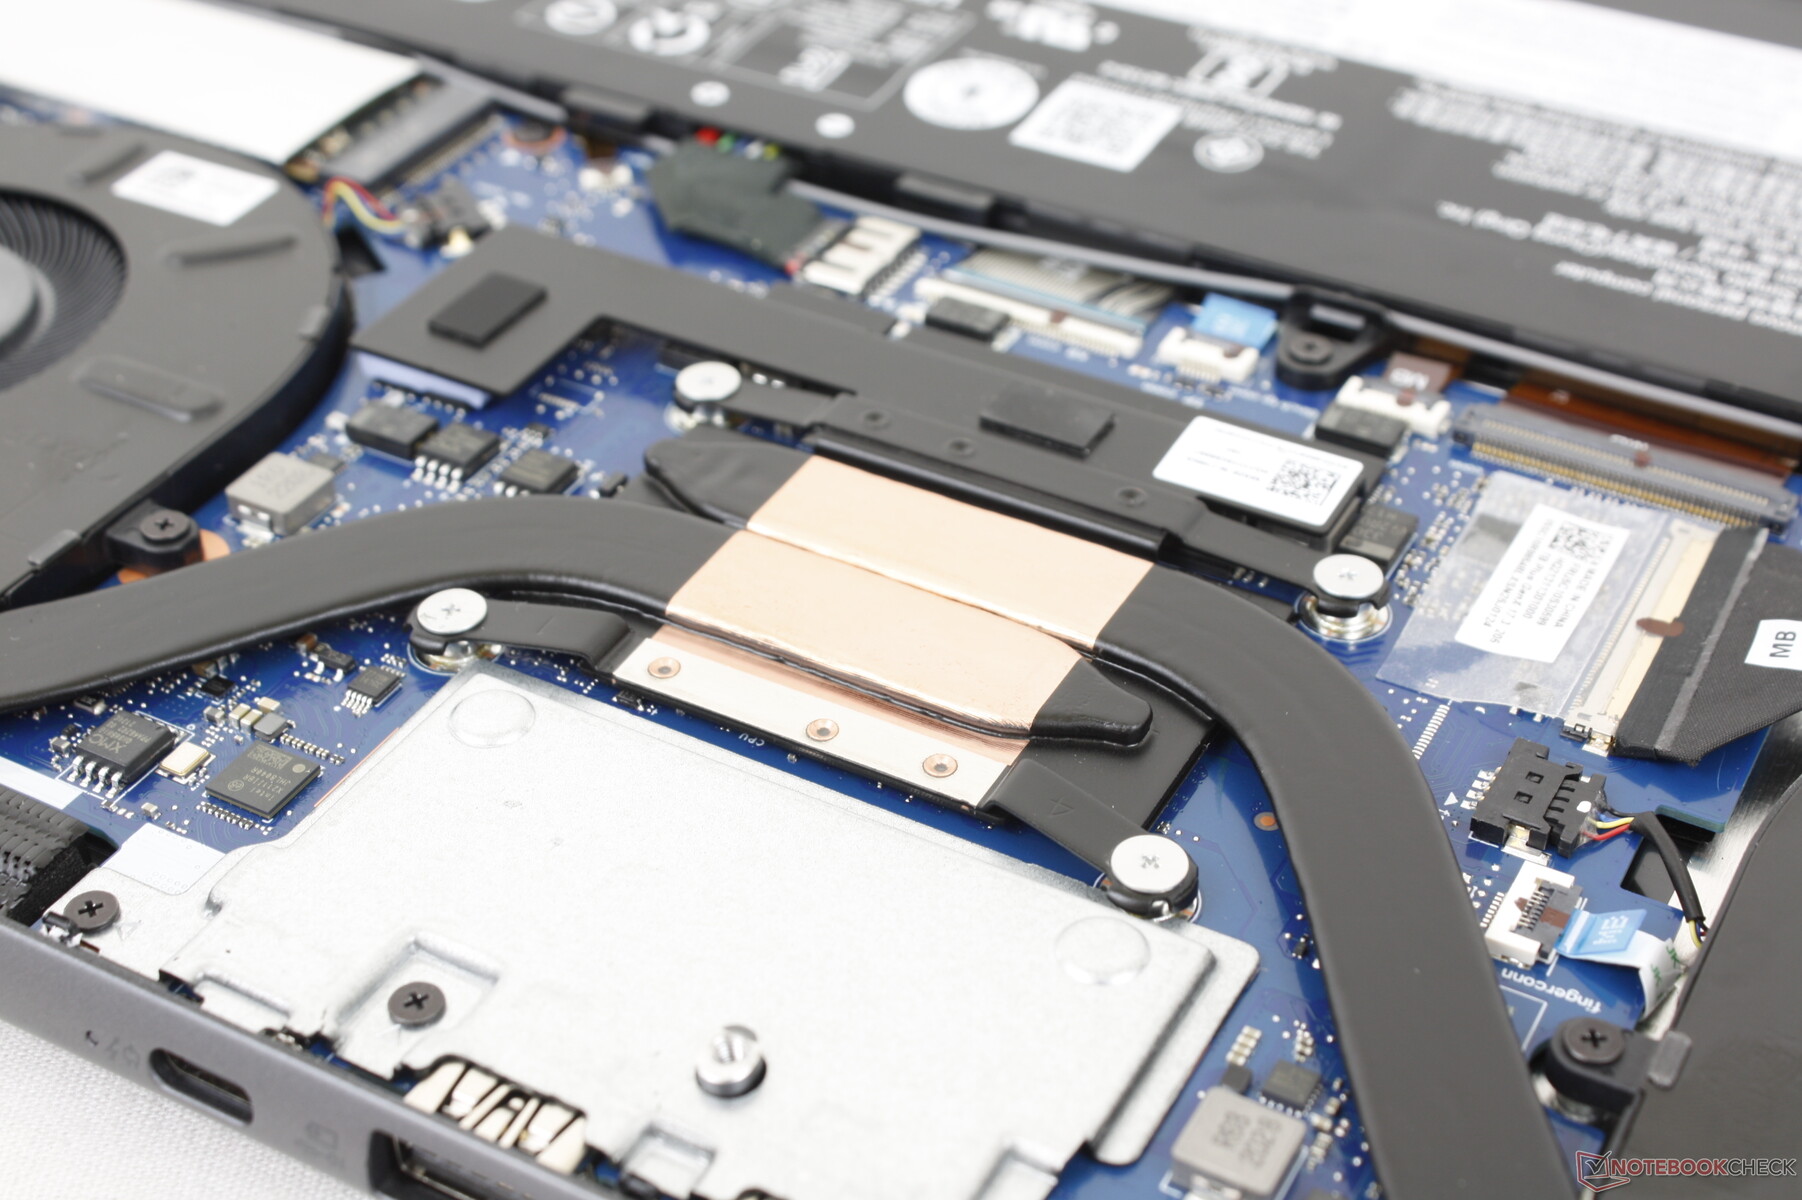
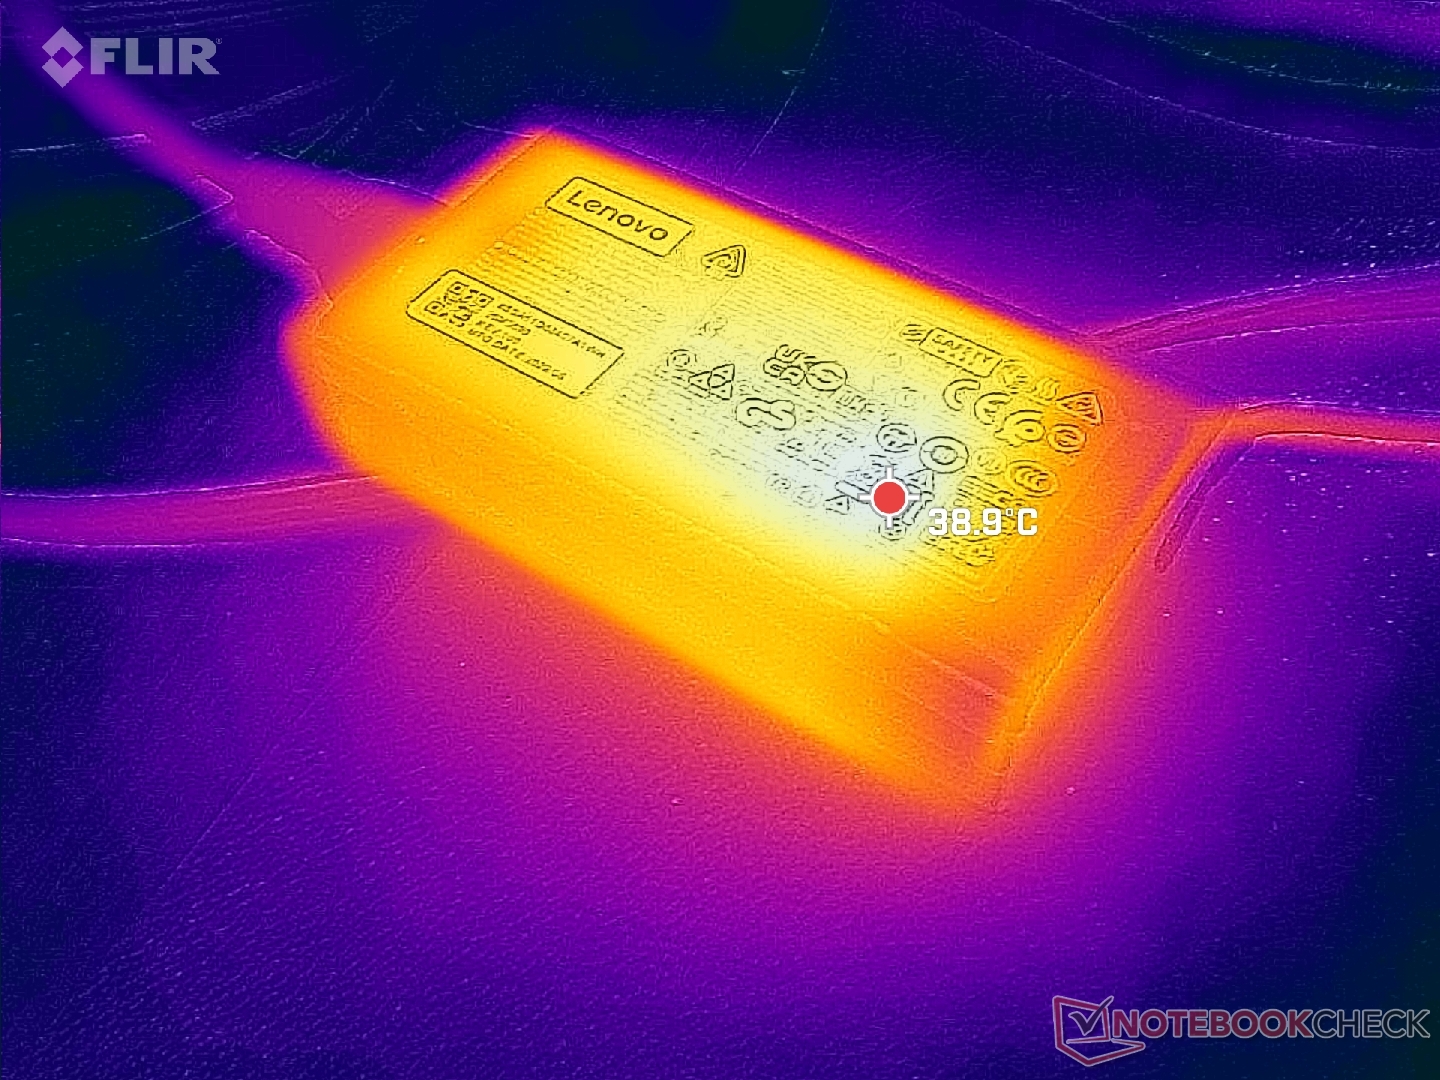
Test de stress
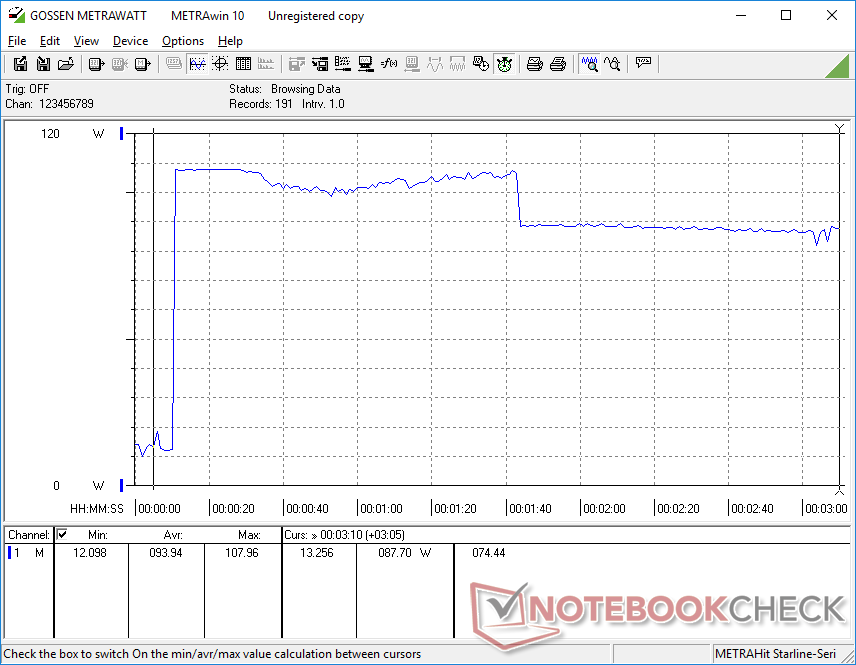
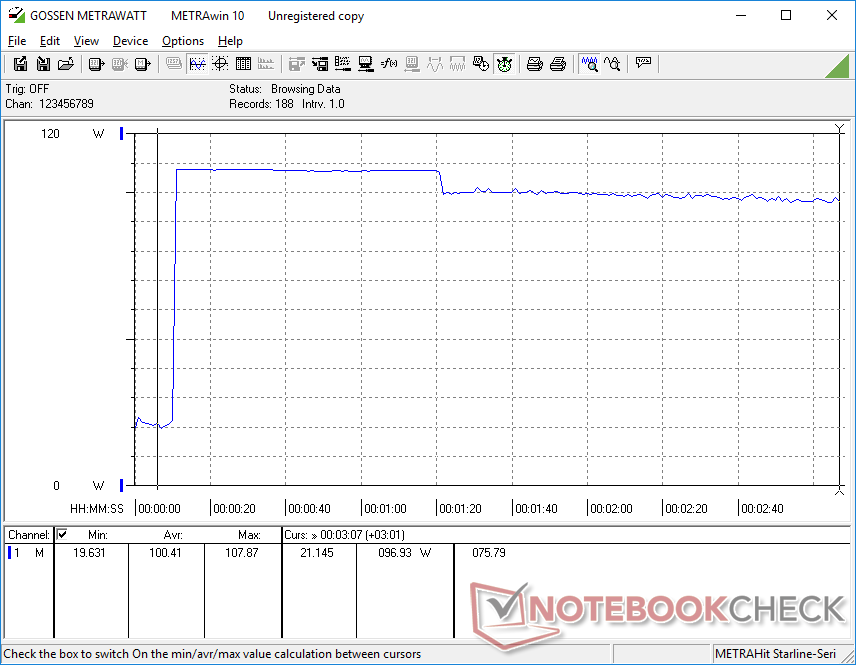
Lors de l'exécution du test Prime95 pour solliciter le processeur, les fréquences d'horloge et la consommation d'énergie de la carte ont atteint respectivement 3,6 GHz et 80 W, pendant quelques secondes seulement, pour une température centrale de 98 C. Les fréquences d'horloge et la consommation d'énergie de la carte ont ensuite chuté rapidement à 3 GHz et 60 W avant de se stabiliser à 2,8 GHz et 52 W, respectivement, pour maintenir la température centrale juste en dessous de 90 C. La répétition de ce test sur le XPS 17 avec le même processeur Core i7-12700H a donné des fréquences d'horloge similaires, mais à une température centrale plus froide de 75 C.
Les fréquences d'horloge et la température du GPU en fonctionnement Witcher 3 se stabiliseraient à 1297 MHz et 85 C, respectivement, ce qui est une fourchette courante pour les ordinateurs portables multimédias minces équipés d'un Core H, tels que l'Inspiron 16 Plus 7620 de Dell Dell Inspiron 16 Plus 7620.
L'utilisation de la batterie a un impact sur les performances. Une exécution de 3DMark 11 sur batterie donnerait des scores de physique et de graphisme de 16704 et 5421 points, respectivement, contre 18948 et 6524 points sur le secteur.
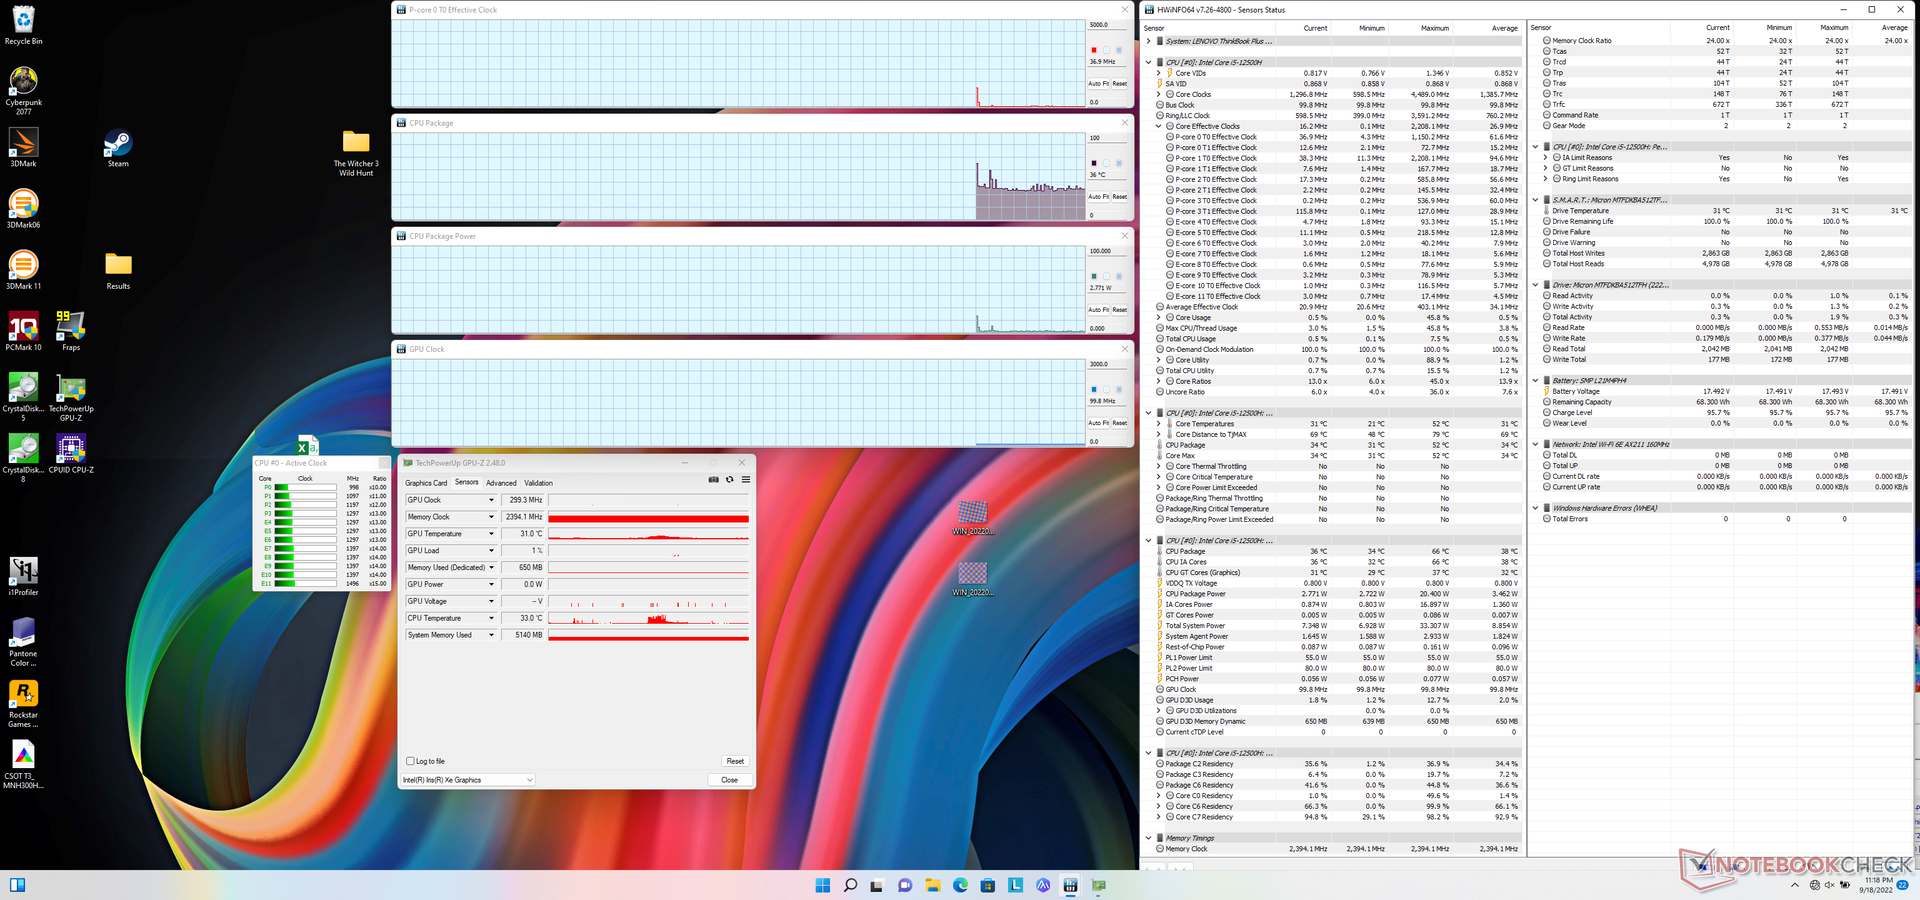
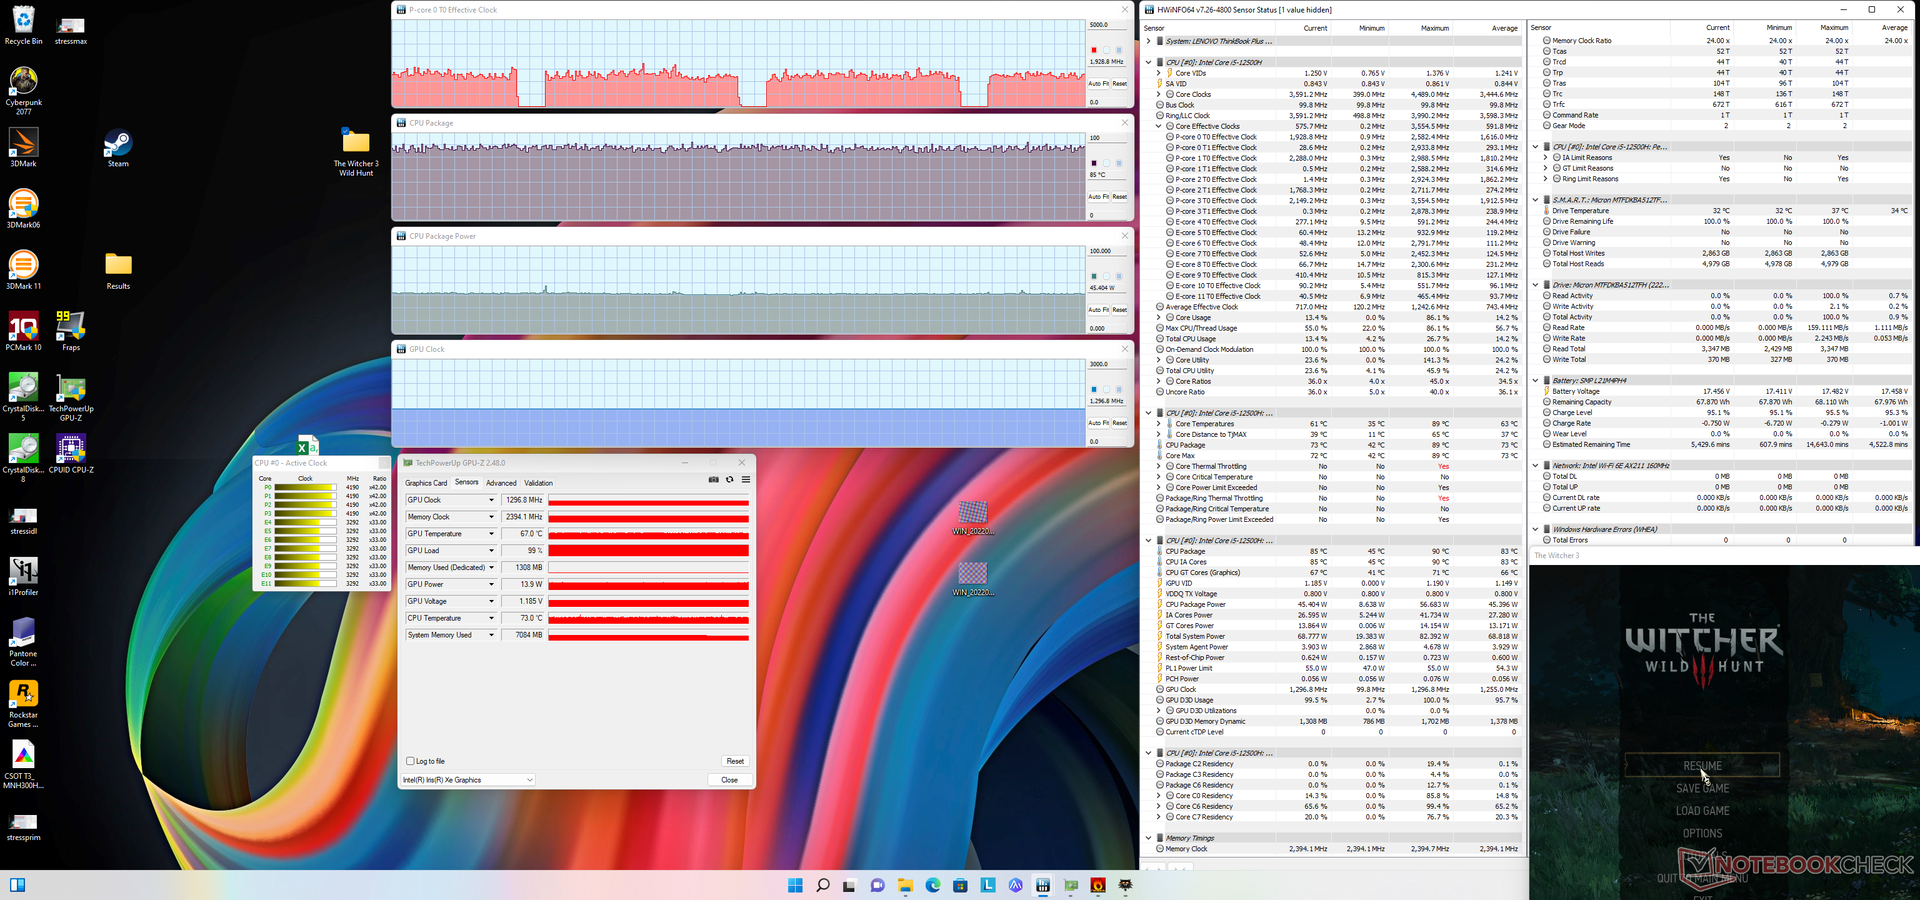
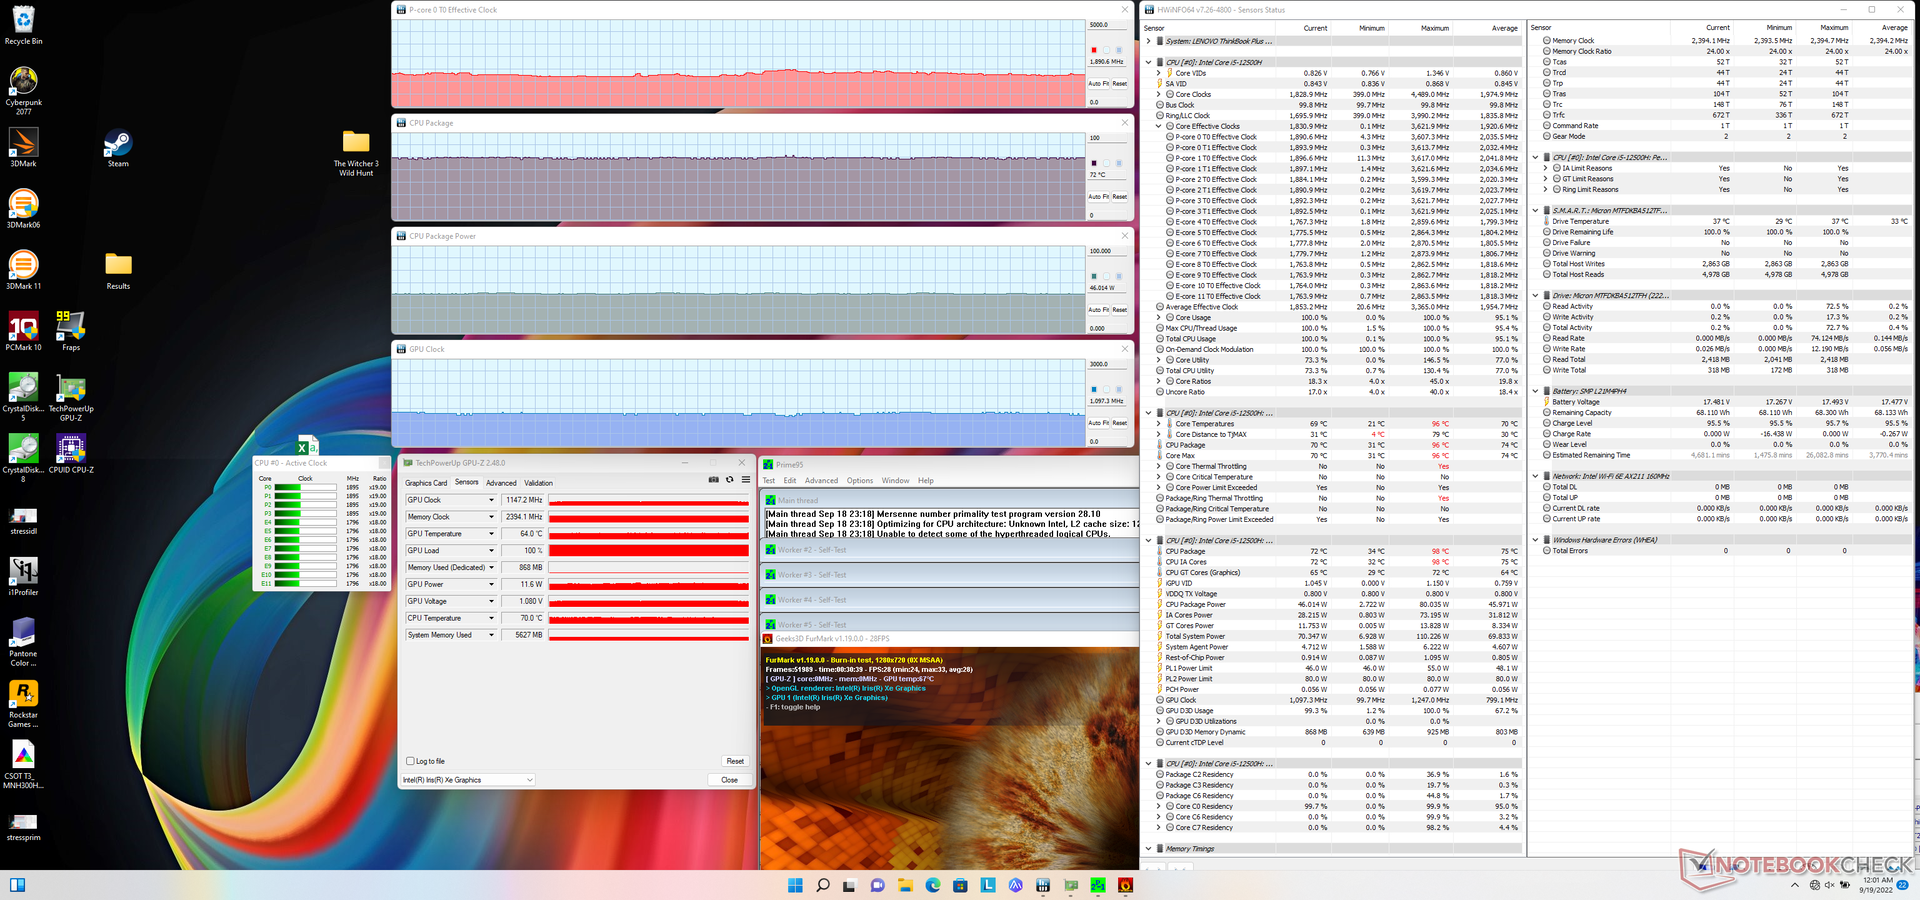
| Fréquence du CPU (GHz) | Fréquence du GPU (MHz) | Température moyenne du CPU (°C) | |
| Système au repos | -- | -- | 36 |
| Prime95 Stress | 2.6 | -- | 88 |
| Prime95 + FurMark Stress | 1.9 | 1147 | 72 |
| Witcher 3 Stress | ~1.9 | 1297 | 85 |
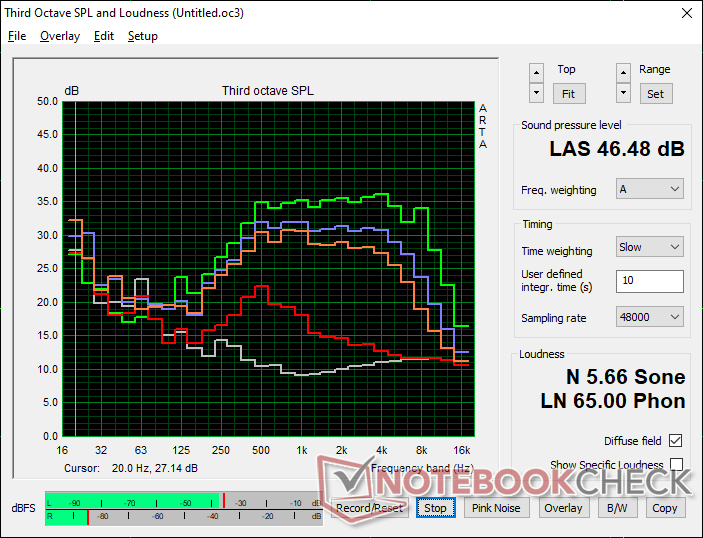
Haut-parleurs
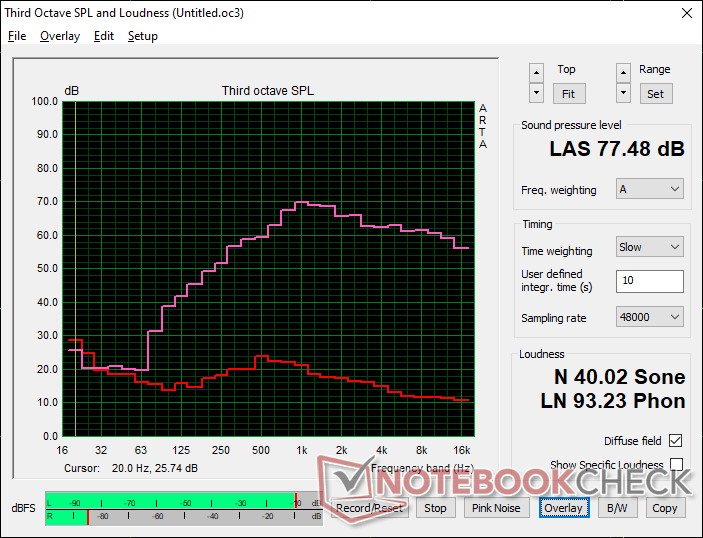
Lenovo ThinkBook Plus Gen3 analyse audio
(±) | le niveau sonore du haut-parleur est moyen mais bon (77.5# dB)
Basses 100 - 315 Hz
(±) | basse réduite - en moyenne 14% inférieure à la médiane
(±) | la linéarité des basses est moyenne (9.4% delta à la fréquence précédente)
Médiums 400 - 2000 Hz
(±) | médiane supérieure - en moyenne 5% supérieure à la médiane
(+) | les médiums sont linéaires (5% delta à la fréquence précédente)
Aiguës 2 - 16 kHz
(+) | des sommets équilibrés - à seulement 1.4% de la médiane
(+) | les aigus sont linéaires (2.5% delta à la fréquence précédente)
Globalement 100 - 16 000 Hz
(±) | la linéarité du son global est moyenne (16% de différence avec la médiane)
Par rapport à la même classe
» 19% de tous les appareils testés de cette catégorie étaient meilleurs, 6% similaires, 76% pires
» Le meilleur avait un delta de 7%, la moyenne était de 21%, le pire était de 53%.
Par rapport à tous les appareils testés
» 25% de tous les appareils testés étaient meilleurs, 5% similaires, 69% pires
» Le meilleur avait un delta de 4%, la moyenne était de 23%, le pire était de 134%.
Apple MacBook Pro 16 2021 M1 Pro analyse audio
(+) | les haut-parleurs peuvent jouer relativement fort (84.7# dB)
Basses 100 - 315 Hz
(+) | bonne basse - seulement 3.8% loin de la médiane
(+) | les basses sont linéaires (5.2% delta à la fréquence précédente)
Médiums 400 - 2000 Hz
(+) | médiane équilibrée - seulement 1.3% de la médiane
(+) | les médiums sont linéaires (2.1% delta à la fréquence précédente)
Aiguës 2 - 16 kHz
(+) | des sommets équilibrés - à seulement 1.9% de la médiane
(+) | les aigus sont linéaires (2.7% delta à la fréquence précédente)
Globalement 100 - 16 000 Hz
(+) | le son global est linéaire (4.6% différence à la médiane)
Par rapport à la même classe
» 0% de tous les appareils testés de cette catégorie étaient meilleurs, 0% similaires, 100% pires
» Le meilleur avait un delta de 5%, la moyenne était de 17%, le pire était de 45%.
Par rapport à tous les appareils testés
» 0% de tous les appareils testés étaient meilleurs, 0% similaires, 100% pires
» Le meilleur avait un delta de 4%, la moyenne était de 23%, le pire était de 134%.
Gestion de l'énergie
Consommation d'énergie
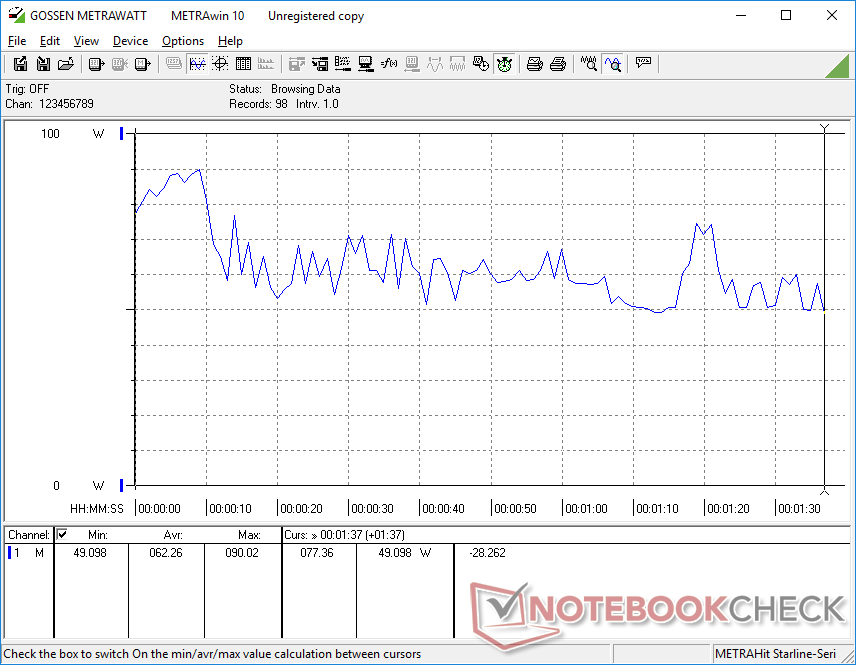
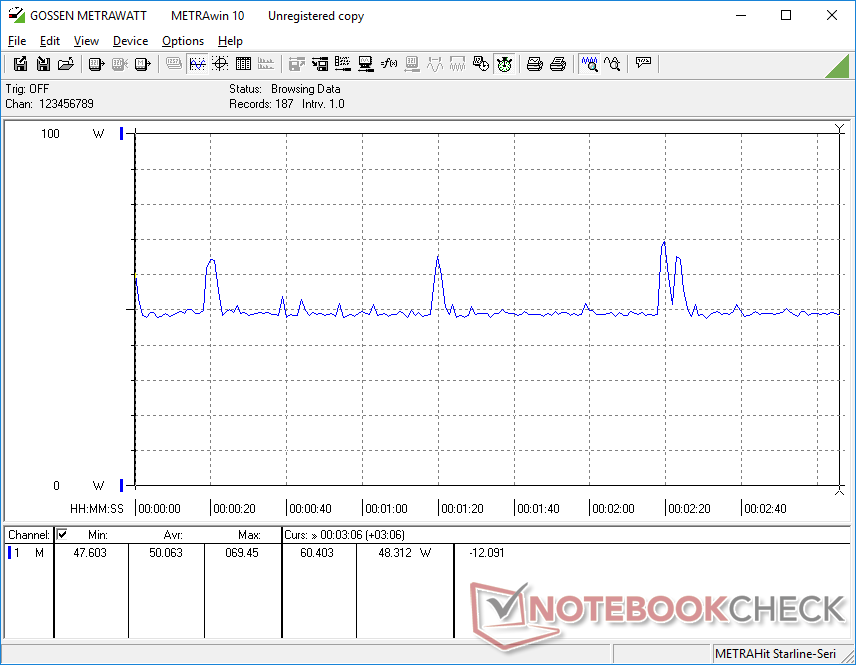
La marche au ralenti sur le bureau en mode Economiseur d'énergie ne consomme que 7 W lorsque le niveau de luminosité est minimal et que l'écran secondaire est éteint. Si l'écran secondaire est activé et réglé sur son niveau de luminosité maximum, la consommation sera supérieure d'environ 2,8 W. Le fonctionnement au ralenti sur le bureau, avec les deux écrans réglés sur la luminosité maximale et en mode Performance extrême, nécessite un peu moins de 17 W pour être aussi performant que les ordinateurs portables 17 pouces plus rapides équipés de GPU discrets.
L'exécution de charges élevées, comme les jeux, nécessite entre 50 et 65 W, contre seulement ~40 W pour la plupart des ordinateurs portables Core U ou P dotés du même GPU intégré Iris Xe 96 EUs, comme le LG Gram 17.
La consommation d'énergie globale est environ deux fois plus élevée que celle de la génération précédente de ThinkBook Plus Gen 2 dans la plupart des cas, en raison de l'augmentation de la taille et des performances et de l'utilité supplémentaire de l'écran secondaire.
| Éteint/en veille | |
| Au repos | |
| Fortement sollicité |
|
Légende:
min: | |
| Lenovo ThinkBook Plus Gen3 i7-12700H, Iris Xe G7 96EUs, Micron 3400 MTFDKBA512TFH 512GB, IPS, 3072x1440, 17.3" | Lenovo ThinkBook Plus Gen2 Core i5 i5-1130G7, Iris Xe G7 80EUs, Samsung PM9A1 MZVL2512HCJQ, IPS, E-Ink, 2560x1600, 13.3" | Asus ProArt StudioBook Pro 17 W700G3T i7-9750H, Quadro RTX 3000 Max-Q, Samsung SSD PM981 MZVLB1T0HALR, IPS, 1920x1200, 17" | LG Gram 17 (2022) i5-1240P, Iris Xe G7 80EUs, Samsung PM9A1 MZVL2512HCJQ, IPS, 2560x1600, 17" | Dell XPS 17 9720 i7-12700H, GeForce RTX 3050 4GB Laptop GPU, Micron 3400 MTFDKBA512TFH 512GB, IPS, 3840x2400, 17" | Gigabyte Aero 17 HDR YD i9-11980HK, GeForce RTX 3080 Laptop GPU, Samsung PM9A1 MZVL2512HCJQ, IPS, 3840x2160, 17.3" | |
|---|---|---|---|---|---|---|
| Power Consumption | 46% | -48% | 33% | -40% | -150% | |
| Idle Minimum * (Watt) | 7.4 | 5 32% | 11.3 -53% | 4 46% | 7.8 -5% | 25 -238% |
| Idle Average * (Watt) | 16.4 | 7.9 52% | 16 2% | 12.2 26% | 15.1 8% | 28 -71% |
| Idle Maximum * (Watt) | 16.8 | 8.3 51% | 16.8 -0% | 13.2 21% | 17 -1% | 40 -138% |
| Load Average * (Watt) | 62.3 | 30.9 50% | 93.6 -50% | 34 45% | 114 -83% | 114 -83% |
| Witcher 3 ultra * (Watt) | 50 | 25.2 50% | 106 -112% | 39.4 21% | 115.2 -130% | 176 -252% |
| Load Maximum * (Watt) | 107.9 | 66.8 38% | 186.6 -73% | 65.9 39% | 135.6 -26% | 236 -119% |
* ... Moindre est la valeur, meilleures sont les performances
Power Consumption Witcher 3 / Stresstest
Power Consumption external Monitor
Autonomie de la batterie - Pas très longue
Les durées d'exécution sont au mieux moyennes pour un ordinateur portable de 17 pouces. La capacité de la batterie est plus faible que sur le LG Gram 17 ou le Dell XPS 17 pour une autonomie WLAN plus courte de plusieurs heures. Nous sommes en mesure d'enregistrer un peu moins de 5,5 heures d'utilisation du WLAN dans le monde réel avec l'écran secondaire actif, contre 9+ heures chacun sur les Asus et Dell susmentionnés.
Le chargement d'une batterie vide à sa pleine capacité prend entre 1 heure et 1 heure et demie lorsque la fonction de charge rapide est activée.
| Lenovo ThinkBook Plus Gen3 i7-12700H, Iris Xe G7 96EUs, 70 Wh | Lenovo ThinkBook Plus Gen2 Core i5 i5-1130G7, Iris Xe G7 80EUs, 53 Wh | Asus ProArt StudioBook Pro 17 W700G3T i7-9750H, Quadro RTX 3000 Max-Q, 57 Wh | LG Gram 17 (2022) i5-1240P, Iris Xe G7 80EUs, 80 Wh | Dell XPS 17 9720 i7-12700H, GeForce RTX 3050 4GB Laptop GPU, 97 Wh | Gigabyte Aero 17 HDR YD i9-11980HK, GeForce RTX 3080 Laptop GPU, 99 Wh | |
|---|---|---|---|---|---|---|
| Autonomie de la batterie | 43% | 41% | 186% | 47% | 13% | |
| Reader / Idle (h) | 8.1 | 28.2 248% | ||||
| WiFi v1.3 (h) | 5.3 | 7.6 43% | 5.9 11% | 11.2 111% | 9.2 74% | 5.6 6% |
| Load (h) | 1 | 1.7 70% | 3 200% | 1.2 20% | 1.2 20% | |
| H.264 (h) | 6.9 | 14.1 | 11.2 | |||
| Witcher 3 ultra (h) | 1.7 |
Points positifs
Points négatifs
Verdict : idéal pour les espaces de travail restreints
Le ThinkBook Plus Gen 3 est unique dans sa catégorie de taille et pas seulement pour son écran secondaire de 8 pouces ou son facteur de forme 21:10. Plus précisément, il est l'un des rares ordinateurs portables de 17 pouces à être équipé d'un processeur Intel Core H de 12e génération et d'aucune option graphique discrète. Cette approche a permis de concevoir un châssis relativement mince et léger malgré le deuxième écran et les dimensions plus longues du châssis.
L'un des principaux inconvénients de ce modèle est qu'il peut être sous-puissant pour certains utilisateurs. Les performances du processeur sont plus lentes que celles de nombreux autres ordinateurs portables de 17 pouces équipés du même processeur Core i7-12700H et l'absence de dGPU risque de rebuter la plupart des utilisateurs expérimentés. Ce dernier point est dommage car l'écran principal possède les couleurs et les fonctionnalités nécessaires à l'édition graphique tandis que l'écran secondaire peut être intrinsèquement utile pour le multitâche lourd. Tant que vos charges de travail ne sont pas particulièrement lourdes pour le GPU, cet inconvénient ne devrait pas poser trop de problèmes.
Le ThinkBook Plus Gen 3 optimise la productivité en offrant aux utilisateurs plus de surface d'écran que la plupart des autres ordinateurs portables du marché. Vous devrez toutefois renoncer à un peu de performances graphiques.
Quant à l'écran secondaire intégré, il est surtout utile pour les fenêtres de l'explorateur de fichiers, les textes, les lignes de commande et d'autres applications où la précision des couleurs n'est pas un problème majeur. La fonctionnalité de l'écran tactile n'est pas aussi fiable que sur un smartphone ou une tablette, cependant, et nous trouvons que l'écran est plus facile à utiliser avec une souris à la place
Si vous avez la place sur votre bureau pour un moniteur secondaire externe comme le Lepow C2le ThinkBook Plus Gen 3 devient alors beaucoup moins attrayant. Les utilisateurs qui sont constamment en déplacement ou qui n'ont pas d'espace pour des moniteurs externes sont ceux qui trouveront ce Lenovo étonnamment spacieux par rapport aux autres modèles de 17 pouces.
Prix et disponibilité
Le ThinkBook Plus Gen 3 n'est pas encore disponible chez les principaux revendeurs comme Amazon, Best Buy ou Newegg. Les utilisateurs peuvent acheter directement auprès de Lenovo à partir de 1500 USD pour l'option Core i5 ou 1600 USD pour notre configuration Core i7.
Lenovo ThinkBook Plus Gen3
- 09/21/2022 v7 (old)
Allen Ngo
Price comparison

