Test du Dell XPS 17 9720 RTX 3060 : un processeur 50 % plus rapide qu'avant
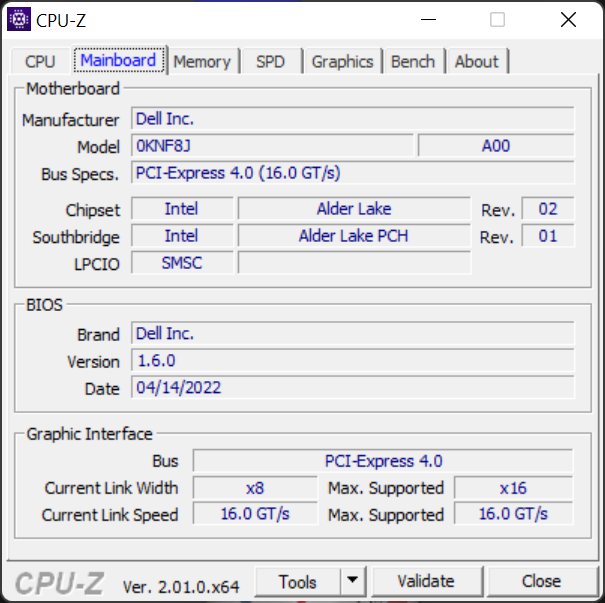
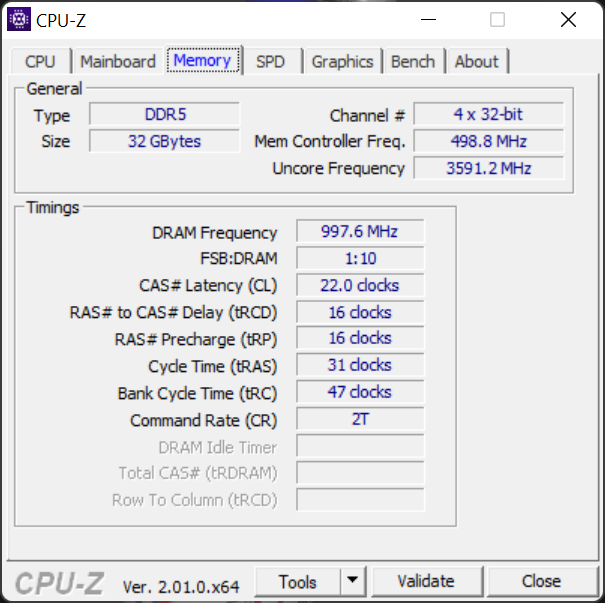
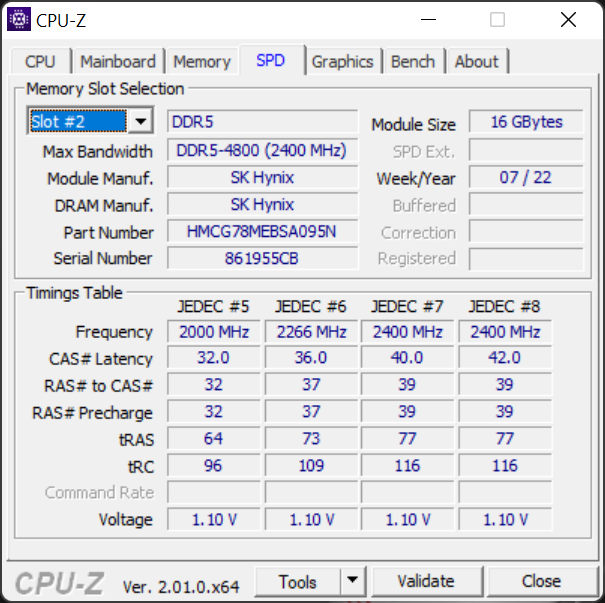
Le Dell XPS 17 9720 est la troisième itération de la série XPS 17 de 17,0 pouces qui a débuté avec le XPS 17 9700 de 2020. Alors que les versions XPS 17 9700 et 2021 9710 étaient livrées avec des CPU Intel de 10e et 11e génération, respectivement, la version 2022 9720 a ajouté des CPU de 12e génération et des options de RAM DDR5 au mélange. Les autres caractéristiques principales, comme le châssis et les options de GPU, sont identiques à celles des XPS 17 9700 et 9710 critiques existantes sur la série pour en savoir plus sur les caractéristiques physiques du modèle
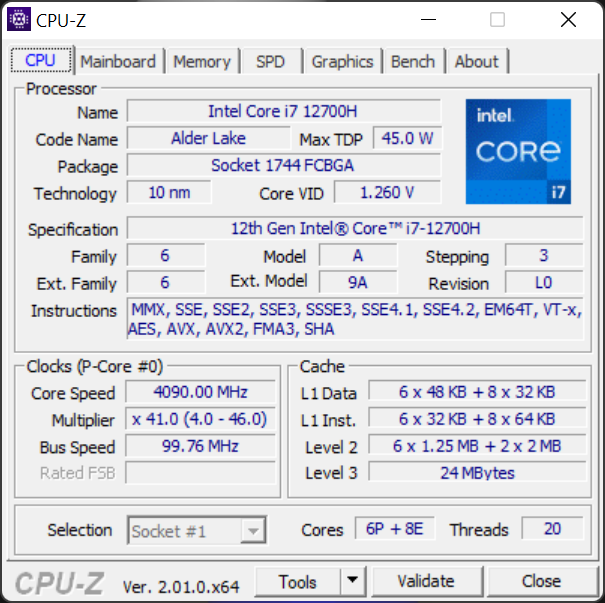
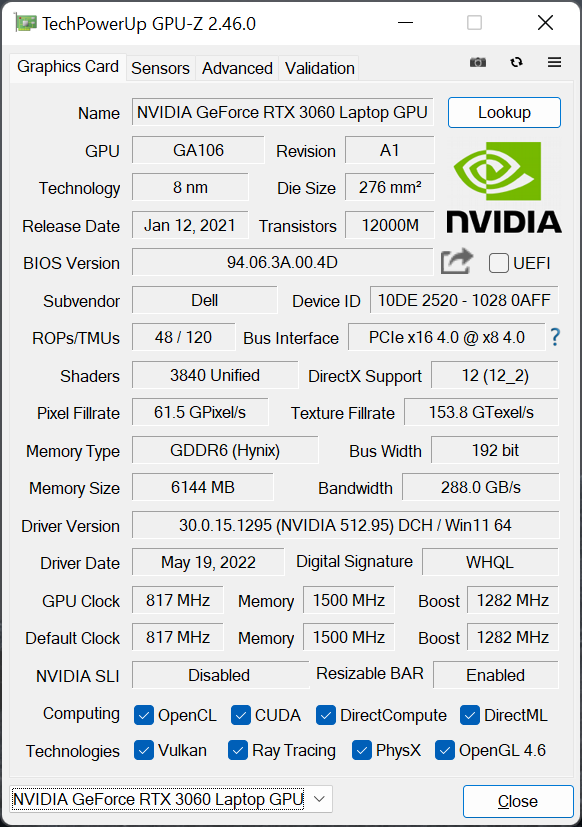
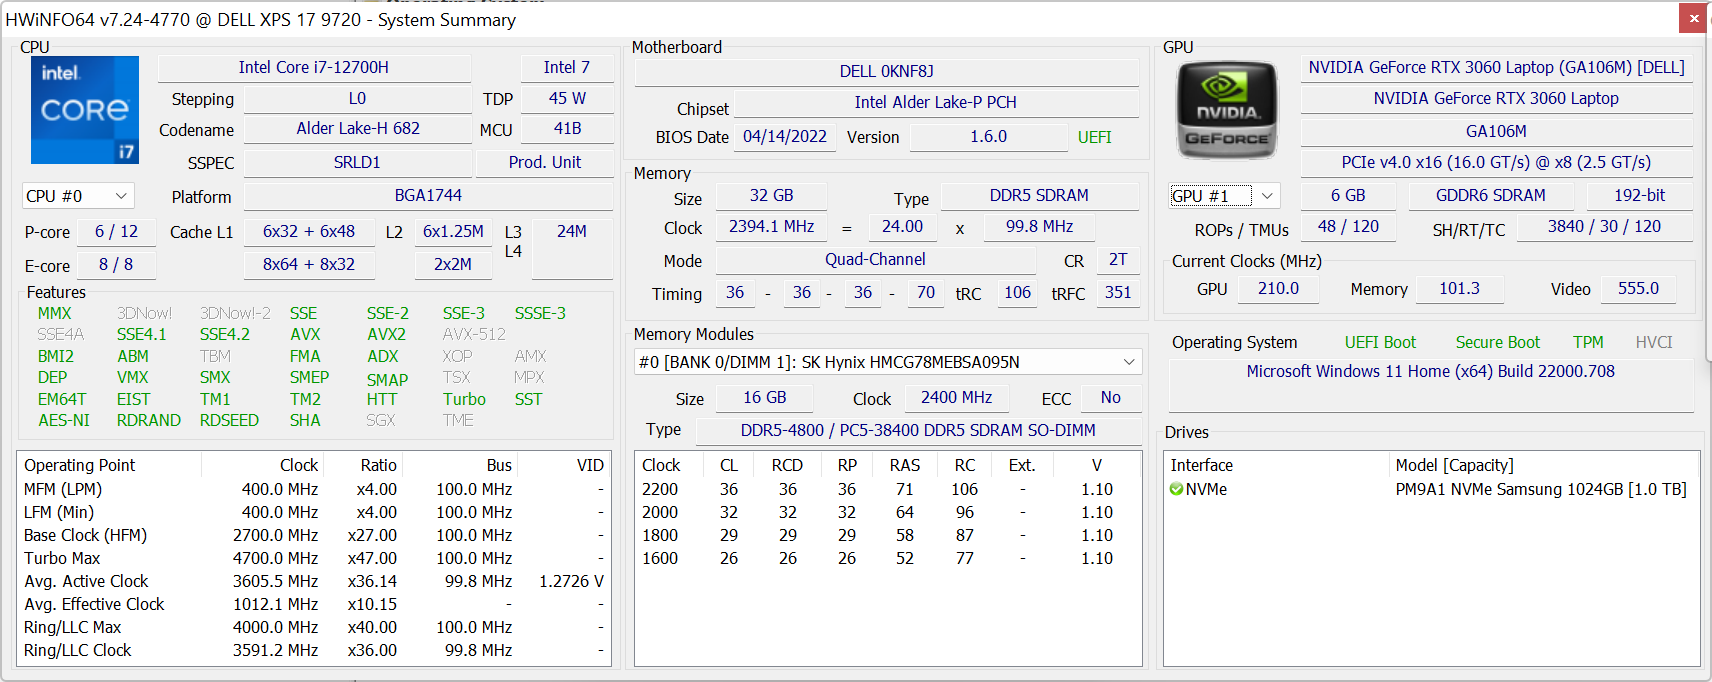
L'unité que nous avons testée est une configuration haut de gamme avec le processeur Core i7-12700H, l'écran tactile UHD+ (3840 x 2400) IPS et le GPU GeForce RTX 3060 pour environ 3 000 USD. D'autres SKU sont également disponibles avec les processeurs i5-12500H, i9-12900HK, GeForce RTX 3050 Ti, un écran 1200p, ou des graphiques intégrés uniquement
Les concurrents du XPS 17 9720 comprennent des ordinateurs portables de 17,3 pouces pour le multimédia ou la consommation comme le Gigabyte Aero 17, Razer Blade 17, HP Envy 17ou Lenovo Legion 5 17
Plus de commentaires sur Dell
Potentiële concurrenten in vergelijking
Note | Date | Modèle | Poids | Épaisseur | Taille | Résolution | Prix |
|---|---|---|---|---|---|---|---|
| 88.8 % v7 (old) | 06/22 | Dell XPS 17 9720 RTX 3060 i7-12700H, GeForce RTX 3060 Laptop GPU | 2.5 kg | 19.5 mm | 17.00" | 3840x2400 | |
| 82.4 % v7 (old) | 08/21 | HP Envy 17-cg i5-1135G7, GeForce MX450 | 2.7 kg | 19.3 mm | 17.30" | 1920x1080 | |
| 87.9 % v7 (old) | 07/21 | Dell XPS 17 9710 Core i7 RTX 3060 i7-11800H, GeForce RTX 3060 Laptop GPU | 2.5 kg | 19.5 mm | 17.00" | 3840x2400 | |
| 87.9 % v7 (old) | 08/20 | Dell XPS 17 9700 Core i7 RTX 2060 Max-Q i7-10875H, GeForce RTX 2060 Max-Q | 2.5 kg | 19.5 mm | 17.00" | 3840x2400 | |
| 85.2 % v7 (old) | 02/22 | Lenovo Legion 5 17ACH6H-82JY0003GE R5 5600H, GeForce RTX 3060 Laptop GPU | 3.1 kg | 24.3 mm | 17.30" | 1920x1080 | |
| 76.5 % v7 (old) | 05/22 | Asus VivoBook 17 F712JA-AU708W i7-1065G7, Iris Plus Graphics G7 (Ice Lake 64 EU) | 2.2 kg | 21.4 mm | 17.30" | 1920x1080 | |
| 90.1 % v7 (old) | 05/22 | Razer Blade 17 (i7-12800H, RTX 3070 Ti) i7-12800H, GeForce RTX 3070 Ti Laptop GPU | 2.8 kg | 19.9 mm | 17.30" | 2560x1440 |
Cas - Identique mais toujours aussi génial
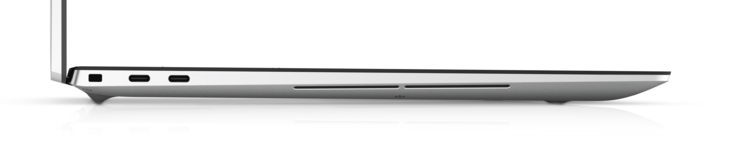
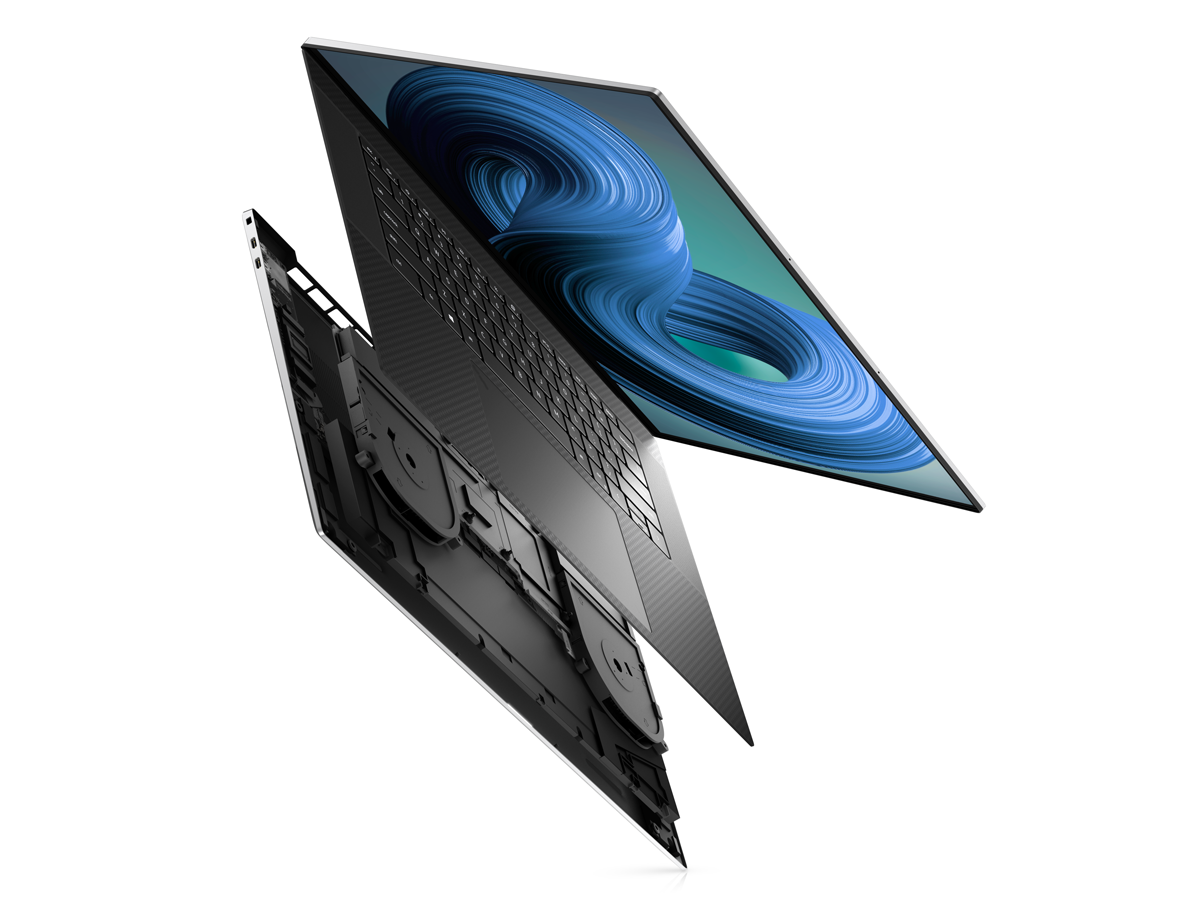
Le châssis n'a pas changé depuis le XPS 17 9700 ou 9710. Bien qu'il s'agisse d'un design vieux de deux ans, son facteur de forme unique 16:10 de 17,0 pouces permet au modèle d'être sensiblement plus petit et plus fin que les autres modèles de la même catégorie de taille.
Lecteur de carte SD
| SD Card Reader | |
| average JPG Copy Test (av. of 3 runs) | |
| Dell XPS 17 9720 RTX 3060 (Toshiba Exceria Pro SDXC 64 GB UHS-II) | |
| Dell XPS 17 9700 Core i7 RTX 2060 Max-Q (Toshiba Exceria Pro SDXC 64 GB UHS-II) | |
| Dell XPS 17 9710 Core i7 RTX 3060 (AV PRO microSD 128 GB V60) | |
| Razer Blade 17 (i7-12800H, RTX 3070 Ti) | |
| Lenovo Legion 5 17ACH6H-82JY0003GE (AV Pro SD microSD 128 GB V60) | |
| HP Envy 17-cg (AV Pro microSD 128 GB V60) | |
| Asus VivoBook 17 F712JA-AU708W (AV Pro SD microSD 128 GB V60) | |
| maximum AS SSD Seq Read Test (1GB) | |
| Dell XPS 17 9720 RTX 3060 (Toshiba Exceria Pro SDXC 64 GB UHS-II) | |
| Dell XPS 17 9700 Core i7 RTX 2060 Max-Q (Toshiba Exceria Pro SDXC 64 GB UHS-II) | |
| Razer Blade 17 (i7-12800H, RTX 3070 Ti) | |
| Dell XPS 17 9710 Core i7 RTX 3060 (AV PRO microSD 128 GB V60) | |
| Lenovo Legion 5 17ACH6H-82JY0003GE (AV Pro SD microSD 128 GB V60) | |
| HP Envy 17-cg (AV Pro microSD 128 GB V60) | |
| Asus VivoBook 17 F712JA-AU708W (AV Pro SD microSD 128 GB V60) | |
Communication - Pas de Wi-Fi 6E
Dell a mis à niveau le WLAN de la puce Intel AX1650 sur le XPS 17 9710 à la puce Intel AX1675 (ou AX211) sur le XPS 17 9720. La nouvelle puce prend en charge le Wi-Fi 6E, mais la fonction est désactivée sur le XPS 17 9720, comme nous l'avons découvert sur le XPS 15 9520 ce que nous avons découvert sur le XPS 15 9520. Ainsi, les utilisateurs ne pourront se connecter qu'aux réseaux 2,4 GHz ou 5 GHz et non aux réseaux 6 GHz.
| Networking | |
| iperf3 transmit AX12 | |
| HP Envy 17-cg | |
| Dell XPS 17 9710 Core i7 RTX 3060 | |
| Asus VivoBook 17 F712JA-AU708W | |
| Lenovo Legion 5 17ACH6H-82JY0003GE | |
| Dell XPS 17 9700 Core i7 RTX 2060 Max-Q | |
| iperf3 receive AX12 | |
| HP Envy 17-cg | |
| Dell XPS 17 9710 Core i7 RTX 3060 | |
| Dell XPS 17 9700 Core i7 RTX 2060 Max-Q | |
| Asus VivoBook 17 F712JA-AU708W | |
| Lenovo Legion 5 17ACH6H-82JY0003GE | |
| iperf3 receive AXE11000 | |
| Dell XPS 17 9720 RTX 3060 | |
| iperf3 transmit AXE11000 | |
| Dell XPS 17 9720 RTX 3060 | |
Webcam
L'appareil photo n'est toujours que de 720p, sans obturateur privé. La faible résolution native se marie mal avec l'écran haute résolution, ce qui donne une image inévitablement brouillée. Dell affirme que les capteurs IR et RVB sont désormais séparés pour de meilleures performances, mais la densité de pixels reste très faible. En comparaison, le Razer Blade 17 est livré avec une webcam 1080p à plus haute résolution.
Windows Hello est toujours pris en charge.


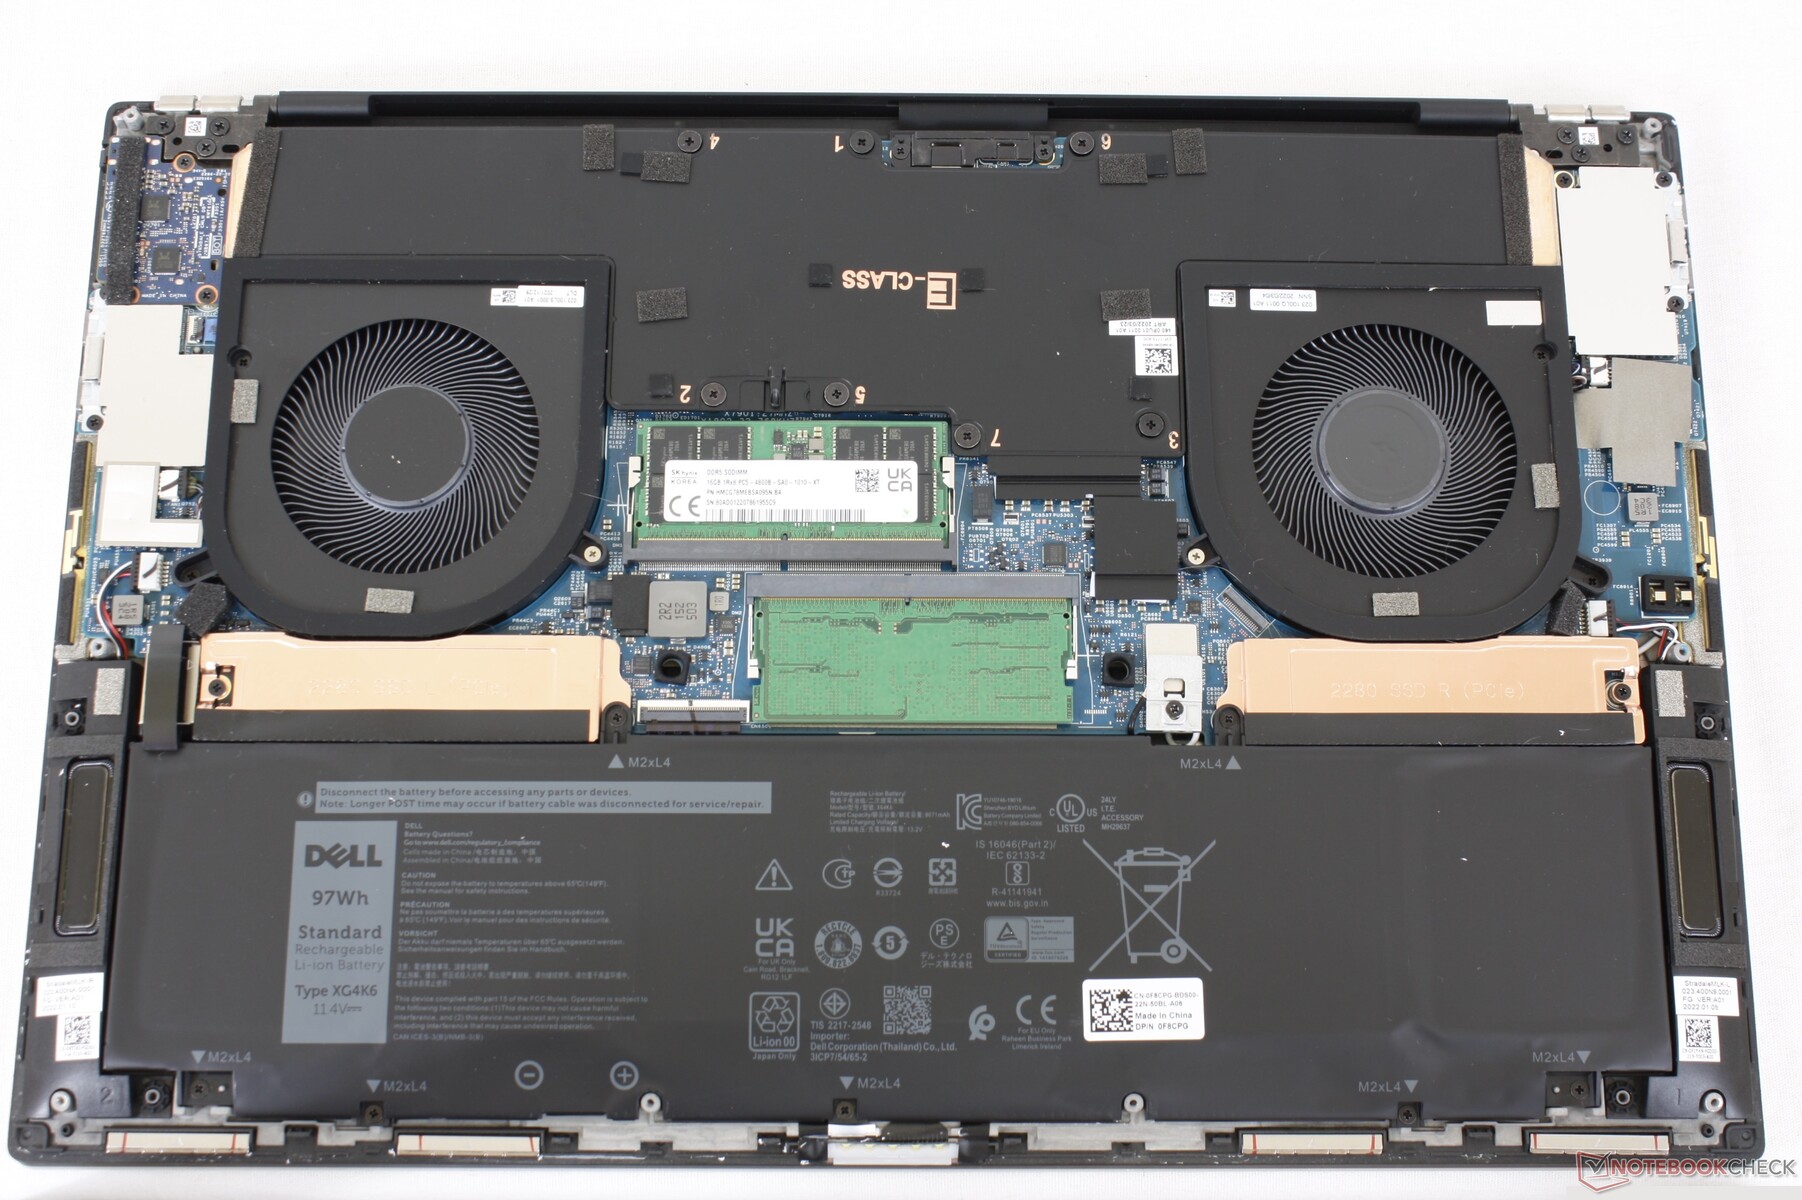
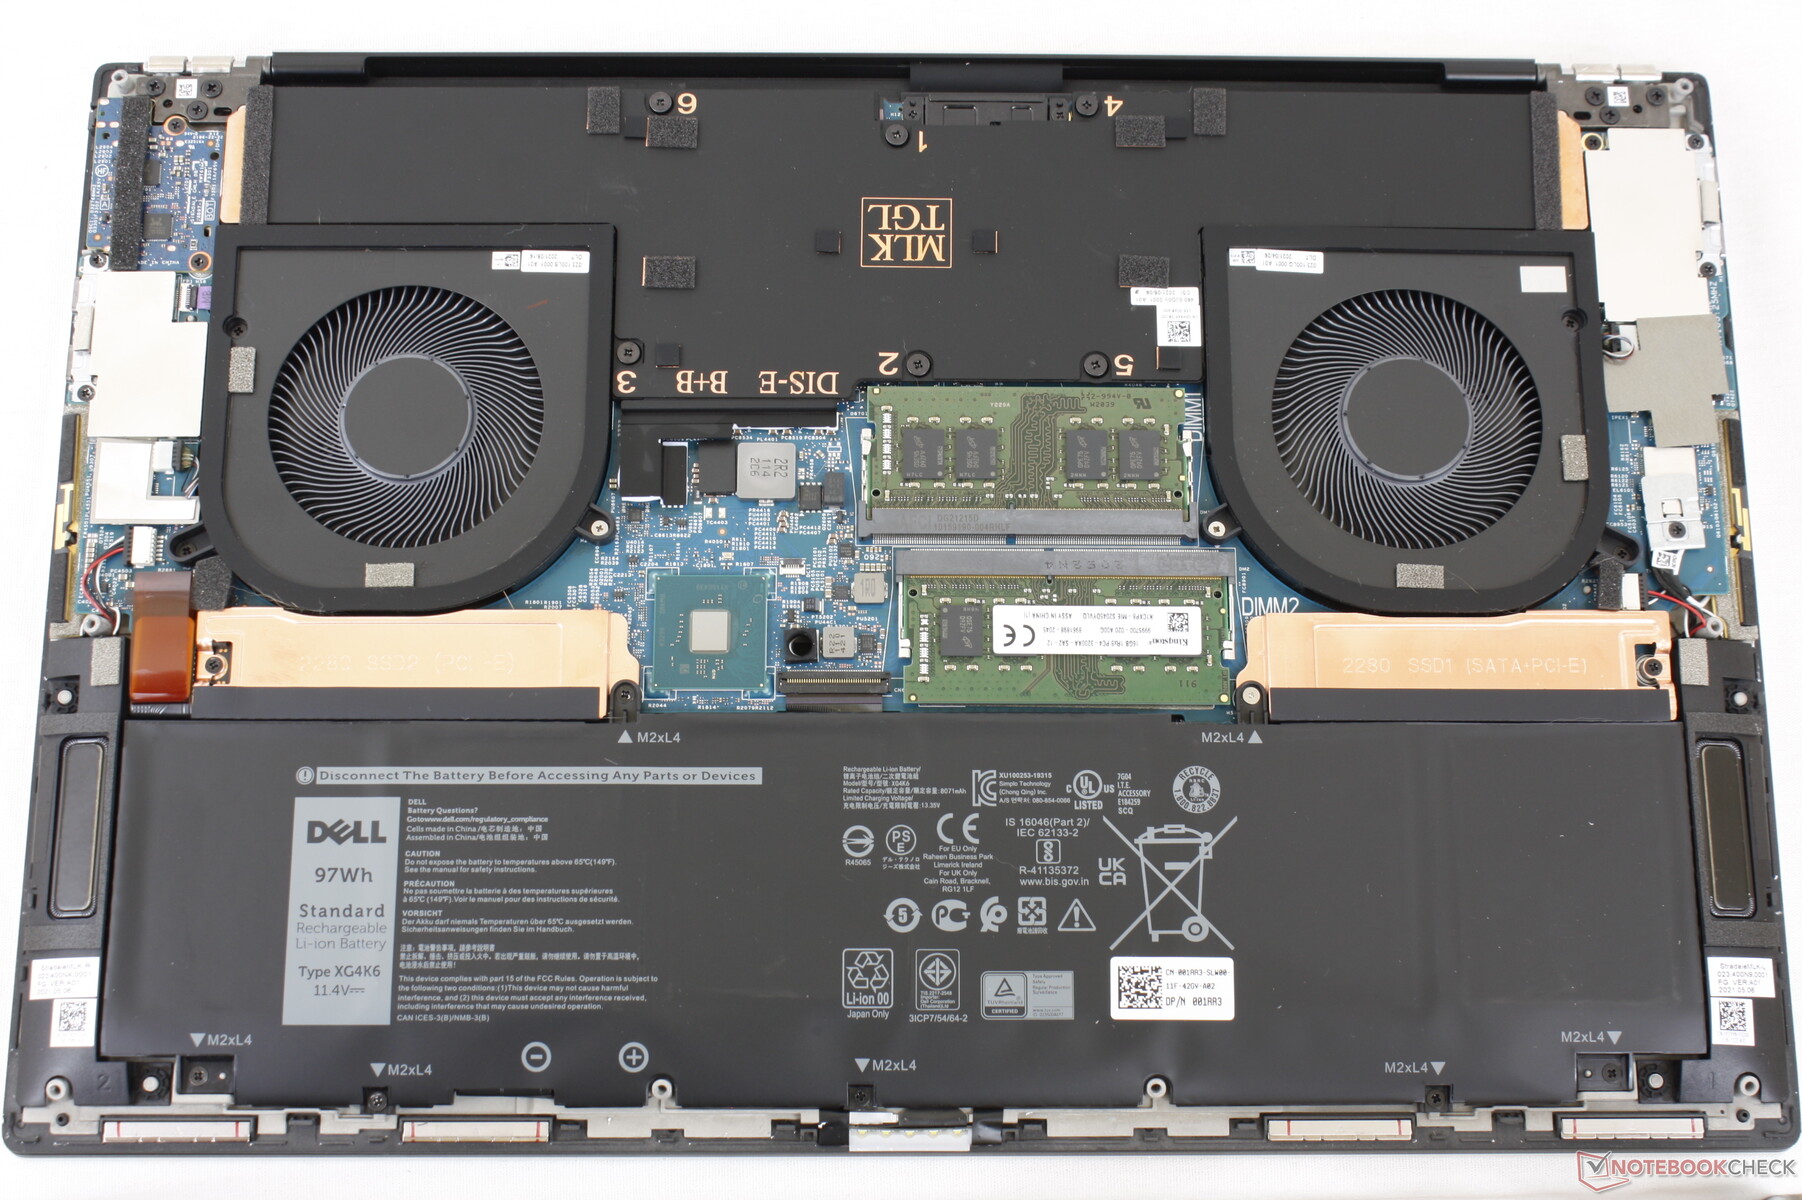
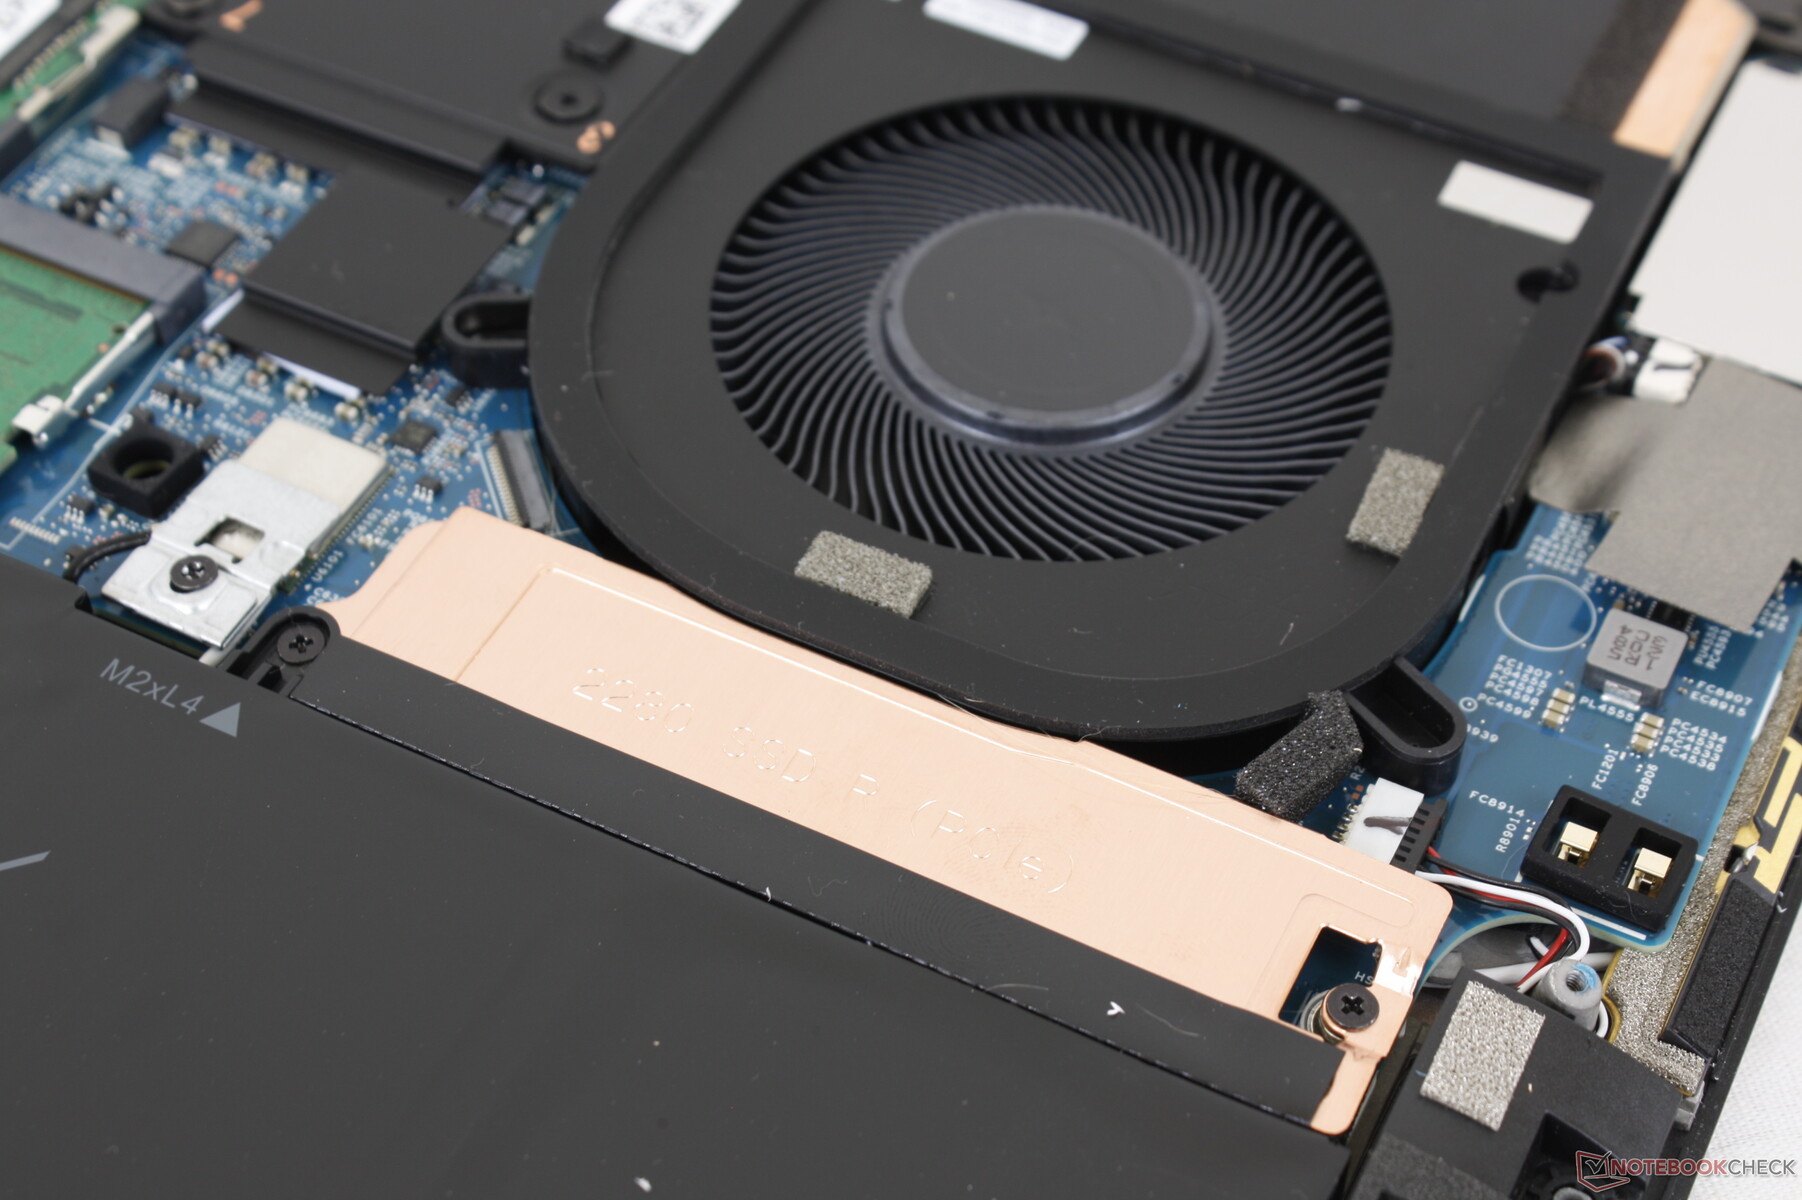
Maintenance
Accessoires et garantie
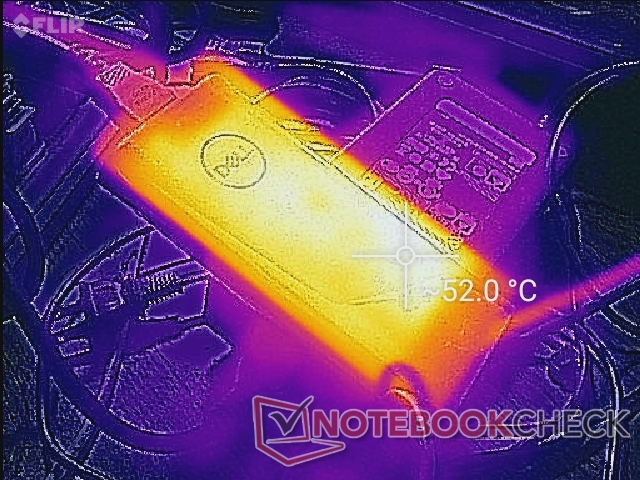
Le XPS 17 9720 est livré avec le même adaptateur secteur 130 W et le même adaptateur USB-C vers HDMI et USB-A que sur les XPS 15 9520, XPS 17 9710 et XPS 17 9700. Une garantie fabricant limitée de base d'un an s'applique si elle est achetée aux États-Unis.
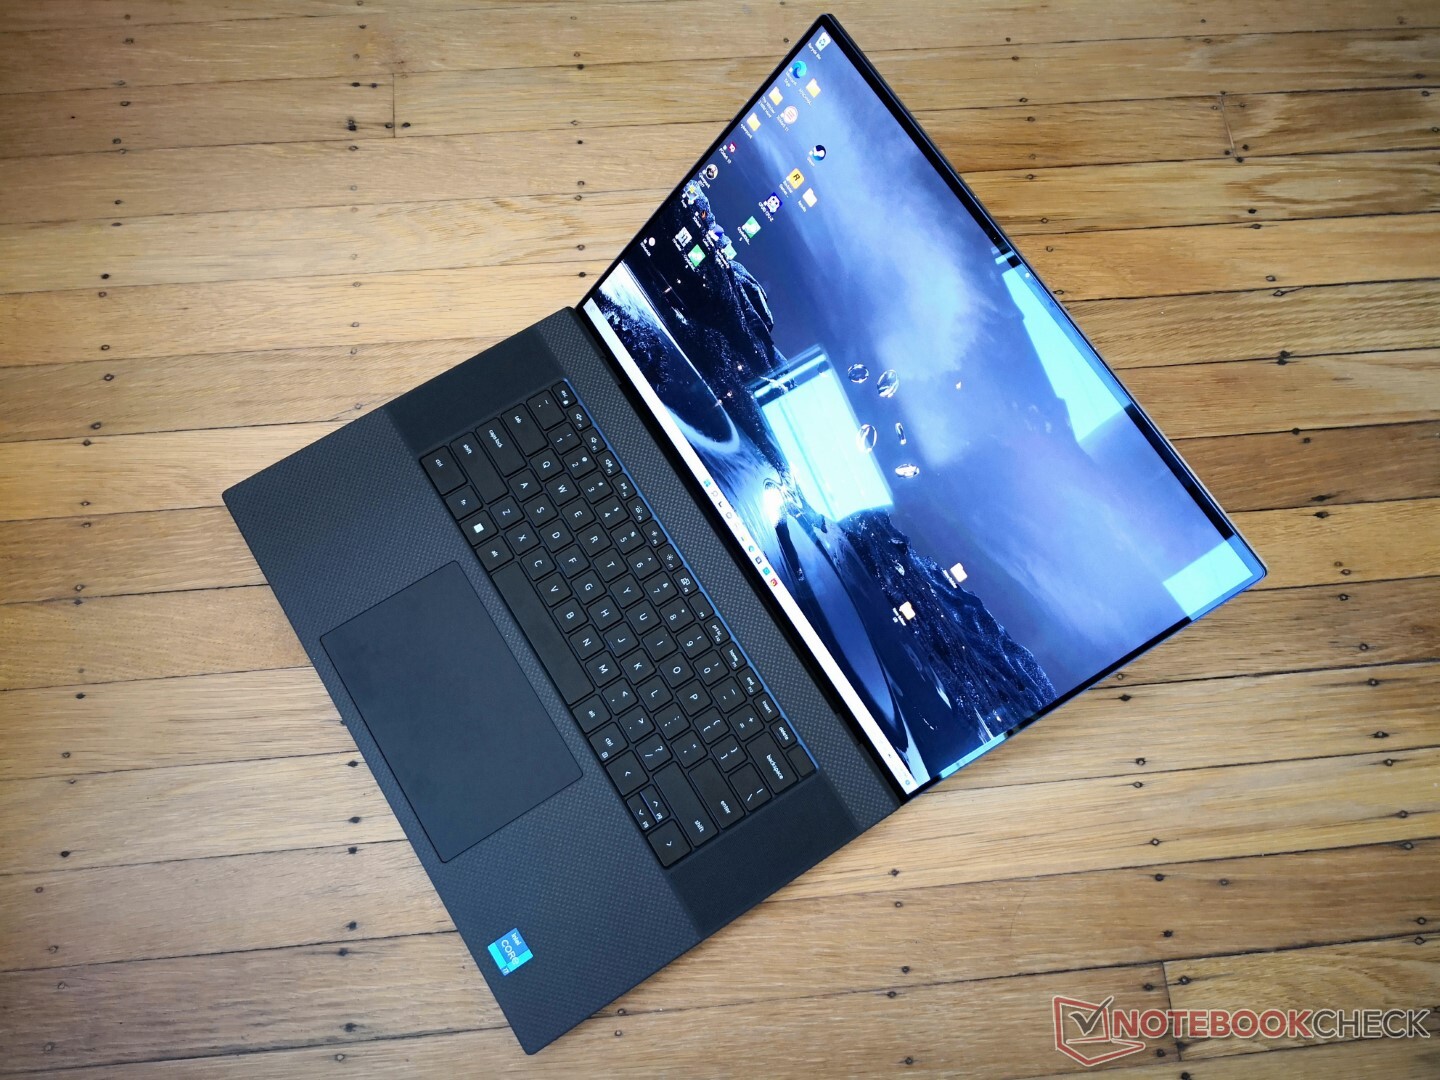
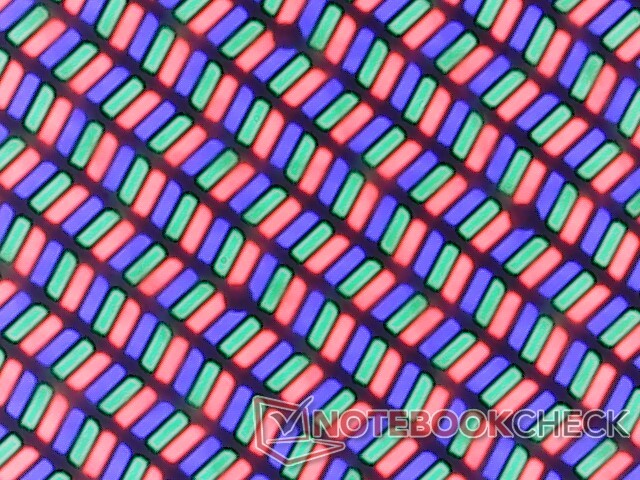
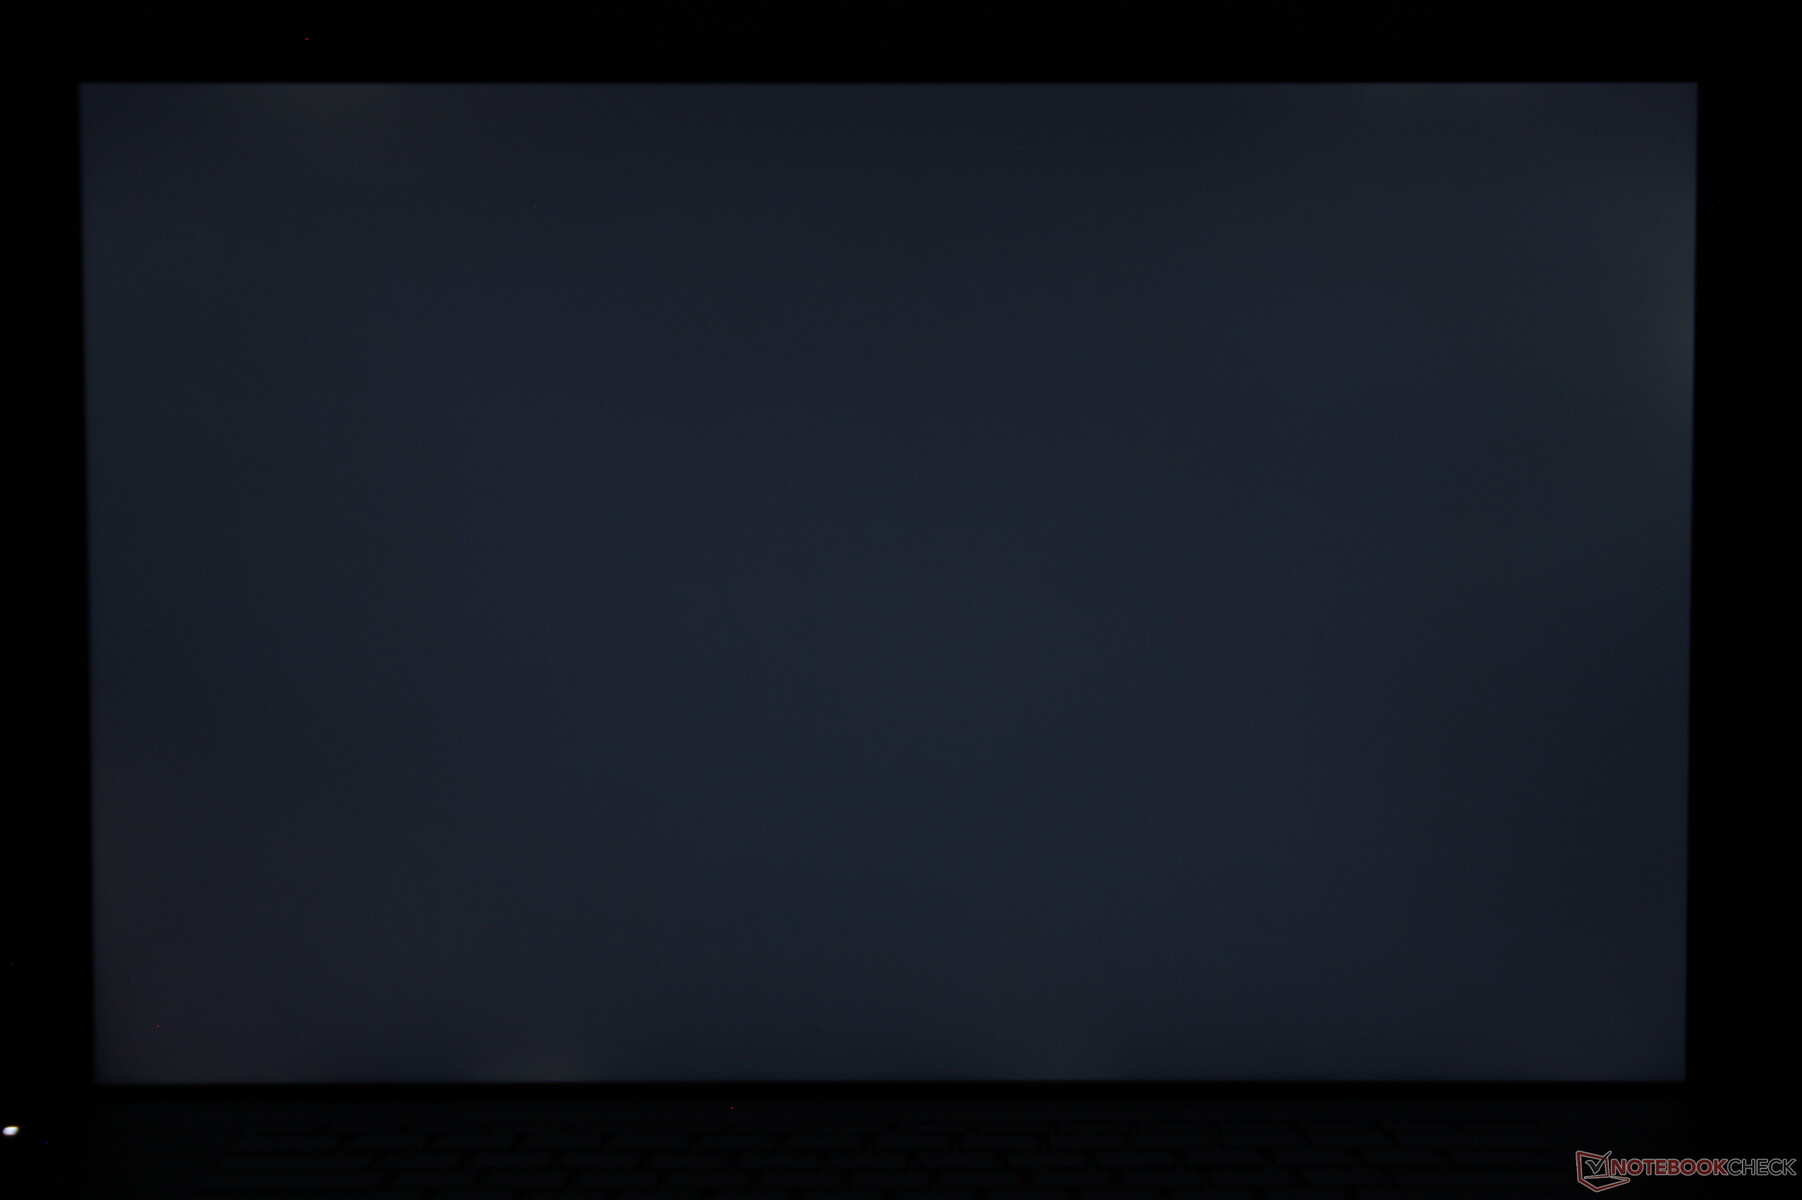
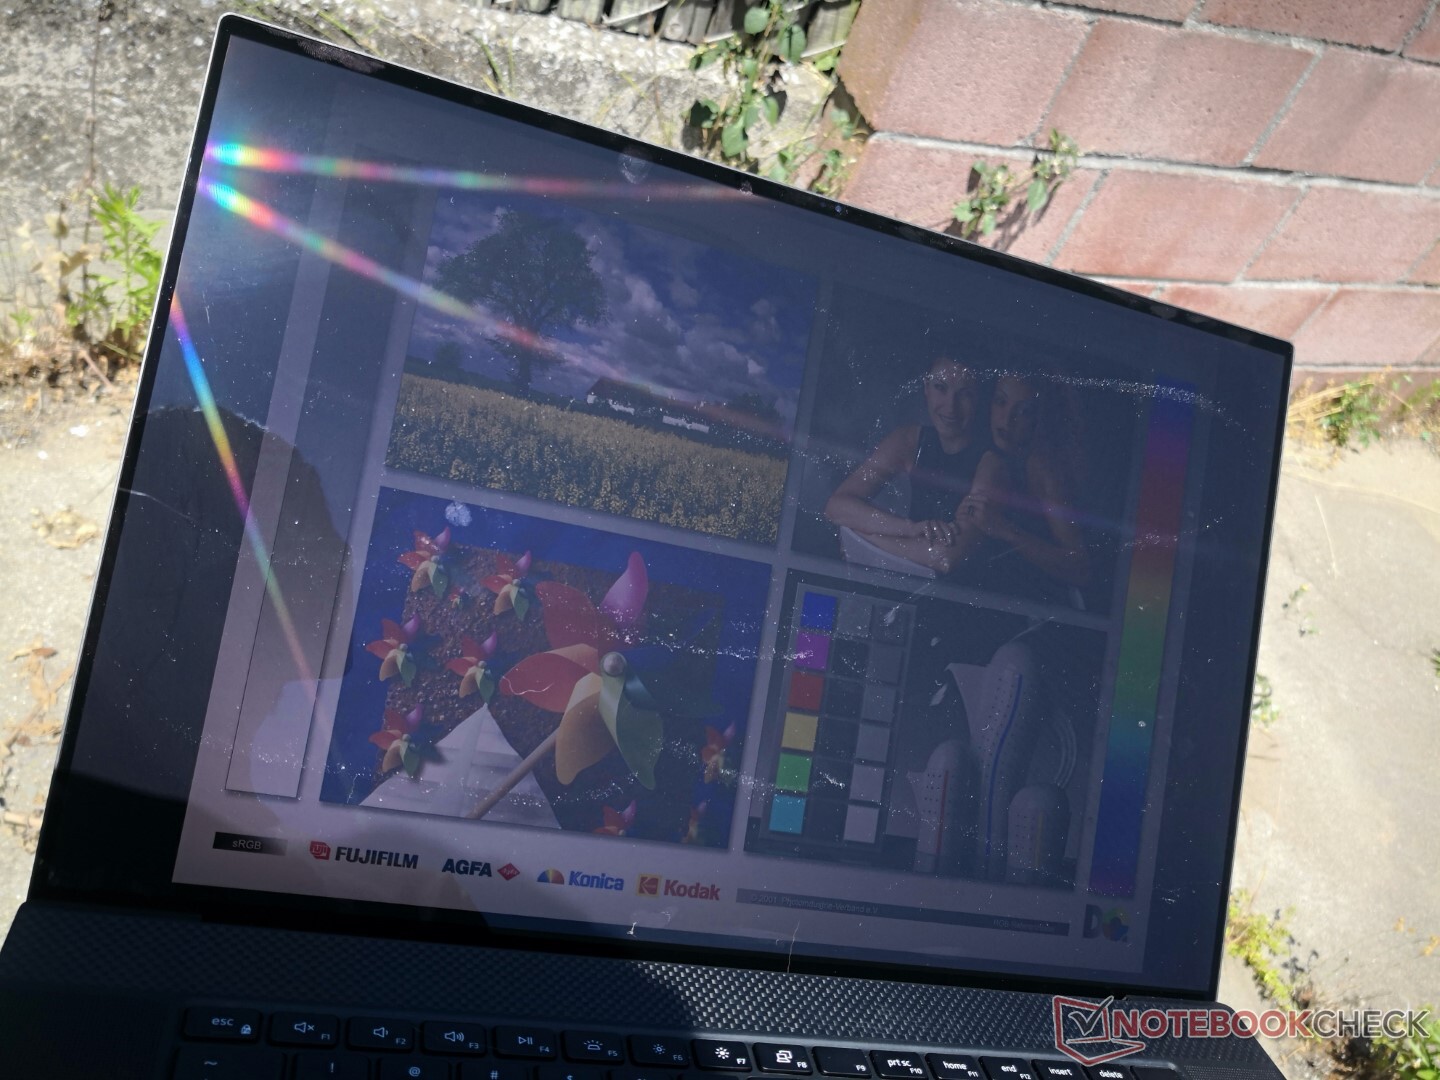
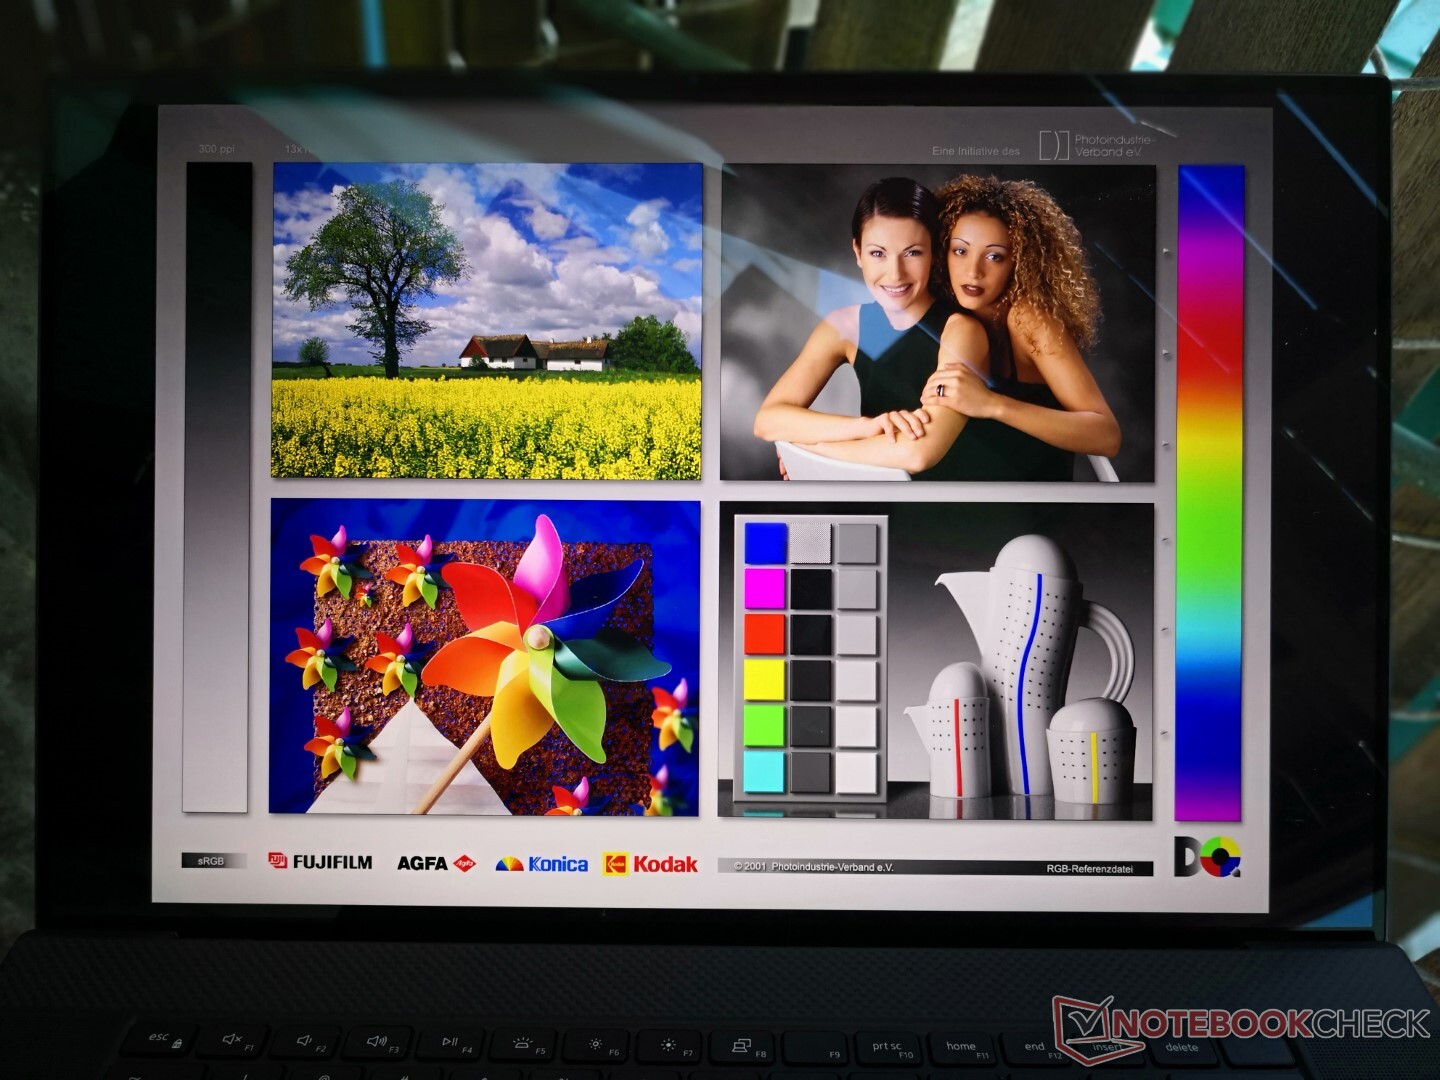
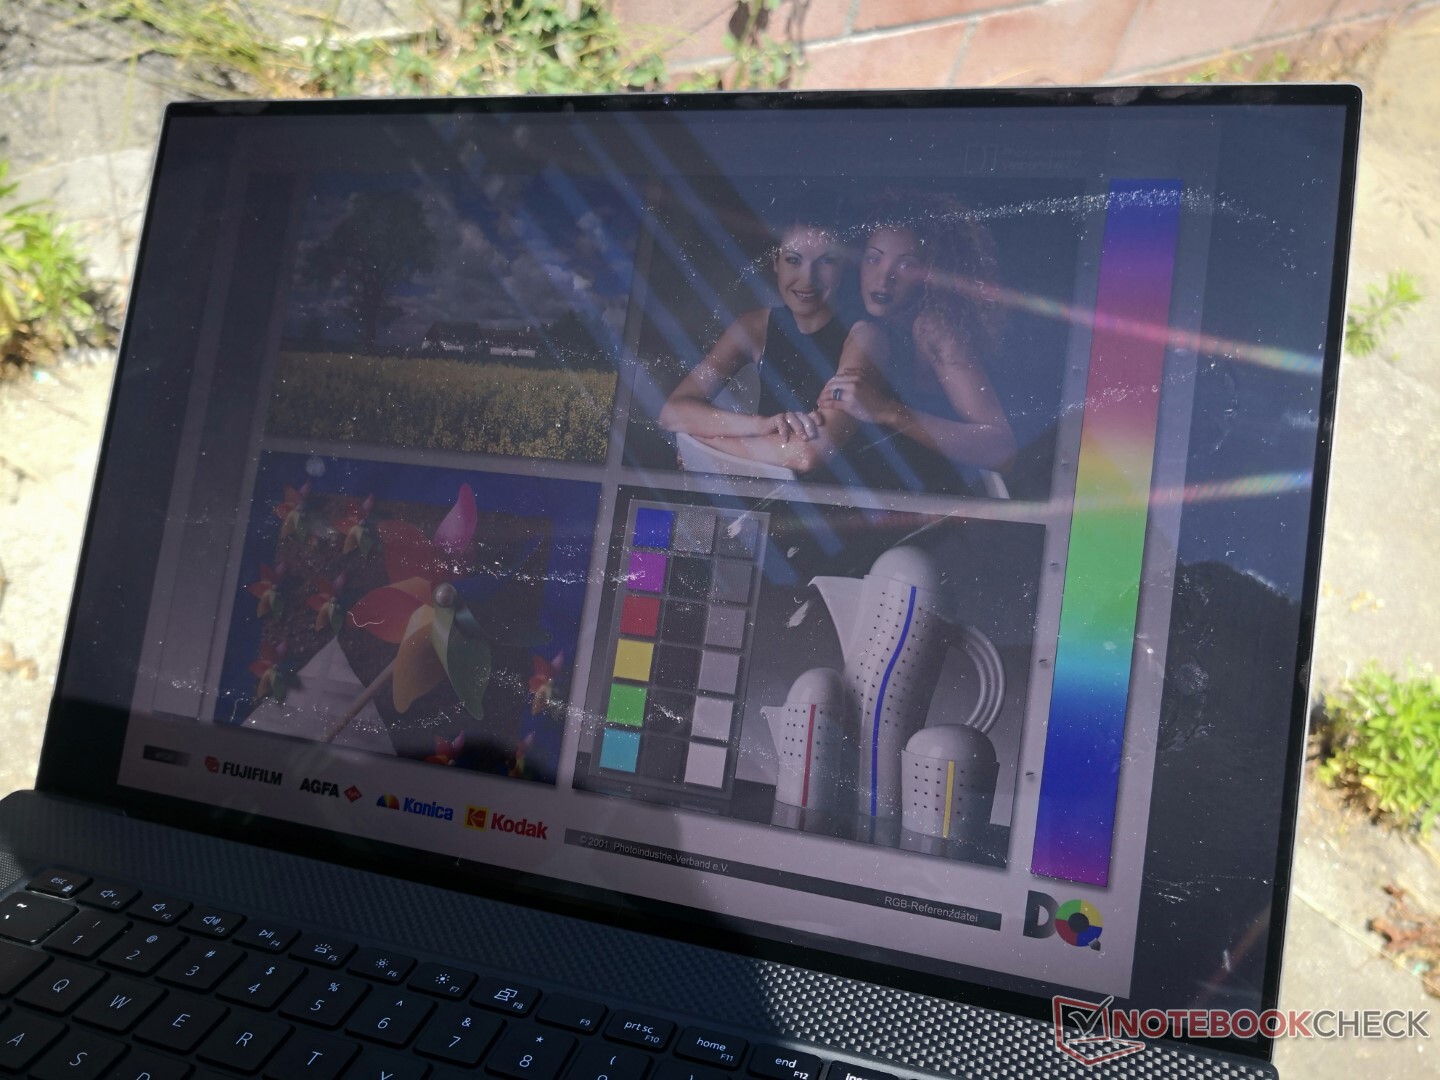
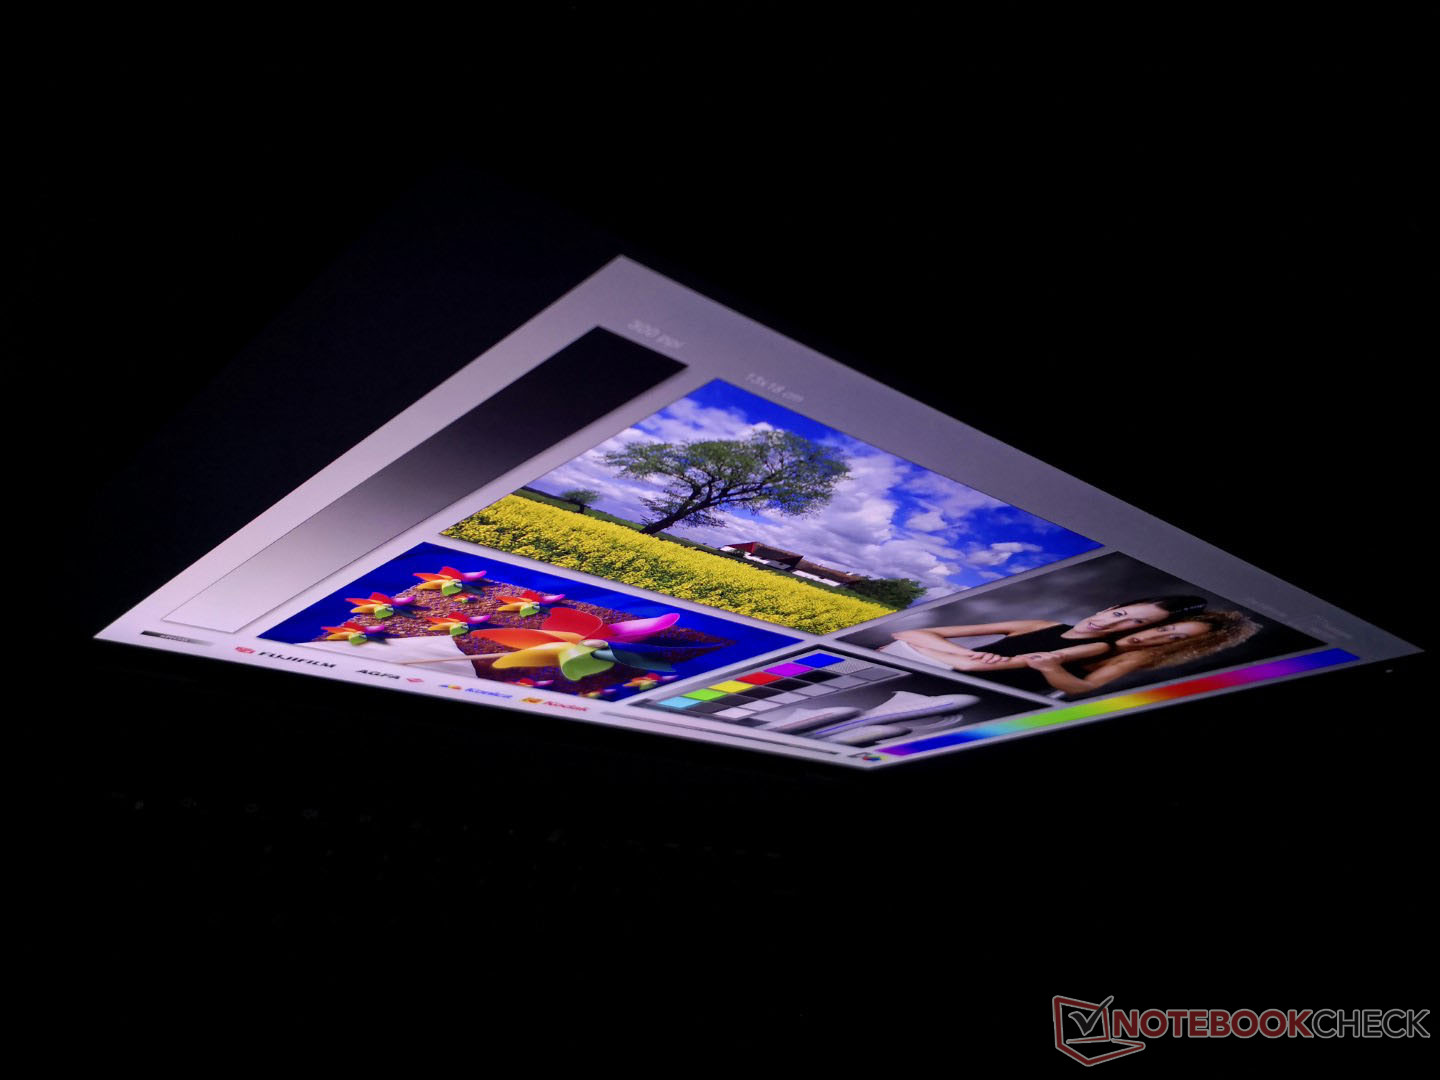
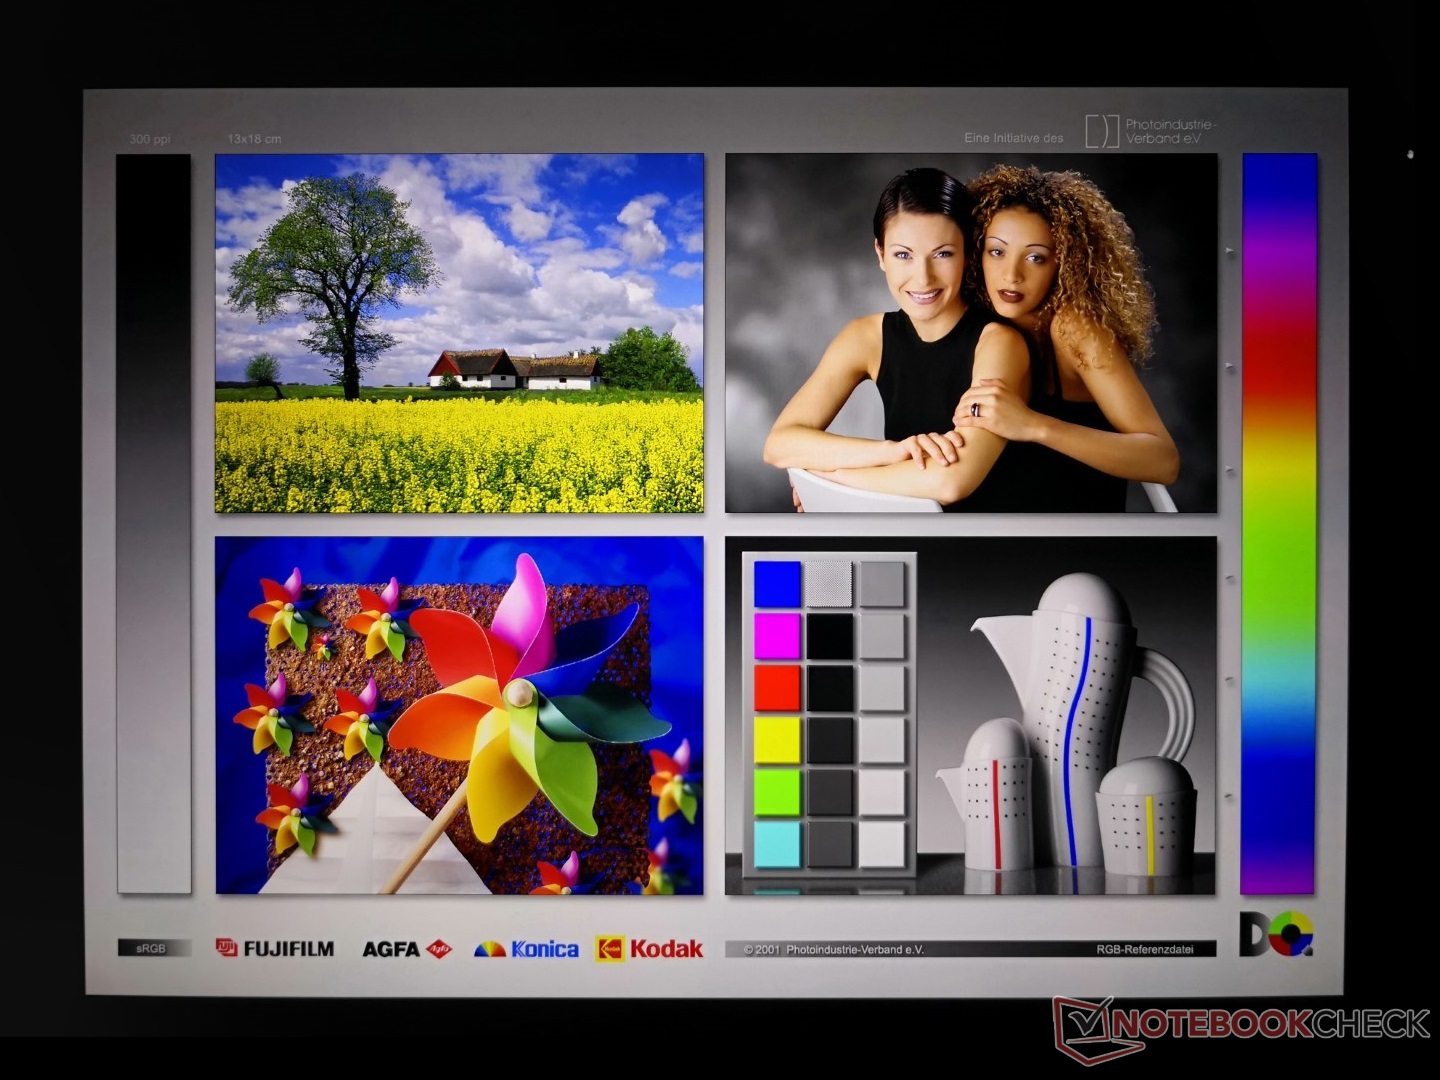
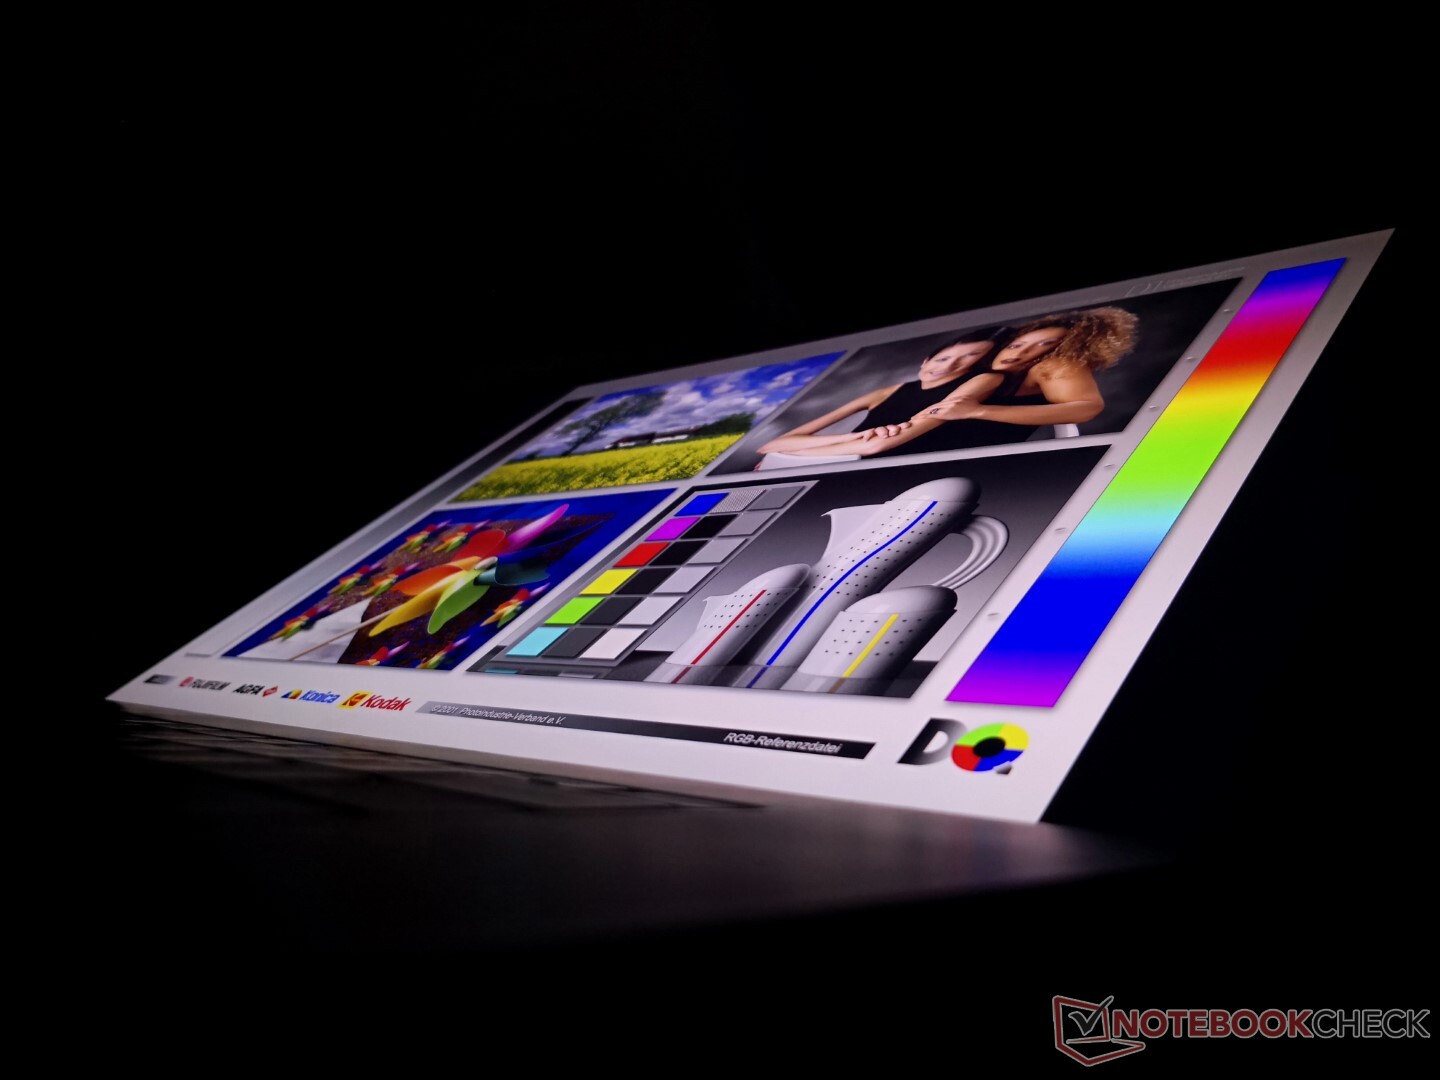
Affichage - 16:10 60 Hz IPS
Il y a deux options d'affichage à choisir (1200p et 2400p) par rapport à trois sur le XPS 15 9520. L'écran de notre appareil est le même panneau Sharp LQ170R1 IPS que l'on trouve sur le XPS 17 9710 ou 9700, ce qui signifie que l'expérience visuelle n'a pas changé depuis le modèle original 2020. C'était un excellent écran à l'époque et il l'est toujours aujourd'hui, surtout en termes de taux de contraste par rapport aux autres panneaux IPS, mais nous aimerions voir un taux de rafraîchissement de 90 Hz ou des options plus rapides à l'avenir, similaires à ce qui est déjà disponible sur le plus récent IdeaPad Slim 7i Pro ou le prochain Zenbook Pro 14 Duo.
| |||||||||||||||||||||||||
Homogénéité de la luminosité: 85 %
Valeur mesurée au centre, sur batterie: 512.7 cd/m²
Contraste: 1602:1 (Valeurs des noirs: 0.32 cd/m²)
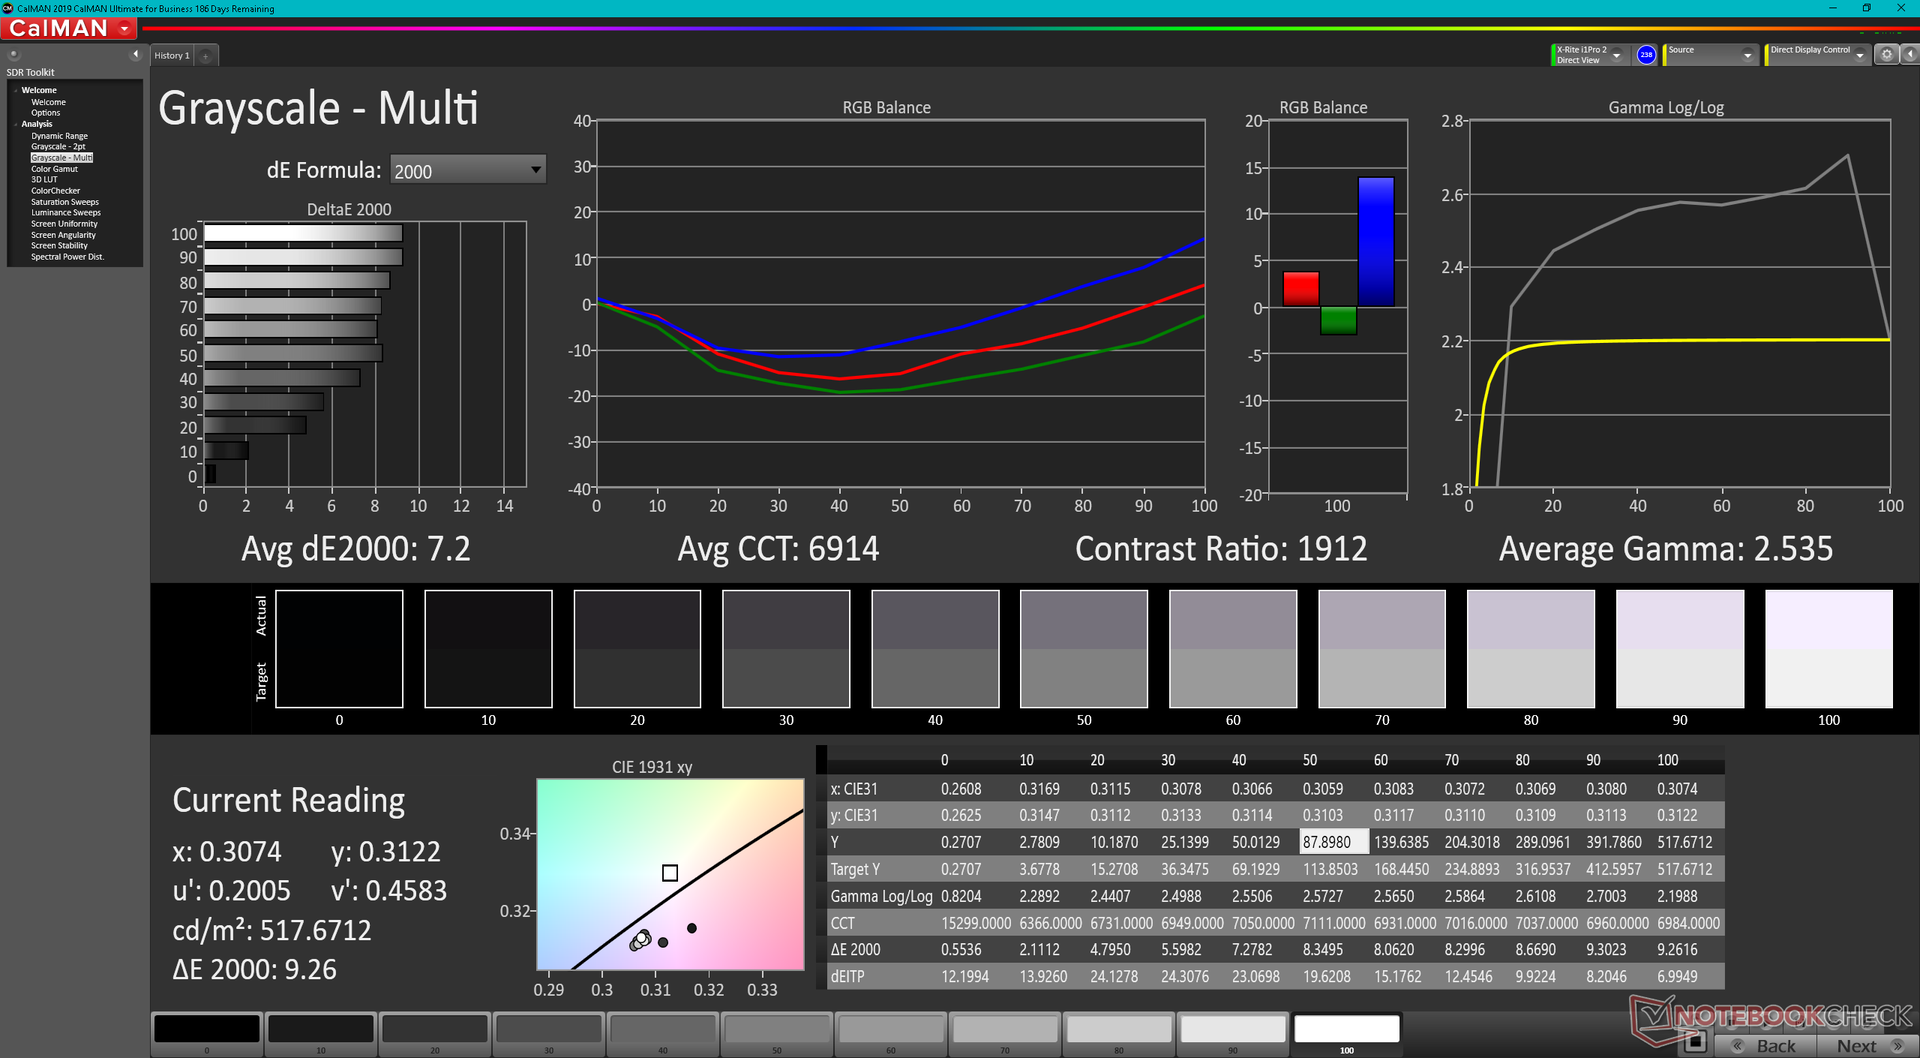
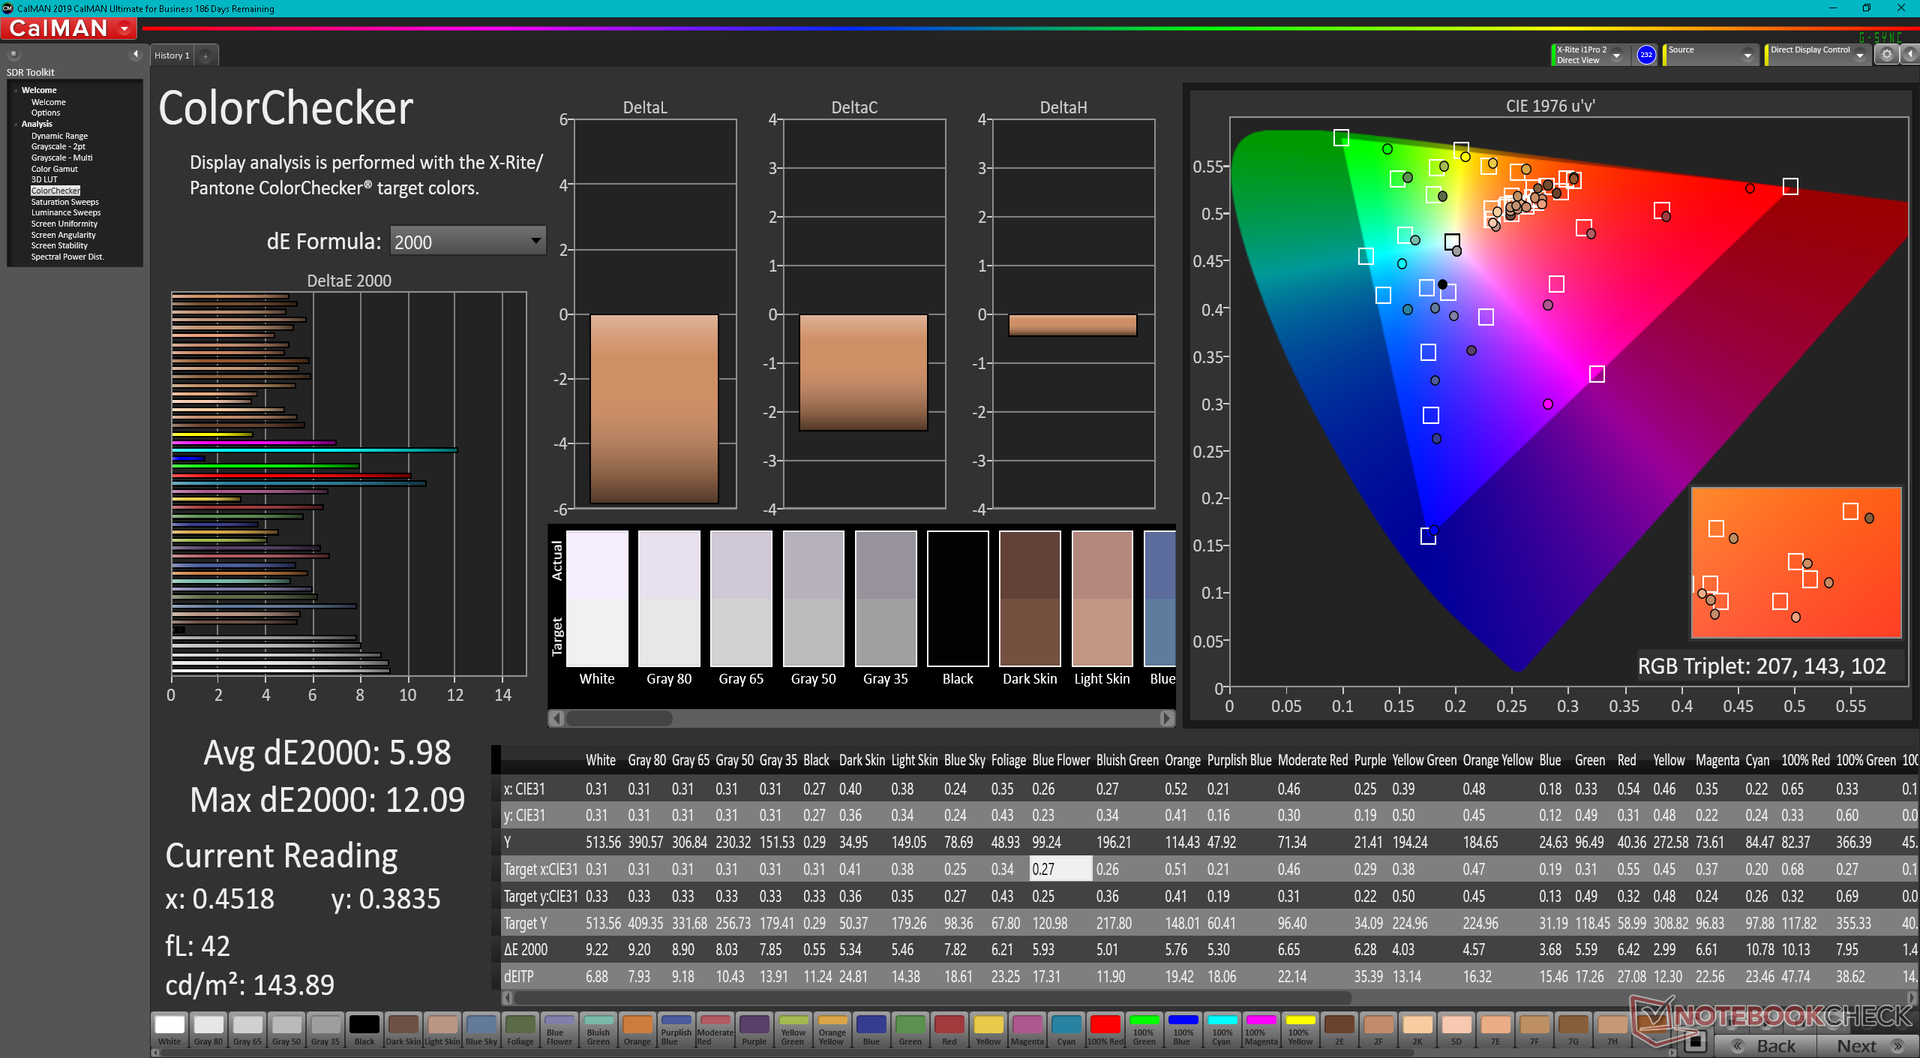
ΔE ColorChecker Calman: 5.98 | ∀{0.5-29.43 Ø4.71}
ΔE Greyscale Calman: 7.2 | ∀{0.09-98 Ø4.96}
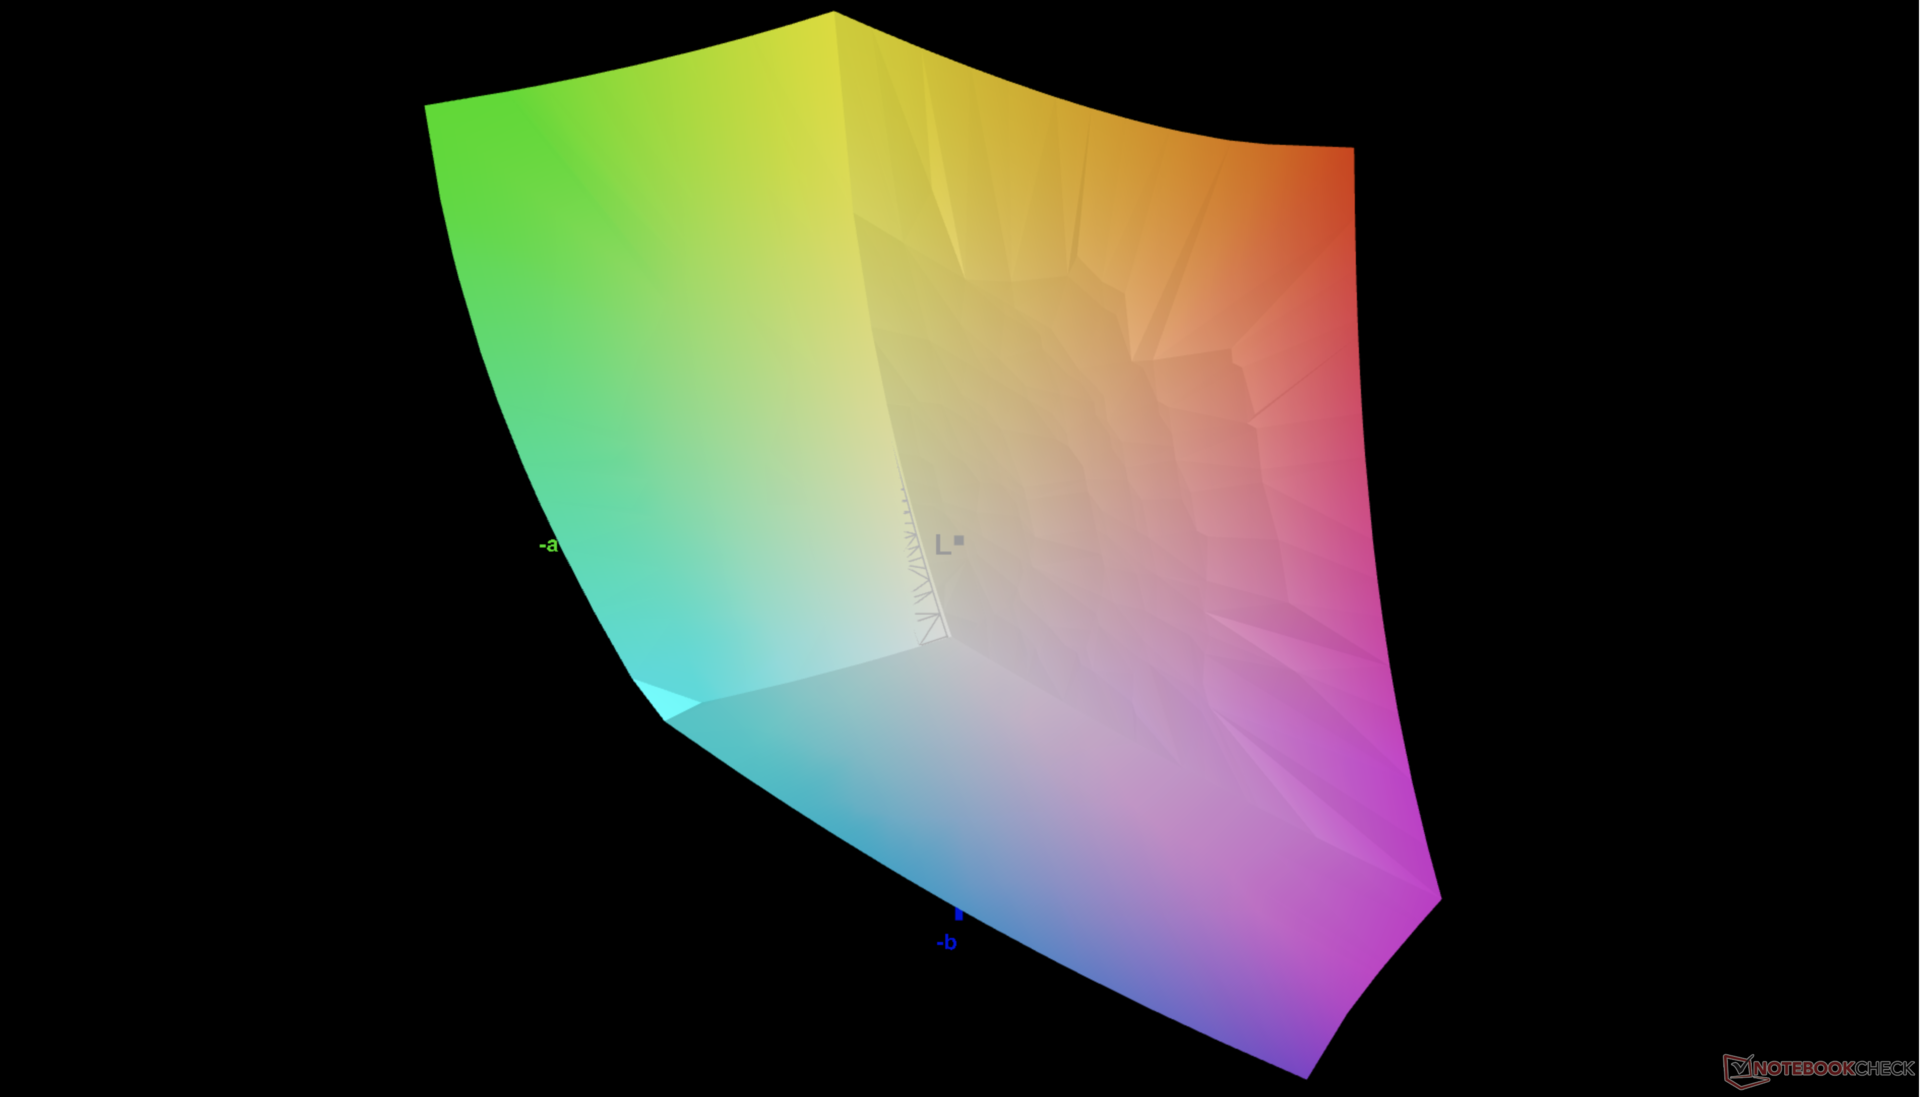
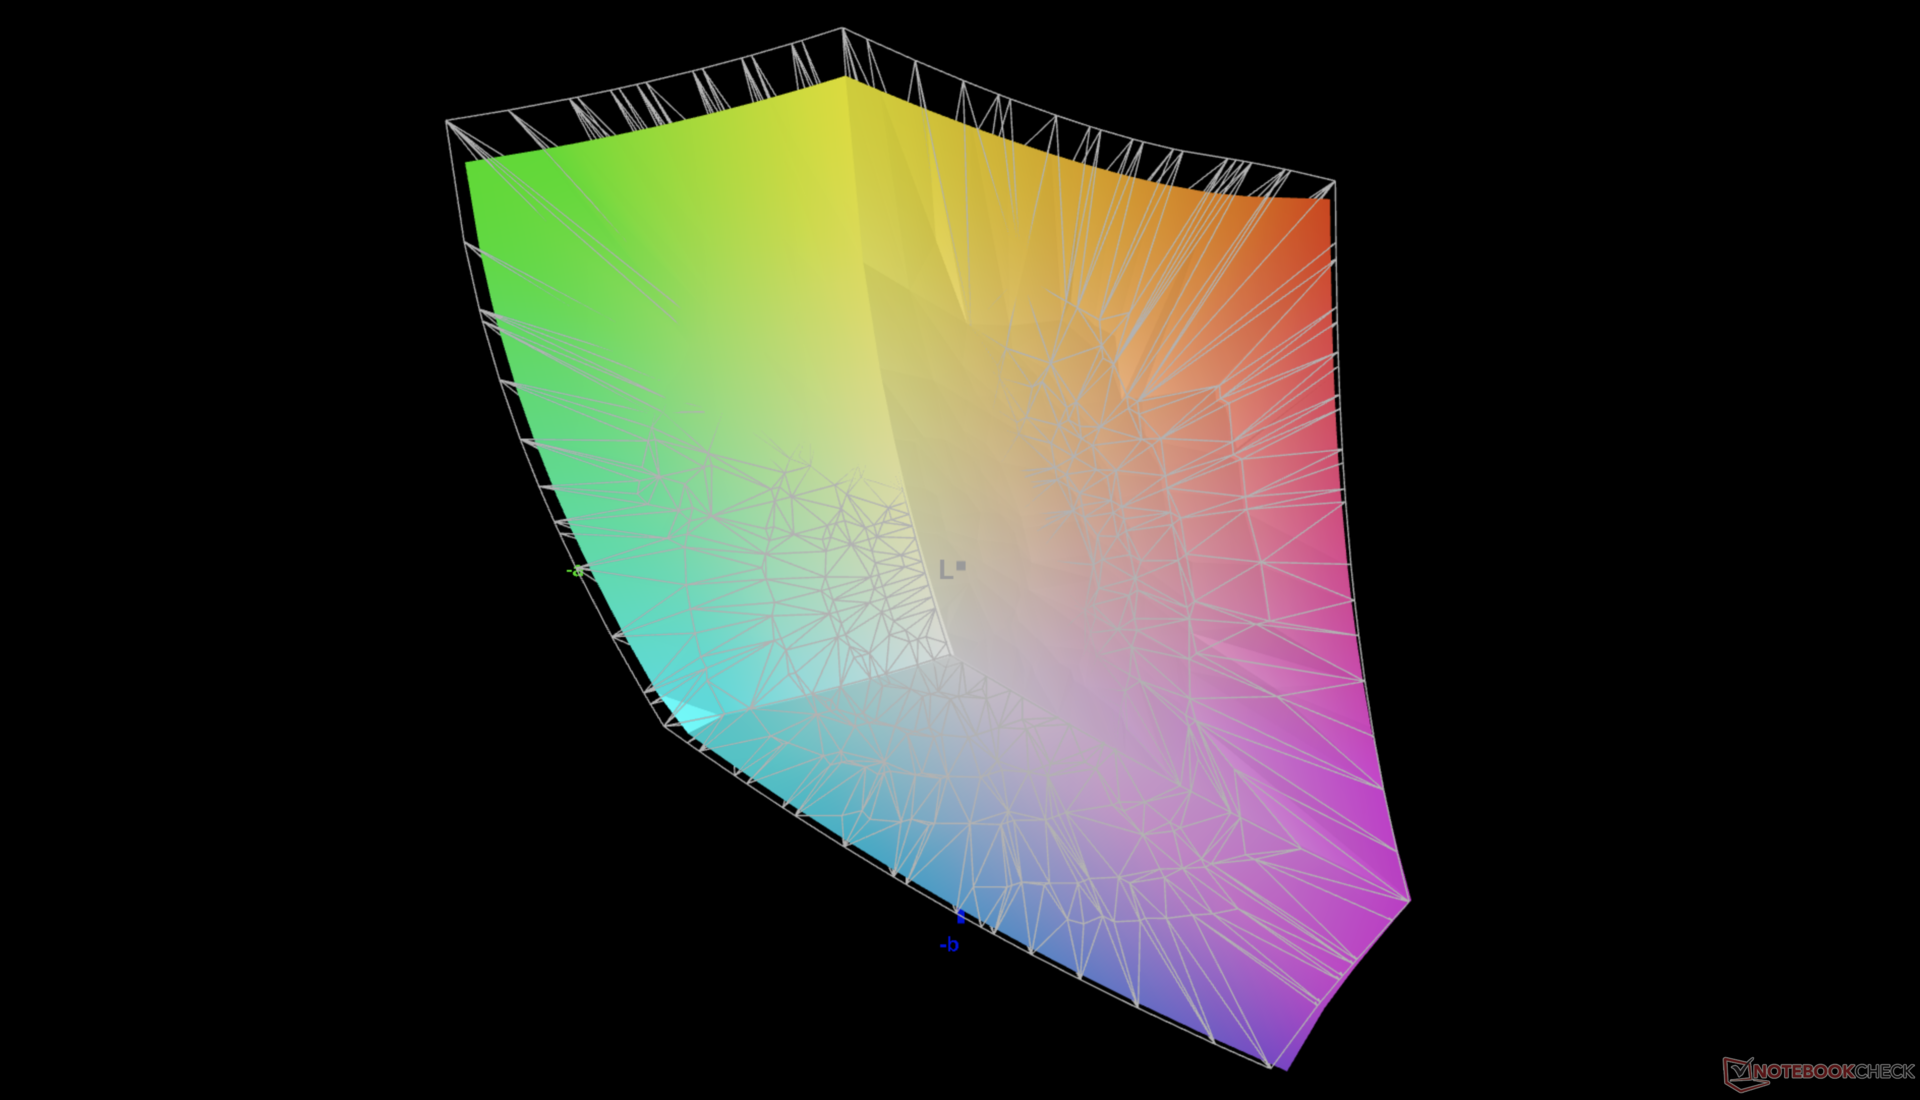
85.3% AdobeRGB 1998 (Argyll 3D)
100% sRGB (Argyll 3D)
92.9% Display P3 (Argyll 3D)
Gamma: 2.54
CCT: 6914 K
| Dell XPS 17 9720 RTX 3060 Sharp LQ170R1, IPS, 3840x2400, 17" | Dell XPS 17 9700 Core i7 RTX 2060 Max-Q Sharp LQ170R1, IPS, 3840x2400, 17" | Dell XPS 17 9700 i5-10300H SHP14D7, IPS, 1920x1200, 17.3" | HP Envy 17-cg AU Optronics AUO439D, IPS, 1920x1080, 17.3" | Lenovo Legion 5 17ACH6H-82JY0003GE LEN173FHD, IPS, 1920x1080, 17.3" | Asus VivoBook 17 F712JA-AU708W BOE NV173FHM-N49, IPS, 1920x1080, 17.3" | Razer Blade 17 (i7-12800H, RTX 3070 Ti) BOE CQ NE173QHM-NZ1 (BOE09F9), IPS, 2560x1440, 17.3" | |
|---|---|---|---|---|---|---|---|
| Display | 5% | -9% | -17% | -18% | -50% | 2% | |
| Display P3 Coverage (%) | 92.9 | 90.5 -3% | 77.4 -17% | 68 -27% | 64.8 -30% | 39.53 -57% | 97.9 5% |
| sRGB Coverage (%) | 100 | 100 0% | 100 0% | 95 -5% | 97.2 -3% | 58.85 -41% | 99.9 0% |
| AdobeRGB 1998 Coverage (%) | 85.3 | 99.8 17% | 76.6 -10% | 69 -19% | 66.7 -22% | 40.84 -52% | 85.5 0% |
| Response Times | 5% | -13% | 19% | 73% | 57% | 69% | |
| Response Time Grey 50% / Grey 80% * (ms) | 51.2 ? | 51.2 ? -0% | 60.4 ? -18% | 40 ? 22% | 15 ? 71% | 22 ? 57% | 15.2 ? 70% |
| Response Time Black / White * (ms) | 35.2 ? | 32 ? 9% | 37.6 ? -7% | 30 ? 15% | 9 ? 74% | 15 ? 57% | 11.2 ? 68% |
| PWM Frequency (Hz) | 2500 ? | ||||||
| Screen | 20% | 33% | 6% | 16% | -16% | -9% | |
| Brightness middle (cd/m²) | 512.7 | 539.4 5% | 636 24% | 347 -32% | 323 -37% | 269 -48% | 341 -33% |
| Brightness (cd/m²) | 463 | 494 7% | 580 25% | 329 -29% | 305 -34% | 263 -43% | 308 -33% |
| Brightness Distribution (%) | 85 | 84 -1% | 86 1% | 89 5% | 89 5% | 88 4% | 82 -4% |
| Black Level * (cd/m²) | 0.32 | 0.32 -0% | 0.34 -6% | 0.27 16% | 0.25 22% | 0.3 6% | 0.45 -41% |
| Contrast (:1) | 1602 | 1686 5% | 1871 17% | 1285 -20% | 1292 -19% | 897 -44% | 758 -53% |
| Colorchecker dE 2000 * | 5.98 | 4.12 31% | 2.4 60% | 3.75 37% | 1.87 69% | 5.8 3% | 4.16 30% |
| Colorchecker dE 2000 max. * | 12.09 | 7.65 37% | 3.5 71% | 7.53 38% | 4.84 60% | 18.46 -53% | 8.14 33% |
| Greyscale dE 2000 * | 7.2 | 1.5 79% | 2 72% | 4.88 32% | 2.57 64% | 3.64 49% | 5.09 29% |
| Gamma | 2.54 87% | 2.15 102% | 2.08 106% | 2.53 87% | 2.42 91% | 2.35 94% | 2.48 89% |
| CCT | 6914 94% | 6438 101% | 6704 97% | 6624 98% | 7012 93% | 6995 93% | 6884 94% |
| Colorchecker dE 2000 calibrated * | 3.91 | 1.5 | 0.92 | 3 | |||
| Color Space (Percent of AdobeRGB 1998) (%) | 90.4 | 67.5 | |||||
| Color Space (Percent of sRGB) (%) | 100 | 100 | |||||
| Moyenne finale (programmes/paramètres) | 10% /
14% | 4% /
16% | 3% /
3% | 24% /
17% | -3% /
-12% | 21% /
5% |
* ... Moindre est la valeur, meilleures sont les performances
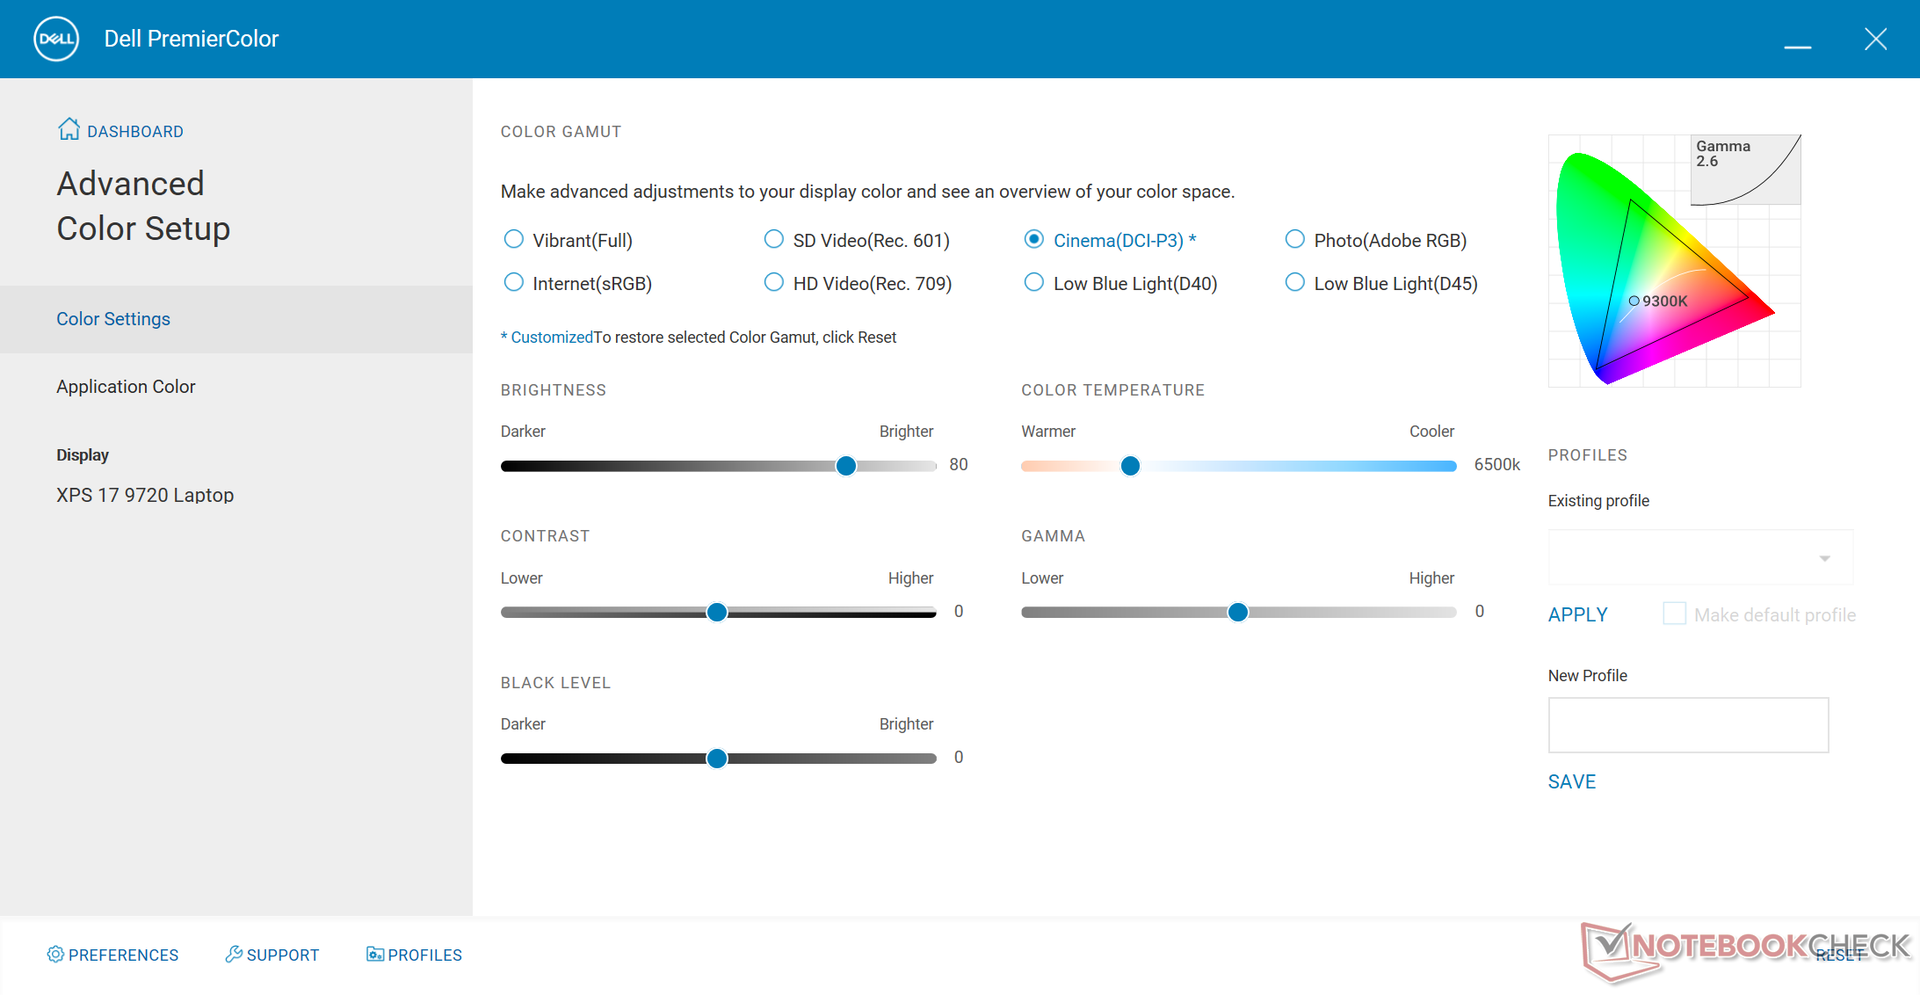
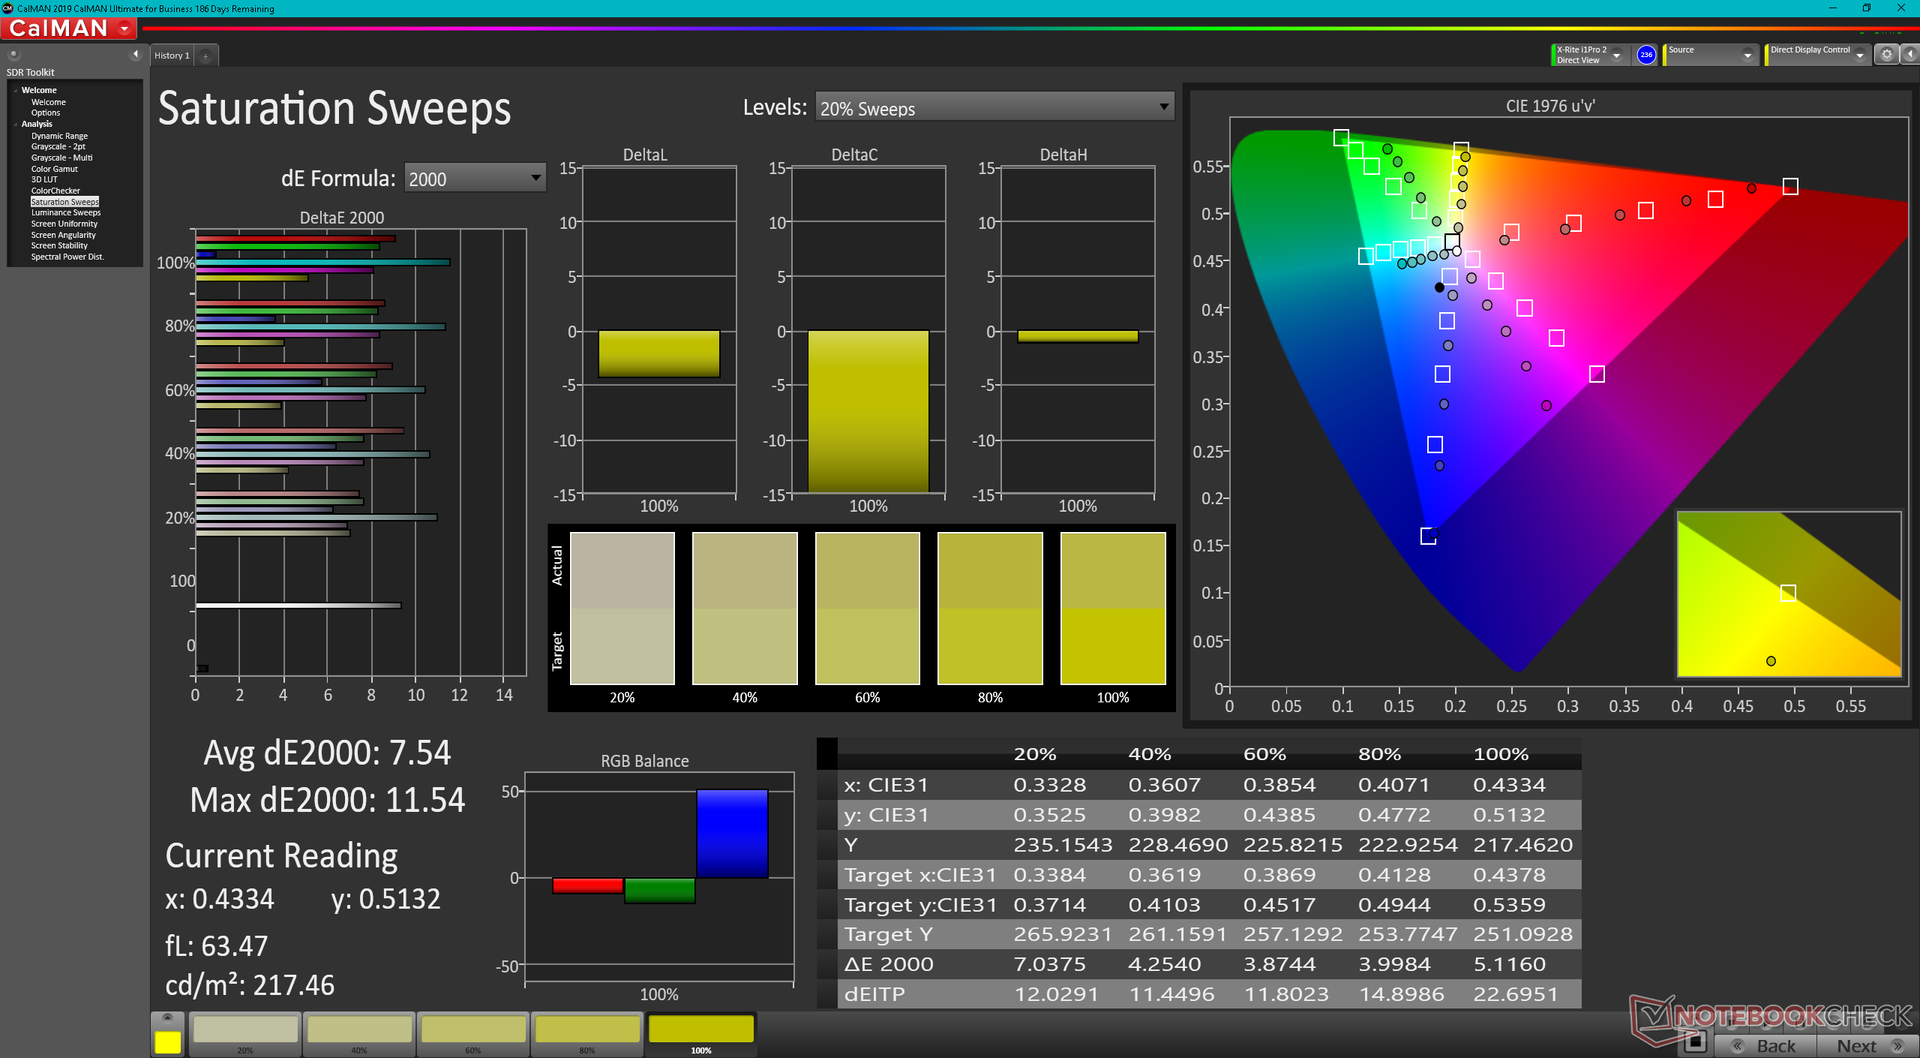
La température des couleurs est plus chaude que prévu lorsqu'elle est réglée sur la norme de couleur DCI-P3 via le logiciel Dell PremierColor. Contrairement à de nombreux ordinateurs portables professionnels comme les séries Dell Precision, Gigabyte Aero ou HP ZBook, la série XPS n'est pas calibrée par X-Rite en usine. Un calibrage par l'utilisateur final serait nécessaire pour mieux exploiter la large gamme de couleurs du panneau.
Temps de réponse de l'écran
| ↔ Temps de réponse noir à blanc | ||
|---|---|---|
| 35.2 ms ... hausse ↗ et chute ↘ combinées | ↗ 18.8 ms hausse | 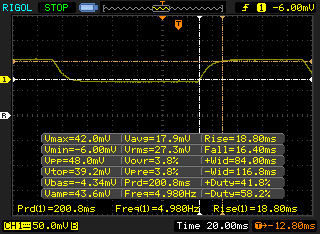 |
| ↘ 16.4 ms chute | ||
| L'écran souffre de latences très élevées, à éviter pour le jeu. En comparaison, tous les appareils testés affichent entre 0.1 (minimum) et 240 (maximum) ms. » 93 % des appareils testés affichent de meilleures performances. Cela signifie que les latences relevées sont moins bonnes que la moyenne (19.8 ms) de tous les appareils testés. | ||
| ↔ Temps de réponse gris 50% à gris 80% | ||
| 51.2 ms ... hausse ↗ et chute ↘ combinées | ↗ 26 ms hausse | 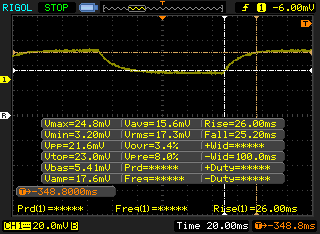 |
| ↘ 25.2 ms chute | ||
| L'écran souffre de latences très élevées, à éviter pour le jeu. En comparaison, tous les appareils testés affichent entre 0.165 (minimum) et 636 (maximum) ms. » 88 % des appareils testés affichent de meilleures performances. Cela signifie que les latences relevées sont moins bonnes que la moyenne (30.9 ms) de tous les appareils testés. | ||
Scintillement / MLI (Modulation de largeur d'impulsion)
| Scintillement / MLI (Modulation de largeur d'impulsion) non décelé |  | ||
En comparaison, 52 % des appareils testés n'emploient pas MDI pour assombrir leur écran. Nous avons relevé une moyenne à 7741 (minimum : 5 - maximum : 343500) Hz dans le cas où une MDI était active. | |||
Performance - Alder Lake-H fait monter les enchères
Conditions d'essai
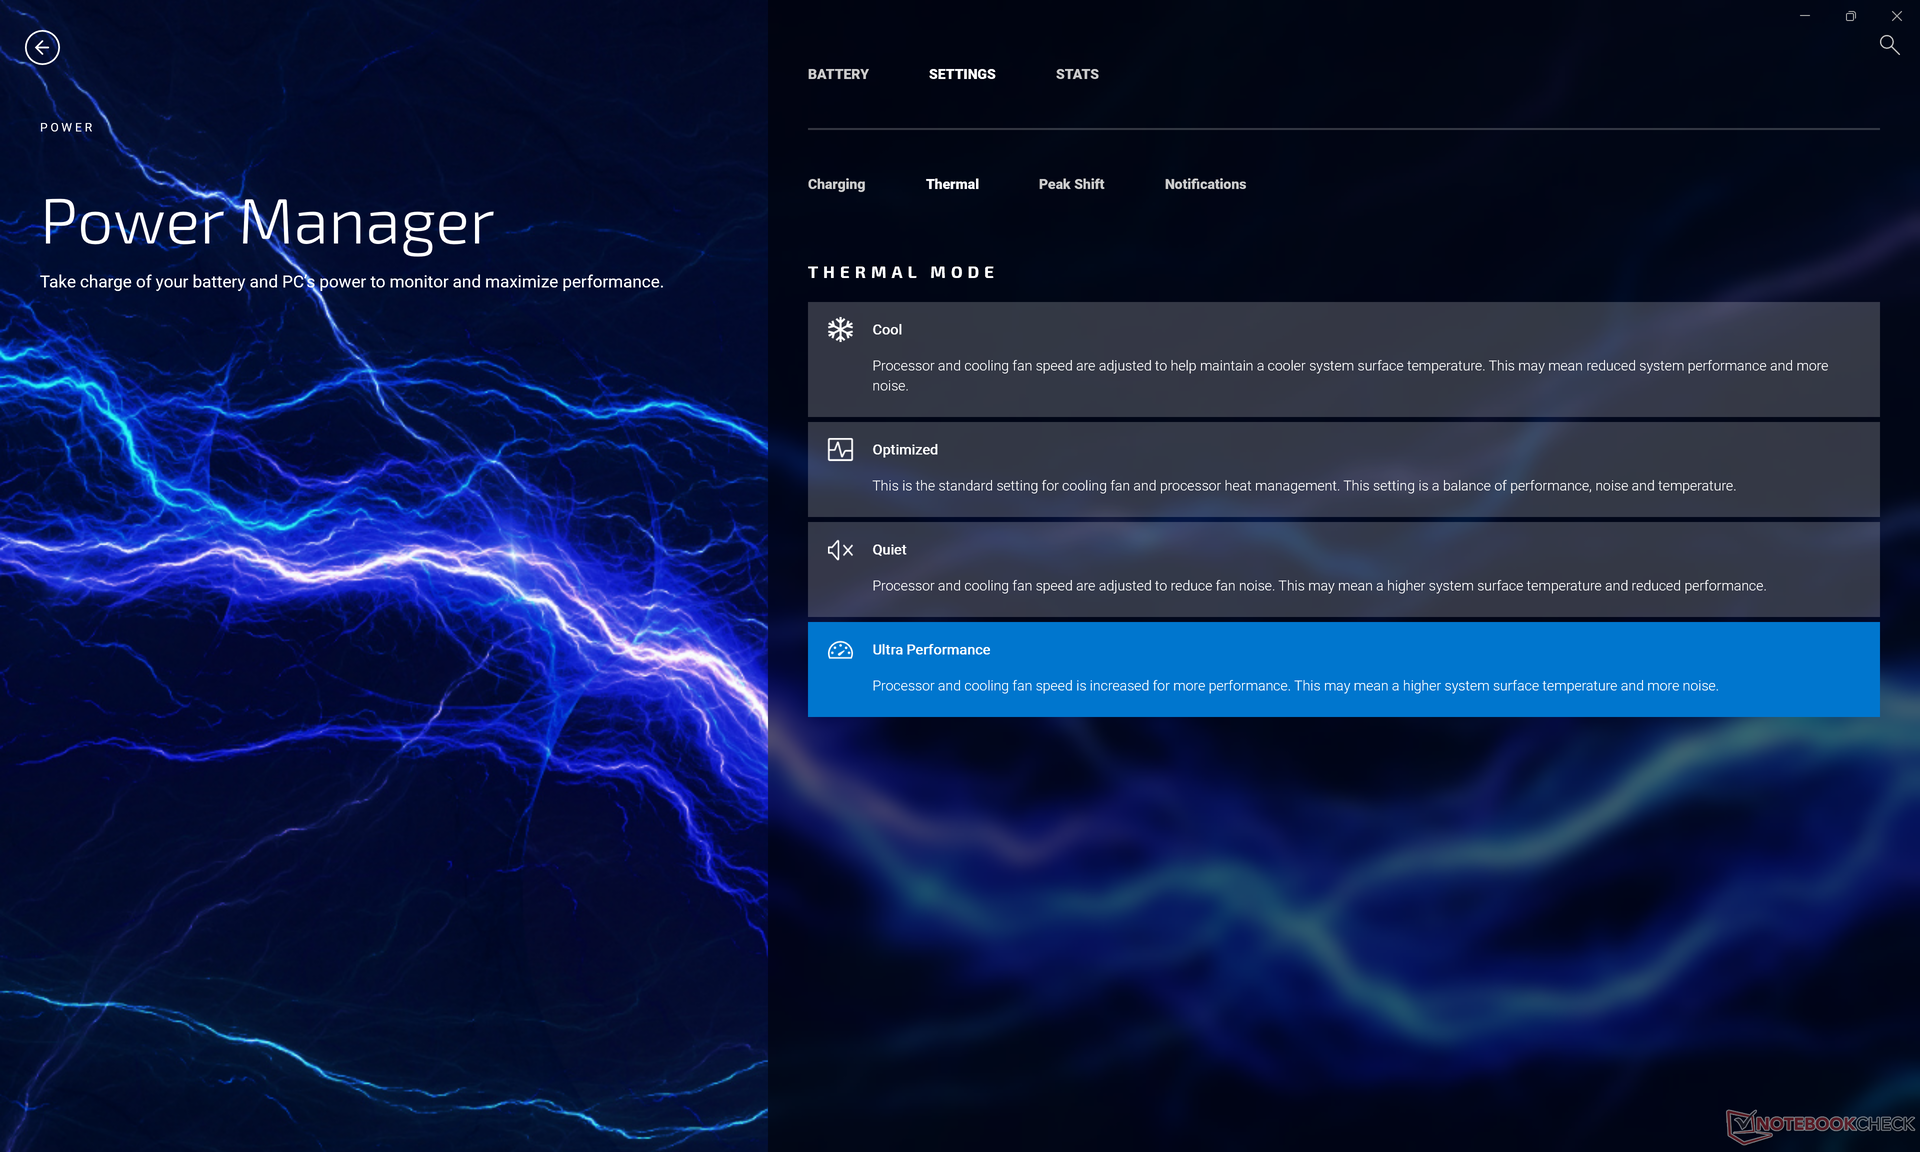
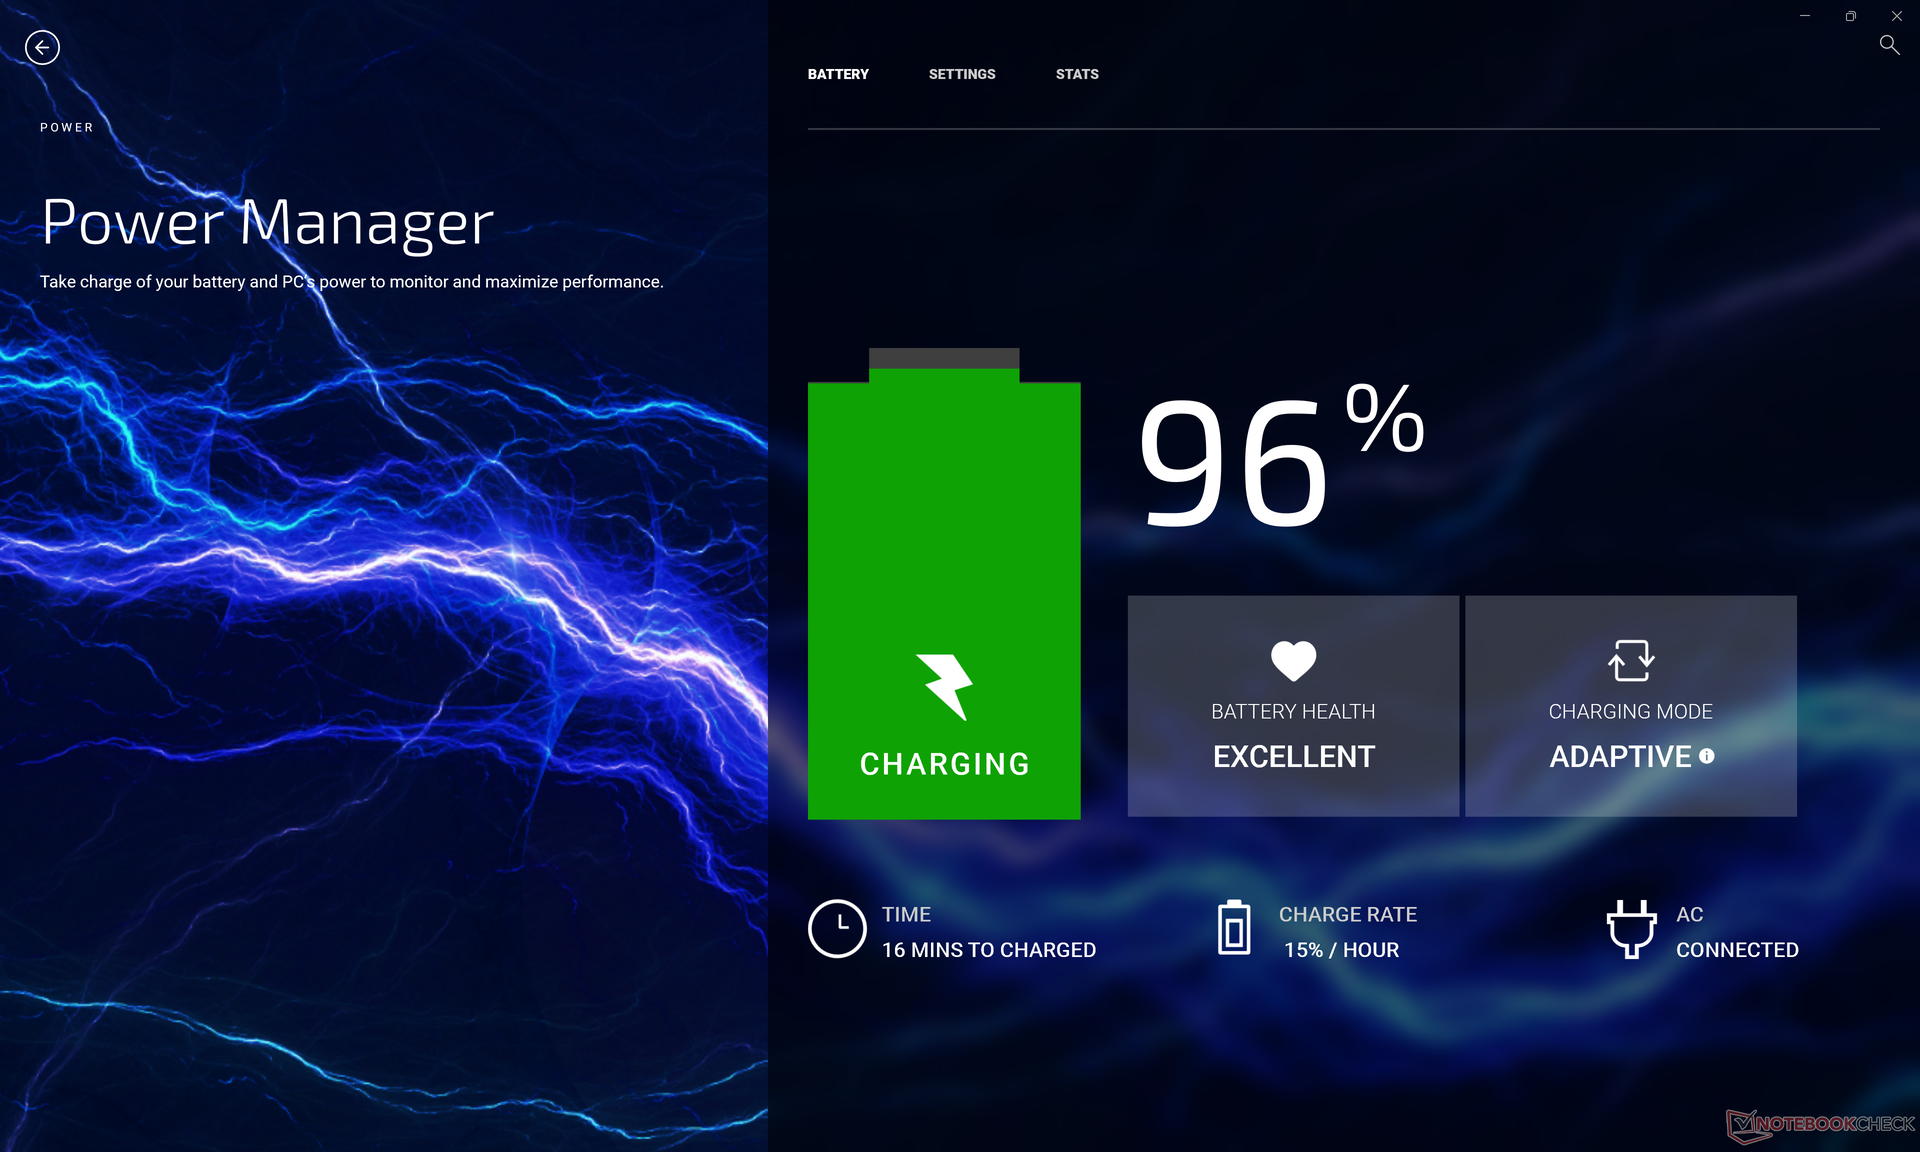
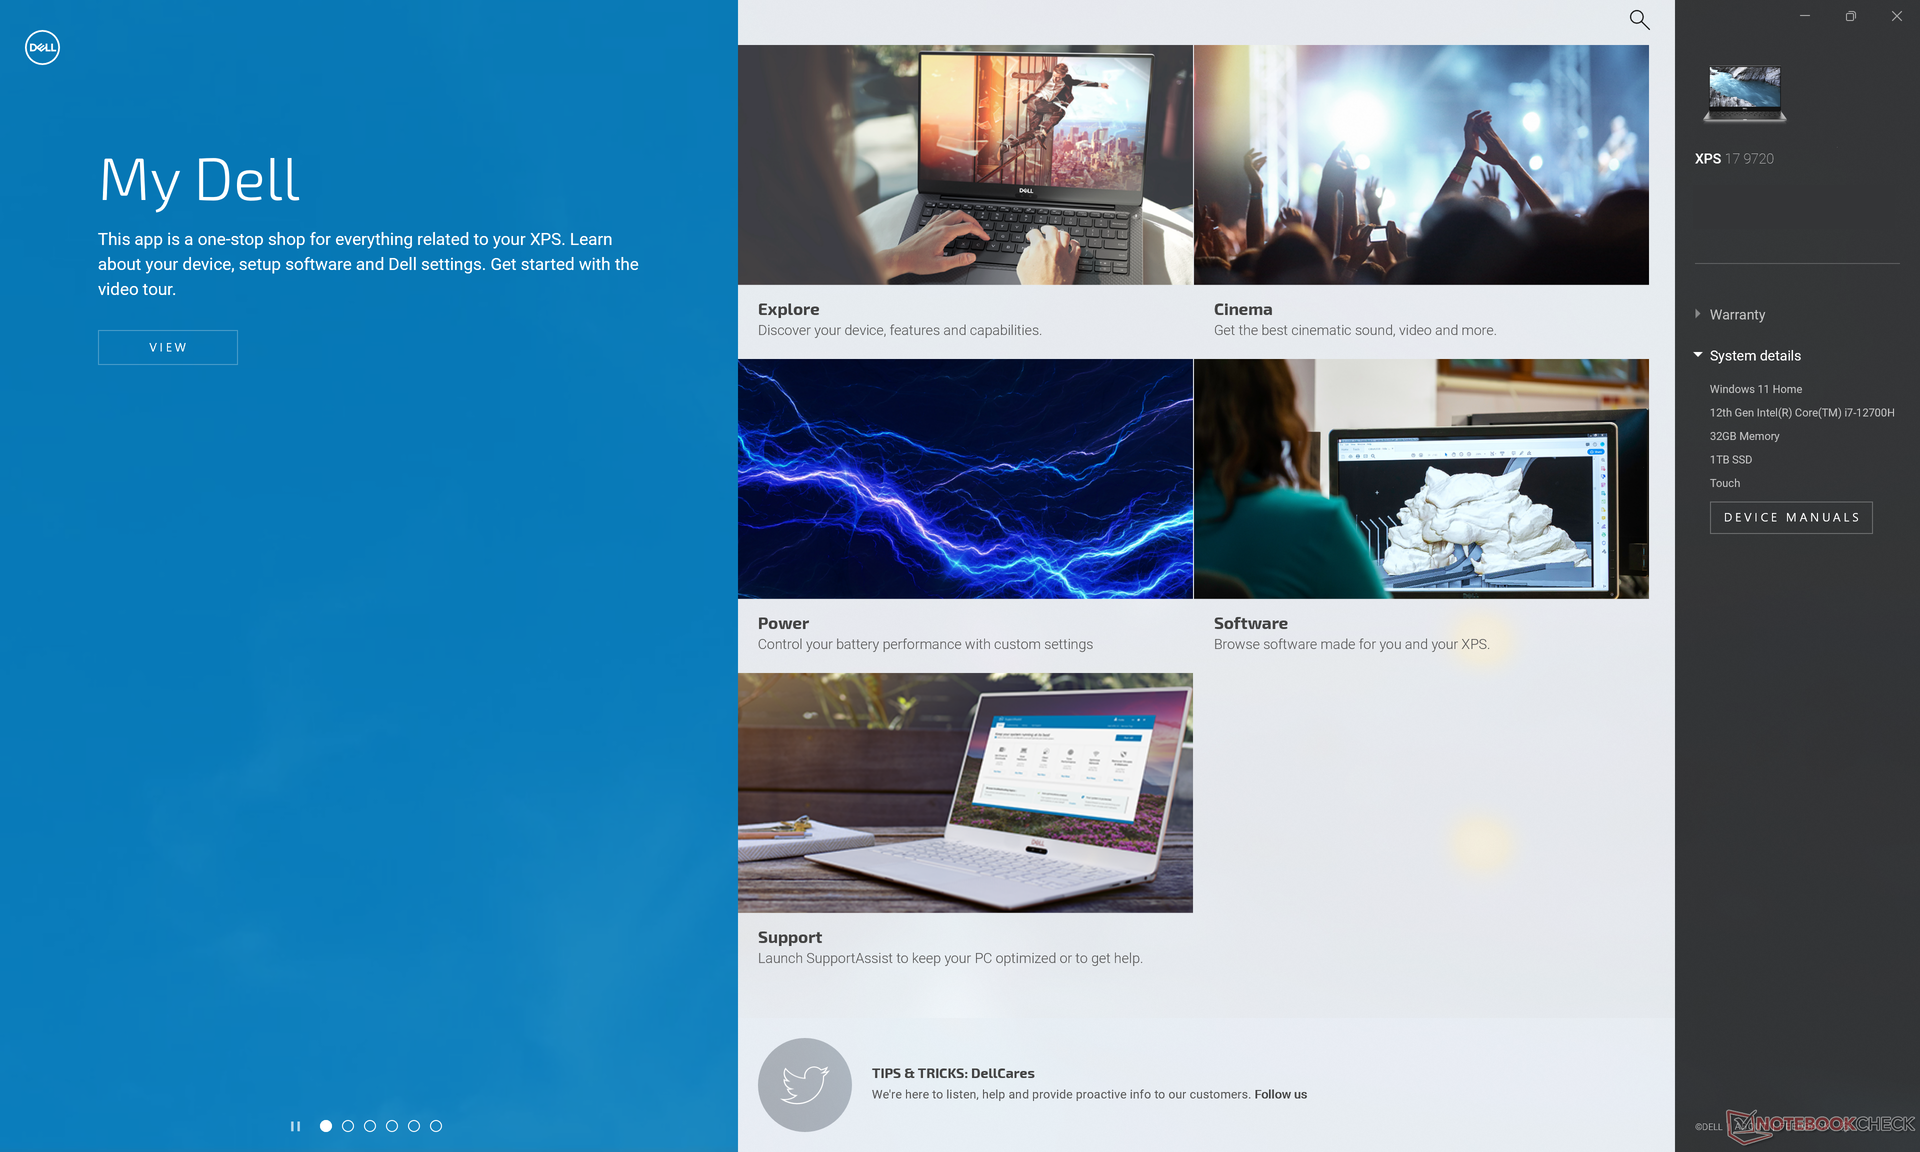
Notre appareil a été réglé en mode Ultra Performance via le logiciel My Dell avant d'exécuter les tests de référence ci-dessous pour obtenir les meilleurs résultats possibles. Nous recommandons aux utilisateurs de se familiariser avec les logiciels My Dell, Dell Update et PremierColor, car les fonctions clés du système sont activées par ces applications
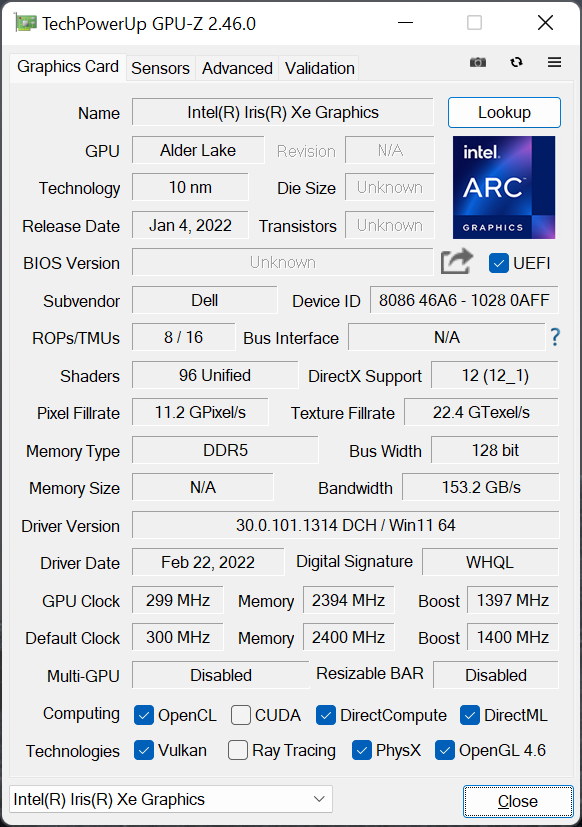
Optimus 1.0 est fourni en standard pour la commutation graphique automatique entre le GPU intégré et le GPU discret GeForce RTX 3060. La synchronisation adaptative interne et le MUX ne sont pas pris en charge car le XPS 17 n'est pas une machine de jeu.
Processeur
Les benchmarks CineBench xT et certains subtests AIDA64 peuvent être jusqu'à 50 % plus rapides que sur le XPS 15 9710 équipé de la dernière génération du Core i7-11800H ce qui représente une amélioration significative des performances du processeur d'une année sur l'autre. Les gains sont toutefois beaucoup plus faibles sur d'autres tests, notamment Blender et HWBOT x265, mais les gains moyens restent supérieurs à ce que nous avons observé entre le XPS 17 9700 et le XPS 17 9710.
Curieusement, le Core i7-12700H se retrouve derrière le Core i7-10875H de 10ème génération dans un certain nombre de benchmarks AIDA64, comme indiqué ci-dessous.
Certains ordinateurs portables plus épais équipés du même processeur Core i7-12800H sont capables de faire fonctionner le processeur à des fréquences d'horloge plus élevées et jusqu'à 20 % plus rapides, comme sur le HP Omen 16
L'exécution de CineBench R15 xT en boucle ne montre aucun problème majeur d'étranglement des performances lorsqu'il est soumis à des charges de traitement extrêmes pendant de longues périodes.
Cinebench R15 Multi Loop
Cinebench R23: Multi Core | Single Core
Cinebench R15: CPU Multi 64Bit | CPU Single 64Bit
Blender: v2.79 BMW27 CPU
7-Zip 18.03: 7z b 4 | 7z b 4 -mmt1
Geekbench 5.5: Multi-Core | Single-Core
HWBOT x265 Benchmark v2.2: 4k Preset
LibreOffice : 20 Documents To PDF
R Benchmark 2.5: Overall mean
| Geekbench 5.5 / Single-Core | |
| Alienware x17 R2 P48E | |
| Razer Blade 17 RTX 3080 Ti | |
| Moyenne Intel Core i7-12700H (803 - 1851, n=64) | |
| Dell XPS 17 9720 RTX 3060 | |
| MSI GS76 Stealth 11UH | |
| Acer Nitro 5 AN517-53-54DQ | |
| Dell XPS 17 9700 Core i7 RTX 2060 Max-Q | |
| Schenker XMG Core 17 (Early 2021) | |
| Dell XPS 17 9700 i5-10300H | |
Cinebench R23: Multi Core | Single Core
Cinebench R15: CPU Multi 64Bit | CPU Single 64Bit
Blender: v2.79 BMW27 CPU
7-Zip 18.03: 7z b 4 | 7z b 4 -mmt1
Geekbench 5.5: Multi-Core | Single-Core
HWBOT x265 Benchmark v2.2: 4k Preset
LibreOffice : 20 Documents To PDF
R Benchmark 2.5: Overall mean
* ... Moindre est la valeur, meilleures sont les performances
| AIDA64 / FP32 Ray-Trace | |
| Eurocom RX315 NH57AF1 | |
| Lenovo Legion 5 17ACH6H-82JY0003GE | |
| Moyenne Intel Core i7-12700H (2585 - 17957, n=64) | |
| Dell XPS 17 9700 Core i7 RTX 2060 Max-Q | |
| Razer Blade 17 (i7-12800H, RTX 3070 Ti) | |
| Dell XPS 17 9720 RTX 3060 | |
| Asus VivoBook 17 F712JA-AU708W | |
| AIDA64 / FPU SinJulia | |
| Eurocom RX315 NH57AF1 | |
| Razer Blade 17 (i7-12800H, RTX 3070 Ti) | |
| Lenovo Legion 5 17ACH6H-82JY0003GE | |
| Moyenne Intel Core i7-12700H (3249 - 9939, n=64) | |
| Dell XPS 17 9720 RTX 3060 | |
| Dell XPS 17 9700 Core i7 RTX 2060 Max-Q | |
| Asus VivoBook 17 F712JA-AU708W | |
| AIDA64 / FP64 Ray-Trace | |
| Eurocom RX315 NH57AF1 | |
| Lenovo Legion 5 17ACH6H-82JY0003GE | |
| Moyenne Intel Core i7-12700H (1437 - 9692, n=64) | |
| Dell XPS 17 9700 Core i7 RTX 2060 Max-Q | |
| Dell XPS 17 9720 RTX 3060 | |
| Razer Blade 17 (i7-12800H, RTX 3070 Ti) | |
| Asus VivoBook 17 F712JA-AU708W | |
| AIDA64 / CPU PhotoWorxx | |
| Dell XPS 17 9720 RTX 3060 | |
| Moyenne Intel Core i7-12700H (12863 - 52207, n=64) | |
| Razer Blade 17 (i7-12800H, RTX 3070 Ti) | |
| Dell XPS 17 9700 Core i7 RTX 2060 Max-Q | |
| Eurocom RX315 NH57AF1 | |
| Asus VivoBook 17 F712JA-AU708W | |
| Lenovo Legion 5 17ACH6H-82JY0003GE | |
Performance du système
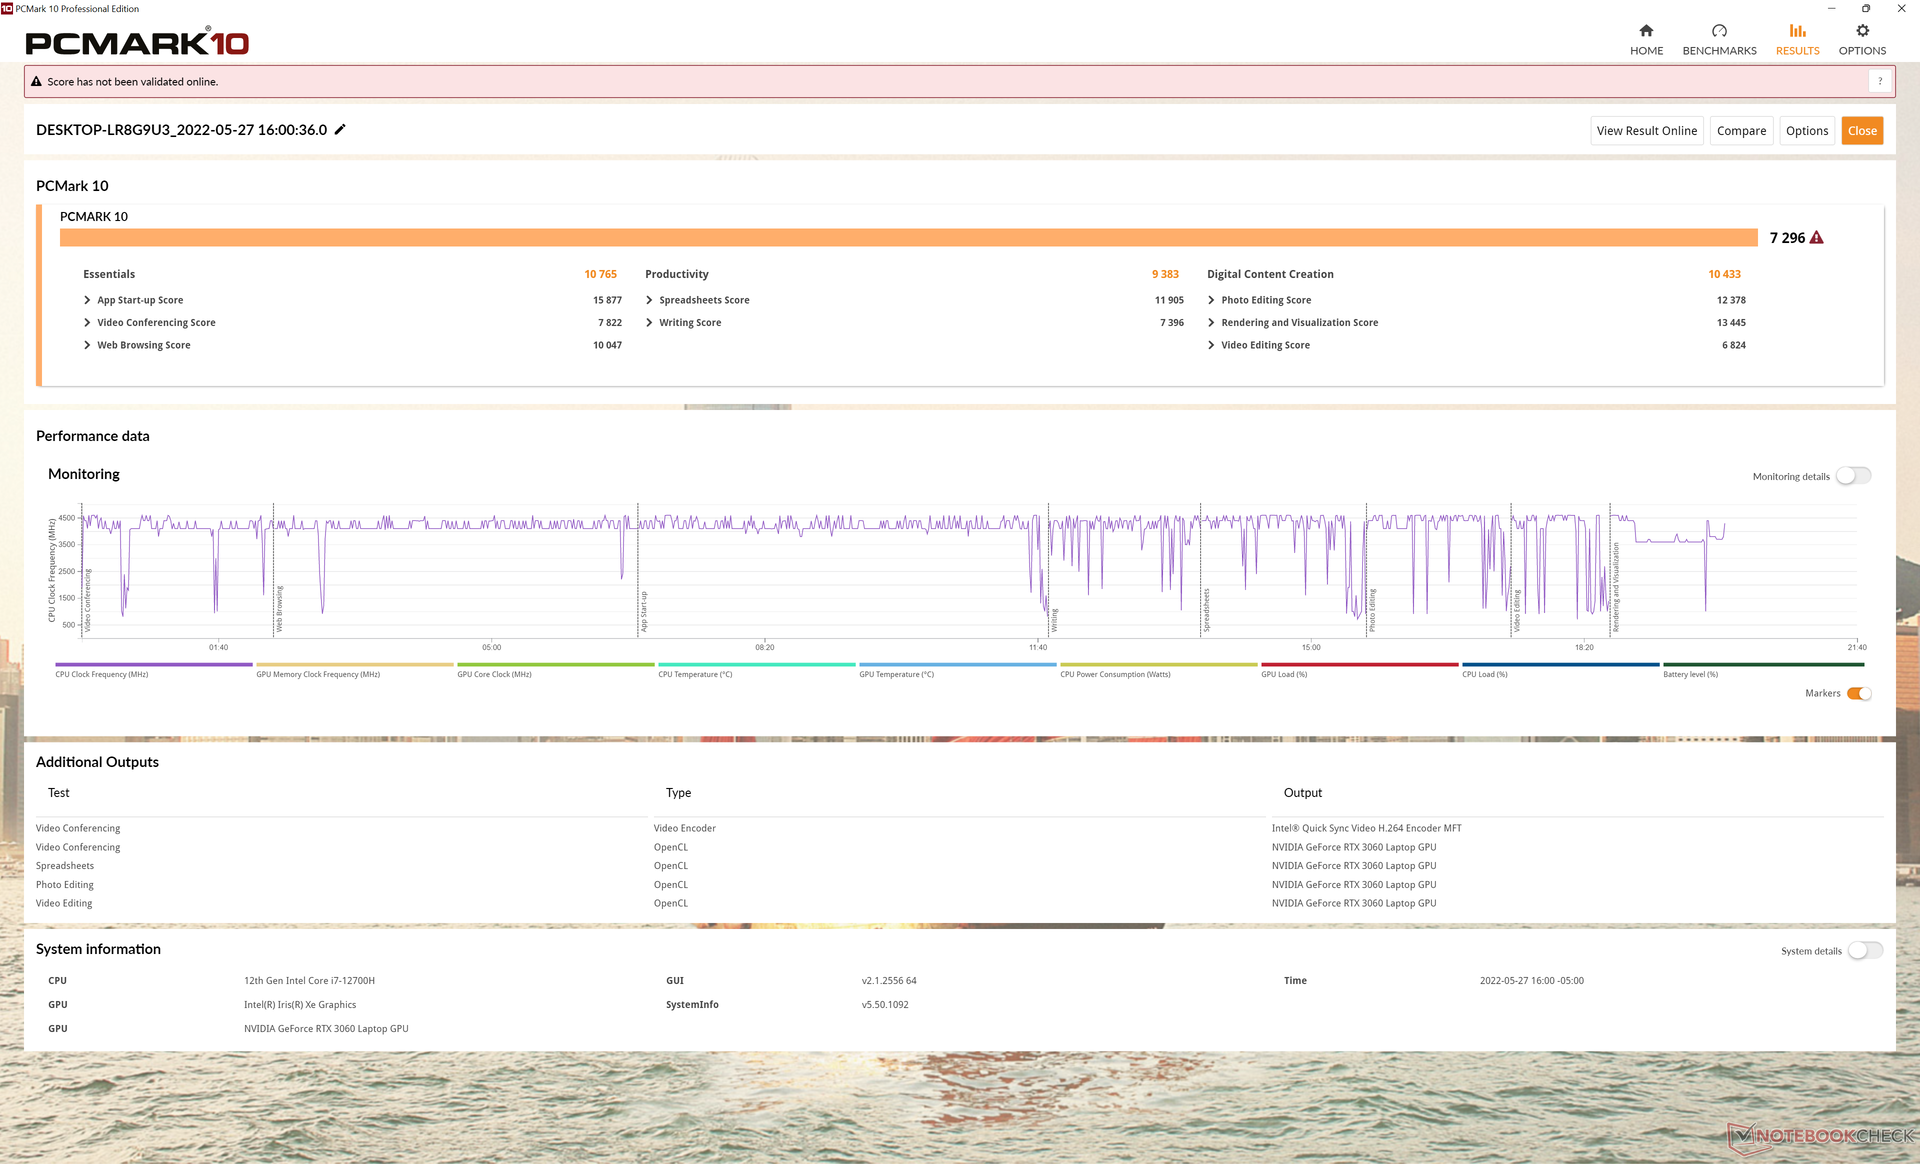
Les résultats de PCMark 10 sont systématiquement supérieurs à ceux que nous avons enregistrés sur le XPS 17 9710, mais à peine. Les scores du XPS 17 9720 sont toujours parmi les plus rapides dans la catégorie multimédia.
Nous avons rencontré un bug sur notre unité où la consommation d'énergie se stabilisait étrangement à 40 W en mode veille au lieu des <2 W habituels, ce qui entraînait des températures de surface très chaudes et un gaspillage d'énergie. La modification des profils d'alimentation via My Dell semble être une solution temporaire à ce problème.
CrossMark: Overall | Productivity | Creativity | Responsiveness
| PCMark 10 / Score | |
| Moyenne de la classe Multimedia (4325 - 10386, n=51, 2 dernières années) | |
| Dell XPS 17 9720 RTX 3060 | |
| Razer Blade 17 (i7-12800H, RTX 3070 Ti) | |
| Moyenne Intel Core i7-12700H, NVIDIA GeForce RTX 3060 Laptop GPU (5986 - 8156, n=12) | |
| Dell XPS 17 9710 Core i7 RTX 3060 | |
| Lenovo Legion 5 17ACH6H-82JY0003GE | |
| Dell XPS 17 9700 Core i7 RTX 2060 Max-Q | |
| HP Envy 17-cg | |
| Asus VivoBook 17 F712JA-AU708W | |
| PCMark 10 / Essentials | |
| Dell XPS 17 9720 RTX 3060 | |
| Moyenne Intel Core i7-12700H, NVIDIA GeForce RTX 3060 Laptop GPU (9289 - 12144, n=12) | |
| Moyenne de la classe Multimedia (8025 - 11664, n=50, 2 dernières années) | |
| Razer Blade 17 (i7-12800H, RTX 3070 Ti) | |
| Dell XPS 17 9710 Core i7 RTX 3060 | |
| Lenovo Legion 5 17ACH6H-82JY0003GE | |
| Dell XPS 17 9700 Core i7 RTX 2060 Max-Q | |
| HP Envy 17-cg | |
| Asus VivoBook 17 F712JA-AU708W | |
| PCMark 10 / Productivity | |
| Moyenne de la classe Multimedia (7323 - 18233, n=50, 2 dernières années) | |
| Dell XPS 17 9720 RTX 3060 | |
| Moyenne Intel Core i7-12700H, NVIDIA GeForce RTX 3060 Laptop GPU (6161 - 10362, n=12) | |
| Razer Blade 17 (i7-12800H, RTX 3070 Ti) | |
| Lenovo Legion 5 17ACH6H-82JY0003GE | |
| Dell XPS 17 9710 Core i7 RTX 3060 | |
| HP Envy 17-cg | |
| Dell XPS 17 9700 Core i7 RTX 2060 Max-Q | |
| Asus VivoBook 17 F712JA-AU708W | |
| PCMark 10 / Digital Content Creation | |
| Razer Blade 17 (i7-12800H, RTX 3070 Ti) | |
| Moyenne Intel Core i7-12700H, NVIDIA GeForce RTX 3060 Laptop GPU (8950 - 12554, n=12) | |
| Moyenne de la classe Multimedia (3651 - 16240, n=50, 2 dernières années) | |
| Dell XPS 17 9720 RTX 3060 | |
| Dell XPS 17 9710 Core i7 RTX 3060 | |
| Lenovo Legion 5 17ACH6H-82JY0003GE | |
| Dell XPS 17 9700 Core i7 RTX 2060 Max-Q | |
| HP Envy 17-cg | |
| Asus VivoBook 17 F712JA-AU708W | |
| CrossMark / Overall | |
| Dell XPS 17 9720 RTX 3060 | |
| Moyenne de la classe Multimedia (866 - 2728, n=59, 2 dernières années) | |
| Moyenne Intel Core i7-12700H, NVIDIA GeForce RTX 3060 Laptop GPU (1649 - 2017, n=11) | |
| Razer Blade 17 (i7-12800H, RTX 3070 Ti) | |
| Lenovo Legion 5 17ACH6H-82JY0003GE | |
| Asus VivoBook 17 F712JA-AU708W | |
| CrossMark / Productivity | |
| Moyenne de la classe Multimedia (931 - 2489, n=59, 2 dernières années) | |
| Dell XPS 17 9720 RTX 3060 | |
| Moyenne Intel Core i7-12700H, NVIDIA GeForce RTX 3060 Laptop GPU (1536 - 1958, n=11) | |
| Razer Blade 17 (i7-12800H, RTX 3070 Ti) | |
| Lenovo Legion 5 17ACH6H-82JY0003GE | |
| Asus VivoBook 17 F712JA-AU708W | |
| CrossMark / Creativity | |
| Moyenne de la classe Multimedia (907 - 3465, n=59, 2 dernières années) | |
| Dell XPS 17 9720 RTX 3060 | |
| Moyenne Intel Core i7-12700H, NVIDIA GeForce RTX 3060 Laptop GPU (1816 - 2084, n=11) | |
| Razer Blade 17 (i7-12800H, RTX 3070 Ti) | |
| Lenovo Legion 5 17ACH6H-82JY0003GE | |
| Asus VivoBook 17 F712JA-AU708W | |
| CrossMark / Responsiveness | |
| Dell XPS 17 9720 RTX 3060 | |
| Moyenne Intel Core i7-12700H, NVIDIA GeForce RTX 3060 Laptop GPU (1210 - 2207, n=11) | |
| Razer Blade 17 (i7-12800H, RTX 3070 Ti) | |
| Moyenne de la classe Multimedia (605 - 2024, n=59, 2 dernières années) | |
| Lenovo Legion 5 17ACH6H-82JY0003GE | |
| Asus VivoBook 17 F712JA-AU708W | |
| PCMark 10 Score | 7296 points | |
Aide | ||
| AIDA64 / Memory Copy | |
| Dell XPS 17 9720 RTX 3060 | |
| Moyenne Intel Core i7-12700H (25615 - 80511, n=64) | |
| Razer Blade 17 (i7-12800H, RTX 3070 Ti) | |
| Dell XPS 17 9700 Core i7 RTX 2060 Max-Q | |
| Lenovo Legion 5 17ACH6H-82JY0003GE | |
| Asus VivoBook 17 F712JA-AU708W | |
| AIDA64 / Memory Read | |
| Dell XPS 17 9720 RTX 3060 | |
| Moyenne Intel Core i7-12700H (25586 - 79442, n=64) | |
| Razer Blade 17 (i7-12800H, RTX 3070 Ti) | |
| Lenovo Legion 5 17ACH6H-82JY0003GE | |
| Dell XPS 17 9700 Core i7 RTX 2060 Max-Q | |
| Asus VivoBook 17 F712JA-AU708W | |
| AIDA64 / Memory Write | |
| Dell XPS 17 9720 RTX 3060 | |
| Moyenne Intel Core i7-12700H (23679 - 88660, n=64) | |
| Razer Blade 17 (i7-12800H, RTX 3070 Ti) | |
| Dell XPS 17 9700 Core i7 RTX 2060 Max-Q | |
| Lenovo Legion 5 17ACH6H-82JY0003GE | |
| Asus VivoBook 17 F712JA-AU708W | |
* ... Moindre est la valeur, meilleures sont les performances
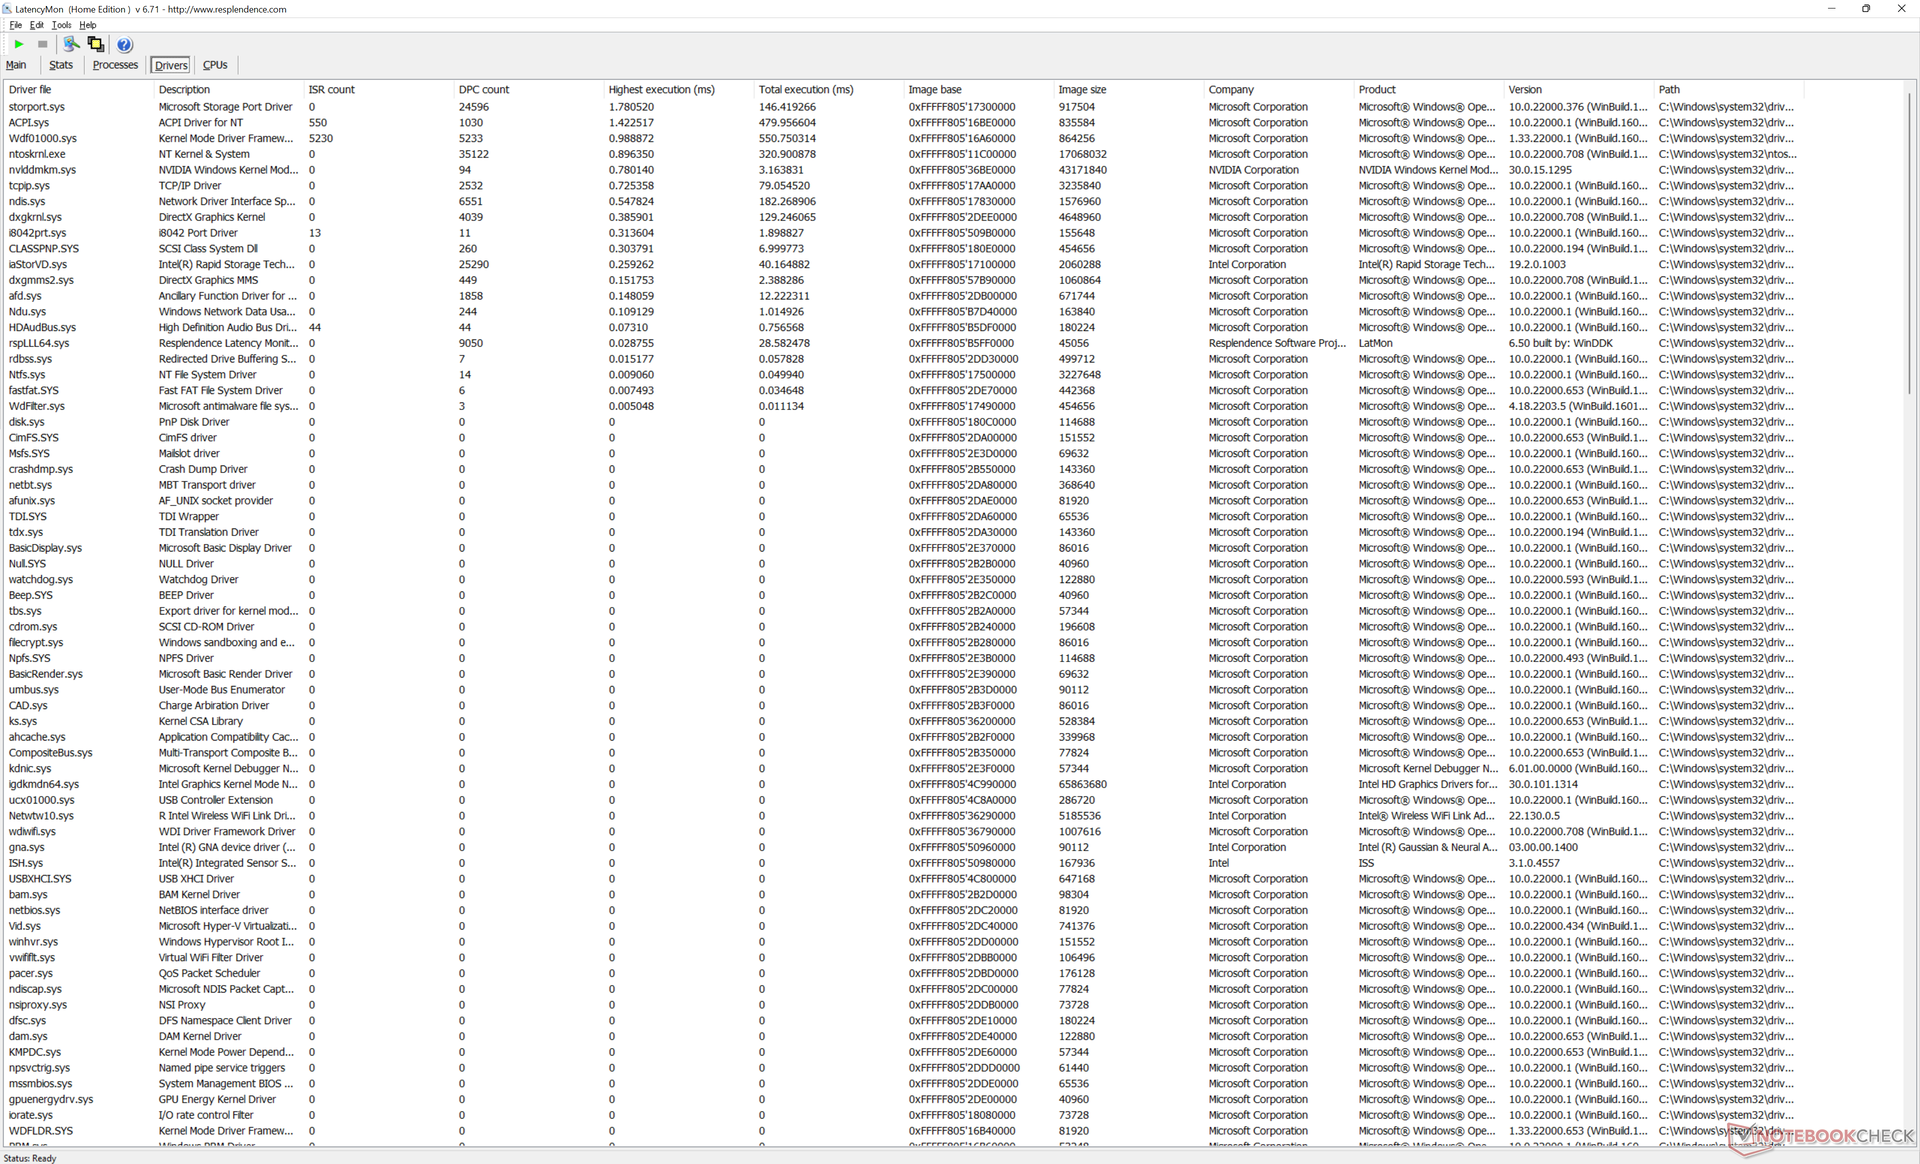
Latence DPC
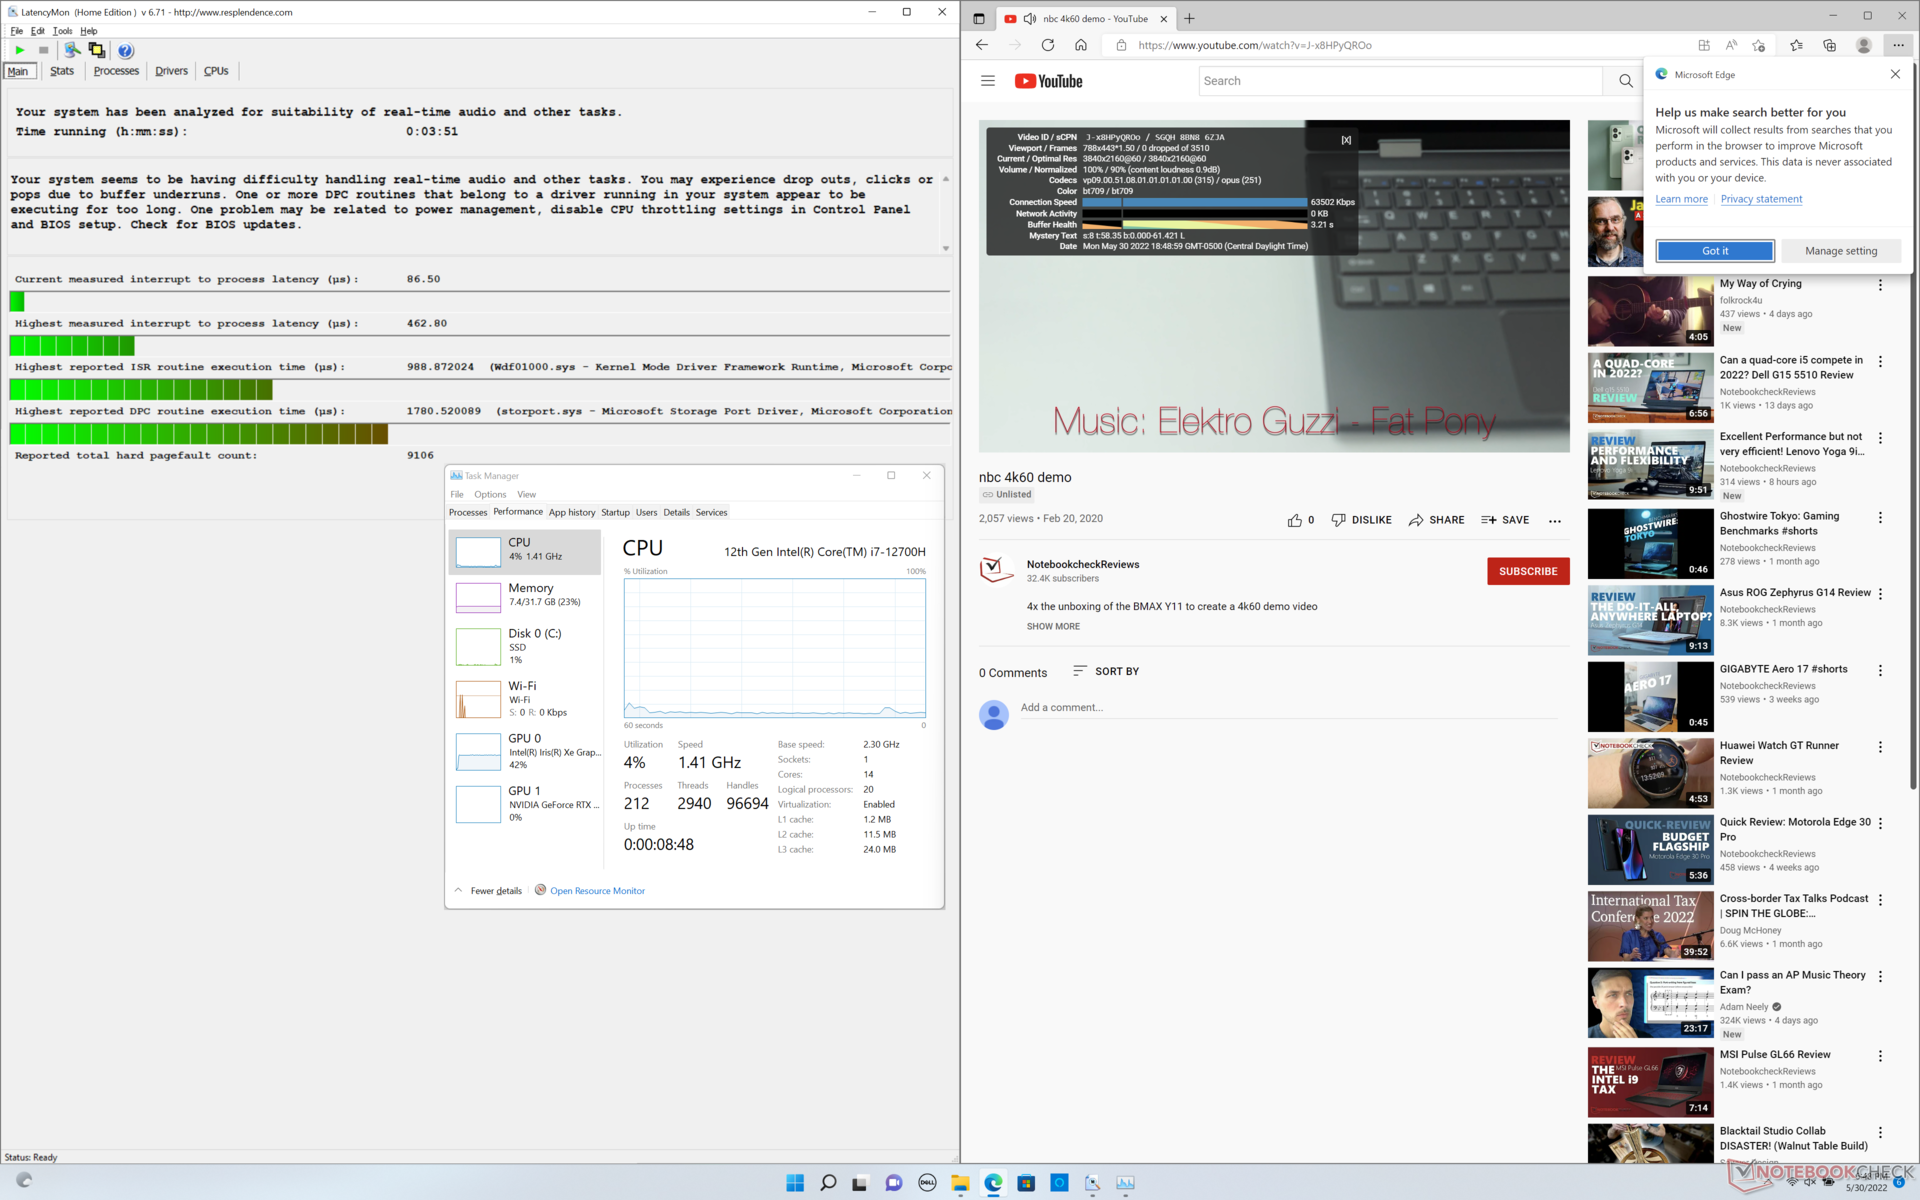
LatencyMon révèle des problèmes mineurs de DPC lors de l'ouverture de plusieurs onglets de navigateur sur notre page d'accueil, un peu comme ce que nous avons observé sur les XPS 17 9710 et 9700. la lecture de vidéos 4K à 60 FPS est par ailleurs parfaitement fluide, sans perte d'images, comme on peut s'y attendre de la part d'un portable multimédia équipé d'un Core H.
| DPC Latencies / LatencyMon - interrupt to process latency (max), Web, Youtube, Prime95 | |
| HP Envy 17-cg | |
| Lenovo Legion 5 17ACH6H-82JY0003GE | |
| Asus VivoBook 17 F712JA-AU708W | |
| Razer Blade 17 (i7-12800H, RTX 3070 Ti) | |
| Dell XPS 17 9700 Core i7 RTX 2060 Max-Q | |
| Dell XPS 17 9710 Core i7 RTX 3060 | |
| Dell XPS 17 9720 RTX 3060 | |
* ... Moindre est la valeur, meilleures sont les performances
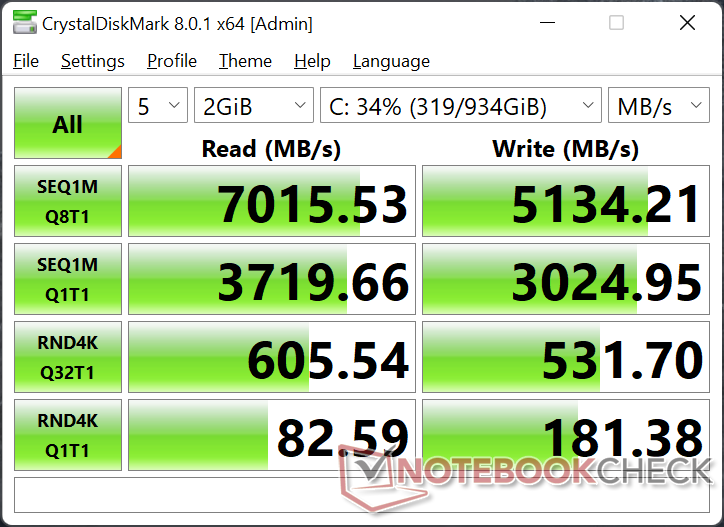
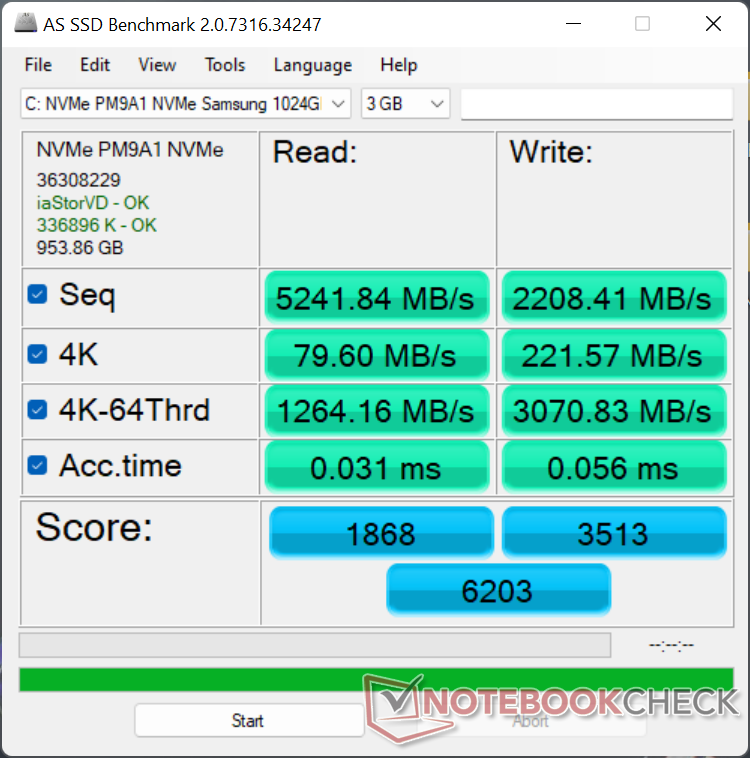
Périphériques de stockage
Le XPS 17 9710 a été livré à une époque où les SSD NVMe PCIe4 x4 n'étaient pas encore largement disponibles et où les SKUs n'avaient que des options PCIe3 x4 à la place. Les disques PCIe4 sont heureusement plus courants aujourd'hui et il est bon de voir que le XPS 17 9720 a adopté une solution rapide.Samsung PM9A1 rapide. Nos tests de stress montrent que le disque dans notre unité n'aurait aucun problème à maintenir son taux de lecture séquentielle maximale de plus de 7000 Mo / s pour des périodes prolongées sans avoir besoin de throttle, bien que la performance globale est toujours plus lent que ce que nous avons enregistré sur leRazer Blade 17 équipé du même disque Samsung de 1 To.

* ... Moindre est la valeur, meilleures sont les performances
Disk Throttling: DiskSpd Read Loop, Queue Depth 8
Performances du GPU
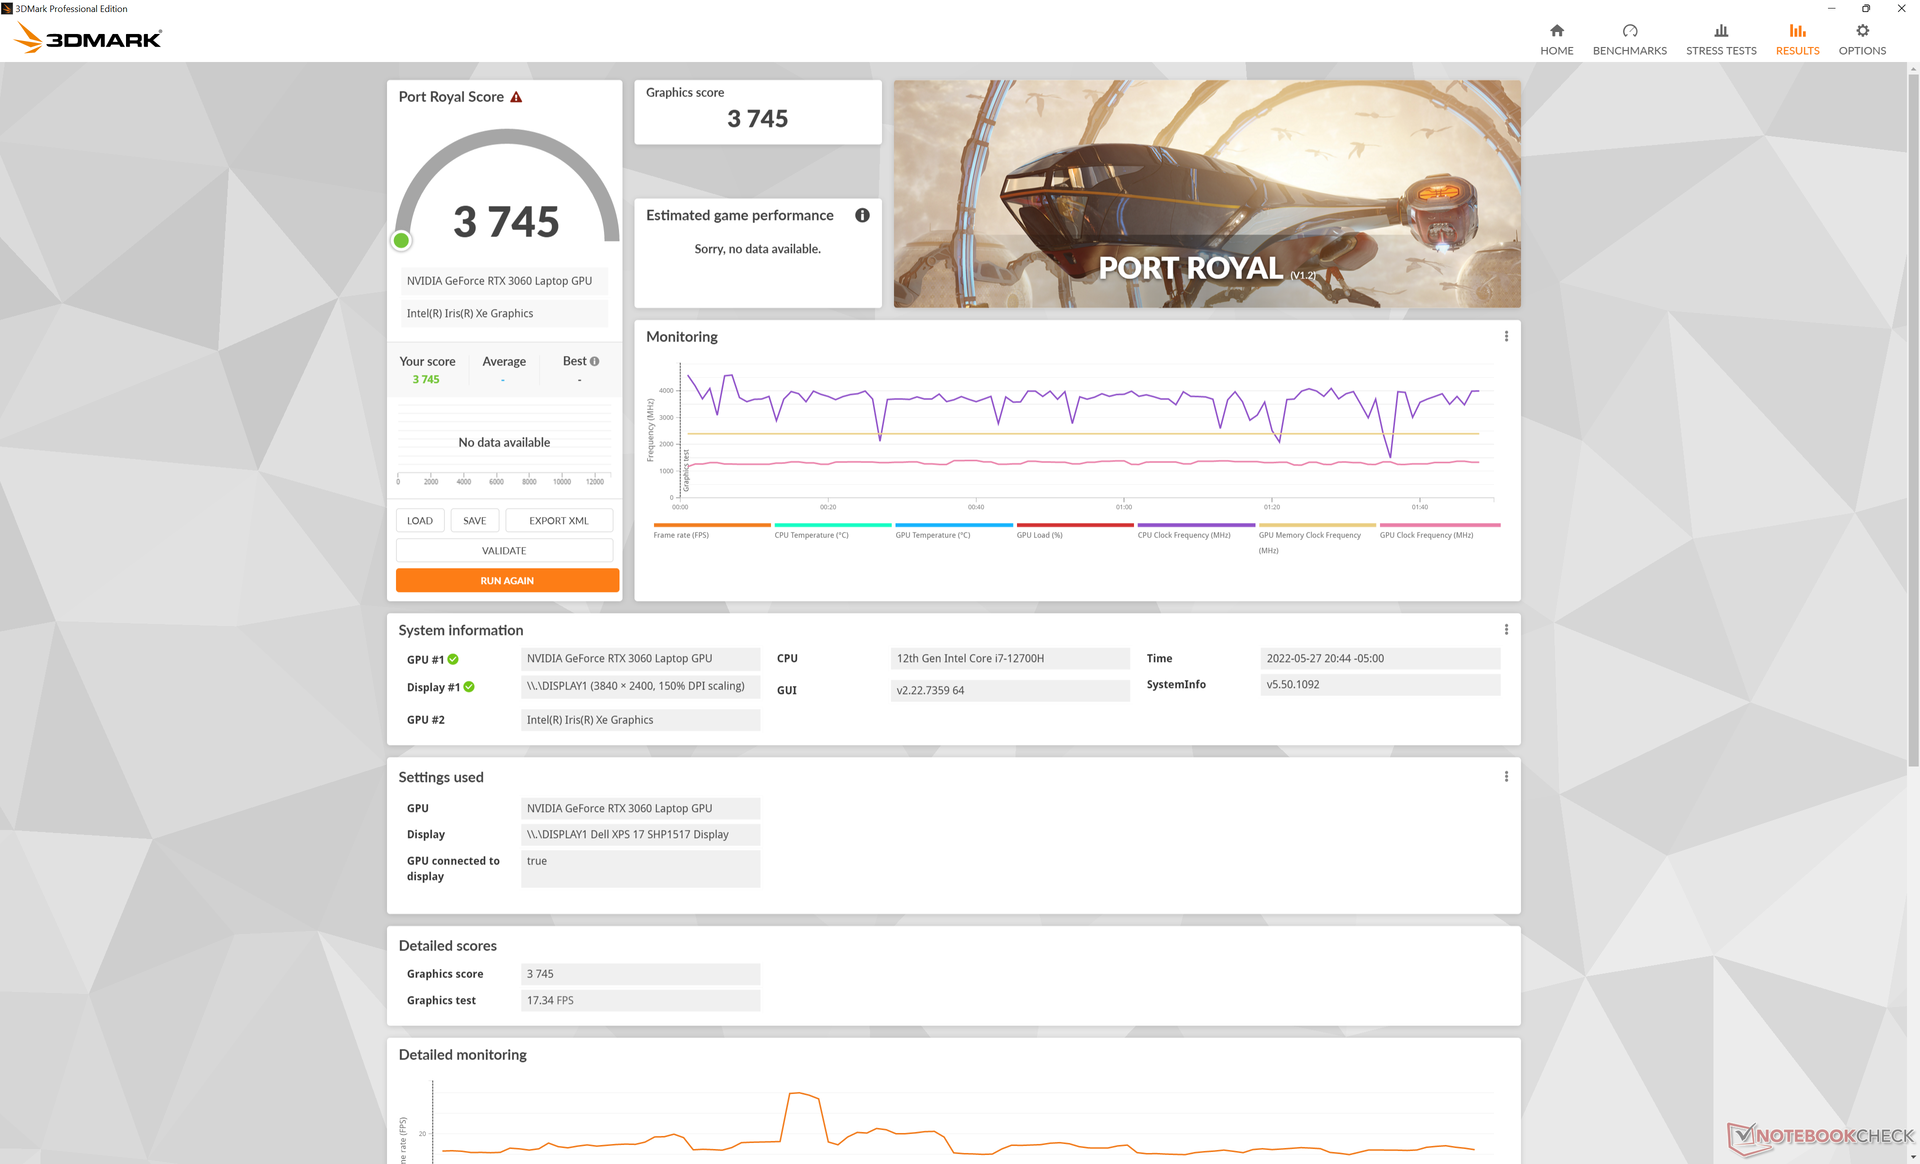
Dell a rétrogradé le TGP GeForce RTX 3060 de 70 W sur le XPS 17 9710 à 65 W sur le XPS 17 9720. Bien que Dell annonce un GPU de 60 W pour le 9720, nous pouvons confirmer que le panneau de contrôle Nvidia indique 65 W, ce qui est plus proche de nos propres résultats indépendants pendant les tests. L'effet est une diminution de 10% des performances graphiques brutes selon les benchmarks 3DMark et les jeux testés comme Final Fantasy XV, Stratos, etc Witcher 3 final Fantasy XV ou Strange Brigade.
Par rapport à l'ordinateur portable moyen équipé du même GPU GeForce RTX 3060, celui du XPS 17 9720 est environ 20 % plus lent. Il convient de noter que la plupart des autres ordinateurs portables équipés de la RTX 3060 visent généralement des plafonds TGP plus élevés de 80 W ou plus. Au minimum, le GPU ici est toujours meilleur que le RTX 2060 Max-Q dans le XPS 17 9700 original d'environ 15 pour cent. En revanche, le passage à la RTX 3050 Ti NVIDIA GeForce RTX 3050 Ti Laptop GPU SKU entraînerait un déficit de performance de 25 à 30 %.
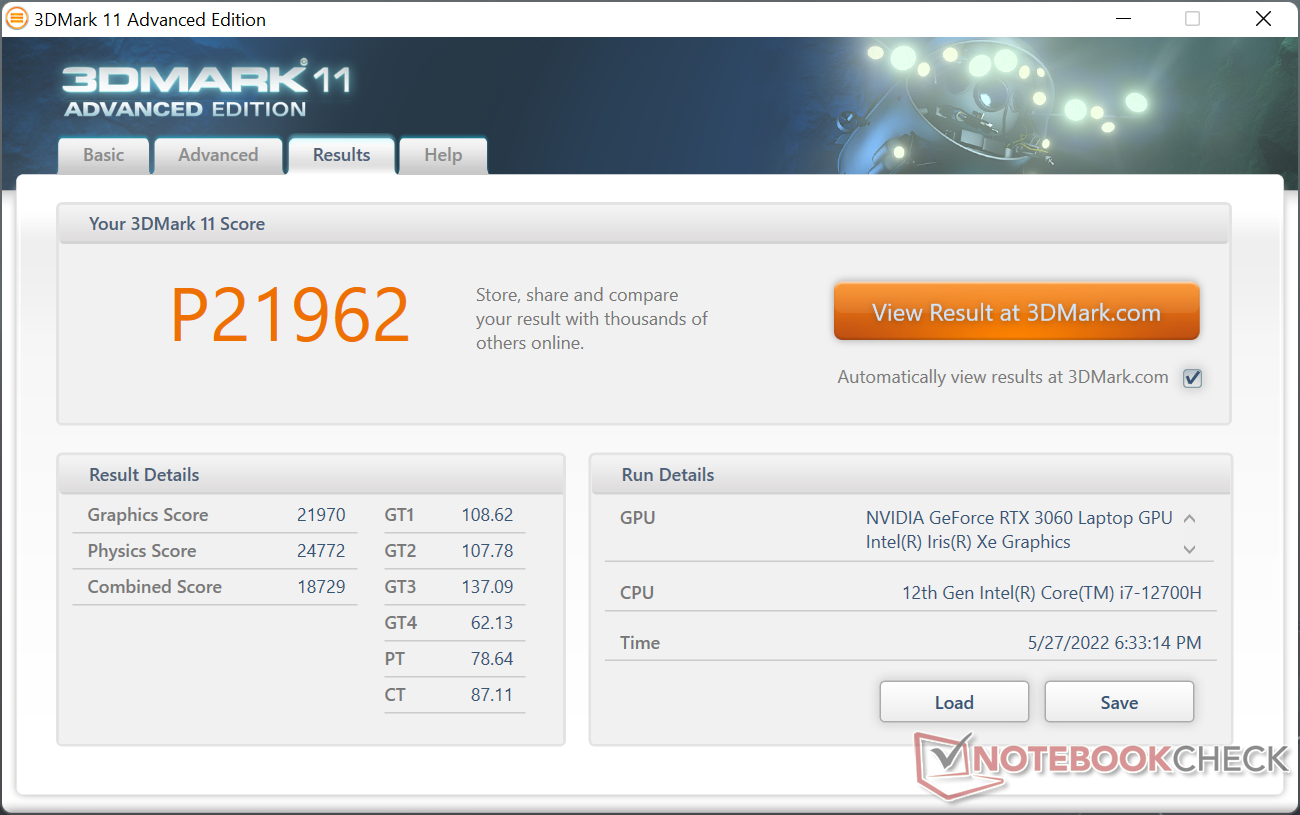
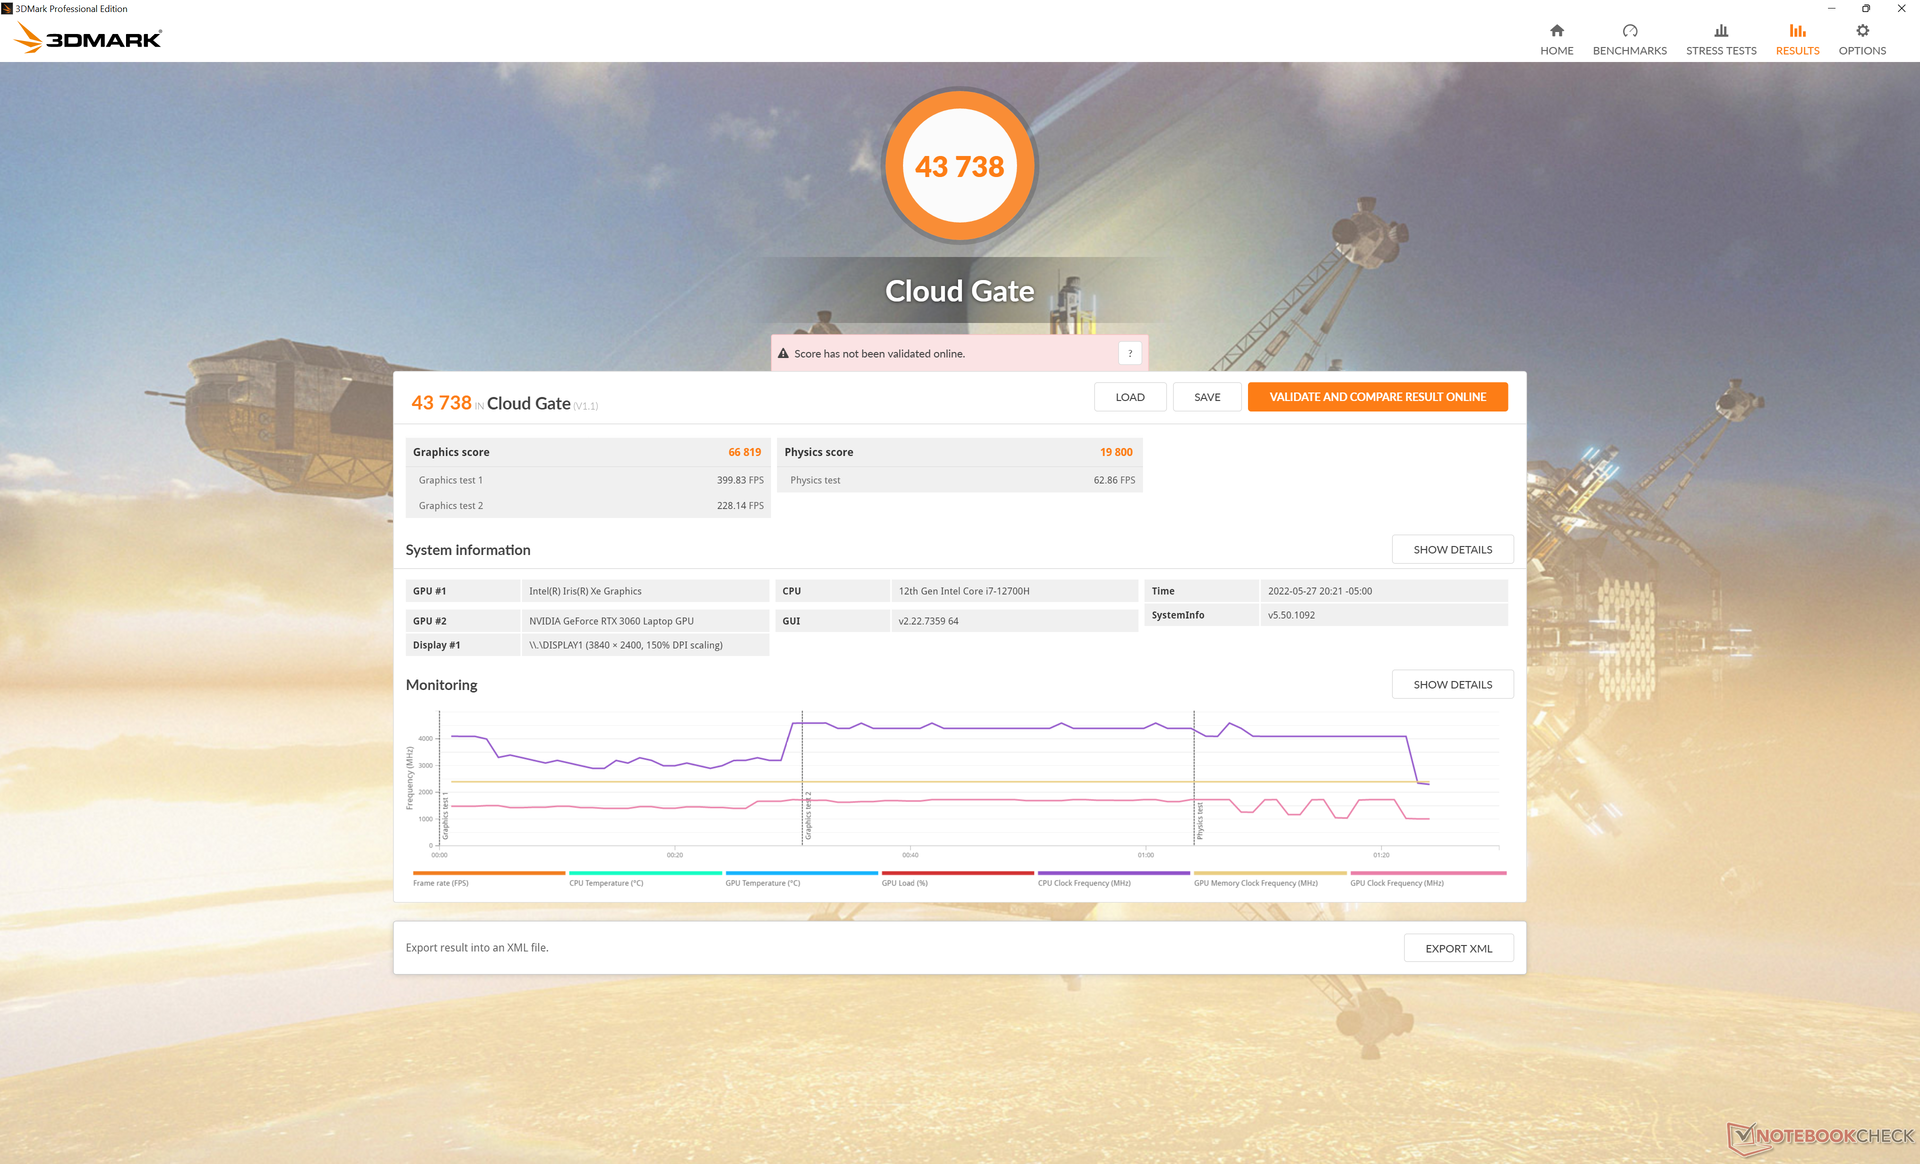
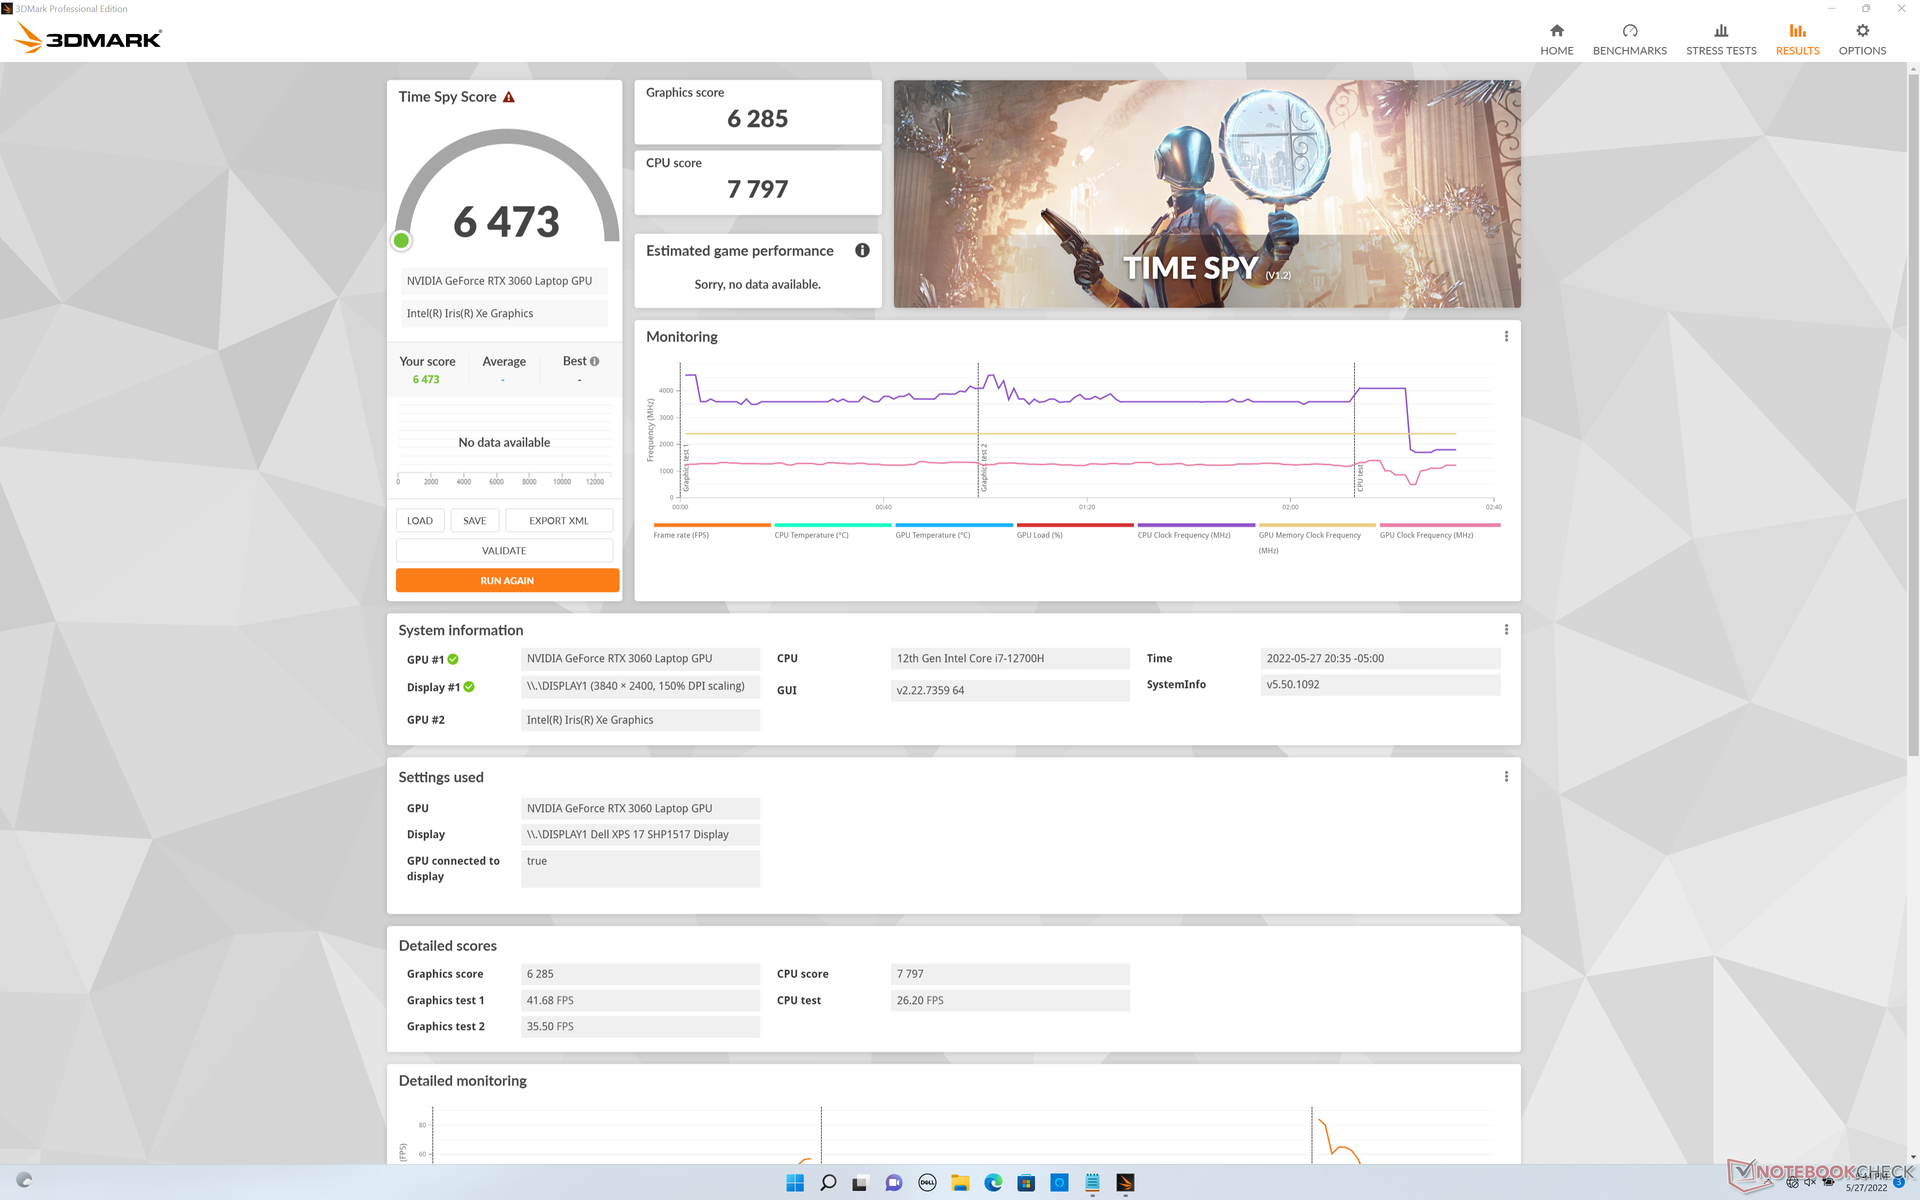
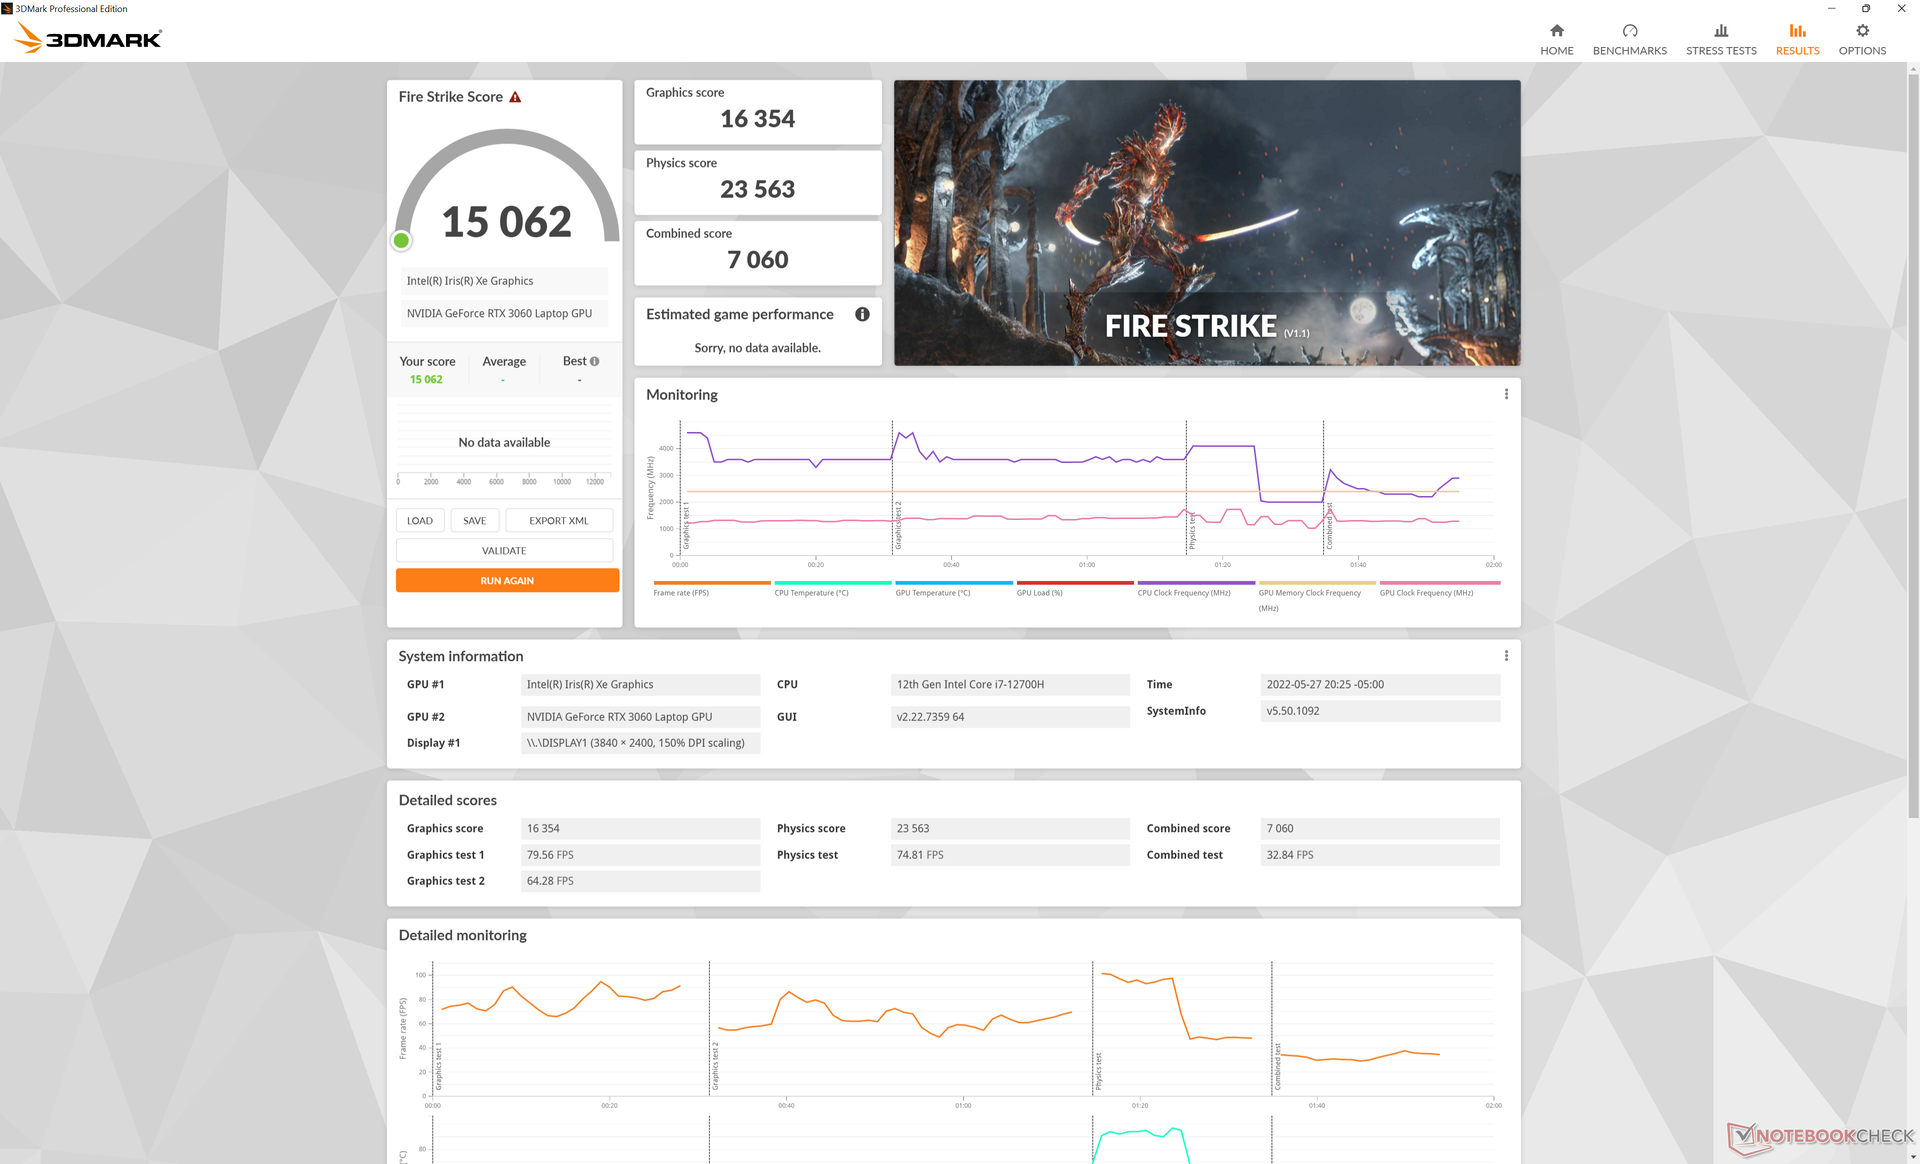
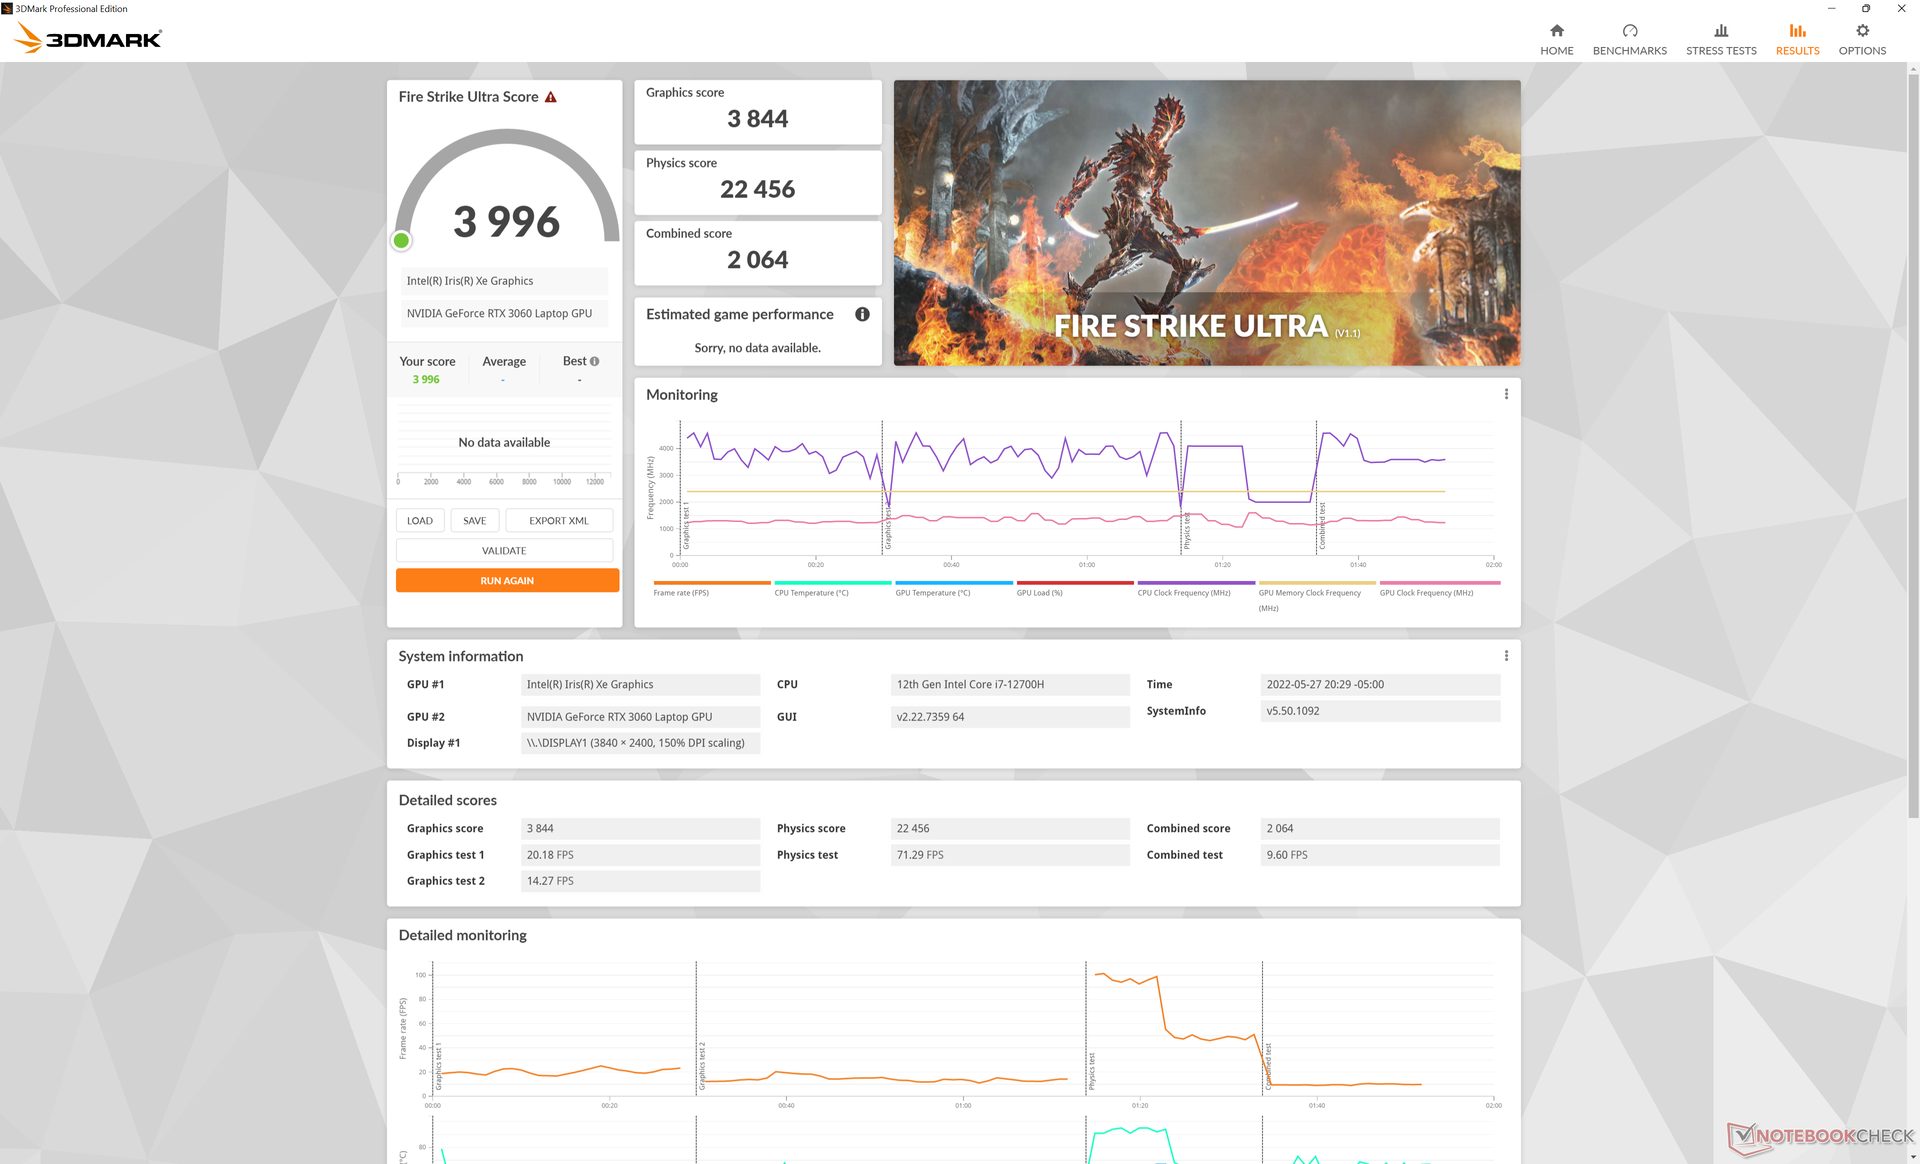
| 3DMark 11 Performance | 21962 points | |
| 3DMark Cloud Gate Standard Score | 43738 points | |
| 3DMark Fire Strike Score | 15062 points | |
| 3DMark Time Spy Score | 6473 points | |
Aide | ||
Witcher 3 FPS Chart
| Bas | Moyen | Élevé | Ultra | QHD | 4K | |
|---|---|---|---|---|---|---|
| GTA V (2015) | 186.6 | 179 | 152.8 | 83.8 | 63.4 | |
| The Witcher 3 (2015) | 347.7 | 214.6 | 133.9 | 67.8 | ||
| Dota 2 Reborn (2015) | 185.7 | 169.9 | 163 | 133.5 | 84.6 | |
| Final Fantasy XV Benchmark (2018) | 137.9 | 90.5 | 69.3 | 49.1 | 28.3 | |
| X-Plane 11.11 (2018) | 133.3 | 111.6 | 93.8 | 92.3 | ||
| Strange Brigade (2018) | 352 | 162.6 | 130.6 | 113.4 | 82.3 | |
| Cyberpunk 2077 1.6 (2022) | 95.4 | 78.1 | 60 | 48.9 | 29 | 11.6 |
Emissions - Bruit et températures des ordinateurs portables de jeu
Bruit du système
Le bruit et le comportement du ventilateur n'ont pas changé depuis le XPS 17 9700 original, ce qui signifie que le bruit du ventilateur atteindra toujours presque 50 db(A) lors des jeux ou d'autres charges élevées. Le bruit est comparable à celui de nombreux ordinateurs portables de jeu dans de telles conditions de stress.
Les ventilateurs passent du silence au bruit assez rapidement lorsque des charges moyennes à élevées sont introduites. Nous recommandons donc le profil d'alimentation silencieux pour limiter les pulsations des ventilateurs si la puissance supplémentaire n'est pas nécessaire.
Degré de la nuisance sonore
| Au repos |
| 24.1 / 24.1 / 24.1 dB(A) |
| Fortement sollicité |
| 43.2 / 48 dB(A) |
 | ||
30 dB silencieux 40 dB(A) audible 50 dB(A) bruyant |
||
min: | ||
| Dell XPS 17 9720 RTX 3060 GeForce RTX 3060 Laptop GPU, i7-12700H, Samsung PM9A1 MZVL21T0HCLR | HP Envy 17-cg GeForce MX450, i5-1135G7, Samsung PM991 MZVLQ1T0HALB | Dell XPS 17 9710 Core i7 RTX 3060 GeForce RTX 3060 Laptop GPU, i7-11800H, Micron 2300 1TB MTFDHBA1T0TDV | Dell XPS 17 9700 Core i7 RTX 2060 Max-Q GeForce RTX 2060 Max-Q, i7-10875H, Micron 2200S 1TB MTFDHBA1T0TCK | Lenovo Legion 5 17ACH6H-82JY0003GE GeForce RTX 3060 Laptop GPU, R5 5600H, Samsung PM991a MZALQ512HBLU | Asus VivoBook 17 F712JA-AU708W Iris Plus Graphics G7 (Ice Lake 64 EU), i7-1065G7, Kingston OM8PCP3512F-AB | Razer Blade 17 (i7-12800H, RTX 3070 Ti) GeForce RTX 3070 Ti Laptop GPU, i7-12800H, Samsung PM9A1 MZVL21T0HCLR | |
|---|---|---|---|---|---|---|---|
| Noise | -9% | -5% | -10% | -6% | -14% | 4% | |
| arrêt / environnement * (dB) | 23.8 | 26 -9% | 25.5 -7% | 28 -18% | 25 -5% | 29.6 -24% | 23 3% |
| Idle Minimum * (dB) | 24.1 | 26 -8% | 25.2 -5% | 28 -16% | 25 -4% | 31.4 -30% | 23 5% |
| Idle Average * (dB) | 24.1 | 31.7 -32% | 25.2 -5% | 28 -16% | 25 -4% | 31.4 -30% | 23 5% |
| Idle Maximum * (dB) | 24.1 | 25.2 -5% | 28 -16% | 30.5 -27% | 31.4 -30% | 23 5% | |
| Load Average * (dB) | 43.2 | 43.2 -0% | 45.9 -6% | 43.2 -0% | 37.5 13% | 36.1 16% | 36.92 15% |
| Witcher 3 ultra * (dB) | 48 | 49 -2% | 49 -2% | 50 -4% | |||
| Load Maximum * (dB) | 48 | 46.6 3% | 50.4 -5% | 50.5 -5% | 51 -6% | 40.1 16% | 50 -4% |
* ... Moindre est la valeur, meilleures sont les performances
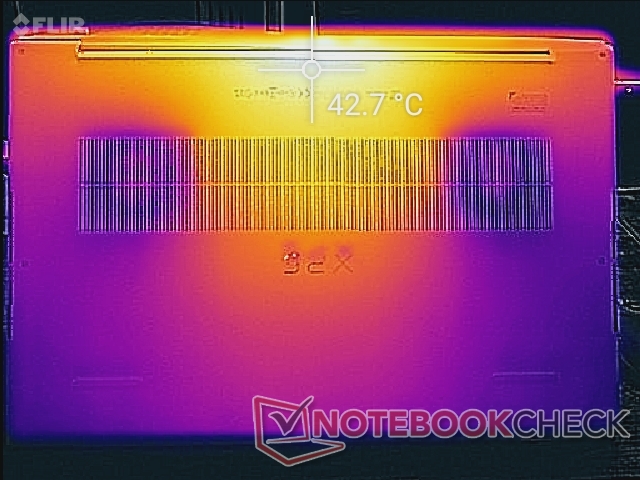
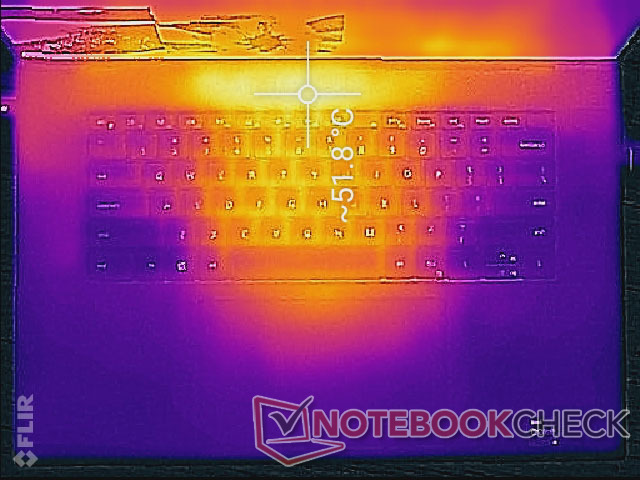
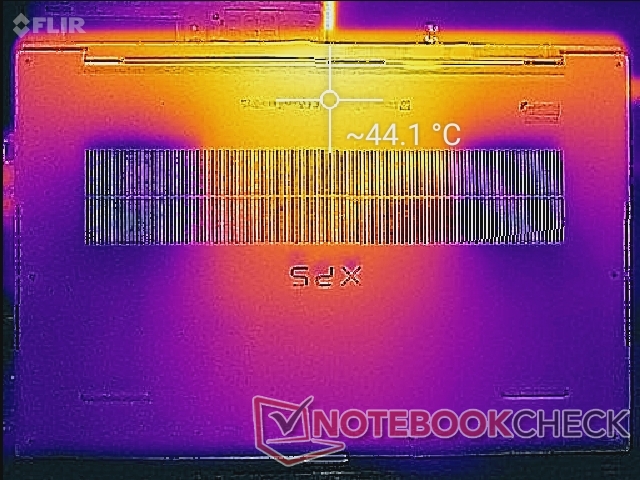
Température
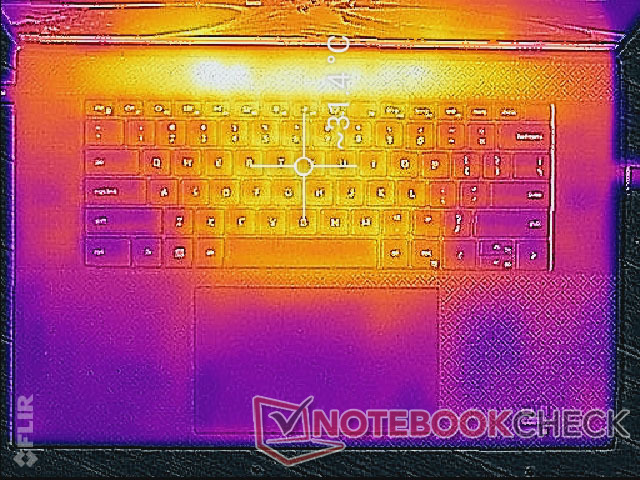
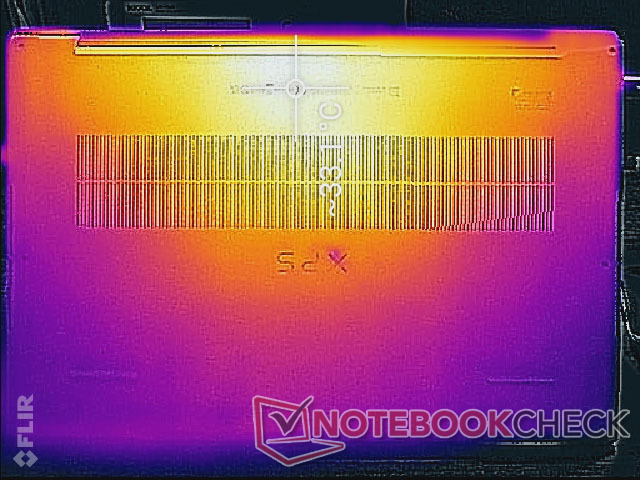
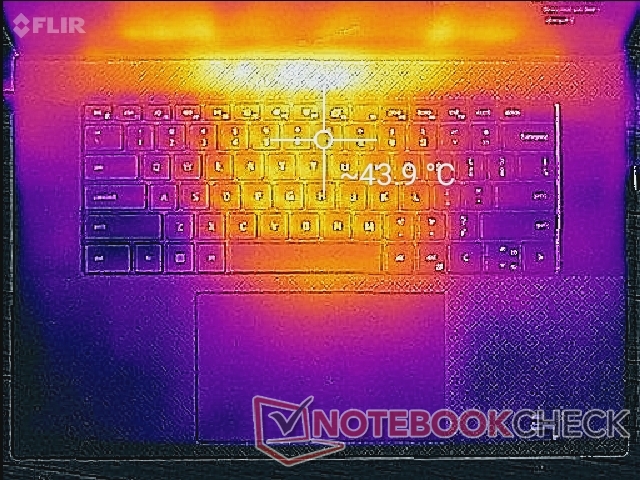
Les points chauds peuvent atteindre plus de 52 C et 44 C sur les côtés supérieur et inférieur, respectivement, lors de l'exécution de charges stressantes pendant de longues périodes. Ces zones se trouvent stratégiquement vers l'arrière du châssis et loin des repose-poignets et de la plupart des touches. La surface inférieure restera cependant très chaude, car la plaque inférieure est une seule pièce de métal.
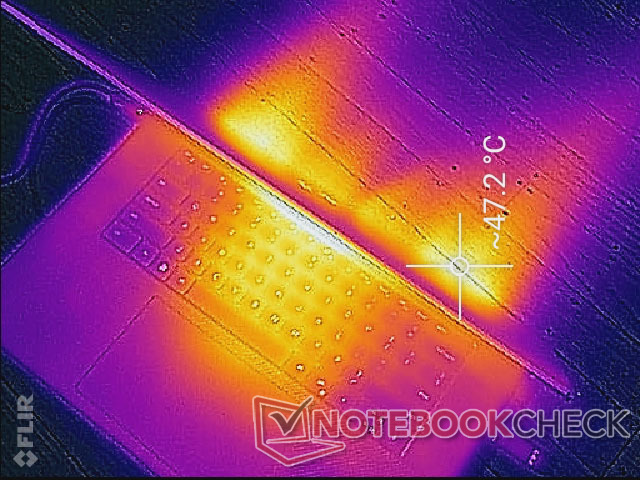
(-) La température maximale du côté supérieur est de 51.8 °C / 125 F, par rapport à la moyenne de 36.8 °C / 98 F, allant de 21 à 71 °C pour la classe Multimedia.
(±) Le fond chauffe jusqu'à un maximum de 44.2 °C / 112 F, contre une moyenne de 39.1 °C / 102 F
(+) En utilisation inactive, la température moyenne du côté supérieur est de 28.6 °C / 83 F, par rapport à la moyenne du dispositif de 31.3 °C / 88 F.
(±) En jouant à The Witcher 3, la température moyenne du côté supérieur est de 33.9 °C / 93 F, alors que la moyenne de l'appareil est de 31.3 °C / 88 F.
(+) Les repose-poignets et le pavé tactile atteignent la température maximale de la peau (33.2 °C / 91.8 F) et ne sont donc pas chauds.
(-) La température moyenne de la zone de l'appui-paume de dispositifs similaires était de 28.7 °C / 83.7 F (-4.5 °C / #-8.1 F).
| Dell XPS 17 9720 RTX 3060 Intel Core i7-12700H, NVIDIA GeForce RTX 3060 Laptop GPU | HP Envy 17-cg Intel Core i5-1135G7, NVIDIA GeForce MX450 | Dell XPS 17 9710 Core i7 RTX 3060 Intel Core i7-11800H, NVIDIA GeForce RTX 3060 Laptop GPU | Dell XPS 17 9700 Core i7 RTX 2060 Max-Q Intel Core i7-10875H, NVIDIA GeForce RTX 2060 Max-Q | Lenovo Legion 5 17ACH6H-82JY0003GE AMD Ryzen 5 5600H, NVIDIA GeForce RTX 3060 Laptop GPU | Asus VivoBook 17 F712JA-AU708W Intel Core i7-1065G7, Intel Iris Plus Graphics G7 (Ice Lake 64 EU) | Razer Blade 17 (i7-12800H, RTX 3070 Ti) Intel Core i7-12800H, NVIDIA GeForce RTX 3070 Ti Laptop GPU | |
|---|---|---|---|---|---|---|---|
| Heat | 14% | 1% | -1% | 2% | 12% | 6% | |
| Maximum Upper Side * (°C) | 51.8 | 45.9 11% | 50.2 3% | 53 -2% | 42.2 19% | 40.2 22% | 43 17% |
| Maximum Bottom * (°C) | 44.2 | 49.7 -12% | 38.4 13% | 39.2 11% | 50.9 -15% | 47.9 -8% | 44 -0% |
| Idle Upper Side * (°C) | 34.8 | 24.2 30% | 37.6 -8% | 37 -6% | 34.3 1% | 27.3 22% | 32 8% |
| Idle Bottom * (°C) | 33.2 | 24.8 25% | 34.2 -3% | 35.8 -8% | 32 4% | 28.9 13% | 34 -2% |
* ... Moindre est la valeur, meilleures sont les performances
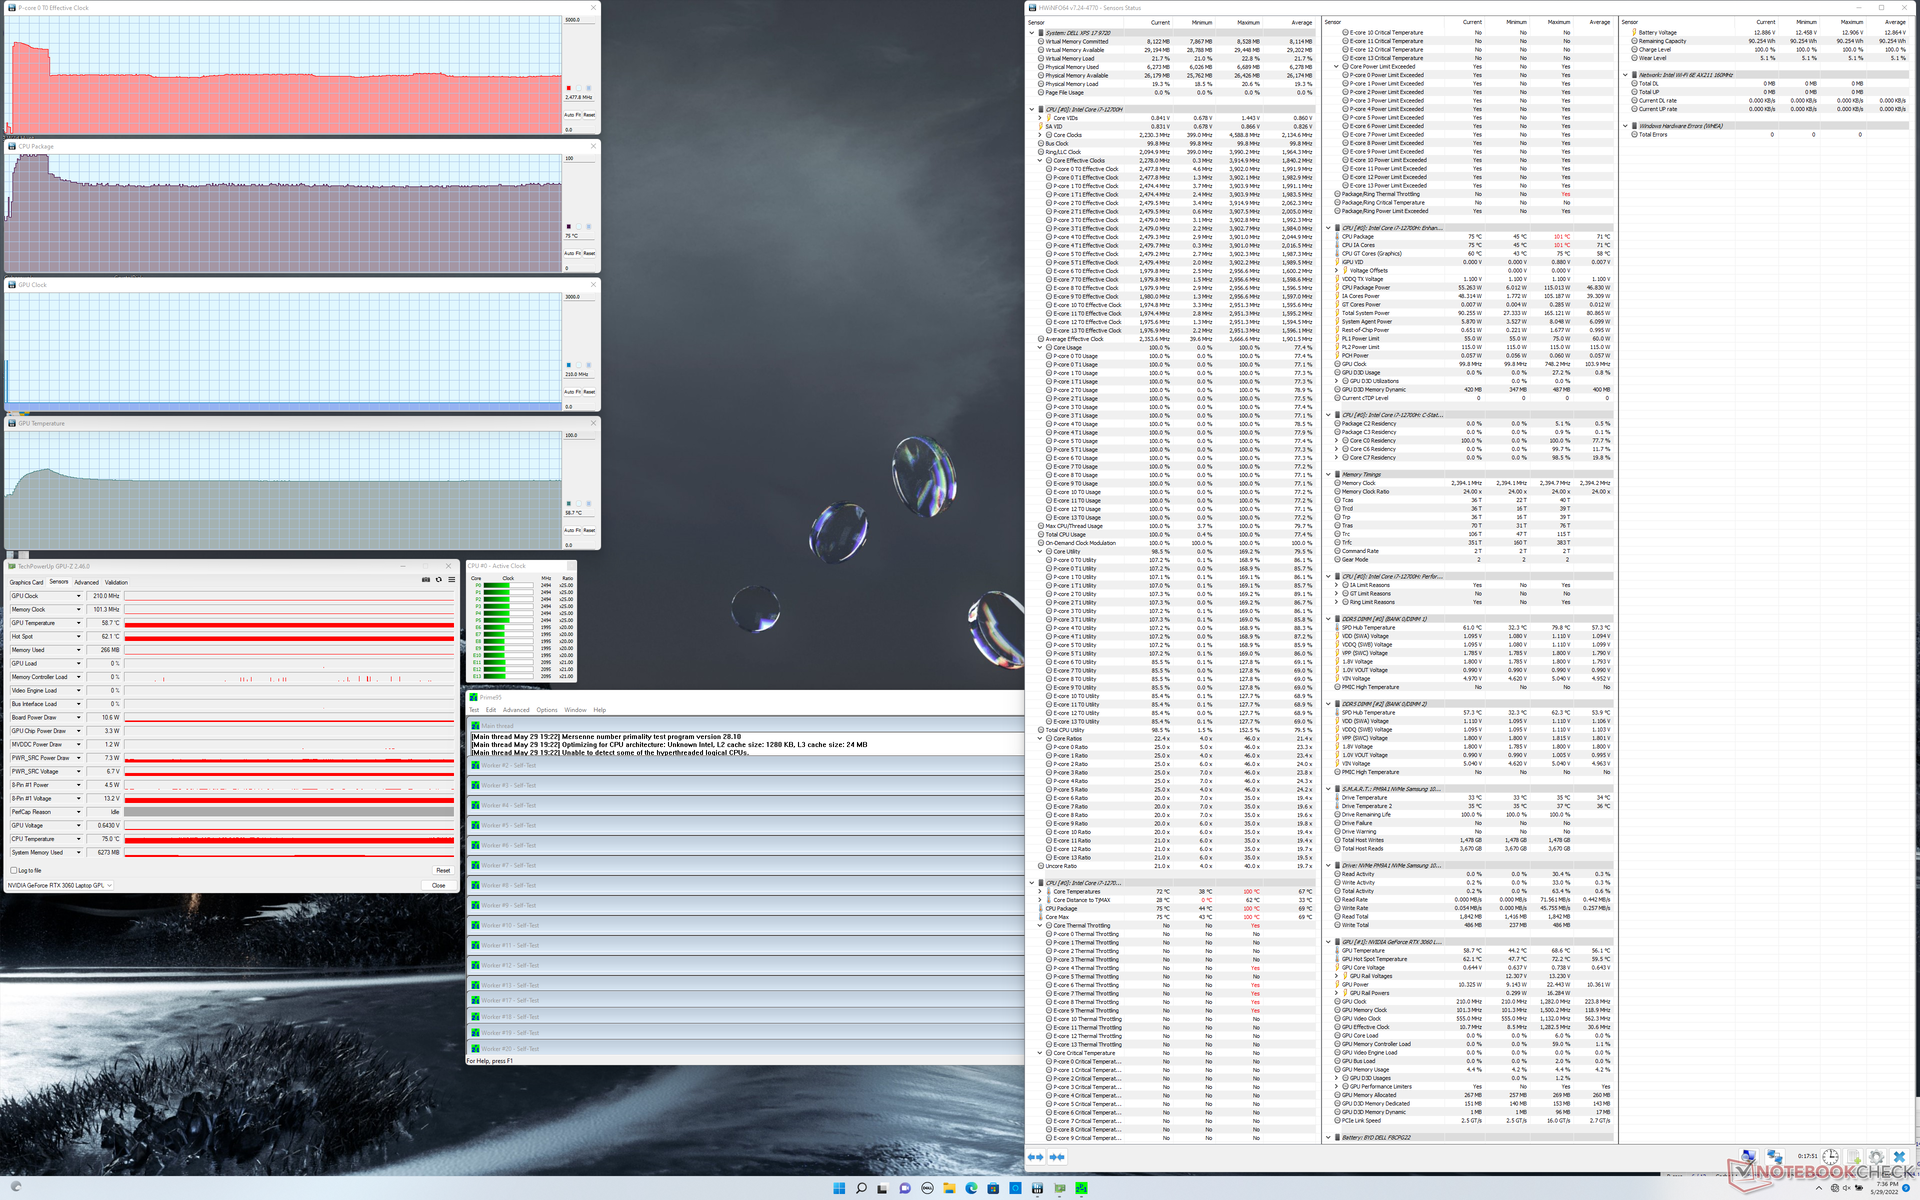
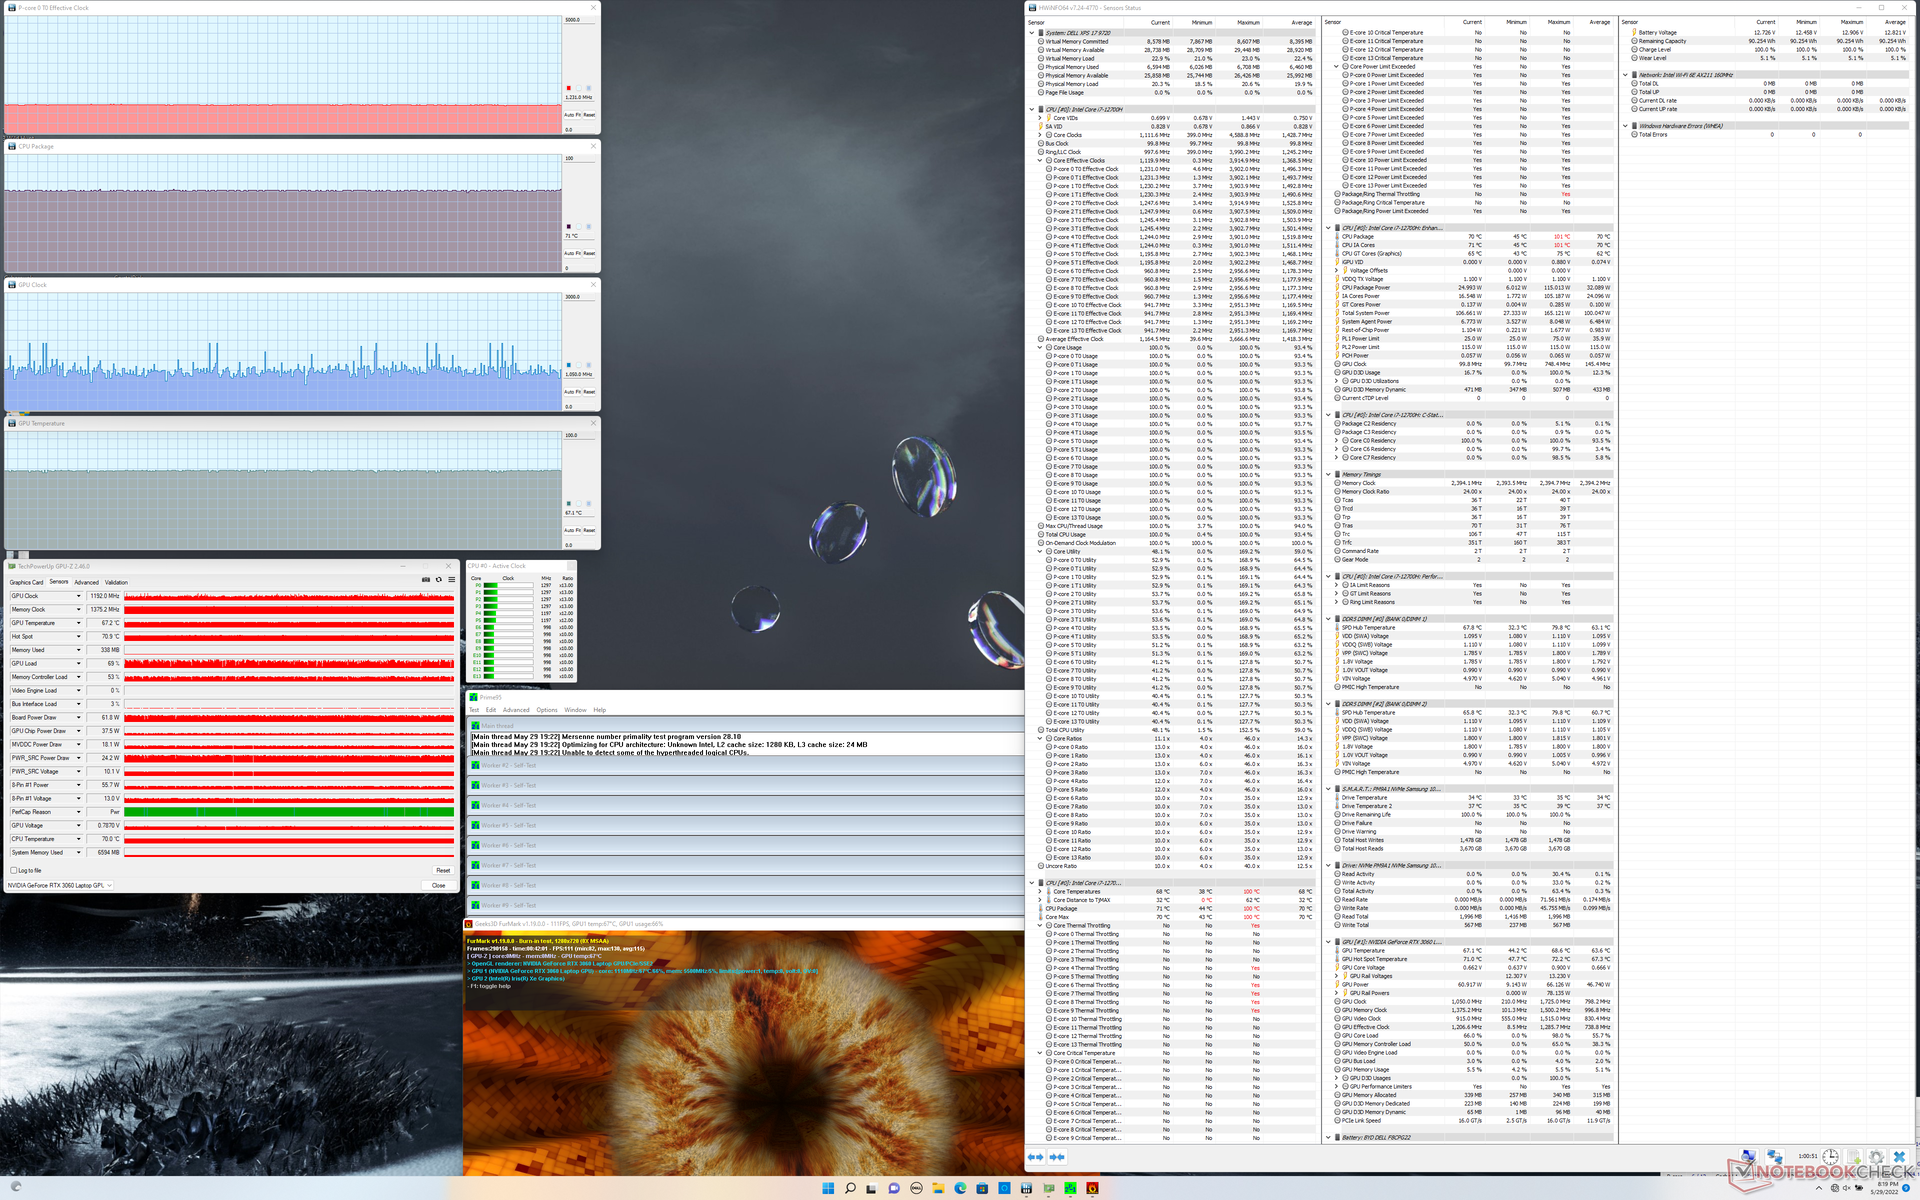
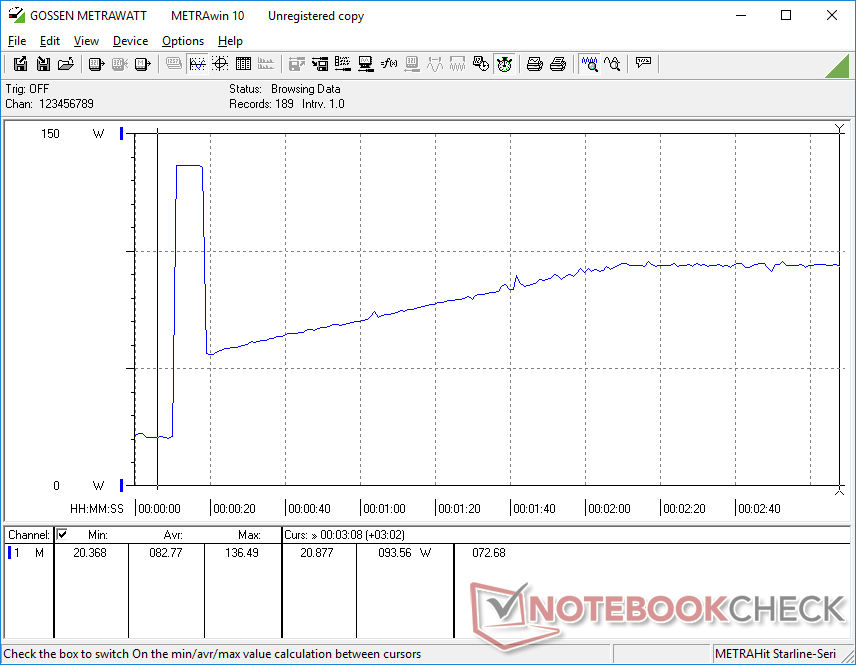
Test de stress
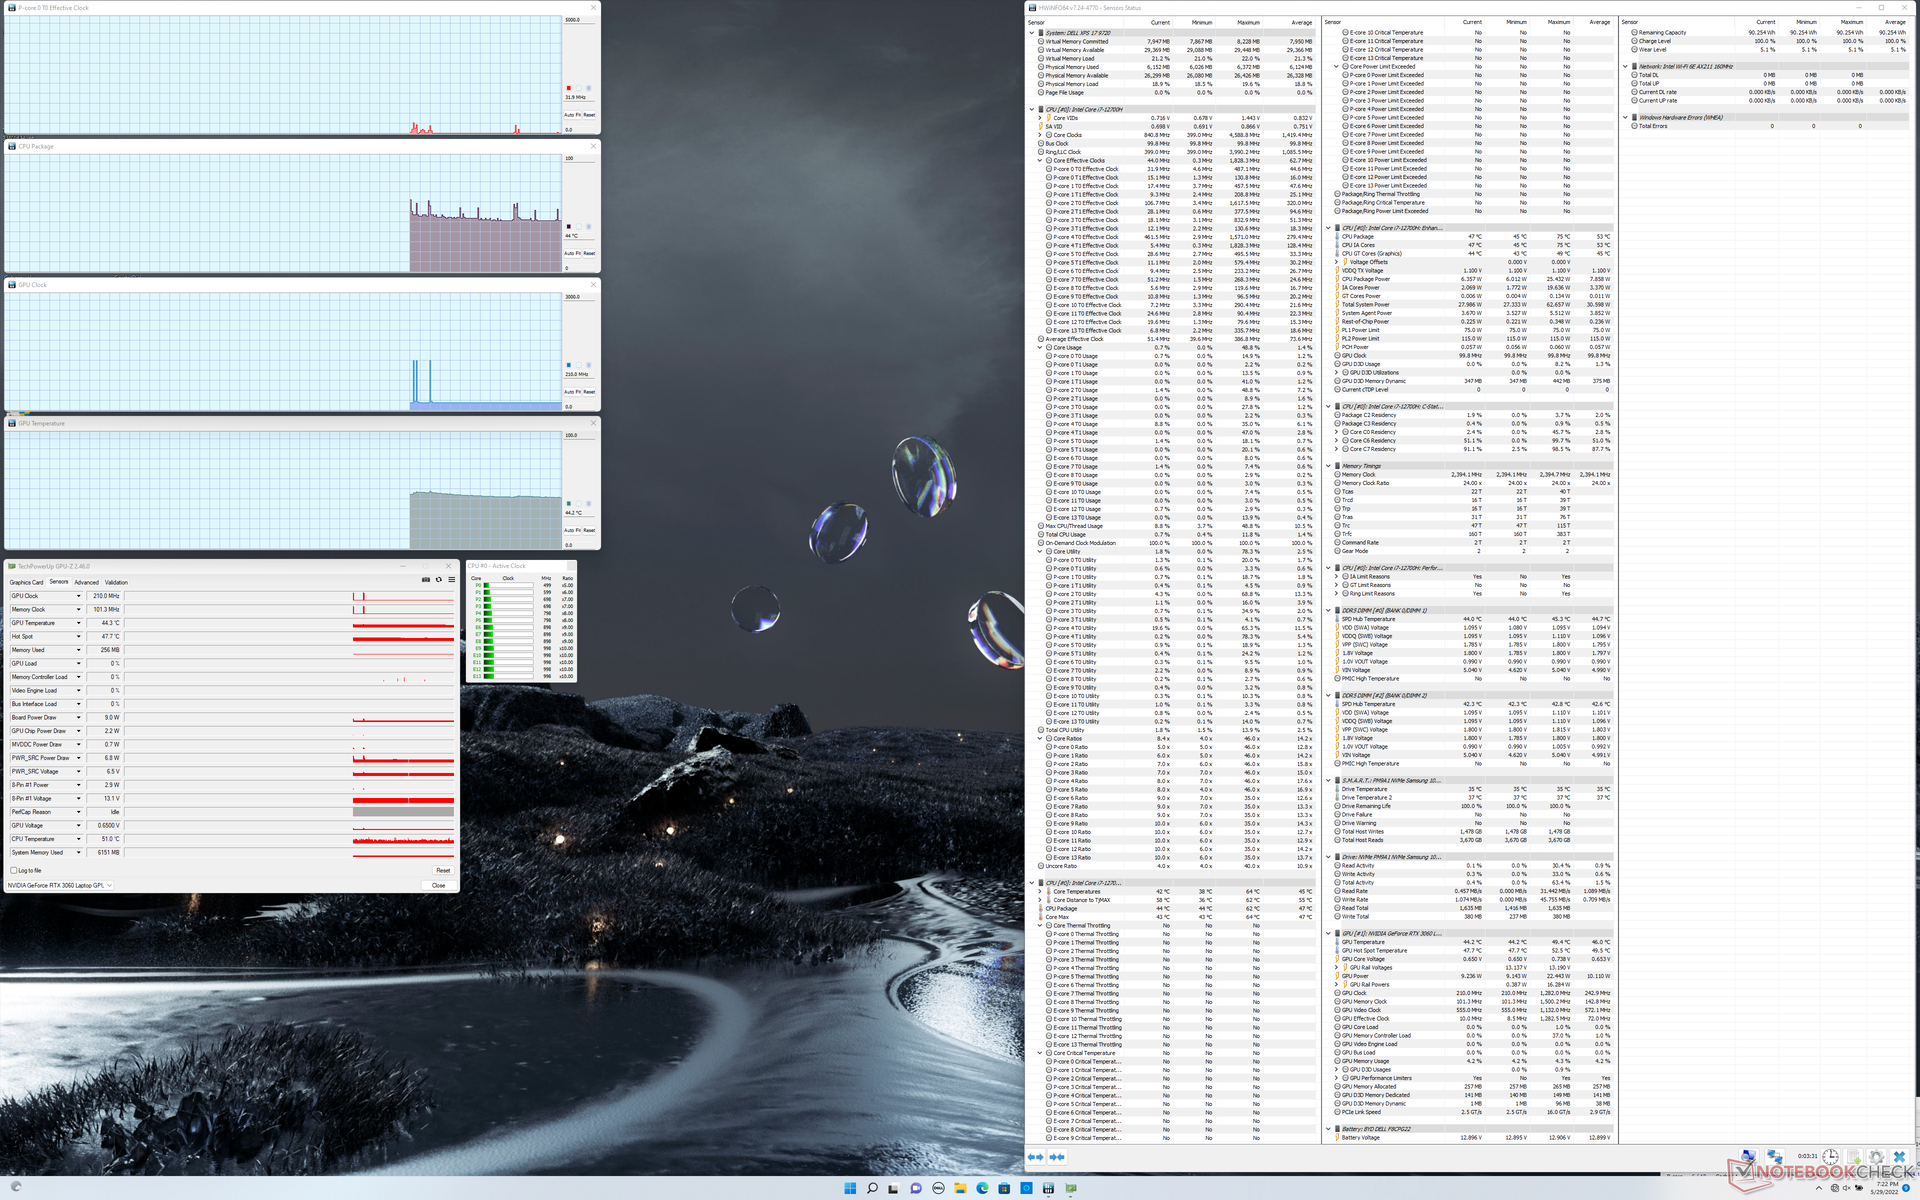
Lorsqu'il est sollicité sous Prime95, le processeur monte à 3,8 GHz, 100 C et 115 W pendant 10 à 15 secondes avant de redescendre et de se stabiliser à 2,5 GHz, 75 C et 55 W. Comparé au Core i7-11800H du XPS 17 9710, notre unité 9720 peut atteindre une consommation initiale plus élevée (115 W contre 87 W) tout en se stabilisant à une température centrale plus basse (75 C contre 82 C) et à une consommation identique (55 W). Ainsi, le système XPS n'est capable d'exploiter les plages de TDP ou les fréquences d'horloge plus élevées de la plateforme Alder Lake que pendant de courtes périodes avant que les limitations thermiques n'interviennent.
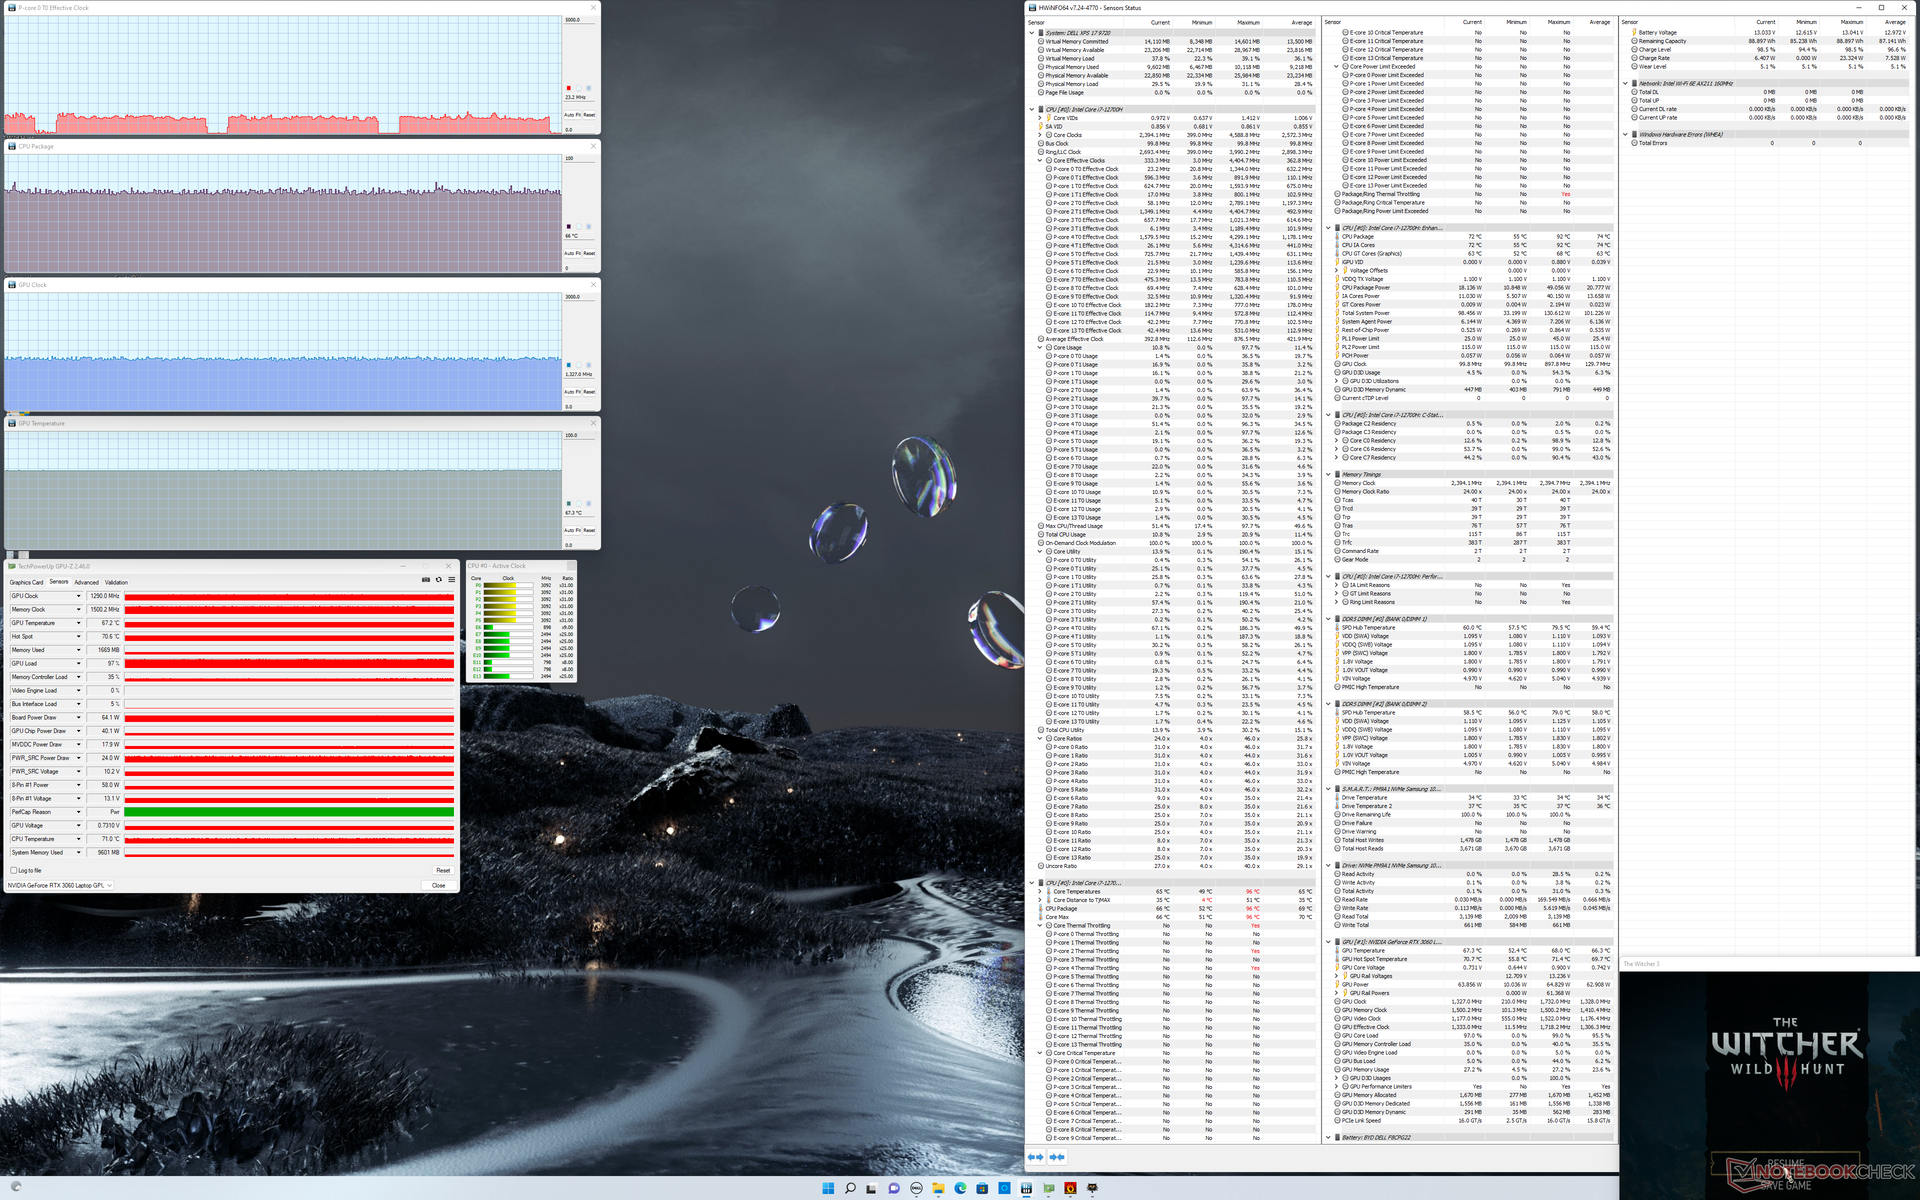
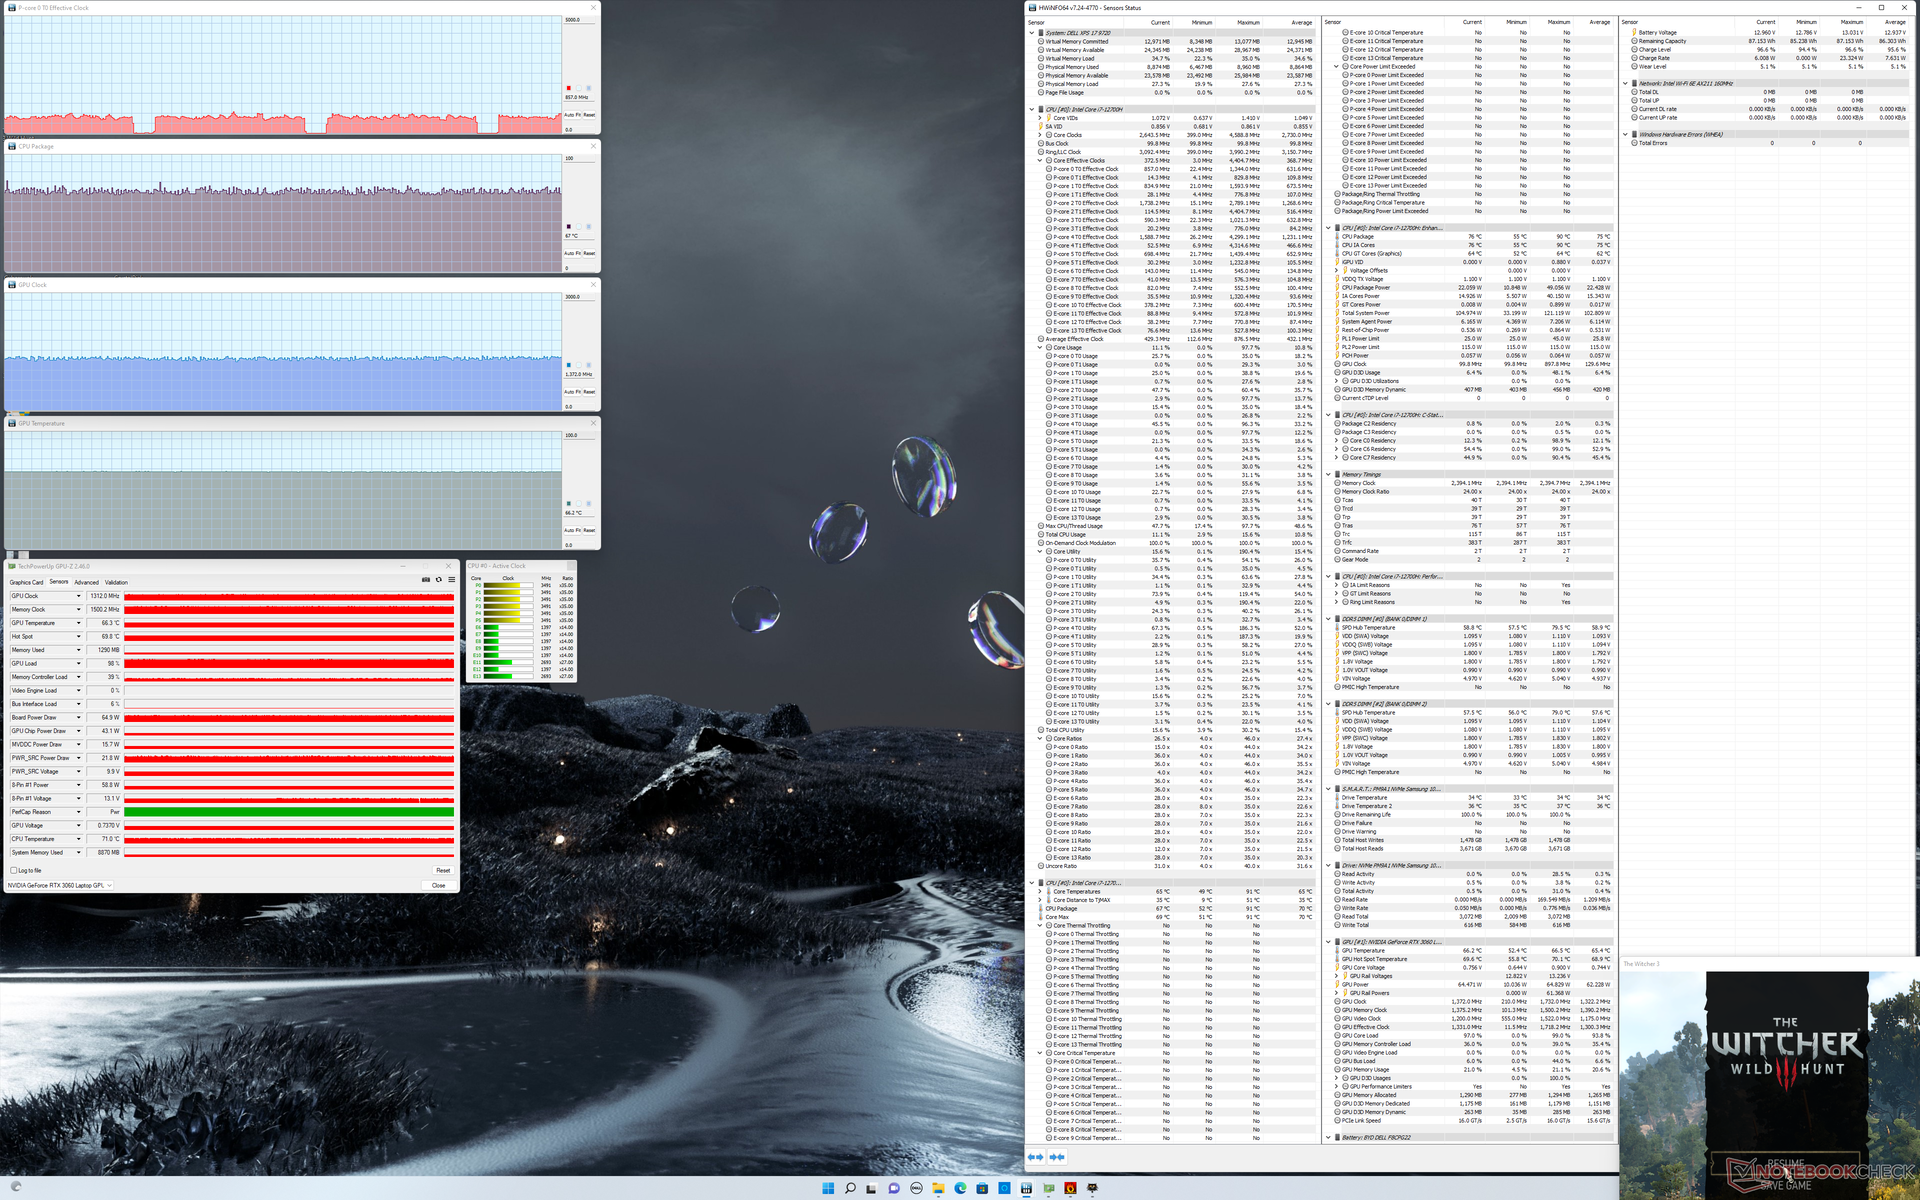
La fréquence d'horloge du GPU, la température et la consommation électrique de la carte en fonctionnement Witcher 3 se stabilisent à 1312 MHz, 66 C et 65 W, respectivement, contre 1530 MHz, 67 C et 69 W sur le XPS 17 9710. Le ralentissement général des performances graphiques d'une année sur l'autre reflète nos résultats 3DMark plus faibles enregistrés ci-dessus.
Le gain de performance du GPU en mode Ultra Performance par rapport au mode Optimisé semble être négligeable.
Le fonctionnement sur batterie limite les performances du CPU et du GPU. Un test Fire Strike sur batterie donnerait des scores de physique et de graphisme de 14770 et 24927 points, respectivement, contre 16354 et 23563 points sur secteur.
| Fréquence du CPU (GHz) | Fréquence du GPU (MHz) | Température moyenne du CPU (°C) | Température moyenne du GPU (°C) | |
| Système au repos | -- | -- | 44 | 44 |
| Prime95 Stress | 2.5 | -- | 75 | 59 |
| Prime95 + FurMark Stress | ||||
| Witcher 3 Stress (mode optimisé) | ~0.7 | 1290 | 66 | 67 |
| Witcher 3 Stress (mode Ultra Performance) | ~0.8 | 1312 | 67 | 66 |
Haut-parleurs
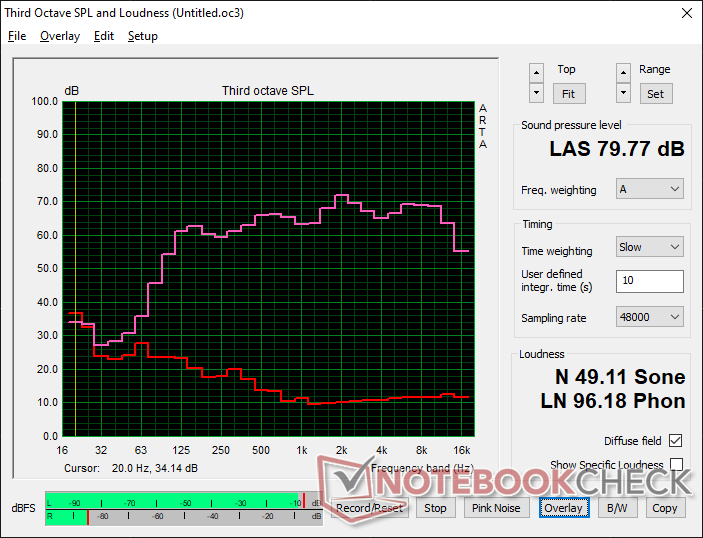
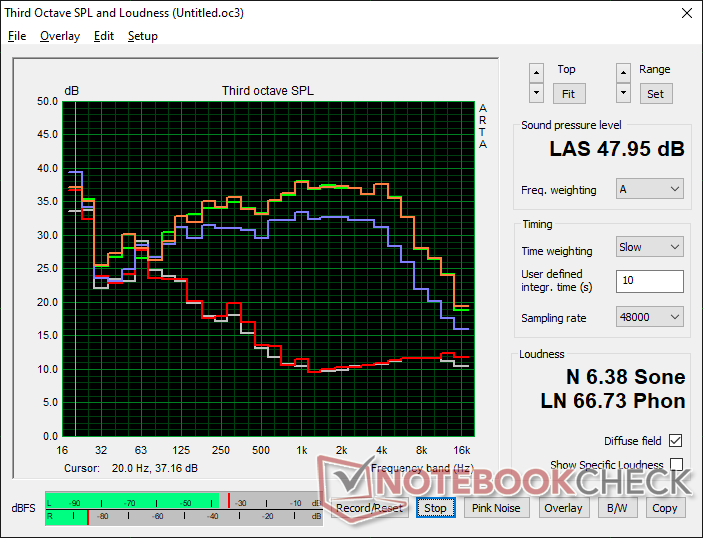
Dell XPS 17 9720 RTX 3060 analyse audio
(±) | le niveau sonore du haut-parleur est moyen mais bon (79.8# dB)
Basses 100 - 315 Hz
(±) | basse réduite - en moyenne 5.2% inférieure à la médiane
(±) | la linéarité des basses est moyenne (7% delta à la fréquence précédente)
Médiums 400 - 2000 Hz
(+) | médiane équilibrée - seulement 2.2% de la médiane
(+) | les médiums sont linéaires (3.8% delta à la fréquence précédente)
Aiguës 2 - 16 kHz
(+) | des sommets équilibrés - à seulement 2.8% de la médiane
(+) | les aigus sont linéaires (3.1% delta à la fréquence précédente)
Globalement 100 - 16 000 Hz
(+) | le son global est linéaire (8.3% différence à la médiane)
Par rapport à la même classe
» 9% de tous les appareils testés de cette catégorie étaient meilleurs, 2% similaires, 89% pires
» Le meilleur avait un delta de 5%, la moyenne était de 17%, le pire était de 45%.
Par rapport à tous les appareils testés
» 2% de tous les appareils testés étaient meilleurs, 1% similaires, 97% pires
» Le meilleur avait un delta de 4%, la moyenne était de 23%, le pire était de 134%.
Apple MacBook Pro 16 2021 M1 Pro analyse audio
(+) | les haut-parleurs peuvent jouer relativement fort (84.7# dB)
Basses 100 - 315 Hz
(+) | bonne basse - seulement 3.8% loin de la médiane
(+) | les basses sont linéaires (5.2% delta à la fréquence précédente)
Médiums 400 - 2000 Hz
(+) | médiane équilibrée - seulement 1.3% de la médiane
(+) | les médiums sont linéaires (2.1% delta à la fréquence précédente)
Aiguës 2 - 16 kHz
(+) | des sommets équilibrés - à seulement 1.9% de la médiane
(+) | les aigus sont linéaires (2.7% delta à la fréquence précédente)
Globalement 100 - 16 000 Hz
(+) | le son global est linéaire (4.6% différence à la médiane)
Par rapport à la même classe
» 0% de tous les appareils testés de cette catégorie étaient meilleurs, 0% similaires, 100% pires
» Le meilleur avait un delta de 5%, la moyenne était de 17%, le pire était de 45%.
Par rapport à tous les appareils testés
» 0% de tous les appareils testés étaient meilleurs, 0% similaires, 100% pires
» Le meilleur avait un delta de 4%, la moyenne était de 23%, le pire était de 134%.
Gestion de l'énergie - Consommation d'énergie plus élevée du Turbo Boost
Consommation d'énergie
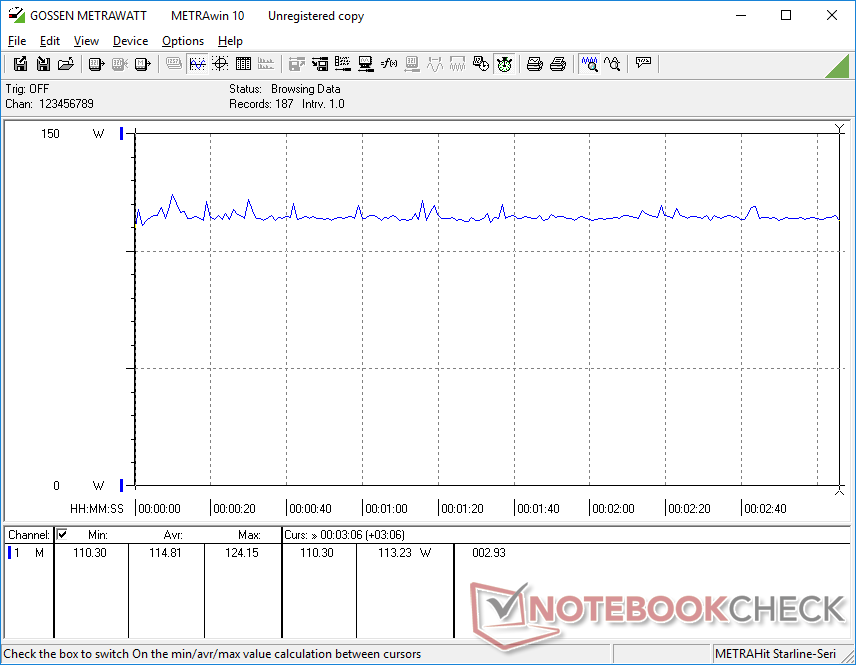
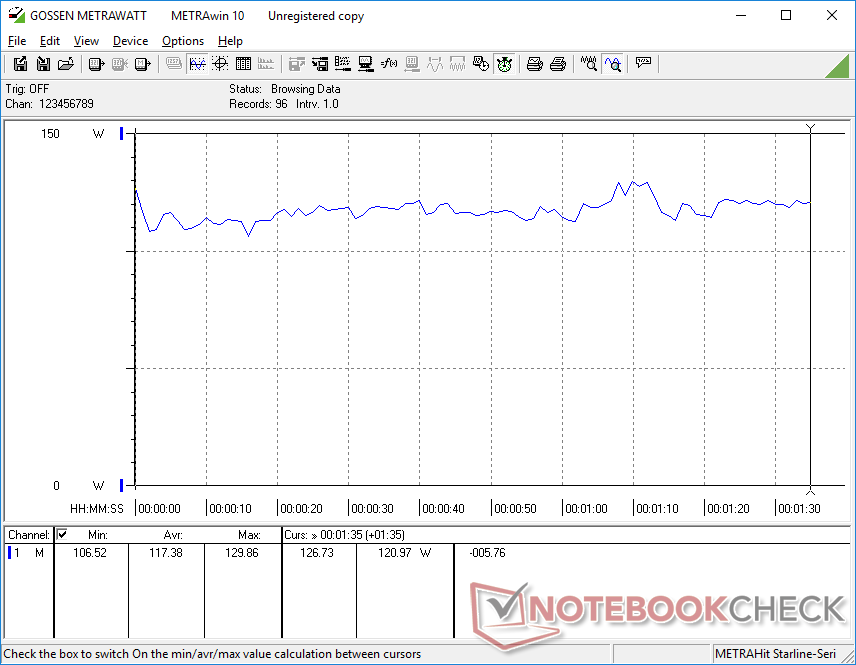
Le XPS 17 9700 a présenté des problèmes de charge le système était incapable de tirer plus de 100 W de l'adaptateur secteur de 130 W. Heureusement, Dell a résolu ce problème sur le XPS 17 9710 qui lui a succédé et le 9720 n'est pas différent. En fonctionnement Witcher 3notre unité 9720 consomme 115 W, ce qui est presque identique à ce que nous avons enregistré sur l'ancien 9710. Les séries XPS 15 et XPS 17 continuent d'être les seuls modèles du marché à être livrés avec un adaptateur USB-C de 130 watts.
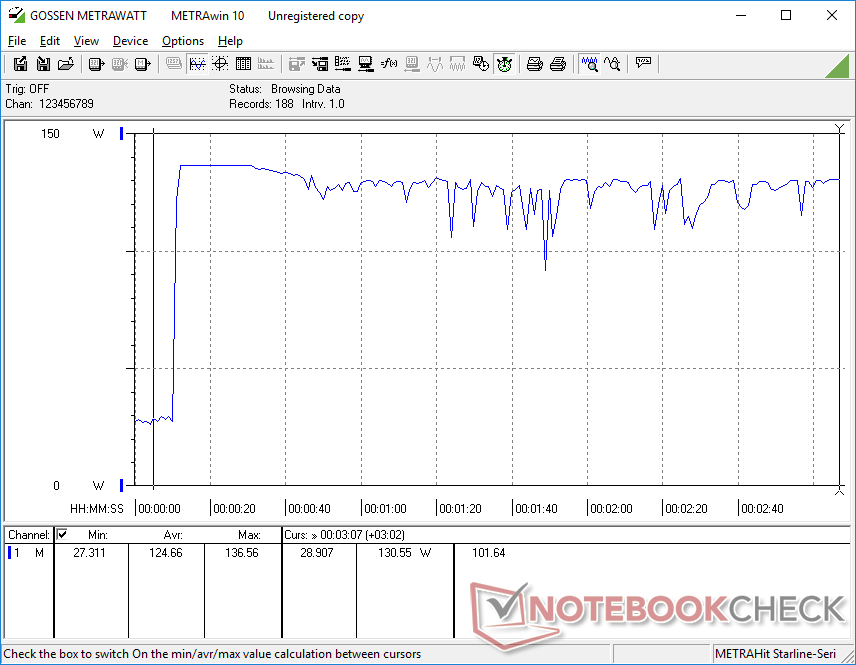
Notamment, la consommation d'énergie lors de l'exécution de Prime95 est légèrement plus élevée que sur le 9710 au début du test avant de se stabiliser autour de 94 W chacun. La consommation électrique plus élevée du CPU de 12e génération est donc de courte durée avant de devenir similaire à celle du modèle 9710 doté de processeurs de 11e génération
La charge est ralentie de manière significative lors des jeux ou de l'exécution de charges élevées. Lorsque l'appareil fonctionne Witcher 3 à 13 % de la capacité de la batterie et sur le courant alternatif, par exemple, la batterie n'augmente que de 12 % supplémentaires au cours d'une heure.
| Éteint/en veille | |
| Au repos | |
| Fortement sollicité |
|
Légende:
min: | |
| Dell XPS 17 9720 RTX 3060 i7-12700H, GeForce RTX 3060 Laptop GPU, Samsung PM9A1 MZVL21T0HCLR, IPS, 3840x2400, 17" | HP Envy 17-cg i5-1135G7, GeForce MX450, Samsung PM991 MZVLQ1T0HALB, IPS, 1920x1080, 17.3" | Dell XPS 17 9710 Core i7 RTX 3060 i7-11800H, GeForce RTX 3060 Laptop GPU, Micron 2300 1TB MTFDHBA1T0TDV, IPS, 3840x2400, 17" | Dell XPS 17 9700 Core i7 RTX 2060 Max-Q i7-10875H, GeForce RTX 2060 Max-Q, Micron 2200S 1TB MTFDHBA1T0TCK, IPS, 3840x2400, 17" | Lenovo Legion 5 17ACH6H-82JY0003GE R5 5600H, GeForce RTX 3060 Laptop GPU, Samsung PM991a MZALQ512HBLU, IPS, 1920x1080, 17.3" | Asus VivoBook 17 F712JA-AU708W i7-1065G7, Iris Plus Graphics G7 (Ice Lake 64 EU), Kingston OM8PCP3512F-AB, IPS, 1920x1080, 17.3" | Razer Blade 17 (i7-12800H, RTX 3070 Ti) i7-12800H, GeForce RTX 3070 Ti Laptop GPU, Samsung PM9A1 MZVL21T0HCLR, IPS, 2560x1440, 17.3" | |
|---|---|---|---|---|---|---|---|
| Power Consumption | 46% | 3% | 7% | -40% | 61% | -54% | |
| Idle Minimum * (Watt) | 5.9 | 3.8 36% | 7.5 -27% | 5.8 2% | 15.6 -164% | 4.2 29% | 14.4 -144% |
| Idle Average * (Watt) | 15.8 | 9.4 41% | 15.7 1% | 20.6 -30% | 20.7 -31% | 7.9 50% | 20 -27% |
| Idle Maximum * (Watt) | 26.7 | 10.1 62% | 23.1 13% | 21 21% | 22.9 14% | 8.8 67% | 21.5 19% |
| Load Average * (Watt) | 117.4 | 64.4 45% | 87.2 26% | 104.7 11% | 134 -14% | 29.7 75% | 119 -1% |
| Witcher 3 ultra * (Watt) | 114.8 | 64.4 44% | 116 -1% | 99.2 14% | 135 -18% | 28.8 75% | 218 -90% |
| Load Maximum * (Watt) | 136.6 | 68 50% | 131.6 4% | 107.6 21% | 170 -24% | 44 68% | 248 -82% |
* ... Moindre est la valeur, meilleures sont les performances
Power Consumption Witcher 3 / Stresstest
Power Consumption external Monitor
Autonomie de la batterie
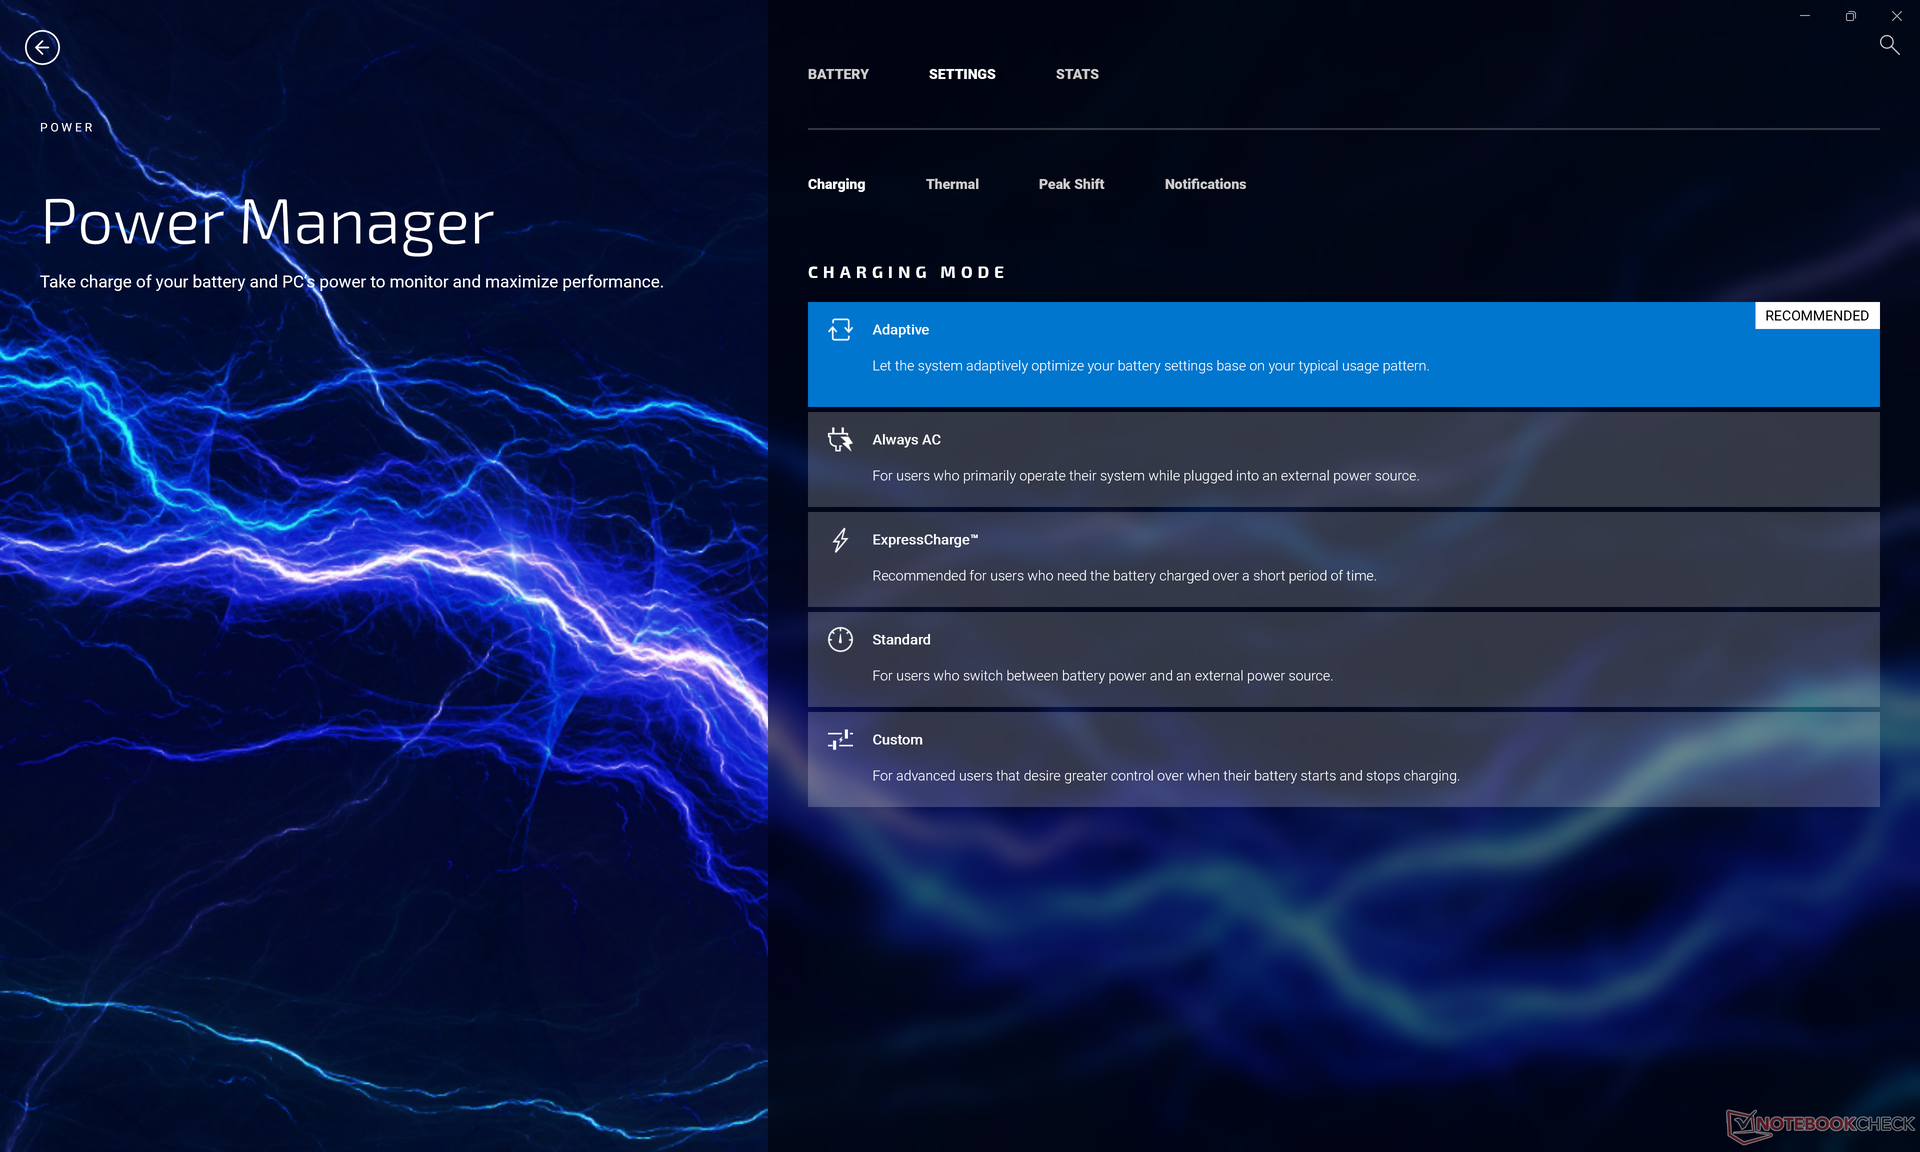
Les durées d'exécution n'ont pas changé de manière significative par rapport aux modèles 9710 ou 9700 de la génération précédente. Attendez-vous à un peu moins de 9 heures d'utilisation réelle du WLAN lorsque vous utilisez le profil d'alimentation équilibré ou optimisé avec le GPU intégré actif. Le chargement de la batterie vide à la pleine capacité prend un peu plus de 2 heures, en supposant que vous n'exécutez pas d'applications exigeantes comme indiqué ci-dessus.
| Dell XPS 17 9720 RTX 3060 i7-12700H, GeForce RTX 3060 Laptop GPU, 97 Wh | HP Envy 17-cg i5-1135G7, GeForce MX450, 55.67 Wh | Dell XPS 17 9710 Core i7 RTX 3060 i7-11800H, GeForce RTX 3060 Laptop GPU, 97 Wh | Dell XPS 17 9700 Core i7 RTX 2060 Max-Q i7-10875H, GeForce RTX 2060 Max-Q, 97 Wh | Lenovo Legion 5 17ACH6H-82JY0003GE R5 5600H, GeForce RTX 3060 Laptop GPU, 80 Wh | Asus VivoBook 17 F712JA-AU708W i7-1065G7, Iris Plus Graphics G7 (Ice Lake 64 EU), 32 Wh | Razer Blade 17 (i7-12800H, RTX 3070 Ti) i7-12800H, GeForce RTX 3070 Ti Laptop GPU, 82 Wh | |
|---|---|---|---|---|---|---|---|
| Autonomie de la batterie | 46% | 74% | 56% | 21% | 11% | 24% | |
| WiFi v1.3 (h) | 8.7 | 7.9 -9% | 7.6 -13% | 9.7 11% | 4.4 -49% | 4.4 -49% | 5.9 -32% |
| Load (h) | 1 | 2 100% | 2.6 160% | 2 100% | 1.9 90% | 1.7 70% | 1.8 80% |
| Reader / Idle (h) | 17.7 | 17.7 | 23.8 | 5.5 | |||
| H.264 (h) | 3.5 | 4.9 |
Points positifs
Points négatifs
Verdict - Tout sur cette unité centrale
Il n'y a pas grand-chose à redire sur le processeur mis à jour. S'il est vrai que la plateforme Alder Lake peut être très gourmande en énergie, les gains de performances sont au moins respectables. Les utilisateurs de puissance qui savent qu'ils peuvent exploiter les performances supplémentaires apprécieront certainement le compromis à cet égard.
Le Dell XPS 17 9720 introduit un tout nouveau processeur avec des gains de performances significatifs par rapport aux anciennes options de 10e et 11e génération. En dehors du processeur, cependant, les mêmes inconvénients que ceux des XPS 17 9710 ou 9700 demeurent.
Malheureusement, il y a quelques inconvénients mineurs qui n'ont pas encore été corrigés après deux ans de conception. La qualité vidéo de la webcam reste médiocre, la charge est nettement plus lente lors de l'exécution de charges exigeantes, le couvercle est difficile à ouvrir avec sa mauvaise prise en main, et il n'y a toujours pas d'obturateur de confidentialité de la webcam ou de support Wi-Fi 6E. Le fait que le GPU a pris un coup apparemment de nulle part peut être une pilule difficile à avaler pour les amateurs de XPS. Les plus grands avantages du XPS 17 9720 par rapport aux alternatives avec plus de fonctionnalités comme le Gigabyte Aero 17 continuent d'être son châssis plus compact et son rapport d'aspect 16:10.
Prix et disponibilité
Amazon n'a qu'une seule UGS XPS 17 9720 disponible pour le moment au prix de 2250 USD avec le Core i7-12700H, GeForce RTX 3050, et un écran 1200p. Pour plus d'options, les utilisateurs peuvent commander directement auprès de Dell plutôt.
Dell XPS 17 9720 RTX 3060
- 05/31/2022 v7 (old)
Allen Ngo
Price comparison

