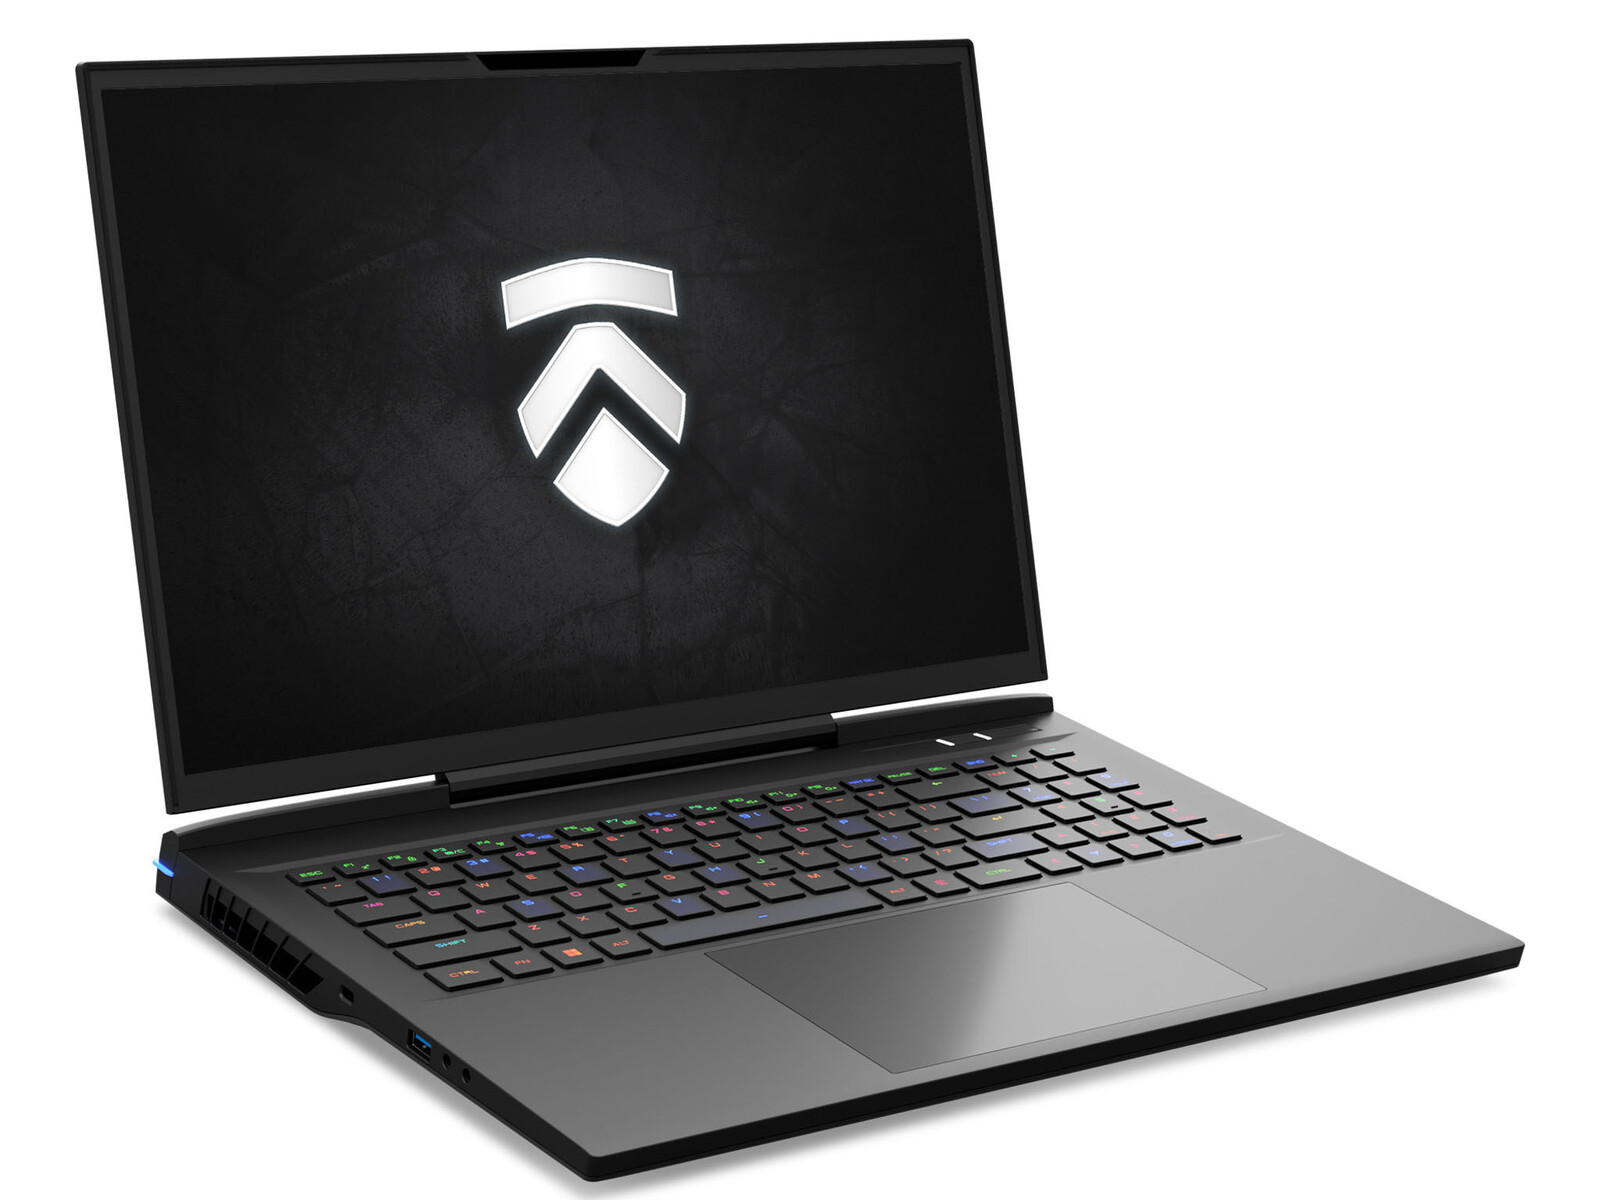
Test de l'Eluktronics Mech-17 GP2 : un MSI GT77 Titan avec les performances sans la taille
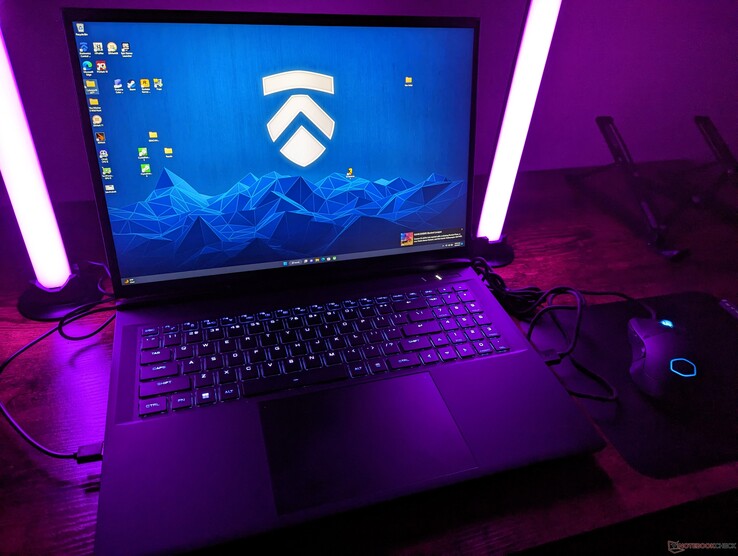
Le Mech-17 GP2 d'Eluktronics remplace le Mech-17 GP de l'année dernière en remplaçant les options Intel 12e génération et Nvidia Ampere par Intel 13e génération et Nvidia Ada Lovelace, respectivement. GeForce Le Mech-17 GP2 se distingue par ses processeurs Core HX et sa carte graphique RTX 4090 de 175 W, malgré son faible encombrement par rapport à d'autres ordinateurs portables de jeu de 17 pouces.
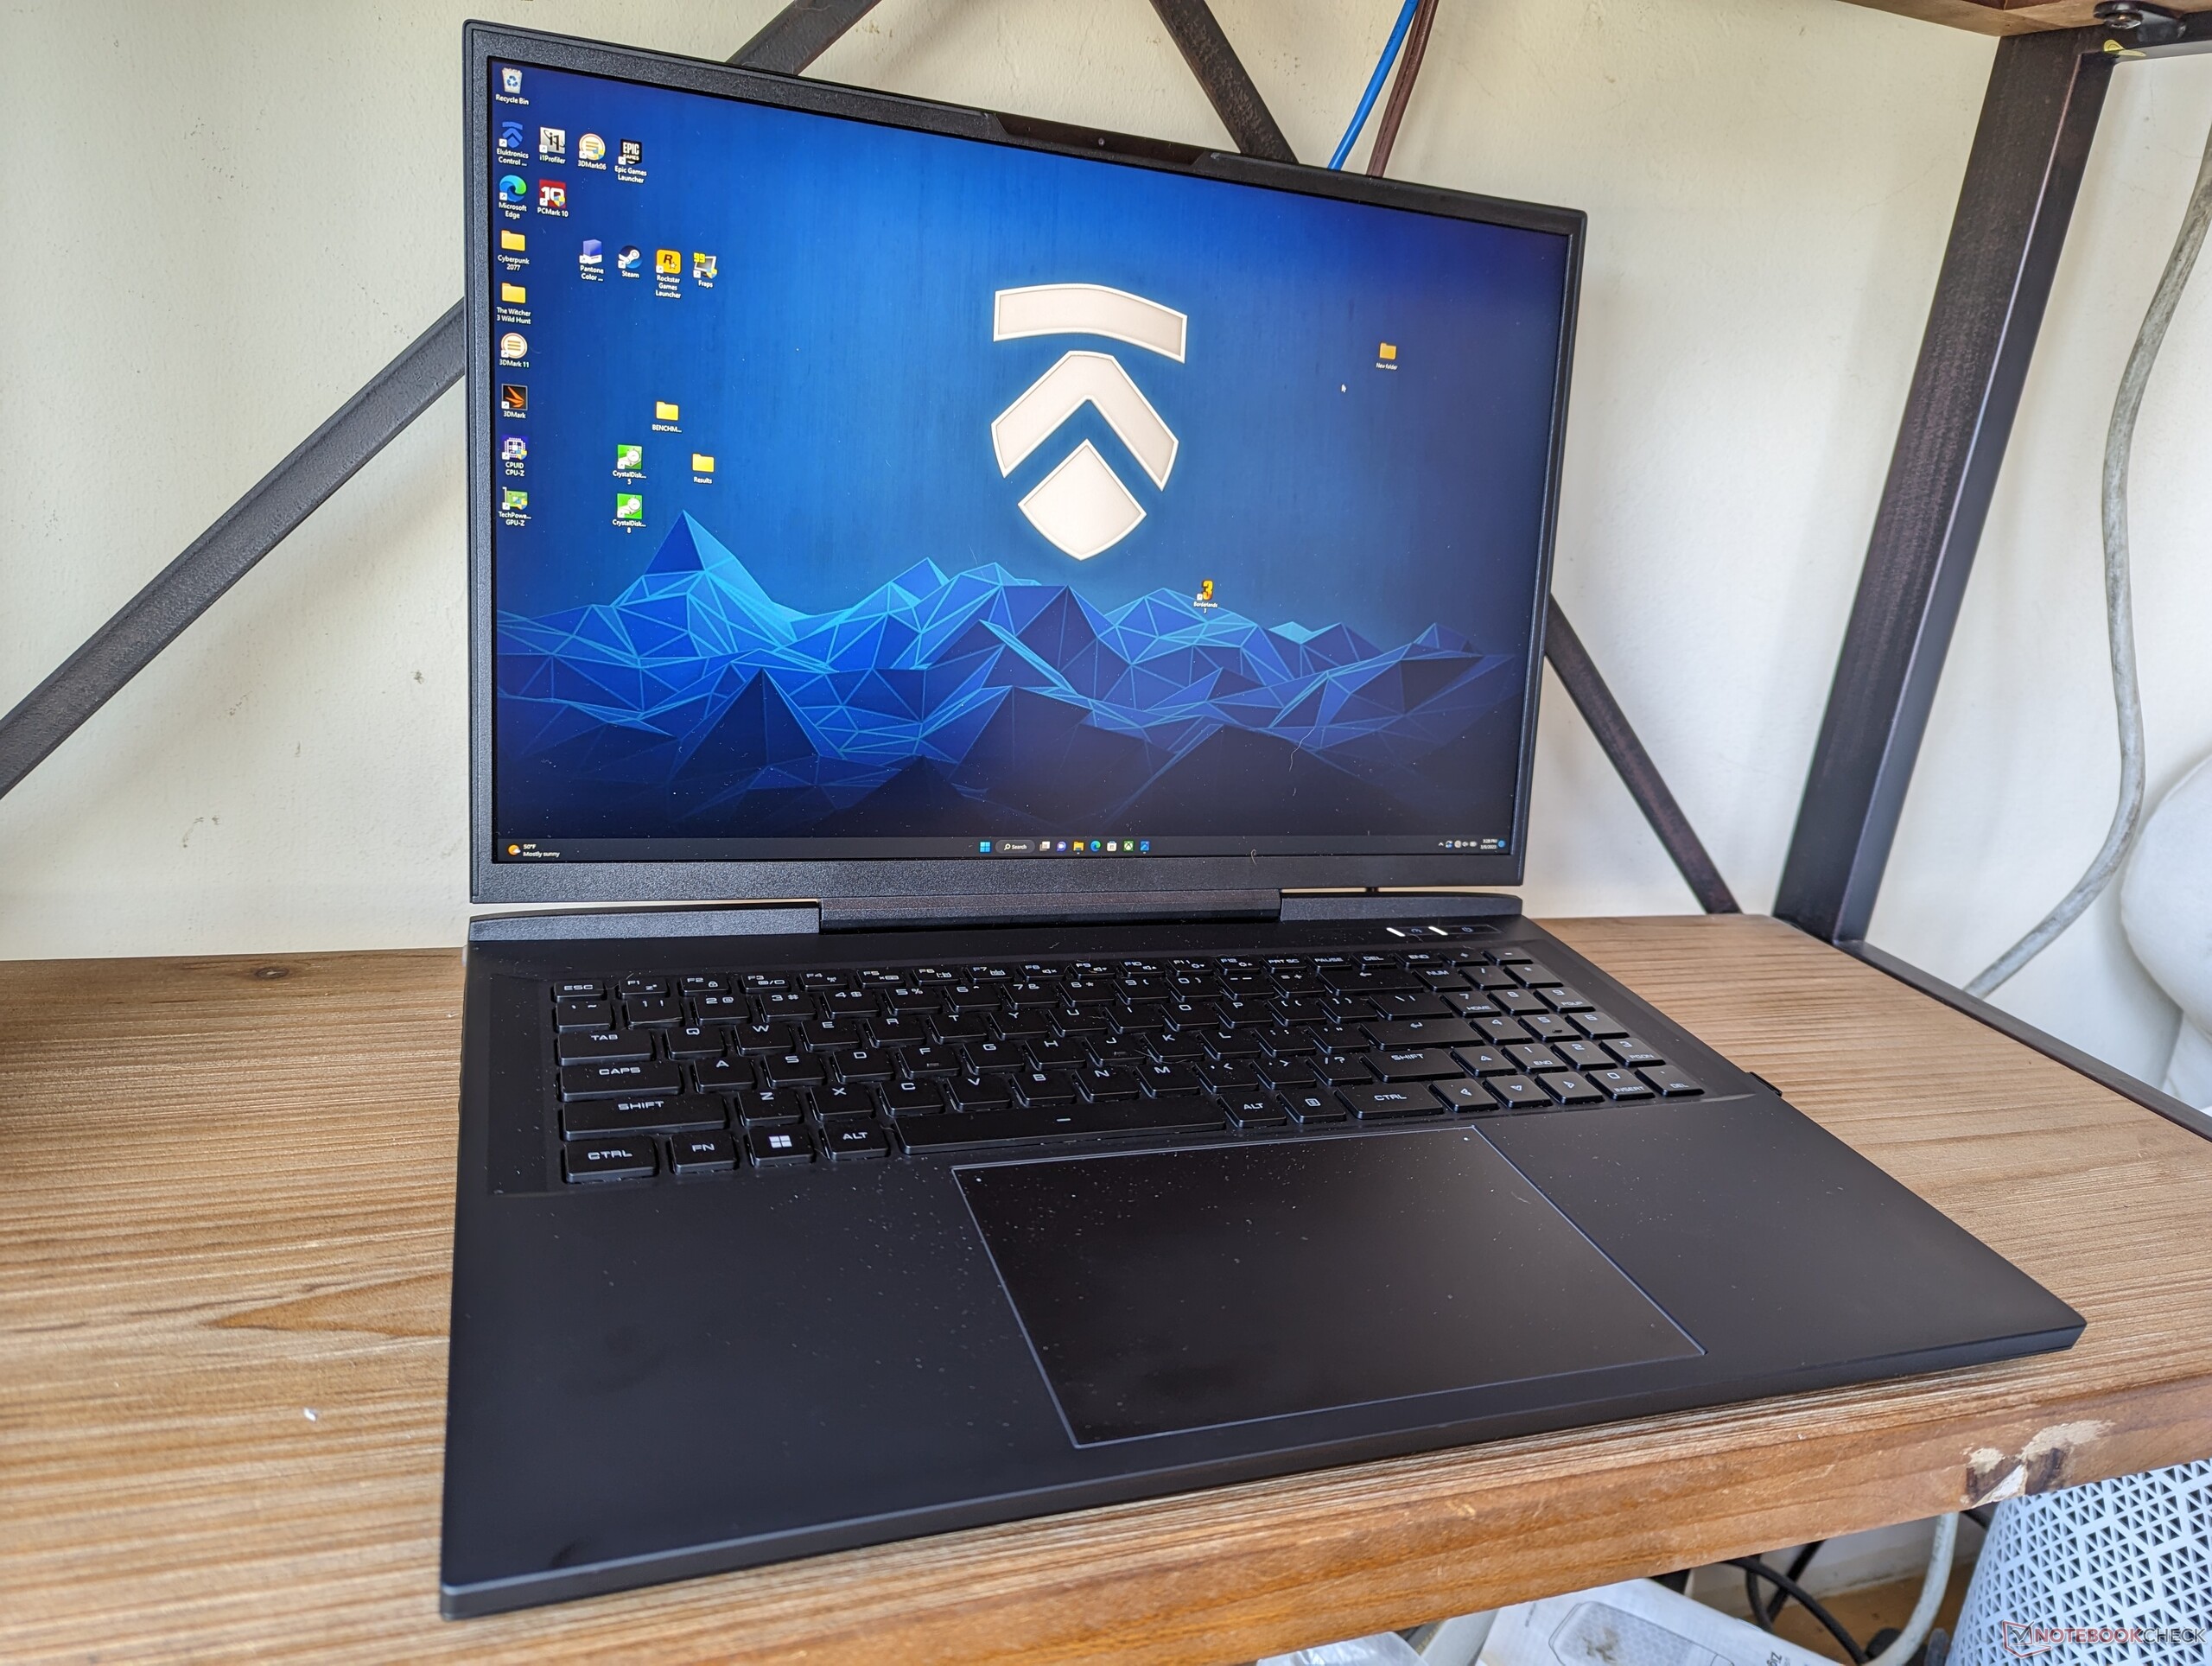
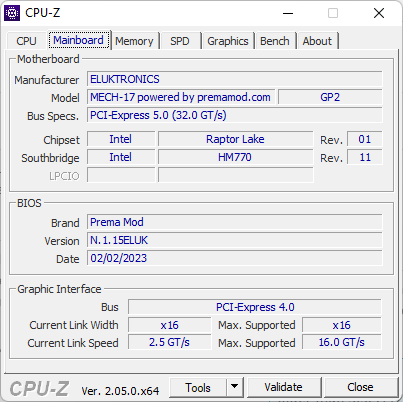
Le Mech-17 GP2 est basé sur une version mise à jour du Schenker Neo 17 M22 conçu par Uniwill l'année dernière. Il s'agit essentiellement du Neo 17 E23, mais sous la marque Eluktronics. Plusieurs changements importants ont été apportés à la carte mère cette année, que nous détaillerons dans nos analyses ci-dessous. Pour le reste, les designs extérieurs restent identiques et nous vous recommandons de consulter notre article sur le Schenker Neo 17 M22 pour en savoir plus sur les caractéristiques physiques du Mech-17 GP2.
Notre configuration a été entièrement configurée avec le Core i9-13900HX et la RTX 4090 pour environ 3400 USD. Des SKUs inférieurs sont disponibles jusqu'à la RTX 4070, mais toutes les options sont équipées du même CPU et d'un écran IPS 240 Hz 2560 x 1600.
Les alternatives au Mech-17 GP2 comprennent d'autres ordinateurs portables de jeu haut de gamme de 17 pouces comme le Razer Blade 17, Alienware m17 R5, Asus Zephyrus S17, ou le Test du MSI Titan GT77 HX 13V : le PC portable de jeu ultime avec RTX 4090 et Core i9-13950HX
MSI
Plus de commentaires sur Eluktronics :
Comparaison avec les concurrents potentiels
Note | Date | Modèle | Poids | Épaisseur | Taille | Résolution | Prix |
|---|---|---|---|---|---|---|---|
| 89.9 % v7 (old) | 03/23 | Eluktronics Mech-17 GP2 i9-13900HX, GeForce RTX 4090 Laptop GPU | 2.9 kg | 27 mm | 17.00" | 2560x1600 | |
| 87.6 % v7 (old) | 09/22 | Schenker XMG Neo 17 M22 R9 6900HX, GeForce RTX 3080 Ti Laptop GPU | 2.8 kg | 27 mm | 17.00" | 2560x1600 | |
| 82.1 % v7 (old) | 02/23 | MSI Katana 17 B13VFK i7-13620H, GeForce RTX 4060 Laptop GPU | 2.8 kg | 25.2 mm | 17.30" | 1920x1080 | |
| 89 % v7 (old) | 02/23 | MSI Titan GT77 HX 13VI i9-13950HX, GeForce RTX 4090 Laptop GPU | 3.5 kg | 23 mm | 17.30" | 3840x2160 | |
| 86.1 % v7 (old) | 01/23 | Alienware m17 R5 (R9 6900HX, RX 6850M XT) R9 6900HX, Radeon RX 6850M XT | 3.4 kg | 26.7 mm | 17.00" | 3840x2160 | |
| 91.4 % v7 (old) | 02/23 | Razer Blade 18 RTX 4070 i9-13950HX, GeForce RTX 4070 Laptop GPU | 3 kg | 21.9 mm | 18.00" | 2560x1600 |
Cas
Lecteur de carte SD
Le lecteur de carte SD est lent par rapport au prix élevé du modèle. Le Razer Blade 18 et les Dell XPS ont des lecteurs de cartes 2 à 3 fois plus rapides.
| SD Card Reader | |
| average JPG Copy Test (av. of 3 runs) | |
| Razer Blade 18 RTX 4070 (Angelibird AV Pro V60) | |
| MSI Titan GT77 HX 13VI (Angelibird AV Pro V60) | |
| Eluktronics Mech-17 GP2 (Angelibird AV Pro V60) | |
| Schenker XMG Neo 17 M22 (AV PRO microSD 128 GB V60) | |
| maximum AS SSD Seq Read Test (1GB) | |
| Razer Blade 18 RTX 4070 (Angelibird AV Pro V60) | |
| Eluktronics Mech-17 GP2 (Angelibird AV Pro V60) | |
| MSI Titan GT77 HX 13VI (Angelibird AV Pro V60) | |
Communication
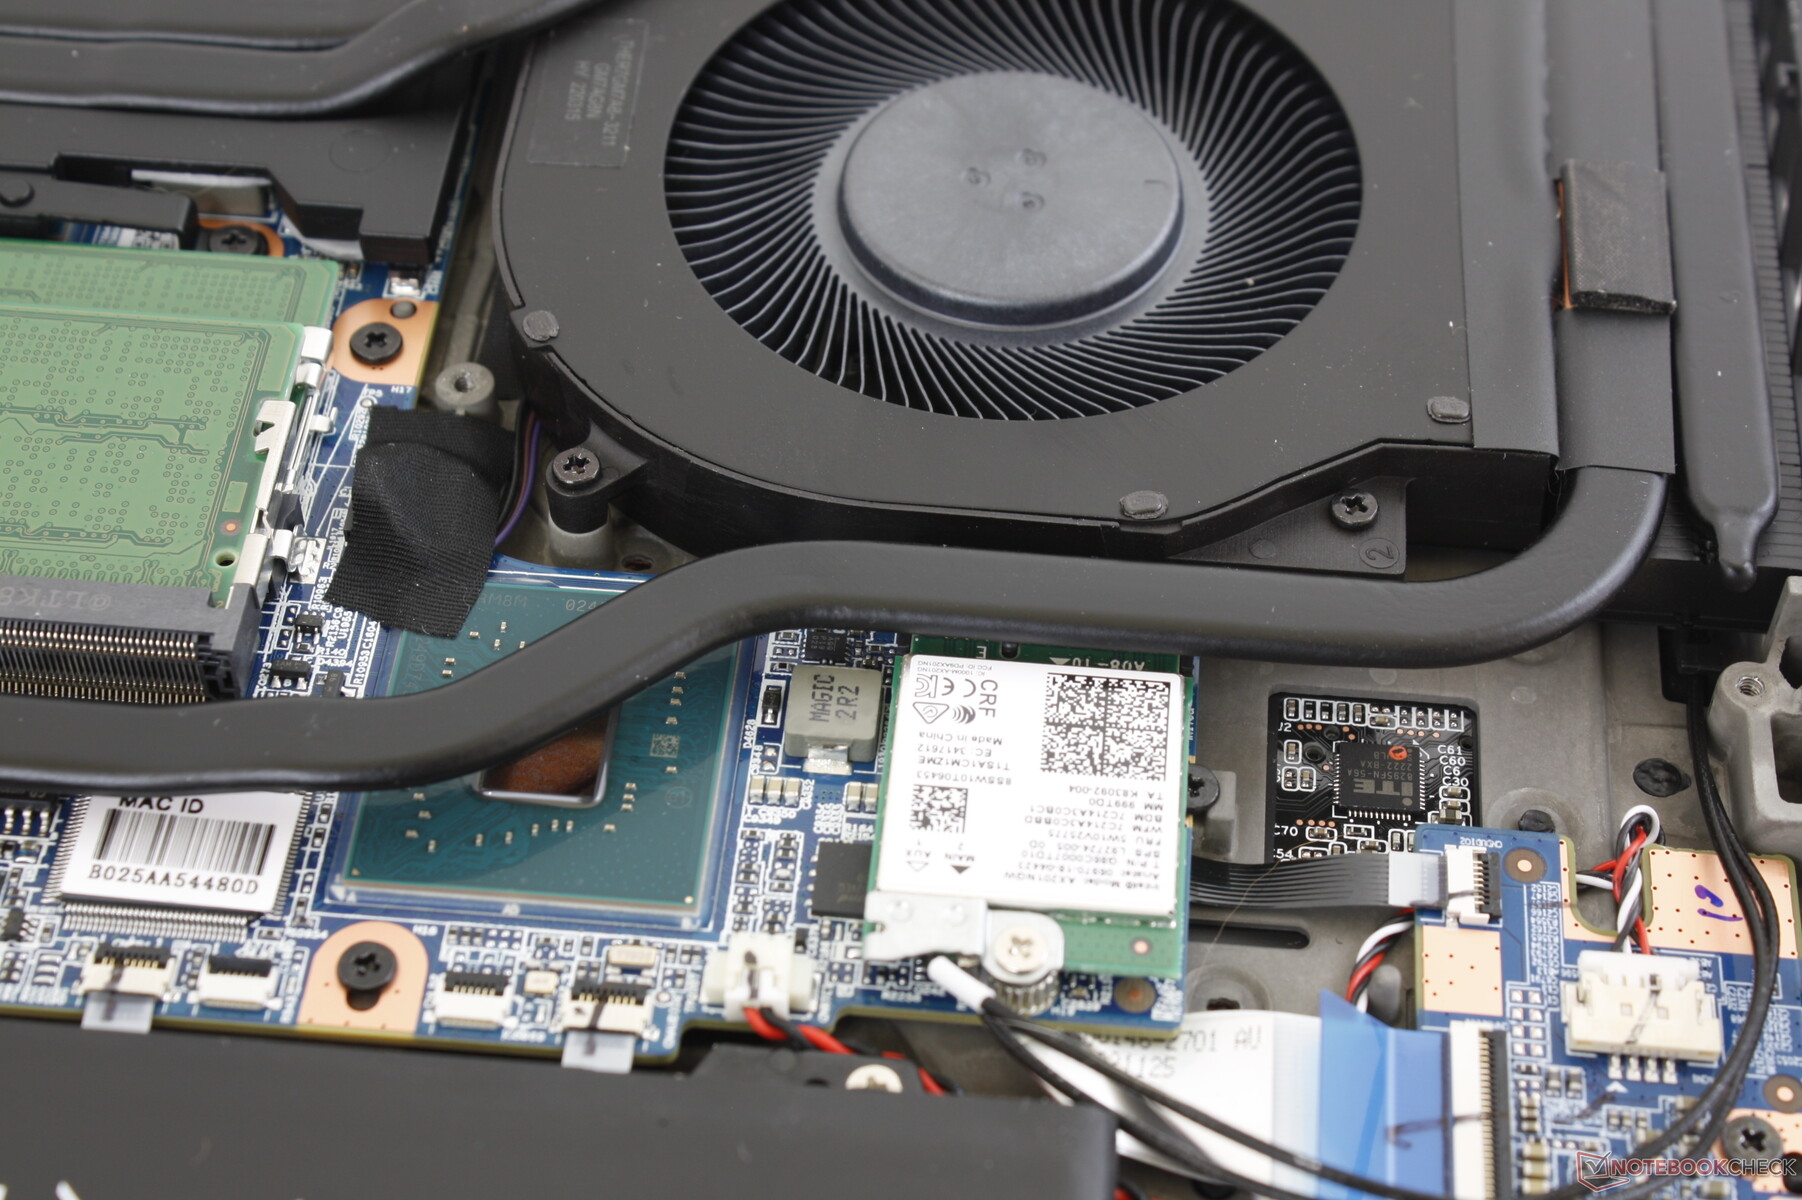
Un Intel AX201 est livré en standard pour la connectivité Wi-Fi 6 et Bluetooth 5.2. Néanmoins, nous nous attendions à un AX210/211 pour des vitesses Wi-Fi 6E plus rapides, compte tenu du prix du système.
| Networking | |
| iperf3 transmit AXE11000 | |
| MSI Titan GT77 HX 13VI | |
| MSI Katana 17 B13VFK | |
| Eluktronics Mech-17 GP2 | |
| Razer Blade 18 RTX 4070 | |
| Alienware m17 R5 (R9 6900HX, RX 6850M XT) | |
| Schenker XMG Neo 17 M22 | |
| iperf3 receive AXE11000 | |
| MSI Katana 17 B13VFK | |
| MSI Titan GT77 HX 13VI | |
| Razer Blade 18 RTX 4070 | |
| Eluktronics Mech-17 GP2 | |
| Alienware m17 R5 (R9 6900HX, RX 6850M XT) | |
| Schenker XMG Neo 17 M22 | |
| iperf3 transmit AXE11000 6GHz | |
| Razer Blade 18 RTX 4070 | |
| iperf3 receive AXE11000 6GHz | |
| Razer Blade 18 RTX 4070 | |
Webcam
La webcam FHD de 2 mégapixels et l'infrarouge sont fournis en standard pour la prise en charge de Hello. En revanche, il n'y a pas de bouton de confidentialité ni d'option d'obturation.


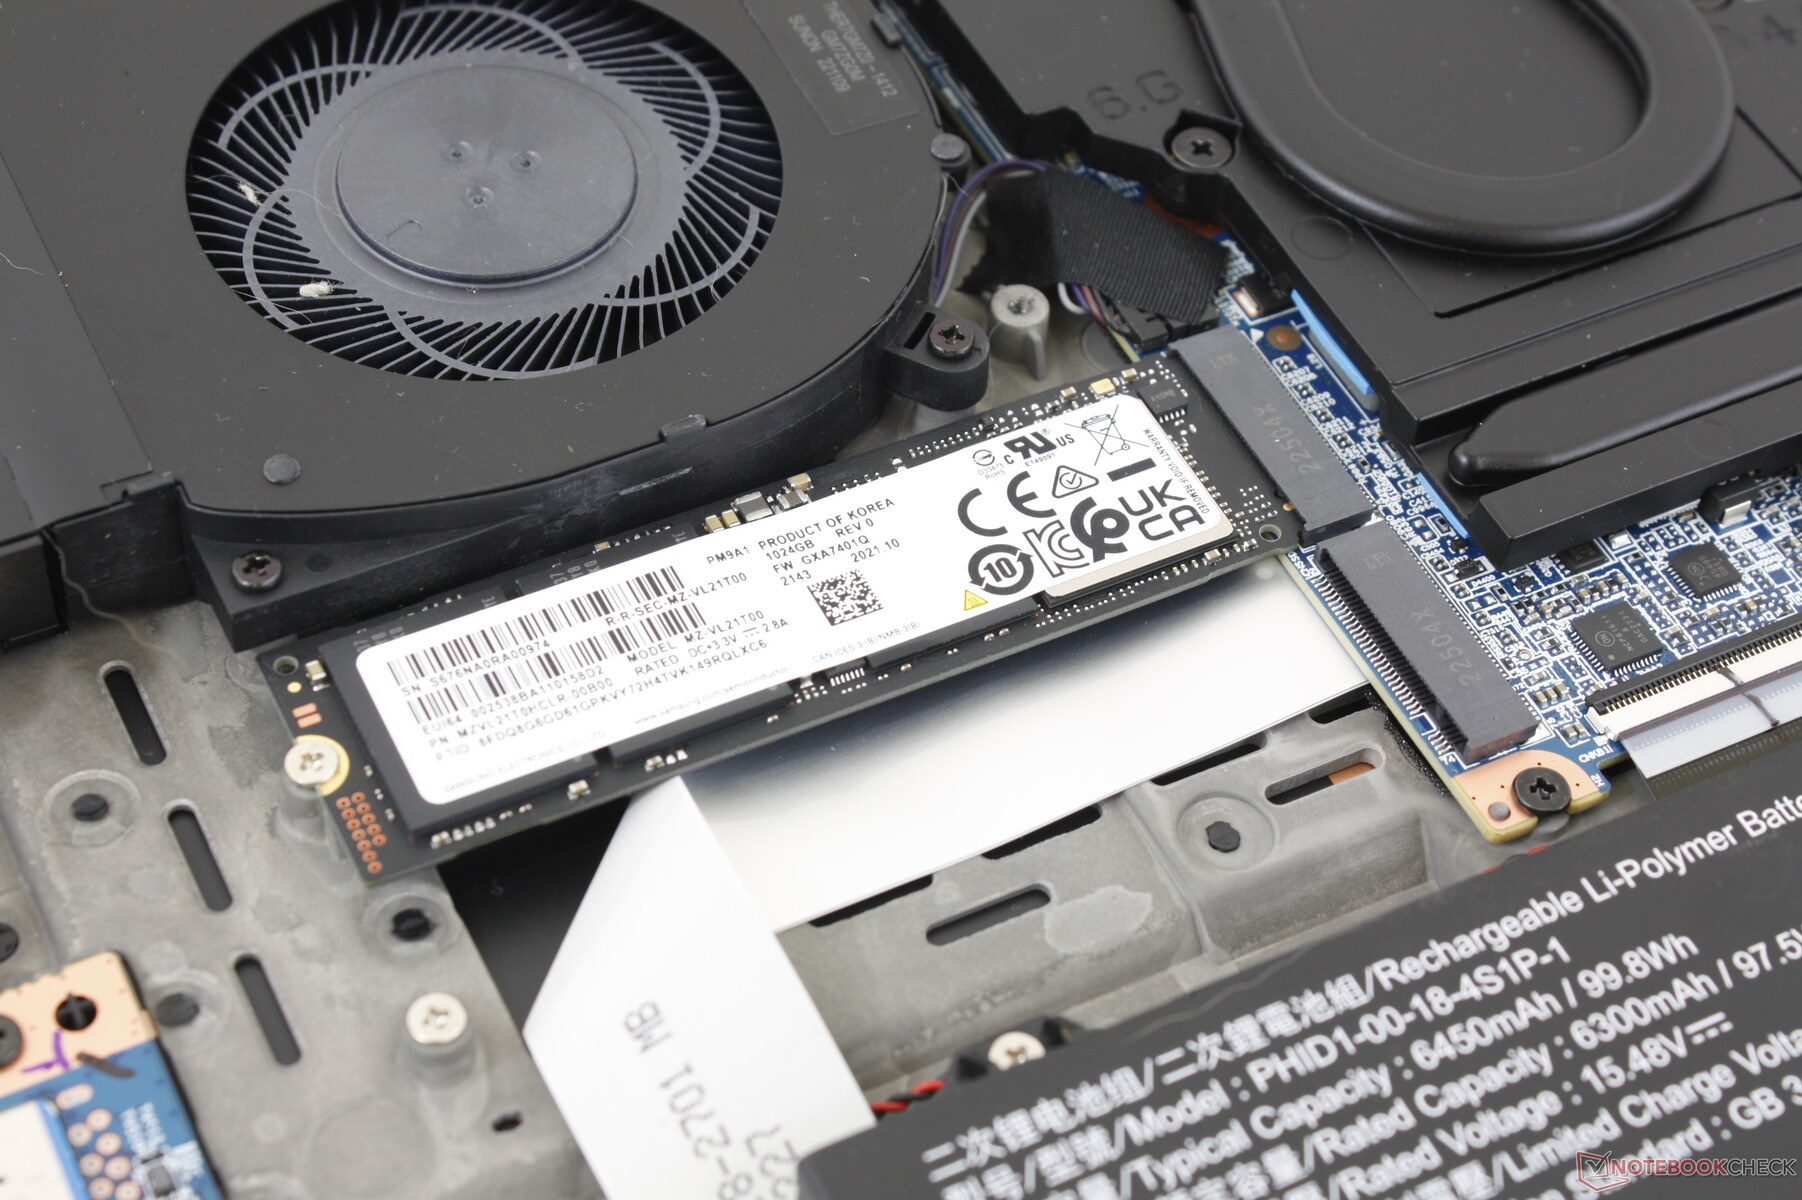
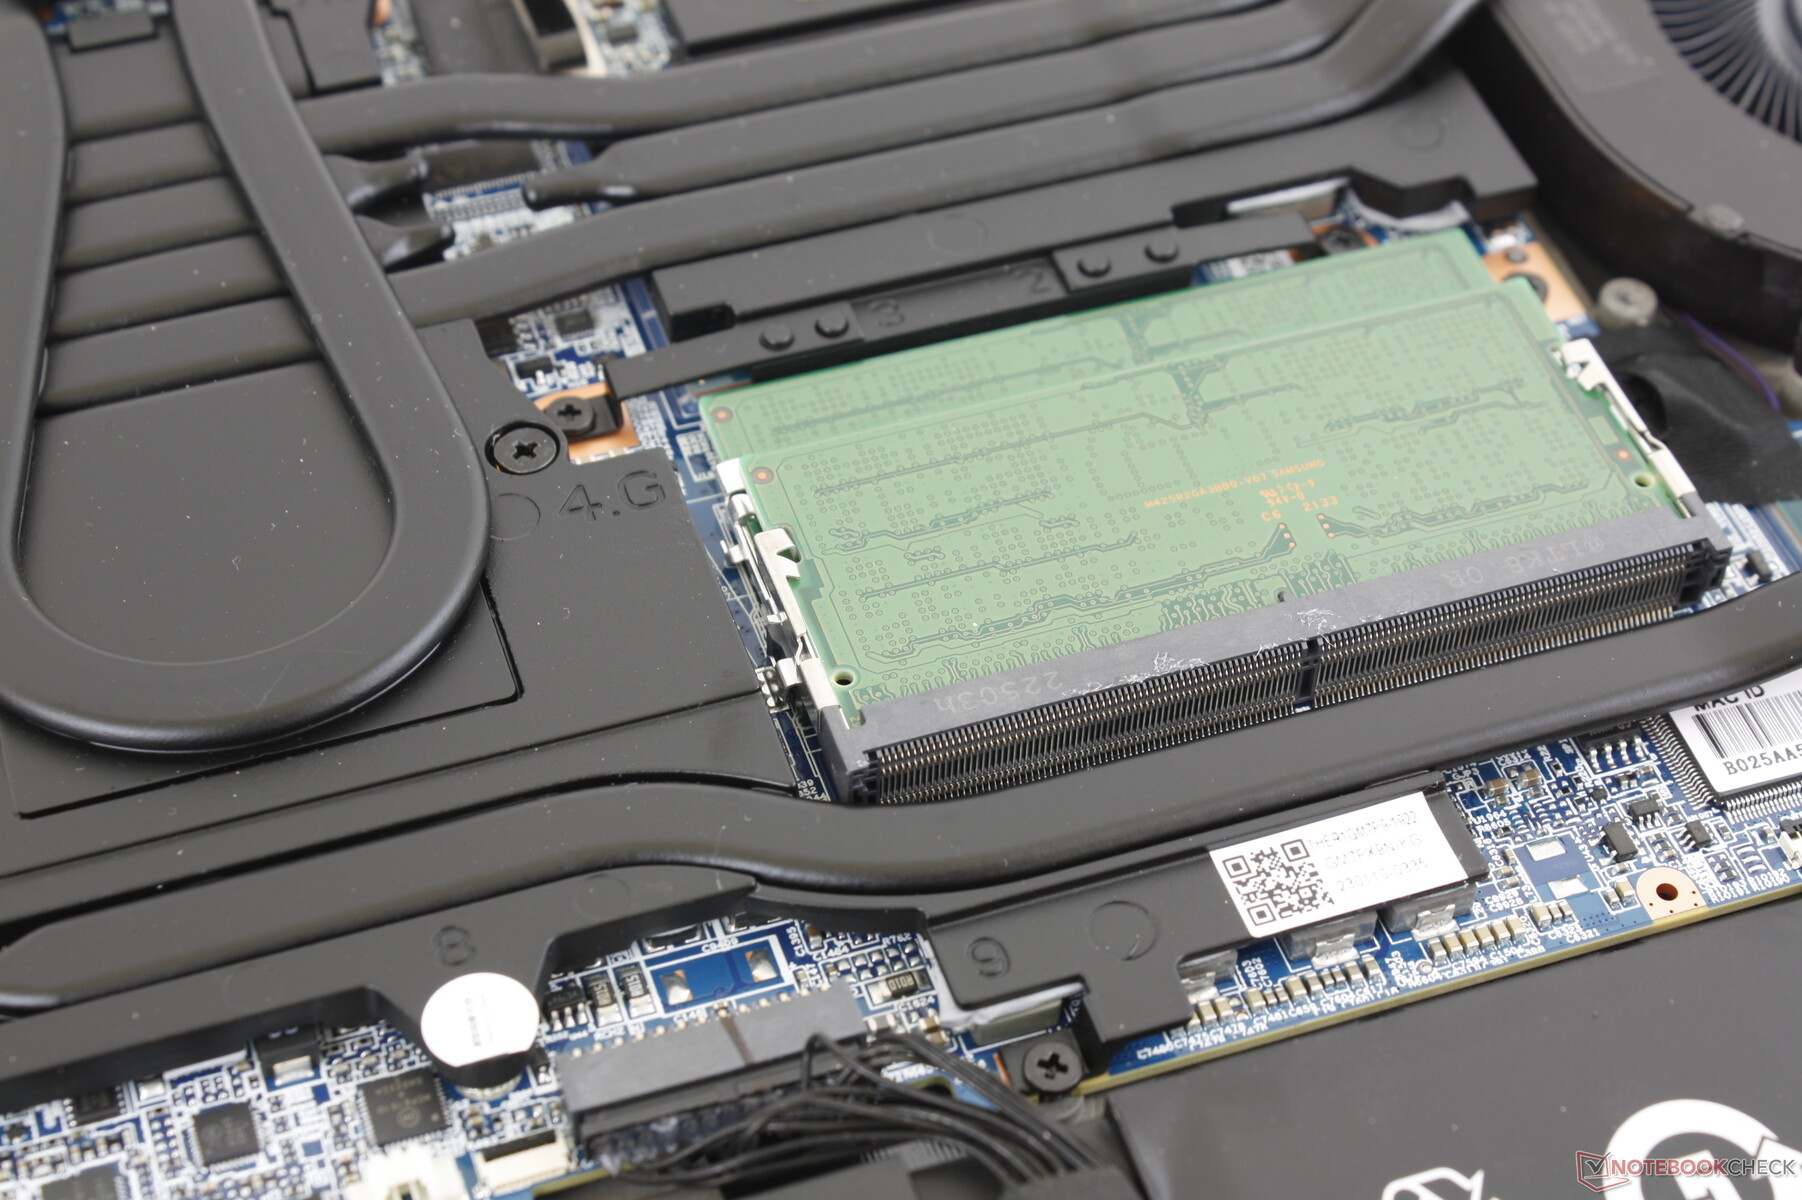
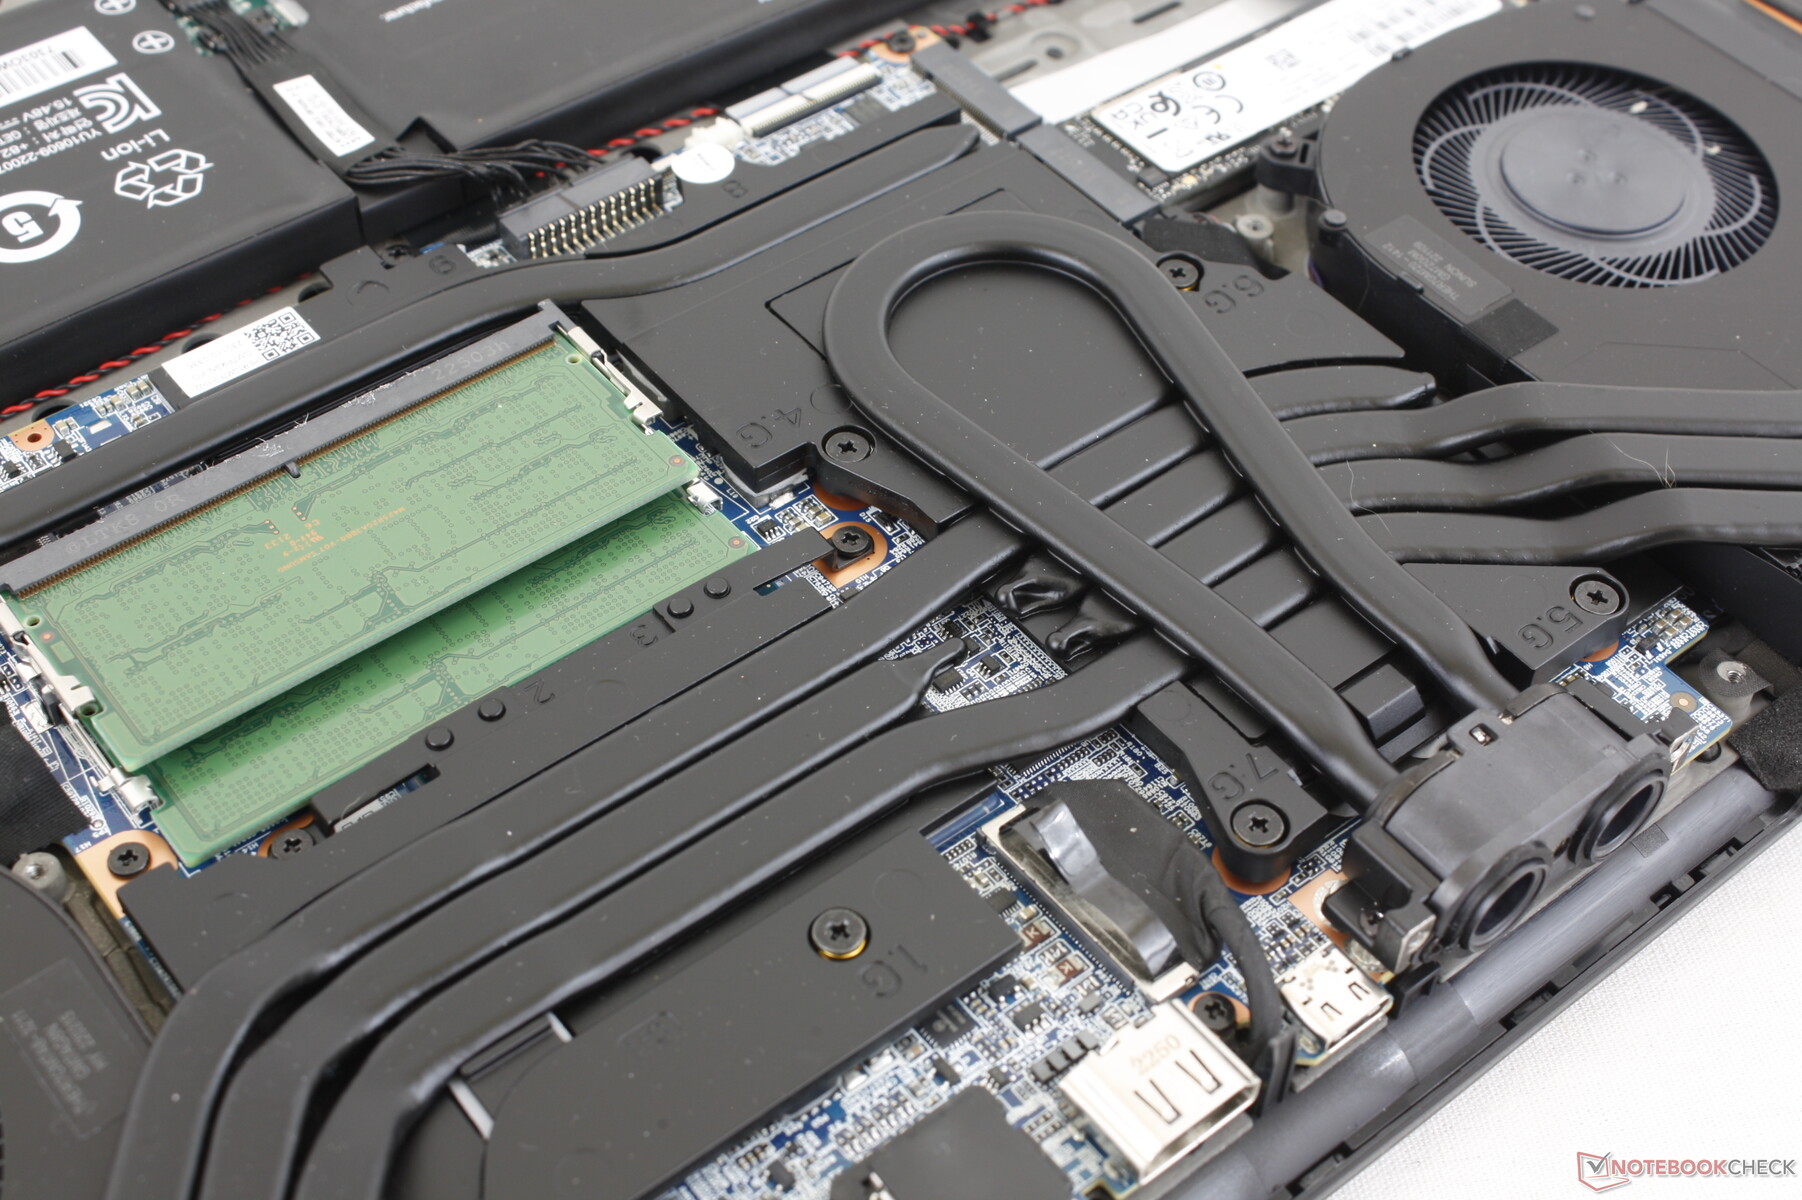
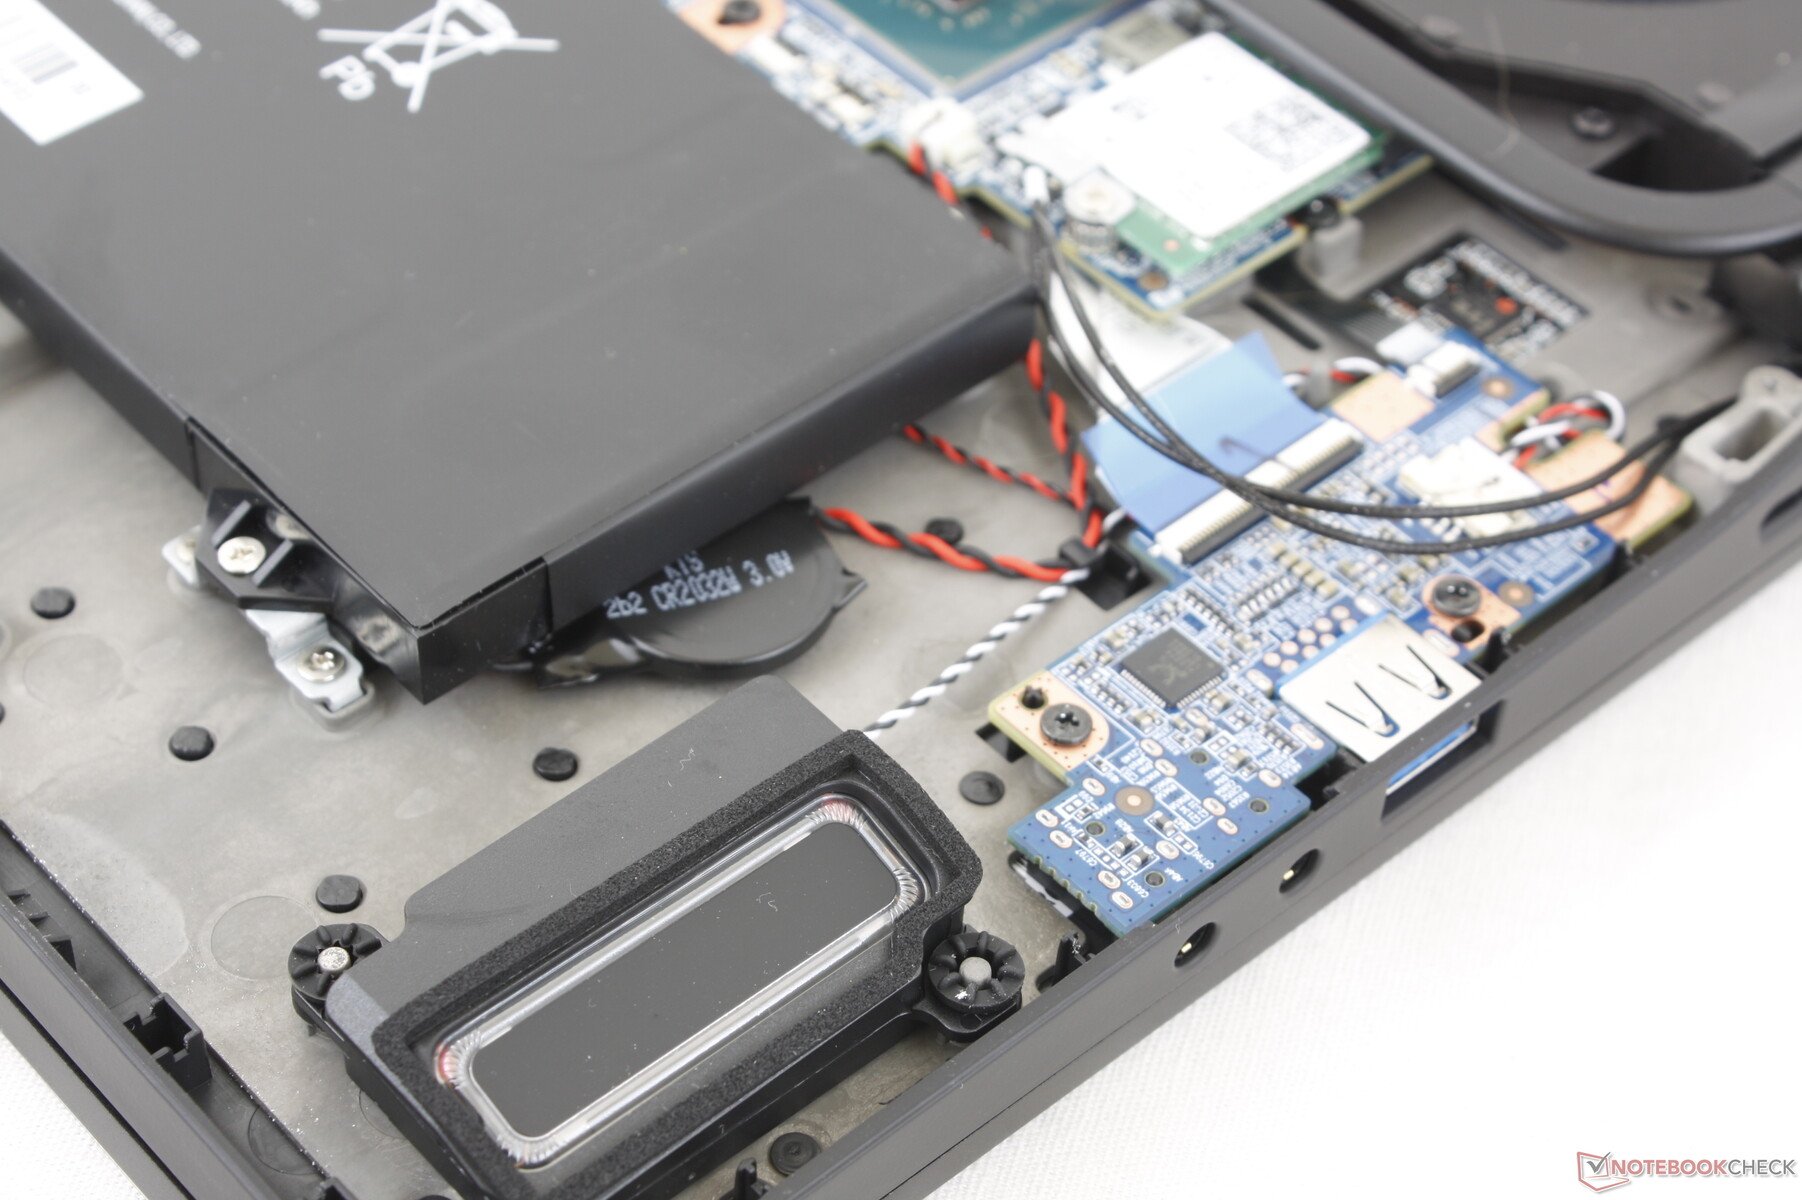
Maintenance
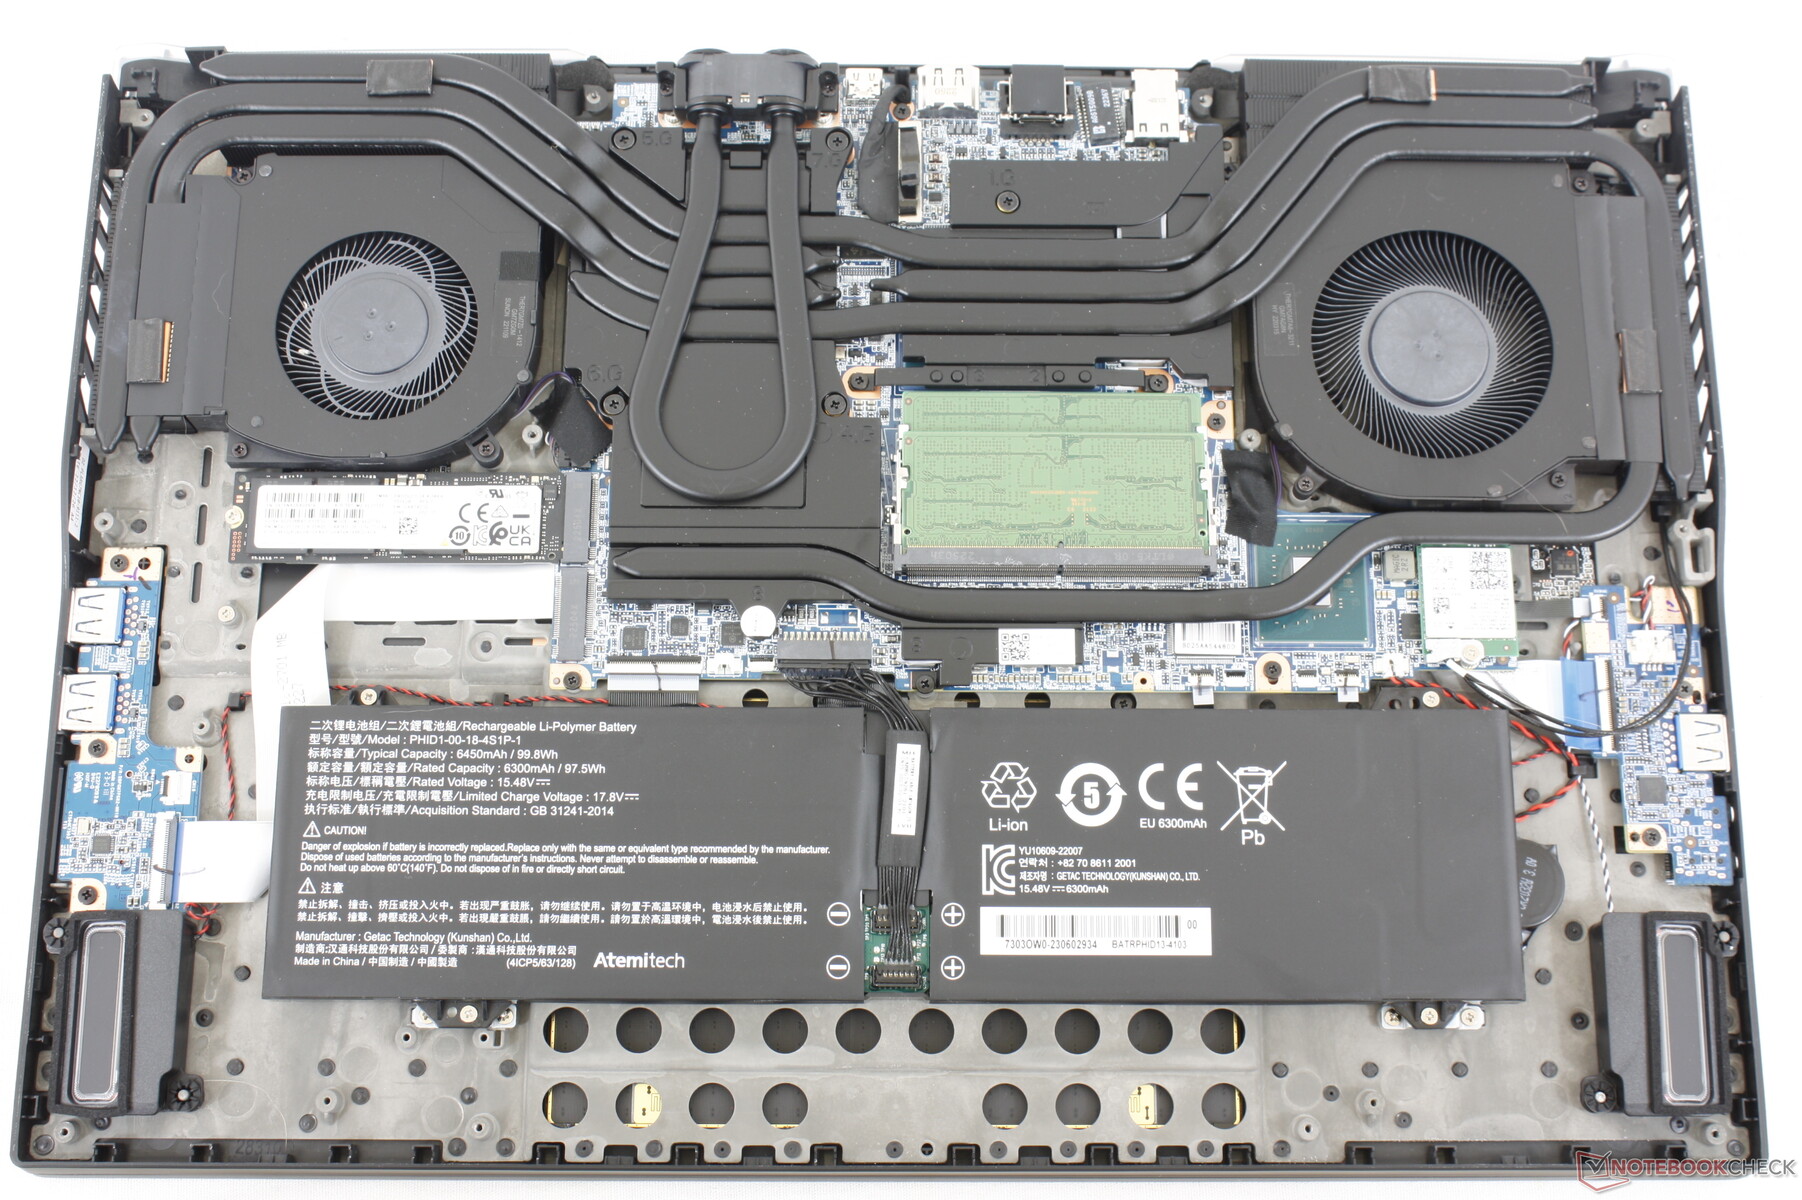
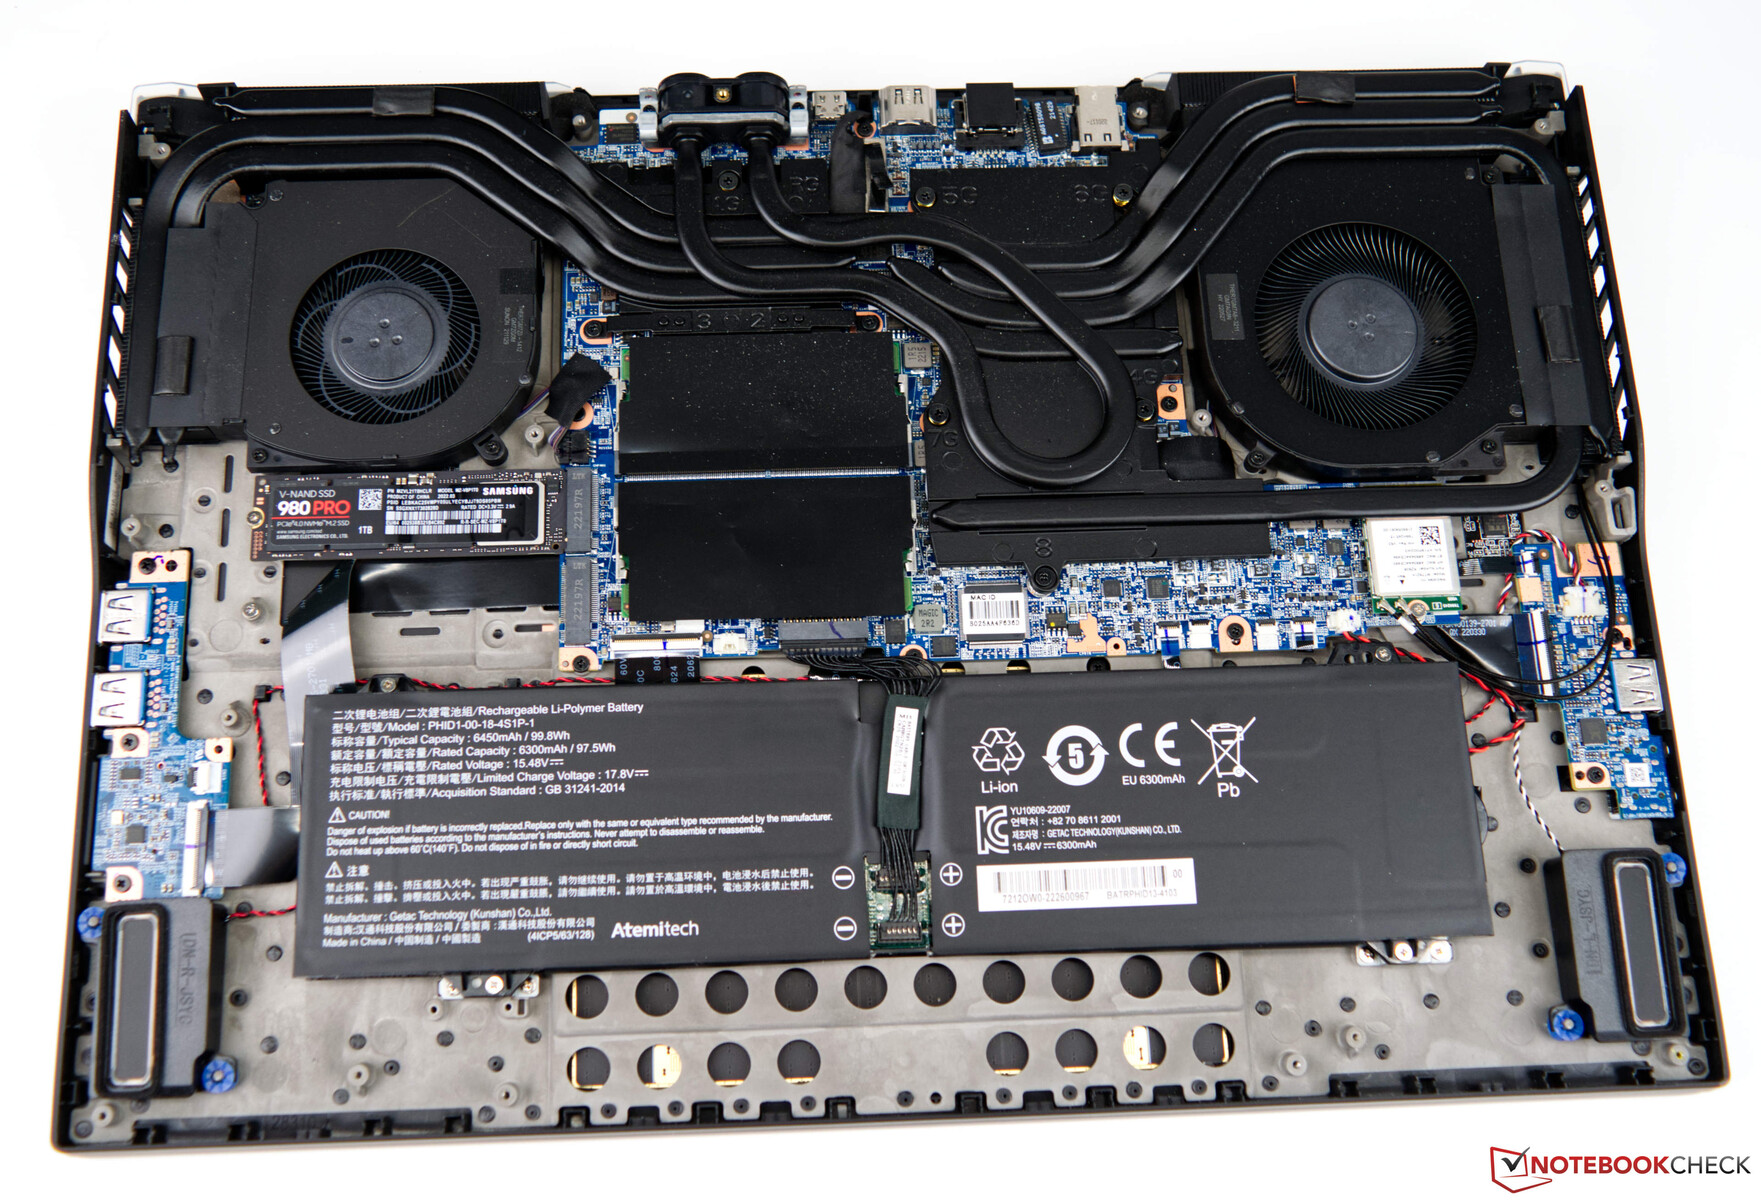
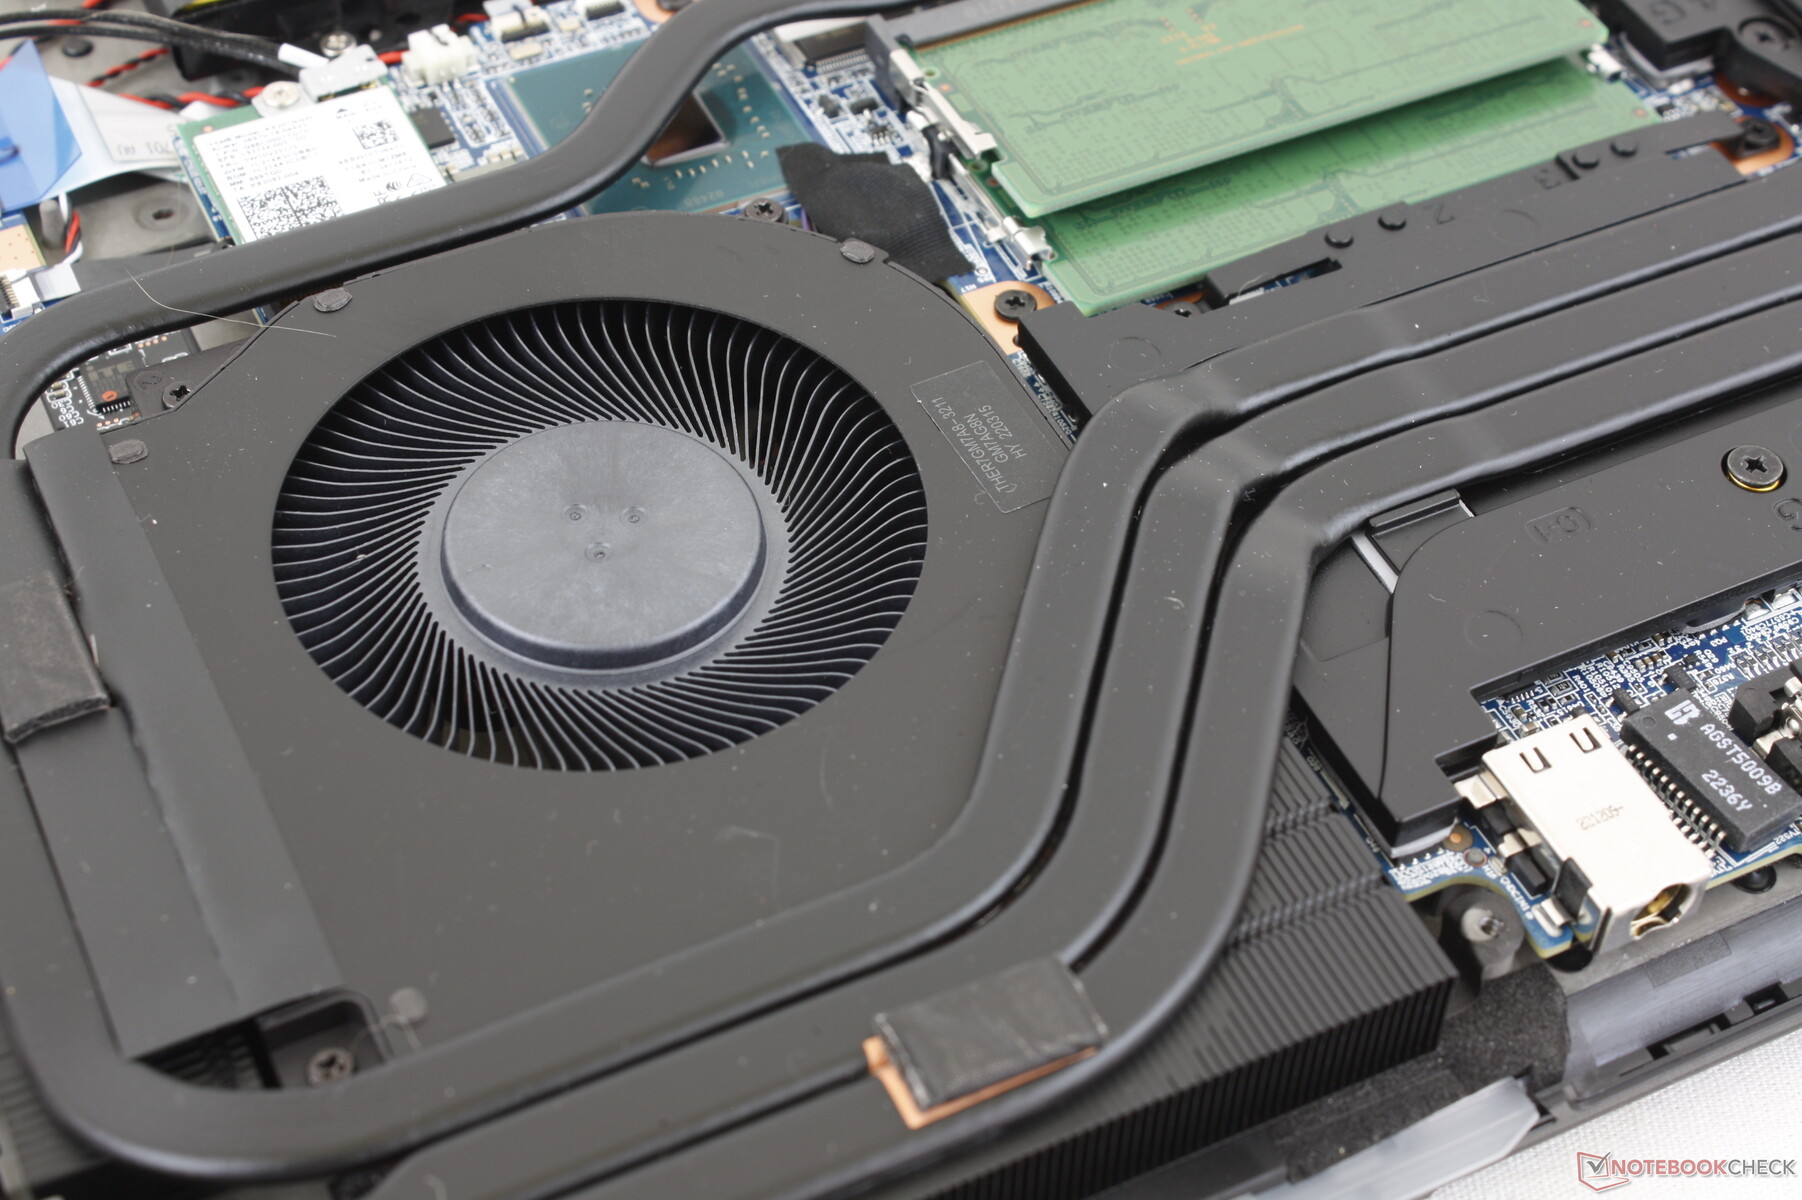
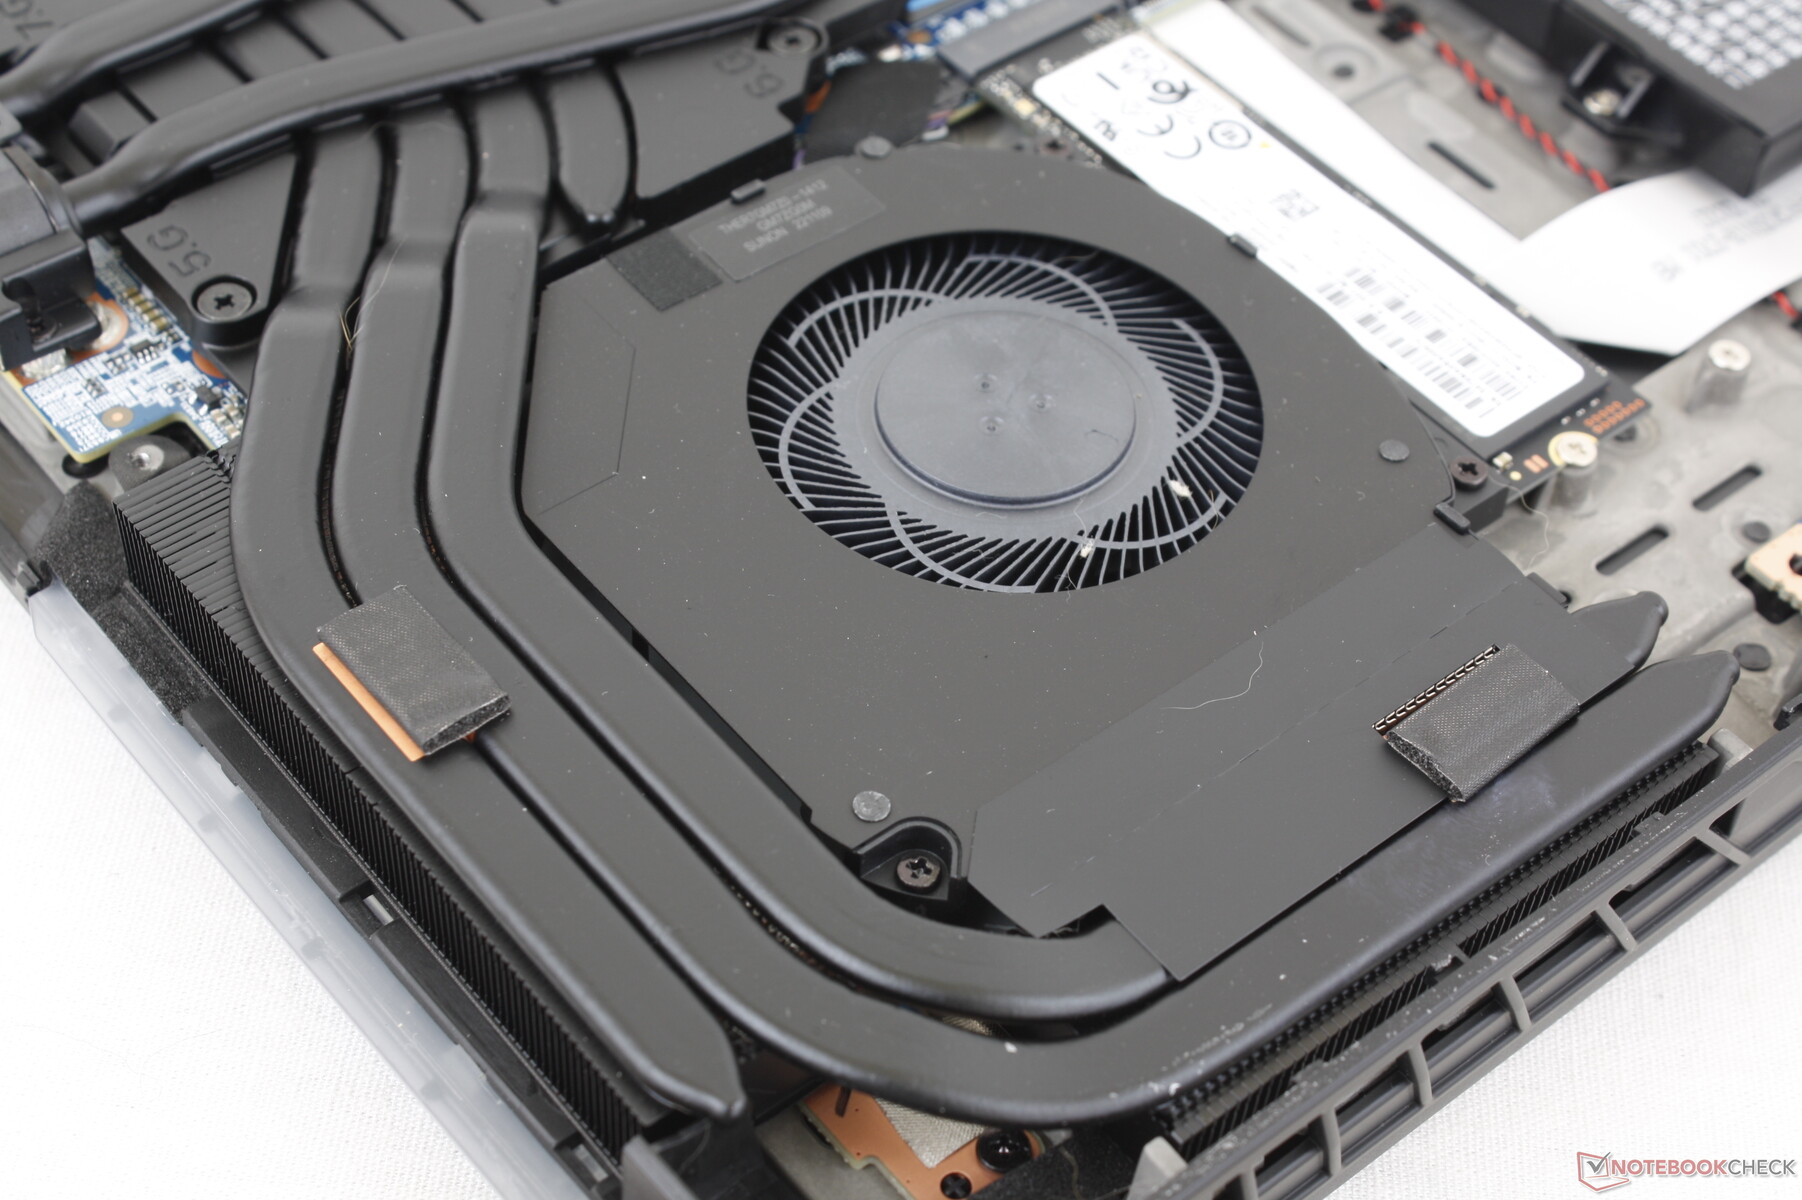
Le panneau inférieur est fixé par 14 vis Philips pour faciliter l'entretien. Le fabricant a revu les composants internes par rapport au modèle de l'année dernière, comme le montre le schéma ci-dessous, même si les conceptions externes restent identiques. Les deux modules de mémoire vive sont désormais empilés pour gagner de la place sur la carte mère, tandis que le CPU et le GPU ont changé de place.
Accessoires et garantie
La boîte ne contient pas d'autres éléments que l'adaptateur secteur et la documentation. Le modèle est compatible avec le refroidisseur externe optionnel LPP G2 (Liquid Propulsion Package) de deuxième génération.
La garantie standard du fabricant, limitée à un an, s'applique. Une mise à niveau à trois ans est disponible pour un supplément de 250 $.
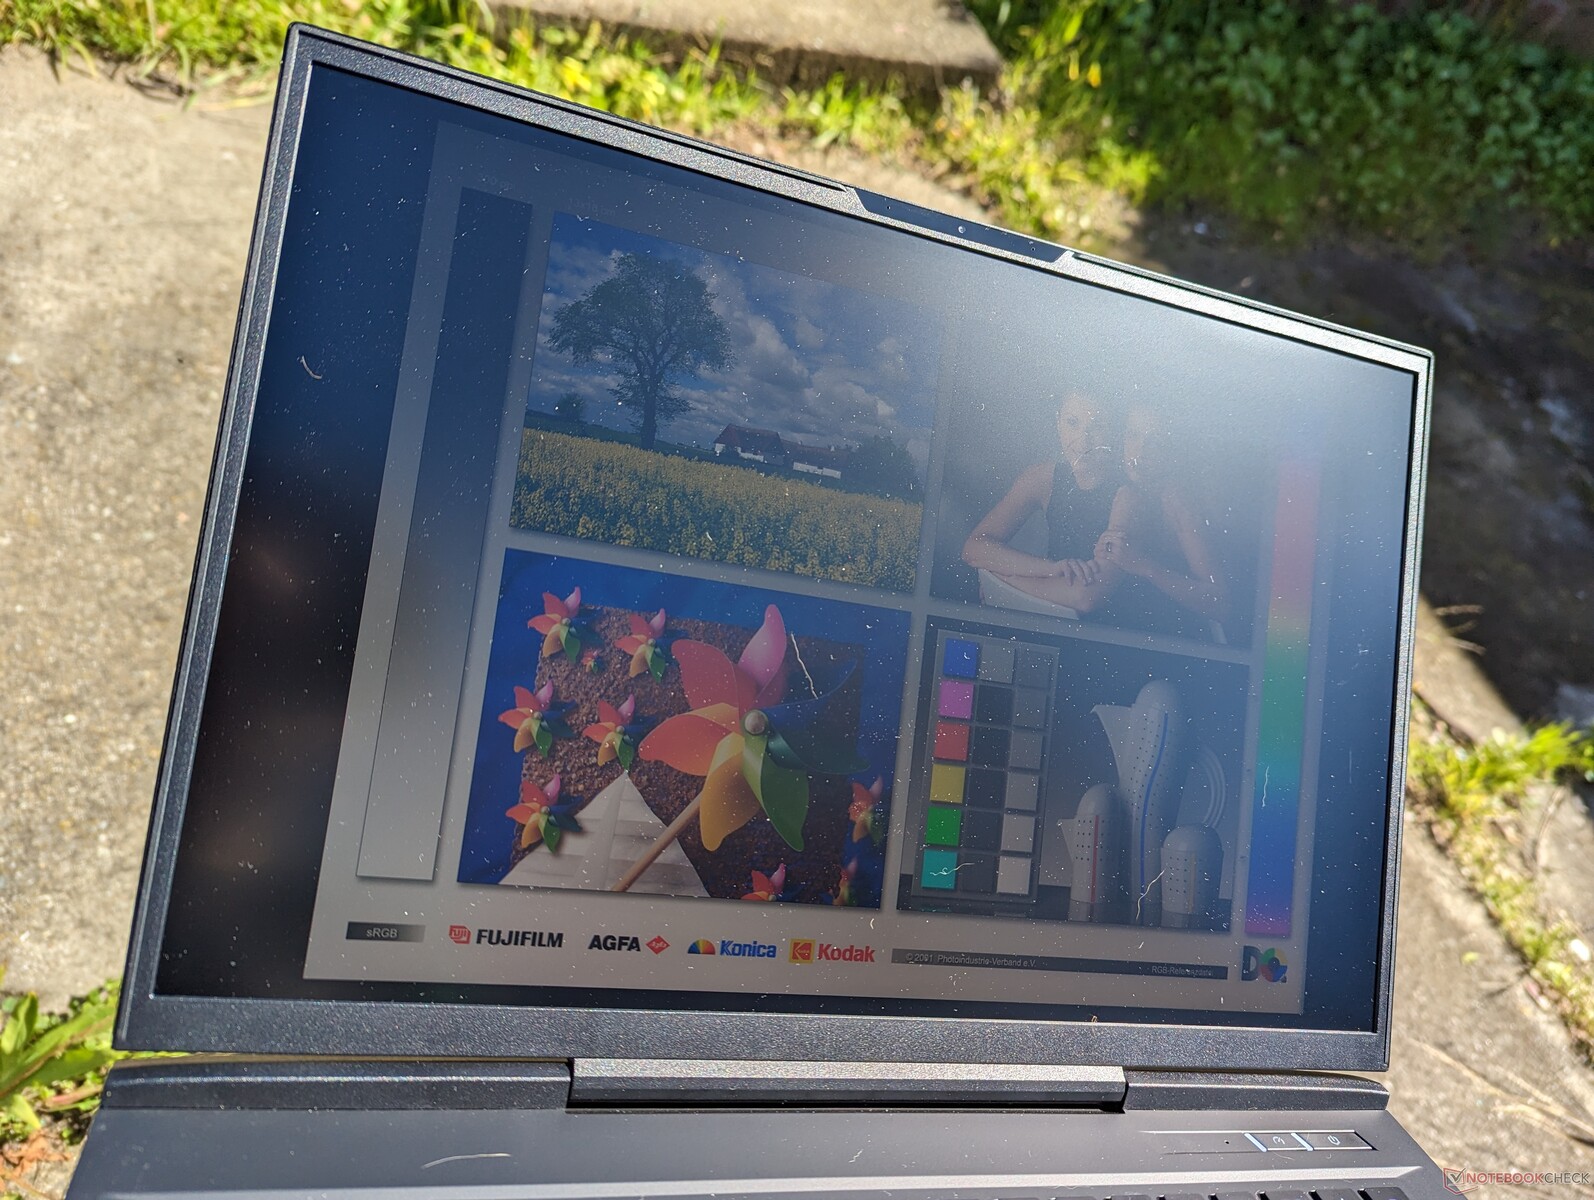
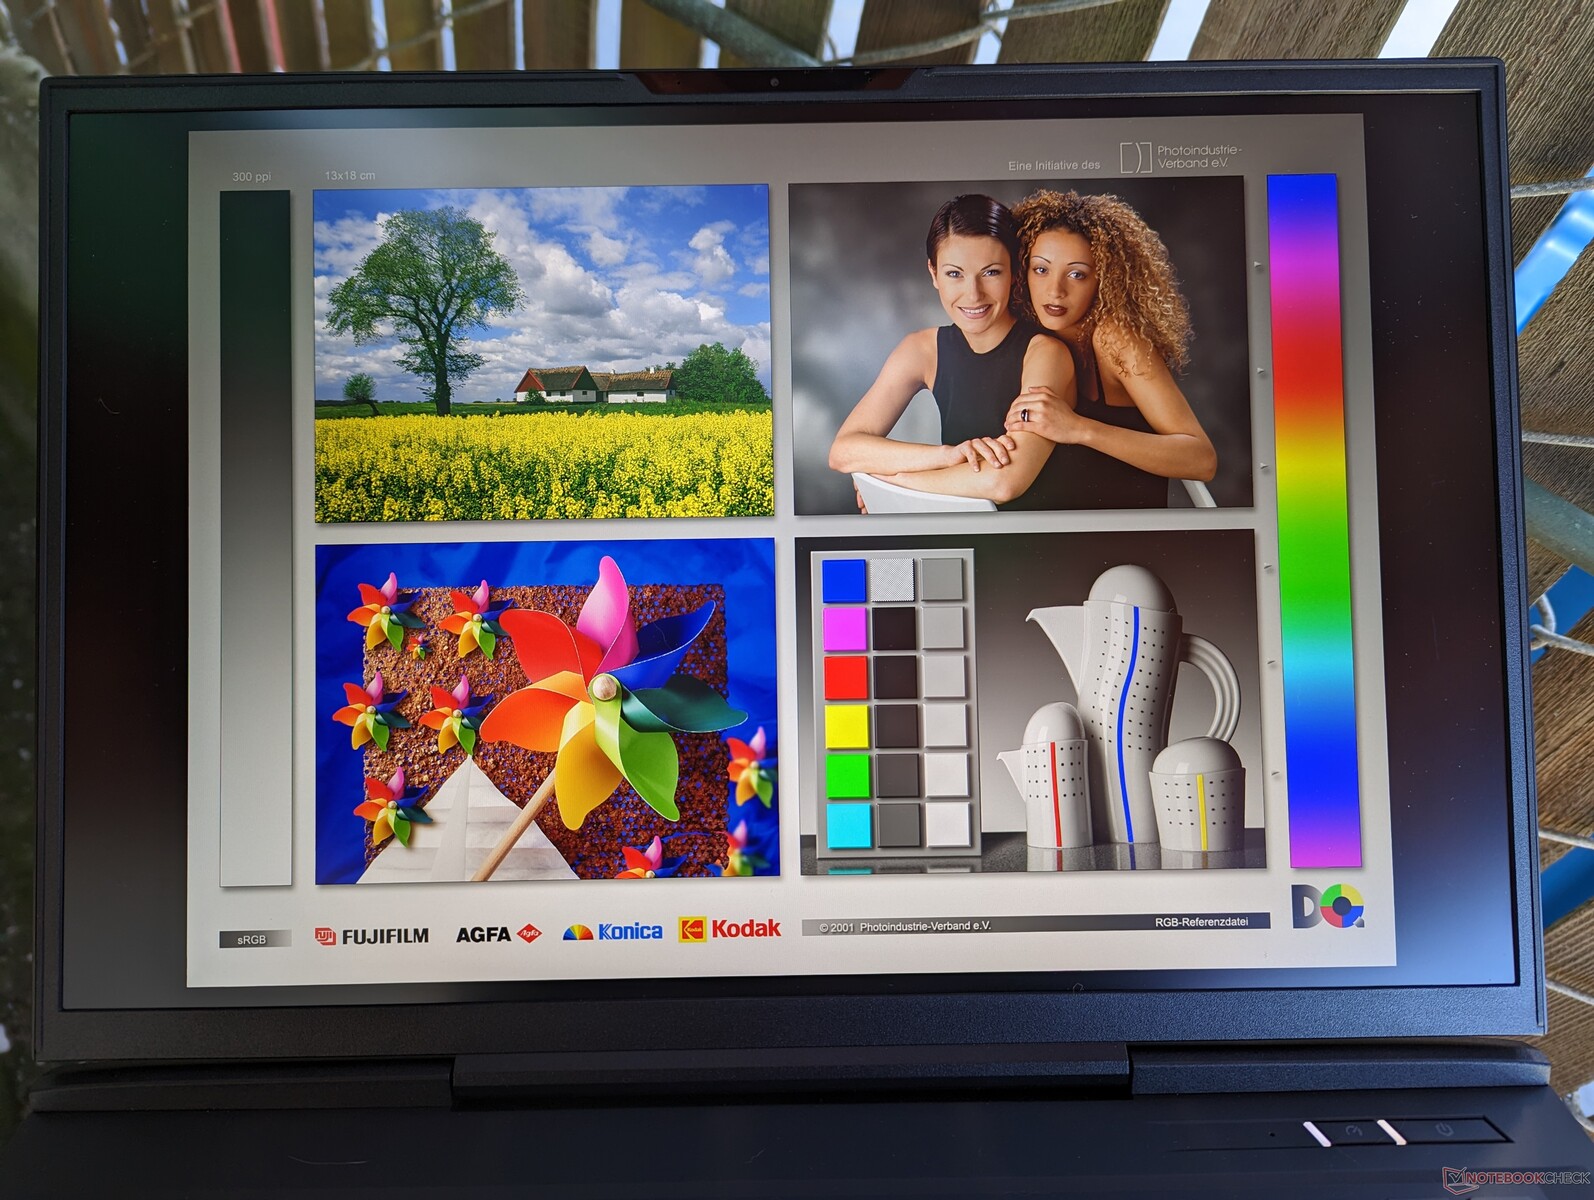
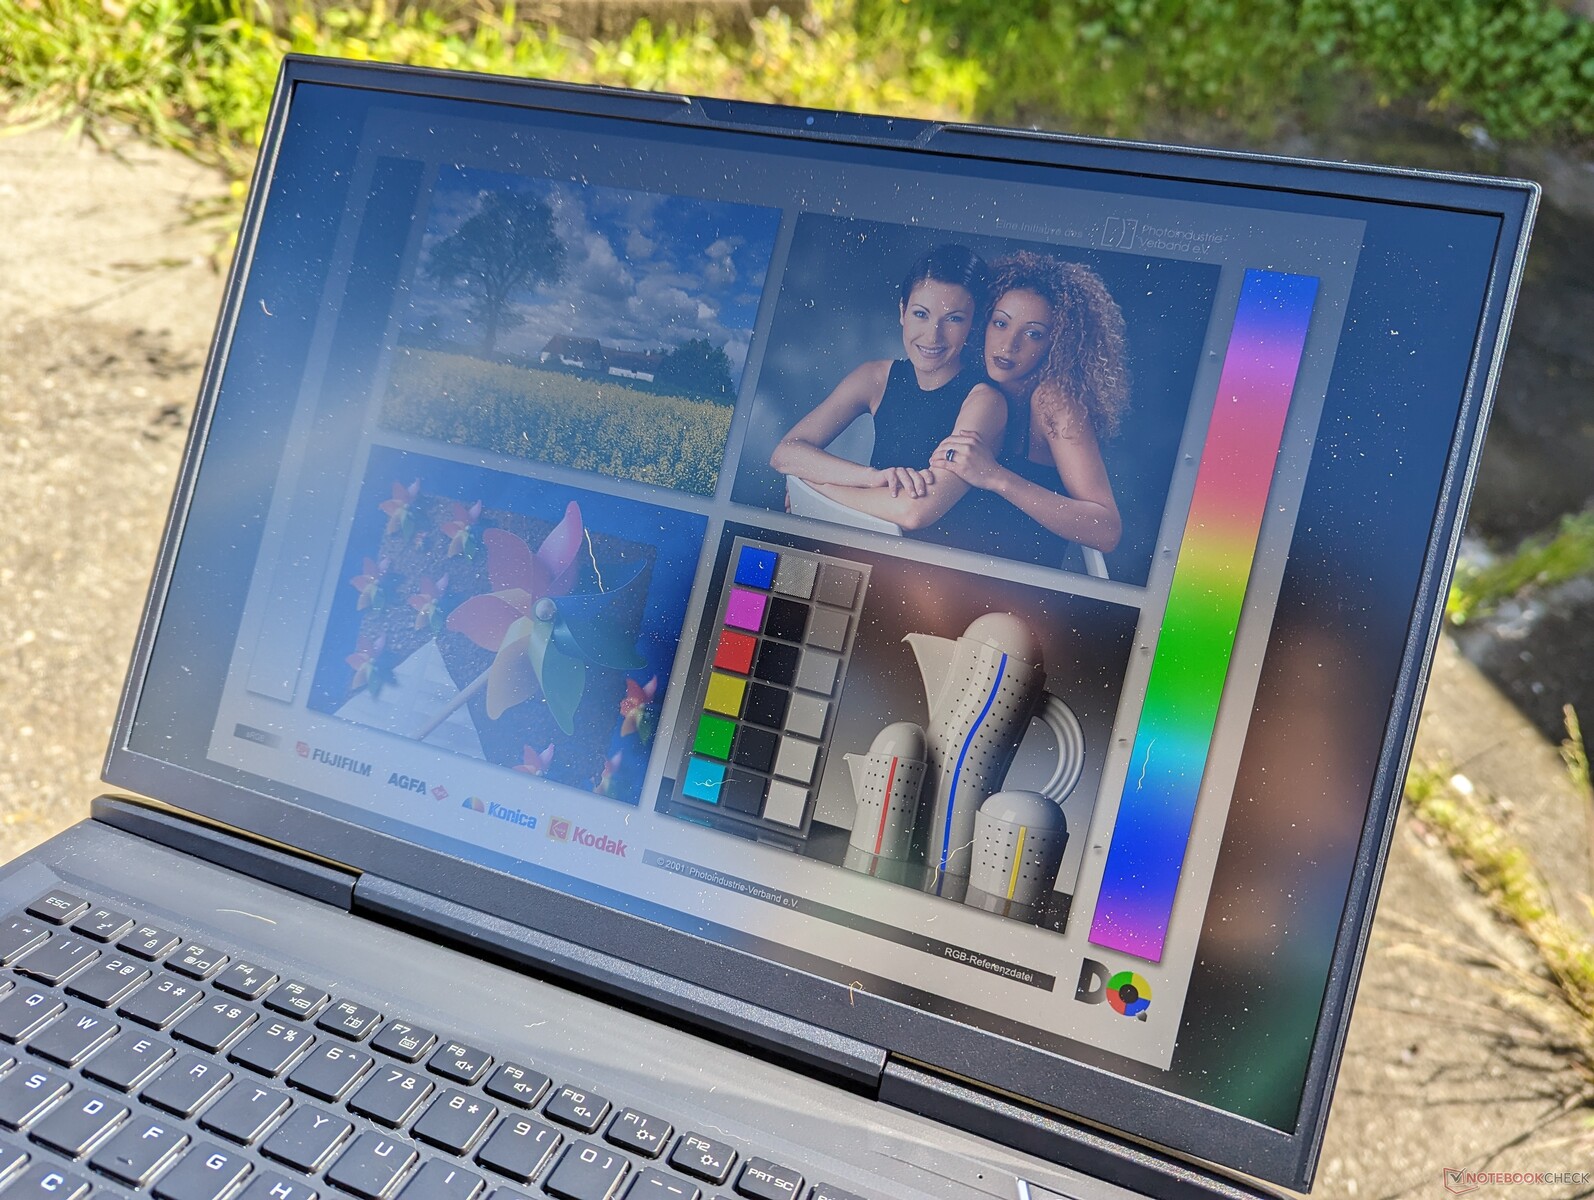
Affichage
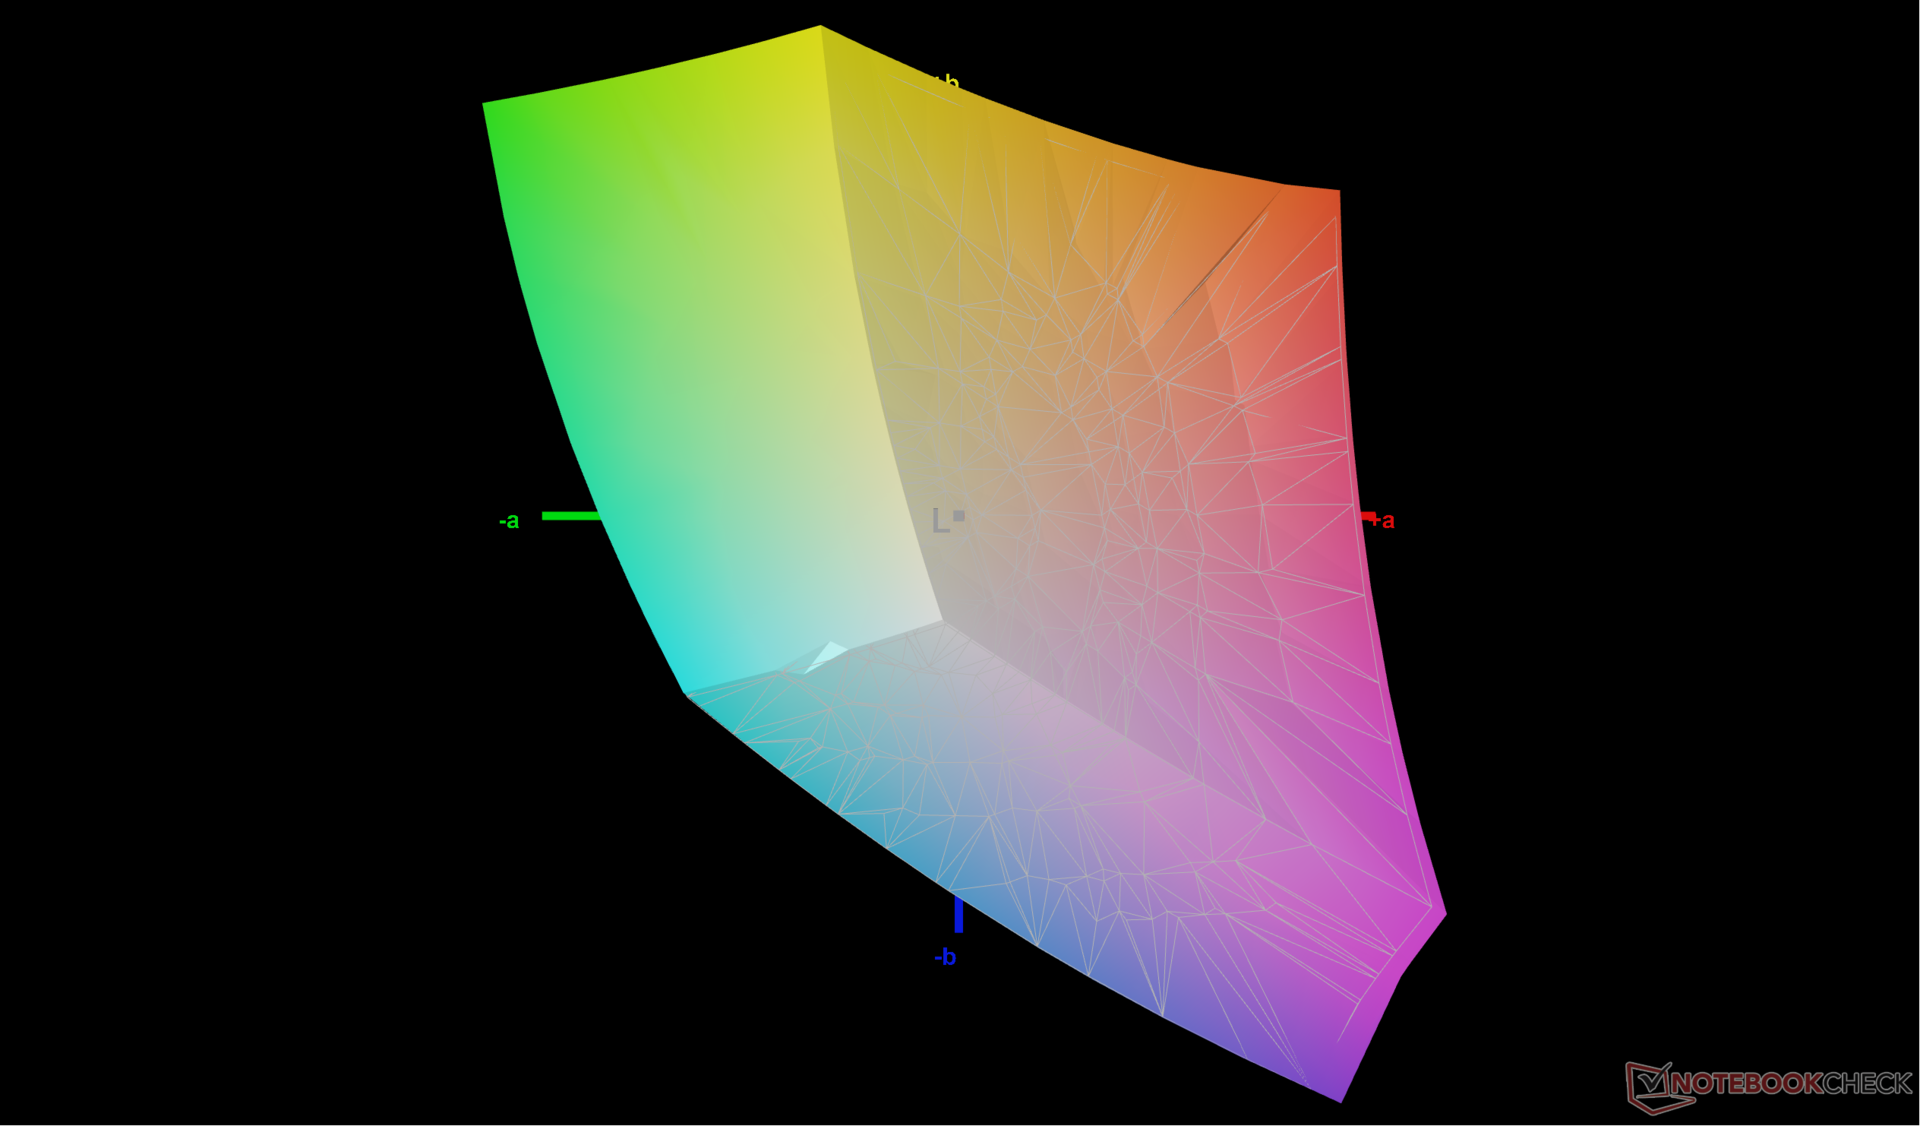
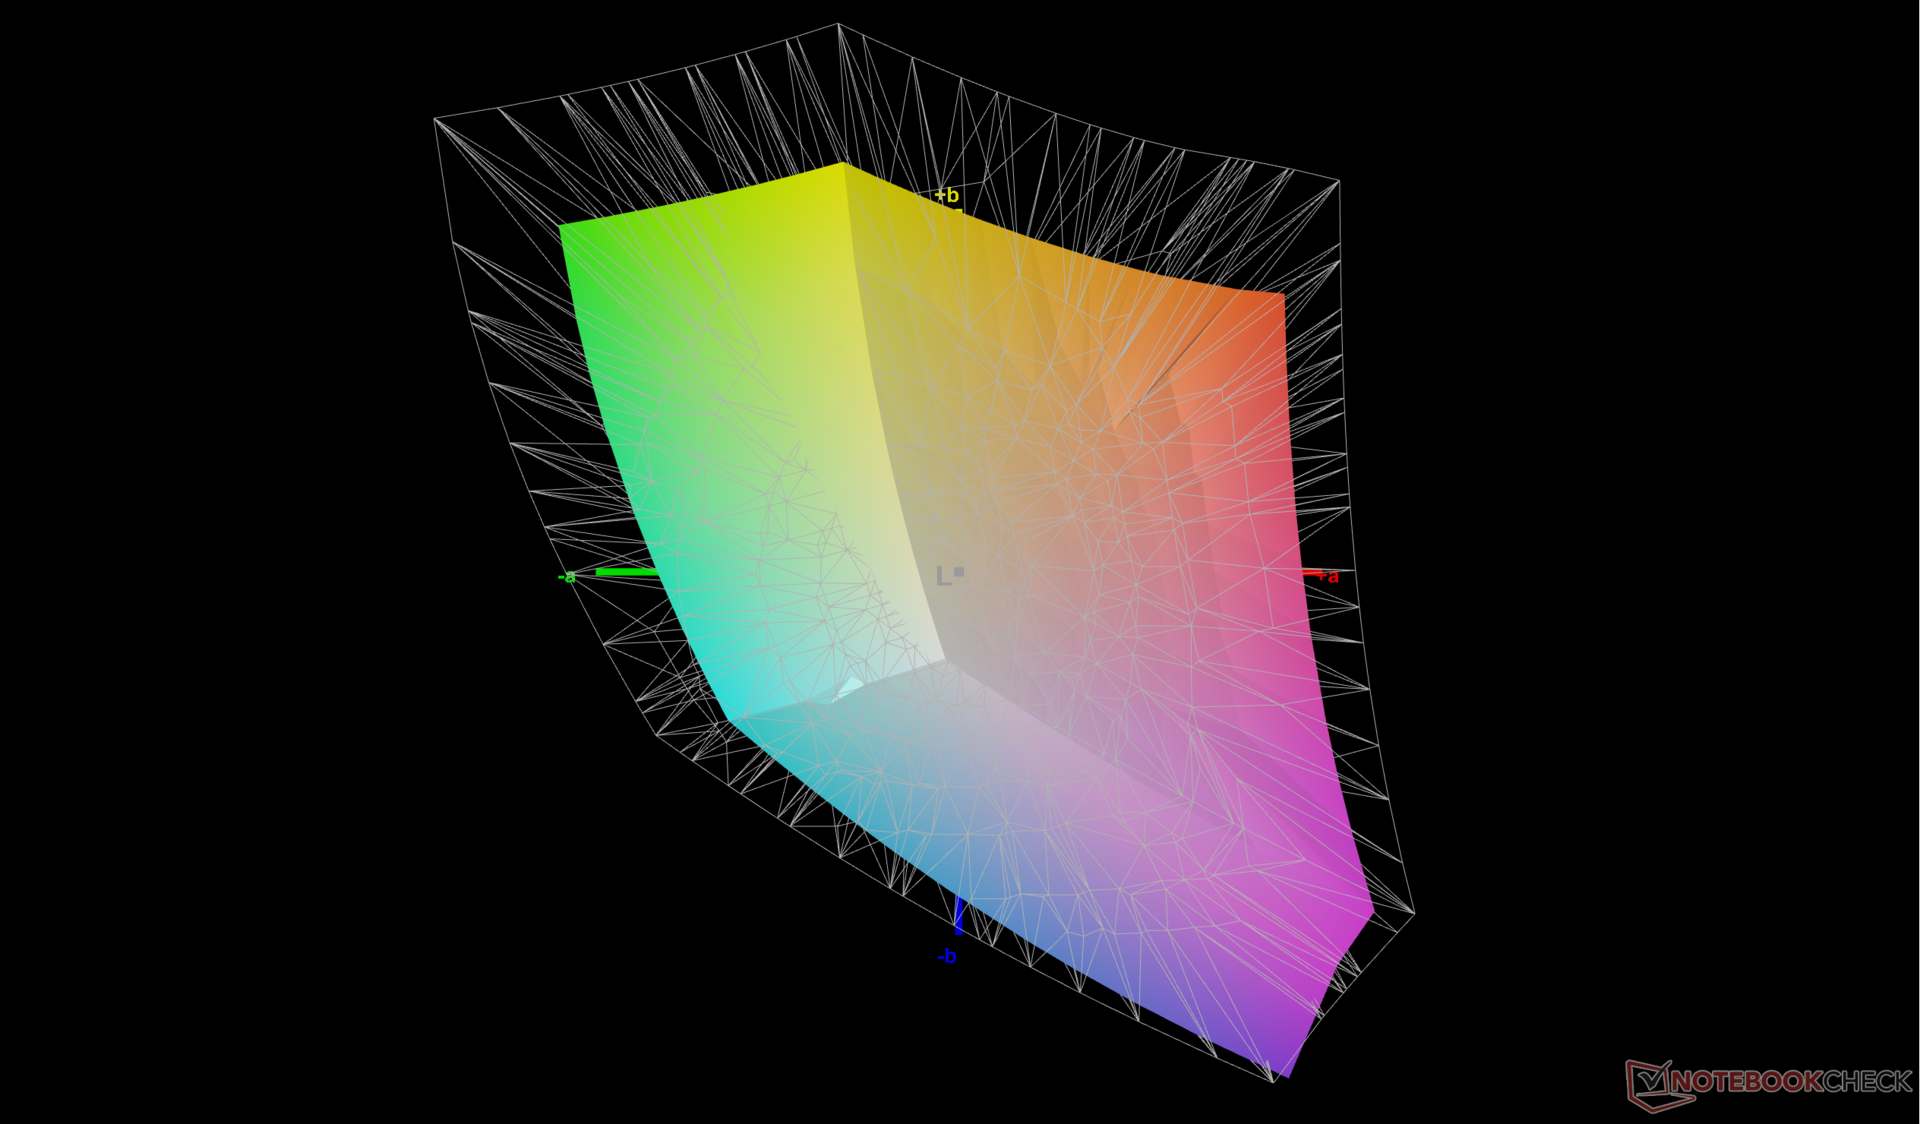
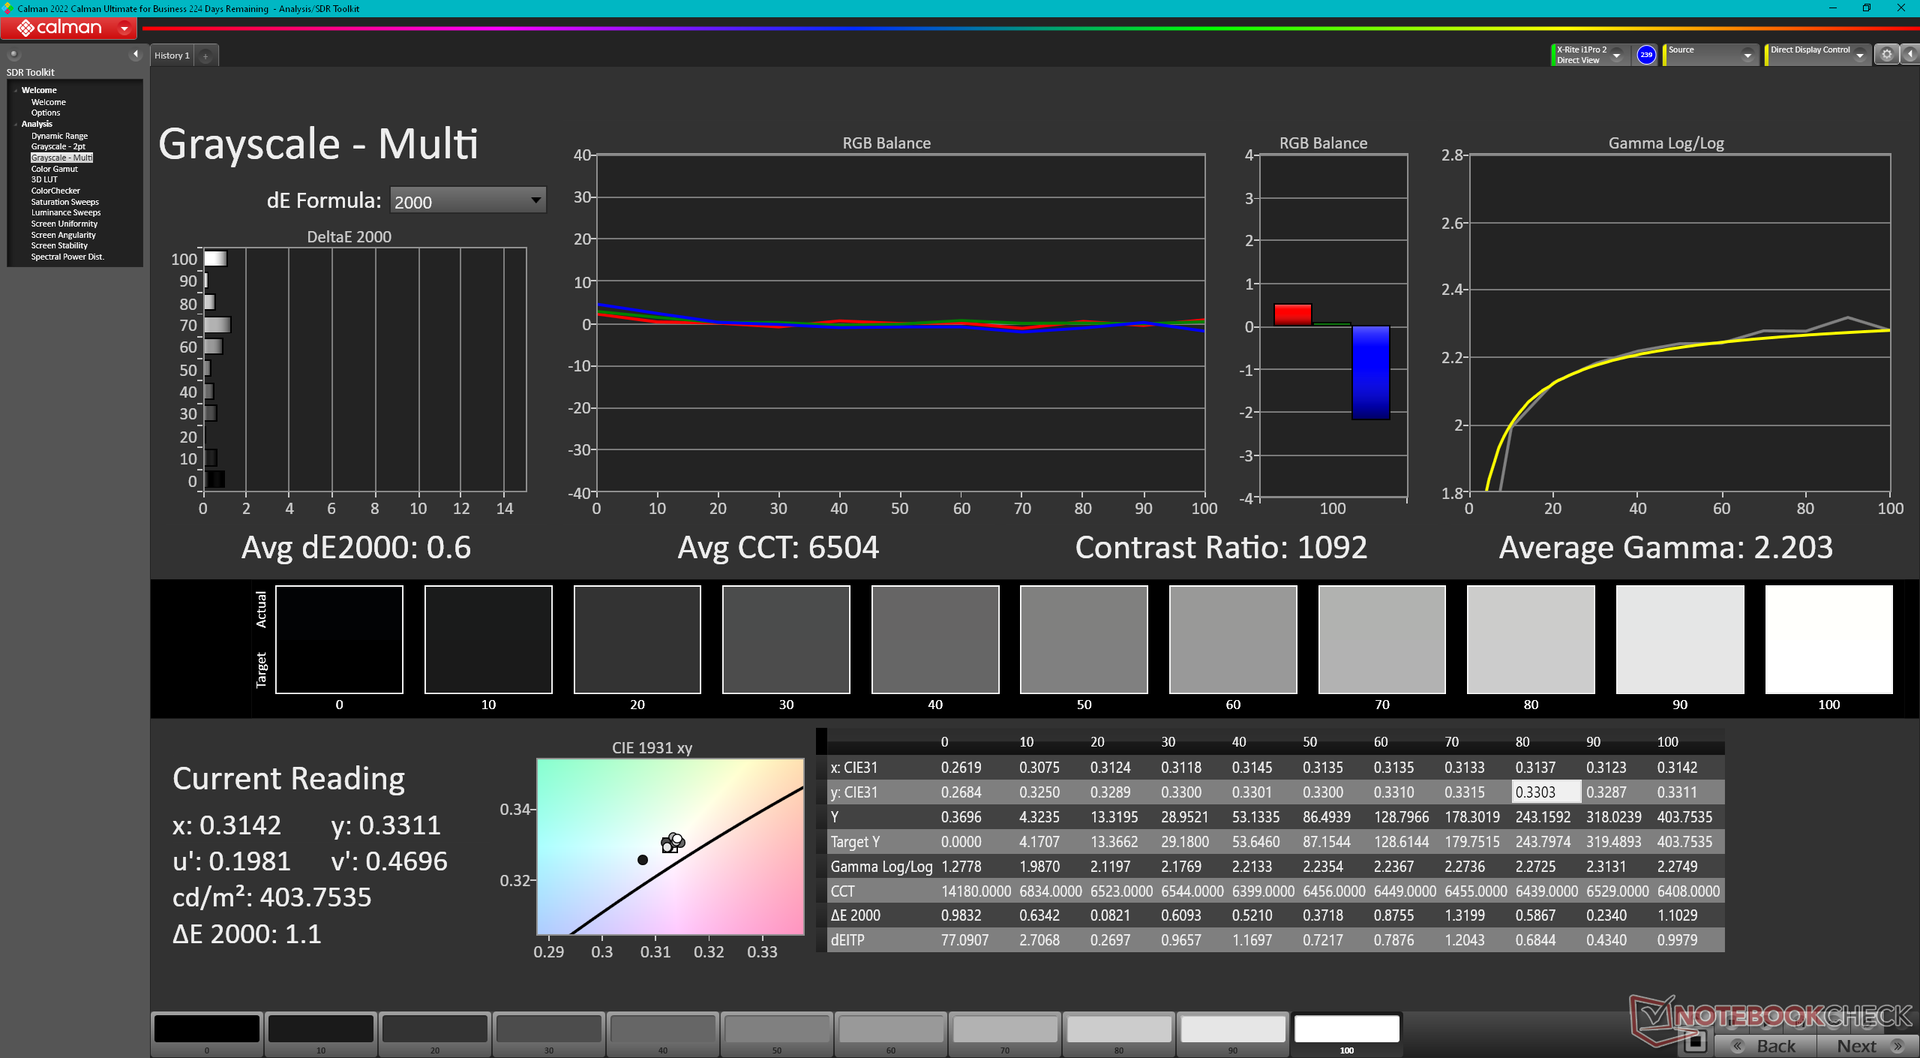
Notre modèle 2023 précoce utilise le même panneau BOE NE170QDM-NZ1 et le même contrôleur BOE0A99 que sur le modèle 2022, ce qui signifie que l'expérience visuelle n'est pas différente d'une année sur l'autre. Nos mesures ci-dessous sont donc presque identiques entre les modèles 2022 et 2023. Il ne s'agit pas d'une plainte car le panneau offre presque tout ce que nous attendons d'un ordinateur portable de jeu haut de gamme, y compris des taux de rafraîchissement rapides, des temps de réponse rapides, une couverture sRGB complète et le support G-Sync. Pour des résolutions plus élevées et des couleurs P3 encore plus profondes, vous devrez plutôt chercher ailleurs, comme le MSI GT77 ou le Razer Blade 18.
| |||||||||||||||||||||||||
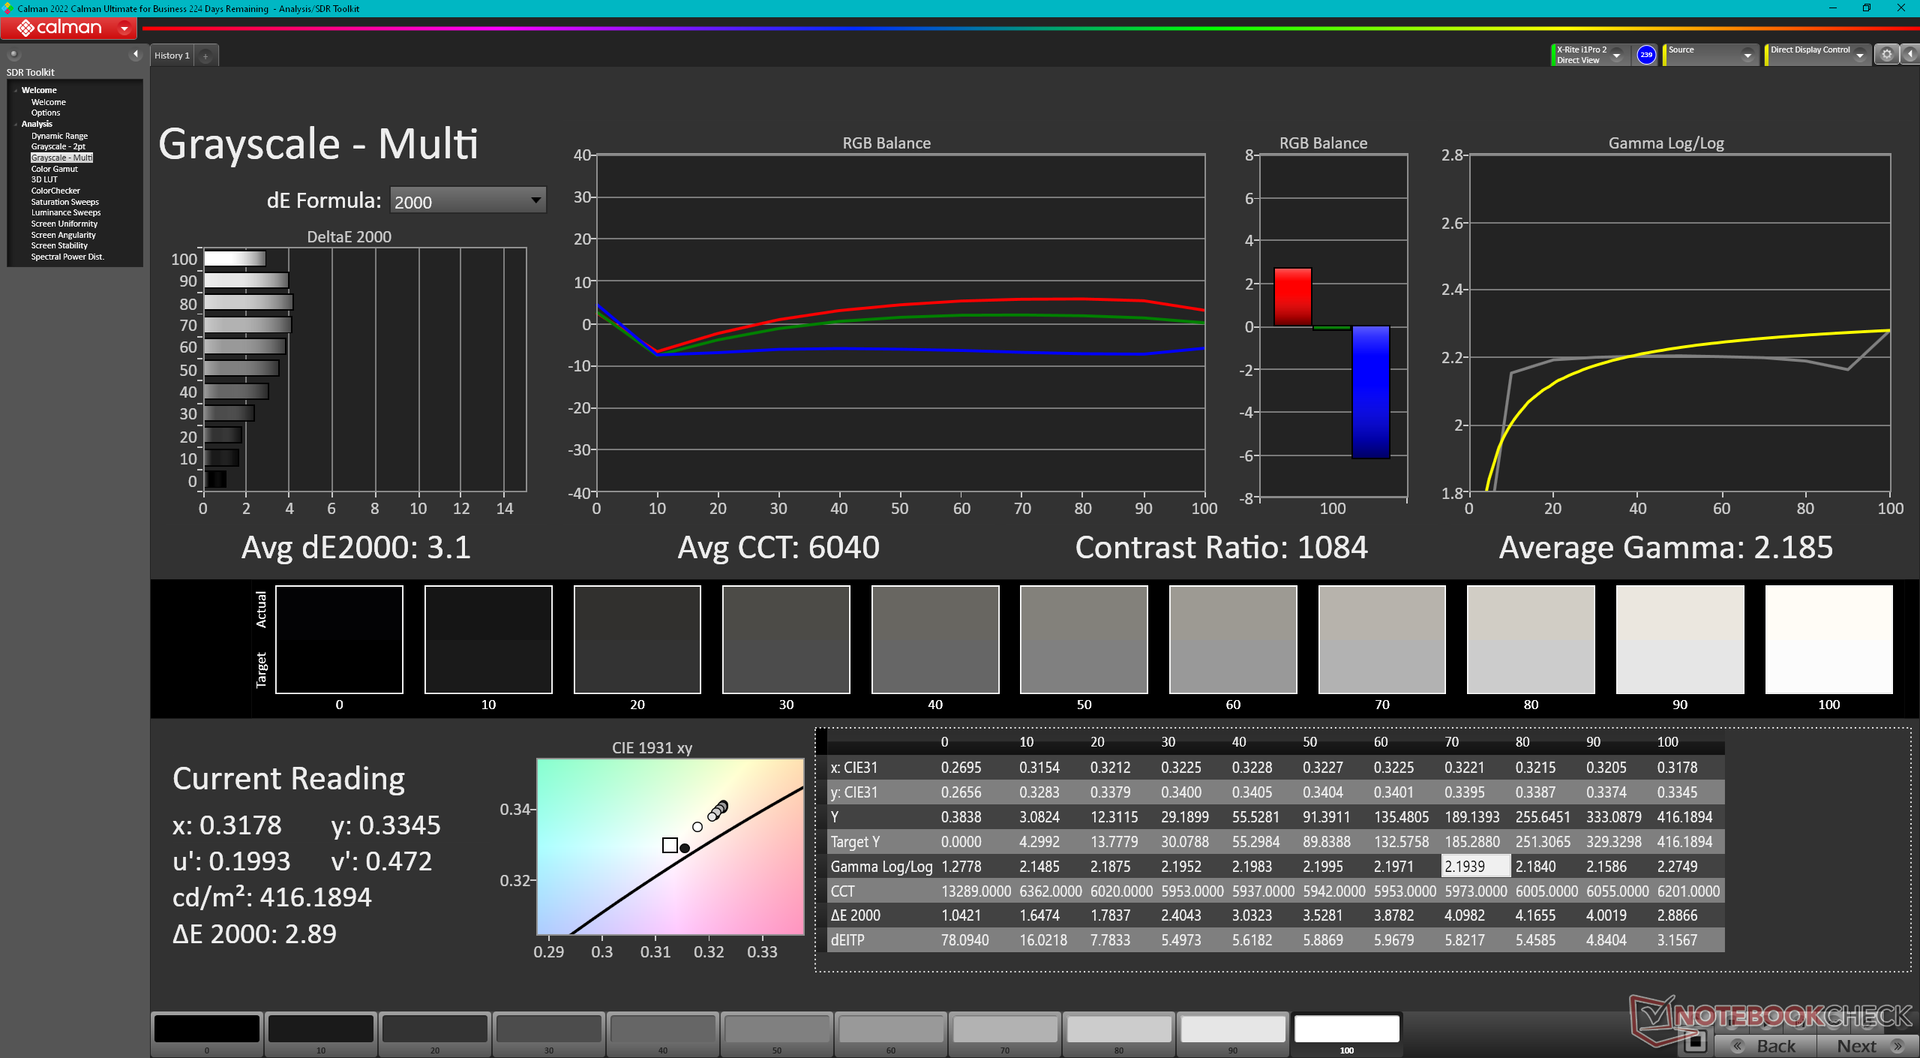
Homogénéité de la luminosité: 87 %
Valeur mesurée au centre, sur batterie: 417.3 cd/m²
Contraste: 994:1 (Valeurs des noirs: 0.42 cd/m²)
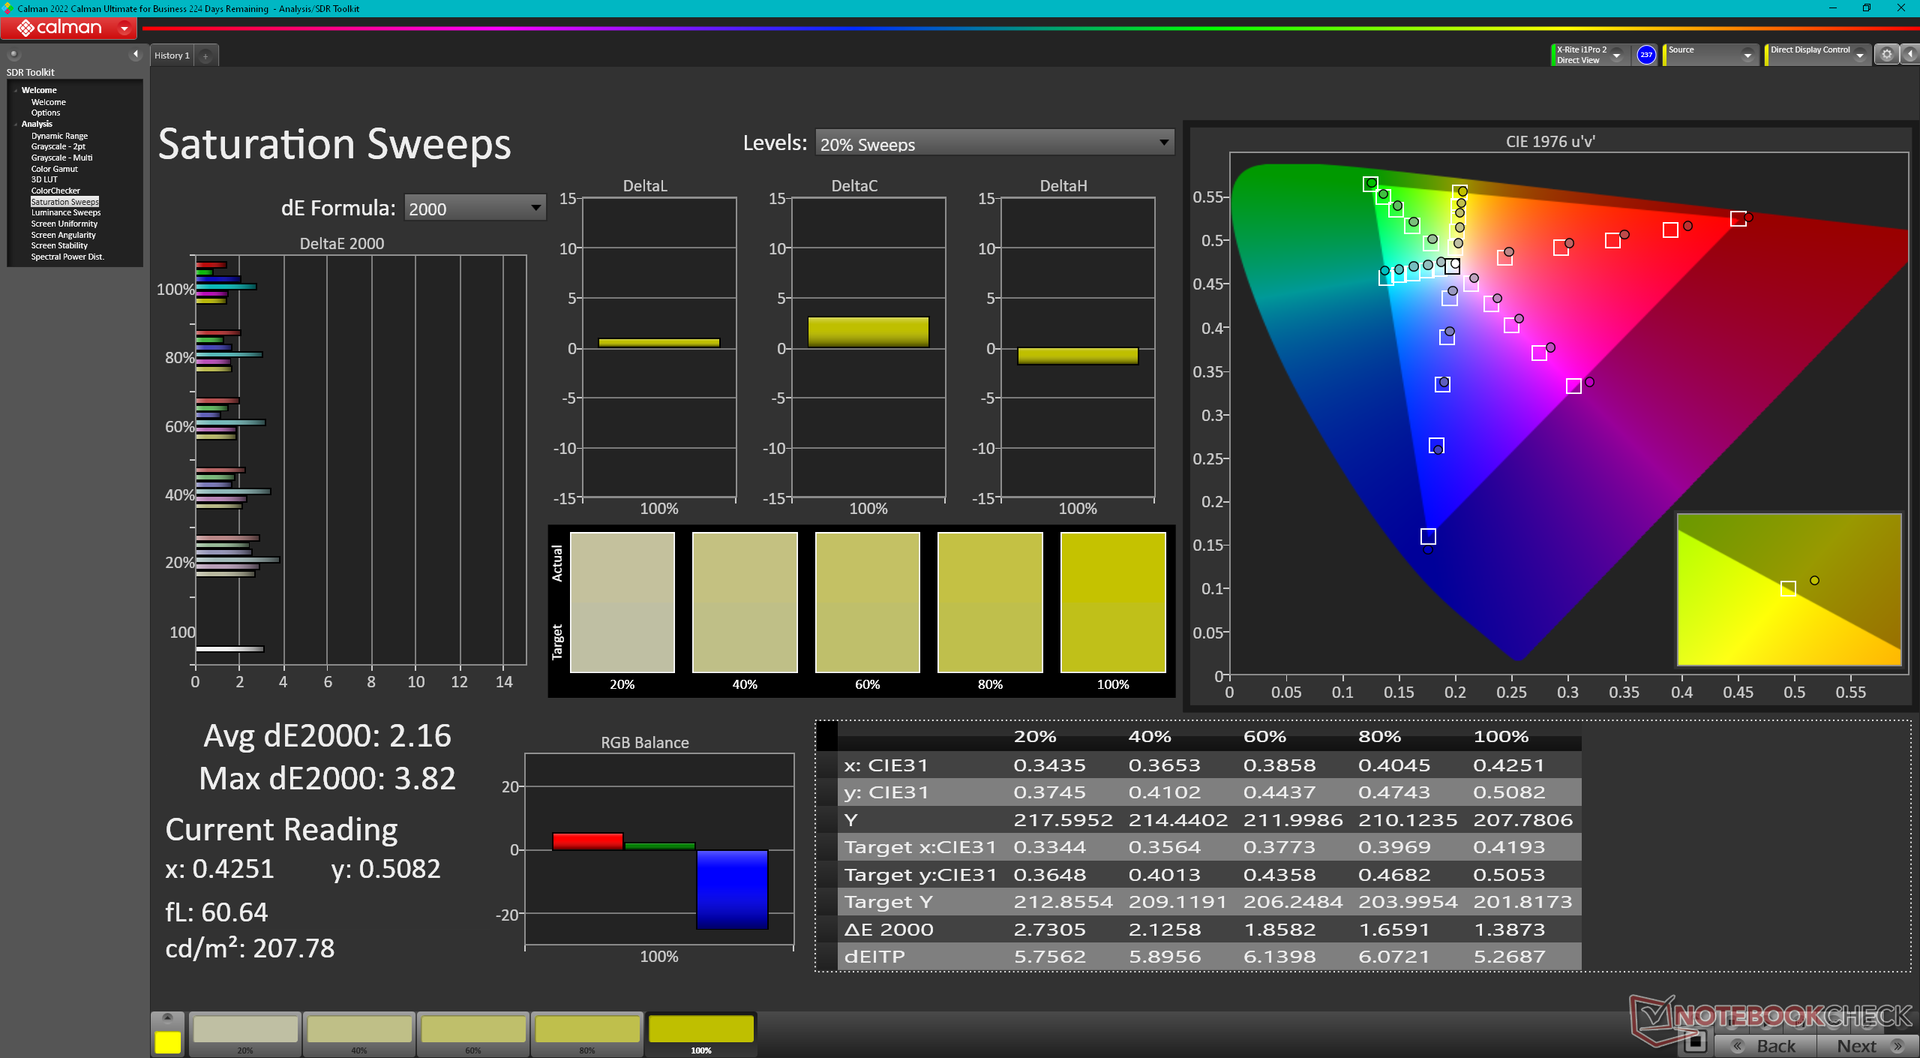
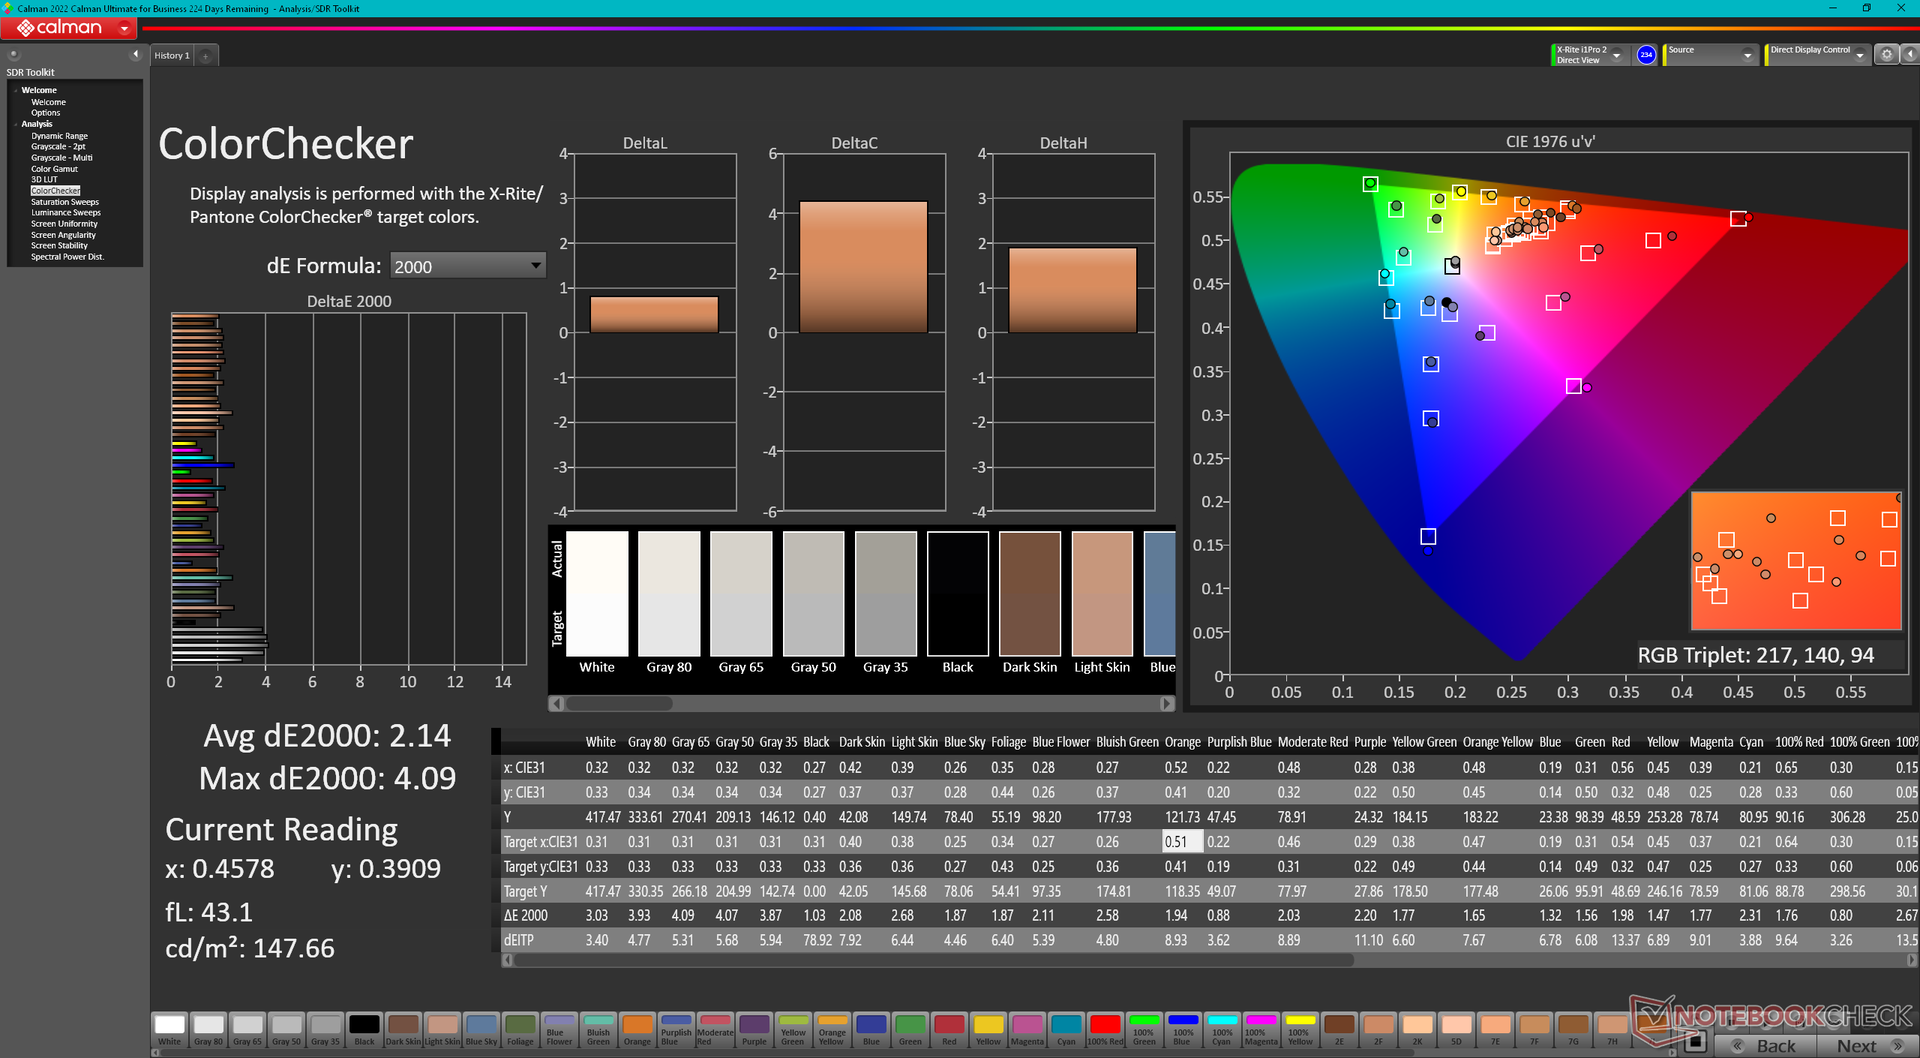
ΔE ColorChecker Calman: 2.14 | ∀{0.5-29.43 Ø4.74}
calibrated: 0.42
ΔE Greyscale Calman: 3.1 | ∀{0.09-98 Ø4.99}
69.8% AdobeRGB 1998 (Argyll 3D)
99.7% sRGB (Argyll 3D)
69.1% Display P3 (Argyll 3D)
Gamma: 2.19
CCT: 6040 K
| Eluktronics Mech-17 GP2 BOE NE170QDM-NZ1, IPS, 2560x1600, 17" | Schenker XMG Neo 17 M22 BOE0A99, IPS, 2560x1600, 17" | MSI Katana 17 B13VFK B173HAN04.9, IPS LED, 1920x1080, 17.3" | MSI Titan GT77 HX 13VI B173ZAN06.C, Mini-LED, 3840x2160, 17.3" | Alienware m17 R5 (R9 6900HX, RX 6850M XT) AU Optronics AUODBA3, IPS, 3840x2160, 17" | Razer Blade 18 RTX 4070 AU Optronics B180QAN01.0, IPS, 2560x1600, 18" | |
|---|---|---|---|---|---|---|
| Display | 0% | -40% | 23% | 23% | 21% | |
| Display P3 Coverage (%) | 69.1 | 69 0% | 40.8 -41% | 94.9 37% | 97.2 41% | 96.9 40% |
| sRGB Coverage (%) | 99.7 | 99.8 0% | 61 -39% | 99.9 0% | 99.6 0% | 99.8 0% |
| AdobeRGB 1998 Coverage (%) | 69.8 | 69.6 0% | 42.2 -40% | 92.4 32% | 88.4 27% | 85.3 22% |
| Response Times | 23% | -176% | -202% | -30% | 40% | |
| Response Time Grey 50% / Grey 80% * (ms) | 12 ? | 10.8 ? 10% | 33 ? -175% | 38.4 ? -220% | 16.4 ? -37% | 4.2 ? 65% |
| Response Time Black / White * (ms) | 9.4 ? | 6.1 ? 35% | 26 ? -177% | 26.6 ? -183% | 11.6 ? -23% | 8 ? 15% |
| PWM Frequency (Hz) | 2380 ? | |||||
| Screen | 1% | -158% | 67678% | -147% | -64% | |
| Brightness middle (cd/m²) | 417.3 | 415 -1% | 267 -36% | 606 45% | 484 16% | 549.6 32% |
| Brightness (cd/m²) | 387 | 399 3% | 256 -34% | 602 56% | 449 16% | 524 35% |
| Brightness Distribution (%) | 87 | 90 3% | 93 7% | 93 7% | 87 0% | 89 2% |
| Black Level * (cd/m²) | 0.42 | 0.43 -2% | 0.21 50% | 0.0001 100% | 0.55 -31% | 0.53 -26% |
| Contrast (:1) | 994 | 965 -3% | 1271 28% | 6060000 609558% | 880 -11% | 1037 4% |
| Colorchecker dE 2000 * | 2.14 | 1.44 33% | 4.7 -120% | 4.8 -124% | 4.8 -124% | 3.32 -55% |
| Colorchecker dE 2000 max. * | 4.09 | 2.33 43% | 20.4 -399% | 8.2 -100% | 7.48 -83% | 6.63 -62% |
| Colorchecker dE 2000 calibrated * | 0.42 | 0.89 -112% | 4.5 -971% | 1.8 -329% | 4.74 -1029% | 2.7 -543% |
| Greyscale dE 2000 * | 3.1 | 1.8 42% | 1.5 52% | 6.5 -110% | 5.5 -77% | 2 35% |
| Gamma | 2.19 100% | 2.132 103% | 2.12 104% | 2.63 84% | 2.42 91% | 2.29 96% |
| CCT | 6040 108% | 6327 103% | 6552 99% | 6596 99% | 6148 106% | 6319 103% |
| Moyenne finale (programmes/paramètres) | 8% /
4% | -125% /
-135% | 22500% /
43484% | -51% /
-94% | -1% /
-31% |
* ... Moindre est la valeur, meilleures sont les performances
L'écran est bien calibré dès sa sortie de l'emballage, avec des valeurs moyennes de deltaE en niveaux de gris et en couleurs de seulement 3,1 et 2,14, respectivement. En le calibrant nous-mêmes, nous améliorerions encore les valeurs moyennes de deltaE, qui atteindraient seulement 0,6 et 0,42 par rapport à la norme sRGB. Notre profil ICM calibré ci-dessus peut être téléchargé gratuitement.
Temps de réponse de l'écran
| ↔ Temps de réponse noir à blanc | ||
|---|---|---|
| 9.4 ms ... hausse ↗ et chute ↘ combinées | ↗ 4.9 ms hausse | 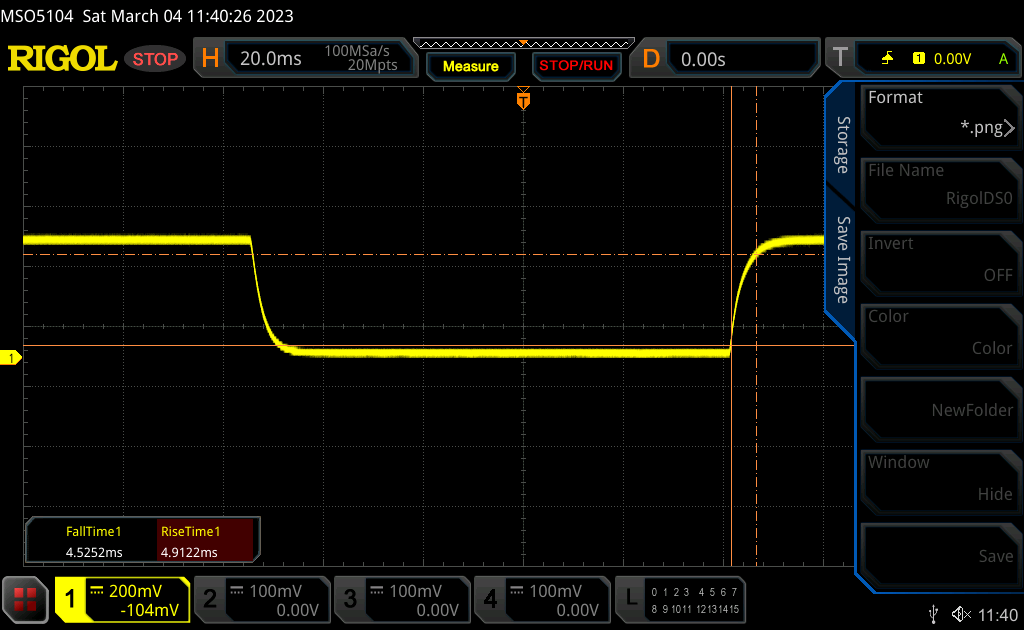 |
| ↘ 4.5 ms chute | ||
| L'écran montre de faibles temps de réponse, un bon écran pour jouer. En comparaison, tous les appareils testés affichent entre 0.1 (minimum) et 240 (maximum) ms. » 26 % des appareils testés affichent de meilleures performances. Cela signifie que les latences relevées sont meilleures que la moyenne (20 ms) de tous les appareils testés. | ||
| ↔ Temps de réponse gris 50% à gris 80% | ||
| 12 ms ... hausse ↗ et chute ↘ combinées | ↗ 5.4 ms hausse | 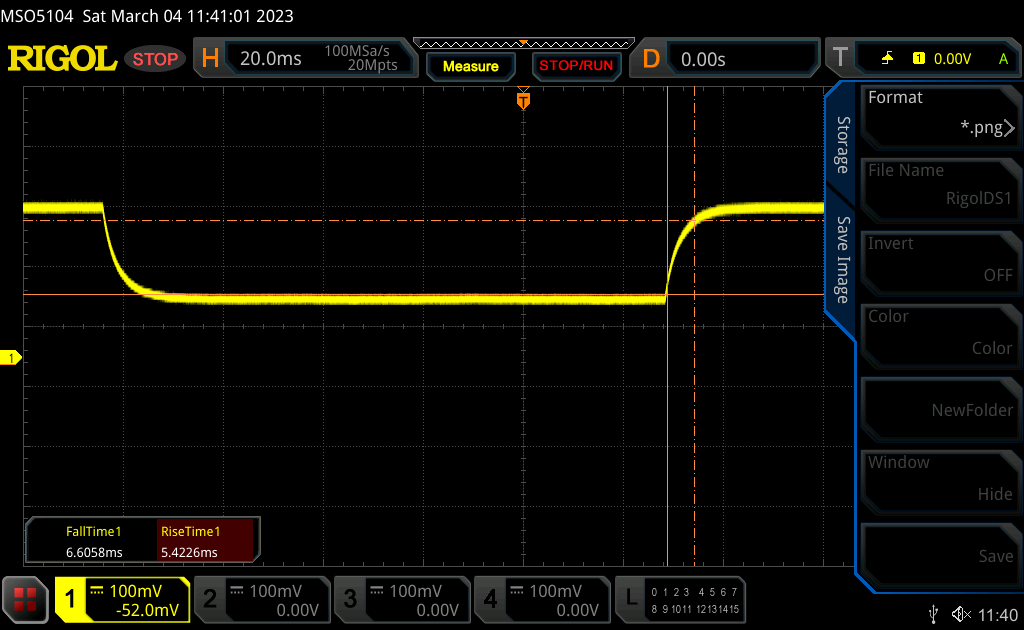 |
| ↘ 6.6 ms chute | ||
| L'écran montre de bons temps de réponse, mais insuffisant pour du jeu compétitif. En comparaison, tous les appareils testés affichent entre 0.165 (minimum) et 636 (maximum) ms. » 25 % des appareils testés affichent de meilleures performances. Cela signifie que les latences relevées sont meilleures que la moyenne (31.3 ms) de tous les appareils testés. | ||
Scintillement / MLI (Modulation de largeur d'impulsion)
| Scintillement / MLI (Modulation de largeur d'impulsion) non décelé | 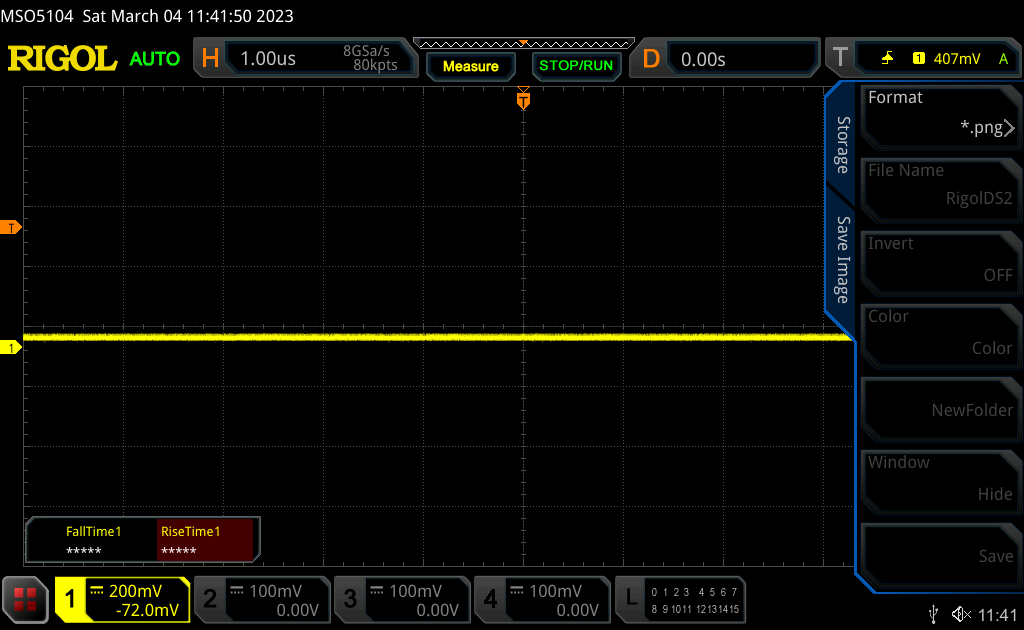 | ||
En comparaison, 53 % des appareils testés n'emploient pas MDI pour assombrir leur écran. Nous avons relevé une moyenne à 7920 (minimum : 5 - maximum : 343500) Hz dans le cas où une MDI était active. | |||
Performance
Conditions d'essai
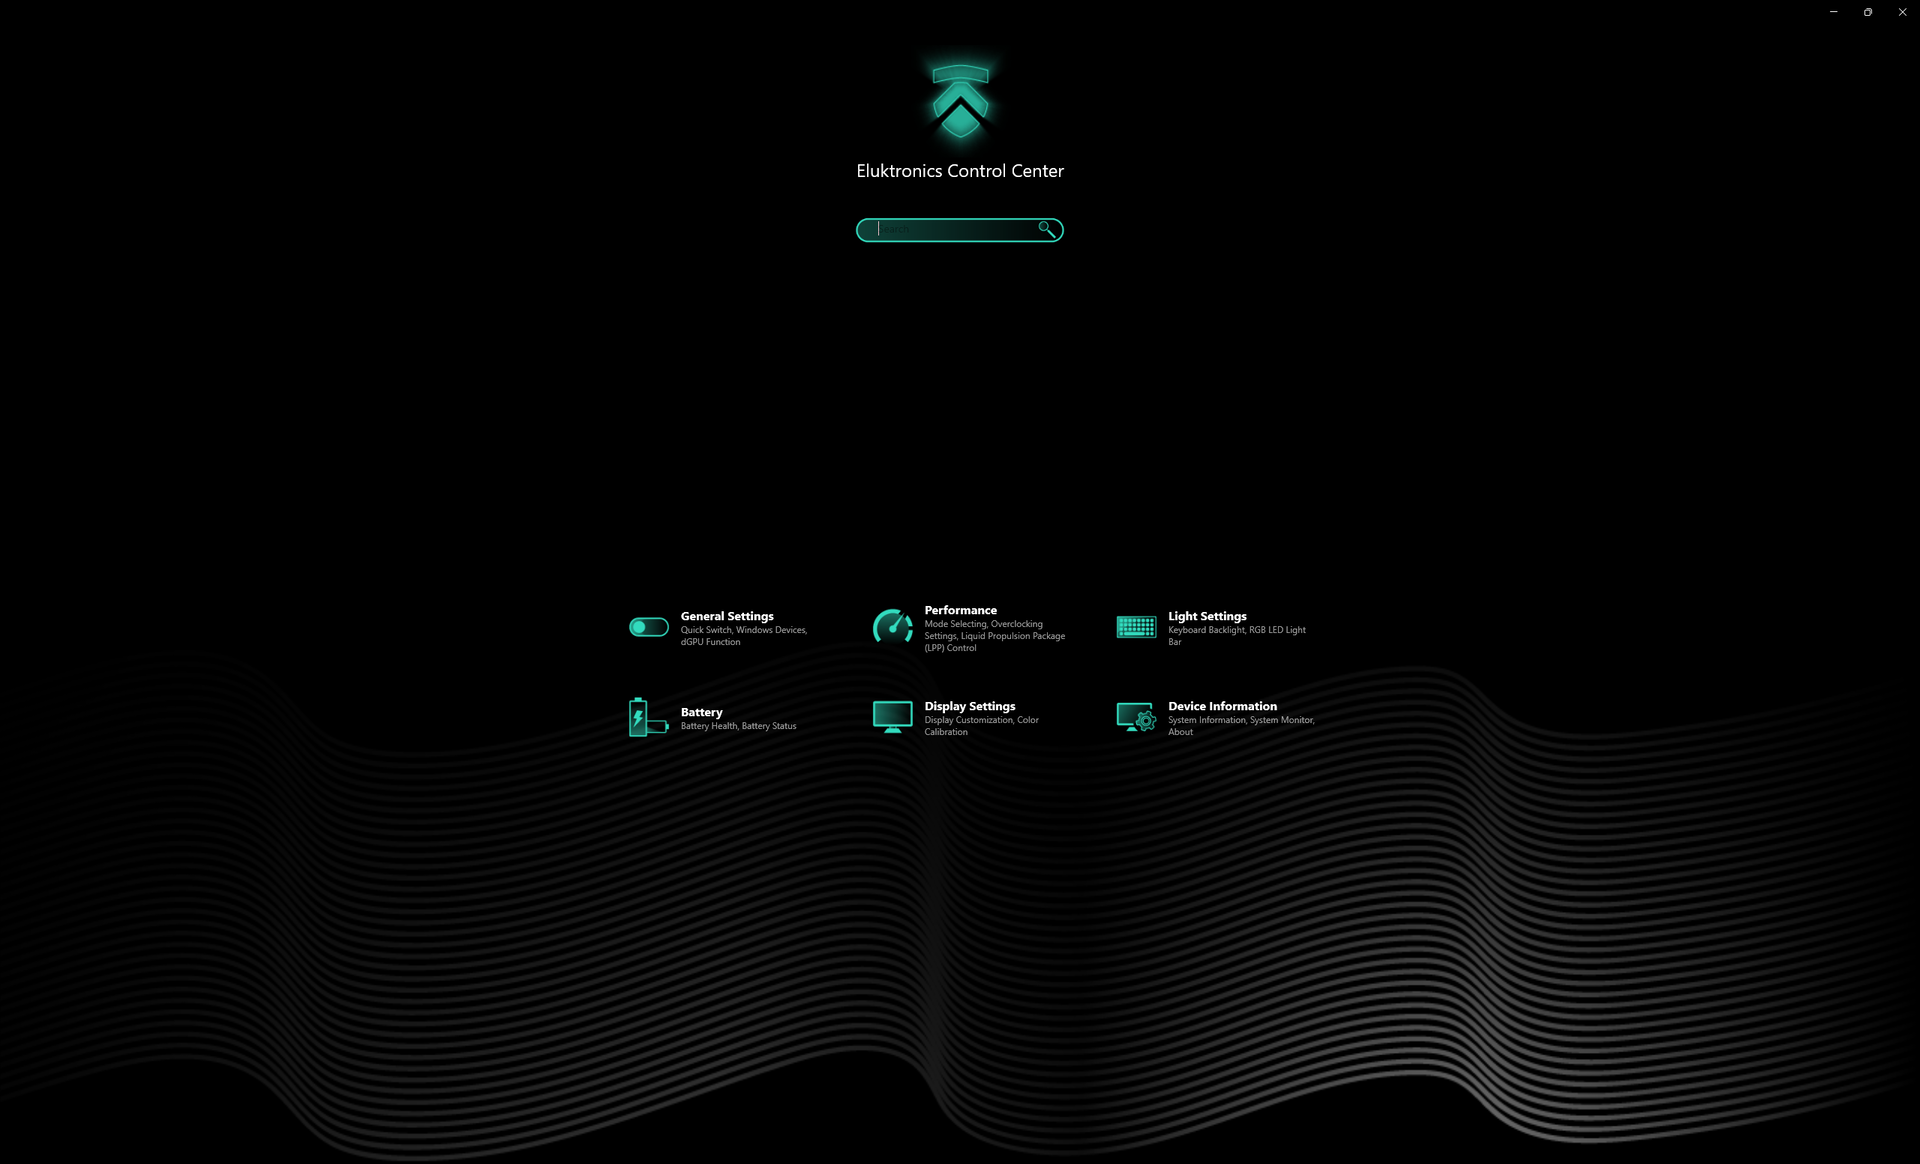
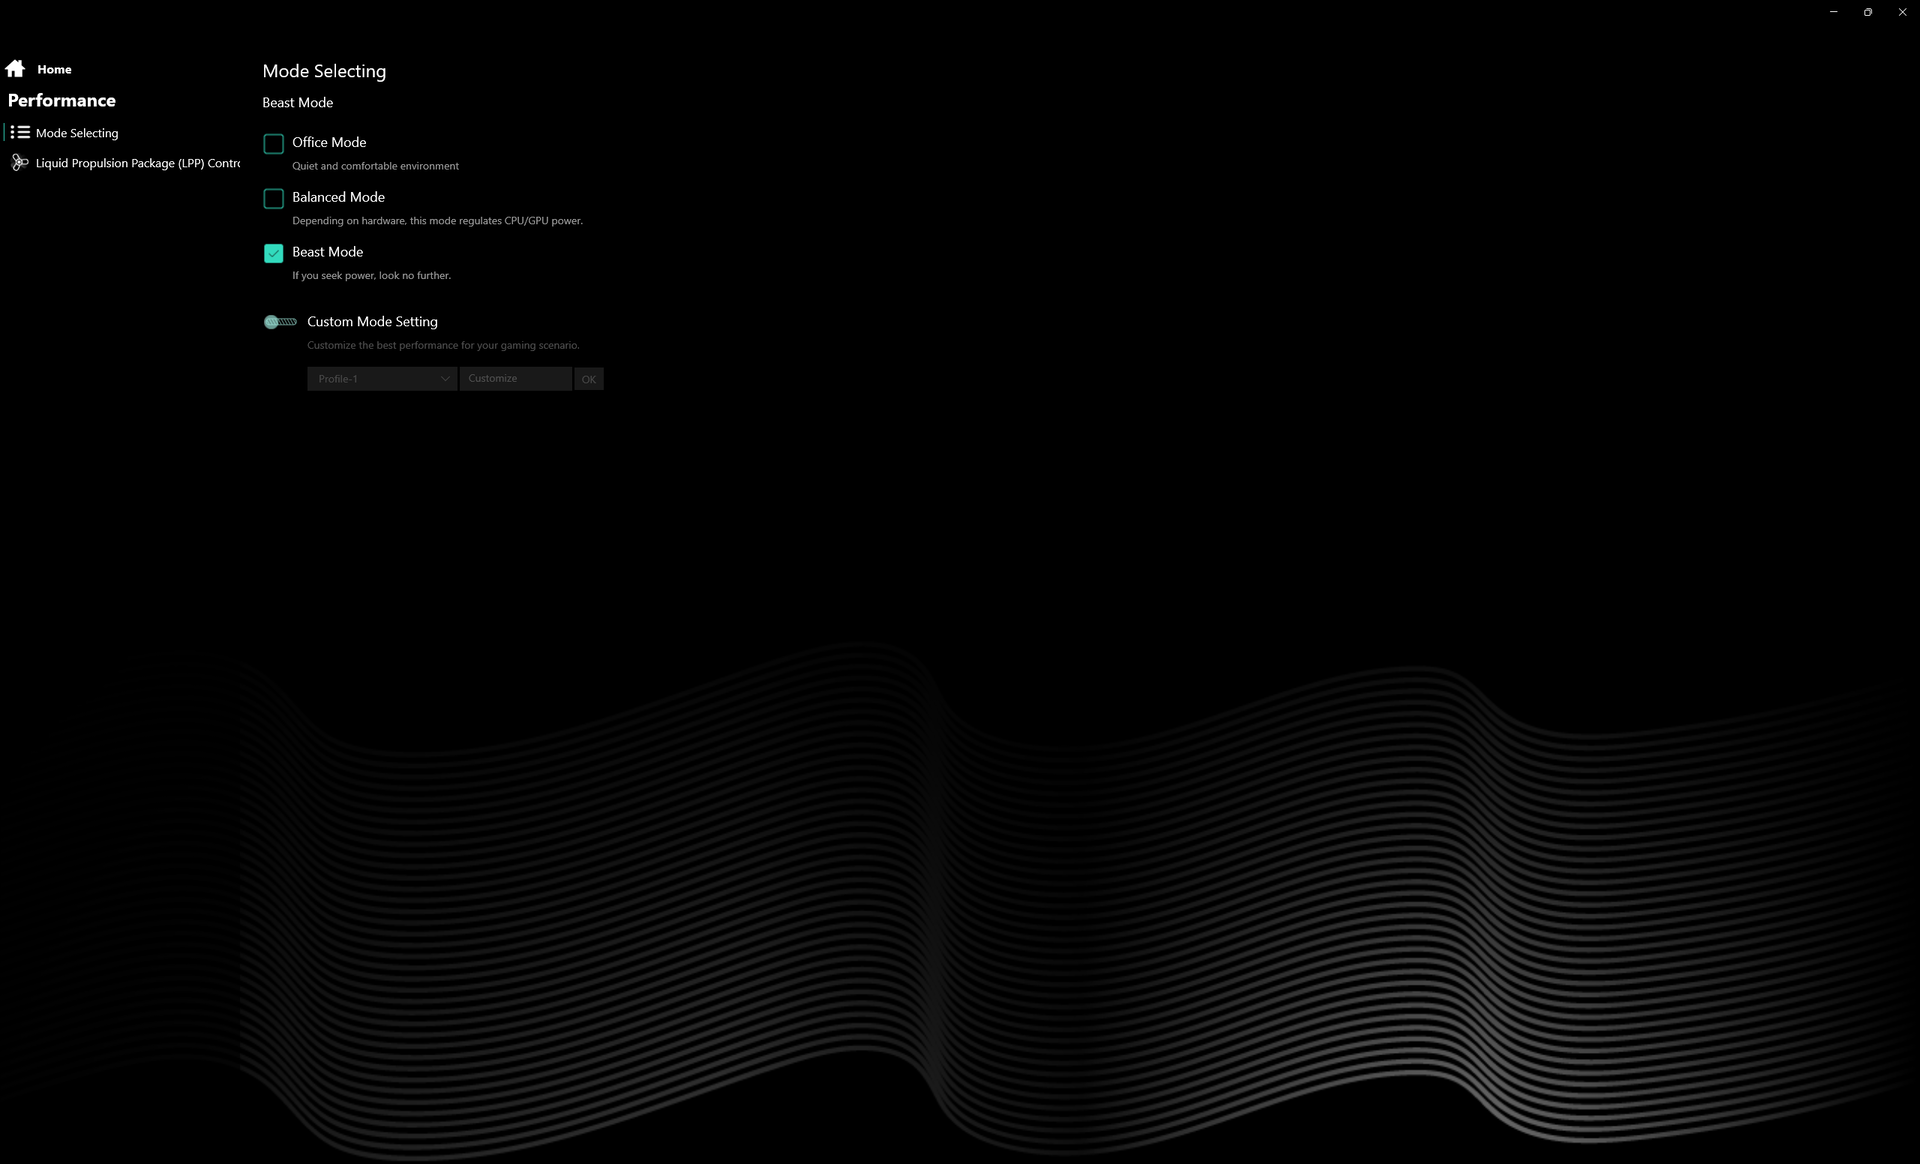
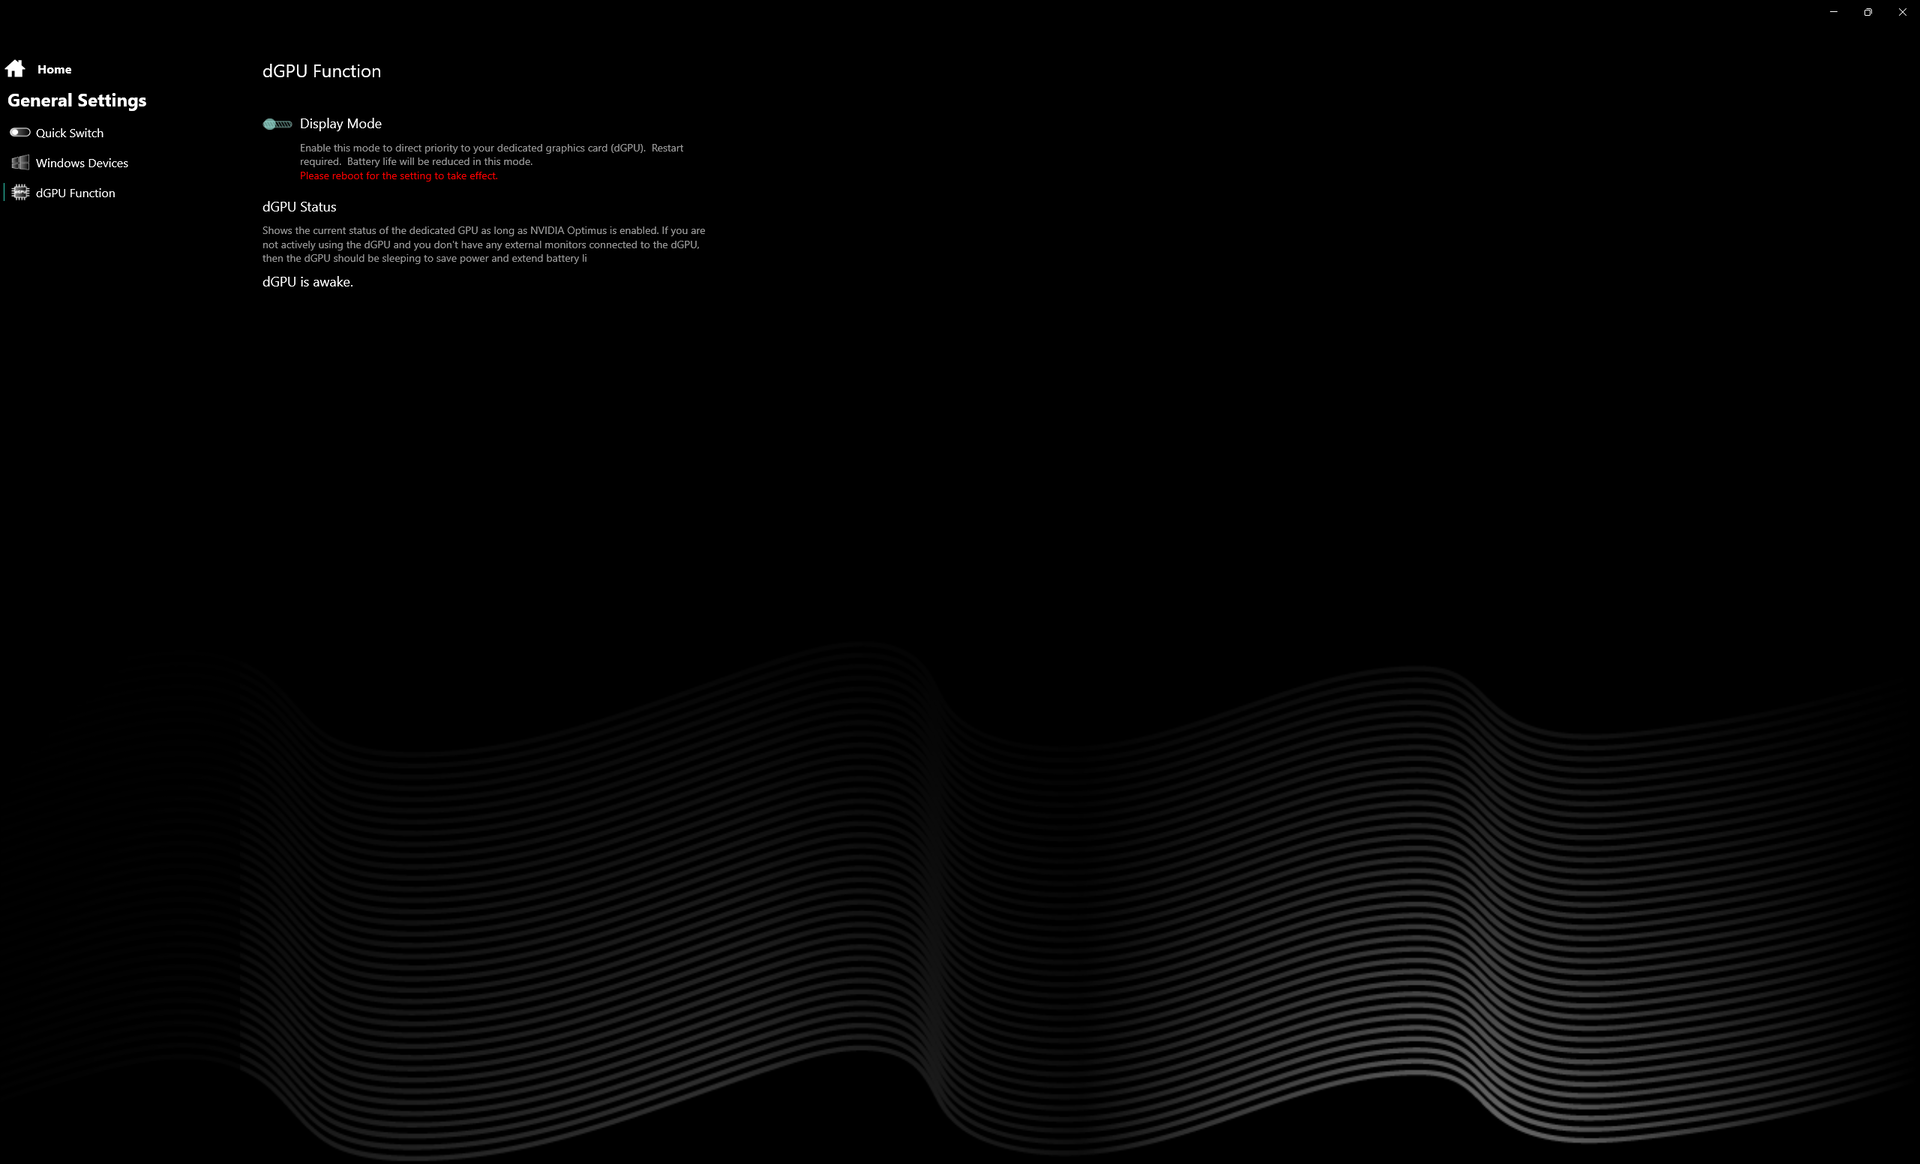
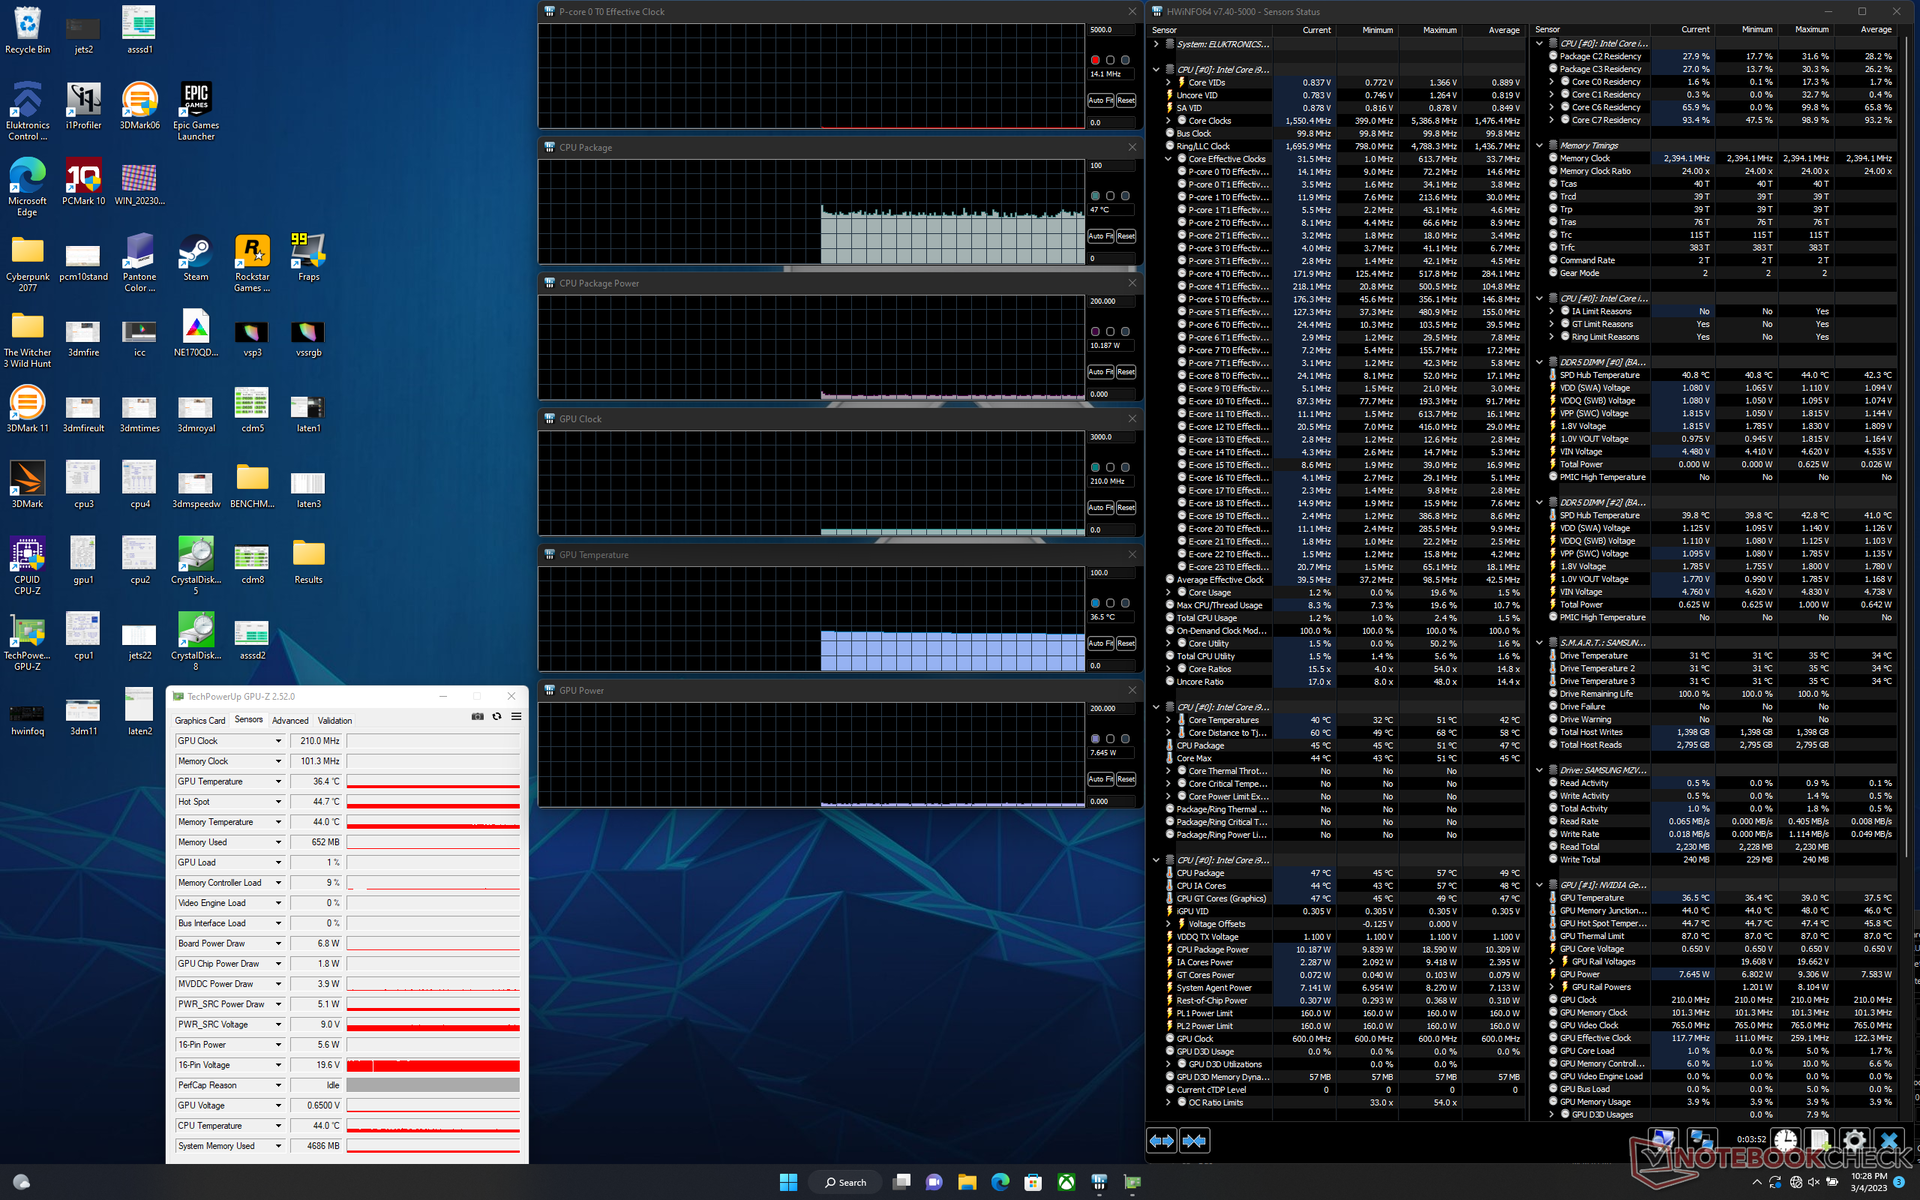
Nous avons réglé notre unité en mode Performance via Windows et en "Beast Mode" via le logiciel préinstallé Eluktronics Control Center avant d'effectuer les tests de référence ci-dessous. Nous avons également réglé le système en mode dGPU via le panneau de configuration Nvidia. Les propriétaires doivent se familiariser avec le Control Center, car c'est le centre de commutation des fonctions spécifiques au modèle, comme le RVB, les modes de charge de la batterie, les modes de performance, le mode de refroidissement liquide, et bien plus encore. Advanced Optimus (MUX) est pris en charge.
Nous avons rencontré quelques problèmes sur notre unité de test, notamment des écrans de démarrage vides, au moins un blocage du système pendant les jeux, et des redémarrages automatiques lorsque le CPU et le GPU sont utilisés au maximum pendant de longues périodes. Nous avons résolu le premier problème en désactivant le démarrage rapide dans le menu du BIOS, mais de tels problèmes ne devraient pas exister en premier lieu.
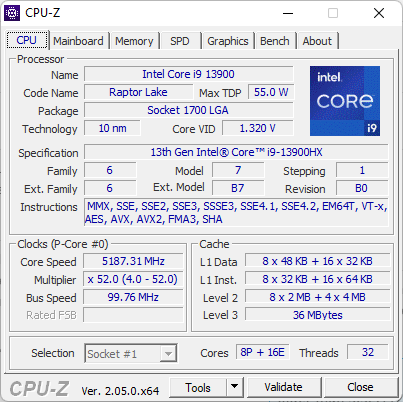
Processeur
Les performances brutes du processeur ne sont inférieures que de 1 à 2 % à celles du Core i9-13950HX de la 13e génération Core i9-13950HX de la MSI Titan GT77 et ils sont donc équivalents dans la plupart des scénarios. En passant du Ryzen 9 6900HX à notre Core i9-13900HX augmente les performances multithread d'un extraordinaire 2x à 2,5x. Le Core i7-12700HX de 12e génération Core i7-12700Hde 12e génération, qui équipe encore de nombreux ordinateurs portables de jeu de milieu de gamme, est environ 50 % plus lent.
La durabilité des performances est excellente et il n'y a pas de baisse importante des performances ni de comportement cyclique au fil du temps.
Cinebench R15 Multi Loop
Cinebench R23: Multi Core | Single Core
Cinebench R20: CPU (Multi Core) | CPU (Single Core)
Cinebench R15: CPU Multi 64Bit | CPU Single 64Bit
Blender: v2.79 BMW27 CPU
7-Zip 18.03: 7z b 4 | 7z b 4 -mmt1
Geekbench 5.5: Multi-Core | Single-Core
HWBOT x265 Benchmark v2.2: 4k Preset
LibreOffice : 20 Documents To PDF
R Benchmark 2.5: Overall mean
| Cinebench R20 / CPU (Multi Core) | |
| MSI Titan GT77 HX 13VI | |
| Eluktronics Mech-17 GP2 | |
| Razer Blade 18 RTX 4070 | |
| Moyenne Intel Core i9-13900HX (9152 - 12541, n=21) | |
| Corsair One i300 | |
| MSI Titan GT77 12UHS | |
| MSI Pulse GL76 12UGK | |
| MSI Katana 17 B13VFK | |
| Schenker XMG Neo 17 M22 | |
| HP Omen 16-n0033dx | |
| MSI GS76 Stealth 11UH | |
| Schenker XMG Core 17 (Early 2021) | |
| Cinebench R20 / CPU (Single Core) | |
| MSI Titan GT77 HX 13VI | |
| Eluktronics Mech-17 GP2 | |
| Razer Blade 18 RTX 4070 | |
| Moyenne Intel Core i9-13900HX (722 - 810, n=21) | |
| Corsair One i300 | |
| MSI Titan GT77 12UHS | |
| MSI Katana 17 B13VFK | |
| MSI Pulse GL76 12UGK | |
| MSI GS76 Stealth 11UH | |
| Schenker XMG Neo 17 M22 | |
| HP Omen 16-n0033dx | |
| Schenker XMG Core 17 (Early 2021) | |
| Cinebench R15 / CPU Multi 64Bit | |
| MSI Titan GT77 HX 13VI | |
| Eluktronics Mech-17 GP2 | |
| Moyenne Intel Core i9-13900HX (3913 - 4970, n=22) | |
| Razer Blade 18 RTX 4070 | |
| MSI Titan GT77 12UHS | |
| Corsair One i300 | |
| MSI Pulse GL76 12UGK | |
| MSI Katana 17 B13VFK | |
| Schenker XMG Neo 17 M22 | |
| HP Omen 16-n0033dx | |
| MSI GS76 Stealth 11UH | |
| Schenker XMG Core 17 (Early 2021) | |
| Cinebench R15 / CPU Single 64Bit | |
| MSI Titan GT77 HX 13VI | |
| Eluktronics Mech-17 GP2 | |
| Razer Blade 18 RTX 4070 | |
| Corsair One i300 | |
| Moyenne Intel Core i9-13900HX (247 - 304, n=22) | |
| MSI Titan GT77 12UHS | |
| MSI Katana 17 B13VFK | |
| MSI Pulse GL76 12UGK | |
| Schenker XMG Neo 17 M22 | |
| HP Omen 16-n0033dx | |
| MSI GS76 Stealth 11UH | |
| Schenker XMG Core 17 (Early 2021) | |
| HWBOT x265 Benchmark v2.2 / 4k Preset | |
| Eluktronics Mech-17 GP2 | |
| MSI Titan GT77 HX 13VI | |
| Razer Blade 18 RTX 4070 | |
| Moyenne Intel Core i9-13900HX (23.5 - 34.4, n=22) | |
| Corsair One i300 | |
| MSI Titan GT77 12UHS | |
| MSI Pulse GL76 12UGK | |
| Schenker XMG Neo 17 M22 | |
| MSI Katana 17 B13VFK | |
| HP Omen 16-n0033dx | |
| MSI GS76 Stealth 11UH | |
| Schenker XMG Core 17 (Early 2021) | |
| LibreOffice / 20 Documents To PDF | |
| HP Omen 16-n0033dx | |
| MSI Katana 17 B13VFK | |
| Schenker XMG Core 17 (Early 2021) | |
| Schenker XMG Neo 17 M22 | |
| MSI GS76 Stealth 11UH | |
| MSI Titan GT77 HX 13VI | |
| MSI Pulse GL76 12UGK | |
| Razer Blade 18 RTX 4070 | |
| Moyenne Intel Core i9-13900HX (32.8 - 51.1, n=21) | |
| MSI Titan GT77 12UHS | |
| Corsair One i300 | |
| Eluktronics Mech-17 GP2 | |
* ... Moindre est la valeur, meilleures sont les performances
AIDA64: FP32 Ray-Trace | FPU Julia | CPU SHA3 | CPU Queen | FPU SinJulia | FPU Mandel | CPU AES | CPU ZLib | FP64 Ray-Trace | CPU PhotoWorxx
| Performance rating | |
| Eluktronics Mech-17 GP2 | |
| MSI Titan GT77 HX 13VI | |
| Razer Blade 18 RTX 4070 | |
| Moyenne Intel Core i9-13900HX | |
| Schenker XMG Neo 17 M22 | |
| Alienware m17 R5 (R9 6900HX, RX 6850M XT) | |
| MSI Katana 17 B13VFK | |
| AIDA64 / FP32 Ray-Trace | |
| MSI Titan GT77 HX 13VI | |
| Eluktronics Mech-17 GP2 | |
| Razer Blade 18 RTX 4070 | |
| Moyenne Intel Core i9-13900HX (17589 - 27615, n=22) | |
| Alienware m17 R5 (R9 6900HX, RX 6850M XT) | |
| Schenker XMG Neo 17 M22 | |
| MSI Katana 17 B13VFK | |
| AIDA64 / FPU Julia | |
| MSI Titan GT77 HX 13VI | |
| Eluktronics Mech-17 GP2 | |
| Razer Blade 18 RTX 4070 | |
| Moyenne Intel Core i9-13900HX (88686 - 137015, n=22) | |
| Alienware m17 R5 (R9 6900HX, RX 6850M XT) | |
| Schenker XMG Neo 17 M22 | |
| MSI Katana 17 B13VFK | |
| AIDA64 / CPU SHA3 | |
| MSI Titan GT77 HX 13VI | |
| Eluktronics Mech-17 GP2 | |
| Razer Blade 18 RTX 4070 | |
| Moyenne Intel Core i9-13900HX (4362 - 7029, n=22) | |
| Alienware m17 R5 (R9 6900HX, RX 6850M XT) | |
| Schenker XMG Neo 17 M22 | |
| MSI Katana 17 B13VFK | |
| AIDA64 / CPU Queen | |
| Eluktronics Mech-17 GP2 | |
| MSI Titan GT77 HX 13VI | |
| Razer Blade 18 RTX 4070 | |
| Moyenne Intel Core i9-13900HX (125644 - 141385, n=22) | |
| Alienware m17 R5 (R9 6900HX, RX 6850M XT) | |
| Schenker XMG Neo 17 M22 | |
| MSI Katana 17 B13VFK | |
| AIDA64 / FPU SinJulia | |
| Eluktronics Mech-17 GP2 | |
| MSI Titan GT77 HX 13VI | |
| Razer Blade 18 RTX 4070 | |
| Moyenne Intel Core i9-13900HX (12334 - 17179, n=22) | |
| Alienware m17 R5 (R9 6900HX, RX 6850M XT) | |
| Schenker XMG Neo 17 M22 | |
| MSI Katana 17 B13VFK | |
| AIDA64 / FPU Mandel | |
| MSI Titan GT77 HX 13VI | |
| Eluktronics Mech-17 GP2 | |
| Razer Blade 18 RTX 4070 | |
| Moyenne Intel Core i9-13900HX (43850 - 69202, n=22) | |
| Alienware m17 R5 (R9 6900HX, RX 6850M XT) | |
| Schenker XMG Neo 17 M22 | |
| MSI Katana 17 B13VFK | |
| AIDA64 / CPU AES | |
| Eluktronics Mech-17 GP2 | |
| Moyenne Intel Core i9-13900HX (89413 - 237881, n=22) | |
| MSI Titan GT77 HX 13VI | |
| Schenker XMG Neo 17 M22 | |
| Razer Blade 18 RTX 4070 | |
| MSI Katana 17 B13VFK | |
| Alienware m17 R5 (R9 6900HX, RX 6850M XT) | |
| AIDA64 / CPU ZLib | |
| MSI Titan GT77 HX 13VI | |
| Eluktronics Mech-17 GP2 | |
| Razer Blade 18 RTX 4070 | |
| Moyenne Intel Core i9-13900HX (1284 - 1958, n=22) | |
| Alienware m17 R5 (R9 6900HX, RX 6850M XT) | |
| Schenker XMG Neo 17 M22 | |
| MSI Katana 17 B13VFK | |
| AIDA64 / FP64 Ray-Trace | |
| MSI Titan GT77 HX 13VI | |
| Eluktronics Mech-17 GP2 | |
| Razer Blade 18 RTX 4070 | |
| Moyenne Intel Core i9-13900HX (9481 - 15279, n=22) | |
| Alienware m17 R5 (R9 6900HX, RX 6850M XT) | |
| Schenker XMG Neo 17 M22 | |
| MSI Katana 17 B13VFK | |
| AIDA64 / CPU PhotoWorxx | |
| Razer Blade 18 RTX 4070 | |
| Moyenne Intel Core i9-13900HX (42994 - 51994, n=22) | |
| Eluktronics Mech-17 GP2 | |
| MSI Titan GT77 HX 13VI | |
| MSI Katana 17 B13VFK | |
| Alienware m17 R5 (R9 6900HX, RX 6850M XT) | |
| Schenker XMG Neo 17 M22 | |
Performance du système
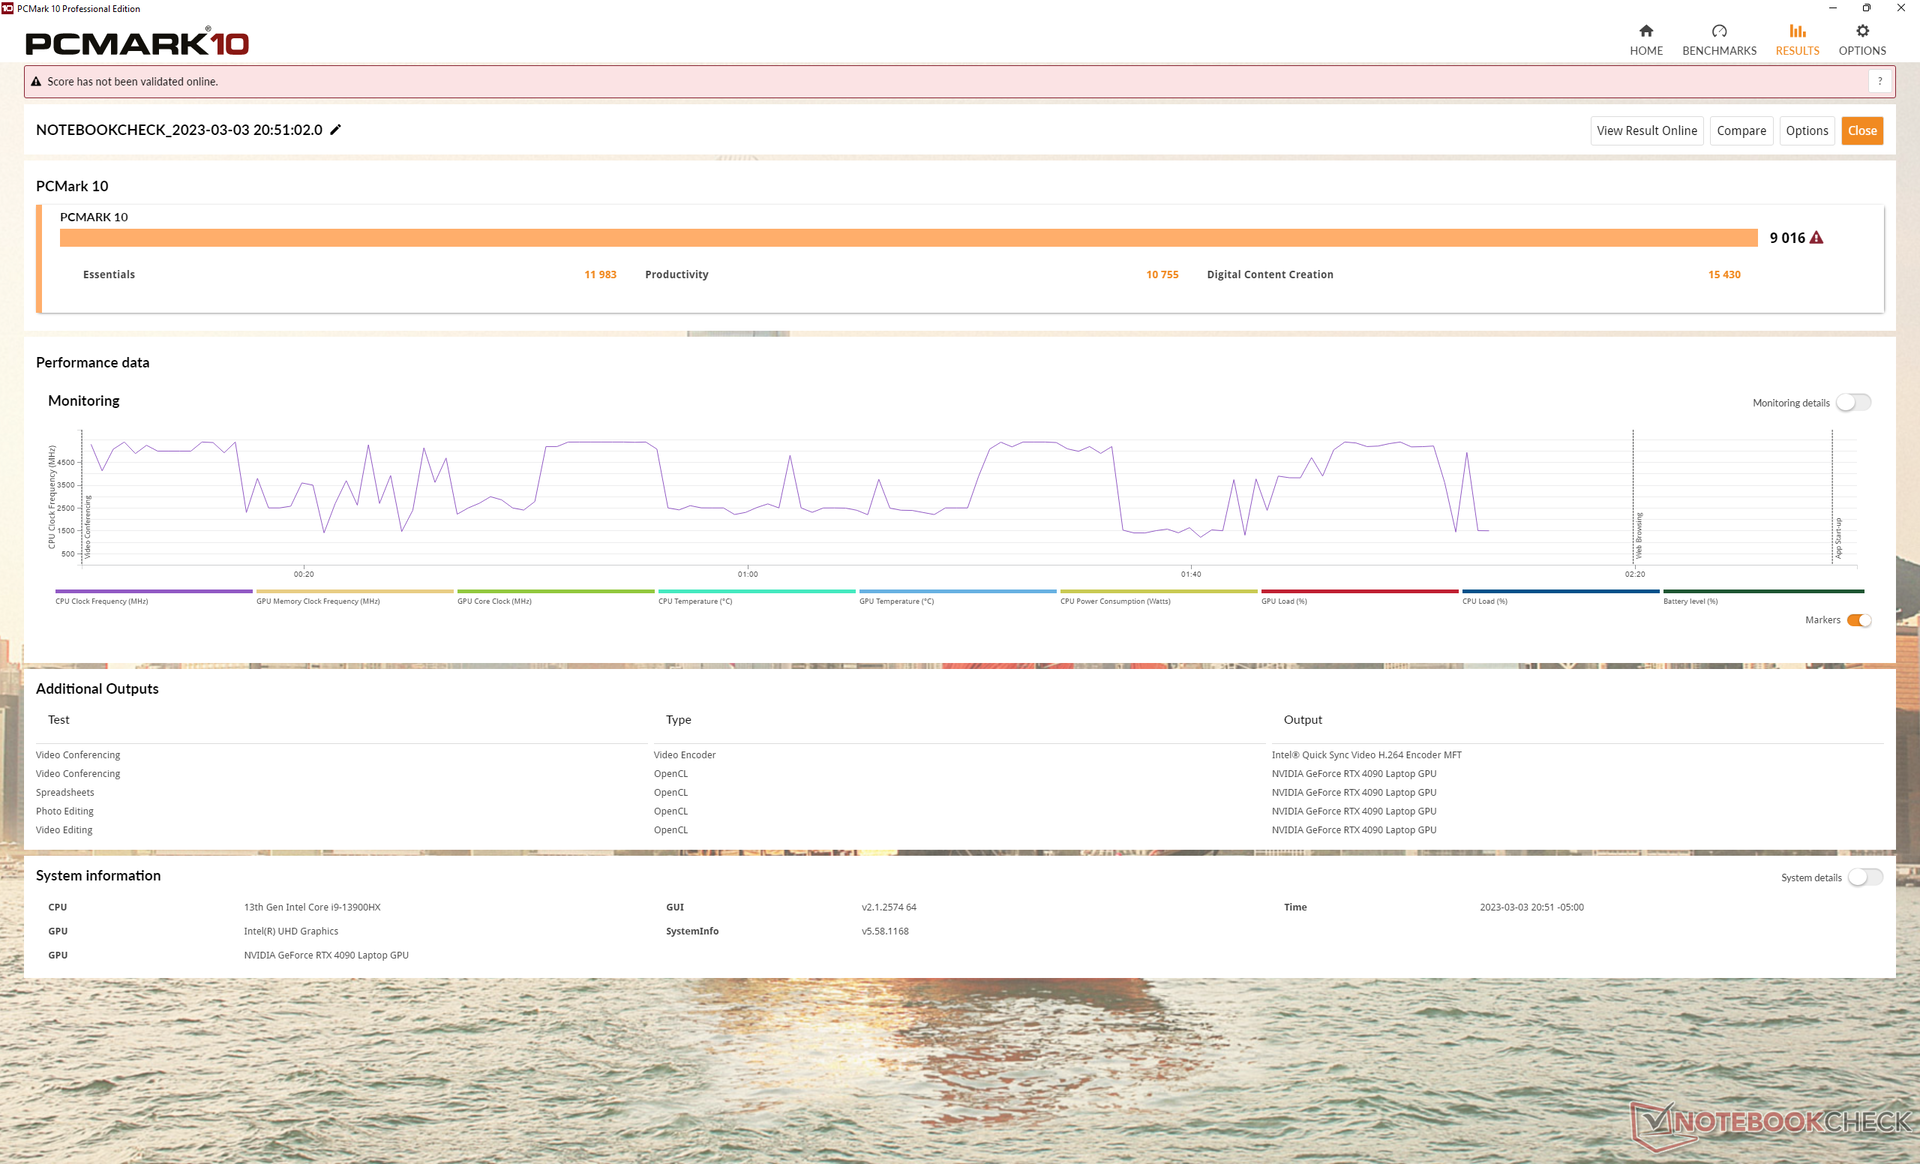
Les scores PCMark sont parmi les plus élevés de notre base de données et rivalisent avec ceux de la MSI Titan GT77. Son score de création de contenu numérique, en particulier, est presque 70 % plus élevé que celui du modèle RTX 3080 Ti de l'année dernière, en raison de l'augmentation des performances graphiques.
CrossMark: Overall | Productivity | Creativity | Responsiveness
| PCMark 10 / Score | |
| Eluktronics Mech-17 GP2 | |
| MSI Titan GT77 HX 13VI | |
| Moyenne Intel Core i9-13900HX, NVIDIA GeForce RTX 4090 Laptop GPU (7690 - 9331, n=8) | |
| Razer Blade 18 RTX 4070 | |
| Alienware m17 R5 (R9 6900HX, RX 6850M XT) | |
| MSI Katana 17 B13VFK | |
| Schenker XMG Neo 17 M22 | |
| PCMark 10 / Essentials | |
| Eluktronics Mech-17 GP2 | |
| MSI Titan GT77 HX 13VI | |
| Razer Blade 18 RTX 4070 | |
| Moyenne Intel Core i9-13900HX, NVIDIA GeForce RTX 4090 Laptop GPU (10972 - 11983, n=8) | |
| MSI Katana 17 B13VFK | |
| Alienware m17 R5 (R9 6900HX, RX 6850M XT) | |
| Schenker XMG Neo 17 M22 | |
| PCMark 10 / Productivity | |
| Eluktronics Mech-17 GP2 | |
| Moyenne Intel Core i9-13900HX, NVIDIA GeForce RTX 4090 Laptop GPU (9038 - 11680, n=8) | |
| MSI Titan GT77 HX 13VI | |
| Razer Blade 18 RTX 4070 | |
| Schenker XMG Neo 17 M22 | |
| MSI Katana 17 B13VFK | |
| Alienware m17 R5 (R9 6900HX, RX 6850M XT) | |
| PCMark 10 / Digital Content Creation | |
| MSI Titan GT77 HX 13VI | |
| Eluktronics Mech-17 GP2 | |
| Moyenne Intel Core i9-13900HX, NVIDIA GeForce RTX 4090 Laptop GPU (10605 - 16395, n=8) | |
| Alienware m17 R5 (R9 6900HX, RX 6850M XT) | |
| Razer Blade 18 RTX 4070 | |
| MSI Katana 17 B13VFK | |
| Schenker XMG Neo 17 M22 | |
| CrossMark / Overall | |
| Eluktronics Mech-17 GP2 | |
| MSI Titan GT77 HX 13VI | |
| Razer Blade 18 RTX 4070 | |
| Moyenne Intel Core i9-13900HX, NVIDIA GeForce RTX 4090 Laptop GPU (1825 - 2295, n=8) | |
| MSI Katana 17 B13VFK | |
| Schenker XMG Neo 17 M22 | |
| Alienware m17 R5 (R9 6900HX, RX 6850M XT) | |
| CrossMark / Productivity | |
| Eluktronics Mech-17 GP2 | |
| MSI Titan GT77 HX 13VI | |
| Razer Blade 18 RTX 4070 | |
| Moyenne Intel Core i9-13900HX, NVIDIA GeForce RTX 4090 Laptop GPU (1666 - 2166, n=8) | |
| MSI Katana 17 B13VFK | |
| Schenker XMG Neo 17 M22 | |
| Alienware m17 R5 (R9 6900HX, RX 6850M XT) | |
| CrossMark / Creativity | |
| Eluktronics Mech-17 GP2 | |
| MSI Titan GT77 HX 13VI | |
| Razer Blade 18 RTX 4070 | |
| Moyenne Intel Core i9-13900HX, NVIDIA GeForce RTX 4090 Laptop GPU (2162 - 2514, n=8) | |
| MSI Katana 17 B13VFK | |
| Schenker XMG Neo 17 M22 | |
| Alienware m17 R5 (R9 6900HX, RX 6850M XT) | |
| CrossMark / Responsiveness | |
| Razer Blade 18 RTX 4070 | |
| MSI Titan GT77 HX 13VI | |
| Eluktronics Mech-17 GP2 | |
| Moyenne Intel Core i9-13900HX, NVIDIA GeForce RTX 4090 Laptop GPU (1441 - 2275, n=8) | |
| MSI Katana 17 B13VFK | |
| Schenker XMG Neo 17 M22 | |
| Alienware m17 R5 (R9 6900HX, RX 6850M XT) | |
| PCMark 10 Score | 9016 points | |
Aide | ||
| AIDA64 / Memory Copy | |
| Razer Blade 18 RTX 4070 | |
| Moyenne Intel Core i9-13900HX (67716 - 79193, n=22) | |
| Eluktronics Mech-17 GP2 | |
| MSI Titan GT77 HX 13VI | |
| MSI Katana 17 B13VFK | |
| Alienware m17 R5 (R9 6900HX, RX 6850M XT) | |
| Schenker XMG Neo 17 M22 | |
| AIDA64 / Memory Read | |
| Razer Blade 18 RTX 4070 | |
| Moyenne Intel Core i9-13900HX (73998 - 88462, n=22) | |
| Eluktronics Mech-17 GP2 | |
| MSI Titan GT77 HX 13VI | |
| MSI Katana 17 B13VFK | |
| Schenker XMG Neo 17 M22 | |
| Alienware m17 R5 (R9 6900HX, RX 6850M XT) | |
| AIDA64 / Memory Write | |
| Razer Blade 18 RTX 4070 | |
| Moyenne Intel Core i9-13900HX (65472 - 77045, n=22) | |
| Eluktronics Mech-17 GP2 | |
| MSI Titan GT77 HX 13VI | |
| Schenker XMG Neo 17 M22 | |
| Alienware m17 R5 (R9 6900HX, RX 6850M XT) | |
| MSI Katana 17 B13VFK | |
| AIDA64 / Memory Latency | |
| MSI Katana 17 B13VFK | |
| Alienware m17 R5 (R9 6900HX, RX 6850M XT) | |
| MSI Titan GT77 HX 13VI | |
| Schenker XMG Neo 17 M22 | |
| Eluktronics Mech-17 GP2 | |
| Moyenne Intel Core i9-13900HX (75.3 - 91.1, n=22) | |
| Razer Blade 18 RTX 4070 | |
* ... Moindre est la valeur, meilleures sont les performances
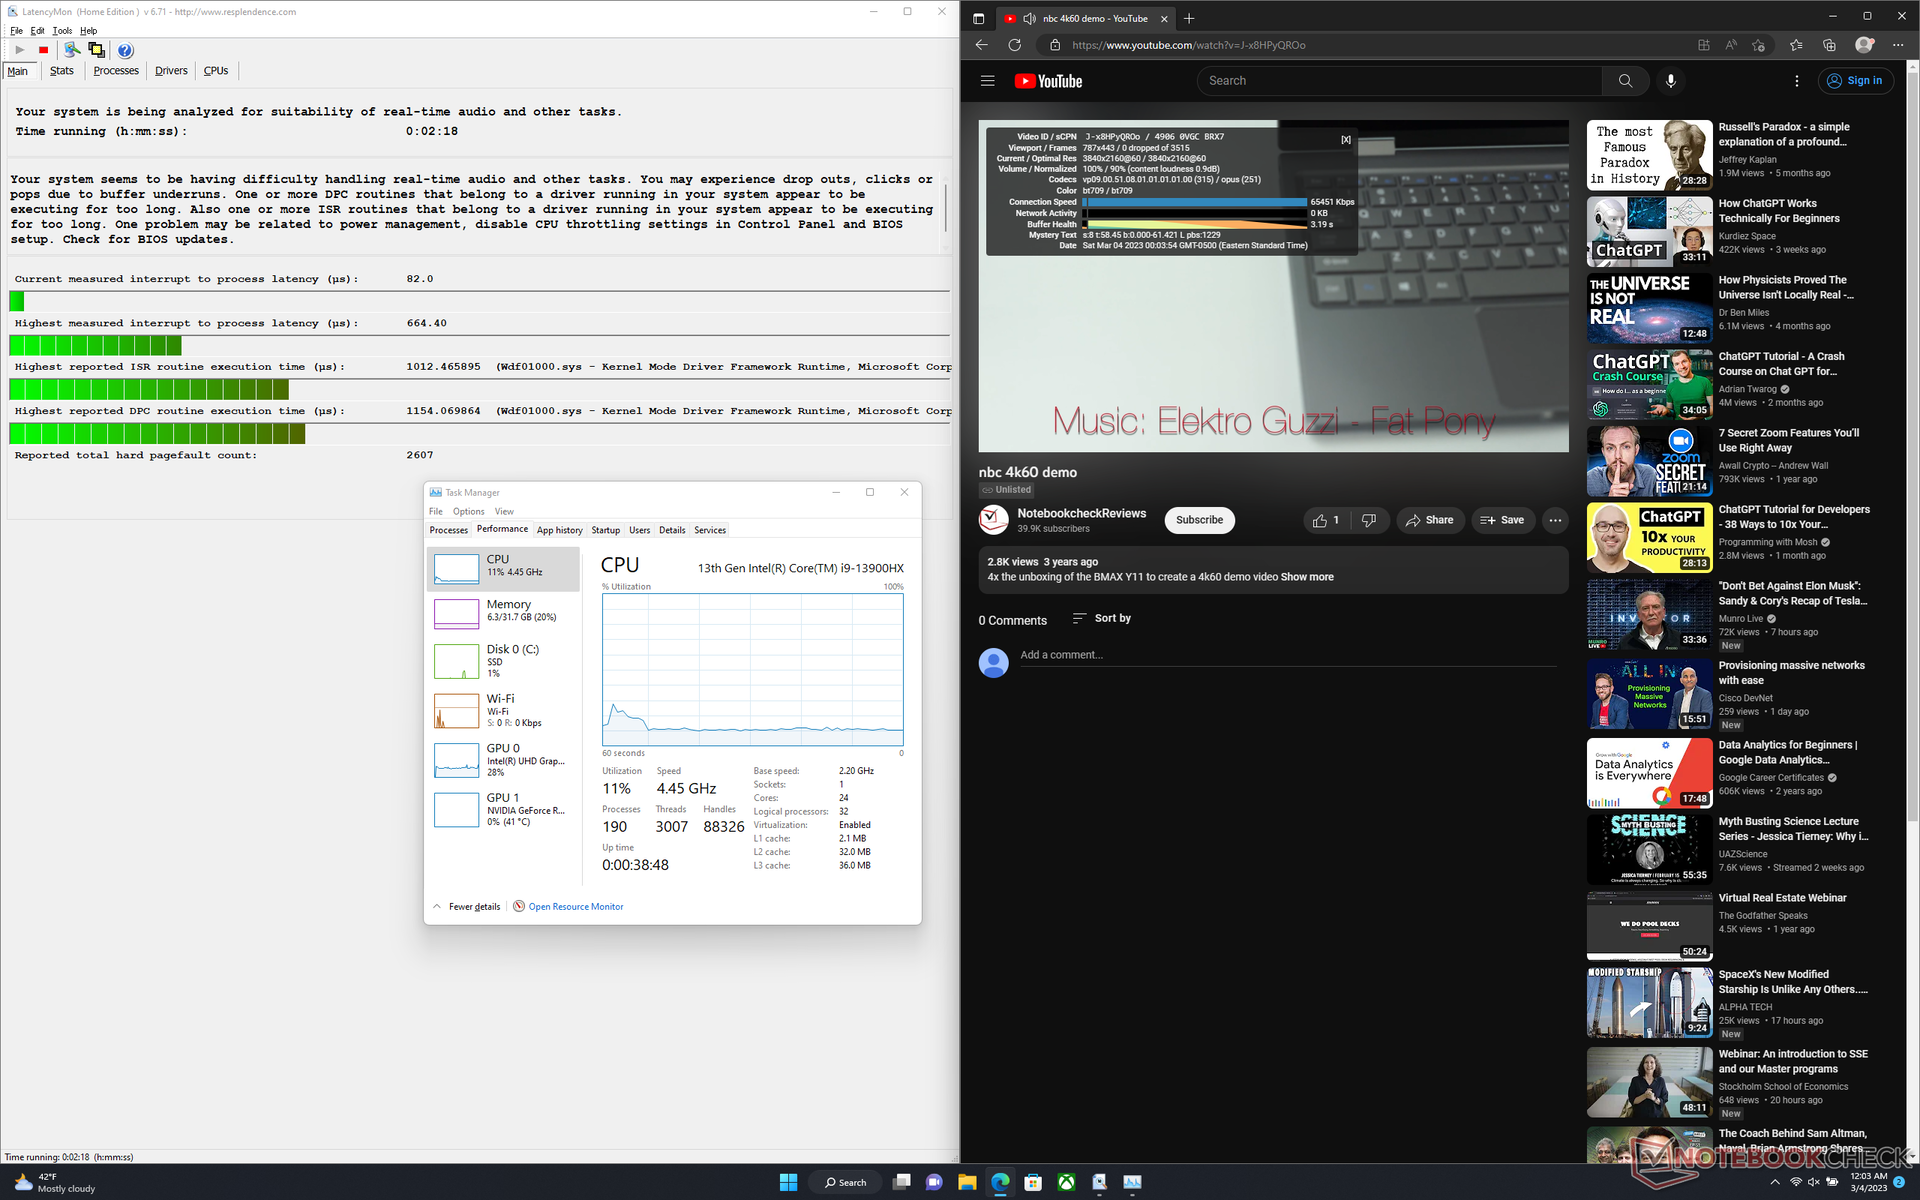
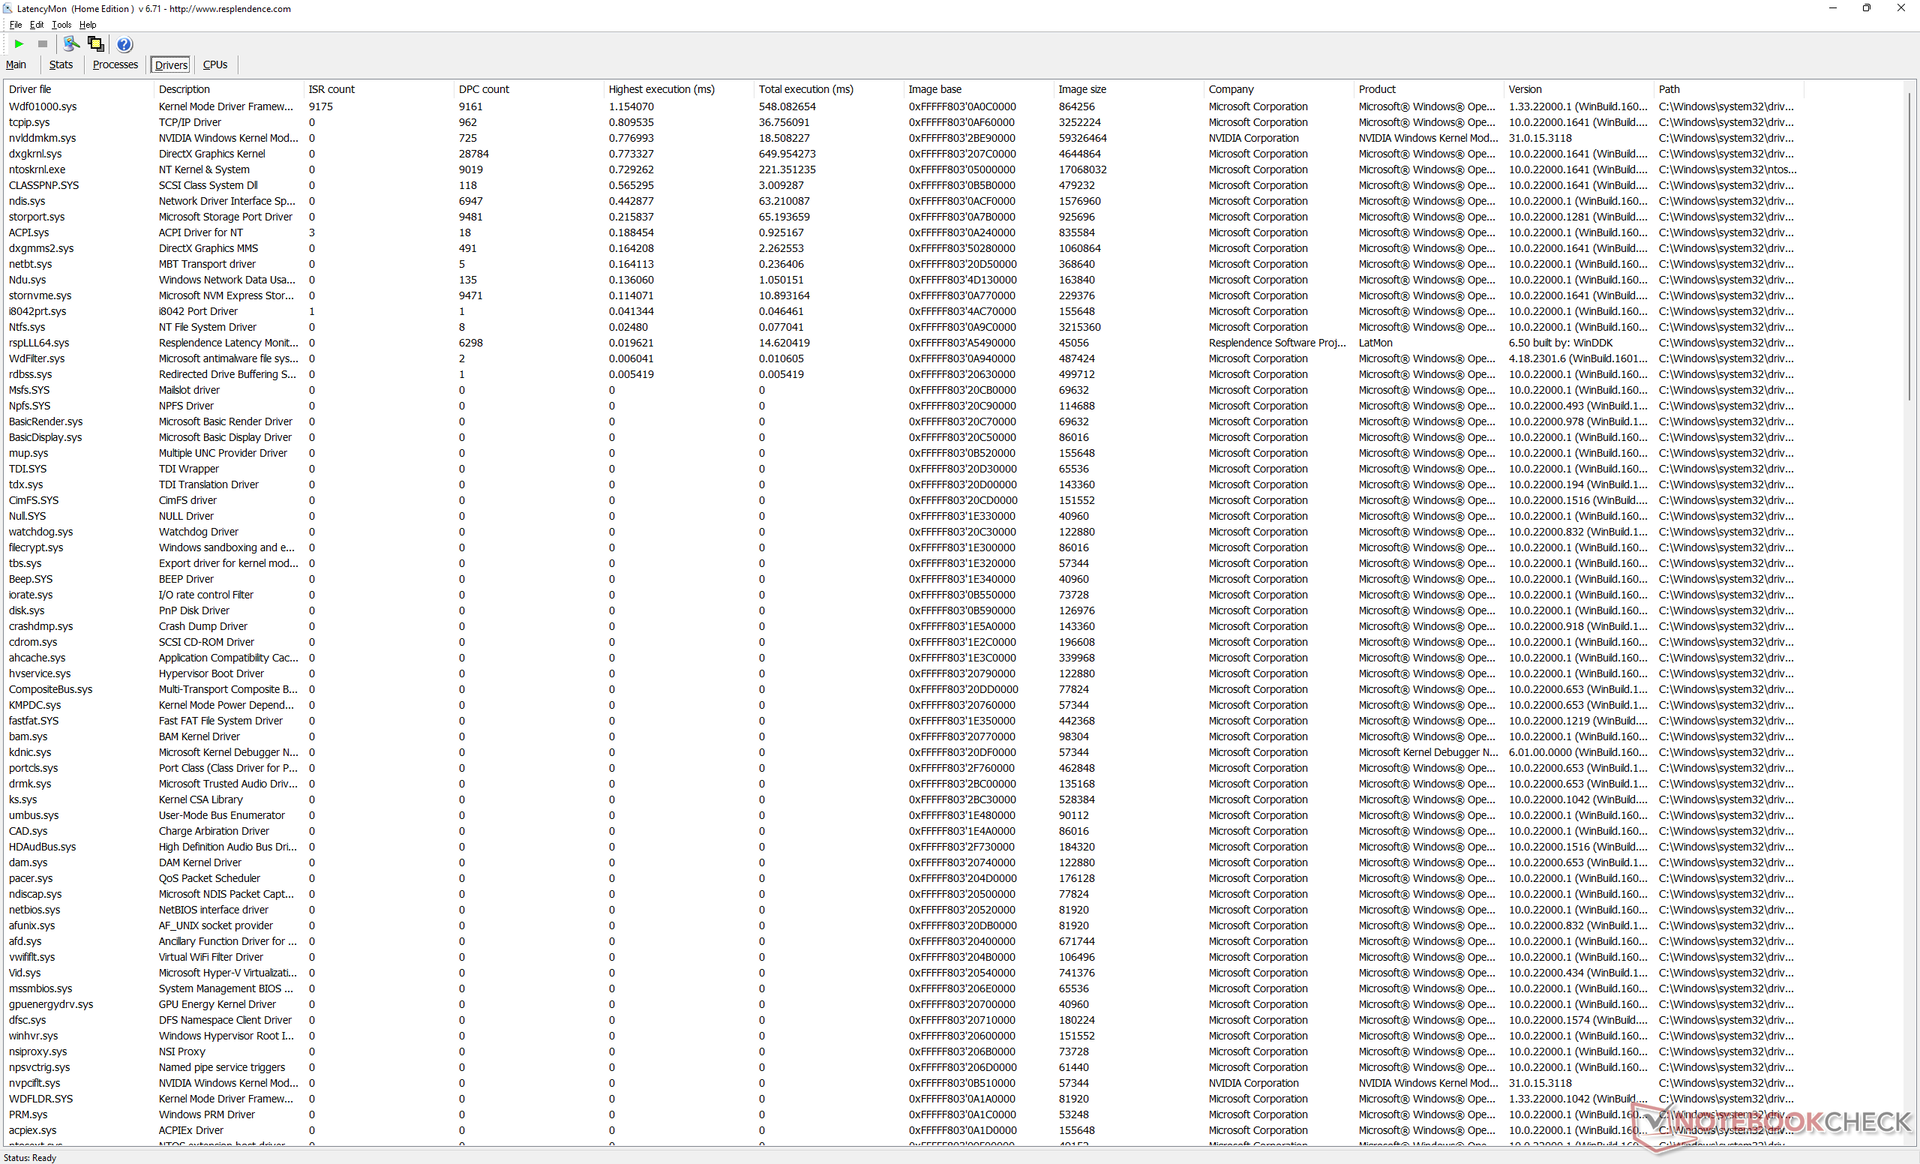
Latence DPC
LatencyMon révèle des problèmes mineurs de DPC lors de l'ouverture de plusieurs onglets de notre page d'accueil. la lecture de vidéos 4K à 60 FPS est par ailleurs parfaite, sans aucune perte d'images.
| DPC Latencies / LatencyMon - interrupt to process latency (max), Web, Youtube, Prime95 | |
| MSI Titan GT77 HX 13VI | |
| Schenker XMG Neo 17 M22 | |
| MSI Katana 17 B13VFK | |
| Alienware m17 R5 (R9 6900HX, RX 6850M XT) | |
| Razer Blade 18 RTX 4070 | |
| Eluktronics Mech-17 GP2 | |
* ... Moindre est la valeur, meilleures sont les performances
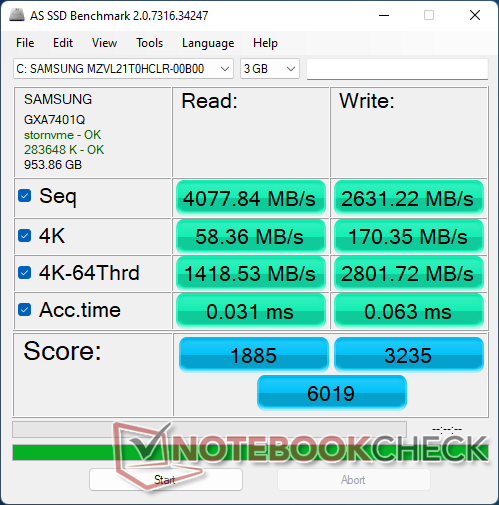
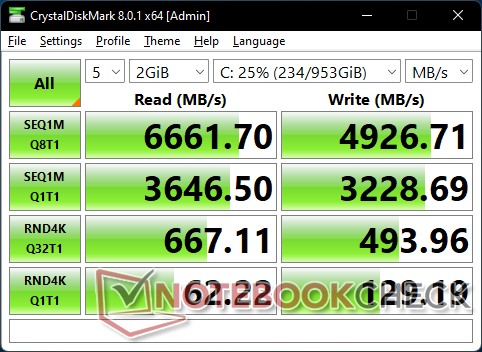
Dispositifs de stockage
Notre appareil est livré avec un disque dur de 1 To Samsung PM9A1 MZVL21T0HCLR qui est l'un des disques SSD NVMe PCIe4 x4 les plus rapides actuellement disponibles pour le grand public. Malheureusement, le disque de notre unité présente des problèmes pour maintenir les taux de transfert maximaux pendant des périodes prolongées, comme le montre notre graphique de test de stress ci-dessous. En comparaison, le Razer Blade 15 équipé du même disque Samsung est capable de maintenir des taux de transfert de 6700 Mo/s sans aucun problème.

| Drive Performance rating - Percent | |
| Schenker XMG Neo 17 M22 | |
| MSI Titan GT77 HX 13VI | |
| Razer Blade 18 RTX 4070 | |
| MSI Katana 17 B13VFK | |
| Eluktronics Mech-17 GP2 | |
| Alienware m17 R5 (R9 6900HX, RX 6850M XT) | |
* ... Moindre est la valeur, meilleures sont les performances
Disk Throttling: DiskSpd Read Loop, Queue Depth 8
Performance du GPU
Les performances globales sont environ 40 à 60 % plus rapides que celles de la rTX 3080 Ti mobile pour être à peu près au même niveau que la rTX 3080 Ti de bureau. L'activation de DLSS 3 sur les titres pris en charge augmente encore les performances de 2 à 3 fois, mais avec des artefacts graphiques potentiels.
La plupart des jeux peuvent tourner en 4K native et à 60 FPS si les effets RT ne sont pas pris en charge ou sont désactivés. Les exceptions incluent des titres très exigeants comme Cyberpunk 2077 ou F1 22, où les taux d'images se situent plutôt entre 40 et 50 FPS. Dans ce cas, G-Sync et DLSS peuvent s'avérer utiles pour réduire le tearing et augmenter les performances, respectivement.
Opter pour la configuration RTX 4080 ou RTX 4070 au lieu de la RTX 4090 réduira les performances graphiques de 10 à 15 % et de 40 à 45 %, respectivement. Ainsi, l'écart de performance entre la 4090 et la 4080 est beaucoup plus faible que l'écart de performance entre la 4080 et la 4070, même si la différence de prix est de 500 $ entre chaque étape.
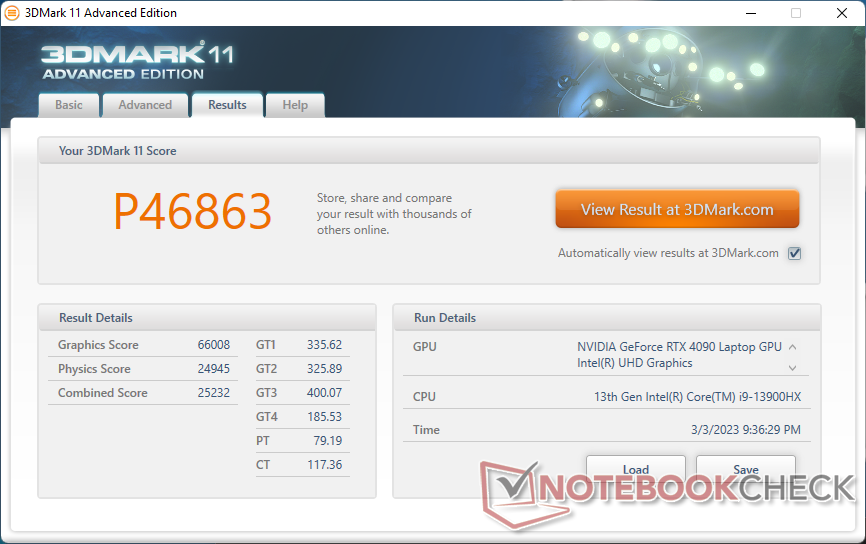
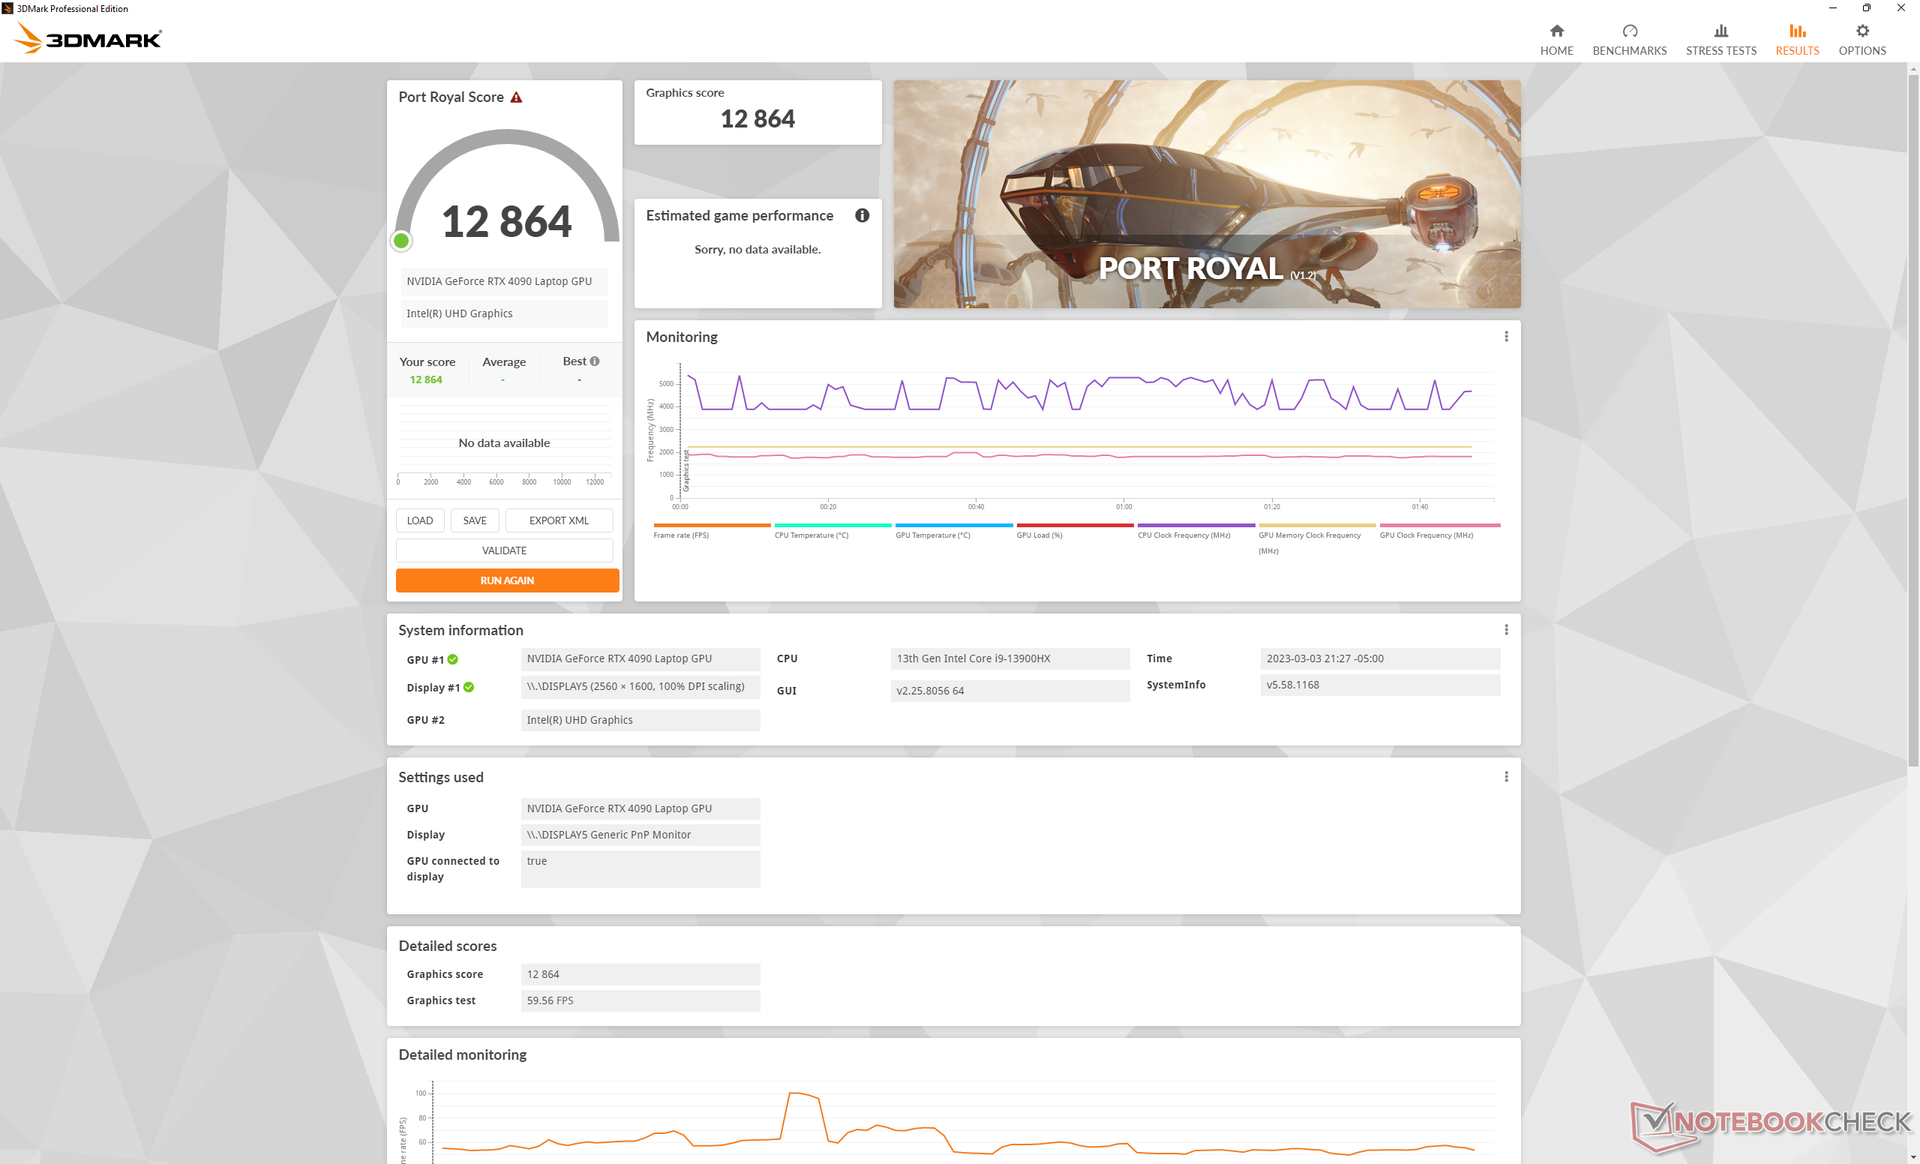
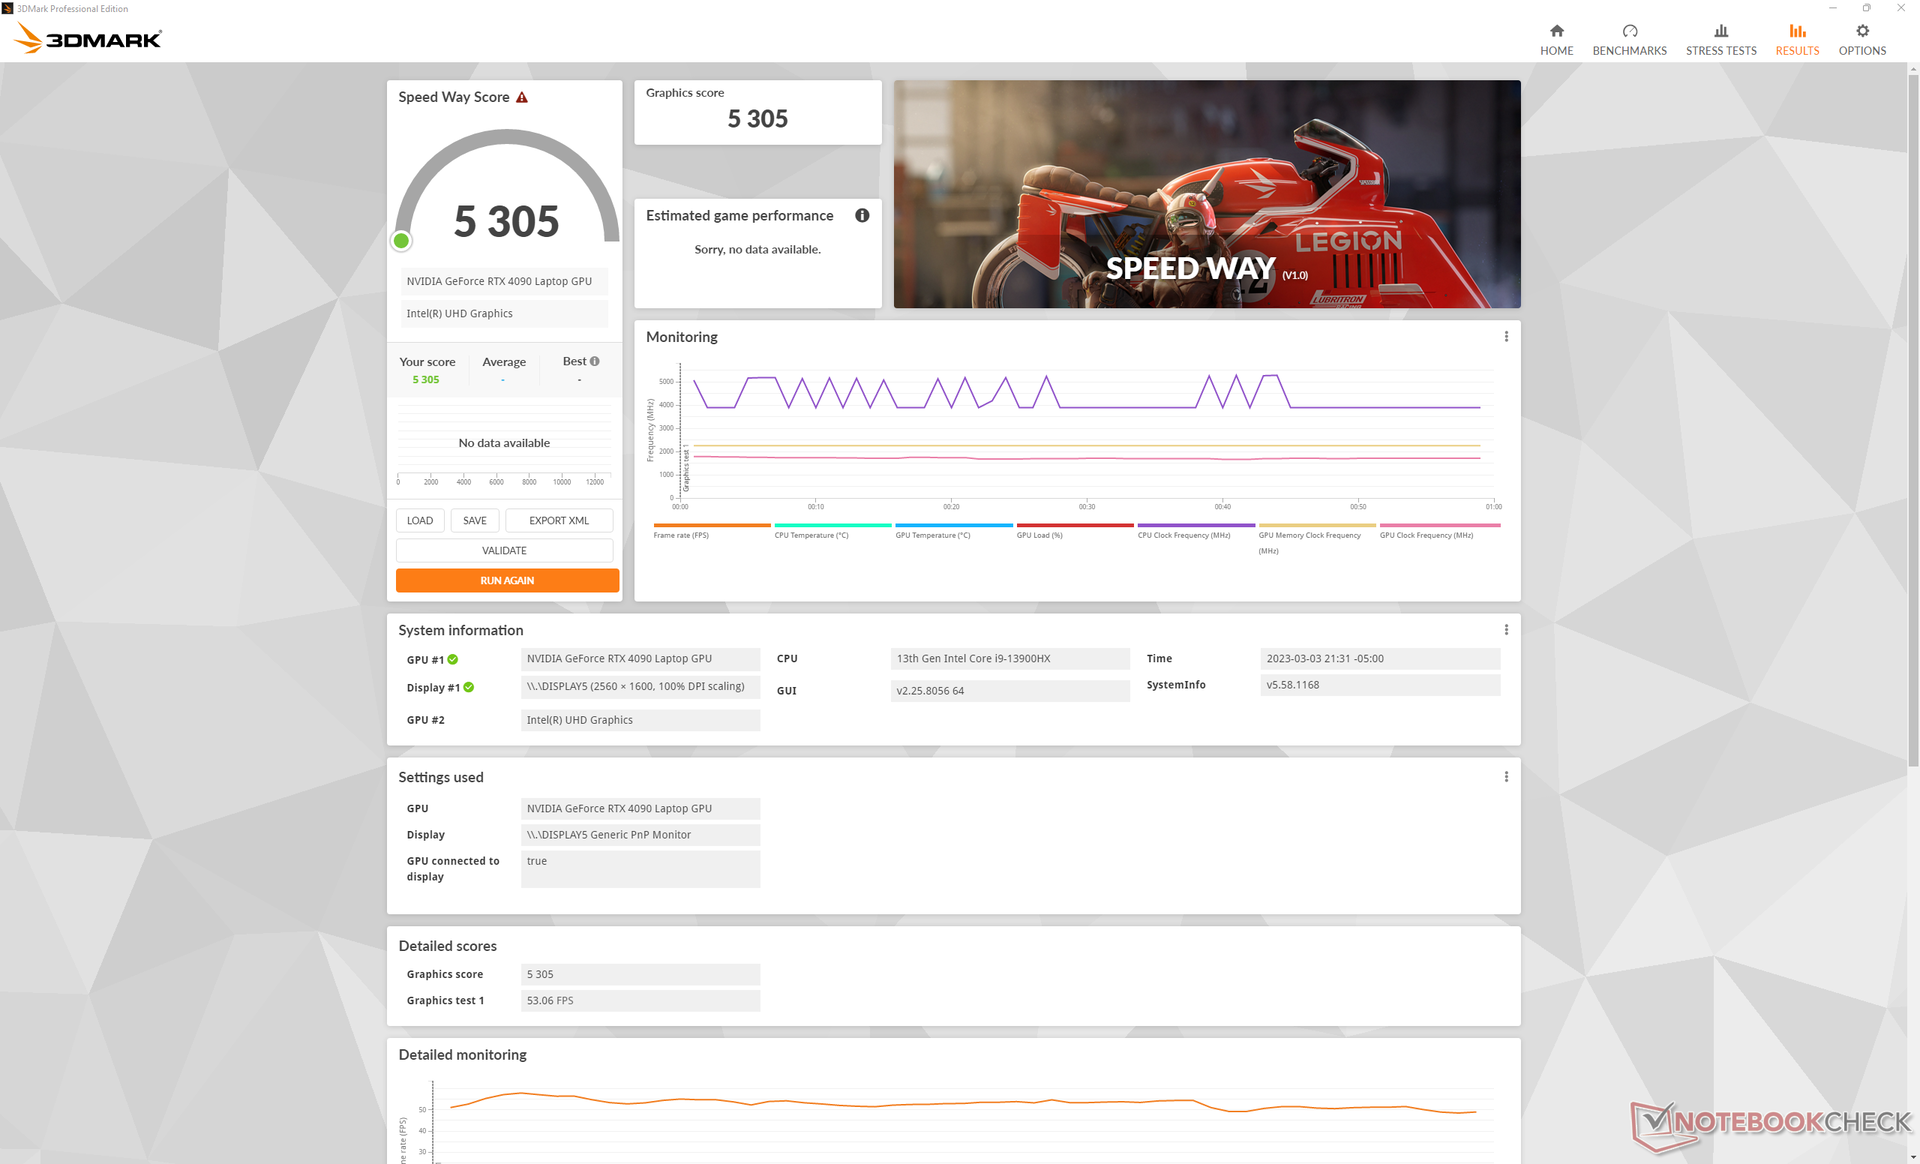
| 3DMark 11 Performance | 46863 points | |
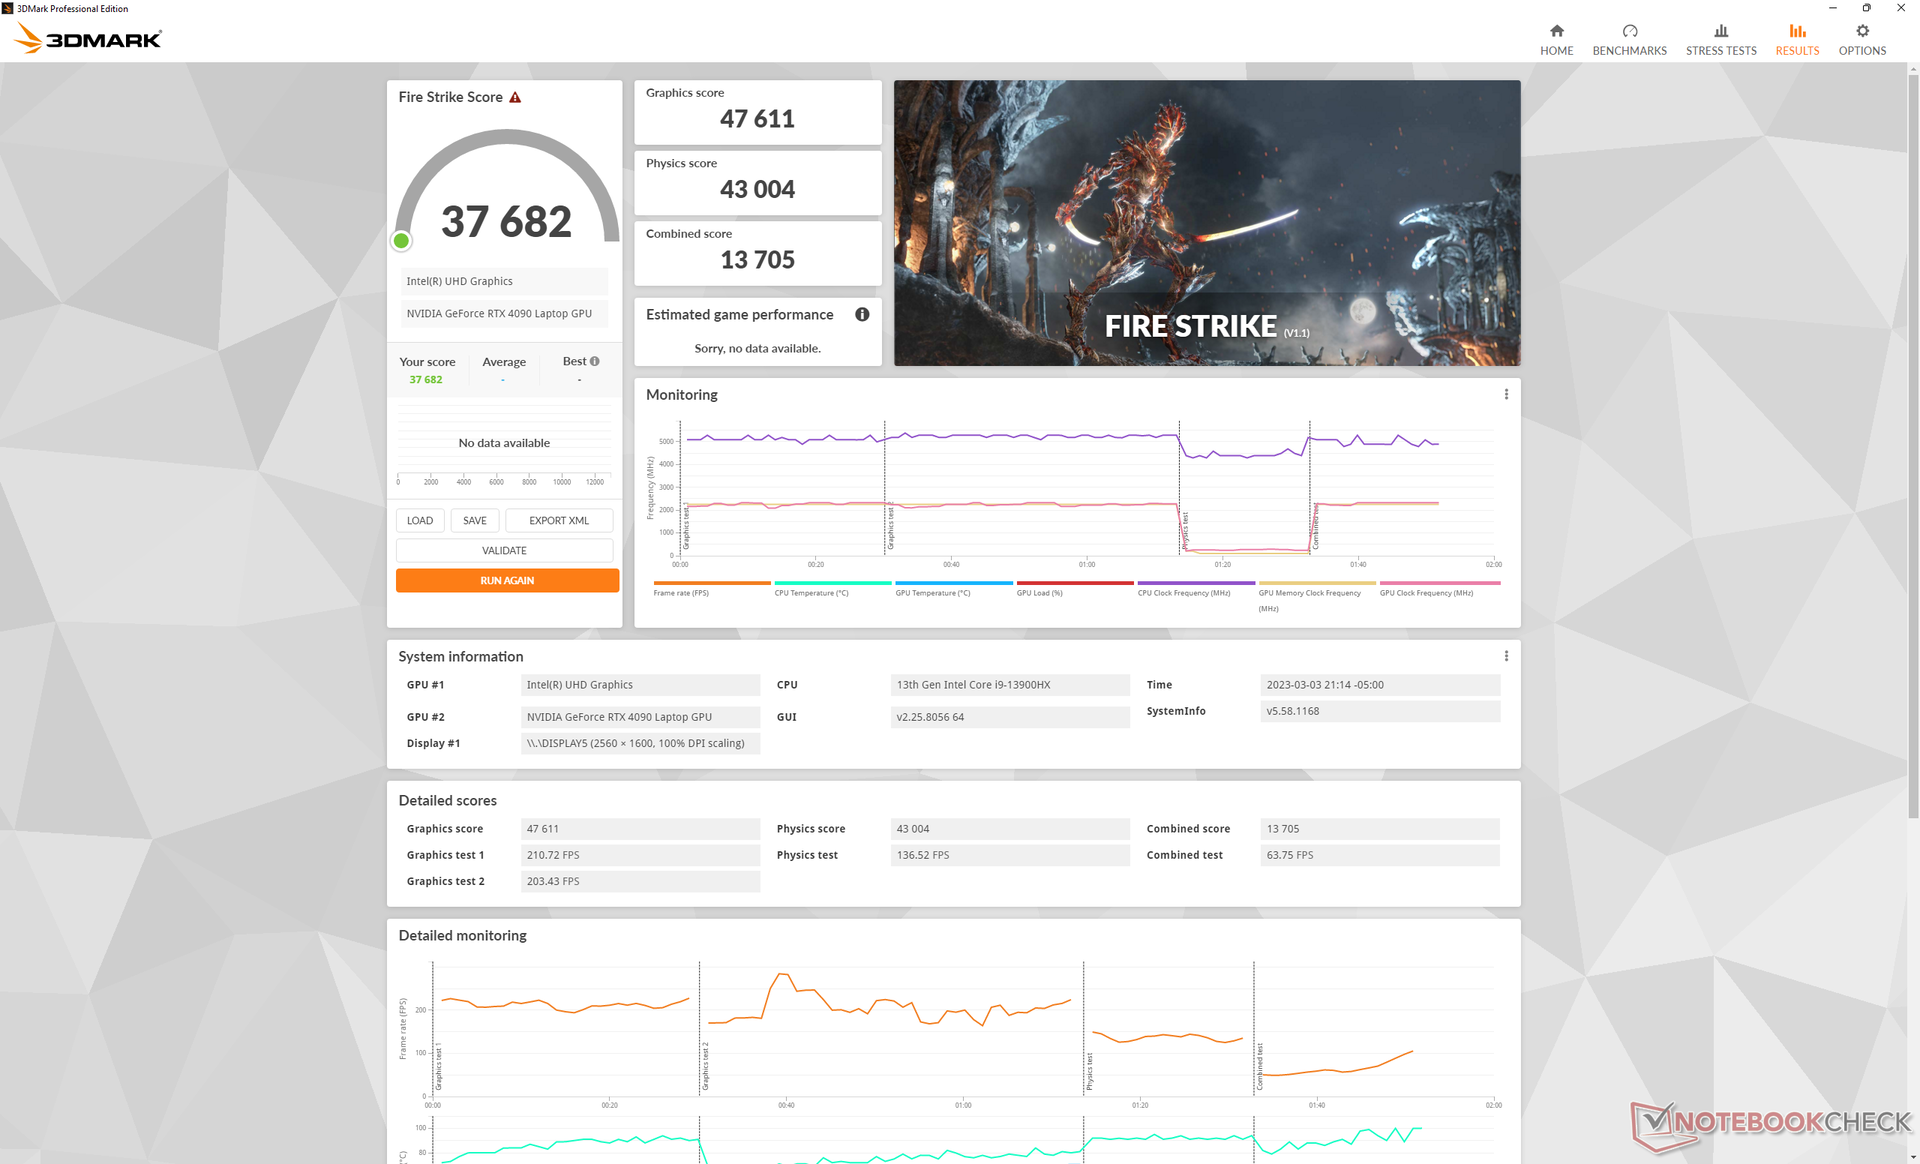
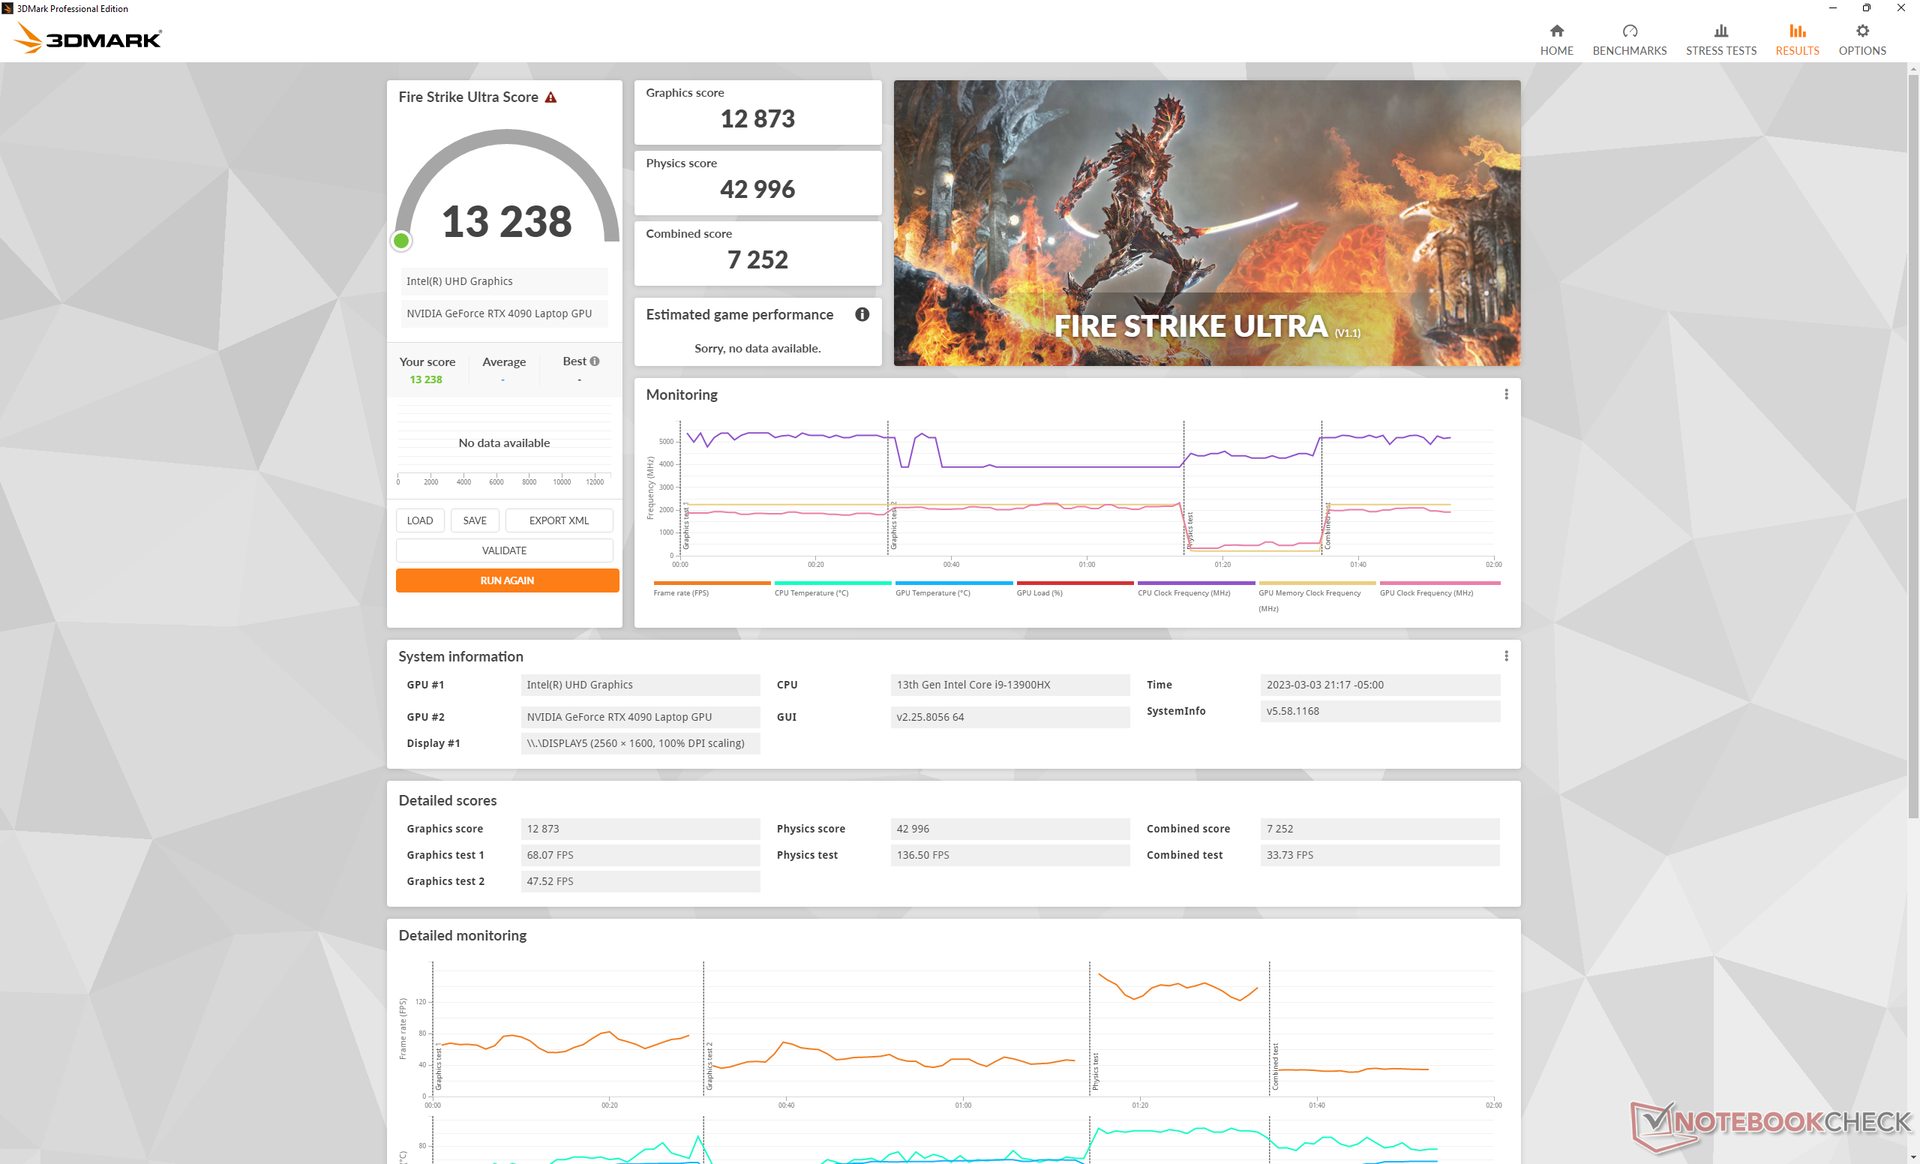
| 3DMark Fire Strike Score | 37682 points | |
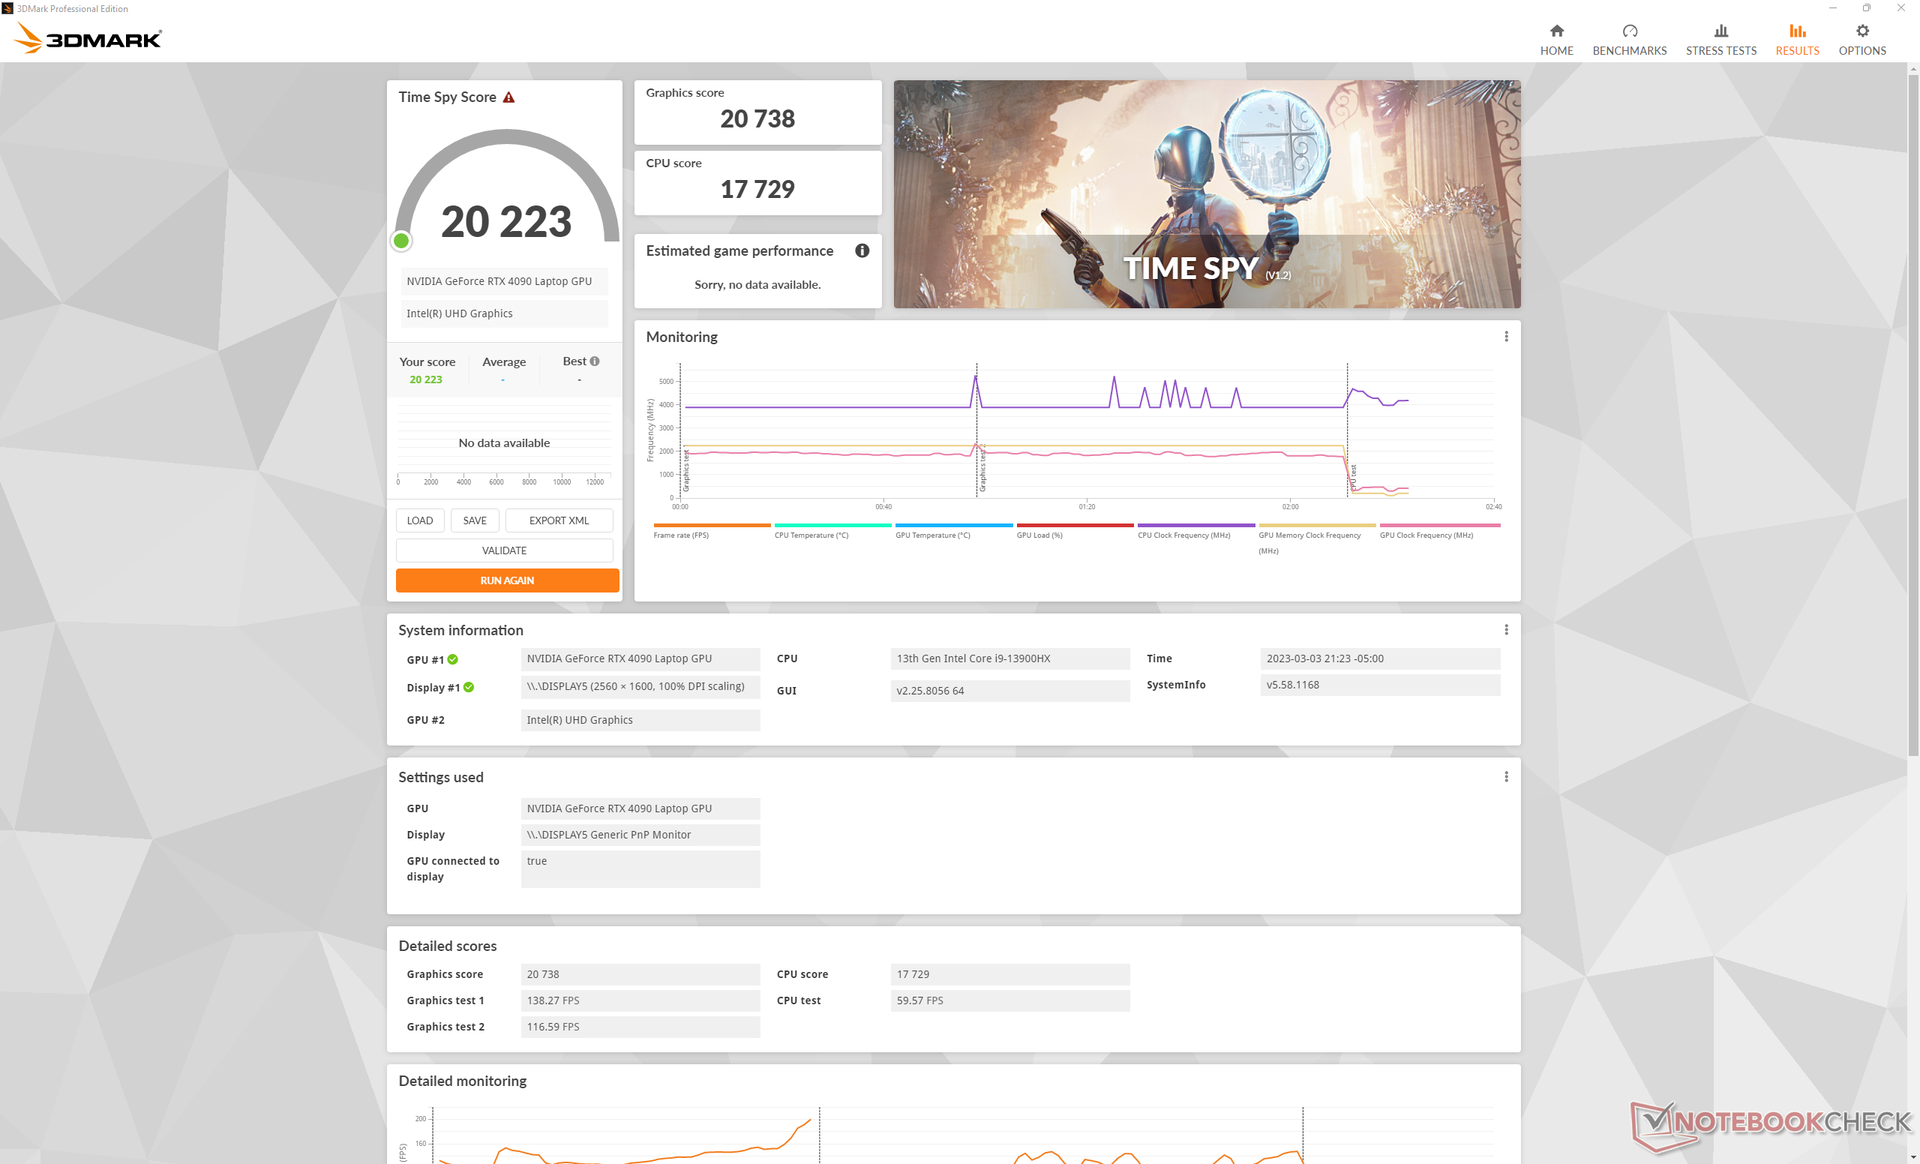
| 3DMark Time Spy Score | 20223 points | |
Aide | ||
* ... Moindre est la valeur, meilleures sont les performances
| The Witcher 3 - 1920x1080 Ultra Graphics & Postprocessing (HBAO+) | |
| Schenker XMG SECTOR, i9 13900K, RTX 4090 | |
| Eluktronics Mech-17 GP2 | |
| Corsair One i300 | |
| MSI Titan GT77 12UHS | |
| Schenker XMG Neo 17 M22 | |
| Razer Blade 18 RTX 4070 | |
| MSI Katana 17 B13VFK | |
| MSI GS76 Stealth 11UH | |
| MSI Pulse GL76 12UGK | |
| HP Omen 16-n0033dx | |
| Schenker XMG Core 17 (Early 2021) | |
| Cyberpunk 2077 1.6 - 1920x1080 Ultra Preset | |
| Schenker XMG SECTOR, i9 13900K, RTX 4090 | |
| Eluktronics Mech-17 GP2 | |
| MSI Titan GT77 12UHS | |
| Razer Blade 18 RTX 4070 | |
| MSI Katana 17 B13VFK | |
| MSI Pulse GL76 12UGK | |
| HP Omen 16-n0033dx | |
Witcher 3 FPS Chart
| Bas | Moyen | Élevé | Ultra | QHD | 4K | |
|---|---|---|---|---|---|---|
| GTA V (2015) | 187.5 | 187.2 | 186.5 | 149.8 | 146.3 | 180.2 |
| The Witcher 3 (2015) | 717.7 | 617.3 | 449 | 216.3 | 167.6 | |
| Dota 2 Reborn (2015) | 243 | 216 | 205 | 192.5 | 186.7 | |
| Final Fantasy XV Benchmark (2018) | 233 | 230 | 194.9 | 157.1 | 90.8 | |
| X-Plane 11.11 (2018) | 212 | 188.8 | 146.4 | 124.7 | ||
| Strange Brigade (2018) | 656 | 508 | 465 | 421 | 315 | 163.4 |
| Metro Exodus (2019) | 240.1 | 207.1 | 173.8 | 146.5 | 127.7 | 82.1 |
| Borderlands 3 (2019) | 284.2 | 269.7 | 238.5 | 179.7 | 129.4 | 72.2 |
| Cyberpunk 2077 1.6 (2022) | 191.1 | 178.6 | 166.9 | 159.7 | 101.3 | 47.8 |
| F1 22 (2022) | 375 | 358 | 322 | 140.6 | 91.8 | 45.3 |
Émissions
Bruit du système
Bien que des ajustements aient été apportés à la solution de refroidissement par rapport au modèle de l'année dernière, le bruit global des ventilateurs reste à peu près le même. Les ventilateurs internes sont toujours actifs, quel que soit le réglage ou la charge à l'écran. Nous recommandons le mode bureautique ou le mode équilibré si vous n'utilisez pas d'applications intensives, car les ventilateurs deviennent nettement plus silencieux et plus léthargiques.
En mode Performance ou "Beast", le bruit des ventilateurs se situe entre 50 et 52 dB(A), ce qui est similaire à l'Alienware m17 R5 ou au Razer Blade 18 dans des conditions similaires. Un casque d'écoute est presque nécessaire lorsque le bruit du ventilateur est supérieur à 50 dB(A) dans les jeux.
Le Thermal Grizzly liquid metal est livré en standard sur toutes les configurations.
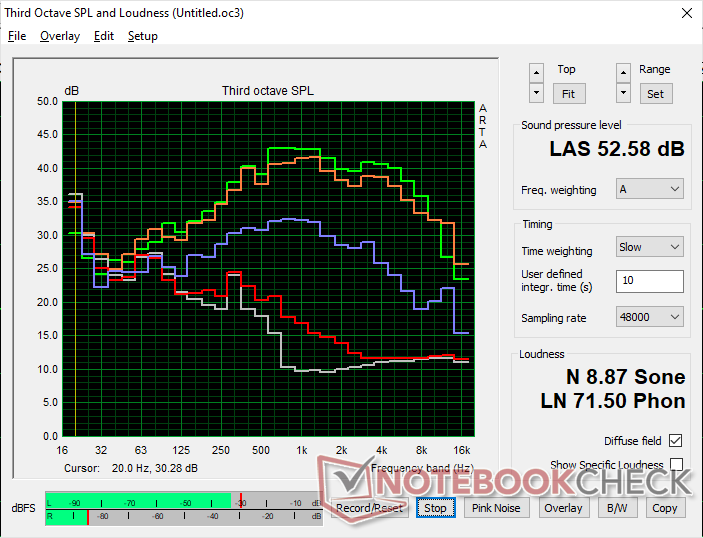
Degré de la nuisance sonore
| Au repos |
| 28 / 28 / 30.4 dB(A) |
| Fortement sollicité |
| 41 / 52.6 dB(A) |
 | ||
30 dB silencieux 40 dB(A) audible 50 dB(A) bruyant |
||
min: | ||
| Eluktronics Mech-17 GP2 GeForce RTX 4090 Laptop GPU, i9-13900HX, Samsung PM9A1 MZVL21T0HCLR | Schenker XMG Neo 17 M22 GeForce RTX 3080 Ti Laptop GPU, R9 6900HX, Samsung SSD 980 Pro 1TB MZ-V8P1T0BW | MSI Katana 17 B13VFK GeForce RTX 4060 Laptop GPU, i7-13620H, Micron 2400 MTFDKBA1T0QFM | MSI Titan GT77 HX 13VI GeForce RTX 4090 Laptop GPU, i9-13950HX, Samsung PM9A1 MZVL22T0HBLB | Alienware m17 R5 (R9 6900HX, RX 6850M XT) Radeon RX 6850M XT, R9 6900HX, SSSTC CA6-8D1024 | Razer Blade 18 RTX 4070 GeForce RTX 4070 Laptop GPU, i9-13950HX, SSSTC CA6-8D1024 | |
|---|---|---|---|---|---|---|
| Noise | -8% | -6% | -7% | 10% | 9% | |
| arrêt / environnement * (dB) | 25.2 | 26 -3% | 24.5 3% | 24.6 2% | 23 9% | 23.5 7% |
| Idle Minimum * (dB) | 28 | 26 7% | 24.5 12% | 29.2 -4% | 23 18% | 23.8 15% |
| Idle Average * (dB) | 28 | 29 -4% | 24.5 12% | 29.2 -4% | 28.11 -0% | 23.8 15% |
| Idle Maximum * (dB) | 30.4 | 40 -32% | 40 -32% | 29.2 4% | 28.11 8% | 26.8 12% |
| Load Average * (dB) | 41 | 47 -15% | 48.3 -18% | 50.7 -24% | 30.62 25% | 37.3 9% |
| Witcher 3 ultra * (dB) | 50.7 | 52 -3% | 56 -10% | 53.3 -5% | 49.75 2% | 48 5% |
| Load Maximum * (dB) | 52.6 | 54 -3% | 59.1 -12% | 61 -16% | 50.17 5% | 53.5 -2% |
* ... Moindre est la valeur, meilleures sont les performances
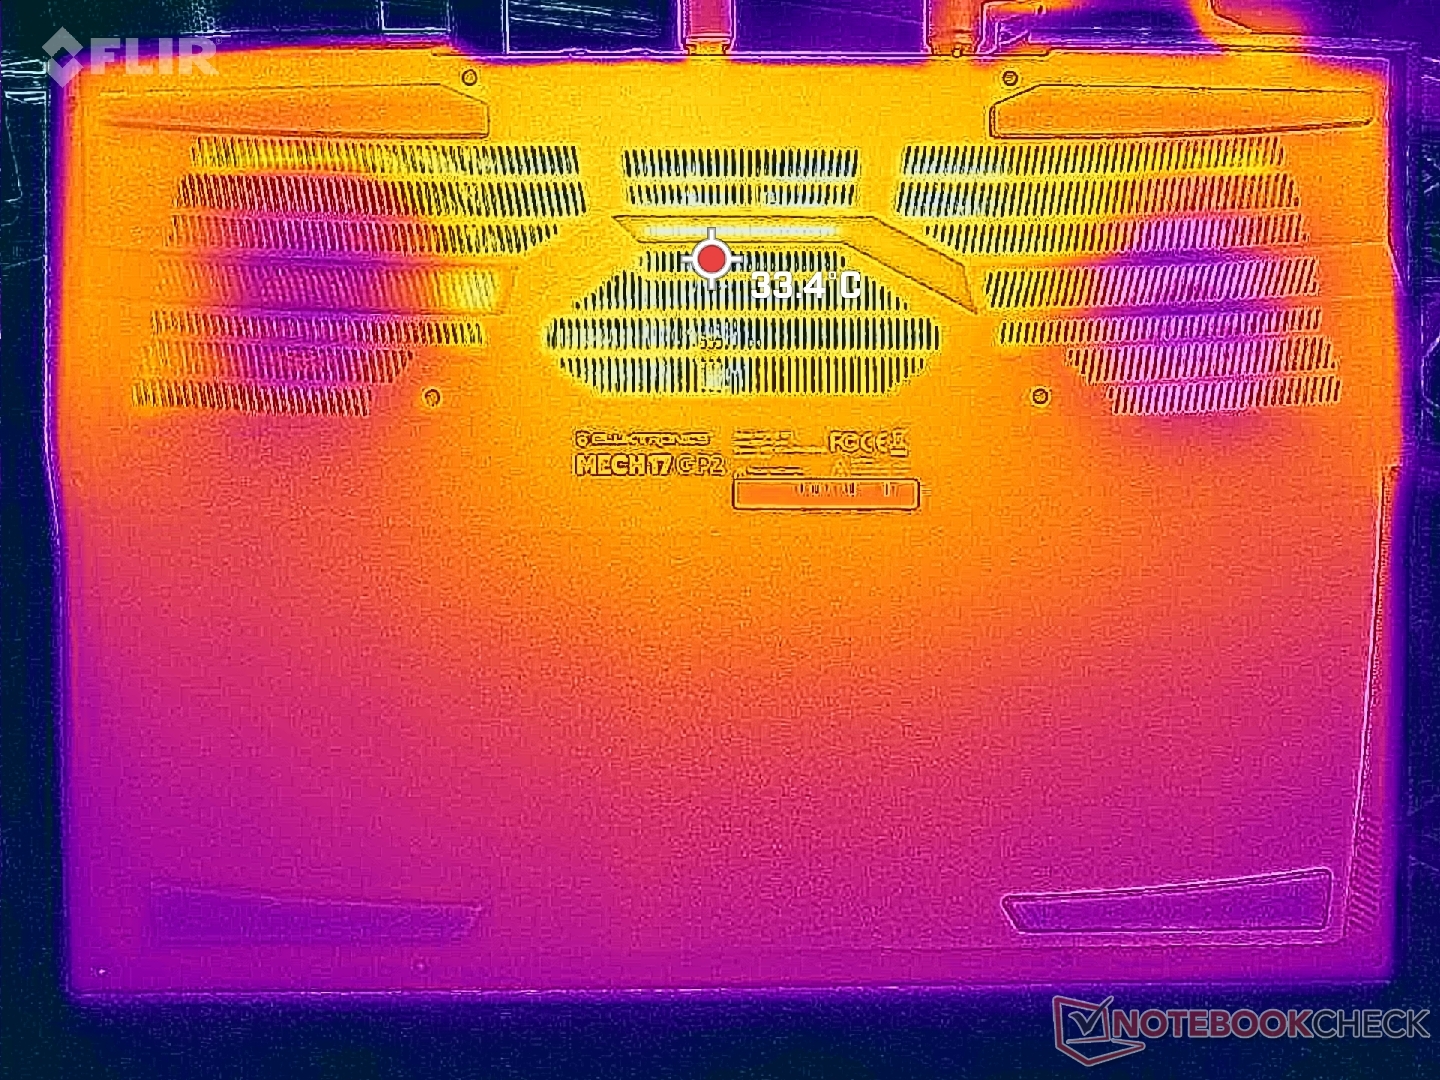
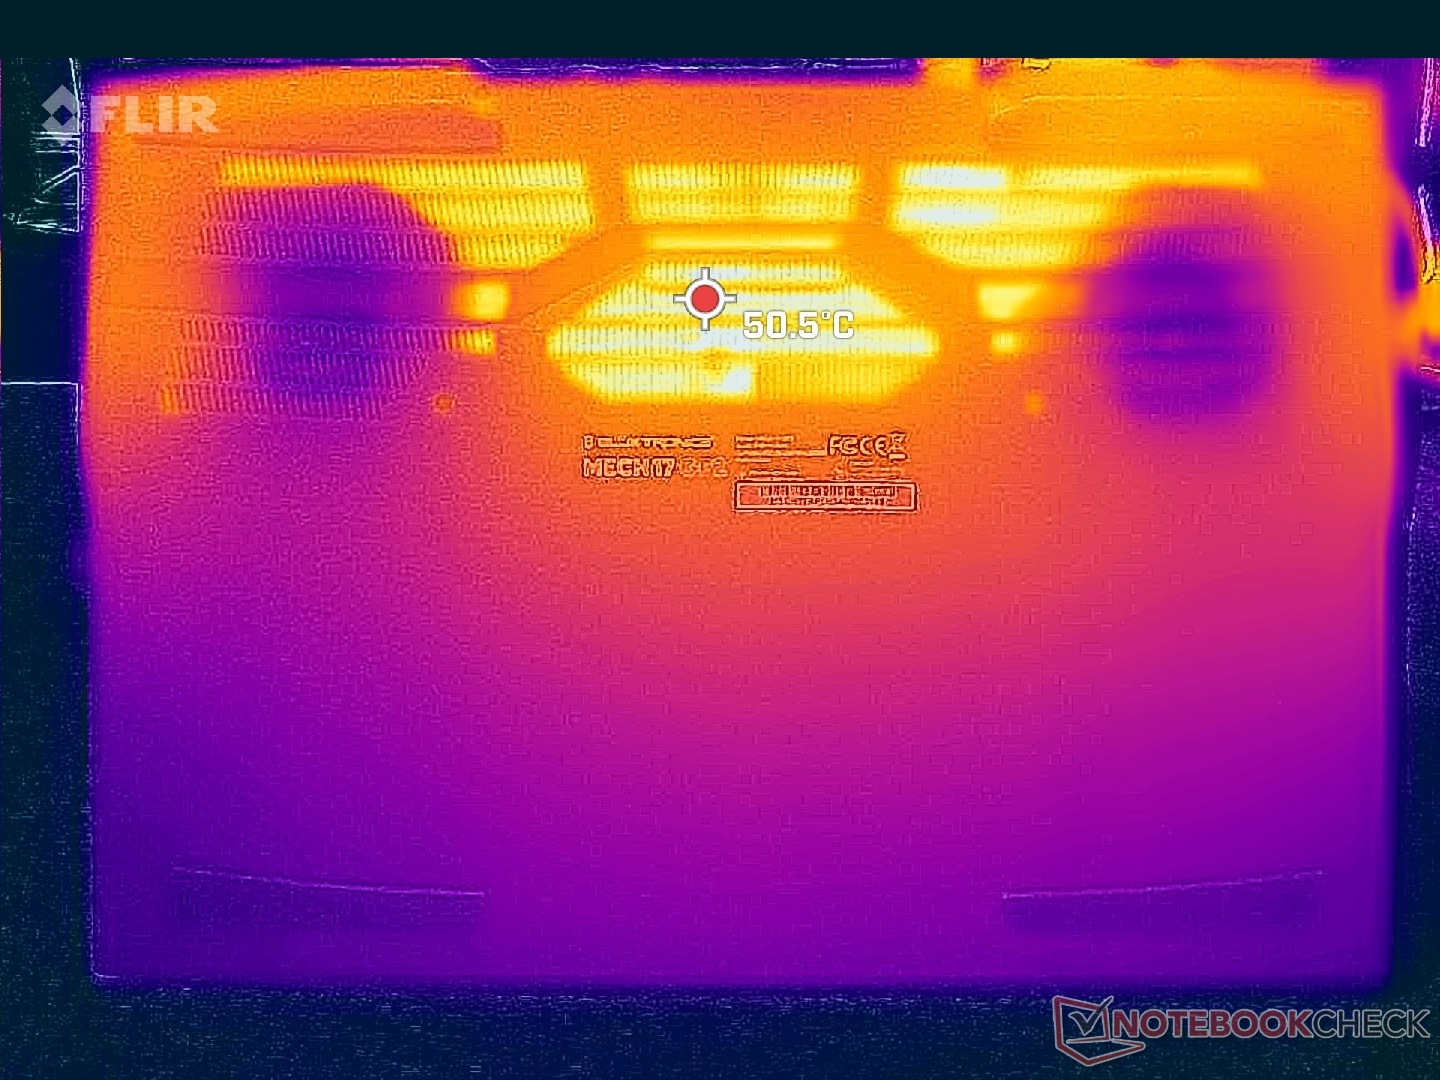
Température
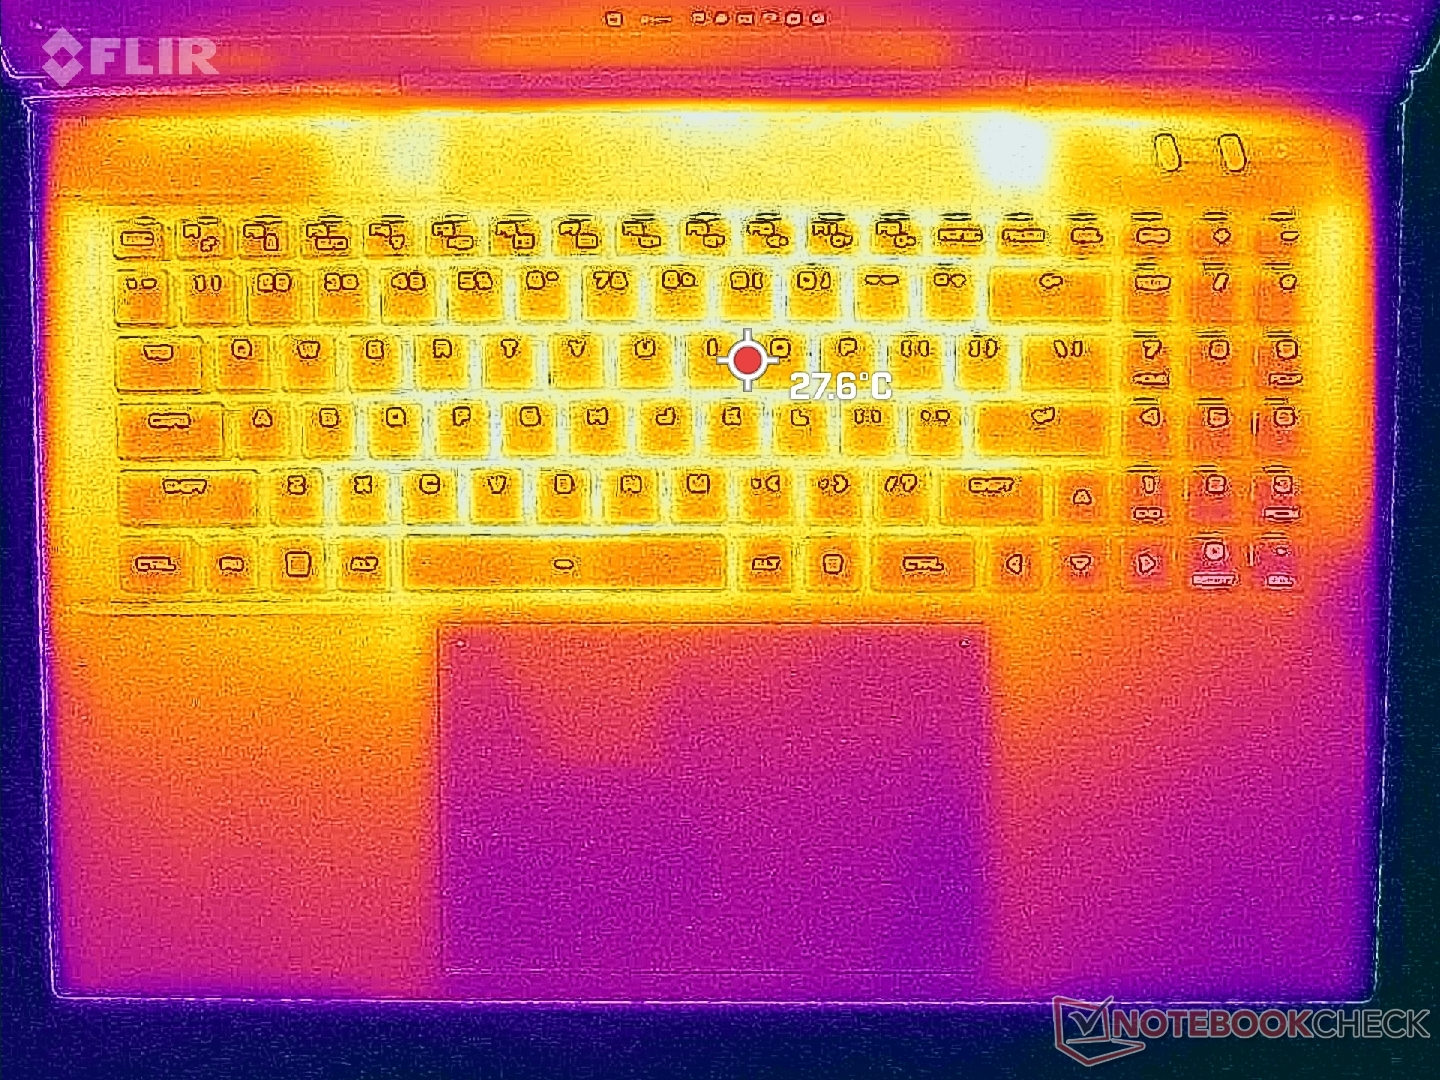
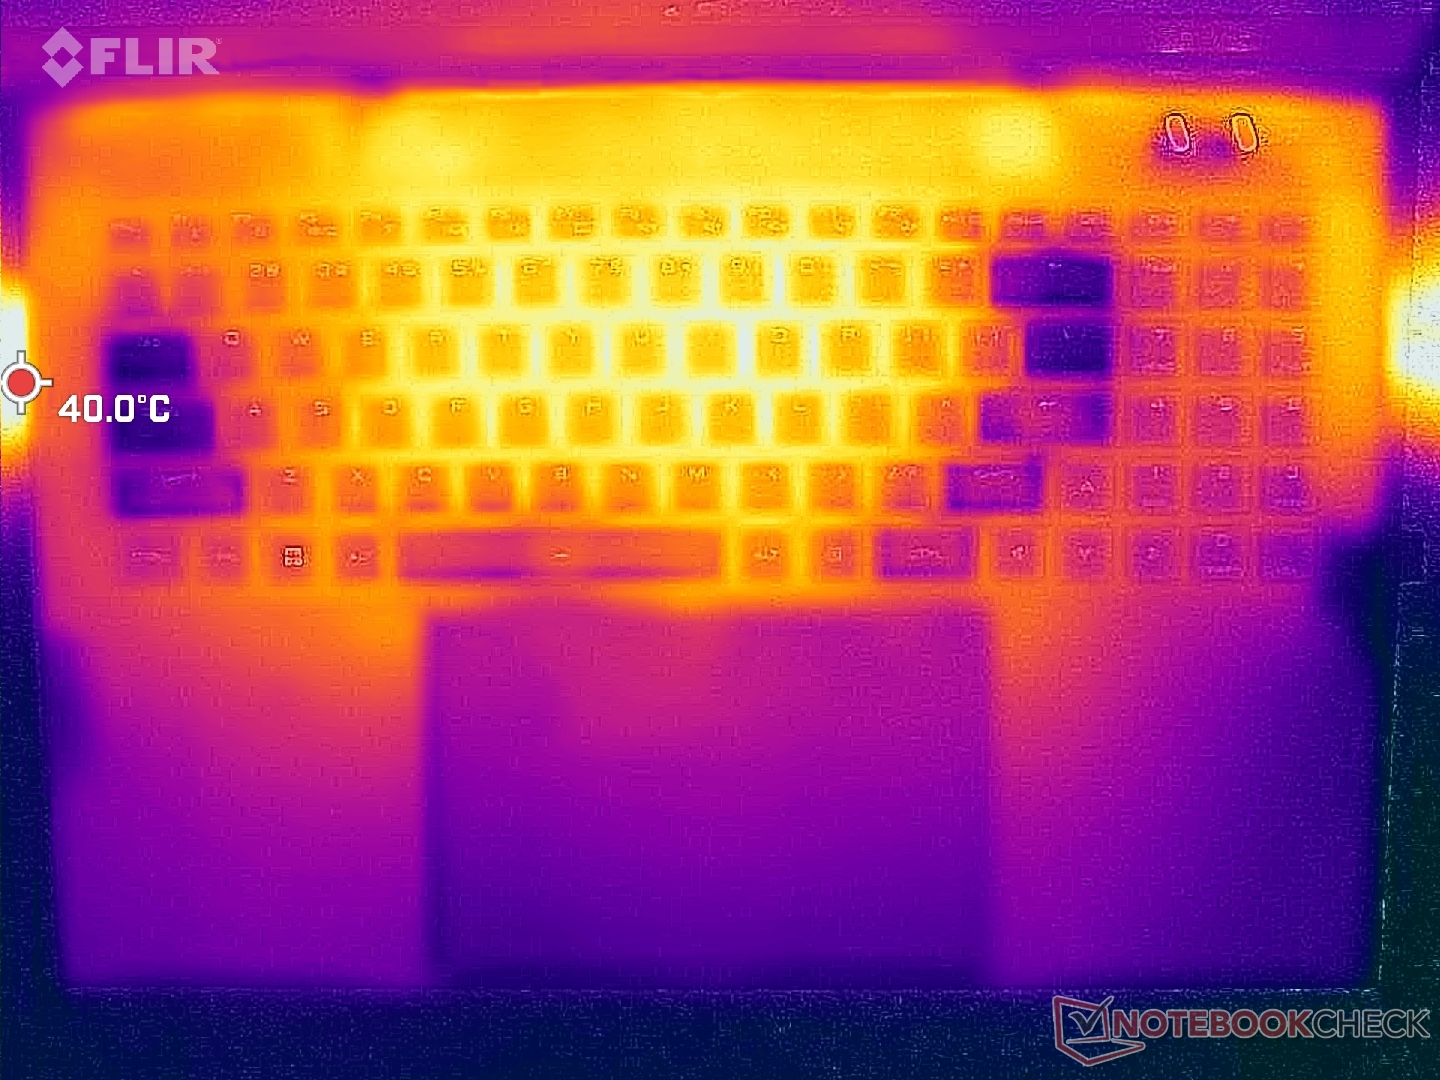
Les températures de surface sont les plus chaudes vers le centre et les plus froides sur les côtés du clavier et les repose-paumes. De l'air frais entre par les touches WASD pour garder les doigts au frais pendant le jeu. Les points chauds de 39°C à 44°C sont moins chauds que ceux que nous avons enregistrés sur l'Alienware m17 R5 Alienware m17 R5 où les points chauds peuvent atteindre 50°C à 57°C dans des conditions de jeu similaires.
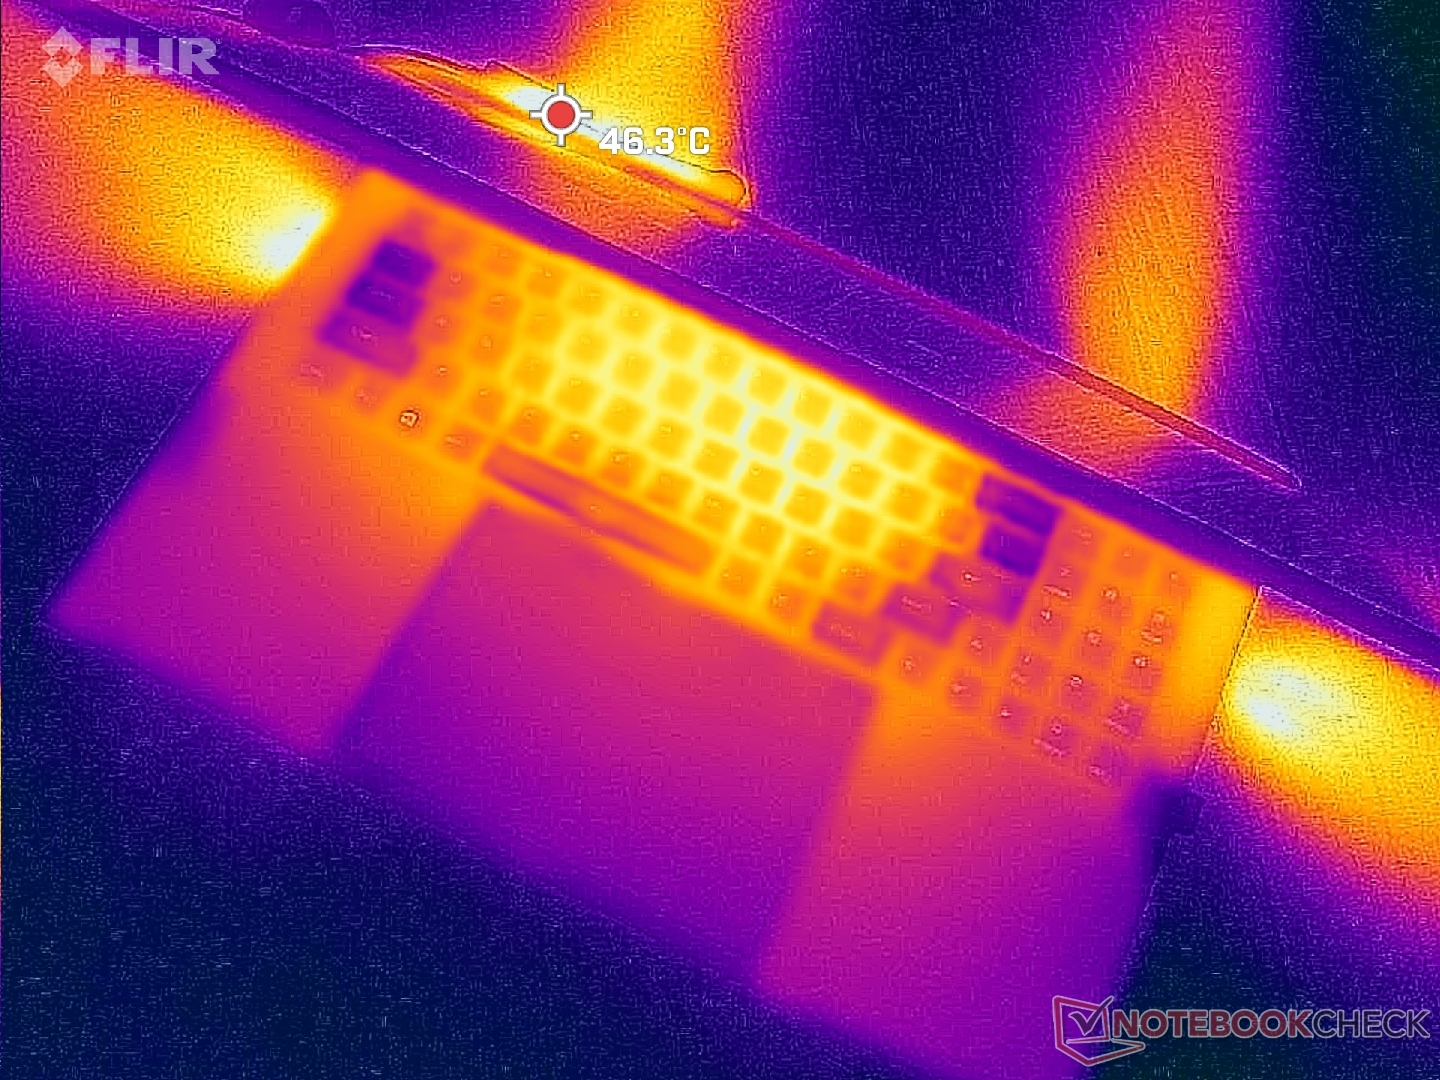
(+) La température maximale du côté supérieur est de 39 °C / 102 F, par rapport à la moyenne de 40.4 °C / 105 F, allant de 21.2 à 68.8 °C pour la classe Gaming.
(±) Le fond chauffe jusqu'à un maximum de 44 °C / 111 F, contre une moyenne de 43.3 °C / 110 F
(+) En utilisation inactive, la température moyenne du côté supérieur est de 27.5 °C / 82 F, par rapport à la moyenne du dispositif de 33.9 °C / 93 F.
(+) Les repose-poignets et le pavé tactile sont plus froids que la température de la peau avec un maximum de 25 °C / 77 F et sont donc froids au toucher.
(+) La température moyenne de la zone de l'appui-paume de dispositifs similaires était de 28.8 °C / 83.8 F (+3.8 °C / #6.8 F).
| Eluktronics Mech-17 GP2 Intel Core i9-13900HX, NVIDIA GeForce RTX 4090 Laptop GPU | Schenker XMG Neo 17 M22 AMD Ryzen 9 6900HX, NVIDIA GeForce RTX 3080 Ti Laptop GPU | MSI Katana 17 B13VFK Intel Core i7-13620H, NVIDIA GeForce RTX 4060 Laptop GPU | MSI Titan GT77 HX 13VI Intel Core i9-13950HX, NVIDIA GeForce RTX 4090 Laptop GPU | Alienware m17 R5 (R9 6900HX, RX 6850M XT) AMD Ryzen 9 6900HX, AMD Radeon RX 6850M XT | Razer Blade 18 RTX 4070 Intel Core i9-13950HX, NVIDIA GeForce RTX 4070 Laptop GPU | |
|---|---|---|---|---|---|---|
| Heat | -13% | -7% | 4% | -14% | 1% | |
| Maximum Upper Side * (°C) | 39 | 49 -26% | 41.6 -7% | 40.6 -4% | 53 -36% | 39.2 -1% |
| Maximum Bottom * (°C) | 44 | 52 -18% | 43.1 2% | 41.1 7% | 56 -27% | 35.6 19% |
| Idle Upper Side * (°C) | 31 | 30 3% | 32 -3% | 26.2 15% | 30 3% | 31.8 -3% |
| Idle Bottom * (°C) | 29.8 | 33 -11% | 35.8 -20% | 30.3 -2% | 29 3% | 33.2 -11% |
* ... Moindre est la valeur, meilleures sont les performances
Test de stress
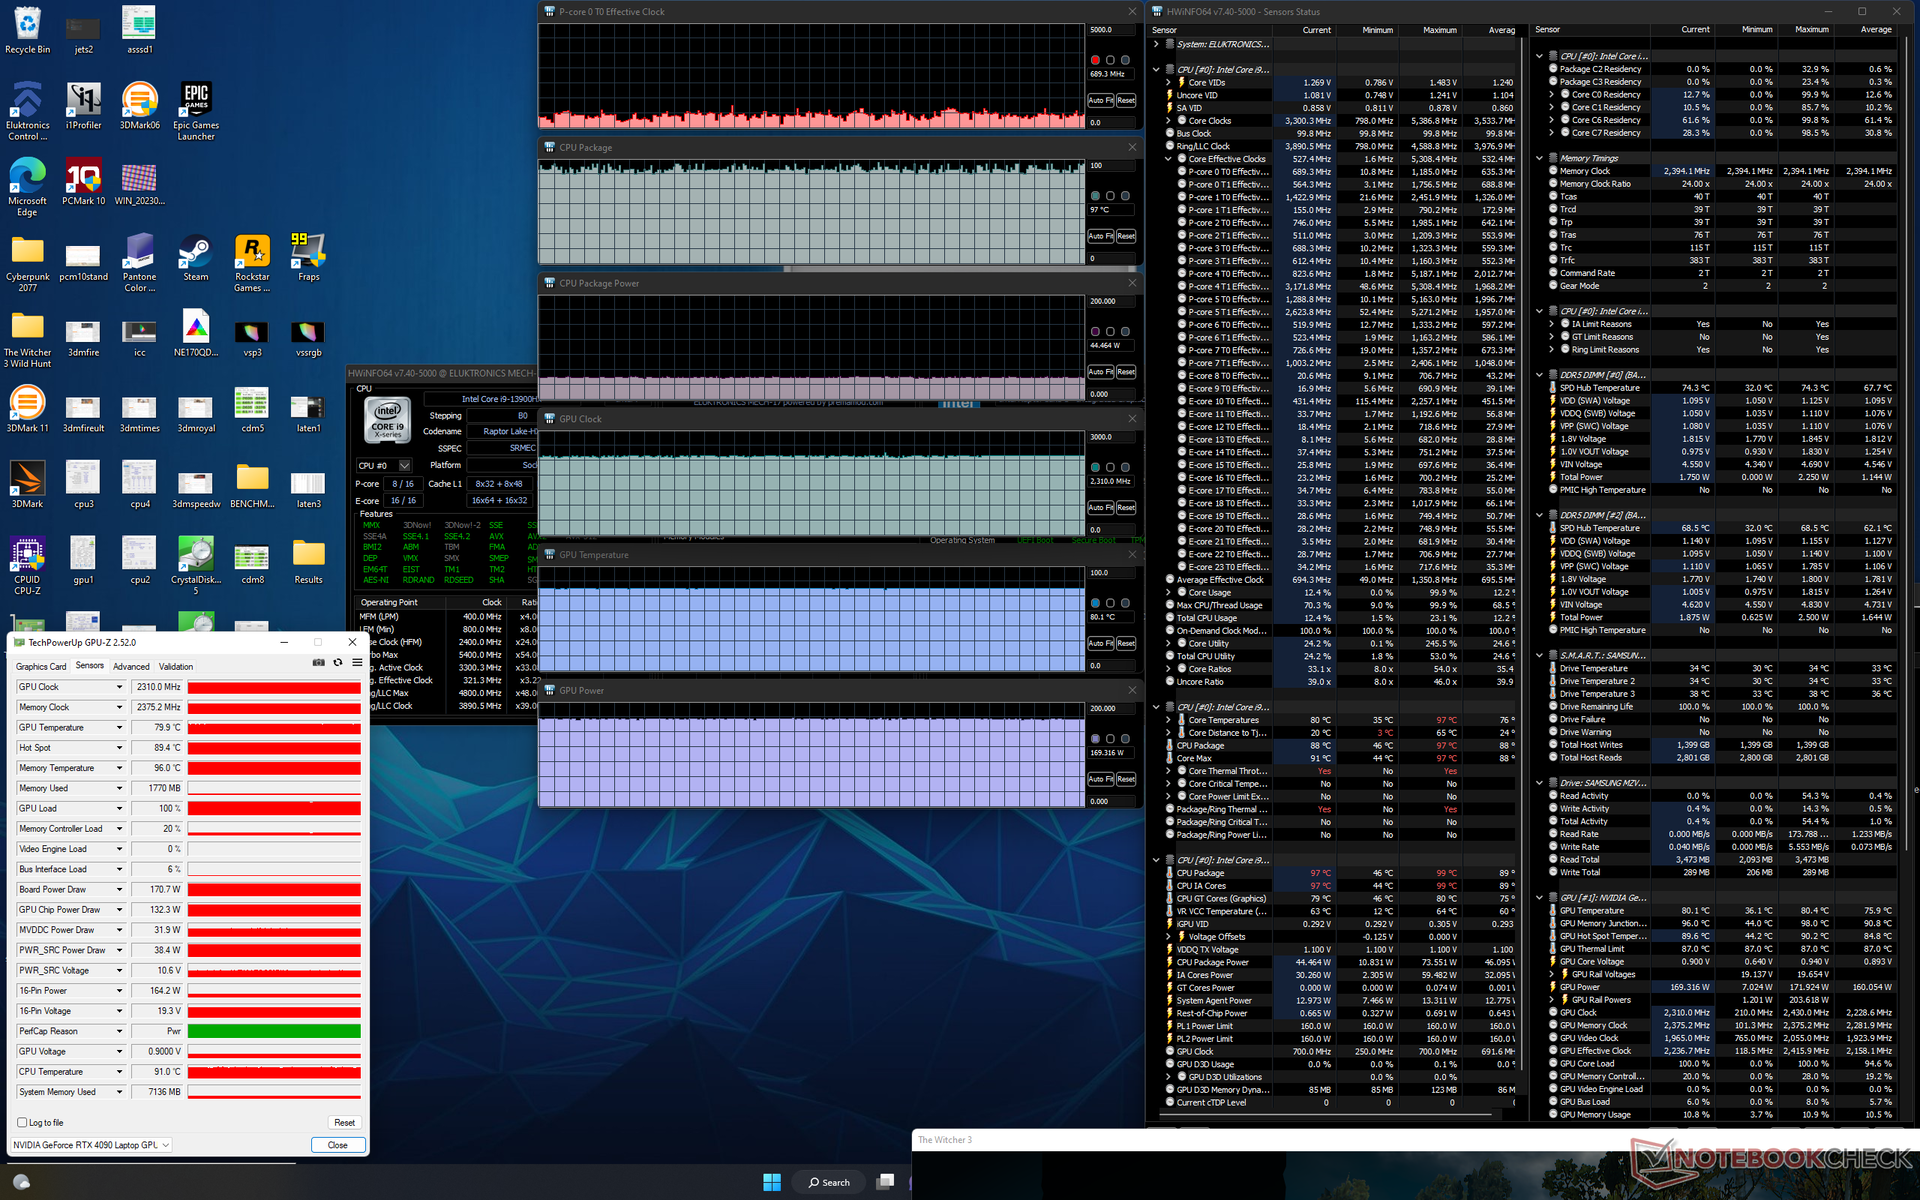
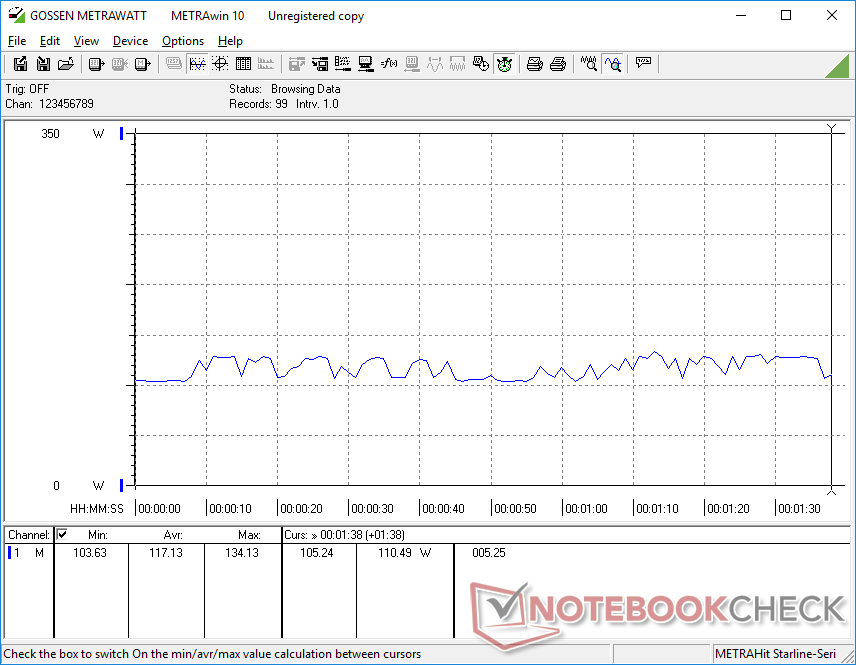
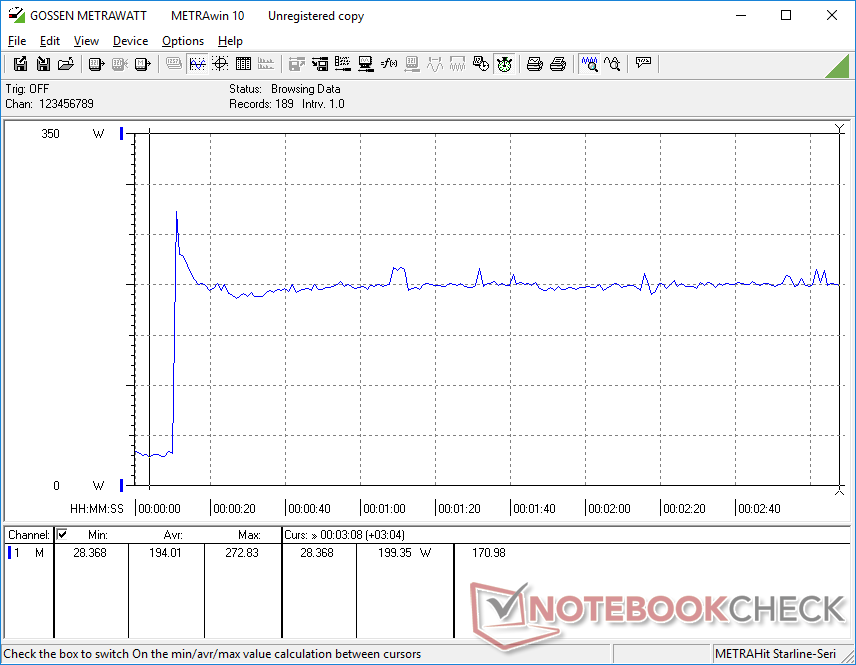
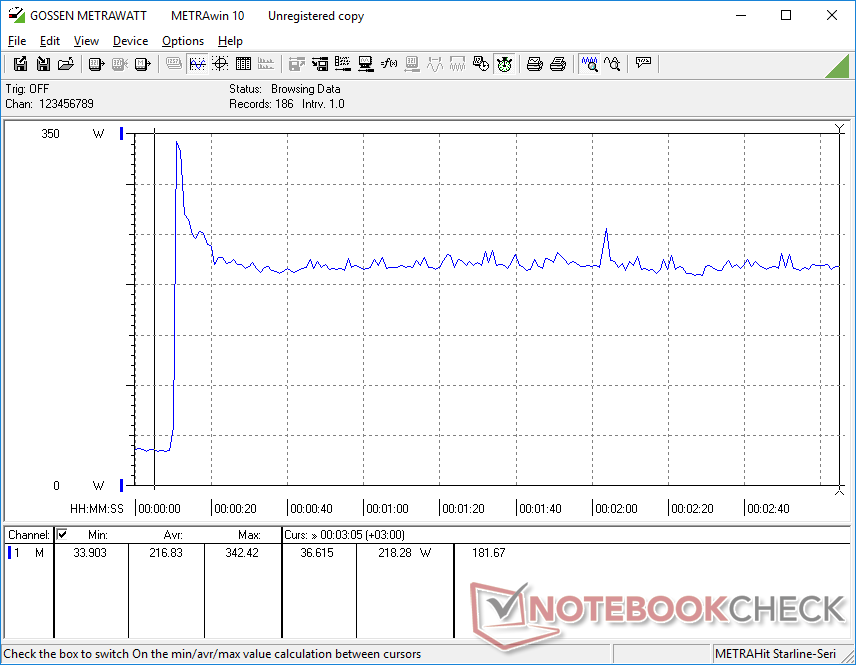
Lorsqu'il est sollicité sous Prime95, le CPU atteint 4,7 GHz, 160 W et 96 C pendant seulement une ou deux secondes avant de redescendre immédiatement à 4,1 GHz et 107 W. La température du cœur reste cependant très élevée à 96 C. Après quelques minutes supplémentaires, les fréquences d'horloge chutent encore à 3,4 GHz avec des changements minimes au niveau de la température et de la consommation d'énergie de la carte mère.
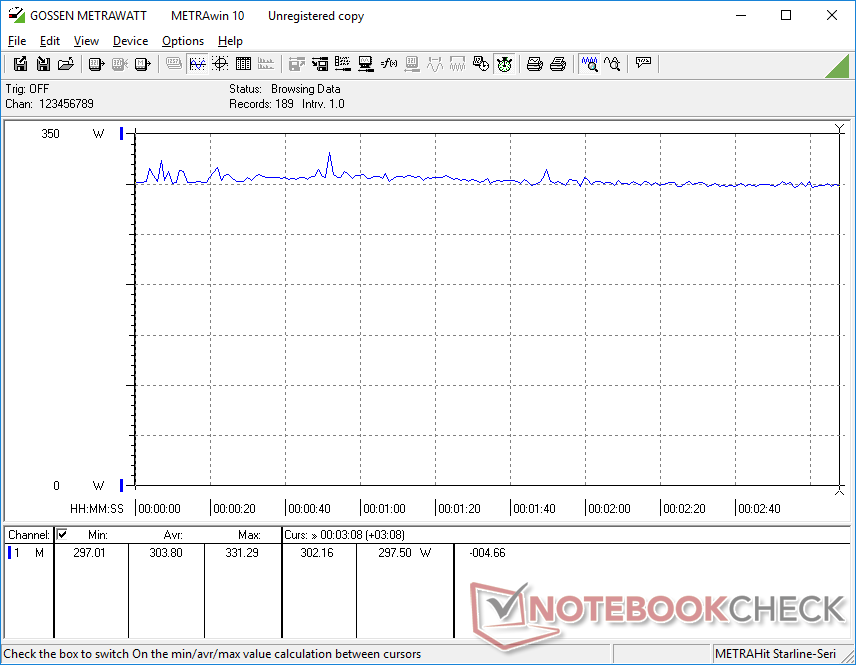
La fréquence d'horloge, la température et la consommation d'énergie du GPU se sont stabilisées à 2310 MHz, 80 C et 169 W, respectivement, lors de l'utilisation de la carte mère Witcher 3. Le GPU est prévu pour un TGP de 175 W et la consommation réelle de 169 W est donc très proche. La température du CPU reste malheureusement élevée à 96°C contre 85°C ou 66°C sur la Razer Blade 18(RTX 4070) ou la MSI GT77respectivement.
L'exécution simultanée de Prime95 et FurMark pendant plus de quelques minutes fait planter notre appareil à chaque fois. Nous pensons que les températures élevées du cœur sont responsables de l'arrêt et du redémarrage automatiques. La plupart des autres ordinateurs portables réduiraient les performances lorsqu'ils sont soumis à des charges aussi extrêmes afin d'éviter les pannes.
L'utilisation de la batterie limite considérablement les performances. Un test Fire Strike sur batterie donnerait des scores en physique et en graphique de 11430 et 11496 points, respectivement, contre 43004 et 47611 points sur secteur.
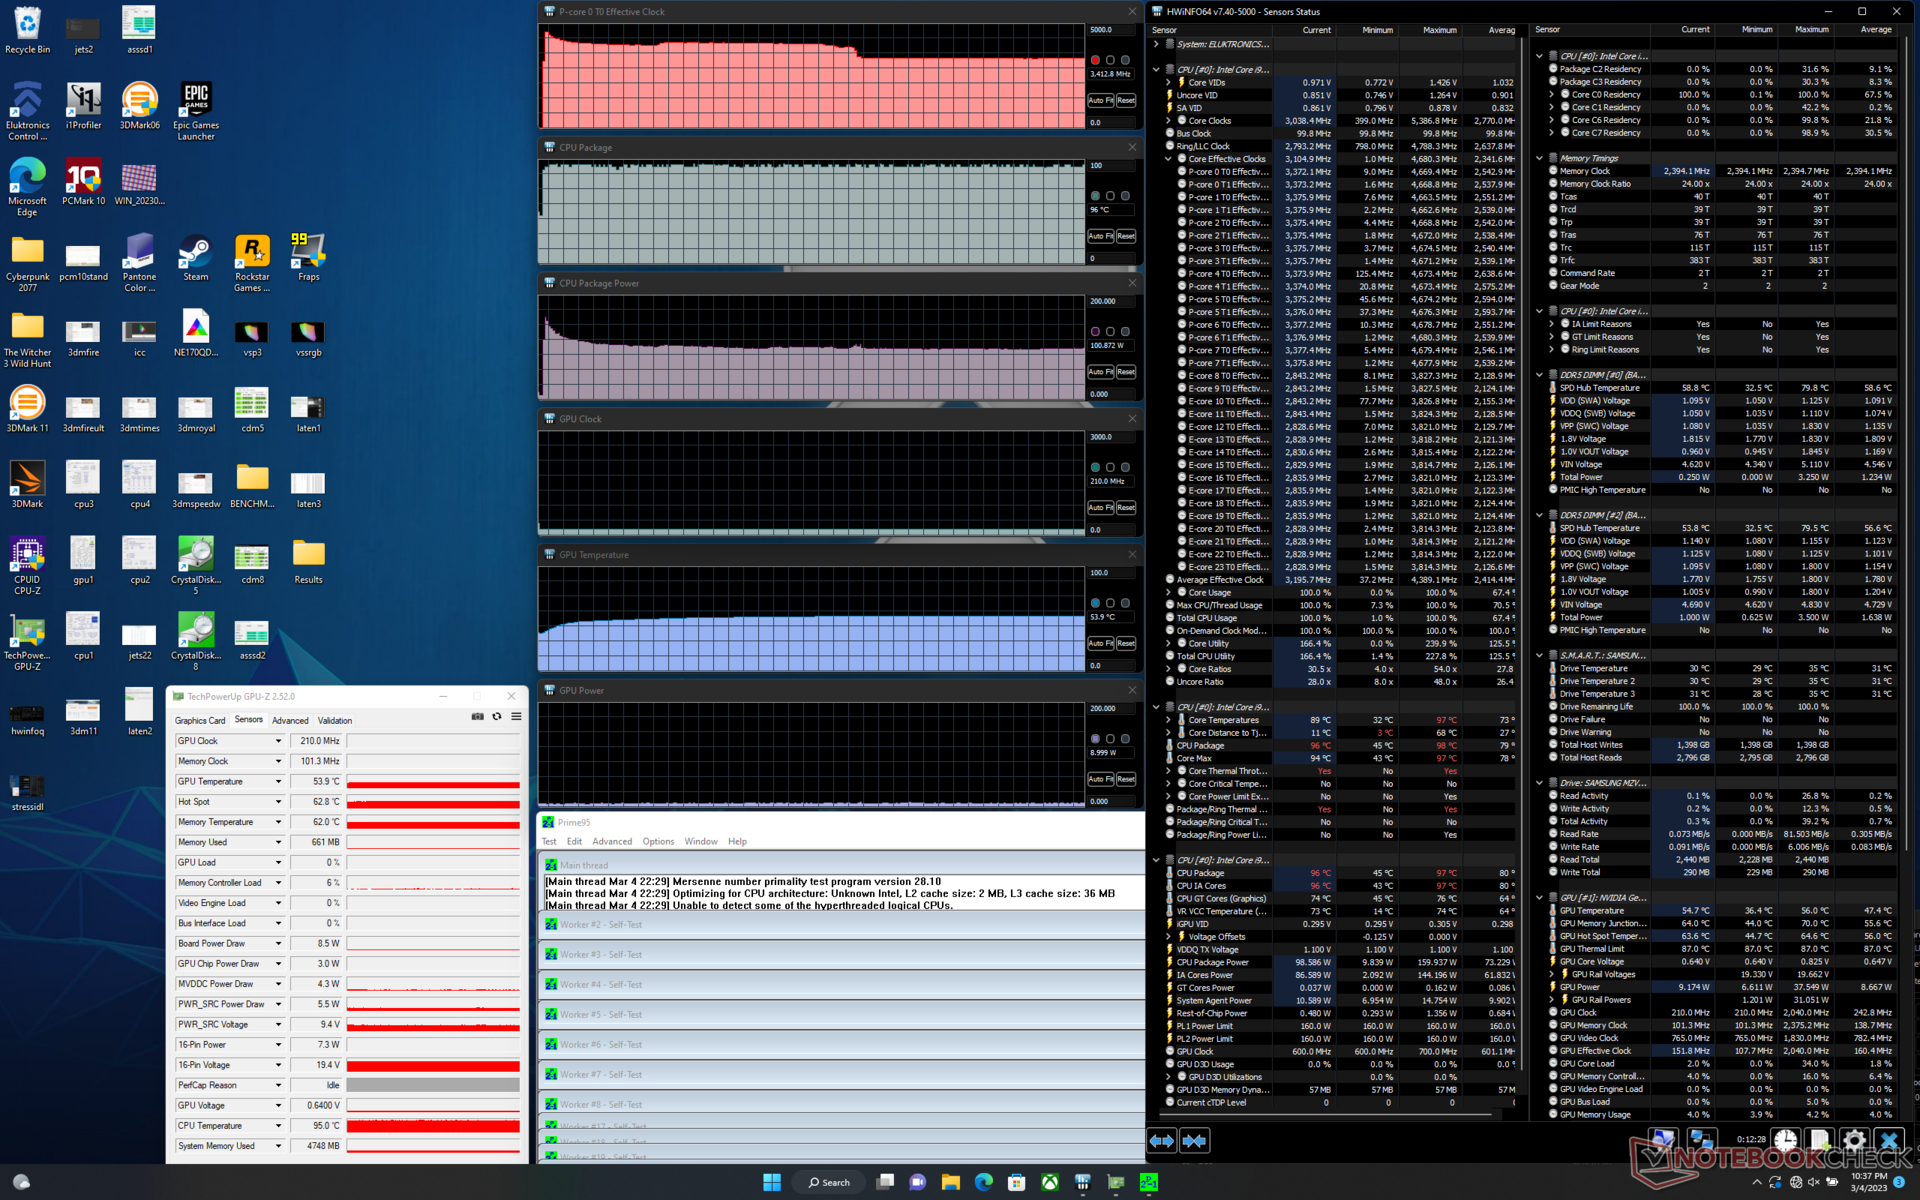
| Horloge du CPU (GHz) | Horloge du GPU (MHz) | Température moyenne du CPU (°C) | Température moyenne du GPU (°C) | |
| Système en veille | -- | -- | 47 | 37 |
| Prime95 Stress | 3.4 | -- | 96 | 54 |
| Witcher 3 Stress | ~0.7 | 2310 | 97 | 80 |
Intervenants
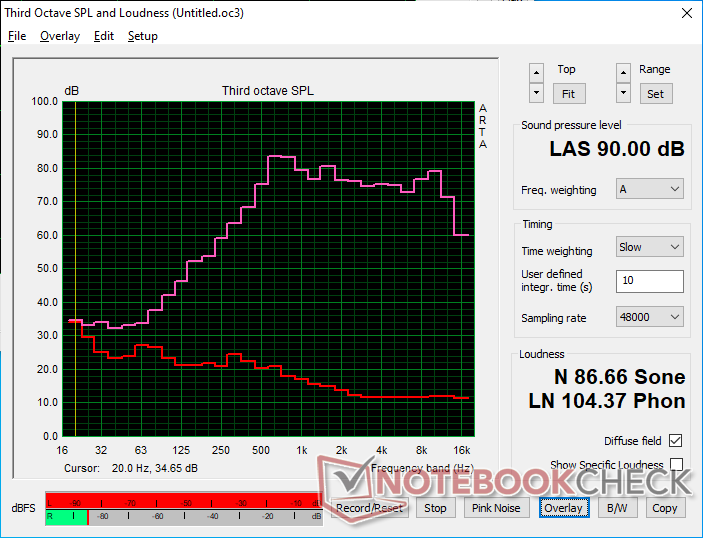
Eluktronics Mech-17 GP2 analyse audio
(+) | les haut-parleurs peuvent jouer relativement fort (90# dB)
Basses 100 - 315 Hz
(-) | presque aucune basse - en moyenne 22.5% plus bas que la médiane
(±) | la linéarité des basses est moyenne (7.3% delta à la fréquence précédente)
Médiums 400 - 2000 Hz
(+) | médiane équilibrée - seulement 4.4% de la médiane
(±) | la linéarité des médiums est moyenne (7.4% delta à la fréquence précédente)
Aiguës 2 - 16 kHz
(+) | des sommets équilibrés - à seulement 1.3% de la médiane
(+) | les aigus sont linéaires (2.7% delta à la fréquence précédente)
Globalement 100 - 16 000 Hz
(±) | la linéarité du son global est moyenne (15% de différence avec la médiane)
Par rapport à la même classe
» 31% de tous les appareils testés de cette catégorie étaient meilleurs, 6% similaires, 63% pires
» Le meilleur avait un delta de 6%, la moyenne était de 18%, le pire était de 132%.
Par rapport à tous les appareils testés
» 20% de tous les appareils testés étaient meilleurs, 4% similaires, 76% pires
» Le meilleur avait un delta de 4%, la moyenne était de 24%, le pire était de 134%.
Apple MacBook Pro 16 2021 M1 Pro analyse audio
(+) | les haut-parleurs peuvent jouer relativement fort (84.7# dB)
Basses 100 - 315 Hz
(+) | bonne basse - seulement 3.8% loin de la médiane
(+) | les basses sont linéaires (5.2% delta à la fréquence précédente)
Médiums 400 - 2000 Hz
(+) | médiane équilibrée - seulement 1.3% de la médiane
(+) | les médiums sont linéaires (2.1% delta à la fréquence précédente)
Aiguës 2 - 16 kHz
(+) | des sommets équilibrés - à seulement 1.9% de la médiane
(+) | les aigus sont linéaires (2.7% delta à la fréquence précédente)
Globalement 100 - 16 000 Hz
(+) | le son global est linéaire (4.6% différence à la médiane)
Par rapport à la même classe
» 0% de tous les appareils testés de cette catégorie étaient meilleurs, 0% similaires, 100% pires
» Le meilleur avait un delta de 5%, la moyenne était de 17%, le pire était de 45%.
Par rapport à tous les appareils testés
» 0% de tous les appareils testés étaient meilleurs, 0% similaires, 100% pires
» Le meilleur avait un delta de 4%, la moyenne était de 24%, le pire était de 134%.
Gestion de l'énergie
Consommation électrique
La consommation d'énergie globale est nettement plus élevée que celle du modèle AMD-Ampere 2022. Par exemple, le simple fait de tourner au ralenti sur un ordinateur de bureau consomme entre 14 et 37 W, contre seulement 7 à 17 W sur la version 2022. Le jeu demande 37 % de puissance en plus sur notre unité 2023, mais la performance par watt reste très bonne puisque les utilisateurs obtiennent 40 à 60 % de performance graphique en plus par rapport à la RTX 3080 Ti mobile.
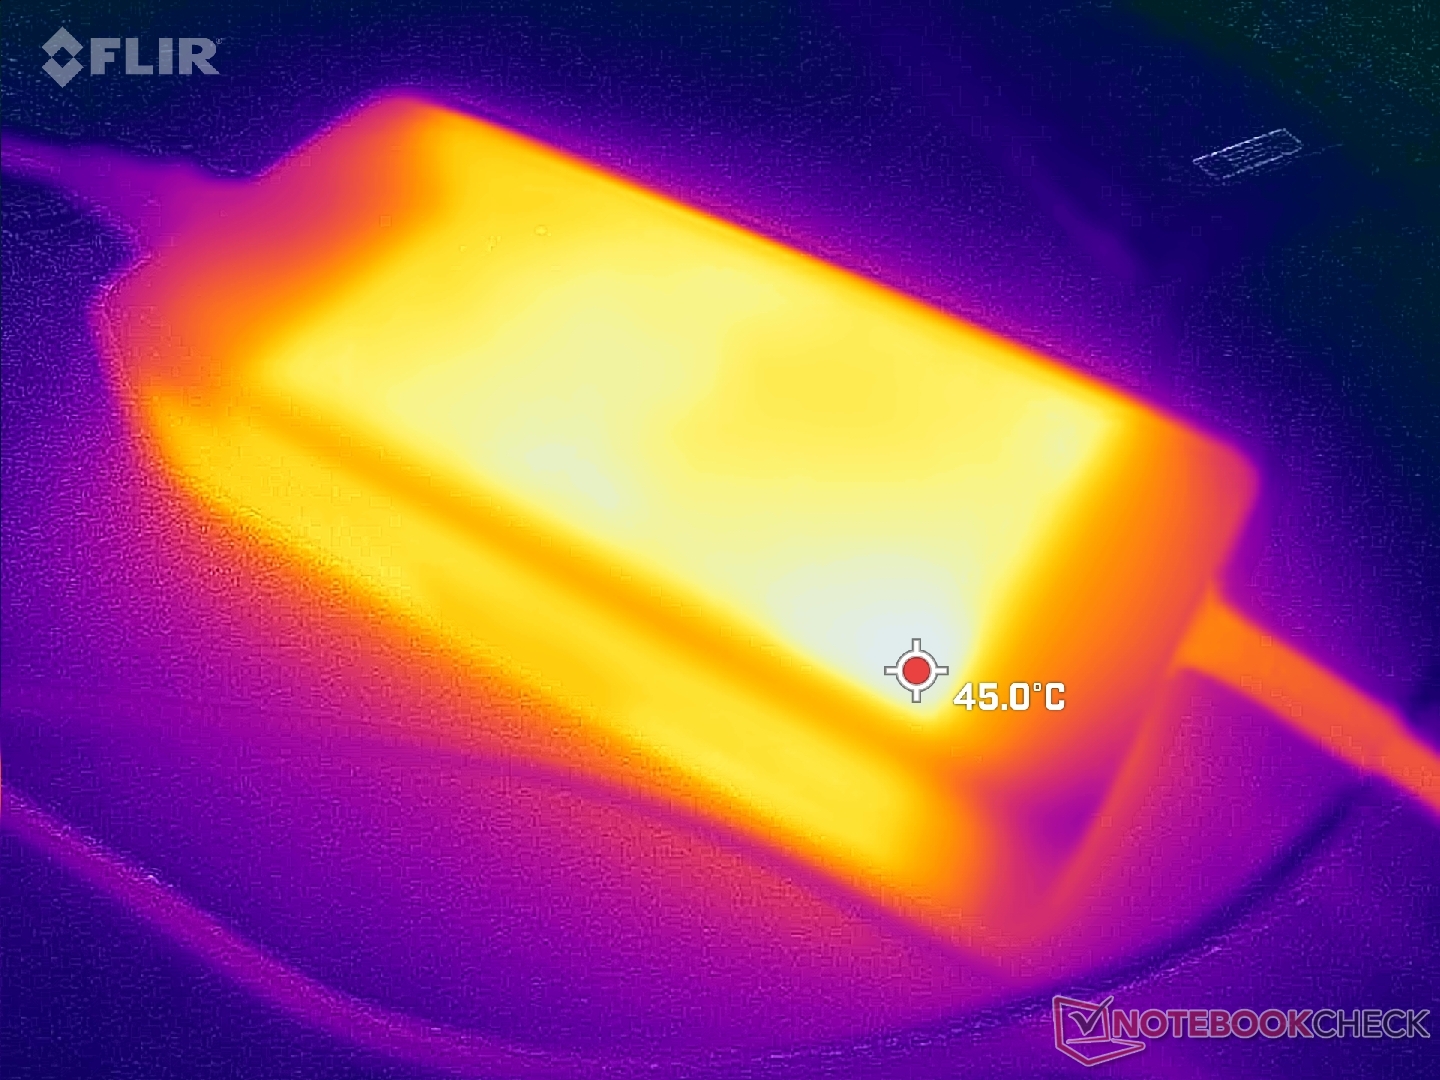
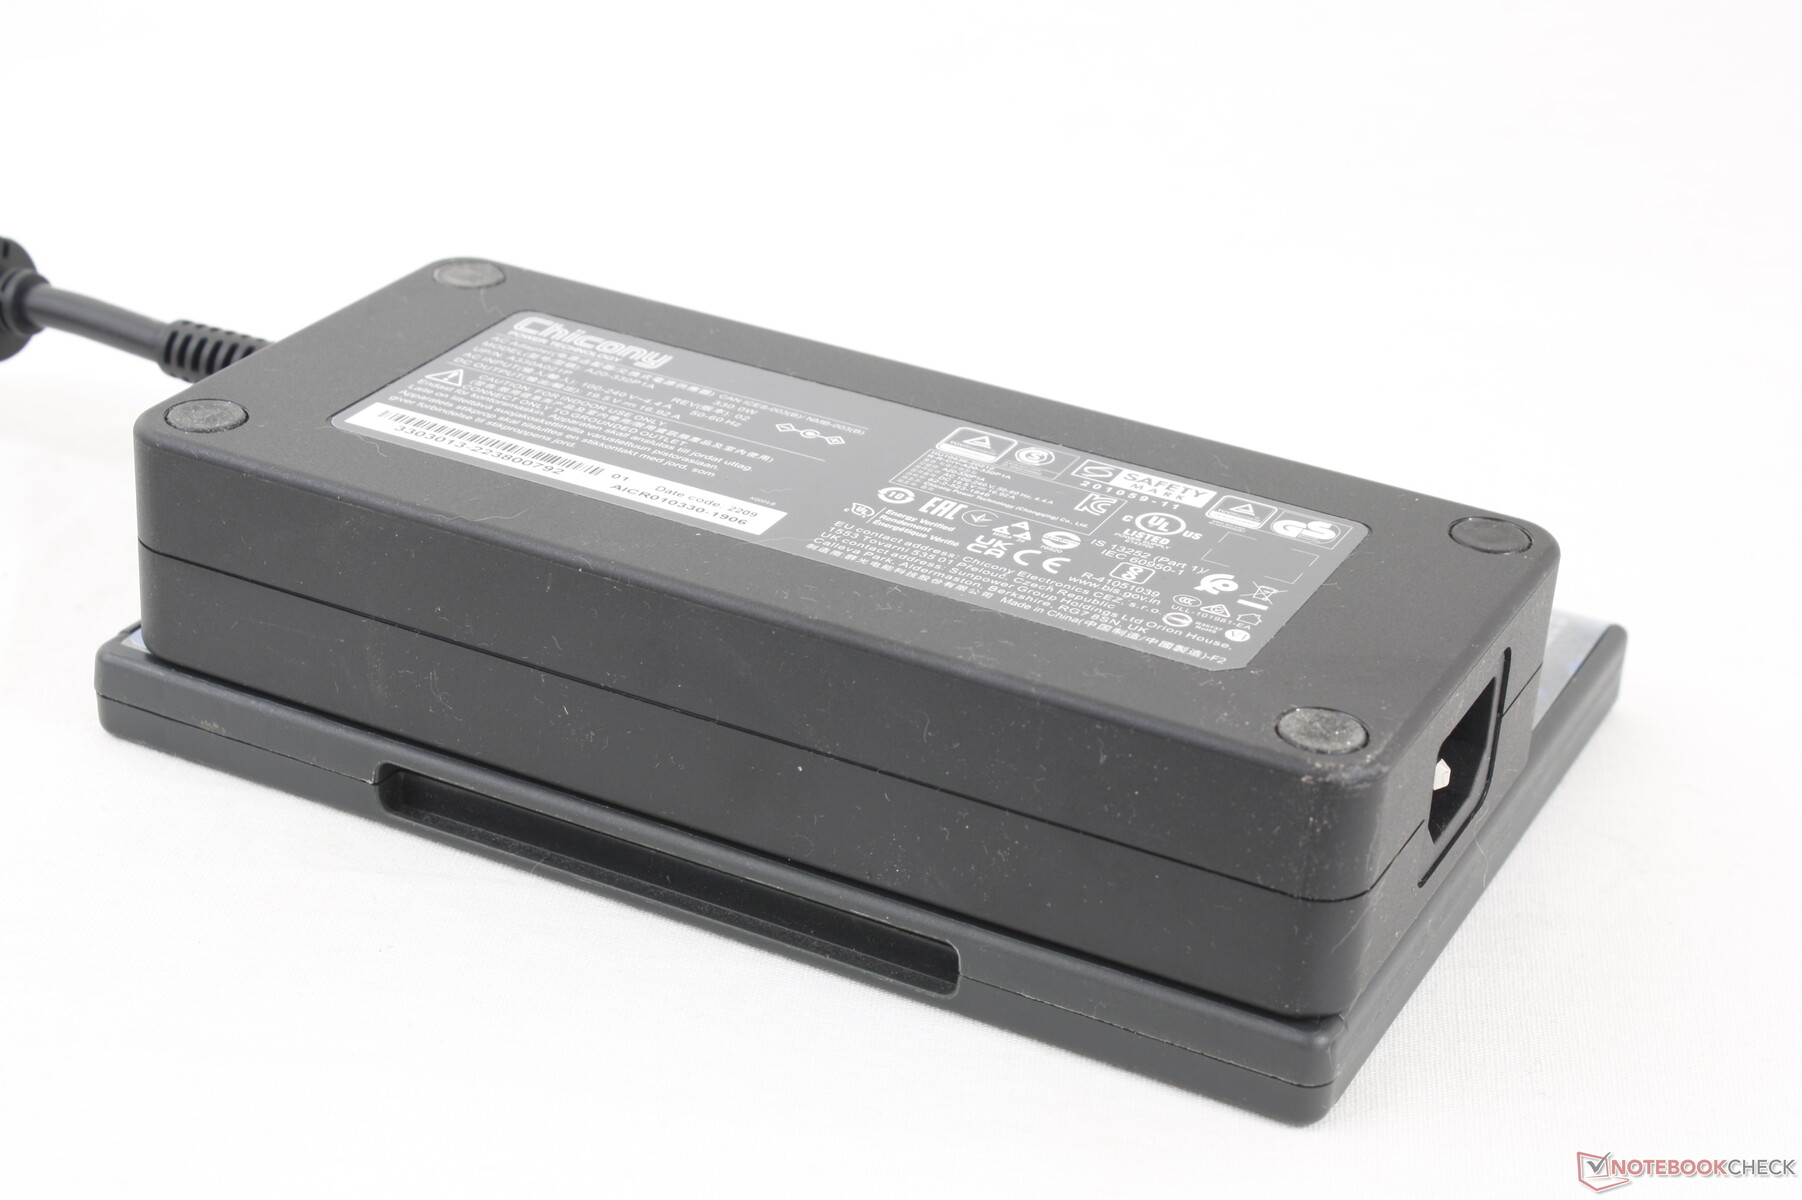
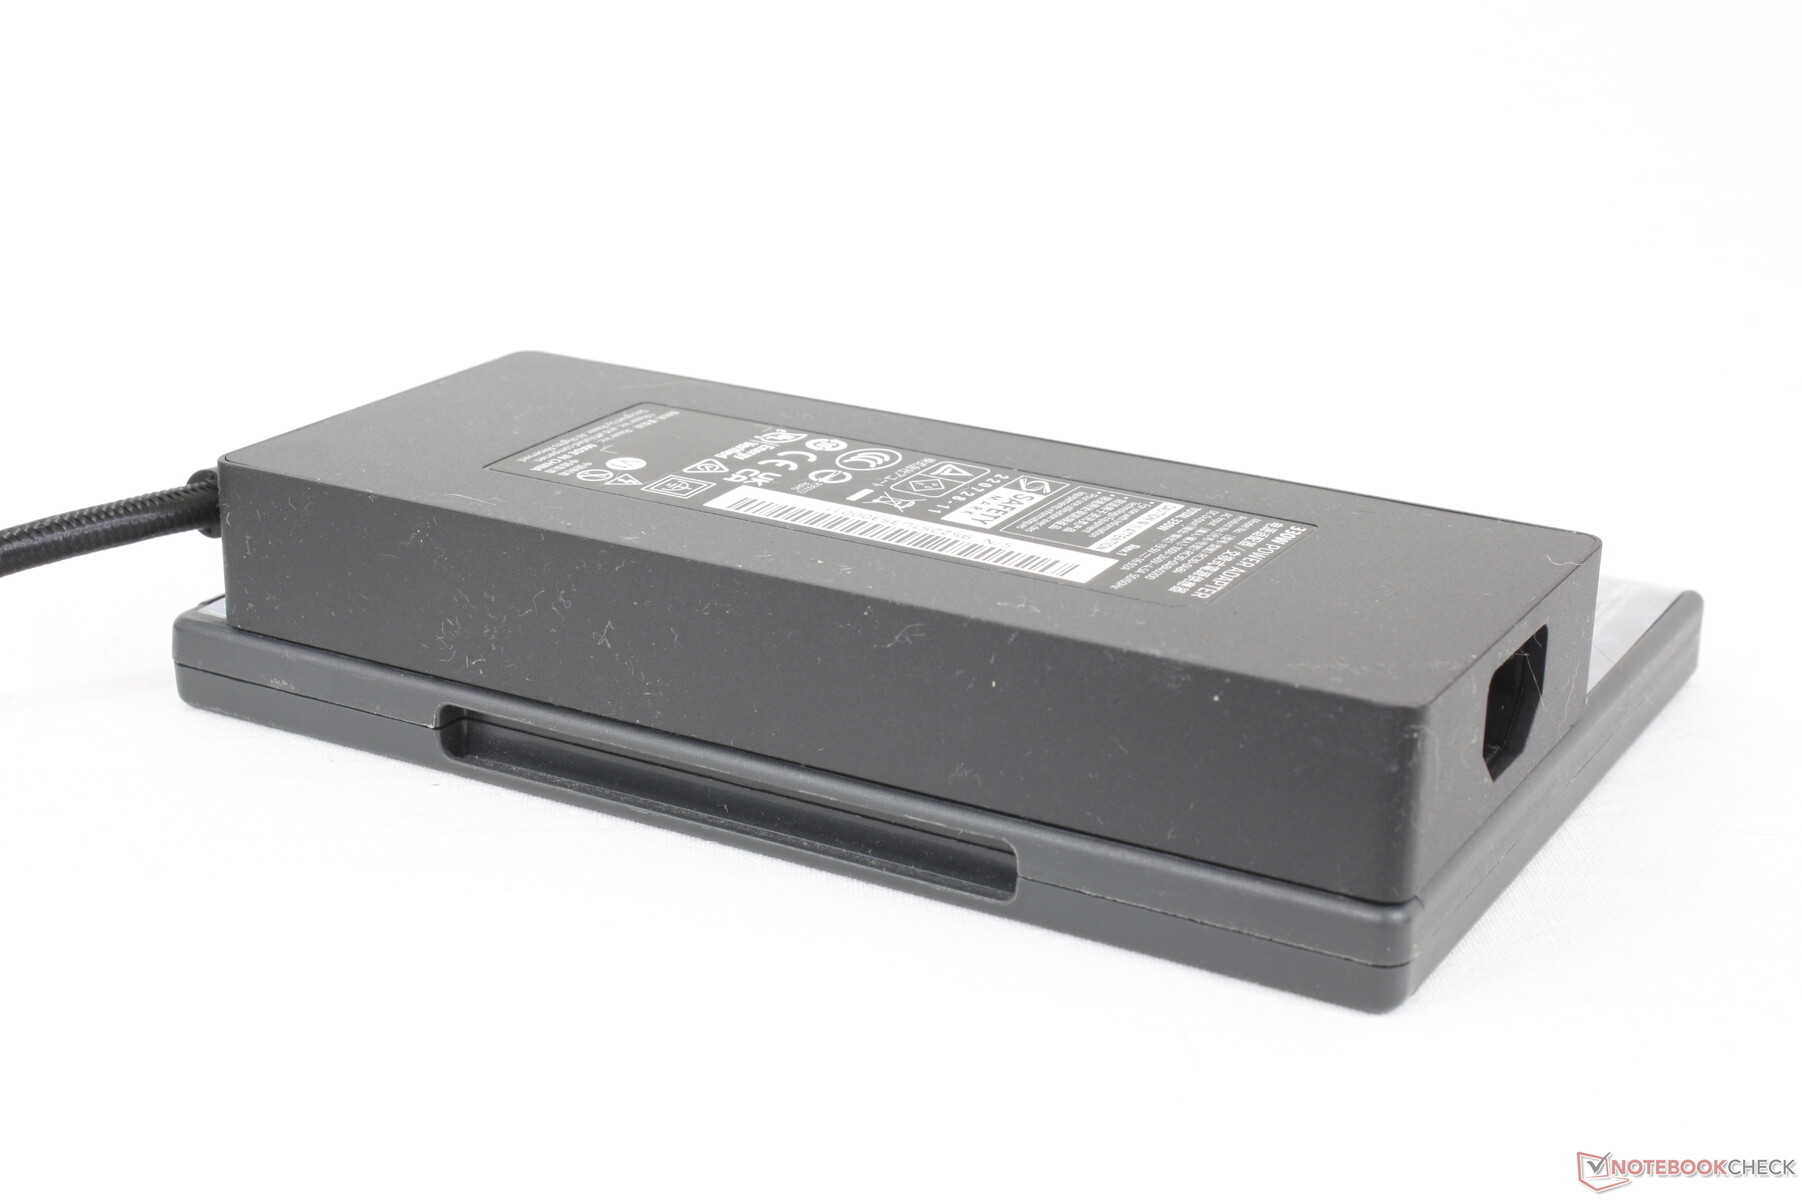
L'adaptateur secteur de 330 W est plus grand que l'adaptateur secteur de 330 W de la nouveau Razer Blade (~18,5 x 8,5 x 3,6 cm contre ~18 x 7,5 x 2,5 cm) car Eluktronics et Uniwill ne sont pas encore passés à la charge GaN. Nous avons pu enregistrer une consommation maximale temporaire de 343 W lorsque le CPU et le GPU sont tous deux utilisés à 100 %.
| Éteint/en veille | |
| Au repos | |
| Fortement sollicité |
|
Légende:
min: | |
| Eluktronics Mech-17 GP2 i9-13900HX, GeForce RTX 4090 Laptop GPU, Samsung PM9A1 MZVL21T0HCLR, IPS, 2560x1600, 17" | Schenker XMG Neo 17 M22 R9 6900HX, GeForce RTX 3080 Ti Laptop GPU, Samsung SSD 980 Pro 1TB MZ-V8P1T0BW, IPS, 2560x1600, 17" | MSI Katana 17 B13VFK i7-13620H, GeForce RTX 4060 Laptop GPU, Micron 2400 MTFDKBA1T0QFM, IPS LED, 1920x1080, 17.3" | MSI Titan GT77 HX 13VI i9-13950HX, GeForce RTX 4090 Laptop GPU, Samsung PM9A1 MZVL22T0HBLB, Mini-LED, 3840x2160, 17.3" | Alienware m17 R5 (R9 6900HX, RX 6850M XT) R9 6900HX, Radeon RX 6850M XT, SSSTC CA6-8D1024, IPS, 3840x2160, 17" | Razer Blade 18 RTX 4070 i9-13950HX, GeForce RTX 4070 Laptop GPU, SSSTC CA6-8D1024, IPS, 2560x1600, 18" | |
|---|---|---|---|---|---|---|
| Power Consumption | 35% | 35% | 1% | 24% | -24% | |
| Idle Minimum * (Watt) | 14 | 7 50% | 12.2 13% | 14 -0% | 13 7% | 24.5 -75% |
| Idle Average * (Watt) | 19.3 | 11 43% | 14.9 23% | 21.6 -12% | 16.5 15% | 34.1 -77% |
| Idle Maximum * (Watt) | 36.8 | 17 54% | 15.8 57% | 24.8 33% | 17 54% | 47.7 -30% |
| Load Average * (Watt) | 117.2 | 92 22% | 85.22 27% | 122.5 -5% | 93 21% | 140 -19% |
| Witcher 3 ultra * (Watt) | 304 | 221 27% | 151.1 50% | 265 13% | 239 21% | 202 34% |
| Load Maximum * (Watt) | 342.5 | 306 11% | 212.8 38% | 418 -22% | 251 27% | 261 24% |
* ... Moindre est la valeur, meilleures sont les performances
Power Consumption Witcher 3 / Stresstest
Power Consumption external Monitor
Autonomie de la batterie
L'autonomie du WLAN est inférieure de plusieurs heures à celle du Neo 17 M22 de l'année dernière, alimenté par AMD, pour un total d'un peu plus de 5 heures. Les deux unités de test sont réglées sur le profil d'alimentation équilibré avec Optimus actif sur l'iGPU.
Le chargement d'une batterie vide à une batterie pleine prend entre 2 et 2,5 heures. Le système ne peut pas être rechargé via l'USB-C.
| Eluktronics Mech-17 GP2 i9-13900HX, GeForce RTX 4090 Laptop GPU, 99 Wh | Schenker XMG Neo 17 M22 R9 6900HX, GeForce RTX 3080 Ti Laptop GPU, 99 Wh | MSI Katana 17 B13VFK i7-13620H, GeForce RTX 4060 Laptop GPU, 53.5 Wh | MSI Titan GT77 HX 13VI i9-13950HX, GeForce RTX 4090 Laptop GPU, 99.9 Wh | Alienware m17 R5 (R9 6900HX, RX 6850M XT) R9 6900HX, Radeon RX 6850M XT, 97 Wh | Razer Blade 18 RTX 4070 i9-13950HX, GeForce RTX 4070 Laptop GPU, 91.7 Wh | |
|---|---|---|---|---|---|---|
| Autonomie de la batterie | 76% | -43% | 4% | -6% | -22% | |
| WiFi v1.3 (h) | 5.1 | 9 76% | 2.9 -43% | 5.3 4% | 4.8 -6% | 4 -22% |
| Reader / Idle (h) | 12 | 7 | ||||
| H.264 (h) | 6.6 | 6 | 4.9 | |||
| Load (h) | 1.8 | 1 | 1.4 | 1.8 | 1.3 |
Points positifs
Points négatifs
Verdict - Une montée en température un peu trop littérale
La Mech-17 GP2 est 7 % plus petite et 17 % plus légère que la MSI GT77 HX Titan tout en offrant pratiquement les mêmes performances. Il est donc très dense, mais peut-être un peu trop. Les températures du processeur sont extrêmement élevées, même pour un ordinateur portable de jeu, lorsque des jeux sont en cours d'exécution. Bien que la température de ~97°C soit techniquement "sûre" pour le processeur Intel, elle est néanmoins plus élevée que sur le modèle de l'année dernière et n'est pas vraiment réconfortante pour l'utilisateur final. La température élevée du cœur peut peut-être être atténuée par l'utilisation de la station d'accueil externe du refroidisseur d'eau, mais un ordinateur portable ne devrait pas avoir à dépendre d'un accessoire optionnel pour un refroidissement optimal.
Des performances élevées au prix d'une température élevée du cœur.
Outre les performances élevées par volume, le prix est également un facteur distinctif du modèle. Le Mech-17 GP2 est l'un des rares ordinateurs portables GeForce 40 à être livré avec une option "barebones", ce qui signifie que vous pouvez économiser plusieurs centaines de dollars si vous pouvez fournir votre propre RAM, SSD et système d'exploitation. le prix de 2999 USD pour l'un des ordinateurs portables de jeu les plus rapides du marché n'est pas si mal, mais veillez à surveiller de près la température du cœur.
Prix et disponibilité
Amazon expédie maintenant le Mech-17 GP2 avec la RTX 4090 pour $4400 USD, complet avec RAM et stockage. Les utilisateurs peuvent également acheter directement auprès d'Eluktronics pour plus d'options configurables.
Eluktronics Mech-17 GP2
- 03/08/2023 v7 (old)
Allen Ngo
Transparency
La sélection des appareils à examiner est effectuée par notre équipe éditoriale. L'échantillon de test a été prêté à l'auteur par le fabricant ou le détaillant pour les besoins de cet examen. Le prêteur n'a pas eu d'influence sur cette évaluation et le fabricant n'a pas reçu de copie de cette évaluation avant sa publication. Il n'y avait aucune obligation de publier cet article. En tant que média indépendant, Notebookcheck n'est pas soumis à l'autorité des fabricants, des détaillants ou des éditeurs.
Voici comment Notebookcheck teste
Chaque année, Notebookcheck examine de manière indépendante des centaines d'ordinateurs portables et de smartphones en utilisant des procédures standardisées afin de garantir que tous les résultats sont comparables. Nous avons continuellement développé nos méthodes de test depuis environ 20 ans et avons établi des normes industrielles dans le processus. Dans nos laboratoires de test, des équipements de mesure de haute qualité sont utilisés par des techniciens et des rédacteurs expérimentés. Ces tests impliquent un processus de validation en plusieurs étapes. Notre système d'évaluation complexe repose sur des centaines de mesures et de points de référence bien fondés, ce qui garantit l'objectivité.Price comparison

