

Verdict - Une station de travail ultra-mince avec des fonctionnalités équilibrées
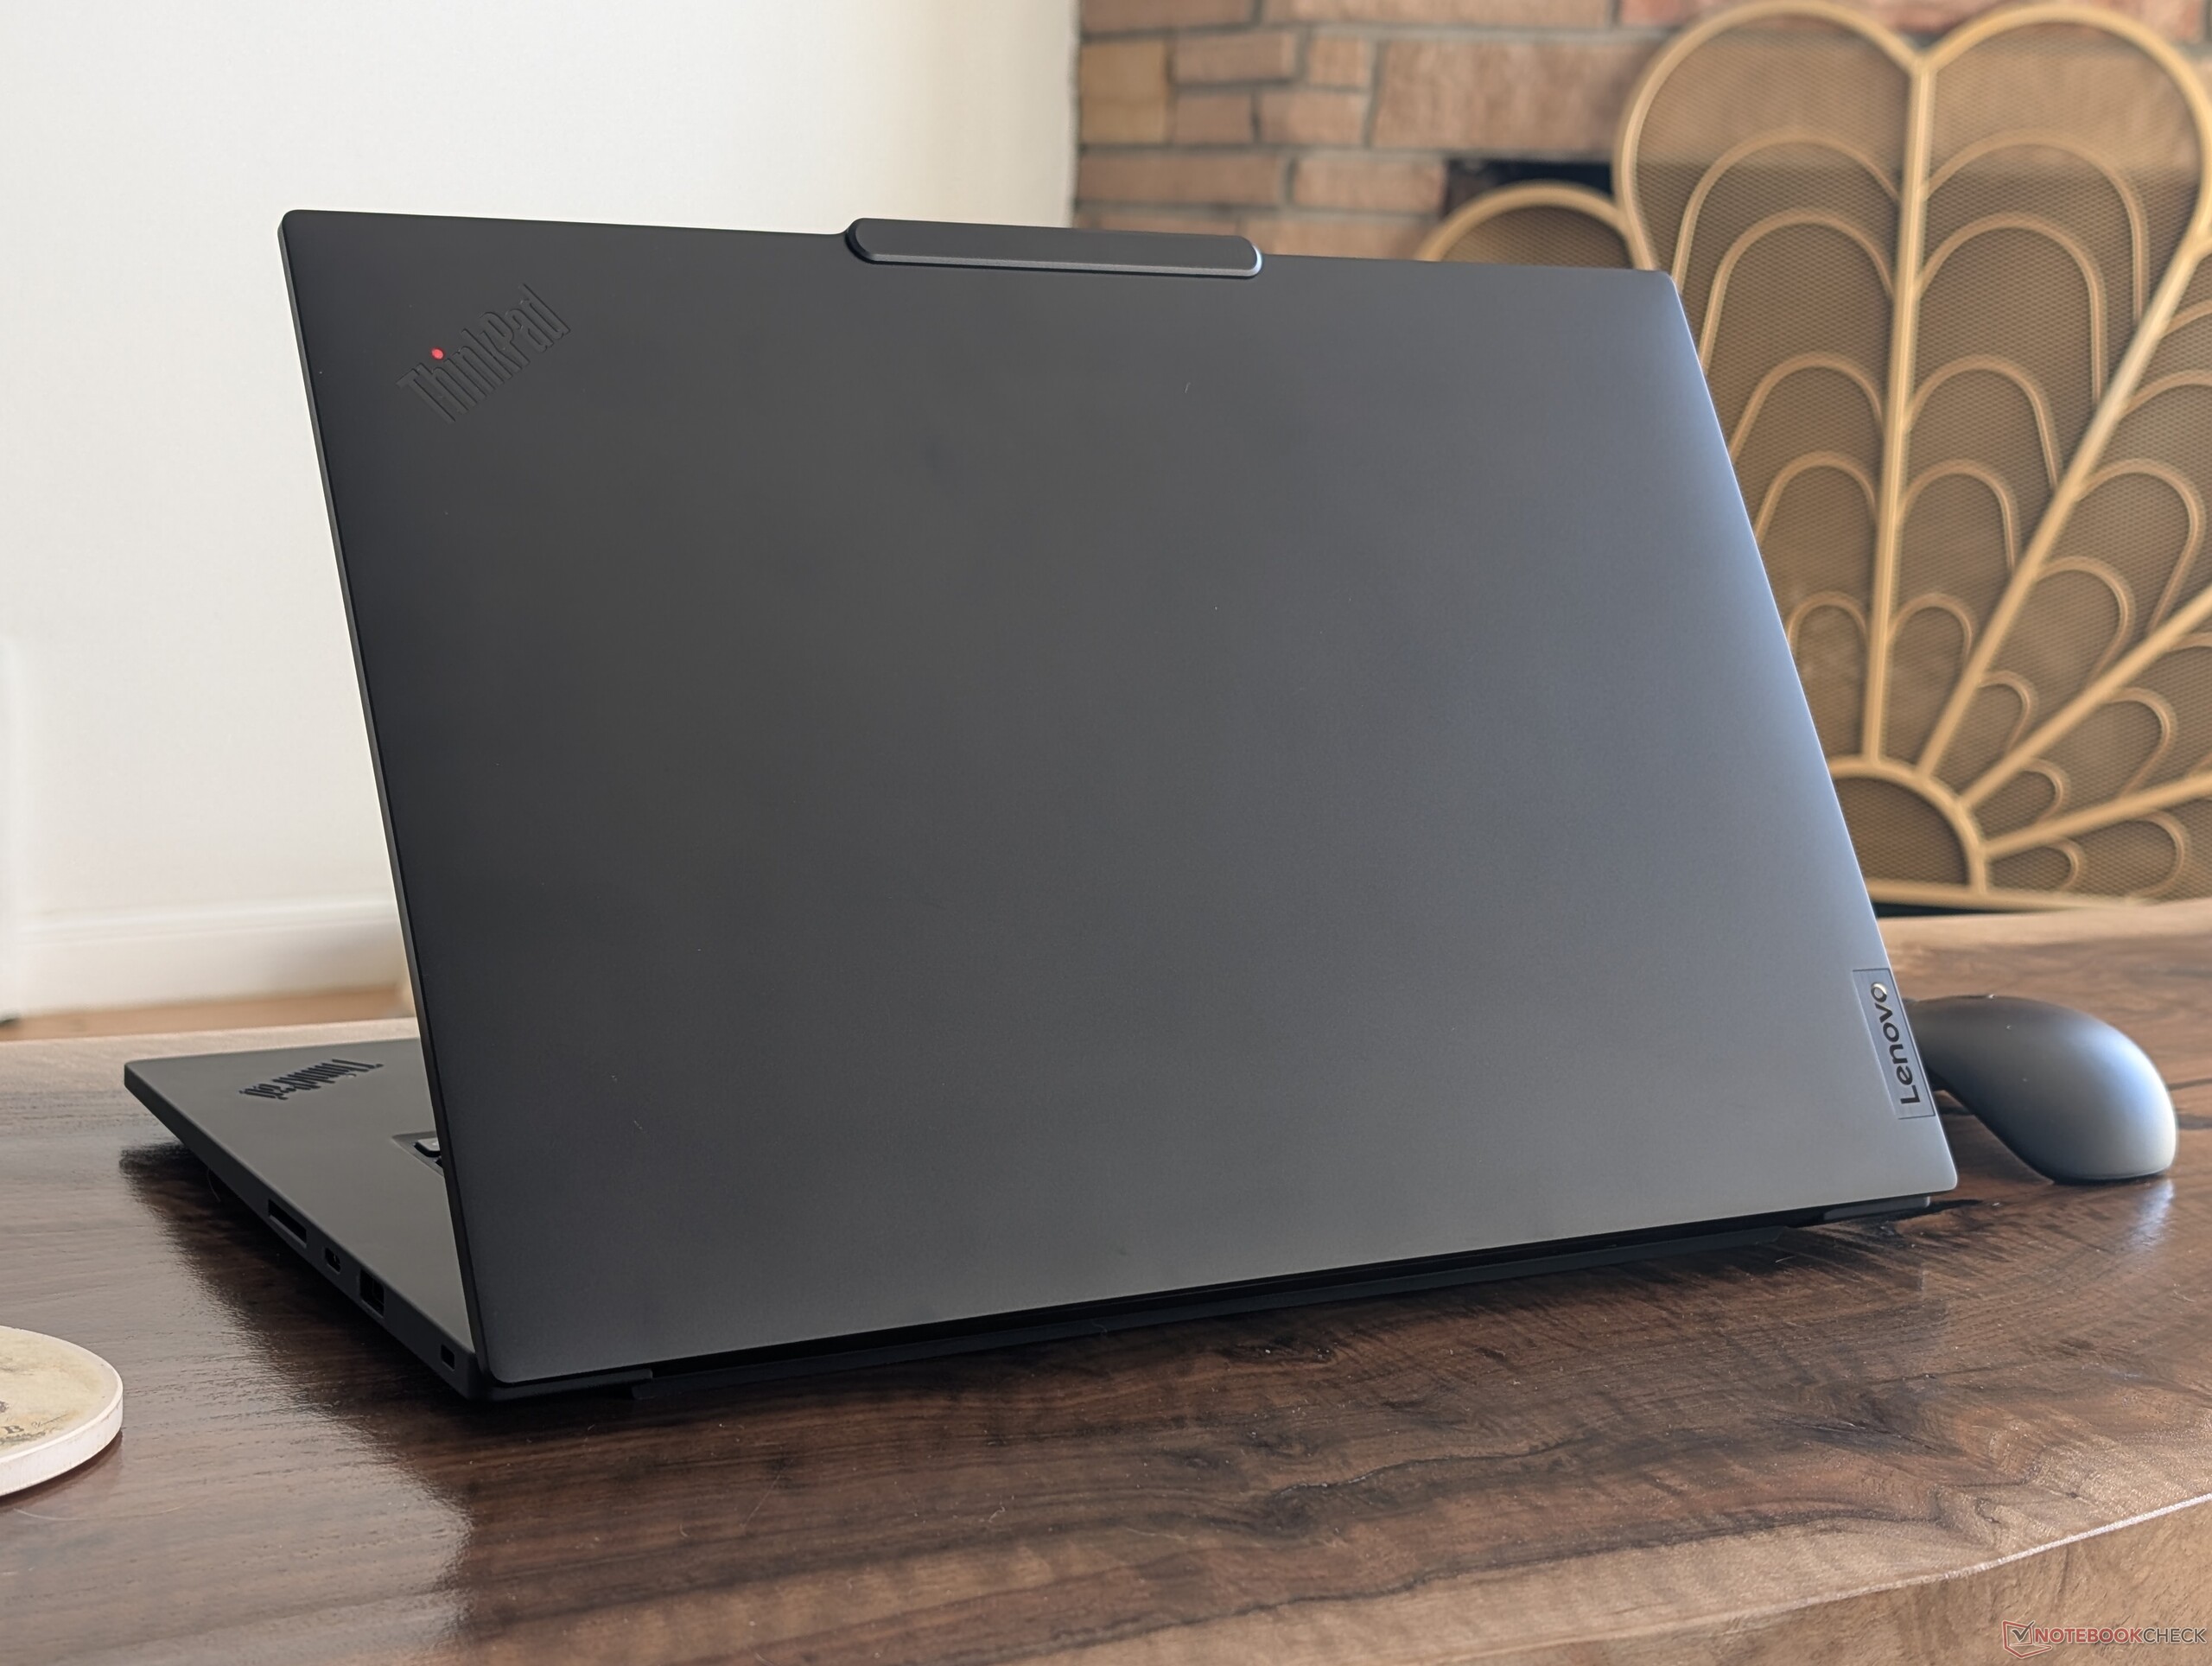
Le ThinkPad P1 Gen 8 est un peu plus rapide que le ThinkPad P1 Gen 7 tout en ajoutant la prise en charge de la connectivité Thunderbolt 5 et un nouvel adaptateur secteur USB-C plus petit. La série est connue pour offrir des options graphiques Nvidia discrètes malgré le profil ultrafin pour des performances élevées par volume et ce dernier modèle poursuit donc la tendance. Il n'y a sinon aucun changement externe pour la révision de cette année.
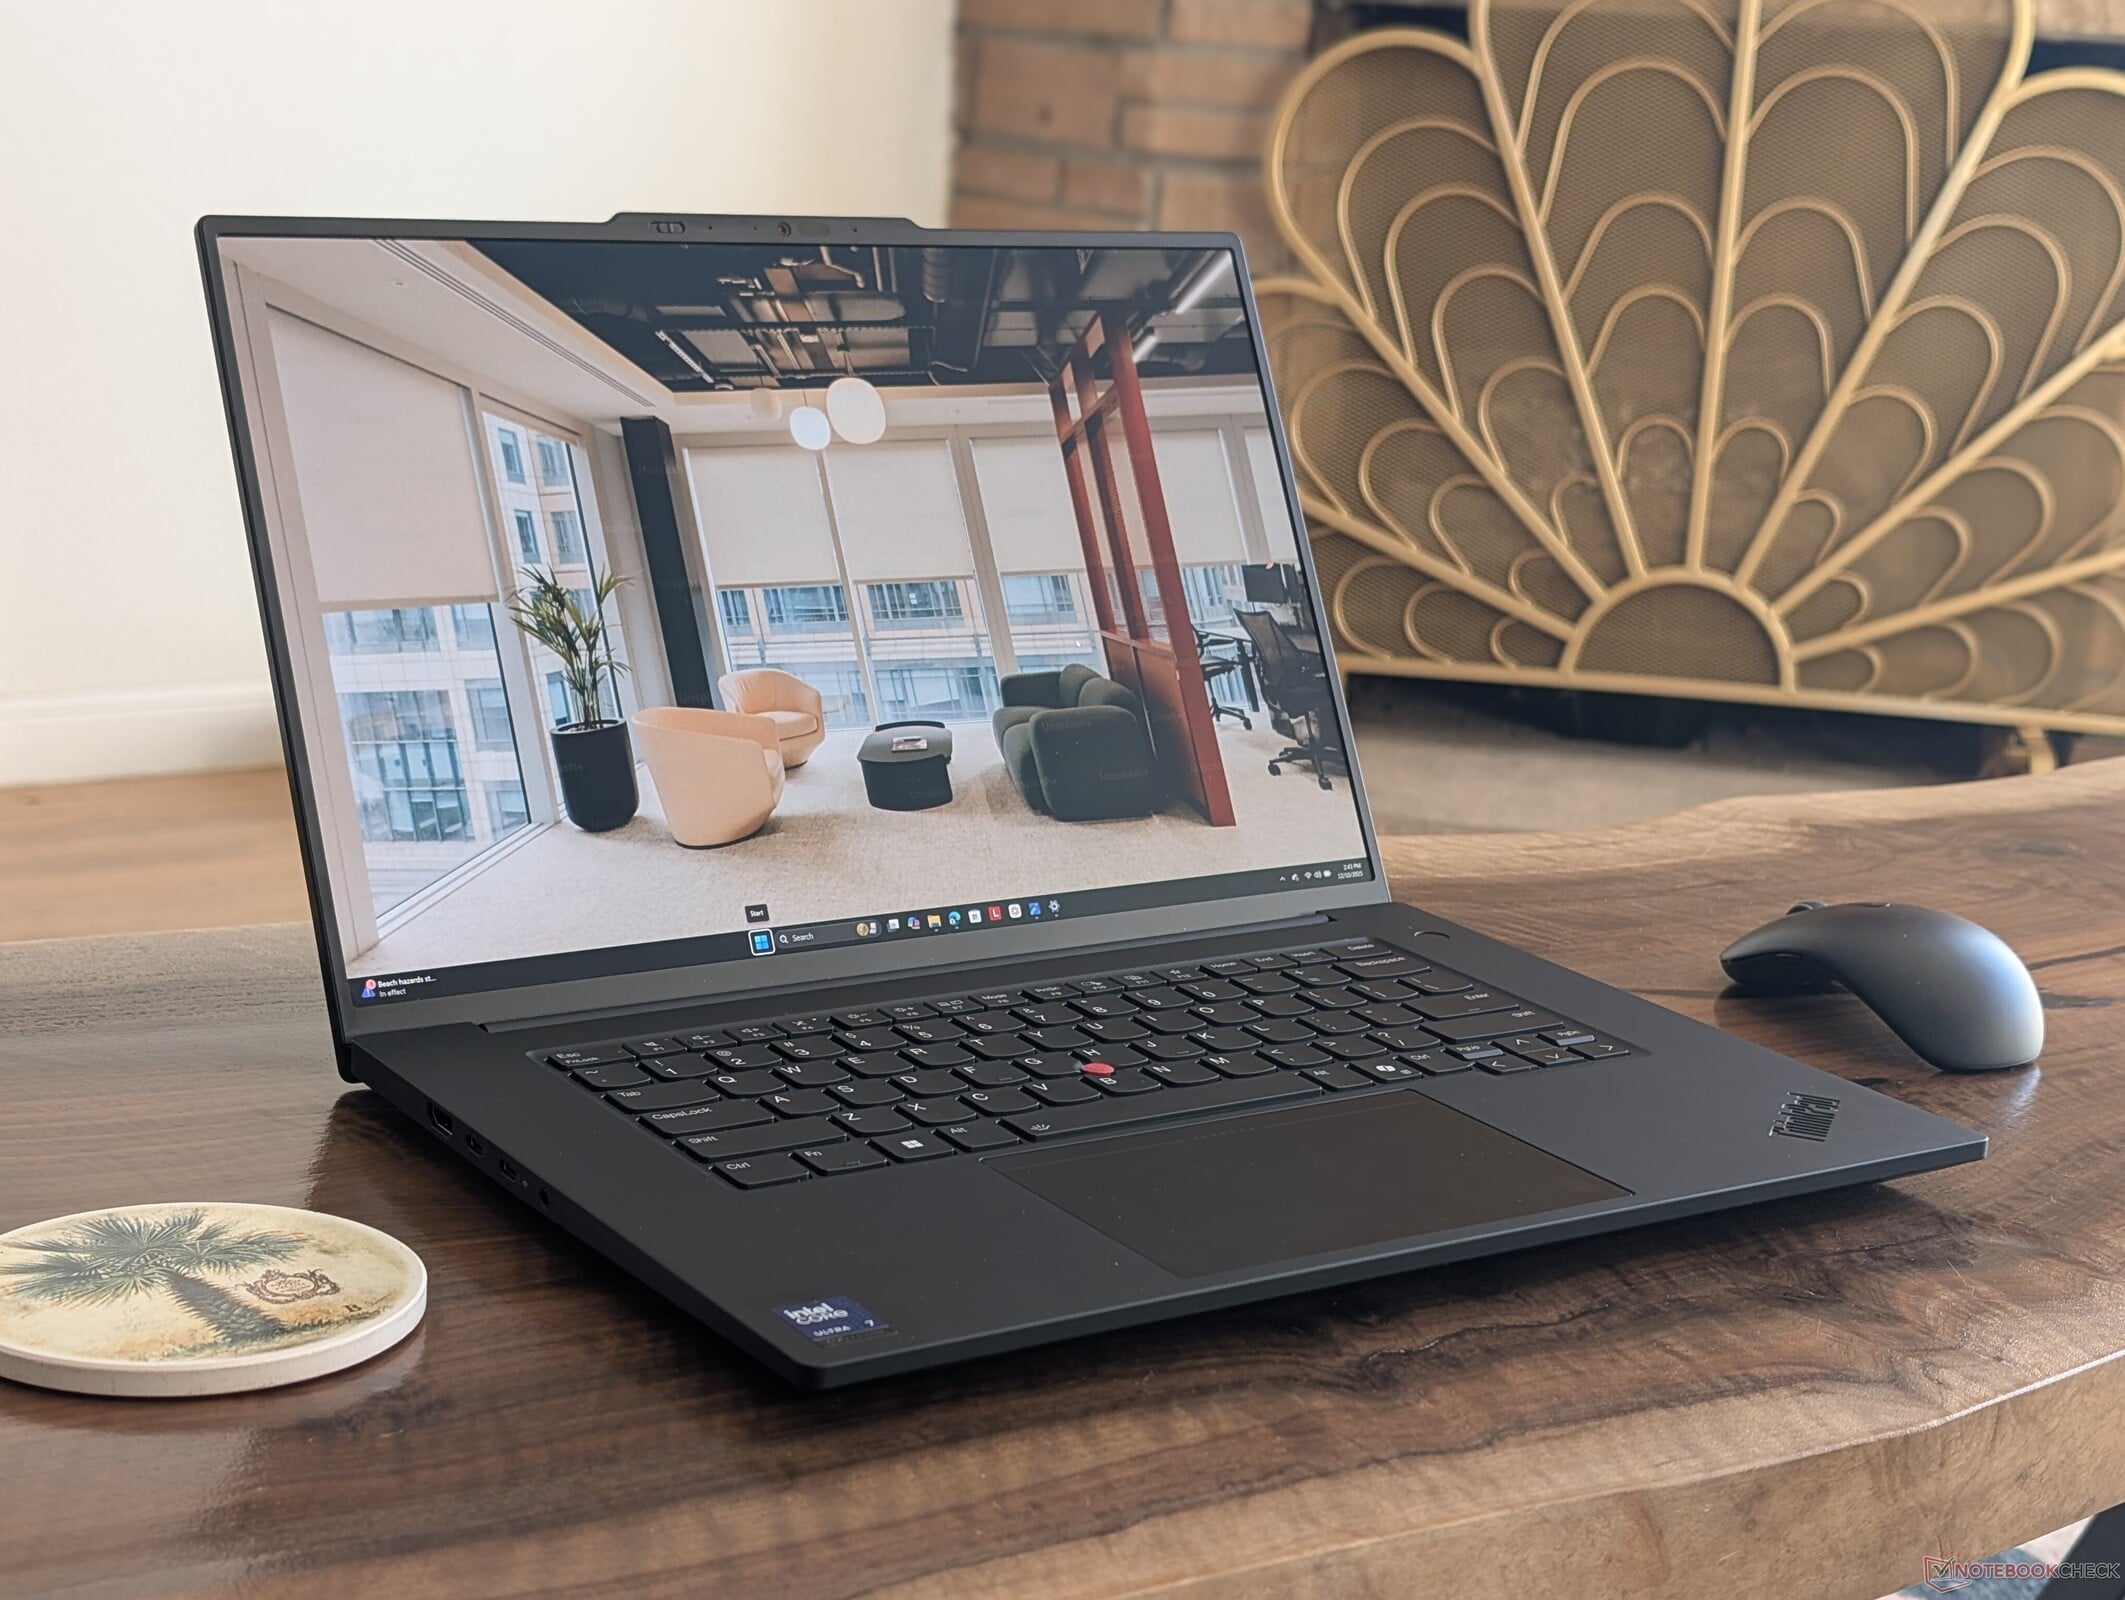
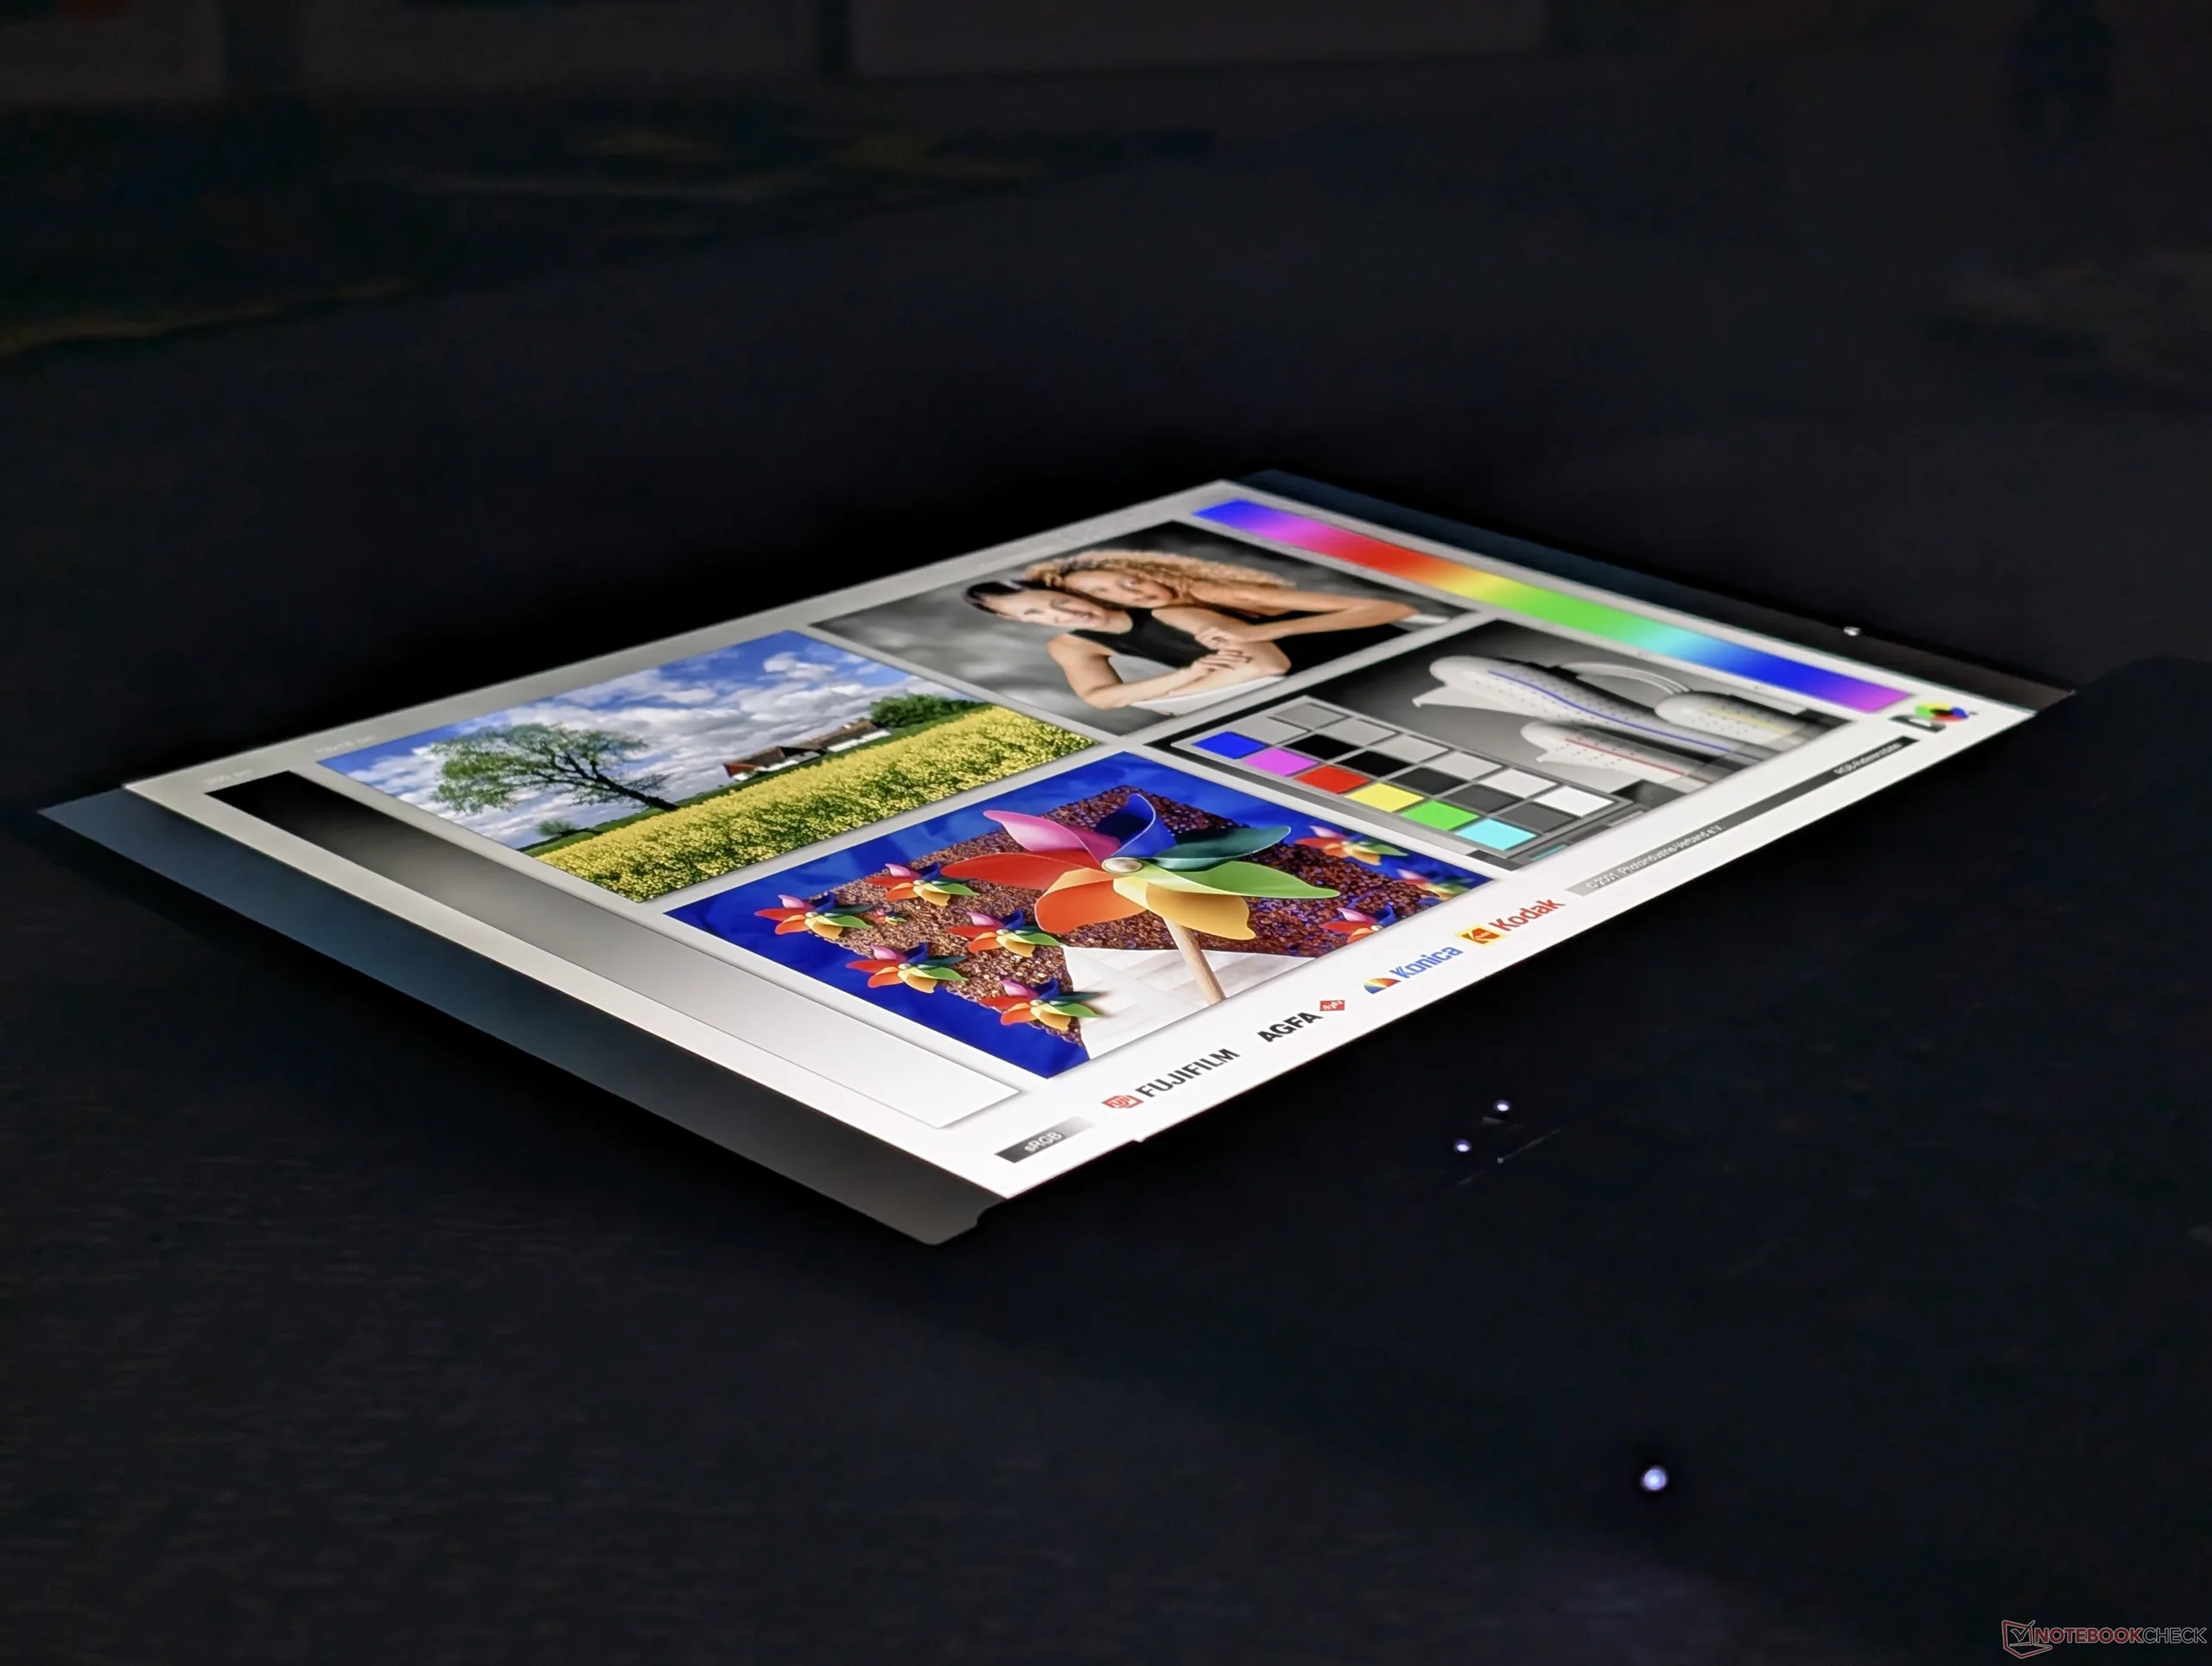
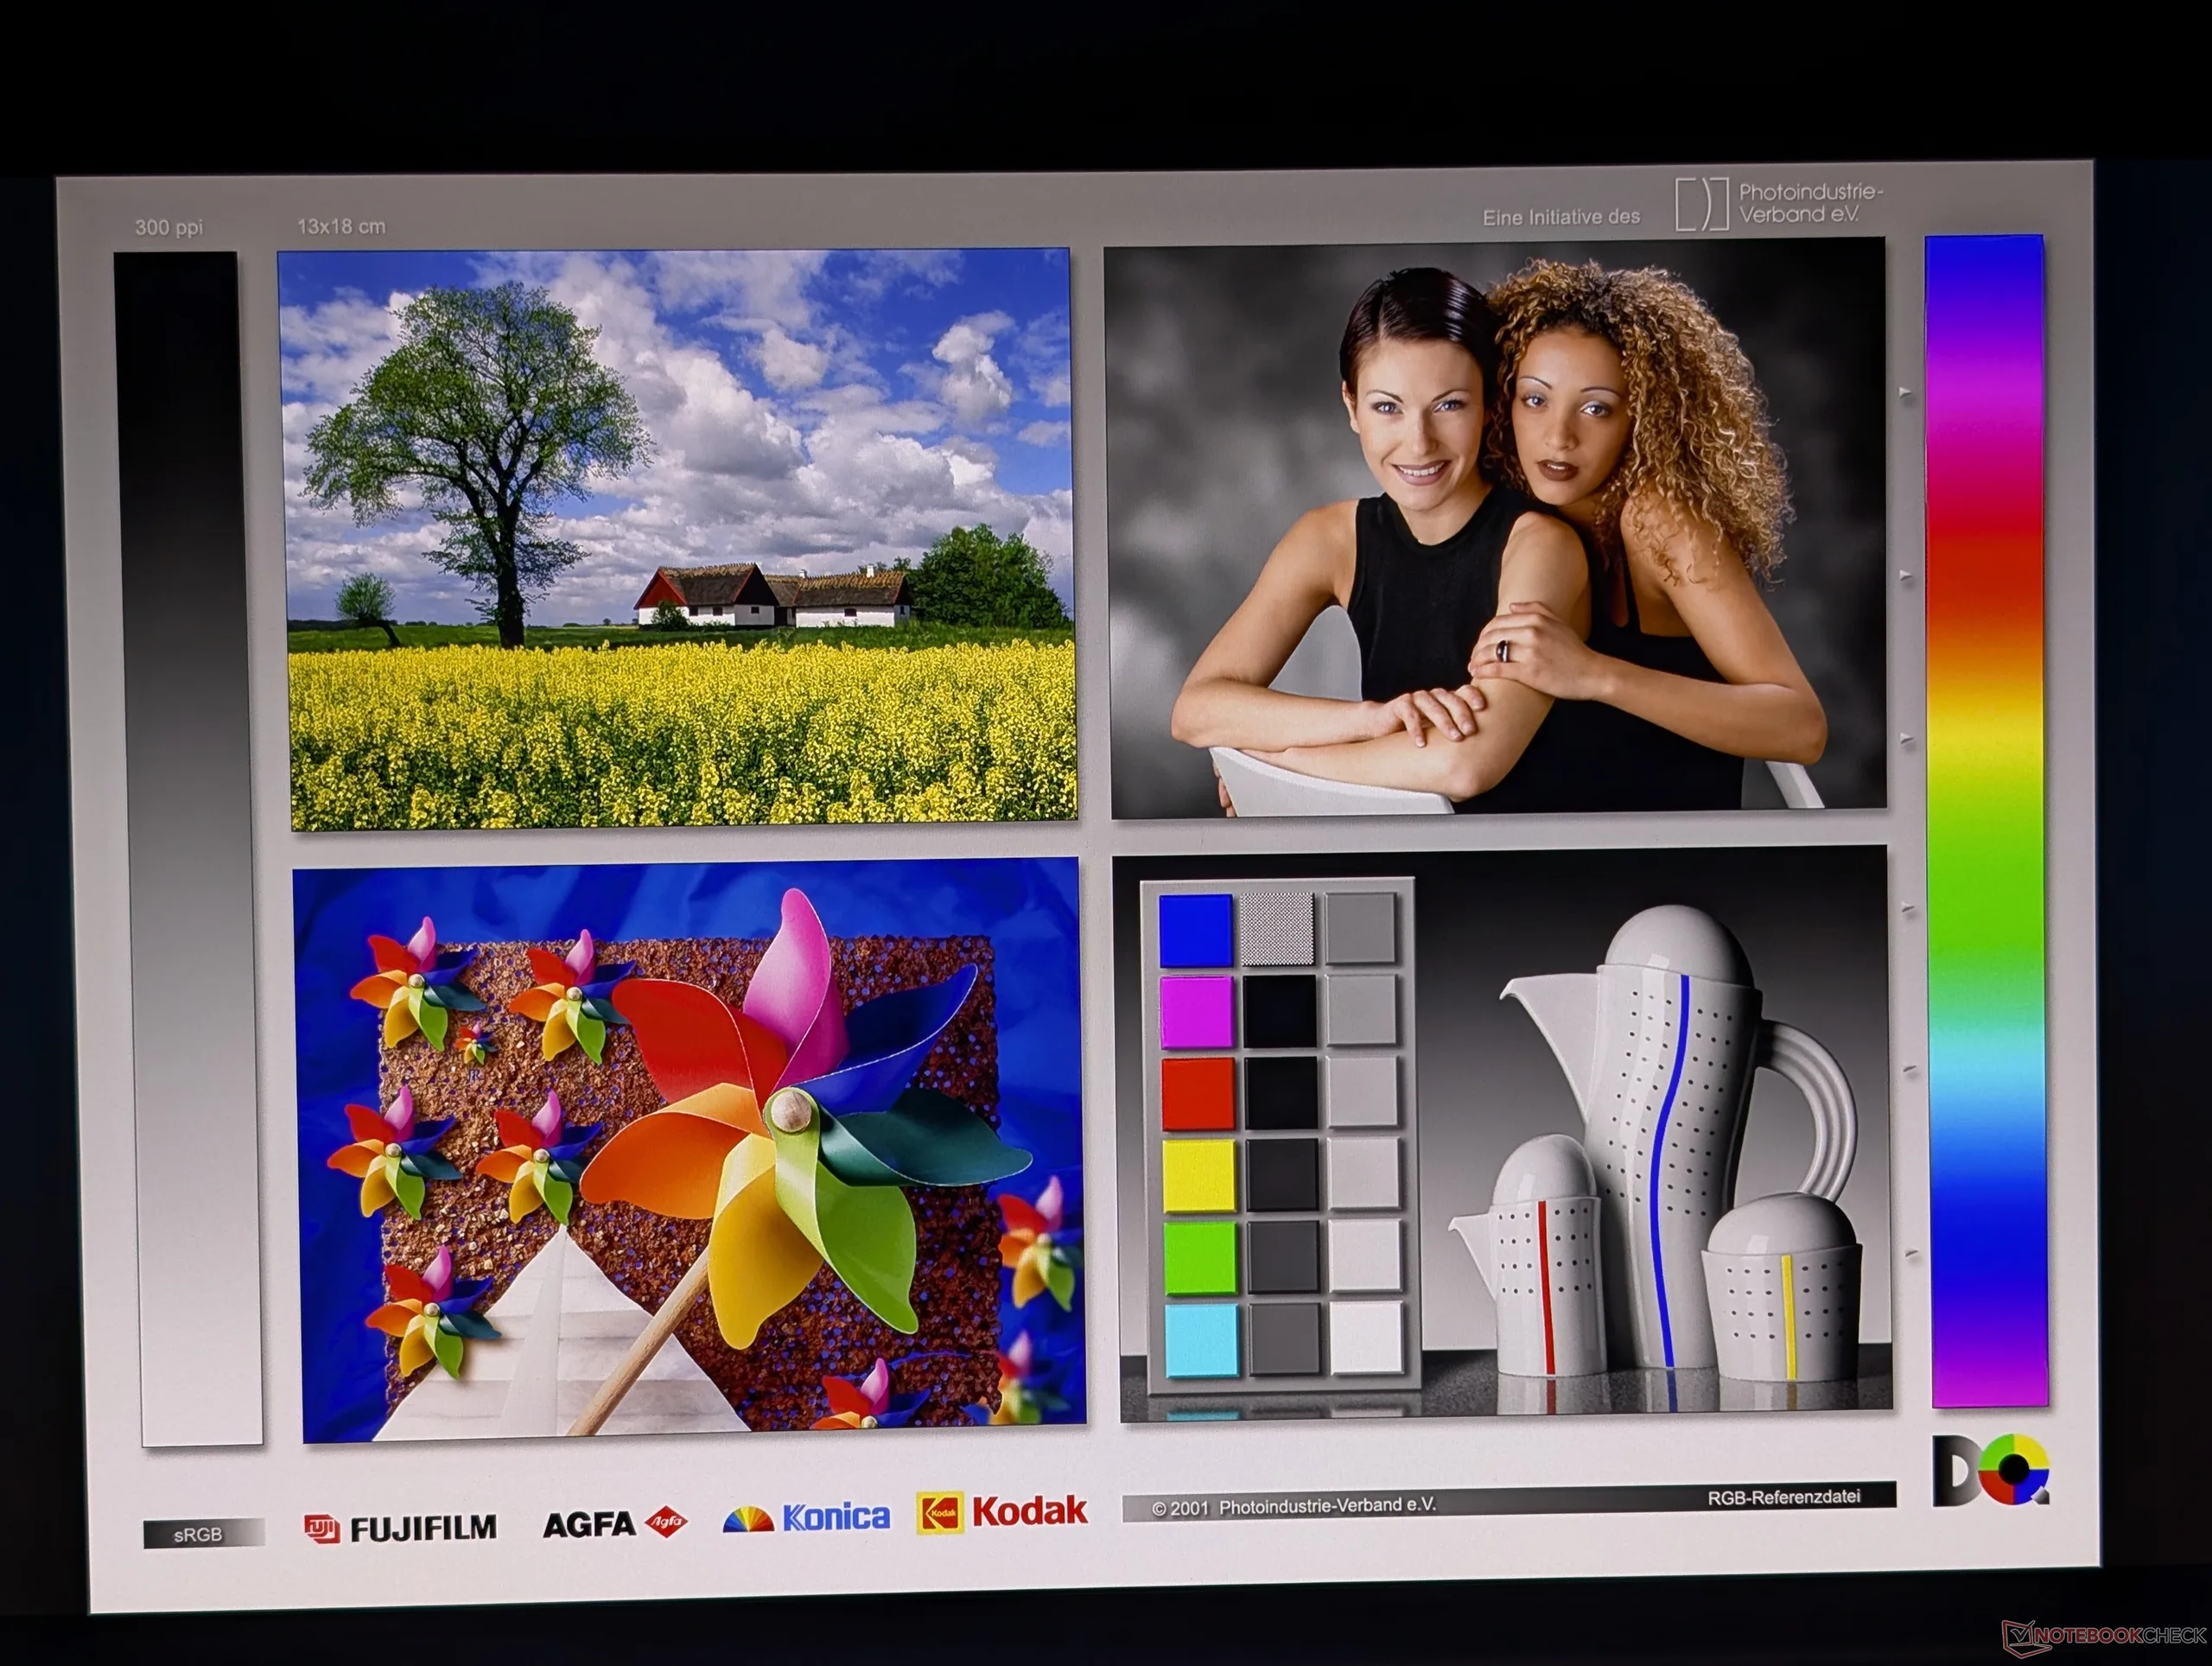
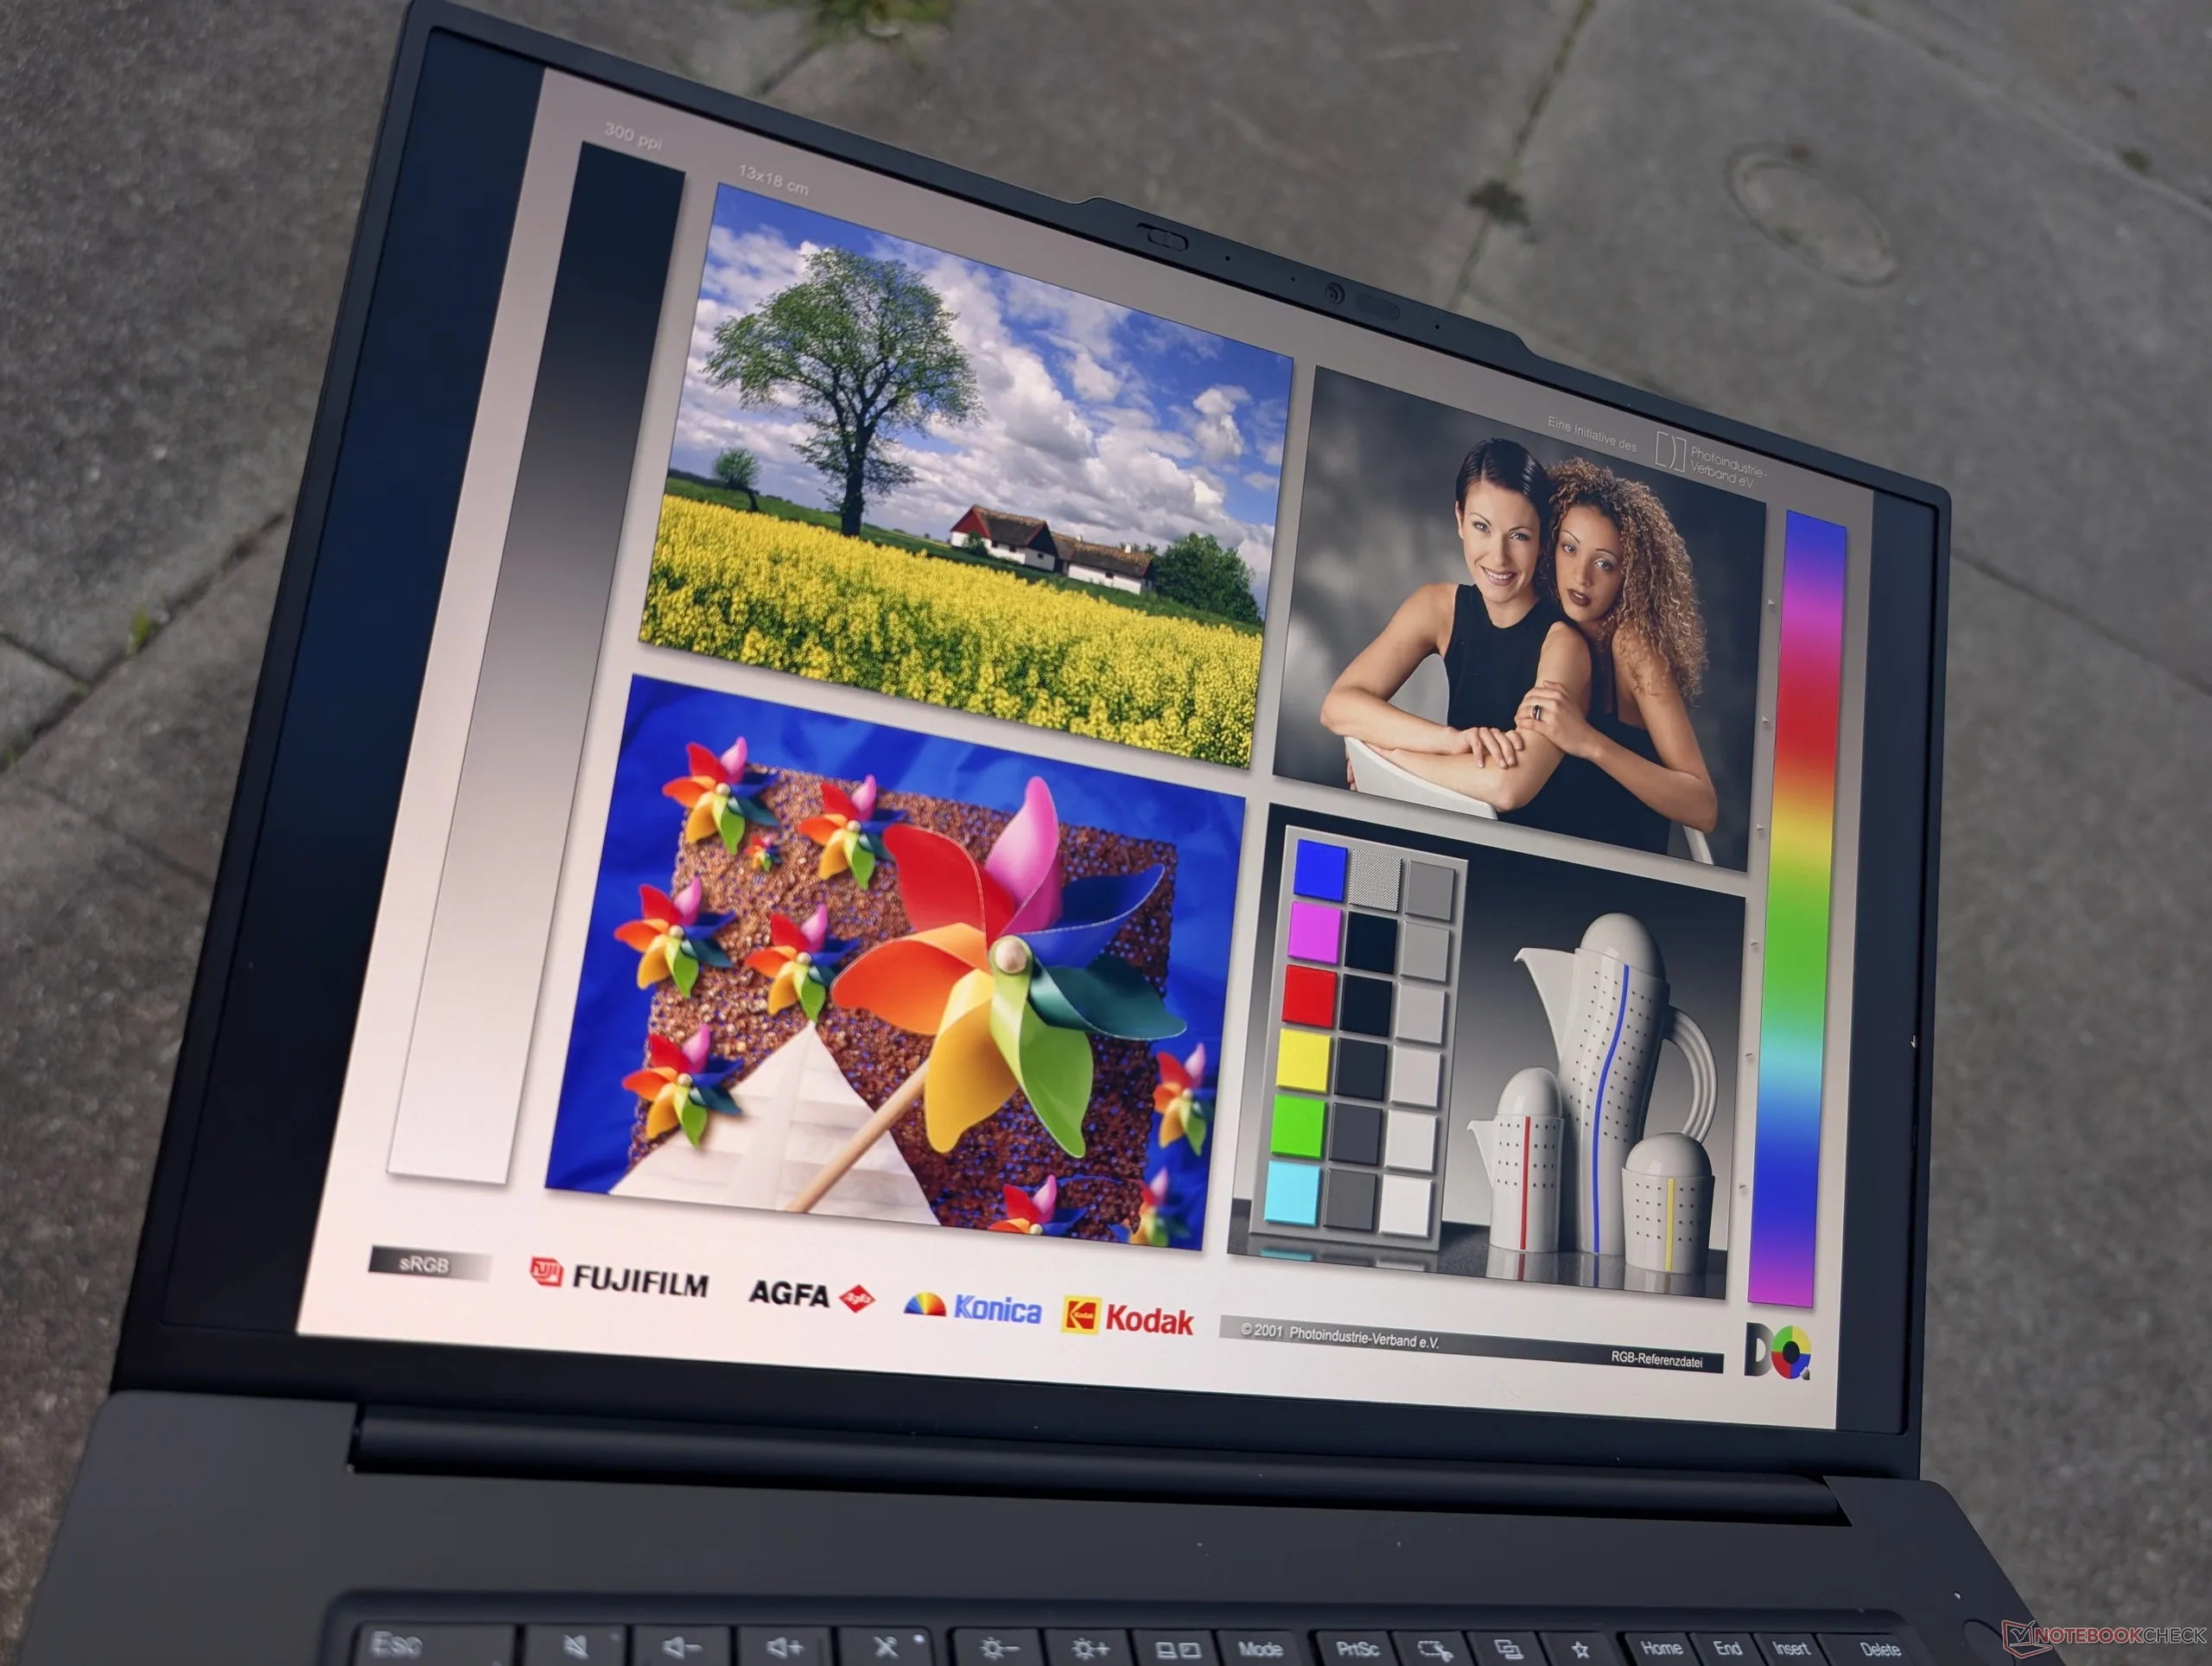
La caractéristique la plus intéressante du ThinkPad P1 Gen 8, cependant, est sans aucun doute son nouvel écran tactile OLED en tandem. Avec une luminosité maximale de 1 500 nits, il s'agit de l'une des stations de travail mobiles de 16 pouces les plus lumineuses, et de loin, pour une meilleure lecture HDR que la grande majorité des ordinateurs portables disponibles sur le marché. Il est donc étrange de voir une telle option sur une station de travail, car le public cible des professionnels n'a probablement pas besoin d'écrans tactiles HDR super lumineux pour leurs charges de travail quotidiennes. En fait, l'autonomie de la batterie est plus courte avec cette configuration et les utilisateurs peuvent donc vouloir configurer avec le panneau IPS 4K normal qui offre des couleurs similaires et une résolution native plus élevée. L'écran Tandem OLED convient mieux aux ordinateurs portables axés sur le jeu ou le multimédia, comme ceux des séries Yoga ou Legion.
Les utilisateurs exigeant plus de puissance peuvent envisager les ordinateurs portables plus épais de la série Série P16 plus épaisse, qui offre des options graphiques au-delà de la RTX Pro 2000 Blackwell.
Points positifs
Points négatifs
Prix et disponibilité
Le Lenovo ThinkPad P1 16 Gen 8 est maintenant expédié directement par le fabricant au prix de 2220 $ tel que configuré. Des configurations similaires sont également disponibles sur Amazon.
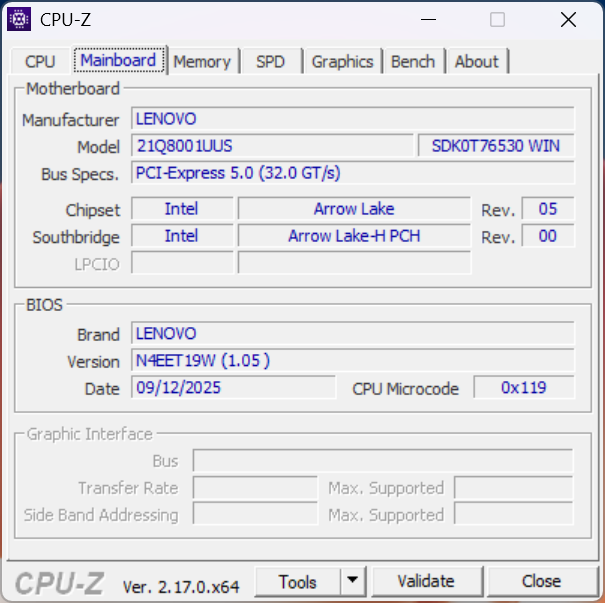
Le ThinkPad P1 Gen 8 succède au ThinkPad P1 Gen 7 de l'année dernière en introduisant les options Intel Arrow Lake-H et Nvidia Blackwell pour remplacer les anciennes options Meteor Lake-H et Ada Lovelace, respectivement. Il est également livré avec de nouvelles options d'affichage, notamment l'IPS 4K ou l'OLED en tandem. Pour le reste, le châssis n'a pas changé et nous vous recommandons de consulter notre test du ThinkPad P1 Gen 7 pour en savoir plus sur les caractéristiques physiques du ThinkPad P1 Gen 7 pour en savoir plus sur les caractéristiques physiques du système.
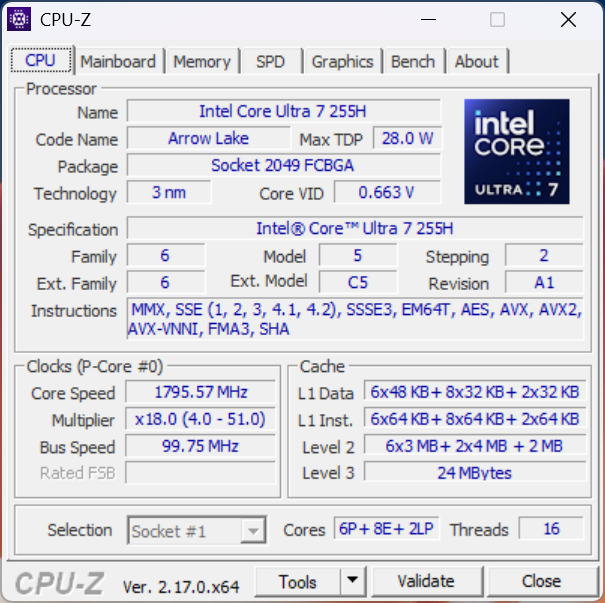
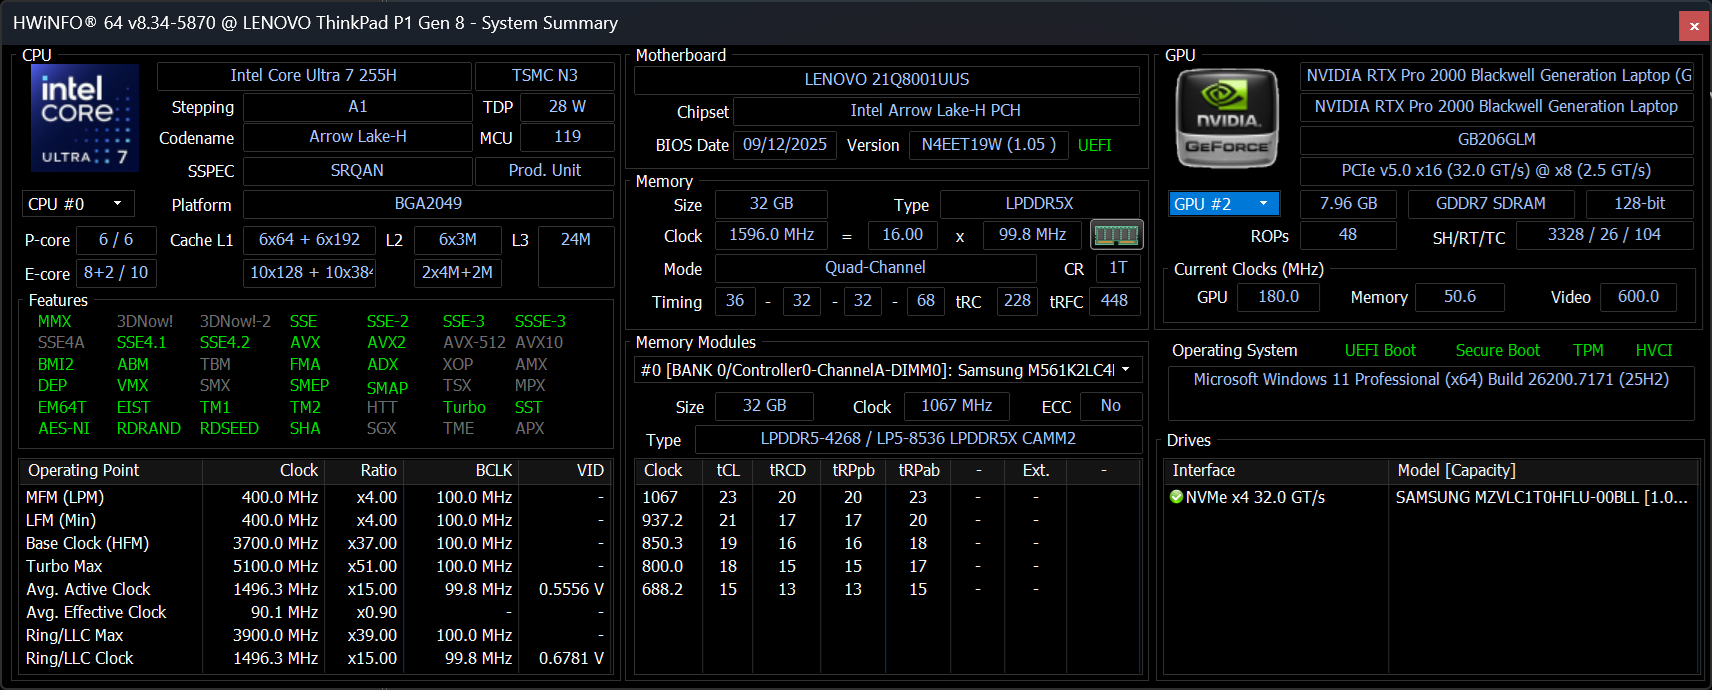
Notre unité de test est une configuration intermédiaire avec un processeur Core Ultra 7 255H, un GPU Blackwell RTX Pro 2000 de 75 W et un écran tactile OLED tandem de 3,2K pour un prix d'environ 2220 $. Les SKUs bas de gamme commencent avec le Core Ultra 5 235H et seulement la carte graphique Arc 140T intégrée avec un écran IPS 1200p60 standard tandis que les SKUs haut de gamme viennent avec le Core Ultra 9 285H et un écran IPS 4K. Il n'y a pas d'options graphiques supérieures à la RTX Pro 2000 Blackwell.
Les alternatives au ThinkPad P1 Gen 8 comprennent d'autres stations de travail ultraplates de 16 pouces comme le HP ZBook X G1i 16dell Pro 16 Plus, ou la série Série ExpertBook d'Asus.
Plus d'avis sur Lenovo :
Spécifications
Cas
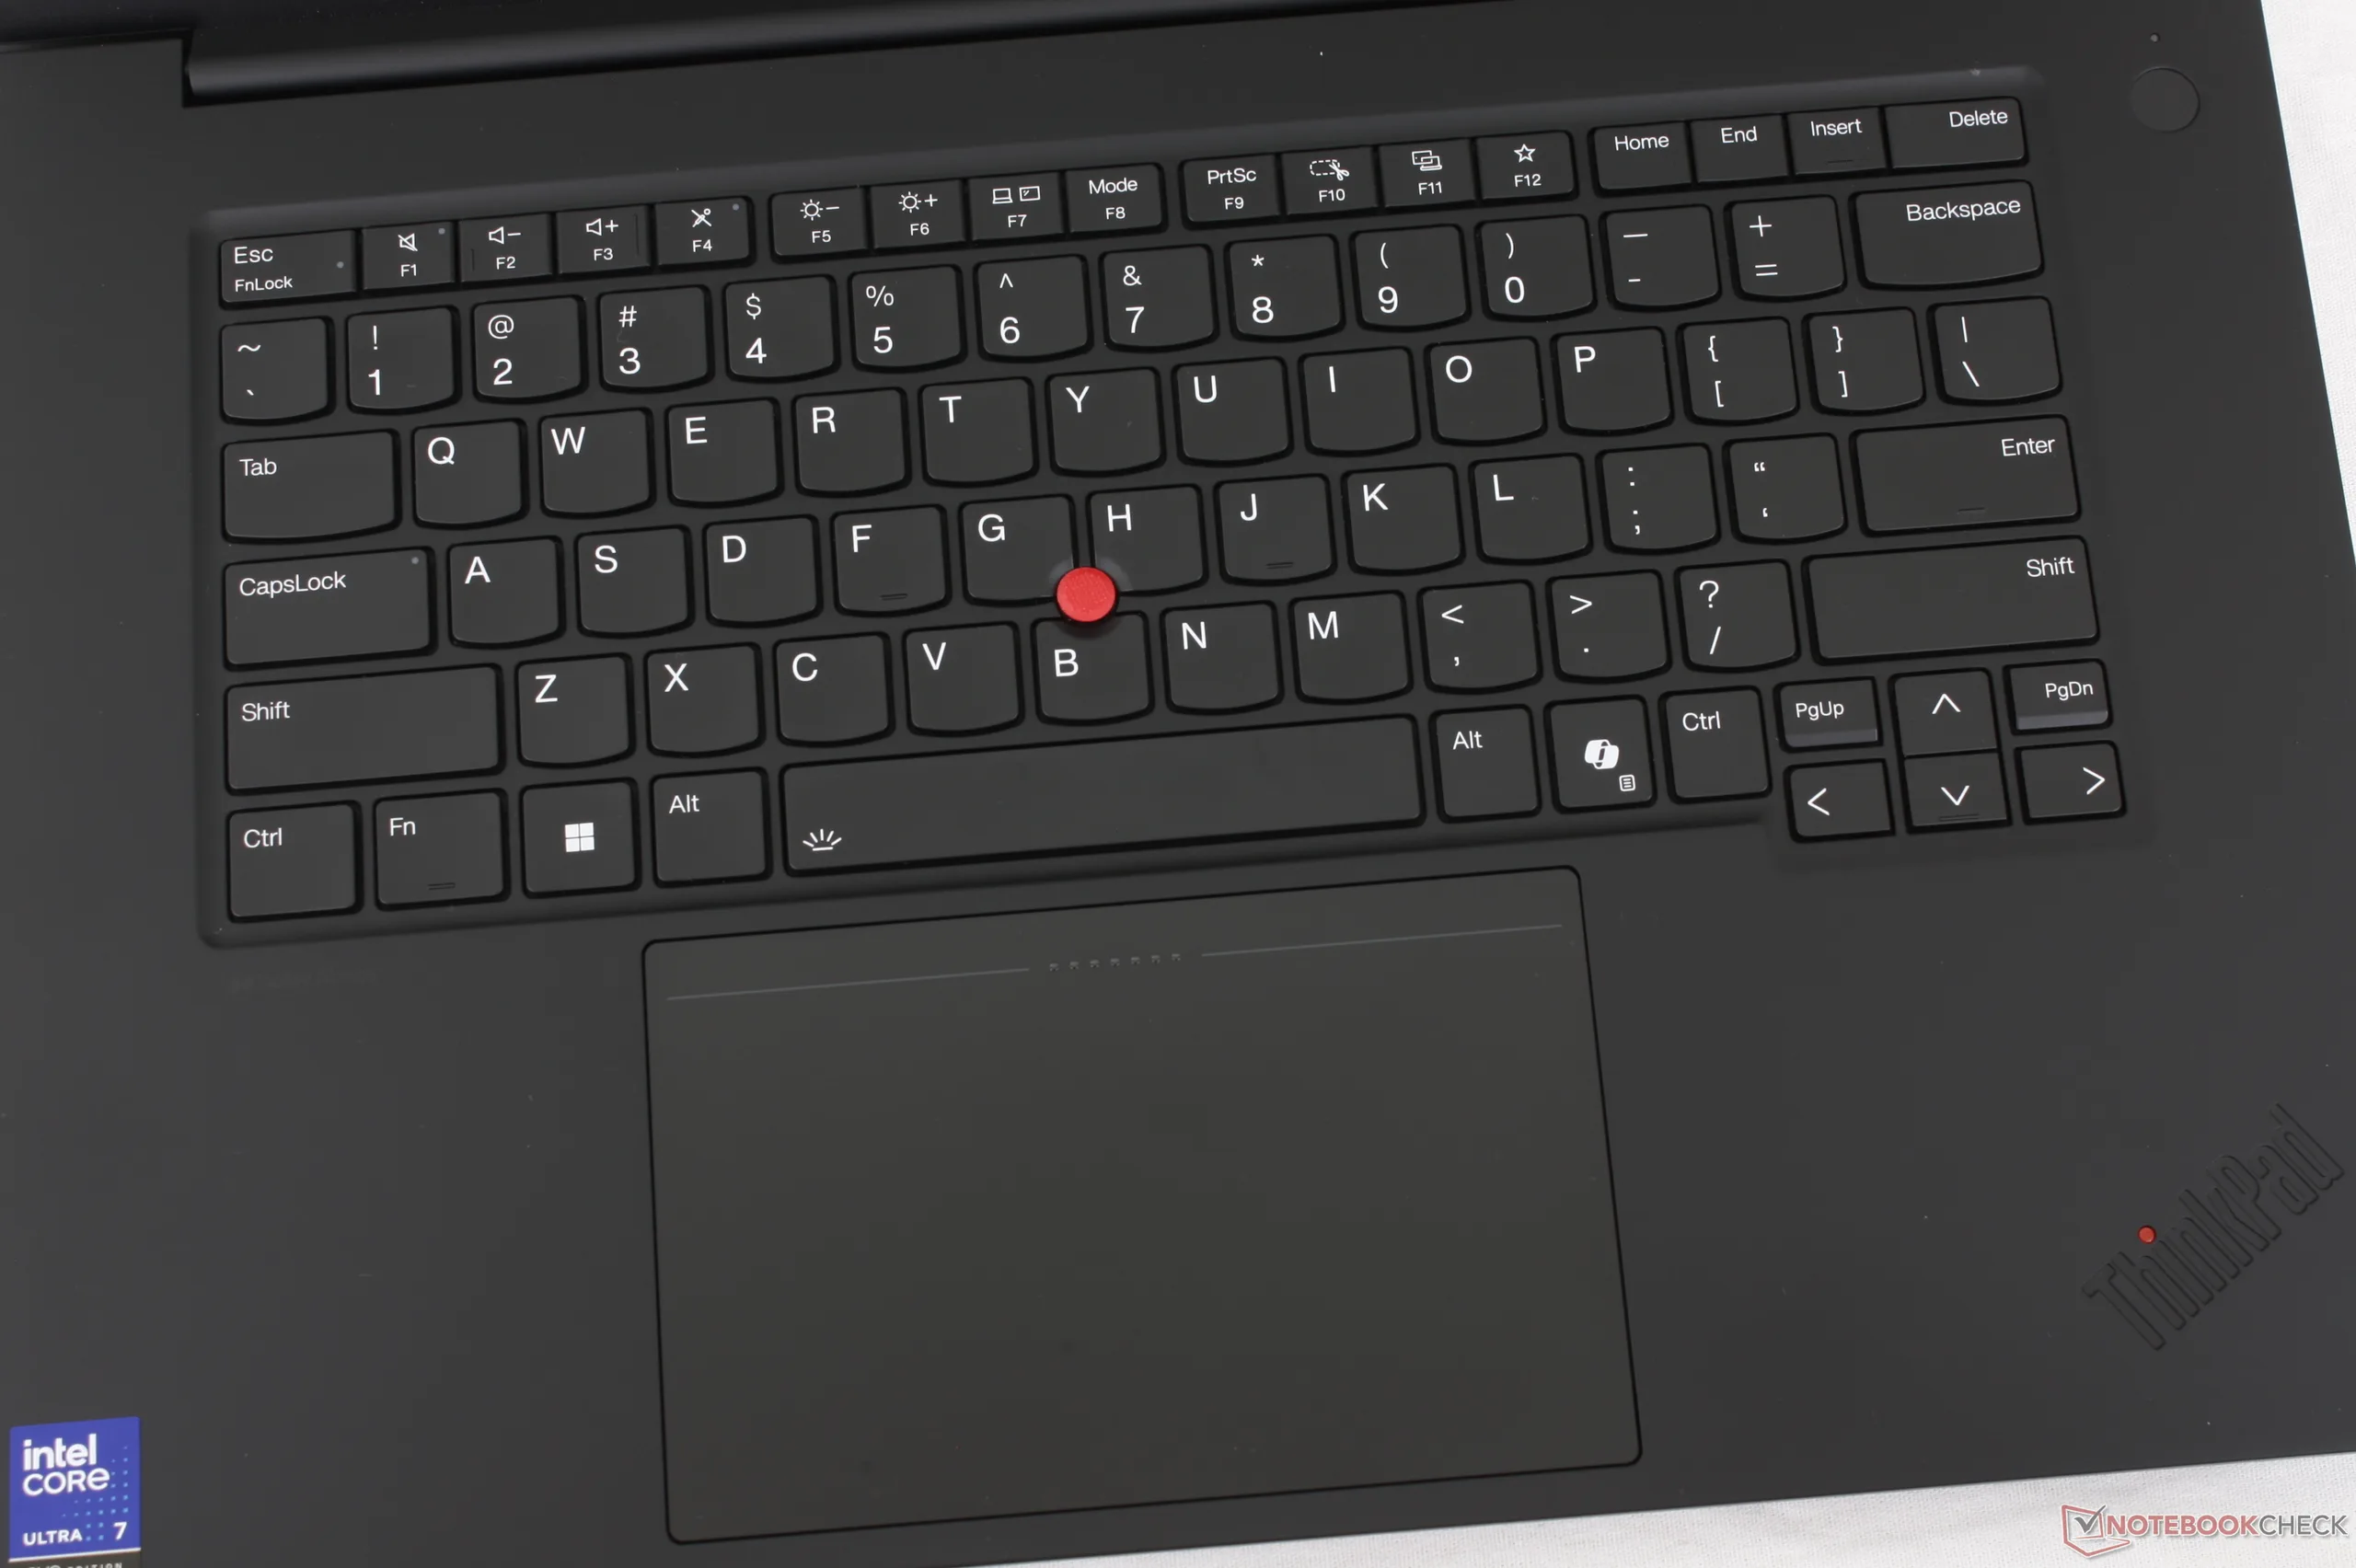
Si le châssis et les dimensions restent inchangés, le modèle Gen 8 introduit quelques changements notables au niveau des ports par rapport au Gen 7. Le support de Thunderbolt 5 est désormais présent tandis que le port propriétaire de l'adaptateur secteur a été abandonné au profit de l'USB-C pour la fourniture d'énergie uniquement. Ainsi, l'un des trois ports USB-C sera toujours occupé pour l'alimentation de l'adaptateur secteur, alors que ce n'était pas le cas pour le modèle de l'année dernière.
Connectivité


Lecteur de carte SD
| SD Card Reader | |
| average JPG Copy Test (av. of 3 runs) | |
| HP ZBook X G1i 16 (Toshiba Exceria Pro SDXC 64 GB UHS-II) | |
| Lenovo ThinkPad P1 Gen 8 (Toshiba Exceria Pro SDXC 64 GB UHS-II) | |
| Dell Pro Max 16 Plus (Toshiba Exceria Pro SDXC 64 GB UHS-II) | |
| Lenovo ThinkPad P1 Gen 7 21KV001SGE (AV Pro V60) | |
| maximum AS SSD Seq Read Test (1GB) | |
| HP ZBook X G1i 16 (Toshiba Exceria Pro SDXC 64 GB UHS-II) | |
| Dell Pro Max 16 Plus (Toshiba Exceria Pro SDXC 64 GB UHS-II) | |
| Lenovo ThinkPad P1 Gen 8 (Toshiba Exceria Pro SDXC 64 GB UHS-II) | |
| Lenovo ThinkPad P1 Gen 7 21KV001SGE (AV Pro V60) | |
Communication
| Networking | |
| iperf3 transmit AXE11000 | |
| Lenovo ThinkPad P1 Gen 7 21KV001SGE | |
| Asus ExpertBook B6 Flip B6602FC2 | |
| Lenovo ThinkPad P16s Gen 4 AMD | |
| Lenovo ThinkPad P1 Gen 8 | |
| Dell Pro Max 16 Plus | |
| HP ZBook X G1i 16 | |
| iperf3 receive AXE11000 | |
| Lenovo ThinkPad P1 Gen 7 21KV001SGE | |
| Lenovo ThinkPad P16s Gen 4 AMD | |
| Asus ExpertBook B6 Flip B6602FC2 | |
| Dell Pro Max 16 Plus | |
| Lenovo ThinkPad P1 Gen 8 | |
| HP ZBook X G1i 16 | |
| iperf3 transmit AXE11000 6GHz | |
| Asus ExpertBook B6 Flip B6602FC2 | |
| Lenovo ThinkPad P16s Gen 4 AMD | |
| Lenovo ThinkPad P1 Gen 7 21KV001SGE | |
| Lenovo ThinkPad P1 Gen 8 | |
| HP ZBook X G1i 16 | |
| Dell Pro Max 16 Plus | |
| iperf3 receive AXE11000 6GHz | |
| Lenovo ThinkPad P16s Gen 4 AMD | |
| Lenovo ThinkPad P1 Gen 7 21KV001SGE | |
| Asus ExpertBook B6 Flip B6602FC2 | |
| Lenovo ThinkPad P1 Gen 8 | |
| HP ZBook X G1i 16 | |
| Dell Pro Max 16 Plus | |
Webcam


Maintenance

Durabilité
Le squelette est constitué de 90 % de magnésium et d'aluminium recyclés pour la base du clavier, de 55 à 75 % d'aluminium recyclé pour les couvercles supérieur et inférieur, et de 50 à 90 % de plastique pour la quasi-totalité du reste. L'emballage ne contient pas non plus de plastique.
Périphériques d'entrée
Affichage

Trois options d'affichage sont disponibles comme suit. Notez que l'option de résolution la plus élevée sacrifie le taux de rafraîchissement plus rapide, les niveaux de noir profonds, la fonctionnalité tactile et la prise en charge HDR supérieure de l'option OLED en tandem.
- 1920 x 1200, non tactile, IPS, 500 nits, mat, 100 % sRGB, 60 Hz, gradation DC
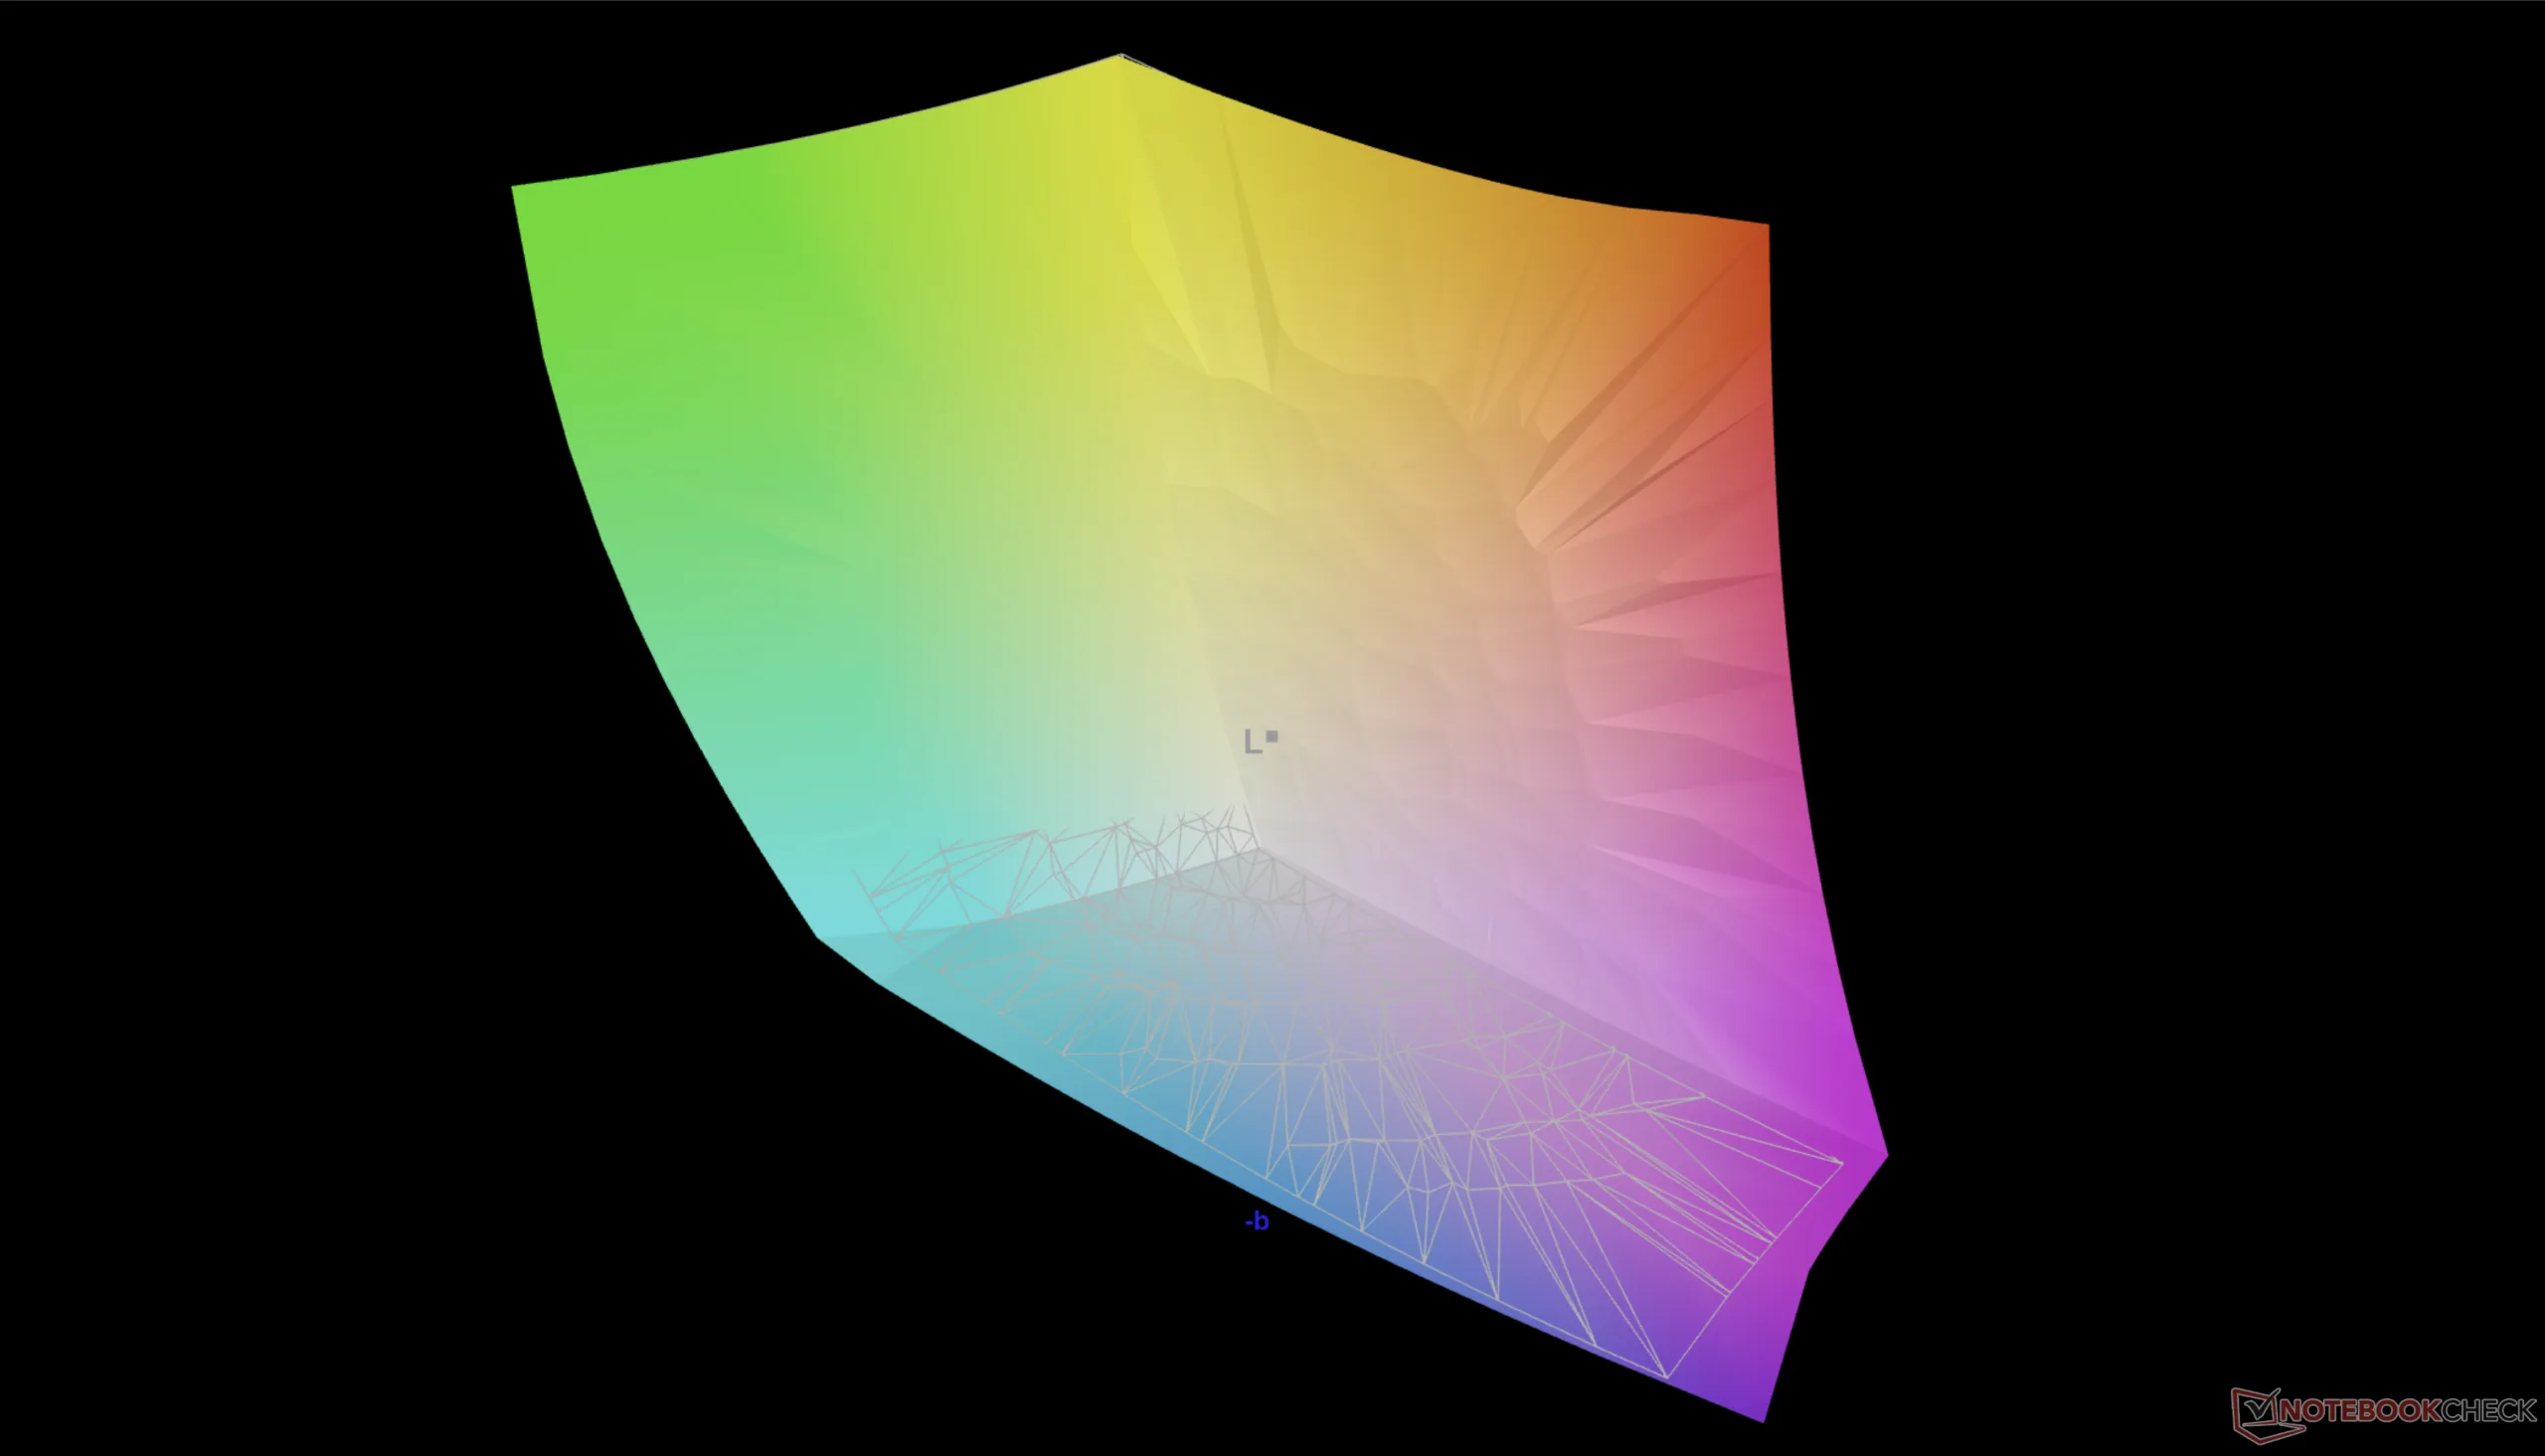
- 3200 x 2000, tactile, Tandem OLED, 1500 nits HDR, mat, 100% DCI-P3, 120 Hz, PWM dimming
- 3840 x 2400, non tactile, IPS, 800 nits, 100% DCI-P3, 60 Hz, gradation DC
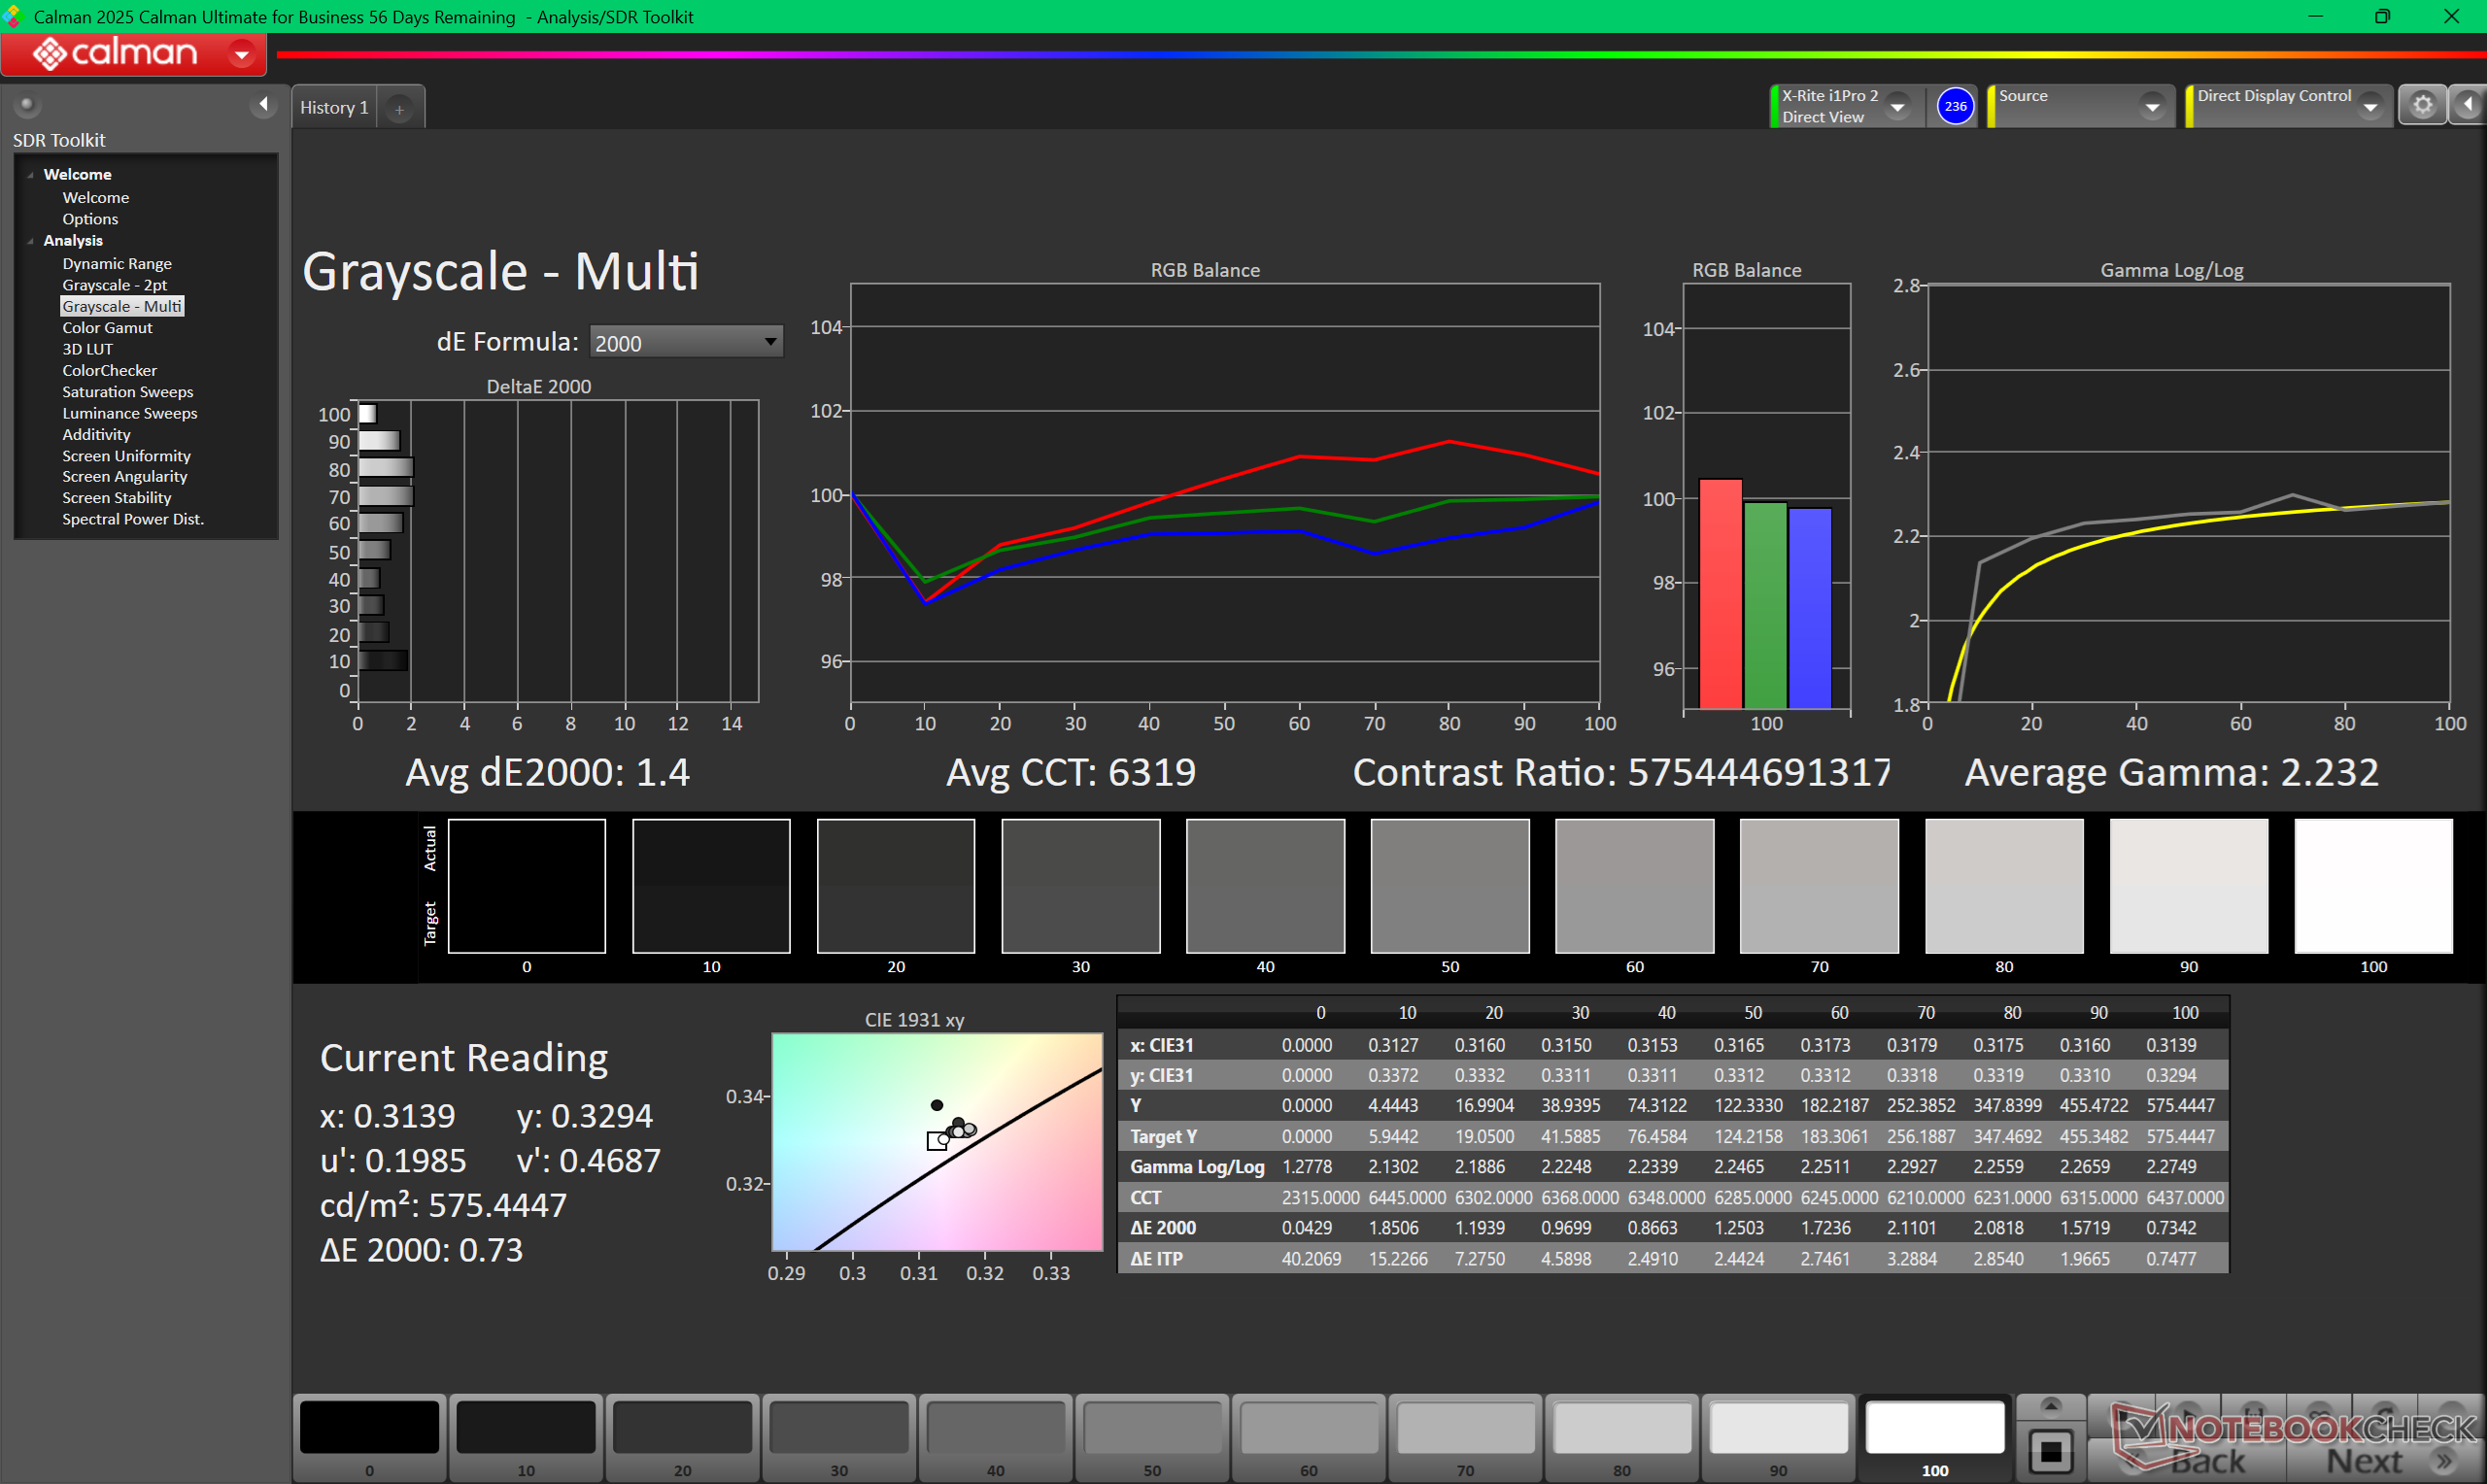
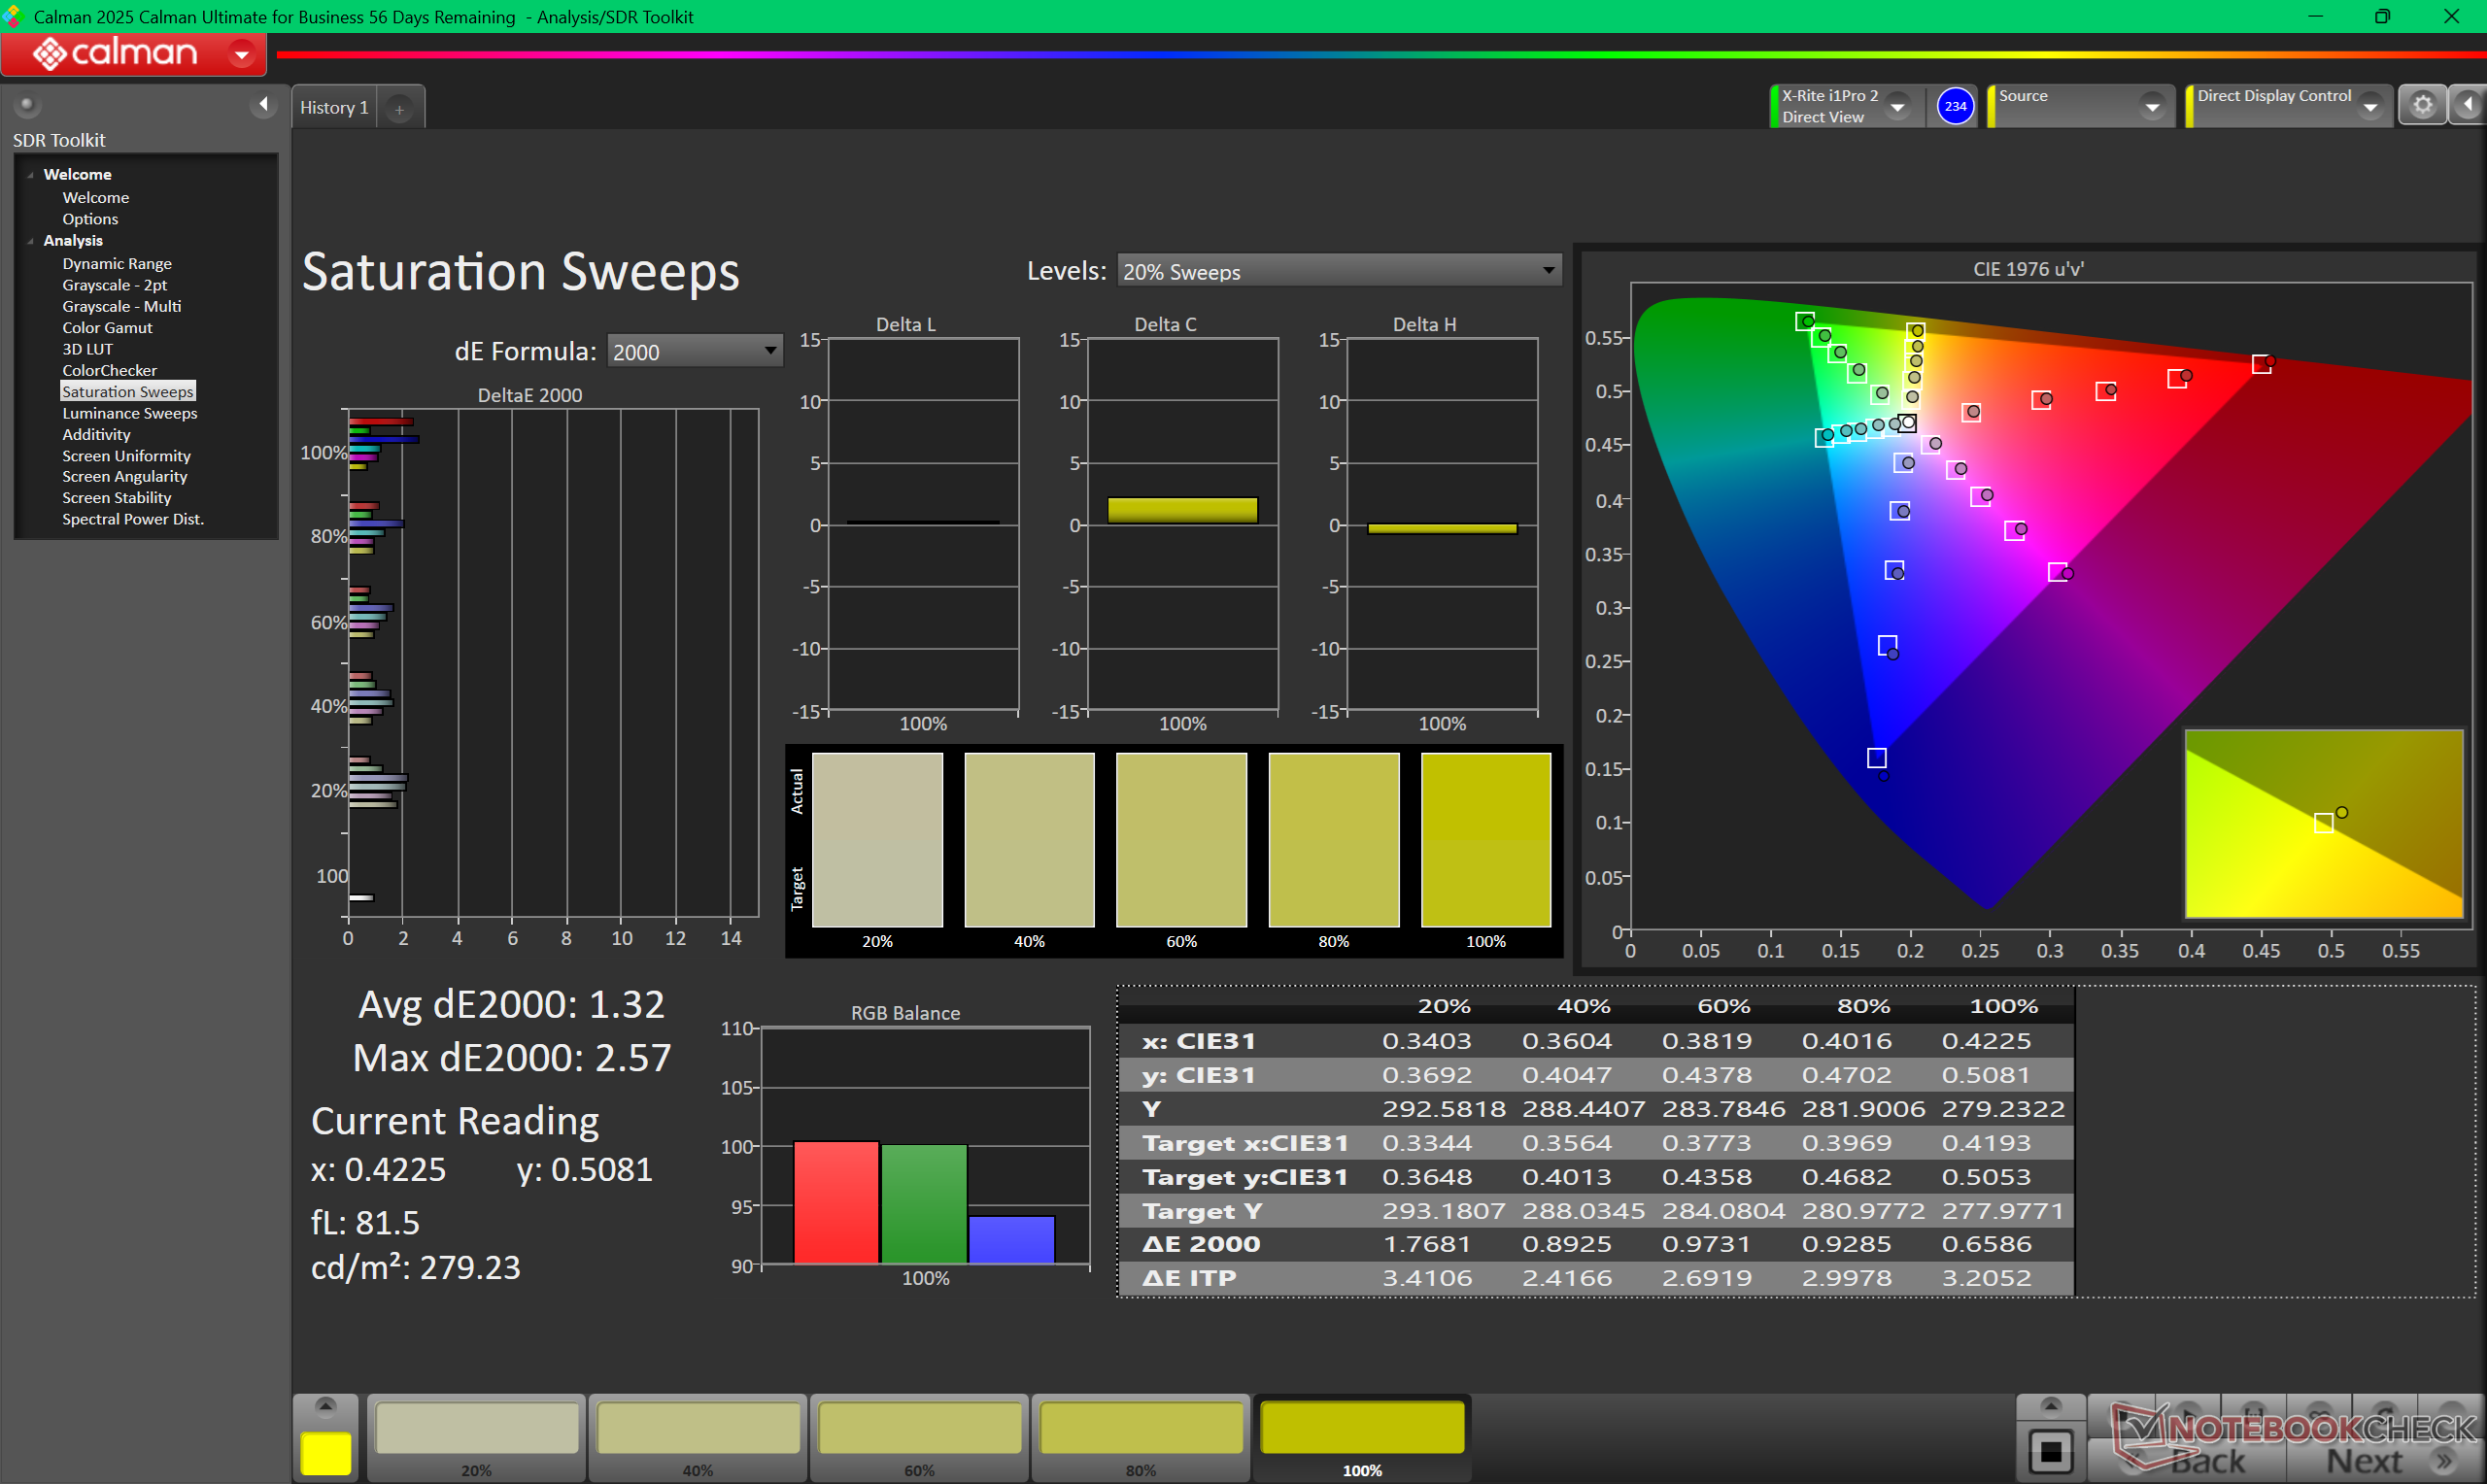
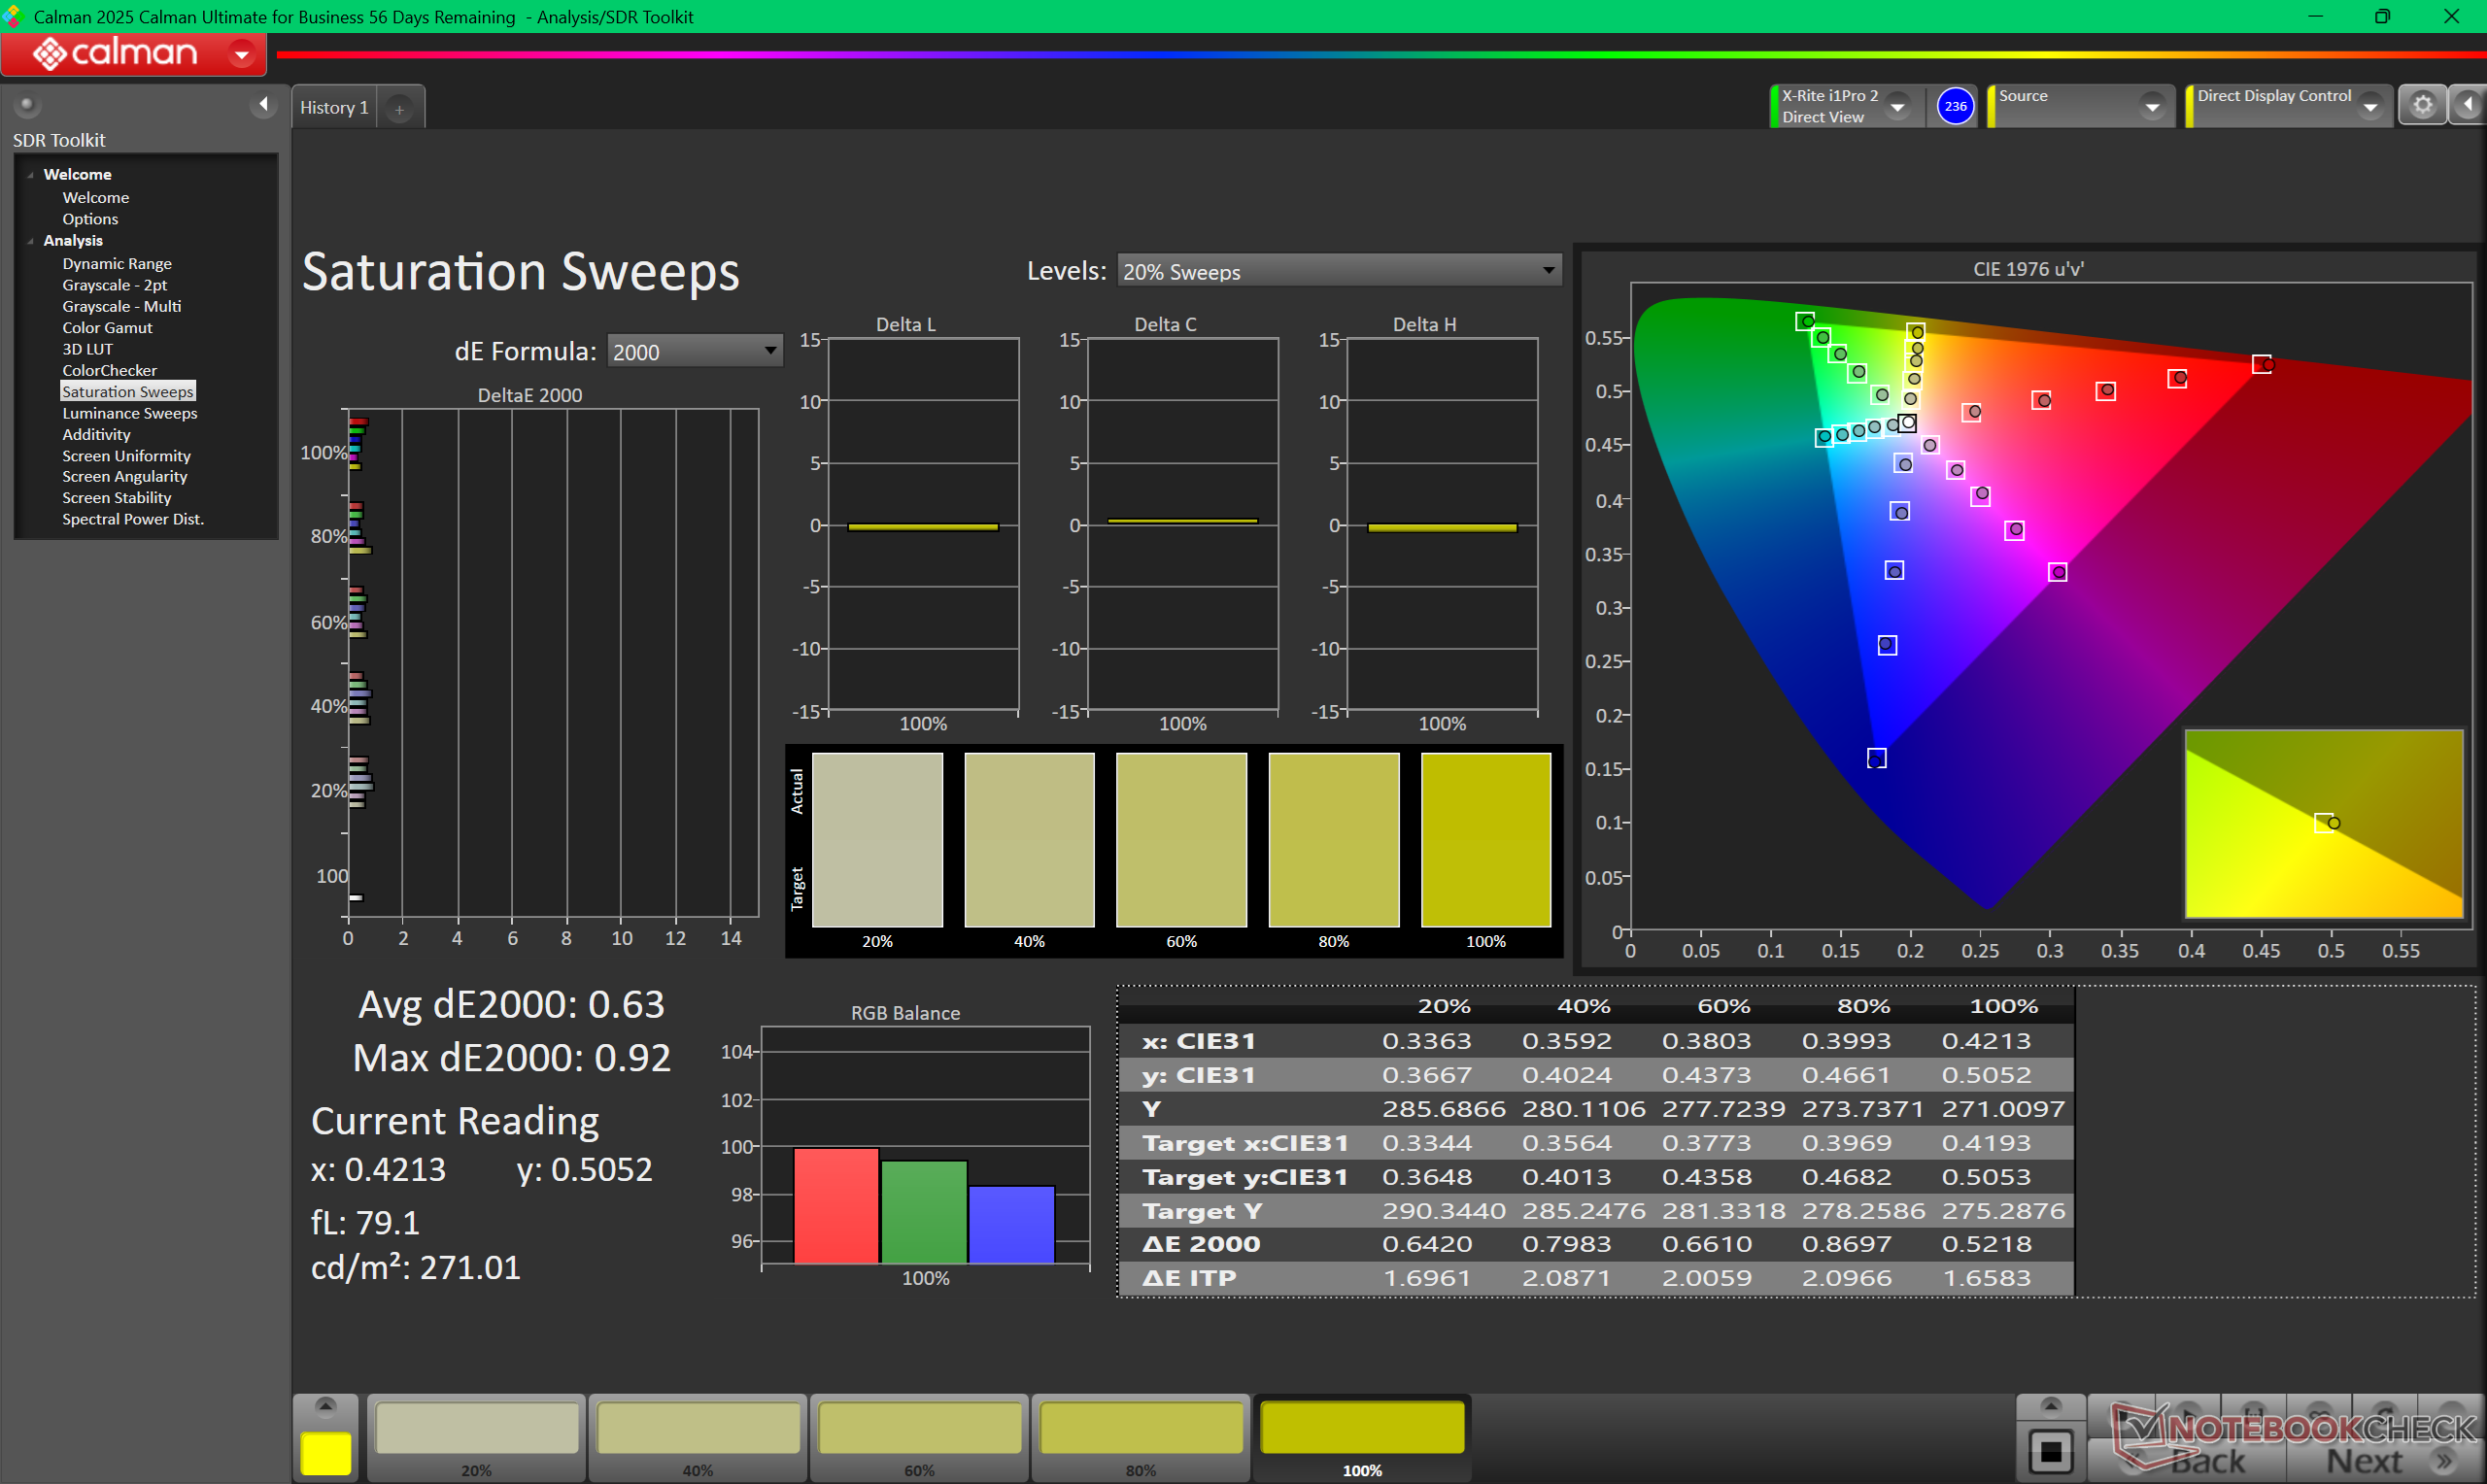
Subjectivement, l'écran OLED tandem mat de notre unité de test semble plus granuleux qu'un écran brillant traditionnel, en particulier lorsqu'il affiche une image entièrement blanche. Il reste néanmoins excellent en lecture HDR grâce à ses niveaux de luminosité très élevés, en particulier pour un panneau OLED. Nos mesures indépendantes avec un colorimètre X-Rite montrent une luminosité maximale de 566 nits en mode SDR et de 1430 nits en mode HDR, ce qui est proche des valeurs annoncées de 600 nits et 1500 nits, respectivement. Si l'écran tactile et les fonctions HDR ne sont pas importants, l'option 2400p peut s'avérer plus intéressante en raison de son nombre de pixels plus élevé.
| |||||||||||||||||||||||||
Homogénéité de la luminosité: 99 %
Valeur mesurée au centre, sur batterie: 561.8 cd/m²
Contraste: ∞:1 (Valeurs des noirs: 0 cd/m²)
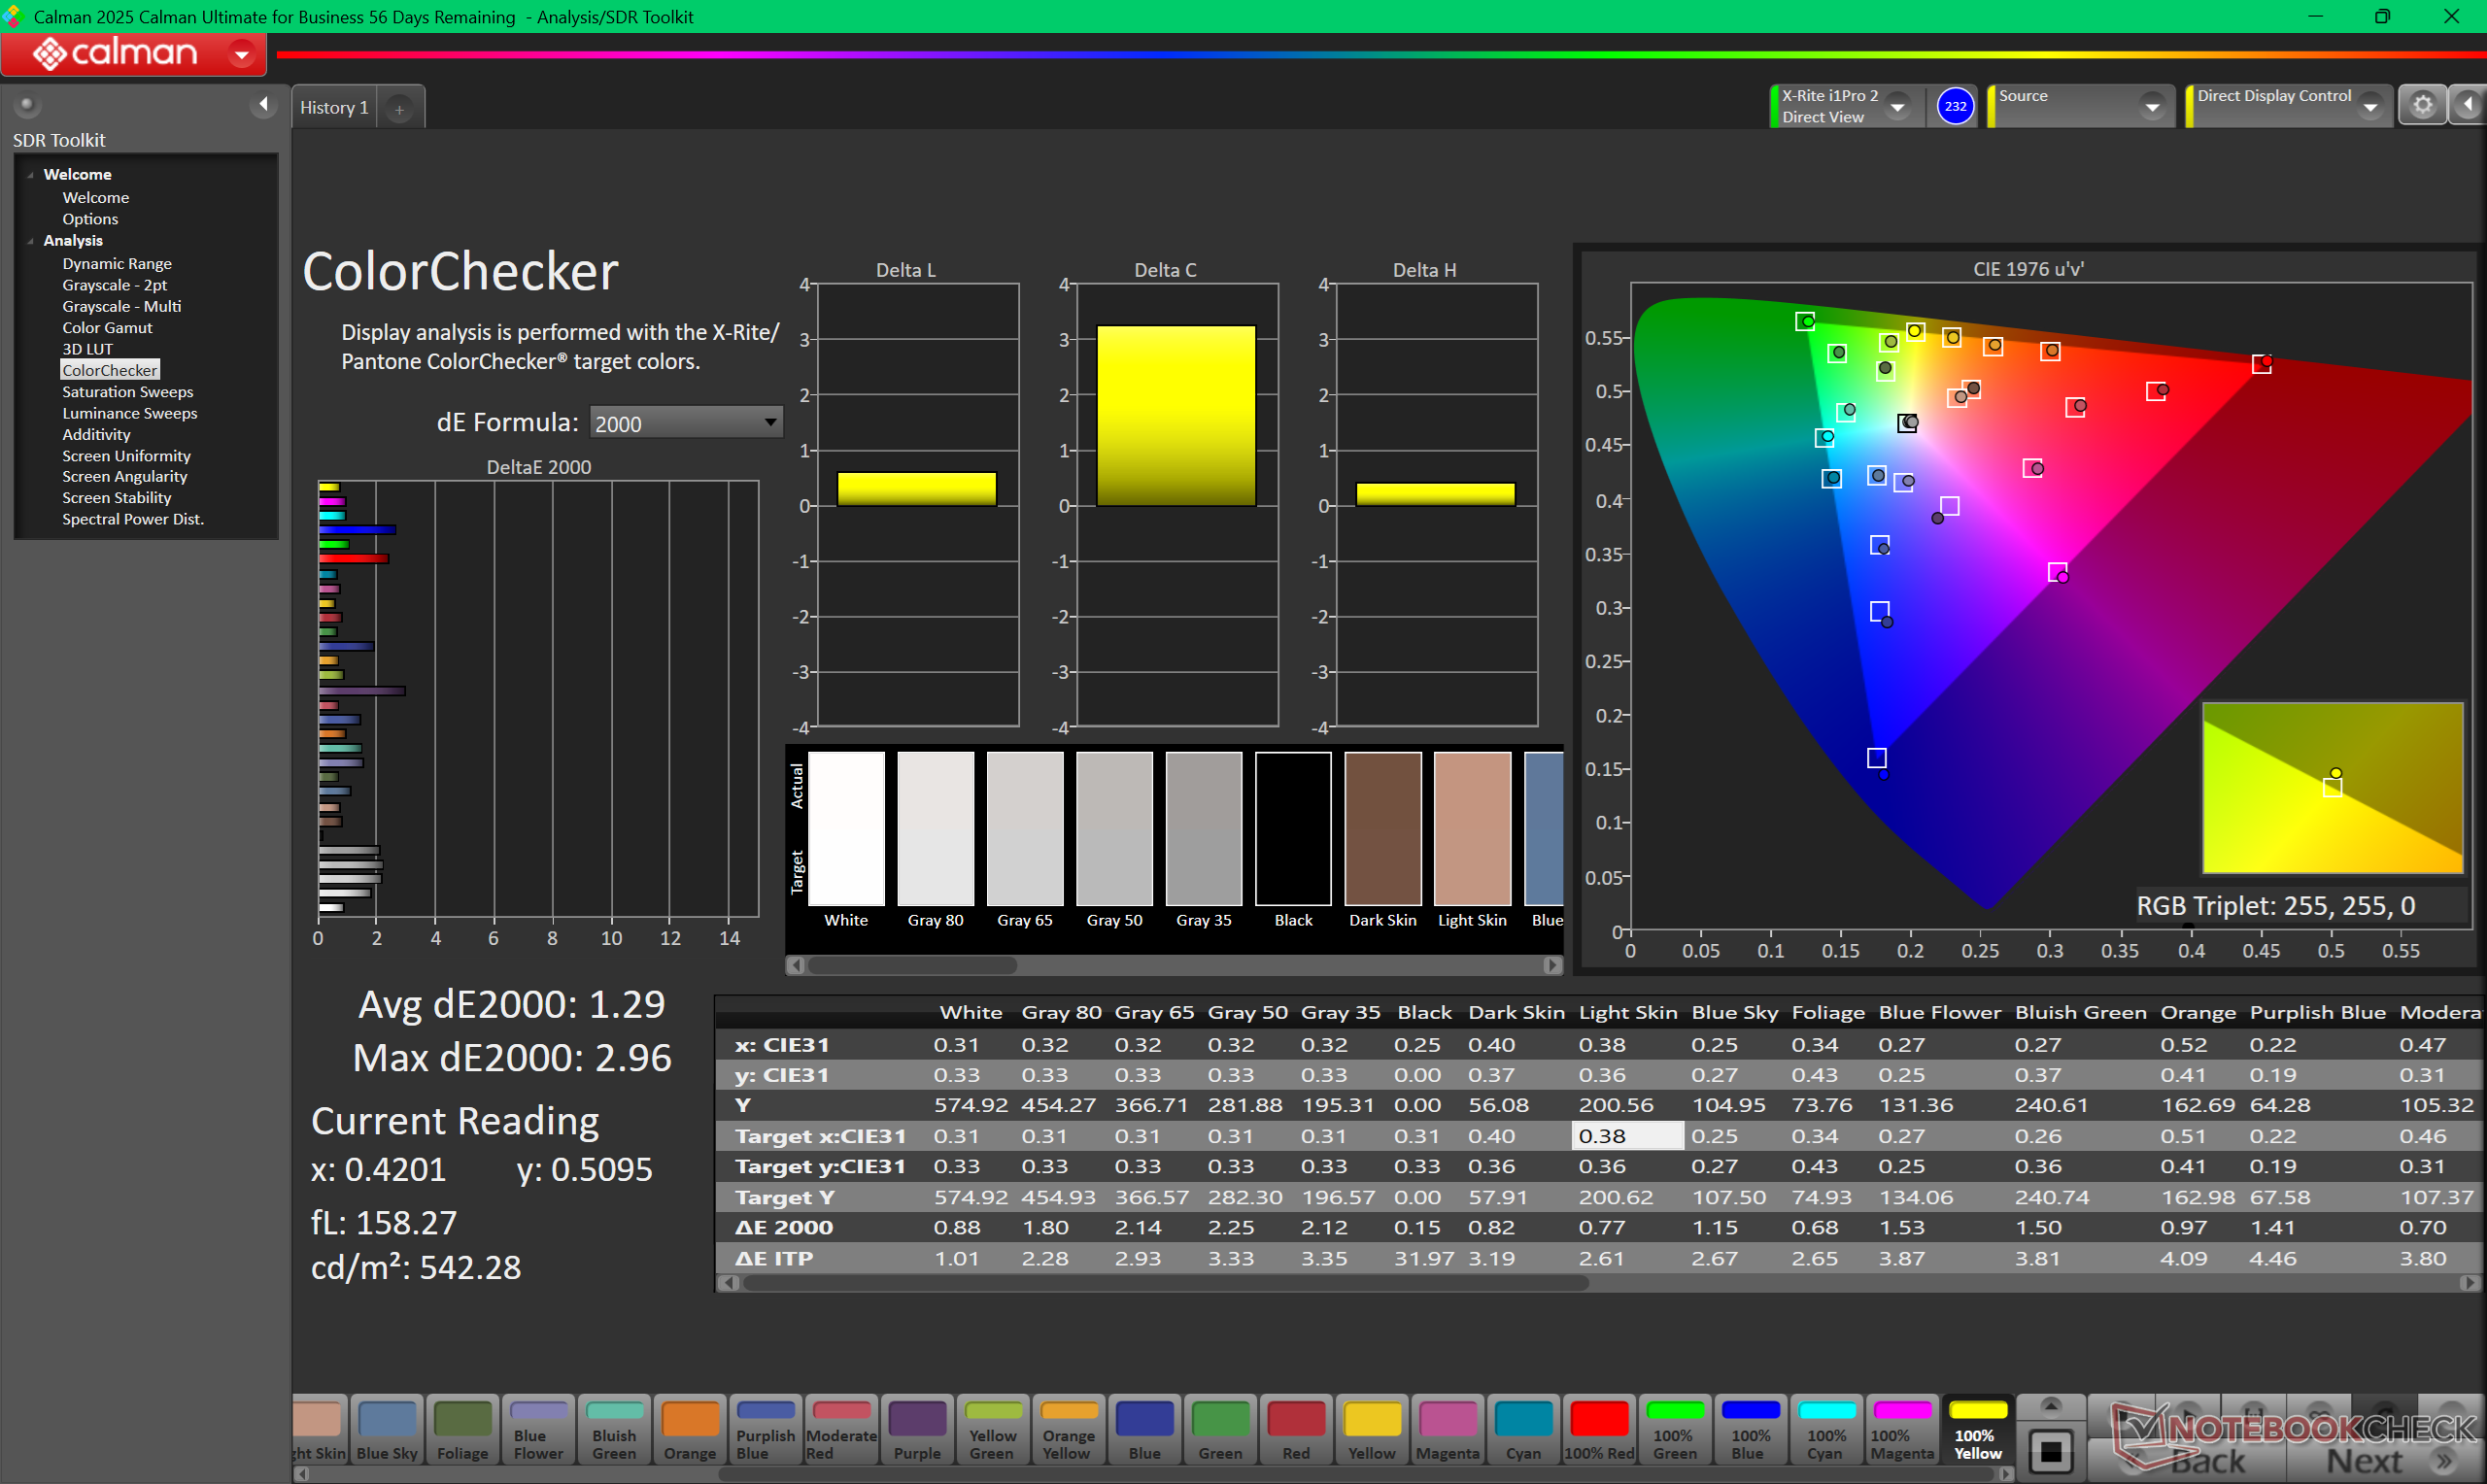
ΔE ColorChecker Calman: 1.29 | ∀{0.5-29.43 Ø4.78}
calibrated: 0.81
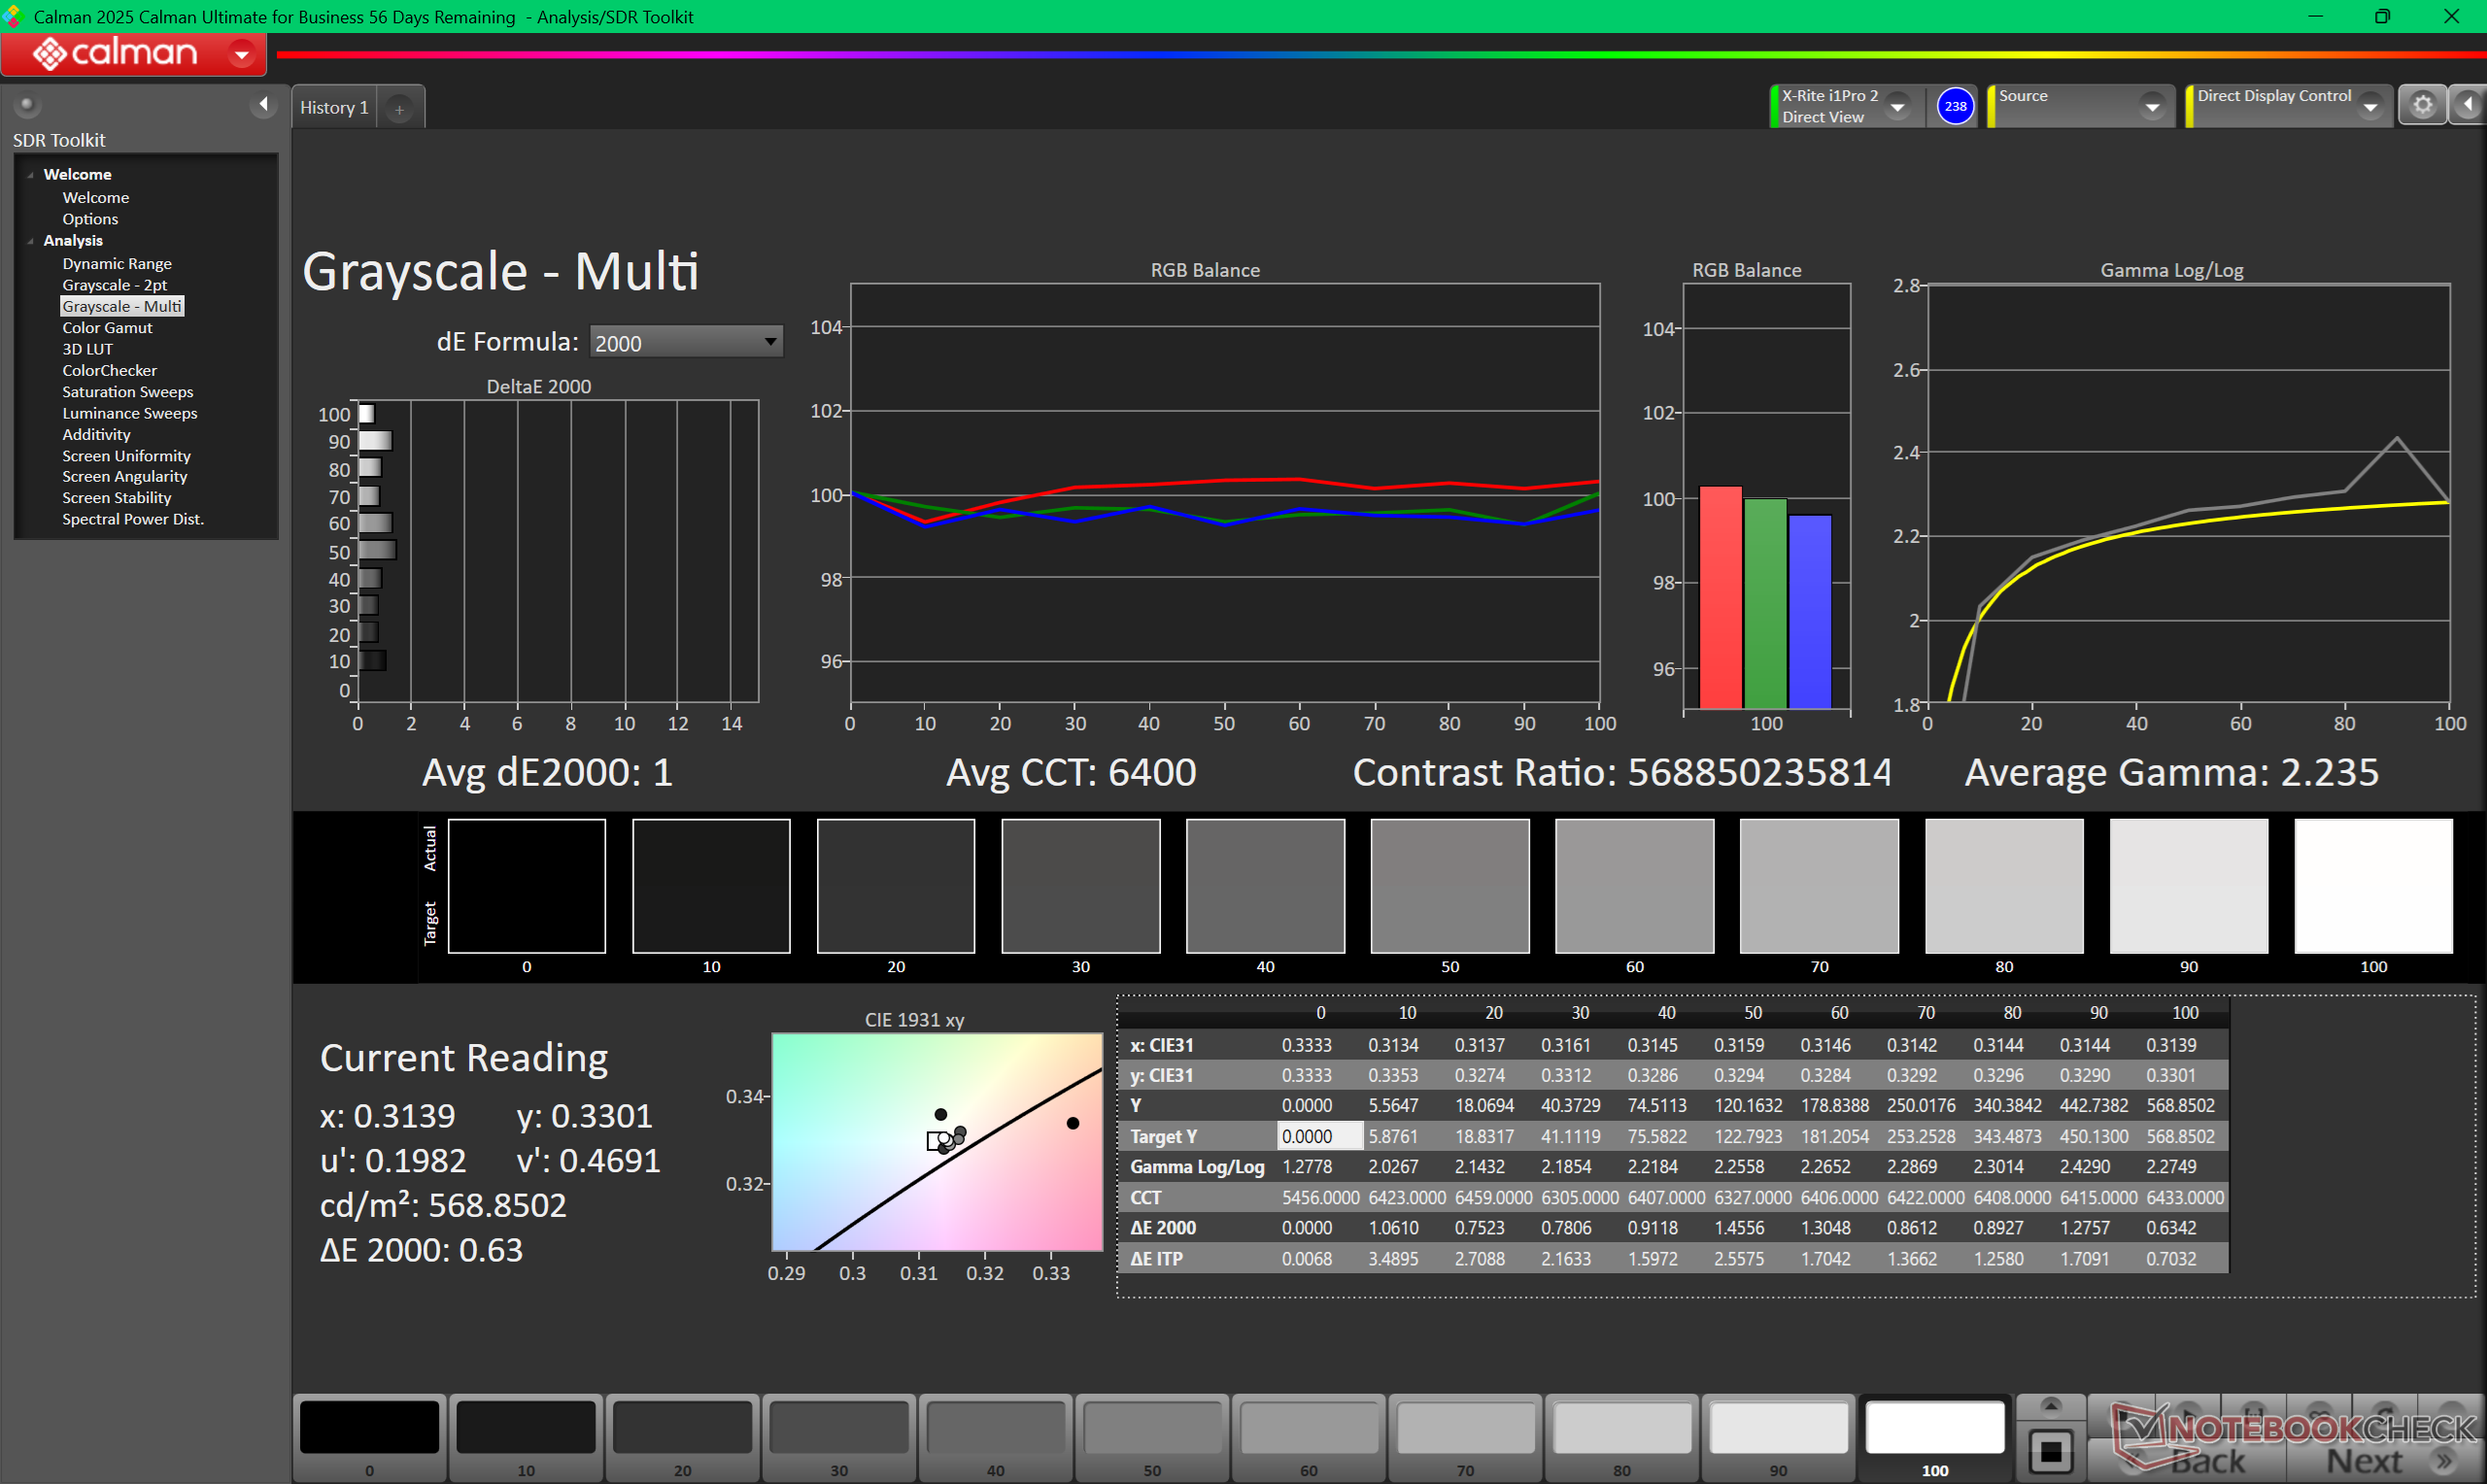
ΔE Greyscale Calman: 1.4 | ∀{0.09-98 Ø5}
97.5% AdobeRGB 1998 (Argyll 3D)
100% sRGB (Argyll 3D)
98.8% Display P3 (Argyll 3D)
Gamma: 2.23
CCT: 6319 K
| Lenovo ThinkPad P1 Gen 8 Samsung ATNA60KA02-0, Tandem OLED, 3200x2000, 16", 120 Hz | Lenovo ThinkPad P16s Gen 4 AMD N160JCA-GT1, , 1920x1200, 16", 60 Hz | Lenovo ThinkPad P1 Gen 7 21KV001SGE MNG007DA1-9 , IPS LED, 2560x1600, 16", 165 Hz | HP ZBook X G1i 16 LG Philips LGD07B3, IPS, 2560x1600, 16", 120 Hz | Dell Pro Max 16 Plus Samsung 160HC01, OLED, 3840x2400, 16", 120 Hz | Asus ExpertBook B6 Flip B6602FC2 AU Optronics Model: AUOE495, IPS, 2560x1600, 16", 120 Hz | |
|---|---|---|---|---|---|---|
| Display | -22% | -19% | 0% | -4% | -4% | |
| Display P3 Coverage (%) | 98.8 | 65.8 -33% | 69.4 -30% | 97.2 -2% | 97.3 -2% | 97.9 -1% |
| sRGB Coverage (%) | 100 | 96.8 -3% | 97.6 -2% | 100 0% | 100 0% | 99.89 0% |
| AdobeRGB 1998 Coverage (%) | 97.5 | 67.8 -30% | 71.8 -26% | 99.9 2% | 88.8 -9% | 85.52 -12% |
| Response Times | -1609% | -3839% | -30% | -4223% | ||
| Response Time Grey 50% / Grey 80% * (ms) | 0.57 ? | 11.2 ? -1865% | 45.5 ? -7882% | 0.63 ? -11% | 36 ? -6216% | |
| Response Time Black / White * (ms) | 0.73 ? | 10.6 ? -1352% | 26.1 ? -3475% | 0.89 ? -22% | 17 ? -2229% | |
| PWM Frequency (Hz) | 1199 | 26536 ? | 479.9 ? | |||
| PWM Amplitude * (%) | 18 | 47 -161% | 28 -56% | |||
| Screen | -72% | -106% | -84% | -20% | -68% | |
| Brightness middle (cd/m²) | 561.8 | 540 -4% | 516 -8% | 461.8 -18% | 530.9 -6% | 440 -22% |
| Brightness (cd/m²) | 566 | 516 -9% | 505 -11% | 427 -25% | 540 -5% | 418 -26% |
| Brightness Distribution (%) | 99 | 93 -6% | 89 -10% | 88 -11% | 95 -4% | 82 -17% |
| Black Level * (cd/m²) | 0.37 | 0.41 | 0.46 | 0.3 | ||
| Colorchecker dE 2000 * | 1.29 | 3.4 -164% | 3.5 -171% | 4.08 -216% | 2.42 -88% | 2.81 -118% |
| Colorchecker dE 2000 max. * | 2.96 | 5.6 -89% | 8.8 -197% | 8.1 -174% | 5.76 -95% | 4.62 -56% |
| Colorchecker dE 2000 calibrated * | 0.81 | 0.9 -11% | 1.2 -48% | 0.75 7% | 0.7 14% | 2.99 -269% |
| Greyscale dE 2000 * | 1.4 | 4.5 -221% | 5.6 -300% | 3.5 -150% | 0.8 43% | 0.91 35% |
| Gamma | 2.23 99% | 2.51 88% | 2.27 97% | 2.15 102% | 2.23 99% | 2.2 100% |
| CCT | 6319 103% | 6294 103% | 6071 107% | 6715 97% | 6488 100% | 6600 98% |
| Contrast (:1) | 1459 | 1259 | 1004 | 1467 | ||
| Moyenne finale (programmes/paramètres) | -47% /
-57% | -578% /
-335% | -1308% /
-931% | -18% /
-19% | -1432% /
-744% |
* ... Moindre est la valeur, meilleures sont les performances

L'écran est pré-calibré et les valeurs moyennes de deltaE sont donc déjà assez basses, comme le montrent nos résultats CalMAN ci-dessous.

Temps de réponse de l'écran
| ↔ Temps de réponse noir à blanc | ||
|---|---|---|
| 0.73 ms ... hausse ↗ et chute ↘ combinées | ↗ 0.34 ms hausse | 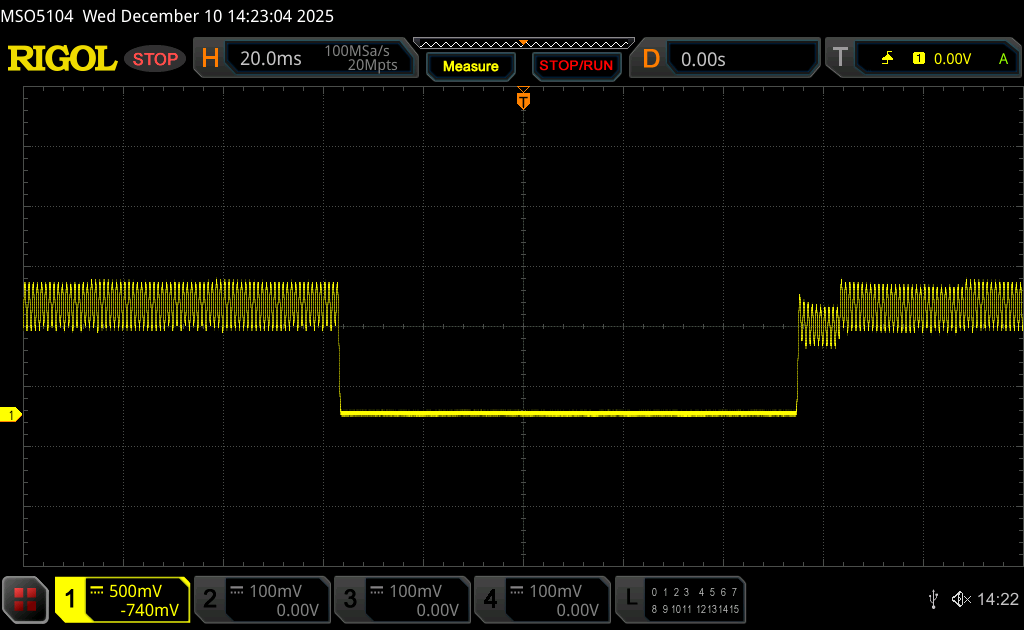 |
| ↘ 0.39 ms chute | ||
| L'écran montre de très faibles temps de réponse, parfait pour le jeu. En comparaison, tous les appareils testés affichent entre 0.1 (minimum) et 240 (maximum) ms. » 2 % des appareils testés affichent de meilleures performances. Cela signifie que les latences relevées sont meilleures que la moyenne (20.2 ms) de tous les appareils testés. | ||
| ↔ Temps de réponse gris 50% à gris 80% | ||
| 0.57 ms ... hausse ↗ et chute ↘ combinées | ↗ 0.29 ms hausse | 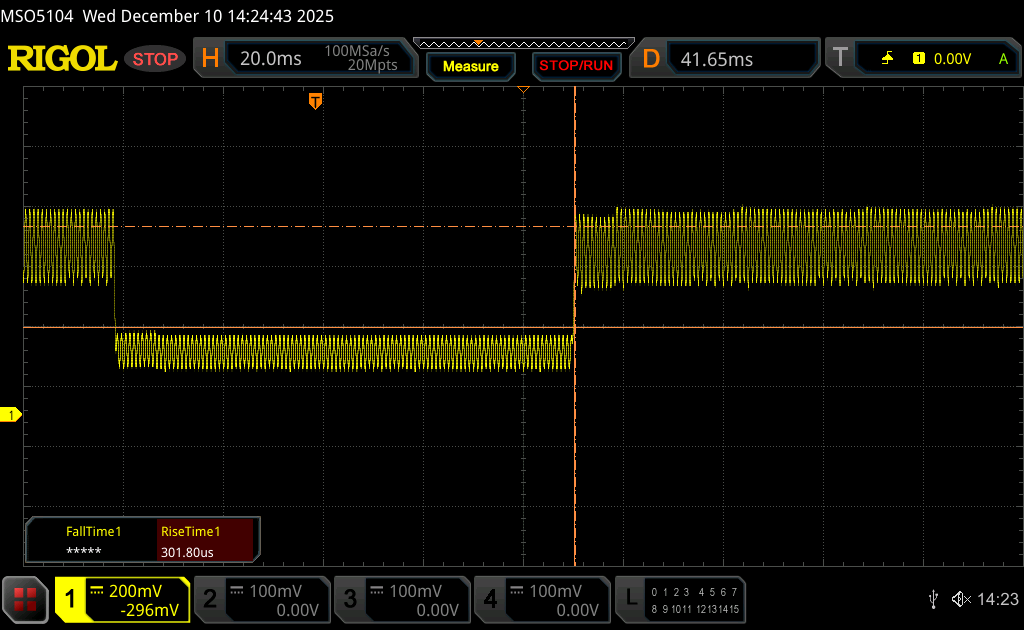 |
| ↘ 0.28 ms chute | ||
| L'écran montre de très faibles temps de réponse, parfait pour le jeu. En comparaison, tous les appareils testés affichent entre 0.165 (minimum) et 636 (maximum) ms. » 1 % des appareils testés affichent de meilleures performances. Cela signifie que les latences relevées sont meilleures que la moyenne (31.6 ms) de tous les appareils testés. | ||
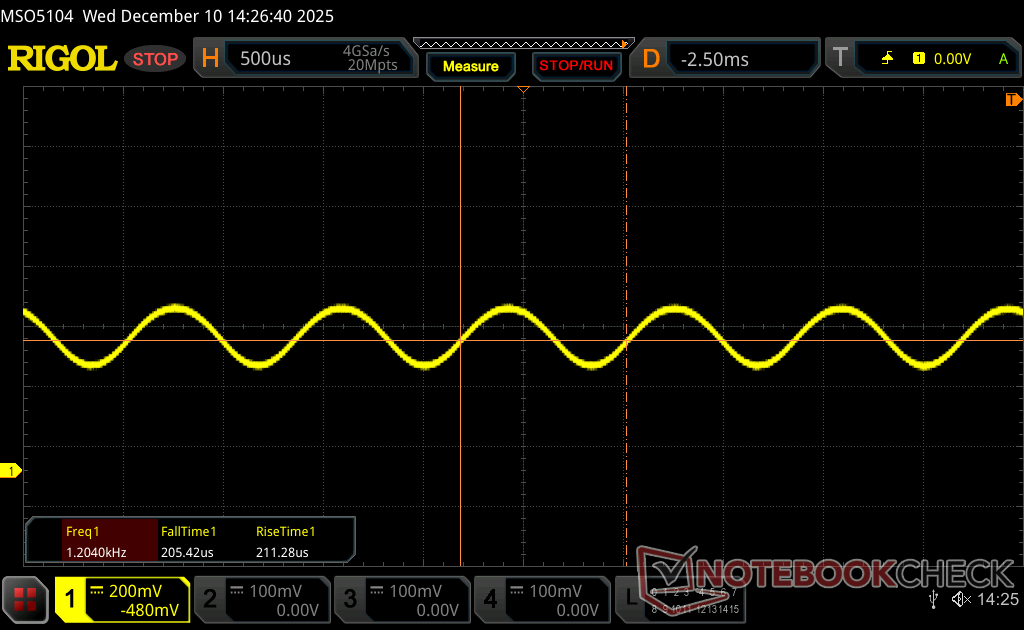
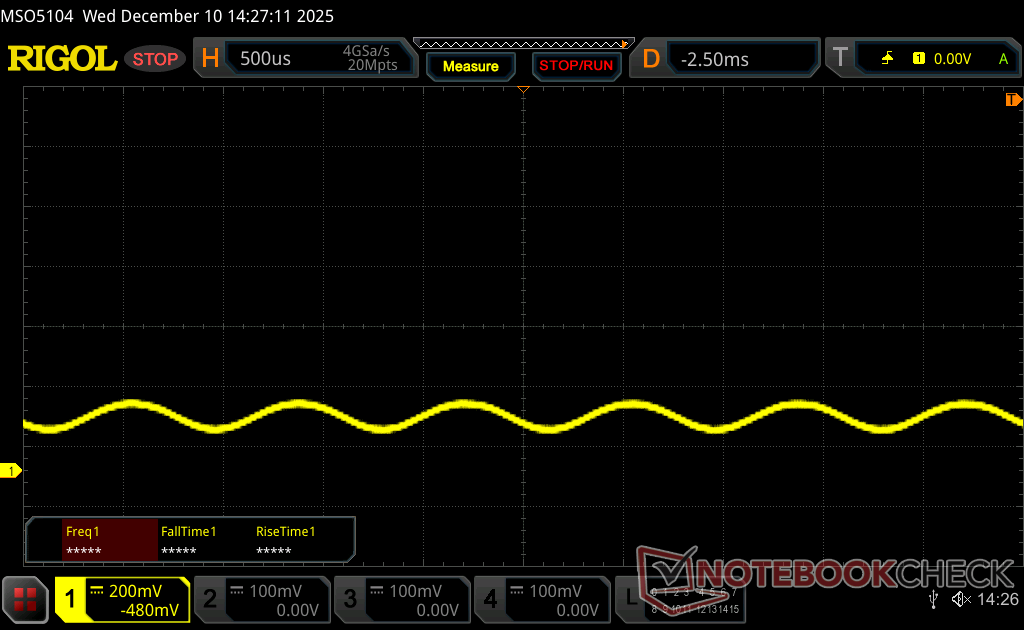
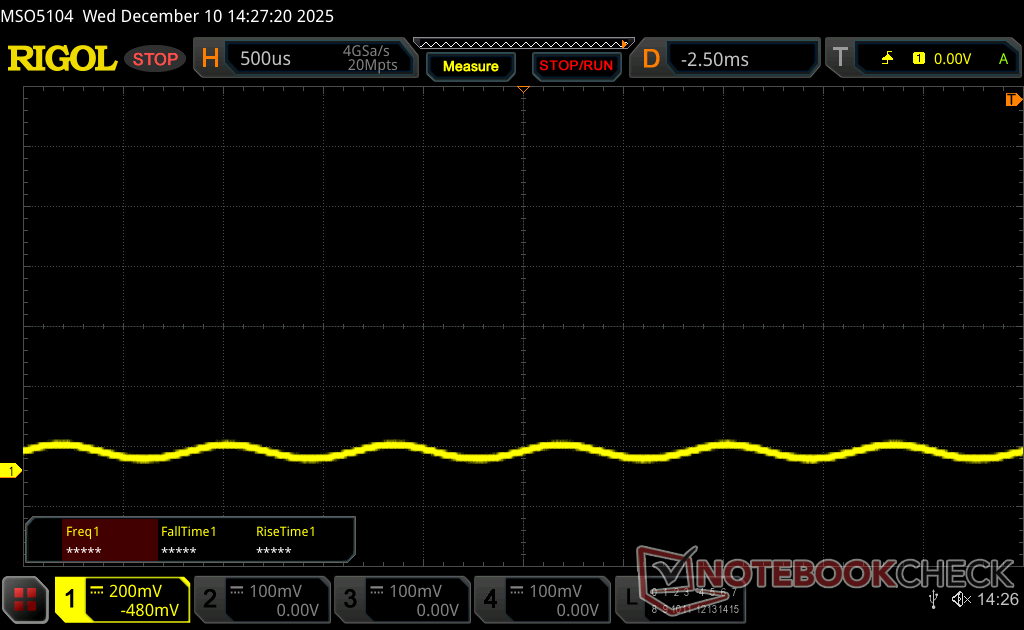
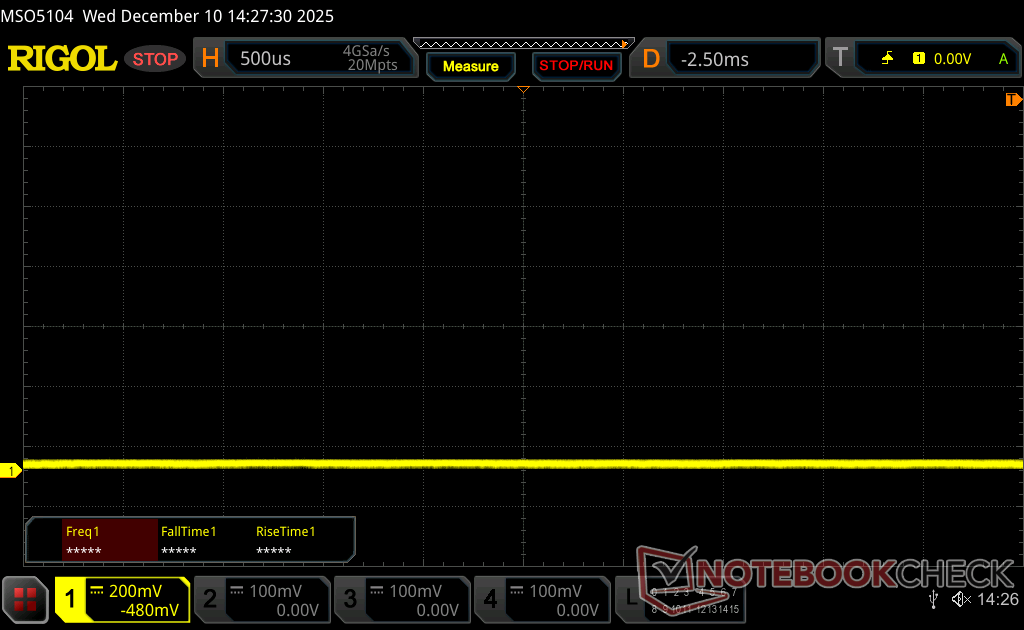
Scintillement / MLI (Modulation de largeur d'impulsion)
| Scintillement / MLI (Modulation de largeur d'impulsion) décelé | 1199 Hz Amplitude: 18 % | 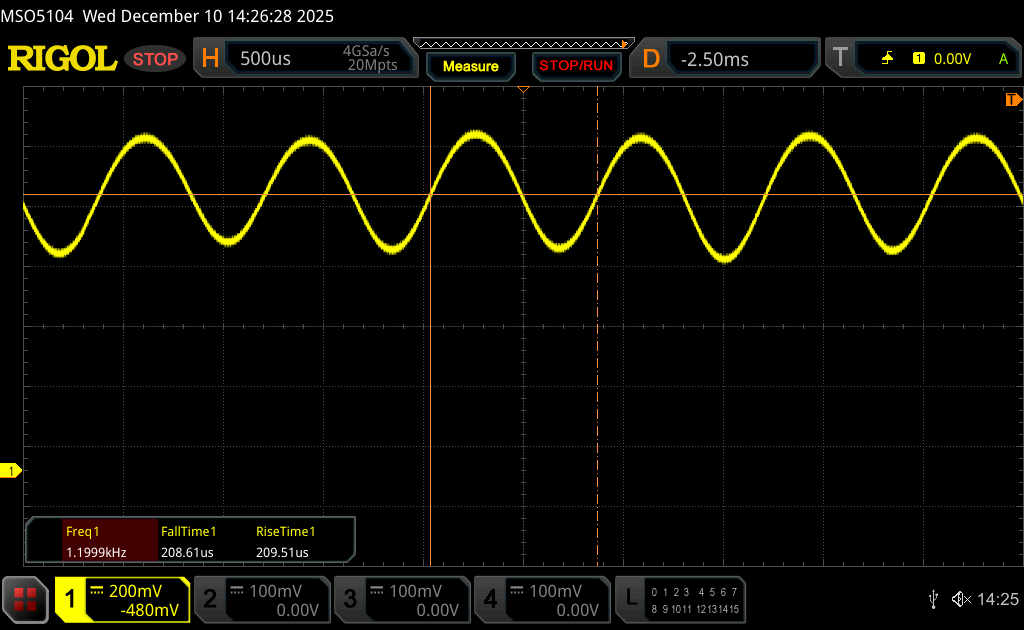 | |
Le rétroéclairage de l'écran scintille à la fréquence de 1199 Hz (certainement du fait de l'utilisation d'une MDI - Modulation de largeur d'impulsion) . La fréquence de rafraîchissement de 1199 Hz est élevée, la grande majorité des utilisateurs ne devrait pas percevoir de scintillements et être sujette à une fatigue oculaire accrue. En comparaison, 53 % des appareils testés n'emploient pas MDI pour assombrir leur écran. Nous avons relevé une moyenne à 8118 (minimum : 5 - maximum : 343500) Hz dans le cas où une MDI était active. | |||


Performance
Conditions d'essai
Nous avons réglé Windows et Nvidia sur le mode Performance avant d'effectuer les tests ci-dessous. Advanced Optimus et GPU ECC ne sont pas pris en charge.
Processeur
Le Core Ultra 7 255H offre des performances multithread de 15 à 20 % supérieures à celles du Core Ultra 7 155H du ThinkPad P1 Gen 7 de l'année dernière. Si vous passez au modèle le plus haut de gamme Core Ultra 9 285H devrait permettre d'augmenter encore davantage les performances, bien que de façon marginale, de 5 à 10 % par rapport au Core Ultra 7 255H.
La durabilité des performances est bonne mais pas parfaite ; lorsque vous exécutez CineBench R15 xT en boucle, le score initial de 3388 points chute de près de 13 % après seulement 4 ou 5 cycles.
Cinebench R15 Multi Loop
Cinebench R23: Multi Core | Single Core
Cinebench R20: CPU (Multi Core) | CPU (Single Core)
Cinebench R15: CPU Multi 64Bit | CPU Single 64Bit
Blender: v2.79 BMW27 CPU
7-Zip 18.03: 7z b 4 | 7z b 4 -mmt1
Geekbench 6.5: Multi-Core | Single-Core
Geekbench 5.5: Multi-Core | Single-Core
HWBOT x265 Benchmark v2.2: 4k Preset
LibreOffice : 20 Documents To PDF
R Benchmark 2.5: Overall mean
| CPU Performance rating | |
| Dell Pro Max 16 Plus | |
| HP ZBook Fury 16 G11 | |
| HP ZBook X G1i 16 | |
| Lenovo ThinkPad P1 Gen 8 | |
| Moyenne Intel Core Ultra 7 255H | |
| Lenovo ThinkPad P16s Gen 4 AMD | |
| Asus ExpertBook B6 Flip B6602FC2 -2! | |
| HP ZBook Studio 16 G11 | |
| Lenovo ThinkPad P1 Gen 7 21KV001SGE | |
| HP ZBook Power 16 G11 A | |
| HP ZBook Studio 16 G9 62U04EA -2! | |
| Lenovo ThinkPad P16s G2 21K9000CGE | |
| Lenovo ThinkPad P1 G4-20Y4Z9DVUS -2! | |
| Cinebench R23 / Multi Core | |
| Dell Pro Max 16 Plus | |
| HP ZBook Fury 16 G11 | |
| Lenovo ThinkPad P1 Gen 8 | |
| HP ZBook X G1i 16 | |
| Asus ExpertBook B6 Flip B6602FC2 | |
| Lenovo ThinkPad P1 Gen 7 21KV001SGE | |
| Lenovo ThinkPad P16s Gen 4 AMD | |
| Moyenne Intel Core Ultra 7 255H (16105 - 22578, n=17) | |
| HP ZBook Studio 16 G11 | |
| HP ZBook Studio 16 G9 62U04EA | |
| HP ZBook Power 16 G11 A | |
| Lenovo ThinkPad P16s G2 21K9000CGE | |
| Lenovo ThinkPad P1 G4-20Y4Z9DVUS | |
| Cinebench R23 / Single Core | |
| HP ZBook Fury 16 G11 | |
| Moyenne Intel Core Ultra 7 255H (1874 - 2152, n=17) | |
| Dell Pro Max 16 Plus | |
| HP ZBook X G1i 16 | |
| Lenovo ThinkPad P1 Gen 8 | |
| Lenovo ThinkPad P16s Gen 4 AMD | |
| Asus ExpertBook B6 Flip B6602FC2 | |
| HP ZBook Studio 16 G9 62U04EA | |
| Lenovo ThinkPad P1 Gen 7 21KV001SGE | |
| HP ZBook Studio 16 G11 | |
| HP ZBook Power 16 G11 A | |
| Lenovo ThinkPad P16s G2 21K9000CGE | |
| Lenovo ThinkPad P1 G4-20Y4Z9DVUS | |
| Cinebench R20 / CPU (Multi Core) | |
| Dell Pro Max 16 Plus | |
| HP ZBook Fury 16 G11 | |
| Lenovo ThinkPad P1 Gen 8 | |
| HP ZBook X G1i 16 | |
| Asus ExpertBook B6 Flip B6602FC2 | |
| Lenovo ThinkPad P1 Gen 7 21KV001SGE | |
| Moyenne Intel Core Ultra 7 255H (6356 - 8860, n=16) | |
| Lenovo ThinkPad P16s Gen 4 AMD | |
| HP ZBook Studio 16 G11 | |
| HP ZBook Studio 16 G9 62U04EA | |
| HP ZBook Power 16 G11 A | |
| Lenovo ThinkPad P16s G2 21K9000CGE | |
| Lenovo ThinkPad P1 G4-20Y4Z9DVUS | |
| Cinebench R20 / CPU (Single Core) | |
| HP ZBook Fury 16 G11 | |
| Dell Pro Max 16 Plus | |
| Lenovo ThinkPad P16s Gen 4 AMD | |
| Moyenne Intel Core Ultra 7 255H (748 - 826, n=16) | |
| HP ZBook X G1i 16 | |
| Lenovo ThinkPad P1 Gen 8 | |
| Asus ExpertBook B6 Flip B6602FC2 | |
| HP ZBook Studio 16 G9 62U04EA | |
| HP ZBook Studio 16 G11 | |
| Lenovo ThinkPad P1 Gen 7 21KV001SGE | |
| HP ZBook Power 16 G11 A | |
| Lenovo ThinkPad P16s G2 21K9000CGE | |
| Lenovo ThinkPad P1 G4-20Y4Z9DVUS | |
| Cinebench R15 / CPU Multi 64Bit | |
| Dell Pro Max 16 Plus | |
| HP ZBook Fury 16 G11 | |
| Asus ExpertBook B6 Flip B6602FC2 | |
| HP ZBook X G1i 16 | |
| Lenovo ThinkPad P1 Gen 8 | |
| Lenovo ThinkPad P16s Gen 4 AMD | |
| Lenovo ThinkPad P1 Gen 7 21KV001SGE | |
| HP ZBook Studio 16 G11 | |
| Moyenne Intel Core Ultra 7 255H (2414 - 3444, n=16) | |
| HP ZBook Power 16 G11 A | |
| HP ZBook Studio 16 G9 62U04EA | |
| Lenovo ThinkPad P16s G2 21K9000CGE | |
| Lenovo ThinkPad P1 G4-20Y4Z9DVUS | |
| Cinebench R15 / CPU Single 64Bit | |
| Lenovo ThinkPad P16s Gen 4 AMD | |
| Dell Pro Max 16 Plus | |
| HP ZBook X G1i 16 | |
| Moyenne Intel Core Ultra 7 255H (258 - 322, n=17) | |
| Lenovo ThinkPad P1 Gen 8 | |
| HP ZBook Fury 16 G11 | |
| HP ZBook Power 16 G11 A | |
| Asus ExpertBook B6 Flip B6602FC2 | |
| HP ZBook Studio 16 G9 62U04EA | |
| Lenovo ThinkPad P1 Gen 7 21KV001SGE | |
| Lenovo ThinkPad P16s G2 21K9000CGE | |
| HP ZBook Studio 16 G11 | |
| Lenovo ThinkPad P1 G4-20Y4Z9DVUS | |
| Blender / v2.79 BMW27 CPU | |
| Lenovo ThinkPad P1 G4-20Y4Z9DVUS | |
| Lenovo ThinkPad P16s G2 21K9000CGE | |
| Moyenne Intel Core Ultra 7 255H (157 - 293, n=16) | |
| HP ZBook Power 16 G11 A | |
| HP ZBook Studio 16 G9 62U04EA | |
| Asus ExpertBook B6 Flip B6602FC2 | |
| HP ZBook Studio 16 G11 | |
| Lenovo ThinkPad P1 Gen 7 21KV001SGE | |
| Lenovo ThinkPad P16s Gen 4 AMD | |
| Lenovo ThinkPad P1 Gen 8 | |
| HP ZBook X G1i 16 | |
| HP ZBook Fury 16 G11 | |
| Dell Pro Max 16 Plus | |
| 7-Zip 18.03 / 7z b 4 | |
| Dell Pro Max 16 Plus | |
| HP ZBook Fury 16 G11 | |
| HP ZBook Studio 16 G11 | |
| Lenovo ThinkPad P16s Gen 4 AMD | |
| Asus ExpertBook B6 Flip B6602FC2 | |
| Lenovo ThinkPad P1 Gen 7 21KV001SGE | |
| HP ZBook Studio 16 G9 62U04EA | |
| HP ZBook X G1i 16 | |
| HP ZBook Power 16 G11 A | |
| Lenovo ThinkPad P1 Gen 8 | |
| Lenovo ThinkPad P16s G2 21K9000CGE | |
| Moyenne Intel Core Ultra 7 255H (42155 - 68652, n=17) | |
| Lenovo ThinkPad P1 G4-20Y4Z9DVUS | |
| 7-Zip 18.03 / 7z b 4 -mmt1 | |
| HP ZBook Fury 16 G11 | |
| Dell Pro Max 16 Plus | |
| HP ZBook Power 16 G11 A | |
| Lenovo ThinkPad P16s Gen 4 AMD | |
| Asus ExpertBook B6 Flip B6602FC2 | |
| HP ZBook X G1i 16 | |
| HP ZBook Studio 16 G9 62U04EA | |
| Lenovo ThinkPad P16s G2 21K9000CGE | |
| Moyenne Intel Core Ultra 7 255H (4589 - 6385, n=17) | |
| Lenovo ThinkPad P1 G4-20Y4Z9DVUS | |
| Lenovo ThinkPad P1 Gen 7 21KV001SGE | |
| HP ZBook Studio 16 G11 | |
| Lenovo ThinkPad P1 Gen 8 | |
| Geekbench 6.5 / Multi-Core | |
| Dell Pro Max 16 Plus | |
| HP ZBook X G1i 16 | |
| Lenovo ThinkPad P1 Gen 8 | |
| HP ZBook Fury 16 G11 | |
| Moyenne Intel Core Ultra 7 255H (11979 - 17489, n=17) | |
| Lenovo ThinkPad P16s Gen 4 AMD | |
| HP ZBook Studio 16 G11 | |
| Lenovo ThinkPad P1 Gen 7 21KV001SGE | |
| HP ZBook Power 16 G11 A | |
| Lenovo ThinkPad P16s G2 21K9000CGE | |
| Geekbench 6.5 / Single-Core | |
| Lenovo ThinkPad P16s Gen 4 AMD | |
| HP ZBook Fury 16 G11 | |
| HP ZBook X G1i 16 | |
| Dell Pro Max 16 Plus | |
| Moyenne Intel Core Ultra 7 255H (2712 - 2925, n=17) | |
| Lenovo ThinkPad P1 Gen 8 | |
| HP ZBook Power 16 G11 A | |
| HP ZBook Studio 16 G11 | |
| Lenovo ThinkPad P16s G2 21K9000CGE | |
| Lenovo ThinkPad P1 Gen 7 21KV001SGE | |
| Geekbench 5.5 / Multi-Core | |
| Dell Pro Max 16 Plus | |
| HP ZBook Fury 16 G11 | |
| Lenovo ThinkPad P1 Gen 8 | |
| HP ZBook X G1i 16 | |
| Asus ExpertBook B6 Flip B6602FC2 | |
| Lenovo ThinkPad P16s Gen 4 AMD | |
| Moyenne Intel Core Ultra 7 255H (11348 - 17218, n=16) | |
| HP ZBook Studio 16 G11 | |
| Lenovo ThinkPad P1 Gen 7 21KV001SGE | |
| HP ZBook Studio 16 G9 62U04EA | |
| HP ZBook Power 16 G11 A | |
| Lenovo ThinkPad P16s G2 21K9000CGE | |
| Lenovo ThinkPad P1 G4-20Y4Z9DVUS | |
| Geekbench 5.5 / Single-Core | |
| Lenovo ThinkPad P16s Gen 4 AMD | |
| Dell Pro Max 16 Plus | |
| HP ZBook X G1i 16 | |
| Moyenne Intel Core Ultra 7 255H (1938 - 2121, n=16) | |
| HP ZBook Fury 16 G11 | |
| Lenovo ThinkPad P1 Gen 8 | |
| HP ZBook Power 16 G11 A | |
| Asus ExpertBook B6 Flip B6602FC2 | |
| HP ZBook Studio 16 G11 | |
| HP ZBook Studio 16 G9 62U04EA | |
| Lenovo ThinkPad P1 Gen 7 21KV001SGE | |
| Lenovo ThinkPad P16s G2 21K9000CGE | |
| Lenovo ThinkPad P1 G4-20Y4Z9DVUS | |
| HWBOT x265 Benchmark v2.2 / 4k Preset | |
| Dell Pro Max 16 Plus | |
| HP ZBook Fury 16 G11 | |
| Lenovo ThinkPad P1 Gen 8 | |
| HP ZBook X G1i 16 | |
| Lenovo ThinkPad P16s Gen 4 AMD | |
| Asus ExpertBook B6 Flip B6602FC2 | |
| Lenovo ThinkPad P1 Gen 7 21KV001SGE | |
| Moyenne Intel Core Ultra 7 255H (13.7 - 26.5, n=16) | |
| HP ZBook Studio 16 G11 | |
| HP ZBook Power 16 G11 A | |
| HP ZBook Studio 16 G9 62U04EA | |
| Lenovo ThinkPad P16s G2 21K9000CGE | |
| Lenovo ThinkPad P1 G4-20Y4Z9DVUS | |
| LibreOffice / 20 Documents To PDF | |
| Lenovo ThinkPad P16s Gen 4 AMD | |
| Lenovo ThinkPad P16s G2 21K9000CGE | |
| HP ZBook Power 16 G11 A | |
| Lenovo ThinkPad P1 G4-20Y4Z9DVUS | |
| Moyenne Intel Core Ultra 7 255H (41.2 - 61.6, n=16) | |
| HP ZBook Fury 16 G11 | |
| HP ZBook Studio 16 G11 | |
| Lenovo ThinkPad P1 Gen 7 21KV001SGE | |
| HP ZBook Studio 16 G9 62U04EA | |
| Dell Pro Max 16 Plus | |
| Asus ExpertBook B6 Flip B6602FC2 | |
| HP ZBook X G1i 16 | |
| Lenovo ThinkPad P1 Gen 8 | |
| R Benchmark 2.5 / Overall mean | |
| Lenovo ThinkPad P16s Gen 4 AMD | |
| Lenovo ThinkPad P1 G4-20Y4Z9DVUS | |
| Lenovo ThinkPad P16s G2 21K9000CGE | |
| Lenovo ThinkPad P1 Gen 7 21KV001SGE | |
| HP ZBook Studio 16 G11 | |
| Asus ExpertBook B6 Flip B6602FC2 | |
| Moyenne Intel Core Ultra 7 255H (0.4233 - 0.515, n=16) | |
| HP ZBook Power 16 G11 A | |
| HP ZBook Studio 16 G9 62U04EA | |
| Lenovo ThinkPad P1 Gen 8 | |
| Dell Pro Max 16 Plus | |
| HP ZBook X G1i 16 | |
| HP ZBook Fury 16 G11 | |
Cinebench R23: Multi Core | Single Core
Cinebench R20: CPU (Multi Core) | CPU (Single Core)
Cinebench R15: CPU Multi 64Bit | CPU Single 64Bit
Blender: v2.79 BMW27 CPU
7-Zip 18.03: 7z b 4 | 7z b 4 -mmt1
Geekbench 6.5: Multi-Core | Single-Core
Geekbench 5.5: Multi-Core | Single-Core
HWBOT x265 Benchmark v2.2: 4k Preset
LibreOffice : 20 Documents To PDF
R Benchmark 2.5: Overall mean
* ... Moindre est la valeur, meilleures sont les performances
AIDA64: FP32 Ray-Trace | FPU Julia | CPU SHA3 | CPU Queen | FPU SinJulia | FPU Mandel | CPU AES | CPU ZLib | FP64 Ray-Trace | CPU PhotoWorxx
| Performance rating | |
| Dell Pro Max 16 Plus | |
| Lenovo ThinkPad P16s Gen 4 AMD | |
| Lenovo ThinkPad P1 Gen 8 | |
| Lenovo ThinkPad P1 Gen 7 21KV001SGE | |
| Moyenne Intel Core Ultra 7 255H | |
| Asus ExpertBook B6 Flip B6602FC2 | |
| AIDA64 / FP32 Ray-Trace | |
| Dell Pro Max 16 Plus | |
| Lenovo ThinkPad P16s Gen 4 AMD | |
| Lenovo ThinkPad P1 Gen 8 | |
| Moyenne Intel Core Ultra 7 255H (13863 - 24741, n=14) | |
| Lenovo ThinkPad P1 Gen 7 21KV001SGE | |
| Asus ExpertBook B6 Flip B6602FC2 | |
| AIDA64 / FPU Julia | |
| Dell Pro Max 16 Plus | |
| Lenovo ThinkPad P1 Gen 8 | |
| Lenovo ThinkPad P16s Gen 4 AMD | |
| Moyenne Intel Core Ultra 7 255H (71030 - 119222, n=14) | |
| Lenovo ThinkPad P1 Gen 7 21KV001SGE | |
| Asus ExpertBook B6 Flip B6602FC2 | |
| AIDA64 / CPU SHA3 | |
| Dell Pro Max 16 Plus | |
| Lenovo ThinkPad P1 Gen 8 | |
| Lenovo ThinkPad P16s Gen 4 AMD | |
| Moyenne Intel Core Ultra 7 255H (3408 - 5548, n=14) | |
| Lenovo ThinkPad P1 Gen 7 21KV001SGE | |
| Asus ExpertBook B6 Flip B6602FC2 | |
| AIDA64 / CPU Queen | |
| Dell Pro Max 16 Plus | |
| Asus ExpertBook B6 Flip B6602FC2 | |
| Lenovo ThinkPad P16s Gen 4 AMD | |
| Lenovo ThinkPad P1 Gen 7 21KV001SGE | |
| Lenovo ThinkPad P1 Gen 8 | |
| Moyenne Intel Core Ultra 7 255H (59098 - 68460, n=14) | |
| AIDA64 / FPU SinJulia | |
| Lenovo ThinkPad P16s Gen 4 AMD | |
| Dell Pro Max 16 Plus | |
| Asus ExpertBook B6 Flip B6602FC2 | |
| Lenovo ThinkPad P1 Gen 7 21KV001SGE | |
| Lenovo ThinkPad P1 Gen 8 | |
| Moyenne Intel Core Ultra 7 255H (6716 - 8971, n=14) | |
| AIDA64 / FPU Mandel | |
| Dell Pro Max 16 Plus | |
| Lenovo ThinkPad P1 Gen 8 | |
| Lenovo ThinkPad P16s Gen 4 AMD | |
| Moyenne Intel Core Ultra 7 255H (37031 - 63347, n=14) | |
| Lenovo ThinkPad P1 Gen 7 21KV001SGE | |
| Asus ExpertBook B6 Flip B6602FC2 | |
| AIDA64 / CPU AES | |
| Dell Pro Max 16 Plus | |
| Lenovo ThinkPad P16s Gen 4 AMD | |
| Lenovo ThinkPad P1 Gen 7 21KV001SGE | |
| Lenovo ThinkPad P1 Gen 8 | |
| Asus ExpertBook B6 Flip B6602FC2 | |
| Moyenne Intel Core Ultra 7 255H (58402 - 83568, n=14) | |
| AIDA64 / CPU ZLib | |
| Dell Pro Max 16 Plus | |
| Lenovo ThinkPad P1 Gen 8 | |
| Lenovo ThinkPad P16s Gen 4 AMD | |
| Lenovo ThinkPad P1 Gen 7 21KV001SGE | |
| Moyenne Intel Core Ultra 7 255H (822 - 1316, n=14) | |
| Asus ExpertBook B6 Flip B6602FC2 | |
| AIDA64 / FP64 Ray-Trace | |
| Dell Pro Max 16 Plus | |
| Lenovo ThinkPad P16s Gen 4 AMD | |
| Lenovo ThinkPad P1 Gen 8 | |
| Moyenne Intel Core Ultra 7 255H (7384 - 13231, n=14) | |
| Lenovo ThinkPad P1 Gen 7 21KV001SGE | |
| Asus ExpertBook B6 Flip B6602FC2 | |
| AIDA64 / CPU PhotoWorxx | |
| Dell Pro Max 16 Plus | |
| Lenovo ThinkPad P1 Gen 8 | |
| Moyenne Intel Core Ultra 7 255H (23836 - 65787, n=14) | |
| Lenovo ThinkPad P16s Gen 4 AMD | |
| Lenovo ThinkPad P1 Gen 7 21KV001SGE | |
| Asus ExpertBook B6 Flip B6602FC2 | |
Performance du système
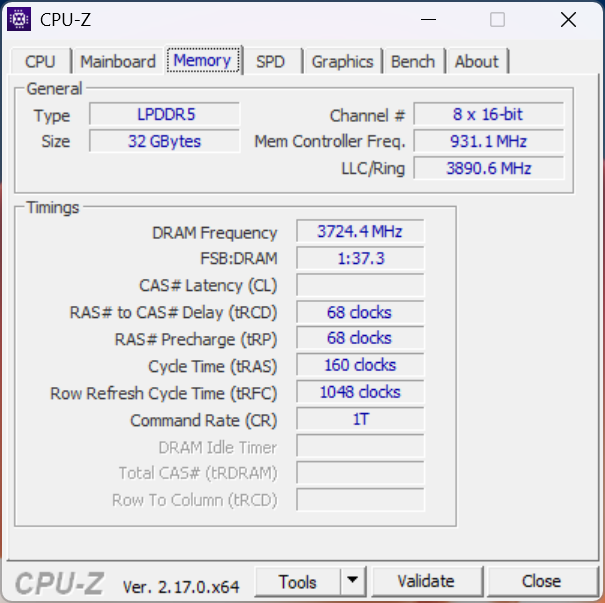
Les résultats du benchmark AIDA64 pour la mémoire vive sont très bons pour un ordinateur portable doté de 32 Go de mémoire amovible. Le modèle est livré en standard avec la mémoire LPDDR5x-7467 LPCAMM2 qui a été conçue pour surmonter les limitations de la mémoire SODIMM.
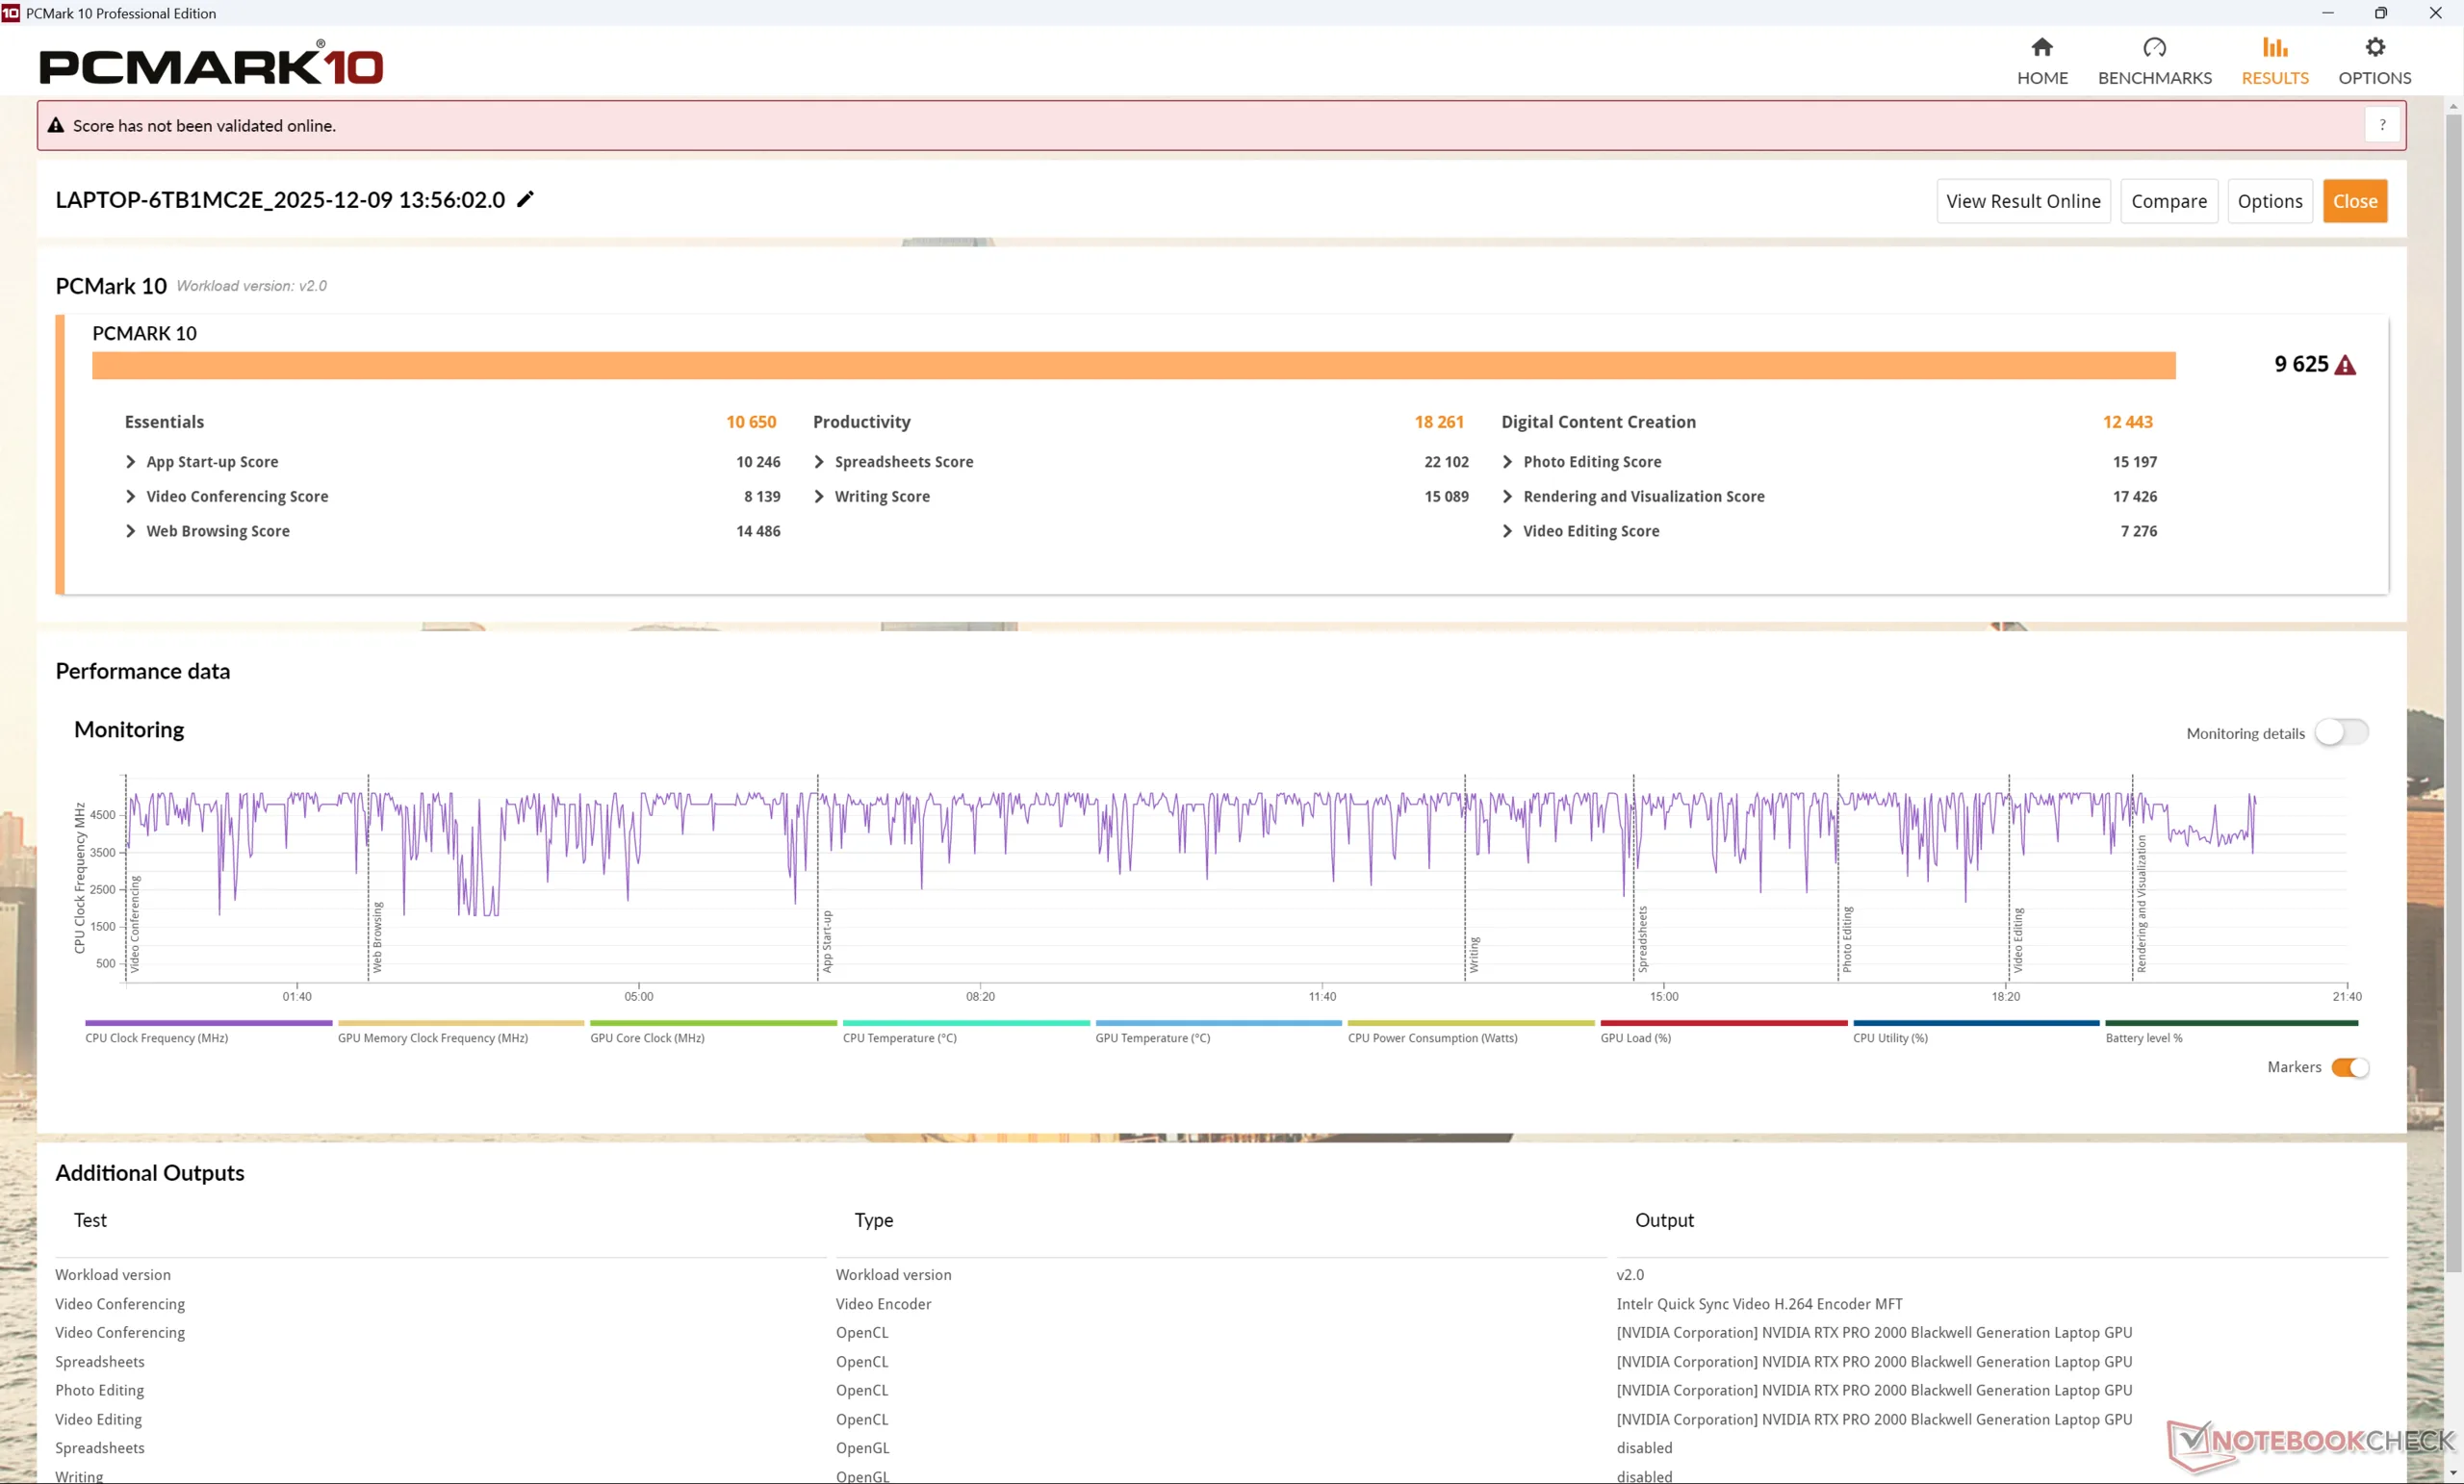
PCMark 10: Score | Essentials | Productivity | Digital Content Creation
CrossMark: Overall | Productivity | Creativity | Responsiveness
WebXPRT 3: Overall
WebXPRT 4: Overall
Mozilla Kraken 1.1: Total
| Performance rating | |
| Dell Pro Max 16 Plus -4! | |
| Lenovo ThinkPad P1 Gen 8 | |
| Moyenne Intel Core Ultra 7 255H, NVIDIA RTX PRO 2000 Blackwell Generation Laptop | |
| HP ZBook X G1i 16 -4! | |
| Asus ExpertBook B6 Flip B6602FC2 | |
| Lenovo ThinkPad P1 Gen 7 21KV001SGE | |
| Lenovo ThinkPad P16s Gen 4 AMD | |
| PCMark 10 / Score | |
| Lenovo ThinkPad P1 Gen 8 | |
| Moyenne Intel Core Ultra 7 255H, NVIDIA RTX PRO 2000 Blackwell Generation Laptop (n=1) | |
| Lenovo ThinkPad P16s Gen 4 AMD | |
| Lenovo ThinkPad P1 Gen 7 21KV001SGE | |
| Asus ExpertBook B6 Flip B6602FC2 | |
| PCMark 10 / Essentials | |
| Asus ExpertBook B6 Flip B6602FC2 | |
| Lenovo ThinkPad P16s Gen 4 AMD | |
| Lenovo ThinkPad P1 Gen 8 | |
| Moyenne Intel Core Ultra 7 255H, NVIDIA RTX PRO 2000 Blackwell Generation Laptop (n=1) | |
| Lenovo ThinkPad P1 Gen 7 21KV001SGE | |
| PCMark 10 / Productivity | |
| Lenovo ThinkPad P1 Gen 8 | |
| Moyenne Intel Core Ultra 7 255H, NVIDIA RTX PRO 2000 Blackwell Generation Laptop (n=1) | |
| Asus ExpertBook B6 Flip B6602FC2 | |
| Lenovo ThinkPad P16s Gen 4 AMD | |
| Lenovo ThinkPad P1 Gen 7 21KV001SGE | |
| PCMark 10 / Digital Content Creation | |
| Lenovo ThinkPad P1 Gen 8 | |
| Moyenne Intel Core Ultra 7 255H, NVIDIA RTX PRO 2000 Blackwell Generation Laptop (n=1) | |
| Lenovo ThinkPad P1 Gen 7 21KV001SGE | |
| Lenovo ThinkPad P16s Gen 4 AMD | |
| Asus ExpertBook B6 Flip B6602FC2 | |
| CrossMark / Overall | |
| Dell Pro Max 16 Plus | |
| HP ZBook X G1i 16 | |
| Asus ExpertBook B6 Flip B6602FC2 | |
| Lenovo ThinkPad P1 Gen 8 | |
| Moyenne Intel Core Ultra 7 255H, NVIDIA RTX PRO 2000 Blackwell Generation Laptop (n=1) | |
| Lenovo ThinkPad P1 Gen 7 21KV001SGE | |
| Lenovo ThinkPad P16s Gen 4 AMD | |
| CrossMark / Productivity | |
| Dell Pro Max 16 Plus | |
| HP ZBook X G1i 16 | |
| Asus ExpertBook B6 Flip B6602FC2 | |
| Lenovo ThinkPad P1 Gen 8 | |
| Moyenne Intel Core Ultra 7 255H, NVIDIA RTX PRO 2000 Blackwell Generation Laptop (n=1) | |
| Lenovo ThinkPad P1 Gen 7 21KV001SGE | |
| Lenovo ThinkPad P16s Gen 4 AMD | |
| CrossMark / Creativity | |
| Dell Pro Max 16 Plus | |
| HP ZBook X G1i 16 | |
| Lenovo ThinkPad P1 Gen 8 | |
| Moyenne Intel Core Ultra 7 255H, NVIDIA RTX PRO 2000 Blackwell Generation Laptop (n=1) | |
| Asus ExpertBook B6 Flip B6602FC2 | |
| Lenovo ThinkPad P1 Gen 7 21KV001SGE | |
| Lenovo ThinkPad P16s Gen 4 AMD | |
| CrossMark / Responsiveness | |
| Dell Pro Max 16 Plus | |
| Asus ExpertBook B6 Flip B6602FC2 | |
| Lenovo ThinkPad P1 Gen 8 | |
| Moyenne Intel Core Ultra 7 255H, NVIDIA RTX PRO 2000 Blackwell Generation Laptop (n=1) | |
| HP ZBook X G1i 16 | |
| Lenovo ThinkPad P1 Gen 7 21KV001SGE | |
| Lenovo ThinkPad P16s Gen 4 AMD | |
| WebXPRT 3 / Overall | |
| Lenovo ThinkPad P1 Gen 8 | |
| Moyenne Intel Core Ultra 7 255H, NVIDIA RTX PRO 2000 Blackwell Generation Laptop (n=1) | |
| Dell Pro Max 16 Plus | |
| HP ZBook X G1i 16 | |
| Lenovo ThinkPad P16s Gen 4 AMD | |
| Asus ExpertBook B6 Flip B6602FC2 | |
| Lenovo ThinkPad P1 Gen 7 21KV001SGE | |
| WebXPRT 4 / Overall | |
| Dell Pro Max 16 Plus | |
| HP ZBook X G1i 16 | |
| Lenovo ThinkPad P1 Gen 8 | |
| Moyenne Intel Core Ultra 7 255H, NVIDIA RTX PRO 2000 Blackwell Generation Laptop (n=1) | |
| Asus ExpertBook B6 Flip B6602FC2 | |
| Lenovo ThinkPad P1 Gen 7 21KV001SGE | |
| Lenovo ThinkPad P16s Gen 4 AMD | |
| Mozilla Kraken 1.1 / Total | |
| Lenovo ThinkPad P1 Gen 7 21KV001SGE | |
| Asus ExpertBook B6 Flip B6602FC2 | |
| Lenovo ThinkPad P16s Gen 4 AMD | |
| Lenovo ThinkPad P1 Gen 8 | |
| Moyenne Intel Core Ultra 7 255H, NVIDIA RTX PRO 2000 Blackwell Generation Laptop (n=1) | |
| HP ZBook X G1i 16 | |
| Dell Pro Max 16 Plus | |
* ... Moindre est la valeur, meilleures sont les performances
| PCMark 10 Score | 9625 points | |
Aide | ||
| AIDA64 / Memory Copy | |
| Lenovo ThinkPad P1 Gen 8 | |
| Dell Pro Max 16 Plus | |
| Moyenne Intel Core Ultra 7 255H (39188 - 110930, n=14) | |
| Lenovo ThinkPad P16s Gen 4 AMD | |
| Lenovo ThinkPad P1 Gen 7 21KV001SGE | |
| Asus ExpertBook B6 Flip B6602FC2 | |
| AIDA64 / Memory Read | |
| Dell Pro Max 16 Plus | |
| Lenovo ThinkPad P16s Gen 4 AMD | |
| Moyenne Intel Core Ultra 7 255H (43703 - 90552, n=14) | |
| Lenovo ThinkPad P1 Gen 8 | |
| Lenovo ThinkPad P1 Gen 7 21KV001SGE | |
| Asus ExpertBook B6 Flip B6602FC2 | |
| AIDA64 / Memory Write | |
| Dell Pro Max 16 Plus | |
| Lenovo ThinkPad P16s Gen 4 AMD | |
| Moyenne Intel Core Ultra 7 255H (36438 - 82641, n=14) | |
| Lenovo ThinkPad P1 Gen 7 21KV001SGE | |
| Lenovo ThinkPad P1 Gen 8 | |
| Asus ExpertBook B6 Flip B6602FC2 | |
| AIDA64 / Memory Latency | |
| Lenovo ThinkPad P1 Gen 8 | |
| Lenovo ThinkPad P1 Gen 7 21KV001SGE | |
| Moyenne Intel Core Ultra 7 255H (110.1 - 147.2, n=14) | |
| Dell Pro Max 16 Plus | |
| Lenovo ThinkPad P16s Gen 4 AMD | |
| Asus ExpertBook B6 Flip B6602FC2 | |
* ... Moindre est la valeur, meilleures sont les performances
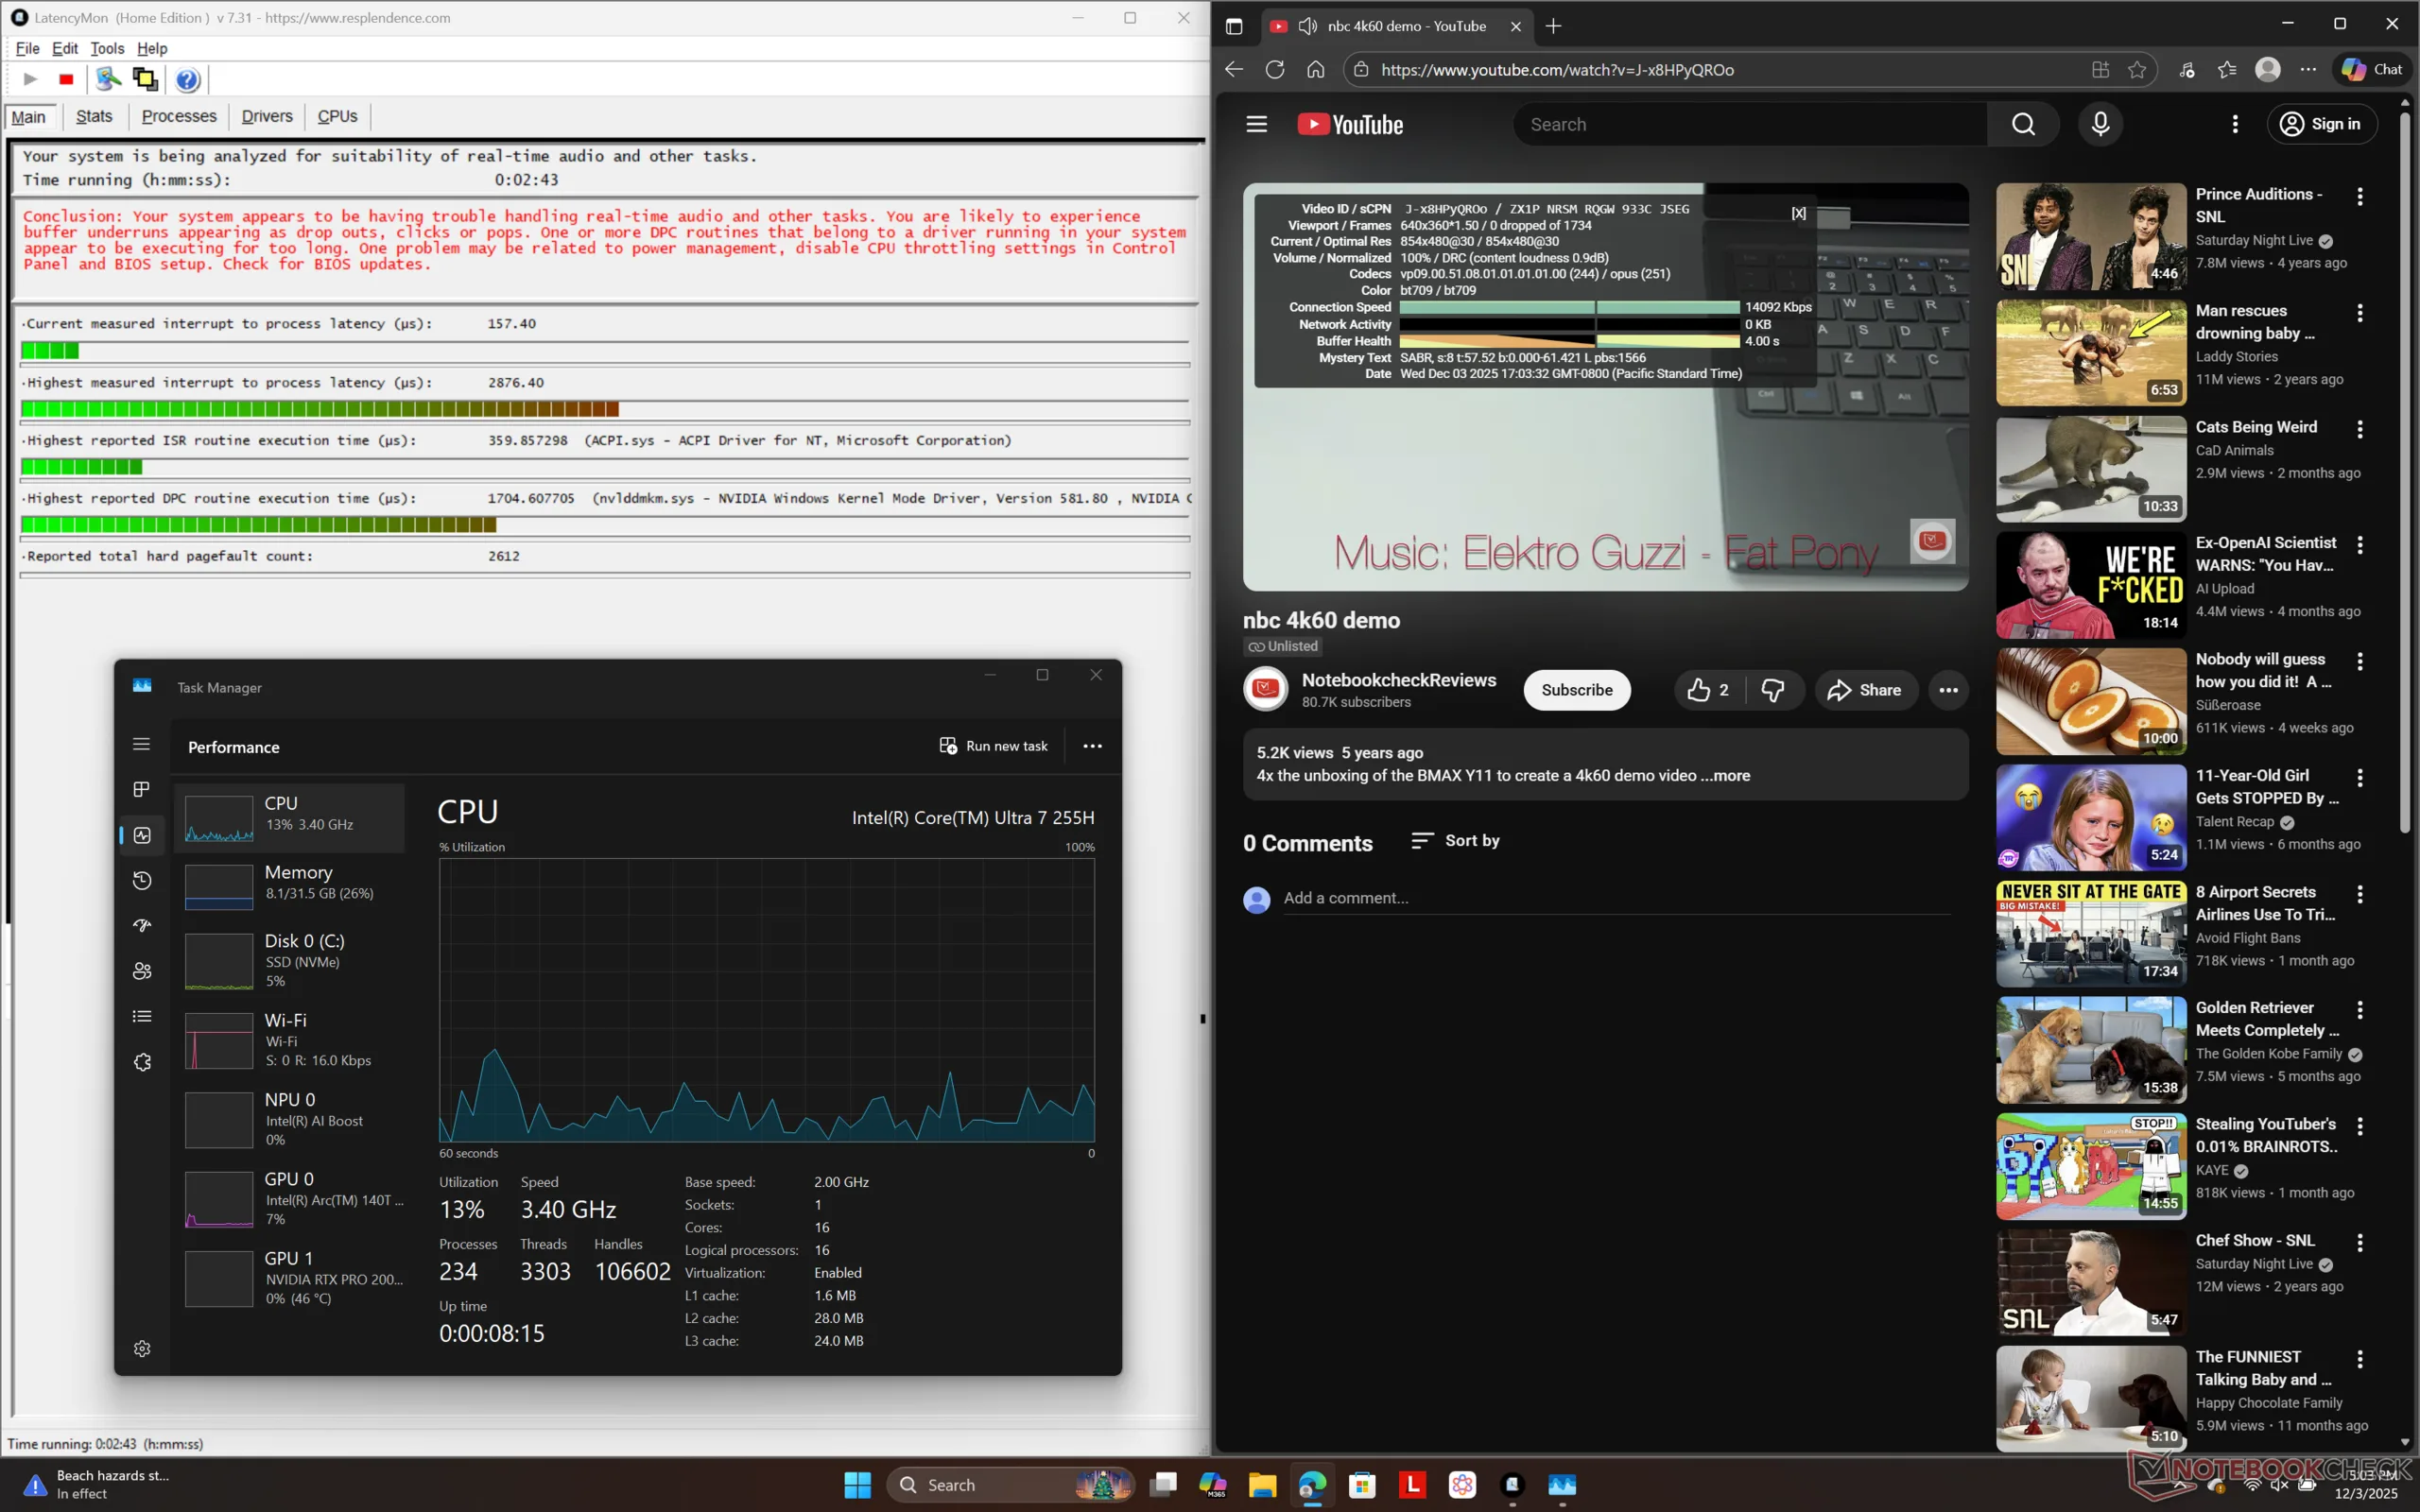
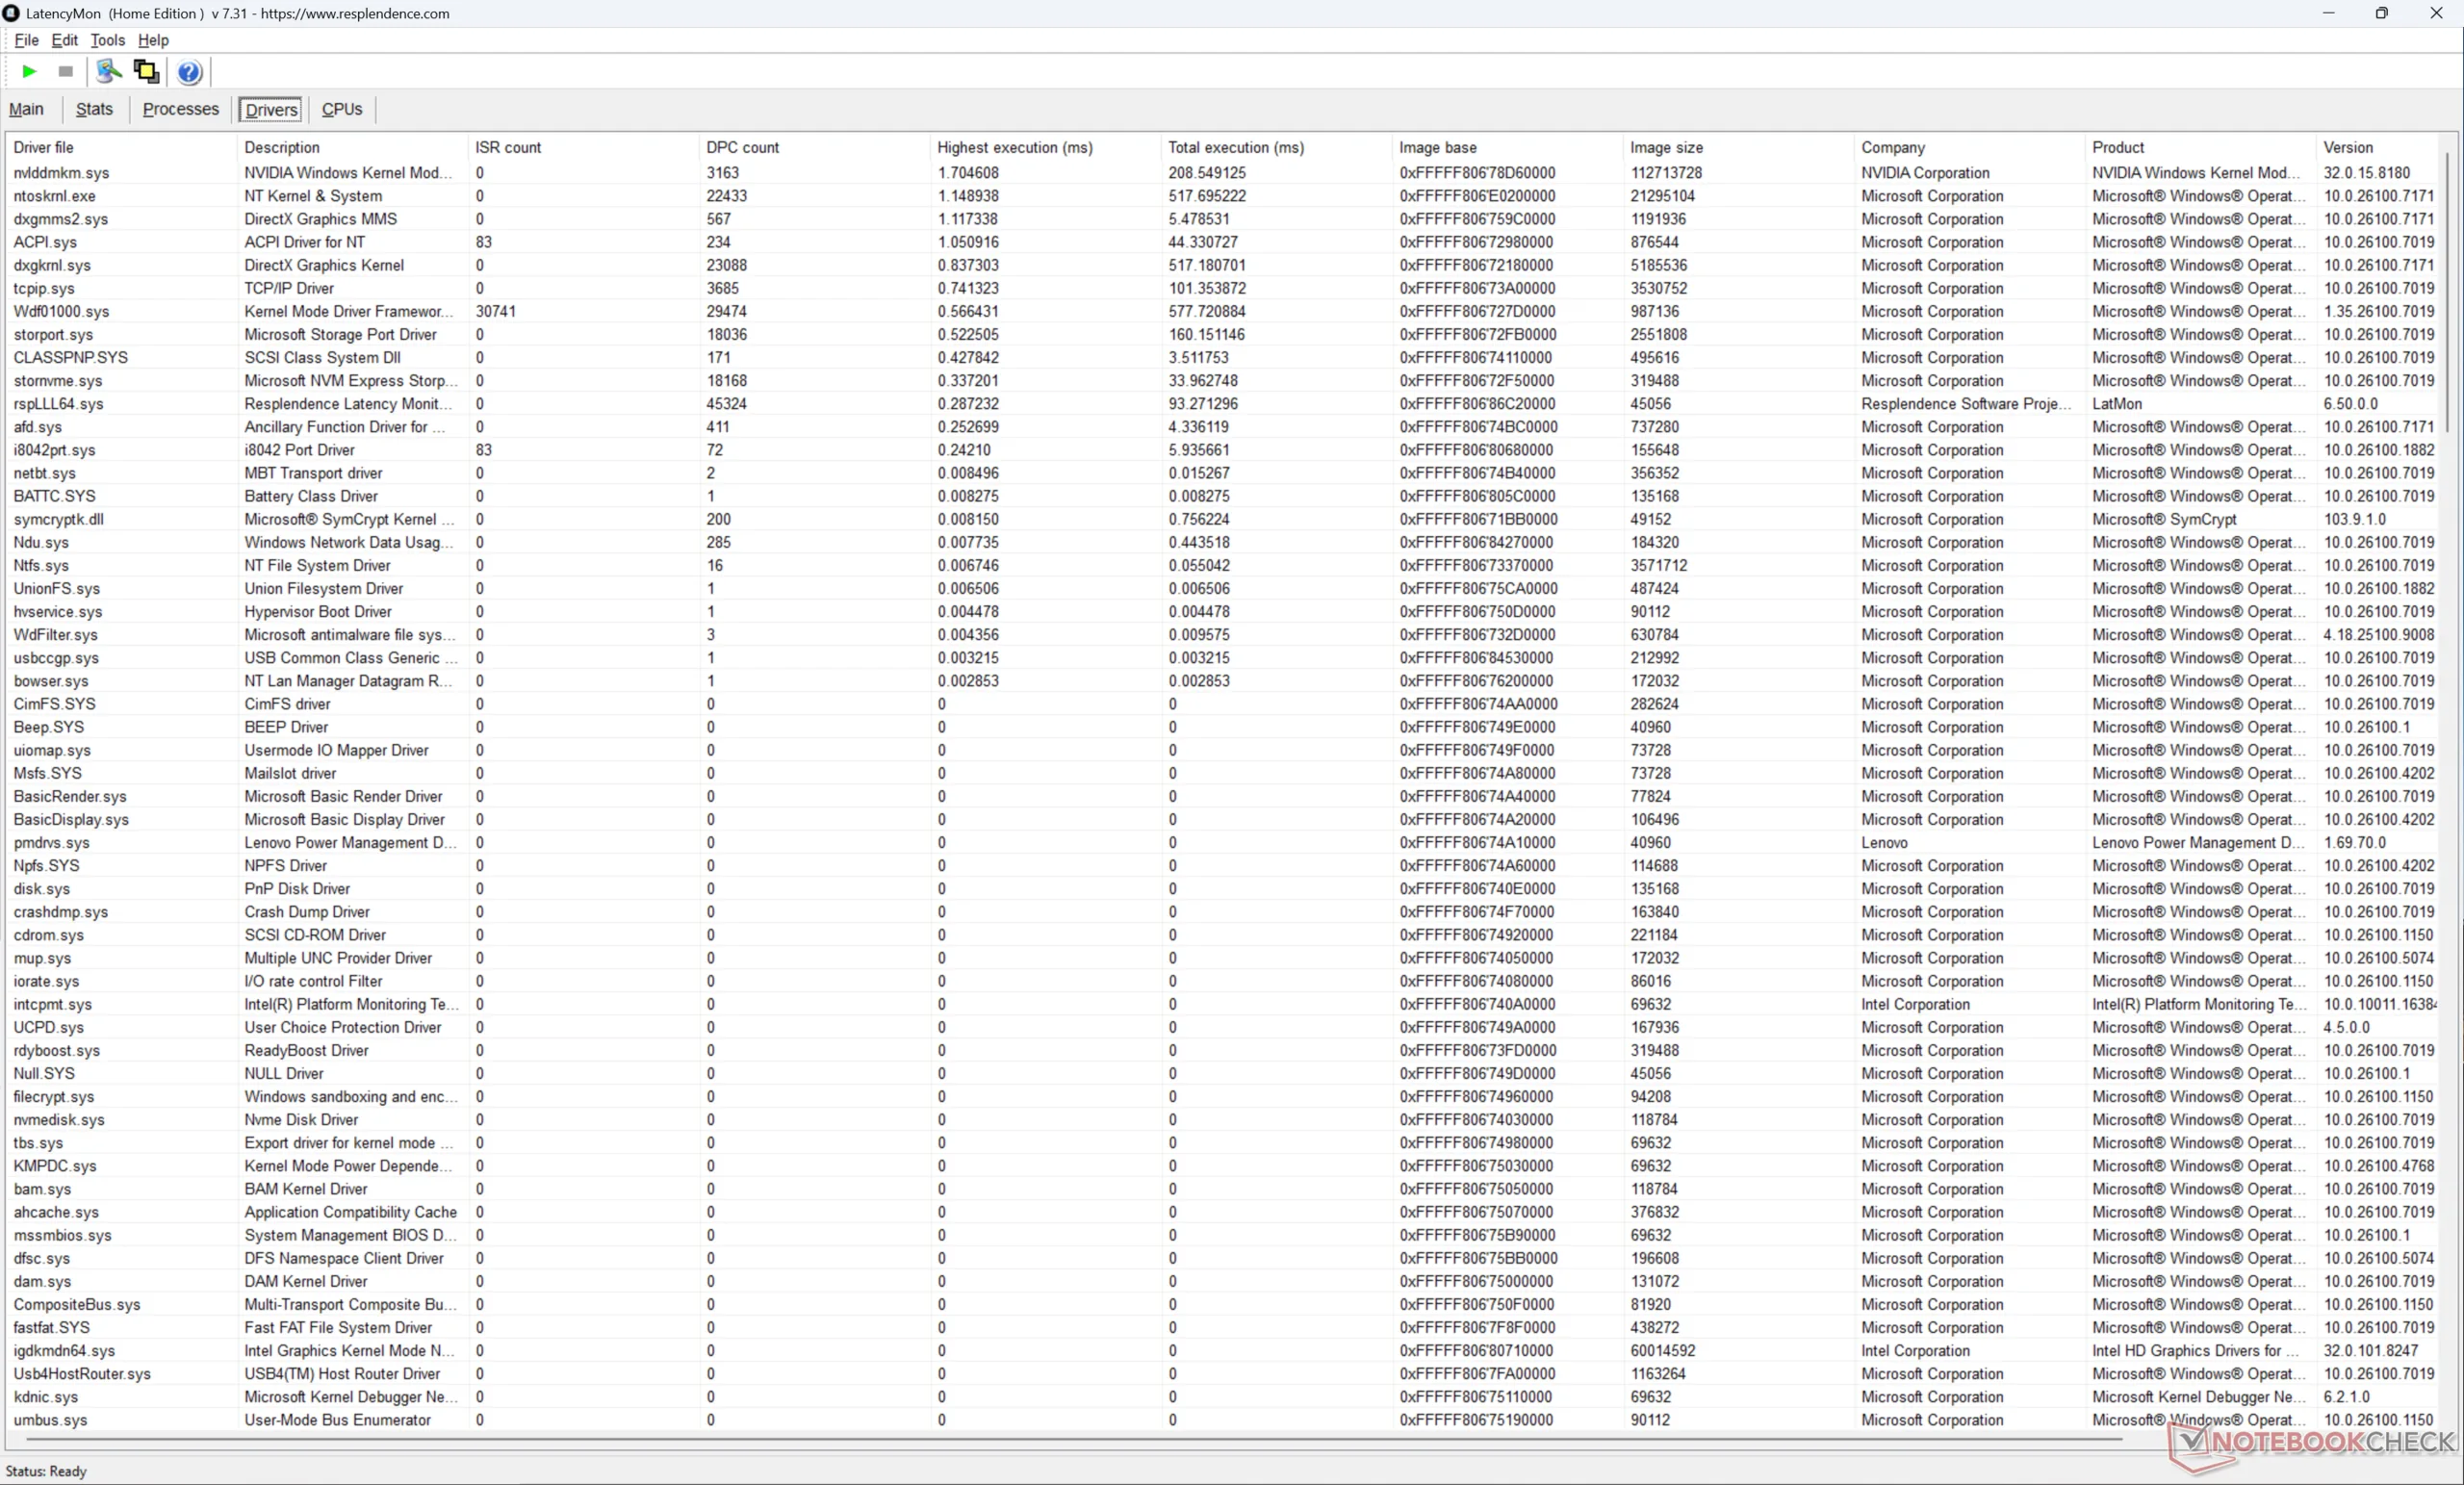
Latence DPC
LatencyMon révèle des problèmes mineurs de DPC, mais pas de perte d'images lors de la lecture de vidéos en 4K60.
| DPC Latencies / LatencyMon - interrupt to process latency (max), Web, Youtube, Prime95 | |
| Lenovo ThinkPad P1 Gen 8 | |
| Dell Pro Max 16 Plus | |
| Asus ExpertBook B6 Flip B6602FC2 | |
| Lenovo ThinkPad P1 Gen 7 21KV001SGE | |
| HP ZBook X G1i 16 | |
* ... Moindre est la valeur, meilleures sont les performances
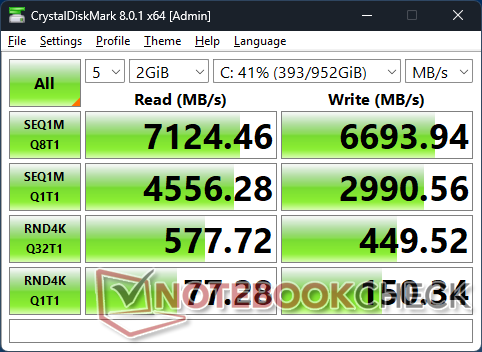
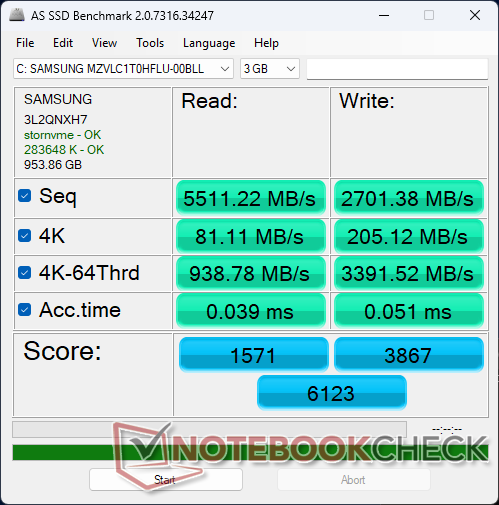
Dispositifs de stockage
Notre unité de test est livrée avec la carte Samsung PM9E1 PCIe5 NVMe SSD alors que le ThinkPad P1 Gen 7 de l'année dernière était livré avec le Kioxia XG8 KXG8AZNV1T02 PCIe4 NVMe SSD. Les taux de transfert sont plus rapides, jusqu'à 7000 Mo/s.

| Drive Performance rating - Percent | |
| Asus ExpertBook B6 Flip B6602FC2 | |
| HP ZBook X G1i 16 | |
| Dell Pro Max 16 Plus | |
| Lenovo ThinkPad P1 Gen 8 | |
| Lenovo ThinkPad P1 Gen 7 21KV001SGE | |
| Lenovo ThinkPad P16s Gen 4 AMD -11! | |
* ... Moindre est la valeur, meilleures sont les performances
Throttoir de disque : Boucle de lecture DiskSpd, profondeur de la file d'attente 8
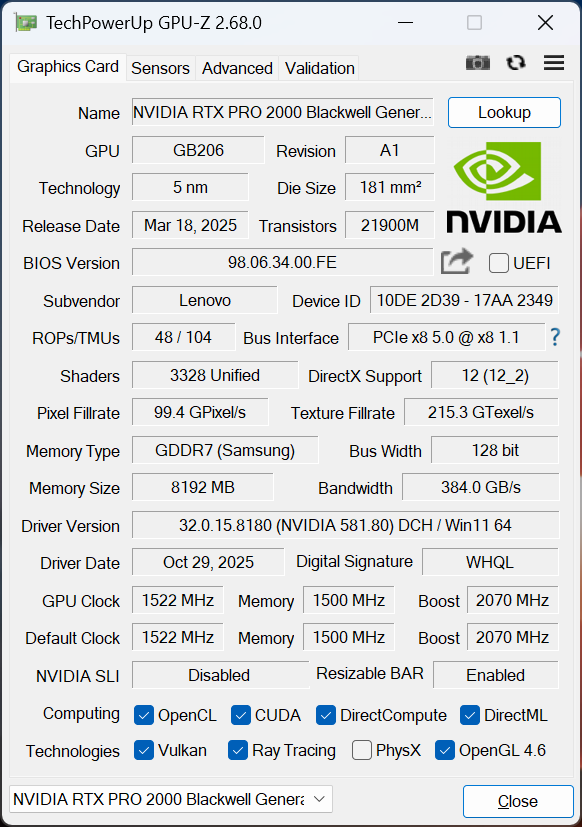
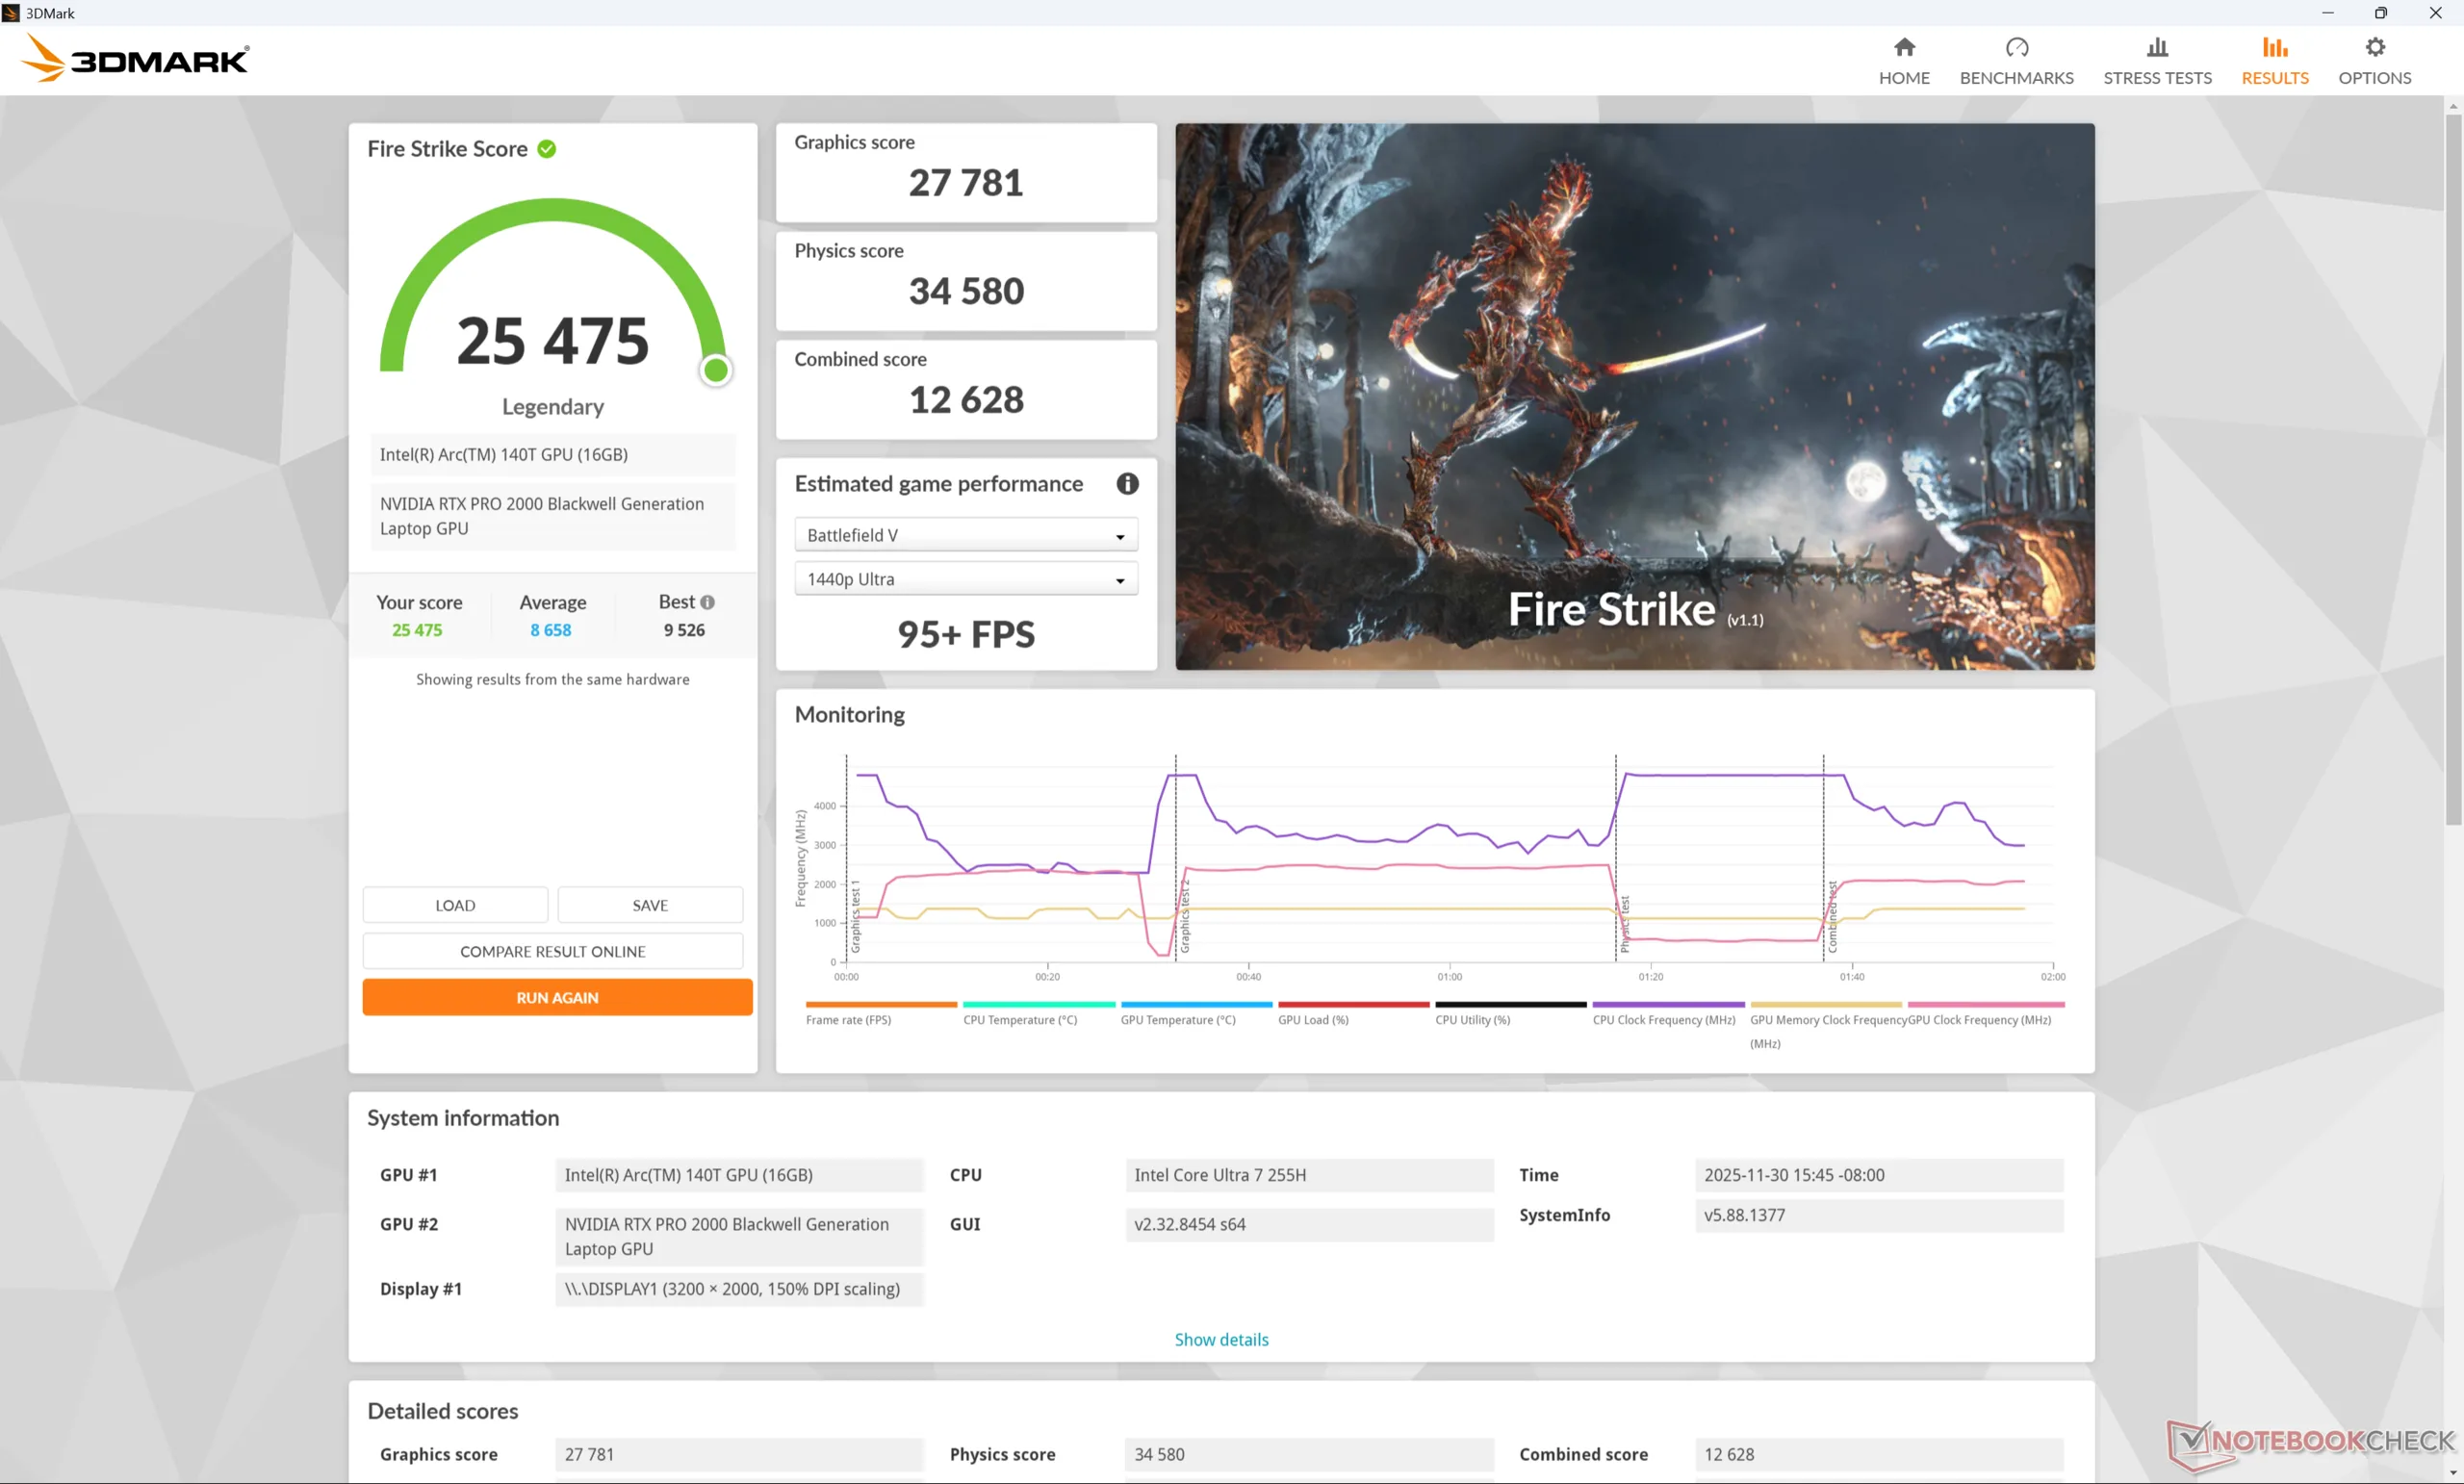
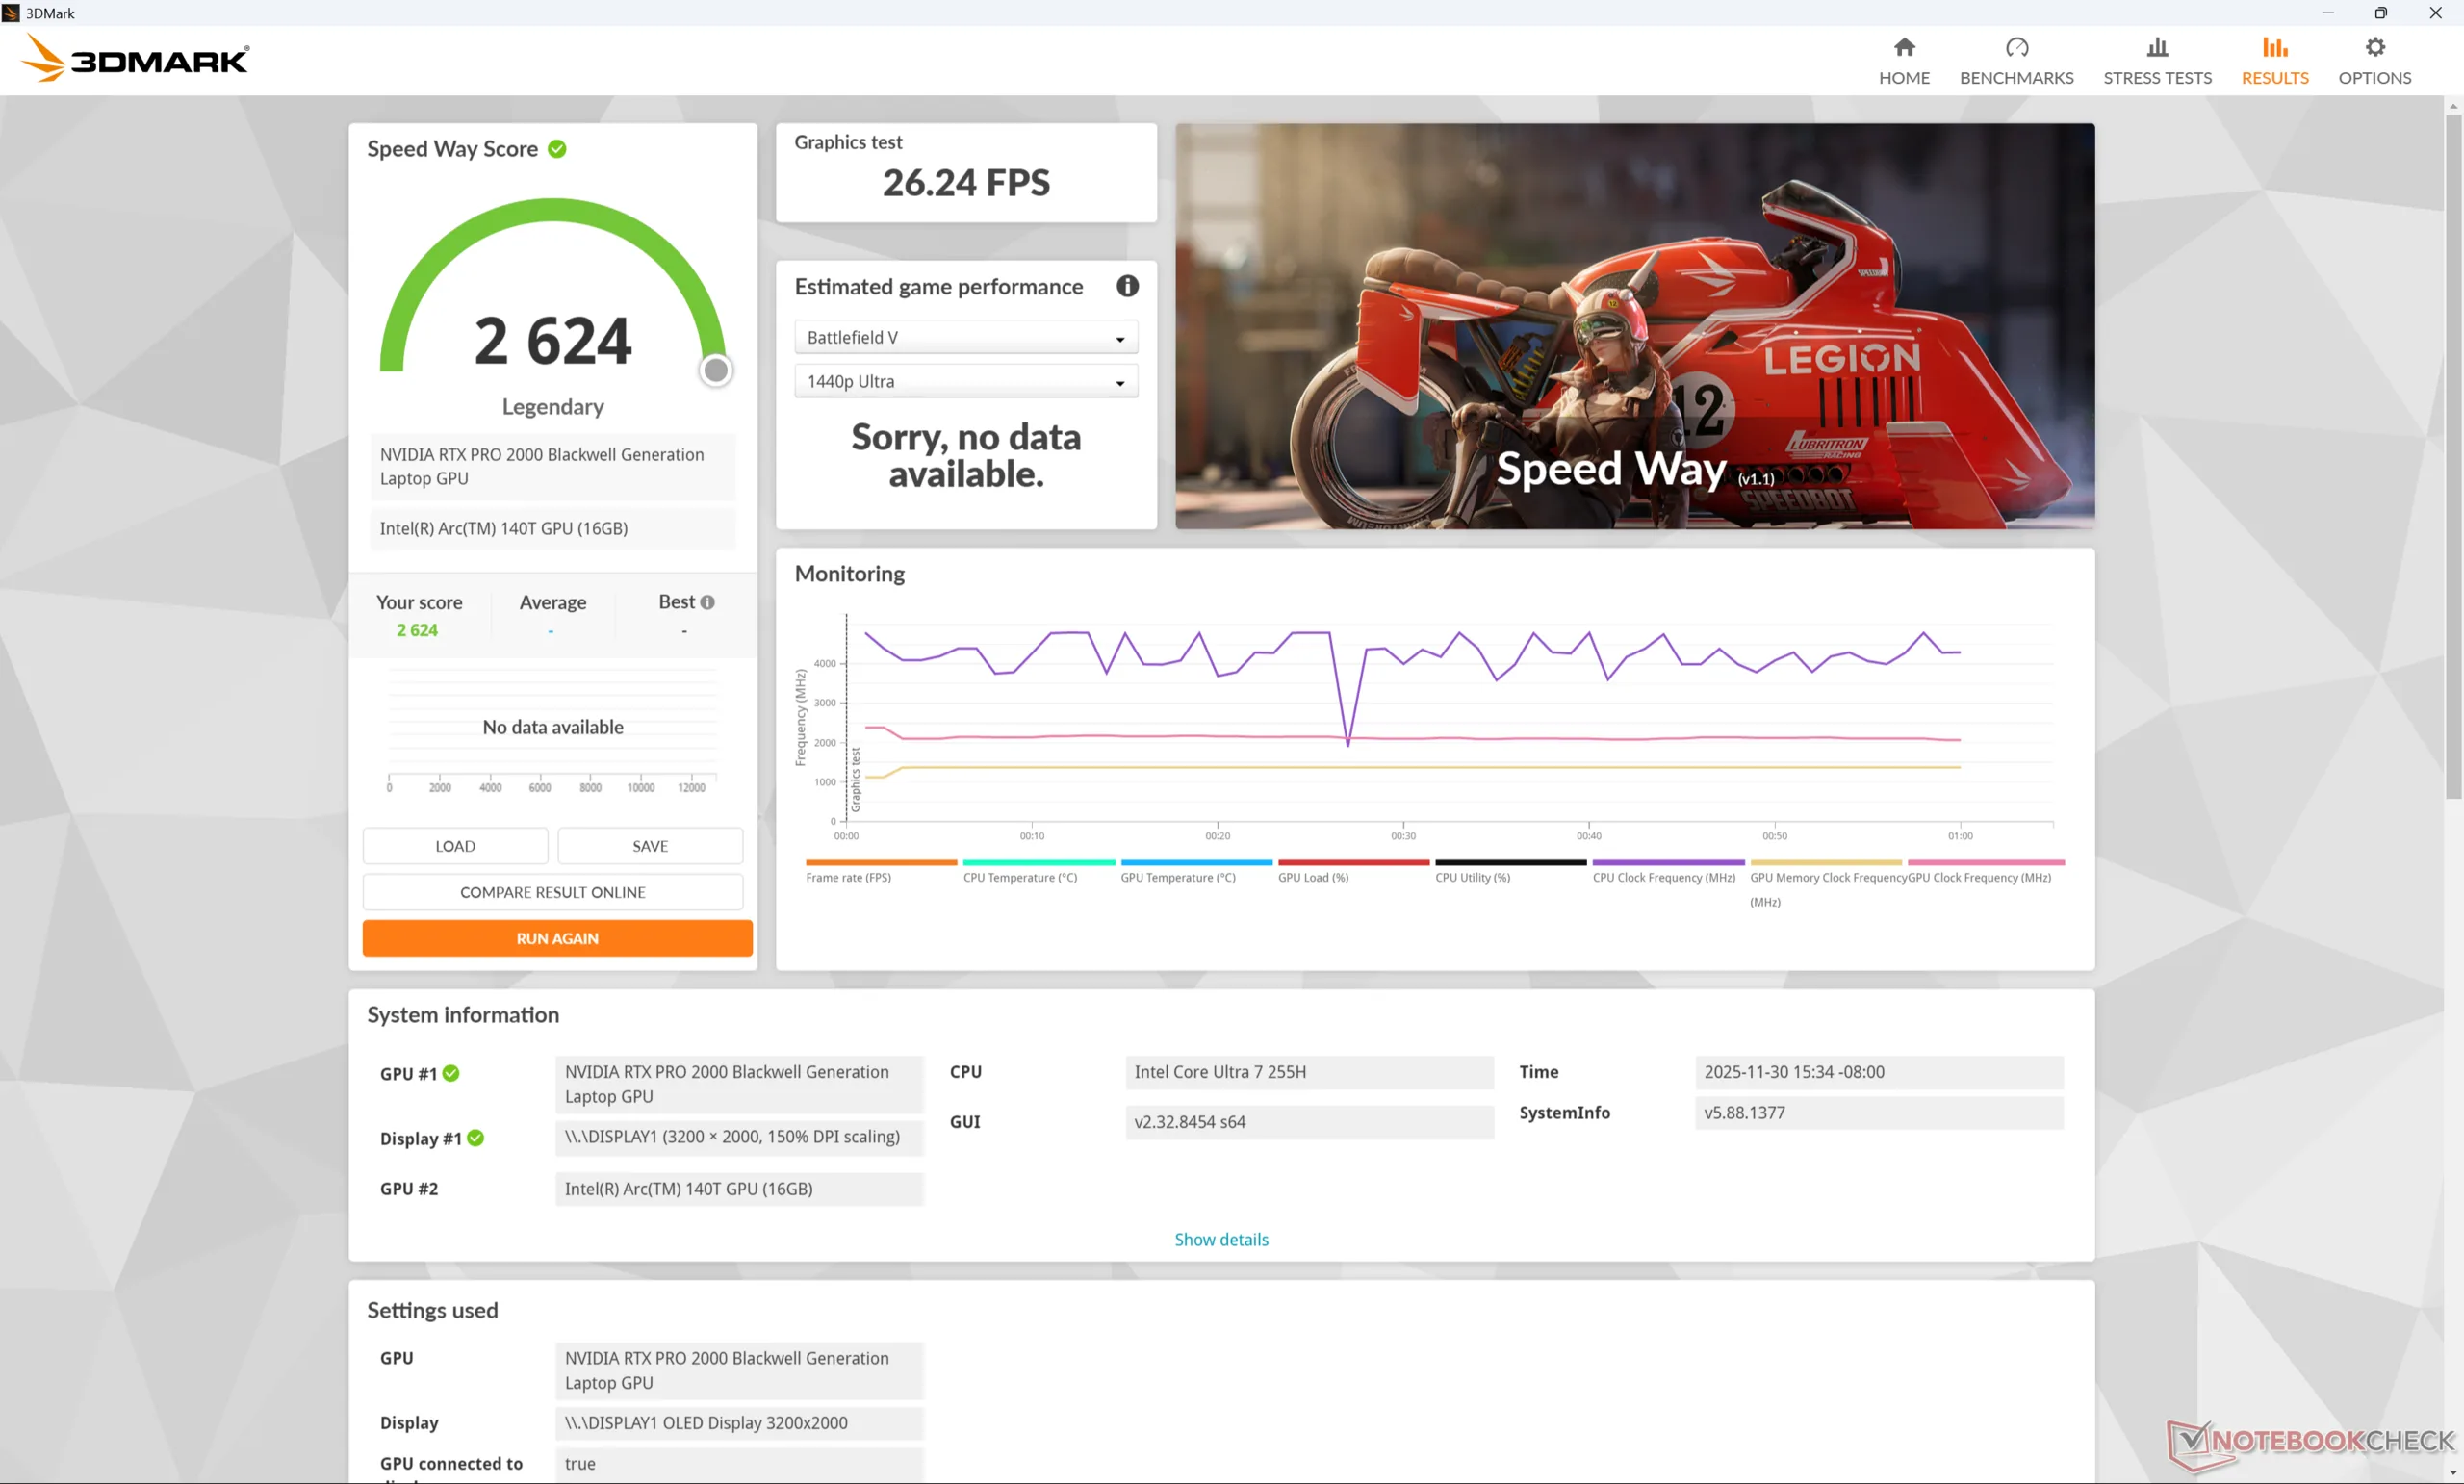
Performance du GPU
Le rTX Pro 2000 Blackwell mobile est dérivé du mobile GeForce RTX 5060 et partagent donc des caractéristiques similaires, notamment le nombre total de pipelines unifiés, de TMU, de cœurs de tenseur et de bande passante mémoire. Les performances brutes sont généralement comparables à celles de la rTX Pro 3000 Ada mobile avant de prendre en compte les améliorations spécifiques à Blackwell, comme les cœurs de tenseur de 5e génération ou les moteurs NVDEC de 6e génération.
| Profil de puissance | Score graphique | Score physique | Score combiné |
| Mode Performance | 27781 | 34580 | 12628 |
| Mode équilibré | 26859 (-3%) | 35322 (+2%) | 11593 (-8%) |
| Alimentation par batterie | 25193 (-9%) | 26579 (-23%) | 10800 (-15%) |


| 3DMark Performance rating - Percent | |
| Dell Pro Max 16 Plus -10! | |
| Lenovo ThinkPad P1 Gen 8 -1! | |
| Moyenne NVIDIA RTX PRO 2000 Blackwell Generation Laptop -1! | |
| HP ZBook Fury 16 G11 -9! | |
| HP ZBook X G1i 16 -10! | |
| HP ZBook Studio 16 G11 -9! | |
| HP ZBook Power 16 G11 A -9! | |
| Lenovo ThinkPad P1 Gen 7 21KV001SGE -26! | |
| Asus ExpertBook B6 Flip B6602FC2 -18! | |
| HP ZBook Studio 16 G9 62U04EA -11! | |
| Lenovo ThinkPad P1 G4-20Y4Z9DVUS -18! | |
| Lenovo ThinkPad P16s Gen 4 AMD -26! | |
| Lenovo ThinkPad P16s G2 21K9000CGE -18! | |
| 3DMark 11 - 1280x720 Performance GPU | |
| Dell Pro Max 16 Plus | |
| HP ZBook Fury 16 G11 | |
| Lenovo ThinkPad P1 Gen 8 | |
| HP ZBook Studio 16 G11 | |
| Moyenne NVIDIA RTX PRO 2000 Blackwell Generation Laptop (31736 - 35003, n=2) | |
| Lenovo ThinkPad P1 Gen 7 21KV001SGE | |
| HP ZBook X G1i 16 | |
| HP ZBook Power 16 G11 A | |
| Asus ExpertBook B6 Flip B6602FC2 | |
| HP ZBook Studio 16 G9 62U04EA | |
| Lenovo ThinkPad P1 G4-20Y4Z9DVUS | |
| Lenovo ThinkPad P16s Gen 4 AMD | |
| Lenovo ThinkPad P16s G2 21K9000CGE | |
| 3DMark 11 Performance | 30916 points | |
| 3DMark Cloud Gate Standard Score | 62652 points | |
| 3DMark Fire Strike Score | 25475 points | |
| 3DMark Time Spy Score | 10595 points | |
Aide | ||
* ... Moindre est la valeur, meilleures sont les performances
Performances des jeux
Bien que les jeux ne soient pas sa fonction première, le ThinkPad P1 Gen 8 est tout à fait capable d'exécuter des jeux exigeants dans des résolutions de 1080p à 2K, avec des niveaux de performance inférieurs d'environ 10 % à ceux du ThinkPad P1 Gen 8 de HP HP Omen 16 équipé de la RTX 5060.
| Performance rating - Percent | |
| Dell Pro Max 16 Plus | |
| Lenovo ThinkPad P1 Gen 8 | |
| HP ZBook X G1i 16 | |
| Asus ExpertBook B6 Flip B6602FC2 -2! | |
| Lenovo ThinkPad P1 Gen 7 21KV001SGE -1! | |
| Lenovo ThinkPad P16s Gen 4 AMD -1! | |
| Cyberpunk 2077 - 1920x1080 Ultra Preset (FSR off) | |
| Dell Pro Max 16 Plus | |
| Lenovo ThinkPad P1 Gen 8 | |
| HP ZBook X G1i 16 | |
| Lenovo ThinkPad P1 Gen 7 21KV001SGE | |
| Lenovo ThinkPad P16s Gen 4 AMD | |
| Baldur's Gate 3 - 1920x1080 Ultra Preset AA:T | |
| Dell Pro Max 16 Plus | |
| Lenovo ThinkPad P1 Gen 8 | |
| HP ZBook X G1i 16 | |
| Lenovo ThinkPad P1 Gen 7 21KV001SGE | |
| Lenovo ThinkPad P16s Gen 4 AMD | |
| GTA V - 1920x1080 Highest AA:4xMSAA + FX AF:16x | |
| Dell Pro Max 16 Plus | |
| Lenovo ThinkPad P1 Gen 8 | |
| HP ZBook X G1i 16 | |
| Lenovo ThinkPad P1 Gen 7 21KV001SGE | |
| Asus ExpertBook B6 Flip B6602FC2 | |
| Lenovo ThinkPad P16s Gen 4 AMD | |
| Final Fantasy XV Benchmark - 1920x1080 High Quality | |
| Dell Pro Max 16 Plus | |
| Lenovo ThinkPad P1 Gen 8 | |
| HP ZBook X G1i 16 | |
| Lenovo ThinkPad P1 Gen 7 21KV001SGE | |
| Asus ExpertBook B6 Flip B6602FC2 | |
| Lenovo ThinkPad P16s Gen 4 AMD | |
| Strange Brigade - 1920x1080 ultra AA:ultra AF:16 | |
| Dell Pro Max 16 Plus | |
| Lenovo ThinkPad P1 Gen 8 | |
| HP ZBook X G1i 16 | |
| Asus ExpertBook B6 Flip B6602FC2 | |
| Dota 2 Reborn - 1920x1080 ultra (3/3) best looking | |
| Dell Pro Max 16 Plus | |
| Asus ExpertBook B6 Flip B6602FC2 | |
| HP ZBook X G1i 16 | |
| Lenovo ThinkPad P1 Gen 7 21KV001SGE | |
| Lenovo ThinkPad P1 Gen 8 | |
| Lenovo ThinkPad P16s Gen 4 AMD | |
| X-Plane 11.11 - 1920x1080 high (fps_test=3) | |
| Asus ExpertBook B6 Flip B6602FC2 | |
| Dell Pro Max 16 Plus | |
| Lenovo ThinkPad P1 Gen 7 21KV001SGE | |
| HP ZBook X G1i 16 | |
| Lenovo ThinkPad P1 Gen 8 | |
| Lenovo ThinkPad P16s Gen 4 AMD | |
| X-Plane 11.11 - 1920x1080 high (fps_test=3) | |
| HP ZBook Fury 16 G11 | |
| Asus ExpertBook B6 Flip B6602FC2 | |
| Dell Pro Max 16 Plus | |
| HP ZBook Studio 16 G9 62U04EA | |
| HP ZBook Studio 16 G11 | |
| Lenovo ThinkPad P1 Gen 7 21KV001SGE | |
| HP ZBook X G1i 16 | |
| Moyenne NVIDIA RTX PRO 2000 Blackwell Generation Laptop (76.3 - 80.6, n=2) | |
| Lenovo ThinkPad P1 Gen 8 | |
| Lenovo ThinkPad P1 G4-20Y4Z9DVUS | |
| HP ZBook Power 16 G11 A | |
| Lenovo ThinkPad P16s Gen 4 AMD | |
| Lenovo ThinkPad P16s G2 21K9000CGE | |
| Lenovo ThinkPad P16s G2 21K9000CGE | |
| F1 24 | |
| 1920x1080 High Preset AA:T AF:16x | |
| Dell Pro Max 16 Plus | |
| Lenovo ThinkPad P1 Gen 8 | |
| Moyenne NVIDIA RTX PRO 2000 Blackwell Generation Laptop (161.4 - 185.2, n=2) | |
| HP ZBook X G1i 16 | |
| Lenovo ThinkPad P1 Gen 7 21KV001SGE | |
| 1920x1080 Ultra High Preset AA:T AF:16x | |
| Dell Pro Max 16 Plus | |
| Lenovo ThinkPad P1 Gen 8 | |
| Moyenne NVIDIA RTX PRO 2000 Blackwell Generation Laptop (48.2 - 57.2, n=2) | |
| HP ZBook X G1i 16 | |
| Lenovo ThinkPad P1 Gen 7 21KV001SGE | |
| 2560x1440 Ultra High Preset AA:T AF:16x | |
| Dell Pro Max 16 Plus | |
| Lenovo ThinkPad P1 Gen 8 | |
| Moyenne NVIDIA RTX PRO 2000 Blackwell Generation Laptop (32.2 - 36.5, n=2) | |
| HP ZBook X G1i 16 | |
| Lenovo ThinkPad P1 Gen 7 21KV001SGE | |
| 2560x1440 Ultra High Preset + Quality DLSS AF:16x | |
| Dell Pro Max 16 Plus | |
| HP ZBook X G1i 16 | |
| Moyenne NVIDIA RTX PRO 2000 Blackwell Generation Laptop (n=1) | |
| Lenovo ThinkPad P1 Gen 7 21KV001SGE | |
| Dota 2 Reborn - 1920x1080 ultra (3/3) best looking | |
| Dell Pro Max 16 Plus | |
| HP ZBook Fury 16 G11 | |
| HP ZBook Studio 16 G9 62U04EA | |
| HP ZBook Studio 16 G11 | |
| Asus ExpertBook B6 Flip B6602FC2 | |
| HP ZBook X G1i 16 | |
| Moyenne NVIDIA RTX PRO 2000 Blackwell Generation Laptop (125.7 - 141.8, n=2) | |
| Lenovo ThinkPad P1 Gen 7 21KV001SGE | |
| Lenovo ThinkPad P1 Gen 8 | |
| HP ZBook Power 16 G11 A | |
| Lenovo ThinkPad P1 G4-20Y4Z9DVUS | |
| Lenovo ThinkPad P16s Gen 4 AMD | |
| Lenovo ThinkPad P16s G2 21K9000CGE | |
Cyberpunk 2077 ultra FPS Chart
| Bas | Moyen | Élevé | Ultra | QHD DLSS | QHD | 4K | |
|---|---|---|---|---|---|---|---|
| GTA V (2015) | 184.4 | 179.9 | 175 | 119.3 | 97.2 | ||
| Dota 2 Reborn (2015) | 149.2 | 137.2 | 132.5 | 125.7 | 103.5 | ||
| Final Fantasy XV Benchmark (2018) | 204 | 142.7 | 106.5 | 79.4 | |||
| X-Plane 11.11 (2018) | 108.6 | 91 | 76.3 | 58.7 | |||
| Strange Brigade (2018) | 502 | 281 | 229 | 199.8 | 142.4 | ||
| Baldur's Gate 3 (2023) | 132.2 | 116.4 | 101.4 | 102 | 101.3 | 69.9 | |
| Cyberpunk 2077 (2023) | 124 | 101.5 | 86.4 | 77.8 | 57.9 | 48.9 | |
| F1 24 (2024) | 250 | 229 | 185.2 | 57.2 | 36.5 |
Émissions
Bruit du système
Les ventilateurs sont silencieux lors de la navigation ou de l'exécution de charges peu exigeantes et ils restent silencieux à seulement 27 dB(A) lors de la lecture en continu, même lorsqu'ils sont réglés sur le mode Performance. Le maximum de 48 dB(A) peut être atteint dans les jeux ou lorsque le CPU et le GPU sont sollicités pendant de longues périodes.
Degré de la nuisance sonore
| Au repos |
| 23.1 / 23.1 / 23.1 dB(A) |
| Fortement sollicité |
| 27.3 / 47.9 dB(A) |
 | ||
30 dB silencieux 40 dB(A) audible 50 dB(A) bruyant |
||
min: | ||
| Lenovo ThinkPad P1 Gen 8 Ultra 7 255H, RTX PRO 2000 Blackwell Generation Laptop | Lenovo ThinkPad P16s Gen 4 AMD Ryzen AI 9 HX 370, Radeon 890M | Lenovo ThinkPad P1 Gen 7 21KV001SGE Ultra 7 155H, GeForce RTX 4060 Laptop GPU | HP ZBook X G1i 16 Ultra 7 265H, RTX PRO 2000 Blackwell Generation Laptop | Dell Pro Max 16 Plus Ultra 9 285HX, RTX PRO 5000 Blackwell Generation Laptop | Asus ExpertBook B6 Flip B6602FC2 i9-12950HX, RTX A2000 Laptop GPU | |
|---|---|---|---|---|---|---|
| Noise | -20% | -17% | -5% | -26% | -39% | |
| arrêt / environnement * (dB) | 23.1 | 25.9 -12% | 24.7 -7% | 23.7 -3% | 23.2 -0% | 26 -13% |
| Idle Minimum * (dB) | 23.1 | 25.9 -12% | 24.7 -7% | 23.7 -3% | 26.7 -16% | 32.4 -40% |
| Idle Average * (dB) | 23.1 | 25.9 -12% | 24.7 -7% | 23.7 -3% | 30.5 -32% | 32.4 -40% |
| Idle Maximum * (dB) | 23.1 | 28.5 -23% | 24.7 -7% | 23.7 -3% | 34 -47% | 32.4 -40% |
| Load Average * (dB) | 27.3 | 42.9 -57% | 43.7 -60% | 32.7 -20% | 39.8 -46% | 51.9 -90% |
| Load Maximum * (dB) | 47.9 | 48.5 -1% | 53.3 -11% | 48 -0% | 54.3 -13% | 52.1 -9% |
| Cyberpunk 2077 ultra * (dB) | 48.7 | 53.2 | 50.9 | 54.3 |
* ... Moindre est la valeur, meilleures sont les performances
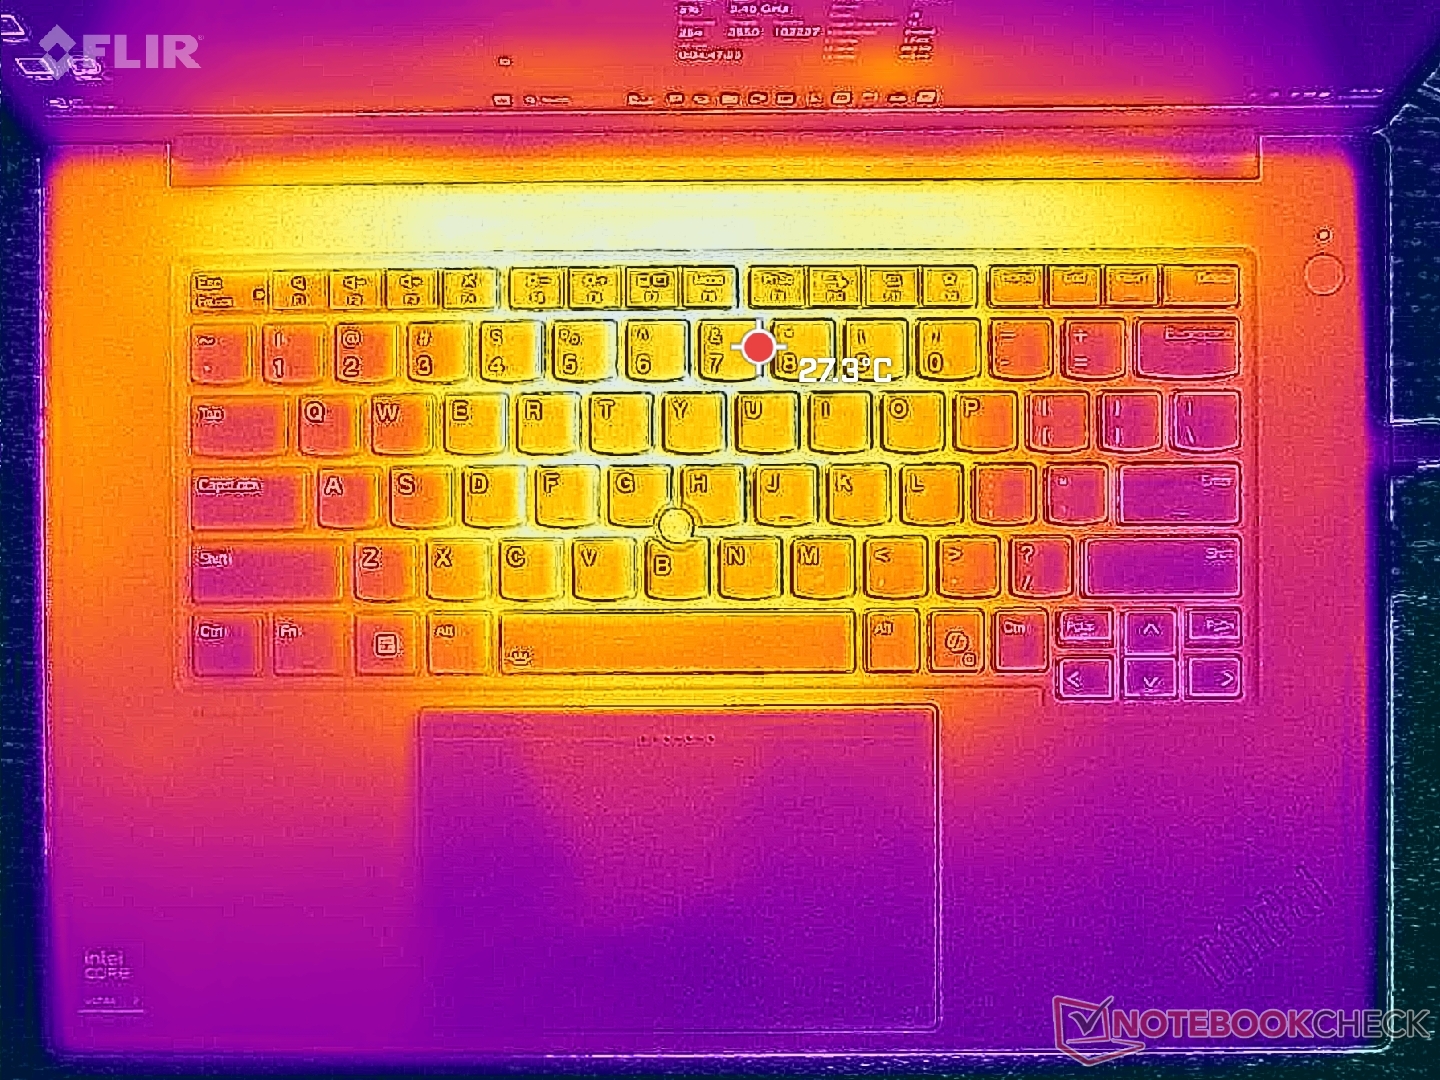
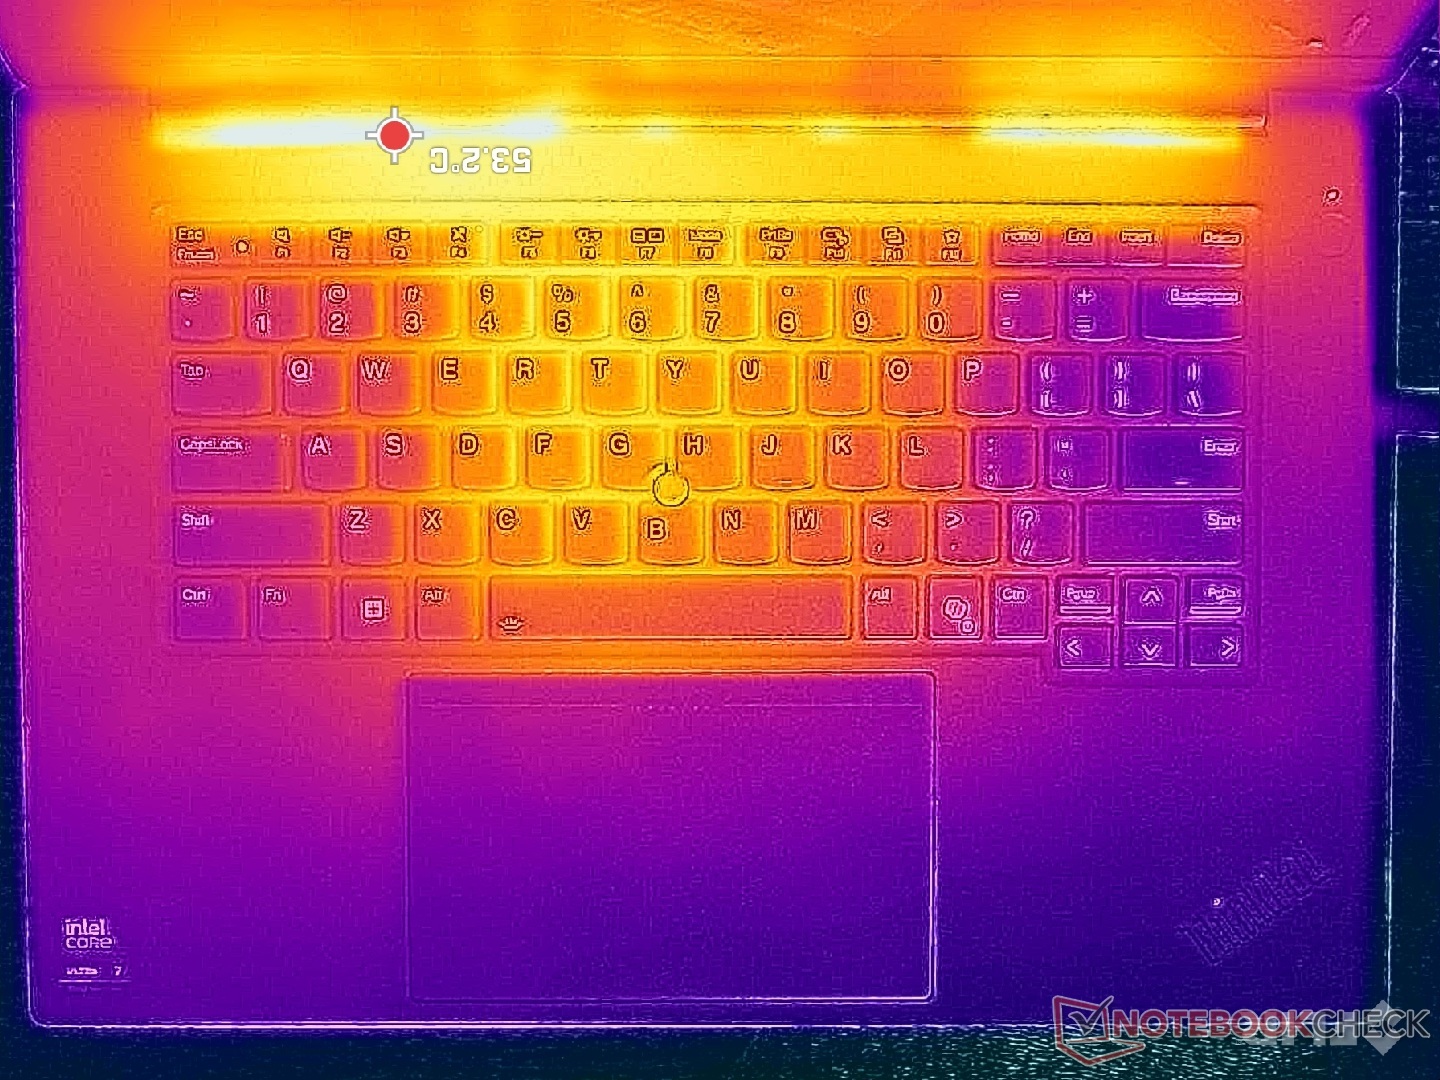
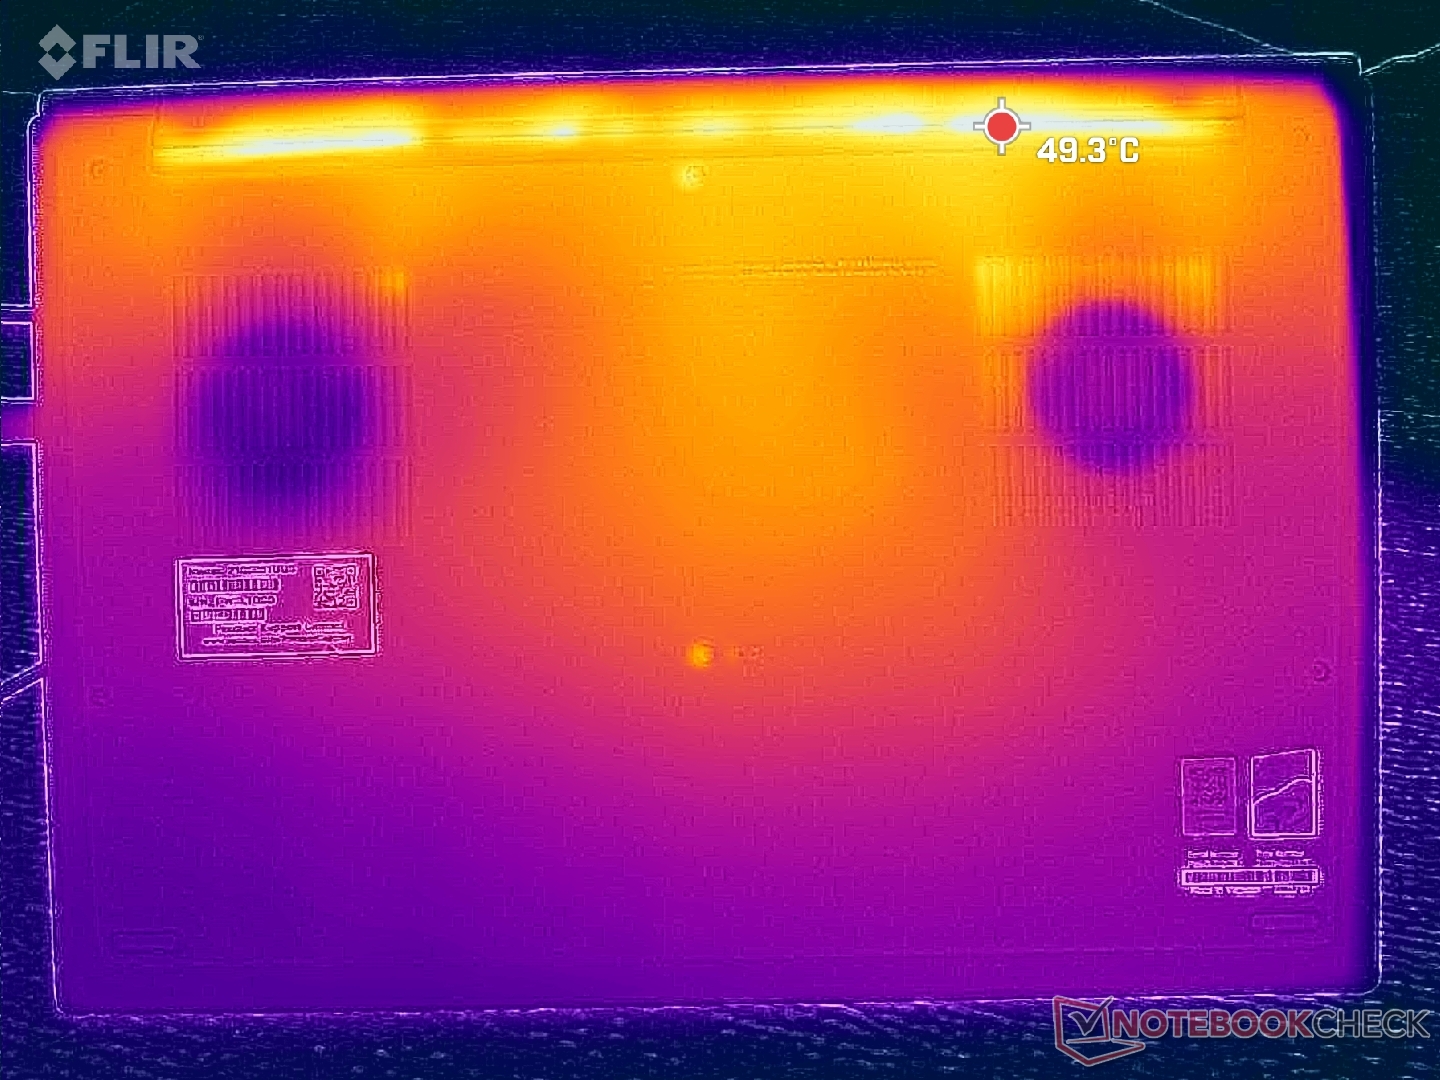
Température
L'évolution de la température de surface est symétrique avec des points chauds près du centre du clavier atteignant 40 C à 45 C lors de l'exécution de charges très exigeantes comme Prime95 ou FurMark. Les résultats sont plus froids que prévu compte tenu de la finesse du châssis. Le ThinkPad P1 Gen 7 de l'année dernière atteignait des températures de surface plus élevées en comparaison, probablement en raison de son enveloppe d'alimentation plus élevée de 170 W.
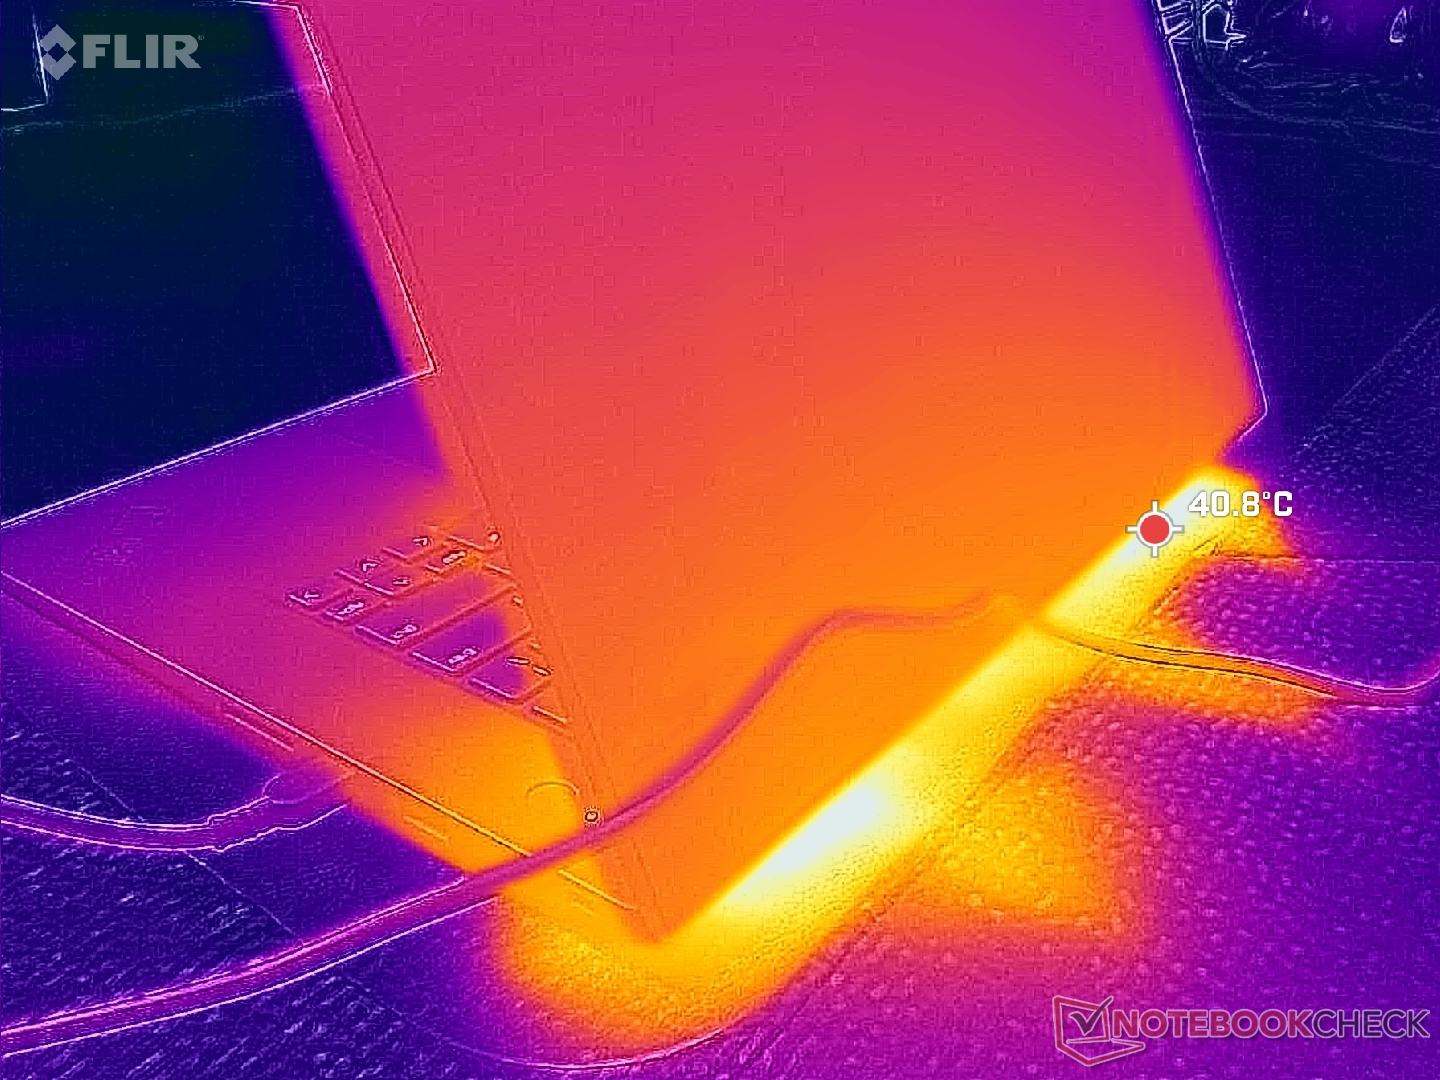
(±) La température maximale du côté supérieur est de 45 °C / 113 F, par rapport à la moyenne de 38.2 °C / 101 F, allant de 22.2 à 69.8 °C pour la classe Workstation.
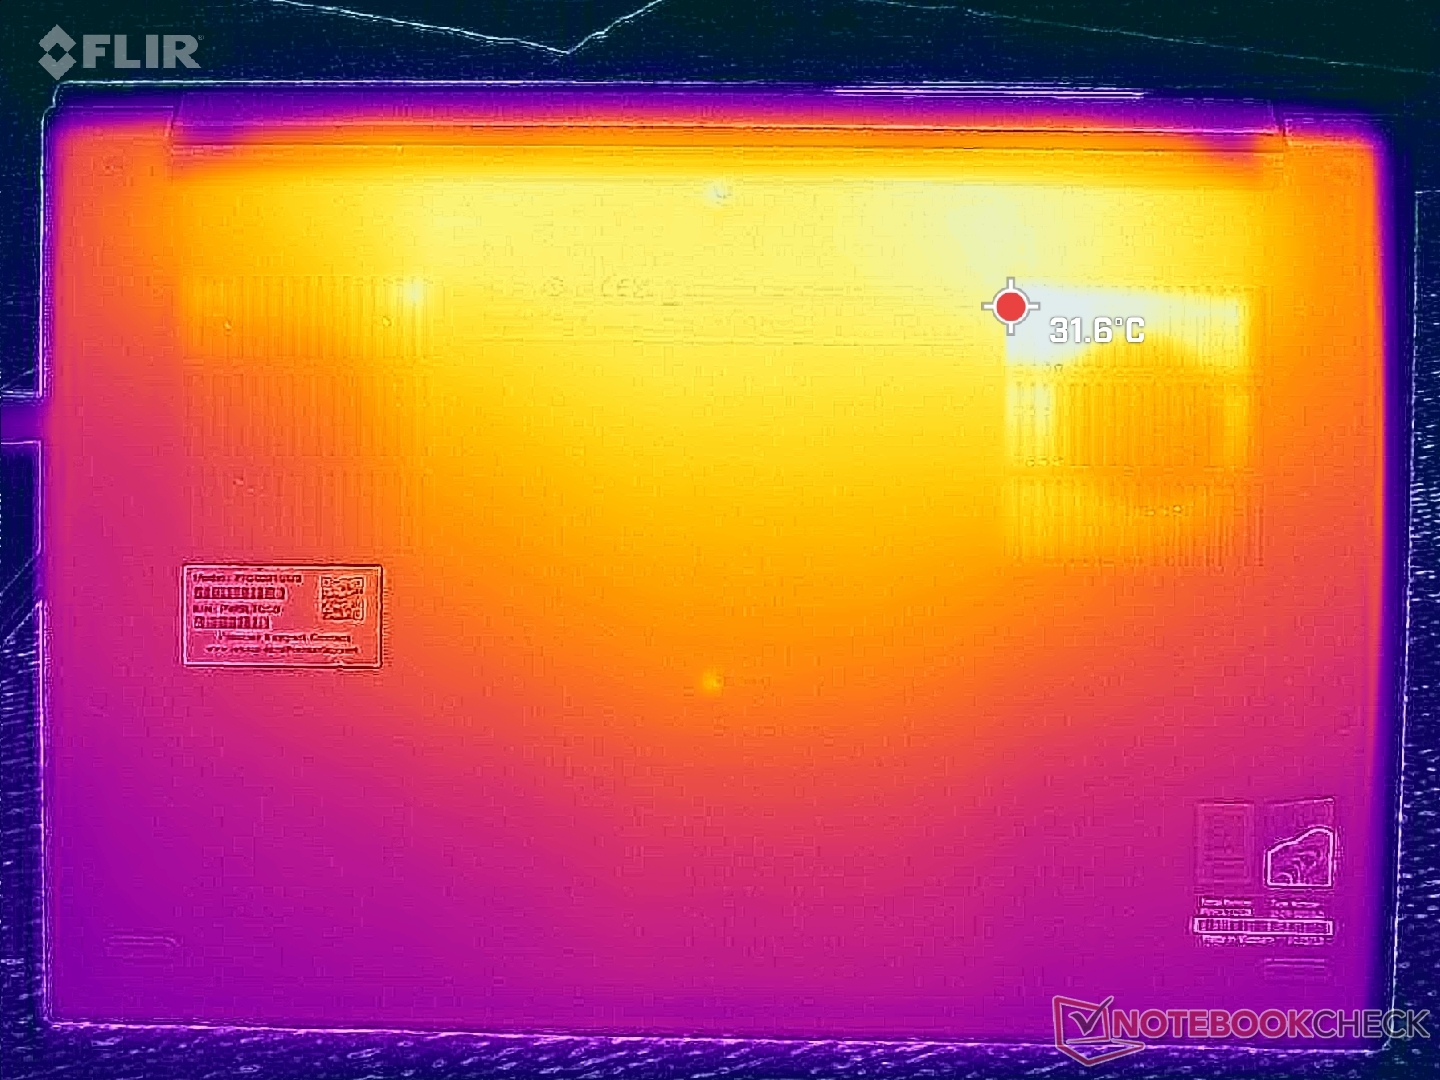
(+) Le fond chauffe jusqu'à un maximum de 33 °C / 91 F, contre une moyenne de 41.1 °C / 106 F
(+) En utilisation inactive, la température moyenne du côté supérieur est de 26 °C / 79 F, par rapport à la moyenne du dispositif de 32 °C / 90 F.
(+) Les repose-poignets et le pavé tactile sont plus froids que la température de la peau avec un maximum de 23.2 °C / 73.8 F et sont donc froids au toucher.
(+) La température moyenne de la zone de l'appui-paume de dispositifs similaires était de 27.8 °C / 82 F (+4.6 °C / #8.2 F).
| Lenovo ThinkPad P1 Gen 8 Ultra 7 255H, RTX PRO 2000 Blackwell Generation Laptop | Lenovo ThinkPad P16s Gen 4 AMD Ryzen AI 9 HX 370, Radeon 890M | Lenovo ThinkPad P1 Gen 7 21KV001SGE Ultra 7 155H, GeForce RTX 4060 Laptop GPU | HP ZBook X G1i 16 Ultra 7 265H, RTX PRO 2000 Blackwell Generation Laptop | Dell Pro Max 16 Plus Ultra 9 285HX, RTX PRO 5000 Blackwell Generation Laptop | Asus ExpertBook B6 Flip B6602FC2 i9-12950HX, RTX A2000 Laptop GPU | |
|---|---|---|---|---|---|---|
| Heat | -29% | -1% | 0% | -10% | -13% | |
| Maximum Upper Side * (°C) | 45 | 50.6 -12% | 50.3 -12% | 36 20% | 40.4 10% | 48.4 -8% |
| Maximum Bottom * (°C) | 33 | 54.3 -65% | 38 -15% | 39.4 -19% | 45.6 -38% | 52.3 -58% |
| Idle Upper Side * (°C) | 30.6 | 35.3 -15% | 28.3 8% | 30.4 1% | 32.8 -7% | 27.8 9% |
| Idle Bottom * (°C) | 31.6 | 38.5 -22% | 27.3 14% | 31.8 -1% | 33 -4% | 30.3 4% |
* ... Moindre est la valeur, meilleures sont les performances
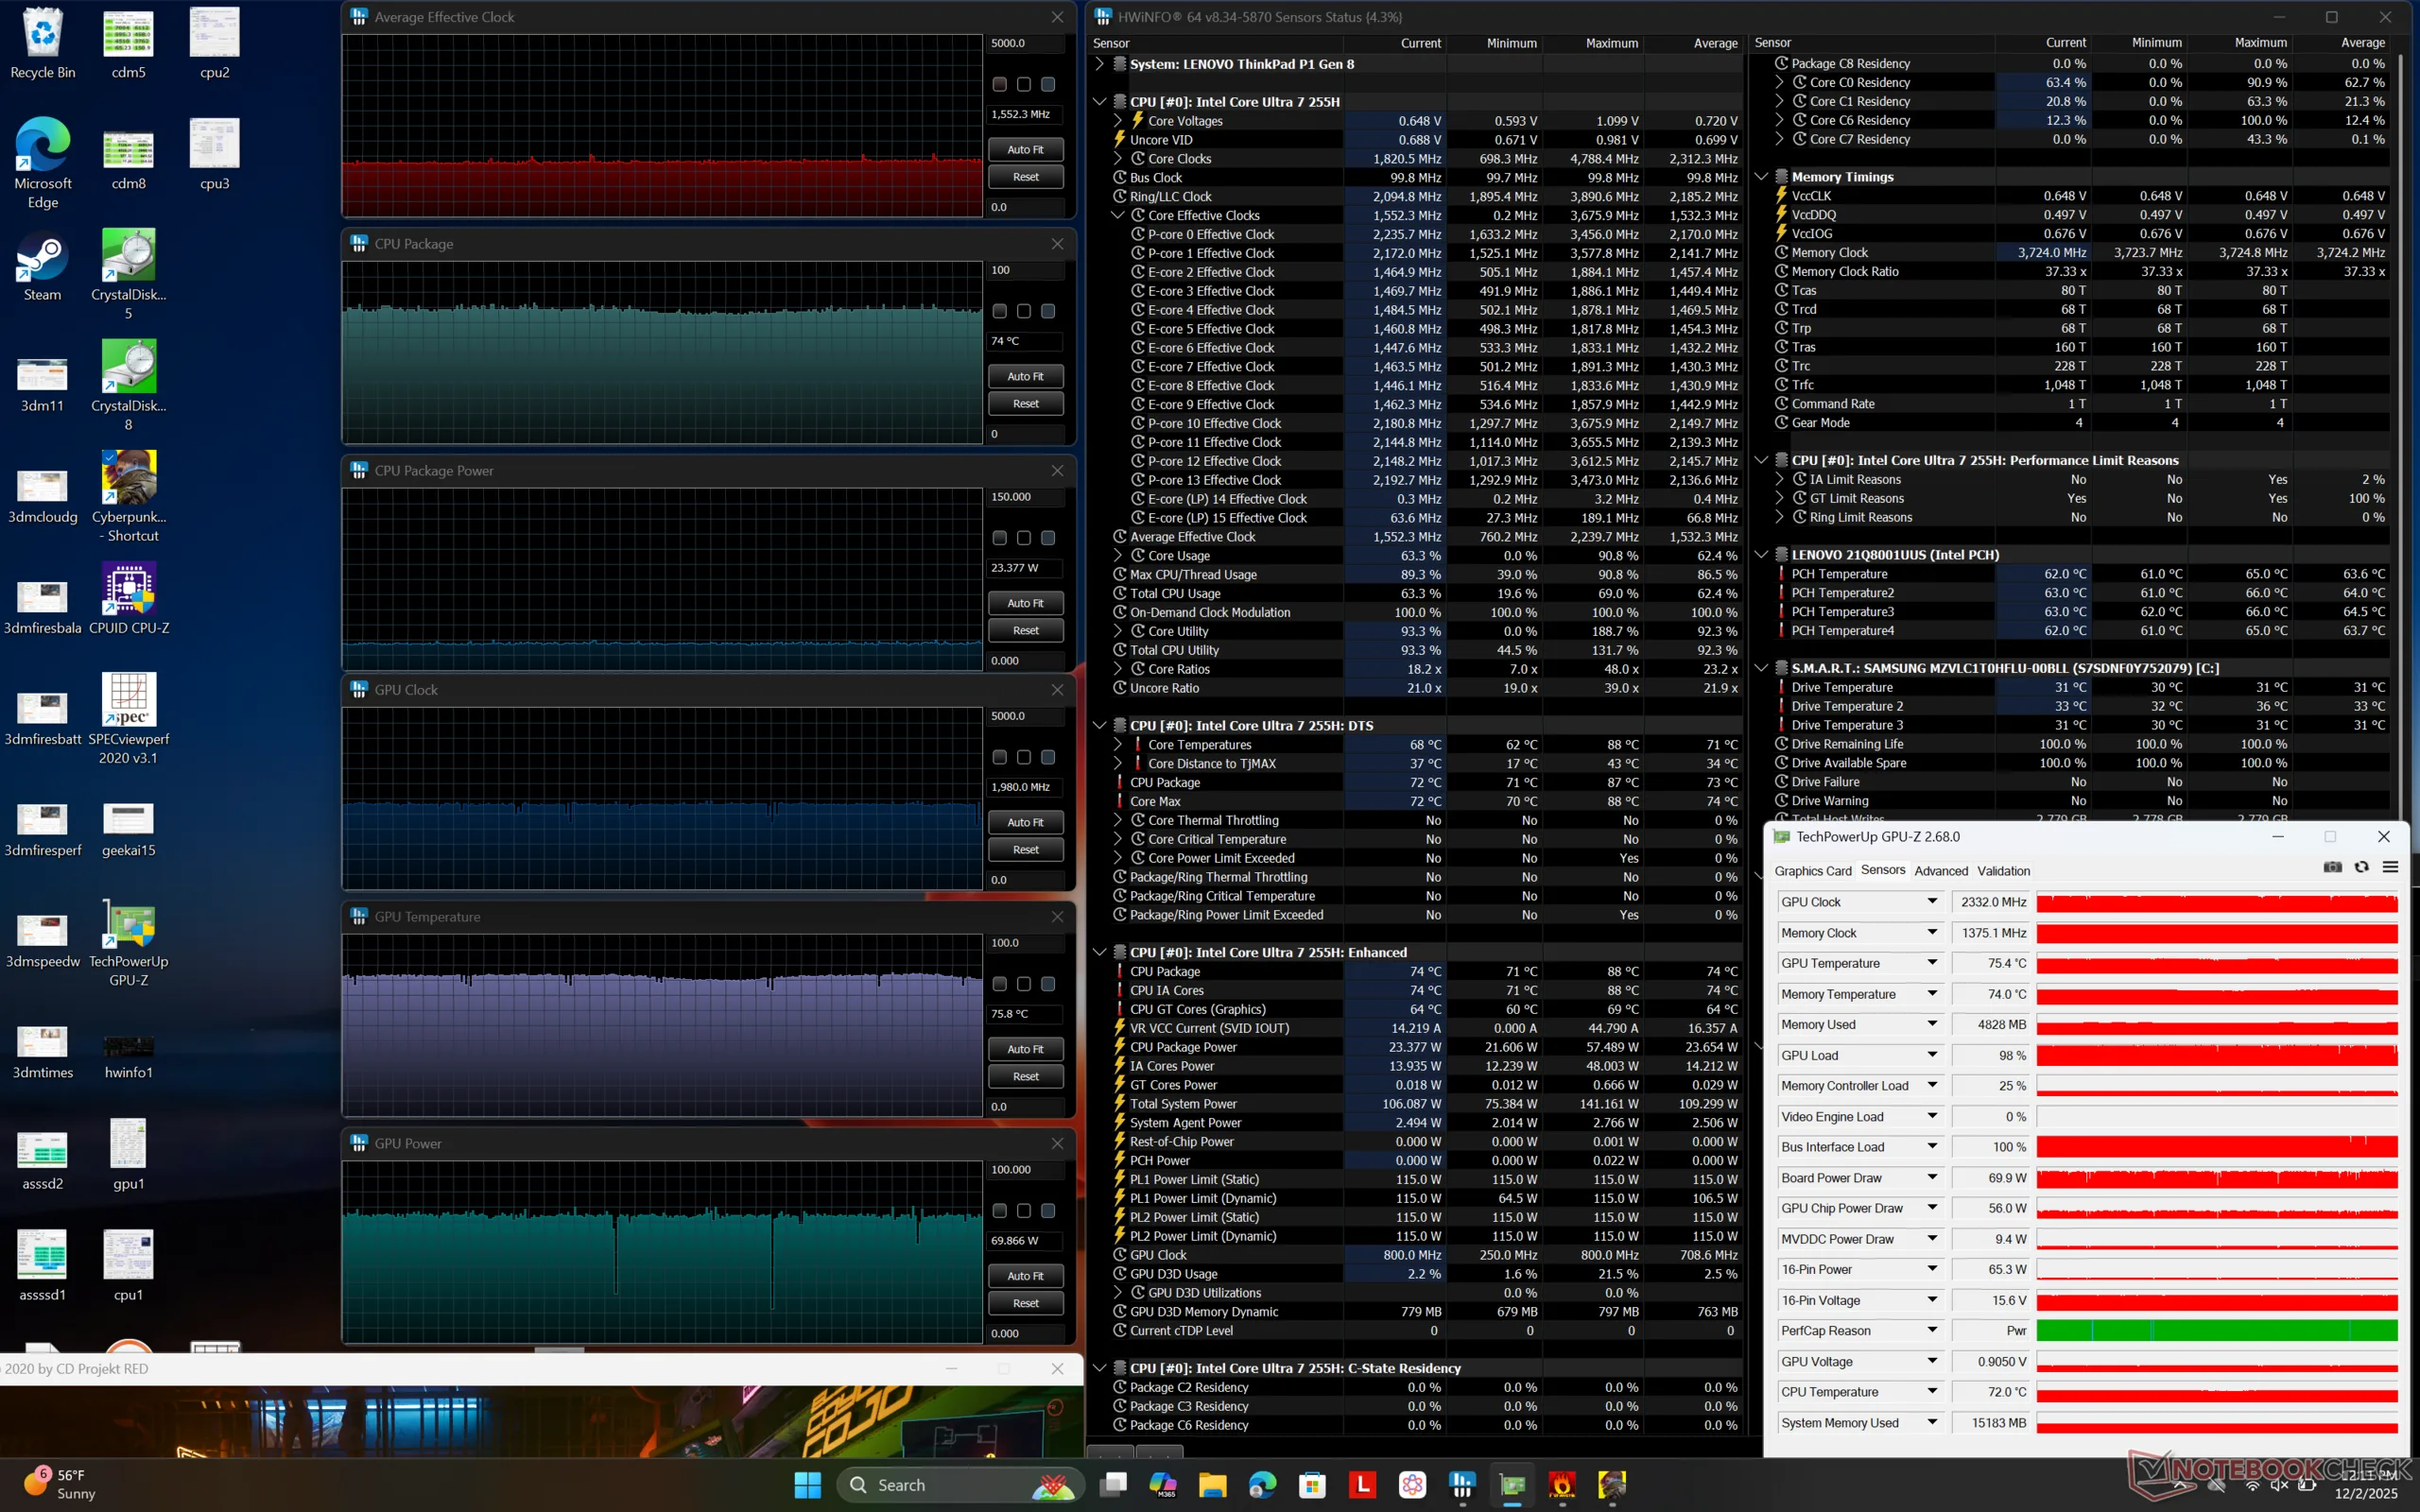
Test de stress
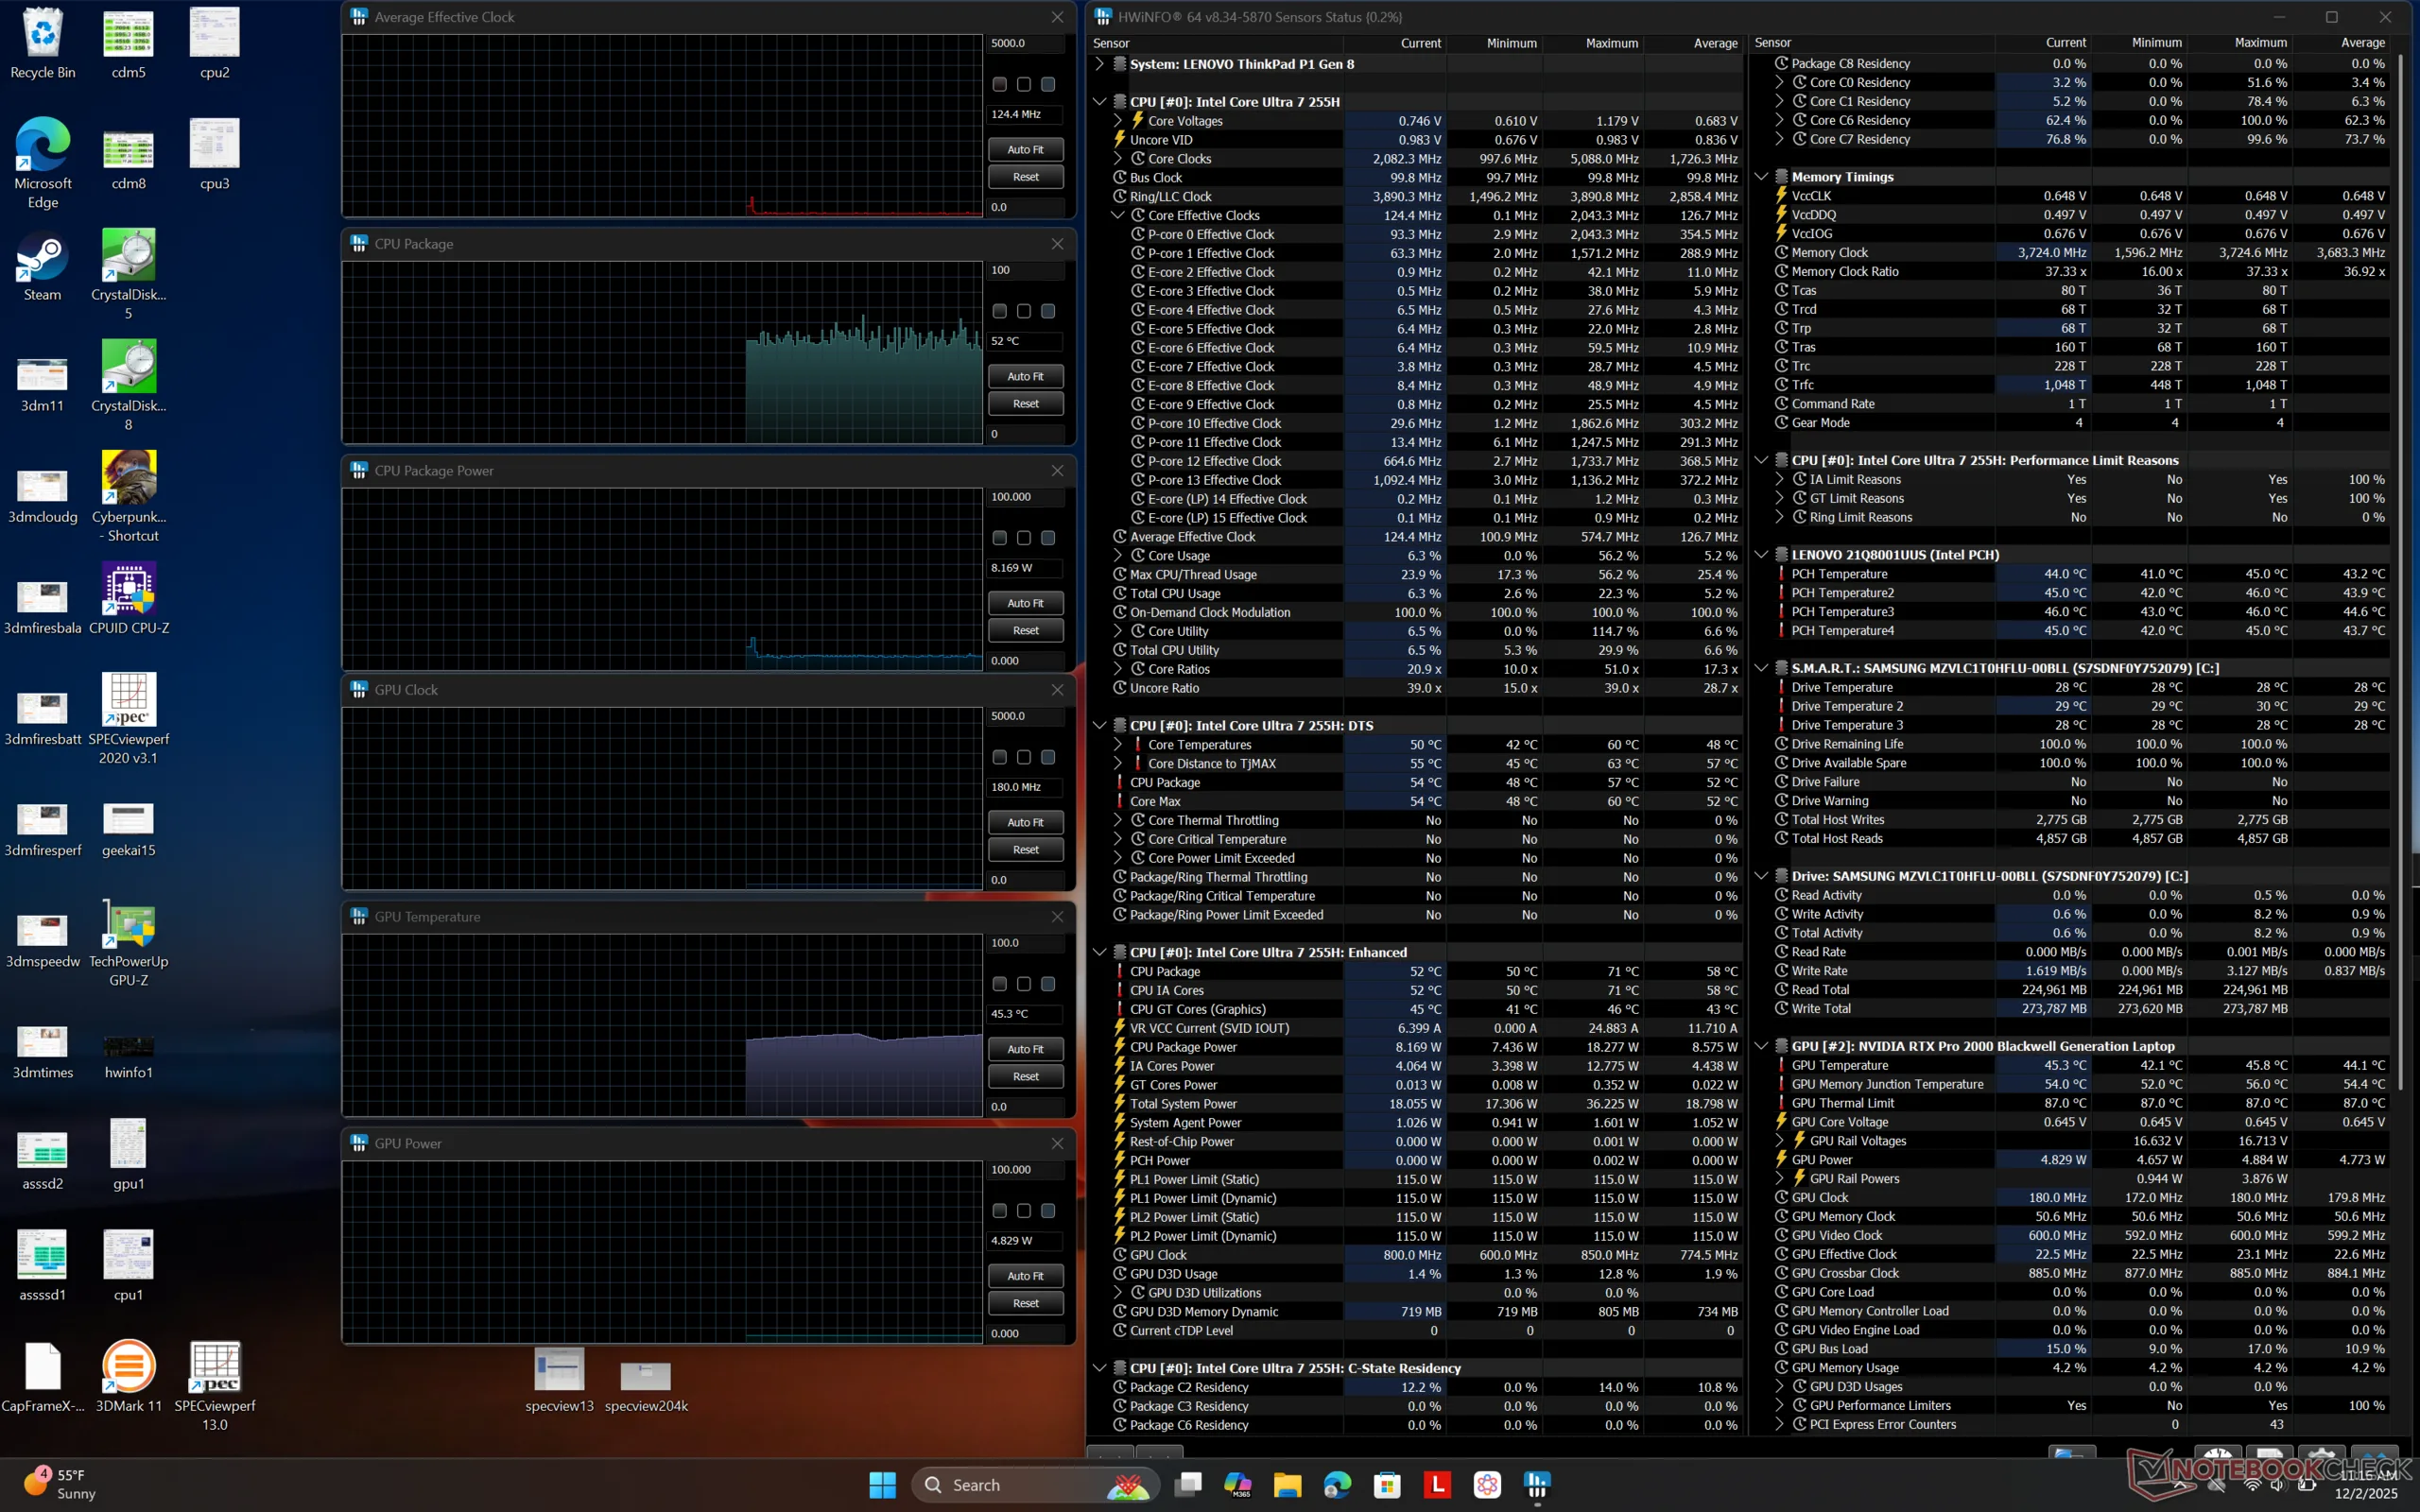
Le CPU passe à 3,8 GHz, 120 W et 100 C lors de l'initialisation du stress Prime95 avant de baisser légèrement et de se stabiliser à 3,6 GHz et 101 W afin de maintenir une température plus gérable de 91 C. La consommation d'énergie de la carte GPU passe de 63 W à près de 70 W lorsque l'on passe du mode équilibré au mode performance et nous vous suggérons donc d'utiliser le mode performance malgré ses températures de cœur légèrement plus élevées d'environ 75 C. L'horloge de la mémoire GPU en particulier passe de 1125 MHz à 1375 MHz lorsque l'on passe au mode performance.


| Horloge du CPU (GHz) | Horloge du GPU (MHz) | Température moyenne du CPU (°C) | Température moyenne du GPU (°C) | |
| Système en veille | -- | -- | 52 | 45 |
| Prime95 Stress | 3.6 | -- | 91 | 60 |
| Prime95 + FurMark Stress | 2.7 | 1672 | 77 | 72 |
| Cyberpunk 2077 Stress (mode équilibré) | 1.6 | 2325 | 63 | 66 |
| Cyberpunk 2077 Stress (mode Performance) | 1.6 | 2332 | 74 | 76 |
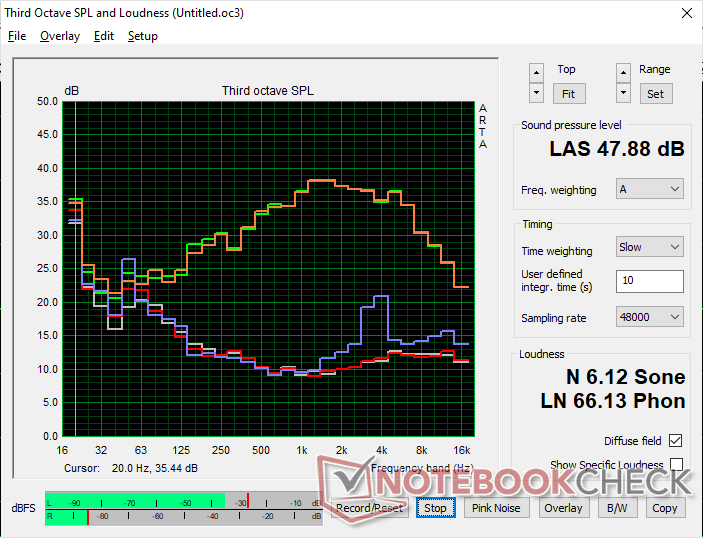
Intervenants
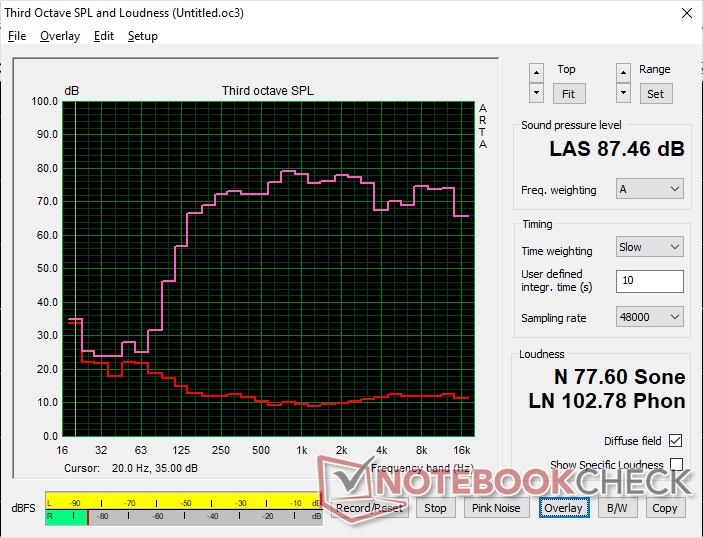
Lenovo ThinkPad P1 Gen 8 analyse audio
(+) | les haut-parleurs peuvent jouer relativement fort (87.5# dB)
Basses 100 - 315 Hz
(±) | basse réduite - en moyenne 9.8% inférieure à la médiane
(±) | la linéarité des basses est moyenne (11.2% delta à la fréquence précédente)
Médiums 400 - 2000 Hz
(+) | médiane équilibrée - seulement 2.9% de la médiane
(+) | les médiums sont linéaires (2.8% delta à la fréquence précédente)
Aiguës 2 - 16 kHz
(+) | des sommets équilibrés - à seulement 3% de la médiane
(+) | les aigus sont linéaires (4.7% delta à la fréquence précédente)
Globalement 100 - 16 000 Hz
(+) | le son global est linéaire (8.3% différence à la médiane)
Par rapport à la même classe
» 1% de tous les appareils testés de cette catégorie étaient meilleurs, 1% similaires, 97% pires
» Le meilleur avait un delta de 7%, la moyenne était de 17%, le pire était de 35%.
Par rapport à tous les appareils testés
» 2% de tous les appareils testés étaient meilleurs, 1% similaires, 98% pires
» Le meilleur avait un delta de 4%, la moyenne était de 24%, le pire était de 134%.
Apple MacBook Pro 16 2021 M1 Pro analyse audio
(+) | les haut-parleurs peuvent jouer relativement fort (84.7# dB)
Basses 100 - 315 Hz
(+) | bonne basse - seulement 3.8% loin de la médiane
(+) | les basses sont linéaires (5.2% delta à la fréquence précédente)
Médiums 400 - 2000 Hz
(+) | médiane équilibrée - seulement 1.3% de la médiane
(+) | les médiums sont linéaires (2.1% delta à la fréquence précédente)
Aiguës 2 - 16 kHz
(+) | des sommets équilibrés - à seulement 1.9% de la médiane
(+) | les aigus sont linéaires (2.7% delta à la fréquence précédente)
Globalement 100 - 16 000 Hz
(+) | le son global est linéaire (4.6% différence à la médiane)
Par rapport à la même classe
» 0% de tous les appareils testés de cette catégorie étaient meilleurs, 0% similaires, 100% pires
» Le meilleur avait un delta de 5%, la moyenne était de 17%, le pire était de 45%.
Par rapport à tous les appareils testés
» 0% de tous les appareils testés étaient meilleurs, 0% similaires, 100% pires
» Le meilleur avait un delta de 4%, la moyenne était de 24%, le pire était de 134%.
Gestion de l'énergie
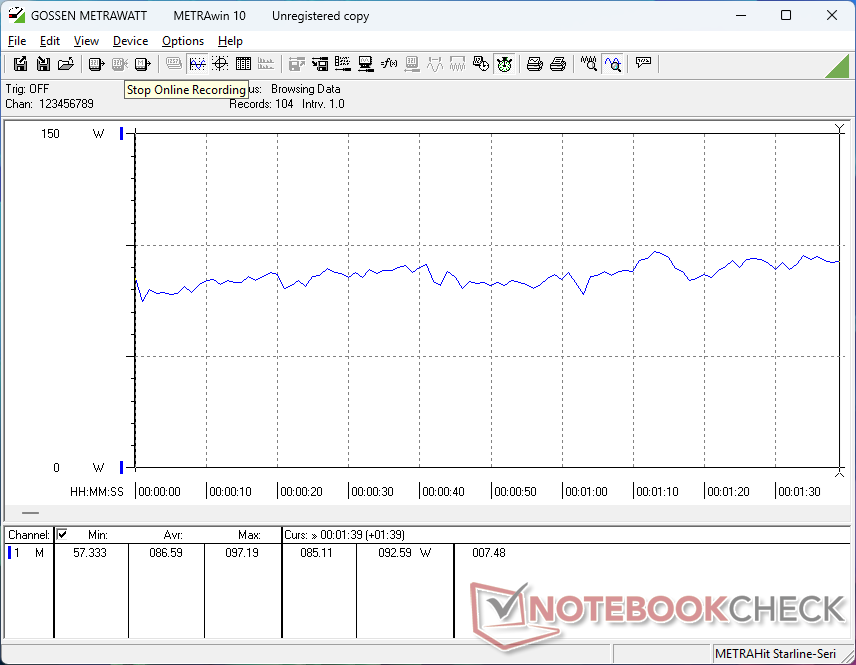
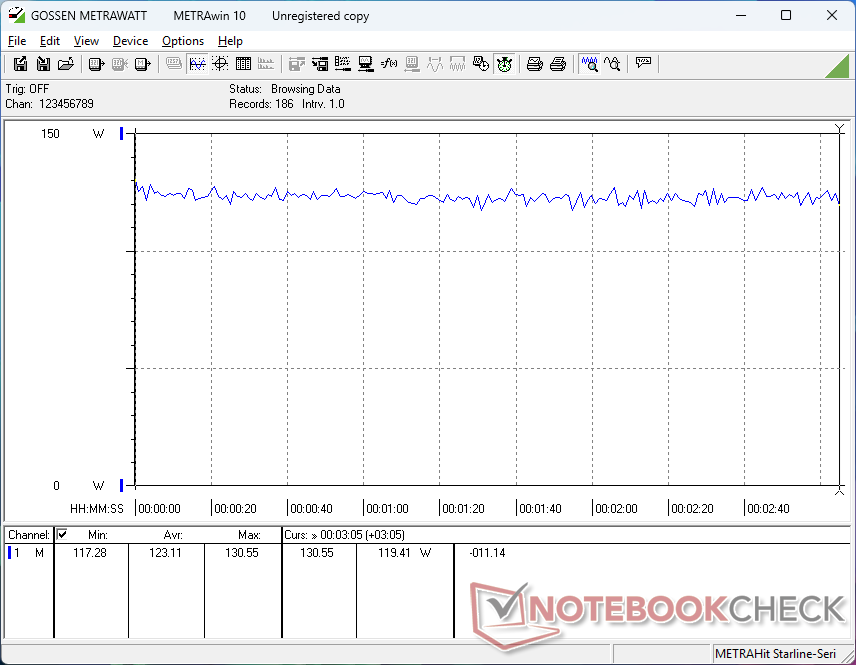
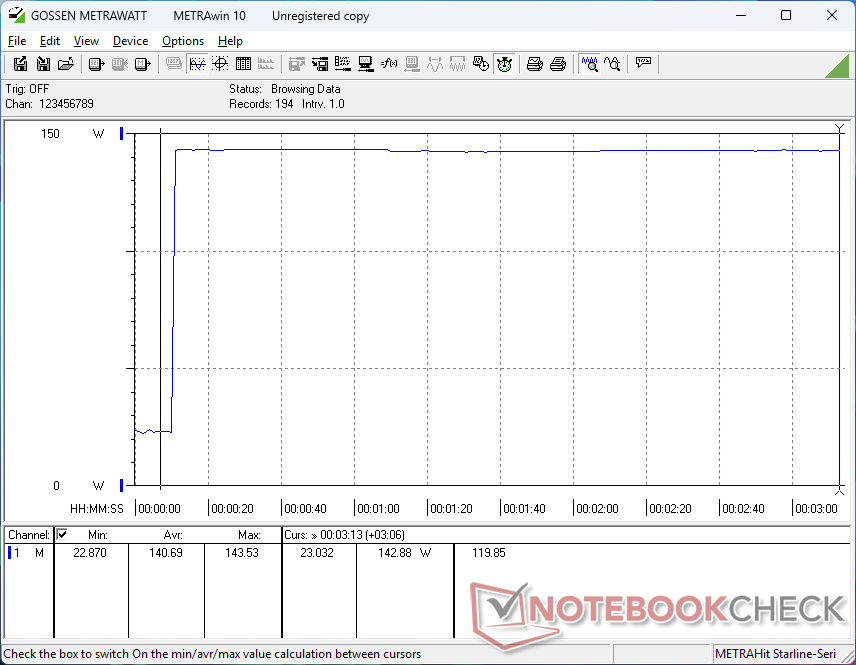
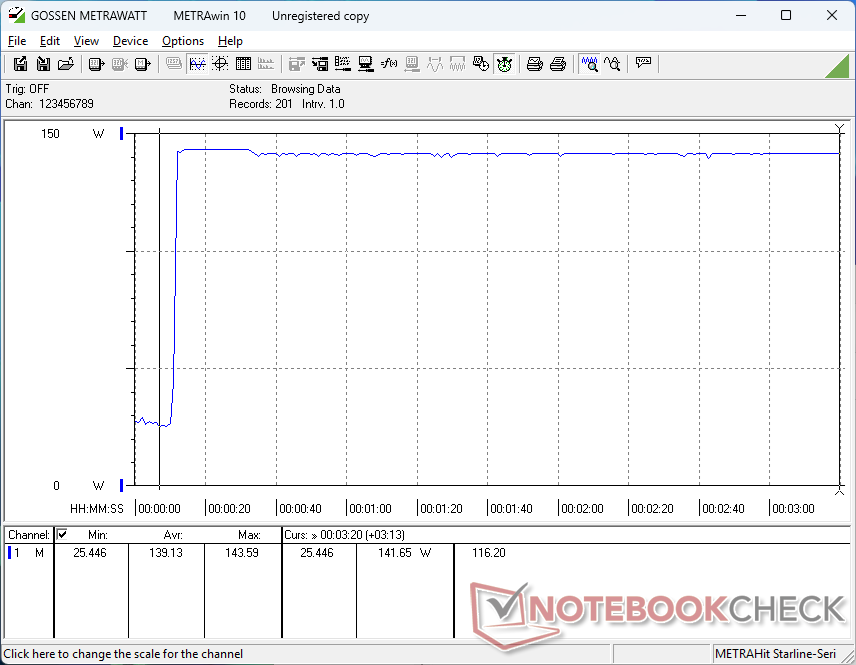
Consommation électrique
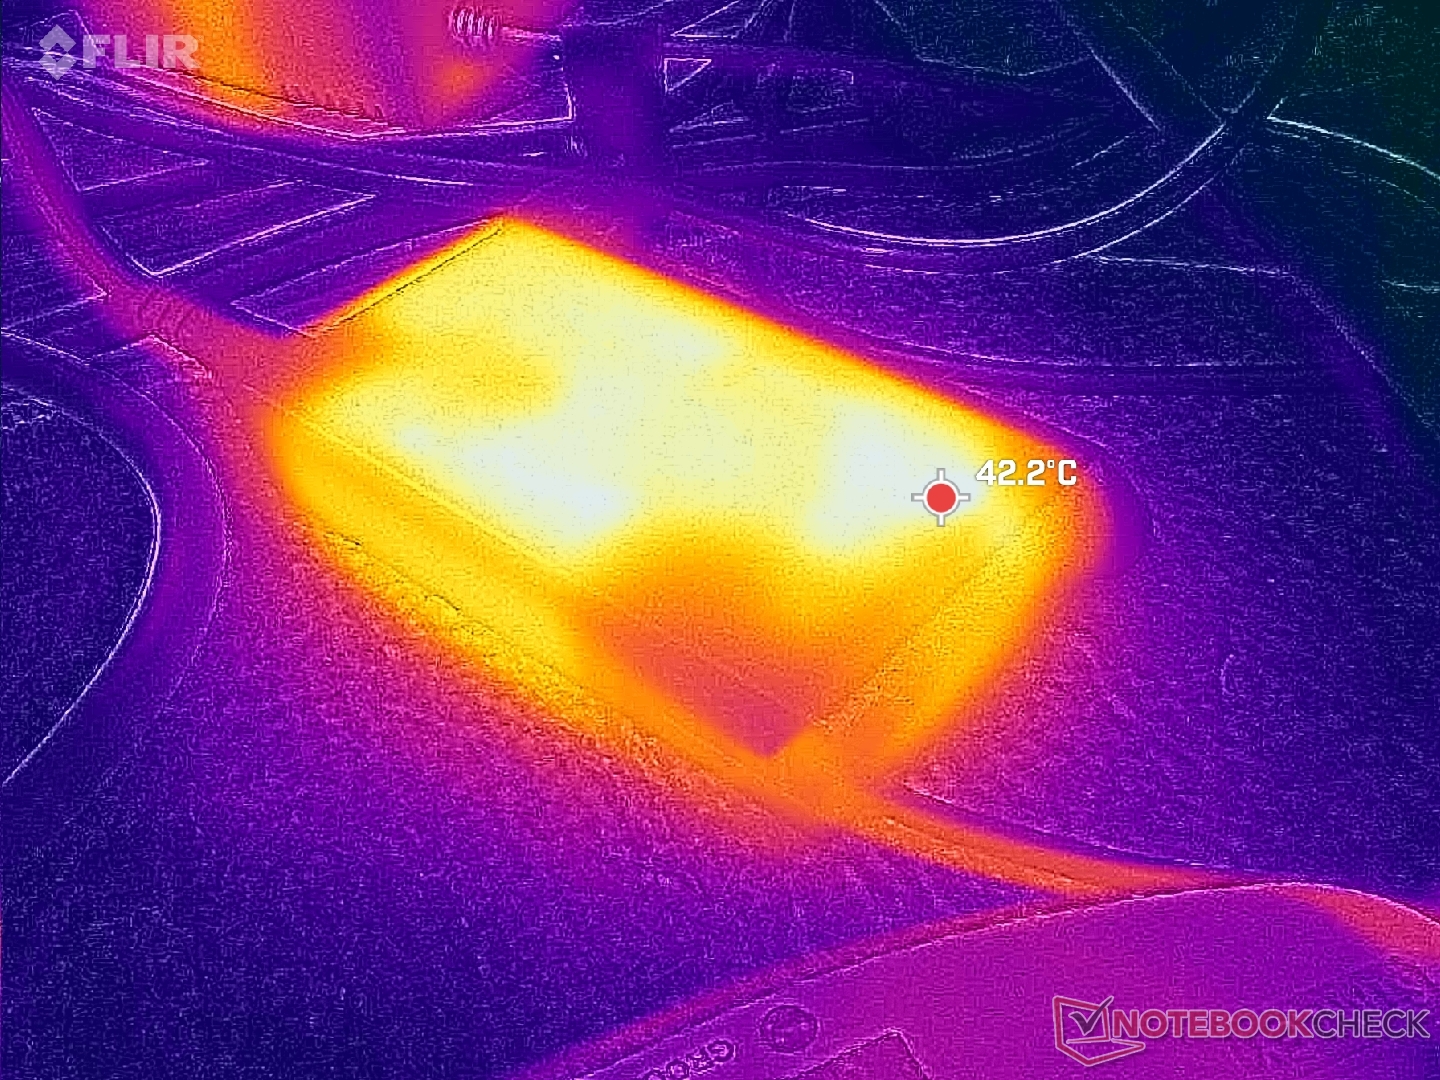
La consommation au ralenti est généralement plus élevée que celle du modèle IPS de l'année dernière, ce qui se traduit par des durées d'utilisation plus courtes. Les taux de consommation sont par ailleurs très similaires entre les deux modèles lors de l'exécution de charges plus exigeantes, malgré les niveaux de performance plus élevés du modèle Gen 8 pour une meilleure performance par watt.
Notez que le ThinkPad P1 Gen 8 est livré avec un adaptateur secteur USB-C plus petit de 140 W (~12,8 x 6,2 x 2,3 cm) alors que le ThinkPad P1 Gen 7 est livré avec un adaptateur de 170 W.
| Éteint/en veille | |
| Au repos | |
| Fortement sollicité |
|
Légende:
min: | |
| Lenovo ThinkPad P1 Gen 8 Ultra 7 255H, RTX PRO 2000 Blackwell Generation Laptop, Samsung PM9E1 1 TB MZVLC1T0HFLU, Tandem OLED, 3200x2000, 16" | Lenovo ThinkPad P16s Gen 4 AMD Ryzen AI 9 HX 370, Radeon 890M, , , 1920x1200, 16" | Lenovo ThinkPad P1 Gen 7 21KV001SGE Ultra 7 155H, GeForce RTX 4060 Laptop GPU, Kioxia XG8 KXG8AZNV1T02, IPS LED, 2560x1600, 16" | HP ZBook X G1i 16 Ultra 7 265H, RTX PRO 2000 Blackwell Generation Laptop, Samsung PM9A1 MZVL22T0HBLB, IPS, 2560x1600, 16" | Dell Pro Max 16 Plus Ultra 9 285HX, RTX PRO 5000 Blackwell Generation Laptop, SK hynix PCB01 HFS001TFM9X186N, OLED, 3840x2400, 16" | Asus ExpertBook B6 Flip B6602FC2 i9-12950HX, RTX A2000 Laptop GPU, Samsung PM9A1 MZVL21T0HCLR, IPS, 2560x1600, 16" | |
|---|---|---|---|---|---|---|
| Power Consumption | 56% | 14% | 29% | -103% | -17% | |
| Idle Minimum * (Watt) | 15.4 | 3.9 75% | 7.3 53% | 4.1 73% | 35.1 -128% | 10.5 32% |
| Idle Average * (Watt) | 16.5 | 8.3 50% | 12.3 25% | 9 45% | 39.2 -138% | 11.9 28% |
| Idle Maximum * (Watt) | 23.1 | 8.7 62% | 17.9 23% | 9.4 59% | 56 -142% | 18 22% |
| Load Average * (Watt) | 86.6 | 51.6 40% | 78.2 10% | 86.7 -0% | 130.2 -50% | 182 -110% |
| Cyberpunk 2077 ultra external monitor * (Watt) | 121.8 | 54.6 55% | 117.7 3% | 102 16% | 213 -75% | |
| Cyberpunk 2077 ultra * (Watt) | 123.1 | 55.4 55% | 123.5 -0% | 106.1 14% | 229 -86% | |
| Load Maximum * (Watt) | 143.6 | 63.7 56% | 167.5 -17% | 152.9 -6% | 285.2 -99% | 229 -59% |
| Witcher 3 ultra * (Watt) | 177.5 |
* ... Moindre est la valeur, meilleures sont les performances
Consommation électrique Cyberpunk / Stress Test
Consommation électrique du moniteur externe
Autonomie de la batterie
Les durées d'utilisation sont nettement plus courtes que sur la configuration IPS de l'année dernière, de plusieurs heures, même en mode équilibré et avec le même niveau de luminosité d'environ 150 nit.
| Lenovo ThinkPad P1 Gen 8 Ultra 7 255H, RTX PRO 2000 Blackwell Generation Laptop, 90 Wh | Lenovo ThinkPad P1 Gen 7 21KV001SGE Ultra 7 155H, GeForce RTX 4060 Laptop GPU, 90 Wh | HP ZBook X G1i 16 Ultra 7 265H, RTX PRO 2000 Blackwell Generation Laptop, 83 Wh | Dell Pro Max 16 Plus Ultra 9 285HX, RTX PRO 5000 Blackwell Generation Laptop, 96 Wh | Asus ExpertBook B6 Flip B6602FC2 i9-12950HX, RTX A2000 Laptop GPU, 90 Wh | |
|---|---|---|---|---|---|
| Autonomie de la batterie | 80% | 127% | -35% | 58% | |
| WiFi v1.3 (h) | 5.5 | 9.9 80% | 12.5 127% | 3.6 -35% | 8.7 58% |
| Load (h) | 1.9 | 1.7 | |||
| Reader / Idle (h) | 12.5 | ||||
| H.264 (h) | 5.8 |
Notebookcheck Rating
Le ThinkPad P1 Gen 8 est une station de travail ultra-mince de 16 pouces dotée d'un processeur Core de série H de milieu de gamme et d'une carte graphique Nvidia Pro RTX discrète.
Lenovo ThinkPad P1 Gen 8
- 12/10/2025 v8
Allen Ngo
 Total Sustainability Score:
 Comparaison avec des concurrents potentiels
Image | Modèle | Prix | Poids | Épaisseur | Écran |
|---|---|---|---|---|---|
1. 91.6%  | Lenovo ThinkPad P1 Gen 8 Intel Core Ultra 7 255H ⎘ NVIDIA RTX PRO 2000 Blackwell Generation Laptop ⎘ 32 Go Mémoire, 1024 Go SSD | Amazon: $4,299.00 Prix de liste: 2000 USD | 1.9 kg | 20.6 mm | 16.00" 3200x2000 236 PPI Tandem OLED |
2.  | Lenovo ThinkPad P16s Gen 4 AMD AMD Ryzen AI 9 HX 370 ⎘ AMD Radeon 890M ⎘ 64 Go Mémoire | Amazon: $2,965.45 Prix de liste: 2440€ | 2 kg | 23 mm | 16.00" 1920x1200 142 PPI |
3. 83.5%  | Lenovo ThinkPad P1 Gen 7 21KV001SGE Intel Core Ultra 7 155H ⎘ NVIDIA GeForce RTX 4060 Laptop GPU ⎘ 32 Go Mémoire, 1024 Go SSD | Amazon: $2,199.00 Prix de liste: 3239 Euro | 2 kg | 20.5 mm | 16.00" 2560x1600 189 PPI IPS LED |
4. 87.4%  | HP ZBook X G1i 16 Intel Core Ultra 7 265H ⎘ NVIDIA RTX PRO 2000 Blackwell Generation Laptop ⎘ 64 Go Mémoire, 2048 Go SSD | Amazon: $2,999.00 Prix de liste: 2700 USD | 2.2 kg | 23 mm | 16.00" 2560x1600 189 PPI IPS |
5. 88.4%  | Dell Pro Max 16 Plus Intel Core Ultra 9 285HX ⎘ Nvidia RTX PRO 5000 Blackwell Generation Laptop ⎘ 128 Go Mémoire, SSD | Amazon: 1. $1,299.95 Dell Pro 16 Plus PB16250 (Re... 2. $27.99 SLRIOYS 130W USB-C Charger C... 3. $45.99 Smatree Hard EVA Protective ... Prix de liste: 5000 USD | 2.8 kg | 30.9 mm | 16.00" 3840x2400 283 PPI OLED |
6. 89.6% v7 (old)  | Asus ExpertBook B6 Flip B6602FC2 Intel Core i9-12950HX ⎘ NVIDIA RTX A2000 Laptop GPU ⎘ 32 Go Mémoire, 1024 Go SSD | Amazon: 1. $80.99 20V 12A 240W Charger for Asu... 2. $101.50 Adamanta 8GB (1x8GB) Compati... 3. $440.00 Adamanta 32GB (2x16GB) Compa... | 2.8 kg | 27.2 mm | 16.00" 2560x1600 189 PPI IPS |
Transparency
La sélection des appareils à examiner est effectuée par notre équipe éditoriale. L'échantillon de test a été prêté à l'auteur par le fabricant ou le détaillant pour les besoins de cet examen. Le prêteur n'a pas eu d'influence sur cette évaluation et le fabricant n'a pas reçu de copie de cette évaluation avant sa publication. Il n'y avait aucune obligation de publier cet article. En tant que média indépendant, Notebookcheck n'est pas soumis à l'autorité des fabricants, des détaillants ou des éditeurs.
Voici comment Notebookcheck teste
Chaque année, Notebookcheck examine de manière indépendante des centaines d'ordinateurs portables et de smartphones en utilisant des procédures standardisées afin de garantir que tous les résultats sont comparables. Nous avons continuellement développé nos méthodes de test depuis environ 20 ans et avons établi des normes industrielles dans le processus. Dans nos laboratoires de test, des équipements de mesure de haute qualité sont utilisés par des techniciens et des rédacteurs expérimentés. Ces tests impliquent un processus de validation en plusieurs étapes. Notre système d'évaluation complexe repose sur des centaines de mesures et de points de référence bien fondés, ce qui garantit l'objectivité.
