Verdict : un peu en retrait par rapport à Dell
Le HP ZBook Fury G1i 18 présente quelques avantages notables par rapport au Dell Pro Max 18 Plus. Il fonctionne plus froidement, est légèrement plus mince et plus léger, comprend un éclairage RGB par touche et des boutons de souris réels, et il est livré avec un écran plus rapide de 165 Hz avec moins d'images fantômes perceptibles. Par ailleurs, le matériel est tout aussi robuste, voire plus polyvalent, avec ses charnières plus larges et son panneau inférieur "sans outil" qui facilite l'entretien.
Malheureusement, plusieurs inconvénients empêchent le HP d'être la station de travail mobile de 18 pouces par excellence. Le plus important est peut-être que son processeur et son GPU fonctionnent légèrement, mais toujours plus lentement que ceux du Dell, alors qu'ils sont tous deux configurés avec des processeurs identiques. Le Dell Pro Max 18 Plus fonctionne plus chaudement tout en visant un TGP plus élevé de 175 W pour plus de performance. L'autonomie de la batterie et le bruit du ventilateur du HP ne sont pas nécessairement plus longs ou plus silencieux, respectivement, malgré les différences de performances entre les deux modèles. La machine Dell est également plus optimisée pour les charges de travail d'IA avec sa RAM CAMM2 de plus grande capacité et son DGFF amovible qui peut être remplacé par un NPU d'inférence Qualcomm discret. Les chasseurs de performances pourraient donc trouver plus de valeur dans la machine Dell.
Points positifs
Points négatifs
Prix et disponibilité
HP livre maintenant le ZBook Fury G1i 18 à partir de 5660 $ pour la configuration de base et jusqu'à plus de 10000 $ s'il est configuré avec le Core Ultra 9 285HX et la Nvidia RTX Pro 5000 Blackwell.
Table des matières
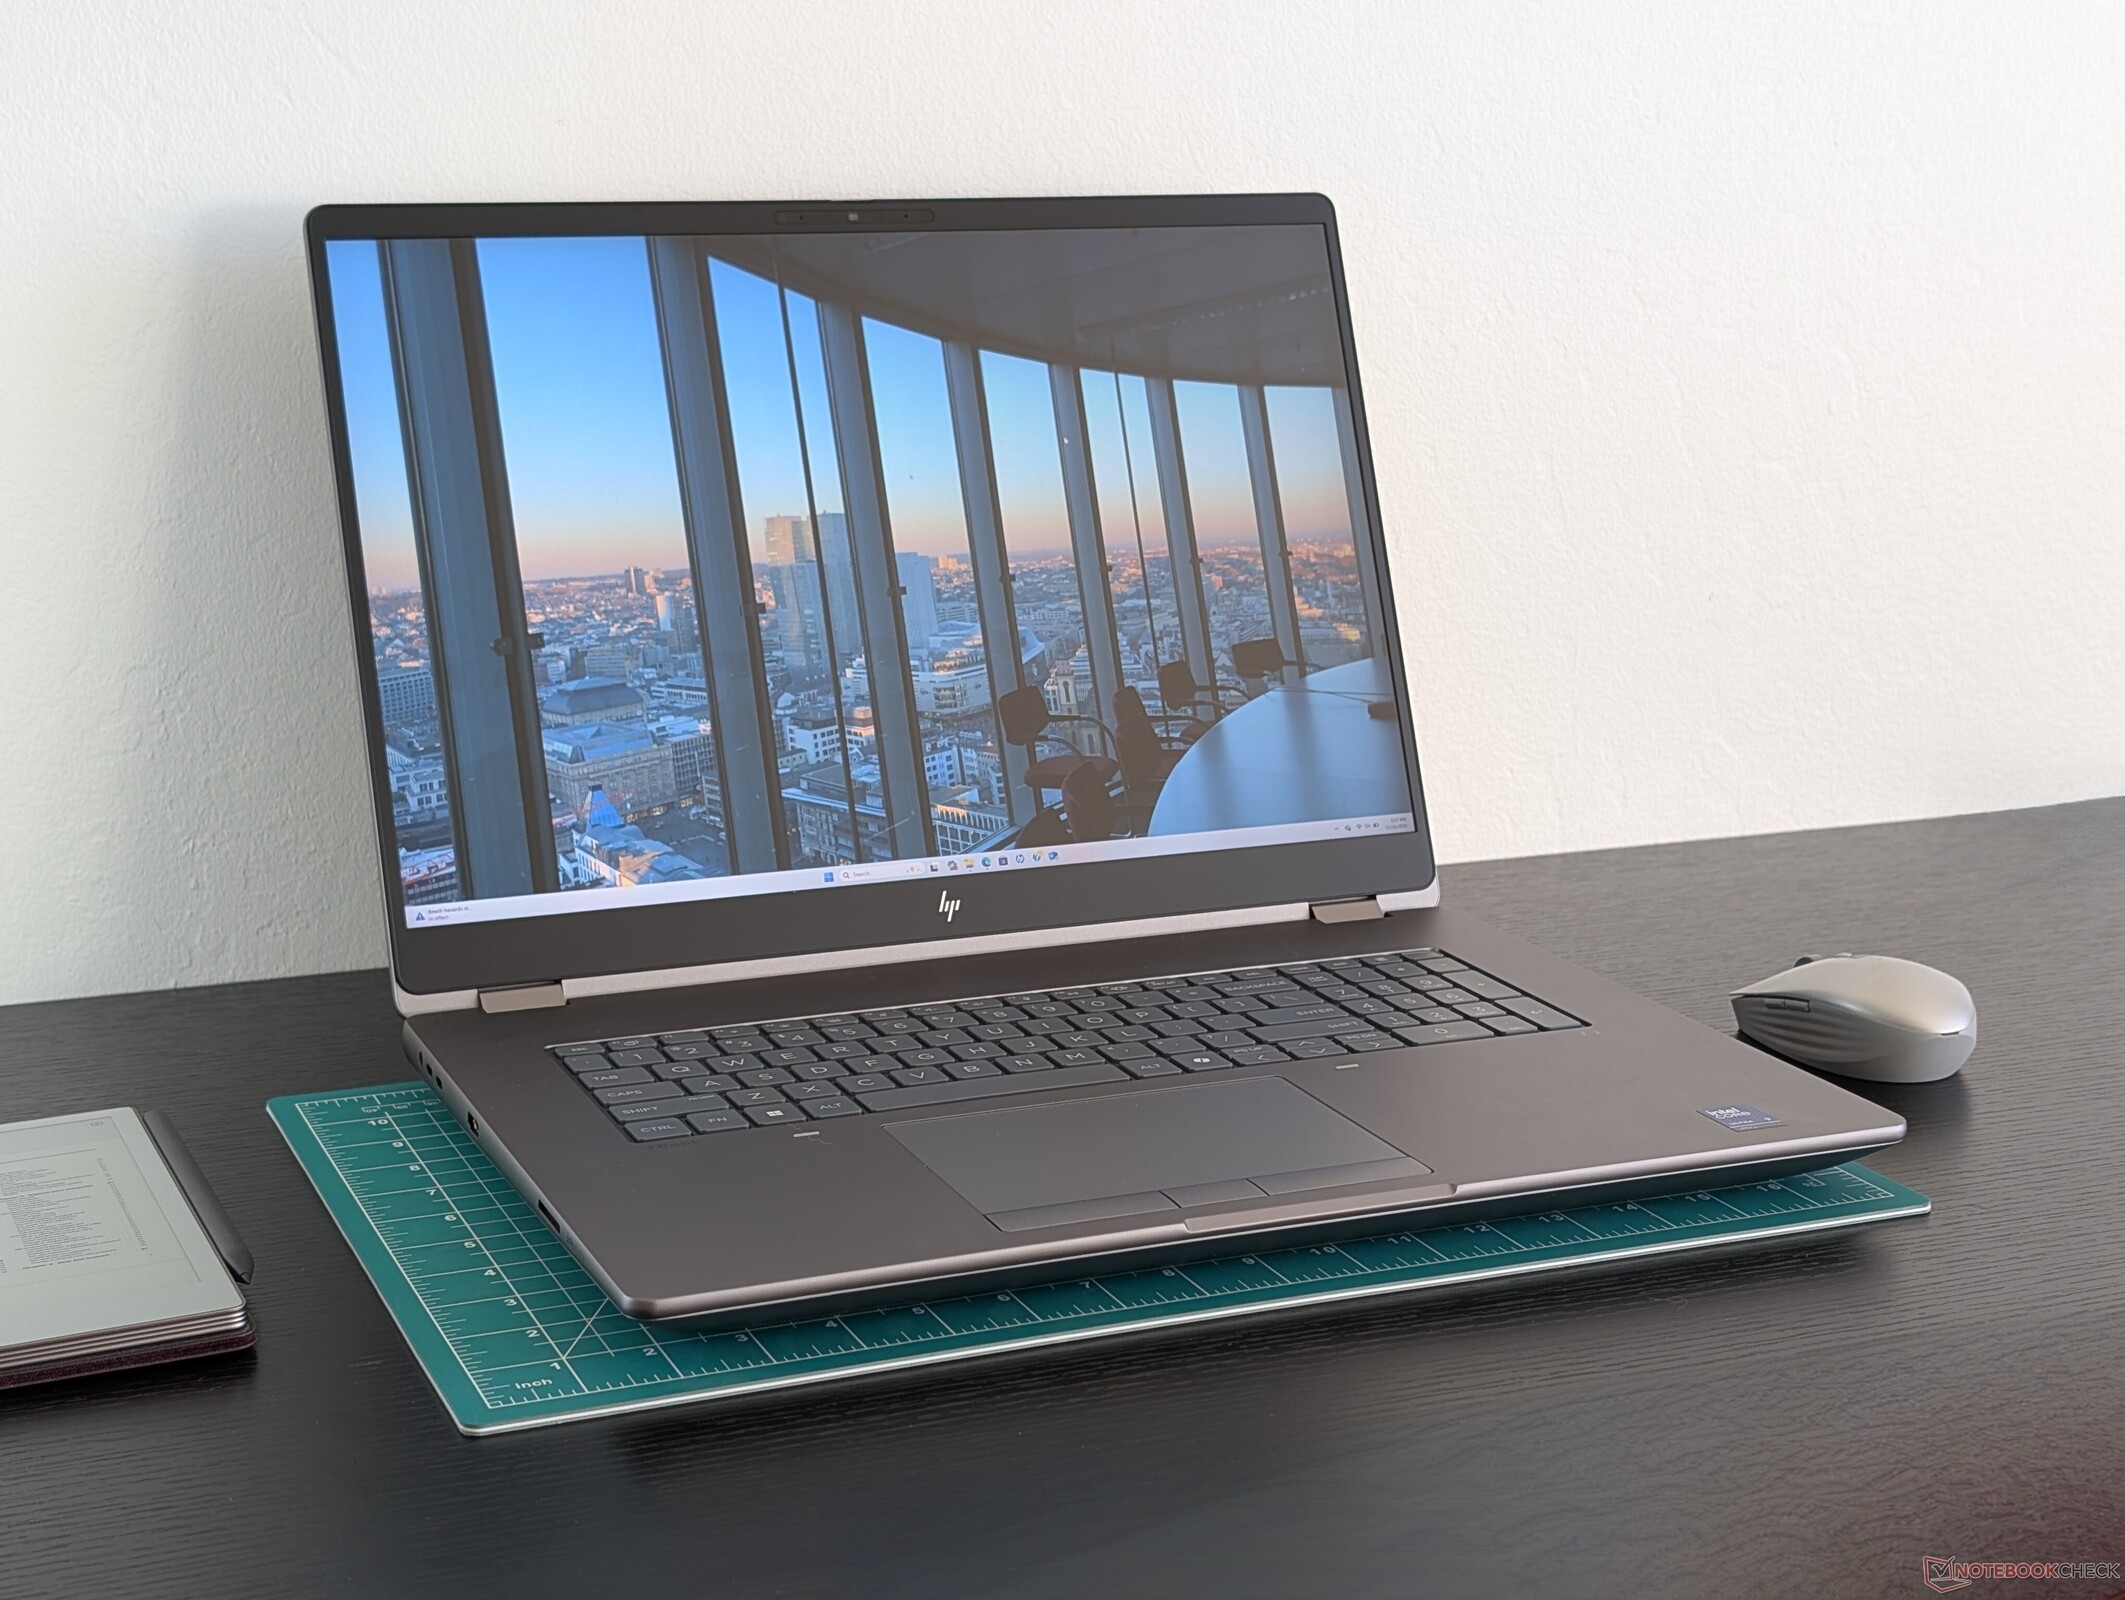
Le ZBook Fury G1i 18 est le premier modèle 18 pouces de la famille Fury de stations de travail mobiles hautes performances. Il est équipé des derniers CPU Intel Arrow Lake-HX et des GPU Nvidia Pro Blackwell, ce qui en fait l'un des plus puissants de la catégorie.
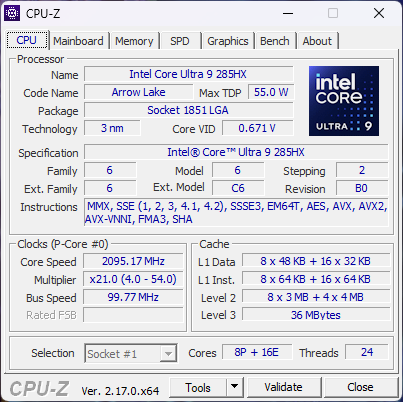
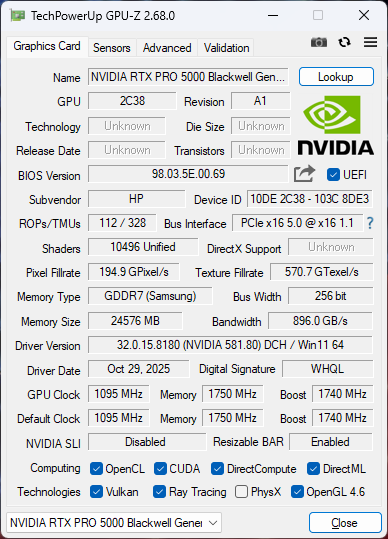
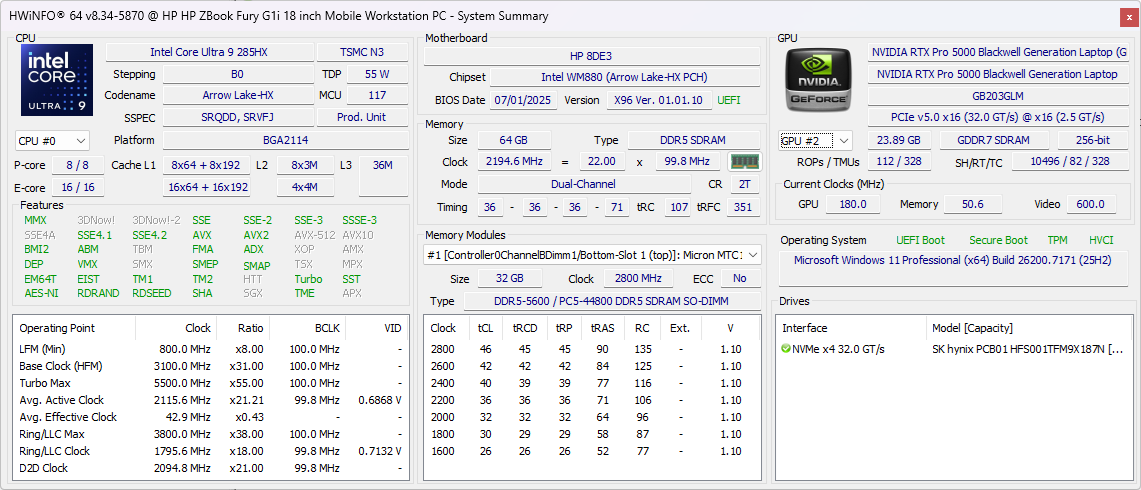
Notre unité de test spécifique a été configurée au maximum avec le CPU Core Ultra 9 285HX, le GPU Nvidia RTX Pro 5000 Blackwell de 150 W et 64 Go de RAM DDR5-5600 pour un prix de détail d'environ 9000 $+. Pour l'instant, tous les modèles sont livrés avec le même écran IPS 2560 x 1600p 165 Hz.
Les stations de travail concurrentes de 18 pouces sont peu nombreuses avec le Dell Pro Max 18 Plus étant le seul concurrent direct à l'heure où nous écrivons ces lignes. Lenovo, par exemple, ne propose pas encore de ThinkPad 18 pouces avec des options de GPU professionnels Nvidia.
Plus d'avis sur HP :
Spécifications
Cas
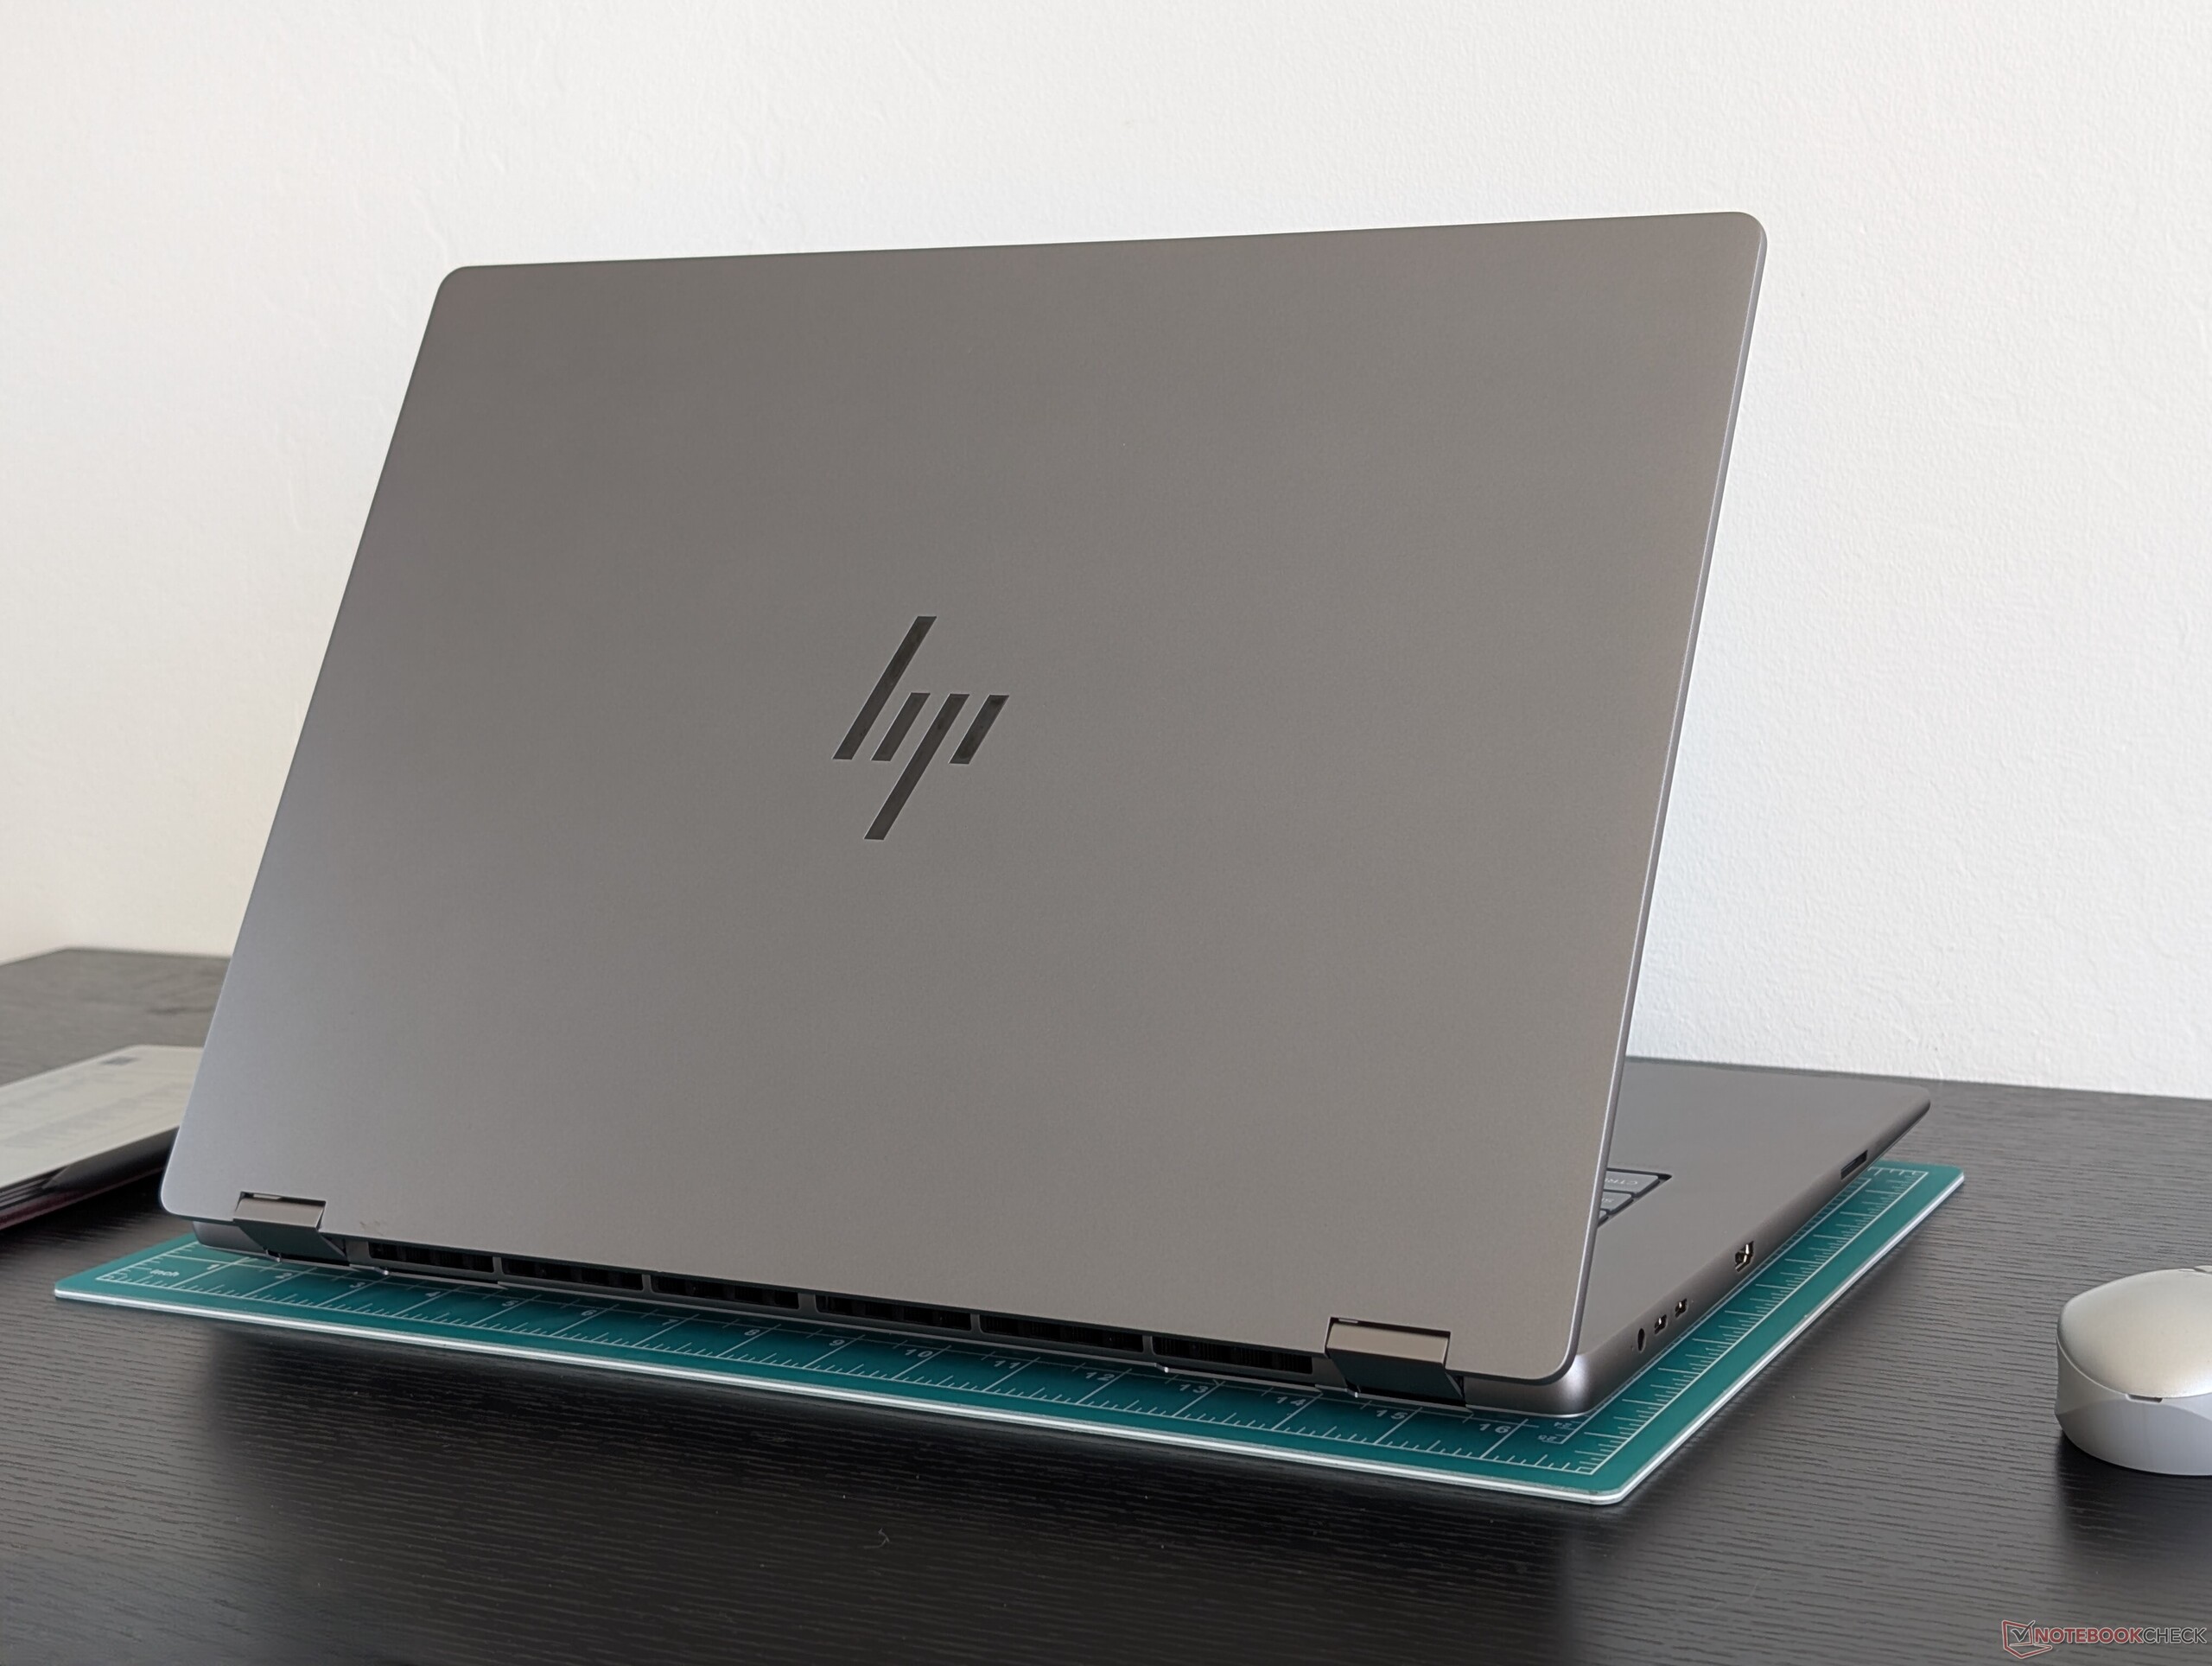
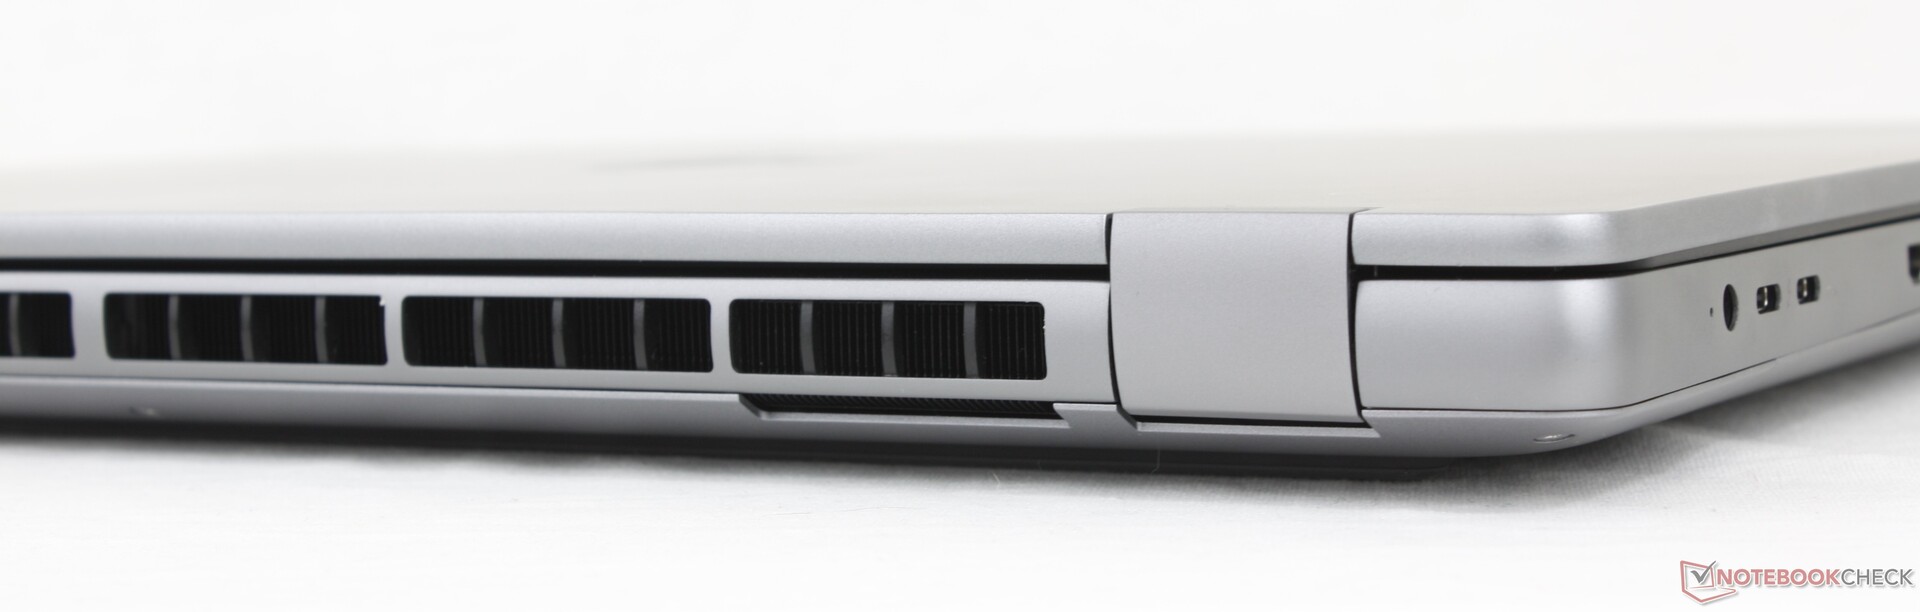
Le châssis en alliage d'aluminium n'est ni plus faible ni plus solide que celui du Dell Pro Max 18 Plus, mais il est légèrement plus fin et plus léger que celui du Dell, tout en étant plus long et plus large. Un avantage notable pour le HP, cependant, est que son écran peut s'ouvrir à 180 degrés pour un peu plus de polyvalence.
Connectivité
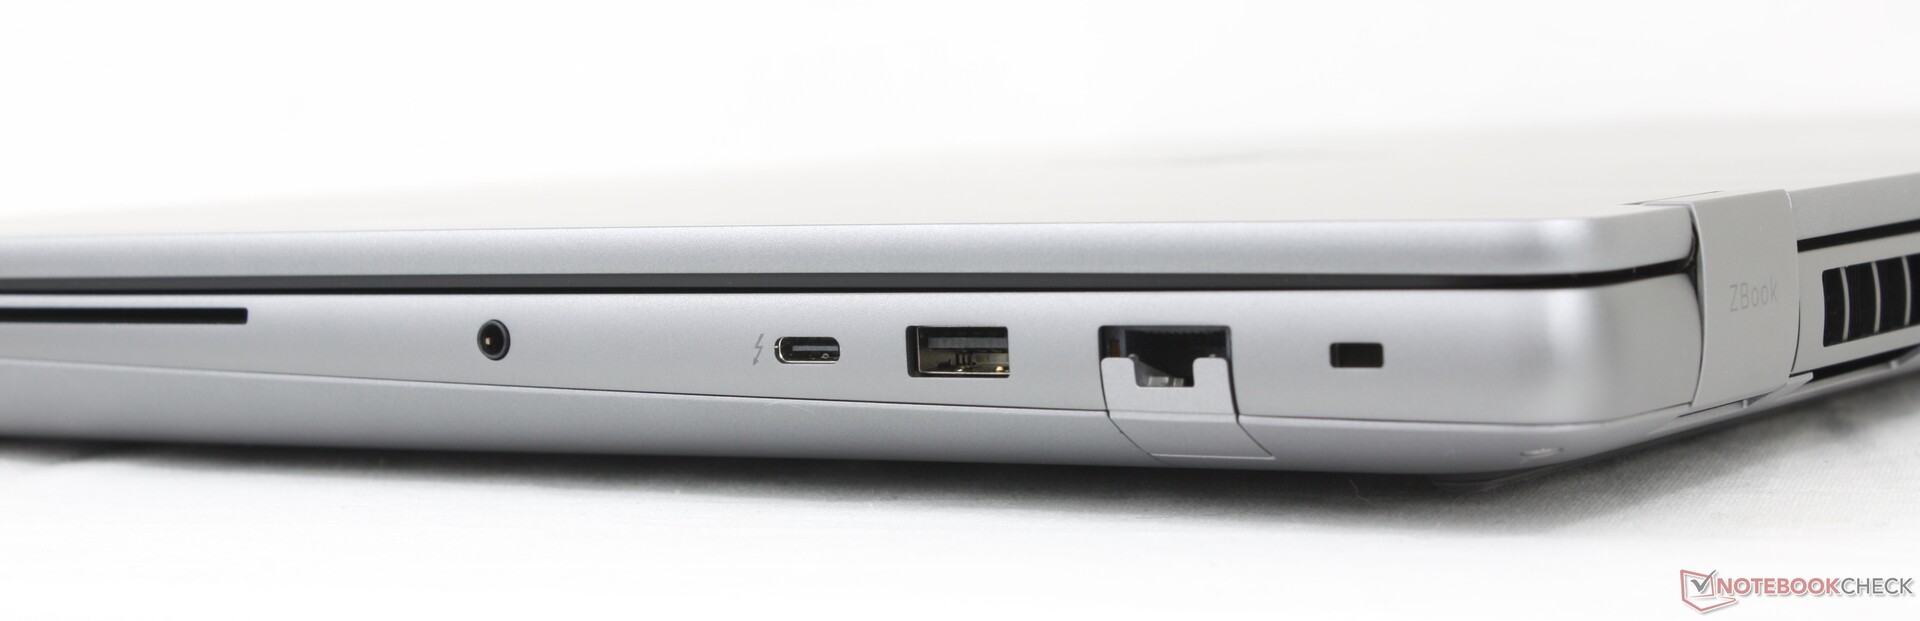
Le modèle dispose de tous les ports présents sur le Dell Pro Max 18 Plus, mais avec un port USB-A en moins. Notre principal reproche est que les deux ports USB-C situés le long du bord gauche sont trop proches du port de l'adaptateur secteur. Il est donc difficile de brancher plusieurs câbles.
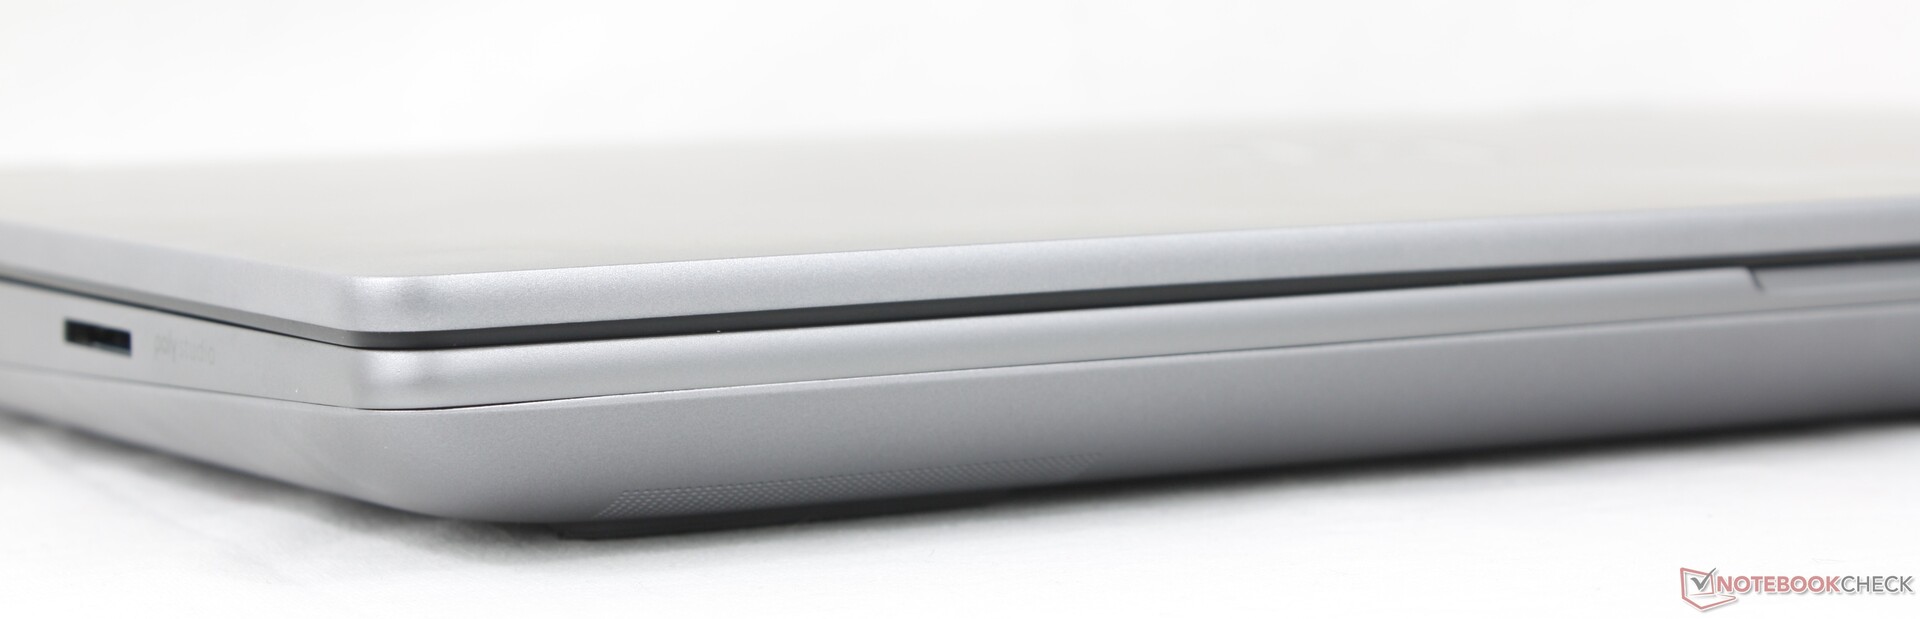
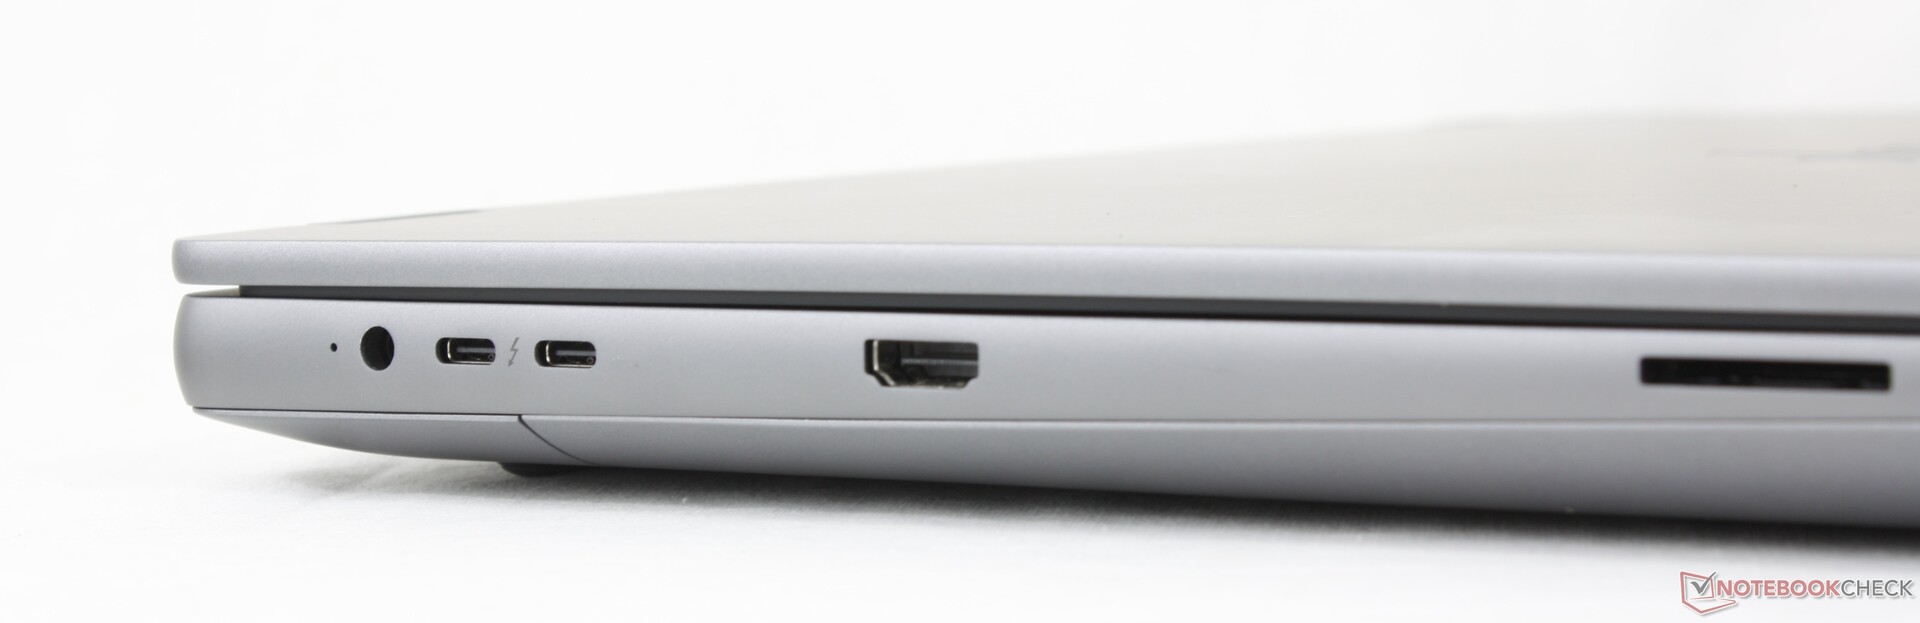
Lecteur de carte SD
| SD Card Reader | |
| average JPG Copy Test (av. of 3 runs) | |
| HP ZBook X G1i 16 (Toshiba Exceria Pro SDXC 64 GB UHS-II) | |
| Dell Pro Max 18 Plus MB18250 (Toshiba Exceria Pro SDXC 64 GB UHS-II) | |
| HP ZBook Fury G1i 18 (Toshiba Exceria Pro SDXC 64 GB UHS-II) | |
| Lenovo ThinkPad P16 Gen 2 (Toshiba Exceria Pro SDXC 64 GB UHS-II) | |
| Schenker Key 18 Pro M25 RTX 5090 (Angelbird AV Pro V60) | |
| maximum AS SSD Seq Read Test (1GB) | |
| HP ZBook X G1i 16 (Toshiba Exceria Pro SDXC 64 GB UHS-II) | |
| Dell Pro Max 18 Plus MB18250 (Toshiba Exceria Pro SDXC 64 GB UHS-II) | |
| HP ZBook Fury G1i 18 (Toshiba Exceria Pro SDXC 64 GB UHS-II) | |
| Schenker Key 18 Pro M25 RTX 5090 (Angelbird AV Pro V60) | |
| Lenovo ThinkPad P16 Gen 2 (Toshiba Exceria Pro SDXC 64 GB UHS-II) | |
Communication
Webcam
Un appareil photo de 5 mégapixels est fourni en standard, avec une technologie infrarouge et un obturateur physique. Le logiciel Poly Camera Pro, qui est également inclus dans la plupart des autres ordinateurs portables HP, est préinstallé sur le ZBook Fury pour des fonctions de vidéoconférence supplémentaires.


Maintenance
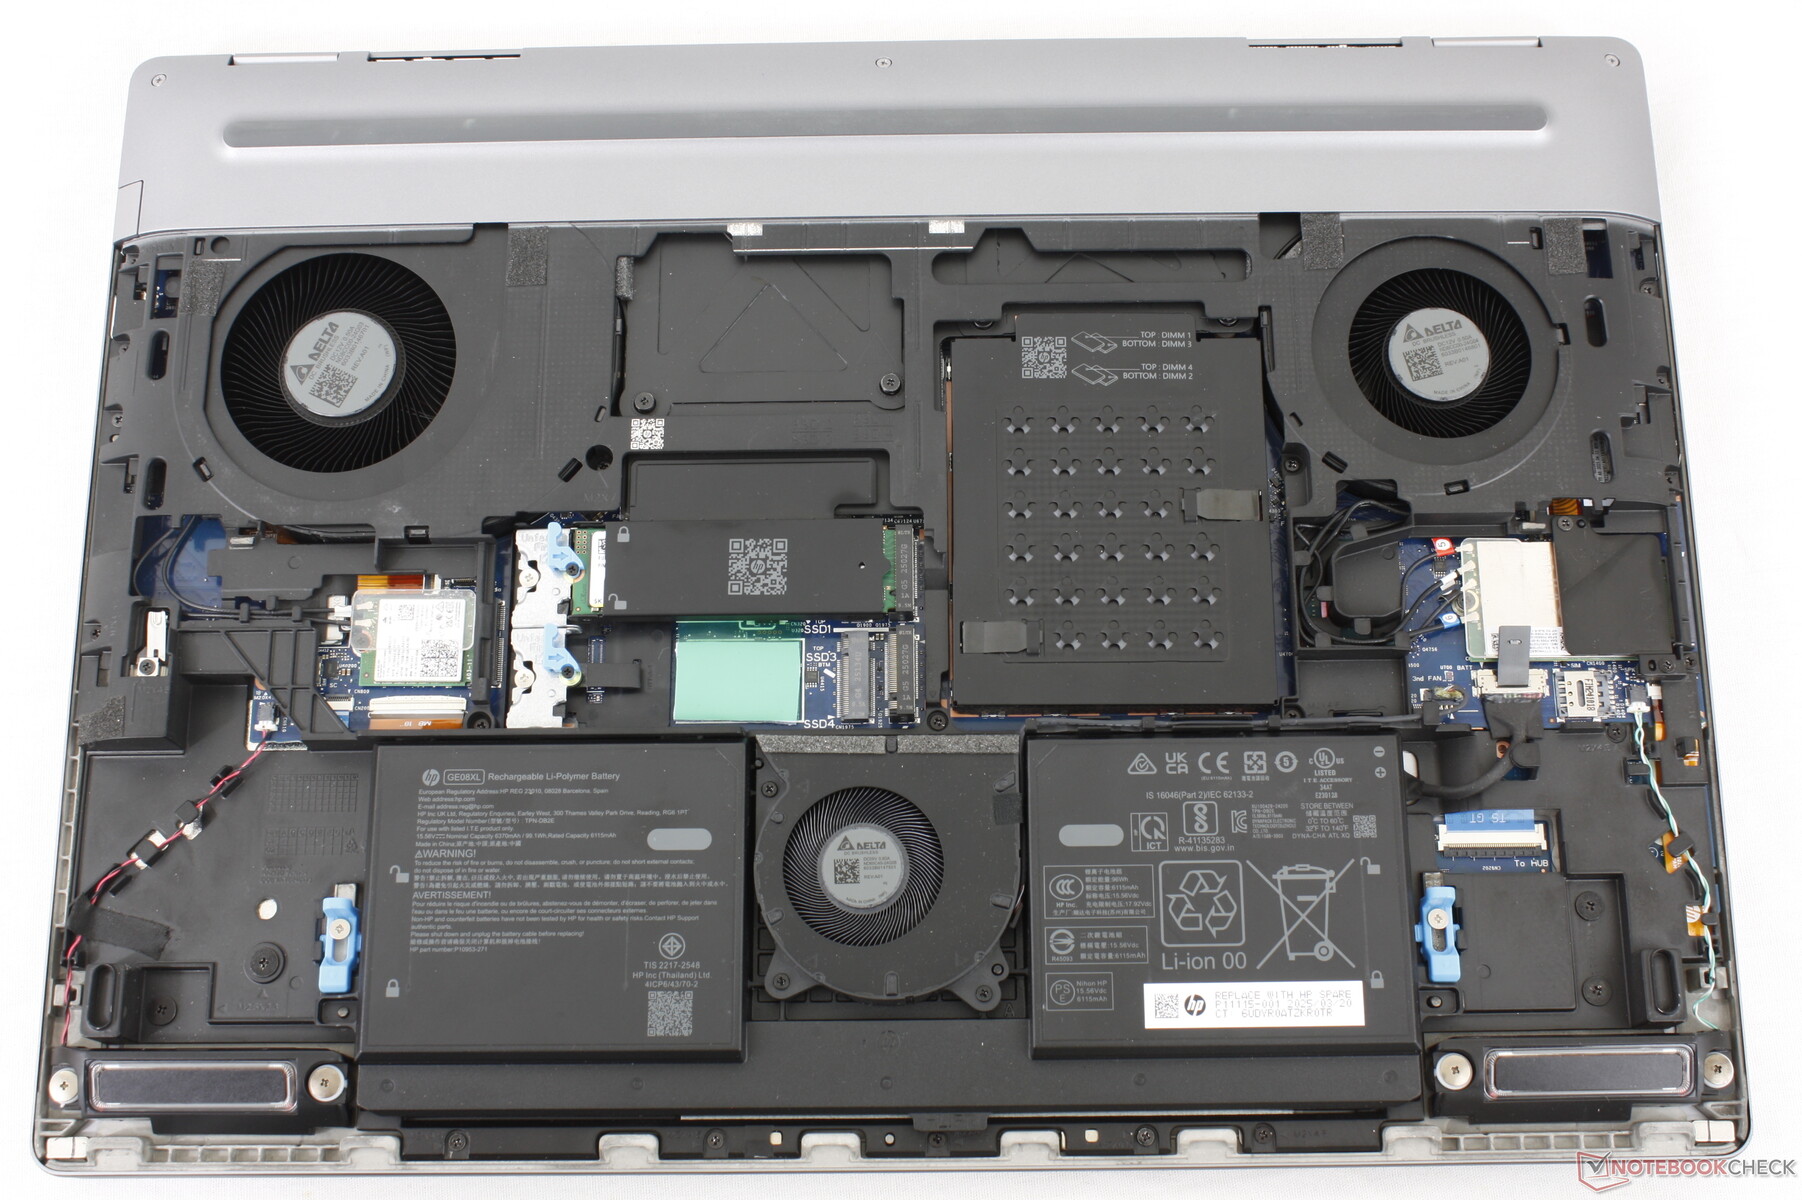
Le panneau inférieur est "sans outil" et peut être retiré sans tournevis. Néanmoins, la plupart des composants sont vissés sur la carte mère et un tournevis est donc toujours nécessaire pour l'entretien.
Durabilité
40 % des plastiques entourant le châssis sont issus du recyclage post-consommation, tandis que l'emballage est principalement constitué de pulpe de papier, avec un peu d'emballage plastique pour l'adaptateur secteur.
Accessoires et garantie
Il n'y a rien d'autre dans la boîte que l'adaptateur secteur et la documentation. Il est décevant de constater que le système n'est accompagné que d'une garantie limitée du fabricant d'un an lorsque vous le commandez sur le site officiel de HP, au lieu des trois ans habituels pour les stations de travail haut de gamme.
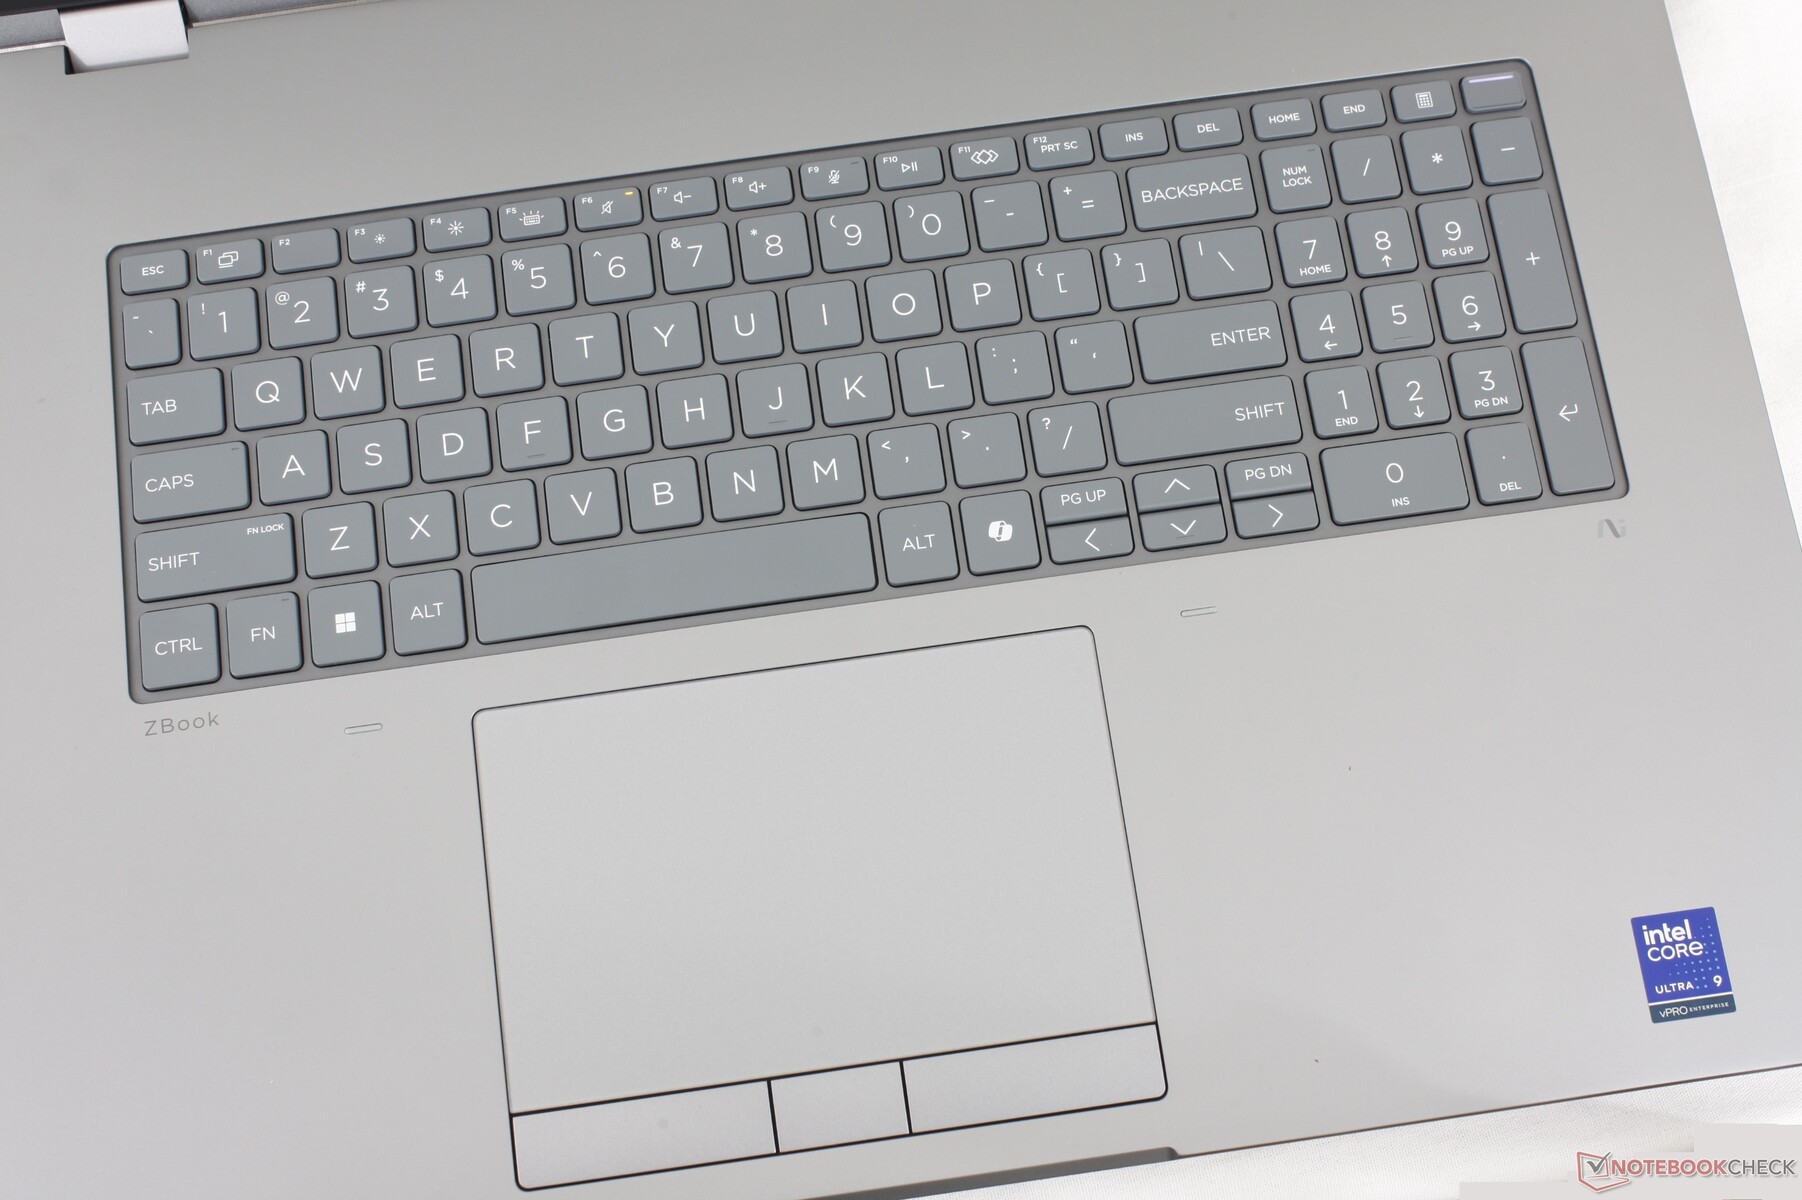
Périphériques d'entrée
Affichage - Pas de 4K ni d'OLED pour l'instant
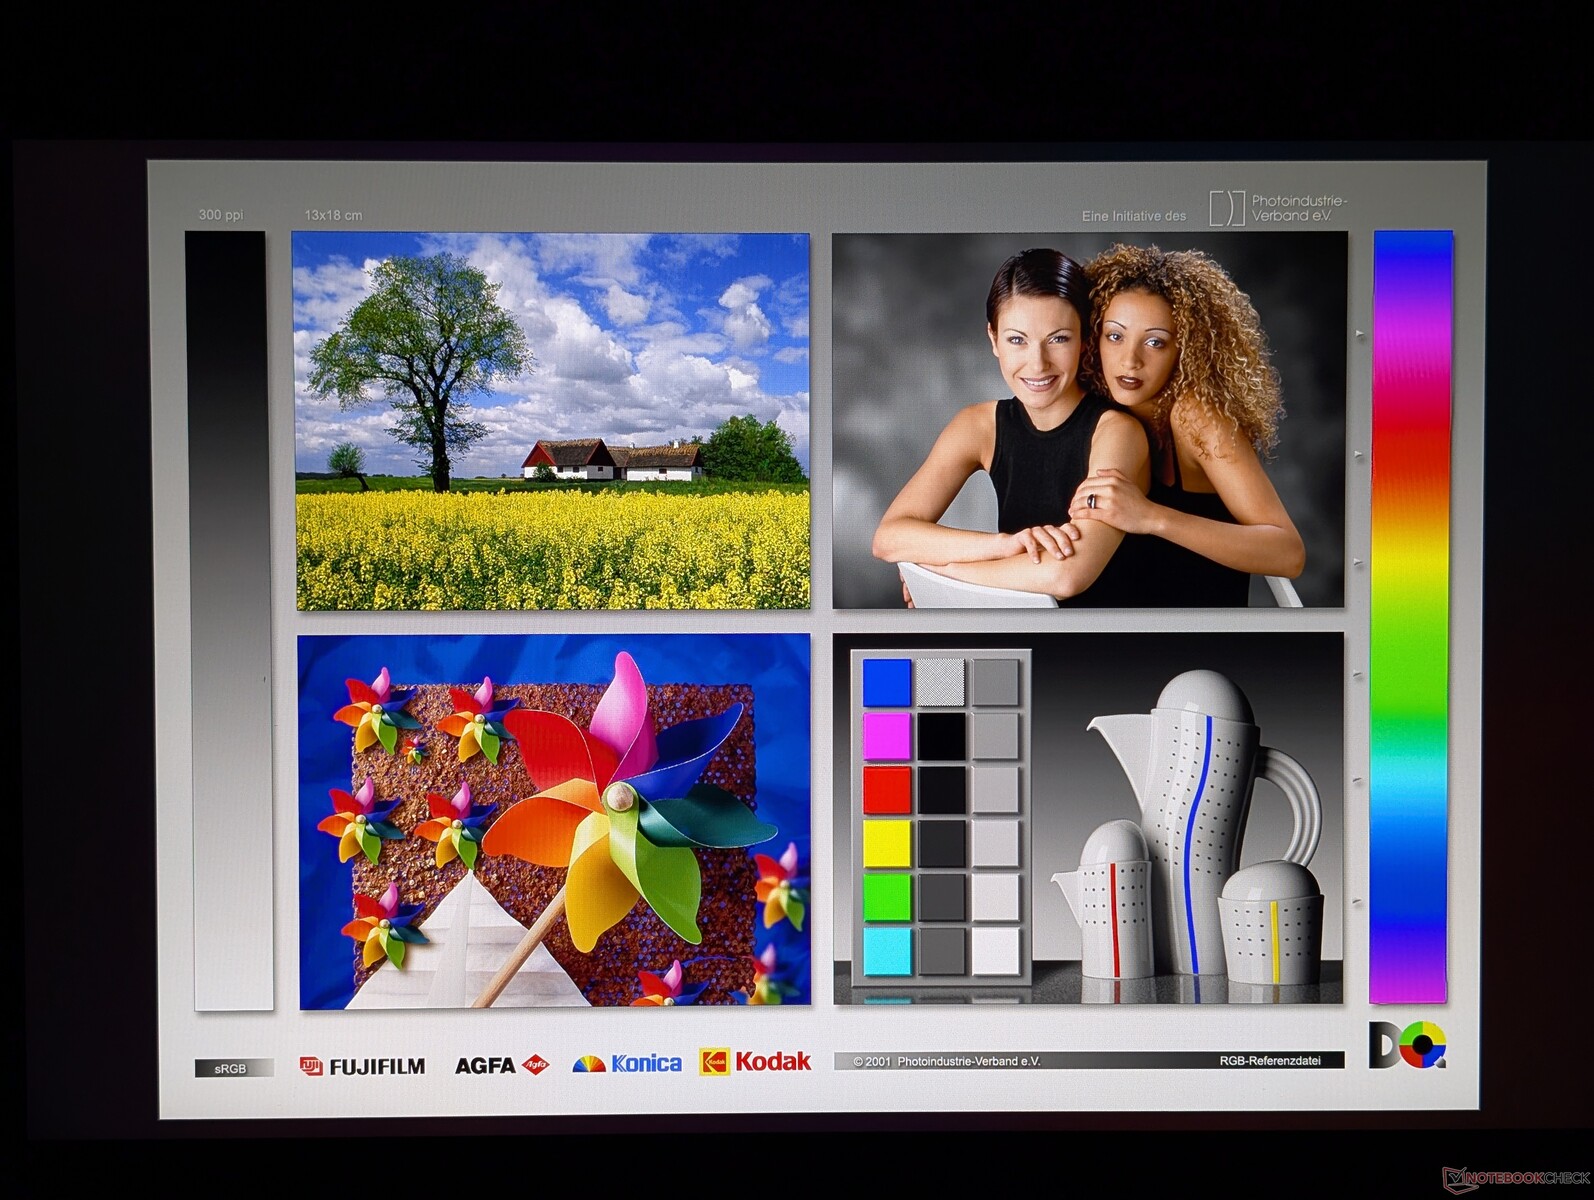
Comme le Dell Pro Max 18 Plusle HP ZBook Fury G1i 18 est également limité à une seule option 2560 x 1600 IPS non tactile. Cependant, HP utilise un panneau différent de AU Optronics au lieu de BOE qui offre des couleurs P3 et des niveaux de luminosité similaires, mais avec des temps de réponse noir-blanc plus rapides, un taux de rafraîchissement natif plus rapide, un support PSR2, et des niveaux de contraste légèrement inférieurs.
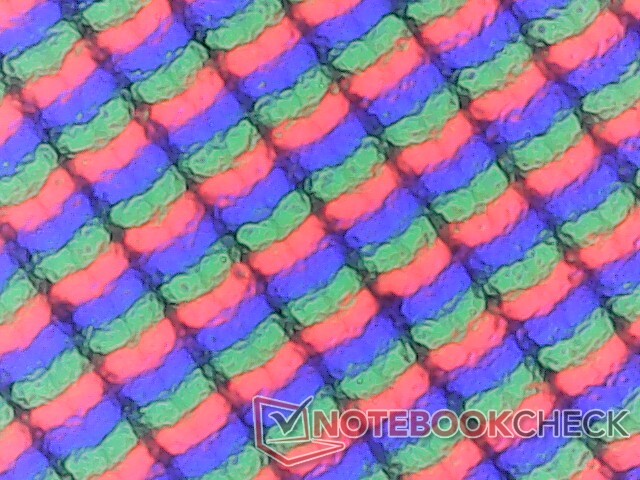
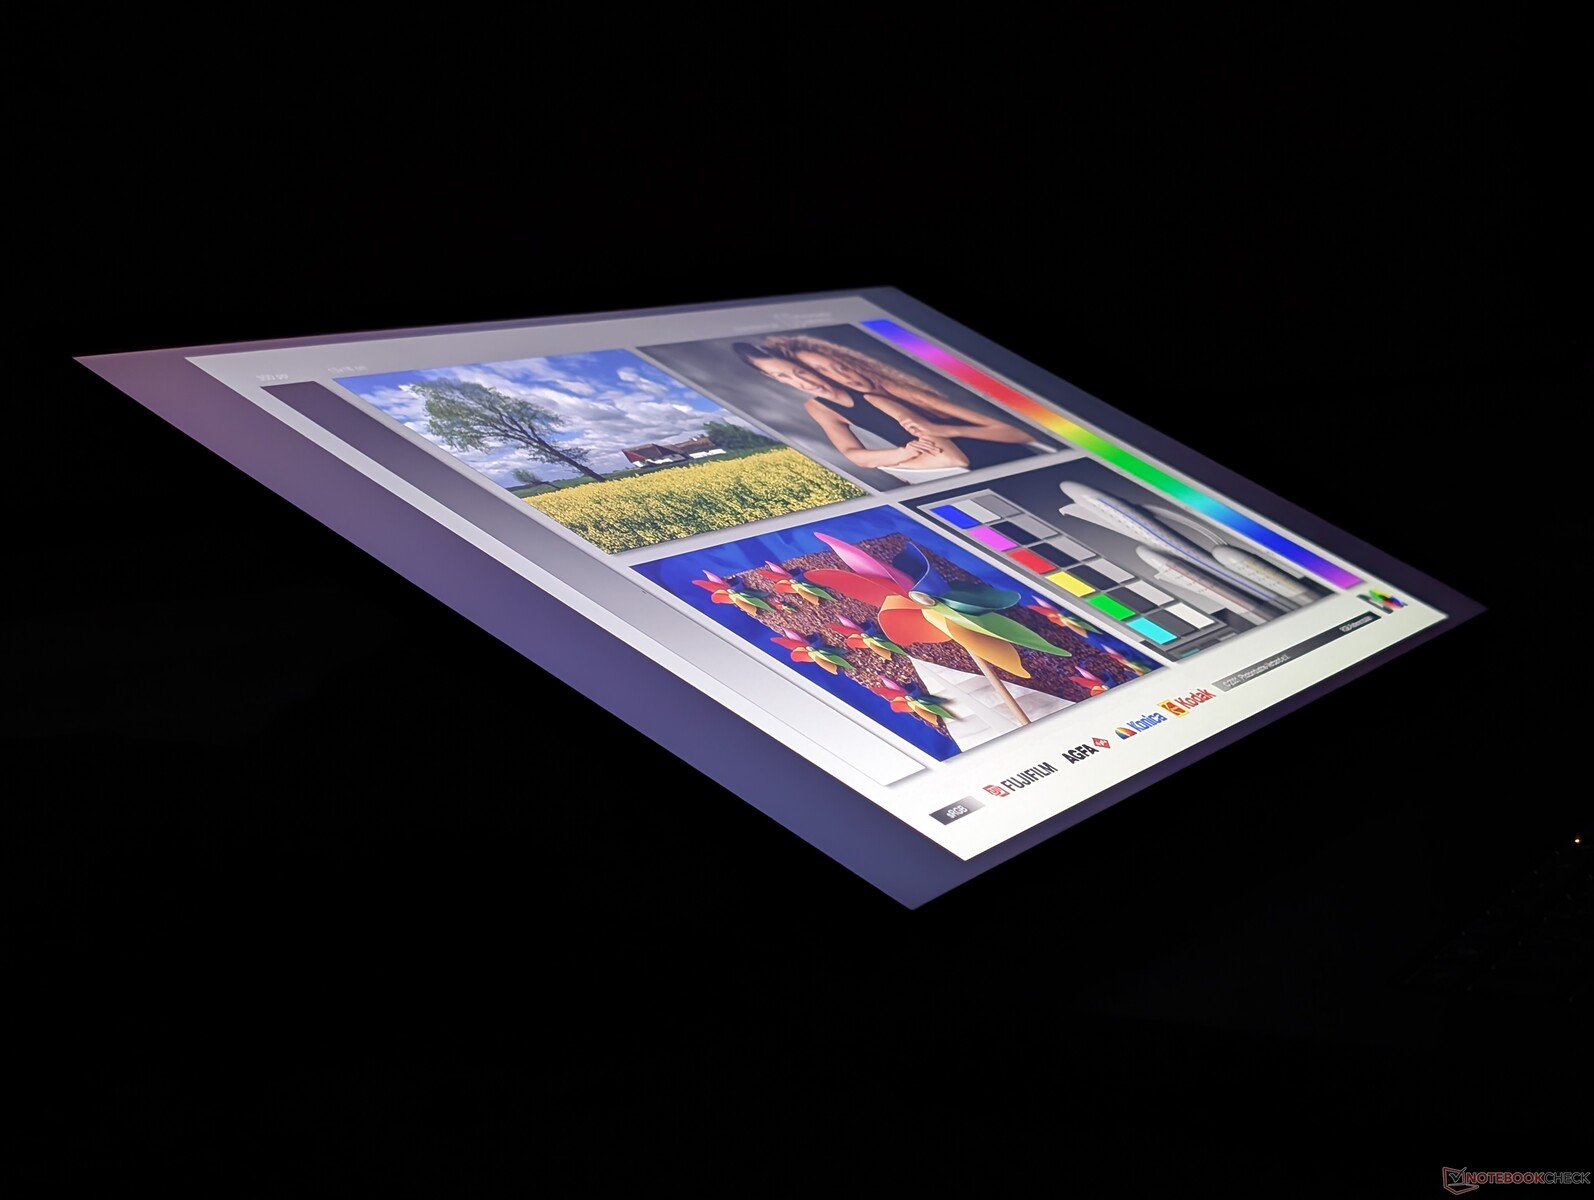
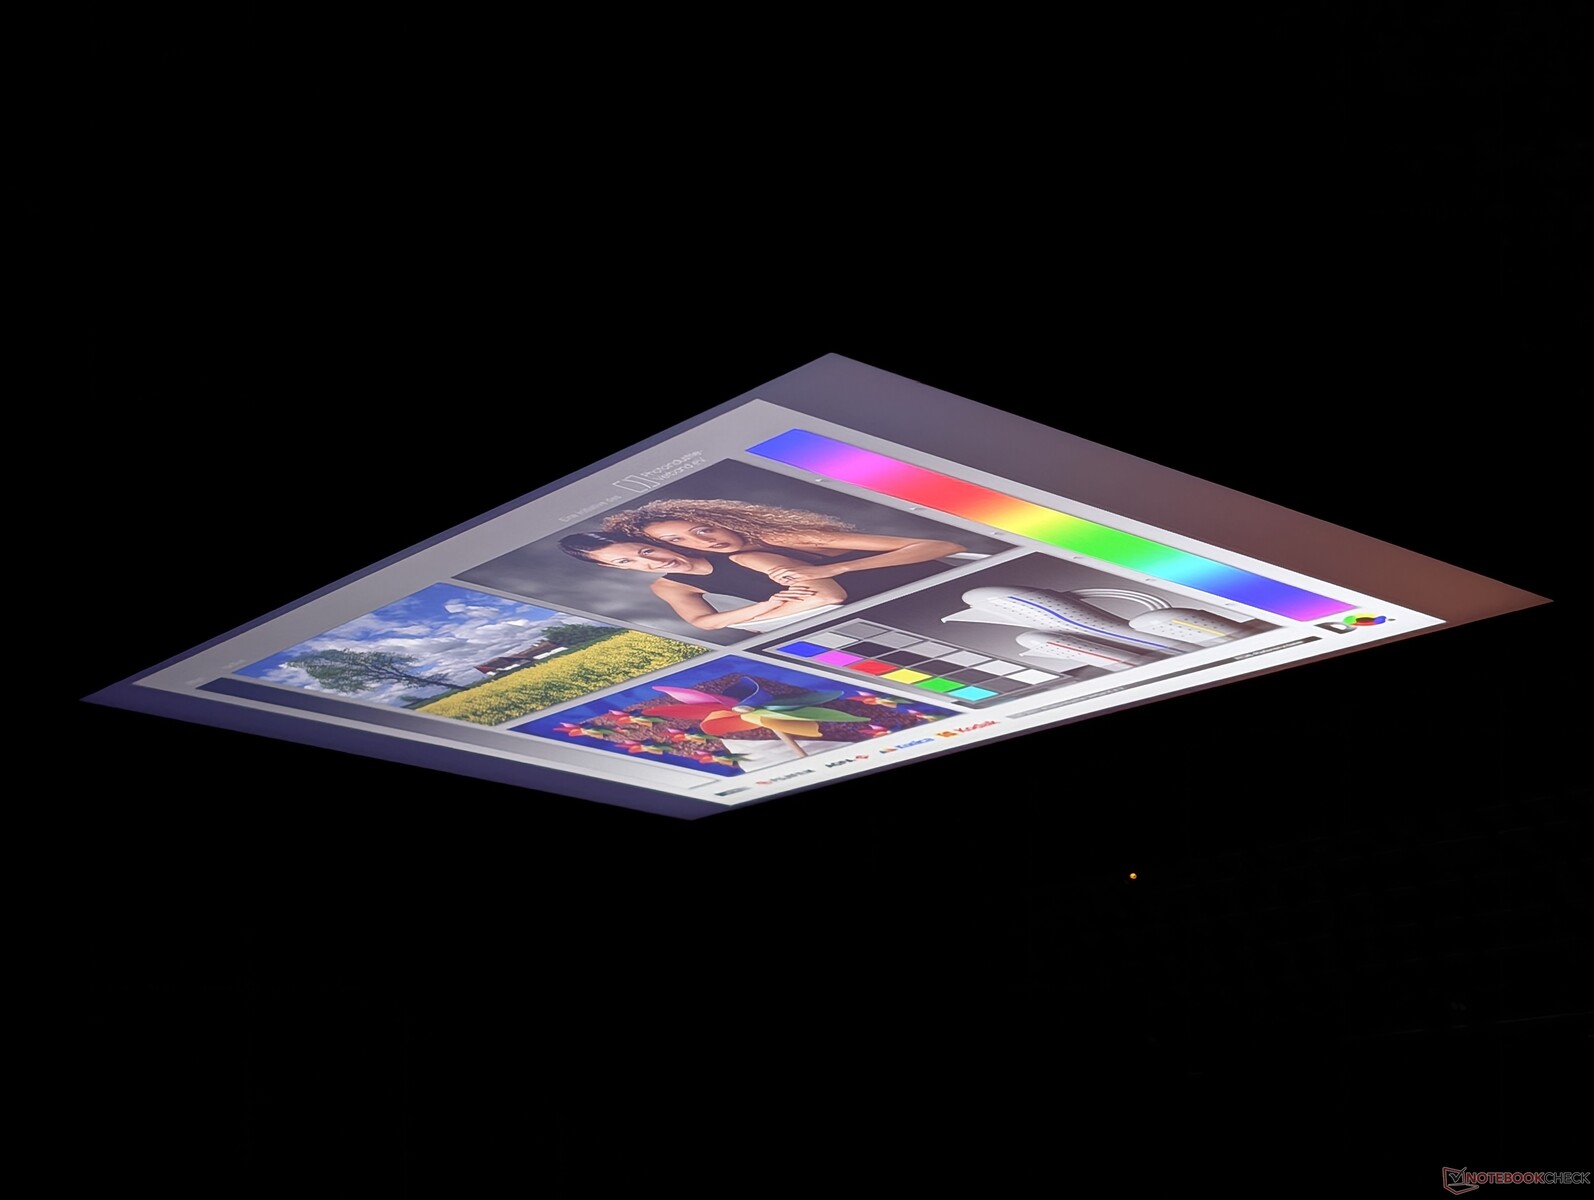
Notre unité de test souffre d'une perte de luminosité modérée et inégale dans les coins, comme le montre l'image ci-dessous. Bien qu'acceptable sur des ordinateurs portables moins chers, ce phénomène est un peu décevant sur une station de travail de premier plan comme le ZBook.

| |||||||||||||||||||||||||
Homogénéité de la luminosité: 92 %
Valeur mesurée au centre, sur batterie: 517.5 cd/m²
Contraste: 1617:1 (Valeurs des noirs: 0.32 cd/m²)
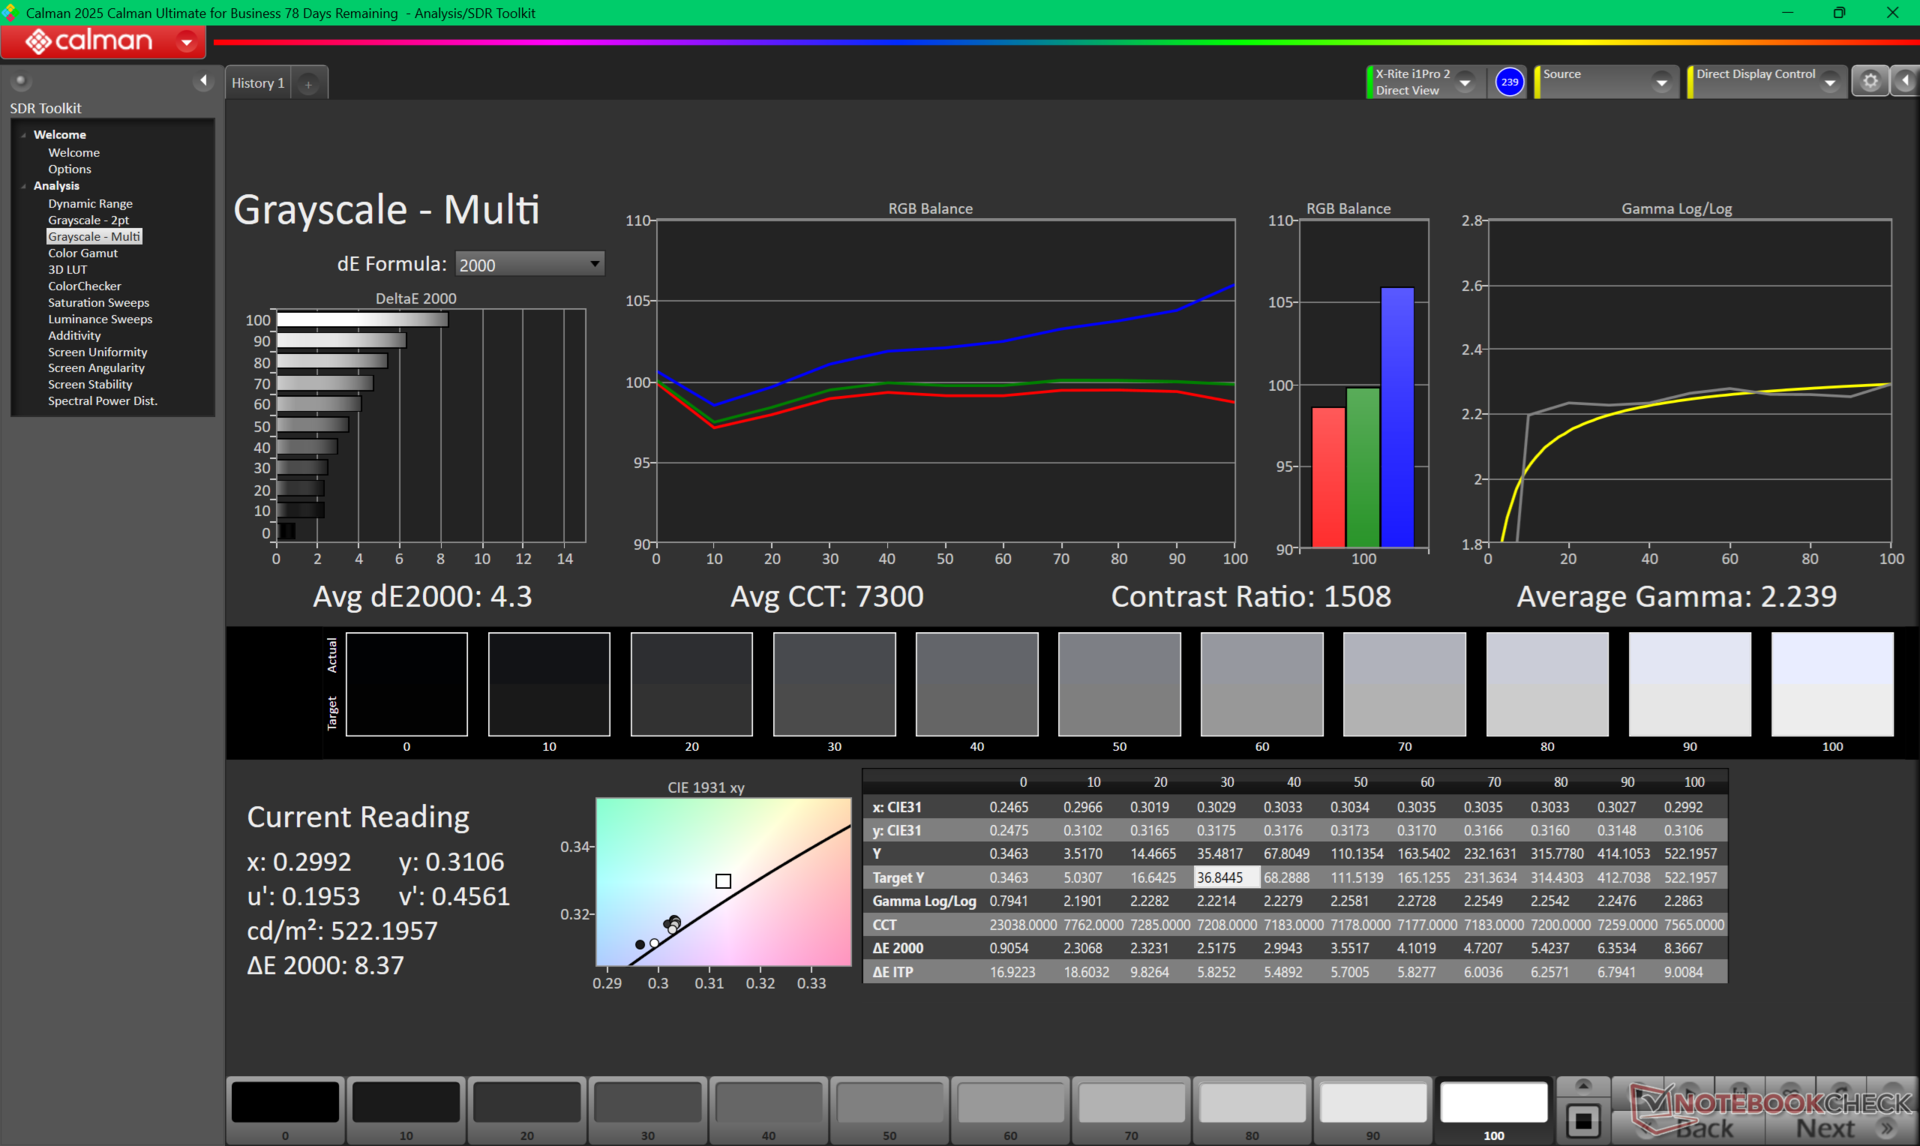
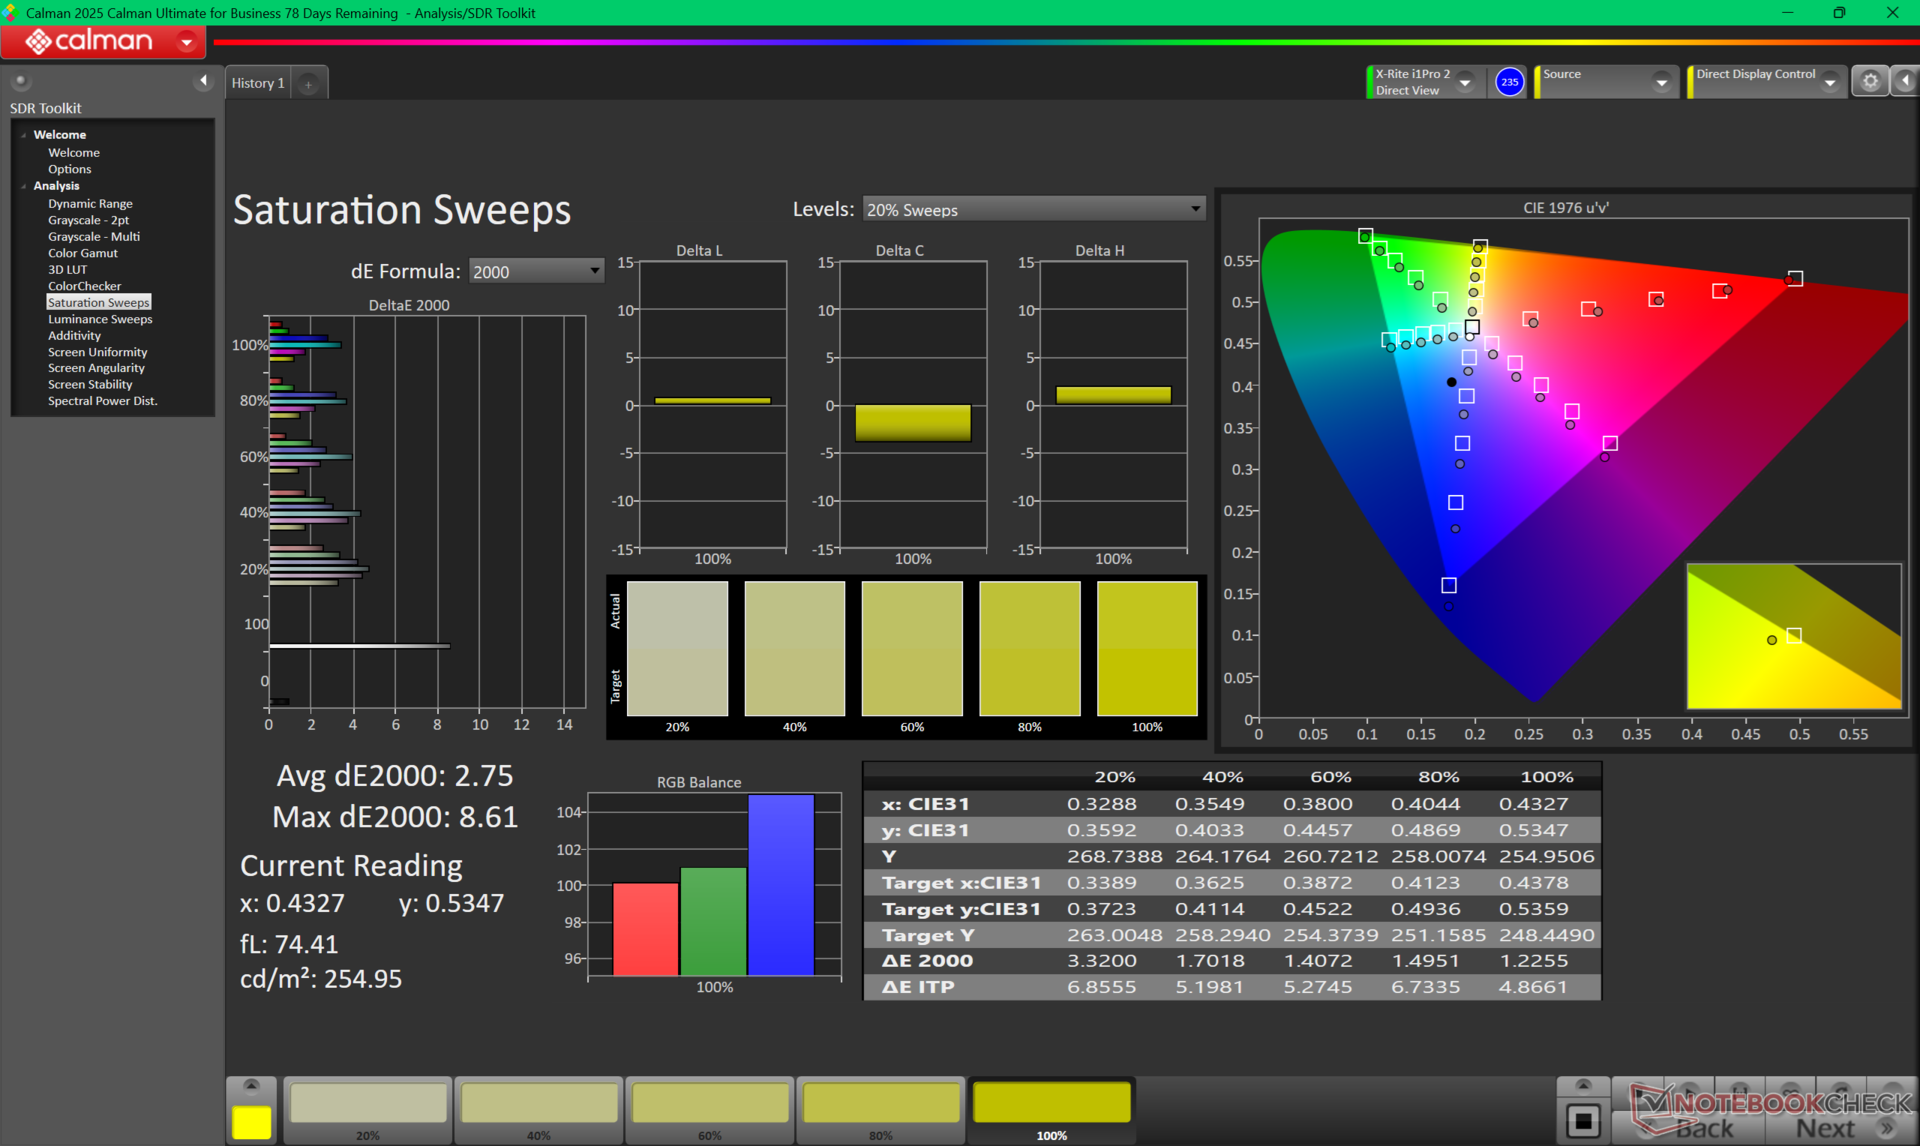
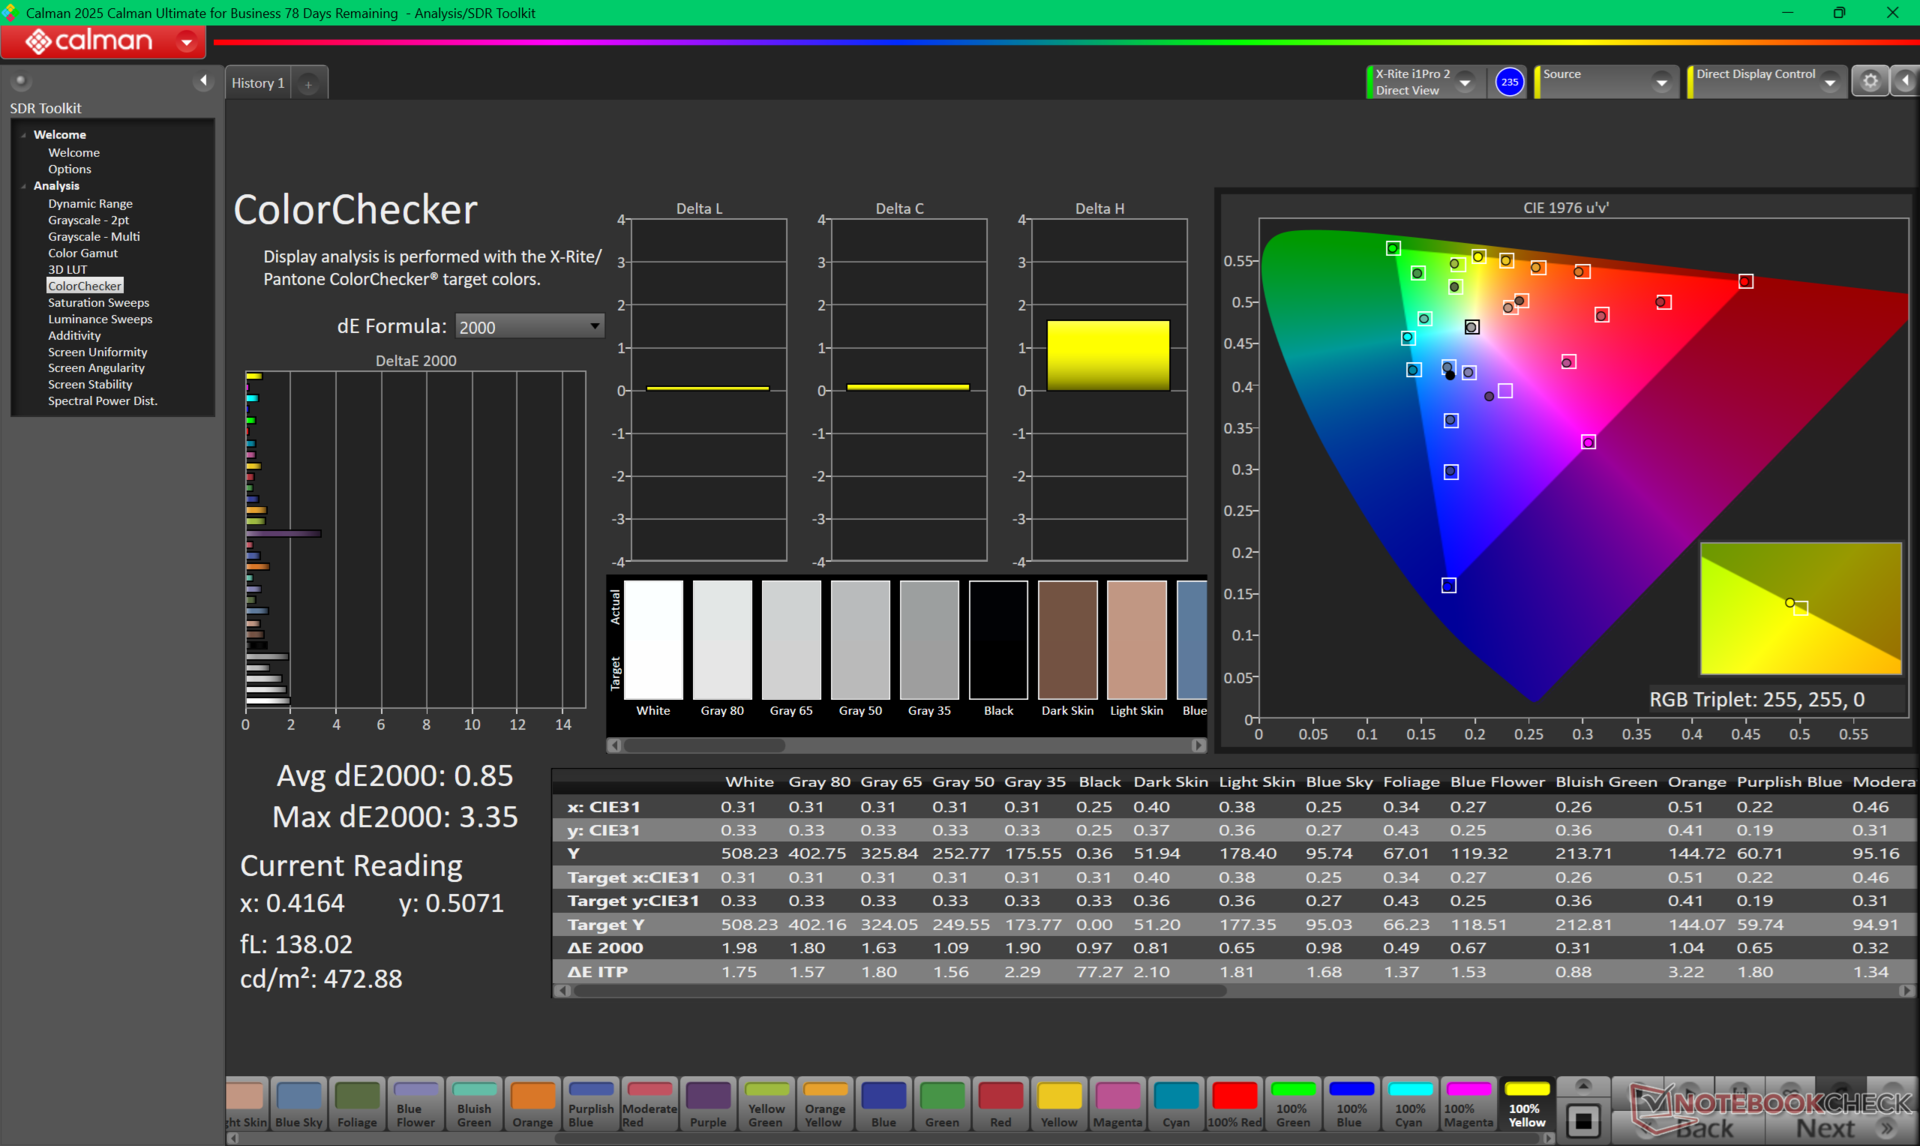
ΔE ColorChecker Calman: 3.62 | ∀{0.5-29.43 Ø4.76}
calibrated: 0.85
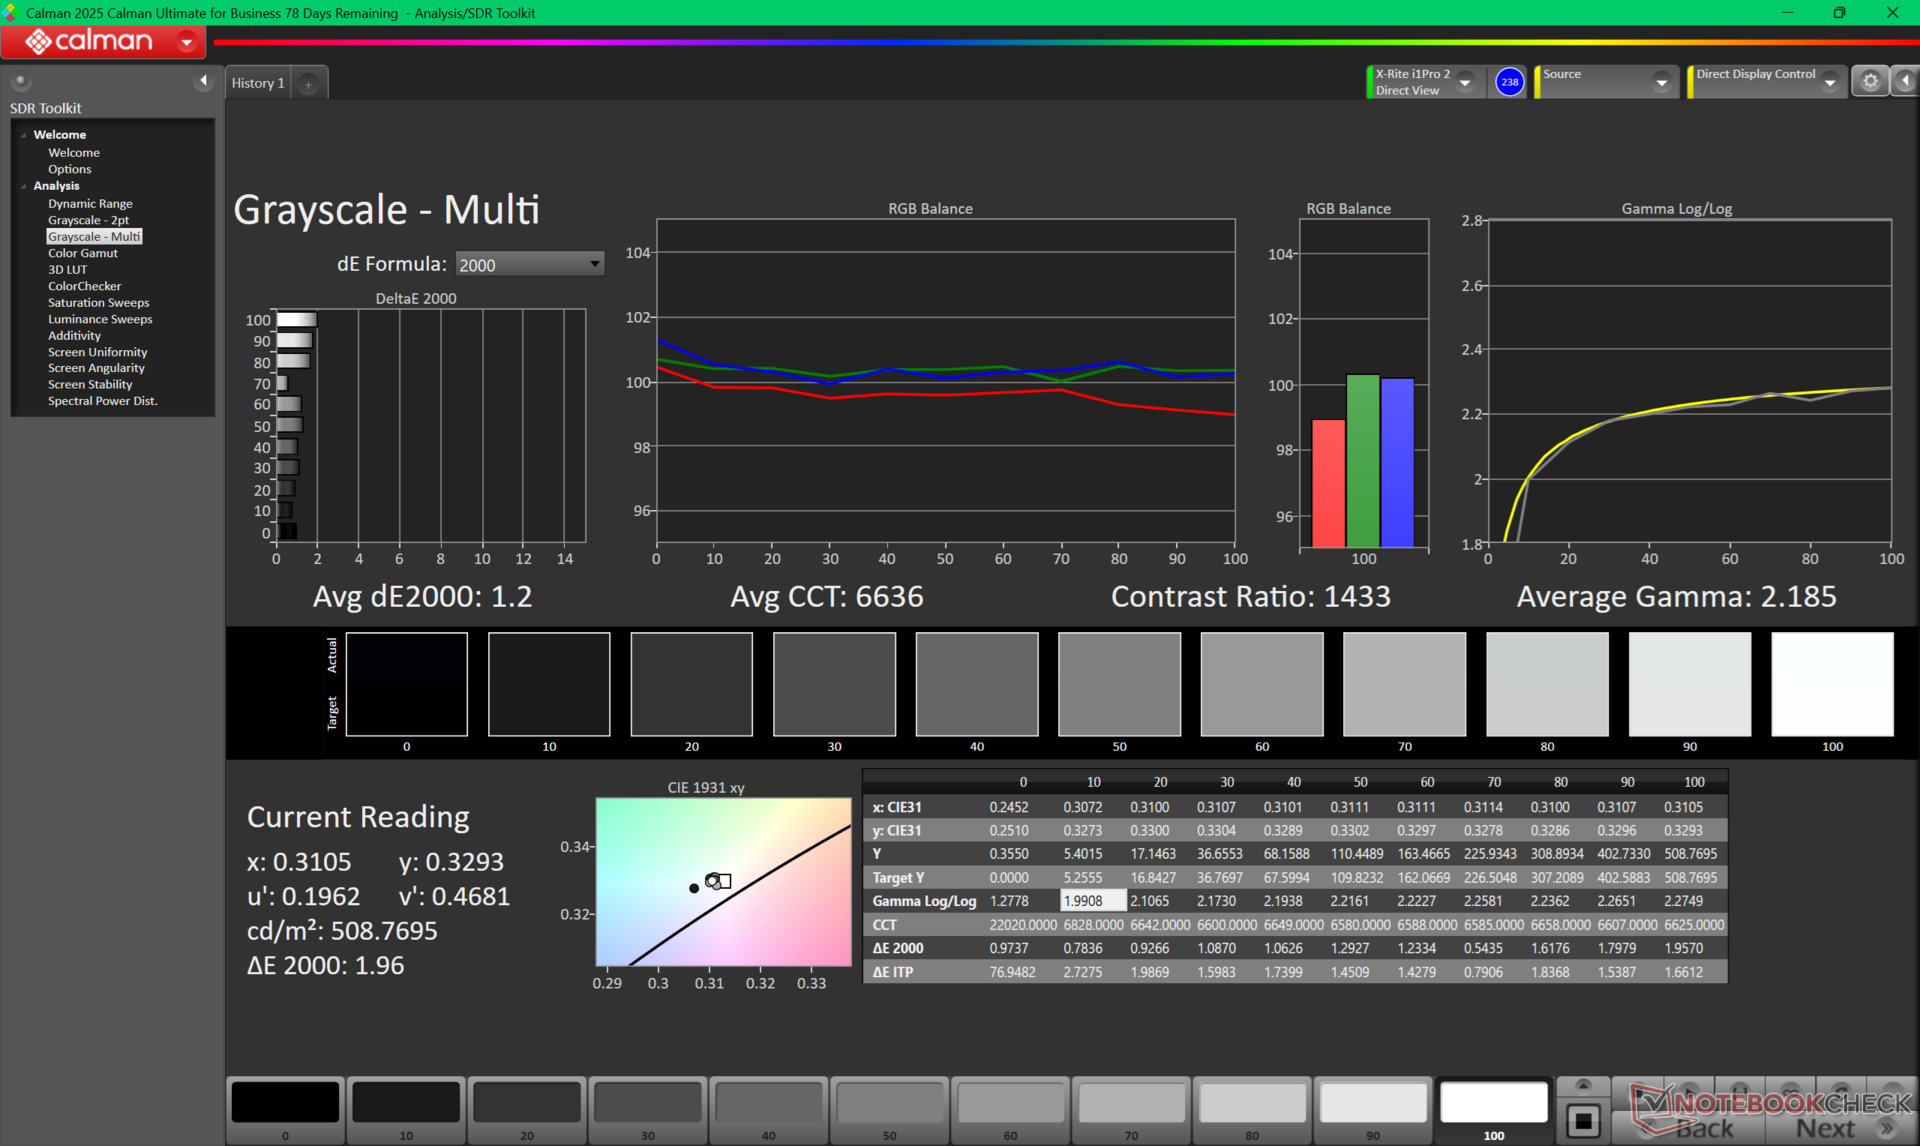
ΔE Greyscale Calman: 4.3 | ∀{0.09-98 Ø5}
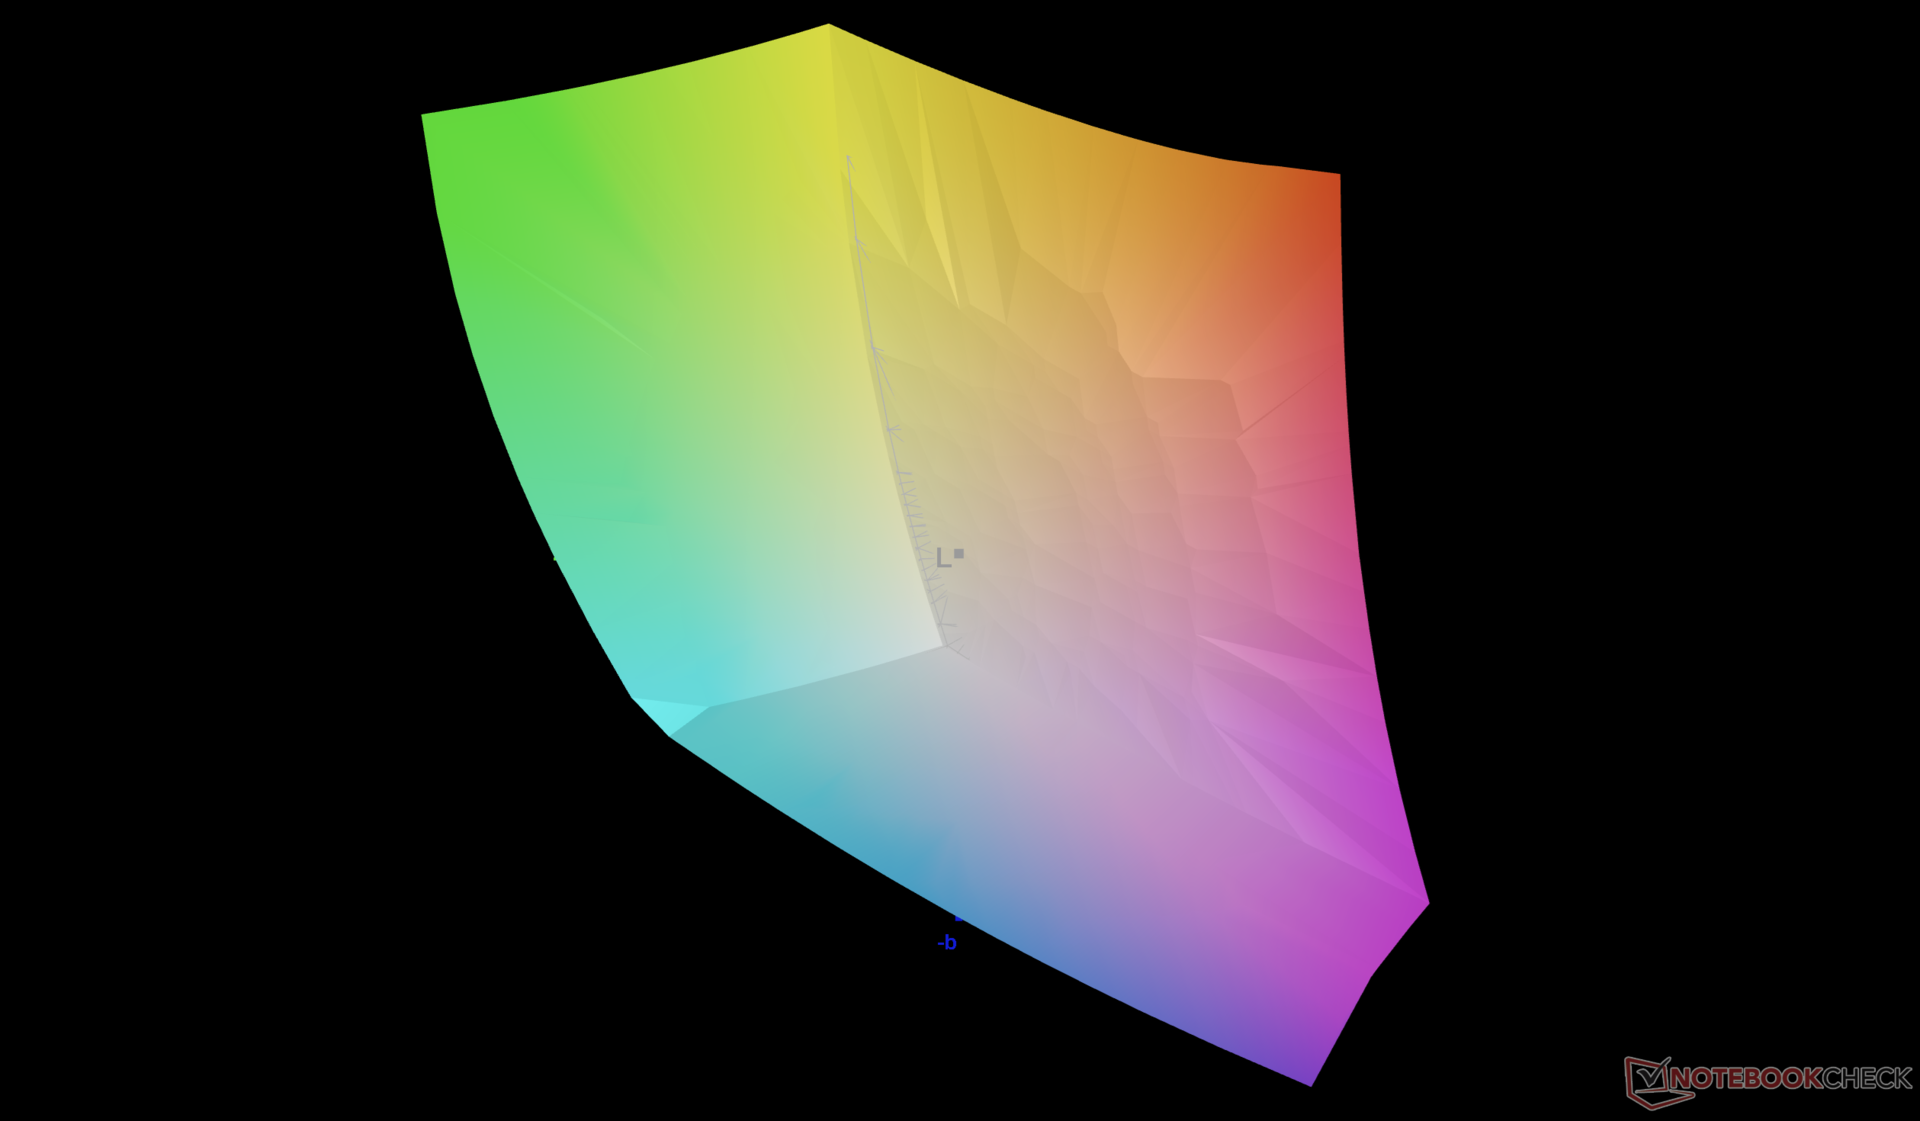
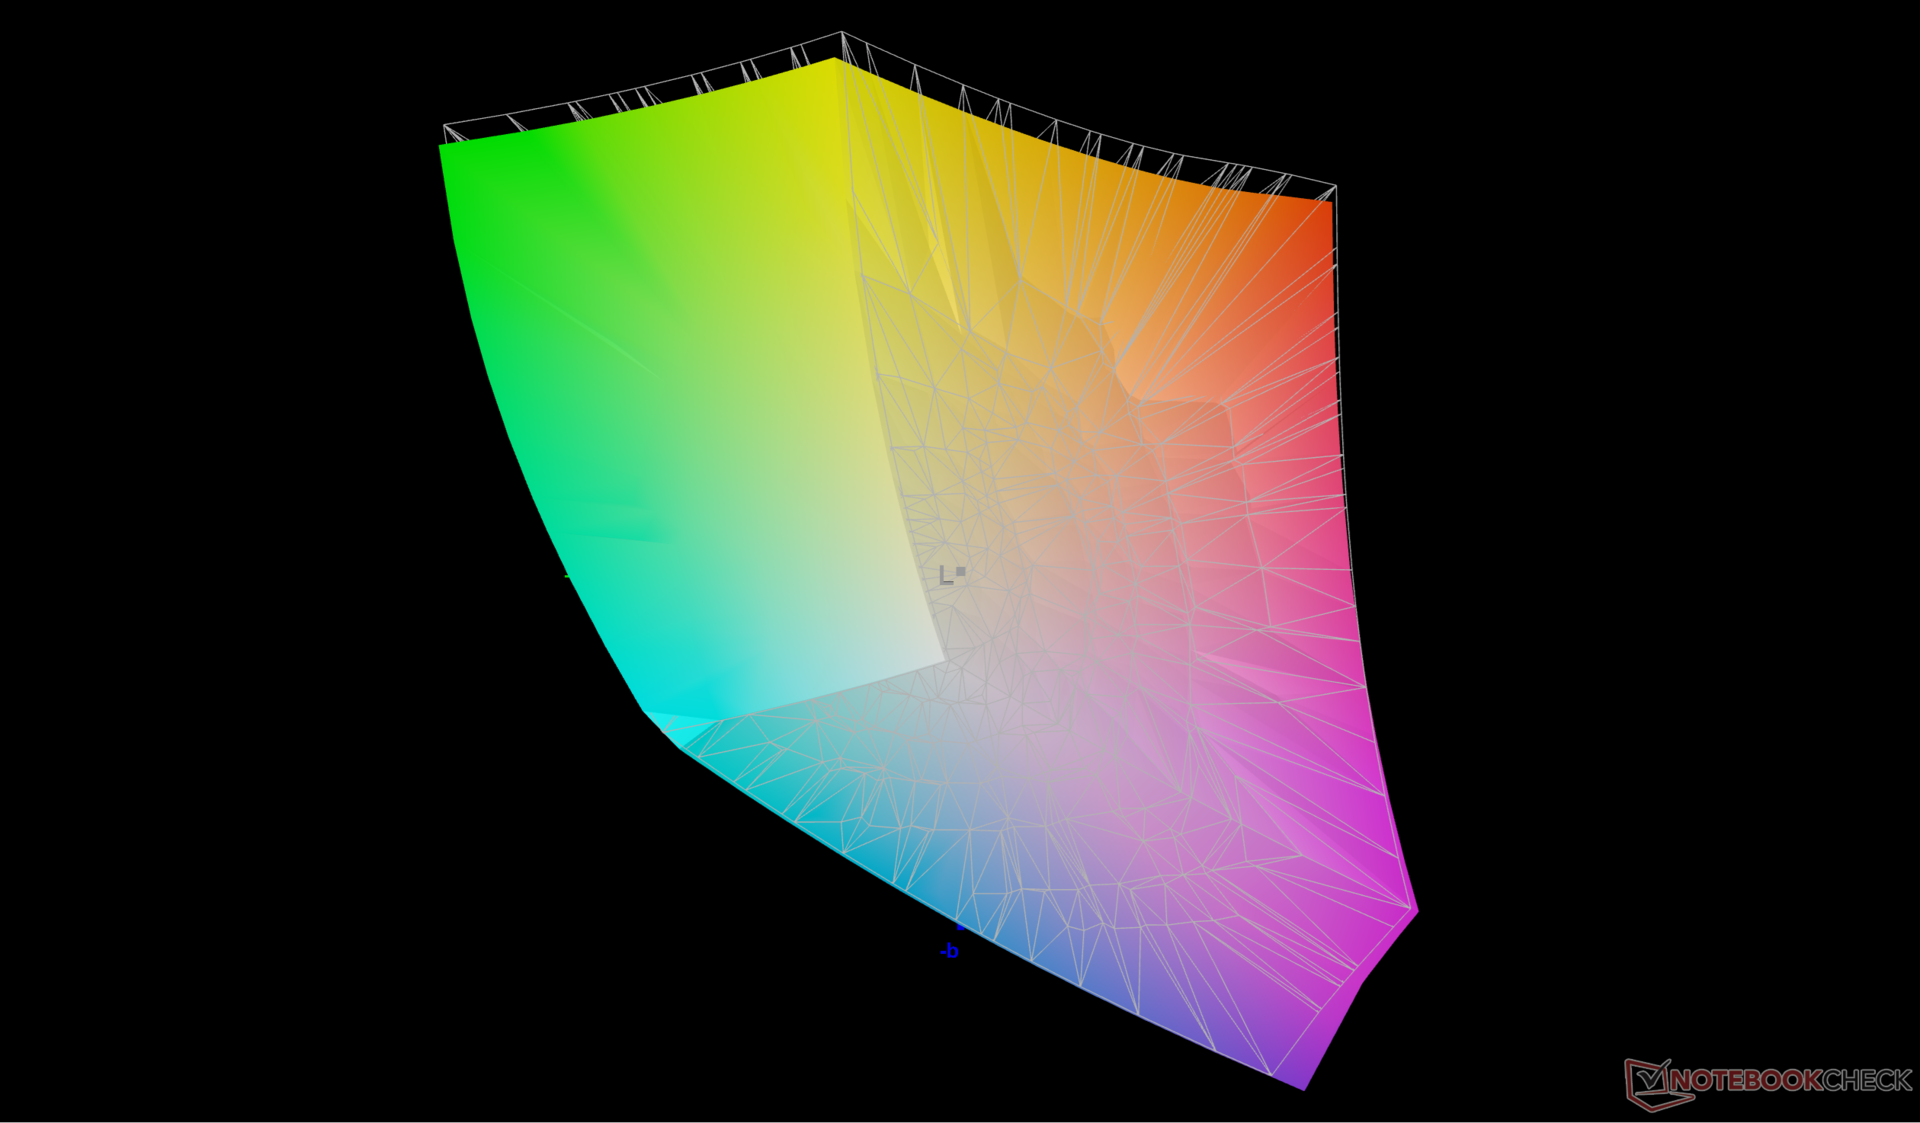
87.7% AdobeRGB 1998 (Argyll 3D)
100% sRGB (Argyll 3D)
96.6% Display P3 (Argyll 3D)
Gamma: 2.24
CCT: 7300 K
| HP ZBook Fury G1i 18 AUO12B6, IPS, 2560x1600, 18", 165 Hz | Dell Pro Max 18 Plus MB18250 BOE NE18NZ7, IPS, 2560x1600, 18", 120 Hz | Schenker Key 18 Pro M25 RTX 5090 LQ180D1JW01, IPS, 3840x2400, 18", 200 Hz | Lenovo ThinkPad P16 Gen 2 NE160QDM-NY1, IPS, 2560x1600, 16", 165 Hz | HP ZBook X G1i 16 LG Philips LGD07B3, IPS, 2560x1600, 16", 120 Hz | HP ZBook Studio 16 G11 AUO87A8, IPS, 3840x2400, 16", 120 Hz | |
|---|---|---|---|---|---|---|
| Display | -0% | -2% | -17% | 5% | -0% | |
| Display P3 Coverage (%) | 96.6 | 97.7 1% | 90.5 -6% | 68.4 -29% | 97.2 1% | 97.7 1% |
| sRGB Coverage (%) | 100 | 99.9 0% | 100 0% | 96.9 -3% | 100 0% | 99.9 0% |
| AdobeRGB 1998 Coverage (%) | 87.7 | 85.9 -2% | 87.4 0% | 70.6 -19% | 99.9 14% | 85.7 -2% |
| Response Times | -225% | 55% | -12% | -229% | -17% | |
| Response Time Grey 50% / Grey 80% * (ms) | 12.5 ? | 39.9 ? -219% | 5.2 ? 58% | 14.1 ? -13% | 45.5 ? -264% | 14.2 ? -14% |
| Response Time Black / White * (ms) | 8.9 ? | 29.4 ? -230% | 4.3 ? 52% | 9.9 ? -11% | 26.1 ? -193% | 10.6 ? -19% |
| PWM Frequency (Hz) | 26536 ? | |||||
| PWM Amplitude * (%) | 47 | |||||
| Screen | 27% | 5% | 19% | -10% | 2% | |
| Brightness middle (cd/m²) | 517.5 | 528.8 2% | 529 2% | 531.5 3% | 461.8 -11% | 404.3 -22% |
| Brightness (cd/m²) | 497 | 515 4% | 513 3% | 499 0% | 427 -14% | 405 -19% |
| Brightness Distribution (%) | 92 | 91 -1% | 95 3% | 89 -3% | 88 -4% | 92 0% |
| Black Level * (cd/m²) | 0.32 | 0.22 31% | 0.31 3% | 0.38 -19% | 0.46 -44% | 0.28 12% |
| Contrast (:1) | 1617 | 2404 49% | 1706 6% | 1399 -13% | 1004 -38% | 1444 -11% |
| Colorchecker dE 2000 * | 3.62 | 2.76 24% | 2.7 25% | 1.82 50% | 4.08 -13% | 2.63 27% |
| Colorchecker dE 2000 max. * | 8.75 | 5.38 39% | 7.8 11% | 4.1 53% | 8.1 7% | 4.48 49% |
| Colorchecker dE 2000 calibrated * | 0.85 | 0.47 45% | 0.8 6% | 0.63 26% | 0.75 12% | 1.46 -72% |
| Greyscale dE 2000 * | 4.3 | 2.2 49% | 4.9 -14% | 1.2 72% | 3.5 19% | 2.1 51% |
| Gamma | 2.24 98% | 2.14 103% | 2.23 99% | 2.15 102% | 2.15 102% | 2.3 96% |
| CCT | 7300 89% | 2584 252% | 6997 93% | 6484 100% | 6715 97% | 6810 95% |
| Moyenne finale (programmes/paramètres) | -66% /
-15% | 19% /
11% | -3% /
7% | -78% /
-38% | -5% /
-1% |
* ... Moindre est la valeur, meilleures sont les performances
La température de couleur est froide dès la sortie de l'emballage (7300). L'écran est par ailleurs calibré de manière satisfaisante par rapport à la norme P3.

Temps de réponse de l'écran
| ↔ Temps de réponse noir à blanc | ||
|---|---|---|
| 8.9 ms ... hausse ↗ et chute ↘ combinées | ↗ 4.5 ms hausse | 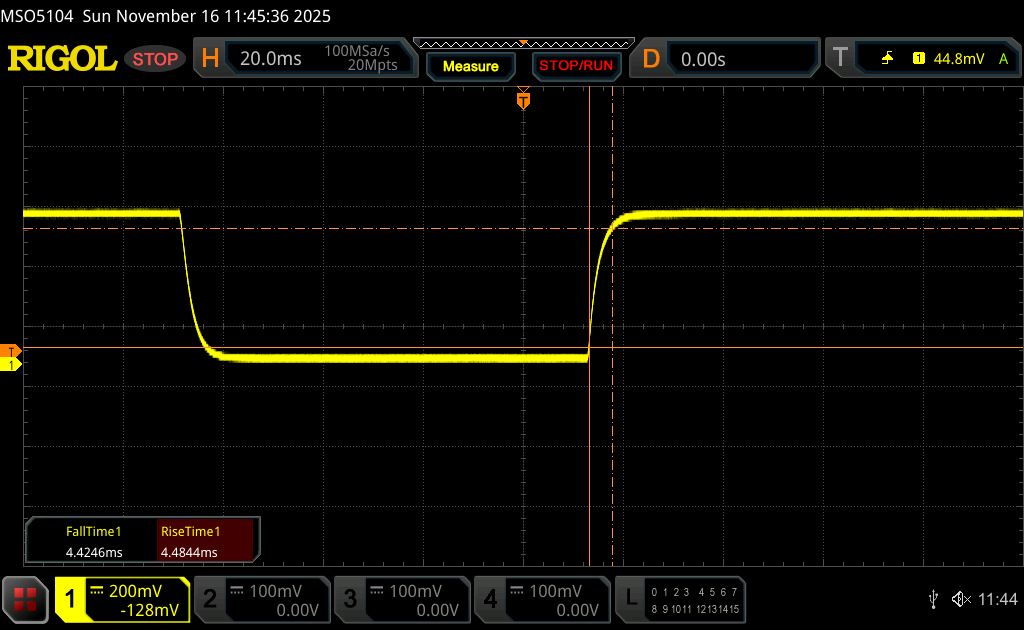 |
| ↘ 4.4 ms chute | ||
| L'écran montre de faibles temps de réponse, un bon écran pour jouer. En comparaison, tous les appareils testés affichent entre 0.1 (minimum) et 240 (maximum) ms. » 24 % des appareils testés affichent de meilleures performances. Cela signifie que les latences relevées sont meilleures que la moyenne (20.1 ms) de tous les appareils testés. | ||
| ↔ Temps de réponse gris 50% à gris 80% | ||
| 12.5 ms ... hausse ↗ et chute ↘ combinées | ↗ 6.1 ms hausse | 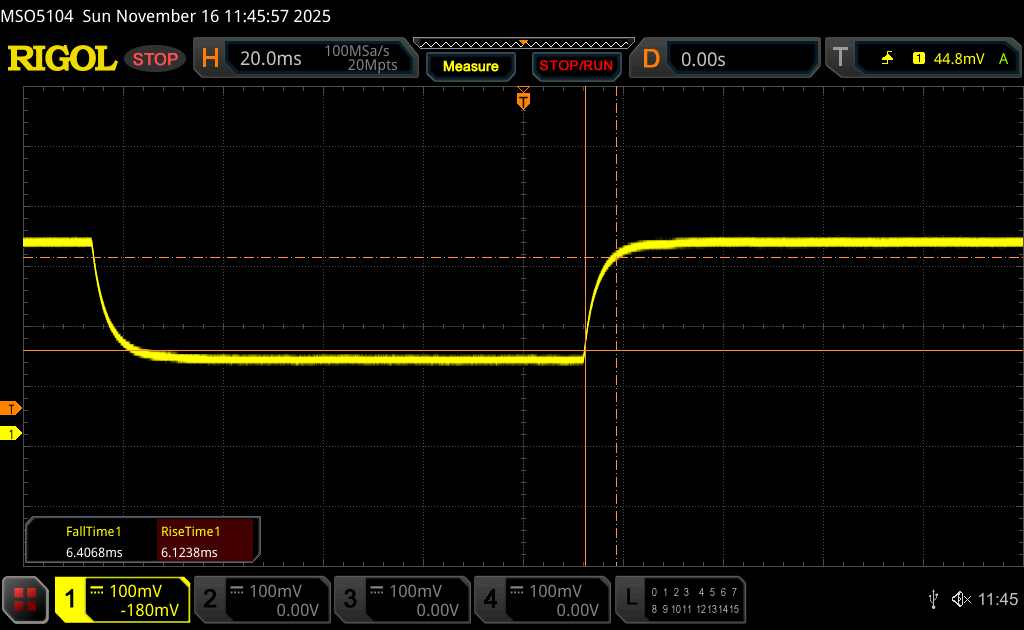 |
| ↘ 6.4 ms chute | ||
| L'écran montre de bons temps de réponse, mais insuffisant pour du jeu compétitif. En comparaison, tous les appareils testés affichent entre 0.165 (minimum) et 636 (maximum) ms. » 25 % des appareils testés affichent de meilleures performances. Cela signifie que les latences relevées sont meilleures que la moyenne (31.4 ms) de tous les appareils testés. | ||
Scintillement / MLI (Modulation de largeur d'impulsion)
| Scintillement / MLI (Modulation de largeur d'impulsion) non décelé | 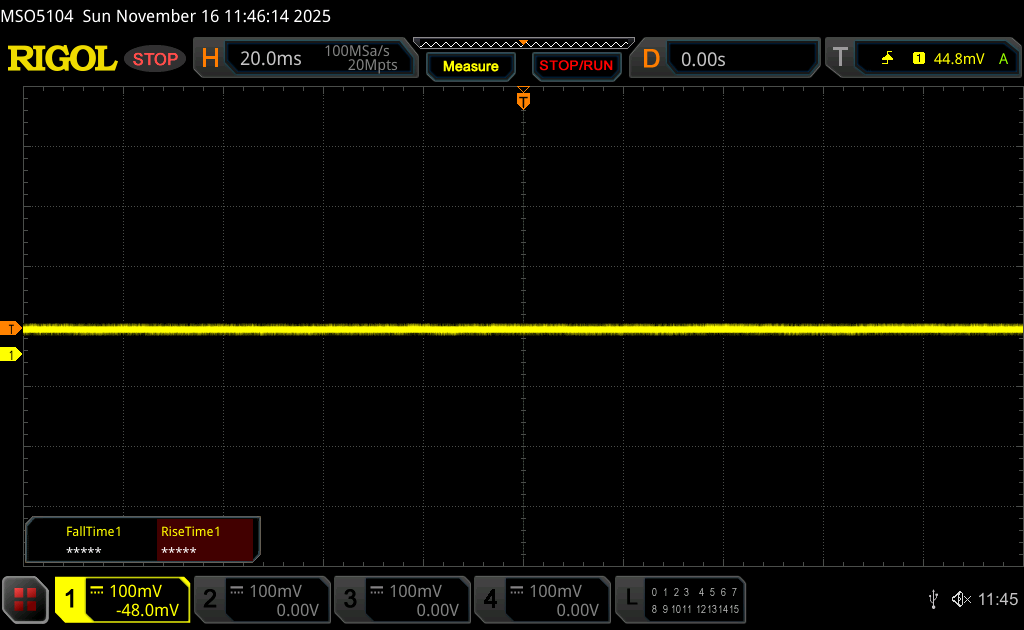 | ||
En comparaison, 53 % des appareils testés n'emploient pas MDI pour assombrir leur écran. Nous avons relevé une moyenne à 8002 (minimum : 5 - maximum : 343500) Hz dans le cas où une MDI était active. | |||

Performance - Arrow Lake-HX et Nvidia Blackwell
Conditions d'essai
Nous avons réglé Windows sur le mode Performance avec le GPU discret actif avant d'exécuter les tests de référence ci-dessous. Advanced Optimus n'est pas pris en charge, contrairement à l'ordinateur Dell Pro Max 18 Plus.
Processeur
Le Core Ultra 9 285HX de notre HP est systématiquement plus lent que le même processeur du Dell Pro Max 18 Plus, à quelques points de pourcentage près. Turbo Boost semble être plus faible sur le HP, comme le montrent les résultats de la boucle CineBench R15 xT ci-dessous, mais les deux machines plafonnent à des fréquences d'horloge presque identiques une fois que les avantages de Turbo Boost s'estompent.
Configuration avec le Core Ultra 7 255HX au lieu du Core Ultra 9 285HX devrait avoir un impact sur les performances du processeur de seulement 5 %, d'après les résultats obtenus avec la machine Lenovo Legion Pro 5 16IAX10. Les utilisateurs peuvent donc envisager l'option d'un processeur plus bas de gamme pour réduire les coûts.
Cinebench R15 Multi Loop
Cinebench R23: Multi Core | Single Core
Cinebench R20: CPU (Multi Core) | CPU (Single Core)
Cinebench R15: CPU Multi 64Bit | CPU Single 64Bit
Blender: v2.79 BMW27 CPU
7-Zip 18.03: 7z b 4 | 7z b 4 -mmt1
Geekbench 6.5: Multi-Core | Single-Core
Geekbench 5.5: Multi-Core | Single-Core
HWBOT x265 Benchmark v2.2: 4k Preset
LibreOffice : 20 Documents To PDF
R Benchmark 2.5: Overall mean
* ... Moindre est la valeur, meilleures sont les performances
AIDA64: FP32 Ray-Trace | FPU Julia | CPU SHA3 | CPU Queen | FPU SinJulia | FPU Mandel | CPU AES | CPU ZLib | FP64 Ray-Trace | CPU PhotoWorxx
| Performance rating | |
| Dell Pro Max 18 Plus MB18250 | |
| Schenker Key 18 Pro M25 RTX 5090 | |
| Moyenne Intel Core Ultra 9 285HX | |
| HP ZBook Fury G1i 18 | |
| Lenovo ThinkPad P16 Gen 2 | |
| HP ZBook Studio 16 G11 | |
| AIDA64 / FP32 Ray-Trace | |
| Schenker Key 18 Pro M25 RTX 5090 | |
| Dell Pro Max 18 Plus MB18250 | |
| Moyenne Intel Core Ultra 9 285HX (29076 - 42341, n=6) | |
| HP ZBook Fury G1i 18 | |
| Lenovo ThinkPad P16 Gen 2 | |
| HP ZBook Studio 16 G11 | |
| AIDA64 / FPU Julia | |
| Schenker Key 18 Pro M25 RTX 5090 | |
| Moyenne Intel Core Ultra 9 285HX (161276 - 210885, n=6) | |
| Dell Pro Max 18 Plus MB18250 | |
| HP ZBook Fury G1i 18 | |
| Lenovo ThinkPad P16 Gen 2 | |
| HP ZBook Studio 16 G11 | |
| AIDA64 / CPU SHA3 | |
| Schenker Key 18 Pro M25 RTX 5090 | |
| Dell Pro Max 18 Plus MB18250 | |
| Moyenne Intel Core Ultra 9 285HX (7757 - 9815, n=6) | |
| HP ZBook Fury G1i 18 | |
| Lenovo ThinkPad P16 Gen 2 | |
| HP ZBook Studio 16 G11 | |
| AIDA64 / CPU Queen | |
| Lenovo ThinkPad P16 Gen 2 | |
| Moyenne Intel Core Ultra 9 285HX (134345 - 141681, n=6) | |
| Dell Pro Max 18 Plus MB18250 | |
| Schenker Key 18 Pro M25 RTX 5090 | |
| HP ZBook Fury G1i 18 | |
| HP ZBook Studio 16 G11 | |
| AIDA64 / FPU SinJulia | |
| Schenker Key 18 Pro M25 RTX 5090 | |
| Dell Pro Max 18 Plus MB18250 | |
| Lenovo ThinkPad P16 Gen 2 | |
| Moyenne Intel Core Ultra 9 285HX (12559 - 14431, n=6) | |
| HP ZBook Fury G1i 18 | |
| HP ZBook Studio 16 G11 | |
| AIDA64 / FPU Mandel | |
| Schenker Key 18 Pro M25 RTX 5090 | |
| Moyenne Intel Core Ultra 9 285HX (84053 - 108922, n=6) | |
| Dell Pro Max 18 Plus MB18250 | |
| HP ZBook Fury G1i 18 | |
| Lenovo ThinkPad P16 Gen 2 | |
| HP ZBook Studio 16 G11 | |
| AIDA64 / CPU AES | |
| Schenker Key 18 Pro M25 RTX 5090 | |
| Dell Pro Max 18 Plus MB18250 | |
| HP ZBook Fury G1i 18 | |
| Moyenne Intel Core Ultra 9 285HX (119553 - 134195, n=6) | |
| Lenovo ThinkPad P16 Gen 2 | |
| HP ZBook Studio 16 G11 | |
| AIDA64 / CPU ZLib | |
| Dell Pro Max 18 Plus MB18250 | |
| Schenker Key 18 Pro M25 RTX 5090 | |
| Moyenne Intel Core Ultra 9 285HX (1886 - 2267, n=6) | |
| HP ZBook Fury G1i 18 | |
| Lenovo ThinkPad P16 Gen 2 | |
| HP ZBook Studio 16 G11 | |
| AIDA64 / FP64 Ray-Trace | |
| Schenker Key 18 Pro M25 RTX 5090 | |
| Moyenne Intel Core Ultra 9 285HX (15059 - 22312, n=6) | |
| Dell Pro Max 18 Plus MB18250 | |
| HP ZBook Fury G1i 18 | |
| Lenovo ThinkPad P16 Gen 2 | |
| HP ZBook Studio 16 G11 | |
| AIDA64 / CPU PhotoWorxx | |
| Dell Pro Max 18 Plus MB18250 | |
| HP ZBook Studio 16 G11 | |
| Moyenne Intel Core Ultra 9 285HX (39232 - 62611, n=6) | |
| Lenovo ThinkPad P16 Gen 2 | |
| HP ZBook Fury G1i 18 | |
| Schenker Key 18 Pro M25 RTX 5090 | |
Test de stress
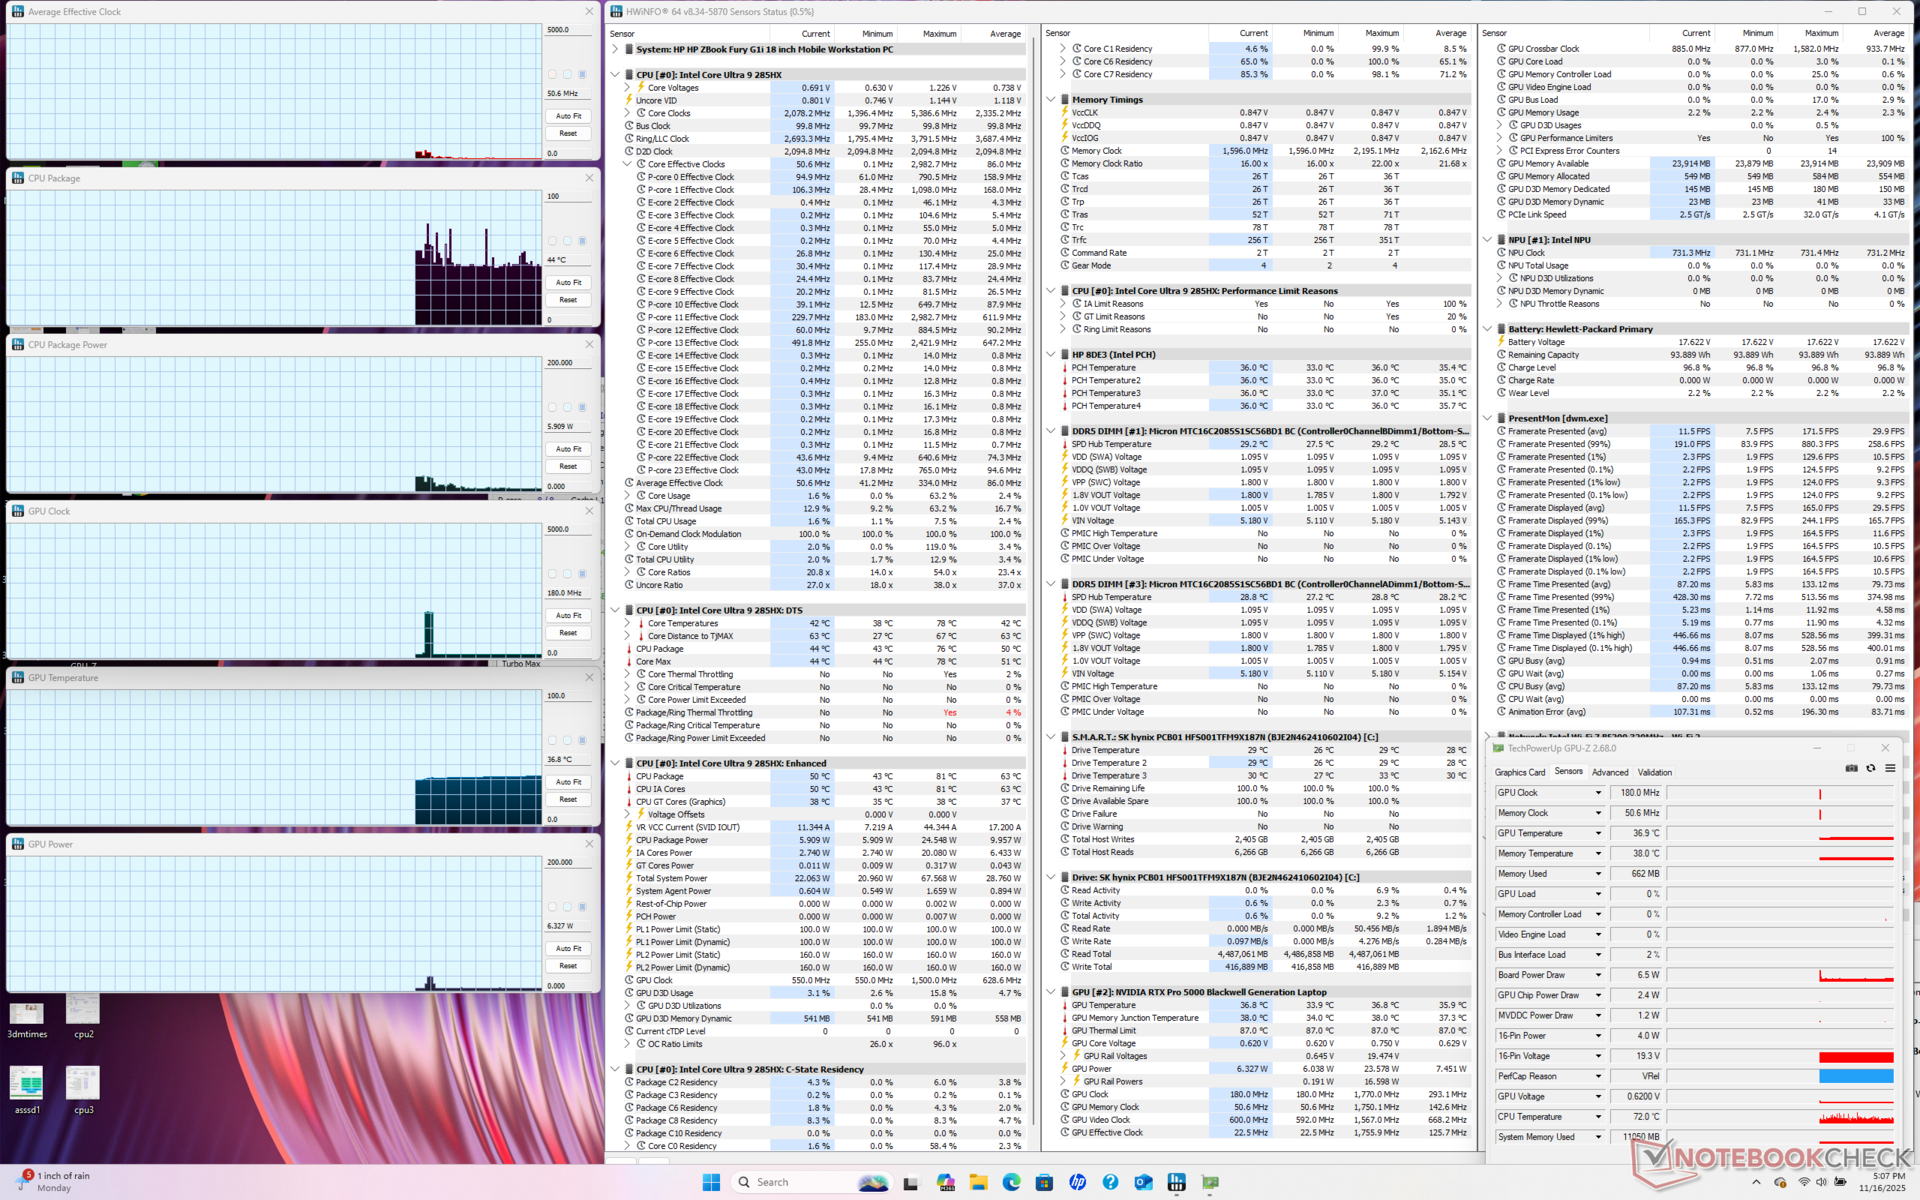
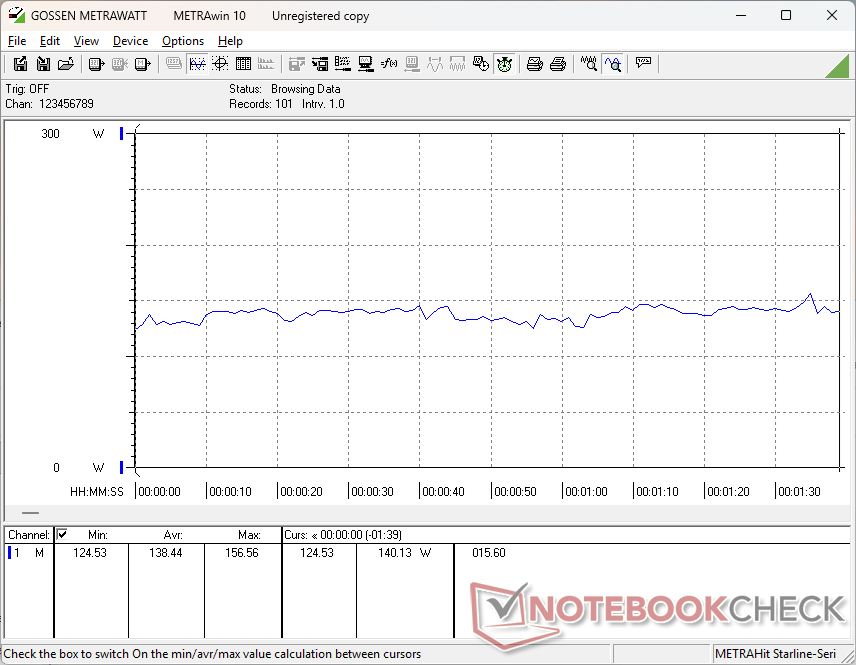
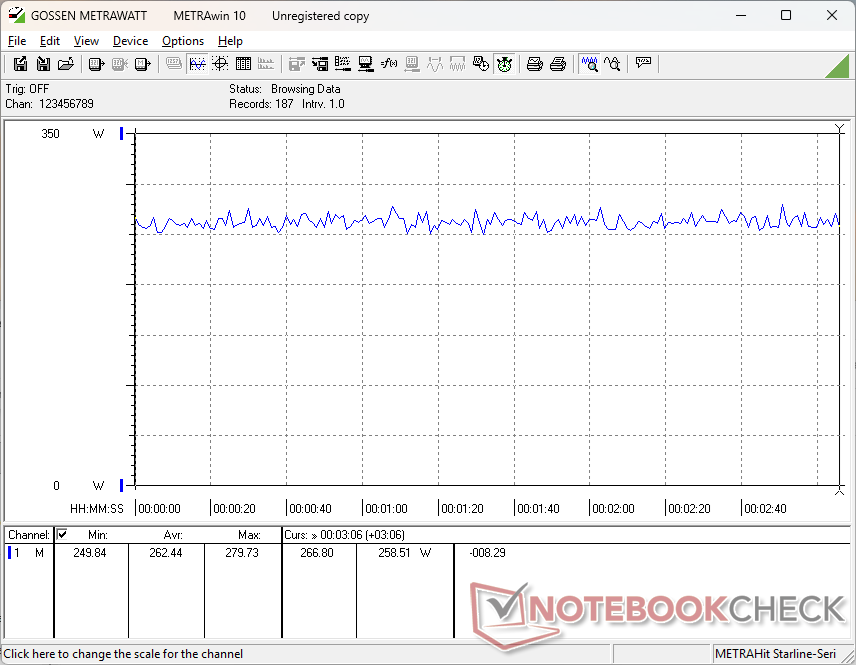
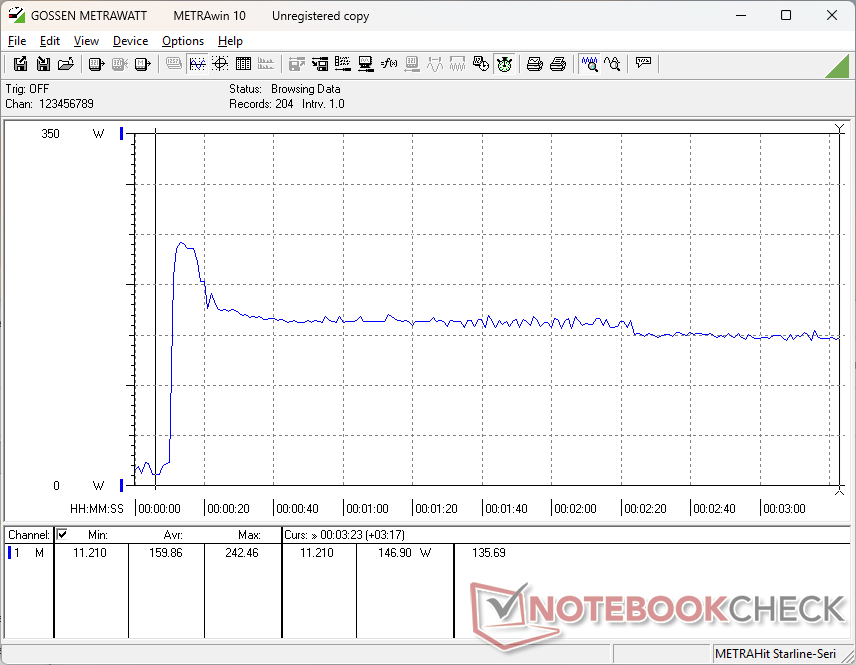
Lors de l'exécution de Prime95 pour stresser le CPU, les fréquences d'horloge moyennes augmentaient jusqu'à 3,9 GHz, 99 C et 160 W pendant quelques secondes avant de baisser et de se stabiliser à 3,3 GHz, 91 C et 89 W. Ce comportement est similaire à ce que nous avons observé sur le Dell Pro Max 18 Plus, bien qu'avec des fréquences d'horloge légèrement plus lentes en moyenne sur le HP.
Les températures du CPU et du GPU lors de l'exécution de Cyberpunk 2077 se sont stabilisées à 77 C et 64 C, respectivement, par rapport à 104 C et 75 C sur le Dell Pro Max 18 Plus. Cependant, les performances sont légèrement plus lentes sur le HP, avec une consommation d'énergie du GPU de 135 W en moyenne, contre 163 W sur le Dell, lorsque les deux systèmes sont réglés sur le mode Performance.
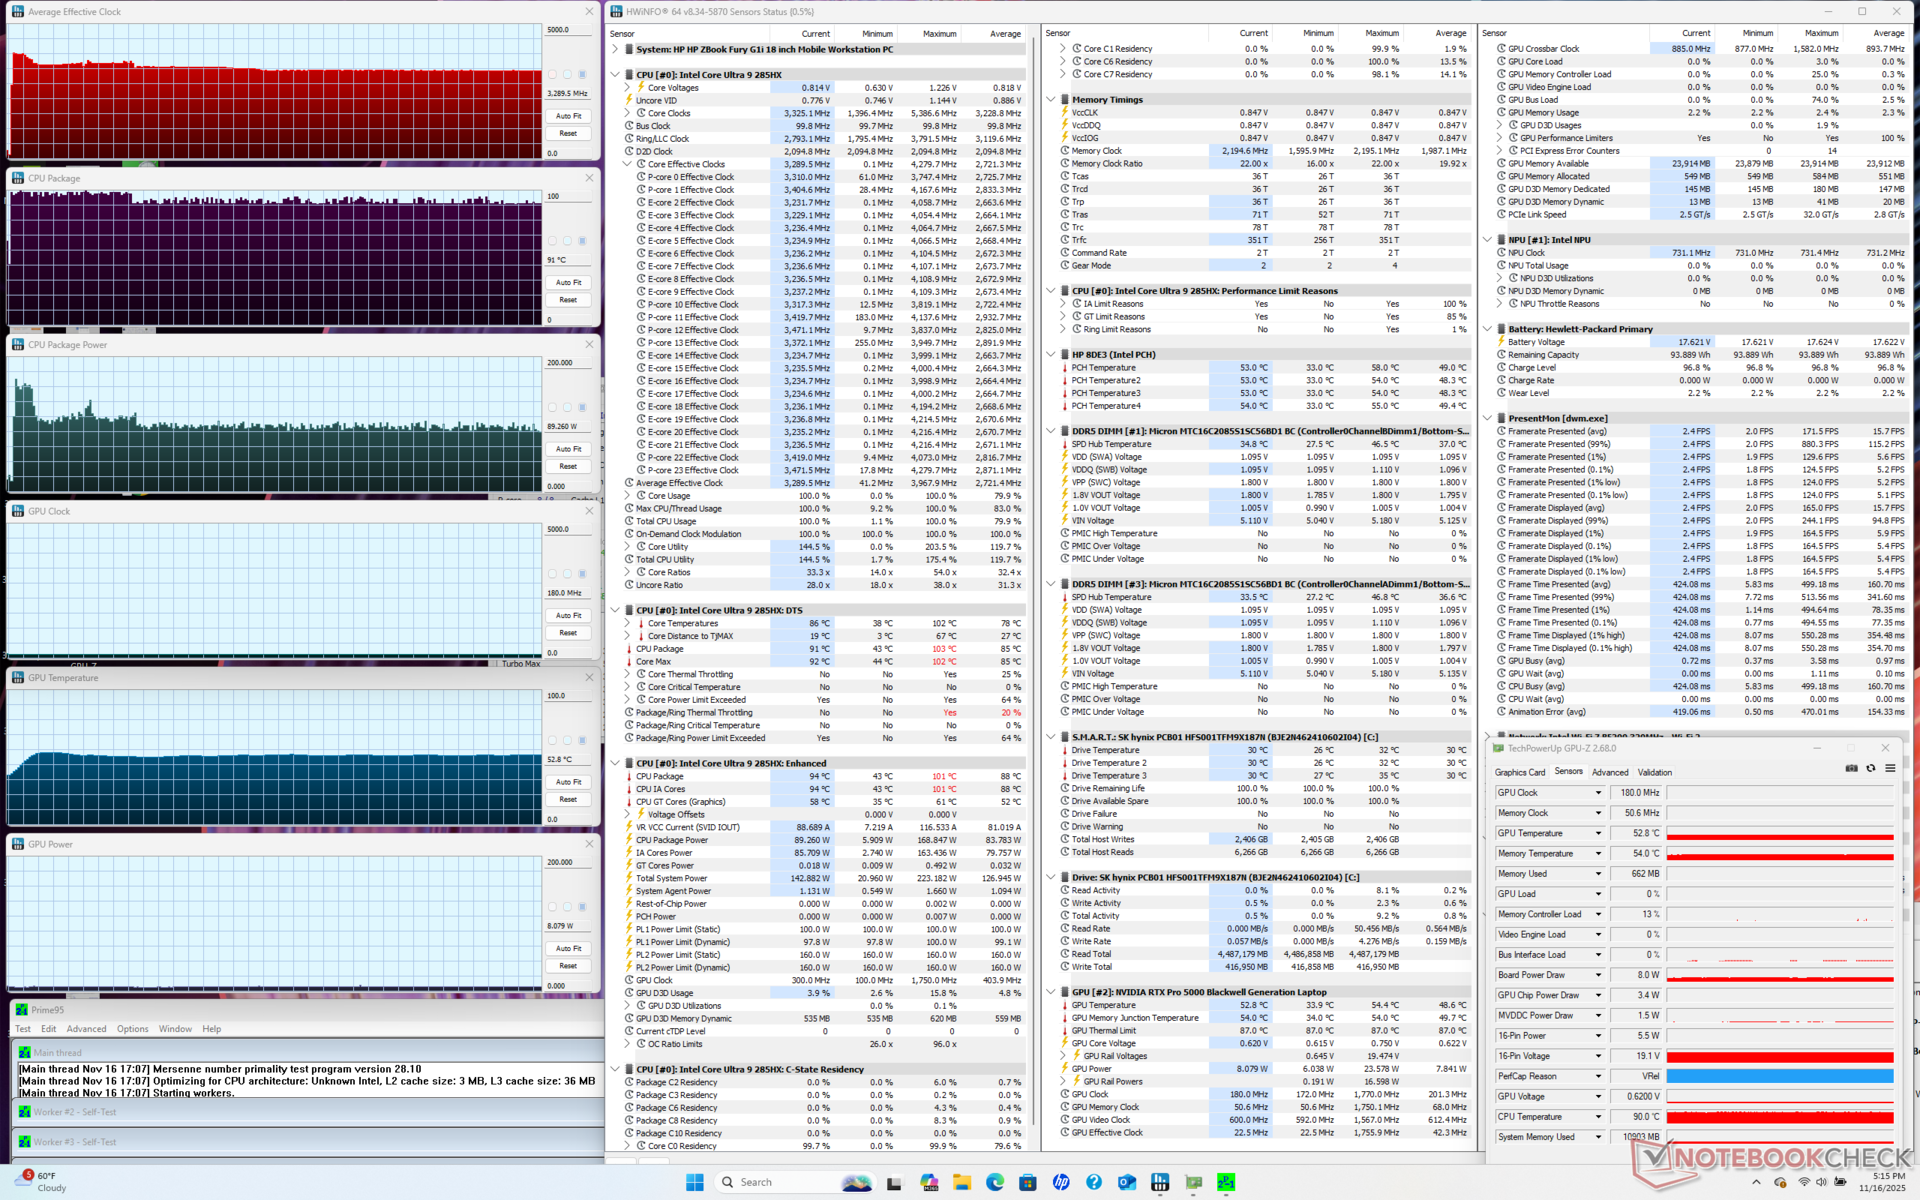

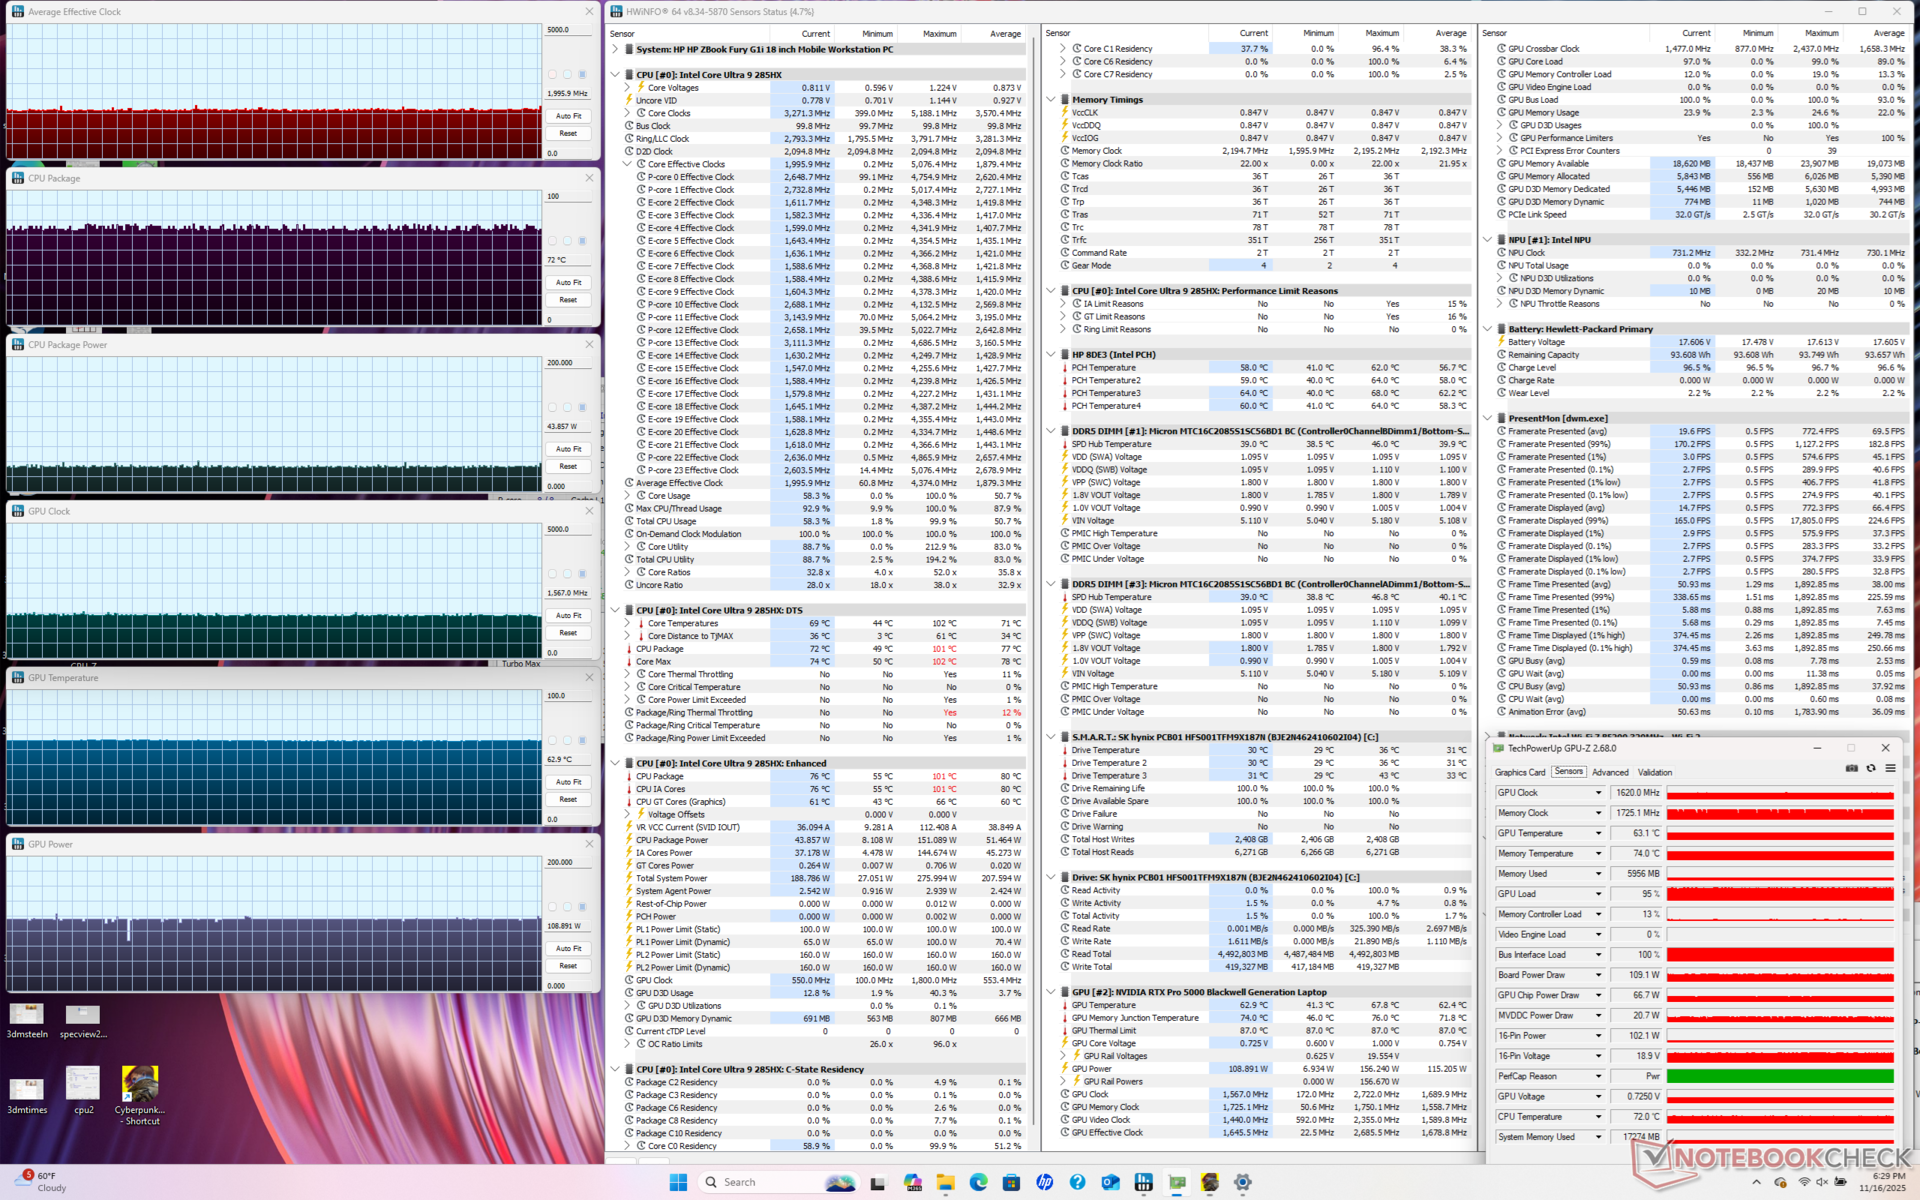
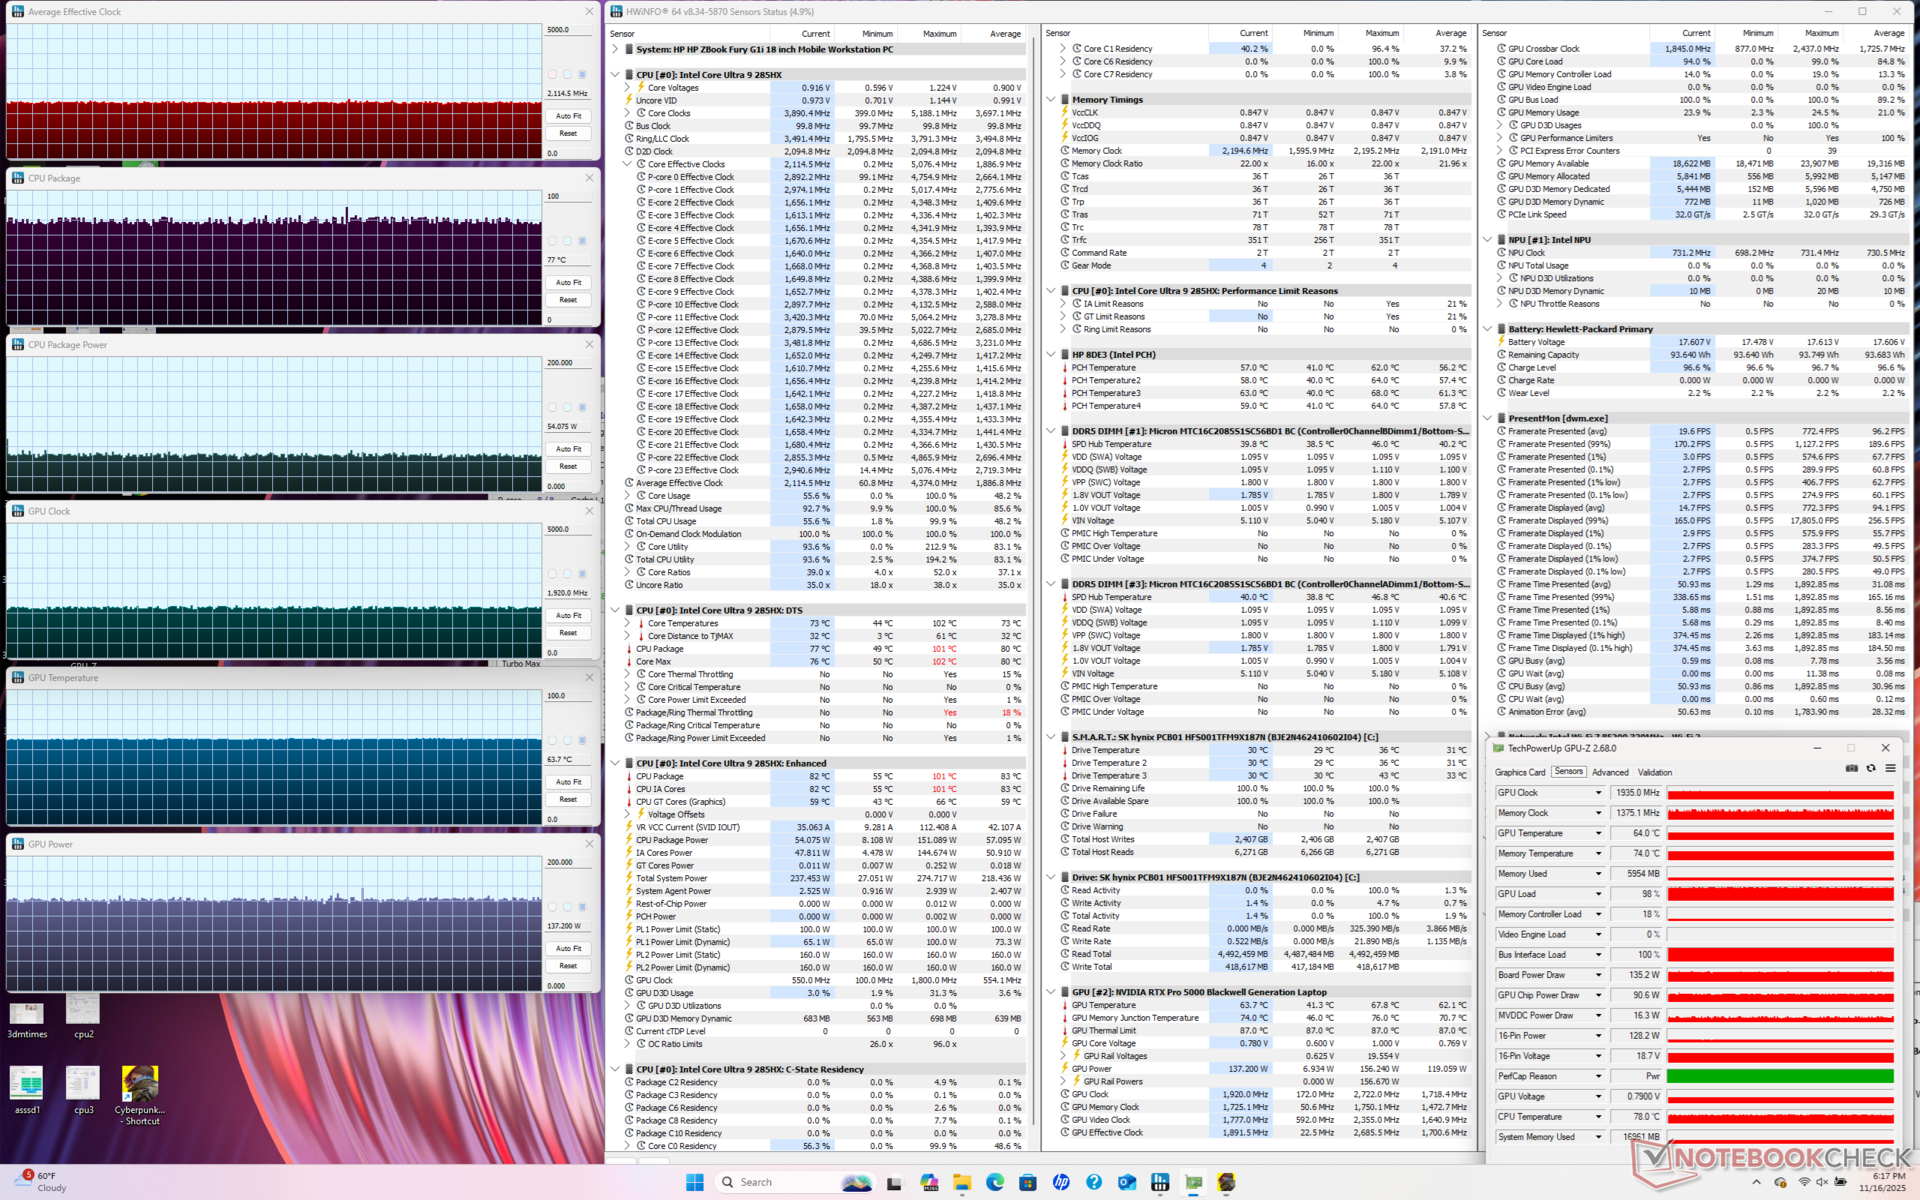
| Horloge moyenne du CPU (GHz) | Horloge du GPU (MHz) | Température moyenne du CPU (°C) | Température moyenne du GPU (°C) | |
| Système en veille | -- | -- | 44 | 37 |
| Prime95 Stress | 3.3 | -- | 91 | 53 |
| Prime95 + FurMark Stress | 3.0 | 1882 | 86 | 65 |
| Cyberpunk 2077 Stress (Mode équilibré) | 2.0 | 1567 | 72 | 63 |
| Cyberpunk 2077 Stress (Mode Performance) | 2.1 | 1920 | 77 | 64 |
Performance du système
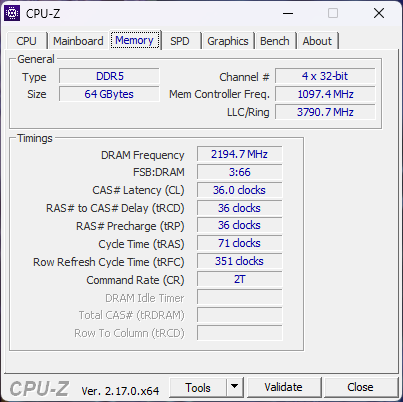
PCMark 10 n'a pas réussi à s'exécuter complètement, quels que soient les paramètres du GPU, et ses résultats ne sont donc pas inclus ci-dessous. Notez que les scores de mémoire AIDA64 sont nettement plus lents que sur le Dell Pro Max 18 Plus, la technologie de la RAM étant l'un des principaux facteurs de différenciation entre les deux modèles.
CrossMark: Overall | Productivity | Creativity | Responsiveness
WebXPRT 3: Overall
WebXPRT 4: Overall
Mozilla Kraken 1.1: Total
Geekbench AI: Quantized GPU 1.5 | Half Precision GPU 1.5 | Single Precision GPU 1.5
| Performance rating | |
| Dell Pro Max 18 Plus MB18250 | |
| Moyenne Intel Core Ultra 9 285HX, NVIDIA RTX PRO 5000 Blackwell Generation Laptop | |
| HP ZBook Fury G1i 18 | |
| Schenker Key 18 Pro M25 RTX 5090 | |
| Lenovo ThinkPad P16 Gen 2 -3! | |
| HP ZBook X G1i 16 | |
| HP ZBook Studio 16 G11 -3! | |
| CrossMark / Overall | |
| Dell Pro Max 18 Plus MB18250 | |
| Moyenne Intel Core Ultra 9 285HX, NVIDIA RTX PRO 5000 Blackwell Generation Laptop (2142 - 2267, n=3) | |
| HP ZBook Fury G1i 18 | |
| Schenker Key 18 Pro M25 RTX 5090 | |
| Lenovo ThinkPad P16 Gen 2 | |
| HP ZBook X G1i 16 | |
| HP ZBook Studio 16 G11 | |
| CrossMark / Productivity | |
| HP ZBook Fury G1i 18 | |
| Moyenne Intel Core Ultra 9 285HX, NVIDIA RTX PRO 5000 Blackwell Generation Laptop (2016 - 2028, n=3) | |
| Dell Pro Max 18 Plus MB18250 | |
| Schenker Key 18 Pro M25 RTX 5090 | |
| HP ZBook X G1i 16 | |
| Lenovo ThinkPad P16 Gen 2 | |
| HP ZBook Studio 16 G11 | |
| CrossMark / Creativity | |
| Dell Pro Max 18 Plus MB18250 | |
| Moyenne Intel Core Ultra 9 285HX, NVIDIA RTX PRO 5000 Blackwell Generation Laptop (2395 - 2725, n=3) | |
| HP ZBook Fury G1i 18 | |
| Lenovo ThinkPad P16 Gen 2 | |
| HP ZBook X G1i 16 | |
| Schenker Key 18 Pro M25 RTX 5090 | |
| HP ZBook Studio 16 G11 | |
| CrossMark / Responsiveness | |
| Schenker Key 18 Pro M25 RTX 5090 | |
| Dell Pro Max 18 Plus MB18250 | |
| Moyenne Intel Core Ultra 9 285HX, NVIDIA RTX PRO 5000 Blackwell Generation Laptop (1806 - 1858, n=3) | |
| HP ZBook Fury G1i 18 | |
| Lenovo ThinkPad P16 Gen 2 | |
| HP ZBook X G1i 16 | |
| HP ZBook Studio 16 G11 | |
| WebXPRT 3 / Overall | |
| HP ZBook Fury G1i 18 | |
| Dell Pro Max 18 Plus MB18250 | |
| Moyenne Intel Core Ultra 9 285HX, NVIDIA RTX PRO 5000 Blackwell Generation Laptop (327 - 360, n=3) | |
| Schenker Key 18 Pro M25 RTX 5090 | |
| Lenovo ThinkPad P16 Gen 2 | |
| HP ZBook X G1i 16 | |
| HP ZBook Studio 16 G11 | |
| WebXPRT 4 / Overall | |
| HP ZBook Fury G1i 18 | |
| Schenker Key 18 Pro M25 RTX 5090 | |
| Moyenne Intel Core Ultra 9 285HX, NVIDIA RTX PRO 5000 Blackwell Generation Laptop (306 - 323, n=3) | |
| Dell Pro Max 18 Plus MB18250 | |
| Lenovo ThinkPad P16 Gen 2 | |
| HP ZBook X G1i 16 | |
| HP ZBook Studio 16 G11 | |
| Mozilla Kraken 1.1 / Total | |
| HP ZBook Studio 16 G11 | |
| HP ZBook X G1i 16 | |
| Lenovo ThinkPad P16 Gen 2 | |
| Dell Pro Max 18 Plus MB18250 | |
| Moyenne Intel Core Ultra 9 285HX, NVIDIA RTX PRO 5000 Blackwell Generation Laptop (411 - 439, n=3) | |
| Schenker Key 18 Pro M25 RTX 5090 | |
| HP ZBook Fury G1i 18 | |
| Geekbench AI / Quantized GPU 1.5 | |
| Dell Pro Max 18 Plus MB18250 | |
| Schenker Key 18 Pro M25 RTX 5090 | |
| Moyenne Intel Core Ultra 9 285HX, NVIDIA RTX PRO 5000 Blackwell Generation Laptop (22519 - 24656, n=3) | |
| HP ZBook Fury G1i 18 | |
| HP ZBook X G1i 16 | |
| Geekbench AI / Half Precision GPU 1.5 | |
| Dell Pro Max 18 Plus MB18250 | |
| Moyenne Intel Core Ultra 9 285HX, NVIDIA RTX PRO 5000 Blackwell Generation Laptop (51812 - 55275, n=3) | |
| Schenker Key 18 Pro M25 RTX 5090 | |
| HP ZBook Fury G1i 18 | |
| HP ZBook X G1i 16 | |
| Geekbench AI / Single Precision GPU 1.5 | |
| Dell Pro Max 18 Plus MB18250 | |
| Schenker Key 18 Pro M25 RTX 5090 | |
| Moyenne Intel Core Ultra 9 285HX, NVIDIA RTX PRO 5000 Blackwell Generation Laptop (28665 - 32028, n=3) | |
| HP ZBook Fury G1i 18 | |
| HP ZBook X G1i 16 | |
* ... Moindre est la valeur, meilleures sont les performances
| AIDA64 / Memory Copy | |
| Dell Pro Max 18 Plus MB18250 | |
| Moyenne Intel Core Ultra 9 285HX (63431 - 93933, n=6) | |
| HP ZBook Studio 16 G11 | |
| HP ZBook Fury G1i 18 | |
| Lenovo ThinkPad P16 Gen 2 | |
| Schenker Key 18 Pro M25 RTX 5090 | |
| AIDA64 / Memory Read | |
| Dell Pro Max 18 Plus MB18250 | |
| Moyenne Intel Core Ultra 9 285HX (67084 - 97565, n=6) | |
| HP ZBook Studio 16 G11 | |
| Lenovo ThinkPad P16 Gen 2 | |
| HP ZBook Fury G1i 18 | |
| Schenker Key 18 Pro M25 RTX 5090 | |
| AIDA64 / Memory Write | |
| Dell Pro Max 18 Plus MB18250 | |
| Moyenne Intel Core Ultra 9 285HX (64112 - 89691, n=6) | |
| HP ZBook Studio 16 G11 | |
| HP ZBook Fury G1i 18 | |
| Lenovo ThinkPad P16 Gen 2 | |
| Schenker Key 18 Pro M25 RTX 5090 | |
| AIDA64 / Memory Latency | |
| Schenker Key 18 Pro M25 RTX 5090 | |
| HP ZBook Fury G1i 18 | |
| Moyenne Intel Core Ultra 9 285HX (104.8 - 151.7, n=6) | |
| HP ZBook Studio 16 G11 | |
| Dell Pro Max 18 Plus MB18250 | |
| Lenovo ThinkPad P16 Gen 2 | |
* ... Moindre est la valeur, meilleures sont les performances
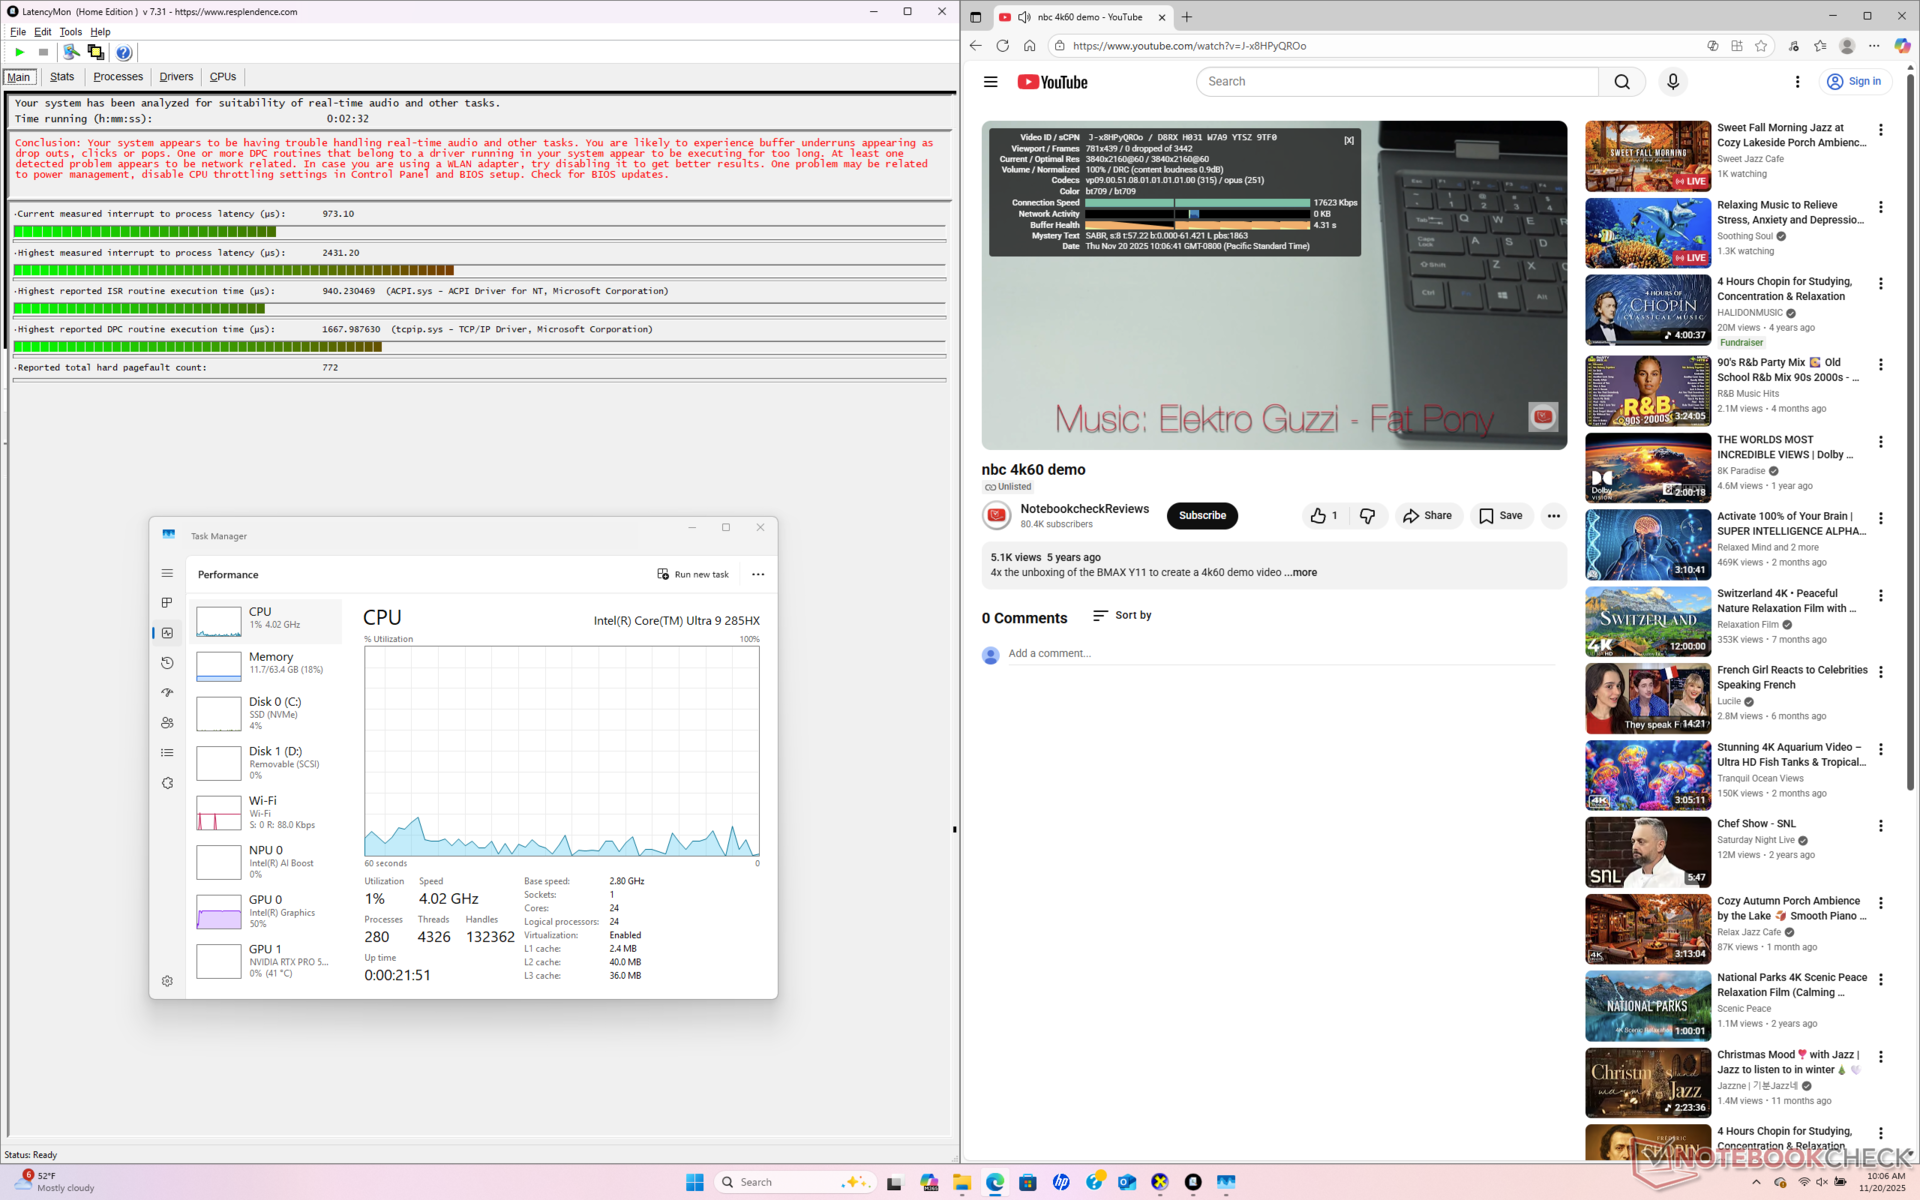
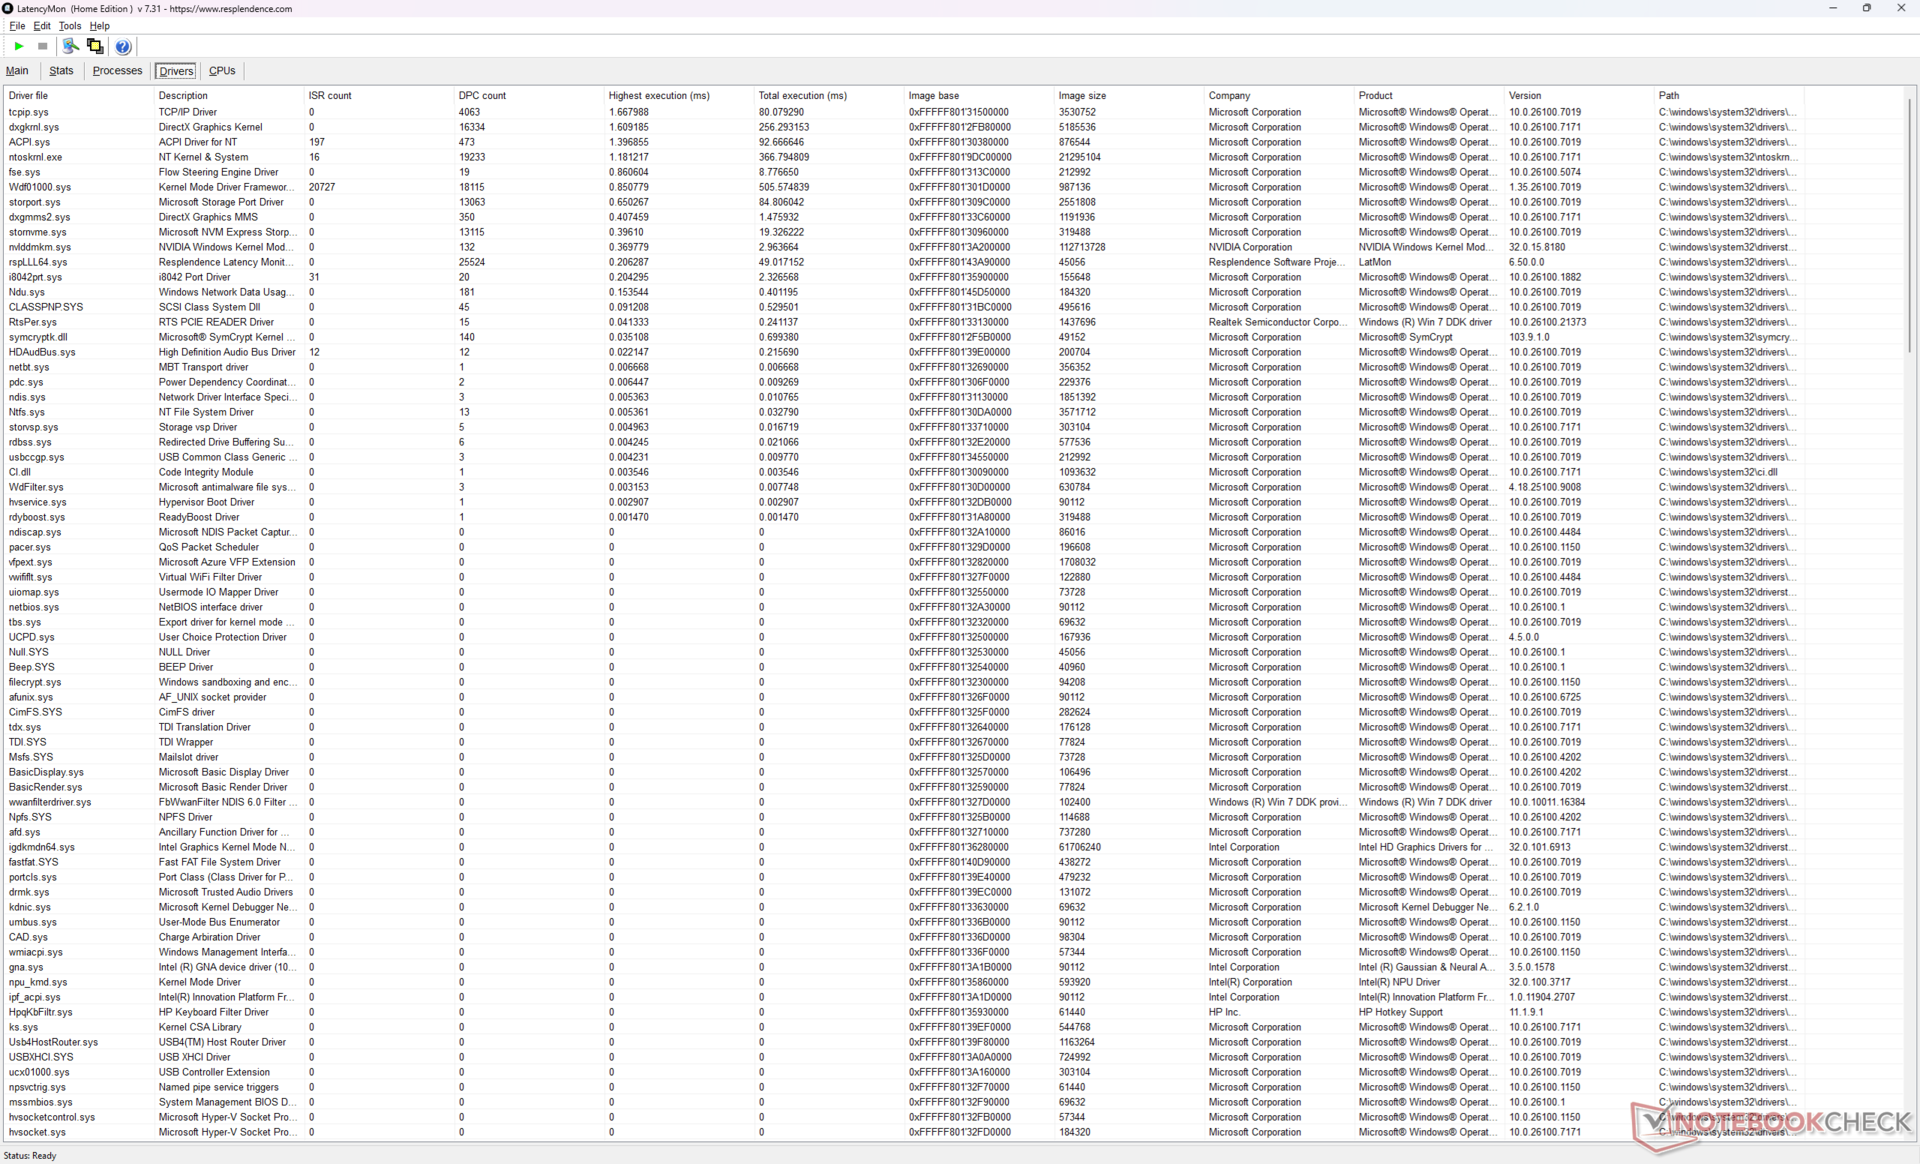
Latence DPC
| DPC Latencies / LatencyMon - interrupt to process latency (max), Web, Youtube, Prime95 | |
| Schenker Key 18 Pro M25 RTX 5090 | |
| HP ZBook Fury G1i 18 | |
| HP ZBook Studio 16 G11 | |
| Dell Pro Max 18 Plus MB18250 | |
| Lenovo ThinkPad P16 Gen 2 | |
| HP ZBook X G1i 16 | |
* ... Moindre est la valeur, meilleures sont les performances
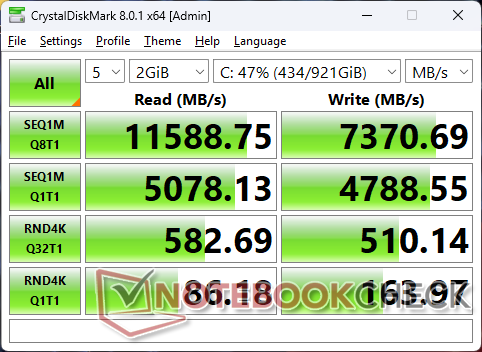
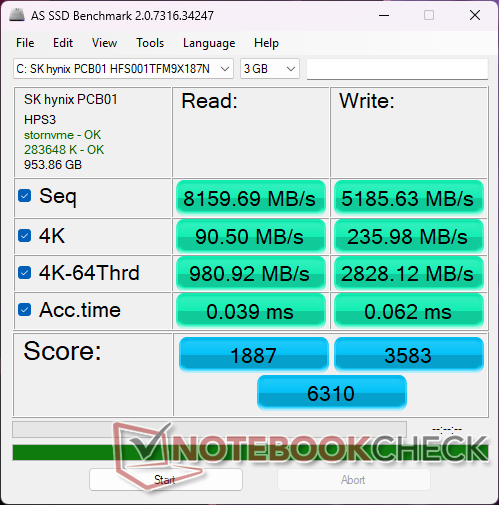
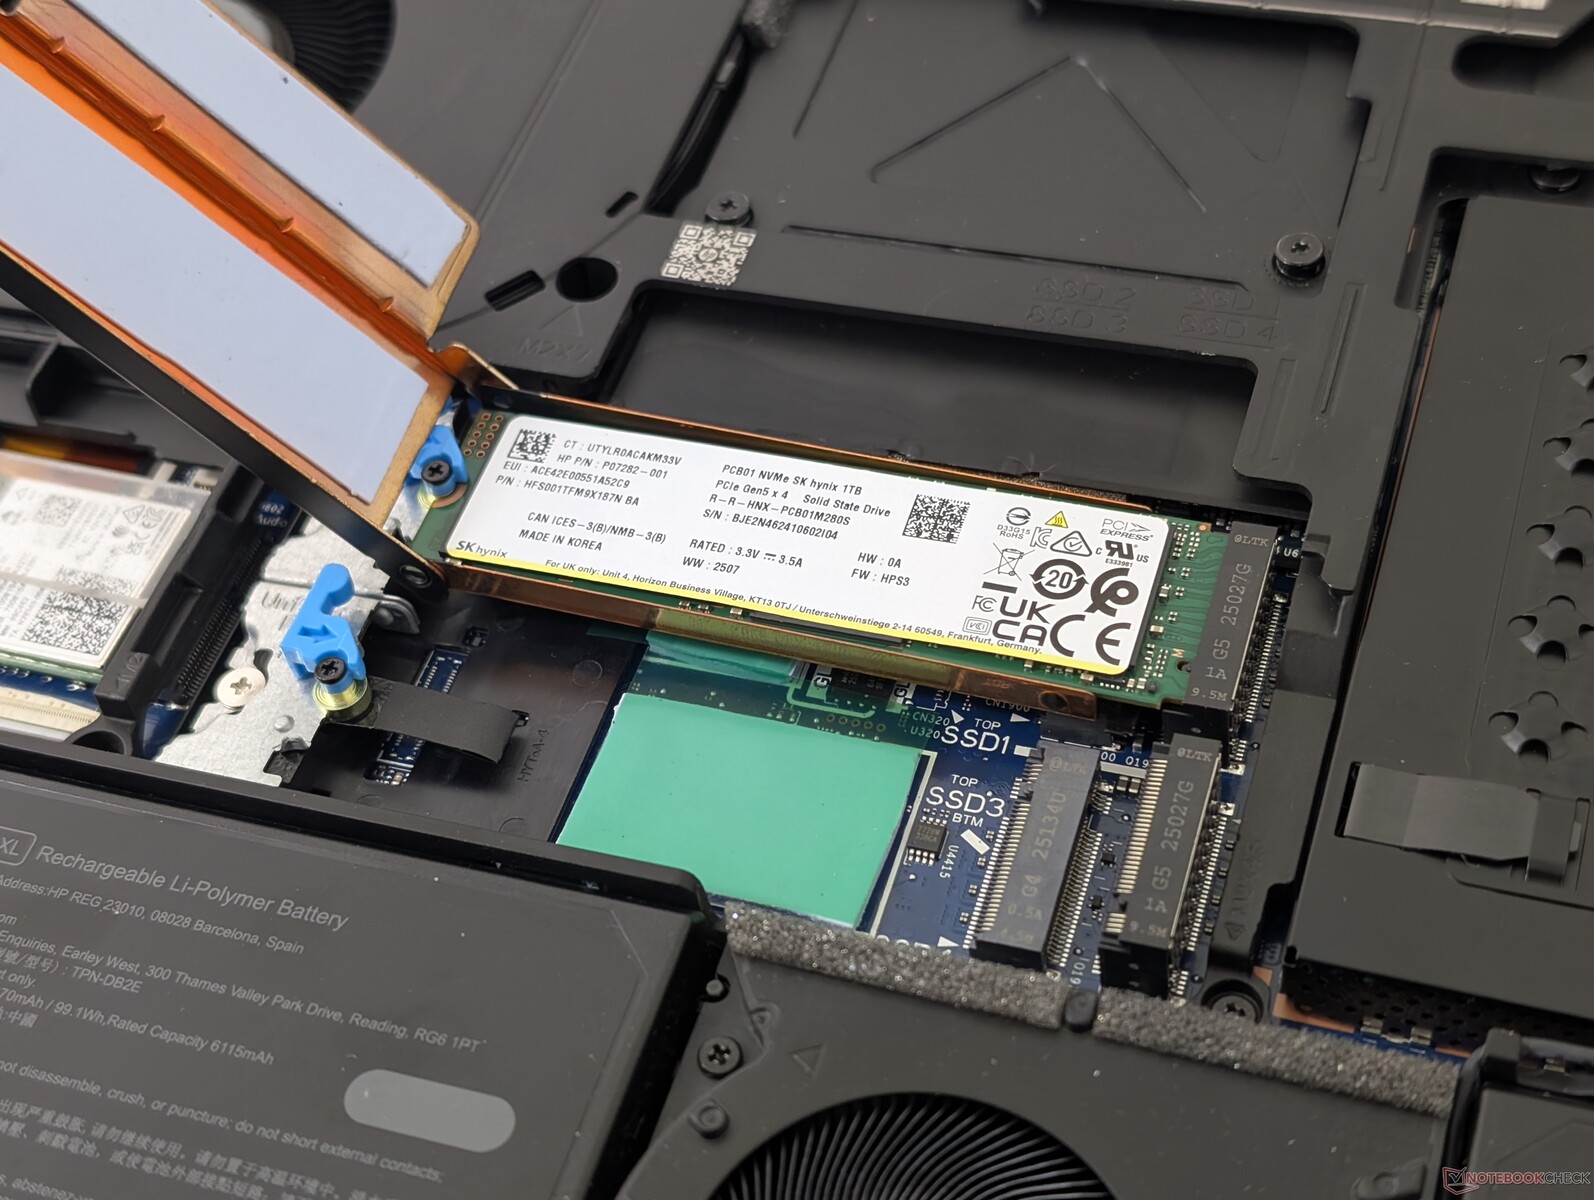
Dispositifs de stockage
Notre unité est livrée avec le SK Hynix PCB01 PCIe5 x4 NVMe SSD pour des taux de transfert réguliers d'environ 12 000 Mo/s. Le HP prend en charge jusqu'à quatre SSD M.2 2280 individuels, tandis que le Dell Pro Max 18 Plus ne peut en prendre en charge que deux.

| Drive Performance rating - Percent | |
| Schenker Key 18 Pro M25 RTX 5090 | |
| HP ZBook Fury G1i 18 | |
| HP ZBook X G1i 16 | |
| Dell Pro Max 18 Plus MB18250 | |
| Lenovo ThinkPad P16 Gen 2 | |
| HP ZBook Studio 16 G11 | |
* ... Moindre est la valeur, meilleures sont les performances
Throttoir de disque : Boucle de lecture DiskSpd, profondeur de la file d'attente 8
Performance du GPU
La Nvidia RTX Pro 5000 Blackwell de notre HP est systématiquement plus lent que le même GPU dans le Dell Pro Max 18 Plus. Cela s'explique en grande partie par le fait que le GPU de la HP vise 150 W alors que celui de la Dell vise 175 W pour des performances légèrement plus rapides. Les avantages en termes de performances par rapport aux options Ada de dernière génération sont néanmoins plus significatifs.
| Profil de puissance | Score graphique | Score physique | Score combiné |
| Mode Performance | 45148 | 49397 | 13515 |
| Mode équilibré | 43709 (-3%) | 48299 (-2%) | 11177 (-17%) |
| Alimentation par batterie | 28042 (-38%) | 21361 (-57%) | 7409 (-45%) |
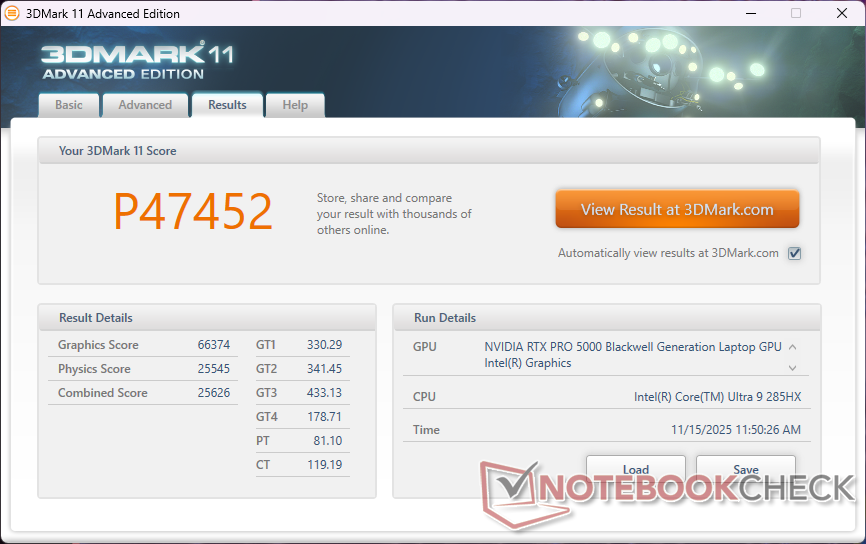
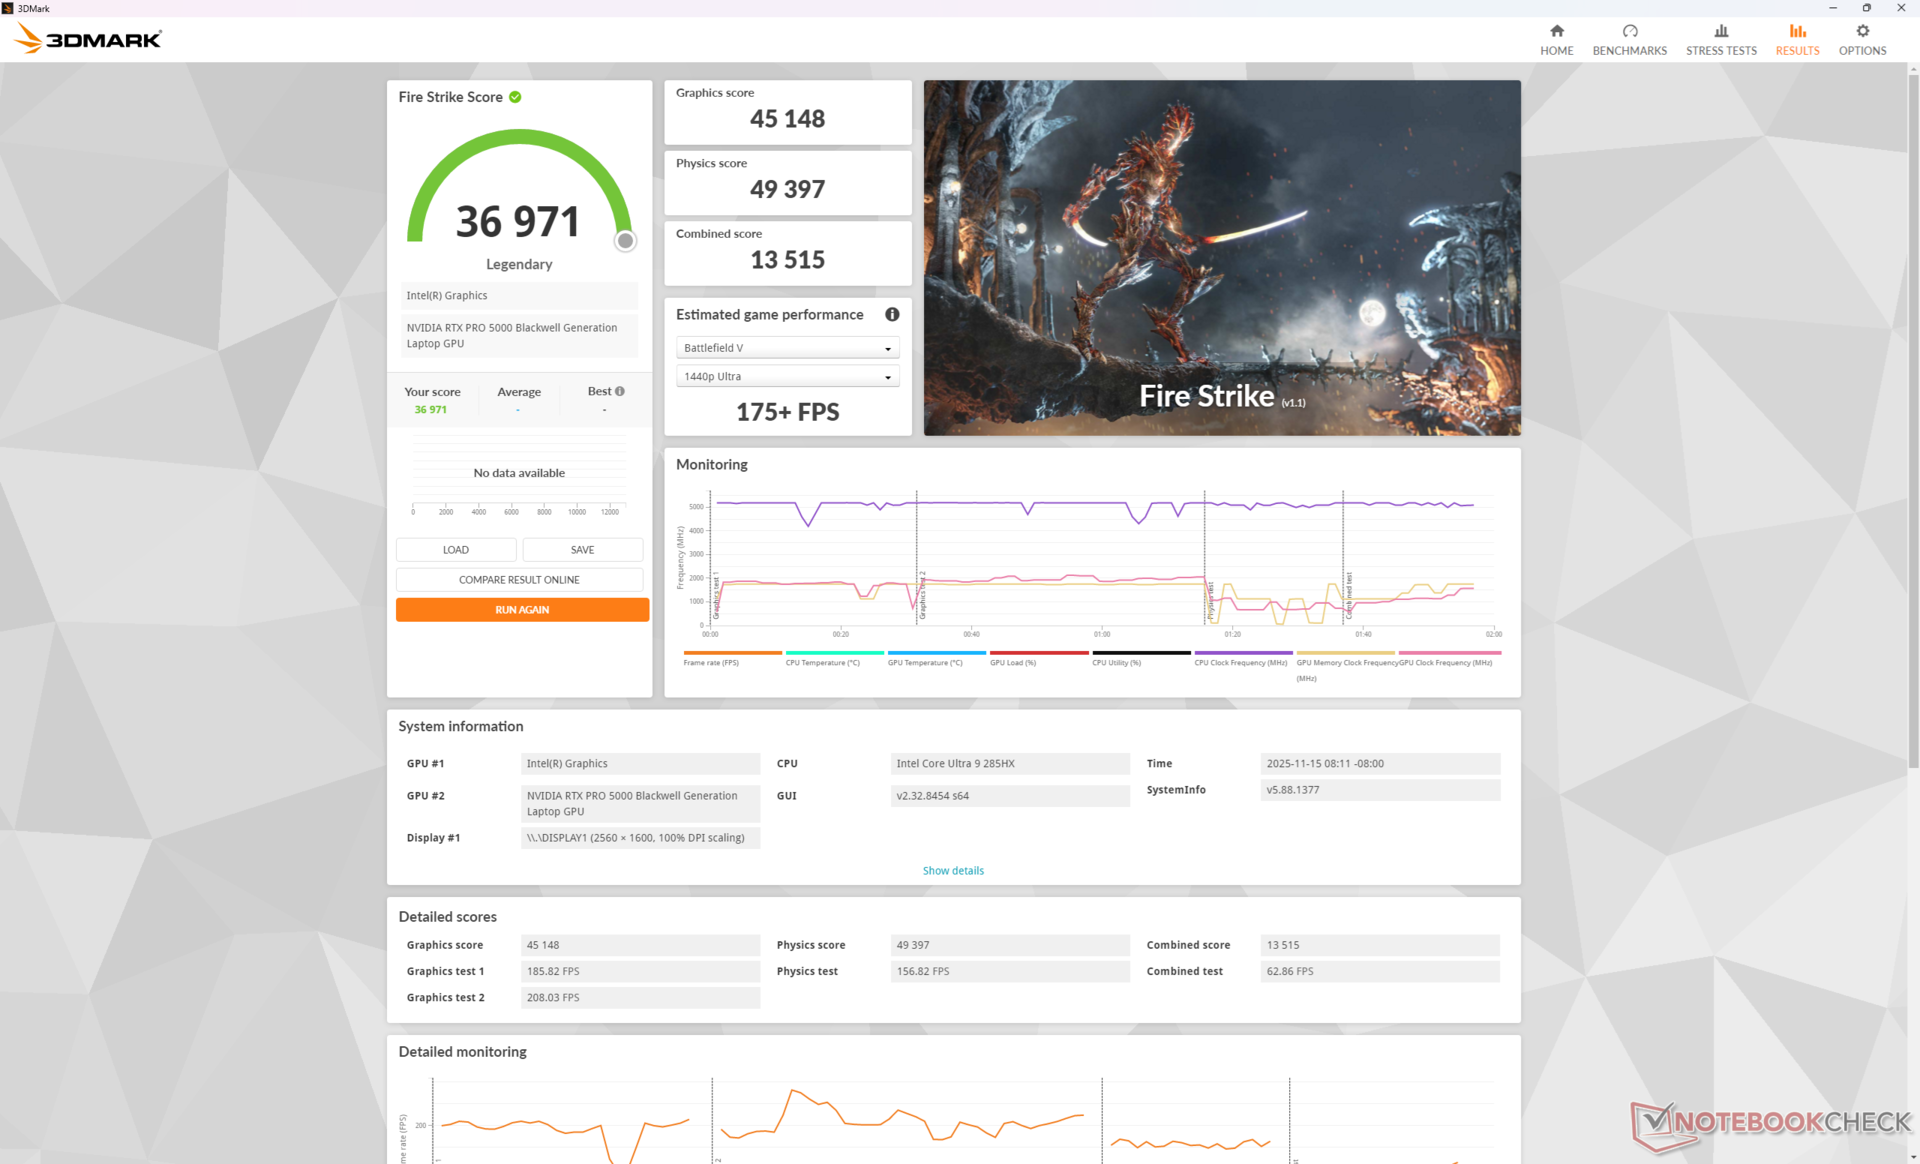
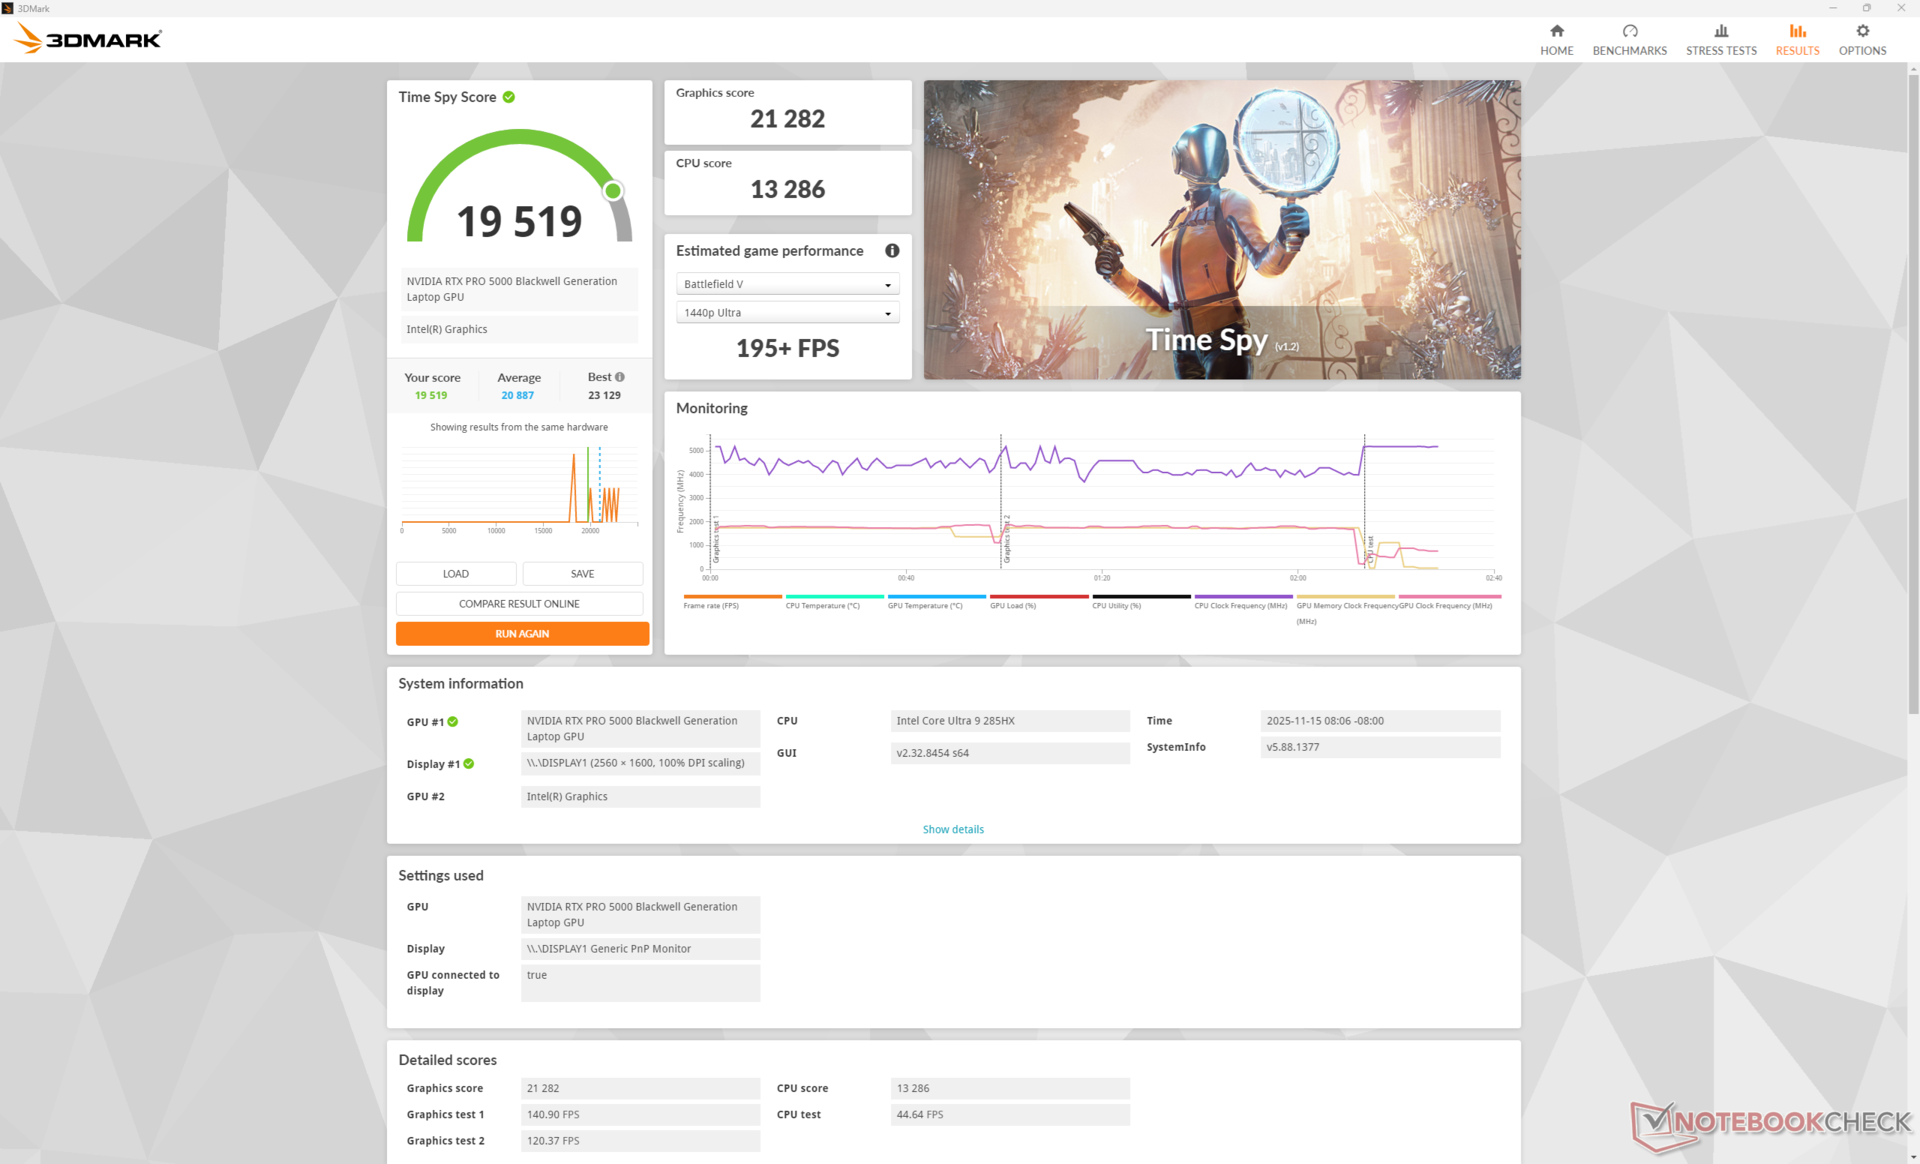
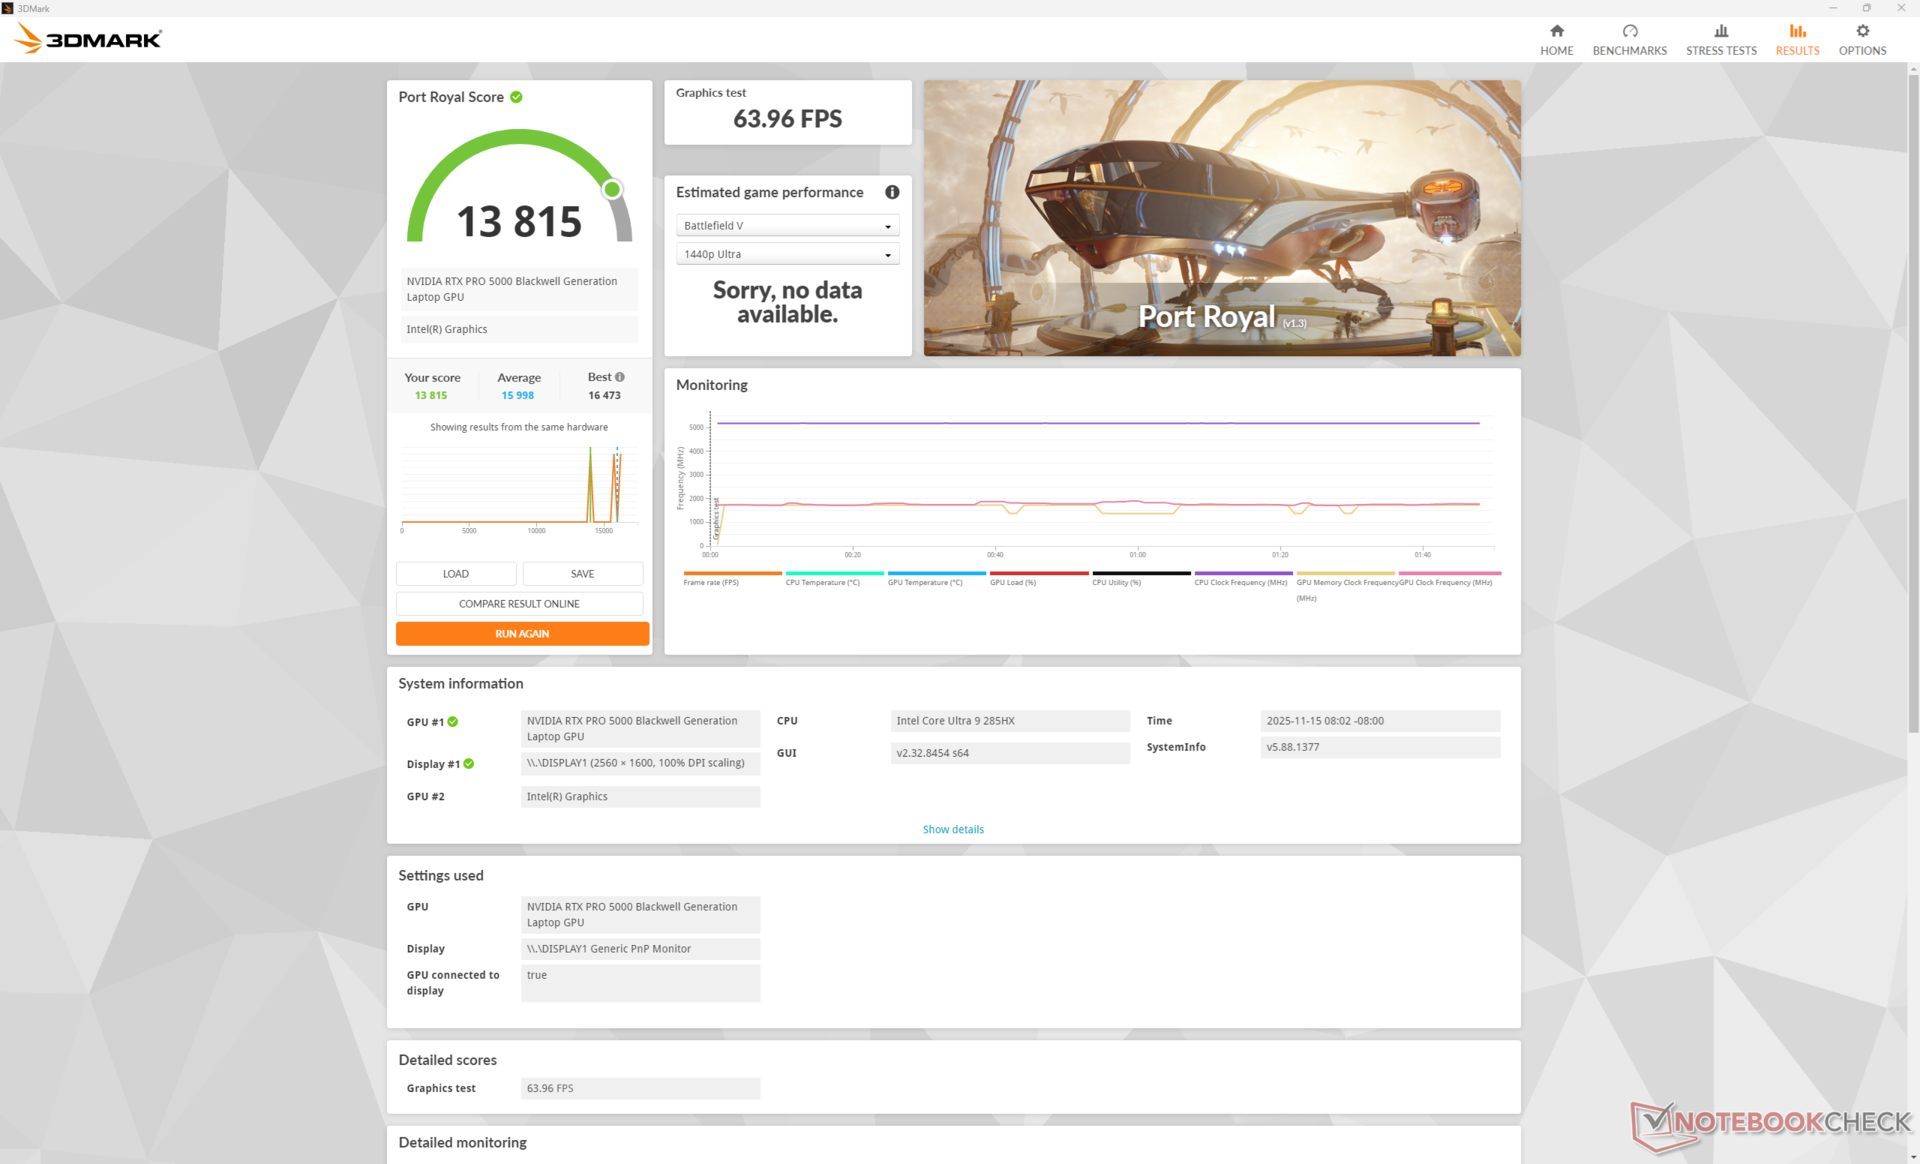
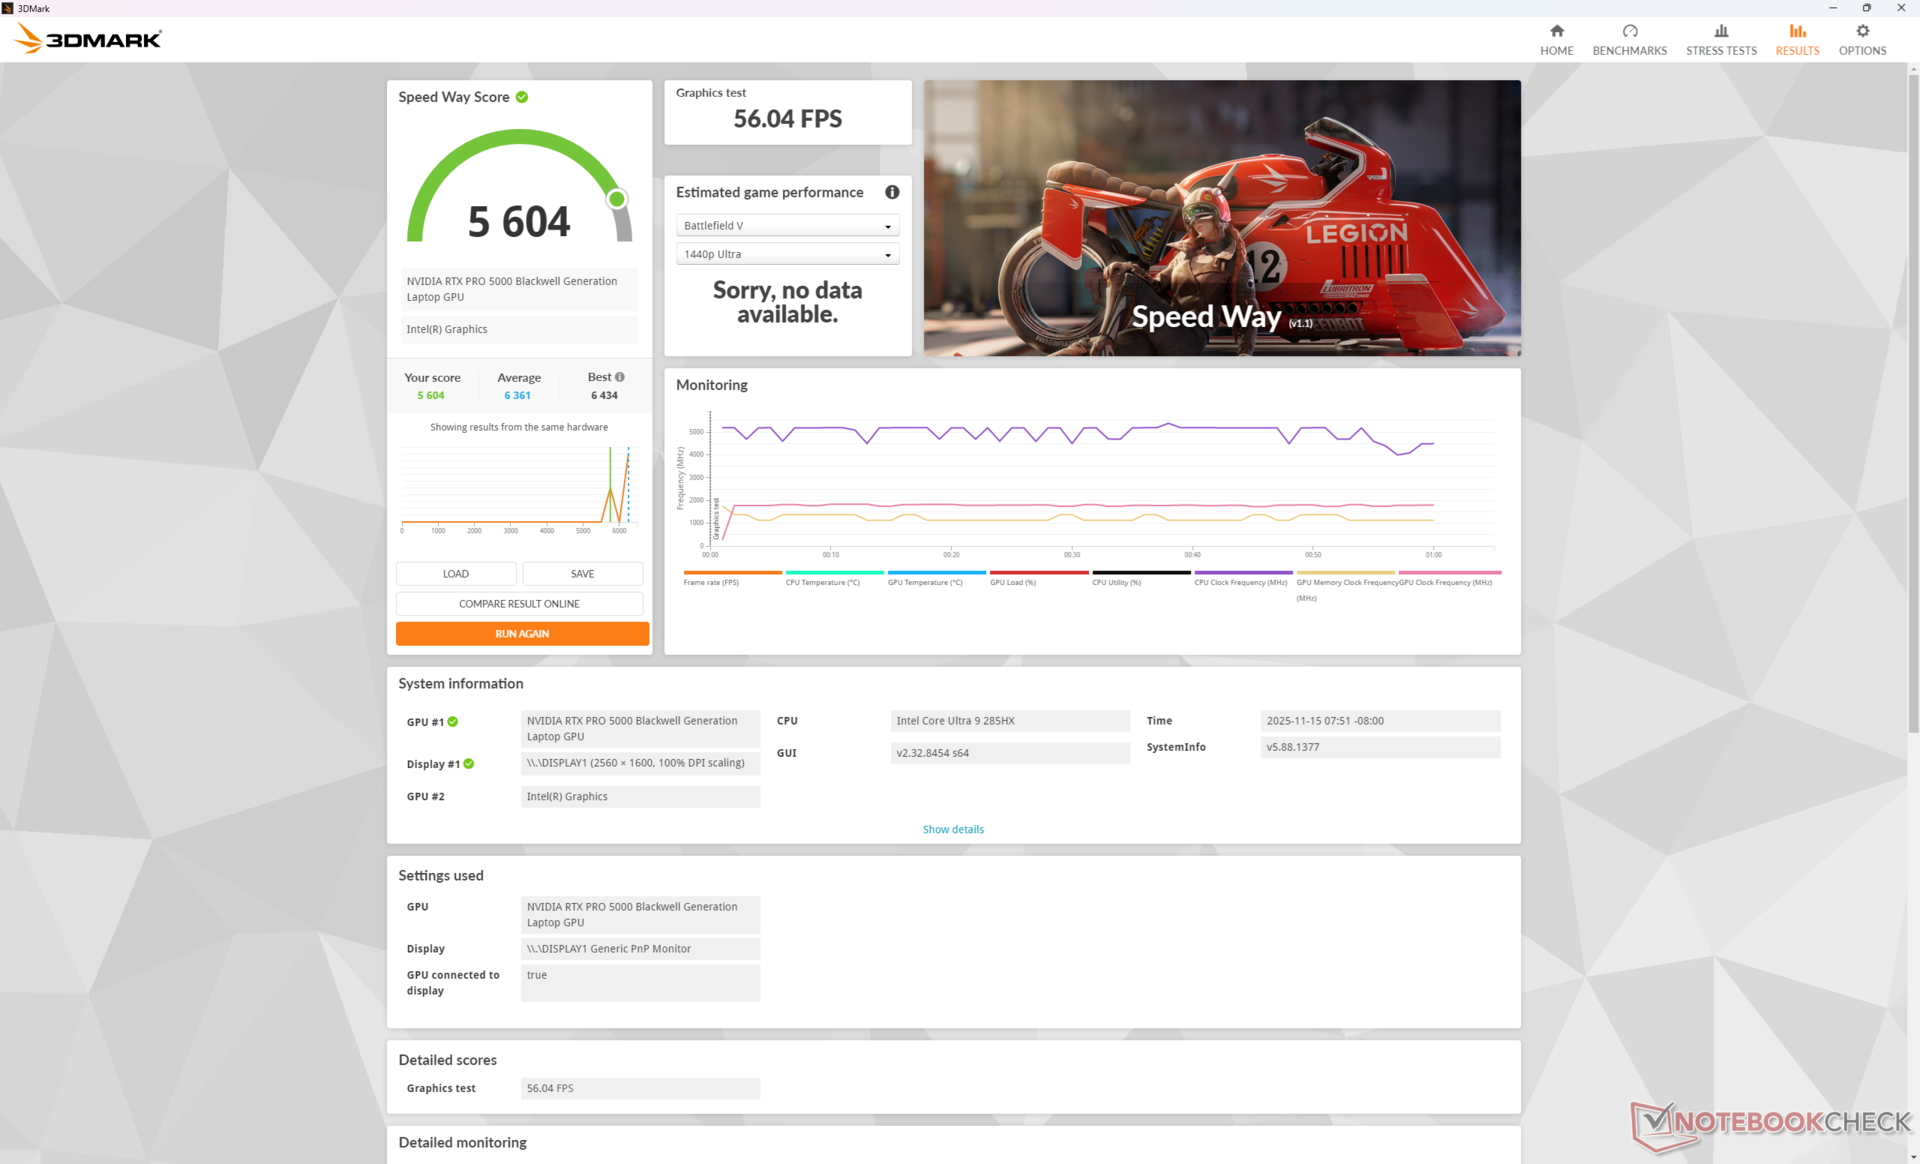
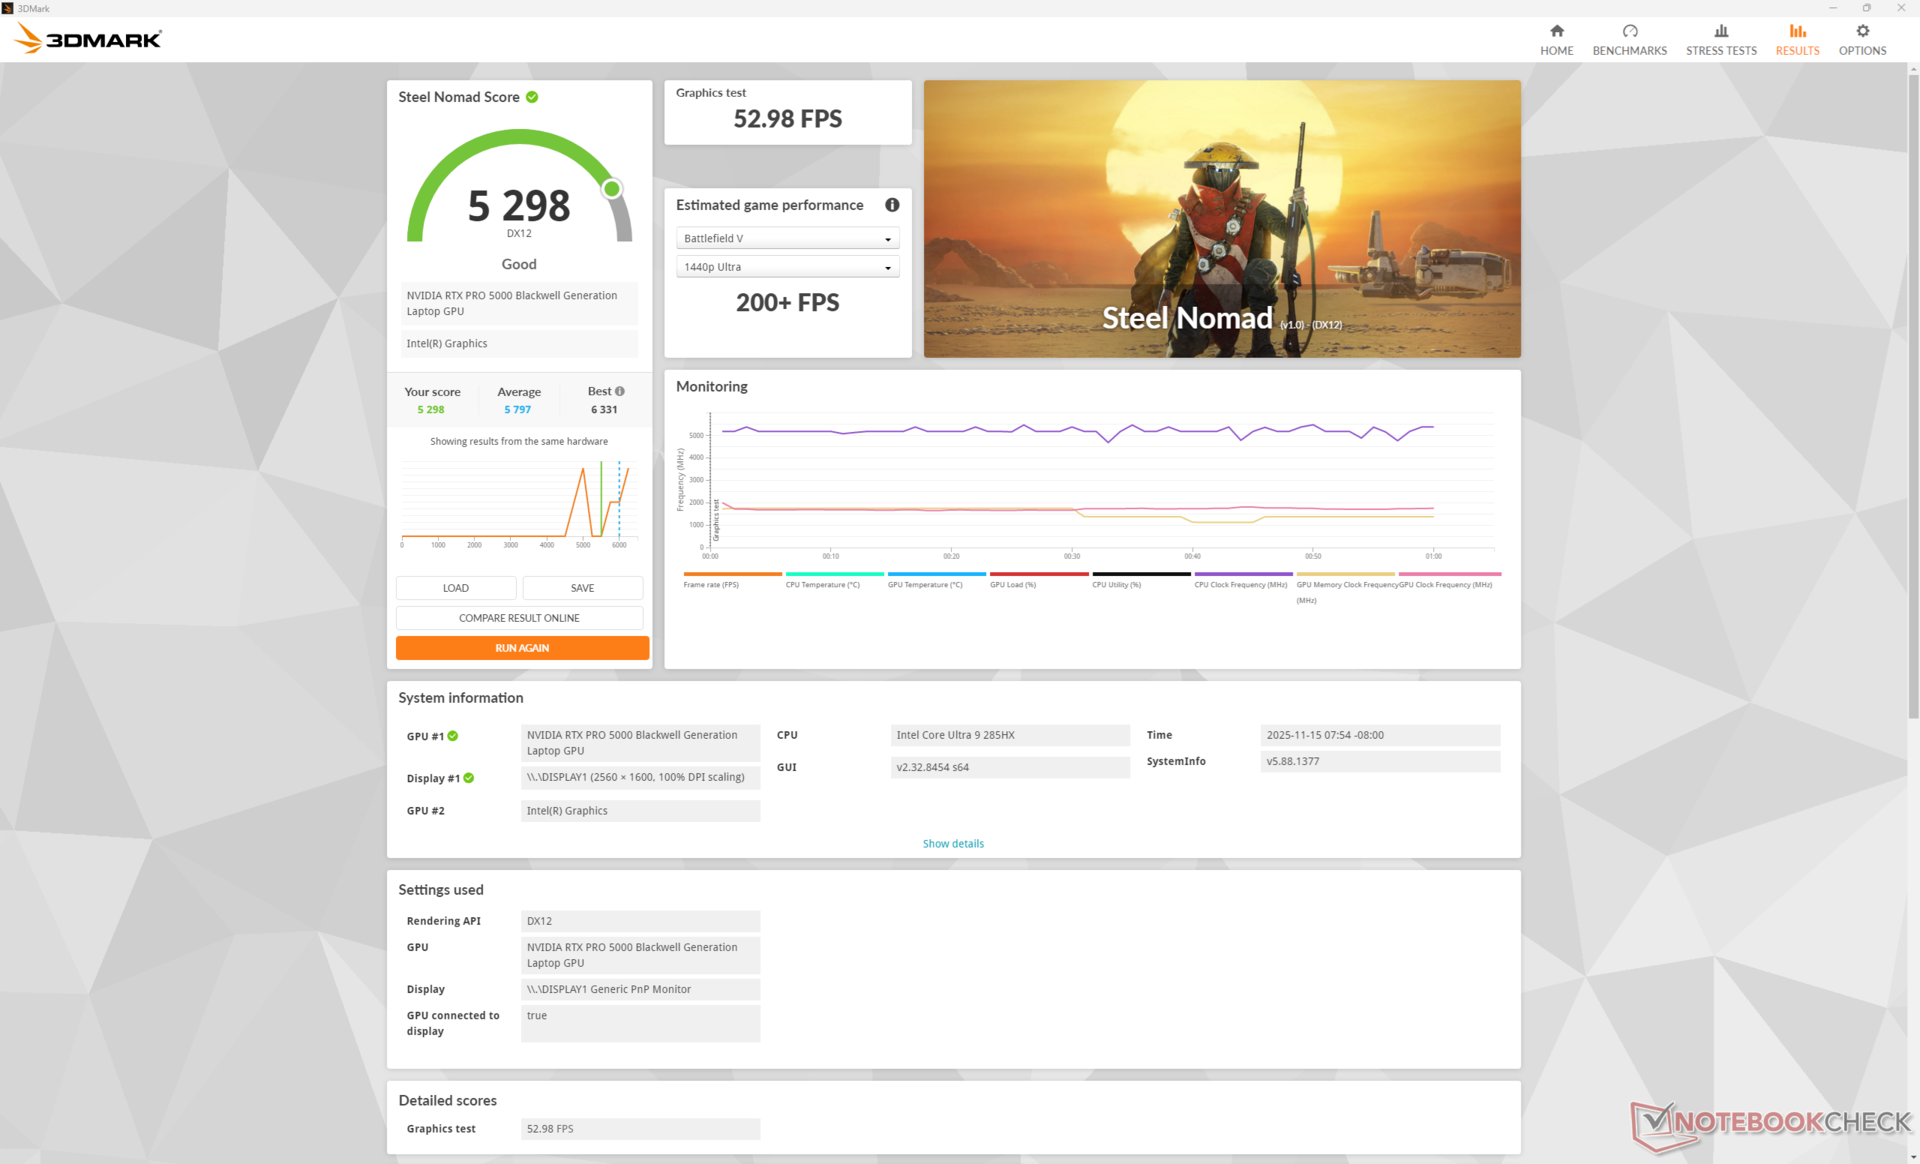
| 3DMark 11 Performance | 47452 points | |
| 3DMark Cloud Gate Standard Score | 51342 points | |
| 3DMark Fire Strike Score | 36971 points | |
| 3DMark Time Spy Score | 19519 points | |
| 3DMark Steel Nomad Score | 5298 points | |
Aide | ||
* ... Moindre est la valeur, meilleures sont les performances
| Performance rating - Percent | |
| Dell Pro Max 18 Plus MB18250 | |
| Schenker Key 18 Pro M25 RTX 5090 | |
| HP ZBook Fury G1i 18 | |
| Lenovo ThinkPad P16 Gen 2 | |
| HP ZBook X G1i 16 | |
| HP ZBook Studio 16 G11 | |
| Cyberpunk 2077 - 1920x1080 Ultra Preset (FSR off) | |
| Dell Pro Max 18 Plus MB18250 | |
| Schenker Key 18 Pro M25 RTX 5090 | |
| HP ZBook Fury G1i 18 | |
| Lenovo ThinkPad P16 Gen 2 | |
| HP ZBook X G1i 16 | |
| HP ZBook Studio 16 G11 | |
| Baldur's Gate 3 - 1920x1080 Ultra Preset AA:T | |
| Dell Pro Max 18 Plus MB18250 | |
| Schenker Key 18 Pro M25 RTX 5090 | |
| HP ZBook Fury G1i 18 | |
| Lenovo ThinkPad P16 Gen 2 | |
| HP ZBook Studio 16 G11 | |
| HP ZBook X G1i 16 | |
| GTA V - 1920x1080 Highest AA:4xMSAA + FX AF:16x | |
| Dell Pro Max 18 Plus MB18250 | |
| Schenker Key 18 Pro M25 RTX 5090 | |
| HP ZBook Fury G1i 18 | |
| Lenovo ThinkPad P16 Gen 2 | |
| HP ZBook X G1i 16 | |
| HP ZBook Studio 16 G11 | |
| Final Fantasy XV Benchmark - 1920x1080 High Quality | |
| Dell Pro Max 18 Plus MB18250 | |
| HP ZBook Fury G1i 18 | |
| Schenker Key 18 Pro M25 RTX 5090 | |
| Lenovo ThinkPad P16 Gen 2 | |
| HP ZBook X G1i 16 | |
| HP ZBook Studio 16 G11 | |
| Strange Brigade - 1920x1080 ultra AA:ultra AF:16 | |
| Dell Pro Max 18 Plus MB18250 | |
| HP ZBook Fury G1i 18 | |
| Schenker Key 18 Pro M25 RTX 5090 | |
| Lenovo ThinkPad P16 Gen 2 | |
| HP ZBook Studio 16 G11 | |
| HP ZBook X G1i 16 | |
| Dota 2 Reborn - 1920x1080 ultra (3/3) best looking | |
| Lenovo ThinkPad P16 Gen 2 | |
| Dell Pro Max 18 Plus MB18250 | |
| HP ZBook Fury G1i 18 | |
| Schenker Key 18 Pro M25 RTX 5090 | |
| HP ZBook Studio 16 G11 | |
| HP ZBook X G1i 16 | |
| X-Plane 11.11 - 1920x1080 high (fps_test=3) | |
| Lenovo ThinkPad P16 Gen 2 | |
| Dell Pro Max 18 Plus MB18250 | |
| Schenker Key 18 Pro M25 RTX 5090 | |
| HP ZBook Fury G1i 18 | |
| HP ZBook Studio 16 G11 | |
| HP ZBook X G1i 16 | |
| F1 24 | |
| 3840x2160 Ultra High Preset AA:T AF:16x | |
| Dell Pro Max 18 Plus MB18250 | |
| Moyenne NVIDIA RTX PRO 5000 Blackwell Generation Laptop (43.2 - 50.2, n=3) | |
| HP ZBook Fury G1i 18 | |
| Schenker Key 18 Pro M25 RTX 5090 | |
| 3840x2160 Ultra High Preset + Quality DLSS AF:16x | |
| Dell Pro Max 18 Plus MB18250 | |
| Moyenne NVIDIA RTX PRO 5000 Blackwell Generation Laptop (71.8 - 85.7, n=3) | |
| HP ZBook Fury G1i 18 | |
| Schenker Key 18 Pro M25 RTX 5090 | |
| 2560x1440 Ultra High Preset + Quality DLSS AF:16x | |
| Dell Pro Max 18 Plus MB18250 | |
| Moyenne NVIDIA RTX PRO 5000 Blackwell Generation Laptop (126.8 - 148.6, n=3) | |
| HP ZBook Fury G1i 18 | |
| Schenker Key 18 Pro M25 RTX 5090 | |
| HP ZBook X G1i 16 | |
| GTA V | |
| 3840x2160 High/On (Advanced Graphics Off) AA:FX AF:8x | |
| Moyenne NVIDIA RTX PRO 5000 Blackwell Generation Laptop (165.3 - 170.3, n=2) | |
| HP ZBook Fury G1i 18 | |
| Lenovo Legion Pro 5 16IAX10, RTX 5070 | |
| 3840x2160 Highest AA:4xMSAA + FX AF:16x | |
| Schenker Key 18 Pro M25 RTX 5090 | |
| Moyenne NVIDIA RTX PRO 5000 Blackwell Generation Laptop (101.6 - 105.5, n=2) | |
| HP ZBook Fury G1i 18 | |
| Lenovo Legion Pro 5 16IAX10, RTX 5070 | |
| Lenovo Legion Pro 5 16IAX10, RTX 5070 | |
| Final Fantasy XV Benchmark - 3840x2160 High Quality | |
| Schenker Key 18 Pro M25 RTX 5090 | |
| Dell Pro Max 18 Plus MB18250 | |
| Moyenne NVIDIA RTX PRO 5000 Blackwell Generation Laptop (88.4 - 102.2, n=3) | |
| HP ZBook Fury G1i 18 | |
| Lenovo Legion Pro 5 16IAX10, RTX 5070 | |
| Lenovo ThinkPad P16 G1 RTX A5500 | |
Cyberpunk 2077 ultra FPS Chart
| Bas | Moyen | Élevé | Ultra | QHD DLSS | QHD | 4K DLSS | 4K | |
|---|---|---|---|---|---|---|---|---|
| GTA V (2015) | 186.5 | 181.3 | 175.3 | 133.6 | 130.5 | 165.3 | ||
| Dota 2 Reborn (2015) | 215 | 187.2 | 175 | 162 | 143.9 | |||
| Final Fantasy XV Benchmark (2018) | 232 | 222 | 183.8 | 145.7 | 88.4 | |||
| X-Plane 11.11 (2018) | 137.3 | 114.9 | 92 | 74.2 | ||||
| Strange Brigade (2018) | 619 | 493 | 440 | 396 | 303 | 165.7 | ||
| Baldur's Gate 3 (2023) | 245 | 208 | 182 | 177 | 179.4 | 129.5 | 114.3 | 74.1 |
| Cyberpunk 2077 (2023) | 171.8 | 173.3 | 157.7 | 143.7 | 109 | 98 | 46.1 | |
| F1 24 (2024) | 281 | 297 | 272 | 125.7 | 126.8 | 84.4 | 71.8 | 43.2 |
Émissions
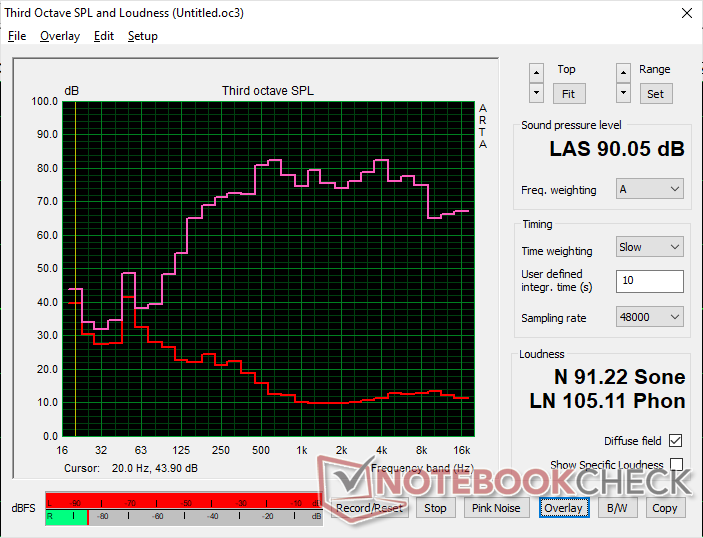
Bruit du système
Les ventilateurs internes sont inaudibles au ralenti ou lors de l'exécution de tâches peu exigeantes telles que les navigateurs ou Excel. En revanche, ils se font plus bruyants lorsque les charges sont plus élevées. En fait, le système n'est pas plus silencieux que le Dell, bien que les deux modèles soient équipés du même processeur et du même GPU.
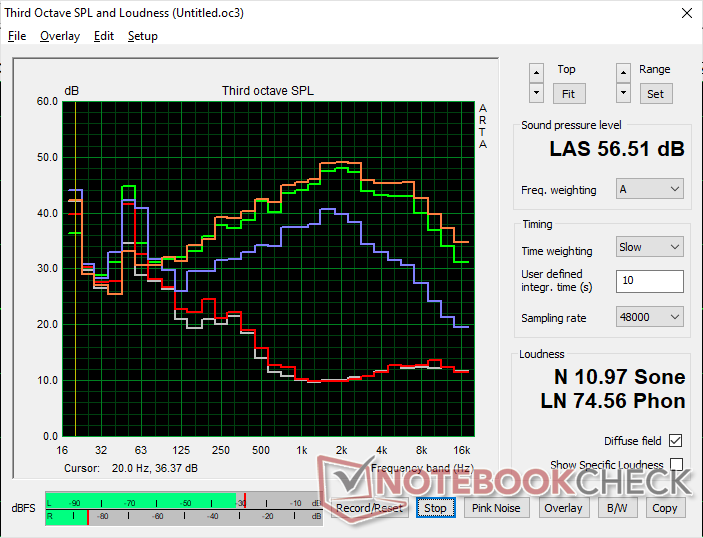
Degré de la nuisance sonore
| Au repos |
| 25.7 / 25.7 / 25.7 dB(A) |
| Fortement sollicité |
| 48.3 / 56.5 dB(A) |
 | ||
30 dB silencieux 40 dB(A) audible 50 dB(A) bruyant |
||
min: | ||
| HP ZBook Fury G1i 18 Ultra 9 285HX, RTX PRO 5000 Blackwell Generation Laptop | Dell Pro Max 18 Plus MB18250 Ultra 9 285HX, RTX PRO 5000 Blackwell Generation Laptop | Schenker Key 18 Pro M25 RTX 5090 Ultra 9 275HX, GeForce RTX 5090 Laptop | Lenovo ThinkPad P16 Gen 2 i7-14700HX, RTX 4000 Ada Generation Laptop | HP ZBook X G1i 16 Ultra 7 265H, RTX PRO 2000 Blackwell Generation Laptop | HP ZBook Studio 16 G11 Ultra 9 185H, RTX 3000 Ada Generation Laptop | |
|---|---|---|---|---|---|---|
| Noise | 4% | 2% | -1% | 13% | 9% | |
| arrêt / environnement * (dB) | 24.9 | 23.1 7% | 23.9 4% | 23.9 4% | 23.7 5% | 23.8 4% |
| Idle Minimum * (dB) | 25.7 | 27.1 -5% | 25.2 2% | 29.1 -13% | 23.7 8% | 23.8 7% |
| Idle Average * (dB) | 25.7 | 27.1 -5% | 25.2 2% | 29.1 -13% | 23.7 8% | 26.4 -3% |
| Idle Maximum * (dB) | 25.7 | 27.1 -5% | 25.2 2% | 29.1 -13% | 23.7 8% | 26.4 -3% |
| Load Average * (dB) | 48.3 | 38 21% | 47.8 1% | 41 15% | 32.7 32% | 33.7 30% |
| Cyberpunk 2077 ultra * (dB) | 58.2 | 53.8 8% | 54.4 7% | 52.8 9% | 50.9 13% | 46.1 21% |
| Load Maximum * (dB) | 56.5 | 53.8 5% | 58.6 -4% | 52.9 6% | 48 15% | 53.2 6% |
* ... Moindre est la valeur, meilleures sont les performances
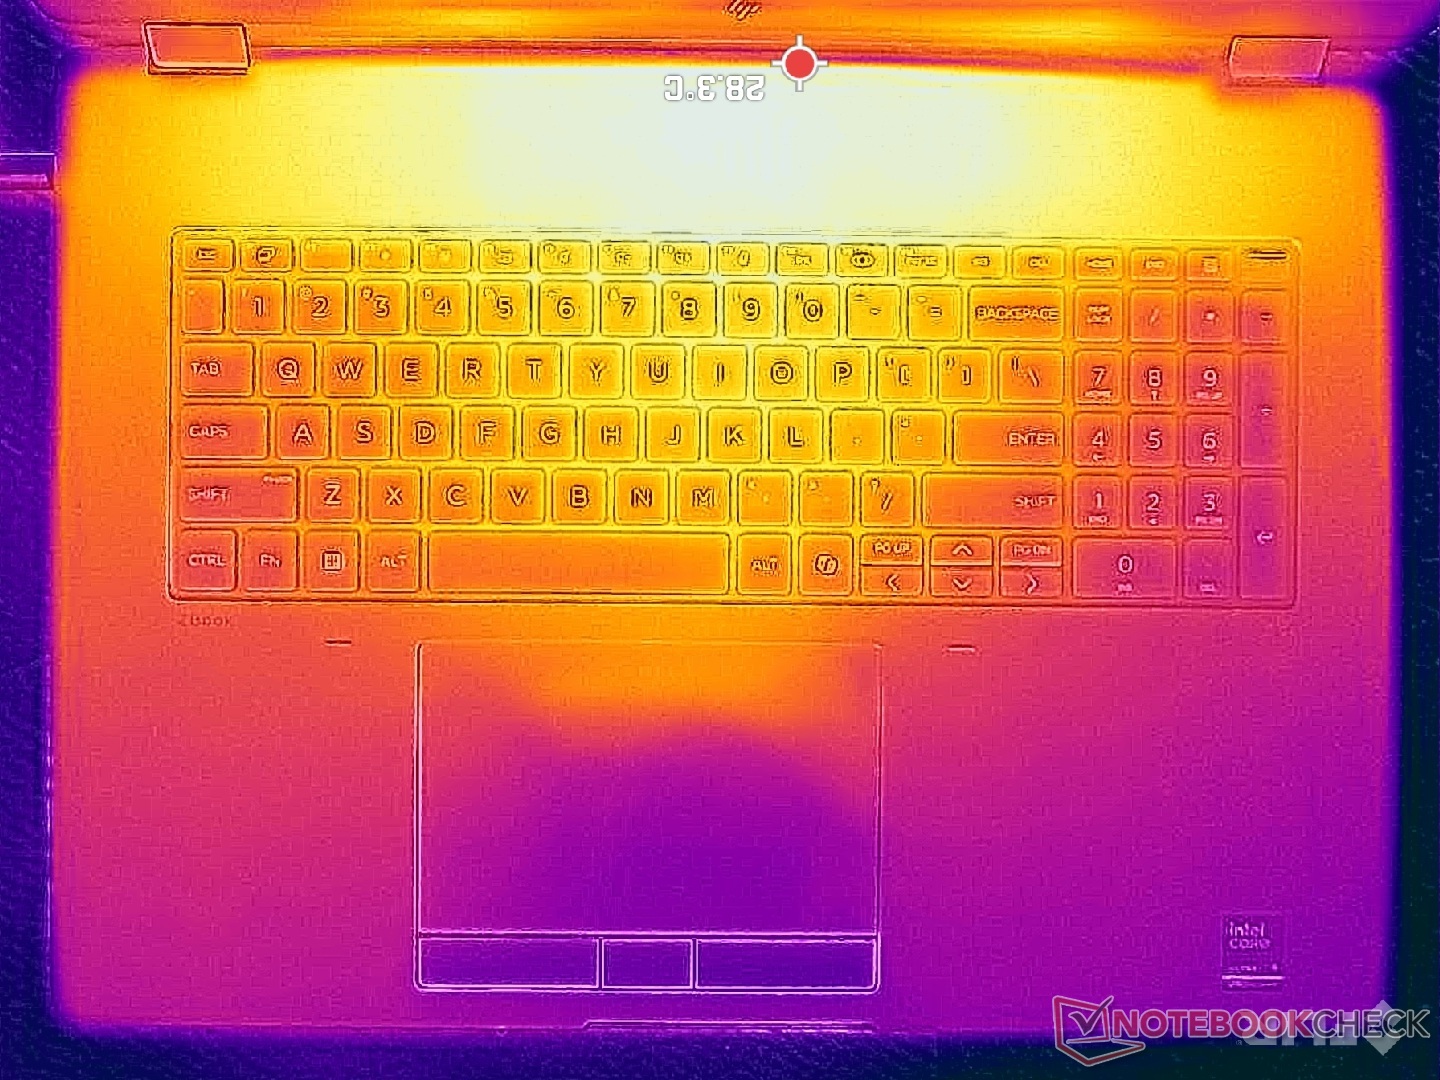
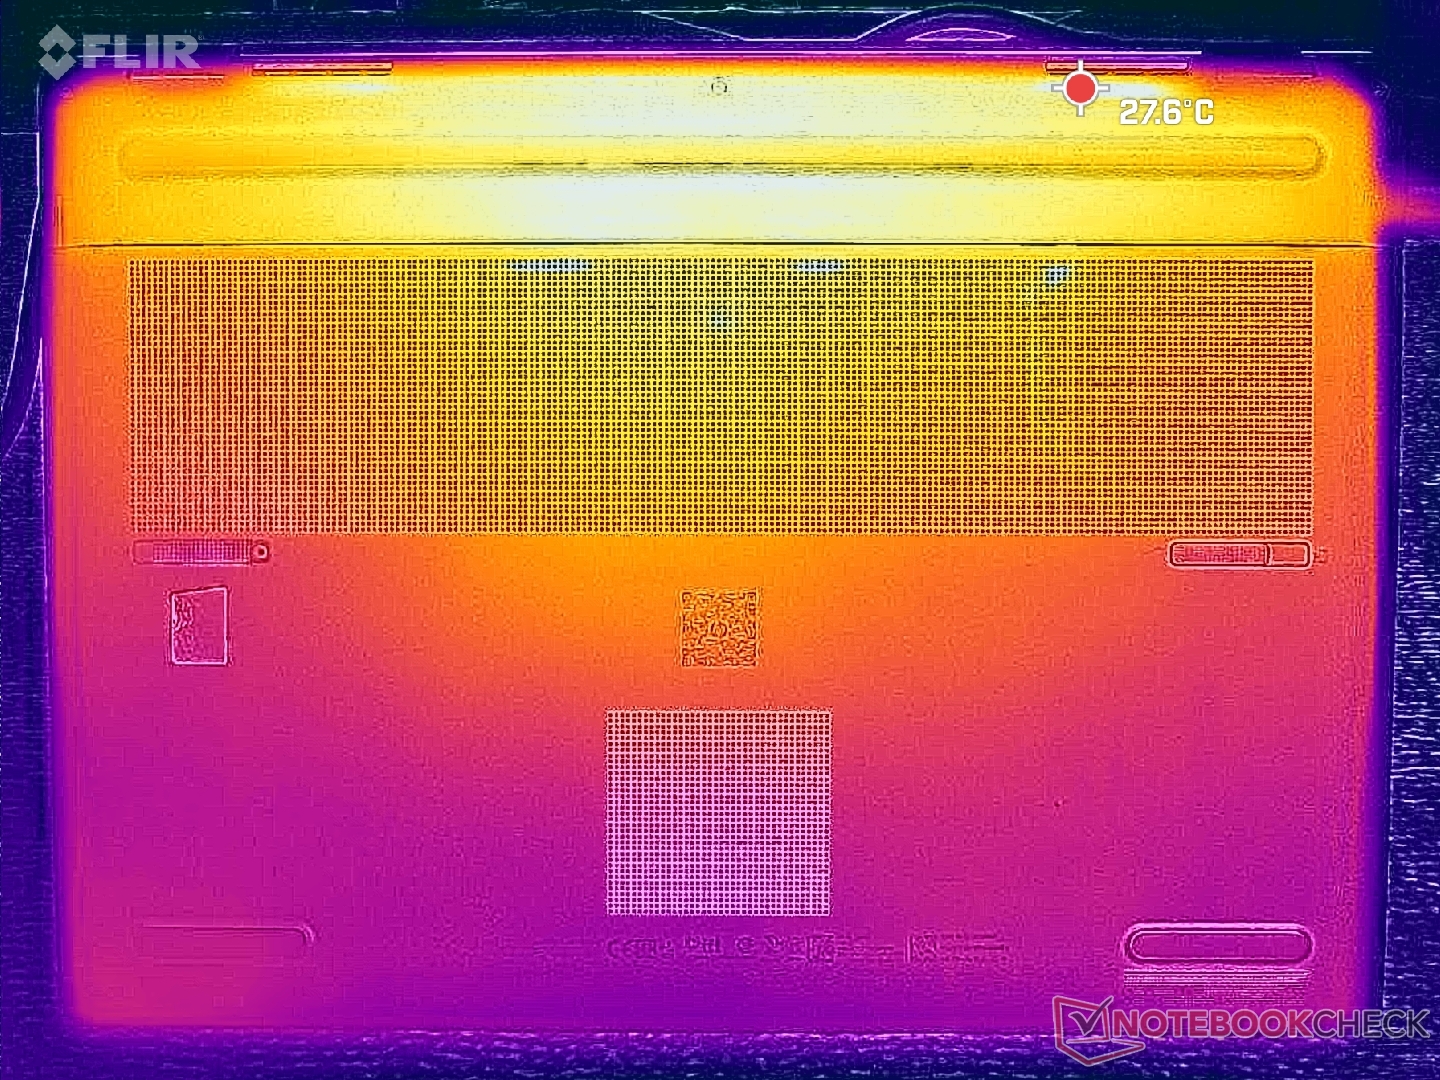
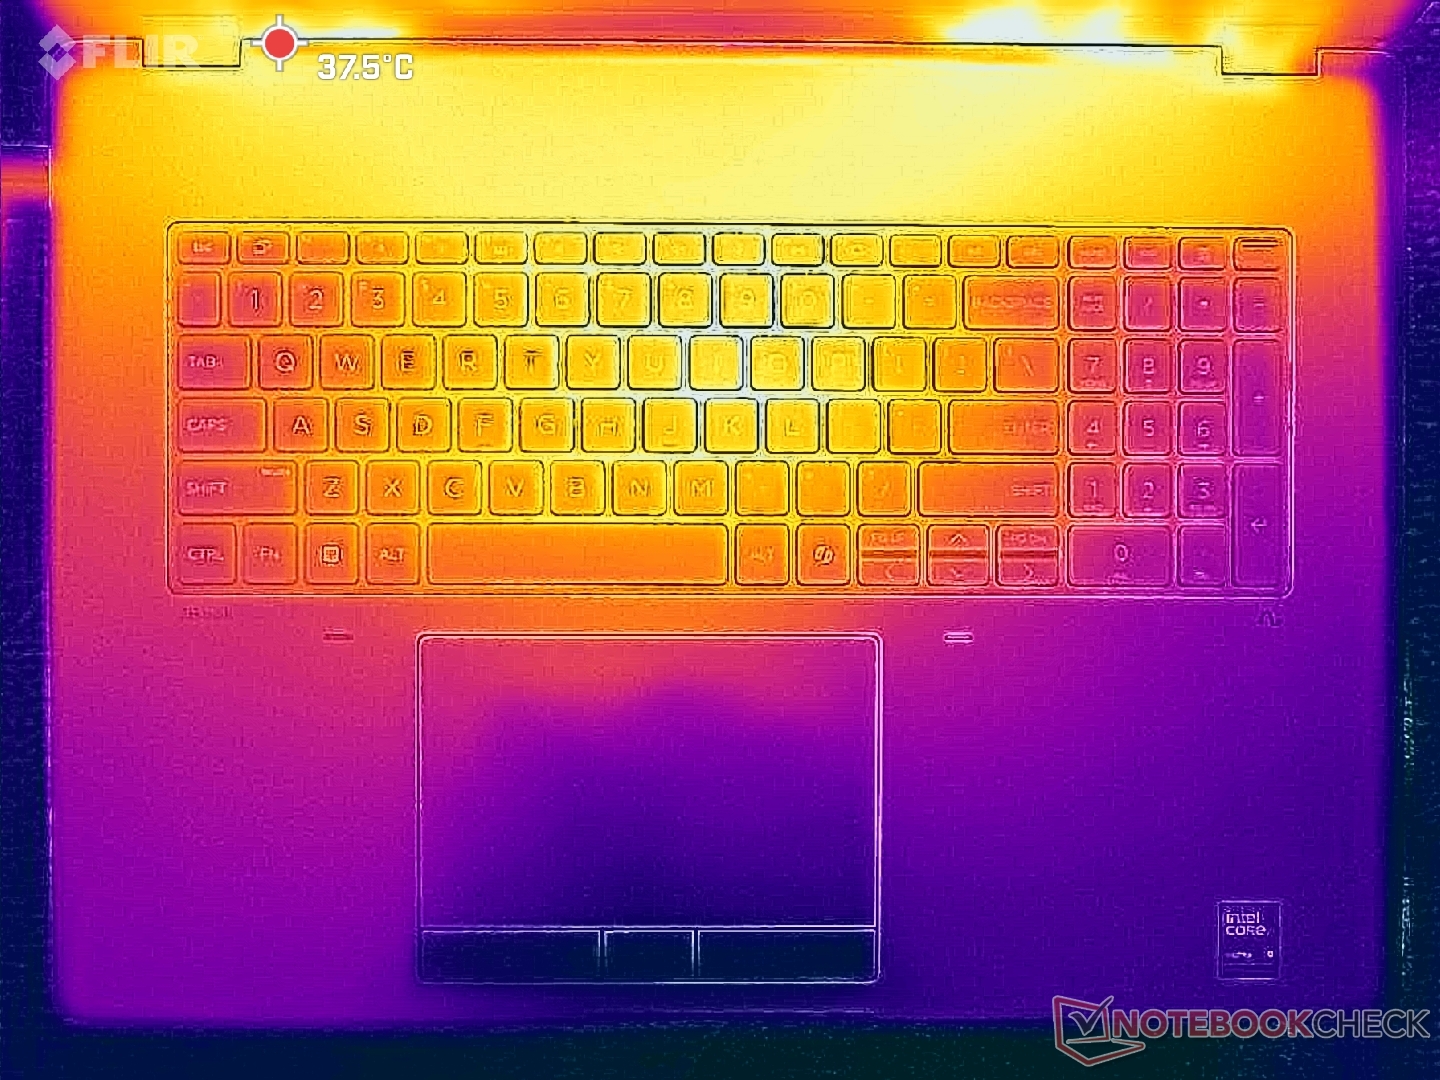
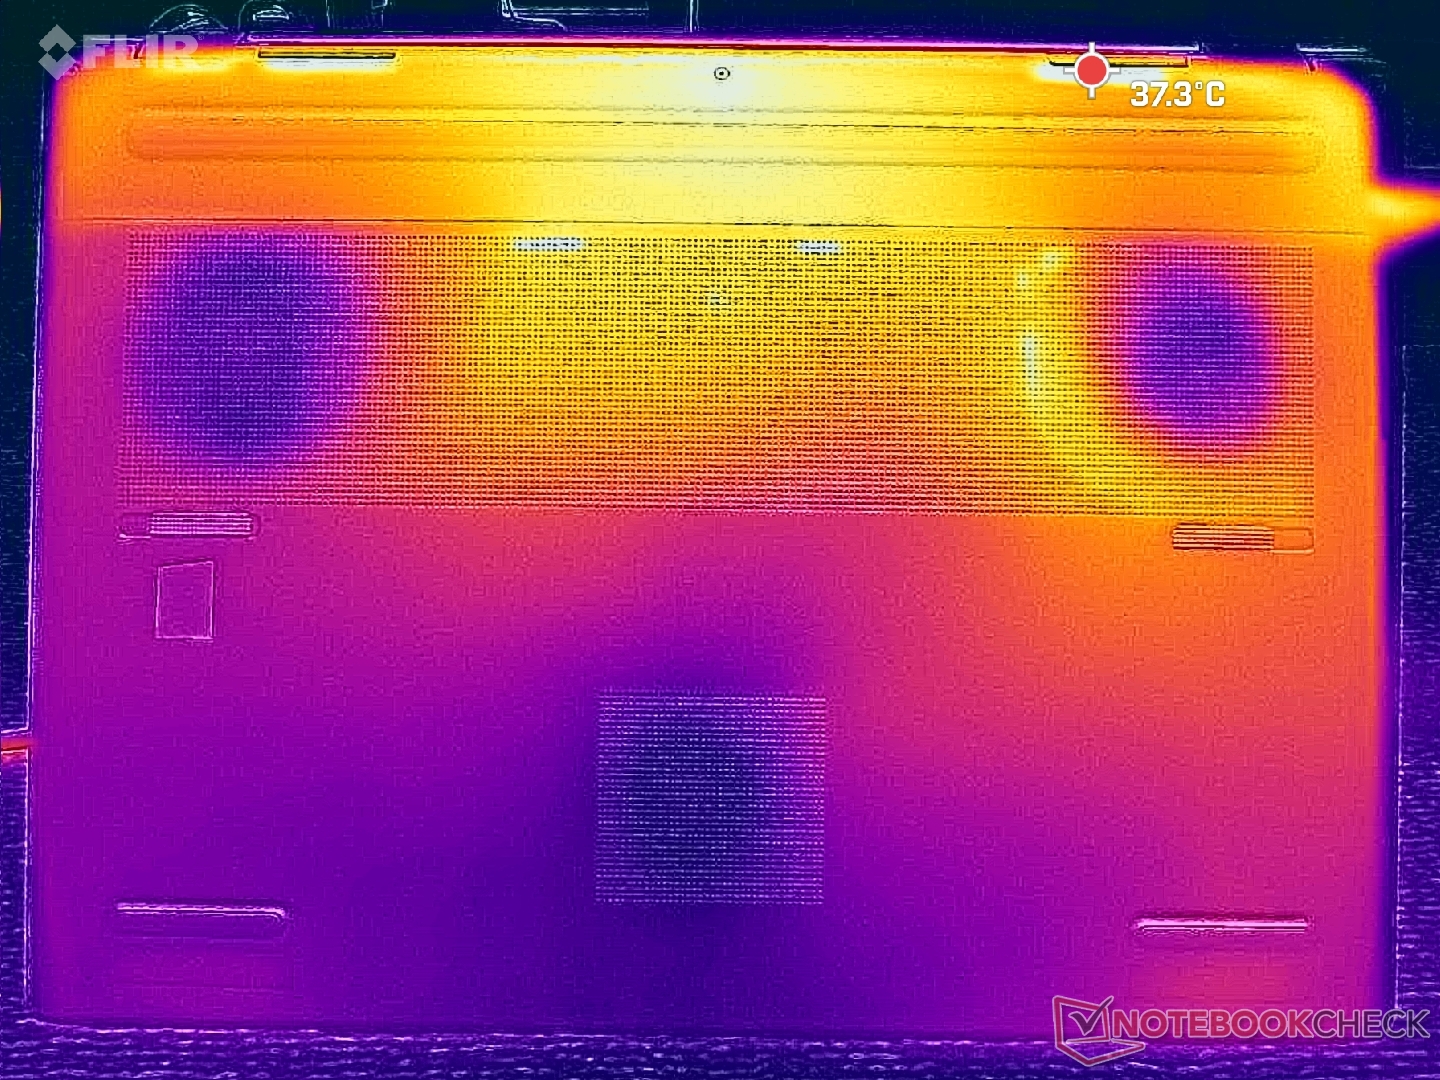
Température
Les températures de surface restent raisonnablement fraîches, même en cas d'utilisation intensive. Les points chauds sur le clavier et le capot inférieur atteignent respectivement 40 et 36 °C, contre près de 50 °C sur le clavier de l'ordinateur Schenker Key 18 Pro.
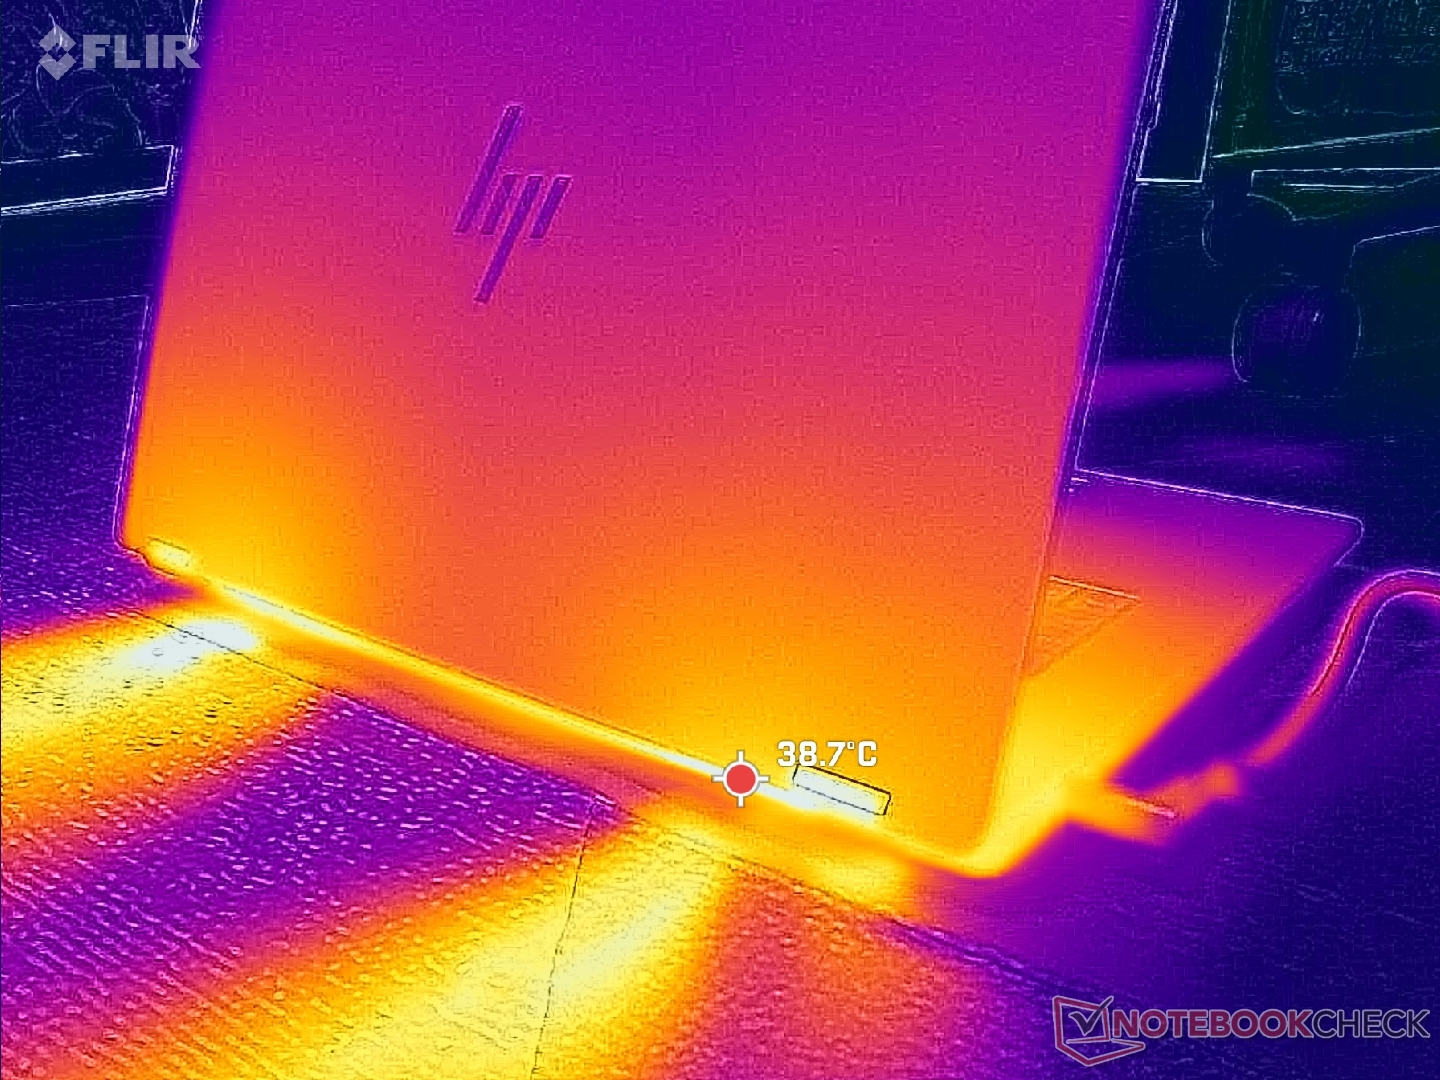
(+) La température maximale du côté supérieur est de 39.6 °C / 103 F, par rapport à la moyenne de 38.2 °C / 101 F, allant de 22.2 à 69.8 °C pour la classe Workstation.
(+) Le fond chauffe jusqu'à un maximum de 35.4 °C / 96 F, contre une moyenne de 41.1 °C / 106 F
(+) En utilisation inactive, la température moyenne du côté supérieur est de 28.4 °C / 83 F, par rapport à la moyenne du dispositif de 32 °C / 90 F.
(+) Les repose-poignets et le pavé tactile sont plus froids que la température de la peau avec un maximum de 26 °C / 78.8 F et sont donc froids au toucher.
(±) La température moyenne de la zone de l'appui-paume de dispositifs similaires était de 27.8 °C / 82 F (+1.8 °C / #3.2 F).
| HP ZBook Fury G1i 18 Ultra 9 285HX, RTX PRO 5000 Blackwell Generation Laptop | Dell Pro Max 18 Plus MB18250 Ultra 9 285HX, RTX PRO 5000 Blackwell Generation Laptop | Schenker Key 18 Pro M25 RTX 5090 Ultra 9 275HX, GeForce RTX 5090 Laptop | Lenovo ThinkPad P16 Gen 2 i7-14700HX, RTX 4000 Ada Generation Laptop | HP ZBook X G1i 16 Ultra 7 265H, RTX PRO 2000 Blackwell Generation Laptop | HP ZBook Studio 16 G11 Ultra 9 185H, RTX 3000 Ada Generation Laptop | |
|---|---|---|---|---|---|---|
| Heat | -12% | -14% | -6% | 0% | -10% | |
| Maximum Upper Side * (°C) | 39.6 | 44.8 -13% | 47.5 -20% | 46.6 -18% | 36 9% | 36.6 8% |
| Maximum Bottom * (°C) | 35.4 | 47 -33% | 52.8 -49% | 51 -44% | 39.4 -11% | 47.8 -35% |
| Idle Upper Side * (°C) | 31.6 | 31.8 -1% | 28.5 10% | 24.8 22% | 30.4 4% | 31.4 1% |
| Idle Bottom * (°C) | 31.2 | 31.4 -1% | 30.1 4% | 25.6 18% | 31.8 -2% | 35.6 -14% |
* ... Moindre est la valeur, meilleures sont les performances
Intervenants
HP ZBook Fury G1i 18 analyse audio
(+) | les haut-parleurs peuvent jouer relativement fort (90.1# dB)
Basses 100 - 315 Hz
(±) | basse réduite - en moyenne 11.4% inférieure à la médiane
(±) | la linéarité des basses est moyenne (8.9% delta à la fréquence précédente)
Médiums 400 - 2000 Hz
(+) | médiane équilibrée - seulement 3.2% de la médiane
(+) | les médiums sont linéaires (5.6% delta à la fréquence précédente)
Aiguës 2 - 16 kHz
(+) | des sommets équilibrés - à seulement 3.7% de la médiane
(+) | les aigus sont linéaires (6.5% delta à la fréquence précédente)
Globalement 100 - 16 000 Hz
(+) | le son global est linéaire (10.8% différence à la médiane)
Par rapport à la même classe
» 9% de tous les appareils testés de cette catégorie étaient meilleurs, 4% similaires, 86% pires
» Le meilleur avait un delta de 7%, la moyenne était de 17%, le pire était de 35%.
Par rapport à tous les appareils testés
» 6% de tous les appareils testés étaient meilleurs, 2% similaires, 93% pires
» Le meilleur avait un delta de 4%, la moyenne était de 24%, le pire était de 134%.
Apple MacBook Pro 16 2021 M1 Pro analyse audio
(+) | les haut-parleurs peuvent jouer relativement fort (84.7# dB)
Basses 100 - 315 Hz
(+) | bonne basse - seulement 3.8% loin de la médiane
(+) | les basses sont linéaires (5.2% delta à la fréquence précédente)
Médiums 400 - 2000 Hz
(+) | médiane équilibrée - seulement 1.3% de la médiane
(+) | les médiums sont linéaires (2.1% delta à la fréquence précédente)
Aiguës 2 - 16 kHz
(+) | des sommets équilibrés - à seulement 1.9% de la médiane
(+) | les aigus sont linéaires (2.7% delta à la fréquence précédente)
Globalement 100 - 16 000 Hz
(+) | le son global est linéaire (4.6% différence à la médiane)
Par rapport à la même classe
» 0% de tous les appareils testés de cette catégorie étaient meilleurs, 0% similaires, 100% pires
» Le meilleur avait un delta de 5%, la moyenne était de 17%, le pire était de 45%.
Par rapport à tous les appareils testés
» 0% de tous les appareils testés étaient meilleurs, 0% similaires, 100% pires
» Le meilleur avait un delta de 4%, la moyenne était de 24%, le pire était de 134%.
Gestion de l'énergie
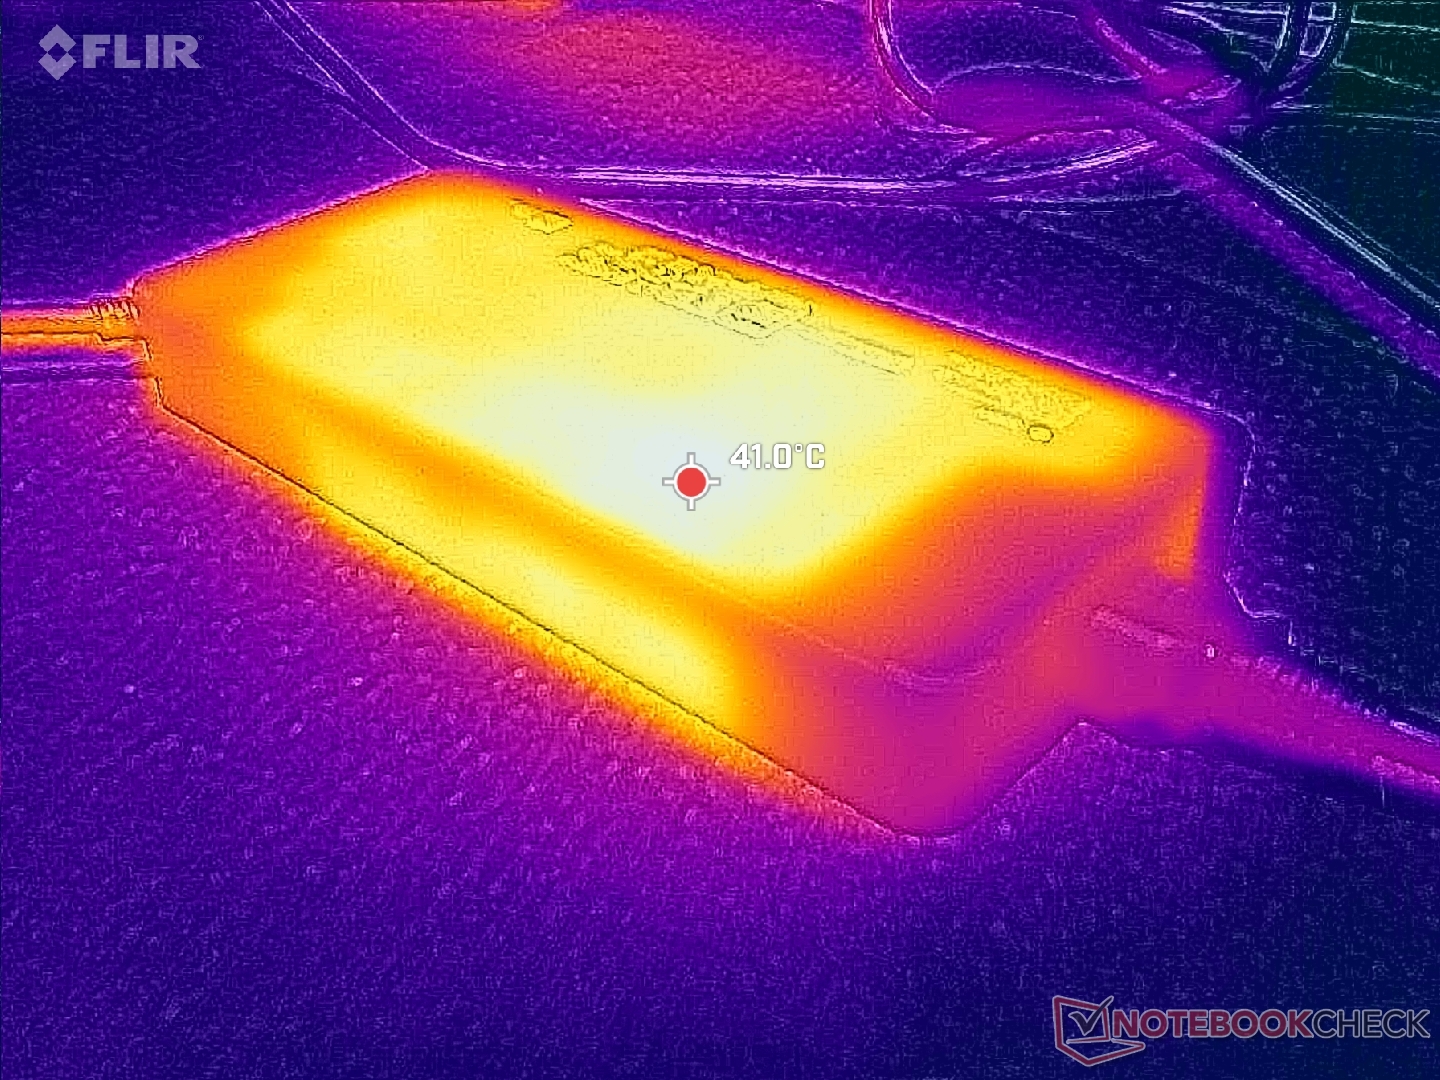
Consommation électrique
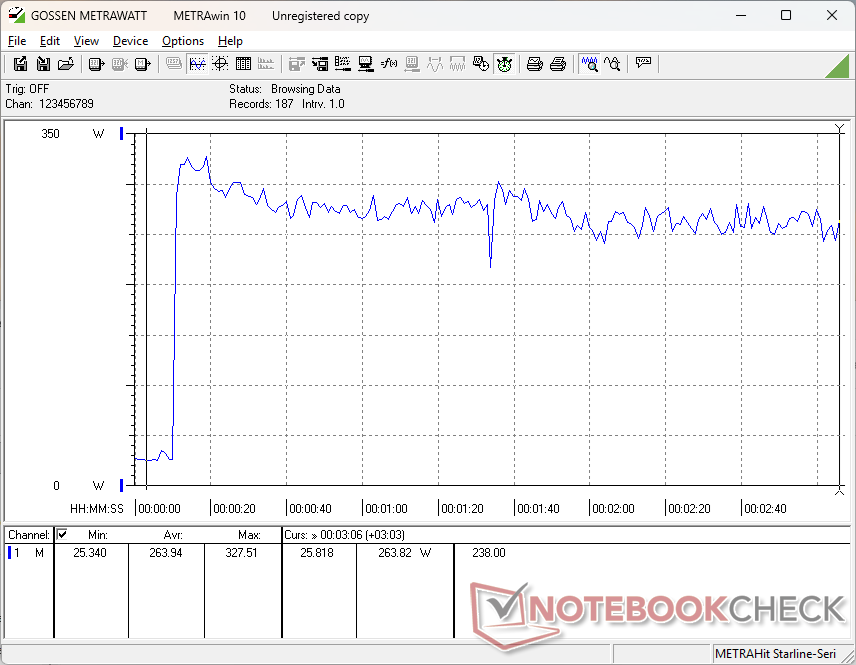
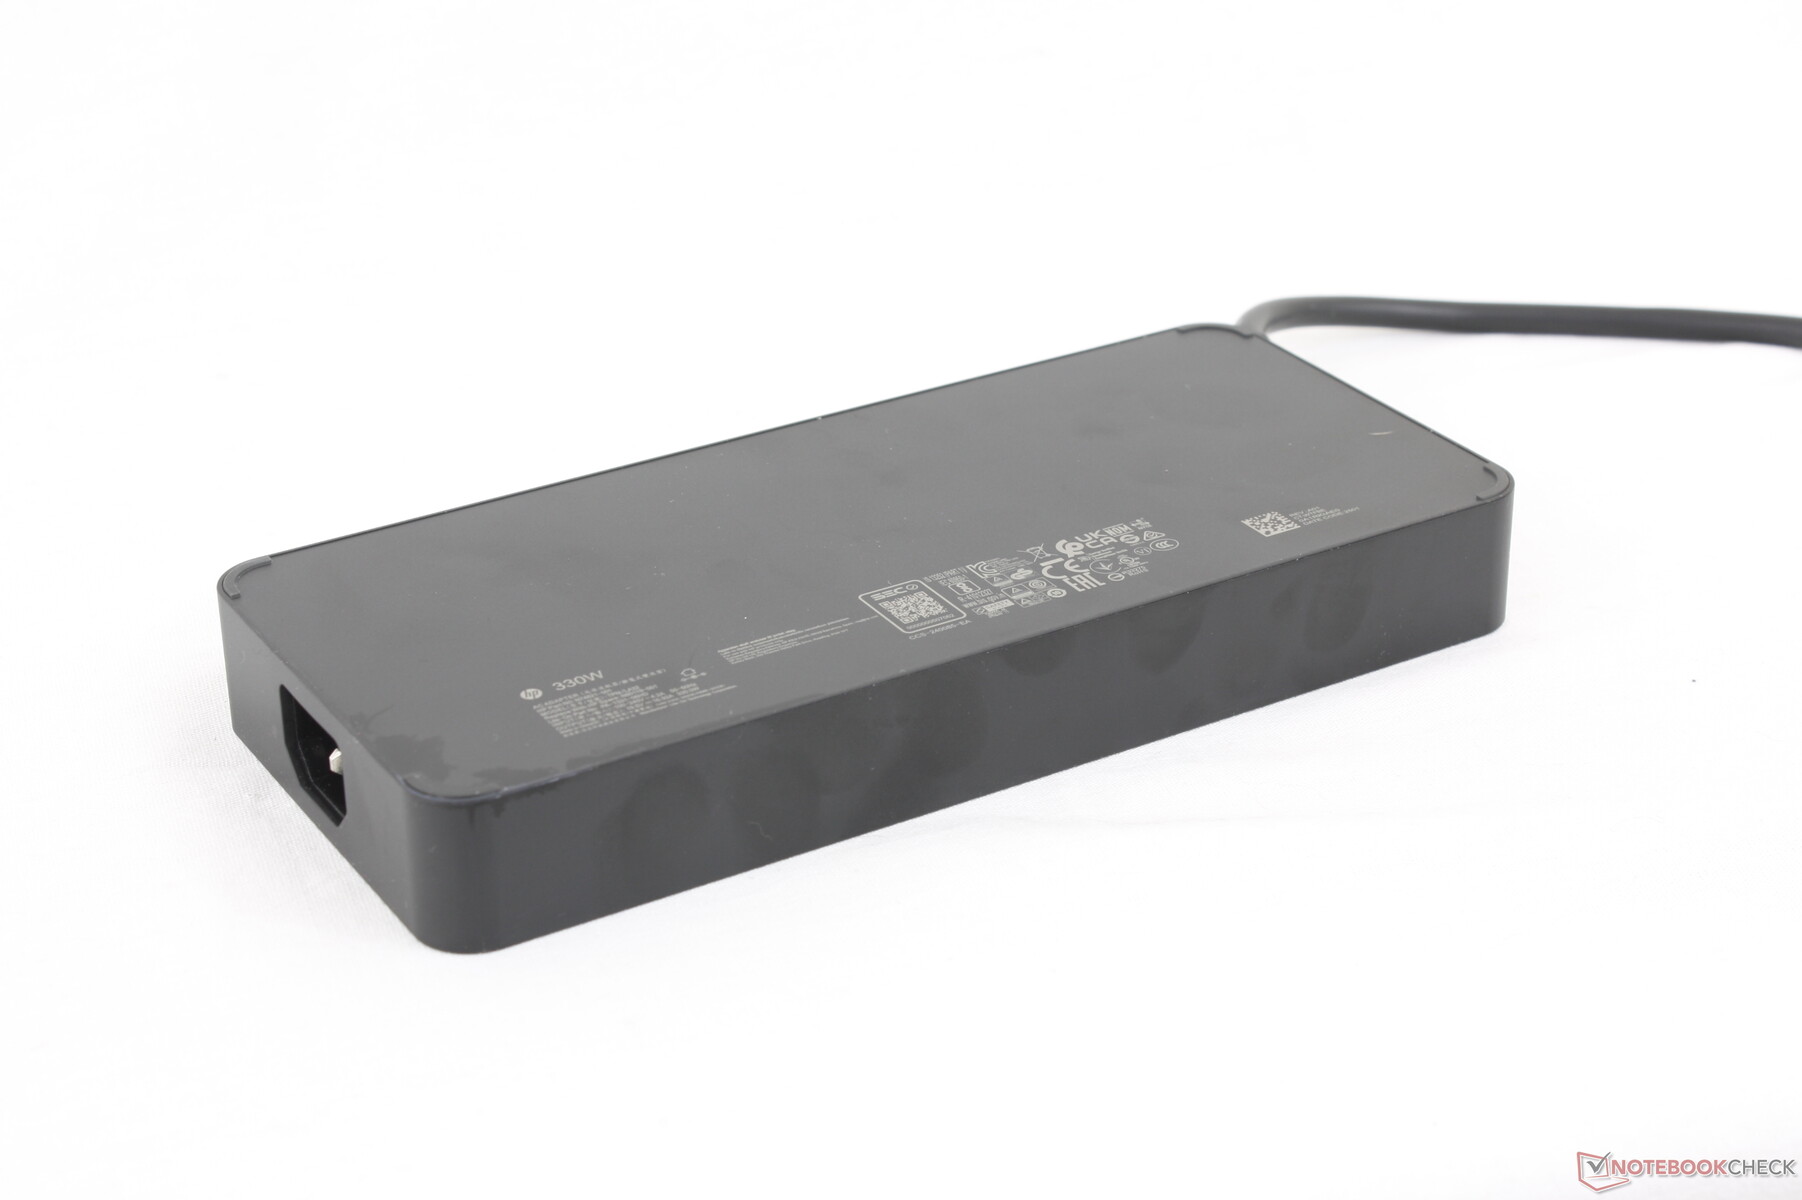
Le HP est livré avec un adaptateur secteur de 330 W tandis que le Dell est livré avec un adaptateur secteur USB-C de 280 W. La consommation maximale est donc plus élevée sur le HP où elle peut atteindre jusqu'à 328 W dans nos tests contre 281 W sur le Dell, mais cette forte consommation est de courte durée en raison des limitations thermiques ou des plafonds imposés. Lors de l'exécution simultanée de Prime95 et FurMark, par exemple, la consommation atteignait un pic de 328 W avant de se stabiliser rapidement autour de 265 W, comme nous l'avons observé sur le Dell. Ainsi, en termes de performances, l'adaptateur CA de 330 W n'a que peu d'importance.
| Éteint/en veille | |
| Au repos | |
| Fortement sollicité |
|
Légende:
min: | |
| HP ZBook Fury G1i 18 Ultra 9 285HX, RTX PRO 5000 Blackwell Generation Laptop, , IPS, 2560x1600, 18" | Dell Pro Max 18 Plus MB18250 Ultra 9 285HX, RTX PRO 5000 Blackwell Generation Laptop, , IPS, 2560x1600, 18" | Schenker Key 18 Pro M25 RTX 5090 Ultra 9 275HX, GeForce RTX 5090 Laptop, Samsung 9100 Pro 4 TB, IPS, 3840x2400, 18" | Lenovo ThinkPad P16 Gen 2 i7-14700HX, RTX 4000 Ada Generation Laptop, SK hynix PC801 HFS001TEJ9X162N, IPS, 2560x1600, 16" | HP ZBook X G1i 16 Ultra 7 265H, RTX PRO 2000 Blackwell Generation Laptop, Samsung PM9A1 MZVL22T0HBLB, IPS, 2560x1600, 16" | HP ZBook Studio 16 G11 Ultra 9 185H, RTX 3000 Ada Generation Laptop, Kioxia XG8 KXG80ZNV1T02, IPS, 3840x2400, 16" | |
|---|---|---|---|---|---|---|
| Power Consumption | 11% | -11% | 21% | 58% | 28% | |
| Idle Minimum * (Watt) | 16.1 | 6.1 62% | 14 13% | 7.9 51% | 4.1 75% | 14 13% |
| Idle Average * (Watt) | 20.3 | 15.2 25% | 21.9 -8% | 13.1 35% | 9 56% | 22.4 -10% |
| Idle Maximum * (Watt) | 25 | 32.4 -30% | 22.3 11% | 24.2 3% | 9.4 62% | 25.7 -3% |
| Load Average * (Watt) | 138.5 | 130.1 6% | 149.5 -8% | 127.4 8% | 86.7 37% | 90.2 35% |
| Cyberpunk 2077 ultra external monitor * (Watt) | 255 | 252 1% | 336 -32% | 219 14% | 102 60% | 120.3 53% |
| Cyberpunk 2077 ultra * (Watt) | 262 | 256 2% | 333 -27% | 225 14% | 106.1 60% | 125.4 52% |
| Load Maximum * (Watt) | 327.5 | 280.9 14% | 415.4 -27% | 248.5 24% | 152.9 53% | 142 57% |
* ... Moindre est la valeur, meilleures sont les performances
Consommation électrique Cyberpunk / Stress Test
Consommation électrique du moniteur externe
Autonomie de la batterie
L'autonomie du WLAN est toujours très bonne pour la taille, bien que légèrement plus courte que sur le Dell Pro Max 18 Plus. L'écran prend en charge le PSR2 ou Panel Self Refresh 2 pour économiser de l'énergie à la place d'Advanced Optimus.
| HP ZBook Fury G1i 18 Ultra 9 285HX, RTX PRO 5000 Blackwell Generation Laptop, 99 Wh | Dell Pro Max 18 Plus MB18250 Ultra 9 285HX, RTX PRO 5000 Blackwell Generation Laptop, 96 Wh | Schenker Key 18 Pro M25 RTX 5090 Ultra 9 275HX, GeForce RTX 5090 Laptop, 98 Wh | Lenovo ThinkPad P16 Gen 2 i7-14700HX, RTX 4000 Ada Generation Laptop, 94 Wh | HP ZBook X G1i 16 Ultra 7 265H, RTX PRO 2000 Blackwell Generation Laptop, 83 Wh | HP ZBook Studio 16 G11 Ultra 9 185H, RTX 3000 Ada Generation Laptop, 86 Wh | |
|---|---|---|---|---|---|---|
| Autonomie de la batterie | ||||||
| WiFi v1.3 (h) | 8 | 9.3 16% | 5.8 -27% | 2.5 -69% | 12.5 56% | 4.8 -40% |
Notebookcheck Rating
Le HP ZBook Fury G1i 18 semble excellent sur le papier, mais les performances conservatrices du CPU et du GPU et le manque général d'innovations font du Dell Pro Max 18 Plus une option nettement plus attrayante.
HP ZBook Fury G1i 18
- 11/22/2025 v8
Allen Ngo
 Total Sustainability Score:
 Comparaison avec des concurrents potentiels
Image | Modèle | Prix | Poids | Épaisseur | Écran |
|---|---|---|---|---|---|
1. 89.5%  | HP ZBook Fury G1i 18 Intel Core Ultra 9 285HX ⎘ NVIDIA RTX PRO 5000 Blackwell Generation Laptop ⎘ 64 Go Mémoire | Amazon: Prix de liste: 11000 USD | 3.4 kg | 27 mm | 18.00" 2560x1600 168 PPI IPS |
2. 88.9%  | Dell Pro Max 18 Plus MB18250 Intel Core Ultra 9 285HX ⎘ NVIDIA RTX PRO 5000 Blackwell Generation Laptop ⎘ 128 Go Mémoire | Amazon: Prix de liste: 6000 USD | 3.6 kg | 30.2 mm | 18.00" 2560x1600 168 PPI IPS |
3. 84.6%  | Schenker Key 18 Pro M25 RTX 5090 Intel Core Ultra 9 275HX ⎘ NVIDIA GeForce RTX 5090 Laptop ⎘ 256 Go Mémoire, 4096 Go SSD | Amazon: Prix de liste: 6400€ | 4.1 kg | 29.5 mm | 18.00" 3840x2400 252 PPI IPS |
4. 85.9%  | Lenovo ThinkPad P16 Gen 2 Intel Core i7-14700HX ⎘ NVIDIA RTX 4000 Ada Generation Laptop ⎘ 32 Go Mémoire, 1024 Go SSD | Amazon: Prix de liste: 3500 USD | 3.1 kg | 30.23 mm | 16.00" 2560x1600 189 PPI IPS |
5. 87.4%  | HP ZBook X G1i 16 Intel Core Ultra 7 265H ⎘ NVIDIA RTX PRO 2000 Blackwell Generation Laptop ⎘ 64 Go Mémoire, 2048 Go SSD | Prix de liste: 2700 USD | 2.2 kg | 23 mm | 16.00" 2560x1600 189 PPI IPS |
6. 84.2%  | HP ZBook Studio 16 G11 Intel Core Ultra 9 185H ⎘ NVIDIA RTX 3000 Ada Generation Laptop ⎘ 64 Go Mémoire, 1024 Go SSD | Prix de liste: 4300 USD | 1.8 kg | 19 mm | 16.00" 3840x2400 283 PPI IPS |
Transparency
La sélection des appareils à examiner est effectuée par notre équipe éditoriale. L'échantillon de test a été prêté à l'auteur par le fabricant ou le détaillant pour les besoins de cet examen. Le prêteur n'a pas eu d'influence sur cette évaluation et le fabricant n'a pas reçu de copie de cette évaluation avant sa publication. Il n'y avait aucune obligation de publier cet article. En tant que média indépendant, Notebookcheck n'est pas soumis à l'autorité des fabricants, des détaillants ou des éditeurs.
Voici comment Notebookcheck teste
Chaque année, Notebookcheck examine de manière indépendante des centaines d'ordinateurs portables et de smartphones en utilisant des procédures standardisées afin de garantir que tous les résultats sont comparables. Nous avons continuellement développé nos méthodes de test depuis environ 20 ans et avons établi des normes industrielles dans le processus. Dans nos laboratoires de test, des équipements de mesure de haute qualité sont utilisés par des techniciens et des rédacteurs expérimentés. Ces tests impliquent un processus de validation en plusieurs étapes. Notre système d'évaluation complexe repose sur des centaines de mesures et de points de référence bien fondés, ce qui garantit l'objectivité.
