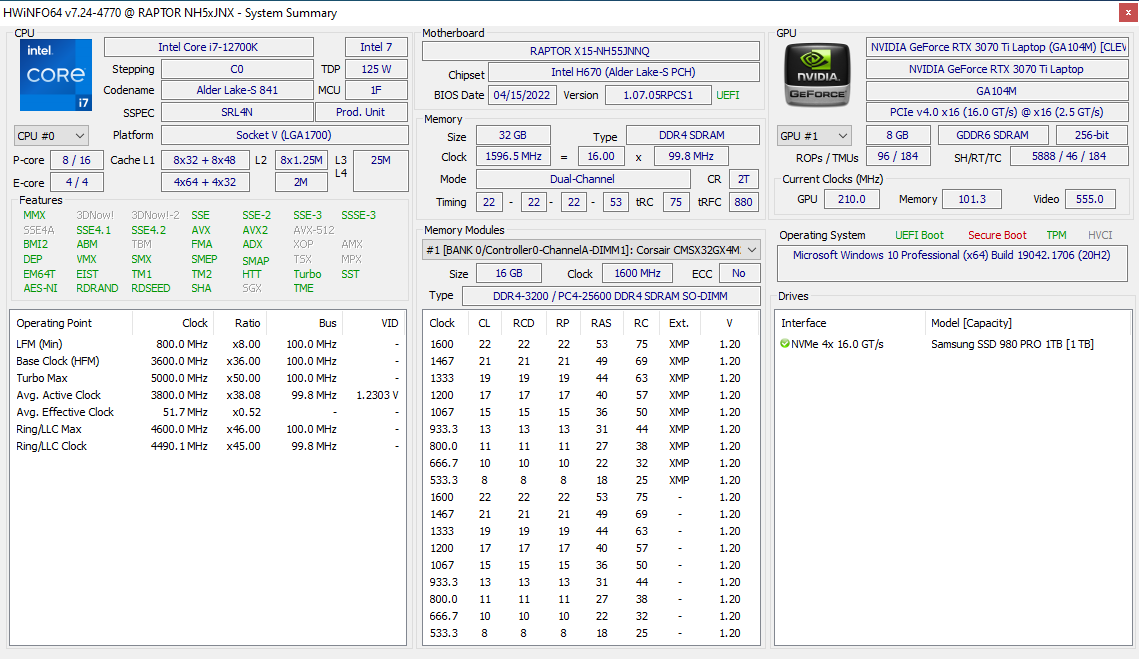
Test de l'Eurocom Raptor X15 : un Core i7-12700K LGA1700 dans un ordinateur portable
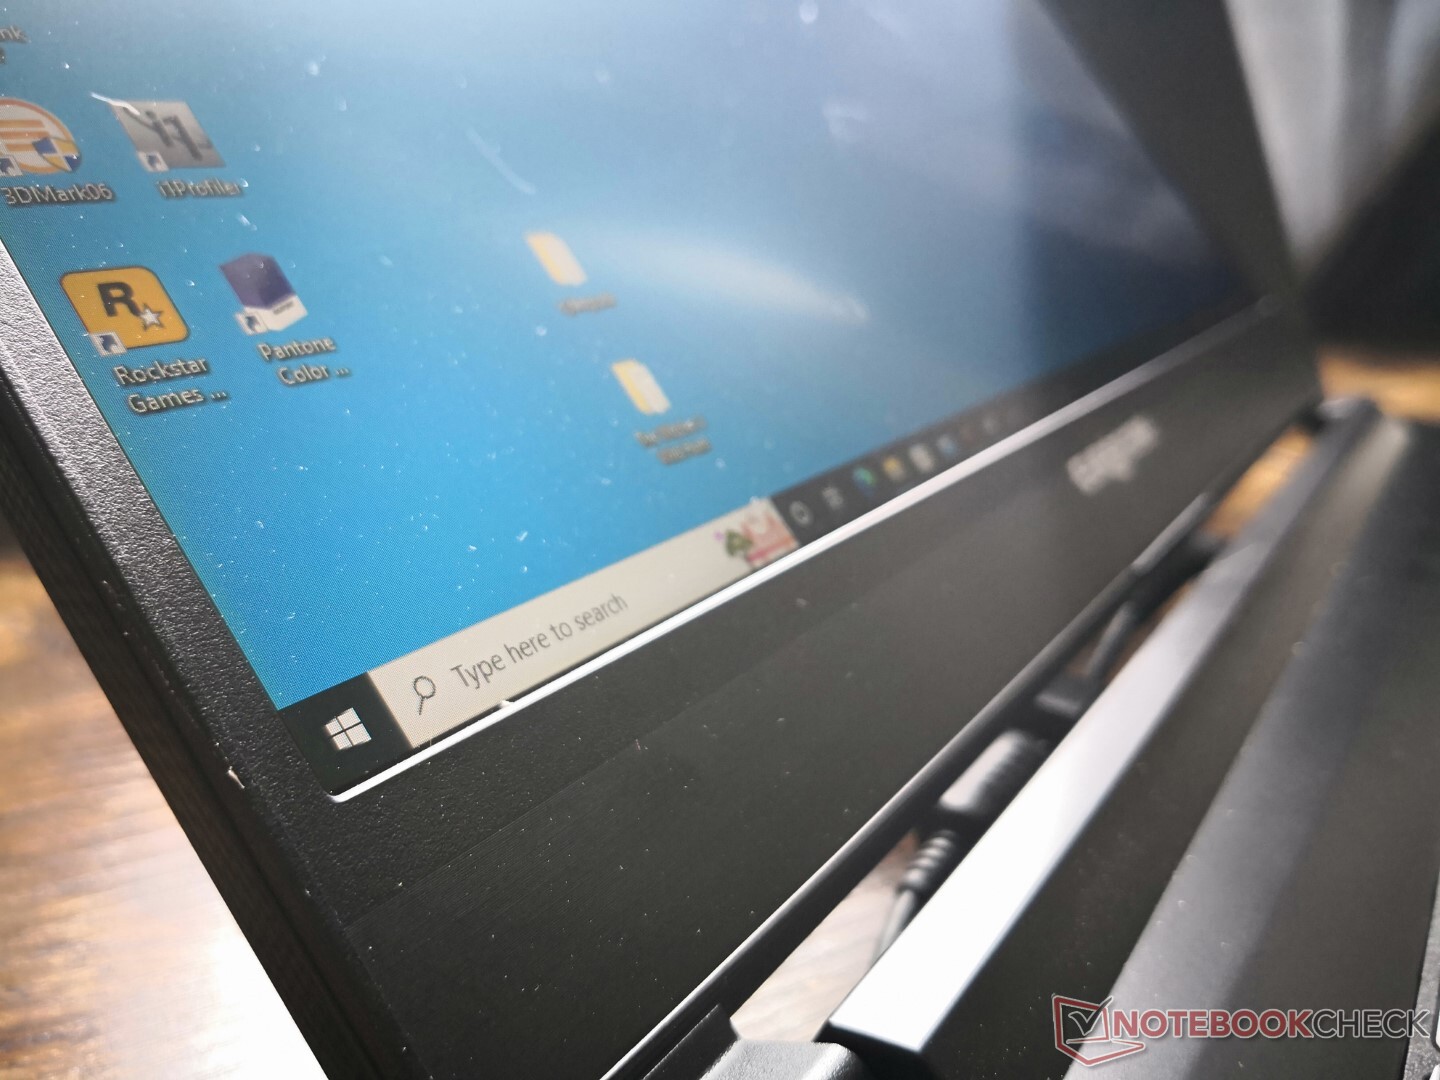
Le châssis du Raptor X15 est le Clevo NH57AF1 que Schenker utilise également pour son ordinateur portable XMG Apex 15. Ainsi, nous vous recommandons de consulter notre Page d'examen Schenker car nos commentaires sur les ports et la conception générale du modèle s'appliquent tous ici pour le Raptor X15. Cette page se concentrera plutôt sur les performances du Raptor X15 et sur ce que les utilisateurs peuvent attendre du CPU Core i7-12700K de 12ème génération lorsqu'il est appliqué à un facteur de forme d'ordinateur portable.
Le Raptor X15 est en concurrence avec d'autres ordinateurs portables de 15,6 pouces pour le jeu qui ne sont pas de type Ultrathin, comme le MSI GE66, Gigabyte A5 X1, Asus TUF Gaming A15ou Lenovo Legion 5 15. Cependant, un facteur clé de différenciation est l'utilisation d'un processeur de bureau à socket LGA1700 au lieu d'un processeur mobile de série H typique.
Plus de commentaires sur Eurocom :
Comparaison avec les concurrents potentiels
Note | Date | Modèle | Poids | Épaisseur | Taille | Résolution | Prix |
|---|---|---|---|---|---|---|---|
| 86.1 % v7 (old) | 06/22 | Eurocom Raptor X15 i7-12700K, GeForce RTX 3070 Ti Laptop GPU | 2.7 kg | 32.5 mm | 15.60" | 1920x1080 | |
| 87.4 % v7 (old) | 06/22 | MSI Raider GE66 12UHS i9-12900HK, GeForce RTX 3080 Ti Laptop GPU | 2.4 kg | 23.4 mm | 15.60" | 3840x2160 | |
| 88.3 % v7 (old) | 05/22 | Razer Blade 15 Advanced Model Early 2022 i7-12800H, GeForce RTX 3080 Ti Laptop GPU | 2.1 kg | 16.99 mm | 15.60" | 1920x1080 | |
| 85.2 % v7 (old) | 03/22 | Eurocom RX315 NH57AF1 i7-11800H, GeForce RTX 3070 Laptop GPU | 2 kg | 20 mm | 15.60" | 1920x1080 | |
| 84.1 % v7 (old) | 01/22 | Gigabyte A5 X1 R9 5900HX, GeForce RTX 3070 Laptop GPU | 2.2 kg | 25.3 mm | 15.60" | 1920x1080 | |
| 85 % v7 (old) | 07/21 | Asus TUF Gaming A15 FA506QR-AZ061T R7 5800H, GeForce RTX 3070 Laptop GPU | 2.3 kg | 24 mm | 15.60" | 1920x1080 |
Cas
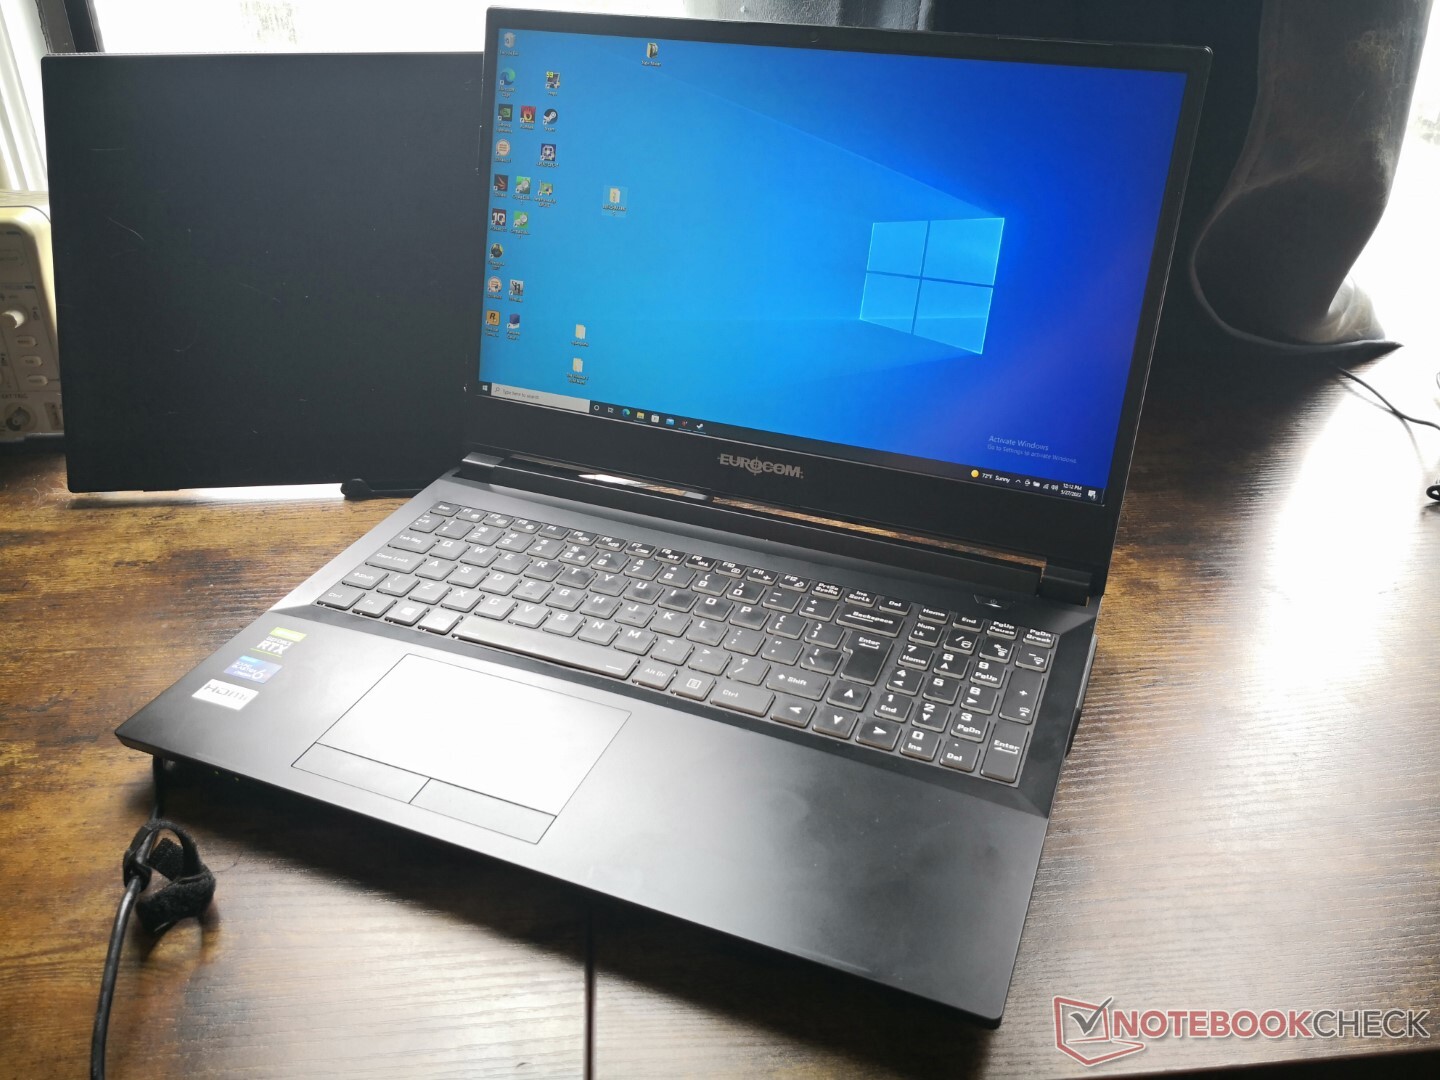
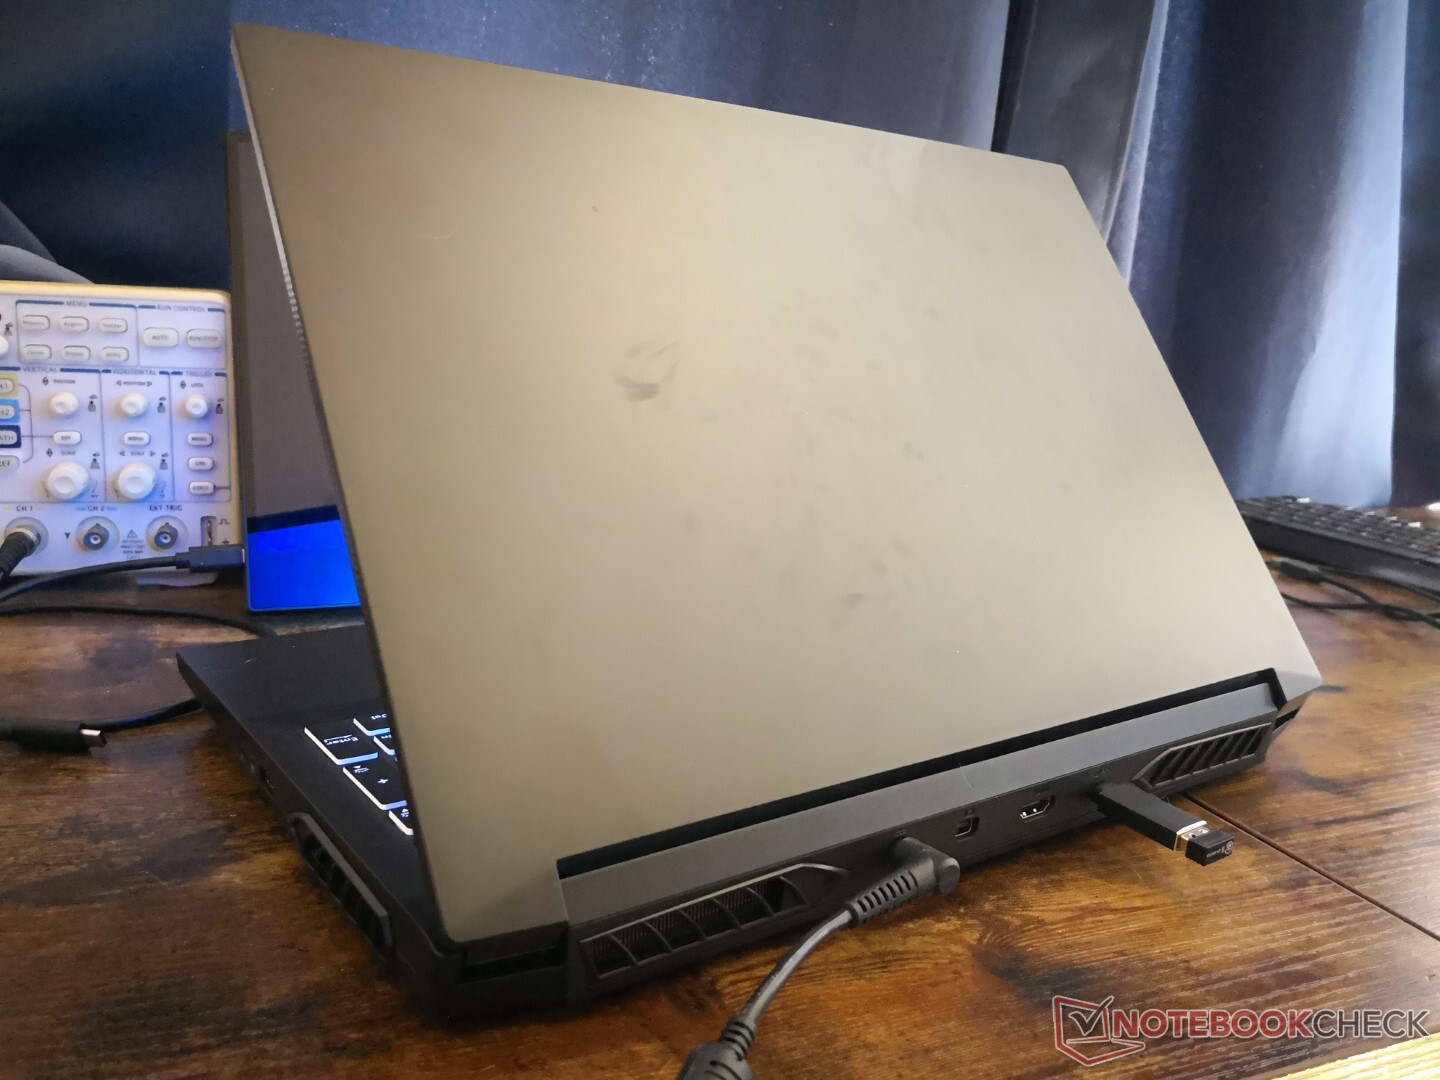
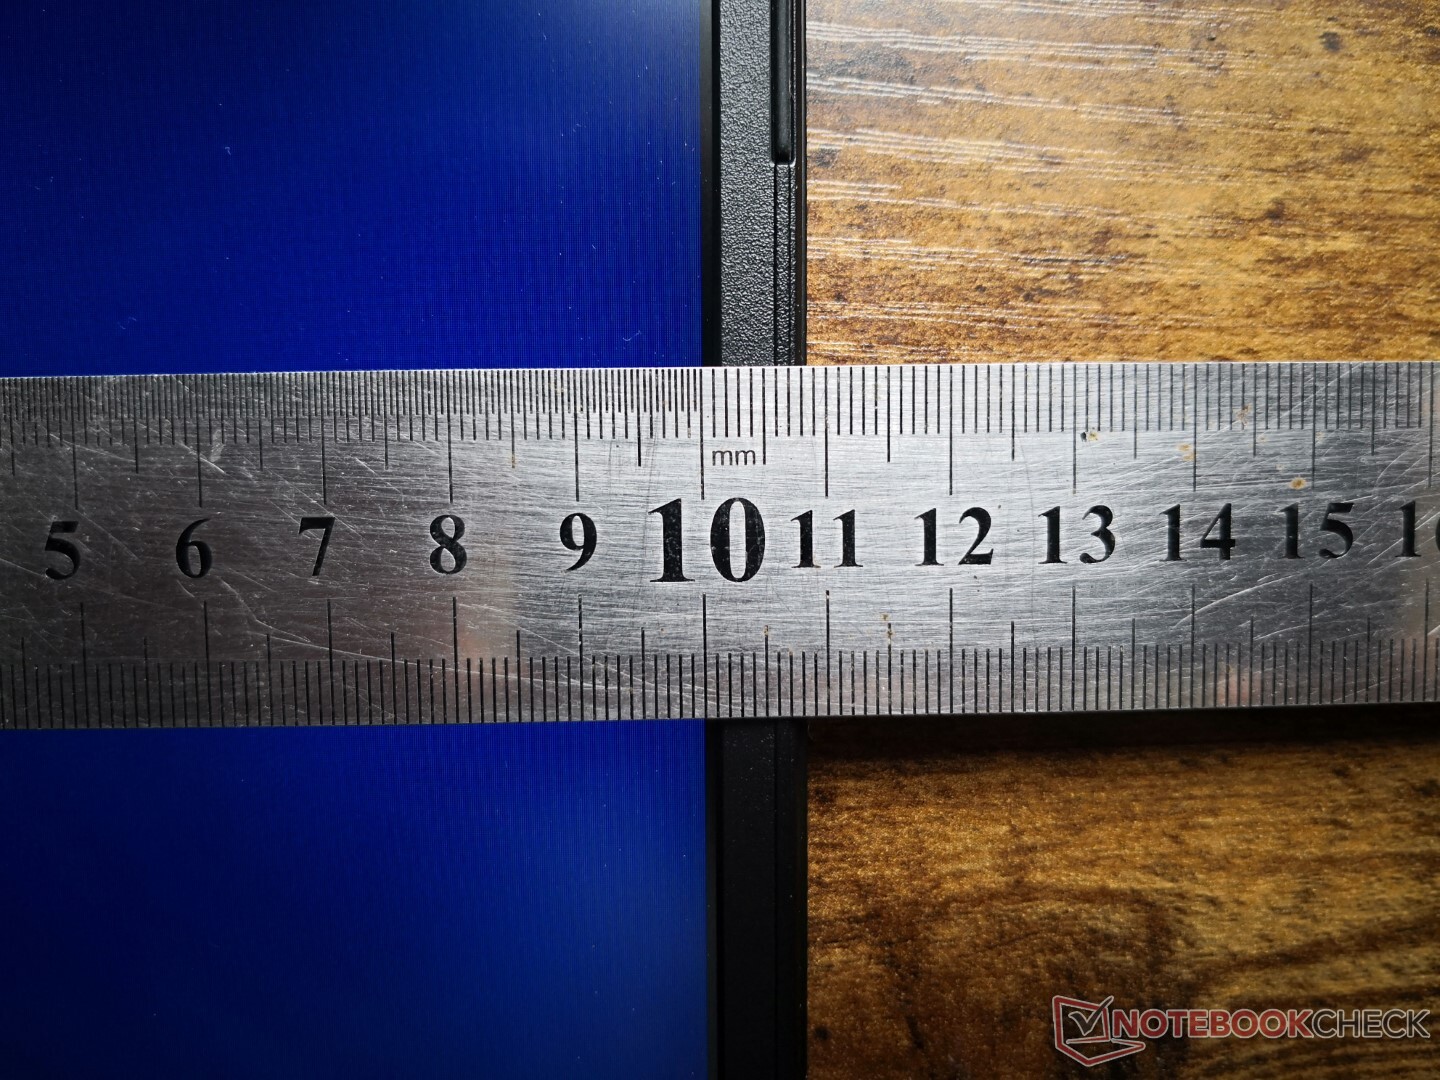
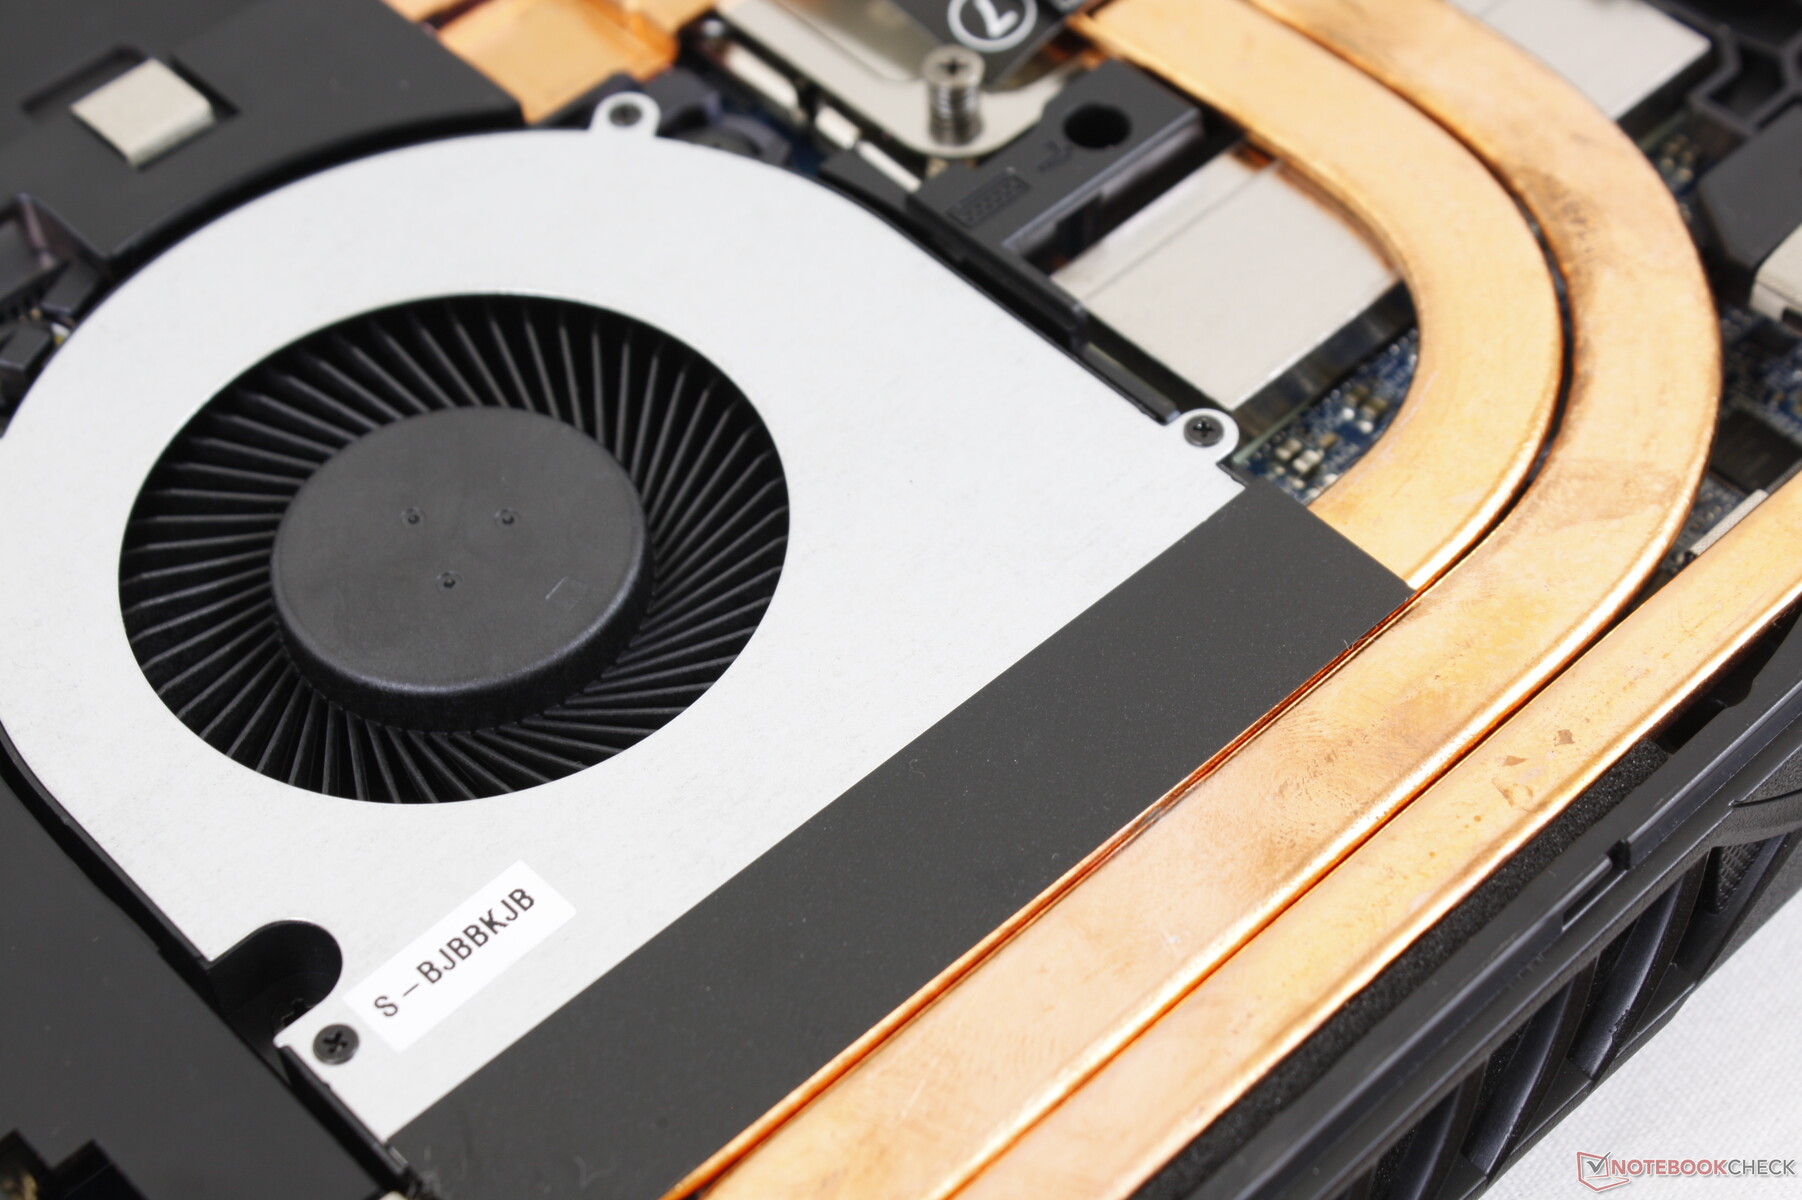
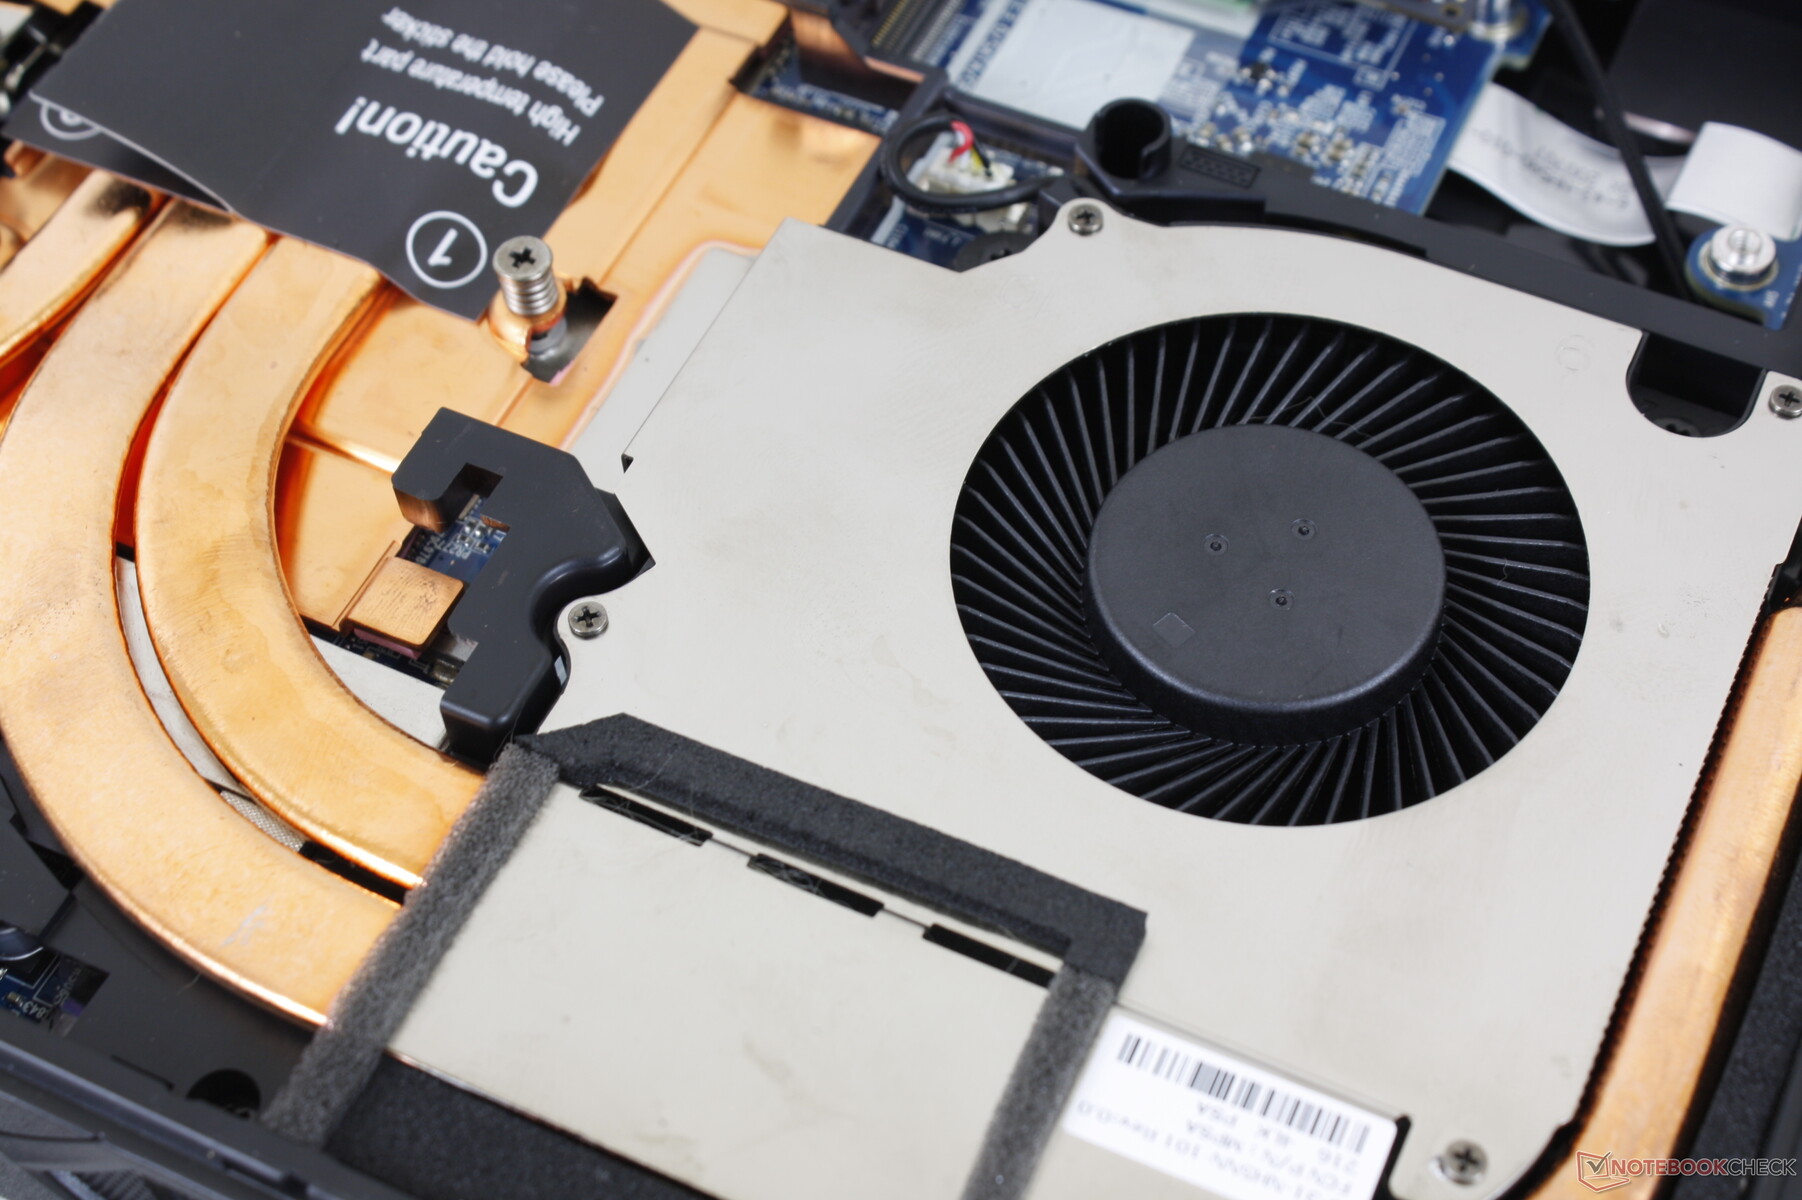
Avec ses 2,7 kg et ses 32,5 mm d'épaisseur, le Raptor X15 est plus lourd et plus épais que la plupart des autres ordinateurs portables de jeu de 15,6 pouces, notamment le MSI GE66 ou le Asus TUF Gaming A15. Le poids supplémentaire peut être en partie attribué à la solution de refroidissement plus volumineuse nécessaire pour loger et refroidir de manière adéquate le socket LGA1700 et le processeur.
Connectivité
Les options de port sont variées et identiques à celles du Schenker XMG Apex 15. Notez qu'il n'y a qu'un seul port USB-C avec prise en charge de DisplayPort mais pas de Thunderbolt ou de Power Delivery, contrairement à de nombreux autres ordinateurs portables de jeu alimentés par Intel, comme la série Razer Blade ou la série GS de MSI.
Lecteur de carte SD
Étrangement, le modèle intègre un lecteur de carte microSD au lieu d'un lecteur de taille normale, malgré son facteur de forme important et relativement épais. Les taux de transfert sont seulement moyens, à moins de la moitié de la vitesse du lecteur de carte sur le Dell XPS 15.
| SD Card Reader | |
| average JPG Copy Test (av. of 3 runs) | |
| Dell XPS 15 9510 i5 11400H FHD (AV Pro V60) | |
| Asus ZenBook Flip 14 UN5401QA-KN085W (AV Pro SD microSD 128 GB V60) | |
| Asus Zenbook Pro 15 OLED UM535Q (Toshiba Exceria Pro SDXC 64 GB UHS-II) | |
| Eurocom Raptor X15 (AV Pro V60) | |
| Asus ZenBook 14X OLED UX5400EA-L7154W | |
| maximum AS SSD Seq Read Test (1GB) | |
| Dell XPS 15 9510 i5 11400H FHD (AV Pro V60) | |
| Eurocom Raptor X15 (AV Pro V60) | |
| Asus ZenBook Flip 14 UN5401QA-KN085W (AV Pro SD microSD 128 GB V60) | |
| Asus Zenbook Pro 15 OLED UM535Q (Toshiba Exceria Pro SDXC 64 GB UHS-II) | |
| Asus ZenBook 14X OLED UX5400EA-L7154W | |
Communication
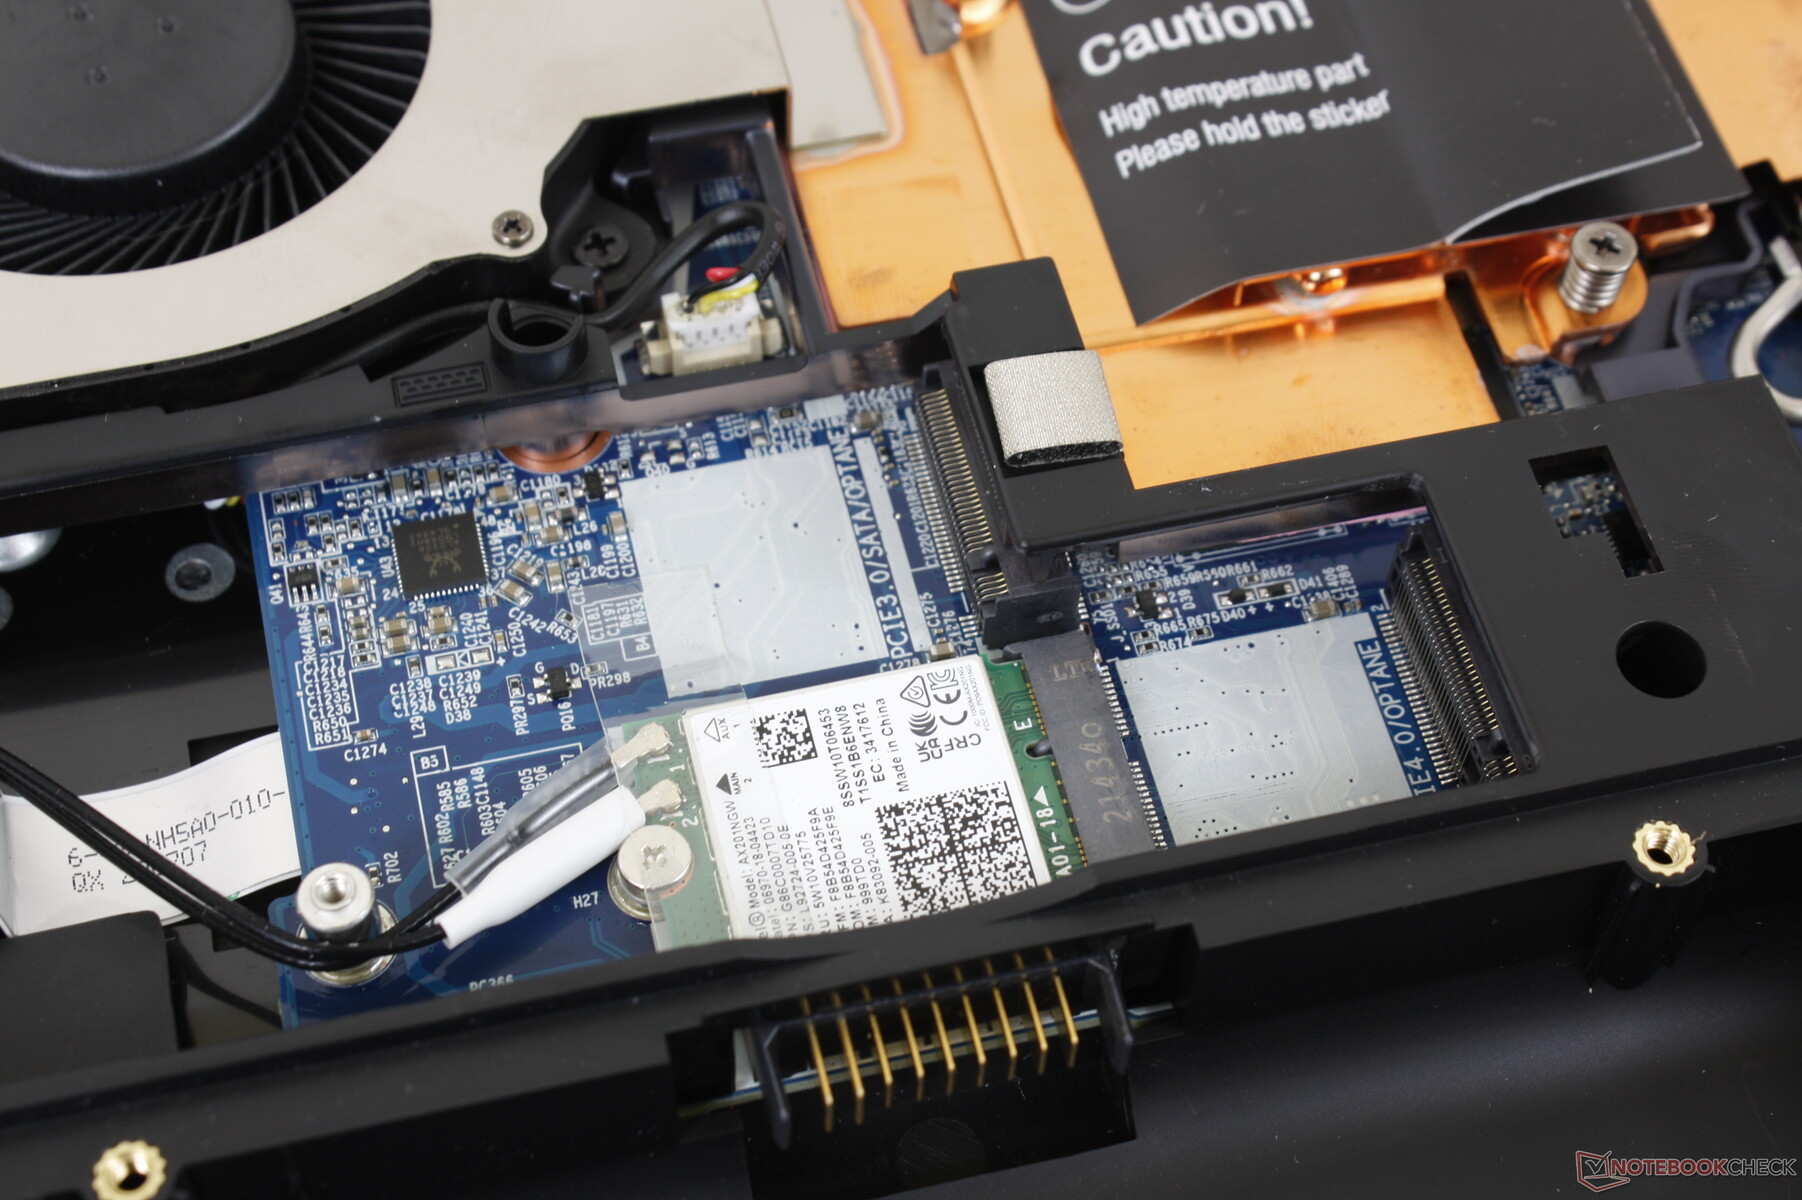
L'Intel AX200/201 est disponible comme option haut de gamme pour la connectivité Wi-Fi 6 et Bluetooth 5.2. Nous n'avons rencontré aucun problème lorsque nous l'avons couplé à notre routeur de test Asus GT-AXE11000.
Le Wi-Fi 6E n'est malheureusement pas compatible.
| Networking | |
| iperf3 transmit AX12 | |
| Gigabyte A5 X1 | |
| Asus TUF Gaming A15 FA506QR-AZ061T | |
| Eurocom RX315 NH57AF1 | |
| iperf3 receive AX12 | |
| Asus TUF Gaming A15 FA506QR-AZ061T | |
| Gigabyte A5 X1 | |
| Eurocom RX315 NH57AF1 | |
| iperf3 receive AXE11000 | |
| Razer Blade 15 Advanced Model Early 2022 | |
| MSI Raider GE66 12UHS | |
| Eurocom Raptor X15 | |
| iperf3 transmit AXE11000 | |
| Razer Blade 15 Advanced Model Early 2022 | |
| MSI Raider GE66 12UHS | |
| Eurocom Raptor X15 | |
Webcam
La webcam est médiocre, avec une résolution de 720p seulement, alors qu'elle est de 1080p sur d'autres portables de jeu comme le Razer Blade 15. Il n'y a pas non plus de prise en charge de Windows Hello. La caméra peut être désactivée électroniquement via la touche F10 à la place d'un obturateur physique.


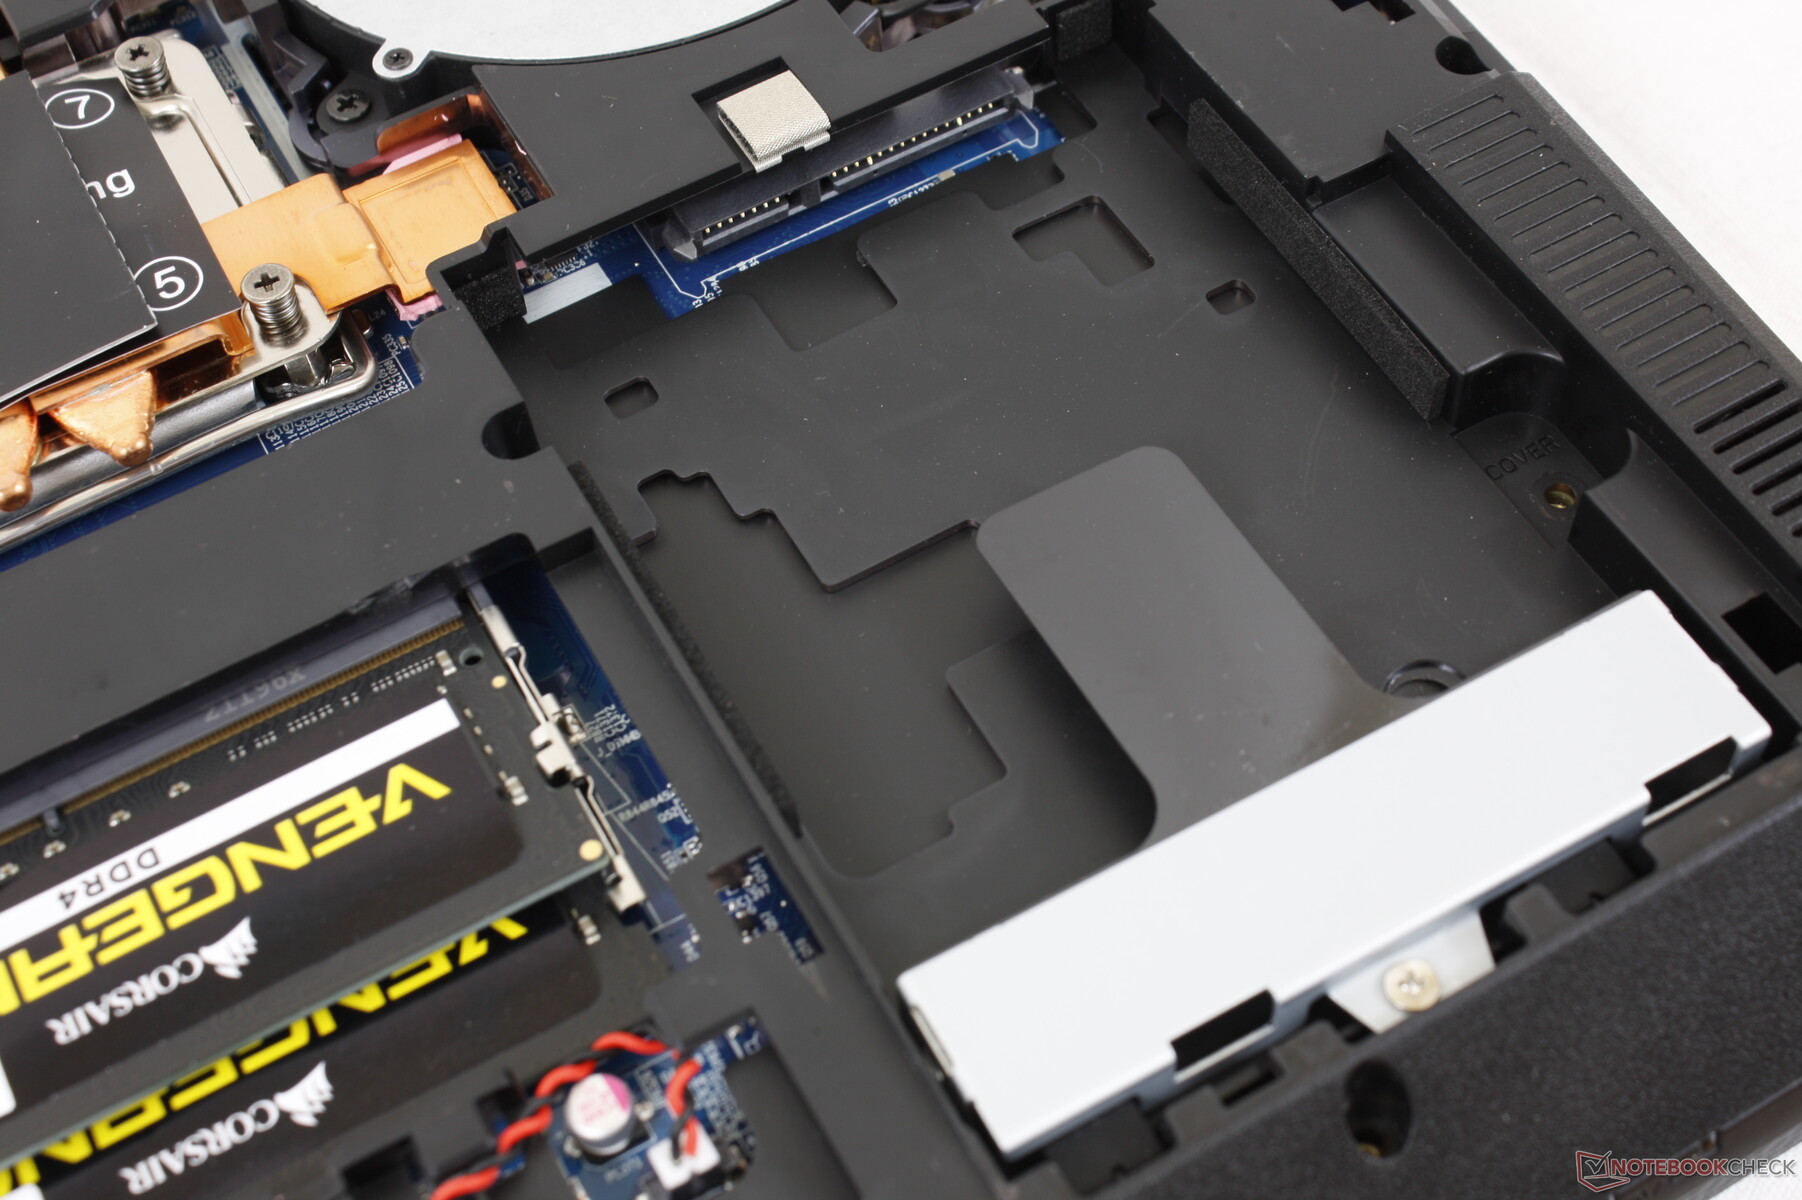
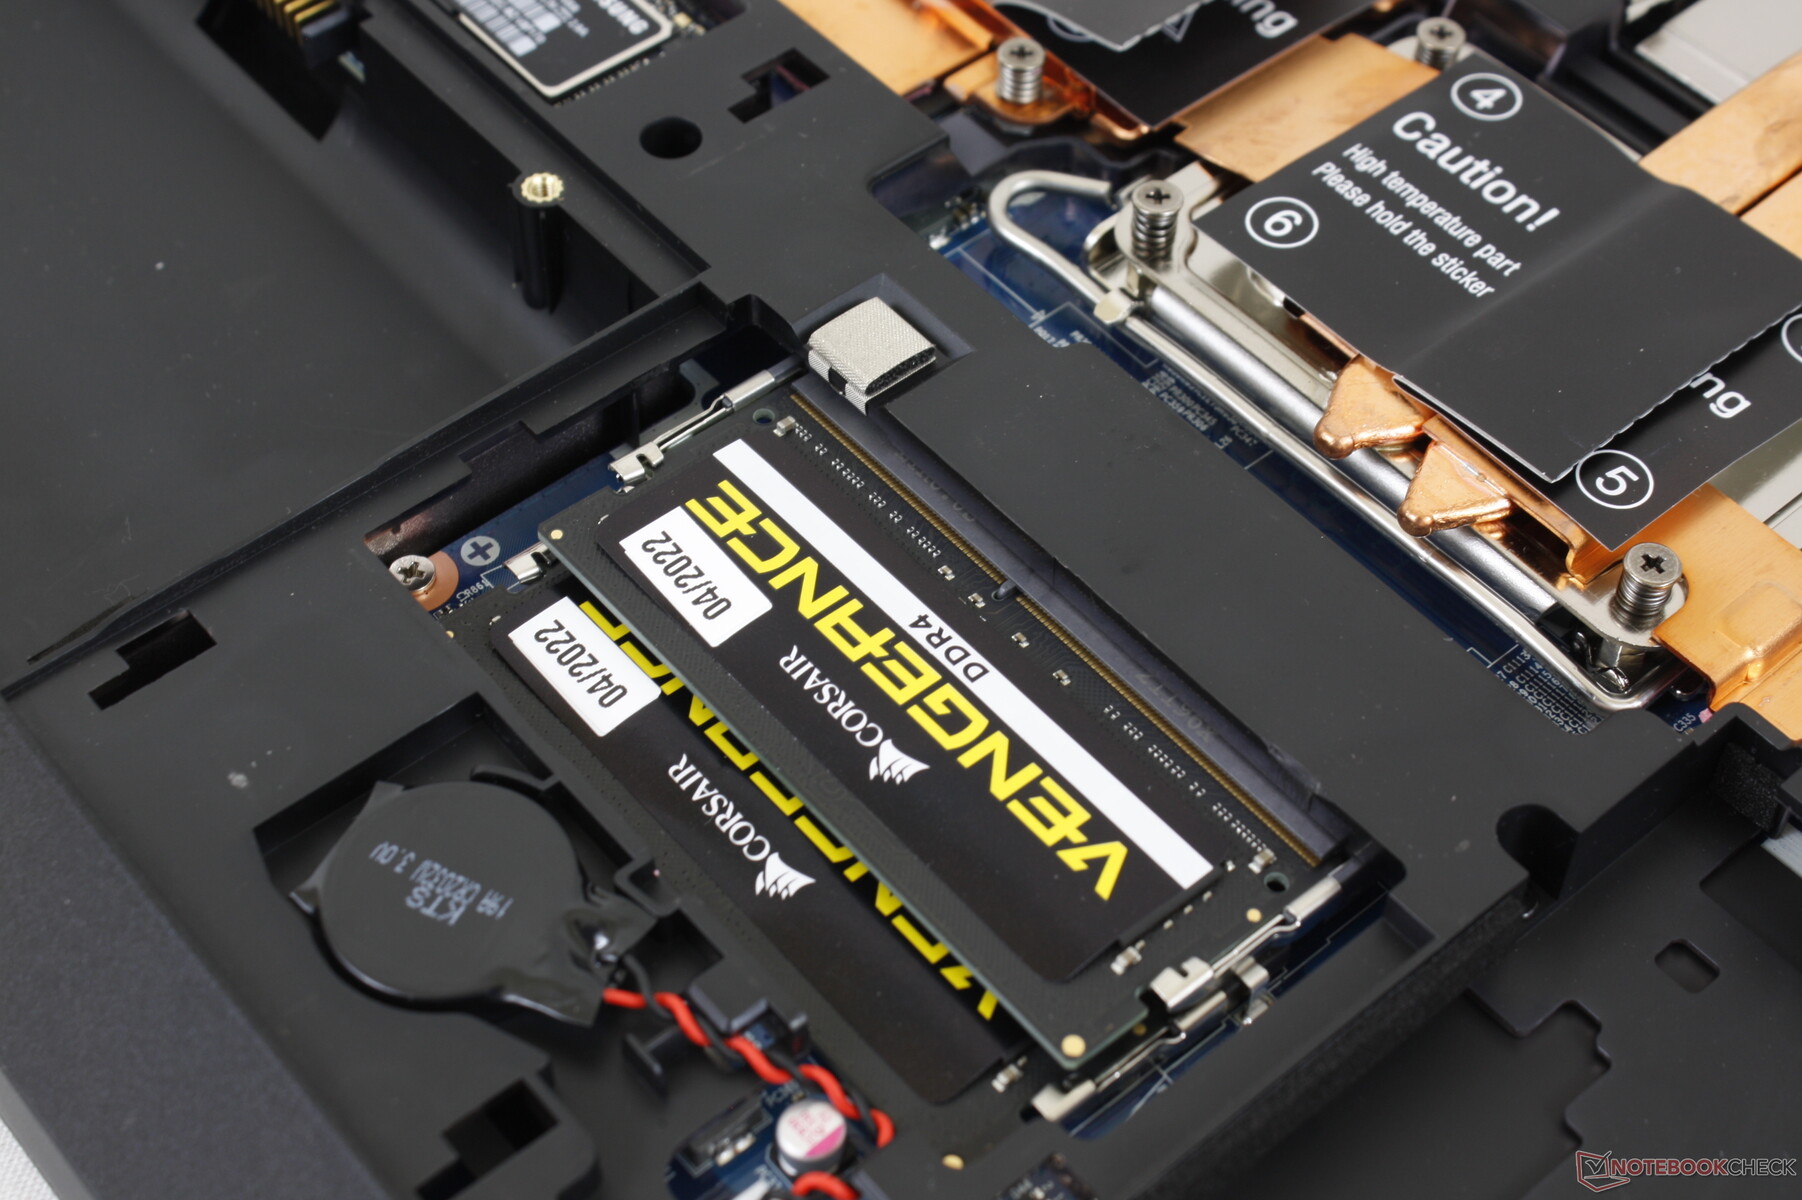
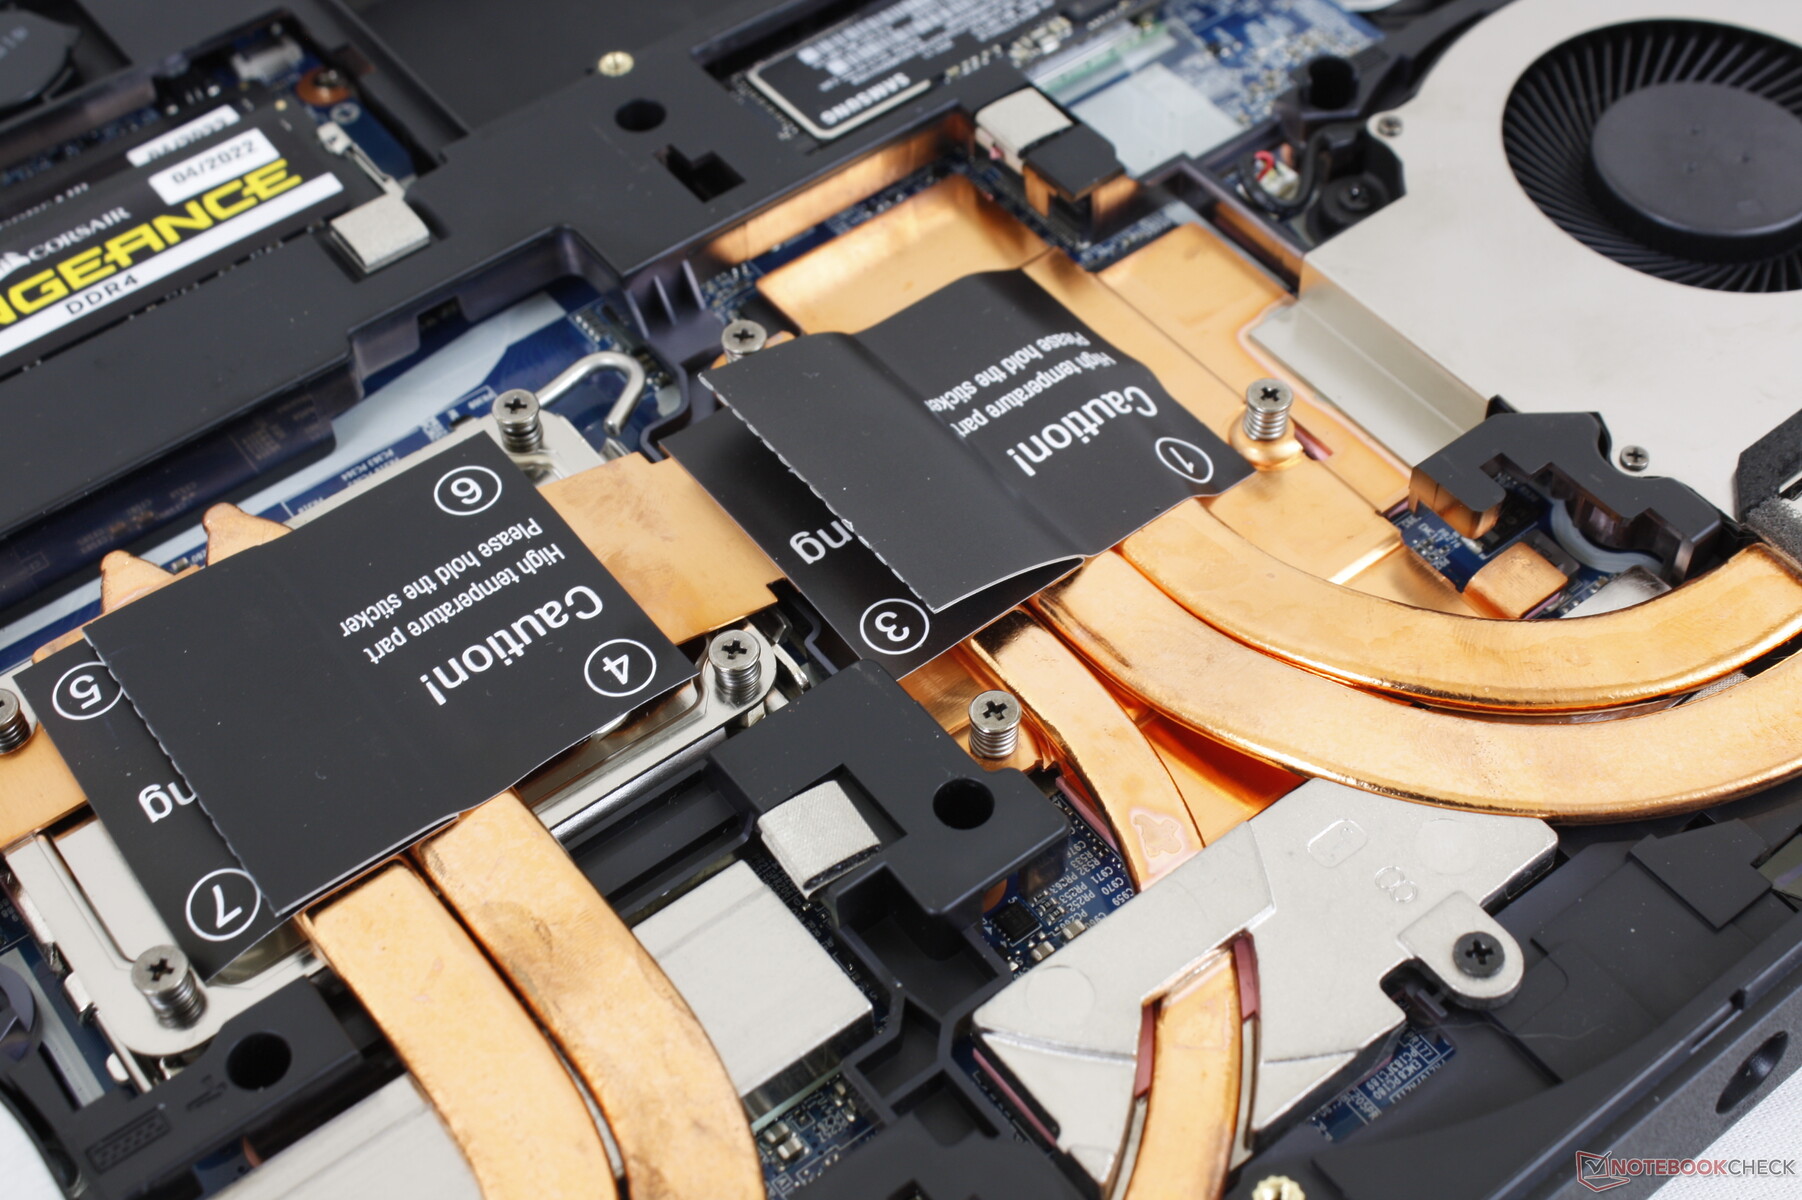
Maintenance
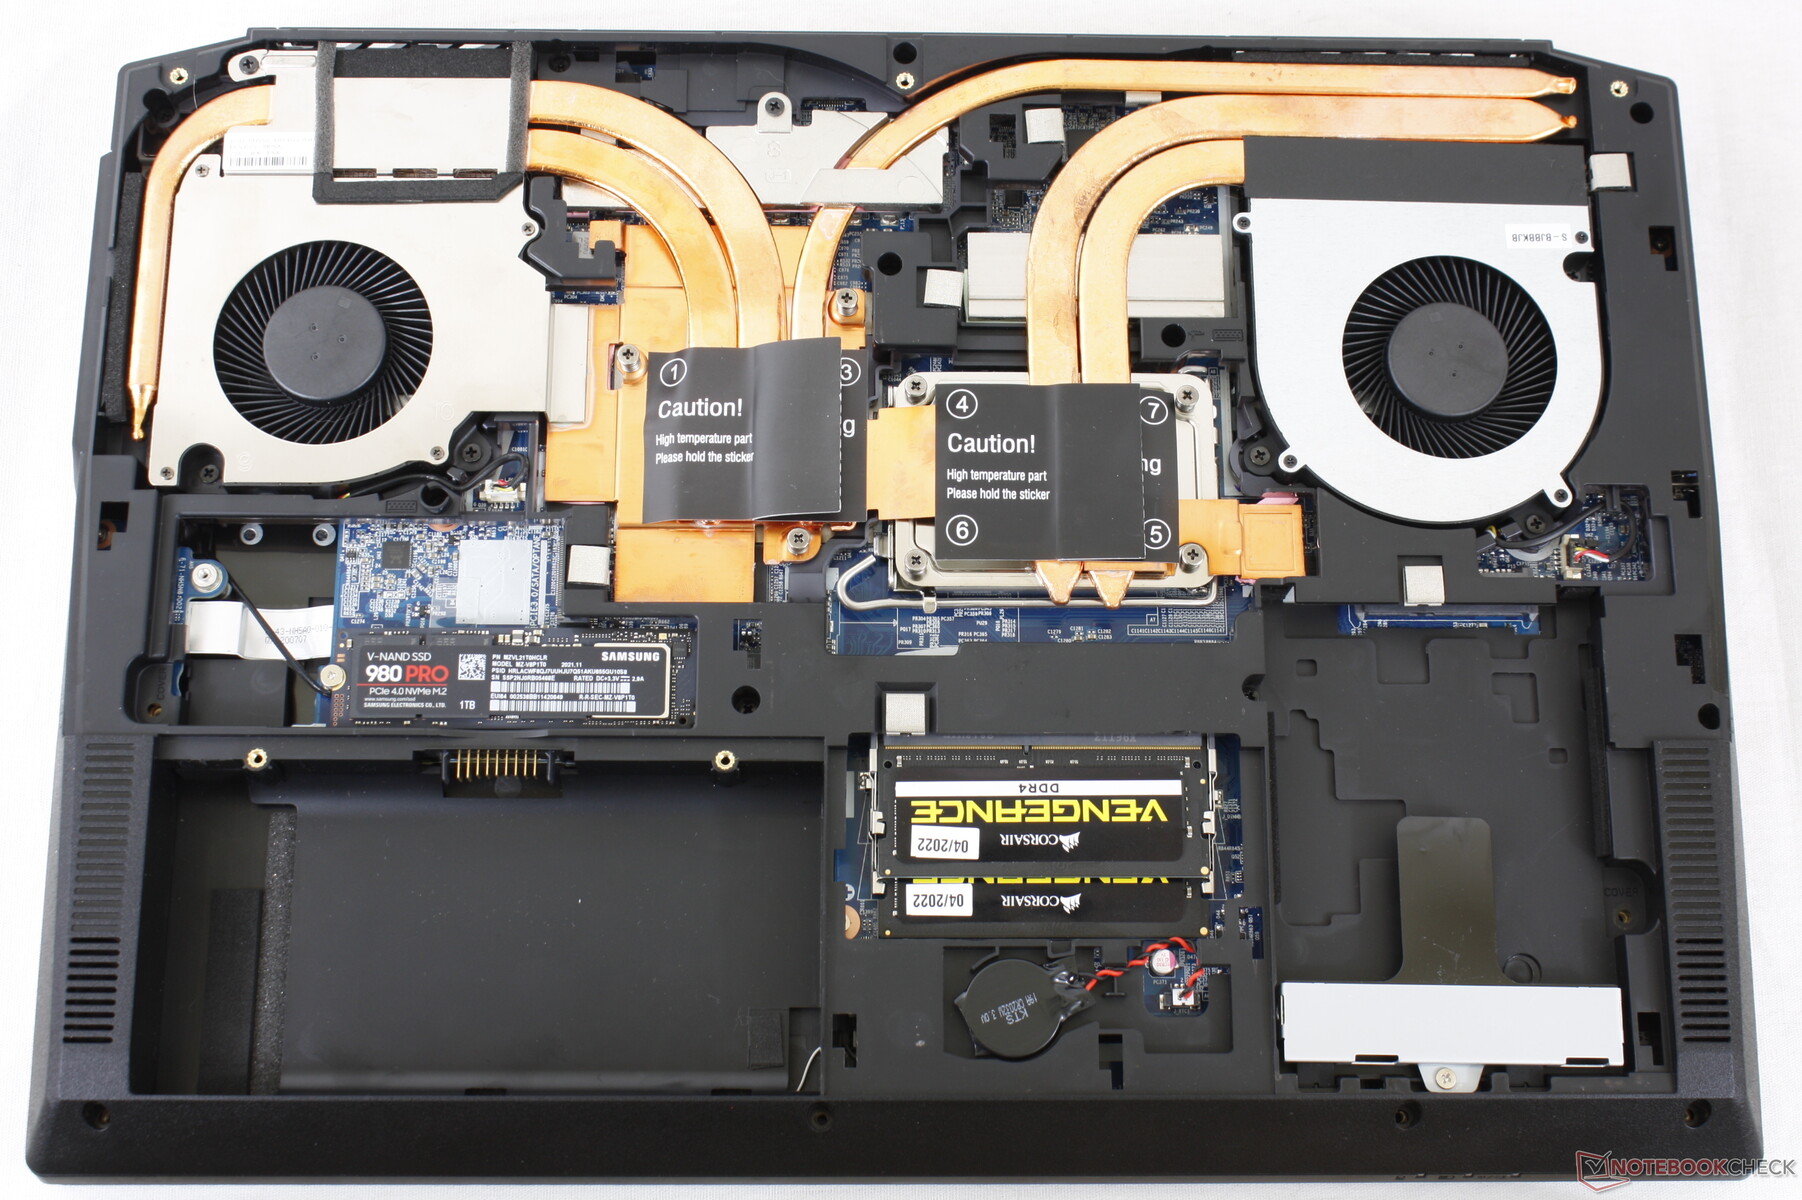
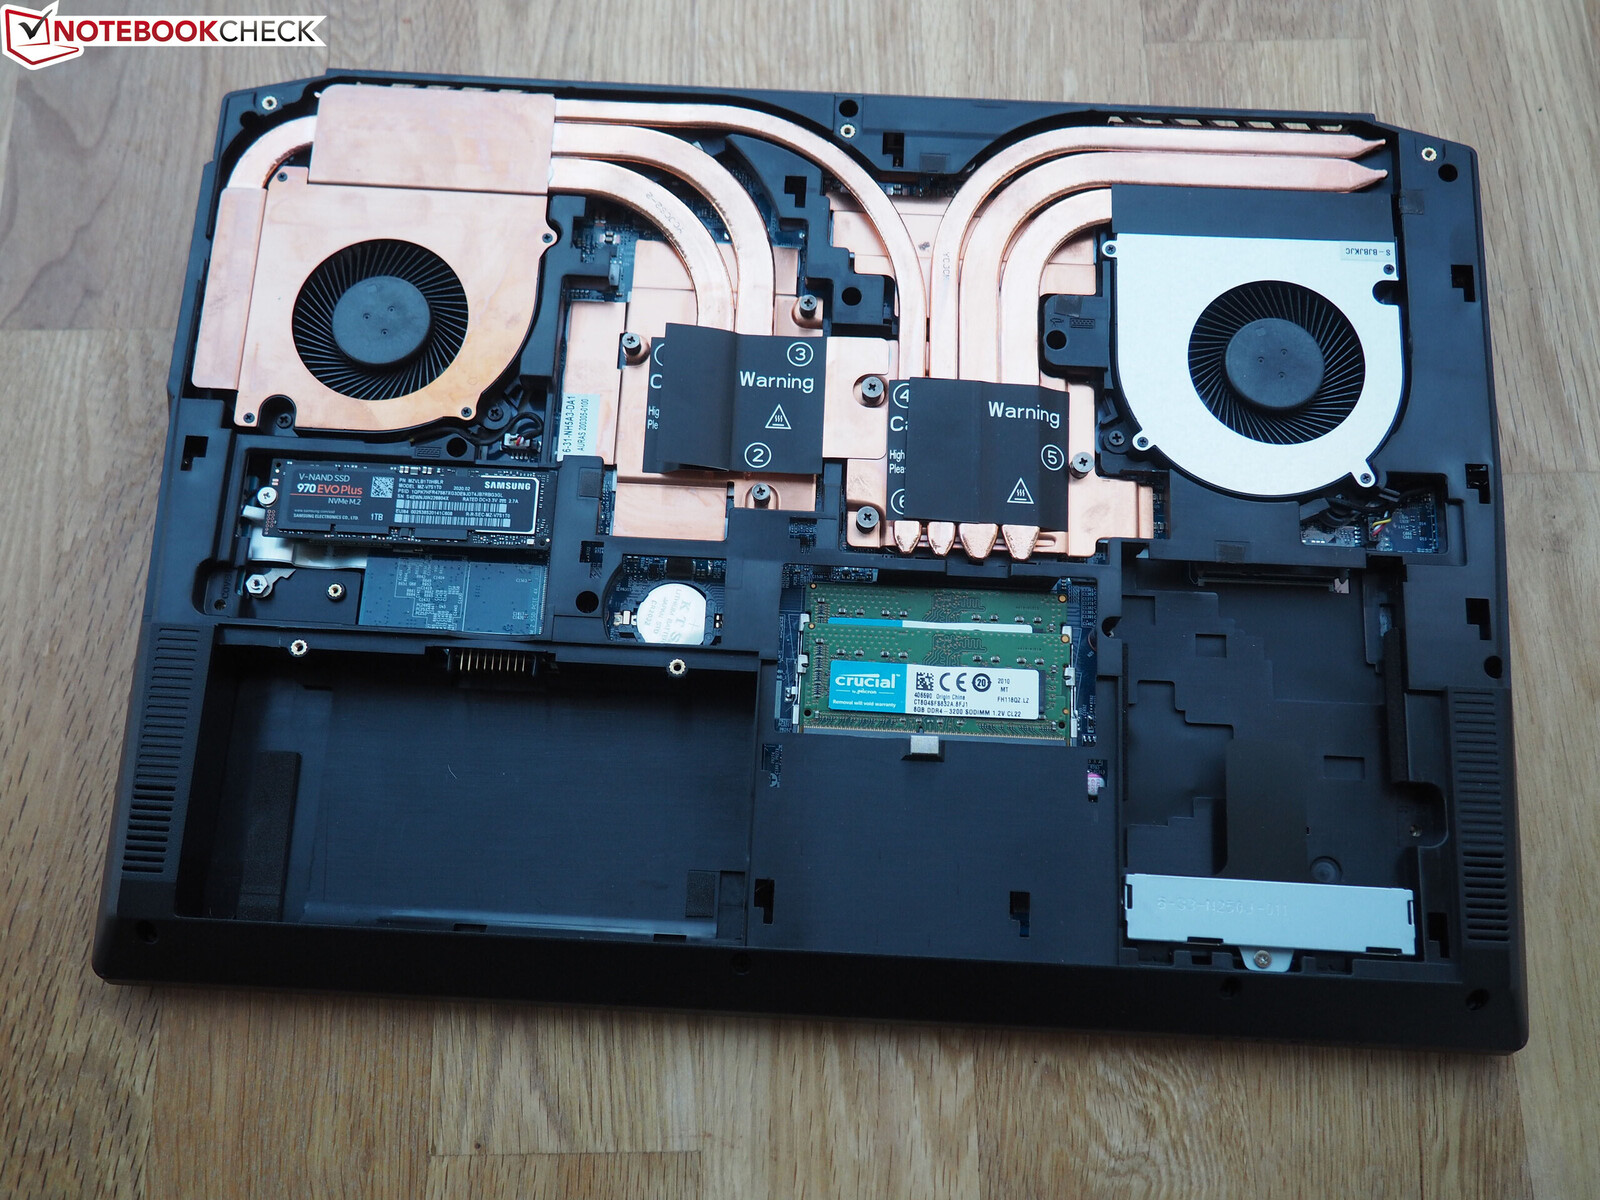
Accessoires et garantie
La boîte de détail comprend des vis et des tampons pour l'installation de SSD supplémentaires et un disque de pilotes. La pâte thermique pour le CPU n'est pas incluse.
La garantie limitée standard d'un an s'applique en cas d'achat aux États-Unis, avec des extensions optionnelles de deux et trois ans.
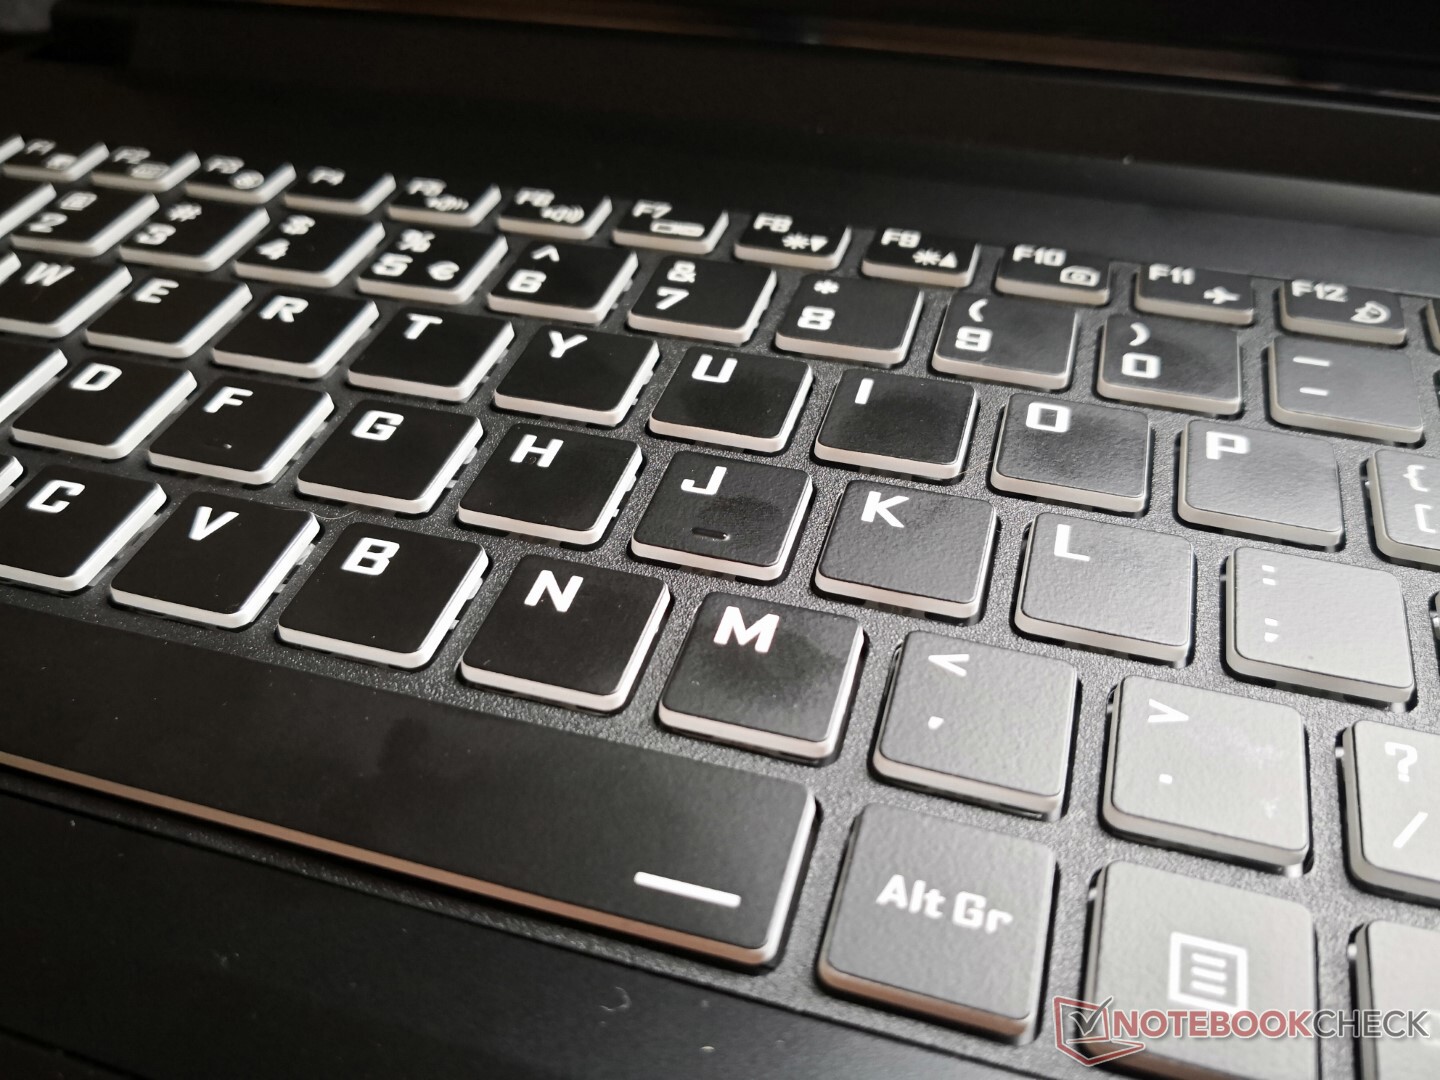
Périphériques d'entrée
La frappe est confortable avec un retour d'information plus ferme mais un bruit plus fort que celui auquel nous sommes habitués sur d'autres ordinateurs portables de jeu.
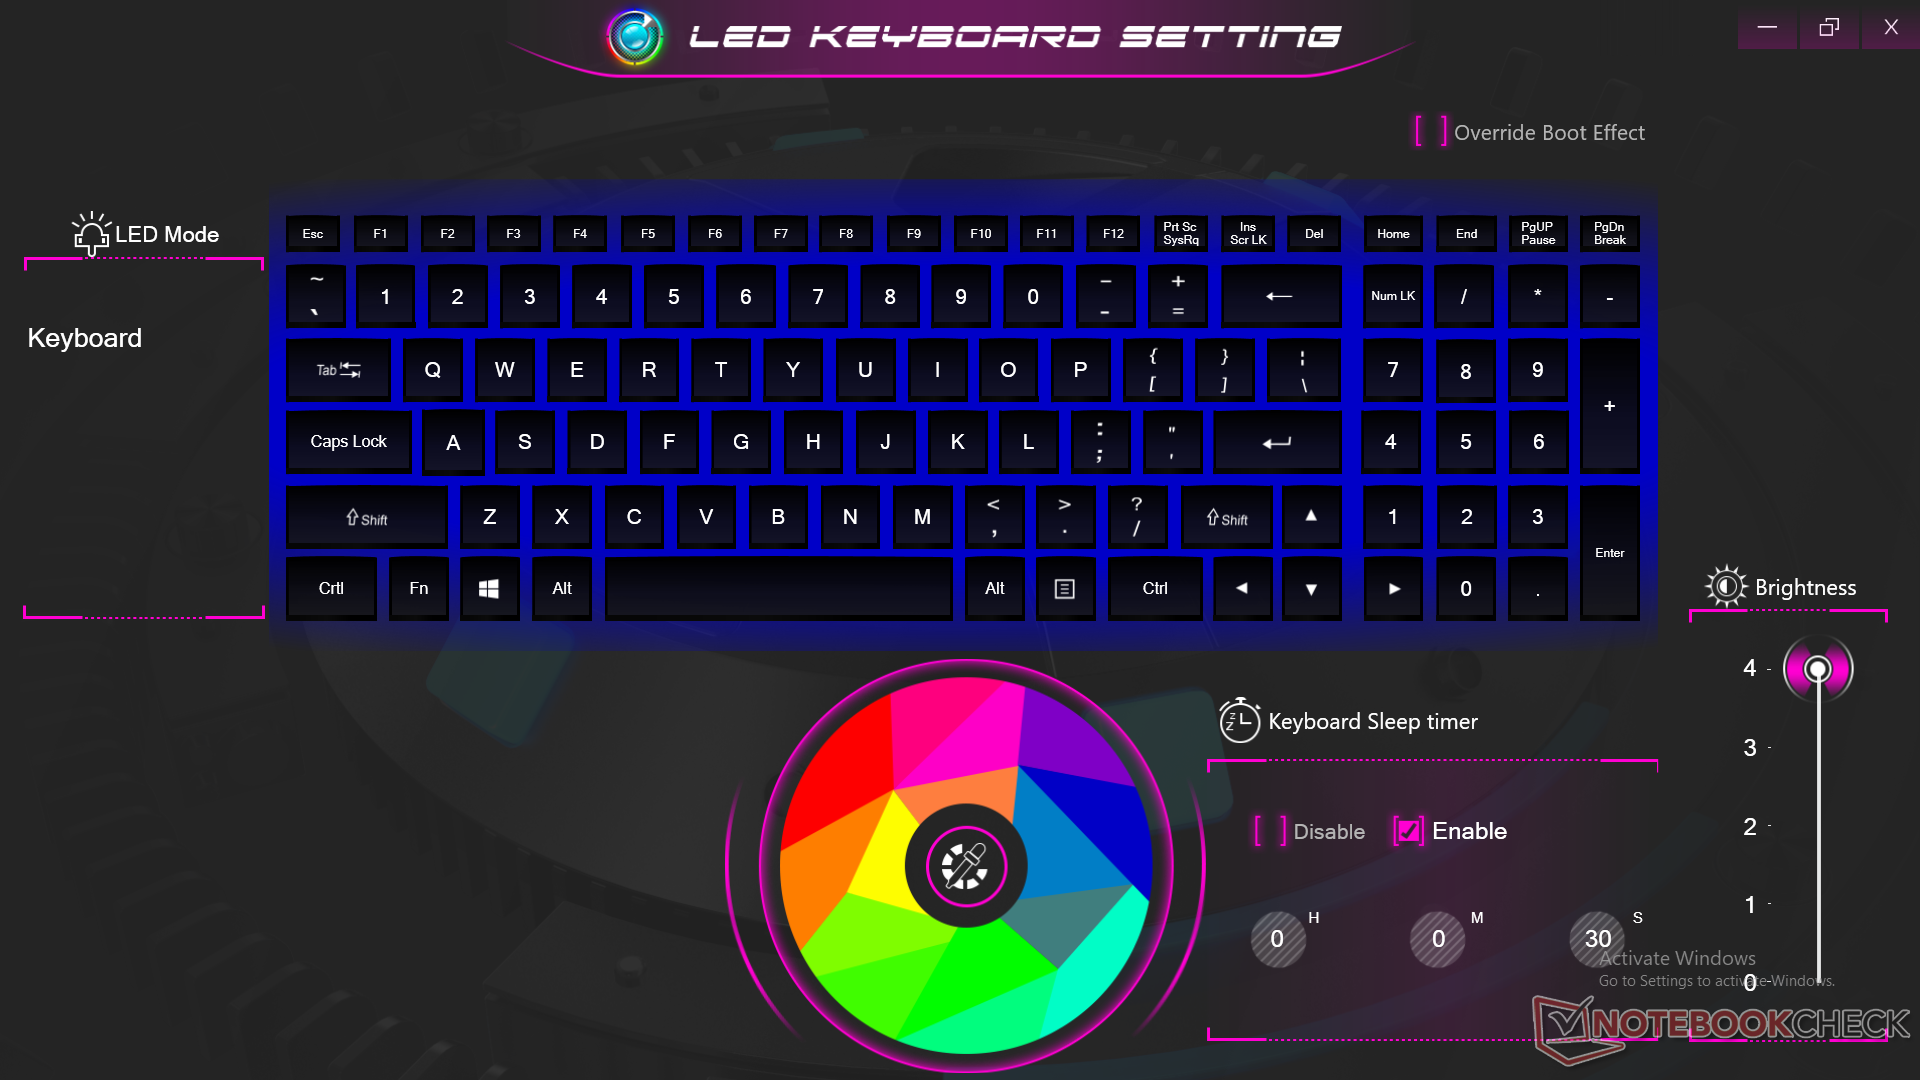
L'éclairage du clavier n'est malheureusement qu'à une zone, alors que la plupart des autres ordinateurs portables performants offrent un éclairage RVB à quatre zones ou par touche. Nous apprécions cependant les boutons de souris dédiés pour faciliter les entrées multi-touch.
Afficher
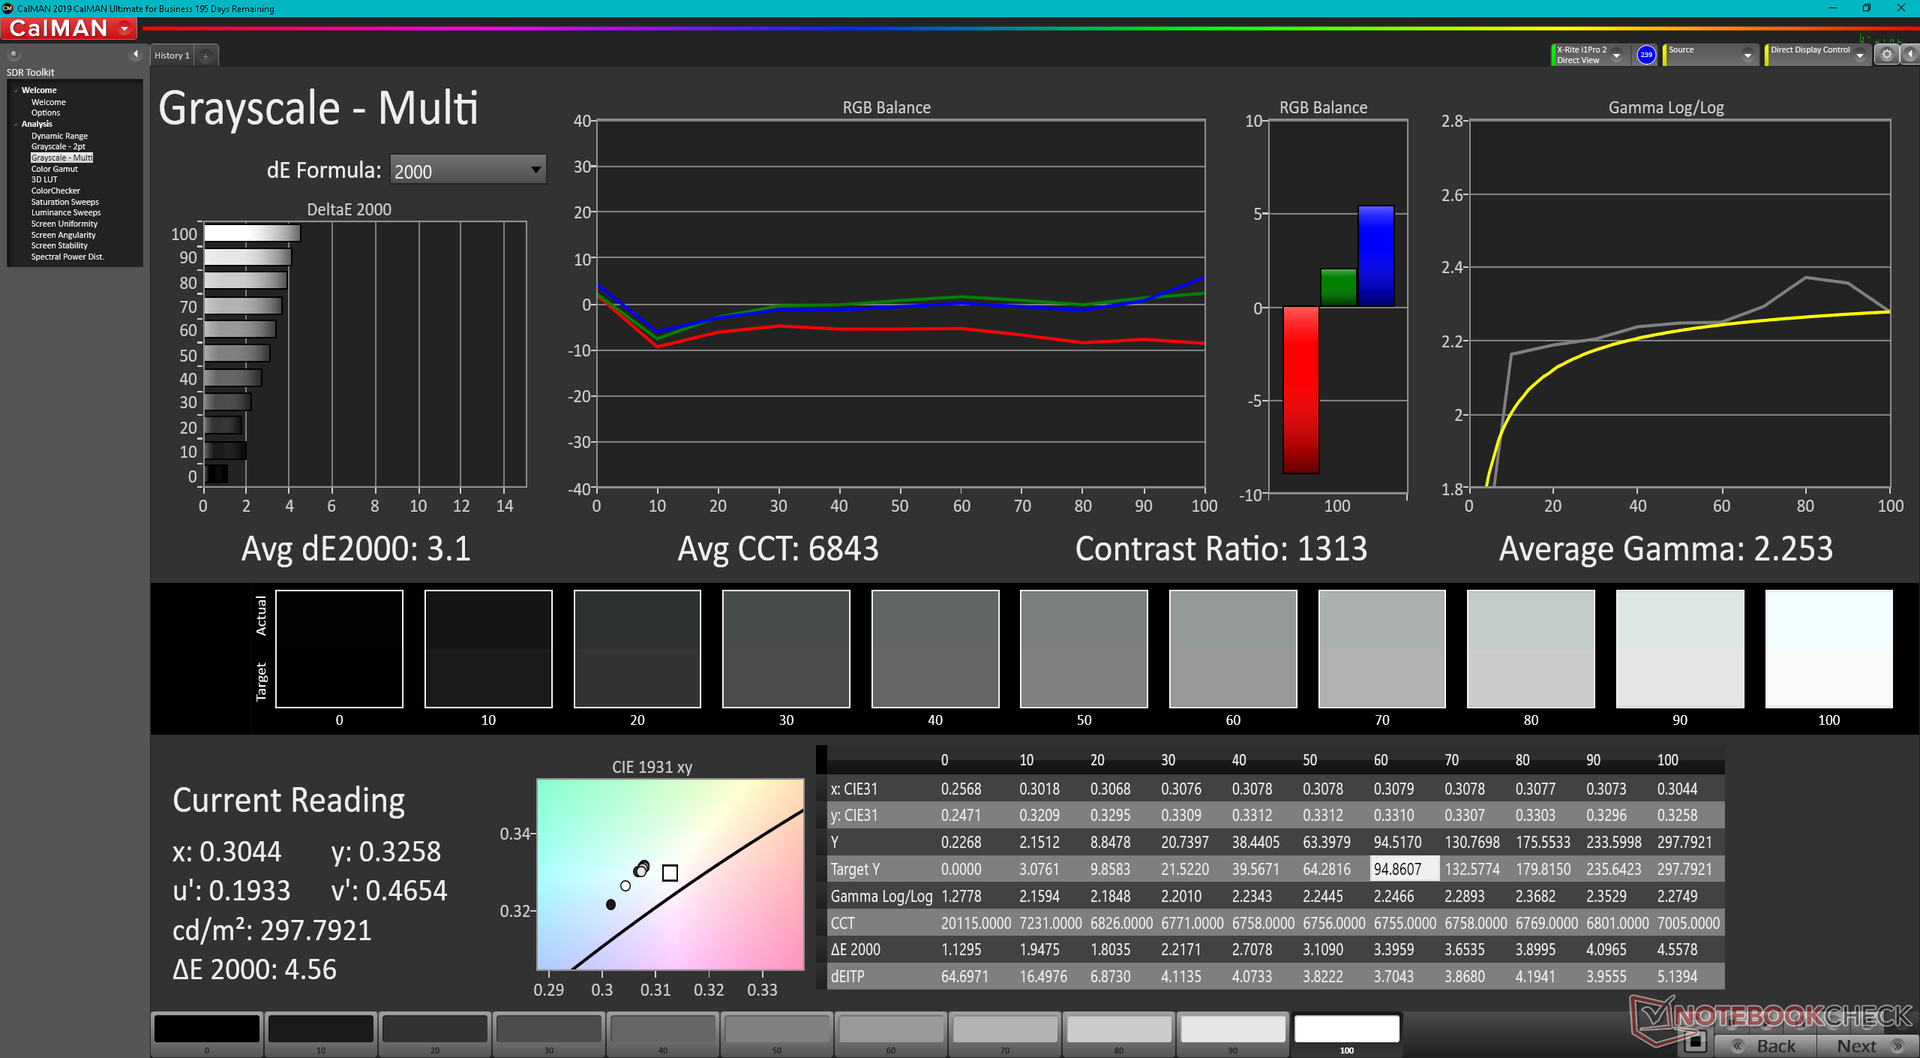
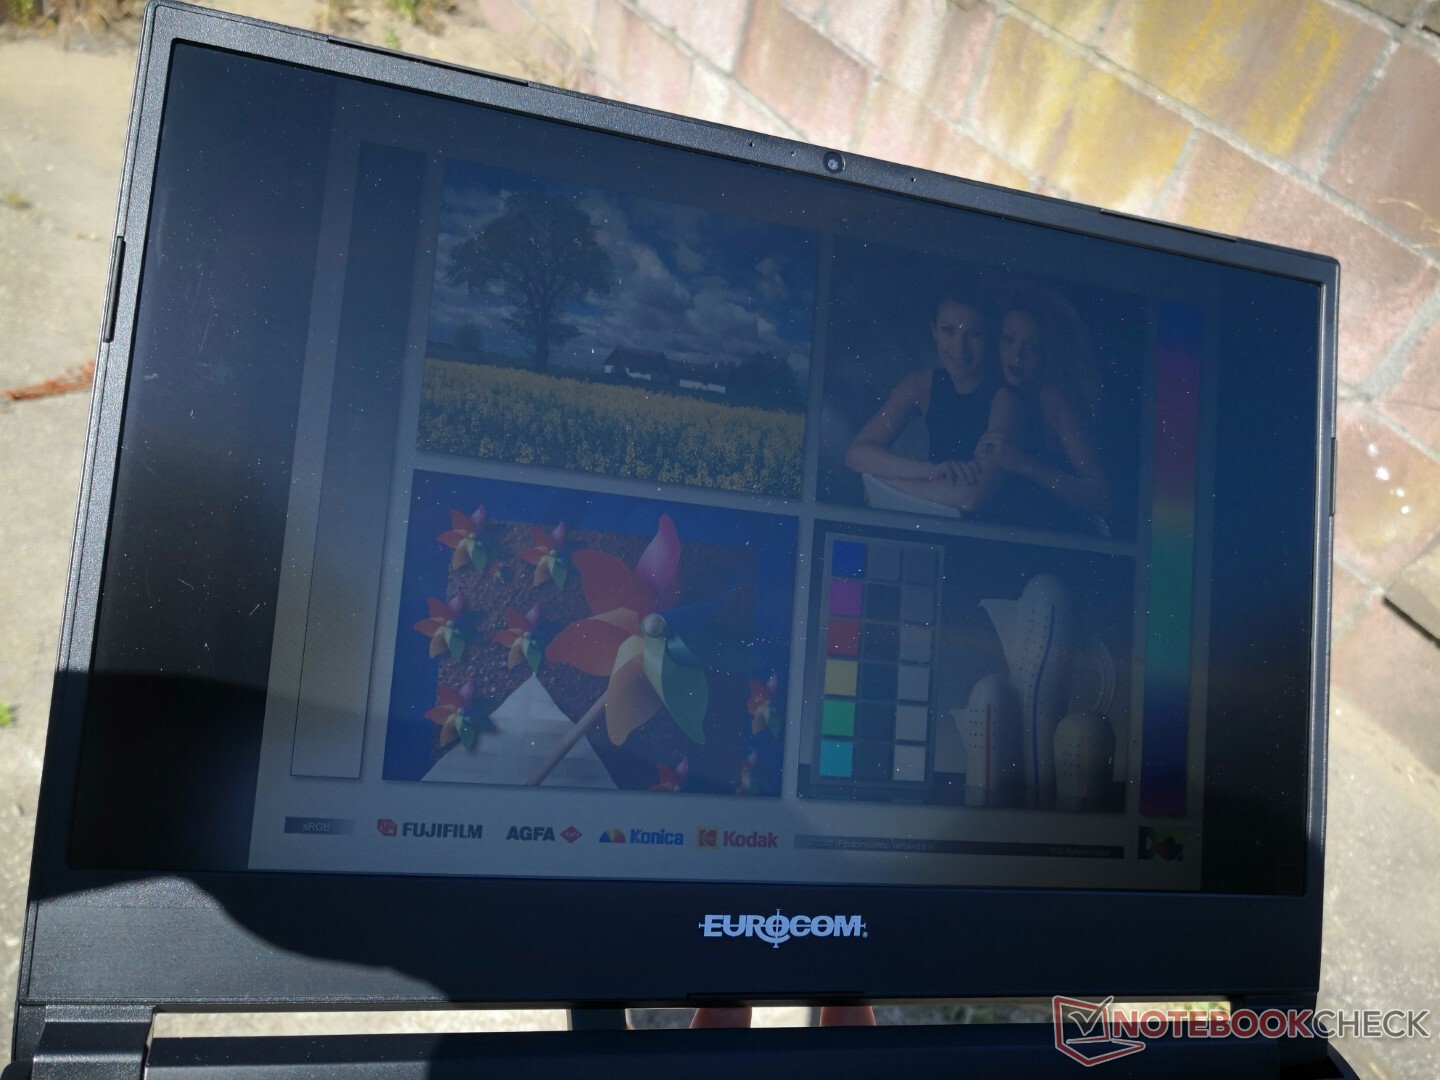
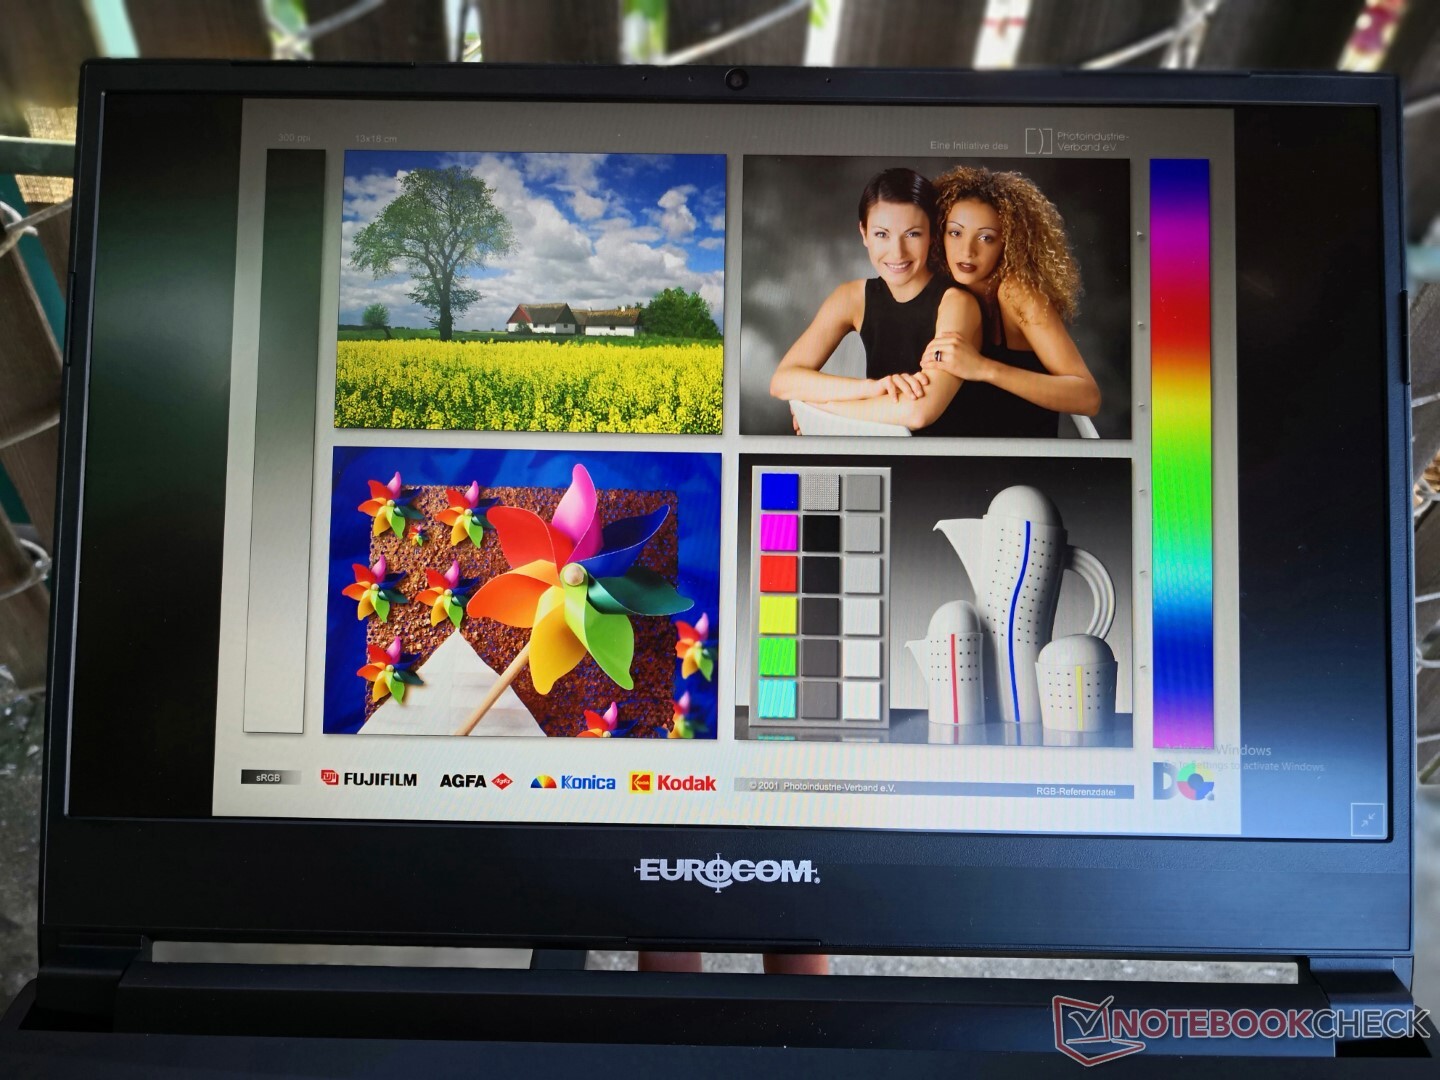
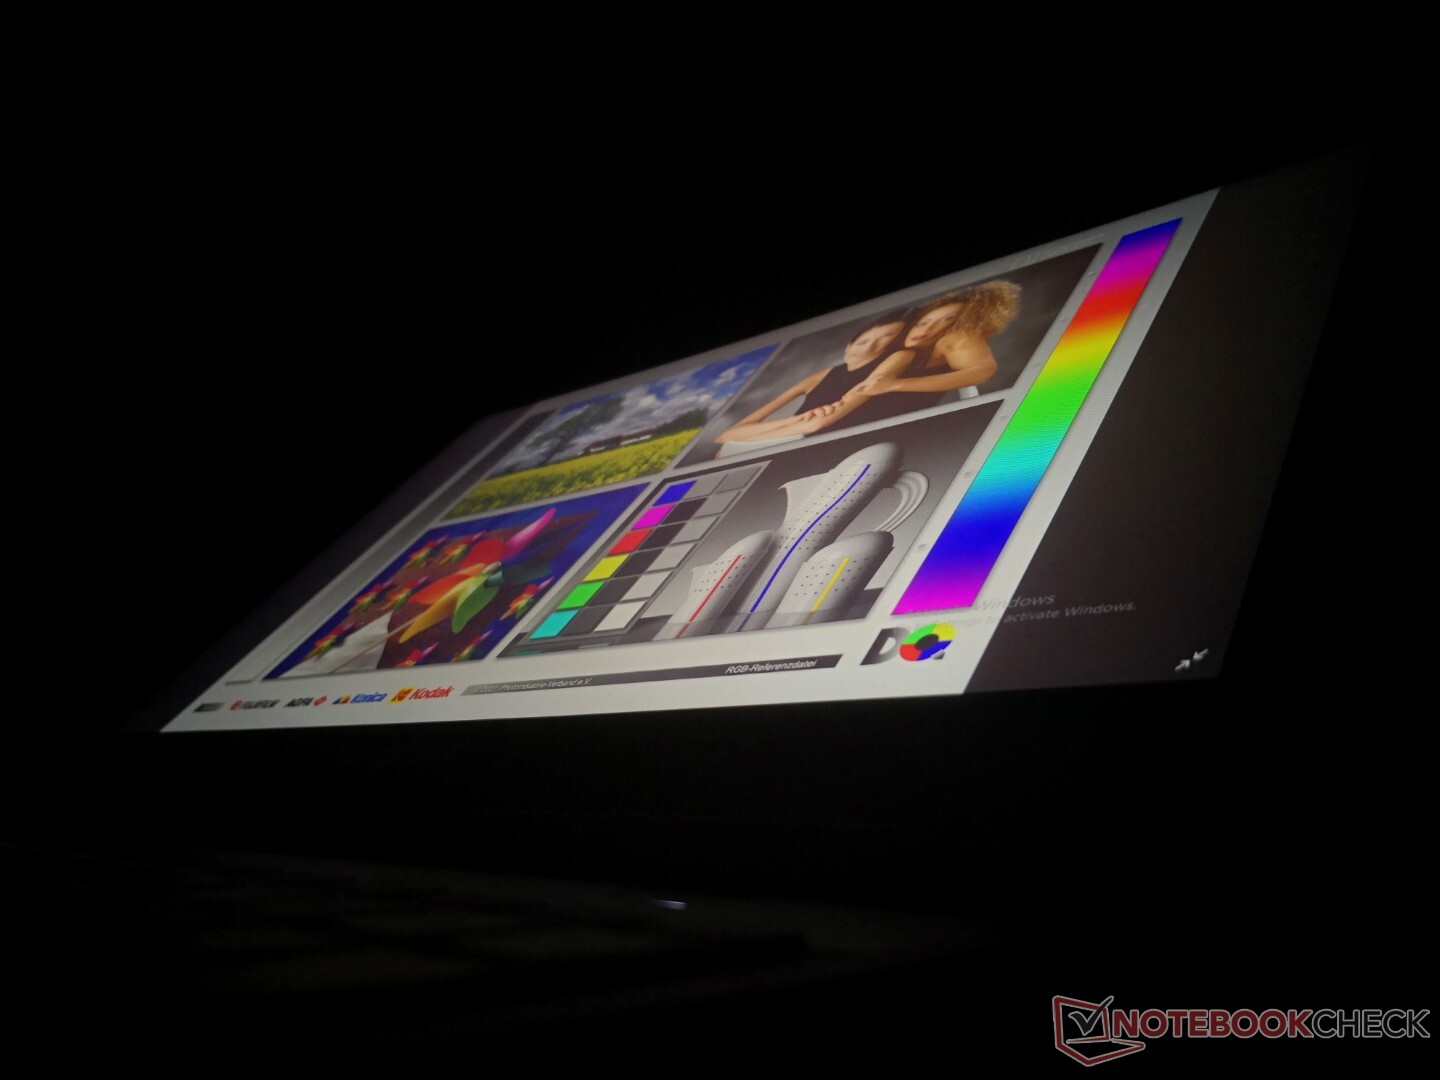
Notre unité est configurée avec le même panneau Sharp LQ156M1JW03 IPS que l'on trouve sur l'écran duEurocom RX315. Cette dalle est remarquable pour son taux de rafraîchissement très rapide de 240 Hz, ses temps de réponse rapides et sa couverture sRGB complète qui convient à la fois aux jeux et à la plupart des éditions graphiques. Une dalle QHD de plus haute résolution est également disponible et promet une couverture DCI-P3 complète, bien qu'avec un taux de rafraîchissement plus lent de 165 Hz.

| |||||||||||||||||||||||||
Homogénéité de la luminosité: 91 %
Valeur mesurée au centre, sur batterie: 299.2 cd/m²
Contraste: 997:1 (Valeurs des noirs: 0.3 cd/m²)
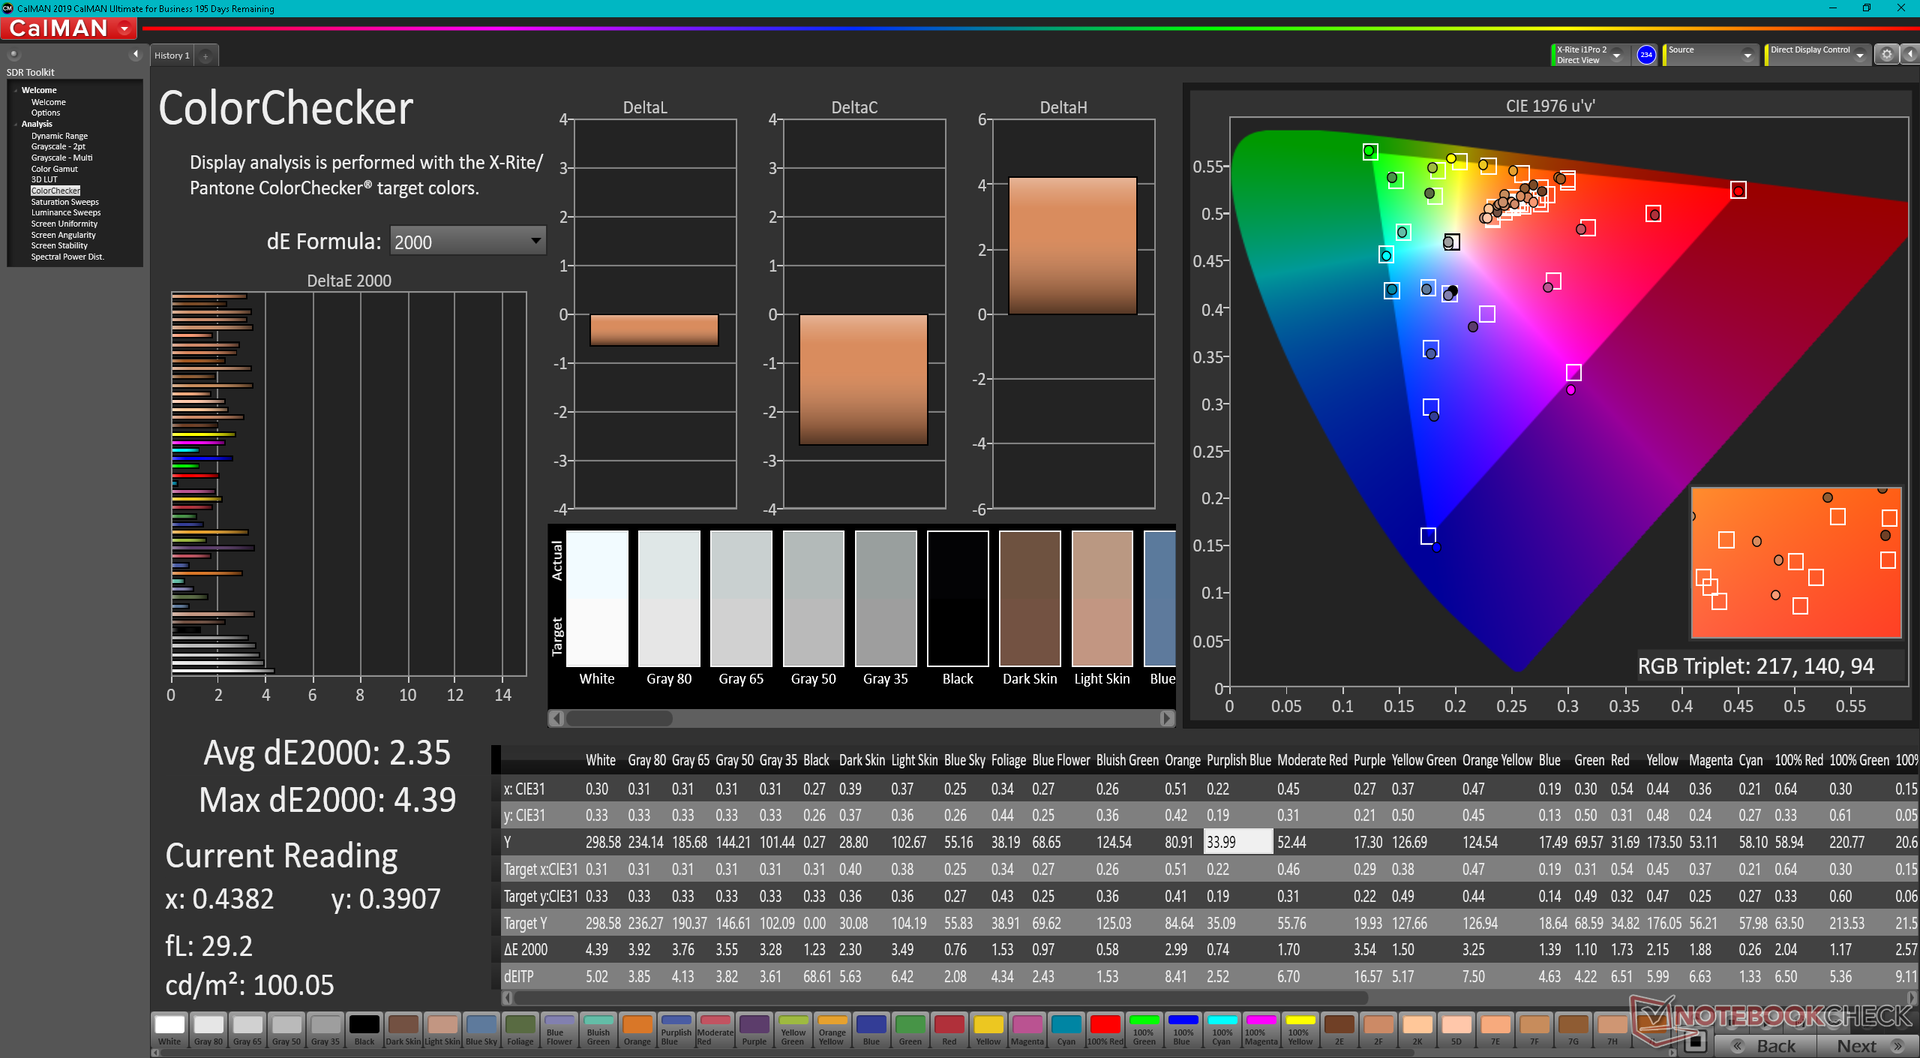
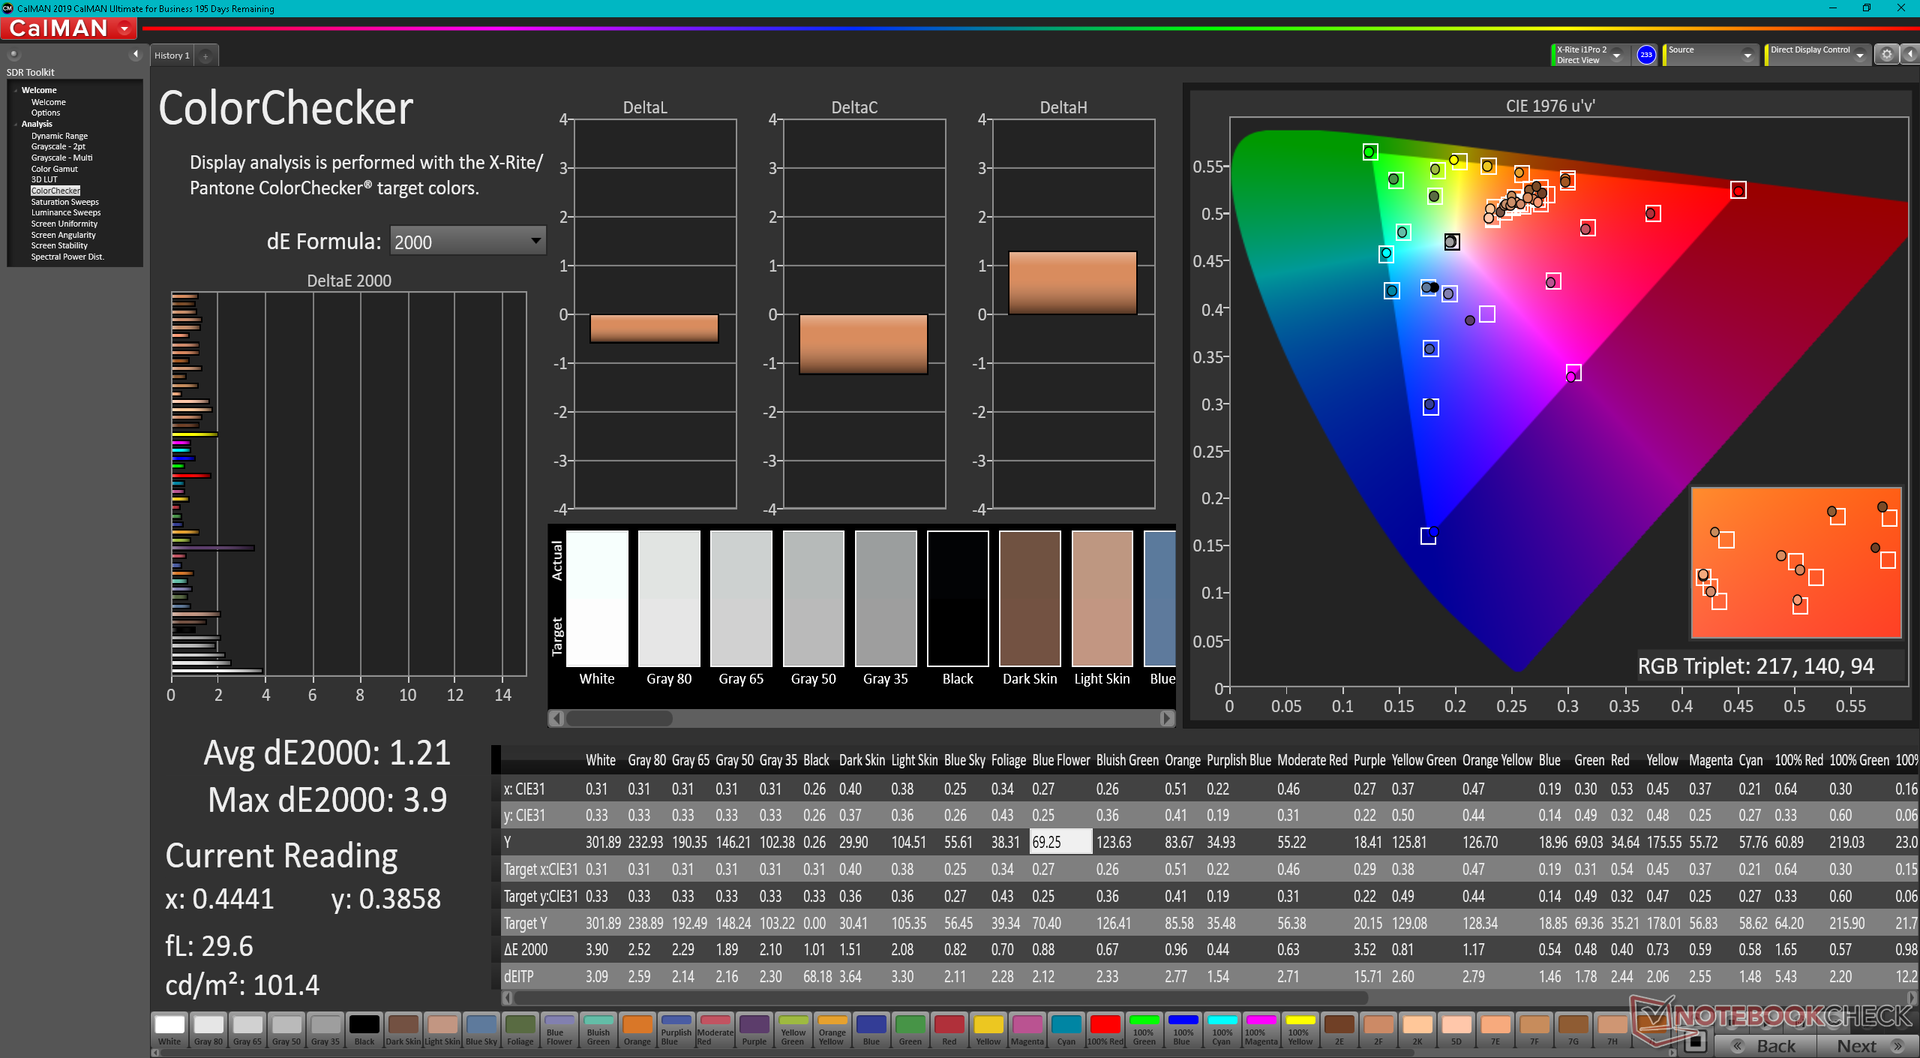
ΔE ColorChecker Calman: 2.35 | ∀{0.5-29.43 Ø4.71}
calibrated: 1.21
ΔE Greyscale Calman: 3.1 | ∀{0.09-98 Ø4.96}
67.7% AdobeRGB 1998 (Argyll 3D)
97.3% sRGB (Argyll 3D)
66.5% Display P3 (Argyll 3D)
Gamma: 2.25
CCT: 6843 K
| Eurocom Raptor X15 Sharp LQ156M1JW03, IPS, 1920x1080, 15.6" | MSI Raider GE66 12UHS AUO51EB, IPS, 3840x2160, 15.6" | Razer Blade 15 Advanced Model Early 2022 TL156VDXP02-0, IPS, 1920x1080, 15.6" | Eurocom RX315 NH57AF1 Sharp LQ156M1JW03, IPS, 1920x1080, 15.6" | Gigabyte A5 X1 AU Optronics B156HAN12.0, IPS, 1920x1080, 15.6" | Asus TUF Gaming A15 FA506QR-AZ061T Sharp SHP1532, IPS, 1920x1080, 15.6" | |
|---|---|---|---|---|---|---|
| Display | 21% | -5% | 1% | 4% | ||
| Display P3 Coverage (%) | 66.5 | 80.4 21% | 65.3 -2% | 67.5 2% | 69.6 5% | |
| sRGB Coverage (%) | 97.3 | 98.4 1% | 85.1 -13% | 98 1% | 98.6 1% | |
| AdobeRGB 1998 Coverage (%) | 67.7 | 94.7 40% | 67.4 0% | 68.5 1% | 70.8 5% | |
| Response Times | -35% | 33% | 4% | 28% | 15% | |
| Response Time Grey 50% / Grey 80% * (ms) | 12.8 ? | 18.8 ? -47% | 4.3 ? 66% | 10.4 ? 19% | 4.8 ? 63% | 12 ? 6% |
| Response Time Black / White * (ms) | 10.4 ? | 12.8 ? -23% | 10.5 ? -1% | 11.6 ? -12% | 11.2 ? -8% | 8 ? 23% |
| PWM Frequency (Hz) | 23810 ? | 22730 ? | 1250 ? | |||
| Screen | -7% | 27% | -23% | -13% | 18% | |
| Brightness middle (cd/m²) | 299.2 | 351 17% | 330 10% | 291.3 -3% | 335 12% | 297 -1% |
| Brightness (cd/m²) | 282 | 347 23% | 315 12% | 273 -3% | 325 15% | 268 -5% |
| Brightness Distribution (%) | 91 | 90 -1% | 89 -2% | 91 0% | 90 -1% | 84 -8% |
| Black Level * (cd/m²) | 0.3 | 0.35 -17% | 0.24 20% | 0.35 -17% | 0.4 -33% | 0.22 27% |
| Contrast (:1) | 997 | 1003 1% | 1375 38% | 832 -17% | 838 -16% | 1350 35% |
| Colorchecker dE 2000 * | 2.35 | 2.54 -8% | 1.47 37% | 2.39 -2% | 2.63 -12% | 1.36 42% |
| Colorchecker dE 2000 max. * | 4.39 | 8.36 -90% | 2.73 38% | 8.05 -83% | 7.71 -76% | 3.82 13% |
| Colorchecker dE 2000 calibrated * | 1.21 | 0.67 45% | 0.63 48% | 1.49 -23% | 0.97 20% | |
| Greyscale dE 2000 * | 3.1 | 4.1 -32% | 1.8 42% | 4.8 -55% | 4 -29% | 1.88 39% |
| Gamma | 2.25 98% | 2.089 105% | 2.282 96% | 2.25 98% | 2.129 103% | 2.48 89% |
| CCT | 6843 95% | 7036 92% | 6499 100% | 7124 91% | 7434 87% | 6768 96% |
| Color Space (Percent of AdobeRGB 1998) (%) | 63 | |||||
| Color Space (Percent of sRGB) (%) | 99 | |||||
| Moyenne finale (programmes/paramètres) | -7% /
-5% | 18% /
21% | -6% /
-14% | 6% /
-4% | 17% /
17% |
* ... Moindre est la valeur, meilleures sont les performances
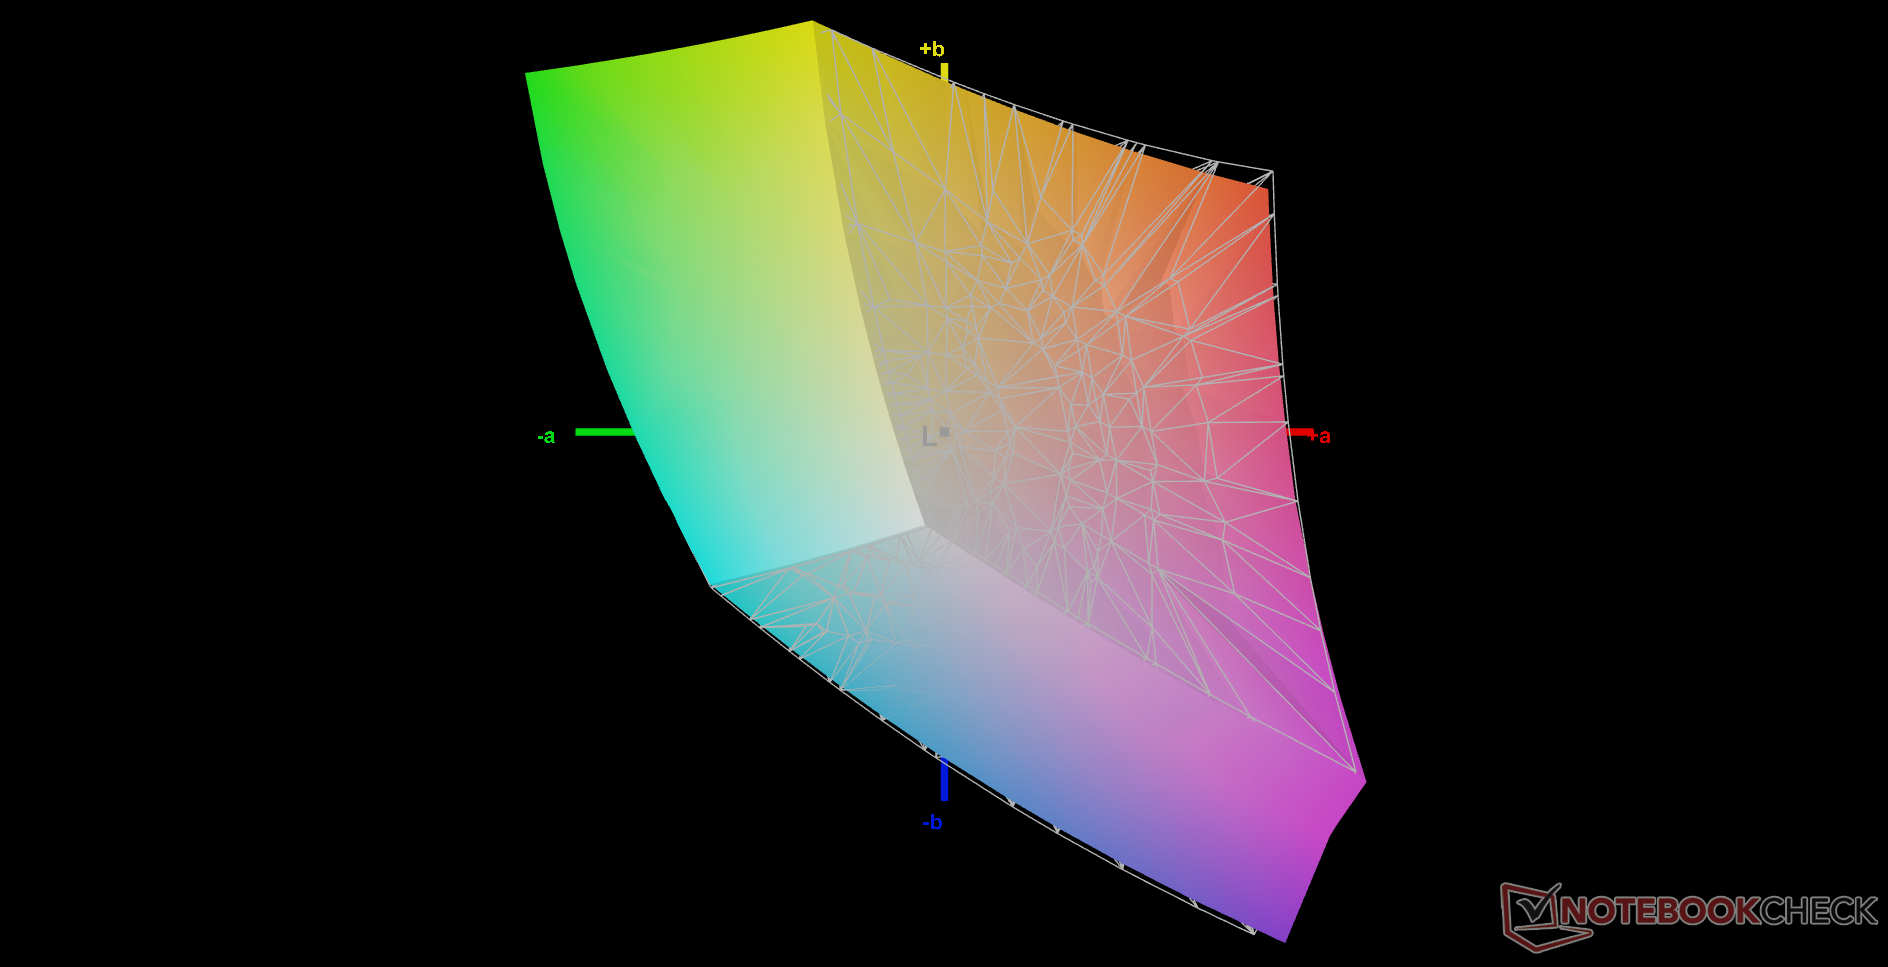
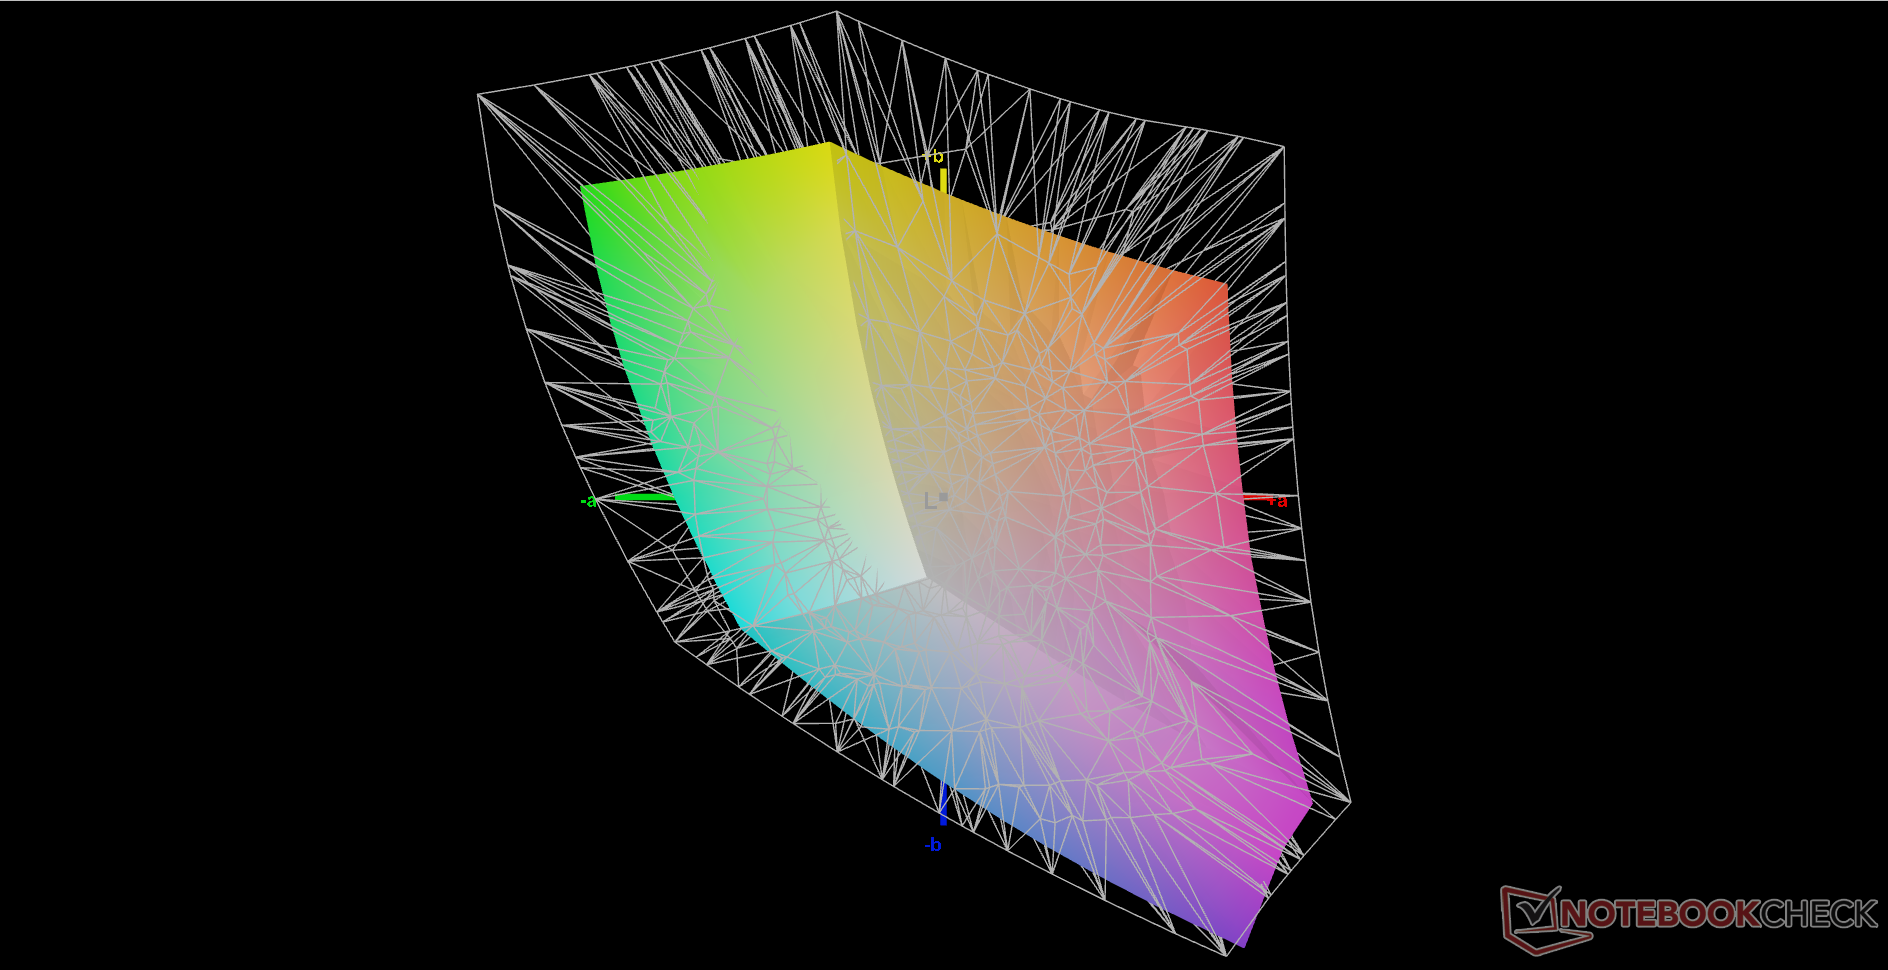
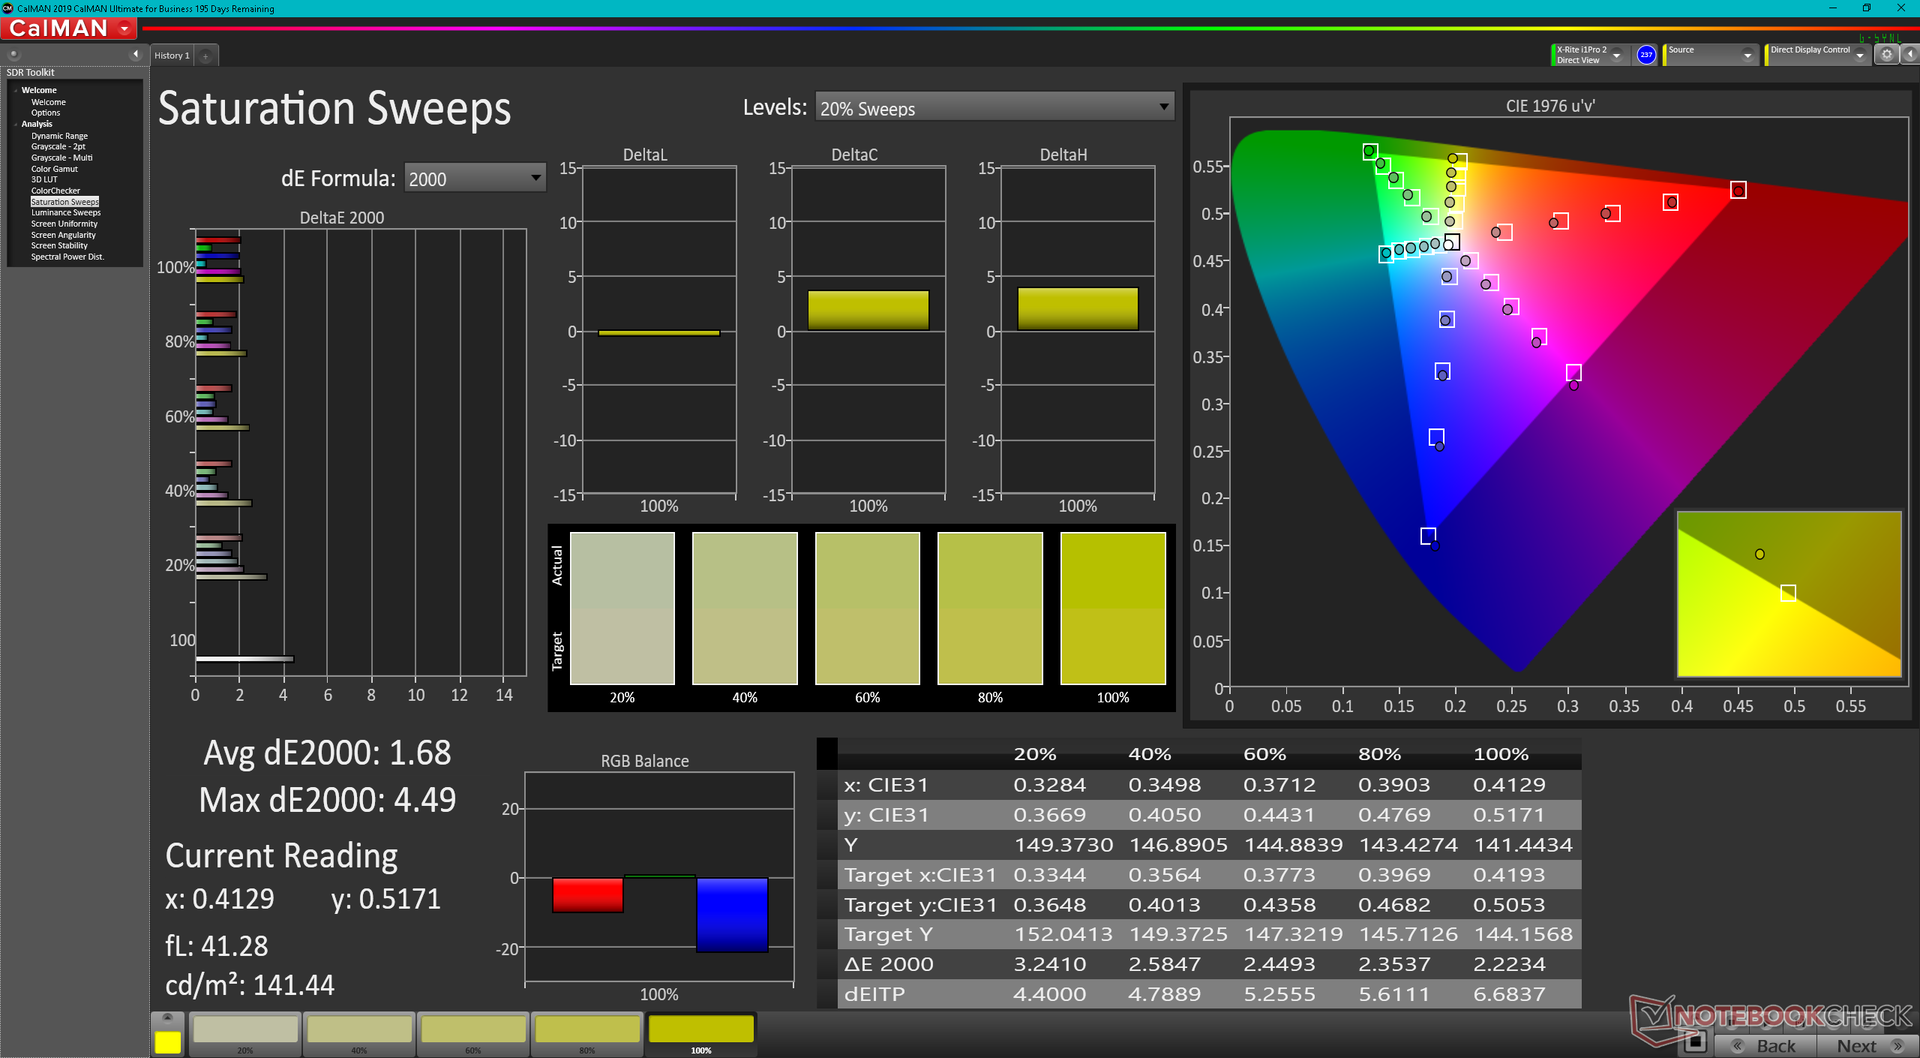
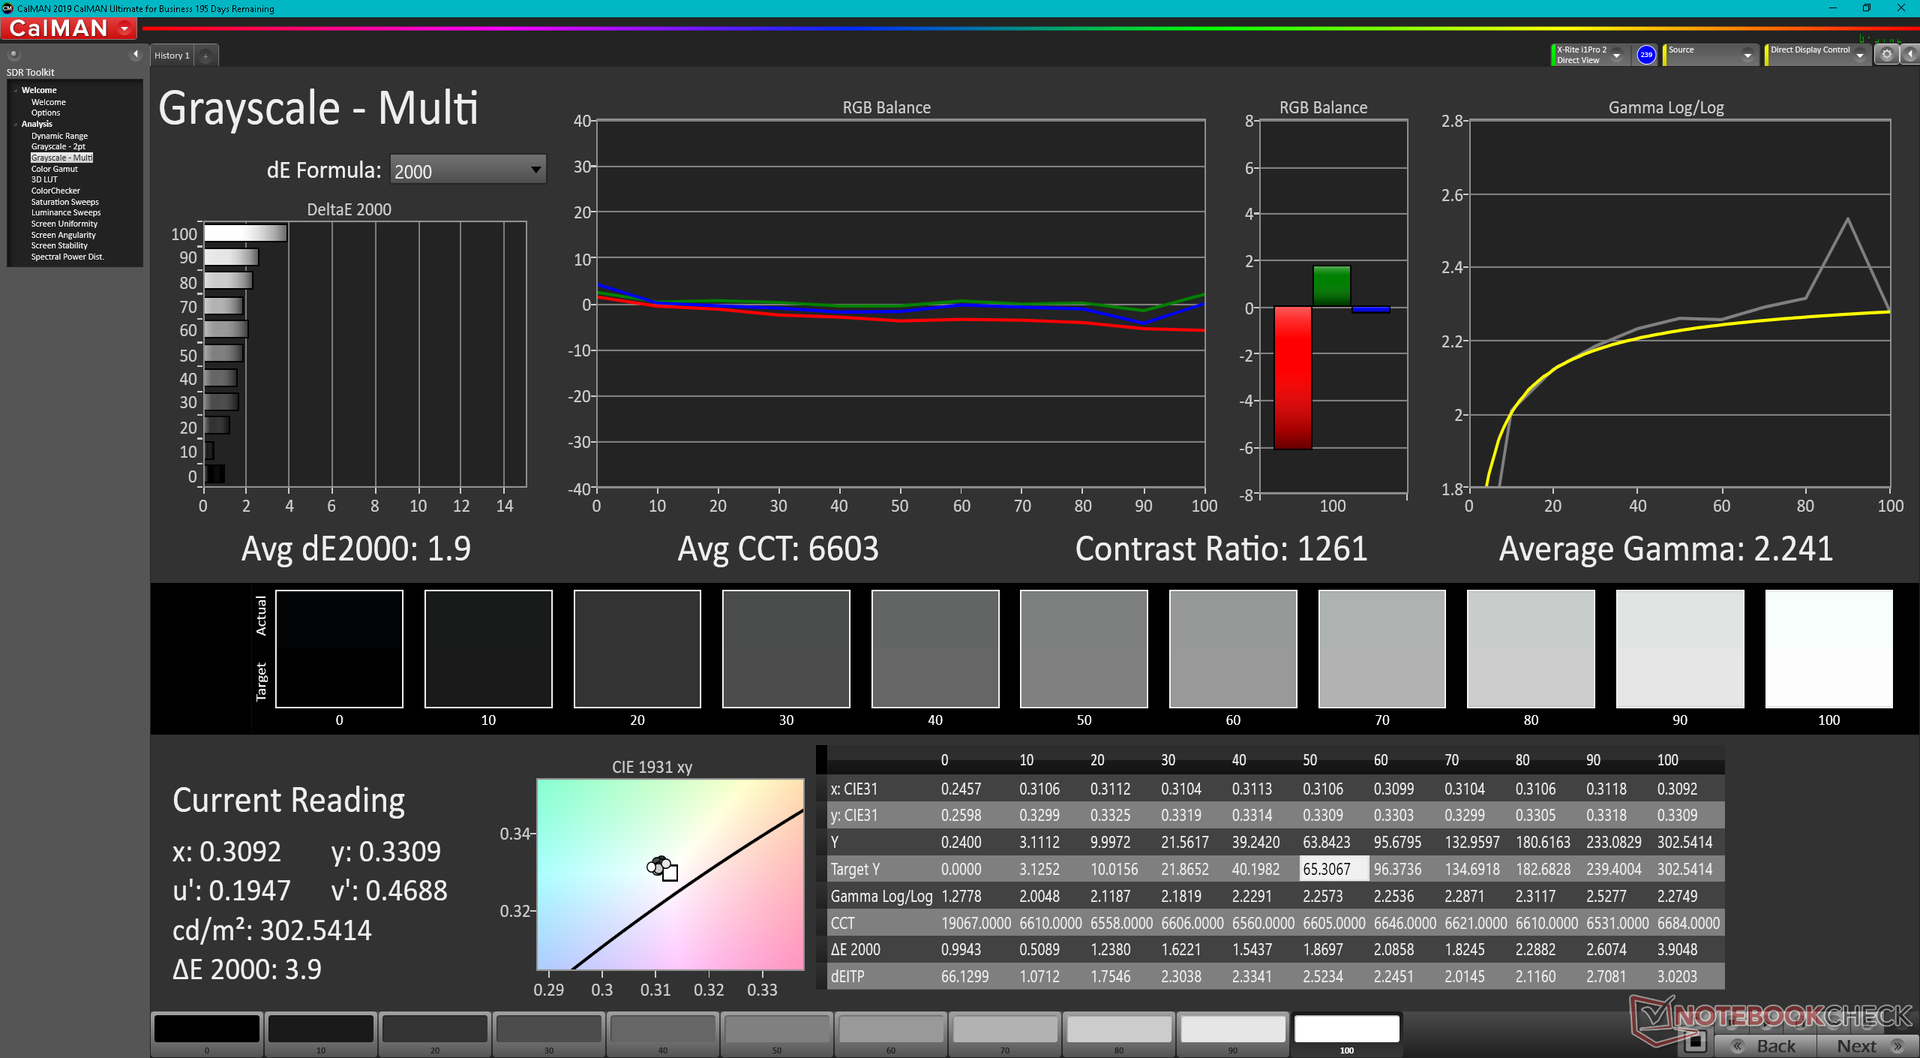
L'écran est correctement calibré dès sa sortie de l'emballage, avec des valeurs moyennes de niveaux de gris et de DeltaE ColorChecker de seulement 3,1 et 2,35, respectivement. Nous sommes en mesure d'améliorer encore plus le DeltaE avec notre colorimètre X-Rite, comme le montrent nos captures d'écran ci-dessous.

Temps de réponse de l'écran
| ↔ Temps de réponse noir à blanc | ||
|---|---|---|
| 10.4 ms ... hausse ↗ et chute ↘ combinées | ↗ 5.2 ms hausse | 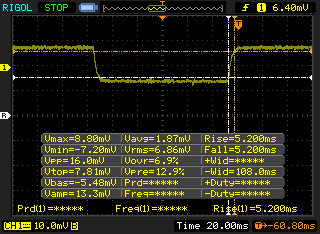 |
| ↘ 5.2 ms chute | ||
| L'écran montre de bons temps de réponse, mais insuffisant pour du jeu compétitif. En comparaison, tous les appareils testés affichent entre 0.1 (minimum) et 240 (maximum) ms. » 28 % des appareils testés affichent de meilleures performances. Cela signifie que les latences relevées sont meilleures que la moyenne (19.8 ms) de tous les appareils testés. | ||
| ↔ Temps de réponse gris 50% à gris 80% | ||
| 12.8 ms ... hausse ↗ et chute ↘ combinées | ↗ 4.8 ms hausse | 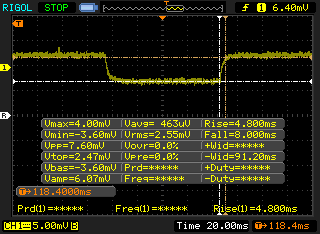 |
| ↘ 8 ms chute | ||
| L'écran montre de bons temps de réponse, mais insuffisant pour du jeu compétitif. En comparaison, tous les appareils testés affichent entre 0.165 (minimum) et 636 (maximum) ms. » 26 % des appareils testés affichent de meilleures performances. Cela signifie que les latences relevées sont meilleures que la moyenne (30.9 ms) de tous les appareils testés. | ||
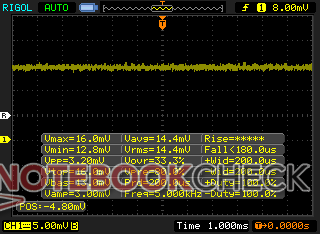
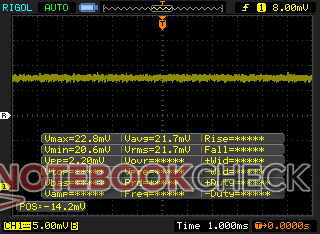
Scintillement / MLI (Modulation de largeur d'impulsion)
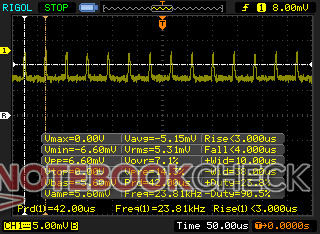
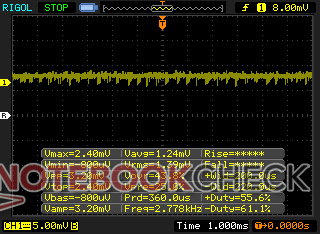
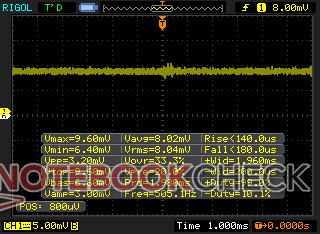
| Scintillement / MLI (Modulation de largeur d'impulsion) décelé | 23810 Hz | ≤ 25 Niveau de luminosité | 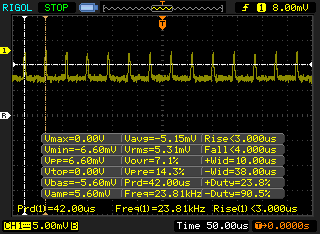 |
Le rétroéclairage de l'écran scintille à la fréquence de 23810 Hz (certainement du fait de l'utilisation d'une MDI - Modulation de largeur d'impulsion) à un niveau de luminosité inférieur ou égal à 25 % . Aucun scintillement ne devrait être perceptible au-dessus de cette valeur. La fréquence de rafraîchissement de 23810 Hz est élevée, la grande majorité des utilisateurs ne devrait pas percevoir de scintillements et être sujette à une fatigue oculaire accrue. En comparaison, 52 % des appareils testés n'emploient pas MDI pour assombrir leur écran. Nous avons relevé une moyenne à 7741 (minimum : 5 - maximum : 343500) Hz dans le cas où une MDI était active. | |||

Performance
Conditions d'essai
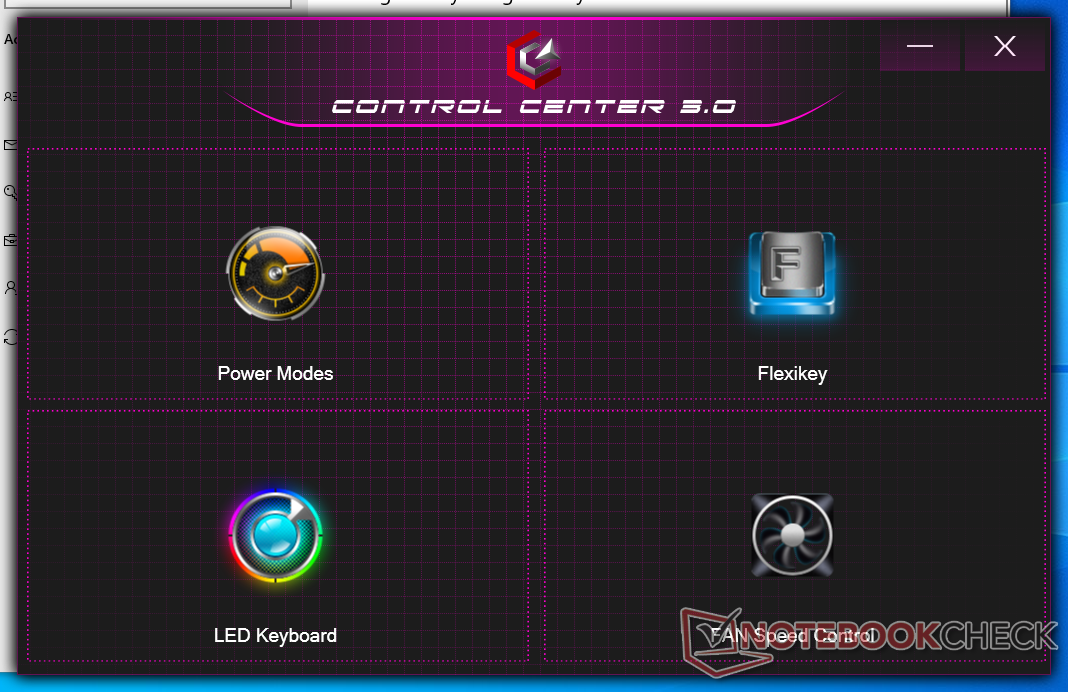
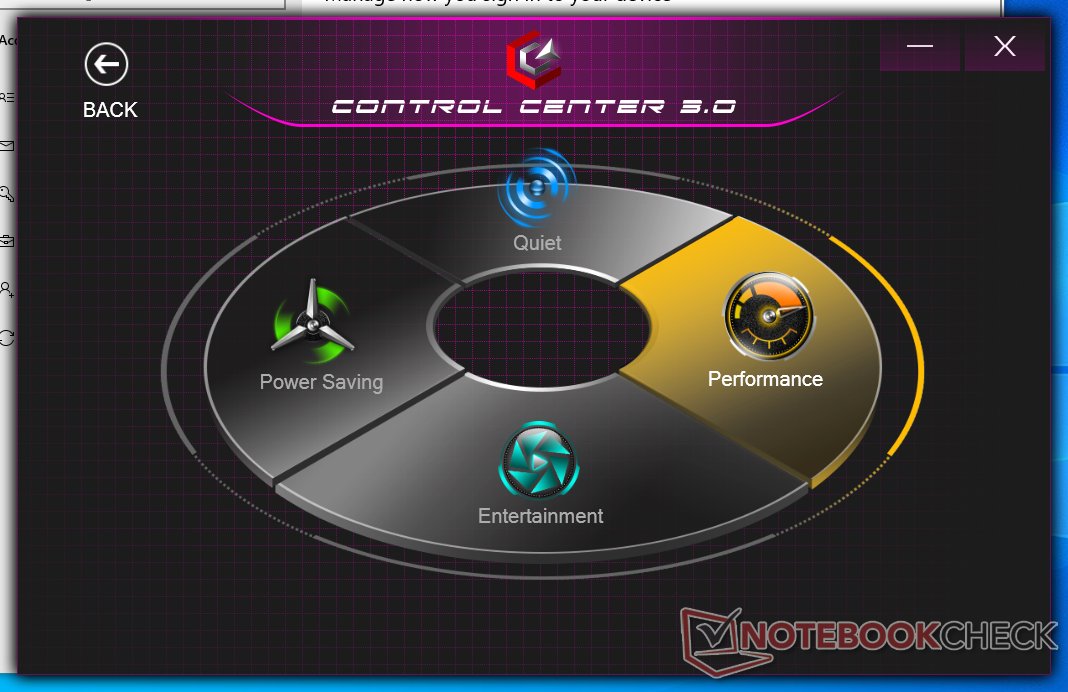
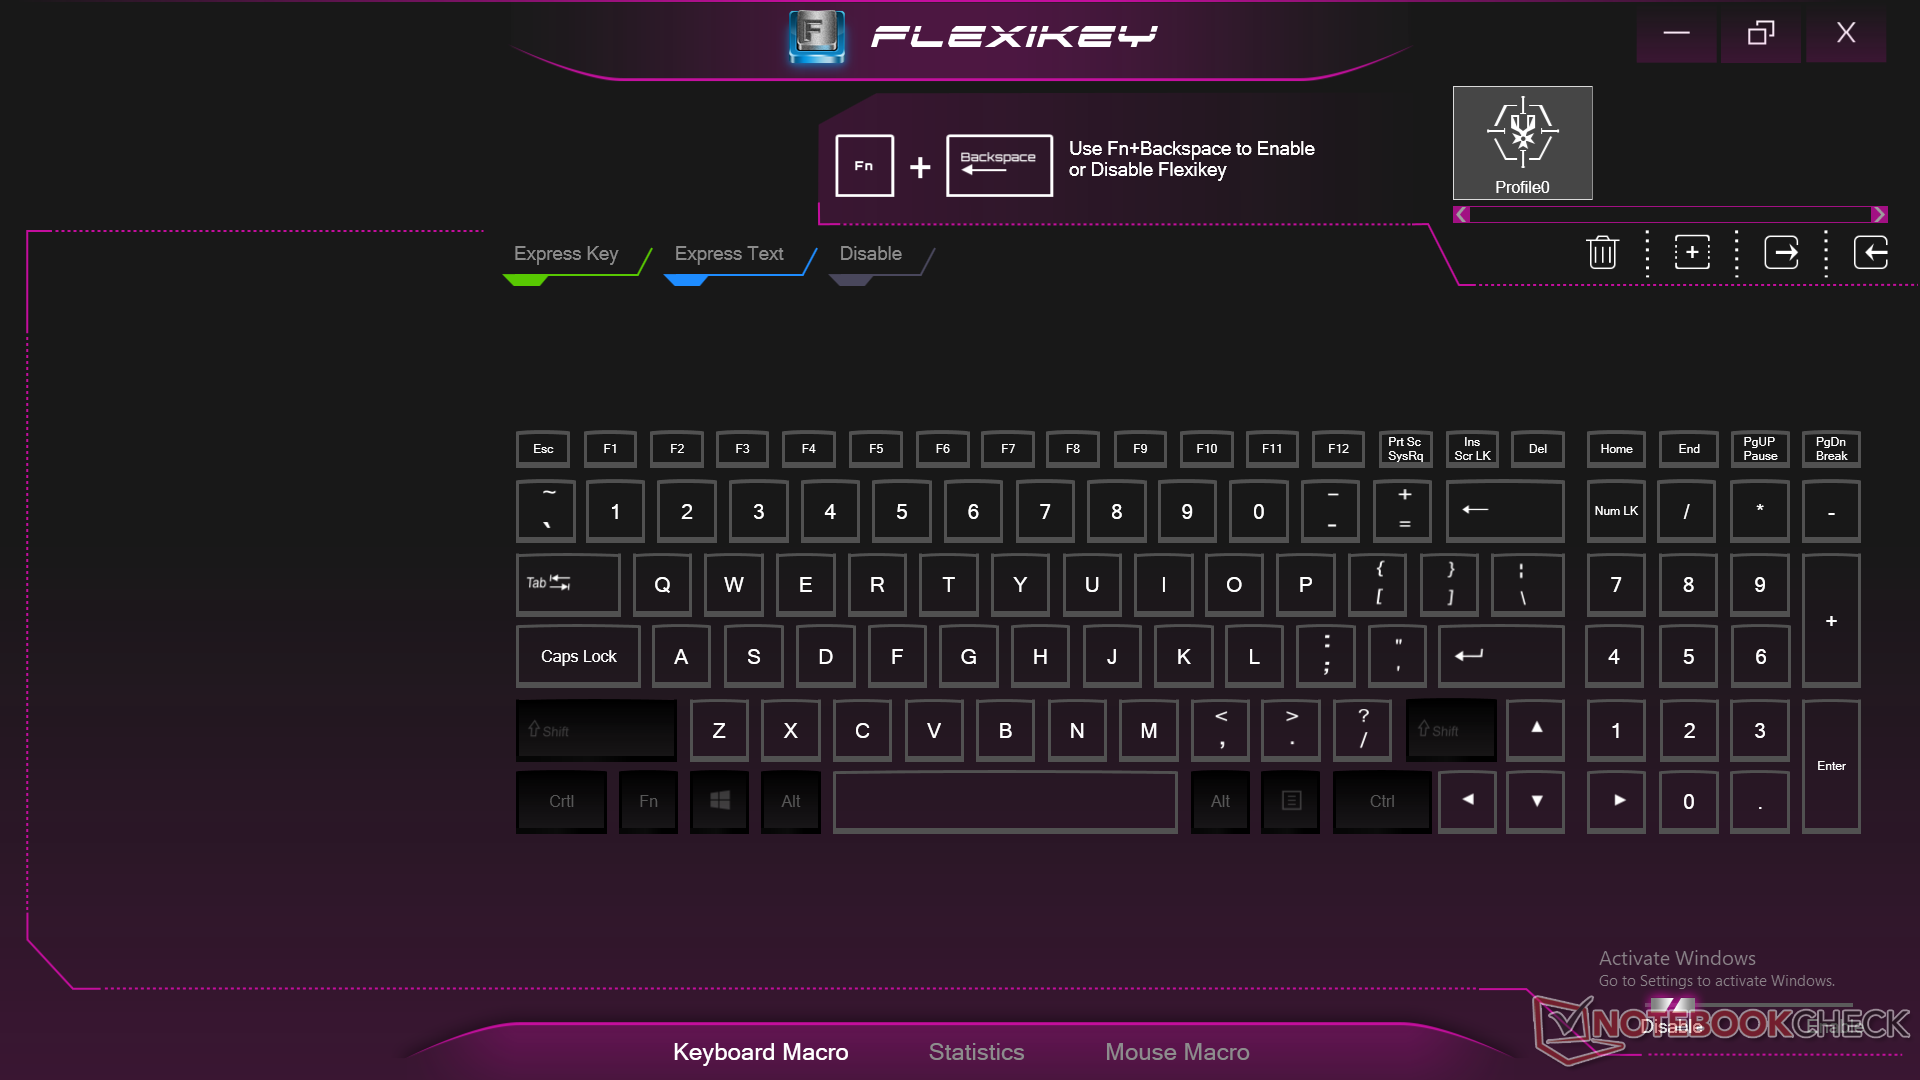
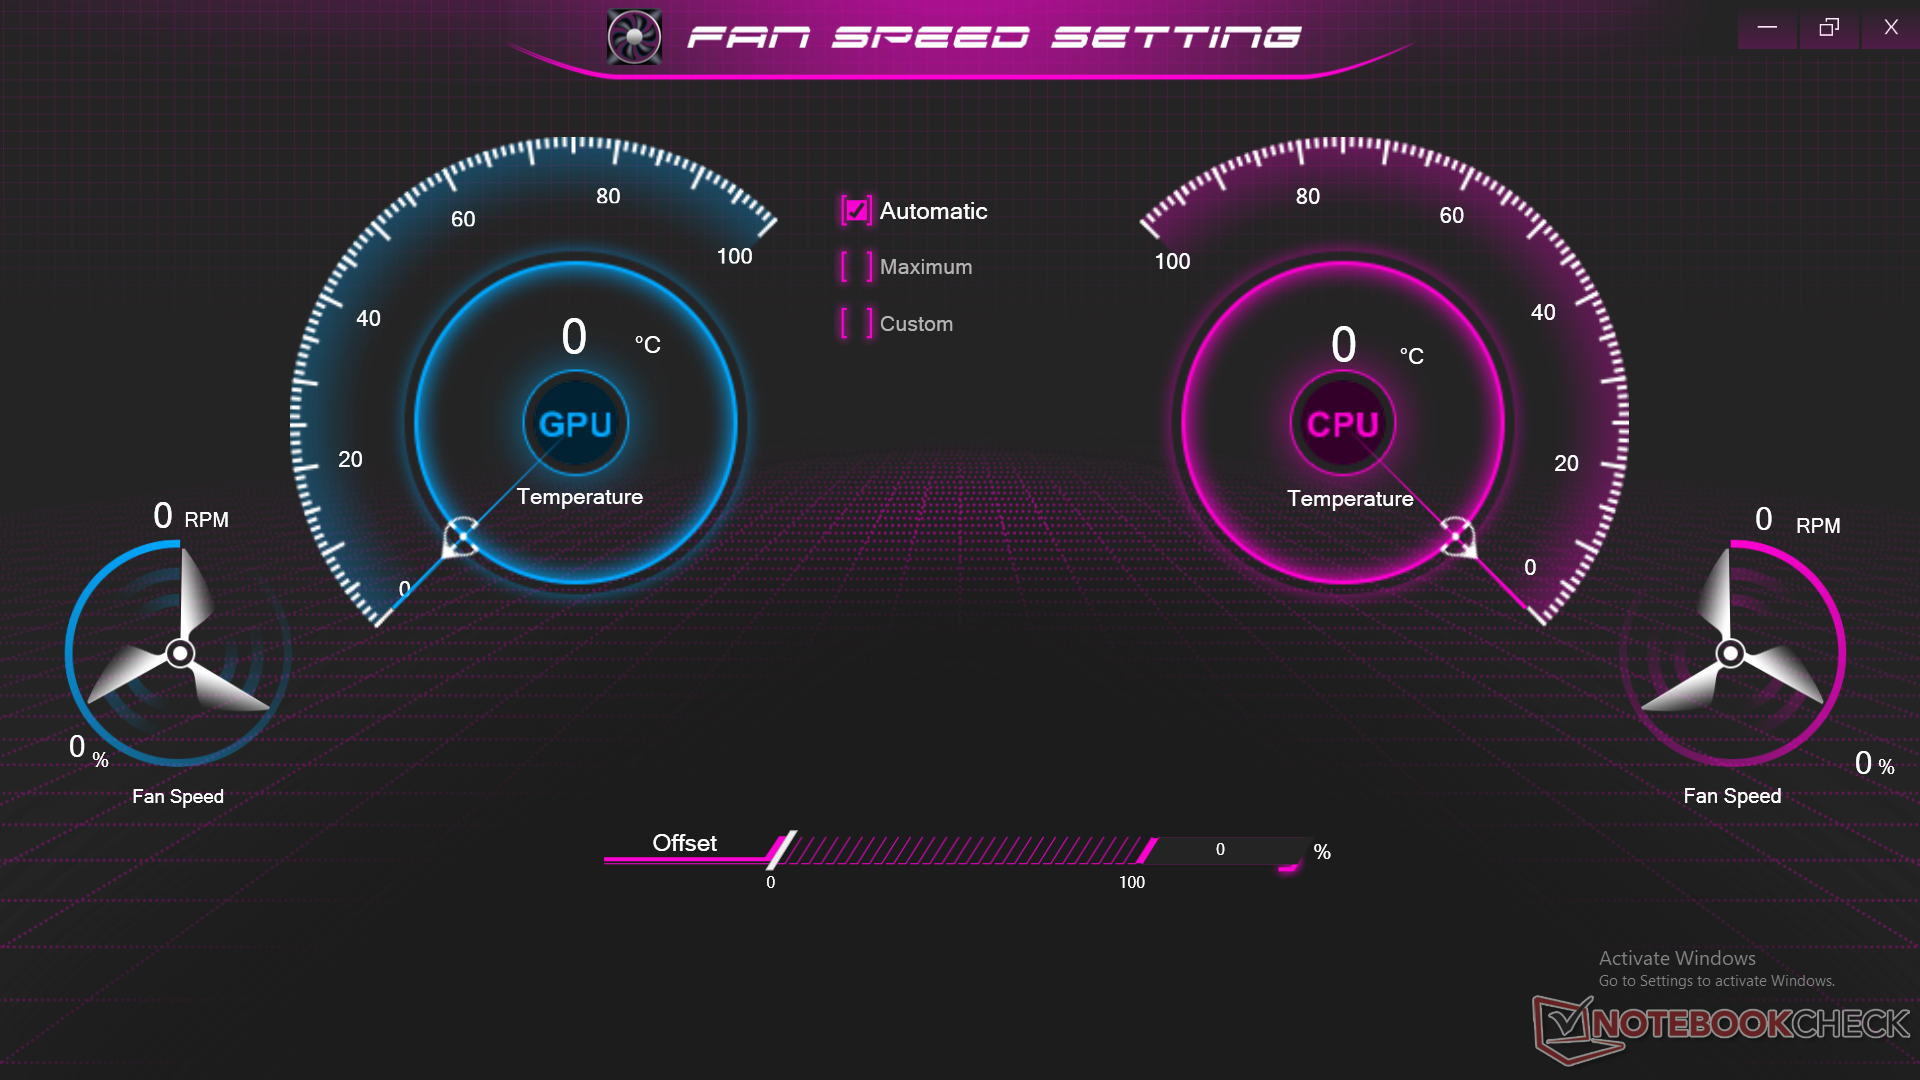
Notre appareil a été réglé en mode Performance via Windows et le logiciel Control Center 3.0 avant d'exécuter les tests de performance ci-dessous pour obtenir les meilleurs résultats possibles sans overclocking de l'utilisateur. Il est recommandé aux propriétaires de se familiariser avec le Control Center 3.0, car les contrôles des ventilateurs, les modes d'alimentation et les caractéristiques des LED/macro sont tous basculés ici.
Il n'y a pas de commutateur MUX et il n'y a donc que le support Optimus 1.0. Eurocom dit que le Raptor X15 n'a pas été conçu avec un commutateur MUX à l'esprit.
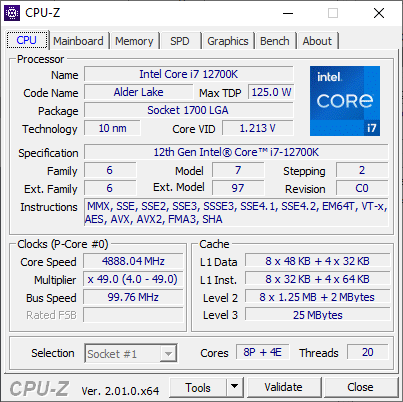
Processeur
Malheureusement, notre unité présentait des bogues de performance lors de l'exécution de CineBench R15, ce qui nous empêchait d'enregistrer des scores corrects avec le benchmark. Eurocom a confirmé avec nous que le bug est reproductible sur plusieurs unités Raptor X15. Heureusement, tous les autres benchmarks ont fonctionné sans problème. En comparaison avec notre ordinateur de référence avec le même Core i7-12700K Le i7-12700K de notre Eurocom serait de 20 à 25 % plus lent dans les charges de travail multithreadées pour un niveau de performance global qui est le plus similaire au mobile Core i7-12700H.
Cinebench R15 Multi Loop
Cinebench R23: Multi Core | Single Core
Cinebench R15: CPU Multi 64Bit | CPU Single 64Bit
Blender: v2.79 BMW27 CPU
7-Zip 18.03: 7z b 4 | 7z b 4 -mmt1
Geekbench 5.5: Multi-Core | Single-Core
HWBOT x265 Benchmark v2.2: 4k Preset
LibreOffice : 20 Documents To PDF
R Benchmark 2.5: Overall mean
| Cinebench R20 / CPU (Multi Core) | |
| Intel Core i7-12700K | |
| Moyenne Intel Core i7-12700K (6953 - 8648, n=2) | |
| Eurocom Raptor X15 | |
| MSI Vector GP76 12UGS-434 | |
| Schenker XMG Apex 15 NH57AF1 | |
| MSI Raider GE66 12UHS | |
| Razer Blade 15 2022 | |
| Razer Blade 14 Ryzen 9 6900HX | |
| Gigabyte A5 X1 | |
| Eurocom Nightsky ARX315 | |
| Schenker XMG Apex 15 NH57E PS | |
| Eurocom RX315 NH57AF1 | |
| Aorus 15P XC | |
| Lenovo Legion C7 15IMH05 82EH0030GE | |
| Cinebench R20 / CPU (Single Core) | |
| Eurocom Raptor X15 | |
| Moyenne Intel Core i7-12700K (731 - 740, n=2) | |
| Intel Core i7-12700K | |
| MSI Raider GE66 12UHS | |
| Razer Blade 15 2022 | |
| MSI Vector GP76 12UGS-434 | |
| Razer Blade 14 Ryzen 9 6900HX | |
| Eurocom Nightsky ARX315 | |
| Gigabyte A5 X1 | |
| Eurocom RX315 NH57AF1 | |
| Schenker XMG Apex 15 NH57E PS | |
| Schenker XMG Apex 15 NH57AF1 | |
| Lenovo Legion C7 15IMH05 82EH0030GE | |
| Aorus 15P XC | |
| Cinebench R23 / Multi Core | |
| Intel Core i7-12700K | |
| Moyenne Intel Core i7-12700K (17003 - 22565, n=2) | |
| MSI Vector GP76 12UGS-434 | |
| Eurocom Raptor X15 | |
| MSI Raider GE66 12UHS | |
| Razer Blade 15 2022 | |
| Razer Blade 14 Ryzen 9 6900HX | |
| Gigabyte A5 X1 | |
| Eurocom Nightsky ARX315 | |
| Schenker XMG Apex 15 NH57E PS | |
| Eurocom RX315 NH57AF1 | |
| Aorus 15P XC | |
| Lenovo Legion C7 15IMH05 82EH0030GE | |
| Cinebench R23 / Single Core | |
| Intel Core i7-12700K | |
| MSI Raider GE66 12UHS | |
| Moyenne Intel Core i7-12700K (1806 - 1895, n=2) | |
| Eurocom Raptor X15 | |
| Razer Blade 15 2022 | |
| MSI Vector GP76 12UGS-434 | |
| Eurocom Nightsky ARX315 | |
| Razer Blade 14 Ryzen 9 6900HX | |
| Eurocom RX315 NH57AF1 | |
| Gigabyte A5 X1 | |
| Schenker XMG Apex 15 NH57E PS | |
| Lenovo Legion C7 15IMH05 82EH0030GE | |
| Aorus 15P XC | |
| Cinebench R15 / CPU Multi 64Bit | |
| Intel Core i7-12700K | |
| Moyenne Intel Core i7-12700K (n=1) | |
| MSI Vector GP76 12UGS-434 | |
| Schenker XMG Apex 15 NH57AF1 | |
| MSI Raider GE66 12UHS | |
| Razer Blade 14 Ryzen 9 6900HX | |
| Eurocom Nightsky ARX315 | |
| Razer Blade 15 2022 | |
| Gigabyte A5 X1 | |
| Schenker XMG Apex 15 NH57E PS | |
| Eurocom RX315 NH57AF1 | |
| Aorus 15P XC | |
| Lenovo Legion C7 15IMH05 82EH0030GE | |
| Cinebench R15 / CPU Single 64Bit | |
| Intel Core i7-12700K | |
| Moyenne Intel Core i7-12700K (n=1) | |
| MSI Raider GE66 12UHS | |
| Razer Blade 15 2022 | |
| MSI Vector GP76 12UGS-434 | |
| Eurocom Nightsky ARX315 | |
| Razer Blade 14 Ryzen 9 6900HX | |
| Gigabyte A5 X1 | |
| Schenker XMG Apex 15 NH57E PS | |
| Eurocom RX315 NH57AF1 | |
| Lenovo Legion C7 15IMH05 82EH0030GE | |
| Aorus 15P XC | |
| Schenker XMG Apex 15 NH57AF1 | |
| Blender / v2.79 BMW27 CPU | |
| Lenovo Legion C7 15IMH05 82EH0030GE | |
| Aorus 15P XC | |
| Eurocom RX315 NH57AF1 | |
| Schenker XMG Apex 15 NH57E PS | |
| Gigabyte A5 X1 | |
| Razer Blade 15 2022 | |
| Razer Blade 14 Ryzen 9 6900HX | |
| Eurocom Nightsky ARX315 | |
| MSI Vector GP76 12UGS-434 | |
| MSI Raider GE66 12UHS | |
| Eurocom Raptor X15 | |
| Schenker XMG Apex 15 NH57AF1 | |
| Moyenne Intel Core i7-12700K (152.3 - 193.9, n=2) | |
| Intel Core i7-12700K | |
| 7-Zip 18.03 / 7z b 4 -mmt1 | |
| Eurocom Nightsky ARX315 | |
| Eurocom Raptor X15 | |
| Moyenne Intel Core i7-12700K (6117 - 6422, n=2) | |
| Intel Core i7-12700K | |
| MSI Raider GE66 12UHS | |
| Razer Blade 14 Ryzen 9 6900HX | |
| Razer Blade 15 2022 | |
| Gigabyte A5 X1 | |
| Schenker XMG Apex 15 NH57E PS | |
| MSI Vector GP76 12UGS-434 | |
| Lenovo Legion C7 15IMH05 82EH0030GE | |
| Eurocom RX315 NH57AF1 | |
| Aorus 15P XC | |
| Schenker XMG Apex 15 NH57AF1 | |
| Geekbench 5.5 / Multi-Core | |
| Intel Core i7-12700K | |
| Moyenne Intel Core i7-12700K (12475 - 15557, n=2) | |
| MSI Raider GE66 12UHS | |
| Eurocom Raptor X15 | |
| Razer Blade 15 2022 | |
| MSI Vector GP76 12UGS-434 | |
| Schenker XMG Apex 15 NH57AF1 | |
| Eurocom Nightsky ARX315 | |
| Razer Blade 14 Ryzen 9 6900HX | |
| Eurocom RX315 NH57AF1 | |
| Gigabyte A5 X1 | |
| Schenker XMG Apex 15 NH57E PS | |
| Lenovo Legion C7 15IMH05 82EH0030GE | |
| Aorus 15P XC | |
| Geekbench 5.5 / Single-Core | |
| Eurocom Raptor X15 | |
| Moyenne Intel Core i7-12700K (1890 - 1933, n=2) | |
| Intel Core i7-12700K | |
| MSI Raider GE66 12UHS | |
| MSI Vector GP76 12UGS-434 | |
| Razer Blade 15 2022 | |
| Eurocom Nightsky ARX315 | |
| Razer Blade 14 Ryzen 9 6900HX | |
| Eurocom RX315 NH57AF1 | |
| Gigabyte A5 X1 | |
| Schenker XMG Apex 15 NH57E PS | |
| Lenovo Legion C7 15IMH05 82EH0030GE | |
| Aorus 15P XC | |
| Schenker XMG Apex 15 NH57AF1 | |
| HWBOT x265 Benchmark v2.2 / 4k Preset | |
| Intel Core i7-12700K | |
| Moyenne Intel Core i7-12700K (14.9 - 26.1, n=2) | |
| MSI Vector GP76 12UGS-434 | |
| Schenker XMG Apex 15 NH57AF1 | |
| MSI Raider GE66 12UHS | |
| Razer Blade 14 Ryzen 9 6900HX | |
| Eurocom Nightsky ARX315 | |
| Razer Blade 15 2022 | |
| Gigabyte A5 X1 | |
| Schenker XMG Apex 15 NH57E PS | |
| Eurocom RX315 NH57AF1 | |
| Eurocom Raptor X15 | |
| Aorus 15P XC | |
| Lenovo Legion C7 15IMH05 82EH0030GE | |
| LibreOffice / 20 Documents To PDF | |
| Gigabyte A5 X1 | |
| Schenker XMG Apex 15 NH57AF1 | |
| Lenovo Legion C7 15IMH05 82EH0030GE | |
| Schenker XMG Apex 15 NH57E PS | |
| Aorus 15P XC | |
| Razer Blade 15 2022 | |
| Razer Blade 14 Ryzen 9 6900HX | |
| Eurocom RX315 NH57AF1 | |
| Eurocom Nightsky ARX315 | |
| MSI Vector GP76 12UGS-434 | |
| Intel Core i7-12700K | |
| Moyenne Intel Core i7-12700K (37.8 - 39.8, n=2) | |
| Eurocom Raptor X15 | |
| MSI Raider GE66 12UHS | |
| R Benchmark 2.5 / Overall mean | |
| Aorus 15P XC | |
| Lenovo Legion C7 15IMH05 82EH0030GE | |
| Eurocom RX315 NH57AF1 | |
| Schenker XMG Apex 15 NH57AF1 | |
| Schenker XMG Apex 15 NH57E PS | |
| Gigabyte A5 X1 | |
| Eurocom Nightsky ARX315 | |
| Razer Blade 14 Ryzen 9 6900HX | |
| Razer Blade 15 2022 | |
| MSI Vector GP76 12UGS-434 | |
| MSI Raider GE66 12UHS | |
| Intel Core i7-12700K | |
| Moyenne Intel Core i7-12700K (0.412 - 0.423, n=2) | |
| Eurocom Raptor X15 | |
Cinebench R23: Multi Core | Single Core
Cinebench R15: CPU Multi 64Bit | CPU Single 64Bit
Blender: v2.79 BMW27 CPU
7-Zip 18.03: 7z b 4 | 7z b 4 -mmt1
Geekbench 5.5: Multi-Core | Single-Core
HWBOT x265 Benchmark v2.2: 4k Preset
LibreOffice : 20 Documents To PDF
R Benchmark 2.5: Overall mean
* ... Moindre est la valeur, meilleures sont les performances
AIDA64: FP32 Ray-Trace | FPU Julia | CPU SHA3 | CPU Queen | FPU SinJulia | FPU Mandel | CPU AES | CPU ZLib | FP64 Ray-Trace | CPU PhotoWorxx
| Performance rating | |
| Gigabyte A5 X1 | |
| Eurocom RX315 NH57AF1 | |
| Asus TUF Gaming A15 FA506QR-AZ061T | |
| MSI Raider GE66 12UHS | |
| Eurocom Raptor X15 | |
| Moyenne Intel Core i7-12700K | |
| Razer Blade 15 Advanced Model Early 2022 | |
| AIDA64 / FP32 Ray-Trace | |
| Gigabyte A5 X1 | |
| Eurocom RX315 NH57AF1 | |
| Asus TUF Gaming A15 FA506QR-AZ061T | |
| MSI Raider GE66 12UHS | |
| Eurocom Raptor X15 | |
| Moyenne Intel Core i7-12700K (n=1) | |
| Razer Blade 15 Advanced Model Early 2022 | |
| AIDA64 / FPU Julia | |
| Gigabyte A5 X1 | |
| Asus TUF Gaming A15 FA506QR-AZ061T | |
| Eurocom RX315 NH57AF1 | |
| Eurocom Raptor X15 | |
| Moyenne Intel Core i7-12700K (n=1) | |
| MSI Raider GE66 12UHS | |
| Razer Blade 15 Advanced Model Early 2022 | |
| AIDA64 / CPU SHA3 | |
| Eurocom RX315 NH57AF1 | |
| Gigabyte A5 X1 | |
| Eurocom Raptor X15 | |
| Moyenne Intel Core i7-12700K (n=1) | |
| MSI Raider GE66 12UHS | |
| Asus TUF Gaming A15 FA506QR-AZ061T | |
| Razer Blade 15 Advanced Model Early 2022 | |
| AIDA64 / CPU Queen | |
| MSI Raider GE66 12UHS | |
| Gigabyte A5 X1 | |
| Eurocom Raptor X15 | |
| Moyenne Intel Core i7-12700K (n=1) | |
| Asus TUF Gaming A15 FA506QR-AZ061T | |
| Eurocom RX315 NH57AF1 | |
| Razer Blade 15 Advanced Model Early 2022 | |
| AIDA64 / FPU SinJulia | |
| Gigabyte A5 X1 | |
| Asus TUF Gaming A15 FA506QR-AZ061T | |
| Eurocom Raptor X15 | |
| Moyenne Intel Core i7-12700K (n=1) | |
| Eurocom RX315 NH57AF1 | |
| MSI Raider GE66 12UHS | |
| Razer Blade 15 Advanced Model Early 2022 | |
| AIDA64 / FPU Mandel | |
| Gigabyte A5 X1 | |
| Eurocom RX315 NH57AF1 | |
| Asus TUF Gaming A15 FA506QR-AZ061T | |
| MSI Raider GE66 12UHS | |
| Eurocom Raptor X15 | |
| Moyenne Intel Core i7-12700K (n=1) | |
| Razer Blade 15 Advanced Model Early 2022 | |
| AIDA64 / CPU AES | |
| Eurocom RX315 NH57AF1 | |
| Gigabyte A5 X1 | |
| MSI Raider GE66 12UHS | |
| Eurocom Raptor X15 | |
| Moyenne Intel Core i7-12700K (n=1) | |
| Asus TUF Gaming A15 FA506QR-AZ061T | |
| Razer Blade 15 Advanced Model Early 2022 | |
| AIDA64 / CPU ZLib | |
| Eurocom Raptor X15 | |
| Moyenne Intel Core i7-12700K (n=1) | |
| MSI Raider GE66 12UHS | |
| Gigabyte A5 X1 | |
| Eurocom RX315 NH57AF1 | |
| Asus TUF Gaming A15 FA506QR-AZ061T | |
| Razer Blade 15 Advanced Model Early 2022 | |
| AIDA64 / FP64 Ray-Trace | |
| Eurocom RX315 NH57AF1 | |
| Gigabyte A5 X1 | |
| Asus TUF Gaming A15 FA506QR-AZ061T | |
| MSI Raider GE66 12UHS | |
| Eurocom Raptor X15 | |
| Moyenne Intel Core i7-12700K (n=1) | |
| Razer Blade 15 Advanced Model Early 2022 | |
| AIDA64 / CPU PhotoWorxx | |
| MSI Raider GE66 12UHS | |
| Razer Blade 15 Advanced Model Early 2022 | |
| Eurocom Raptor X15 | |
| Moyenne Intel Core i7-12700K (n=1) | |
| Eurocom RX315 NH57AF1 | |
| Gigabyte A5 X1 | |
| Asus TUF Gaming A15 FA506QR-AZ061T | |
Performance du système
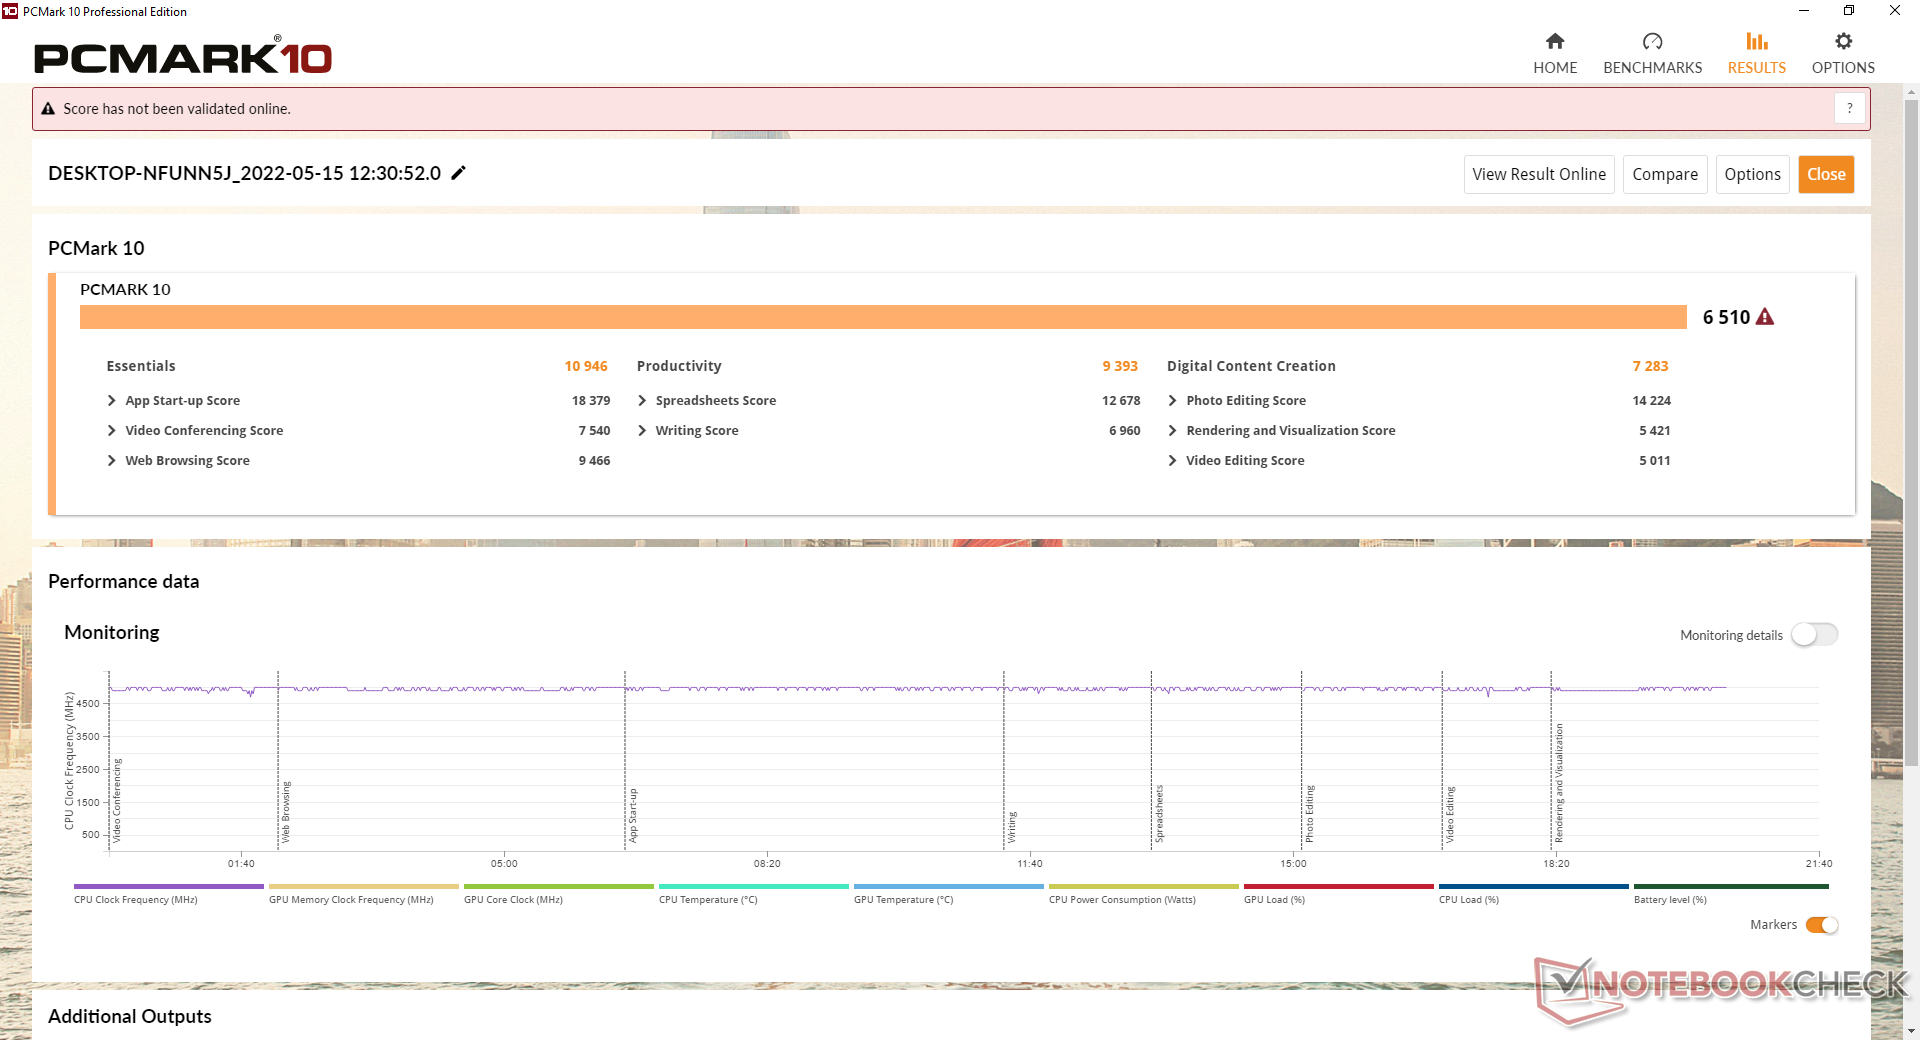
Les scores PCMark 10 sont comparables à ceux des ordinateurs portables de jeu haut de gamme équipés de CPU mobiles "ordinaires" comme le MSI GE66 i9-12900HK ou le Razer Blade 15 i7-12800H. Le score du subtest de création de contenu numérique est toutefois plus faible que prévu.
CrossMark: Overall | Productivity | Creativity | Responsiveness
| PCMark 10 / Score | |
| MSI Raider GE66 12UHS | |
| Razer Blade 15 Advanced Model Early 2022 | |
| Eurocom RX315 NH57AF1 | |
| Asus TUF Gaming A15 FA506QR-AZ061T | |
| Gigabyte A5 X1 | |
| Eurocom Raptor X15 | |
| Moyenne Intel Core i7-12700K, NVIDIA GeForce RTX 3070 Ti Laptop GPU (n=1) | |
| PCMark 10 / Essentials | |
| MSI Raider GE66 12UHS | |
| Eurocom Raptor X15 | |
| Moyenne Intel Core i7-12700K, NVIDIA GeForce RTX 3070 Ti Laptop GPU (n=1) | |
| Razer Blade 15 Advanced Model Early 2022 | |
| Eurocom RX315 NH57AF1 | |
| Asus TUF Gaming A15 FA506QR-AZ061T | |
| Gigabyte A5 X1 | |
| PCMark 10 / Productivity | |
| MSI Raider GE66 12UHS | |
| Razer Blade 15 Advanced Model Early 2022 | |
| Asus TUF Gaming A15 FA506QR-AZ061T | |
| Eurocom Raptor X15 | |
| Moyenne Intel Core i7-12700K, NVIDIA GeForce RTX 3070 Ti Laptop GPU (n=1) | |
| Gigabyte A5 X1 | |
| Eurocom RX315 NH57AF1 | |
| PCMark 10 / Digital Content Creation | |
| MSI Raider GE66 12UHS | |
| Razer Blade 15 Advanced Model Early 2022 | |
| Eurocom RX315 NH57AF1 | |
| Gigabyte A5 X1 | |
| Asus TUF Gaming A15 FA506QR-AZ061T | |
| Eurocom Raptor X15 | |
| Moyenne Intel Core i7-12700K, NVIDIA GeForce RTX 3070 Ti Laptop GPU (n=1) | |
| CrossMark / Overall | |
| Eurocom Raptor X15 | |
| Moyenne Intel Core i7-12700K, NVIDIA GeForce RTX 3070 Ti Laptop GPU (n=1) | |
| Razer Blade 15 Advanced Model Early 2022 | |
| CrossMark / Productivity | |
| Eurocom Raptor X15 | |
| Moyenne Intel Core i7-12700K, NVIDIA GeForce RTX 3070 Ti Laptop GPU (n=1) | |
| Razer Blade 15 Advanced Model Early 2022 | |
| CrossMark / Creativity | |
| Eurocom Raptor X15 | |
| Moyenne Intel Core i7-12700K, NVIDIA GeForce RTX 3070 Ti Laptop GPU (n=1) | |
| Razer Blade 15 Advanced Model Early 2022 | |
| CrossMark / Responsiveness | |
| Eurocom Raptor X15 | |
| Moyenne Intel Core i7-12700K, NVIDIA GeForce RTX 3070 Ti Laptop GPU (n=1) | |
| Razer Blade 15 Advanced Model Early 2022 | |
| PCMark 10 Score | 6510 points | |
Aide | ||
| AIDA64 / Memory Copy | |
| MSI Raider GE66 12UHS | |
| Razer Blade 15 Advanced Model Early 2022 | |
| Eurocom Raptor X15 | |
| Moyenne Intel Core i7-12700K (n=1) | |
| Eurocom RX315 NH57AF1 | |
| Gigabyte A5 X1 | |
| Asus TUF Gaming A15 FA506QR-AZ061T | |
| AIDA64 / Memory Read | |
| MSI Raider GE66 12UHS | |
| Razer Blade 15 Advanced Model Early 2022 | |
| Eurocom Raptor X15 | |
| Moyenne Intel Core i7-12700K (n=1) | |
| Eurocom RX315 NH57AF1 | |
| Gigabyte A5 X1 | |
| Asus TUF Gaming A15 FA506QR-AZ061T | |
| AIDA64 / Memory Write | |
| Razer Blade 15 Advanced Model Early 2022 | |
| MSI Raider GE66 12UHS | |
| Eurocom Raptor X15 | |
| Moyenne Intel Core i7-12700K (n=1) | |
| Eurocom RX315 NH57AF1 | |
| Gigabyte A5 X1 | |
| Asus TUF Gaming A15 FA506QR-AZ061T | |
| AIDA64 / Memory Latency | |
| Razer Blade 15 Advanced Model Early 2022 | |
| MSI Raider GE66 12UHS | |
| Eurocom RX315 NH57AF1 | |
| Asus TUF Gaming A15 FA506QR-AZ061T | |
| Gigabyte A5 X1 | |
| Eurocom Raptor X15 | |
| Moyenne Intel Core i7-12700K (n=1) | |
* ... Moindre est la valeur, meilleures sont les performances
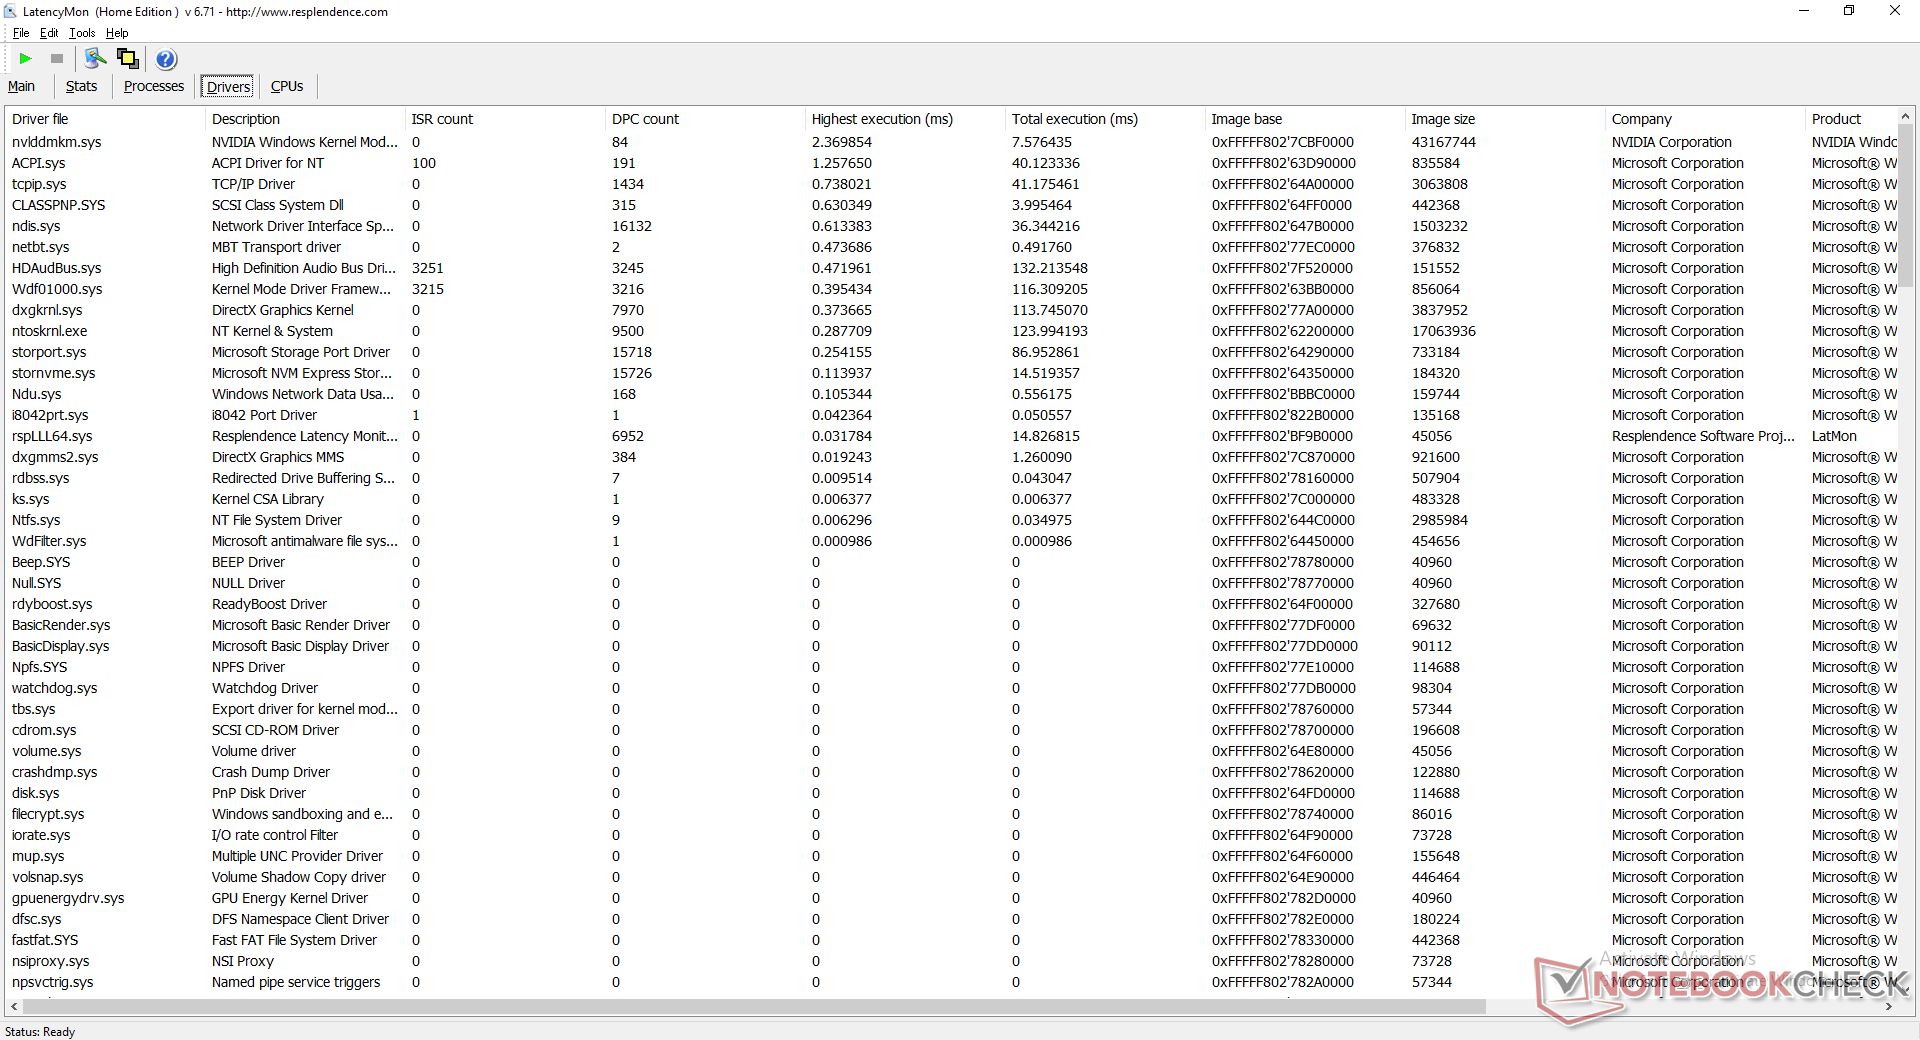
Latence DPC
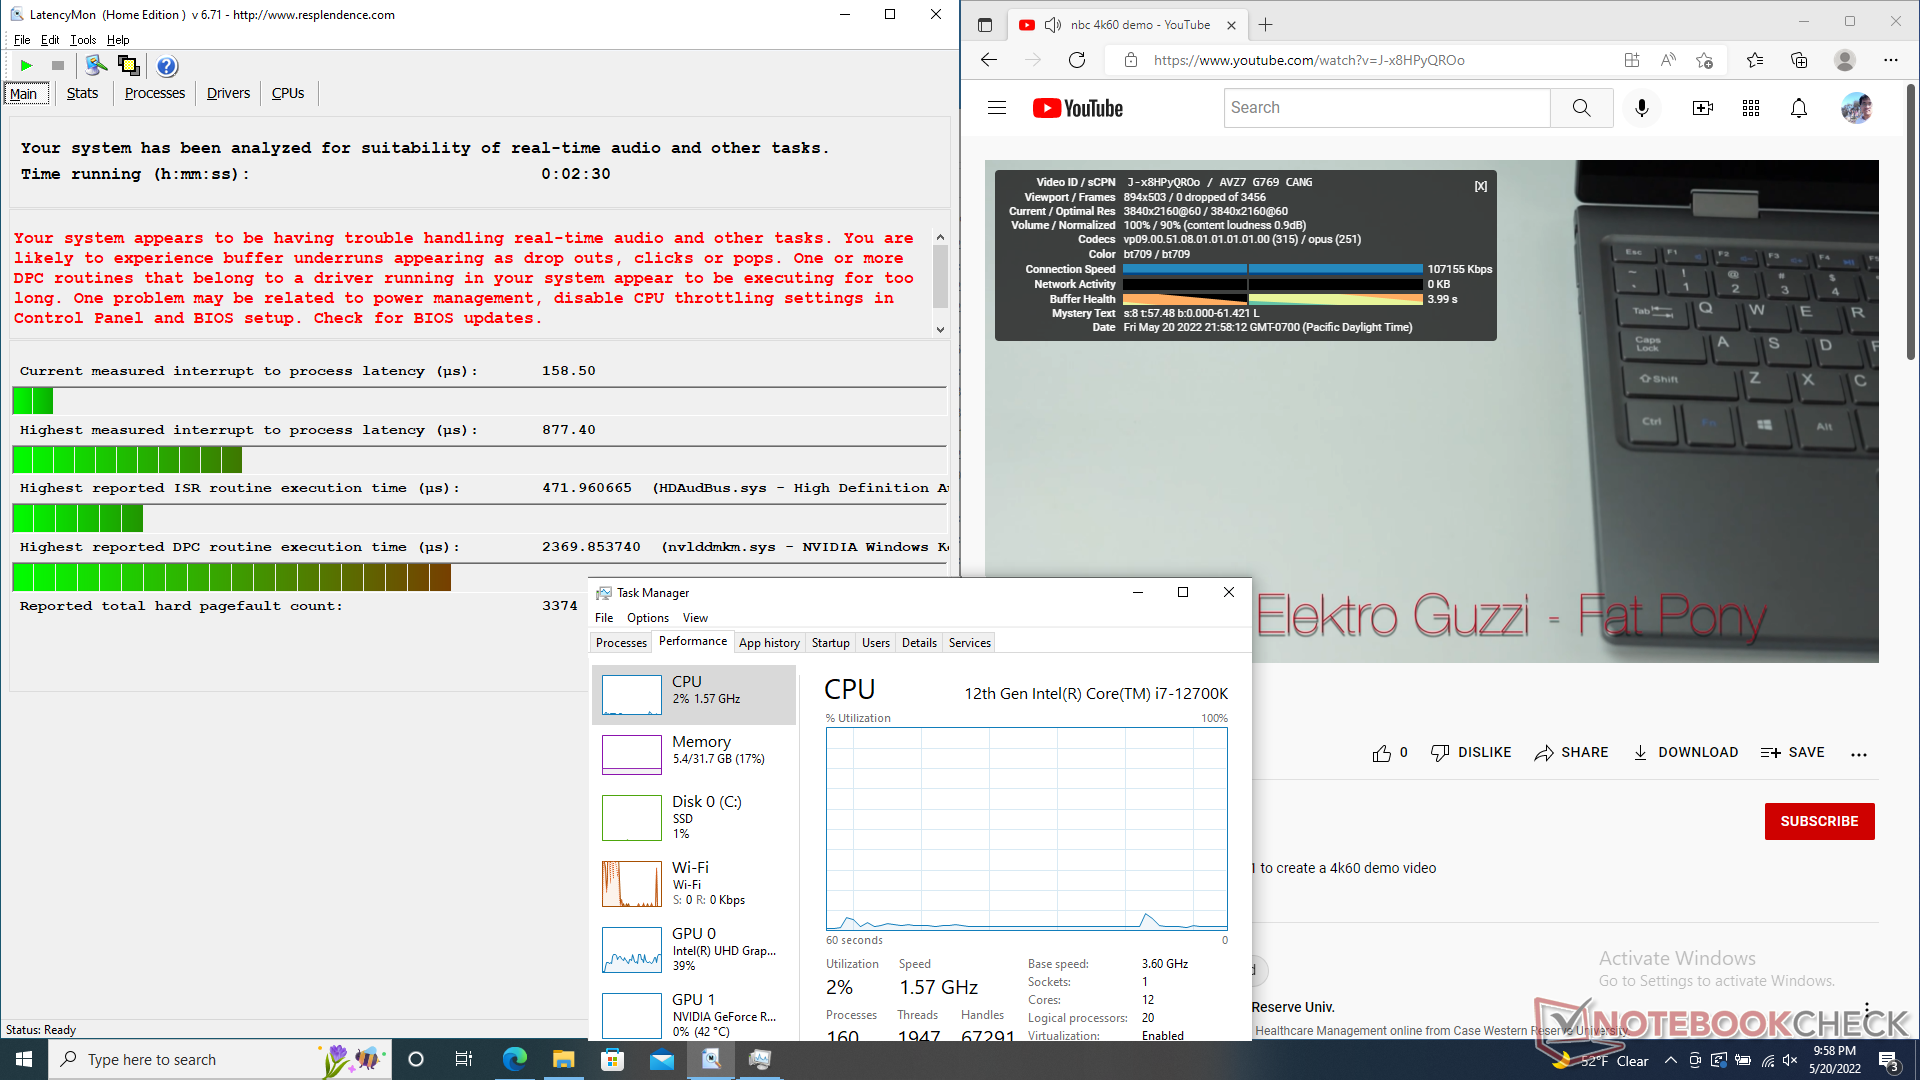
LatencyMon révèle des problèmes de CPD lors de l'ouverture de plusieurs onglets de navigateur de notre page d'accueil. la lecture de vidéos 4K à 60 FPS est par ailleurs parfaite et sans images perdues lorsqu'elle est réglée sur le GPU intégré.
| DPC Latencies / LatencyMon - interrupt to process latency (max), Web, Youtube, Prime95 | |
| MSI Raider GE66 12UHS | |
| Razer Blade 15 Advanced Model Early 2022 | |
| Eurocom RX315 NH57AF1 | |
| Asus TUF Gaming A15 FA506QR-AZ061T | |
| Eurocom Raptor X15 | |
| Gigabyte A5 X1 | |
* ... Moindre est la valeur, meilleures sont les performances
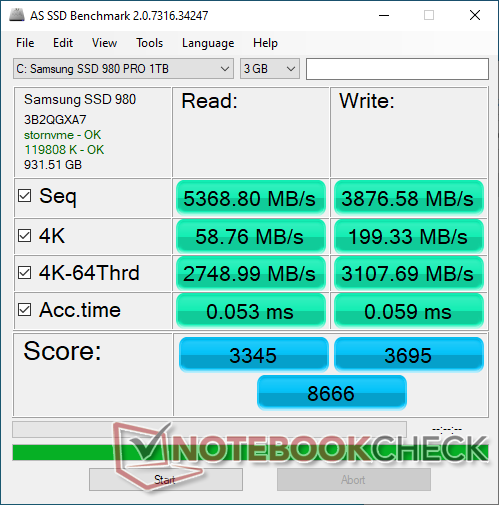
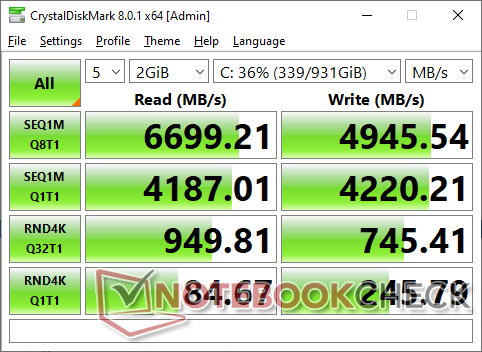
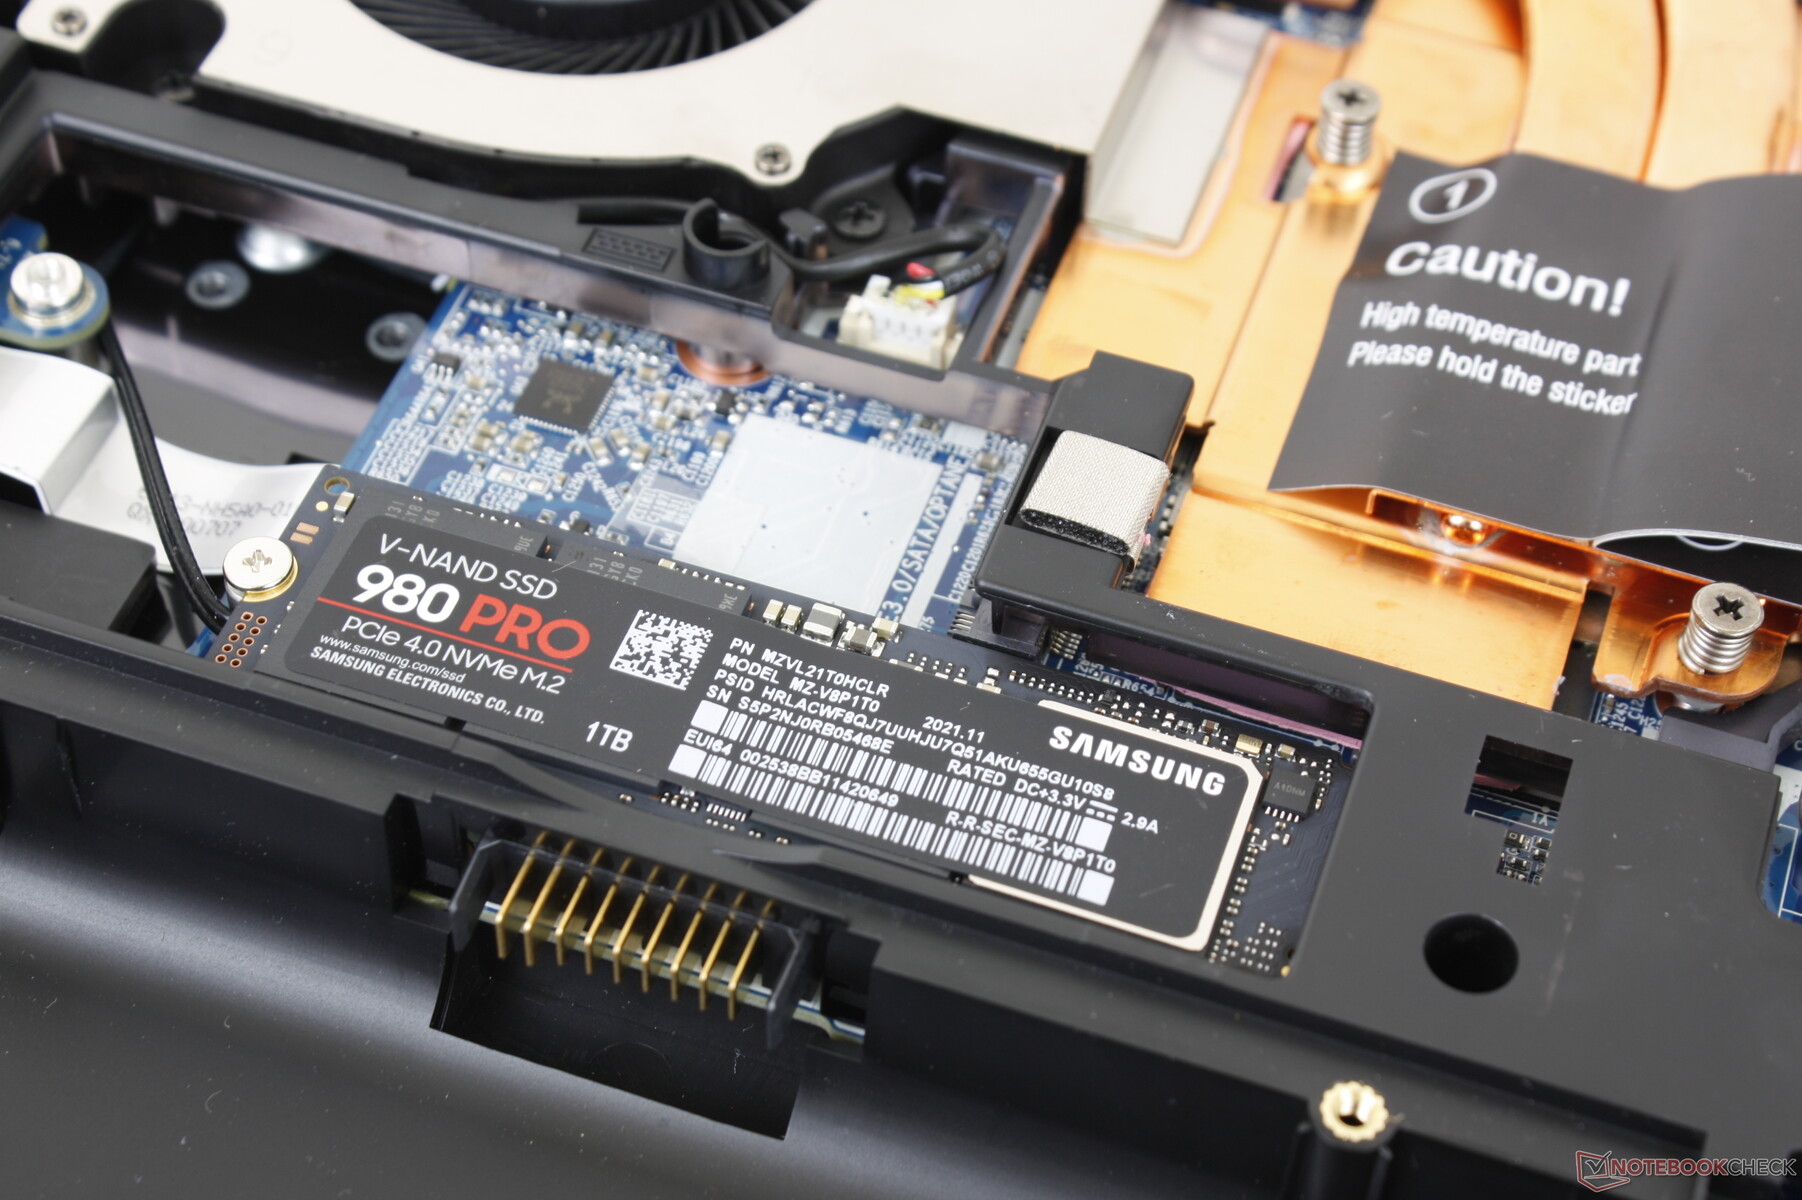
Périphériques de stockage
La durabilité des performances est faible lorsqu'un disque PCIe4 est installé. Comme le montre notre graphique ci-dessous, leSamsung SSD 980 Pro a du mal à maintenir son taux de transfert maximal, même pendant de courtes périodes. L'étranglement des performances se produit très tôt en raison des limitations thermiques dues à l'absence d'un dissipateur thermique.

| Drive Performance rating - Percent | |
| MSI Raider GE66 12UHS | |
| Razer Blade 15 Advanced Model Early 2022 | |
| Eurocom Raptor X15 | |
| Eurocom RX315 NH57AF1 | |
| Asus TUF Gaming A15 FA506QR-AZ061T | |
| Gigabyte A5 X1 | |
* ... Moindre est la valeur, meilleures sont les performances
Disk Throttling: DiskSpd Read Loop, Queue Depth 8
Performances du GPU
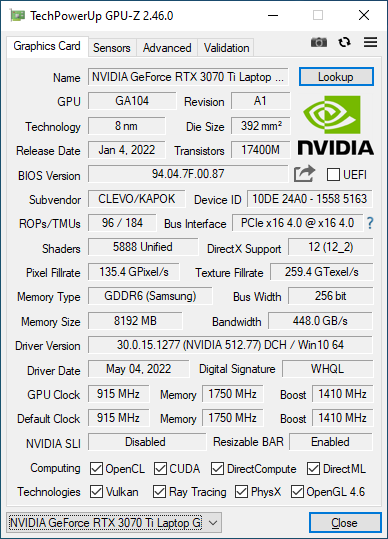
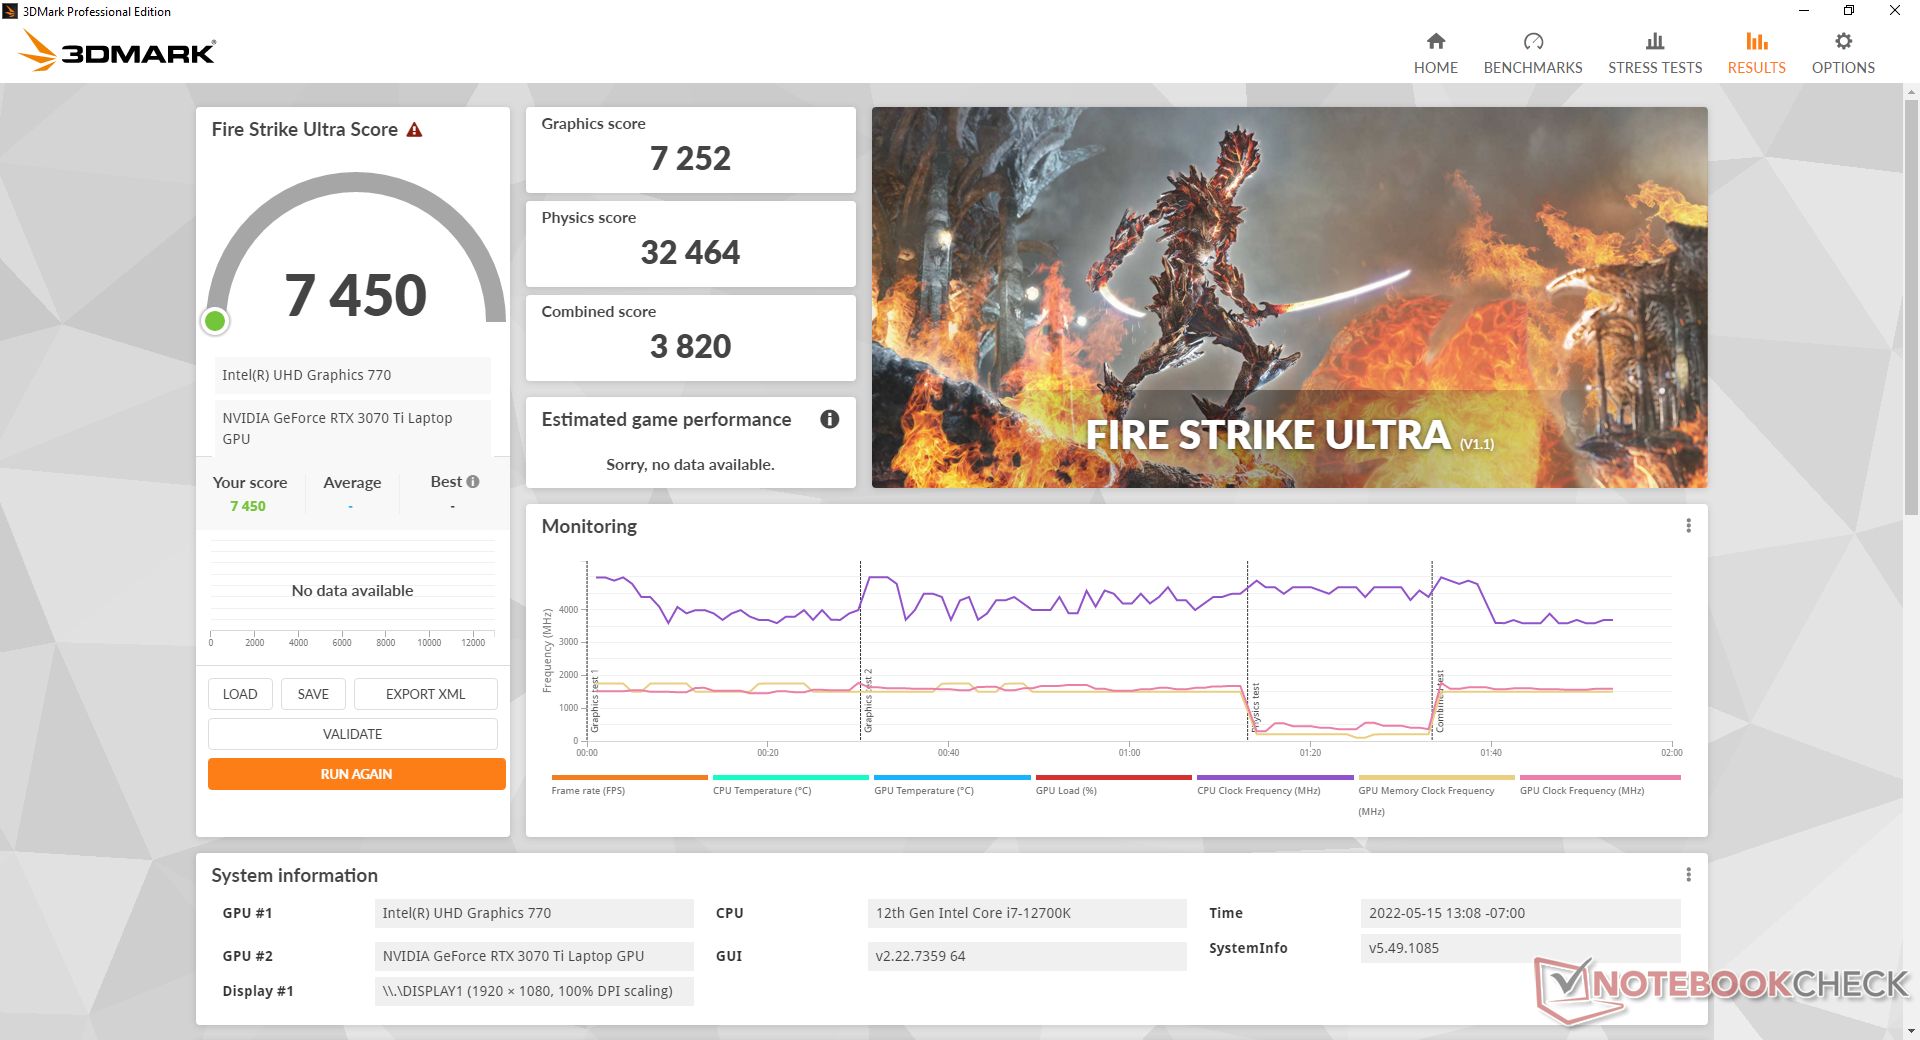
Les performances graphiques sont excellentes, jusqu'à 10 % plus rapides que celles de l'ordinateur portable moyen de notre base de données équipé de la même technologie GeForce RTX 3070 Ti GPU. Le châssis relativement épais a permis de viser un TGP plus élevé que la moyenne de 140 W, contre seulement 105 W ou moins comme sur le MSI GS66. Les performances sont tout juste inférieures à celles de la GeForce RTX 3070 pour les ordinateurs de bureau.
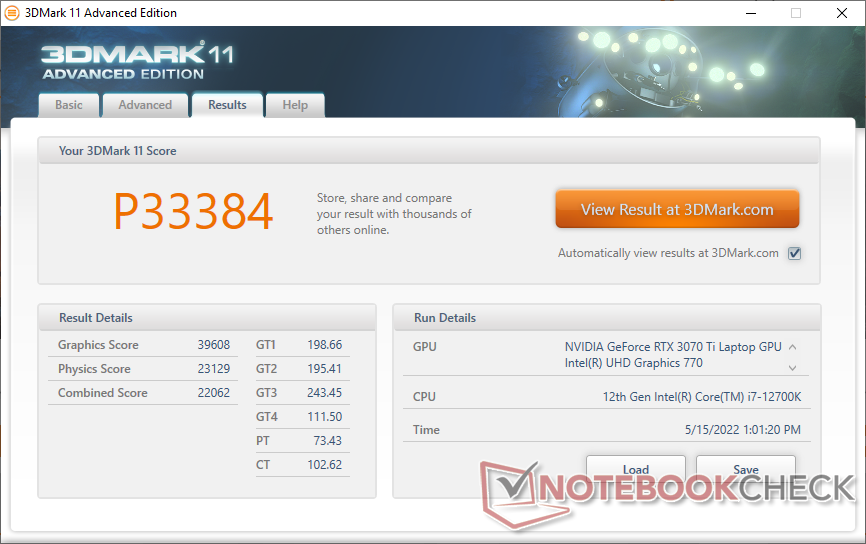
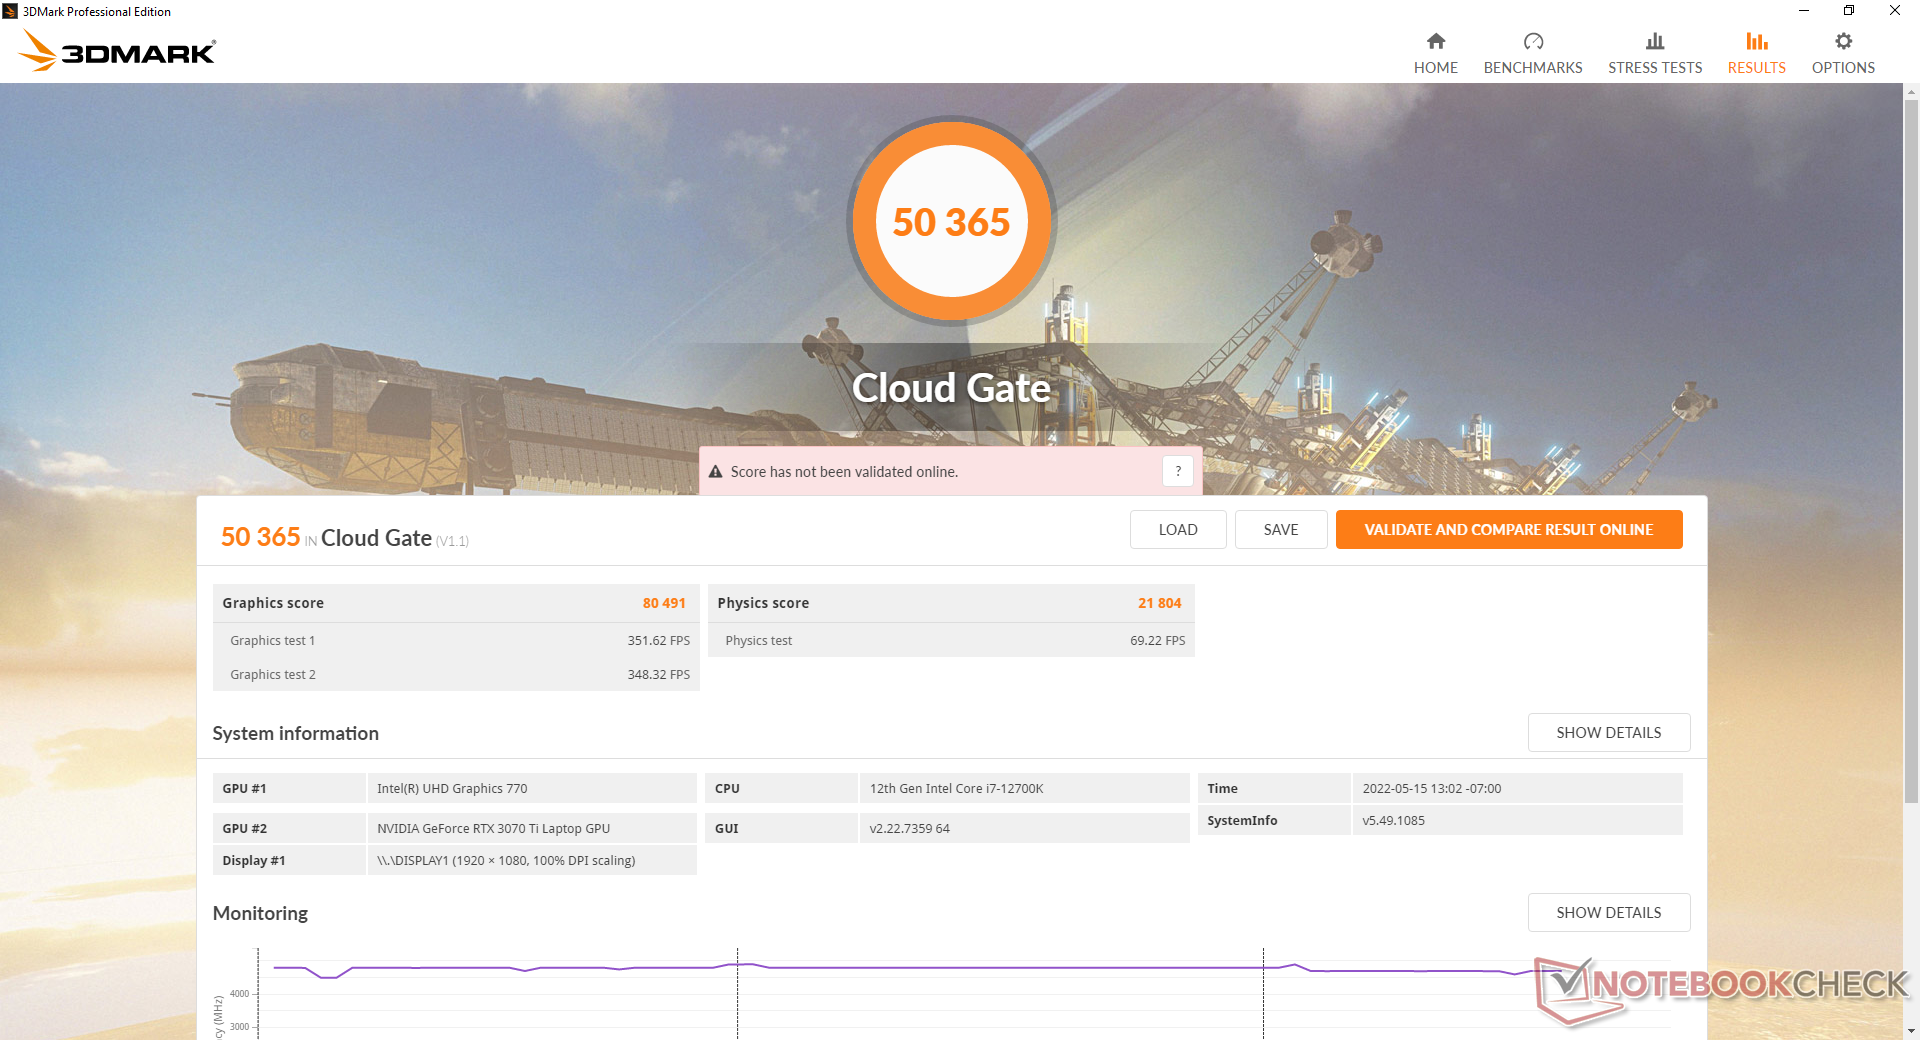
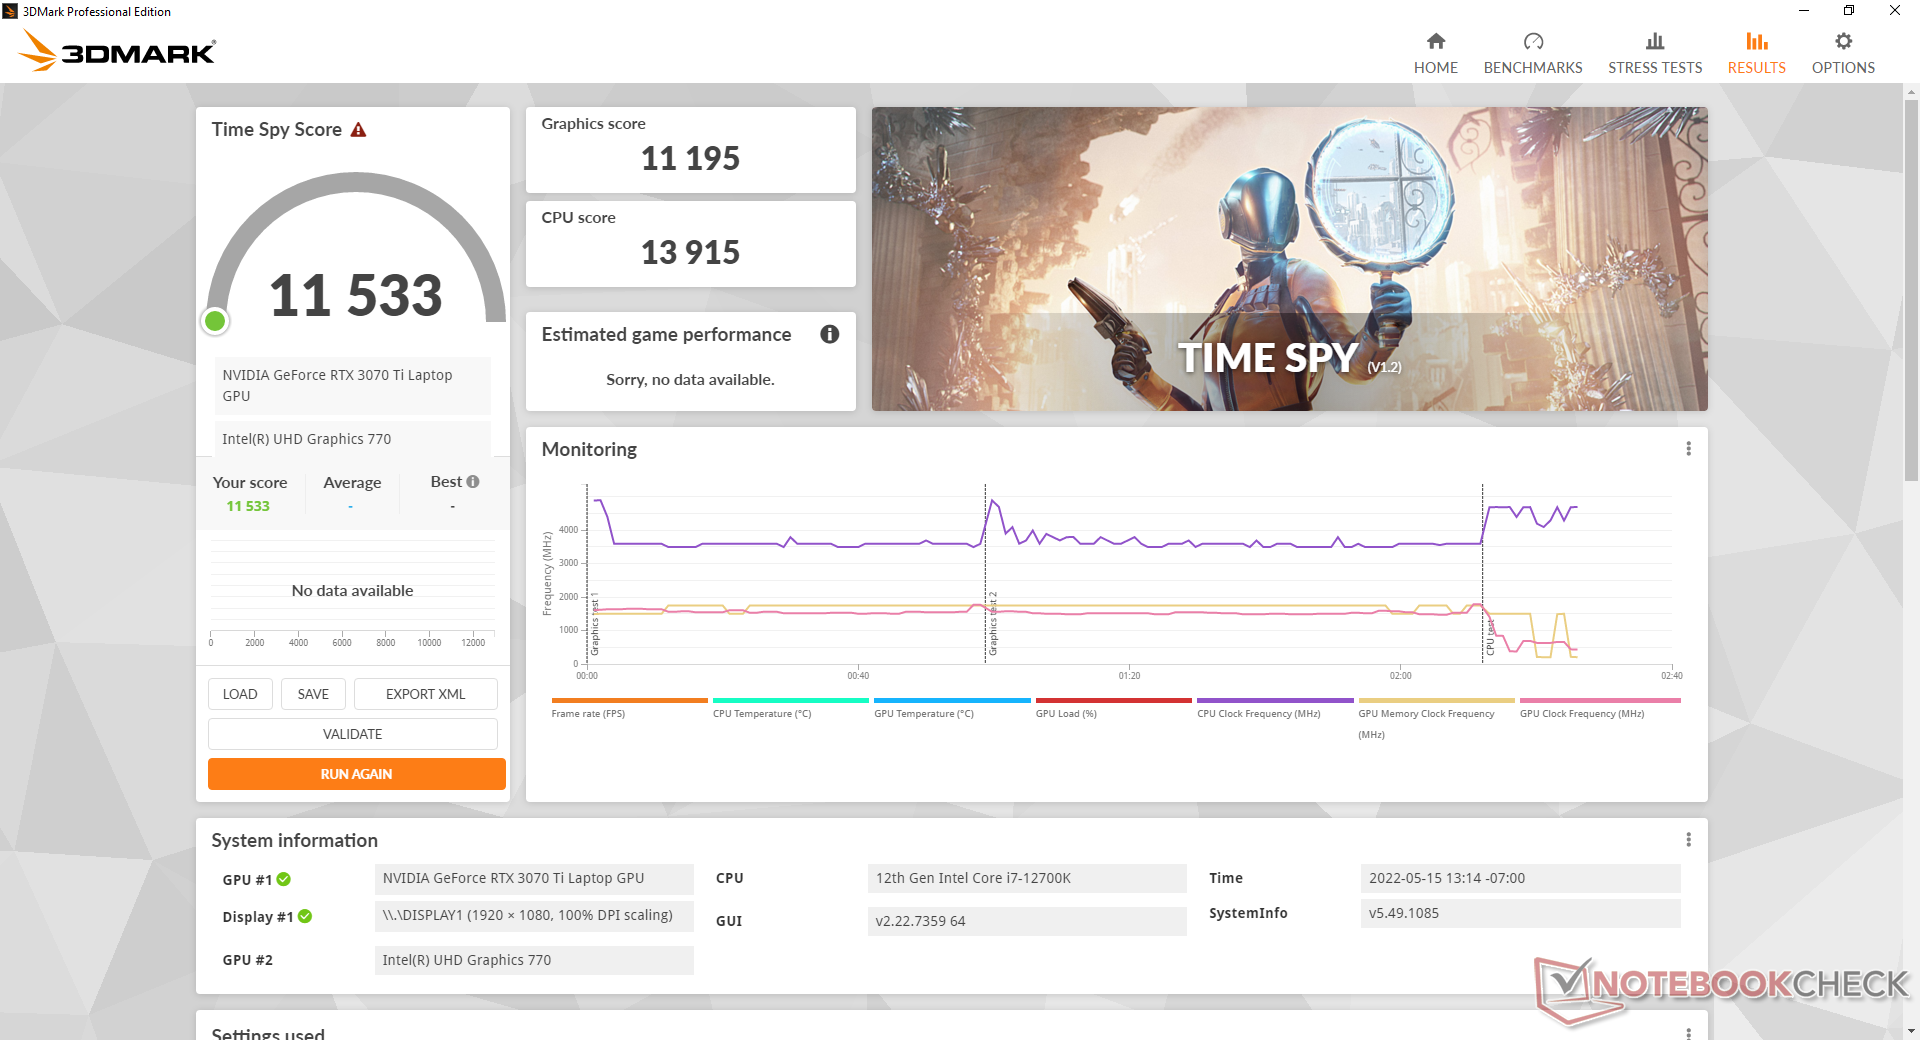
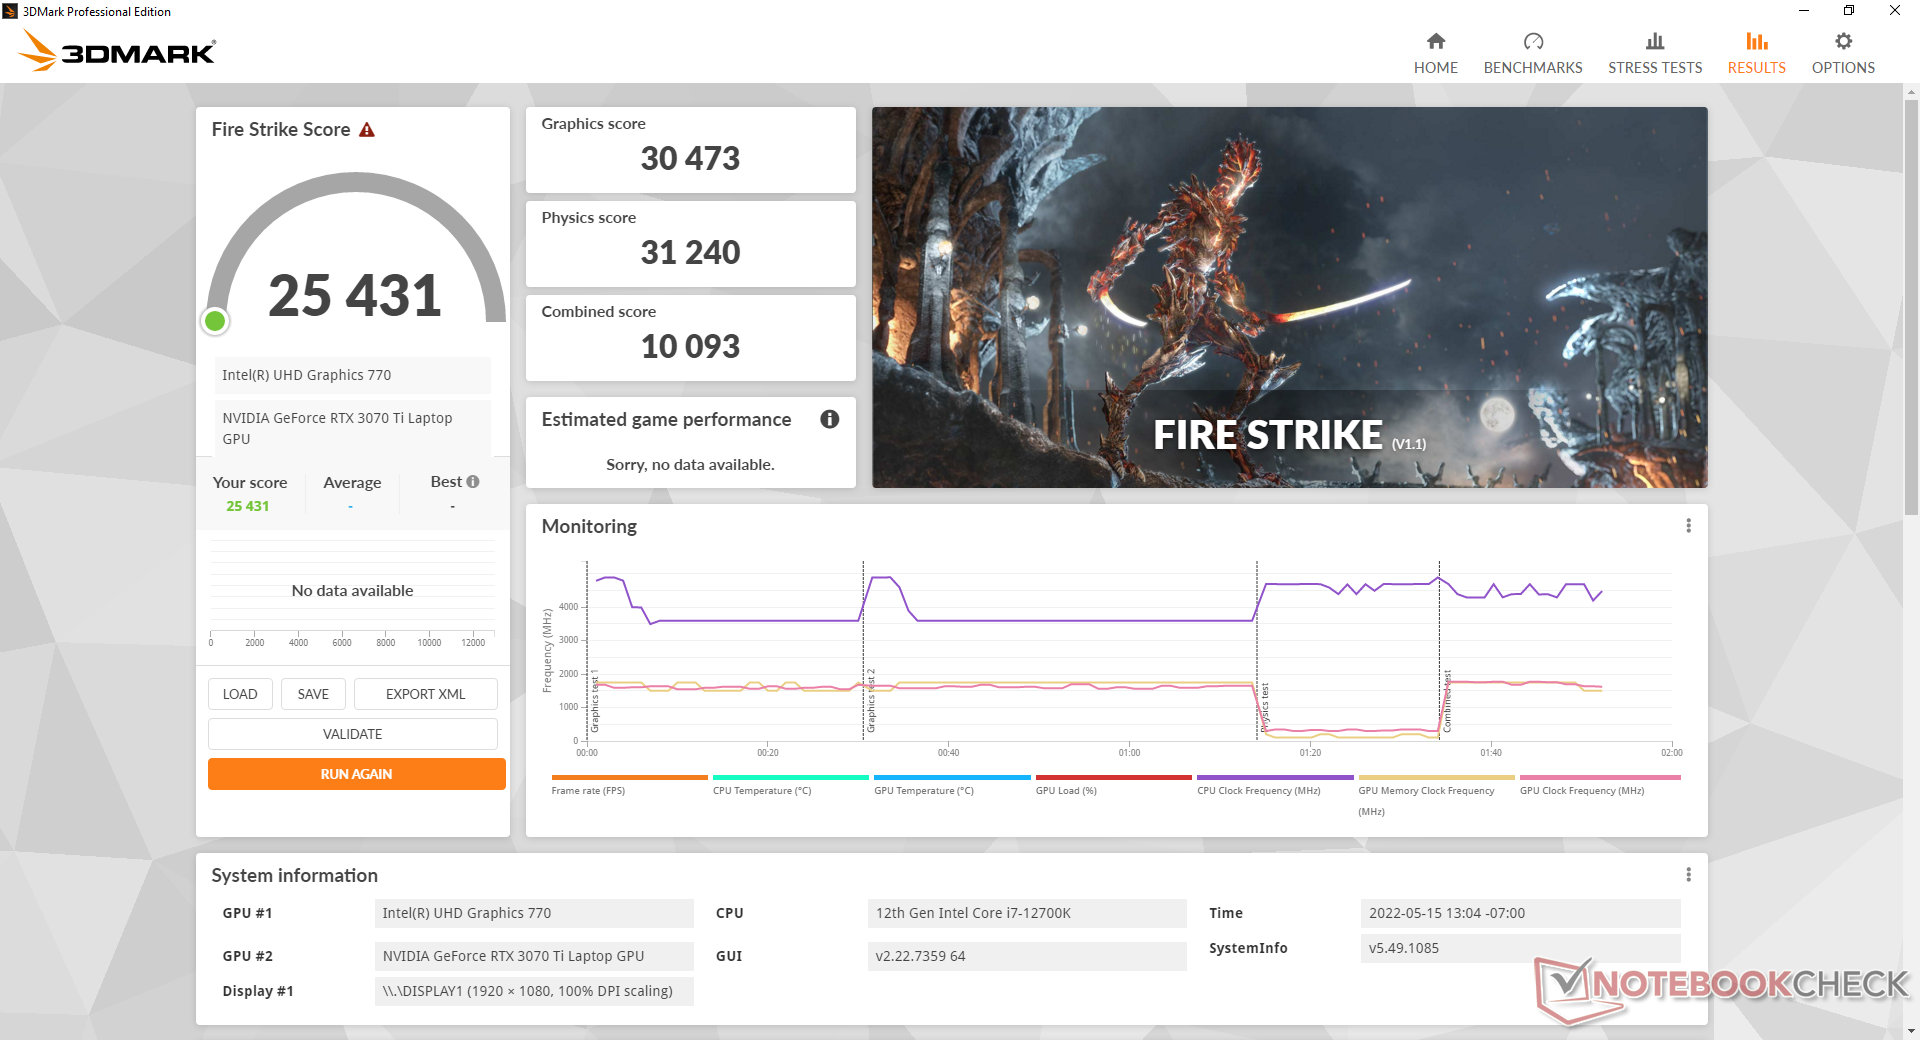
| 3DMark 11 Performance | 33384 points | |
| 3DMark Cloud Gate Standard Score | 50365 points | |
| 3DMark Fire Strike Score | 25431 points | |
| 3DMark Time Spy Score | 11533 points | |
Aide | ||
Witcher 3 FPS Chart
| Bas | Moyen | Élevé | Ultra | |
|---|---|---|---|---|
| GTA V (2015) | 186.6 | 182.8 | 174.6 | 116.5 |
| The Witcher 3 (2015) | 429 | 329.2 | 213.9 | 111.4 |
| Dota 2 Reborn (2015) | 199 | 178.4 | 166.3 | 155.6 |
| Final Fantasy XV Benchmark (2018) | 202 | 145.8 | 109.5 | |
| X-Plane 11.11 (2018) | 160.9 | 137.6 | 109.9 | |
| Strange Brigade (2018) | 490 | 271 | 223 | 194 |
| Cyberpunk 2077 1.6 (2022) | 140.4 | 124.6 | 132.3 | 81.8 |
Émissions
Bruit du système
Le bruit du ventilateur dépend des cinq réglages du mode d'alimentation du Control Center : Économie d'énergie, Silencieux, Divertissement, Performances et Ventilateur maximum. Les modes Silencieux ou Économie d'énergie sont recommandés pour la simple navigation ou le streaming vidéo afin de réduire au maximum le bruit du ventilateur. Dans le cas contraire, les ventilateurs émettront des impulsions plus fréquentes lors de l'exécution d'applications peu exigeantes en mode Divertissement ou Performances
Attendez-vous à ce que le bruit du ventilateur se situe dans la fourchette basse à moyenne de 50 dB(A) lorsque vous jouez, ce qui est plus fort que celui de nombreux autres ordinateurs portables de jeu dans des conditions similaires. Si le mode Performance et le mode Ventilateur maximum sont tous deux actifs, le bruit du ventilateur peut atteindre 55 dB(A).
Degré de la nuisance sonore
| Au repos |
| 23.8 / 23.8 / 30.1 dB(A) |
| Fortement sollicité |
| 31.1 / 55.1 dB(A) |
 | ||
30 dB silencieux 40 dB(A) audible 50 dB(A) bruyant |
||
min: | ||
| Eurocom Raptor X15 GeForce RTX 3070 Ti Laptop GPU, i7-12700K, Samsung SSD 980 Pro 1TB MZ-V8P1T0BW | MSI Raider GE66 12UHS GeForce RTX 3080 Ti Laptop GPU, i9-12900HK, Samsung PM9A1 MZVL22T0HBLB | Razer Blade 15 Advanced Model Early 2022 GeForce RTX 3080 Ti Laptop GPU, i7-12800H, Samsung PM9A1 MZVL21T0HCLR | Eurocom RX315 NH57AF1 GeForce RTX 3070 Laptop GPU, i7-11800H, Samsung SSD 980 Pro 1TB MZ-V8P1T0BW | Gigabyte A5 X1 GeForce RTX 3070 Laptop GPU, R9 5900HX, ADATA XPG SX8200 Pro (ASX8200PNP-512GT) | Asus TUF Gaming A15 FA506QR-AZ061T GeForce RTX 3070 Laptop GPU, R7 5800H, SK Hynix HFM001TD3JX013N | |
|---|---|---|---|---|---|---|
| Noise | -14% | -2% | -18% | -21% | -10% | |
| arrêt / environnement * (dB) | 23.3 | 26 -12% | 26 -12% | 26.3 -13% | 25 -7% | 26 -12% |
| Idle Minimum * (dB) | 23.8 | 27 -13% | 26 -9% | 26.4 -11% | 27 -13% | 26 -9% |
| Idle Average * (dB) | 23.8 | 30 -26% | 27 -13% | 31 -30% | 29 -22% | 26 -9% |
| Idle Maximum * (dB) | 30.1 | 39 -30% | 29 4% | 34 -13% | 32 -6% | 27.4 9% |
| Load Average * (dB) | 31.1 | 45 -45% | 37 -19% | 47.8 -54% | 57 -83% | 46.6 -50% |
| Witcher 3 ultra * (dB) | 51.3 | 45 12% | 44 14% | 51.7 -1% | 56 -9% | |
| Load Maximum * (dB) | 55.1 | 47 15% | 45 18% | 57.1 -4% | 58 -5% | 49.3 11% |
* ... Moindre est la valeur, meilleures sont les performances
Température
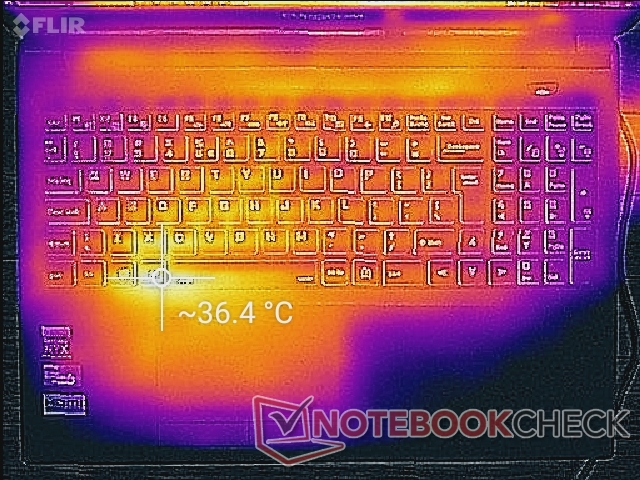
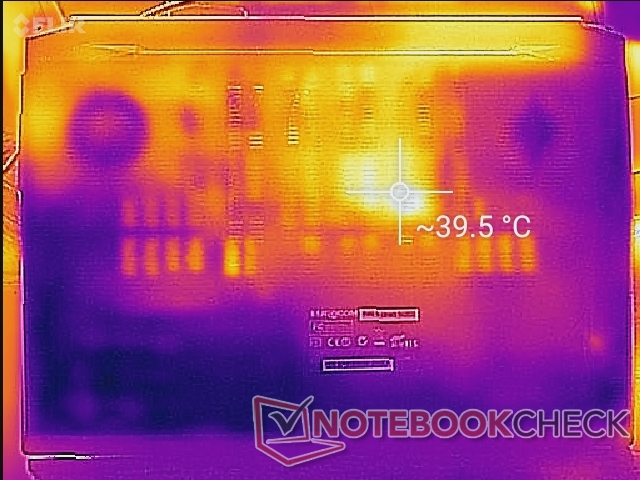
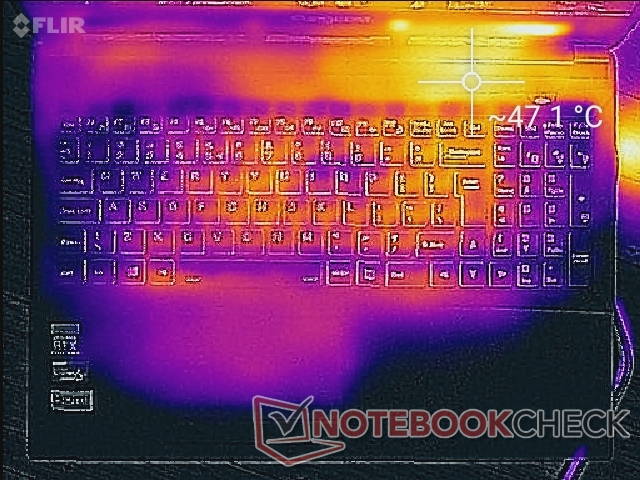
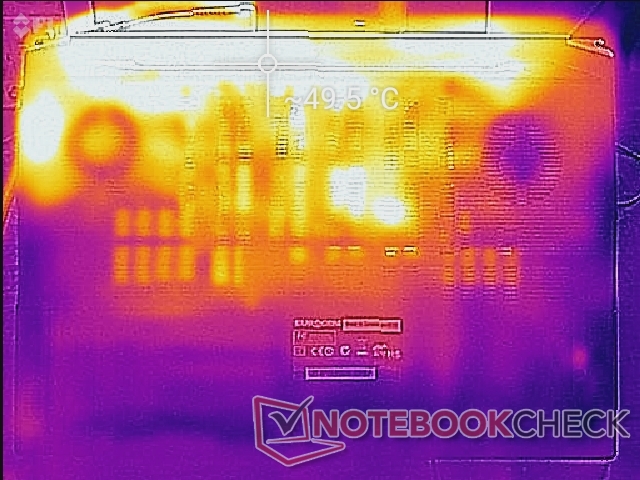
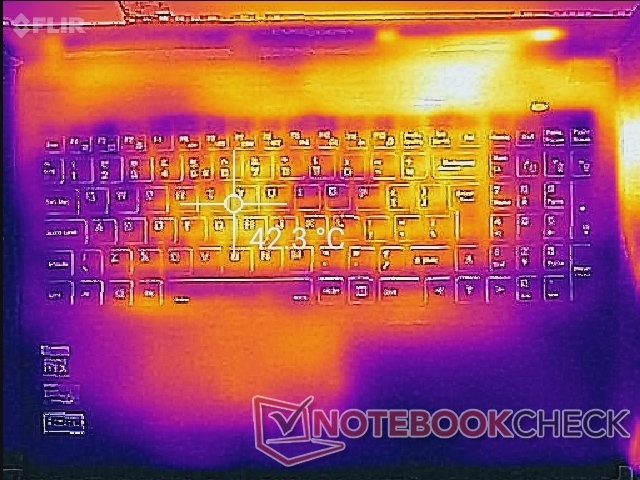
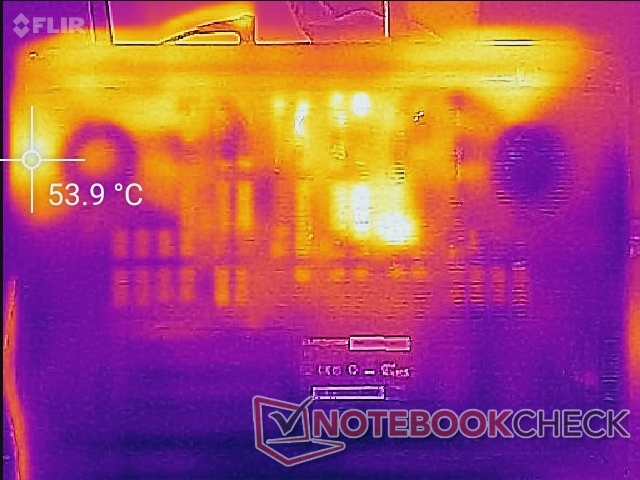
Les points chauds de la température de surface sont les plus proches du repose-paume gauche et du centre du clavier lors de l'exécution d'applications exigeantes. Le repose-poignet gauche est généralement plus chaud que le droit puisque le SSD NVMe PCIe4 est positionné en dessous. Les points chauds peuvent atteindre environ 50 C sur les zones supérieure et inférieure, comme le montrent les cartes de température ci-dessous.
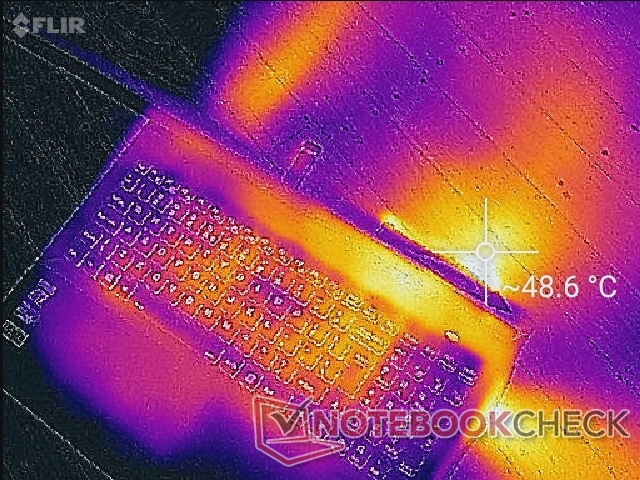
(-) La température maximale du côté supérieur est de 48.8 °C / 120 F, par rapport à la moyenne de 40.4 °C / 105 F, allant de 21.2 à 68.8 °C pour la classe Gaming.
(-) Le fond chauffe jusqu'à un maximum de 57.8 °C / 136 F, contre une moyenne de 43.2 °C / 110 F
(+) En utilisation inactive, la température moyenne du côté supérieur est de 30.2 °C / 86 F, par rapport à la moyenne du dispositif de 33.9 °C / 93 F.
(±) En jouant à The Witcher 3, la température moyenne du côté supérieur est de 34.3 °C / 94 F, alors que la moyenne de l'appareil est de 33.9 °C / 93 F.
(±) Les repose-poignets et le pavé tactile peuvent devenir très chauds au toucher, avec un maximum de 37.2 °C / 99# F.
(-) La température moyenne de la zone de l'appui-paume de dispositifs similaires était de 28.8 °C / 83.8 F (-8.4 °C / #-15.2 F).
| Eurocom Raptor X15 Intel Core i7-12700K, NVIDIA GeForce RTX 3070 Ti Laptop GPU | MSI Raider GE66 12UHS Intel Core i9-12900HK, NVIDIA GeForce RTX 3080 Ti Laptop GPU | Razer Blade 15 Advanced Model Early 2022 Intel Core i7-12800H, NVIDIA GeForce RTX 3080 Ti Laptop GPU | Eurocom RX315 NH57AF1 Intel Core i7-11800H, NVIDIA GeForce RTX 3070 Laptop GPU | Gigabyte A5 X1 AMD Ryzen 9 5900HX, NVIDIA GeForce RTX 3070 Laptop GPU | Asus TUF Gaming A15 FA506QR-AZ061T AMD Ryzen 7 5800H, NVIDIA GeForce RTX 3070 Laptop GPU | |
|---|---|---|---|---|---|---|
| Heat | 2% | 2% | 14% | 17% | 3% | |
| Maximum Upper Side * (°C) | 48.8 | 54 -11% | 53 -9% | 36 26% | 47 4% | 46.7 4% |
| Maximum Bottom * (°C) | 57.8 | 65 -12% | 53 8% | 46 20% | 51 12% | 55.9 3% |
| Idle Upper Side * (°C) | 36.6 | 30 18% | 36 2% | 35.6 3% | 27 26% | 37.1 -1% |
| Idle Bottom * (°C) | 40.2 | 35 13% | 38 5% | 36.8 8% | 30 25% | 38.1 5% |
* ... Moindre est la valeur, meilleures sont les performances
Test de stress
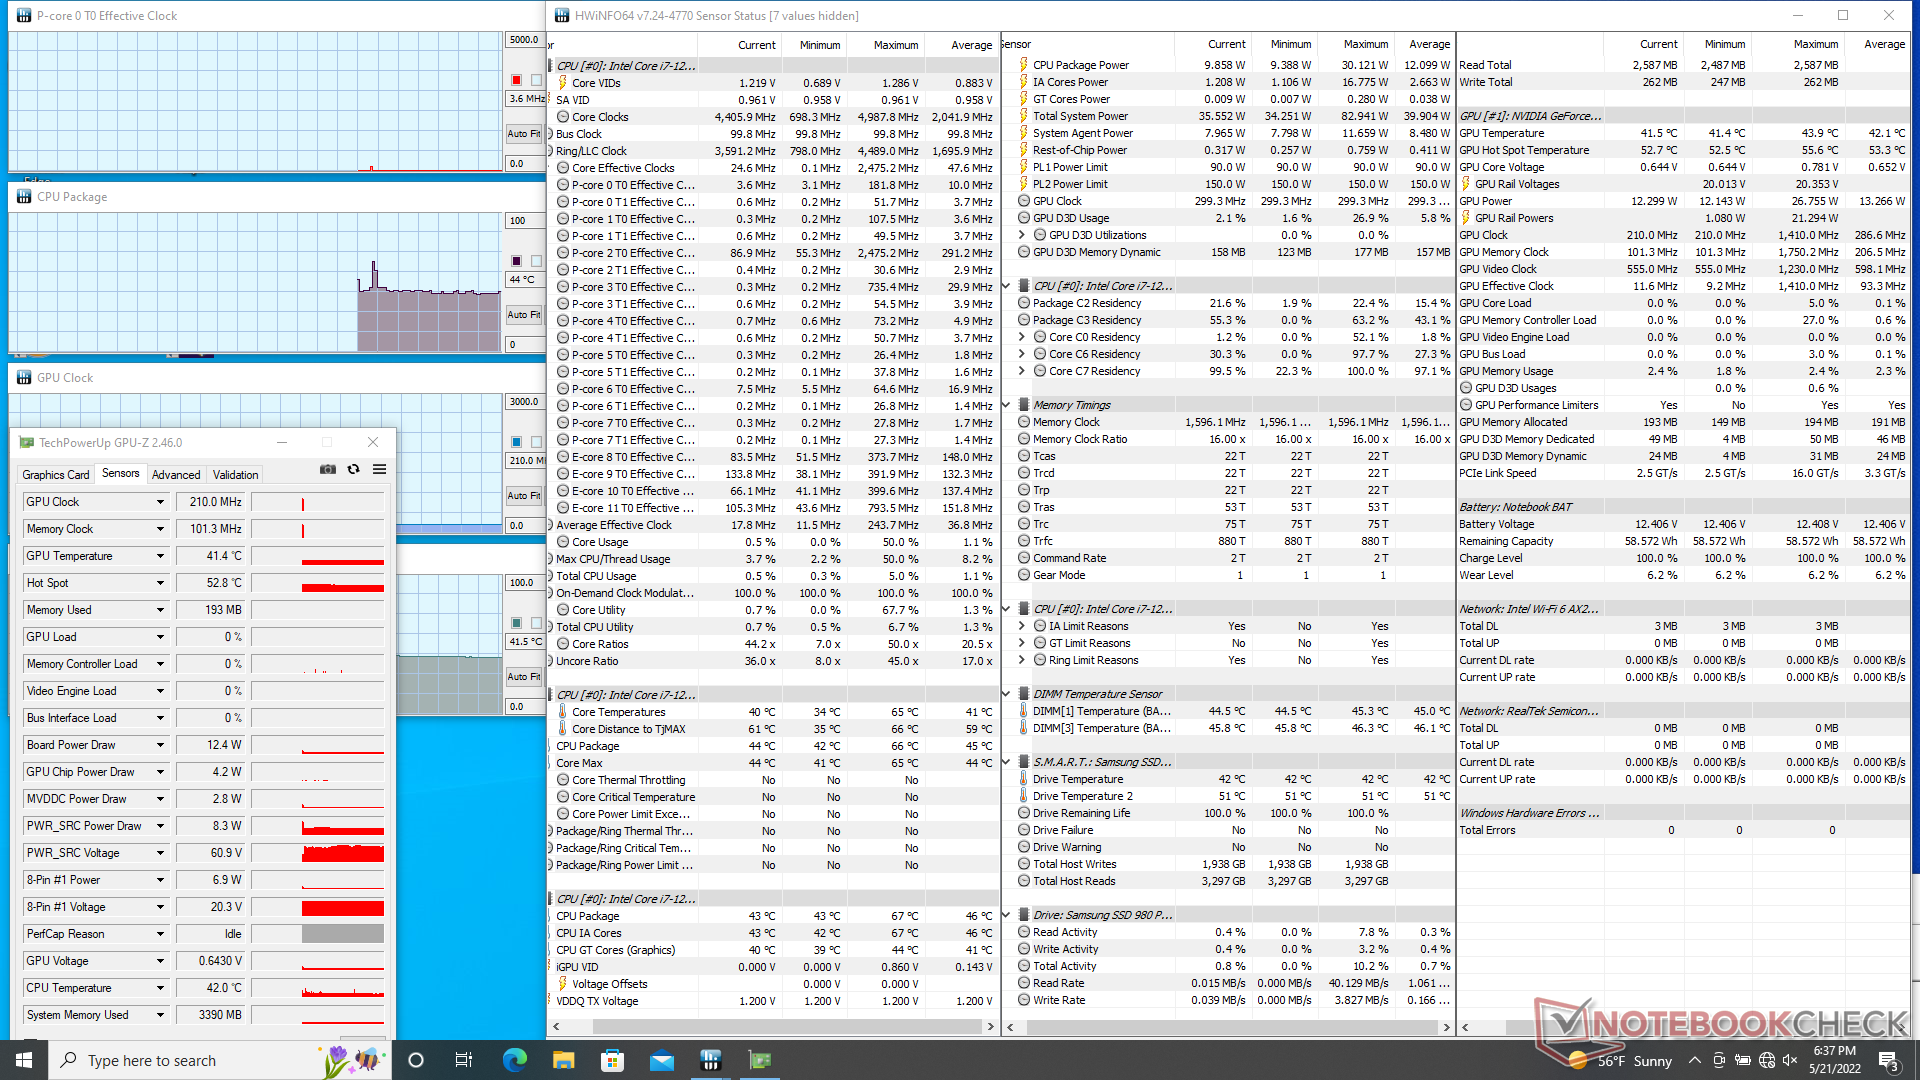
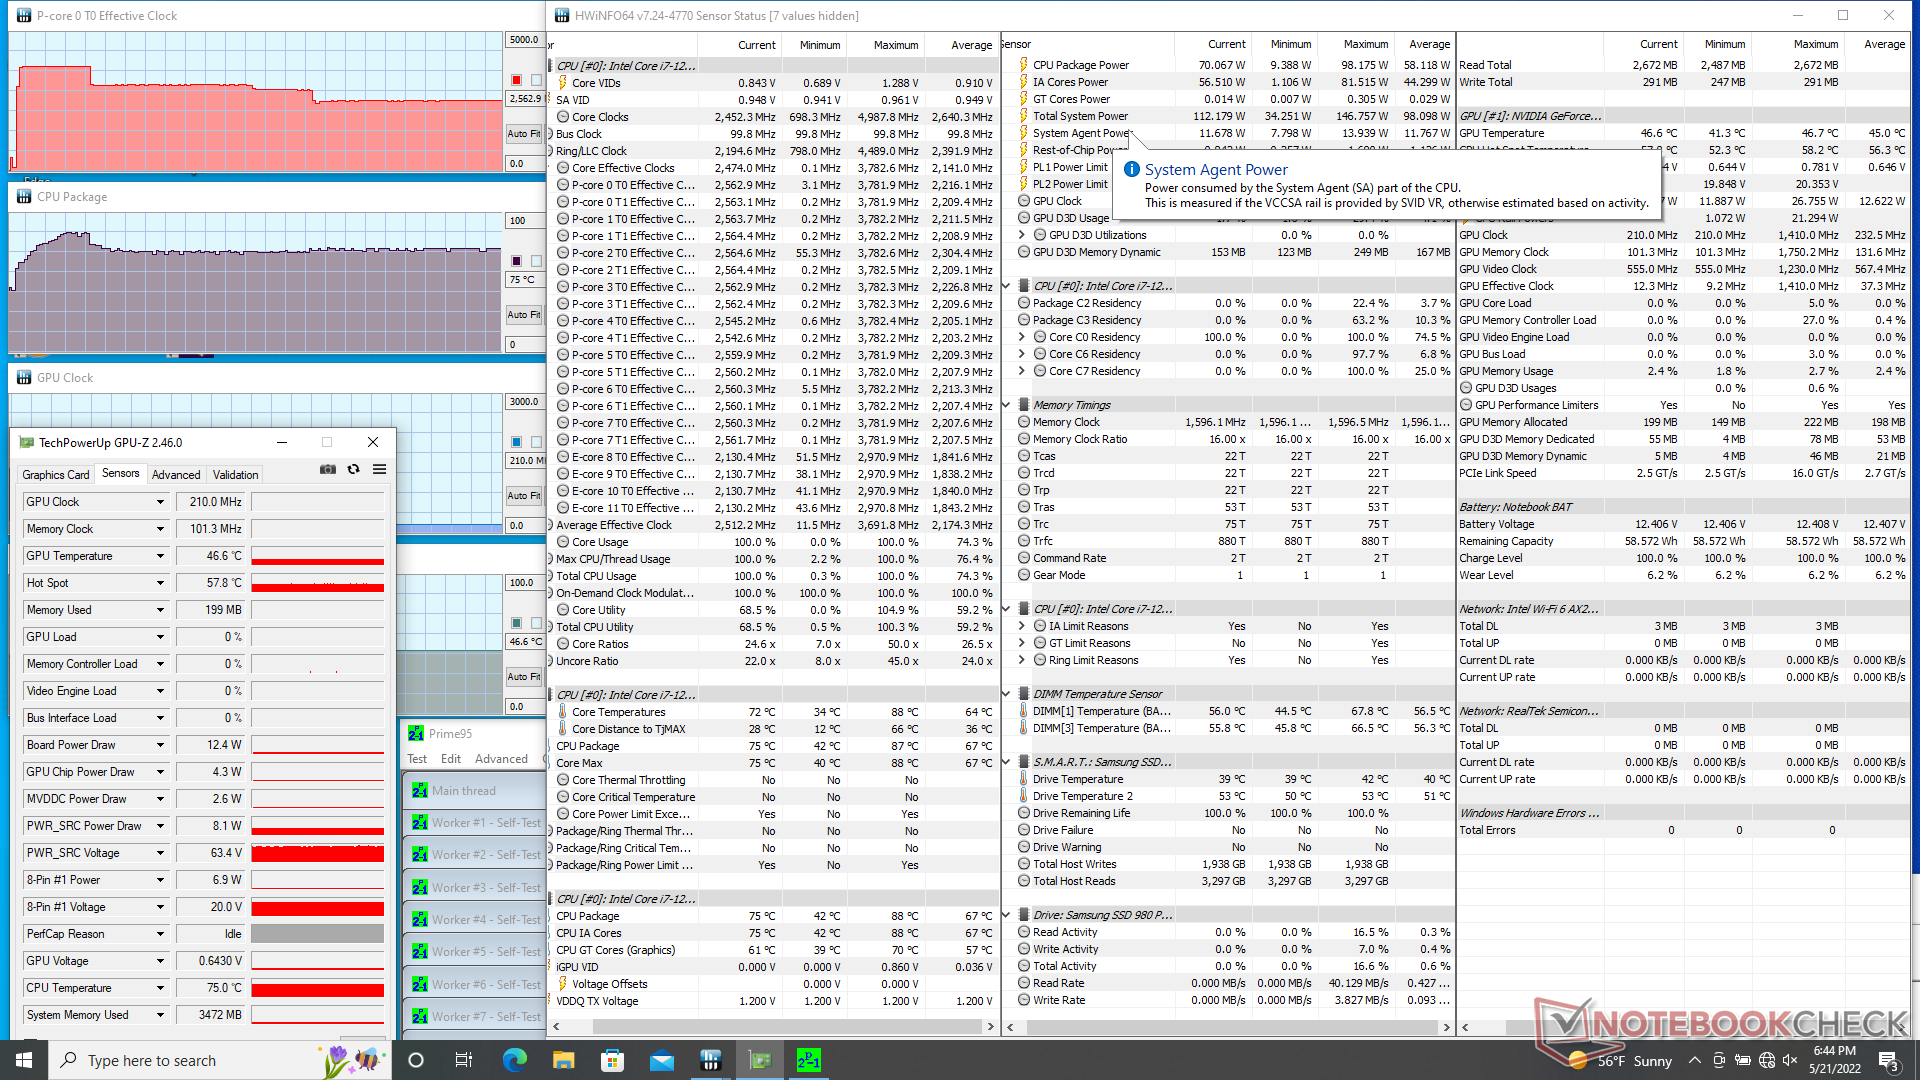
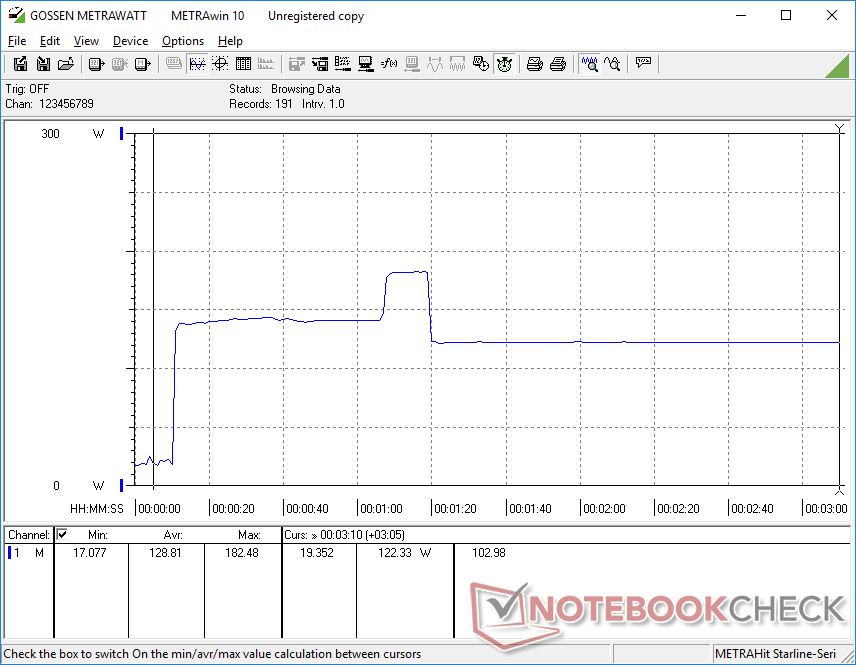
Lorsqu'il est sollicité sous Prime95, le CPU passe à 3,8 GHz et 100 W pendant près d'une minute complète avant d'atteindre une température centrale de 86 C. Ensuite, les fréquences d'horloge chutent régulièrement avant de se stabiliser à seulement 2,6 GHz et 70 W afin d'atteindre une température centrale plus stable de 75 C. En d'autres termes, le CPU est incapable de maintenir la puissance maximale de 100 W pendant de longues périodes en raison de limitations thermiques.
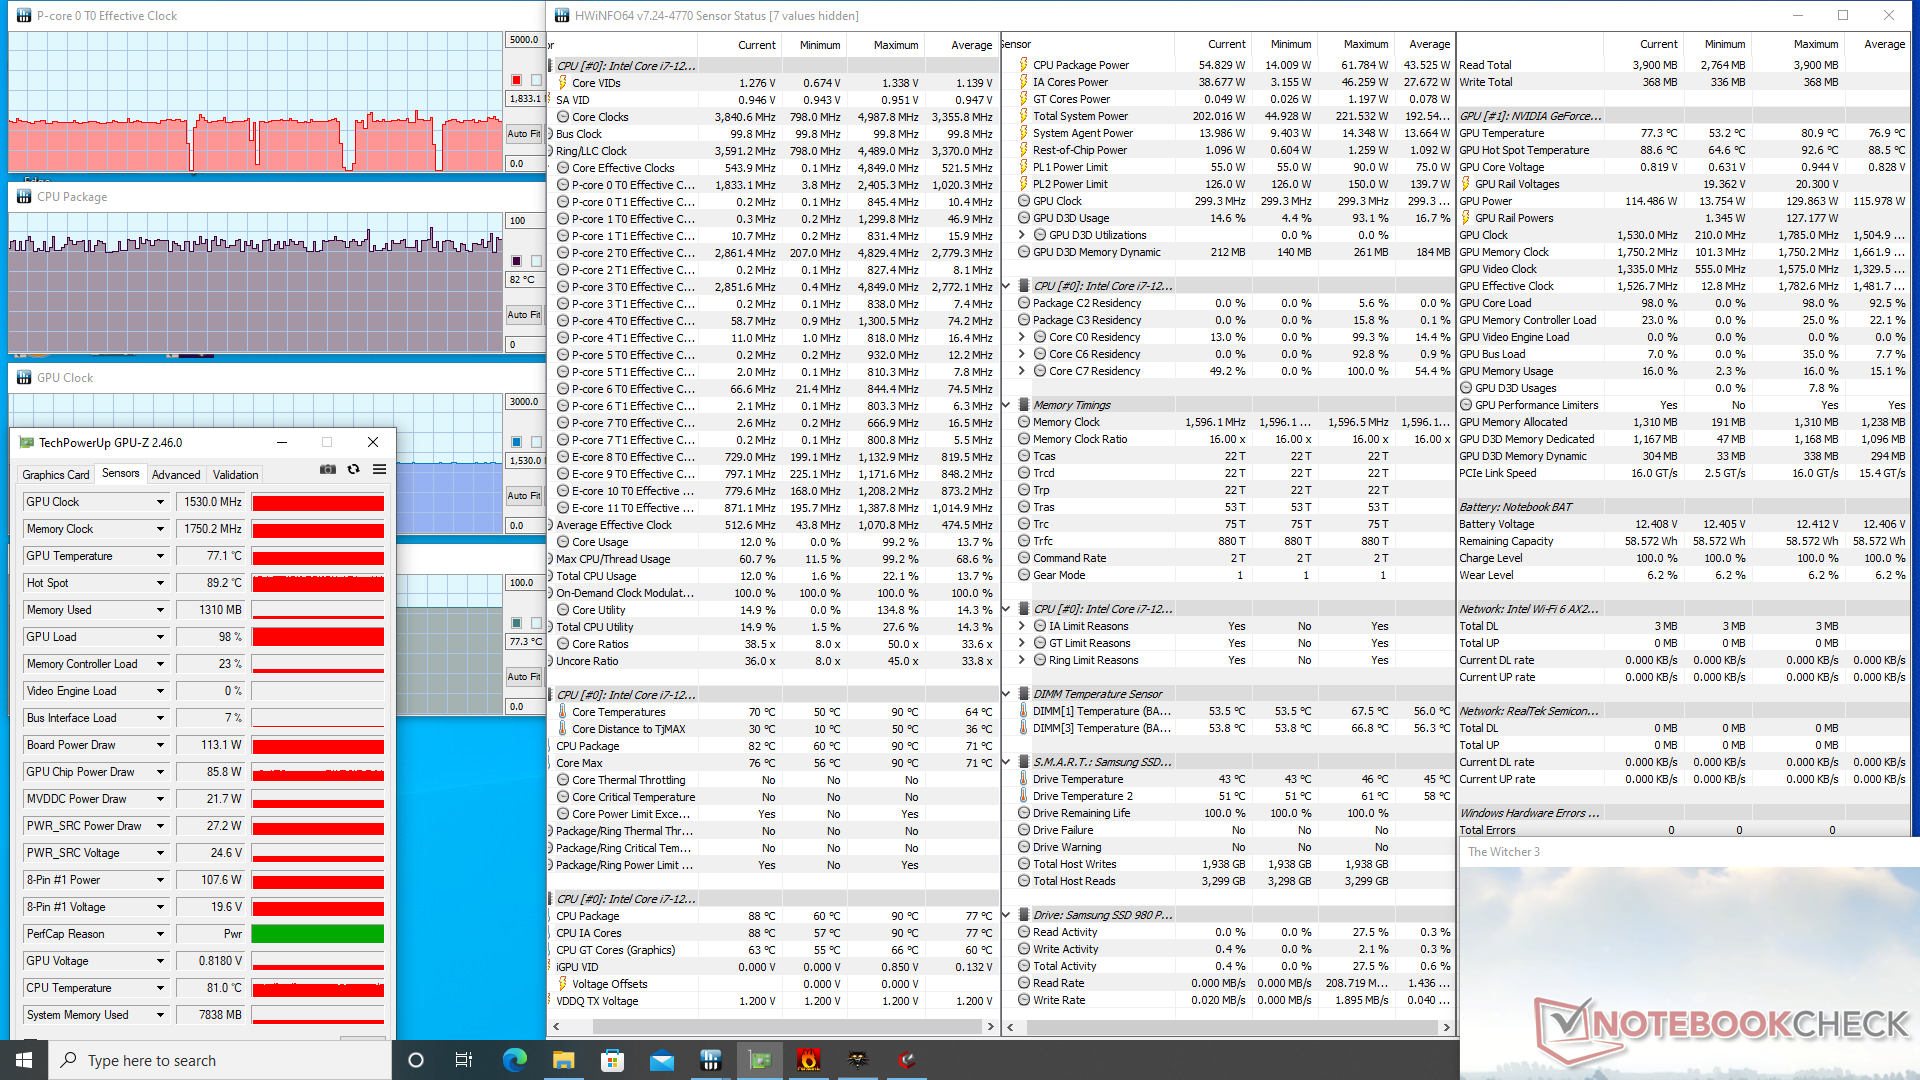
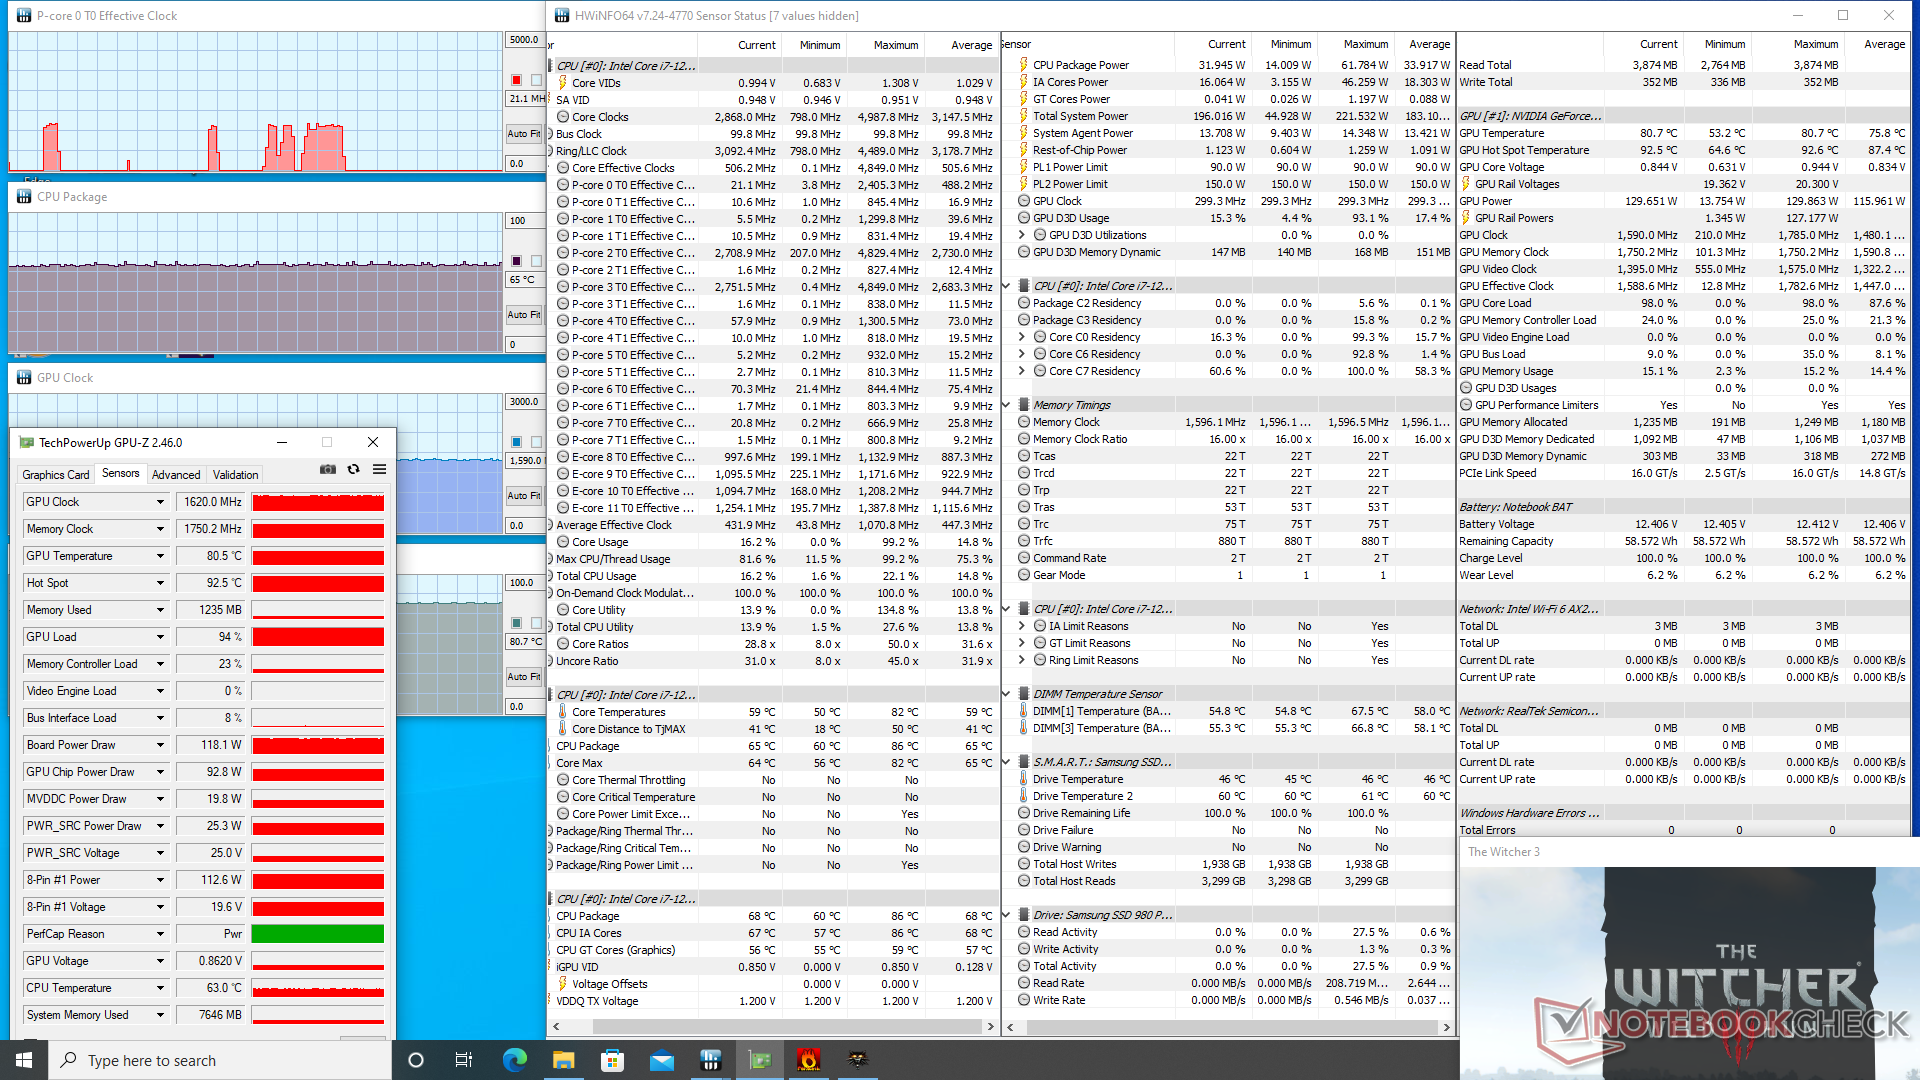
Les performances graphiques sont légèrement améliorées lorsque l'on passe du mode Divertissement au mode Performance. La consommation d'énergie et la fréquence d'horloge de la carte GPU se stabilisent à 118 W et 1620 MHz, respectivement, lorsque vous exécutez Witcher 3 en mode Performance, contre 113 W et 1530 MHz lorsque vous exécutez le même jeu en mode Divertissement. Si le mode Ventilateur maximum est activé, la fréquence d'horloge du GPU et la consommation électrique de la carte se stabilisent à des valeurs encore plus élevées de 1725 MHz et 130 W, respectivement. Il est décevant que le GPU ne puisse pas se rapprocher de l'objectif de 140 W comme indiqué sur le panneau de configuration de Nvidia et que les utilisateurs doivent activer le mode Ventilateur maximum pour tirer le niveau de performance attendu du GPU.
Le fonctionnement sur batterie limite les performances. Un test de Fire Strike sur batteries donnerait des scores de physique et de graphisme de 12708 et 3419 points, respectivement, contre 31240 et 30473 points sur secteur.
| Fréquence du CPU (GHz) | Fréquence du GPU (MHz) | Température moyenne du CPU (°C) | Température moyenne du GPU (°C) | |
| Système au repos | -- | -- | 44 | 41 |
| Prime95 Stress | 2.6 | -- | 75 | 47 |
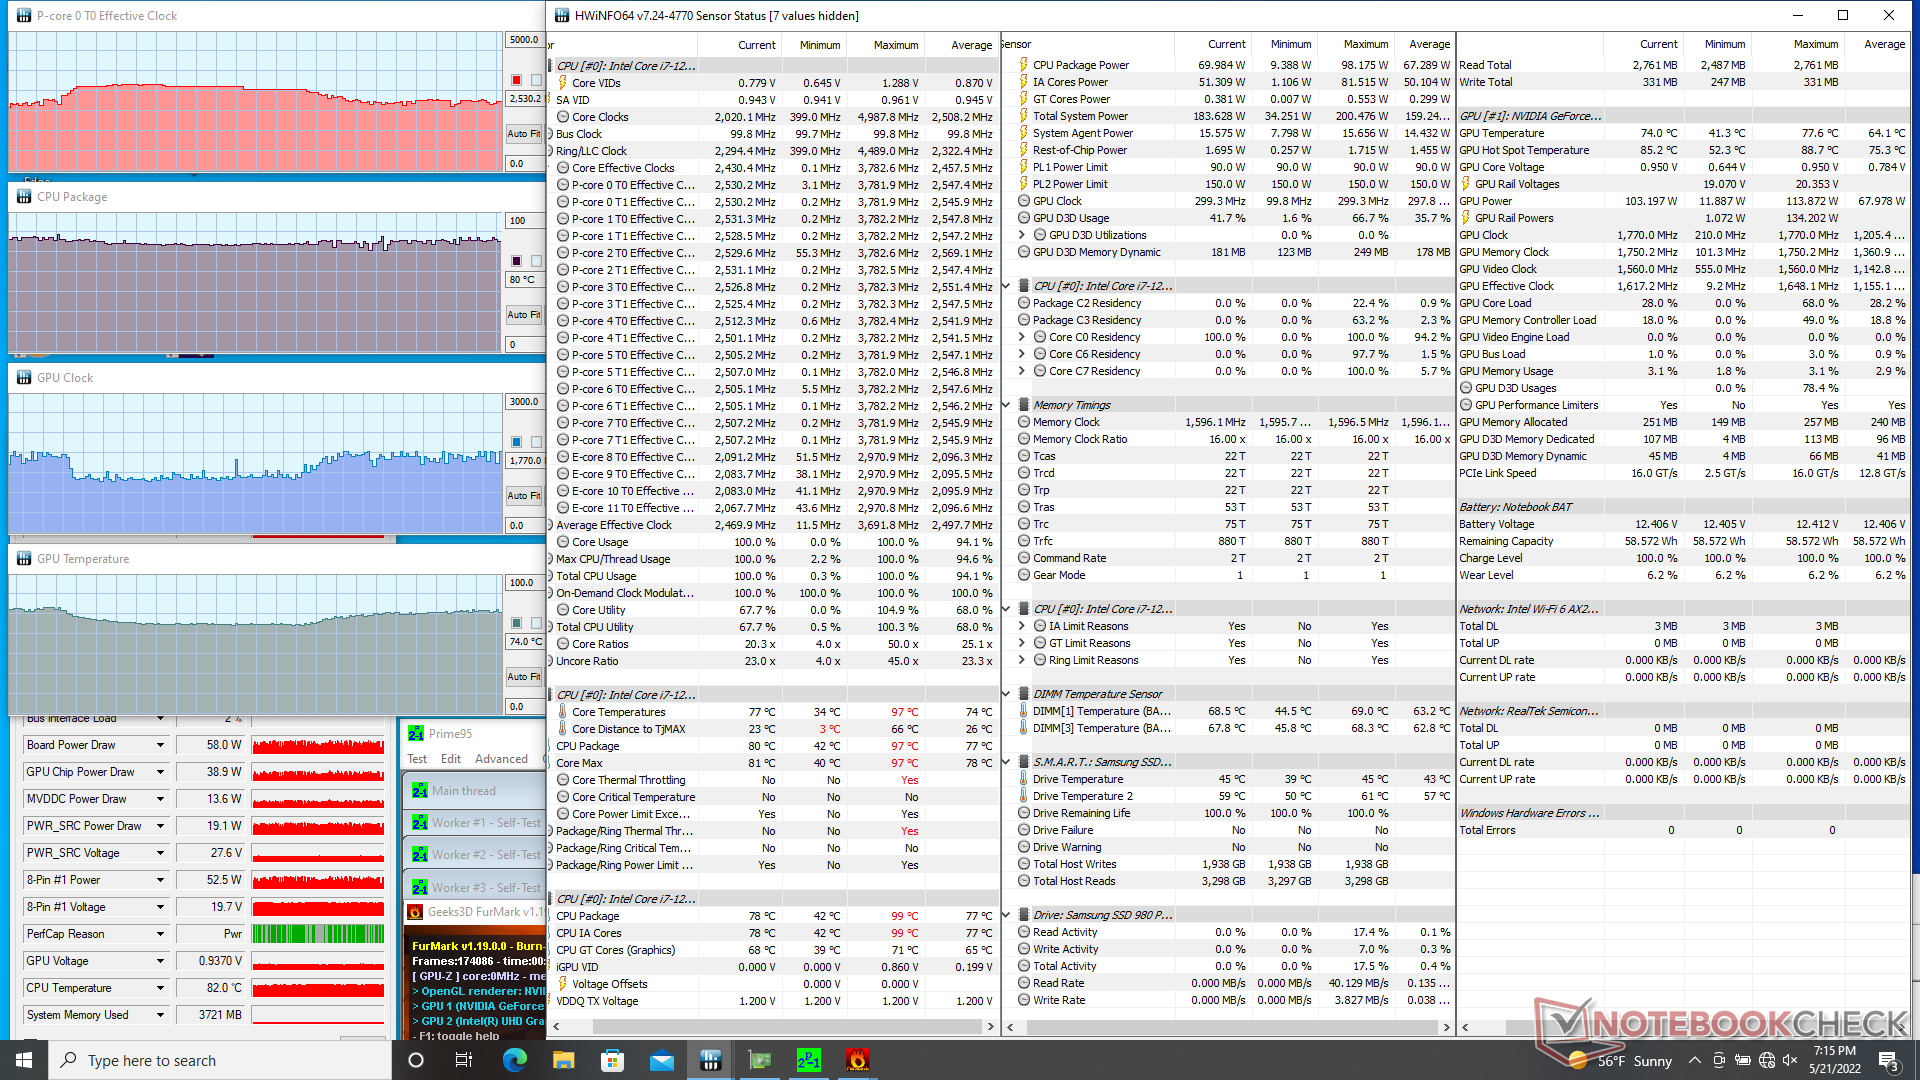
| Prime95 + FurMark Stress | ~2.5 | ~1770 | 80 | 74 |
| Witcher 3 Stress (mode divertissement) | -- | 1530 | ~82 | 77 |
| Witcher 3 Stress (mode Performance) | -- | 1620 | 65 | 81 |
Haut-parleurs
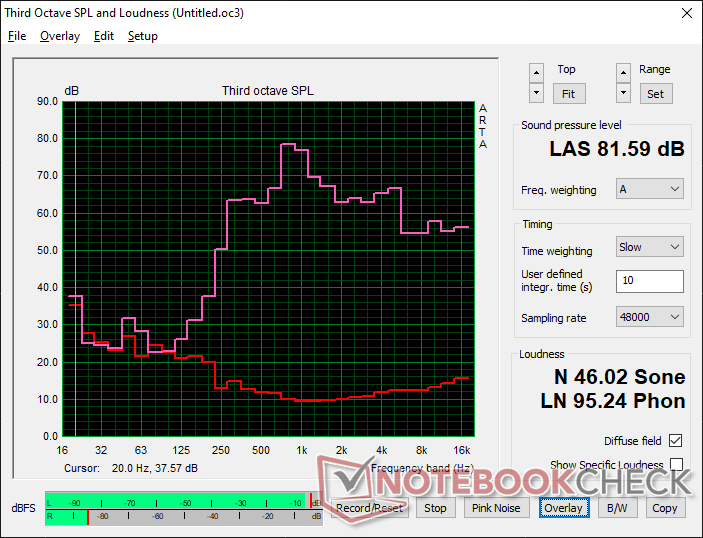
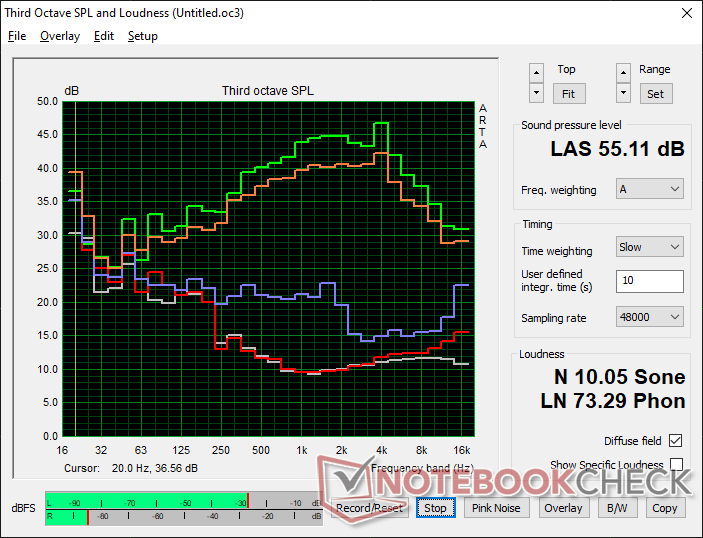
Eurocom Raptor X15 analyse audio
(±) | le niveau sonore du haut-parleur est moyen mais bon (81.6# dB)
Basses 100 - 315 Hz
(-) | presque aucune basse - en moyenne 24.6% plus bas que la médiane
(±) | la linéarité des basses est moyenne (13.4% delta à la fréquence précédente)
Médiums 400 - 2000 Hz
(±) | médiane supérieure - en moyenne 5.6% supérieure à la médiane
(±) | la linéarité des médiums est moyenne (8.1% delta à la fréquence précédente)
Aiguës 2 - 16 kHz
(+) | des sommets équilibrés - à seulement 4.2% de la médiane
(+) | les aigus sont linéaires (6% delta à la fréquence précédente)
Globalement 100 - 16 000 Hz
(±) | la linéarité du son global est moyenne (21.5% de différence avec la médiane)
Par rapport à la même classe
» 77% de tous les appareils testés de cette catégorie étaient meilleurs, 5% similaires, 18% pires
» Le meilleur avait un delta de 6%, la moyenne était de 18%, le pire était de 132%.
Par rapport à tous les appareils testés
» 61% de tous les appareils testés étaient meilleurs, 7% similaires, 32% pires
» Le meilleur avait un delta de 4%, la moyenne était de 23%, le pire était de 134%.
Apple MacBook Pro 16 2021 M1 Pro analyse audio
(+) | les haut-parleurs peuvent jouer relativement fort (84.7# dB)
Basses 100 - 315 Hz
(+) | bonne basse - seulement 3.8% loin de la médiane
(+) | les basses sont linéaires (5.2% delta à la fréquence précédente)
Médiums 400 - 2000 Hz
(+) | médiane équilibrée - seulement 1.3% de la médiane
(+) | les médiums sont linéaires (2.1% delta à la fréquence précédente)
Aiguës 2 - 16 kHz
(+) | des sommets équilibrés - à seulement 1.9% de la médiane
(+) | les aigus sont linéaires (2.7% delta à la fréquence précédente)
Globalement 100 - 16 000 Hz
(+) | le son global est linéaire (4.6% différence à la médiane)
Par rapport à la même classe
» 0% de tous les appareils testés de cette catégorie étaient meilleurs, 0% similaires, 100% pires
» Le meilleur avait un delta de 5%, la moyenne était de 17%, le pire était de 45%.
Par rapport à tous les appareils testés
» 0% de tous les appareils testés étaient meilleurs, 0% similaires, 100% pires
» Le meilleur avait un delta de 4%, la moyenne était de 23%, le pire était de 134%.
Gestion de l'énergie
Consommation d'énergie
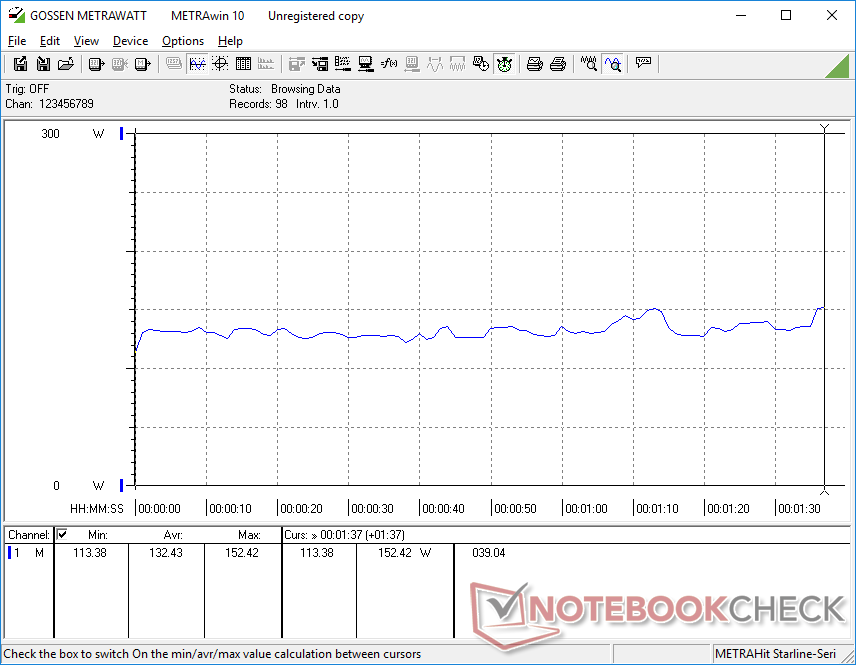
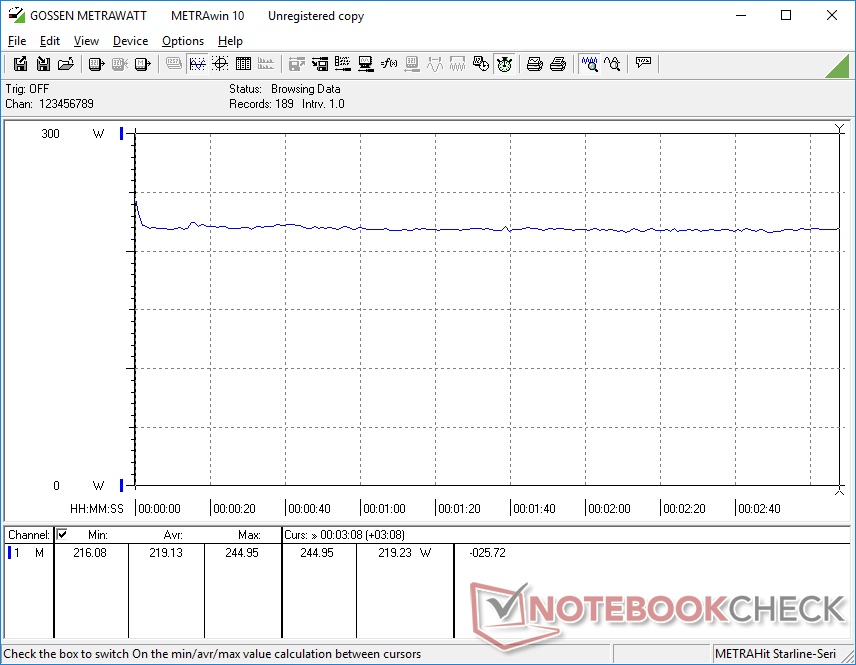
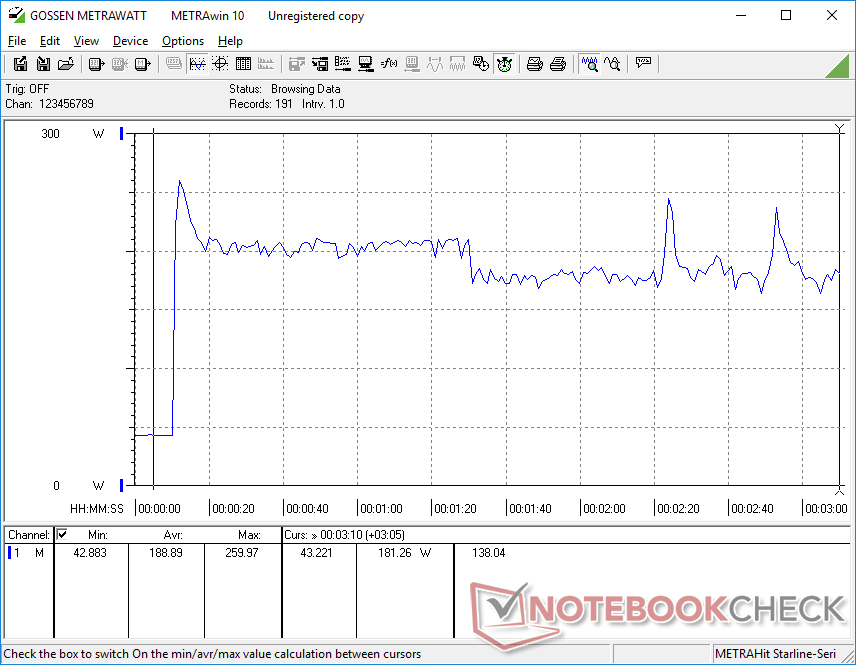
La consommation d'énergie est raisonnablement faible lorsqu'elle tourne au ralenti sur le bureau. Notre appareil consomme entre 12 W et 22 W lorsqu'il tourne au ralenti sur le bureau, contre 33 W à 44 W pour l'Eurocom Sky X4C, beaucoup plus ancien, équipé d'un processeur de bureau Intel de 9e génération. Néanmoins, la consommation reste très élevée lors de l'exécution d'applications plus exigeantes. L'exécution de Witcher 3par exemple, demande plus d'énergie que la plupart des ordinateurs portables équipés d'un processeur Intel ou AMD de série H et d'un GPU de classe RTX 3070 similaire à GeForce.
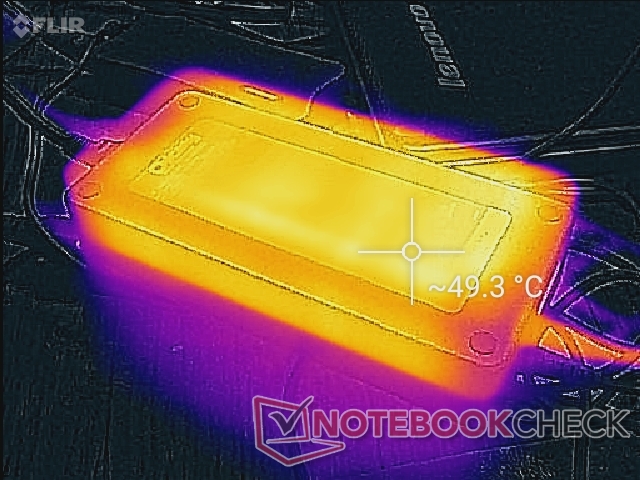
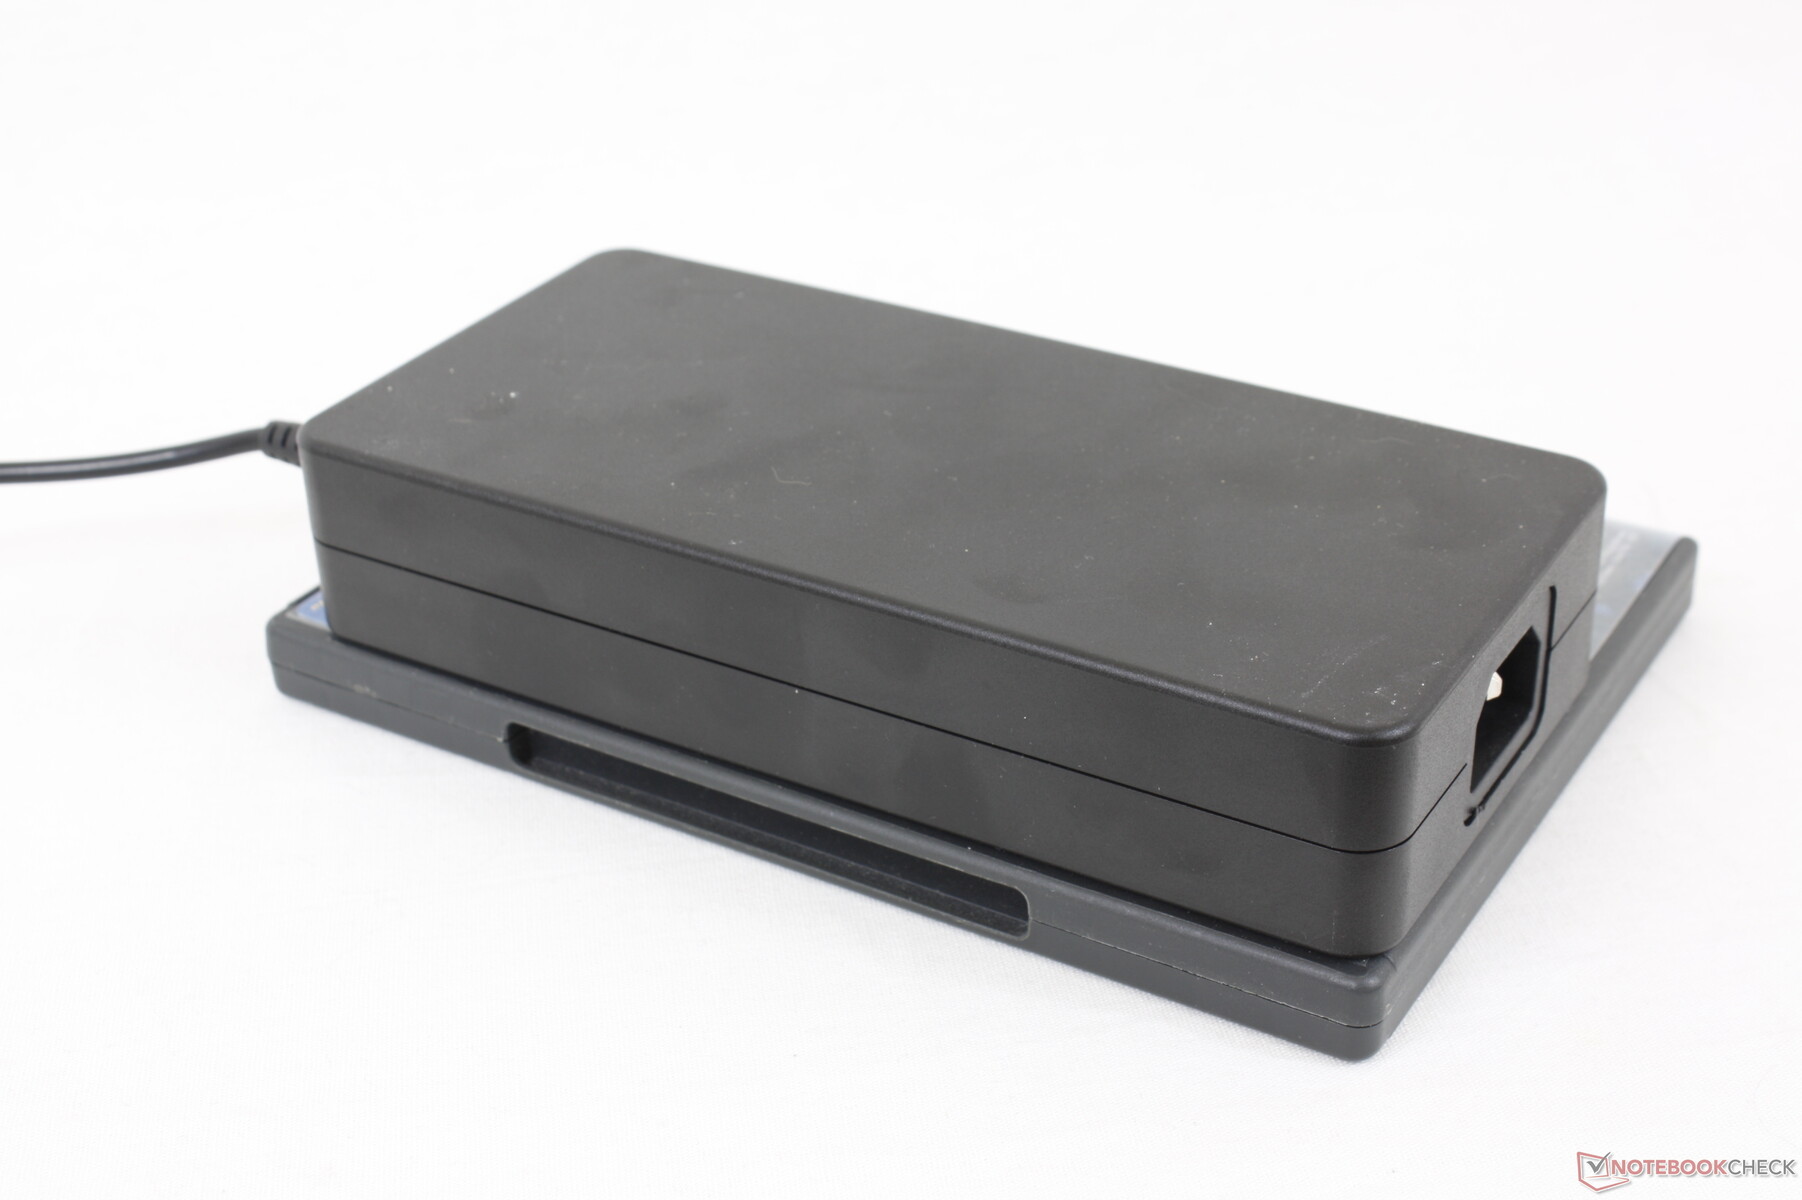
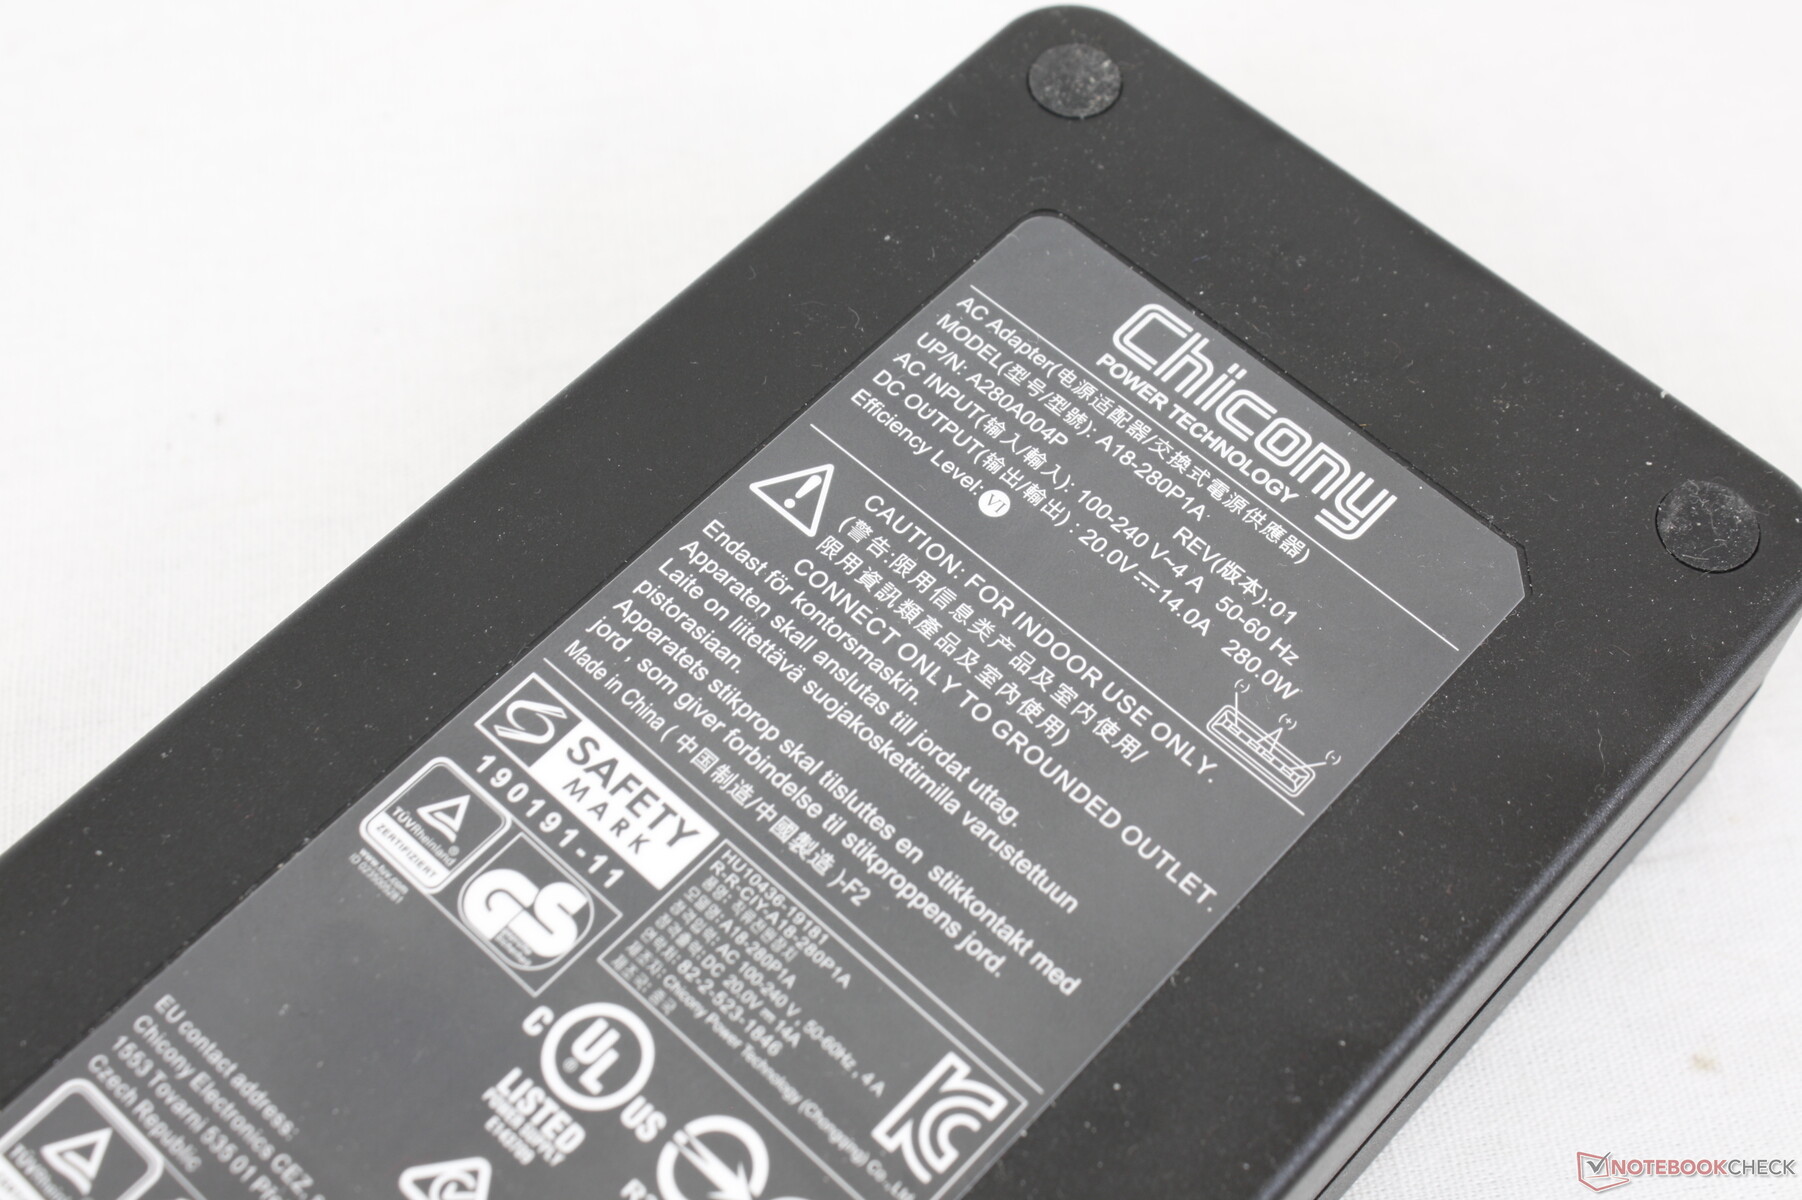
L'adaptateur secteur de 280 W est peut-être volumineux, mais il est nécessaire pour faire fonctionner le système à pleine puissance. Nous sommes capables d'atteindre une consommation de 260 W lorsque le CPU et le GPU sont utilisés au maximum.
| Éteint/en veille | |
| Au repos | |
| Fortement sollicité |
|
Légende:
min: | |
| Eurocom Raptor X15 i7-12700K, GeForce RTX 3070 Ti Laptop GPU, Samsung SSD 980 Pro 1TB MZ-V8P1T0BW, IPS, 1920x1080, 15.6" | MSI Raider GE66 12UHS i9-12900HK, GeForce RTX 3080 Ti Laptop GPU, Samsung PM9A1 MZVL22T0HBLB, IPS, 3840x2160, 15.6" | Razer Blade 15 Advanced Model Early 2022 i7-12800H, GeForce RTX 3080 Ti Laptop GPU, Samsung PM9A1 MZVL21T0HCLR, IPS, 1920x1080, 15.6" | Eurocom RX315 NH57AF1 i7-11800H, GeForce RTX 3070 Laptop GPU, Samsung SSD 980 Pro 1TB MZ-V8P1T0BW, IPS, 1920x1080, 15.6" | Gigabyte A5 X1 R9 5900HX, GeForce RTX 3070 Laptop GPU, ADATA XPG SX8200 Pro (ASX8200PNP-512GT), IPS, 1920x1080, 15.6" | Asus TUF Gaming A15 FA506QR-AZ061T R7 5800H, GeForce RTX 3070 Laptop GPU, SK Hynix HFM001TD3JX013N, IPS, 1920x1080, 15.6" | |
|---|---|---|---|---|---|---|
| Power Consumption | 0% | 8% | 3% | 17% | 27% | |
| Idle Minimum * (Watt) | 12.8 | 16 -25% | 17 -33% | 12.7 1% | 10 22% | 10.2 20% |
| Idle Average * (Watt) | 21.7 | 19 12% | 19 12% | 16.4 24% | 12 45% | 12.8 41% |
| Idle Maximum * (Watt) | 21.8 | 26 -19% | 25 -15% | 36.1 -66% | 16 27% | 15 31% |
| Load Average * (Watt) | 132.4 | 110 17% | 108 18% | 101.5 23% | 124 6% | 130 2% |
| Witcher 3 ultra * (Watt) | 219 | 202 8% | 150 32% | 197 10% | 204 7% | 137 37% |
| Load Maximum * (Watt) | 260 | 242 7% | 179 31% | 196.1 25% | 272 -5% | 184 29% |
* ... Moindre est la valeur, meilleures sont les performances
Power Consumption Witcher 3 / Stresstest
Power Consumption external Monitor
Autonomie de la batterie
Les durées d'exécution sont courtes, avec un peu moins de 4 heures d'utilisation du WLAN dans le monde réel avec le profil d'alimentation équilibré et le GPU intégré actif. Le taux de charge est décent, avec 2 à 2,5 heures pour passer d'une batterie vide à une batterie pleine. Nous apprécions cependant que la batterie soit facilement amovible, contrairement à la plupart des autres ordinateurs portables.
| Eurocom Raptor X15 i7-12700K, GeForce RTX 3070 Ti Laptop GPU, 62 Wh | MSI Raider GE66 12UHS i9-12900HK, GeForce RTX 3080 Ti Laptop GPU, 99 Wh | Razer Blade 15 Advanced Model Early 2022 i7-12800H, GeForce RTX 3080 Ti Laptop GPU, 80 Wh | Eurocom RX315 NH57AF1 i7-11800H, GeForce RTX 3070 Laptop GPU, 71 Wh | Gigabyte A5 X1 R9 5900HX, GeForce RTX 3070 Laptop GPU, 48.96 Wh | Asus TUF Gaming A15 FA506QR-AZ061T R7 5800H, GeForce RTX 3070 Laptop GPU, 90 Wh | |
|---|---|---|---|---|---|---|
| Autonomie de la batterie | 43% | 23% | 20% | 60% | 185% | |
| WiFi v1.3 (h) | 4 | 5.7 43% | 4.9 23% | 4.8 20% | 6.4 60% | 11.4 185% |
| H.264 (h) | 7.1 | 5.9 | 7.3 | |||
| Load (h) | 1.7 | 2 | 1.3 | 2.4 | ||
| Reader / Idle (h) | 8.1 | 10.1 | 17.4 |
Points positifs
Points négatifs
Verdict
Le Raptor X15 utilise les derniers processeurs Intel et GPU Nvidia emprisonnés dans un châssis vieillissant. Il lui manque des fonctionnalités que l'on trouve couramment sur d'autres ordinateurs portables de jeu haut de gamme de 15,6 pouces, comme l'éclairage RVB par touche, le DisplayPort-over-USB, Thunderbolt, la prise en charge du Wi-Fi 6E et un meilleur refroidissement des SSD NVMe. Lorsque des modèles concurrents comme le MSI GE66 ou Gigabyte A5 X1 peuvent chacun être plus fin et plus léger tout en offrant des objectifs TGP similaires à ceux du Raptor, il peut être difficile de recommander l'Eurocom par rapport à ces alternatives.
Gardez à l'esprit que la performance maximale est liée au mode Maximum Fan. Les utilisateurs doivent donc régler manuellement le profil du système sur le mode Maximum Fan et supporter des ventilateurs puissants afin d'obtenir les meilleures performances du système.
Le Raptor X15 dispose d'un processeur LGA1700 amovible et de nombreuses options de stockage, mais la conception générale de son châssis aurait besoin d'un lifting.
Il existe tout de même quelques caractéristiques notables qui méritent d'être saluées. Le modèle prend en charge les disques SATA III de 2,5 pouces et une batterie facilement amovible, par exemple, qui sont désormais des raretés sur les ordinateurs portables de jeu modernes. Si vous ne pensez pas exploiter son socket LGA1700, alors le plus gros argument de vente du Raptor X15 devient discutable.
Prix et disponibilité
Eurocom expédie maintenant le Raptor X15 à partir de $2000 USD pour la configuration de base ou environ $3500 comme configuré dans notre revue.
Eurocom Raptor X15
- 06/09/2022 v7 (old)
Allen Ngo
Price comparison

