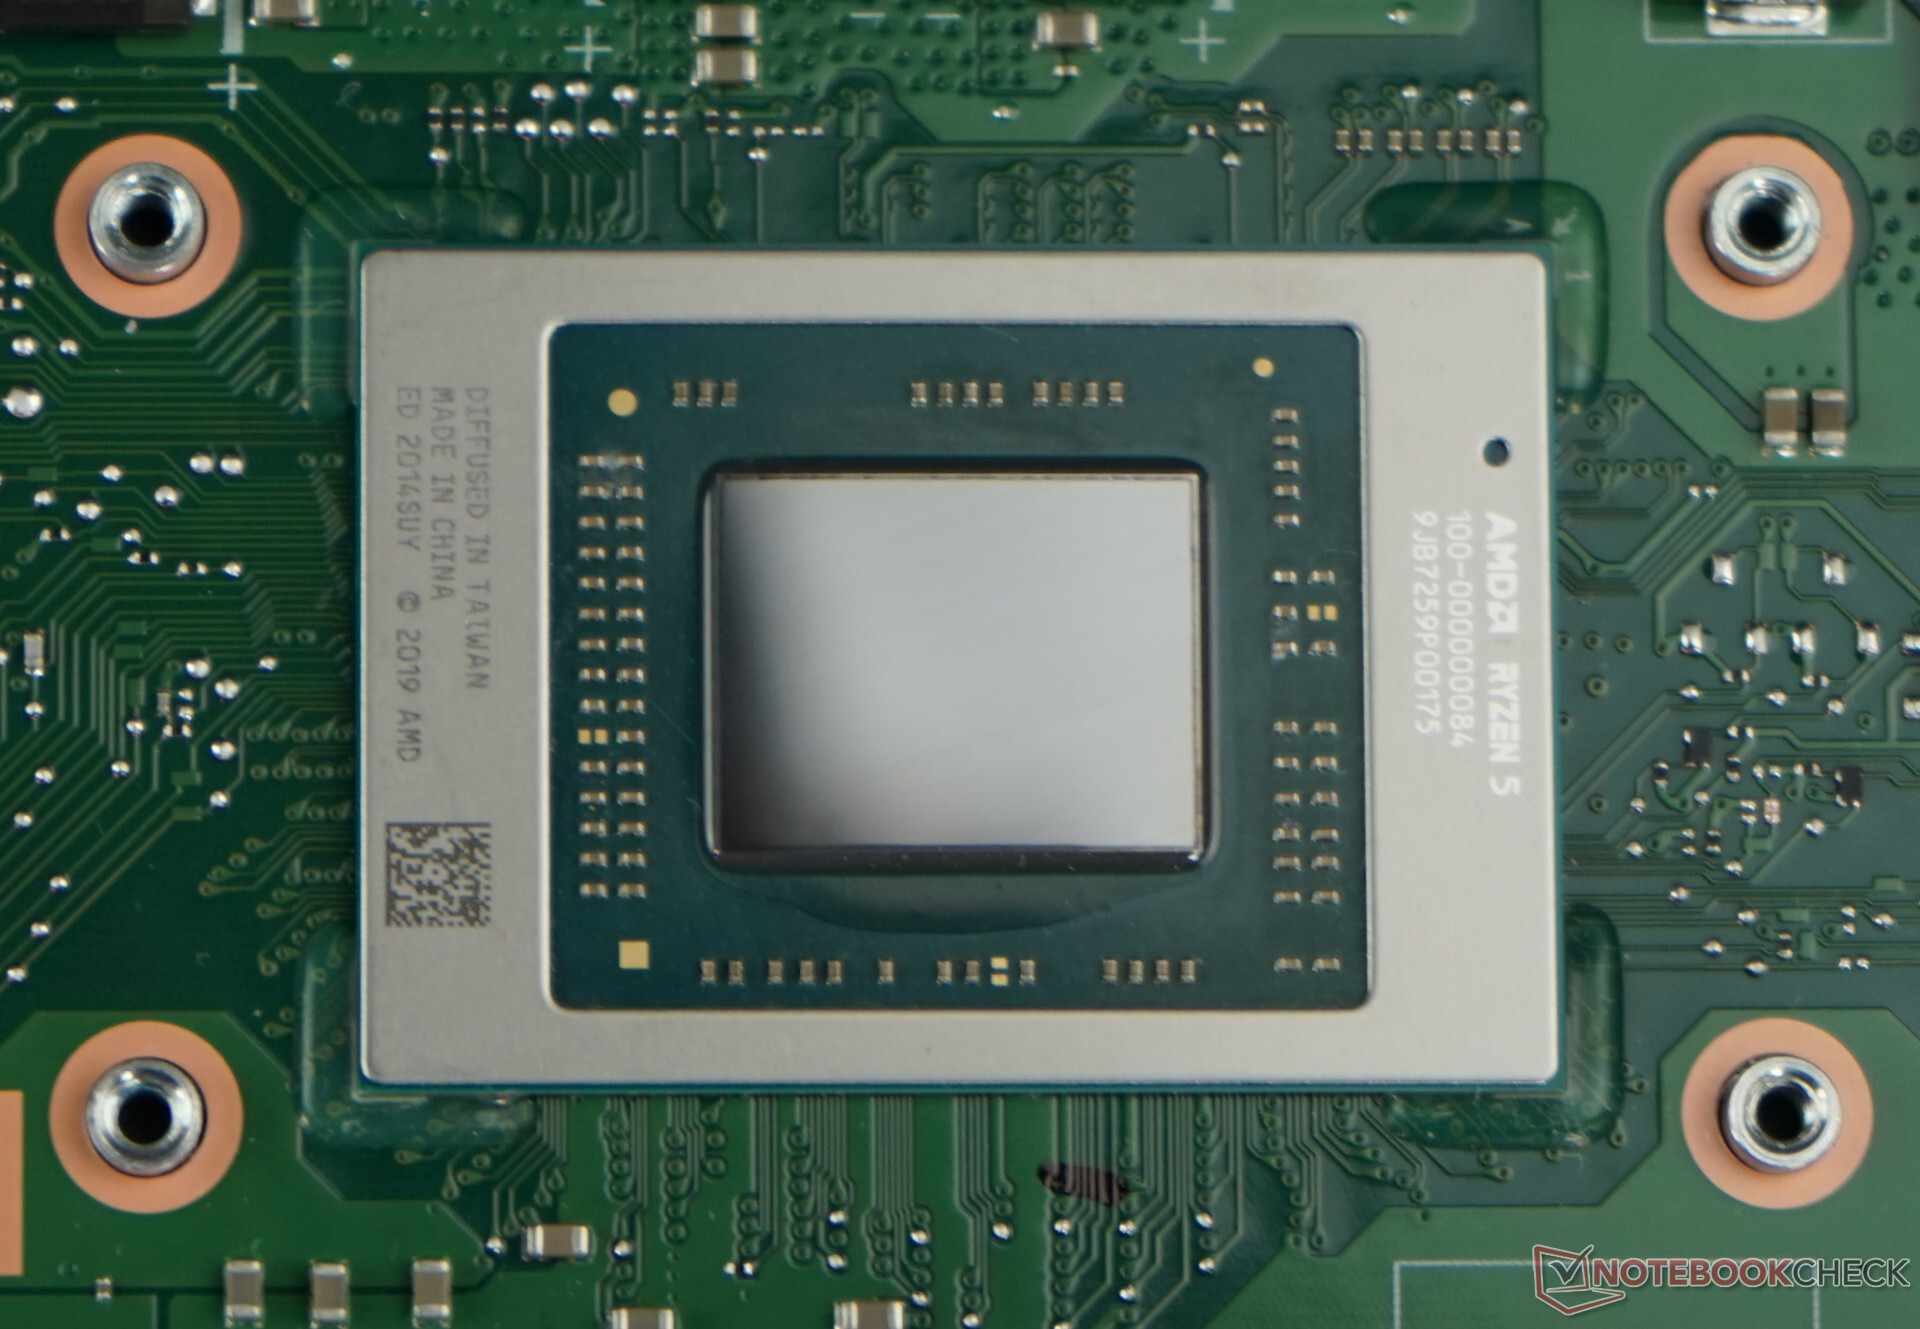
Critiques du AMD Ryzen 5 4500U processeur
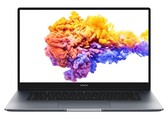
Test du Honor MagicBook 15 : petit prix et puissance
Avec son AMD Ryzen 5 4500U, Honor propose le MagicBook 15 à un prix extrêmement bas tout en maintenant des performances élevées. Toutefois, l'ordinateur portable, qui connaît un grand succès à bien des égards, présente également de petites particularités. Nous vous montrerons lesquelles dans notre revue.
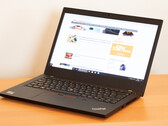
AMD Ryzen 5 4500U, Vega 6, 15.6", 1.5 kgTest du Lenovo ThinkPad L14 : AMD récidive
Le prédécesseur souffrait d'un affichage peu lumineux et d'un processeur Whiskey Lake à l'arrêt. Pour la toute première fois, nous jetons également un coup d'œil sur le SKU AMD du ThinkPad Lenovo de série L de cette année et sommes ravis de voir les performances du Ryzen 5 4500U hexa-core. Après tout, les ordinateurs portables ThinkPad E14 et T14 équipés d'AMD ont géré leurs homologues d'Intel par des marges significatives.
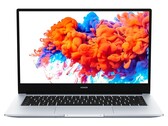
AMD Ryzen 5 4500U, Vega 6, 14", 1.7 kgTest du Honor MagicBook 14 : ordinateur portable robuste avec Ryzen 5 4500U
Le MateBook 14 est suivi par le... MateBook 14. Cependant, le Ryzen 5 4500U d'AMD porte les performances à un tout autre niveau dans la version actuelle. Le portable de Honor est non seulement puissant au quotidien, mais aussi extrêmement résistant. Nous montrerons ce que l'ordinateur portable de 14 pouces a d'autre à offrir dans notre revue.
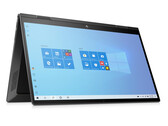
AMD Ryzen 5 4500U, Vega 6, 14", 1.4 kgTest du HP Envy x360 15 (2020) (Ryzen 5 4500U, RX Vega 6, FHD) : Ryzen 5 mal exploité
L'Envy possède un APU Ryzen 5 4500U, 16 Go de mémoire vive et un SSD NVMe. Il possède également une très bonne autonomie. Enfin, l'écran peut être utilisé à la main, mais également avec un stylet, disponible séparément.
AMD Ryzen 5 4500U, Vega 6, 15.6", 2 kgTest du HP ProBook x360 435 G7 (Ryzen 5 4500U, RX Vega 6, FHD) : Ryzen brille également dans les convertibles professionnels
Si la série Ryzen 4000 est déjà présente dans les PC portables professionnels classiques, pourquoi pas l'intégrer aussi dans les convertibles ? HP s'est certainement dit cela quand il a développé le ProBook x360 435 G7. Résultat : un convertible plus puissant que chez la concurrence, et qui surpasse aisément les HP EliteBook bien plus chers.
AMD Ryzen 5 4500U, Vega 6, 13.3", 1.4 kgLenovo ThinkPad E14 Gen2-20T7S00W00: AMD Radeon RX Vega 6 (Ryzen 4000/5000), 14.00", 1.6 kg
Critique » Test du Lenovo ThinkPad E14 (Ryzen 5 4500U, Vega 6, FHD) : abordable et puissant grâce à AMD Renoir
Lenovo IdeaPad 5 14ARE05: AMD Radeon RX Vega 6 (Ryzen 4000/5000), 14.00", 1.4 kg
Critique » Test du Lenovo IdeaPad 5 14ARE05 (Ryzen 5 4500U, RX Vega 6, FHD) : puissant et compact
HP Envy x360 13-ay0010nr: AMD Radeon RX Vega 6 (Ryzen 4000/5000), 13.30", 1.3 kg
Critique » Test du HP Envy x360 13 2020 (Ryzen 5 4500U, RX Vega 6, FHD) : le convertible Ryzen 5 fait mieux que le Core i7
HP Envy x360 15-ee0257ng: AMD Radeon RX Vega 6 (Ryzen 4000/5000), 15.60", 2 kg
Autres tests » HP Envy x360 15-ee0257ng
Acer Swift 3 SF314-42-R0EG: AMD Radeon RX Vega 6 (Ryzen 4000/5000), 14.00", 1.2 kg
Autres tests » Acer Swift 3 SF314-42-R0EG
Acer Swift 3 SF314-42-R0V4: AMD Radeon RX Vega 6 (Ryzen 4000/5000), 14.00", 1.2 kg
Autres tests » Acer Swift 3 SF314-42-R0V4
HP ProBook 635 Aero G7-2W8S6EA: AMD Radeon RX Vega 6 (Ryzen 4000/5000), 13.30", 1 kg
Autres tests » HP ProBook 635 Aero G7-2W8S6EA
Lenovo IdeaPad 5 15ARE05-81YQ0030MH: AMD Radeon RX Vega 6 (Ryzen 4000/5000), 15.60", 0.7 kg
Autres tests » Lenovo IdeaPad 5 15ARE05-81YQ0030MH
Medion Akoya E15303: AMD Radeon RX Vega 6 (Ryzen 4000/5000), 15.60", 1.8 kg
Autres tests » Medion Akoya E15303
MSI Modern 14 B4MW-056XES: AMD Radeon RX Vega 6 (Ryzen 4000/5000), 14.00", 1.3 kg
Autres tests » MSI Modern 14 B4MW-056XES
HP 15s-eq1104ns: AMD Radeon RX Vega 6 (Ryzen 4000/5000), 15.60", 1.7 kg
Autres tests » HP 15s-eq1104ns
HP 15s-eq1070ns: AMD Radeon RX Vega 6 (Ryzen 4000/5000), 15.60", 1.7 kg
Autres tests » HP 15s-eq1070ns
HP 15s-eq1069ns: AMD Radeon RX Vega 6 (Ryzen 4000/5000), 15.60", 1.7 kg
Autres tests » HP 15s-eq1069ns
Asus VivoBook 14 M413IA-HM899T: AMD Radeon RX Vega 6 (Ryzen 4000/5000), 14.00", 1.4 kg
Autres tests » Asus VivoBook 14 M413IA-HM899T
HP 15s-eq1101ns: AMD Radeon RX Vega 6 (Ryzen 4000/5000), 15.60", 1.7 kg
Autres tests » HP 15s-eq1101ns
HP Pavilion 15-eh0000ns: AMD Radeon RX Vega 6 (Ryzen 4000/5000), 15.60", 1.8 kg
Autres tests » HP Pavilion 15-eh0000ns
Lenovo Yoga 6 13ARE05-82FN000TGE: AMD Radeon RX Vega 6 (Ryzen 4000/5000), 13.30", 1.4 kg
Autres tests » Lenovo Yoga 6 13ARE05-82FN000TGE
Lenovo IdeaPad 3 15ARE05-81W4005AMH: AMD Radeon RX Vega 6 (Ryzen 4000/5000), 15.60", 1.7 kg
Autres tests » Lenovo IdeaPad 3 15ARE05-81W4005AMH
Lenovo Yoga Slim 7 14ARE05-82A20073MH: AMD Radeon RX Vega 6 (Ryzen 4000/5000), 14.00", 1.4 kg
Autres tests » Lenovo Yoga Slim 7 14ARE05-82A20073MH
HP 15s-eq1050ns: AMD Radeon RX Vega 6 (Ryzen 4000/5000), 15.60", 1.7 kg
Autres tests » HP 15s-eq1050ns
HP 15s-eq1054ns: AMD Radeon RX Vega 6 (Ryzen 4000/5000), 15.60", 1.7 kg
Autres tests » HP 15s-eq1054ns
Honor MagicBook 15 4500U: AMD Radeon RX Vega 6 (Ryzen 4000/5000), 15.60", 1.5 kg
Autres tests » Honor MagicBook 15 4500U
Asus ZenBook 14 UM425IA-AM005T: AMD Radeon RX Vega 6 (Ryzen 4000/5000), 14.00", 1.3 kg
Autres tests » Asus ZenBook 14 UM425IA-AM005T
Lenovo ThinkPad E14-20T6000RSP: AMD Radeon RX Vega 6 (Ryzen 4000/5000), 14.00", 1.7 kg
Autres tests » Lenovo ThinkPad E14-20T6000RSP
Acer Swift 3 SF314-42-R2MP: AMD Radeon RX Vega 6 (Ryzen 4000/5000), 14.00", 1.2 kg
Autres tests » Acer Swift 3 SF314-42-R2MP
Honor MagicBook 15 2020: AMD Radeon RX Vega 6 (Ryzen 4000/5000), 15.60", 1.6 kg
Autres tests » Honor MagicBook 15 2020
HP ProBook 455 G7-12X20EA: AMD Radeon RX Vega 6 (Ryzen 4000/5000), 15.60", 2 kg
Autres tests » HP ProBook 455 G7-12X20EA
Asus ZenBook 14 UM425I: AMD Radeon RX Vega 6 (Ryzen 4000/5000), 14.00", 1.2 kg
Autres tests » Asus ZenBook 14 UM425I
HP ProBook 445 G7 175W4EA: AMD Radeon RX Vega 6 (Ryzen 4000/5000), 14.00", 1.6 kg
Autres tests » HP ProBook 445 G7 175W4EA
Huawei MateBook D 15 2020 AMD: AMD Radeon RX Vega 6 (Ryzen 4000/5000), 15.60", 1.5 kg
Autres tests » Huawei MateBook D 15 2020 AMD
Lenovo IdeaPad 3 15ARE05-81W4006GMB: AMD Radeon RX Vega 6 (Ryzen 4000/5000), 15.60", 1.9 kg
Autres tests » Lenovo IdeaPad 3 15ARE05-81W4006GMB
Lenovo ThinkPad E15 20T8000YMH: AMD Radeon RX Vega 6 (Ryzen 4000/5000), 15.60"
Autres tests » Lenovo ThinkPad E15 20T8000YMH
Acer Swift 3 SF314-42-R8WD: AMD Radeon RX Vega 6 (Ryzen 4000/5000), 14.00", 1.2 kg
Autres tests » Acer Swift 3 SF314-42-R8WD
MSI Modern 14 B4MW-048: AMD Radeon RX Vega 6 (Ryzen 4000/5000), 14.00", 1.3 kg
Autres tests » MSI Modern 14 B4MW-048
Acer Aspire 5 A515-44-R41B: AMD Radeon RX Vega 6 (Ryzen 4000/5000), 15.60", 1.8 kg
Autres tests » Acer Aspire 5 A515-44-R41B
Acer Aspire 5 A515-44G-R83X: AMD Radeon RX 640, 15.60", 1.8 kg
Autres tests » Acer Aspire 5 A515-44G-R83X
Honor MagicBook 14, Ryzen 5 4500U: AMD Radeon RX Vega 6 (Ryzen 4000/5000), 14.00", 1.4 kg
Autres tests » Honor MagicBook 14, Ryzen 5 4500U
HP Envy x360 13-ay0800no: AMD Radeon RX Vega 6 (Ryzen 4000/5000), 13.30", 1.3 kg
Autres tests » HP Envy x360 13-ay0800no
Lenovo IdeaPad 5 14ARE05-81YM000JCK: AMD Radeon RX Vega 6 (Ryzen 4000/5000), 14.00", 1.5 kg
Autres tests » Lenovo IdeaPad 5 14ARE05-81YM000JCK
Acer Swift 3 SF314-42-R4VD: AMD Radeon RX Vega 6 (Ryzen 4000/5000), 14.00", 1.2 kg
Autres tests » Acer Swift 3 SF314-42-R4VD
Asus ZenBook 14 UM425IA-HM067R: AMD Radeon RX Vega 6 (Ryzen 4000/5000), 14.00", 1.1 kg
Autres tests » Asus ZenBook 14 UM425IA-HM067R
Asus VivoBook S15 M533IA-BQ034T: AMD Radeon RX Vega 6 (Ryzen 4000/5000), 15.60", 1.8 kg
Autres tests » Asus VivoBook S15 M533IA-BQ034T
HP Envy x360 13-ay0010nr: AMD Radeon RX Vega 6 (Ryzen 4000/5000), 13.30", 1.3 kg
Autres tests » HP Envy x360 13-ay0010nr
Lenovo IdeaPad 5 14ARE05-81YM007EMH: AMD Radeon RX Vega 6 (Ryzen 4000/5000), 14.00", 1.4 kg
Autres tests » Lenovo IdeaPad 5 14ARE05-81YM007EMH
Acer Swift 3 SF314-42-R8ZV: AMD Radeon RX Vega 6 (Ryzen 4000/5000), 14.00", 1.2 kg
Autres tests » Acer Swift 3 SF314-42-R8ZV
HP Envy x360 13-ay0001nd: AMD Radeon RX Vega 6 (Ryzen 4000/5000), 13.30", 1.3 kg
Autres tests » HP Envy x360 13-ay0001nd
Asus ZenBook 14 Q407IQ: NVIDIA GeForce MX350, 14.00", 1.2 kg
Autres tests » Asus ZenBook 14 Q407IQ
Lenovo IdeaPad 5 14ARE05: AMD Radeon RX Vega 6 (Ryzen 4000/5000), 14.00", 1.4 kg
Autres tests » Lenovo IdeaPad 5 14ARE05
Lenovo Yoga Slim 7 14ARE05, Ryzen 5 4500U: AMD Radeon RX Vega 6 (Ryzen 4000/5000), 14.00", 1.3 kg
Autres tests » Lenovo Yoga Slim 7 14ARE05, Ryzen 5 4500U
Lenovo IdeaPad Flex 5 14ARE05-81X2006QMH: AMD Radeon RX Vega 6 (Ryzen 4000/5000), 14.00"
Autres tests » Lenovo IdeaPad Flex 5 14ARE05-81X2006QMH
Lenovo IdeaPad Flex 5 14ARE05-81X2003MMH: AMD Radeon RX Vega 6 (Ryzen 4000/5000), 14.00", 1.5 kg
Autres tests » Lenovo IdeaPad Flex 5 14ARE05-81X2003MMH
HP Envy x360 13-ay0001ns: AMD Radeon RX Vega 6 (Ryzen 4000/5000), 13.30", 1.3 kg
Autres tests » HP Envy x360 13-ay0001ns
Lenovo IdeaPad 5 15ARE05-81YQ002BMH: AMD Radeon RX Vega 6 (Ryzen 4000/5000), 15.60", 1.6 kg
Autres tests » Lenovo IdeaPad 5 15ARE05-81YQ002BMH
Lenovo IdeaPad Flex 5 14 AMD 81X20005US: AMD Radeon RX Vega 6 (Ryzen 4000/5000), 14.00", 1.7 kg
Autres tests » Lenovo Flex 5 14 AMD 81X20005US
Acer Swift 3 SF314-42-R1PR: AMD Radeon RX Vega 6 (Ryzen 4000/5000), 14.00", 1.2 kg
Autres tests » Acer Swift 3 SF314-42-R1PR
HP ProBook x360 435 G7, Ryzen 5 4500U: AMD Radeon RX Vega 6 (Ryzen 4000/5000), 13.30", 1.4 kg
Autres tests » HP ProBook x360 435 G7, Ryzen 5 4500U
Honor MagicBook 14, Ryzen 5 4500U: AMD Radeon RX Vega 6 (Ryzen 4000/5000), 14.00", 1.4 kg
» Honor MagicBook 14 : Ryzen 5 avec une performance de haut niveau
Lenovo IdeaPad 5 14ARE05: AMD Radeon RX Vega 6 (Ryzen 4000/5000), 14.00", 1.4 kg
» Sous-portable puissant grâce au Ryzen 5 4500U : Lenovo IdeaPad 5 14ARE05