Test de la station de travail HP ZBook Fury 15 G7 : une chambre à vapeur pour des performances maximales
Le HP ZBook Fury 15 G7 est la station de travail mobile 15,6 pouces phare de la société, conçue pour les utilisateurs de CAO haute performance et les professionnels. Contrairement aux séries ZBook 15u ou Firefly, plus fines, le ZBook Fury 15 utilise des CPU Intel de série H beaucoup plus rapides avec des options de GPU GeForce RTX haut de gamme au lieu des GPU Intel de série U plus lents avec des GPU Quadro P.
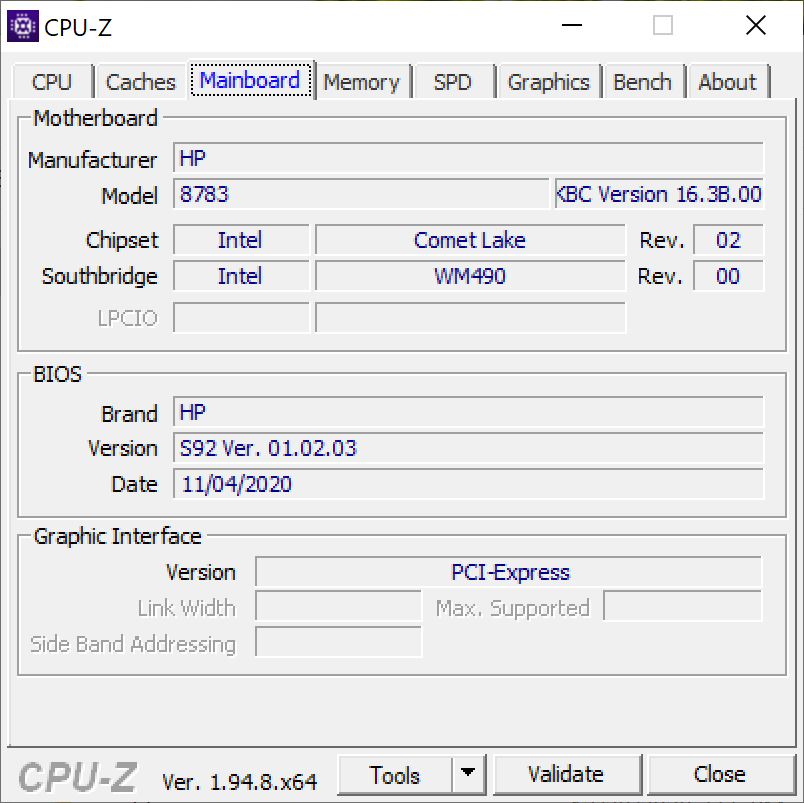
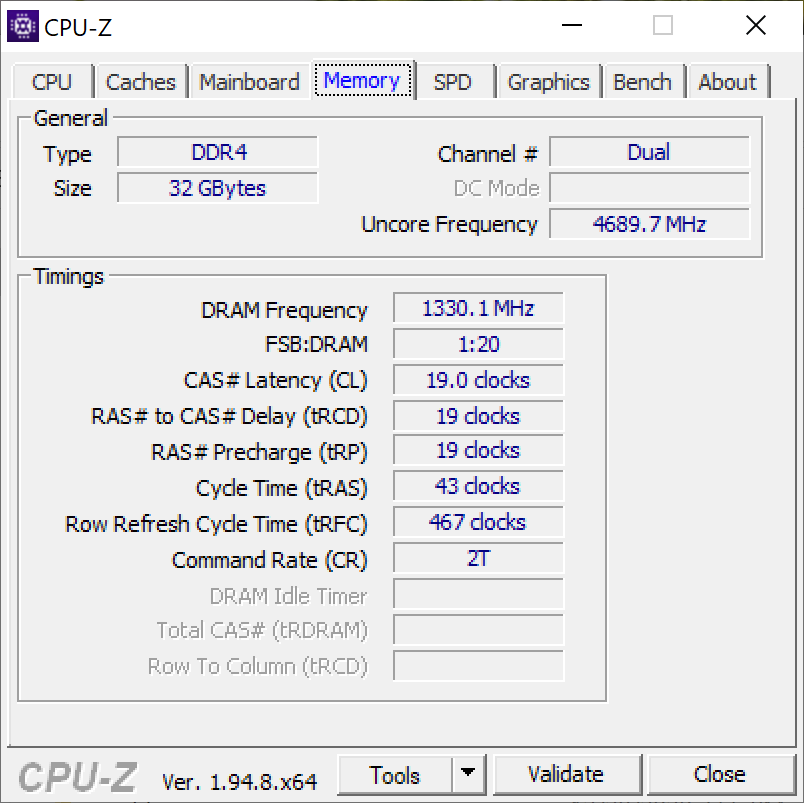
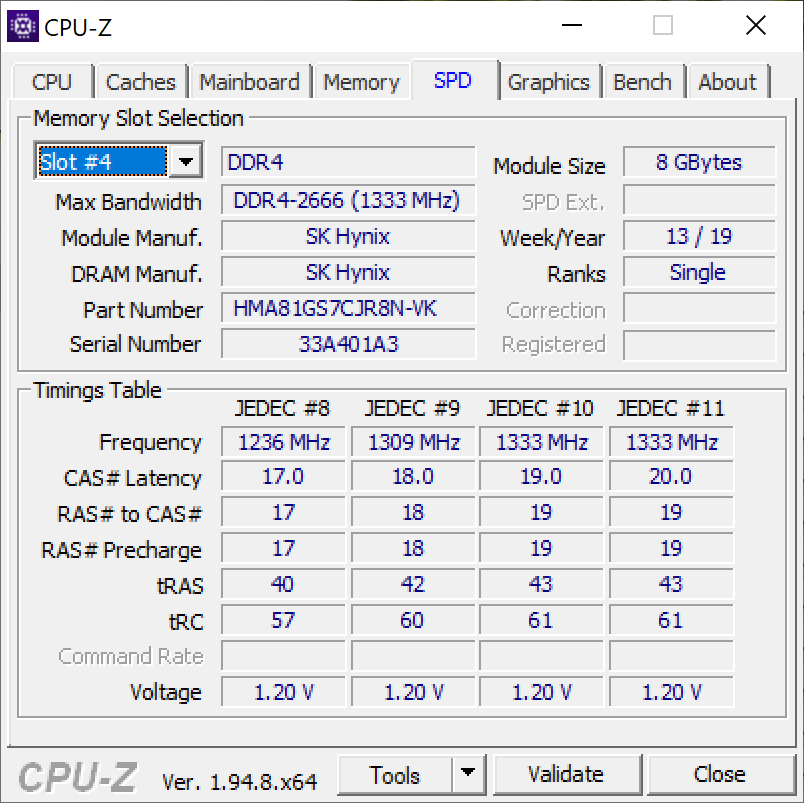
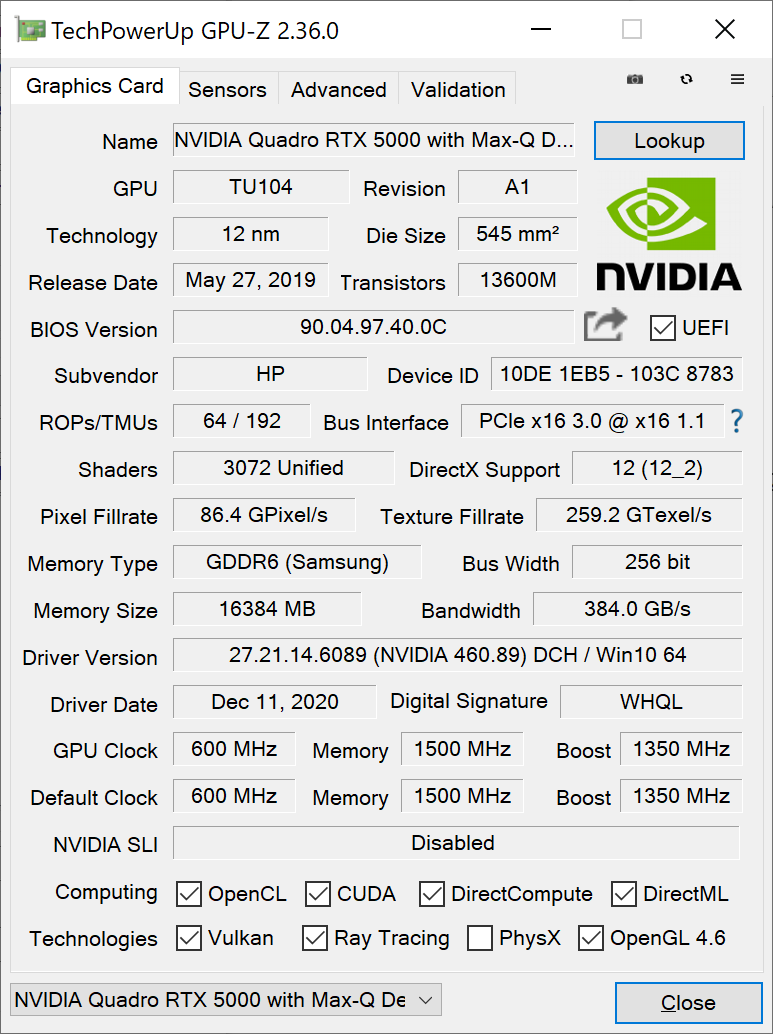
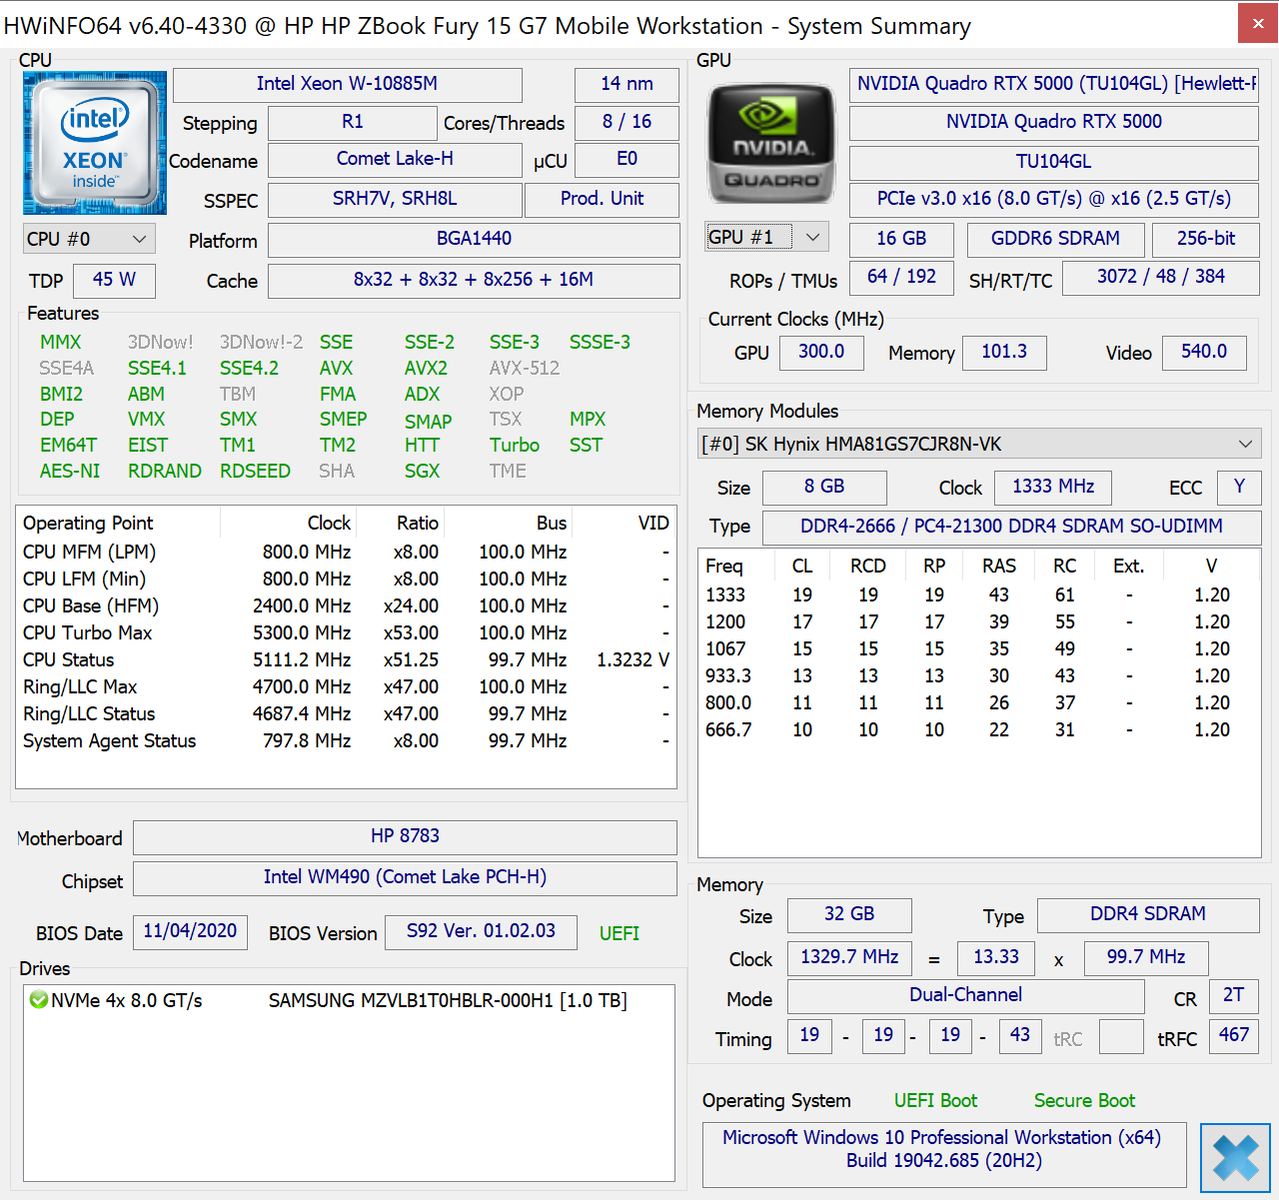
Un large éventail de configurations est disponible, allant du CPU Core i5-10300H au Xeon W-10885M, 16 Go de RAM jusqu'à 128 Go, affichage 1080p 250 nit jusqu'à 4K UHD 600 nits, et le GPU Quadro T2000 Max-Q jusqu'au RTX 5000 Max-Q. La liste complète des spécifications peut être consultée sur la fiche technique officielle de HP ici. L'unité que nous avons en main dans une configuration haut de gamme avec le CPU Xeon, l'écran 4K et le GPU Quadr RTX 5000 Max-Q pour environ 6100 USD.
Les alternatives au ZBook Fury 15 G7 comprennent d'autres stations de travail haut de gamme de 15,6 pouces comme le Dell Precision 7550, le Lenovo ThinkPad P series, le Asus ProArt StudioBook Pro 15, ou le MSI WS66.
D'autres critiques de HP :
potential competitors in comparison
Note | Date | Modèle | Poids | Épaisseur | Taille | Résolution | Prix |
|---|---|---|---|---|---|---|---|
| 90.2 % v7 (old) | 01/21 | HP ZBook Fury 15 G7 W-10885M, Quadro RTX 5000 Max-Q | 2.4 kg | 25.9 mm | 15.60" | 3840x2160 | |
| 83.1 % v7 (old) | 11/20 | Asus ProArt StudioBook Pro 15 W500G5T i7-9750H, Quadro RTX 5000 Max-Q | 2 kg | 18.9 mm | 15.60" | 3840x2160 | |
| 83.4 % v7 (old) | 09/20 | MSI WS66 10TMT-207US i9-10980HK, Quadro RTX 5000 Max-Q | 2.3 kg | 19.8 mm | 15.60" | 1920x1080 | |
| 87.8 % v7 (old) | 09/20 | Dell Precision 7550 W-10885M, Quadro RTX 5000 Max-Q | 2.8 kg | 27.36 mm | 15.60" | 3840x2160 | |
| 87 % v7 (old) | 09/20 | Razer Blade 15 Studio Edition 2020 i7-10875H, Quadro RTX 5000 Max-Q | 2.2 kg | 13.98 mm | 15.60" | 3840x2160 | |
| 87.8 % v7 (old) | 08/19 | Lenovo ThinkPad P1 2019-20QT000RGE i7-9850H, Quadro T1000 (Laptop) | 1.7 kg | 18.4 mm | 15.60" | 1920x1080 |
Cas
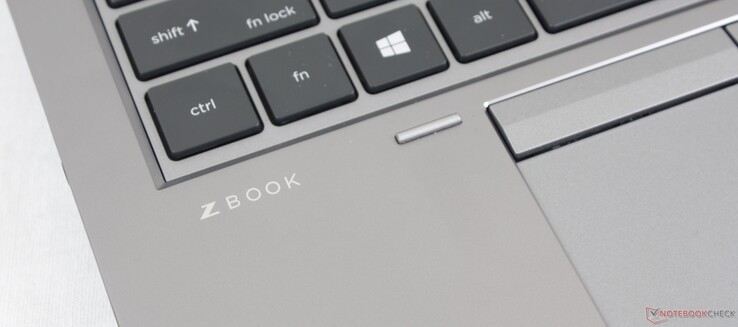
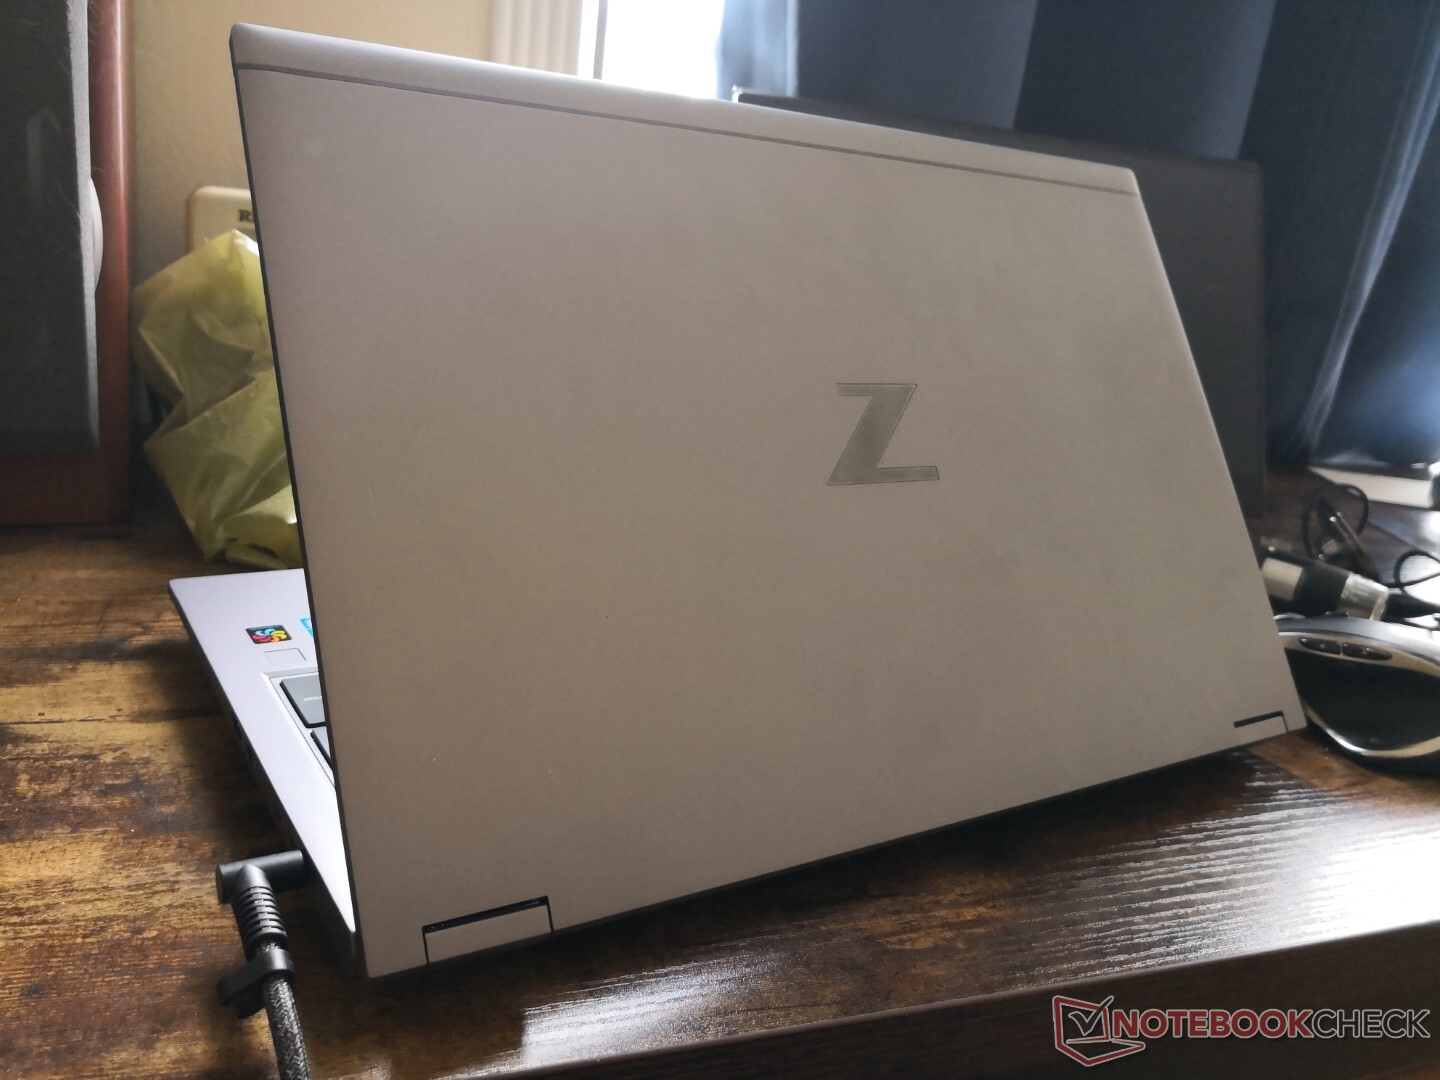
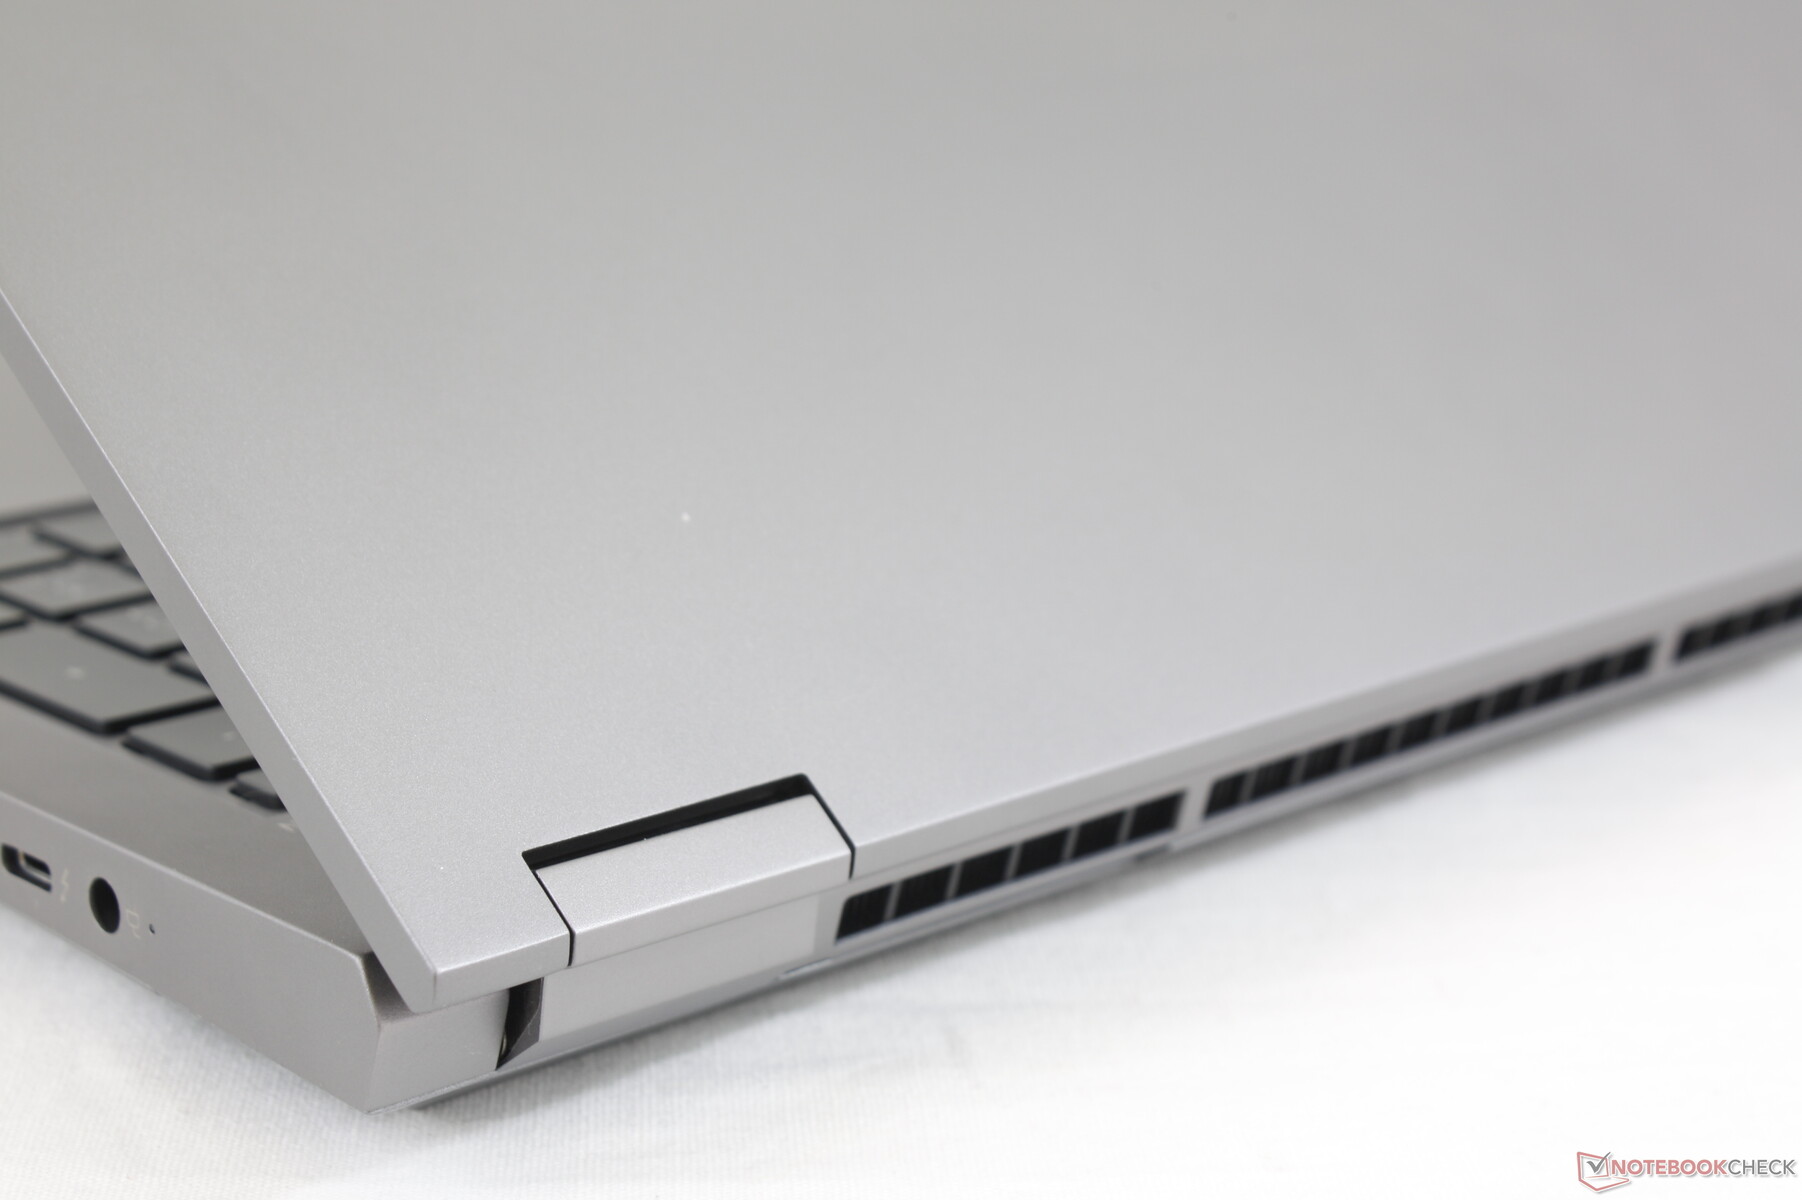
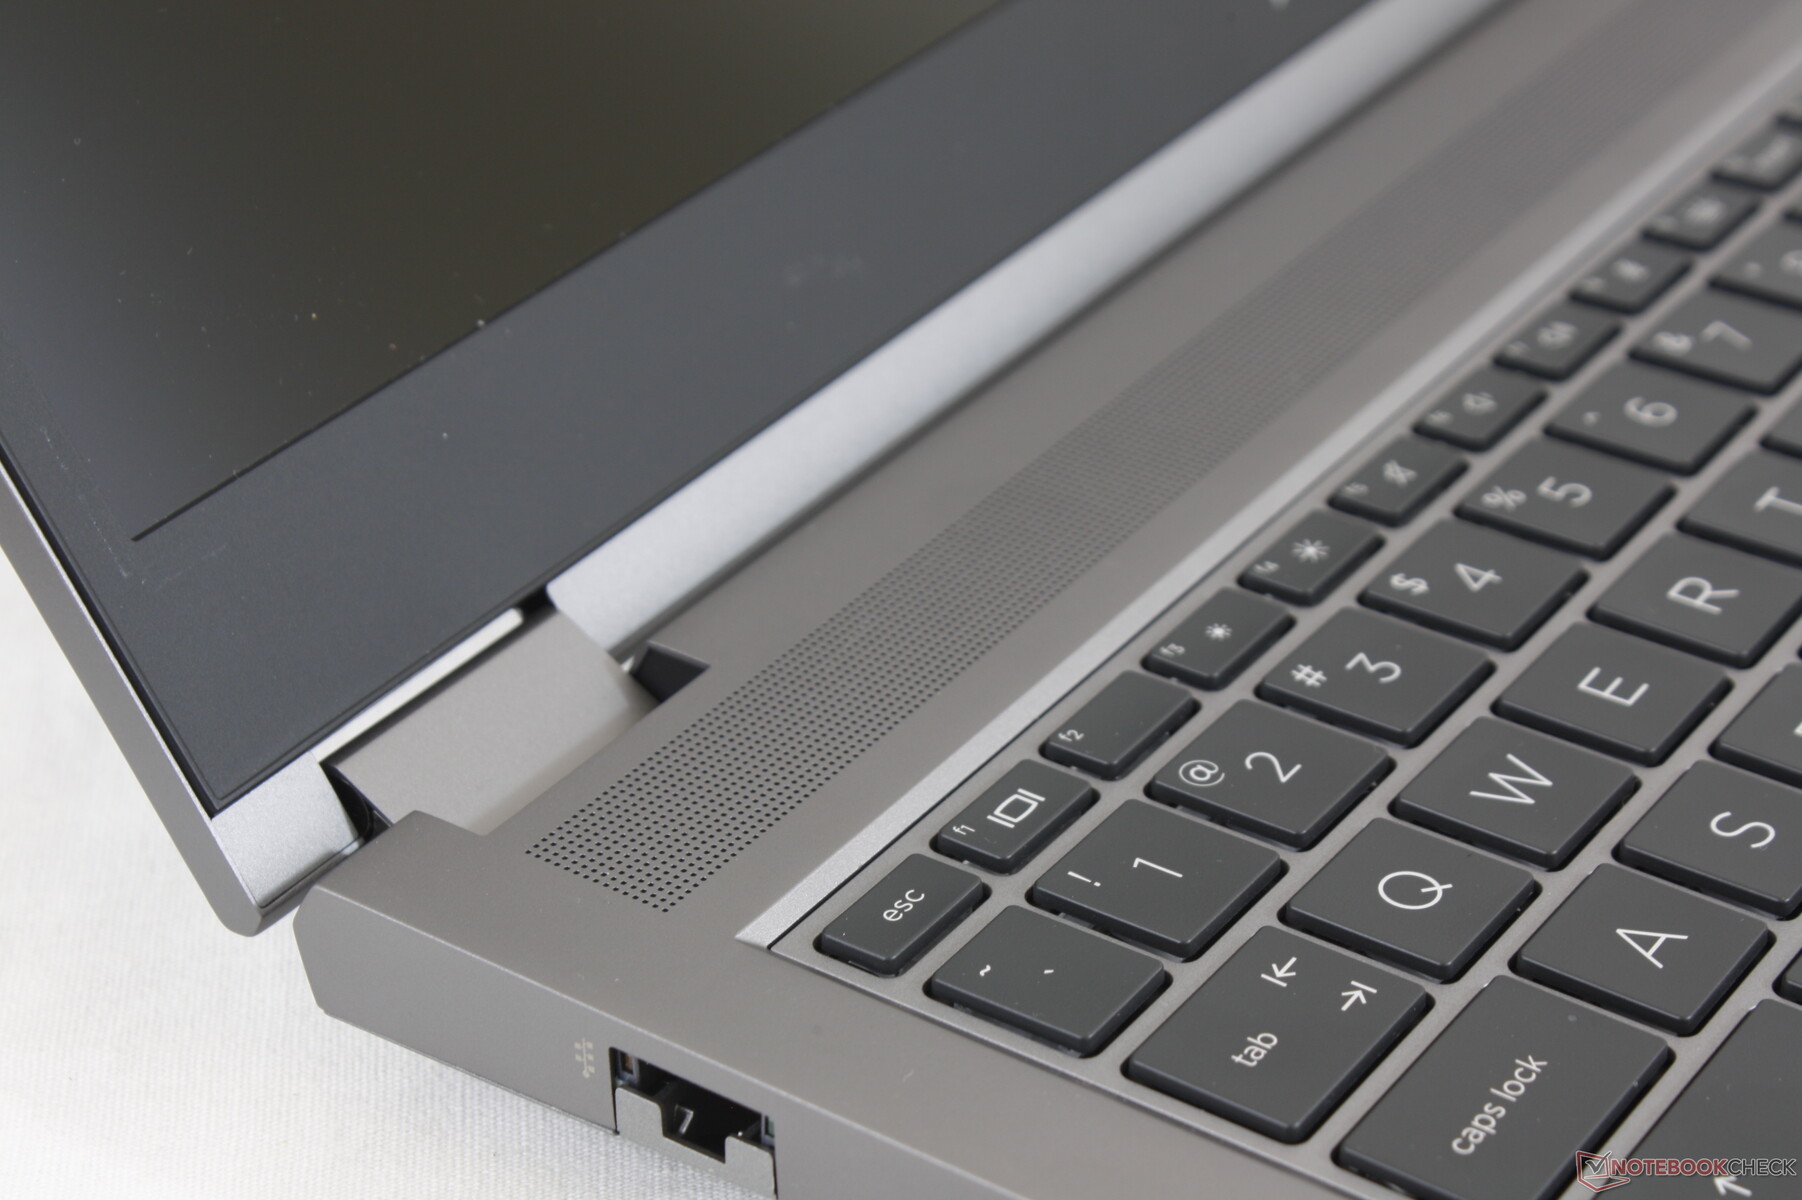
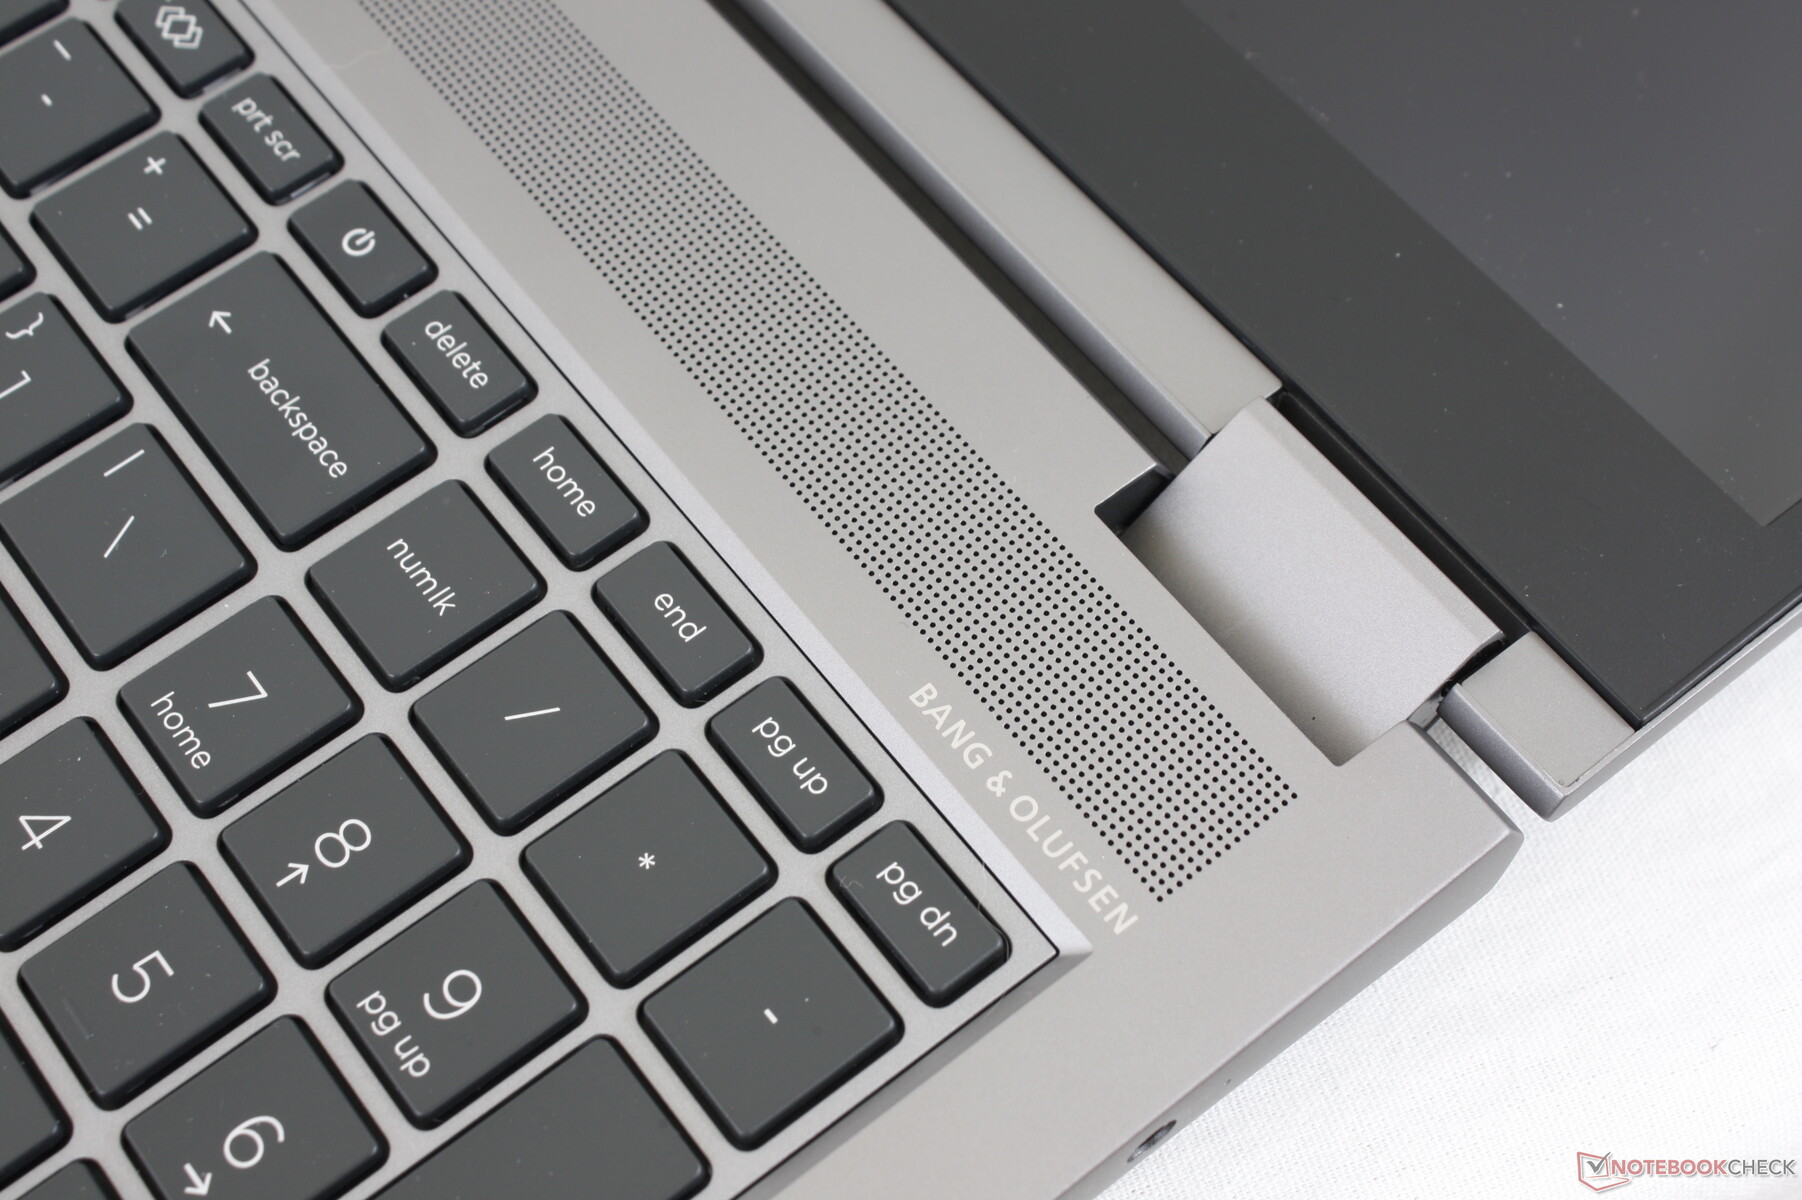
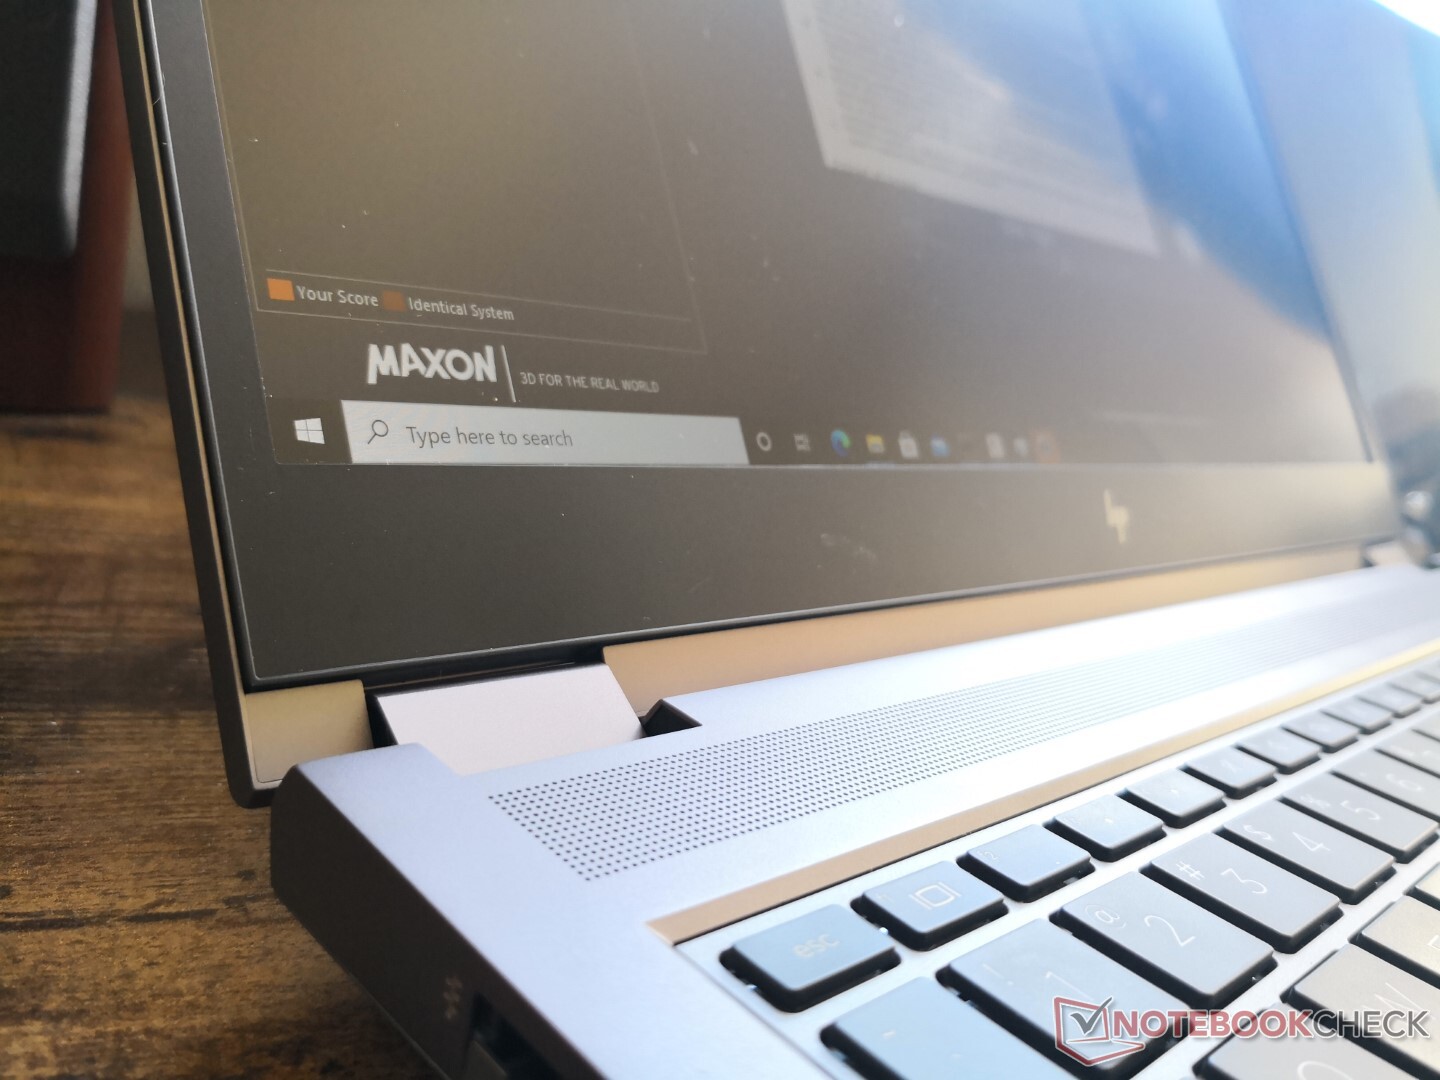
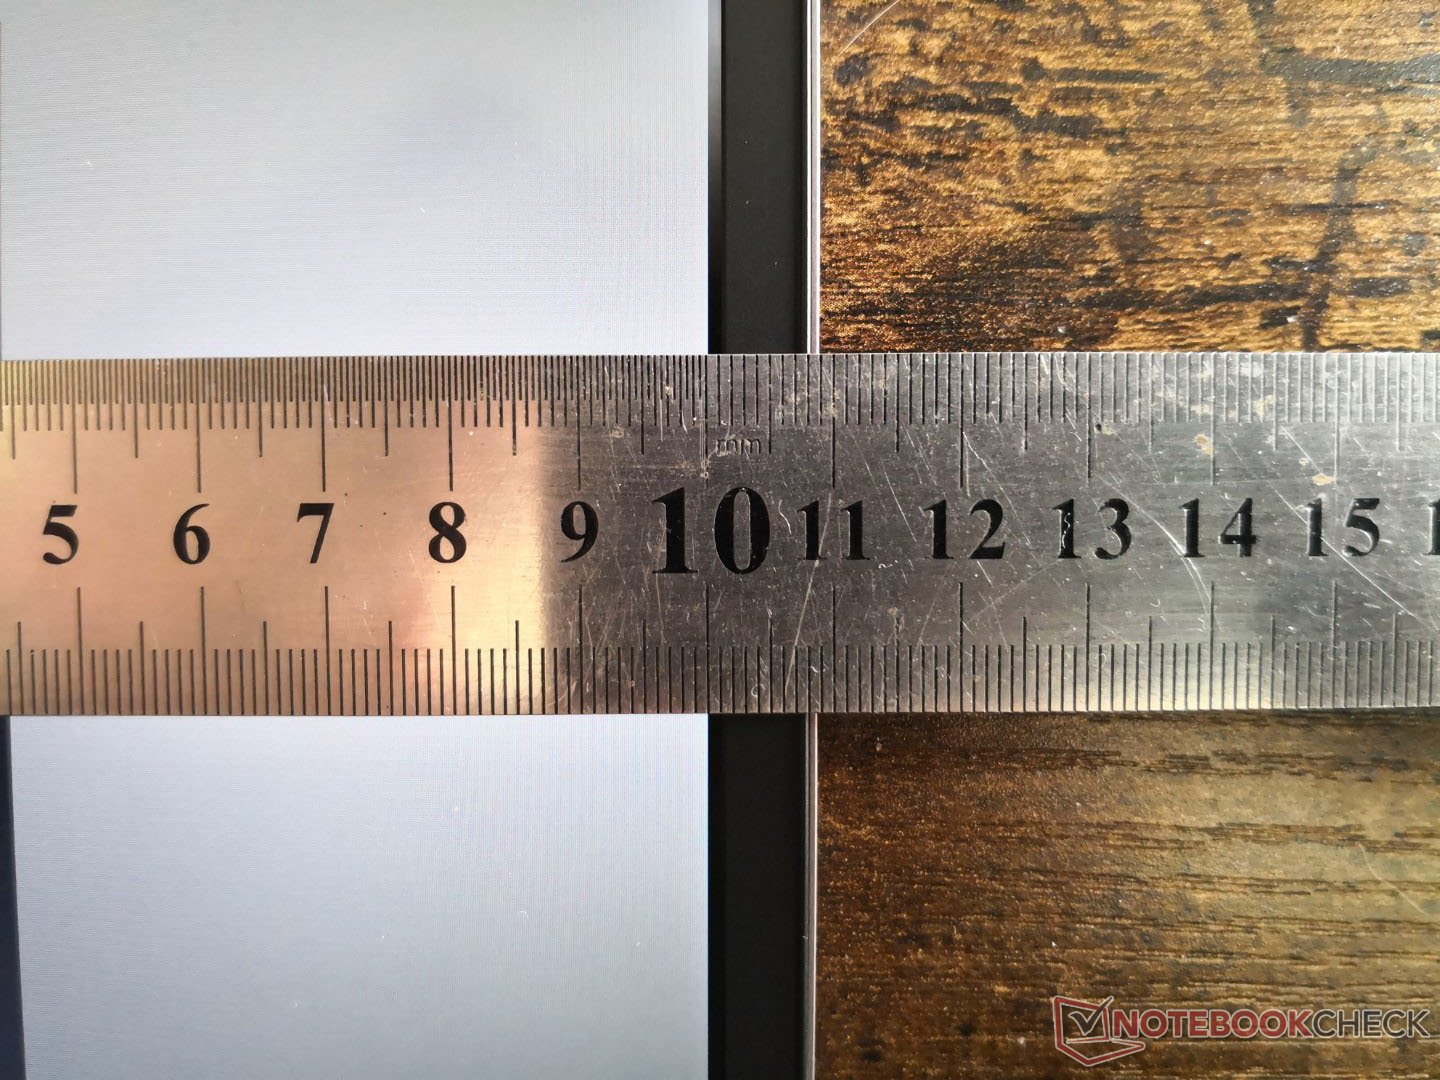
Cela fait quelques années que nous n'avons pas vu un ZBook 15 en taille réelle et beaucoup de choses ont changé. HP a redessiné le châssis de la tête aux pieds avec un aspect plus net sans sacrifier beaucoup de fonctionnalités que les stations de travail plus fines ont tendance à omettre comme les lecteurs de cartes à puce, le pointeur de bâton et les boutons de souris dédiés. Selon HP, les cadres supérieur, latéral et inférieur sont respectivement 59,7 %, 53,1 % et 10,6 % plus petits que ceux du ZBook 15 G6 sortant. La base est solide, avec peu ou pas de déformation ou de grincement, y compris le centre du clavier, qui est l'endroit où la plupart des ordinateurs portables sont les plus faibles. Le couvercle fléchit un peu plus, mais pas assez pour être préoccupant.
Le HP est sensiblement plus léger que le Precision 7550 d'environ 400 g malgré leurs dimensions similaires. Le système Dell semble toutefois plus solide, probablement en raison de son poids plus massif. Il existe de nombreuses stations de travail Nvidia Studio ultra-minces comme la Razer Blade ou la MSI WS66 qui sont conçues pour être encore plus minces et plus légères si les utilisateurs veulent quelque chose de plus portable.
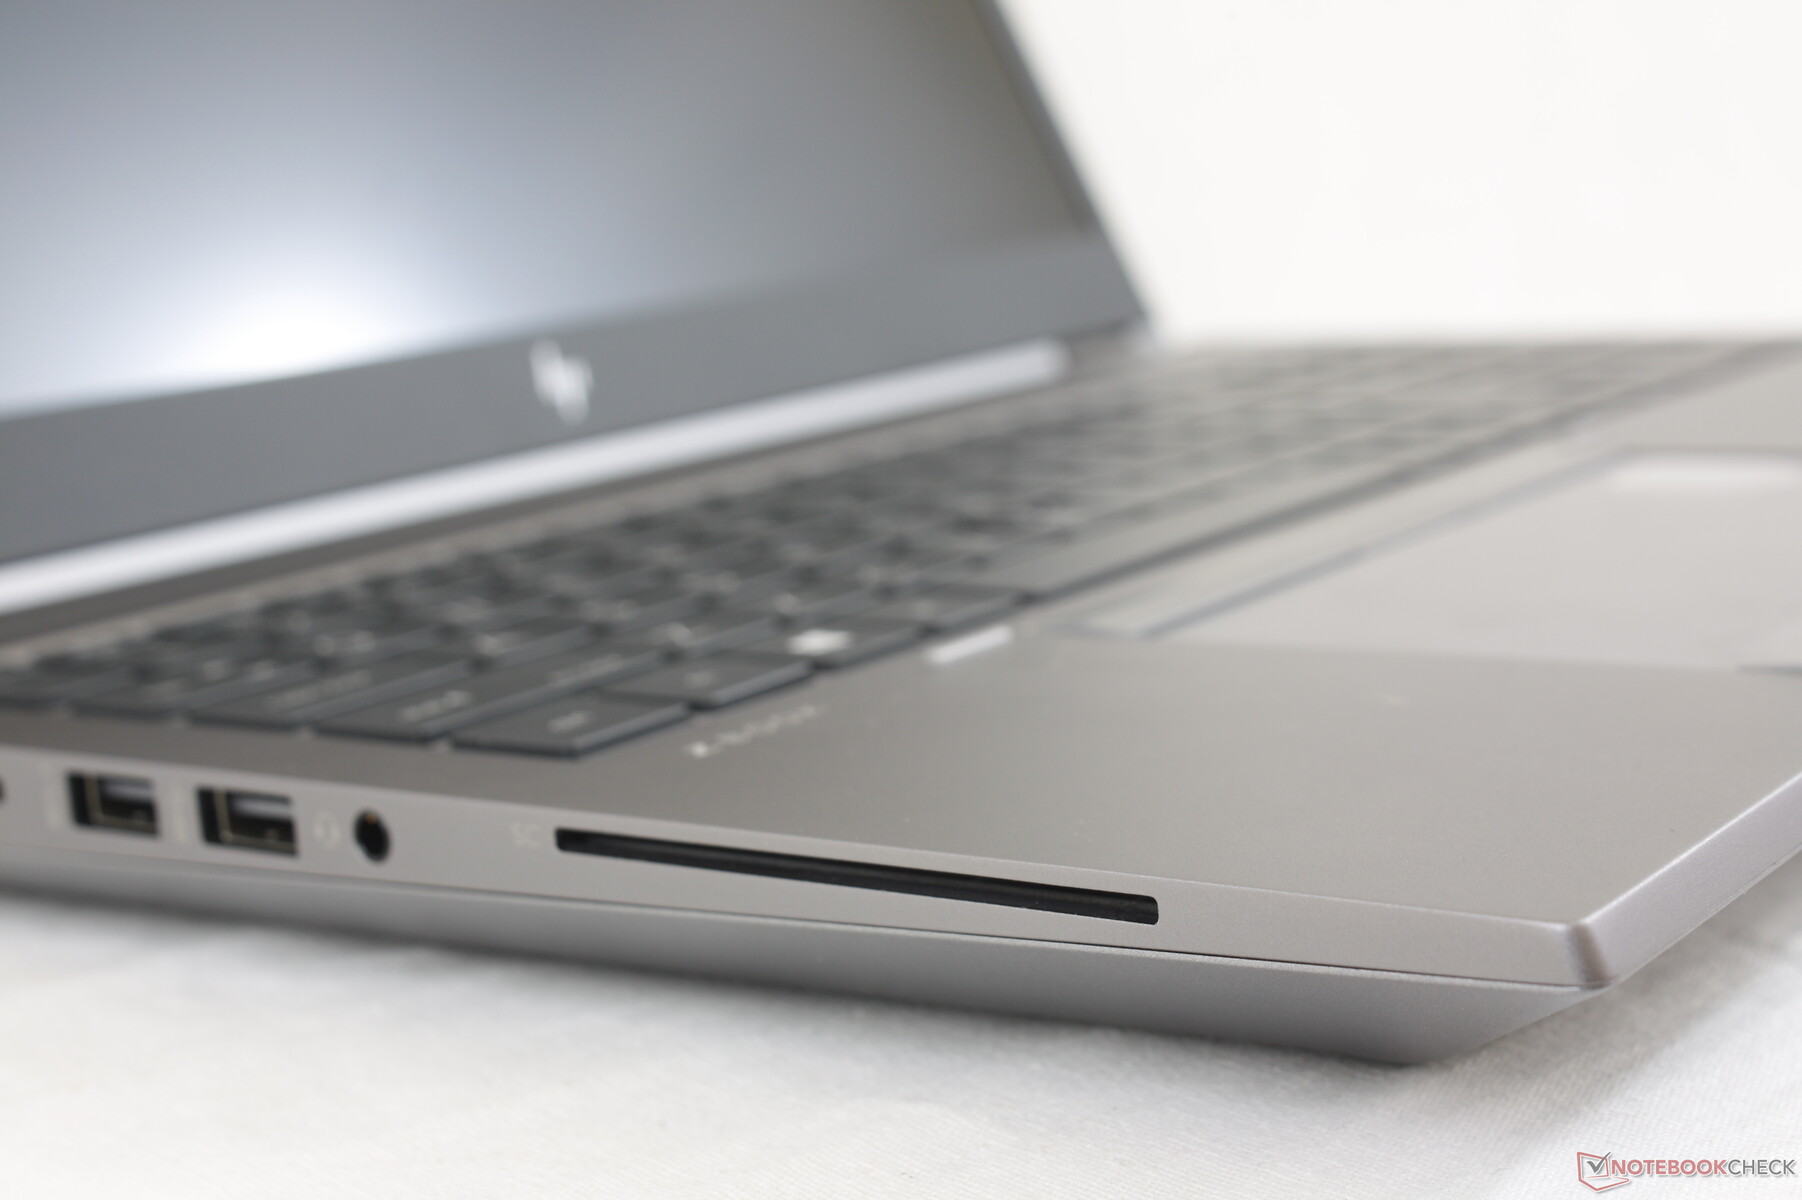
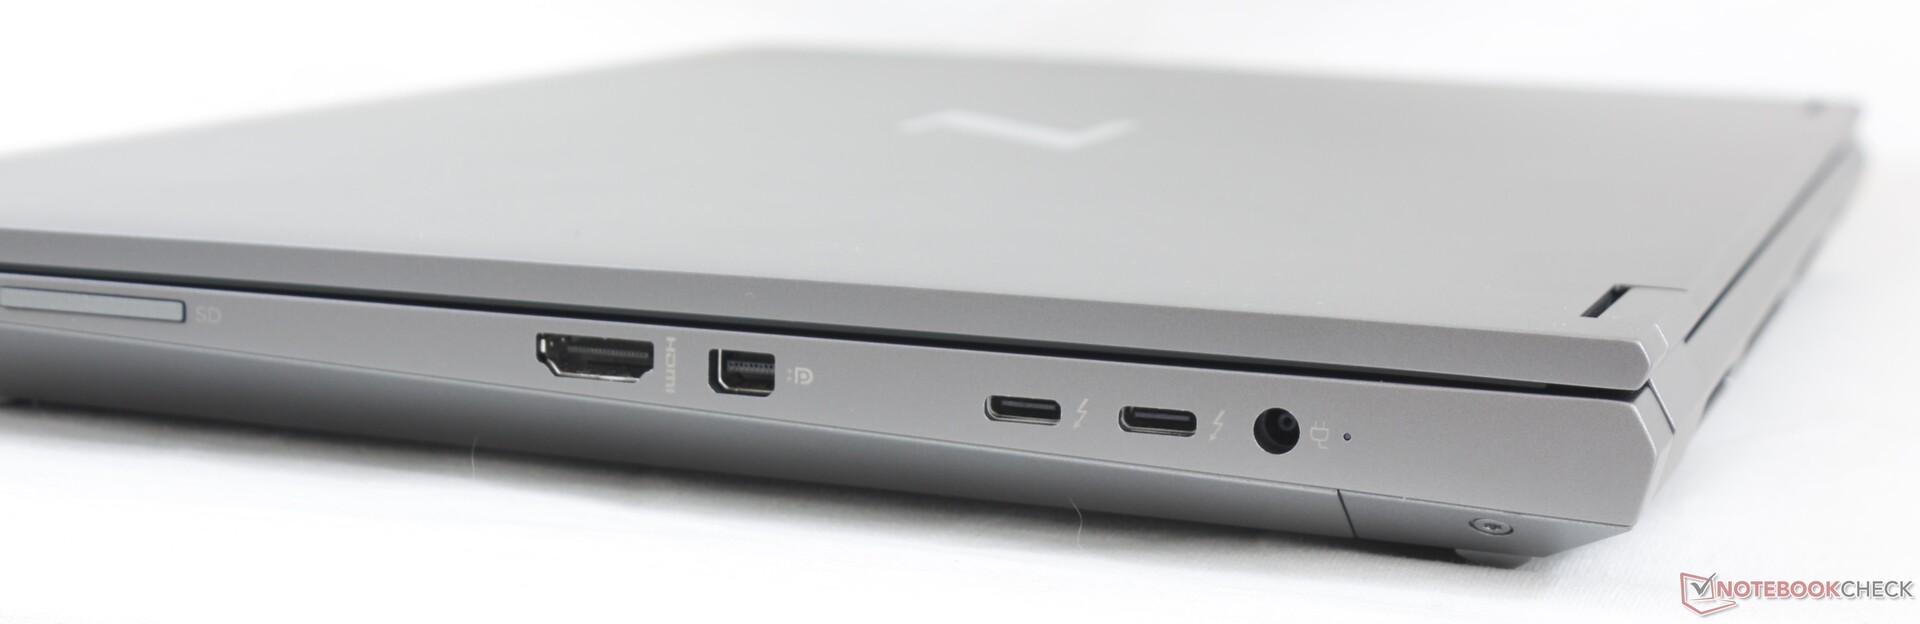
Connectivité
Les options portuaires sont nombreuses et identiques à celles du Dell Precision 7550. Le positionnement des ports est plus accessible sur le HP puisqu'il n'y en a pas le long du bord arrière.
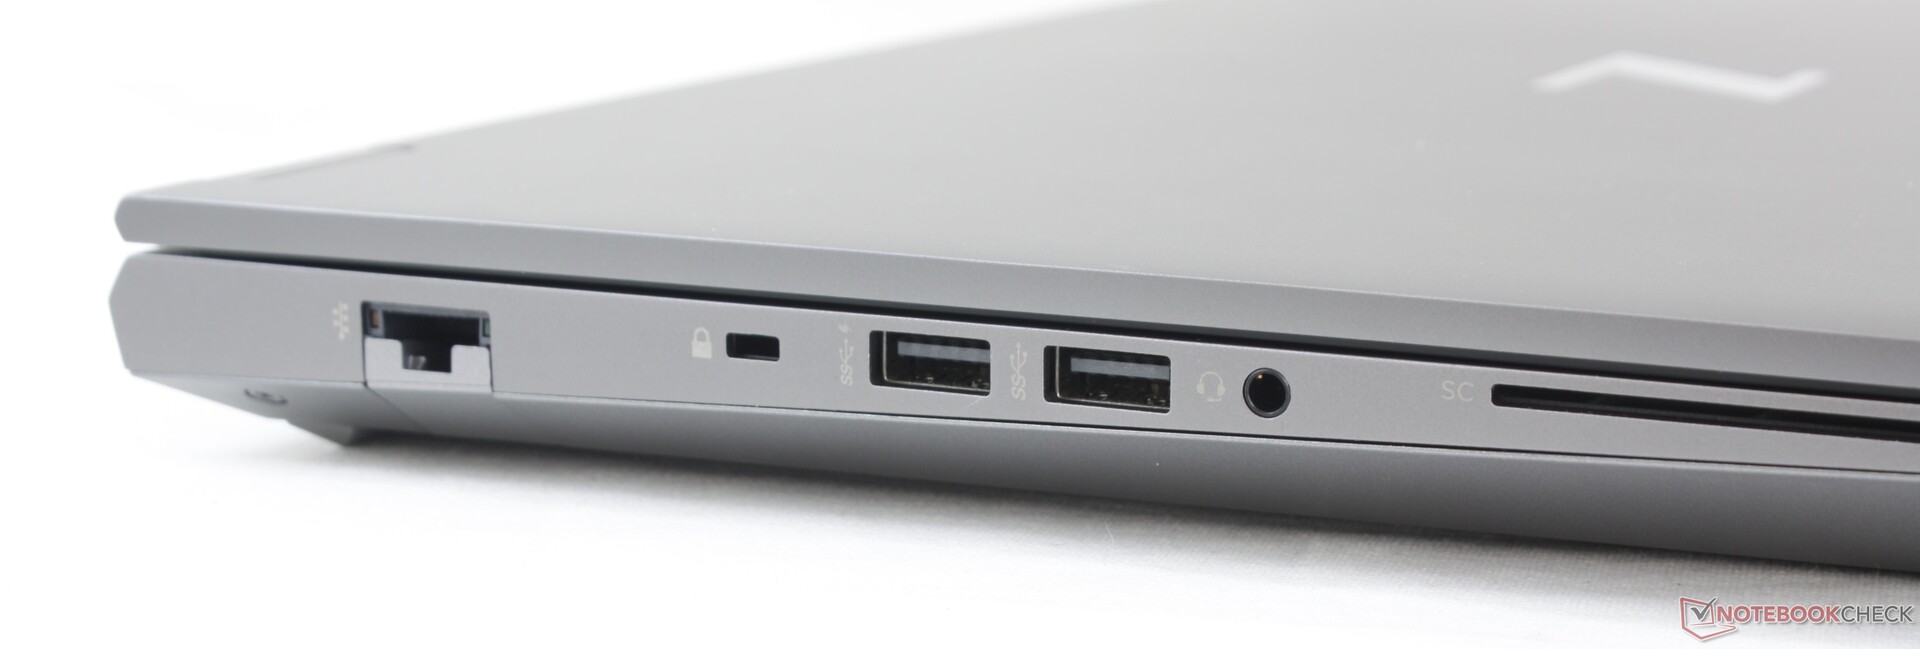
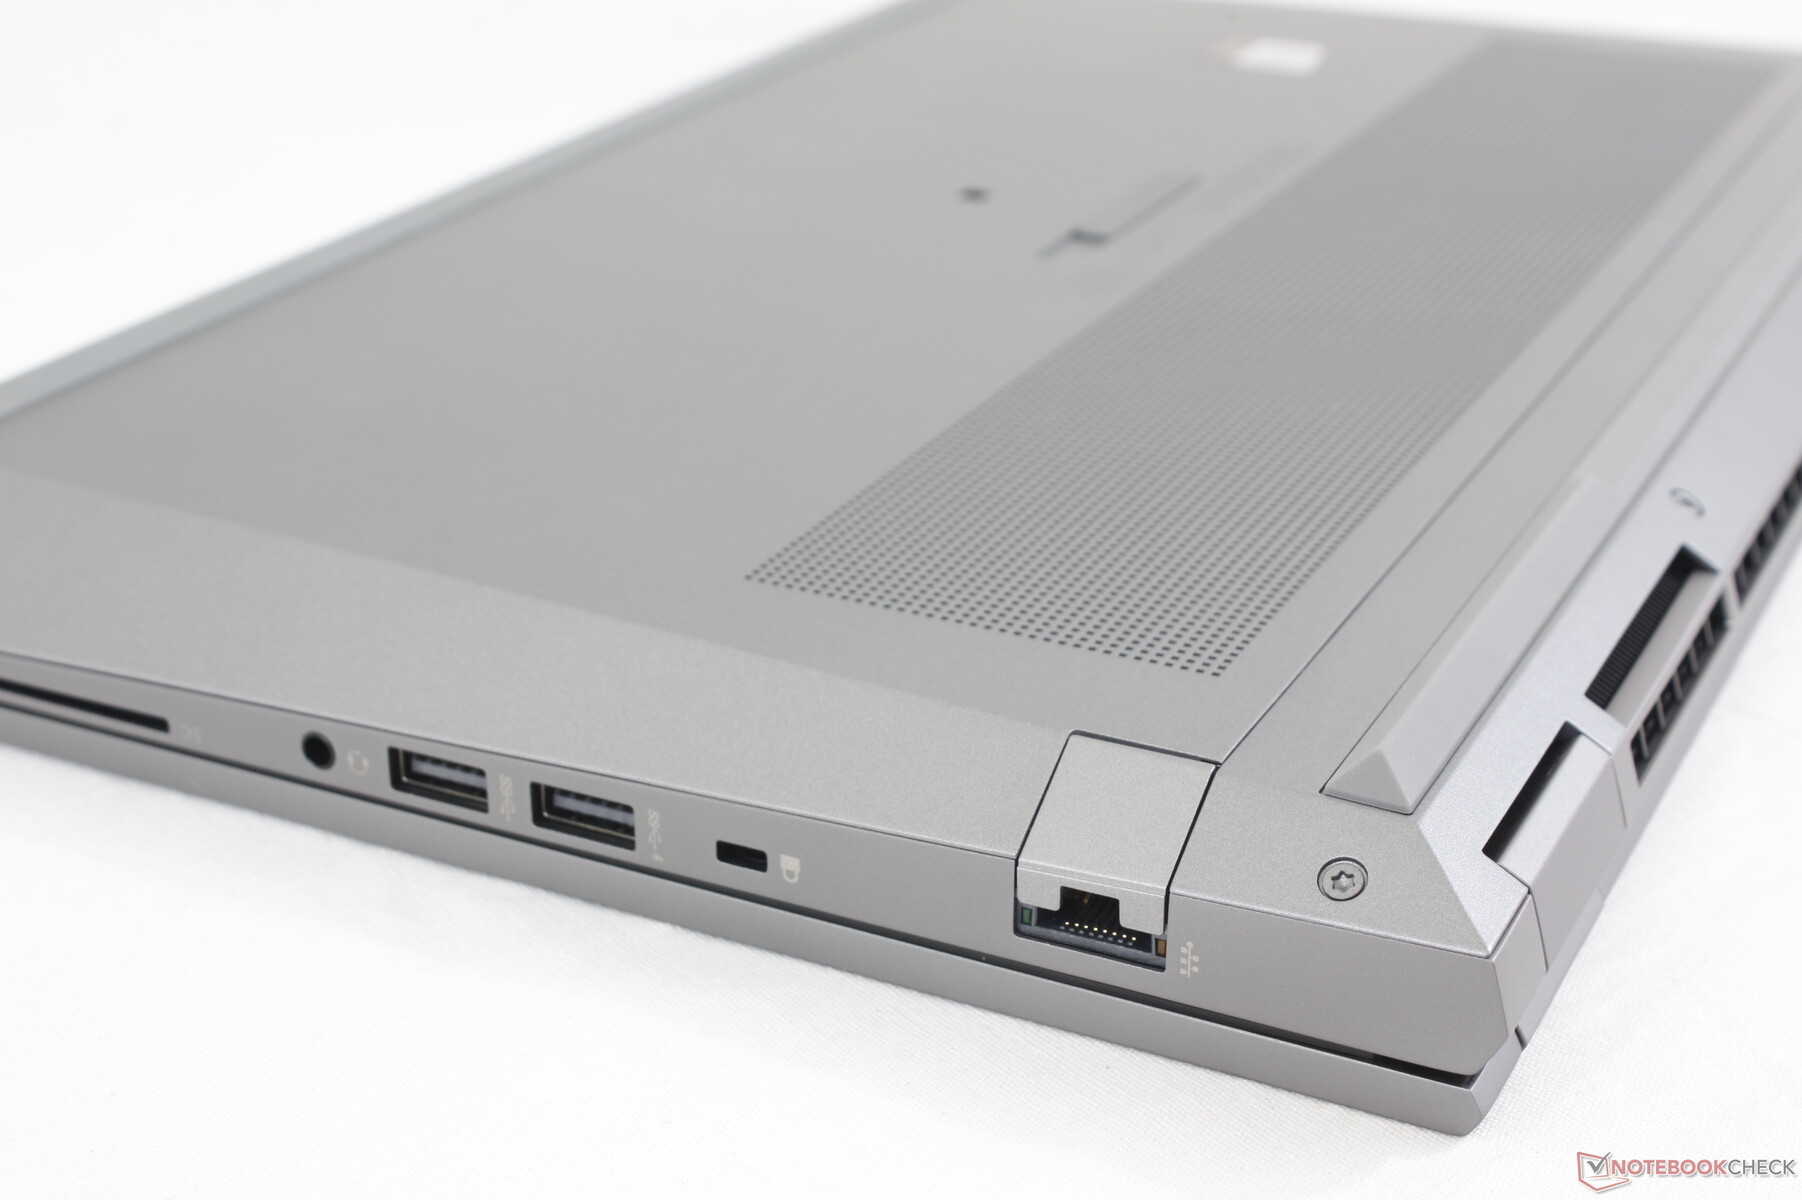
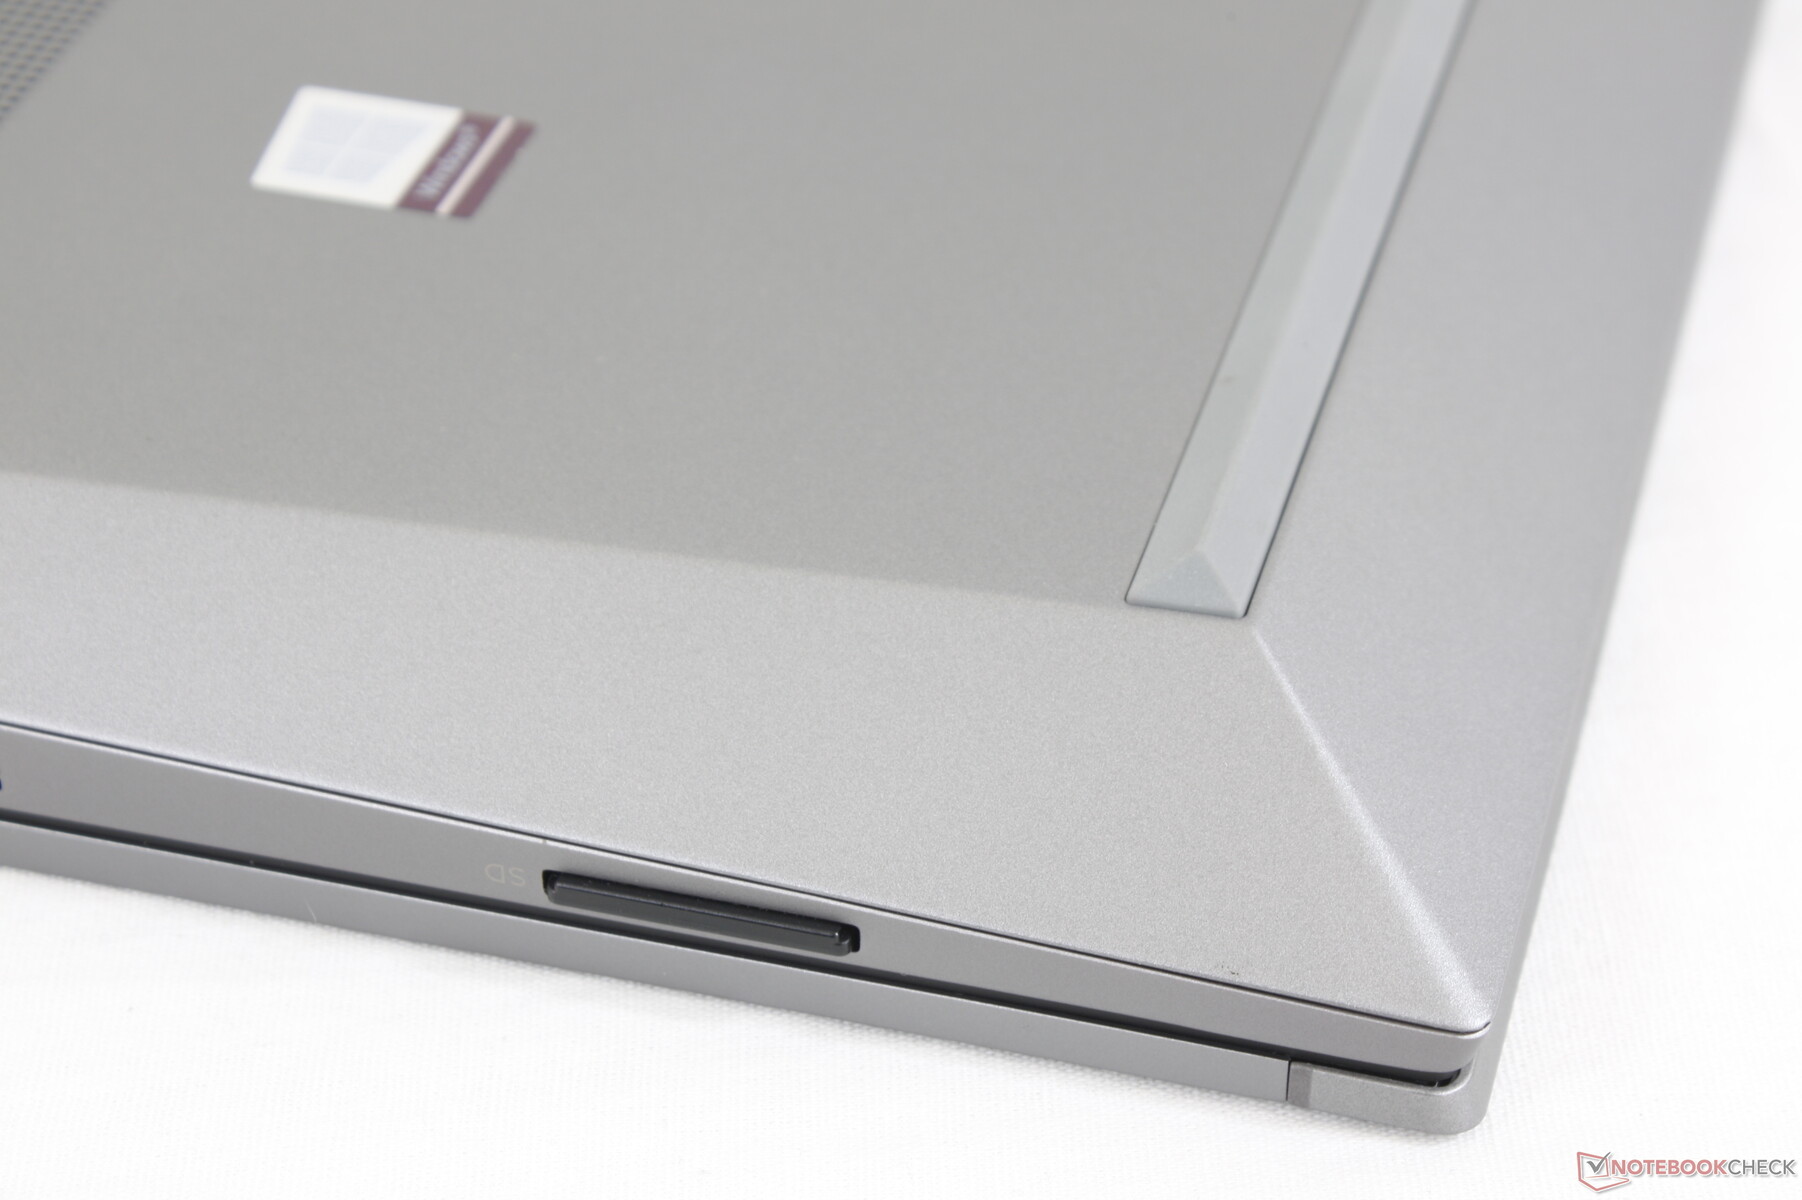
Lecteur de carte SD
Le lecteur de carte SD intégré offre des taux de transfert rapides. Le transfert de 1 Go d'images de notre carte UHS-II vers le bureau prend environ 6 secondes pour être en ligne avec la plupart des autres postes de travail haut de gamme.
| SD Card Reader | |
| average JPG Copy Test (av. of 3 runs) | |
| MSI WS66 10TMT-207US (Toshiba Exceria Pro SDXC 64 GB UHS-II) | |
| Dell Precision 7550 (Toshiba Exceria Pro SDXC 64 GB UHS-II) | |
| Lenovo ThinkPad P1 2019-20QT000RGE (Toshiba Exceria Pro SDXC 64 GB UHS-II) | |
| HP ZBook Fury 15 G7 (Toshiba Exceria Pro SDXC 64 GB UHS-II) | |
| Razer Blade 15 Studio Edition 2020 (Toshiba Exceria Pro SDXC 64 GB UHS-II) | |
| maximum AS SSD Seq Read Test (1GB) | |
| MSI WS66 10TMT-207US (Toshiba Exceria Pro SDXC 64 GB UHS-II) | |
| HP ZBook Fury 15 G7 (Toshiba Exceria Pro SDXC 64 GB UHS-II) | |
| Lenovo ThinkPad P1 2019-20QT000RGE (Toshiba Exceria Pro SDXC 64 GB UHS-II) | |
| Dell Precision 7550 (Toshiba Exceria Pro SDXC 64 GB UHS-II) | |
Communication
L'Intel AX201 est livré en standard pour la connectivité Wi-Fi 6 et Bluetooth 5.1. Nous n'avons rencontré aucun problème lorsqu'il a été couplé à notre routeur de test Netgear RAX200. Les taux de transfert moyens varient en fonction de l'environnement.
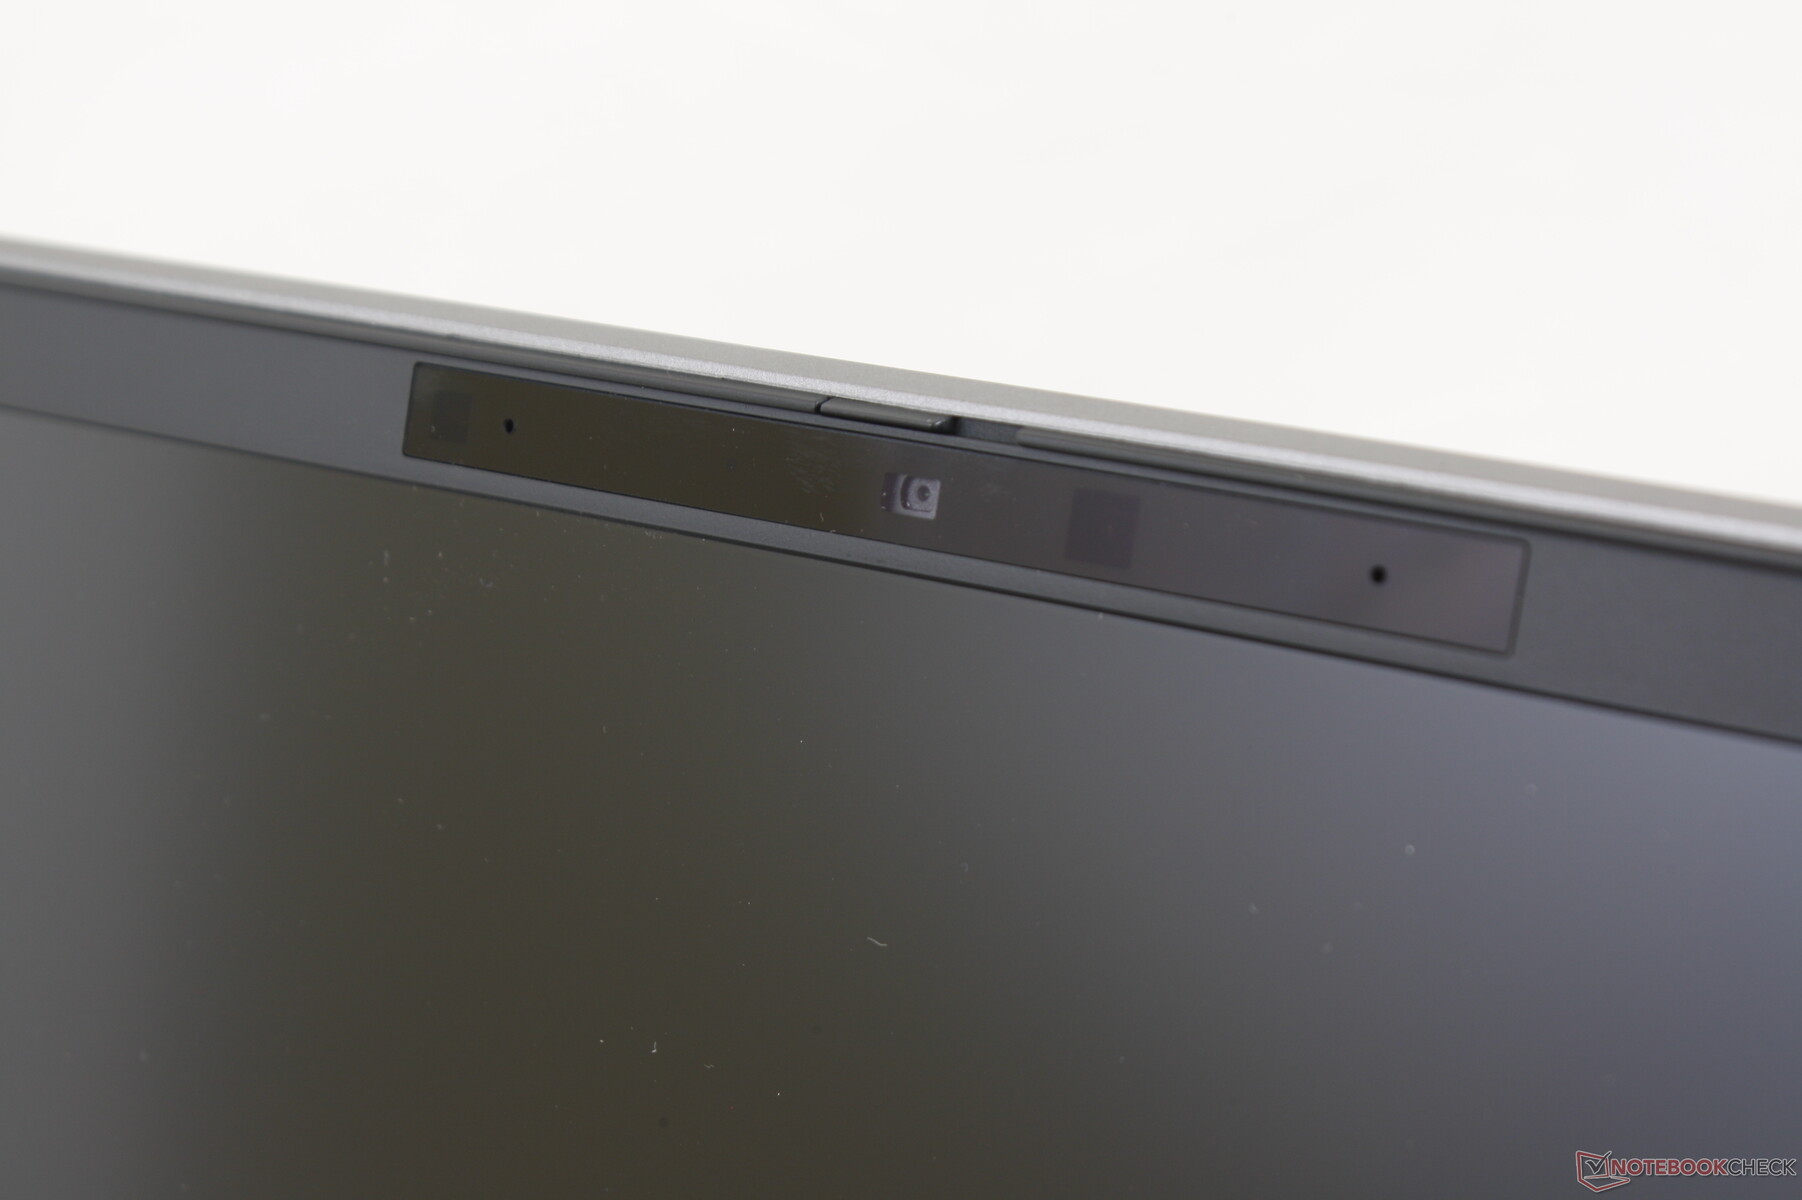
Webcam


Maintenance
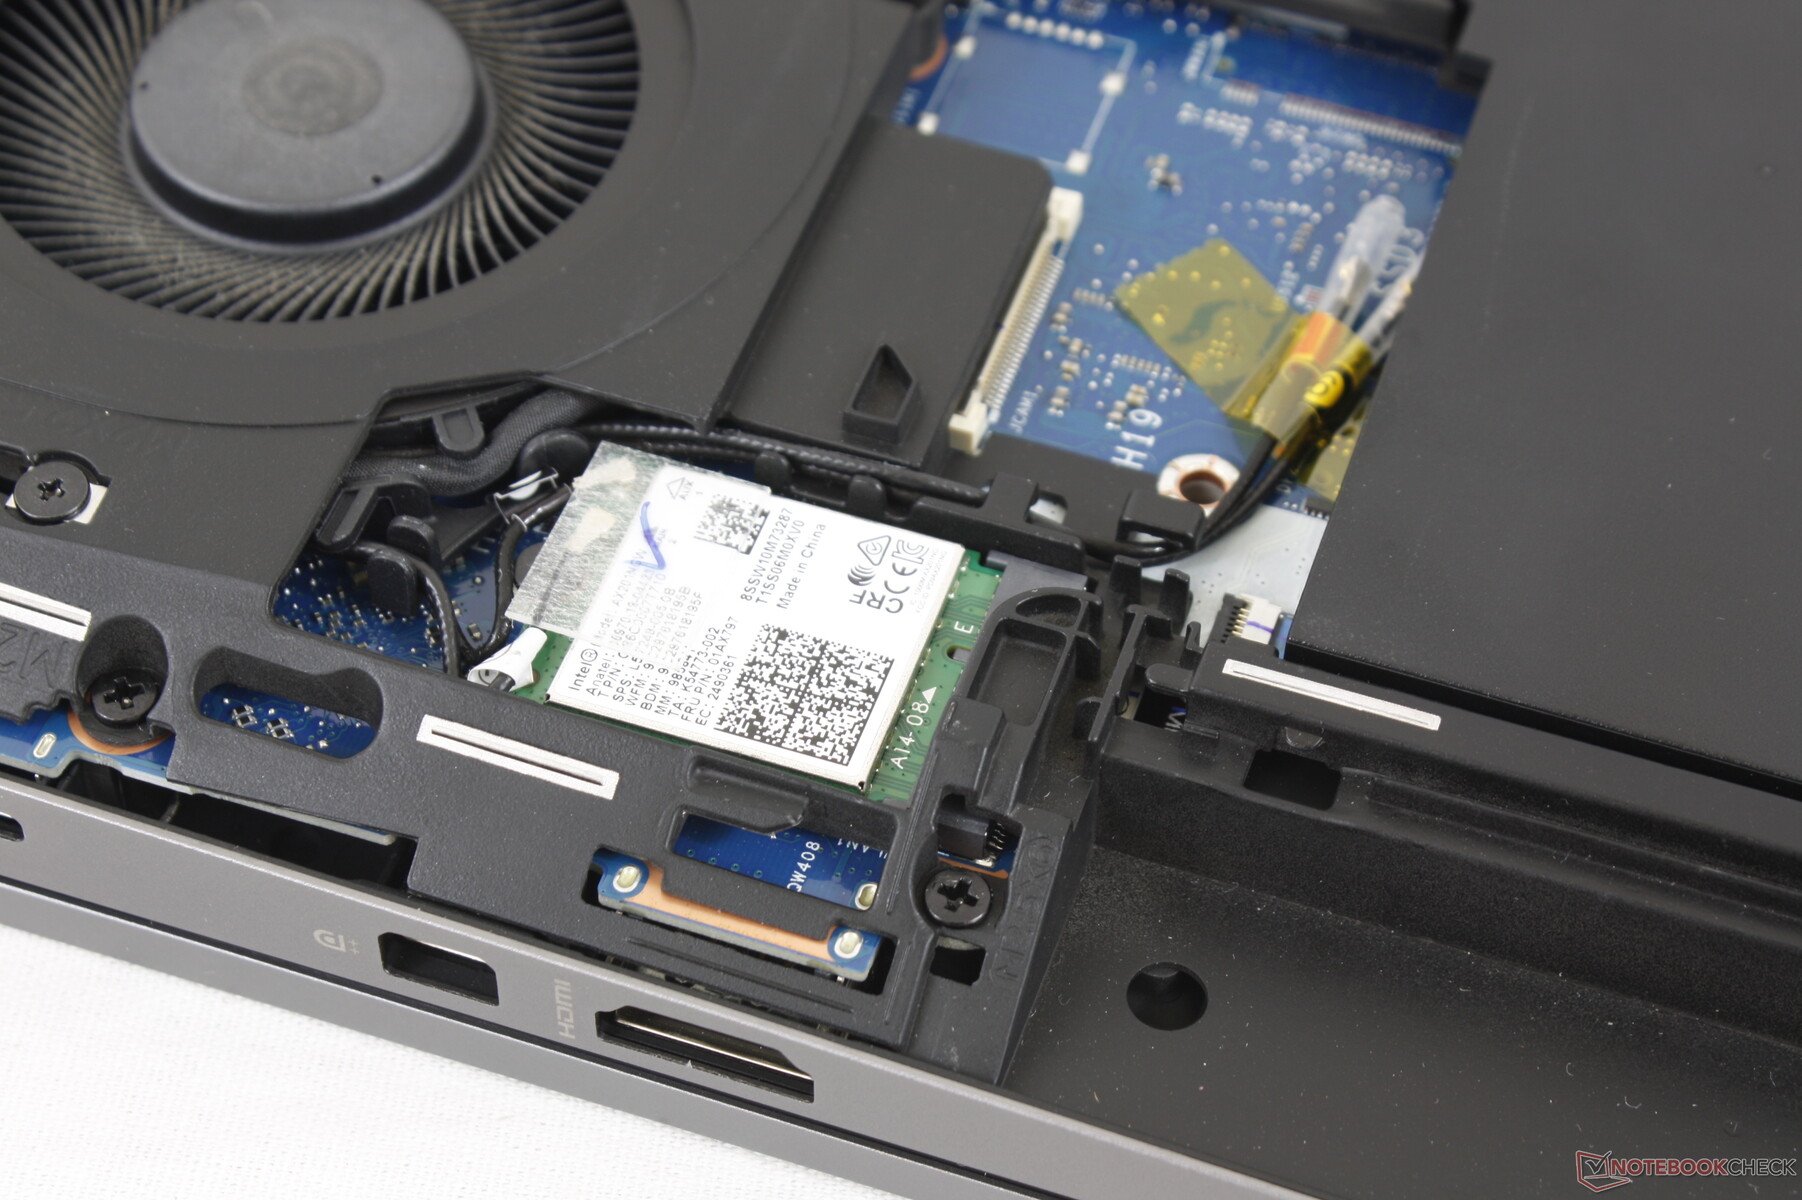
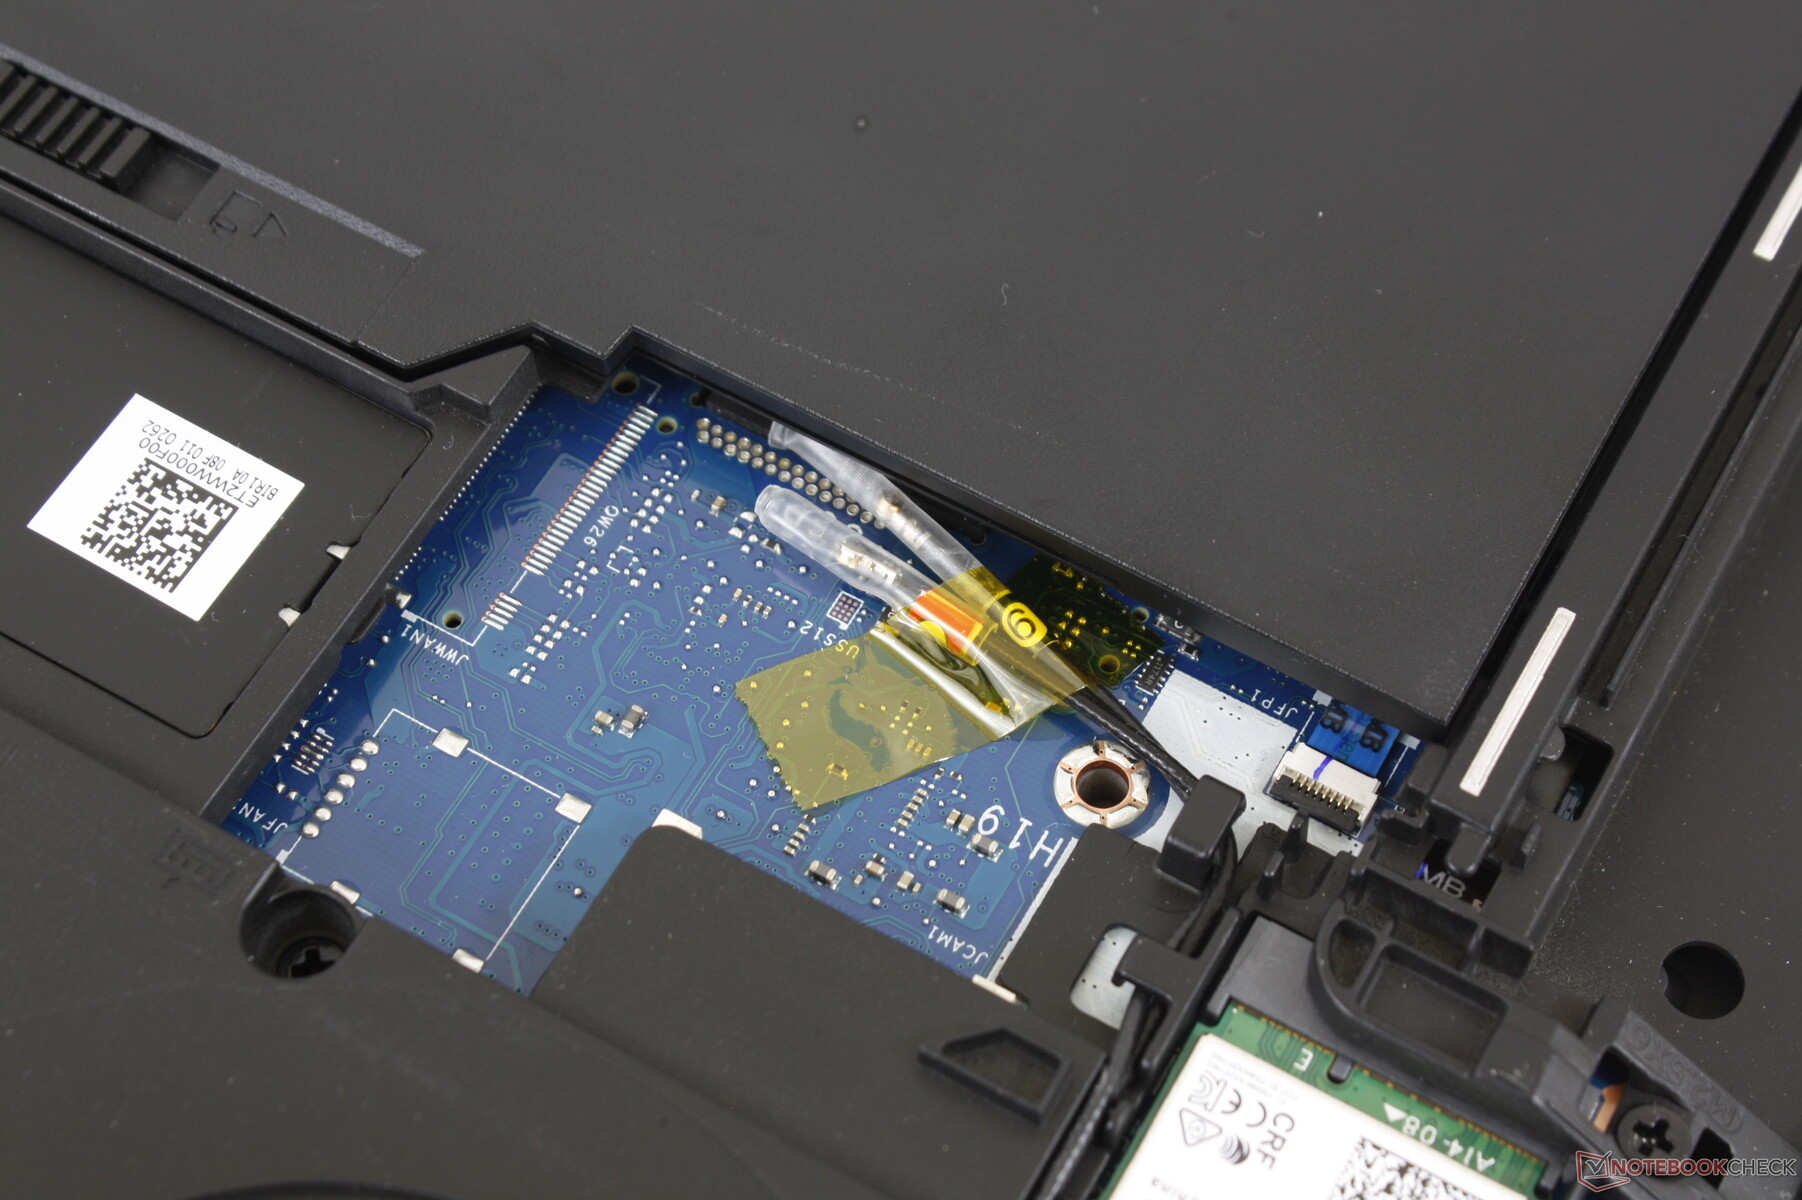
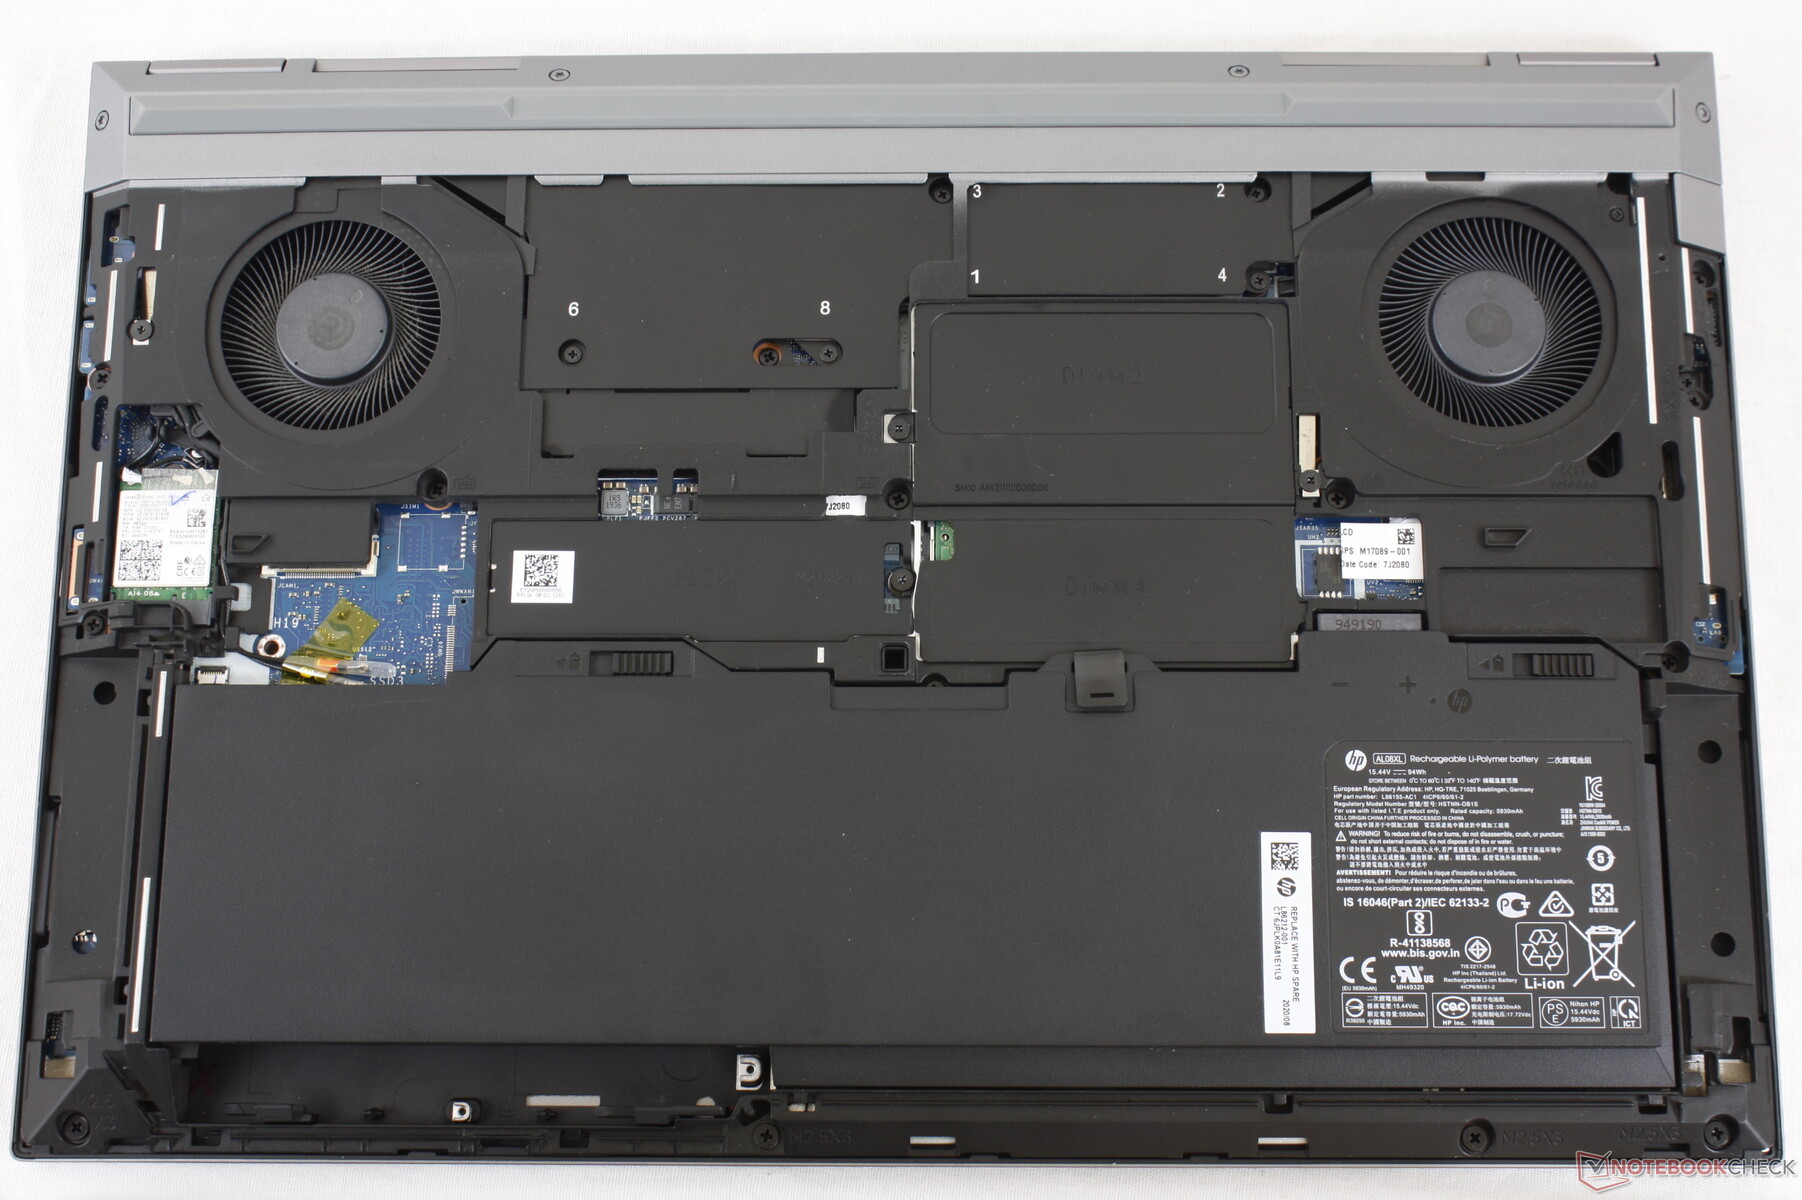
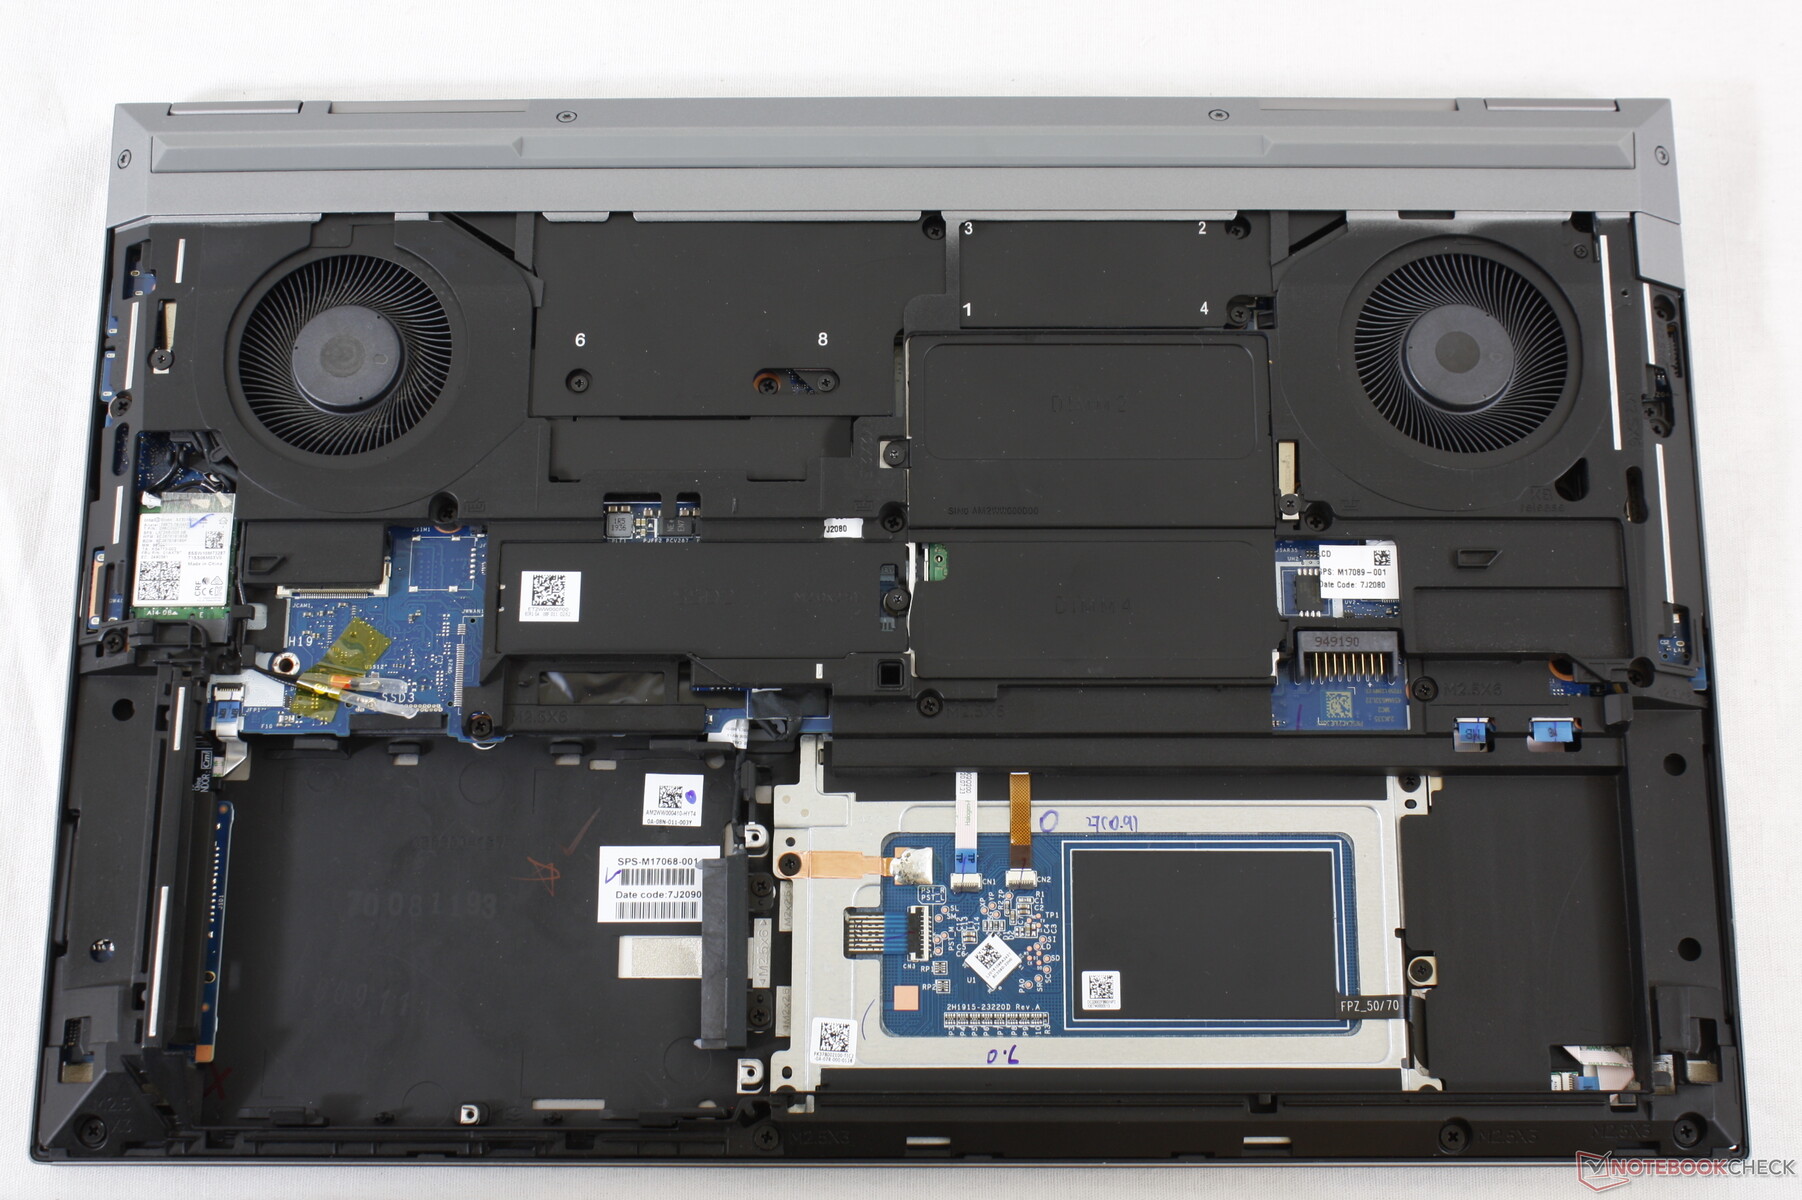
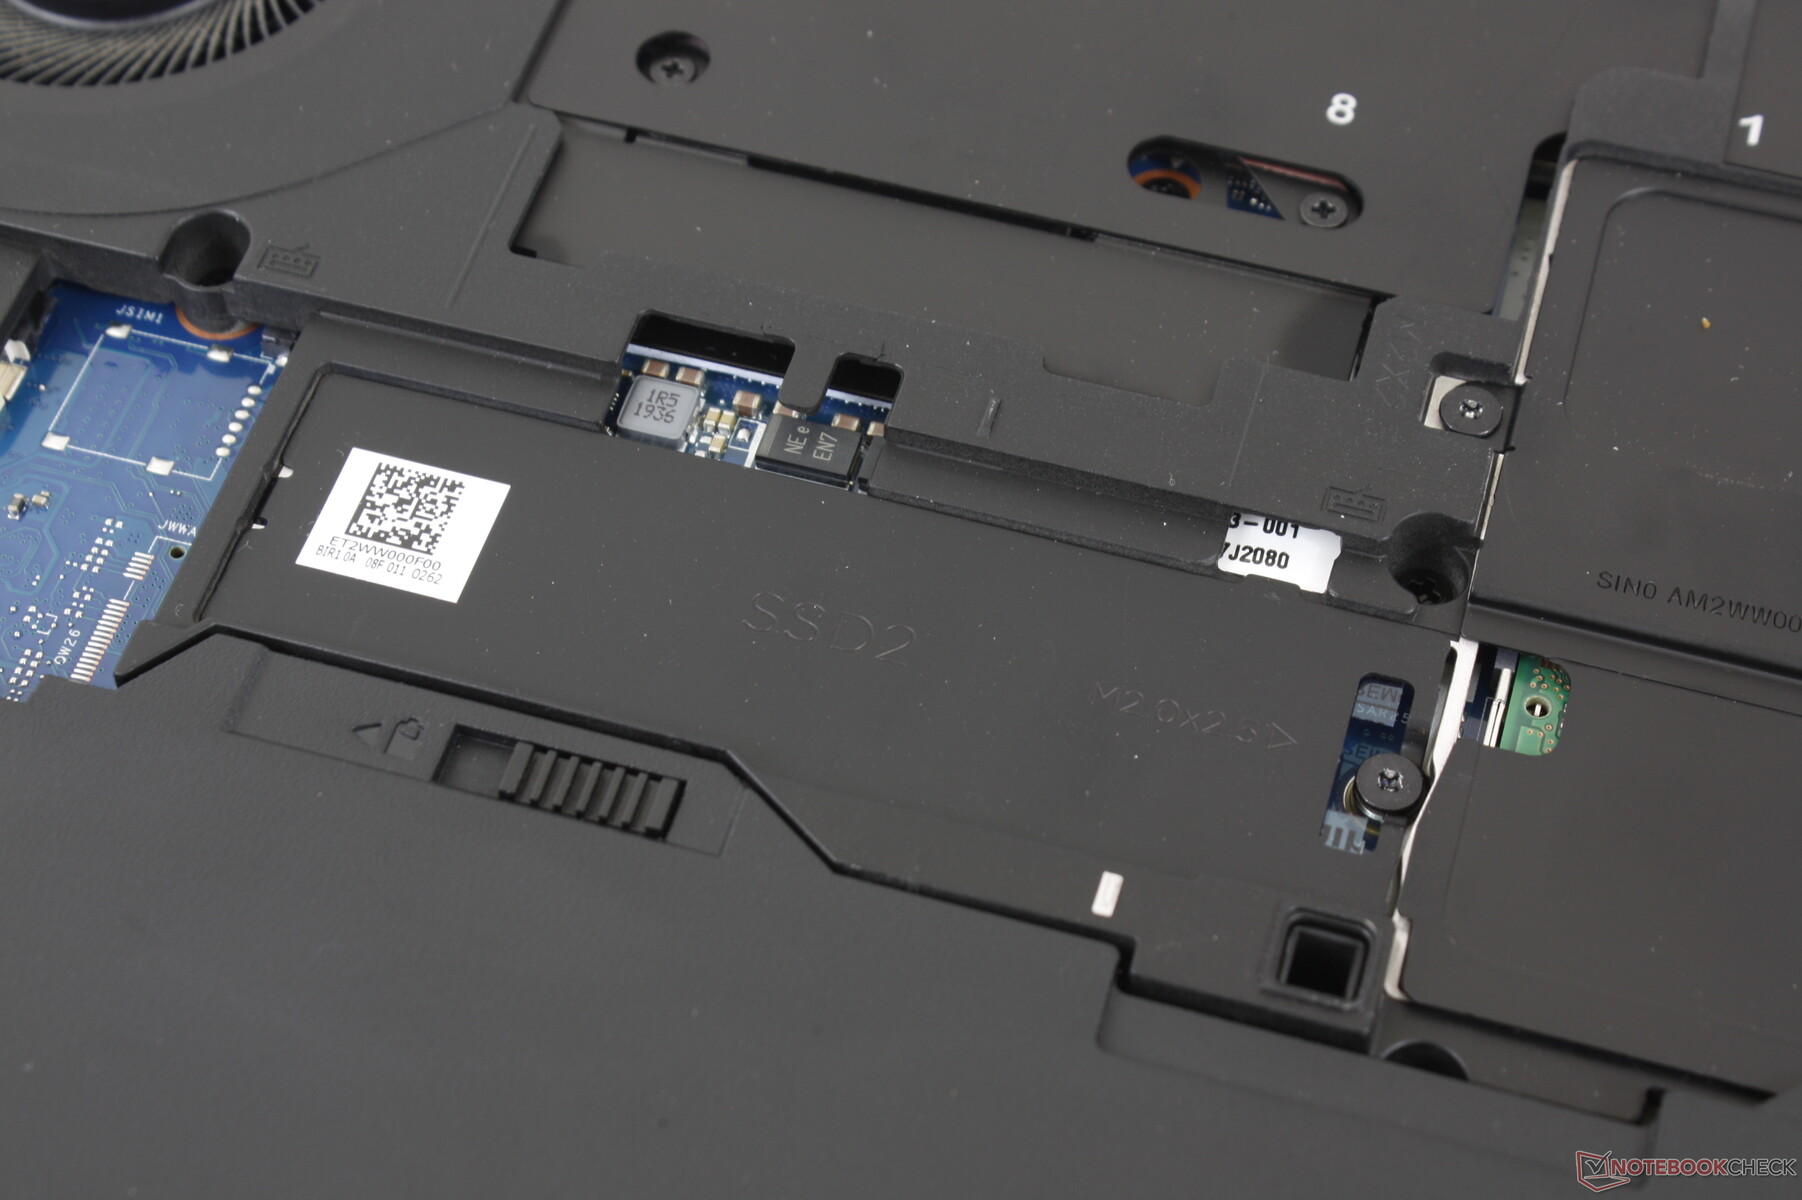
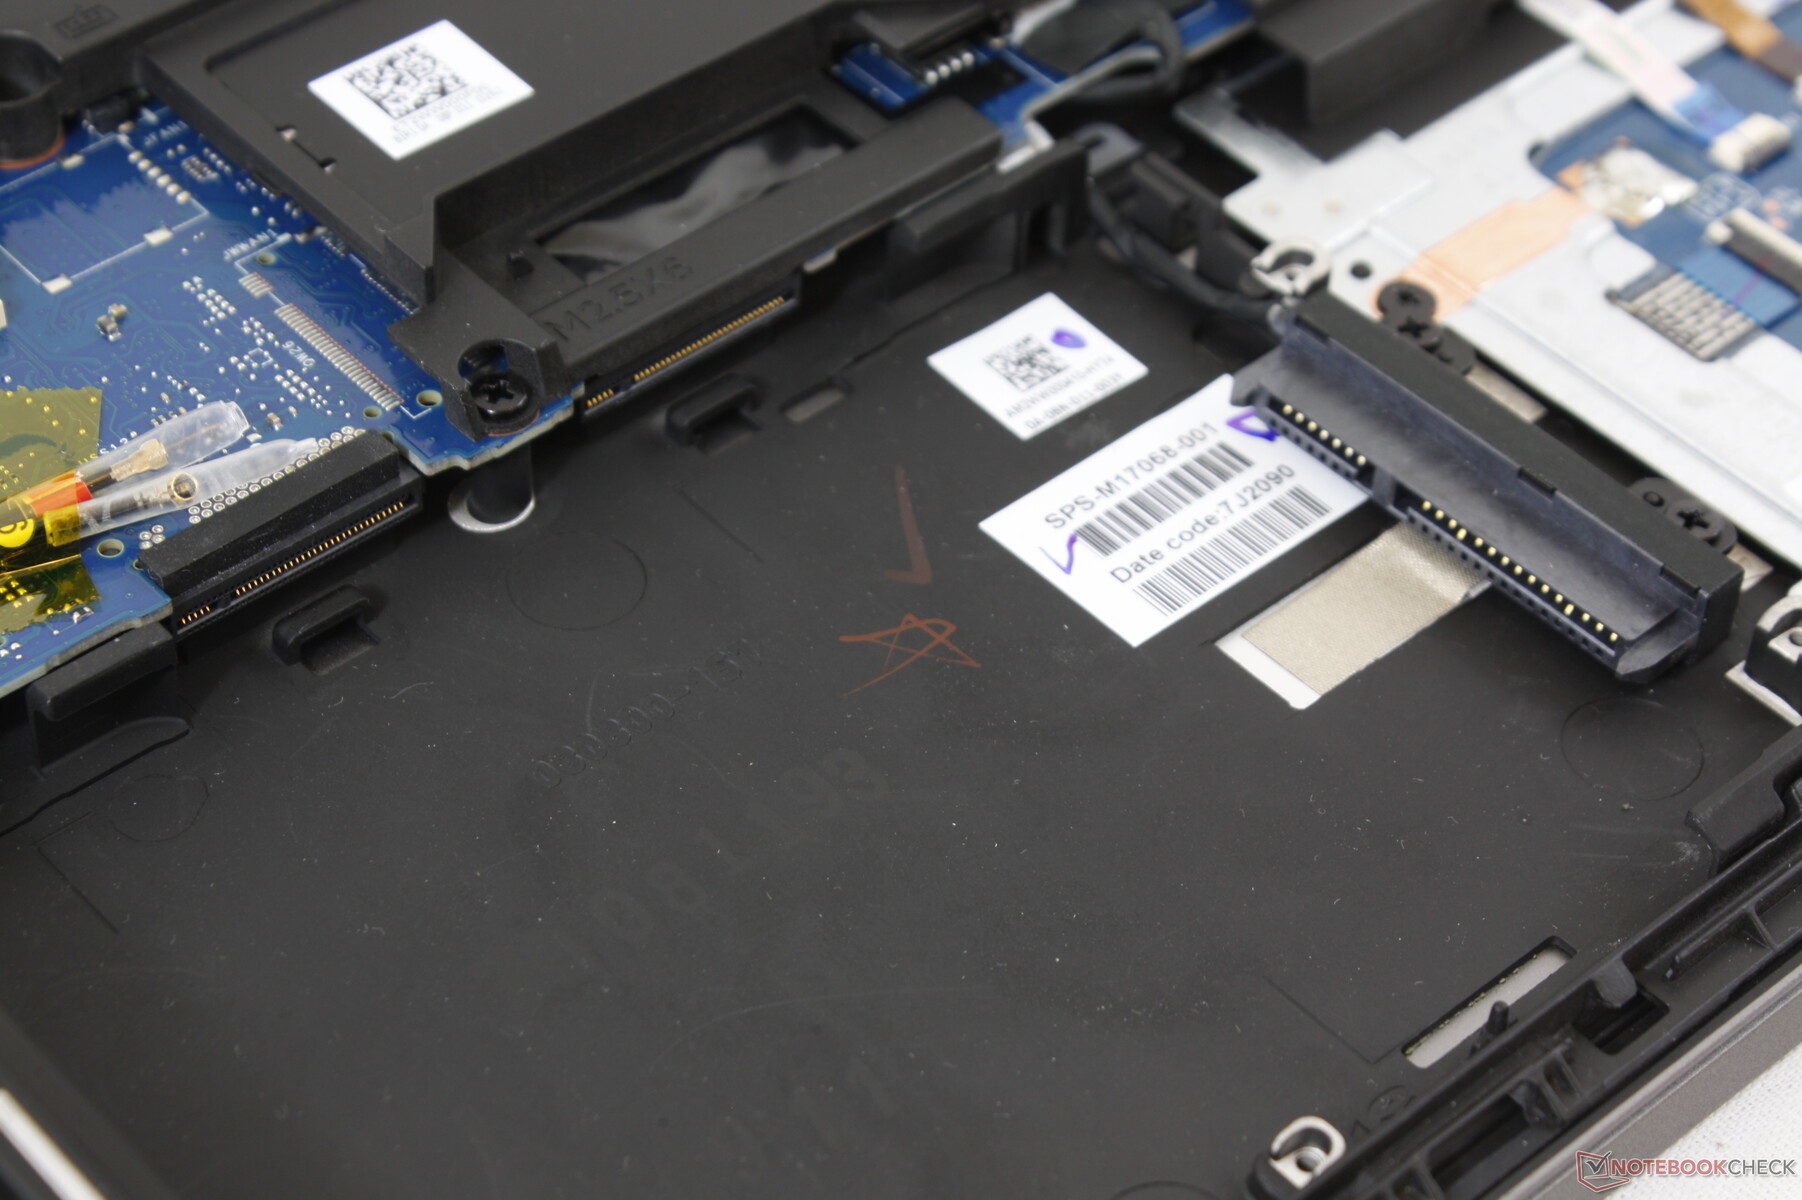
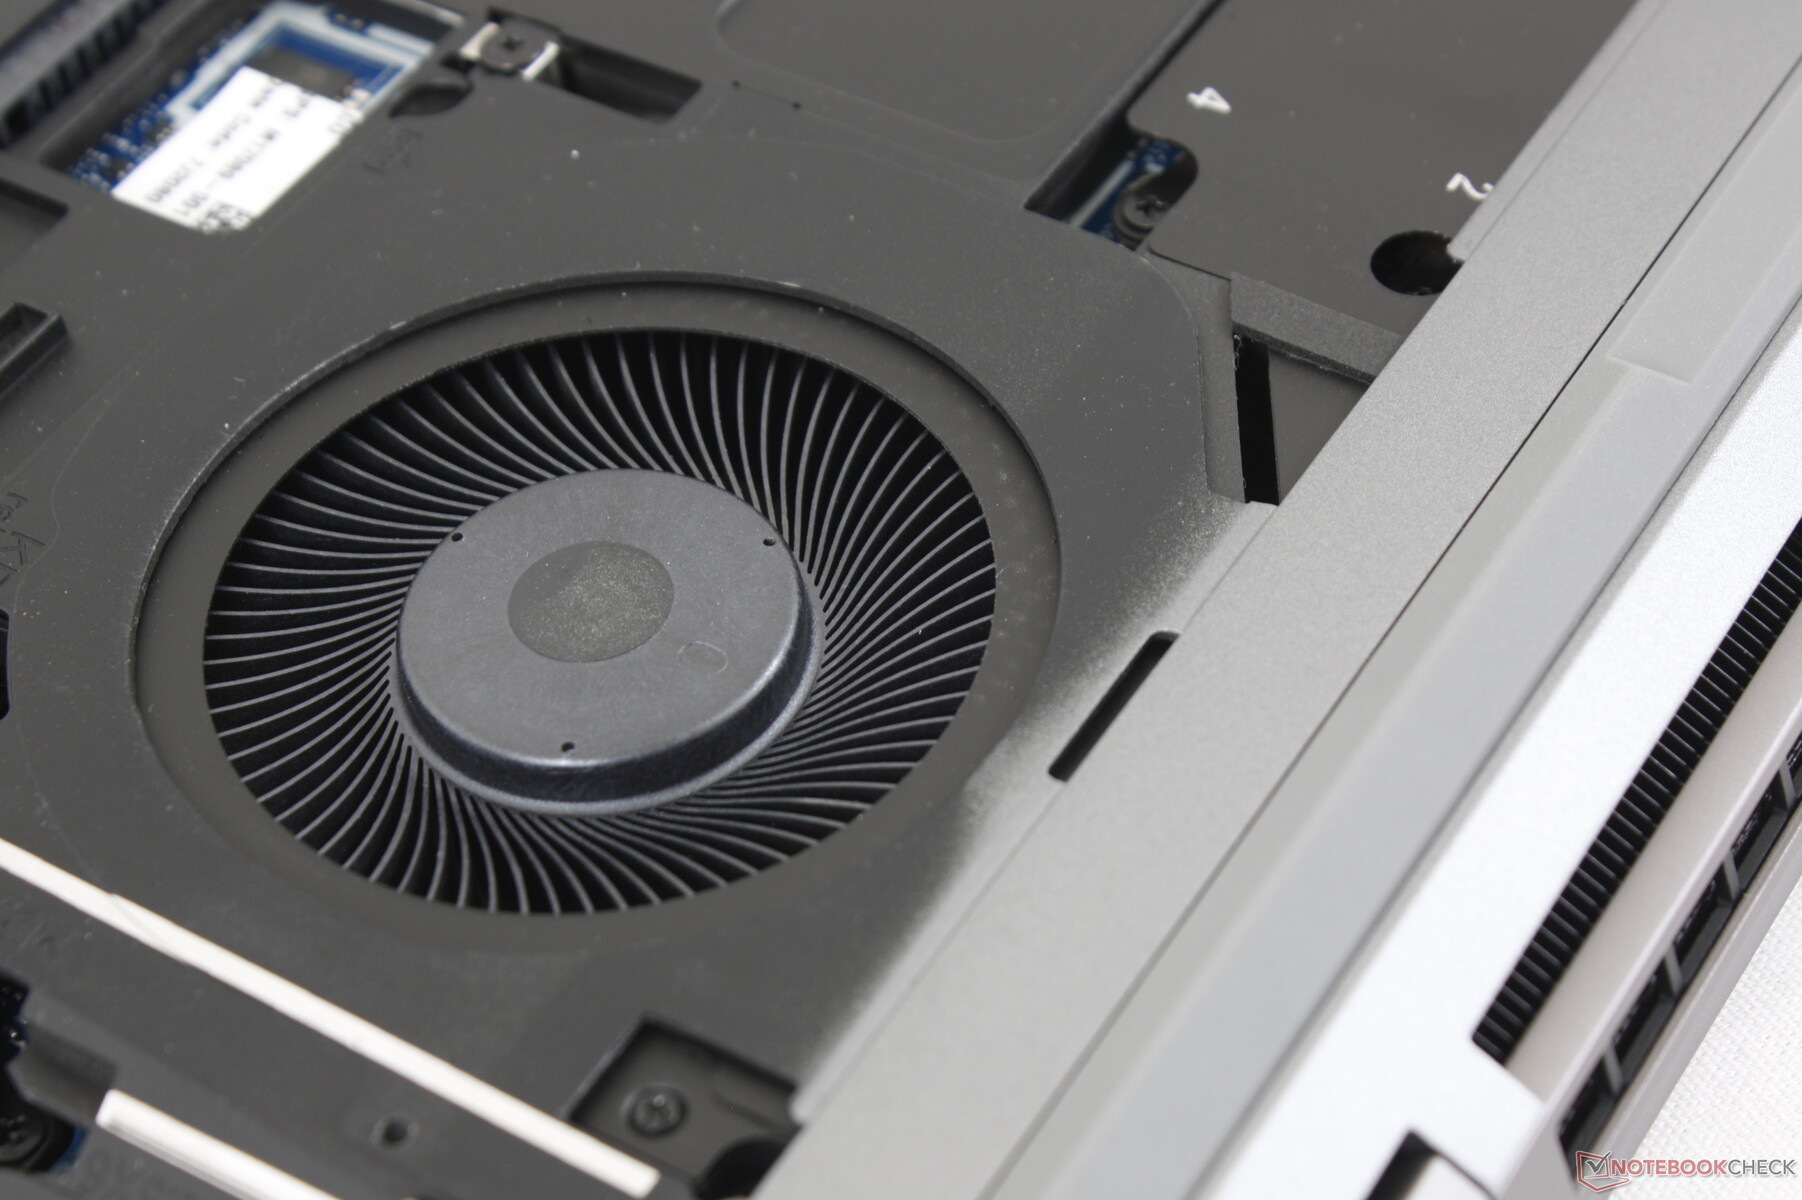
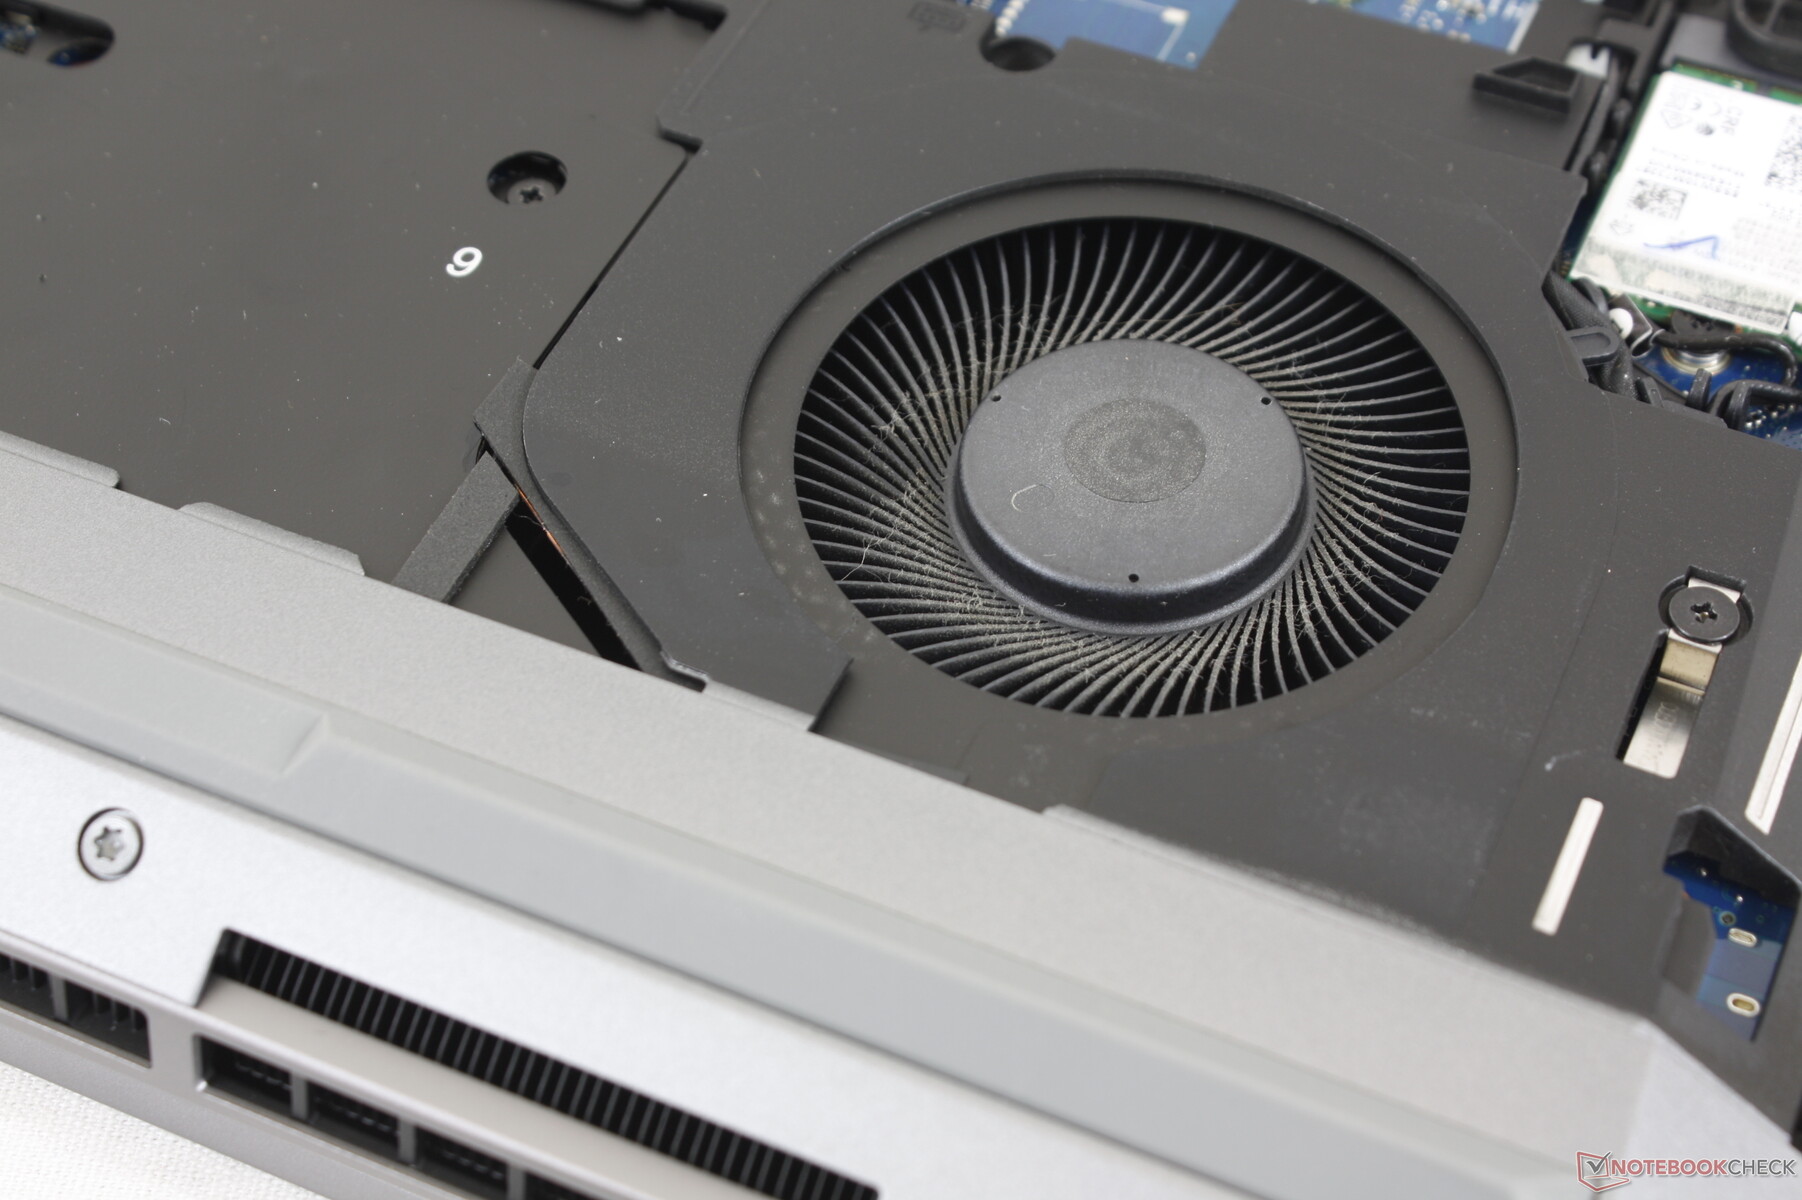
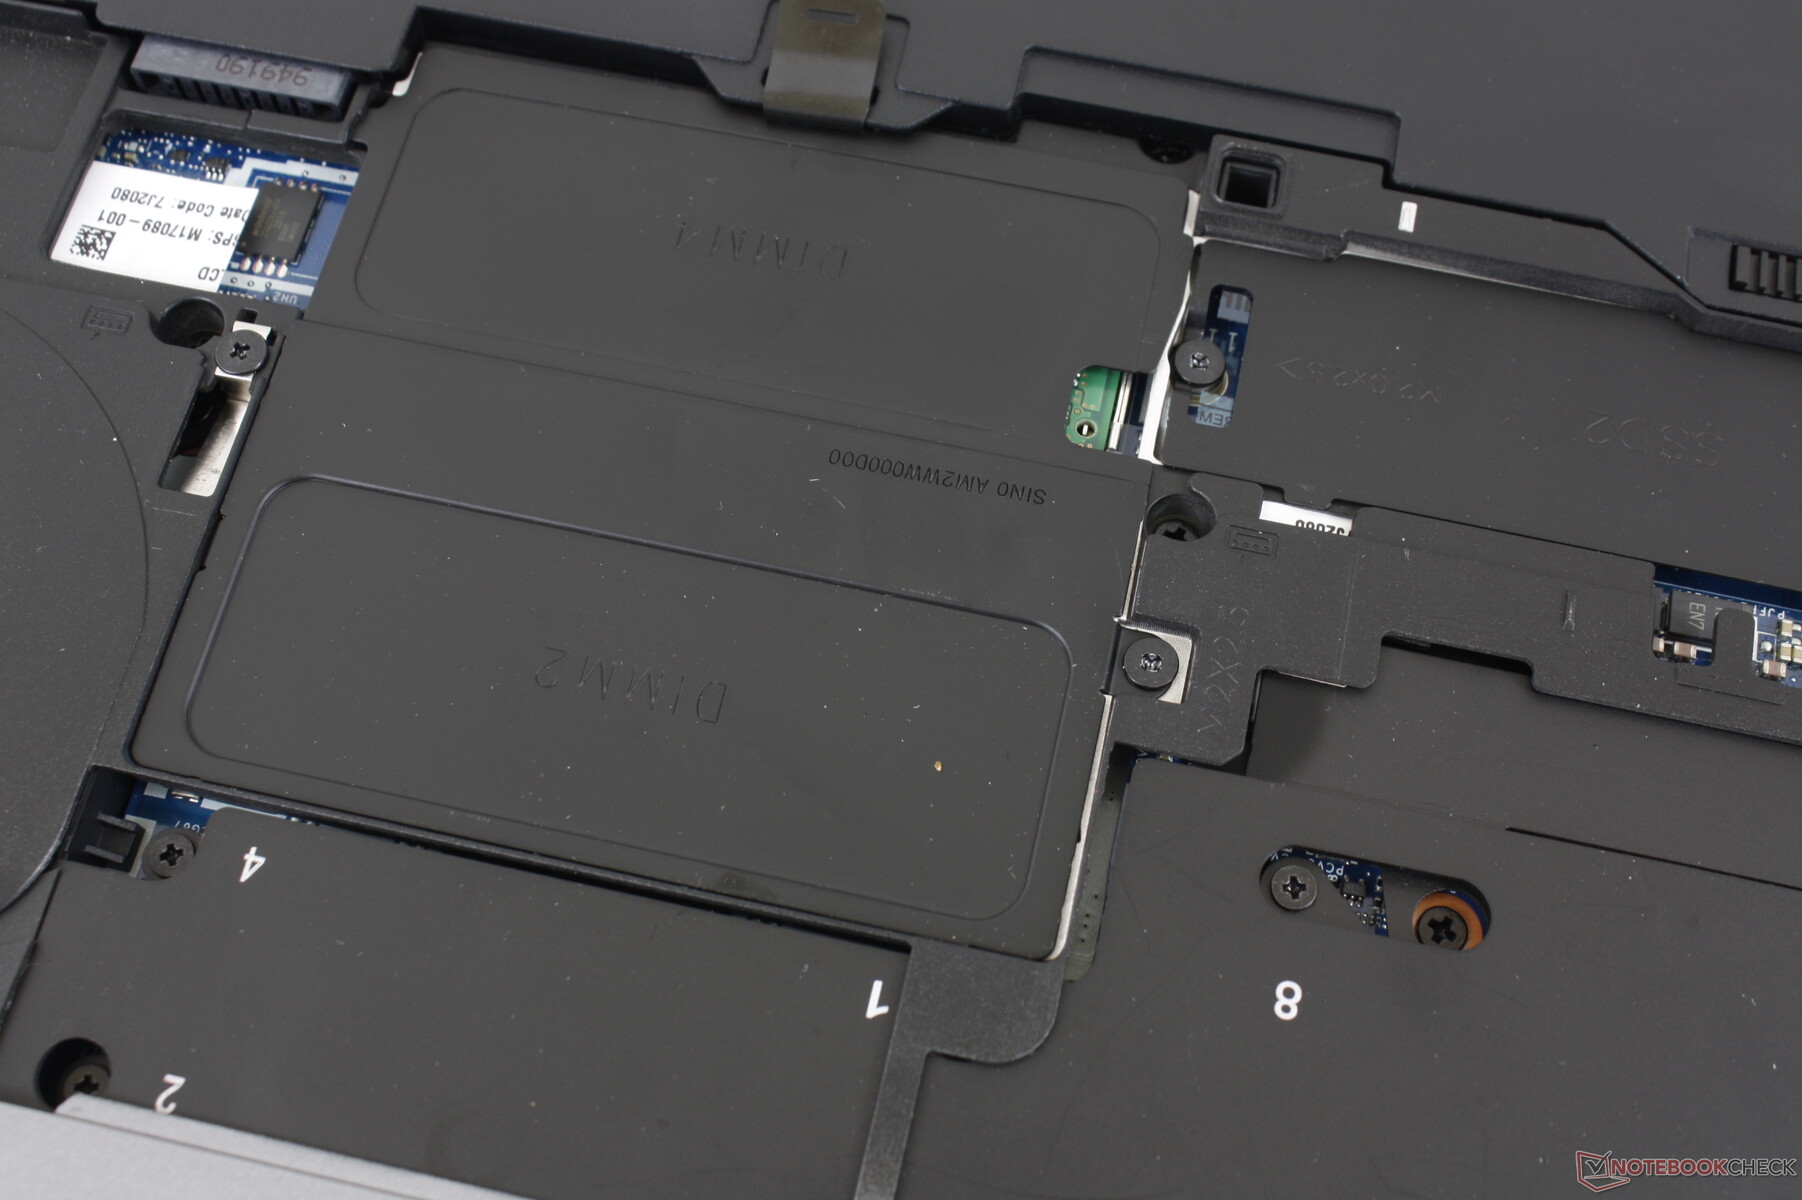
HP fait la publicité d'un entretien "sans outil" car le panneau inférieur et la batterie principale peuvent être facilement retirés en désengageant quelques loquets. Nous aimons absolument cette approche et nous pensons que davantage d'équipementiers devraient mettre en place quelque chose de similaire pour leurs ordinateurs portables professionnels. Malheureusement, il y a un gros problème : un tournevis est toujours nécessaire pour accéder à presque tout le reste. La mémoire vive et le stockage se trouvent derrière un blindage supplémentaire, ce qui signifie que la conception "sans outil" n'est pas tout à fait exacte.
De plus, les vis de fixation des emplacements RAM et SSD sont serrées et souples, ce qui signifie qu'elles peuvent sortir plus facilement. Nous avons démonté de nombreux ordinateurs portables dans nos laboratoires et les vis de ce HP sont plus difficiles à enlever
Accessoires et garantie
Il n'y a pas d'autres suppléments dans la boîte que les documents habituels et l'adaptateur secteur. Néanmoins, il existe de nombreuses stations d'accueil et accessoires en option, dont la station d'accueil HP Thunderbolt Dock.
Une garantie limitée de trois ans est fournie en standard avec des options d'extension si elle est commandée directement auprès de HP.
Dispositifs de saisie
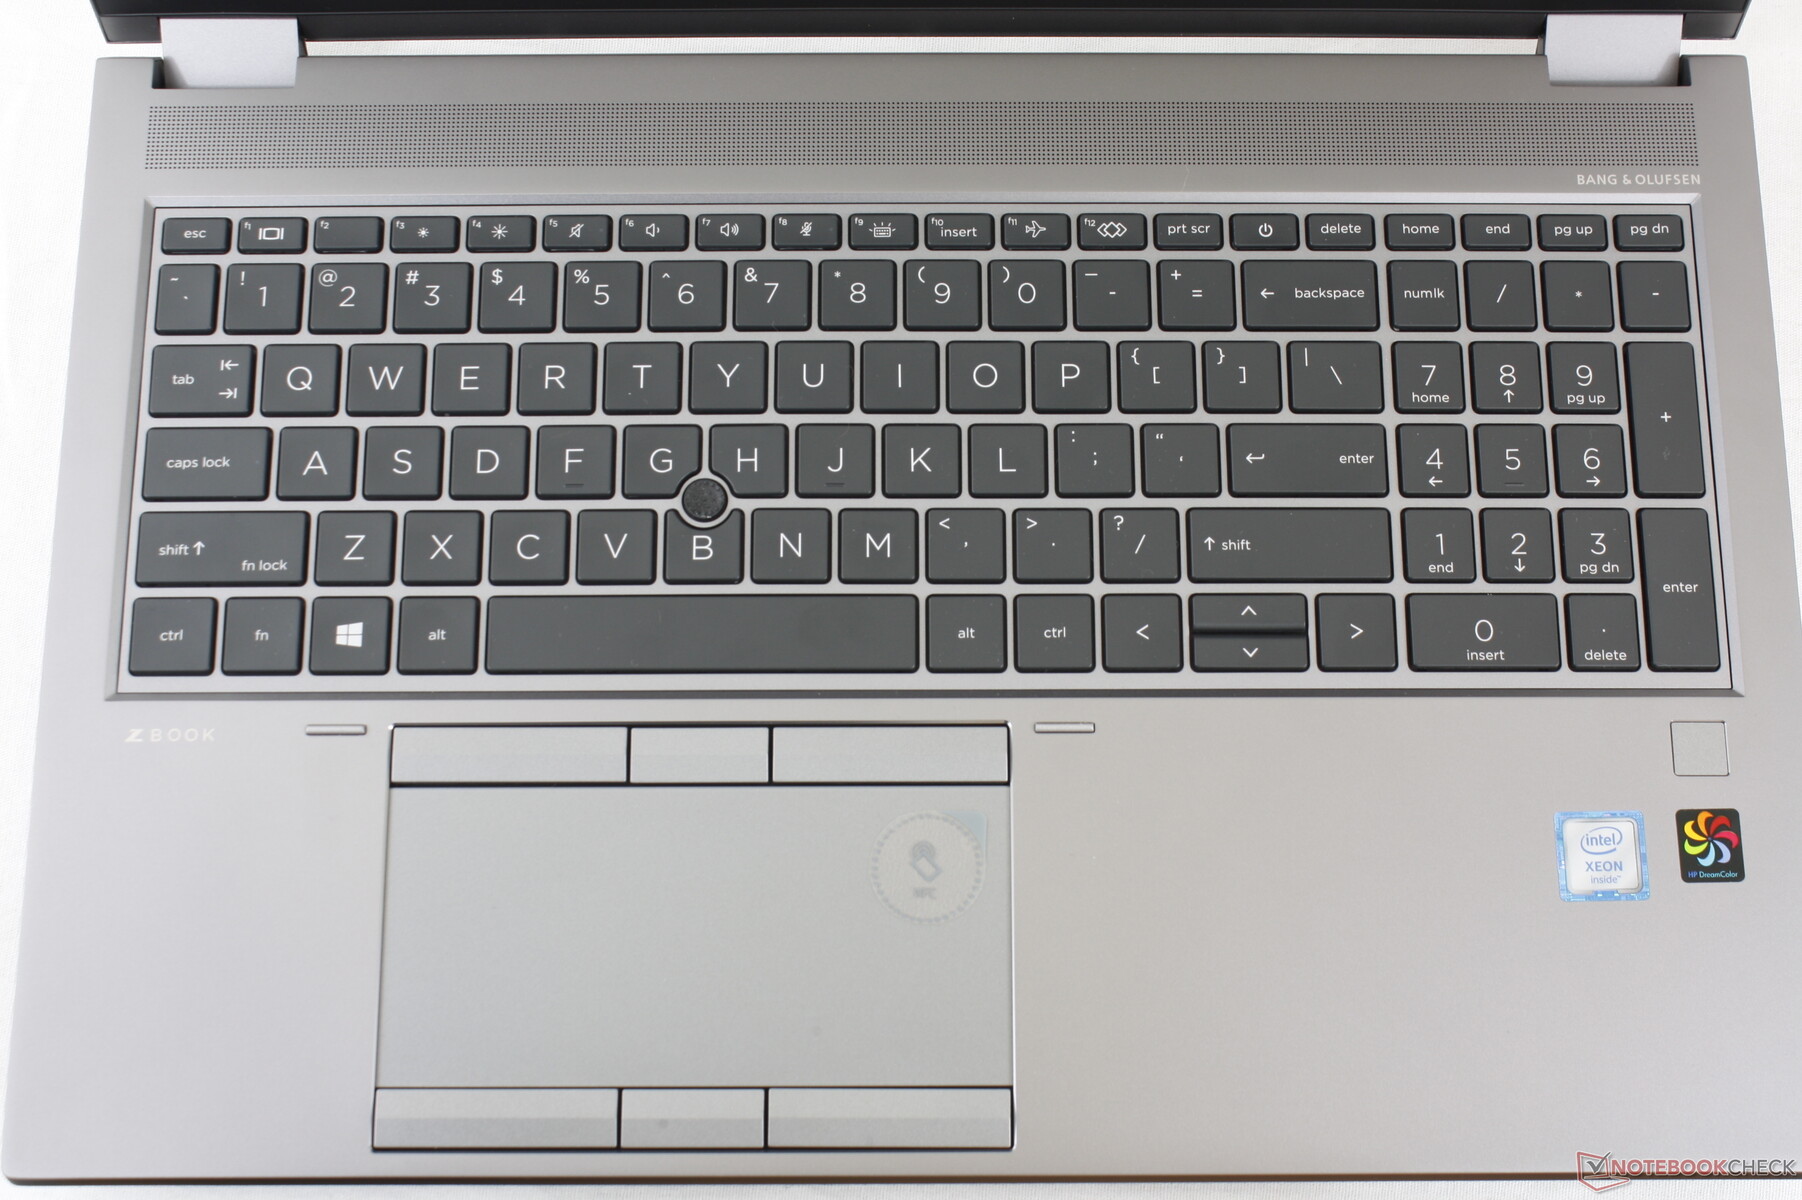
Clavier
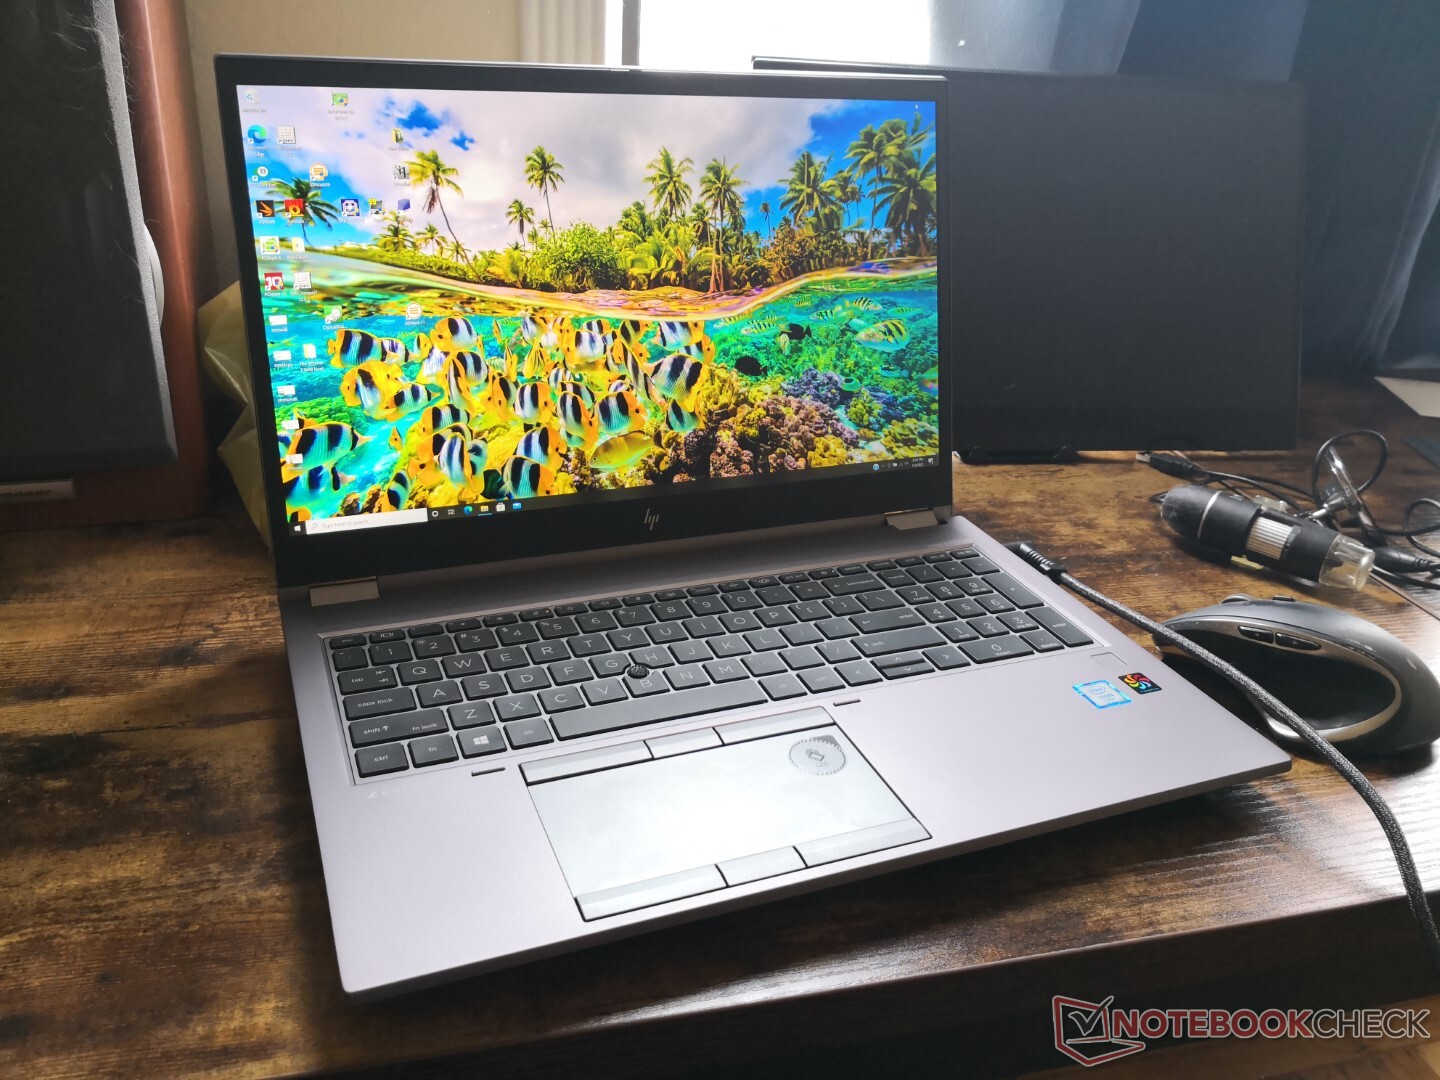
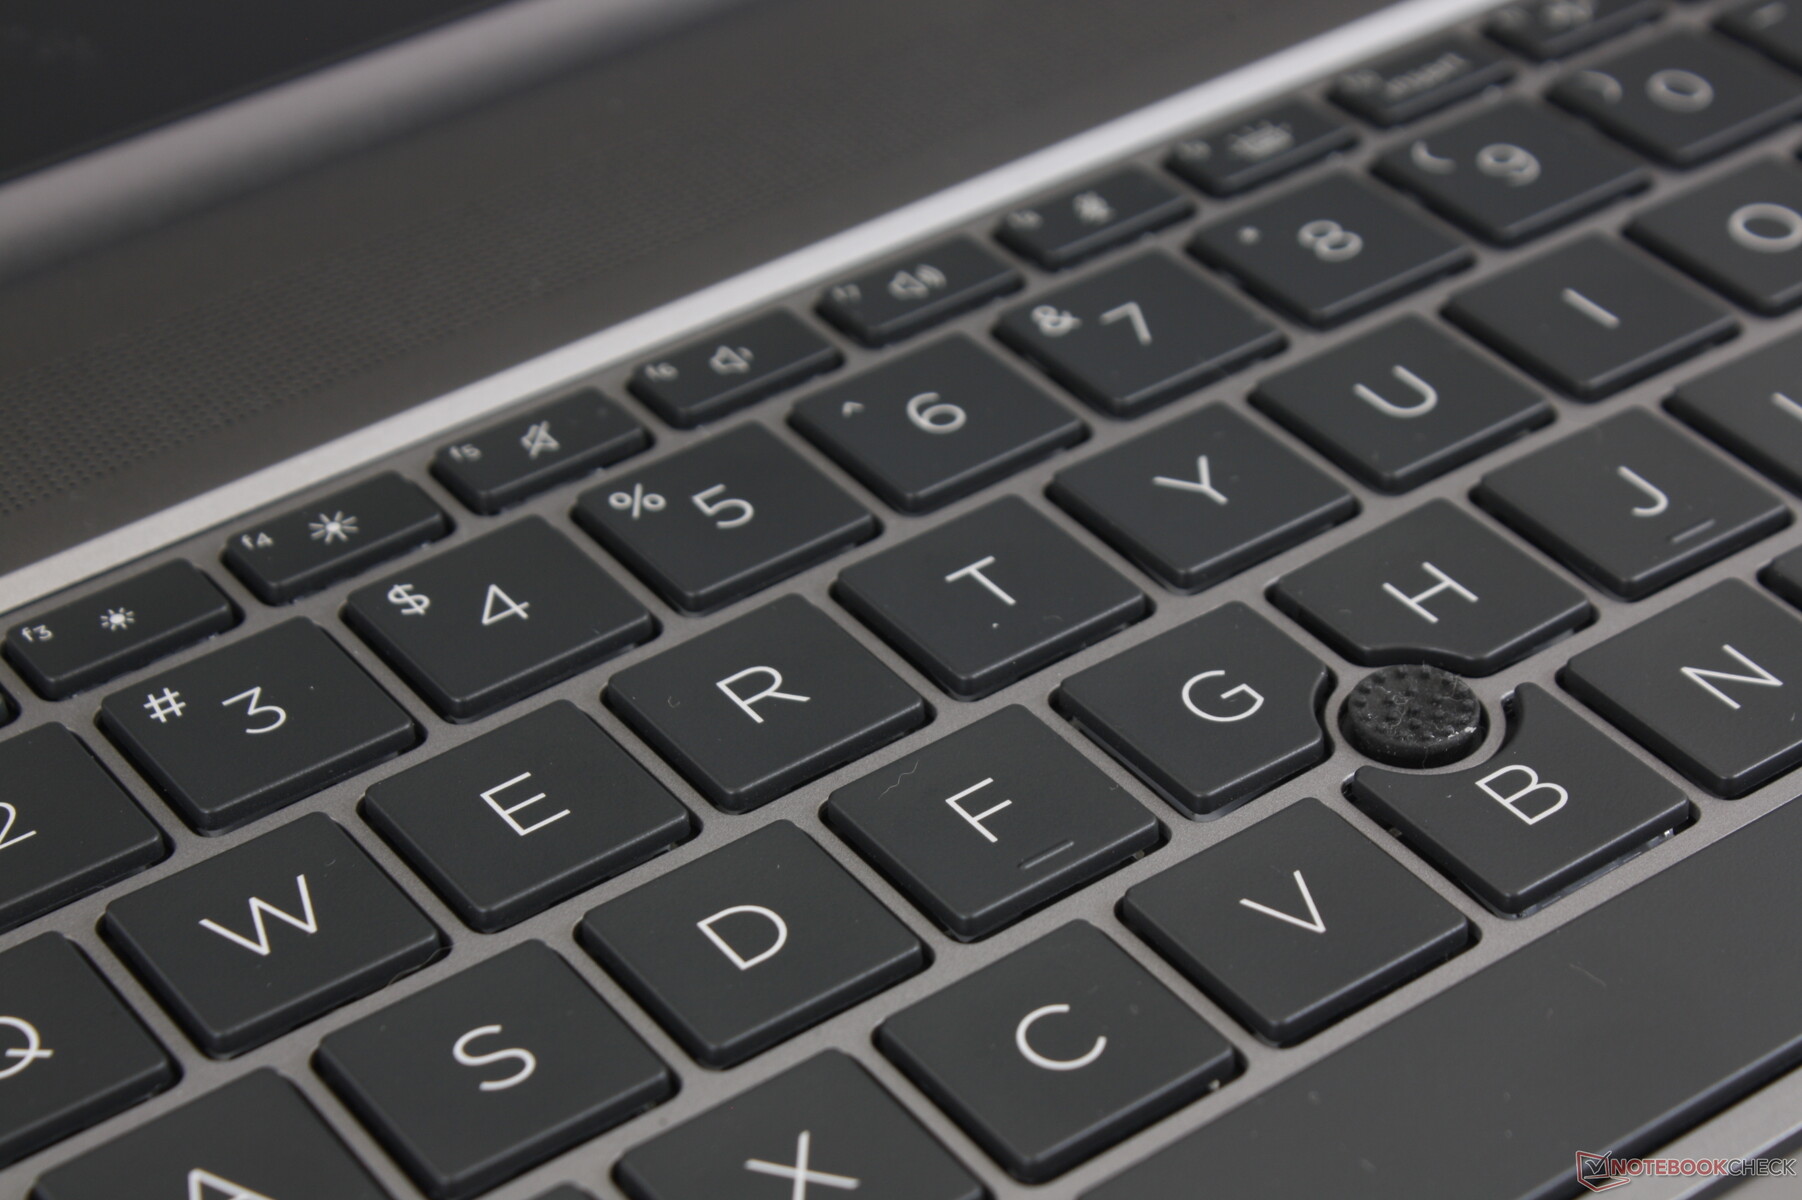
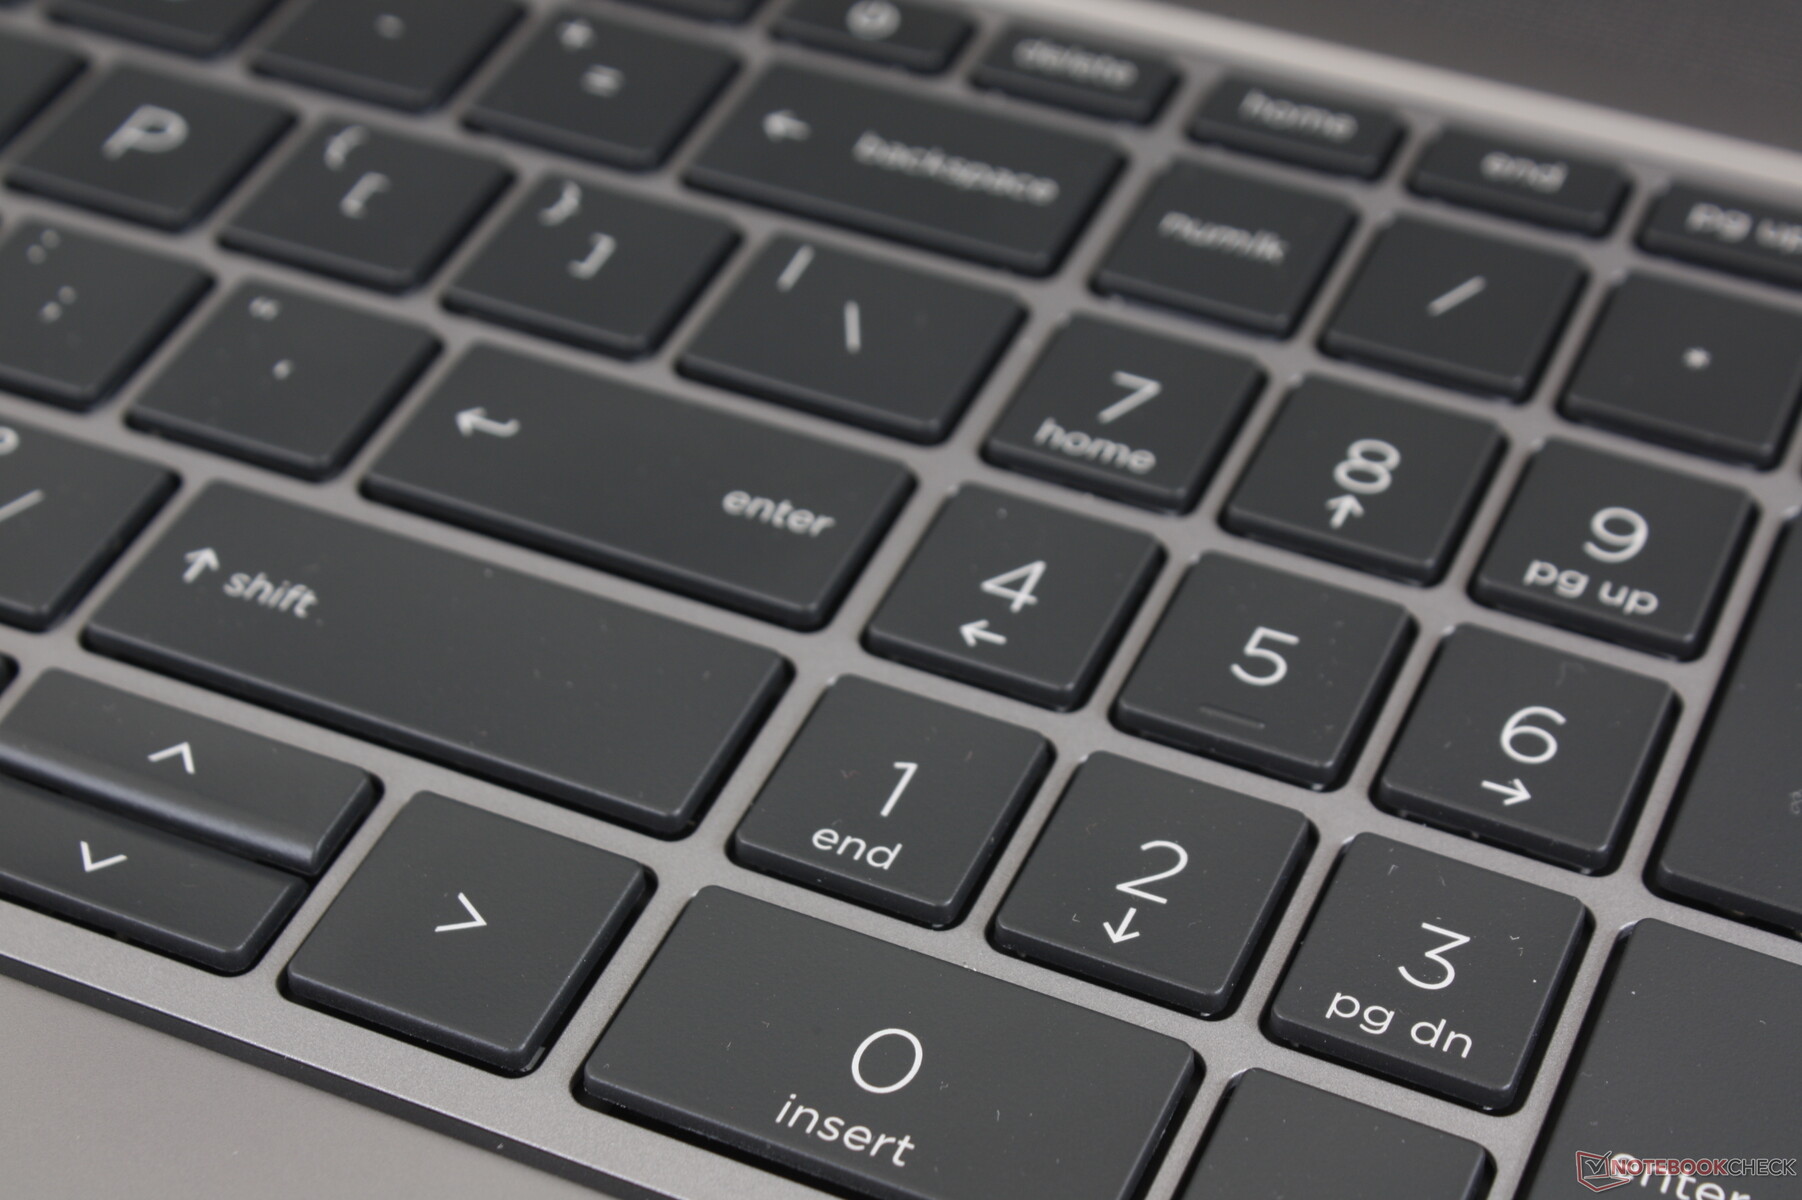
Les claviers des ordinateurs portables HP Spectre, EliteBook et ZBook sont parmi les meilleurs de leurs catégories respectives. Le feedback est net avec un déplacement relativement profond, de sorte qu'on n'a pas l'impression de taper sur un Ultrabook fin avec des touches peu profondes. Le bruit est également relativement faible, à l'exception de la touche Espace, plus bruyante. Le fait que la base soit si dense permet à chaque touche de donner une impression d'uniformité d'un coin à l'autre.
Une nouvelle caractéristique du clavier est sa touche F12 personnalisable, que l'on retrouve également sur les derniers portables Envy et Spectre. Les utilisateurs peuvent régler la touche pour lancer rapidement des programmes, des fichiers, des dossiers ou des sites web. Il ne prend toutefois pas en charge les macros, ce qui constitue à notre avis un énorme oubli.
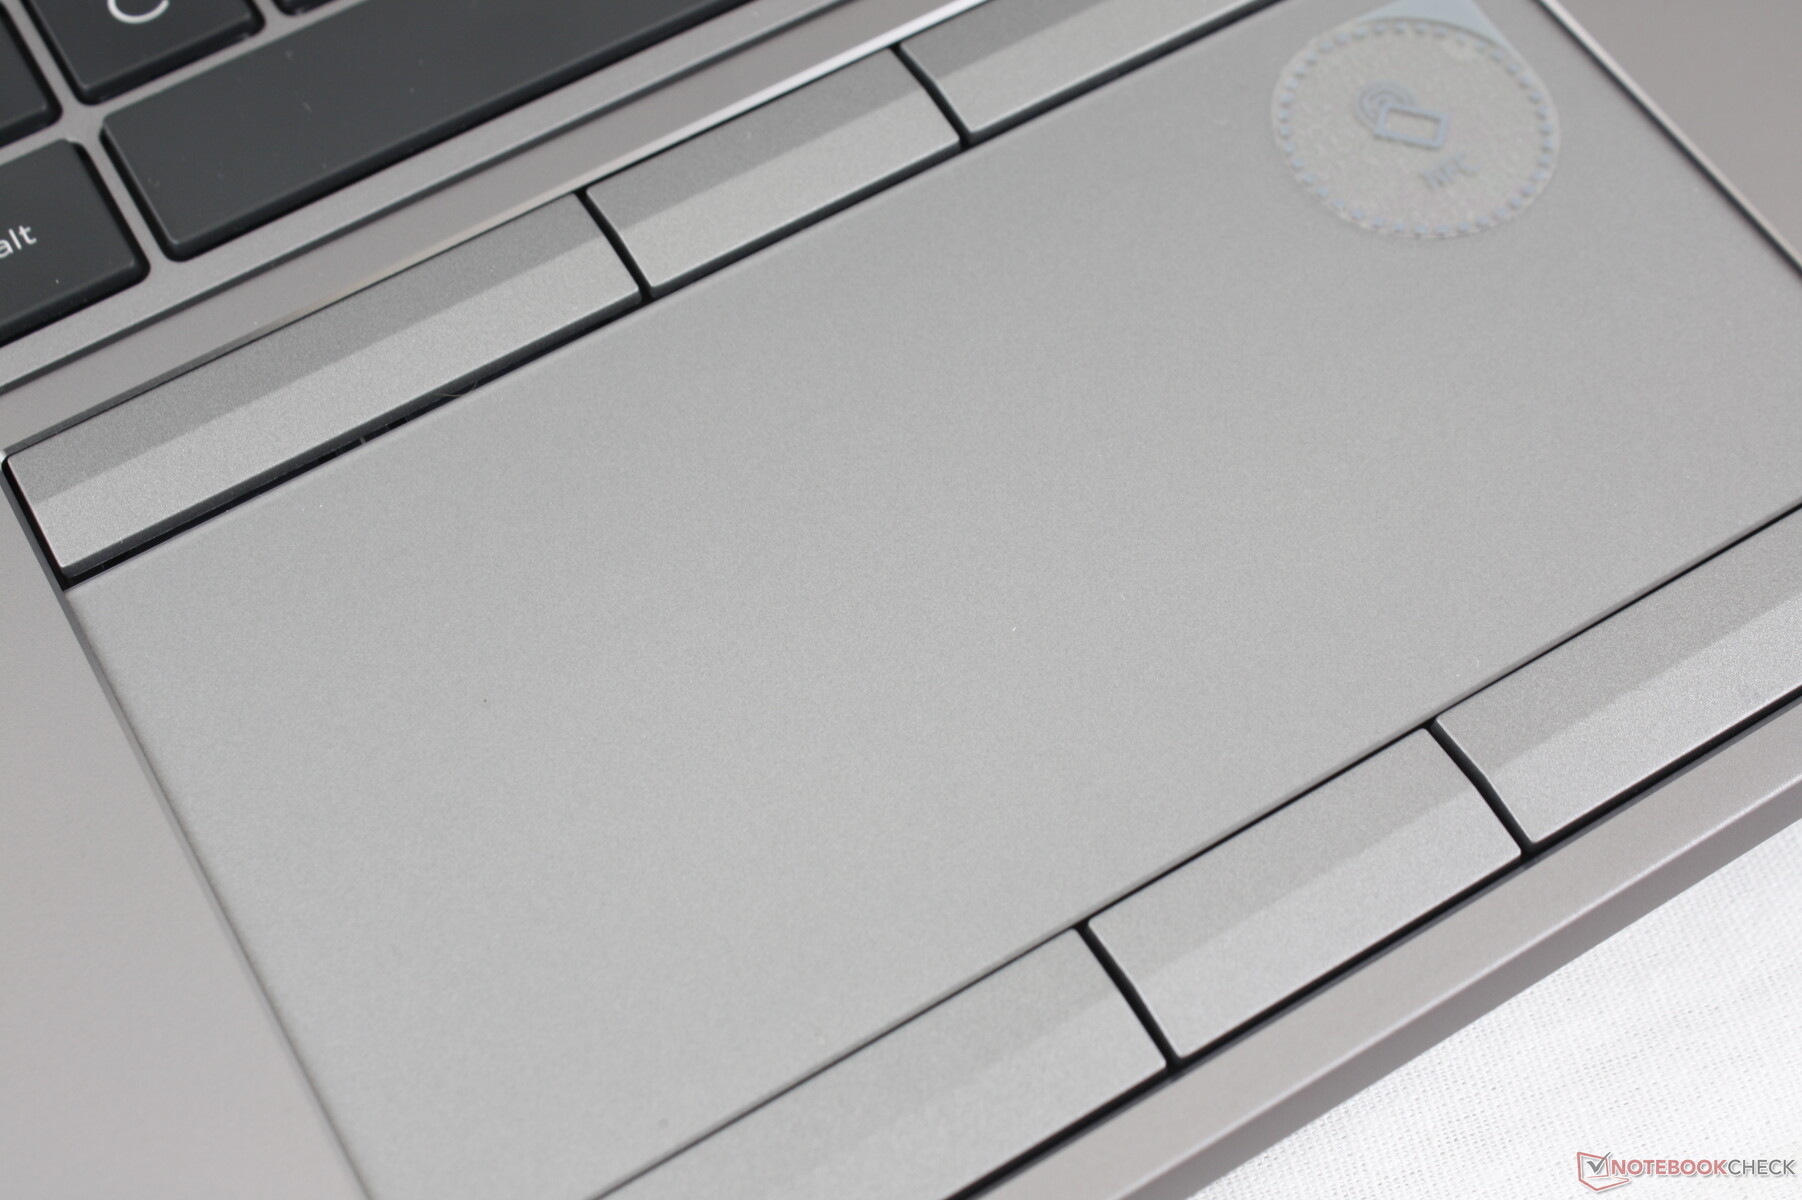
Touchpad
Le touchpad ici est l'un des meilleurs que nous ayons utilisés sur un poste de travail de 15,6 pouces. Il est ferme, glisse en douceur et ne colle que très peu à des vitesses plus faibles. La surface est également plus grande que sur le Precision 7550 (12,5 x 6 cm contre 10 x 6,5 cm) tout en offrant plus de boutons de souris dédiés.
Les réactions des boutons dédiés sont également satisfaisantes avec des déplacements plus profonds que sur la plupart des ordinateurs portables. Le bruit est modéré mais pas assez fort pour être gênant. Le feedback n'est cependant pas uniforme entre chaque touche, car la touche en bas à droite est un peu plus douce que les autres.
Afficher
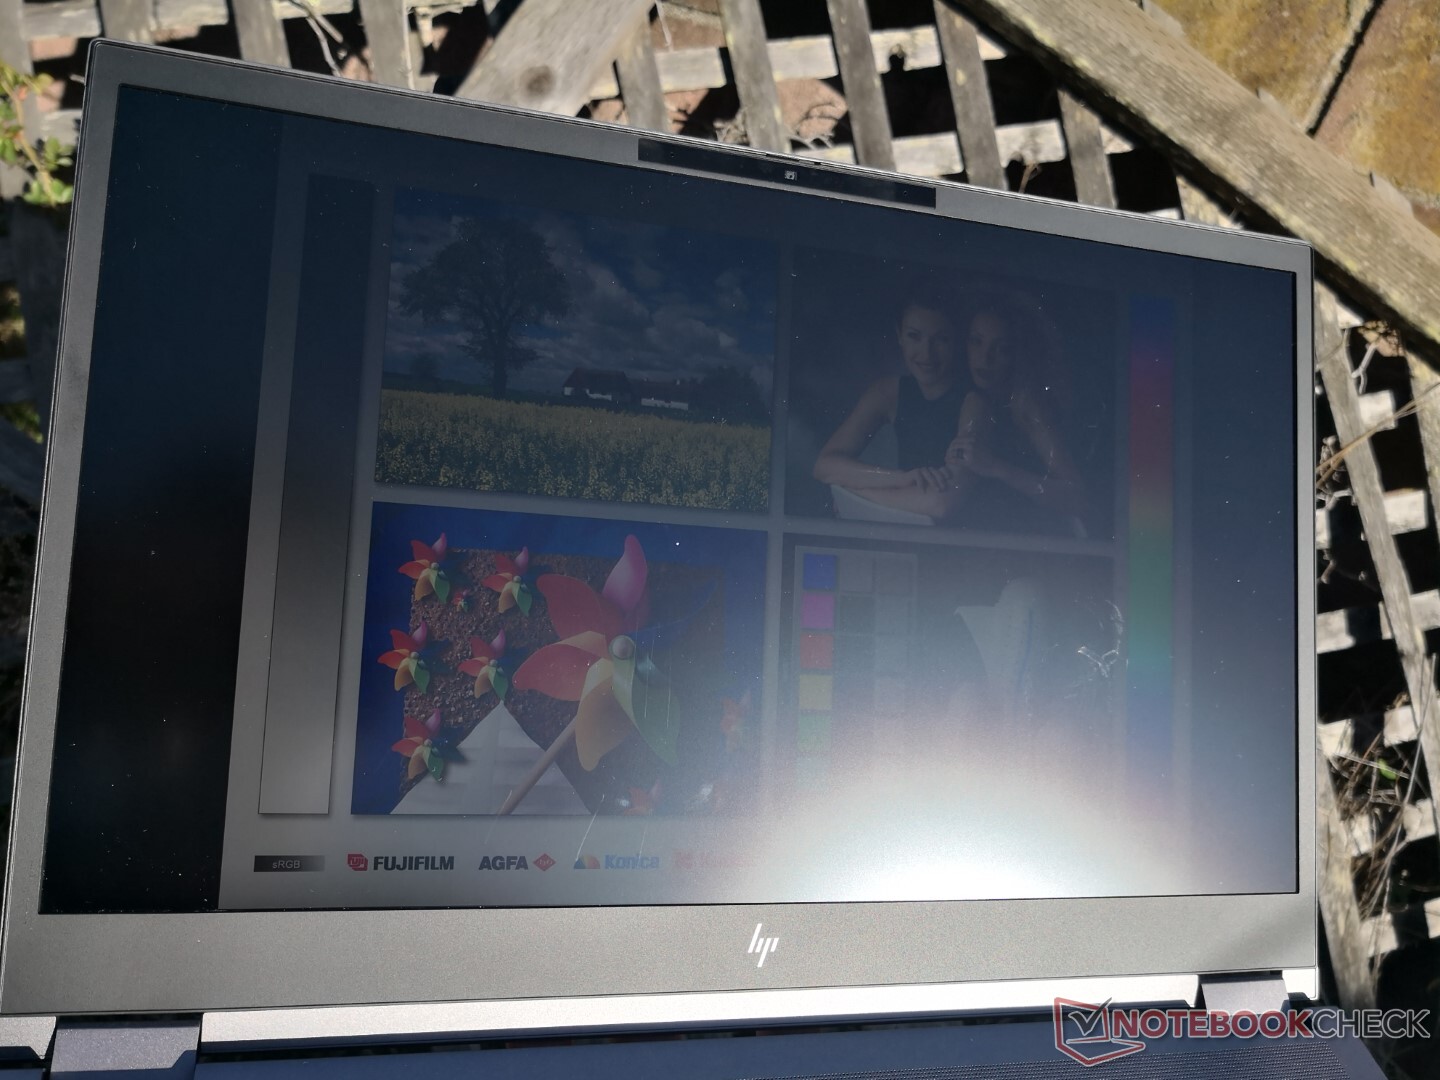
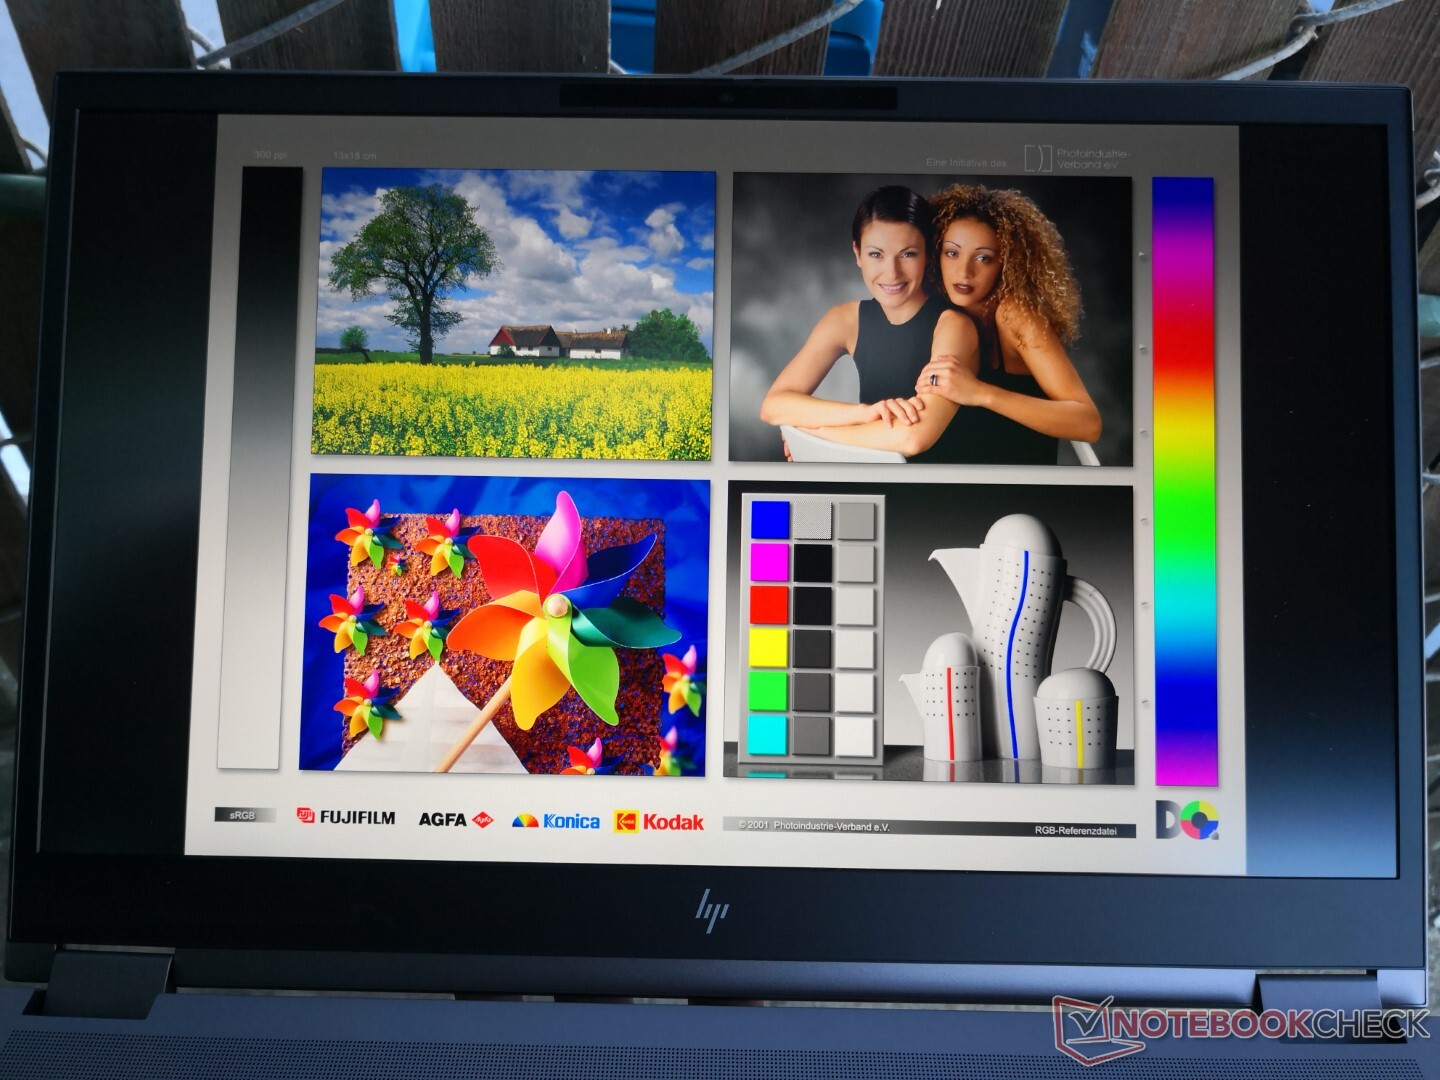
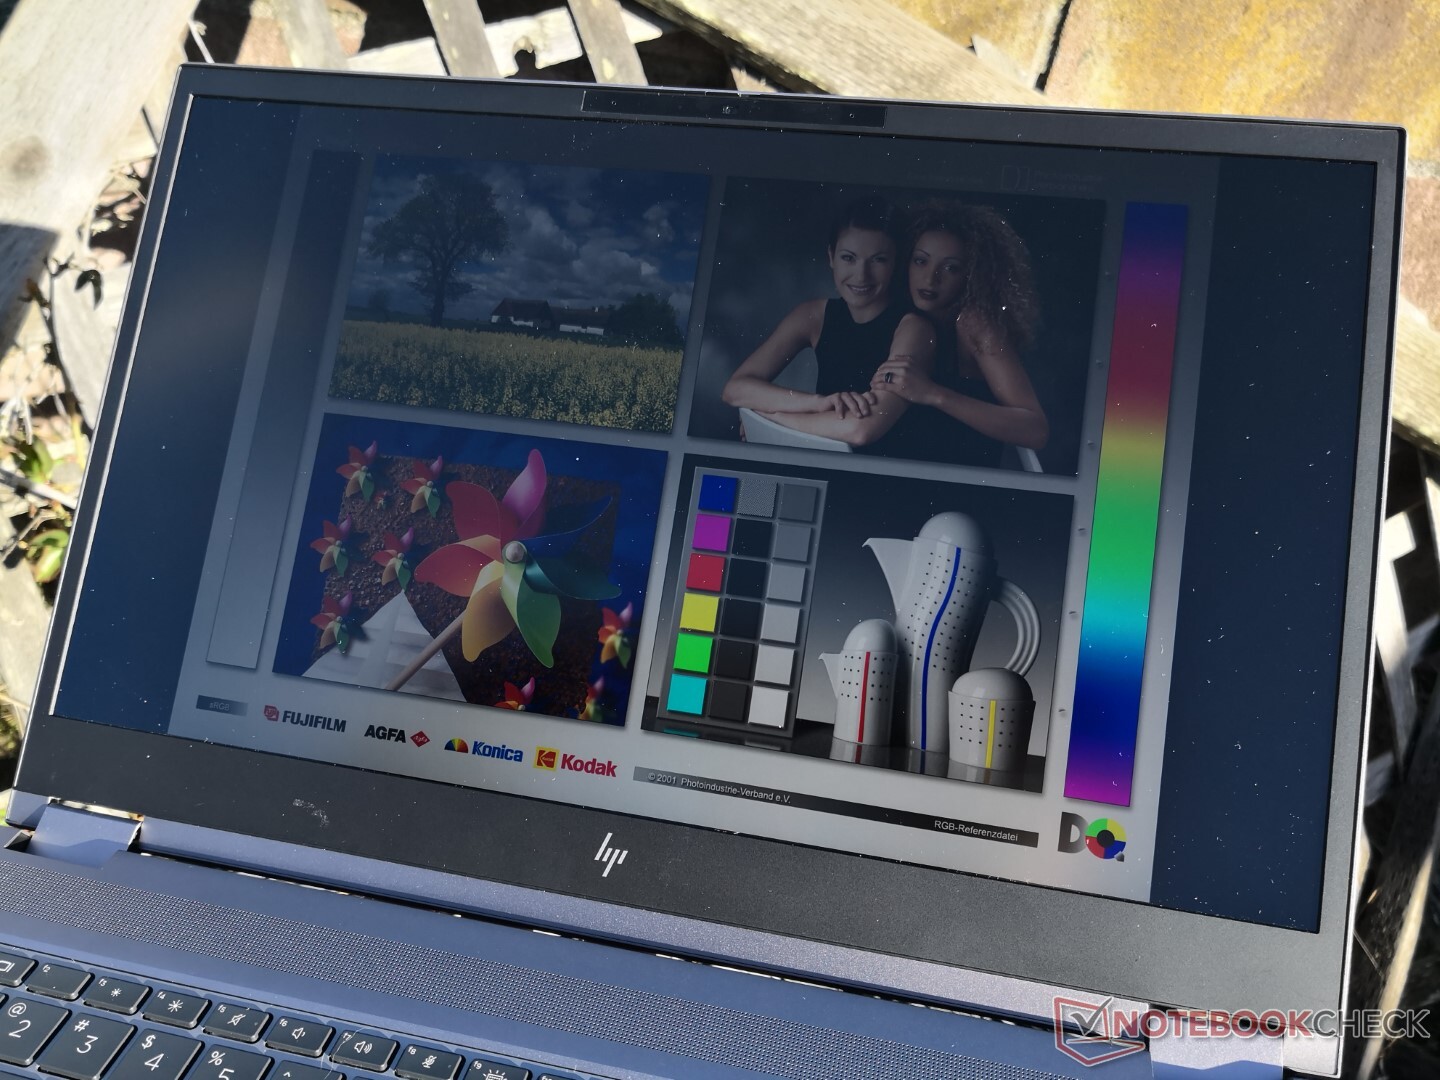
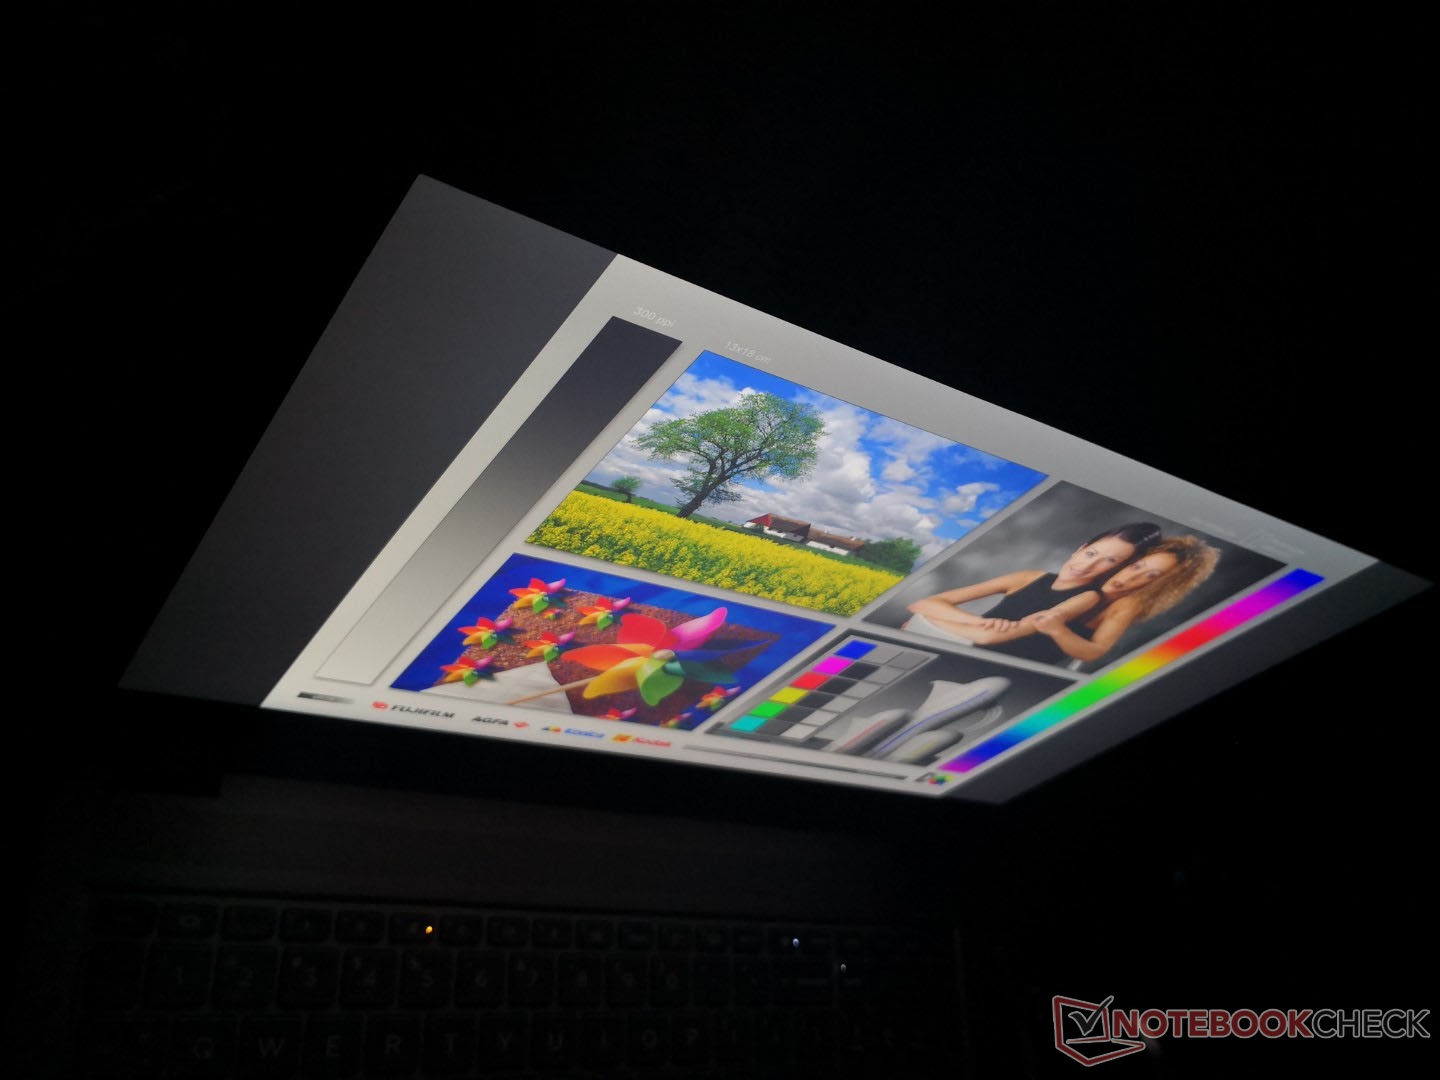
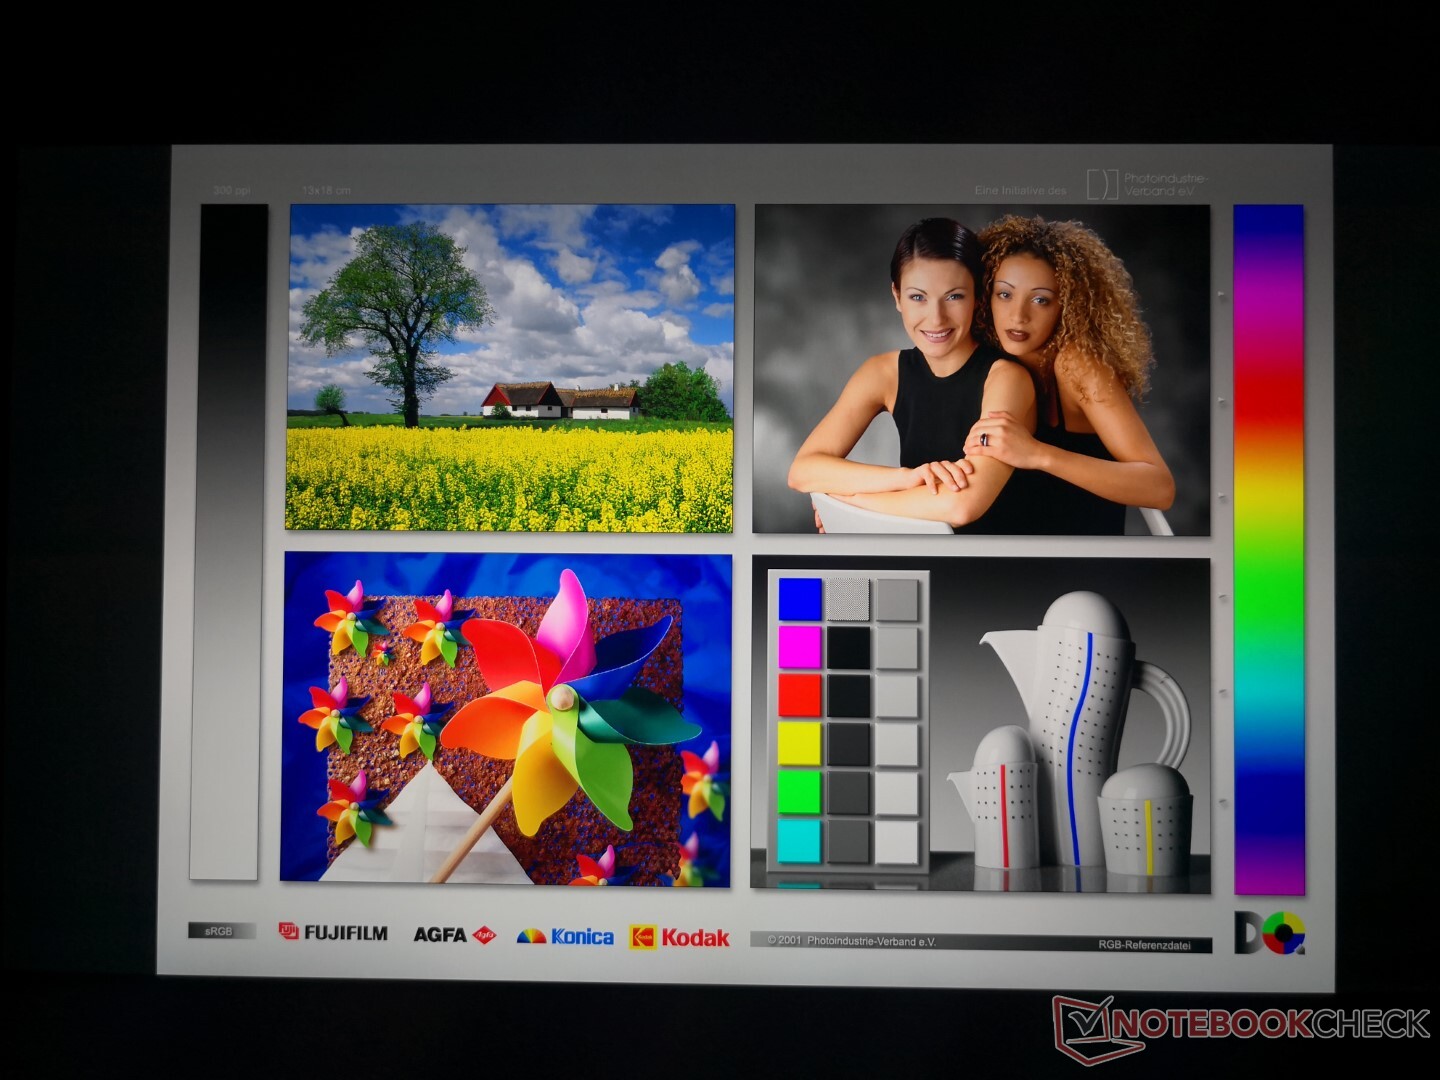
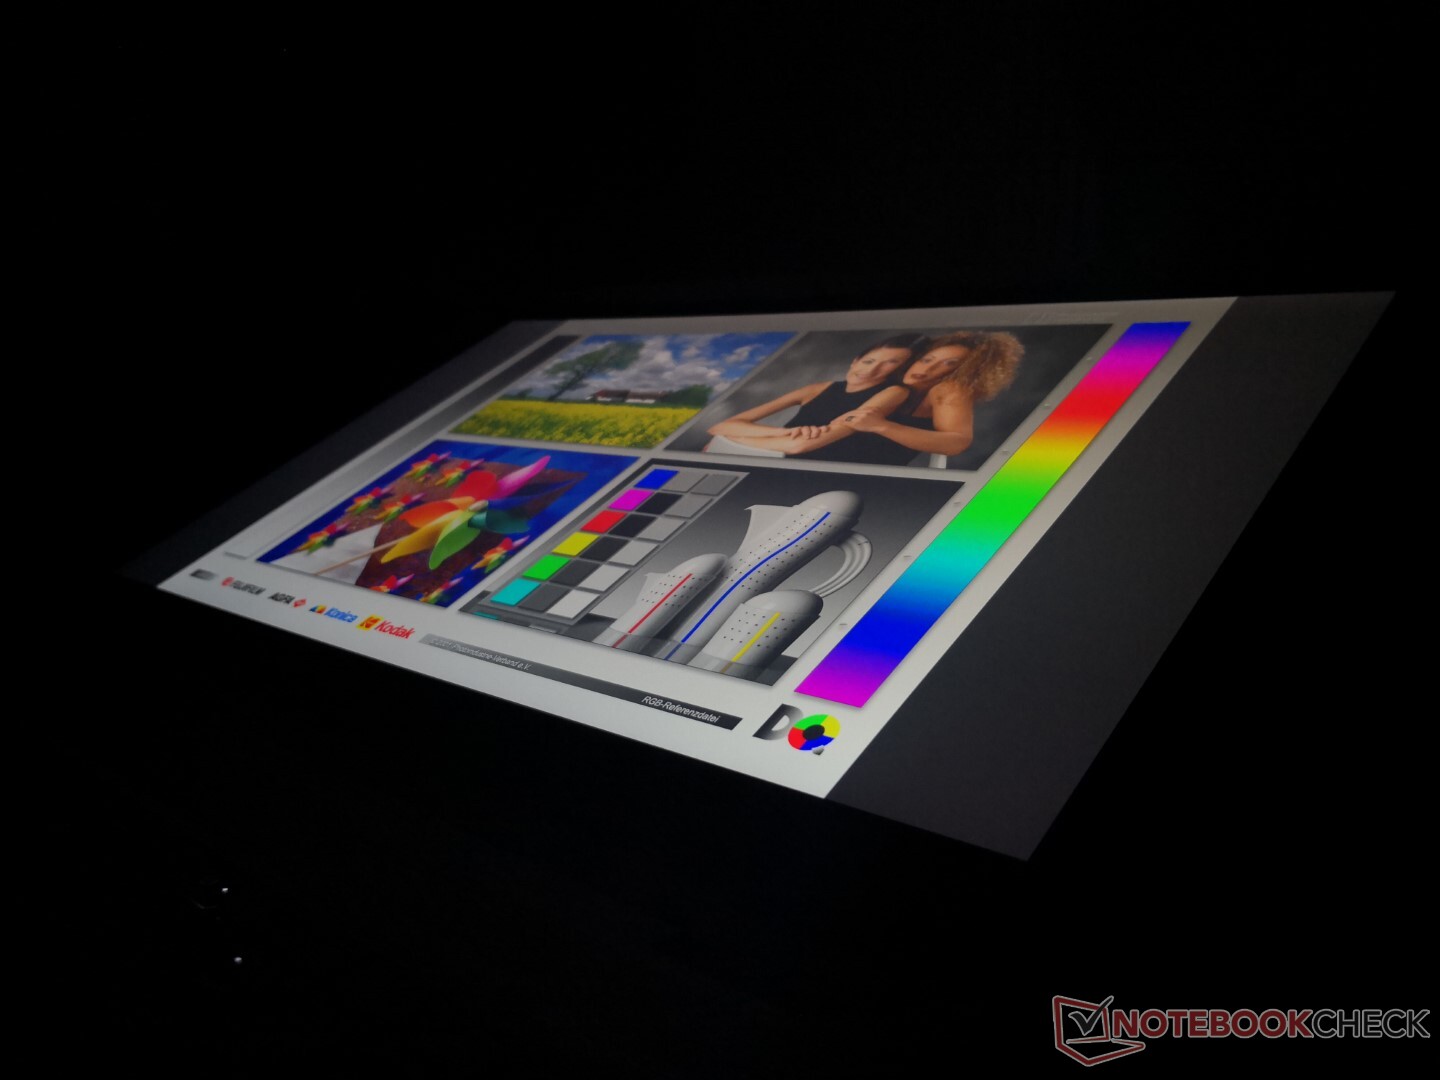
HP offre un déluge d'options d'affichage - 13, en fait - allant de FHD à 4K, de 250 nits à 1000 nits, avec ou sans écran tactile, et tout ce qui se trouve entre les deux. Nos mesures et impressions ci-dessous ne reflètent que l'écran non tactile 4K UHD HDR400 DreamColor, car les autres écrans auront presque certainement des caractéristiques différentes.
HWiNFO est incapable de retrouver le nom exact du panneau de notre unité et ne peut renvoyer que le contrôleur LG Philips LGD0661. Néanmoins, nous pouvons confirmer que le rapport de contraste élevé et l'écran de 600 nit sont plus lumineux que la plupart des autres postes de travail.
| |||||||||||||||||||||||||
Homogénéité de la luminosité: 89 %
Valeur mesurée au centre, sur batterie: 672.8 cd/m²
Contraste: 1346:1 (Valeurs des noirs: 0.5 cd/m²)
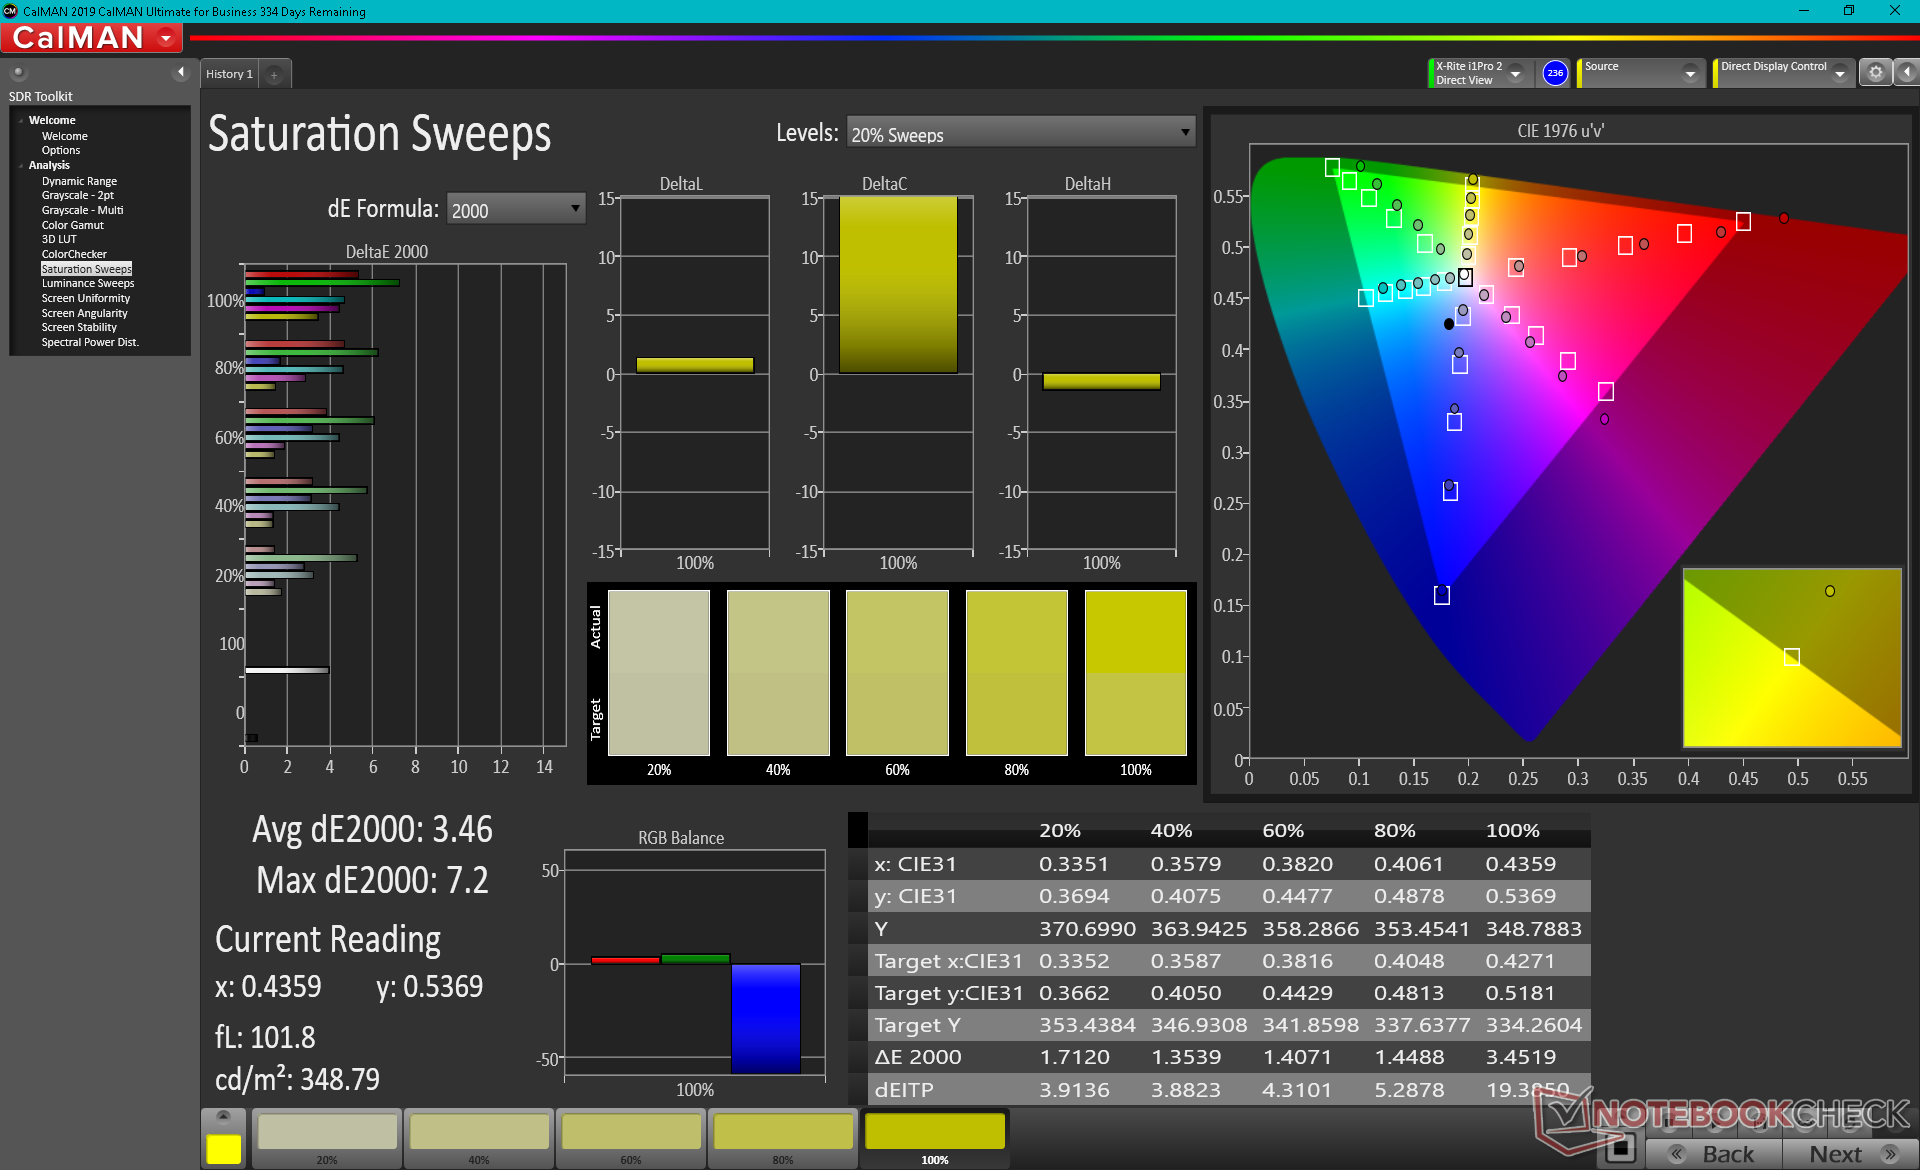
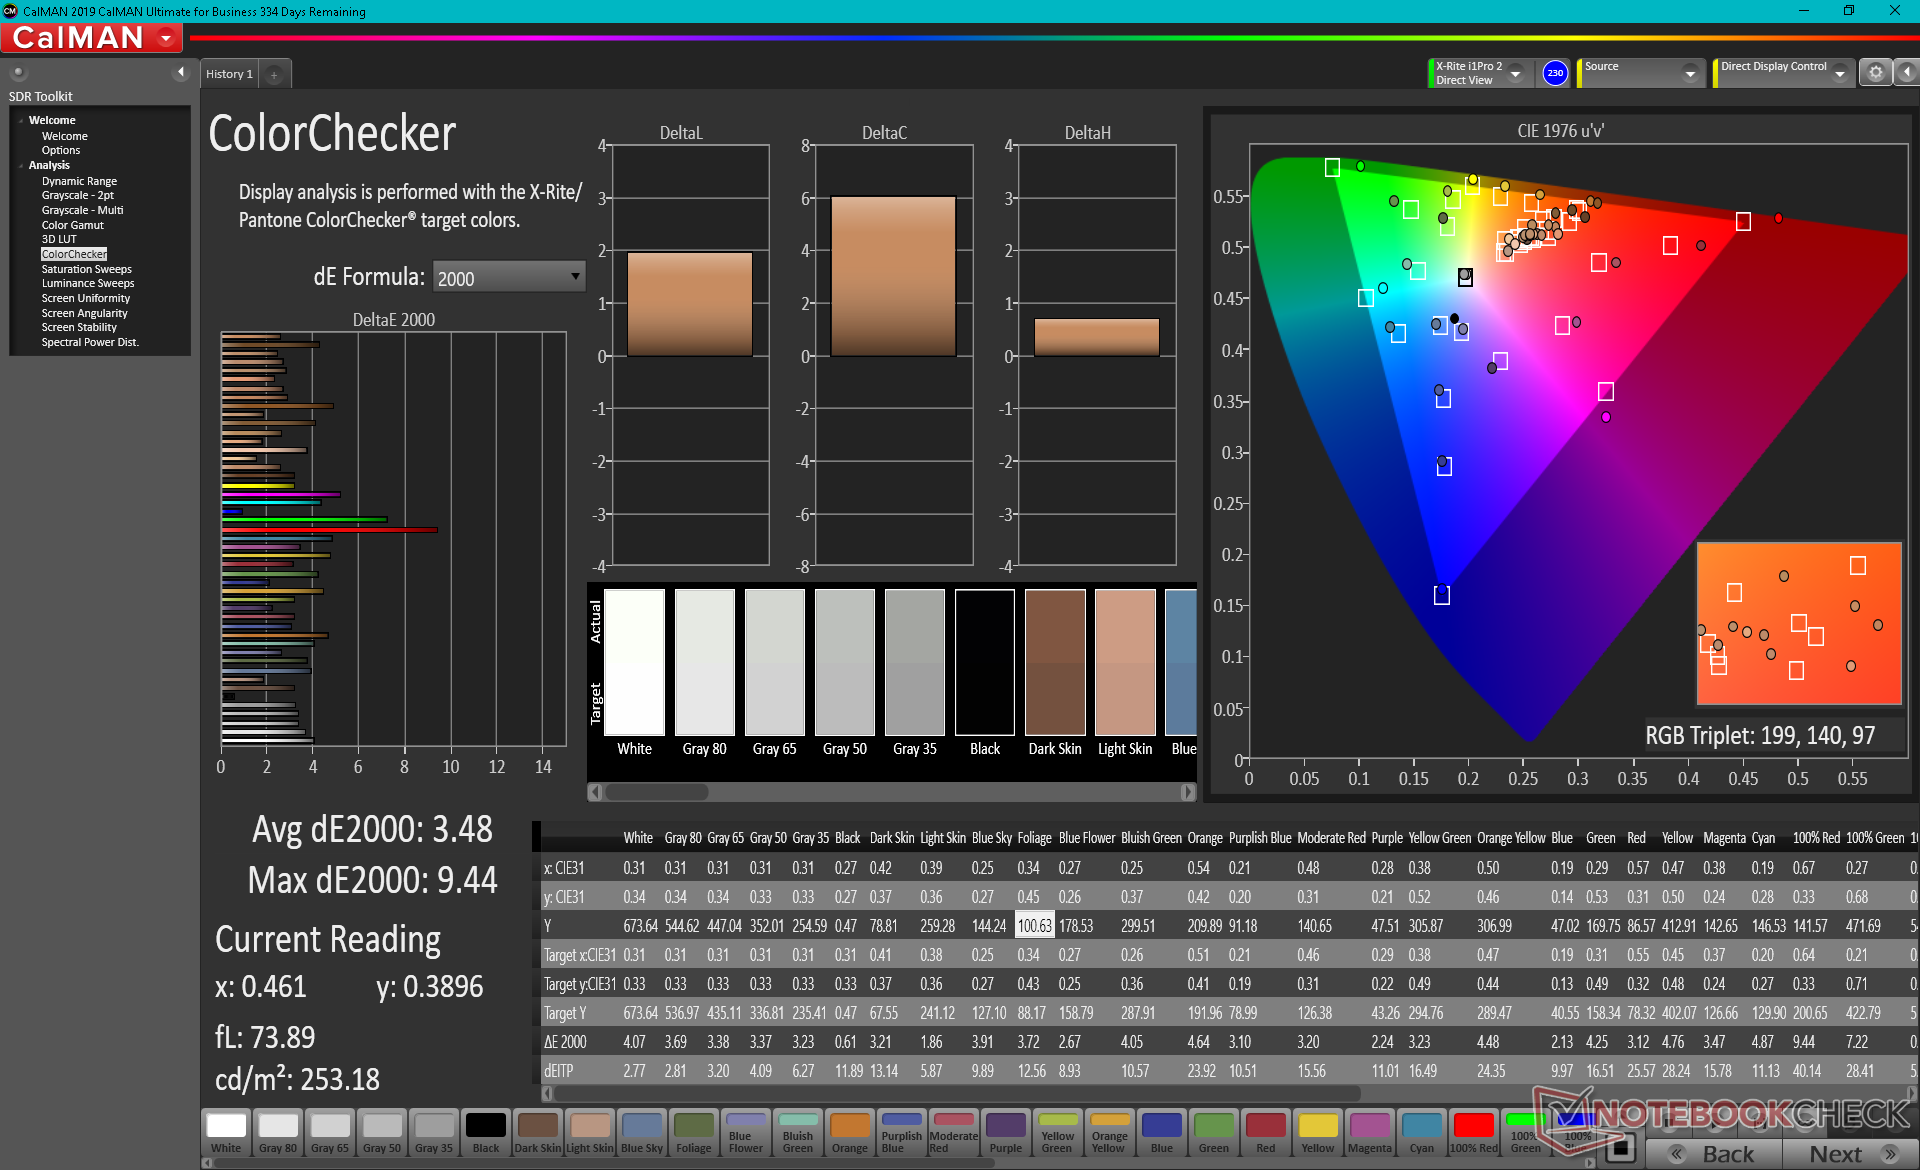
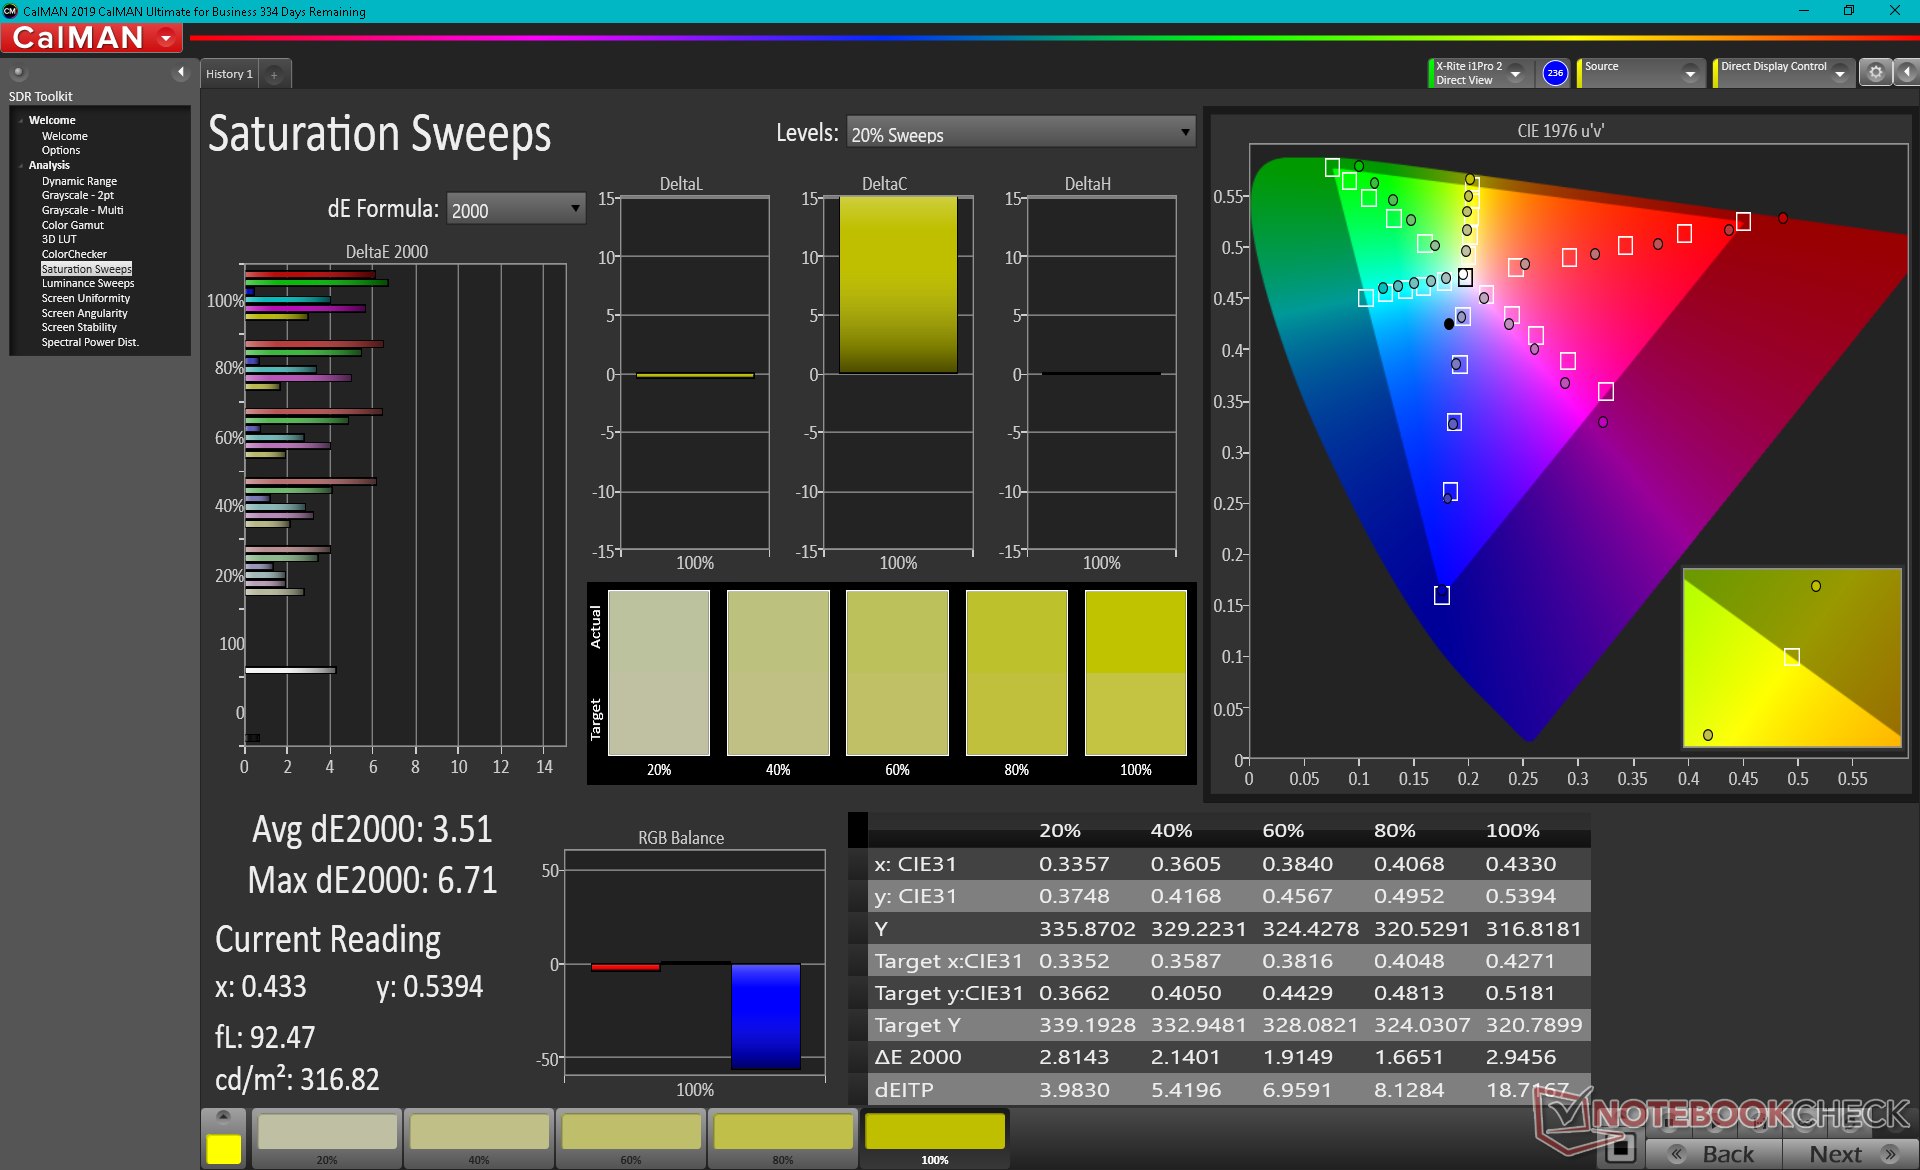
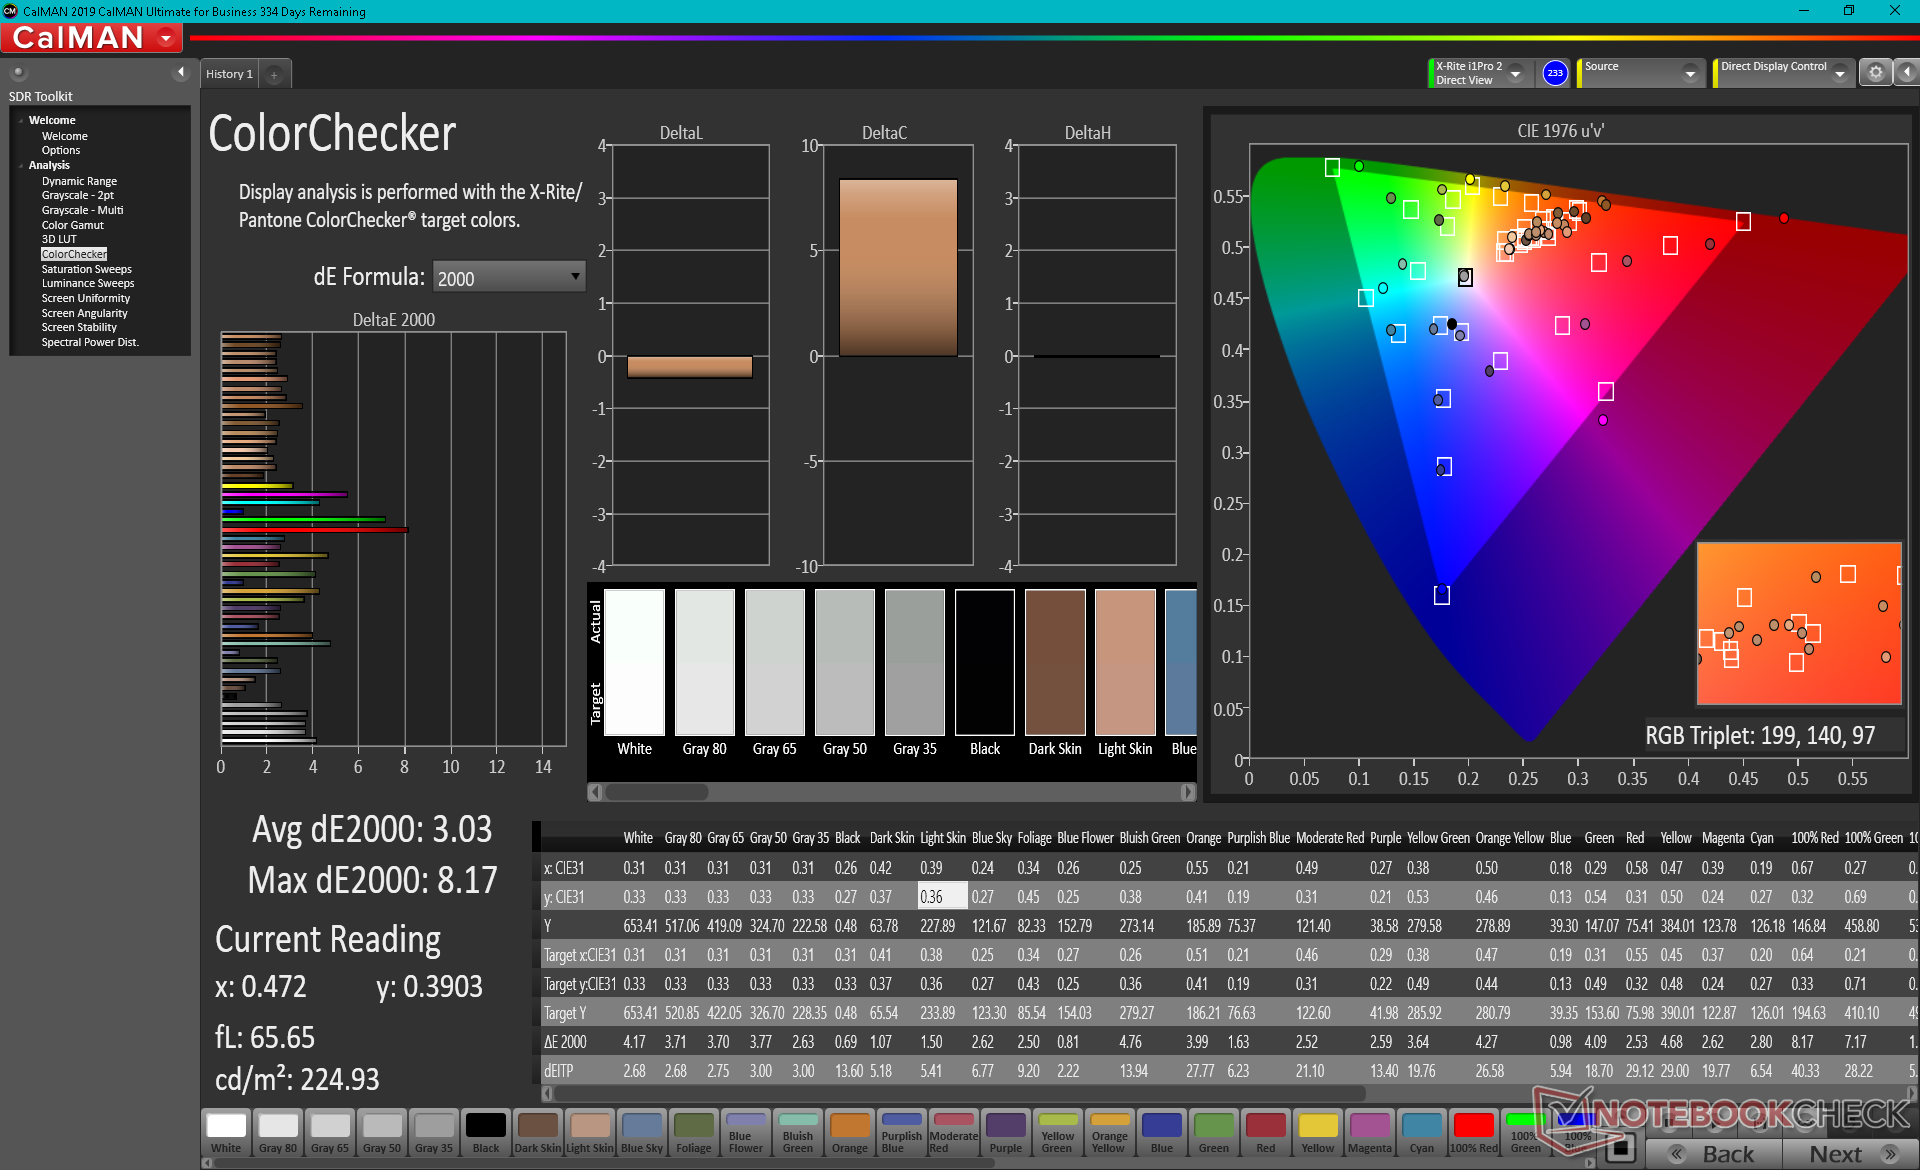
ΔE ColorChecker Calman: 3.48 | ∀{0.5-29.43 Ø4.71}
calibrated: 3.03
ΔE Greyscale Calman: 3.1 | ∀{0.09-98 Ø4.96}
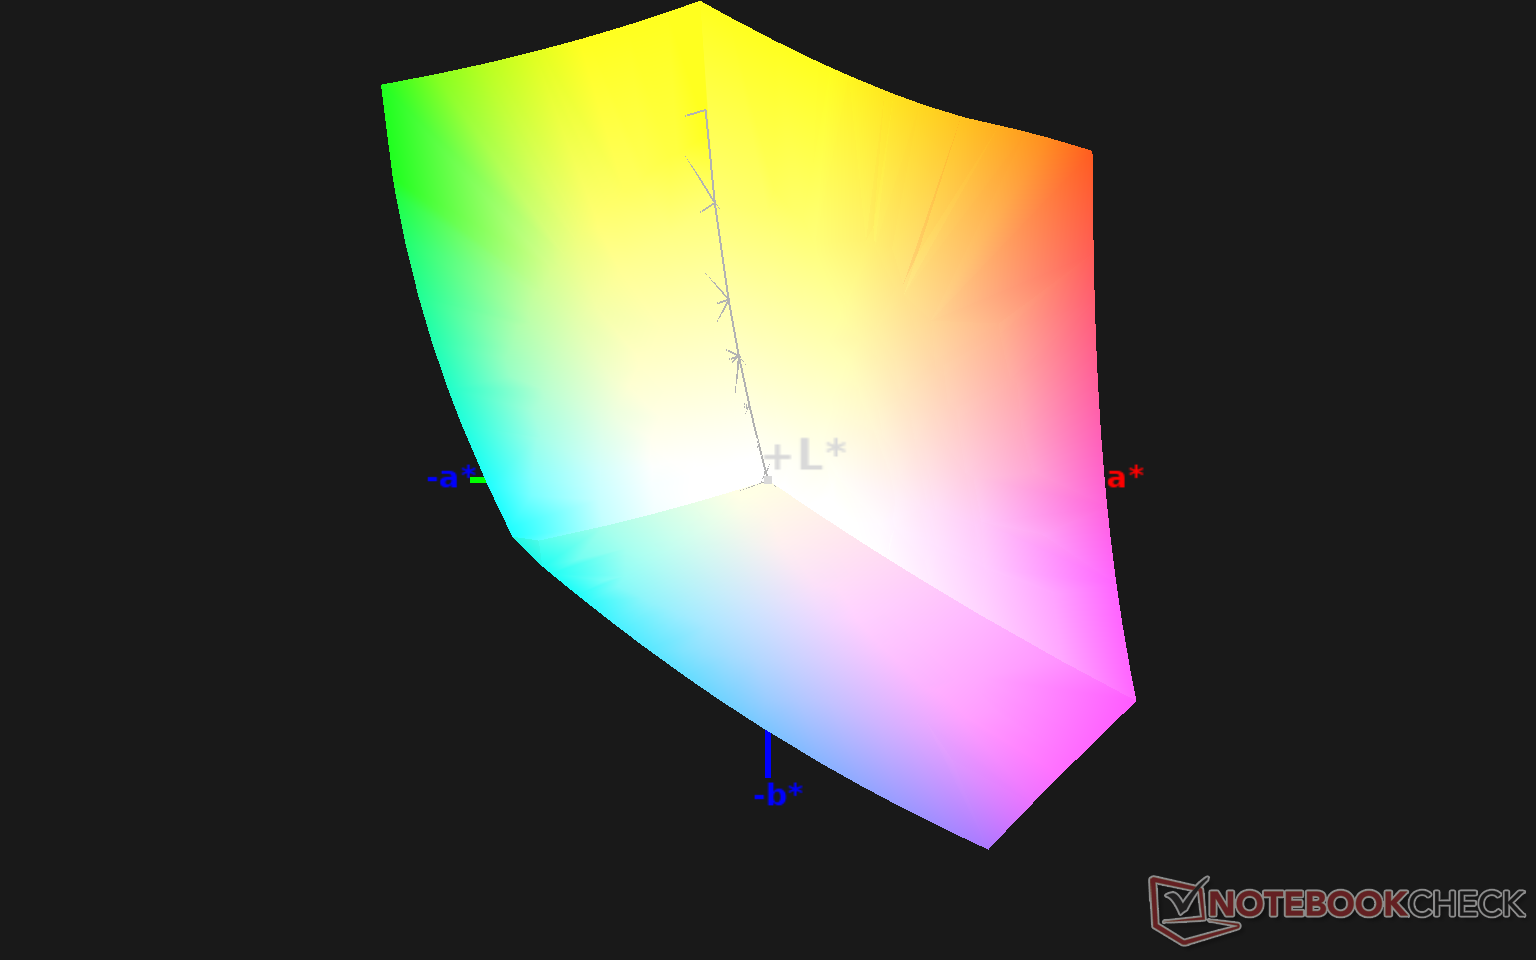
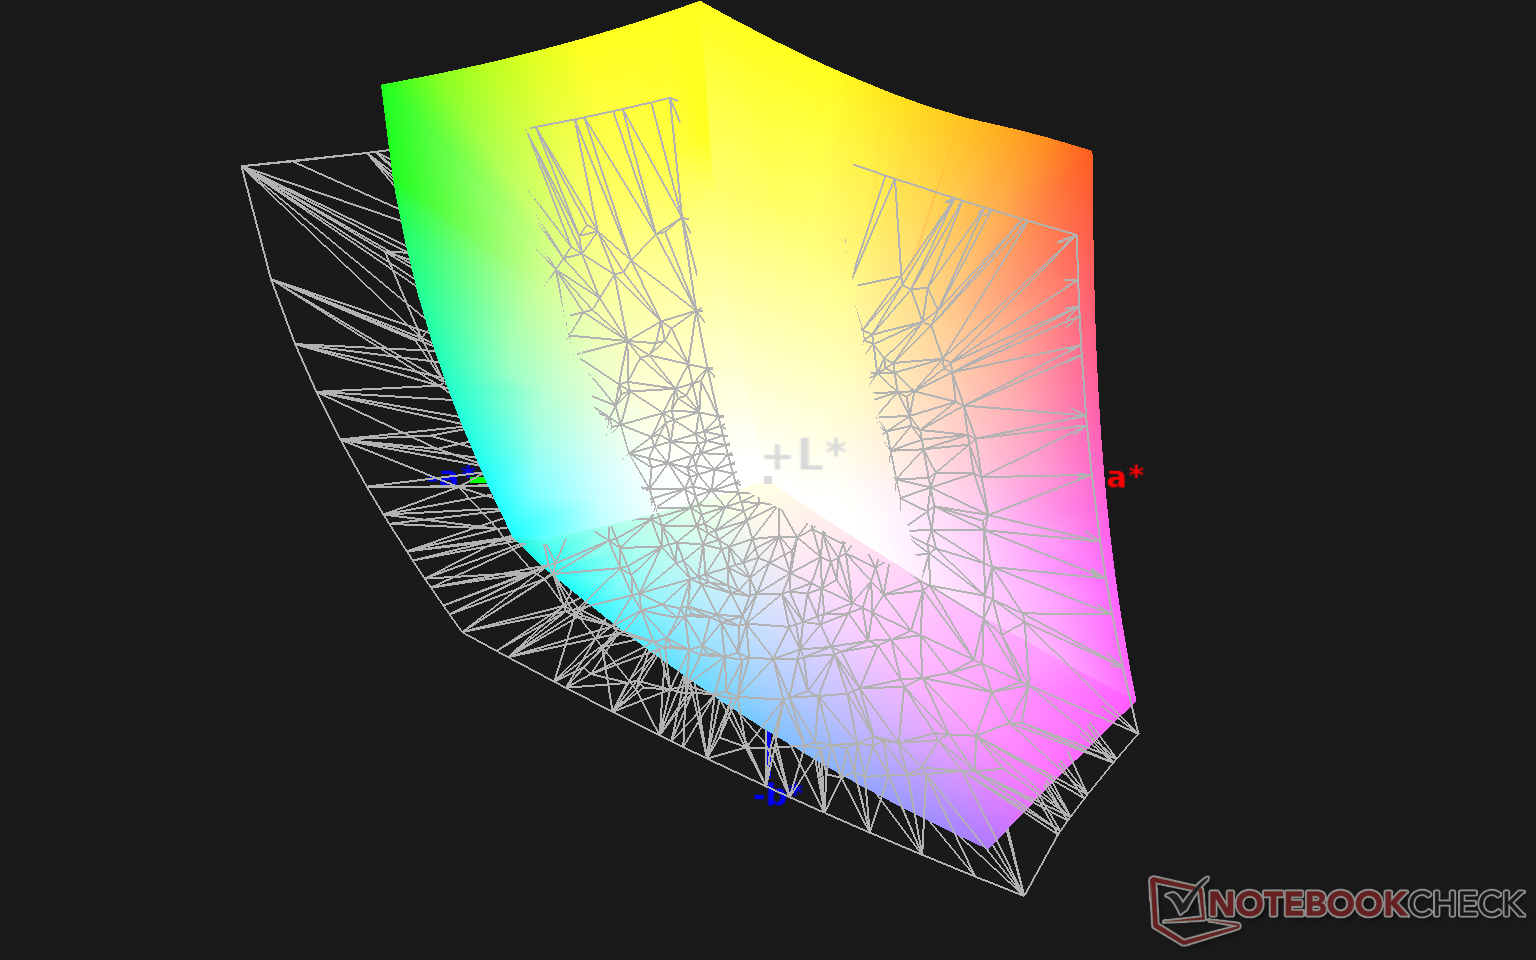
100% sRGB (Argyll 1.6.3 3D)
75.2% AdobeRGB 1998 (Argyll 1.6.3 3D)
84.5% AdobeRGB 1998 (Argyll 3D)
99.8% sRGB (Argyll 3D)
95.6% Display P3 (Argyll 3D)
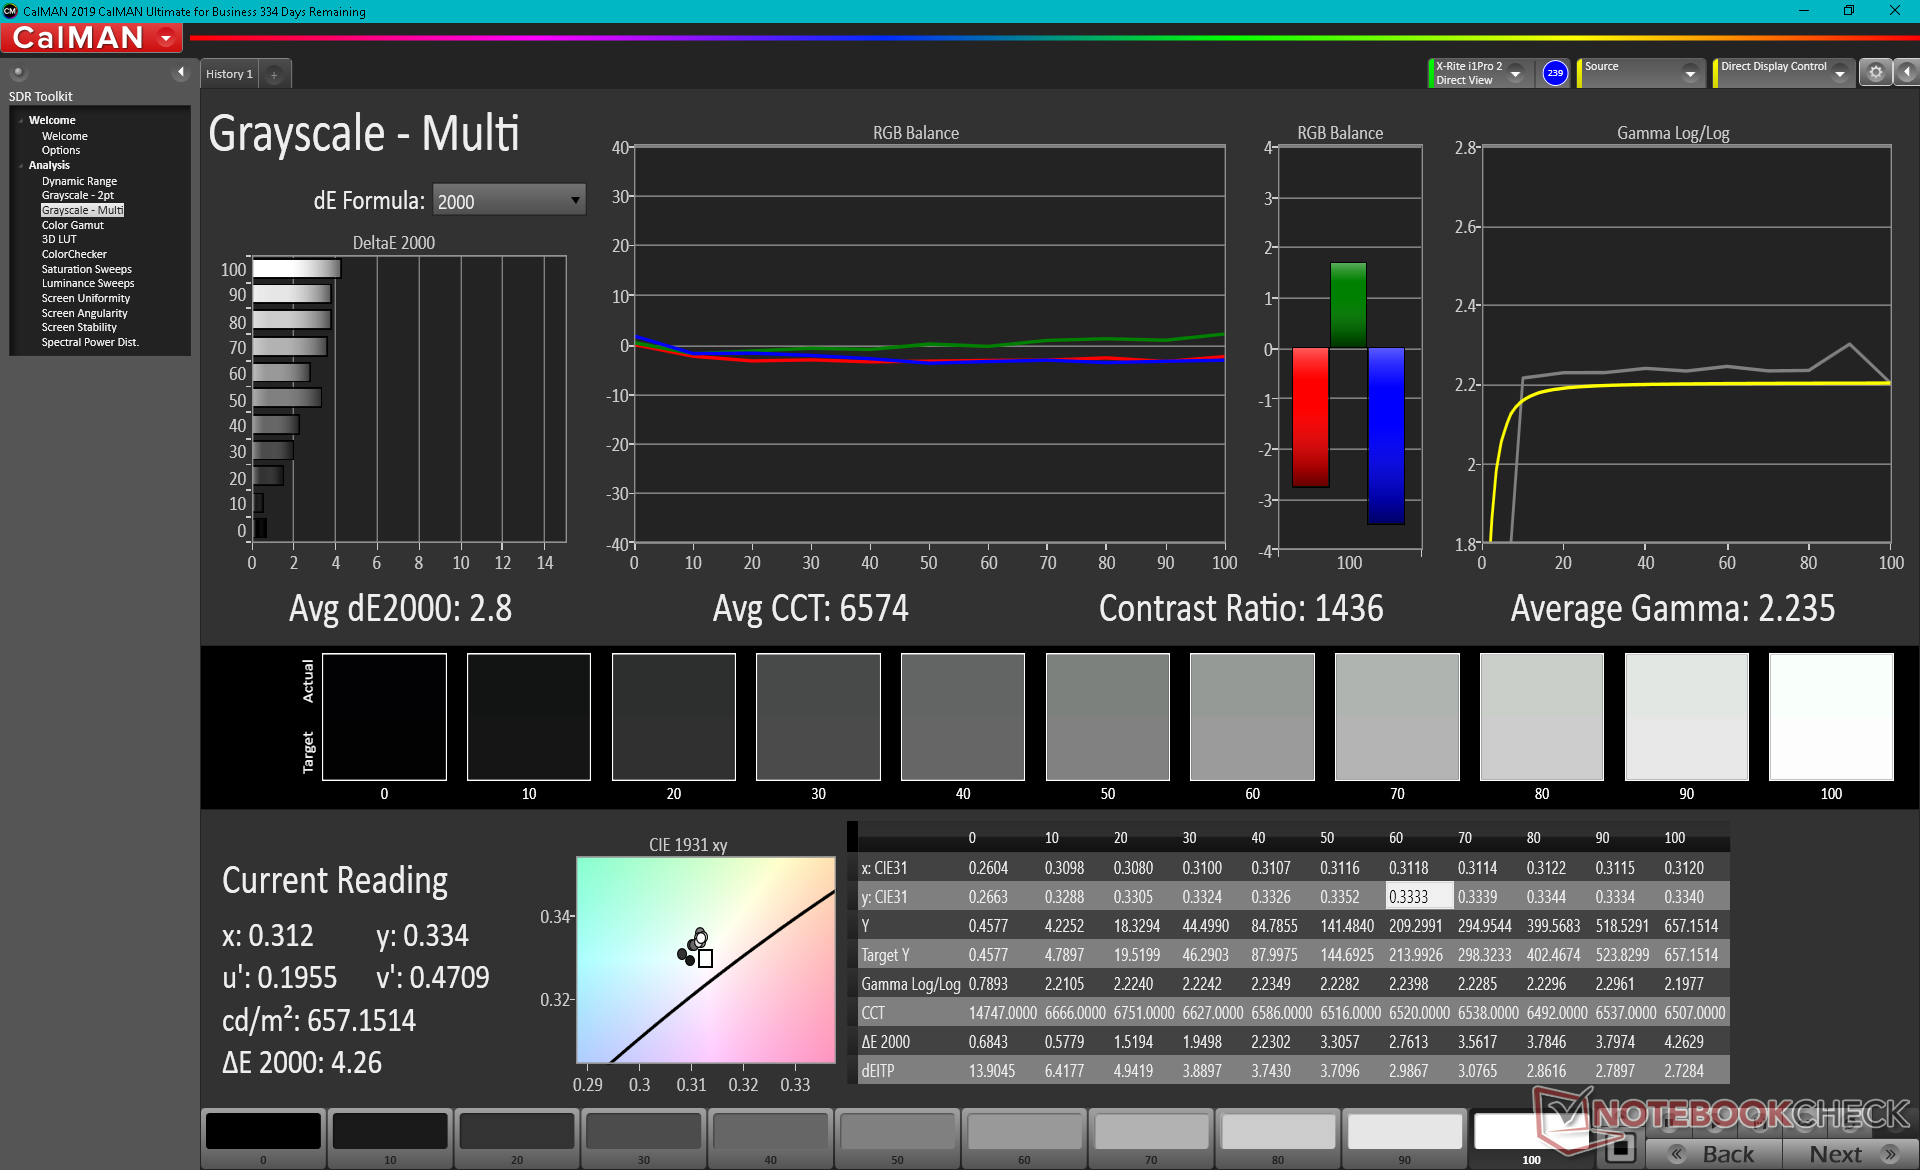
Gamma: 2.04
CCT: 6380 K
| HP ZBook Fury 15 G7 LG Philips LGD0661, IPS, 15.6", 3840x2160 | Asus ProArt StudioBook Pro 15 W500G5T AU Optronics B156ZAN03.1, IPS, 15.6", 3840x2160 | MSI WS66 10TMT-207US AU Optronics B156HAB03.0, IPS, 15.6", 1920x1080 | Dell Precision 7550 AU Optronics B156ZAN, IPS, 15.6", 3840x2160 | Razer Blade 15 Studio Edition 2020 Samsung SDCA029, OLED, 15.6", 3840x2160 | Lenovo ThinkPad P1 2019-20QT000RGE N156HCE-GN1, IPS LED, 15.6", 1920x1080 | |
|---|---|---|---|---|---|---|
| Display | -1% | -24% | 0% | 6% | -23% | |
| Display P3 Coverage (%) | 95.6 | 82.1 -14% | 62.8 -34% | 82.1 -14% | 99.9 4% | 62.4 -35% |
| sRGB Coverage (%) | 99.8 | 97.6 -2% | 86.9 -13% | 99.6 0% | 100 0% | 91.5 -8% |
| AdobeRGB 1998 Coverage (%) | 84.5 | 95 12% | 63.6 -25% | 96.8 15% | 97.3 15% | 63.4 -25% |
| Response Times | -1% | 20% | 8% | 91% | 50% | |
| Response Time Grey 50% / Grey 80% * (ms) | 56 ? | 58 ? -4% | 44.8 ? 20% | 51.2 ? 9% | 4 ? 93% | 34.4 ? 39% |
| Response Time Black / White * (ms) | 36 ? | 35 ? 3% | 28.8 ? 20% | 34 ? 6% | 4 ? 89% | 14 ? 61% |
| PWM Frequency (Hz) | 26040 ? | |||||
| Screen | 1% | -16% | -19% | 126% | -4% | |
| Brightness middle (cd/m²) | 672.8 | 344 -49% | 374.5 -44% | 473.5 -30% | 380 -44% | 542 -19% |
| Brightness (cd/m²) | 674 | 335 -50% | 363 -46% | 461 -32% | 388 -42% | 528 -22% |
| Brightness Distribution (%) | 89 | 93 4% | 91 2% | 90 1% | 93 4% | 84 -6% |
| Black Level * (cd/m²) | 0.5 | 0.37 26% | 0.42 16% | 0.55 -10% | 0.018 96% | 0.41 18% |
| Contrast (:1) | 1346 | 930 -31% | 892 -34% | 861 -36% | 21111 1468% | 1322 -2% |
| Colorchecker dE 2000 * | 3.48 | 1.76 49% | 4.05 -16% | 4.8 -38% | 5.47 -57% | 3.5 -1% |
| Colorchecker dE 2000 max. * | 9.44 | 4.31 54% | 8.17 13% | 8.73 8% | 8.19 13% | 7.8 17% |
| Colorchecker dE 2000 calibrated * | 3.03 | 4.36 -44% | 3.08 -2% | 3.04 -0% | 1.3 57% | |
| Greyscale dE 2000 * | 3.1 | 3.12 -1% | 2.6 16% | 5.6 -81% | 5.3 -71% | 4.8 -55% |
| Gamma | 2.04 108% | 2.2 100% | 2.21 100% | 2.34 94% | 2.15 102% | 2.33 94% |
| CCT | 6380 102% | 6563 99% | 7027 93% | 7549 86% | 6128 106% | 7690 85% |
| Color Space (Percent of AdobeRGB 1998) (%) | 75.2 | 85 13% | 56.4 -25% | 86.4 15% | 86 14% | 58.8 -22% |
| Color Space (Percent of sRGB) (%) | 100 | 98 -2% | 86.3 -14% | 99.7 0% | 100 0% | 91.1 -9% |
| Moyenne finale (programmes/paramètres) | -0% /
1% | -7% /
-13% | -4% /
-12% | 74% /
99% | 8% /
-1% |
* ... Moindre est la valeur, meilleures sont les performances
L'espace couleur couvre tous les sRGB et DCI-P3. Par rapport à AdobeRVB, DCI-P3 couvre plus de jaune et de rouge, ce que nos images ci-dessous peuvent confirmer pour notre ZBook.
Les mesures du colorimètre X-Rite montrent que la température de la couleur est légèrement du côté chaud. Le calibrage de l'écran par nos soins permet de résoudre le petit problème de la balance RGB et des courbes gamma plus plates. HP ne propose pas de logiciel de gestion des couleurs préinstallé, contrairement à Dell et à son logiciel Premier Color.

Temps de réponse de l'écran
| ↔ Temps de réponse noir à blanc | ||
|---|---|---|
| 36 ms ... hausse ↗ et chute ↘ combinées | ↗ 20.4 ms hausse | 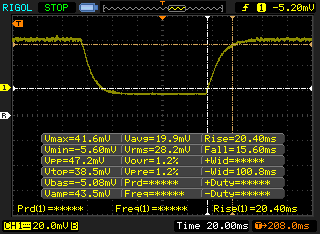 |
| ↘ 15.6 ms chute | ||
| L'écran souffre de latences très élevées, à éviter pour le jeu. En comparaison, tous les appareils testés affichent entre 0.1 (minimum) et 240 (maximum) ms. » 94 % des appareils testés affichent de meilleures performances. Cela signifie que les latences relevées sont moins bonnes que la moyenne (19.8 ms) de tous les appareils testés. | ||
| ↔ Temps de réponse gris 50% à gris 80% | ||
| 56 ms ... hausse ↗ et chute ↘ combinées | ↗ 27.6 ms hausse | 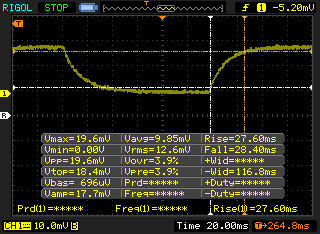 |
| ↘ 28.4 ms chute | ||
| L'écran souffre de latences très élevées, à éviter pour le jeu. En comparaison, tous les appareils testés affichent entre 0.165 (minimum) et 636 (maximum) ms. » 93 % des appareils testés affichent de meilleures performances. Cela signifie que les latences relevées sont moins bonnes que la moyenne (30.9 ms) de tous les appareils testés. | ||
Scintillement / MLI (Modulation de largeur d'impulsion)
| Scintillement / MLI (Modulation de largeur d'impulsion) non décelé | 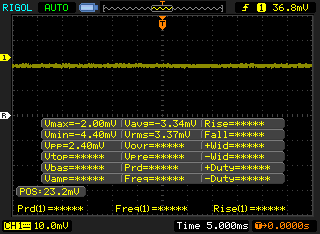 | ||
En comparaison, 52 % des appareils testés n'emploient pas MDI pour assombrir leur écran. Nous avons relevé une moyenne à 7744 (minimum : 5 - maximum : 343500) Hz dans le cas où une MDI était active. | |||
La visibilité extérieure est bonne si l'on se trouve à l'ombre, notamment parce que l'écran est nettement plus lumineux qu'un ordinateur portable ou un poste de travail moyen de 15,6 pouces. Cependant, la lumière directe du soleil continue de laver l'écran.
Performance
En tant que station de travail mobile complète, le ZBook Fury 15 peut être équipé du Core i9-10885H ou du Xeon W-10885M pour le support de la RAM ECC. Il est à noter que les utilisateurs peuvent configurer jusqu'à 128 Go de RAM non ECC alors que l'ECC sera limité à 64 Go. Les professionnels qui ne sont pas des utilisateurs expérimentés peuvent préférer le HP ZBook Firefly, plus petit et plus portable, à la place.
Notre unité a été réglée en mode haute performance via Windows avant de lancer tous les benchmarks ci-dessous pour obtenir les meilleurs scores possibles.
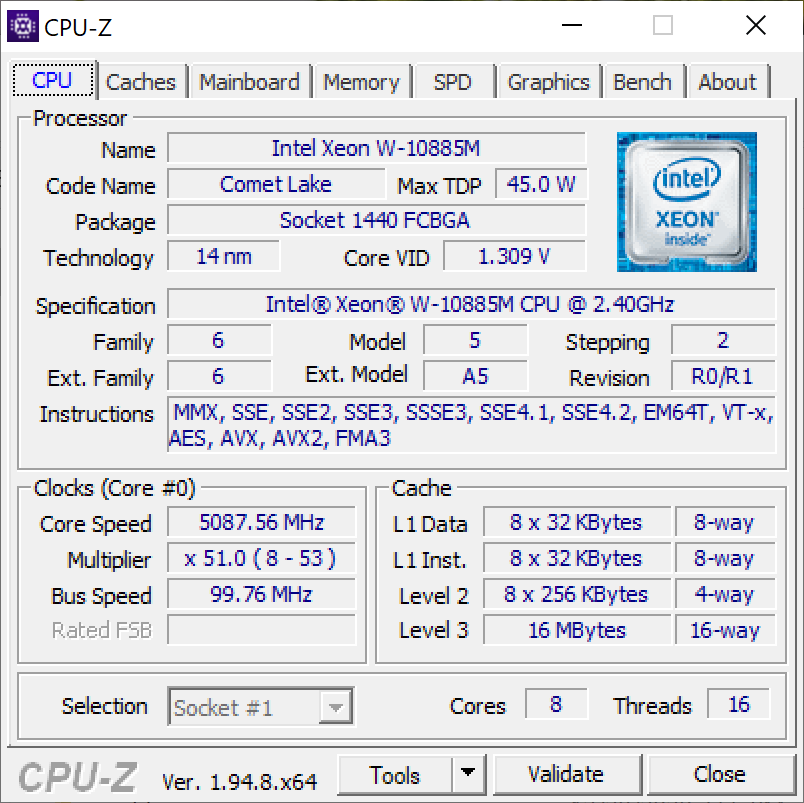
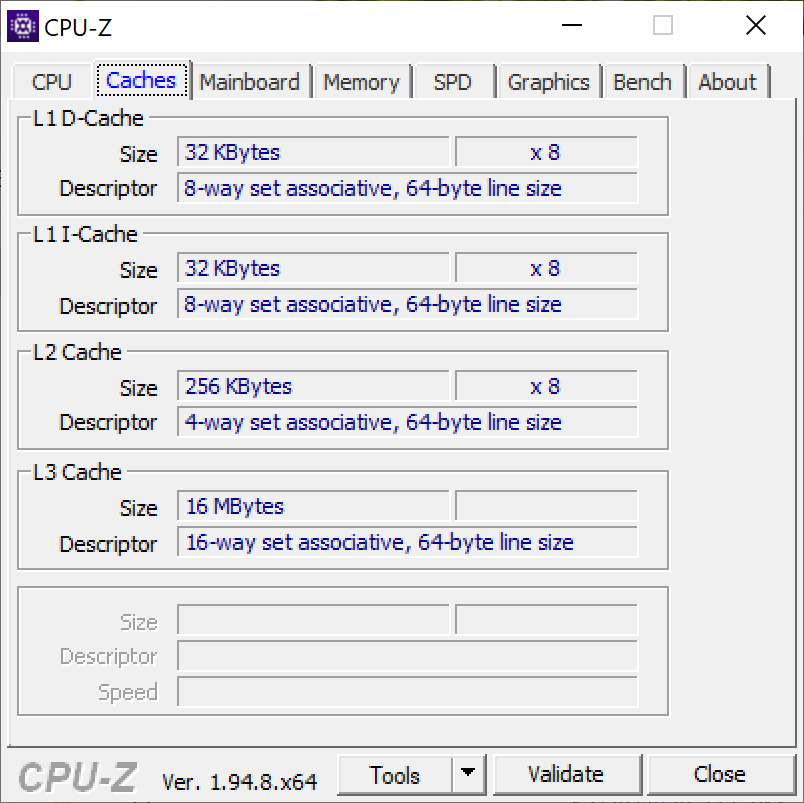
Processeur
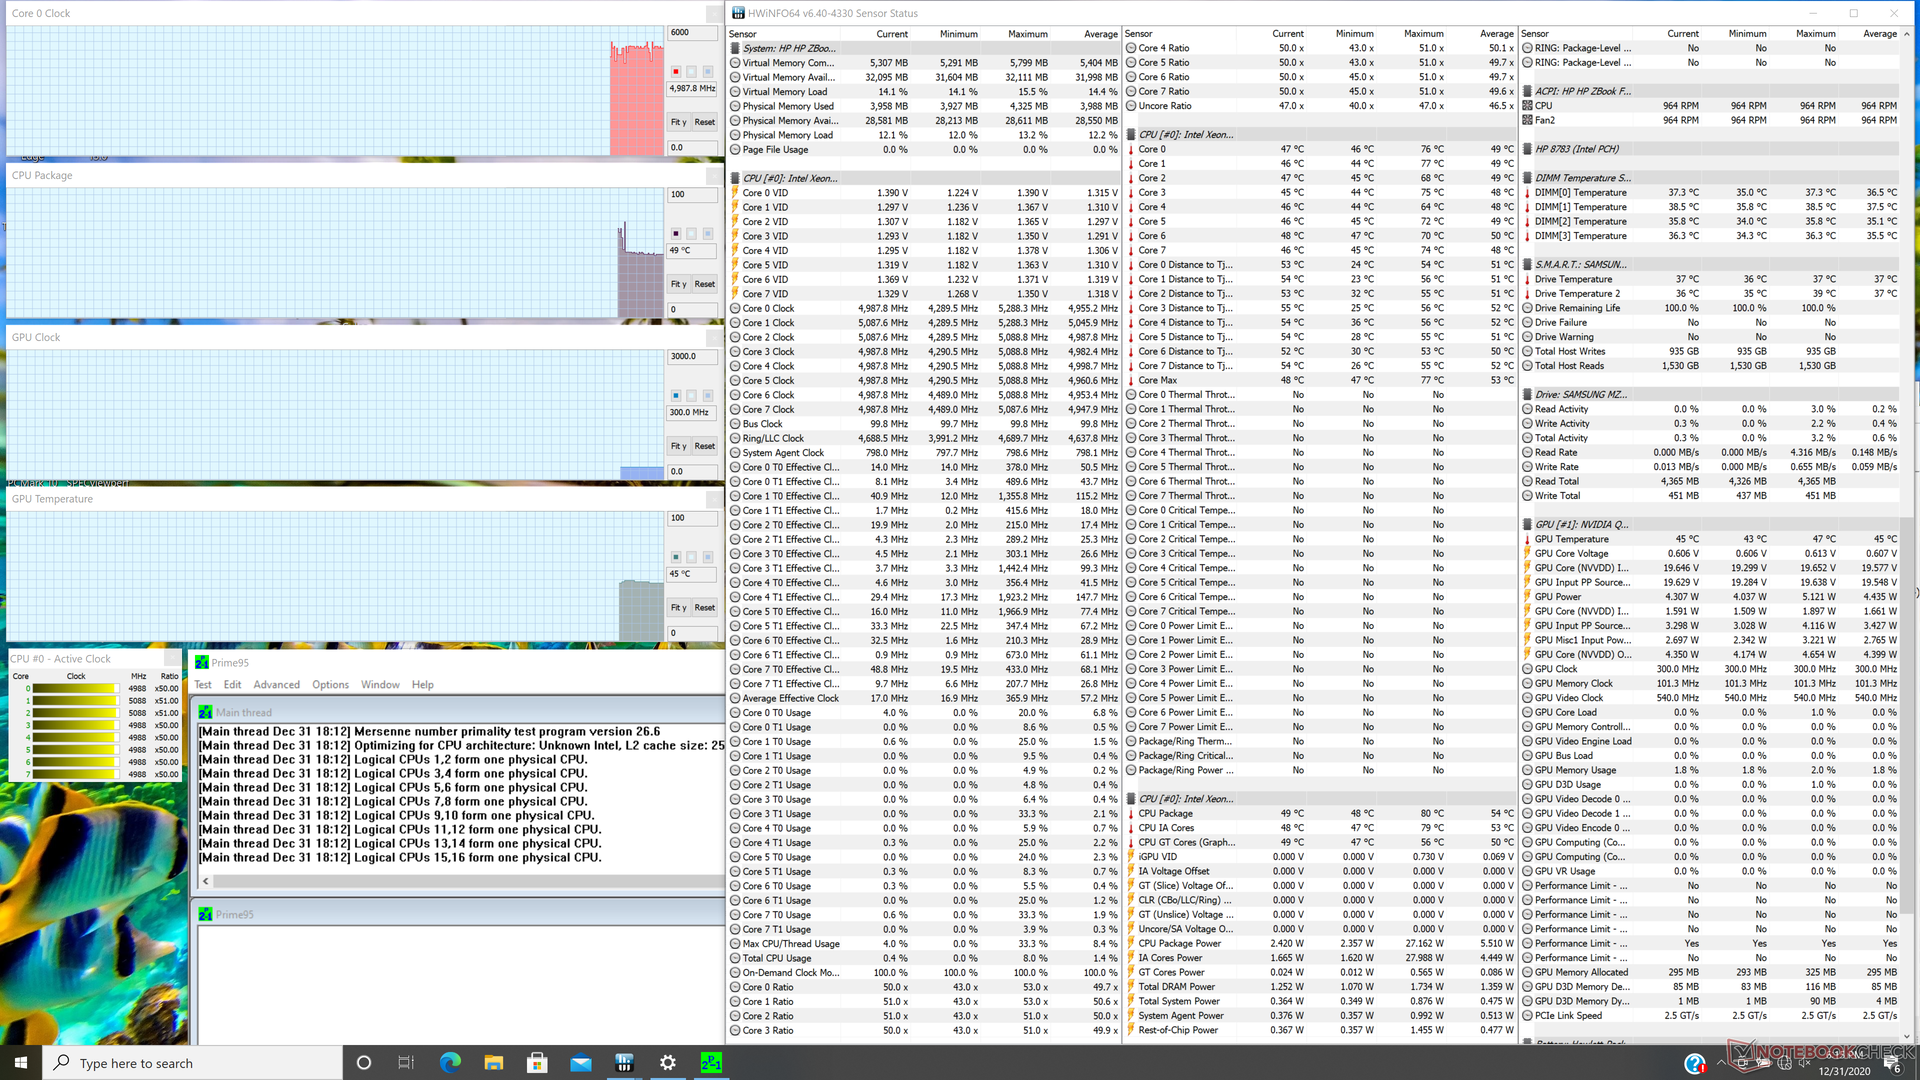
Les performances brutes du multithread sont plus lentes que prévu, à environ 30 % de moins que le Precision 7550 équipé du même processeur Xeon. Les avantages du Turbo Boost sont minimes, comme le montrent les résultats de notre test en boucle CineBench R15 xT ci-dessous.
Les performances s'améliorent considérablement après la mise à jour du BIOS à la version 1.04.01, probablement en raison d'un bogue dans notre ancienne version du BIOS. Les performances brutes du multi-thread feraient un bond de près de 50 % pour être plus conformes au Dell mentionné ci-dessus. Cela a cependant un coût, que nous détaillons dans la section "Test de stress" ci-dessous
Cinebench R15: CPU Multi 64Bit | CPU Single 64Bit
Blender: v2.79 BMW27 CPU
7-Zip 18.03: 7z b 4 -mmt1 | 7z b 4
Geekbench 5.5: Single-Core | Multi-Core
HWBOT x265 Benchmark v2.2: 4k Preset
LibreOffice : 20 Documents To PDF
R Benchmark 2.5: Overall mean
| Cinebench R20 / CPU (Multi Core) | |
| MSI WS66 10TMT-207US | |
| HP ZBook Fury 15 G7 | |
| HP ZBook Fury 15 G7 | |
| Moyenne Intel Xeon W-10885M (2727 - 4065, n=4) | |
| Dell Precision 5550 P91F | |
| Acer Nitro 5 AN515-44-R5FT | |
| Asus ProArt StudioBook Pro 15 W500G5T | |
| Lenovo ThinkPad X1 Extreme Gen3-20TLS0UV00 | |
| Dell Precision 3000 3551 | |
| Dell XPS 15 9500 Core i5 | |
| Cinebench R20 / CPU (Single Core) | |
| HP ZBook Fury 15 G7 | |
| HP ZBook Fury 15 G7 | |
| MSI WS66 10TMT-207US | |
| Moyenne Intel Xeon W-10885M (488 - 502, n=4) | |
| Dell Precision 5550 P91F | |
| Lenovo ThinkPad X1 Extreme Gen3-20TLS0UV00 | |
| Asus ProArt StudioBook Pro 15 W500G5T | |
| Dell Precision 3000 3551 | |
| Dell XPS 15 9500 Core i5 | |
| Acer Nitro 5 AN515-44-R5FT | |
| Geekbench 5.5 / Single-Core | |
| MSI WS66 10TMT-207US | |
| HP ZBook Fury 15 G7 | |
| Moyenne Intel Xeon W-10885M (1331 - 1347, n=3) | |
| Dell Precision 5550 P91F | |
| Lenovo ThinkPad X1 Extreme Gen3-20TLS0UV00 | |
| Dell Precision 3000 3551 | |
| Asus ProArt StudioBook Pro 15 W500G5T | |
| Dell XPS 15 9500 Core i5 | |
| Acer Nitro 5 AN515-44-R5FT | |
| HWBOT x265 Benchmark v2.2 / 4k Preset | |
| MSI WS66 10TMT-207US | |
| Moyenne Intel Xeon W-10885M (8.89 - 13.6, n=3) | |
| Dell Precision 5540 | |
| Dell Precision 3000 3551 | |
| Dell Precision 5550 P91F | |
| Lenovo ThinkPad X1 Extreme Gen3-20TLS0UV00 | |
| Acer Nitro 5 AN515-44-R5FT | |
| HP ZBook Fury 15 G7 | |
| Asus ProArt StudioBook Pro 15 W500G5T | |
| Dell XPS 15 9500 Core i5 | |
| LibreOffice / 20 Documents To PDF | |
| Acer Nitro 5 AN515-44-R5FT | |
| Dell XPS 15 9500 Core i5 | |
| Asus ProArt StudioBook Pro 15 W500G5T | |
| HP ZBook Fury 15 G7 | |
| Moyenne Intel Xeon W-10885M (44.4 - 58.1, n=3) | |
| Lenovo ThinkPad X1 Extreme Gen3-20TLS0UV00 | |
| Dell Precision 3000 3551 | |
| MSI WS66 10TMT-207US | |
| Dell Precision 5550 P91F | |
| R Benchmark 2.5 / Overall mean | |
| Dell XPS 15 9500 Core i5 | |
| Asus ProArt StudioBook Pro 15 W500G5T | |
| Acer Nitro 5 AN515-44-R5FT | |
| Lenovo ThinkPad X1 Extreme Gen3-20TLS0UV00 | |
| Dell Precision 5550 P91F | |
| MSI WS66 10TMT-207US | |
| Dell Precision 3000 3551 | |
| Moyenne Intel Xeon W-10885M (0.551 - 0.57, n=3) | |
| HP ZBook Fury 15 G7 | |
* ... Moindre est la valeur, meilleures sont les performances
Performance du système
Les repères PCMark sont là où nous les attendons par rapport aux autres postes de travail mobiles. Le Precision 7550, qui est équipé exactement des mêmes CPU et GPU que notre HP, est capable de devancer notre système de seulement quelques points de pourcentage.
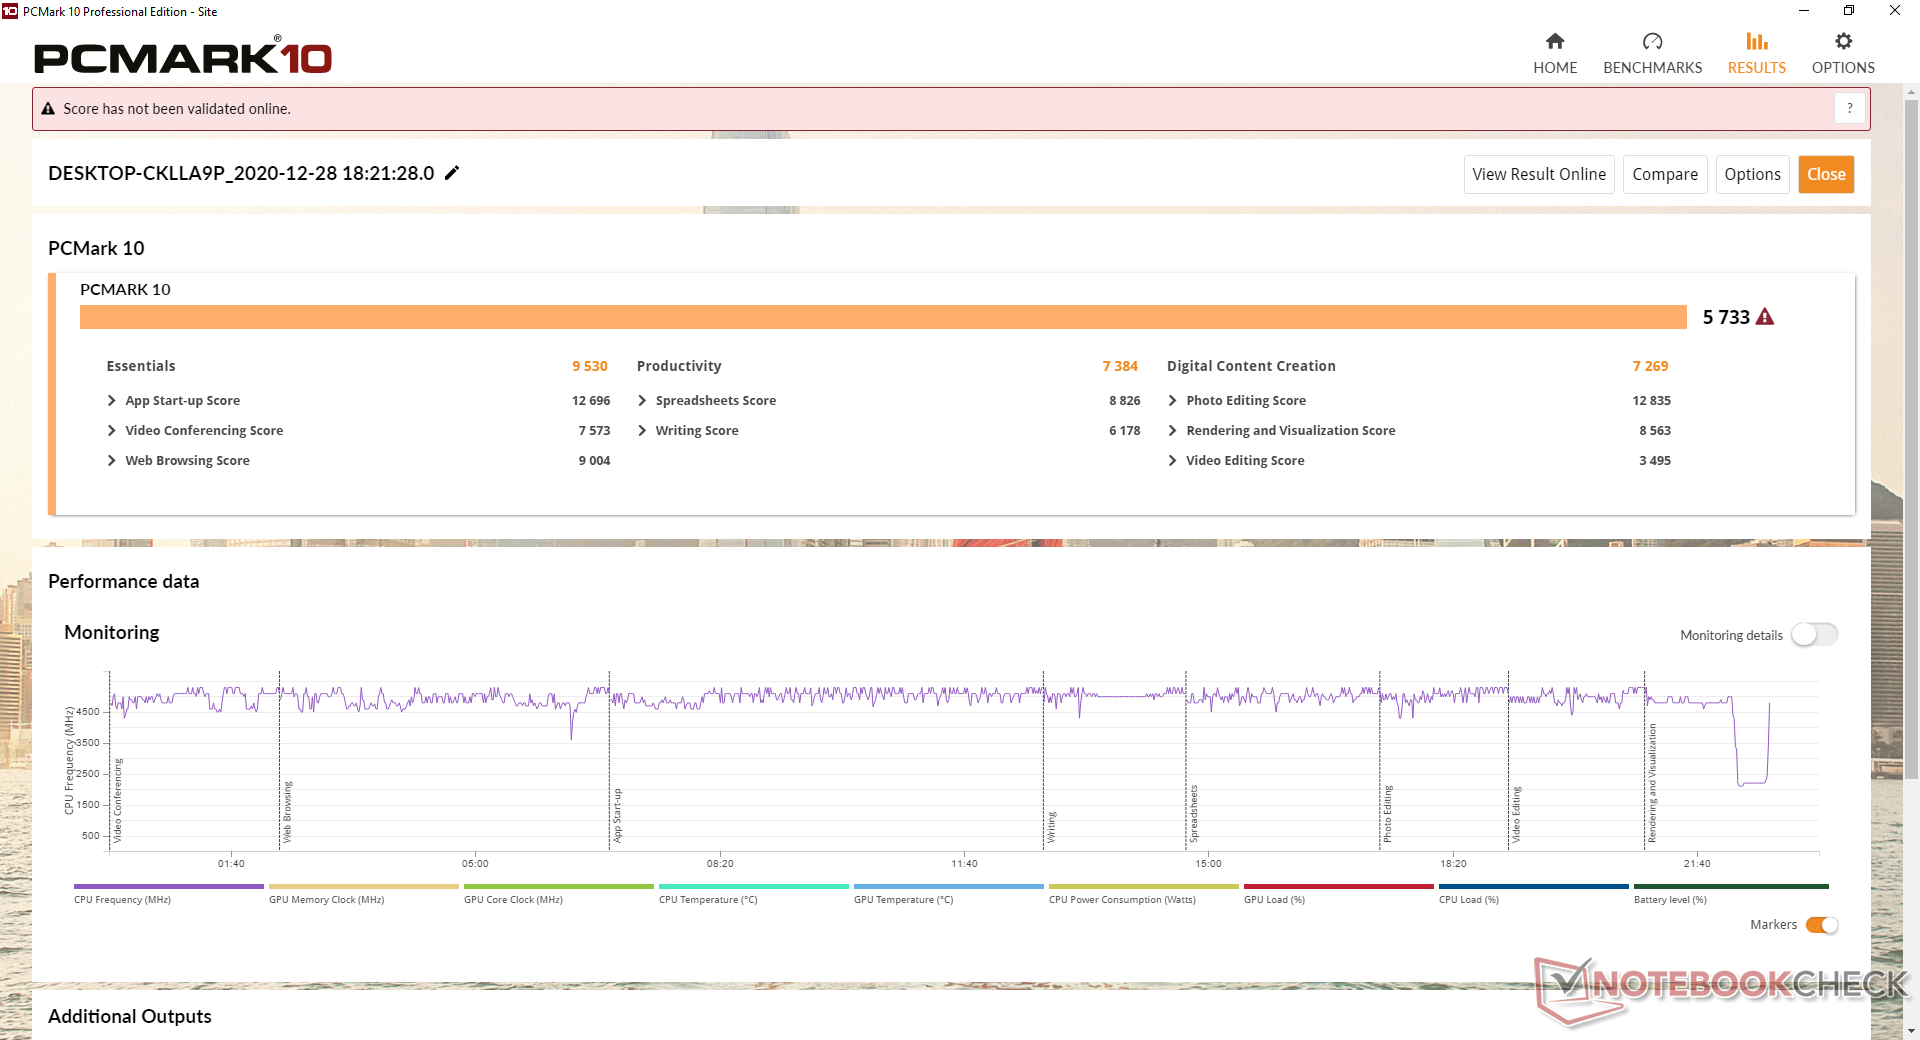
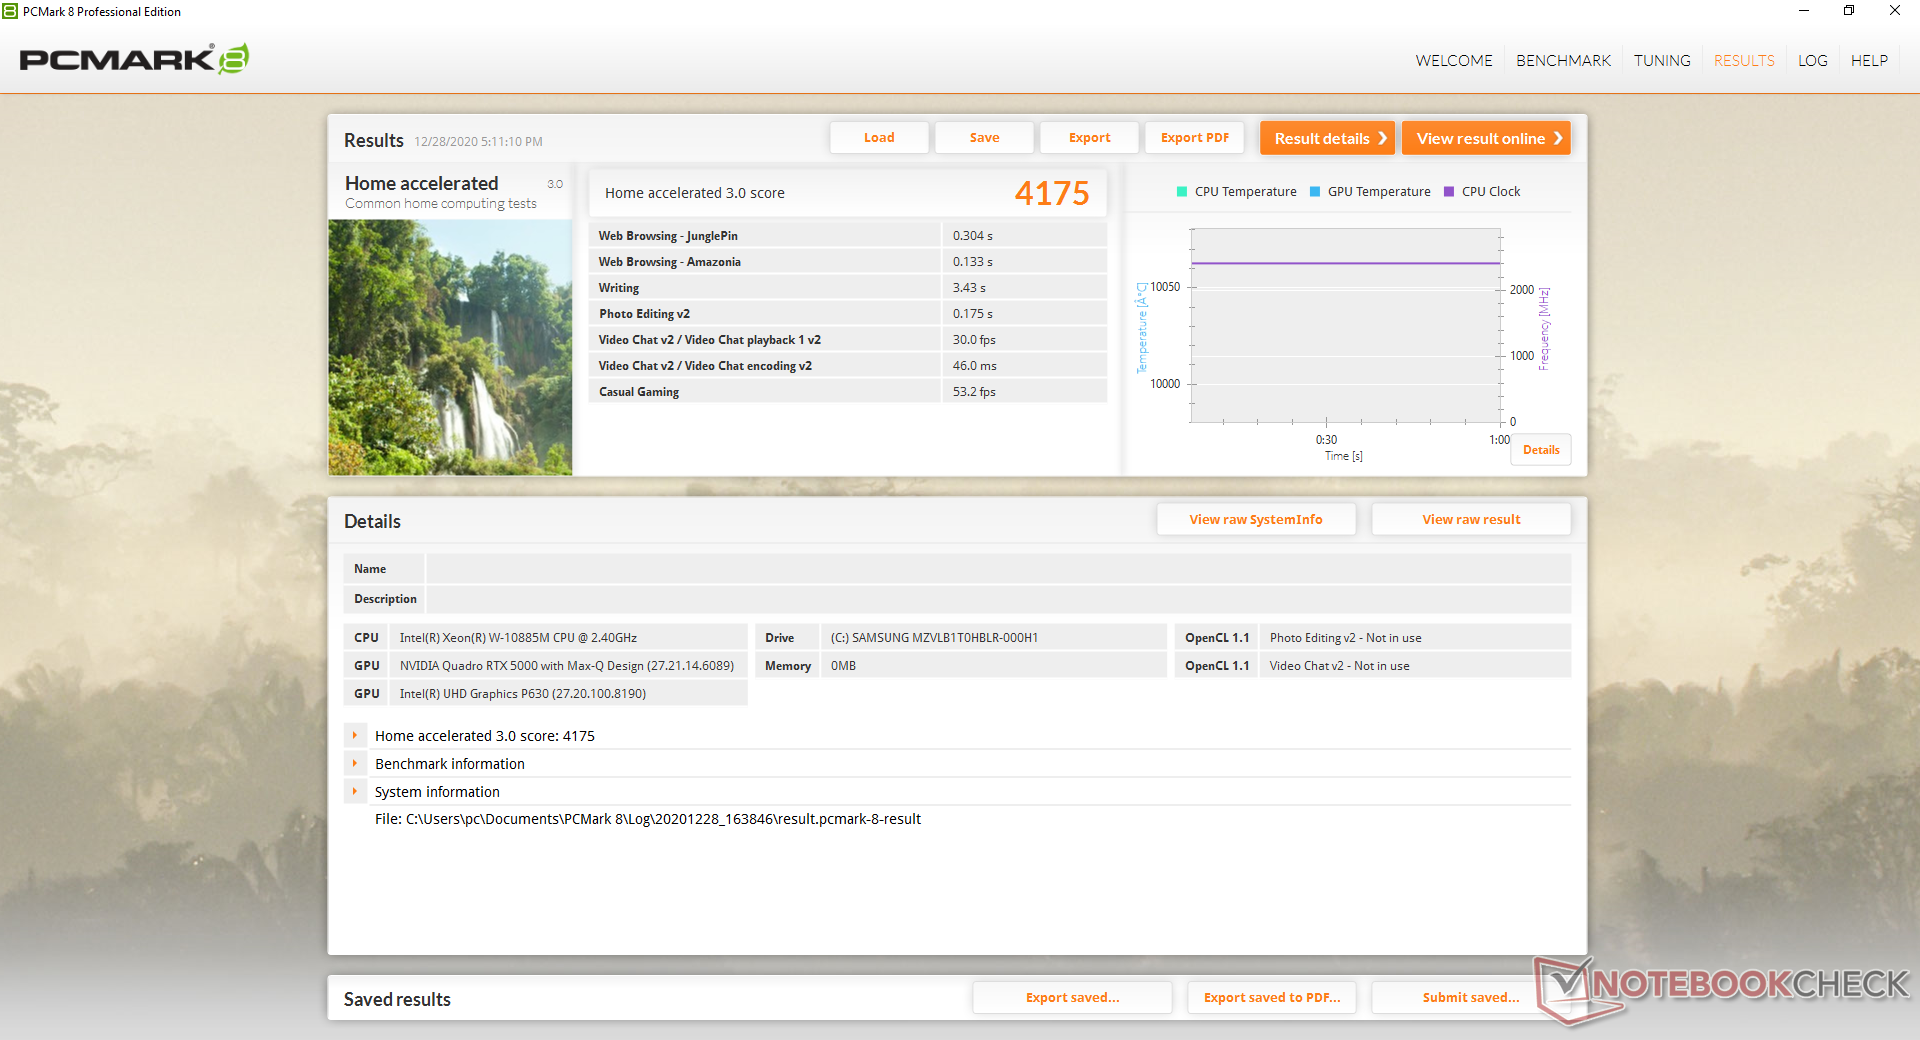
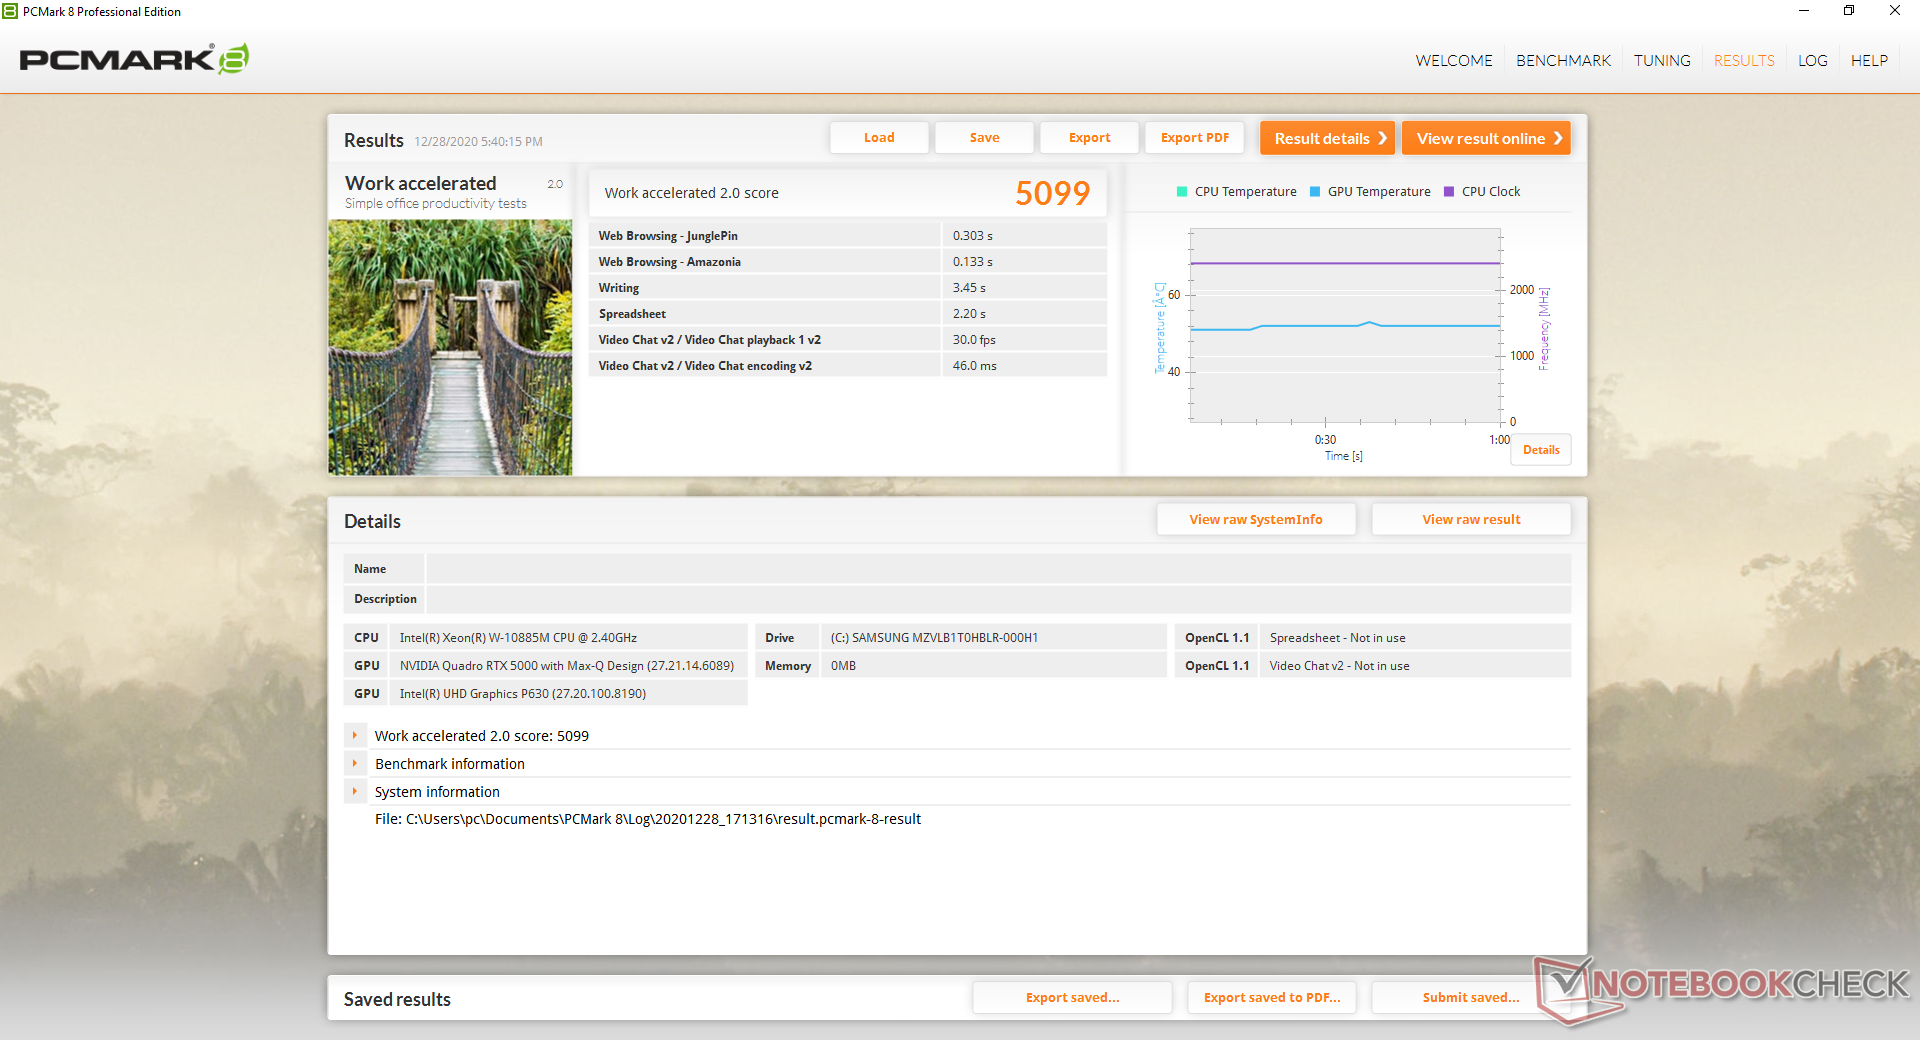
| PCMark 8 Home Score Accelerated v2 | 4175 points | |
| PCMark 8 Work Score Accelerated v2 | 5099 points | |
| PCMark 10 Score | 5733 points | |
Aide | ||
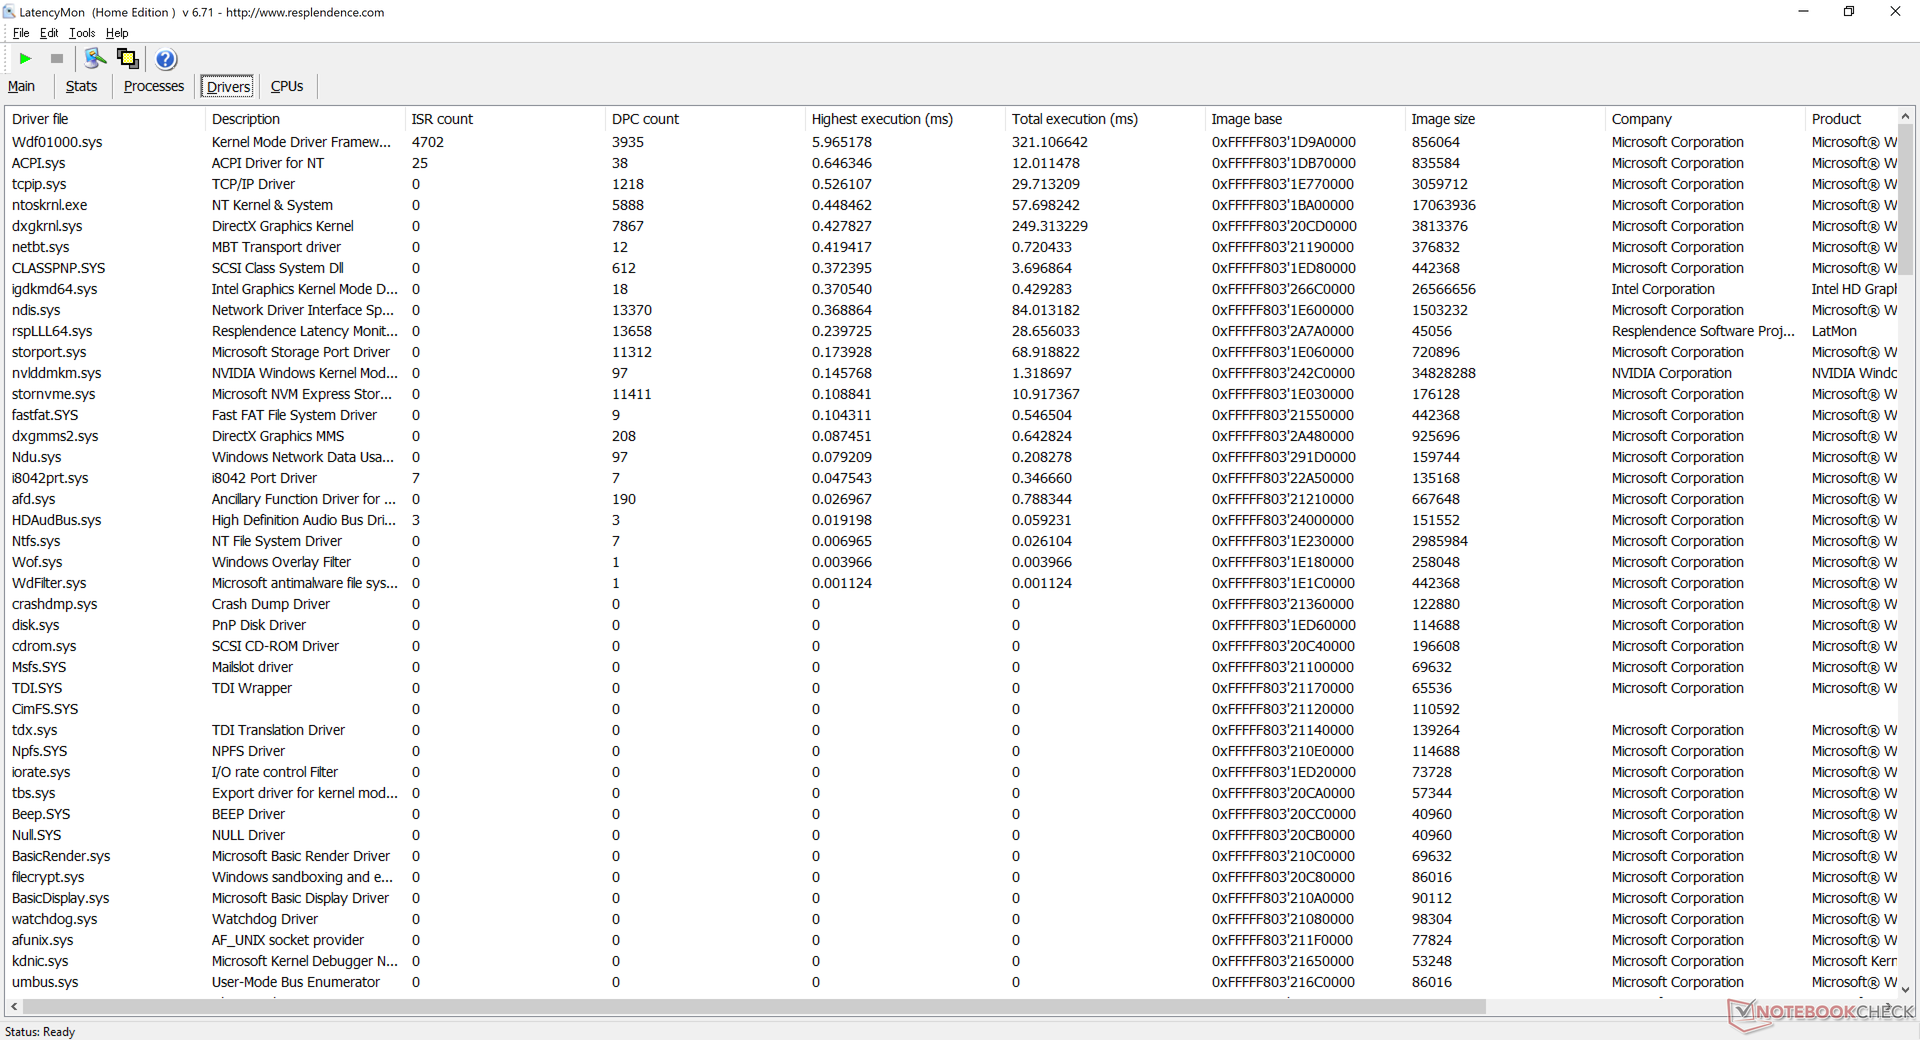
DPC Latence
LatencyMon révèle des problèmes de latence DPC lors de l'ouverture de plusieurs onglets du navigateur de notre page d'accueil, même après plusieurs tests répétés. La lecture de vidéos 4K à 60 FPS est fluide mais pas parfaite car nous avons enregistré 6 images perdues pendant une vidéo YouTube d'une minute.
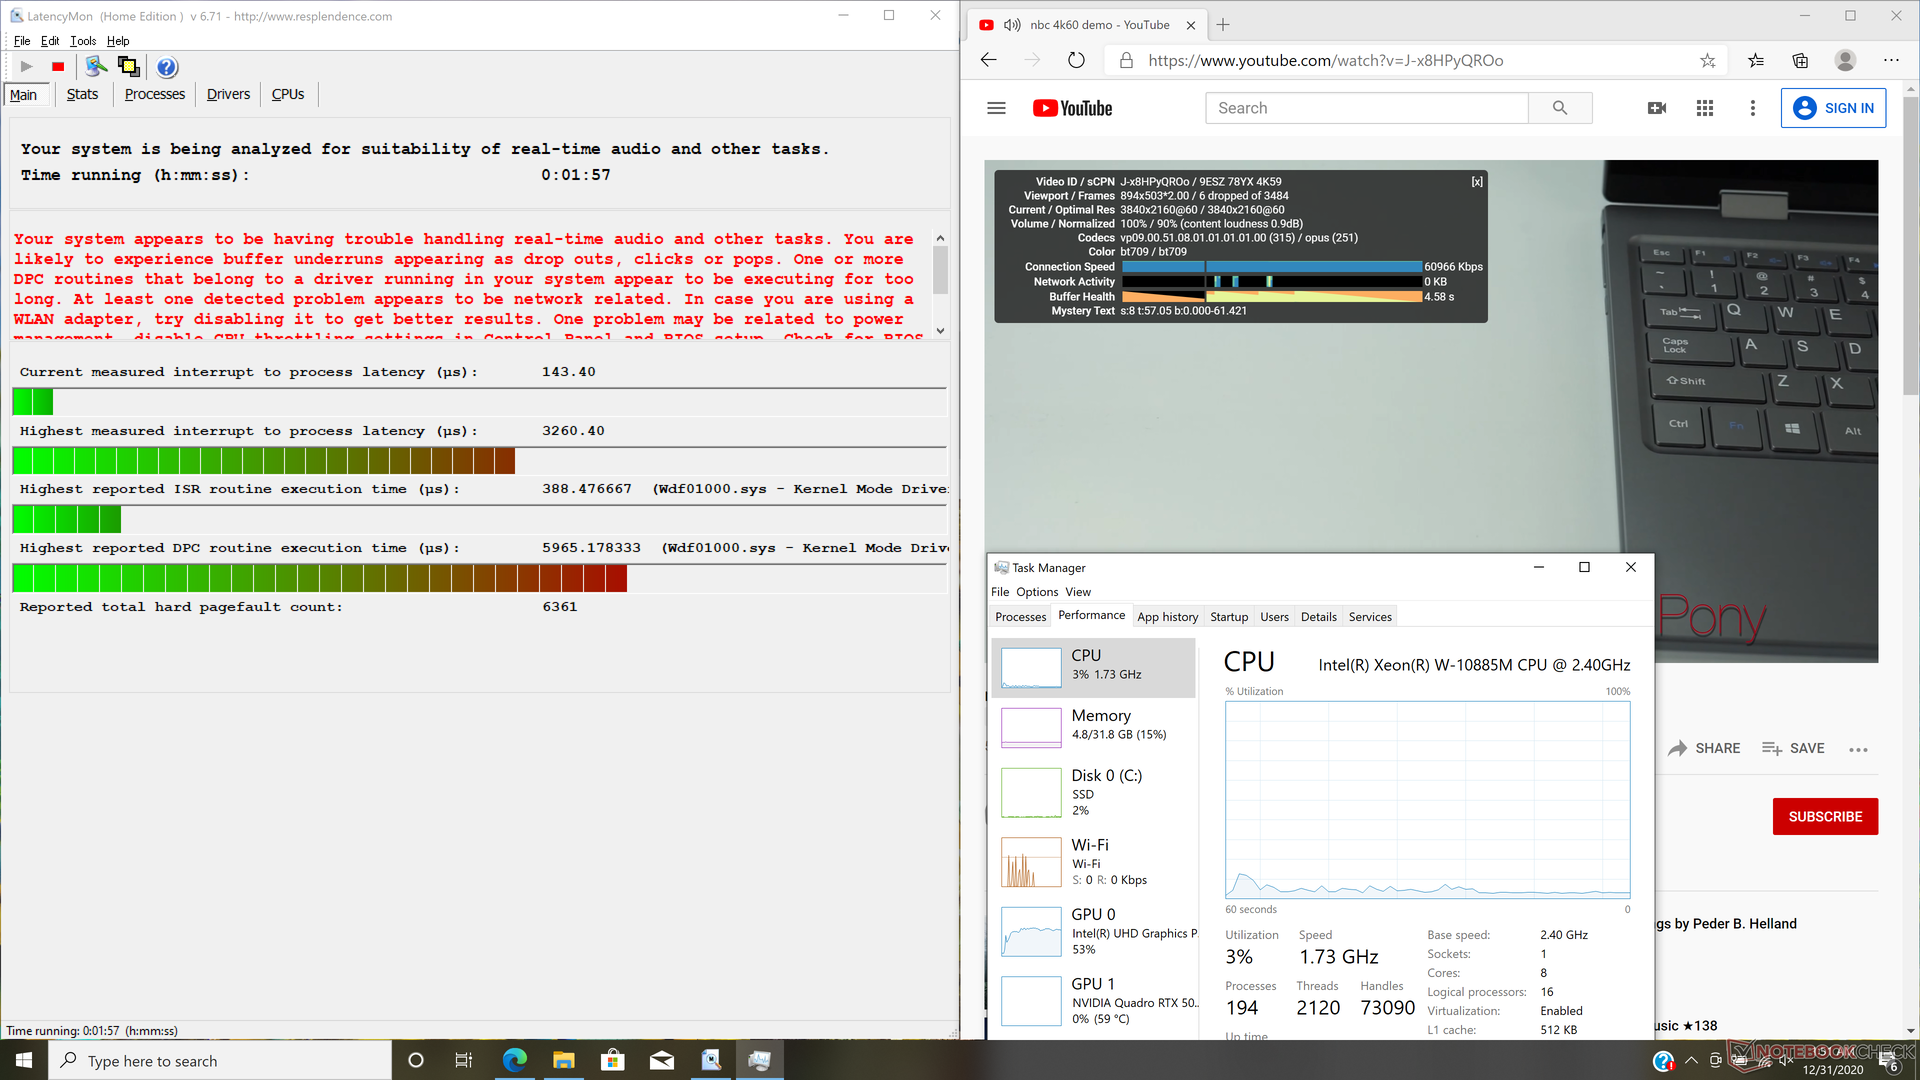
| DPC Latencies / LatencyMon - interrupt to process latency (max), Web, Youtube, Prime95 | |
| Dell Precision 7550 | |
| MSI WS66 10TMT-207US | |
| HP ZBook Fury 15 G7 | |
| Asus ProArt StudioBook Pro 15 W500G5T | |
| Razer Blade 15 Studio Edition 2020 | |
* ... Moindre est la valeur, meilleures sont les performances
Dispositifs de stockage
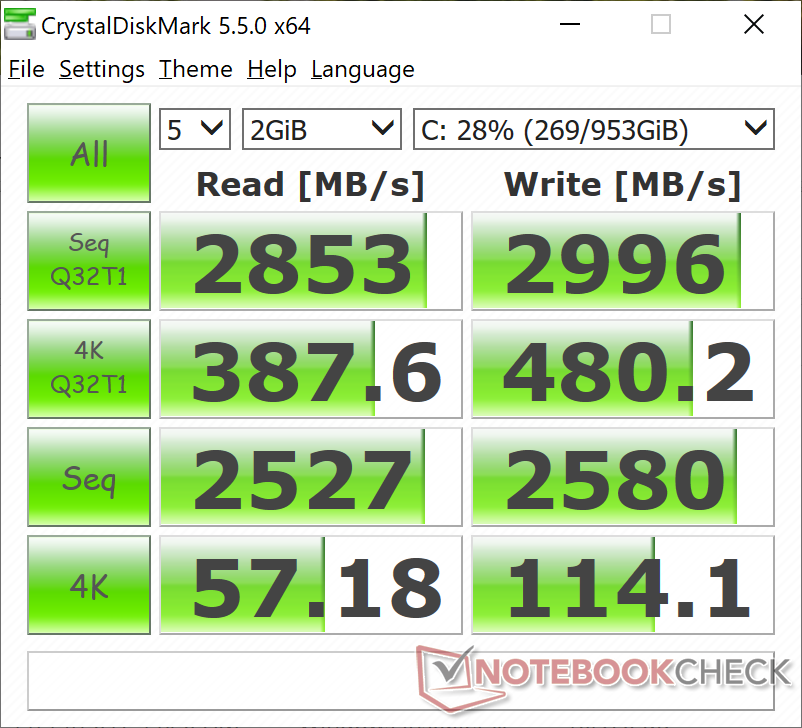
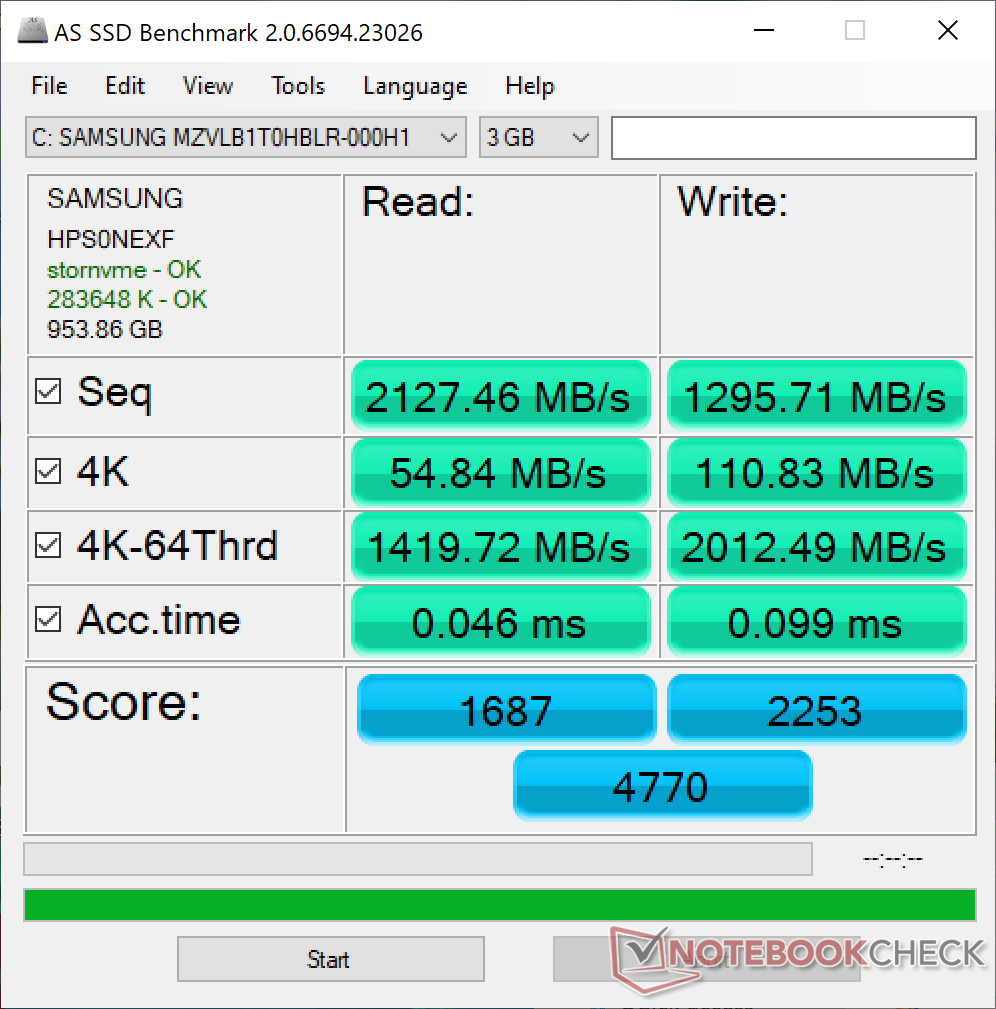
Notre unité de test est fournie avec un Samsung PM981a de 1 To qui est l'un des SSD PCIe 3 x4 NVMe grand public les plus rapides du marché. Les utilisateurs peuvent le configurer avec d'autres tailles ou modèles avec sécurité SED si souhaité.
Au total, quatre emplacements de stockage sont disponibles (3x M.2 2280 + 1x 2,5 pouces SATA III). Cependant, la baie de 2,5 pouces partage le même espace que deux des emplacements M.2, ce qui signifie qu'il n'y a pas assez de place pour installer quatre disques. Les utilisateurs peuvent installer jusqu'à trois disques M.2 ou un disque M.2 plus un disque de 2,5 pouces.
Certaines unités de gestion des stocks omettent le connecteur de 2,5 pouces pour un emplacement M.2 supplémentaire afin de prendre en charge jusqu'à quatre lecteurs M.2 simultanément.
| HP ZBook Fury 15 G7 Samsung PM981a MZVLB1T0HBLR | MSI WS66 10TMT-207US WDC PC SN730 SDBPNTY-1T00 | Dell Precision 7550 SK Hynix PC601A NVMe 1TB | Razer Blade 15 Studio Edition 2020 Samsung PM981a MZVLB1T0HBLR | Lenovo ThinkPad P1 2019-20QT000RGE WDC PC SN720 SDAQNTW-512G | |
|---|---|---|---|---|---|
| AS SSD | 74% | 29% | 31% | 49% | |
| Seq Read (MB/s) | 2127 | 2321 9% | 2028 -5% | 1982 -7% | 2980 40% |
| Seq Write (MB/s) | 1296 | 2620 102% | 1193 -8% | 2252 74% | 2094 62% |
| 4K Read (MB/s) | 54.8 | 48.57 -11% | 42.31 -23% | 47.13 -14% | 45.05 -18% |
| 4K Write (MB/s) | 110.8 | 165.1 49% | 105.5 -5% | 88.2 -20% | 155.4 40% |
| 4K-64 Read (MB/s) | 1420 | 1712 21% | 1128 -21% | 1481 4% | 1291 -9% |
| 4K-64 Write (MB/s) | 2012 | 2174 8% | 1537 -24% | 1842 -8% | 1506 -25% |
| Access Time Read * (ms) | 0.046 | 0.057 -24% | 0.069 -50% | 0.087 -89% | 0.064 -39% |
| Access Time Write * (ms) | 0.099 | 0.068 31% | 0.106 -7% | 0.04 60% | 0.024 76% |
| Score Read (Points) | 1687 | 1993 18% | 1373 -19% | 1726 2% | 1634 -3% |
| Score Write (Points) | 2253 | 2601 15% | 1762 -22% | 2155 -4% | 1871 -17% |
| Score Total (Points) | 4770 | 5630 18% | 3801 -20% | 4781 0% | 4300 -10% |
| Copy ISO MB/s (MB/s) | 2779 | 2589 -7% | 1768 -36% | 1982 -29% | 2015 -27% |
| Copy Program MB/s (MB/s) | 123.3 | 791 542% | 627 409% | 501 306% | 597 384% |
| Copy Game MB/s (MB/s) | 440.8 | 1625 269% | 1477 235% | 1140 159% | 1449 229% |
| CrystalDiskMark 5.2 / 6 | 12% | -9% | 2% | 1% | |
| Write 4K (MB/s) | 114.1 | 185.8 63% | 121 6% | 132.9 16% | 162.2 42% |
| Read 4K (MB/s) | 57.2 | 47.21 -17% | 42.16 -26% | 46.73 -18% | 43.71 -24% |
| Write Seq (MB/s) | 2580 | 2874 11% | 2150 -17% | 2214 -14% | 2441 -5% |
| Read Seq (MB/s) | 2527 | 1786 -29% | 1755 -31% | 2018 -20% | 1753 -31% |
| Write 4K Q32T1 (MB/s) | 480.2 | 466.8 -3% | 395.3 -18% | 478.9 0% | 397.6 -17% |
| Read 4K Q32T1 (MB/s) | 387.6 | 563 45% | 381.8 -1% | 540 39% | 520 34% |
| Write Seq Q32T1 (MB/s) | 2996 | 3091 3% | 2730 -9% | 2975 -1% | 2519 -16% |
| Read Seq Q32T1 (MB/s) | 2853 | 3395 19% | 3468 22% | 3195 12% | 3448 21% |
| Write 4K Q8T8 (MB/s) | 1381 | ||||
| Read 4K Q8T8 (MB/s) | 1371 | ||||
| Moyenne finale (programmes/paramètres) | 43% /
51% | 10% /
15% | 17% /
20% | 25% /
31% |
* ... Moindre est la valeur, meilleures sont les performances

Disk Throttling: DiskSpd Read Loop, Queue Depth 8
Performances des GPU
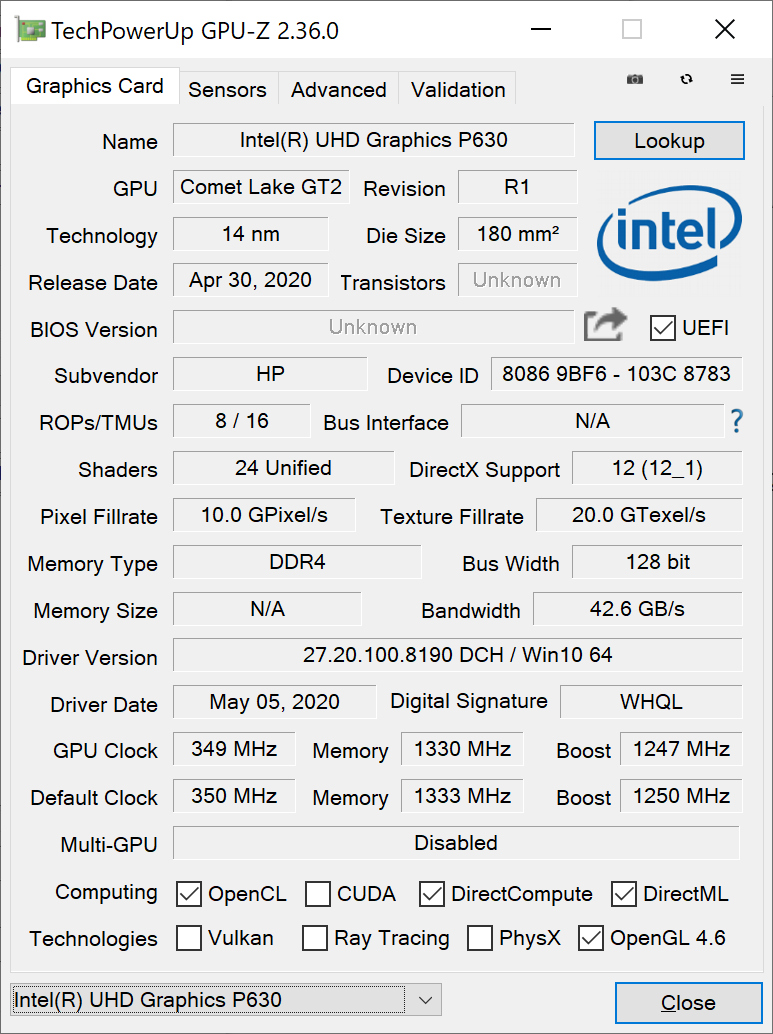
Le système utilise un GPU Quadro RTX 5000 Max-Q au lieu du Quadro RTX 5000 Max-P, plus rapide, qui est capable d'offrir jusqu'à 30 à 35 % de performances en plus que notre variante Max-Q. Les utilisateurs qui souhaitent des performances RTX 5000 maximales devraient plutôt se tourner vers l'Acer ConceptD 9 Pro, plus puissant.
Les performances graphiques brutes restent excellentes, avec des résultats de référence à peine inférieurs à ceux d'une Quadro RTX 4000 Max-P.
| 3DMark 11 Performance | 20890 points | |
| 3DMark Cloud Gate Standard Score | 30434 points | |
| 3DMark Fire Strike Score | 16005 points | |
| 3DMark Time Spy Score | 7276 points | |
Aide | ||
| Bas | Moyen | Élevé | Ultra | QHD | 4K | |
|---|---|---|---|---|---|---|
| The Witcher 3 (2015) | 298.9 | 235.8 | 149.8 | 79.5 | 55.4 | |
| Dota 2 Reborn (2015) | 142 | 126 | 119 | 112 | 96.7 | |
| Final Fantasy XV Benchmark (2018) | 132 | 101 | 79.4 | 58.4 | 33.9 | |
| X-Plane 11.11 (2018) | 96.1 | 86.9 | 73.4 | 60.6 |
Emissions
Bruit du système
Le bruit des ventilateurs n'est jamais un problème lorsqu'ils fonctionnent à faible ou moyenne charge. La première scène de référence de 90 secondes de 3DMark 06, par exemple, induit un bruit de ventilateur de seulement 31,7 dB(A), ce qui est beaucoup plus faible que ce que nous avons observé sur le Precision 7550 ou le MSI WS66. Le bruit du ventilateur atteint un maximum de 47 dB(A) lorsque la charge est plus élevée.
Nous n'avons observé aucun bruit électronique ni aucun gémissement de bobine dans notre unité de test.
| HP ZBook Fury 15 G7 Quadro RTX 5000 Max-Q, W-10885M, Samsung PM981a MZVLB1T0HBLR | Asus ProArt StudioBook Pro 15 W500G5T Quadro RTX 5000 Max-Q, i7-9750H, Samsung SSD PM981 MZVLB1T0HALR | MSI WS66 10TMT-207US Quadro RTX 5000 Max-Q, i9-10980HK, WDC PC SN730 SDBPNTY-1T00 | Dell Precision 7550 Quadro RTX 5000 Max-Q, W-10885M, SK Hynix PC601A NVMe 1TB | Razer Blade 15 Studio Edition 2020 Quadro RTX 5000 Max-Q, i7-10875H, Samsung PM981a MZVLB1T0HBLR | Lenovo ThinkPad P1 2019-20QT000RGE Quadro T1000 (Laptop), i7-9850H, WDC PC SN720 SDAQNTW-512G | |
|---|---|---|---|---|---|---|
| Noise | -10% | -17% | -11% | -12% | -5% | |
| arrêt / environnement * (dB) | 26.4 | 25.2 5% | 26 2% | 25.8 2% | 30.1 -14% | 28.8 -9% |
| Idle Minimum * (dB) | 26.4 | 27.9 -6% | 32 -21% | 25.8 2% | 30.1 -14% | 28.8 -9% |
| Idle Average * (dB) | 26.4 | 27.9 -6% | 32 -21% | 25.8 2% | 30.1 -14% | 28.8 -9% |
| Idle Maximum * (dB) | 26.4 | 27.9 -6% | 32 -21% | 25.9 2% | 30.1 -14% | 28.8 -9% |
| Load Average * (dB) | 31.7 | 47 -48% | 42 -32% | 51.2 -62% | 42.3 -33% | 36.1 -14% |
| Witcher 3 ultra * (dB) | 47 | 47.4 -1% | 51.9 -10% | 48.2 -3% | ||
| Load Maximum * (dB) | 47 | 46.9 -0% | 59.7 -27% | 51.9 -10% | 42.1 10% | 36.7 22% |
* ... Moindre est la valeur, meilleures sont les performances
Degré de la nuisance sonore
| Au repos |
| 26.4 / 26.4 / 26.4 dB(A) |
| Fortement sollicité |
| 31.7 / 47 dB(A) |
 | ||
30 dB silencieux 40 dB(A) audible 50 dB(A) bruyant |
||
min: | ||
Température
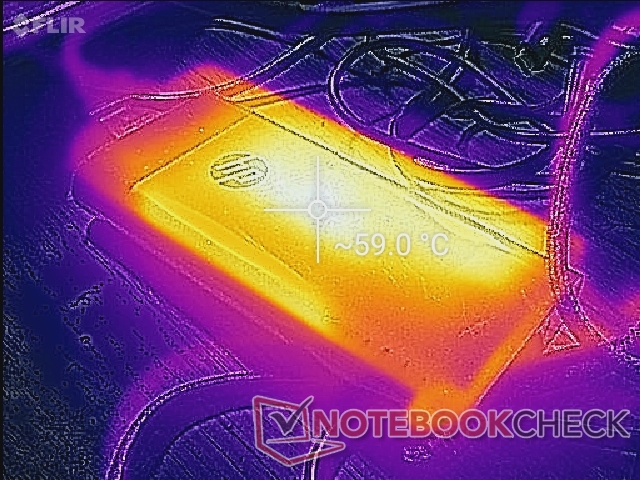
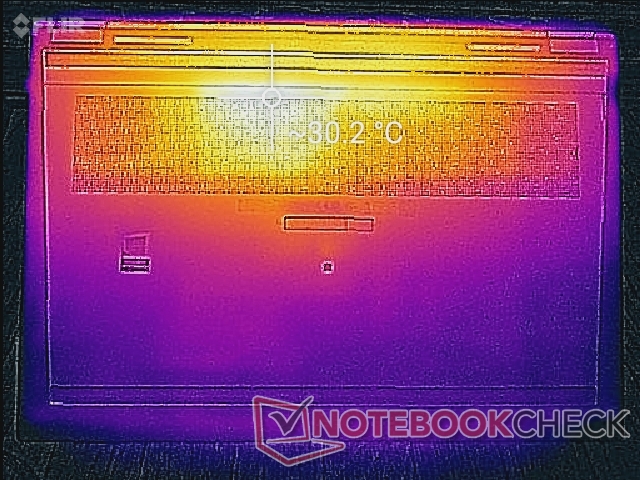
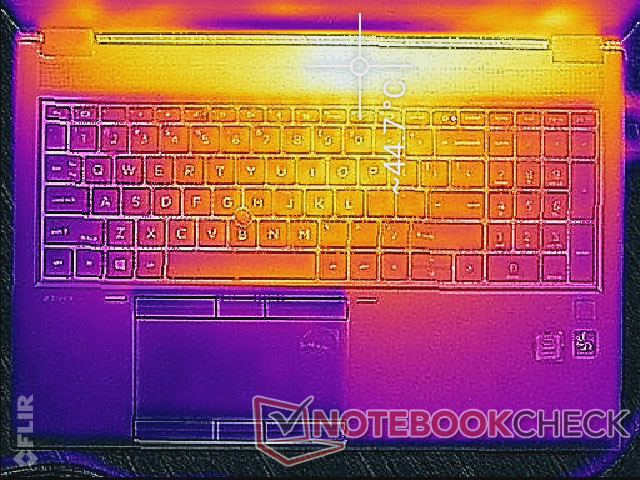
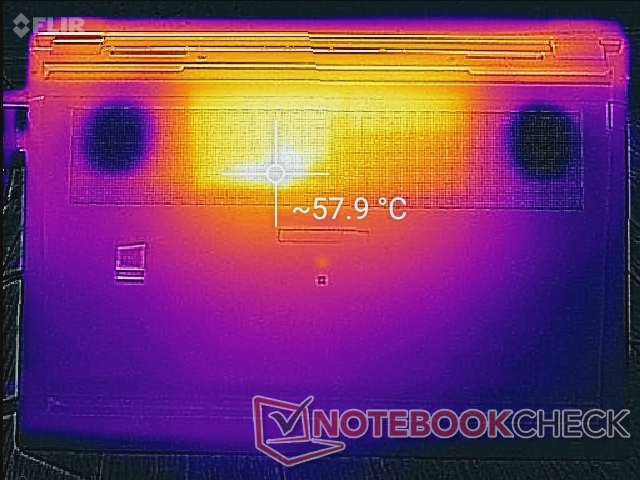
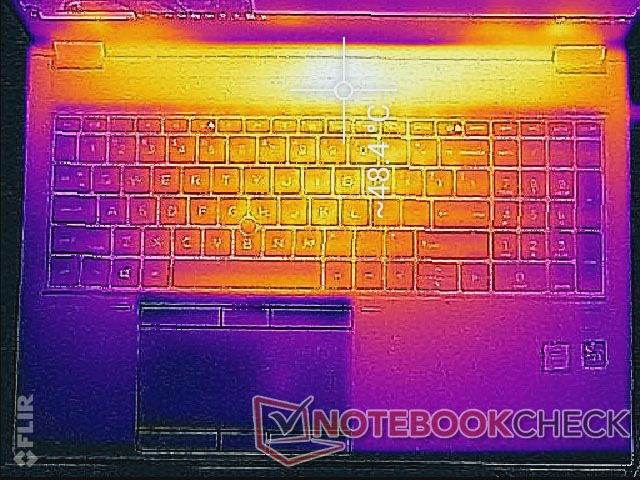
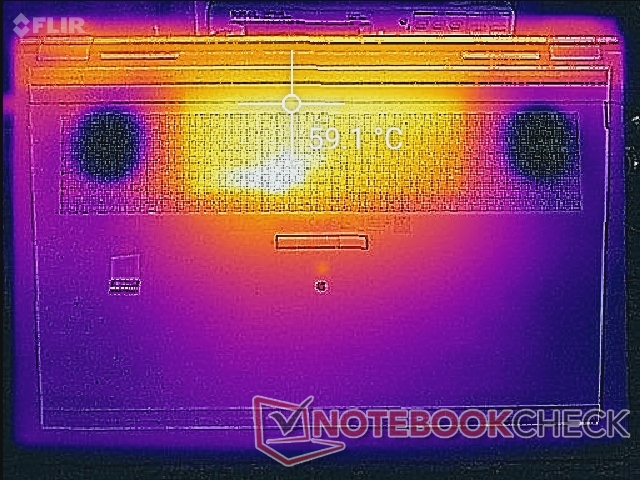
Les points chauds peuvent atteindre 49 °C à 60 °C sur les côtés supérieur et inférieur de l'ordinateur portable, respectivement. Heureusement, ces zones se trouvent à l'arrière de l'ordinateur portable, où les utilisateurs sont moins susceptibles de se toucher. L'AsusProArt StudioBook Pro 15, qui est livré avec le même GPU RTX 5000 Max-Q, fonctionne encore plus chaud jusqu'à 66 C dans des conditions similaires.
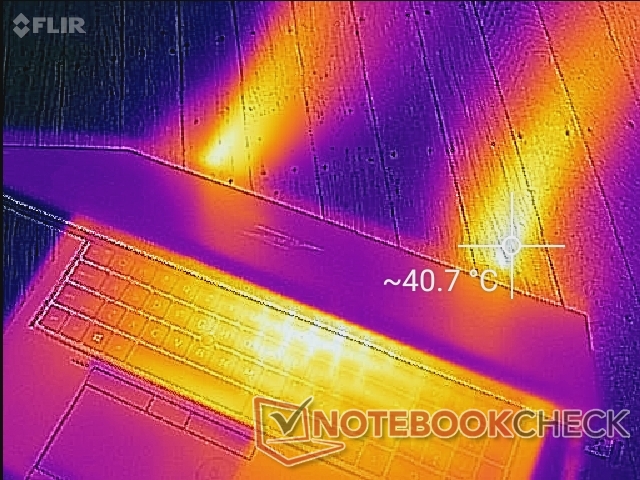
(-) La température maximale du côté supérieur est de 48.8 °C / 120 F, par rapport à la moyenne de 38.2 °C / 101 F, allant de 22.2 à 69.8 °C pour la classe Workstation.
(-) Le fond chauffe jusqu'à un maximum de 62.6 °C / 145 F, contre une moyenne de 41.1 °C / 106 F
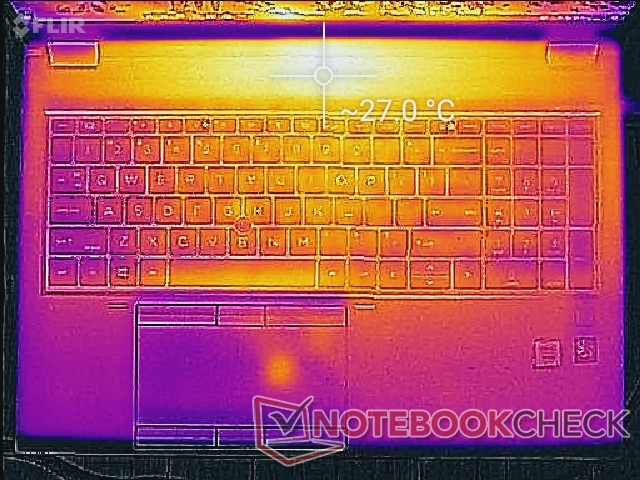
(+) En utilisation inactive, la température moyenne du côté supérieur est de 24.5 °C / 76 F, par rapport à la moyenne du dispositif de 32 °C / 90 F.
(±) En jouant à The Witcher 3, la température moyenne du côté supérieur est de 33.9 °C / 93 F, alors que la moyenne de l'appareil est de 32 °C / 90 F.
(+) Les repose-poignets et le pavé tactile atteignent la température maximale de la peau (33 °C / 91.4 F) et ne sont donc pas chauds.
(-) La température moyenne de la zone de l'appui-paume de dispositifs similaires était de 27.8 °C / 82 F (-5.2 °C / #-9.4 F).
Test de stress
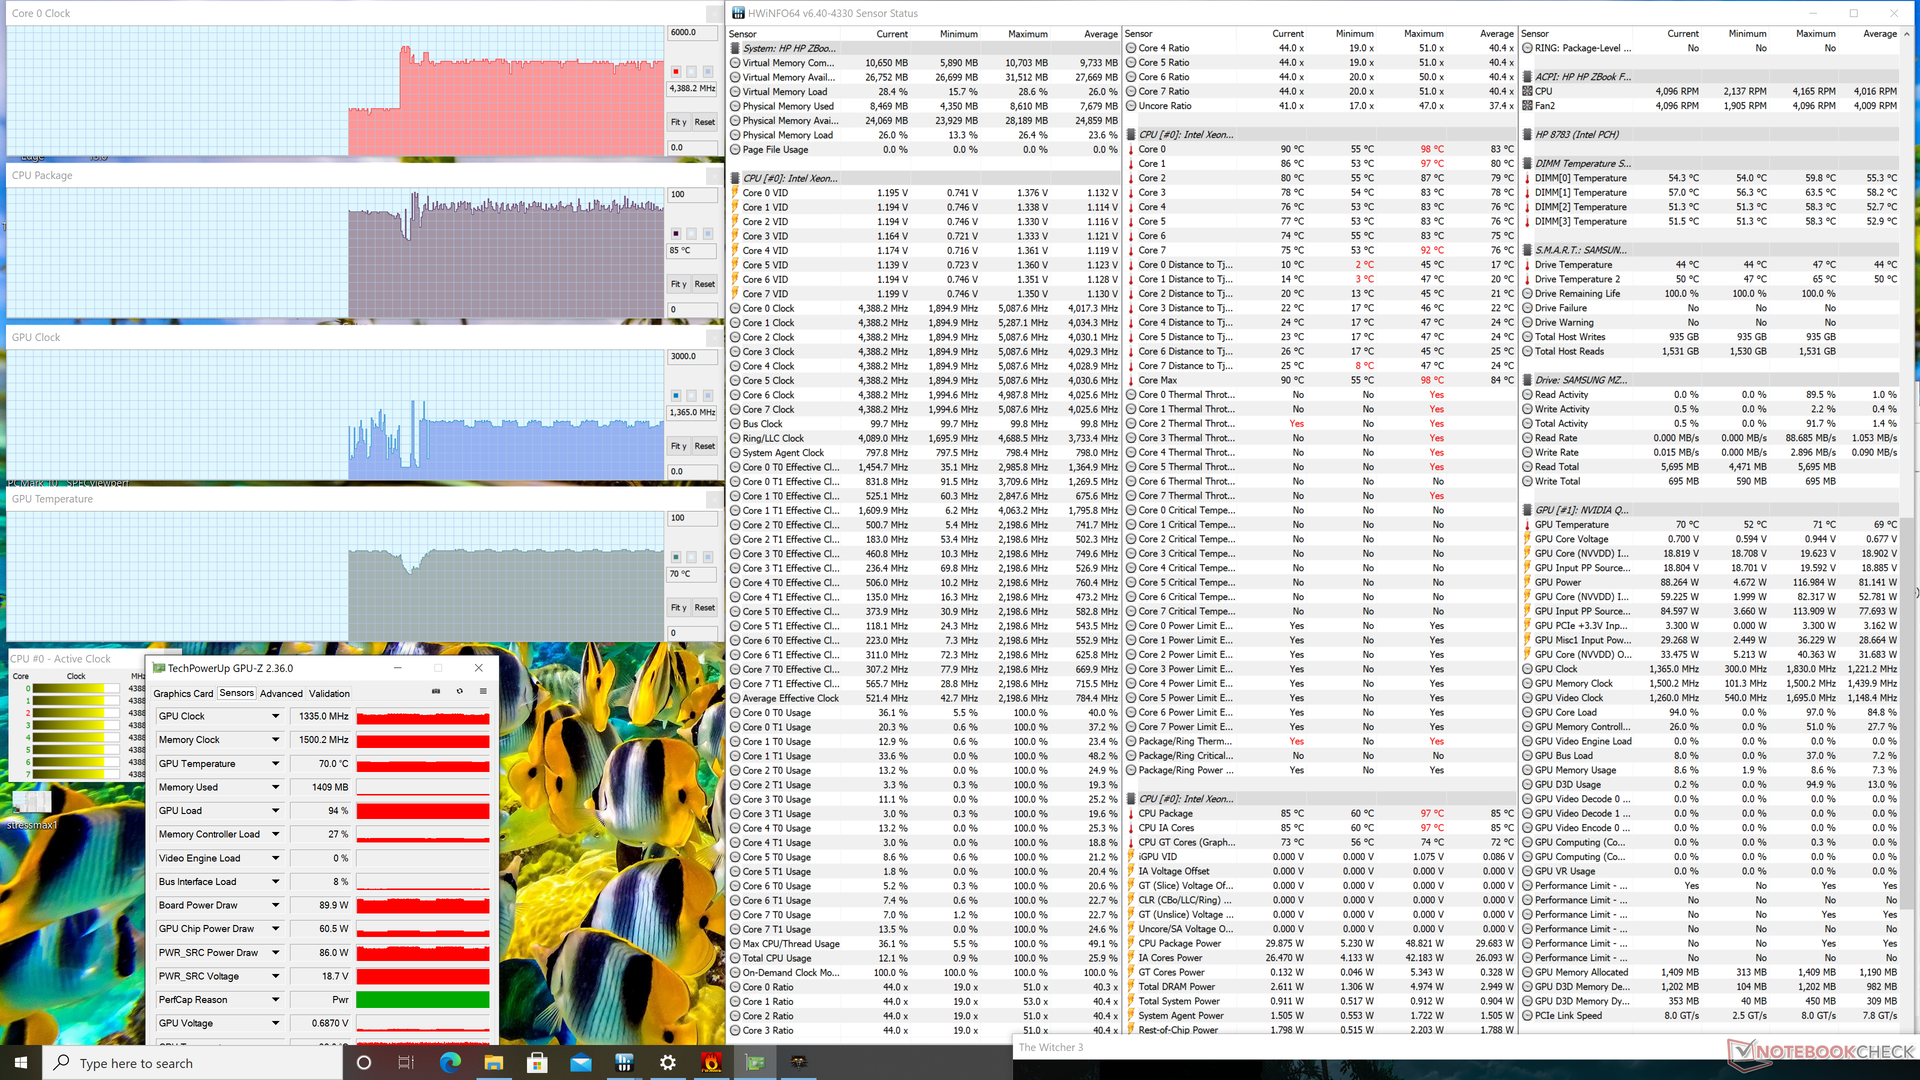
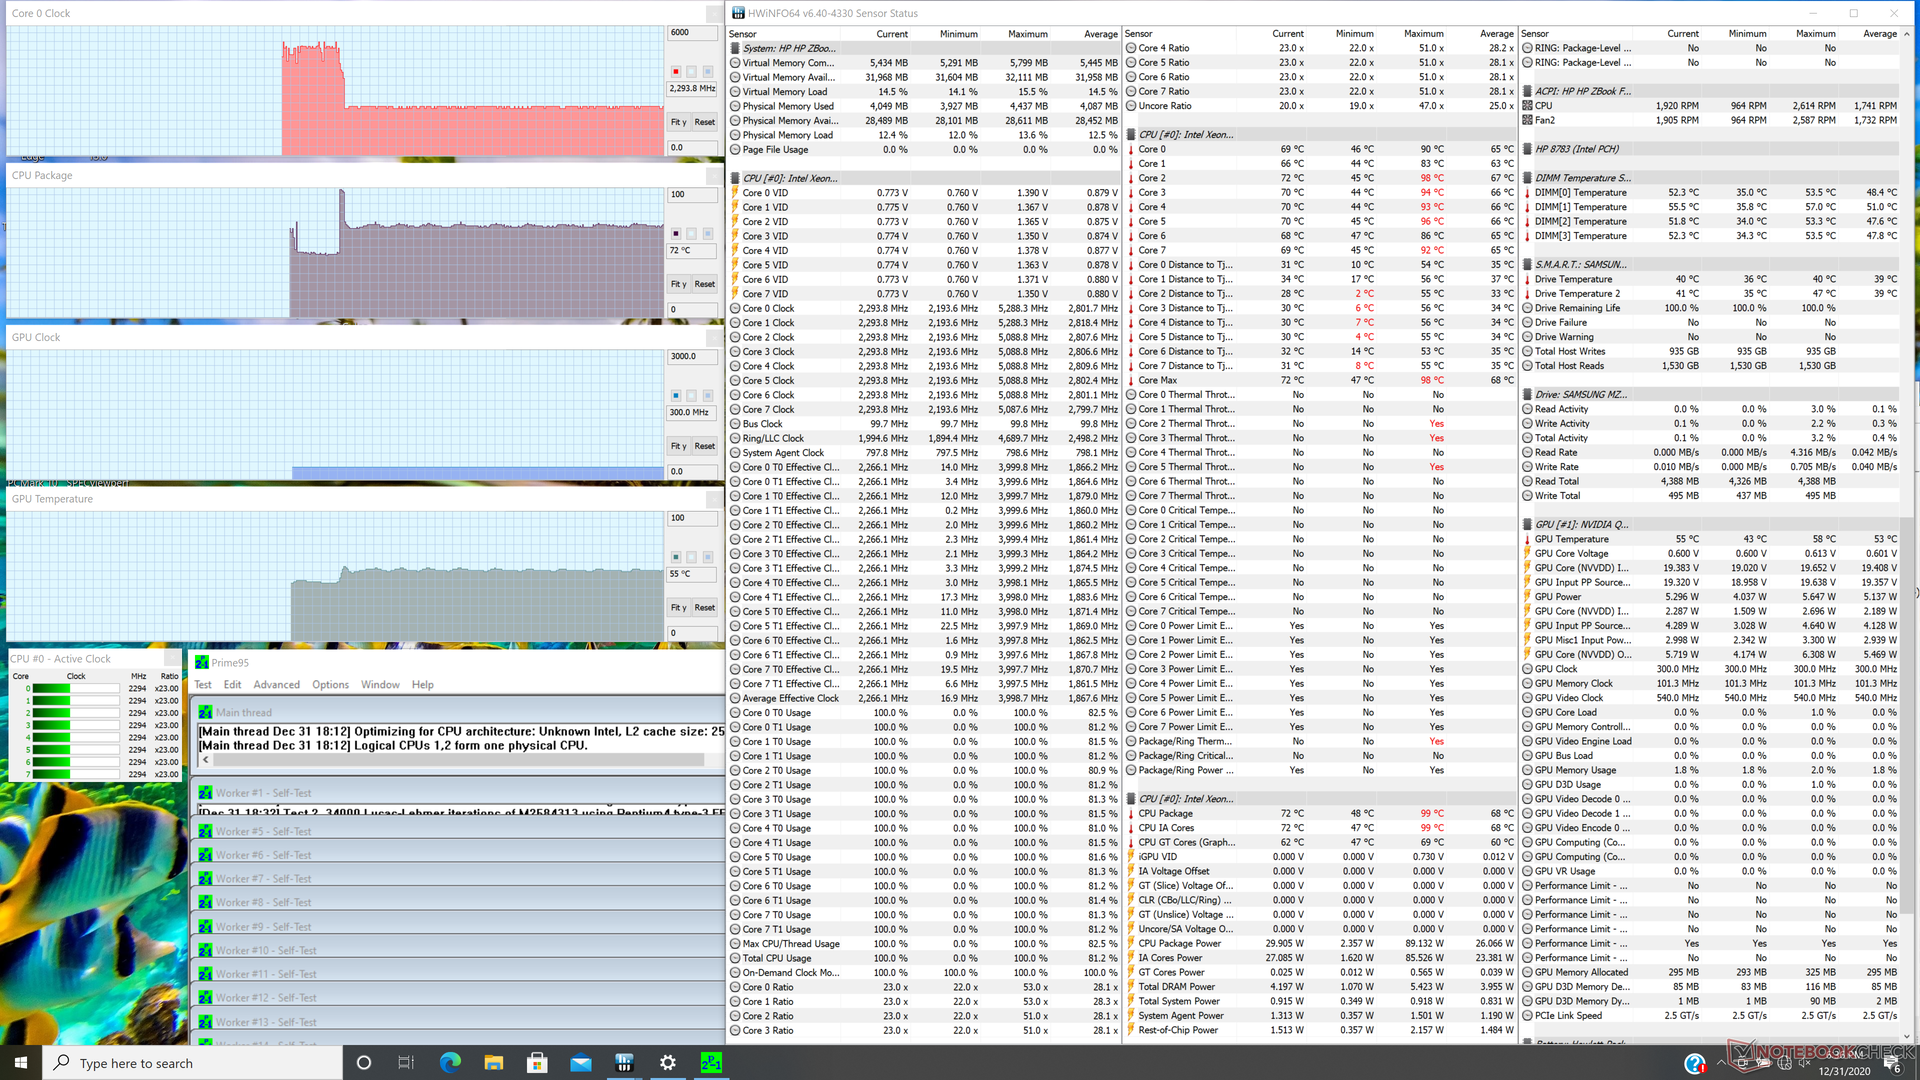
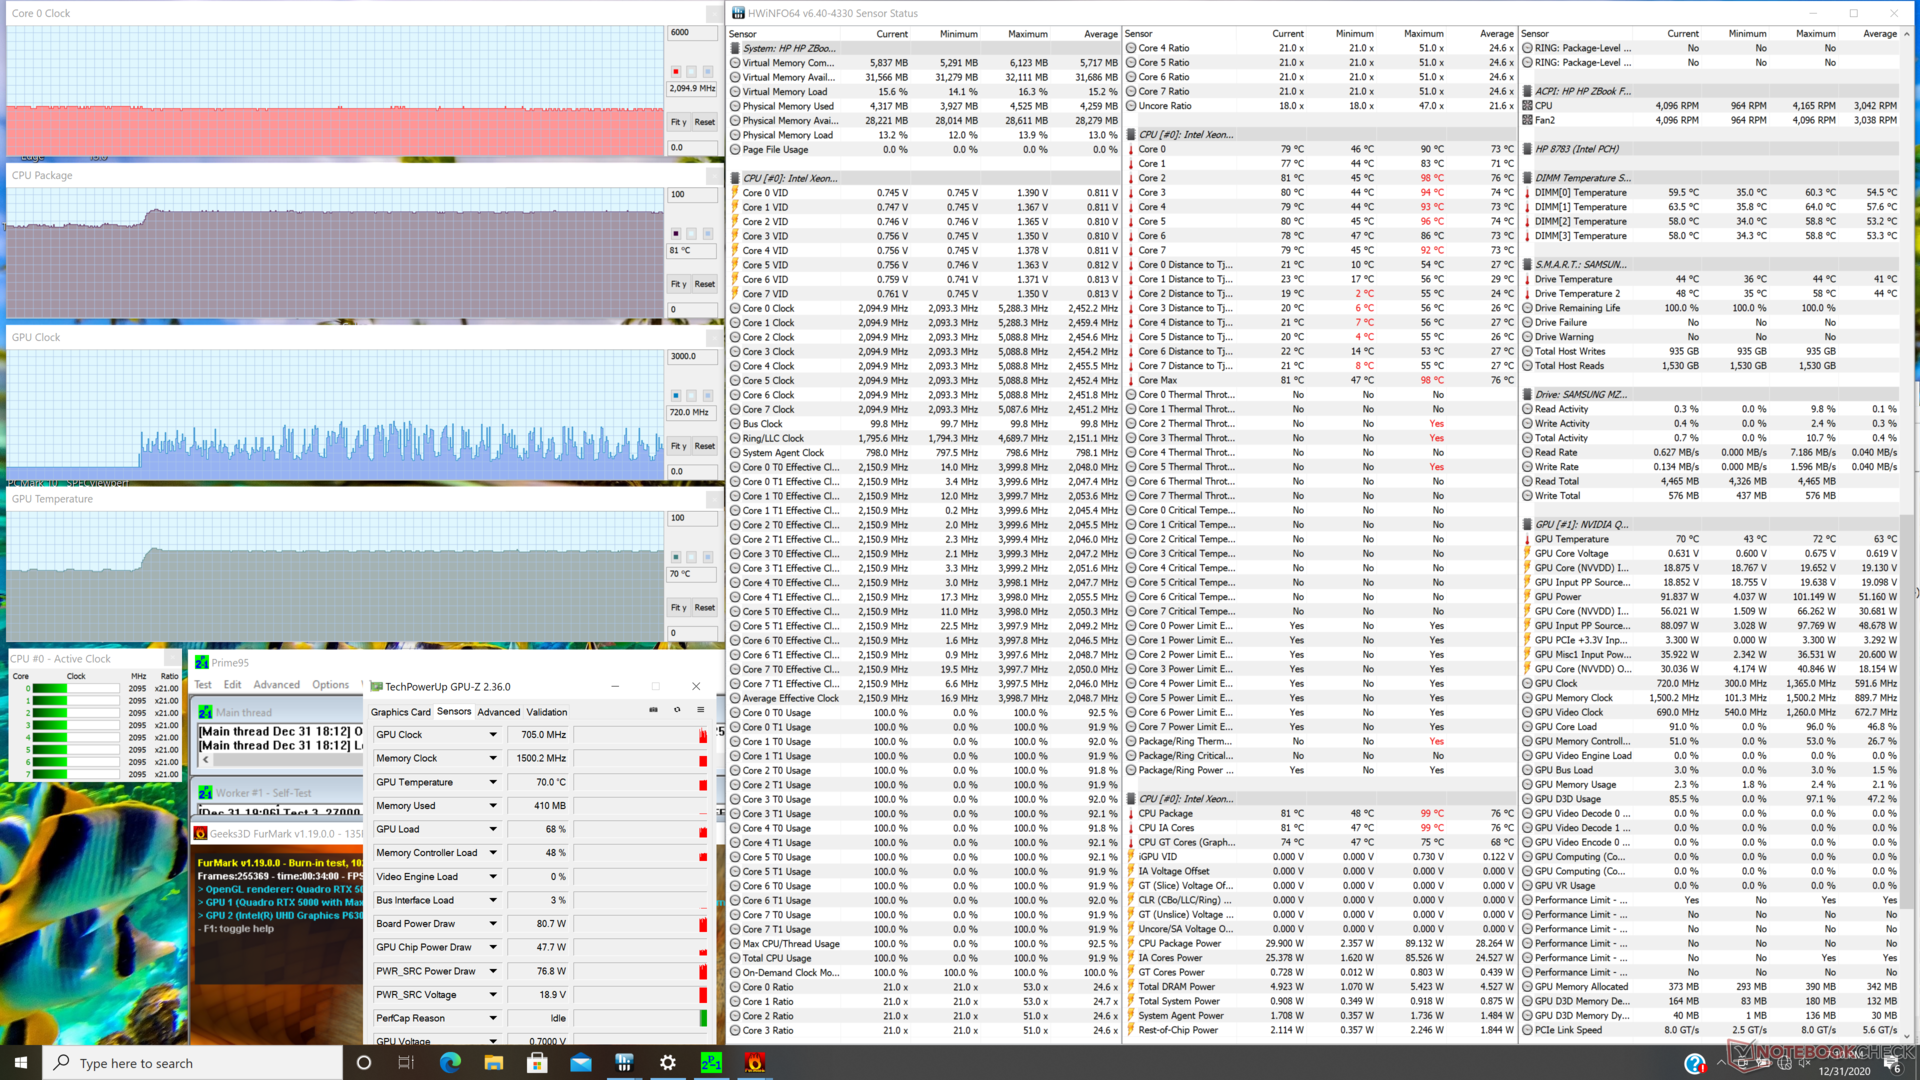
Nous soumettons le système à des charges synthétiques afin d'identifier tout problème potentiel d'étranglement ou de stabilité. Lors du fonctionnement de Prime95, l'unité centrale passerait dans la plage de 3,6 à 4 GHz pendant quelques secondes seulement et à une température centrale de 99 C. Elle tomberait ensuite immédiatement à seulement 2,3 GHz pour une température centrale beaucoup plus froide de 72 C. Après la mise à jour de notre BIOS, cependant, l'unité centrale se stabiliserait plutôt à environ 3,6 GHz et 98 C pour des performances nettement plus rapides, mais au prix de températures centrales beaucoup plus élevées. Les résultats globaux après la mise à jour sont similaires à ceux que nous avons observés sur le site Precision 7550.
Le fonctionnement sur batterie a un impact sur les performances graphiques. Un fonctionnement sur batterie sur Fire Strike donnerait des résultats en physique et en graphique de 15724 et 9428 points, respectivement, contre 15118 et 19759 points sur secteur.
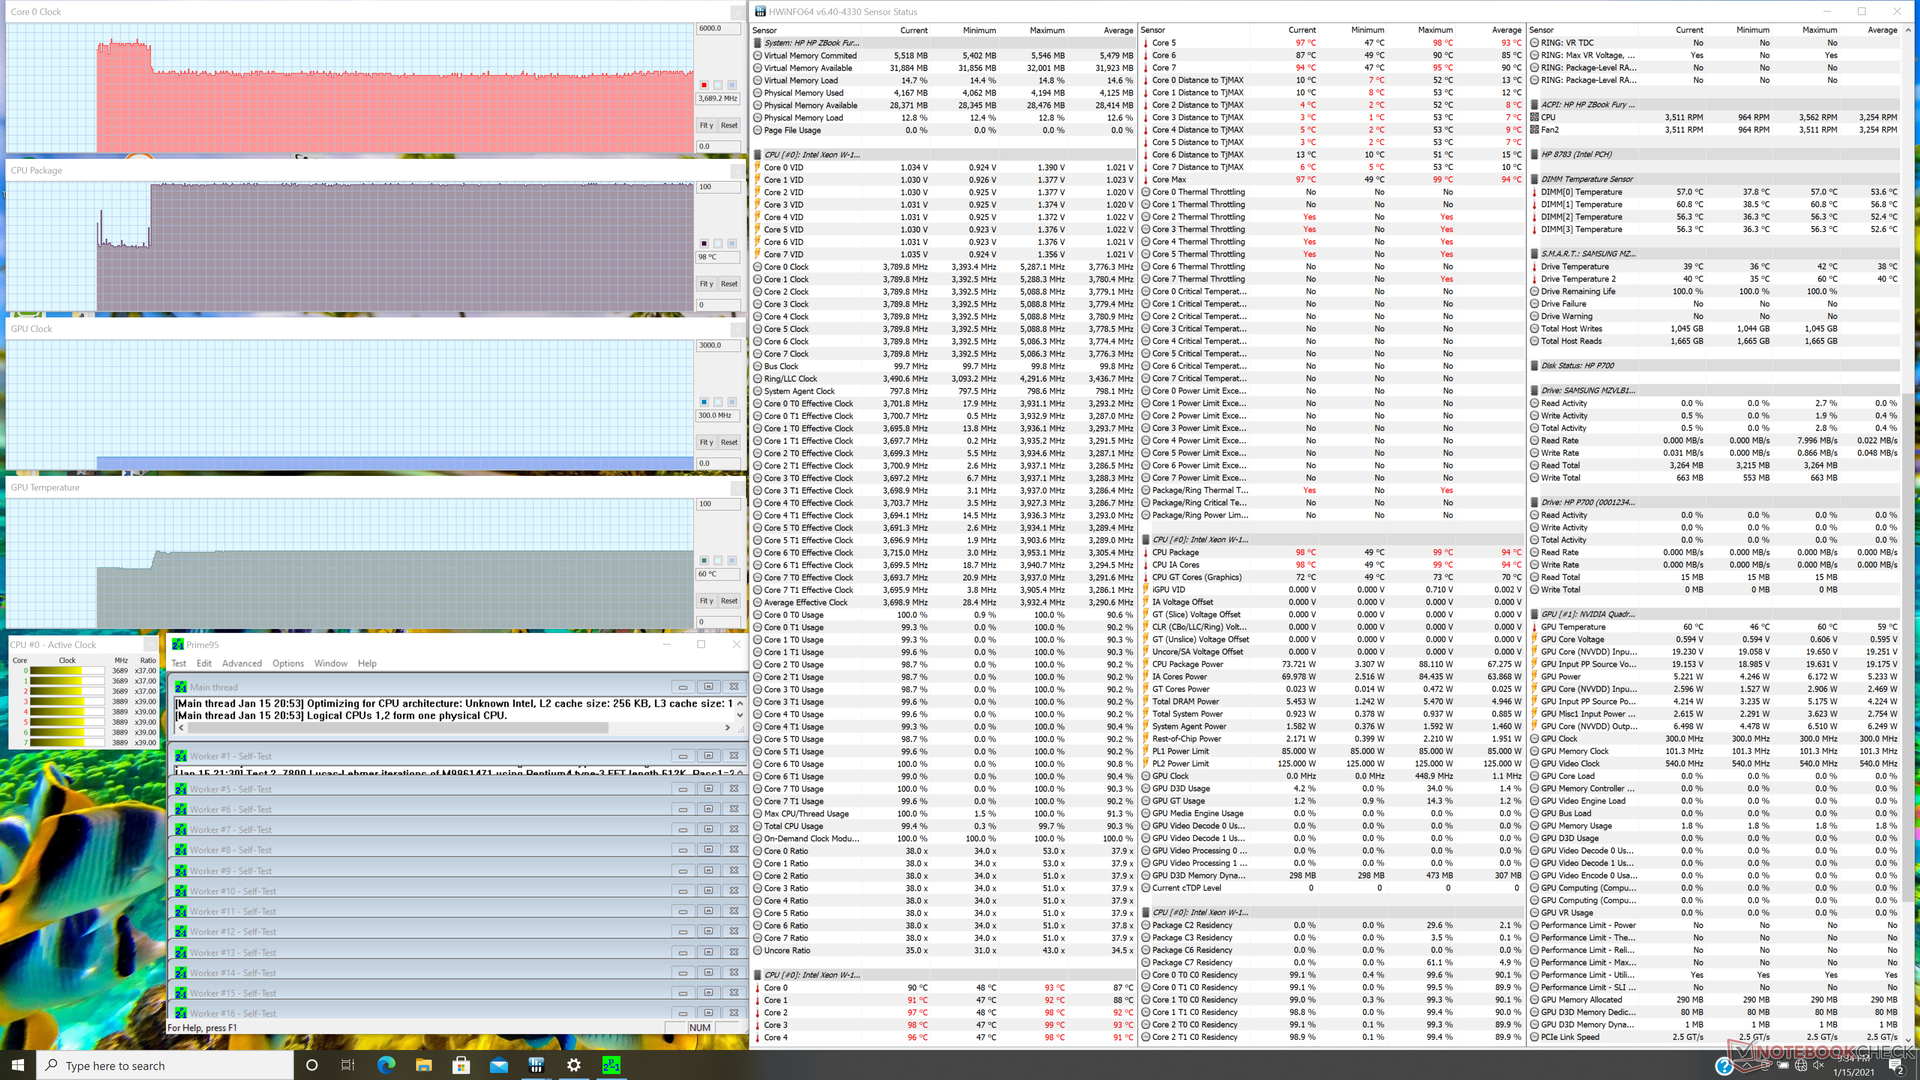
| Horloge CPU (GHz) | HorlogeGPU(MHz) | Températuremoyenne duCPU (°C) | Températuremoyenne duGPU (°C) | |
| Système au repos | -- | ----48 | 45 | |
| Prime95 Stress | 2.2 - 2.3 | -- | 72 | 55 |
| Prime95 Stress (BIOS 1.04.01) | 3.5 - 3.6 | -- | 98 | 60 |
| Prime95 + FurMark Stress | 2.0 - 2.1 | ~510 - 1575 | 81 | 70 |
| Prime95 + FurMark Stress (BIOS 1.04.01) | 2.9 - 3.5 | ~510 - 1575 | 88 - 98 | 71 |
| Witcher 3 Stress | ~4.4 | 1230 - 1380 | 85 | 70 |
Intervenants

HP ZBook Fury 15 G7 analyse audio
(±) | le niveau sonore du haut-parleur est moyen mais bon (80.1# dB)
Basses 100 - 315 Hz
(±) | basse réduite - en moyenne 8% inférieure à la médiane
(±) | la linéarité des basses est moyenne (9.5% delta à la fréquence précédente)
Médiums 400 - 2000 Hz
(+) | médiane équilibrée - seulement 3.3% de la médiane
(+) | les médiums sont linéaires (4.8% delta à la fréquence précédente)
Aiguës 2 - 16 kHz
(+) | des sommets équilibrés - à seulement 2.2% de la médiane
(+) | les aigus sont linéaires (3.5% delta à la fréquence précédente)
Globalement 100 - 16 000 Hz
(+) | le son global est linéaire (10.1% différence à la médiane)
Par rapport à la même classe
» 6% de tous les appareils testés de cette catégorie étaient meilleurs, 4% similaires, 90% pires
» Le meilleur avait un delta de 7%, la moyenne était de 17%, le pire était de 35%.
Par rapport à tous les appareils testés
» 5% de tous les appareils testés étaient meilleurs, 2% similaires, 94% pires
» Le meilleur avait un delta de 4%, la moyenne était de 23%, le pire était de 134%.
Apple MacBook 12 (Early 2016) 1.1 GHz analyse audio
(+) | les haut-parleurs peuvent jouer relativement fort (83.6# dB)
Basses 100 - 315 Hz
(±) | basse réduite - en moyenne 11.3% inférieure à la médiane
(±) | la linéarité des basses est moyenne (14.2% delta à la fréquence précédente)
Médiums 400 - 2000 Hz
(+) | médiane équilibrée - seulement 2.4% de la médiane
(+) | les médiums sont linéaires (5.5% delta à la fréquence précédente)
Aiguës 2 - 16 kHz
(+) | des sommets équilibrés - à seulement 2% de la médiane
(+) | les aigus sont linéaires (4.5% delta à la fréquence précédente)
Globalement 100 - 16 000 Hz
(+) | le son global est linéaire (10.2% différence à la médiane)
Par rapport à la même classe
» 7% de tous les appareils testés de cette catégorie étaient meilleurs, 2% similaires, 90% pires
» Le meilleur avait un delta de 5%, la moyenne était de 18%, le pire était de 53%.
Par rapport à tous les appareils testés
» 5% de tous les appareils testés étaient meilleurs, 1% similaires, 94% pires
» Le meilleur avait un delta de 4%, la moyenne était de 23%, le pire était de 134%.
Energy Management
Consommation d'énergie
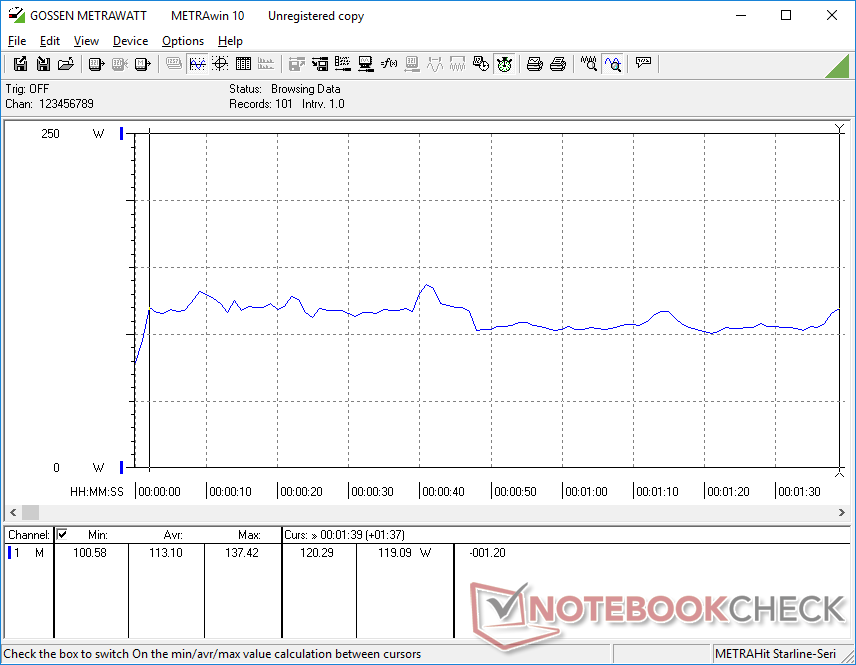
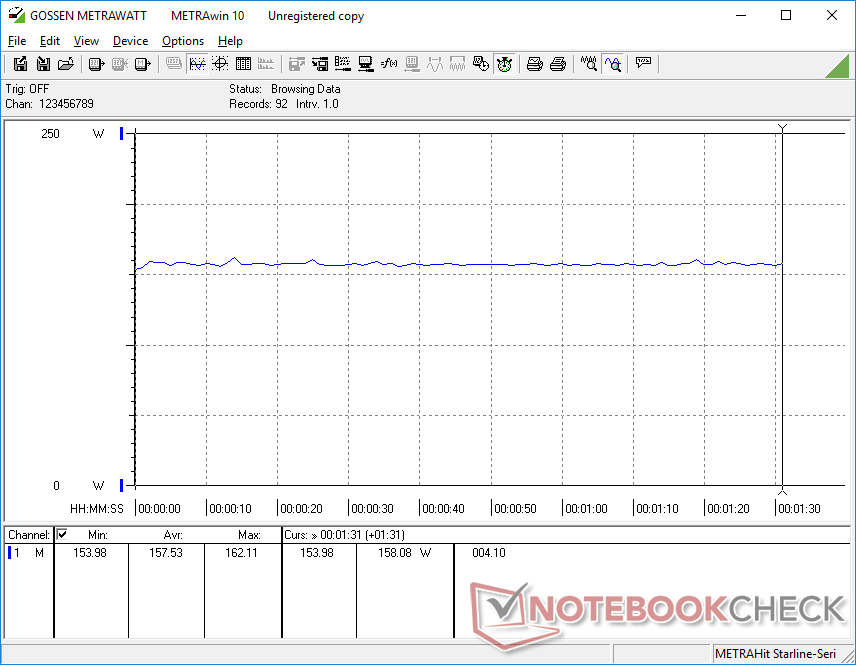
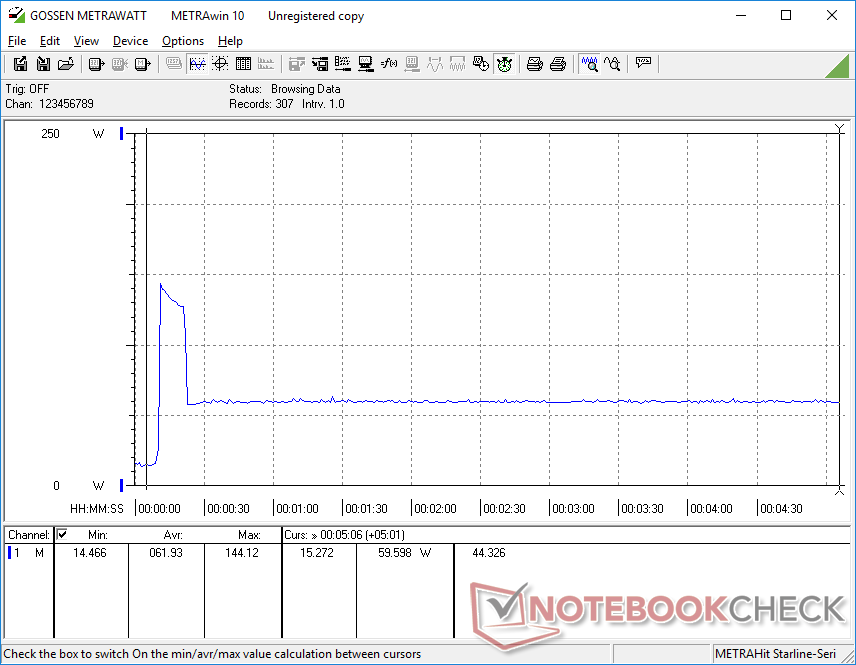
Le ralenti sur le bureau demande entre 4 W et 22 W selon le niveau de luminosité et si le GPU discret est actif. La différence entre la luminosité minimale et maximale peut atteindre 9 W, car l'écran est plus lumineux que la plupart des autres ordinateurs portables.
Des charges plus élevées équivalentes à celles des jeux peuvent consommer entre 113 W et 158 W, ce qui est presque exactement ce que nous avons mesuré sur le Precision 7550 ou le MSI WS66, tous deux équipés du même CPU et du même GPU. Cependant, une différence majeure peut être observée lors de l'utilisation de Prime95. La consommation d'énergie se stabiliserait à seulement 59,6 W sur notre HP contre 135,3 W sur notre Dell. Cela expliquerait également le déficit de performance notable de notre HP pendant les sections "test en boucle" et "test de stress" du CineBench ci-dessus.
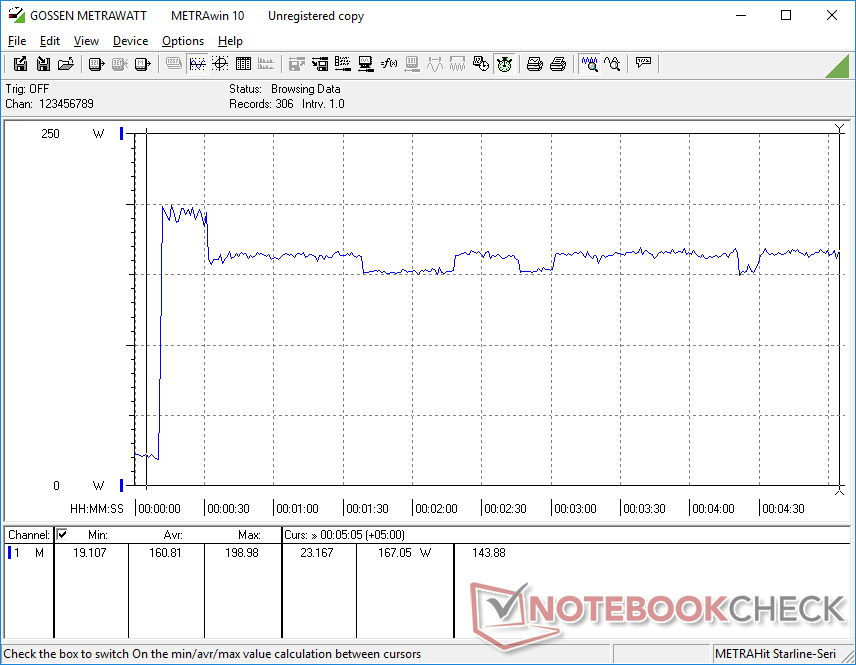
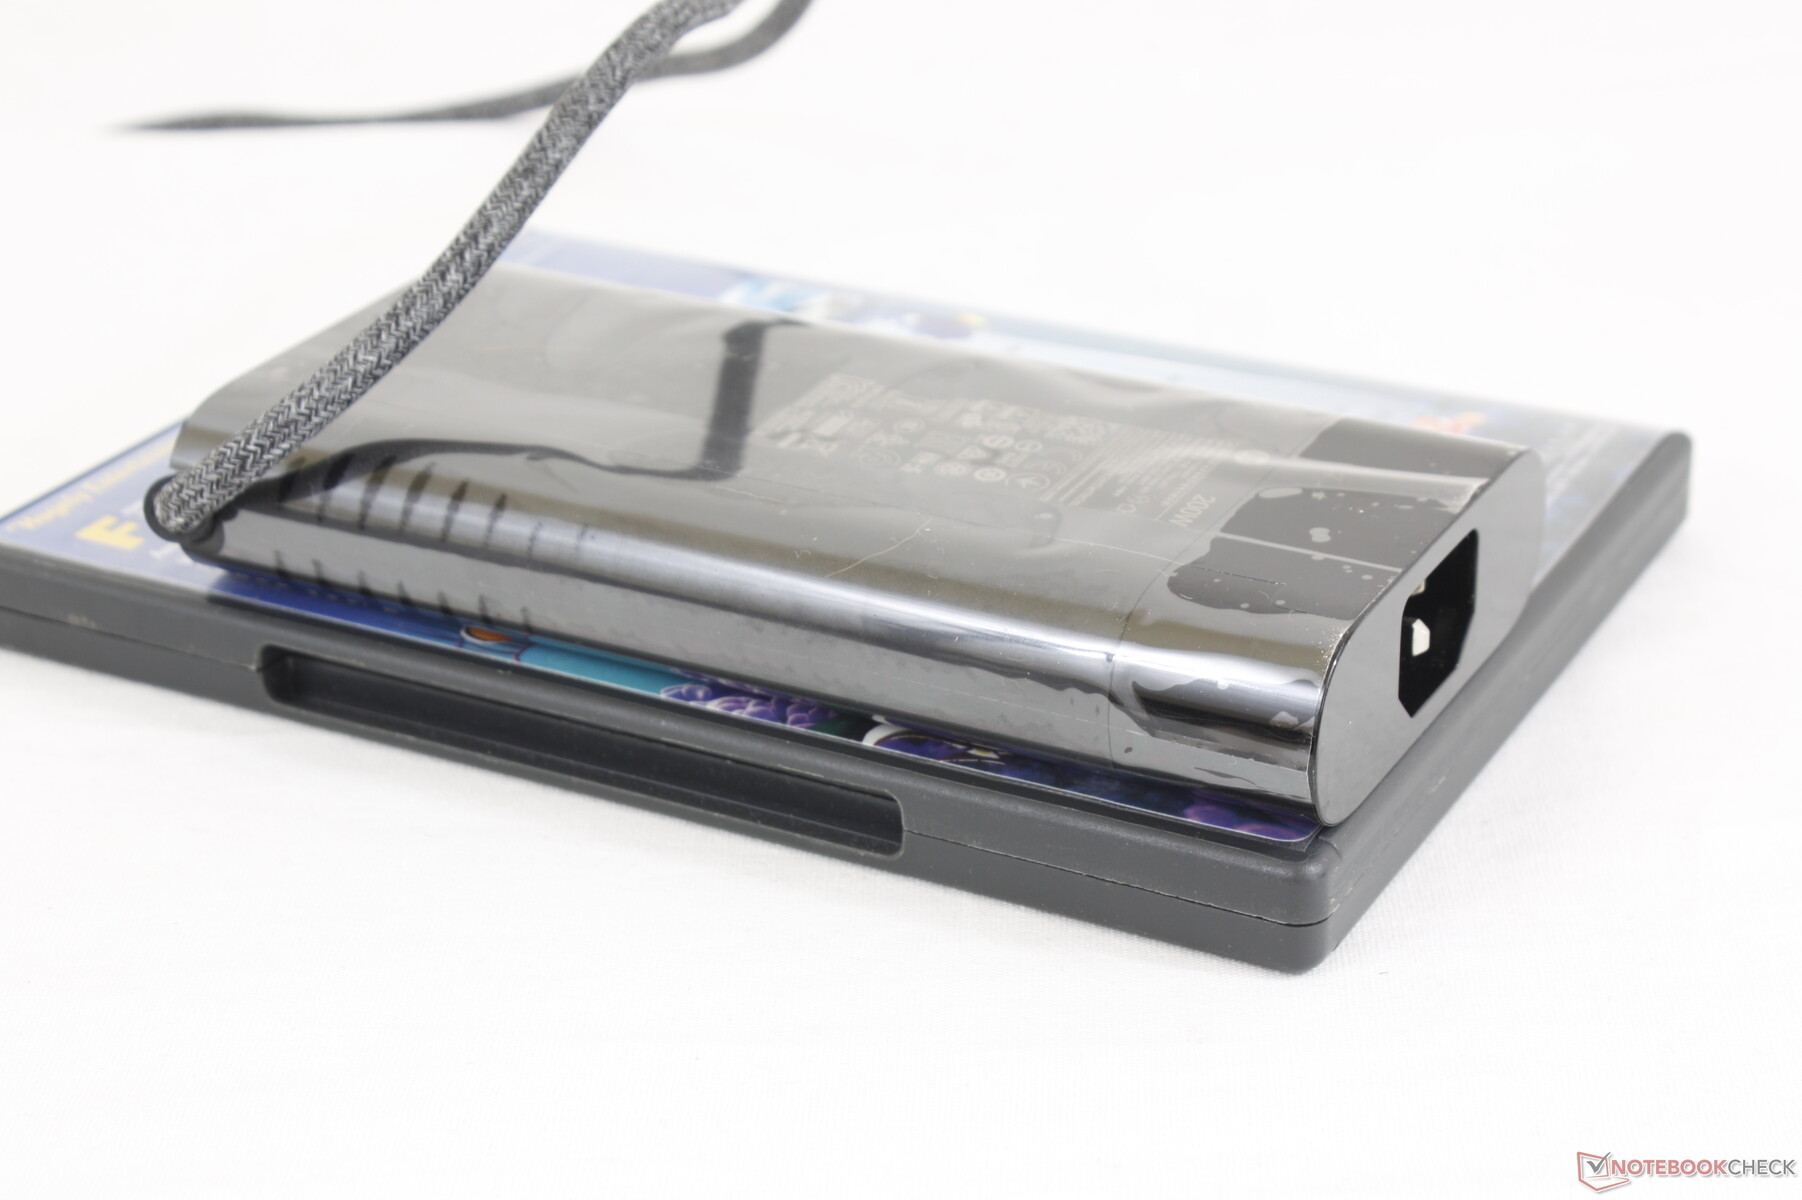
Nous sommes en mesure d'enregistrer une consommation maximale de 199 W à partir de l'adaptateur secteur de 200 W de taille moyenne (~15 x 7,2 x 2,4 cm). Ce taux n'est que temporaire, comme le montrent nos graphiques ci-dessous, probablement pour des raisons thermiques. L'utilisation de charges extrêmes ralentira le taux de charge mais ne videra pas la batterie,contrairement à certains modèles antérieurs de Dell Precision .
| Éteint/en veille | |
| Au repos | |
| Fortement sollicité |
|
Légende:
min: | |
| HP ZBook Fury 15 G7 W-10885M, Quadro RTX 5000 Max-Q, Samsung PM981a MZVLB1T0HBLR, IPS, 3840x2160, 15.6" | Asus ProArt StudioBook Pro 15 W500G5T i7-9750H, Quadro RTX 5000 Max-Q, Samsung SSD PM981 MZVLB1T0HALR, IPS, 3840x2160, 15.6" | MSI WS66 10TMT-207US i9-10980HK, Quadro RTX 5000 Max-Q, WDC PC SN730 SDBPNTY-1T00, IPS, 1920x1080, 15.6" | Dell Precision 7550 W-10885M, Quadro RTX 5000 Max-Q, SK Hynix PC601A NVMe 1TB, IPS, 3840x2160, 15.6" | Razer Blade 15 Studio Edition 2020 i7-10875H, Quadro RTX 5000 Max-Q, Samsung PM981a MZVLB1T0HBLR, OLED, 3840x2160, 15.6" | Lenovo ThinkPad P1 2019-20QT000RGE i7-9850H, Quadro T1000 (Laptop), WDC PC SN720 SDAQNTW-512G, IPS LED, 1920x1080, 15.6" | |
|---|---|---|---|---|---|---|
| Power Consumption | -33% | -56% | -22% | -37% | -31% | |
| Idle Minimum * (Watt) | 4.6 | 11.6 -152% | 13.8 -200% | 8.2 -78% | 13.4 -191% | 13.7 -198% |
| Idle Average * (Watt) | 13.6 | 19 -40% | 18.4 -35% | 16.8 -24% | 18 -32% | 17.5 -29% |
| Idle Maximum * (Watt) | 21.5 | 20.6 4% | 41.5 -93% | 24.4 -13% | 26.1 -21% | 20.9 3% |
| Load Average * (Watt) | 113.1 | 102 10% | 110.5 2% | 131 -16% | 115 -2% | 77.2 32% |
| Witcher 3 ultra * (Watt) | 157.5 | 151.6 4% | 156.6 1% | 145 8% | ||
| Load Maximum * (Watt) | 199 | 178 11% | 227.1 -14% | 201.8 -1% | 165 17% | 123.7 38% |
* ... Moindre est la valeur, meilleures sont les performances
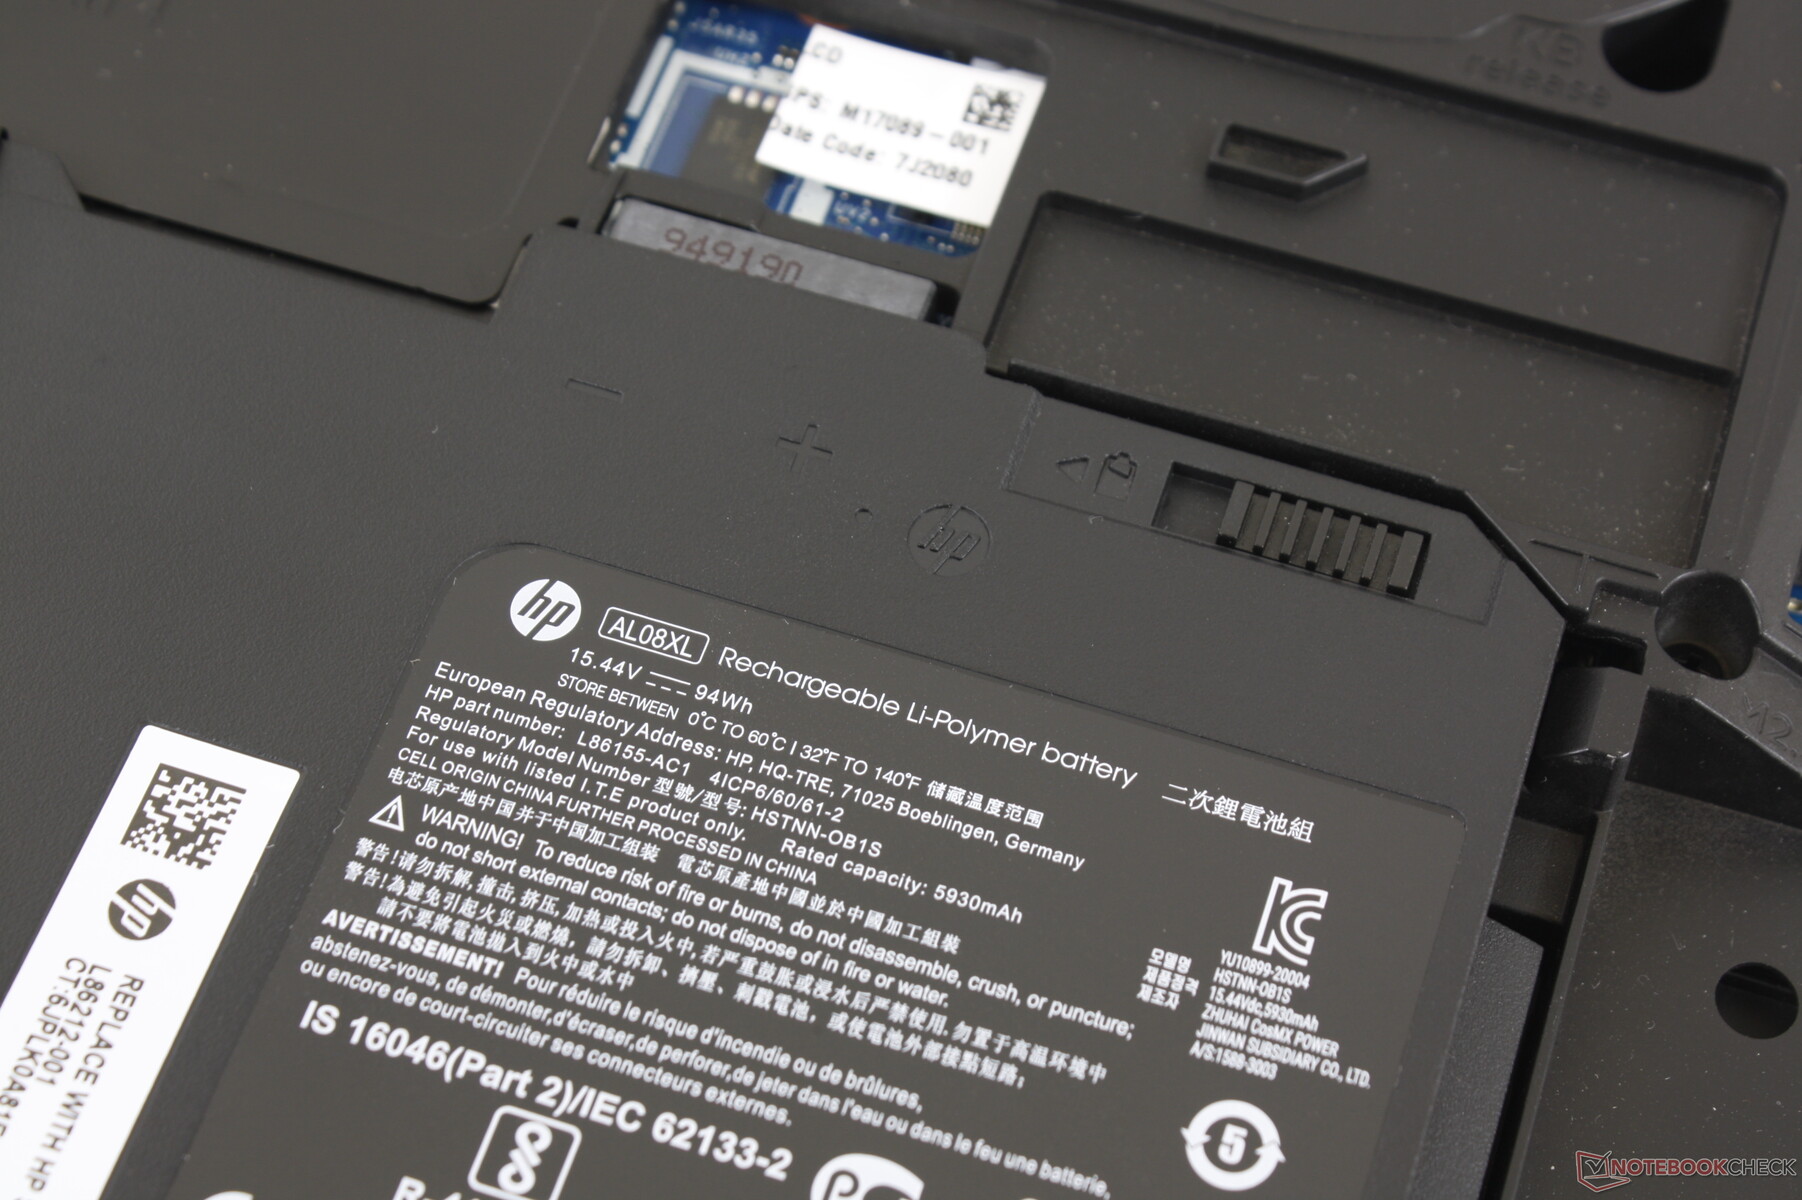
Durée de vie des piles
Attendez-vous à 8,5 heures d'utilisation du WLAN dans le monde réel. Le chargement du vide au plein est également rapide malgré la grande capacité de la batterie de 94 Wh. Le système peut être rechargé via USB-C, mais à un rythme plus lent.
| HP ZBook Fury 15 G7 W-10885M, Quadro RTX 5000 Max-Q, 94 Wh | Asus ProArt StudioBook Pro 15 W500G5T i7-9750H, Quadro RTX 5000 Max-Q, 76 Wh | MSI WS66 10TMT-207US i9-10980HK, Quadro RTX 5000 Max-Q, 99.99 Wh | Dell Precision 7550 W-10885M, Quadro RTX 5000 Max-Q, 95 Wh | Razer Blade 15 Studio Edition 2020 i7-10875H, Quadro RTX 5000 Max-Q, 80 Wh | Lenovo ThinkPad P1 2019-20QT000RGE i7-9850H, Quadro T1000 (Laptop), 80 Wh | |
|---|---|---|---|---|---|---|
| Autonomie de la batterie | -45% | -18% | -12% | -4% | 2% | |
| Reader / Idle (h) | 13.2 | 8.3 -37% | 11.1 -16% | 8.8 -33% | ||
| WiFi v1.3 (h) | 8.6 | 4.7 -45% | 7.8 -9% | 8.9 3% | 5.7 -34% | 8.9 3% |
| Load (h) | 1.3 | 1.2 -8% | 1 -23% | 2 54% | 1.3 0% |
Points positifs
Points négatifs
Verdict
L'aspect le plus remarquable du ZBook Fury 15 est sa capacité à offrir essentiellement toutes les caractéristiques et les options de performance du Dell Precision 7550, mais dans un ensemble sensiblement plus léger. Cela fait de la HP une bonne solution intermédiaire pour les utilisateurs qui veulent un poste de travail mobile sans sacrifier de nombreuses fonctions auxiliaires que les modèles plus fins et plus légers comme le Razer Blade Studio, le MSI WS66 ou l'Asus ProArt omettent fréquemment. C'est également l'une des rares stations de travail à inclure des options de panneau de 1000 bits pour les scénarios occasionnels en extérieur.
Elle est extensible et confortable et offre de nombreuses options de configuration. Le ZBook Fury 15 réussit à remplir de nombreuses fonctions classiques d'une station de travail malgré son poids modéré.
L'expérience de saisie et de pavé tactile mérite d'être saluée car elle est l'une des plus confortables que nous ayons connues sur une station de travail mobile. C'est une bonne chose que HP n'ait pas trouvé nécessaire de "rabaisser" le clavier ou le pavé tactile pour s'adapter aux tendances actuelles des ordinateurs portables ultrafins ou des designs minimalistes. C'est un système conçu dès le départ pour les professionnels et pas seulement un ordinateur portable de jeu recoloré.
Les utilisateurs exigeants n'apprécieront pas le fait que le processeur se stabilise à 98 C à pleine charge et que le GPU Quadro RTX 5000 soit de type Max-Q. Le WAN et certaines options de stockage peuvent être exclus en fonction du SKU, ce qui signifie que vous ne pouvez pas simplement acheter une configuration moins chère et ensuite mettre à niveau certains composants vous-même car les connecteurs manqueront. Des charnières plus fermes pour minimiser le basculement lors du réglage des angles rendraient le châssis encore plus agréable.
Prix et disponibilité
Le ZBook Fury 15 se présente sous une multitude de configurations qui sont toutes très différentes de ce que nous avons examiné. Amazon et Walmart ont tous deux des SKU bas de gamme pour environ 1999 dollars américains à l'époque ou à l'heure actuelle.
Le chèque pour ordinateur portable peut recevoir une commission sur les achats effectués par le biais de nos liens d'affiliation
HP ZBook Fury 15 G7
- 01/16/2021 v7 (old)
Allen Ngo
Price comparison

