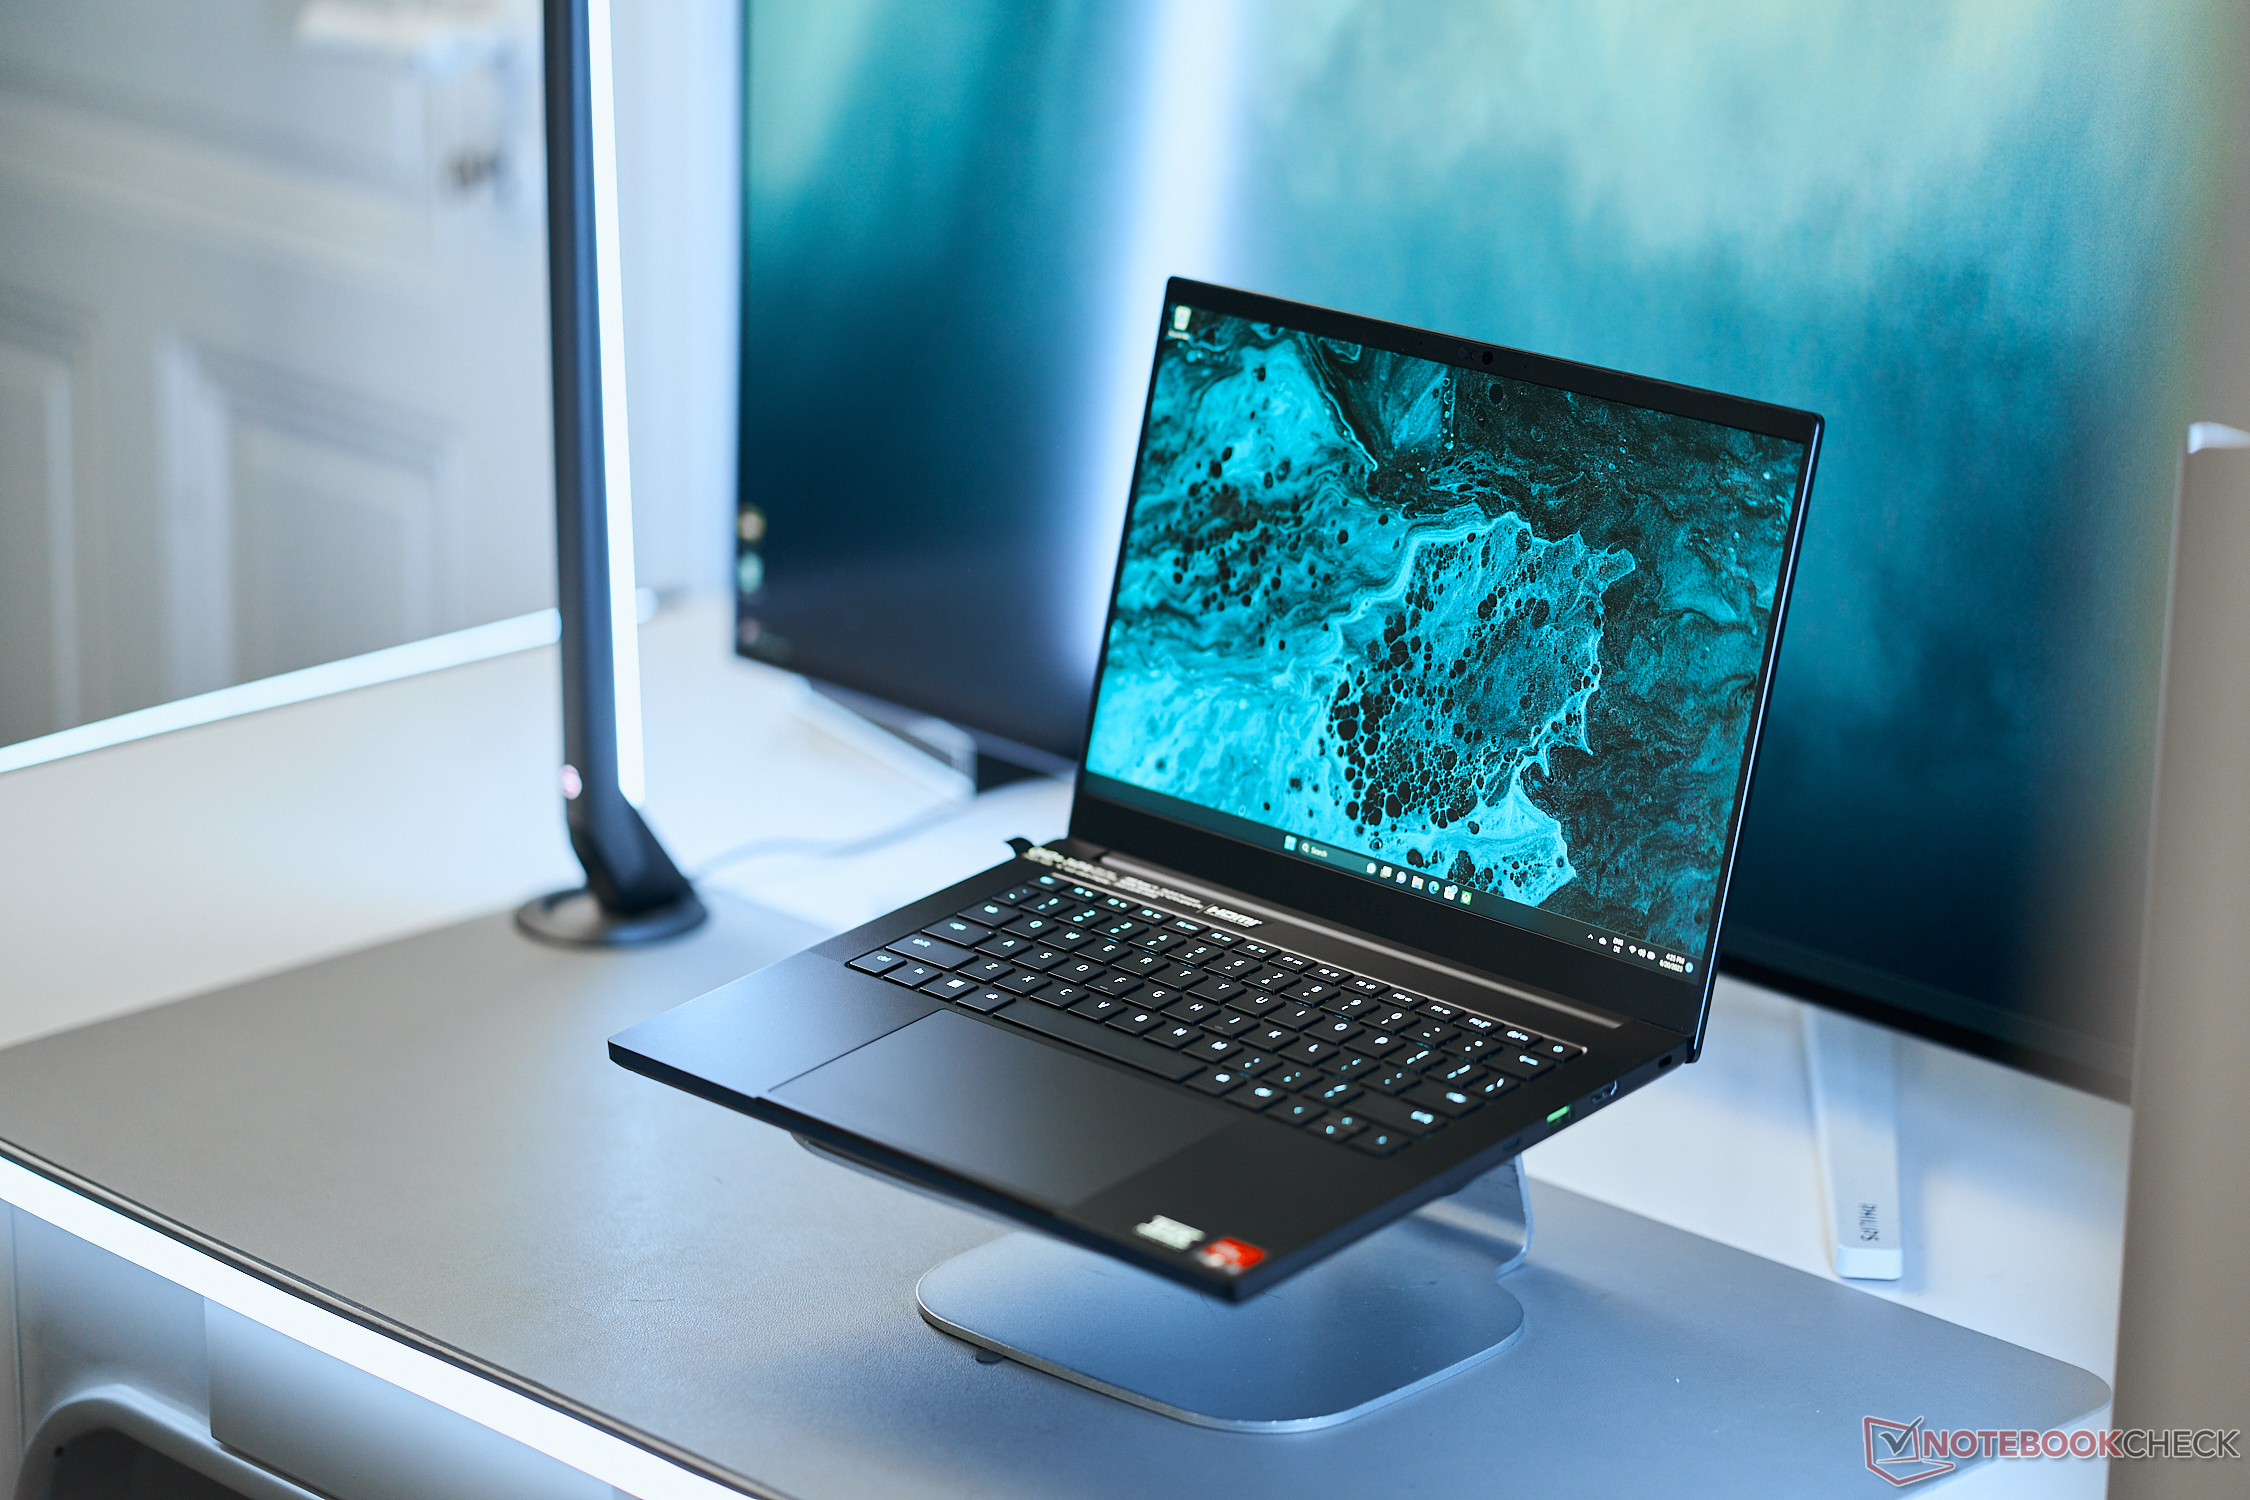
Test du Razer Blade 14 Zen 4 : de nombreux changements qui comptent

Alors que le 2022 Blade 14 était une mise à jour interne mineure du blade 14 20212021, le modèle 2023 est une refonte plus importante avec des changements physiques et internes. Plus précisément, il fait évoluer la série en remplaçant l'ancien format 16:9 par un format 16:10.
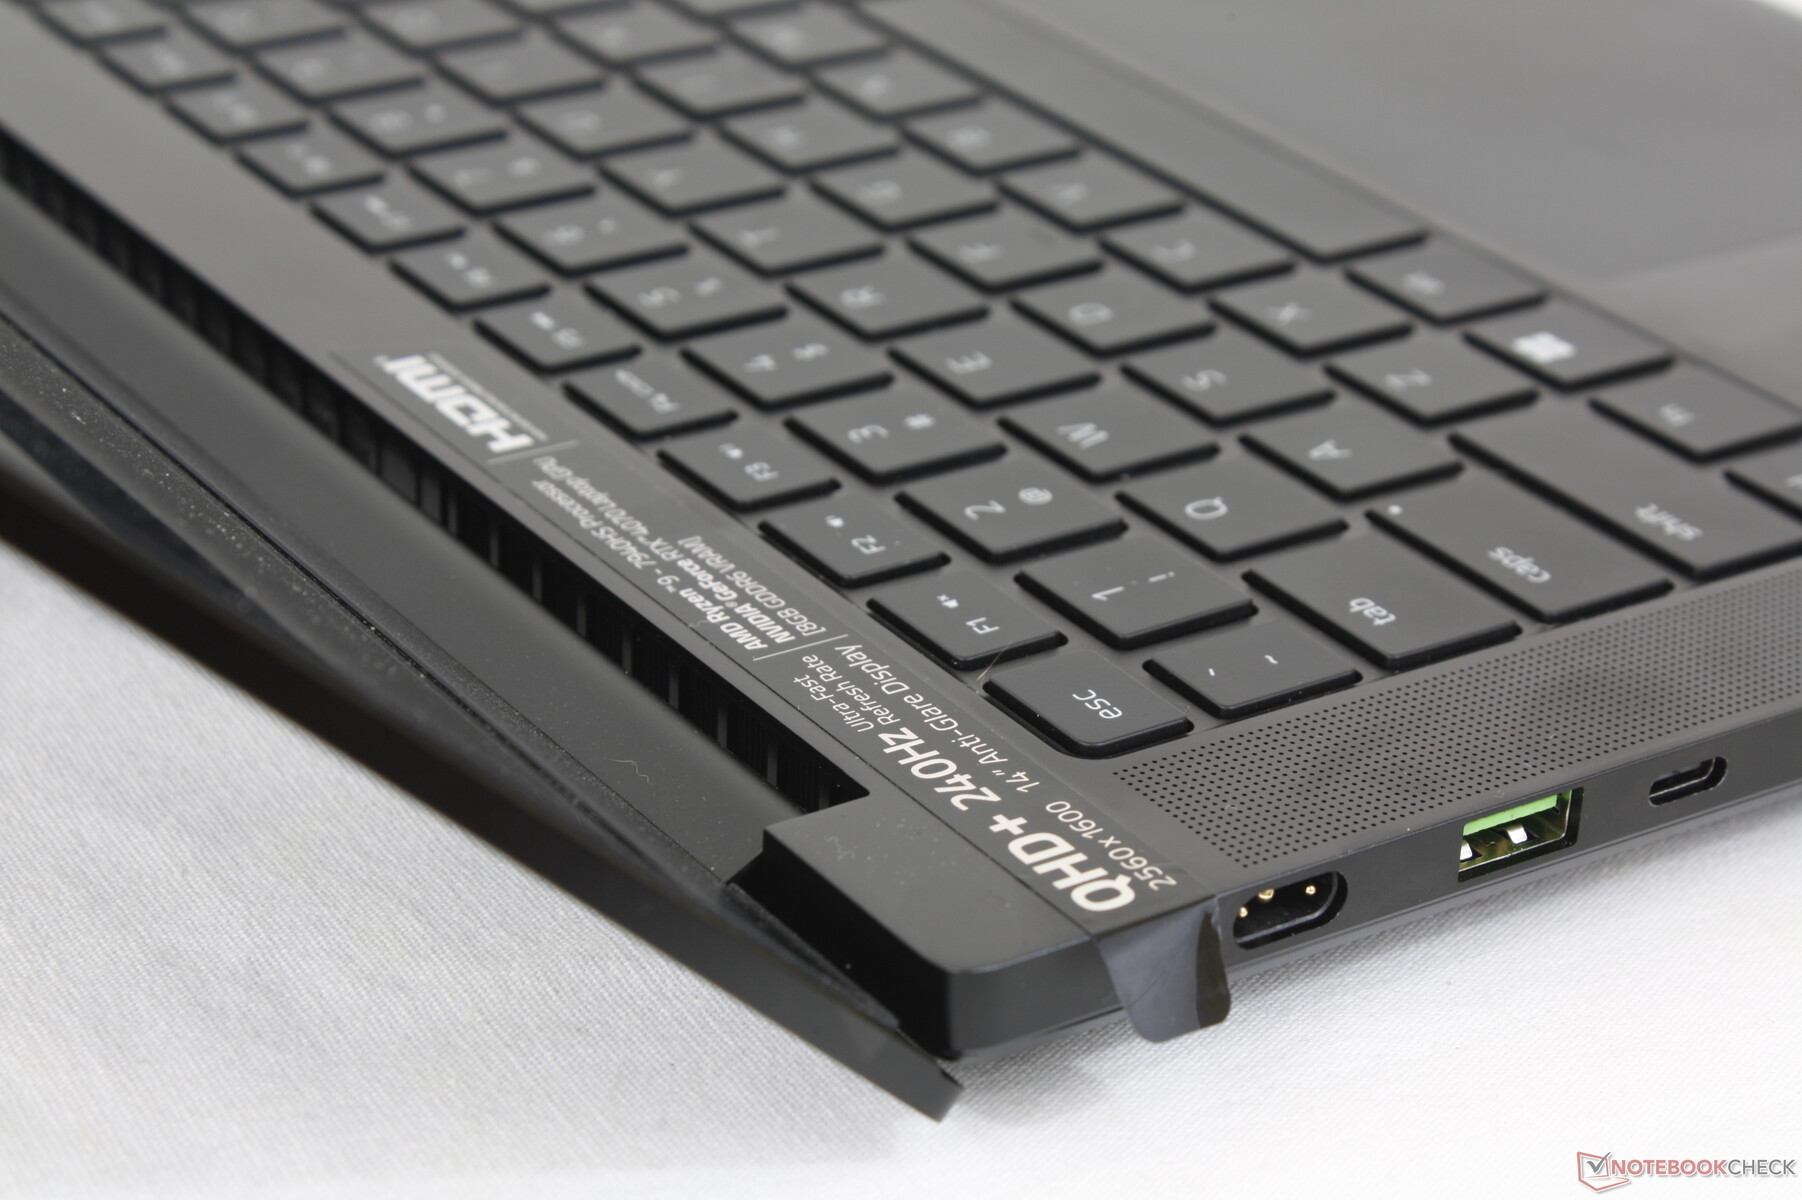
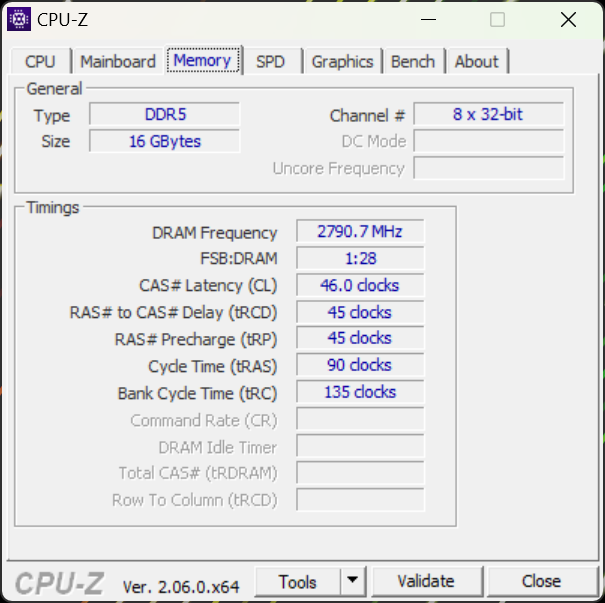
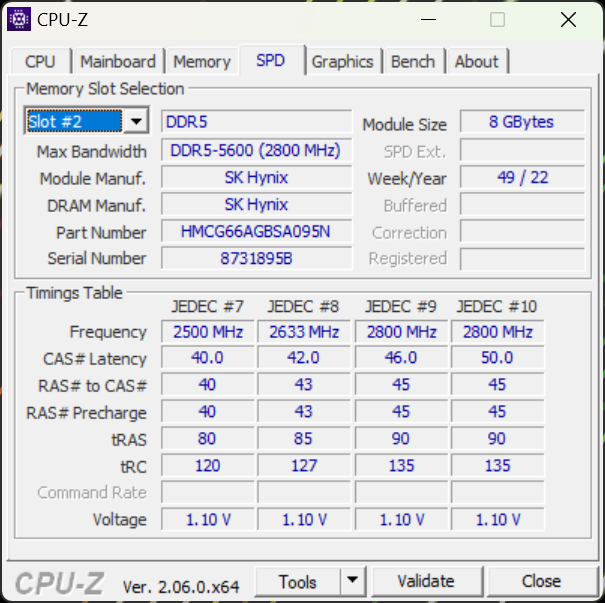
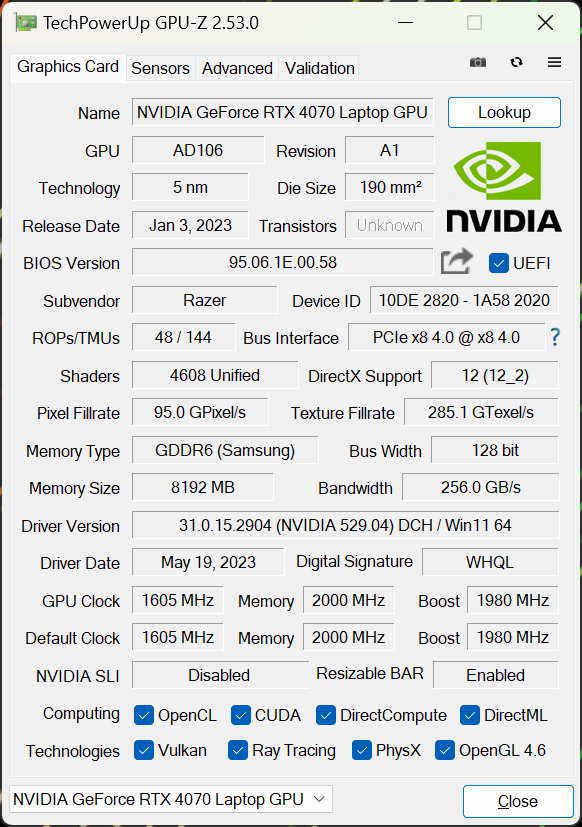
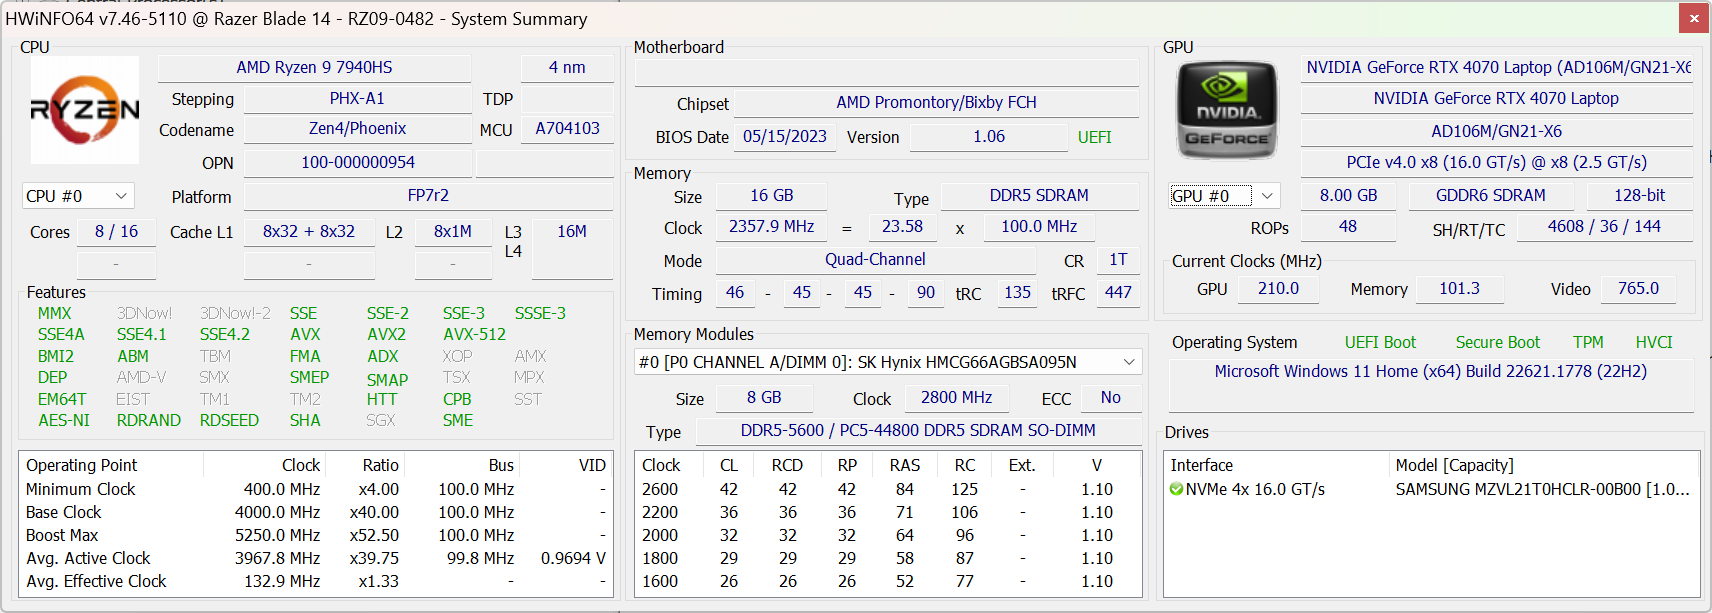
L'appareil que nous avons testé est une configuration haut de gamme avec l'AMD Zen 4 Ryzen 9 7940HS, 140 W GeForce, carte graphique RTX 4070, 16 Go de RAM DDR5-5600 et un écran IPS 2560 x 1600 240 Hz pour remplacer le Zen 3+ de l'année dernière Ryzen 9 6900HSl'écran IPS 2560 x 1440 165 Hz, la carte graphique RTX 3070 Ti 100 W, 16 Go de RAM DDR5-4800, et l'écran IPS 2560 x 1440 165 Hz. Une configuration inférieure avec la RTX 4060 est également disponible avec des prix allant de 2400 à 2800 USD, mais le CPU Ryzen 9 et l'écran 16:10 1600p IPS sont fixes sur tous les SKUs au moment de la rédaction de cet article.
Le concurrent le plus notable du Blade 14 reste le Asus Zephyrus G14 qui peut être configuré avec un GPU RTX 4090 de 125 W alors que le Blade 14 actuel plafonne à notre RTX 4070 de 140 W GeForce. LeAcer Predator Triton 300 SE etAlienware x14 ont également progressé dans l'espace de jeu de 14 pouces.
Plus de commentaires sur Razer :
Comparaison avec les concurrents potentiels
Note | Date | Modèle | Poids | Épaisseur | Taille | Résolution | Prix |
|---|---|---|---|---|---|---|---|
| 88.7 % v7 (old) | 06/23 | Razer Blade 14 RTX 4070 R9 7940HS, GeForce RTX 4070 Laptop GPU | 1.8 kg | 17.99 mm | 14.00" | 2560x1600 | |
| 89.4 % v7 (old) | 05/22 | Razer Blade 14 Ryzen 9 6900HX R9 6900HX, GeForce RTX 3070 Ti Laptop GPU | 1.8 kg | 16.8 mm | 14.00" | 2560x1440 | |
| 90 % v7 (old) | 05/23 | Asus ROG Zephyrus G14 GA402XY R9 7940HS, GeForce RTX 4090 Laptop GPU | 1.7 kg | 20.5 mm | 14.00" | 2560x1600 | |
| 86 % v7 (old) | 11/22 | Acer Predator Triton 300 SE i9-12900H, GeForce RTX 3060 Laptop GPU | 1.7 kg | 19.8 mm | 14.00" | 2880x1800 | |
| 86.7 % v7 (old) | 03/22 | Alienware x14 i7 RTX 3060 i7-12700H, GeForce RTX 3060 Laptop GPU | 1.8 kg | 14.5 mm | 14.00" | 1920x1080 | |
| 90.2 % v7 (old) | 05/23 | Lenovo Yoga Pro 7 14IRH G8 i7-13700H, GeForce RTX 4050 Laptop GPU | 1.5 kg | 15.6 mm | 14.50" | 3072x1920 |
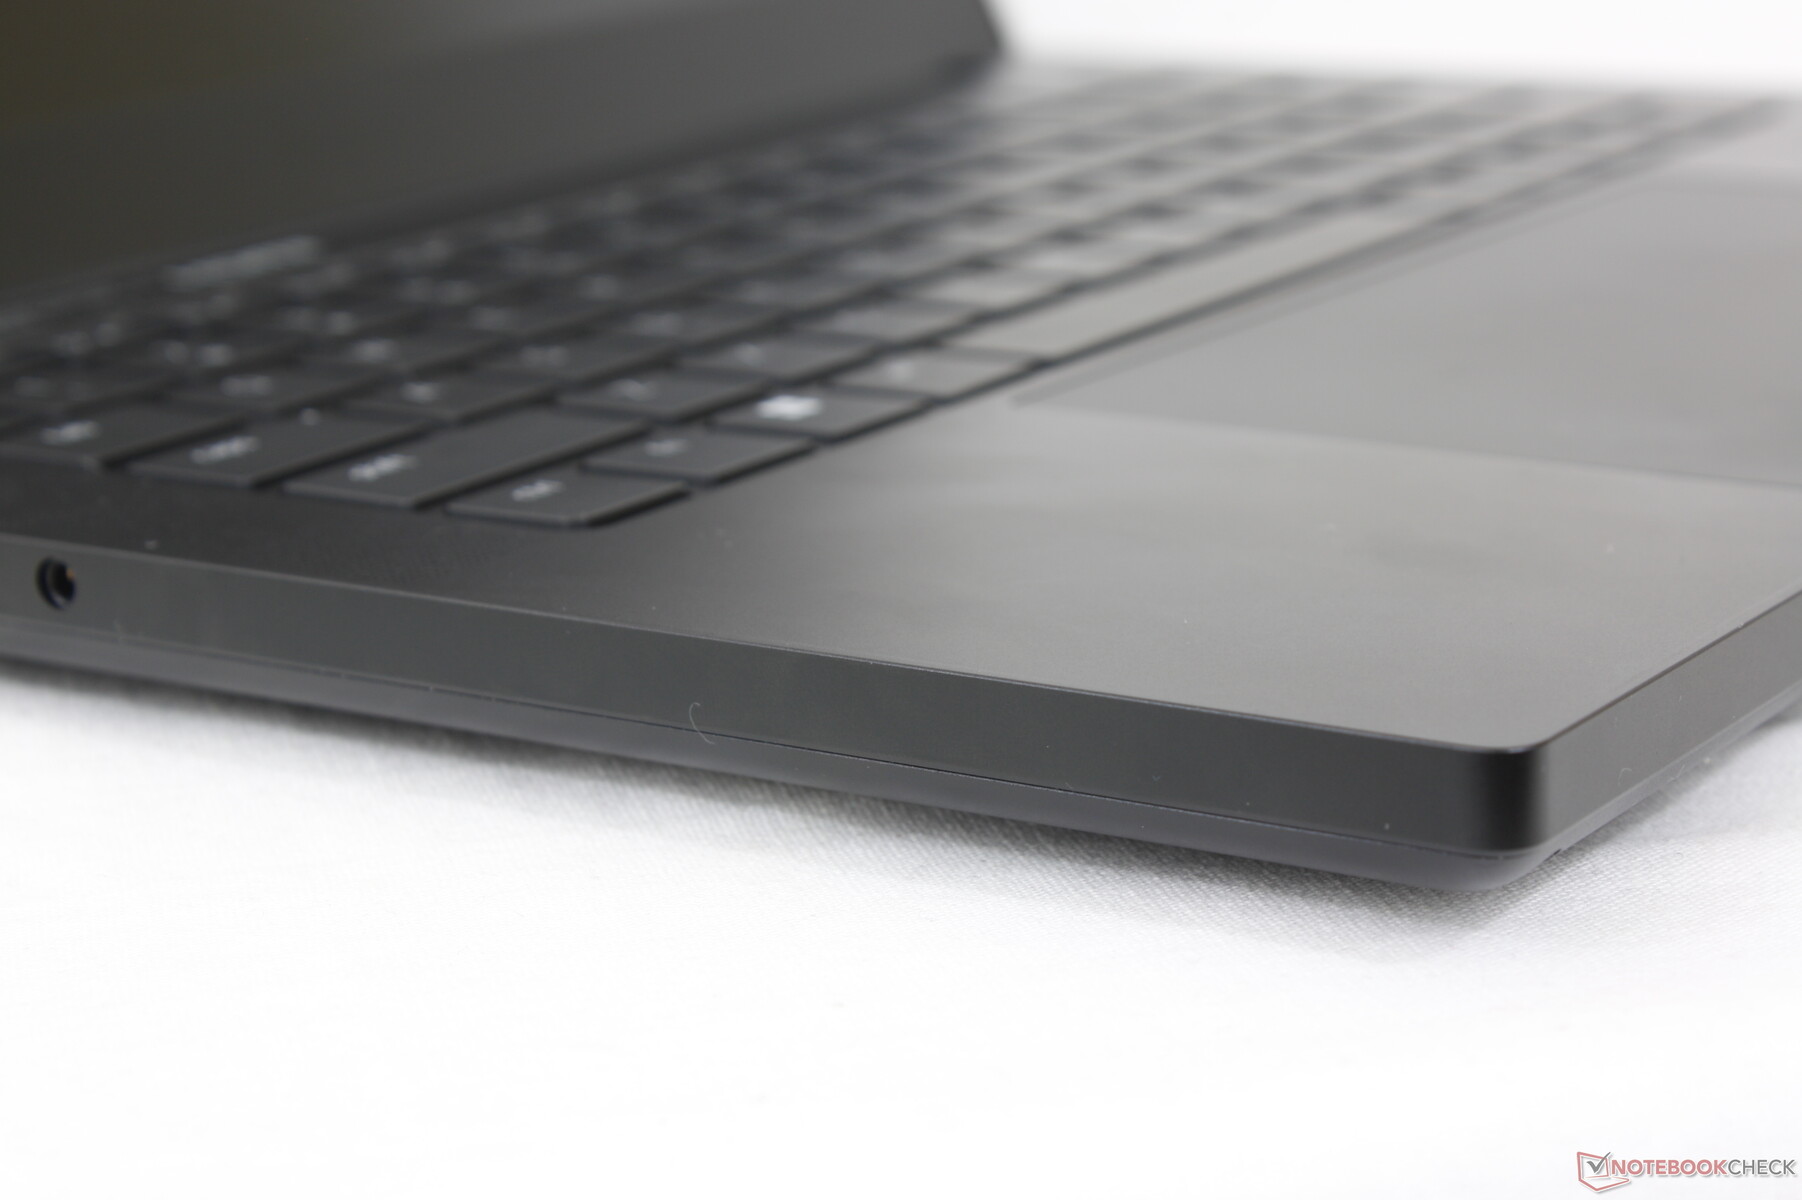
Boîtier - plus carré et plus épais que le modèle de l'année dernière
Comme les autres modèles Blade de la famille, le nouveau 16:10 Blade 14 utilise le même corps en aluminium anodisé CNC de haute qualité pour un aspect et une sensation familiers de Razer. Ce n'est pas une mauvaise chose, bien sûr, car la base et le couvercle semblent plus solides et plus rigides que la plupart des autres subnotebooks, y compris le Zephyrus G14 ou l'Acer Predator Triton 300.
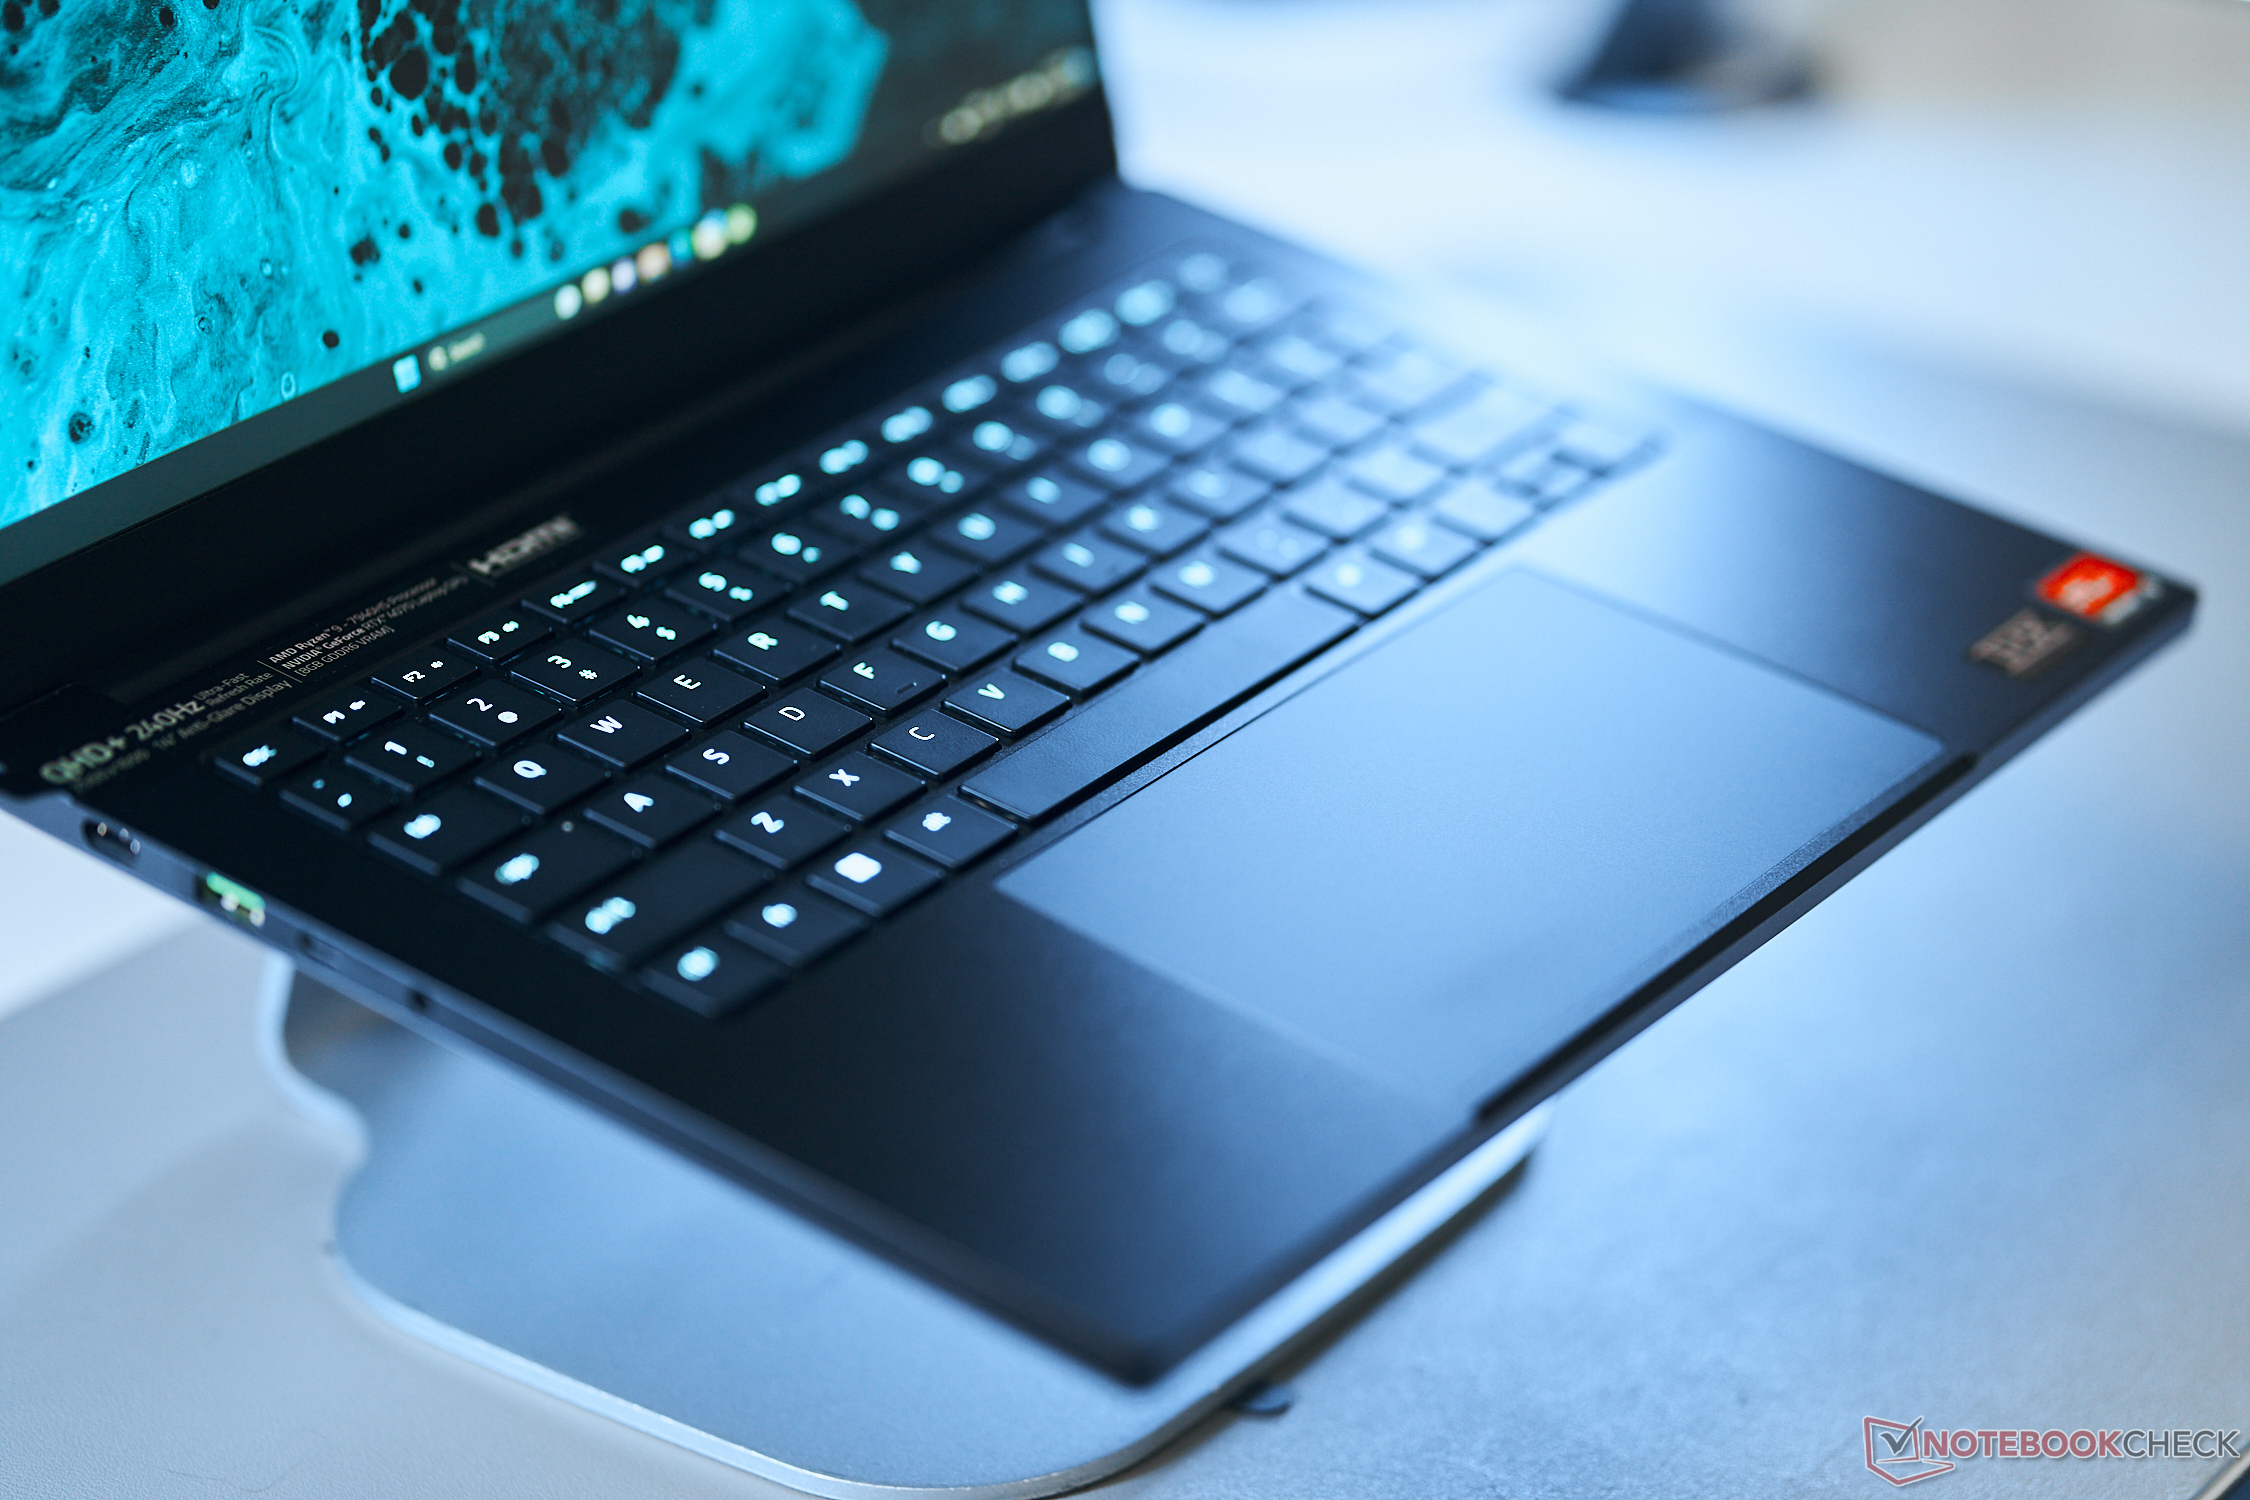
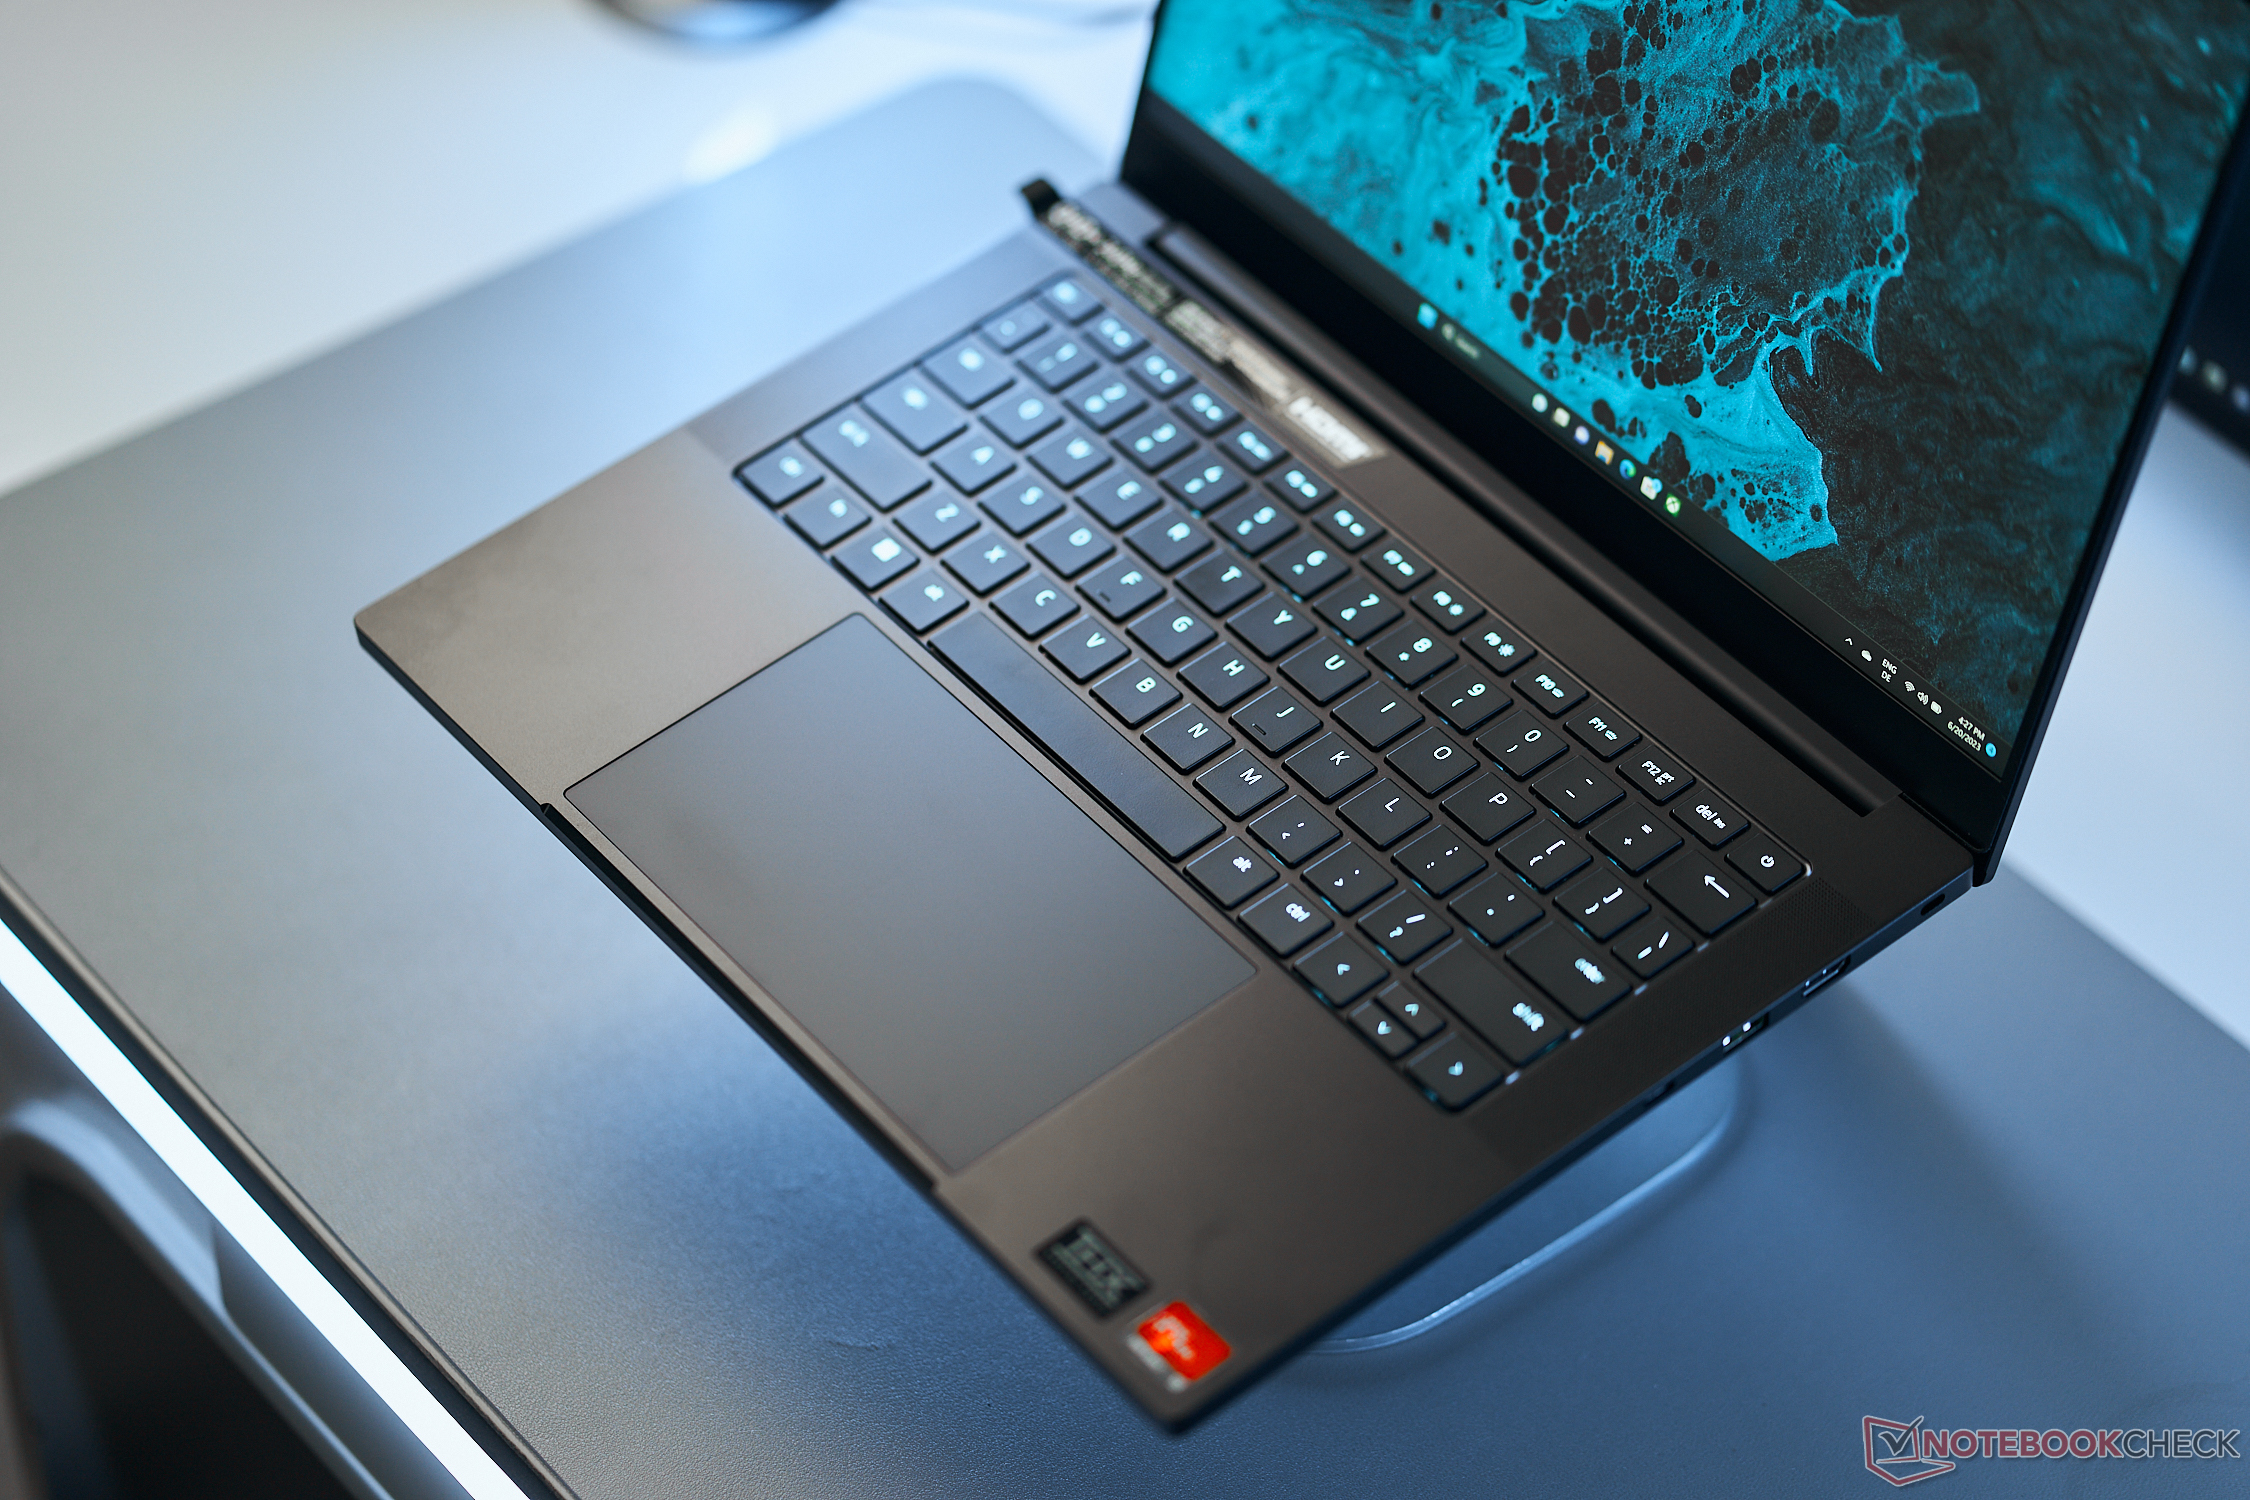
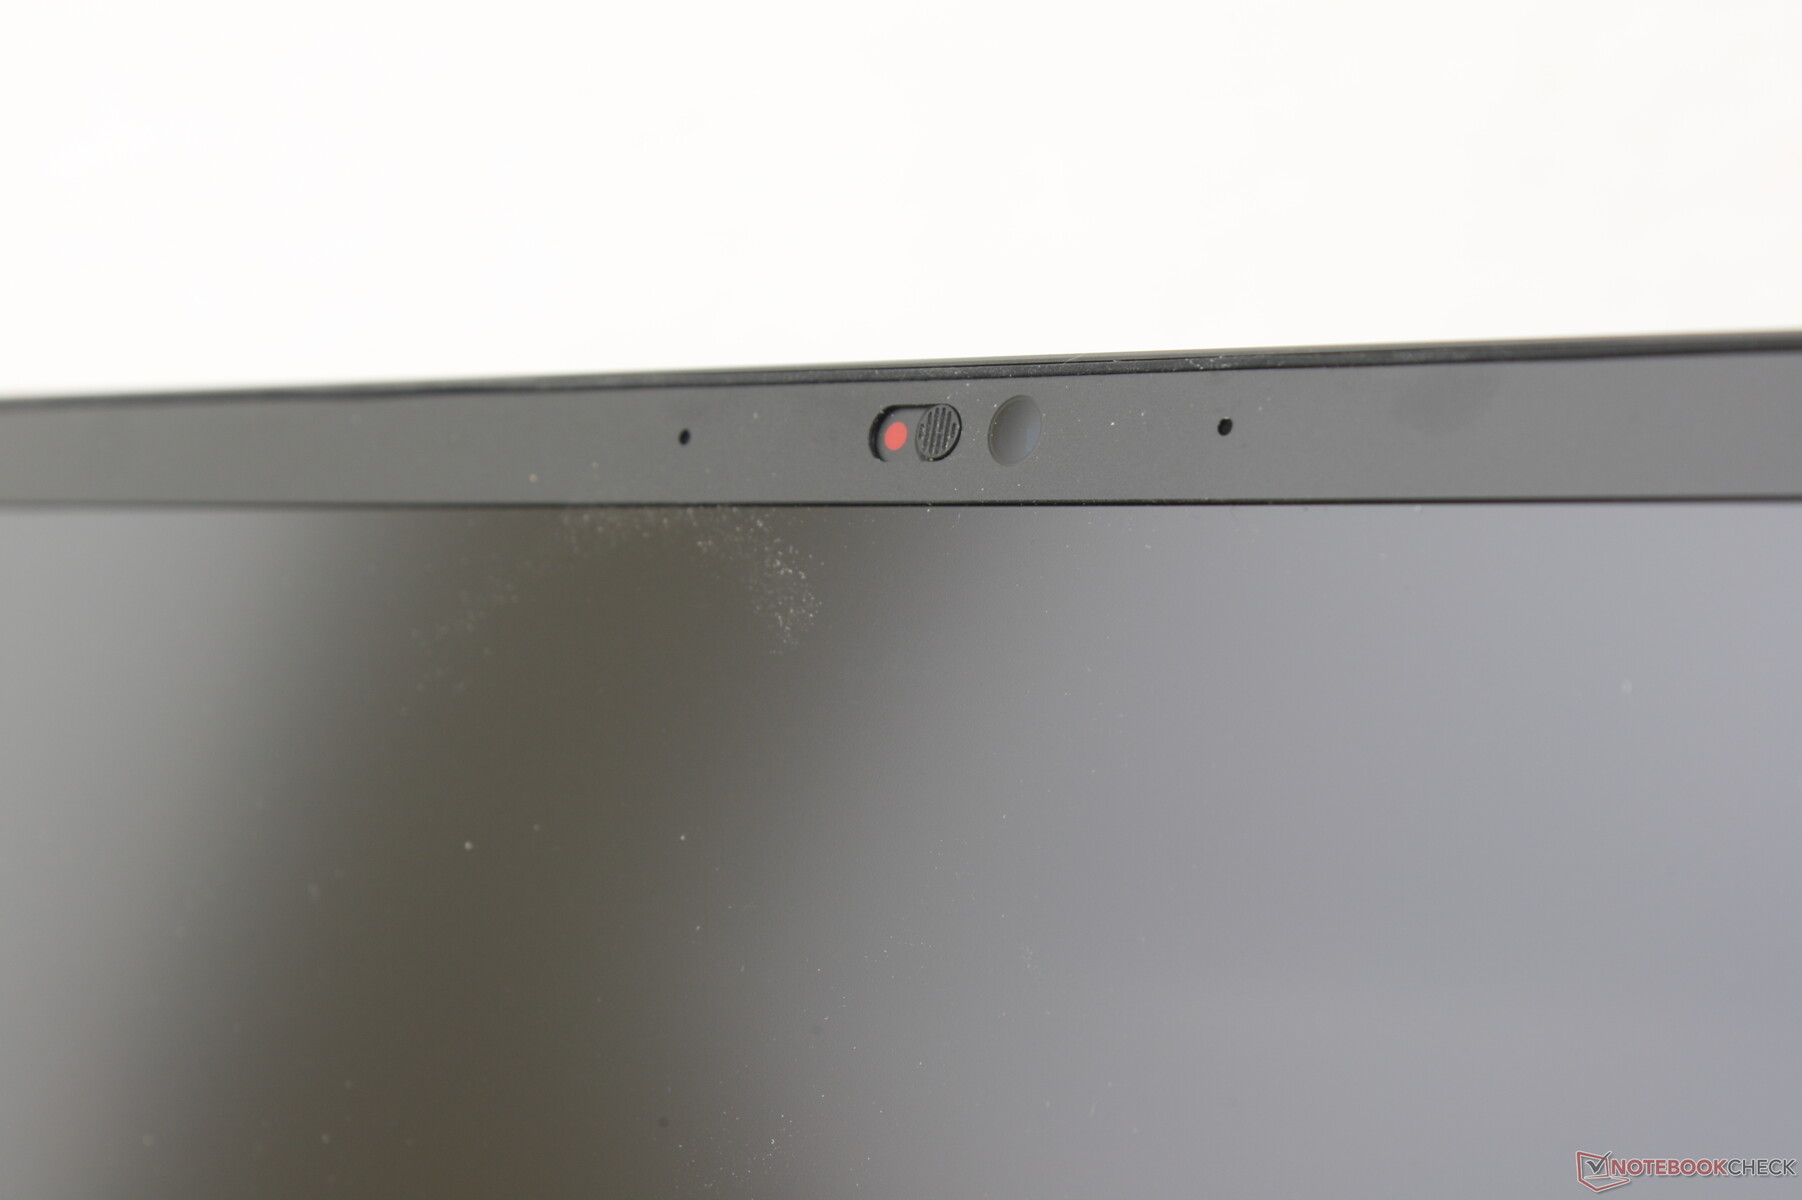
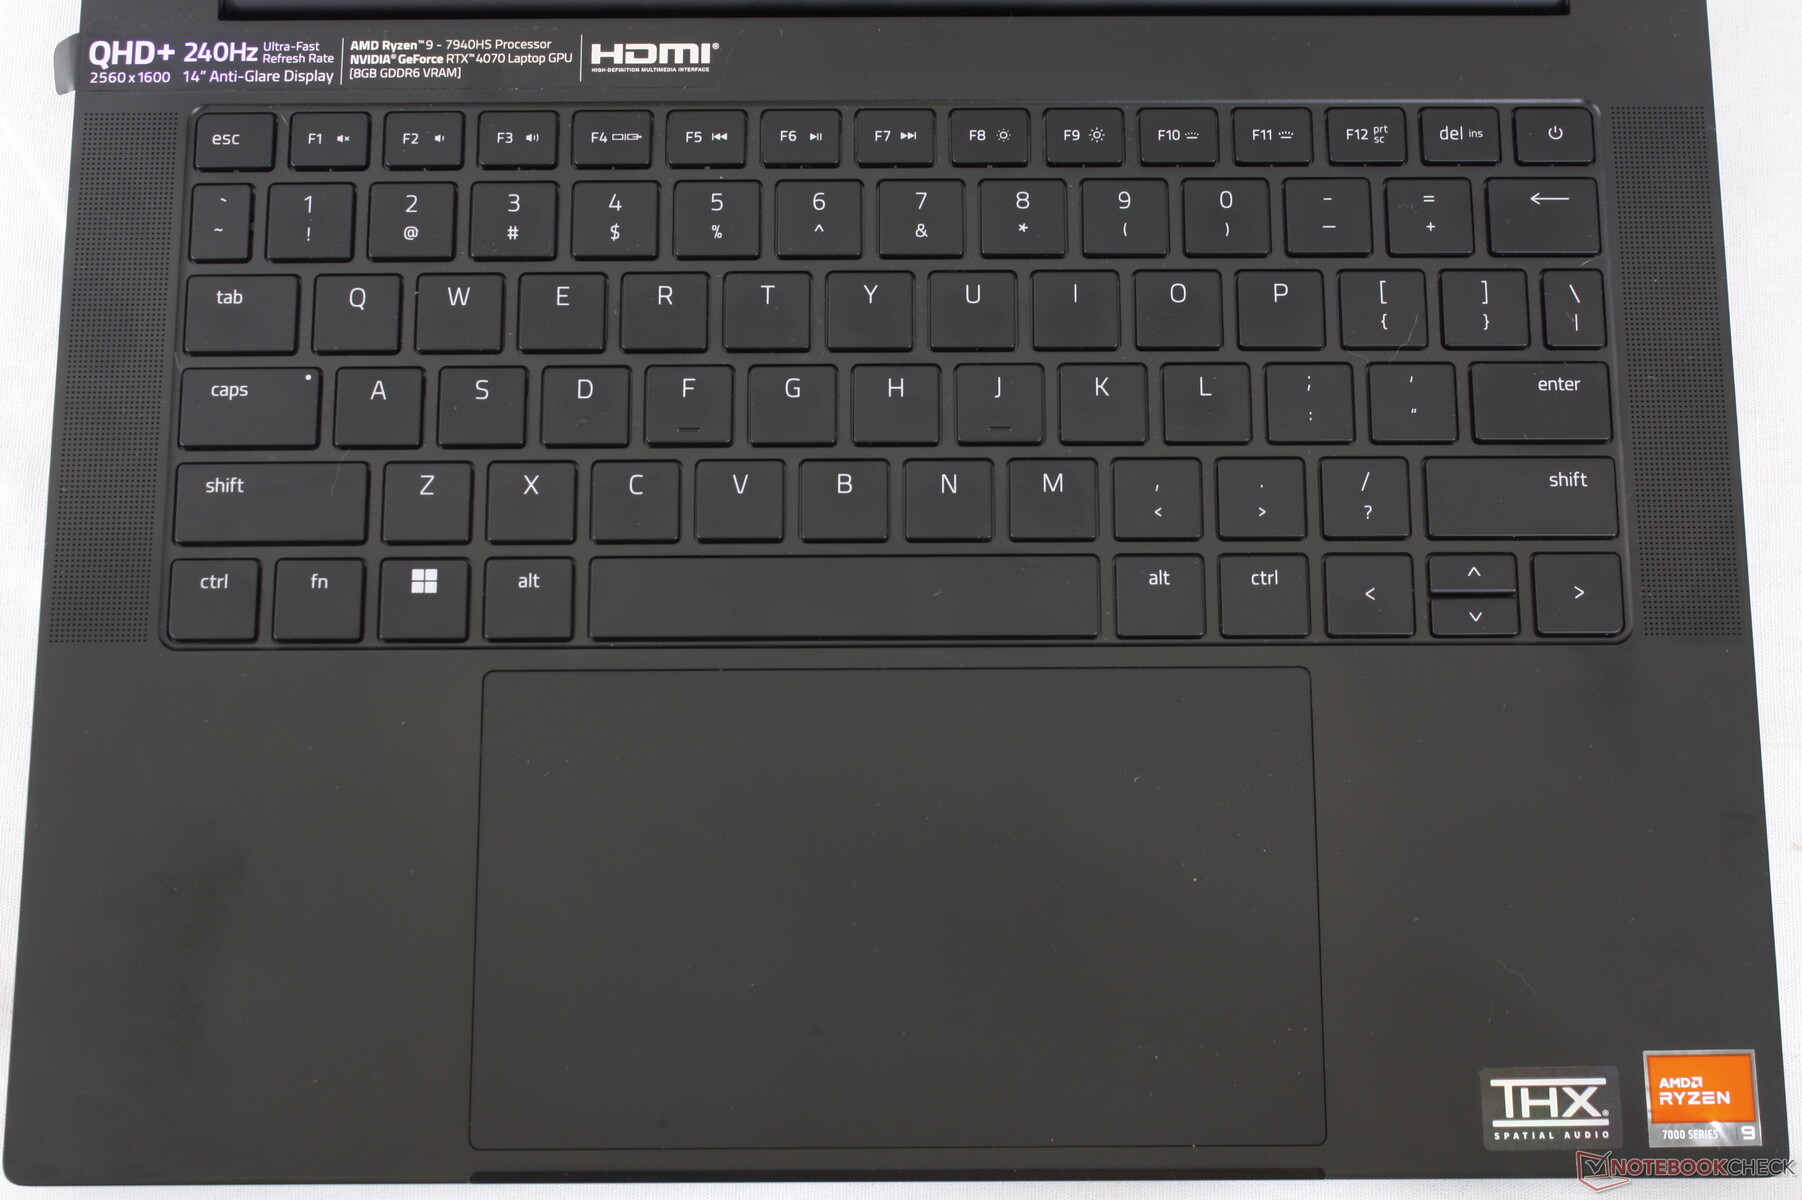
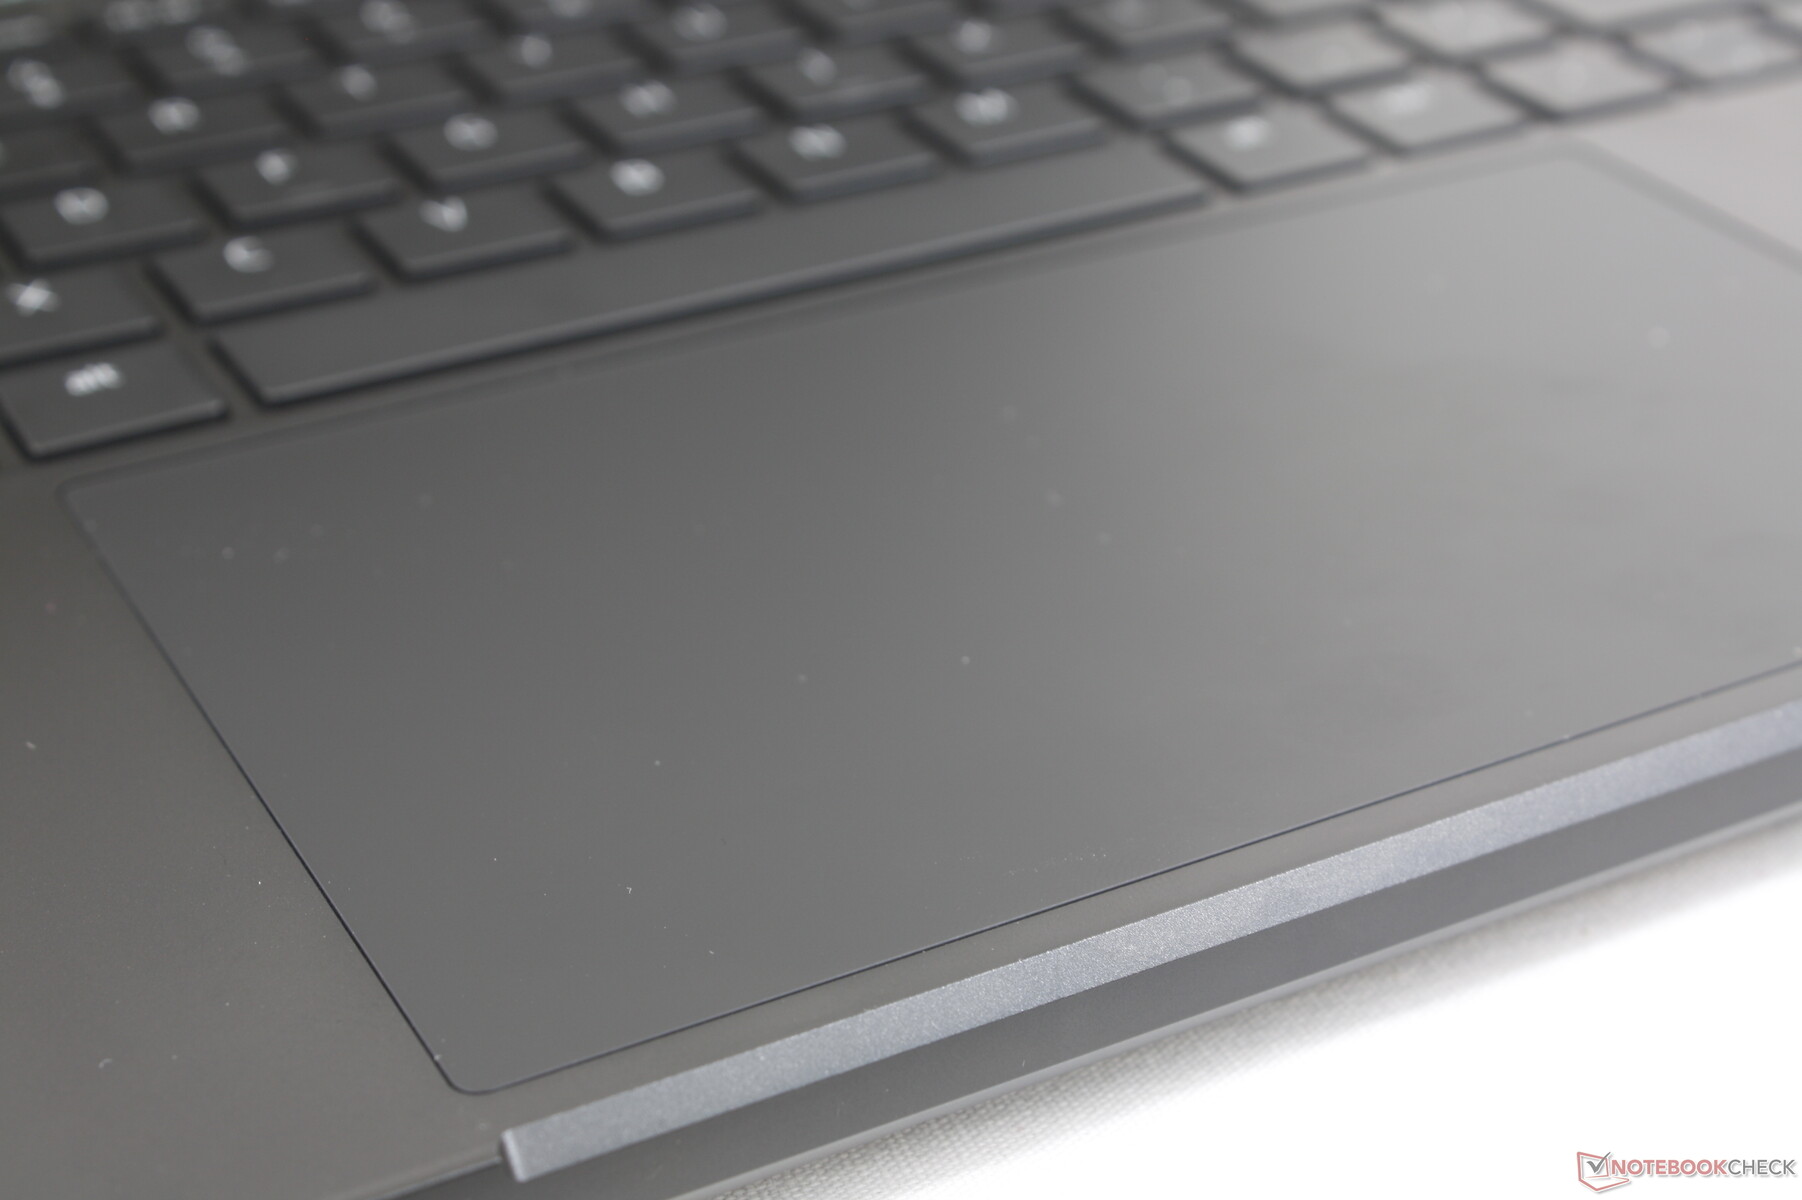
Les moyens les plus faciles de distinguer visuellement le Blade 14 2023 des modèles Blade 14 précédents sont le pavé tactile sensiblement plus grand et la présence d'un nouvel obturateur de webcam coulissant.
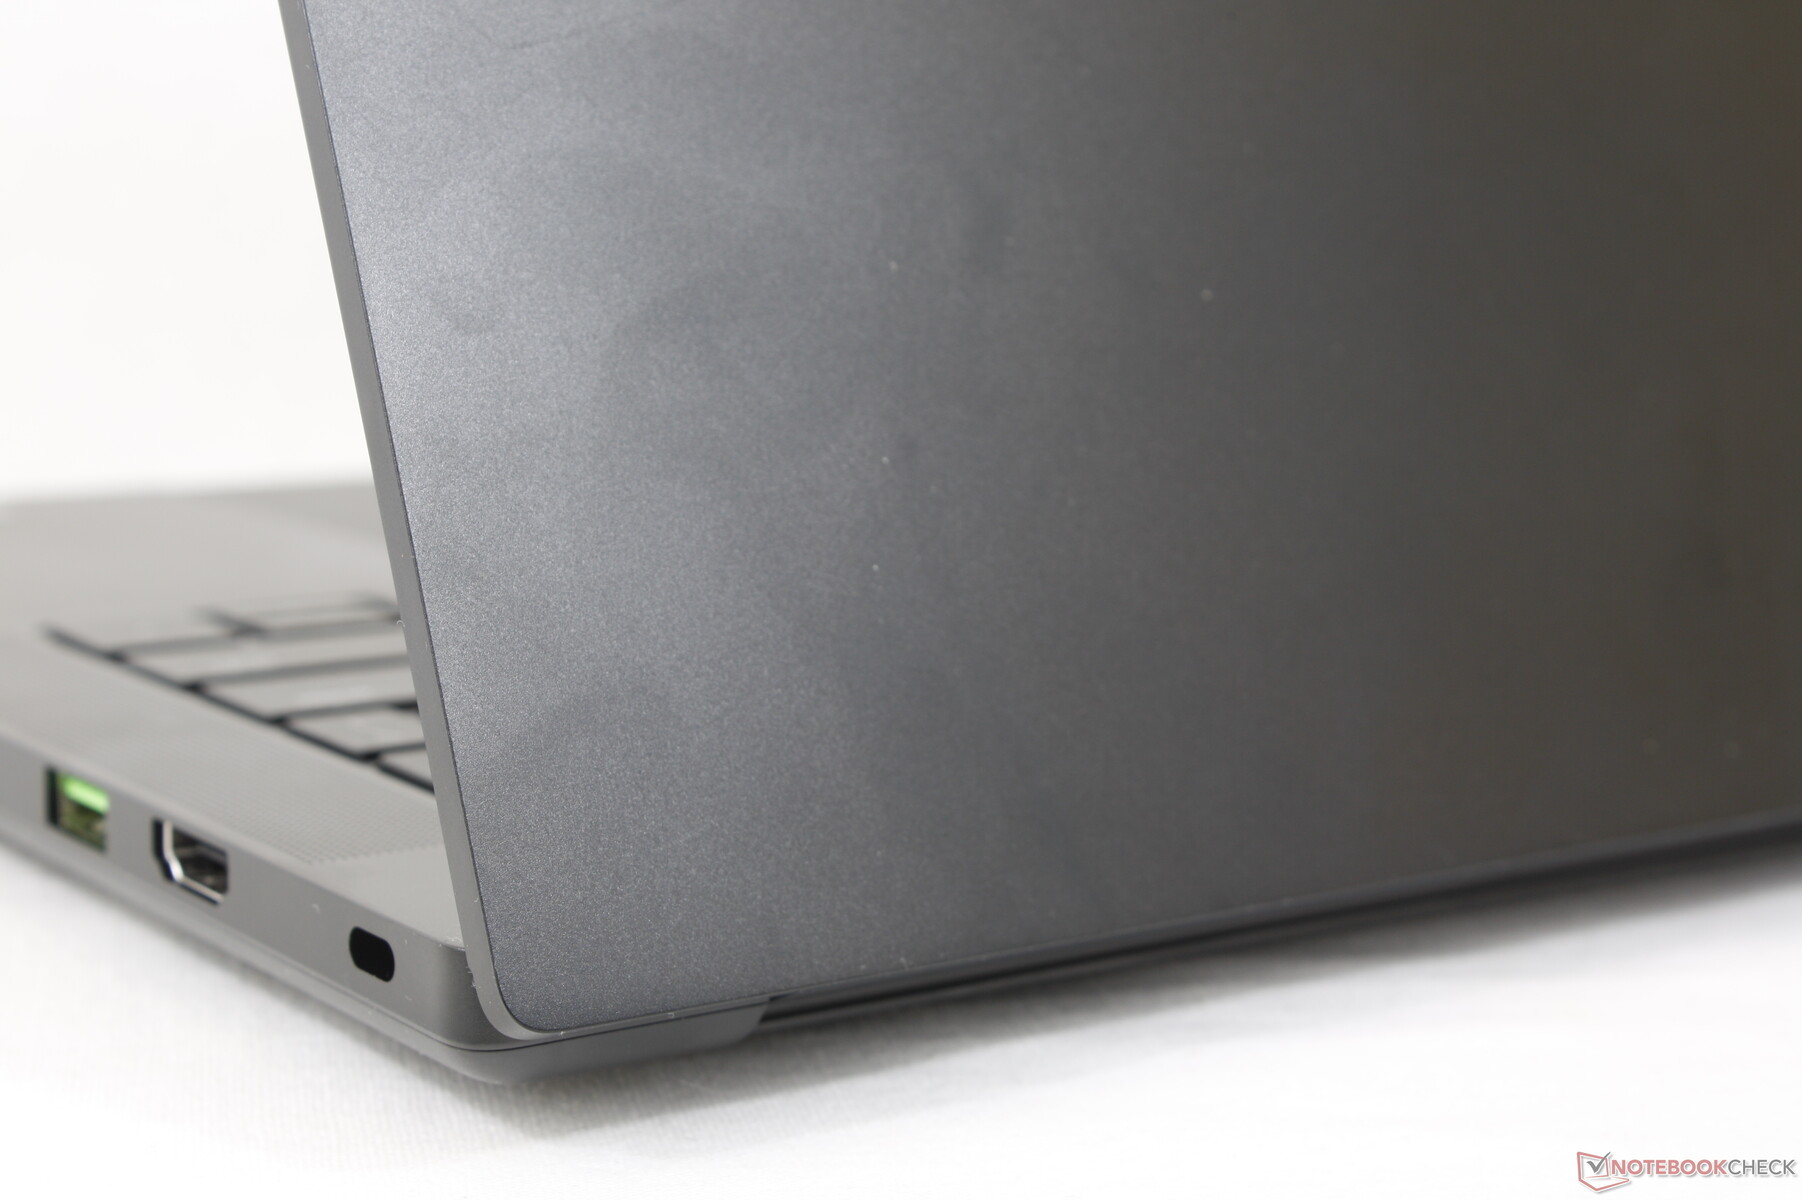
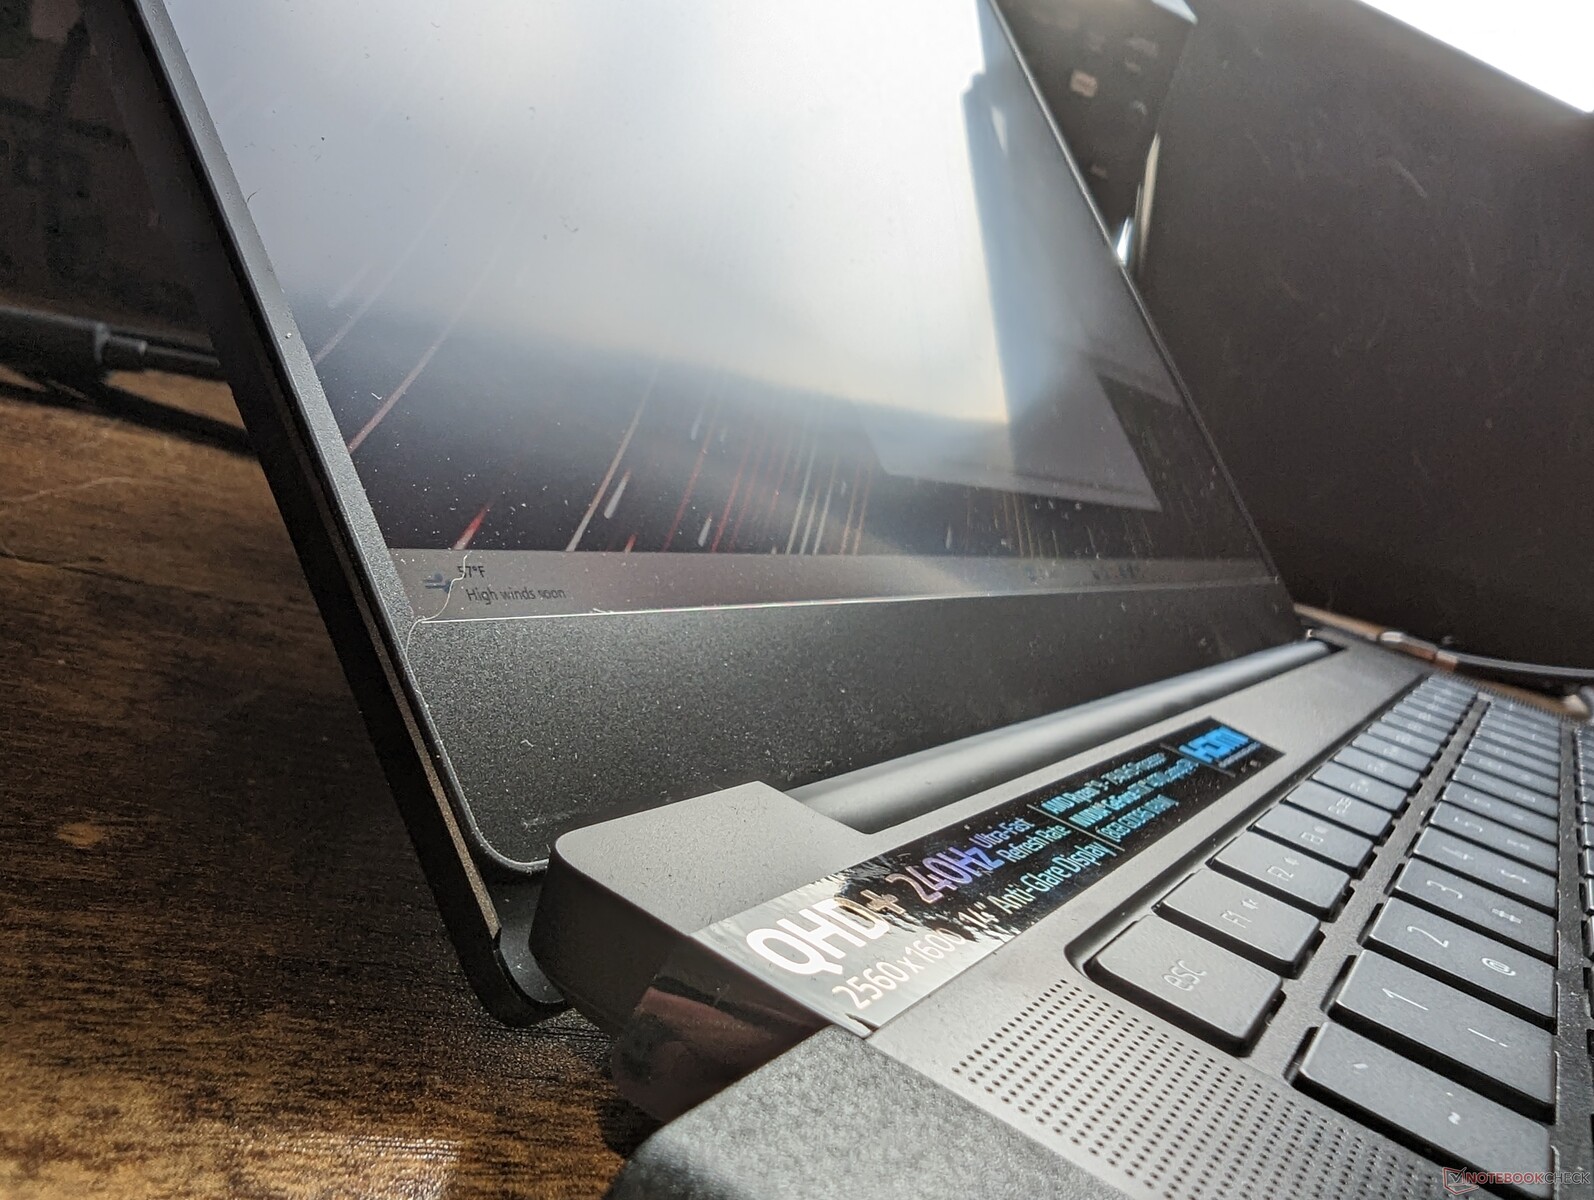
Le passage du 16:9 au 16:10 a élargi le Blade 14 tout en réduisant sa longueur, comme le montre le graphique de comparaison ci-dessous pour un encombrement plus carré. Le poids total est par ailleurs à peu près le même qu'auparavant, à savoir 1,8 kg.
Notez que le nouveau modèle est également un peu plus épais que l'ancien d'environ 1,2 mm, ce qui lui permet d'intégrer des modules de RAM amovibles et un GPU de 140 W plus exigeant. Le Zephyrus G14 concurrent reste l'option la plus épaisse.
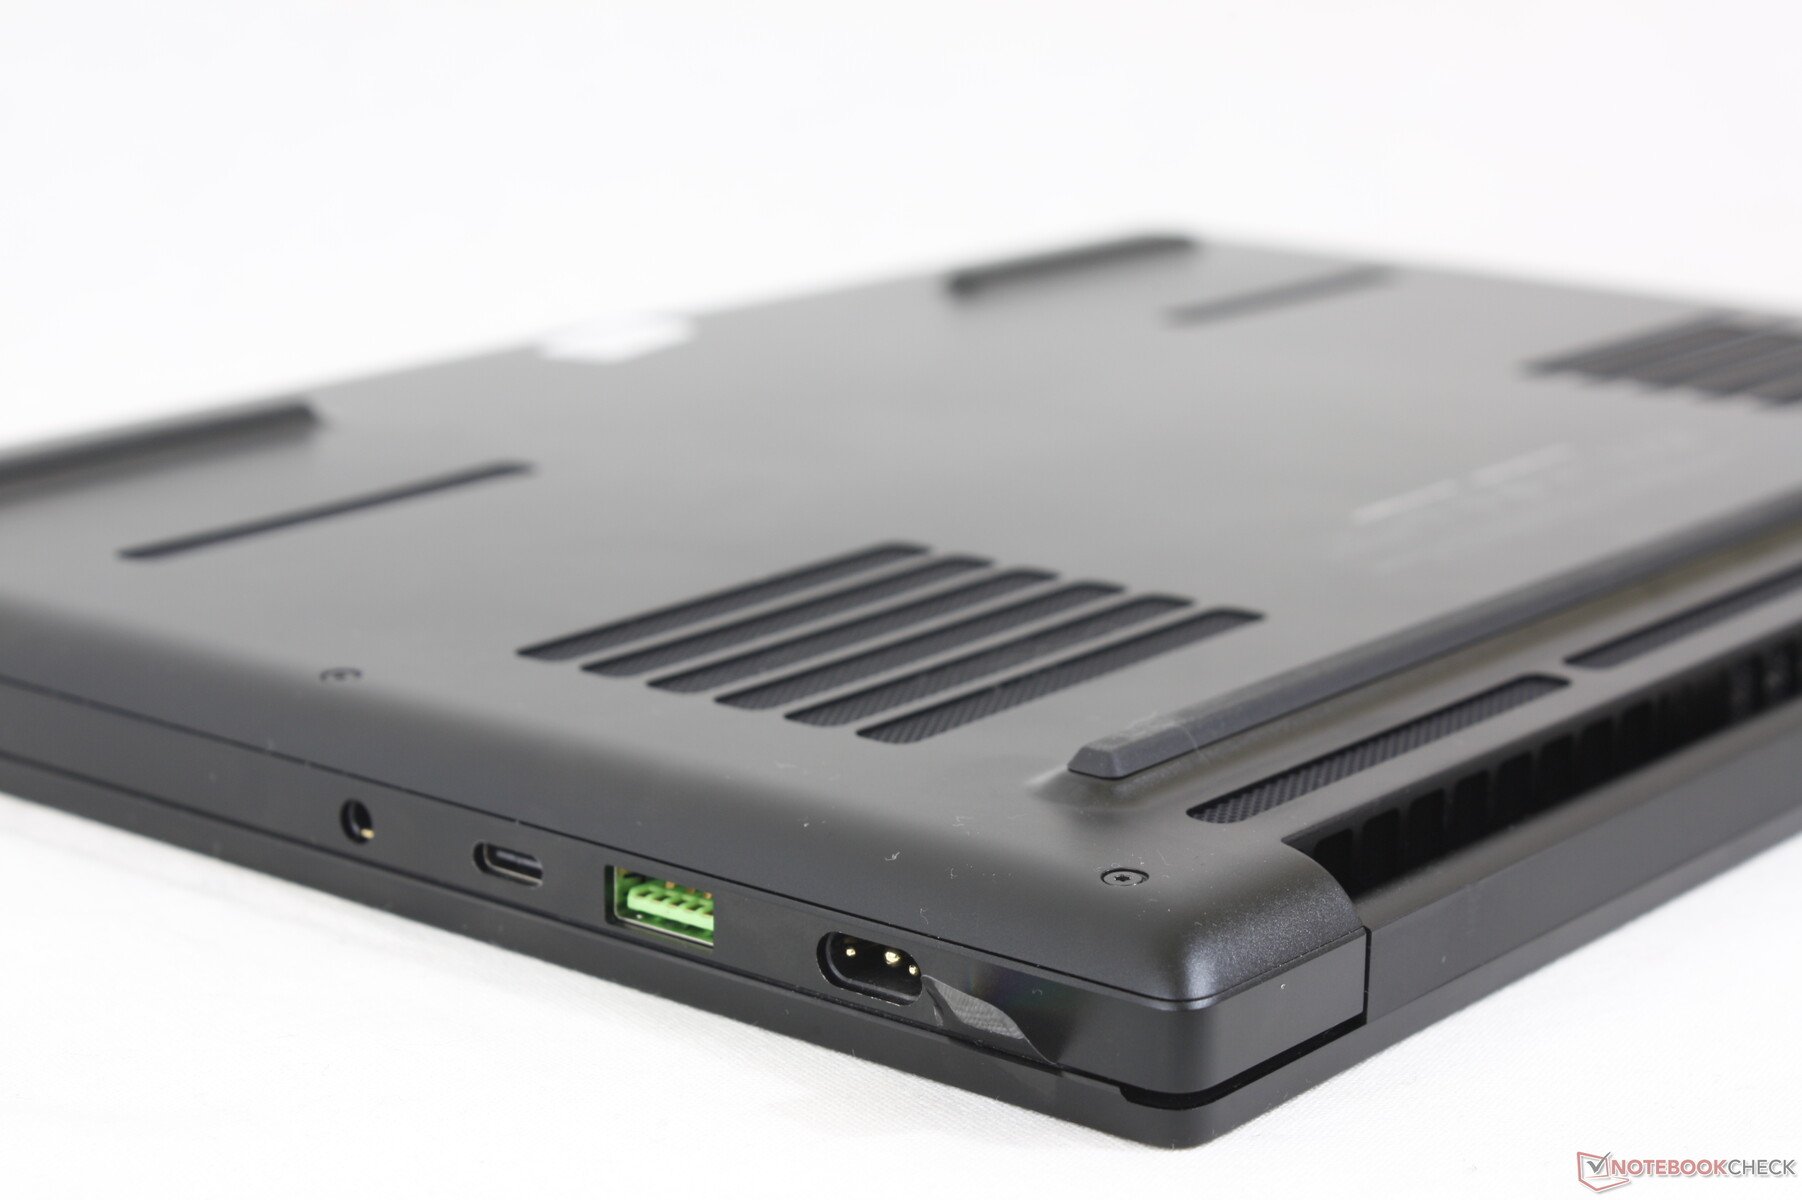
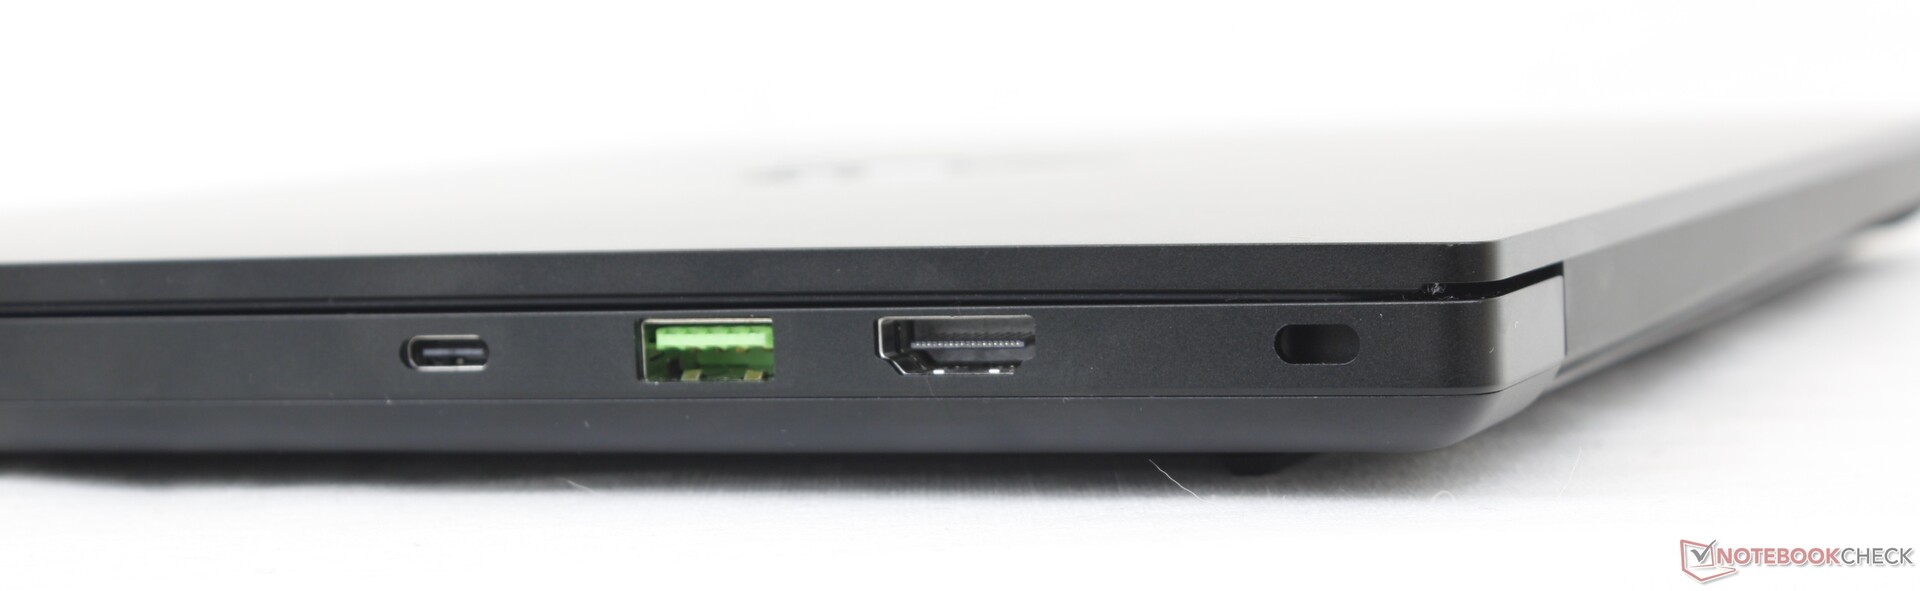
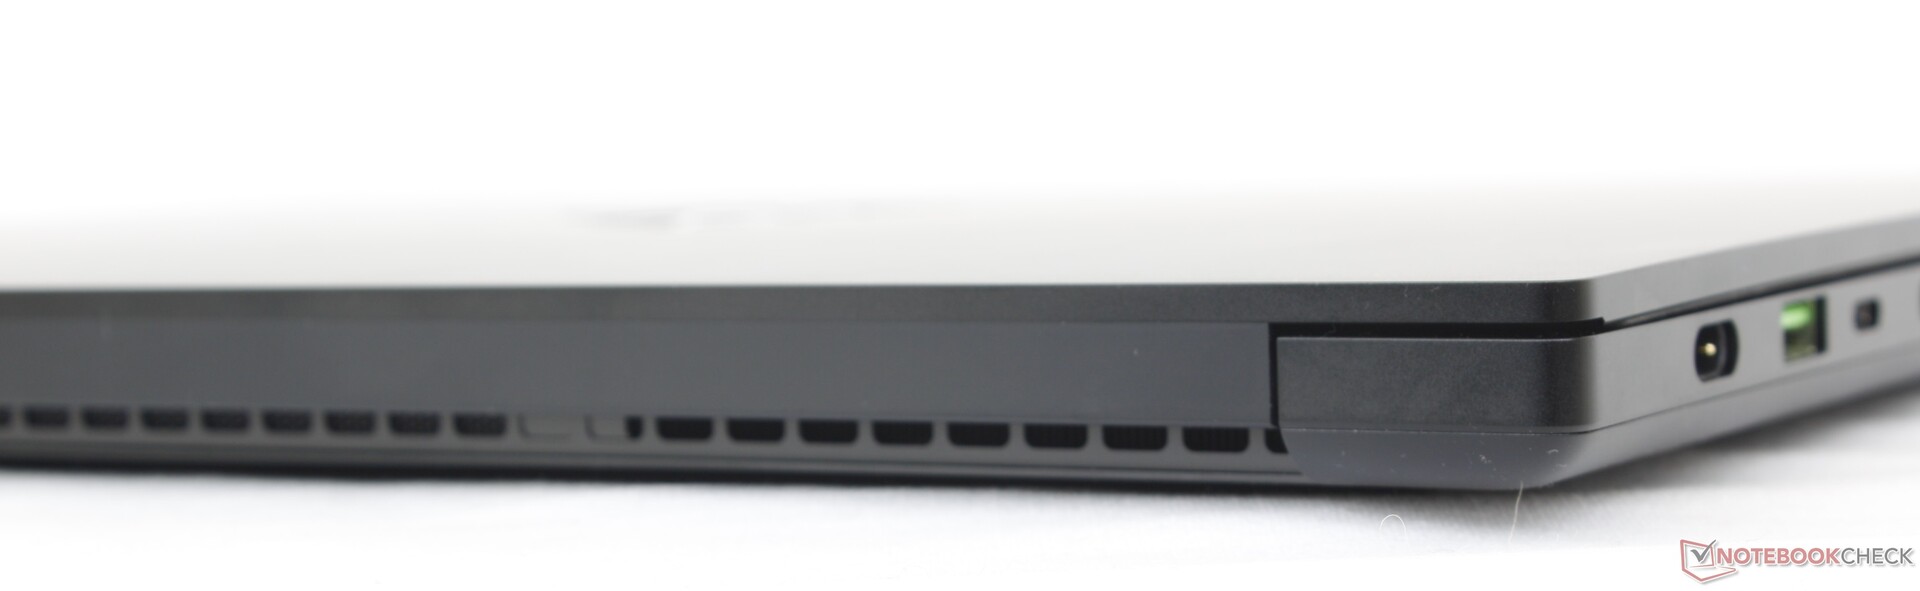
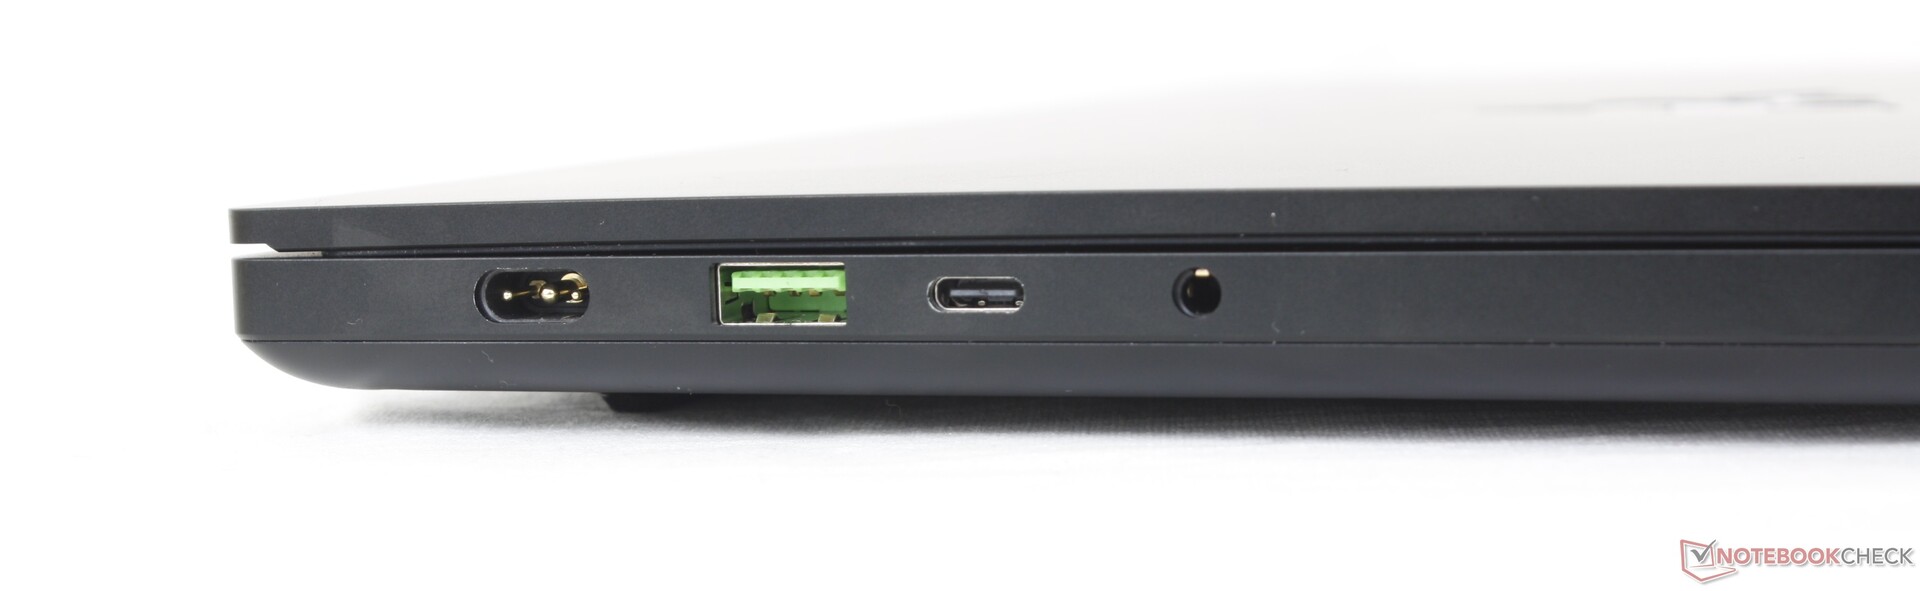
Connectivité
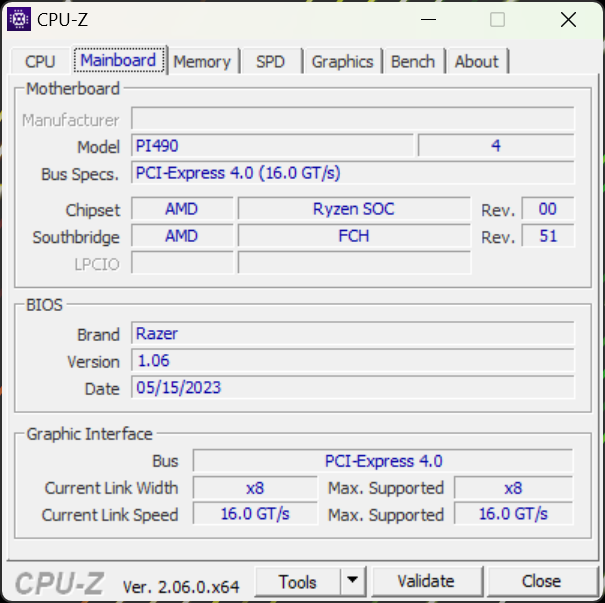
Les options de port restent identiques à celles du modèle de l'année dernière, à l'exception de la prise en charge de l'USB4 et donc des eGPU.
Communication
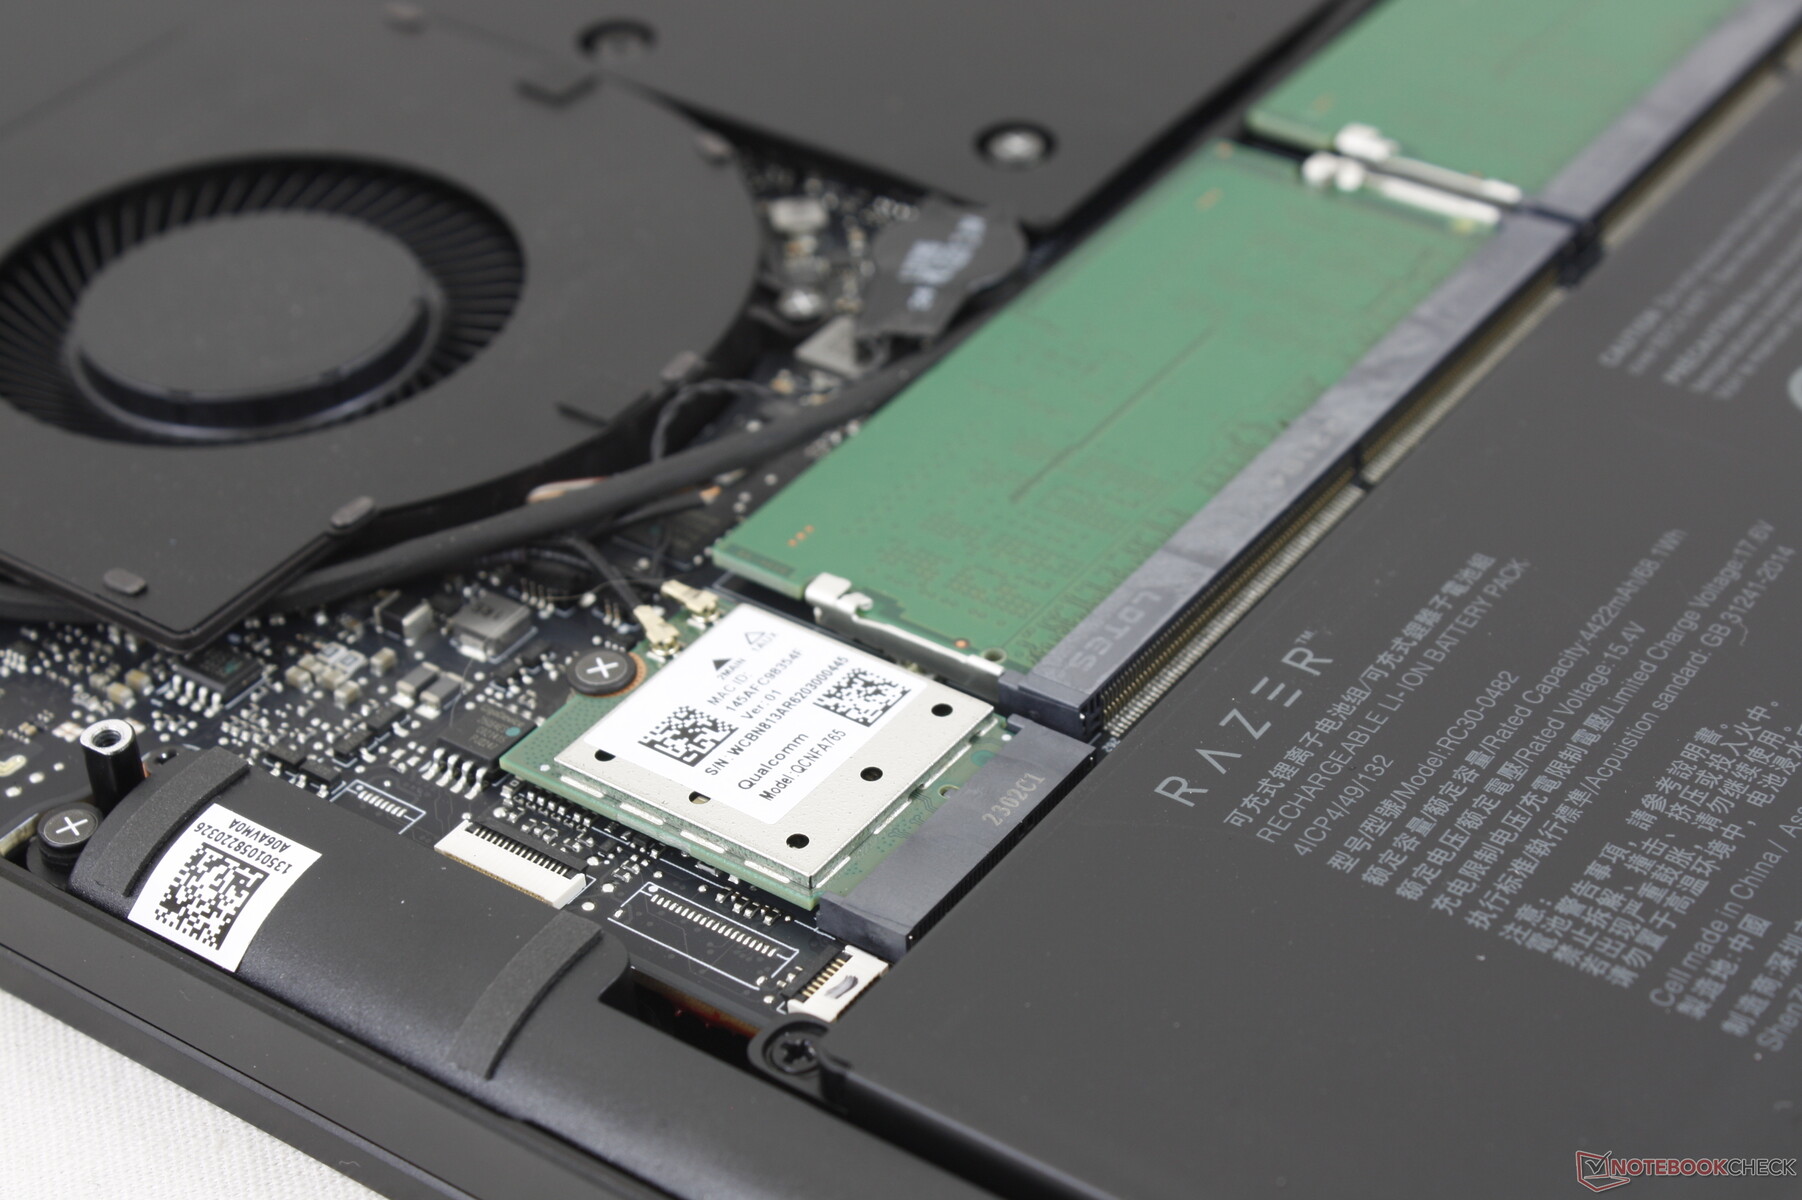
Le Qualcomm WCN685x est une fois de plus fourni en standard pour la connectivité Wi-Fi 6E et Bluetooth 5.2. Nous avons constaté des performances stables et aucun problème de connectivité lorsque nous l'avons couplé à notre routeur de test Asus AXE11000.
| Networking | |
| iperf3 transmit AX12 | |
| Alienware x14 i7 RTX 3060 | |
| Razer Blade 14 Ryzen 9 6900HX | |
| iperf3 receive AX12 | |
| Razer Blade 14 Ryzen 9 6900HX | |
| Alienware x14 i7 RTX 3060 | |
| iperf3 transmit AXE11000 | |
| Asus ROG Zephyrus G14 GA402XY | |
| Lenovo Yoga Pro 7 14IRH G8 | |
| Razer Blade 14 RTX 4070 | |
| iperf3 receive AXE11000 | |
| Asus ROG Zephyrus G14 GA402XY | |
| Lenovo Yoga Pro 7 14IRH G8 | |
| Razer Blade 14 RTX 4070 | |
| iperf3 transmit AXE11000 6GHz | |
| Razer Blade 14 RTX 4070 | |
| Acer Predator Triton 300 SE | |
| iperf3 receive AXE11000 6GHz | |
| Razer Blade 14 RTX 4070 | |
| Acer Predator Triton 300 SE | |
Webcam


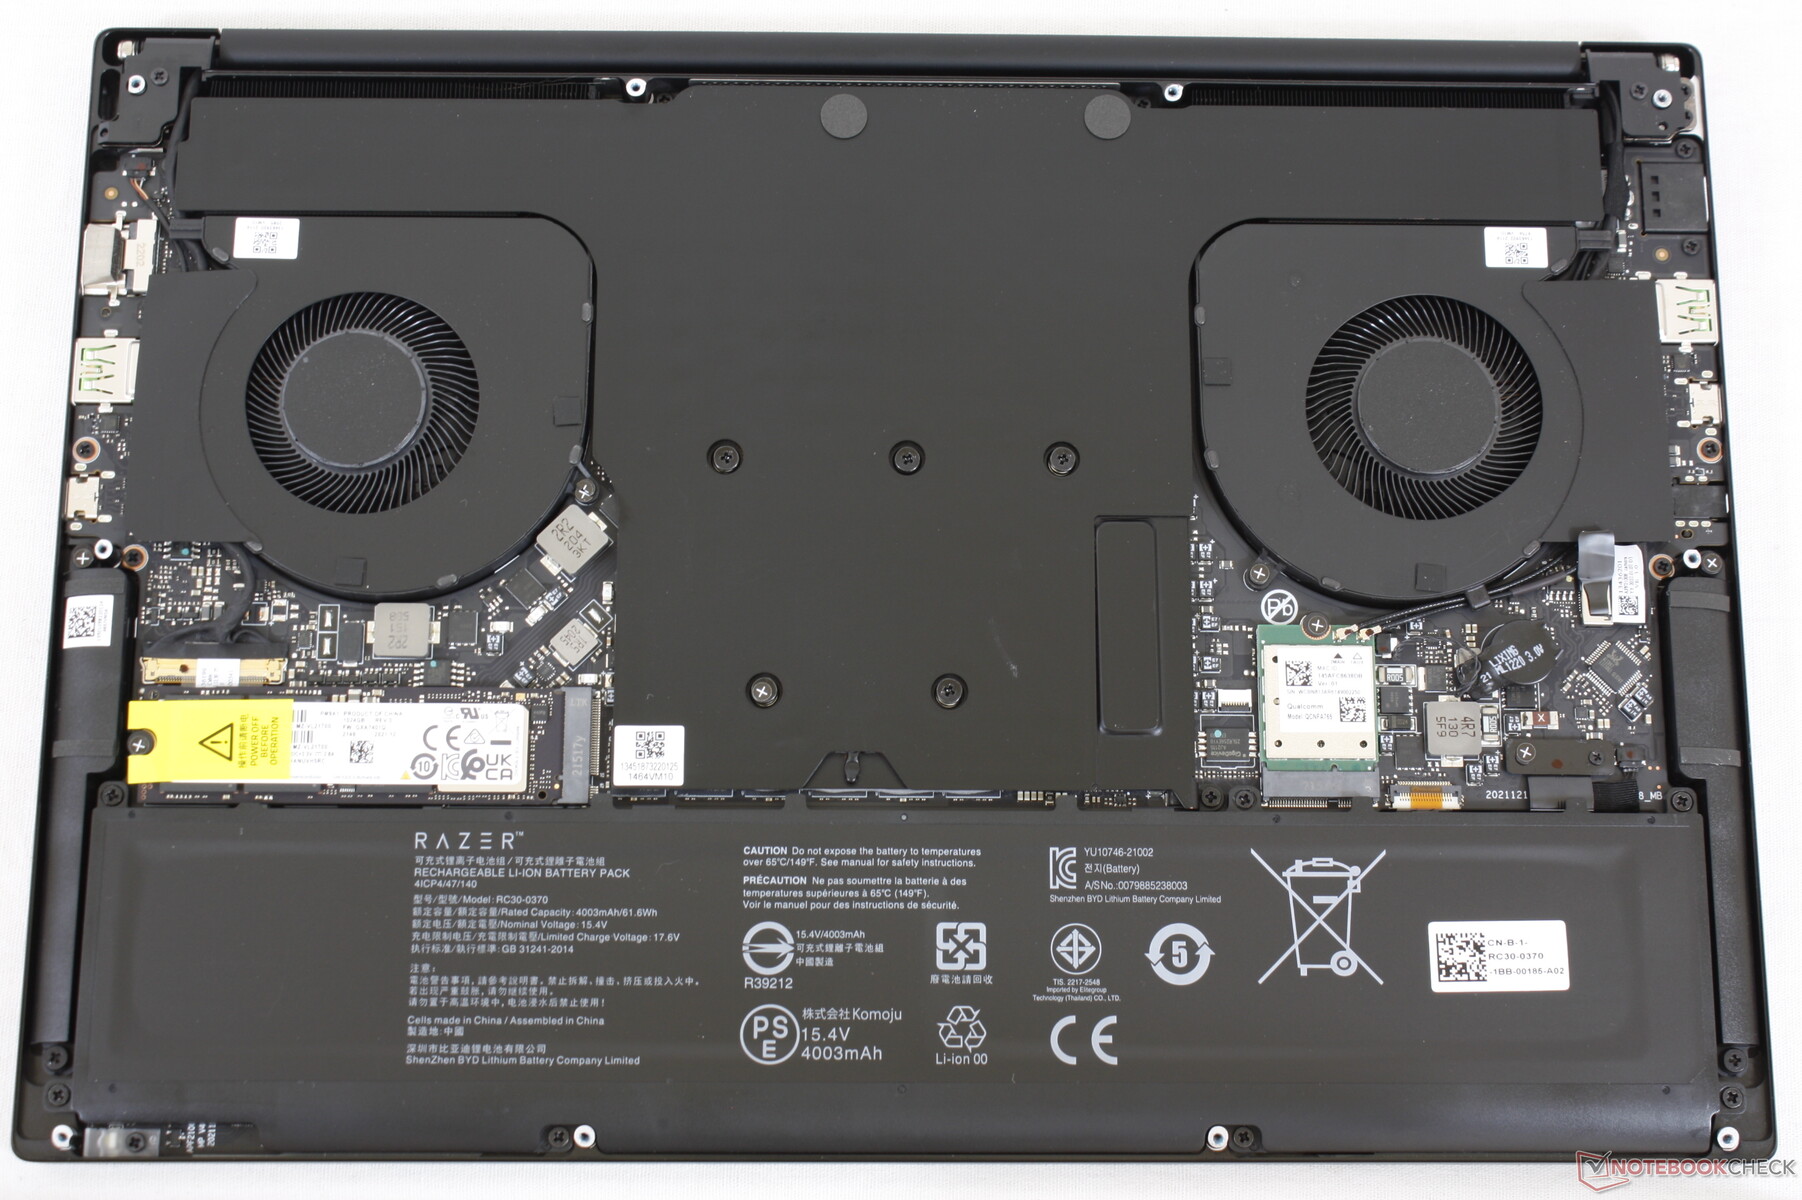
Maintenance
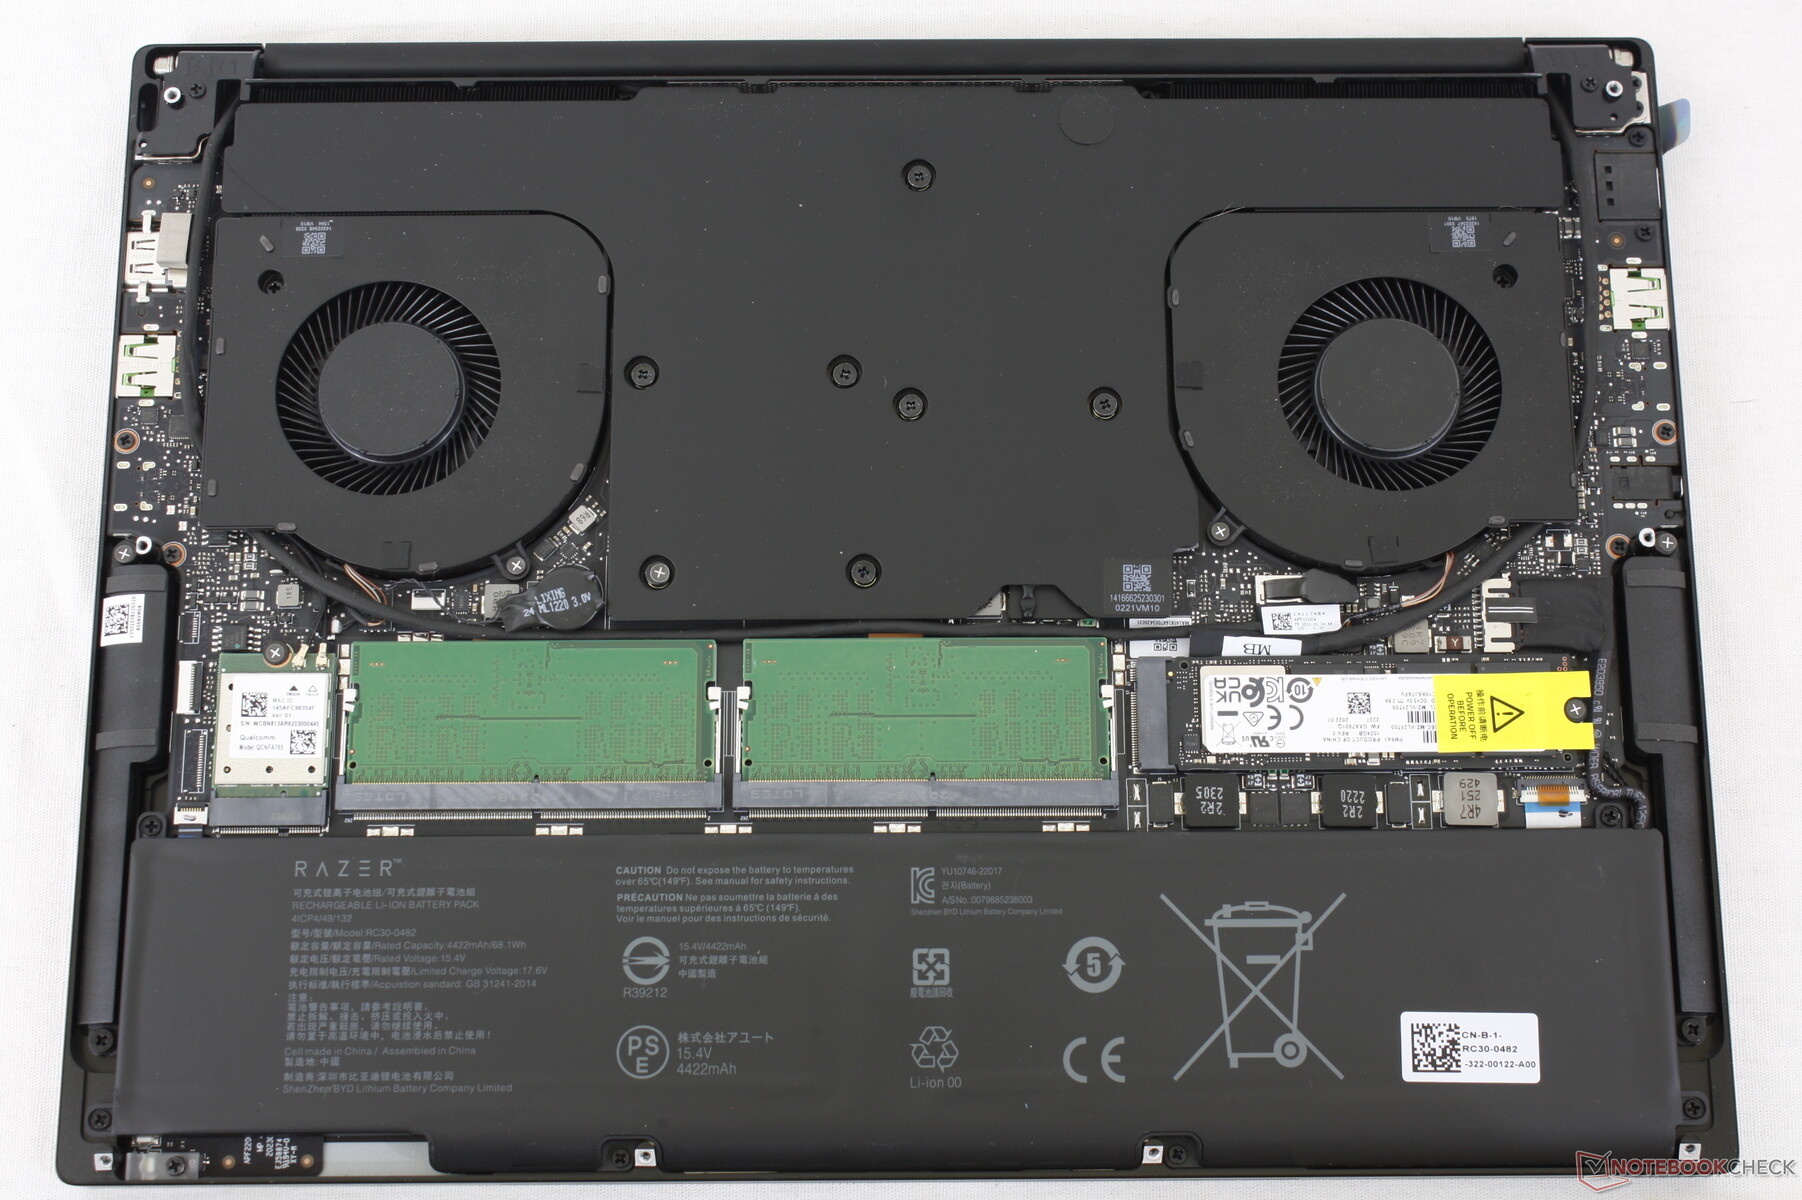
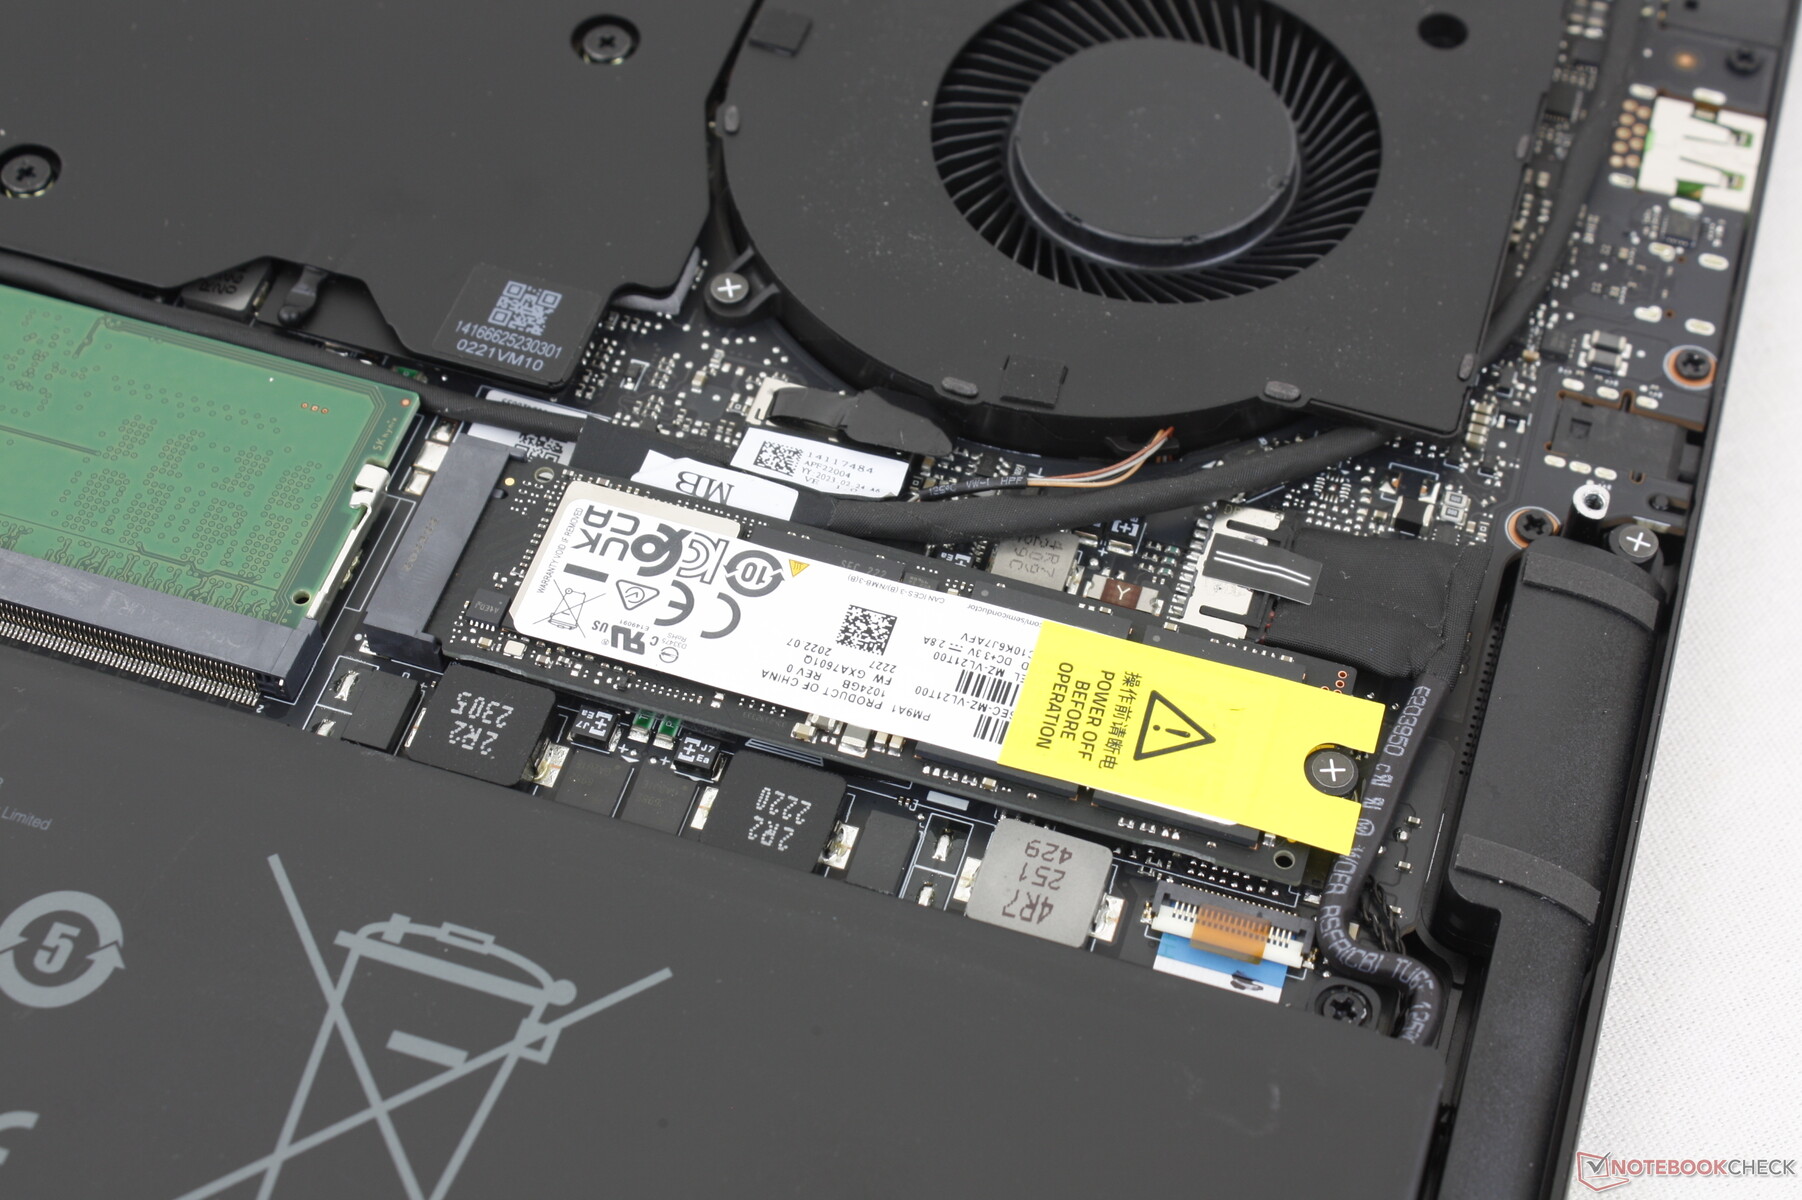
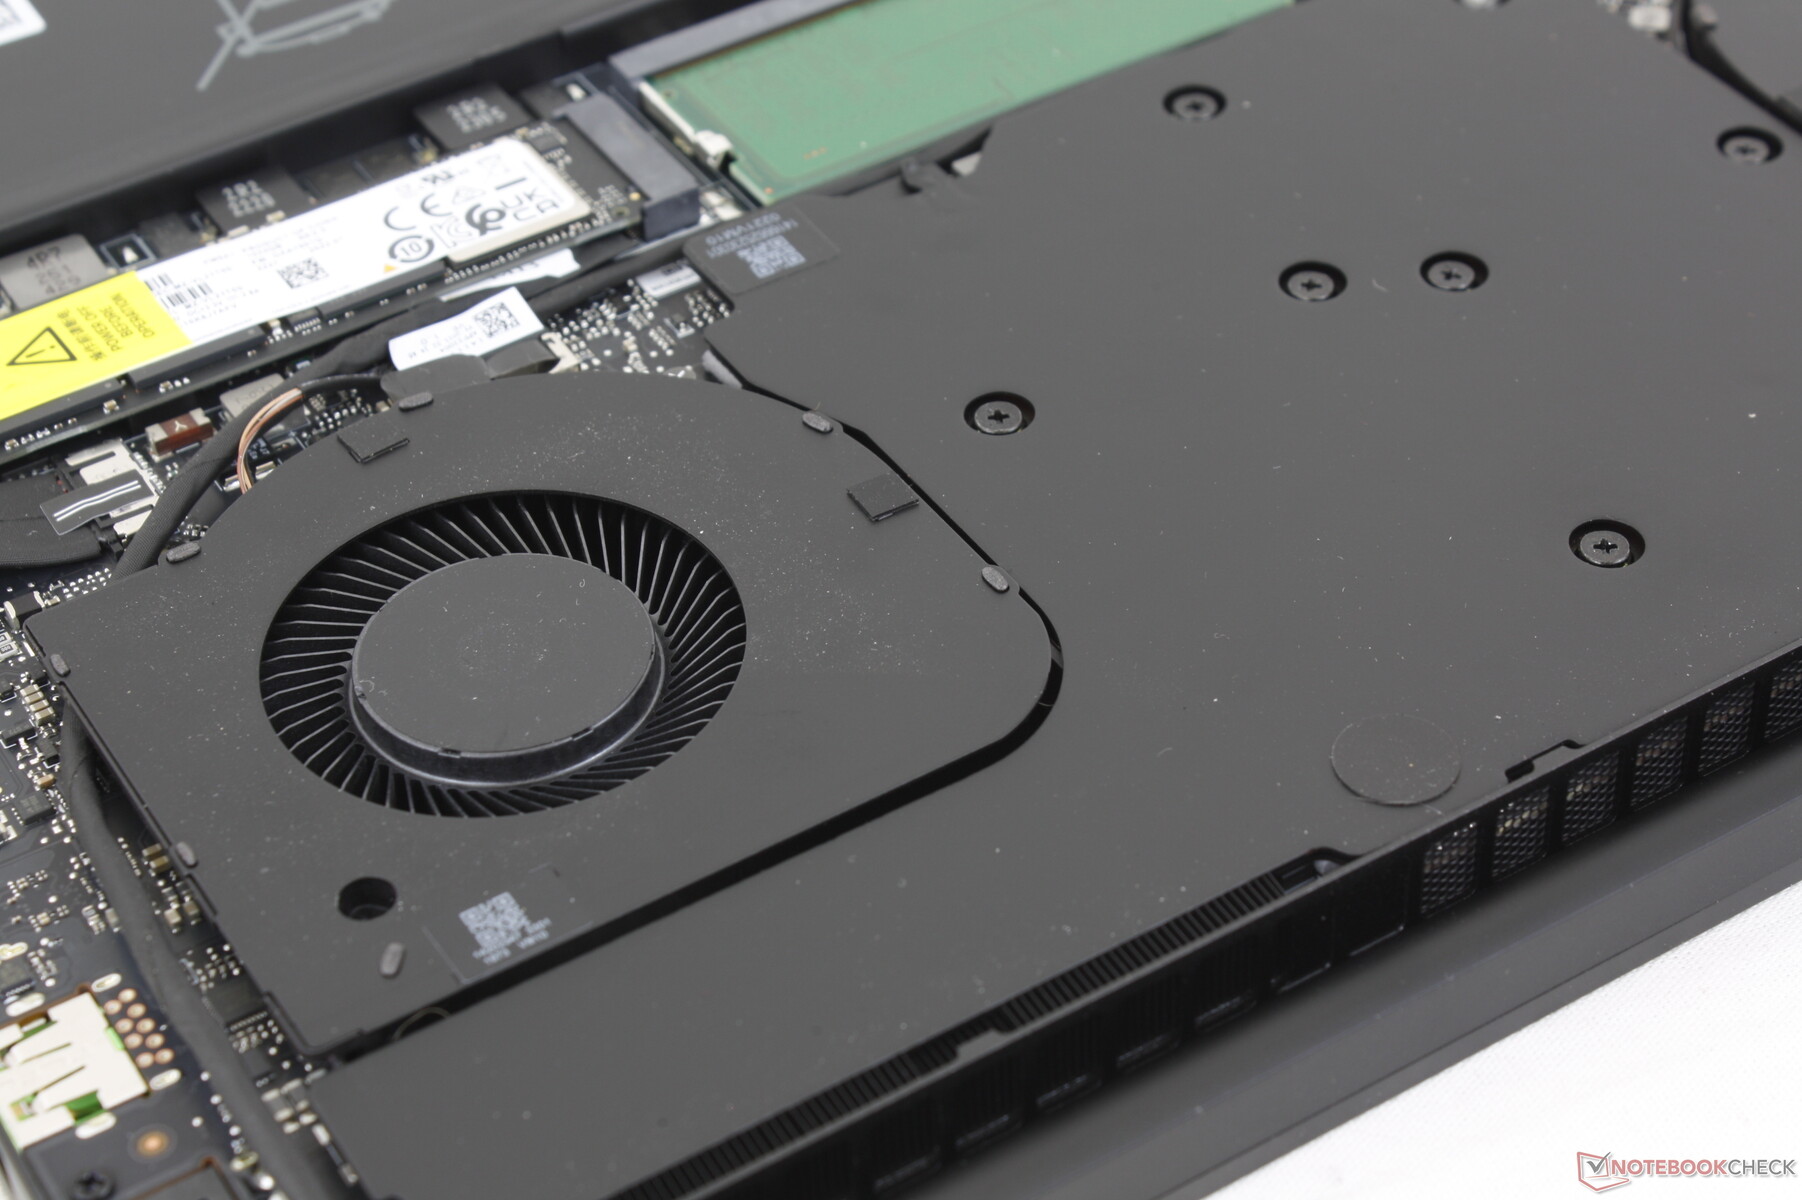
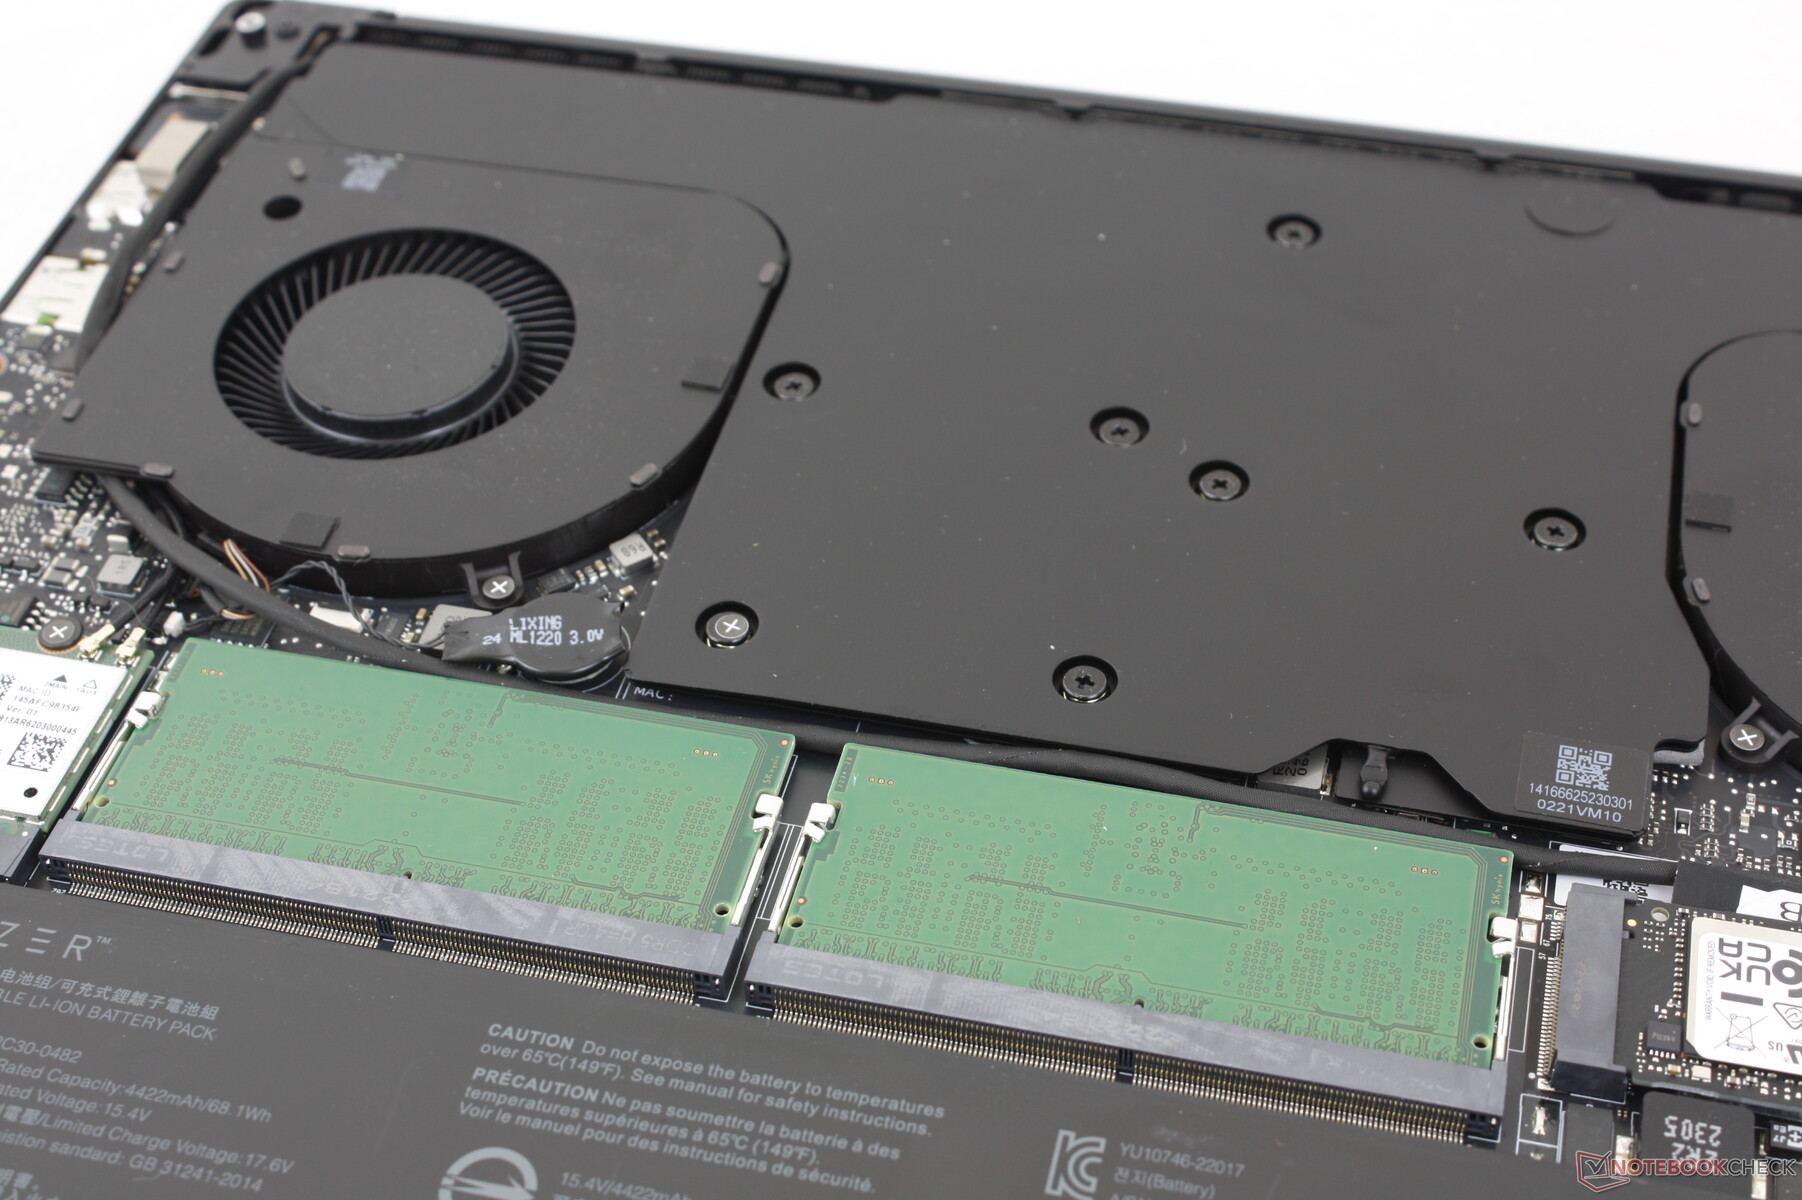
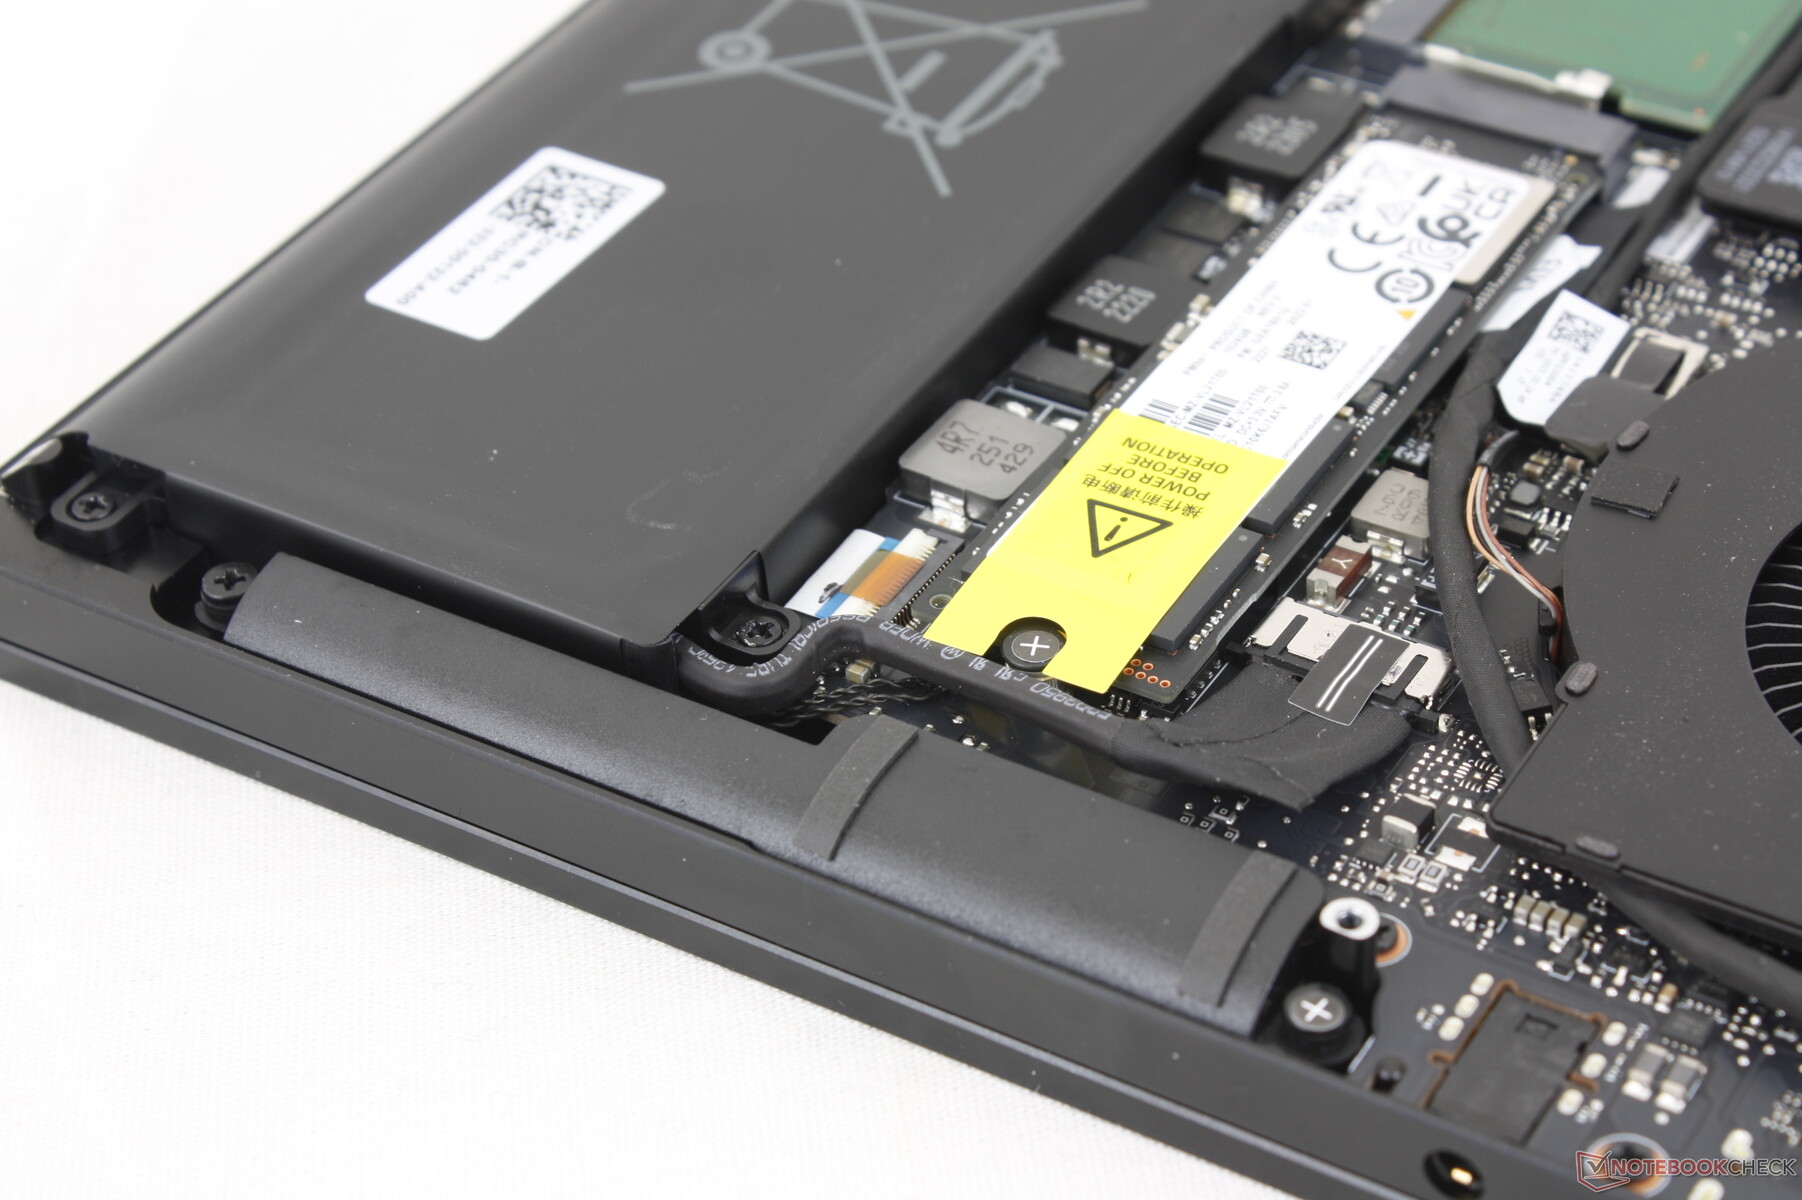
Le panneau inférieur est fixé par 8 vis Torx pour faciliter le retrait. La mémoire vive est cette fois-ci amovible jusqu'à 64 Go, alors que l'ancien modèle était limité à 16 Go. Les utilisateurs intensifs de multitâches et les créateurs de contenu, en particulier, profiteront le plus de ce changement.
Accessoires et garantie
La boîte ne contient pas d'autres éléments que l'adaptateur secteur et quelques autocollants du logo Razer. La garantie constructeur limitée habituelle d'un an s'applique si l'appareil est acheté aux États-Unis.
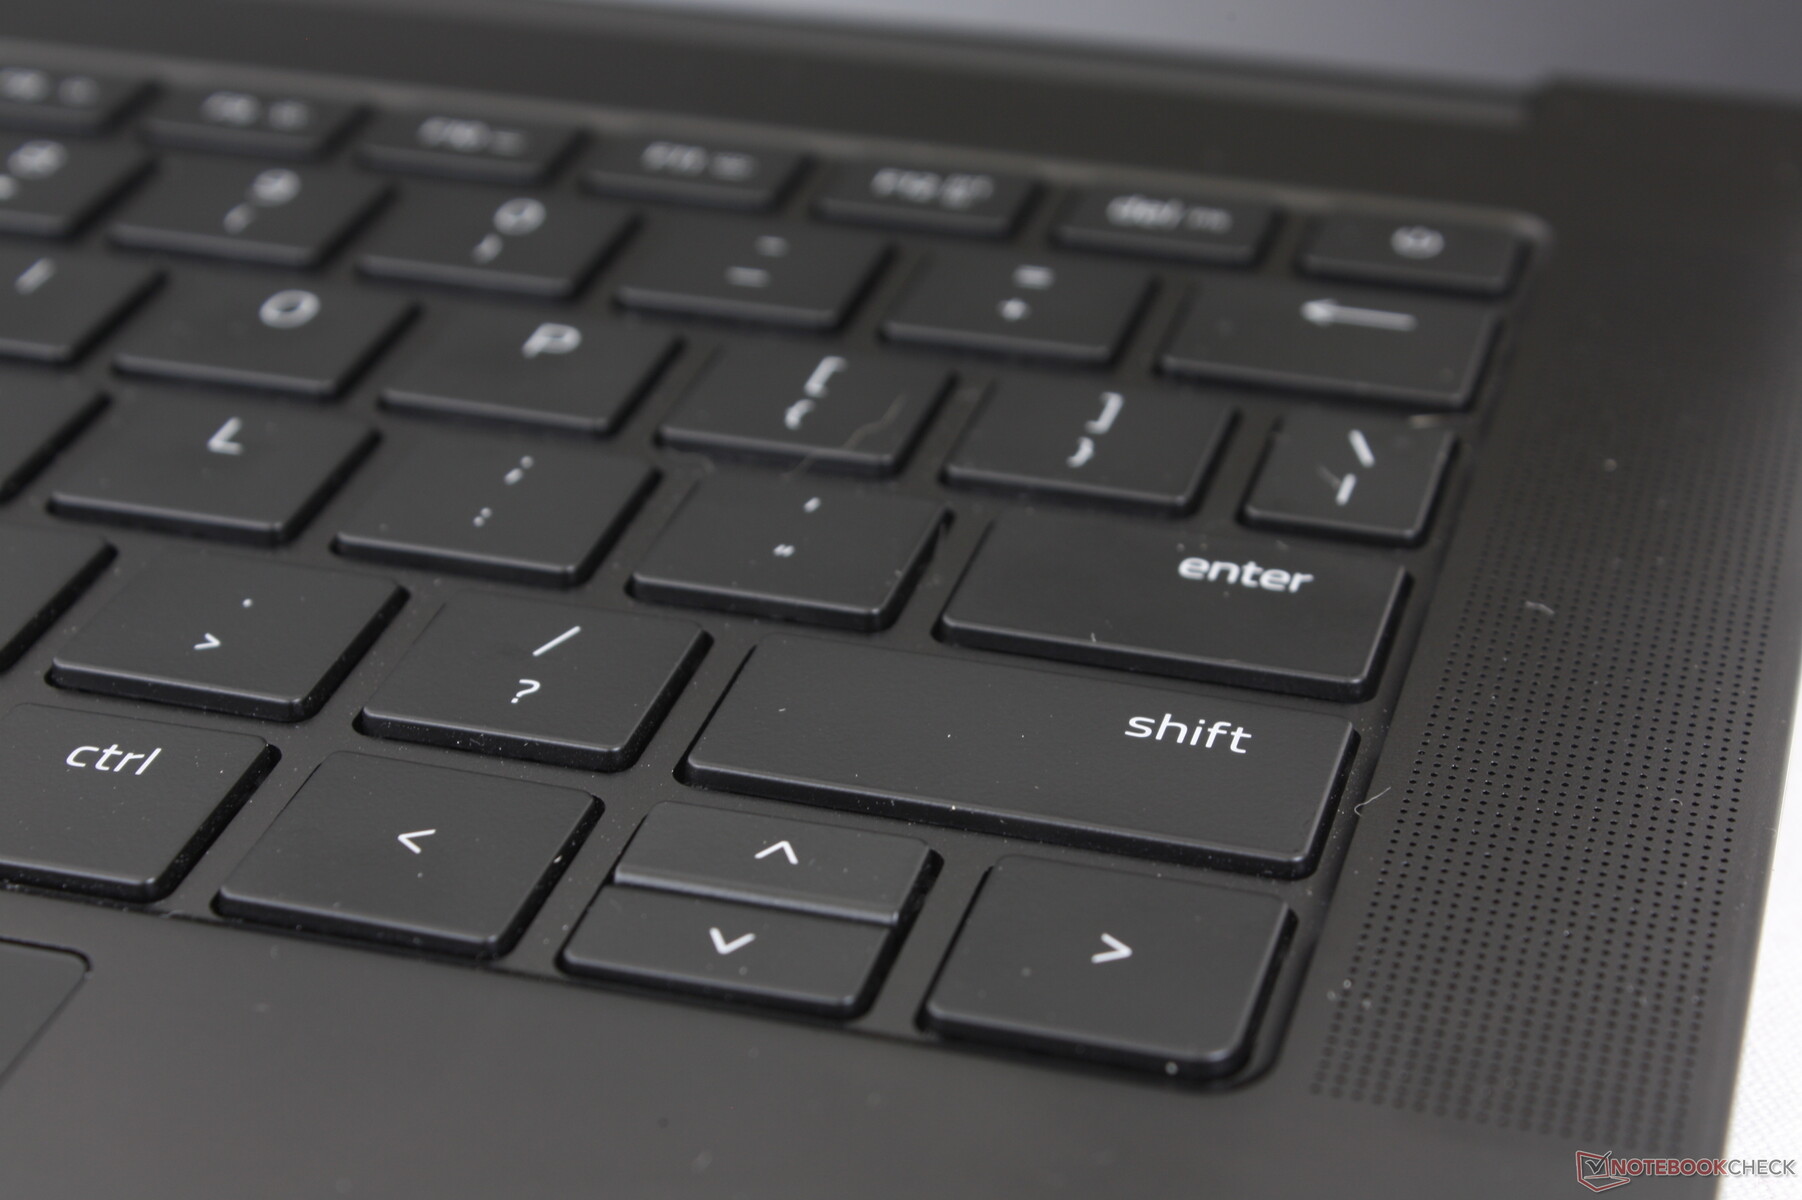
Périphériques d'entrée - Même sensation, pavé tactile plus grand
Clavier
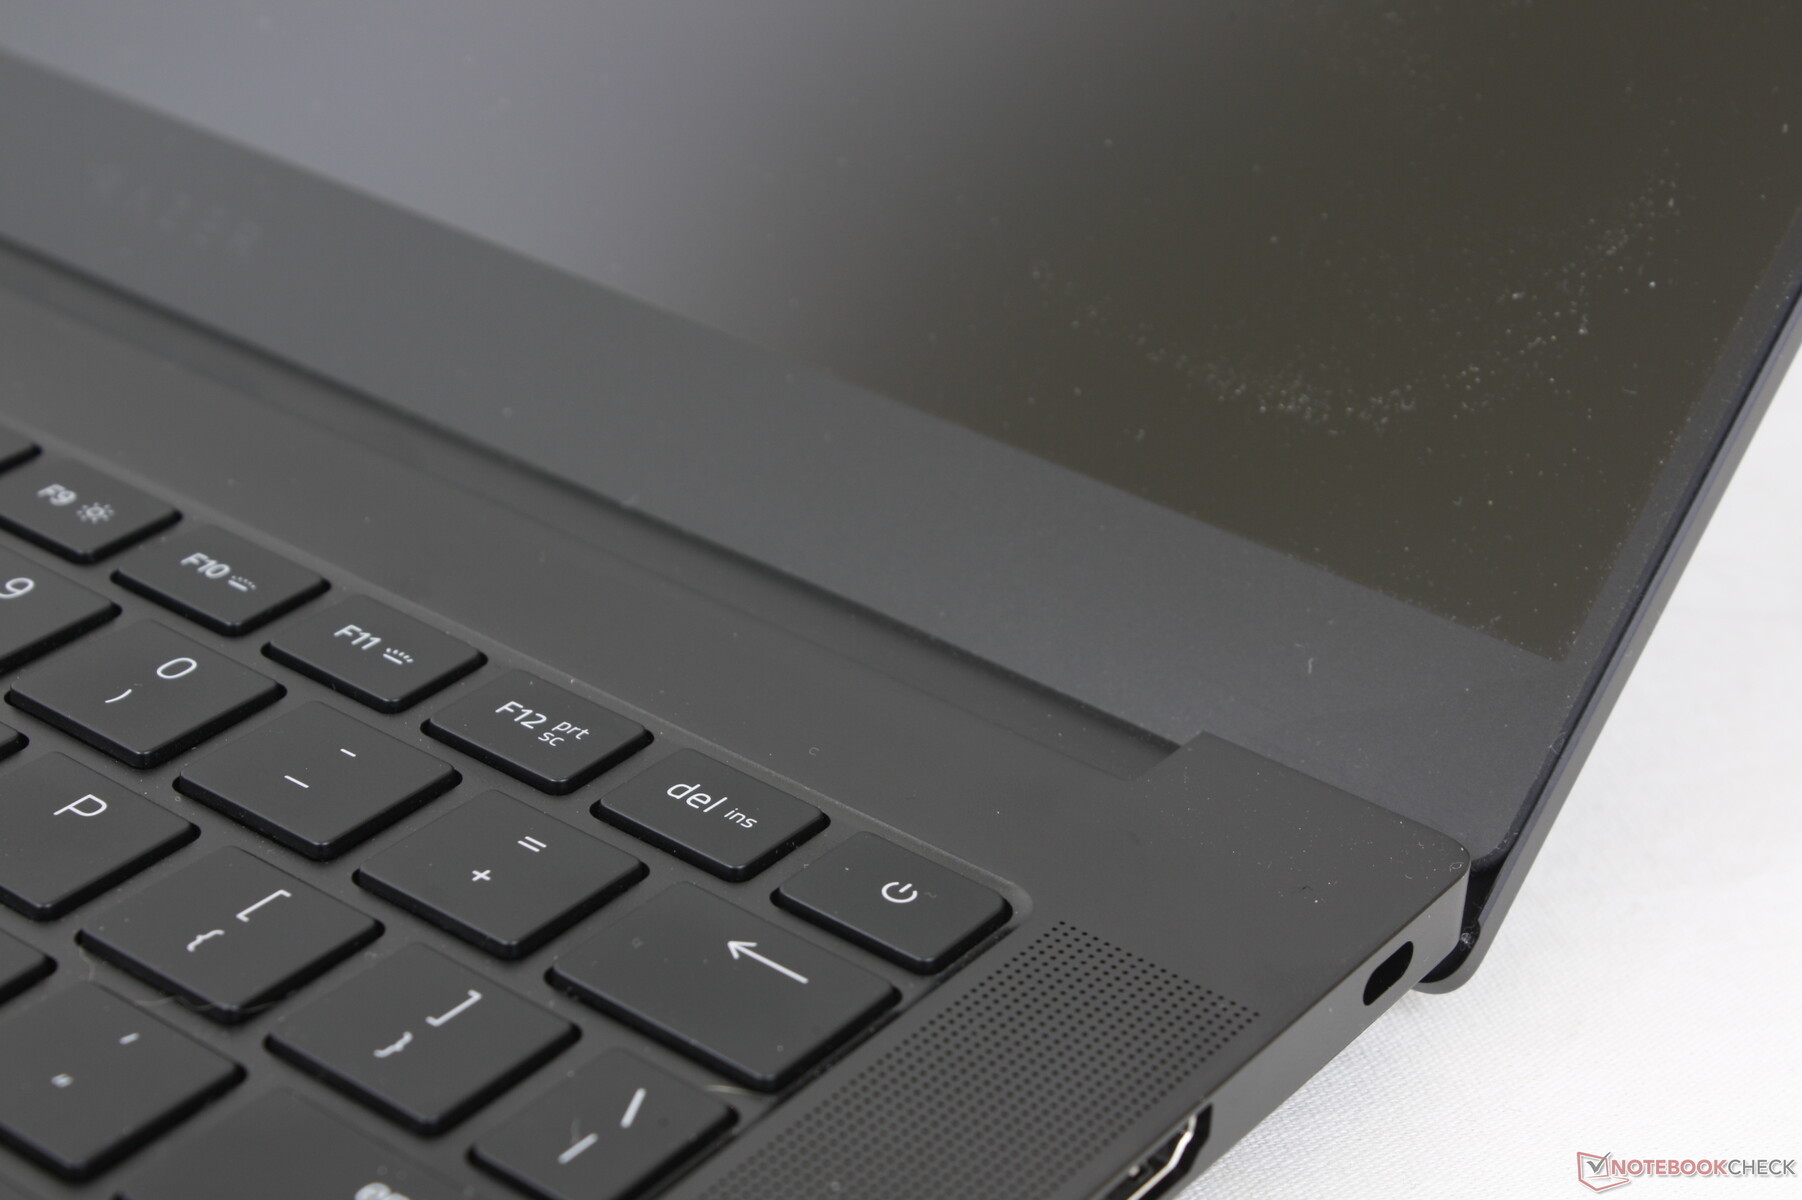
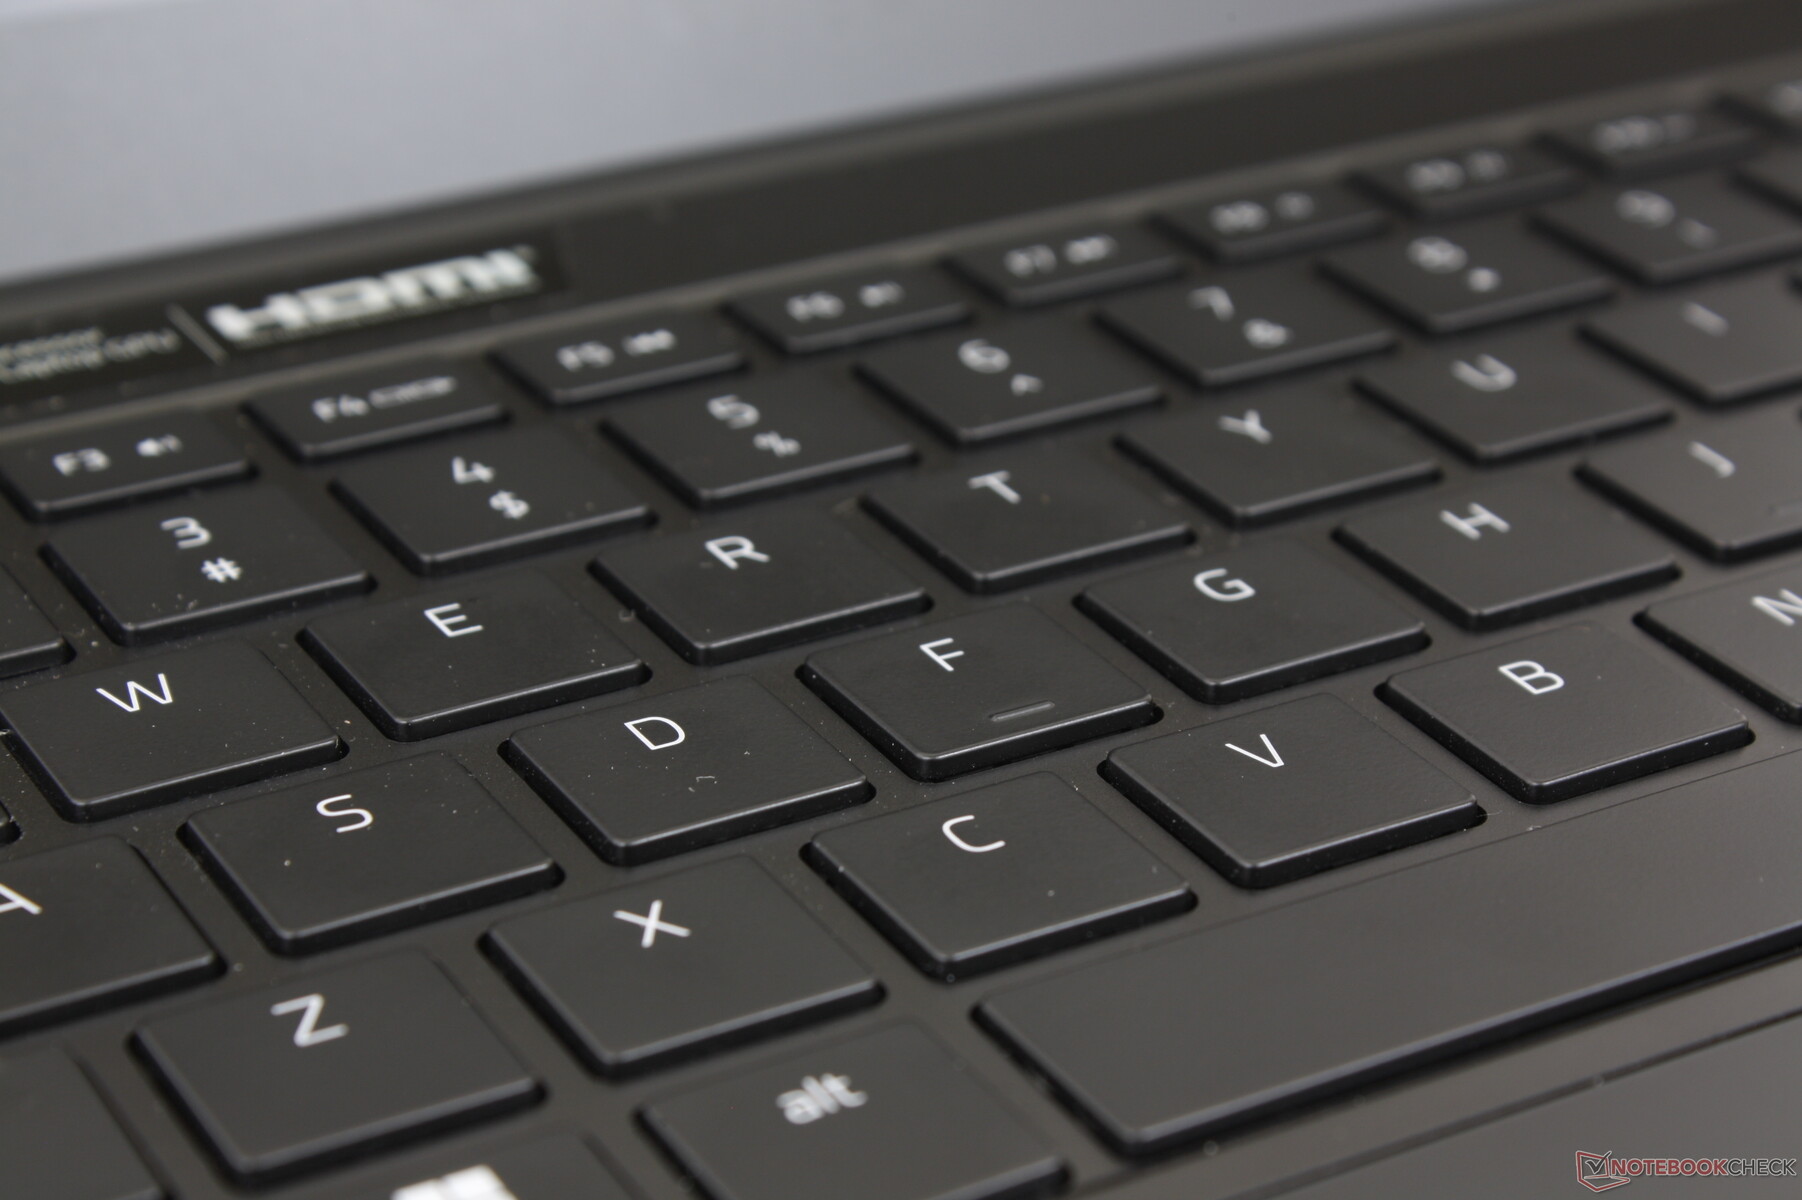
Après l'échec des commutateurs optiques sur le Blade 15 de 2019, Razer a joué la carte de la sécurité en ce qui concerne les claviers. L'expérience de frappe sur le Blade 14 est essentiellement identique à celle du Blade 18, plus grand Blade 18 jusqu'à la course courte et la rétroaction légère des touches. La plupart des joueurs préfèreront un clavier plus bruyant, mais ce n'est pas différent de la plupart des Ultrabooks comme le Lenovo Yoga ou l'Asus VivoBook. Cela dit, les touches du Zephyrus G14 sont plus fermes et plus agréables à utiliser.
Pavé tactile
Si le clavier n'a pas changé, le pavé tactile est désormais beaucoup plus spacieux (15 x 8,5 cm contre 11,1 x 7,6 cm), ce qui en fait l'un des plus grands sur un subnotebook de 14 pouces. La traction est douce et les entrées multi-touch sont particulièrement faciles à réaliser grâce à la surface plus large. Le retour d'information lors du clic reste doux et très silencieux au lieu d'être ferme et claquant.
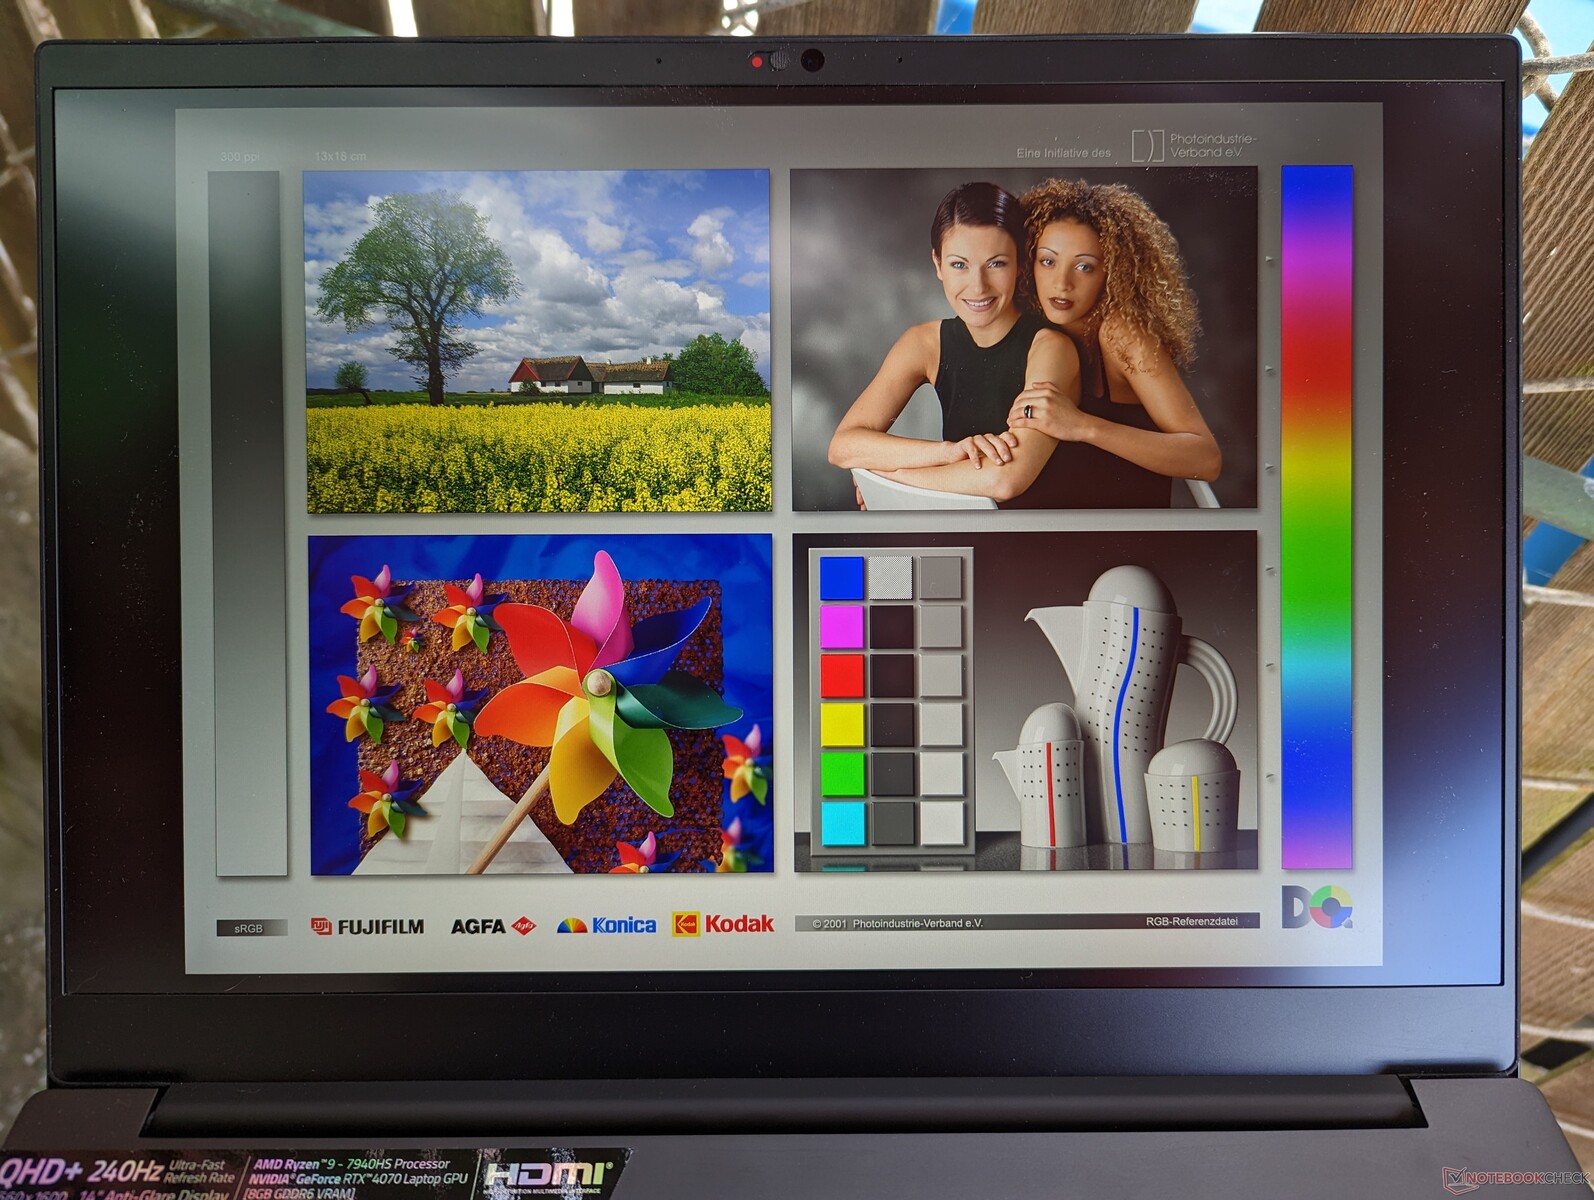
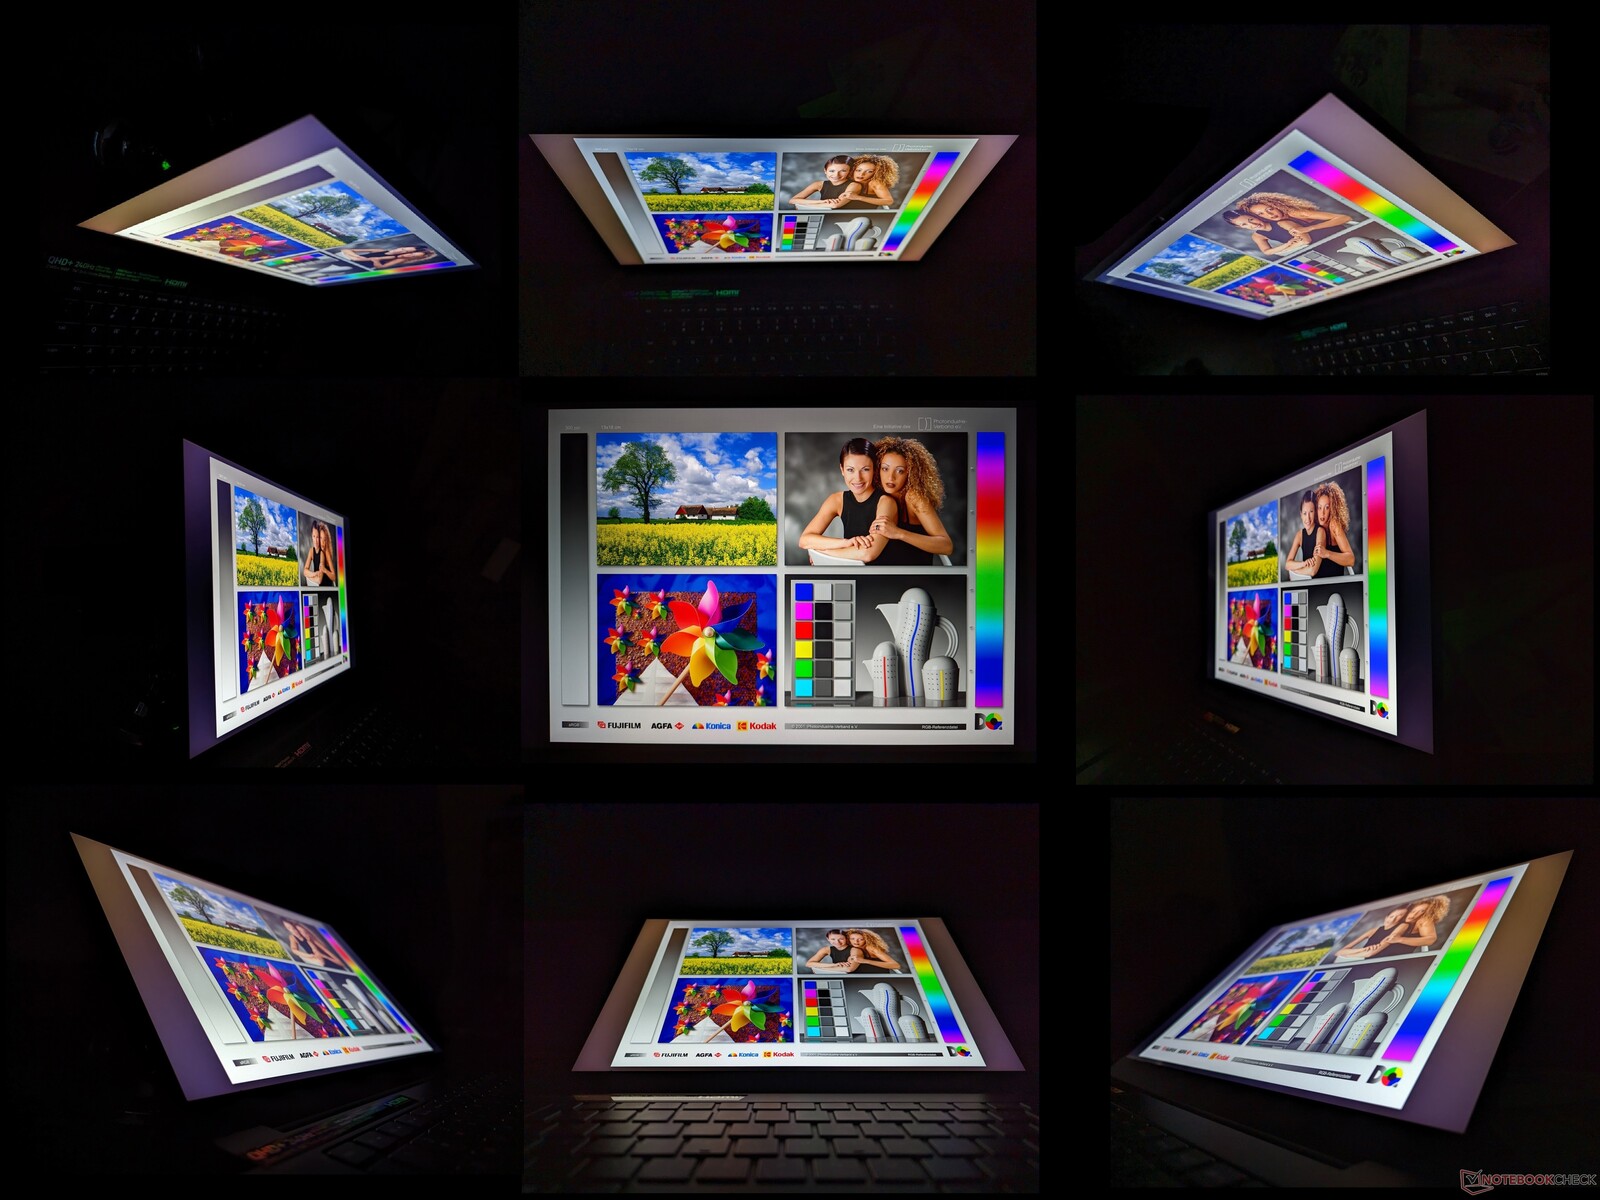
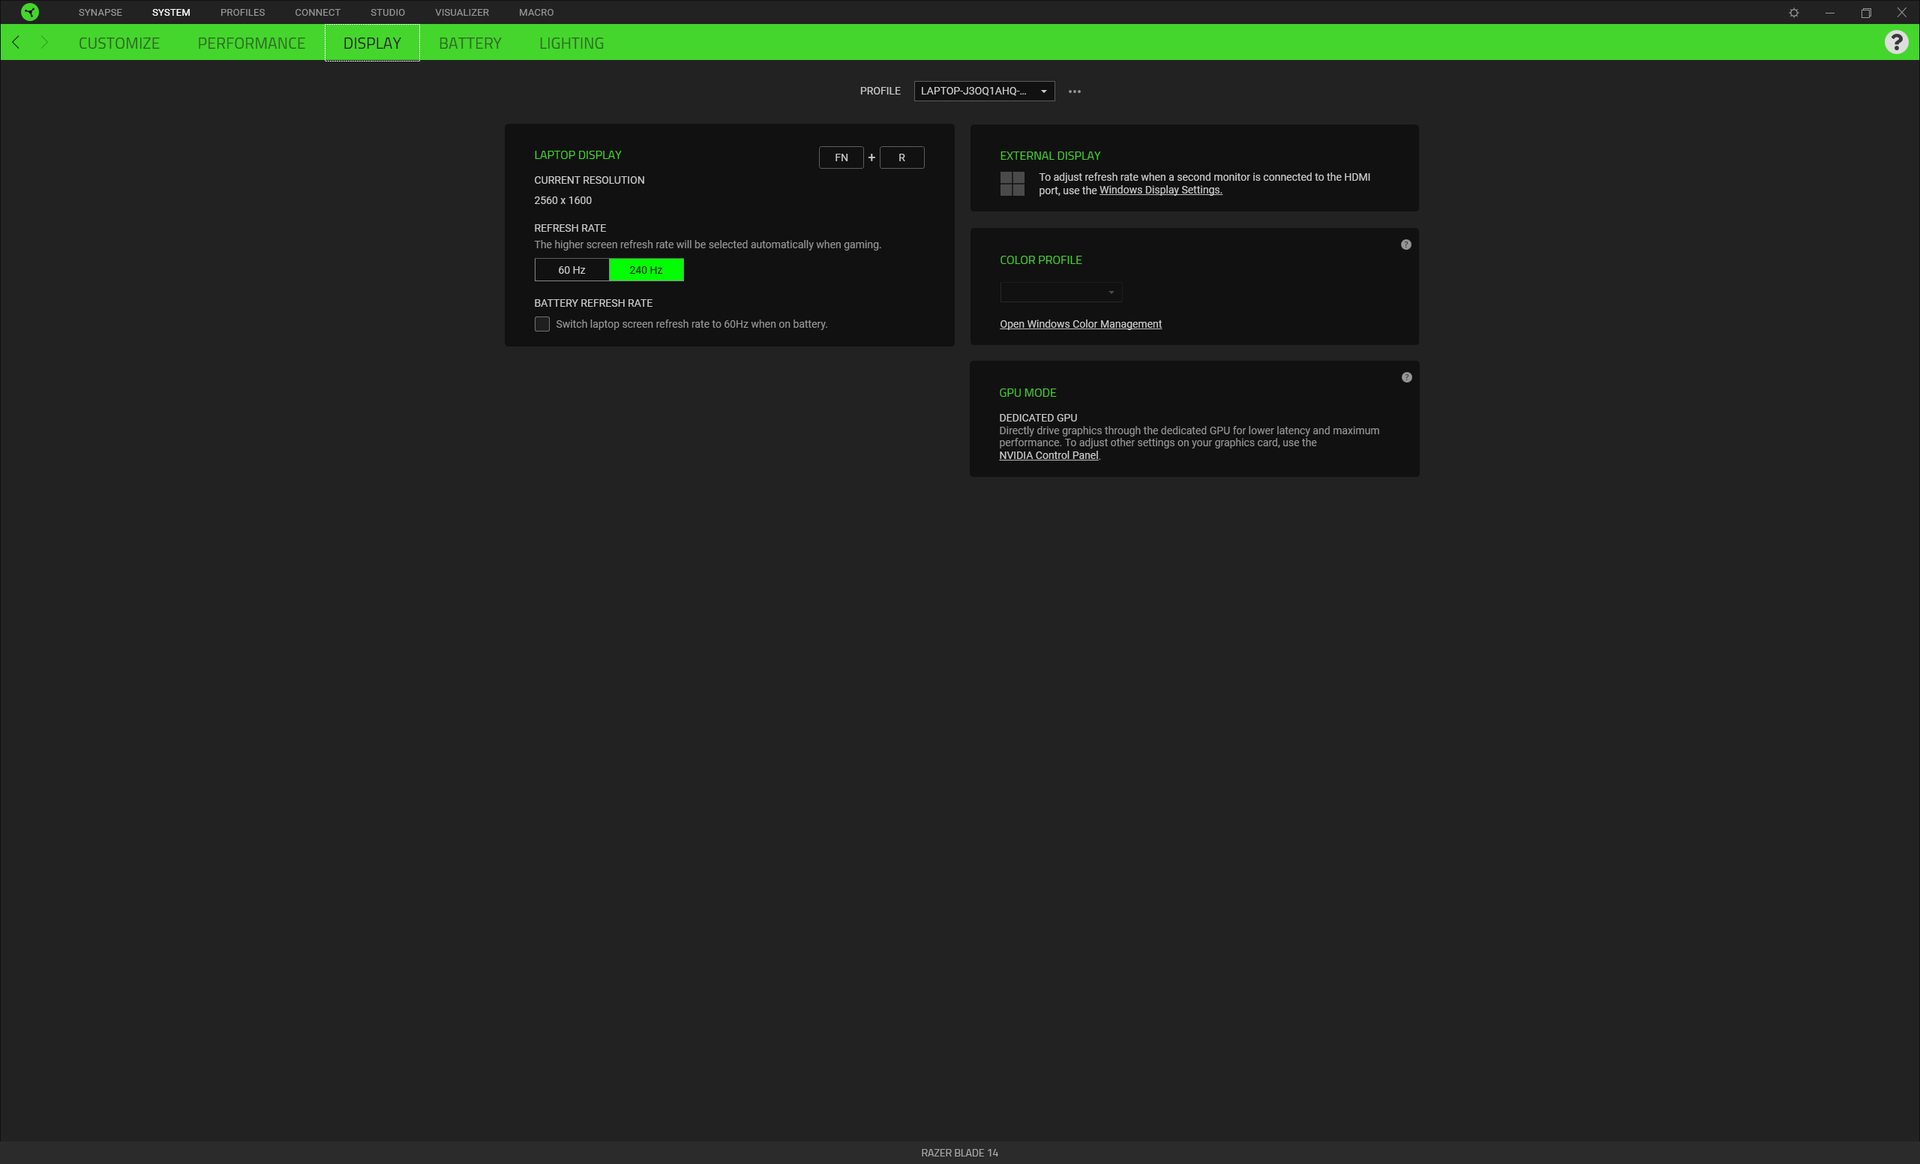
Affichage - 240 Hz, FreeSync Premium, 100% DCI-P3, 1600p
Le nouveau Blade 14 reste simple avec un écran IPS 16:10 d'AU Optronics ; les joueurs qui veulent du mini-LED ou de l'OLED devront se tourner vers le Zephyrus G14 ou l'Acer Predator 300 SE Acer Predator Triton 300 SE à la place. Comparée à la dalle 16:9 du Blade 14 de l'année dernière, la nouvelle dalle est plus lumineuse, avec un taux de rafraîchissement natif plus rapide et une résolution native plus élevée, tout en conservant des temps de réponse, des niveaux de noir, une reproduction des couleurs et un support de synchronisation adaptative via FreeSync Premium similaires. En bref, la nouvelle dalle vient s'ajouter à une dalle déjà excellente, sans aucune concession.
| |||||||||||||||||||||||||
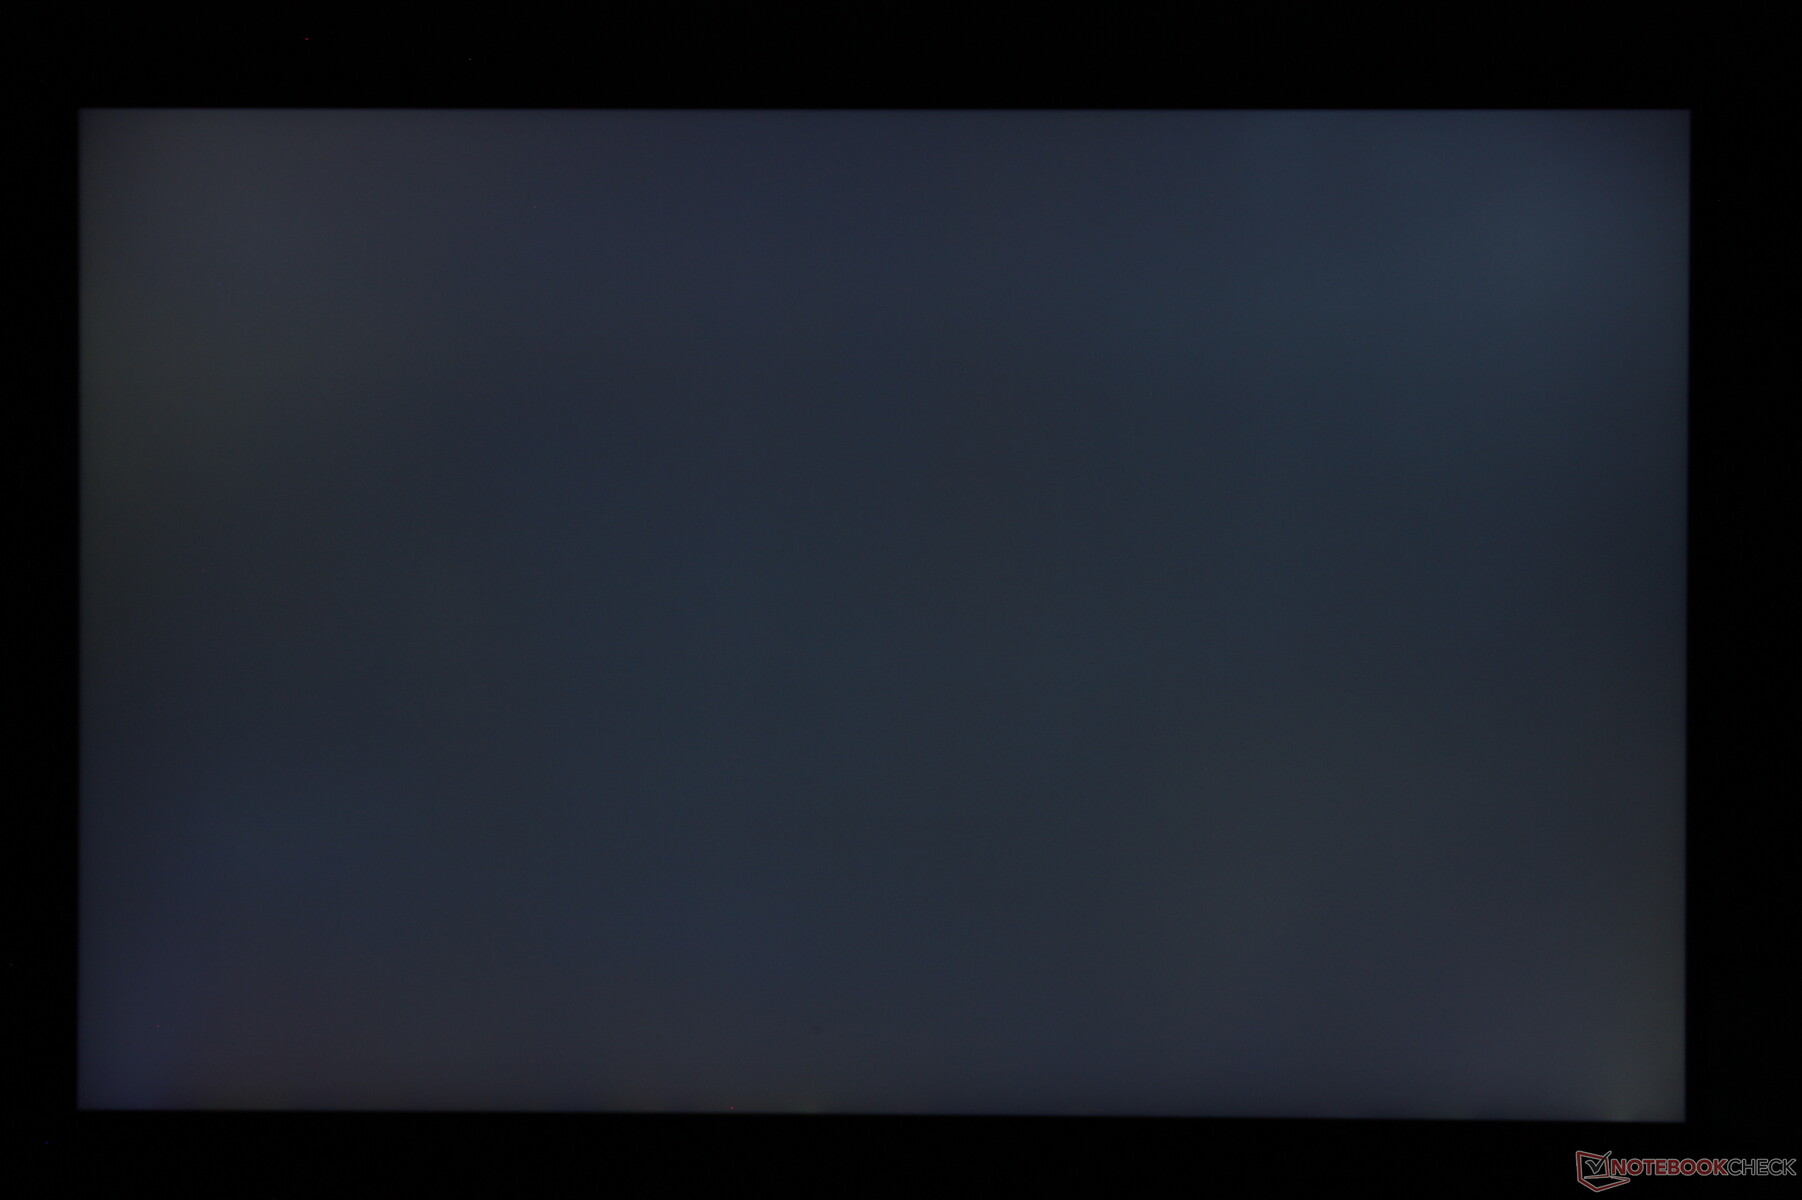
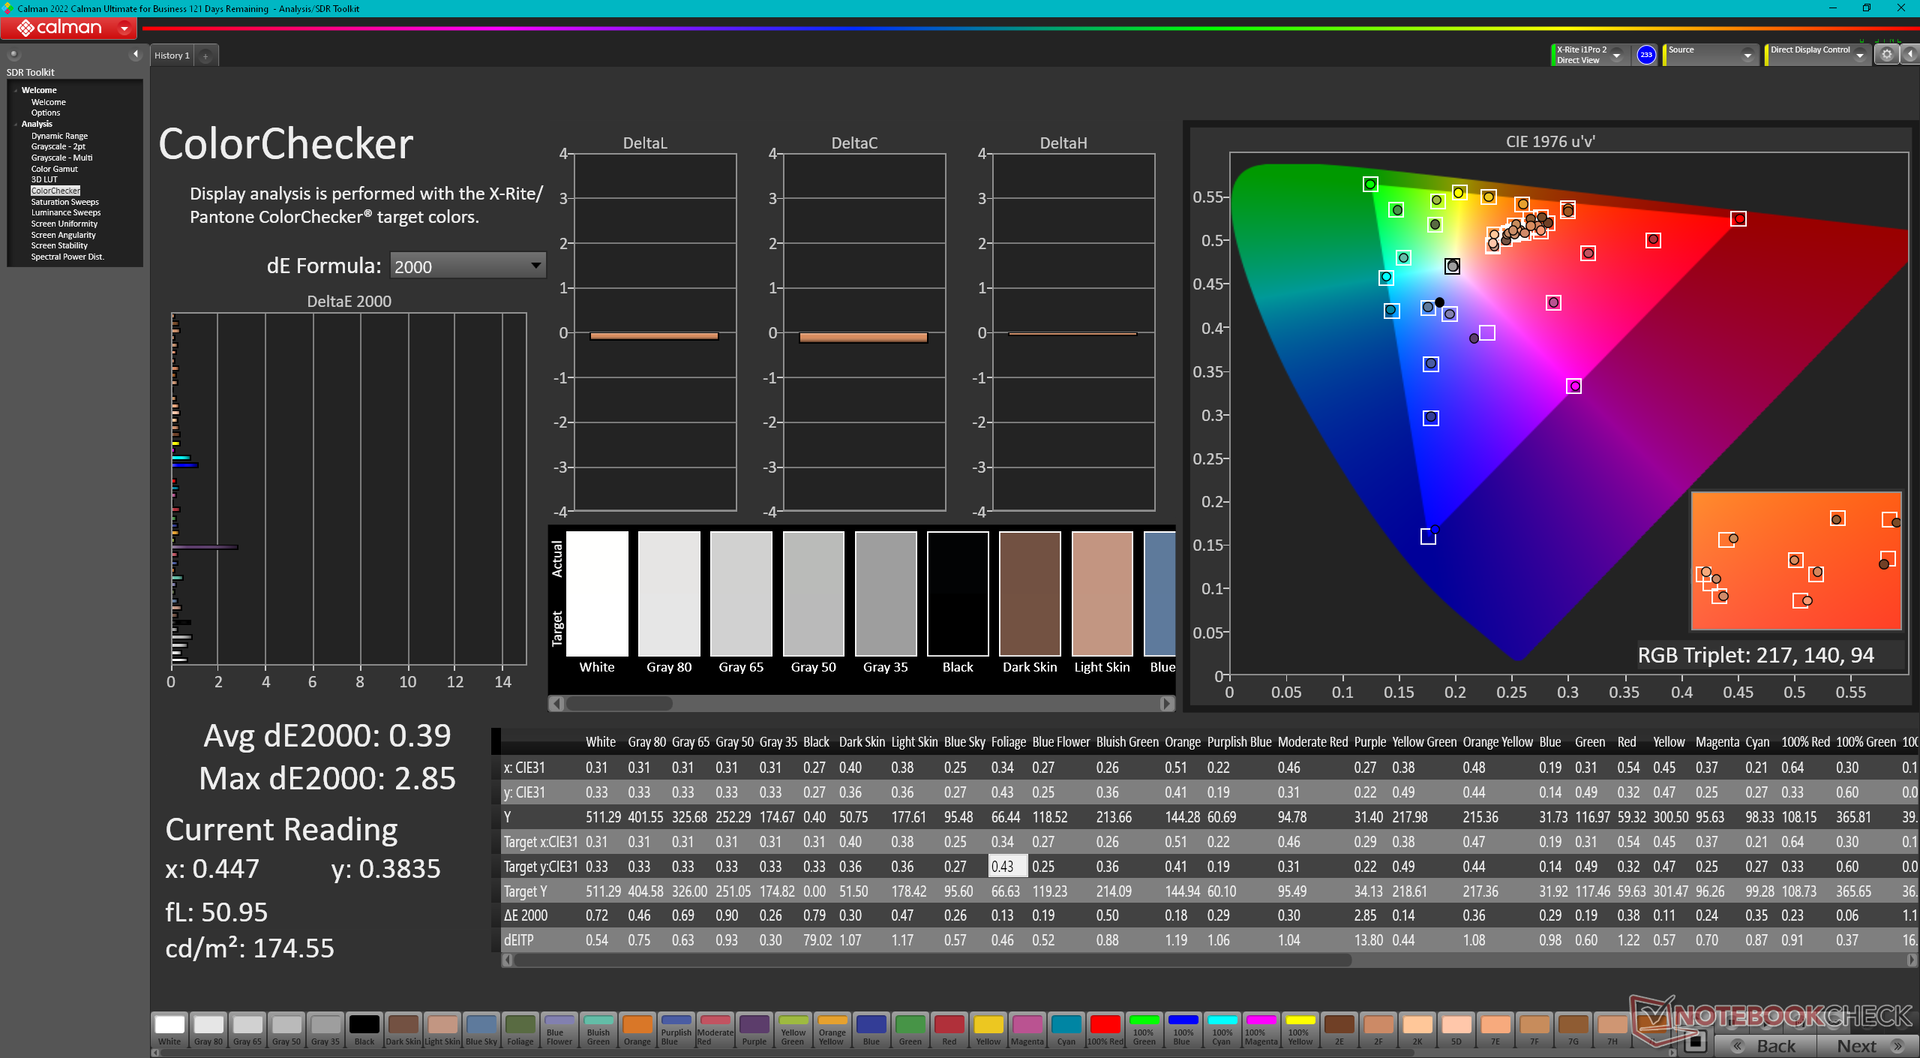
Homogénéité de la luminosité: 88 %
Valeur mesurée au centre, sur batterie: 559.3 cd/m²
Contraste: 1271:1 (Valeurs des noirs: 0.44 cd/m²)
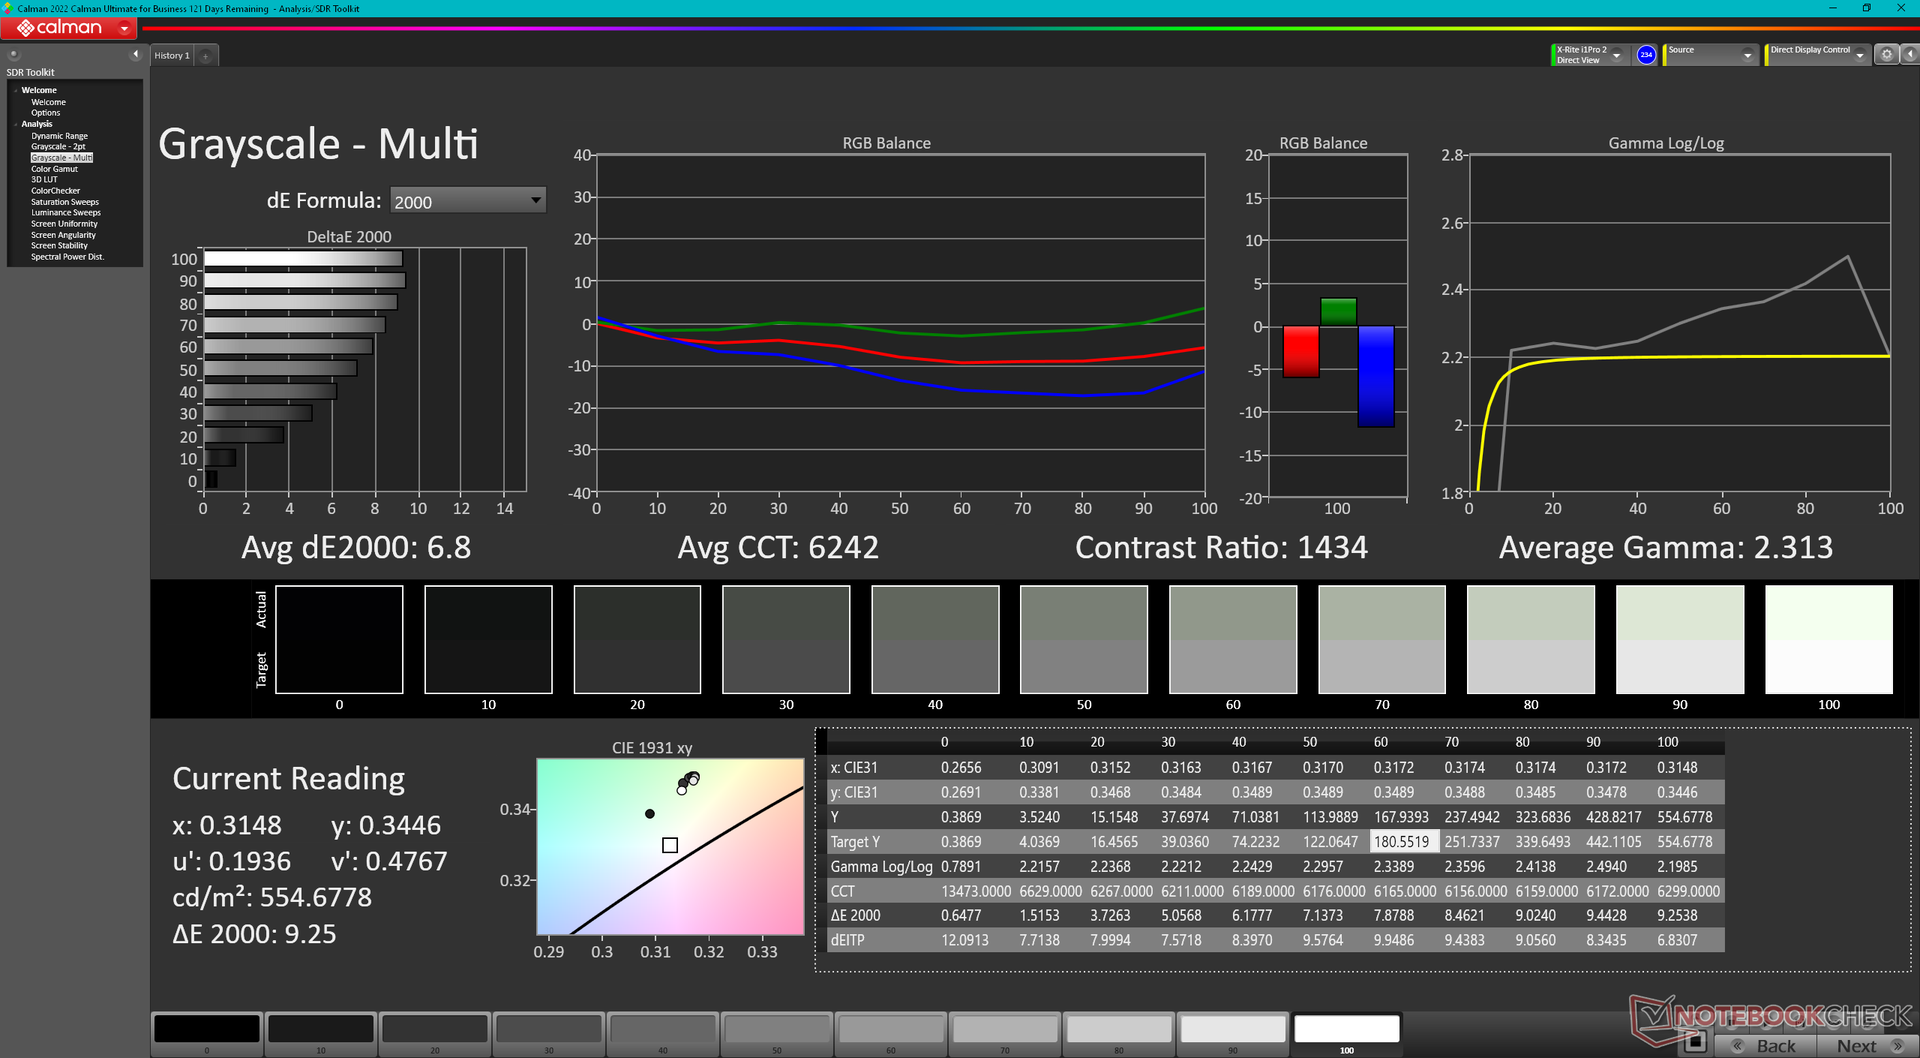
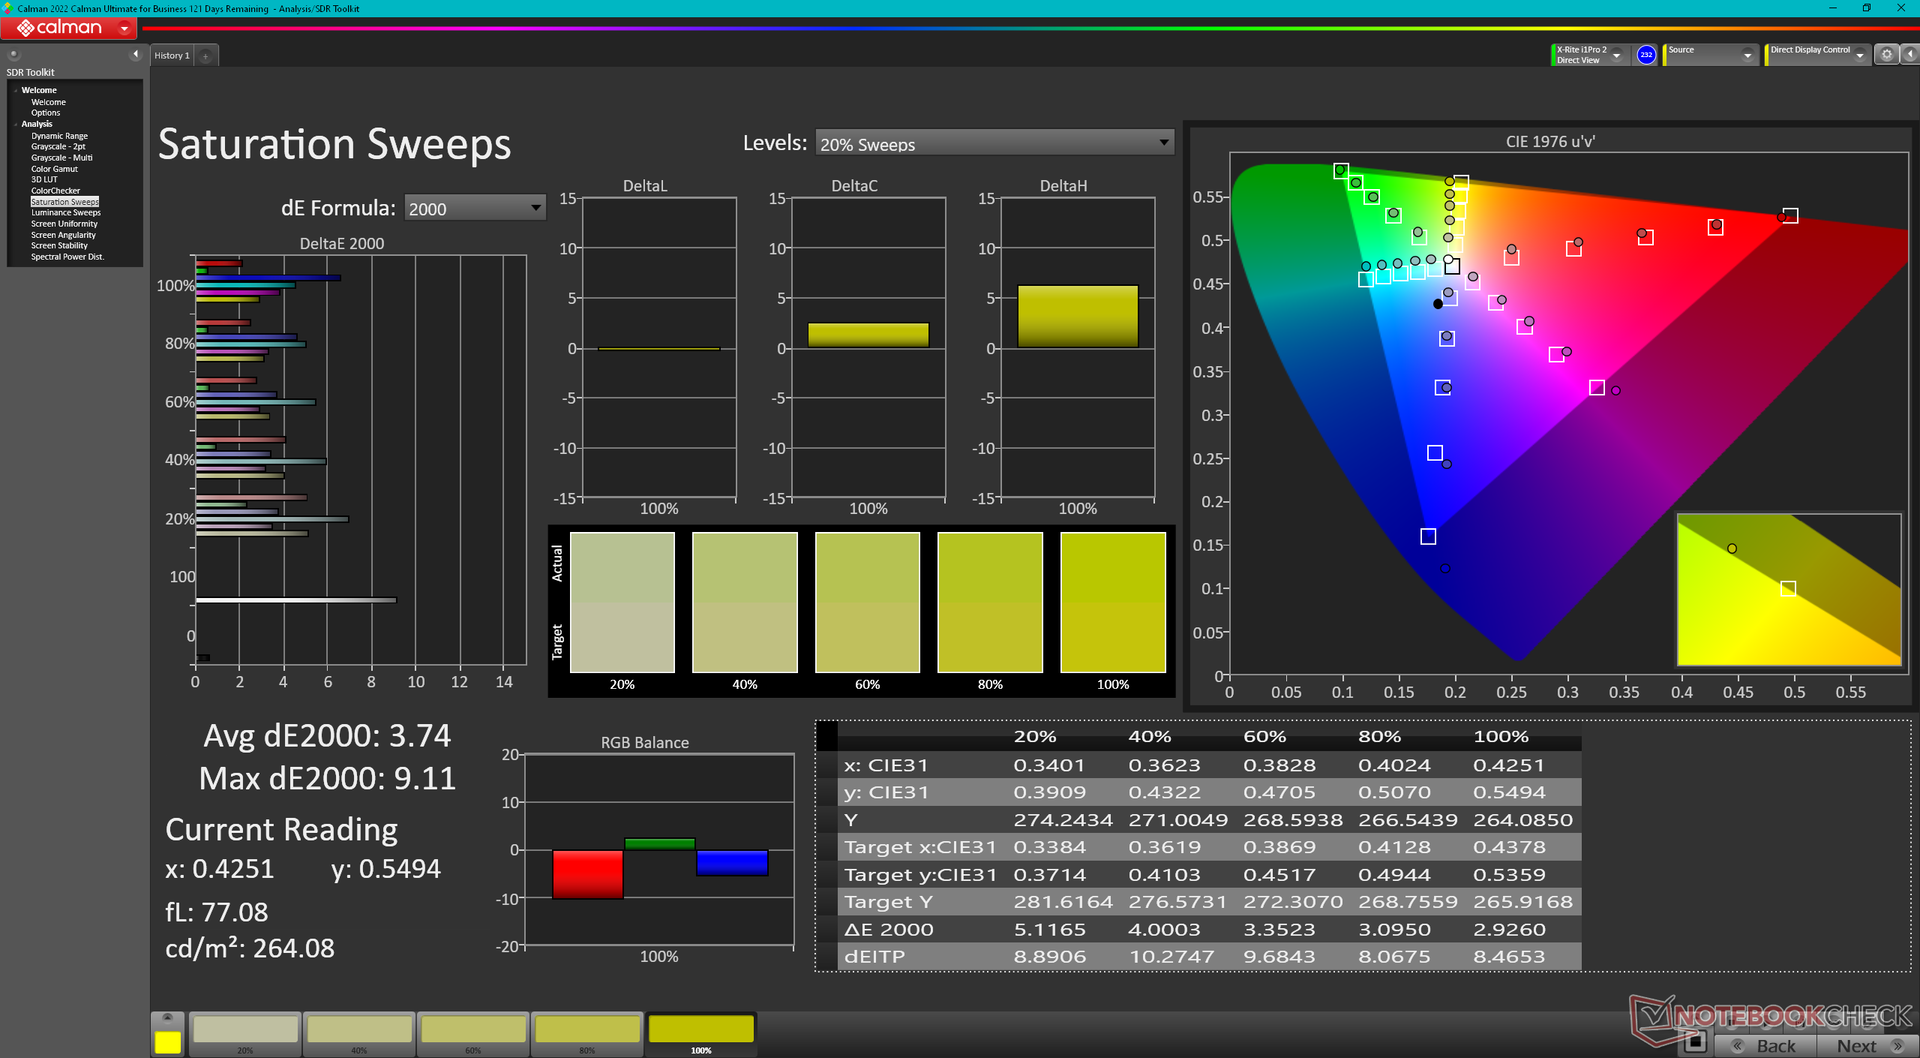
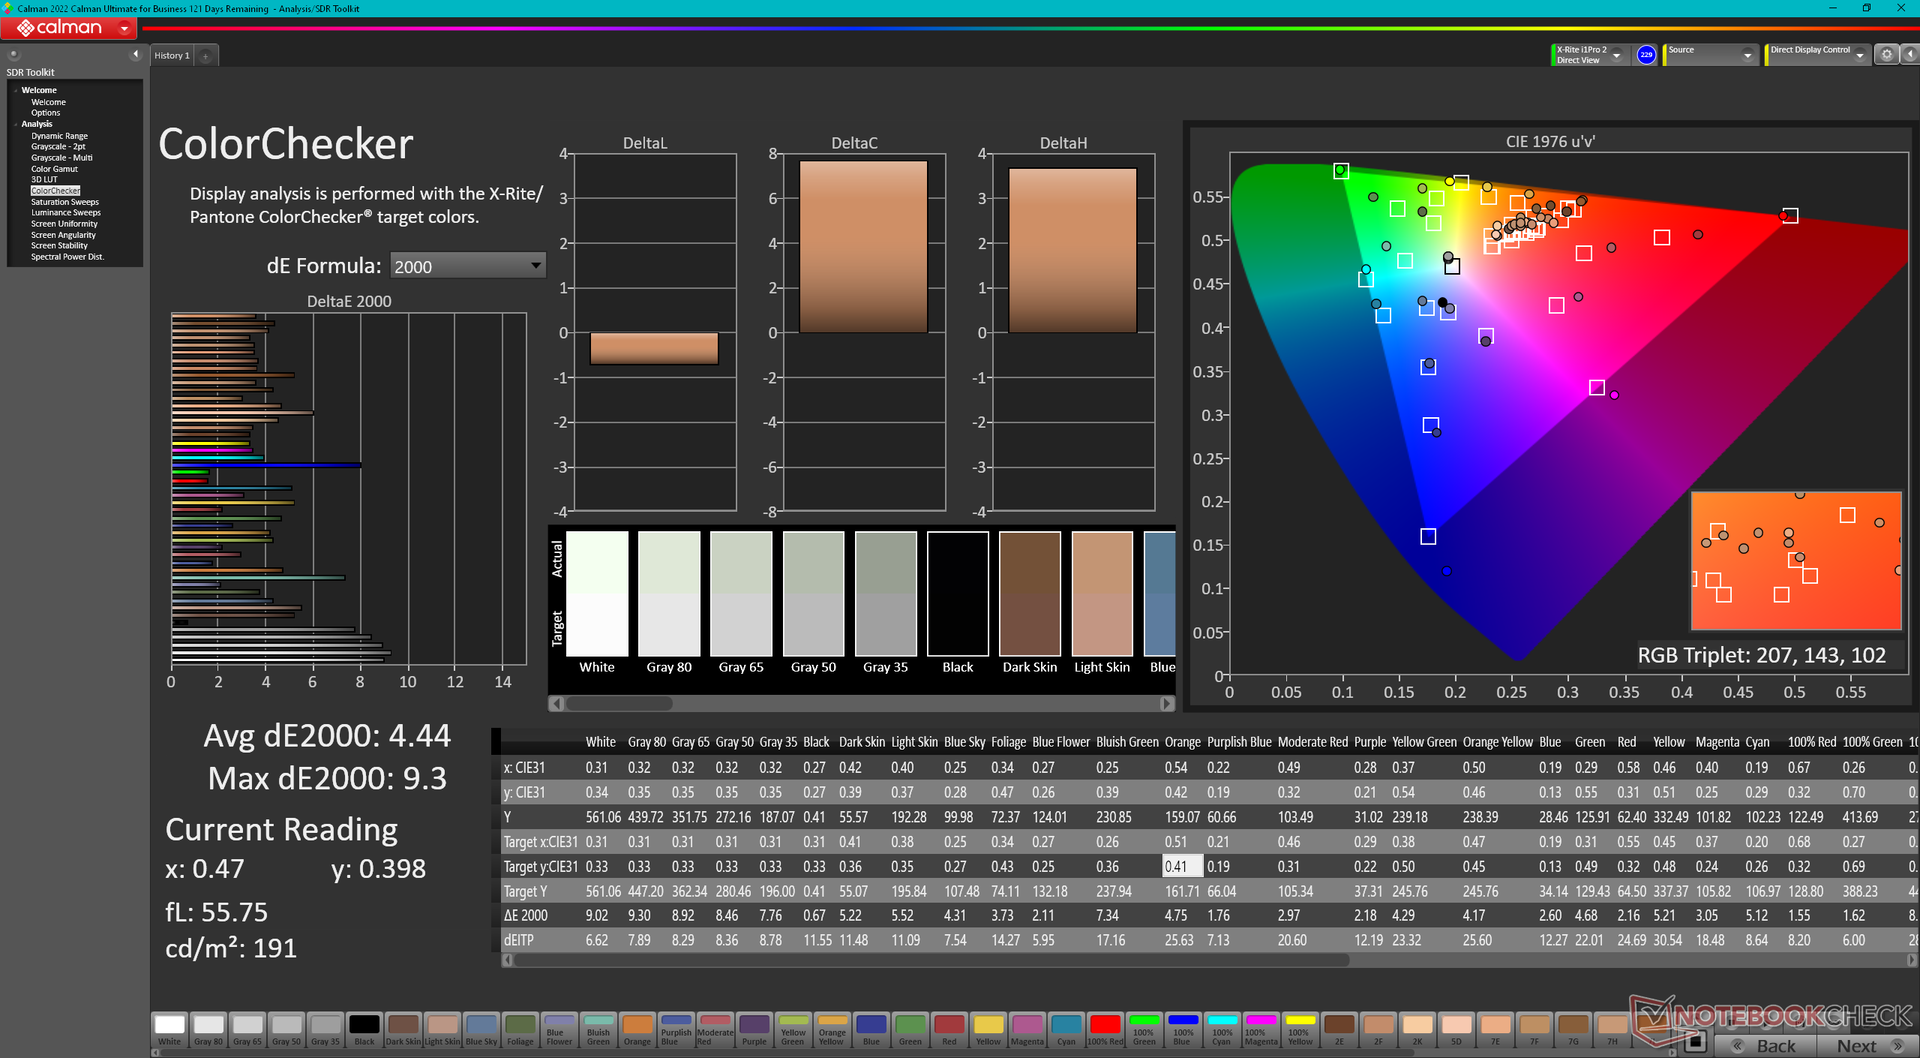
ΔE ColorChecker Calman: 4.44 | ∀{0.5-29.43 Ø4.71}
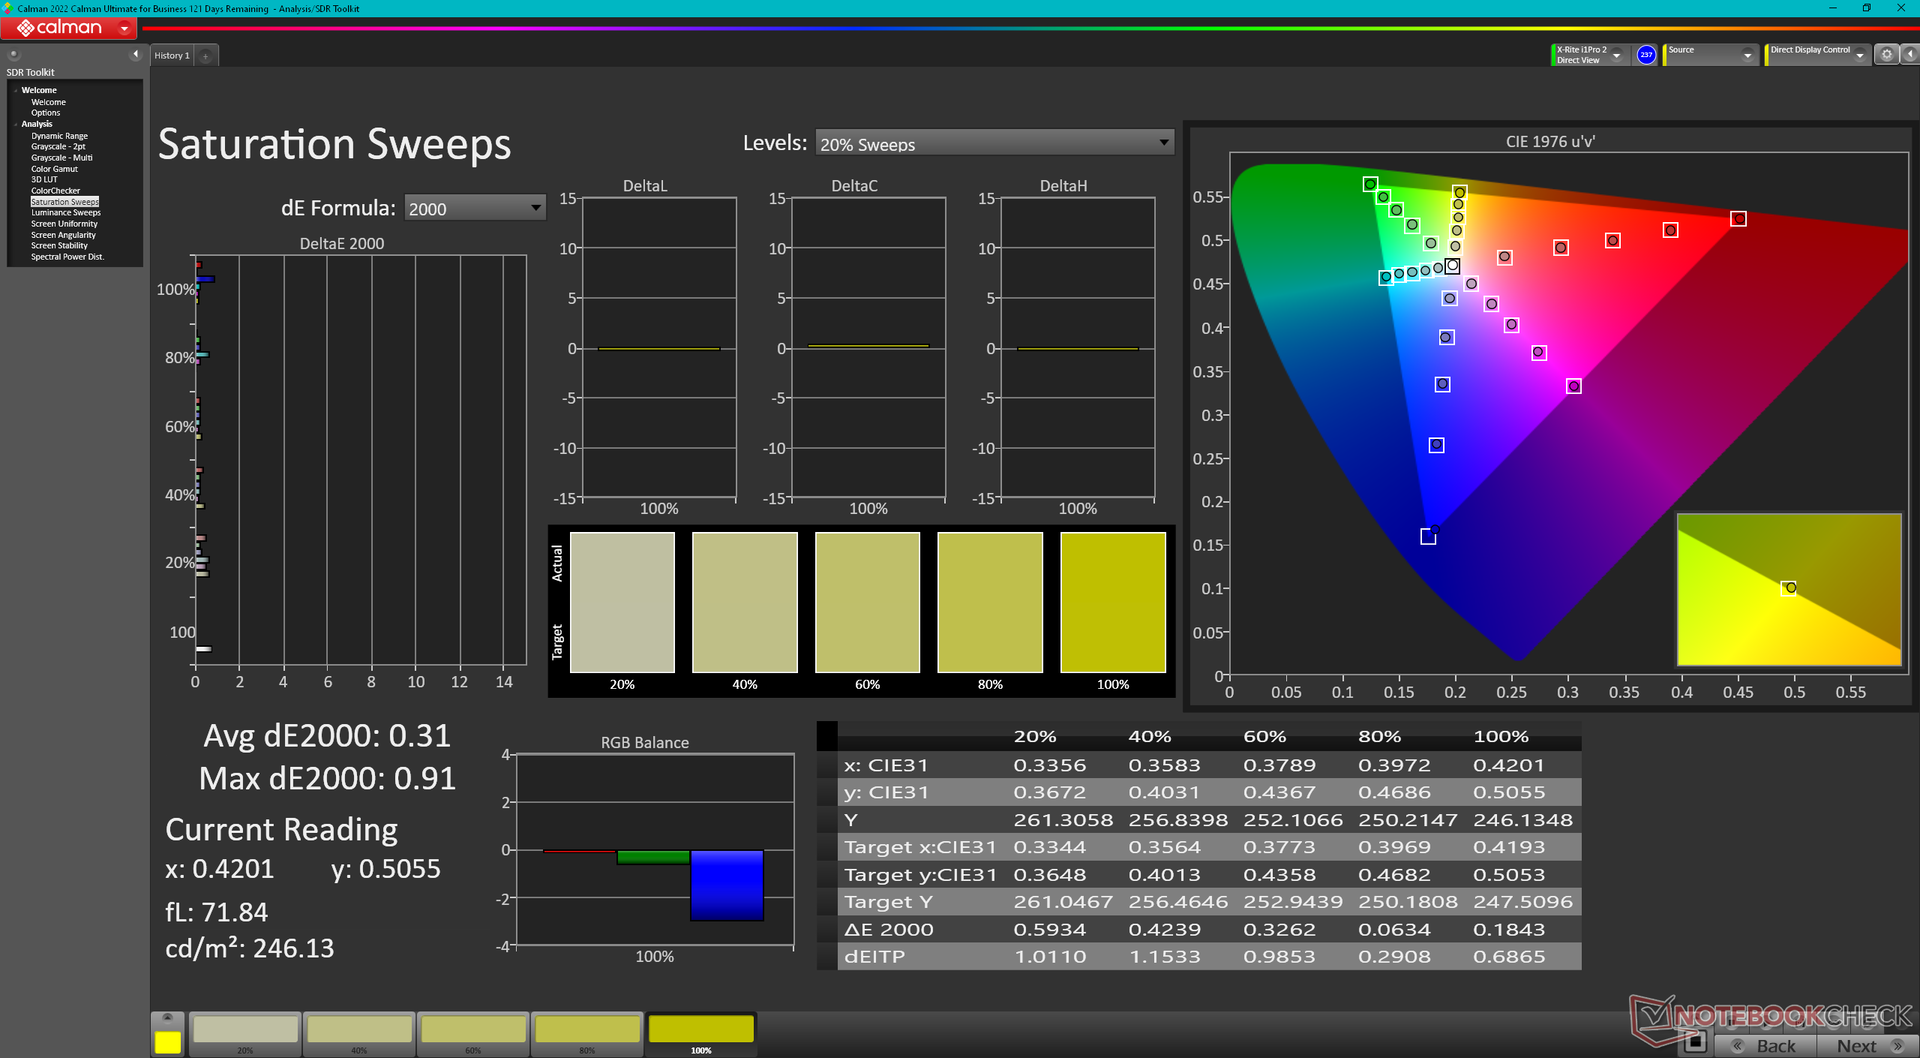
calibrated: 0.39
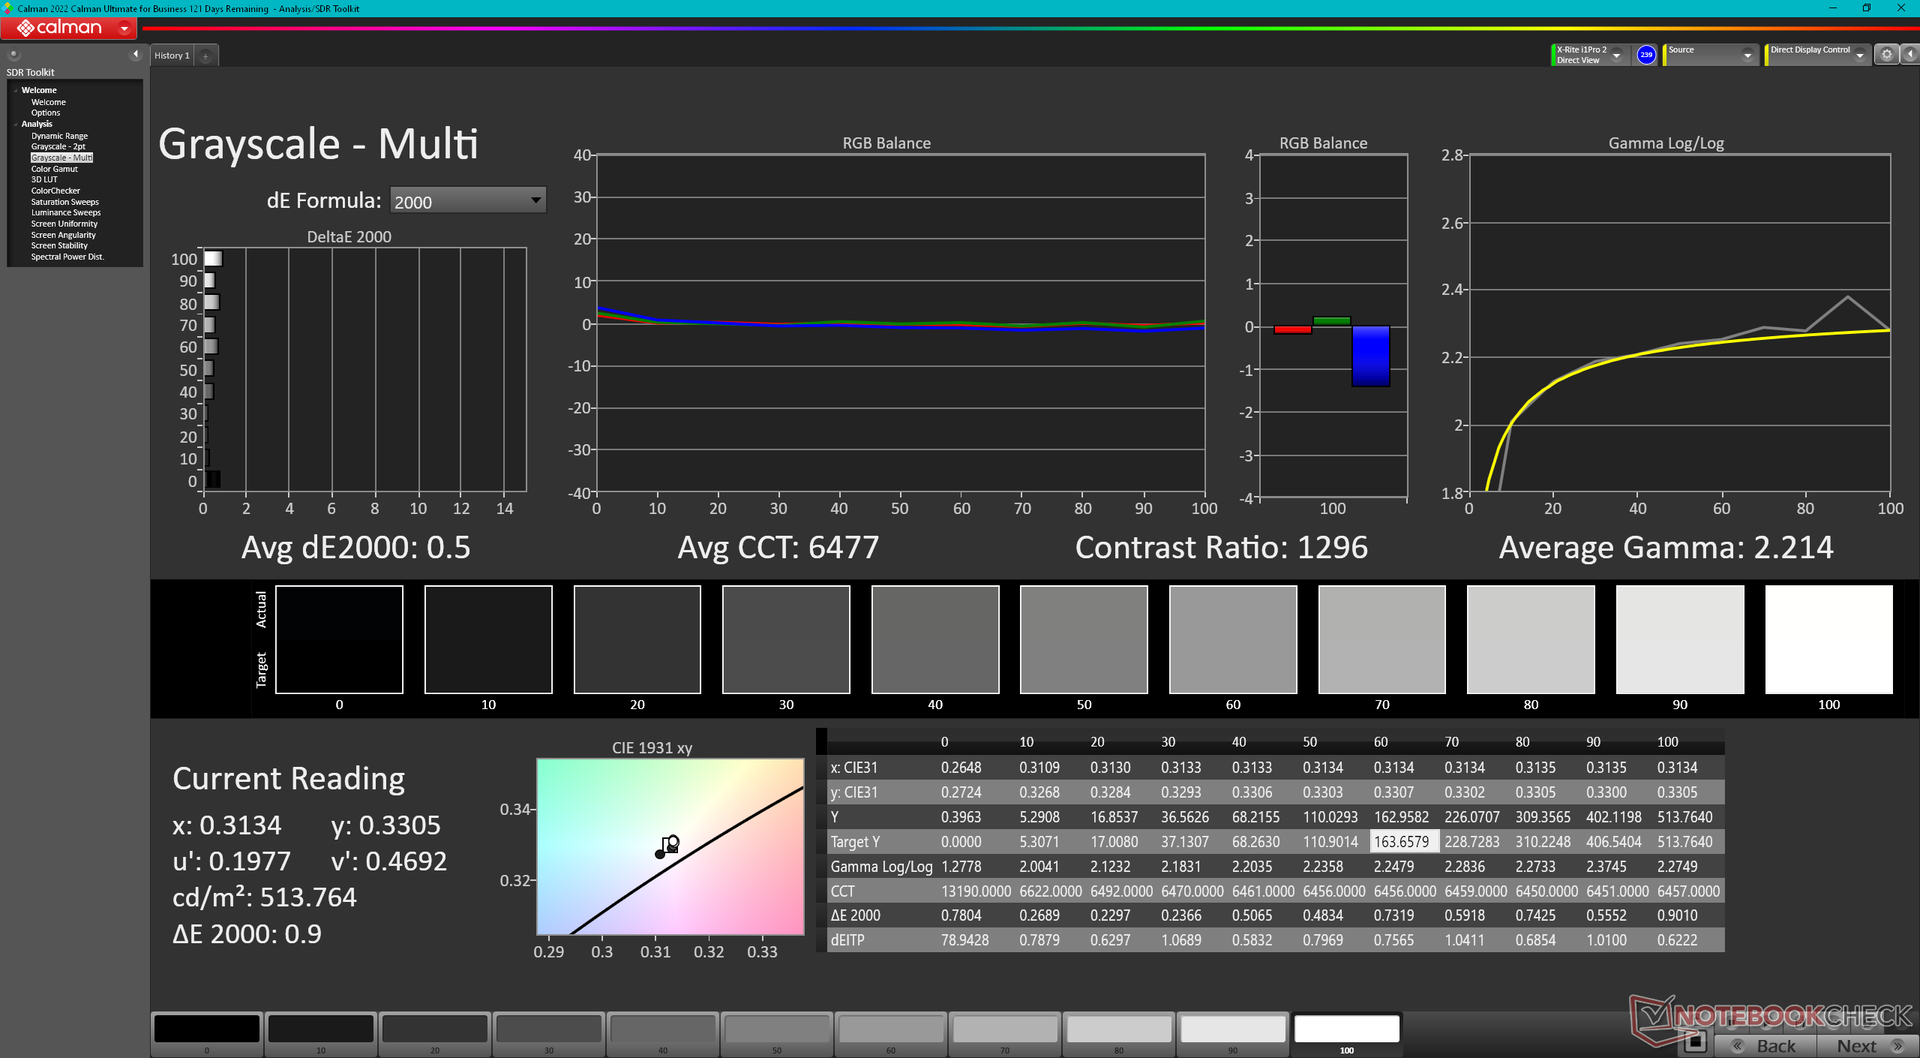
ΔE Greyscale Calman: 6.8 | ∀{0.09-98 Ø4.96}
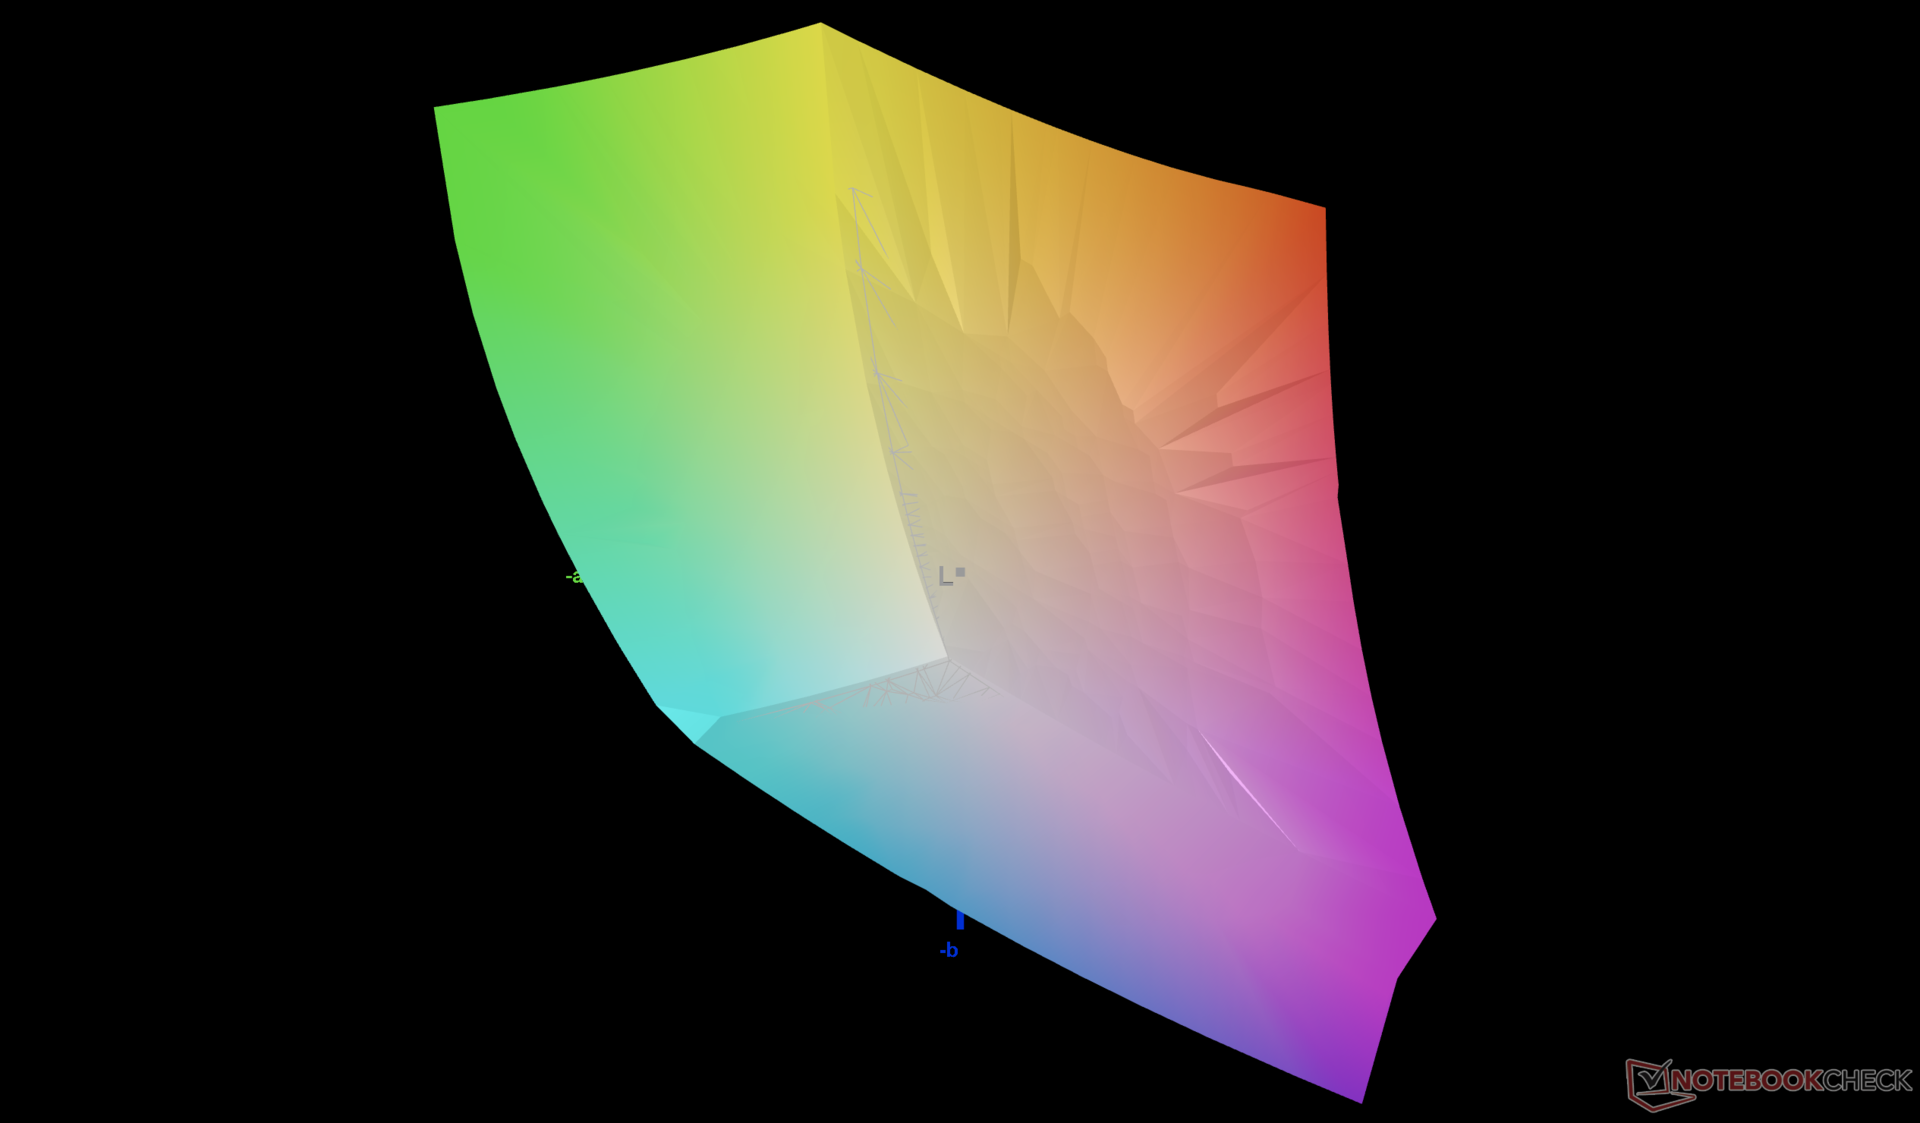
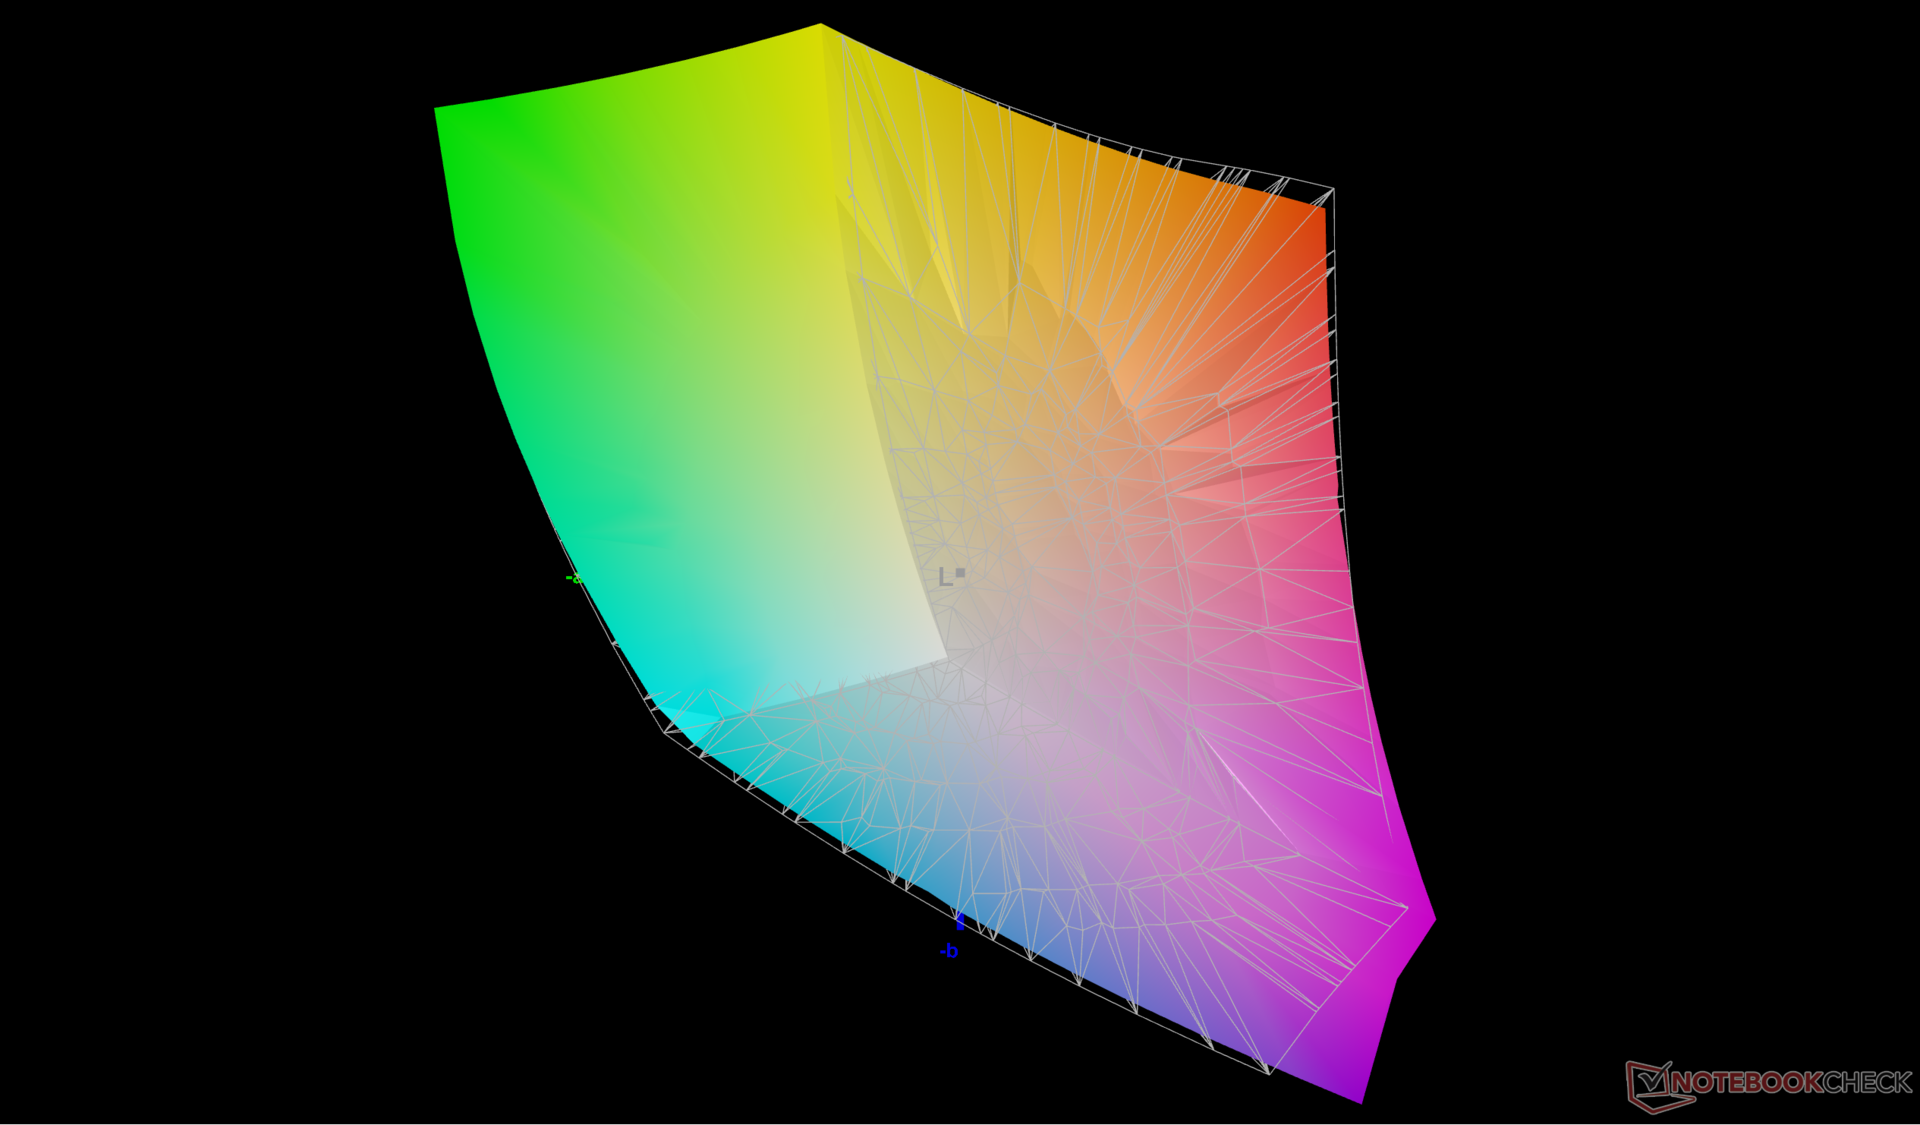
85.3% AdobeRGB 1998 (Argyll 3D)
99.8% sRGB (Argyll 3D)
97.3% Display P3 (Argyll 3D)
Gamma: 2.3
CCT: 6242 K
| Razer Blade 14 RTX 4070 AU Optronics B140QAN06.U, IPS, 2560x1600, 14" | Razer Blade 14 Ryzen 9 6900HX TL140BDXP02-0, IPS, 2560x1440, 14" | Asus ROG Zephyrus G14 GA402XY B140QAN06.S, Mini-LED, 2560x1600, 14" | Acer Predator Triton 300 SE Samsung ATNA40YK07-0, OLED, 2880x1800, 14" | Alienware x14 i7 RTX 3060 SHP154D, IPS, 1920x1080, 14" | Lenovo Yoga Pro 7 14IRH G8 LEN145-3K, IPS, 3072x1920, 14.5" | |
|---|---|---|---|---|---|---|
| Display | 0% | 4% | 6% | 2% | 1% | |
| Display P3 Coverage (%) | 97.3 | 97.2 0% | 99.6 2% | 99.9 3% | 99.6 2% | 98.7 1% |
| sRGB Coverage (%) | 99.8 | 99.9 0% | 100 0% | 100 0% | 100 0% | 100 0% |
| AdobeRGB 1998 Coverage (%) | 85.3 | 85.7 0% | 93.4 9% | 99 16% | 87.6 3% | 87.6 3% |
| Response Times | -66% | -35% | 86% | 12% | -132% | |
| Response Time Grey 50% / Grey 80% * (ms) | 11.9 ? | 16.8 ? -41% | 17.2 ? -45% | 1.36 ? 89% | 9.6 ? 19% | 31.5 ? -165% |
| Response Time Black / White * (ms) | 8 ? | 15.2 ? -90% | 9.9 ? -24% | 1.36 ? 83% | 7.6 ? 5% | 15.8 ? -98% |
| PWM Frequency (Hz) | 5430 | 367.6 ? | ||||
| Screen | 14% | 37% | 8% | 4% | 22% | |
| Brightness middle (cd/m²) | 559.3 | 354 -37% | 535 -4% | 414.3 -26% | 434 -22% | 441 -21% |
| Brightness (cd/m²) | 560 | 328 -41% | 563 1% | 416 -26% | 411 -27% | 453 -19% |
| Brightness Distribution (%) | 88 | 86 -2% | 91 3% | 99 13% | 89 1% | 92 5% |
| Black Level * (cd/m²) | 0.44 | 0.37 16% | 0.25 43% | 0.34 23% | ||
| Contrast (:1) | 1271 | 957 -25% | 1736 37% | 1297 2% | ||
| Colorchecker dE 2000 * | 4.44 | 1.66 63% | 1 77% | 4.68 -5% | 3 32% | 0.6 86% |
| Colorchecker dE 2000 max. * | 9.3 | 3.83 59% | 2.8 70% | 7.78 16% | 7.1 24% | 1.3 86% |
| Colorchecker dE 2000 calibrated * | 0.39 | 0.7 -79% | 0.6 -54% | |||
| Greyscale dE 2000 * | 6.8 | 1.6 76% | 1.8 74% | 1.8 74% | 5.1 25% | 0.8 88% |
| Gamma | 2.3 96% | 2.23 99% | 2.24 98% | 2.22 99% | 2.19 100% | 2.2 100% |
| CCT | 6242 104% | 6542 99% | 6337 103% | 6207 105% | 6204 105% | 6597 99% |
| Moyenne finale (programmes/paramètres) | -17% /
-2% | 2% /
15% | 33% /
22% | 6% /
5% | -36% /
-5% |
* ... Moindre est la valeur, meilleures sont les performances
L'écran n'est pas calibré dès sa sortie de l'emballage, malgré ses couleurs P3 étendues. La température des couleurs est trop chaude, tandis que les valeurs moyennes de l'échelle de gris et du deltaE des couleurs sont plus élevées que prévu, à savoir 6,8 et 4,44, respectivement. Un étalonnage avec notre colorimètre X-Rite permet de résoudre ces problèmes et de mieux exploiter les couleurs profondes de l'écran.
Temps de réponse de l'écran
| ↔ Temps de réponse noir à blanc | ||
|---|---|---|
| 8 ms ... hausse ↗ et chute ↘ combinées | ↗ 4 ms hausse | 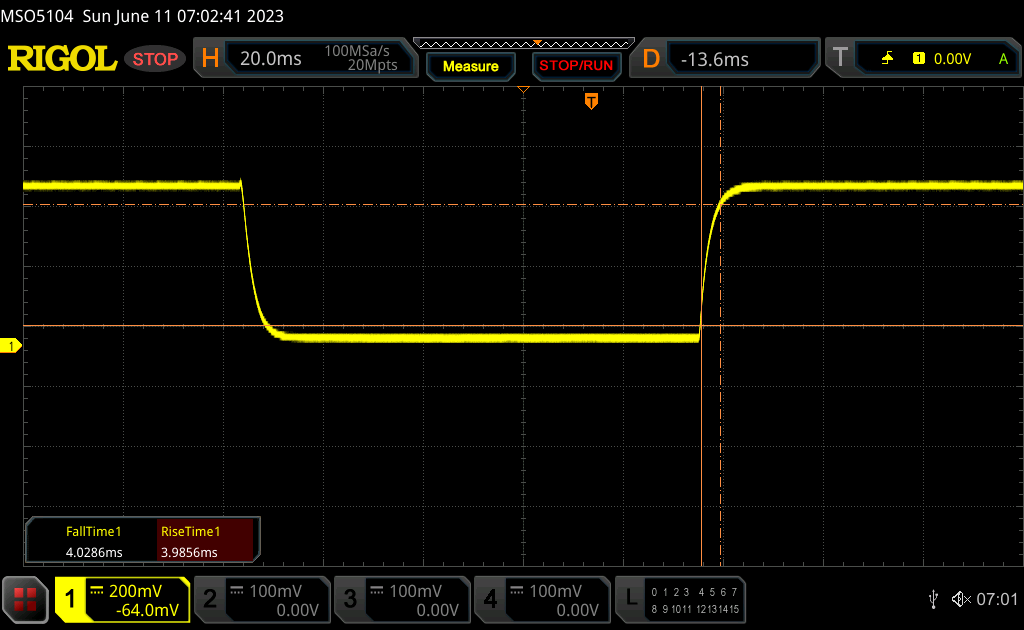 |
| ↘ 4 ms chute | ||
| L'écran montre de faibles temps de réponse, un bon écran pour jouer. En comparaison, tous les appareils testés affichent entre 0.1 (minimum) et 240 (maximum) ms. » 22 % des appareils testés affichent de meilleures performances. Cela signifie que les latences relevées sont meilleures que la moyenne (19.8 ms) de tous les appareils testés. | ||
| ↔ Temps de réponse gris 50% à gris 80% | ||
| 11.9 ms ... hausse ↗ et chute ↘ combinées | ↗ 5.6 ms hausse | 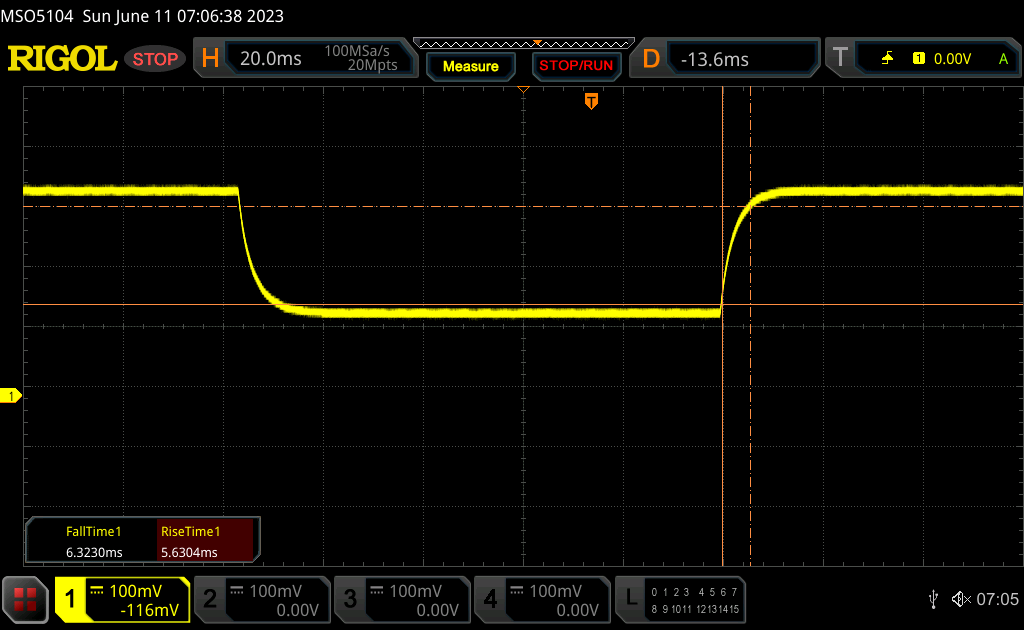 |
| ↘ 6.3 ms chute | ||
| L'écran montre de bons temps de réponse, mais insuffisant pour du jeu compétitif. En comparaison, tous les appareils testés affichent entre 0.165 (minimum) et 636 (maximum) ms. » 25 % des appareils testés affichent de meilleures performances. Cela signifie que les latences relevées sont meilleures que la moyenne (31 ms) de tous les appareils testés. | ||
Scintillement / MLI (Modulation de largeur d'impulsion)
| Scintillement / MLI (Modulation de largeur d'impulsion) non décelé | 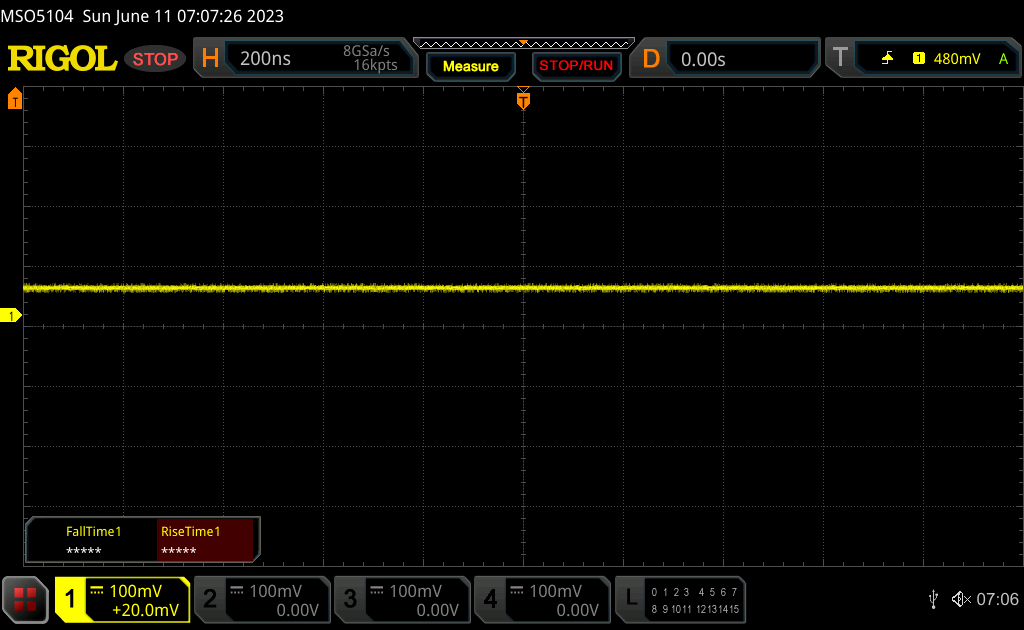 | ||
En comparaison, 52 % des appareils testés n'emploient pas MDI pour assombrir leur écran. Nous avons relevé une moyenne à 7754 (minimum : 5 - maximum : 343500) Hz dans le cas où une MDI était active. | |||
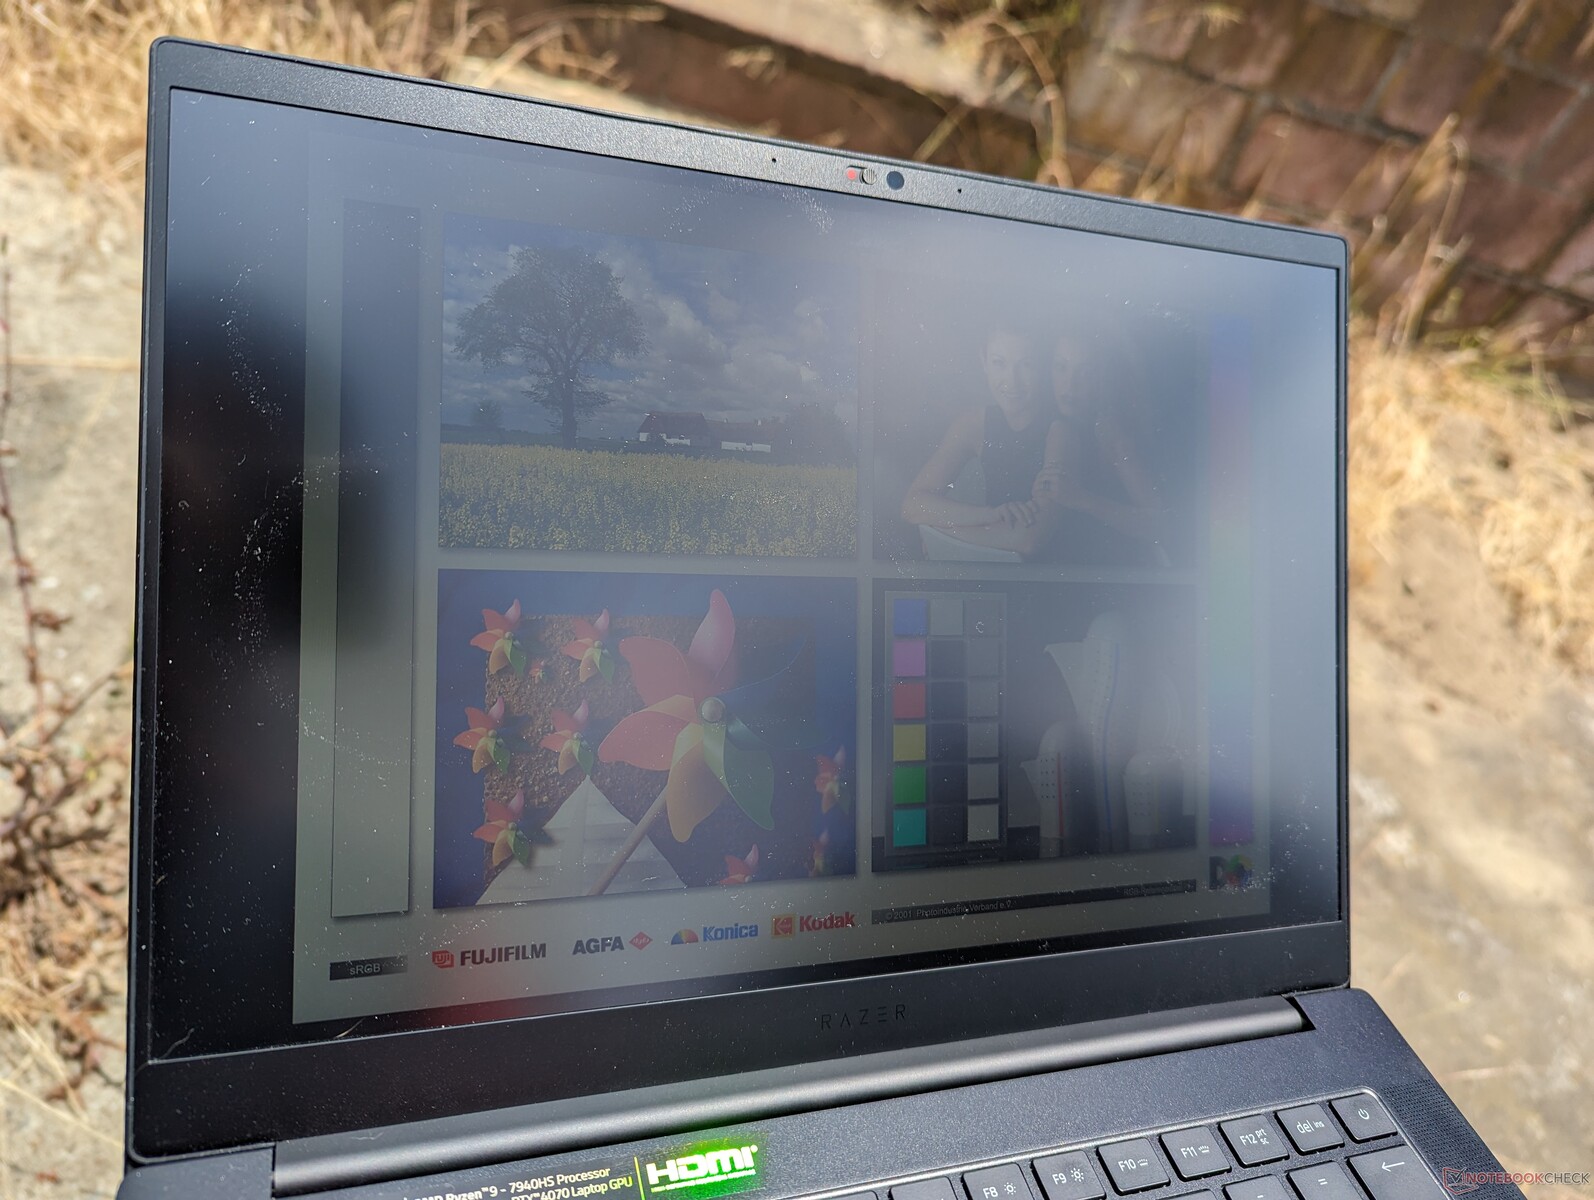
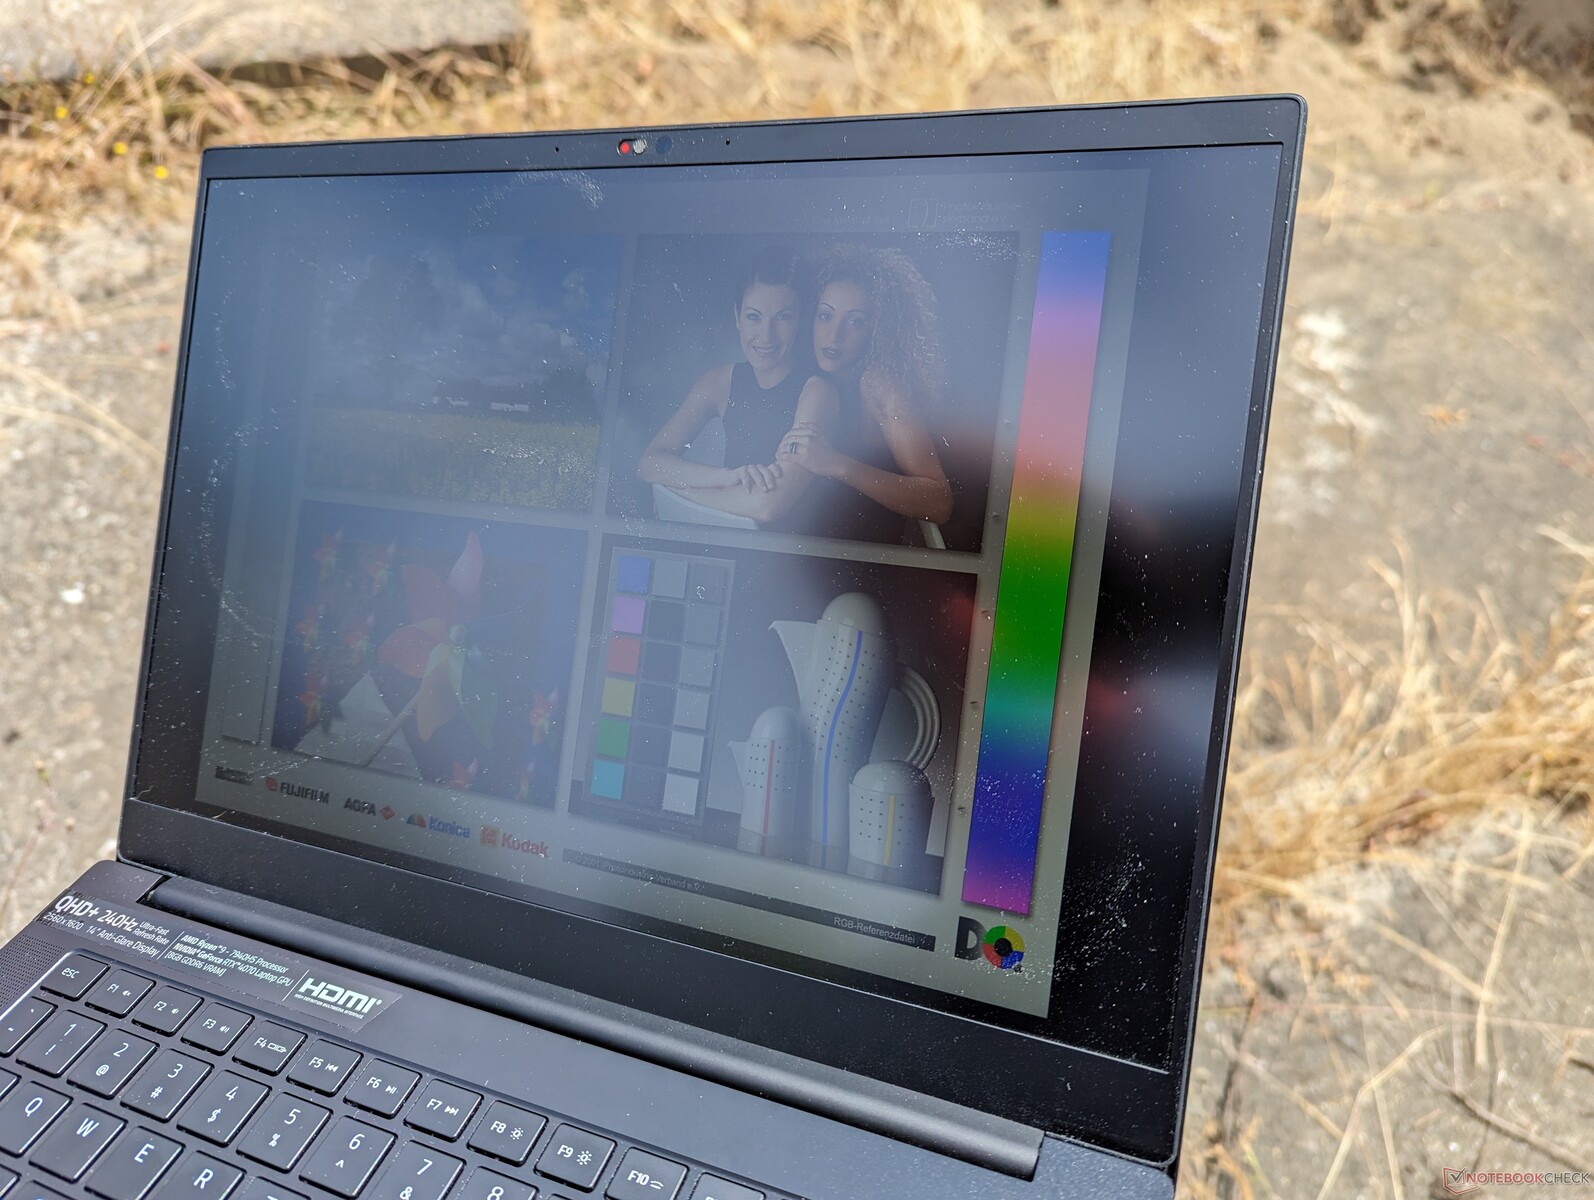
La visibilité en extérieur est meilleure qu'auparavant grâce au rétroéclairage de 500 nm, plus lumineux que celui du XPS 13 ou XPS 15. Il n'est pas assez lumineux pour résister à la lumière directe du soleil, bien sûr, mais il est tout de même plus confortable pour regarder à l'ombre que la plupart des autres ordinateurs portables de jeu.
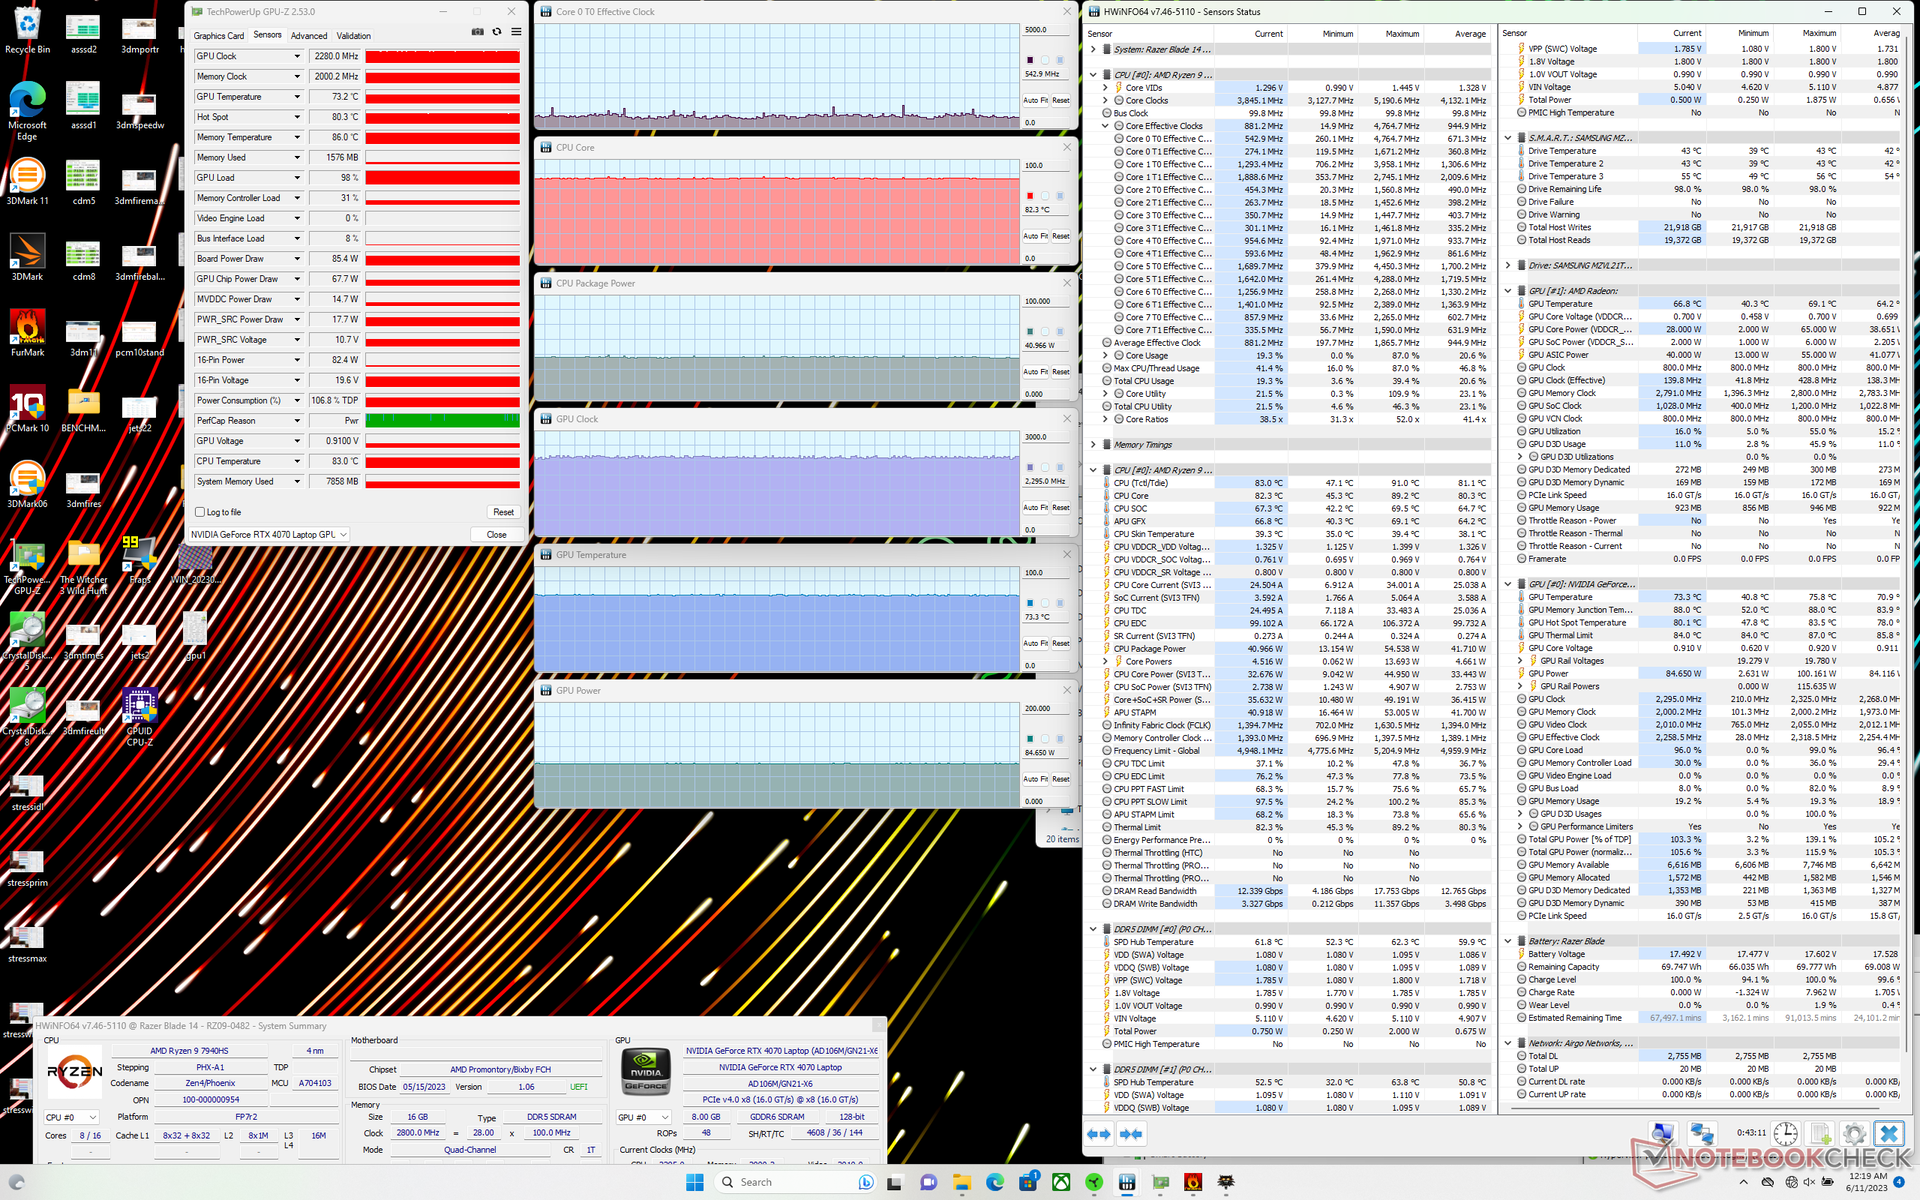
Performance - AMD Zen 4
Conditions d'essai
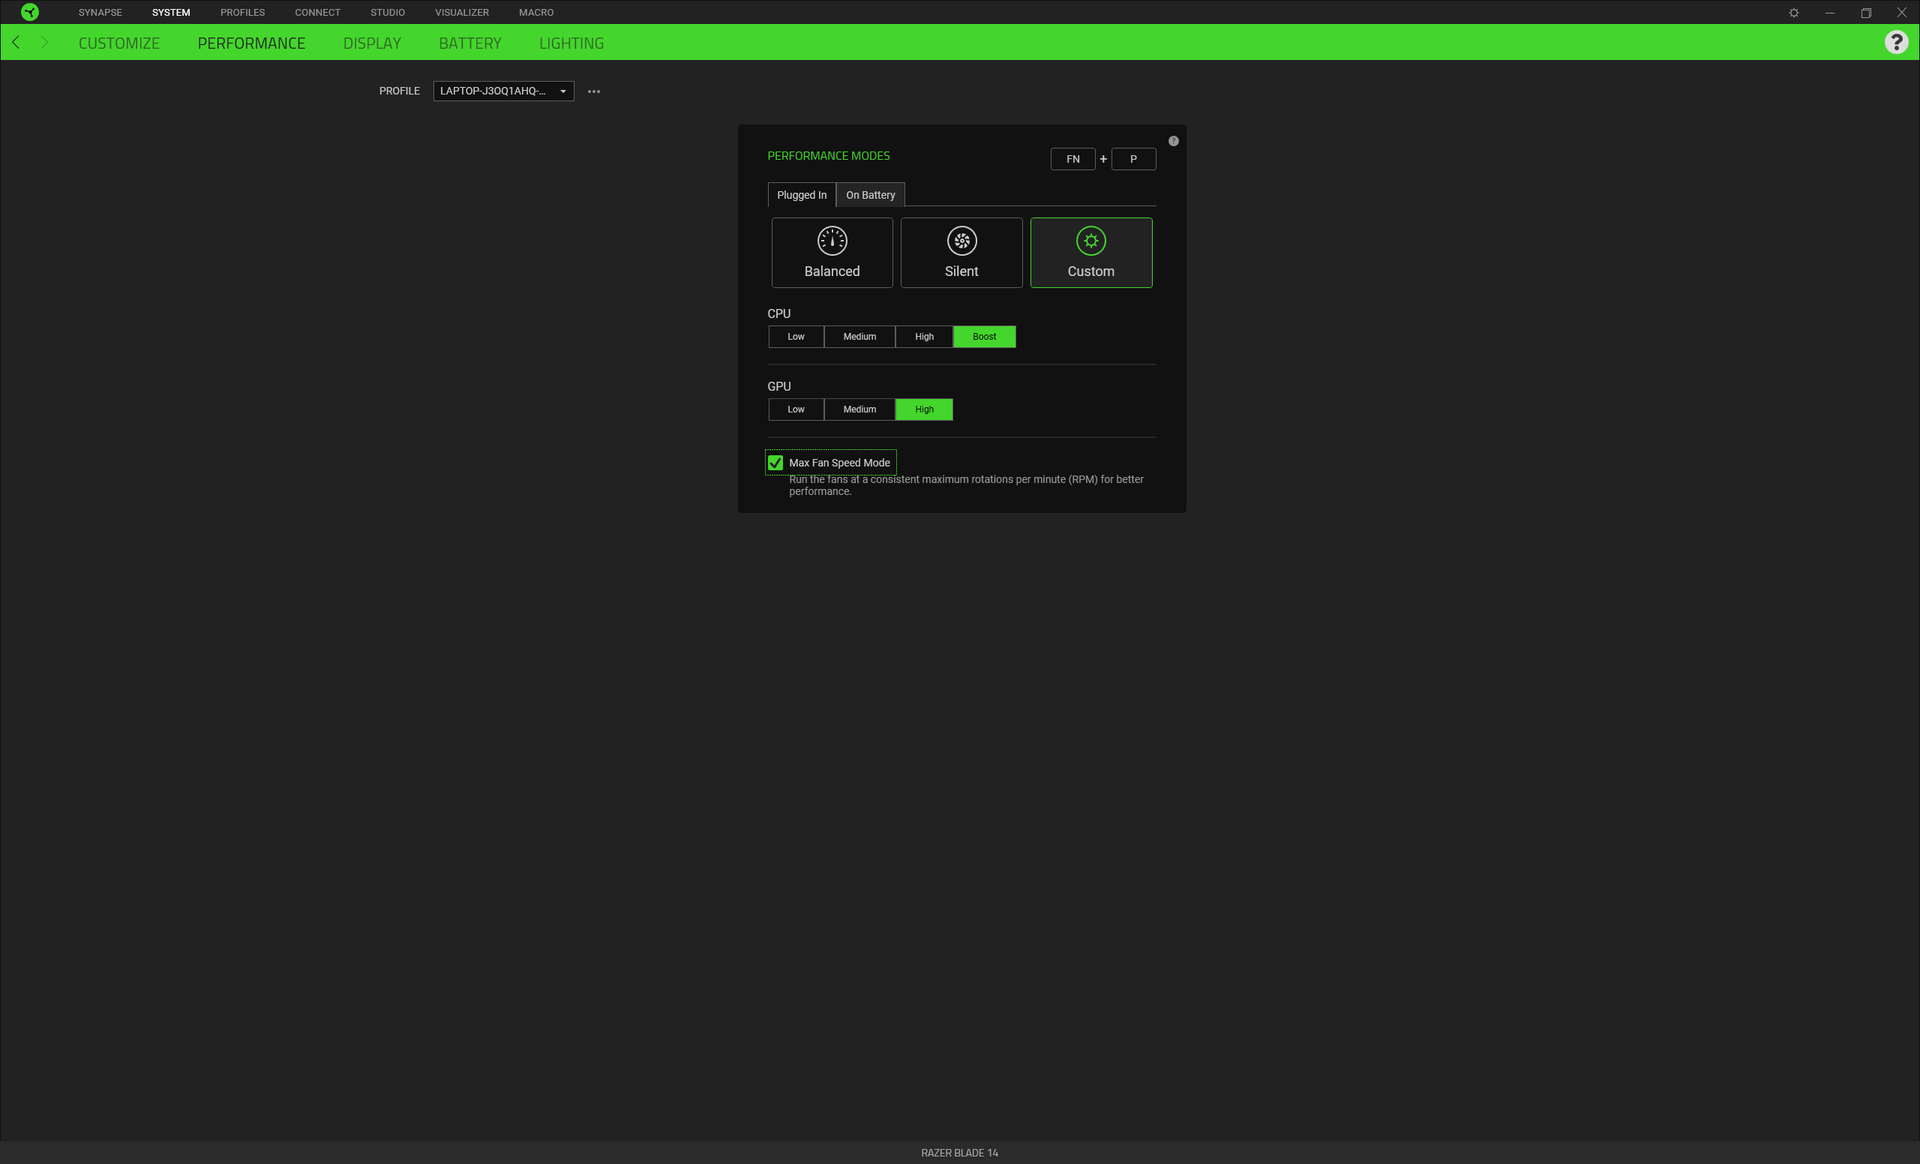
Nous avons réglé notre unité en mode Performance via Windows et en mode Custom via Synapse, avec le CPU et le GPU à leur maximum respectif avant de lancer les benchmarks ci-dessous. Il y a également une nouvelle option pour le mode Max Fan Speed, mais il n'est pas nécessaire de l'activer pour obtenir des performances maximales, comme le montrent les résultats ci-dessous. Il est recommandé aux utilisateurs de se familiariser avec Synapse car c'est le centre de contrôle pour les paramètres spécifiques à Razer.
Malheureusement, les profils d'alimentation de Synapse ne sont pas synchronisés avec les profils d'alimentation de Windows et il est donc possible d'avoir Synapse en mode silencieux et Windows en mode performance.
Advanced Optimus et MUX ne sont malheureusement pas pris en charge.
Processeur
Le dernier Blade 14 est livré avec le même Zen 4 Ryzen 9 7940HS Que l'on retrouve sur le dernier Zephyrus G14. Les performances du processeur sont pratiquement identiques entre les deux modèles, à 5 % près, mais le système Asus parvient toujours à devancer le Razer dans tous nos benchmarks.
Si l'on compare avec le Ryzen 9 6900HS-de l'année dernière, le nouveau Ryzen 9 7940HS offre des performances plus rapides de 15 à 20 % pour les threads simples et de 20 à 25 % pour les threads multiples. LesRyzen 9 7945HX est nettement plus puissant, mais il n'est actuellement disponible que sur des ordinateurs portables beaucoup plus grands, tels que l'ordinateur portable 16 poucesAsus Zephyrus Duo 16.
Nous n'avons pas observé de comportement d'étranglement du processeur sur le Blade 14, comme le montrent les résultats de notre test en boucle CineBench R15 xT ci-dessous.
Cinebench R15 Multi Loop
Cinebench R23: Multi Core | Single Core
Cinebench R20: CPU (Multi Core) | CPU (Single Core)
Cinebench R15: CPU Multi 64Bit | CPU Single 64Bit
Blender: v2.79 BMW27 CPU
7-Zip 18.03: 7z b 4 | 7z b 4 -mmt1
Geekbench 5.5: Multi-Core | Single-Core
HWBOT x265 Benchmark v2.2: 4k Preset
LibreOffice : 20 Documents To PDF
R Benchmark 2.5: Overall mean
* ... Moindre est la valeur, meilleures sont les performances
AIDA64: FP32 Ray-Trace | FPU Julia | CPU SHA3 | CPU Queen | FPU SinJulia | FPU Mandel | CPU AES | CPU ZLib | FP64 Ray-Trace | CPU PhotoWorxx
| Performance rating | |
| Razer Blade 14 RTX 4070 | |
| Moyenne AMD Ryzen 9 7940HS | |
| Razer Blade 14 Ryzen 9 6900HX | |
| Acer Predator Triton 300 SE | |
| Lenovo Yoga Pro 7 14IRH G8 | |
| Alienware x14 i7 RTX 3060 | |
| AIDA64 / FP32 Ray-Trace | |
| Razer Blade 14 RTX 4070 | |
| Moyenne AMD Ryzen 9 7940HS (25226 - 29109, n=10) | |
| Razer Blade 14 Ryzen 9 6900HX | |
| Acer Predator Triton 300 SE | |
| Lenovo Yoga Pro 7 14IRH G8 | |
| Alienware x14 i7 RTX 3060 | |
| AIDA64 / FPU Julia | |
| Razer Blade 14 RTX 4070 | |
| Moyenne AMD Ryzen 9 7940HS (106512 - 123214, n=10) | |
| Razer Blade 14 Ryzen 9 6900HX | |
| Acer Predator Triton 300 SE | |
| Lenovo Yoga Pro 7 14IRH G8 | |
| Alienware x14 i7 RTX 3060 | |
| AIDA64 / CPU SHA3 | |
| Razer Blade 14 RTX 4070 | |
| Moyenne AMD Ryzen 9 7940HS (4566 - 5119, n=10) | |
| Acer Predator Triton 300 SE | |
| Razer Blade 14 Ryzen 9 6900HX | |
| Lenovo Yoga Pro 7 14IRH G8 | |
| Alienware x14 i7 RTX 3060 | |
| AIDA64 / CPU Queen | |
| Razer Blade 14 RTX 4070 | |
| Moyenne AMD Ryzen 9 7940HS (118174 - 124783, n=10) | |
| Acer Predator Triton 300 SE | |
| Lenovo Yoga Pro 7 14IRH G8 | |
| Razer Blade 14 Ryzen 9 6900HX | |
| Alienware x14 i7 RTX 3060 | |
| AIDA64 / FPU SinJulia | |
| Razer Blade 14 RTX 4070 | |
| Moyenne AMD Ryzen 9 7940HS (14663 - 15551, n=10) | |
| Razer Blade 14 Ryzen 9 6900HX | |
| Lenovo Yoga Pro 7 14IRH G8 | |
| Acer Predator Triton 300 SE | |
| Alienware x14 i7 RTX 3060 | |
| AIDA64 / FPU Mandel | |
| Razer Blade 14 RTX 4070 | |
| Moyenne AMD Ryzen 9 7940HS (56839 - 66238, n=10) | |
| Razer Blade 14 Ryzen 9 6900HX | |
| Acer Predator Triton 300 SE | |
| Lenovo Yoga Pro 7 14IRH G8 | |
| Alienware x14 i7 RTX 3060 | |
| AIDA64 / CPU AES | |
| Razer Blade 14 Ryzen 9 6900HX | |
| Acer Predator Triton 300 SE | |
| Moyenne AMD Ryzen 9 7940HS (86309 - 171350, n=10) | |
| Alienware x14 i7 RTX 3060 | |
| Razer Blade 14 RTX 4070 | |
| Lenovo Yoga Pro 7 14IRH G8 | |
| AIDA64 / CPU ZLib | |
| Razer Blade 14 RTX 4070 | |
| Lenovo Yoga Pro 7 14IRH G8 | |
| Moyenne AMD Ryzen 9 7940HS (866 - 1152, n=10) | |
| Acer Predator Triton 300 SE | |
| Alienware x14 i7 RTX 3060 | |
| Razer Blade 14 Ryzen 9 6900HX | |
| AIDA64 / FP64 Ray-Trace | |
| Razer Blade 14 RTX 4070 | |
| Moyenne AMD Ryzen 9 7940HS (13175 - 15675, n=10) | |
| Razer Blade 14 Ryzen 9 6900HX | |
| Acer Predator Triton 300 SE | |
| Lenovo Yoga Pro 7 14IRH G8 | |
| Alienware x14 i7 RTX 3060 | |
| AIDA64 / CPU PhotoWorxx | |
| Acer Predator Triton 300 SE | |
| Alienware x14 i7 RTX 3060 | |
| Lenovo Yoga Pro 7 14IRH G8 | |
| Moyenne AMD Ryzen 9 7940HS (22477 - 41567, n=10) | |
| Razer Blade 14 RTX 4070 | |
| Razer Blade 14 Ryzen 9 6900HX | |
Performance du système
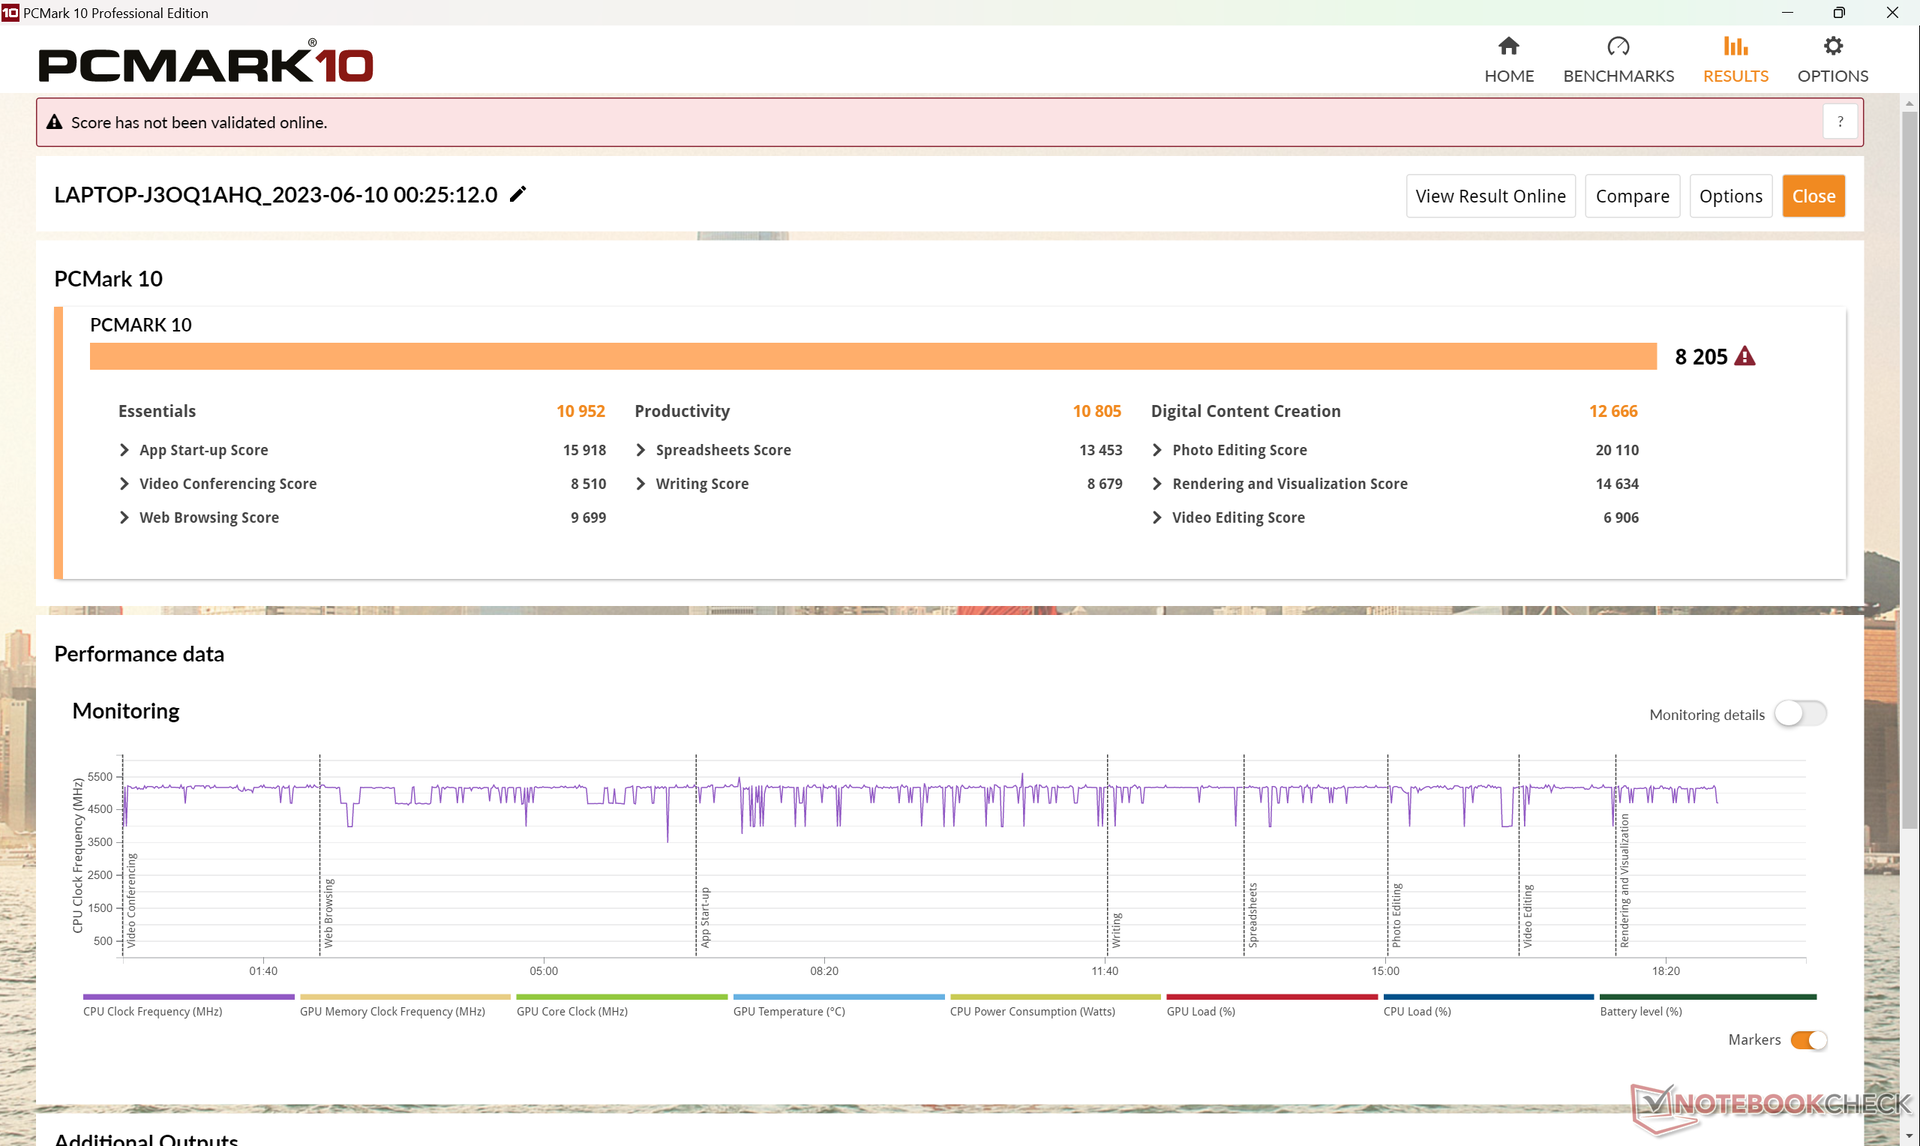
Les scores PCMark sont systématiquement supérieurs à ceux de la Blade 14 de l'année dernière, en particulier dans les sous-tests Productivité et Création de contenu numérique, grâce à un processeur et un GPU plus rapides. Les résultats sont pratiquement au coude à coude avec la Zephyrus G14 équipée d'une RTX 4090.
CrossMark: Overall | Productivity | Creativity | Responsiveness
| PCMark 10 / Score | |
| Asus ROG Zephyrus G14 GA402XY | |
| Razer Blade 14 RTX 4070 | |
| Moyenne AMD Ryzen 9 7940HS, NVIDIA GeForce RTX 4070 Laptop GPU (8092 - 8205, n=2) | |
| Acer Predator Triton 300 SE | |
| Razer Blade 14 Ryzen 9 6900HX | |
| Lenovo Yoga Pro 7 14IRH G8 | |
| Alienware x14 i7 RTX 3060 | |
| PCMark 10 / Essentials | |
| Acer Predator Triton 300 SE | |
| Razer Blade 14 RTX 4070 | |
| Razer Blade 14 Ryzen 9 6900HX | |
| Moyenne AMD Ryzen 9 7940HS, NVIDIA GeForce RTX 4070 Laptop GPU (10896 - 10952, n=2) | |
| Lenovo Yoga Pro 7 14IRH G8 | |
| Asus ROG Zephyrus G14 GA402XY | |
| Alienware x14 i7 RTX 3060 | |
| PCMark 10 / Productivity | |
| Razer Blade 14 RTX 4070 | |
| Asus ROG Zephyrus G14 GA402XY | |
| Moyenne AMD Ryzen 9 7940HS, NVIDIA GeForce RTX 4070 Laptop GPU (9693 - 10805, n=2) | |
| Acer Predator Triton 300 SE | |
| Alienware x14 i7 RTX 3060 | |
| Lenovo Yoga Pro 7 14IRH G8 | |
| Razer Blade 14 Ryzen 9 6900HX | |
| PCMark 10 / Digital Content Creation | |
| Asus ROG Zephyrus G14 GA402XY | |
| Moyenne AMD Ryzen 9 7940HS, NVIDIA GeForce RTX 4070 Laptop GPU (12666 - 13618, n=2) | |
| Razer Blade 14 RTX 4070 | |
| Razer Blade 14 Ryzen 9 6900HX | |
| Acer Predator Triton 300 SE | |
| Lenovo Yoga Pro 7 14IRH G8 | |
| Alienware x14 i7 RTX 3060 | |
| CrossMark / Overall | |
| Acer Predator Triton 300 SE | |
| Alienware x14 i7 RTX 3060 | |
| Asus ROG Zephyrus G14 GA402XY | |
| Razer Blade 14 RTX 4070 | |
| Moyenne AMD Ryzen 9 7940HS, NVIDIA GeForce RTX 4070 Laptop GPU (1797 - 1812, n=2) | |
| Lenovo Yoga Pro 7 14IRH G8 | |
| CrossMark / Productivity | |
| Acer Predator Triton 300 SE | |
| Alienware x14 i7 RTX 3060 | |
| Razer Blade 14 RTX 4070 | |
| Asus ROG Zephyrus G14 GA402XY | |
| Moyenne AMD Ryzen 9 7940HS, NVIDIA GeForce RTX 4070 Laptop GPU (1740 - 1762, n=2) | |
| Lenovo Yoga Pro 7 14IRH G8 | |
| CrossMark / Creativity | |
| Acer Predator Triton 300 SE | |
| Asus ROG Zephyrus G14 GA402XY | |
| Alienware x14 i7 RTX 3060 | |
| Lenovo Yoga Pro 7 14IRH G8 | |
| Moyenne AMD Ryzen 9 7940HS, NVIDIA GeForce RTX 4070 Laptop GPU (1952 - 1979, n=2) | |
| Razer Blade 14 RTX 4070 | |
| CrossMark / Responsiveness | |
| Acer Predator Triton 300 SE | |
| Alienware x14 i7 RTX 3060 | |
| Razer Blade 14 RTX 4070 | |
| Moyenne AMD Ryzen 9 7940HS, NVIDIA GeForce RTX 4070 Laptop GPU (1478 - 1575, n=2) | |
| Asus ROG Zephyrus G14 GA402XY | |
| Lenovo Yoga Pro 7 14IRH G8 | |
| PCMark 10 Score | 8205 points | |
Aide | ||
| AIDA64 / Memory Copy | |
| Alienware x14 i7 RTX 3060 | |
| Acer Predator Triton 300 SE | |
| Lenovo Yoga Pro 7 14IRH G8 | |
| Moyenne AMD Ryzen 9 7940HS (35327 - 78739, n=10) | |
| Razer Blade 14 RTX 4070 | |
| Razer Blade 14 Ryzen 9 6900HX | |
| AIDA64 / Memory Read | |
| Alienware x14 i7 RTX 3060 | |
| Acer Predator Triton 300 SE | |
| Lenovo Yoga Pro 7 14IRH G8 | |
| Razer Blade 14 RTX 4070 | |
| Moyenne AMD Ryzen 9 7940HS (30769 - 61836, n=10) | |
| Razer Blade 14 Ryzen 9 6900HX | |
| AIDA64 / Memory Write | |
| Moyenne AMD Ryzen 9 7940HS (42217 - 91567, n=10) | |
| Razer Blade 14 RTX 4070 | |
| Lenovo Yoga Pro 7 14IRH G8 | |
| Alienware x14 i7 RTX 3060 | |
| Acer Predator Triton 300 SE | |
| Razer Blade 14 Ryzen 9 6900HX | |
| AIDA64 / Memory Latency | |
| Alienware x14 i7 RTX 3060 | |
| Lenovo Yoga Pro 7 14IRH G8 | |
| Acer Predator Triton 300 SE | |
| Moyenne AMD Ryzen 9 7940HS (87.6 - 111.1, n=10) | |
| Razer Blade 14 RTX 4070 | |
| Razer Blade 14 Ryzen 9 6900HX | |
* ... Moindre est la valeur, meilleures sont les performances
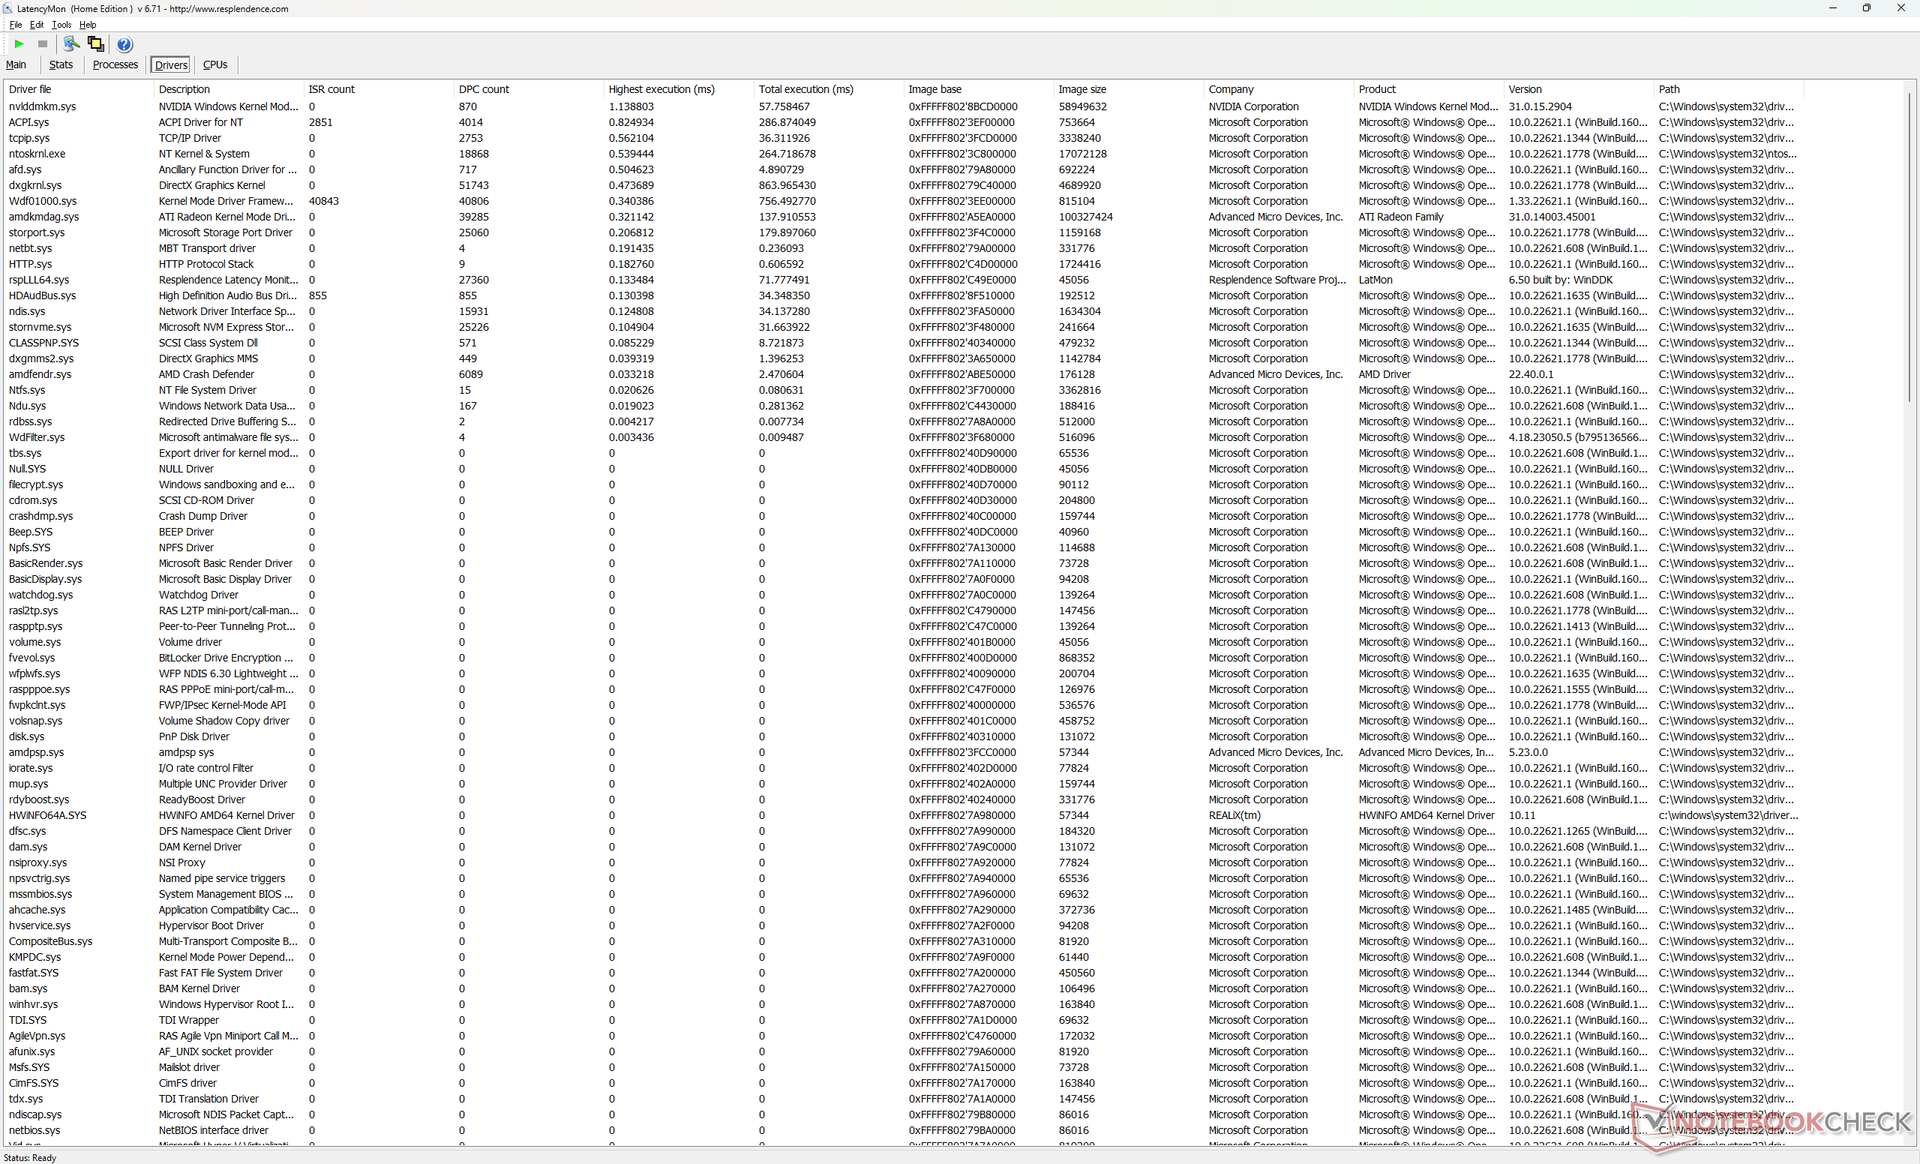
Latence DPC
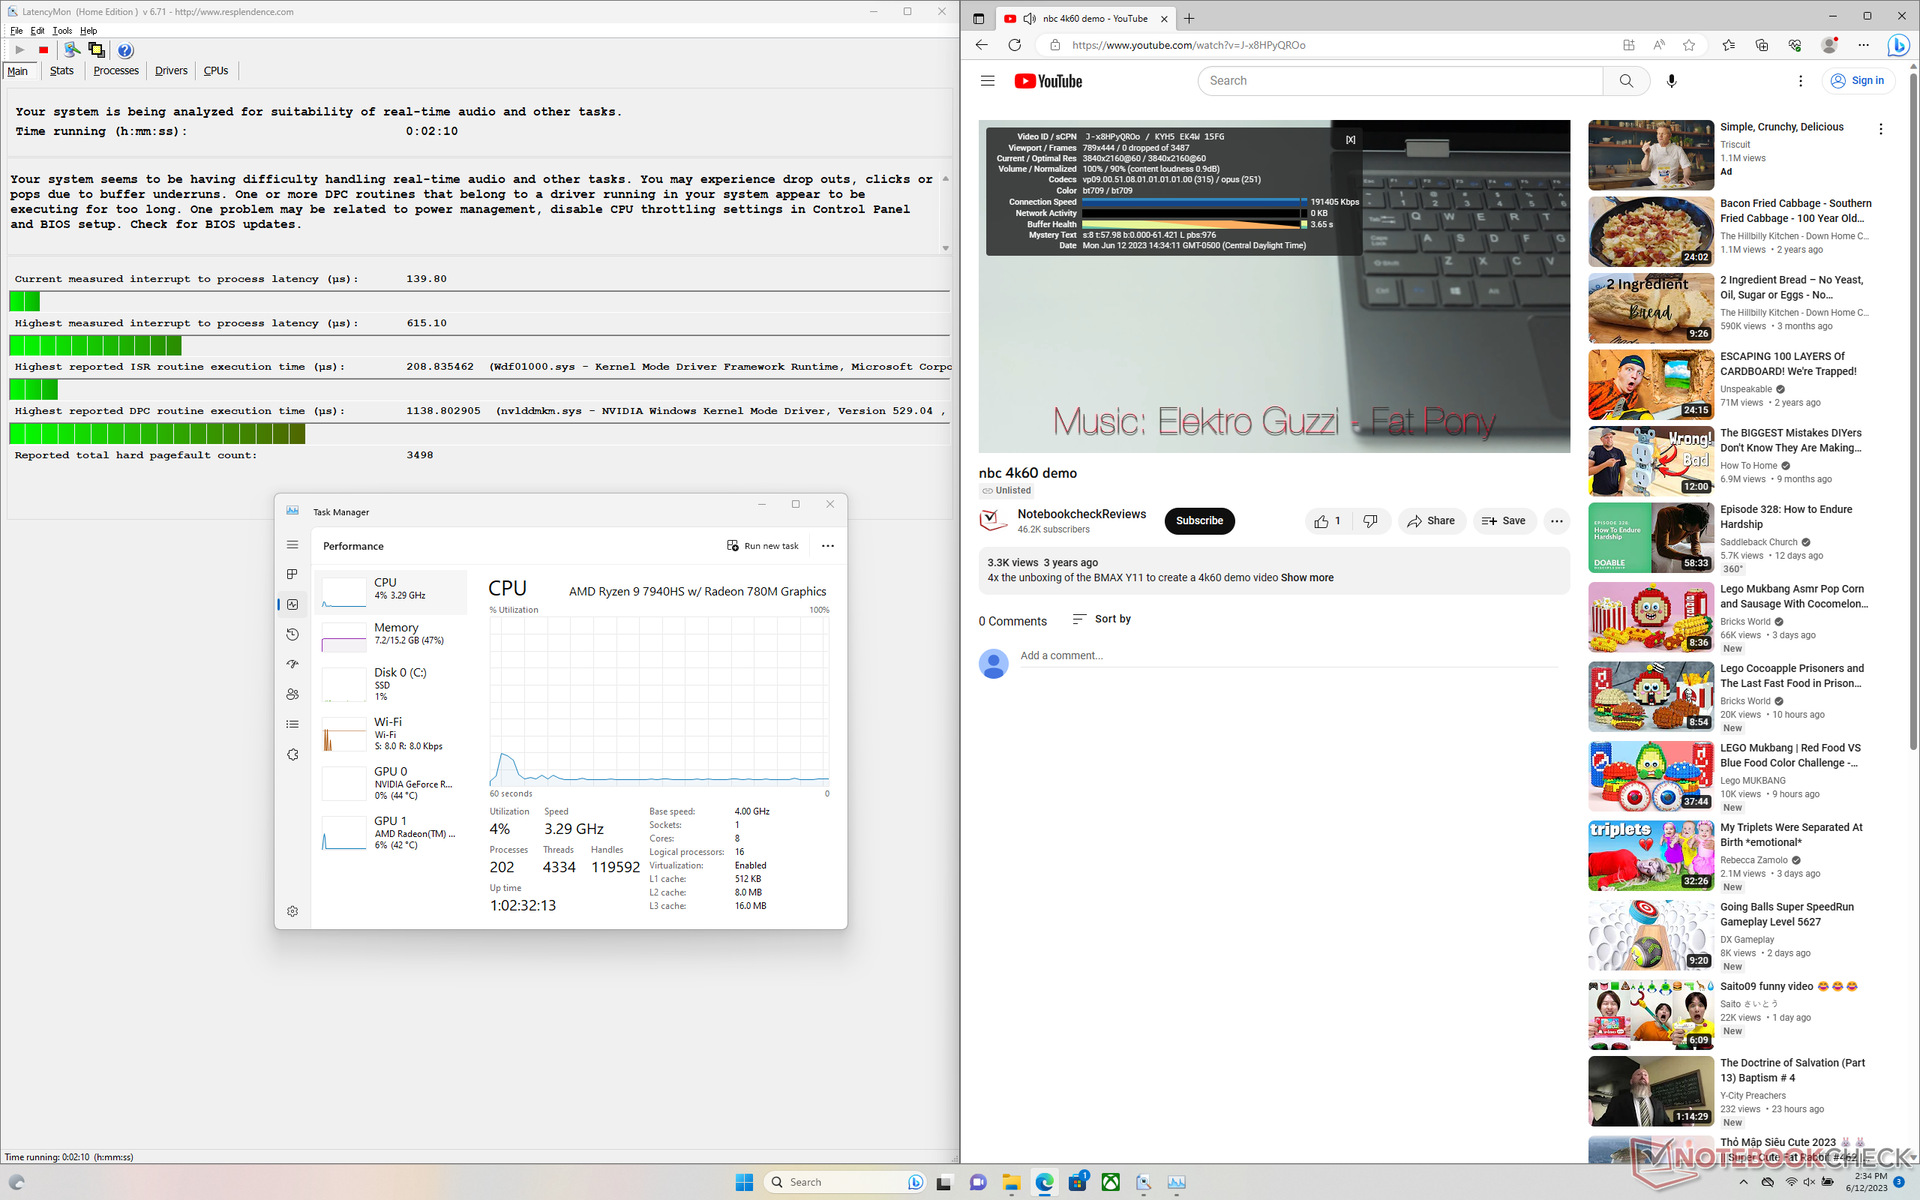
LatencyMon ne révèle que des problèmes mineurs de DPC lors de l'ouverture de plusieurs onglets de notre page d'accueil. la lecture de vidéos 4K à 60 FPS est par ailleurs parfaite, avec une faible utilisation des ressources et sans aucune perte d'images.
| DPC Latencies / LatencyMon - interrupt to process latency (max), Web, Youtube, Prime95 | |
| Acer Predator Triton 300 SE | |
| Razer Blade 14 Ryzen 9 6900HX | |
| Alienware x14 i7 RTX 3060 | |
| Lenovo Yoga Pro 7 14IRH G8 | |
| Asus ROG Zephyrus G14 GA402XY | |
| Razer Blade 14 RTX 4070 | |
* ... Moindre est la valeur, meilleures sont les performances
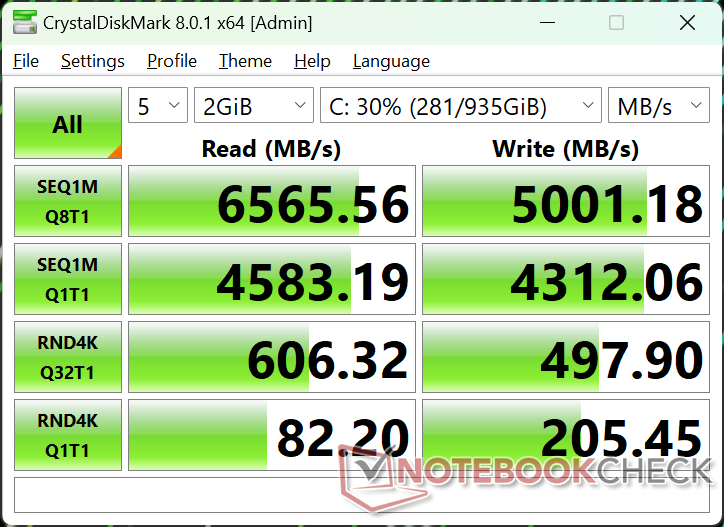
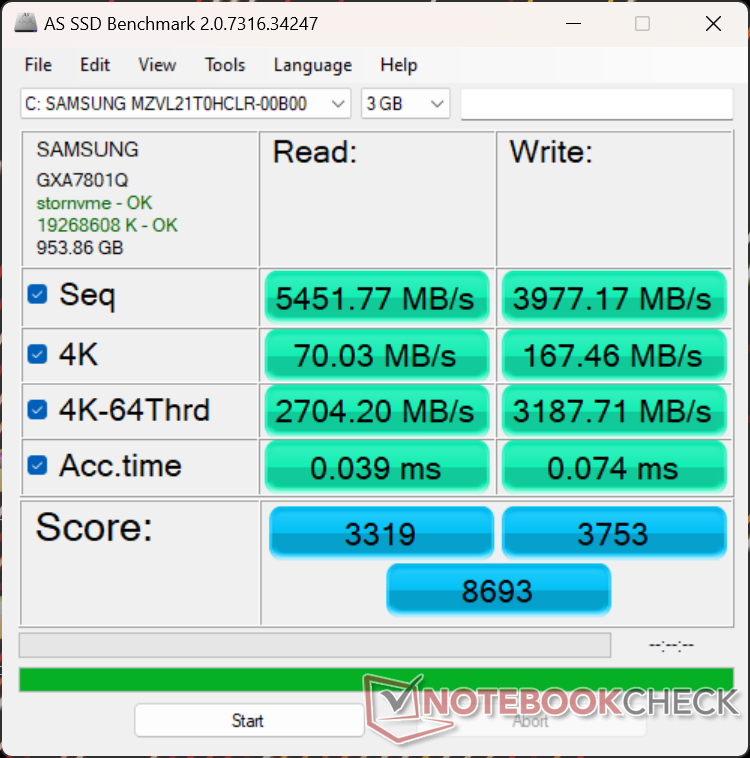
Périphériques de stockage - Pas encore de PCIe5
Si la mémoire vive a été améliorée pour être extensible par l'utilisateur, le stockage est resté le même. Notre Blade 14 2023 est livré avec le même disque dur PCIe4 x4 Samsung PM9A1 MZVL21T0HCLR que sur le modèle 2022. Les performances sont stables et il n'y a pas de problèmes d'étranglement notables.

| Drive Performance rating - Percent | |
| Razer Blade 14 Ryzen 9 6900HX | |
| Razer Blade 14 RTX 4070 | |
| Acer Predator Triton 300 SE -11! | |
| Alienware x14 i7 RTX 3060 | |
| Lenovo Yoga Pro 7 14IRH G8 | |
| Asus ROG Zephyrus G14 GA402XY | |
* ... Moindre est la valeur, meilleures sont les performances
Disk Throttling: DiskSpd Read Loop, Queue Depth 8
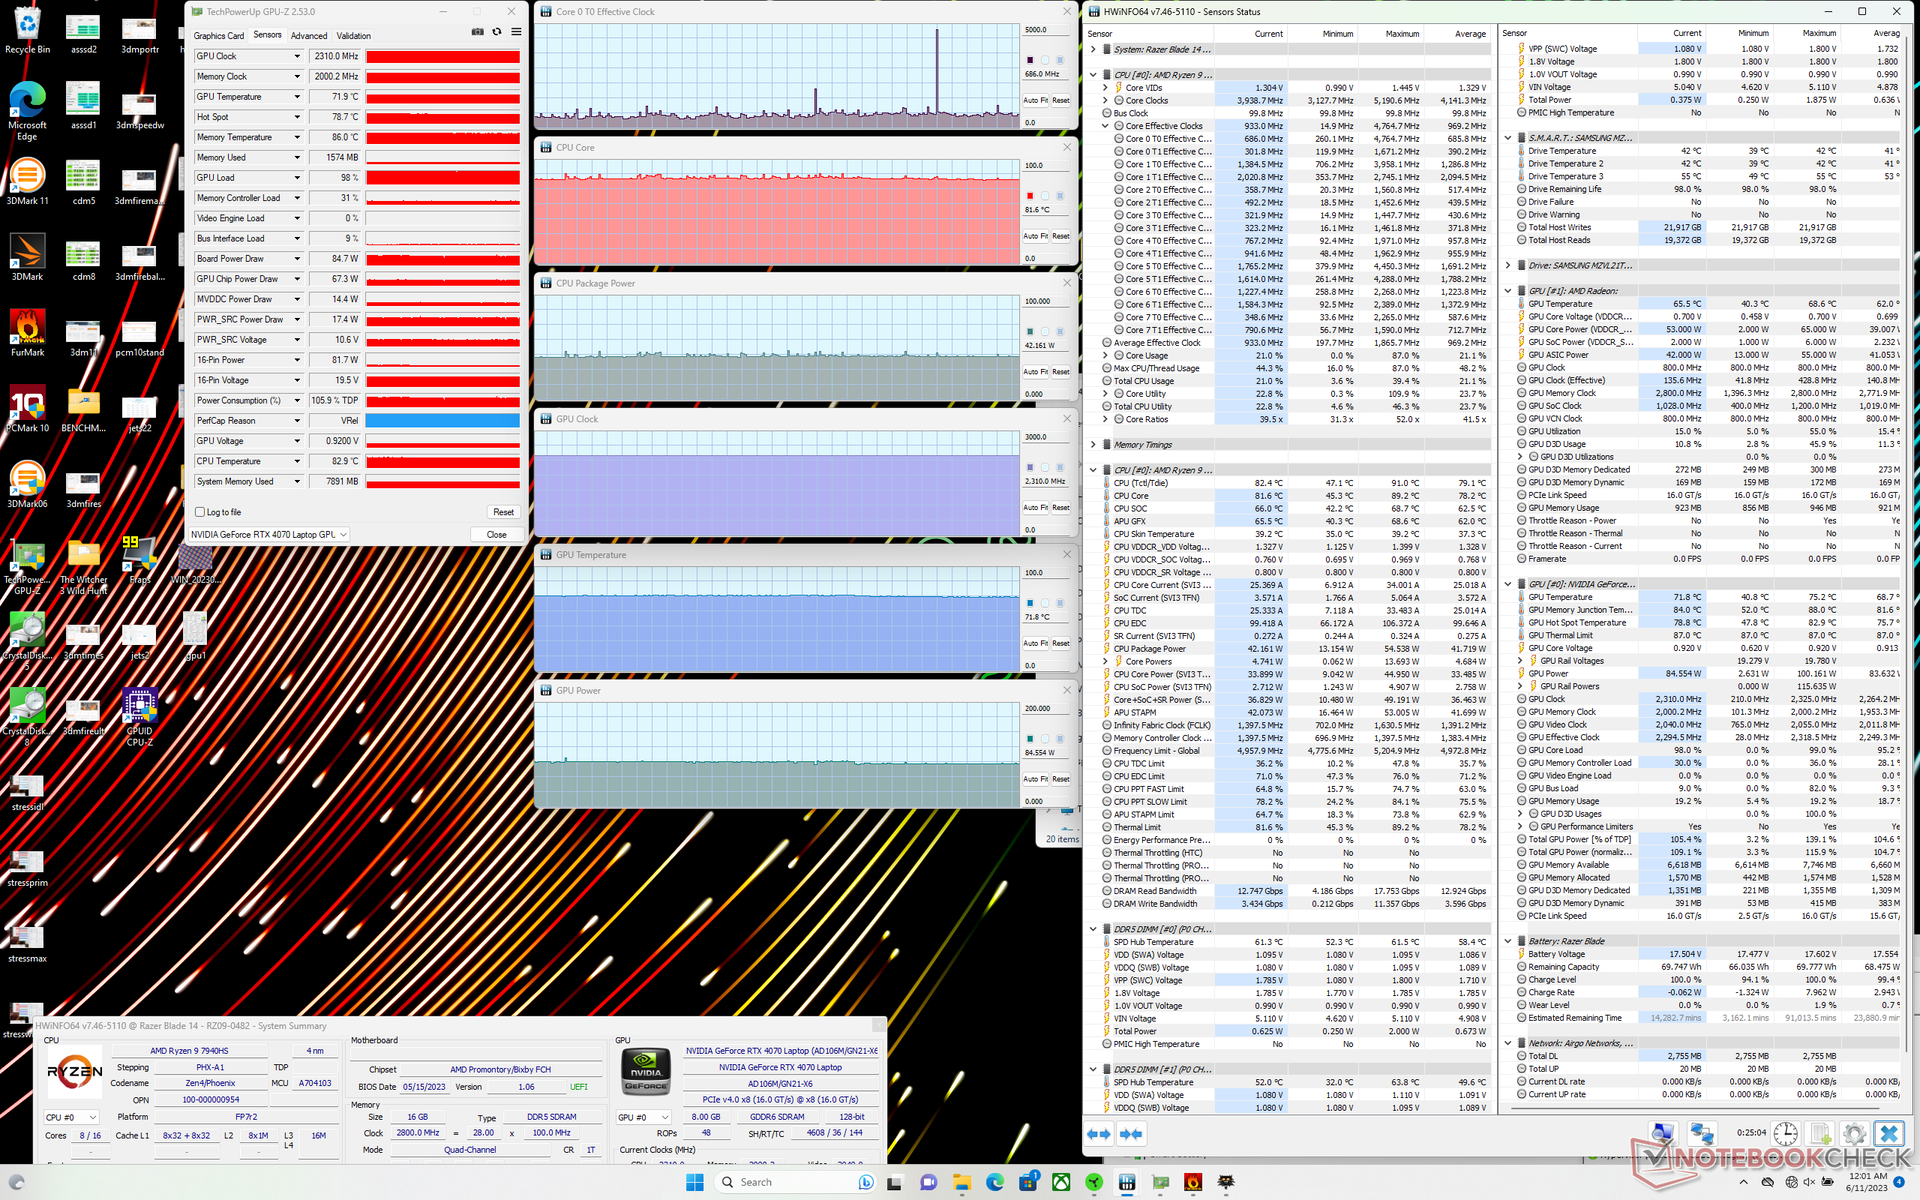
Performances du GPU - Mise à niveau d'Ada Lovelace
La Blade 14 RTX 4070 est environ 10 % plus rapide que la moyenne des ordinateurs portables de notre base de données équipés du même GPU, ce qui est impressionnant compte tenu du petit format du système Razer. La Blade 14 RTX 4070 est donc 20 à 30 % plus rapide que la rTX 3080 de bureau ou de 15 à 25 % par rapport à la RTX 3070 Ti Blade 14 de l'année dernière, avant de prendre en compte les fonctionnalités DLSS.
Il convient de noter que le modèle concurrent Zephyrus G14 offre une carte graphique 125 W RTX 4090 de 125 W, alors que le Blade 14 actuel est limité à une RTX 4070 de 140 W. Le système Asus offre un gain graphique significatif par rapport à notre Blade 14, de l'ordre de 40 à 50 %, malgré les différences de TGP. En revanche, la rétrogradation vers la RTX 4060 de notre RTX 4070 devrait entraîner une perte de performance de 10 à 15 %.
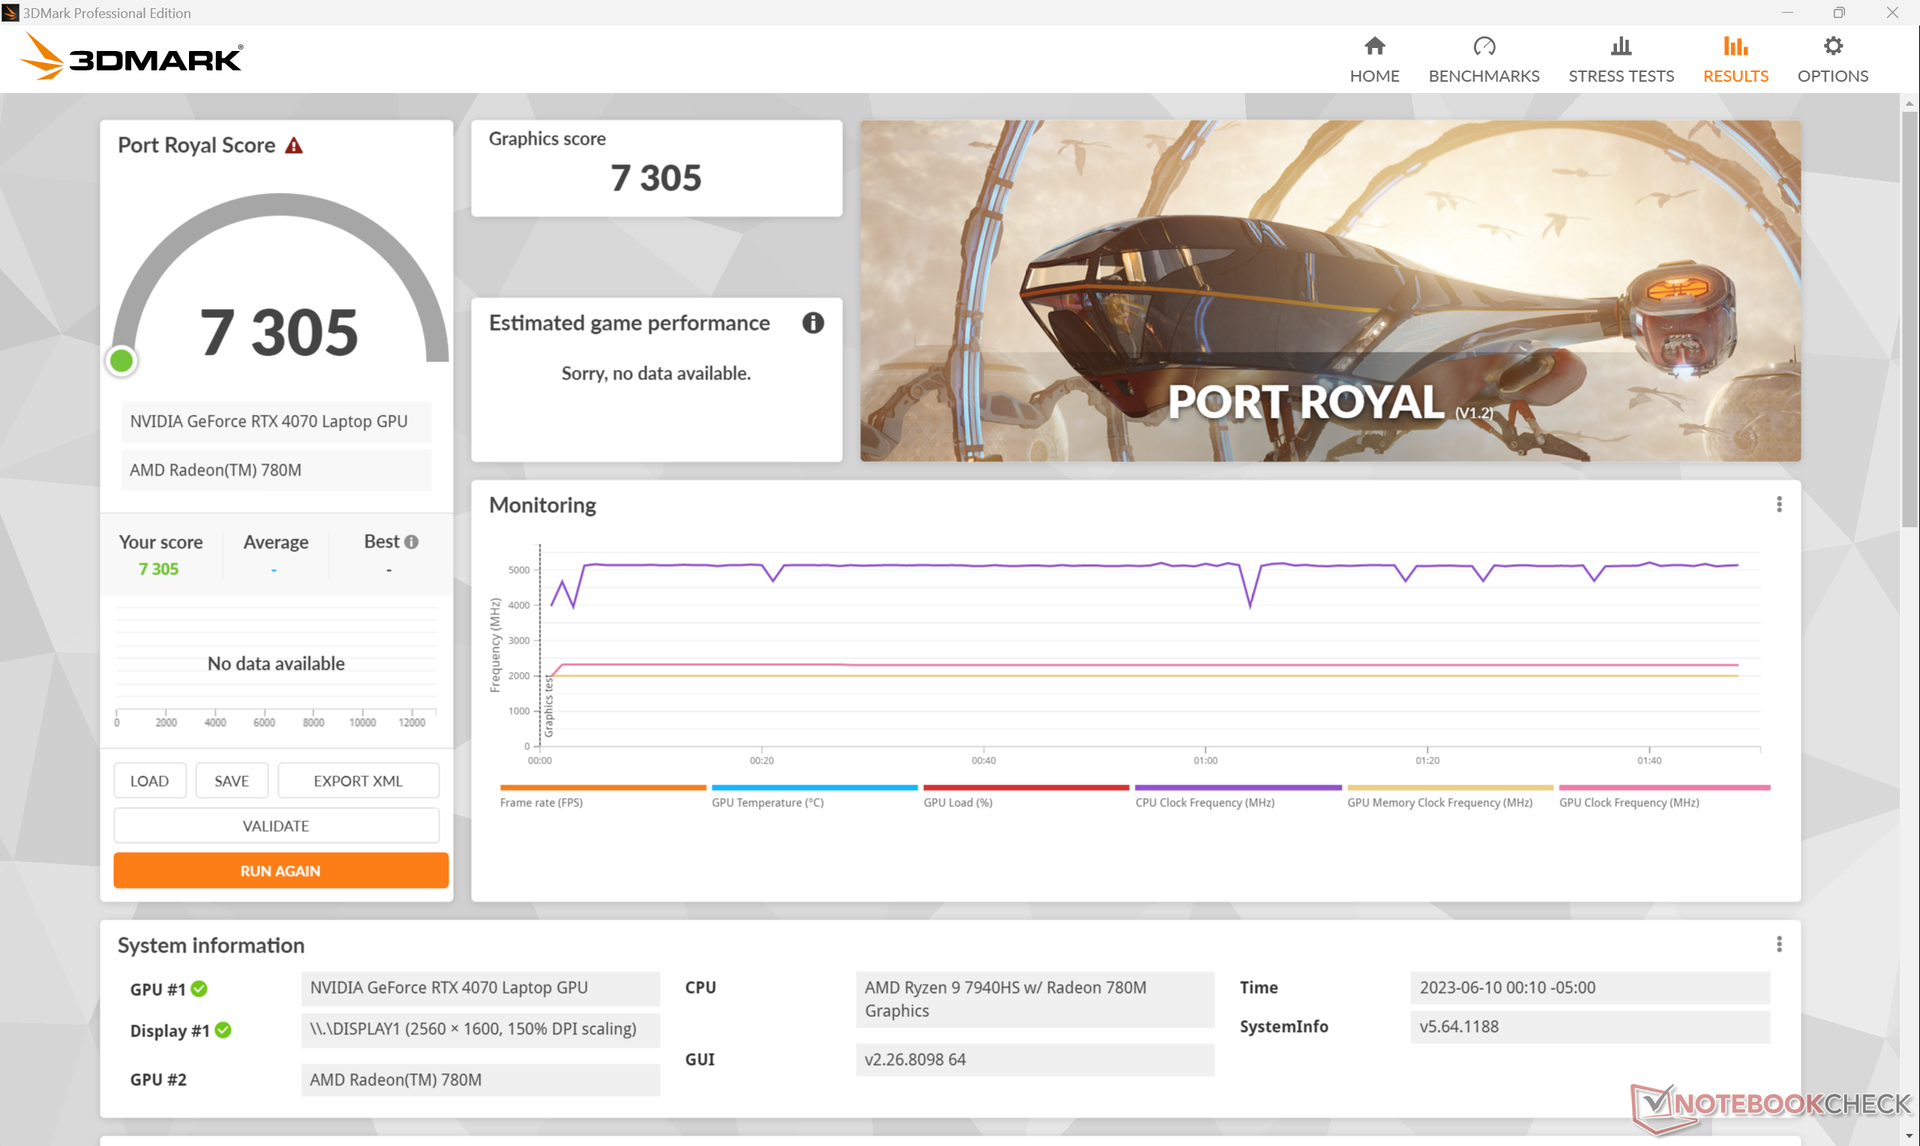
Il est intéressant de noter que l'activation du mode Max Fan ne semble pas améliorer les performances de manière significative. L'exécution de Fire Strike en mode Custom Extreme avec Max Fan activé ne montre pas de différences de performances majeures par rapport à Max Fan désactivé.
| Paramètres du profil d'alimentation | Fire Strike Score physique | Fire Strike Score GPU | Fire Strike Score combiné |
| Mode extrême personnalisé avec ventilateur maximal activé | 29771 | 30668 | 14901 |
| Mode extrême personnalisé avec ventilateur maximal désactivé | 28572 | 30600 | 14743 |
| Mode équilibré | 27016 | 30524 | 14009 |
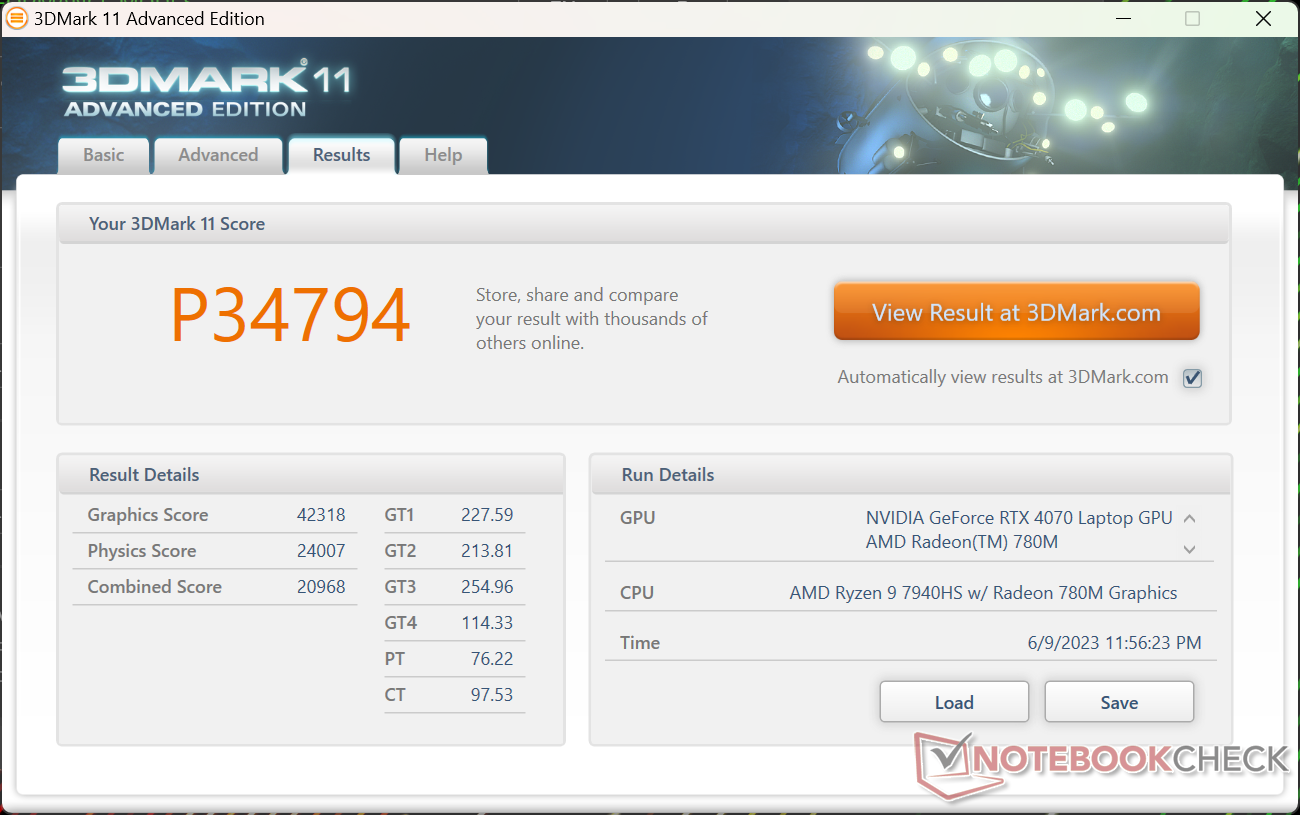
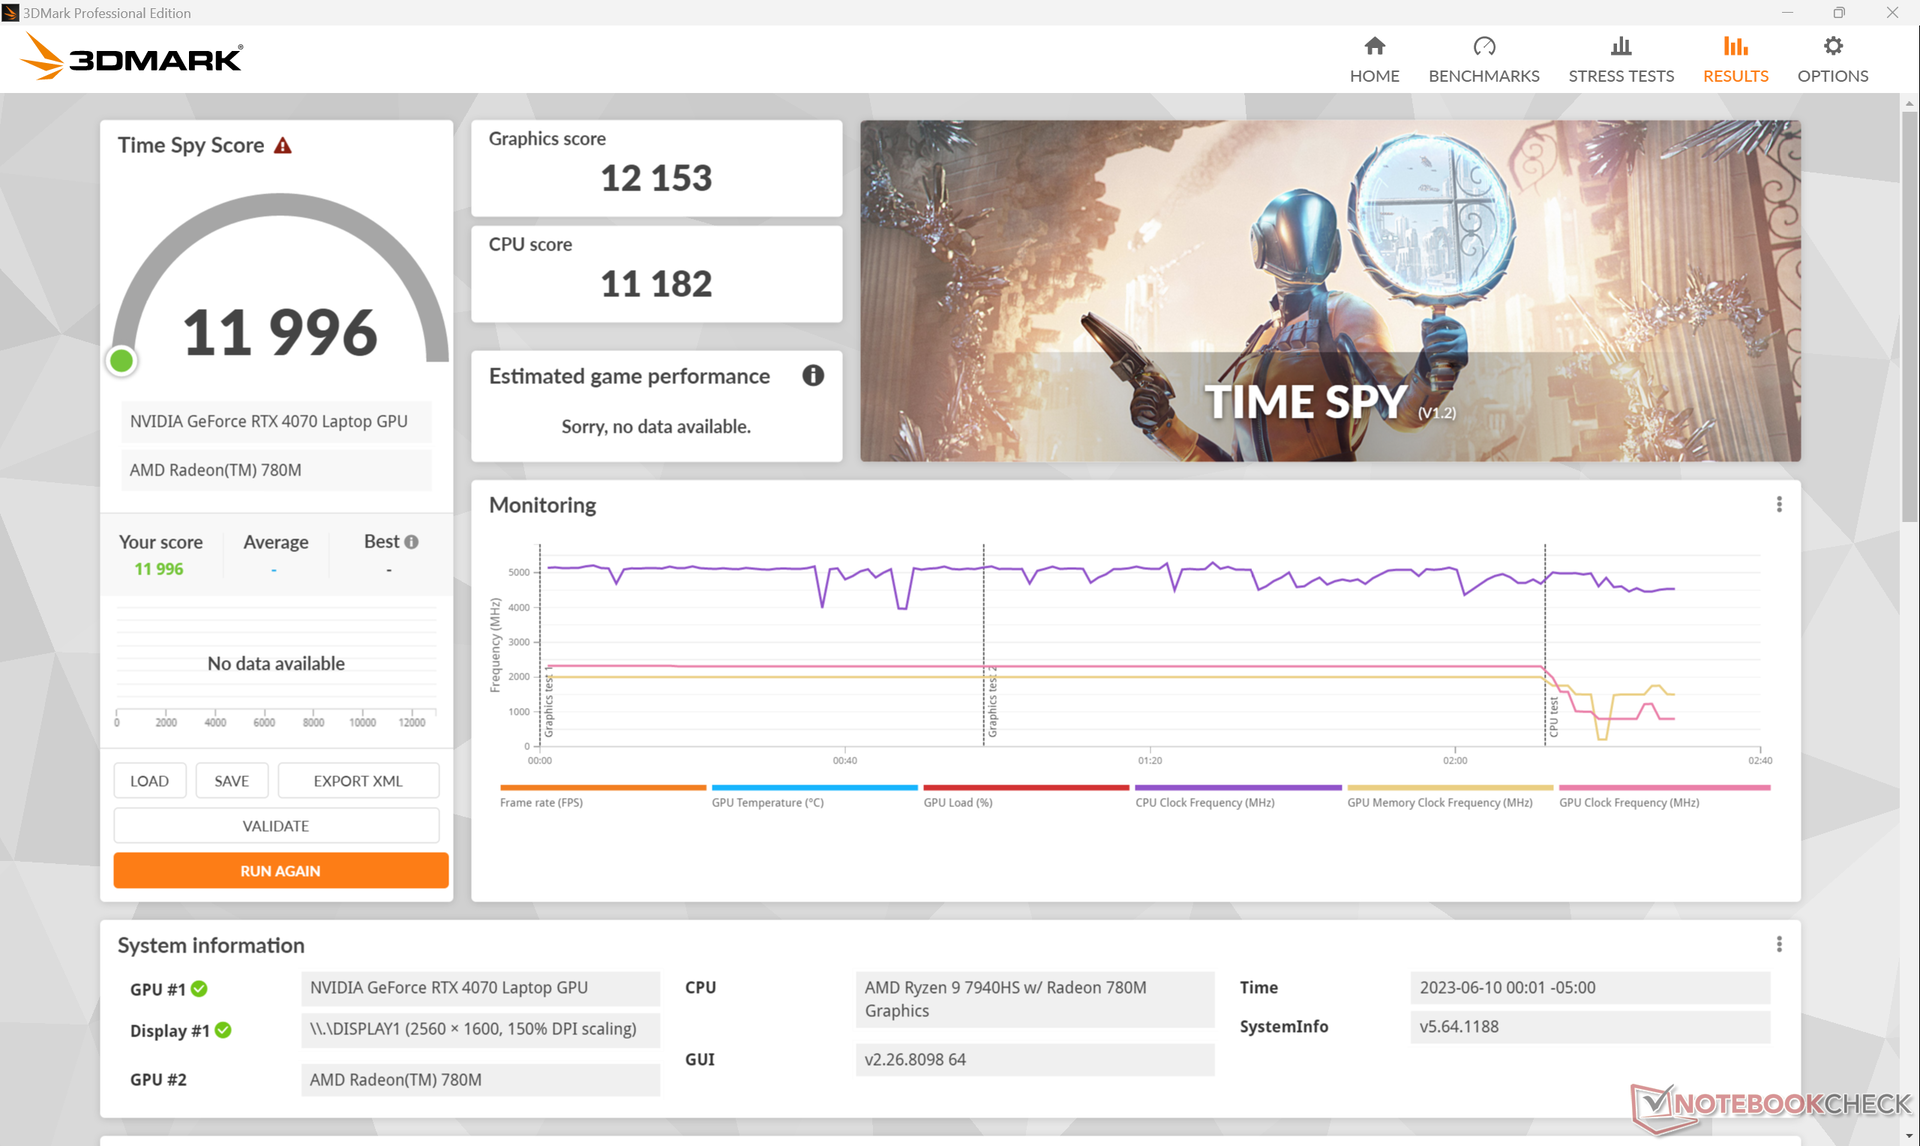
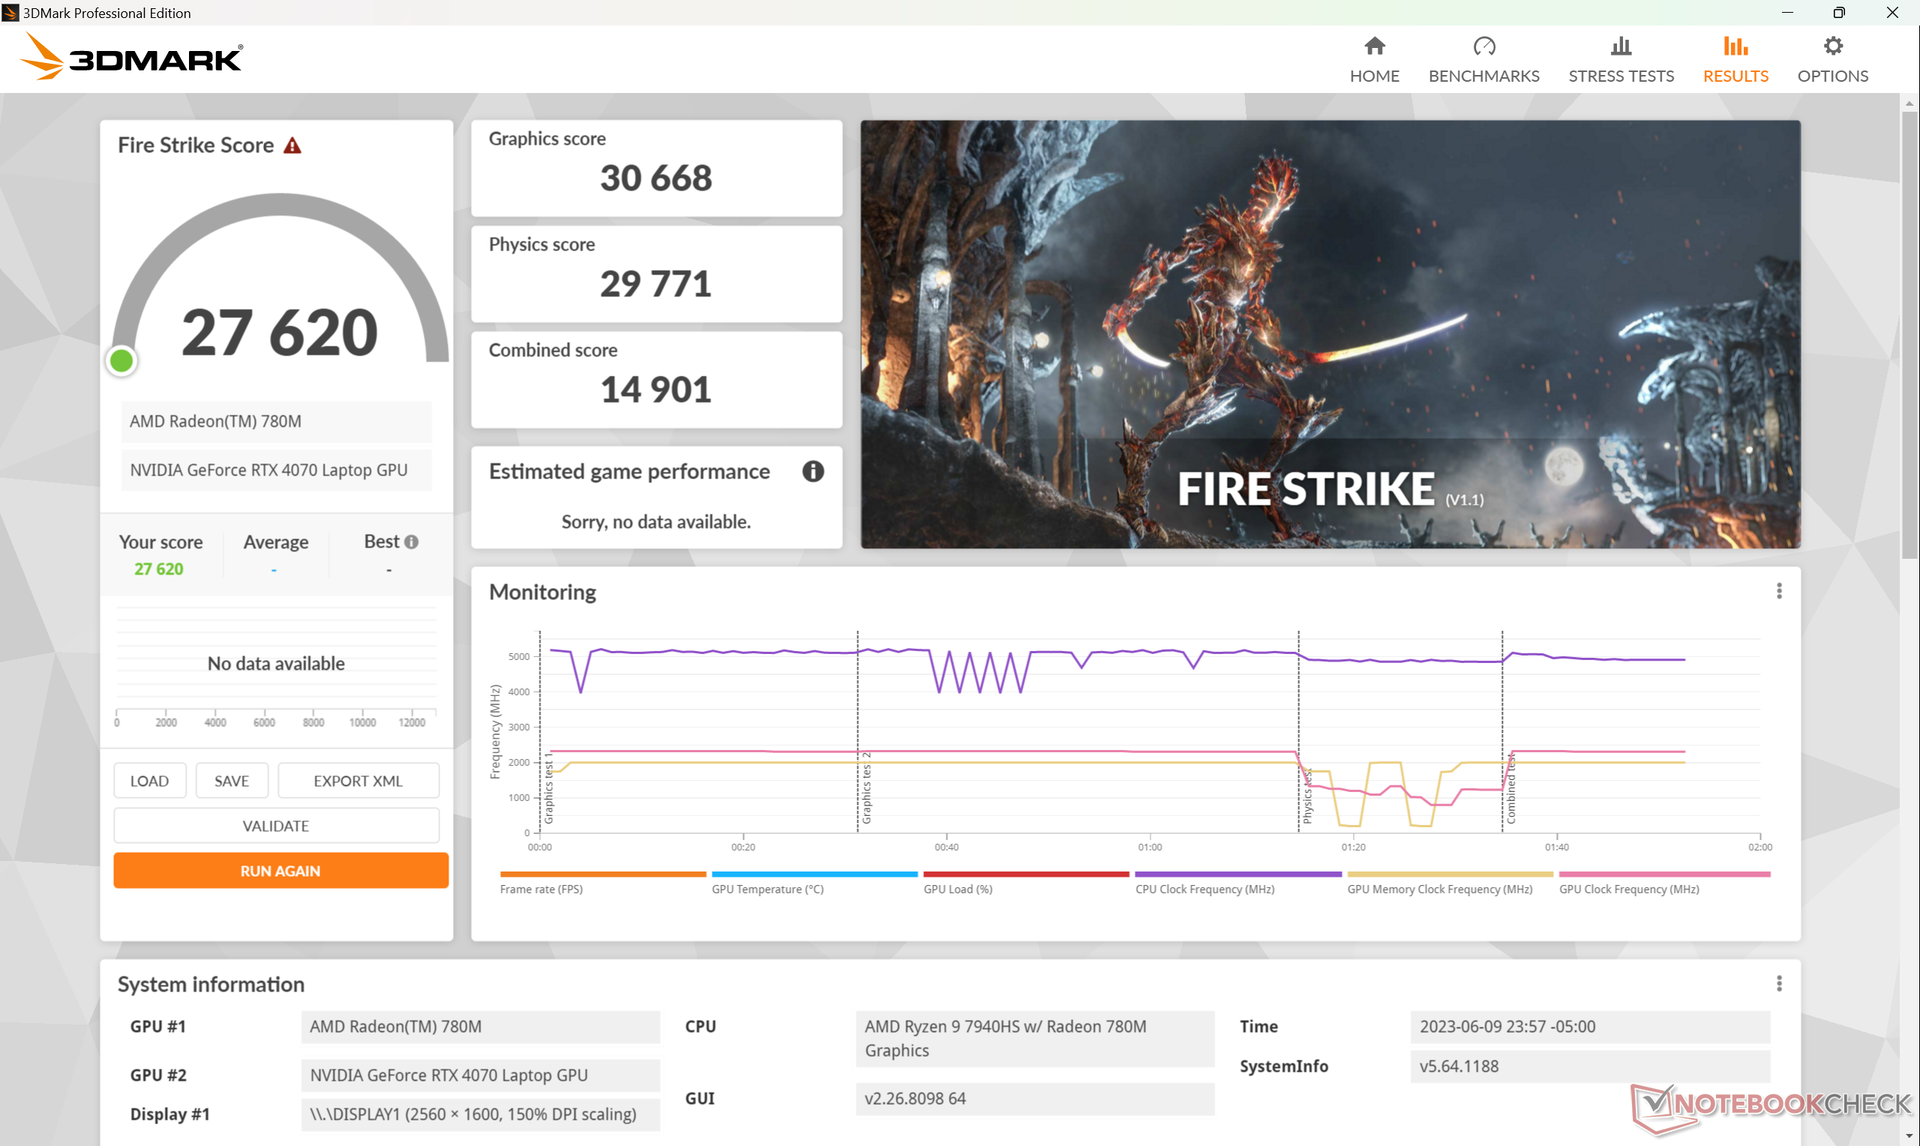
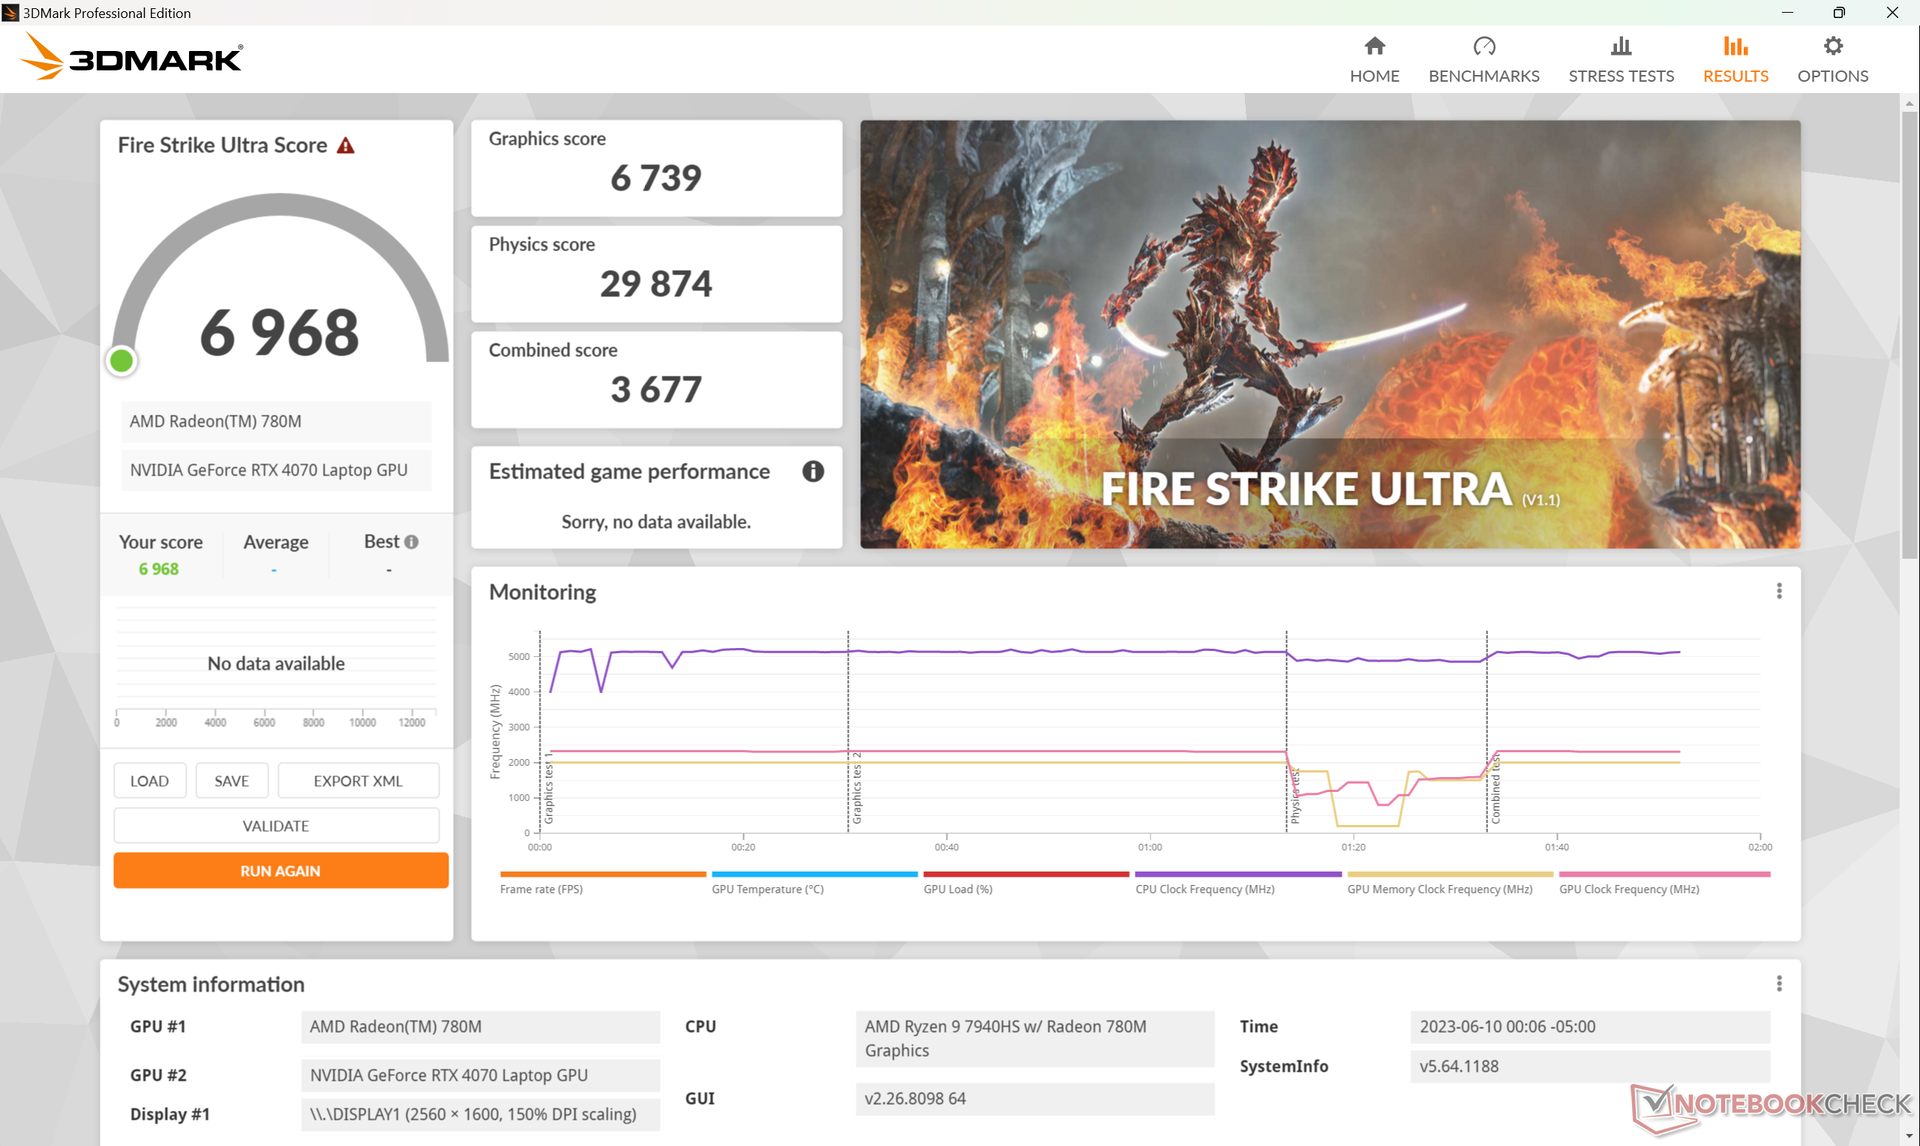
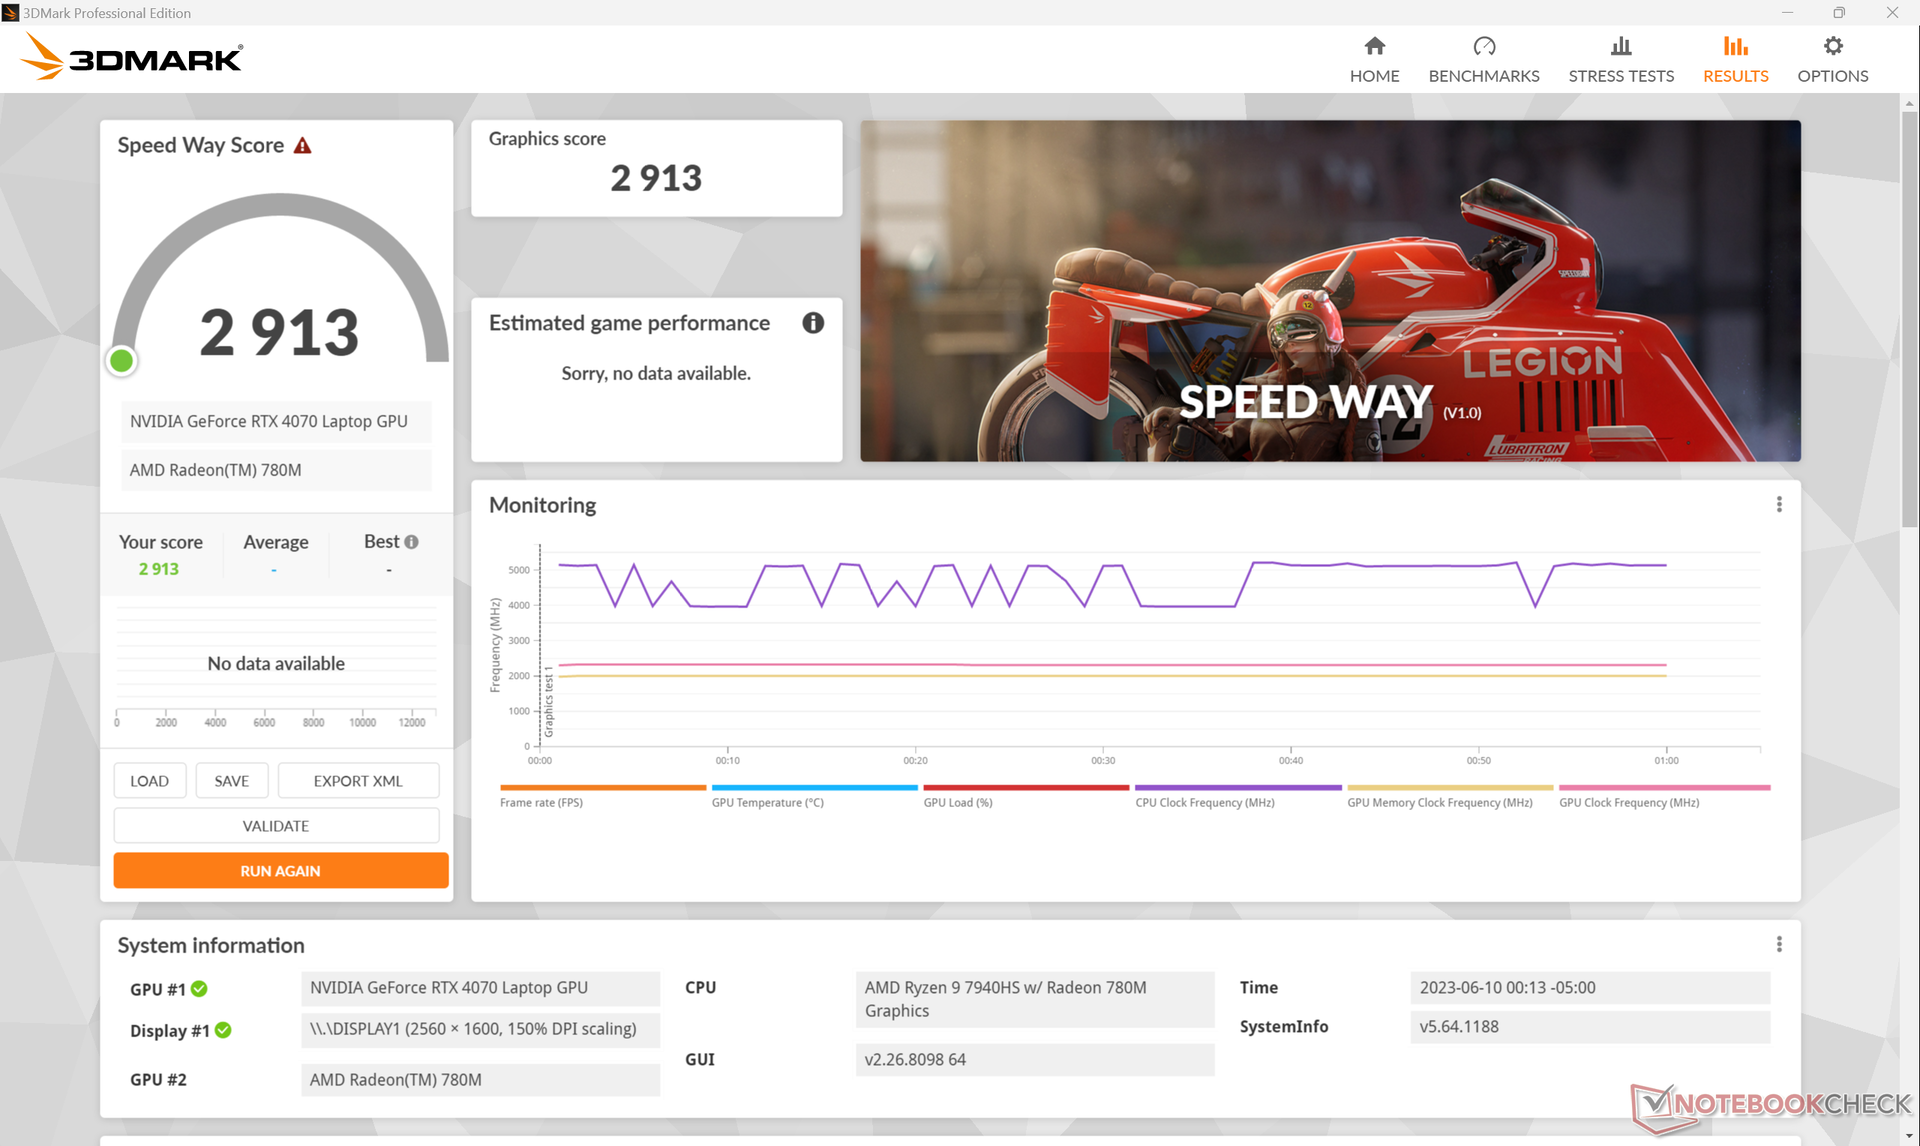
| 3DMark 11 Performance | 34794 points | |
| 3DMark Fire Strike Score | 27620 points | |
| 3DMark Time Spy Score | 11996 points | |
Aide | ||
* ... Moindre est la valeur, meilleures sont les performances
Performance des jeux
Alors que la rTX 4070 Ti est suffisamment puissante pour les jeux en 4K, notre version mobile est mieux adaptée au QHD. Ainsi, le GPU se marie bien avec l'écran FreeSync 1600p du Blade 14. Les titres les plus exigeants peuvent tourner à 1600p et 60 FPS avec des paramètres élevés même sans DLSS, y compris Cyberpunk 2077 et Returnal.
Witcher 3 FPS Chart
| Bas | Moyen | Élevé | Ultra | QHD | 4K | |
|---|---|---|---|---|---|---|
| GTA V (2015) | 182.4 | 176.8 | 169.8 | 108.9 | 90.6 | 87.7 |
| The Witcher 3 (2015) | 335.2 | 295.9 | 218.5 | 109.5 | 68.5 | |
| Dota 2 Reborn (2015) | 166.4 | 152 | 143.6 | 136.1 | 118.6 | |
| Final Fantasy XV Benchmark (2018) | 198.5 | 159.1 | 113.9 | 84.7 | 46.7 | |
| X-Plane 11.11 (2018) | 100.5 | 107.3 | 86.2 | 73.4 | ||
| Strange Brigade (2018) | 390 | 295 | 235 | 203 | 134.3 | 70.4 |
| Shadow of the Tomb Raider (2018) | 137 | 102 | 50 | |||
| Assassin´s Creed Valhalla (2020) | 101 | 75 | 43 | |||
| Far Cry 6 (2021) | 105 | 87 | 48 | |||
| Cyberpunk 2077 1.6 (2022) | 155.9 | 141.3 | 112 | 90.7 | 54.5 | 24 |
| Tiny Tina's Wonderlands (2022) | 227.5 | 193.9 | 132.5 | 103.2 | 71.4 | 37.4 |
| F1 22 (2022) | 232 | 221 | 189.4 | 78.2 | 50.8 | 25.4 |
| Call of Duty Modern Warfare 2 2022 (2022) | 100 | 71 | 41 | |||
| Returnal (2023) | 87 | 85 | 81 | 73 | 52 | 28 |
| The Last of Us (2023) | 69.9 | 41.7 | 30.6 |
Émissions - Plus bruyant que le modèle de l'année dernière
Bruit du système
Le bruit du ventilateur en mode ralenti sur le bureau ou lors de l'exécution de charges peu exigeantes est pratiquement identique à celui du modèle de l'année dernière. En revanche, en mode haute performance, le nouveau modèle peut être beaucoup plus bruyant. En faisant tourner Witcher 3 en mode haute performance avec le Max Fan désactivé, le bruit du ventilateur atteint presque 53 dB(A), contre 42 dB(A) pour le Blade 14 de 2022. Ce bruit peut même atteindre 56 dB(A) si le mode Max Fan est activé. La plage basse à moyenne de 50 dB(A) est comparable à celle du Zephyrus G14, mais reste plus silencieuse que celle du Predator Triton 300 SE.
Degré de la nuisance sonore
| Au repos |
| 23.4 / 23.4 / 23.4 dB(A) |
| Fortement sollicité |
| 33 / 55.6 dB(A) |
 | ||
30 dB silencieux 40 dB(A) audible 50 dB(A) bruyant |
||
min: | ||
| Razer Blade 14 RTX 4070 GeForce RTX 4070 Laptop GPU, R9 7940HS, Samsung PM9A1 MZVL21T0HCLR | Razer Blade 14 Ryzen 9 6900HX GeForce RTX 3070 Ti Laptop GPU, R9 6900HX, Samsung PM9A1 MZVL21T0HCLR | Asus ROG Zephyrus G14 GA402XY GeForce RTX 4090 Laptop GPU, R9 7940HS, Samsung PM9A1 MZVL21T0HCLR | Acer Predator Triton 300 SE GeForce RTX 3060 Laptop GPU, i9-12900H, Micron 3400 1TB MTFDKBA1T0TFH | Alienware x14 i7 RTX 3060 GeForce RTX 3060 Laptop GPU, i7-12700H, WDC PC SN810 1TB | Lenovo Yoga Pro 7 14IRH G8 GeForce RTX 4050 Laptop GPU, i7-13700H, Samsung PM9A1 MZVL21T0HCLR | |
|---|---|---|---|---|---|---|
| Noise | 5% | -13% | -14% | -9% | -8% | |
| arrêt / environnement * (dB) | 22.7 | 23.3 -3% | 23.3 -3% | 23.8 -5% | 24.7 -9% | 22.9 -1% |
| Idle Minimum * (dB) | 23.4 | 23.3 -0% | 23.6 -1% | 23.8 -2% | 24.7 -6% | 22.9 2% |
| Idle Average * (dB) | 23.4 | 23.3 -0% | 23.6 -1% | 23.8 -2% | 24.7 -6% | 22.9 2% |
| Idle Maximum * (dB) | 23.4 | 23.3 -0% | 33 -41% | 30.6 -31% | 30.9 -32% | 36.8 -57% |
| Load Average * (dB) | 33 | 34.7 -5% | 49.5 -50% | 44.2 -34% | 40 -21% | 43.7 -32% |
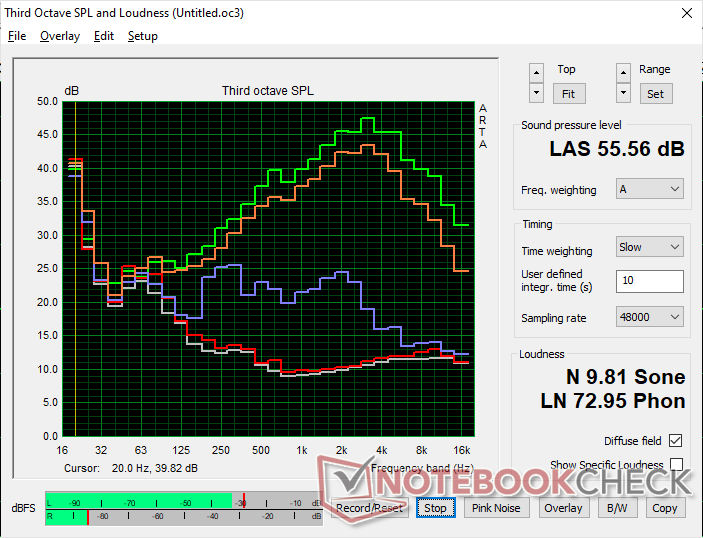
| Witcher 3 ultra * (dB) | 51.8 | 42.1 19% | 52.2 -1% | 60.1 -16% | 51.5 1% | 46.2 11% |
| Load Maximum * (dB) | 55.6 | 42.1 24% | 52.2 6% | 60 -8% | 51.5 7% | 46.2 17% |
* ... Moindre est la valeur, meilleures sont les performances
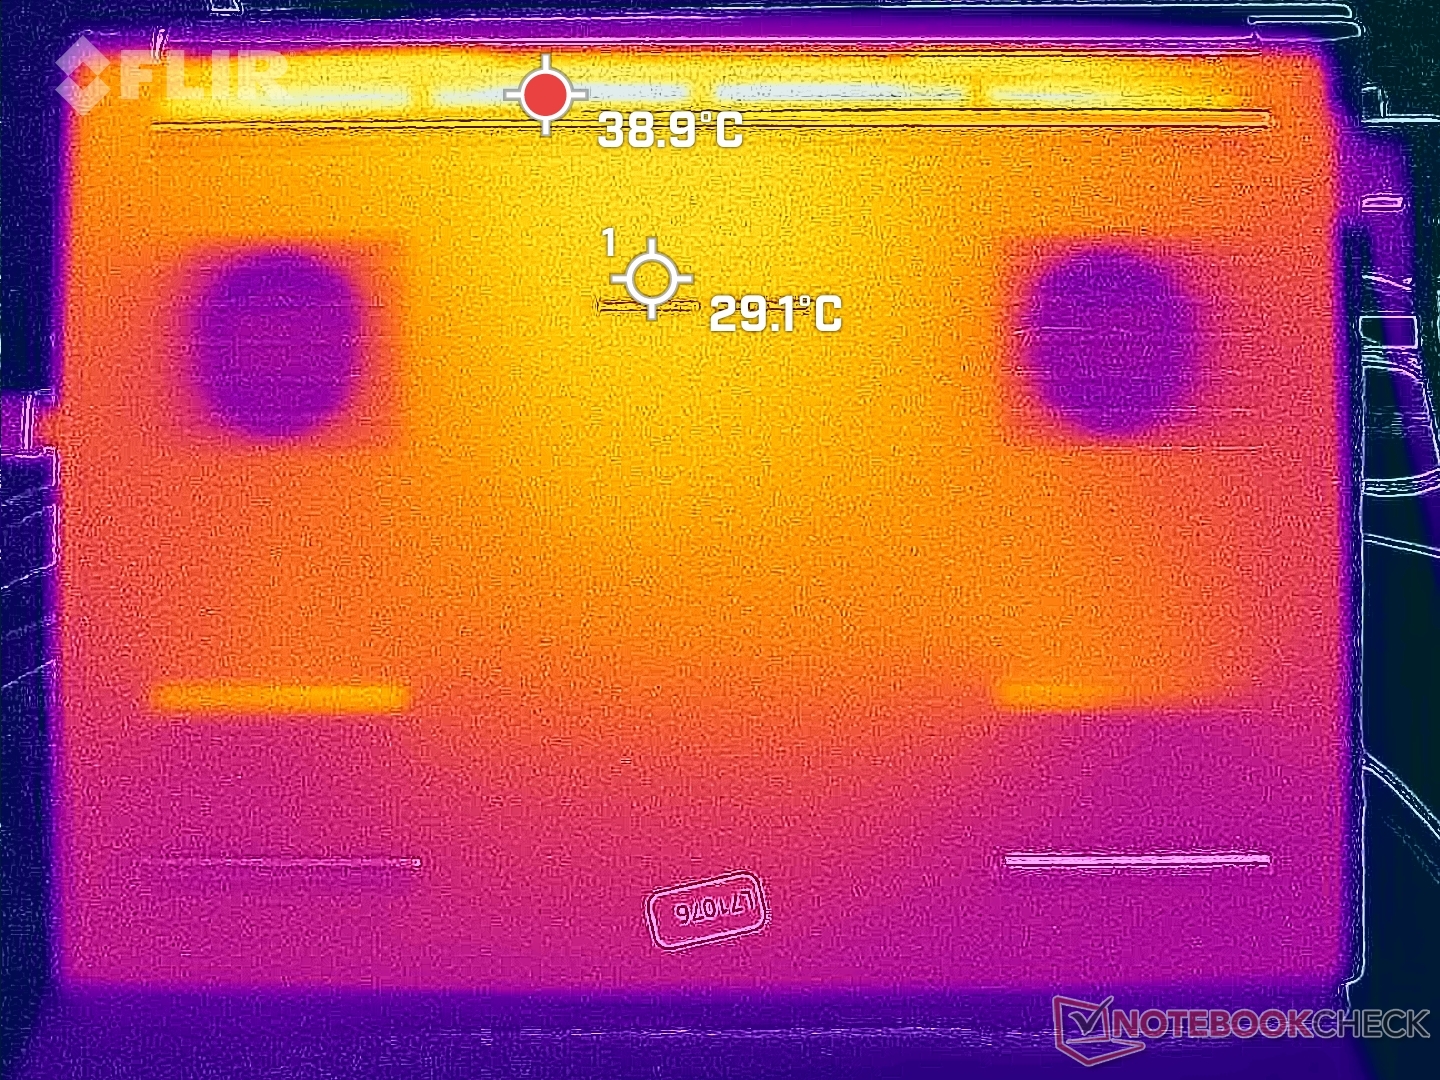
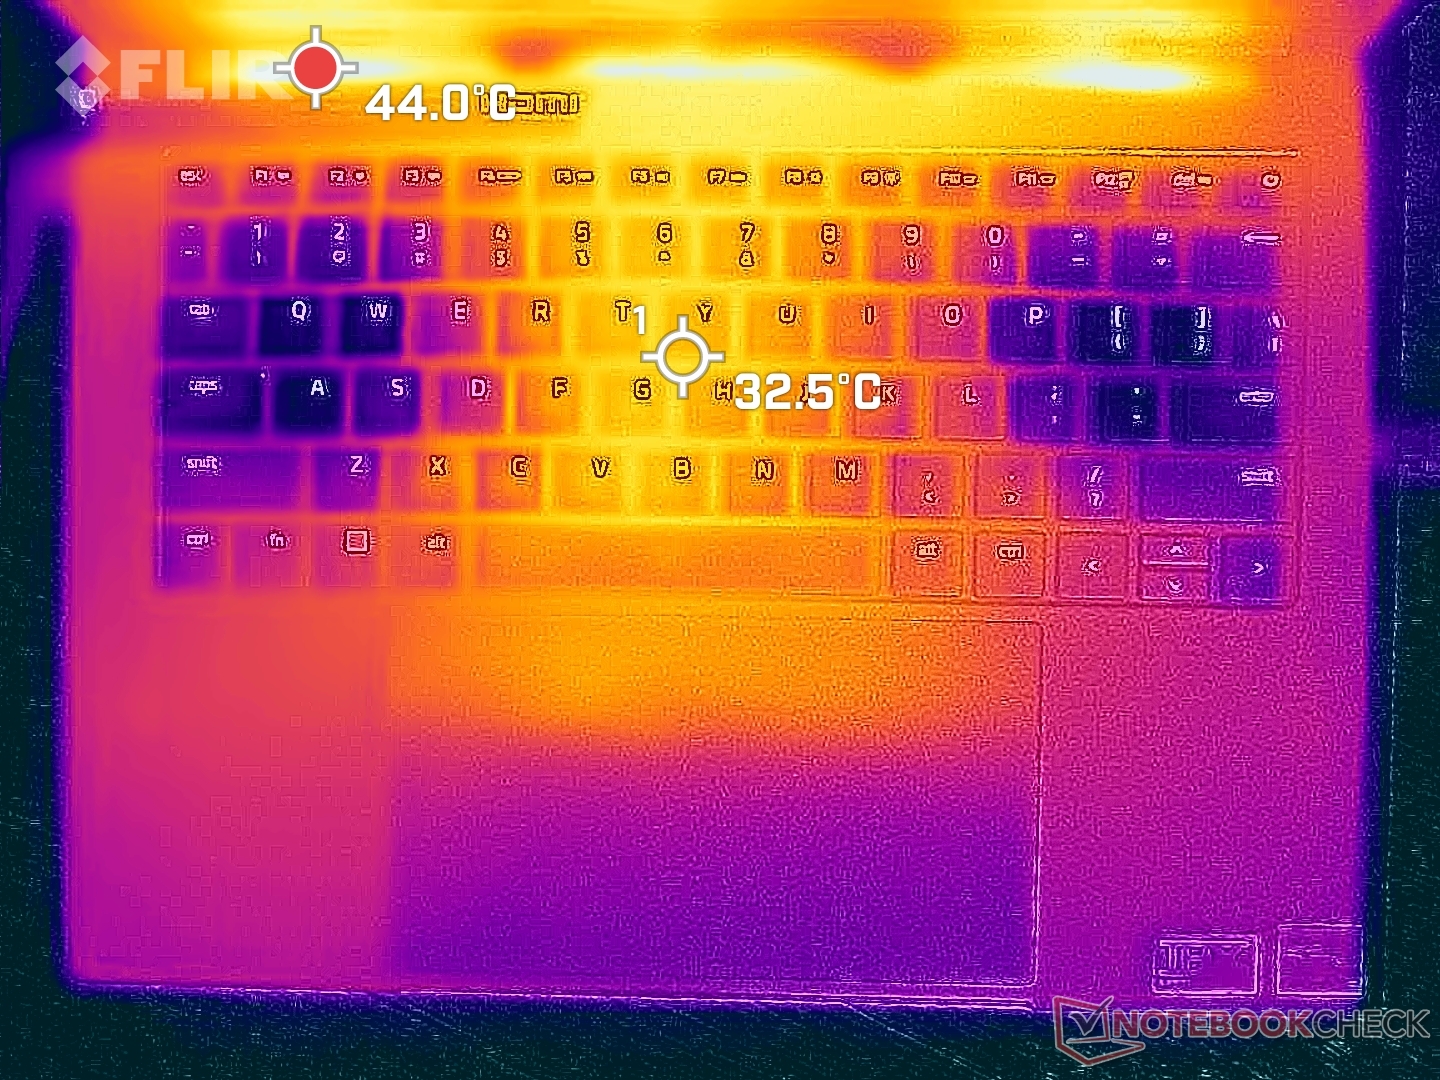
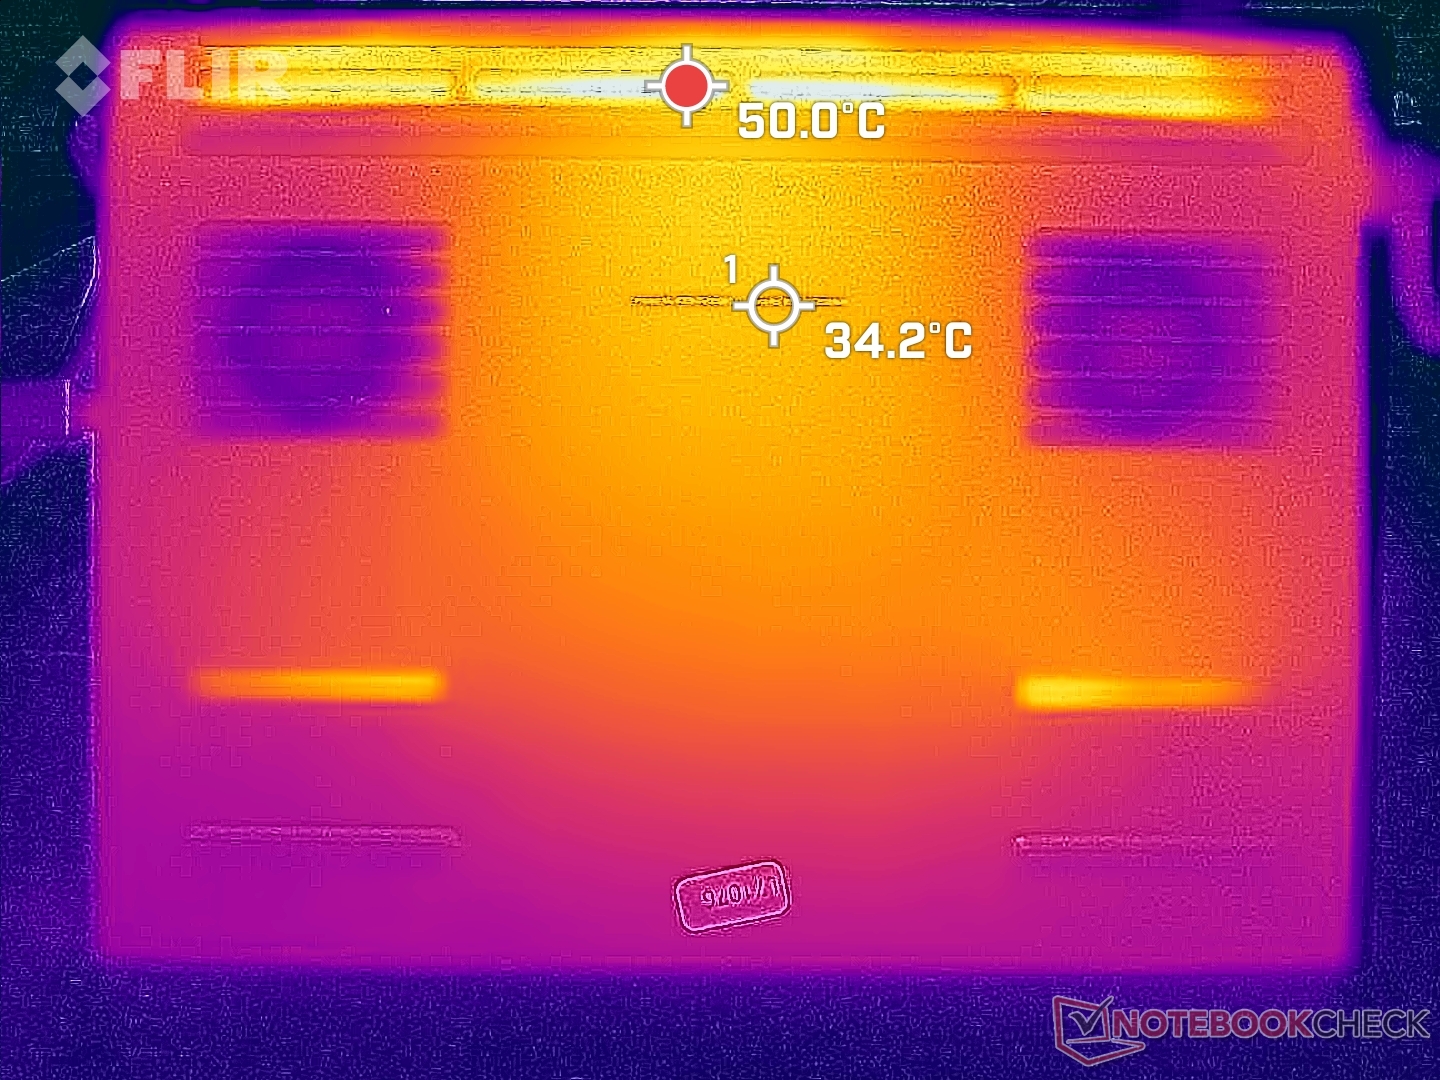
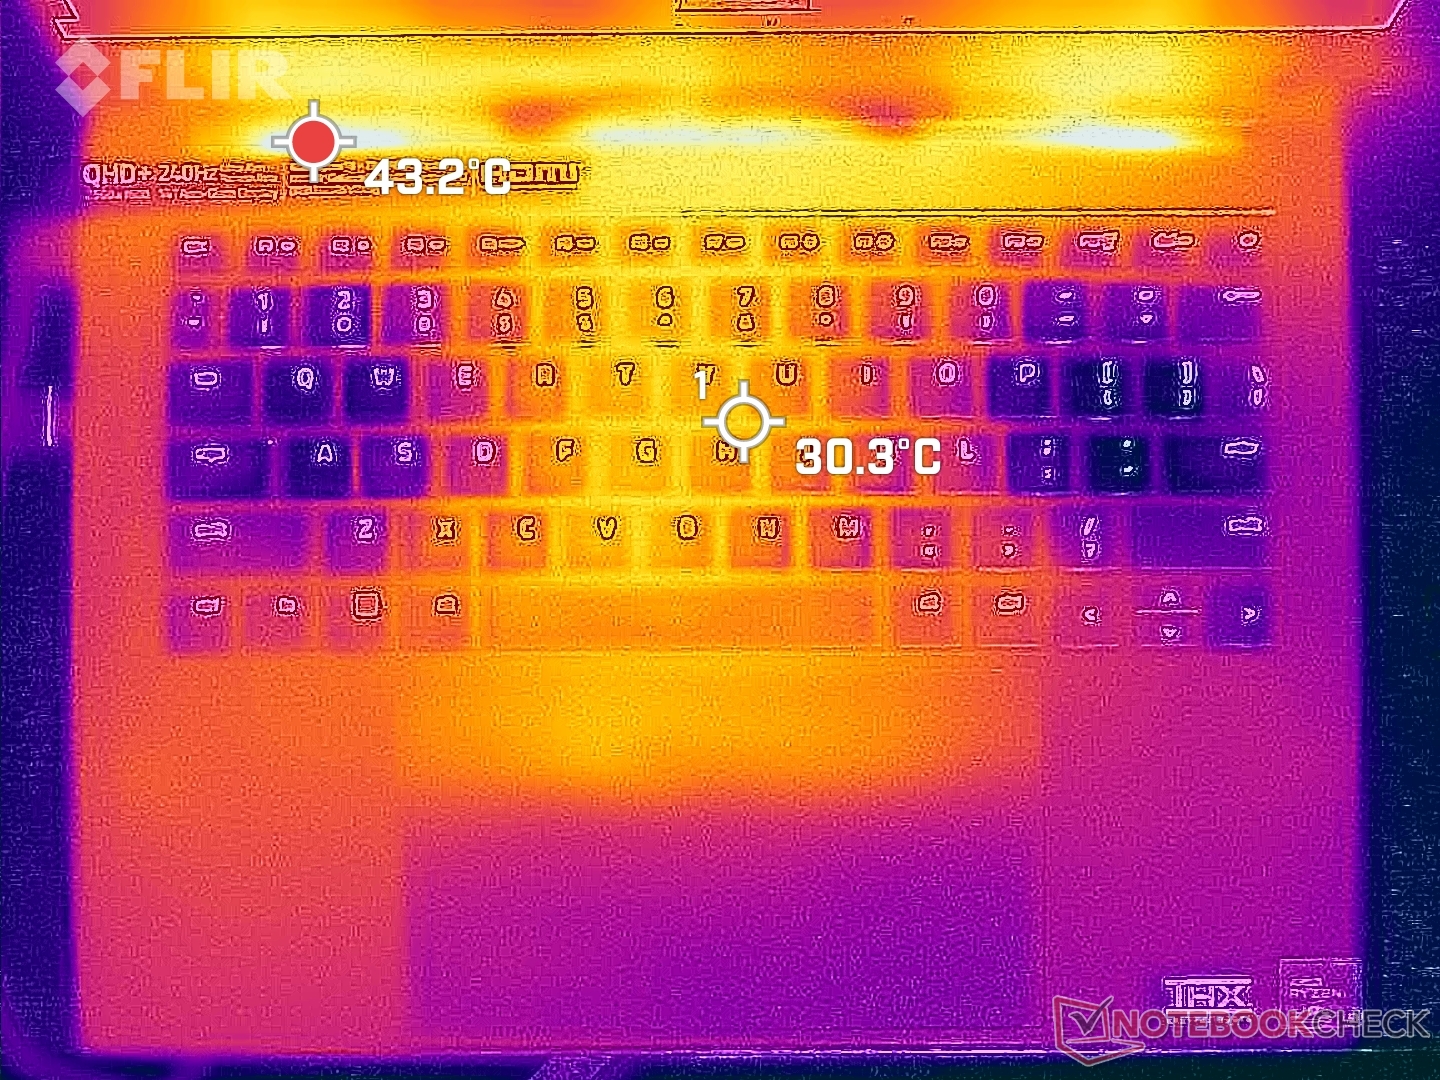
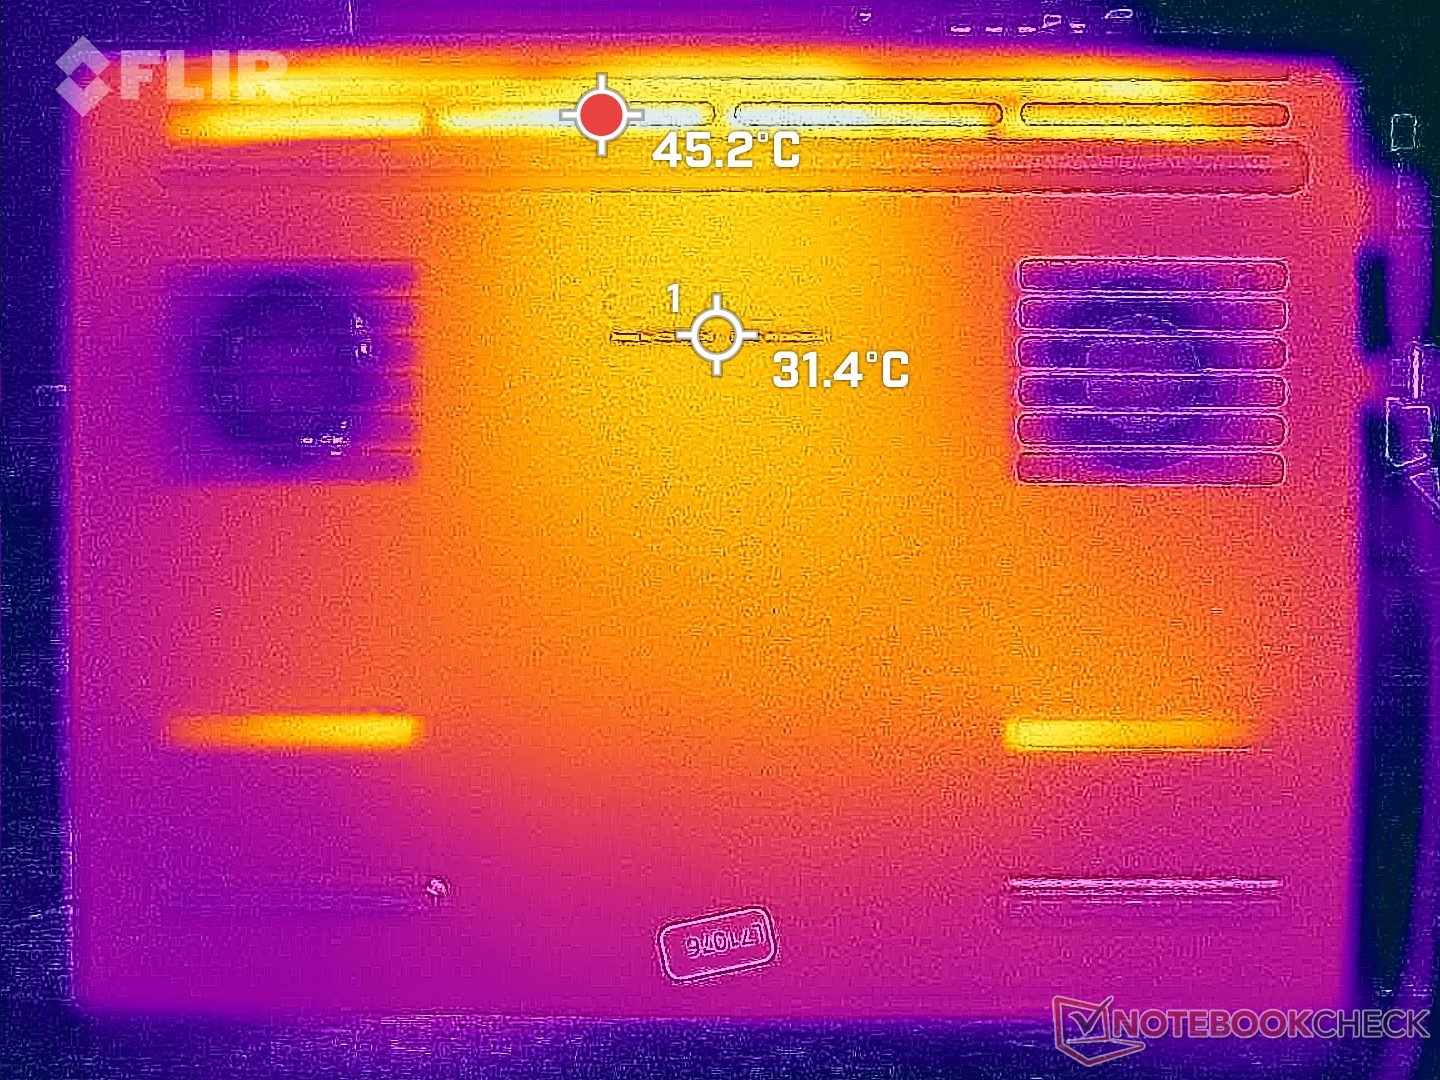
Température
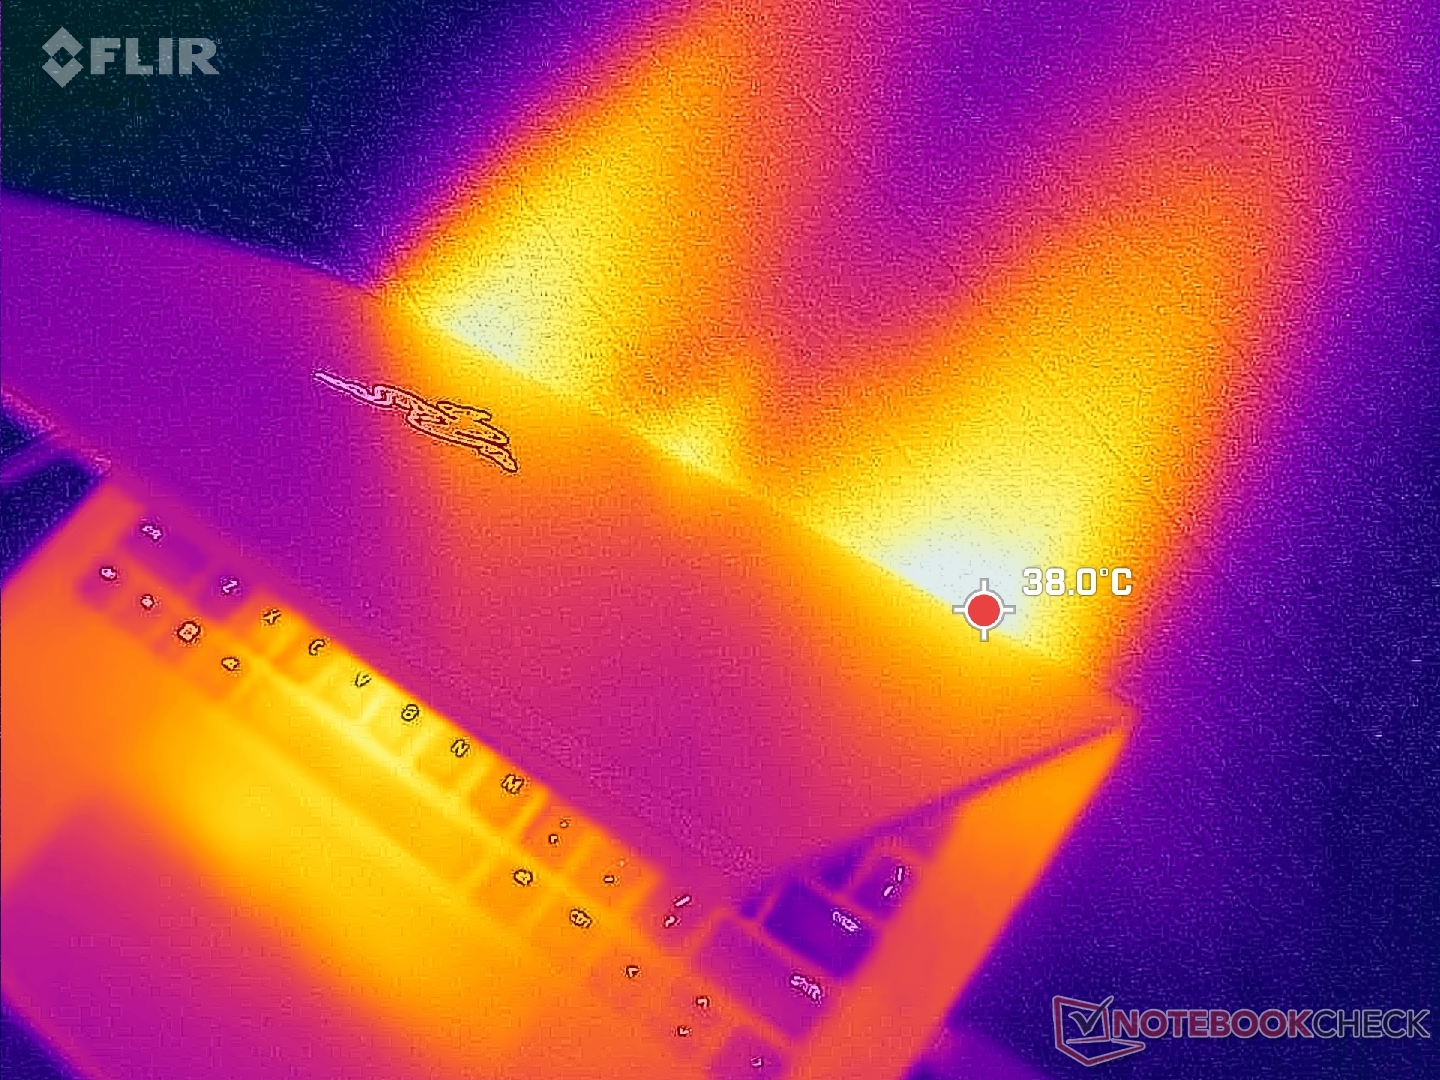
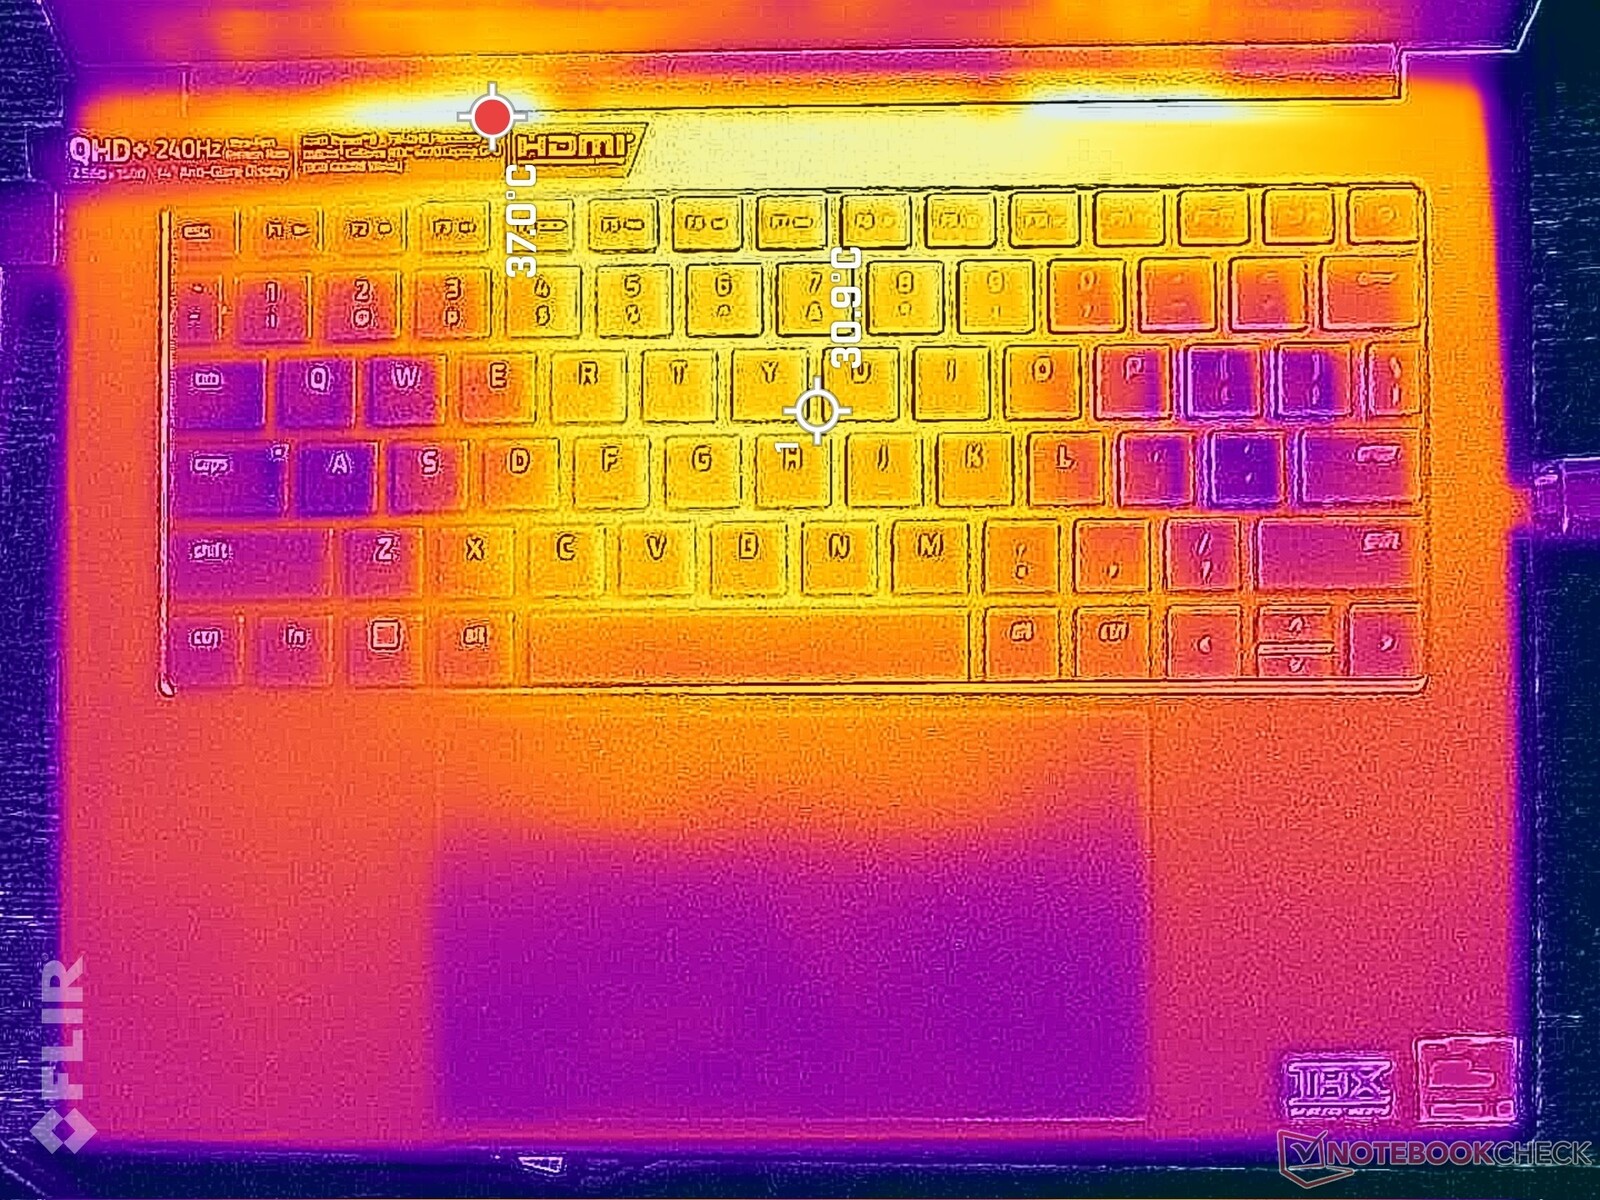
Les températures de surface sont nettement plus basses que sur la 2022 Blade 14 grâce au nouveau mode Max Fan et au profil légèrement plus épais. Lorsque l'on utilise Witcher 3en fonctionnement, par exemple, le centre du clavier et le dessous du modèle 2022 peuvent atteindre 45°C chacun, contre 40°C pour le modèle 2023. Il est également plus froid que leZephyrus G14 en moyenne.
De l'air frais entre par les côtés gauche et droit du clavier pour garder les doigts au frais pendant les jeux. Les repose-poignets peuvent toutefois devenir un peu chauds, même lorsqu'il s'agit simplement de naviguer sur le Web ou de regarder des vidéos en streaming.
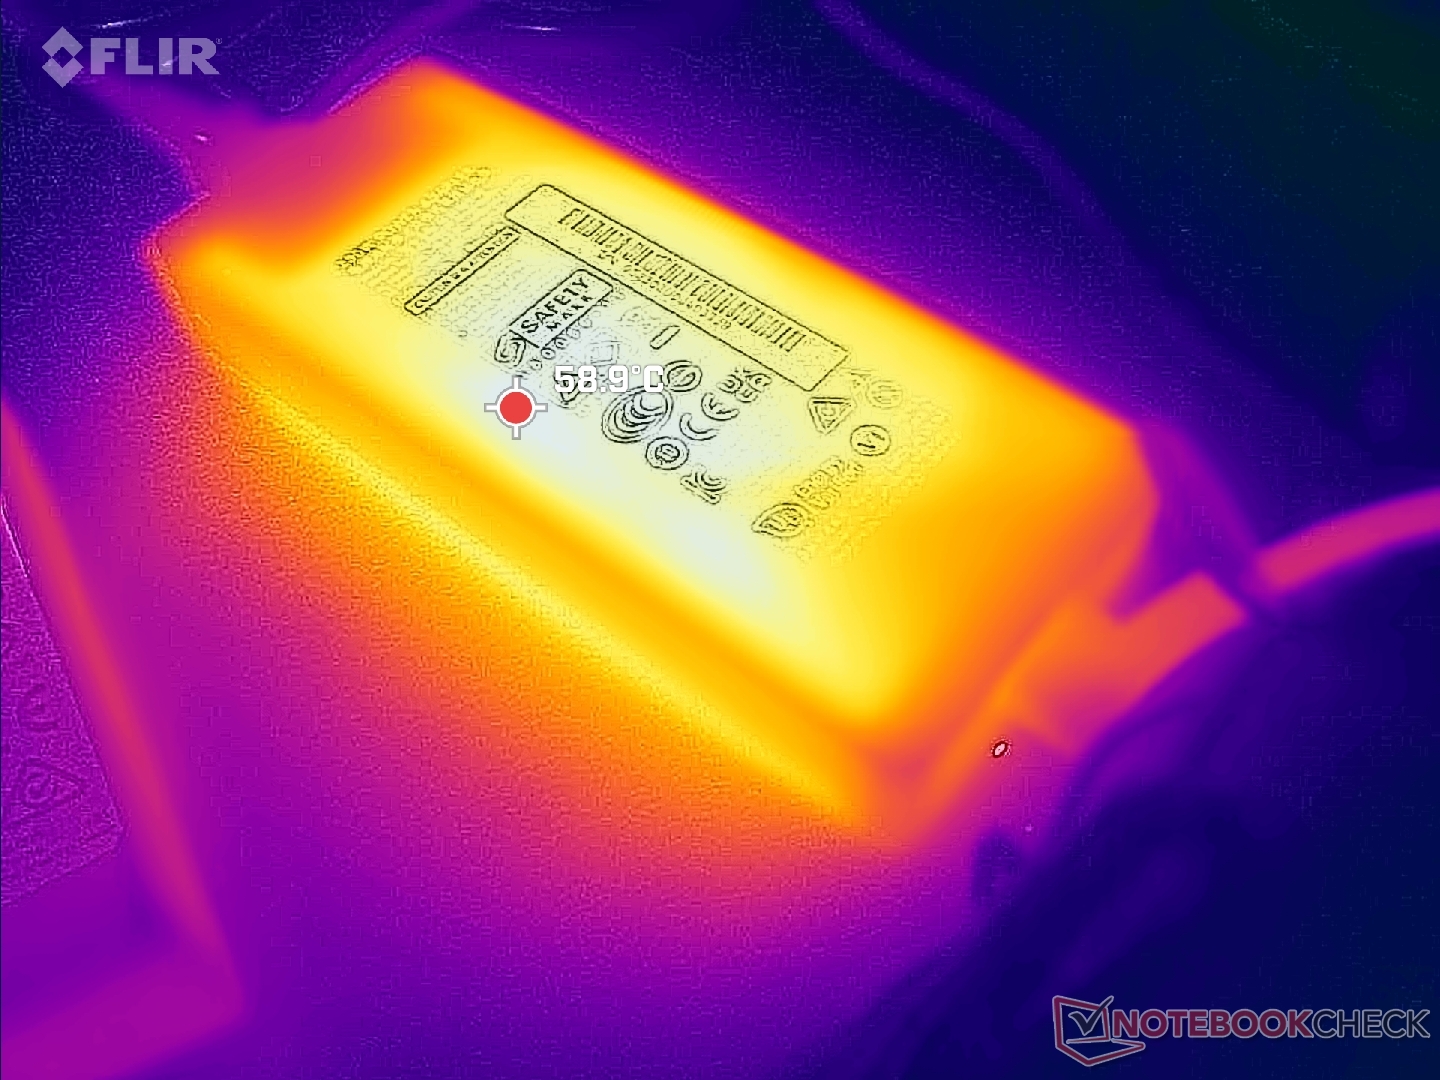
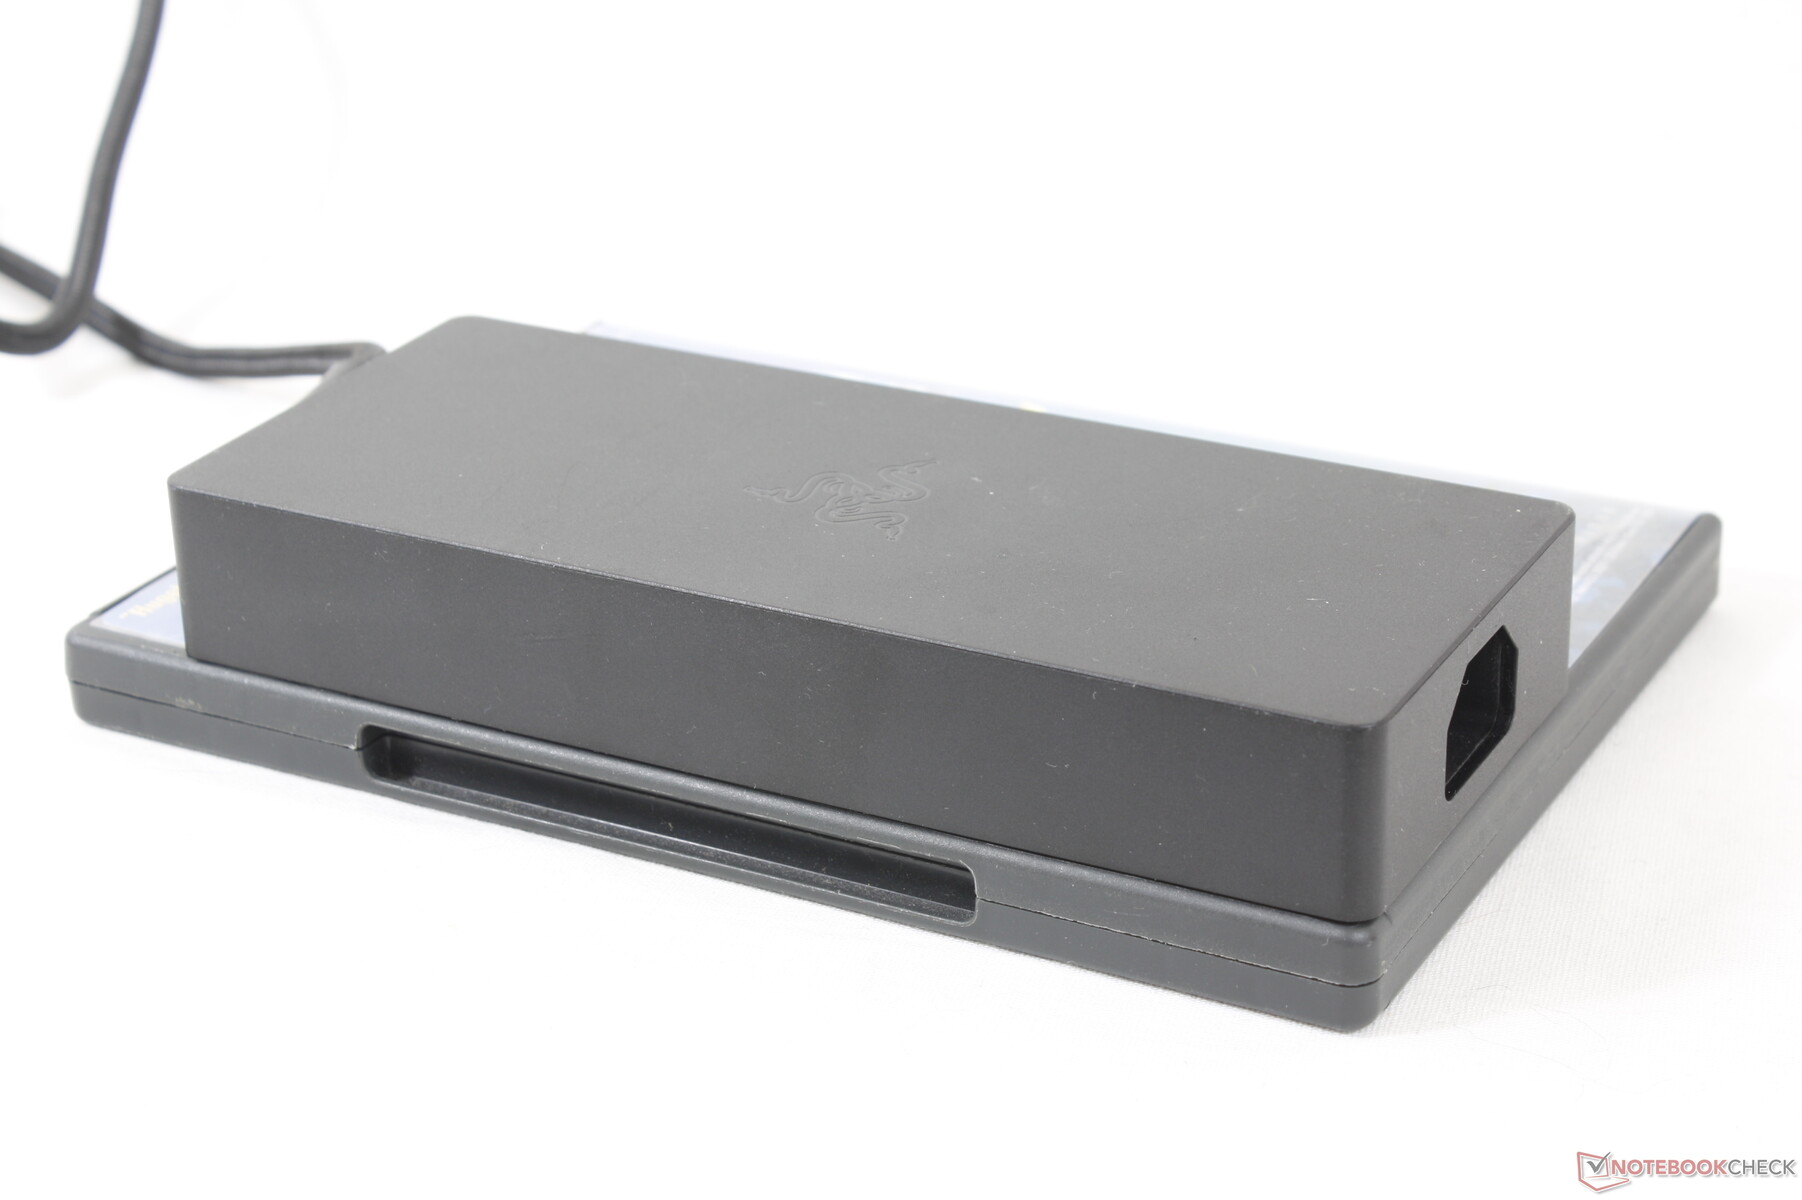
Il convient de noter que l'adaptateur secteur de Razer peut devenir beaucoup plus chaud que la plupart des autres adaptateurs secteur. Par mesure de précaution, il convient de le tenir éloigné de tout objet sensible à la température.
(+) La température maximale du côté supérieur est de 37.4 °C / 99 F, par rapport à la moyenne de 40.4 °C / 105 F, allant de 21.2 à 68.8 °C pour la classe Gaming.
(+) Le fond chauffe jusqu'à un maximum de 35.2 °C / 95 F, contre une moyenne de 43.2 °C / 110 F
(+) En utilisation inactive, la température moyenne du côté supérieur est de 29.7 °C / 85 F, par rapport à la moyenne du dispositif de 33.9 °C / 93 F.
(±) En jouant à The Witcher 3, la température moyenne du côté supérieur est de 34.1 °C / 93 F, alors que la moyenne de l'appareil est de 33.9 °C / 93 F.
(+) Les repose-poignets et le pavé tactile atteignent la température maximale de la peau (34.8 °C / 94.6 F) et ne sont donc pas chauds.
(-) La température moyenne de la zone de l'appui-paume de dispositifs similaires était de 28.8 °C / 83.8 F (-6 °C / #-10.8 F).
| Razer Blade 14 RTX 4070 AMD Ryzen 9 7940HS, NVIDIA GeForce RTX 4070 Laptop GPU | Razer Blade 14 Ryzen 9 6900HX AMD Ryzen 9 6900HX, NVIDIA GeForce RTX 3070 Ti Laptop GPU | Asus ROG Zephyrus G14 GA402XY AMD Ryzen 9 7940HS, NVIDIA GeForce RTX 4090 Laptop GPU | Acer Predator Triton 300 SE Intel Core i9-12900H, NVIDIA GeForce RTX 3060 Laptop GPU | Alienware x14 i7 RTX 3060 Intel Core i7-12700H, NVIDIA GeForce RTX 3060 Laptop GPU | Lenovo Yoga Pro 7 14IRH G8 Intel Core i7-13700H, NVIDIA GeForce RTX 4050 Laptop GPU | |
|---|---|---|---|---|---|---|
| Heat | -12% | -3% | -3% | -5% | -6% | |
| Maximum Upper Side * (°C) | 37.4 | 40.6 -9% | 47 -26% | 43 -15% | 51.3 -37% | 41.6 -11% |
| Maximum Bottom * (°C) | 35.2 | 42.6 -21% | 46.5 -32% | 46.4 -32% | 44.4 -26% | 55.7 -58% |
| Idle Upper Side * (°C) | 33.2 | 38 -14% | 25.9 22% | 28.2 15% | 27.2 18% | 25.9 22% |
| Idle Bottom * (°C) | 36.2 | 37 -2% | 28 23% | 28.4 22% | 26.6 27% | 28 23% |
* ... Moindre est la valeur, meilleures sont les performances
Test de stress
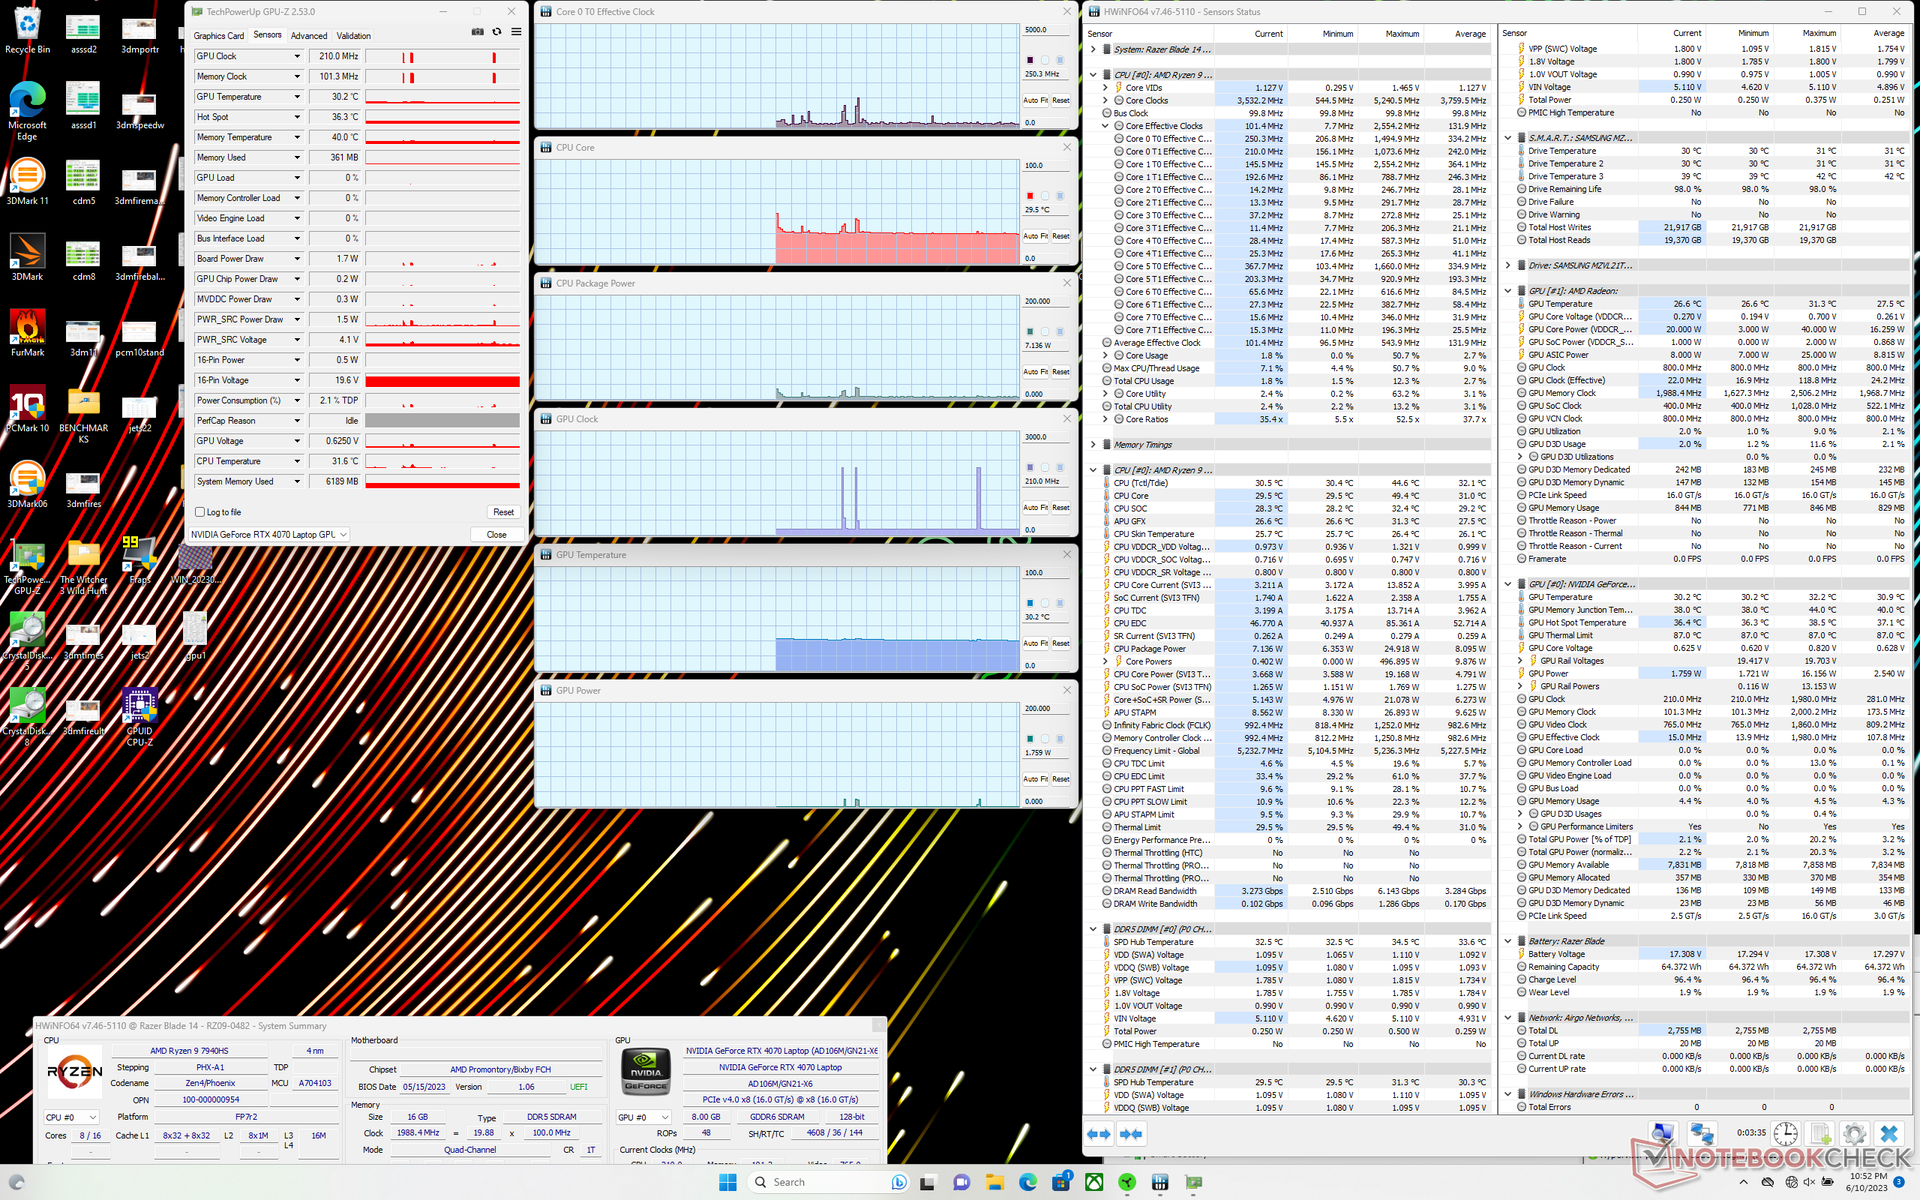
Lors de l'exécution de Prime95 en mode de performance Custom Extreme avec Max Fan activé, le CPU atteignait 4,8 GHz et 88 W seulement pendant les premières secondes avant de se stabiliser à 4,5 GHz, 80 W et 89 C. Répéter ce test sur le Blade 14 2022 plus ancien aurait pour résultat des fréquences d'horloge plus lentes et des températures de cœur plus élevées.
Il est intéressant de noter que les taux de rafraîchissement de Witcher 3 avec le mode Max Fan désactivé donneraient des résultats similaires à ceux du mode Max Fan activé. Ainsi, le mode Max Fan est plus utile pour le refroidissement que pour maximiser les performances dans la plupart des scénarios. Le fait de descendre encore plus bas en mode équilibré aurait un impact plus sévère sur les performances.
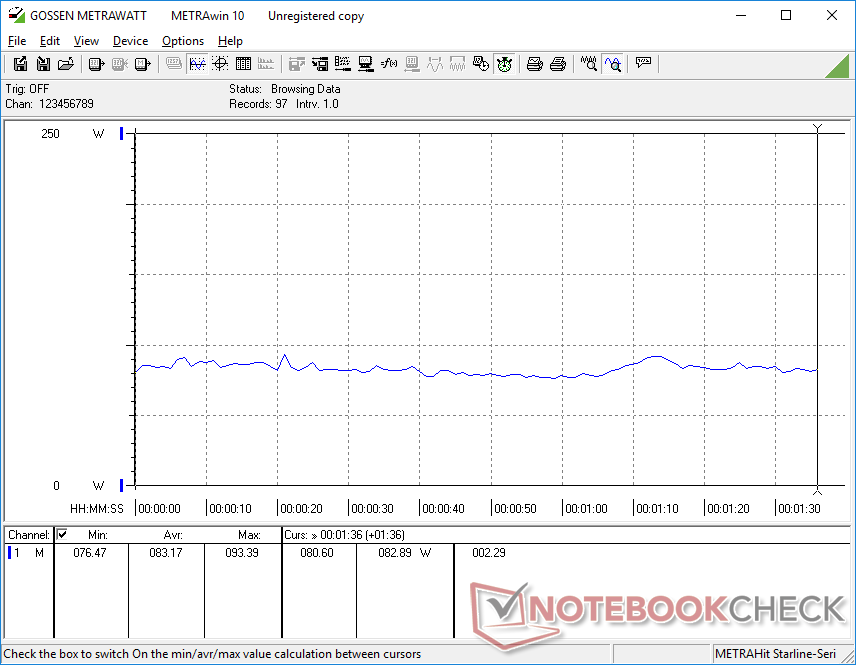
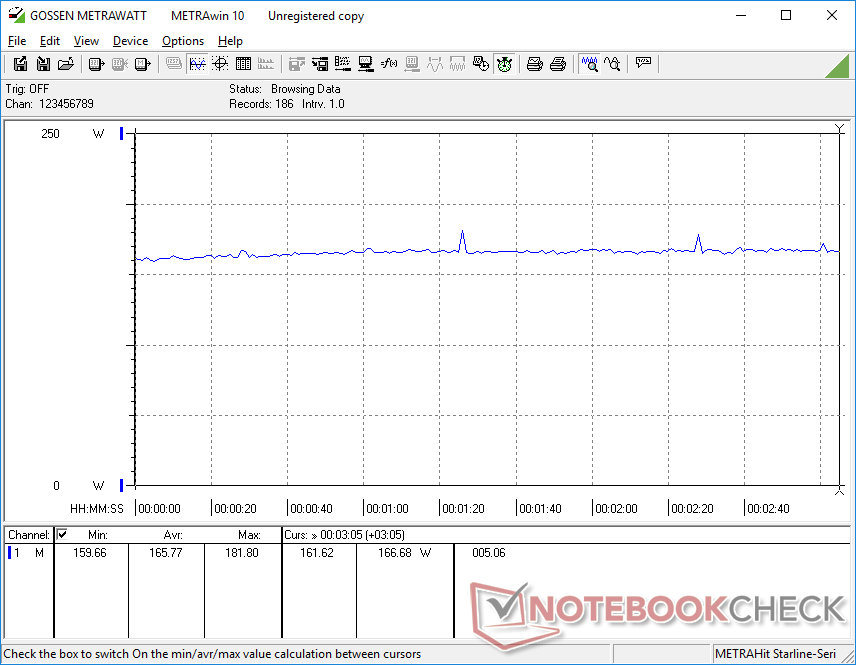
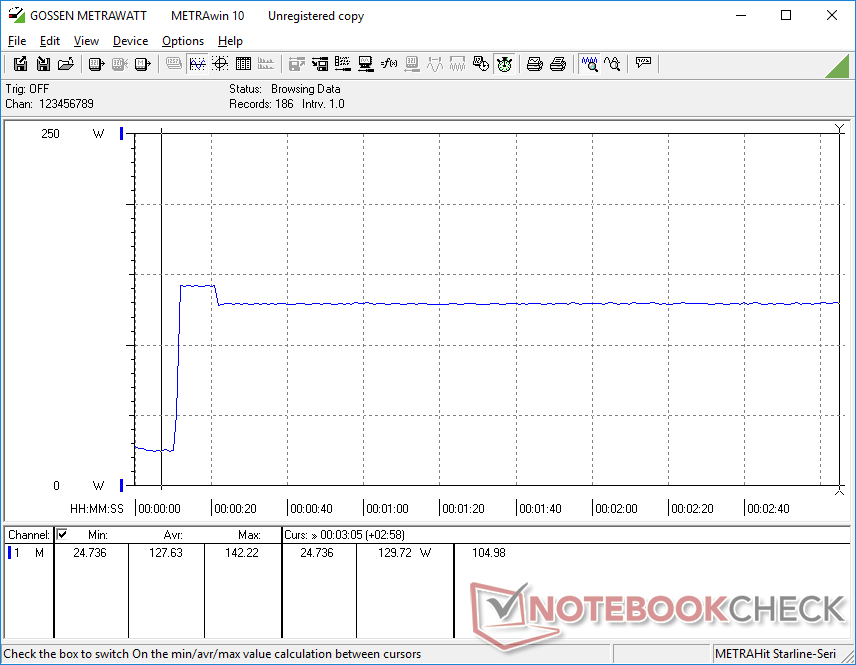
Nous avons pu enregistrer une consommation moyenne de la carte GPU d'environ 87 W et 109 W en exécutant respectivement les jeux Witcher 3 et Cyberpunk 2077, respectivement, en mode Custom Extreme. Au maximum, nous avons pu observer une consommation de 122 W lors de l'exécution de FurMark par rapport à la cible annoncée de 140 W. La consommation du GPU semble plafonner à seulement 95 W en mode équilibré et il est donc recommandé de jouer au moins en mode Custom Extreme avec le ventilateur Max désactivé.
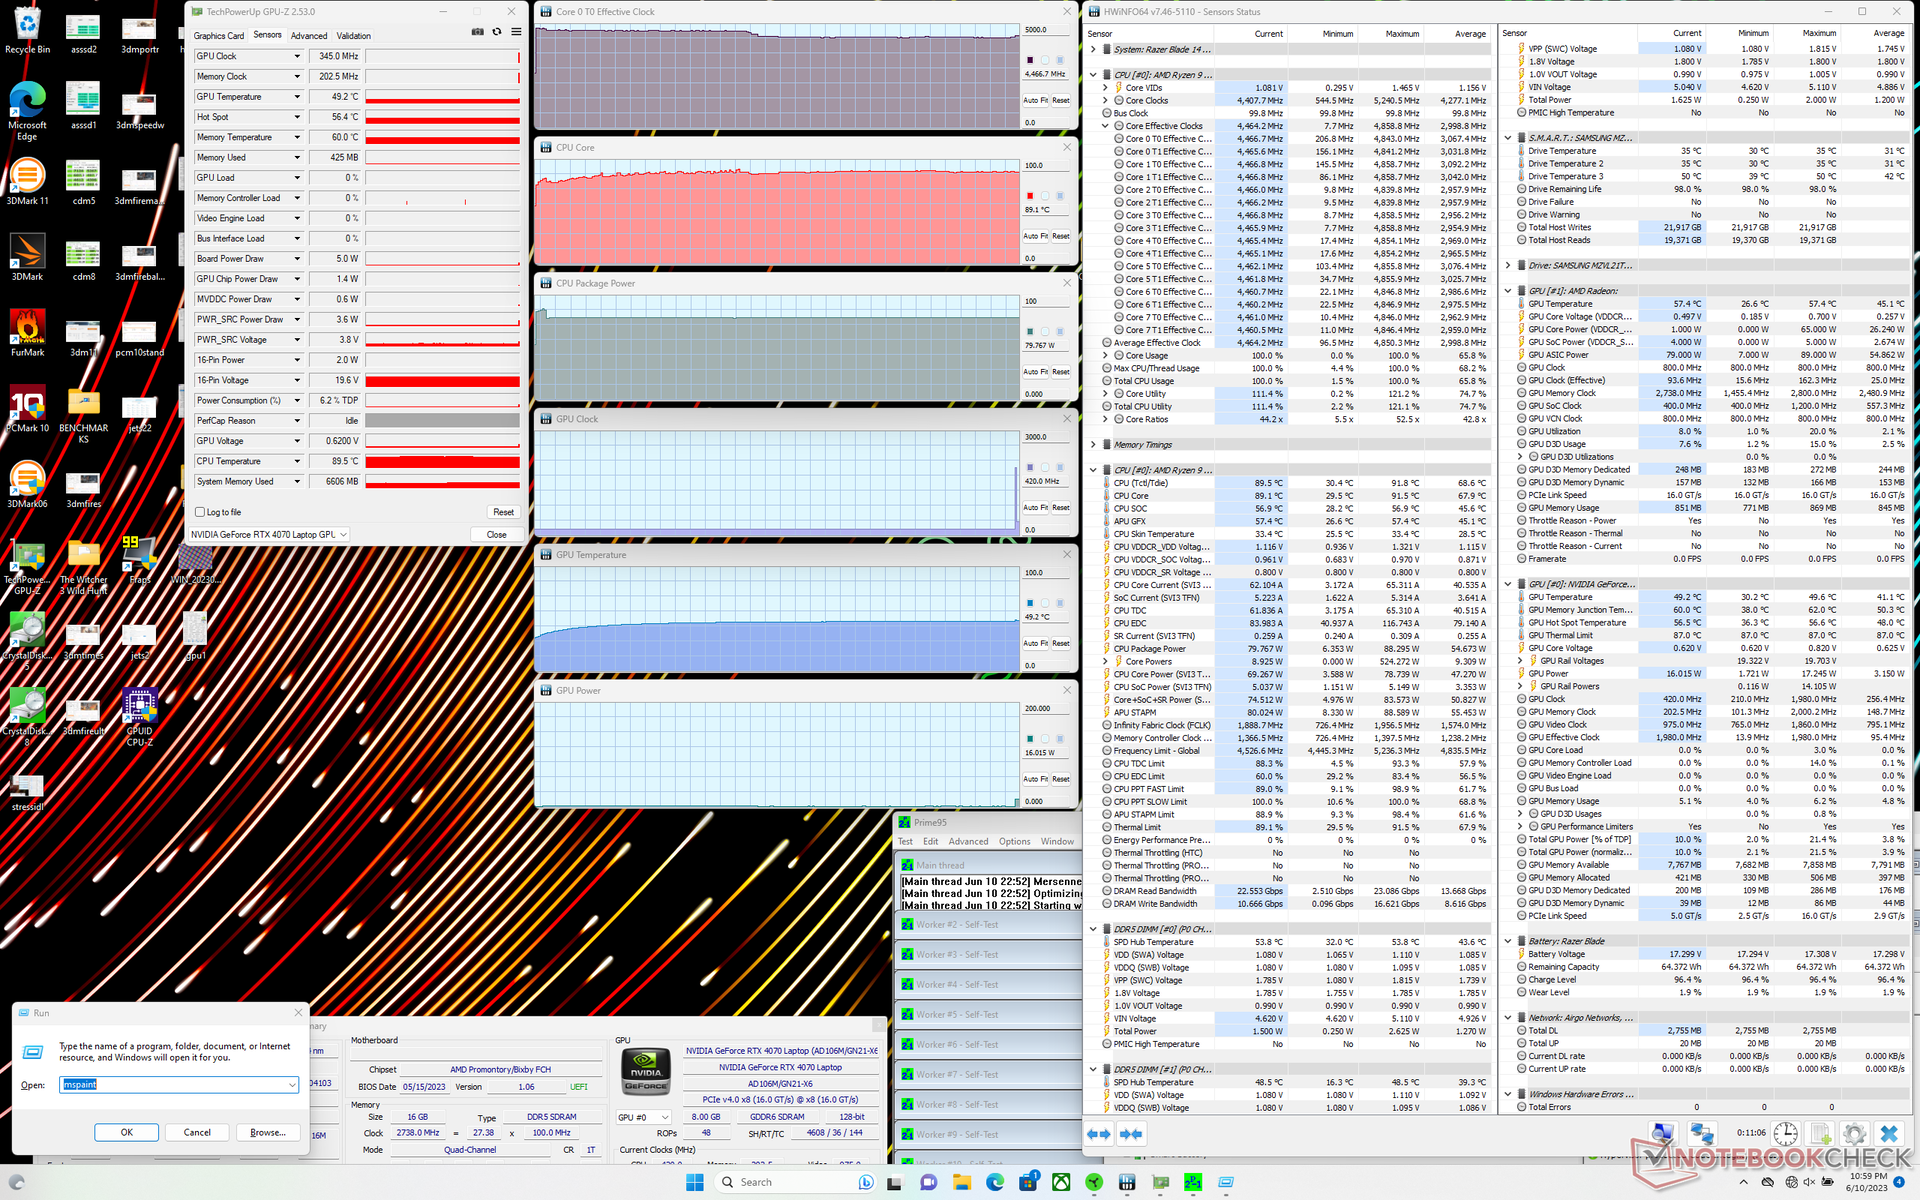
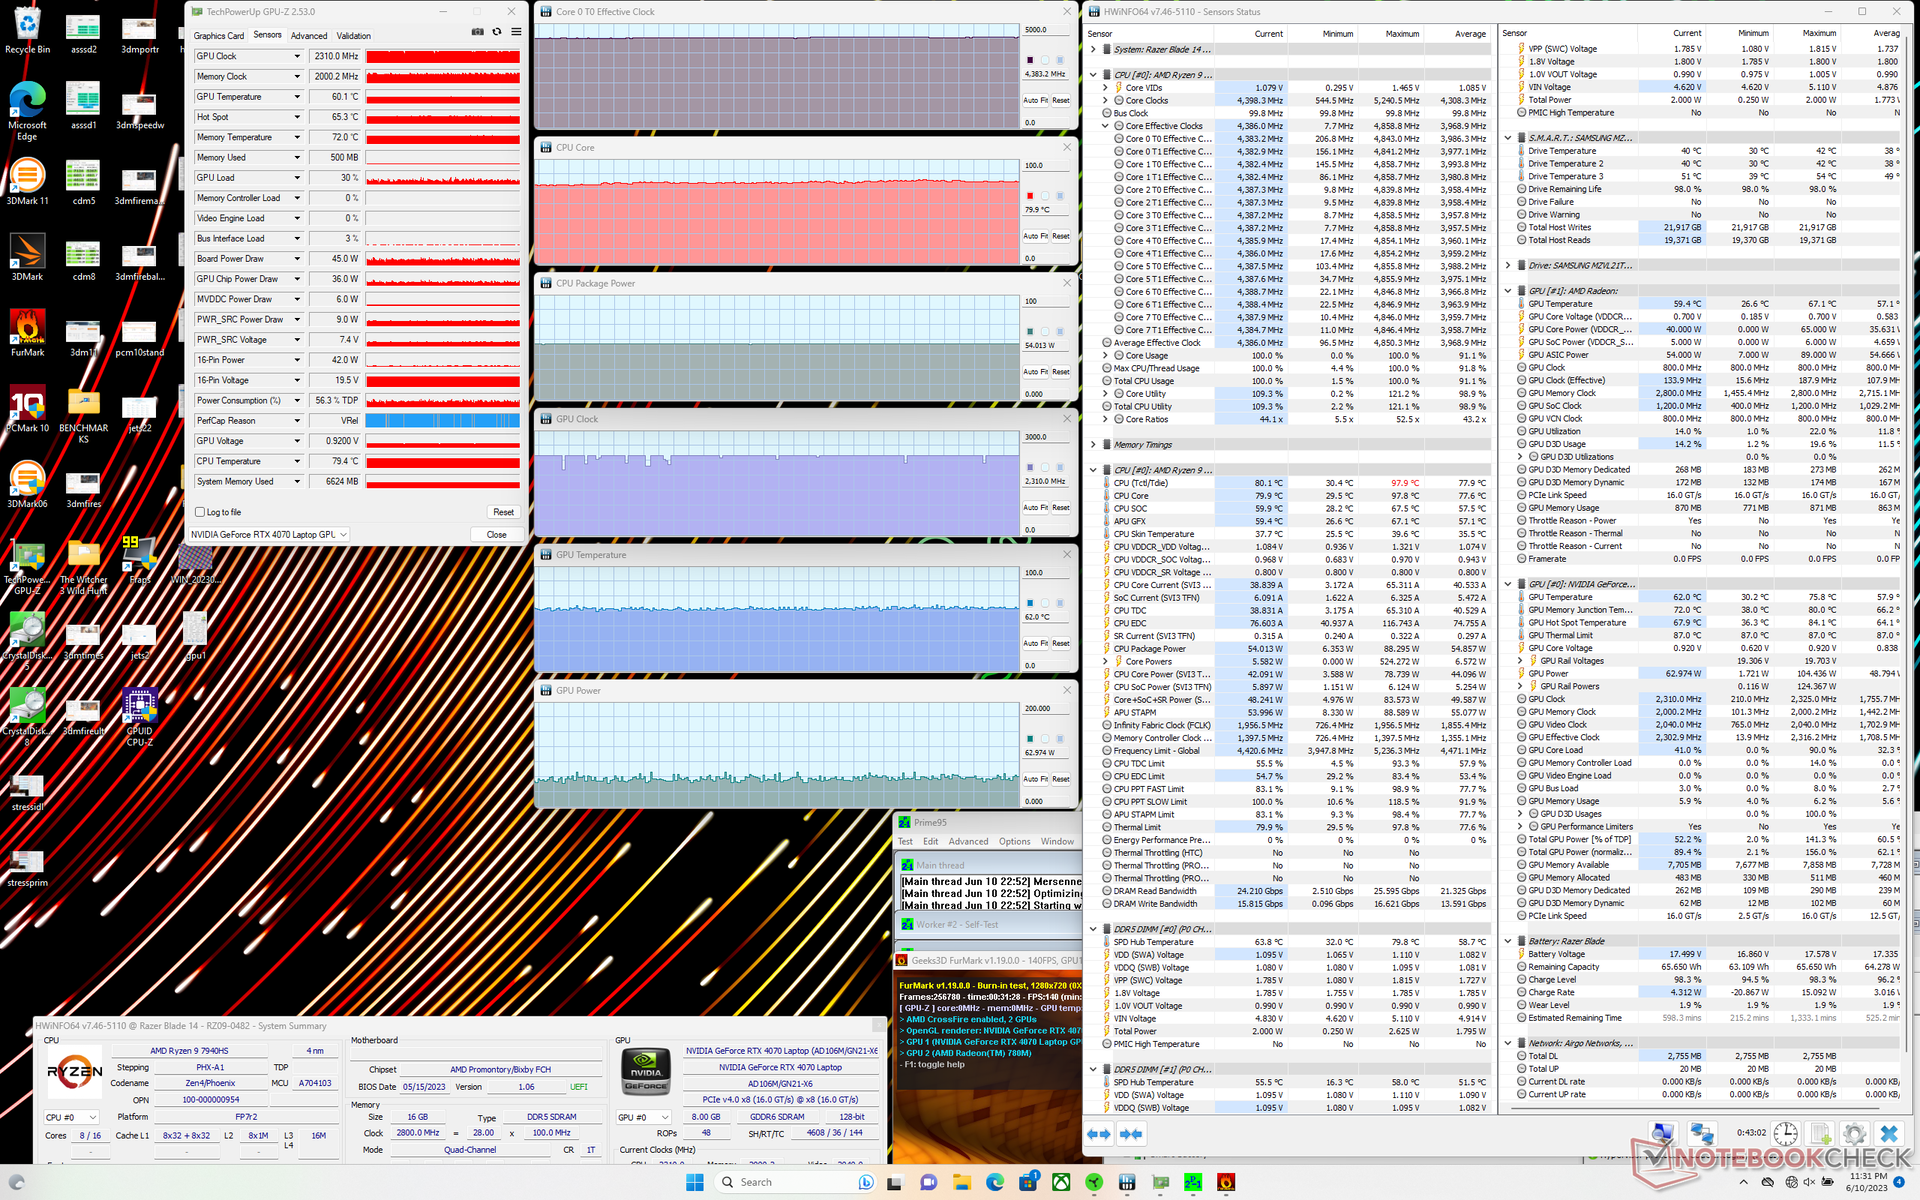
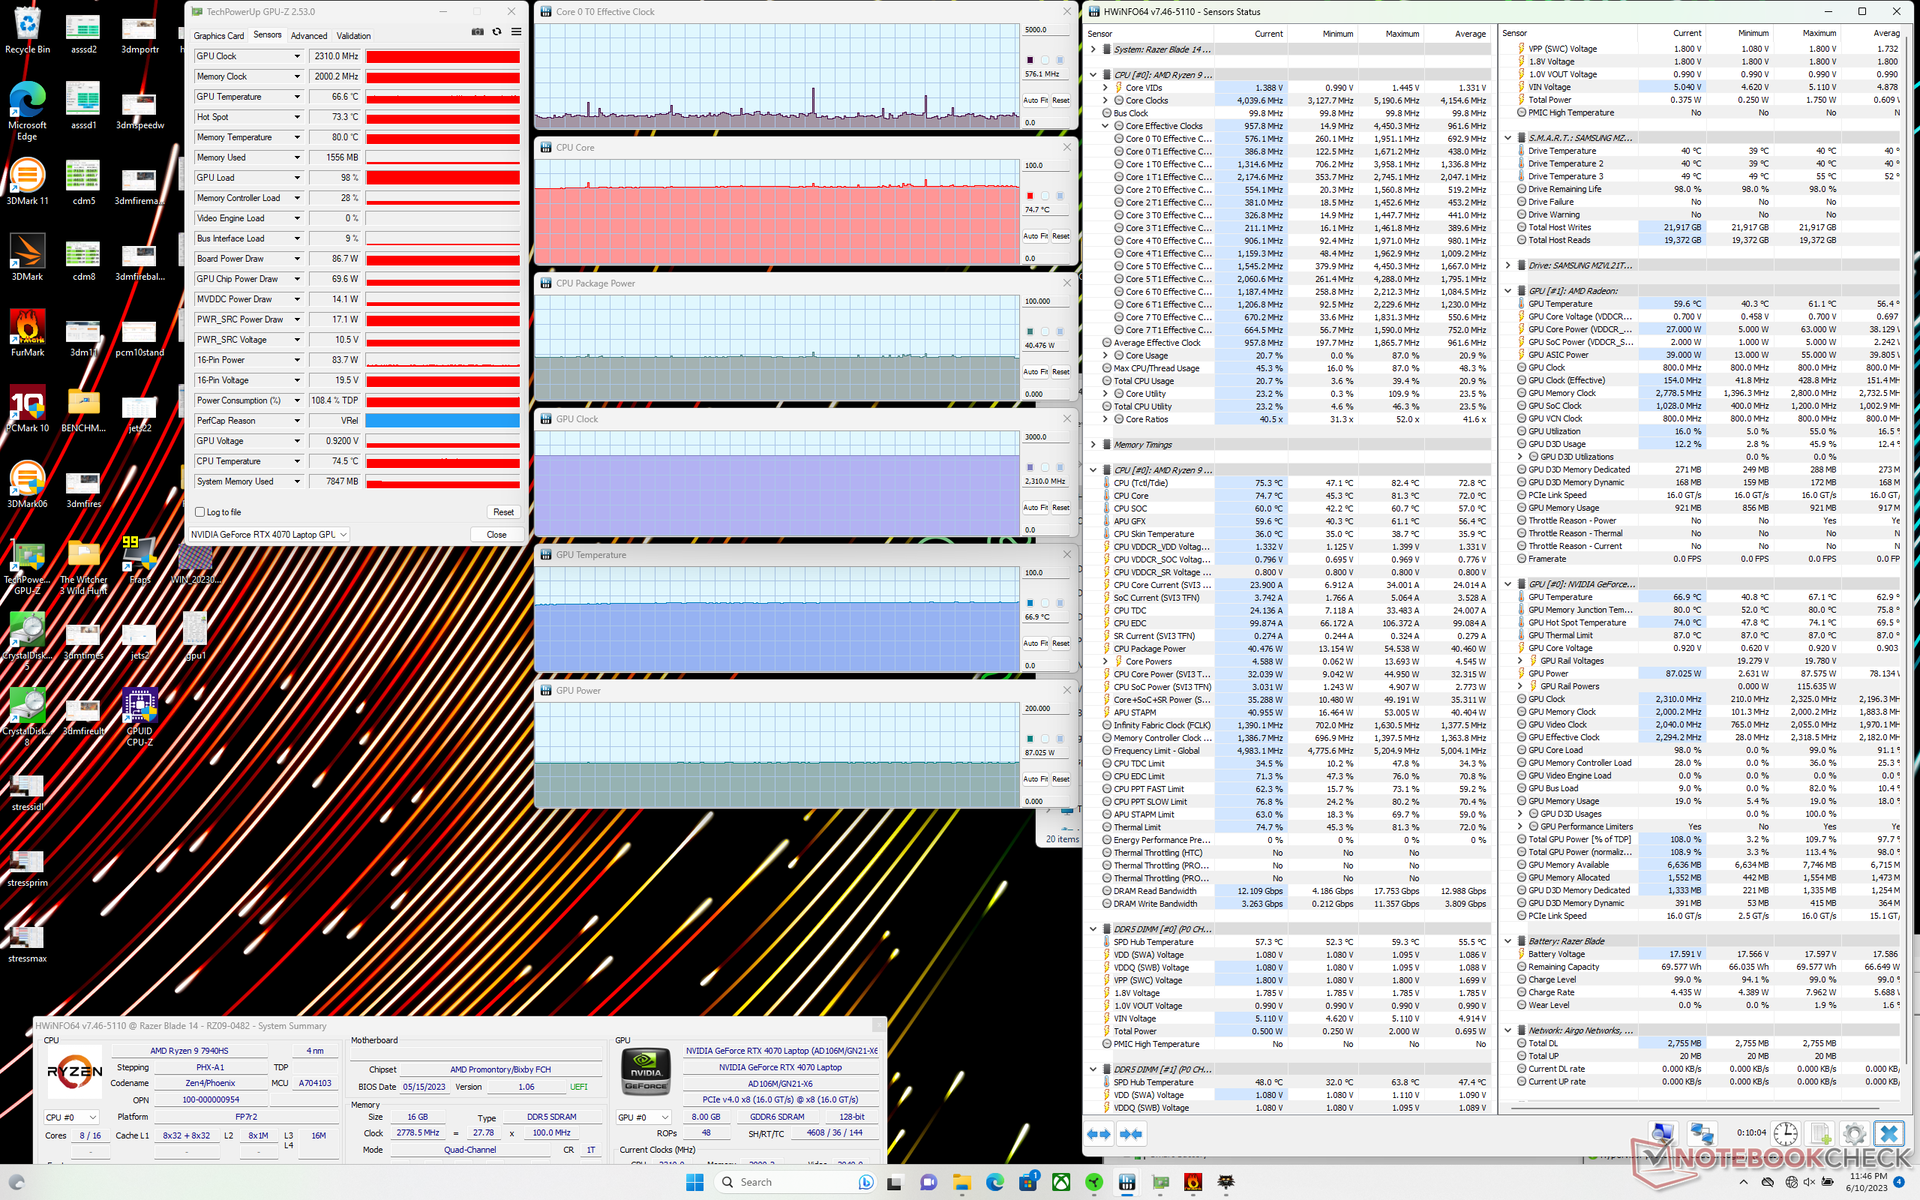

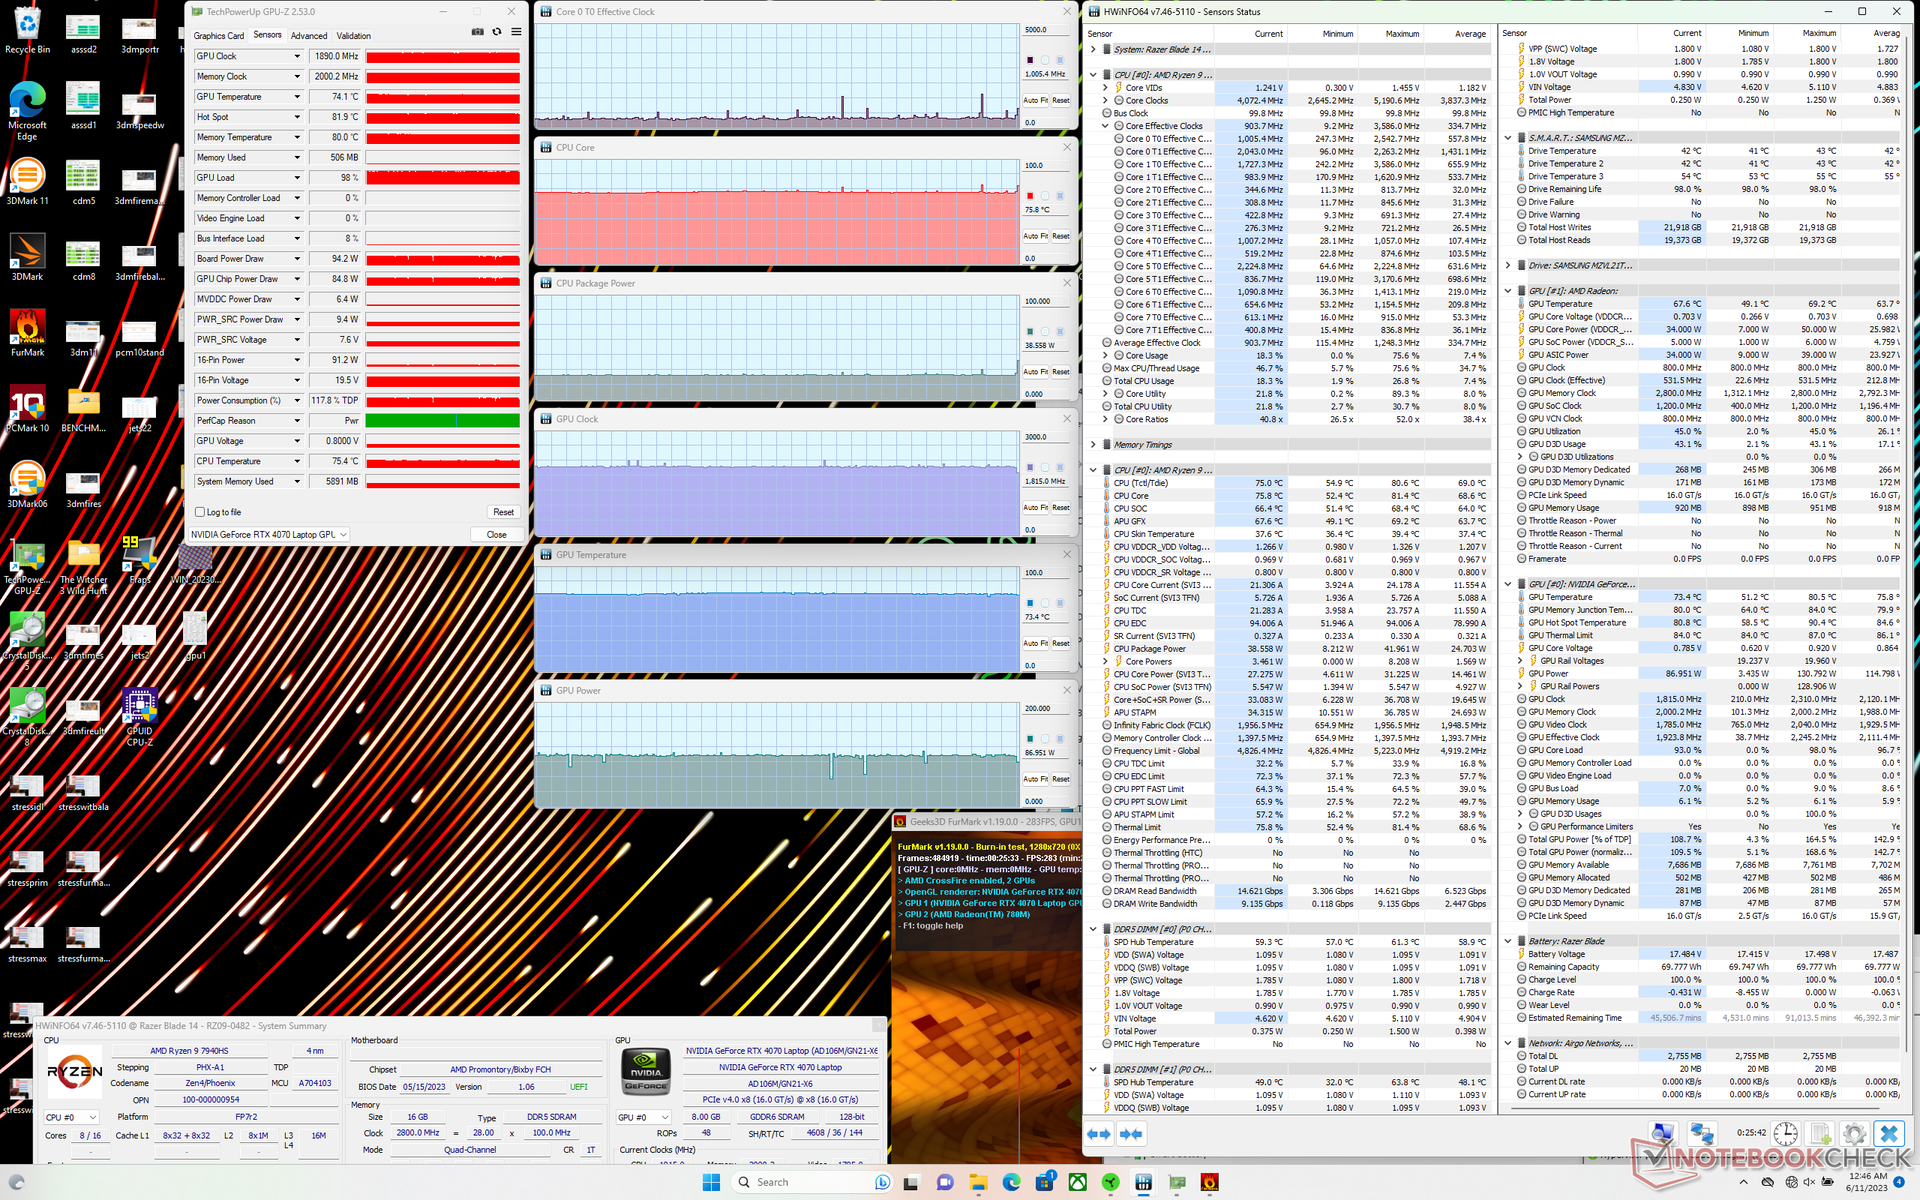

| Horloge du CPU (GHz) | Horloge du GPU (MHz) | Température moyenne du CPU (°C) | Température moyenne du GPU (°C) | |
| Système au repos (ventilateur maximum en marche) | -- | -- | 30 | 30 |
| Prime95 Stress (Ventilateur maximum allumé) | 4.5 | -- | 89 | 49 |
| Prime95 + FurMark Stress (Max Fan on) | 4.4 | 2310 | 80 | 62 |
| Witcher 3 Stress(Max Fan on) | ~0.6 | 2310 | 75 | 67 |
| Witcher 3 Stress (Max Fan off) | ~0.6 | 2310 | 82 | 72 |
| Witcher 3 Stress (mode équilibré) | ~0,6 | 2280 | 82 | 73 |
Intervenants
Razer Blade 14 RTX 4070 analyse audio
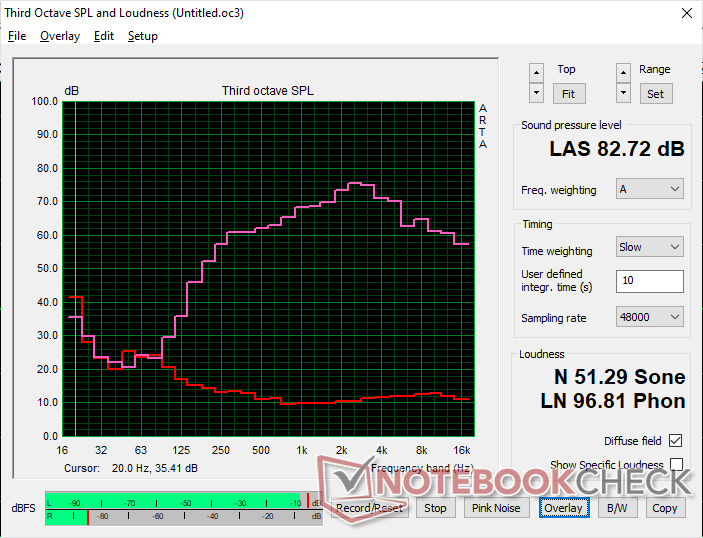
(+) | les haut-parleurs peuvent jouer relativement fort (82.7# dB)
Basses 100 - 315 Hz
(-) | presque aucune basse - en moyenne 15.9% plus bas que la médiane
(±) | la linéarité des basses est moyenne (12.3% delta à la fréquence précédente)
Médiums 400 - 2000 Hz
(+) | médiane équilibrée - seulement 4.3% de la médiane
(+) | les médiums sont linéaires (3.1% delta à la fréquence précédente)
Aiguës 2 - 16 kHz
(±) | sommets plus élevés - en moyenne 6.2% plus élevés que la médiane
(+) | les aigus sont linéaires (5.5% delta à la fréquence précédente)
Globalement 100 - 16 000 Hz
(±) | la linéarité du son global est moyenne (16.7% de différence avec la médiane)
Par rapport à la même classe
» 43% de tous les appareils testés de cette catégorie étaient meilleurs, 10% similaires, 47% pires
» Le meilleur avait un delta de 6%, la moyenne était de 18%, le pire était de 132%.
Par rapport à tous les appareils testés
» 29% de tous les appareils testés étaient meilleurs, 7% similaires, 64% pires
» Le meilleur avait un delta de 4%, la moyenne était de 23%, le pire était de 134%.
Apple MacBook Pro 16 2021 M1 Pro analyse audio
(+) | les haut-parleurs peuvent jouer relativement fort (84.7# dB)
Basses 100 - 315 Hz
(+) | bonne basse - seulement 3.8% loin de la médiane
(+) | les basses sont linéaires (5.2% delta à la fréquence précédente)
Médiums 400 - 2000 Hz
(+) | médiane équilibrée - seulement 1.3% de la médiane
(+) | les médiums sont linéaires (2.1% delta à la fréquence précédente)
Aiguës 2 - 16 kHz
(+) | des sommets équilibrés - à seulement 1.9% de la médiane
(+) | les aigus sont linéaires (2.7% delta à la fréquence précédente)
Globalement 100 - 16 000 Hz
(+) | le son global est linéaire (4.6% différence à la médiane)
Par rapport à la même classe
» 0% de tous les appareils testés de cette catégorie étaient meilleurs, 0% similaires, 100% pires
» Le meilleur avait un delta de 5%, la moyenne était de 17%, le pire était de 45%.
Par rapport à tous les appareils testés
» 0% de tous les appareils testés étaient meilleurs, 0% similaires, 100% pires
» Le meilleur avait un delta de 4%, la moyenne était de 23%, le pire était de 134%.
Gestion de l'énergie - Plus exigeante en période de faible charge
Consommation électrique
Il est intéressant de noter que la consommation d'énergie est presque deux fois plus élevée que sur le modèle RTX 3070 Ti de l'année dernière lorsqu'il tourne au ralenti sur le bureau avec les paramètres de puissance les plus bas, ce qui peut être responsable de la durée de vie de la batterie plus courte que prévu dans la section suivante. Sinon, la consommation en jeu ne serait que de quelques watts de plus, ce qui vaudrait bien l'augmentation de 15 à 25 % des performances graphiques.
L'exécution de Prime95 pour stresser notre CPU Zen 4 donnerait essentiellement les mêmes résultats de consommation d'énergie que sur le modèle Zen 3+ 6900HX de l'année dernière, comme le montrent les graphiques de comparaison ci-dessous, malgré les gains de performance du CPU d'une génération à l'autre. Les performances par watt du CPU et du GPU sont nettement supérieures à celles proposées en 2022.
| Éteint/en veille | |
| Au repos | |
| Fortement sollicité |
|
Légende:
min: | |
| Razer Blade 14 RTX 4070 R9 7940HS, GeForce RTX 4070 Laptop GPU, Samsung PM9A1 MZVL21T0HCLR, IPS, 2560x1600, 14" | Razer Blade 14 Ryzen 9 6900HX R9 6900HX, GeForce RTX 3070 Ti Laptop GPU, Samsung PM9A1 MZVL21T0HCLR, IPS, 2560x1440, 14" | Asus ROG Zephyrus G14 GA402XY R9 7940HS, GeForce RTX 4090 Laptop GPU, Samsung PM9A1 MZVL21T0HCLR, Mini-LED, 2560x1600, 14" | Acer Predator Triton 300 SE i9-12900H, GeForce RTX 3060 Laptop GPU, Micron 3400 1TB MTFDKBA1T0TFH, OLED, 2880x1800, 14" | Alienware x14 i7 RTX 3060 i7-12700H, GeForce RTX 3060 Laptop GPU, WDC PC SN810 1TB, IPS, 1920x1080, 14" | Lenovo Yoga Pro 7 14IRH G8 i7-13700H, GeForce RTX 4050 Laptop GPU, Samsung PM9A1 MZVL21T0HCLR, IPS, 3072x1920, 14.5" | |
|---|---|---|---|---|---|---|
| Power Consumption | 5% | 22% | 20% | 34% | 37% | |
| Idle Minimum * (Watt) | 19.5 | 10.2 48% | 9.4 52% | 7.6 61% | 7.9 59% | 7.6 61% |
| Idle Average * (Watt) | 24.7 | 26 -5% | 14.2 43% | 12.3 50% | 11.1 55% | 13.3 46% |
| Idle Maximum * (Watt) | 27 | 26.7 1% | 14.5 46% | 17.6 35% | 11.8 56% | 13.7 49% |
| Load Average * (Watt) | 83.2 | 89.3 -7% | 79 5% | 111 -33% | 107.4 -29% | 88.2 -6% |
| Witcher 3 ultra * (Watt) | 165.8 | 158.7 4% | 172 -4% | 117.1 29% | 111 33% | 94.2 43% |
| Load Maximum * (Watt) | 204.5 | 227.5 -11% | 220.8 -8% | 245.8 -20% | 140.4 31% | 143 30% |
* ... Moindre est la valeur, meilleures sont les performances
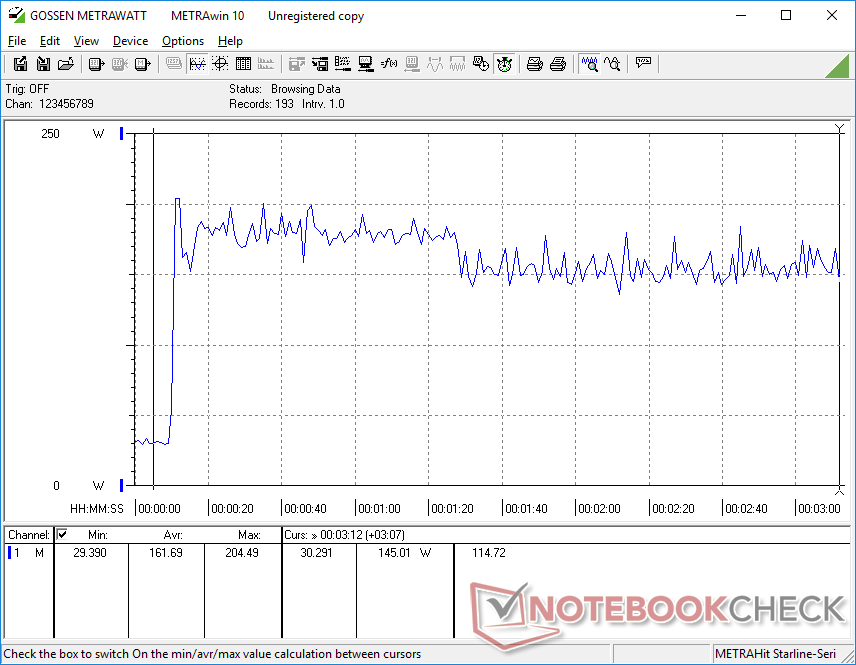
Power Consumption Witcher 3 / Stresstest
Power Consumption external Monitor
Autonomie de la batterie - durées d'utilisation nettement plus courtes
Alors que la capacité de la batterie a légèrement augmenté de 62 Wh à 68 Wh par rapport au modèle de l'année dernière, les durées d'utilisation semblent être beaucoup plus courtes sur le nouveau modèle. Nous avons pu enregistrer un peu plus de six heures de navigation dans le monde réel, soit plus de trois heures de moins qu'avec le Blade 14 de 2022. D'autres ordinateurs portables de jeu comme le Zephyrus G14 ou le Alienware x14 sont également capables de tenir plus longtemps sur la batterie. Il est possible de tirer un peu plus de la batterie en réglant le taux de rafraîchissement de l'écran à 60 Hz au lieu des 240 Hz par défaut. Notre test WLAN consiste à régler les deux ordinateurs portables sur le profil d'alimentation équilibré et la même luminosité de 150 nit avec le rétroéclairage RVB du clavier désactivé.
Le chargement de la batterie vide à la pleine capacité prend environ 90 minutes avec l'adaptateur secteur fourni. Des adaptateurs USB-C tiers peuvent également être utilisés pour recharger le système, mais à un rythme plus lent.
| Razer Blade 14 RTX 4070 R9 7940HS, GeForce RTX 4070 Laptop GPU, 68 Wh | Razer Blade 14 Ryzen 9 6900HX R9 6900HX, GeForce RTX 3070 Ti Laptop GPU, 62 Wh | Asus ROG Zephyrus G14 GA402XY R9 7940HS, GeForce RTX 4090 Laptop GPU, 76 Wh | Acer Predator Triton 300 SE i9-12900H, GeForce RTX 3060 Laptop GPU, 76 Wh | Alienware x14 i7 RTX 3060 i7-12700H, GeForce RTX 3060 Laptop GPU, 80 Wh | Lenovo Yoga Pro 7 14IRH G8 i7-13700H, GeForce RTX 4050 Laptop GPU, 73 Wh | |
|---|---|---|---|---|---|---|
| Autonomie de la batterie | 52% | 11% | 8% | 12% | 20% | |
| Reader / Idle (h) | 8.6 | 12.2 42% | 8.1 -6% | |||
| WiFi v1.3 (h) | 6.2 | 9.5 53% | 7.5 21% | 6.2 0% | 8.9 44% | 9.9 60% |
| Load (h) | 1 | 1.6 60% | 1 0% | 1.3 30% | 0.8 -20% | 0.8 -20% |
| H.264 (h) | 7.2 | 9.4 | 12.4 | |||
| Witcher 3 ultra (h) | 0.8 |
Points positifs
Points négatifs
Verdict - Tous les bons changements, mais où est la GeForce RTX 4090 ?
Le Blade 14 2023 répond à trois plaintes majeures concernant le modèle 2022 : pas d'USB4, de 16:10 ou de RAM amovible. Ces caractéristiques spécifiques devraient enthousiasmer les passionnés qui peuvent réellement exploiter les avantages des eGPU, d'un écran plus grand et d'une mémoire supplémentaire pour leurs charges de travail. Le CPU et le GPU plus rapides, le taux de rafraîchissement plus élevé, l'écran plus lumineux, le nouvel obturateur de webcam et le pavé tactile plus grand sont la cerise sur le gâteau.
Les nouvelles fonctionnalités ne sont pas sans inconvénients. En particulier, la mémoire vive amovible a nécessité un profil légèrement plus épais qu'auparavant, tandis que l'écran à taux de rafraîchissement plus élevé a eu un impact sur l'autonomie de la batterie. Le bruit du ventilateur est également nettement plus fort si l'on utilise le profil Haute performance. Heureusement, les avantages l'emportent largement sur les inconvénients.
Le 2023 Blade 14 offre des améliorations significatives à l'intérieur et à l'extérieur pour être encore meilleur et plus rapide qu'auparavant. Cependant, il est désormais un peu plus épais et il lui manque certaines options de GPU haut de gamme que l'on trouve chez les concurrents.
Le plus gros inconvénient du nouveau Blade 14 est peut-être l'absence d'une option GPU supérieure à la RTX 4070. Le Zephyrus G14 et sa RTX 4090 de 125 W surpasse de loin notre configuration RTX 4070 de 140 W dans les jeux. Cela ne veut pas dire que le nouveau Blade 14 est lent, mais la couronne des performances du 14 pouces revient à Asus à cet égard. Le design épuré du Razer, semblable à celui de Apple, continue d'être son meilleur argument de vente
.Prix et disponibilité
Razer livre dès à présent la 2023 Blade 14 à partir de $2400 USD pour l'option RTX 4060 et $2700 pour l'option RTX 4070.
Razer Blade 14 RTX 4070
- 06/16/2023 v7 (old)
Allen Ngo
Transparency
La sélection des appareils à examiner est effectuée par notre équipe éditoriale. L'échantillon de test a été prêté à l'auteur par le fabricant ou le détaillant pour les besoins de cet examen. Le prêteur n'a pas eu d'influence sur cette évaluation et le fabricant n'a pas reçu de copie de cette évaluation avant sa publication. Il n'y avait aucune obligation de publier cet article. En tant que média indépendant, Notebookcheck n'est pas soumis à l'autorité des fabricants, des détaillants ou des éditeurs.
Voici comment Notebookcheck teste
Chaque année, Notebookcheck examine de manière indépendante des centaines d'ordinateurs portables et de smartphones en utilisant des procédures standardisées afin de garantir que tous les résultats sont comparables. Nous avons continuellement développé nos méthodes de test depuis environ 20 ans et avons établi des normes industrielles dans le processus. Dans nos laboratoires de test, des équipements de mesure de haute qualité sont utilisés par des techniciens et des rédacteurs expérimentés. Ces tests impliquent un processus de validation en plusieurs étapes. Notre système d'évaluation complexe repose sur des centaines de mesures et de points de référence bien fondés, ce qui garantit l'objectivité.Price comparison

