

Verdict - Plus maigre et plus léger qu'avant
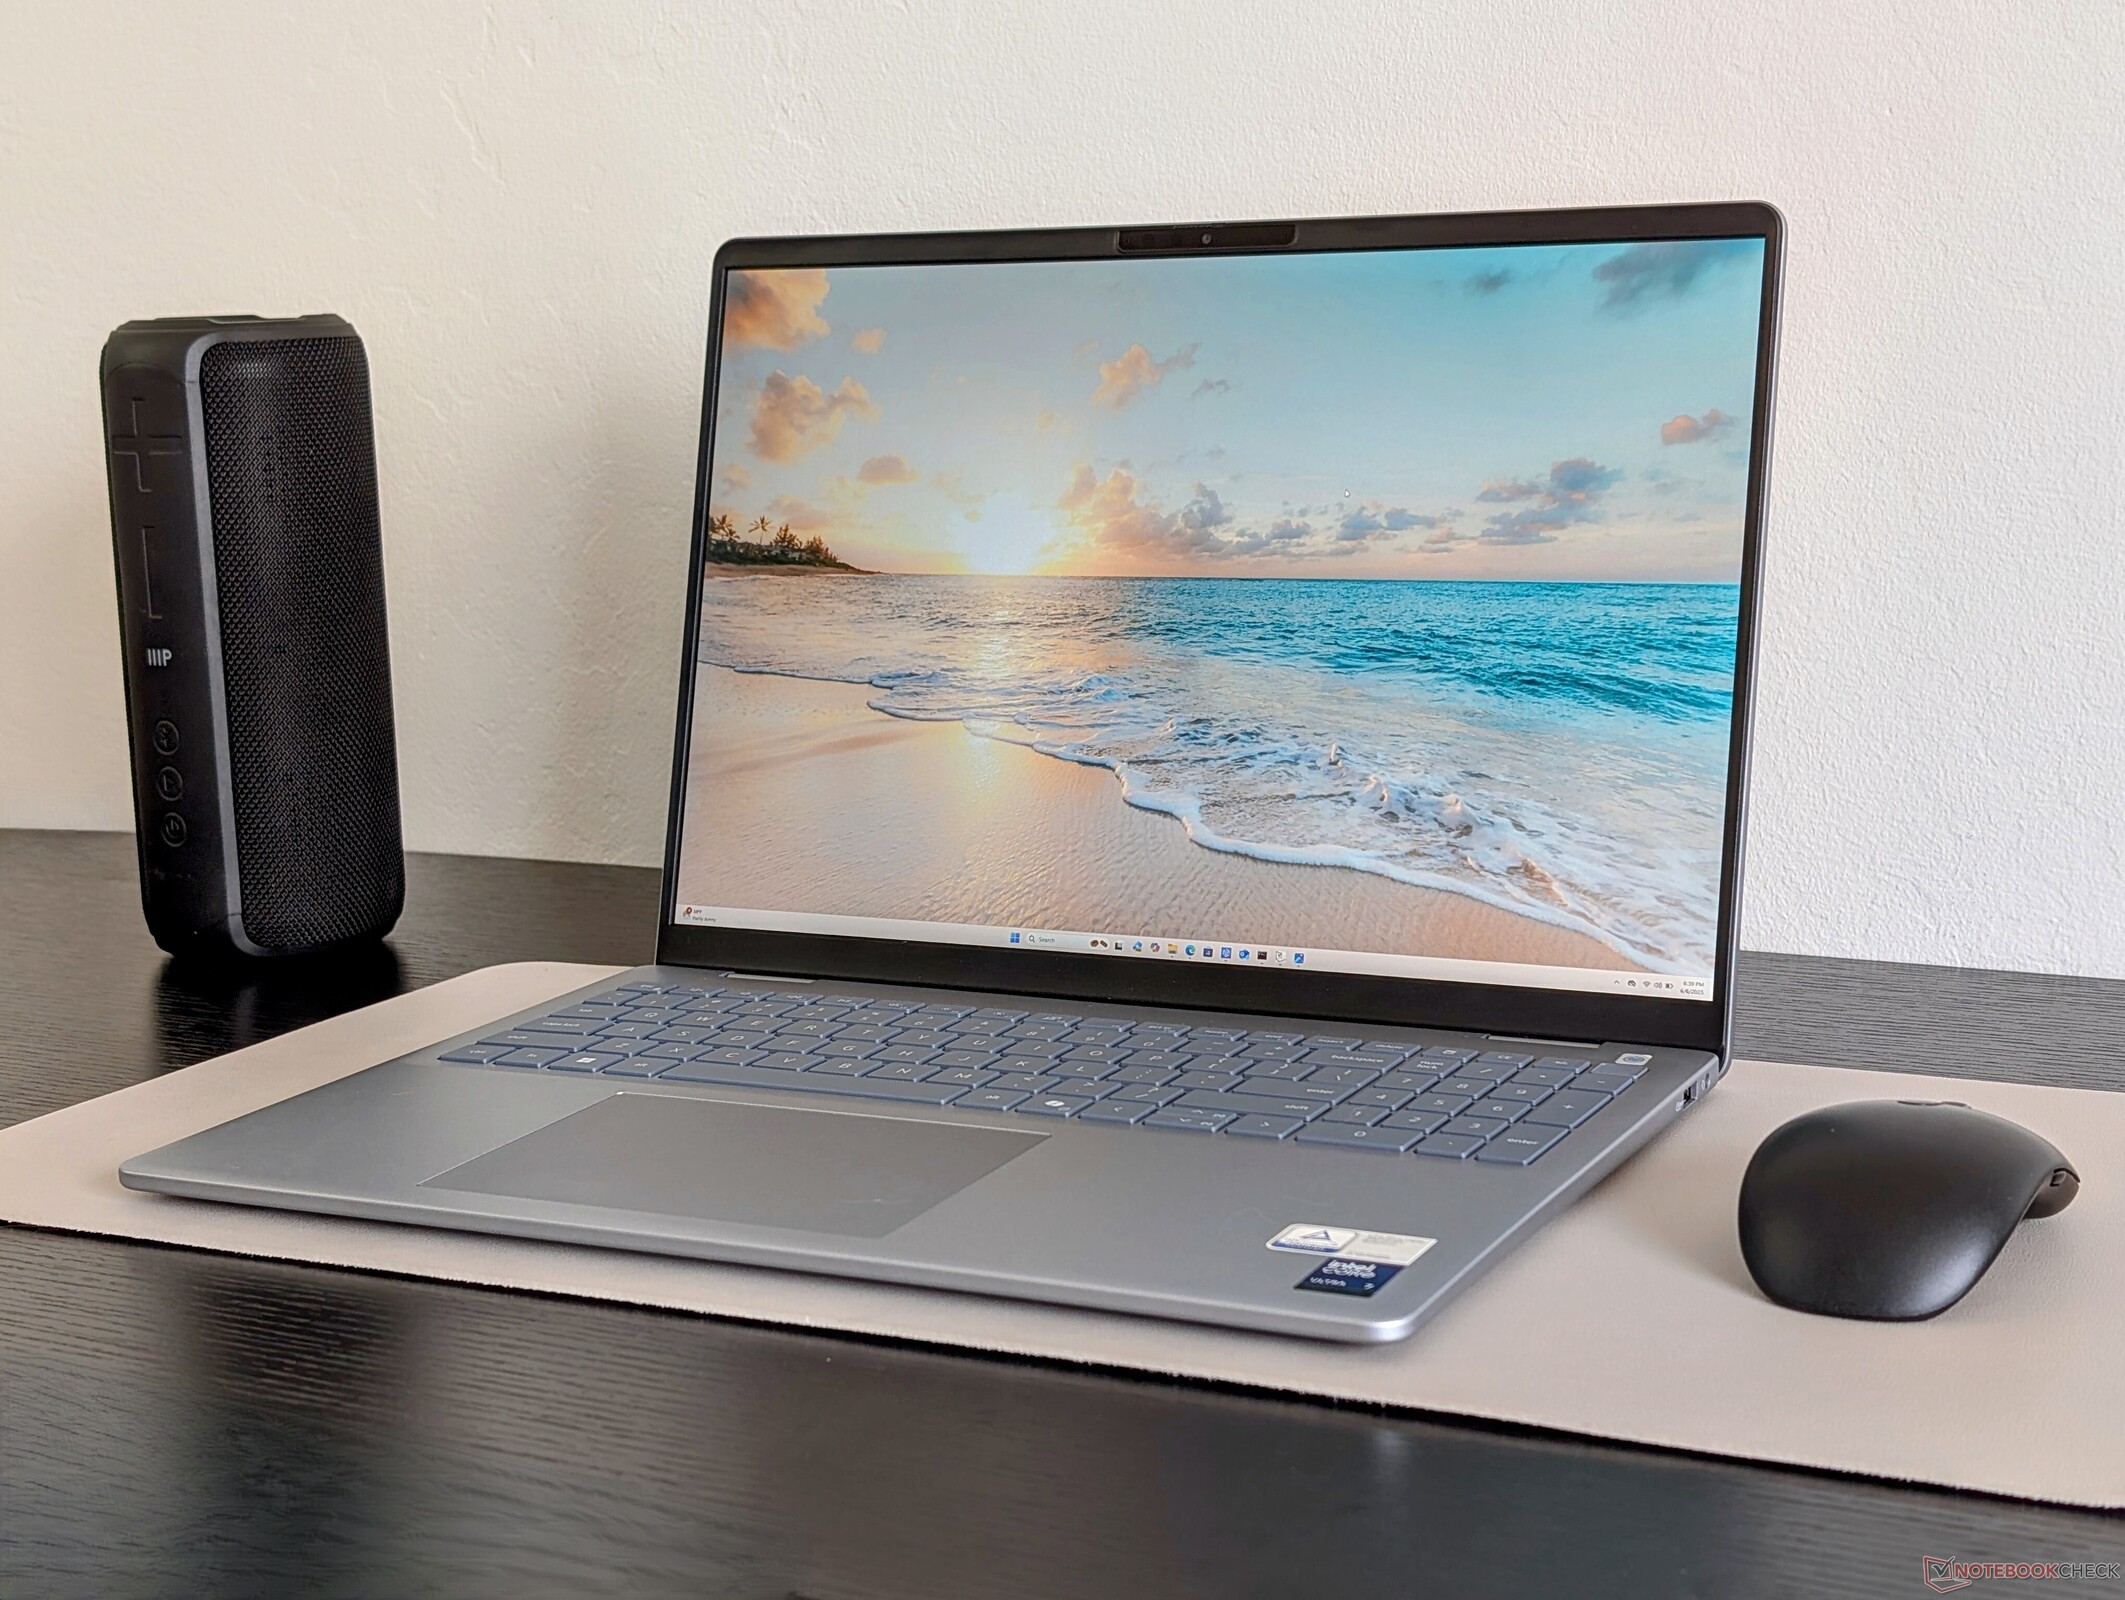
Bien qu'il ressemble beaucoup à son prédécesseur, l Inspiron 16 Plus 7640le Dell 16 Plus est une bête différente grâce au passage d'un CPU Core Ultra-H à un Core Ultra-V Lunar Lake plus récent. Le résultat est une machine plus mince, plus légère et plus durable qui devrait mieux convenir à un public multimédia plus général. Nous apprécions également le fait que l'écran IPS 1600p120 soit livré en standard, ce qui signifie qu'il n'y a pas d'options "bas de gamme" avec des panneaux ou des couleurs médiocres.
Le principal point faible du Dell 16 Plus est son manque de performances pour les applications les plus exigeantes. L'ancien Inspiron 16 Plus 7640 ou Inspiron 16 7640 2-en-1 disposent d'options Core-H ou GPU discret pour des performances bien plus rapides que celles du Dell 16 Plus. Ils offrent également une expérience visuelle identique, voire meilleure, pour un prix à peu près équivalent. Les utilisateurs qui n'ont pas besoin de la puissance supplémentaire trouveront que le Dell 16 Plus est l'option la plus appropriée pour les voyages et l'édition occasionnelle. Sinon, les modèles plus puissants de la série Série Dell Premium plus puissante.
Points positifs
Points négatifs
Prix et disponibilité
Dell livre maintenant le Dell 16 Plus à partir de 1150 $, tel que configuré dans notre revue. L'option Core Ultra 9 est également disponible sur Amazon au prix de 1400 $.
Table des matières
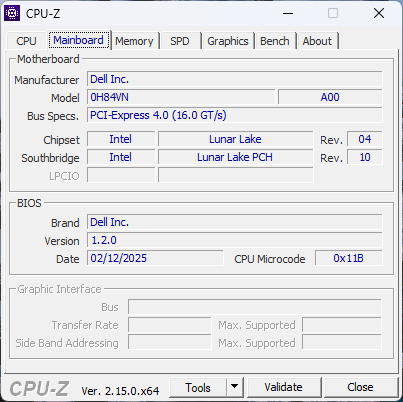
Le Dell 16 Plus remplace la dernière génération de la série Inspiron 16 Plus. Si le nom et les options de processeur sont très différents, les caractéristiques physiques de l'Inspiron 16 Plus s'inspirent fortement de celles de l'Inspiron 16 Plus de l'année dernière Inspiron 16 Plus 7640 ou Inspiron 16 7640 2-en-1 de l'année dernière, comme le montre notre test.
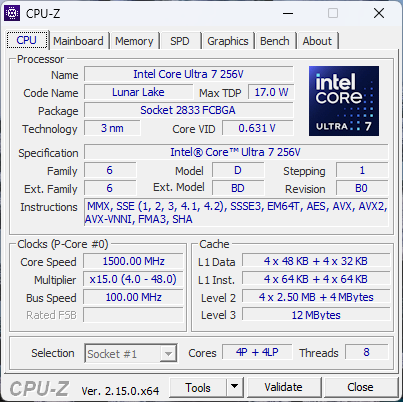
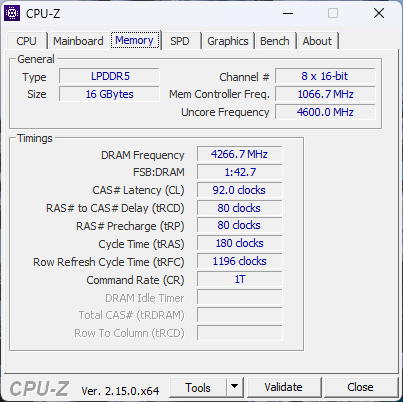
Notre unité de test est une configuration intermédiaire avec le Core Ultra 7 256V et un écran IPS 1600p120 à partir de 1150$. Le Core Ultra 7 258V ou le Core Ultra 9 288V, avec deux fois plus de mémoire vive et d'espace de stockage, sont proposés à partir de 1 650 $, tandis que les autres options d'affichage comprennent l'IPS 1200p ou le Mini-LED 1600p.
Les concurrents dans ce domaine comprennent d'autres ordinateurs portables multimédias de 16 pouces de milieu de gamme, comme le Lenovo IdeaPad Pro 5 16, HP Pavilion Plus 16ou Asus Vivobook 16.
Plus de commentaires sur Dell :
Spécifications
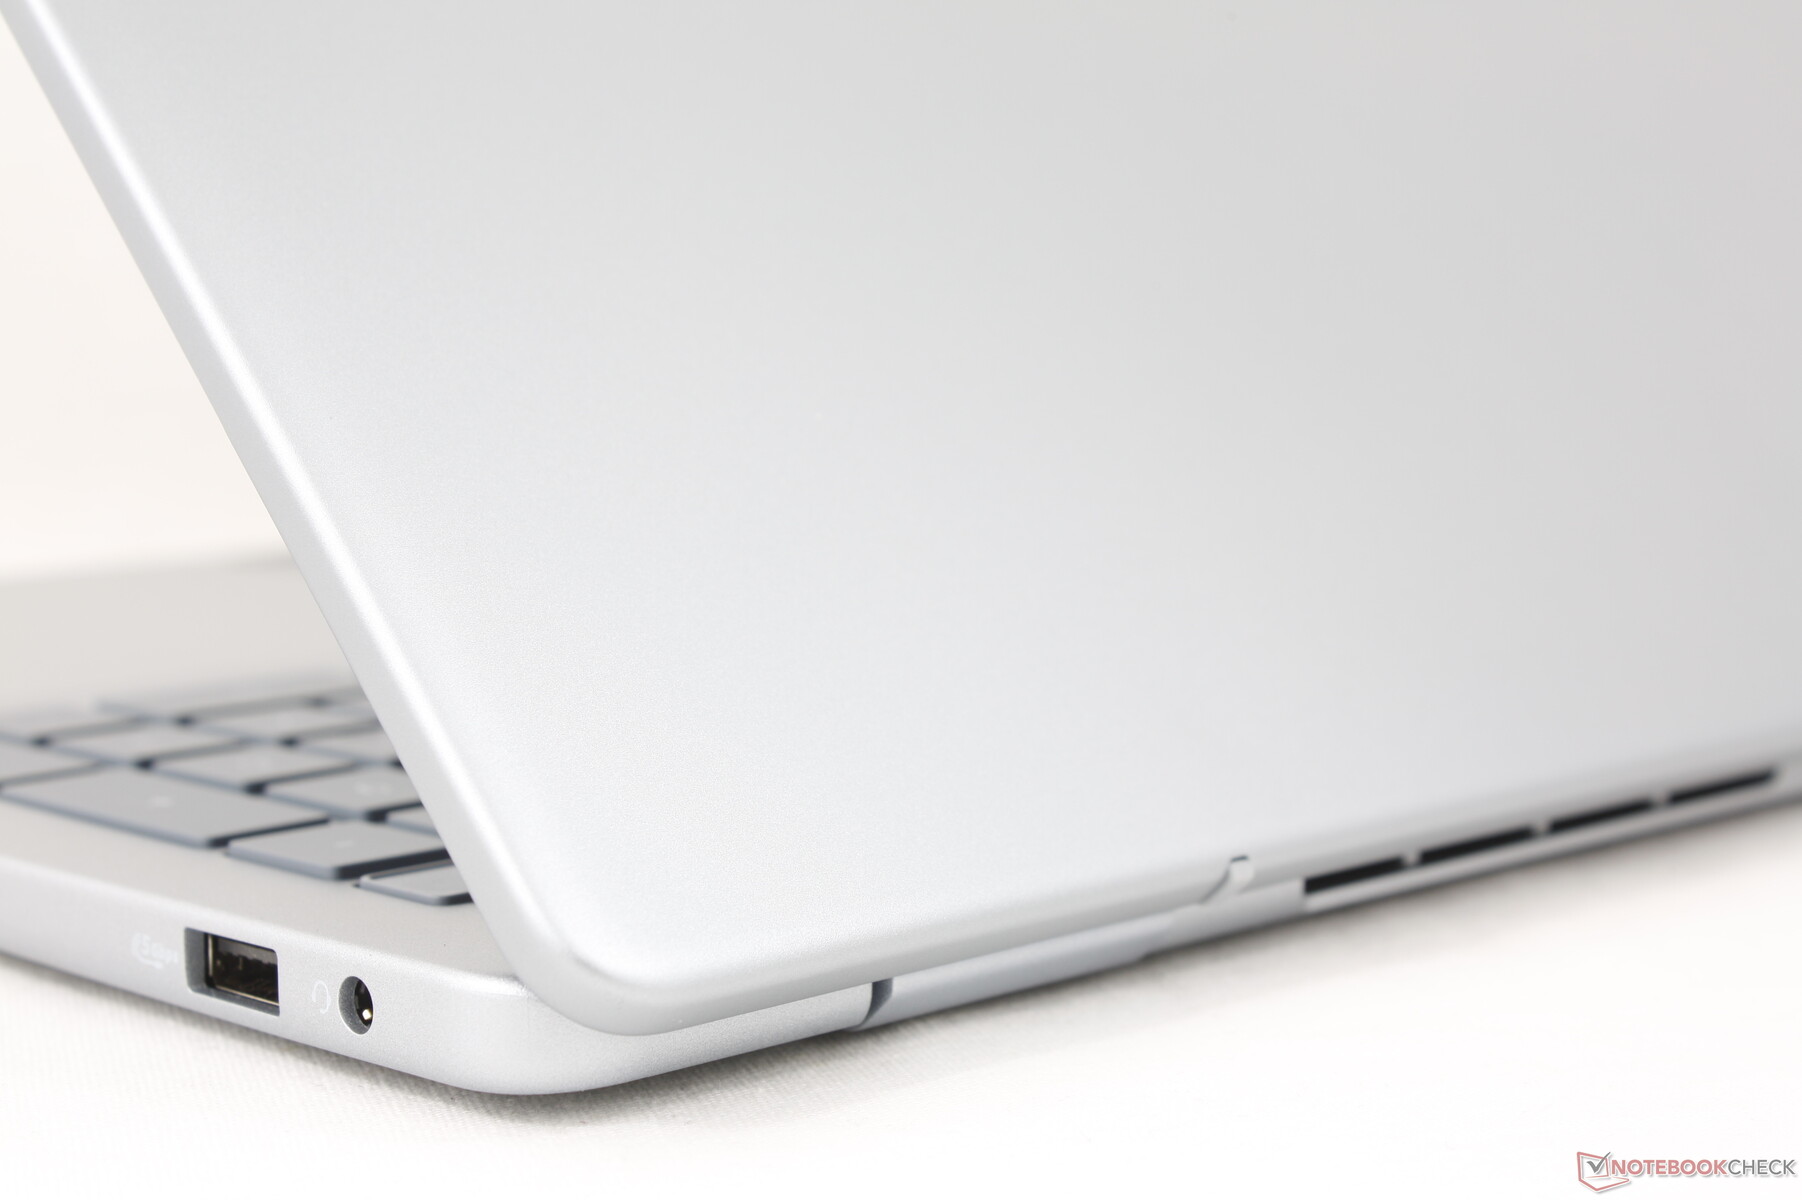
Cas
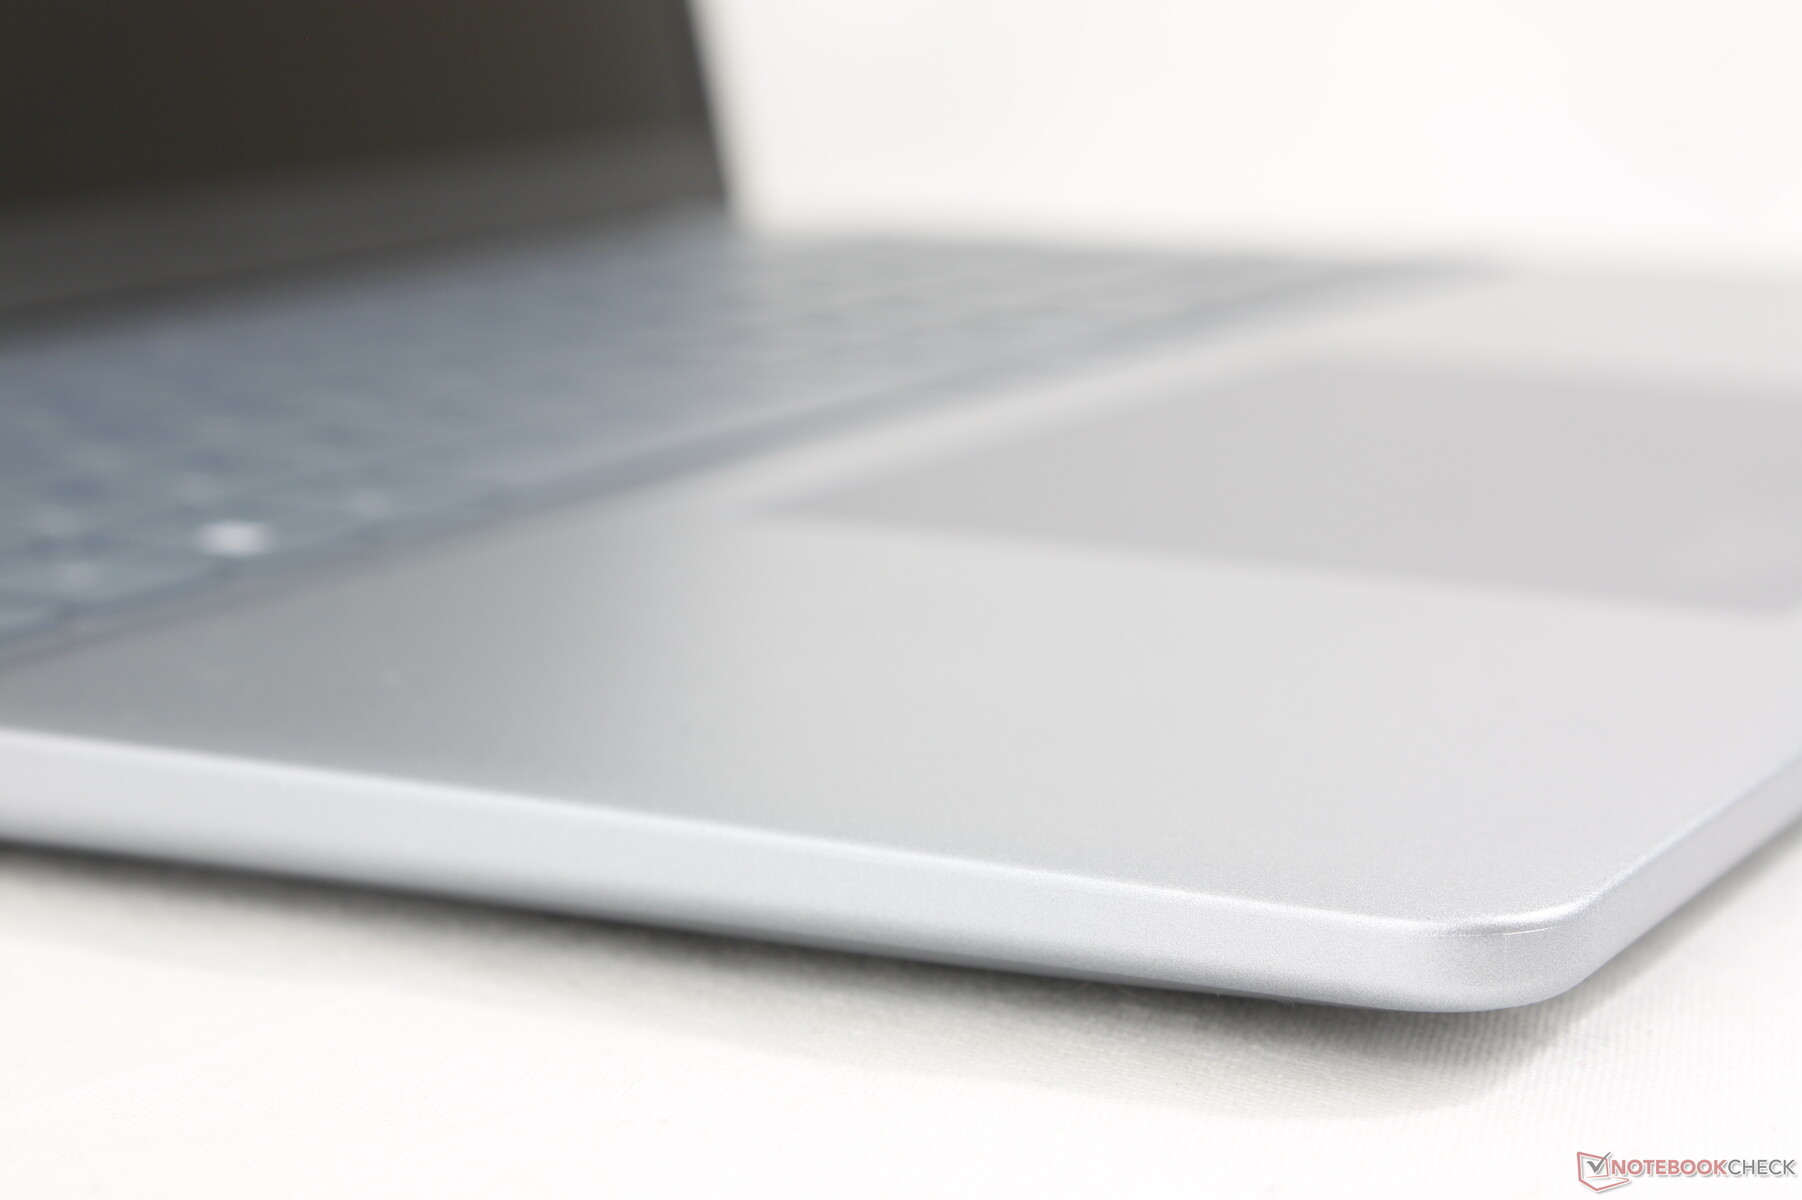
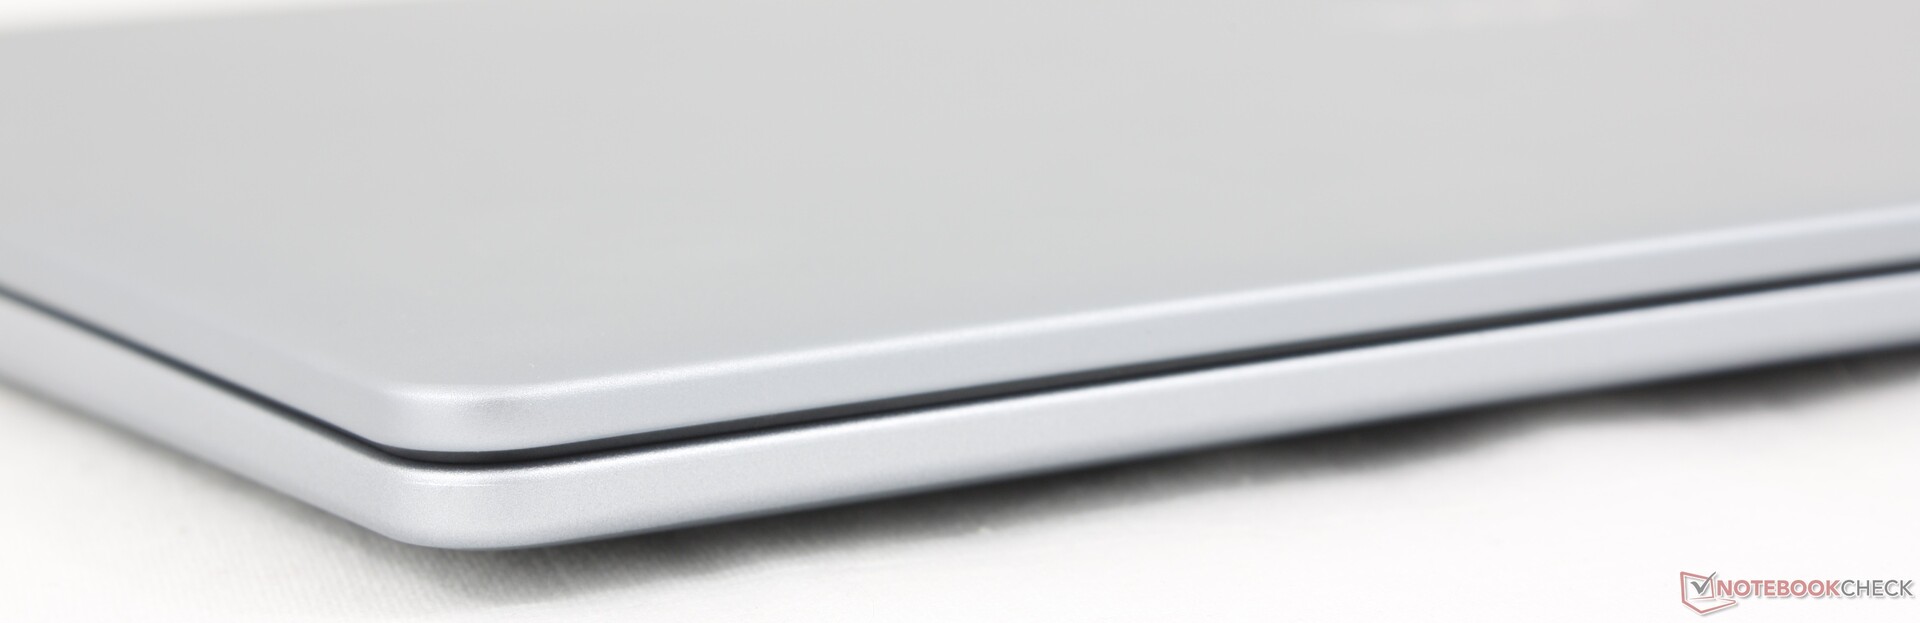
Le châssis argenté mat et lisse devrait sembler et sembler immédiatement familier à tous ceux qui ont déjà utilisé un modèle Inspiron. Les matériaux et le design sont restés largement identiques à ceux de la génération précédente pour une première impression similaire. Le châssis et le couvercle se plient plus facilement que les modèles plus onéreux comme le XPS 16 ou le Lenovo Yoga Pro 9 16mais il est par ailleurs comparable au HP Pavilion Plus 16 ou à l'Asus Vivobook 16.
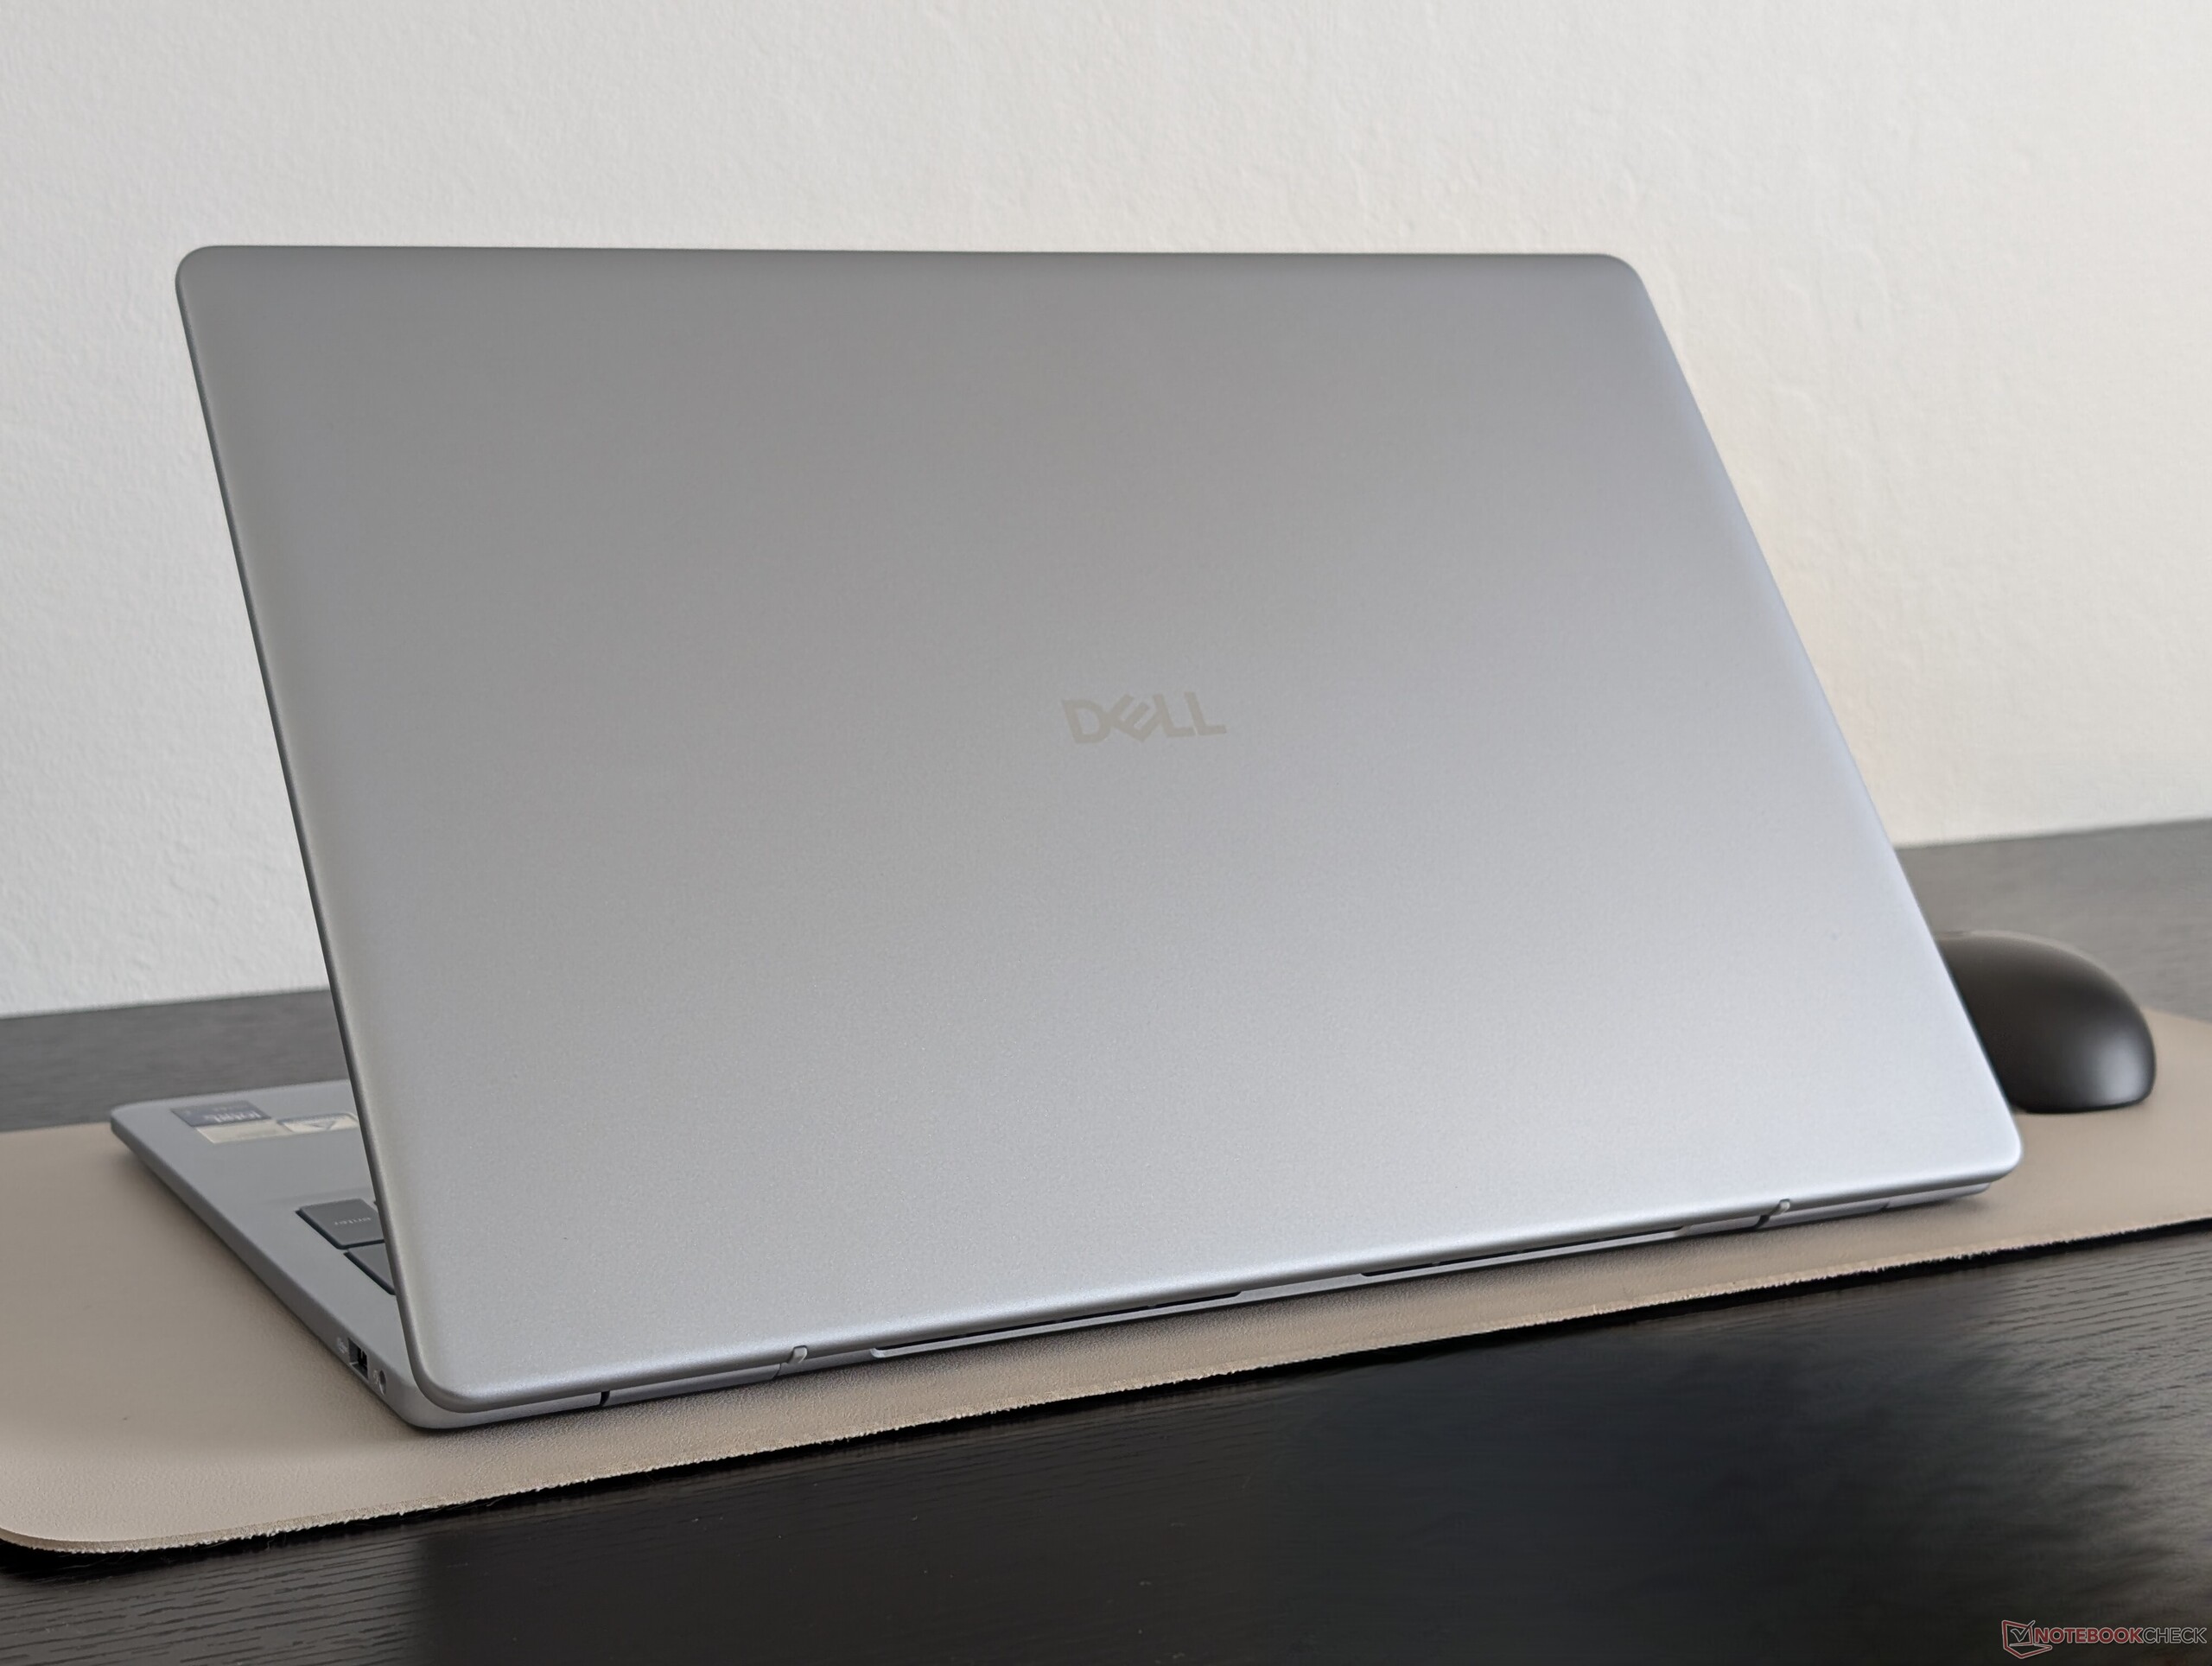
Les dimensions sont presque identiques à celles de l'Inspiron 16 Plus 7640, si ce n'est qu'il est légèrement plus fin. La plus grande différence entre les deux est le poids, puisque le nouveau modèle est plus léger d'environ 400 g, principalement en raison de l'absence d'options GPU discrètes.
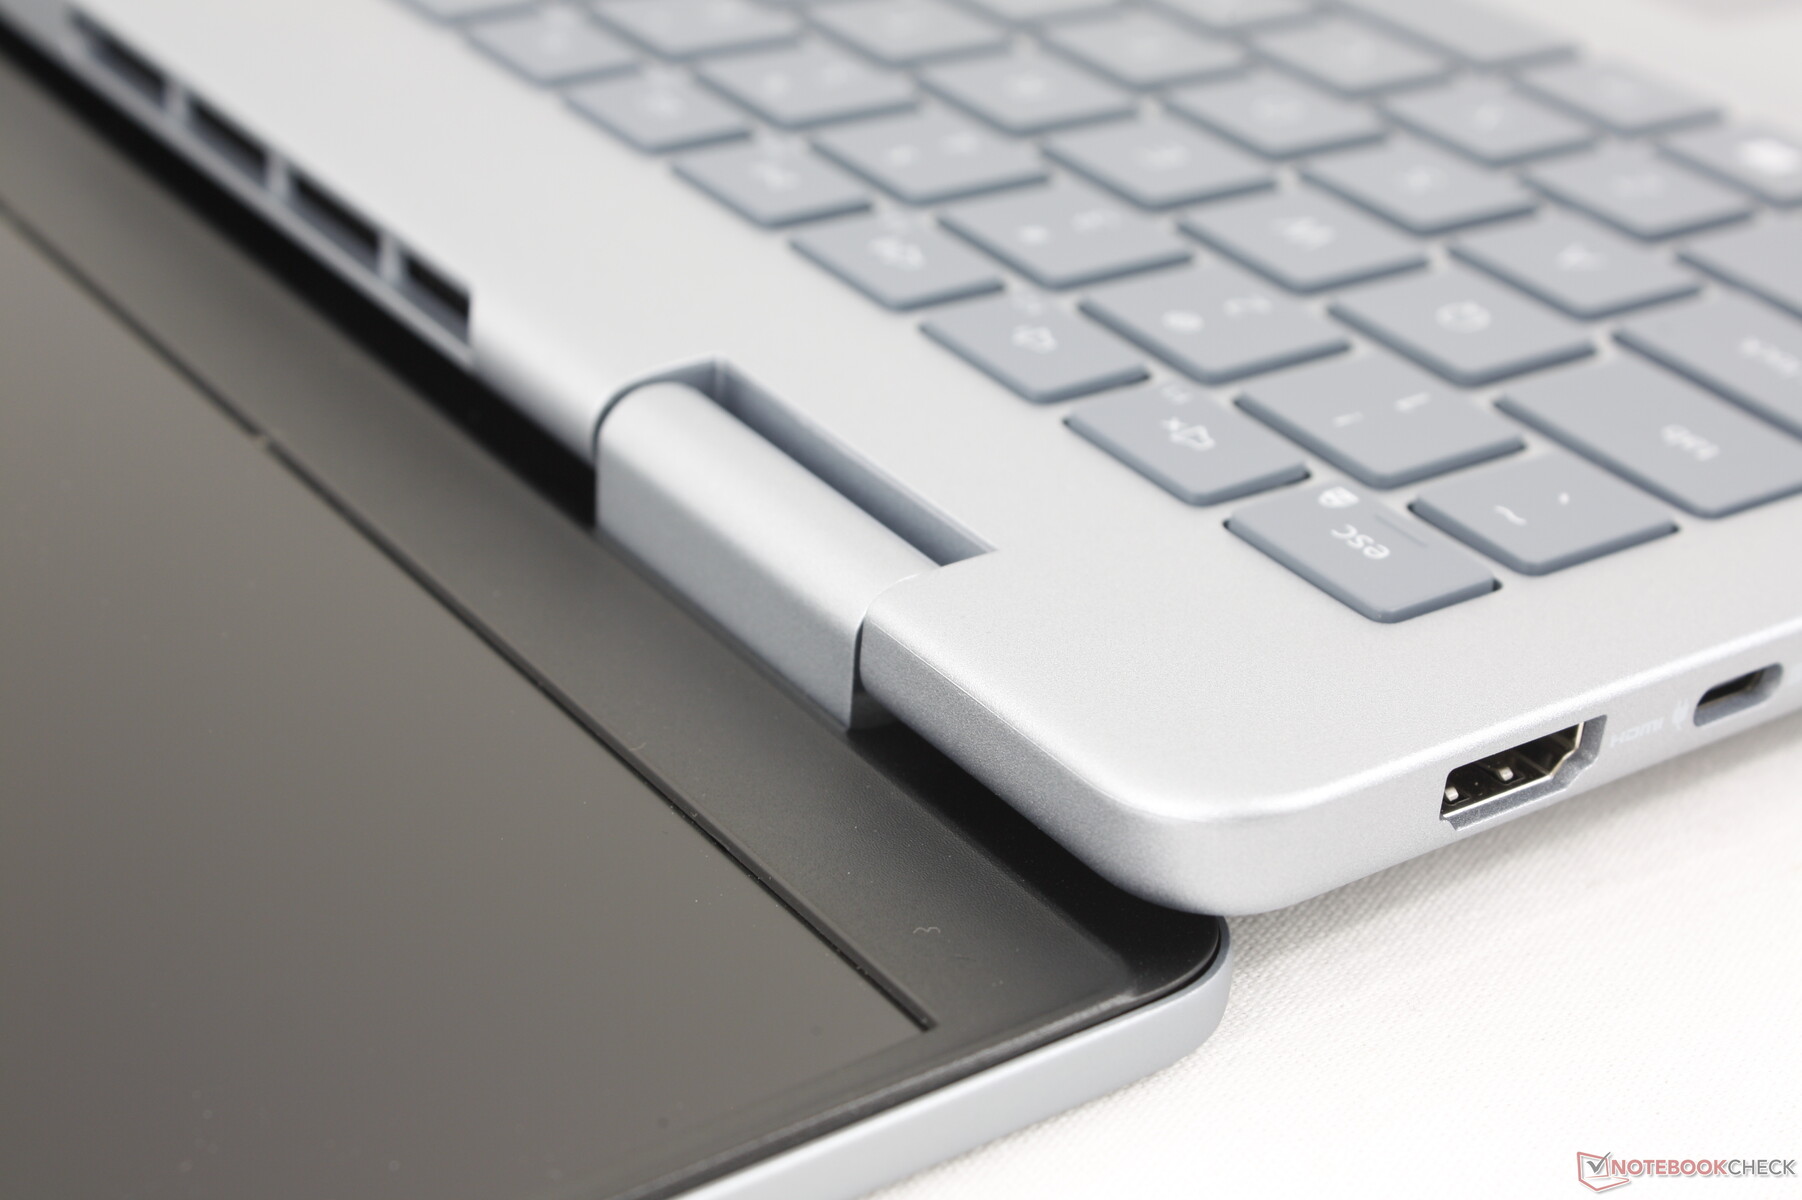
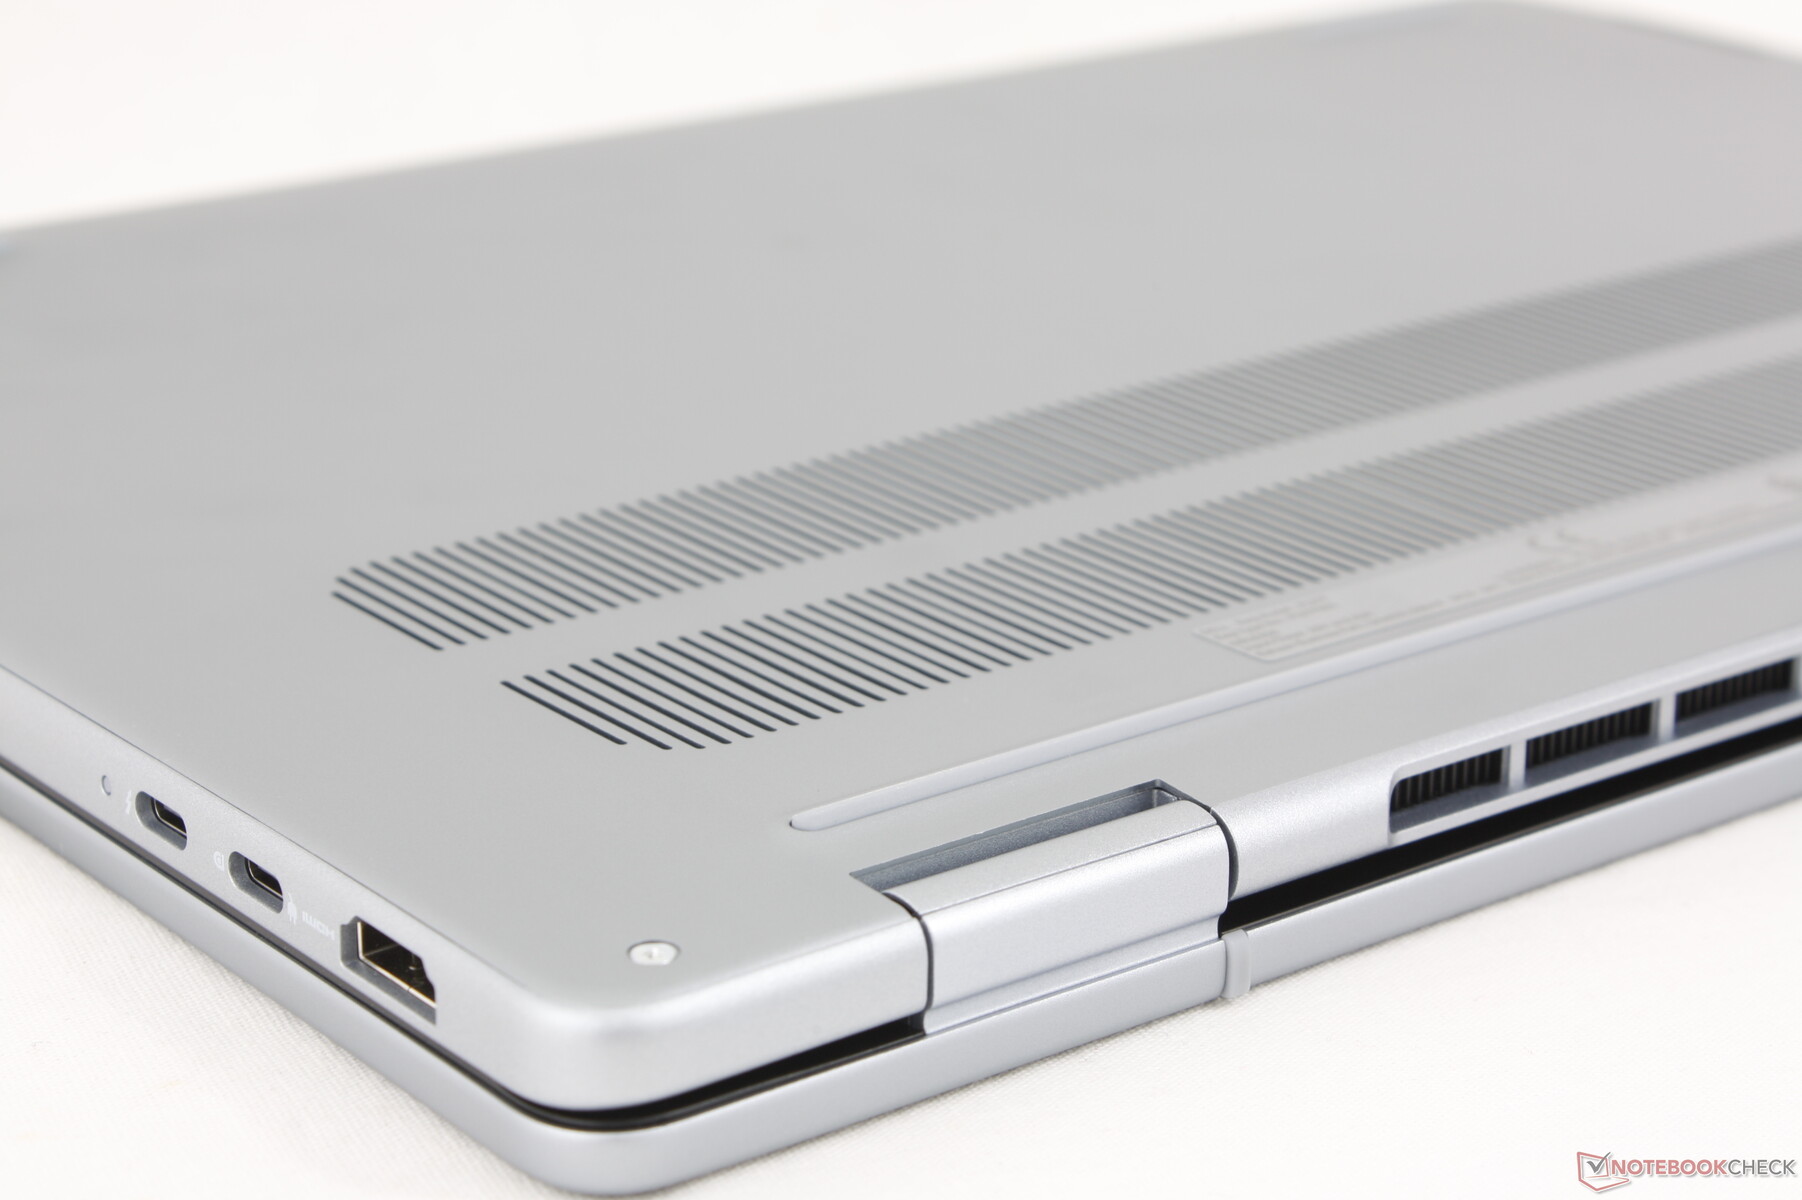
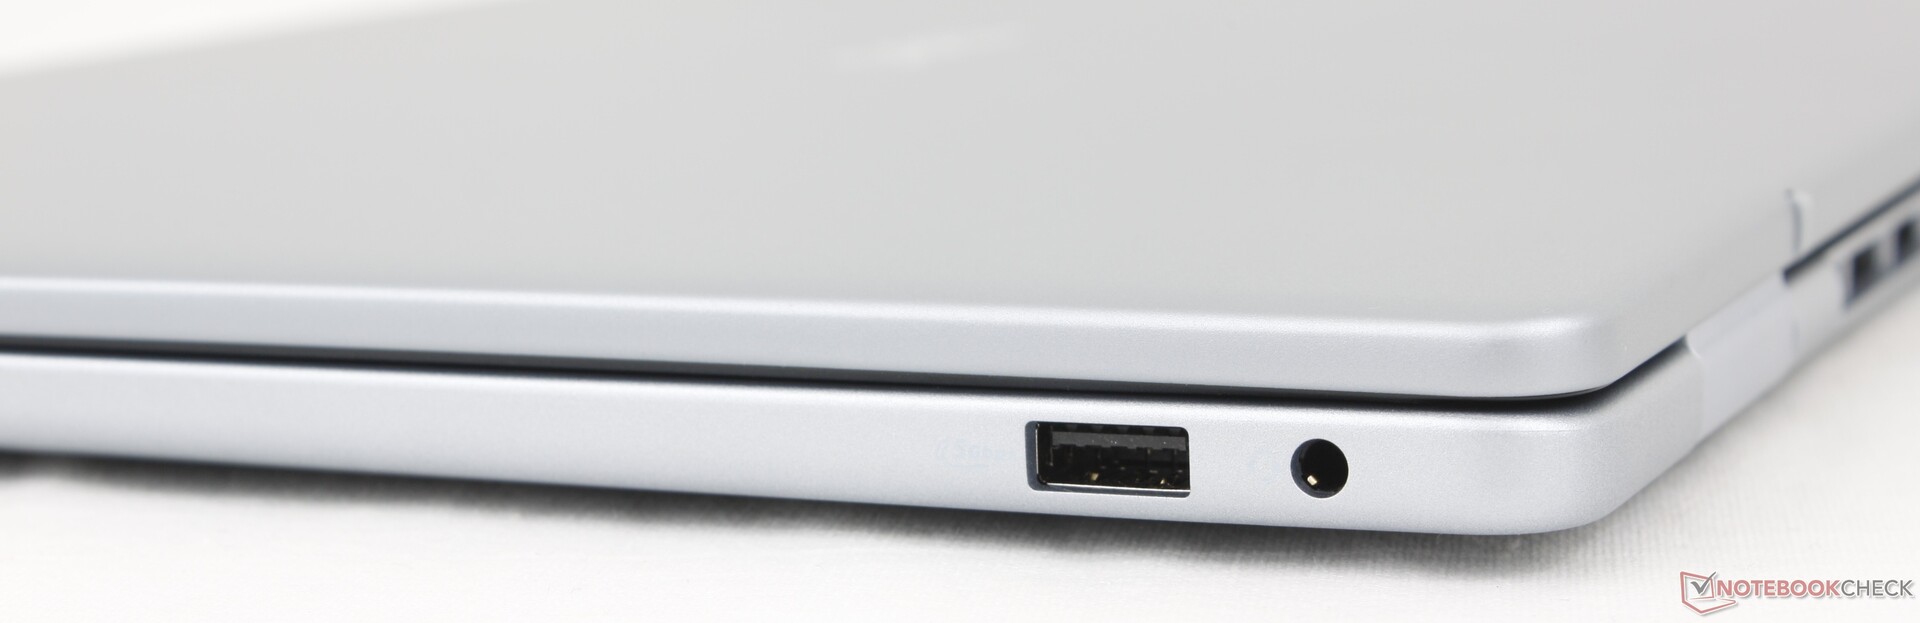
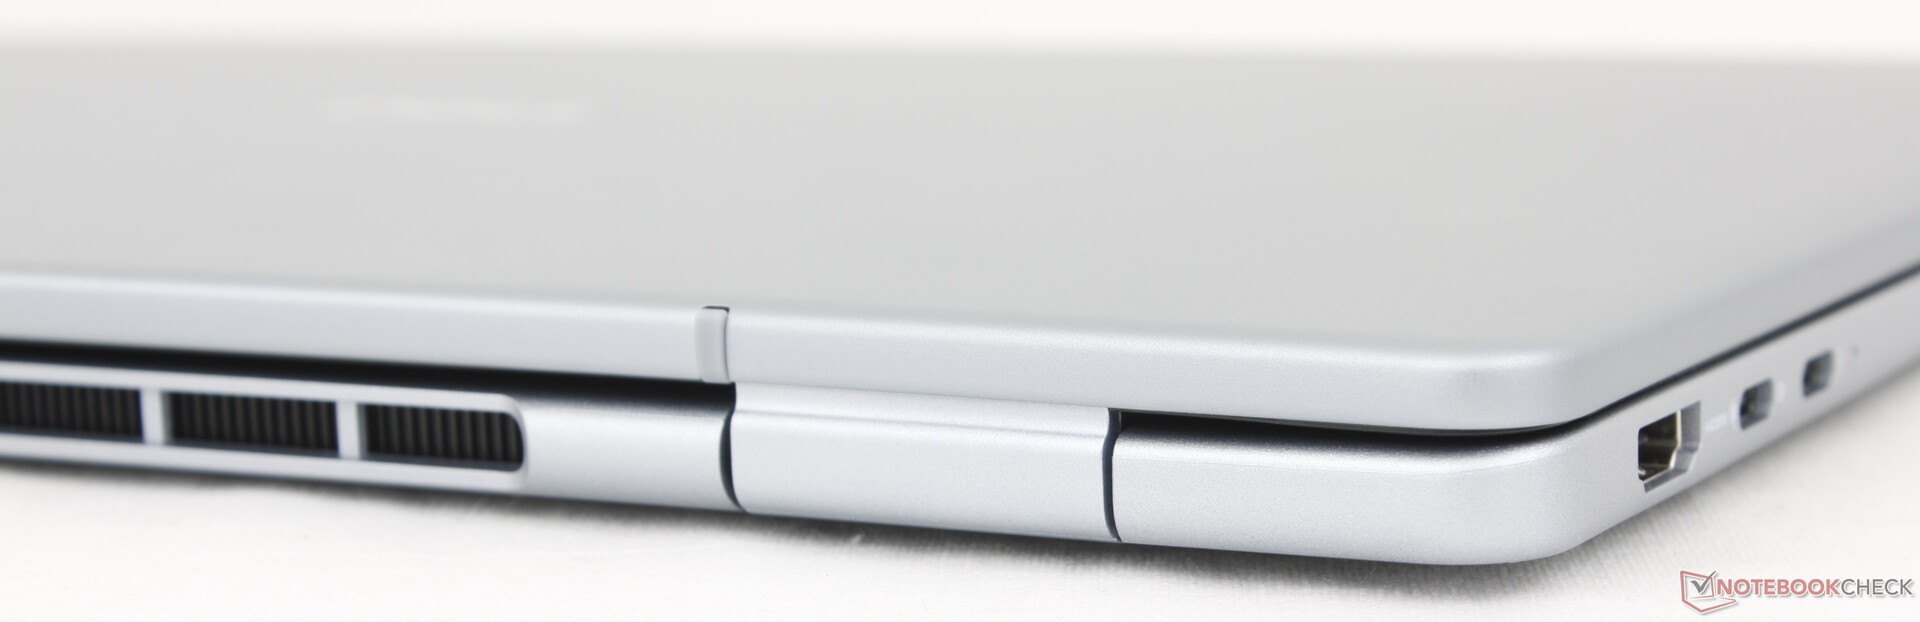
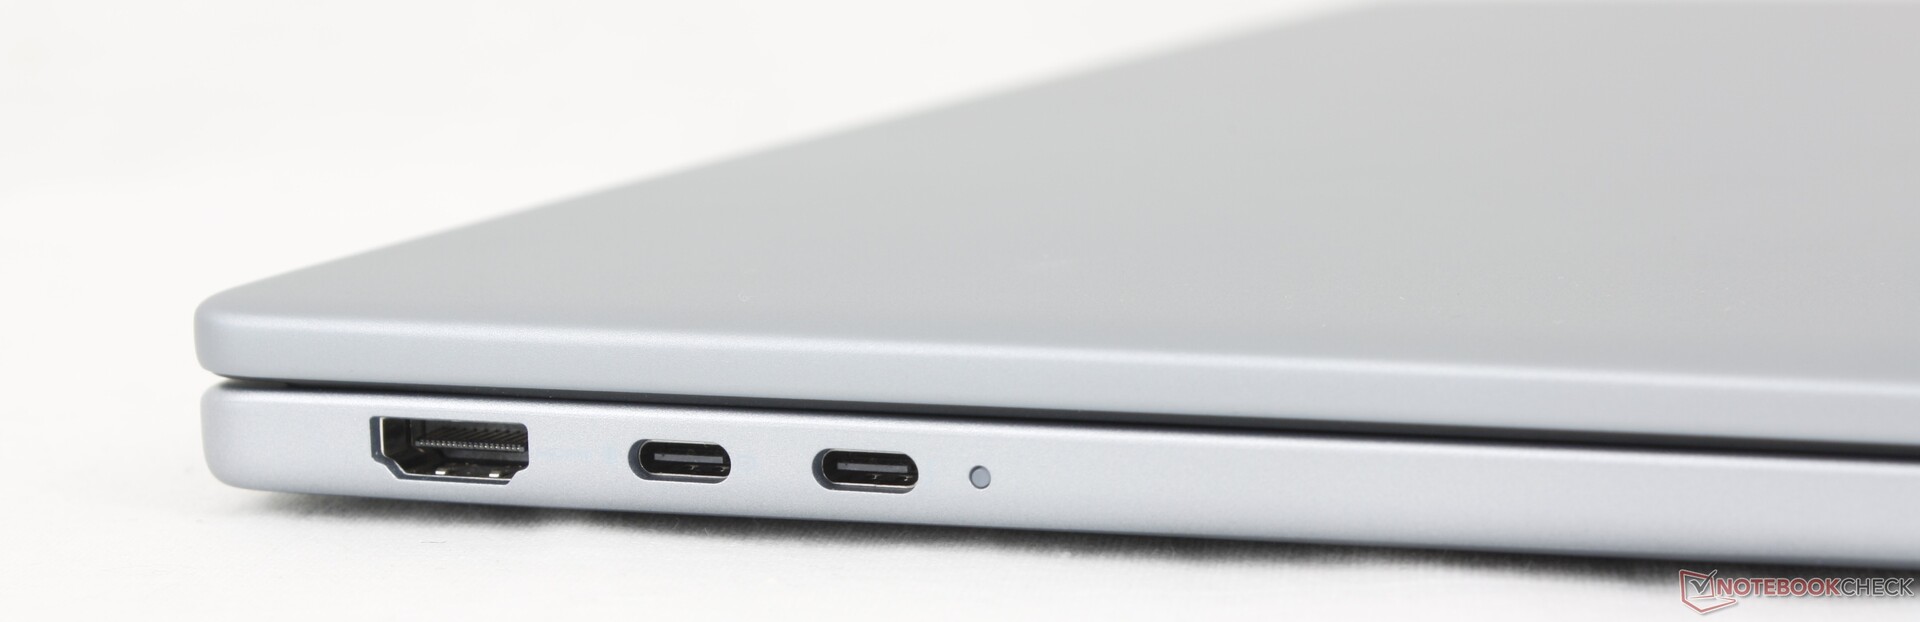
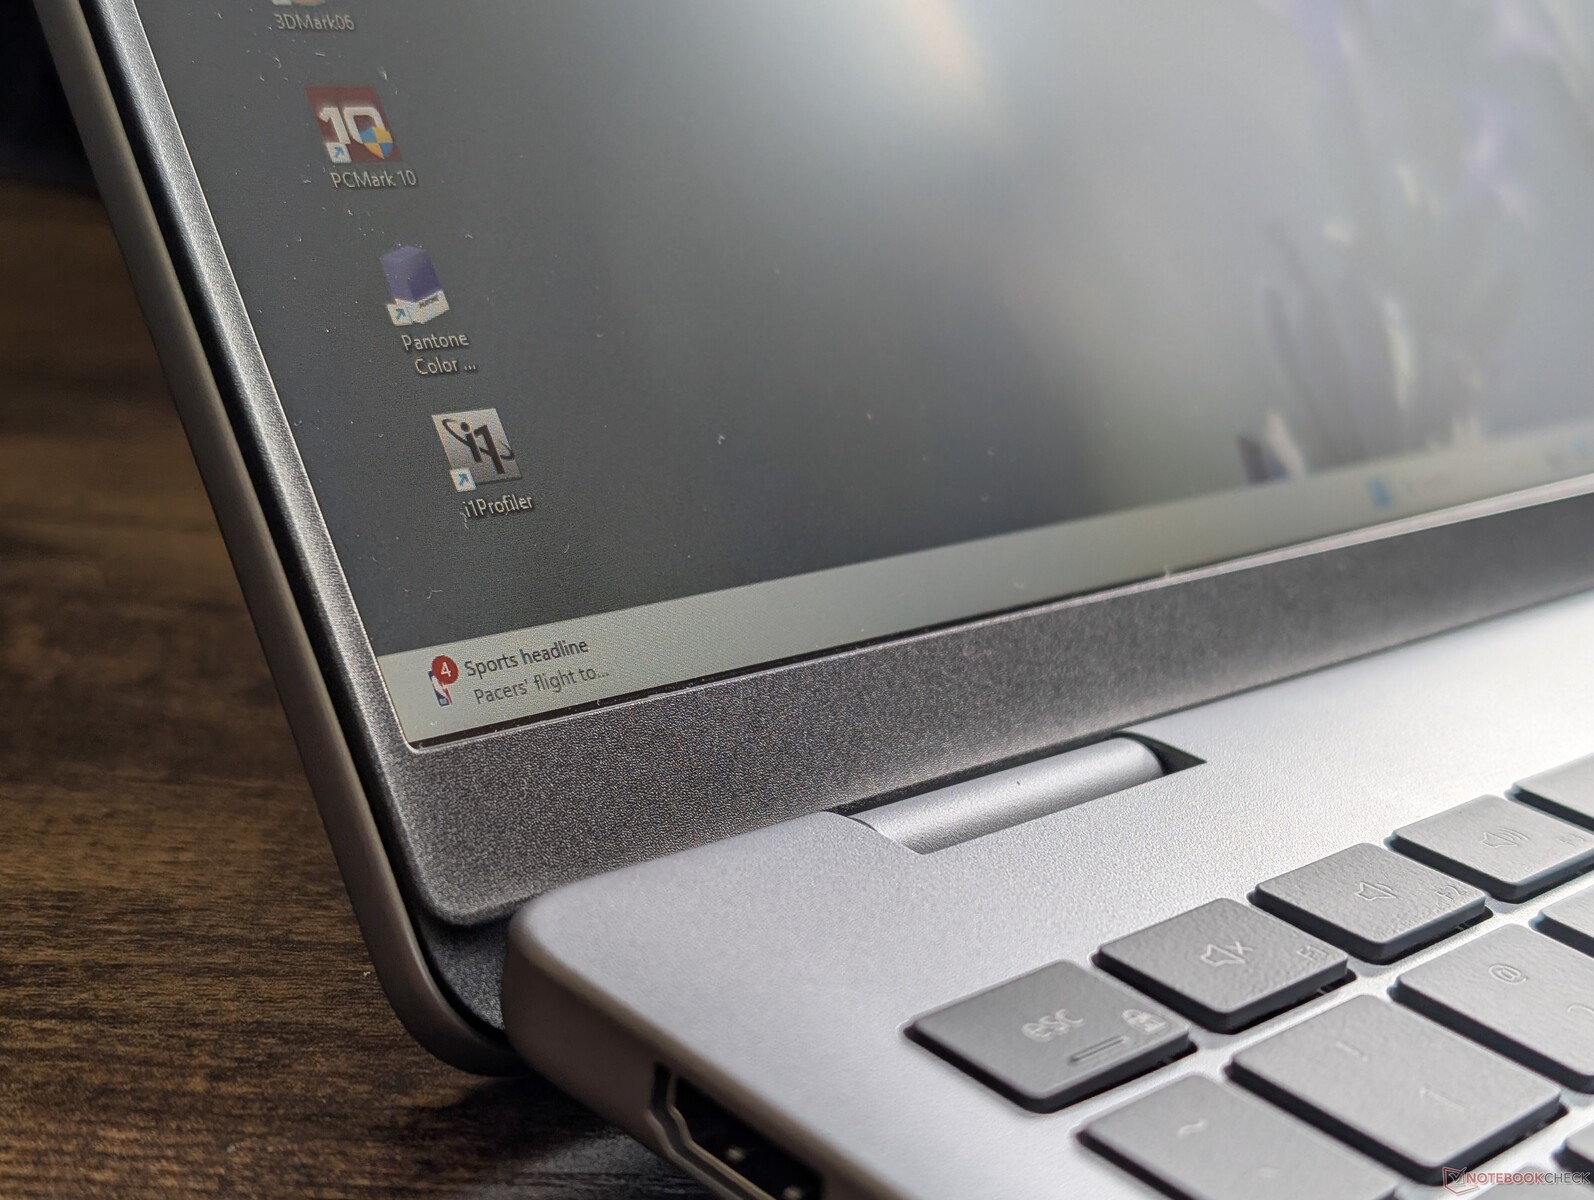
Connectivité
Il y a moins de ports que sur l'Inspiron 16 Plus 7640 ou 7640 2-en-1 de l'année dernière. Le Dell 16 Plus a abandonné le lecteur de carte SD et l'un des ports USB-A au profit d'un second port USB-C. Notez que seul l'un des deux ports USB-C est compatible avec Thunderbolt 4 et DisplayPort 2.1.
Communication
L'Intel BE201 est livré en standard avec une connectivité Wi-Fi 7 et Bluetooth 5.4.
| Networking | |
| iperf3 transmit AXE11000 | |
| Lenovo ThinkBook 16 G7+ AMD | |
| HP Pavilion Plus 16-ab0456tx | |
| Dell 16 Plus | |
| Asus Vivobook 16 M1606K | |
| Dell Inspiron 16 Plus 7640 | |
| iperf3 receive AXE11000 | |
| Lenovo ThinkBook 16 G7+ AMD | |
| HP Pavilion Plus 16-ab0456tx | |
| Dell 16 Plus | |
| Dell Inspiron 16 Plus 7640 | |
| Asus Vivobook 16 M1606K | |
| iperf3 transmit AXE11000 6GHz | |
| HP Pavilion Plus 16-ab0456tx | |
| Dell 16 Plus | |
| Acer Swift 16 AI SF16-51T-932H, Ultra 9 288V | |
| Dell Inspiron 16 Plus 7640 | |
| iperf3 receive AXE11000 6GHz | |
| Acer Swift 16 AI SF16-51T-932H, Ultra 9 288V | |
| HP Pavilion Plus 16-ab0456tx | |
| Dell 16 Plus | |
| Dell Inspiron 16 Plus 7640 | |
Webcam
Une webcam de 2 mégapixels est fournie en standard avec un obturateur IR et un obturateur physique.


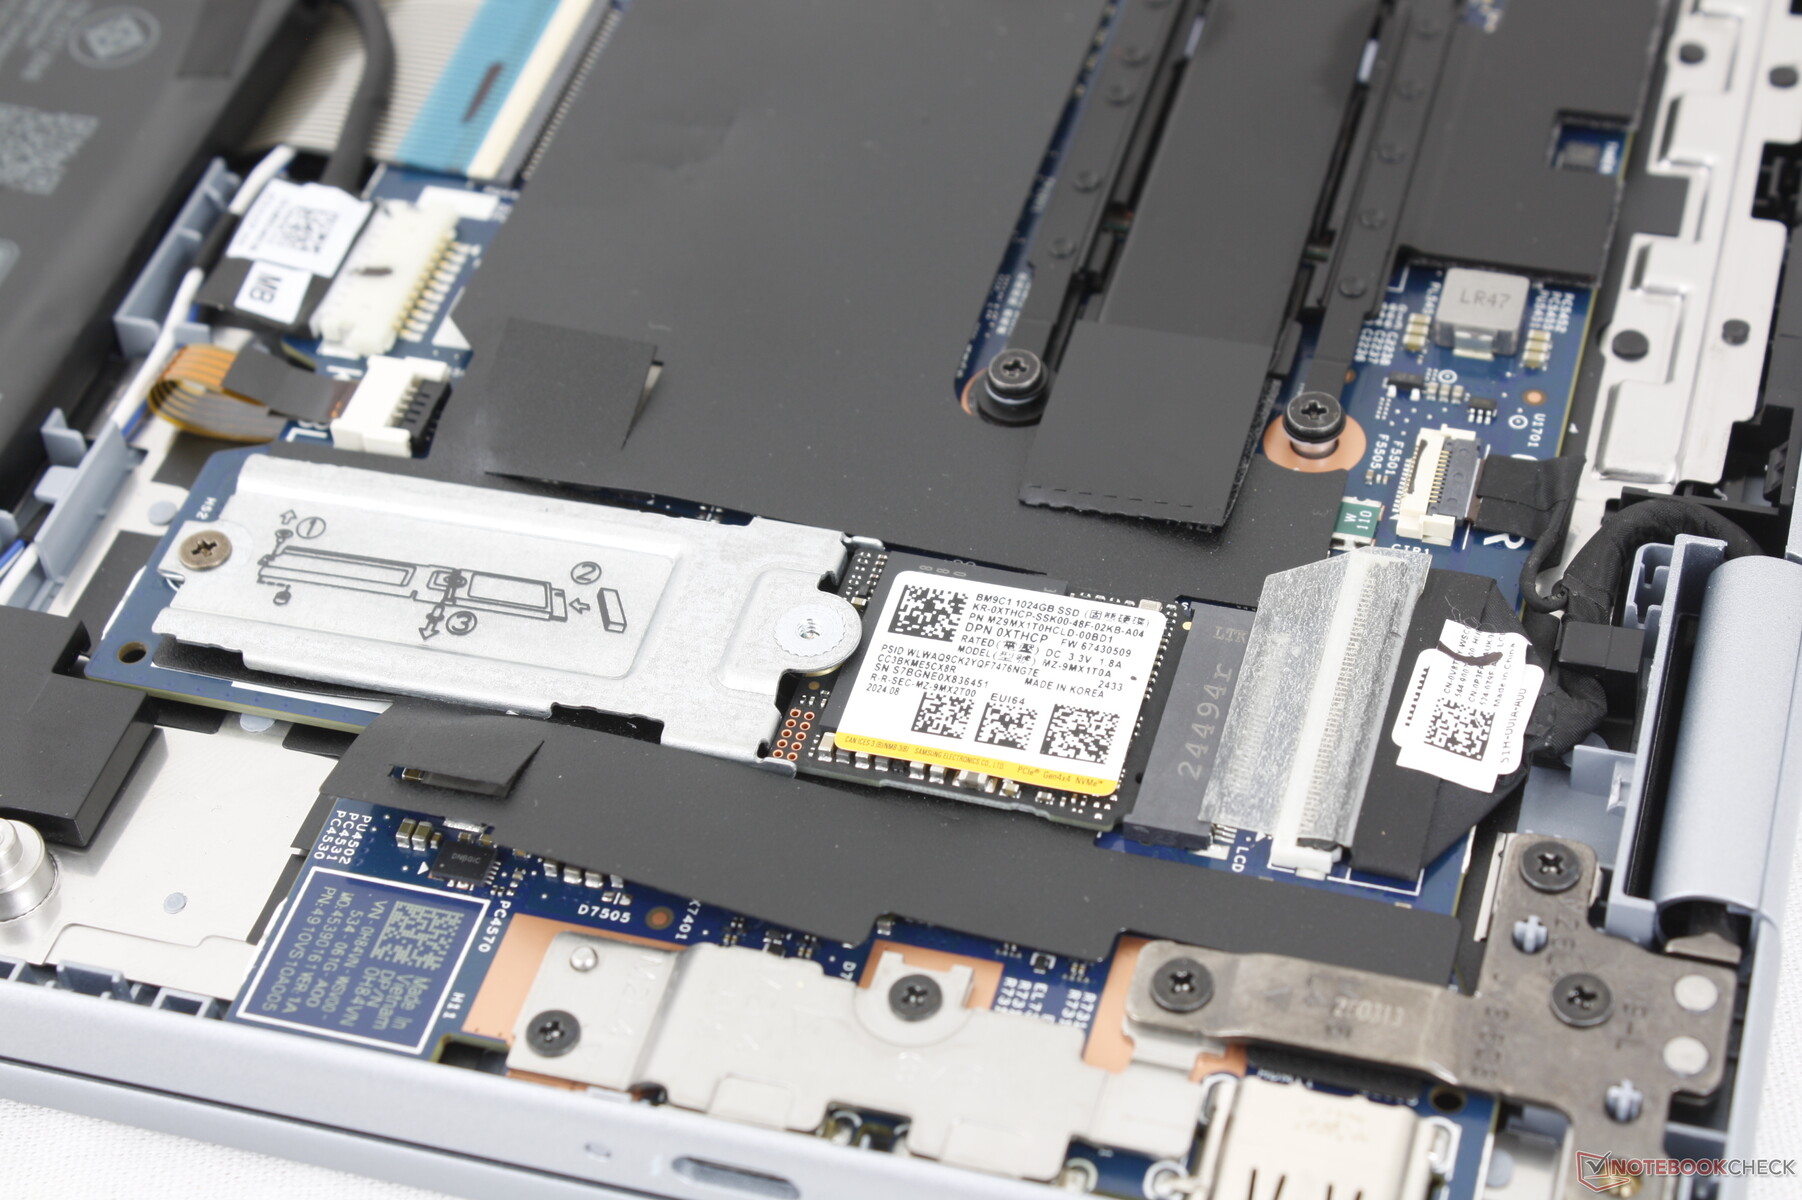
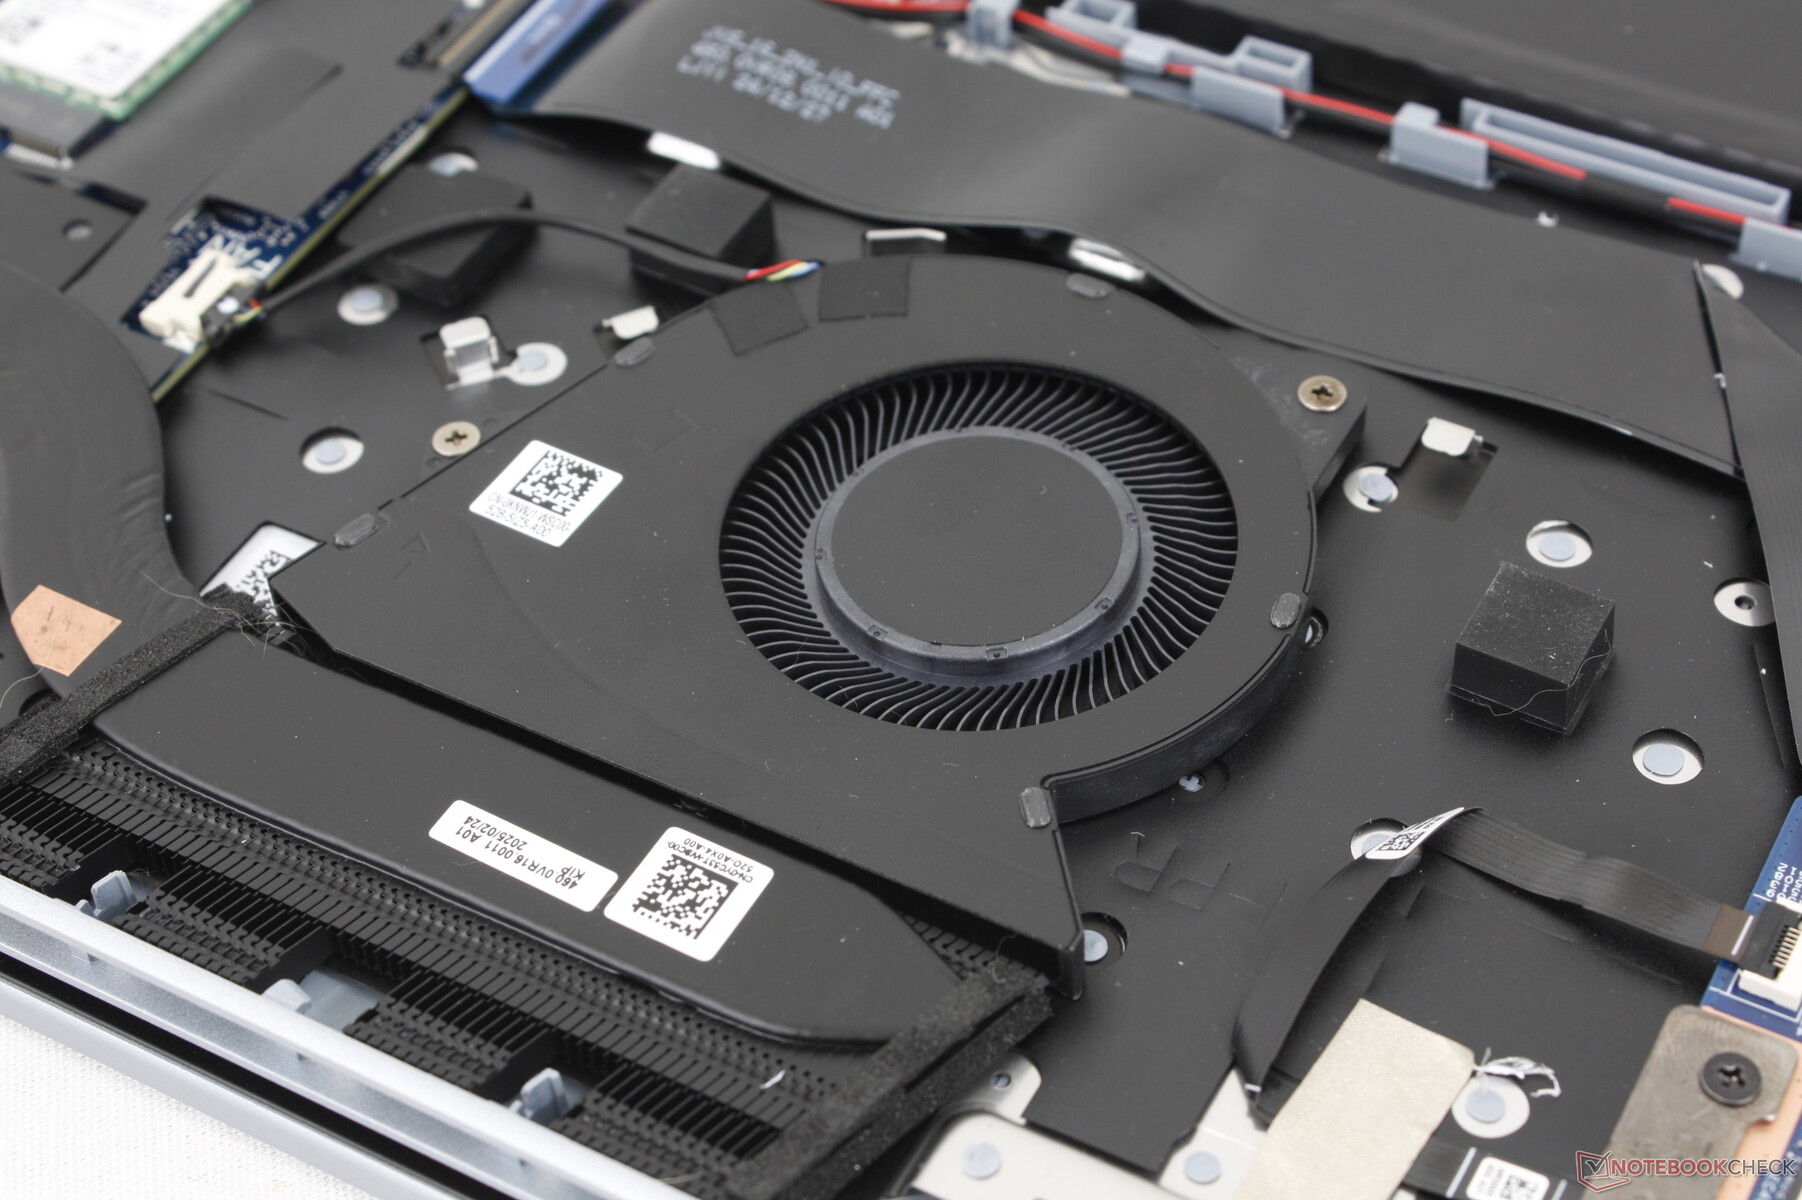
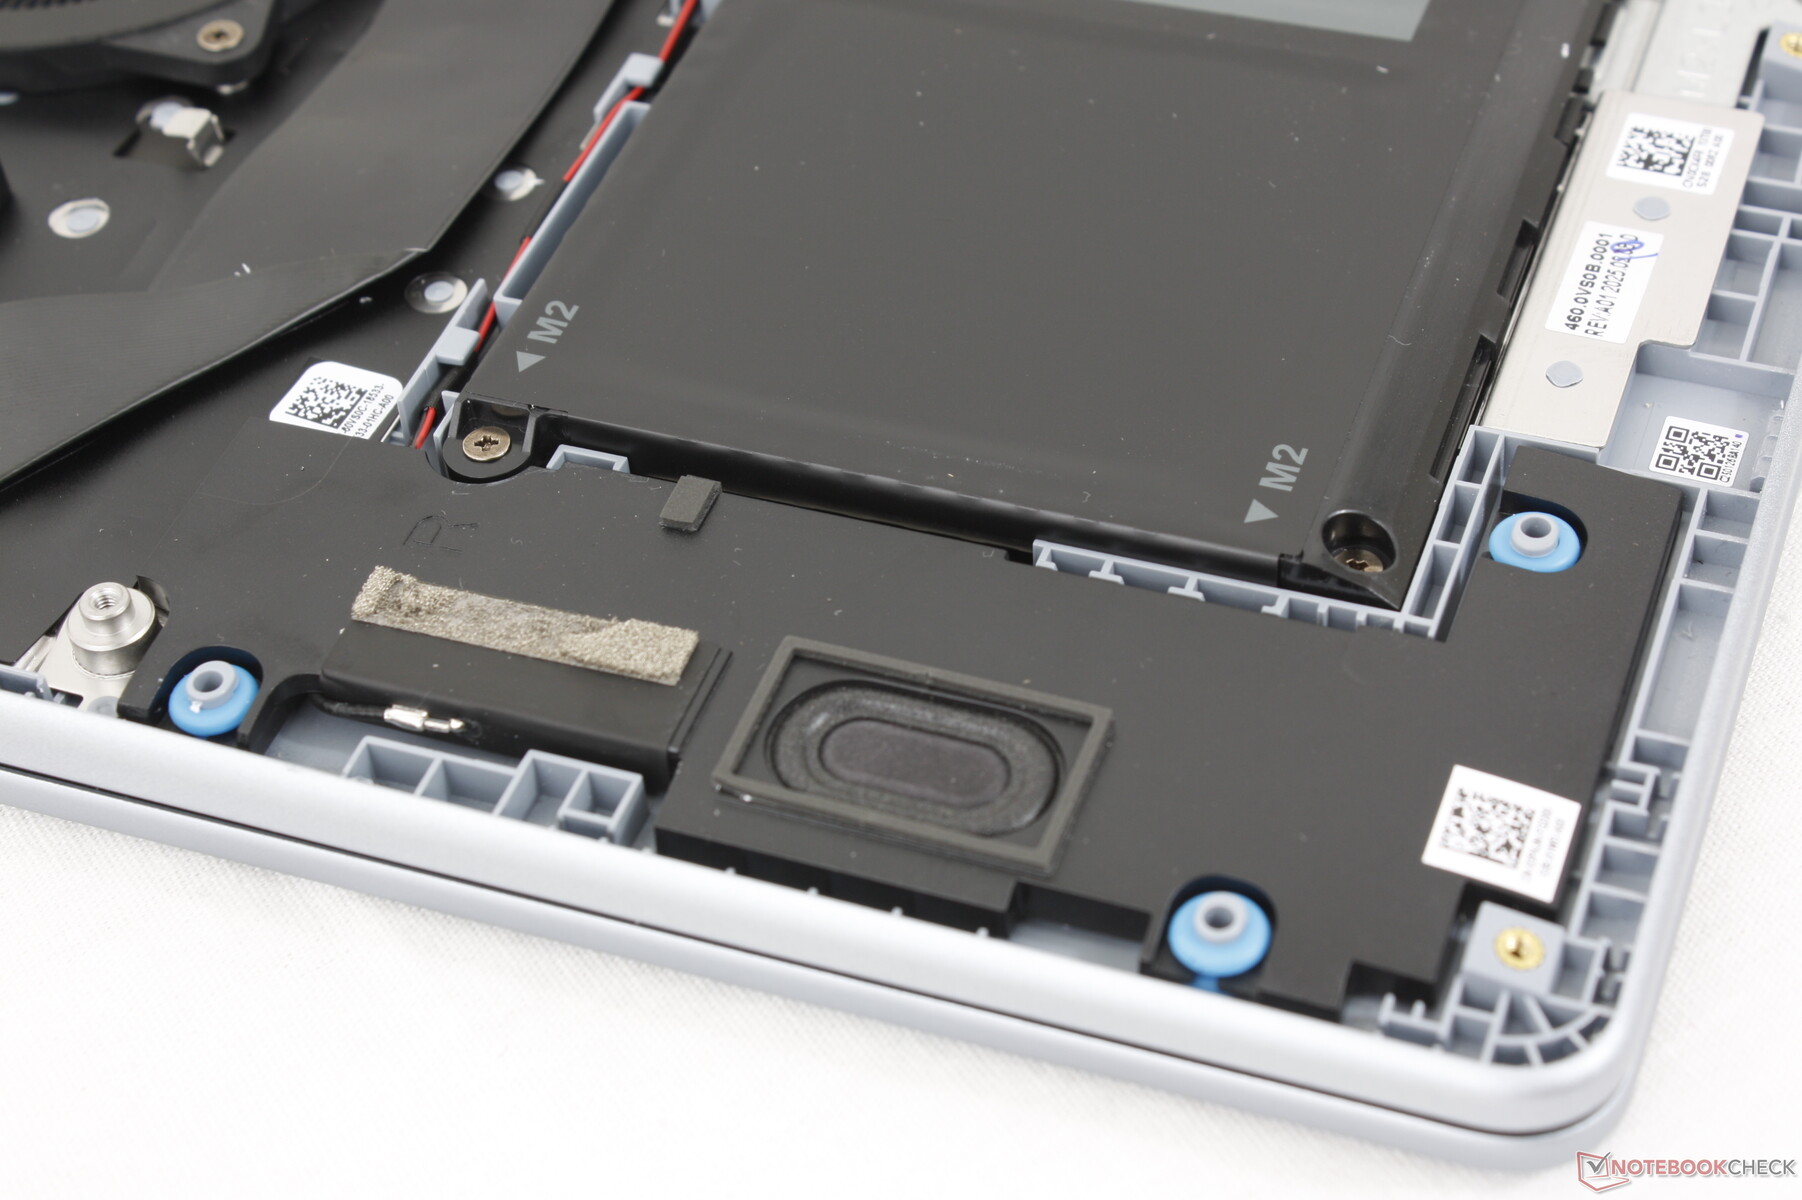
Maintenance
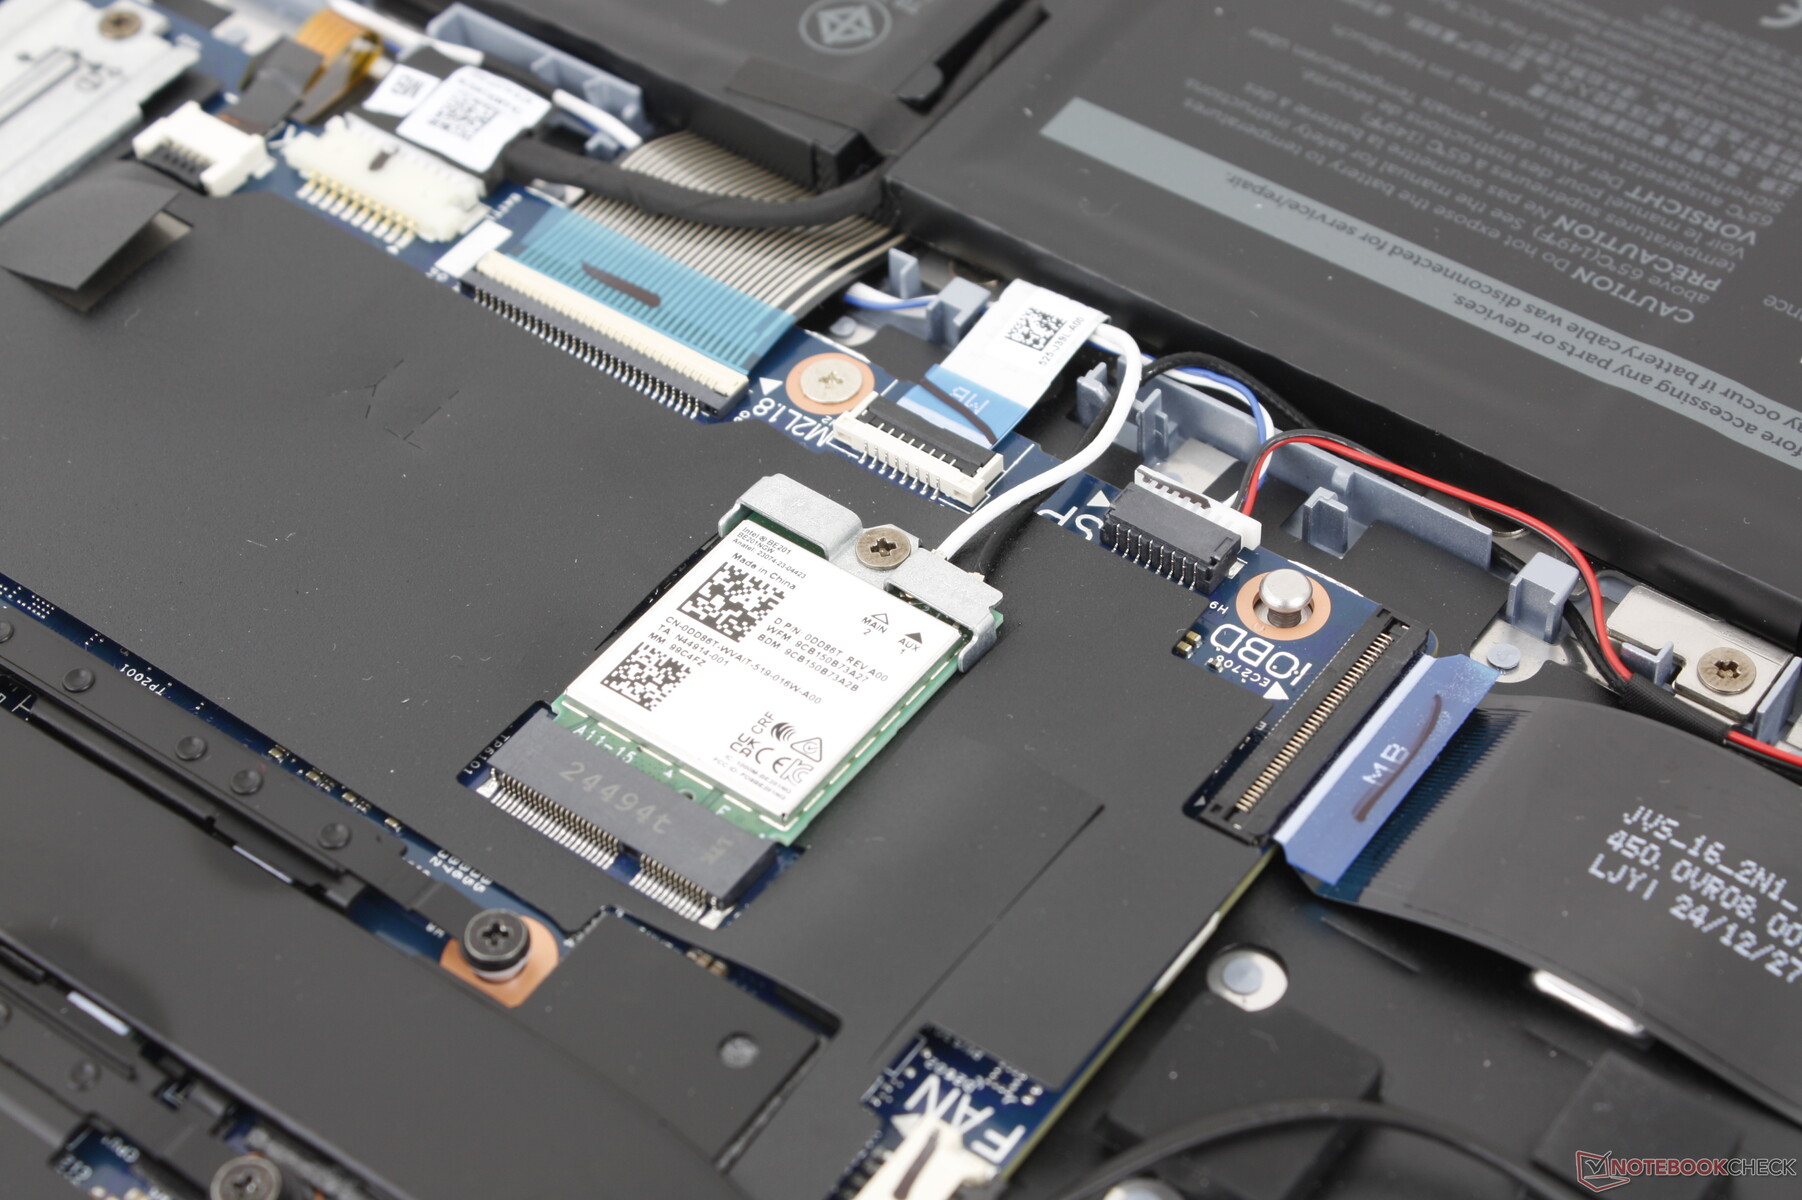
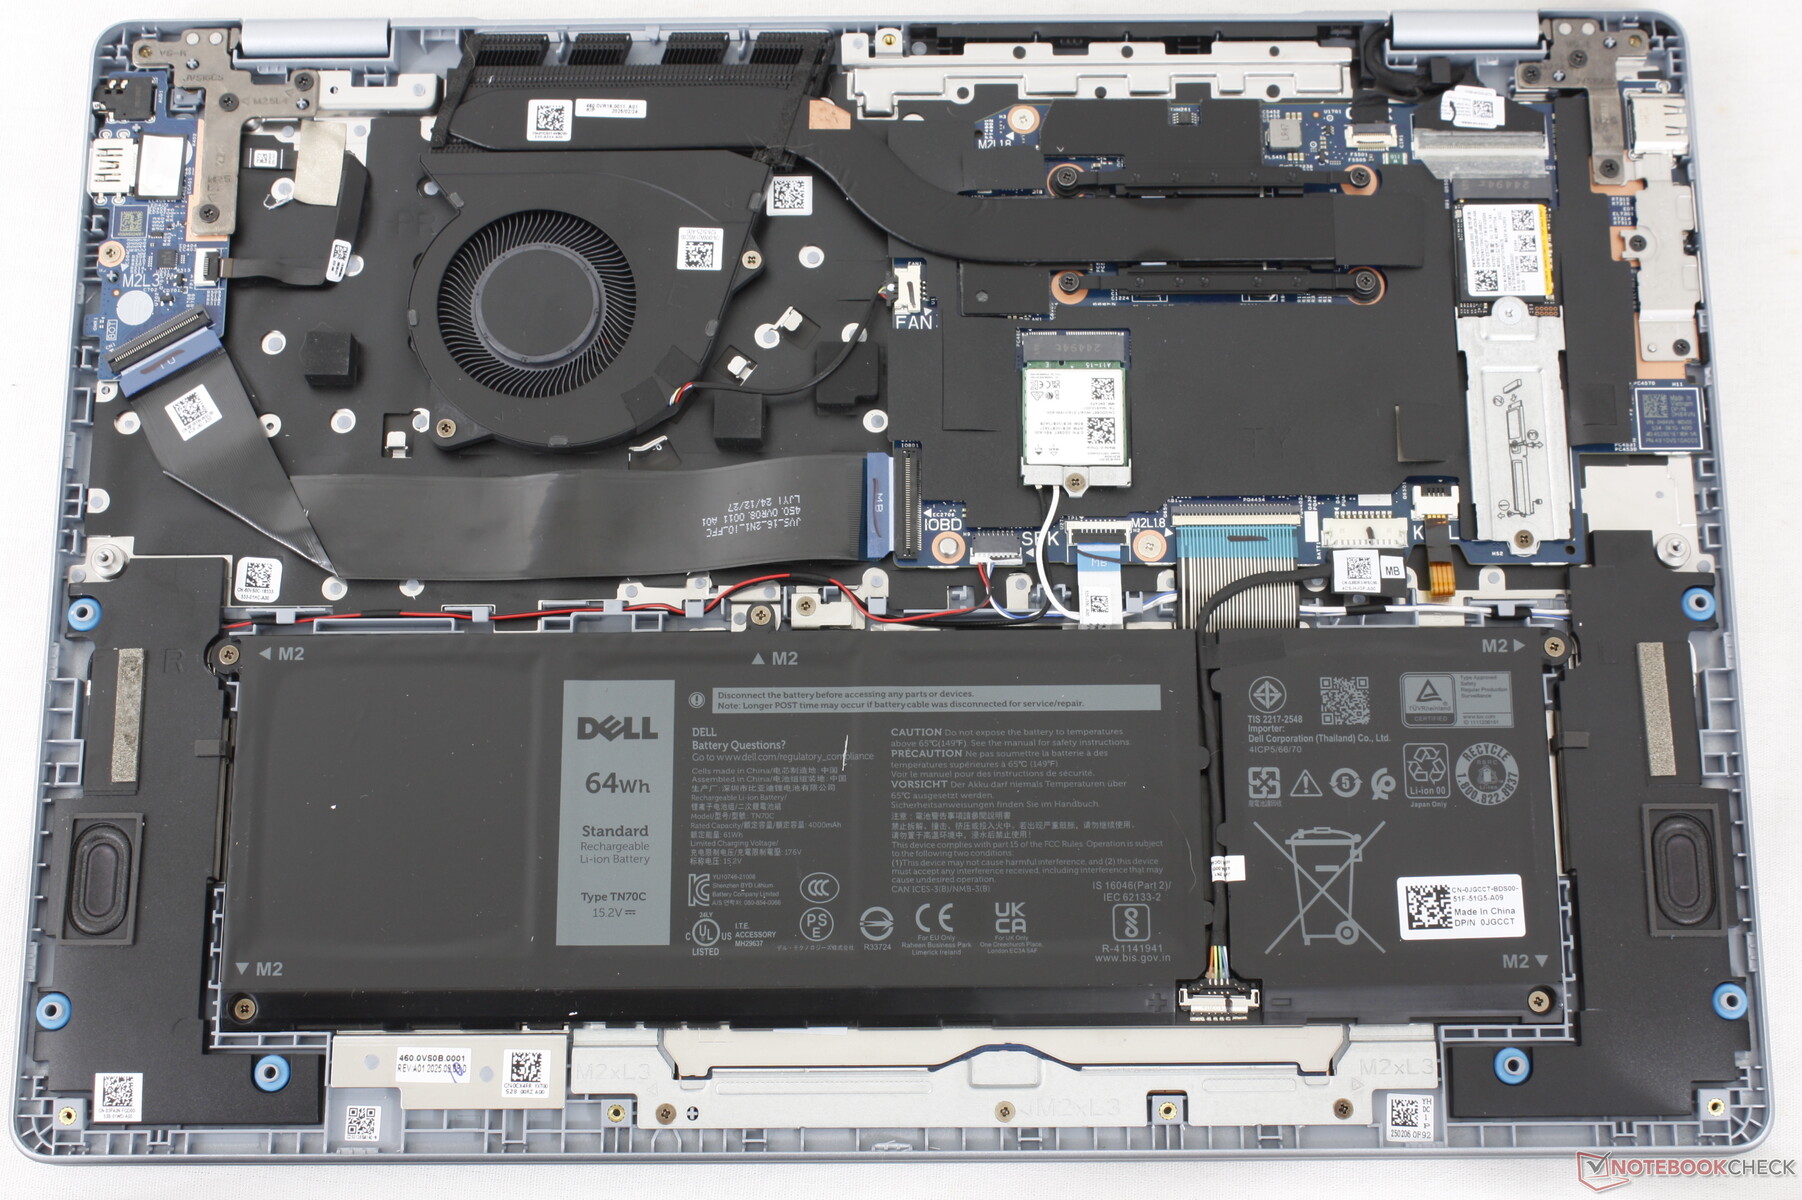
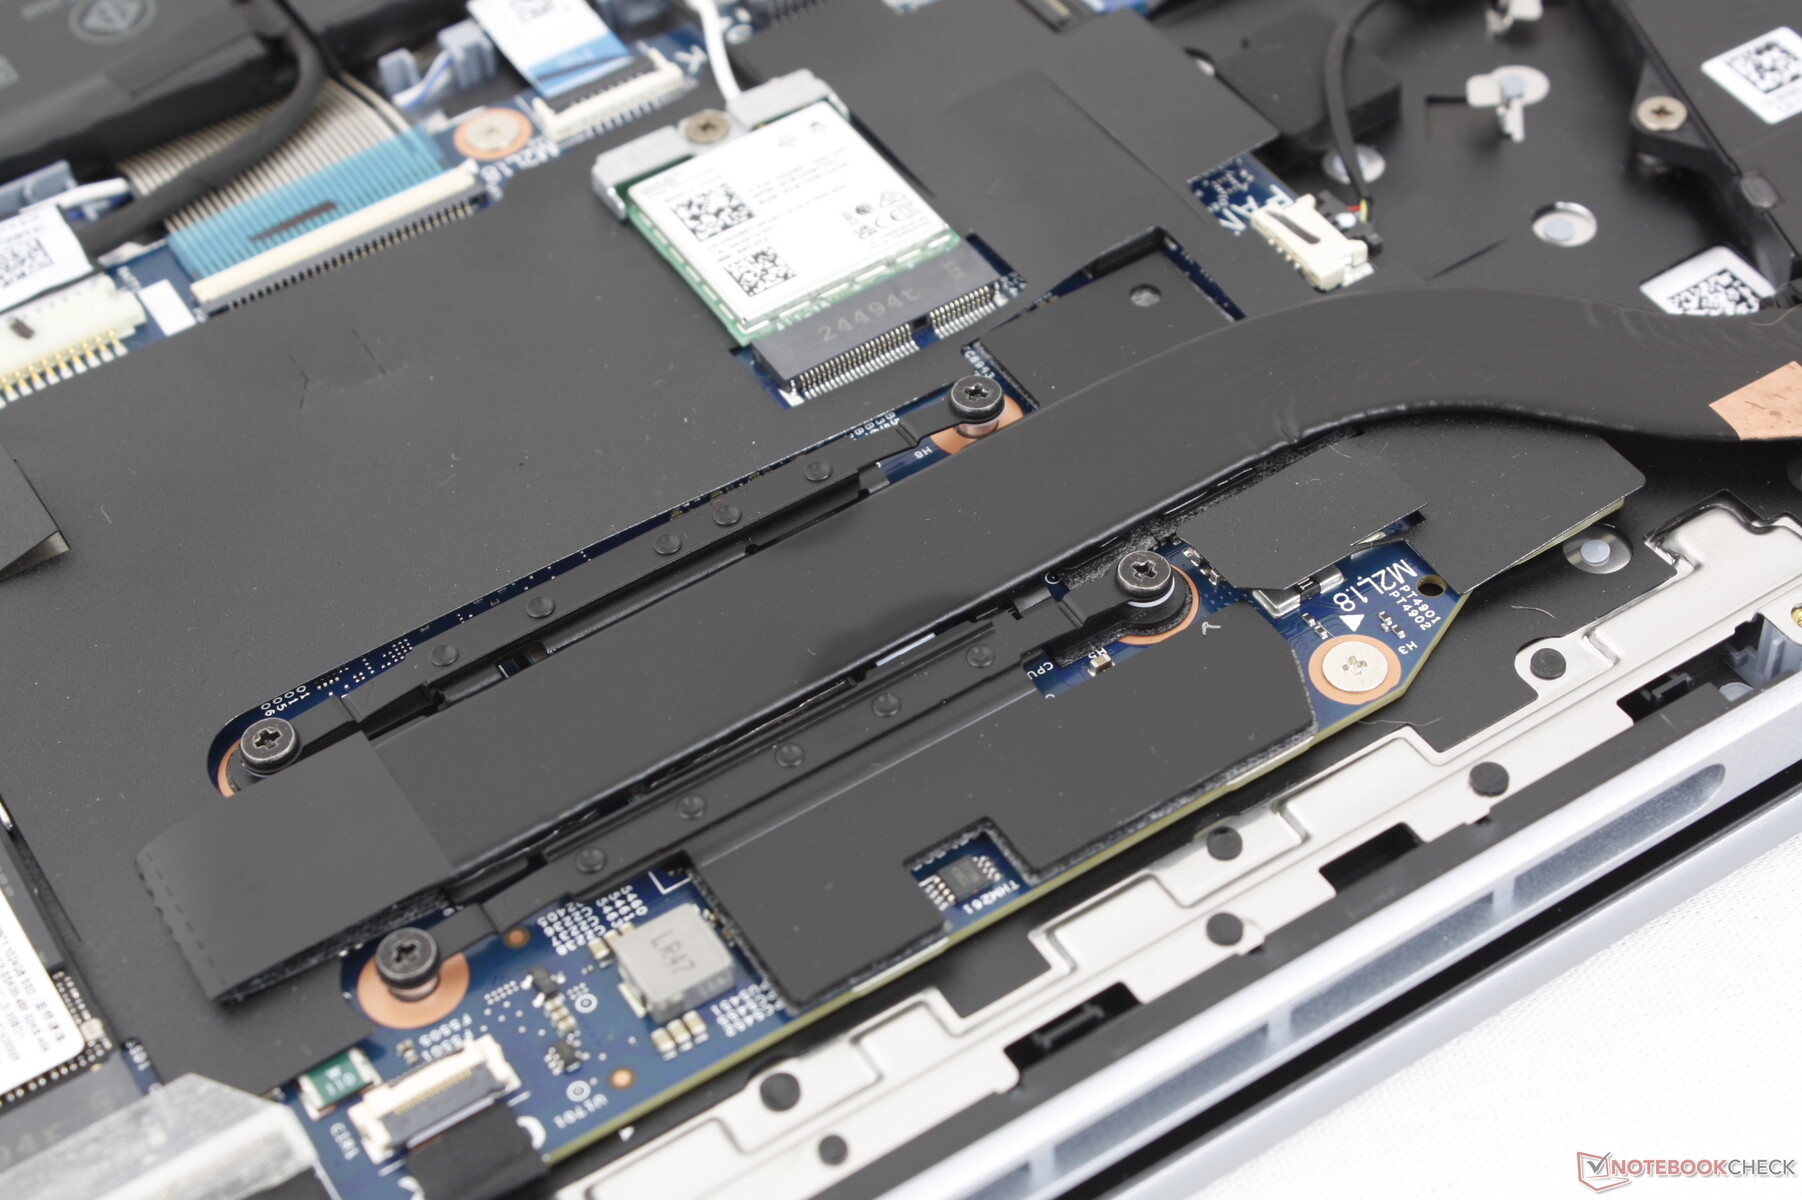
Le fond est fixé par 8 vis Phillips pour faciliter l'entretien. Cependant, il est fortement recommandé d'être prudent et d'utiliser une lame tranchante car les bords du panneau sont plus étroitement fixés à la base que sur la plupart des autres ordinateurs portables. Une fois à l'intérieur, les utilisateurs sont accueillis par l'absence de modules SODIMM amovibles et par un seul emplacement M.2 2280 pour le stockage.
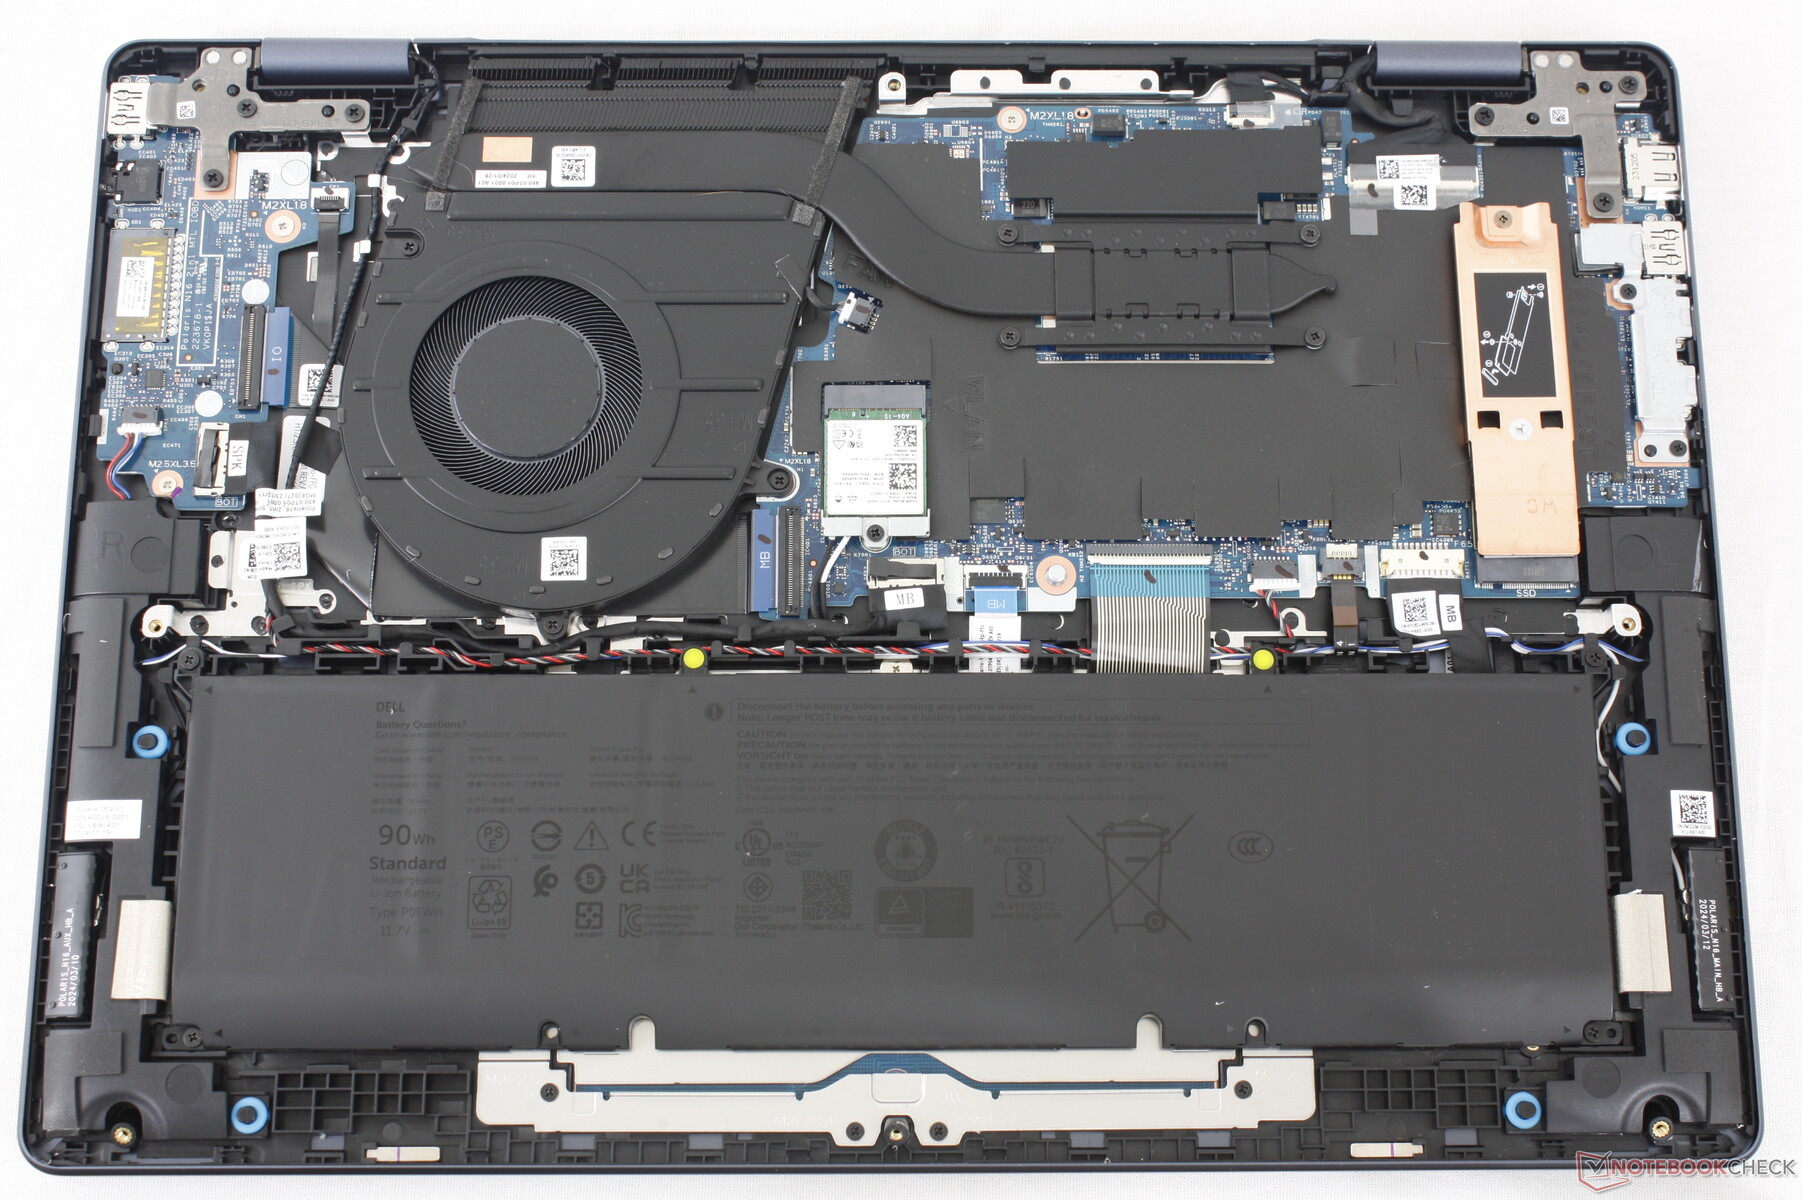
Le Dell 16 Plus partage de nombreuses caractéristiques internes avec l'Inspiron 16 Plus 7640 2-en-1, comme le montrent les photos de comparaison ci-dessous.
Durabilité
Le modèle utilise de l'aluminium, de l'acier et du plastique provenant de l'océan recyclés lors de sa fabrication, tandis que l'emballage est entièrement recyclable.
Accessoires et garantie
La boîte ne contient pas d'autres éléments que l'adaptateur secteur et la documentation. La garantie limitée habituelle d'un an du fabricant s'applique si l'appareil est acheté aux États-Unis.
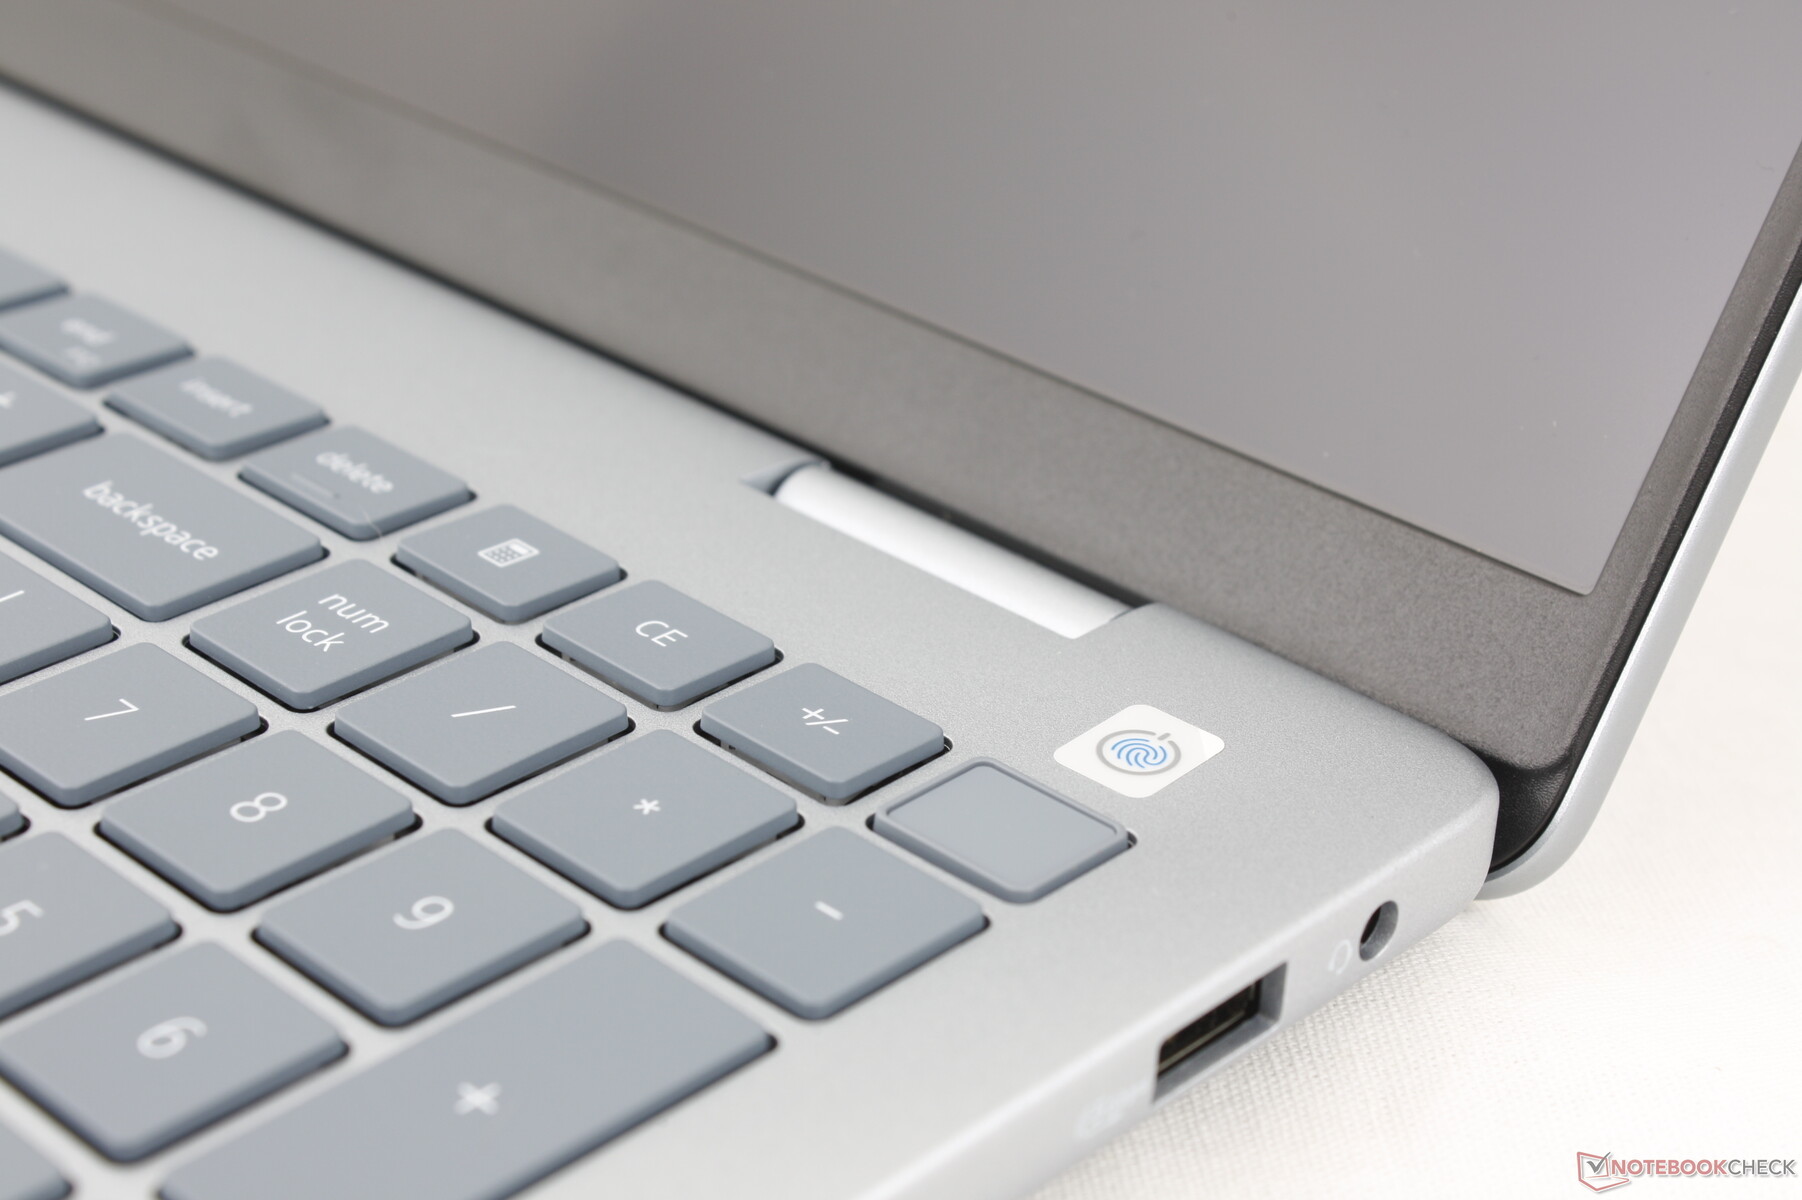
Périphériques d'entrée
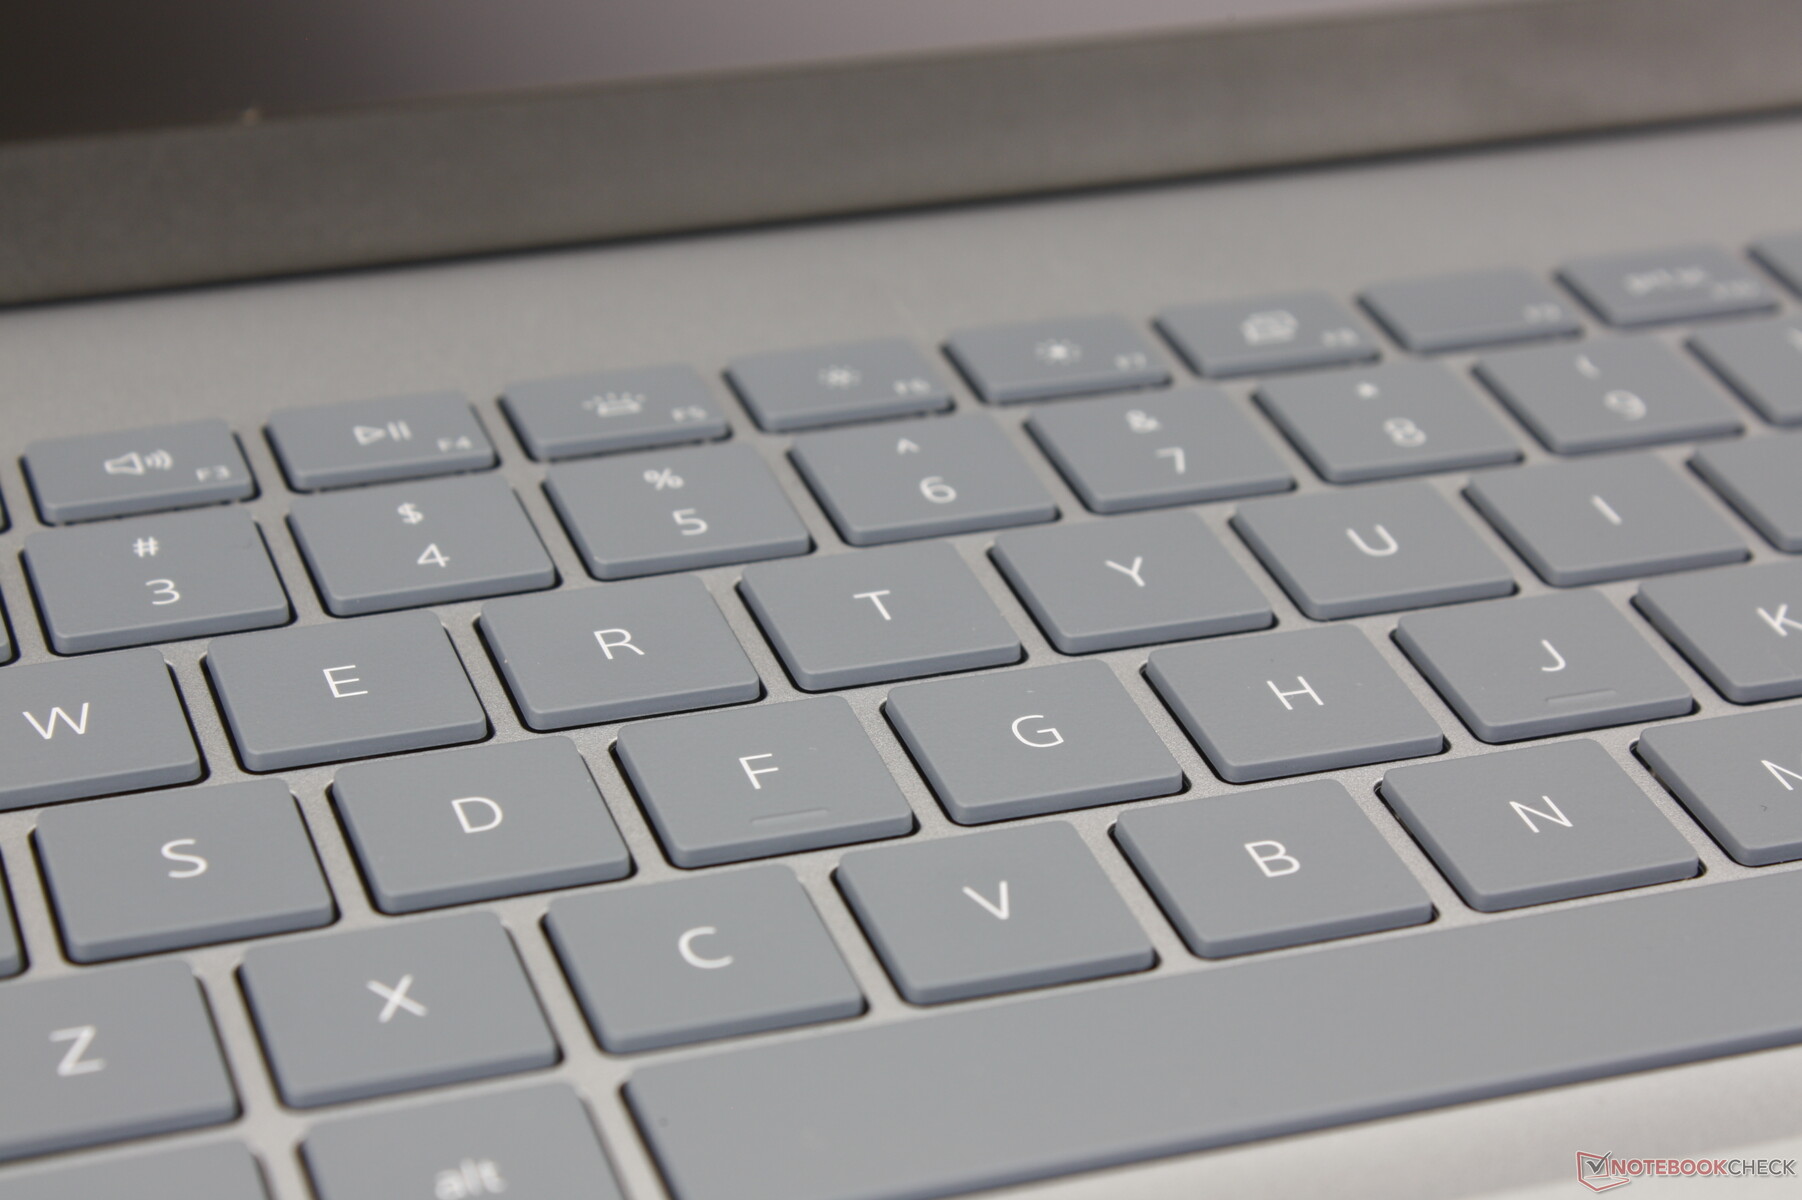
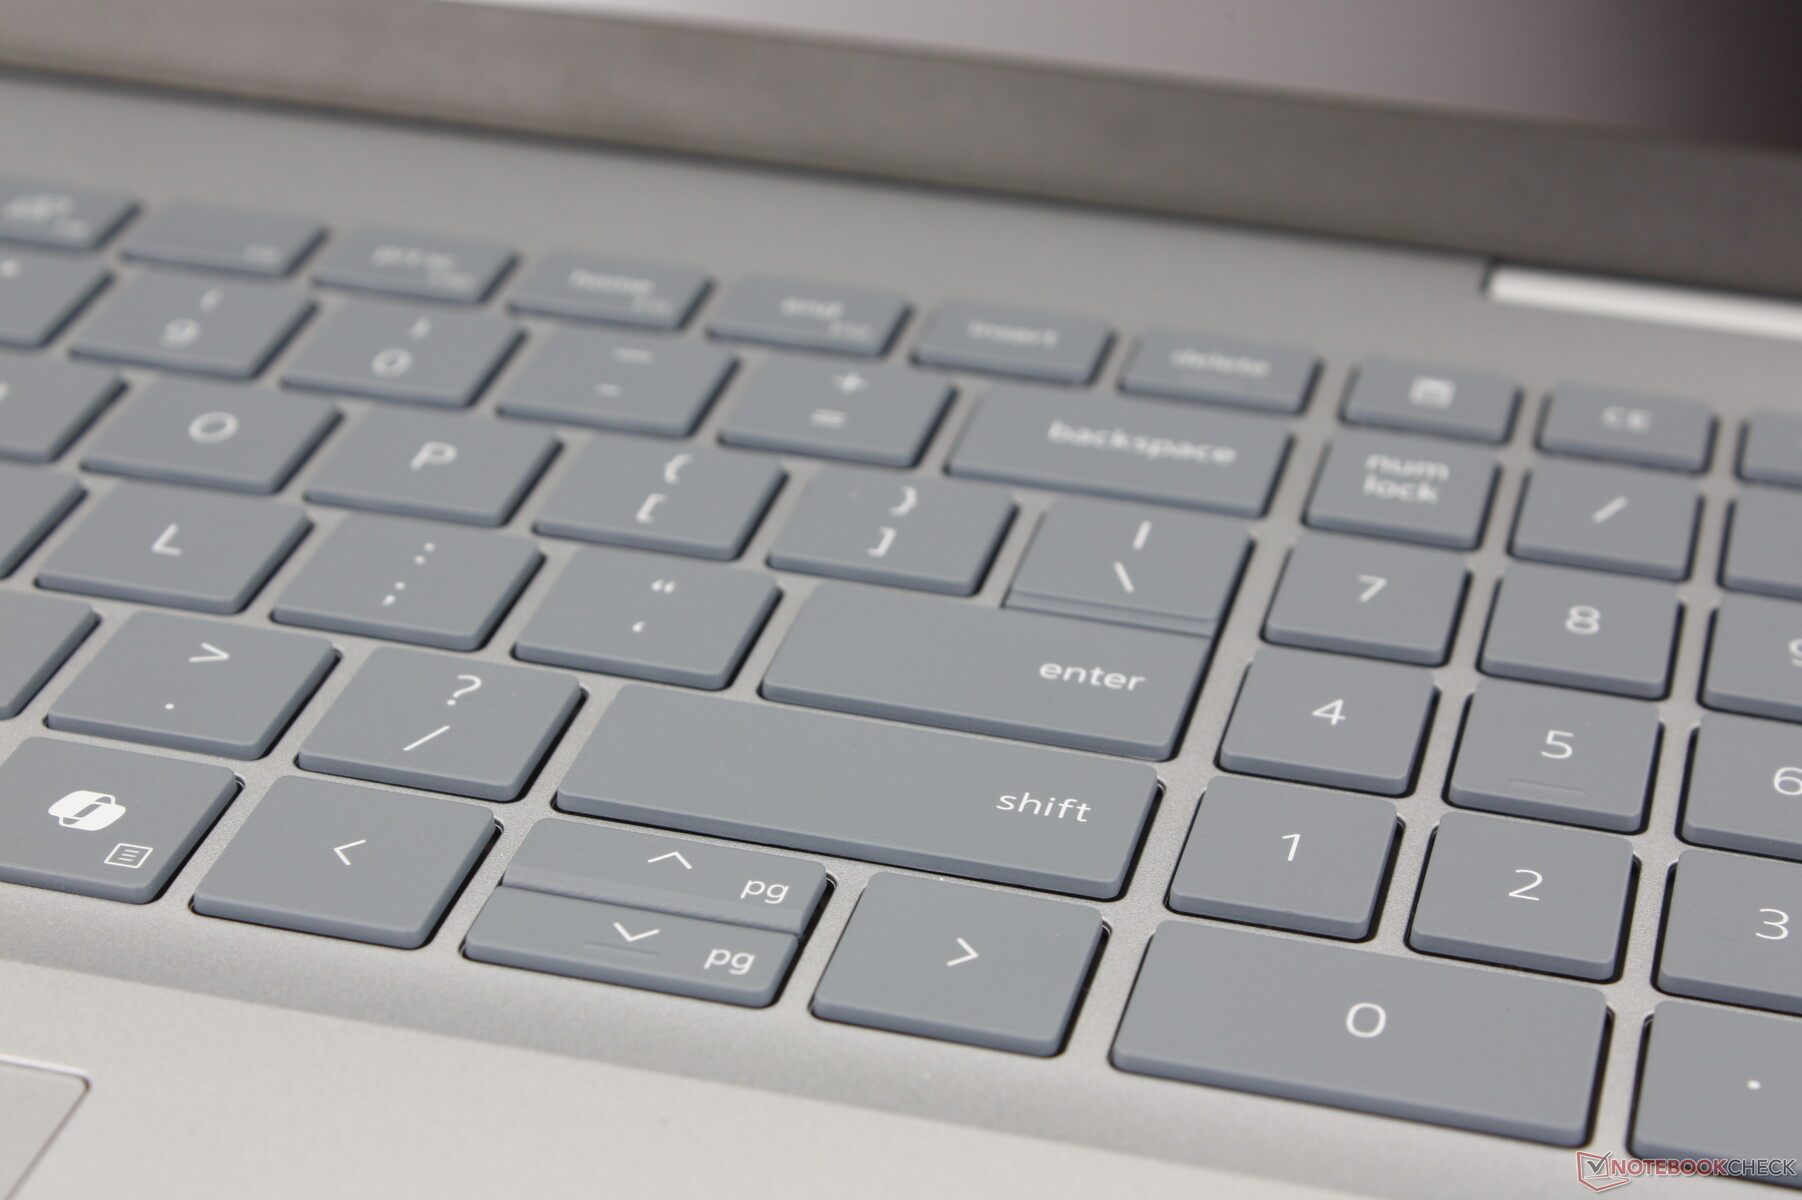
Clavier
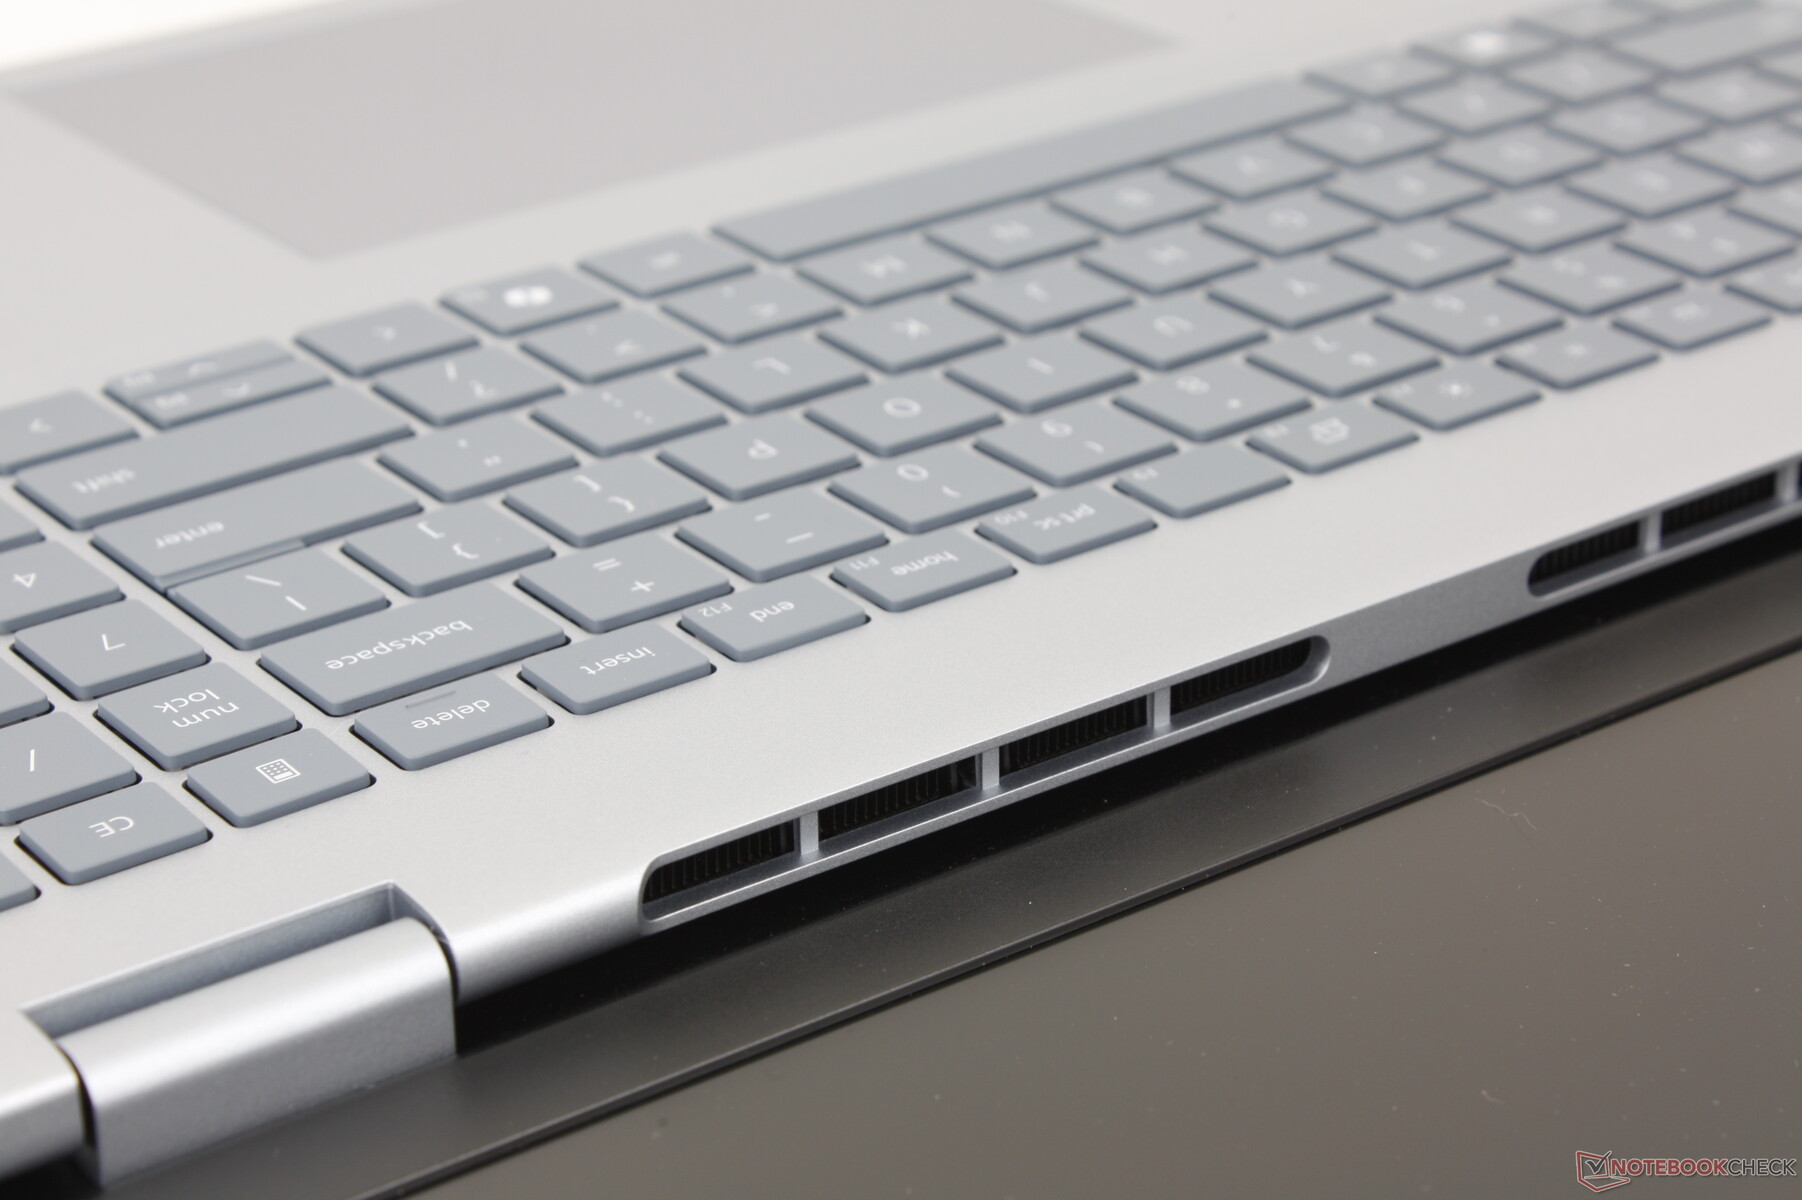
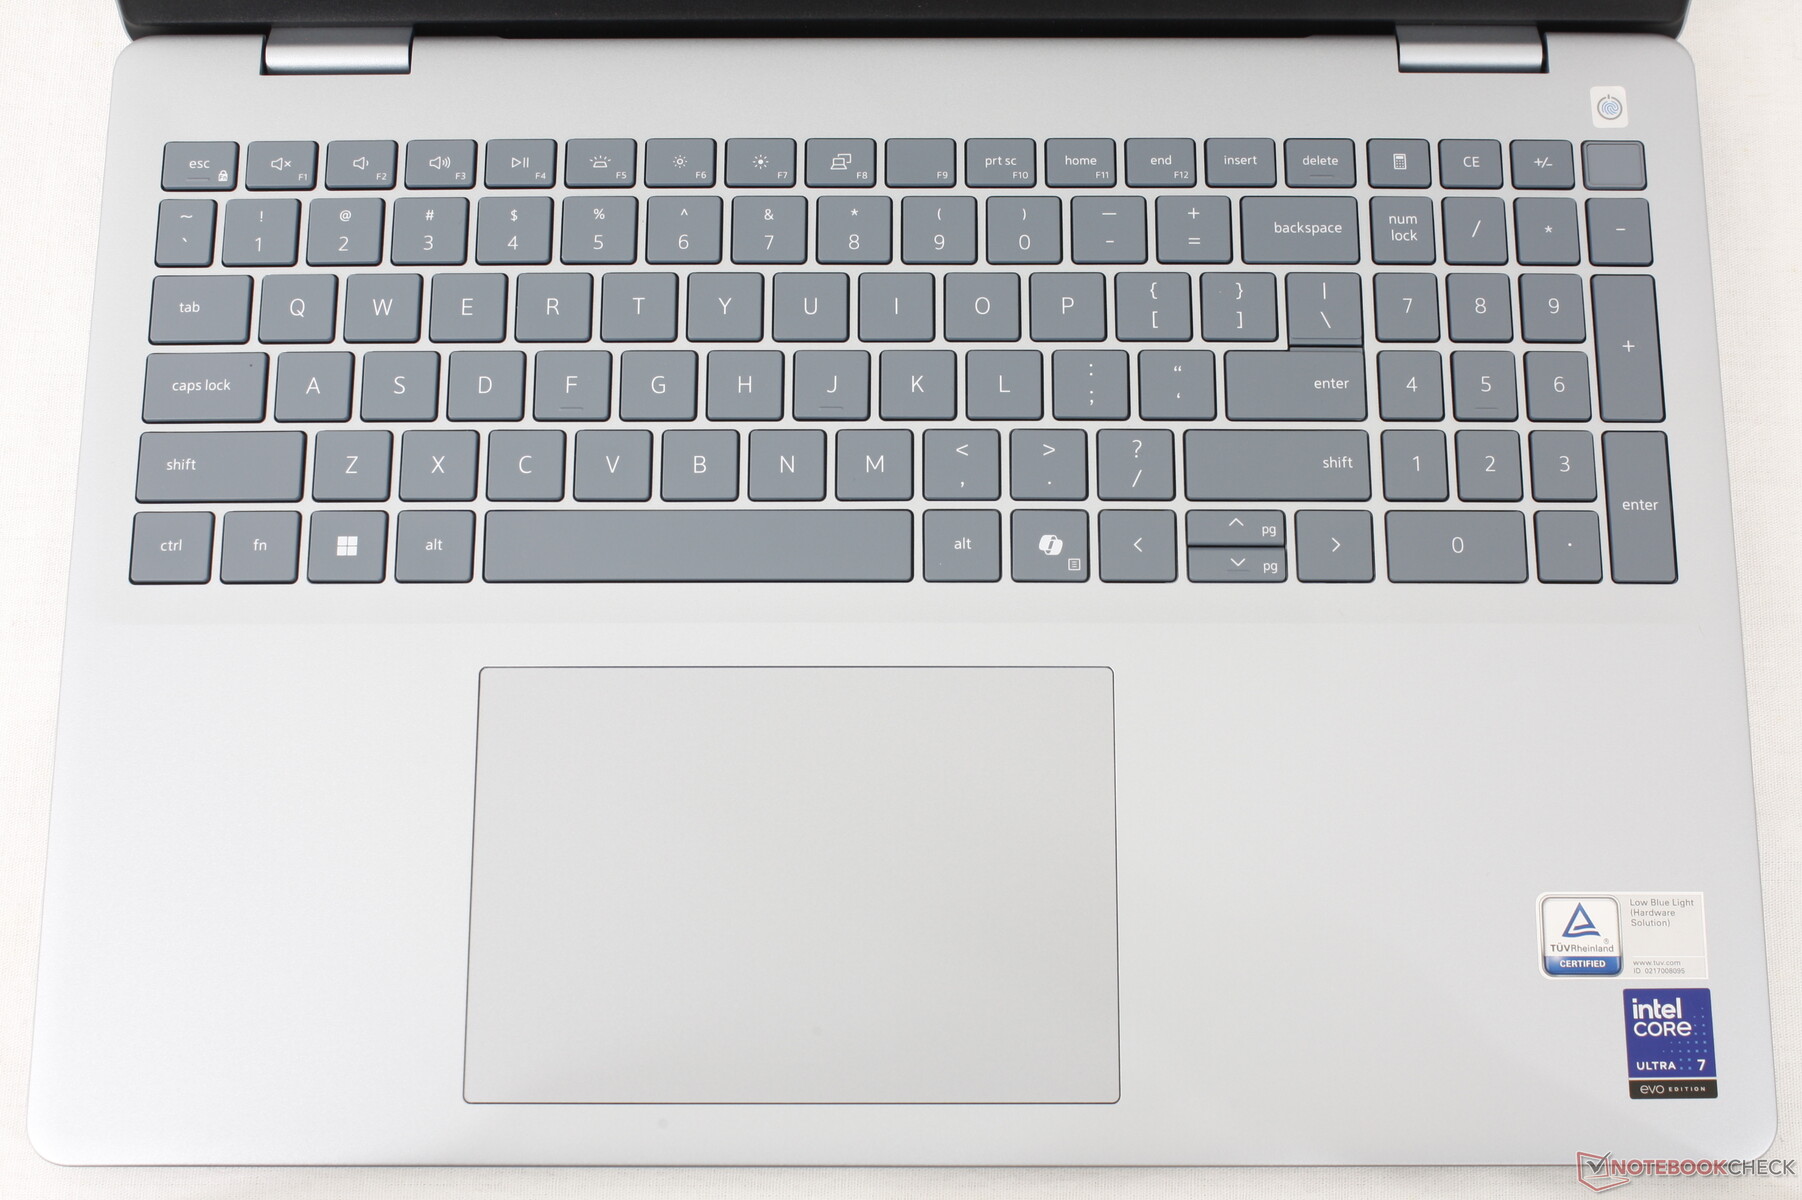
Le Dell 16 Plus introduit un pavé numérique intégré alors que cette fonctionnalité était absente de la gamme Inspiron 16 Plus 7640. L'expérience de frappe est similaire à celle des modèles Inspiron d'ancienne génération, pour le meilleur et pour le pire. Le retour d'information des touches est un peu moins fort, mais la barre d'espace est assez bruyante et cliquante.
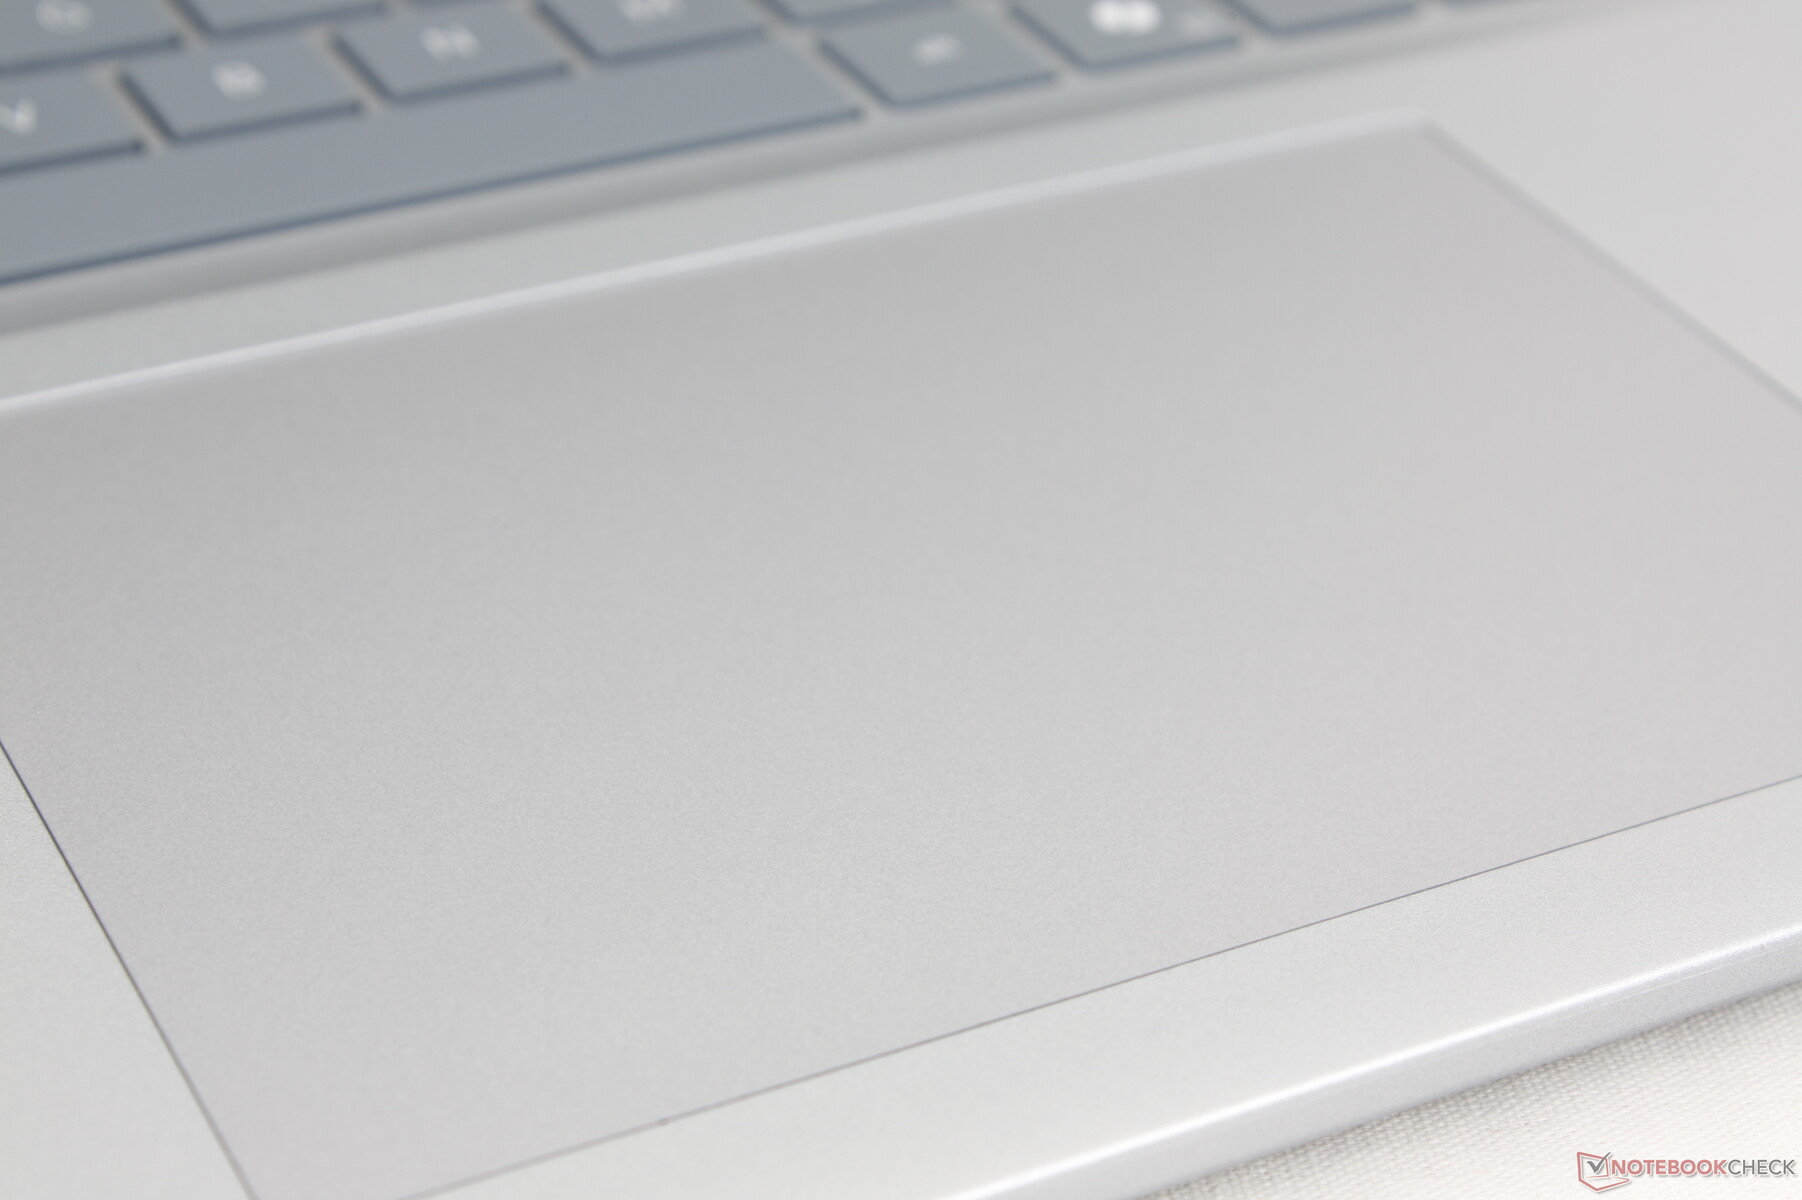
Pavé tactile
Si les fonctionnalités du clavier ont été étendues, le pavé tactile reste identique à celui de l'Inspiron 16 Plus 7640 2-en-1, jusqu'à la taille (13,3 x 9 cm). Il est grand et spacieux pour un contrôle confortable du curseur et des entrées multi-touch, mais cliquer sur sa surface demande plus de force que sur la plupart des autres ordinateurs portables.
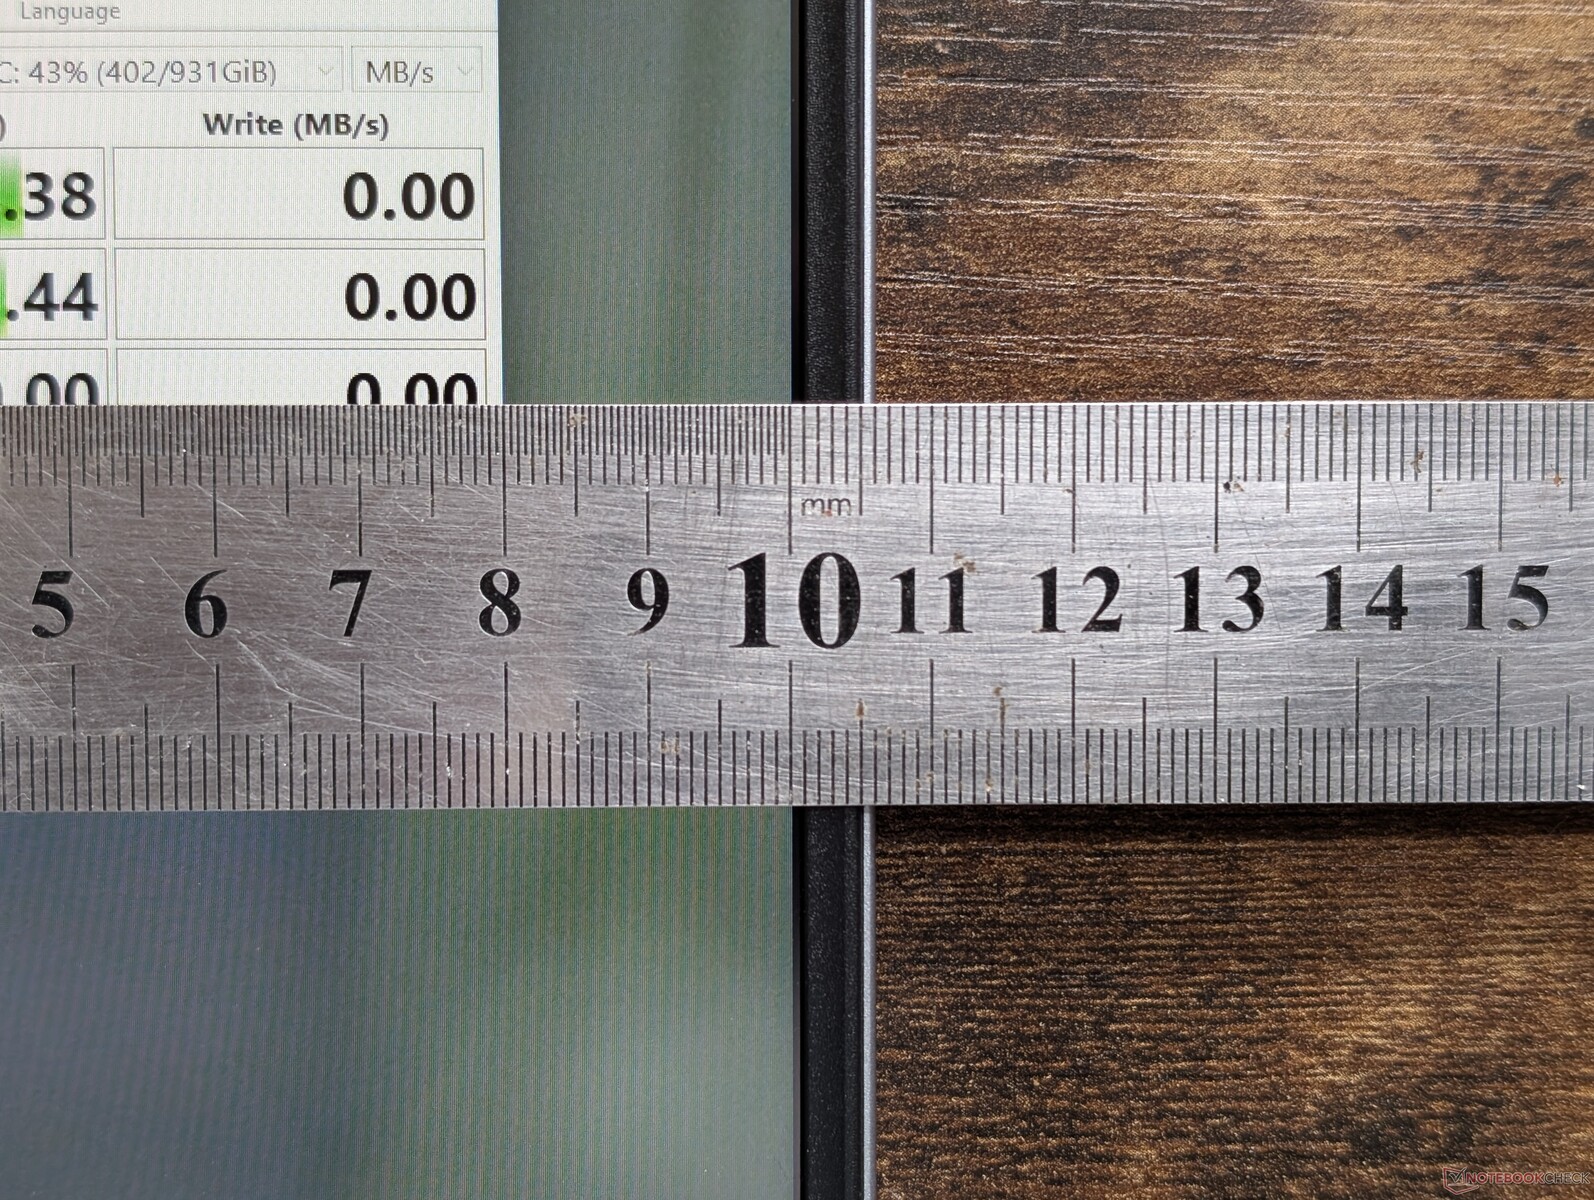
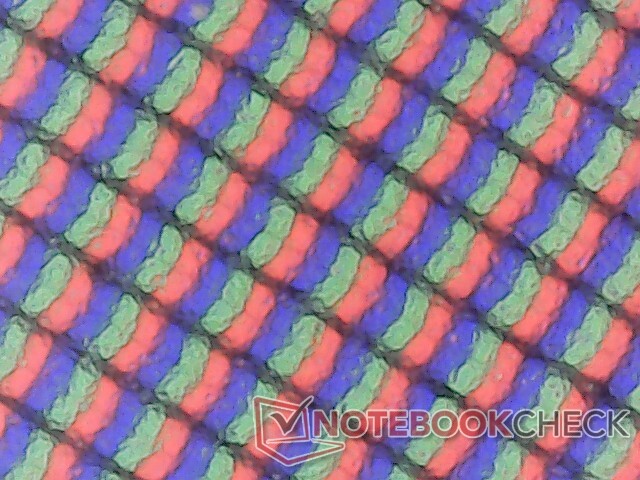
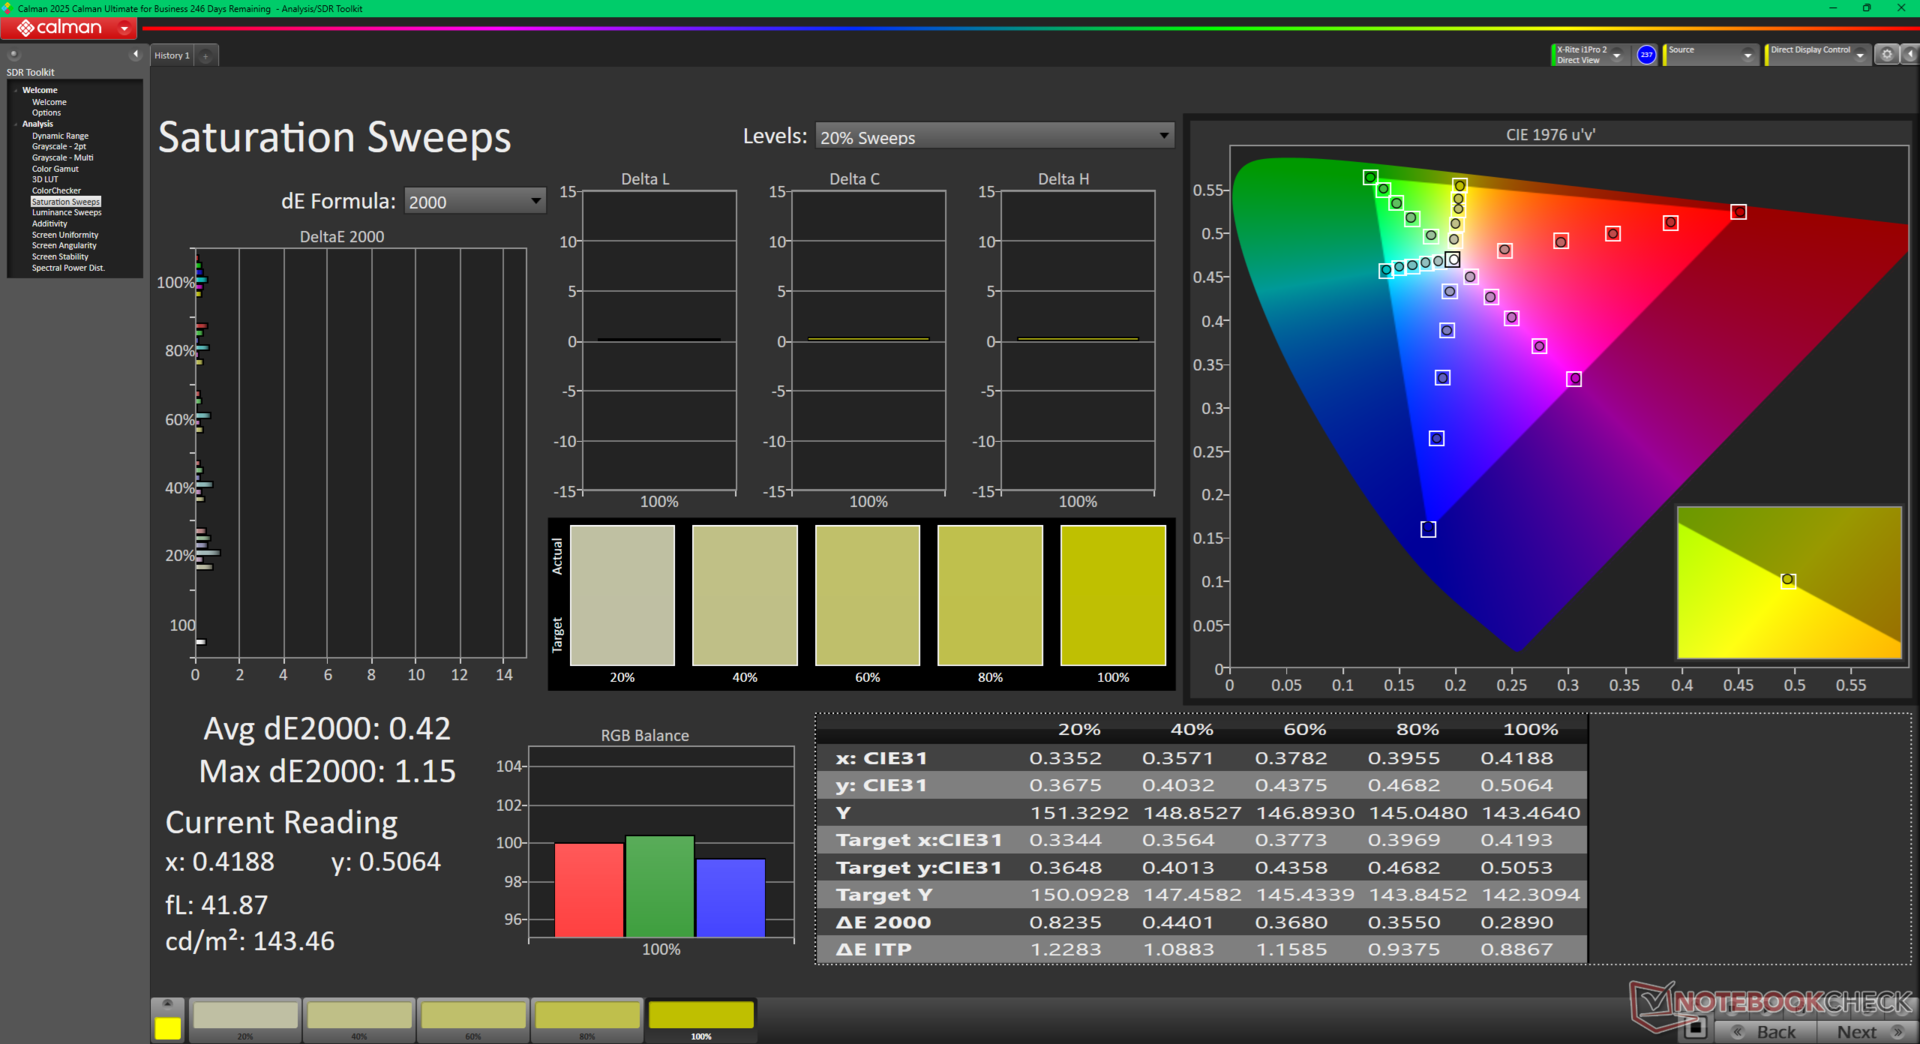
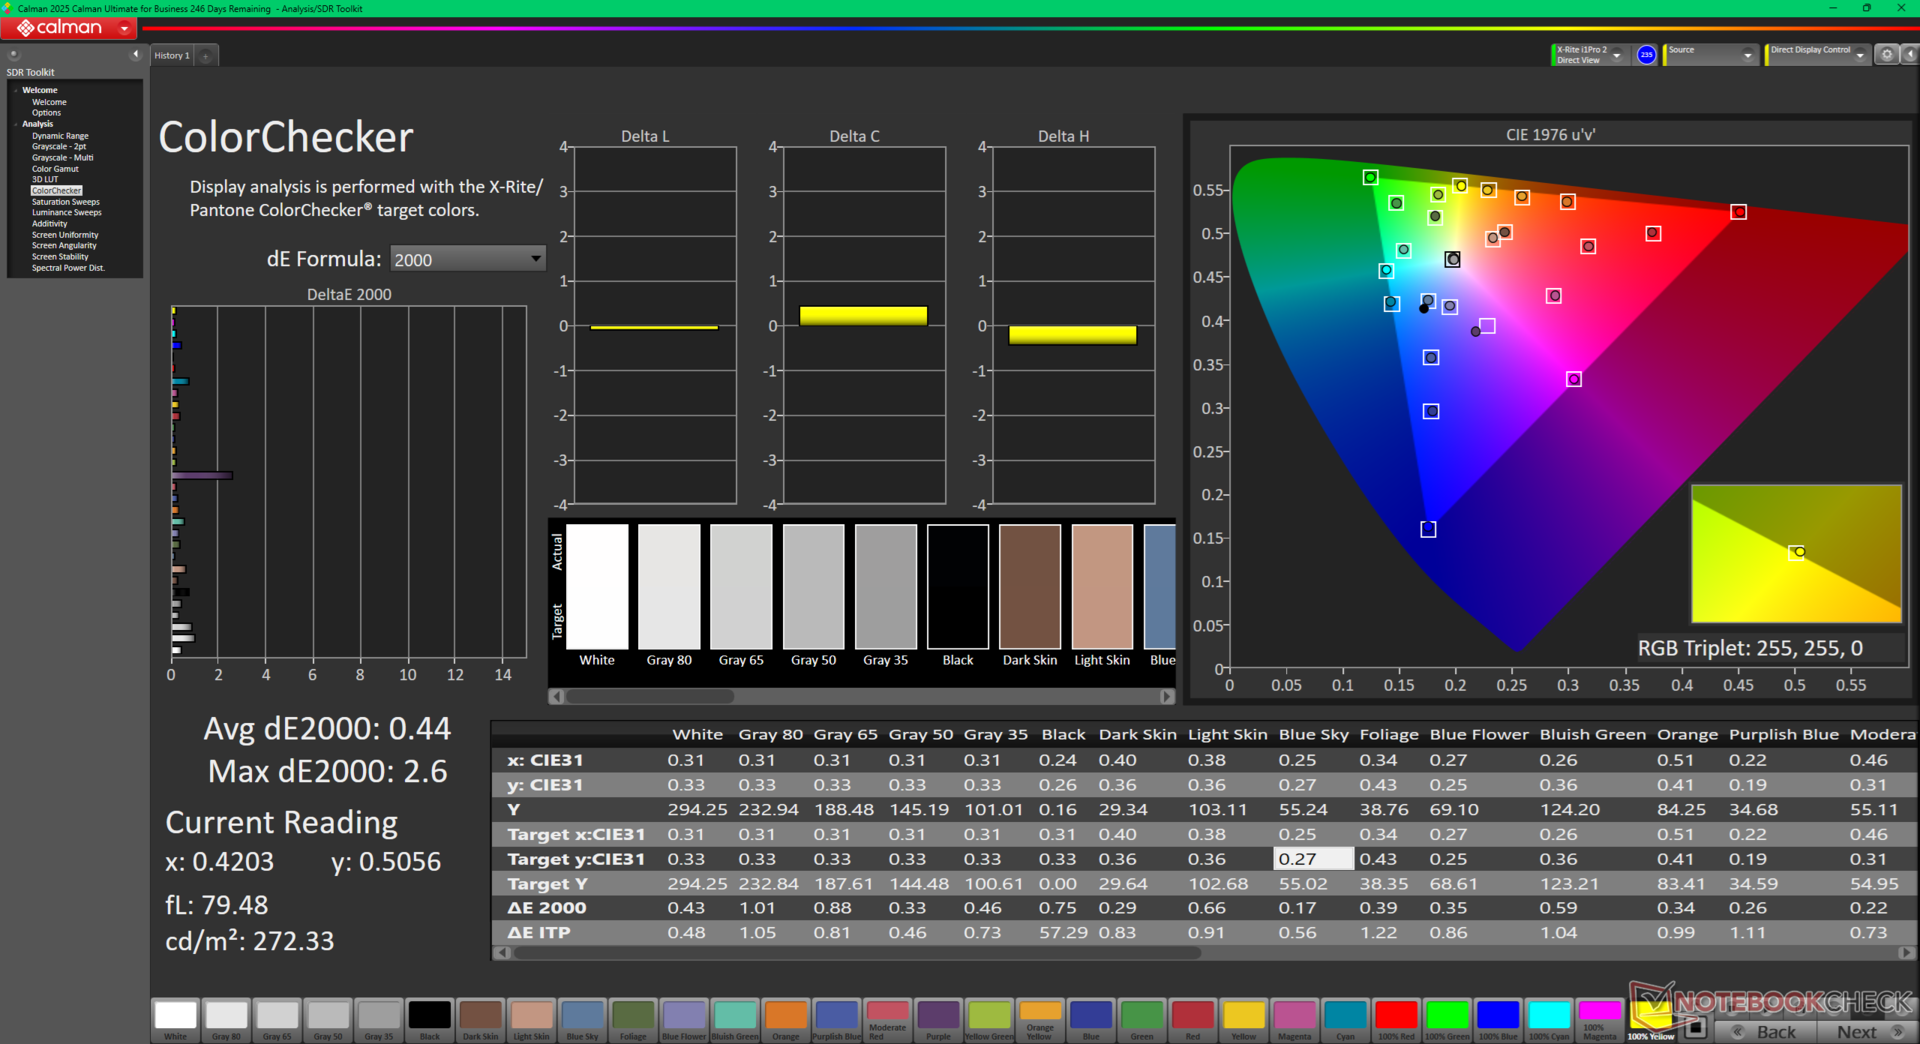
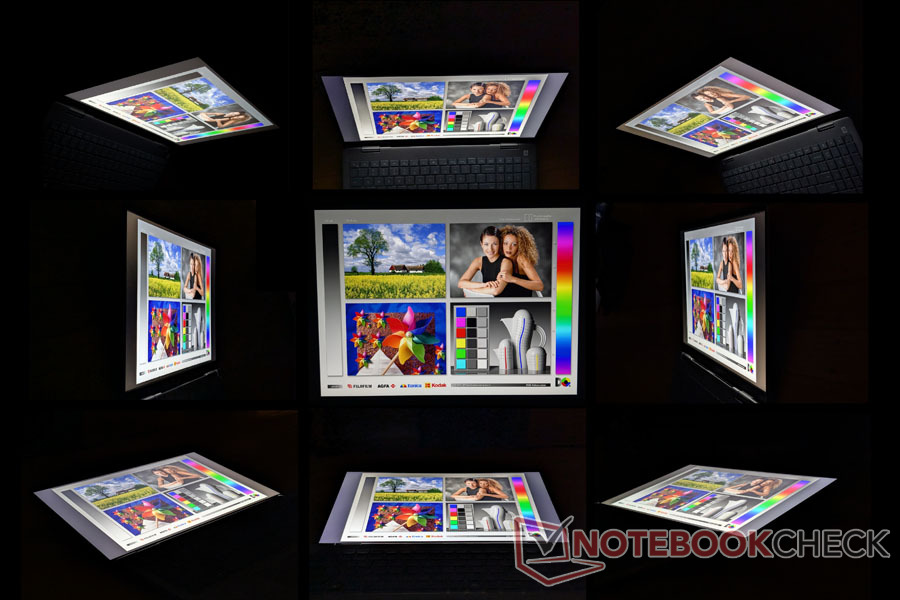
Affichage - 120 Hz et toutes les couleurs sRGB
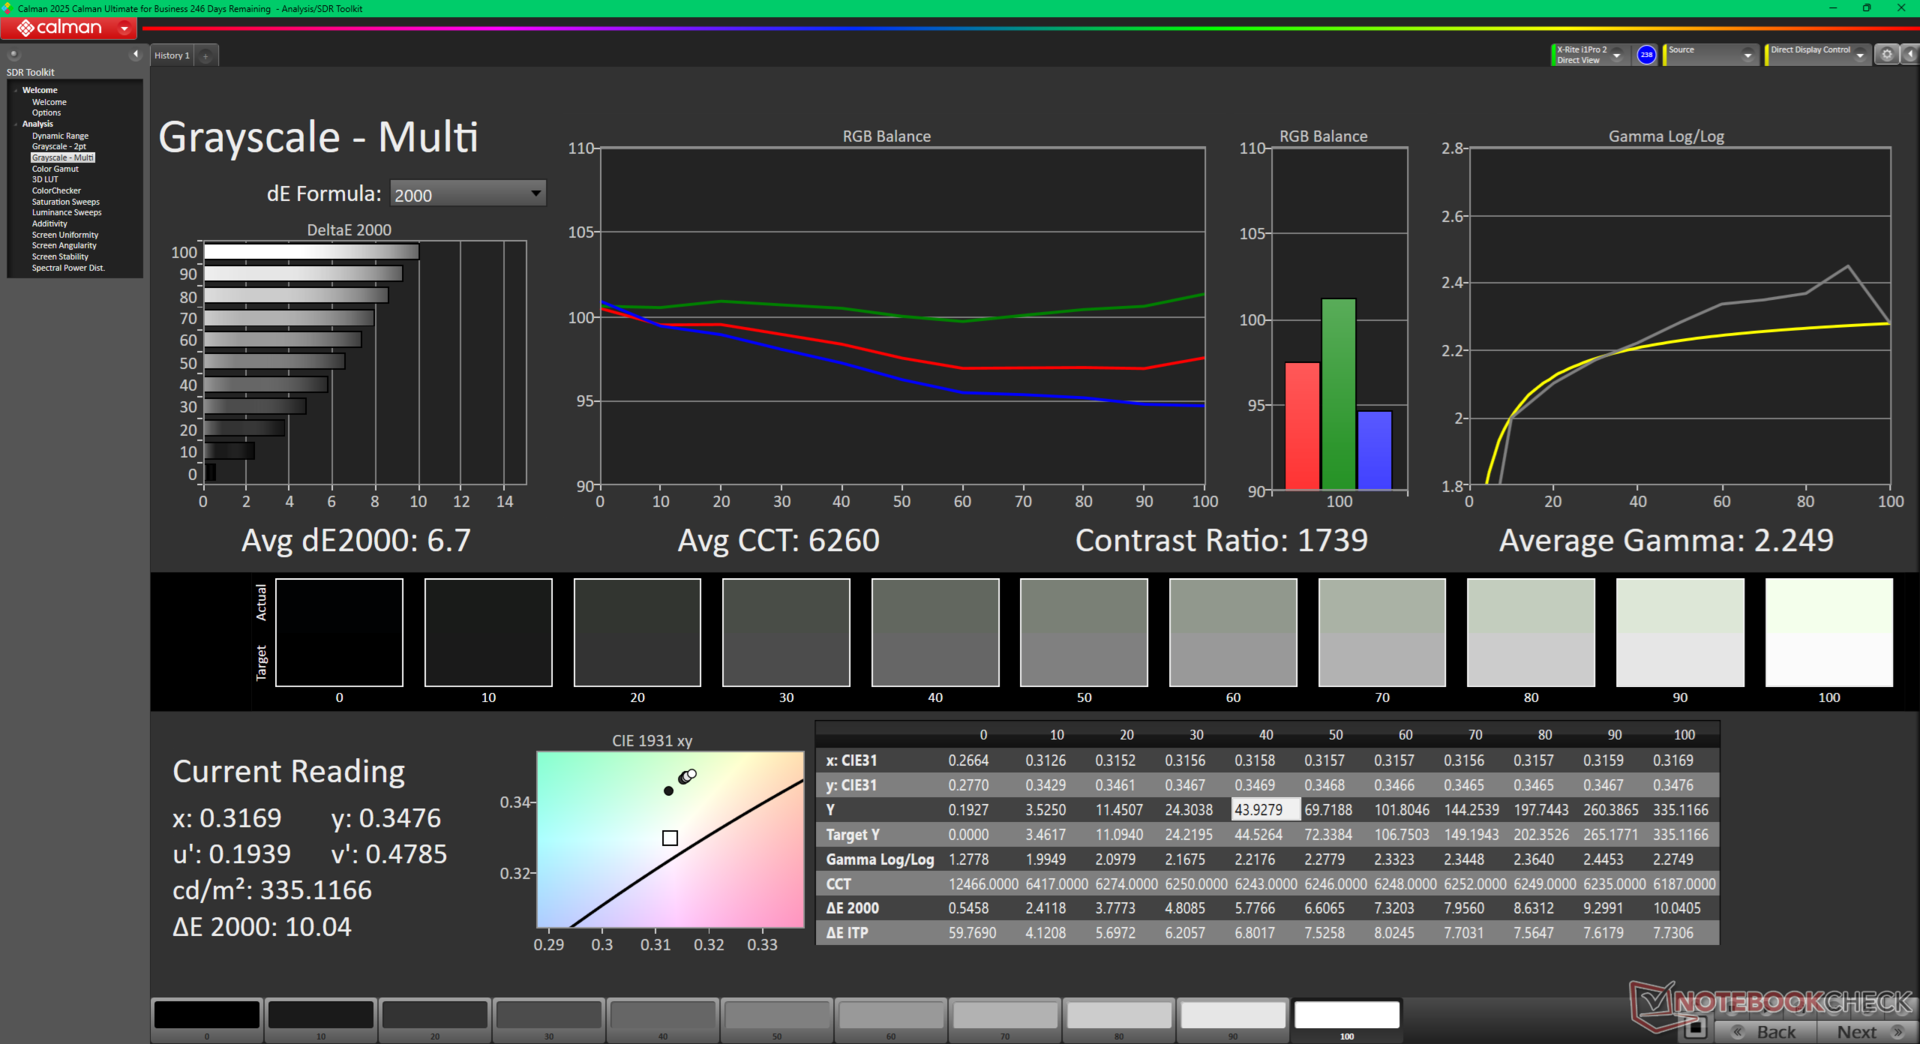
Le Dell 16 Plus partage la même dalle IPS B160QAN d'AU Optronics que l'on trouve sur l' Inspiron 16 Plus 7640 pour une expérience visuelle sensiblement identique. Néanmoins, nous aurions aimé voir des améliorations au niveau de la luminosité et de la prise en charge du HDR.
La configuration mini-LED 90 Hz est plus que probablement le même panneau que celui de l'Inspiron 16 7640 2-en-1 de l'année dernière.
| |||||||||||||||||||||||||
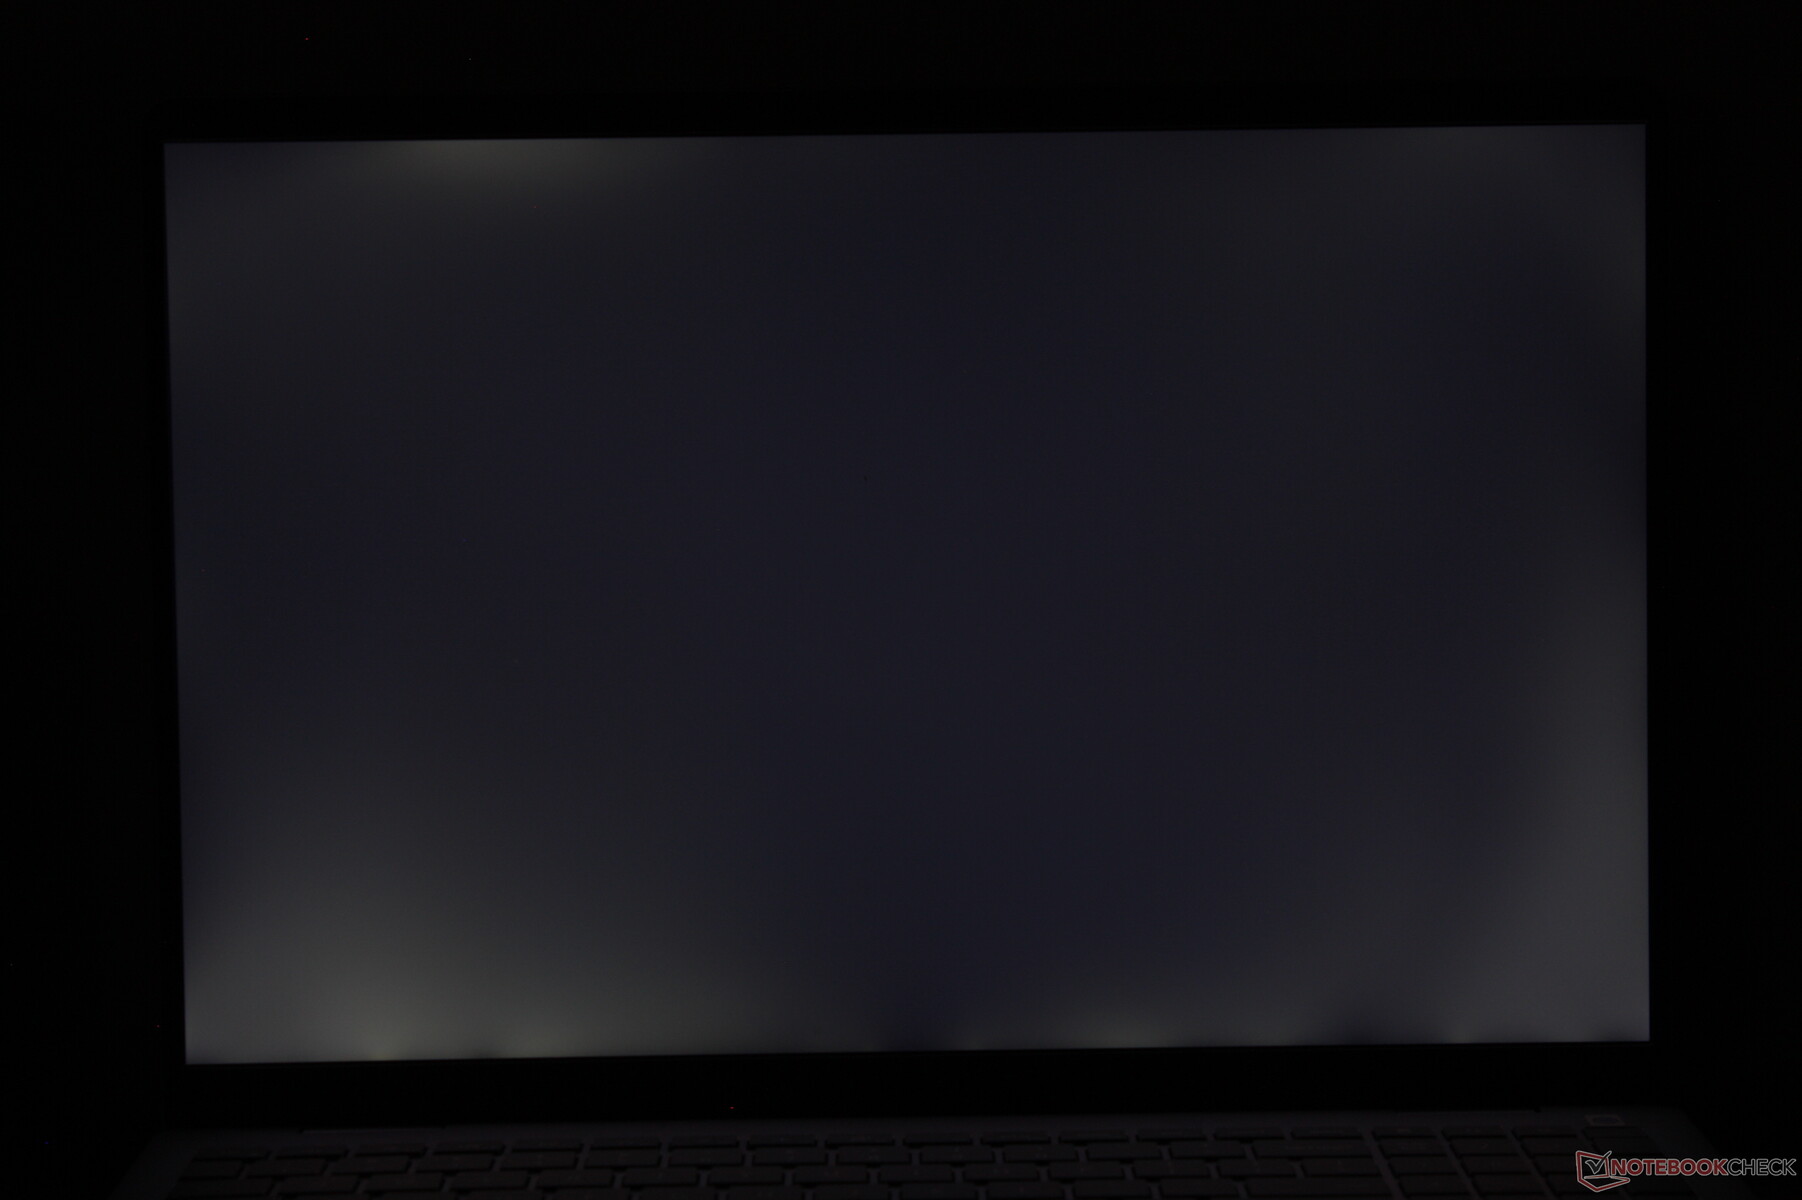
Homogénéité de la luminosité: 88 %
Valeur mesurée au centre, sur batterie: 335.6 cd/m²
Contraste: 1525:1 (Valeurs des noirs: 0.22 cd/m²)
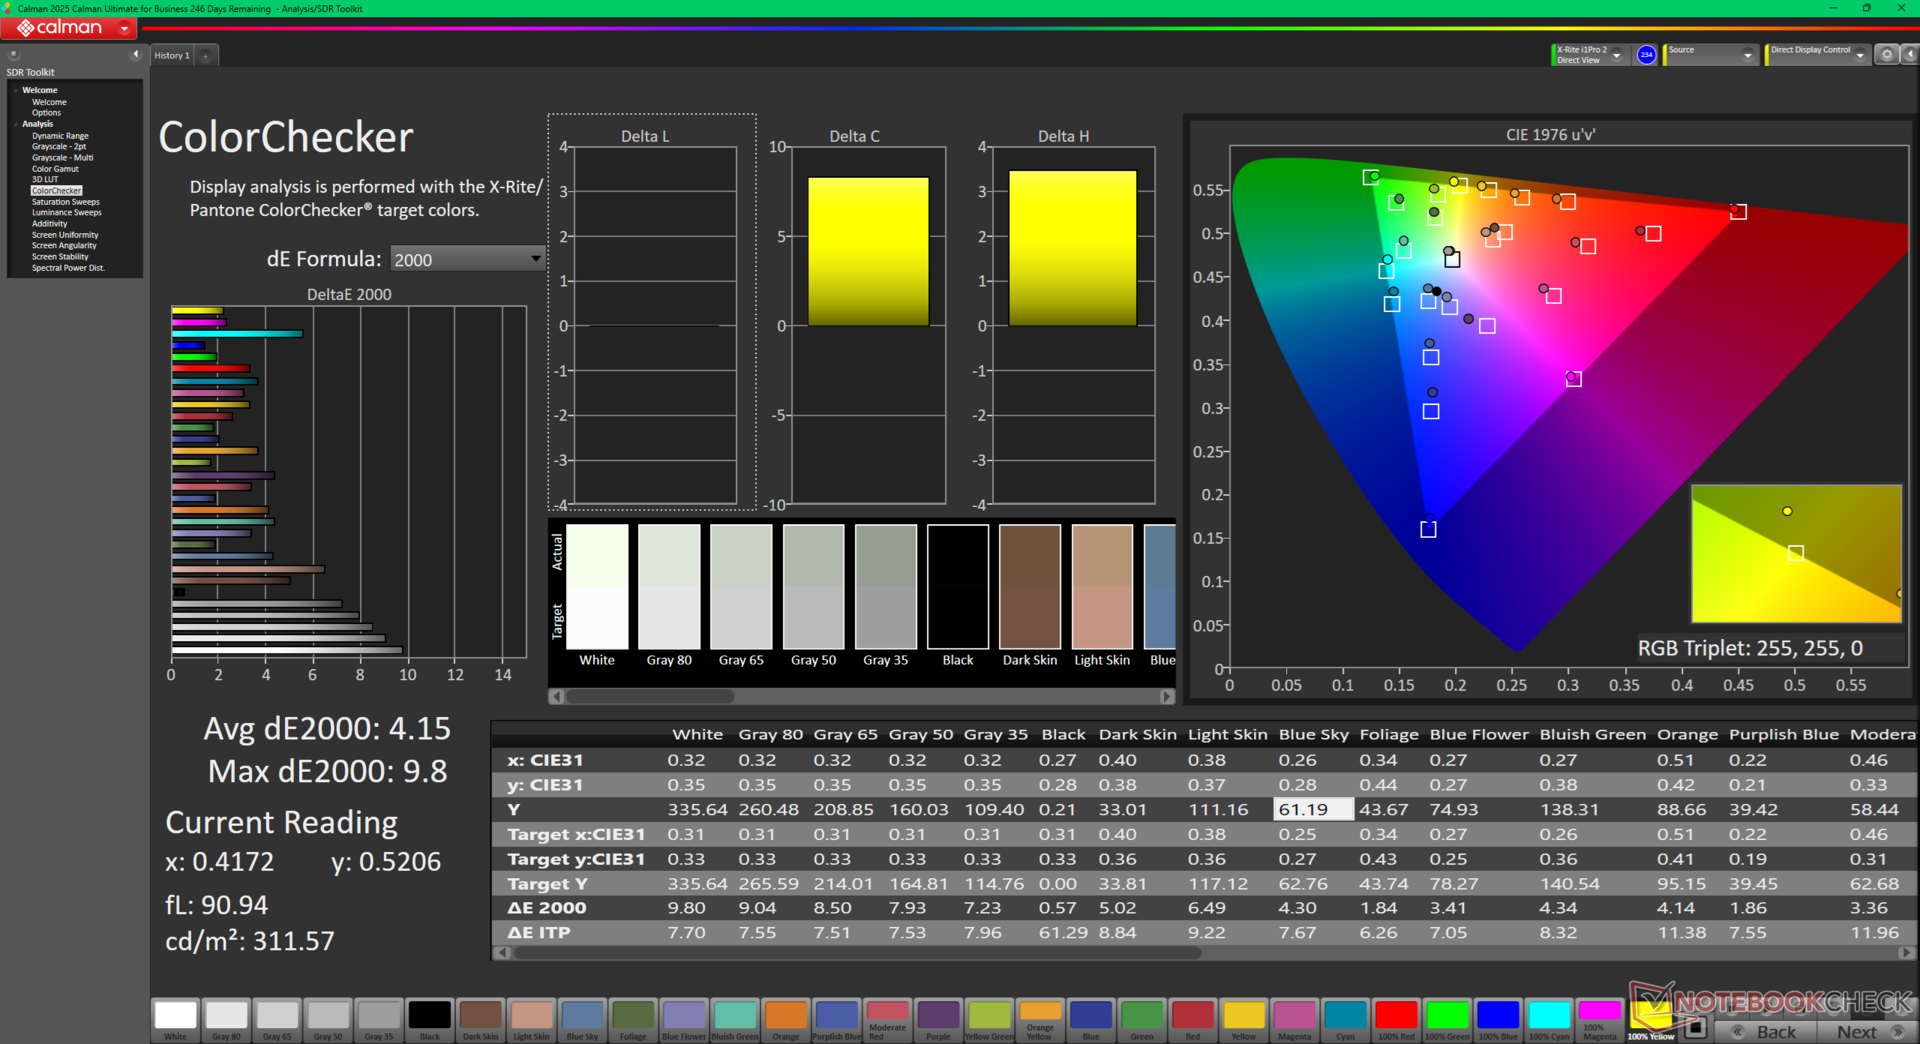
ΔE Color 4.15 | 0.5-29.43 Ø4.85, calibrated: 0.44
ΔE Greyscale 6.7 | 0.09-98 Ø5.1
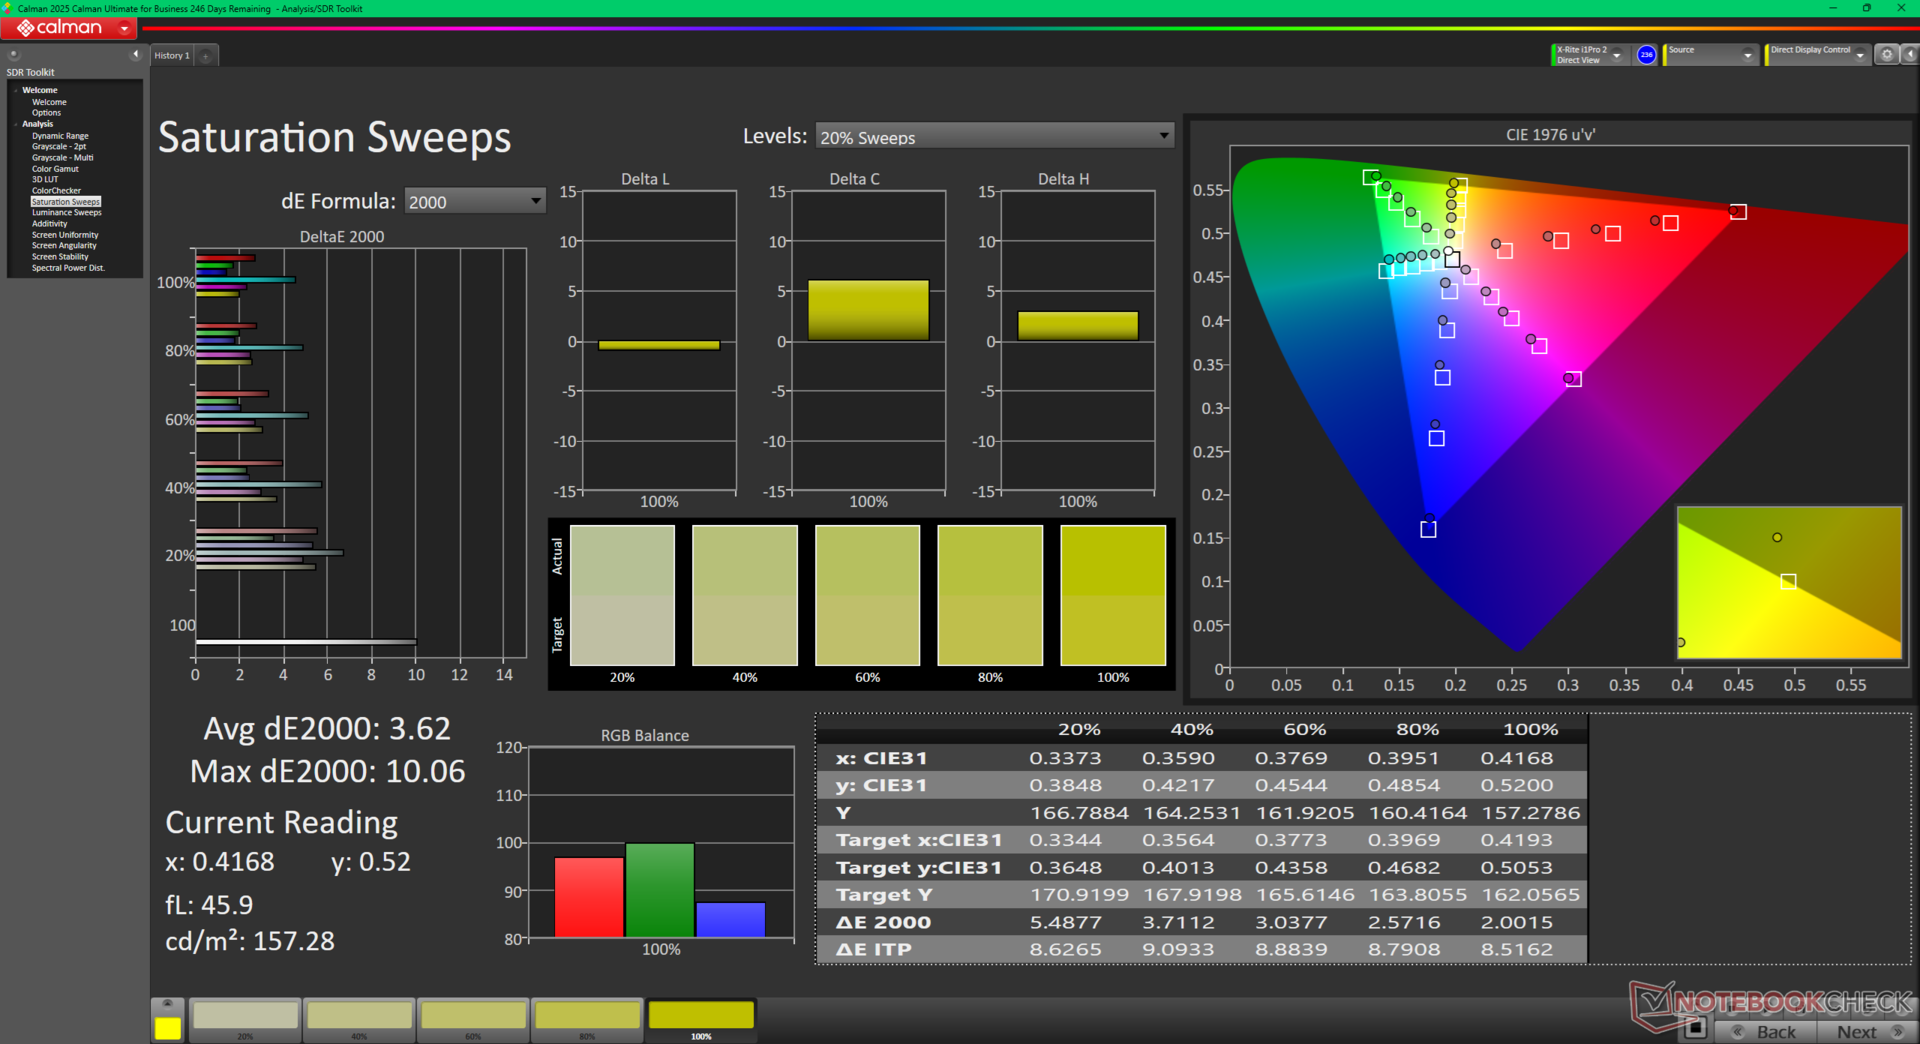
78.4% AdobeRGB 1998 (Argyll 2.2.0 3D)
99.8% sRGB (Argyll 2.2.0 3D)
76.6% Display P3 (Argyll 2.2.0 3D)
Gamma: 2.25
| Dell 16 Plus AU Optronics B160QAN, IPS, 2560x1600, 16", 120 Hz | Dell Inspiron 16 Plus 7640 AU Optronics B160QAN, IPS, 2560x1600, 16", 120 Hz | Acer Swift 16 AI SF16-51T-932H, Ultra 9 288V SDC41B6, OLED, 2880x1800, 16", 120 Hz | Lenovo ThinkBook 16 G7+ AMD LEN160-3.2K, IPS, 3200x2000, 16", 165 Hz | HP Pavilion Plus 16-ab0456tx AU Optronics AUOFDA4, IPS, 2560x1600, 16", 120 Hz | Asus Vivobook 16 M1606K B160UAN04.3 (AUOA5AB), IPS, 1920x1200, 16", 60 Hz | |
|---|---|---|---|---|---|---|
| Display | -1% | 17% | 12% | -2% | -50% | |
| Display P3 Coverage | 76.6 | 76 -1% | 99.9 30% | 96.3 26% | 74.6 -3% | 36.8 -52% |
| sRGB Coverage | 99.8 | 99.8 0% | 100 0% | 100 0% | 99 -1% | 55.3 -45% |
| AdobeRGB 1998 Coverage | 78.4 | 76.7 -2% | 94.6 21% | 86.9 11% | 76.5 -2% | 38 -52% |
| Response Times | 24% | 54% | 66% | 72% | -1% | |
| Response Time Grey 50% / Grey 80% * | 32.8 ? | 25.6 ? 22% | 4.8 ? 85% | 13.9 ? 58% | 9.06 ? 72% | 36 ? -10% |
| Response Time Black / White * | 23.4 ? | 17.6 ? 25% | 18 ? 23% | 6.3 ? 73% | 6.7 ? 71% | 21.4 ? 9% |
| PWM Frequency | 481 | |||||
| PWM Amplitude * | 39 | |||||
| Screen | 0% | 195% | 16% | -23% | -128% | |
| Brightness middle | 335.6 | 314.7 -6% | 425 27% | 422 26% | 403 20% | 326 -3% |
| Brightness | 308 | 291 -6% | 421 37% | 403 31% | 394 28% | 303 -2% |
| Brightness Distribution | 88 | 89 1% | 98 11% | 93 6% | 90 2% | 89 1% |
| Black Level * | 0.22 | 0.28 -27% | 0.0219 90% | 0.3 -36% | 0.34 -55% | 0.24 -9% |
| Contrast | 1525 | 1124 -26% | 19406 1173% | 1407 -8% | 1185 -22% | 1358 -11% |
| Colorchecker dE 2000 * | 4.15 | 1.62 61% | 1.73 58% | 1.7 59% | 3.13 25% | 6.48 -56% |
| Colorchecker dE 2000 max. * | 9.8 | 2.94 70% | 3.82 61% | 3.4 65% | 6.14 37% | 19.42 -98% |
| Colorchecker dE 2000 calibrated * | 0.44 | 1.08 -145% | 0.7 -59% | 1.65 -275% | 4.92 -1018% | |
| Greyscale dE 2000 * | 6.7 | 1.3 81% | 0.09 99% | 2.4 64% | 4.5 33% | 3.85 43% |
| Gamma | 2.25 98% | 2.26 97% | 2.346 94% | 2.19 100% | 2.18 101% | 2.79 79% |
| CCT | 6260 104% | 6385 102% | 6432 101% | 6989 93% | 6261 104% | 6739 96% |
| Moyenne finale (programmes/paramètres) | 8% /
3% | 89% /
132% | 31% /
23% | 16% /
-5% | -60% /
-93% |
* ... Moindre est la valeur, meilleures sont les performances

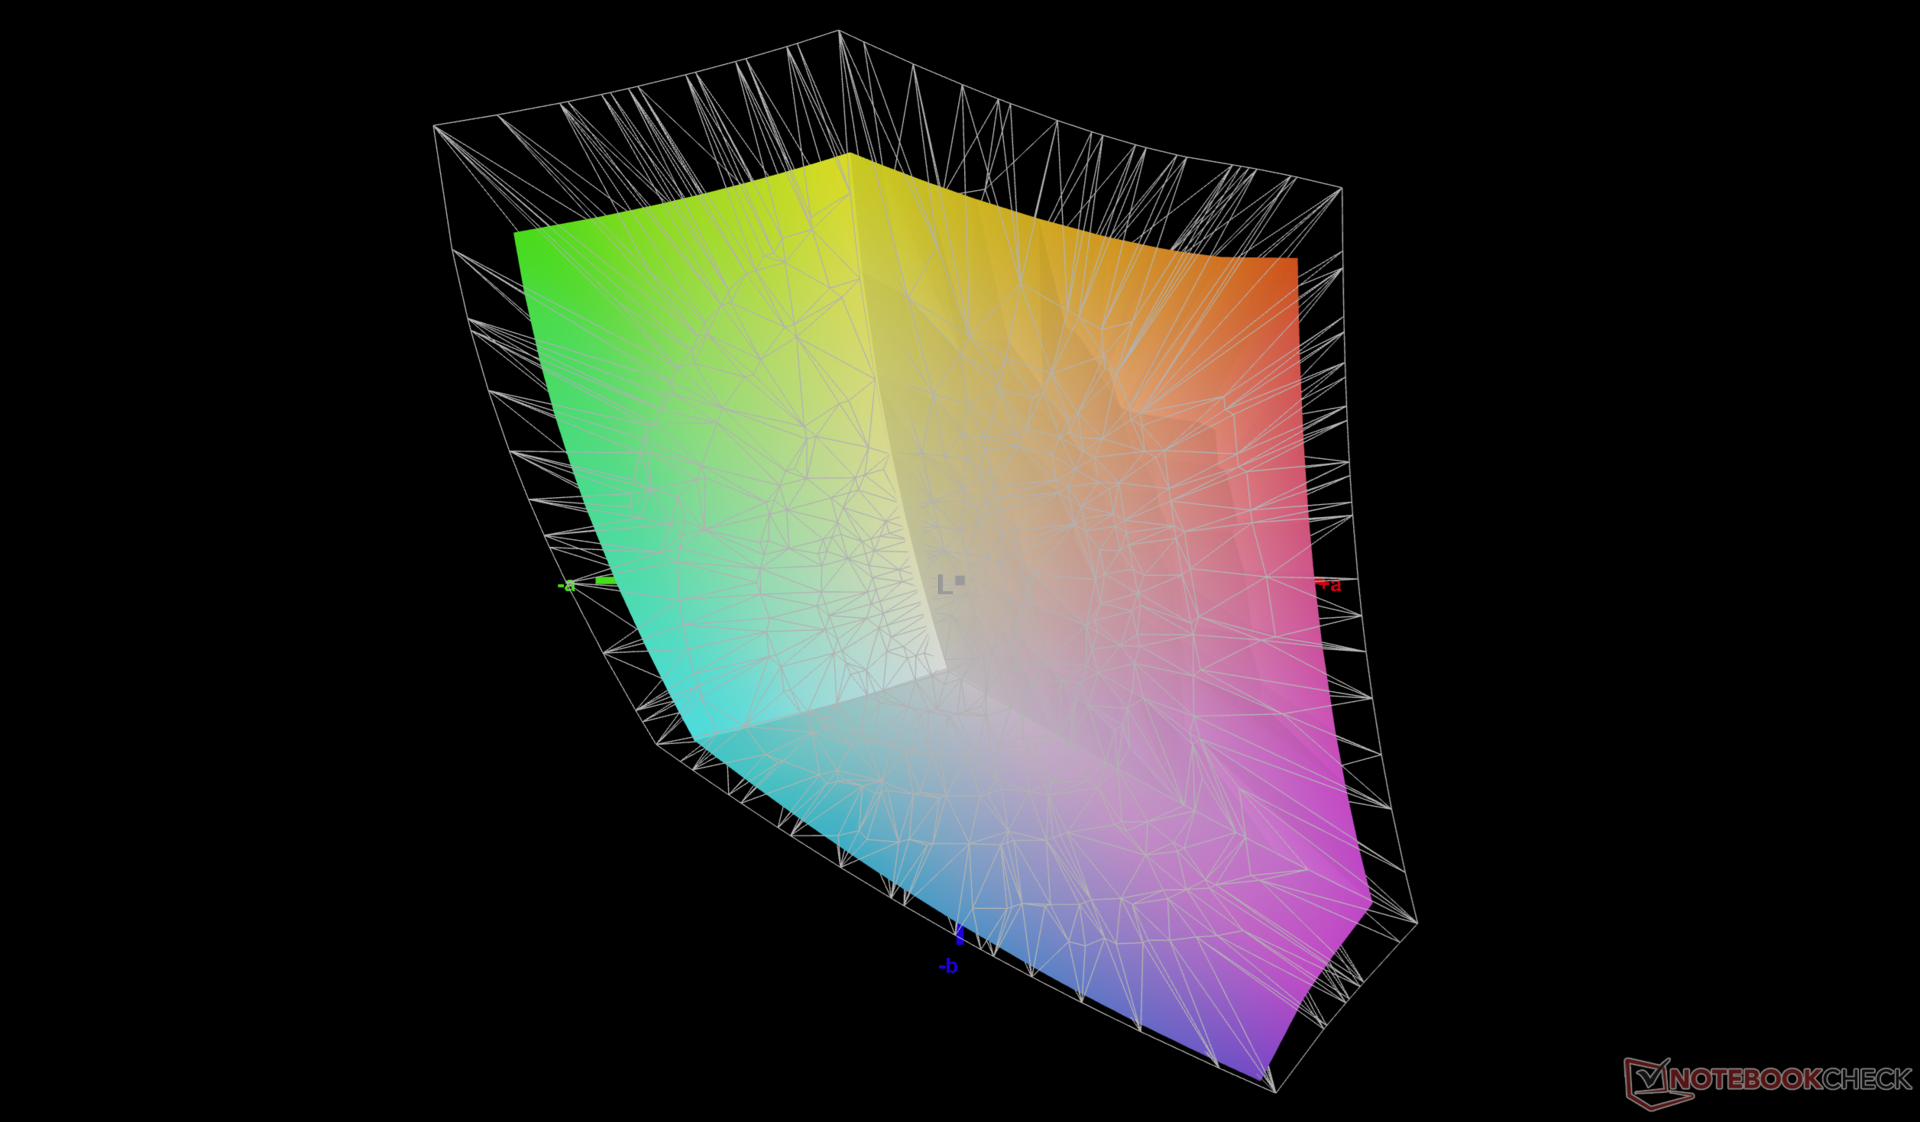
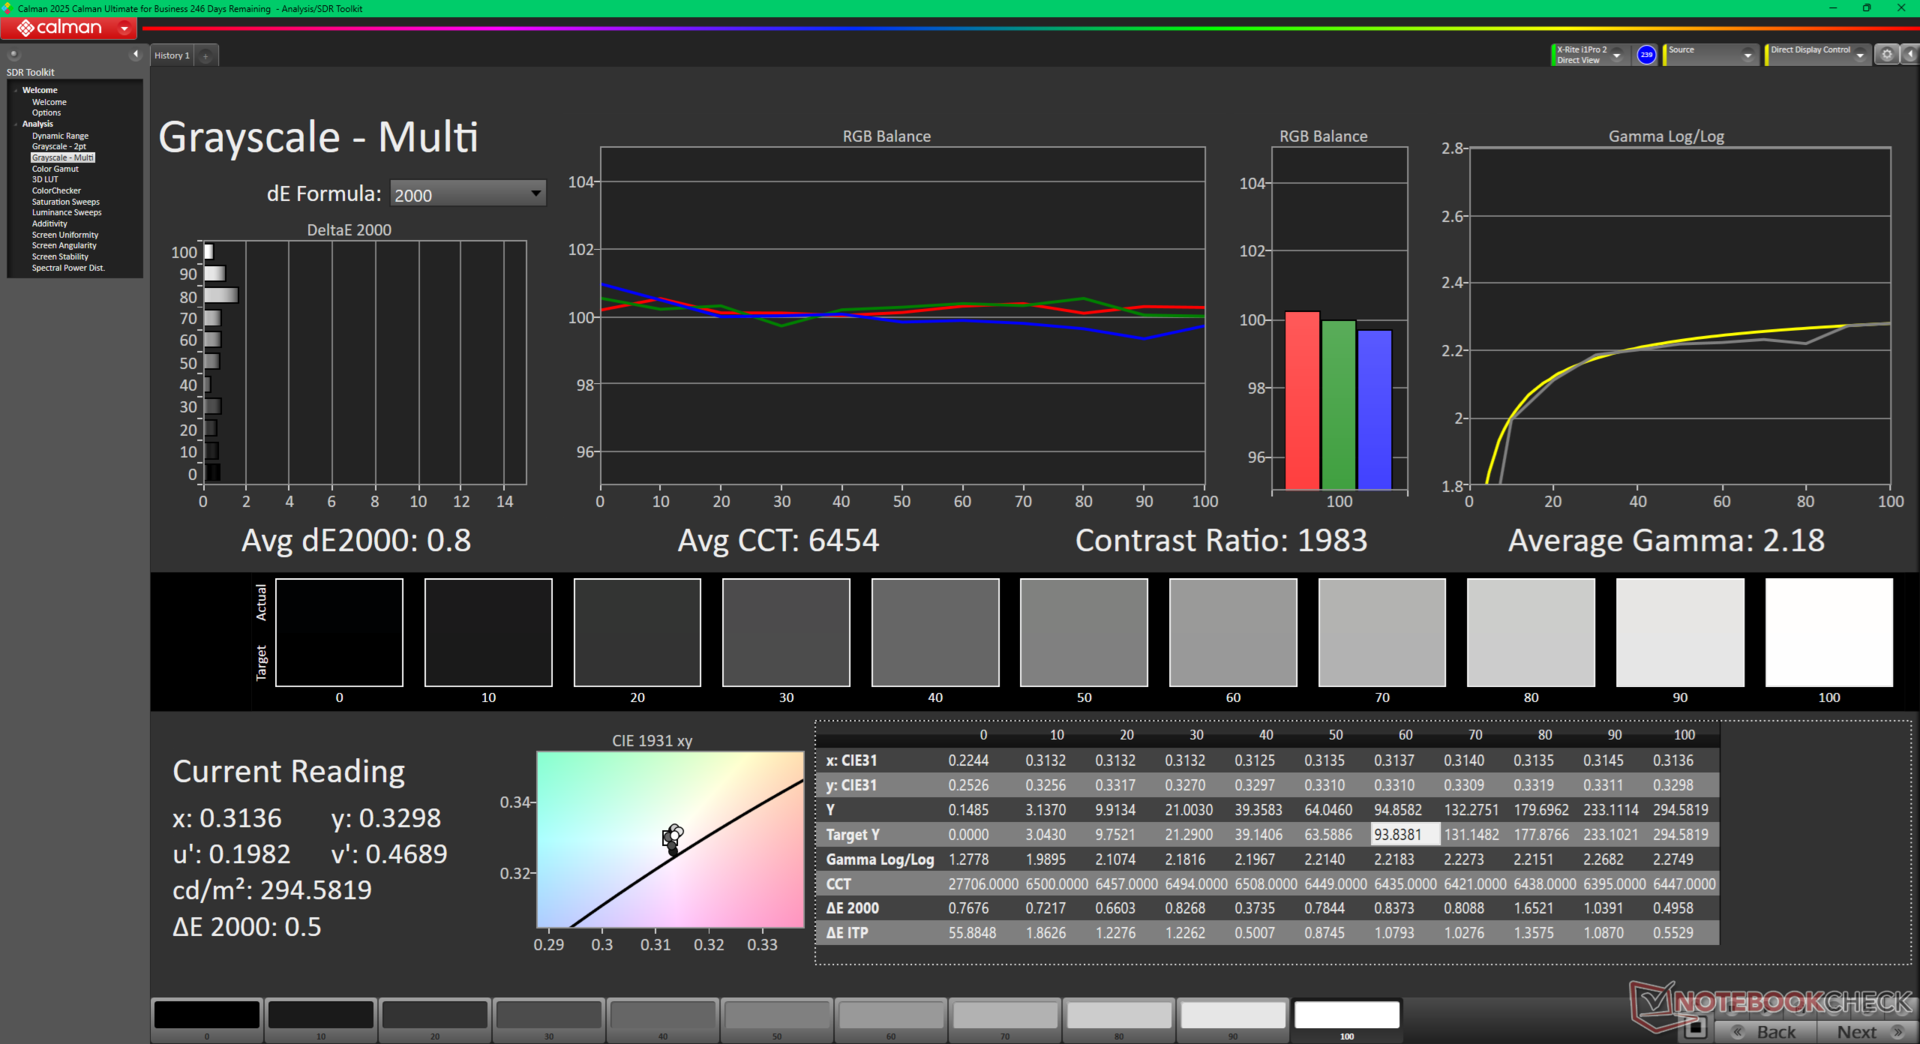
L'écran n'est pas bien calibré à la sortie de la boîte, ce qui est courant sur la plupart des ordinateurs portables grand public de budget et de milieu de gamme. En calibrant nous-mêmes l'écran à l'aide d'un colorimètre X-Rite, nous pourrions améliorer considérablement les valeurs moyennes de l'échelle de gris et du deltaE des couleurs, qui passeraient respectivement de 6,7 et 4,15 à seulement 0,8 et 0,44, afin de mieux utiliser la couverture sRGB complète. Notre profil ICM calibré peut être téléchargé gratuitement ci-dessus.
Temps de réponse de l'écran
| ↔ Temps de réponse noir à blanc | ||
|---|---|---|
| 23.4 ms ... hausse ↗ et chute ↘ combinées | ↗ 11.6 ms hausse | 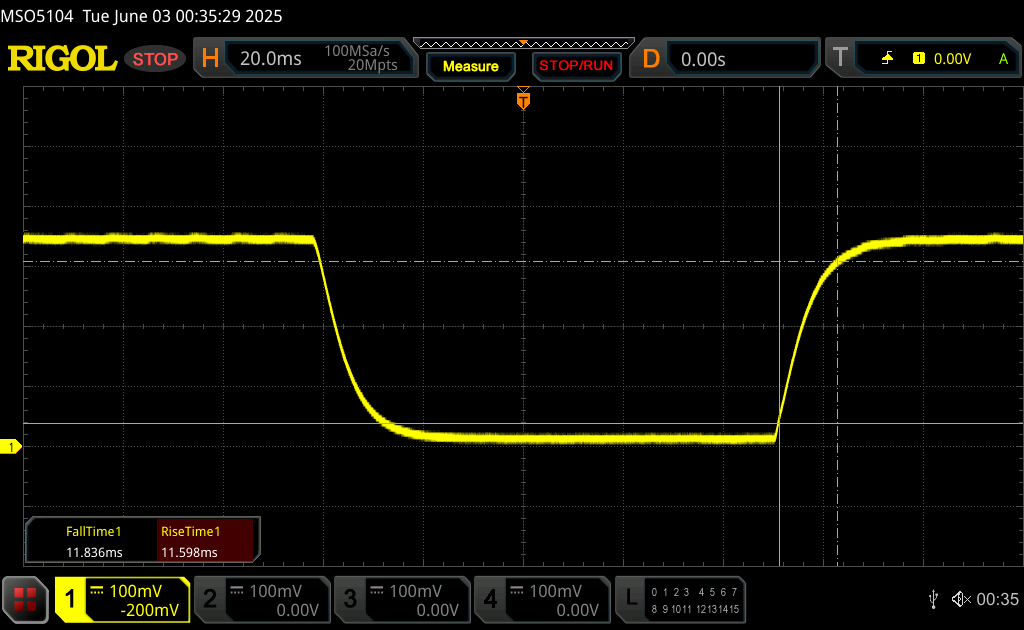 |
| ↘ 11.8 ms chute | ||
| L'écran montre de bons temps de réponse, mais insuffisant pour du jeu compétitif. En comparaison, tous les appareils testés affichent entre 0.1 (minimum) et 240 (maximum) ms. » 51 % des appareils testés affichent de meilleures performances. Cela signifie que les latences relevées sont moins bonnes que la moyenne (20.6 ms) de tous les appareils testés. | ||
| ↔ Temps de réponse gris 50% à gris 80% | ||
| 32.8 ms ... hausse ↗ et chute ↘ combinées | ↗ 16.1 ms hausse | 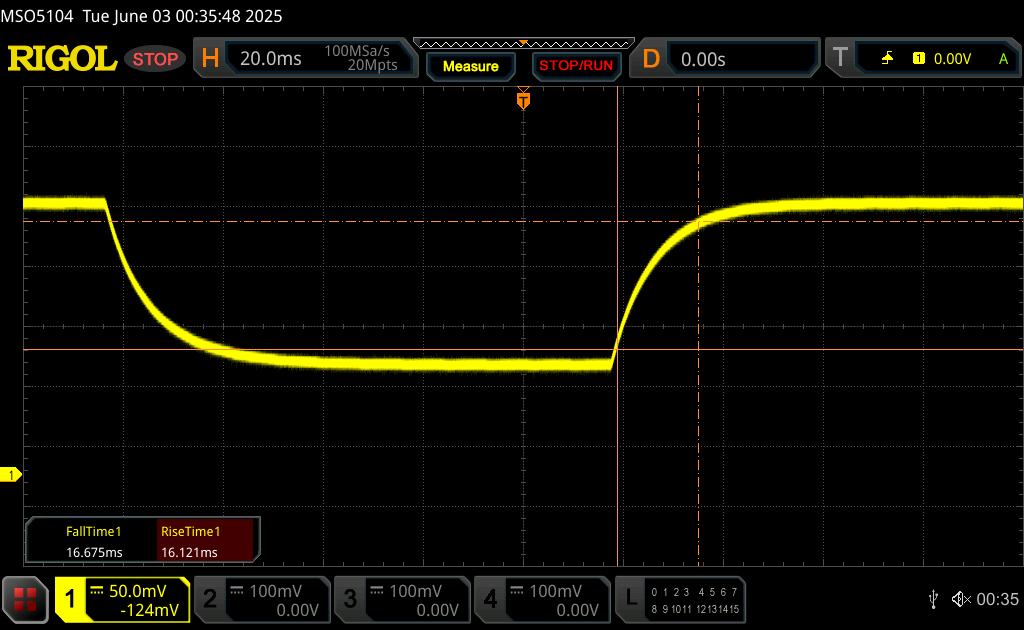 |
| ↘ 16.7 ms chute | ||
| L'écran souffre de latences très élevées, à éviter pour le jeu. En comparaison, tous les appareils testés affichent entre 0.165 (minimum) et 636 (maximum) ms. » 41 % des appareils testés affichent de meilleures performances. Cela signifie que les latences relevées sont similaires à la moyenne (32.3 ms) de tous les appareils testés. | ||
Scintillement / MLI (Modulation de largeur d'impulsion)
| Scintillement / MLI (Modulation de largeur d'impulsion) non décelé |  | ||
En comparaison, 53 % des appareils testés n'emploient pas MDI pour assombrir leur écran. Nous avons relevé une moyenne à 8421 (minimum : 5 - maximum : 343500) Hz dans le cas où une MDI était active. | |||
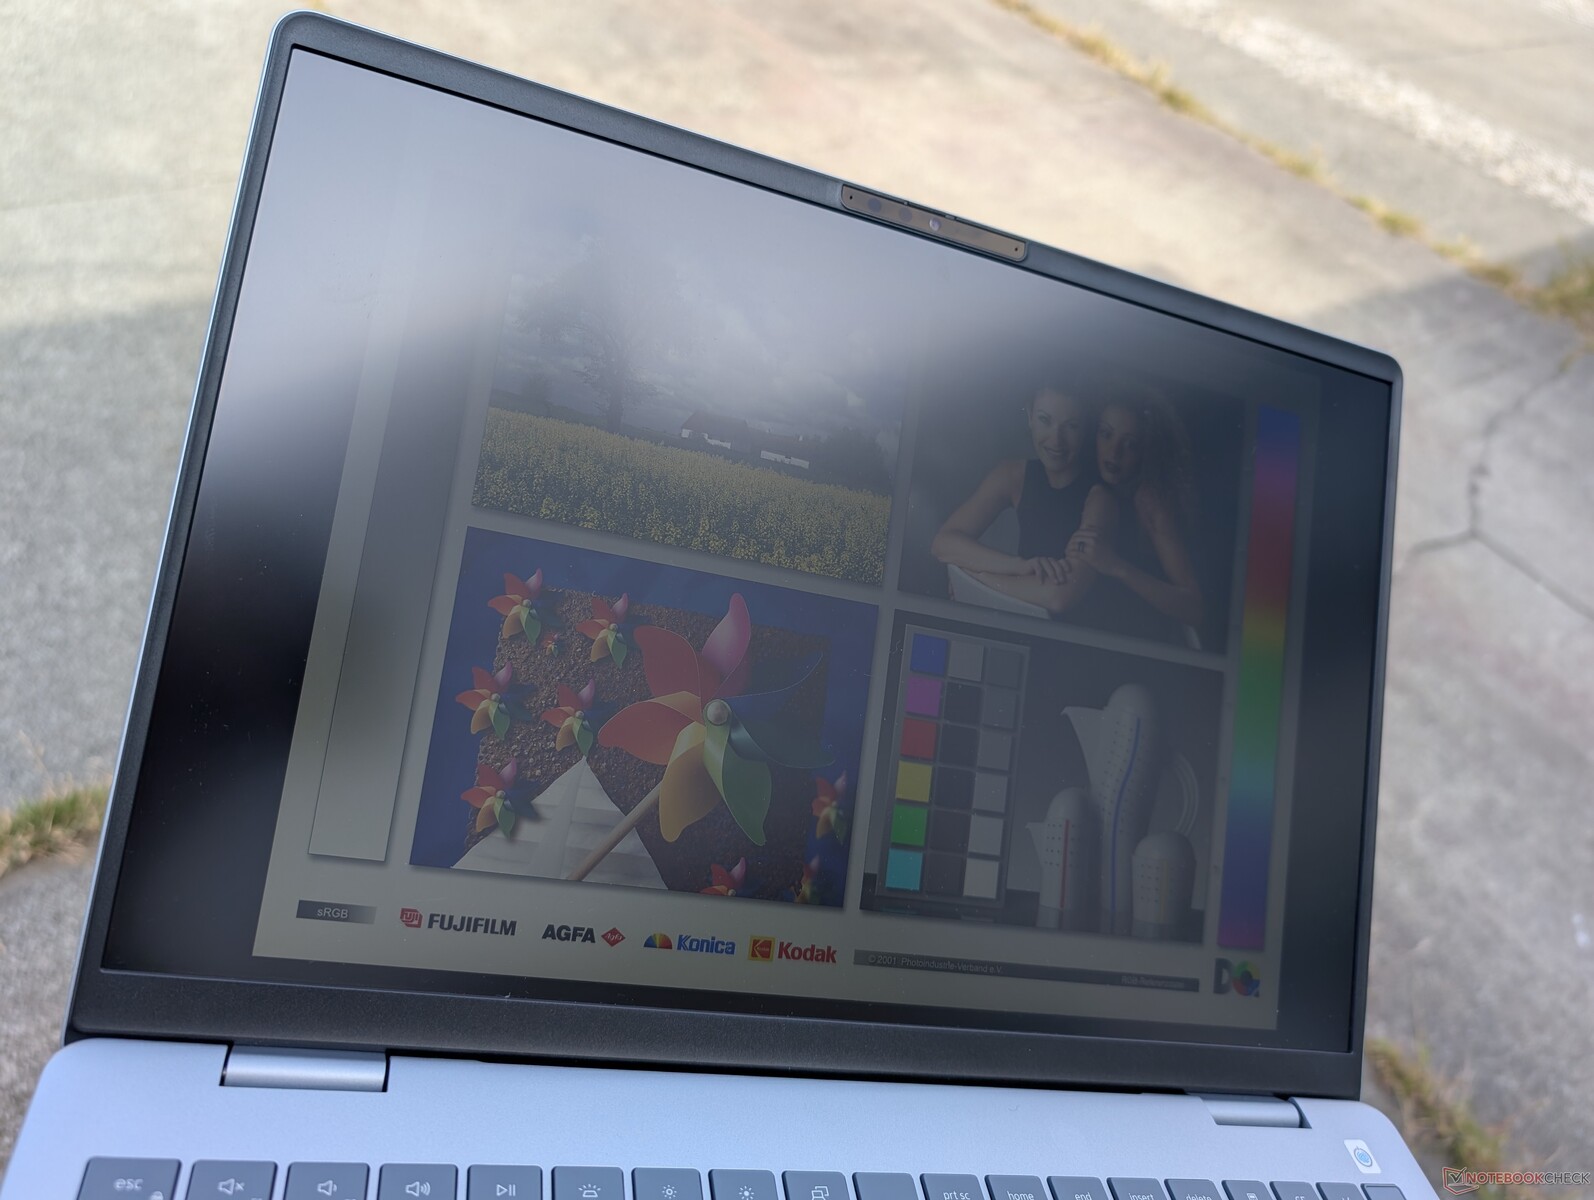
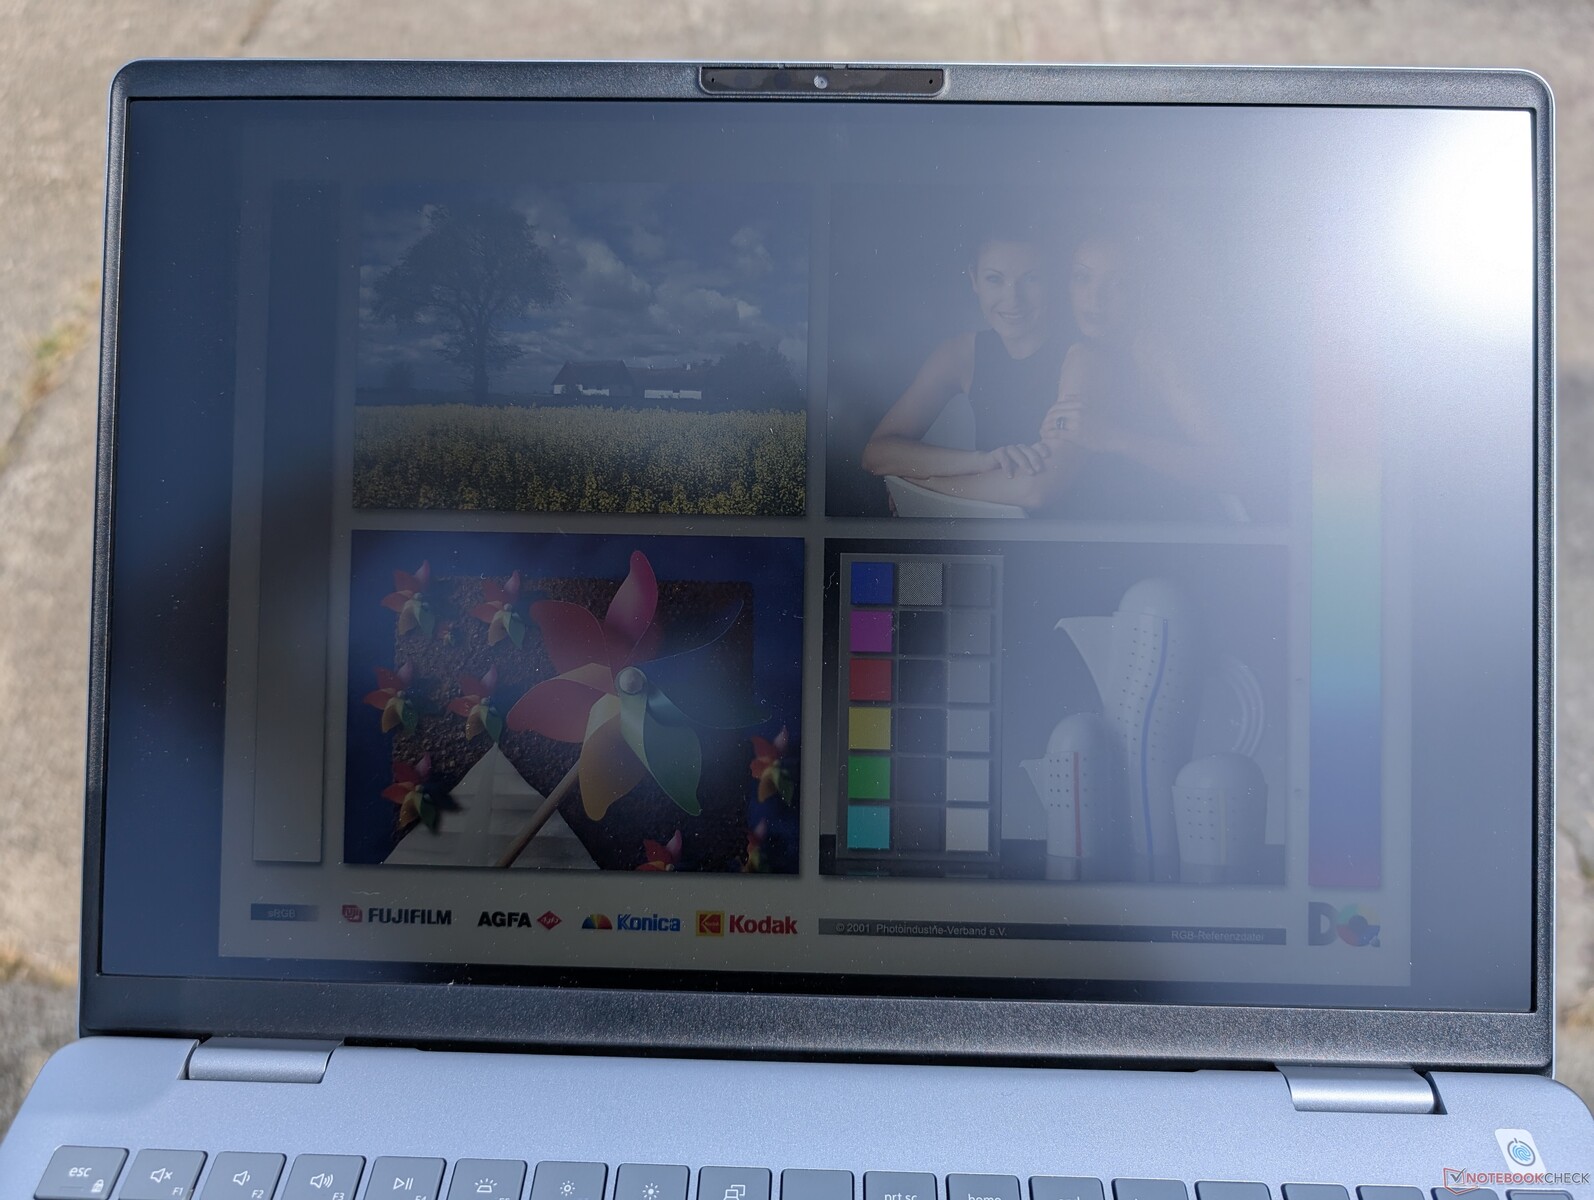
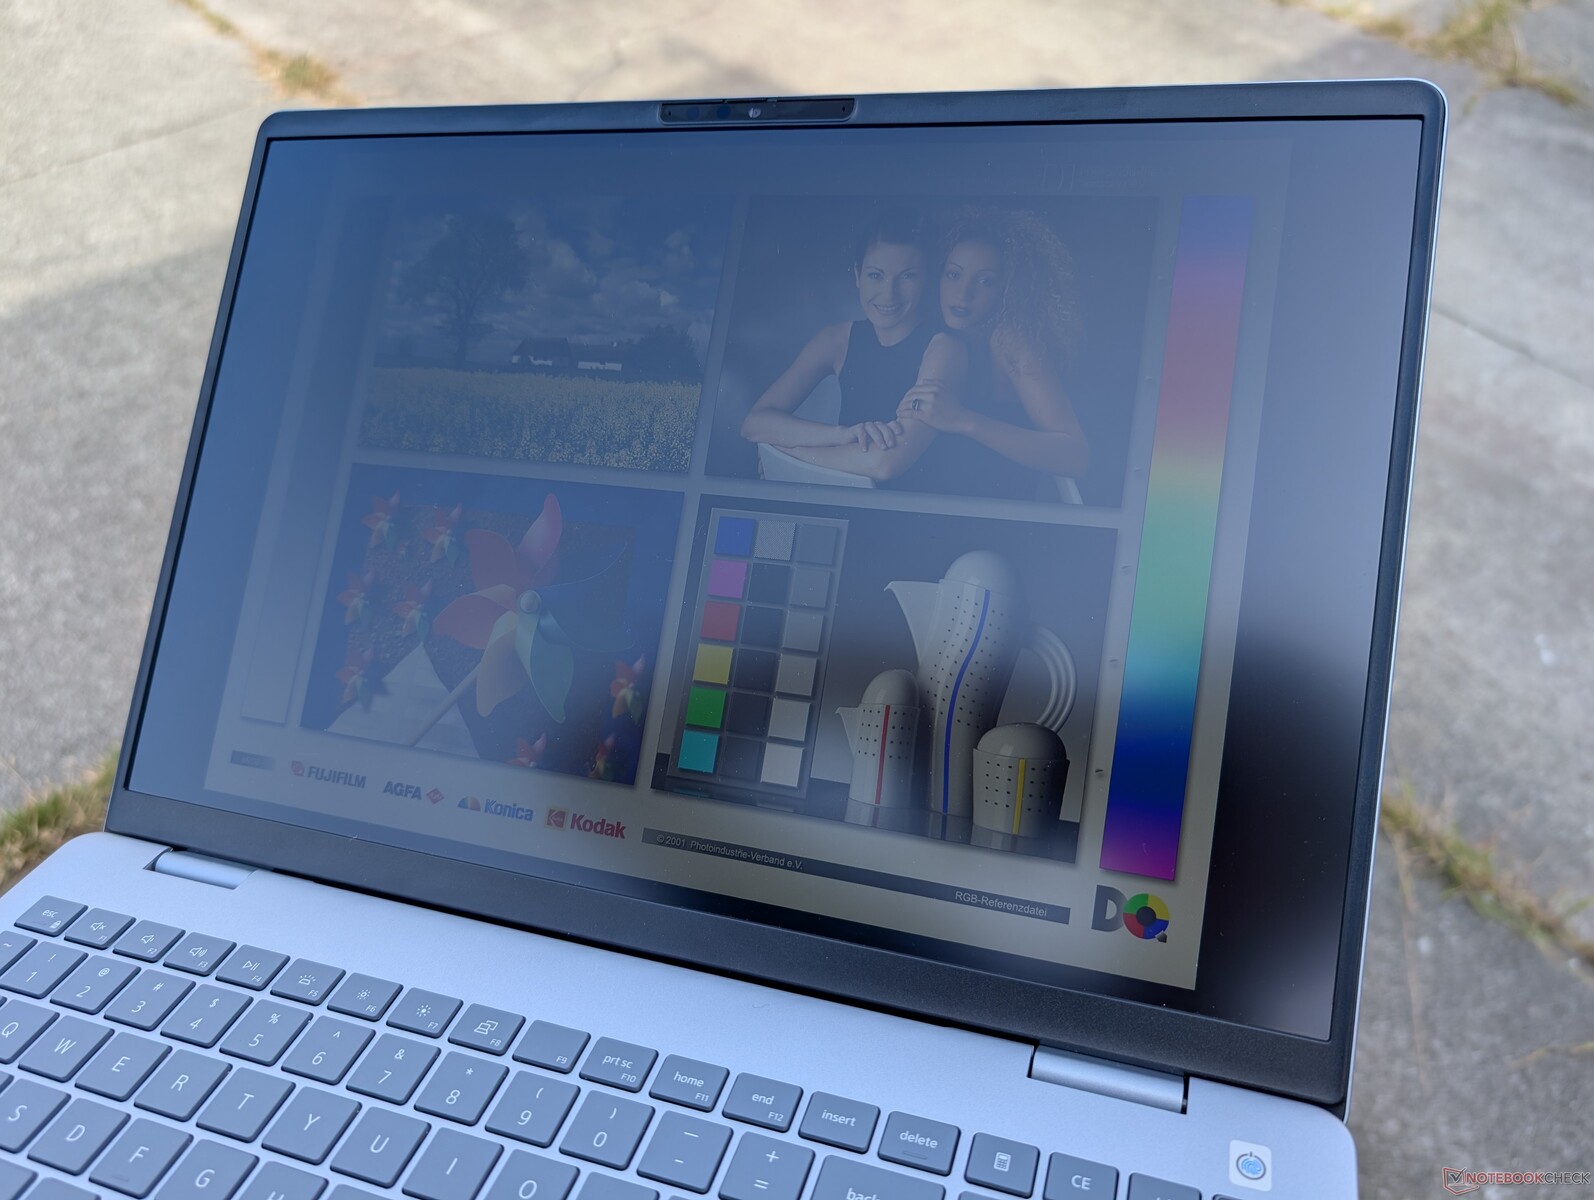
La visibilité à l'extérieur est médiocre car l'écran n'est pas assez lumineux pour éviter l'éblouissement.
Performance - Plus efficace avec des graphiques intégrés plus rapides
Conditions d'essai
Nous avons réglé Dell Optimizer sur le mode Performance avant d'exécuter les tests de référence ci-dessous. Les profils d'alimentation Dell sont en corrélation avec les profils d'alimentation par défaut de Windows et la modification d'un profil se synchronisera avec l'autre.
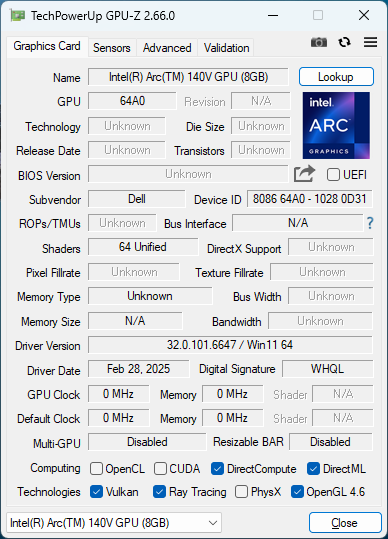
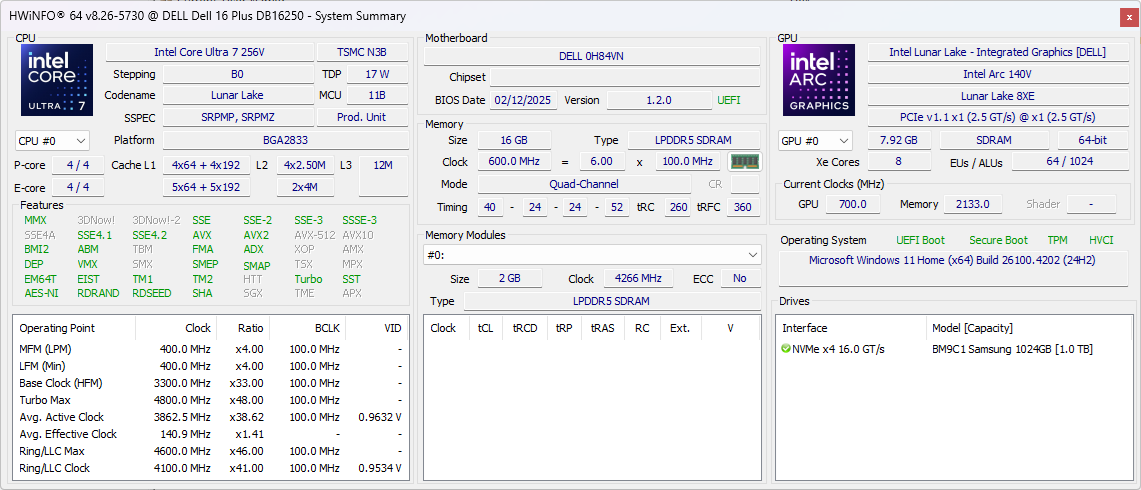
Processeur
Le Core Ultra 7 256V est une question d'efficacité tout en conservant les niveaux de performance brute du processeur de la génération précédente Core Ultra 7 155U. Les modèles plus anciens dotés d'options Core H sont encore nettement plus rapides, notamment l'Inspiron 16 7640 2-en-1. La mise à niveau vers le Core Ultra 9 288V devrait apporter des gains très mineurs, de moins de 10 % au mieux, d'après notre expérience avec le modèle Acer Swift 16 AI.
La durabilité des performances pourrait être meilleure, car nous avons enregistré une baisse de 20 % au fil du temps lors de notre test en boucle CineBench R15 xT, comme le montre le graphique ci-dessous.
Cinebench R15 Multi Loop
Cinebench R23: Multi Core | Single Core
Cinebench R20: CPU (Multi Core) | CPU (Single Core)
Cinebench R15: CPU Multi 64Bit | CPU Single 64Bit
Blender: v2.79 BMW27 CPU
7-Zip 18.03: 7z b 4 | 7z b 4 -mmt1
Geekbench 6.4: Multi-Core | Single-Core
Geekbench 5.5: Multi-Core | Single-Core
HWBOT x265 Benchmark v2.2: 4k Preset
LibreOffice : 20 Documents To PDF
R Benchmark 2.5: Overall mean
* ... Moindre est la valeur, meilleures sont les performances
AIDA64: FP32 Ray-Trace | FPU Julia | CPU SHA3 | CPU Queen | FPU SinJulia | FPU Mandel | CPU AES | CPU ZLib | FP64 Ray-Trace | CPU PhotoWorxx
| Performance Rating | |
| Lenovo ThinkBook 16 G7+ AMD | |
| Asus Vivobook 16 M1606K | |
| HP Pavilion Plus 16-ab0456tx | |
| Dell Inspiron 16 Plus 7640 | |
| Acer Swift 16 AI SF16-51T-932H, Ultra 9 288V | |
| Moyenne Intel Core Ultra 7 256V | |
| Dell 16 Plus | |
| AIDA64 / FP32 Ray-Trace | |
| Lenovo ThinkBook 16 G7+ AMD | |
| Asus Vivobook 16 M1606K | |
| HP Pavilion Plus 16-ab0456tx | |
| Dell Inspiron 16 Plus 7640 | |
| Acer Swift 16 AI SF16-51T-932H, Ultra 9 288V | |
| Moyenne Intel Core Ultra 7 256V (10524 - 12812, n=6) | |
| Dell 16 Plus | |
| AIDA64 / FPU Julia | |
| Lenovo ThinkBook 16 G7+ AMD | |
| Asus Vivobook 16 M1606K | |
| HP Pavilion Plus 16-ab0456tx | |
| Dell Inspiron 16 Plus 7640 | |
| Acer Swift 16 AI SF16-51T-932H, Ultra 9 288V | |
| Moyenne Intel Core Ultra 7 256V (52443 - 61614, n=6) | |
| Dell 16 Plus | |
| AIDA64 / CPU SHA3 | |
| Lenovo ThinkBook 16 G7+ AMD | |
| Asus Vivobook 16 M1606K | |
| HP Pavilion Plus 16-ab0456tx | |
| Dell Inspiron 16 Plus 7640 | |
| Acer Swift 16 AI SF16-51T-932H, Ultra 9 288V | |
| Moyenne Intel Core Ultra 7 256V (2364 - 2814, n=6) | |
| Dell 16 Plus | |
| AIDA64 / CPU Queen | |
| HP Pavilion Plus 16-ab0456tx | |
| Dell Inspiron 16 Plus 7640 | |
| Lenovo ThinkBook 16 G7+ AMD | |
| Asus Vivobook 16 M1606K | |
| Acer Swift 16 AI SF16-51T-932H, Ultra 9 288V | |
| Moyenne Intel Core Ultra 7 256V (49622 - 49794, n=6) | |
| Dell 16 Plus | |
| AIDA64 / FPU SinJulia | |
| Lenovo ThinkBook 16 G7+ AMD | |
| Asus Vivobook 16 M1606K | |
| Dell Inspiron 16 Plus 7640 | |
| HP Pavilion Plus 16-ab0456tx | |
| Moyenne Intel Core Ultra 7 256V (4401 - 4431, n=6) | |
| Acer Swift 16 AI SF16-51T-932H, Ultra 9 288V | |
| Dell 16 Plus | |
| AIDA64 / FPU Mandel | |
| Lenovo ThinkBook 16 G7+ AMD | |
| Asus Vivobook 16 M1606K | |
| HP Pavilion Plus 16-ab0456tx | |
| Dell Inspiron 16 Plus 7640 | |
| Acer Swift 16 AI SF16-51T-932H, Ultra 9 288V | |
| Moyenne Intel Core Ultra 7 256V (27382 - 32644, n=6) | |
| Dell 16 Plus | |
| AIDA64 / CPU AES | |
| Lenovo ThinkBook 16 G7+ AMD | |
| Dell Inspiron 16 Plus 7640 | |
| HP Pavilion Plus 16-ab0456tx | |
| Asus Vivobook 16 M1606K | |
| Moyenne Intel Core Ultra 7 256V (38495 - 40828, n=6) | |
| Acer Swift 16 AI SF16-51T-932H, Ultra 9 288V | |
| Dell 16 Plus | |
| AIDA64 / CPU ZLib | |
| Lenovo ThinkBook 16 G7+ AMD | |
| Dell Inspiron 16 Plus 7640 | |
| Asus Vivobook 16 M1606K | |
| HP Pavilion Plus 16-ab0456tx | |
| Acer Swift 16 AI SF16-51T-932H, Ultra 9 288V | |
| Moyenne Intel Core Ultra 7 256V (536 - 632, n=6) | |
| Dell 16 Plus | |
| AIDA64 / FP64 Ray-Trace | |
| Lenovo ThinkBook 16 G7+ AMD | |
| Asus Vivobook 16 M1606K | |
| HP Pavilion Plus 16-ab0456tx | |
| Dell Inspiron 16 Plus 7640 | |
| Acer Swift 16 AI SF16-51T-932H, Ultra 9 288V | |
| Moyenne Intel Core Ultra 7 256V (5655 - 6878, n=6) | |
| Dell 16 Plus | |
| AIDA64 / CPU PhotoWorxx | |
| Acer Swift 16 AI SF16-51T-932H, Ultra 9 288V | |
| Moyenne Intel Core Ultra 7 256V (49906 - 52282, n=6) | |
| Dell 16 Plus | |
| Lenovo ThinkBook 16 G7+ AMD | |
| HP Pavilion Plus 16-ab0456tx | |
| Dell Inspiron 16 Plus 7640 | |
| Asus Vivobook 16 M1606K | |
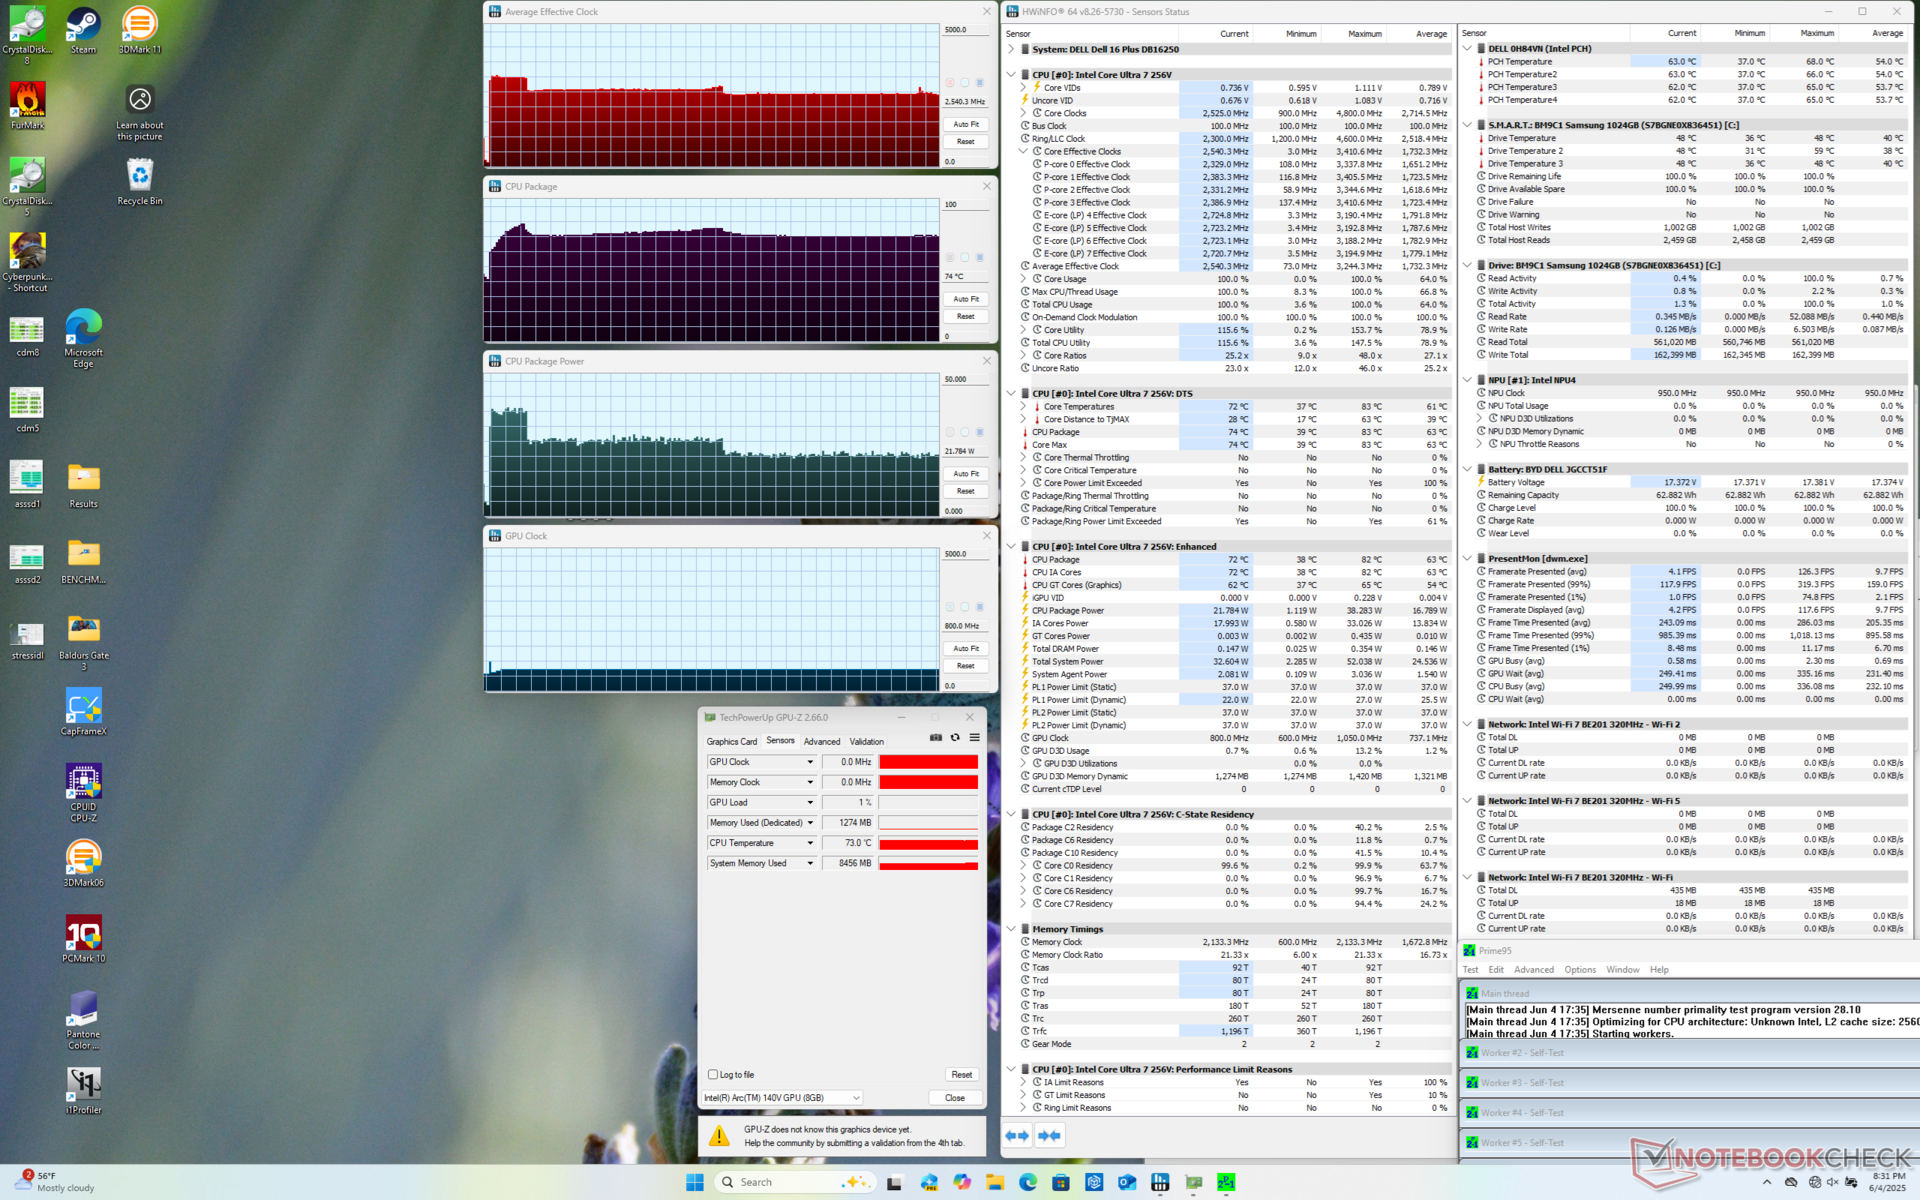
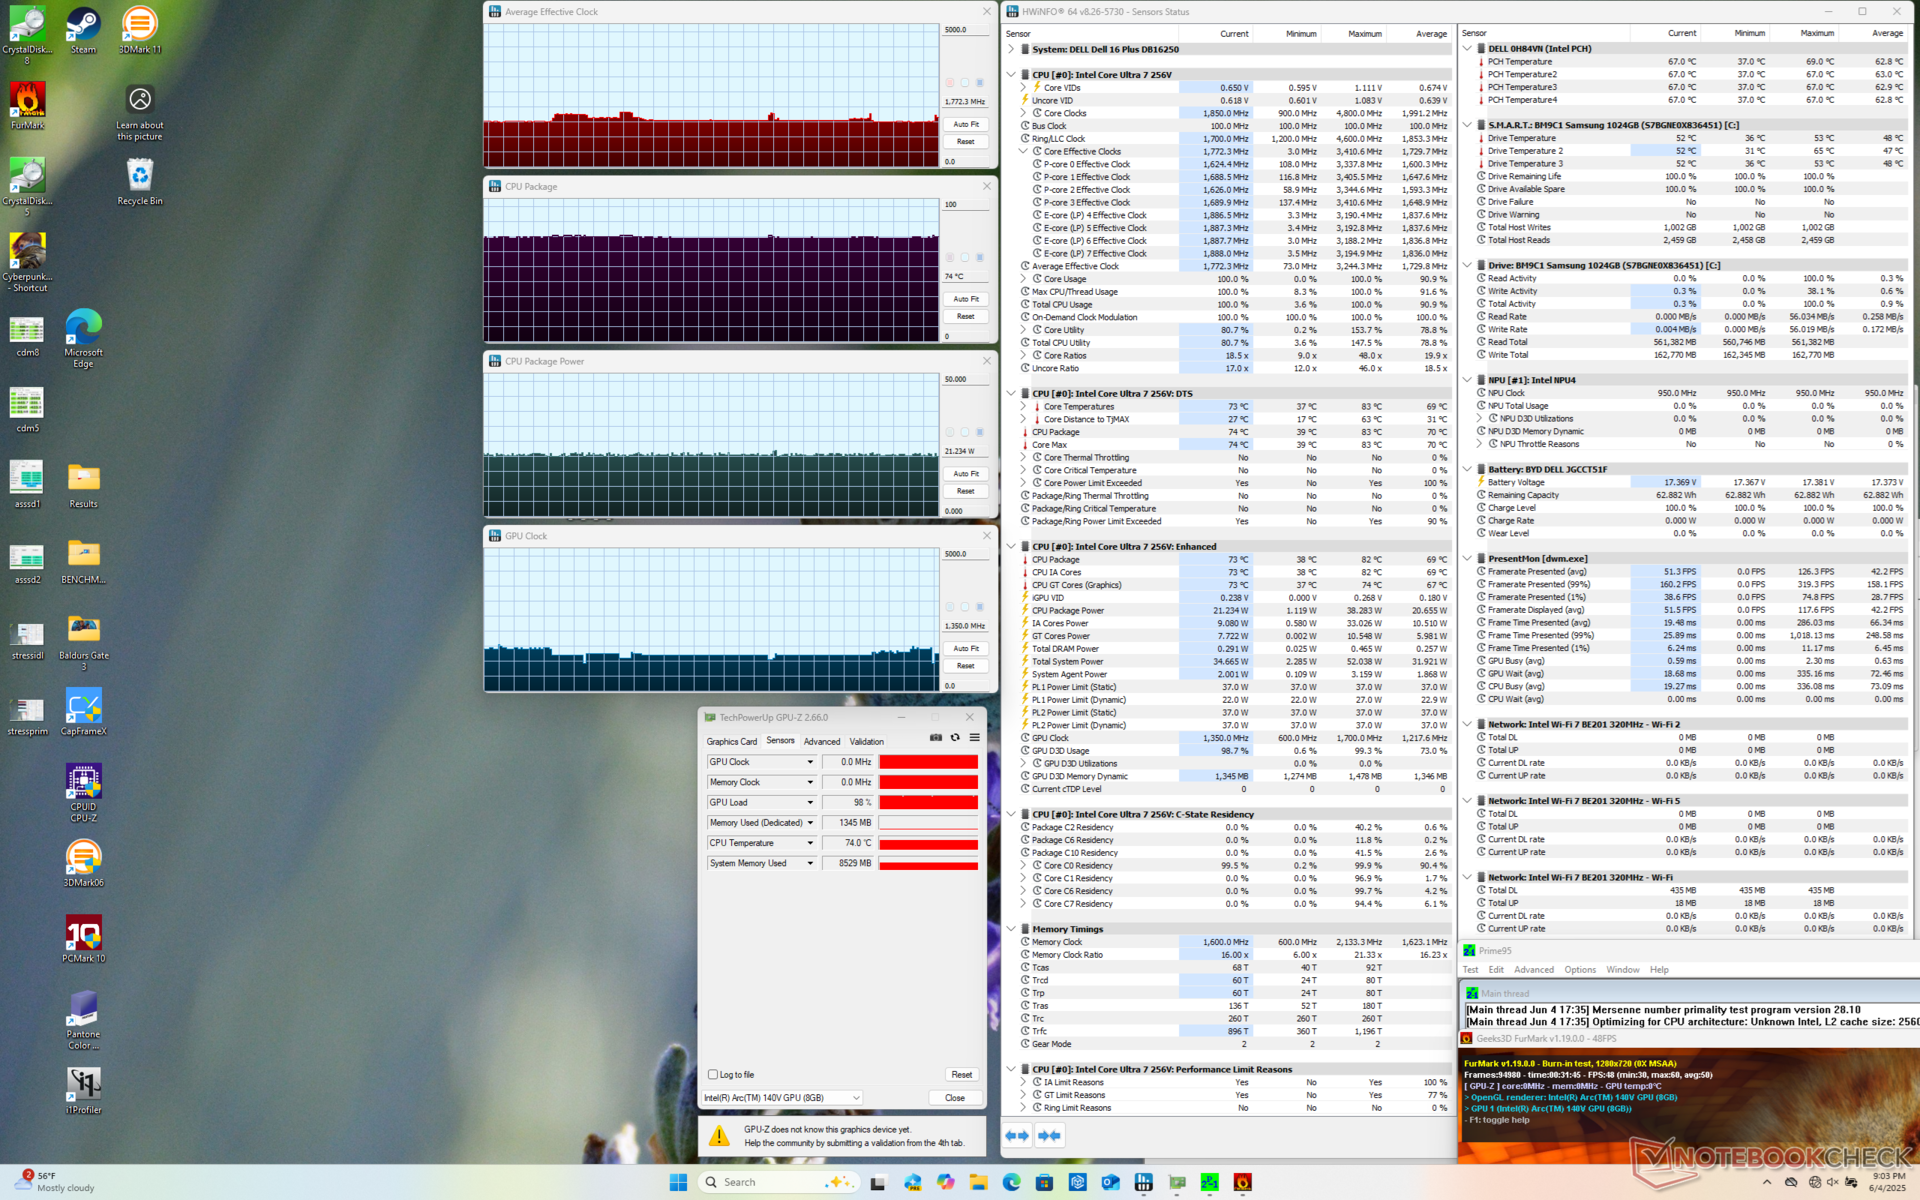
Test de stress
Lors d'un test Prime95, le processeur atteint 3,2 GHz et 38 W pendant environ 20 secondes avant d'atteindre 83 °C. Il retombe ensuite à 2,5 GHz et 21 W afin de maintenir la température du cœur à 74 °C, ce qui représente le potentiel limité du Turbo Boost. Cela se reflète également dans notre test en boucle CineBench R15 xT, comme mentionné ci-dessus.
En exécutant Cyberpunk 2077 pour représenter le stress typique d'un jeu, le processeur atteint à nouveau 74°C, ce qui est nettement moins chaud que ce que nous avons observé sur l'Inspiron 16 7640 2-en-un Inspiron 16 7640 2-en-1.
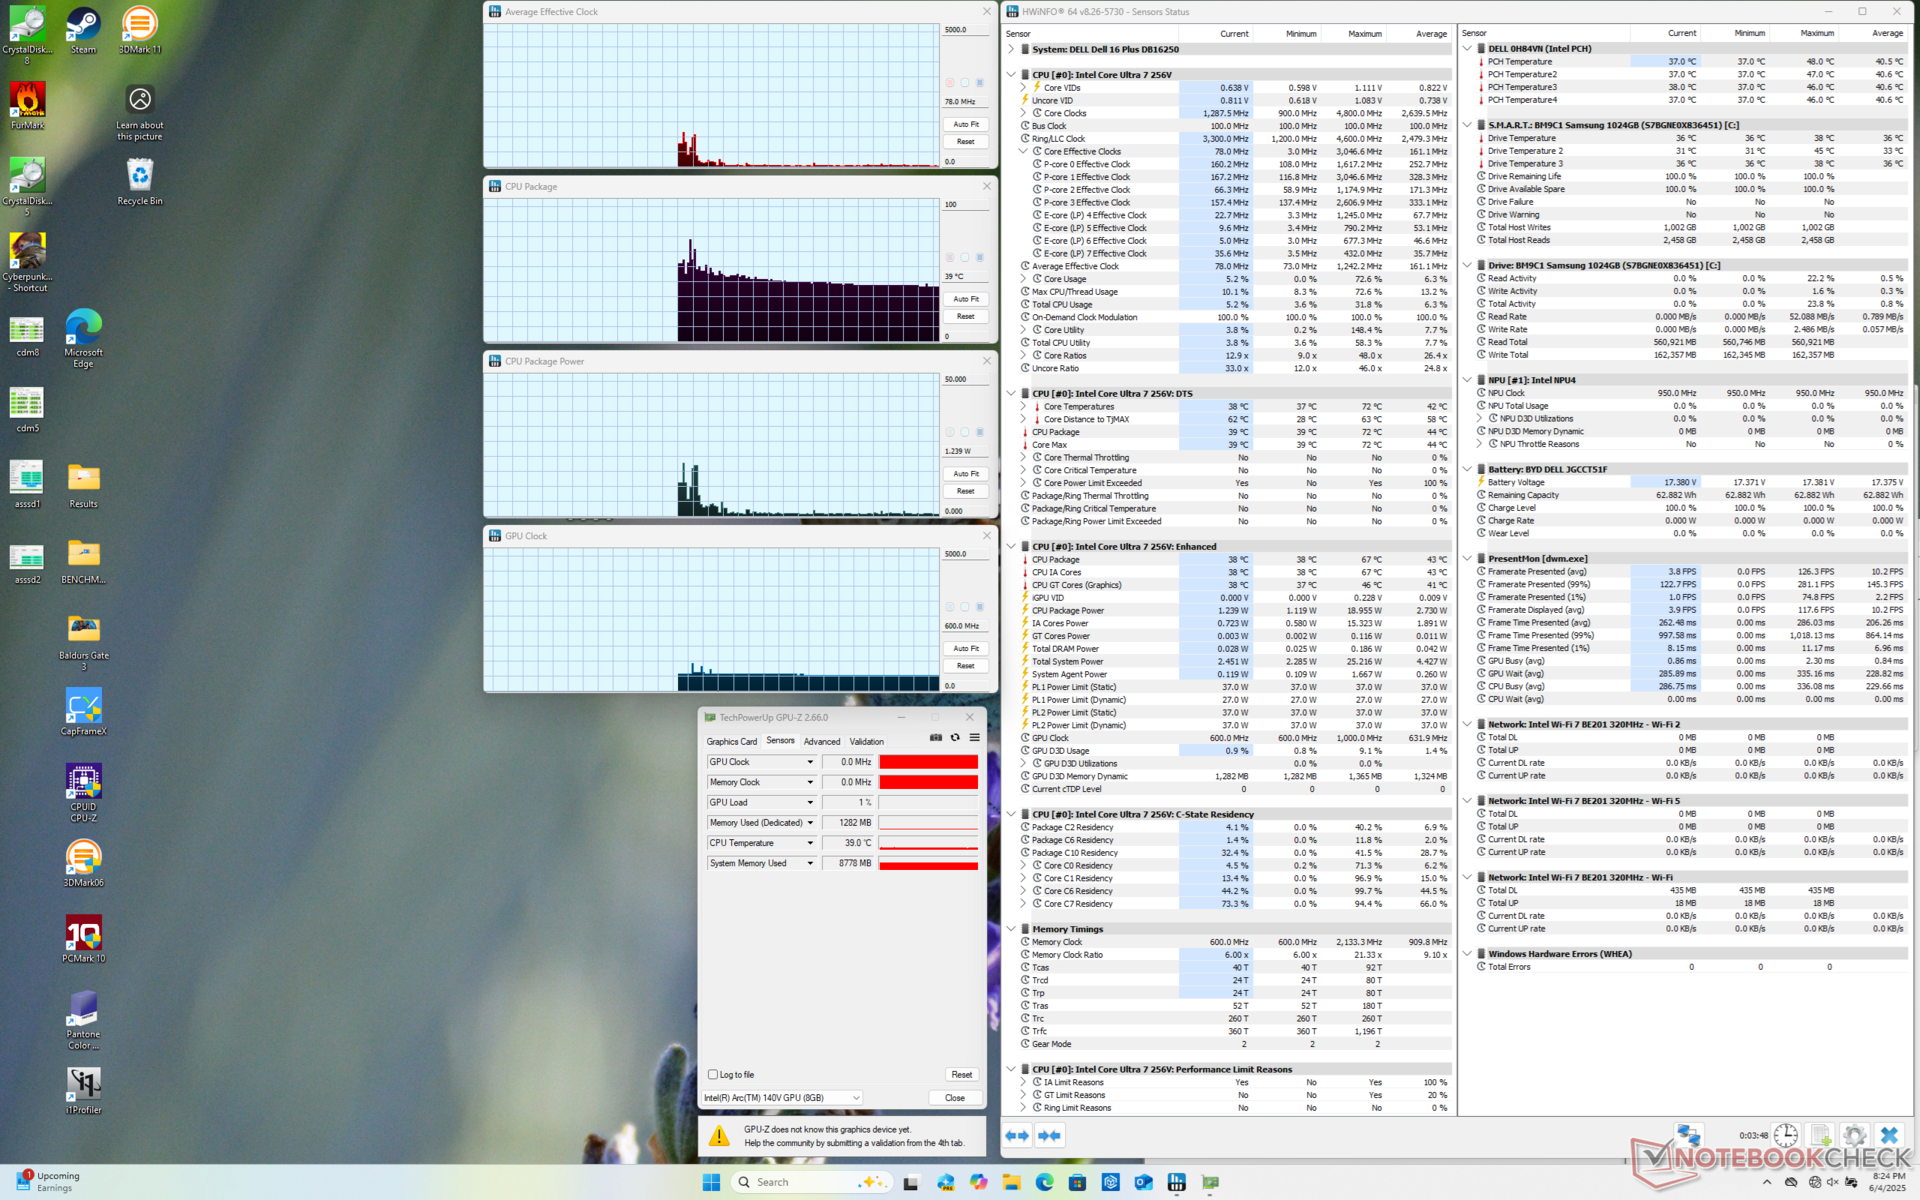
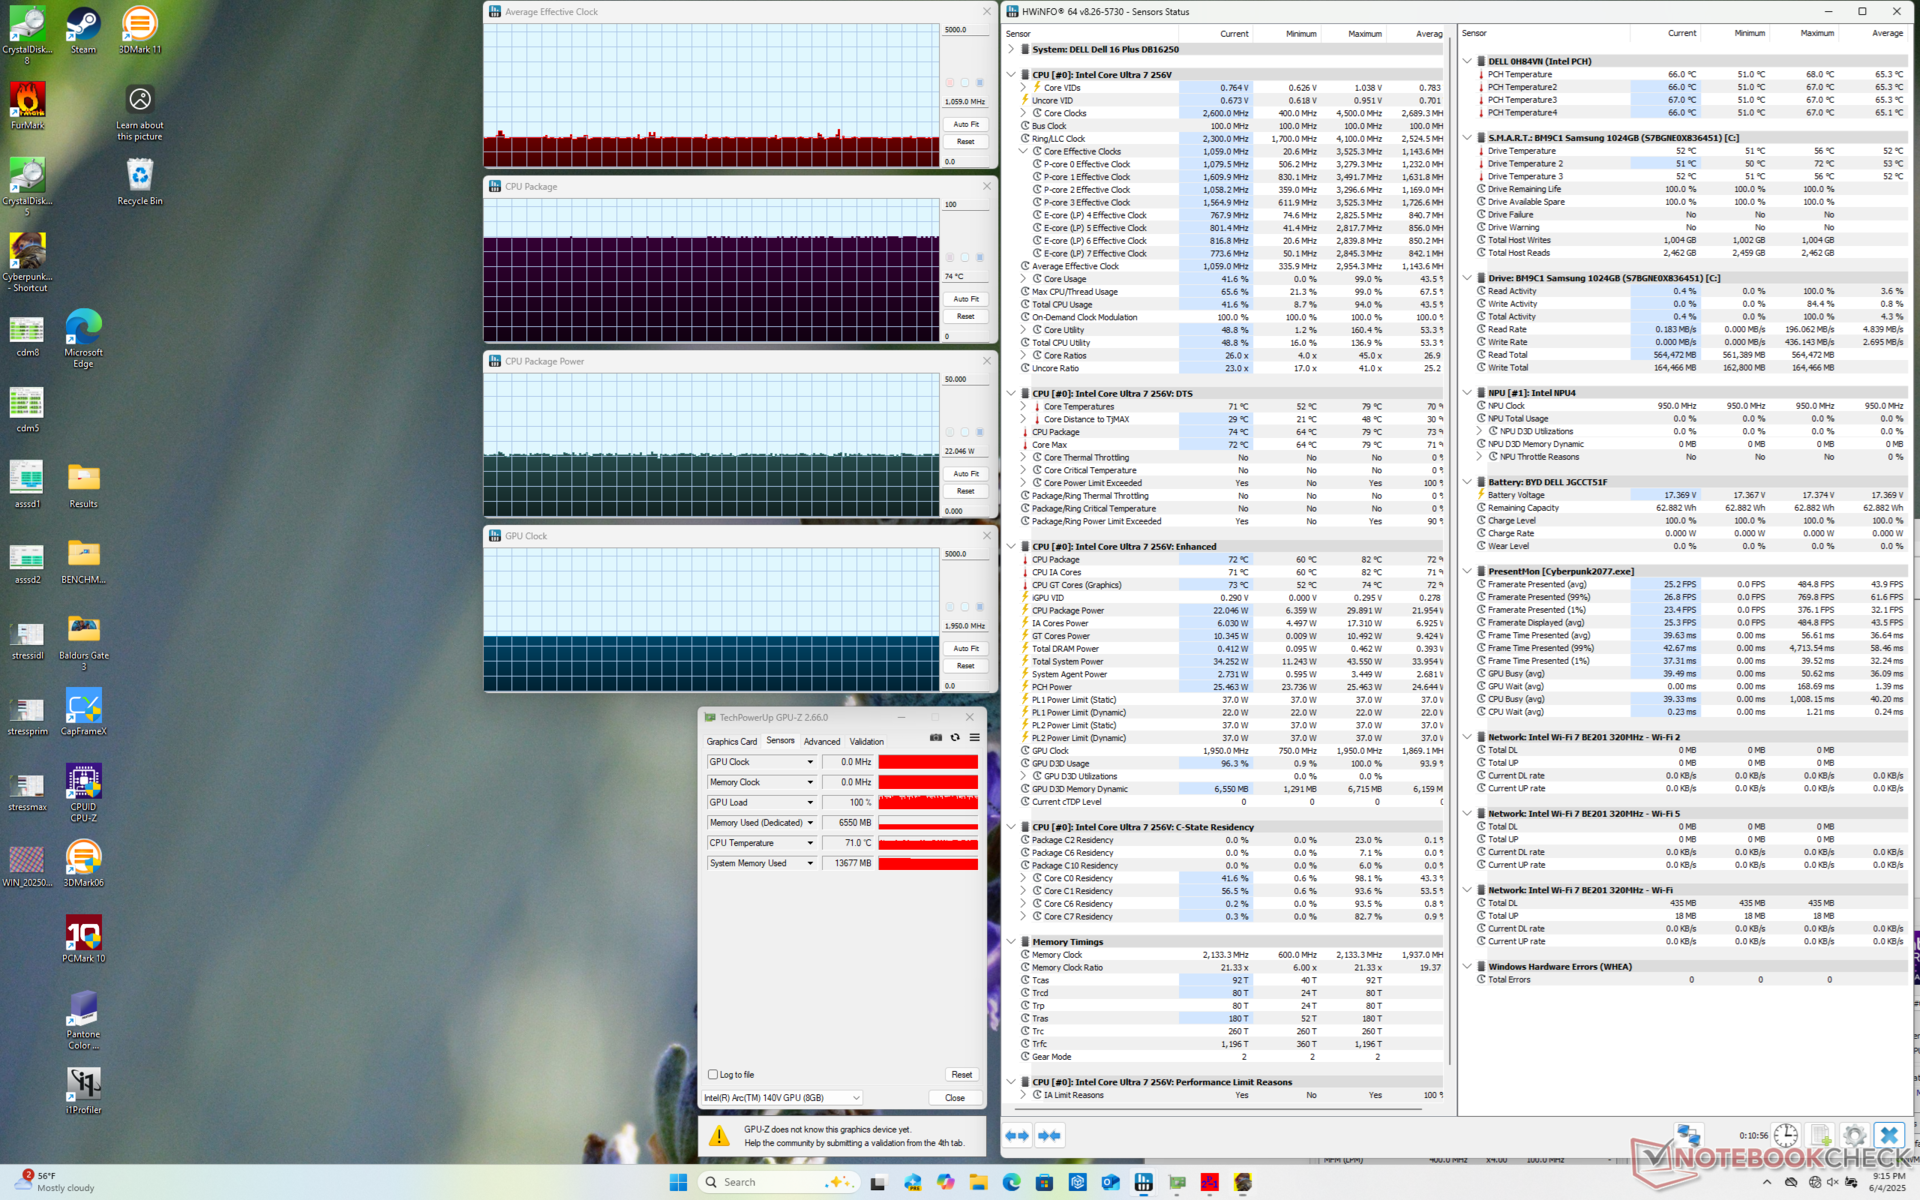
| Horloge moyenne du CPU (GHz) | Horloge du GPU (MHz) | Température moyenne du CPU (°C) | |
| Système au repos | -- | -- | 39 |
| Prime95 Stress | 2.5 | -- | 74 |
| Prime95 + FurMark Stress | 1.7 | 1350 | 74 |
| Cyberpunk 2077 Stress | 1.0 | 1950 | 74 |
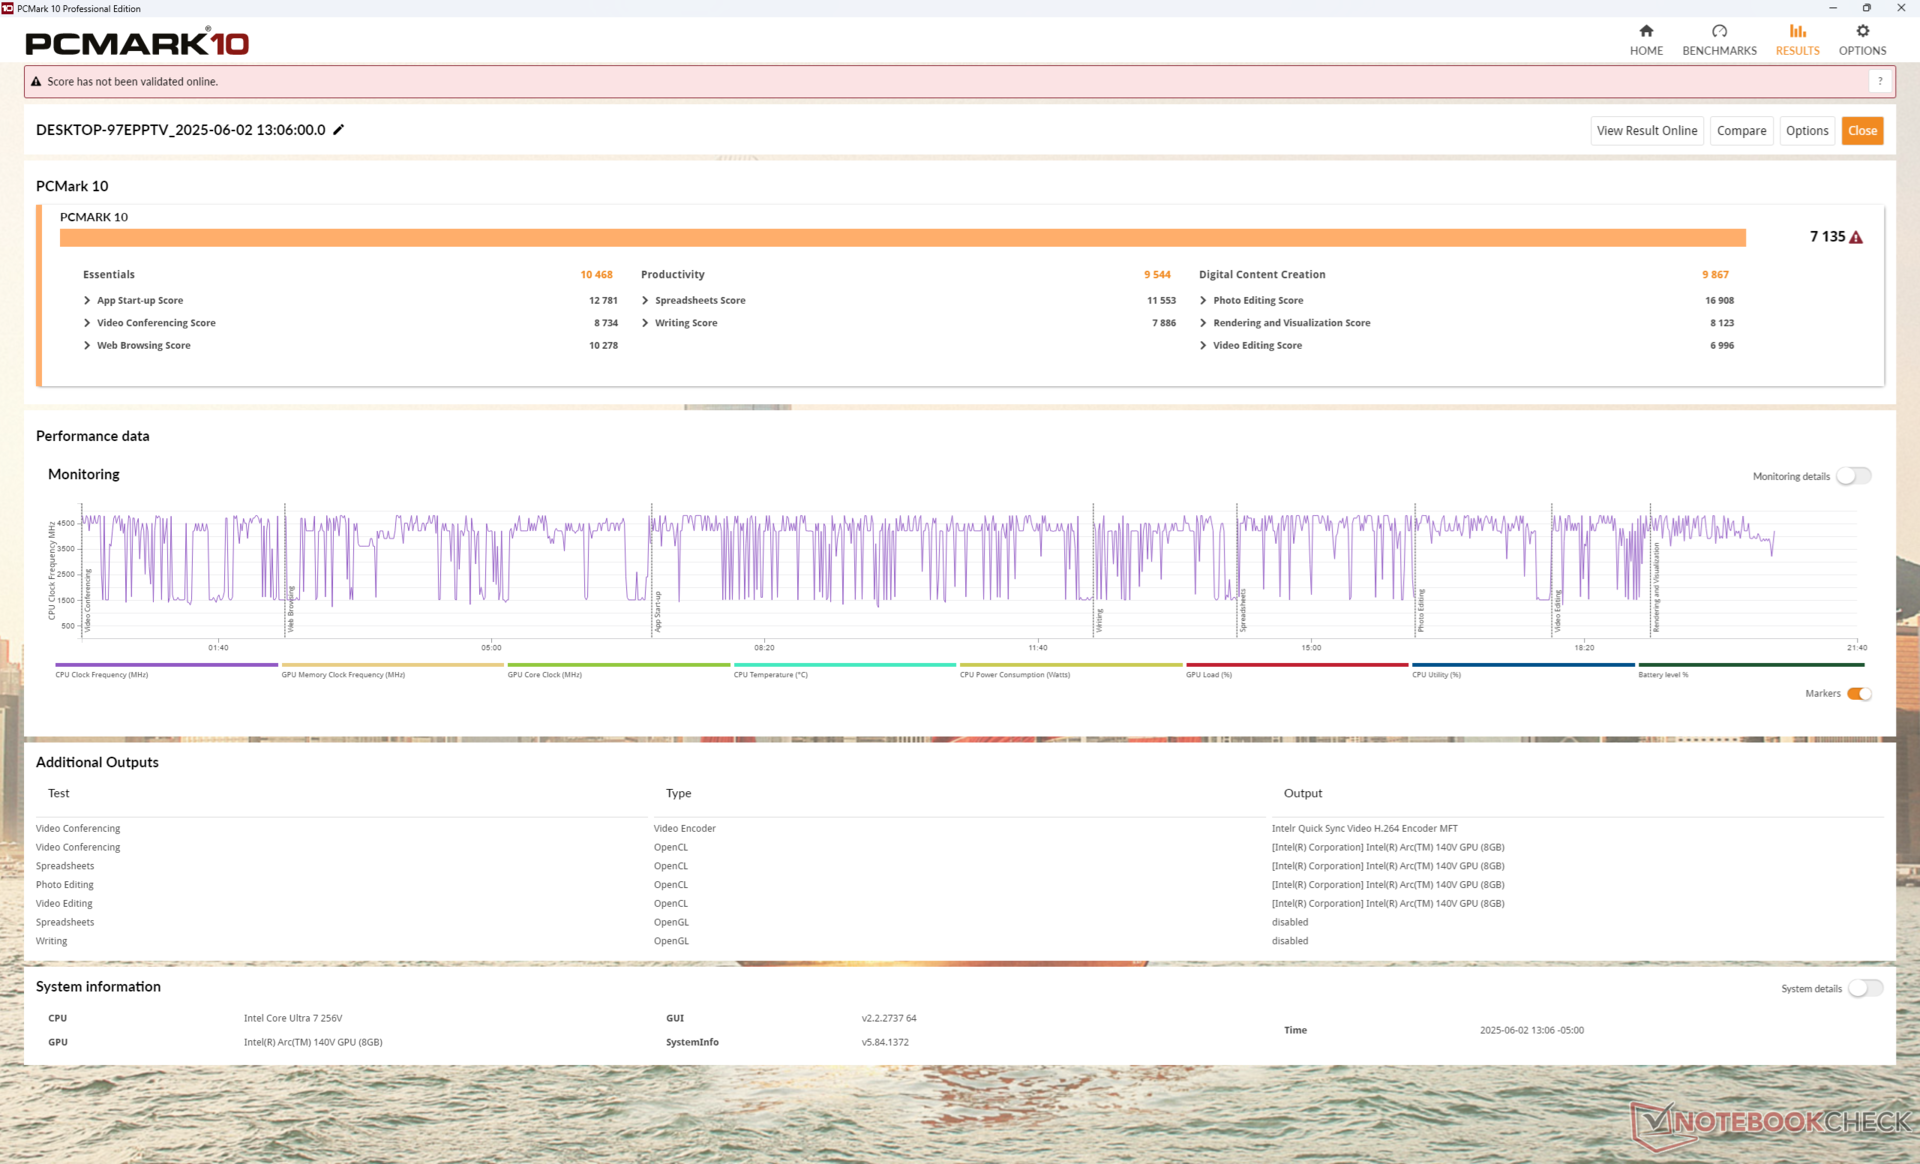
Performance du système
Les scores PCMark sont comparables à ceux des ordinateurs portables 16 pouces concurrents, y compris ceux équipés de processeurs plus rapides de la série H, comme l'Asus Vivobook 16 M160KK Asus Vivobook 16 M1606K. Les performances de la mémoire vive sont également excellentes grâce à la conception " on-package " de Lunar Lake.
PCMark 10: Score | Essentials | Productivity | Digital Content Creation
CrossMark: Overall | Productivity | Creativity | Responsiveness
WebXPRT 3: Overall
WebXPRT 4: Overall
Mozilla Kraken 1.1: Total
| Performance Rating | |
| Lenovo ThinkBook 16 G7+ AMD | |
| Acer Swift 16 AI SF16-51T-932H, Ultra 9 288V | |
| Dell 16 Plus | |
| Asus Vivobook 16 M1606K | |
| Moyenne Intel Core Ultra 7 256V, Intel Arc Graphics 140V | |
| HP Pavilion Plus 16-ab0456tx | |
| Dell Inspiron 16 Plus 7640 | |
| PCMark 10 / Score | |
| Lenovo ThinkBook 16 G7+ AMD | |
| Acer Swift 16 AI SF16-51T-932H, Ultra 9 288V | |
| Dell 16 Plus | |
| Dell Inspiron 16 Plus 7640 | |
| Asus Vivobook 16 M1606K | |
| Moyenne Intel Core Ultra 7 256V, Intel Arc Graphics 140V (6677 - 7367, n=6) | |
| HP Pavilion Plus 16-ab0456tx | |
| PCMark 10 / Essentials | |
| Asus Vivobook 16 M1606K | |
| Lenovo ThinkBook 16 G7+ AMD | |
| Acer Swift 16 AI SF16-51T-932H, Ultra 9 288V | |
| Dell 16 Plus | |
| Dell Inspiron 16 Plus 7640 | |
| Moyenne Intel Core Ultra 7 256V, Intel Arc Graphics 140V (9627 - 11365, n=6) | |
| HP Pavilion Plus 16-ab0456tx | |
| PCMark 10 / Productivity | |
| Lenovo ThinkBook 16 G7+ AMD | |
| Asus Vivobook 16 M1606K | |
| Dell 16 Plus | |
| Acer Swift 16 AI SF16-51T-932H, Ultra 9 288V | |
| Moyenne Intel Core Ultra 7 256V, Intel Arc Graphics 140V (8161 - 9544, n=6) | |
| HP Pavilion Plus 16-ab0456tx | |
| Dell Inspiron 16 Plus 7640 | |
| PCMark 10 / Digital Content Creation | |
| Dell Inspiron 16 Plus 7640 | |
| Lenovo ThinkBook 16 G7+ AMD | |
| Acer Swift 16 AI SF16-51T-932H, Ultra 9 288V | |
| Dell 16 Plus | |
| Moyenne Intel Core Ultra 7 256V, Intel Arc Graphics 140V (9481 - 10126, n=6) | |
| Asus Vivobook 16 M1606K | |
| HP Pavilion Plus 16-ab0456tx | |
| CrossMark / Overall | |
| HP Pavilion Plus 16-ab0456tx | |
| Lenovo ThinkBook 16 G7+ AMD | |
| Acer Swift 16 AI SF16-51T-932H, Ultra 9 288V | |
| Asus Vivobook 16 M1606K | |
| Dell Inspiron 16 Plus 7640 | |
| Moyenne Intel Core Ultra 7 256V, Intel Arc Graphics 140V (1636 - 1736, n=6) | |
| Dell 16 Plus | |
| CrossMark / Productivity | |
| Acer Swift 16 AI SF16-51T-932H, Ultra 9 288V | |
| HP Pavilion Plus 16-ab0456tx | |
| Asus Vivobook 16 M1606K | |
| Moyenne Intel Core Ultra 7 256V, Intel Arc Graphics 140V (1563 - 1682, n=6) | |
| Dell 16 Plus | |
| Lenovo ThinkBook 16 G7+ AMD | |
| Dell Inspiron 16 Plus 7640 | |
| CrossMark / Creativity | |
| Lenovo ThinkBook 16 G7+ AMD | |
| HP Pavilion Plus 16-ab0456tx | |
| Acer Swift 16 AI SF16-51T-932H, Ultra 9 288V | |
| Dell Inspiron 16 Plus 7640 | |
| Moyenne Intel Core Ultra 7 256V, Intel Arc Graphics 140V (1862 - 1962, n=6) | |
| Dell 16 Plus | |
| Asus Vivobook 16 M1606K | |
| CrossMark / Responsiveness | |
| HP Pavilion Plus 16-ab0456tx | |
| Asus Vivobook 16 M1606K | |
| Lenovo ThinkBook 16 G7+ AMD | |
| Dell Inspiron 16 Plus 7640 | |
| Acer Swift 16 AI SF16-51T-932H, Ultra 9 288V | |
| Moyenne Intel Core Ultra 7 256V, Intel Arc Graphics 140V (1215 - 1343, n=6) | |
| Dell 16 Plus | |
| WebXPRT 3 / Overall | |
| Lenovo ThinkBook 16 G7+ AMD | |
| Dell 16 Plus | |
| Acer Swift 16 AI SF16-51T-932H, Ultra 9 288V | |
| Asus Vivobook 16 M1606K | |
| Moyenne Intel Core Ultra 7 256V, Intel Arc Graphics 140V (243 - 310, n=6) | |
| Dell Inspiron 16 Plus 7640 | |
| HP Pavilion Plus 16-ab0456tx | |
| WebXPRT 4 / Overall | |
| Moyenne Intel Core Ultra 7 256V, Intel Arc Graphics 140V (282 - 286, n=6) | |
| Dell 16 Plus | |
| Acer Swift 16 AI SF16-51T-932H, Ultra 9 288V | |
| HP Pavilion Plus 16-ab0456tx | |
| Dell Inspiron 16 Plus 7640 | |
| Lenovo ThinkBook 16 G7+ AMD | |
| Asus Vivobook 16 M1606K | |
| Mozilla Kraken 1.1 / Total | |
| Dell Inspiron 16 Plus 7640 | |
| HP Pavilion Plus 16-ab0456tx | |
| Moyenne Intel Core Ultra 7 256V, Intel Arc Graphics 140V (470 - 480, n=6) | |
| Dell 16 Plus | |
| Acer Swift 16 AI SF16-51T-932H, Ultra 9 288V | |
| Asus Vivobook 16 M1606K | |
| Lenovo ThinkBook 16 G7+ AMD | |
* ... Moindre est la valeur, meilleures sont les performances
| PCMark 10 Score | 7135 points | |
Aide | ||
| AIDA64 / Memory Copy | |
| Acer Swift 16 AI SF16-51T-932H, Ultra 9 288V | |
| Moyenne Intel Core Ultra 7 256V (99227 - 104459, n=6) | |
| Dell 16 Plus | |
| Lenovo ThinkBook 16 G7+ AMD | |
| HP Pavilion Plus 16-ab0456tx | |
| Dell Inspiron 16 Plus 7640 | |
| Asus Vivobook 16 M1606K | |
| AIDA64 / Memory Read | |
| Lenovo ThinkBook 16 G7+ AMD | |
| Dell 16 Plus | |
| Moyenne Intel Core Ultra 7 256V (86352 - 89144, n=6) | |
| Acer Swift 16 AI SF16-51T-932H, Ultra 9 288V | |
| Dell Inspiron 16 Plus 7640 | |
| HP Pavilion Plus 16-ab0456tx | |
| Asus Vivobook 16 M1606K | |
| AIDA64 / Memory Write | |
| Dell 16 Plus | |
| Moyenne Intel Core Ultra 7 256V (108692 - 117933, n=6) | |
| Acer Swift 16 AI SF16-51T-932H, Ultra 9 288V | |
| Lenovo ThinkBook 16 G7+ AMD | |
| HP Pavilion Plus 16-ab0456tx | |
| Dell Inspiron 16 Plus 7640 | |
| Asus Vivobook 16 M1606K | |
| AIDA64 / Memory Latency | |
| Dell Inspiron 16 Plus 7640 | |
| Lenovo ThinkBook 16 G7+ AMD | |
| Dell 16 Plus | |
| Moyenne Intel Core Ultra 7 256V (96.1 - 99.6, n=6) | |
| Acer Swift 16 AI SF16-51T-932H, Ultra 9 288V | |
| HP Pavilion Plus 16-ab0456tx | |
| Asus Vivobook 16 M1606K | |
* ... Moindre est la valeur, meilleures sont les performances
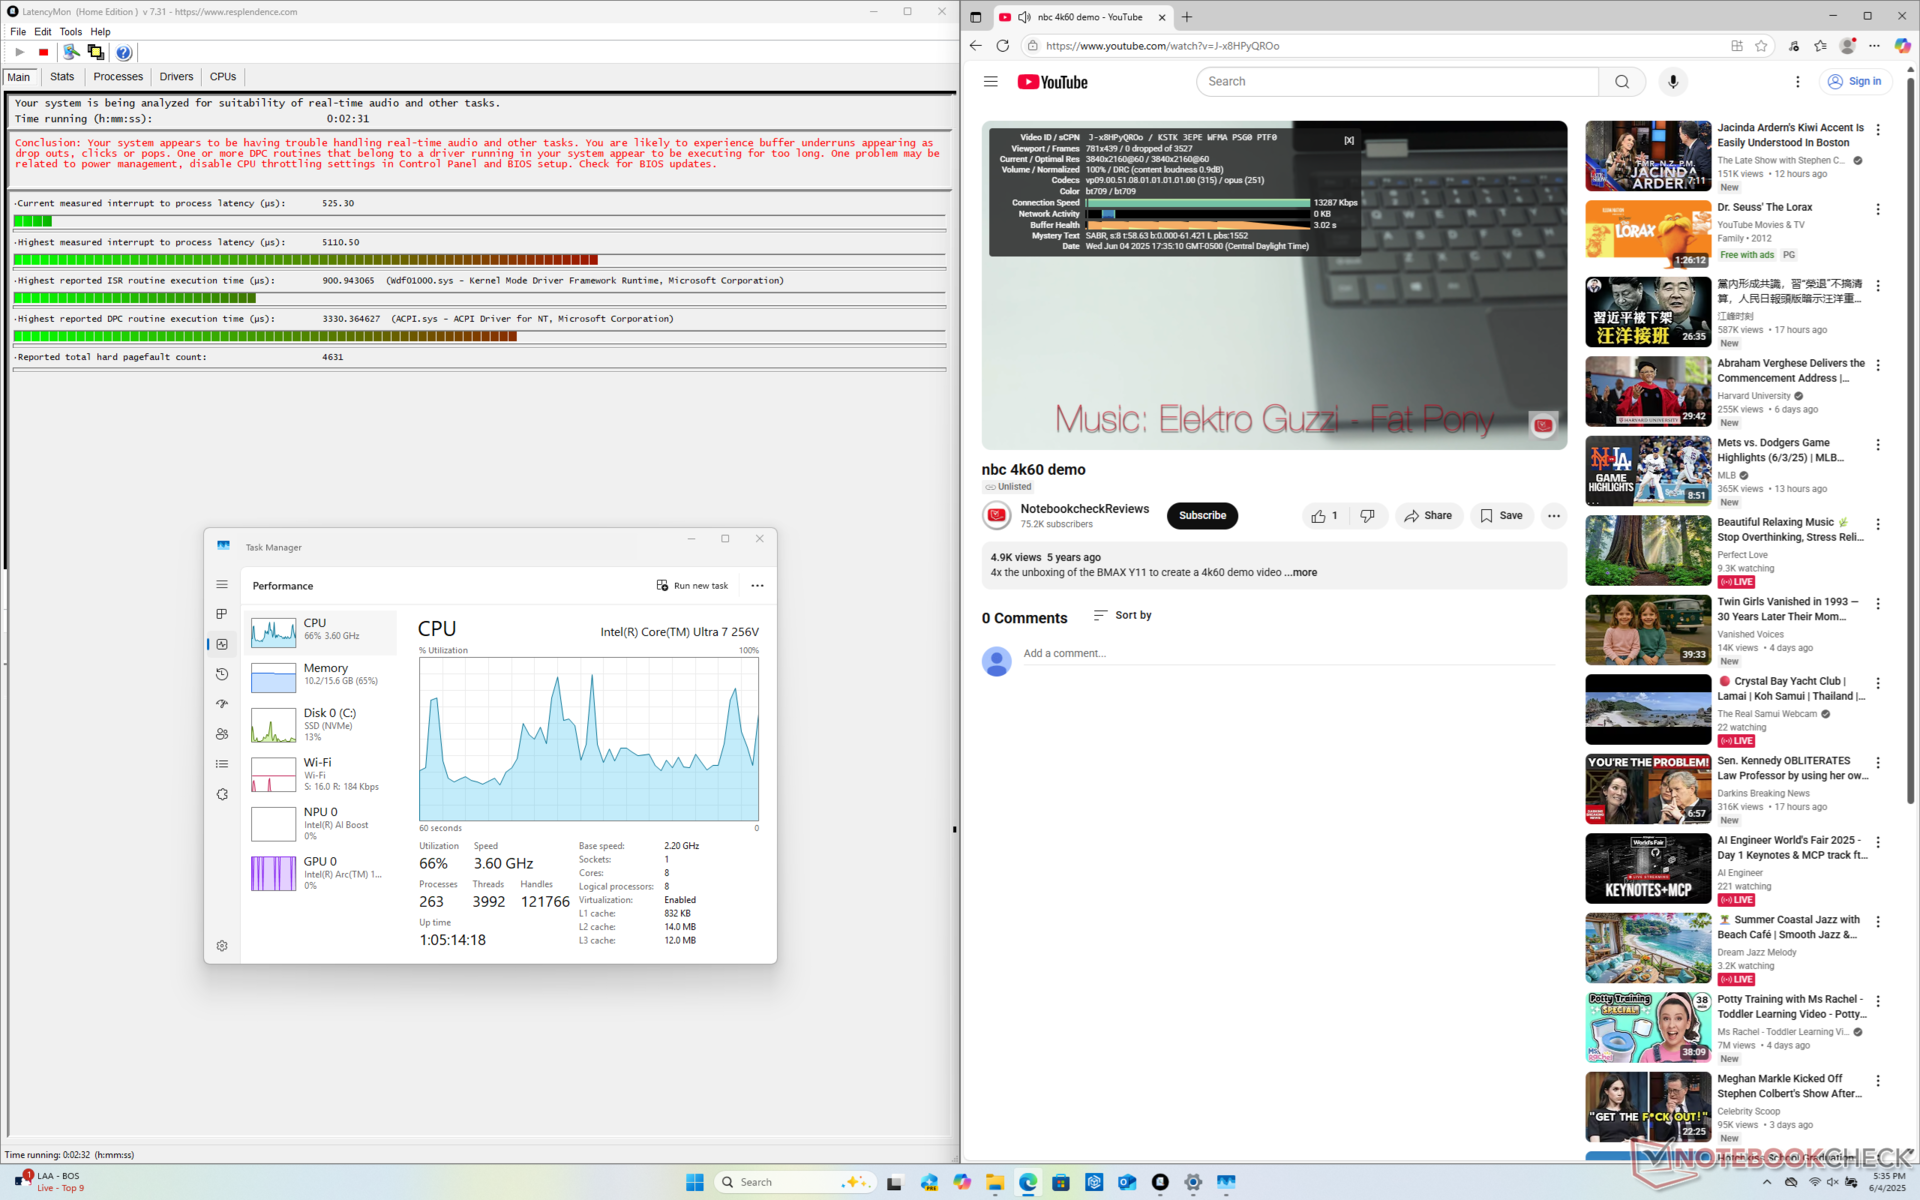
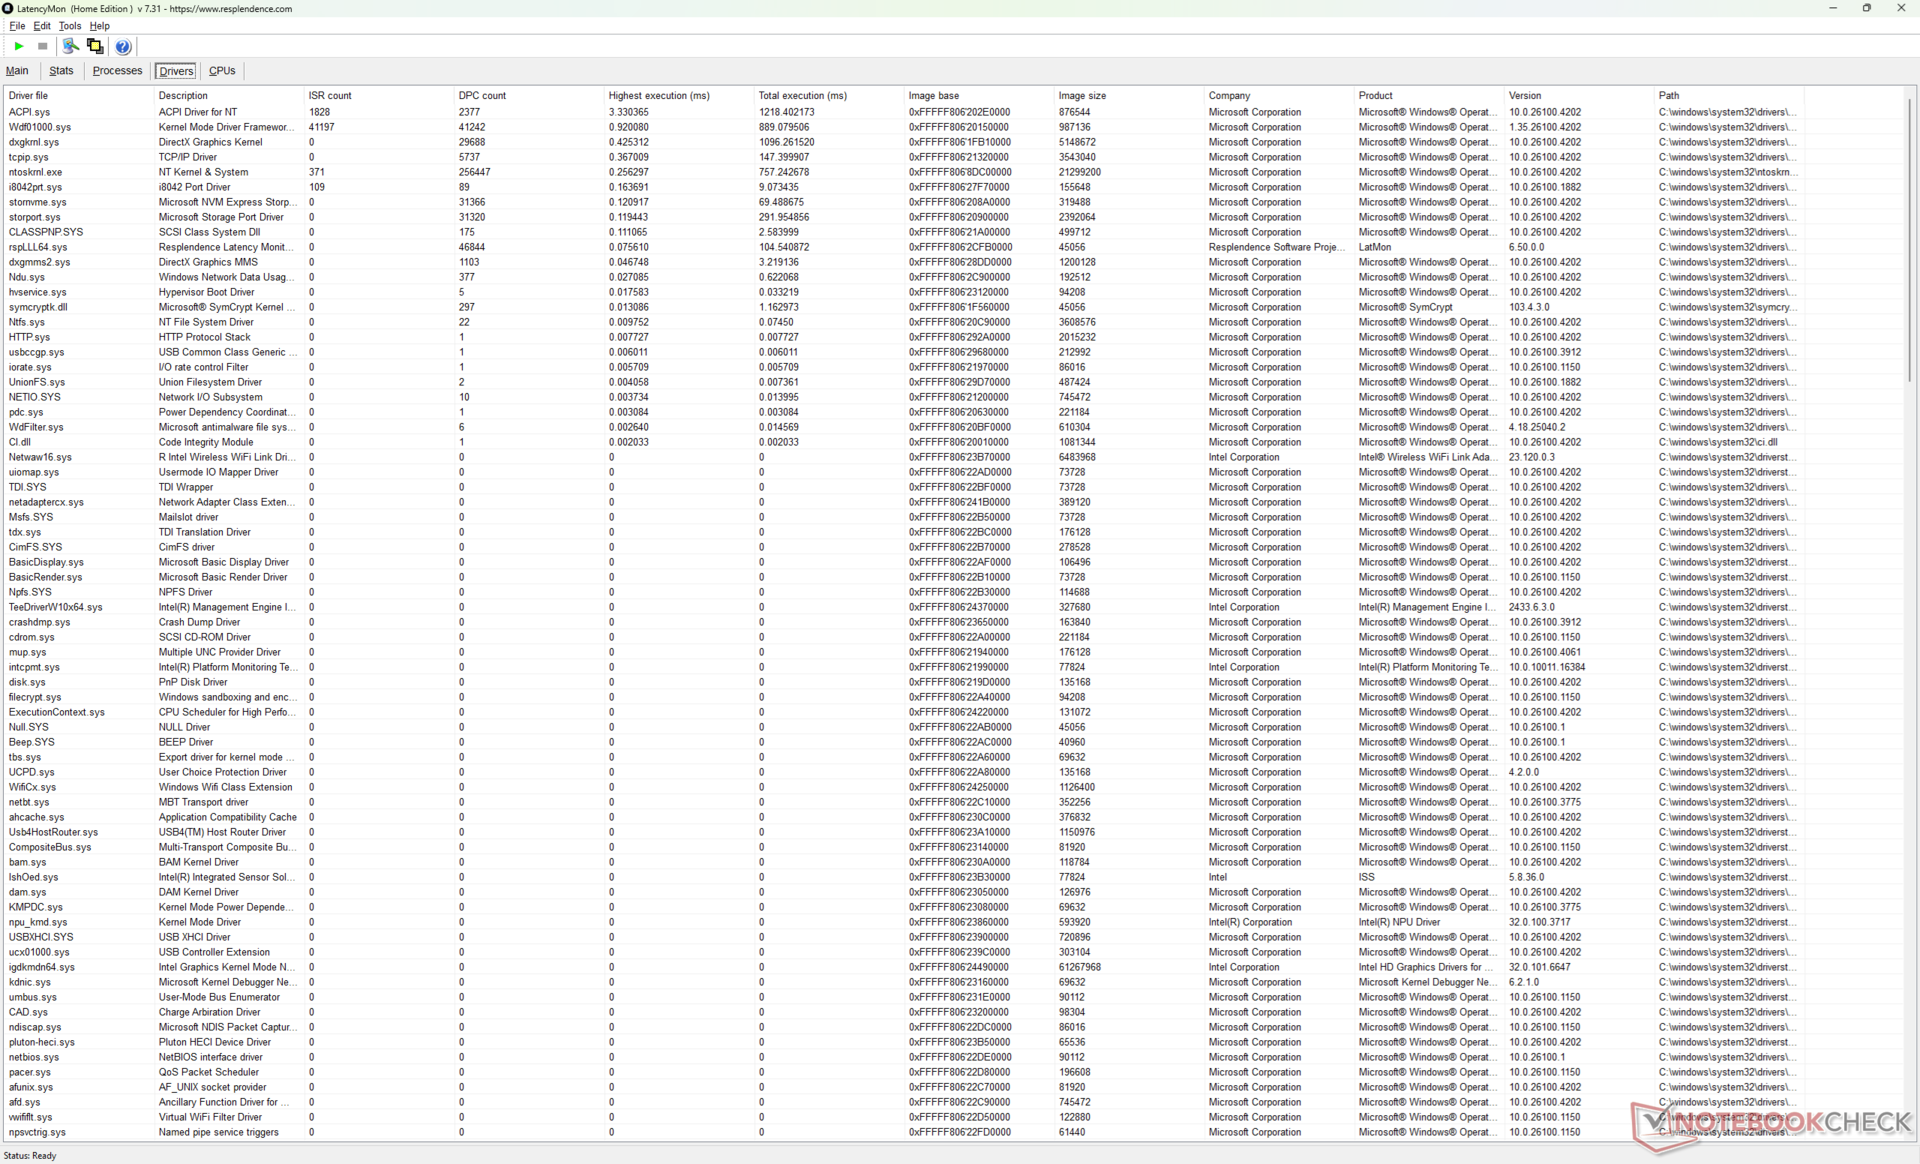
Latence DPC
LatencyMon révèle des problèmes de DPC lors de l'ouverture de plusieurs onglets de notre page d'accueil. Étrangement, l'activité du GPU oscille entre 0 et 100 % lors de la lecture de vidéos en 4K60, alors que le GPU est stable à ~40 % sur la plupart des autres ordinateurs portables Lunar Lake. Il n'y a pas d'images perdues enregistrées pour une expérience de streaming 4K60 fluide.
| DPC Latencies / LatencyMon - interrupt to process latency (max), Web, Youtube, Prime95 | |
| HP Pavilion Plus 16-ab0456tx | |
| Dell 16 Plus | |
| Acer Swift 16 AI SF16-51T-932H, Ultra 9 288V | |
| Lenovo ThinkBook 16 G7+ AMD | |
| Asus Vivobook 16 M1606K | |
| Dell Inspiron 16 Plus 7640 | |
* ... Moindre est la valeur, meilleures sont les performances
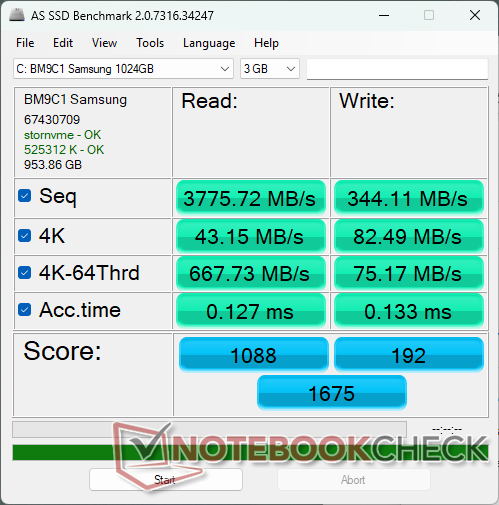
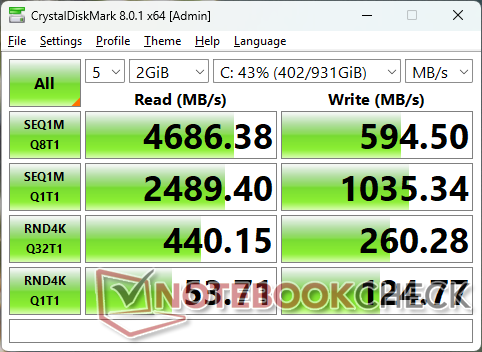
Dispositifs de stockage
Le Samsung BM9C1 est inférieur au Micron 2550 de l'Inspiron 16 7640 2-en-1 de l'année dernière. Les taux de transfert ne sont pas aussi stables, puisqu'ils fluctuent entre 3600 Mo/s et 4900 Mo/s, et même jusqu'à 2200 Mo/s lors de notre test en boucle DiskSpd.

| Drive Performance Rating - Percent | |
| HP Pavilion Plus 16-ab0456tx | |
| Asus Vivobook 16 M1606K | |
| Lenovo ThinkBook 16 G7+ AMD | |
| Dell Inspiron 16 Plus 7640 | |
| Acer Swift 16 AI SF16-51T-932H, Ultra 9 288V | |
| Dell 16 Plus | |
* ... Moindre est la valeur, meilleures sont les performances
Disk Throttling: DiskSpd Read Loop, Queue Depth 8
Performance du GPU
L'Arc Arc 140V est une amélioration décente par rapport à l'Arc 8V de l'année dernière Arc 8. En fait, le Dell 16 Plus exécute la plupart des jeux systématiquement plus vite que l'Inspiron 16 7640 2-en-1 de l'année dernière, jusqu'à 25 %, même si ce dernier est équipé d'un processeur Core-H beaucoup plus rapide.
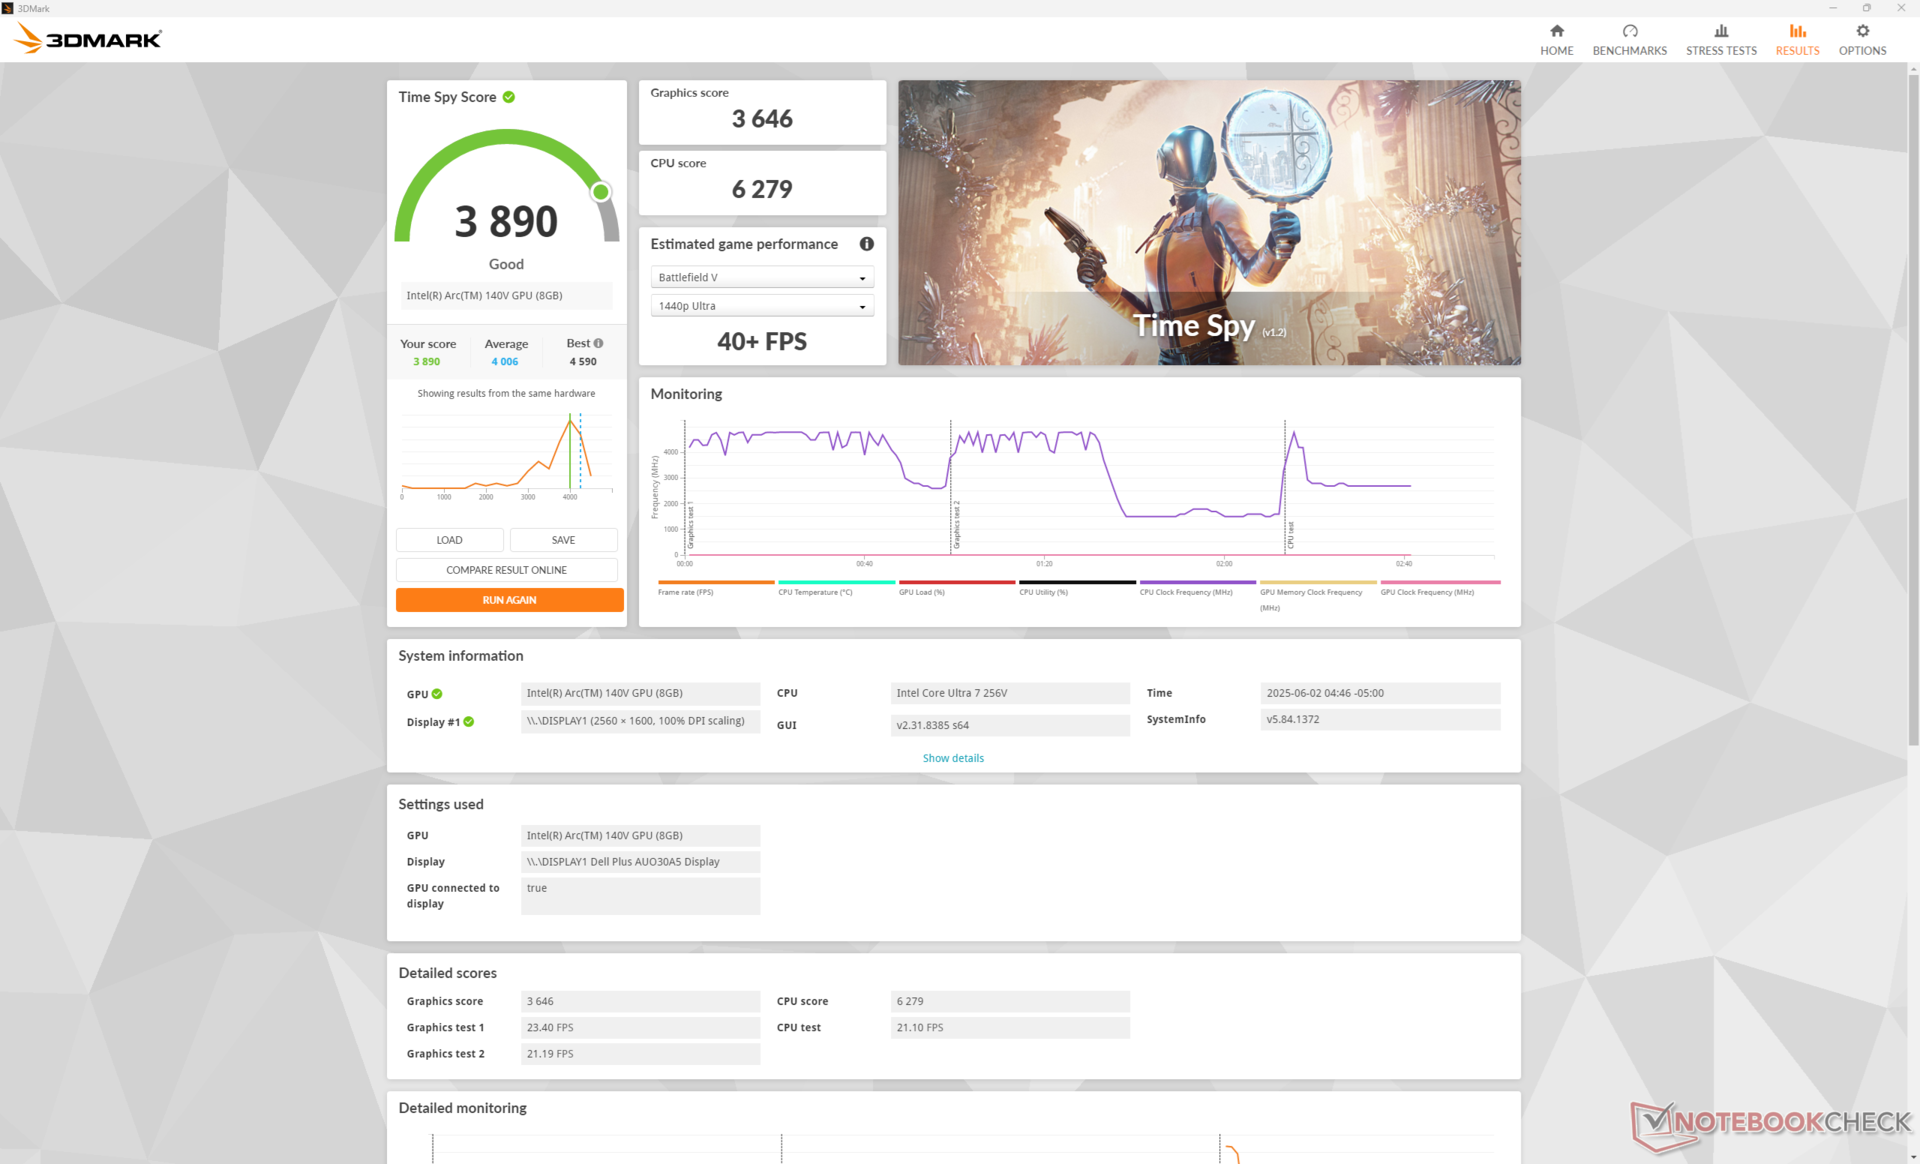
| Profil de puissance | Score graphique | Score physique | Score combiné |
| Mode performance | 9682 | 19037 | 3057 |
| Mode équilibré | 8164 (-16%) | 16591 (-13%) | 2296 (-25%) |
| Alimentation par batterie | 8266 (-15%) | 16361 (-14%) | 2350 (-23%) |
L'exécution en mode équilibré au lieu du mode performance a un impact considérable sur les performances globales, comme le montre notre tableau de résultats Fire Strike ci-dessus.
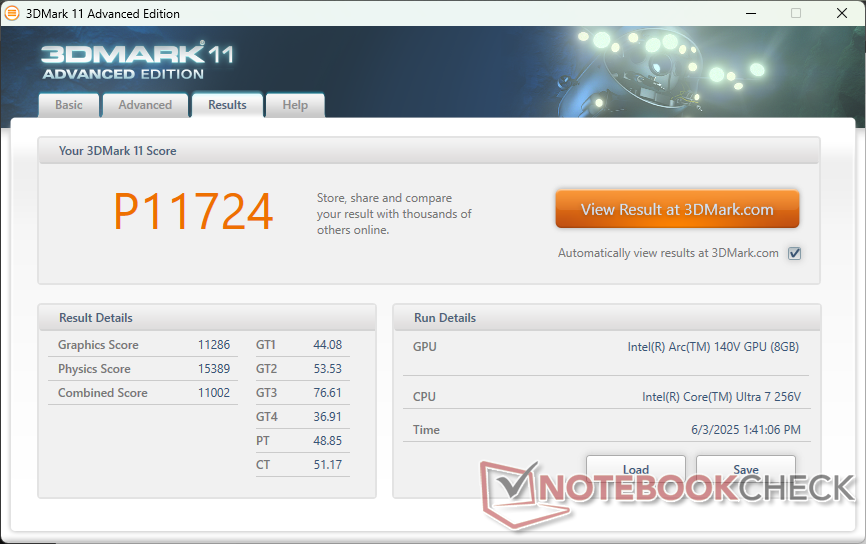

| 3DMark 11 Performance | 11724 points | |
| 3DMark Fire Strike Score | 8470 points | |
| 3DMark Time Spy Score | 3890 points | |
Aide | ||
* ... Moindre est la valeur, meilleures sont les performances
Performances des jeux
La plupart des titres tournent bien sur le système en 1080p natif et avec des paramètres bas, y compris Baldur's Gate 3. Les titres plus exigeants, comme Cyberpunk 2077, peuvent cependant nécessiter de descendre à 720p pour une expérience plus fluide.
| F1 24 | |
| 1920x1080 Low Preset AA:T AF:16x | |
| Moyenne Intel Arc Graphics 140V (54 - 99, n=17) | |
| Dell 16 Plus | |
| Lenovo ThinkPad T16 Gen 3 21MN005XGE | |
| 1920x1080 Medium Preset AA:T AF:16x | |
| Moyenne Intel Arc Graphics 140V (49.2 - 87, n=17) | |
| Dell 16 Plus | |
| Lenovo ThinkPad T16 Gen 3 21MN005XGE | |
| 1920x1080 High Preset AA:T AF:16x | |
| Moyenne Intel Arc Graphics 140V (34.4 - 66.4, n=18) | |
| Dell 16 Plus | |
| LG Gram Pro 16Z90TS-G.AU89G | |
| Lenovo ThinkPad T16 Gen 3 21MN005XGE | |
| 1920x1080 Ultra High Preset AA:T AF:16x | |
| Moyenne Intel Arc Graphics 140V (15.8 - 21.2, n=16) | |
| Dell 16 Plus | |
| Lenovo ThinkPad T16 Gen 3 21MN005XGE | |
Cyberpunk 2077 ultra FPS Chart
| Bas | Moyen | Élevé | Ultra | |
|---|---|---|---|---|
| Dota 2 Reborn (2015) | 98.3 | 70.3 | 71.1 | 71.9 |
| Final Fantasy XV Benchmark (2018) | 80.5 | 45.7 | 33.3 | |
| X-Plane 11.11 (2018) | 51.2 | 39.7 | 35.7 | |
| Strange Brigade (2018) | 205 | 81 | 68 | 56.9 |
| Baldur's Gate 3 (2023) | 38.1 | 31 | 27.7 | 27 |
| Cyberpunk 2077 2.2 Phantom Liberty (2023) | 44.2 | 35.2 | 24.7 | 24.1 |
| F1 24 (2024) | 75.3 | 70.7 | 55.3 | 18.8 |
Émissions
Bruit du système
Le ventilateur interne est généralement léthargique en réponse aux charges, ce qui signifie qu'il monte lentement en puissance lors du lancement ou de l'exécution d'applications plus exigeantes. C'est une bonne chose, car il faut plus de temps avant que le bruit du ventilateur ne devienne plus perceptible lors d'une utilisation intensive. Après un certain temps, cependant, le système atteint un niveau maximal similaire à celui de la plupart des autres ordinateurs portables multimédias de 16 pouces, y compris l'Acer Swift 16 AI ou l'Asus Vivobook 16.
Degré de la nuisance sonore
| Au repos |
| 23.5 / 23.5 / 23.5 dB(A) |
| Fortement sollicité |
| 31.9 / 46.9 dB(A) |
 | ||
30 dB silencieux 40 dB(A) audible 50 dB(A) bruyant |
||
min: | ||
| Dell 16 Plus Arc 140V, Core Ultra 7 256V | Dell Inspiron 16 Plus 7640 NVIDIA GeForce RTX 4060 Laptop GPU, Ultra 7 155H, SK hynix BC901 HFS001TEJ4X164N | Acer Swift 16 AI SF16-51T-932H, Ultra 9 288V Arc 140V, Core Ultra 9 288V, Western Digital PC SN5000S SDEQNSJ-1T00 | Lenovo ThinkBook 16 G7+ AMD Radeon 880M, Ryzen AI 9 365, Samsung PM9C1a MZAL81T0HDLB | HP Pavilion Plus 16-ab0456tx GeForce RTX 3050 6GB Laptop GPU, i7-13700H, WDC PC SN810 1TB | Asus Vivobook 16 M1606K Radeon 860M, Ryzen AI 7 350, Micron 2500 1TB MTFDKBA1T0QGN | |
|---|---|---|---|---|---|---|
| Noise | -2% | -6% | -2% | -0% | 2% | |
| arrêt / environnement * | 23.4 | 23.8 -2% | 25.8 -10% | 24.5 -5% | 22.22 5% | 23 2% |
| Idle Minimum * | 23.5 | 24.2 -3% | 25.8 -10% | 24.5 -4% | 22.22 5% | 23 2% |
| Idle Average * | 23.5 | 24.2 -3% | 25.8 -10% | 24.5 -4% | 22.22 5% | 23 2% |
| Idle Maximum * | 23.5 | 24.2 -3% | 26.7 -14% | 25.9 -10% | 22.22 5% | 24.67 -5% |
| Load Average * | 31.9 | 28.9 9% | 36.2 -13% | 42.03 -32% | 31.72 1% | |
| Cyberpunk 2077 ultra * | 42.6 | 44.4 -4% | 40.1 6% | 41.53 3% | ||
| Load Maximum * | 46.9 | 51 -9% | 41.1 12% | 40.1 14% | 42.1 10% | 42.51 9% |
| Witcher 3 ultra * | 51 | 42.1 |
* ... Moindre est la valeur, meilleures sont les performances
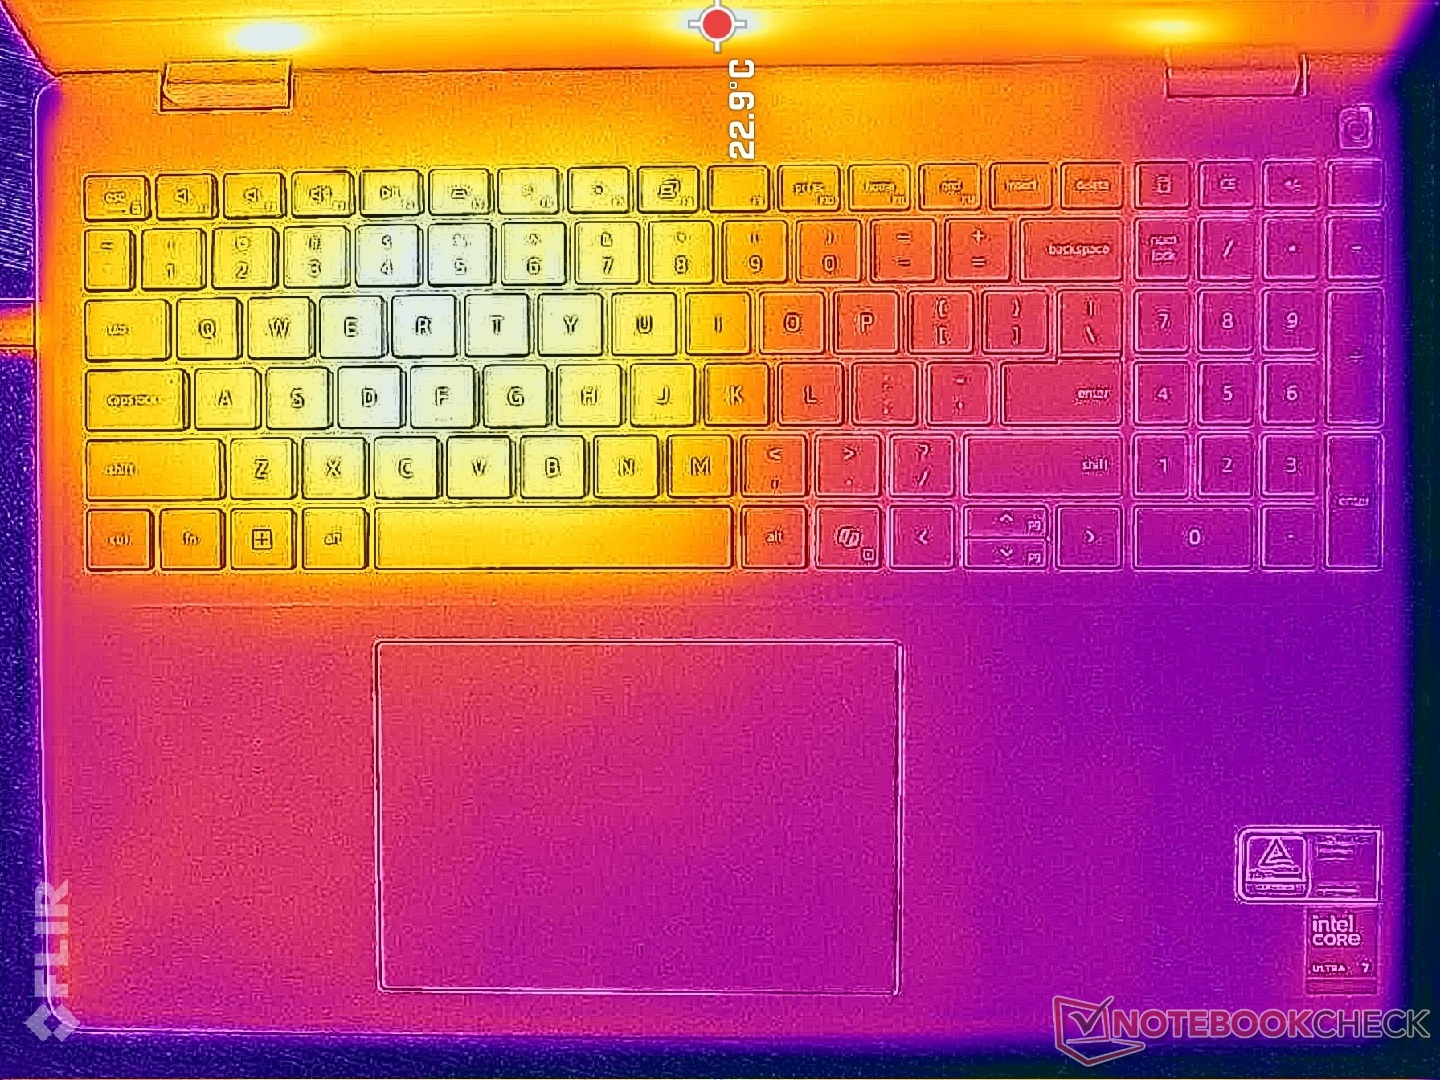
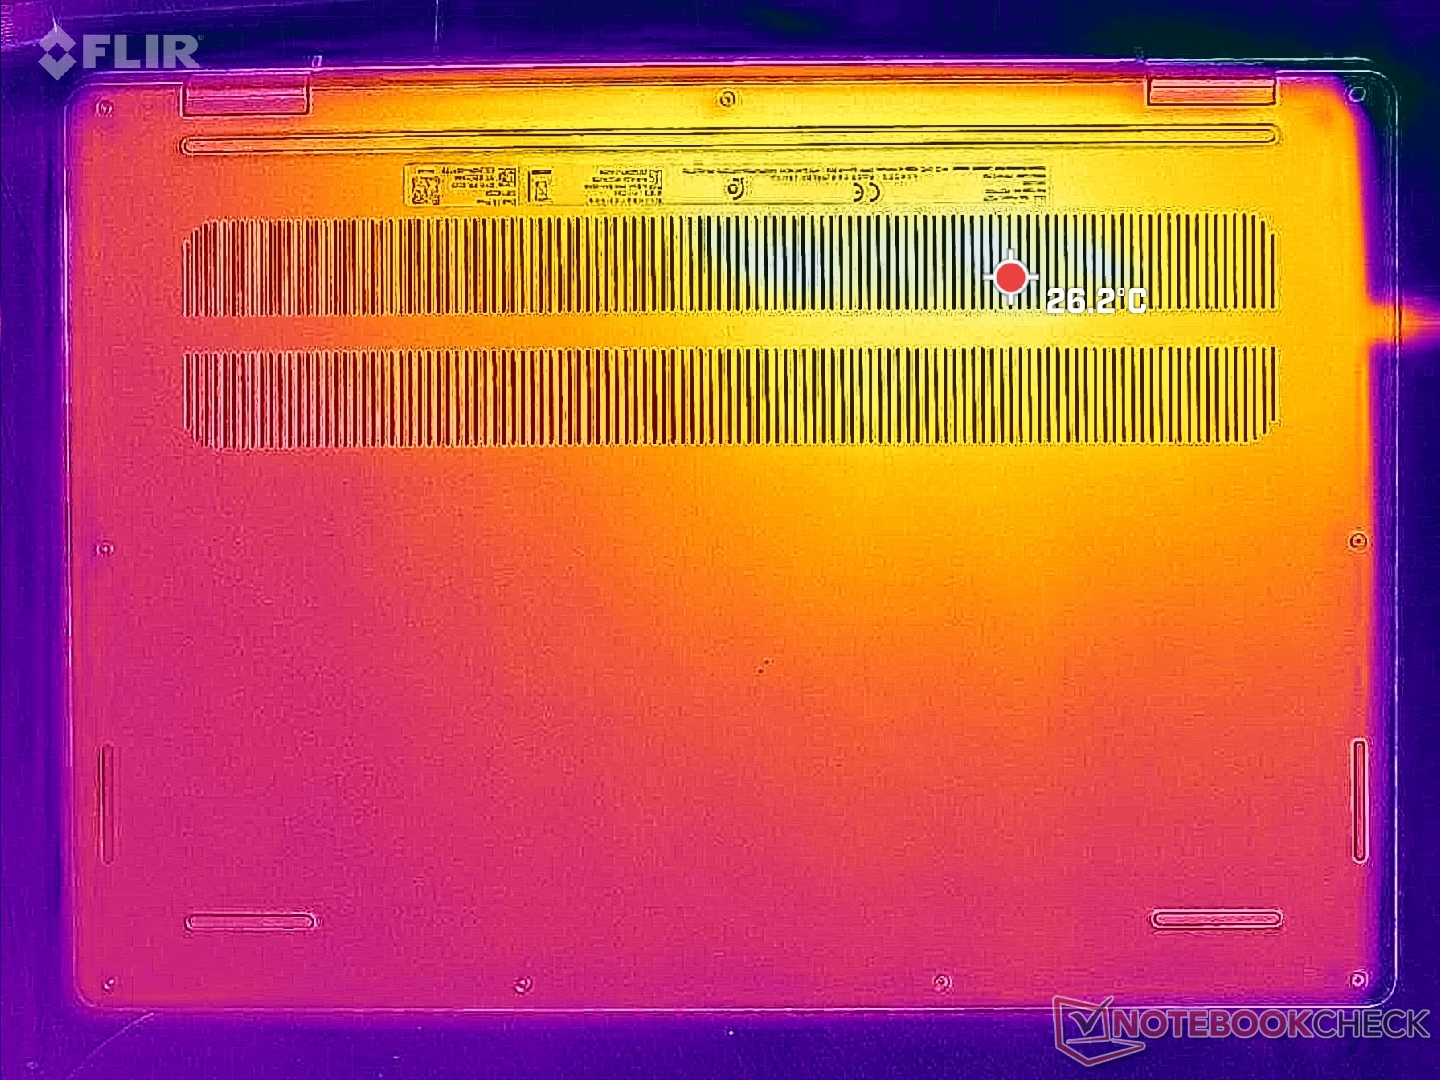
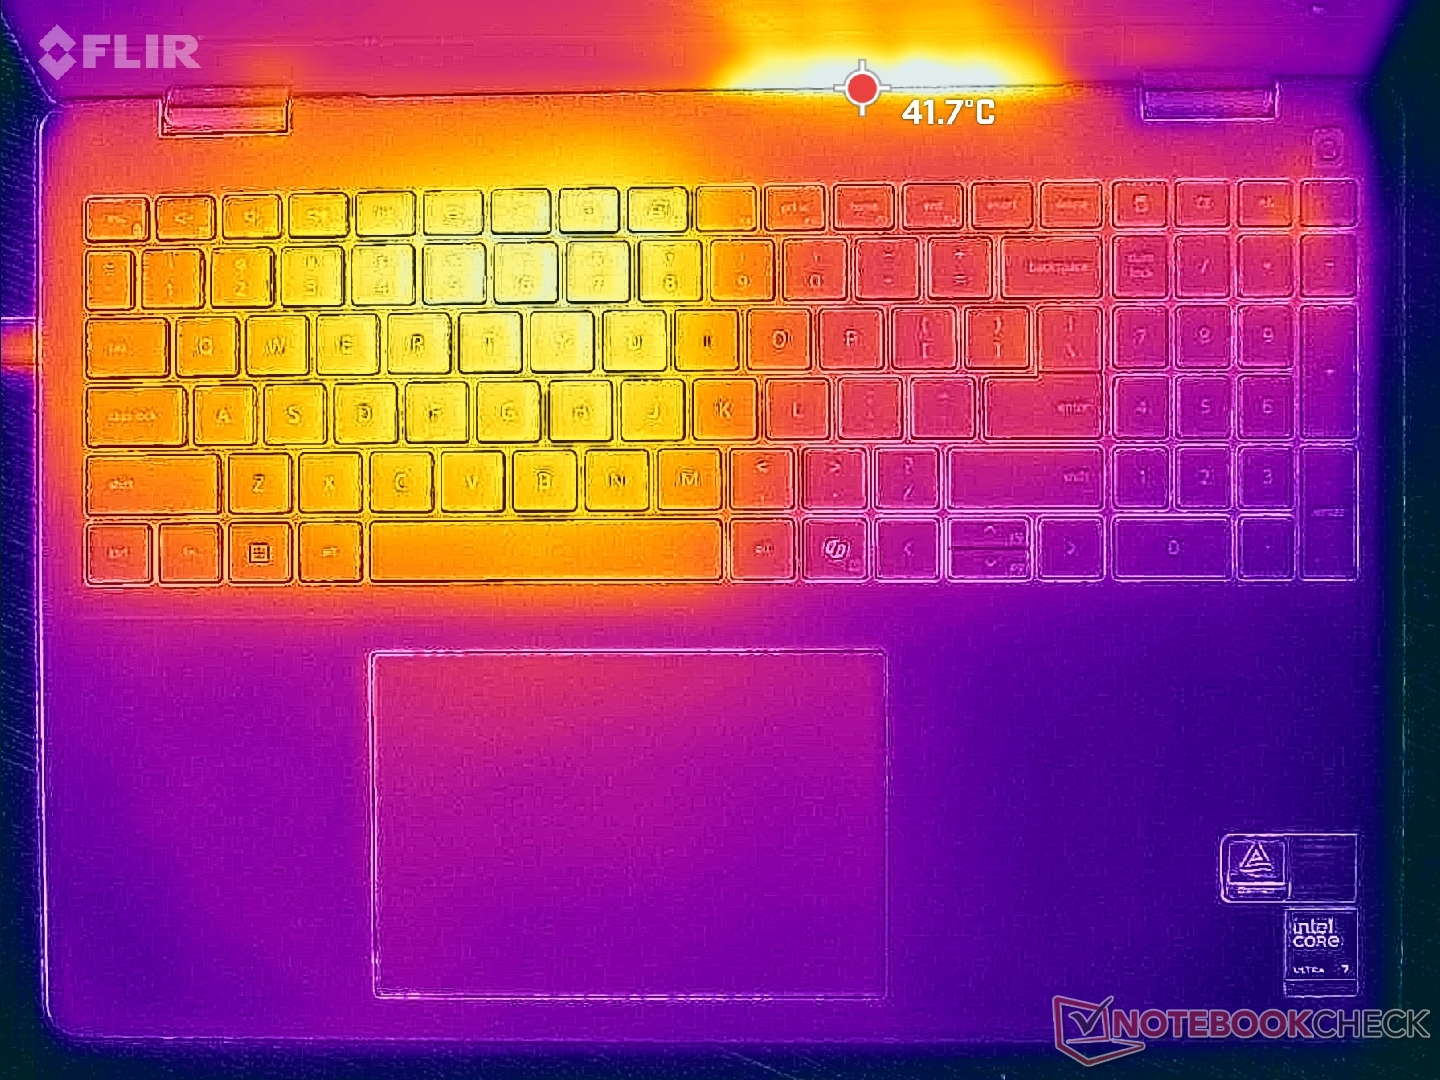
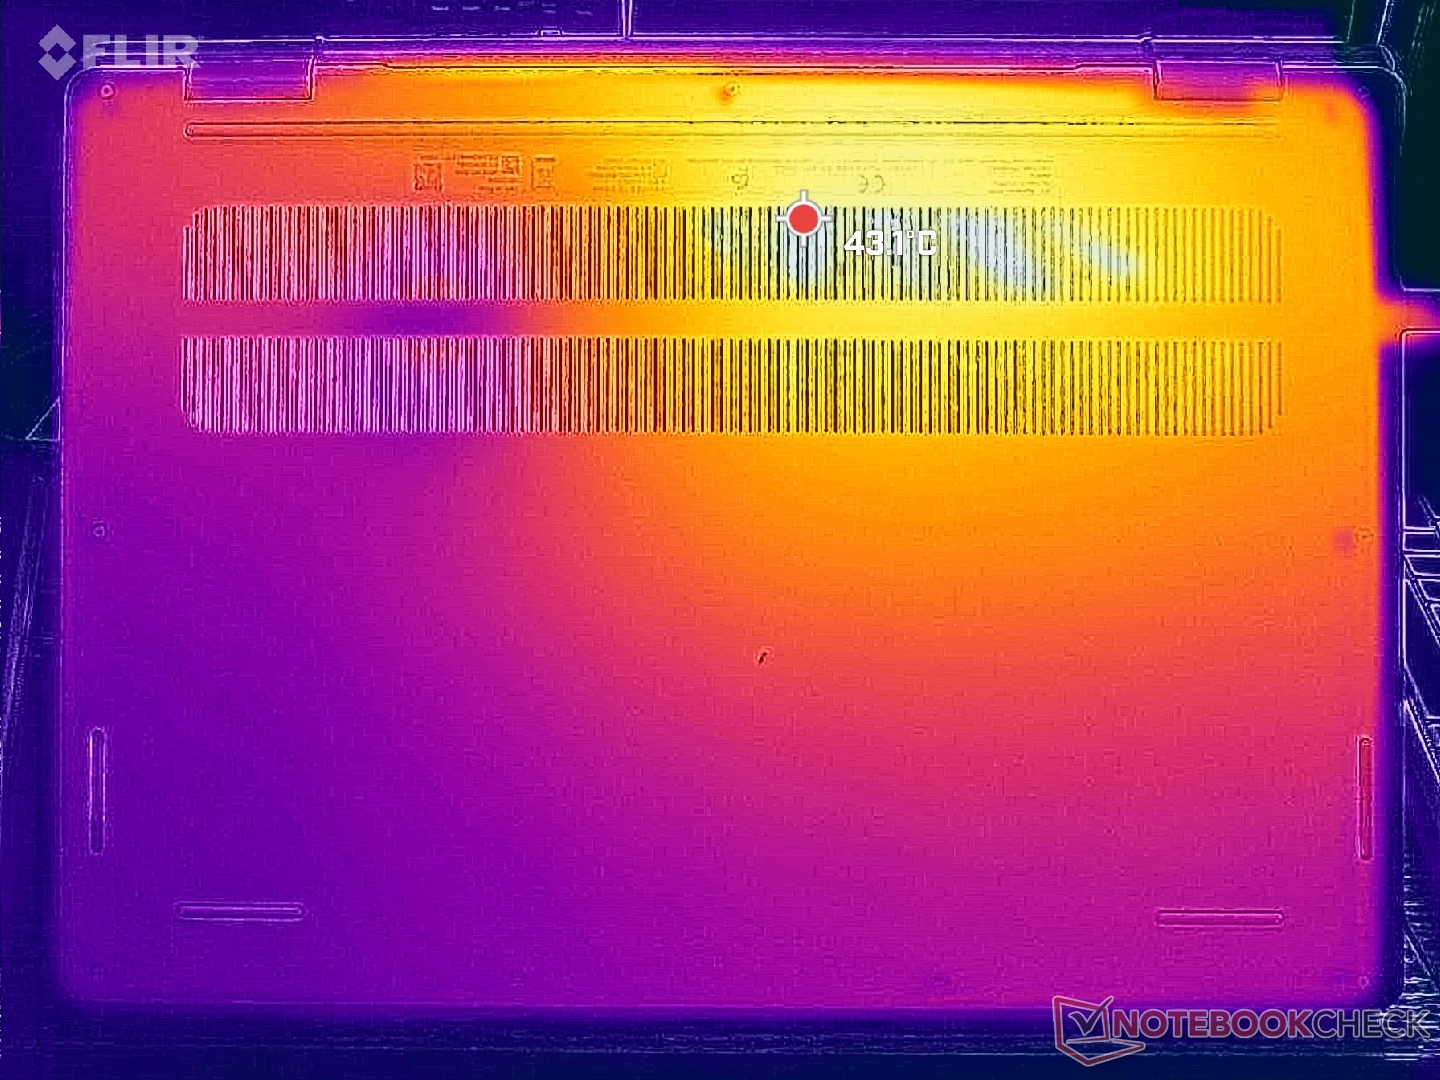
Température
Les températures de surface sont nettement plus basses par rapport à la série Inspiron 16 7640 sortante, en grande partie à cause des changements de processeur. Les points chauds culminent à 40°C au lieu des 40°C plus élevés.
Le système n'est clairement pas conçu pour les joueurs, car la zone WASD peut devenir beaucoup plus chaude que le reste du clavier, comme le montrent les cartes de température ci-dessous.
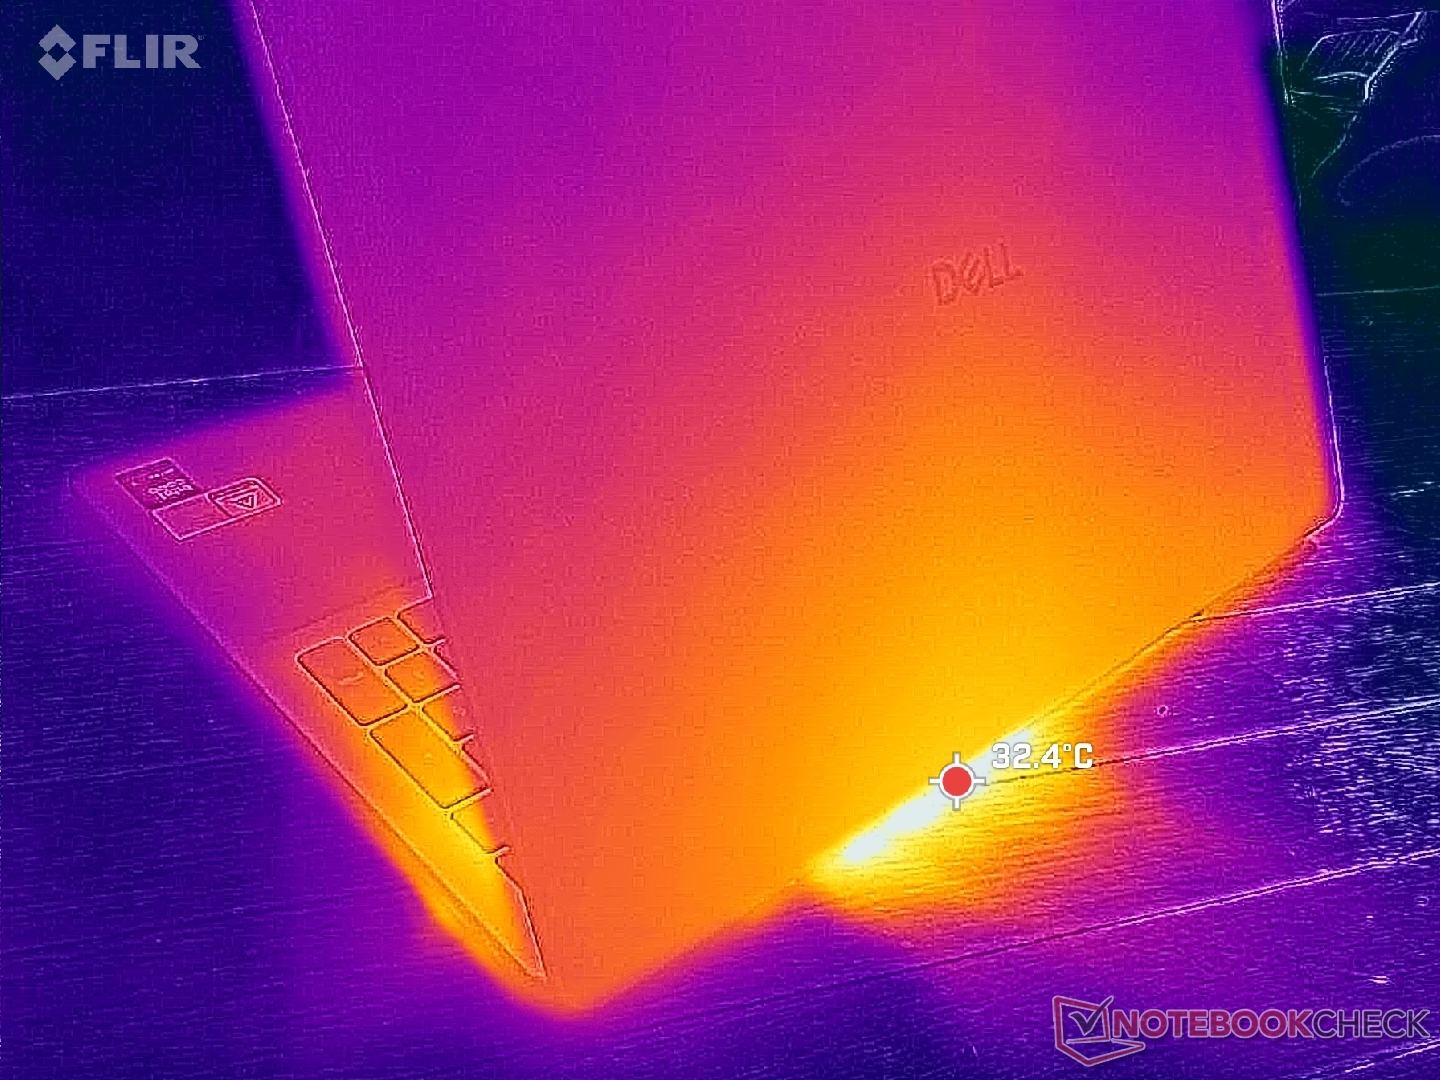
(±) La température maximale du côté supérieur est de 40.6 °C / 105 F, par rapport à la moyenne de 36.9 °C / 98 F, allant de 21.1 à 71 °C pour la classe Multimedia.
(±) Le fond chauffe jusqu'à un maximum de 40 °C / 104 F, contre une moyenne de 39.2 °C / 103 F
(+) En utilisation inactive, la température moyenne du côté supérieur est de 27.2 °C / 81 F, par rapport à la moyenne du dispositif de 31.3 °C / 88 F.
(+) Les repose-poignets et le pavé tactile sont plus froids que la température de la peau avec un maximum de 25.8 °C / 78.4 F et sont donc froids au toucher.
(+) La température moyenne de la zone de l'appui-paume de dispositifs similaires était de 28.8 °C / 83.8 F (+3 °C / #5.4 F).
| Dell 16 Plus Intel Core Ultra 7 256V, Intel Arc Graphics 140V | Dell Inspiron 16 Plus 7640 Intel Core Ultra 7 155H, NVIDIA GeForce RTX 4060 Laptop GPU | Acer Swift 16 AI SF16-51T-932H, Ultra 9 288V Intel Core Ultra 9 288V, Intel Arc Graphics 140V | Lenovo ThinkBook 16 G7+ AMD AMD Ryzen AI 9 365, AMD Radeon 880M | HP Pavilion Plus 16-ab0456tx Intel Core i7-13700H, NVIDIA GeForce RTX 3050 6GB Laptop GPU | Asus Vivobook 16 M1606K AMD Ryzen AI 7 350, AMD Radeon 860M | |
|---|---|---|---|---|---|---|
| Heat | -9% | 7% | 9% | -24% | -0% | |
| Maximum Upper Side * | 40.6 | 43.4 -7% | 37.9 7% | 38.2 6% | 49.6 -22% | 48 -18% |
| Maximum Bottom * | 40 | 41.6 -4% | 31.5 21% | 37.9 5% | 45.8 -15% | 51 -28% |
| Idle Upper Side * | 29.2 | 32.8 -12% | 28.3 3% | 25.4 13% | 39.2 -34% | 22 25% |
| Idle Bottom * | 28.6 | 32.4 -13% | 29.7 -4% | 25.7 10% | 35.4 -24% | 23 20% |
* ... Moindre est la valeur, meilleures sont les performances
Intervenants
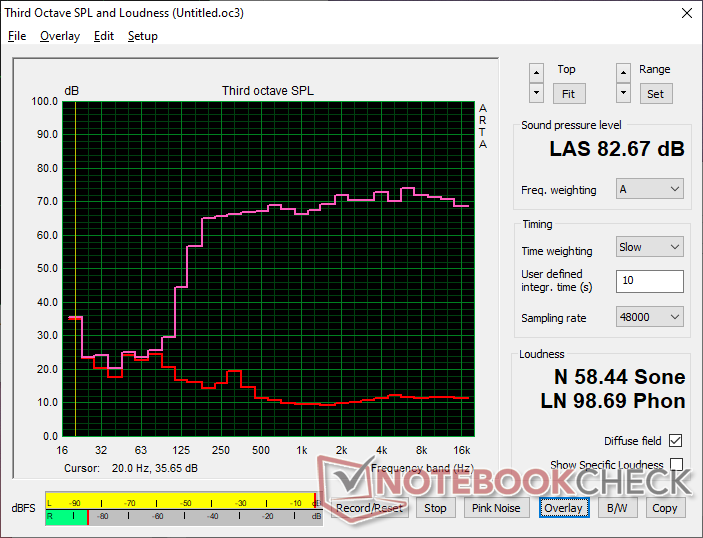
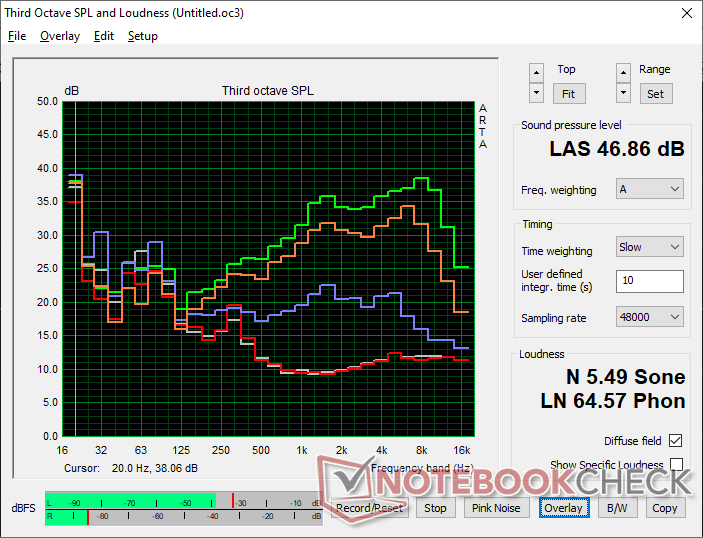
Dell 16 Plus analyse audio
(+) | les haut-parleurs peuvent jouer relativement fort (82.7# dB)
Basses 100 - 315 Hz
(±) | basse réduite - en moyenne 14.2% inférieure à la médiane
(±) | la linéarité des basses est moyenne (11.8% delta à la fréquence précédente)
Médiums 400 - 2000 Hz
(+) | médiane équilibrée - seulement 1.6% de la médiane
(+) | les médiums sont linéaires (2.4% delta à la fréquence précédente)
Aiguës 2 - 16 kHz
(+) | des sommets équilibrés - à seulement 2.9% de la médiane
(+) | les aigus sont linéaires (3.3% delta à la fréquence précédente)
Globalement 100 - 16 000 Hz
(+) | le son global est linéaire (10% différence à la médiane)
Par rapport à la même classe
» 10% de tous les appareils testés de cette catégorie étaient meilleurs, 2% similaires, 89% pires
» Le meilleur avait un delta de 5%, la moyenne était de 18%, le pire était de 45%.
Par rapport à tous les appareils testés
» 4% de tous les appareils testés étaient meilleurs, 1% similaires, 95% pires
» Le meilleur avait un delta de 4%, la moyenne était de 24%, le pire était de 134%.
Apple MacBook Pro 16 2021 M1 Pro analyse audio
(+) | les haut-parleurs peuvent jouer relativement fort (84.7# dB)
Basses 100 - 315 Hz
(+) | bonne basse - seulement 3.8% loin de la médiane
(+) | les basses sont linéaires (5.2% delta à la fréquence précédente)
Médiums 400 - 2000 Hz
(+) | médiane équilibrée - seulement 1.3% de la médiane
(+) | les médiums sont linéaires (2.1% delta à la fréquence précédente)
Aiguës 2 - 16 kHz
(+) | des sommets équilibrés - à seulement 1.9% de la médiane
(+) | les aigus sont linéaires (2.7% delta à la fréquence précédente)
Globalement 100 - 16 000 Hz
(+) | le son global est linéaire (4.6% différence à la médiane)
Par rapport à la même classe
» 0% de tous les appareils testés de cette catégorie étaient meilleurs, 0% similaires, 100% pires
» Le meilleur avait un delta de 5%, la moyenne était de 18%, le pire était de 45%.
Par rapport à tous les appareils testés
» 0% de tous les appareils testés étaient meilleurs, 0% similaires, 100% pires
» Le meilleur avait un delta de 4%, la moyenne était de 24%, le pire était de 134%.
Gestion de l'énergie
Consommation d'énergie - Amélioration des performances par watt
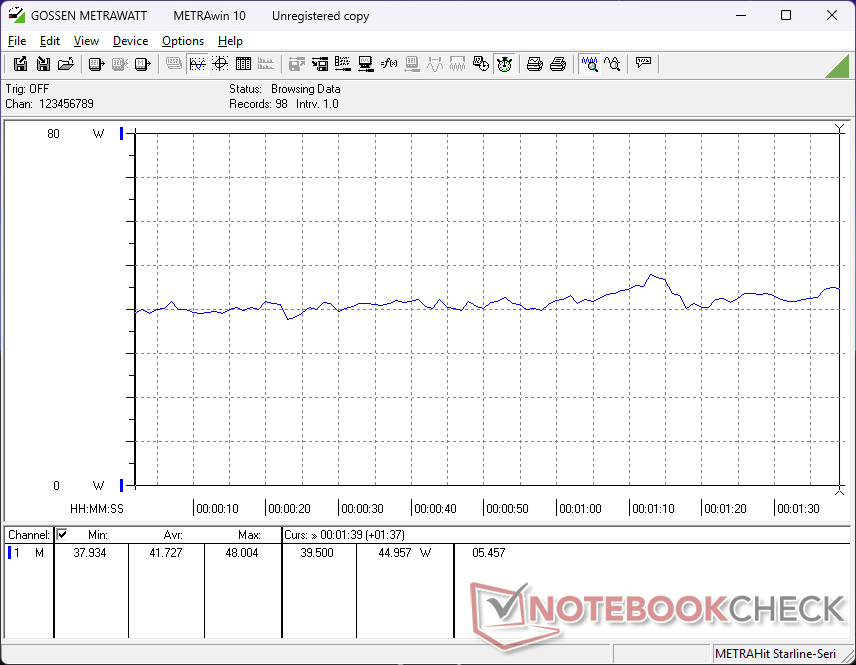
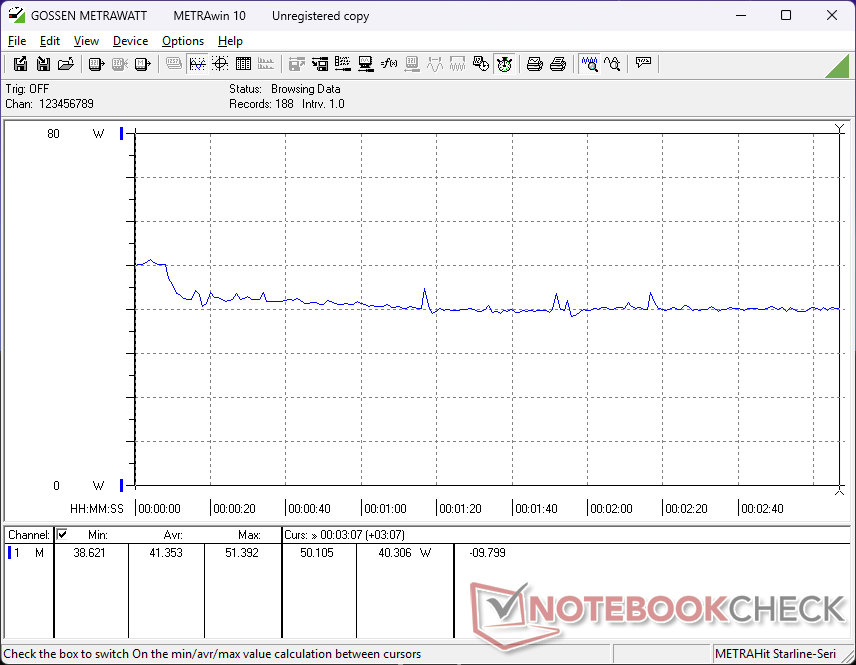
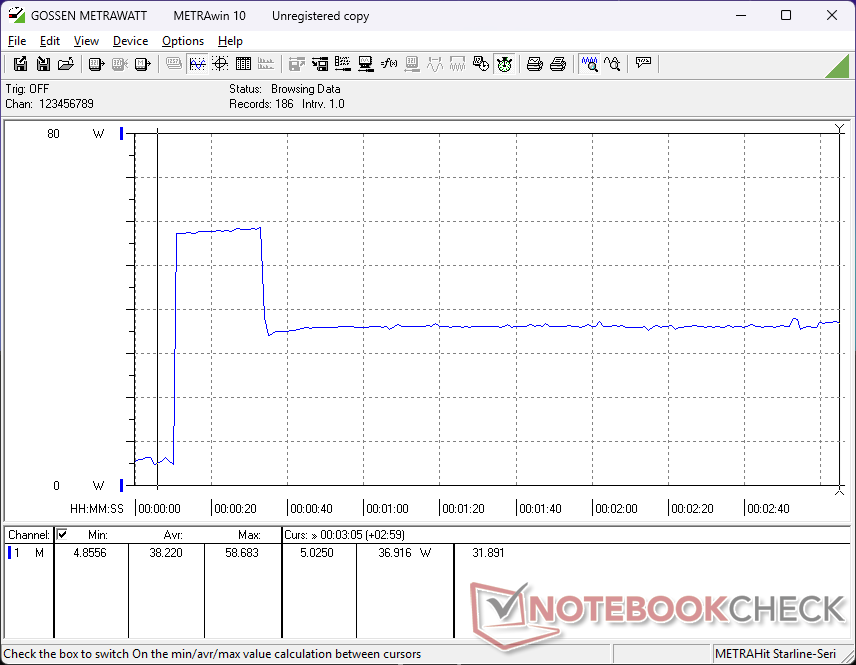
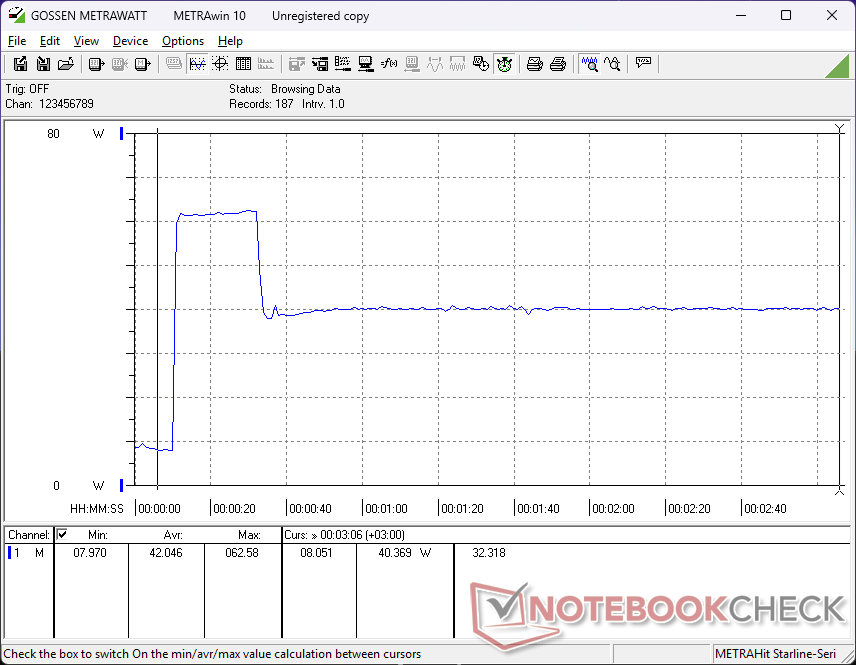
La consommation globale est assez faible pour un portable de 16 pouces en raison de l'absence d'un CPU de série H, d'un GPU discret ou d'options OLED, qui sont tous beaucoup plus exigeants que notre CPU de série V, notre GPU intégré et notre écran IPS. En particulier, le système ne consomme que 41 W lorsqu'il exécute Cyberpunk 2077, contre 67 W sur l'Inspiron 16 7640 2-en-1, même si notre Dell 16 Plus peut exécuter le jeu environ 25 % plus rapidement.
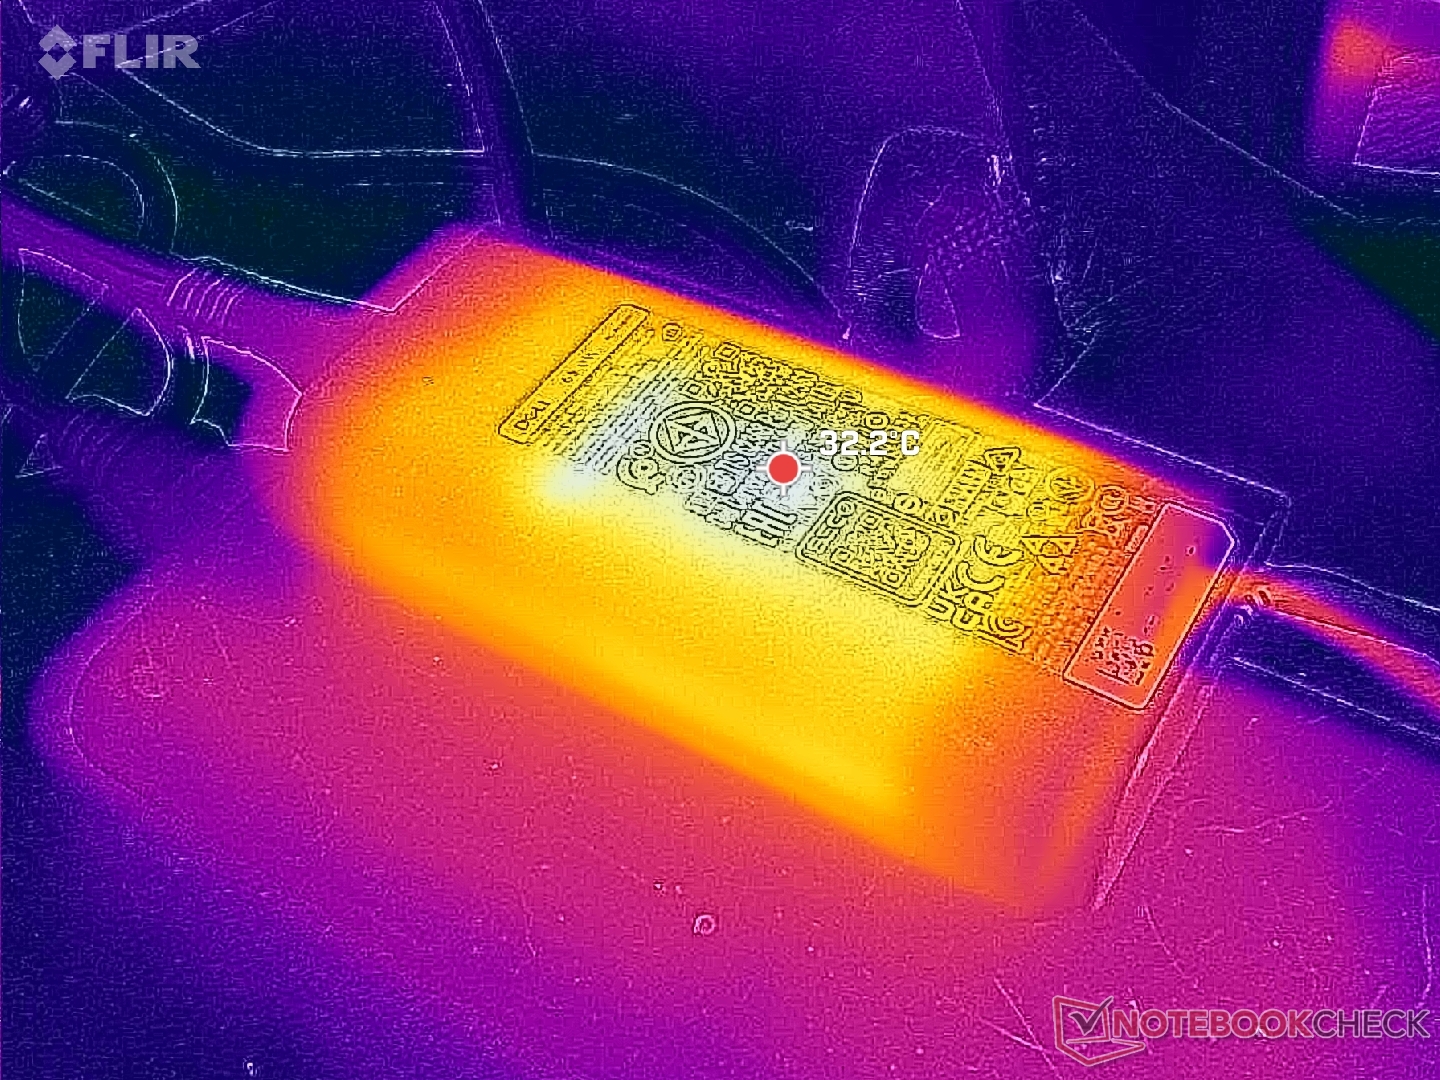
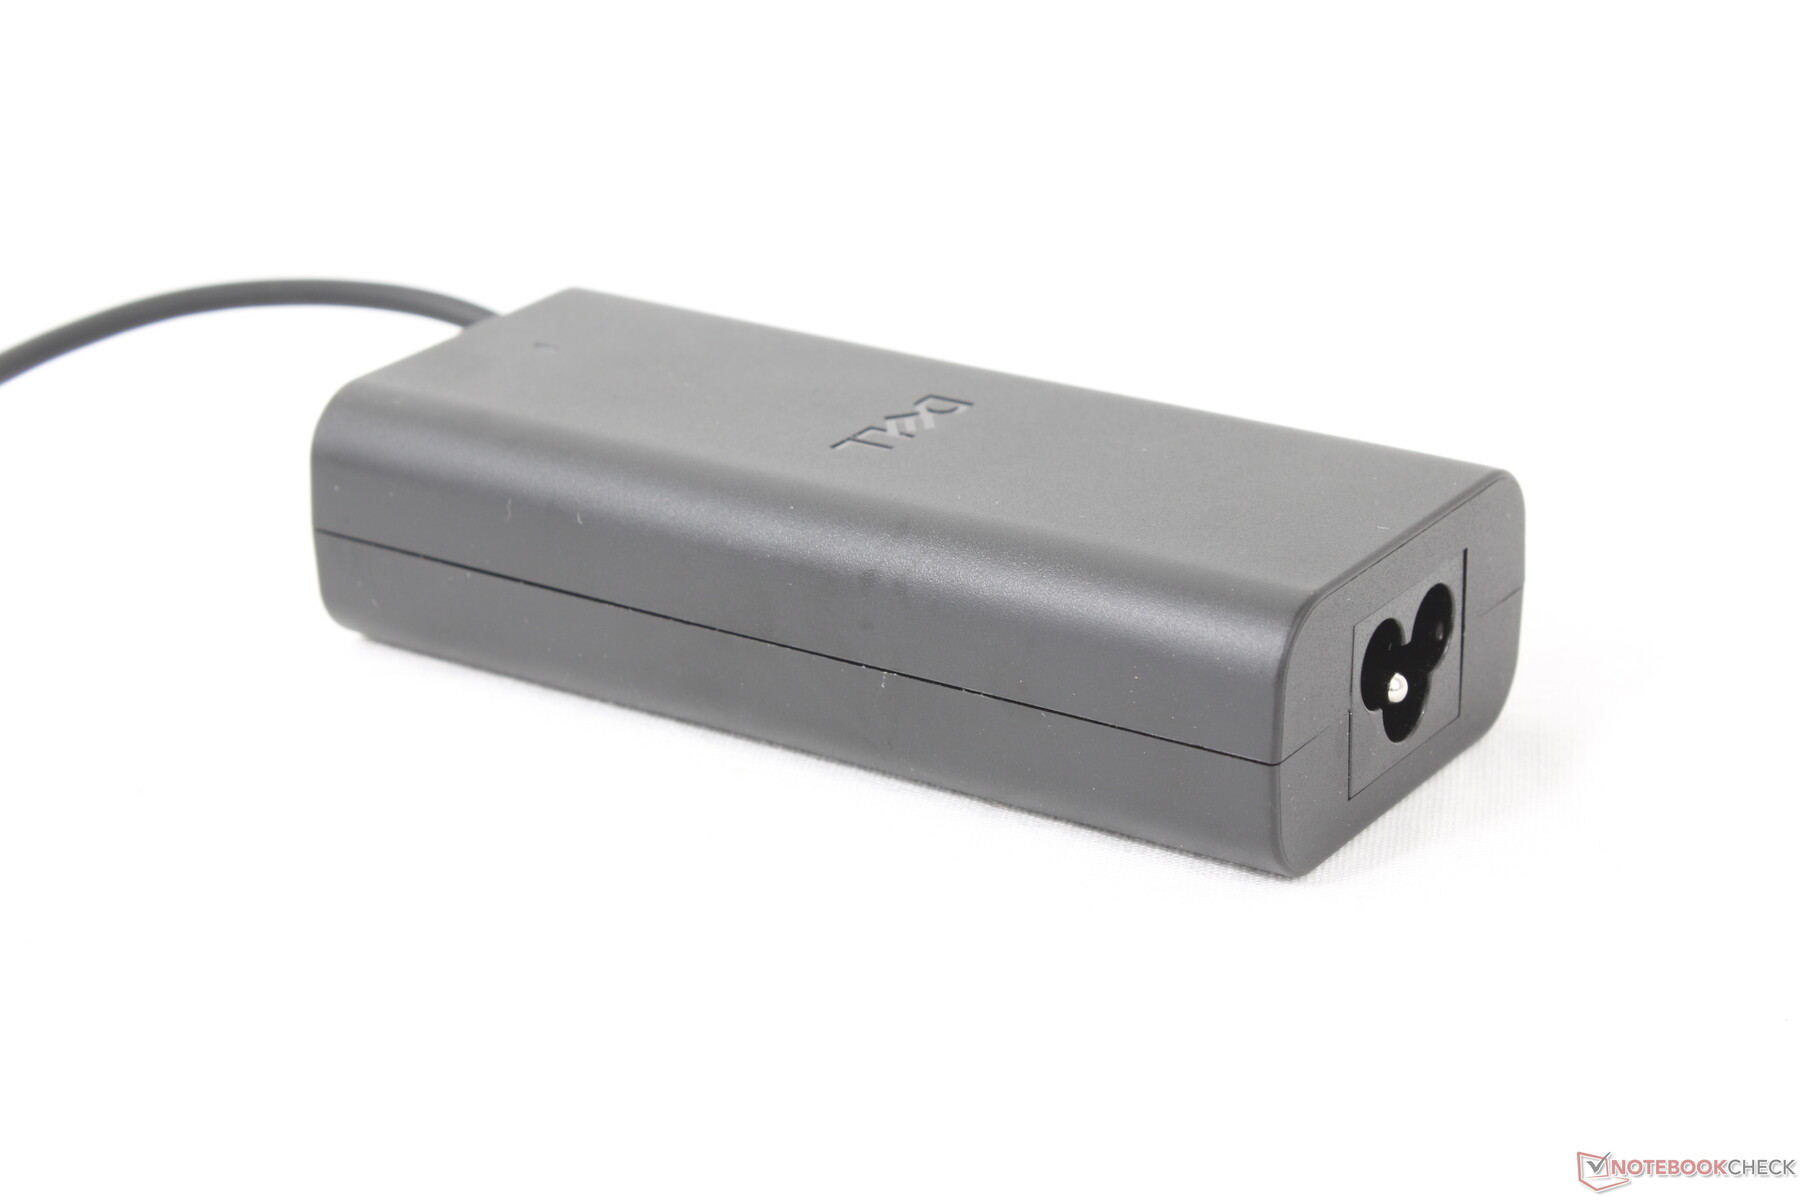
Nous sommes en mesure d'enregistrer une consommation maximale temporaire de 62 W à partir de l'adaptateur secteur USB-C 65 W de taille petite-moyenne (~11,2 x 5 x 2,8 cm).
| Éteint/en veille | |
| Au repos | |
| Fortement sollicité |
|
Légende:
min: | |
| Dell 16 Plus Core Ultra 7 256V, Arc 140V, , IPS, 2560x1600, 16" | Dell Inspiron 16 Plus 7640 Ultra 7 155H, NVIDIA GeForce RTX 4060 Laptop GPU, SK hynix BC901 HFS001TEJ4X164N, IPS, 2560x1600, 16" | Acer Swift 16 AI SF16-51T-932H, Ultra 9 288V Core Ultra 9 288V, Arc 140V, Western Digital PC SN5000S SDEQNSJ-1T00, OLED, 2880x1800, 16" | Lenovo ThinkBook 16 G7+ AMD Ryzen AI 9 365, Radeon 880M, Samsung PM9C1a MZAL81T0HDLB, IPS, 3200x2000, 16" | HP Pavilion Plus 16-ab0456tx i7-13700H, GeForce RTX 3050 6GB Laptop GPU, WDC PC SN810 1TB, IPS, 2560x1600, 16" | Asus Vivobook 16 M1606K Ryzen AI 7 350, Radeon 860M, Micron 2500 1TB MTFDKBA1T0QGN, IPS, 1920x1200, 16" | |
|---|---|---|---|---|---|---|
| Power Consumption | -64% | -22% | -93% | -60% | -36% | |
| Idle Minimum * | 3.4 | 4.2 -24% | 5.7 -68% | 6.4 -88% | 3.3 3% | 4.7 -38% |
| Idle Average * | 6.9 | 6.9 -0% | 7.4 -7% | 14.1 -104% | 7.3 -6% | 8.2 -19% |
| Idle Maximum * | 7.4 | 15.2 -105% | 7.9 -7% | 14.3 -93% | 14.24 -92% | 9 -22% |
| Load Average * | 41.7 | 70.4 -69% | 83.4 -100% | 91.7 -120% | 59 -41% | |
| Cyberpunk 2077 ultra external monitor * | 38 | 77.5 -104% | 58 -53% | |||
| Cyberpunk 2077 ultra * | 41.4 | 49.8 -20% | 79.8 -93% | 65 -57% | ||
| Load Maximum * | 62 | 137.4 -122% | 65.41 -6% | 102.9 -66% | 115.8 -87% | 74 -19% |
| Witcher 3 ultra * | 115.9 | 96.2 |
* ... Moindre est la valeur, meilleures sont les performances
Power Consumption Cyberpunk / Stress Test
Power Consumption external Monitor
Autonomie de la batterie
Les durées d'exécution sont très longues, comme on peut s'y attendre d'un ordinateur portable alimenté par la technologie Lunar Lake. L'autonomie de la batterie WLAN est d'un peu plus de 14 heures, soit encore plus que celle de l'Inspiron 16 Plus 7640, malgré le fait que le Dell 16 Plus dispose d'une batterie 30 % plus petite.
| Dell 16 Plus Core Ultra 7 256V, Arc 140V, 64 Wh | Dell Inspiron 16 Plus 7640 Ultra 7 155H, NVIDIA GeForce RTX 4060 Laptop GPU, 90 Wh | Acer Swift 16 AI SF16-51T-932H, Ultra 9 288V Core Ultra 9 288V, Arc 140V, 70 Wh | Lenovo ThinkBook 16 G7+ AMD Ryzen AI 9 365, Radeon 880M, 85 Wh | HP Pavilion Plus 16-ab0456tx i7-13700H, GeForce RTX 3050 6GB Laptop GPU, 68 Wh | Asus Vivobook 16 M1606K Ryzen AI 7 350, Radeon 860M, 42 Wh | |
|---|---|---|---|---|---|---|
| Autonomie de la batterie | -5% | -6% | -23% | -26% | -51% | |
| WiFi v1.3 | 844 | 799 -5% | 791 -6% | 649 -23% | 624 -26% | 410 -51% |
| H.264 | 832 | 720 | 410 | |||
| Load | 68 |
Notebookcheck Rating
Dell 16 Plus
- 06/06/2025 v8
Allen Ngo
 Total Sustainability Score:
 Potential Competitors in Comparison
Image | Modèle | Prix | Poids | Épaisseur | Écran |
|---|---|---|---|---|---|
1. 81.8%  | Dell 16 Plus Intel Core Ultra 7 256V ⎘ Intel Arc Graphics 140V ⎘ 16 Go Mémoire | Amazon: $1,373.41 Prix de liste: 1150 USD | 1.8 kg | 16.99 mm | 16.00" 2560x1600 189 PPI IPS |
2. 83.4%  | Dell Inspiron 16 Plus 7640 Intel Core Ultra 7 155H ⎘ NVIDIA GeForce RTX 4060 Laptop GPU ⎘ 16 Go Mémoire, 1024 Go SSD | Amazon: Prix de liste: 1300 USD | 2.2 kg | 19.9 mm | 16.00" 2560x1600 189 PPI IPS |
3. 85.3%  | Acer Swift 16 AI SF16-51T-932H, Ultra 9 288V Intel Core Ultra 9 288V ⎘ Intel Arc Graphics 140V ⎘ 32 Go Mémoire, 1024 Go SSD | 1.5 kg | 15.95 mm | 16.00" 2880x1800 212 PPI OLED | |
4. 86.6%  | Lenovo ThinkBook 16 G7+ AMD AMD Ryzen AI 9 365 ⎘ AMD Radeon 880M ⎘ 32 Go Mémoire, 1024 Go SSD | Amazon: 1. $699.04 Lenovo ThinkBook 14 G7 ARP 2... 2. $719.95 Lenovo ThinkBook 16 G7 ARP 2... 3. $614.95 Lenovo ThinkBook 16 G7 ARP 2... Prix de liste: 1399€ | 1.9 kg | 16.9 mm | 16.00" 3200x2000 236 PPI IPS |
5. 88.7% v7 (old)  | HP Pavilion Plus 16-ab0456tx Intel Core i7-13700H ⎘ NVIDIA GeForce RTX 3050 6GB Laptop GPU ⎘ 16 Go Mémoire, 1024 Go SSD | Amazon: 1. $999.21 HP Pavilion Plus 16 inch Lap... 2. $50.99 Power4Laptops 5 Volt Version... 3. $70.00 Laptop Bottom Case for HP Pa... Prix de liste: 1350 USD | 1.9 kg | 19.9 mm | 16.00" 2560x1600 189 PPI IPS |
6. 77.6%  | Asus Vivobook 16 M1606K AMD Ryzen AI 7 350 ⎘ AMD Radeon 860M ⎘ 16 Go Mémoire, 1024 Go SSD | Amazon: 1. $579.00 ASUS Vivobook 16 Laptop, 16�... 2. $899.99 ASUS Vivobook 16 Laptop, Cop... 3. $599.99 ASUS Vivobook 16 Laptop, 16�... | 1.9 kg | 19.9 mm | 16.00" 1920x1200 142 PPI IPS |
Transparency
La sélection des appareils à examiner est effectuée par notre équipe éditoriale. L'échantillon de test a été prêté à l'auteur par le fabricant ou le détaillant pour les besoins de cet examen. Le prêteur n'a pas eu d'influence sur cette évaluation et le fabricant n'a pas reçu de copie de cette évaluation avant sa publication. Il n'y avait aucune obligation de publier cet article. Nous n'acceptons jamais de compensation ou de paiement en échange de nos commentaires. En tant que média indépendant, Notebookcheck n'est pas soumis à l'autorité des fabricants, des détaillants ou des éditeurs.
Voici comment Notebookcheck teste
Chaque année, Notebookcheck examine de manière indépendante des centaines d'ordinateurs portables et de smartphones en utilisant des procédures standardisées afin de garantir que tous les résultats sont comparables. Nous avons continuellement développé nos méthodes de test depuis environ 20 ans et avons établi des normes industrielles dans le processus. Dans nos laboratoires de test, des équipements de mesure de haute qualité sont utilisés par des techniciens et des rédacteurs expérimentés. Ces tests impliquent un processus de validation en plusieurs étapes. Notre système d'évaluation complexe repose sur des centaines de mesures et de points de référence bien fondés, ce qui garantit l'objectivité.
