

Verdict - Un concurrent de choix pour la RTX 5060
Après tous les tests, le XMG Core 15 s'avère être un ordinateur portable de jeu RTX 5060 solide, obtenant de bonnes à très bonnes notes dans la plupart des domaines, y compris la qualité de construction, les ports, le clavier et le pavé tactile, l'affichage, l'autonomie de la batterie et l'audio. Des améliorations sont possibles, notamment en ce qui concerne les performances thermiques, qui sont relativement élevées sous charge. La note globale de 85 % est presque égale à celle de son concurrent, le Lenovo Legion 5, qui a obtenu une note de 87 %.
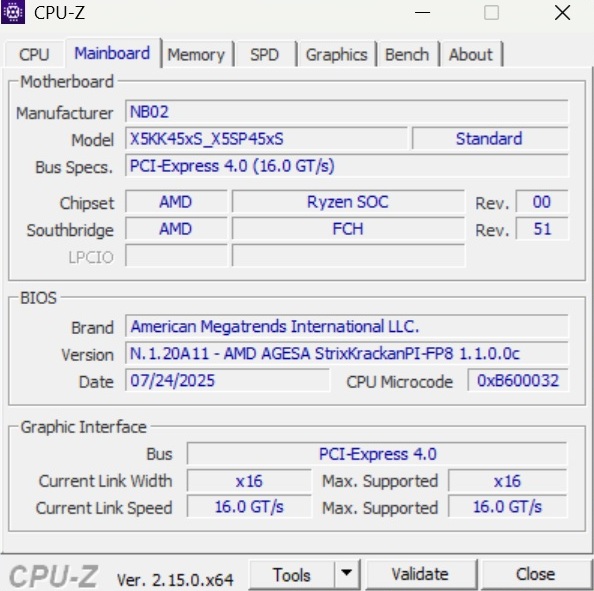
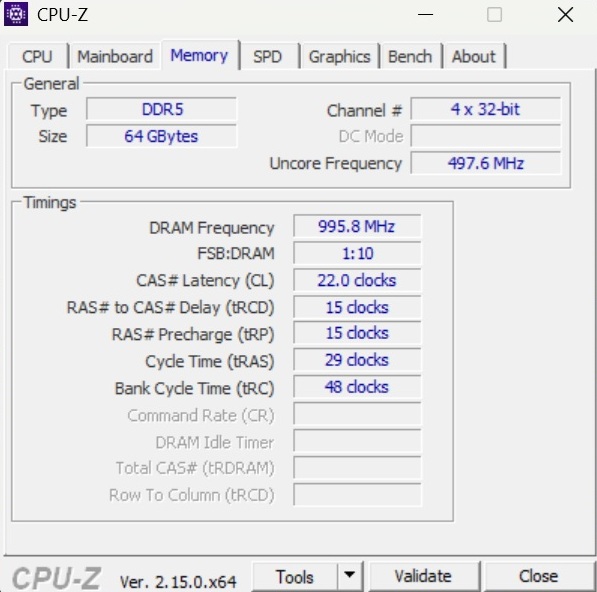
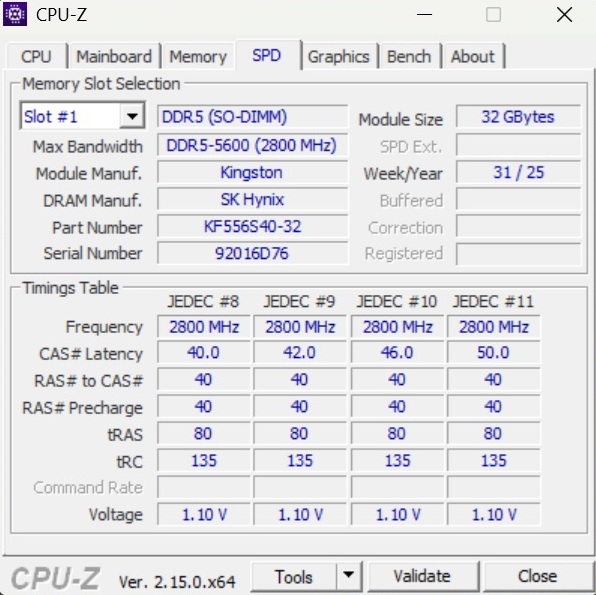
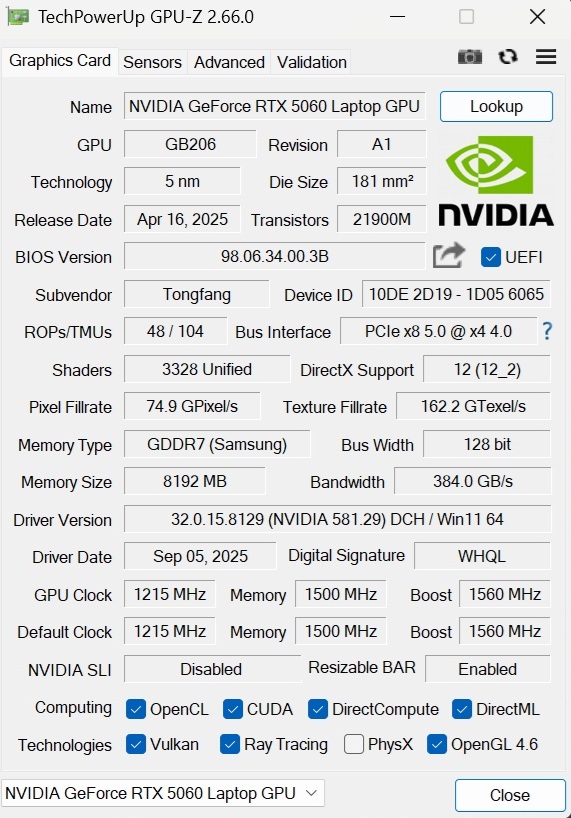
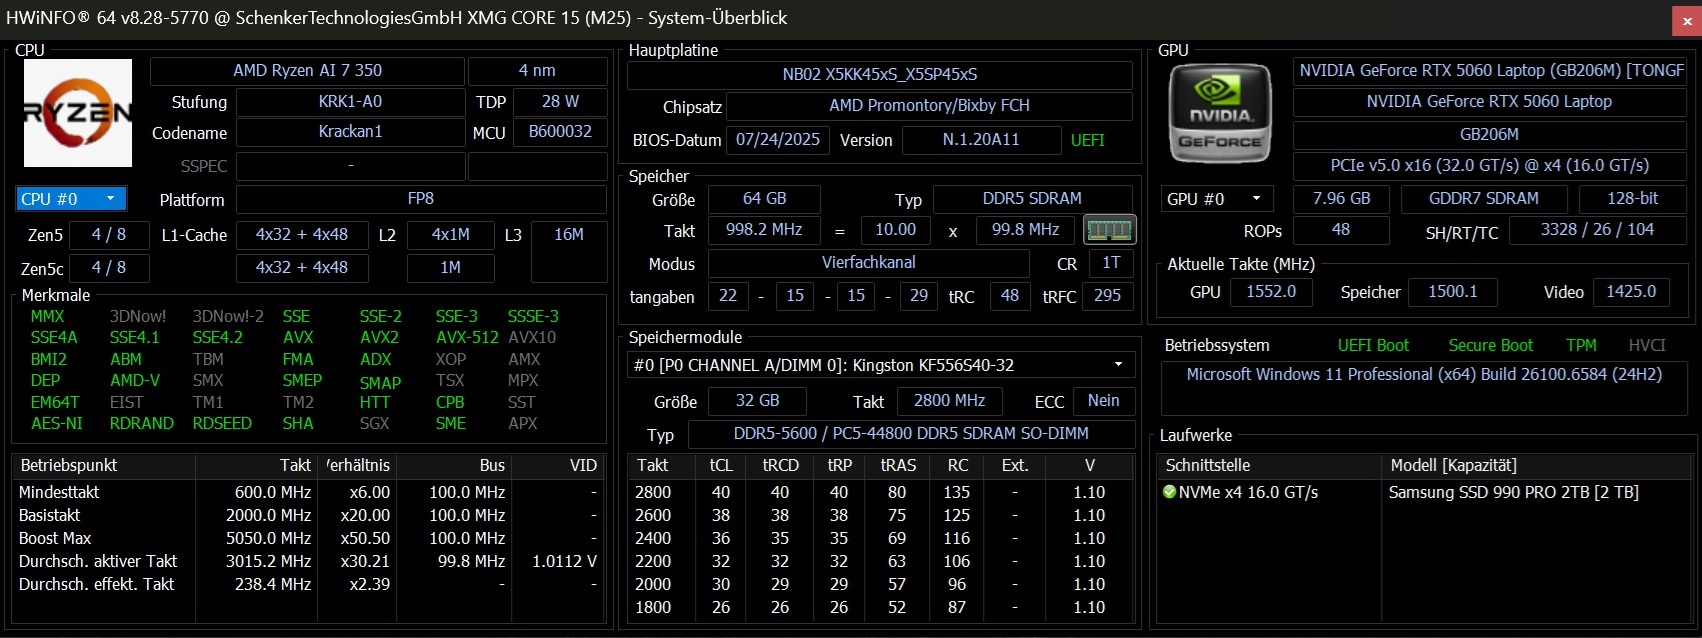
Alors que le XMG Core 15 M24 de l'année dernière était équipé d'un Ryzen 7 8845HS et d'une GeForce RTX 4060, la version 2025 passe à un matériel plus moderne. Les acheteurs peuvent choisir un processeur Ryzen AI 7 350, Ryzen AI 9 365, ou Ryzen AI 9 HX 370, associé à une GeForce RTX 5060 ou RTX 5070, chacune avec 8 Go de VRAM GDDR7. Chaque modèle est doté d'un écran IPS lumineux de 300 Hz au format 16:10 avec une résolution de 2 560 × 1 600. La mémoire va de 8 Go à 128 Go (deux emplacements SO-DIMM), et il y a deux emplacements SSD M.2 à l'intérieur.
Le modèle 15 pouces est proposé à partir de 1 549 euros. Notre modèle de test, équipé d'un Ryzen 7 350, d'une RTX 5060, de 64 Go de RAM, d'un SSD de 2 To et de Windows 11 Pro, coûte environ 1 850 €, ce qui est très élevé compte tenu des performances du GPU.
Points positifs
Points négatifs
Prix et disponibilité
Note du traducteur : Les appareils de Schenker ne sont pas officiellement disponibles en Amérique du Nord.
Le Schenker XMG Core 15 M25 peut être configuré individuellement sur la page d'accueil de bestware.com.
Les concurrents comprennent d'autres ordinateurs portables de jeu basés sur Blackwell, tels que le Lenovo LOQ 15le Lenovo LOQ 15, le Legion 5 15précité, le Medion Erazer Scout 17 E1 et le MSI Katana 17 HXqui figurent tous dans les tableaux comparatifs.
Spécifications
Cas
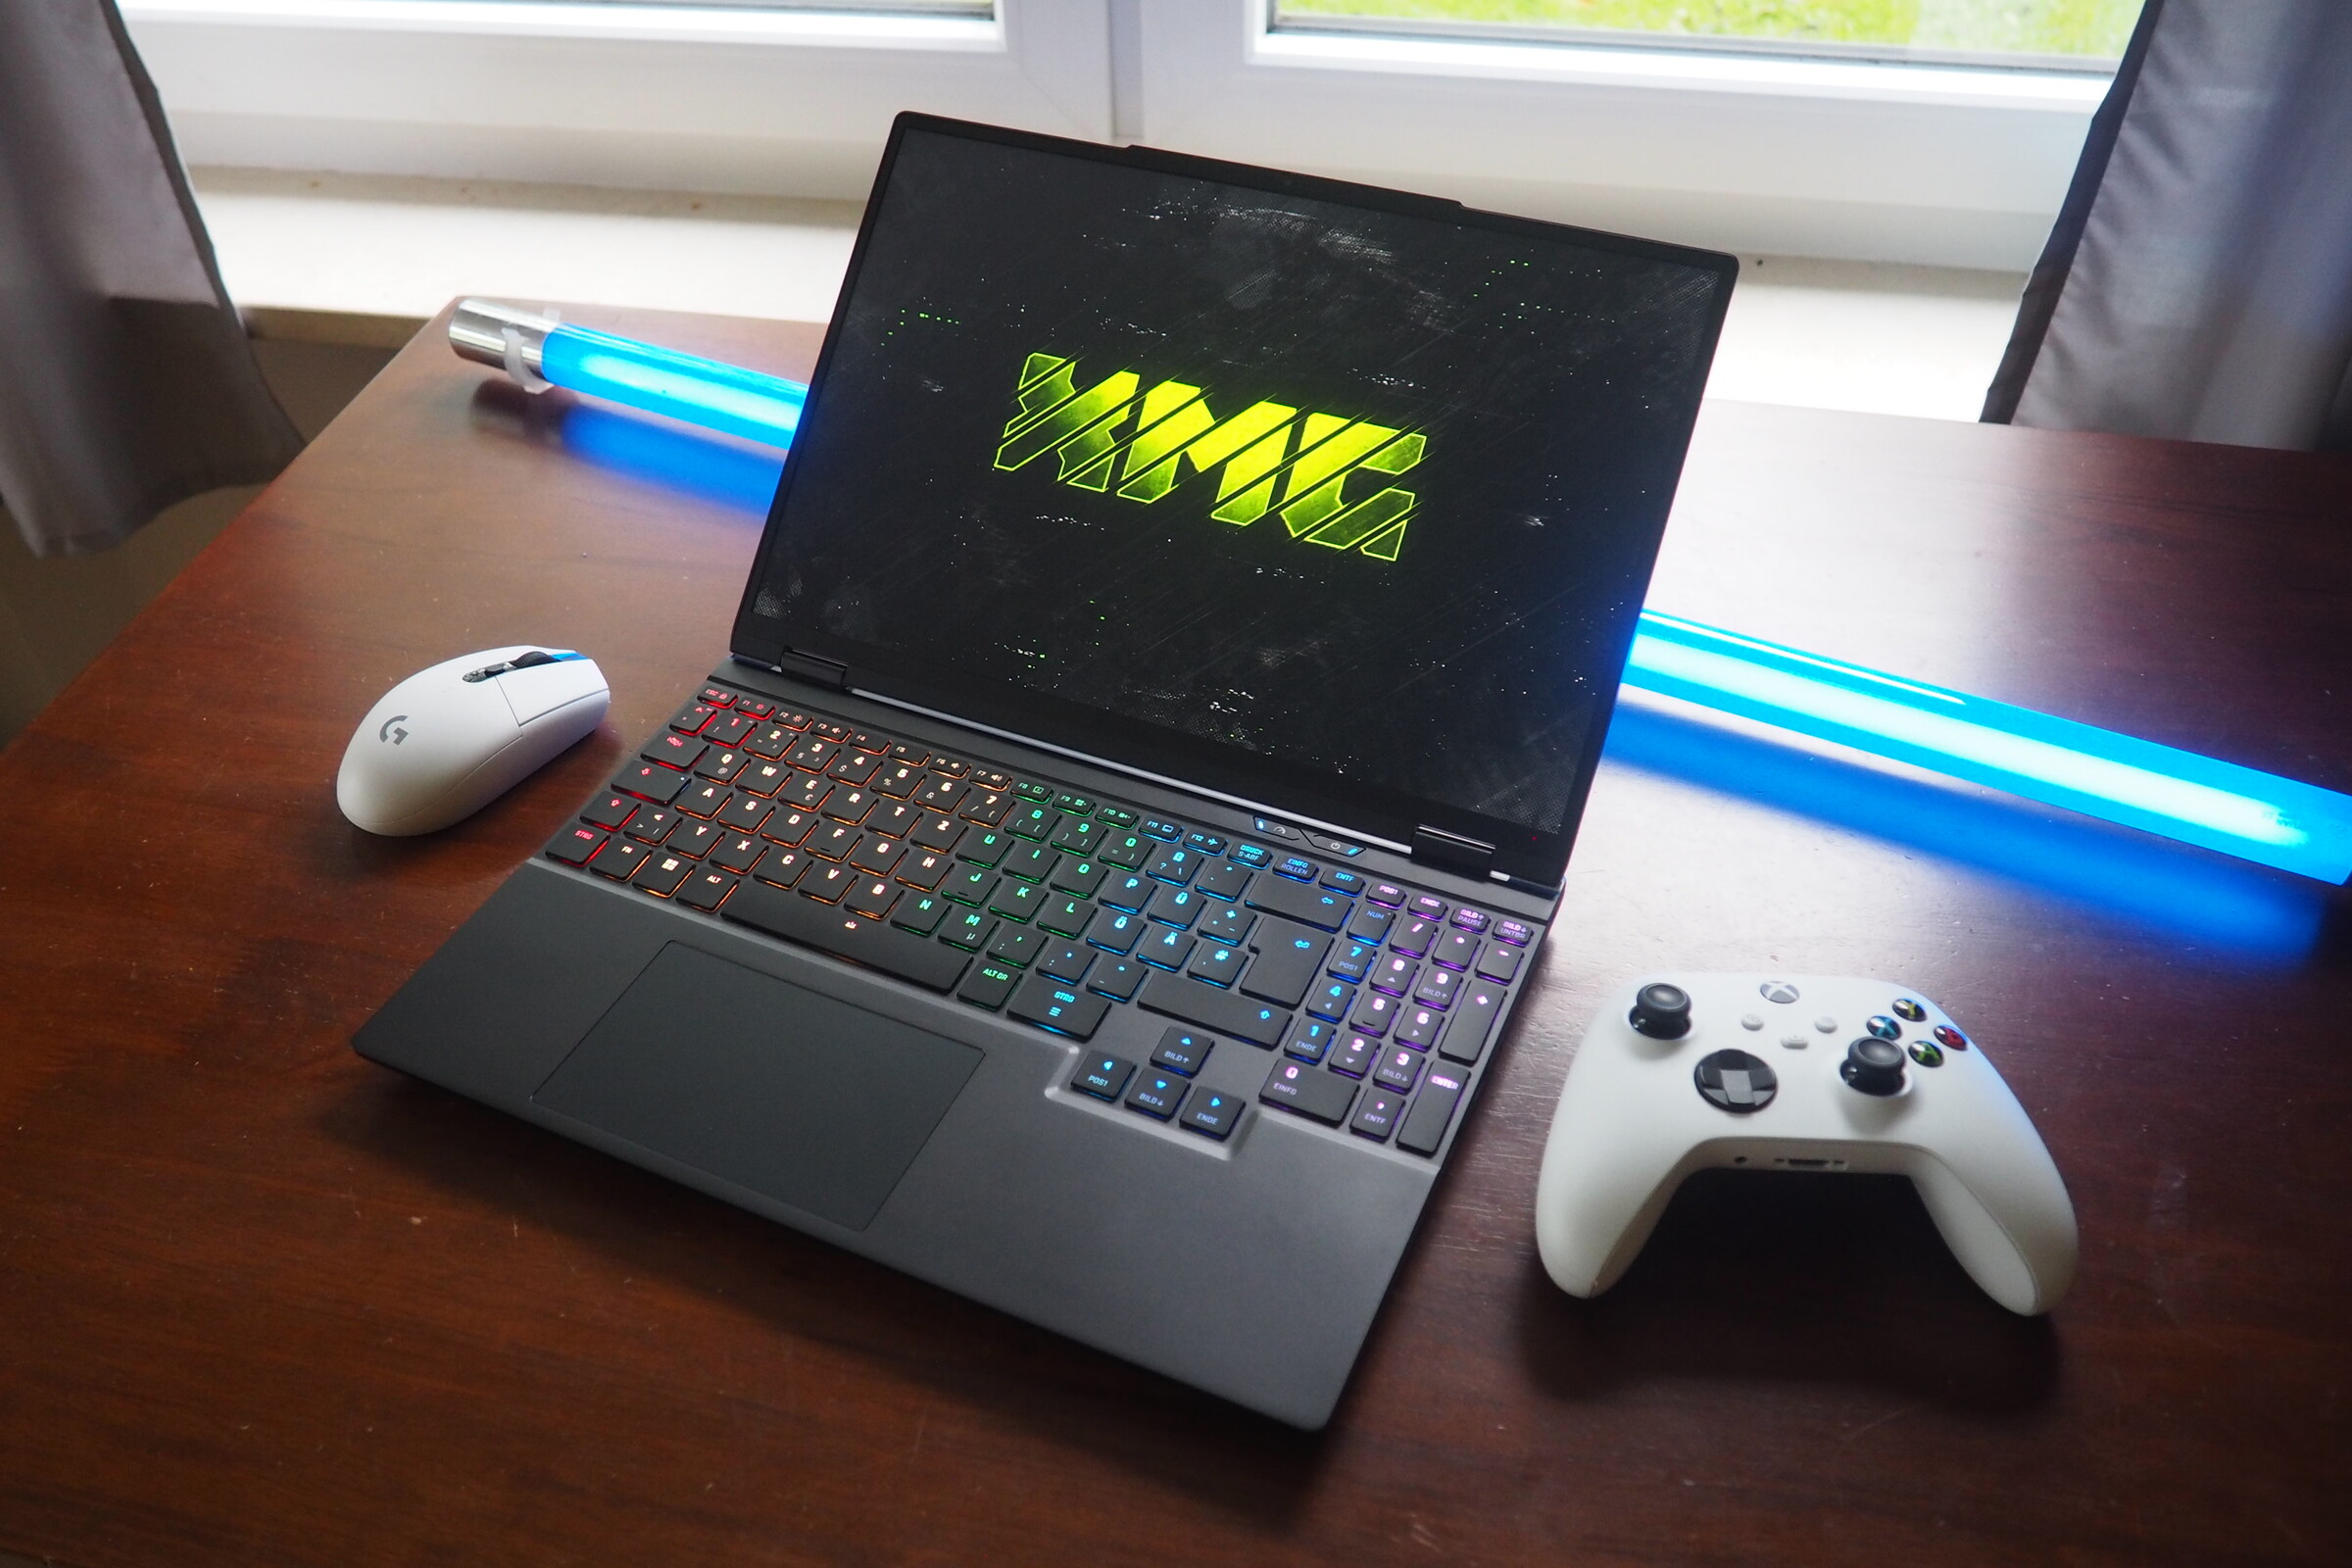
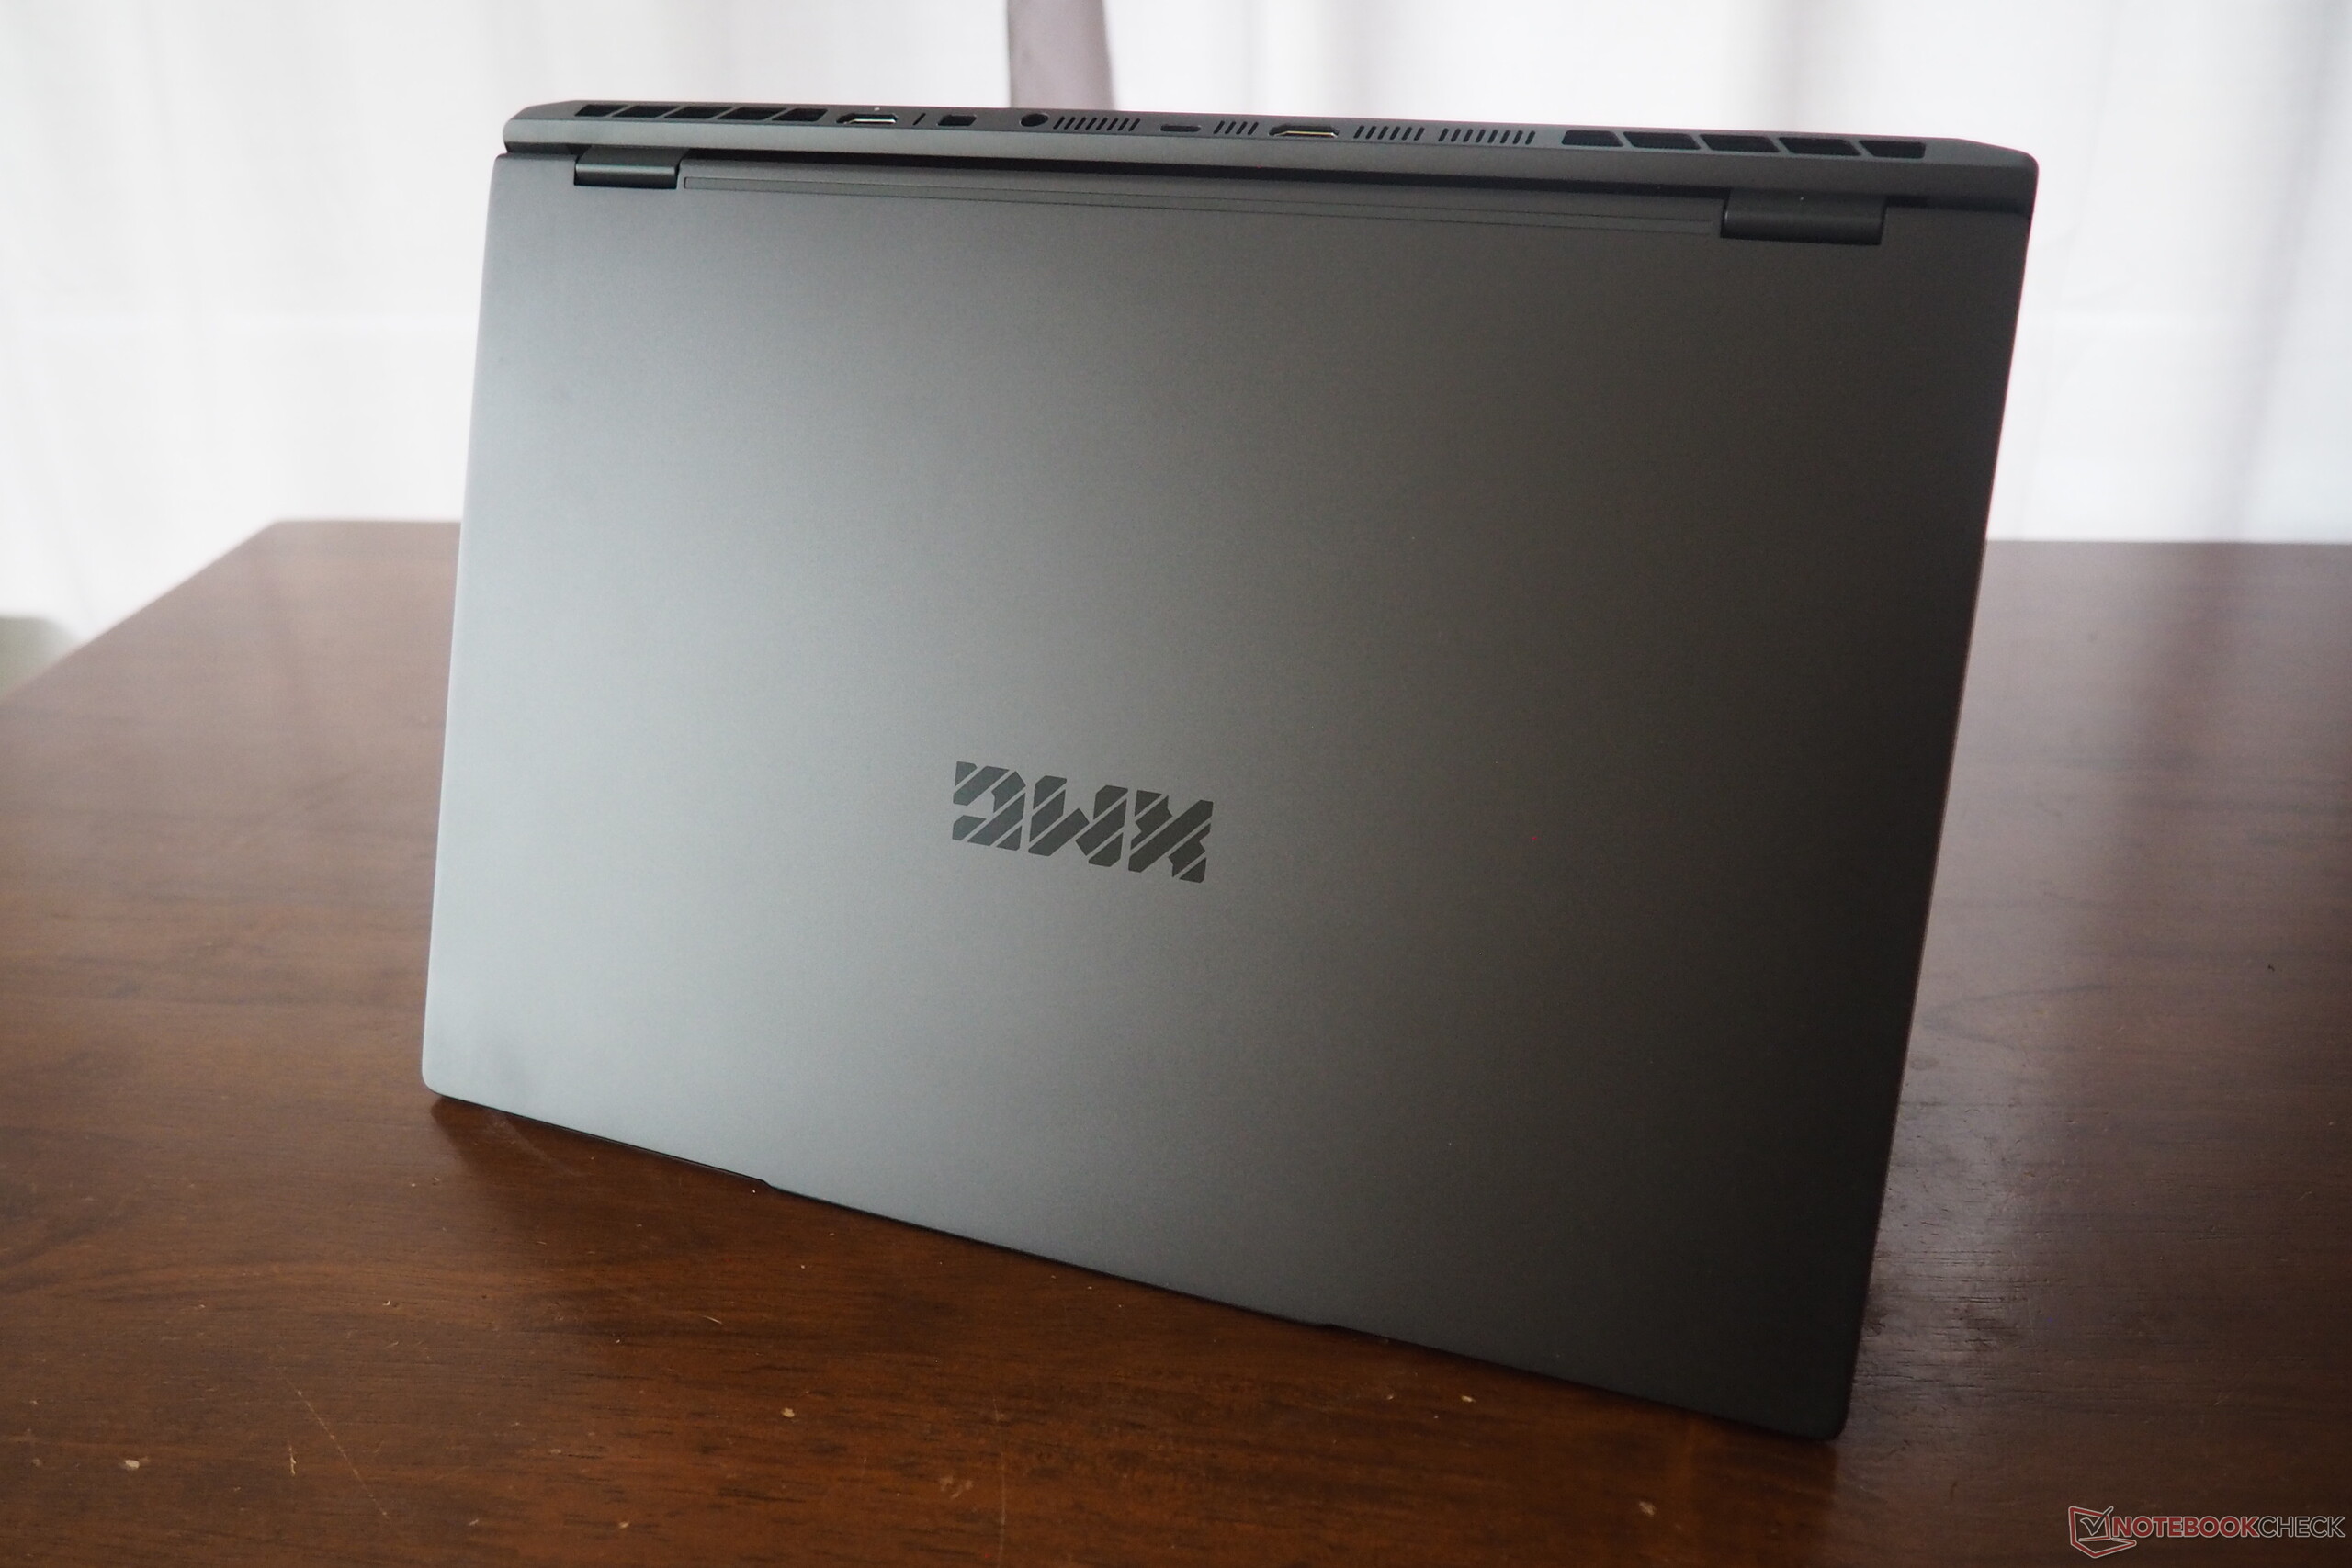
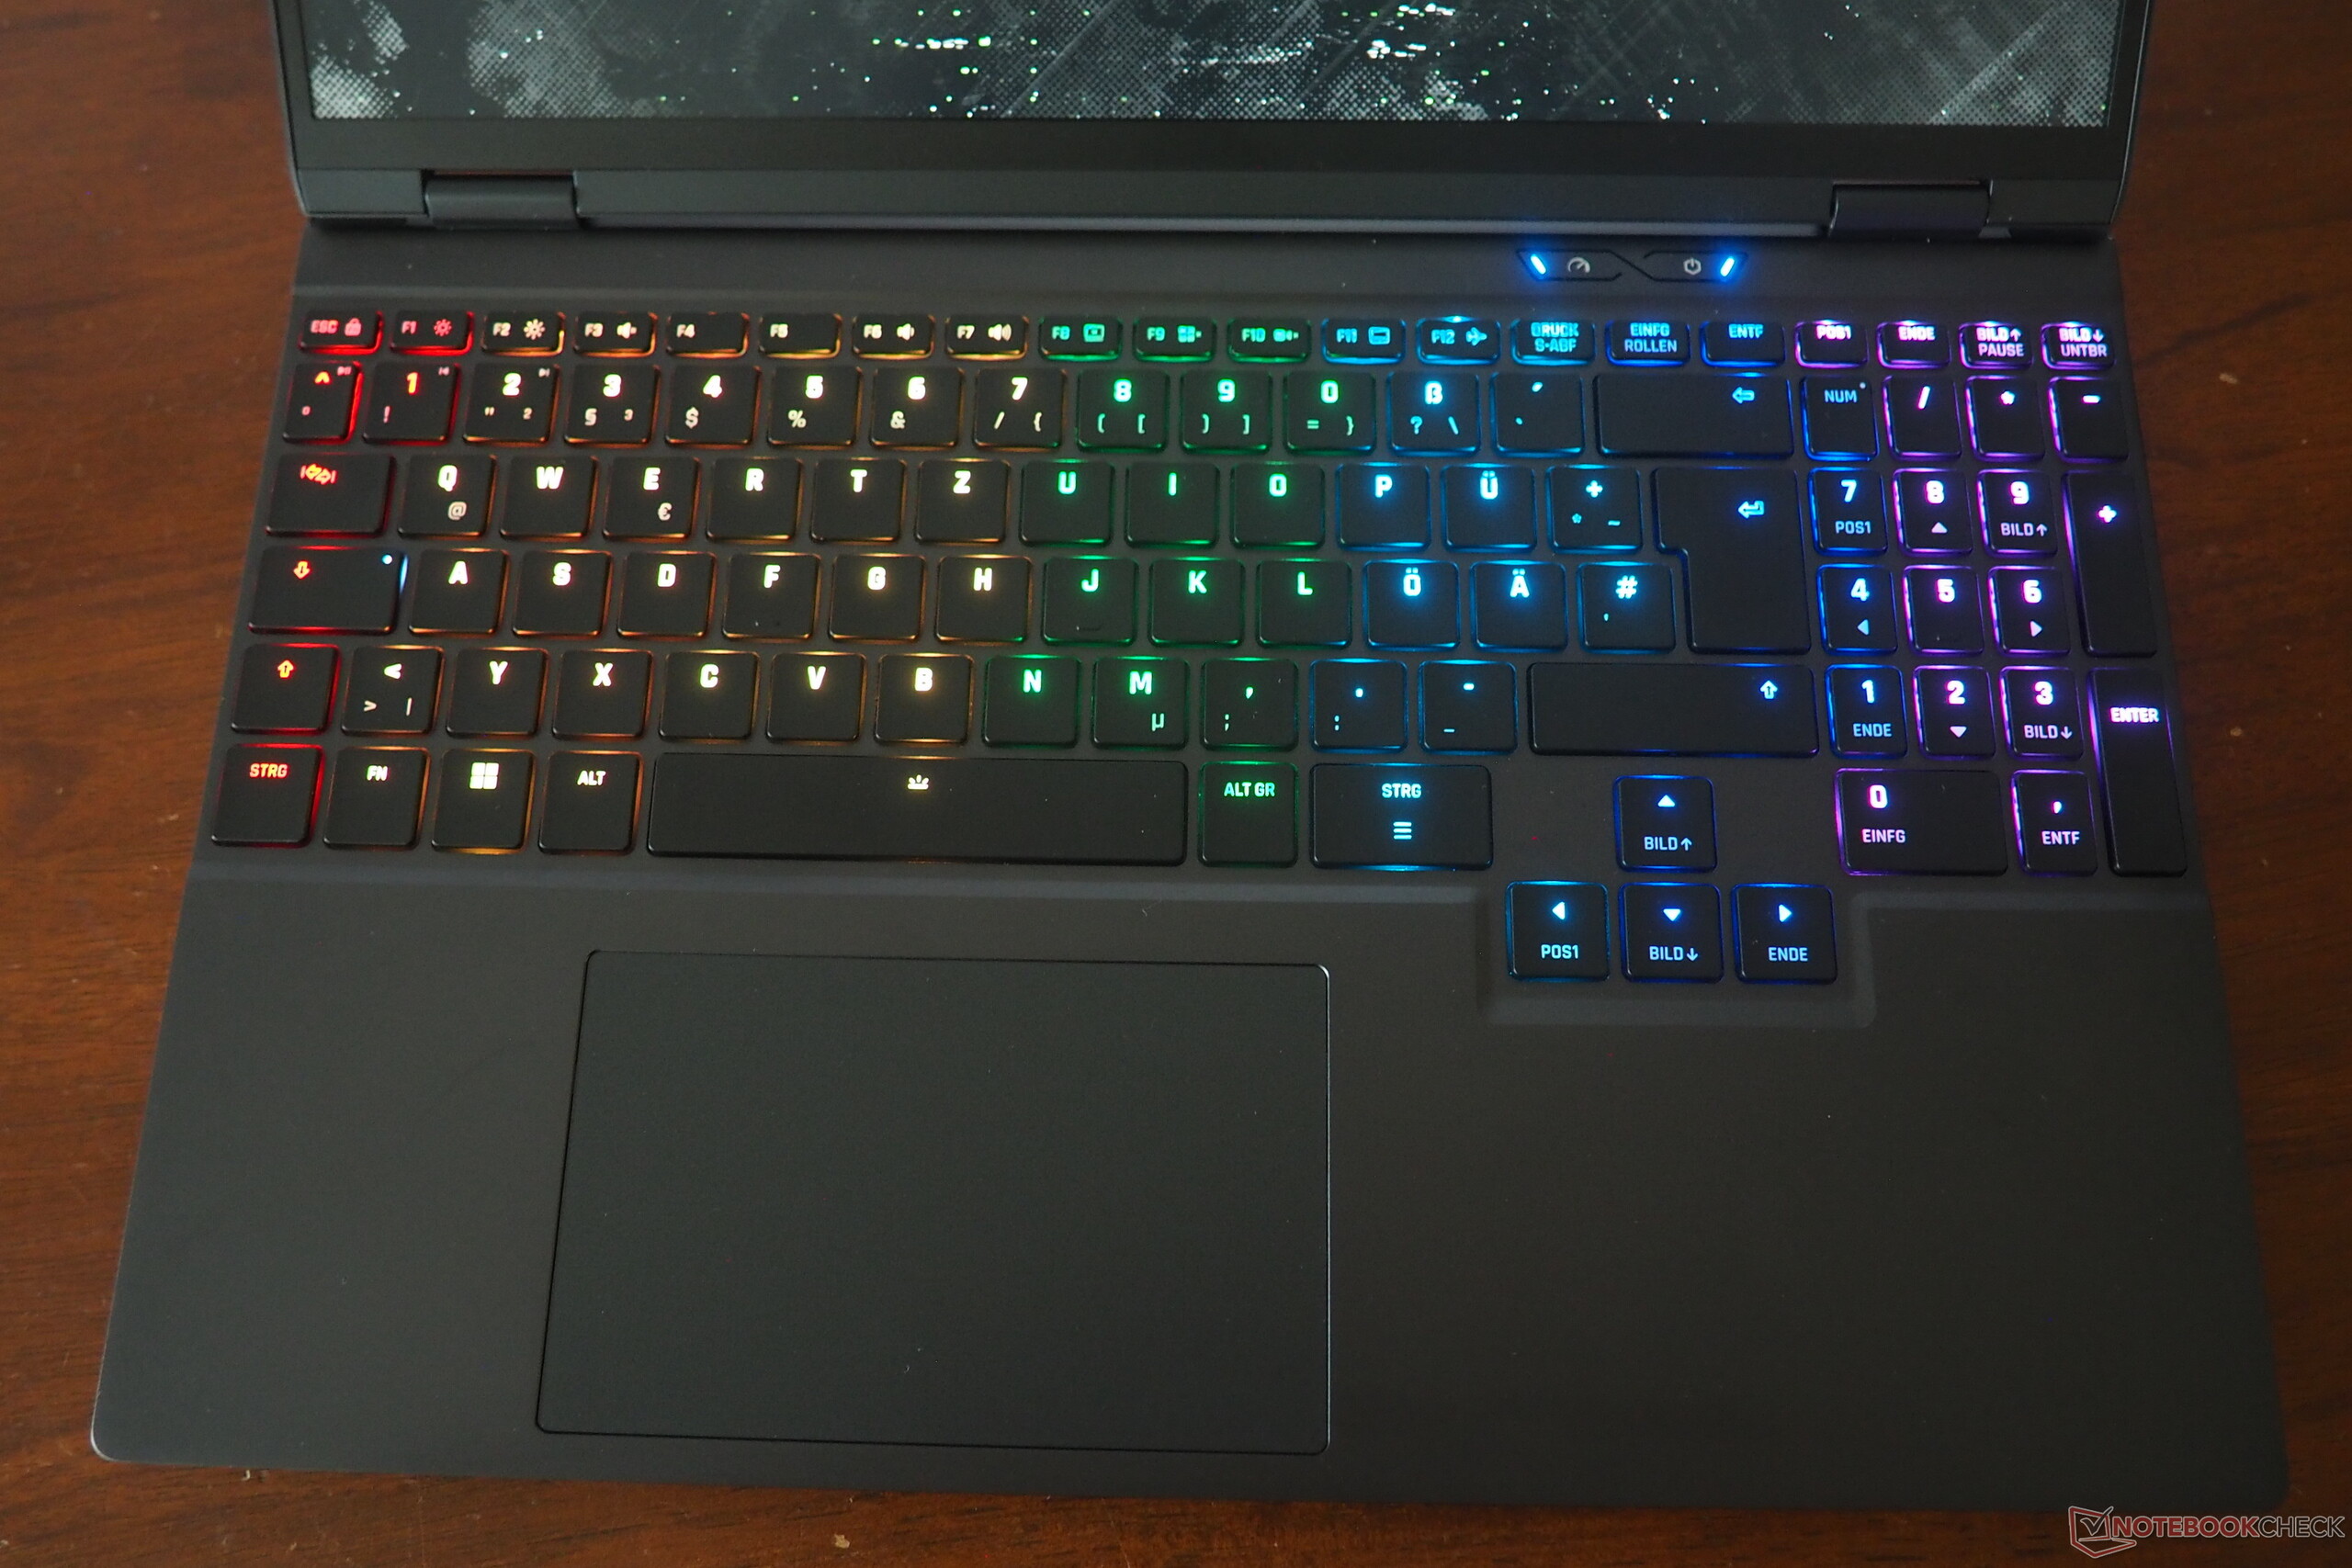
Hormis le rétroéclairage du clavier, le boîtier est assez sobre mais solide. Comme son prédécesseuril provient du spécialiste du barebone Tongfang et semble robuste et de haute qualité grâce à un large insert métallique (sur le Legion 5, par exemple, seul le couvercle est en métal). L'écran peut s'ouvrir à 180 degrés, ce qui n'est pas courant. La qualité de construction et la solidité des charnières sont également impressionnantes et ne laissent place à aucune plainte. Avec un poids de 1,9 kg, le châssis est relativement léger et correspond à peu près à celui du Legion 5.
Equipement
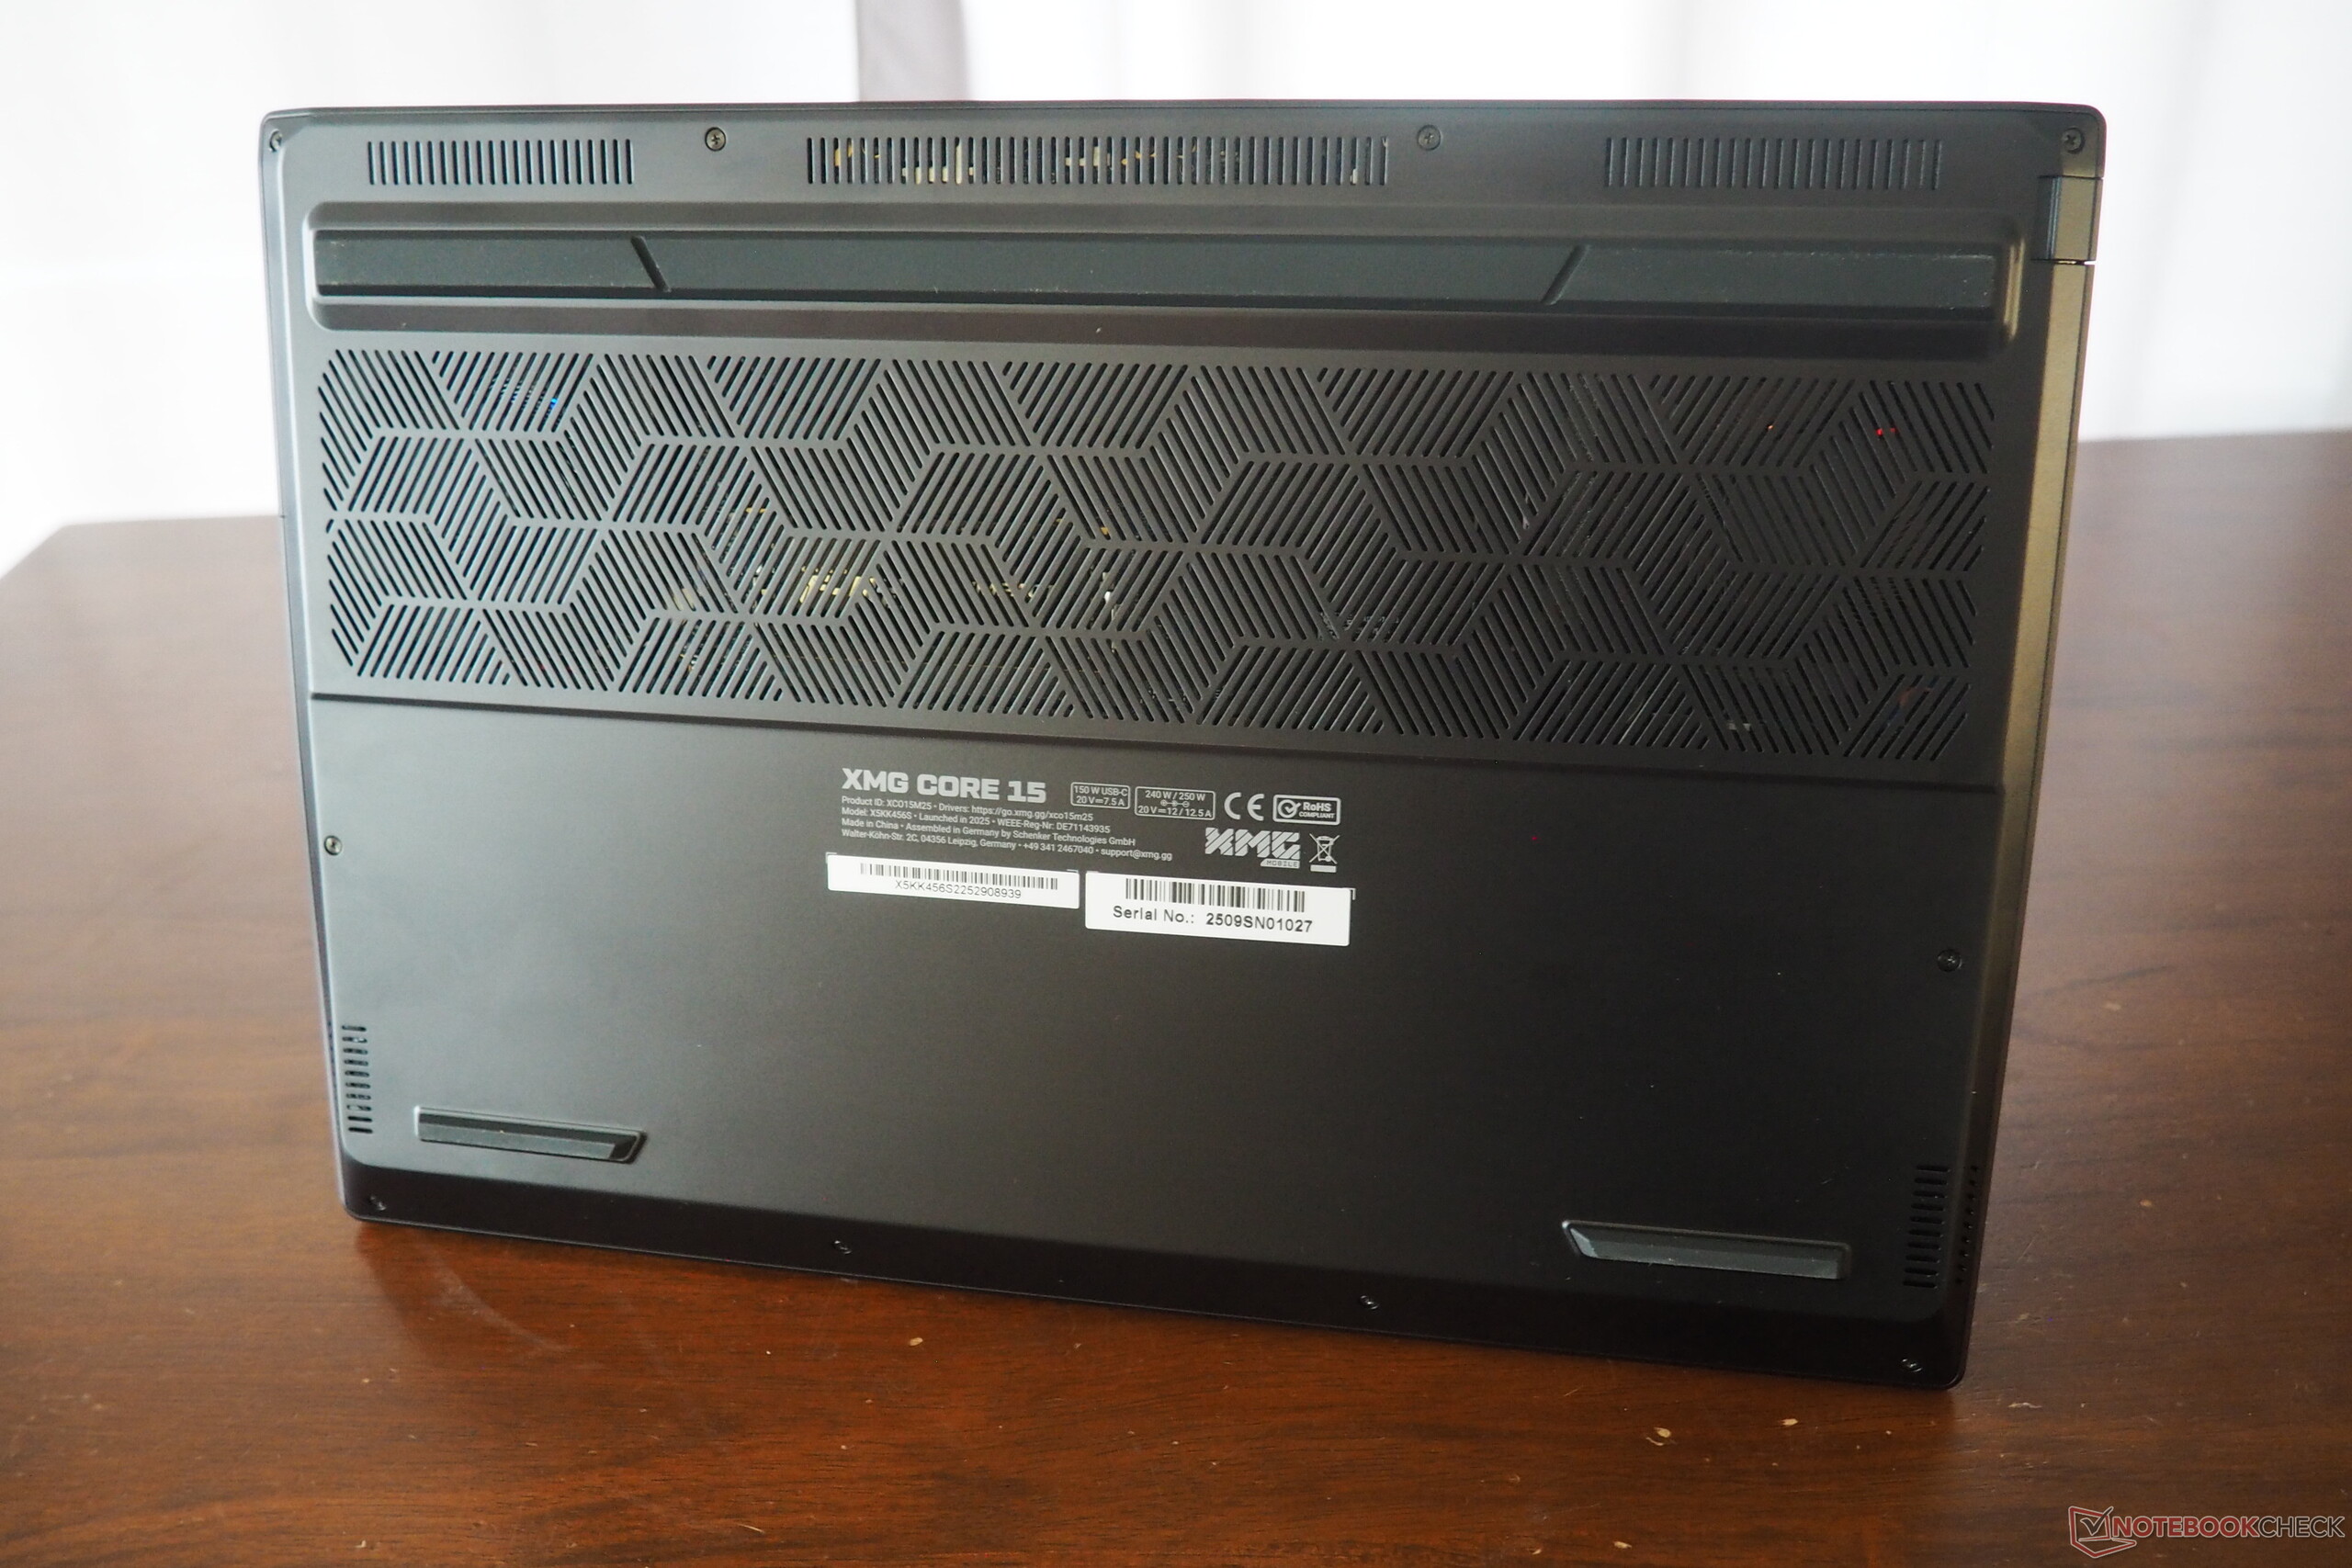
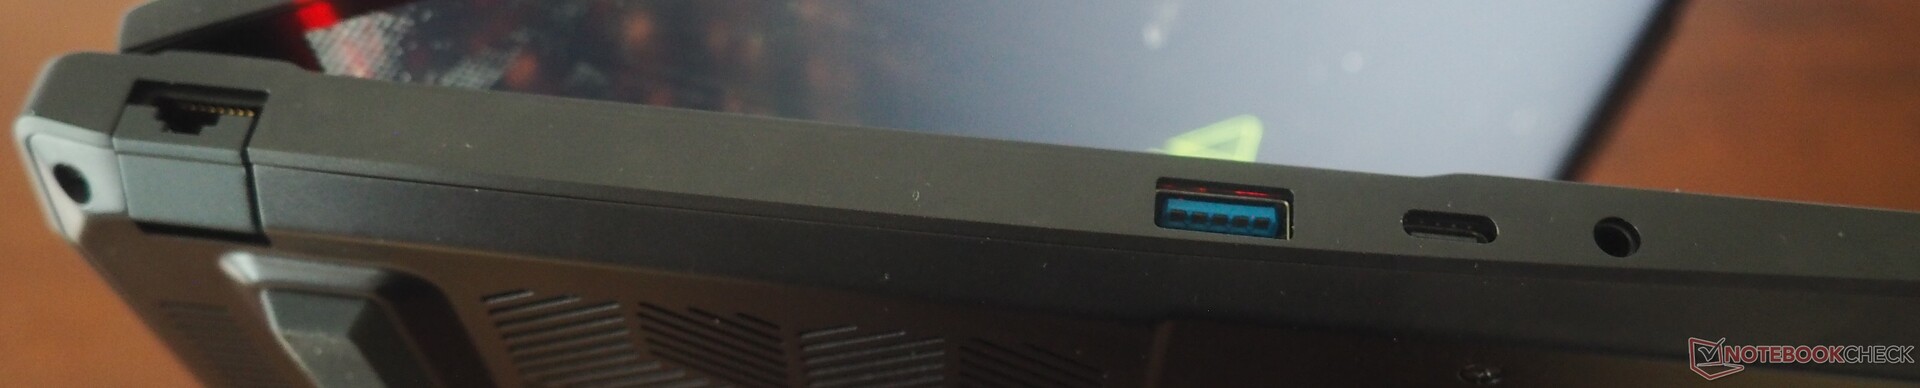
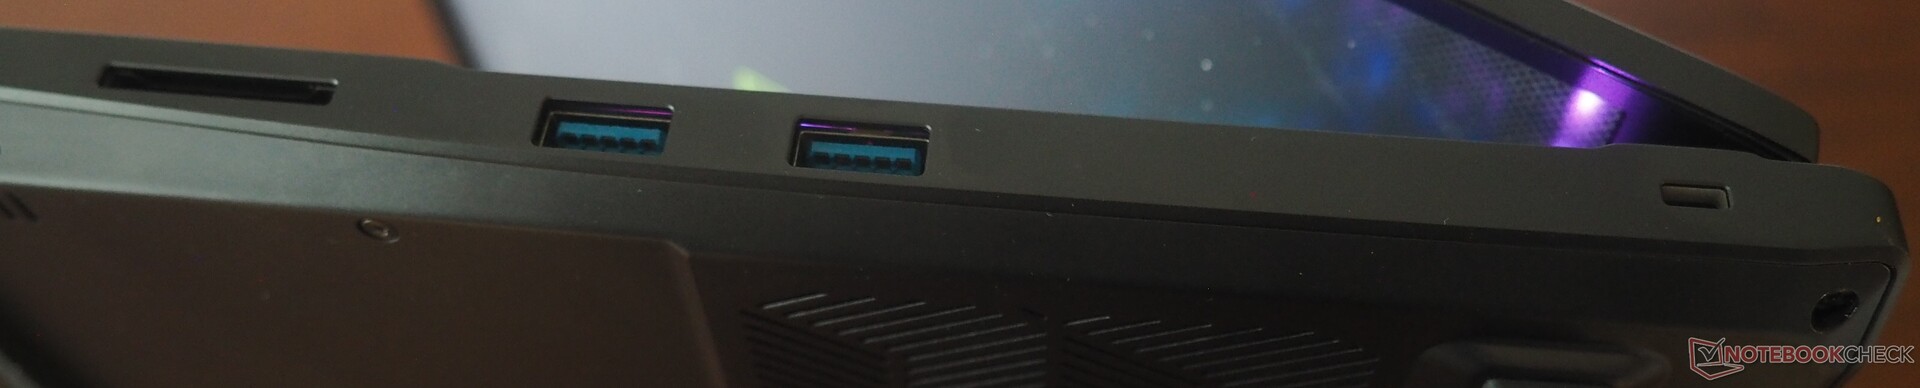
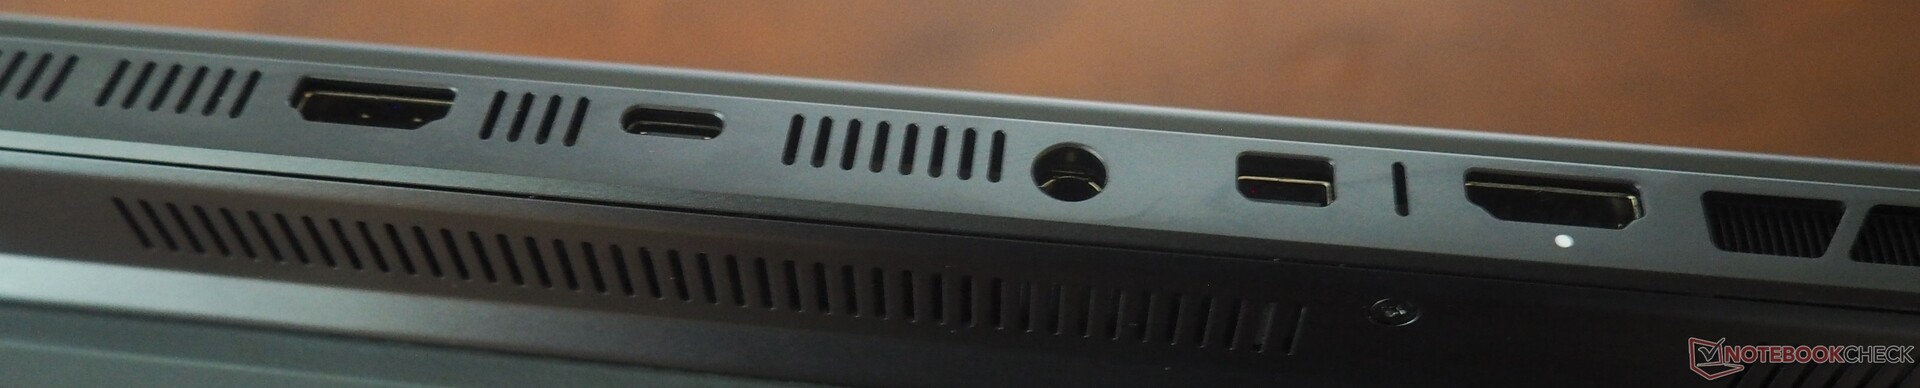
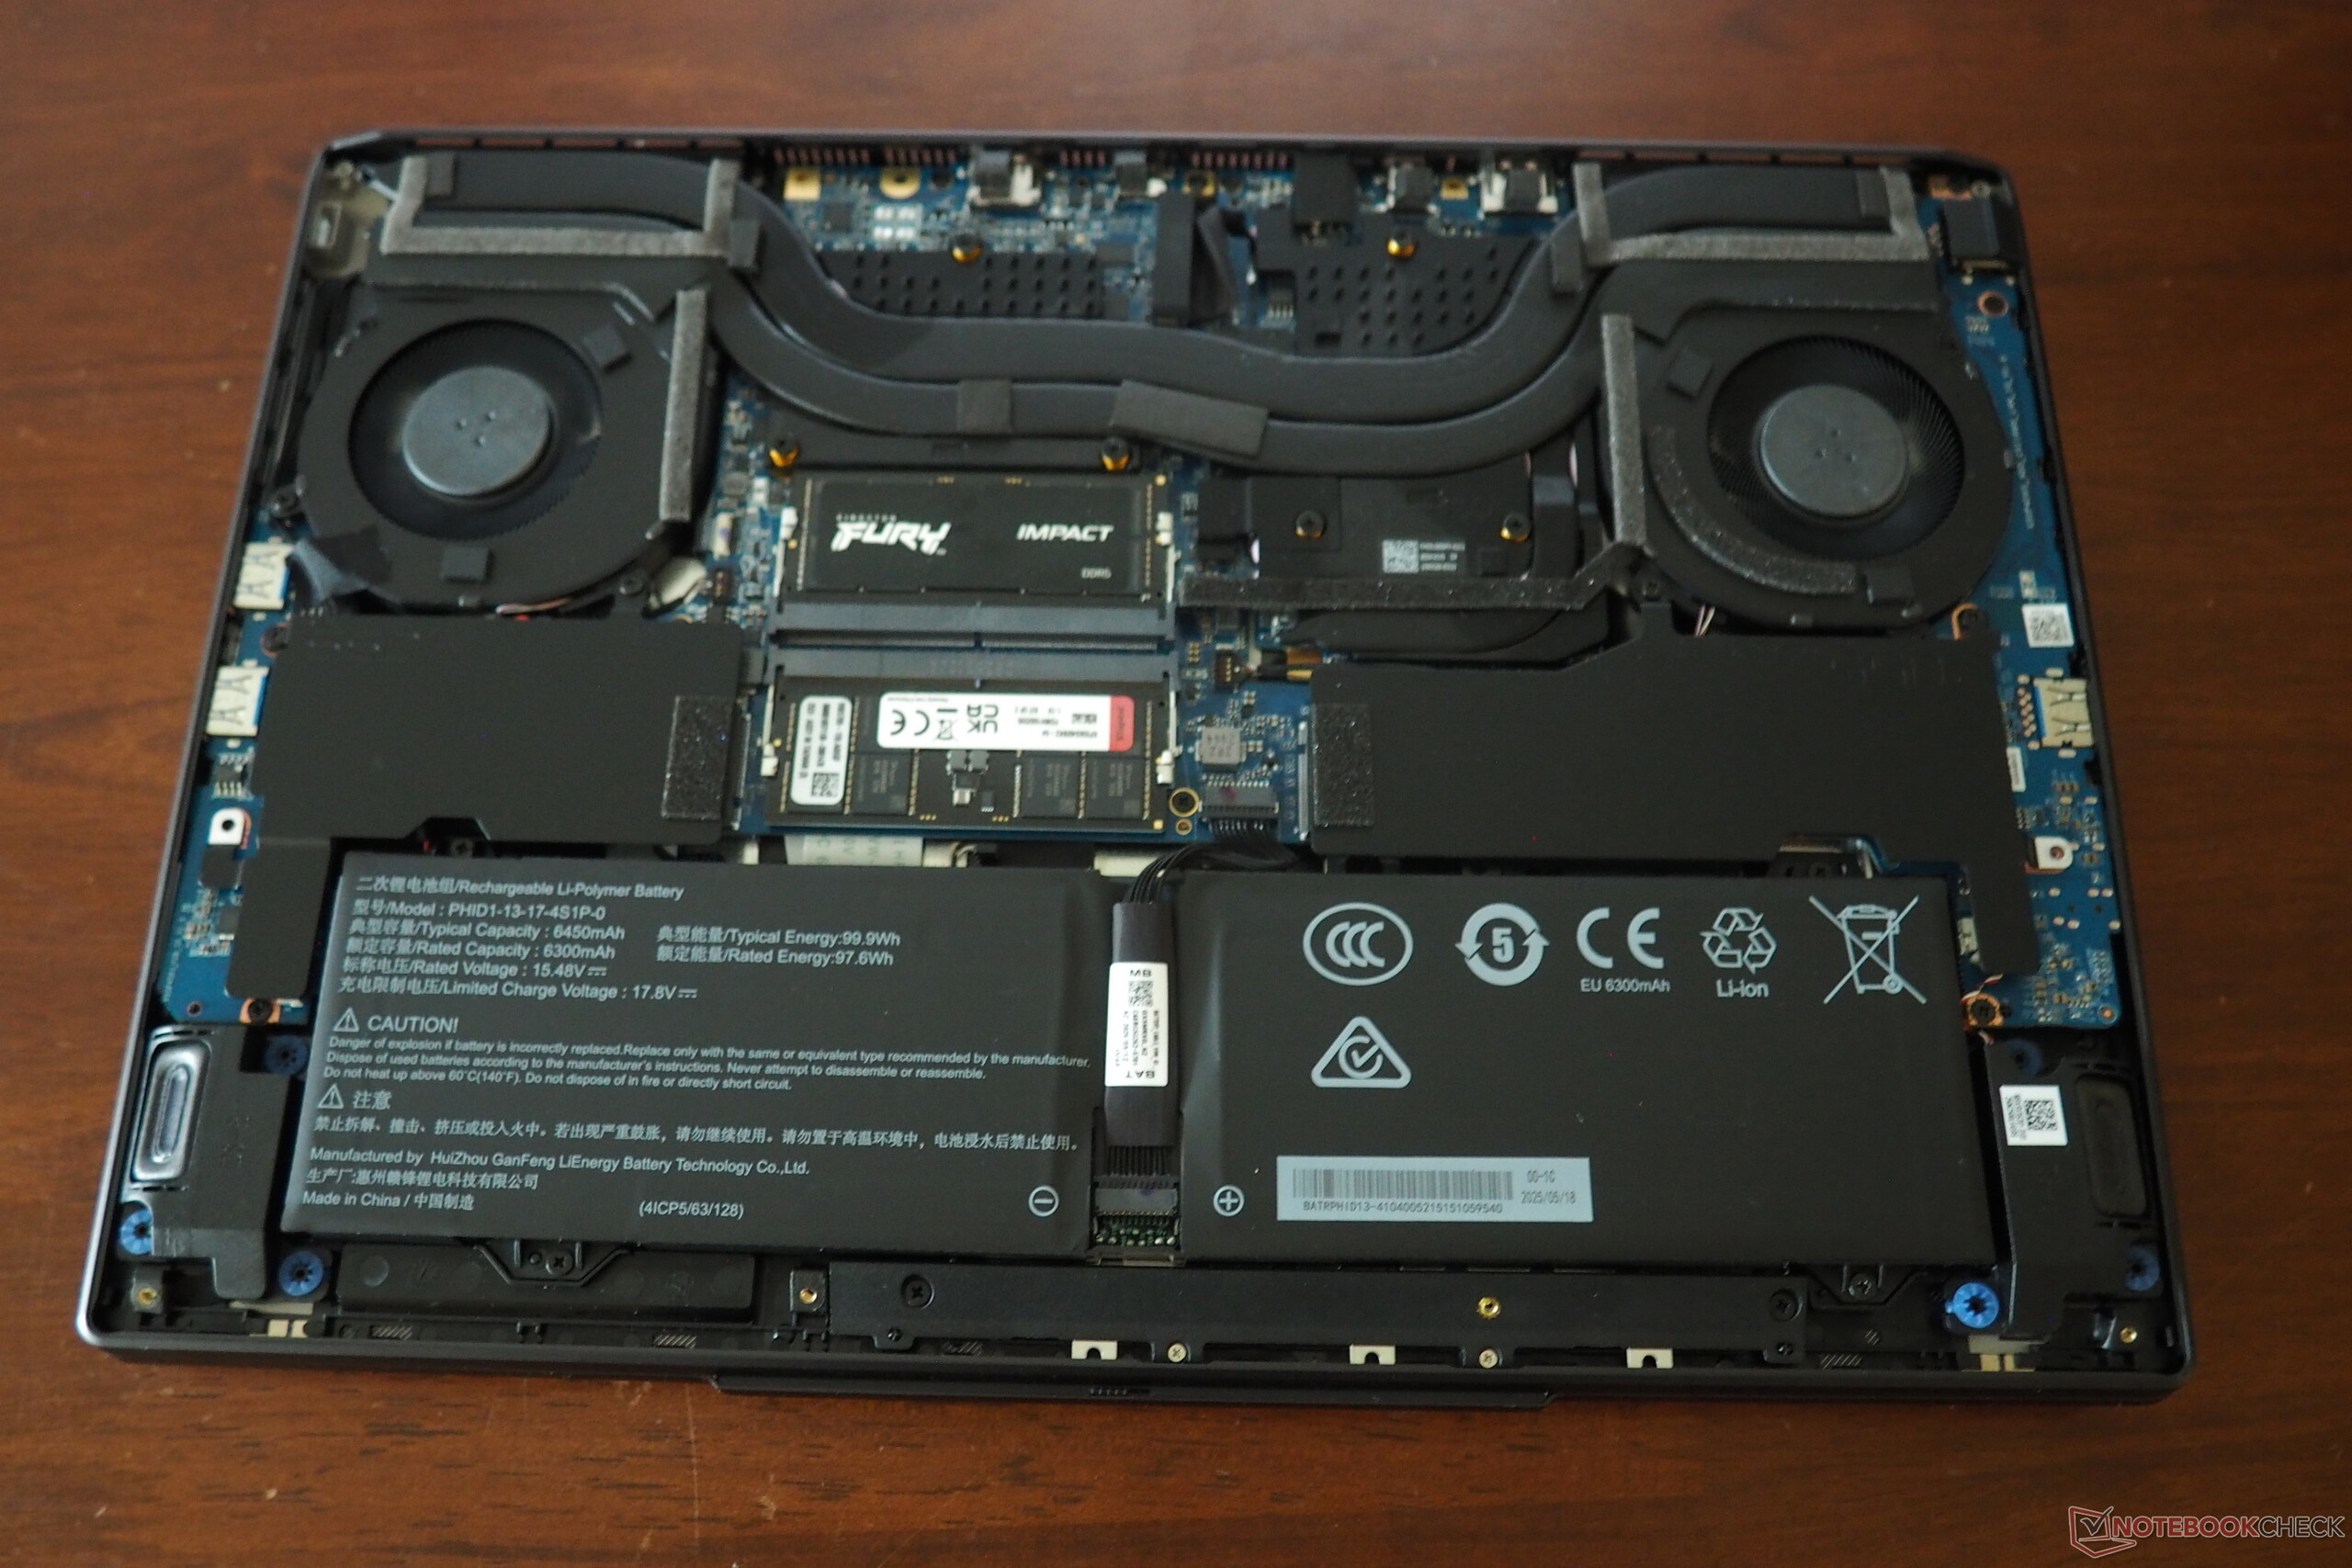
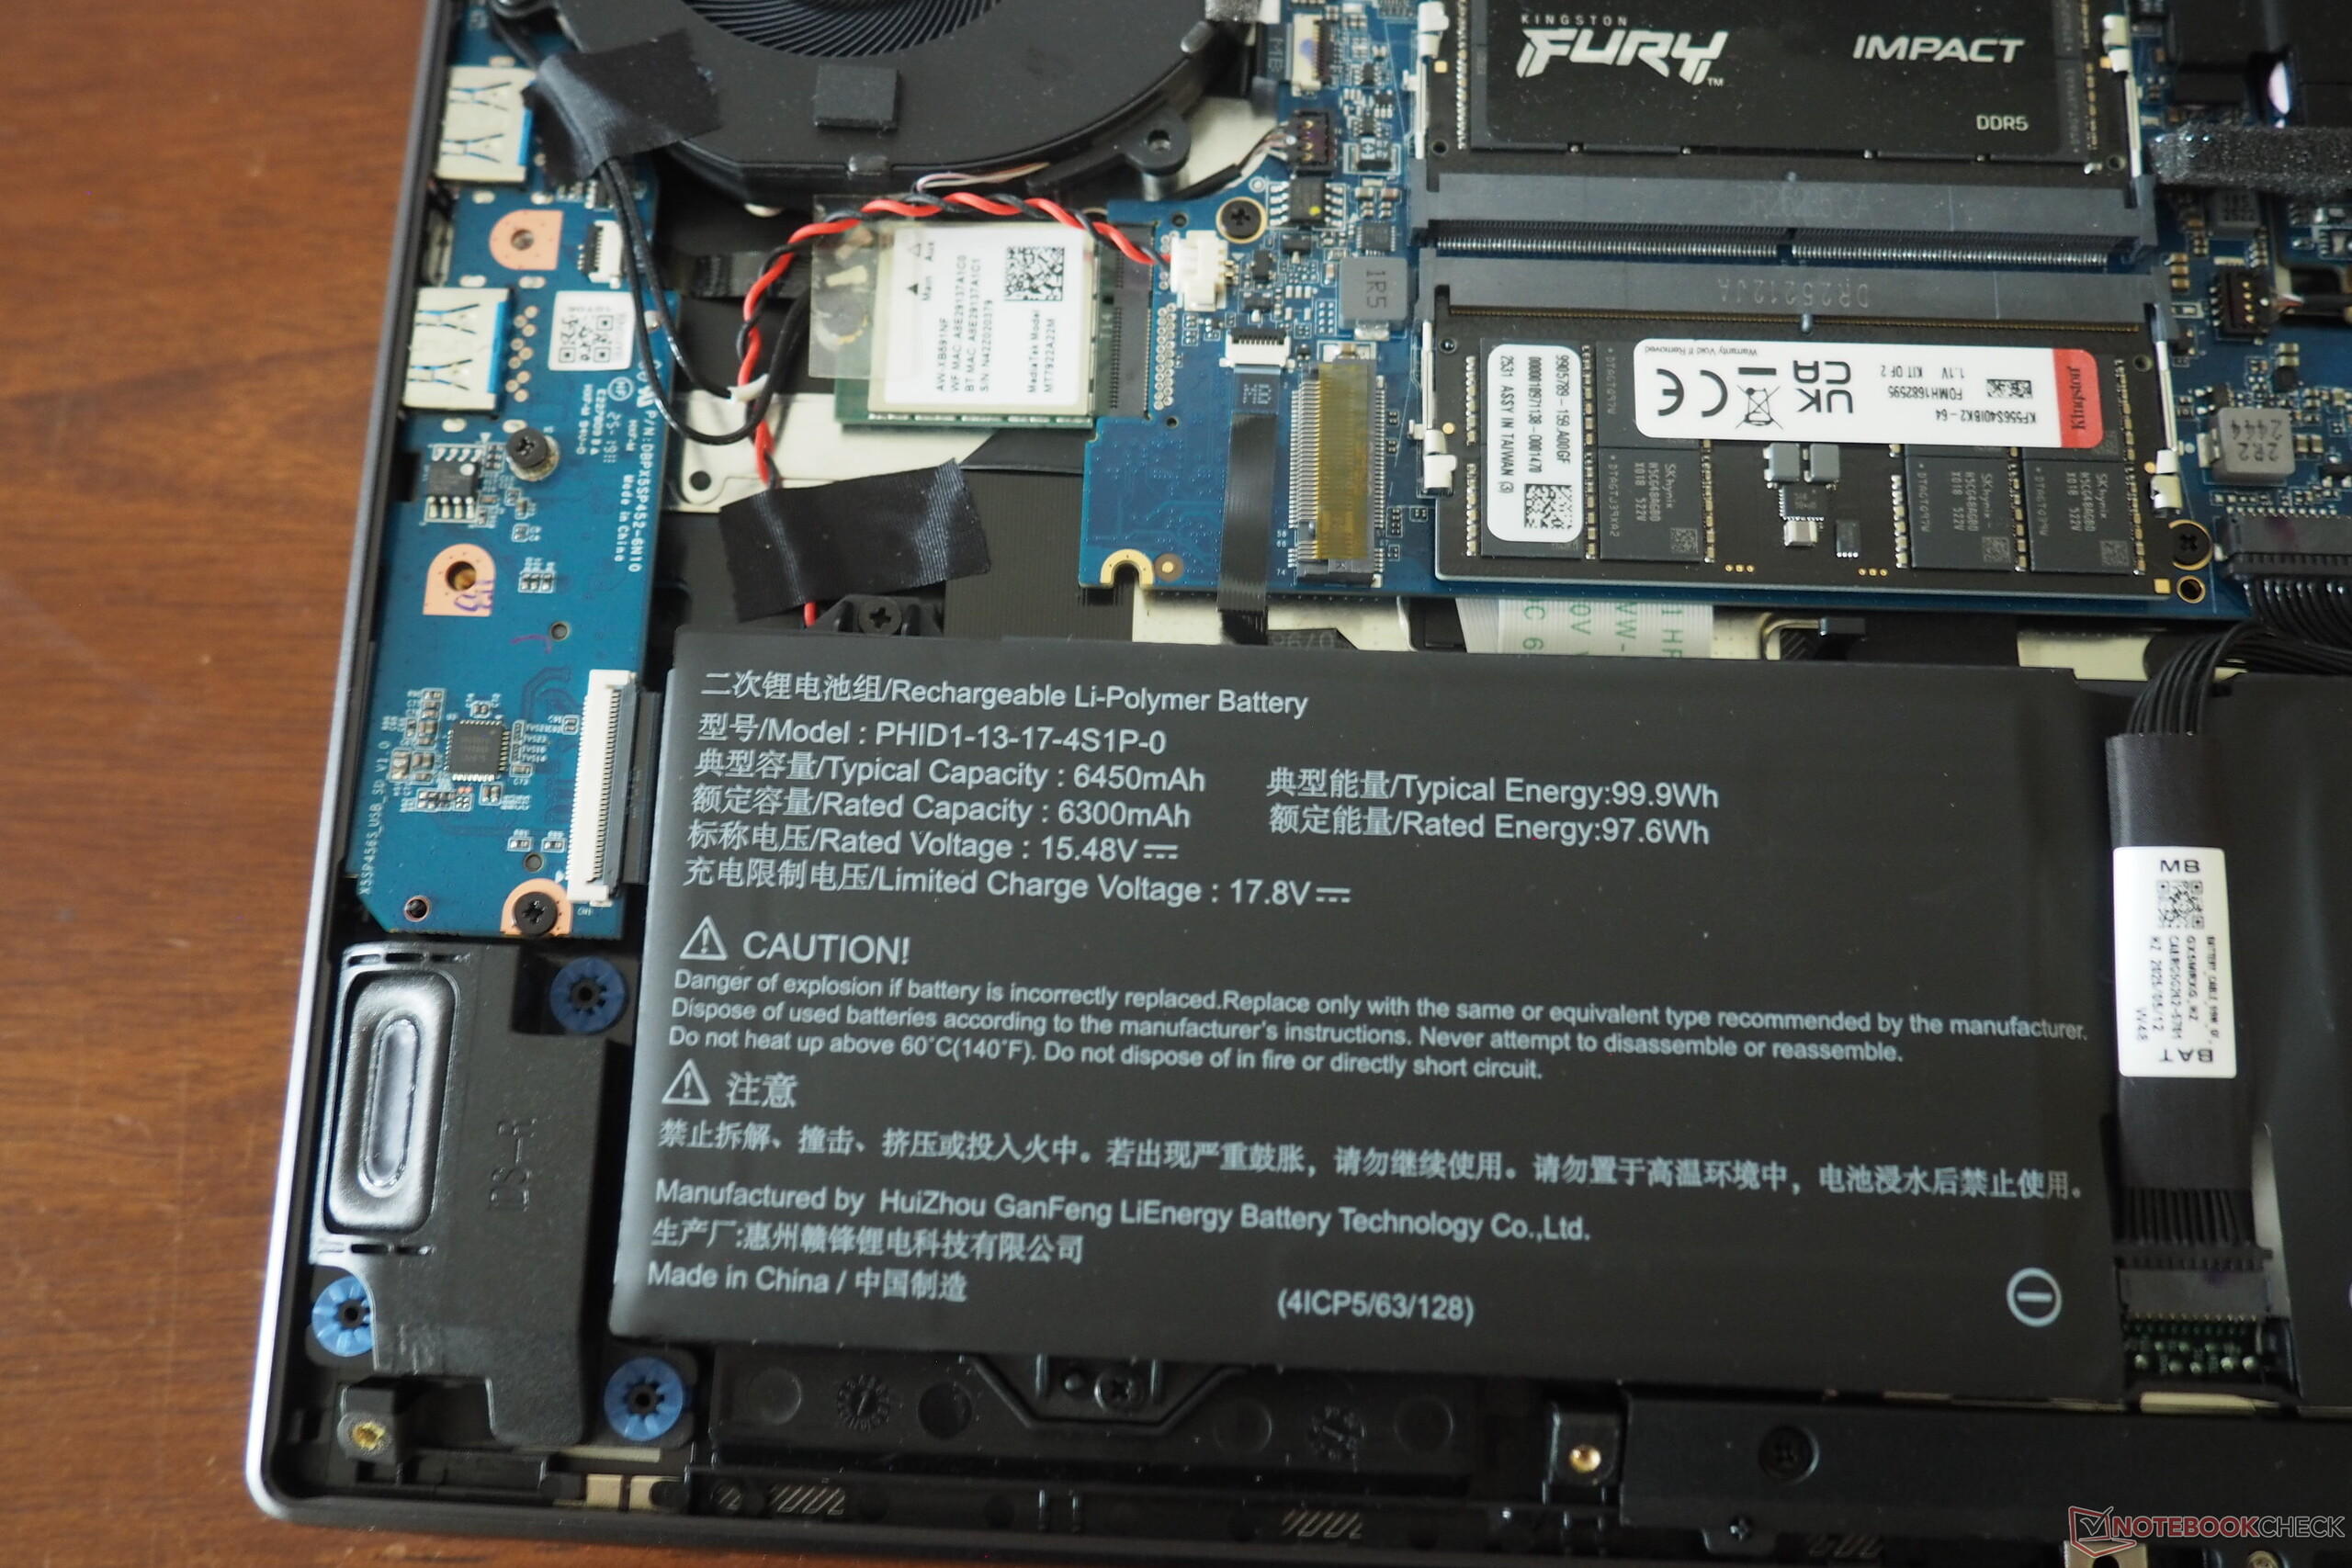
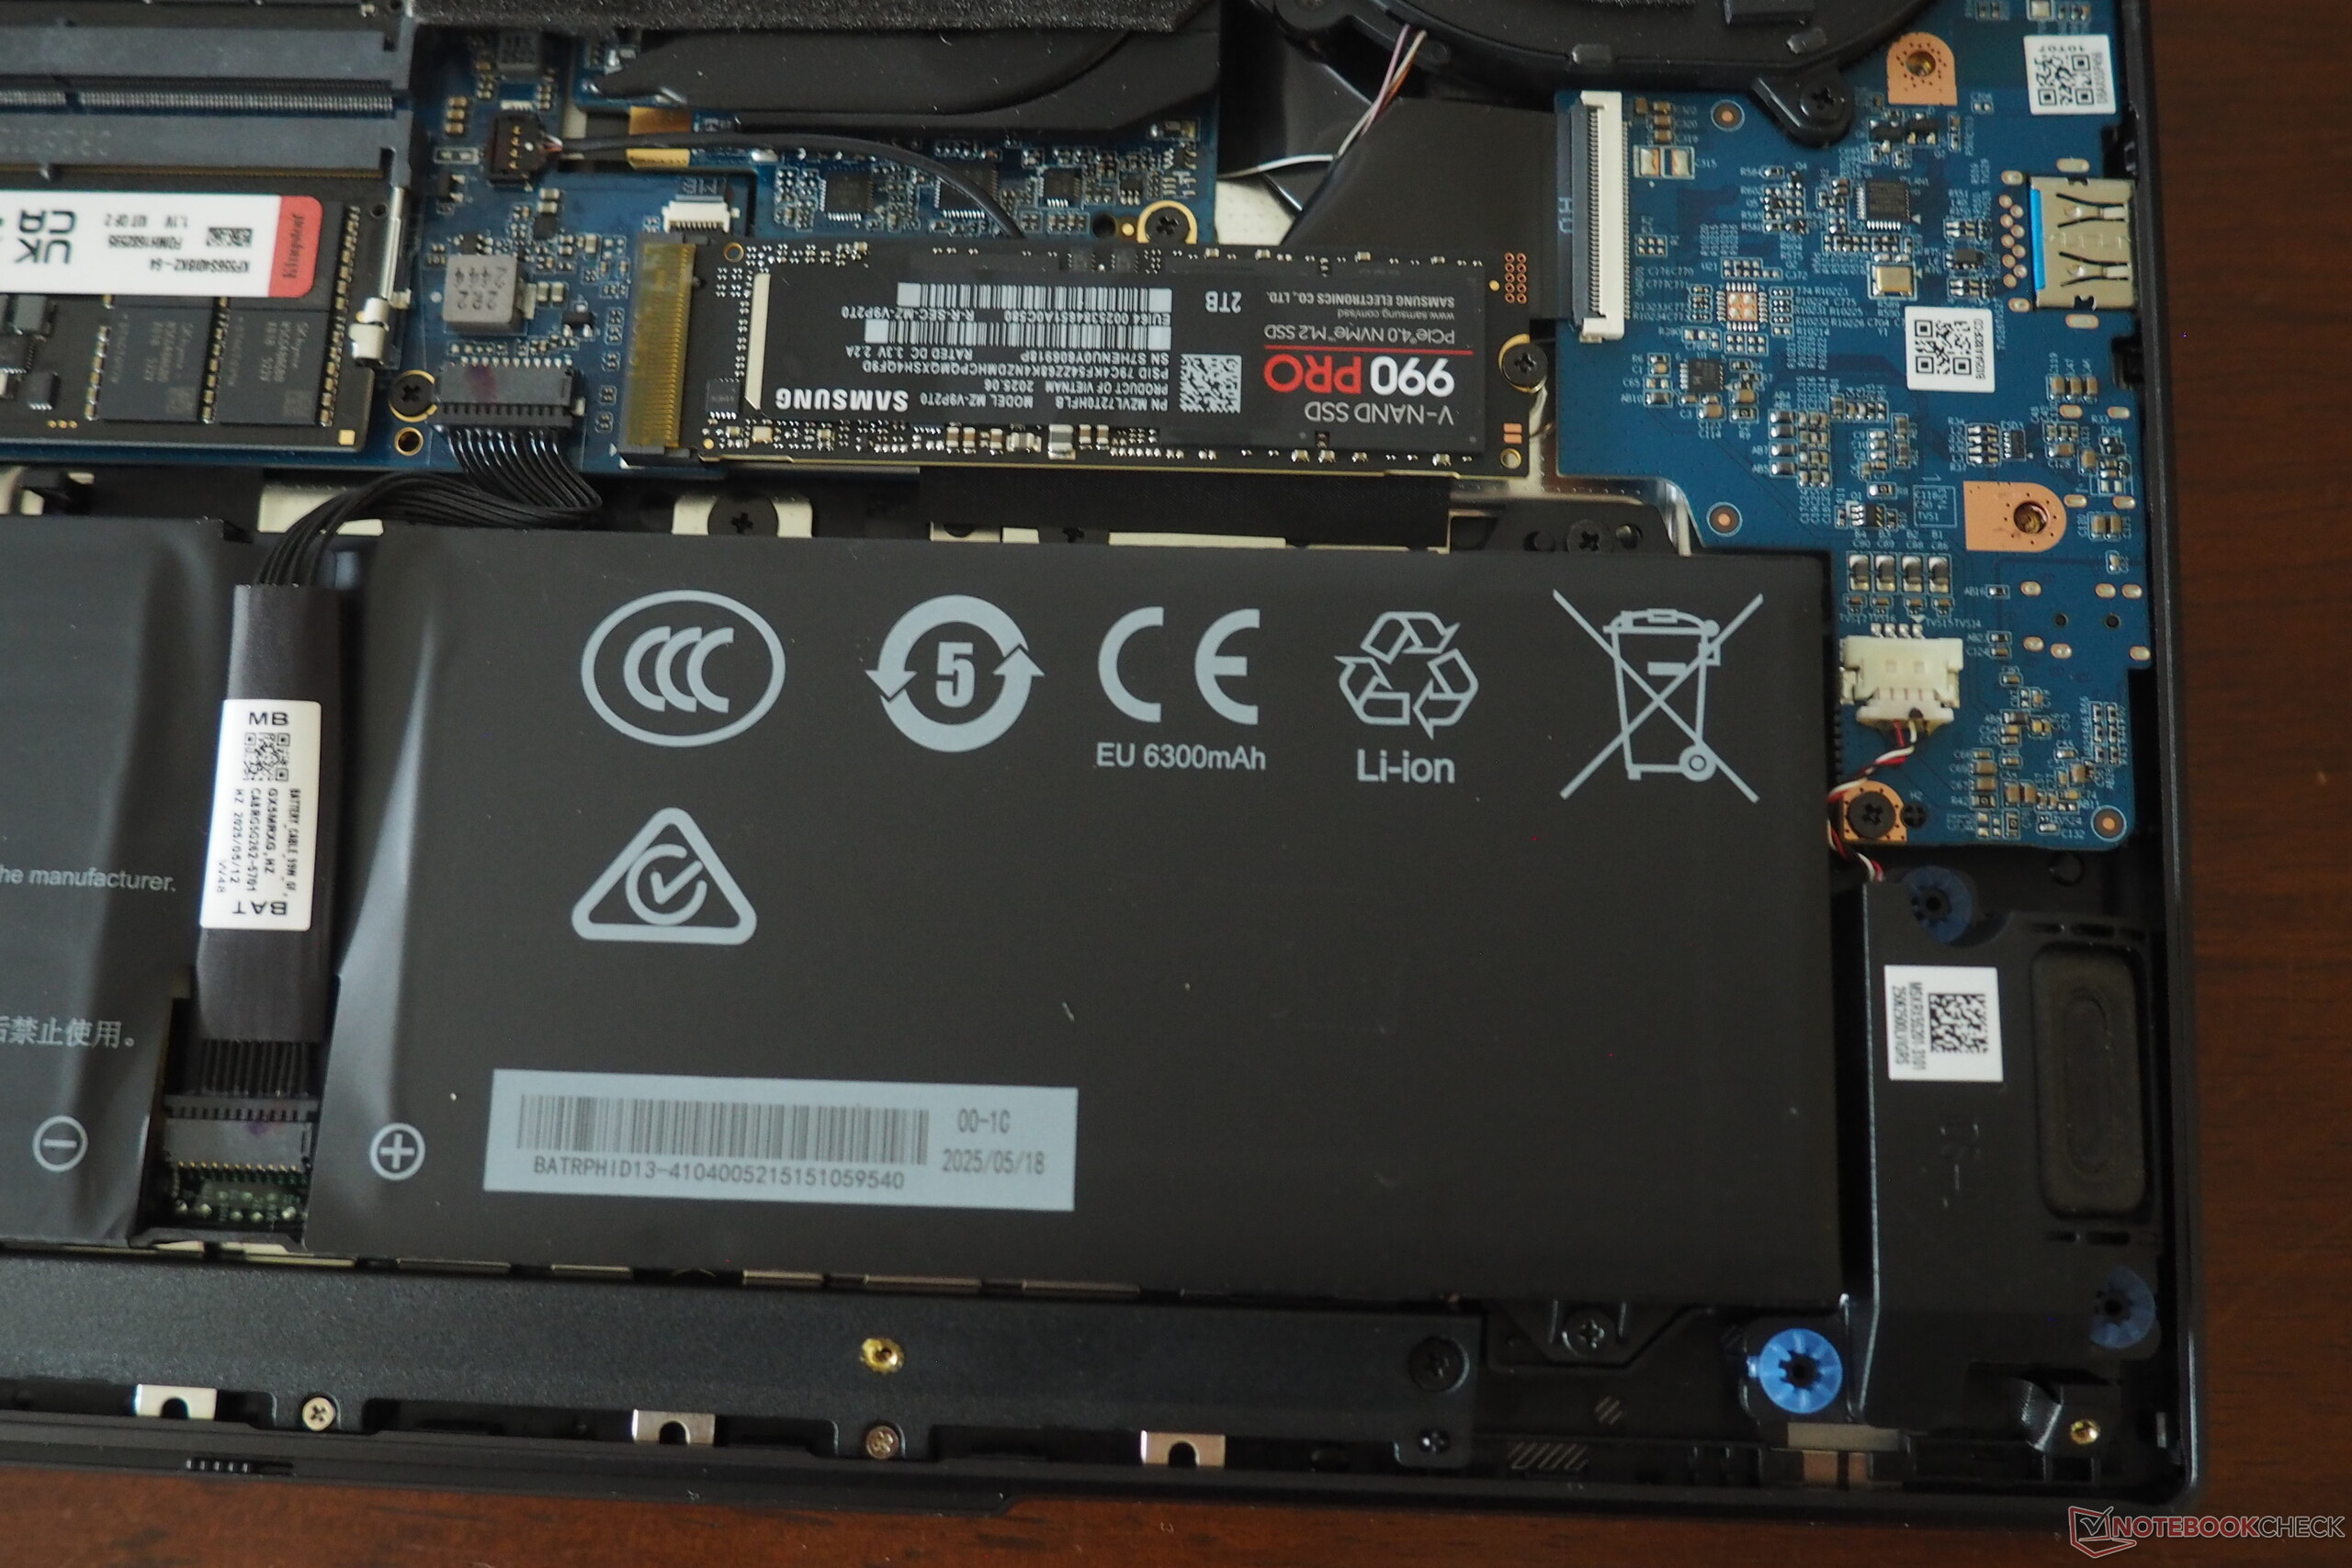
Comme le montrent les photos, la connectivité est à la fois étendue et à jour. Le module sans fil intégré (Wi-Fi 6E) et surtout le lecteur de cartes sont d'une rapidité impressionnante. La webcam (y compris l'obturateur de confidentialité) est décente et offre des images plus nettes que certains concurrents grâce à sa résolution Full HD. Le panneau inférieur peut être retiré après avoir desserré dix vis Phillips.
Lecteur de carte SD
| SD Card Reader - average JPG Copy Test (av. of 3 runs) | |
| SCHENKER XMG Core 15 (M25) (AV PRO microSD 128 GB V60) | |
| Moyenne de la classe Gaming (20 - 210, n=65, 2 dernières années) | |
| Lenovo Yoga Pro 9 16IAH G10 RTX 5060 (Angelbird AV Pro V60) | |
| SCHENKER XMG Core 15 (M24) | |
Communication
Webcam

 GeForce RTX 5060 Laptop, Ryzen AI 7 350, Samsung 990 Pro 2 TB MZVL72T0HDLB")
 GeForce RTX 5060 Laptop, Ryzen AI 7 350, Samsung 990 Pro 2 TB MZVL72T0HDLB")
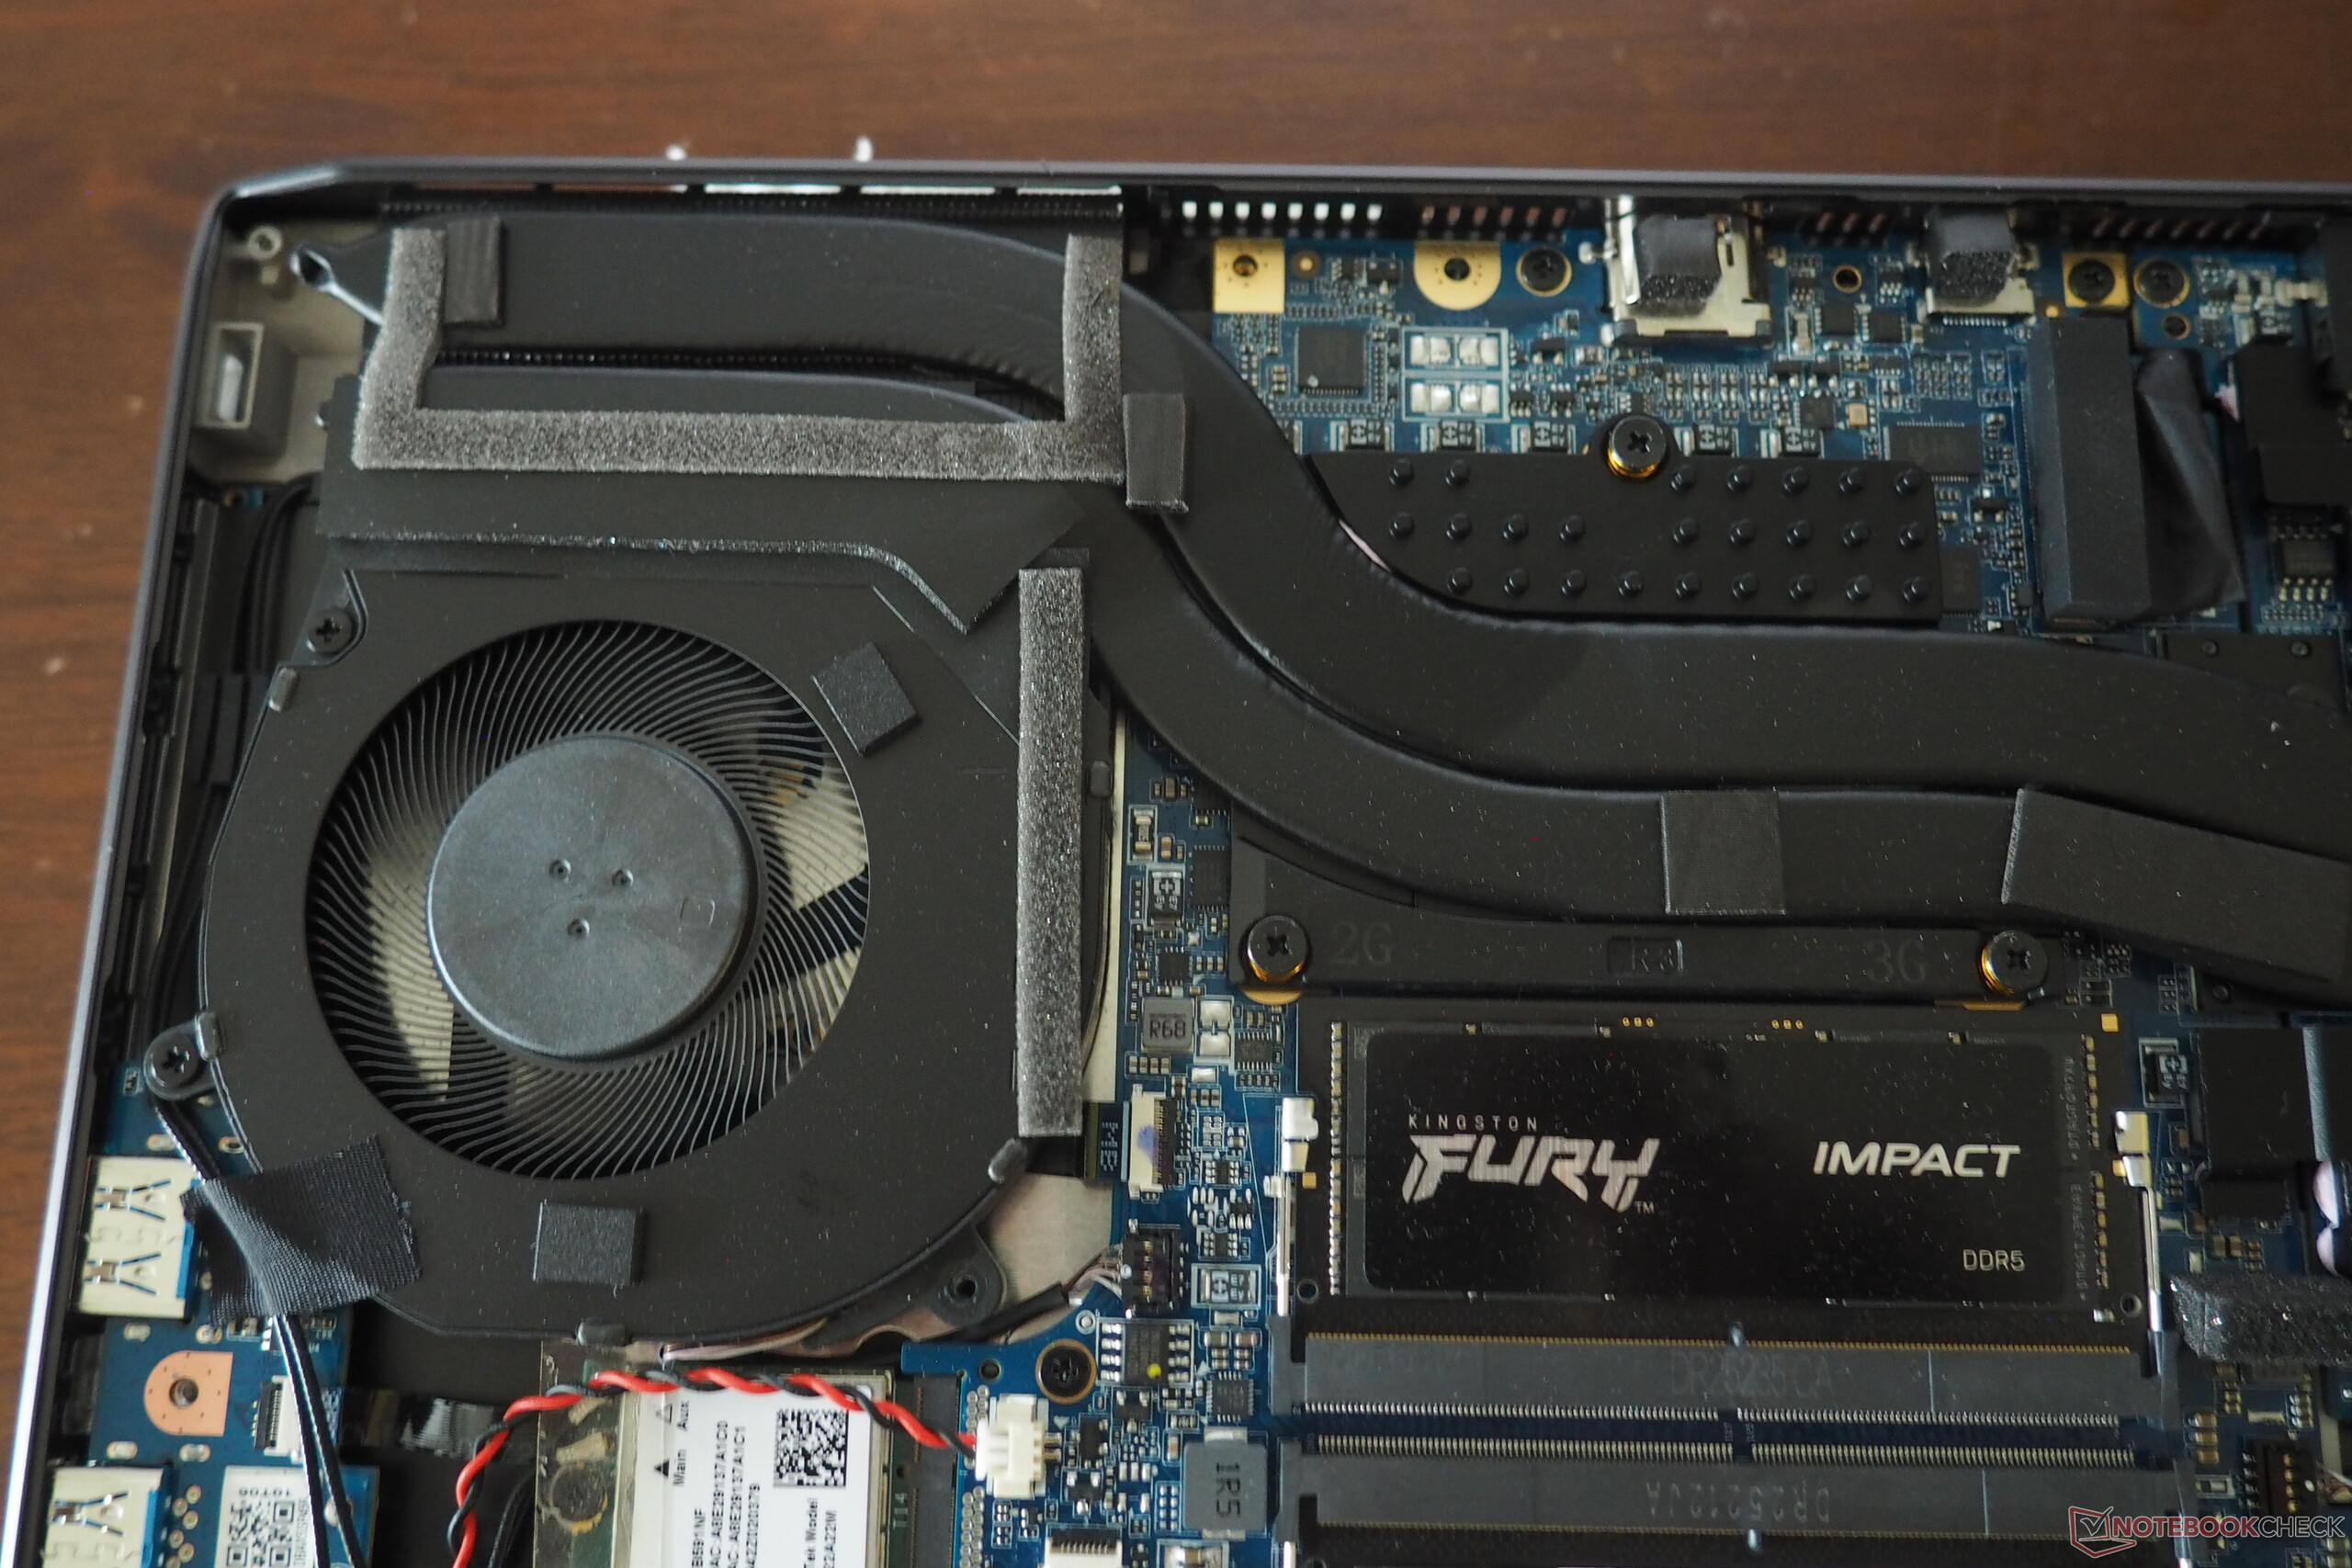
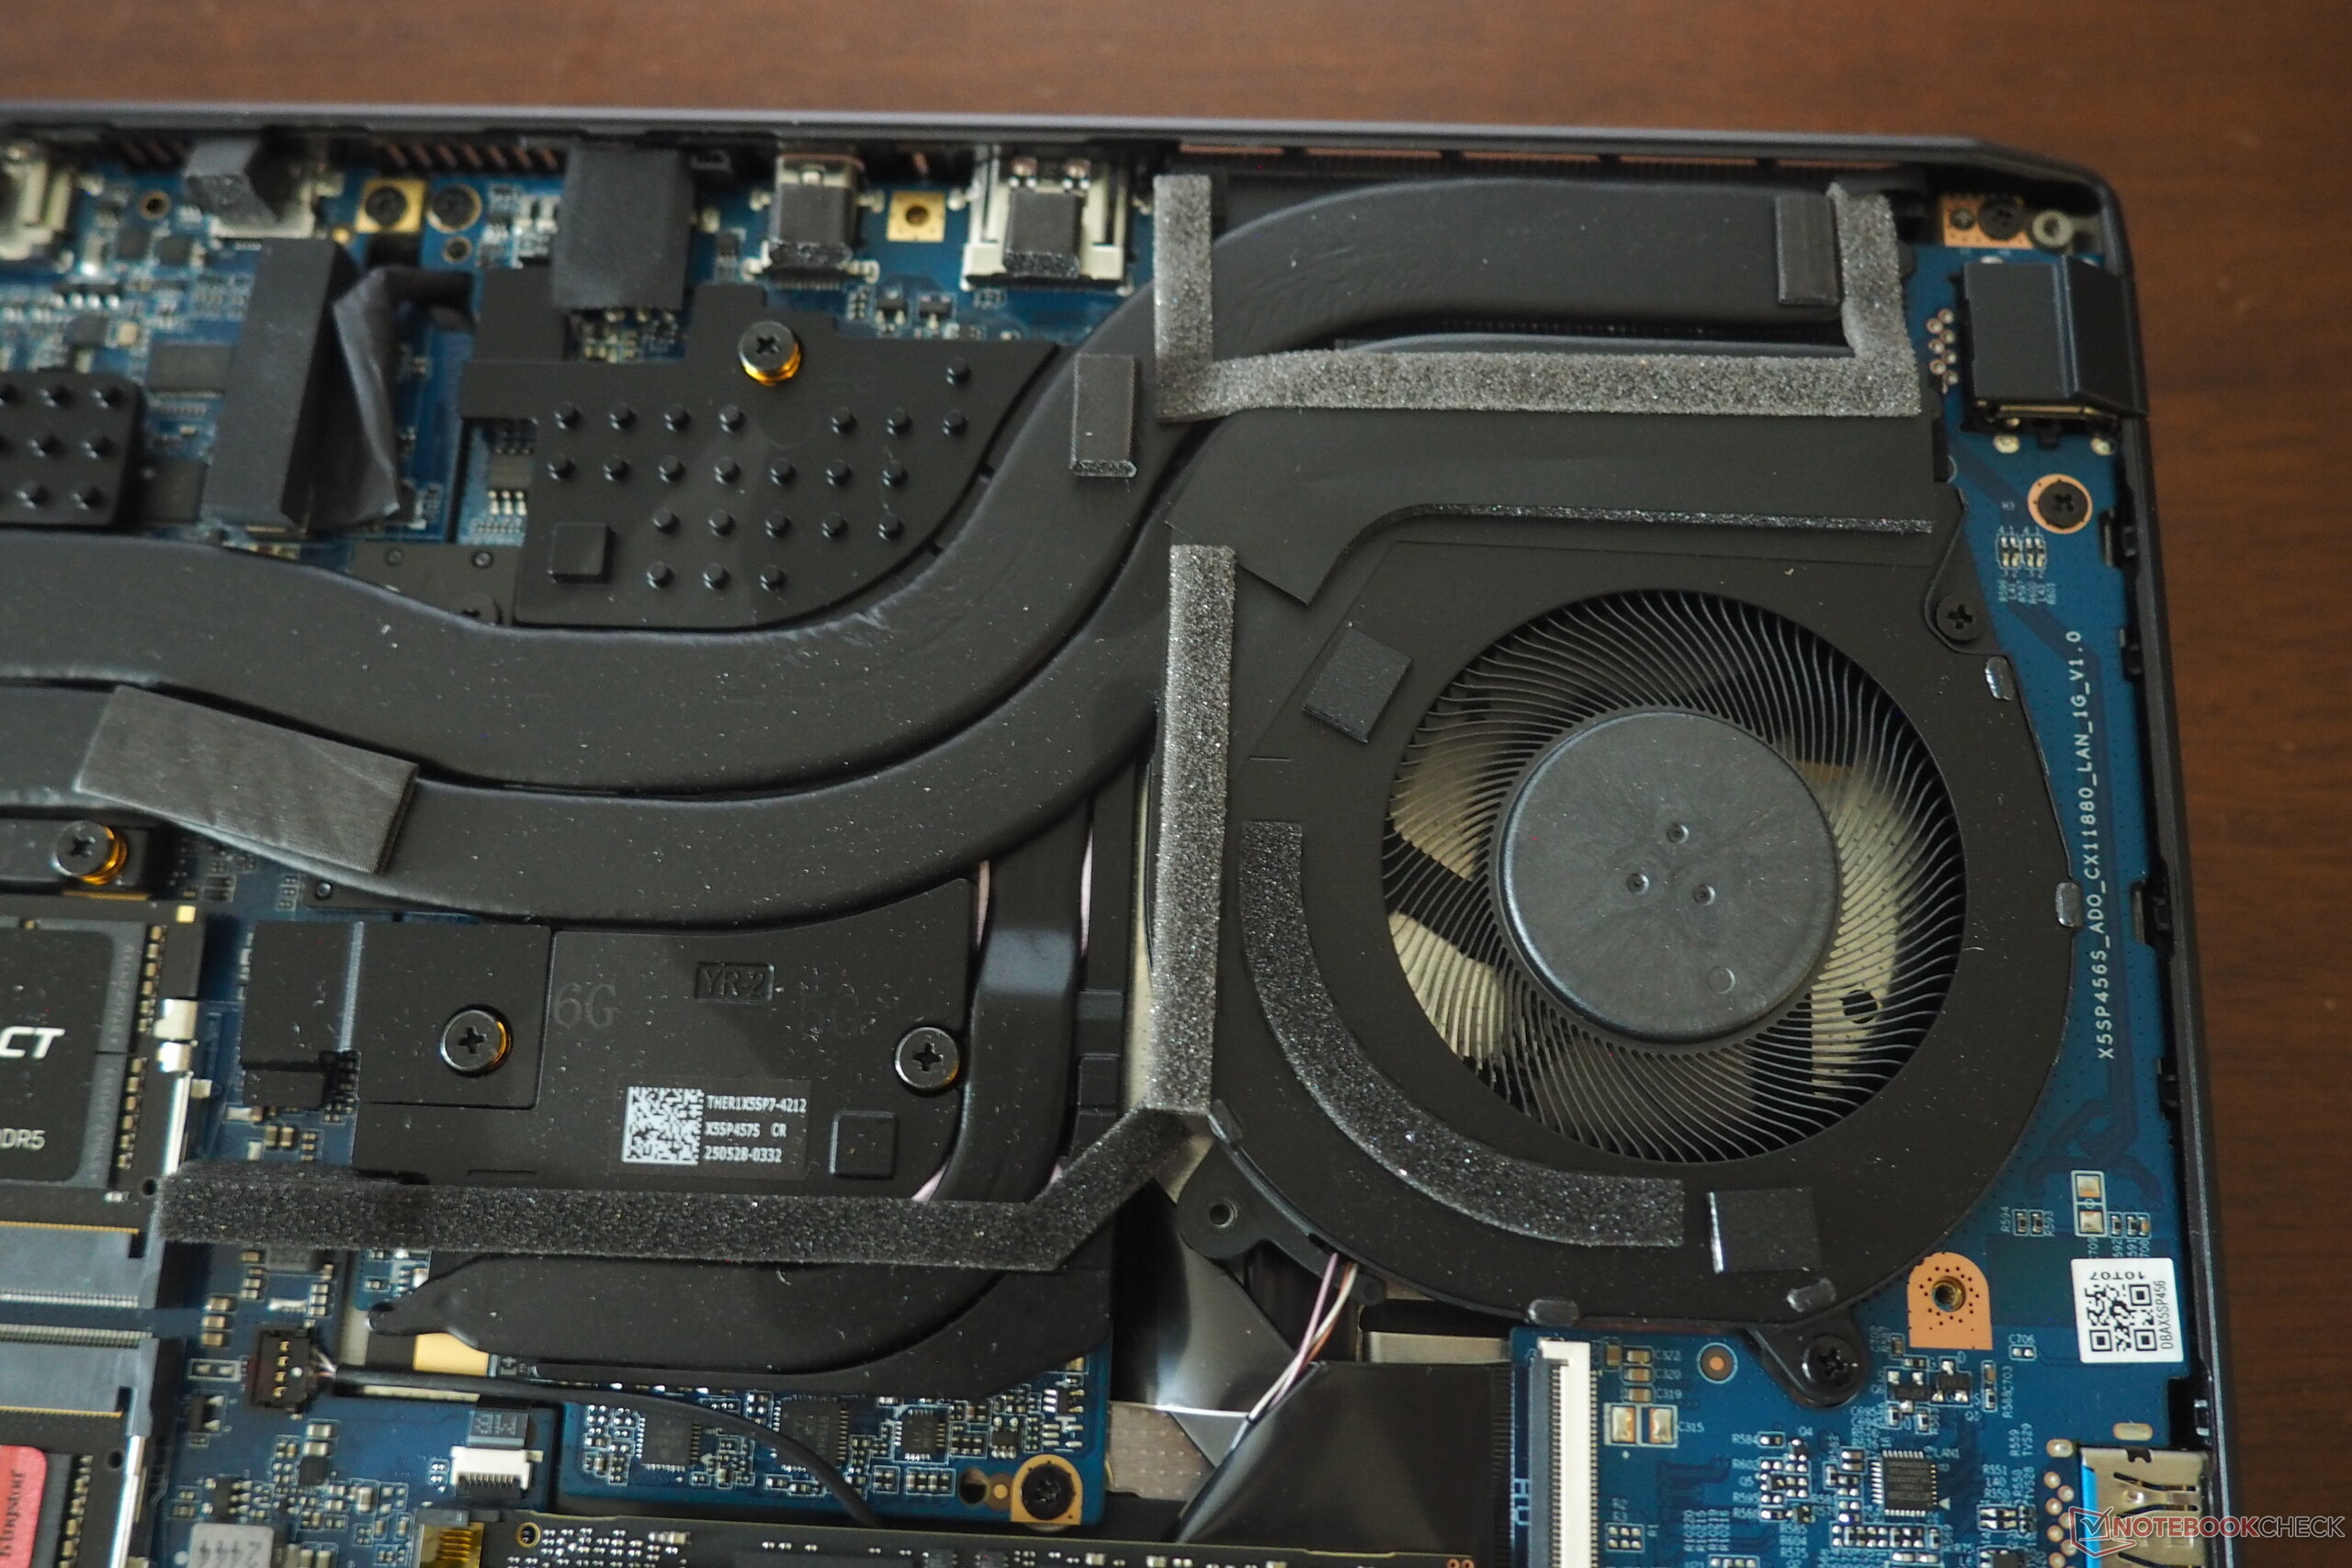
Maintenance
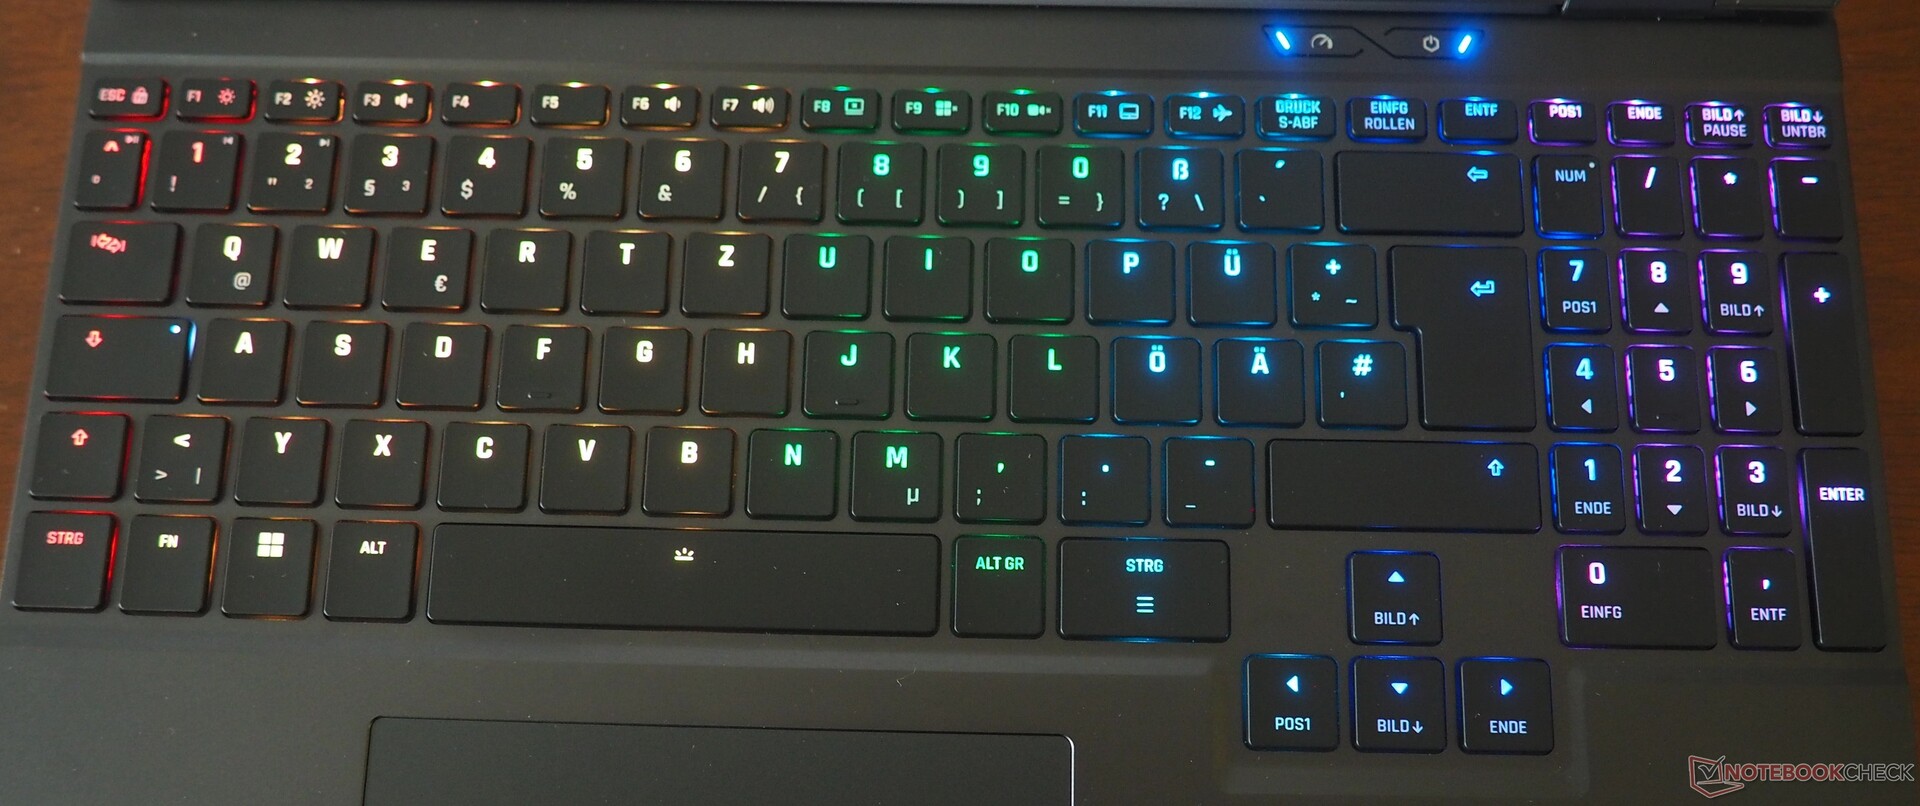
Dispositifs d'entrée
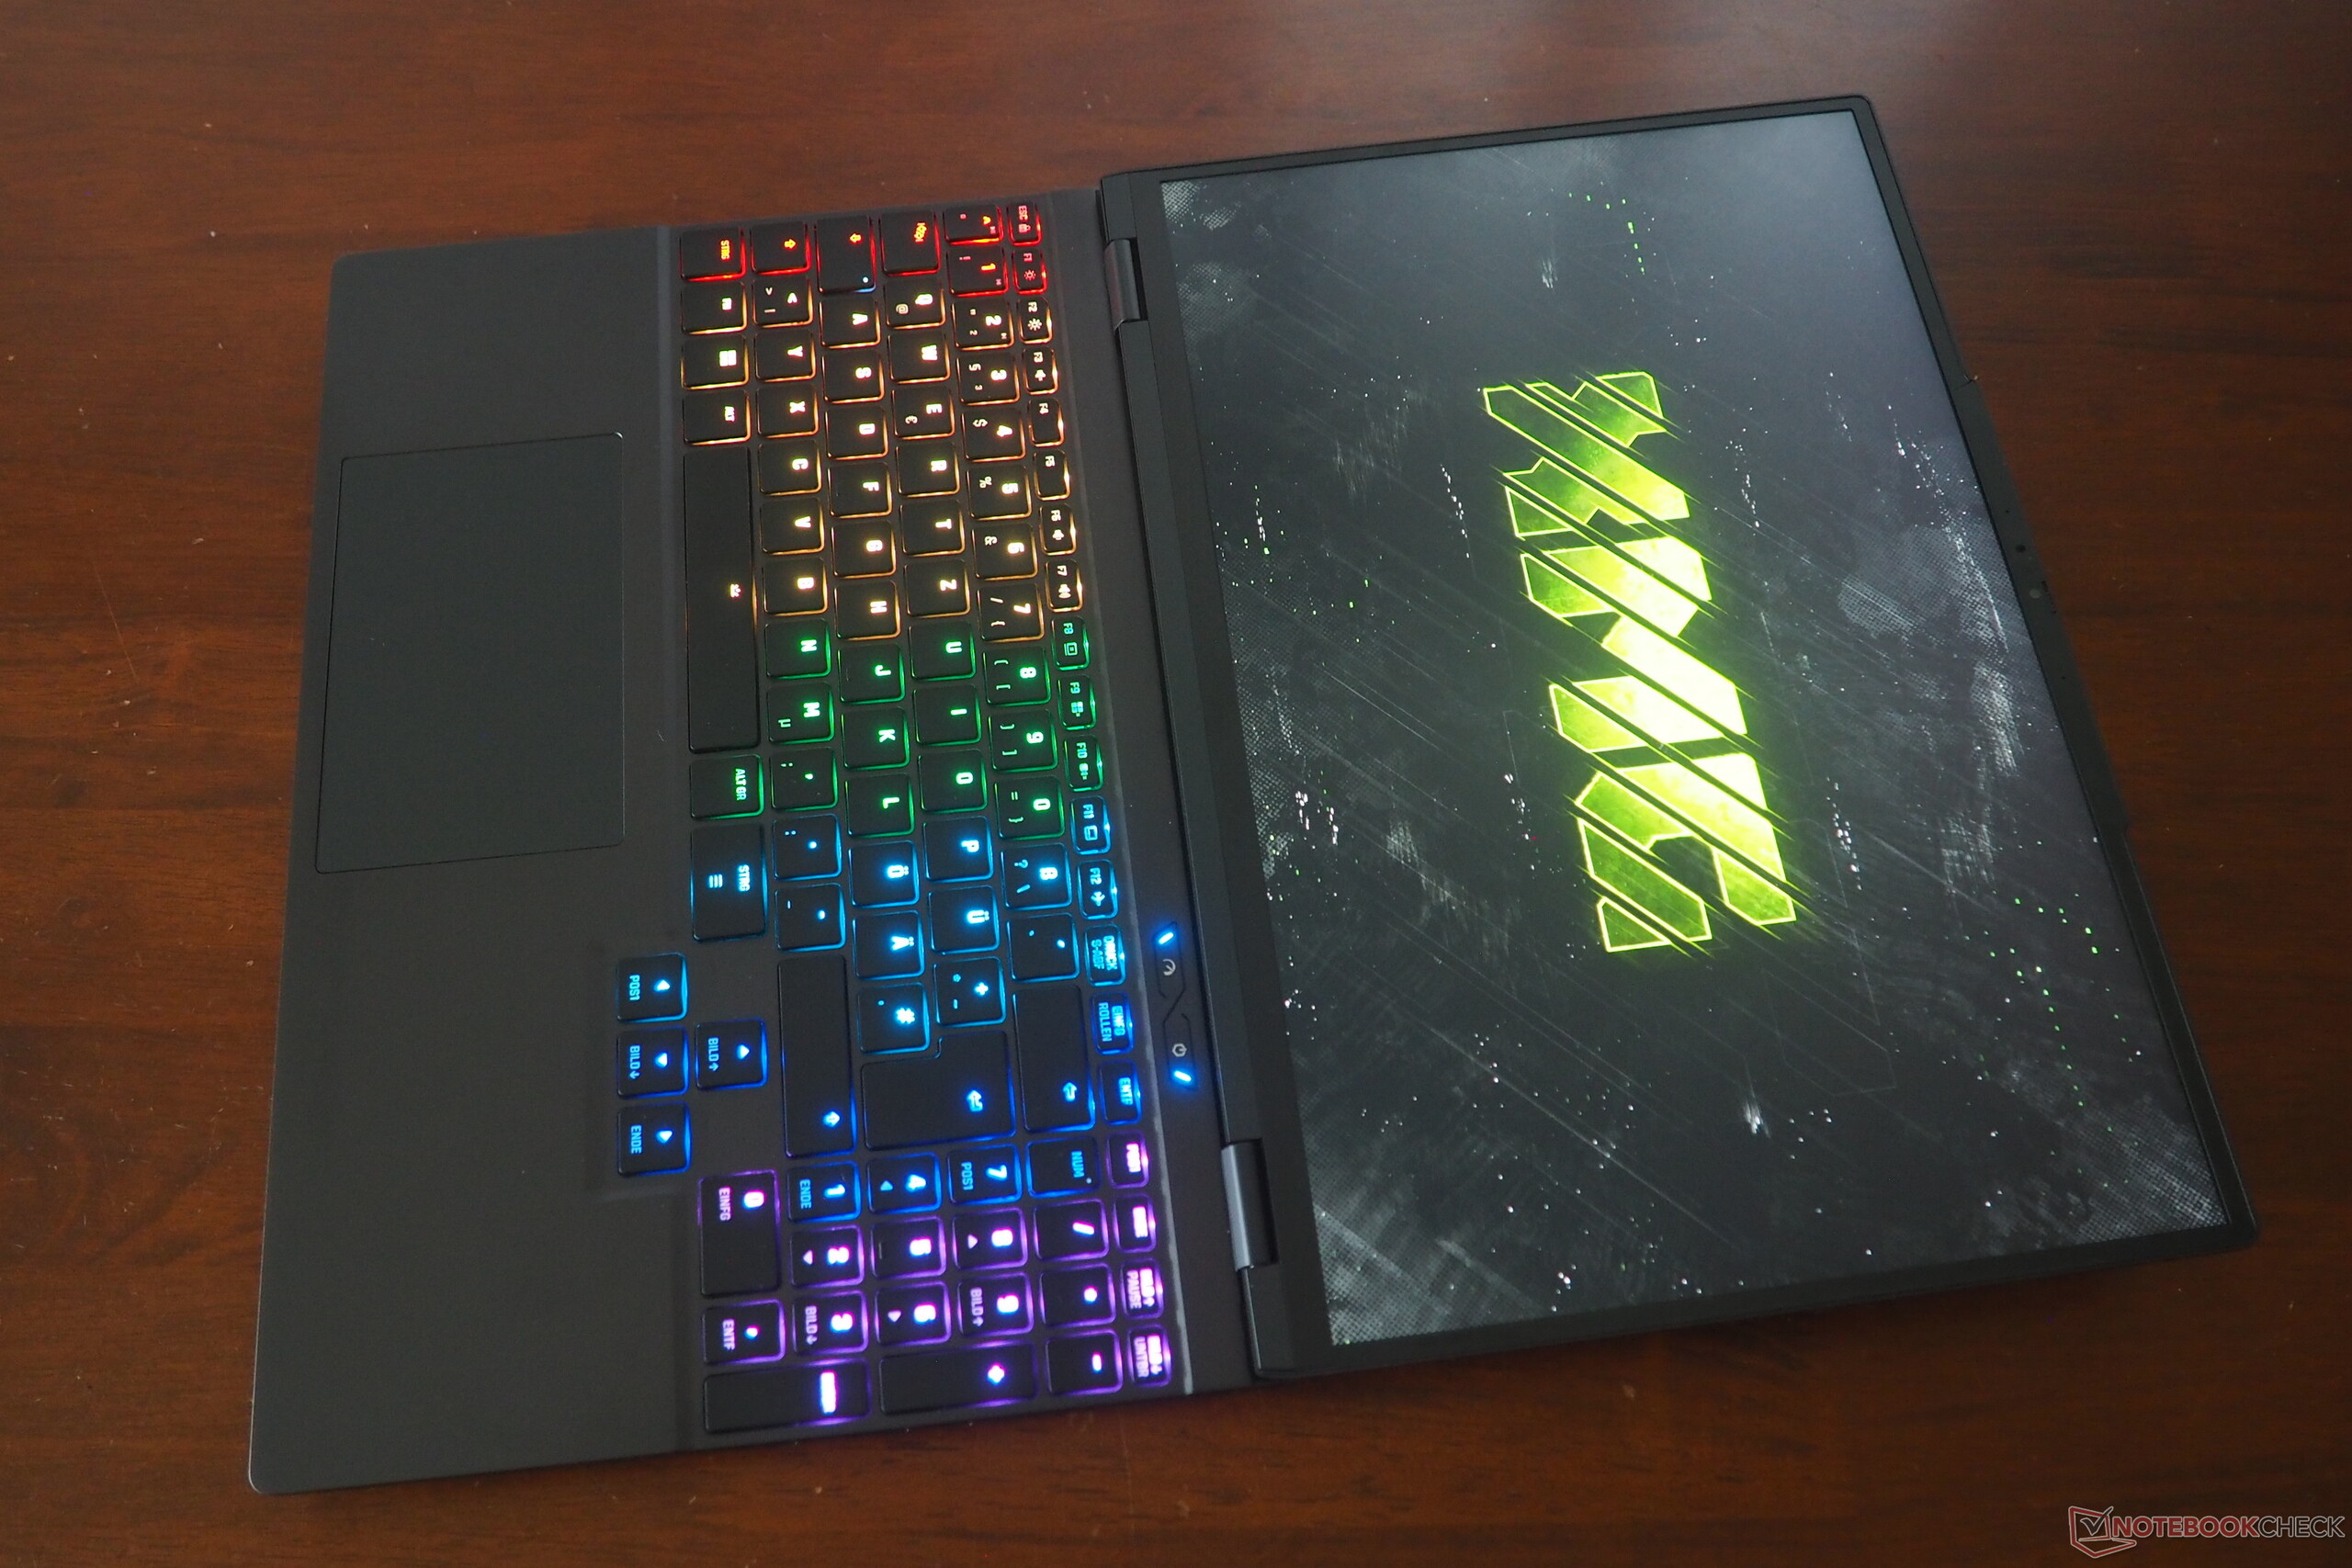
Les périphériques d'entrée fonctionnent bien. Le clavier impressionne par son éclairage RVB lumineux et réglable, sa disposition bien conçue et ses touches fléchées de taille généreuse. Le pavé tactile est agréablement lisse et précis, et mesure 12,3 cm sur 7,6 cm.
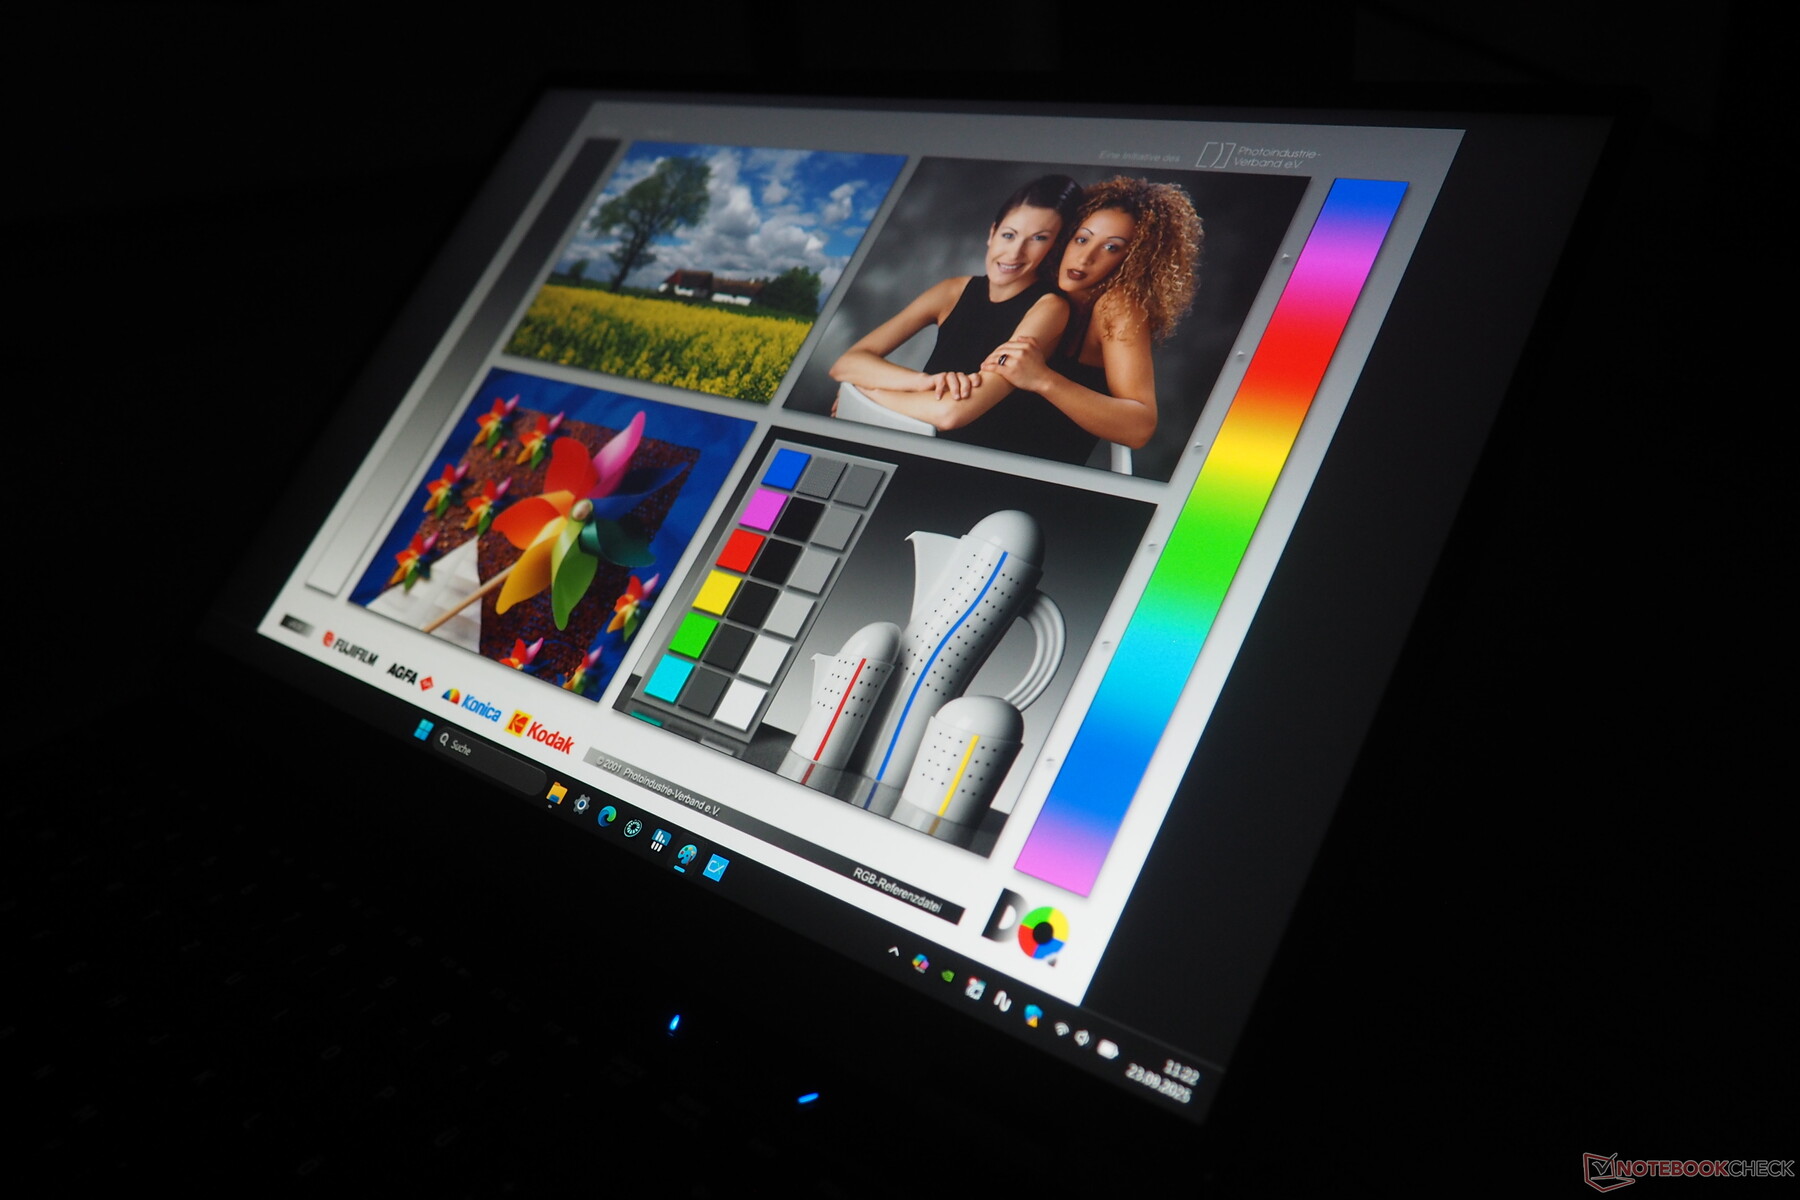
Affichage
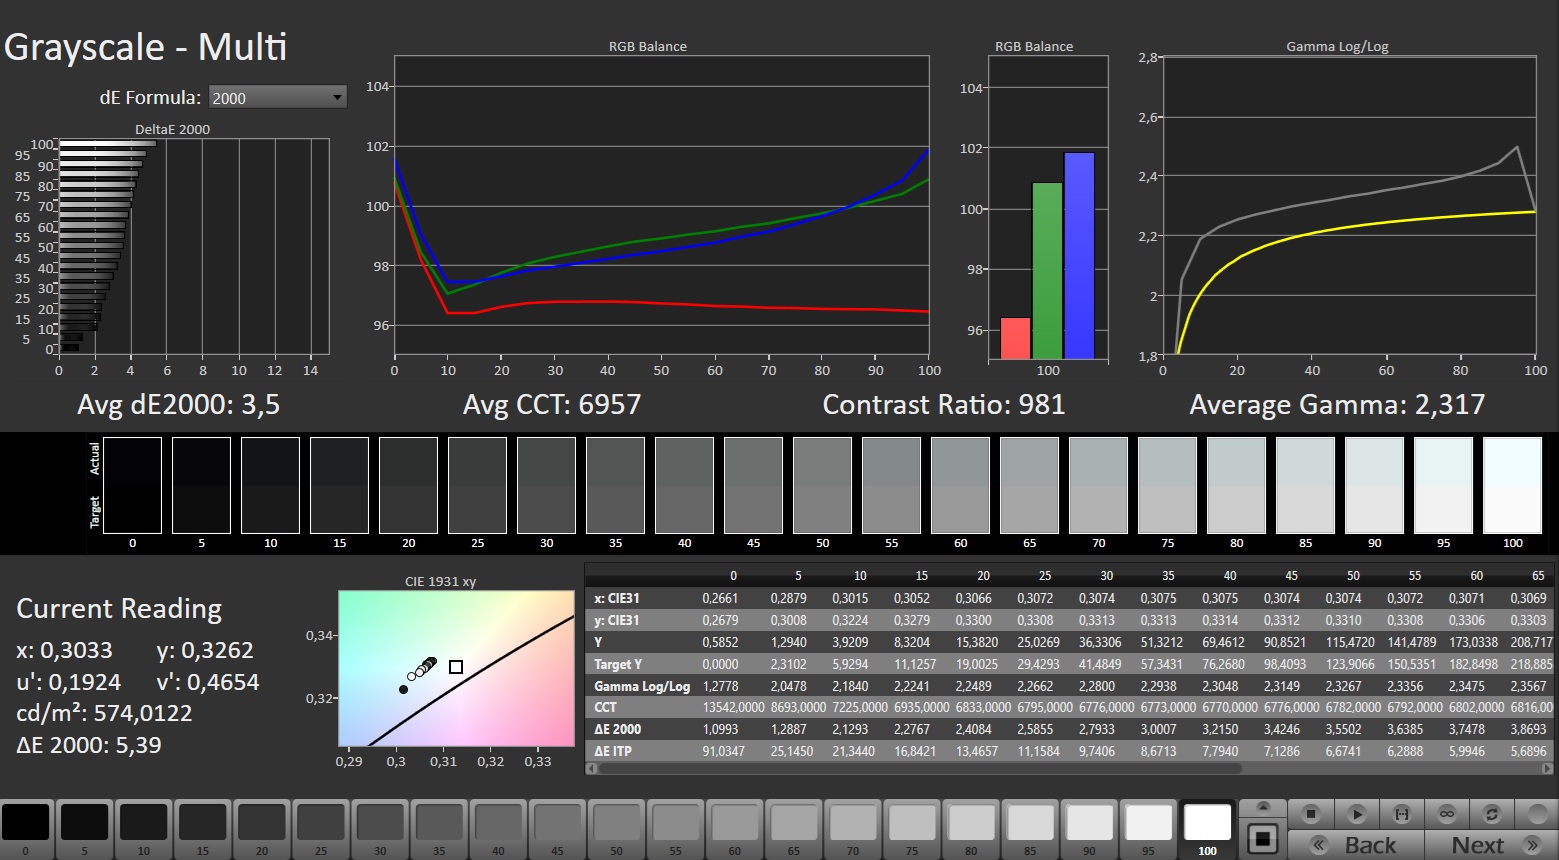
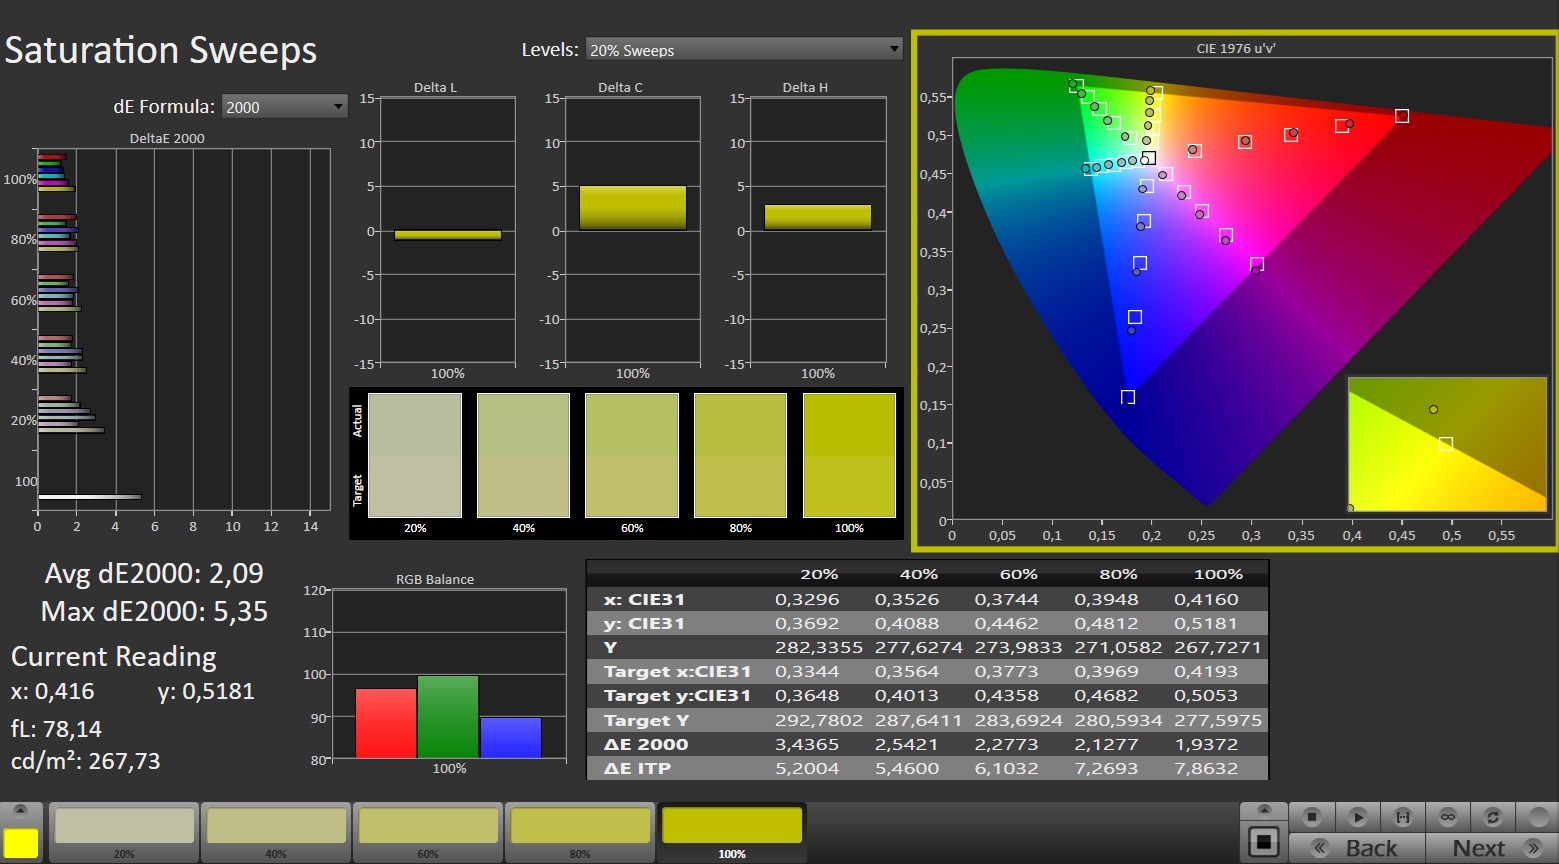
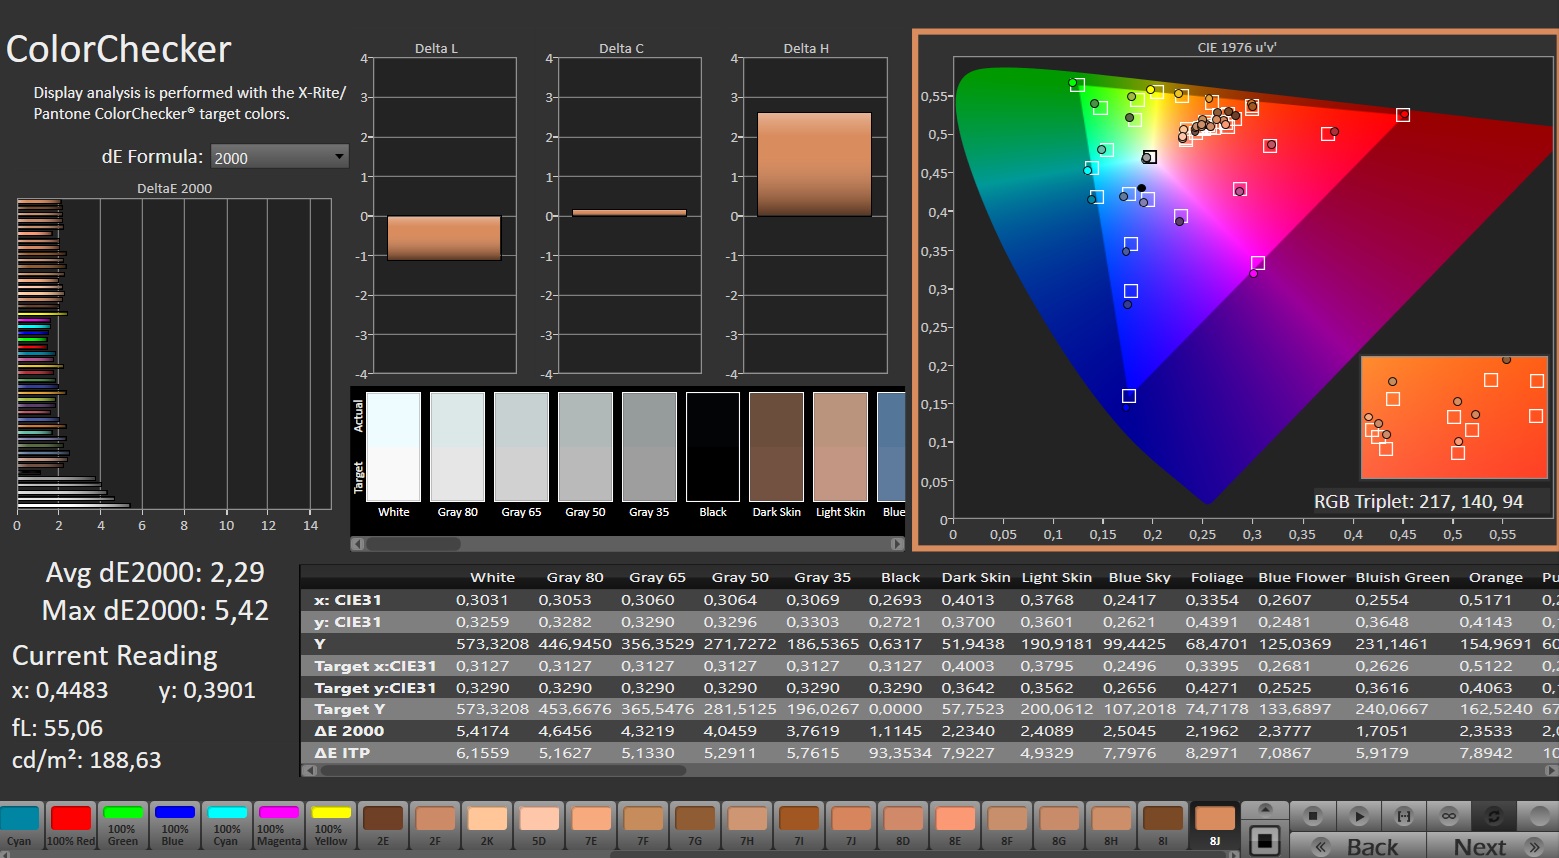
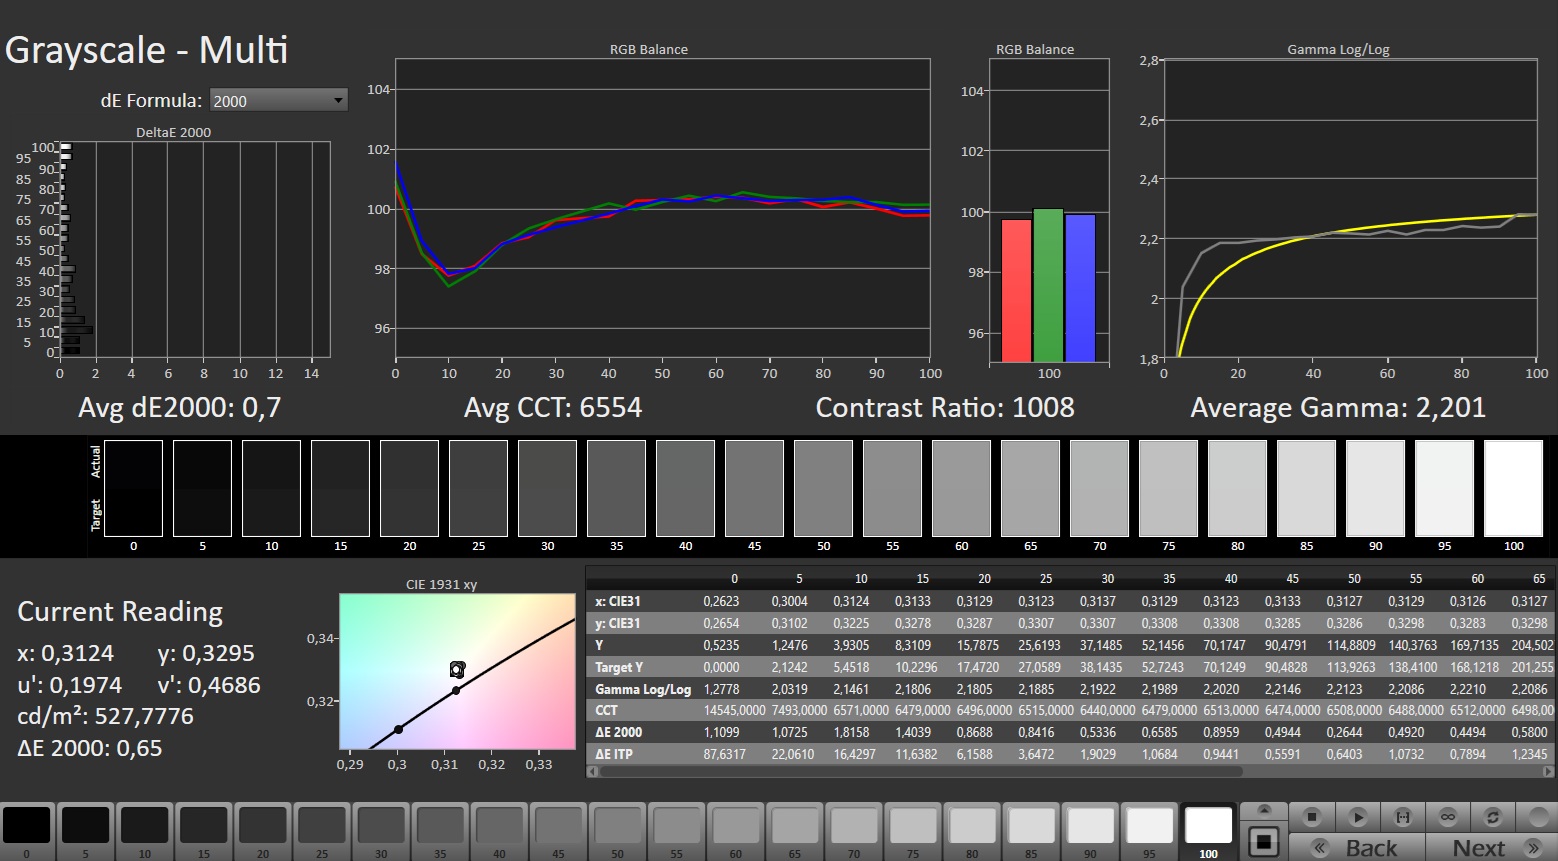
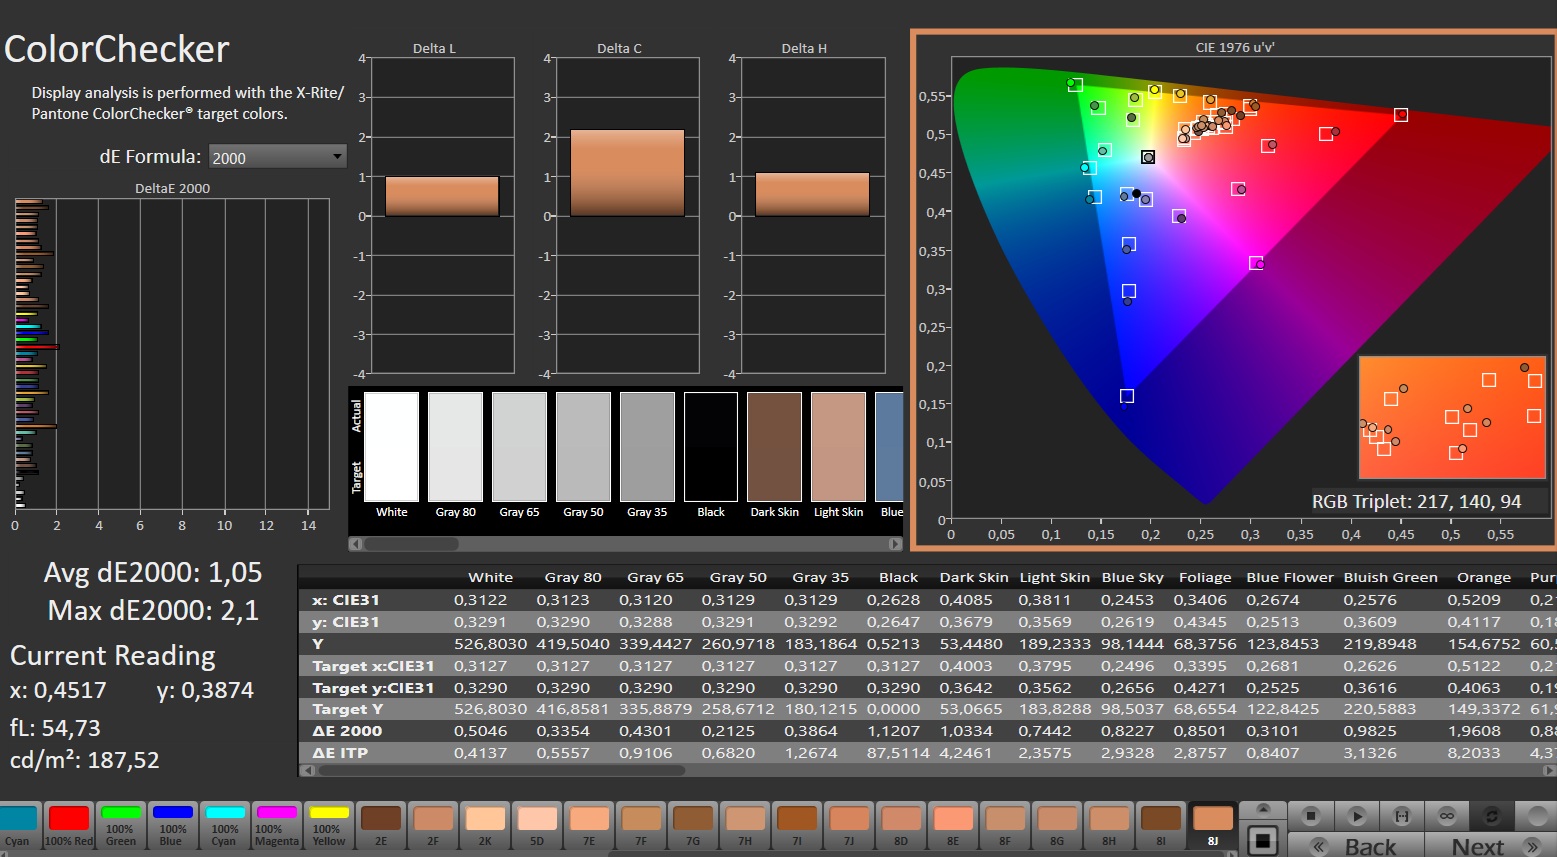
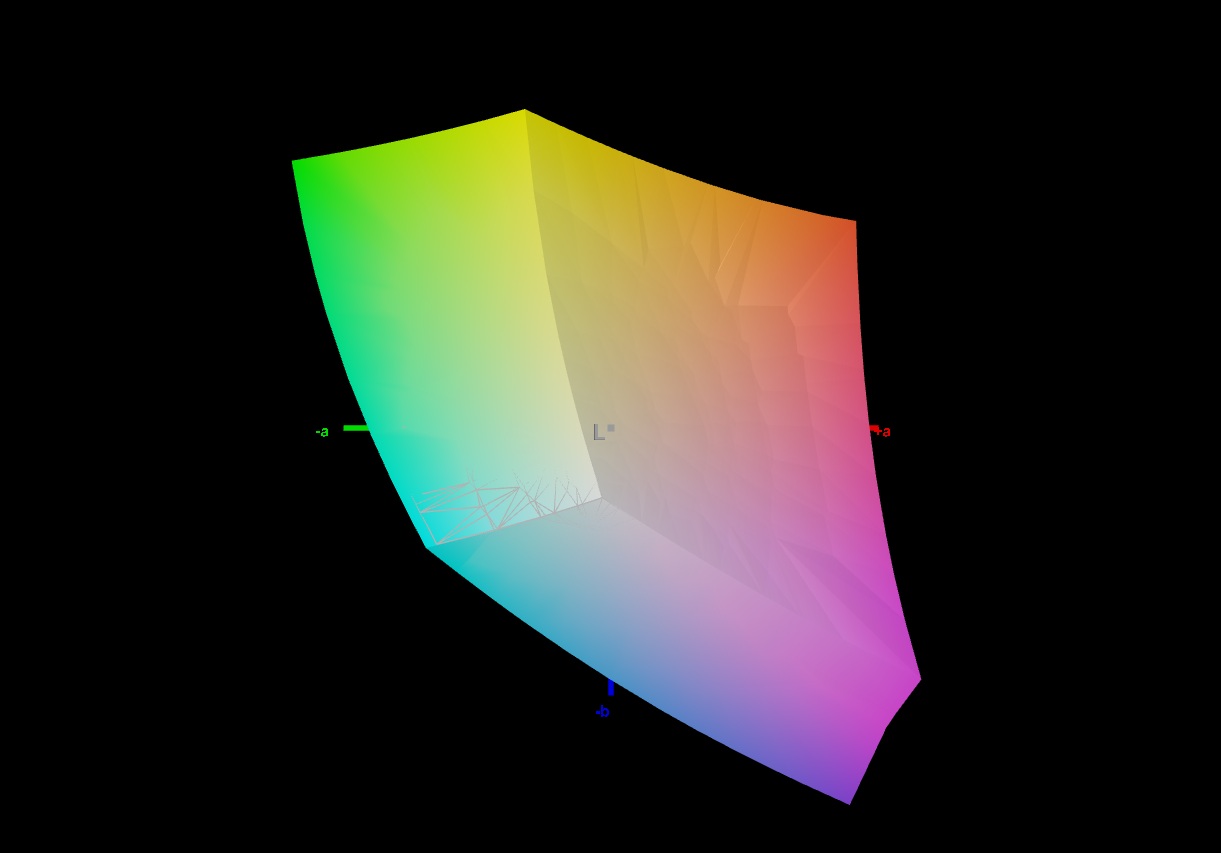
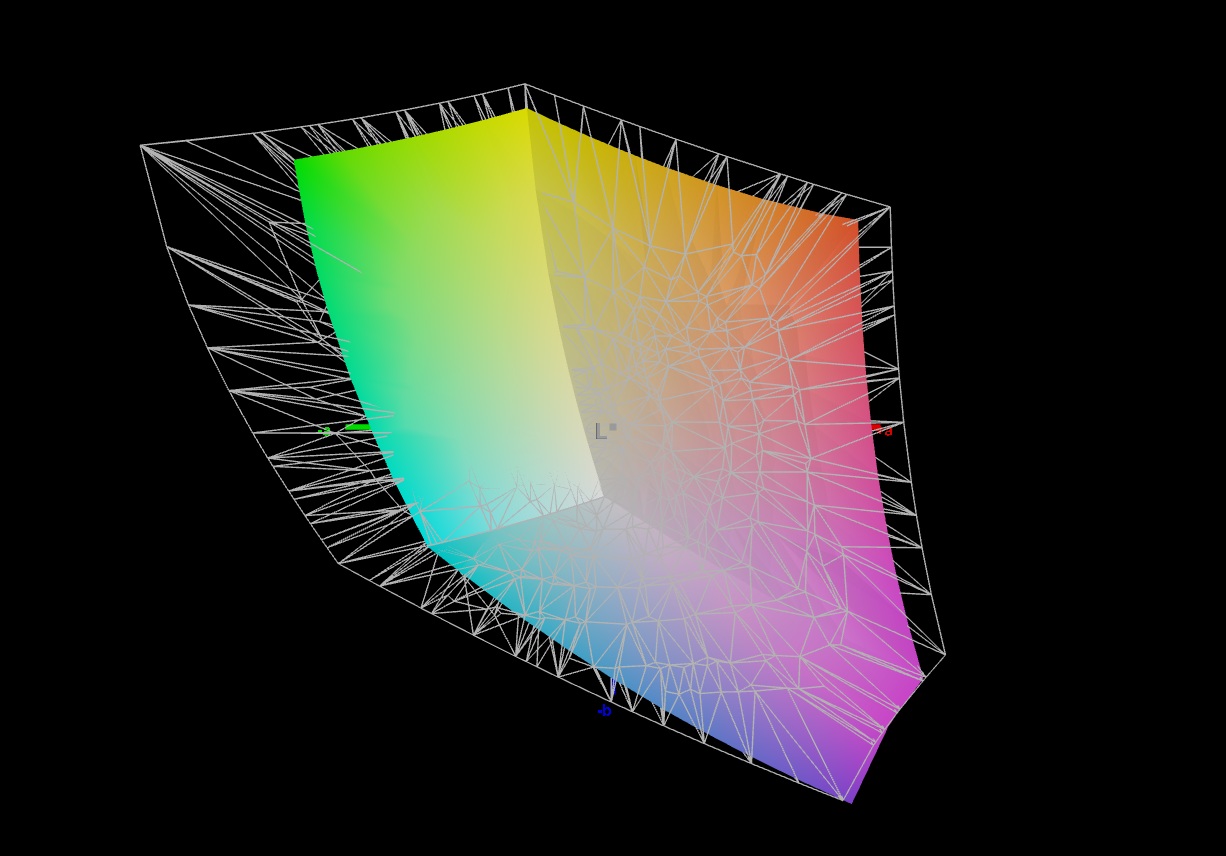
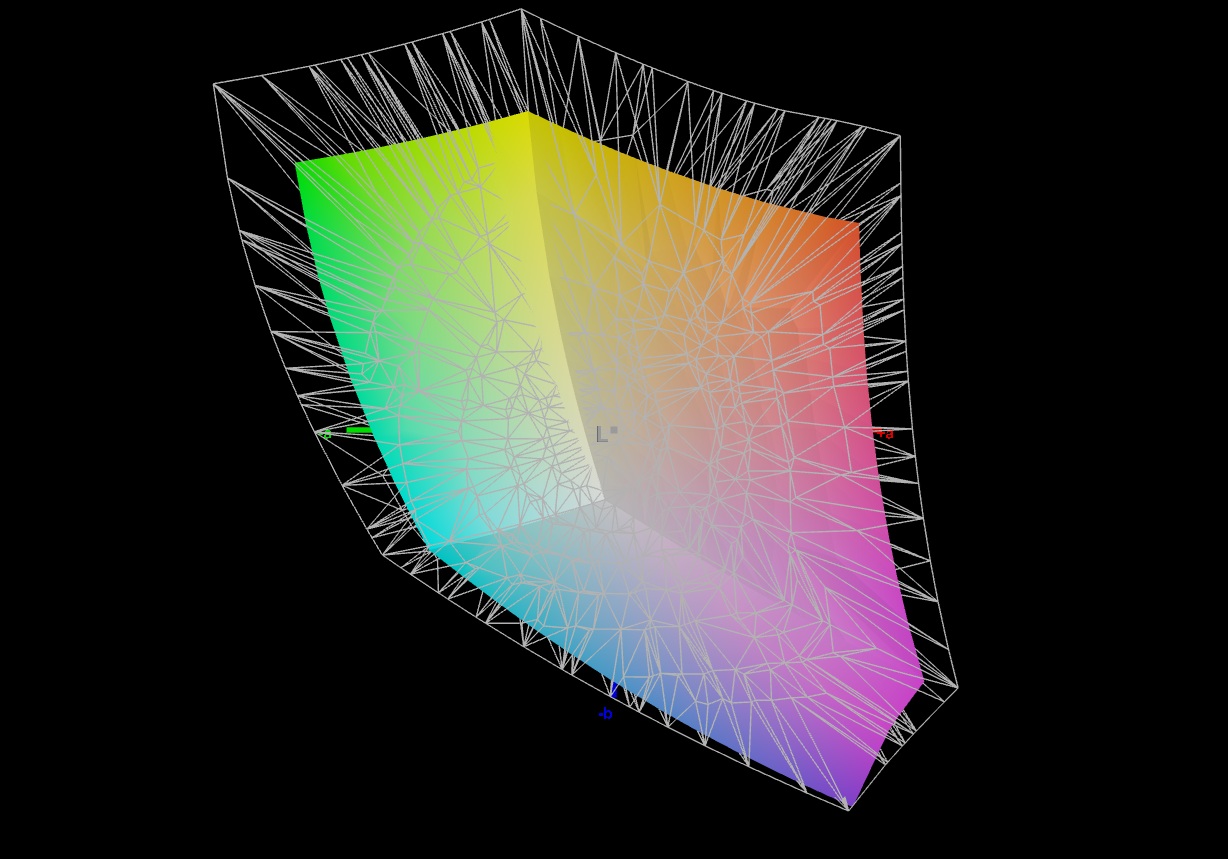
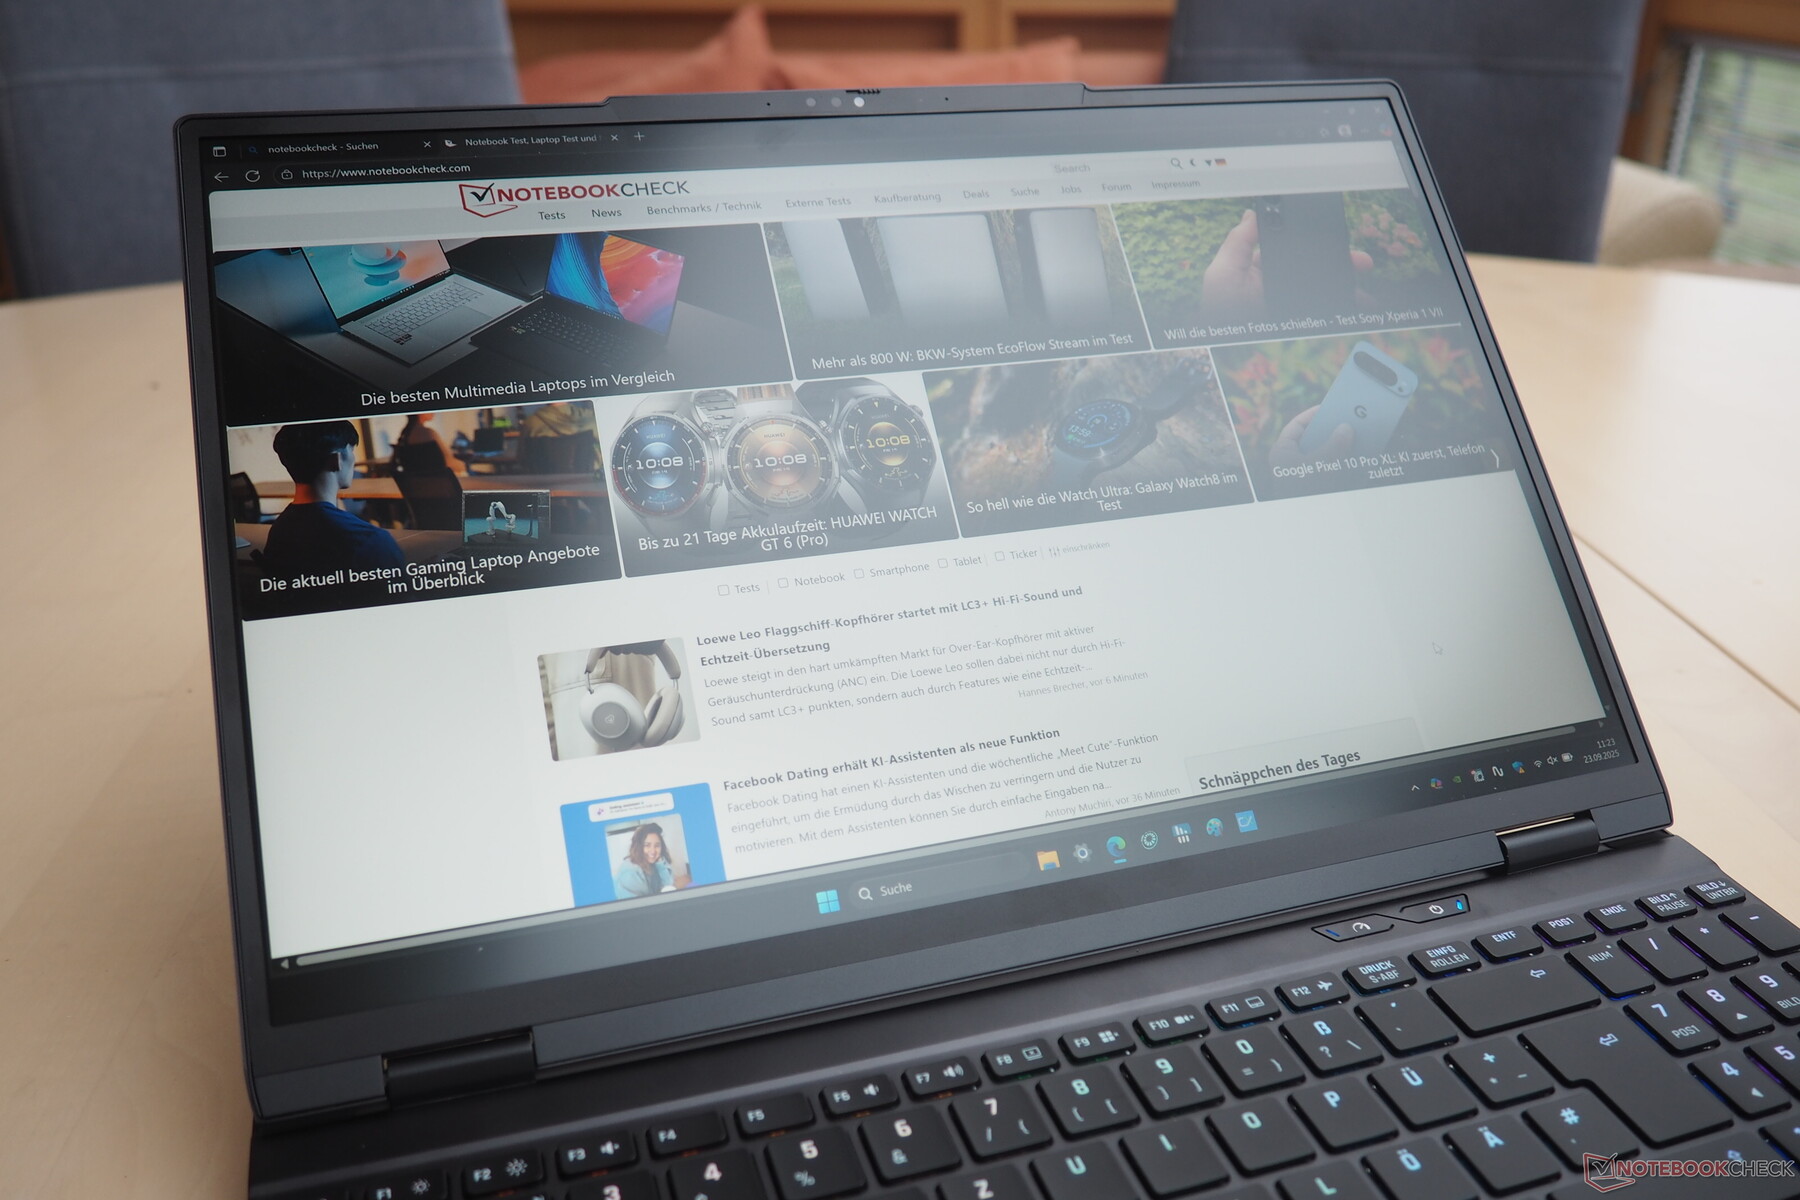
Le fabricant a choisi une dalle IPS pour l'écran, qui convient aux pièces plus lumineuses et à une utilisation extérieure occasionnelle avec une moyenne de 530 cd/m². Le niveau de noir n'étant pas aussi parfait (0,54 cd/m²), le contraste n'atteint qu'environ 1.000:1. Le panneau OLED du Legion 5 y parvient beaucoup mieux, mais il doit faire face à de fortes réflexions. Les acheteurs devront se contenter de l'espace colorimétrique sRGB, car les normes DCI-P3 et AdobeRGB ne sont pas entièrement couvertes. Cependant, la précision des couleurs est déjà bonne dès la sortie de la boîte.
| |||||||||||||||||||||||||
Homogénéité de la luminosité: 94 %
Valeur mesurée au centre, sur batterie: 545 cd/m²
Contraste: 1009:1 (Valeurs des noirs: 0.54 cd/m²)
ΔE ColorChecker Calman: 2.29 | ∀{0.5-29.43 Ø4.81}
calibrated: 1.05
ΔE Greyscale Calman: 3.5 | ∀{0.09-98 Ø5.1}
73.6% AdobeRGB 1998 (Argyll 3D)
99.9% sRGB (Argyll 3D)
71.7% Display P3 (Argyll 3D)
Gamma: 2.317
CCT: 6957 K
| SCHENKER XMG Core 15 (M25) NE153QDM-NZ2 (BOE0D5F), IPS, 2560x1600, 15.3", 300 Hz | Lenovo LOQ 15AHP10 CSOT MNF601BA1-4, IPS, 1920x1080, 15.6", 144 Hz | Lenovo Legion 5 15AHP G10 LEN151WQXGA, OLED, 2560x1600, 15.1", 165 Hz | Medion Erazer Scout 17 E1 MD62758 BOEhydis NV173FHM-NX4, IPS, 1920x1080, 17.3", 144 Hz | MSI Katana 17 HX B14WGK CSOT MNH301CA3-1, IPS, 2560x1440, 17.3", 240 Hz | SCHENKER XMG Core 15 (M24) BOE NJ NE153QDM-NZ1 (BOE0C8E), IPS, 2560x1600, 15.3", 240 Hz | |
|---|---|---|---|---|---|---|
| Display | -4% | 24% | -46% | 19% | 1% | |
| Display P3 Coverage (%) | 71.7 | 67.3 -6% | 99.9 39% | 37.7 -47% | 97.3 36% | 73.2 2% |
| sRGB Coverage (%) | 99.9 | 99.2 -1% | 100 0% | 56.3 -44% | 99.6 0% | 100 0% |
| AdobeRGB 1998 Coverage (%) | 73.6 | 69.1 -6% | 98.3 34% | 39 -47% | 89 21% | 74.6 1% |
| Response Times | -249% | 95% | -137% | -13% | -31% | |
| Response Time Grey 50% / Grey 80% * (ms) | 12.4 ? | 33.9 ? -173% | 0.42 ? 97% | 21.4 ? -73% | 5.2 ? 58% | 9.6 ? 23% |
| Response Time Black / White * (ms) | 5 ? | 21.2 ? -324% | 0.4 ? 92% | 15 ? -200% | 9.2 ? -84% | 9.2 ? -84% |
| PWM Frequency (Hz) | 1152 ? | |||||
| PWM Amplitude * (%) | 11 | |||||
| Screen | 16% | 29% | -79% | 7% | 9% | |
| Brightness middle (cd/m²) | 545 | 318 -42% | 492 -10% | 279 -49% | 296 -46% | 635 17% |
| Brightness (cd/m²) | 530 | 300 -43% | 495 -7% | 260 -51% | 272 -49% | 604 14% |
| Brightness Distribution (%) | 94 | 89 -5% | 92 -2% | 90 -4% | 87 -7% | 91 -3% |
| Black Level * (cd/m²) | 0.54 | 0.2 63% | 0.24 56% | 0.27 50% | 0.64 -19% | |
| Contrast (:1) | 1009 | 1590 58% | 1163 15% | 1096 9% | 992 -2% | |
| Colorchecker dE 2000 * | 2.29 | 1.33 42% | 0.9 61% | 4.97 -117% | 1.35 41% | 1.89 17% |
| Colorchecker dE 2000 max. * | 5.42 | 4.42 18% | 1.8 67% | 20.52 -279% | 4.76 12% | 3.14 42% |
| Colorchecker dE 2000 calibrated * | 1.05 | 0.94 10% | 4.58 -336% | 0.78 26% | 1.14 -9% | |
| Greyscale dE 2000 * | 3.5 | 1.9 46% | 1.2 66% | 1.7 51% | 2.7 23% | 2.53 28% |
| Gamma | 2.317 95% | 2.187 101% | 2.16 102% | 2.201 100% | 2.201 100% | 2.36 93% |
| CCT | 6957 93% | 6678 97% | 6291 103% | 6937 94% | 6770 96% | 6434 101% |
| Moyenne finale (programmes/paramètres) | -79% /
-26% | 49% /
40% | -87% /
-80% | 4% /
6% | -7% /
2% |
* ... Moindre est la valeur, meilleures sont les performances

Temps de réponse de l'écran
| ↔ Temps de réponse noir à blanc | ||
|---|---|---|
| 5 ms ... hausse ↗ et chute ↘ combinées | ↗ 1.4 ms hausse | 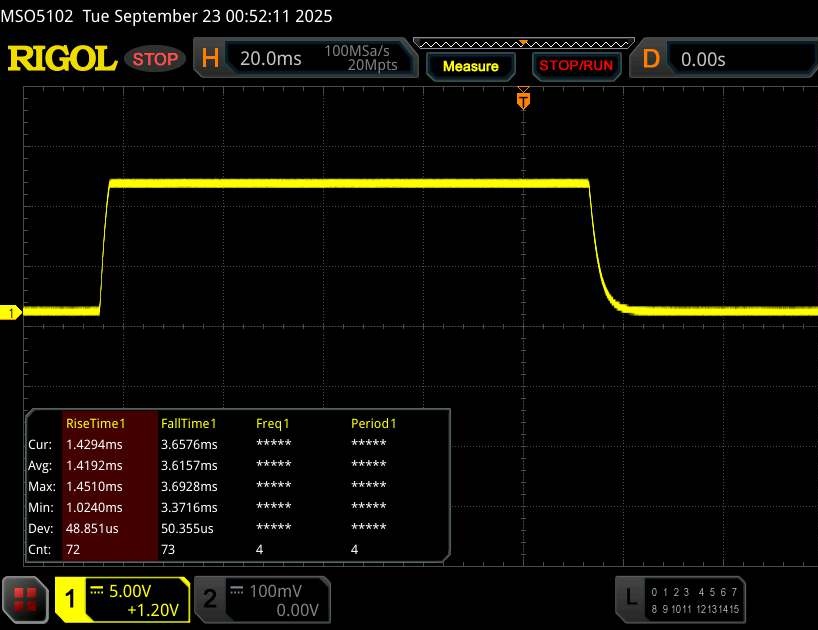 |
| ↘ 3.6 ms chute | ||
| L'écran montre de très faibles temps de réponse, parfait pour le jeu. En comparaison, tous les appareils testés affichent entre 0.1 (minimum) et 240 (maximum) ms. » 16 % des appareils testés affichent de meilleures performances. Cela signifie que les latences relevées sont meilleures que la moyenne (20.4 ms) de tous les appareils testés. | ||
| ↔ Temps de réponse gris 50% à gris 80% | ||
| 12.4 ms ... hausse ↗ et chute ↘ combinées | ↗ 5.8 ms hausse | 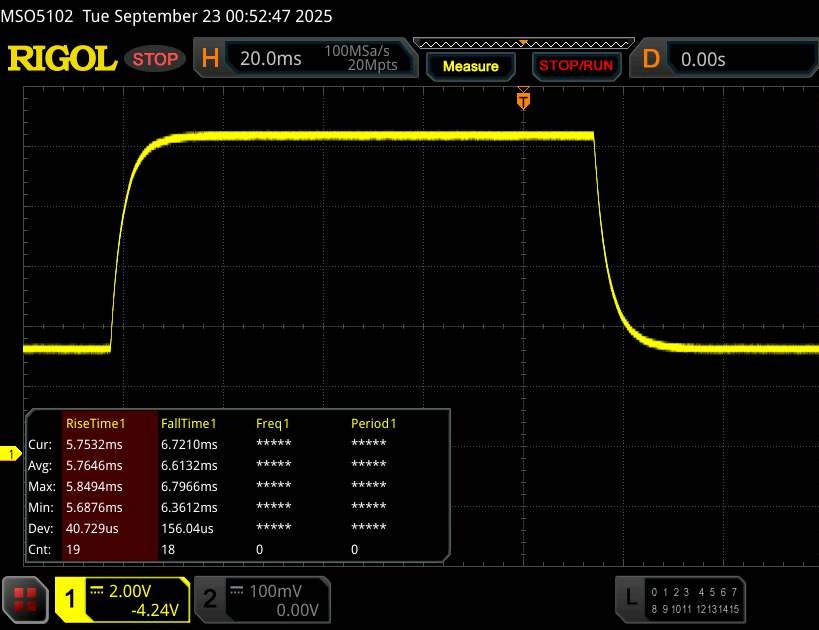 |
| ↘ 6.6 ms chute | ||
| L'écran montre de bons temps de réponse, mais insuffisant pour du jeu compétitif. En comparaison, tous les appareils testés affichent entre 0.165 (minimum) et 636 (maximum) ms. » 24 % des appareils testés affichent de meilleures performances. Cela signifie que les latences relevées sont meilleures que la moyenne (31.8 ms) de tous les appareils testés. | ||
Scintillement / MLI (Modulation de largeur d'impulsion)
| Scintillement / MLI (Modulation de largeur d'impulsion) non décelé | 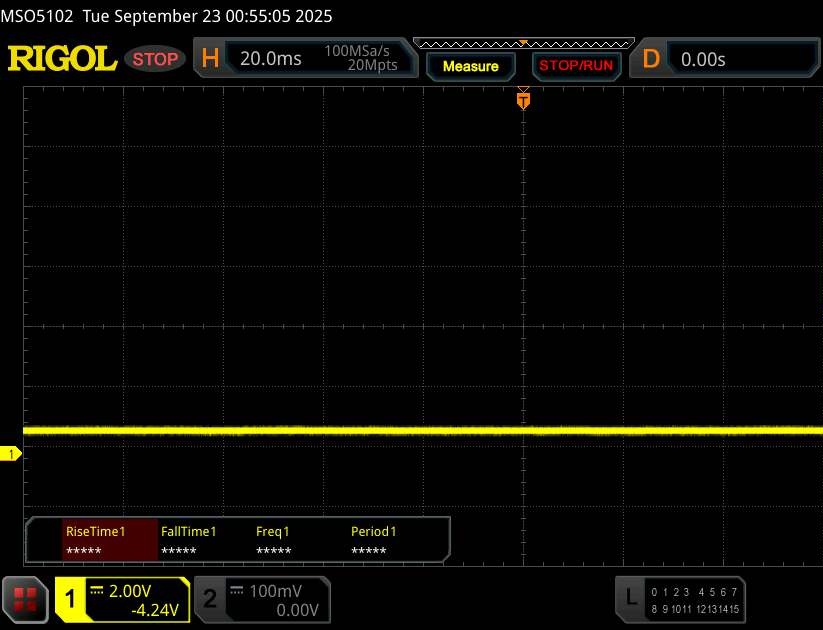 | ||
En comparaison, 53 % des appareils testés n'emploient pas MDI pour assombrir leur écran. Nous avons relevé une moyenne à 8228 (minimum : 5 - maximum : 343500) Hz dans le cas où une MDI était active. | |||

Performance
Conditions d'essai
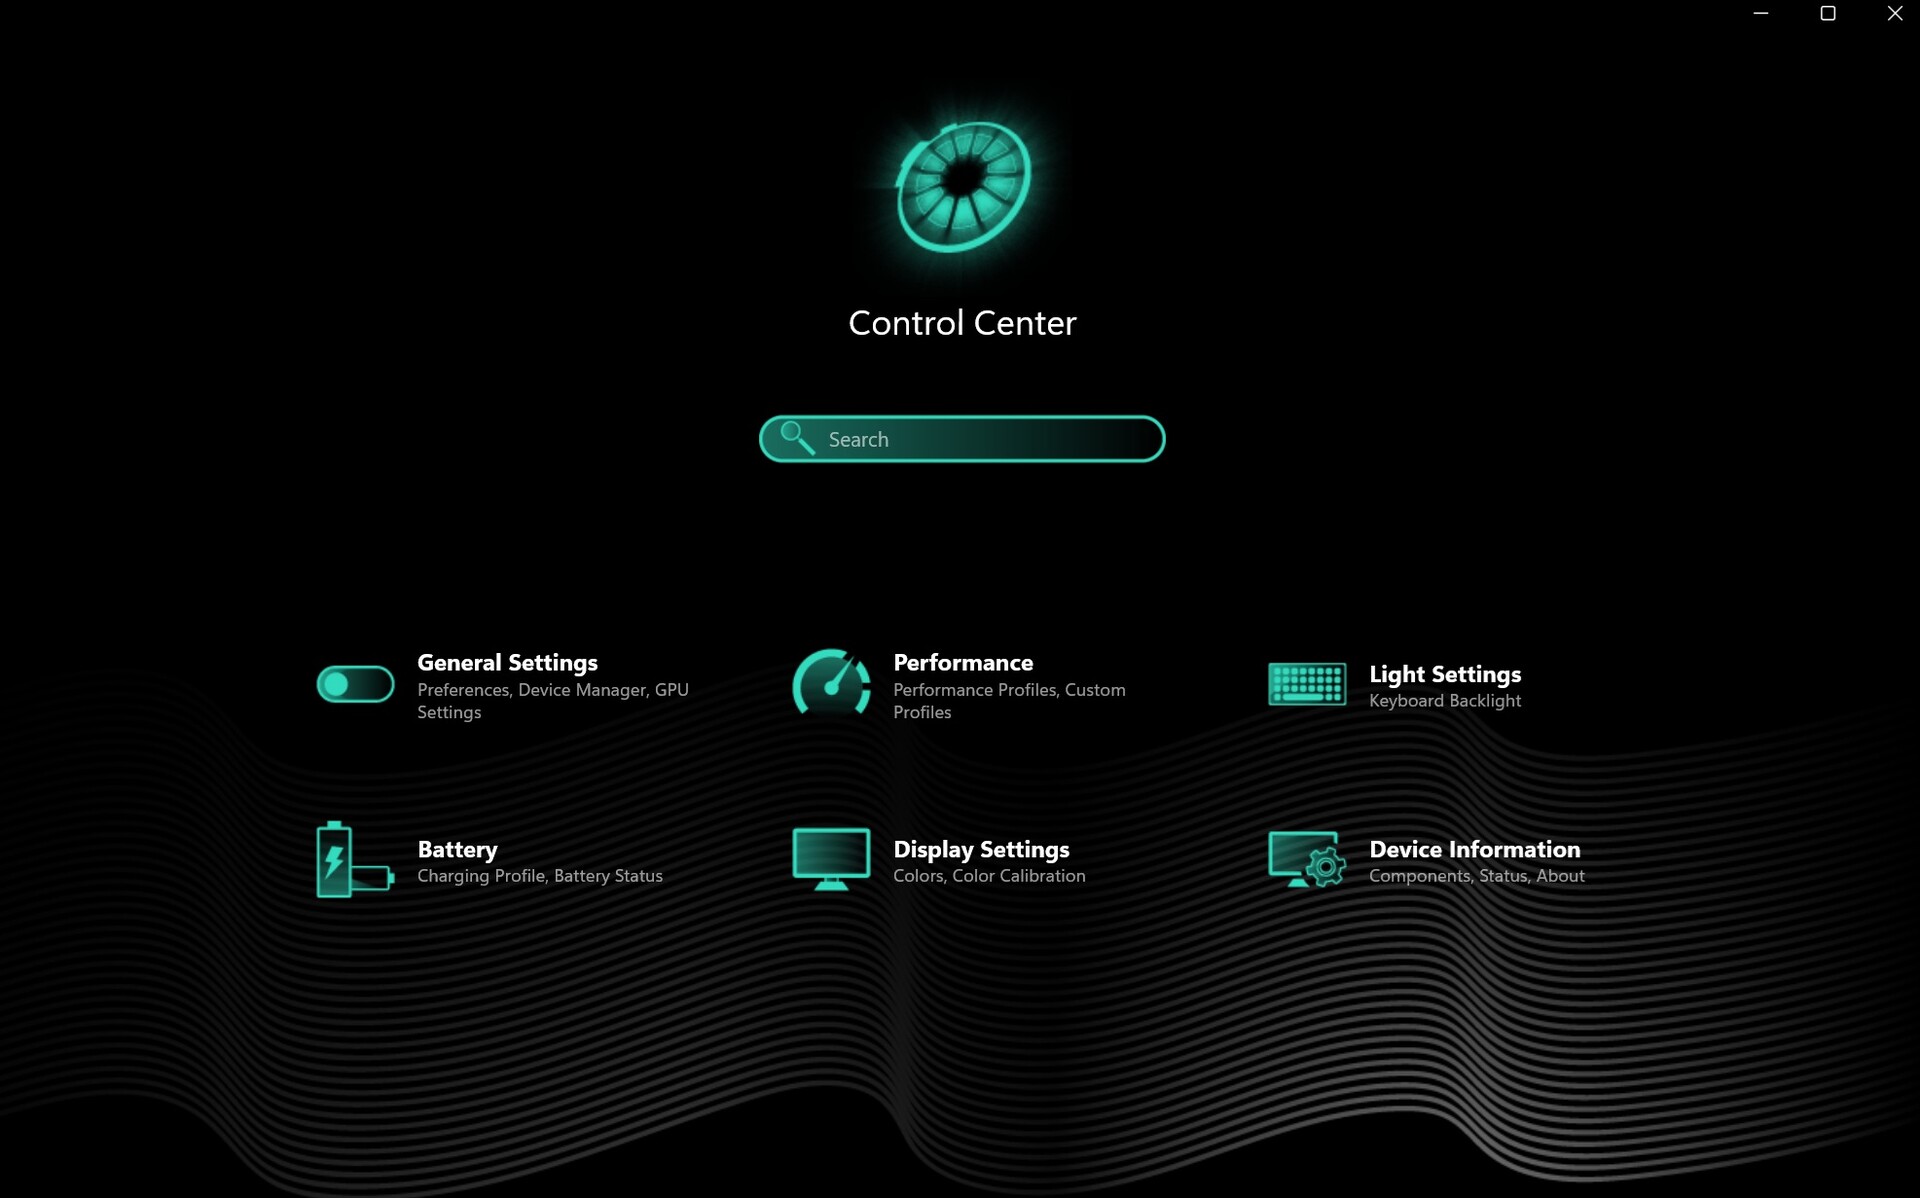
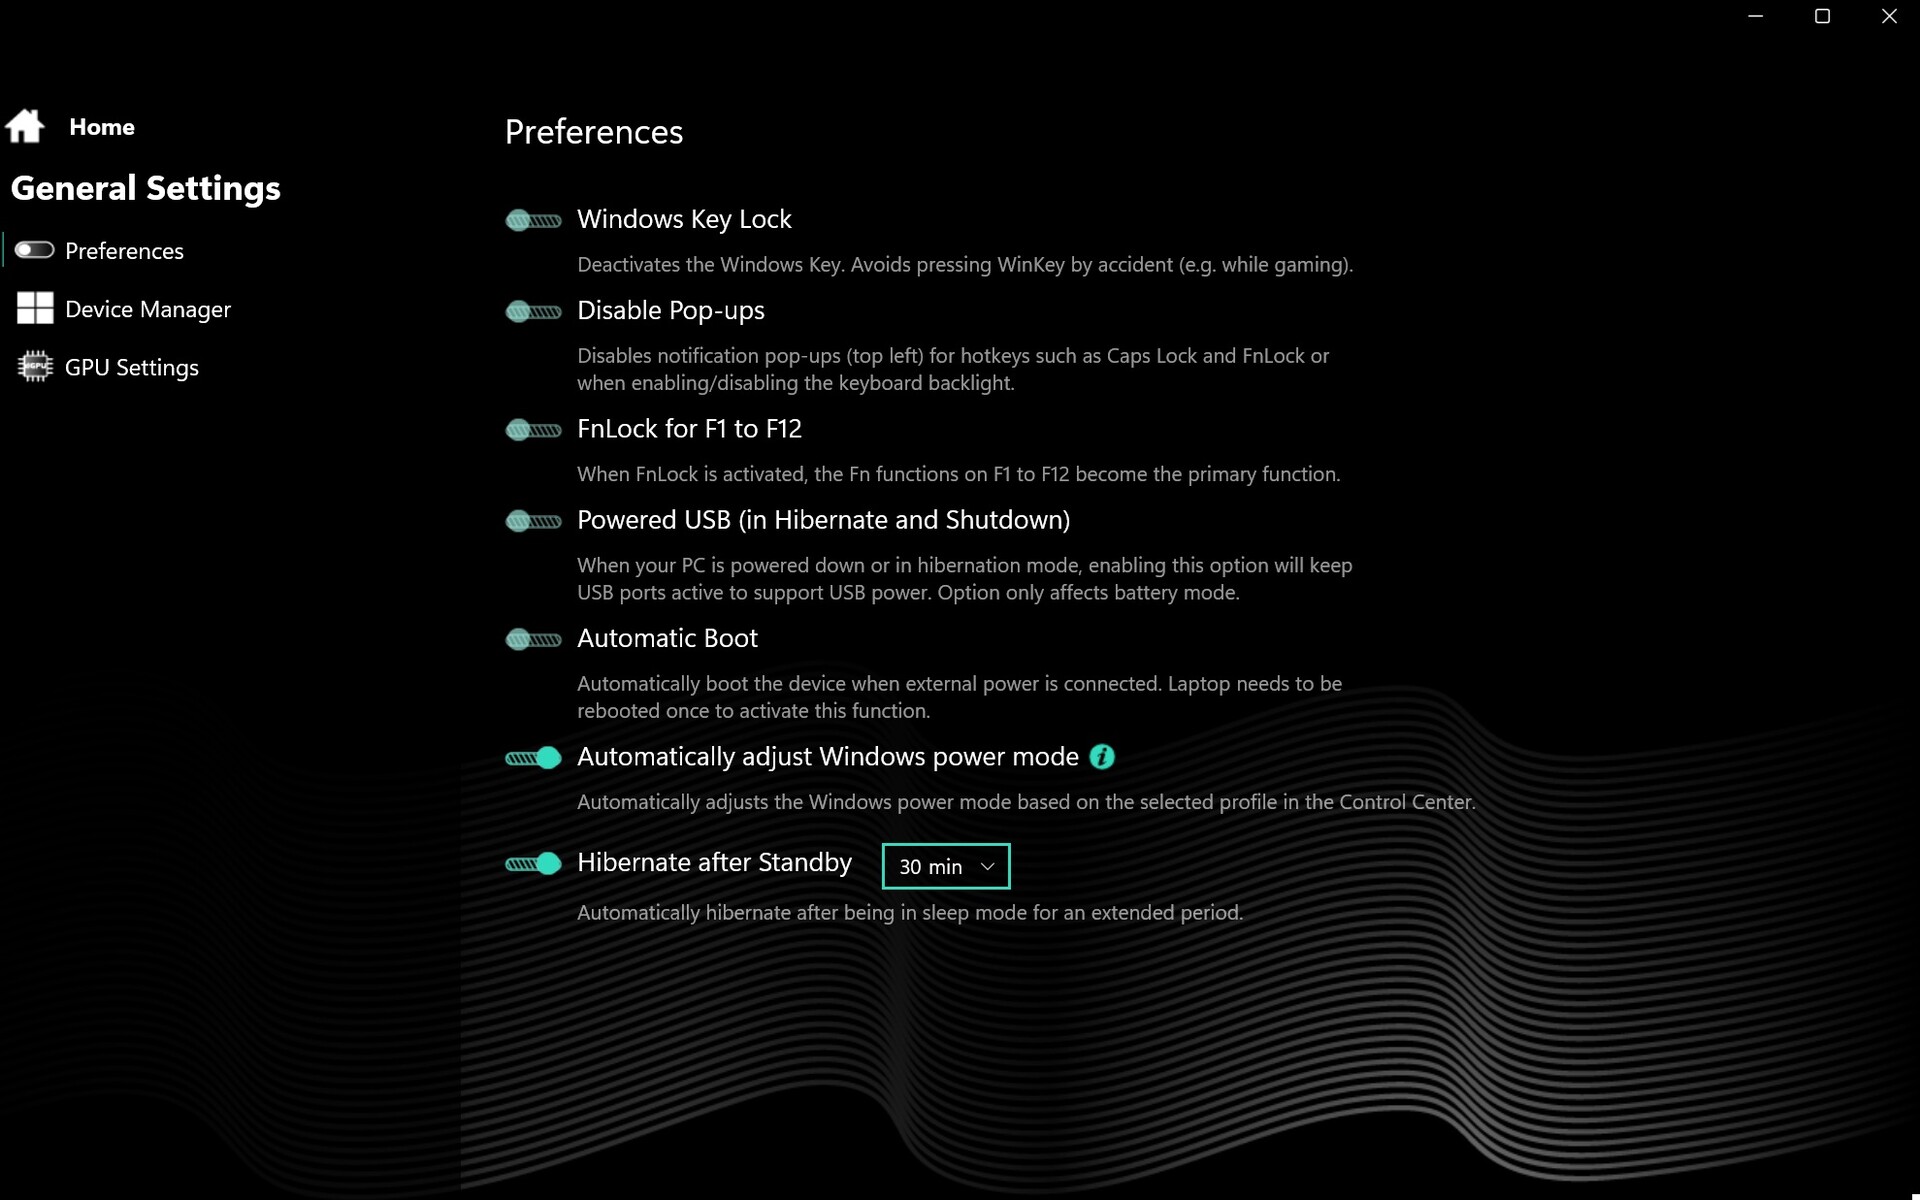
Le centre de contrôle préinstallé offre une variété de fonctions et de réglages. Les joueurs seront particulièrement intéressés par le menu des performances, qui propose trois profils (voir tableau). À l'exception du test de la batterie, toutes les mesures ont été prises en mode Overboost, avec l'overclocking du GPU désactivé. Vous pouvez également créer un profil personnalisé si vous le souhaitez.
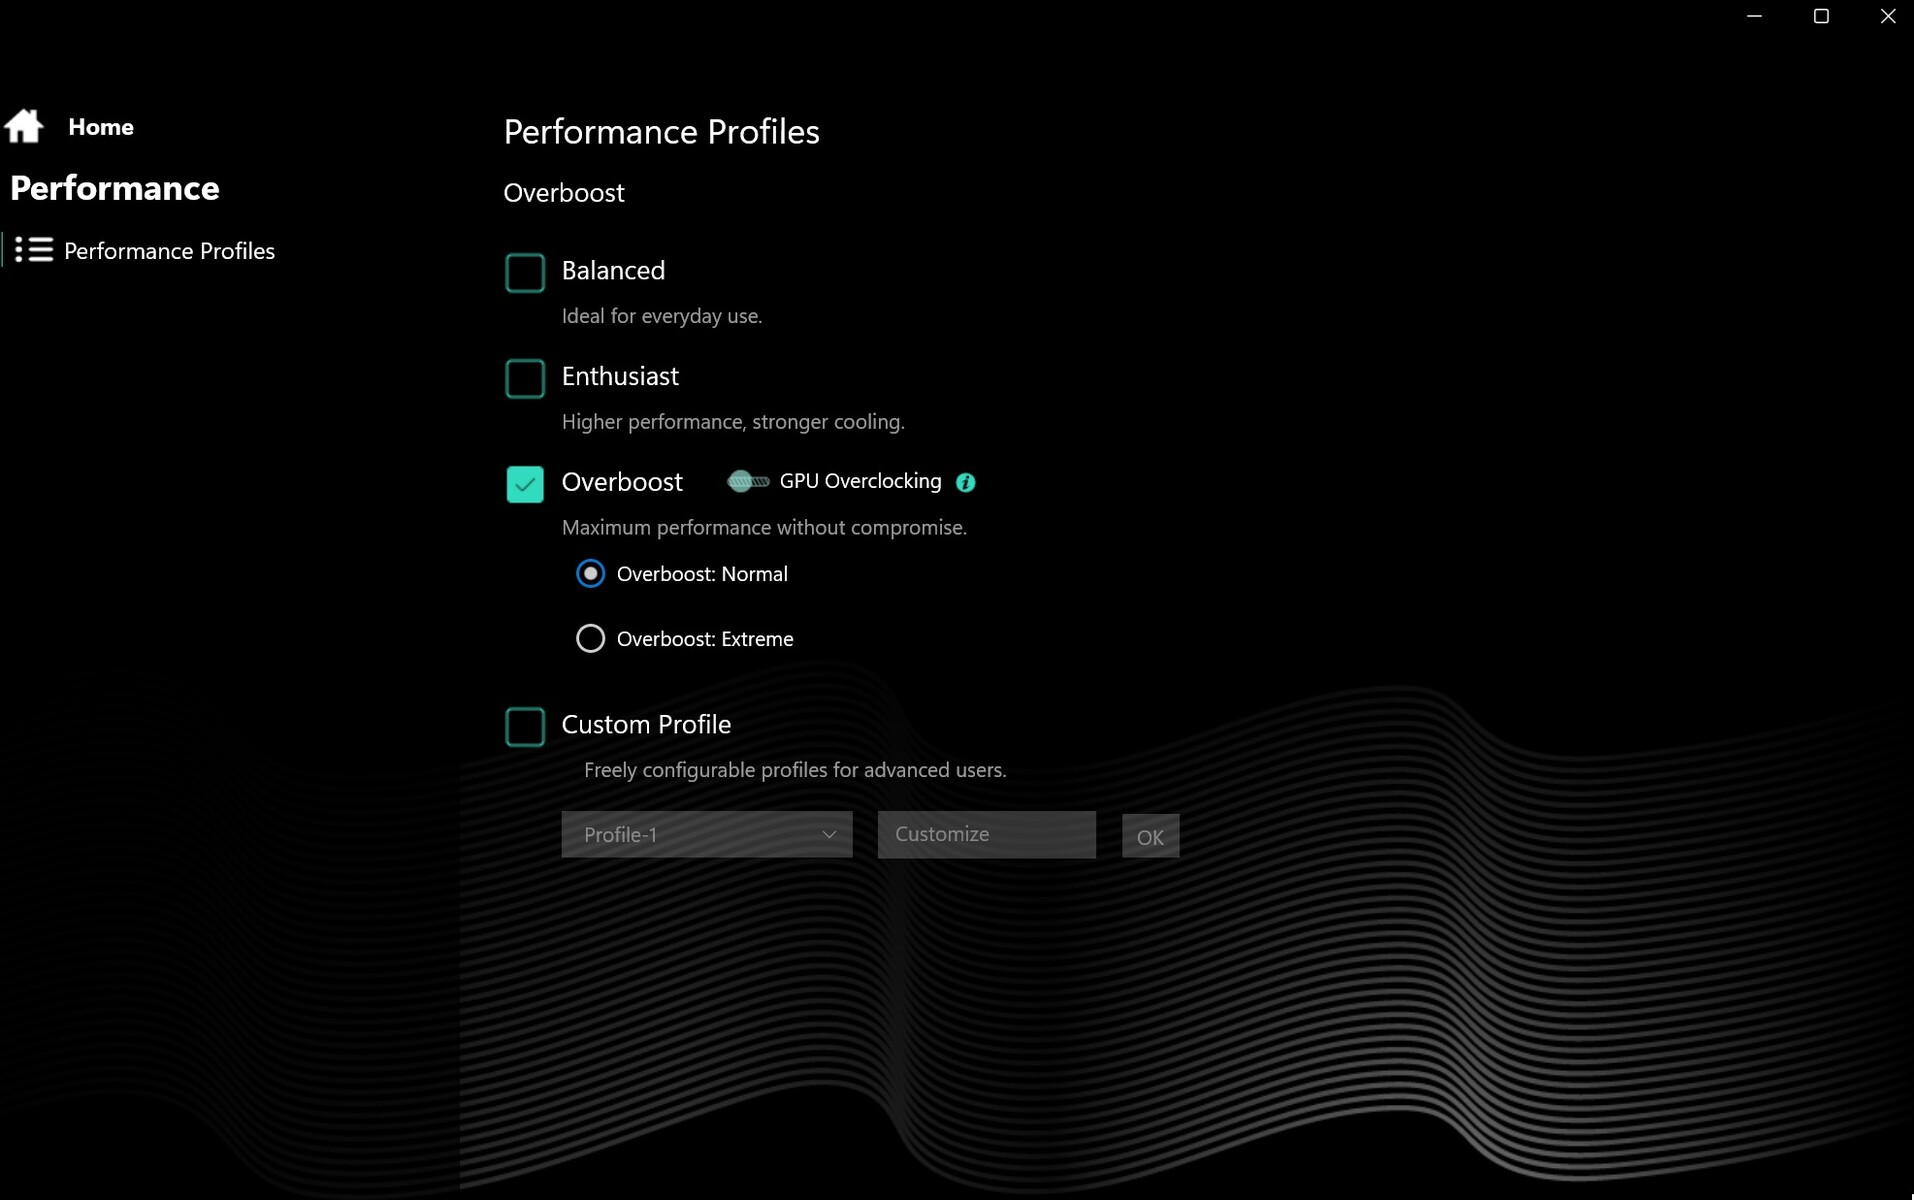
| Mode | Balanced | Enthusiast | Overboost |
| Cyberpunk 2077 Bruit | 34 dB(A) | 46 dB(A) | 49 dB(A) |
| Performances de Cyberpunk 2077 (FHD/Ultra) | 30 fps verrouillé | 79.1 fps | 84.3 fps |
| Consommation d'énergie du GPU de Cyberpunk 2077 | ~25 W | ~80 W | ~105 W |
| Cinebench R15 Multi Score | 2204 Points | 2570 Points | 2753 Points |
| CPU PL1 | 45 W | 54 W | 70 W |
| CPU PL2 | 65 W | 65 W | 105 W |
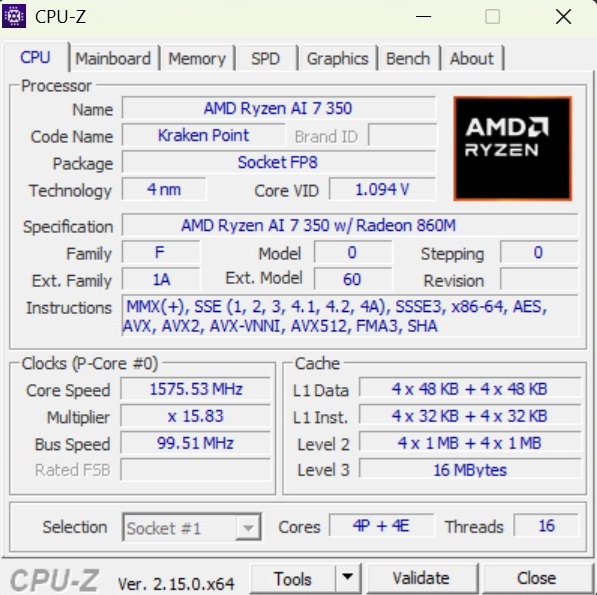
Processeur
Les Ryzen AI 7 350 est un processeur à huit cœurs capable de gérer jusqu'à 16 threads simultanément via SMT. Dans la boucle Cinebench, la puce de 4 nm a fourni des performances assez constantes. Dans tous les benchmarks, l'ancien XMG Core 15, le Ryzen 7 8845HS, a été le plus performant Ryzen 7 8845HS de l'ancien XMG Core 15 a été légèrement plus rapide, tandis que la puce Legion 5 Ryzen 7 260 de l'ancien XMG Core 15 était légèrement plus rapide, tandis que le Ryzen 7 260 de l'ancien 5 affichait des performances similaires.
Test d'endurance multiple Cinebench R15
* ... Moindre est la valeur, meilleures sont les performances
AIDA64: FP32 Ray-Trace | FPU Julia | CPU SHA3 | CPU Queen | FPU SinJulia | FPU Mandel | CPU AES | CPU ZLib | FP64 Ray-Trace | CPU PhotoWorxx
| Performance Rating | |
| Moyenne de la classe Gaming | |
| SCHENKER XMG Core 15 (M24) | |
| Lenovo Legion 5 15AHP G10 | |
| SCHENKER XMG Core 15 (M25) | |
| Lenovo LOQ 15AHP10 | |
| Moyenne AMD Ryzen AI 7 350 | |
| MSI Katana 17 HX B14WGK | |
| Medion Erazer Scout 17 E1 MD62758 | |
| AIDA64 / FP32 Ray-Trace | |
| SCHENKER XMG Core 15 (M24) | |
| Lenovo Legion 5 15AHP G10 | |
| SCHENKER XMG Core 15 (M25) | |
| Moyenne de la classe Gaming (7192 - 85542, n=133, 2 dernières années) | |
| Moyenne AMD Ryzen AI 7 350 (20203 - 28112, n=12) | |
| Lenovo LOQ 15AHP10 | |
| MSI Katana 17 HX B14WGK | |
| Medion Erazer Scout 17 E1 MD62758 | |
| AIDA64 / FPU Julia | |
| Moyenne de la classe Gaming (35040 - 252486, n=133, 2 dernières années) | |
| SCHENKER XMG Core 15 (M24) | |
| Lenovo Legion 5 15AHP G10 | |
| SCHENKER XMG Core 15 (M25) | |
| Lenovo LOQ 15AHP10 | |
| Moyenne AMD Ryzen AI 7 350 (75098 - 108991, n=12) | |
| MSI Katana 17 HX B14WGK | |
| Medion Erazer Scout 17 E1 MD62758 | |
| AIDA64 / CPU SHA3 | |
| Moyenne de la classe Gaming (1728 - 10389, n=133, 2 dernières années) | |
| SCHENKER XMG Core 15 (M24) | |
| Lenovo Legion 5 15AHP G10 | |
| Lenovo LOQ 15AHP10 | |
| SCHENKER XMG Core 15 (M25) | |
| Moyenne AMD Ryzen AI 7 350 (3395 - 4399, n=12) | |
| MSI Katana 17 HX B14WGK | |
| Medion Erazer Scout 17 E1 MD62758 | |
| AIDA64 / CPU Queen | |
| SCHENKER XMG Core 15 (M24) | |
| Lenovo Legion 5 15AHP G10 | |
| Moyenne de la classe Gaming (50699 - 200651, n=133, 2 dernières années) | |
| Lenovo LOQ 15AHP10 | |
| MSI Katana 17 HX B14WGK | |
| Medion Erazer Scout 17 E1 MD62758 | |
| SCHENKER XMG Core 15 (M25) | |
| Moyenne AMD Ryzen AI 7 350 (67317 - 77400, n=12) | |
| AIDA64 / FPU SinJulia | |
| SCHENKER XMG Core 15 (M24) | |
| Lenovo Legion 5 15AHP G10 | |
| Lenovo LOQ 15AHP10 | |
| Moyenne de la classe Gaming (5020 - 33636, n=133, 2 dernières années) | |
| SCHENKER XMG Core 15 (M25) | |
| Moyenne AMD Ryzen AI 7 350 (11916 - 13856, n=12) | |
| MSI Katana 17 HX B14WGK | |
| Medion Erazer Scout 17 E1 MD62758 | |
| AIDA64 / FPU Mandel | |
| SCHENKER XMG Core 15 (M24) | |
| Moyenne de la classe Gaming (17585 - 134044, n=133, 2 dernières années) | |
| Lenovo Legion 5 15AHP G10 | |
| SCHENKER XMG Core 15 (M25) | |
| Lenovo LOQ 15AHP10 | |
| Moyenne AMD Ryzen AI 7 350 (39456 - 58771, n=11) | |
| MSI Katana 17 HX B14WGK | |
| Medion Erazer Scout 17 E1 MD62758 | |
| AIDA64 / CPU AES | |
| Moyenne de la classe Gaming (19065 - 247074, n=133, 2 dernières années) | |
| SCHENKER XMG Core 15 (M24) | |
| SCHENKER XMG Core 15 (M25) | |
| Moyenne AMD Ryzen AI 7 350 (56915 - 87670, n=12) | |
| Lenovo Legion 5 15AHP G10 | |
| Lenovo LOQ 15AHP10 | |
| MSI Katana 17 HX B14WGK | |
| Medion Erazer Scout 17 E1 MD62758 | |
| AIDA64 / CPU ZLib | |
| Moyenne de la classe Gaming (373 - 2531, n=133, 2 dernières années) | |
| SCHENKER XMG Core 15 (M25) | |
| Lenovo Legion 5 15AHP G10 | |
| Lenovo LOQ 15AHP10 | |
| Moyenne AMD Ryzen AI 7 350 (839 - 1138, n=12) | |
| MSI Katana 17 HX B14WGK | |
| SCHENKER XMG Core 15 (M24) | |
| Medion Erazer Scout 17 E1 MD62758 | |
| AIDA64 / FP64 Ray-Trace | |
| SCHENKER XMG Core 15 (M24) | |
| Lenovo Legion 5 15AHP G10 | |
| SCHENKER XMG Core 15 (M25) | |
| Moyenne de la classe Gaming (3856 - 45446, n=133, 2 dernières années) | |
| Moyenne AMD Ryzen AI 7 350 (10707 - 15203, n=11) | |
| Lenovo LOQ 15AHP10 | |
| MSI Katana 17 HX B14WGK | |
| Medion Erazer Scout 17 E1 MD62758 | |
| AIDA64 / CPU PhotoWorxx | |
| SCHENKER XMG Core 15 (M25) | |
| Moyenne de la classe Gaming (10805 - 62916, n=133, 2 dernières années) | |
| SCHENKER XMG Core 15 (M24) | |
| Moyenne AMD Ryzen AI 7 350 (25283 - 47405, n=12) | |
| Lenovo Legion 5 15AHP G10 | |
| Medion Erazer Scout 17 E1 MD62758 | |
| MSI Katana 17 HX B14WGK | |
| Lenovo LOQ 15AHP10 | |
Performance du système
Dans les tests système, le nouveau Core 15 se place en tête de la comparaison, devancé uniquement par le Katana 17. En revanche, dans les tests de mémoire, l'ordinateur portable Schenker occupe la première place.
PCMark 10: Essentials
CrossMark: Overall | Productivity | Creativity | Responsiveness
WebXPRT 3: Overall
WebXPRT 4: Overall
Mozilla Kraken 1.1: Total
| Performance Rating | |
| Moyenne de la classe Gaming | |
| MSI Katana 17 HX B14WGK | |
| SCHENKER XMG Core 15 (M24) | |
| Lenovo Legion 5 15AHP G10 | |
| SCHENKER XMG Core 15 (M25) | |
| Moyenne AMD Ryzen AI 7 350, Nvidia GeForce RTX 5060 Laptop | |
| Lenovo LOQ 15AHP10 -2! | |
| Medion Erazer Scout 17 E1 MD62758 -1! | |
| PCMark 10 / Essentials | |
| Lenovo Legion 5 15AHP G10 | |
| SCHENKER XMG Core 15 (M25) | |
| Moyenne AMD Ryzen AI 7 350, Nvidia GeForce RTX 5060 Laptop (n=1) | |
| Moyenne de la classe Gaming (9057 - 12600, n=117, 2 dernières années) | |
| Lenovo LOQ 15AHP10 | |
| MSI Katana 17 HX B14WGK | |
| SCHENKER XMG Core 15 (M24) | |
| Medion Erazer Scout 17 E1 MD62758 | |
| CrossMark / Overall | |
| Moyenne de la classe Gaming (1247 - 2344, n=106, 2 dernières années) | |
| MSI Katana 17 HX B14WGK | |
| SCHENKER XMG Core 15 (M24) | |
| Lenovo Legion 5 15AHP G10 | |
| Lenovo LOQ 15AHP10 | |
| SCHENKER XMG Core 15 (M25) | |
| Moyenne AMD Ryzen AI 7 350, Nvidia GeForce RTX 5060 Laptop (n=1) | |
| Medion Erazer Scout 17 E1 MD62758 | |
| CrossMark / Productivity | |
| MSI Katana 17 HX B14WGK | |
| Moyenne de la classe Gaming (1299 - 2211, n=106, 2 dernières années) | |
| SCHENKER XMG Core 15 (M24) | |
| Lenovo LOQ 15AHP10 | |
| Lenovo Legion 5 15AHP G10 | |
| SCHENKER XMG Core 15 (M25) | |
| Moyenne AMD Ryzen AI 7 350, Nvidia GeForce RTX 5060 Laptop (n=1) | |
| Medion Erazer Scout 17 E1 MD62758 | |
| CrossMark / Creativity | |
| Moyenne de la classe Gaming (1275 - 2729, n=106, 2 dernières années) | |
| SCHENKER XMG Core 15 (M24) | |
| MSI Katana 17 HX B14WGK | |
| Lenovo Legion 5 15AHP G10 | |
| SCHENKER XMG Core 15 (M25) | |
| Moyenne AMD Ryzen AI 7 350, Nvidia GeForce RTX 5060 Laptop (n=1) | |
| Lenovo LOQ 15AHP10 | |
| Medion Erazer Scout 17 E1 MD62758 | |
| CrossMark / Responsiveness | |
| MSI Katana 17 HX B14WGK | |
| Moyenne de la classe Gaming (1030 - 2330, n=106, 2 dernières années) | |
| Lenovo LOQ 15AHP10 | |
| SCHENKER XMG Core 15 (M24) | |
| Lenovo Legion 5 15AHP G10 | |
| SCHENKER XMG Core 15 (M25) | |
| Moyenne AMD Ryzen AI 7 350, Nvidia GeForce RTX 5060 Laptop (n=1) | |
| Medion Erazer Scout 17 E1 MD62758 | |
| WebXPRT 3 / Overall | |
| Moyenne de la classe Gaming (237 - 532, n=108, 2 dernières années) | |
| Lenovo Legion 5 15AHP G10 | |
| SCHENKER XMG Core 15 (M24) | |
| MSI Katana 17 HX B14WGK | |
| SCHENKER XMG Core 15 (M25) | |
| Moyenne AMD Ryzen AI 7 350, Nvidia GeForce RTX 5060 Laptop (n=1) | |
| WebXPRT 4 / Overall | |
| Moyenne de la classe Gaming (176.4 - 341, n=105, 2 dernières années) | |
| MSI Katana 17 HX B14WGK | |
| SCHENKER XMG Core 15 (M24) | |
| Lenovo Legion 5 15AHP G10 | |
| Medion Erazer Scout 17 E1 MD62758 | |
| SCHENKER XMG Core 15 (M25) | |
| Moyenne AMD Ryzen AI 7 350, Nvidia GeForce RTX 5060 Laptop (n=1) | |
| Mozilla Kraken 1.1 / Total | |
| Medion Erazer Scout 17 E1 MD62758 | |
| Lenovo LOQ 15AHP10 | |
| SCHENKER XMG Core 15 (M24) | |
| Lenovo Legion 5 15AHP G10 | |
| MSI Katana 17 HX B14WGK | |
| Moyenne de la classe Gaming (397 - 674, n=119, 2 dernières années) | |
| SCHENKER XMG Core 15 (M25) | |
| Moyenne AMD Ryzen AI 7 350, Nvidia GeForce RTX 5060 Laptop (n=1) | |
* ... Moindre est la valeur, meilleures sont les performances
| AIDA64 / Memory Copy | |
| Moyenne AMD Ryzen AI 7 350 (38001 - 106997, n=12) | |
| SCHENKER XMG Core 15 (M25) | |
| Moyenne de la classe Gaming (21750 - 104987, n=133, 2 dernières années) | |
| SCHENKER XMG Core 15 (M24) | |
| Lenovo Legion 5 15AHP G10 | |
| MSI Katana 17 HX B14WGK | |
| Medion Erazer Scout 17 E1 MD62758 | |
| Lenovo LOQ 15AHP10 | |
| AIDA64 / Memory Read | |
| Moyenne de la classe Gaming (22956 - 104349, n=133, 2 dernières années) | |
| MSI Katana 17 HX B14WGK | |
| SCHENKER XMG Core 15 (M25) | |
| Moyenne AMD Ryzen AI 7 350 (44209 - 63650, n=12) | |
| SCHENKER XMG Core 15 (M24) | |
| Lenovo Legion 5 15AHP G10 | |
| Medion Erazer Scout 17 E1 MD62758 | |
| Lenovo LOQ 15AHP10 | |
| AIDA64 / Memory Write | |
| Moyenne AMD Ryzen AI 7 350 (42604 - 110817, n=12) | |
| SCHENKER XMG Core 15 (M24) | |
| Lenovo Legion 5 15AHP G10 | |
| SCHENKER XMG Core 15 (M25) | |
| Moyenne de la classe Gaming (22297 - 133486, n=133, 2 dernières années) | |
| Medion Erazer Scout 17 E1 MD62758 | |
| MSI Katana 17 HX B14WGK | |
| Lenovo LOQ 15AHP10 | |
| AIDA64 / Memory Latency | |
| Moyenne de la classe Gaming (59.5 - 259, n=133, 2 dernières années) | |
| Moyenne AMD Ryzen AI 7 350 (87.7 - 109.8, n=12) | |
| Medion Erazer Scout 17 E1 MD62758 | |
| Lenovo LOQ 15AHP10 | |
| MSI Katana 17 HX B14WGK | |
| Lenovo Legion 5 15AHP G10 | |
| SCHENKER XMG Core 15 (M25) | |
| SCHENKER XMG Core 15 (M24) | |
* ... Moindre est la valeur, meilleures sont les performances
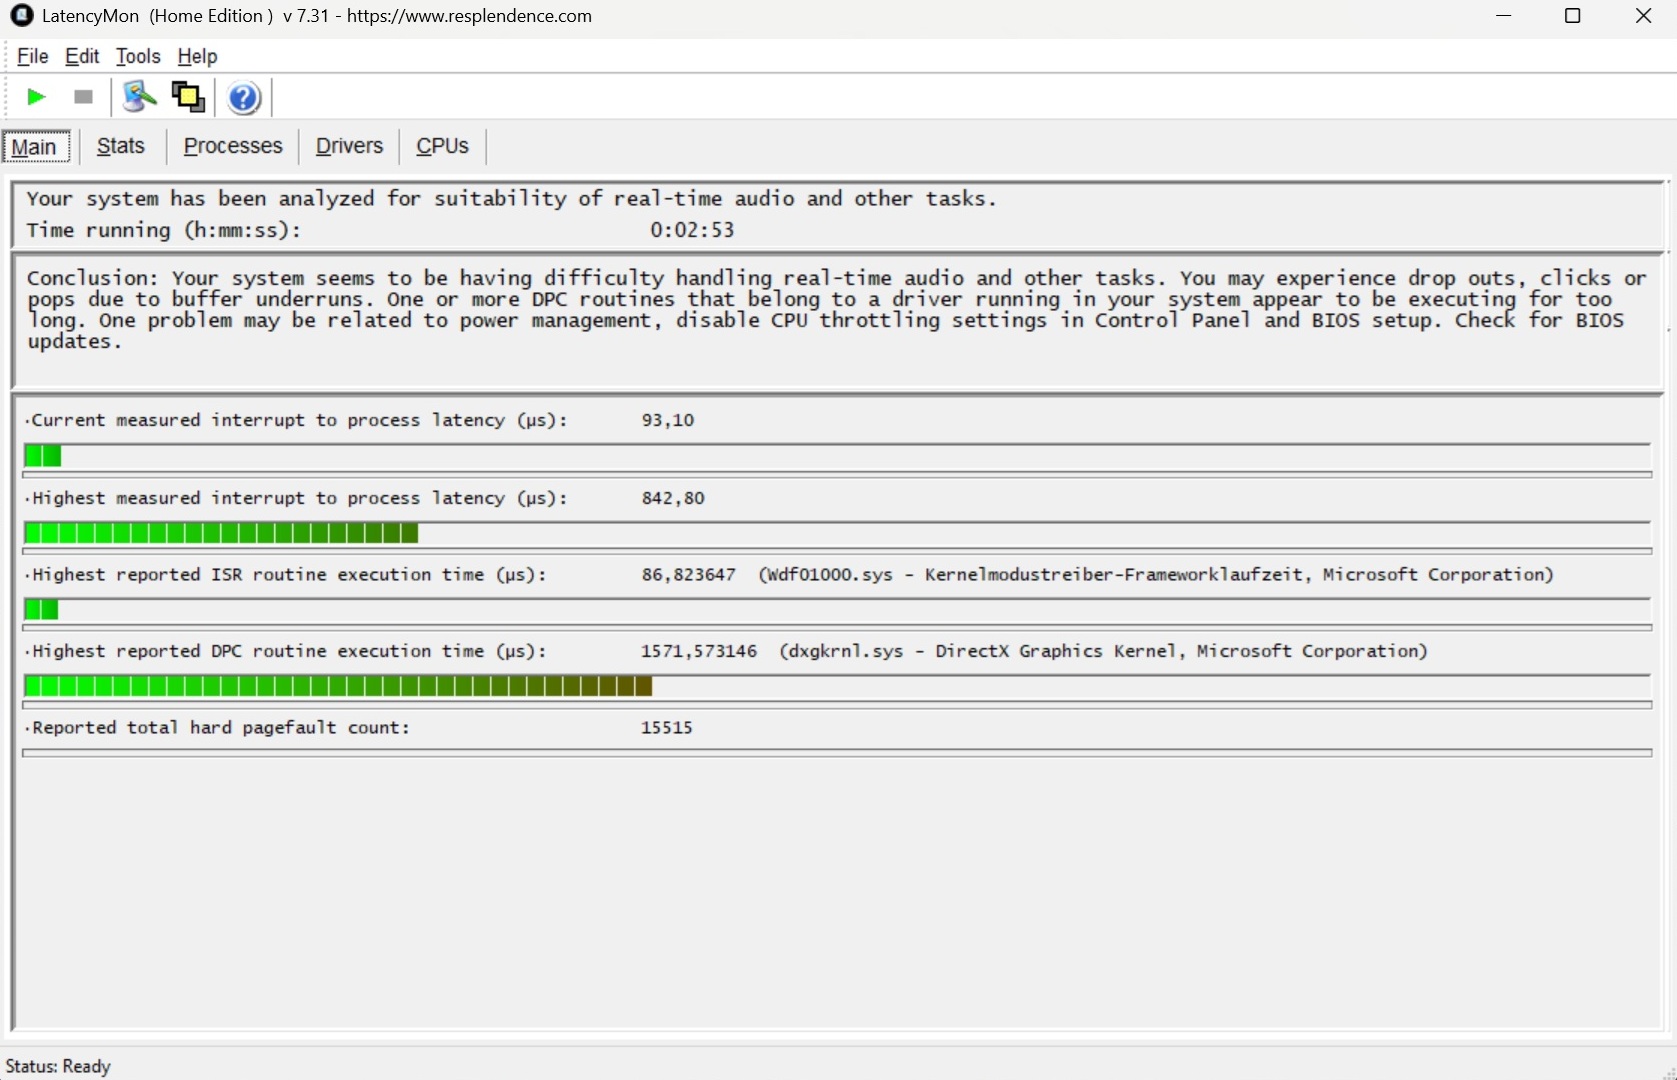
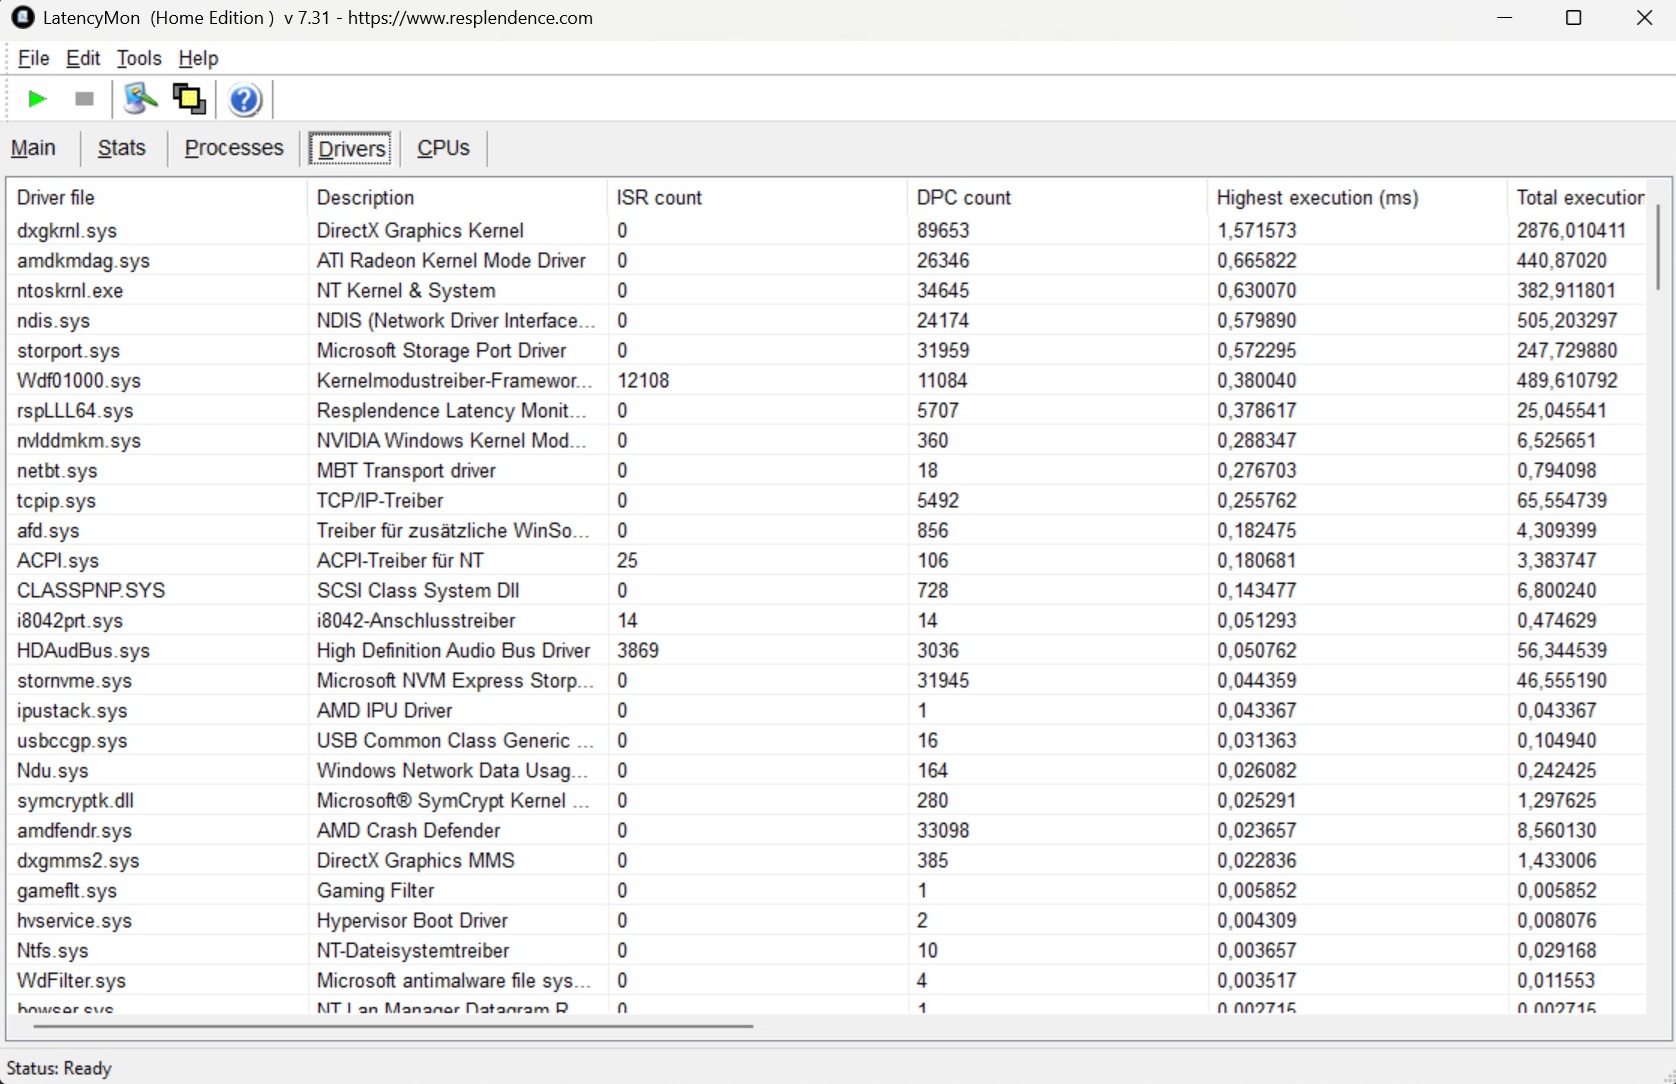
Latences DPC
Les résultats en matière de temps de latence sont également excellents. Bien que l'outil LatencyMon signale des problèmes potentiels, la valeur mesurée est toujours la meilleure - et la plus faible - du groupe de test.
| DPC Latencies / LatencyMon - interrupt to process latency (max), Web, Youtube, Prime95 | |
| MSI Katana 17 HX B14WGK | |
| Medion Erazer Scout 17 E1 MD62758 | |
| Lenovo Legion 5 15AHP G10 | |
| Lenovo LOQ 15AHP10 | |
| SCHENKER XMG Core 15 (M24) | |
| SCHENKER XMG Core 15 (M25) | |
* ... Moindre est la valeur, meilleures sont les performances
Dispositifs de stockage
Notre configuration de test était alimentée par un SSD très rapide de 2 TB de Samsung. Le modèle 990 Pro offre des valeurs élevées et constantes en écriture et en lecture, mais cela vaut également pour la concurrence si l'on exclut le Lenovo LOQ 15 (qui subit parfois des baisses de performances massives dans le benchmark Loop).

* ... Moindre est la valeur, meilleures sont les performances
Performances en lecture continue : Boucle de lecture DiskSpd, profondeur de la file d'attente 8
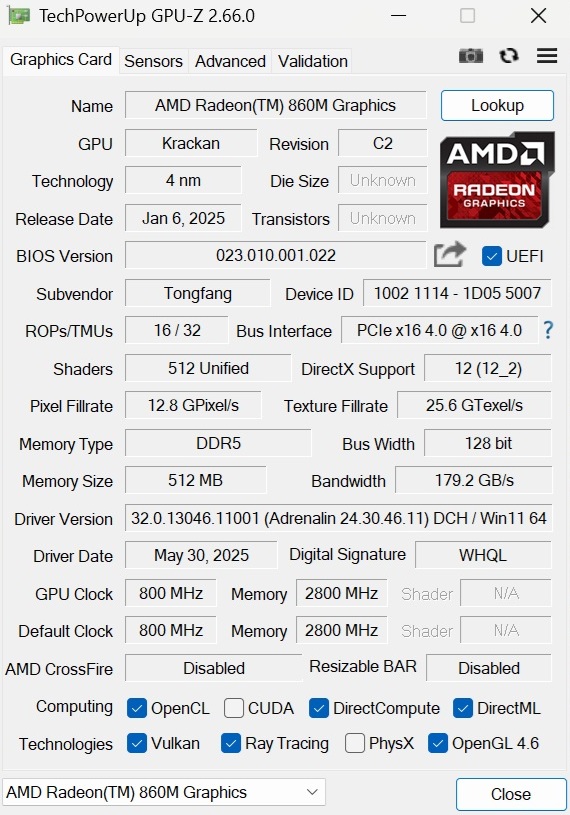
Performance du GPU
Comme nous l'avons vu dans les tests précédents, la RTX 5060 mobile a des forces et des faiblesses. Alors que 8 Go de VRAM ne sont que partiellement appropriés ou suffisants en 2025 (le meilleur exemple est Indiana Jones ; voir L'article de Benchmark), ses autres caractéristiques, telles que DLSS 4 et Multi-Frame Generation, restent impressionnantes. Dans les benchmarks graphiques synthétiques, le XMG Core 15 fait à peu près jeu égal avec les modèles RTX 5060 de Lenovo et les modèles RTX 4060 de son prédécesseur.
| 3DMark 11 Performance | 33080 points | |
| 3DMark Cloud Gate Standard Score | 50015 points | |
| 3DMark Fire Strike Score | 29119 points | |
| 3DMark Time Spy Score | 11779 points | |
Aide | ||
* ... Moindre est la valeur, meilleures sont les performances
Performances des jeux
Sur la base des tests Full HD, le Core 15 se situe entre le LOQ15 (-6%) et le Legion 5 (+5%) dans les benchmarks de jeu. La gamme QHD est plus intéressante pour la plupart des utilisateurs, et les résultats correspondent aux moyennes attendues pour ce GPU. À 2 560 × 1 440/1 600 pixels, le système a parfois du mal, c'est pourquoi il est recommandé d'activer DLSS et la génération de trames multiples lorsque cela est nécessaire. Par exemple, Hellblade 2 qui ne tourne qu'à 28 FPS en QHD sans fonctionnalités supplémentaires. En incluant DLSS 4, il atteint un solide 43 FPS. La quadruple génération d'images permet même d'atteindre 137 FPS, bien que les durées d'images ne soient pas optimales.
| Cyberpunk 2077 2.2 Phantom Liberty - 1920x1080 Ultra Preset (FSR off) | |
| MSI Katana 17 HX B14WGK | |
| Moyenne de la classe Gaming (6.76 - 168, n=133, 2 dernières années) | |
| SCHENKER XMG Core 15 (M24) | |
| Lenovo Legion 5 15AHP G10 | |
| Lenovo LOQ 15AHP10 | |
| Moyenne Nvidia GeForce RTX 5060 Laptop (75 - 94.9, n=8) | |
| SCHENKER XMG Core 15 (M25) | |
| Medion Erazer Scout 17 E1 MD62758 | |
| GTA V - 1920x1080 Highest Settings possible AA:4xMSAA + FX AF:16x | |
| Moyenne de la classe Gaming (12.1 - 186.9, n=121, 2 dernières années) | |
| Moyenne Nvidia GeForce RTX 5060 Laptop (108.7 - 142.9, n=6) | |
| SCHENKER XMG Core 15 (M25) | |
| Lenovo Legion 5 15AHP G10 | |
| MSI Katana 17 HX B14WGK | |
| Medion Erazer Scout 17 E1 MD62758 | |
| SCHENKER XMG Core 15 (M24) | |
| Lenovo LOQ 15AHP10 | |
| Bas | Moyen | Élevé | Ultra | QHD DLSS | QHD | |
|---|---|---|---|---|---|---|
| GTA V (2015) | 183.6 | 176.9 | 170.1 | 120.6 | ||
| Dota 2 Reborn (2015) | 184.5 | 163.4 | 154.4 | 144.6 | ||
| X-Plane 11.11 (2018) | 107.5 | 98.3 | 83.4 | |||
| Baldur's Gate 3 (2023) | 115.7 | 94.1 | 93.3 | 62.6 | ||
| Cyberpunk 2077 2.2 Phantom Liberty (2023) | 107.3 | 93.5 | 84.3 | 53.5 | ||
| Horizon Forbidden West (2024) | 78.3 | 60.6 | 60 | 60.6 | 47 | |
| Ghost of Tsushima (2024) | 87.1 | 76.7 | 60.9 | 61.9 | 46.1 | |
| Senua's Saga Hellblade 2 (2024) | 53.7 | 38.6 | 42.8 | 28.4 | ||
| Star Wars Outlaws (2024) | 51.7 | 46.8 | 37.8 | 37.9 | 27.2 | |
| Space Marine 2 (2024) | 78.7 | 77.4 | 76.7 | 70.3 | 54 | |
| Until Dawn (2024) | 84.9 | 62.5 | 47.9 | 43.5 | 33.2 | |
| Stalker 2 (2024) | 58.8 | 52.3 | 44 | 70.1 | 32.4 | |
| Kingdom Come Deliverance 2 (2025) | 106.3 | 86 | 60.4 | 57.4 | 43.6 | |
| The Elder Scrolls IV Oblivion Remastered (2025) | 61 | 54.9 | 29.2 | 30 | 13.8 | |
| Doom: The Dark Ages (2025) | 64.4 | 57.5 | 56.4 | 52.8 | 38.2 | |
| Borderlands 4 (2025) | 42.8 | 34.7 | 28.7 | 21.2 | 21.9 | 11.5 |
| Performance Rating - Percent | |
| Moyenne de la classe Gaming | |
| MSI Katana 17 HX B14WGK | |
| SCHENKER XMG Core 15 (M25) | |
| Moyenne Nvidia GeForce RTX 5060 Laptop | |
| Lenovo LOQ 15AHP10 | |
| Medion Erazer Scout 17 E1 MD62758 | |
| The Elder Scrolls IV Oblivion Remastered | |
| 2560x1440 Ultra Preset AA:T | |
| Moyenne de la classe Gaming (12.7 - 41.7, n=13, 2 dernières années) | |
| MSI Katana 17 HX B14WGK | |
| SCHENKER XMG Core 15 (M25) | |
| Medion Erazer Scout 17 E1 MD62758 | |
| Moyenne Nvidia GeForce RTX 5060 Laptop (12.7 - 13.8, n=2) | |
| Lenovo LOQ 15AHP10 | |
| 2560x1440 Ultra Preset + Quality DLSS | |
| Moyenne de la classe Gaming (25.3 - 59.7, n=12, 2 dernières années) | |
| MSI Katana 17 HX B14WGK | |
| SCHENKER XMG Core 15 (M25) | |
| Moyenne Nvidia GeForce RTX 5060 Laptop (25.3 - 30, n=2) | |
| Medion Erazer Scout 17 E1 MD62758 | |
| Lenovo LOQ 15AHP10 | |
Comme d'habitude, nous avons testé les performances 3D à long terme avec Cyberpunk 2077. La XMG Core 15 s'est montrée stable, sans baisse notable.
Cyberpunk 2077 ultra FPS chart
Émissions
Bruit
En mode Overboost, le niveau de bruit en mode 3D n'est ni faible ni particulièrement élevé. les 49 dB(A) de Cyberpunk 2077 sont basés sur Legion 5, qui atteint 50 dB(A). Les ventilateurs restent partiellement éteints au repos, et lorsqu'ils tournent, le bruit reste modeste, de l'ordre de 27 à 29 dB.
Degré de la nuisance sonore
| Au repos |
| 25 / 27 / 29 dB(A) |
| Fortement sollicité |
| 48 / 50 dB(A) |
 | ||
30 dB silencieux 40 dB(A) audible 50 dB(A) bruyant |
||
min: | ||
| SCHENKER XMG Core 15 (M25) Ryzen AI 7 350, GeForce RTX 5060 Laptop | Lenovo LOQ 15AHP10 R7 250, GeForce RTX 5060 Laptop | Lenovo Legion 5 15AHP G10 R7 260, GeForce RTX 5060 Laptop | Medion Erazer Scout 17 E1 MD62758 Core 5 210H, GeForce RTX 5050 Laptop | MSI Katana 17 HX B14WGK i7-14650HX, GeForce RTX 5070 Laptop | SCHENKER XMG Core 15 (M24) R7 8845HS, NVIDIA GeForce RTX 4060 Laptop GPU | |
|---|---|---|---|---|---|---|
| Noise | -33% | 4% | -7% | -15% | 8% | |
| arrêt / environnement * (dB) | 24 | 25 -4% | 25.5 -6% | 24 -0% | 25 -4% | 23 4% |
| Idle Minimum * (dB) | 25 | 43 -72% | 25.5 -2% | 27 -8% | 31 -24% | 23 8% |
| Idle Average * (dB) | 27 | 45 -67% | 25.5 6% | 29 -7% | 32 -19% | 23 15% |
| Idle Maximum * (dB) | 29 | 48 -66% | 26.9 7% | 32 -10% | 34 -17% | 23 21% |
| Load Average * (dB) | 48 | 53 -10% | 34.6 28% | 47 2% | 50 -4% | 38.92 19% |
| Cyberpunk 2077 ultra * (dB) | 49 | 51 -4% | 50.1 -2% | 55 -12% | 58 -18% | 52.06 -6% |
| Load Maximum * (dB) | 50 | 53 -6% | 50.1 -0% | 58 -16% | 59 -18% | 52.09 -4% |
| Witcher 3 ultra * (dB) | 50.96 |
* ... Moindre est la valeur, meilleures sont les performances
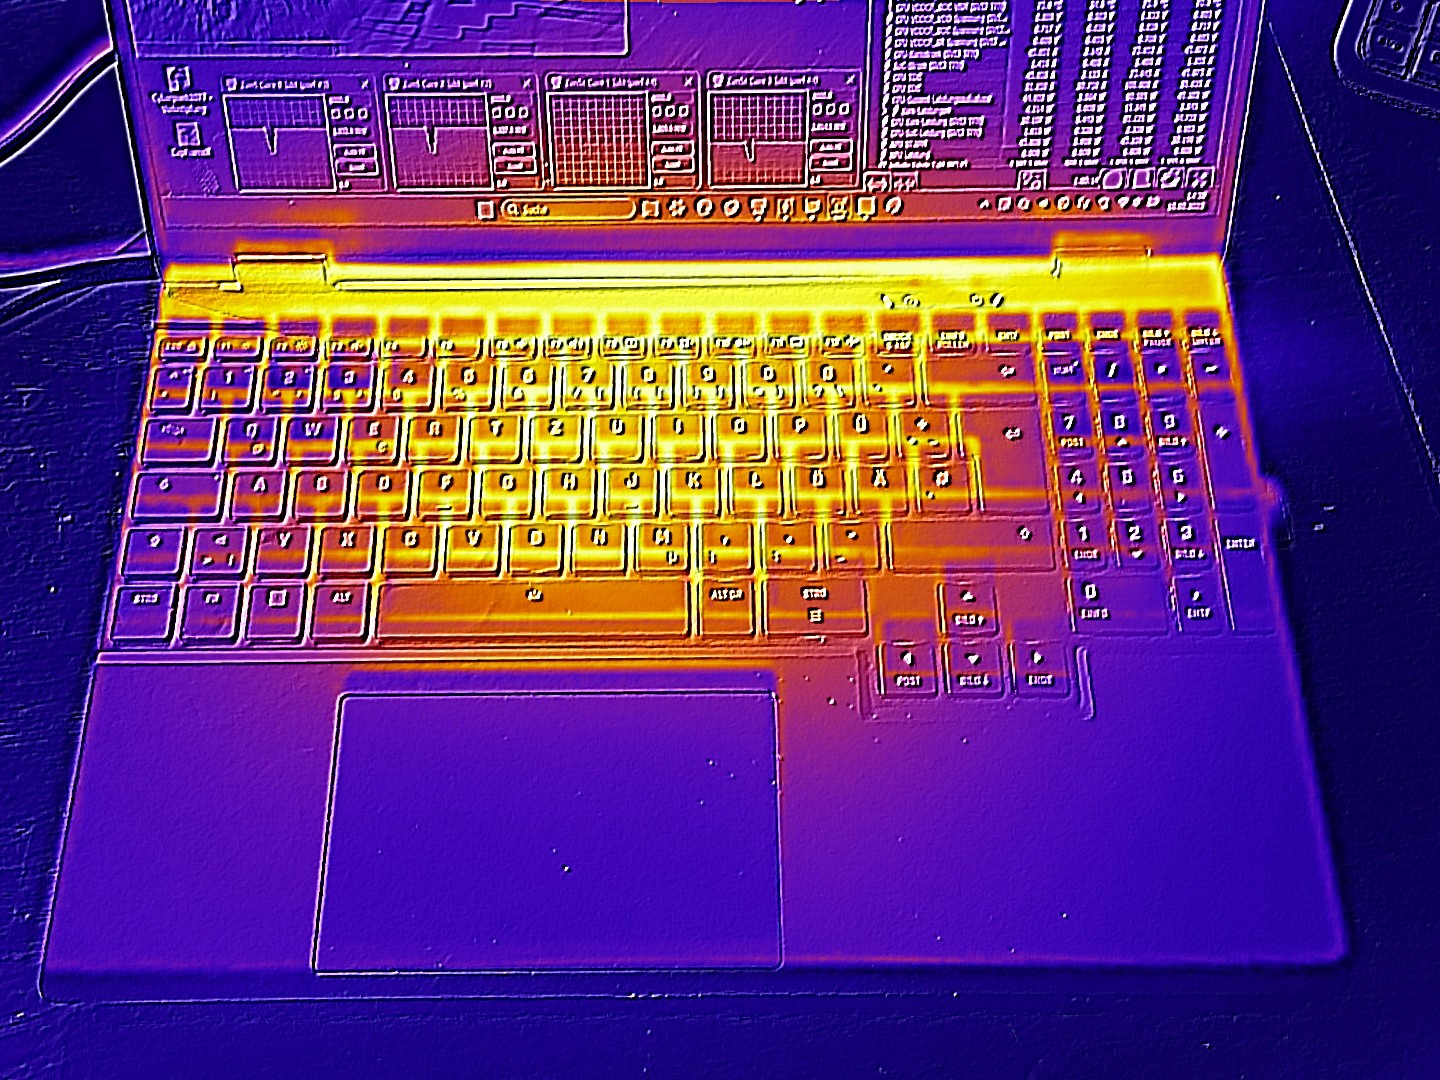
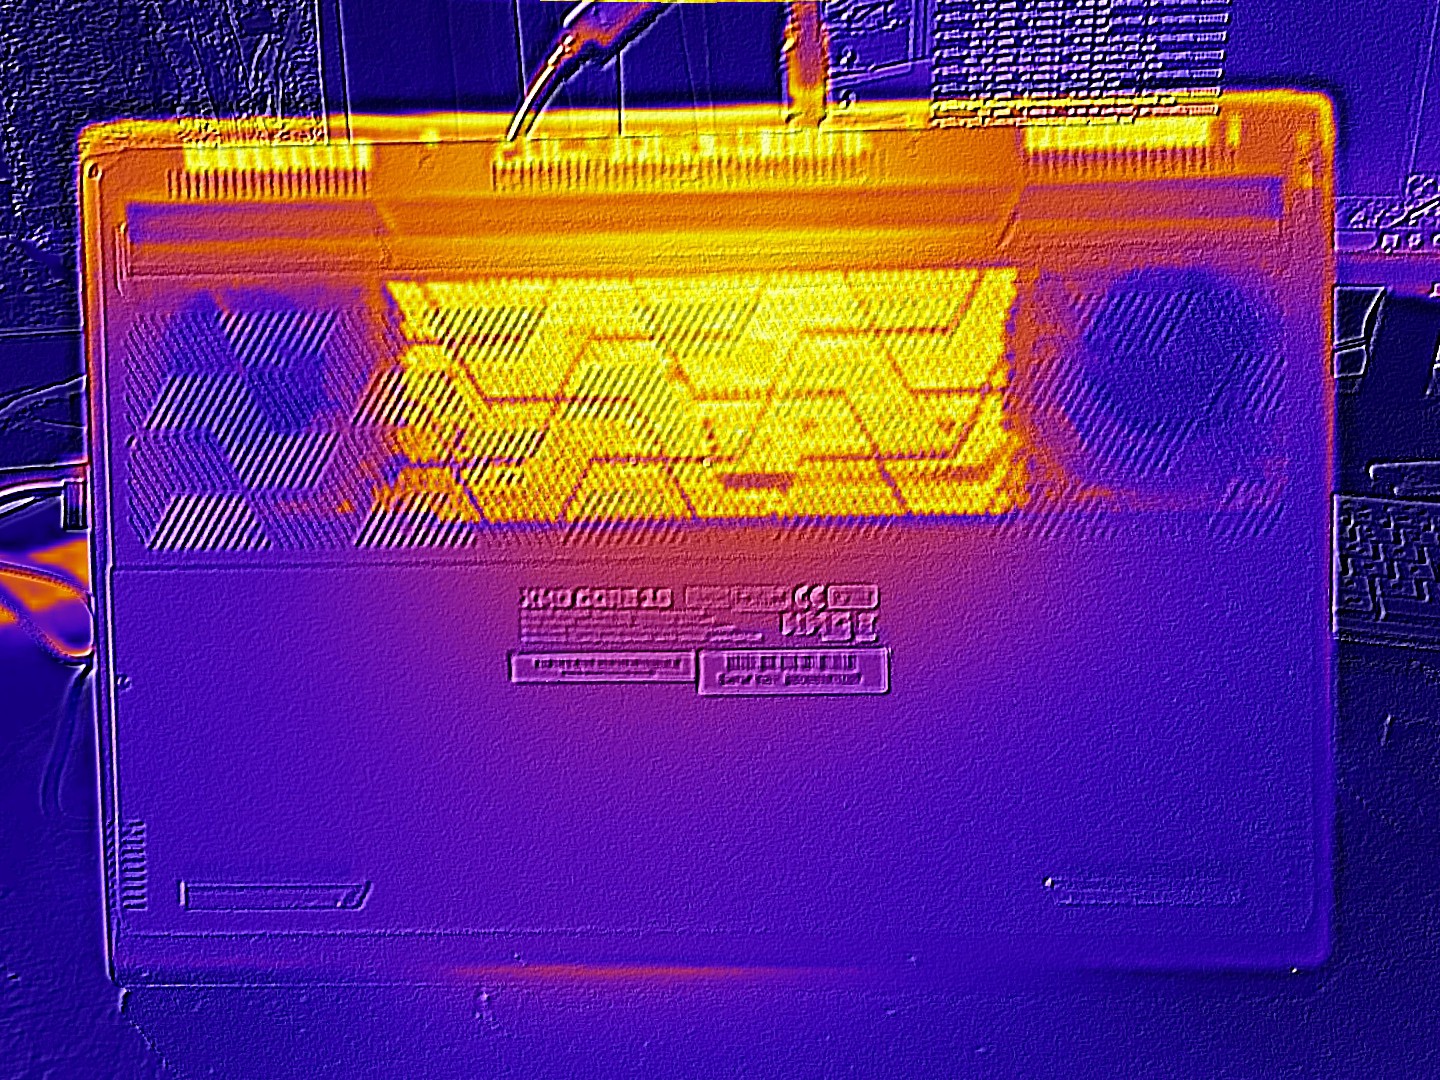
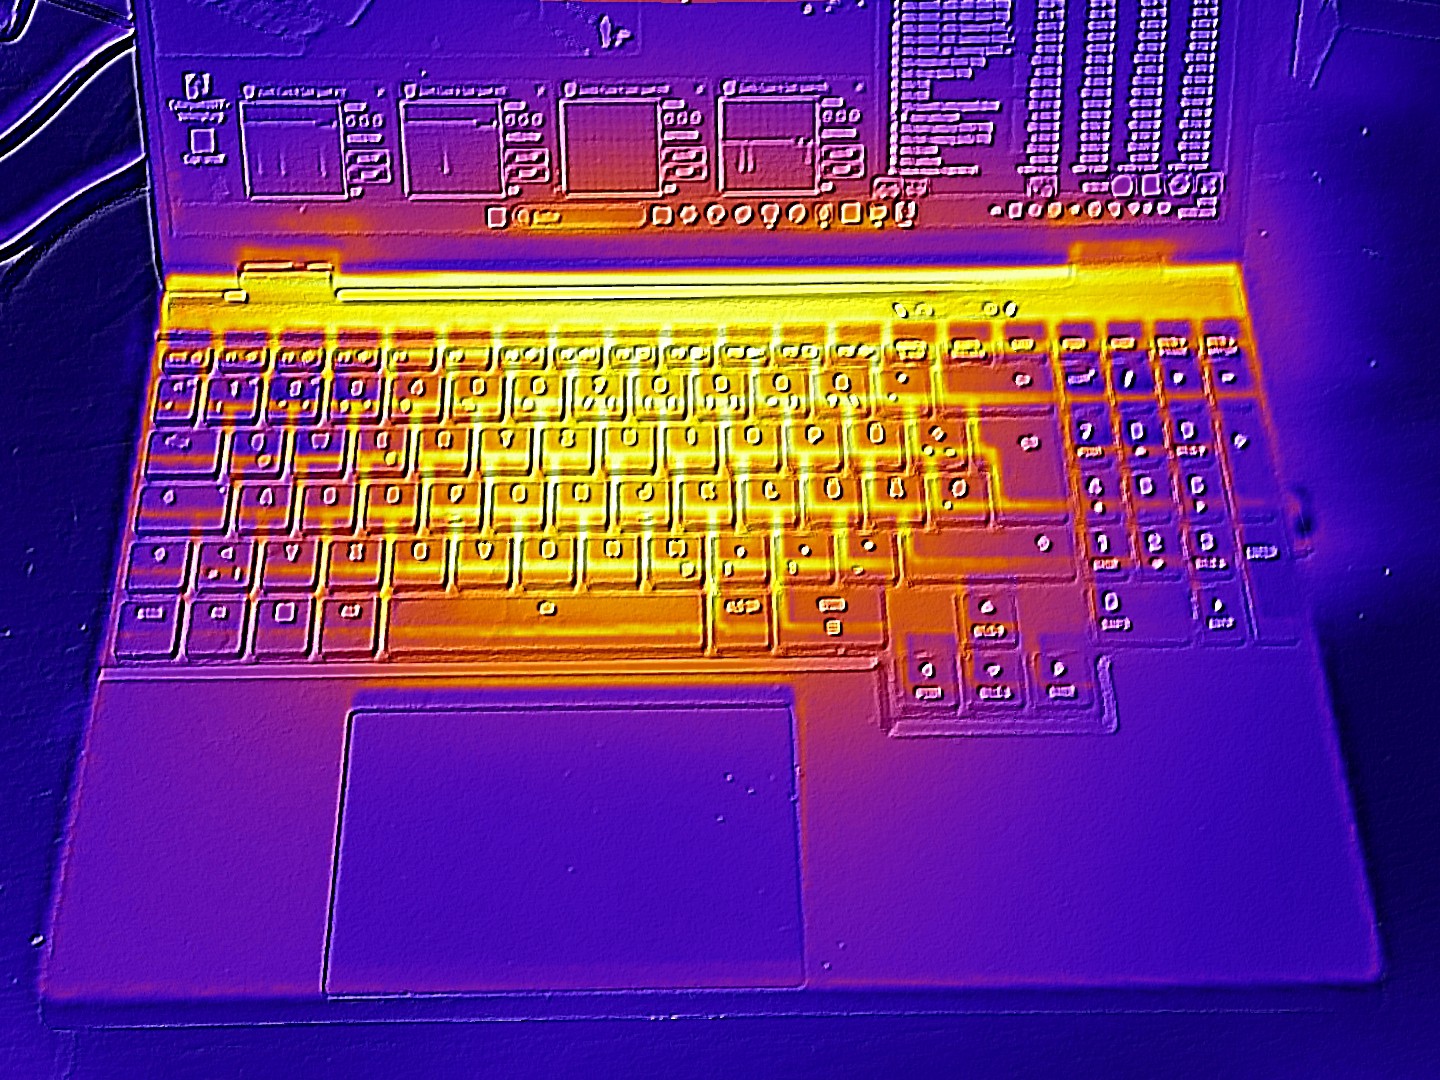
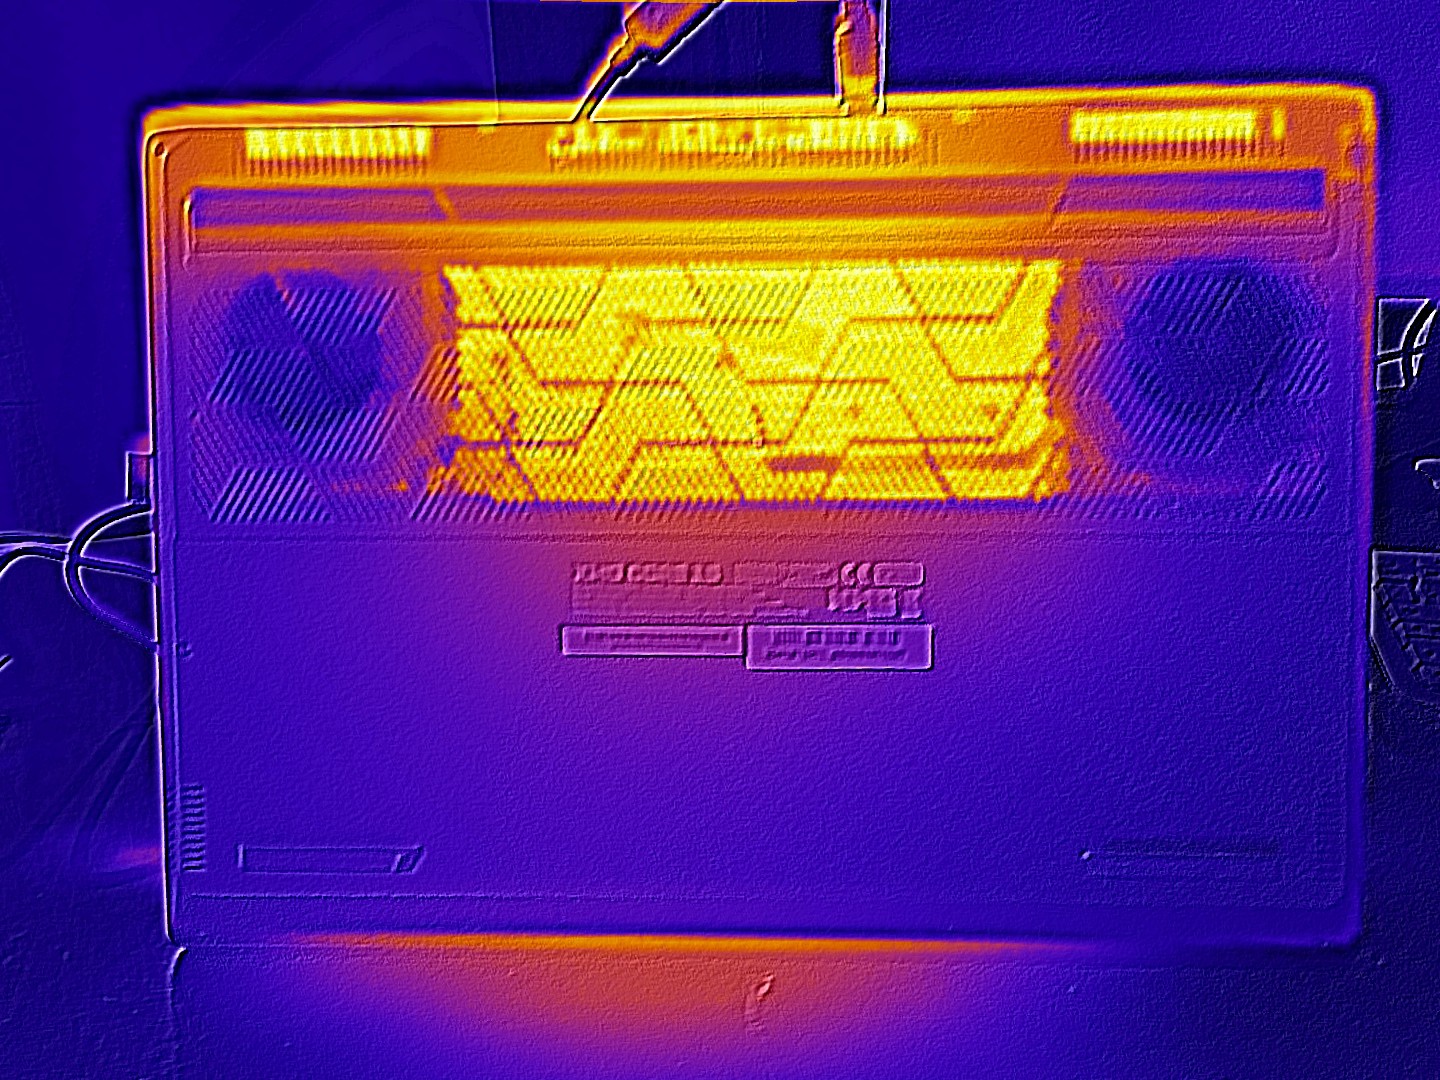
Température
Les résultats en matière de température sont mitigés. Alors que le châssis reste généralement en dessous de 30 °C au repos, les températures de surface grimpent à près de 50 °C sur le dessus et 60 °C sur le dessous en charge. Ces valeurs sont similaires à celles du Lenovo LOQ 15, alors que le Legion 5 est plus froid.
(-) La température maximale du côté supérieur est de 49 °C / 120 F, par rapport à la moyenne de 40.5 °C / 105 F, allant de 21.2 à 68.8 °C pour la classe Gaming.
(-) Le fond chauffe jusqu'à un maximum de 59 °C / 138 F, contre une moyenne de 43.3 °C / 110 F
(+) En utilisation inactive, la température moyenne du côté supérieur est de 27.4 °C / 81 F, par rapport à la moyenne du dispositif de 33.9 °C / 93 F.
(-) 3: The average temperature for the upper side is 41.2 °C / 106 F, compared to the average of 33.9 °C / 93 F for the class Gaming.
(+) Les repose-poignets et le pavé tactile atteignent la température maximale de la peau (35 °C / 95 F) et ne sont donc pas chauds.
(-) La température moyenne de la zone de l'appui-paume de dispositifs similaires était de 28.9 °C / 84 F (-6.1 °C / #-11 F).
| SCHENKER XMG Core 15 (M25) Ryzen AI 7 350, GeForce RTX 5060 Laptop | Lenovo LOQ 15AHP10 R7 250, GeForce RTX 5060 Laptop | Lenovo Legion 5 15AHP G10 R7 260, GeForce RTX 5060 Laptop | Medion Erazer Scout 17 E1 MD62758 Core 5 210H, GeForce RTX 5050 Laptop | MSI Katana 17 HX B14WGK i7-14650HX, GeForce RTX 5070 Laptop | SCHENKER XMG Core 15 (M24) R7 8845HS, NVIDIA GeForce RTX 4060 Laptop GPU | |
|---|---|---|---|---|---|---|
| Heat | -2% | 8% | 5% | -6% | -15% | |
| Maximum Upper Side * (°C) | 49 | 49 -0% | 42.2 14% | 42 14% | 52 -6% | 52 -6% |
| Maximum Bottom * (°C) | 59 | 58 2% | 51.7 12% | 45 24% | 56 5% | 61 -3% |
| Idle Upper Side * (°C) | 28 | 32 -14% | 28.5 -2% | 30 -7% | 33 -18% | 35 -25% |
| Idle Bottom * (°C) | 31 | 29 6% | 29.2 6% | 35 -13% | 32 -3% | 39 -26% |
* ... Moindre est la valeur, meilleures sont les performances
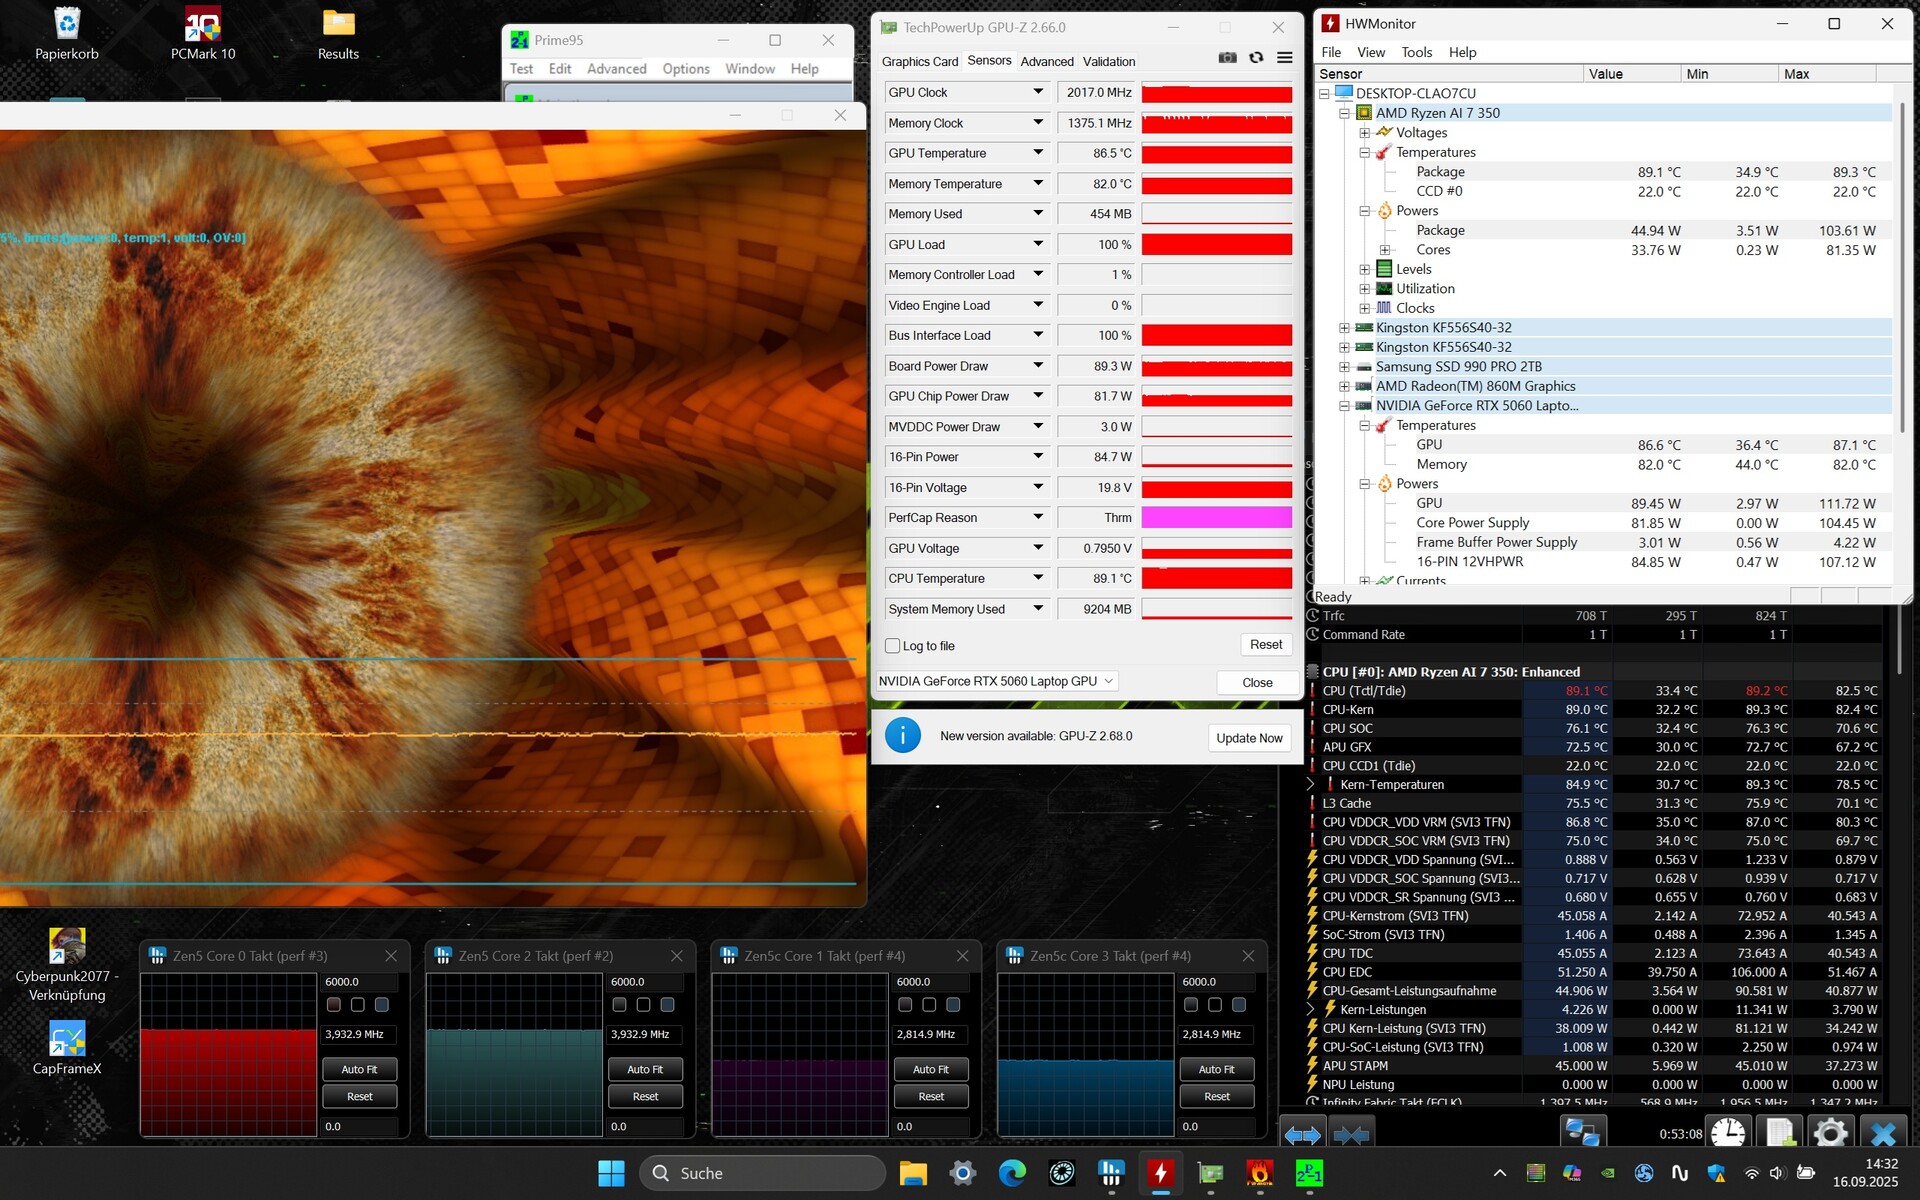
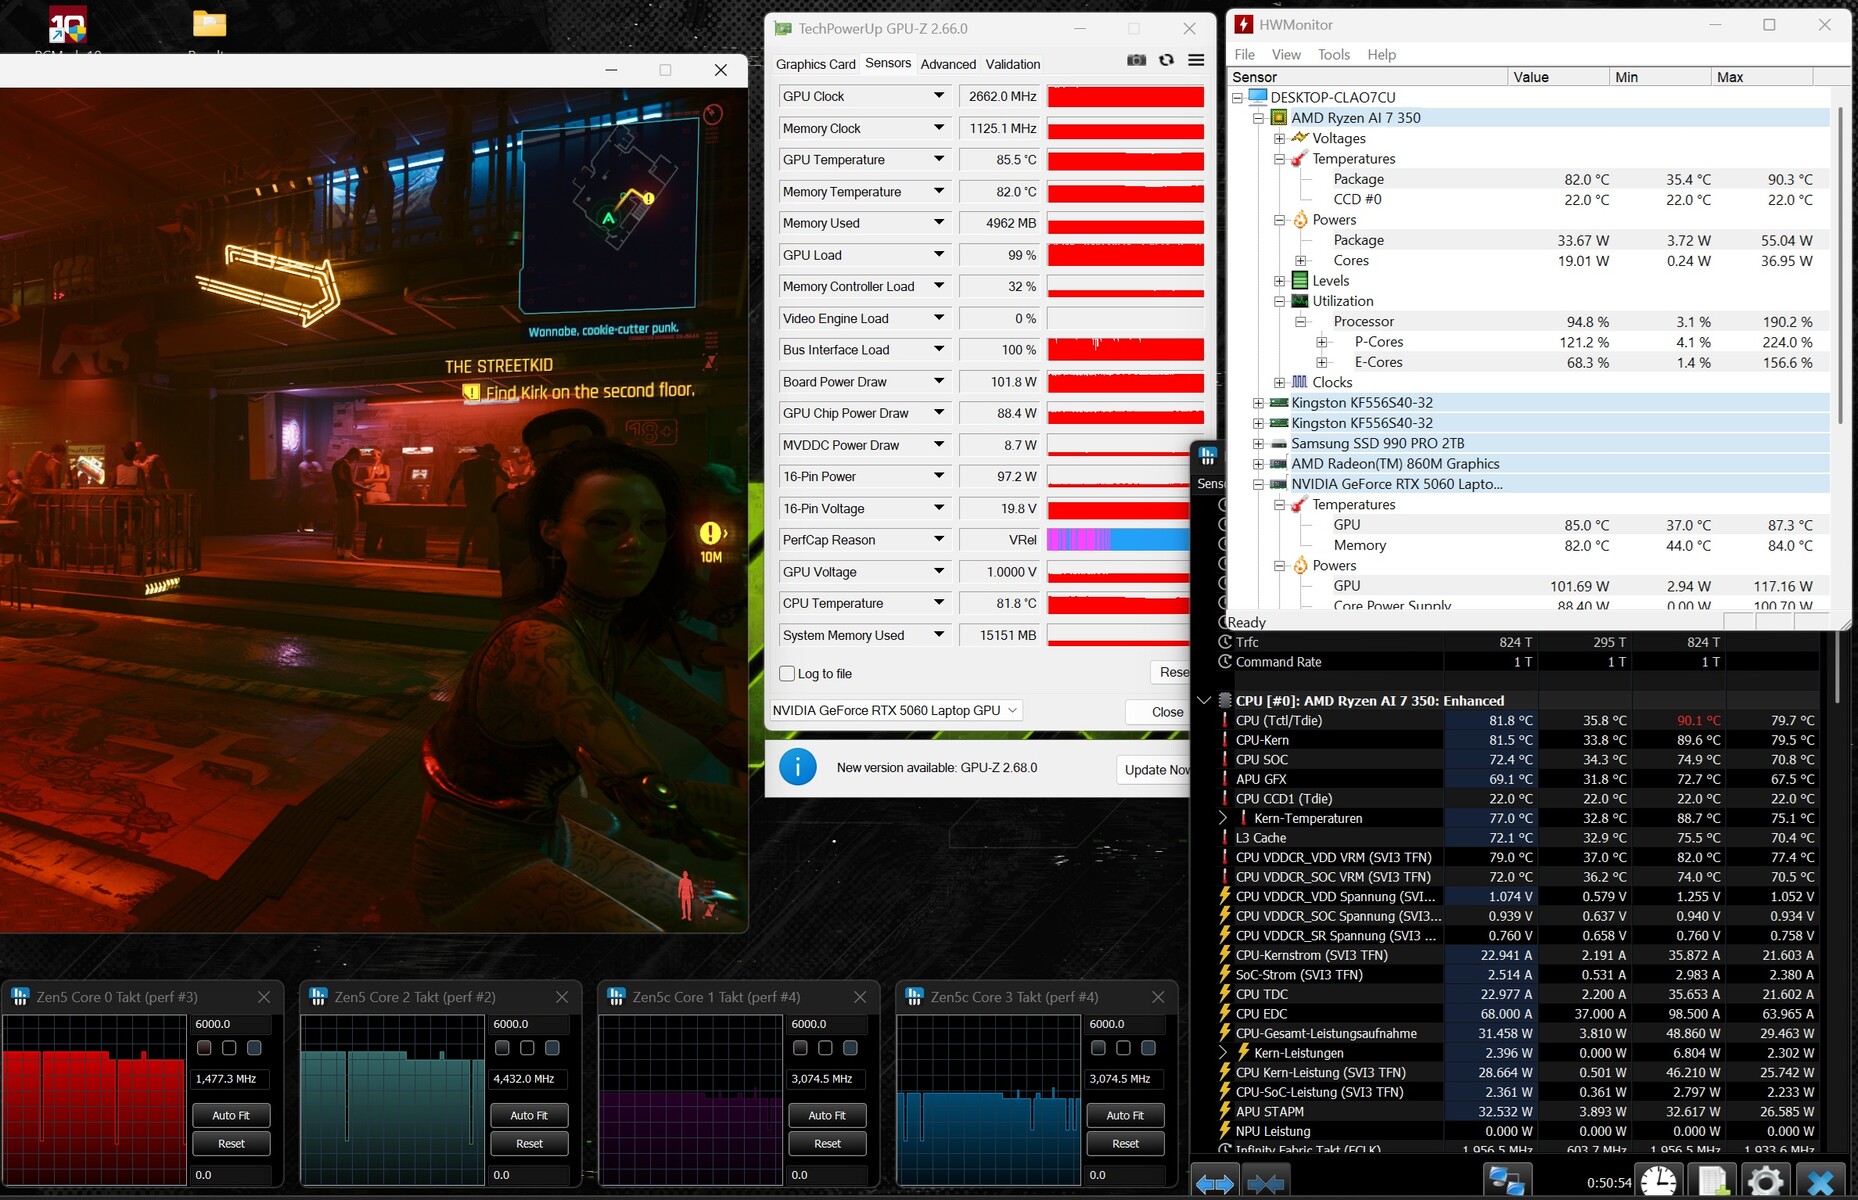
Épreuve d'effort
Lors du test de stress avec les outils Furmark et Prime95, le CPU a chauffé à près de 89 °C, tandis que le GPU s'est stabilisé à environ 86 °C.
Intervenants
La qualité du son est supérieure à la moyenne. Comme d'habitude, les basses pourraient être plus puissantes, mais dans l'ensemble, le Core 15 se comporte bien et, selon notre analyse audio, offre un son légèrement meilleur que celui du Legion 5.
SCHENKER XMG Core 15 (M25) analyse audio
(+) | les haut-parleurs peuvent jouer relativement fort (82# dB)
Basses 100 - 315 Hz
(-) | presque aucune basse - en moyenne 18.3% plus bas que la médiane
(±) | la linéarité des basses est moyenne (9.8% delta à la fréquence précédente)
Médiums 400 - 2000 Hz
(+) | médiane équilibrée - seulement 3.4% de la médiane
(+) | les médiums sont linéaires (5.9% delta à la fréquence précédente)
Aiguës 2 - 16 kHz
(+) | des sommets équilibrés - à seulement 3.2% de la médiane
(+) | les aigus sont linéaires (4.1% delta à la fréquence précédente)
Globalement 100 - 16 000 Hz
(+) | le son global est linéaire (14.3% différence à la médiane)
Par rapport à la même classe
» 26% de tous les appareils testés de cette catégorie étaient meilleurs, 7% similaires, 67% pires
» Le meilleur avait un delta de 6%, la moyenne était de 18%, le pire était de 132%.
Par rapport à tous les appareils testés
» 16% de tous les appareils testés étaient meilleurs, 4% similaires, 80% pires
» Le meilleur avait un delta de 4%, la moyenne était de 24%, le pire était de 134%.
Lenovo Legion 5 15AHP G10 analyse audio
(±) | le niveau sonore du haut-parleur est moyen mais bon (81.5# dB)
Basses 100 - 315 Hz
(-) | presque aucune basse - en moyenne 21% plus bas que la médiane
(±) | la linéarité des basses est moyenne (8.2% delta à la fréquence précédente)
Médiums 400 - 2000 Hz
(+) | médiane équilibrée - seulement 4.7% de la médiane
(+) | les médiums sont linéaires (5.4% delta à la fréquence précédente)
Aiguës 2 - 16 kHz
(+) | des sommets équilibrés - à seulement 3.1% de la médiane
(+) | les aigus sont linéaires (6.4% delta à la fréquence précédente)
Globalement 100 - 16 000 Hz
(±) | la linéarité du son global est moyenne (16.7% de différence avec la médiane)
Par rapport à la même classe
» 43% de tous les appareils testés de cette catégorie étaient meilleurs, 10% similaires, 47% pires
» Le meilleur avait un delta de 6%, la moyenne était de 18%, le pire était de 132%.
Par rapport à tous les appareils testés
» 27% de tous les appareils testés étaient meilleurs, 7% similaires, 66% pires
» Le meilleur avait un delta de 4%, la moyenne était de 24%, le pire était de 134%.
Consommation électrique
la consommation d'énergie
L'ordinateur portable Schenker consomme moins d'énergie que beaucoup de ses concurrents, surtout lorsqu'il est en veille. La consommation d'énergie pour les écrans externes dépend de la sortie utilisée : le Mini DisplayPort et l'un des deux ports HDMI passent par le dGPU, tandis que les autres utilisent l'iGPU.
| Éteint/en veille | |
| Au repos | |
| Fortement sollicité |
|
Légende:
min: | |
| SCHENKER XMG Core 15 (M25) Ryzen AI 7 350, GeForce RTX 5060 Laptop | Lenovo LOQ 15AHP10 R7 250, GeForce RTX 5060 Laptop | Lenovo Legion 5 15AHP G10 R7 260, GeForce RTX 5060 Laptop | Medion Erazer Scout 17 E1 MD62758 Core 5 210H, GeForce RTX 5050 Laptop | MSI Katana 17 HX B14WGK i7-14650HX, GeForce RTX 5070 Laptop | SCHENKER XMG Core 15 (M24) R7 8845HS, NVIDIA GeForce RTX 4060 Laptop GPU | Moyenne de la classe Gaming | |
|---|---|---|---|---|---|---|---|
| Power Consumption | -22% | 12% | -13% | -23% | -6% | -45% | |
| Idle Minimum * (Watt) | 10.6 | 20 -89% | 6.9 35% | 13.5 -27% | 9.7 8% | 9.3 12% | 14.2 ? -34% |
| Idle Average * (Watt) | 12.1 | 20.7 -71% | 10.7 12% | 14.8 -22% | 15 -24% | 12.9 -7% | 20.2 ? -67% |
| Idle Maximum * (Watt) | 15.9 | 22.7 -43% | 11.3 29% | 22.9 -44% | 23.7 -49% | 12.8 19% | 27.3 ? -72% |
| Load Average * (Watt) | 95 | 71 25% | 69.7 27% | 87 8% | 126 -33% | 111 ? -17% | |
| Cyberpunk 2077 ultra external monitor * (Watt) | 165 | 151.1 8% | 165 -0% | 171.9 -4% | 202 -22% | ||
| Cyberpunk 2077 ultra * (Watt) | 169 | 153.1 9% | 162.6 4% | 173.4 -3% | 205 -21% | ||
| Load Maximum * (Watt) | 192 | 172 10% | 233.6 -22% | 195 -2% | 227 -18% | 286 -49% | 263 ? -37% |
| Witcher 3 ultra * (Watt) | 167 |
* ... Moindre est la valeur, meilleures sont les performances
consommation d'énergie Cyberpunk / Stress test
consommation d'énergie avec moniteur externe
Durée de vie de la batterie
Bien que l'autonomie de la batterie soit inférieure à celle du Core 15 précédent, les 10 heures environ du test de navigation à une luminosité de 150 cd/m² restent impressionnantes et correspondent au résultat comparable de l'ordinateur Legion 5.
| SCHENKER XMG Core 15 (M25) Ryzen AI 7 350, GeForce RTX 5060 Laptop, 99.8 Wh | Lenovo LOQ 15AHP10 R7 250, GeForce RTX 5060 Laptop, 60 Wh | Lenovo Legion 5 15AHP G10 R7 260, GeForce RTX 5060 Laptop, 80 Wh | Medion Erazer Scout 17 E1 MD62758 Core 5 210H, GeForce RTX 5050 Laptop, 53 Wh | MSI Katana 17 HX B14WGK i7-14650HX, GeForce RTX 5070 Laptop, 75 Wh | SCHENKER XMG Core 15 (M24) R7 8845HS, NVIDIA GeForce RTX 4060 Laptop GPU, 99.8 Wh | Moyenne de la classe Gaming | |
|---|---|---|---|---|---|---|---|
| Autonomie de la batterie | -55% | -2% | -61% | -48% | 49% | -33% | |
| WiFi v1.3 (h) | 9.9 | 4.5 -55% | 9.7 -2% | 3.9 -61% | 5.1 -48% | 14.8 49% | 6.63 ? -33% |
| Reader / Idle (h) | 6.9 | 9.9 ? | |||||
| Load (h) | 1.3 | 1.2 | 2.5 | 1.432 ? | |||
| H.264 (h) | 11.5 | 10.1 | 7.85 ? | ||||
| Cyberpunk 2077 ultra 150cd (h) | 0.9 |
Notebookcheck note globale
Le 2025 XMG Core 15 reprend le châssis métallique de haute qualité et les bons périphériques d'entrée de son prédécesseur, tout en ajoutant des ports mis à jour et du matériel plus récent. Hormis son prix relativement élevé, il n'y a pas grand-chose à critiquer. Son principal concurrent, le Legion 5 devra suivre. Le principal avantage du Lenovo est son écran OLED, à condition que vous puissiez supporter les reflets.
SCHENKER XMG Core 15 (M25)
- 09/25/2025 v8
Florian Glaser
 Total Sustainability Score:
 Comparaison des alternatives possibles
Image | Modèle | Prix | Poids | Épaisseur | Écran |
|---|---|---|---|---|---|
1. 84.7%  | SCHENKER XMG Core 15 (M25) AMD Ryzen AI 7 350 ⎘ Nvidia GeForce RTX 5060 Laptop ⎘ 64 Go Mémoire, 2048 Go SSD | Prix de liste: 1840 EUR | 1.9 kg | 22 mm | 15.30" 2560x1600 197 PPI IPS |
2. 77.5%  | Lenovo LOQ 15AHP10 AMD Ryzen 7 250 ⎘ Nvidia GeForce RTX 5060 Laptop ⎘ 16 Go Mémoire, 1024 Go SSD | Amazon: 1. $1,439.00 Lenovo LOQ Gaming Laptop, 15... 2. $120.99 20V 12.25A 245W Slim Tip Cha... 3. $75.99 Ruilezyo 300W Laptop Charger... | 2.4 kg | 24 mm | 15.60" 1920x1080 141 PPI IPS |
3. 87.2%  | Lenovo Legion 5 15AHP G10 AMD Ryzen 7 260 ⎘ Nvidia GeForce RTX 5060 Laptop ⎘ 32 Go Mémoire, 1024 Go SSD | Amazon: 1. $1,538.59 Lenovo Legion 5 15AHP10 RTX ... 2. $1,149.99 Lenovo Legion 5 15.1" OLED W... 3. $1,553.31 Lenovo Legion 5 Gen 10 Gamin... Prix de liste: 1449€ | 1.9 kg | 21.5 mm | 15.10" 2560x1600 200 PPI OLED |
4. 76.8%  | Medion Erazer Scout 17 E1 MD62758 Intel Core 5 210H ⎘ Nvidia GeForce RTX 5050 Laptop ⎘ 16 Go Mémoire, 1024 Go | Prix de liste: 1250 EUR | 2.7 kg | 26 mm | 17.30" 1920x1080 127 PPI IPS |
5. 77.3%  | MSI Katana 17 HX B14WGK Intel Core i7-14650HX ⎘ Nvidia GeForce RTX 5070 Laptop ⎘ 16 Go Mémoire, 1024 Go SSD | Amazon: 1. $46.99 GVKRLXZ 230W AC Adapter Comp... 2. $12.99 Rujcloud HDMI 2.1 Cable for ... 3. $114.00 Black Laptop Backlit Keyboar... Prix de liste: 1800 EUR | 2.7 kg | 28 mm | 17.30" 2560x1440 170 PPI IPS |
6. 83.7%  | SCHENKER XMG Core 15 (M24) AMD Ryzen 7 8845HS ⎘ NVIDIA GeForce RTX 4060 Laptop GPU ⎘ 32 Go Mémoire, 1024 Go SSD | Prix de liste: 1650 Euro | 2.1 kg | 21.9 mm | 15.30" 2560x1600 197 PPI IPS |
Transparency
La sélection des appareils à examiner est effectuée par notre équipe éditoriale. L'échantillon de test a été prêté à l'auteur par le fabricant ou le détaillant pour les besoins de cet examen. Le prêteur n'a pas eu d'influence sur cette évaluation et le fabricant n'a pas reçu de copie de cette évaluation avant sa publication. Il n'y avait aucune obligation de publier cet article. Nous n'acceptons jamais de compensation ou de paiement en échange de nos commentaires. En tant que média indépendant, Notebookcheck n'est pas soumis à l'autorité des fabricants, des détaillants ou des éditeurs.
Voici comment Notebookcheck teste
Chaque année, Notebookcheck examine de manière indépendante des centaines d'ordinateurs portables et de smartphones en utilisant des procédures standardisées afin de garantir que tous les résultats sont comparables. Nous avons continuellement développé nos méthodes de test depuis environ 20 ans et avons établi des normes industrielles dans le processus. Dans nos laboratoires de test, des équipements de mesure de haute qualité sont utilisés par des techniciens et des rédacteurs expérimentés. Ces tests impliquent un processus de validation en plusieurs étapes. Notre système d'évaluation complexe repose sur des centaines de mesures et de points de référence bien fondés, ce qui garantit l'objectivité.