Verdict - Des performances élevées et des caractéristiques pratiques
Le Dell Pro Max 16 Plus est une avancée significative par rapport à la génération précédente Precision 7680 ou 7670. Outre l'augmentation attendue des performances, le modèle révisé bénéficie de fonctionnalités supplémentaires que l'on ne trouvait pas sur l'ancien modèle, notamment l'OLED 120 Hz, des ports USB-C modulaires pour la réparabilité, des options SSD PCIe5, la prise en charge de Thunderbolt 5, la charge USB-C compacte et une webcam de plus haute résolution. Les améliorations l'emportent sans doute sur les légères augmentations de l'épaisseur et de l'encombrement.
Les inconvénients sont généralement mineurs. La consommation d'énergie est désormais plus élevée qu'auparavant, atteignant 280 W contre 240 W ou moins sur le site Precision 7680. Ainsi, bien que le Pro Max 16 Plus soit certainement plus puissant, il est également plus exigeant pour la solution de refroidissement, avec une durée de vie de la batterie globalement plus courte. La température du CPU en particulier peut atteindre 95°C à 105°C lorsqu'il est sollicité, ce qui a un impact sur les performances Turbo Boost du système. Pendant ce temps, le GPU tend à se stabiliser à 125 W même s'il est prévu pour 175 W. Il est donc probable que le même CPU et GPU fonctionne plus rapidement sur des facteurs de forme plus épais ou plus grands comme le Pro Max 18 Plus de 18 pouces. Le système Pro Max 16 Plus est néanmoins l'une des stations de travail les plus rapides et les plus pratiques disponibles, malgré les contraintes liées à la solution de refroidissement.
Points positifs
Points négatifs
Prix et disponibilité
Dell livre maintenant le Pro Max 16 Plus à partir de $3700 USD pour la configuration de base Core Ultra 7, RTX Pro 1000. Notre Core Ultra 9 avec RTX Pro 5000 Blackwell n'est pas encore largement disponible.
- $1,749.95Dell Pro 16 Plus PB16250 (Replaces Latitude 5550) AI Business Notebook 16" FHD+ Intel Ultra 7-265U, 32GB DDR5 RAM, 1TB SSD PCIe, Wi-Fi 6E, BT, Backlit Keyboard, HD Webcam, RJ-45, Win 11 Pro - Silver
- $769.00Dell Pro 16 Plus PB16255 Business Laptop 2026 (Replace Latitude 5550), 16" FHD+, AMD Ryzen AI 5 PRO 340 6-Core (Beats Ultra 5 135U), 16GB RAM, 1TB PCIe SSD, IR Cam, WiFi 7, Ethernet, Windows 11 Pro
- $1,019.00Dell 16 Plus Laptop 16" WUXGA Comfortview Touchscreen AMD 8-core Ryzen AI 7 350 (Up to 50 Tops) 32GB RAM 2TB SSD Backlit Fingerprint for Creator Business Professional Win11Pro ICP Hub w/Copilot+ AI
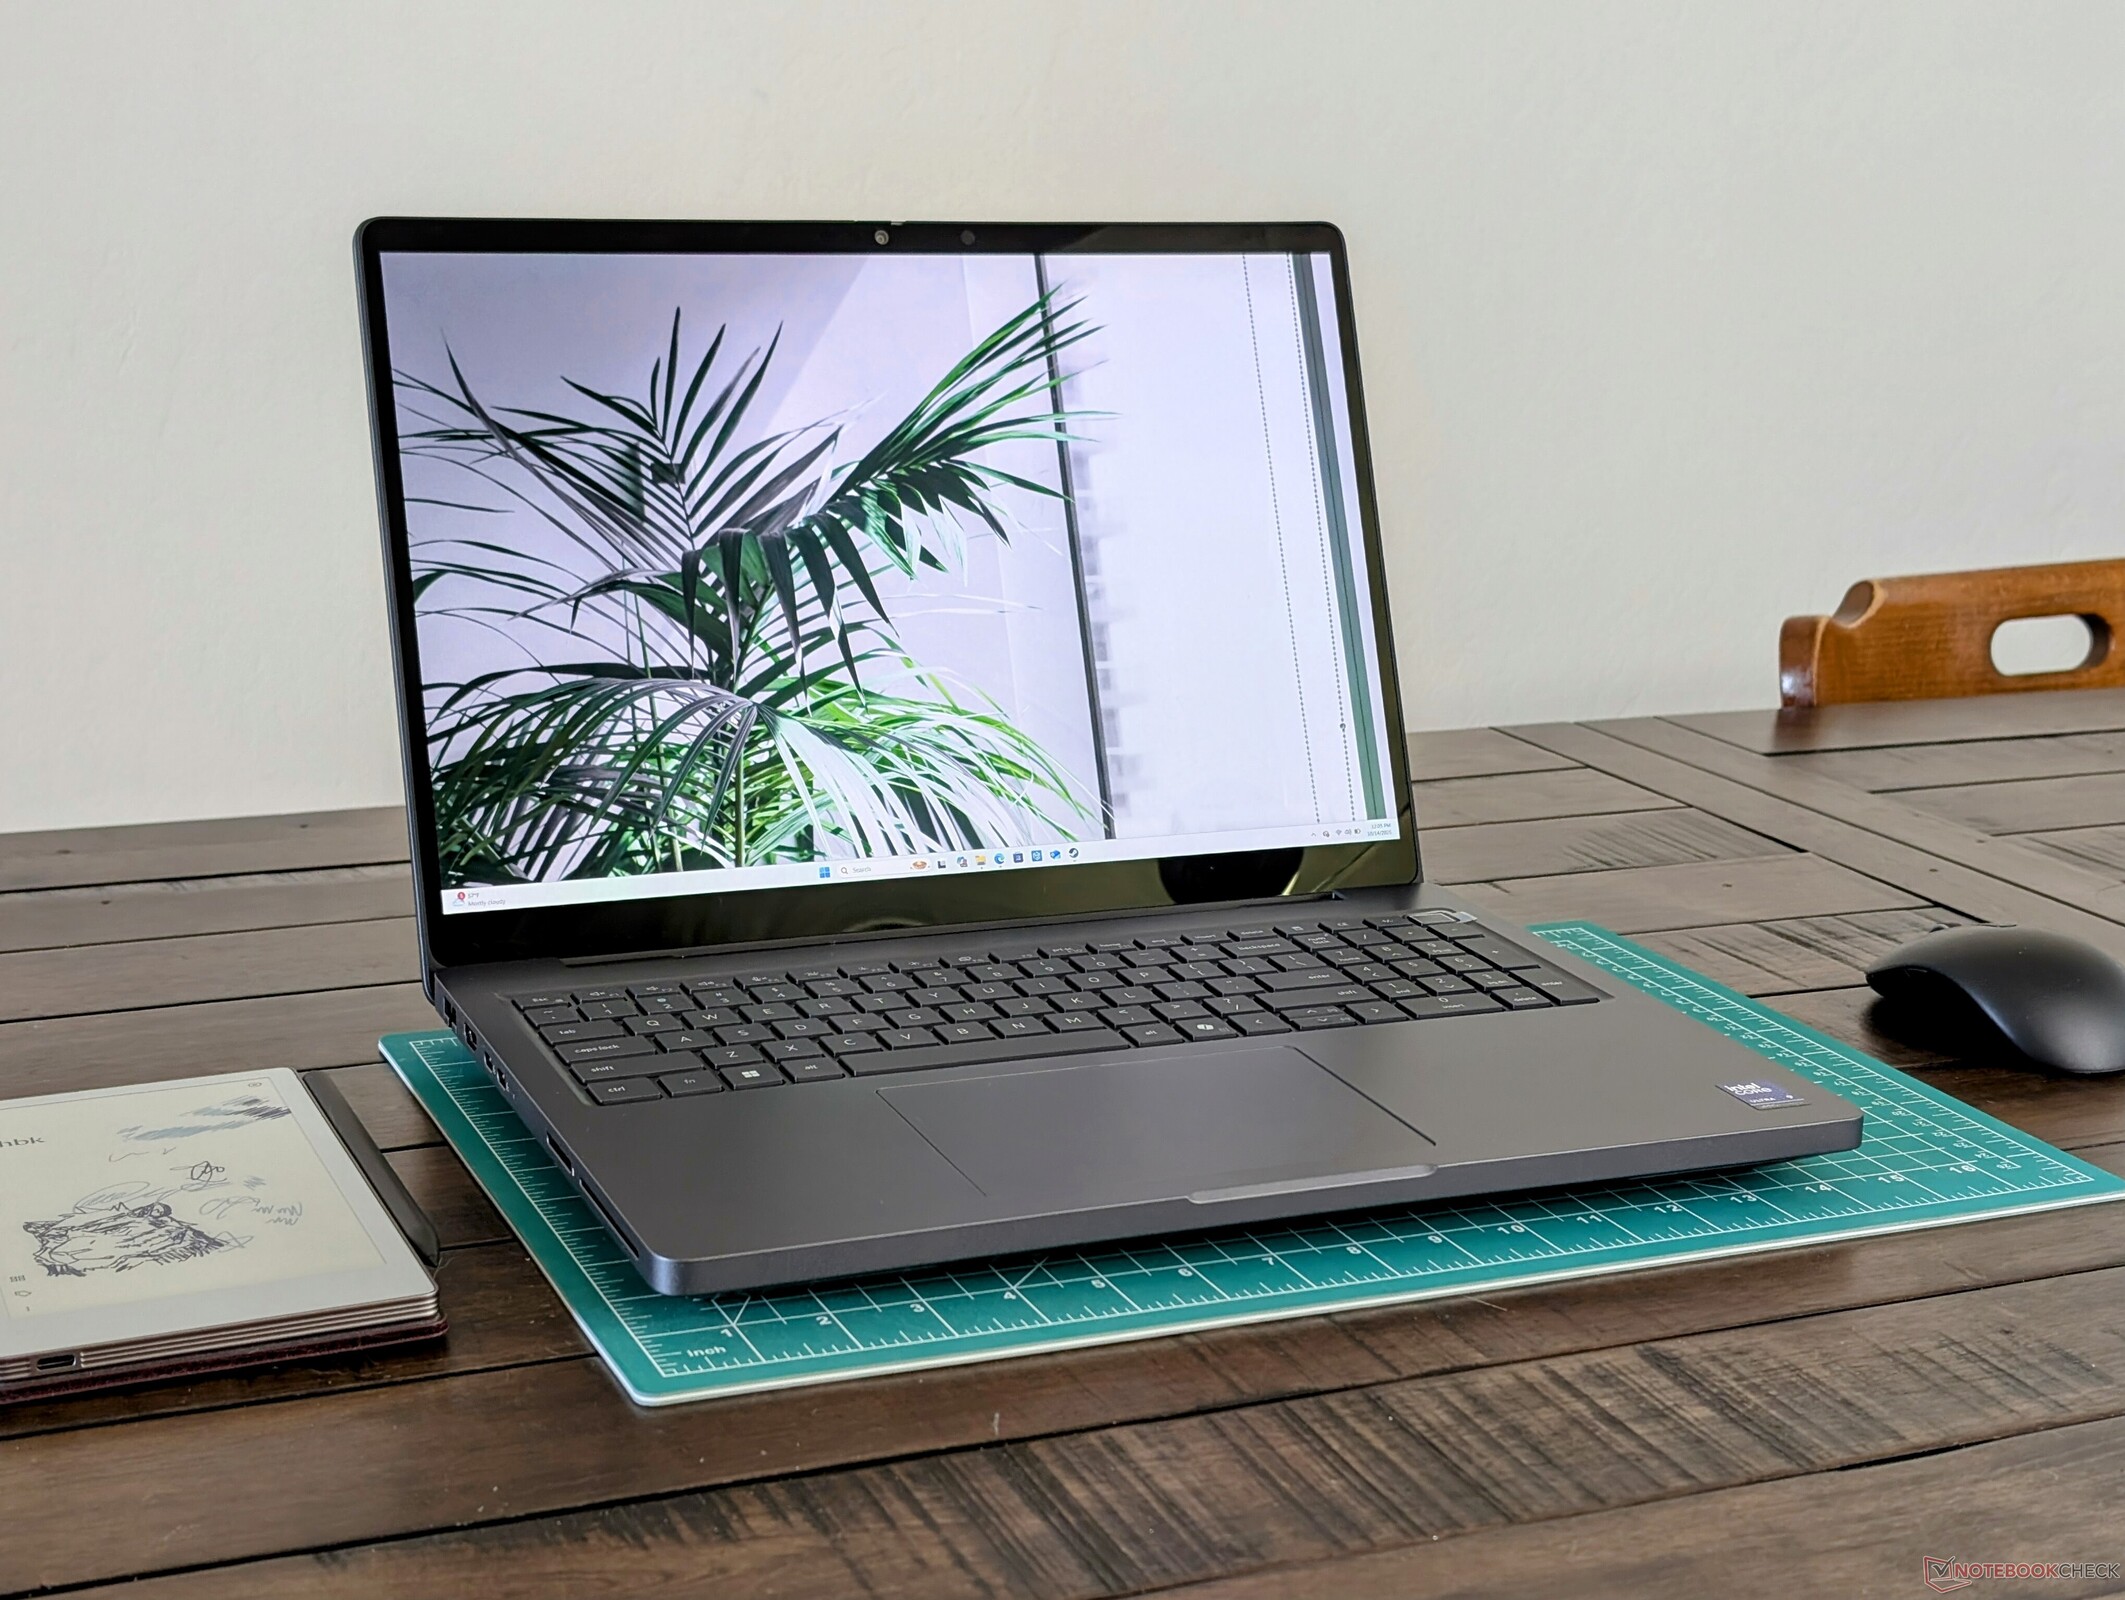
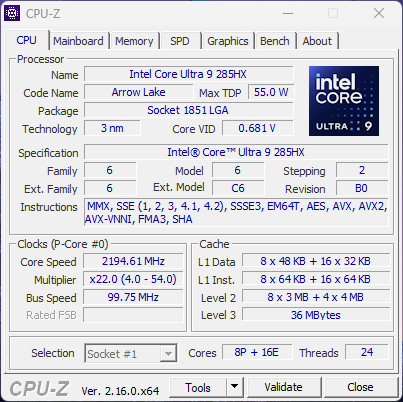
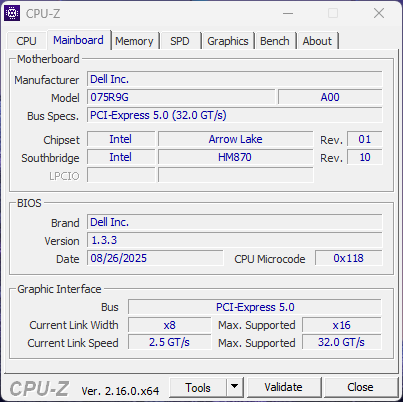
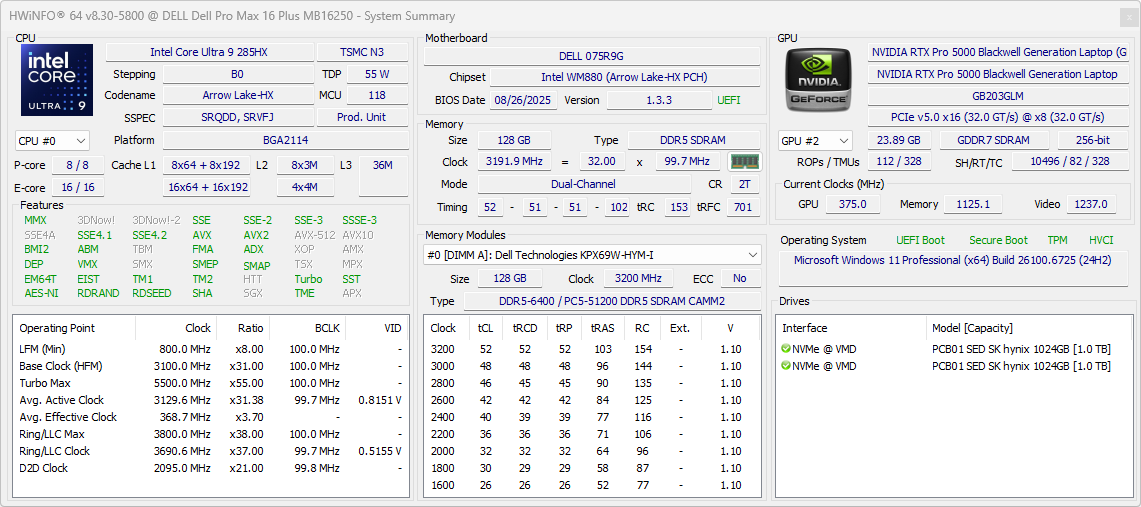
Le Dell Pro Max 16 Plus est la dernière station de travail mobile de 16 pouces du fabricant, succédant à la dernière génération de la série Precision 7680. En tant que telle, il s'agit d'une station de travail haut de gamme dotée de processeurs et de fonctionnalités avancés, notamment les CPU Intel Arrow Lake-HX, les GPU Nvidia Pro Blackwell et la compatibilité avec du matériel spécialisé comme les modules DGFF et CAMM2.
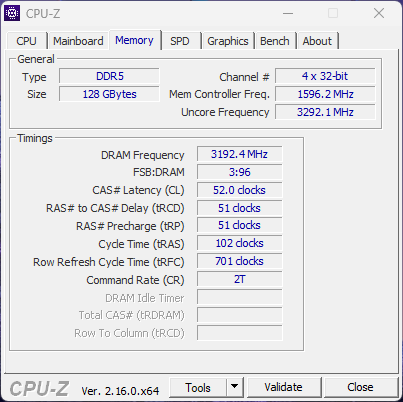
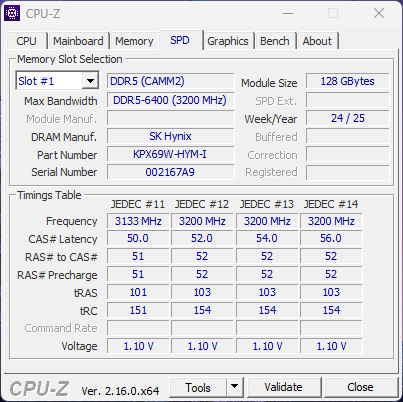
Notre unité de test est la configuration la plus haut de gamme avec le Core Ultra 9 285HX, la RTX Pro 5000 Blackwell, un écran tactile OLED 4K UHD 120 Hz, un SSD PCIe5 de 2 To et 128 Go de RAM CAMM2 pour un prix d'environ 5 000 $. Les SKU moins chers commencent avec le Core Ultra 5 245HX, 16 Go CSoDIMM, graphique intégré uniquement, et un écran FHD+ non tactile de base pour environ 3700 $.
Les alternatives dans ce domaine incluent d'autres stations de travail de 16 pouces orientées vers la performance, comme le MSI CreatorPro Z16P, Lenovo ThinkPad P16 Gen 2ou le HP ZBook Studio 16.
Plus de commentaires sur Dell :
Spécifications
Cas
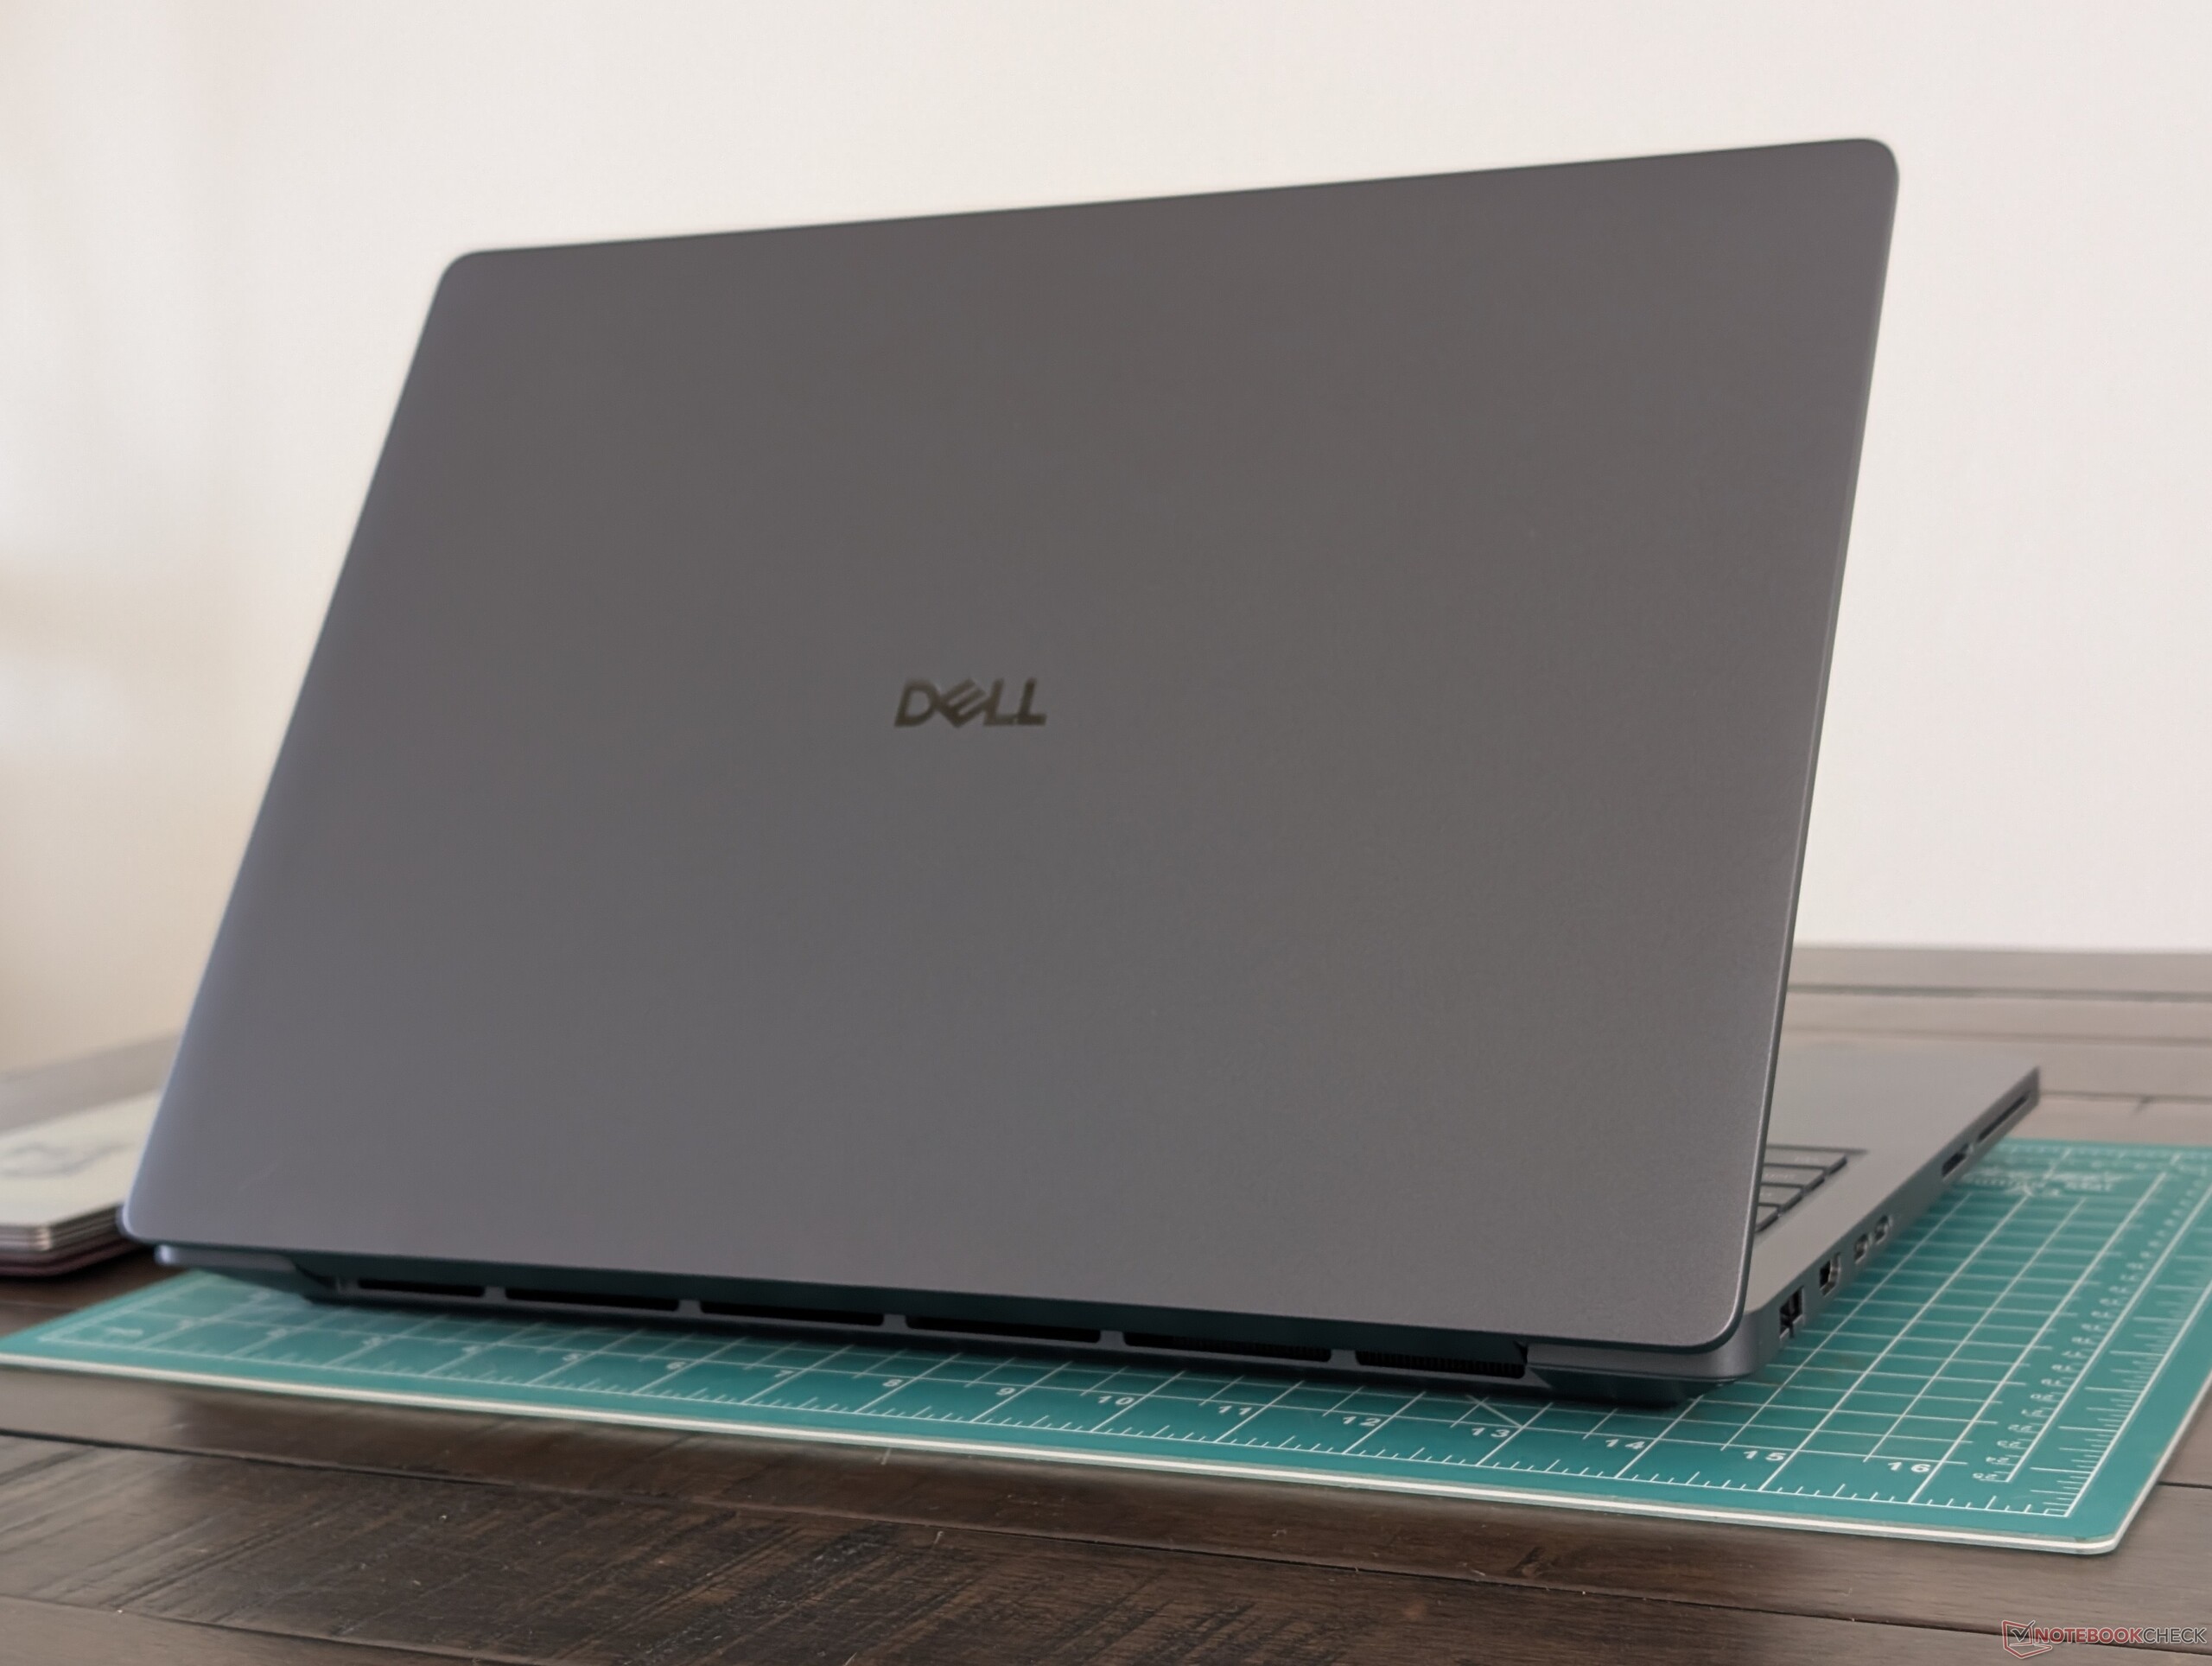
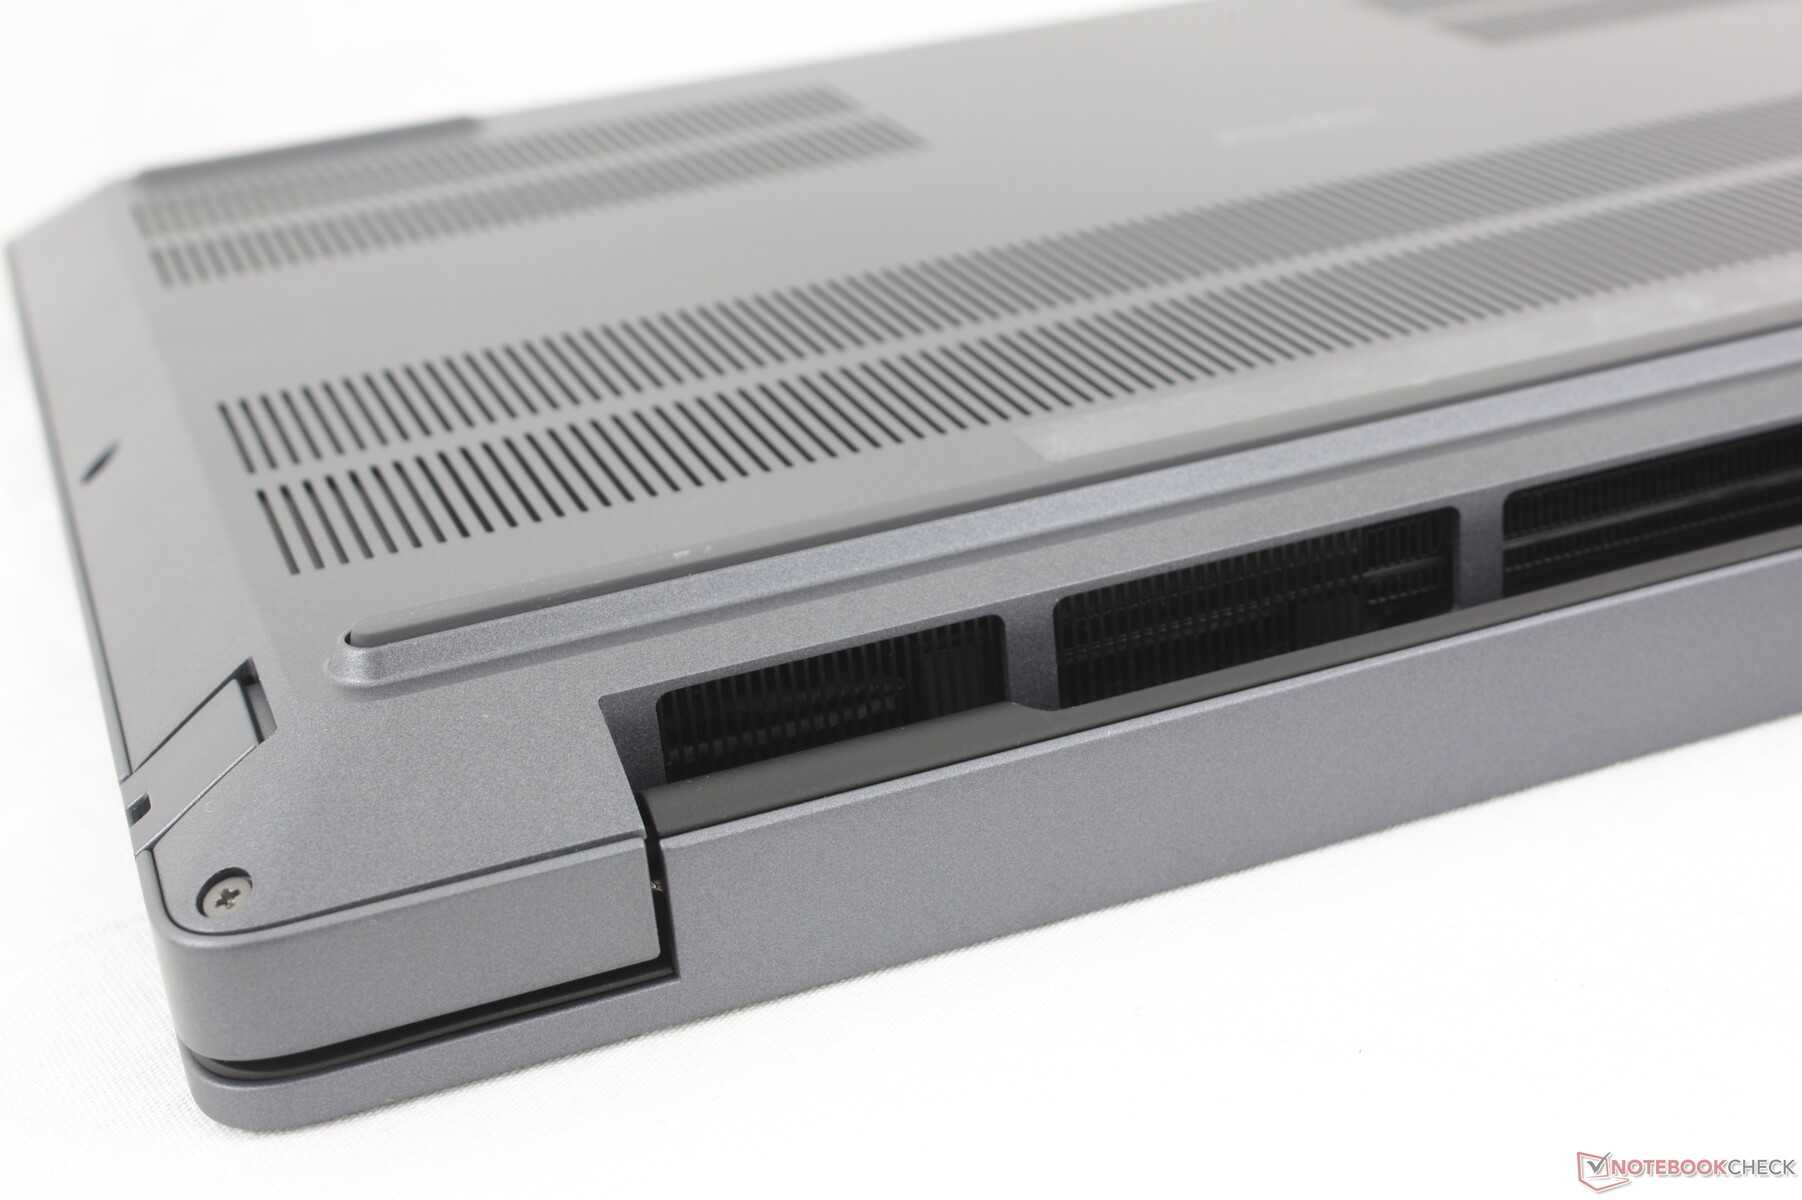
Le modèle est en fait légèrement plus grand et plus épais que le Precision 7670, vieux de 4 ans. Malgré cela, la qualité de construction solide et les fonctionnalités professionnelles telles que CAMM2, DGFF et la réparabilité modulaire USB-C font sans doute que la taille plus importante vaut l'investissement.


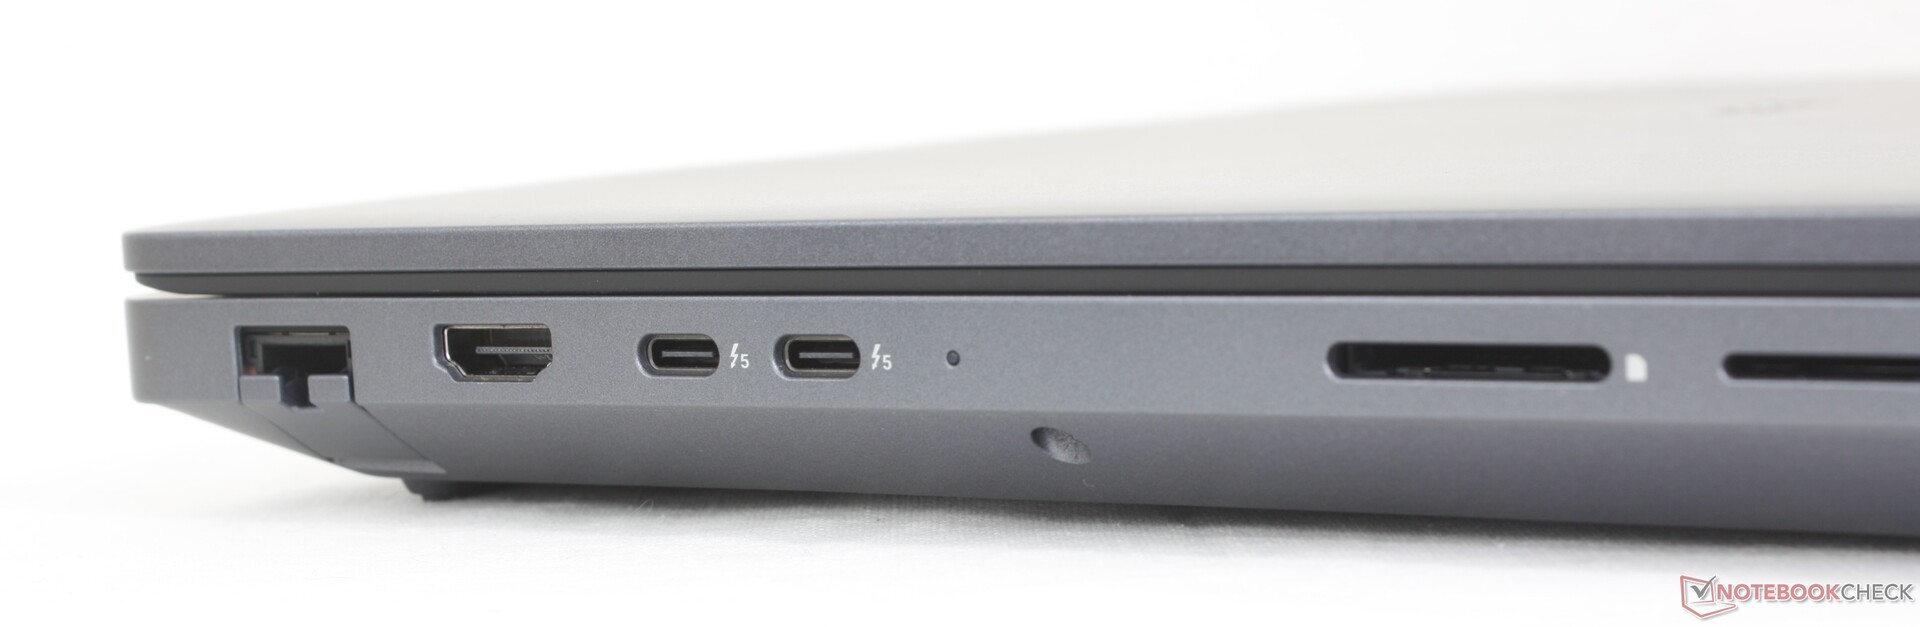
Connectivité
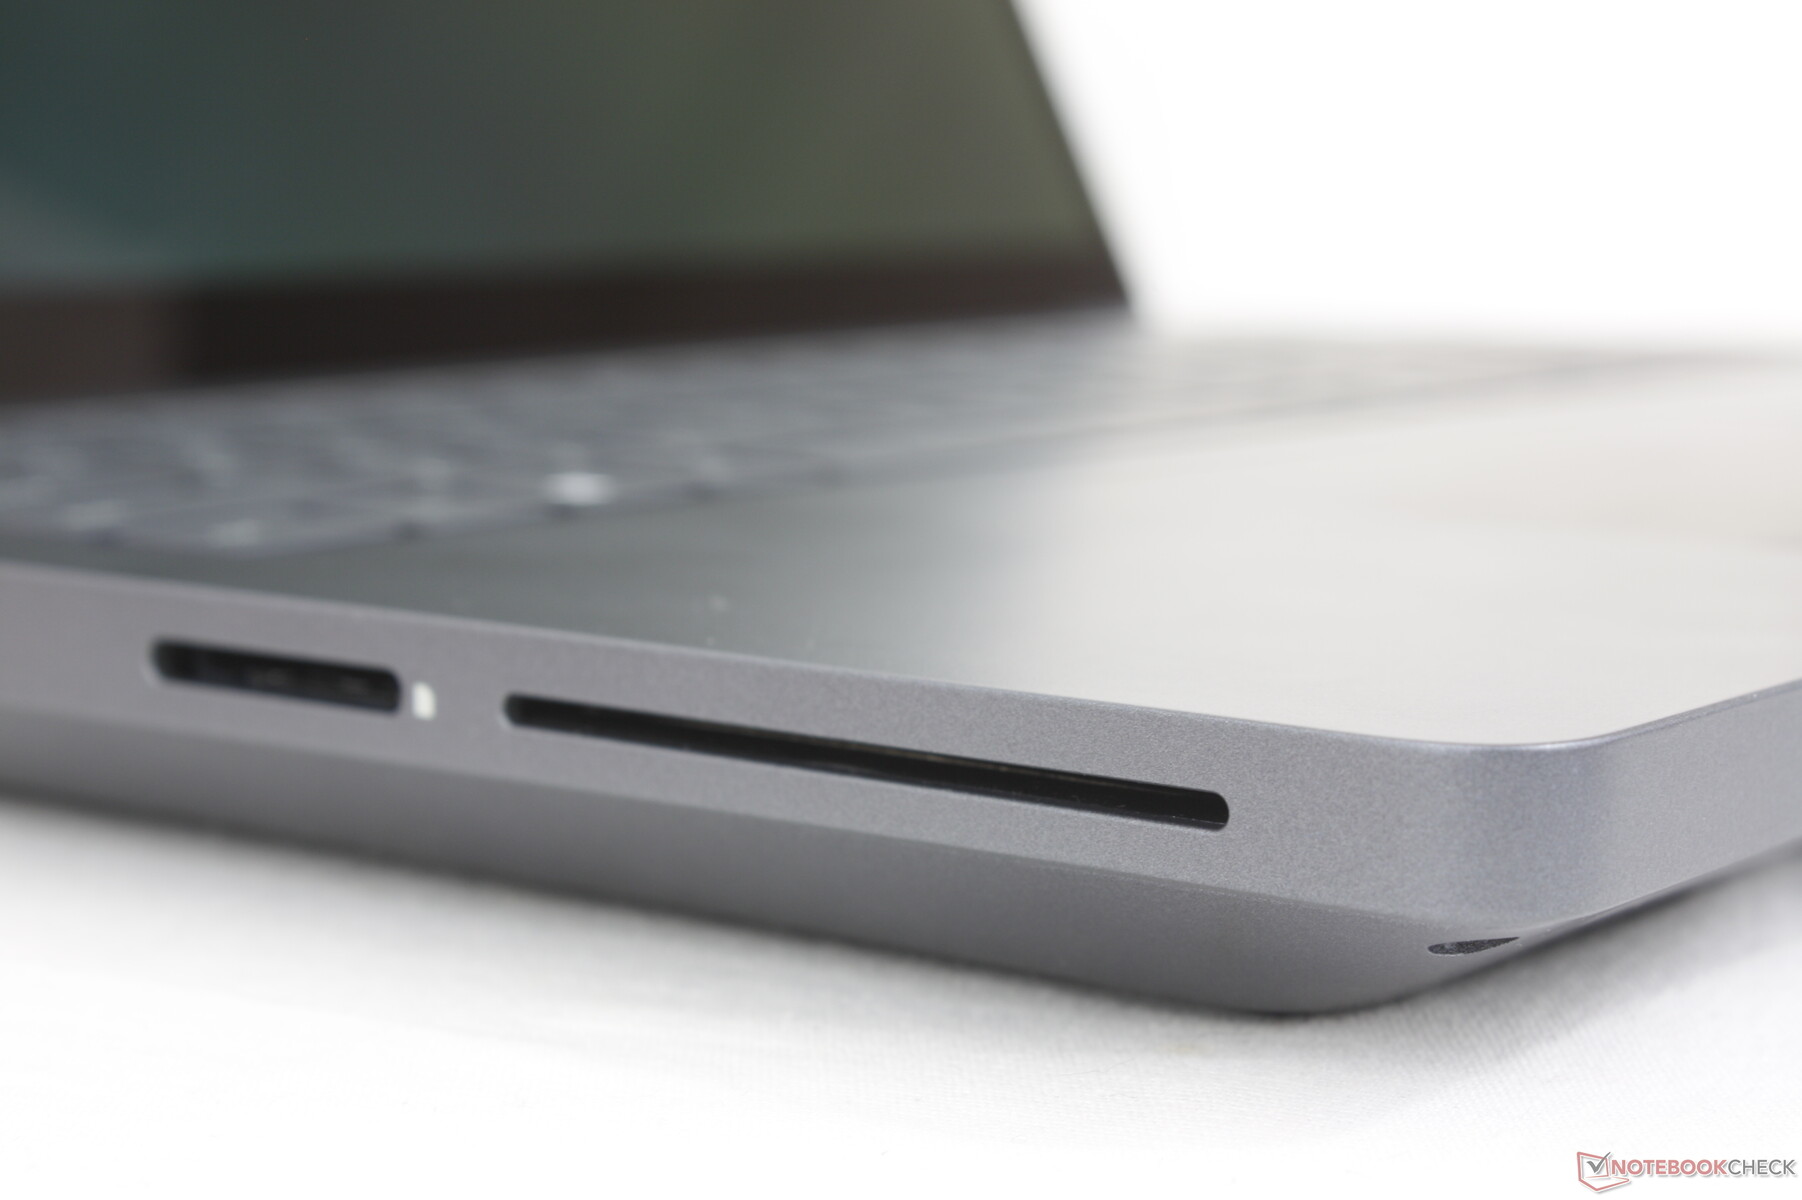
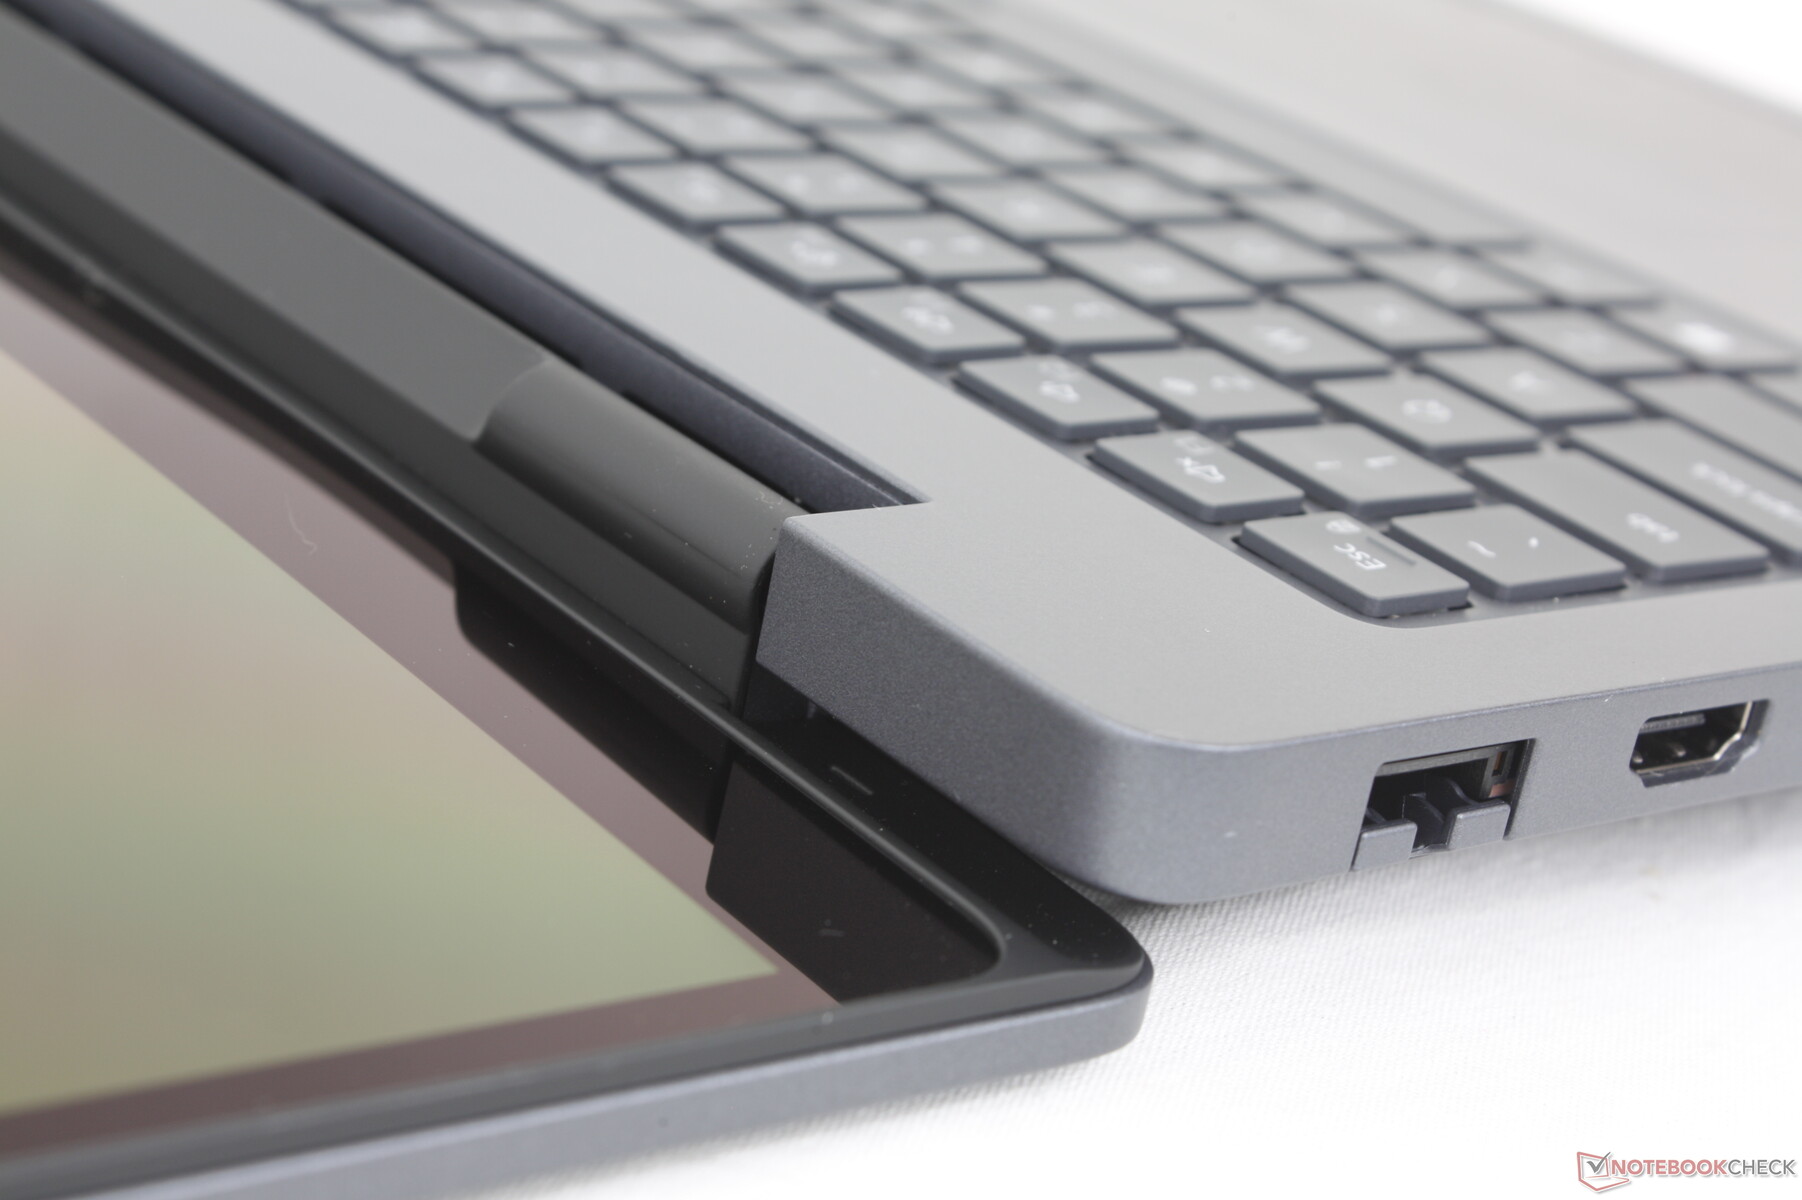
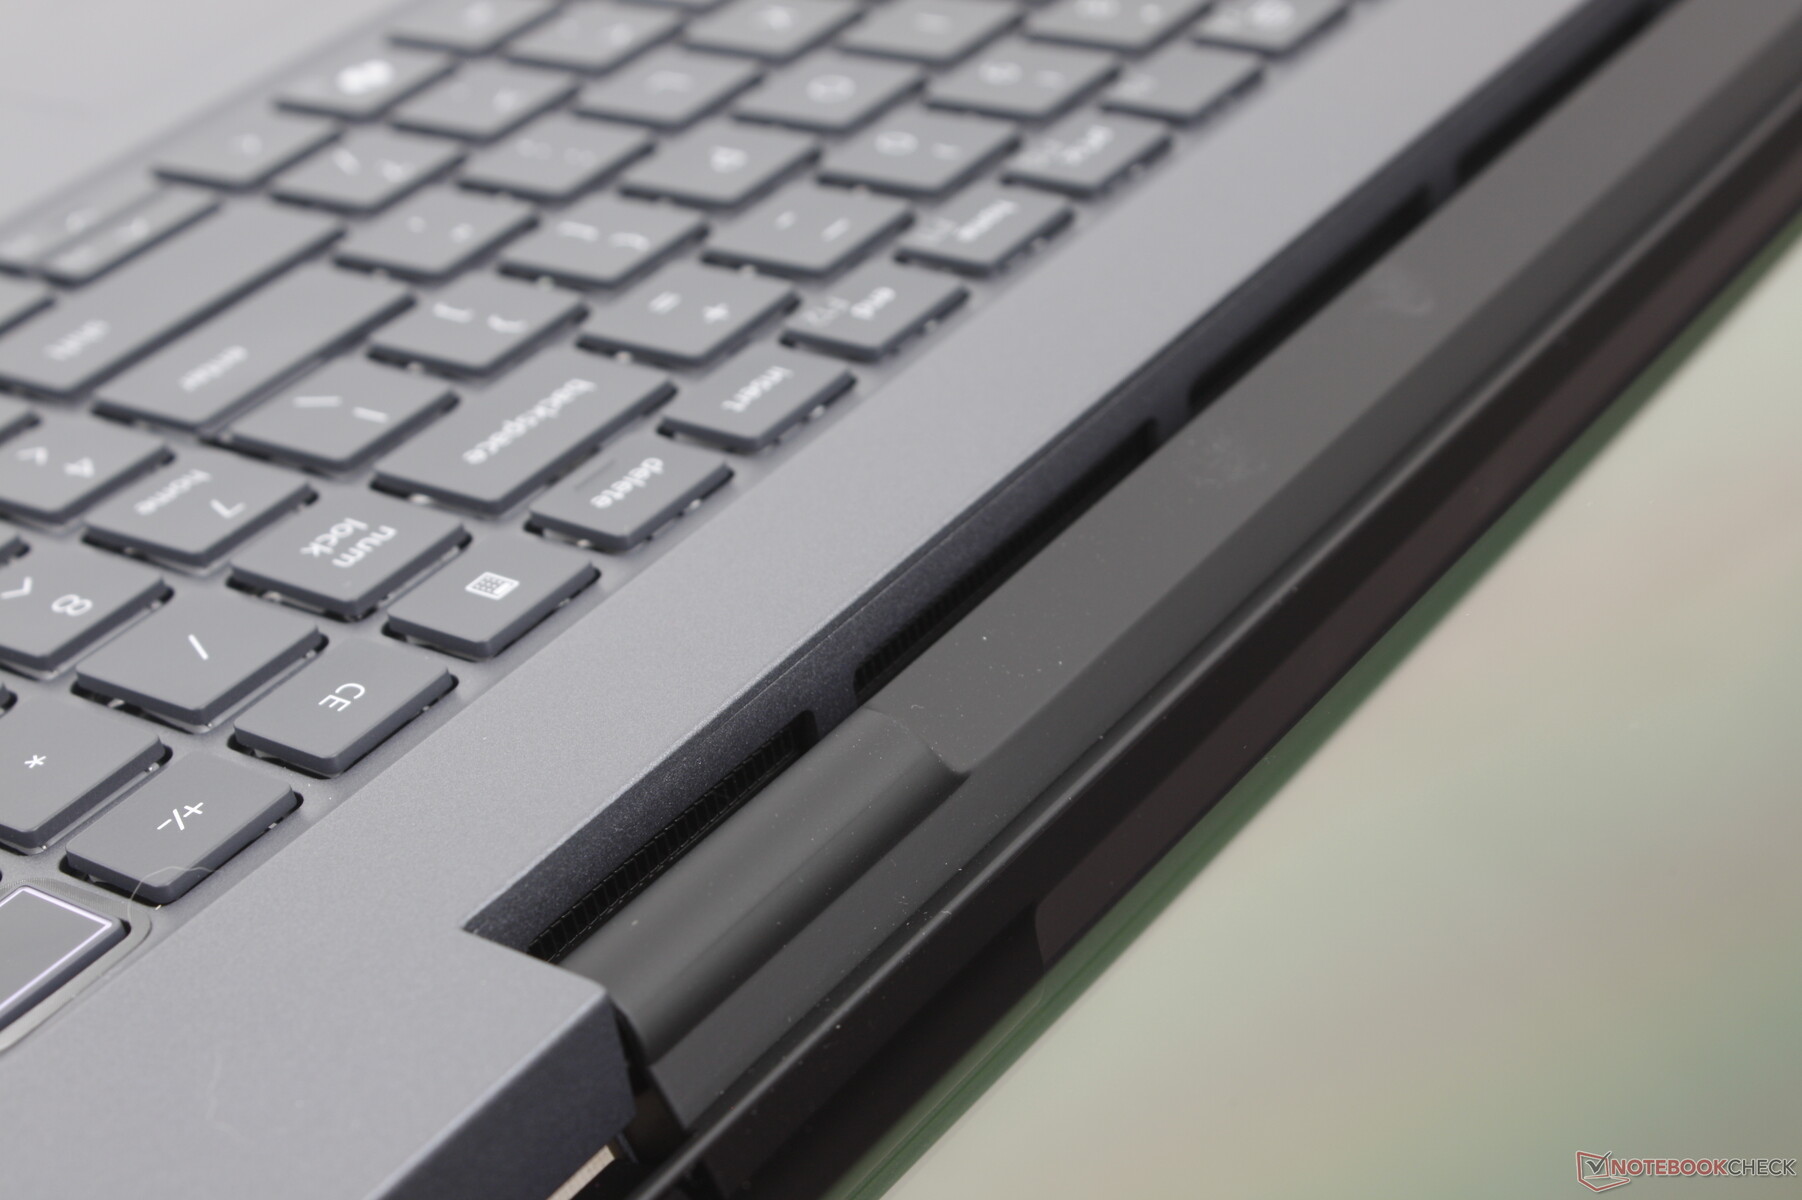
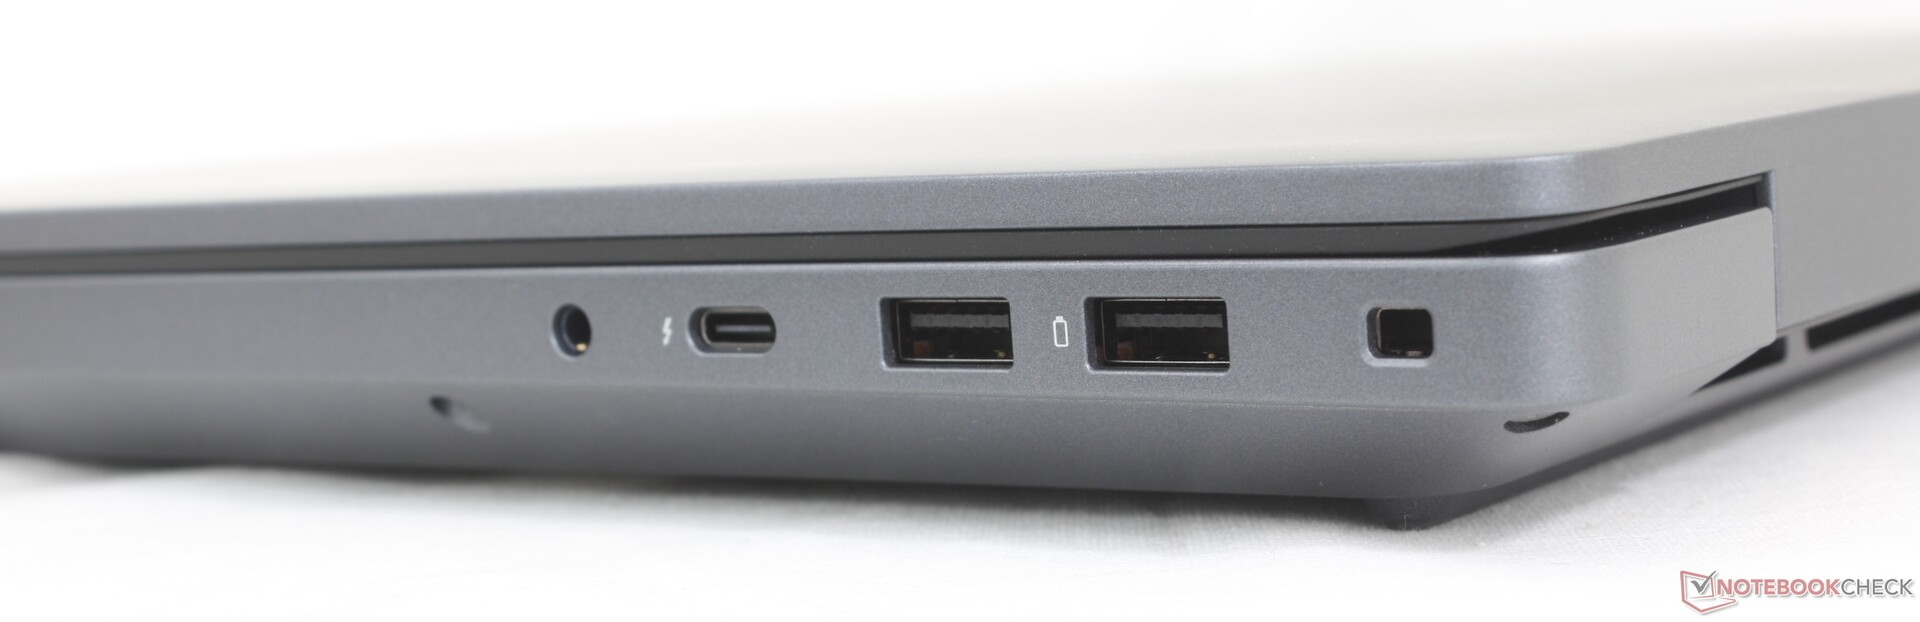
Les options de port sont largement identiques à celles du Precision 7680, avec toutefois quelques changements importants. Le port canon dédié à l'adaptateur secteur, par exemple, a été abandonné sur le Pro Max 16 Plus, ce qui signifie que l'un des trois ports USB-C sera presque toujours occupé à des fins de charge. Pendant ce temps, Thunderbolt 5 est maintenant livré en standard pour des capacités d'ancrage plus avancées.
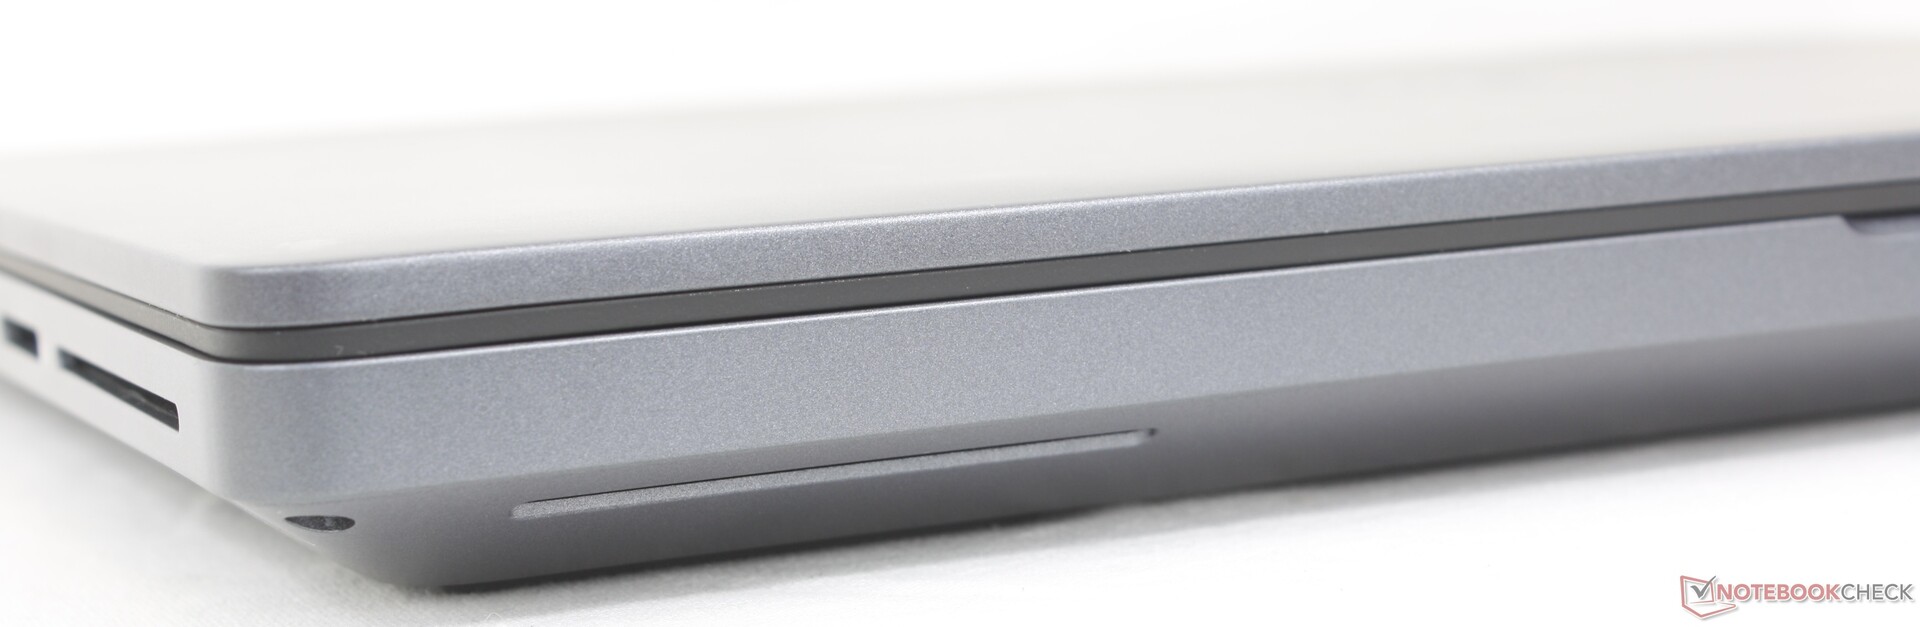

Lecteur de carte SD
| SD Card Reader | |
| average JPG Copy Test (av. of 3 runs) | |
| Dell Precision 5000 5680 (Toshiba Exceria Pro SDXC 64 GB UHS-II) | |
| Lenovo ThinkPad P16 Gen 2 (Toshiba Exceria Pro SDXC 64 GB UHS-II) | |
| MSI CreatorPro Z16P B12UKST (AV Pro V60) | |
| Dell Pro Max 16 Plus (Toshiba Exceria Pro SDXC 64 GB UHS-II) | |
| Lenovo ThinkPad P1 Gen 7 21KV001SGE (AV Pro V60) | |
| maximum AS SSD Seq Read Test (1GB) | |
| Dell Precision 5000 5680 (Toshiba Exceria Pro SDXC 64 GB UHS-II) | |
| Dell Pro Max 16 Plus (Toshiba Exceria Pro SDXC 64 GB UHS-II) | |
| Lenovo ThinkPad P1 Gen 7 21KV001SGE (AV Pro V60) | |
| Lenovo ThinkPad P16 Gen 2 (Toshiba Exceria Pro SDXC 64 GB UHS-II) | |
| MSI CreatorPro Z16P B12UKST (AV Pro V60) | |
Communication
Webcam
Webcam 8 MP en option avec IR et obturateur physique.


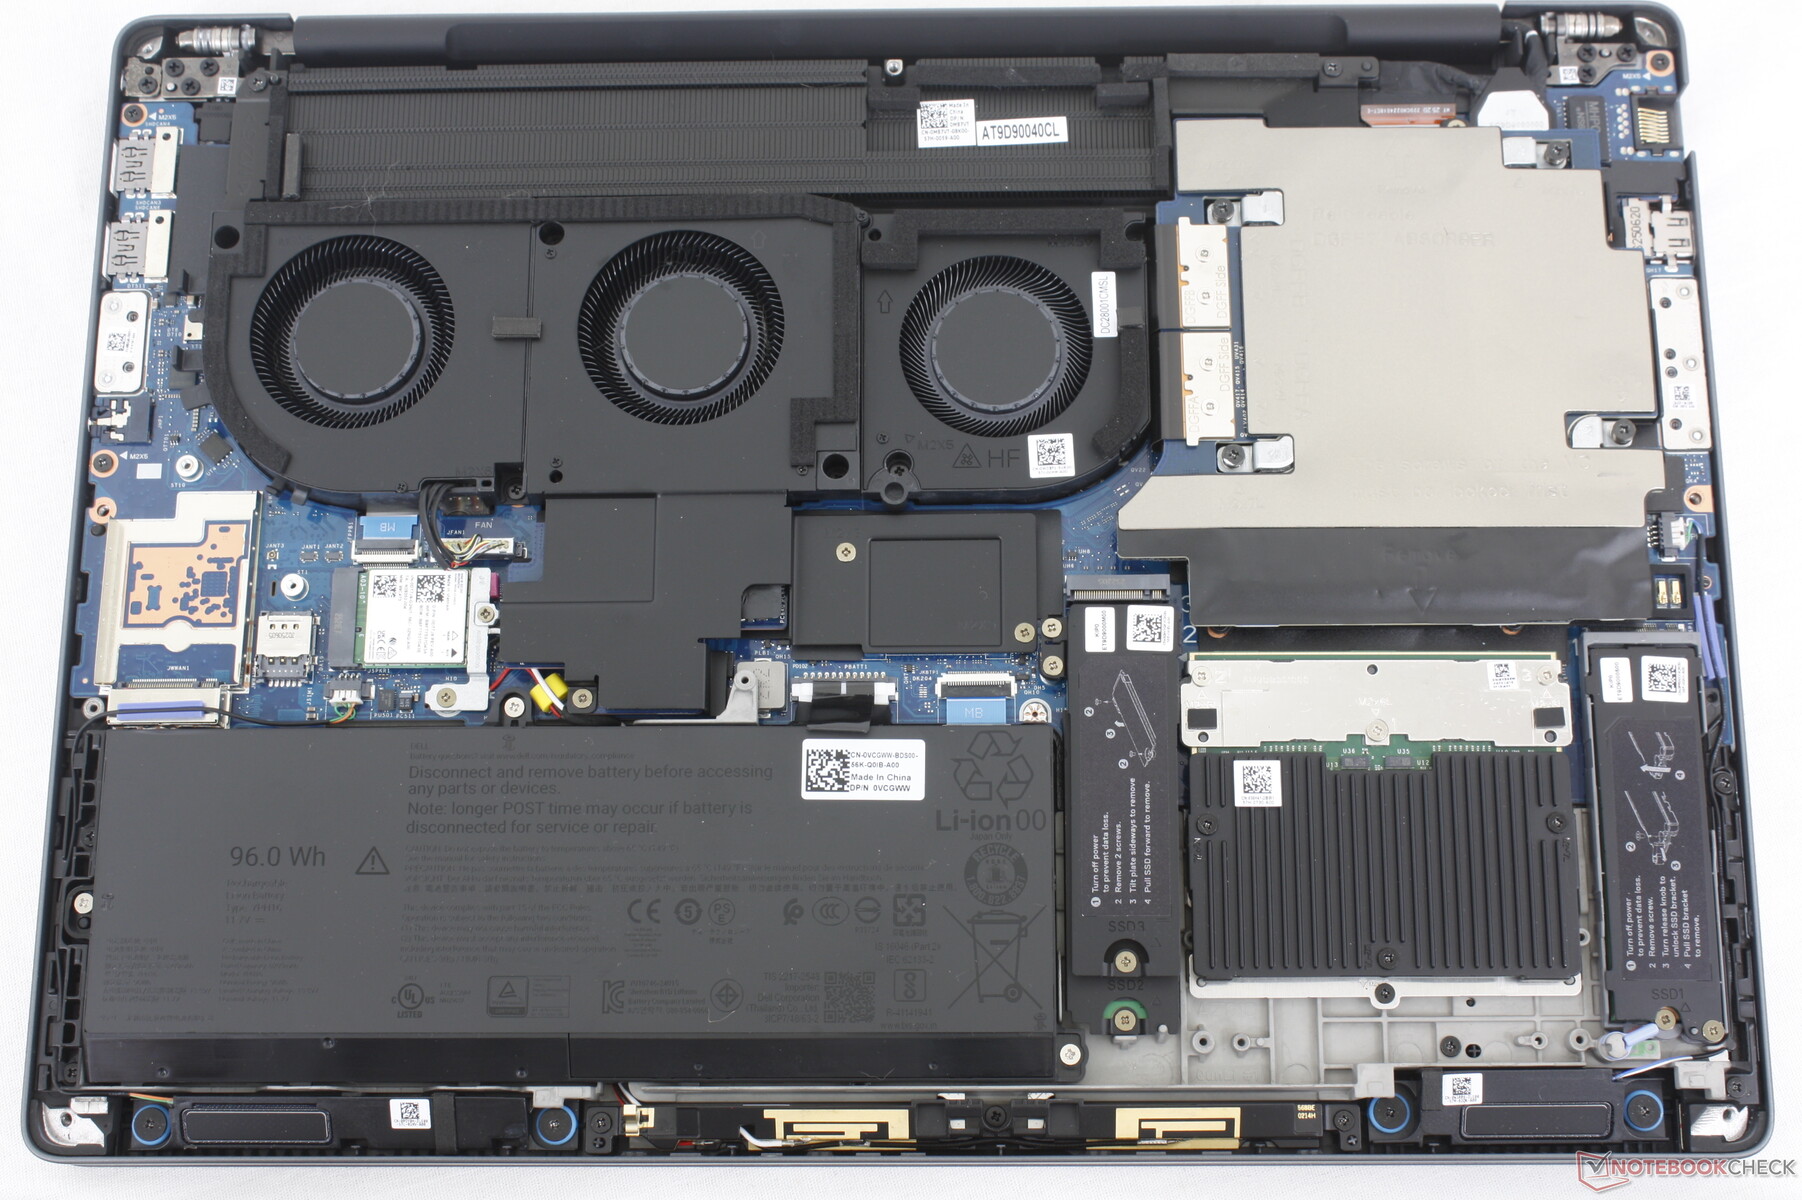
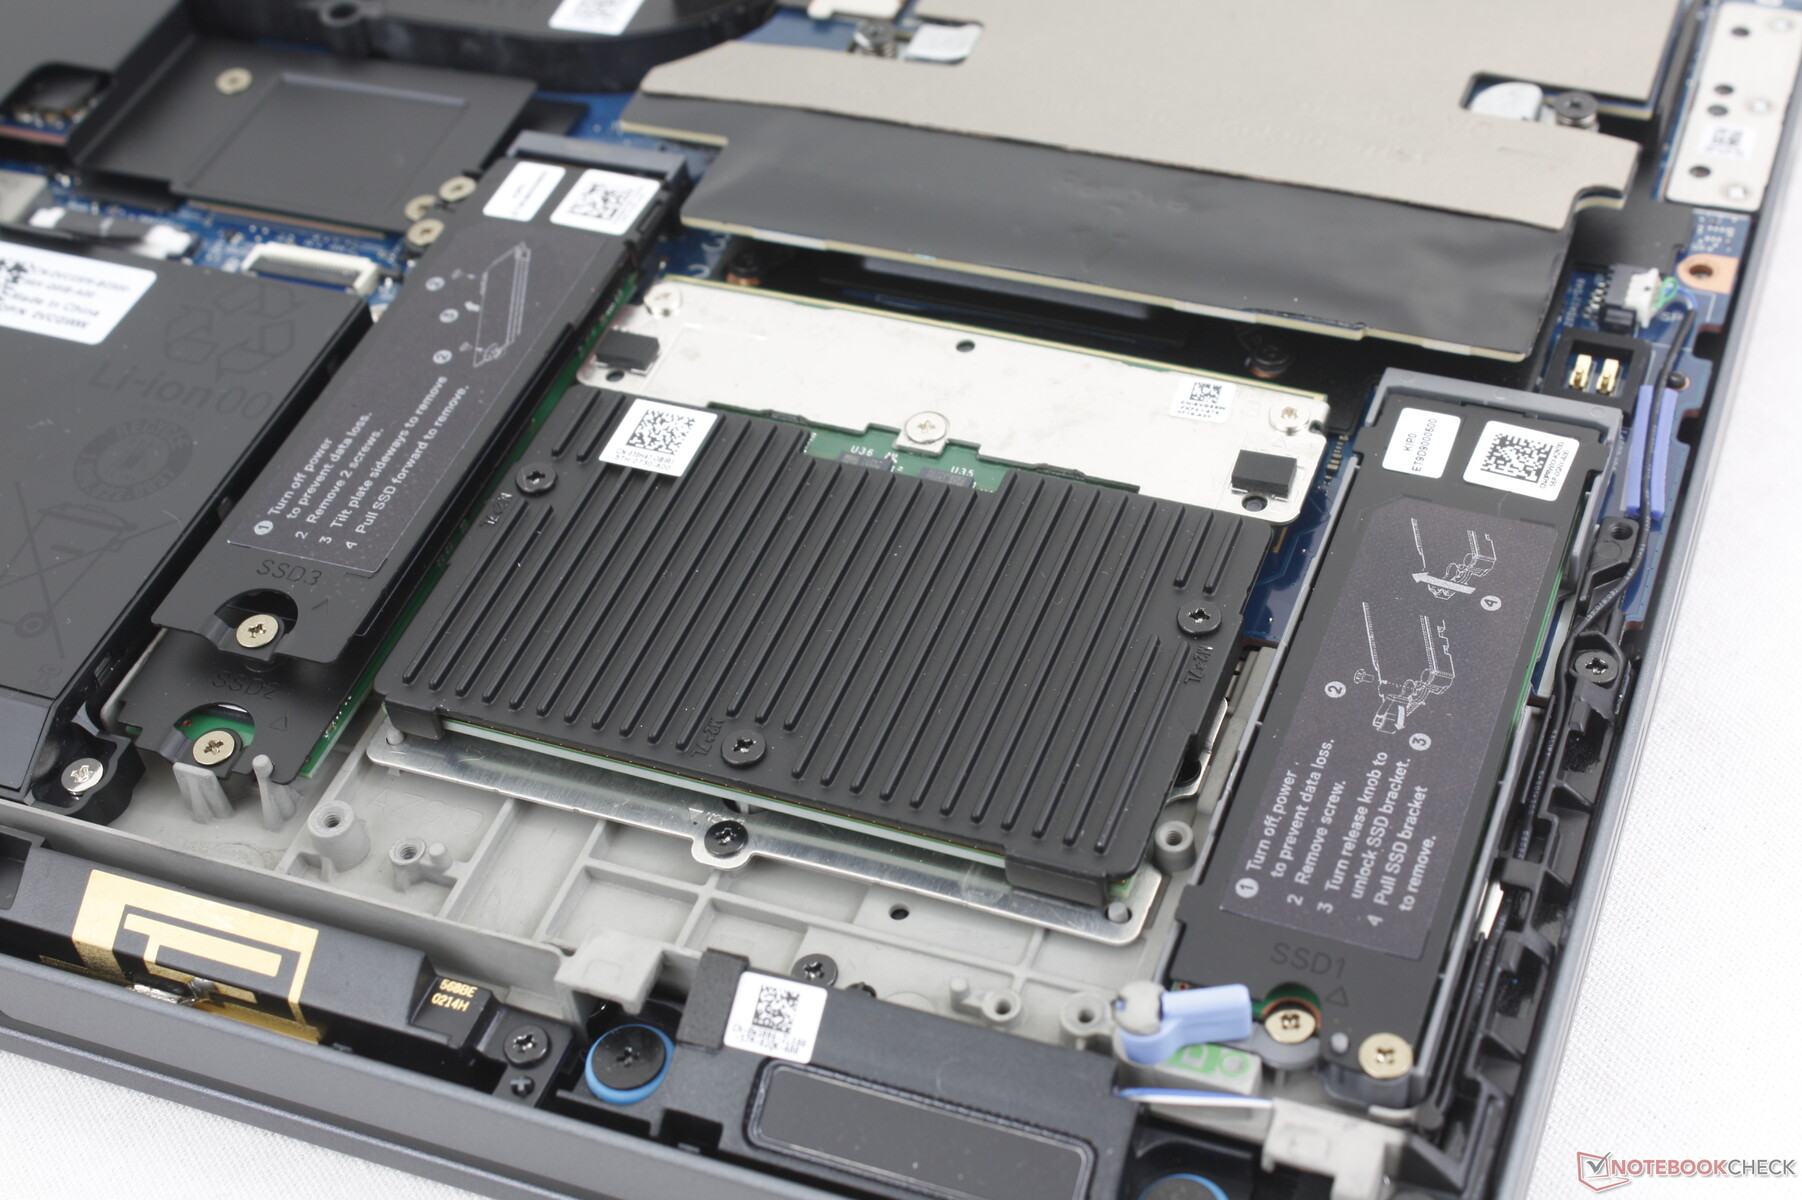
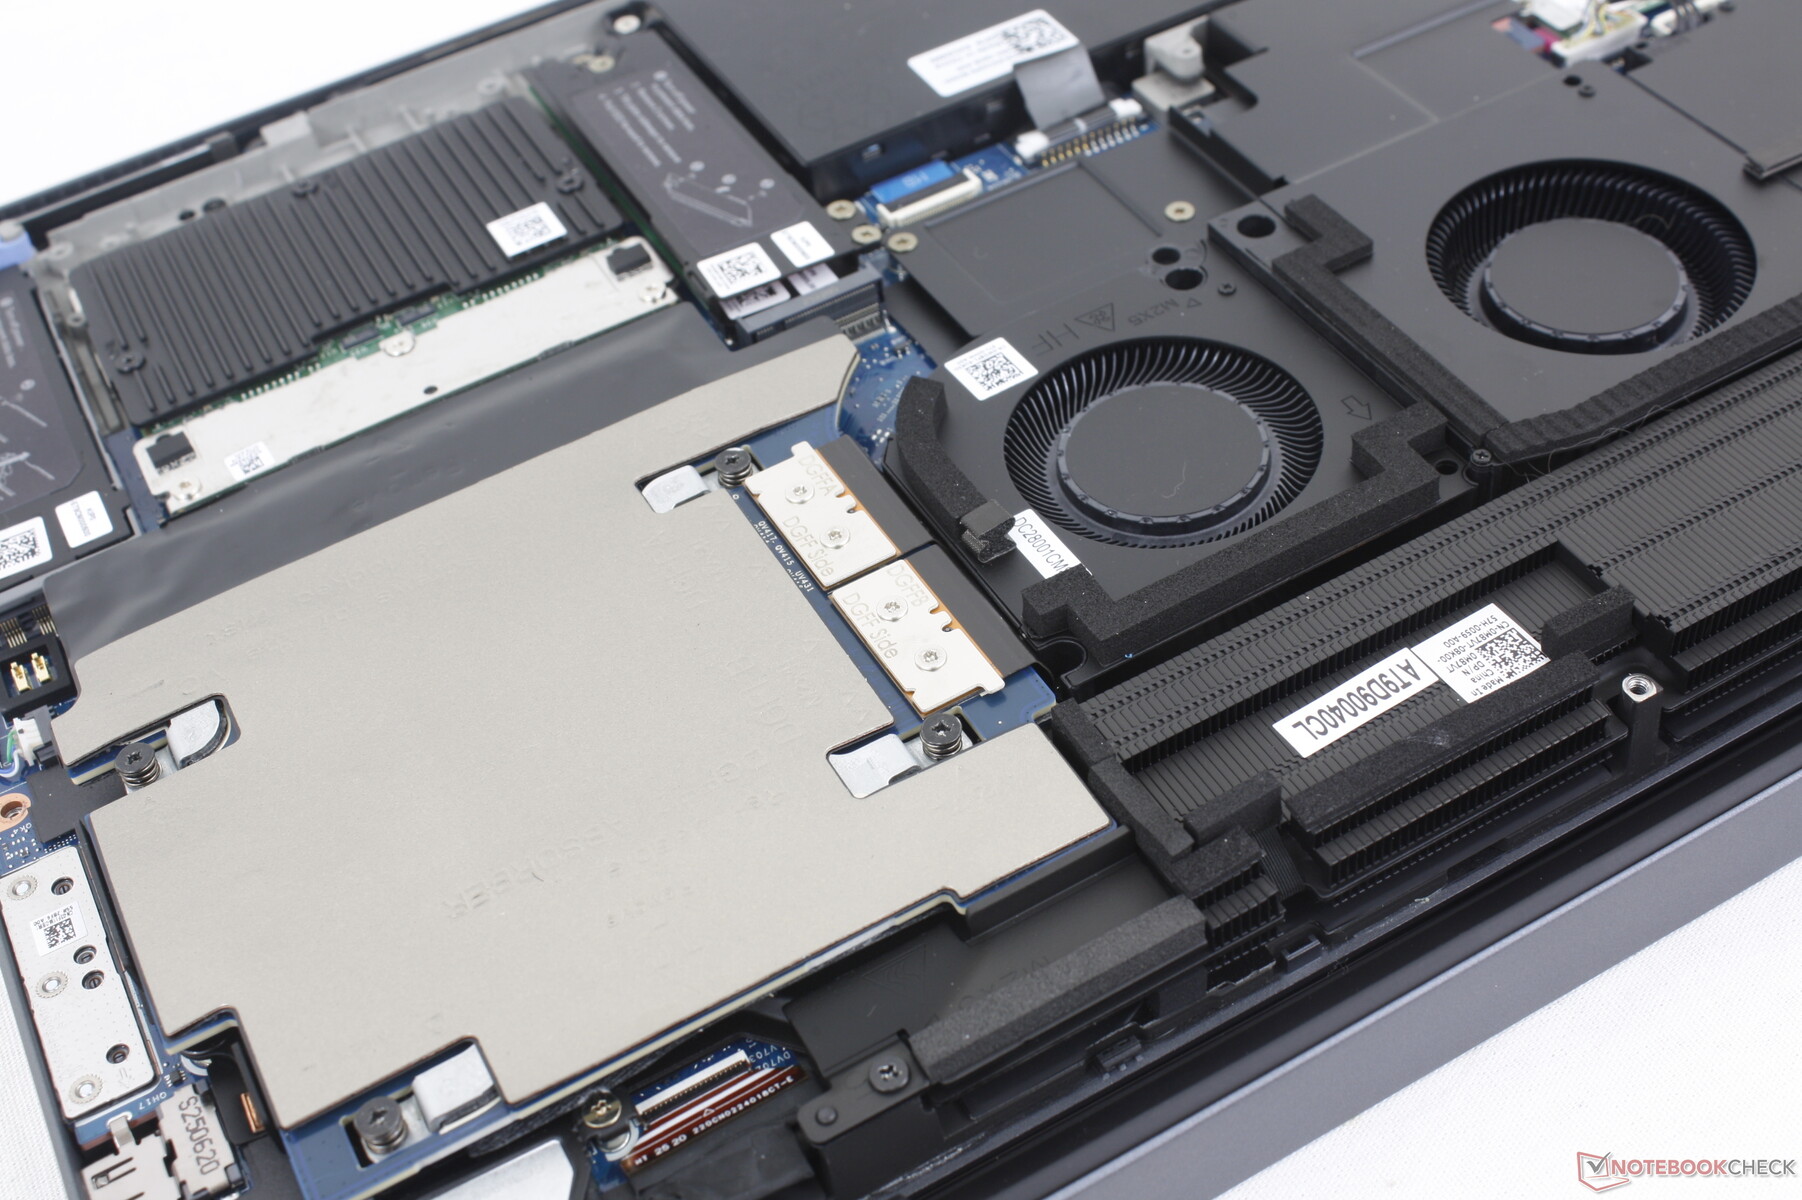
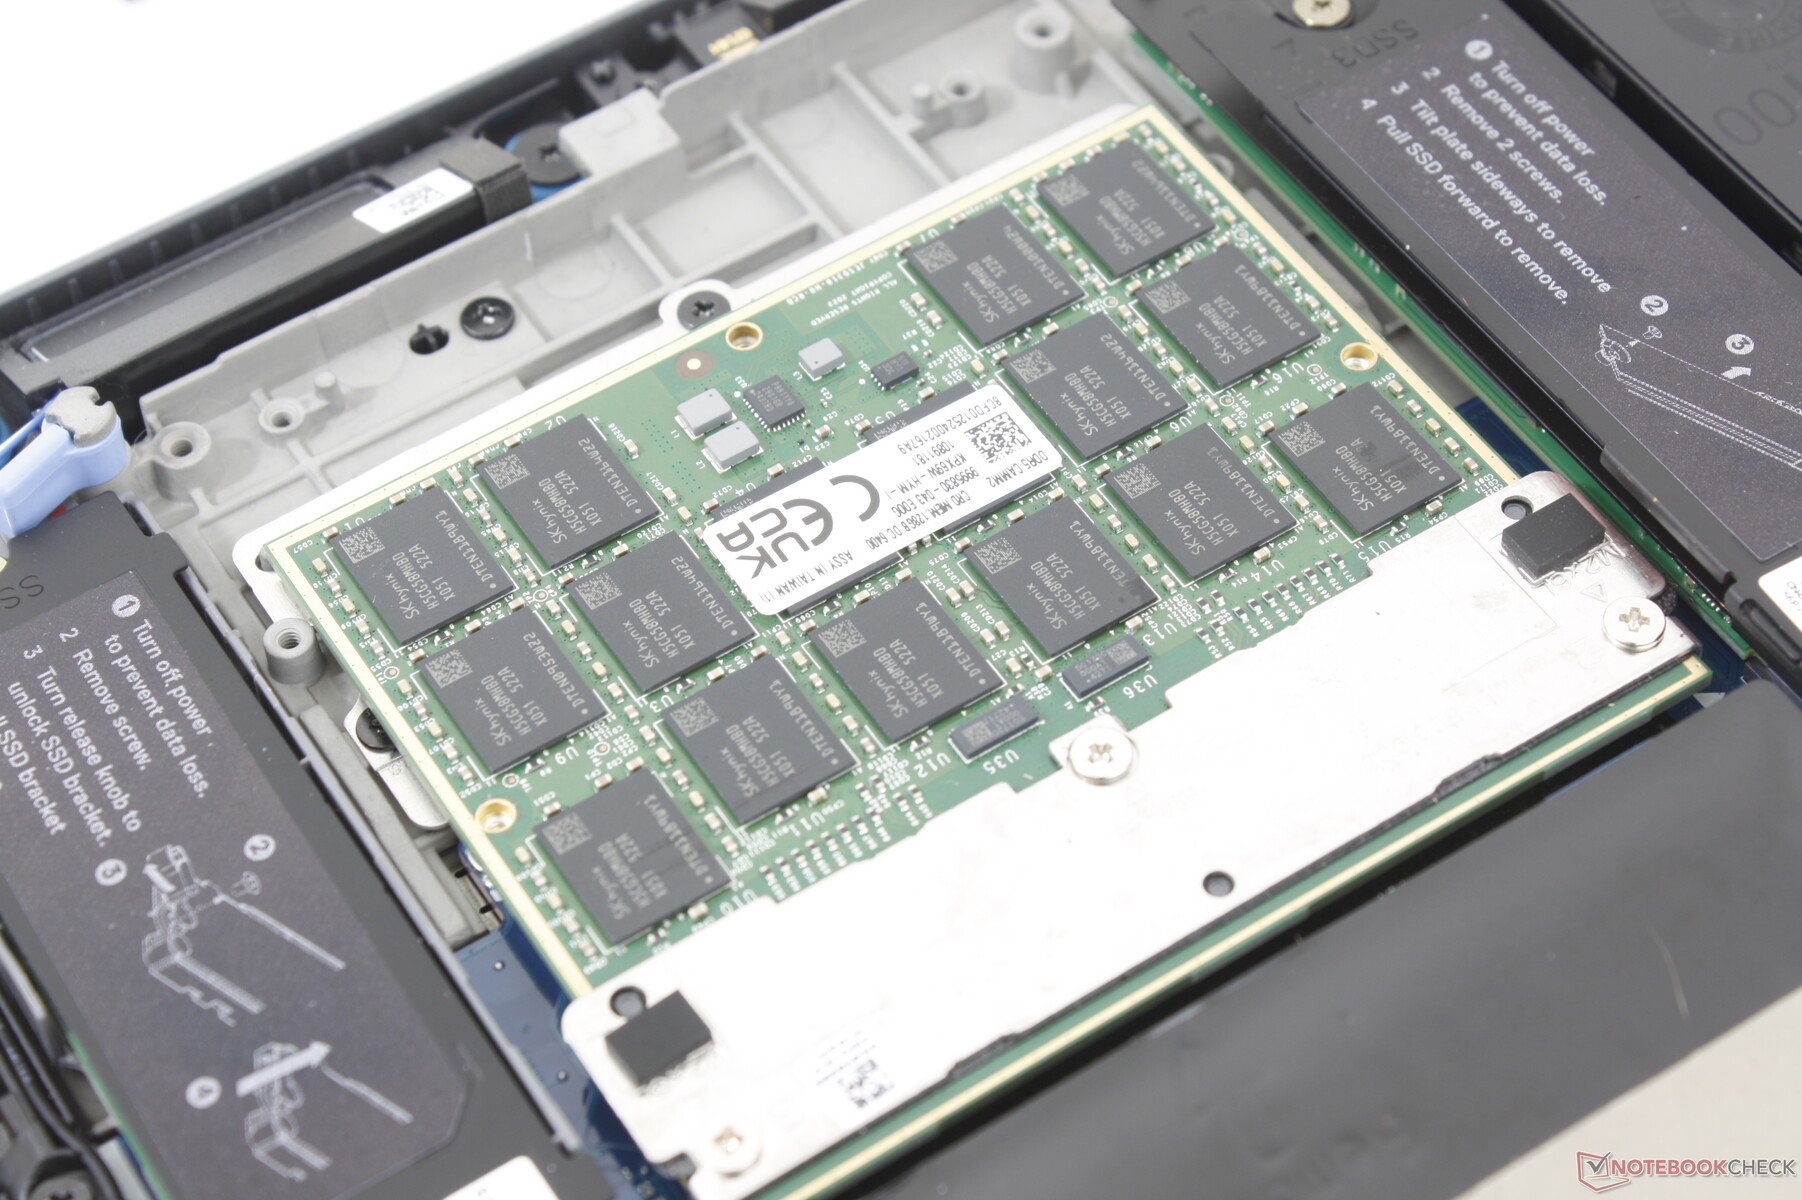
Maintenance
Le panneau inférieur ne nécessite qu'un tournevis Phillips pour être retiré afin de faciliter l'accès aux composants internes. Le module CAMM2, les deux emplacements pour SSD M.2 2280, le module WLAN et la carte graphique (DGFF) sont tous amovibles.
La "porte de lecteur" SSD qui se trouvait sur l'ancien modèle Precision 7670/7680 a été supprimée.
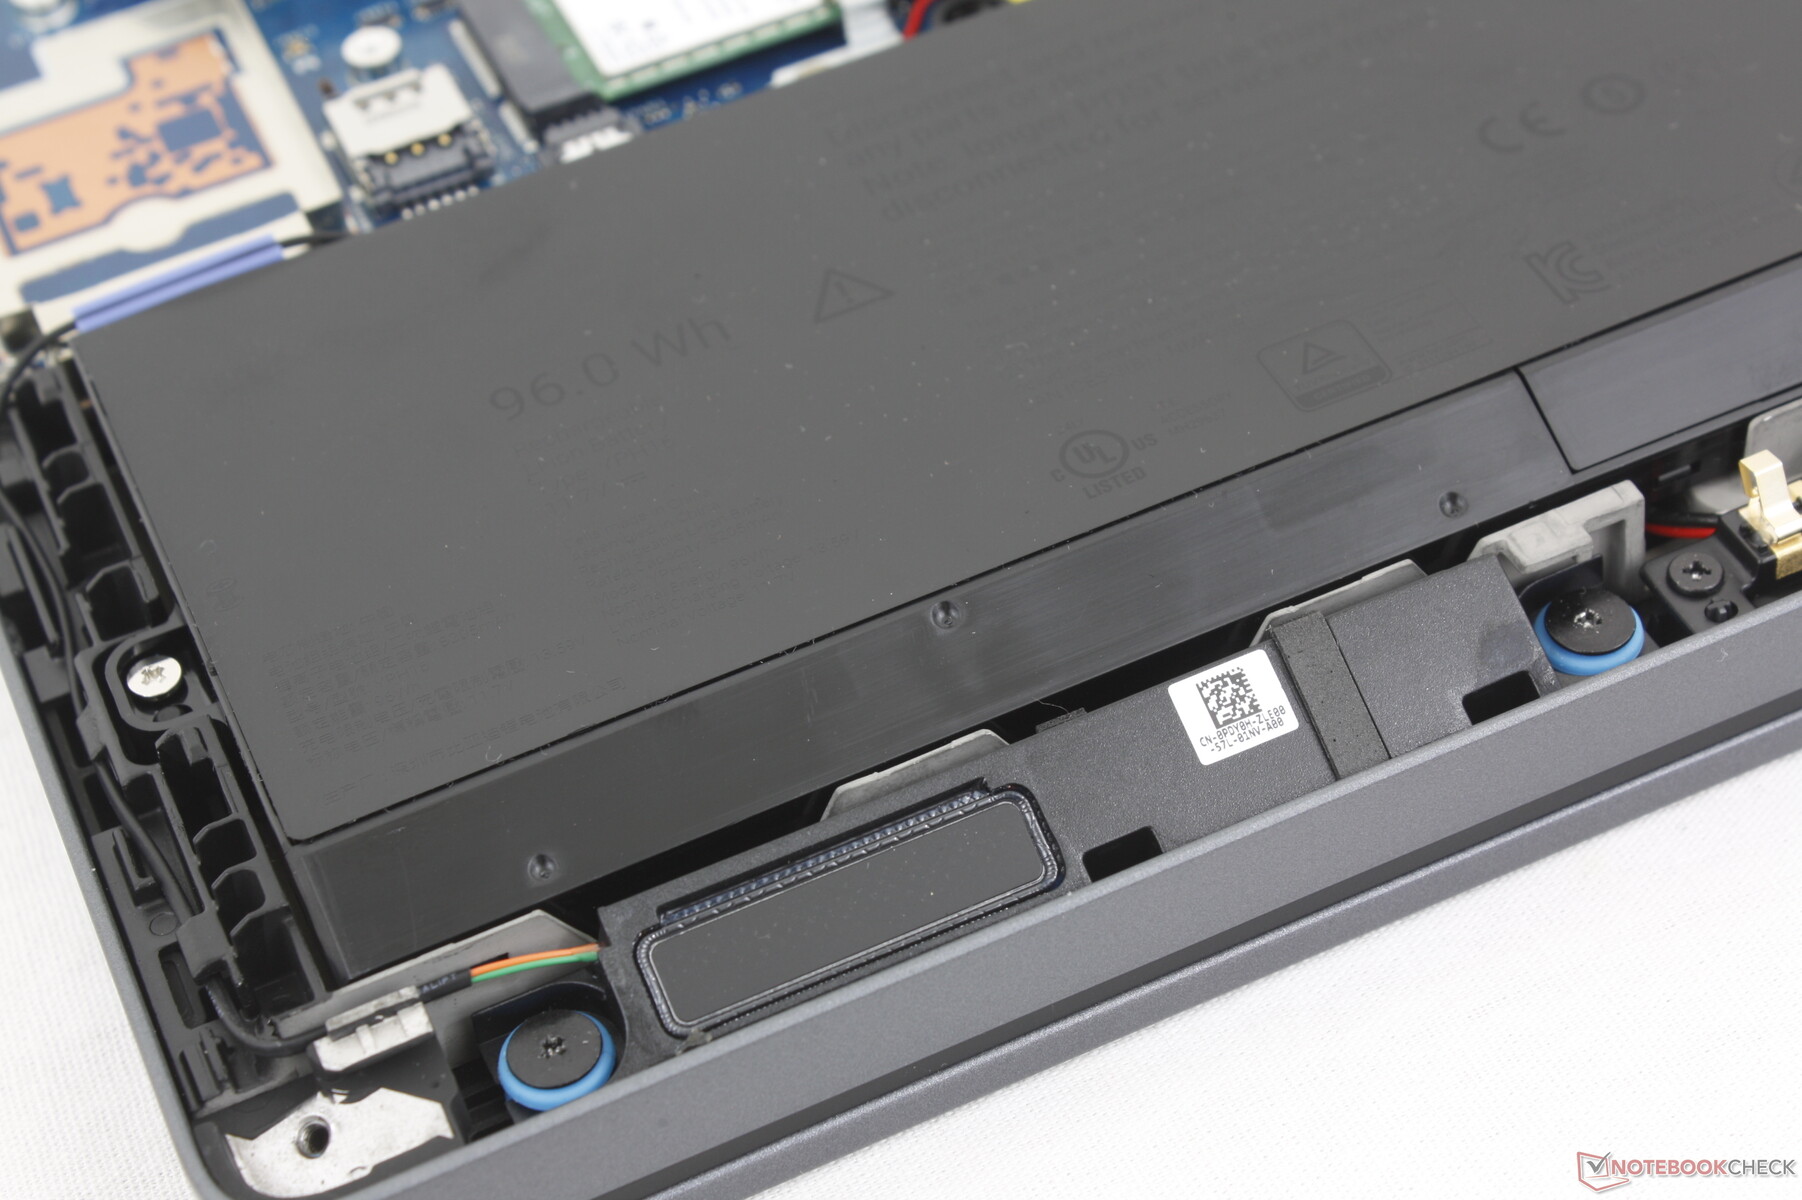
Durabilité
Le châssis est composé de 90 % de magnésium recyclé pour les couvercles supérieur et inférieur, de 30 % de plastiques PCC pour les repose-paumes, de 46 % de plastiques biosourcés pour les pare-chocs inférieurs et de 50 % de cobalt recyclé pour la batterie de 96 Whr. Ce modèle est également l'un des premiers de Dell à intégrer des ports USB-C modulaires pour un remplacement facile si jamais les ports se cassent ou se détachent à cause d'une utilisation excessive.
Accessoires et garantie
La boîte ne contient pas d'autres éléments que l'adaptateur secteur et la documentation. La garantie du fabricant est de trois ans.
Périphériques d'entrée
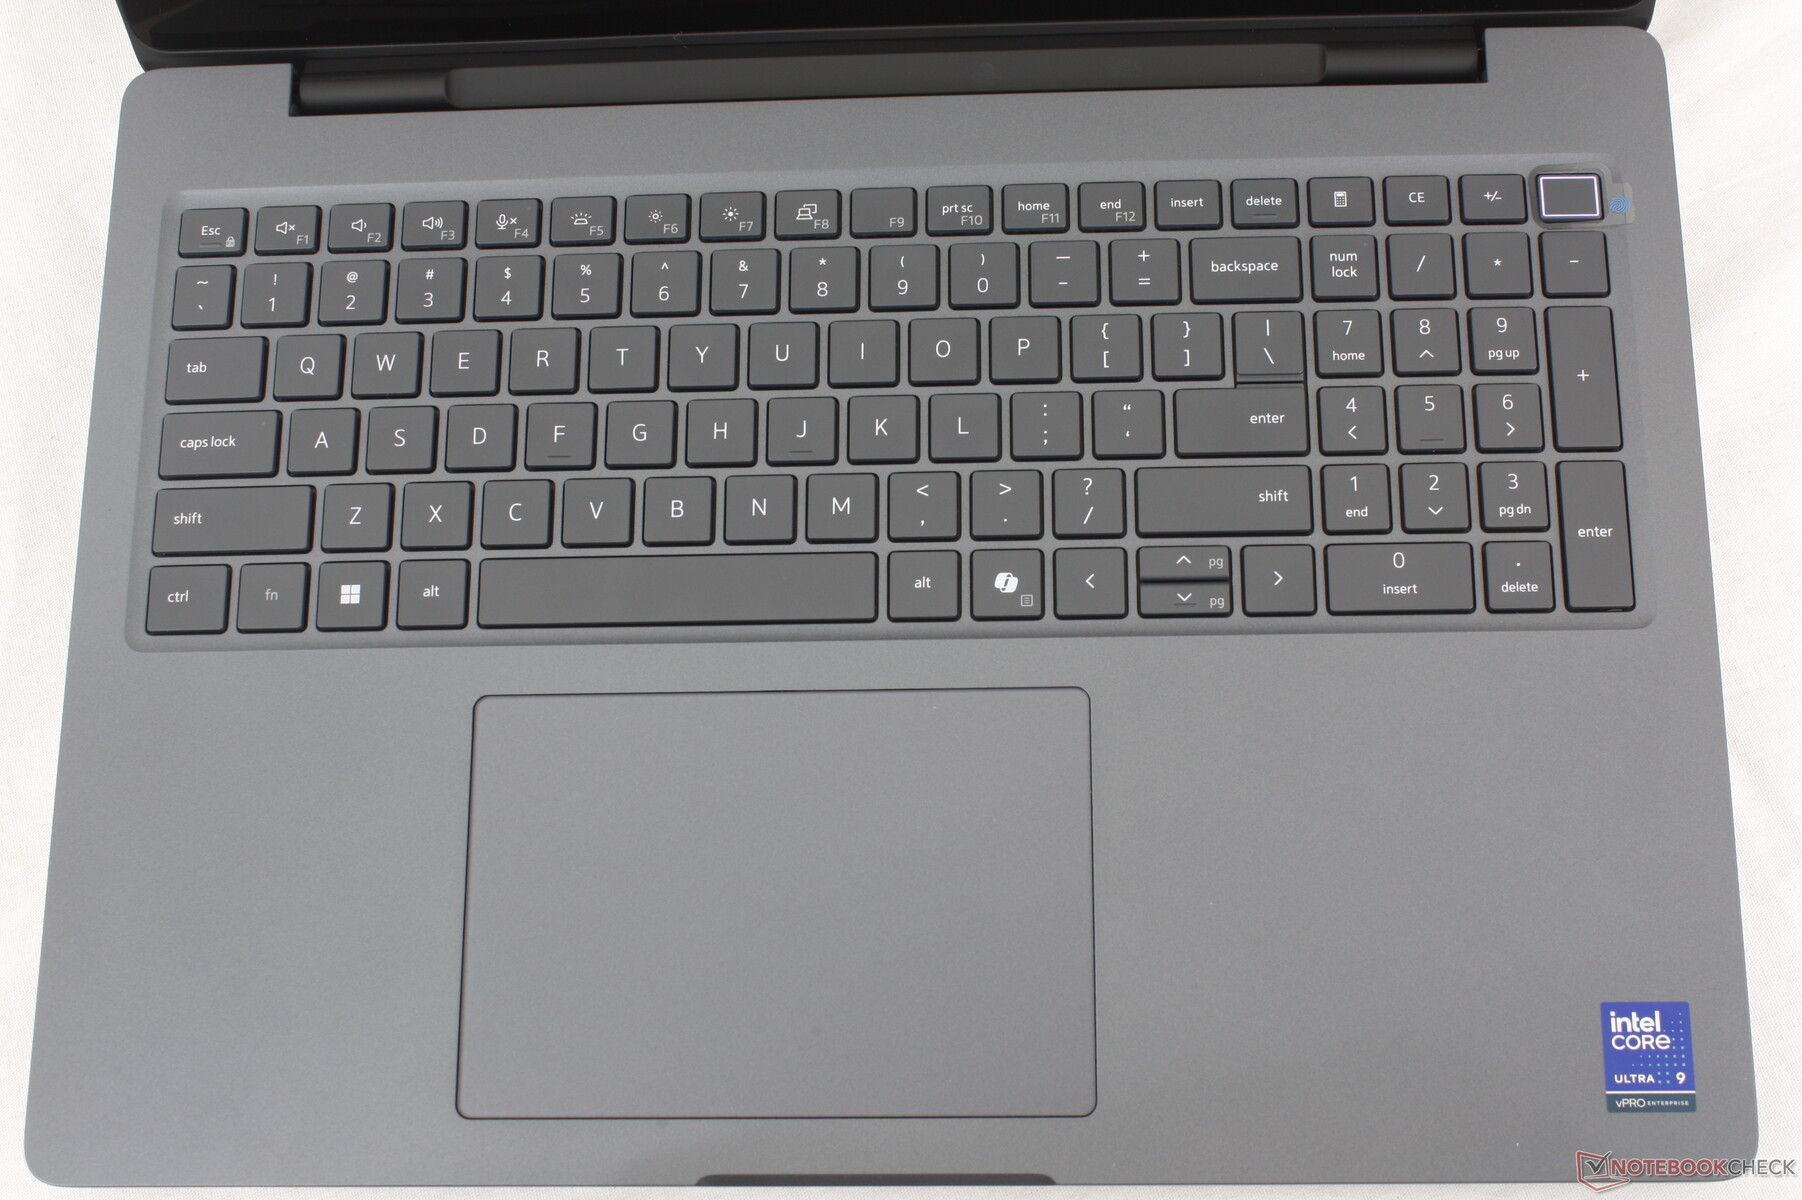
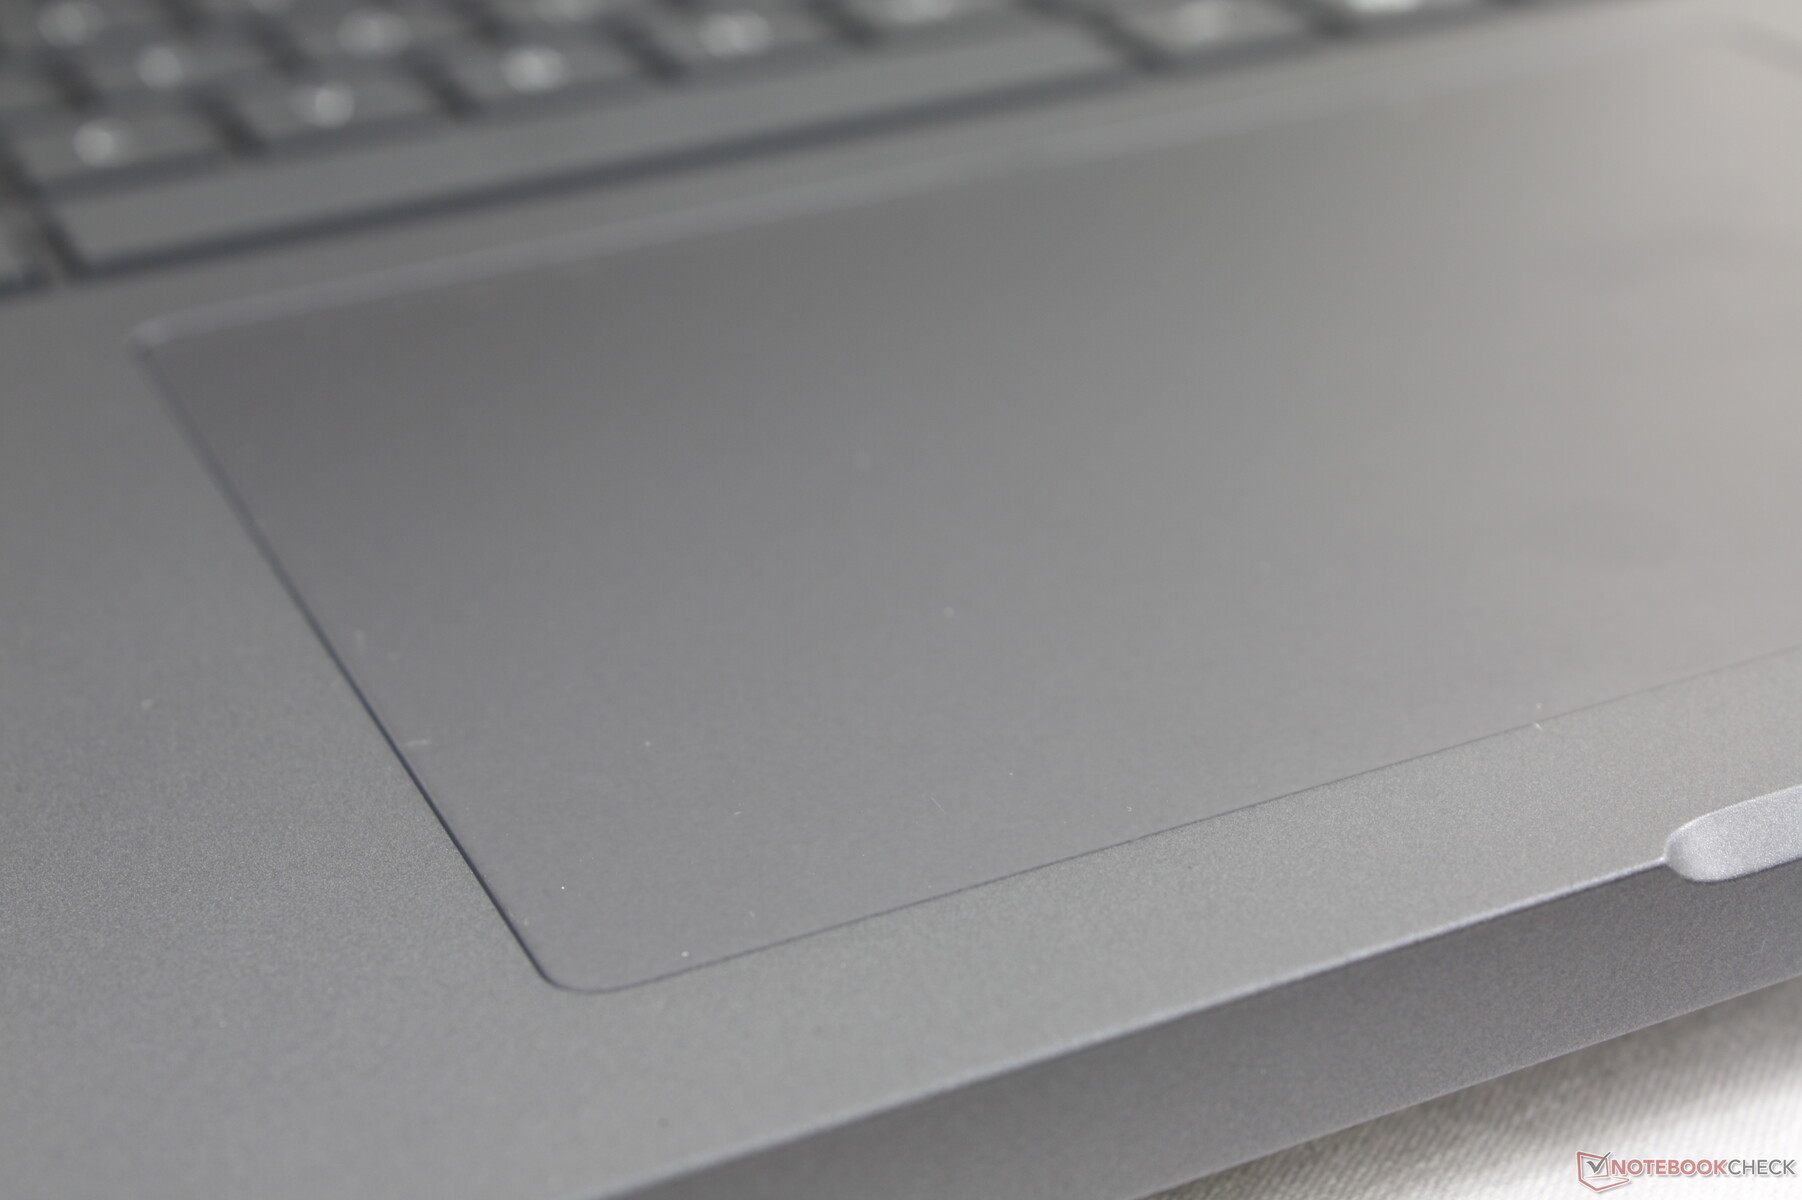
Clavier et pavé tactile

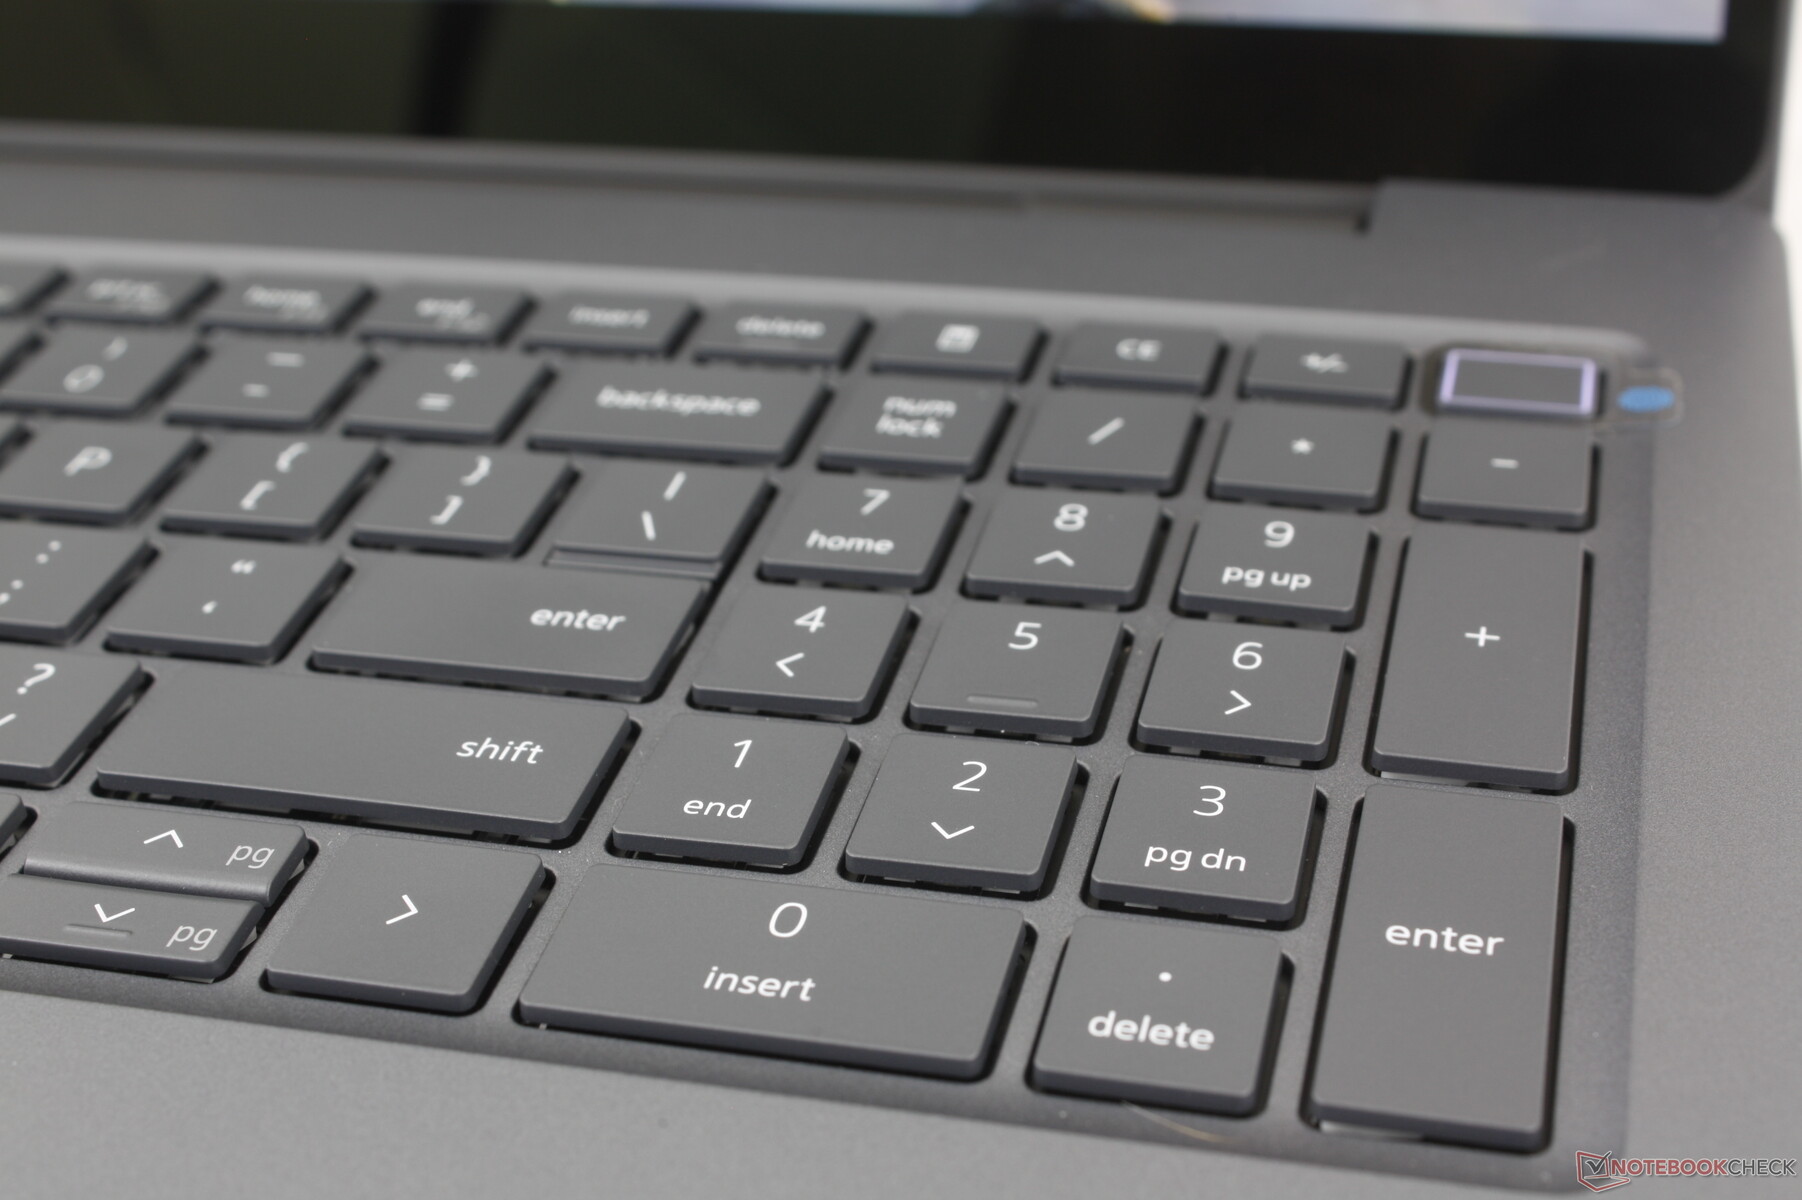
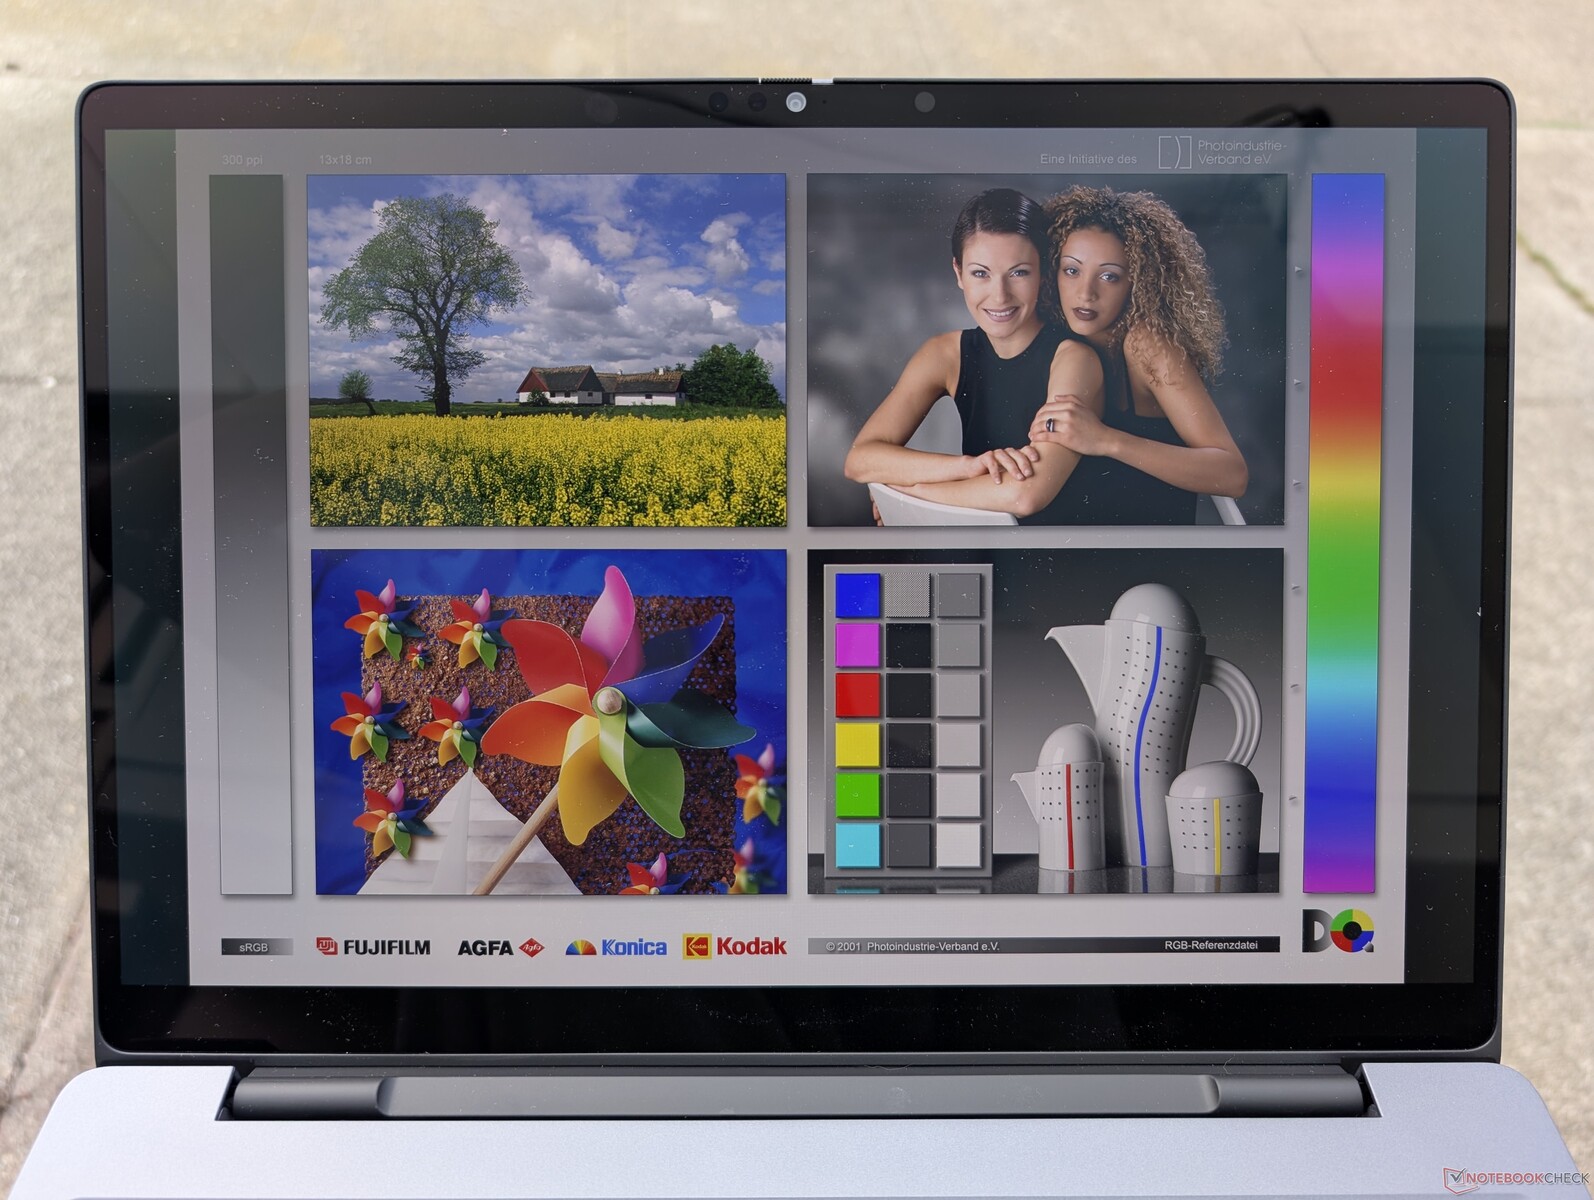
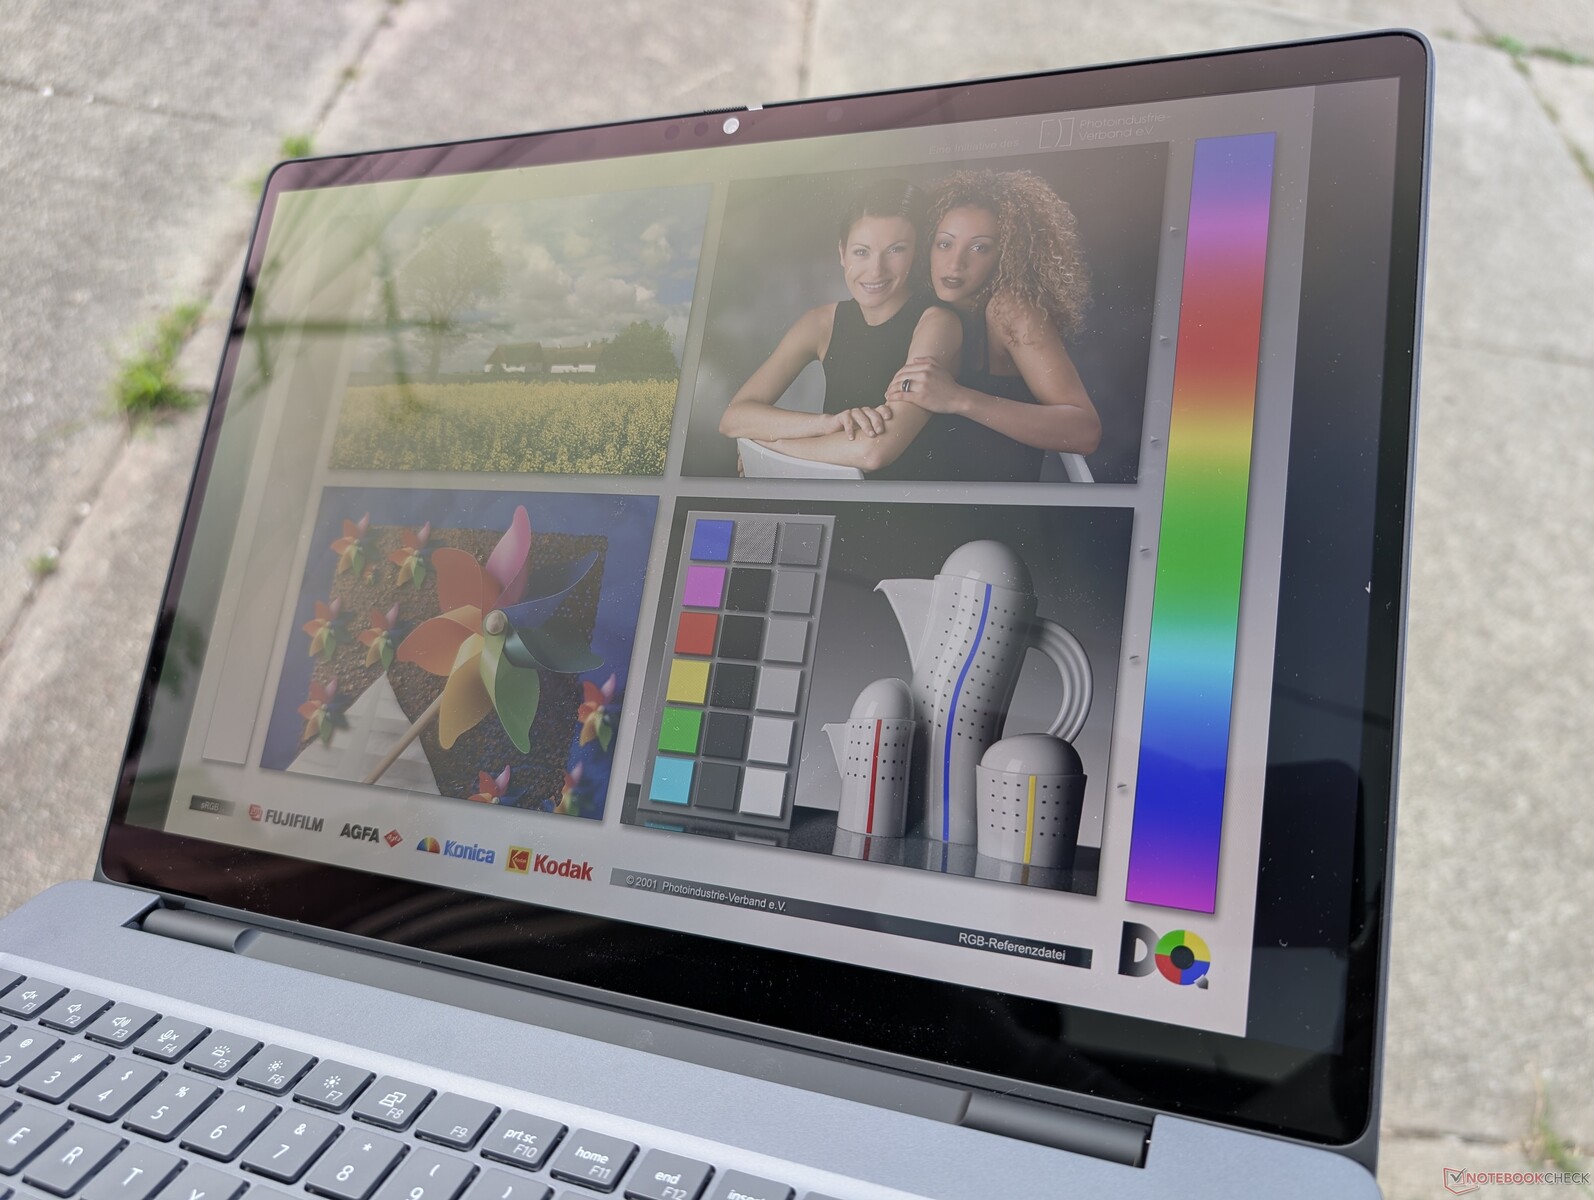
Affichage
Trois options d'affichage sont disponibles :
- 1920 x 1200, 60 Hz, non tactile, 300 nits, ~60% sRGB
- 1920 x 1200, 120 Hz, non tactile, 500 nits, 100% DCI-P3
- 3840 x 2400, 120 Hz, OLED, tactile, 500 nits, 100% DCI-P3
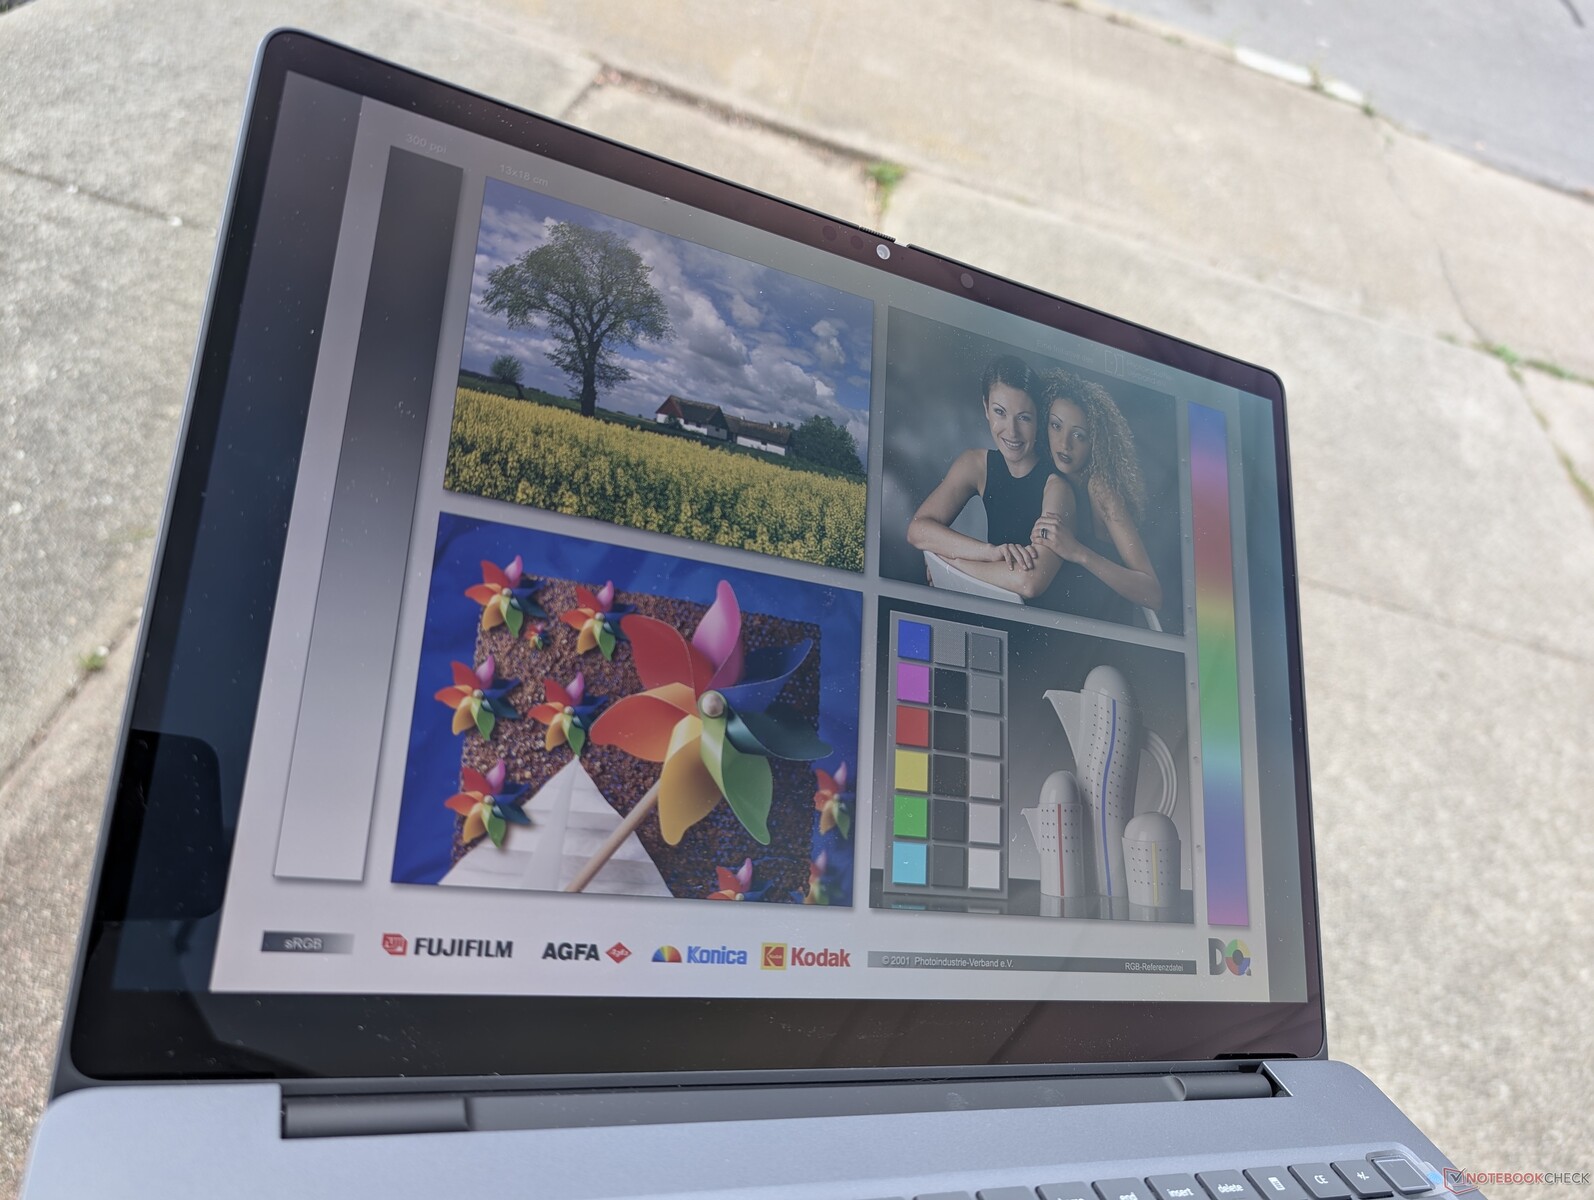
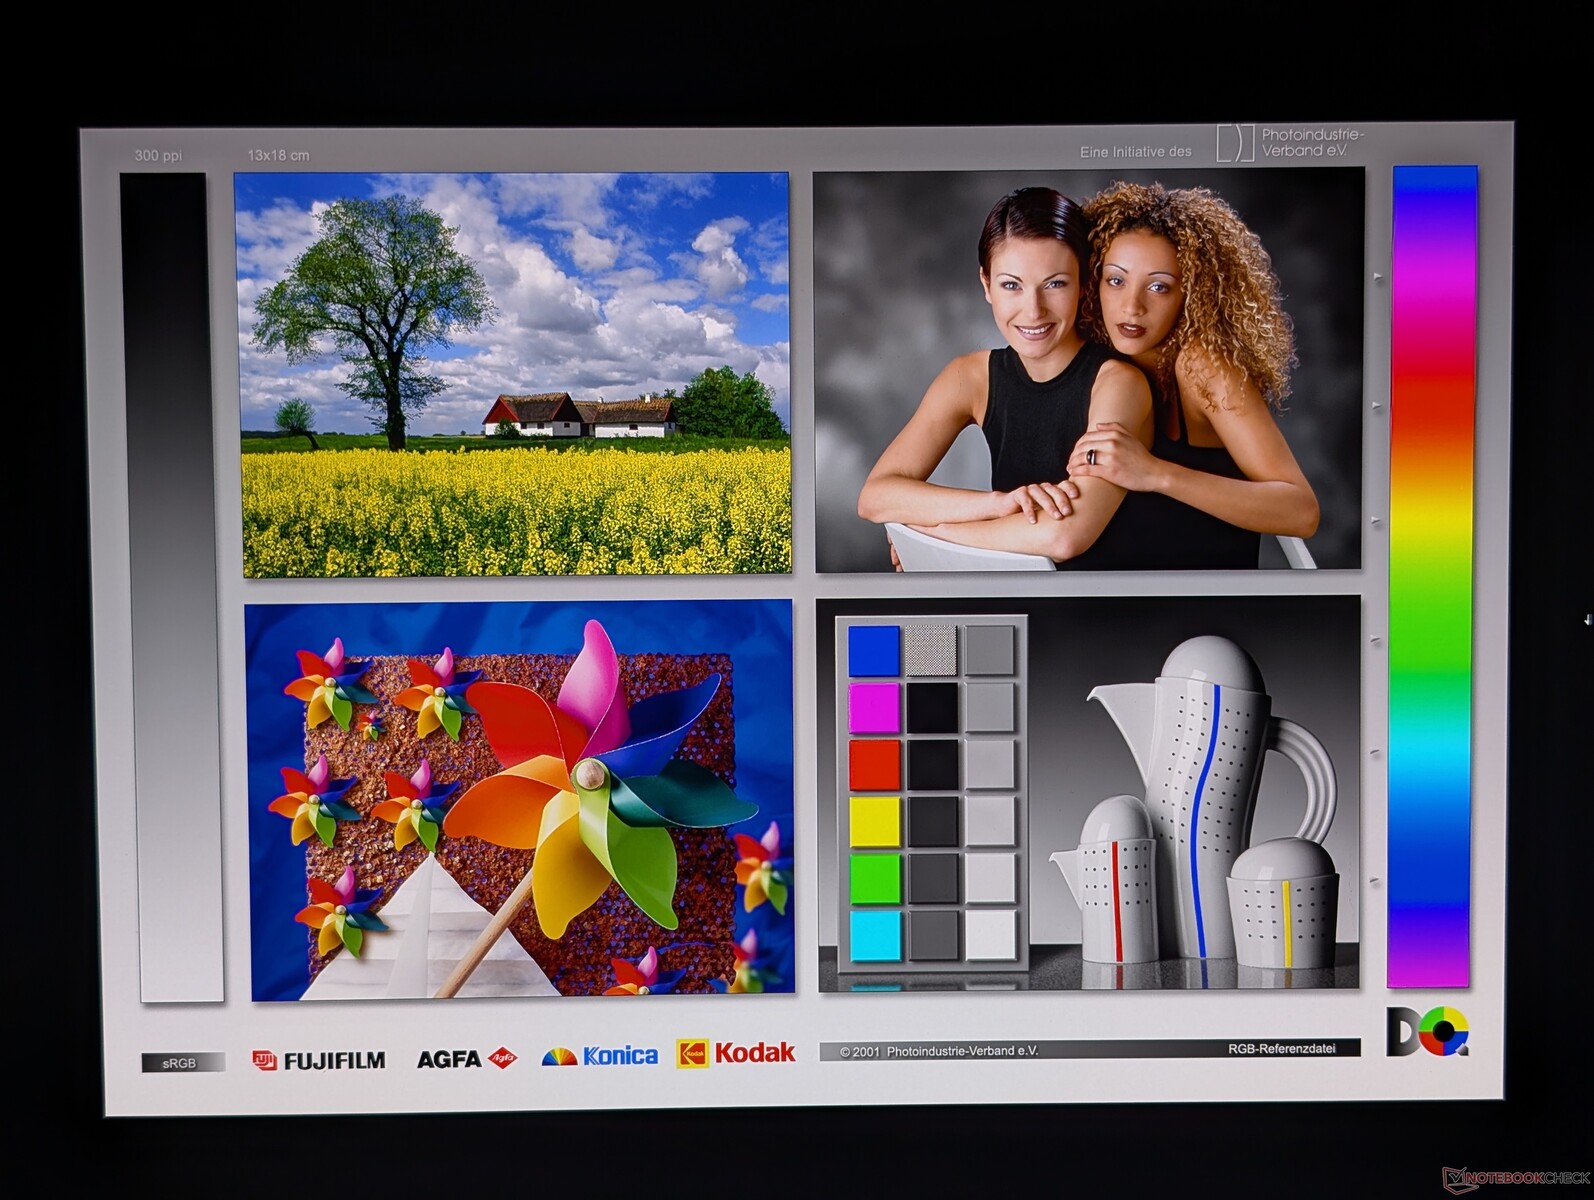
Notre unité de test est équipée de l'option en gras ci-dessus pour être l'une des rares stations de travail de 16 pouces livrées avec des panneaux OLED 4K 120 Hz.
La luminosité maximale atteint ~550 nits en mode SDR ou 1066 nits si le mode HDR est activé. la lecture 4K HDR est donc aussi bonne, voire meilleure, que la plupart des ordinateurs portables grand public.
| |||||||||||||||||||||||||
Homogénéité de la luminosité: 95 %
Valeur mesurée au centre, sur batterie: 530.9 cd/m²
Contraste: ∞:1 (Valeurs des noirs: 0 cd/m²)
ΔE ColorChecker Calman: 2.42 | ∀{0.5-29.43 Ø4.77}
calibrated: 0.7
ΔE Greyscale Calman: 0.8 | ∀{0.09-98 Ø5}
88.8% AdobeRGB 1998 (Argyll 3D)
100% sRGB (Argyll 3D)
97.3% Display P3 (Argyll 3D)
Gamma: 2.23
CCT: 6488 K
| Dell Pro Max 16 Plus Samsung 160HC01, OLED, 3840x2400, 16", 120 Hz | Dell Precision 5690 Samsung 160YV03, OLED, 3840x2400, 16", 60 Hz | Dell Precision 5000 5680 Samsung 160YV03, OLED, 3840x2400, 16", 60 Hz | Lenovo ThinkPad P16 Gen 2 NE160QDM-NY1, IPS, 2560x1600, 16", 165 Hz | Lenovo ThinkPad P1 Gen 7 21KV001SGE MNG007DA1-9 , IPS LED, 2560x1600, 16", 165 Hz | HP ZBook Studio 16 G11 AUO87A8, IPS, 3840x2400, 16", 120 Hz | MSI CreatorPro Z16P B12UKST B160QAN02.N, IPS, 2560x1600, 16", 165 Hz | |
|---|---|---|---|---|---|---|---|
| Display | 4% | 4% | -18% | -17% | -1% | -1% | |
| Display P3 Coverage (%) | 97.3 | 99.8 3% | 99.9 3% | 68.4 -30% | 69.4 -29% | 97.7 0% | 97.6 0% |
| sRGB Coverage (%) | 100 | 100 0% | 100 0% | 96.9 -3% | 97.6 -2% | 99.9 0% | 99.9 0% |
| AdobeRGB 1998 Coverage (%) | 88.8 | 96.6 9% | 97.5 10% | 70.6 -20% | 71.8 -19% | 85.7 -3% | 87.4 -2% |
| Response Times | -131% | -133% | -1575% | -1385% | -1623% | -1332% | |
| Response Time Grey 50% / Grey 80% * (ms) | 0.63 ? | 1.7 ? -170% | 1.68 ? -167% | 14.1 ? -2138% | 11.2 ? -1678% | 14.2 ? -2154% | 12.8 ? -1932% |
| Response Time Black / White * (ms) | 0.89 ? | 1.7 ? -91% | 1.77 ? -99% | 9.9 ? -1012% | 10.6 ? -1091% | 10.6 ? -1091% | 7.4 ? -731% |
| PWM Frequency (Hz) | 479.9 ? | 60 ? | 60 ? | ||||
| PWM Amplitude * (%) | 28 | ||||||
| Screen | -44% | -67% | 0% | -112% | -44% | -17% | |
| Brightness middle (cd/m²) | 530.9 | 348.1 -34% | 345.7 -35% | 531.5 0% | 516 -3% | 404.3 -24% | 407 -23% |
| Brightness (cd/m²) | 540 | 351 -35% | 349 -35% | 499 -8% | 505 -6% | 405 -25% | 388 -28% |
| Brightness Distribution (%) | 95 | 97 2% | 98 3% | 89 -6% | 89 -6% | 92 -3% | 88 -7% |
| Black Level * (cd/m²) | 0.38 | 0.41 | 0.28 | 0.36 | |||
| Colorchecker dE 2000 * | 2.42 | 4.18 -73% | 3.59 -48% | 1.82 25% | 3.5 -45% | 2.63 -9% | 1.3 46% |
| Colorchecker dE 2000 max. * | 5.76 | 6.68 -16% | 7.02 -22% | 4.1 29% | 8.8 -53% | 4.48 22% | 2.5 57% |
| Colorchecker dE 2000 calibrated * | 0.7 | 0.97 -39% | 0.99 -41% | 0.63 10% | 1.2 -71% | 1.46 -109% | 0.7 -0% |
| Greyscale dE 2000 * | 0.8 | 1.7 -113% | 3.1 -288% | 1.2 -50% | 5.6 -600% | 2.1 -163% | 2.1 -163% |
| Gamma | 2.23 99% | 2.2 100% | 2.13 103% | 2.15 102% | 2.27 97% | 2.3 96% | 2.26 97% |
| CCT | 6488 100% | 6198 105% | 6448 101% | 6484 100% | 6071 107% | 6810 95% | 6437 101% |
| Contrast (:1) | 1399 | 1259 | 1444 | 1131 | |||
| Moyenne finale (programmes/paramètres) | -57% /
-46% | -65% /
-60% | -531% /
-267% | -505% /
-300% | -556% /
-297% | -450% /
-232% |
* ... Moindre est la valeur, meilleures sont les performances
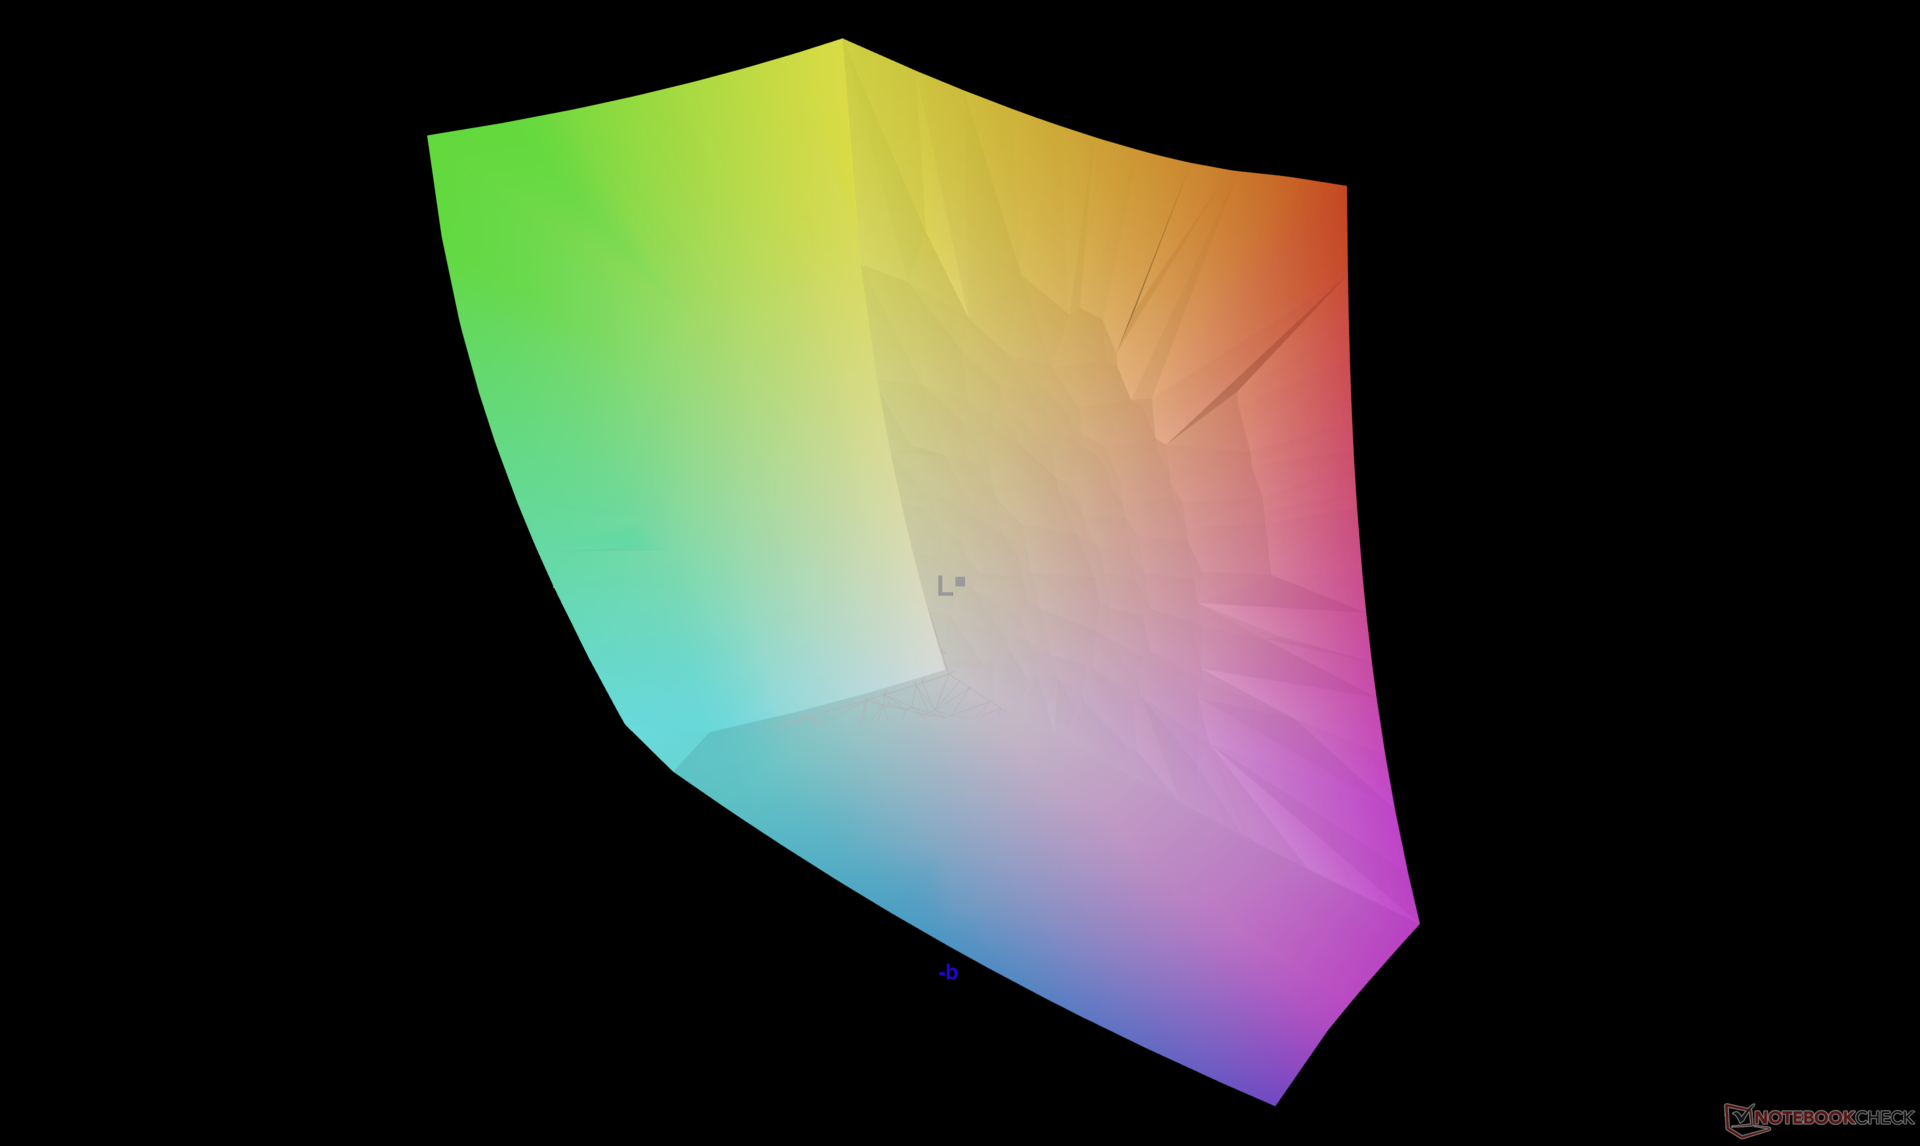
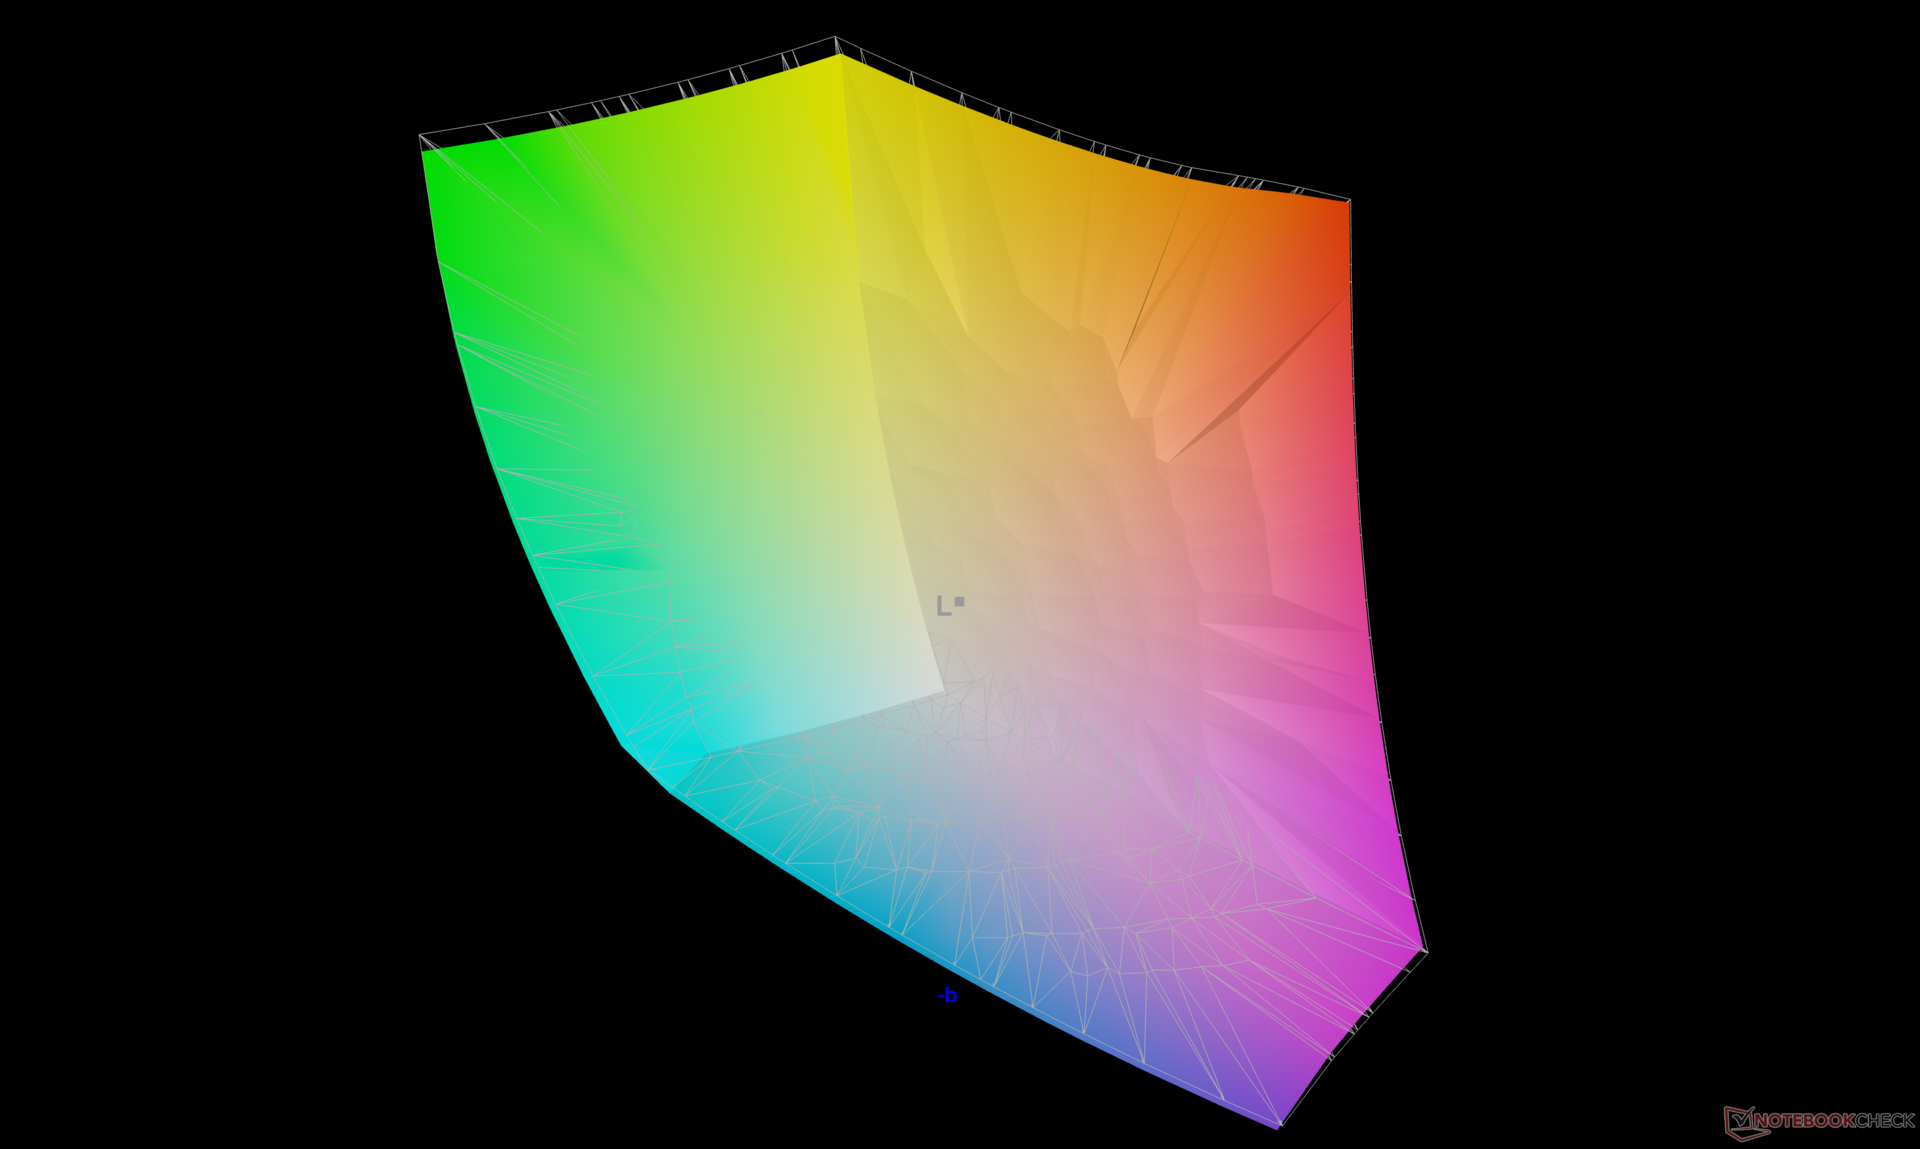
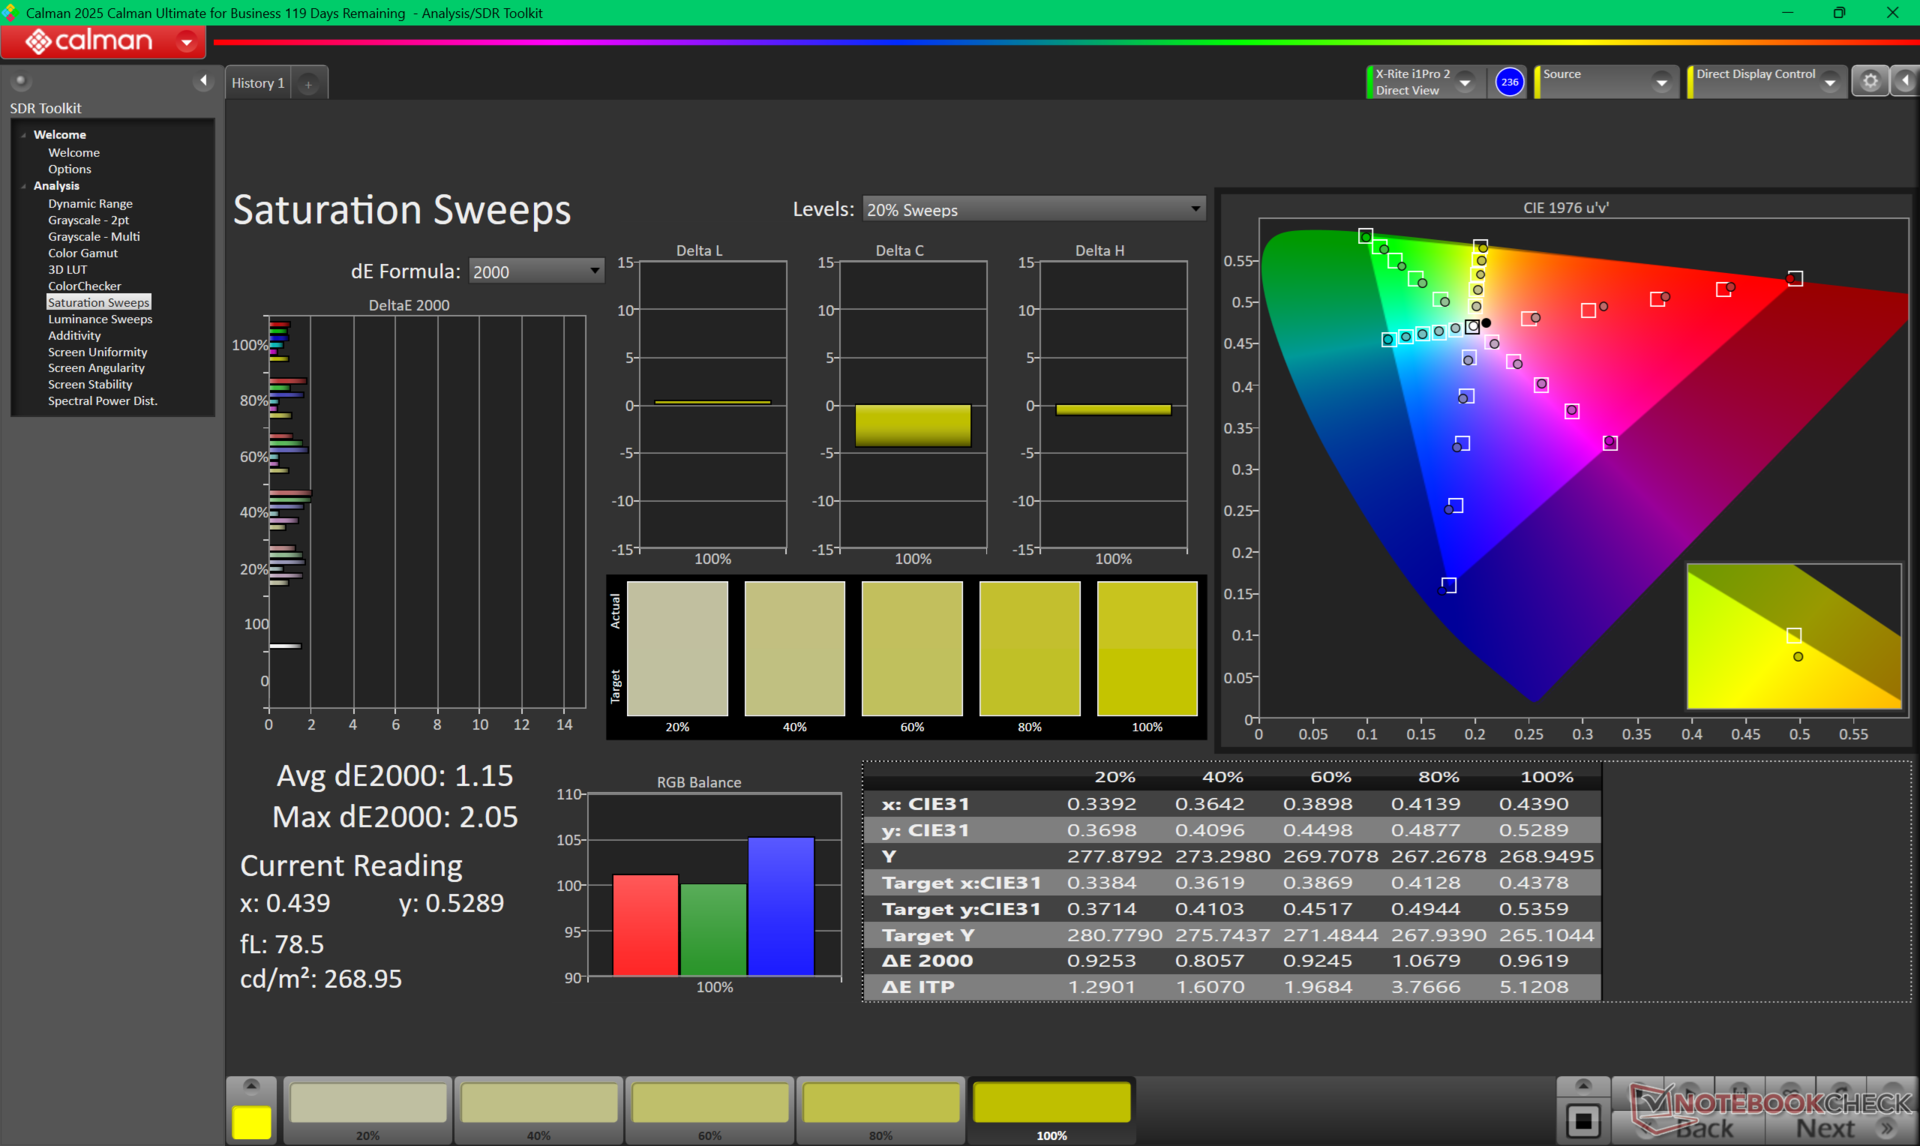
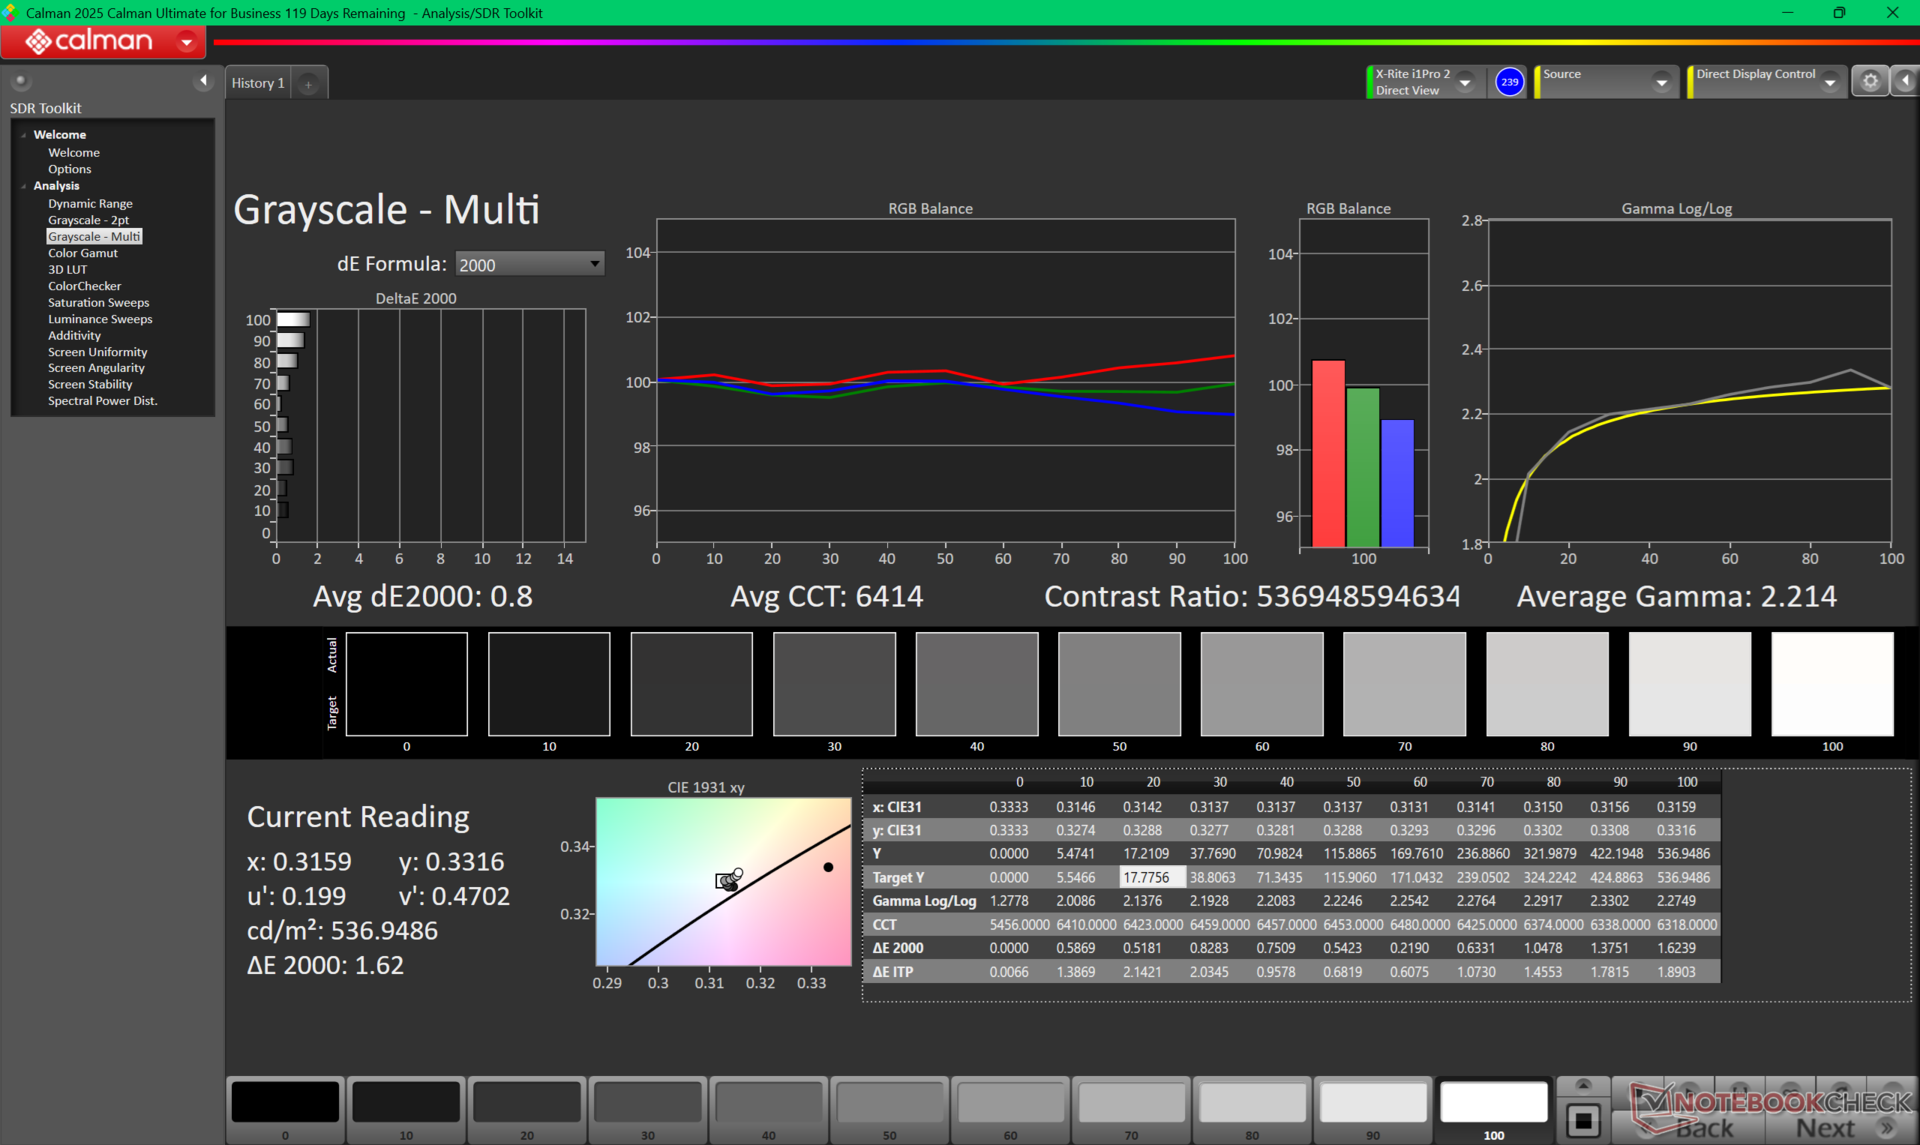
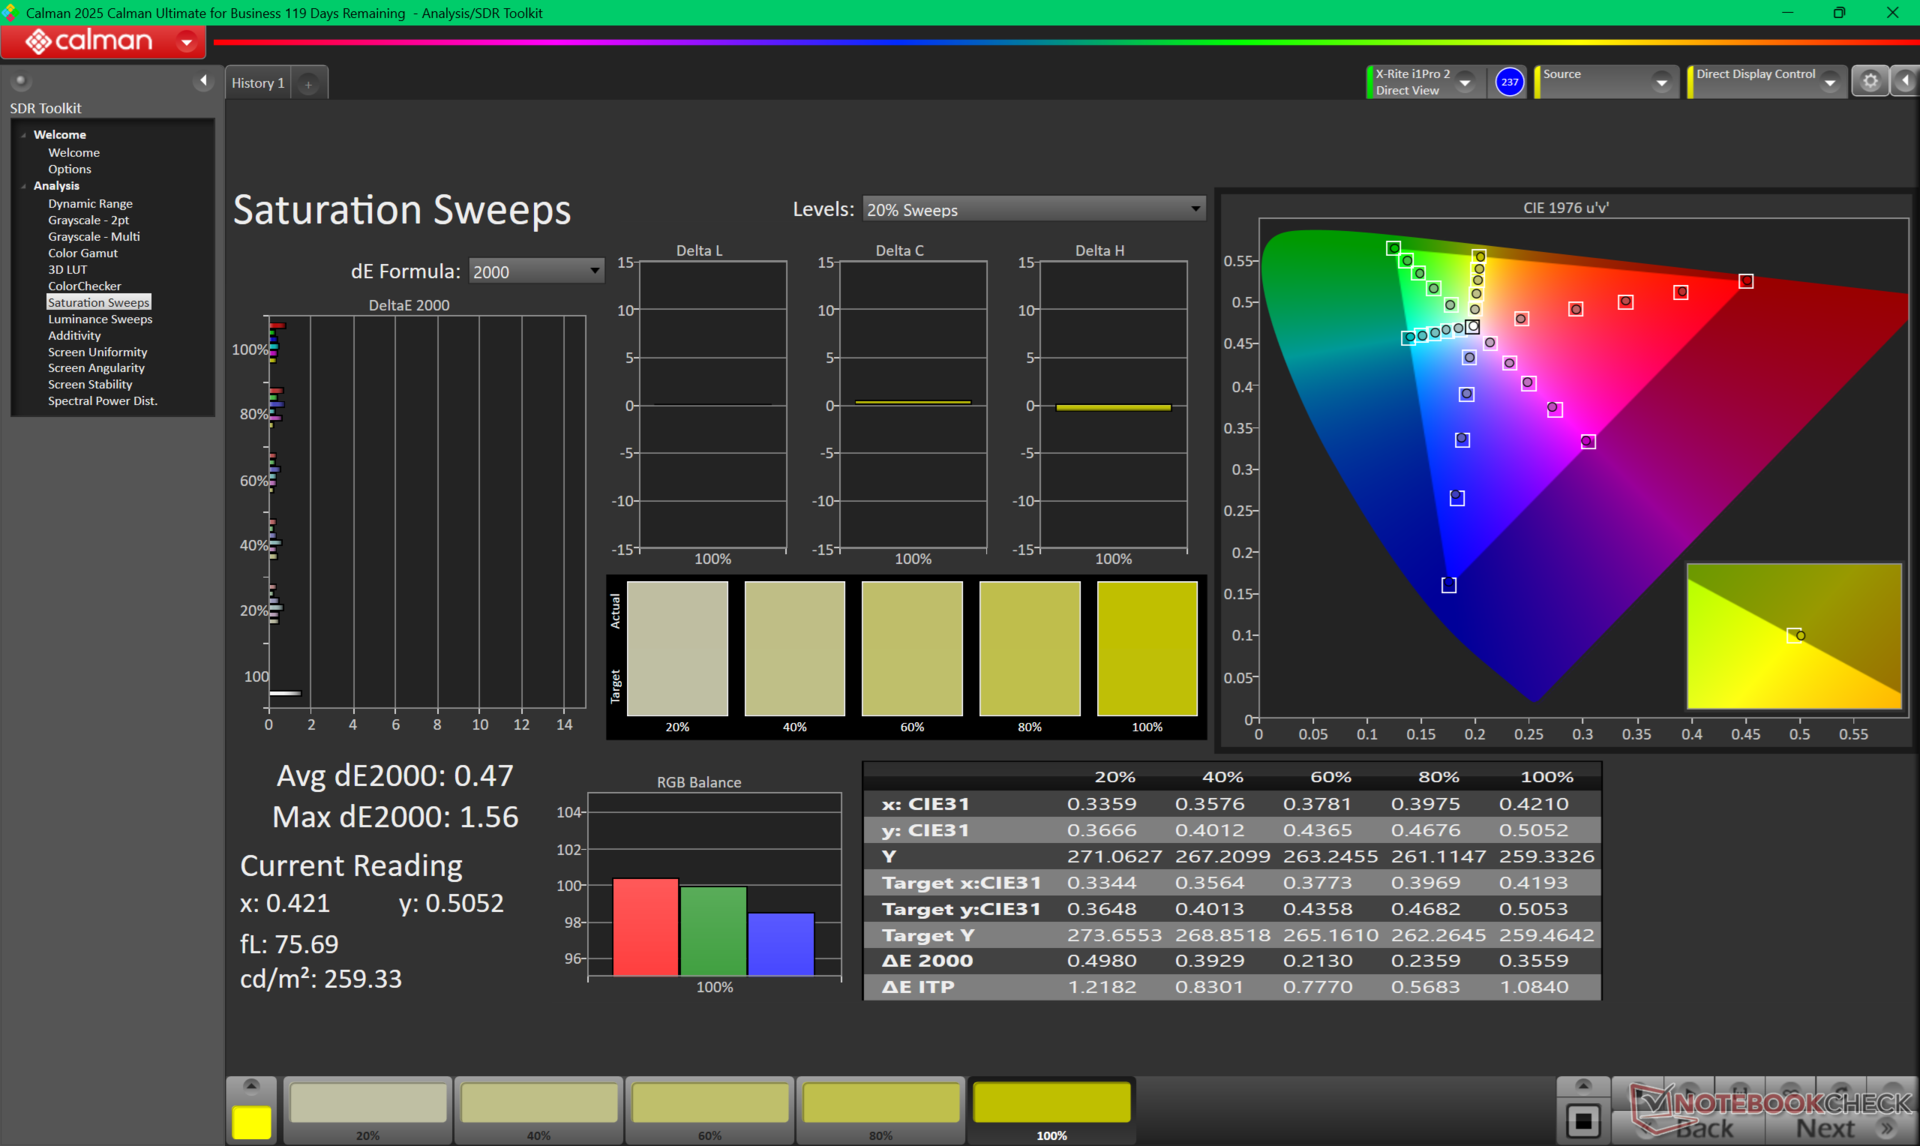
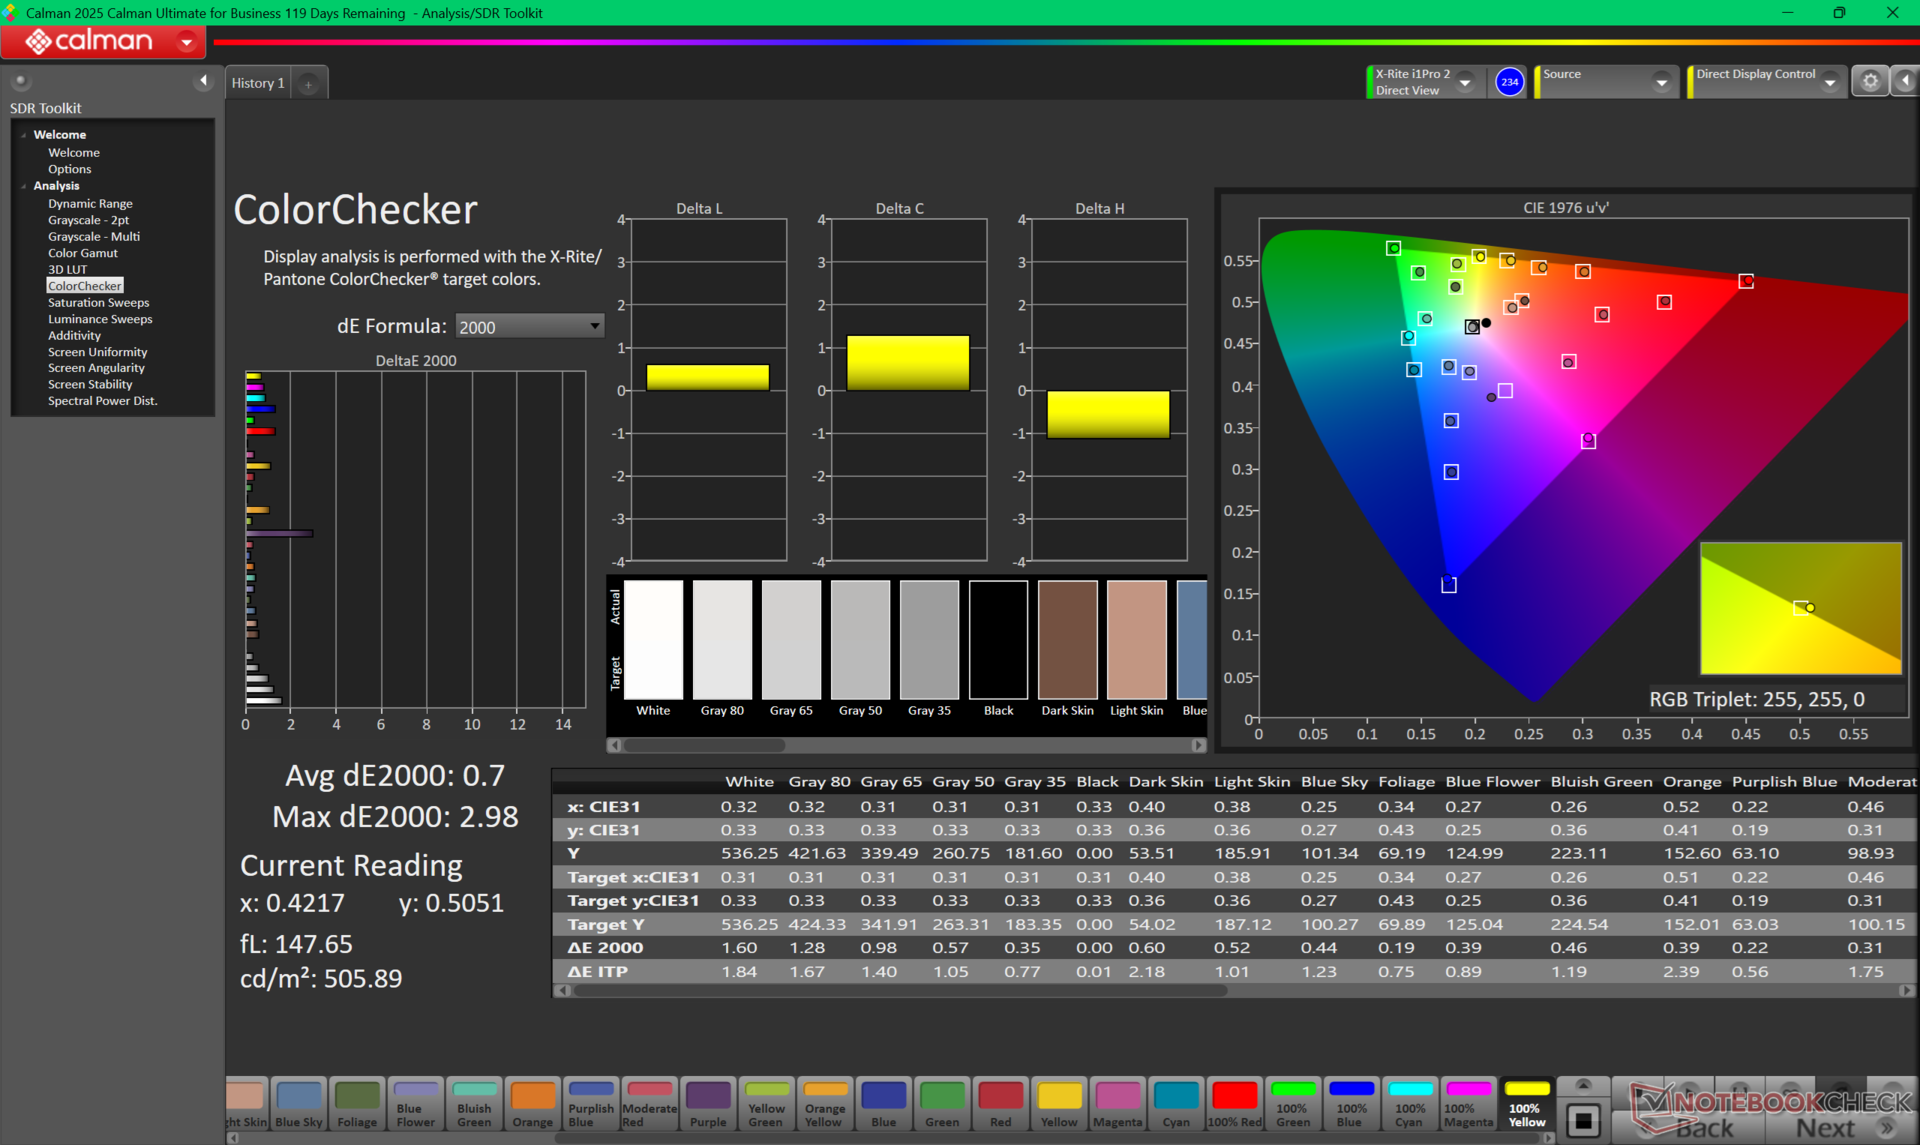
L'écran est bien calibré par rapport à la norme P3, avec des valeurs moyennes de deltaE en niveaux de gris et en couleurs de seulement 0,8 et 2,42, respectivement.


Temps de réponse de l'écran
| ↔ Temps de réponse noir à blanc | ||
|---|---|---|
| 0.89 ms ... hausse ↗ et chute ↘ combinées | ↗ 0.42 ms hausse | 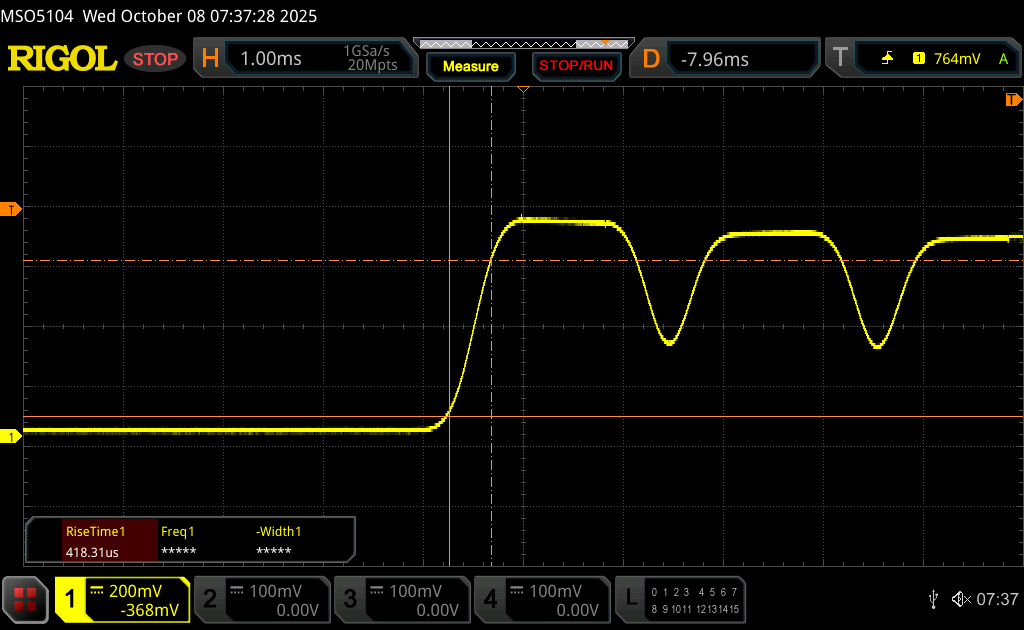 |
| ↘ 0.47 ms chute | ||
| L'écran montre de très faibles temps de réponse, parfait pour le jeu. En comparaison, tous les appareils testés affichent entre 0.1 (minimum) et 240 (maximum) ms. » 2 % des appareils testés affichent de meilleures performances. Cela signifie que les latences relevées sont meilleures que la moyenne (20.2 ms) de tous les appareils testés. | ||
| ↔ Temps de réponse gris 50% à gris 80% | ||
| 0.63 ms ... hausse ↗ et chute ↘ combinées | ↗ 0.34 ms hausse | 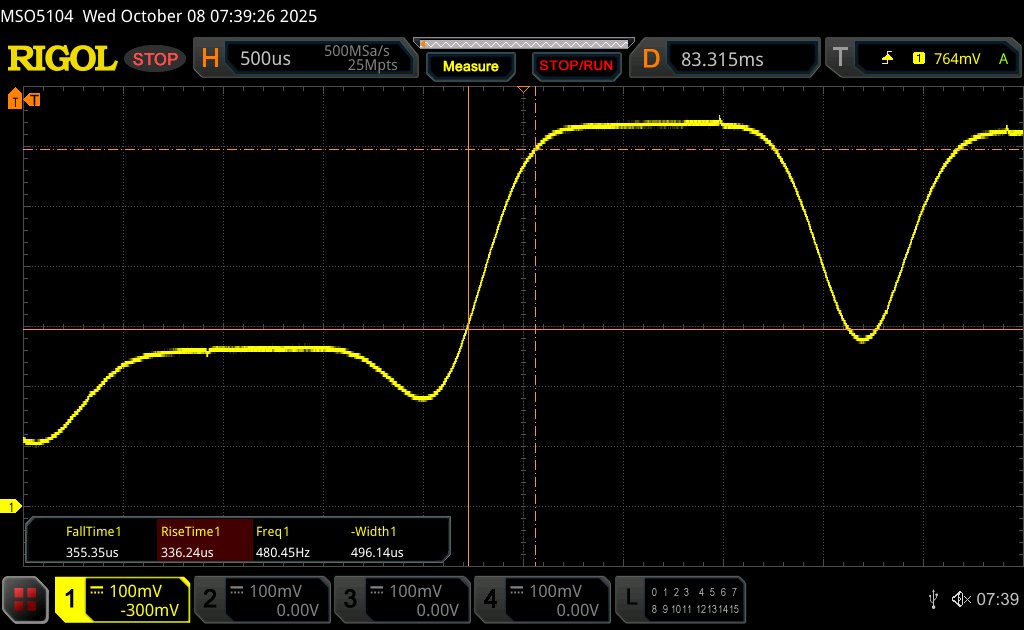 |
| ↘ 0.29 ms chute | ||
| L'écran montre de très faibles temps de réponse, parfait pour le jeu. En comparaison, tous les appareils testés affichent entre 0.165 (minimum) et 636 (maximum) ms. » 1 % des appareils testés affichent de meilleures performances. Cela signifie que les latences relevées sont meilleures que la moyenne (31.6 ms) de tous les appareils testés. | ||
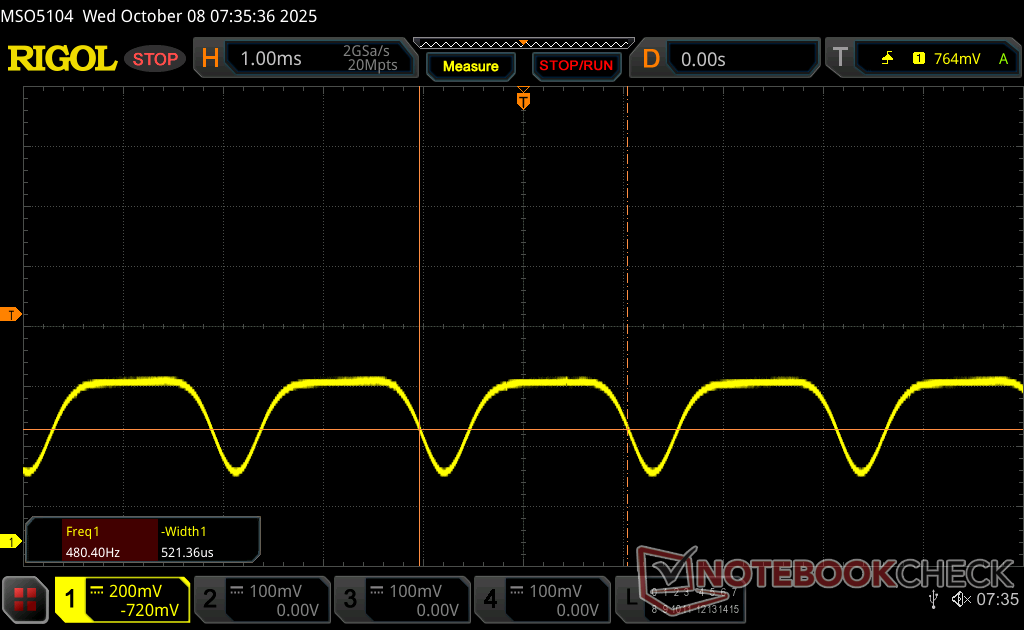
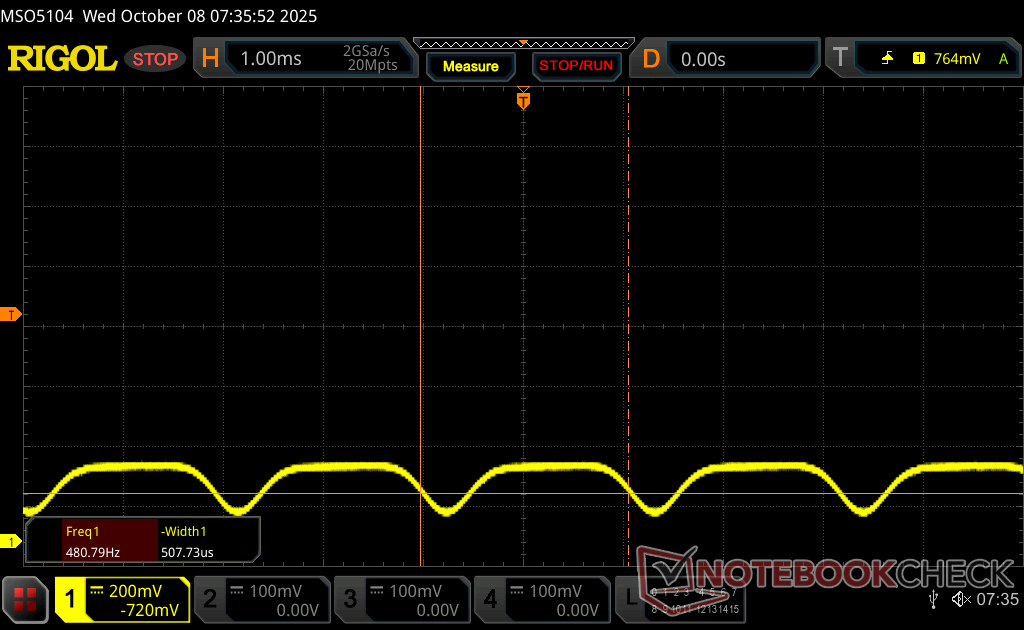
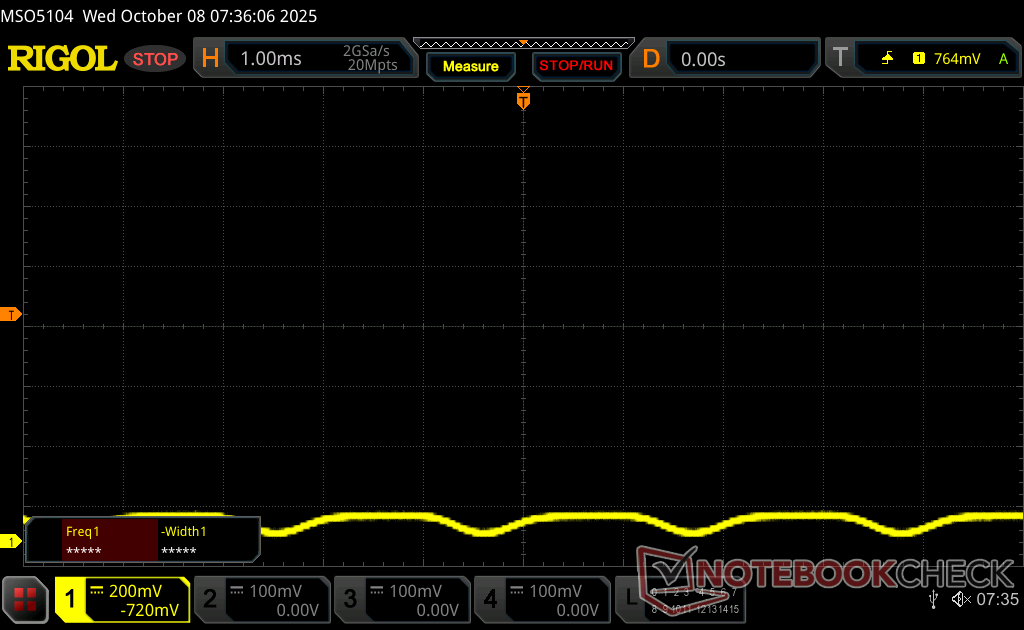
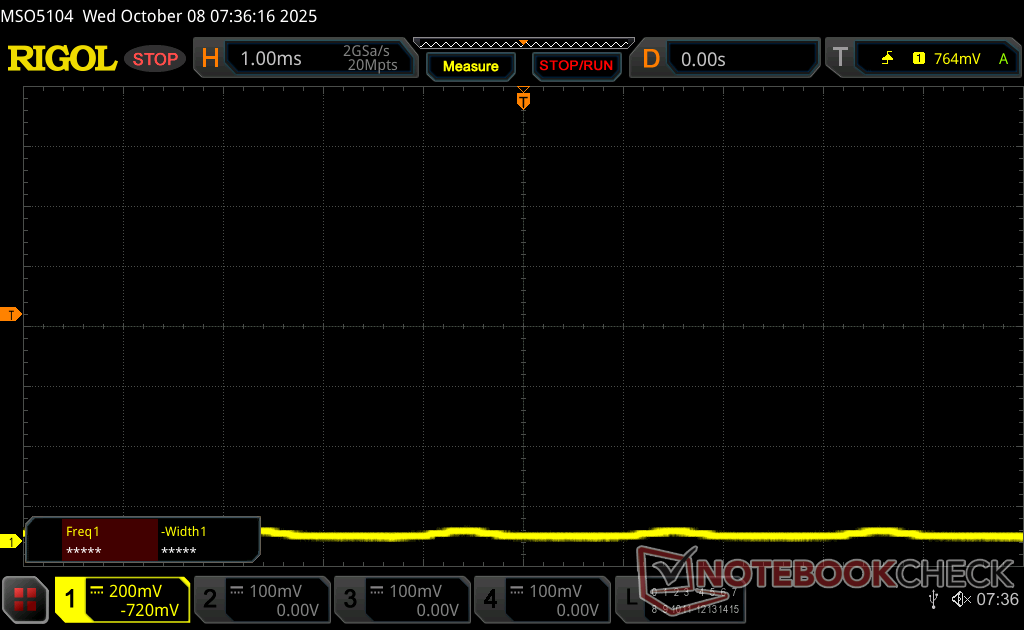
Scintillement / MLI (Modulation de largeur d'impulsion)
| Scintillement / MLI (Modulation de largeur d'impulsion) décelé | 479.9 Hz Amplitude: 28 % | ≤ 100 Niveau de luminosité | 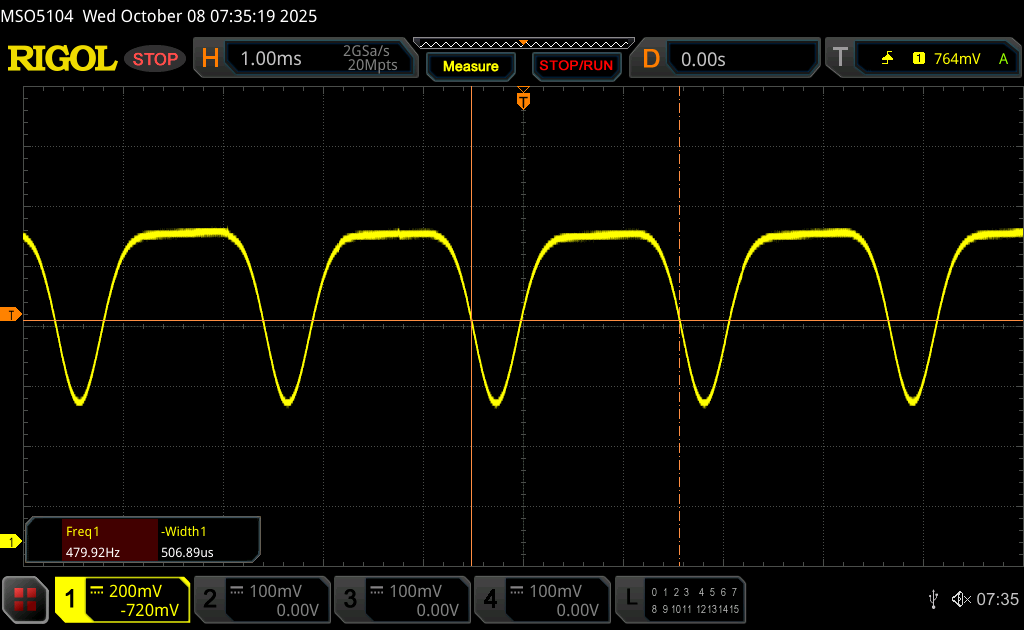 |
Le rétroéclairage de l'écran scintille à la fréquence de 479.9 Hz (certainement du fait de l'utilisation d'une MDI - Modulation de largeur d'impulsion) à un niveau de luminosité inférieur ou égal à 100 % . Aucun scintillement ne devrait être perceptible au-dessus de cette valeur. La fréquence de rafraîchissement de 479.9 Hz est relativement élevée, la grande majorité des utilisateurs ne devrait pas percevLa fréquence de rafraîchissement de 479.9 Hz est relativement élevée, la grande majorité des utilisateurs ne devrait pas percevoir de scintillements et être sujette à une fatigue oculaire accrue.oir de scintillements et être sujette à une fatigue oculaire accrue. Néanmoins certaines personnes pourront toujours percevoir un scintillement. En comparaison, 53 % des appareils testés n'emploient pas MDI pour assombrir leur écran. Nous avons relevé une moyenne à 8077 (minimum : 5 - maximum : 343500) Hz dans le cas où une MDI était active. | |||

Performance
Conditions d'essai
Nous avons réglé Dell Optimizer sur le mode Performance et Nvidia Control Panel sur le mode graphique discret avant d'exécuter les tests de référence ci-dessous. Le passage entre les modes Optimus et dGPU ne nécessite pas de redémarrage.
Processeur
Le Core Ultra 9 285HX est l'un des processeurs les plus rapides disponibles sur une station de travail mobile, avec une augmentation des performances de près de 2 fois par rapport au Core Ultra 9 185H du modèle 5690 de l'année dernière Precision 5690. La durabilité des performances est néanmoins imparfaite ; lorsque vous exécutez CineBench R15 xT en boucle, par exemple, les performances diminuent d'environ 10 % au fil du temps, comme le montre le graphique de comparaison ci-dessous.
Cinebench R15 Multi Loop
Cinebench R23: Multi Core | Single Core
Cinebench R20: CPU (Multi Core) | CPU (Single Core)
Cinebench R15: CPU Multi 64Bit | CPU Single 64Bit
Blender: v2.79 BMW27 CPU
7-Zip 18.03: 7z b 4 | 7z b 4 -mmt1
Geekbench 6.5: Multi-Core | Single-Core
Geekbench 5.5: Multi-Core | Single-Core
HWBOT x265 Benchmark v2.2: 4k Preset
LibreOffice : 20 Documents To PDF
R Benchmark 2.5: Overall mean
| Geekbench 6.5 / Multi-Core | |
| Dell Pro Max 16 Plus | |
| Moyenne Intel Core Ultra 9 285HX (18285 - 22104, n=5) | |
| Lenovo ThinkPad P16 Gen 2 | |
| HP ZBook Fury 16 G10 | |
| Dell Precision 5000 5680 | |
| Dell Precision 5690 | |
| HP ZBook Studio 16 G11 | |
| Lenovo ThinkPad P1 Gen 7 21KV001SGE | |
| Lenovo ThinkPad P16s G2 21K9000CGE | |
| Geekbench 6.5 / Single-Core | |
| Moyenne Intel Core Ultra 9 285HX (2907 - 3088, n=5) | |
| HP ZBook Fury 16 G10 | |
| Dell Pro Max 16 Plus | |
| Lenovo ThinkPad P16 Gen 2 | |
| Dell Precision 5000 5680 | |
| Dell Precision 5690 | |
| HP ZBook Studio 16 G11 | |
| Lenovo ThinkPad P16s G2 21K9000CGE | |
| Lenovo ThinkPad P1 Gen 7 21KV001SGE | |
* ... Moindre est la valeur, meilleures sont les performances
AIDA64: FP32 Ray-Trace | FPU Julia | CPU SHA3 | CPU Queen | FPU SinJulia | FPU Mandel | CPU AES | CPU ZLib | FP64 Ray-Trace | CPU PhotoWorxx
| Performance rating | |
| Moyenne Intel Core Ultra 9 285HX | |
| Dell Pro Max 16 Plus | |
| Lenovo ThinkPad P16 Gen 2 | |
| Dell Precision 5690 | |
| HP ZBook Studio 16 G11 | |
| Lenovo ThinkPad P1 Gen 7 21KV001SGE | |
| MSI CreatorPro Z16P B12UKST | |
| Dell Precision 5000 5680 | |
| AIDA64 / FP32 Ray-Trace | |
| Moyenne Intel Core Ultra 9 285HX (31837 - 42341, n=5) | |
| Dell Pro Max 16 Plus | |
| Lenovo ThinkPad P16 Gen 2 | |
| Dell Precision 5690 | |
| Lenovo ThinkPad P1 Gen 7 21KV001SGE | |
| HP ZBook Studio 16 G11 | |
| Dell Precision 5000 5680 | |
| MSI CreatorPro Z16P B12UKST | |
| AIDA64 / FPU Julia | |
| Moyenne Intel Core Ultra 9 285HX (161276 - 210885, n=5) | |
| Dell Pro Max 16 Plus | |
| Lenovo ThinkPad P16 Gen 2 | |
| Dell Precision 5690 | |
| HP ZBook Studio 16 G11 | |
| Lenovo ThinkPad P1 Gen 7 21KV001SGE | |
| Dell Precision 5000 5680 | |
| MSI CreatorPro Z16P B12UKST | |
| AIDA64 / CPU SHA3 | |
| Moyenne Intel Core Ultra 9 285HX (7757 - 9815, n=5) | |
| Dell Pro Max 16 Plus | |
| Lenovo ThinkPad P16 Gen 2 | |
| Dell Precision 5690 | |
| HP ZBook Studio 16 G11 | |
| Lenovo ThinkPad P1 Gen 7 21KV001SGE | |
| MSI CreatorPro Z16P B12UKST | |
| Dell Precision 5000 5680 | |
| AIDA64 / CPU Queen | |
| Lenovo ThinkPad P16 Gen 2 | |
| Moyenne Intel Core Ultra 9 285HX (134345 - 141681, n=5) | |
| Dell Pro Max 16 Plus | |
| Dell Precision 5000 5680 | |
| MSI CreatorPro Z16P B12UKST | |
| Dell Precision 5690 | |
| HP ZBook Studio 16 G11 | |
| Lenovo ThinkPad P1 Gen 7 21KV001SGE | |
| AIDA64 / FPU SinJulia | |
| Moyenne Intel Core Ultra 9 285HX (12937 - 14431, n=5) | |
| Lenovo ThinkPad P16 Gen 2 | |
| Dell Pro Max 16 Plus | |
| Dell Precision 5690 | |
| HP ZBook Studio 16 G11 | |
| Lenovo ThinkPad P1 Gen 7 21KV001SGE | |
| Dell Precision 5000 5680 | |
| MSI CreatorPro Z16P B12UKST | |
| AIDA64 / FPU Mandel | |
| Moyenne Intel Core Ultra 9 285HX (84053 - 108922, n=5) | |
| Dell Pro Max 16 Plus | |
| Lenovo ThinkPad P16 Gen 2 | |
| Dell Precision 5690 | |
| Lenovo ThinkPad P1 Gen 7 21KV001SGE | |
| HP ZBook Studio 16 G11 | |
| Dell Precision 5000 5680 | |
| MSI CreatorPro Z16P B12UKST | |
| AIDA64 / CPU AES | |
| MSI CreatorPro Z16P B12UKST | |
| Moyenne Intel Core Ultra 9 285HX (119553 - 134195, n=5) | |
| Dell Pro Max 16 Plus | |
| Lenovo ThinkPad P16 Gen 2 | |
| Dell Precision 5690 | |
| HP ZBook Studio 16 G11 | |
| Lenovo ThinkPad P1 Gen 7 21KV001SGE | |
| Dell Precision 5000 5680 | |
| AIDA64 / CPU ZLib | |
| Moyenne Intel Core Ultra 9 285HX (1886 - 2267, n=5) | |
| Dell Pro Max 16 Plus | |
| Lenovo ThinkPad P16 Gen 2 | |
| Dell Precision 5690 | |
| HP ZBook Studio 16 G11 | |
| Lenovo ThinkPad P1 Gen 7 21KV001SGE | |
| MSI CreatorPro Z16P B12UKST | |
| Dell Precision 5000 5680 | |
| AIDA64 / FP64 Ray-Trace | |
| Moyenne Intel Core Ultra 9 285HX (17357 - 22312, n=5) | |
| Dell Pro Max 16 Plus | |
| Lenovo ThinkPad P16 Gen 2 | |
| Dell Precision 5690 | |
| Lenovo ThinkPad P1 Gen 7 21KV001SGE | |
| HP ZBook Studio 16 G11 | |
| Dell Precision 5000 5680 | |
| MSI CreatorPro Z16P B12UKST | |
| AIDA64 / CPU PhotoWorxx | |
| Dell Pro Max 16 Plus | |
| Moyenne Intel Core Ultra 9 285HX (39664 - 62611, n=5) | |
| HP ZBook Studio 16 G11 | |
| Dell Precision 5690 | |
| Dell Precision 5000 5680 | |
| MSI CreatorPro Z16P B12UKST | |
| Lenovo ThinkPad P1 Gen 7 21KV001SGE | |
| Lenovo ThinkPad P16 Gen 2 | |
Performance du système
Les résultats de PCMark 10 ne sont pas inclus car le benchmark plantait systématiquement, même en mettant à jour la dernière version et en essayant différentes configurations de GPU. Cela dit, les scores de mémoire AIDA64 sont parmi les plus élevés de toutes les stations de travail mobiles, grâce aux avantages de la RAM CAMM2 en termes de performances.
CrossMark: Overall | Productivity | Creativity | Responsiveness
WebXPRT 3: Overall
WebXPRT 4: Overall
Mozilla Kraken 1.1: Total
| Performance rating | |
| Moyenne Intel Core Ultra 9 285HX, Nvidia RTX PRO 5000 Blackwell Generation Laptop | |
| Dell Pro Max 16 Plus | |
| Lenovo ThinkPad P16 Gen 2 | |
| Dell Precision 5000 5680 | |
| MSI CreatorPro Z16P B12UKST | |
| Dell Precision 5690 | |
| HP ZBook Studio 16 G11 | |
| Lenovo ThinkPad P1 Gen 7 21KV001SGE | |
| CrossMark / Overall | |
| Dell Pro Max 16 Plus | |
| Moyenne Intel Core Ultra 9 285HX, Nvidia RTX PRO 5000 Blackwell Generation Laptop (2142 - 2267, n=3) | |
| Lenovo ThinkPad P16 Gen 2 | |
| MSI CreatorPro Z16P B12UKST | |
| Dell Precision 5000 5680 | |
| Dell Precision 5690 | |
| HP ZBook Studio 16 G11 | |
| Lenovo ThinkPad P1 Gen 7 21KV001SGE | |
| CrossMark / Productivity | |
| Moyenne Intel Core Ultra 9 285HX, Nvidia RTX PRO 5000 Blackwell Generation Laptop (2016 - 2028, n=3) | |
| Dell Pro Max 16 Plus | |
| Lenovo ThinkPad P16 Gen 2 | |
| MSI CreatorPro Z16P B12UKST | |
| Dell Precision 5000 5680 | |
| Dell Precision 5690 | |
| HP ZBook Studio 16 G11 | |
| Lenovo ThinkPad P1 Gen 7 21KV001SGE | |
| CrossMark / Creativity | |
| Dell Pro Max 16 Plus | |
| Moyenne Intel Core Ultra 9 285HX, Nvidia RTX PRO 5000 Blackwell Generation Laptop (2395 - 2725, n=3) | |
| Lenovo ThinkPad P16 Gen 2 | |
| Dell Precision 5000 5680 | |
| MSI CreatorPro Z16P B12UKST | |
| Dell Precision 5690 | |
| HP ZBook Studio 16 G11 | |
| Lenovo ThinkPad P1 Gen 7 21KV001SGE | |
| CrossMark / Responsiveness | |
| MSI CreatorPro Z16P B12UKST | |
| Moyenne Intel Core Ultra 9 285HX, Nvidia RTX PRO 5000 Blackwell Generation Laptop (1806 - 1858, n=3) | |
| Dell Pro Max 16 Plus | |
| Lenovo ThinkPad P16 Gen 2 | |
| Dell Precision 5000 5680 | |
| Dell Precision 5690 | |
| HP ZBook Studio 16 G11 | |
| Lenovo ThinkPad P1 Gen 7 21KV001SGE | |
| WebXPRT 3 / Overall | |
| Moyenne Intel Core Ultra 9 285HX, Nvidia RTX PRO 5000 Blackwell Generation Laptop (327 - 360, n=3) | |
| Dell Precision 5000 5680 | |
| Lenovo ThinkPad P16 Gen 2 | |
| Dell Pro Max 16 Plus | |
| MSI CreatorPro Z16P B12UKST | |
| HP ZBook Studio 16 G11 | |
| Dell Precision 5690 | |
| Lenovo ThinkPad P1 Gen 7 21KV001SGE | |
| WebXPRT 4 / Overall | |
| Moyenne Intel Core Ultra 9 285HX, Nvidia RTX PRO 5000 Blackwell Generation Laptop (306 - 323, n=3) | |
| Dell Pro Max 16 Plus | |
| Lenovo ThinkPad P16 Gen 2 | |
| Dell Precision 5000 5680 | |
| Dell Precision 5690 | |
| MSI CreatorPro Z16P B12UKST | |
| HP ZBook Studio 16 G11 | |
| Lenovo ThinkPad P1 Gen 7 21KV001SGE | |
| Mozilla Kraken 1.1 / Total | |
| Lenovo ThinkPad P1 Gen 7 21KV001SGE | |
| MSI CreatorPro Z16P B12UKST | |
| HP ZBook Studio 16 G11 | |
| Dell Precision 5690 | |
| Dell Precision 5000 5680 | |
| Lenovo ThinkPad P16 Gen 2 | |
| Dell Pro Max 16 Plus | |
| Moyenne Intel Core Ultra 9 285HX, Nvidia RTX PRO 5000 Blackwell Generation Laptop (411 - 439, n=3) | |
* ... Moindre est la valeur, meilleures sont les performances
| AIDA64 / Memory Copy | |
| Dell Pro Max 16 Plus | |
| Dell Precision 5690 | |
| Moyenne Intel Core Ultra 9 285HX (65267 - 93933, n=5) | |
| HP ZBook Studio 16 G11 | |
| Dell Precision 5000 5680 | |
| Lenovo ThinkPad P1 Gen 7 21KV001SGE | |
| Lenovo ThinkPad P16 Gen 2 | |
| MSI CreatorPro Z16P B12UKST | |
| AIDA64 / Memory Read | |
| Dell Pro Max 16 Plus | |
| Dell Precision 5690 | |
| Moyenne Intel Core Ultra 9 285HX (67236 - 97565, n=5) | |
| HP ZBook Studio 16 G11 | |
| Lenovo ThinkPad P16 Gen 2 | |
| Dell Precision 5000 5680 | |
| MSI CreatorPro Z16P B12UKST | |
| Lenovo ThinkPad P1 Gen 7 21KV001SGE | |
| AIDA64 / Memory Write | |
| Dell Pro Max 16 Plus | |
| Dell Precision 5000 5680 | |
| Moyenne Intel Core Ultra 9 285HX (64112 - 89691, n=5) | |
| HP ZBook Studio 16 G11 | |
| Dell Precision 5690 | |
| MSI CreatorPro Z16P B12UKST | |
| Lenovo ThinkPad P16 Gen 2 | |
| Lenovo ThinkPad P1 Gen 7 21KV001SGE | |
| AIDA64 / Memory Latency | |
| Dell Precision 5690 | |
| Lenovo ThinkPad P1 Gen 7 21KV001SGE | |
| HP ZBook Studio 16 G11 | |
| Moyenne Intel Core Ultra 9 285HX (104.8 - 150.6, n=5) | |
| Dell Pro Max 16 Plus | |
| MSI CreatorPro Z16P B12UKST | |
| Lenovo ThinkPad P16 Gen 2 | |
| Dell Precision 5000 5680 | |
* ... Moindre est la valeur, meilleures sont les performances
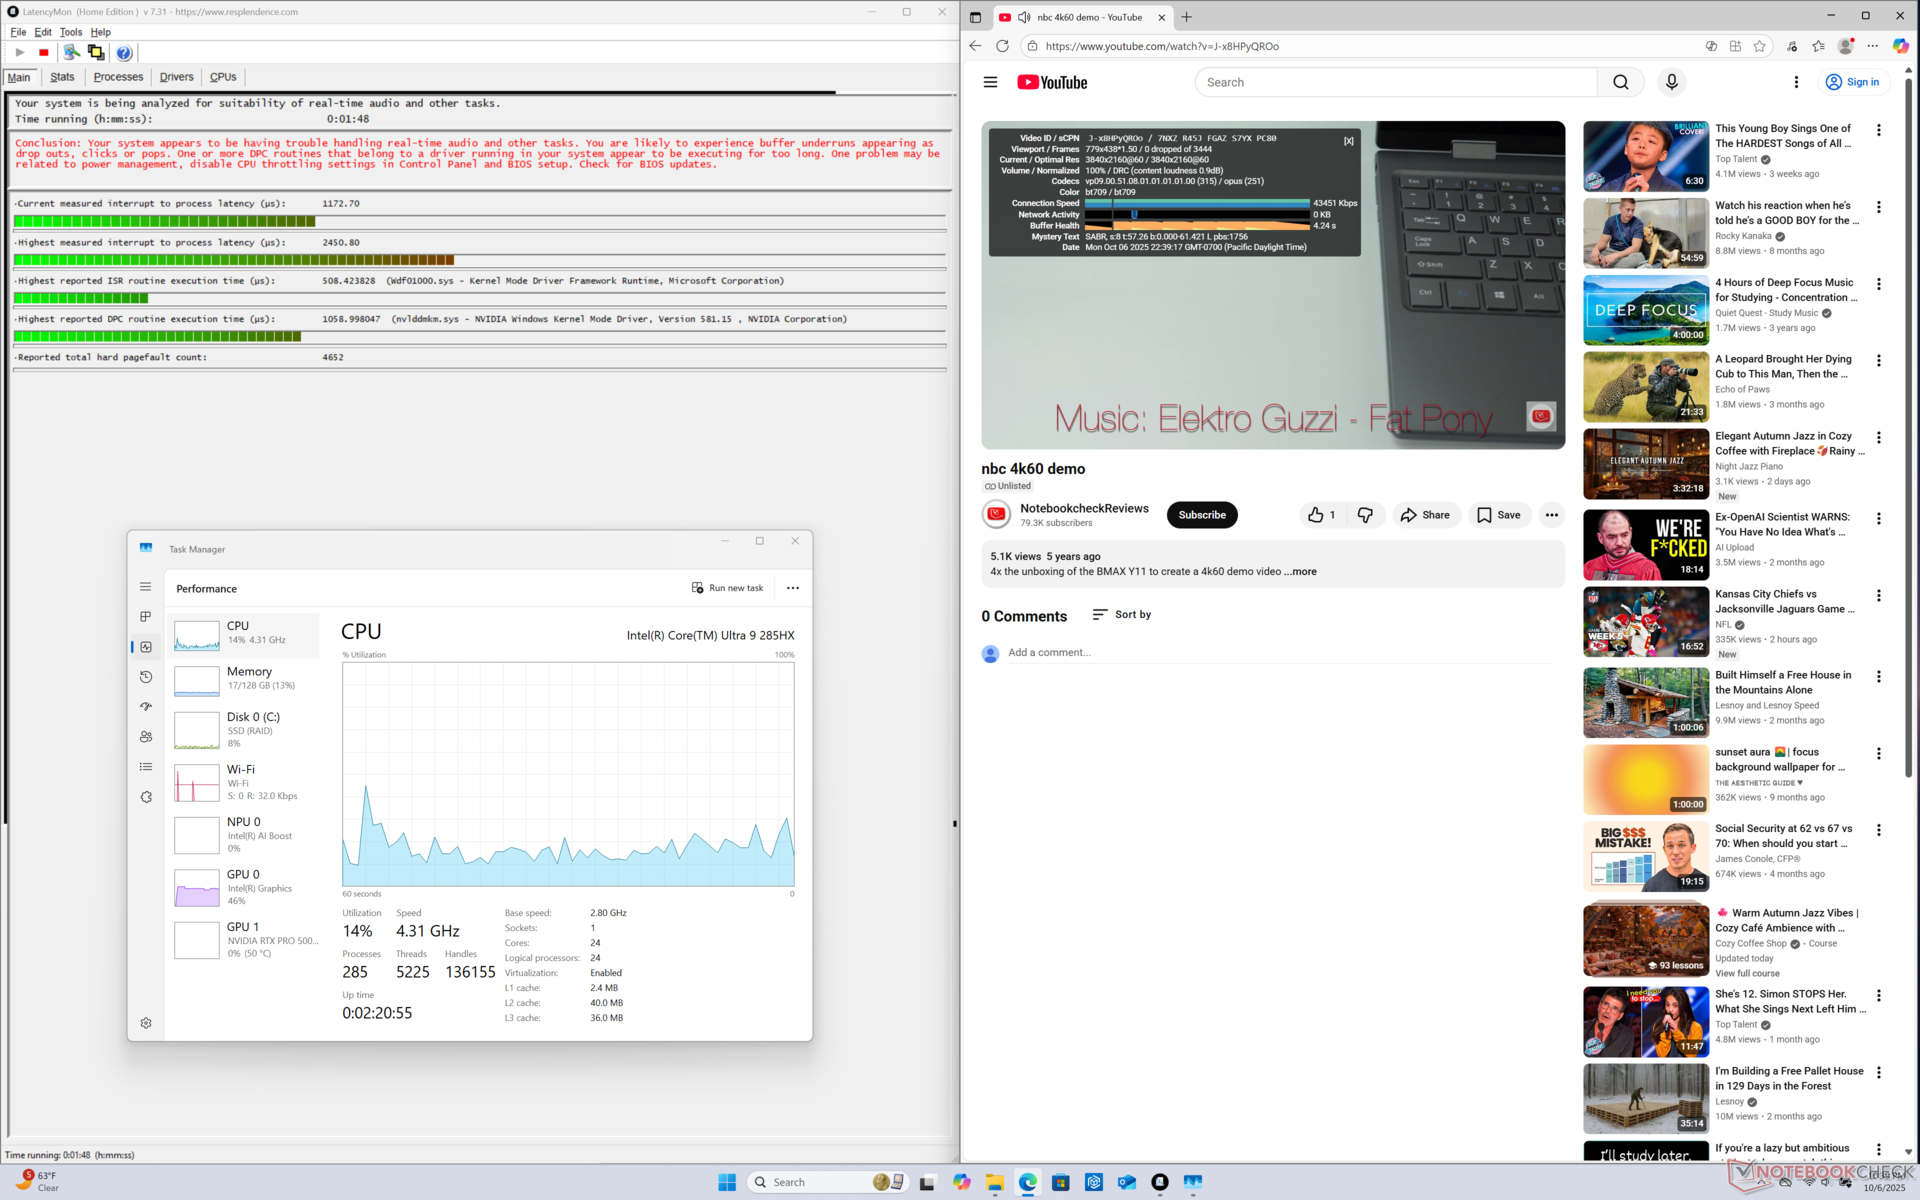
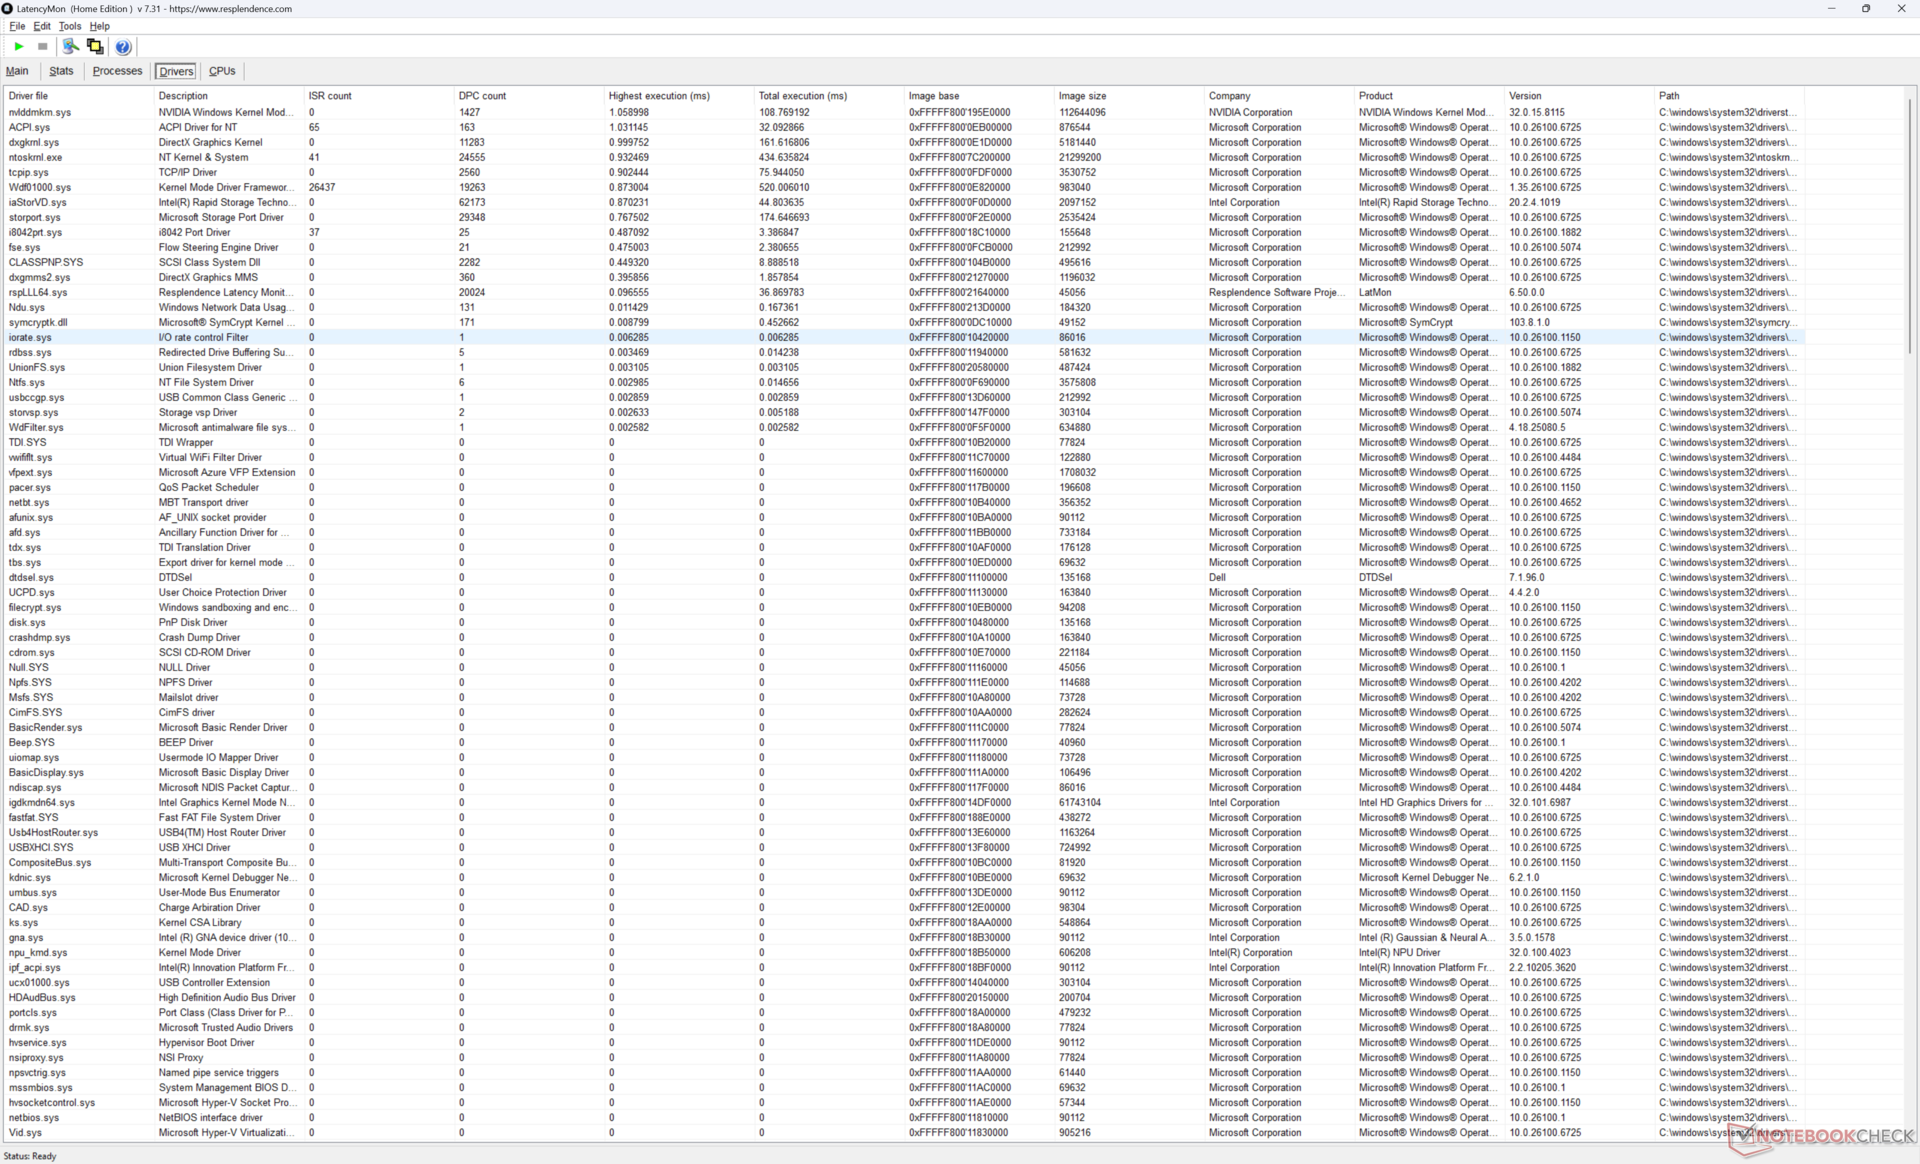
Latence DPC
LatencyMon montre des problèmes mineurs de DPC, mais pas de perte d'images lors de notre test de lecture vidéo en 4K60.
| DPC Latencies / LatencyMon - interrupt to process latency (max), Web, Youtube, Prime95 | |
| Dell Pro Max 16 Plus | |
| Dell Precision 5000 5680 | |
| Lenovo ThinkPad P1 Gen 7 21KV001SGE | |
| HP ZBook Studio 16 G11 | |
| Lenovo ThinkPad P16 Gen 2 | |
| MSI CreatorPro Z16P B12UKST | |
| Dell Precision 5690 | |
* ... Moindre est la valeur, meilleures sont les performances
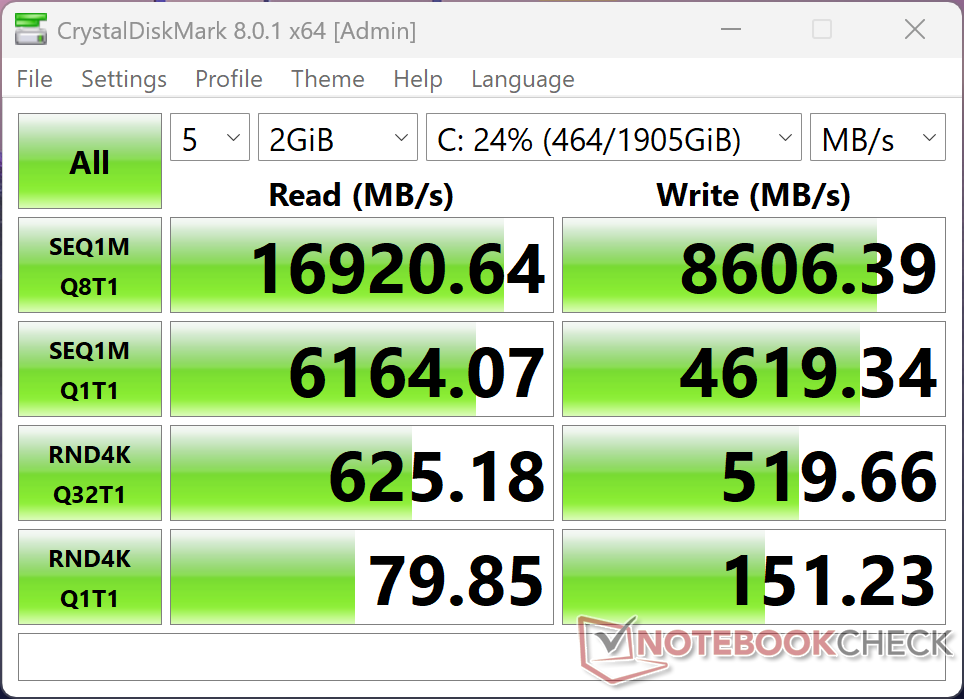
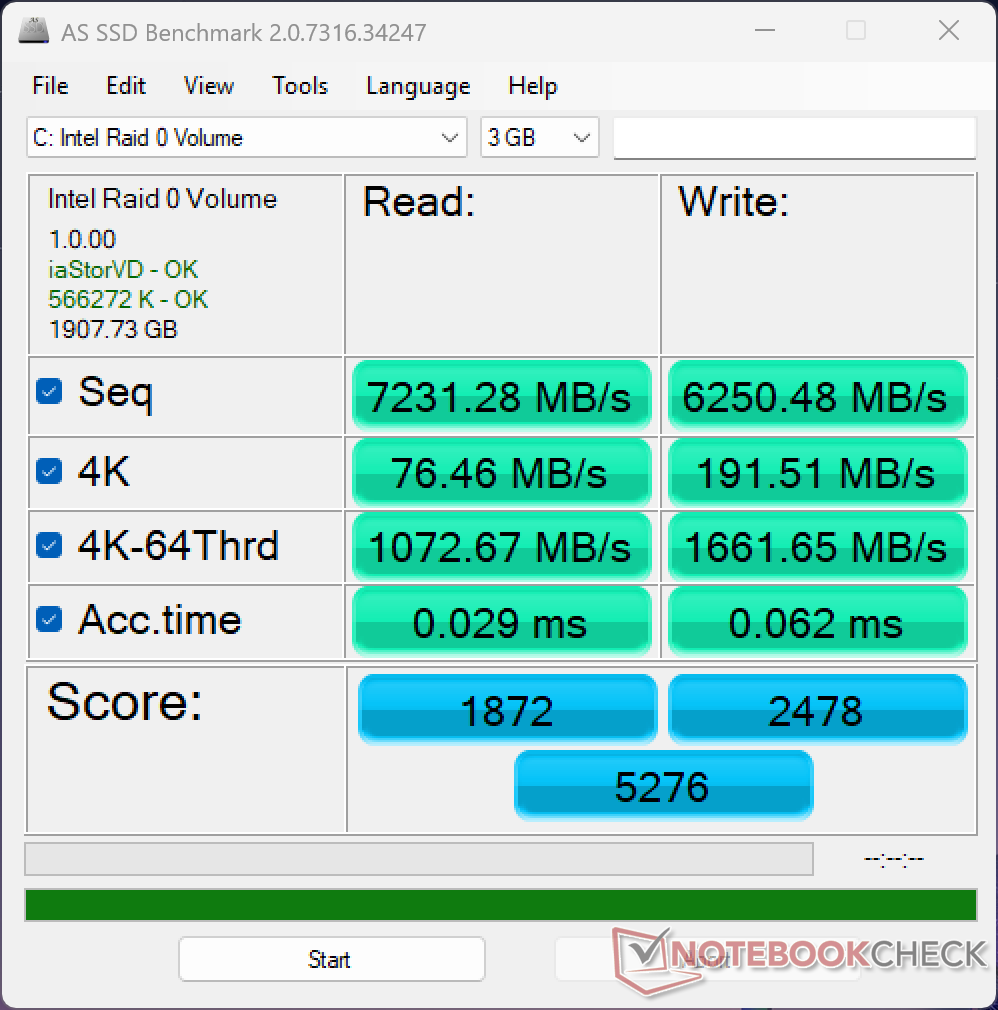
Dispositifs de stockage
Notre unité de test est livrée avec la carte SK Hynix PCB01 PCIe5 x4 NVMe SSD pour des taux de lecture allant jusqu'à ~16 Go/s. Les performances chutent légèrement à ~13 Go/s après quelques minutes de notre test de stress DisKSpd, comme le montre le graphique ci-dessous.

* ... Moindre est la valeur, meilleures sont les performances
Throttoir de disque : Boucle de lecture DiskSpd, profondeur de la file d'attente 8
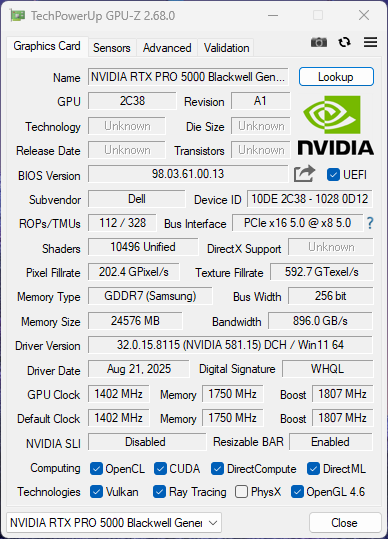
Performance du GPU
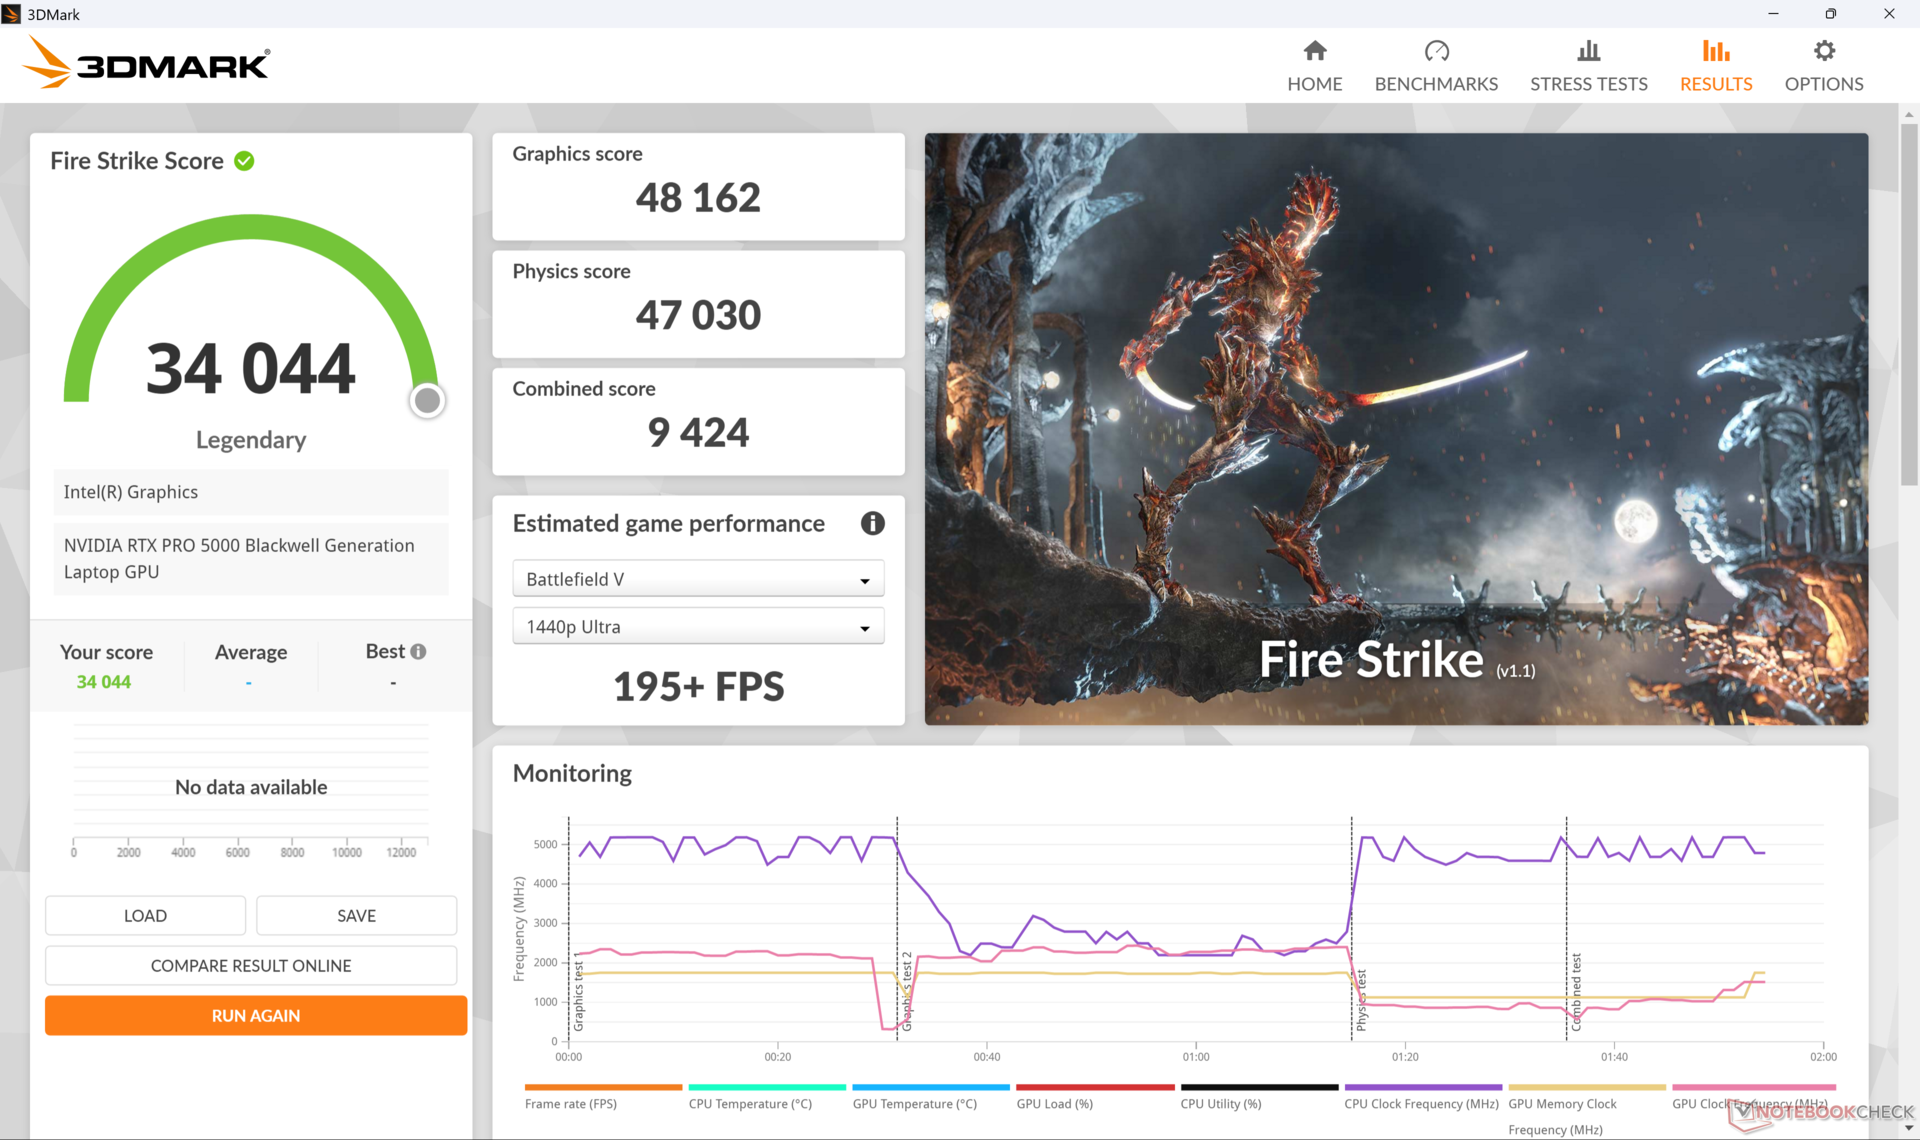
En tant que première station de travail dans notre base de données avec la RTX Pro 5000 Blackwellle GPU surpasse largement le modèle sortant, le RTX 5000 Ada qui prévalait sur les stations de travail phares de la génération précédente, comme le HP ZBook Fury 16 G10 d'environ 35 à 50 %. Les avantages peuvent être encore plus importants si l'on tient compte des résultats de Specviewperf. L'exécution du système en mode équilibré ou optimisé au lieu du mode performance n'aurait qu'un impact minime sur les performances selon les benchmarks 3DMark Fire Strike.
| Profil de puissance | Score graphique | Score physique | Score combiné |
| Mode Performance (~121 W) | 48162 | 47030 | 9424 |
| Mode équilibré (~108 W) | 47134 (-2%) | 45150 (-4%) | 12212 (+30%) |
| Puissance de la batterie | 25838 (-46%) | 34253 (-27%) | 6186 (-34%) |
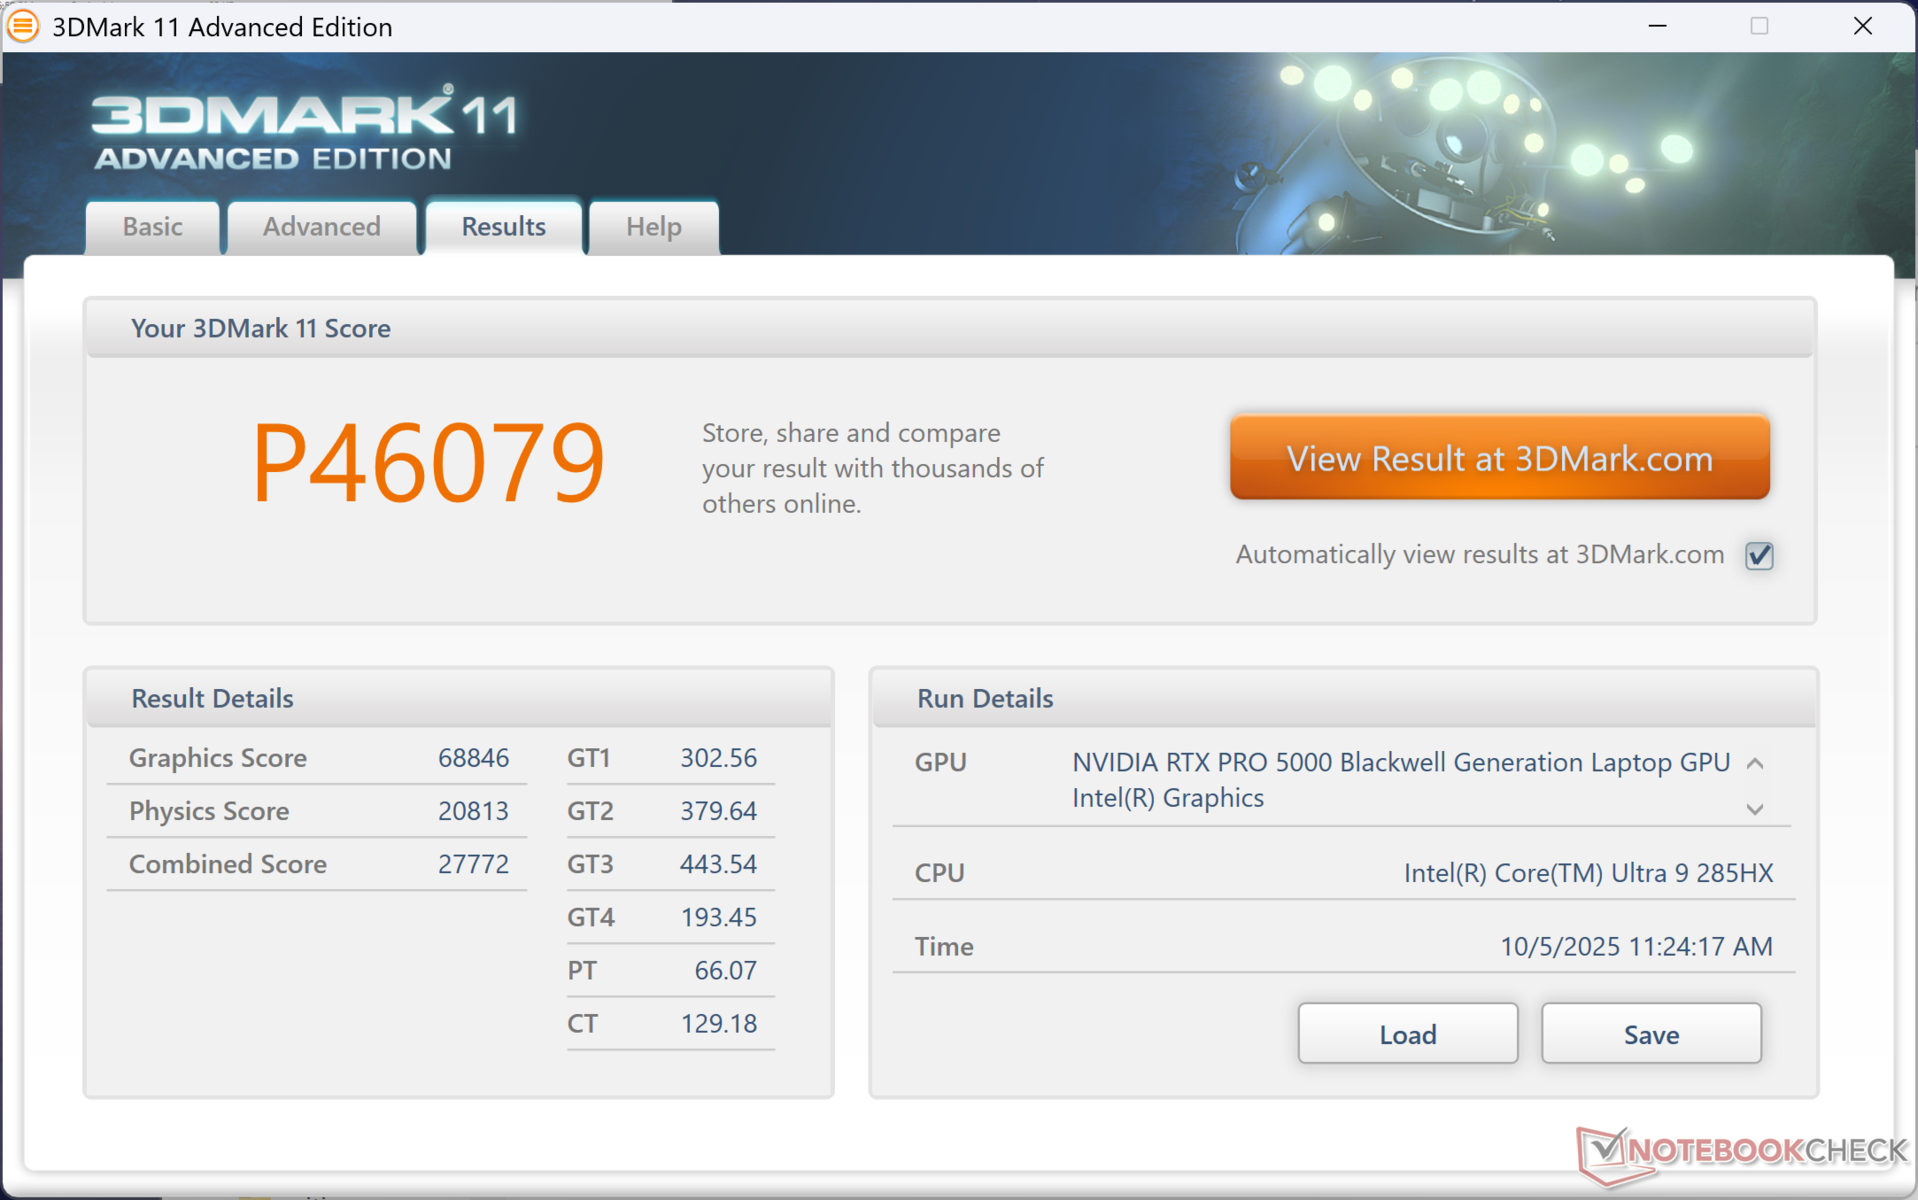

| 3DMark 11 Performance | 46079 points | |
| 3DMark Cloud Gate Standard Score | 67837 points | |
| 3DMark Fire Strike Score | 34044 points | |
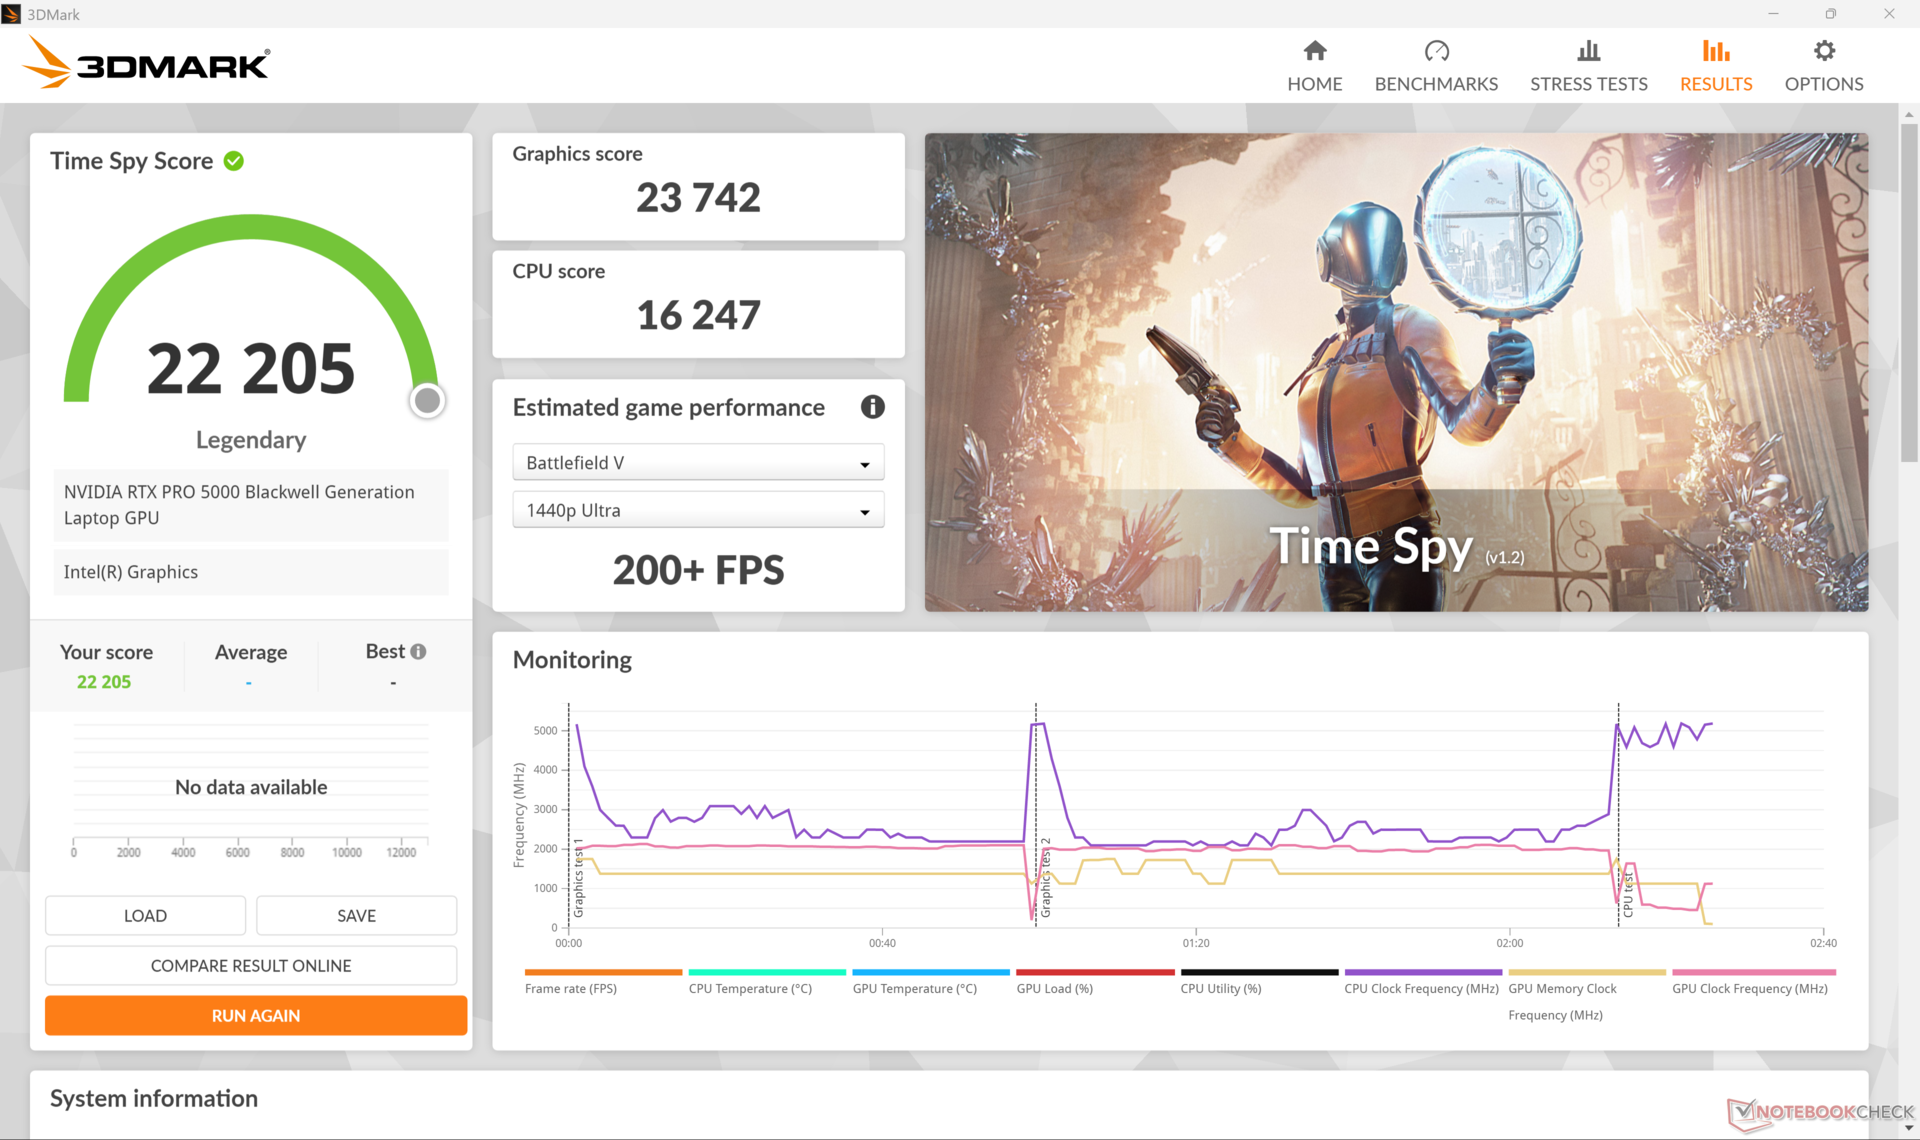
| 3DMark Time Spy Score | 22205 points | |
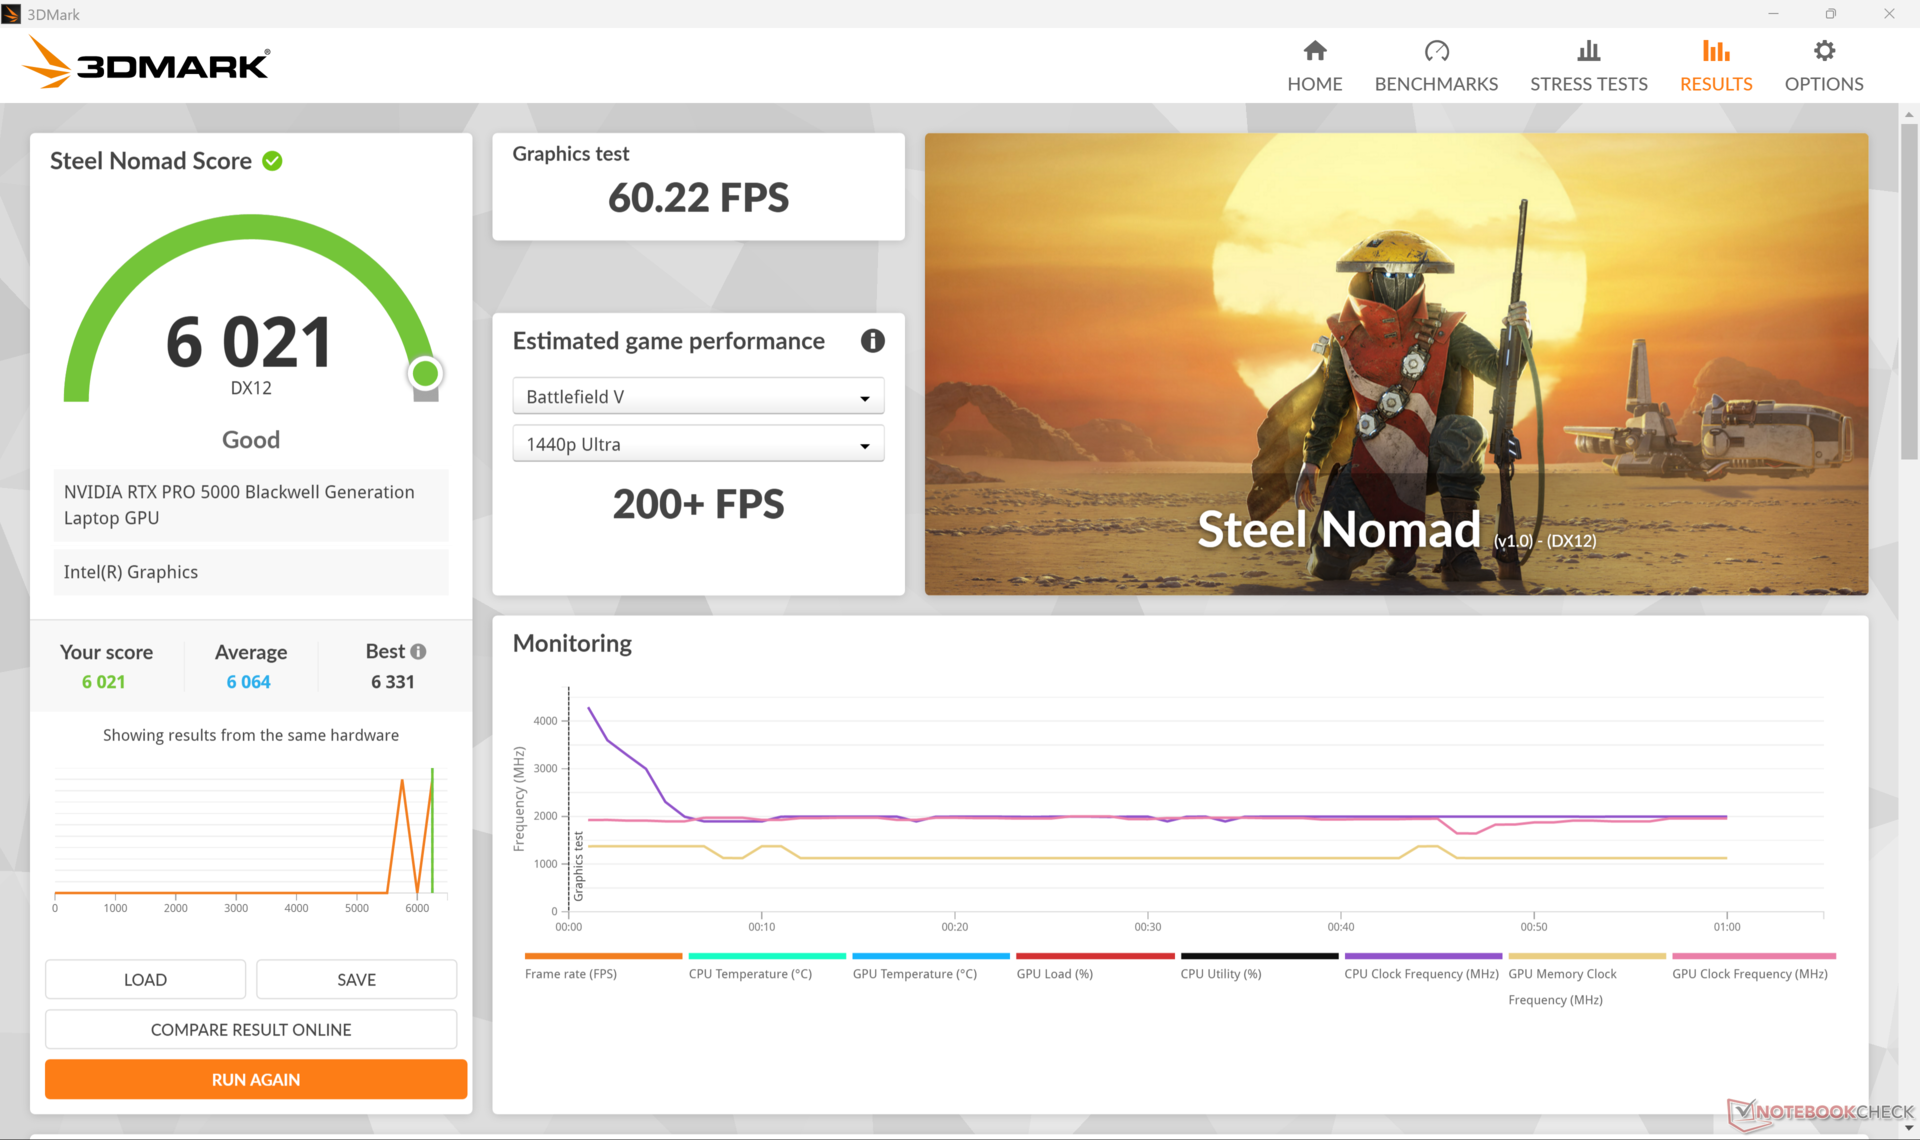
| 3DMark Steel Nomad Score | 6021 points | |
Aide | ||
* ... Moindre est la valeur, meilleures sont les performances
Performances des jeux
Les performances de jeu sont largement similaires à celles de la mobile GeForce RTX 5080 ce qui est prévisible puisque la RTX Pro 5000 Blackwell est basée sur la rTX 5090 mais sans les optimisations pour les jeux. Certains titres tournent moins bien ou de manière incohérente sur la RTX Pro 5000 Blackwell, notamment Monster Hunter Wilds.
| Performance rating - Percent | |
| Dell Pro Max 16 Plus | |
| Lenovo ThinkPad P16 Gen 2 | |
| Dell Precision 5000 5680 -3! | |
| Dell Precision 5690 -1! | |
| HP ZBook Studio 16 G11 | |
| MSI CreatorPro Z16P B12UKST -2! | |
| Lenovo ThinkPad P1 Gen 7 21KV001SGE -1! | |
| Cyberpunk 2077 - 1920x1080 Ultra Preset (FSR off) | |
| Dell Pro Max 16 Plus | |
| Dell Precision 5690 | |
| Lenovo ThinkPad P16 Gen 2 | |
| Lenovo ThinkPad P1 Gen 7 21KV001SGE | |
| HP ZBook Studio 16 G11 | |
| Baldur's Gate 3 - 1920x1080 Ultra Preset AA:T | |
| Dell Pro Max 16 Plus | |
| Lenovo ThinkPad P16 Gen 2 | |
| Dell Precision 5690 | |
| HP ZBook Studio 16 G11 | |
| Lenovo ThinkPad P1 Gen 7 21KV001SGE | |
| GTA V - 1920x1080 Highest AA:4xMSAA + FX AF:16x | |
| Dell Pro Max 16 Plus | |
| Lenovo ThinkPad P16 Gen 2 | |
| Dell Precision 5000 5680 | |
| Lenovo ThinkPad P1 Gen 7 21KV001SGE | |
| HP ZBook Studio 16 G11 | |
| MSI CreatorPro Z16P B12UKST | |
| Final Fantasy XV Benchmark - 1920x1080 High Quality | |
| Dell Pro Max 16 Plus | |
| Lenovo ThinkPad P16 Gen 2 | |
| Dell Precision 5690 | |
| Dell Precision 5000 5680 | |
| HP ZBook Studio 16 G11 | |
| Lenovo ThinkPad P1 Gen 7 21KV001SGE | |
| MSI CreatorPro Z16P B12UKST | |
| Strange Brigade - 1920x1080 ultra AA:ultra AF:16 | |
| Lenovo ThinkPad P16 Gen 2 | |
| Dell Pro Max 16 Plus | |
| Dell Precision 5690 | |
| HP ZBook Studio 16 G11 | |
| MSI CreatorPro Z16P B12UKST | |
| Dota 2 Reborn - 1920x1080 ultra (3/3) best looking | |
| Dell Pro Max 16 Plus | |
| Lenovo ThinkPad P16 Gen 2 | |
| MSI CreatorPro Z16P B12UKST | |
| Dell Precision 5000 5680 | |
| HP ZBook Studio 16 G11 | |
| Dell Precision 5690 | |
| Lenovo ThinkPad P1 Gen 7 21KV001SGE | |
| X-Plane 11.11 - 1920x1080 high (fps_test=3) | |
| Lenovo ThinkPad P16 Gen 2 | |
| Dell Pro Max 16 Plus | |
| Dell Precision 5000 5680 | |
| MSI CreatorPro Z16P B12UKST | |
| Dell Precision 5690 | |
| HP ZBook Studio 16 G11 | |
| Lenovo ThinkPad P1 Gen 7 21KV001SGE | |
Cyberpunk 2077 ultra FPS Chart
| Bas | Moyen | Élevé | Ultra | QHD DLSS | QHD | 4K DLSS | 4K | |
|---|---|---|---|---|---|---|---|---|
| GTA V (2015) | 184.7 | 183.5 | 178.1 | 142.5 | 138 | 170.3 | ||
| Dota 2 Reborn (2015) | 212 | 181 | 184.8 | 166 | 146.4 | |||
| Final Fantasy XV Benchmark (2018) | 233 | 220 | 184.2 | 162.8 | 102.2 | |||
| X-Plane 11.11 (2018) | 144.4 | 125.7 | 103.2 | 82.6 | ||||
| Strange Brigade (2018) | 382 | 285 | 261 | 288 | 300 | 177.3 | ||
| Baldur's Gate 3 (2023) | 204 | 201.8 | 155.2 | 128.1 | 80.1 | |||
| Cyberpunk 2077 (2023) | 133.9 | 121.6 | 120.6 | 119.8 | 116.3 | 105.1 | 51 | |
| F1 24 (2024) | 251 | 243 | 231 | 131.2 | 128.1 | 94.9 | 82 | 47.2 |
| Black Myth: Wukong (2024) | 142 | 72 | 54 | 42 | 36 | 37 | 32 | 26 |
| Monster Hunter Wilds (2025) | 25.4 | 27 | 27.8 | 43.3 | 39 | 33.9 | 35.3 | |
| Assassin's Creed Shadows (2025) | 103 | 98 | 86 | 68 | 67 | 57 | 56 | 42 |
Émissions
Bruit du système
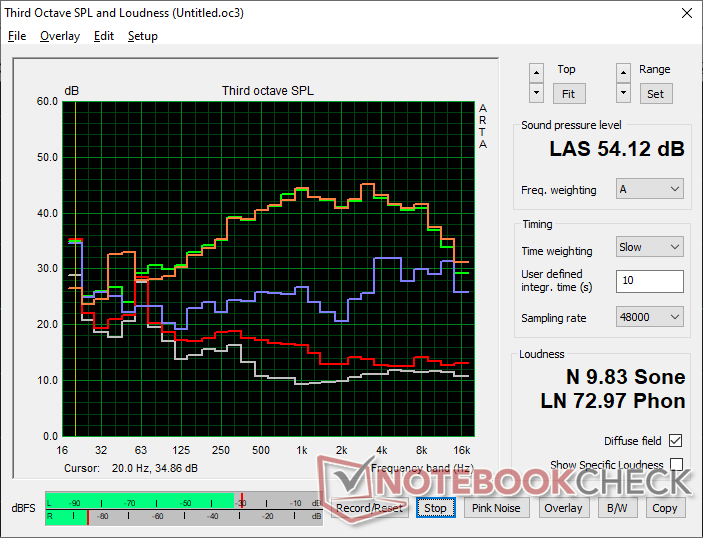
Bien que les ventilateurs soient presque toujours actifs, les pulsations sont généralement réduites au minimum afin de limiter les augmentations brutales de bruit. Cela dit, le système peut être assez bruyant, avec près de 55 dB(A) lorsqu'il fonctionne avec des charges exigeantes, ce qui est similaire à ce que nous avons enregistré sur le Lenovo ThinkPad P1 ou le HP ZBook Studio 16 G11.
Le bruit du ventilateur atteint 49 dB(A) et 54,3 dB(A) en mode équilibré et en mode performance, respectivement.
Degré de la nuisance sonore
| Au repos |
| 26.7 / 30.5 / 34 dB(A) |
| Fortement sollicité |
| 39.8 / 54.3 dB(A) |
 | ||
30 dB silencieux 40 dB(A) audible 50 dB(A) bruyant |
||
min: | ||
| Dell Pro Max 16 Plus RTX PRO 5000 Blackwell Generation Laptop, Ultra 9 285HX, SK hynix PCB01 HFS001TFM9X186N | Dell Precision 5690 RTX 5000 Ada Generation Laptop, Ultra 9 185H, 2x Samsung PM9A1 1TB (RAID 0) | Dell Precision 5000 5680 RTX 5000 Ada Generation Laptop, i9-13900H, 2x SK hynix PC801 HFS512GEJ9X101N RAID 0 | Lenovo ThinkPad P16 Gen 2 RTX 4000 Ada Generation Laptop, i7-14700HX, SK hynix PC801 HFS001TEJ9X162N | Lenovo ThinkPad P1 Gen 7 21KV001SGE GeForce RTX 4060 Laptop GPU, Ultra 7 155H, Kioxia XG8 KXG8AZNV1T02 | HP ZBook Studio 16 G11 RTX 3000 Ada Generation Laptop, Ultra 9 185H, Kioxia XG8 KXG80ZNV1T02 | MSI CreatorPro Z16P B12UKST RTX A3000 Laptop GPU, i7-12700H, Samsung PM9A1 MZVL21T0HCLR | |
|---|---|---|---|---|---|---|---|
| Noise | 7% | 14% | 1% | 6% | 11% | 5% | |
| arrêt / environnement * (dB) | 23.2 | 23.4 -1% | 22.8 2% | 23.9 -3% | 24.7 -6% | 23.8 -3% | 24.1 -4% |
| Idle Minimum * (dB) | 26.7 | 23.6 12% | 23 14% | 29.1 -9% | 24.7 7% | 23.8 11% | 27.1 -1% |
| Idle Average * (dB) | 30.5 | 24.9 18% | 23 25% | 29.1 5% | 24.7 19% | 26.4 13% | 27.1 11% |
| Idle Maximum * (dB) | 34 | 30.9 9% | 23 32% | 29.1 14% | 24.7 27% | 26.4 22% | 27.1 20% |
| Load Average * (dB) | 39.8 | 40.4 -2% | 37.2 7% | 41 -3% | 43.7 -10% | 33.7 15% | 42.9 -8% |
| Cyberpunk 2077 ultra * (dB) | 54.3 | 52.8 3% | 53.2 2% | 46.1 15% | |||
| Load Maximum * (dB) | 54.3 | 51.9 4% | 51 6% | 52.9 3% | 53.3 2% | 53.2 2% | 47 13% |
| Witcher 3 ultra * (dB) | 48.3 | 51 | 44 |
* ... Moindre est la valeur, meilleures sont les performances
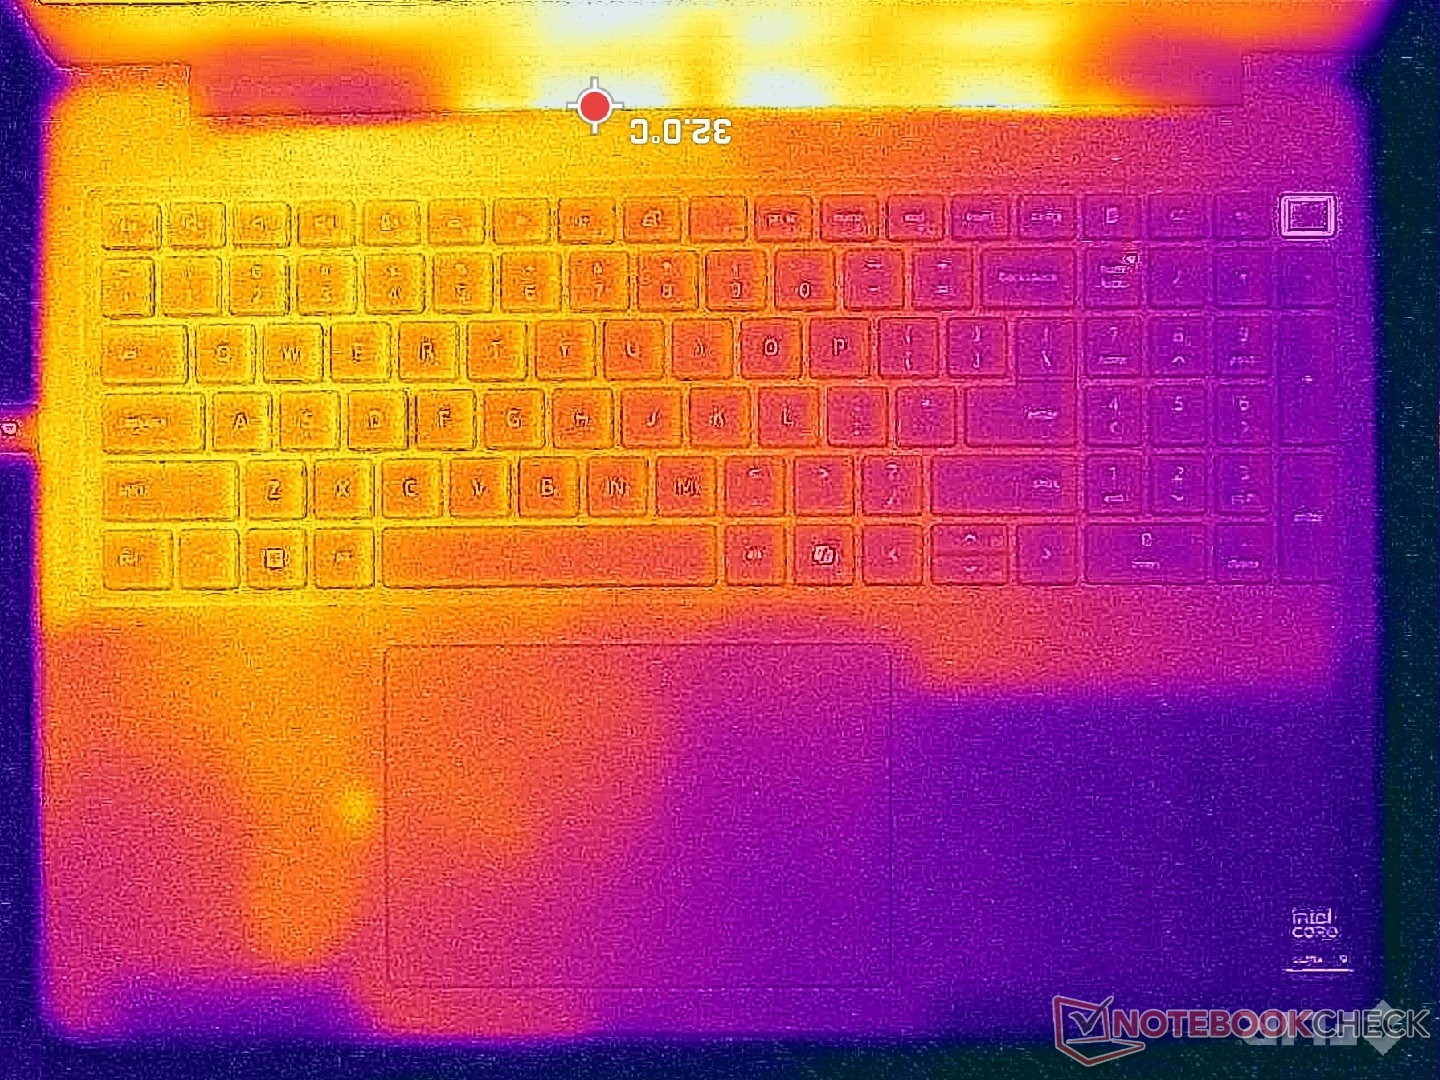
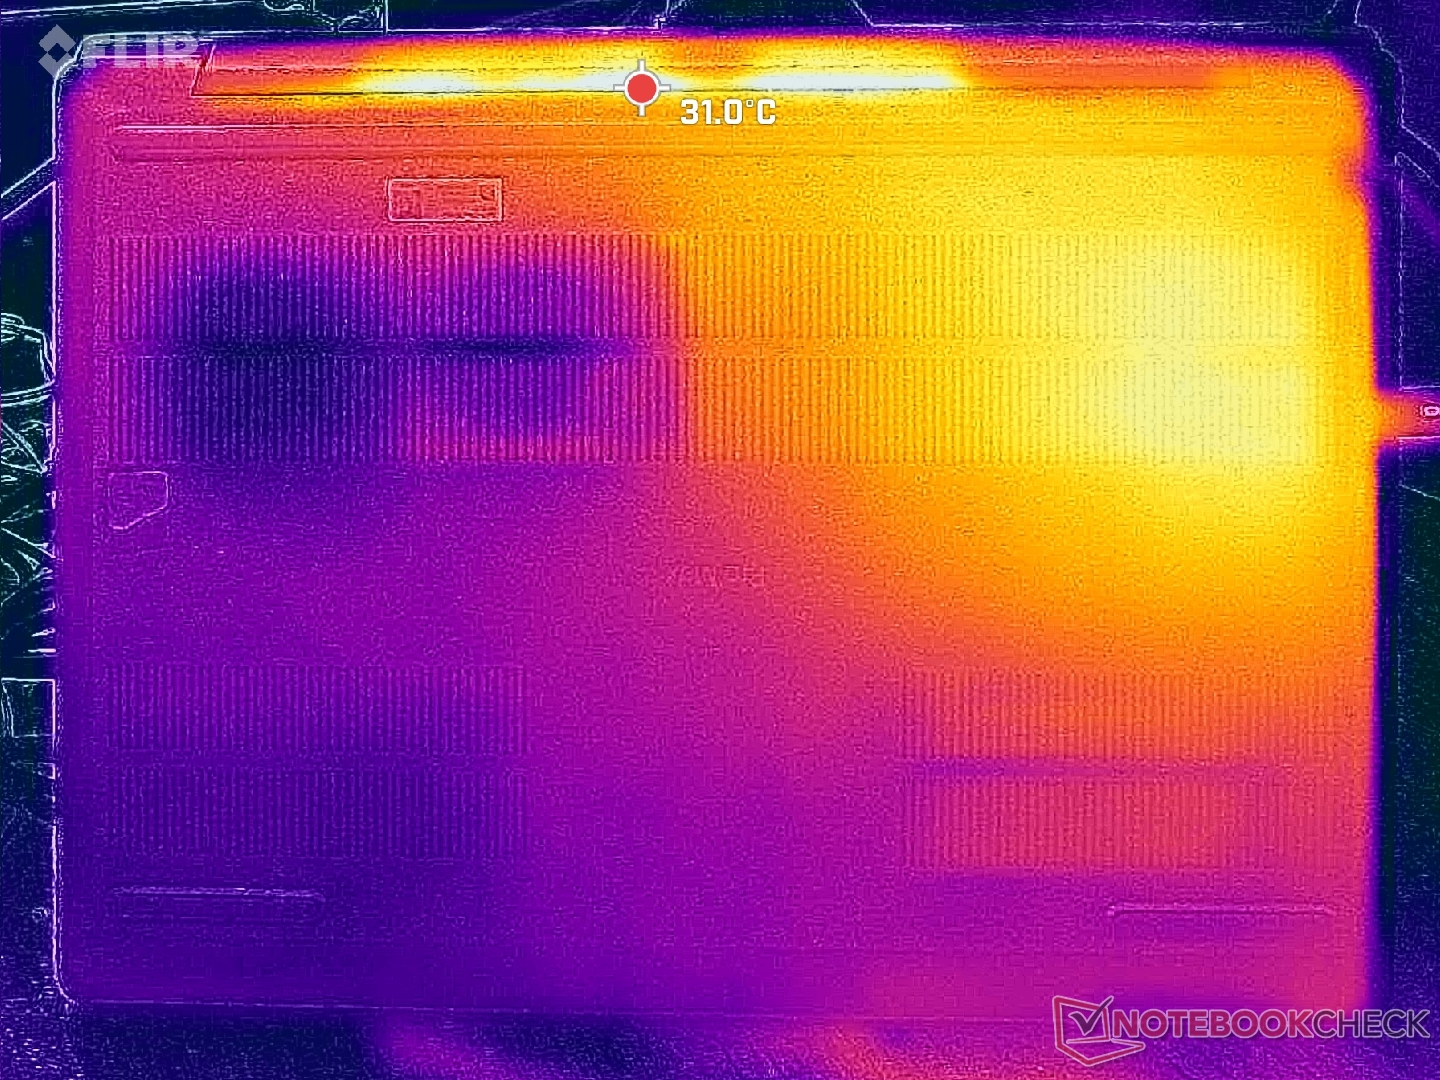
Température
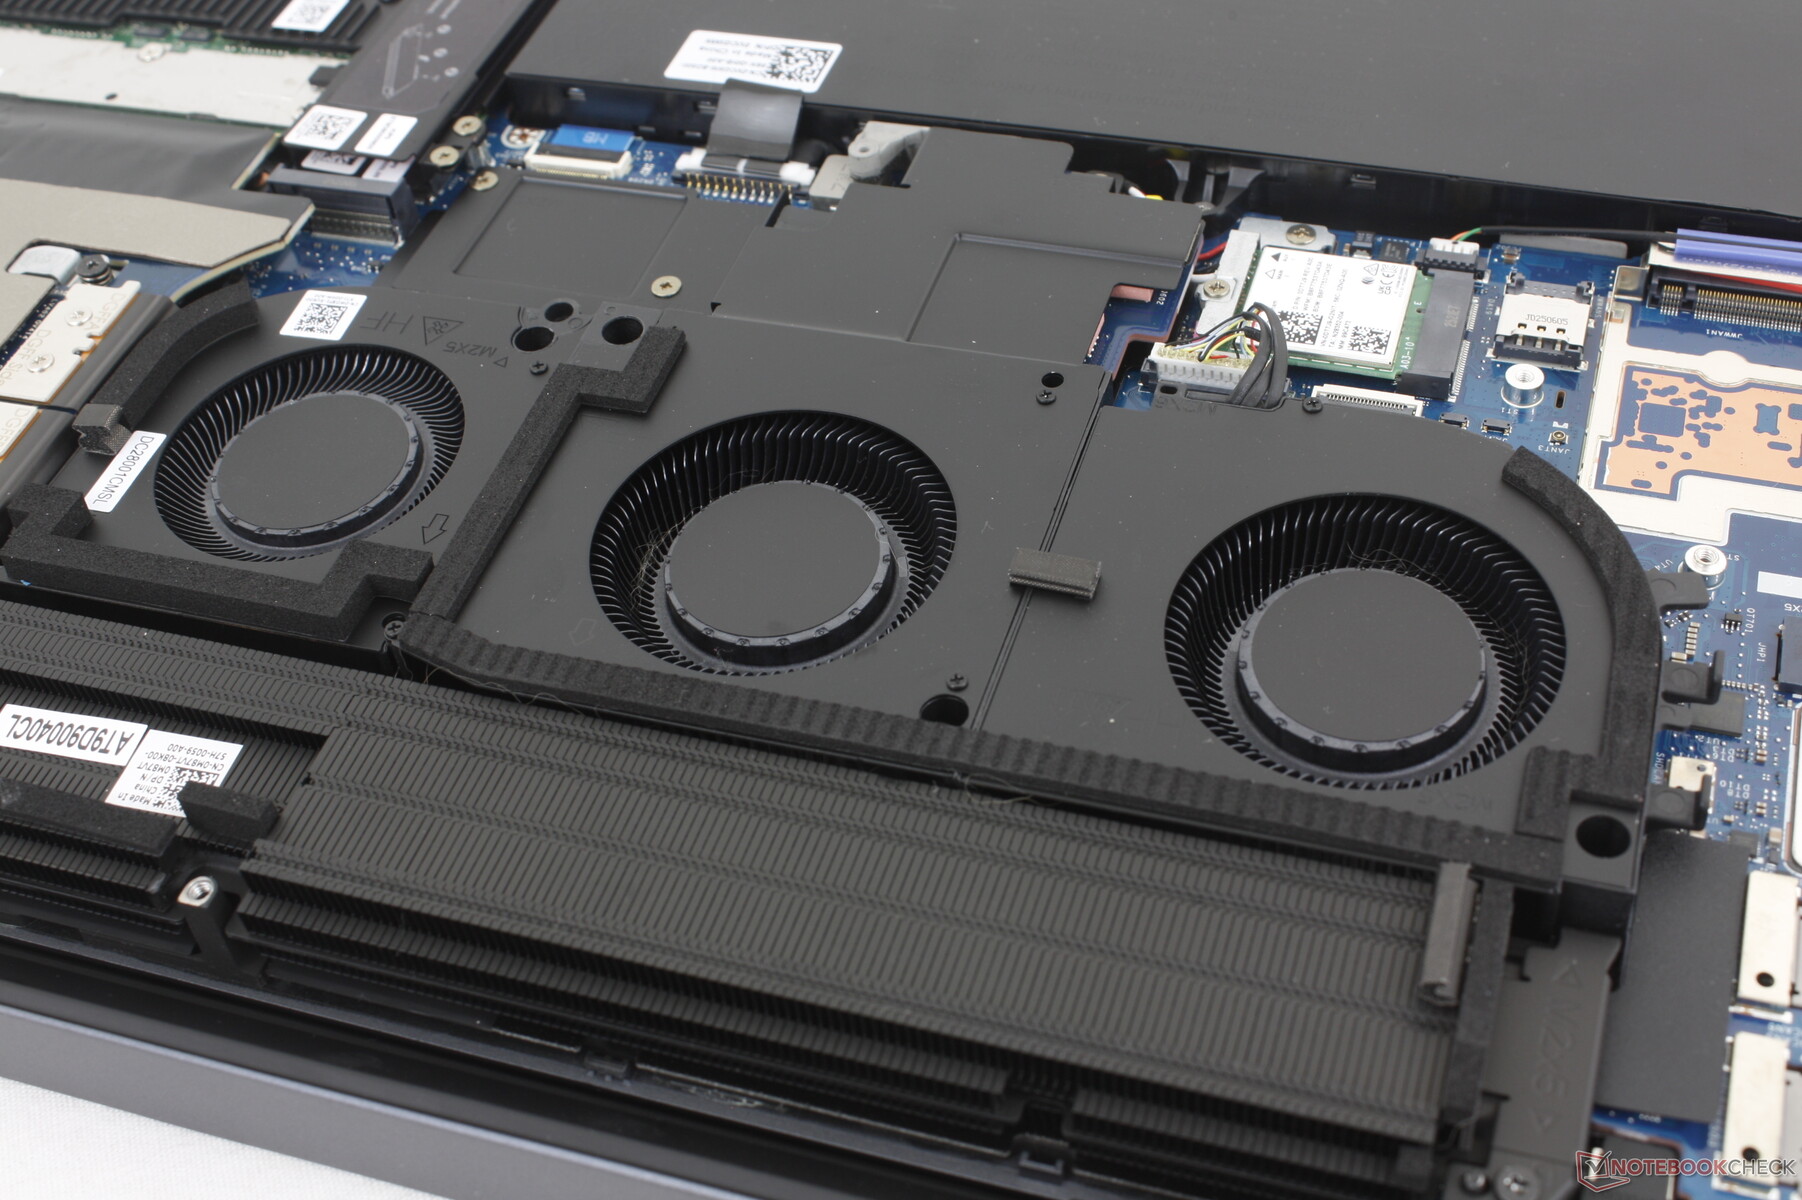
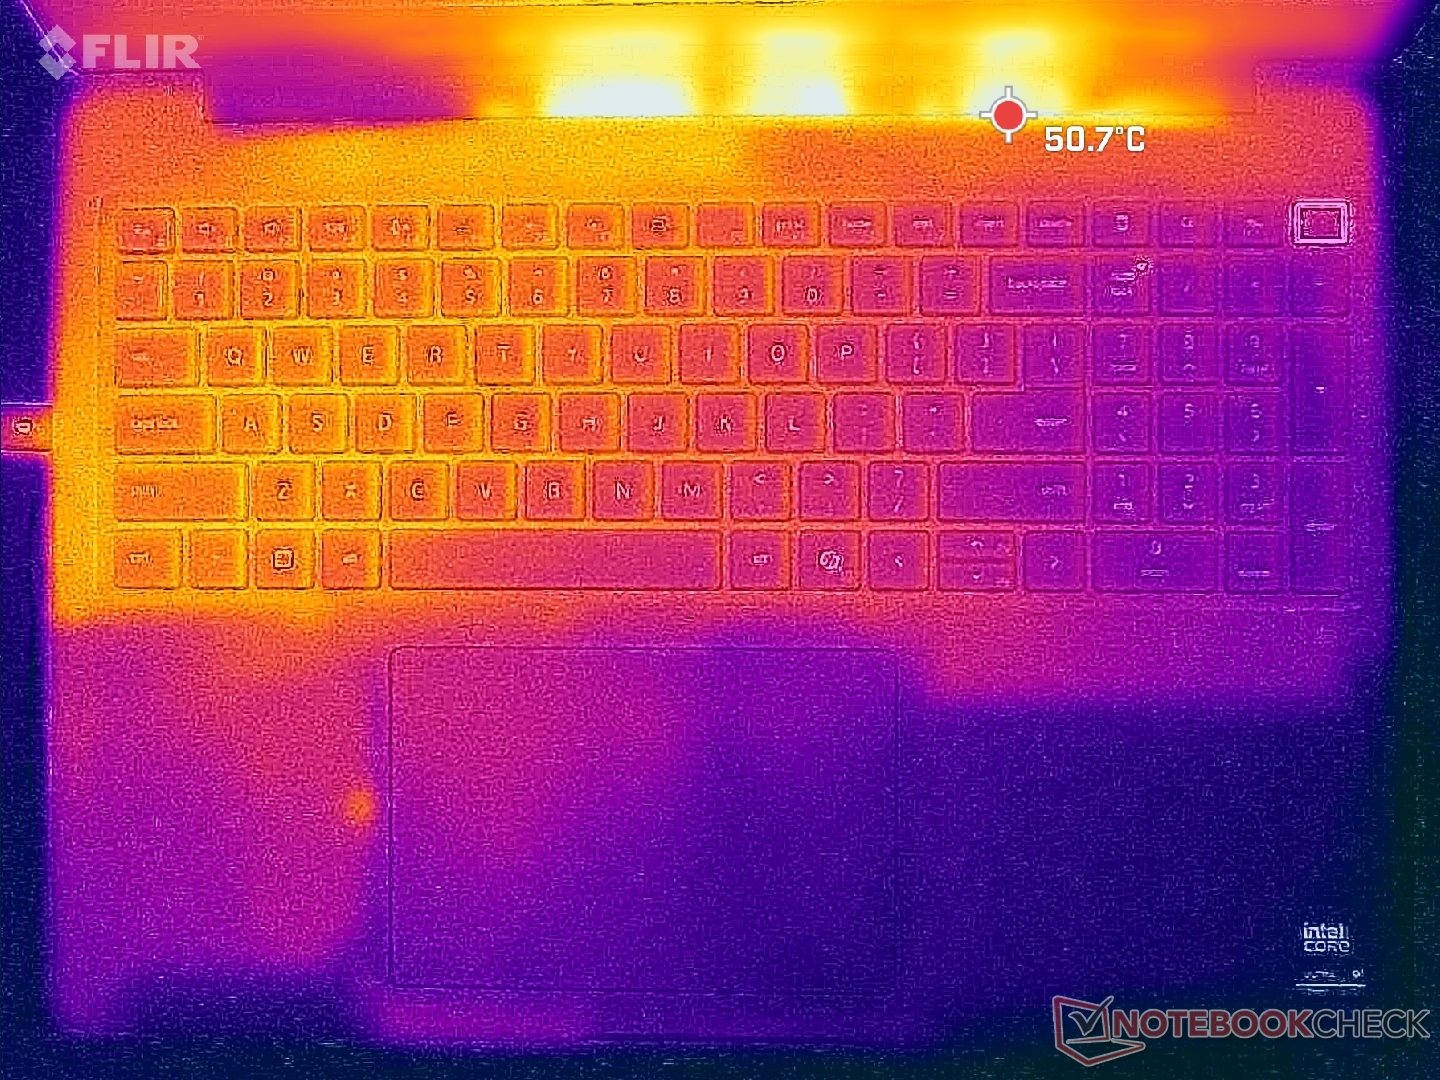
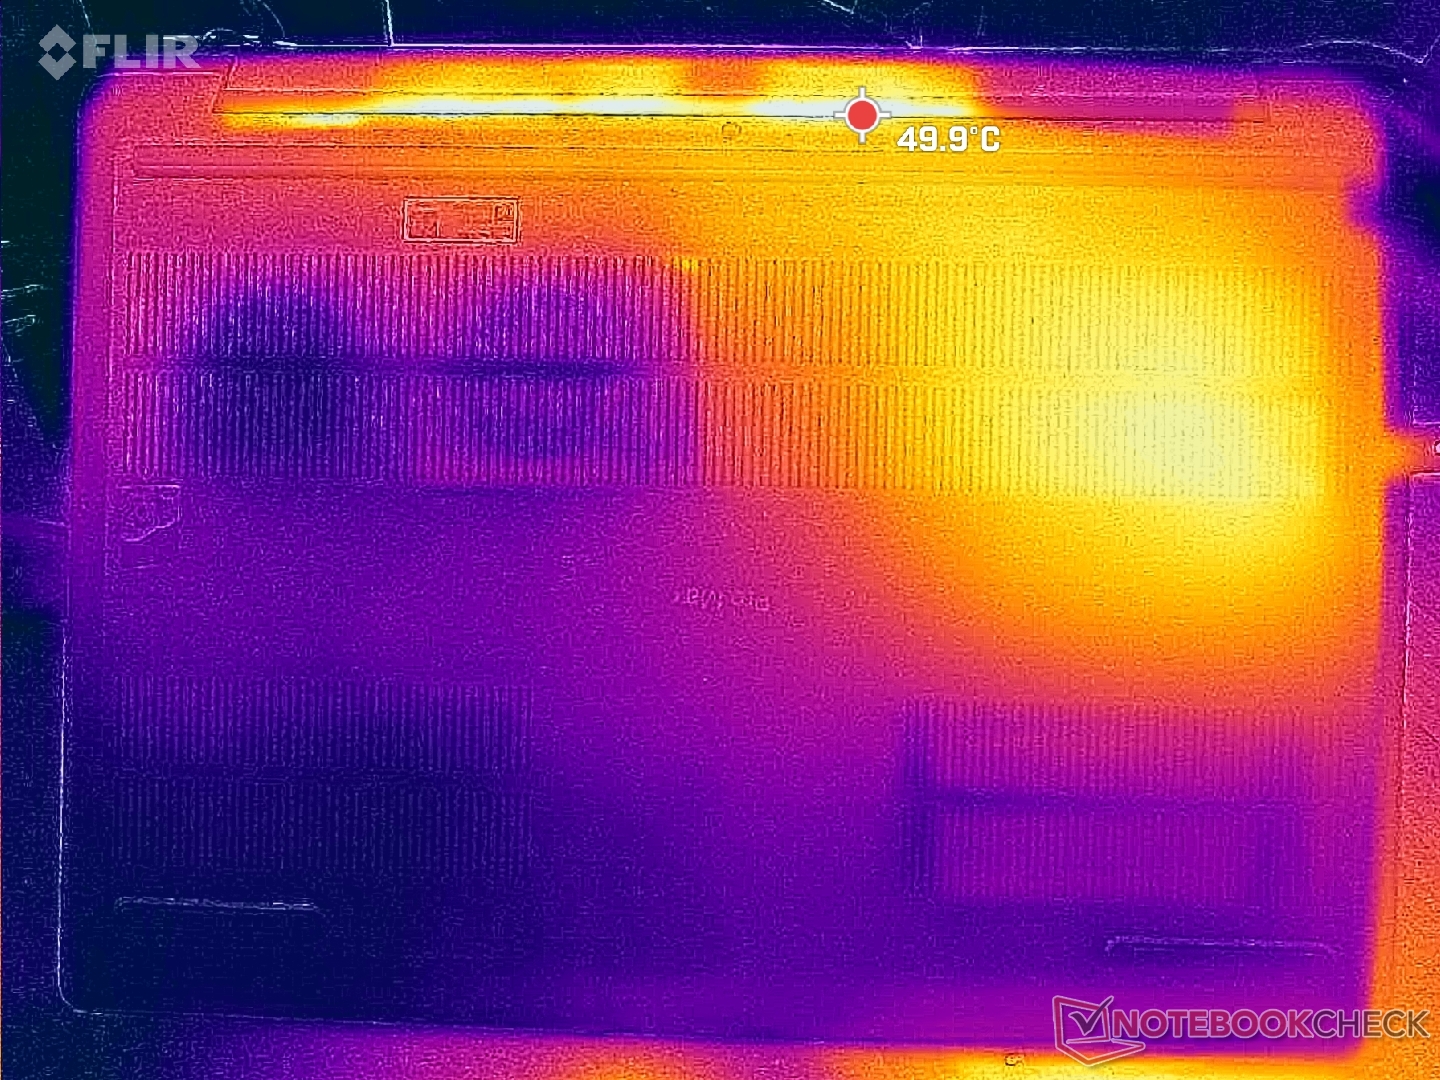
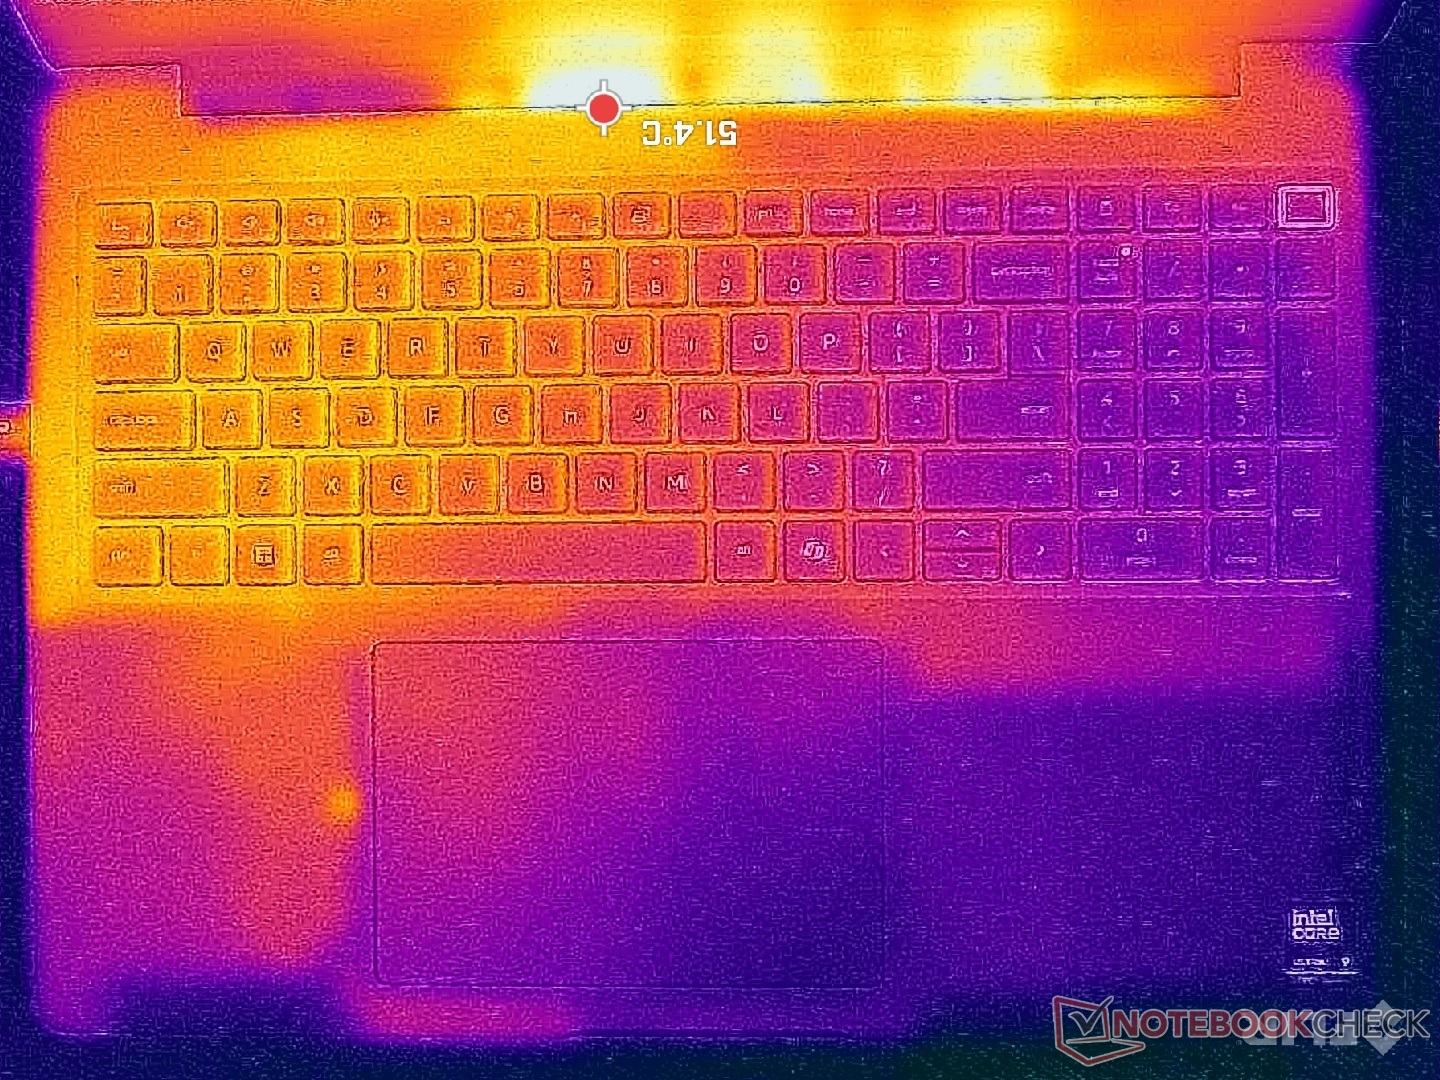
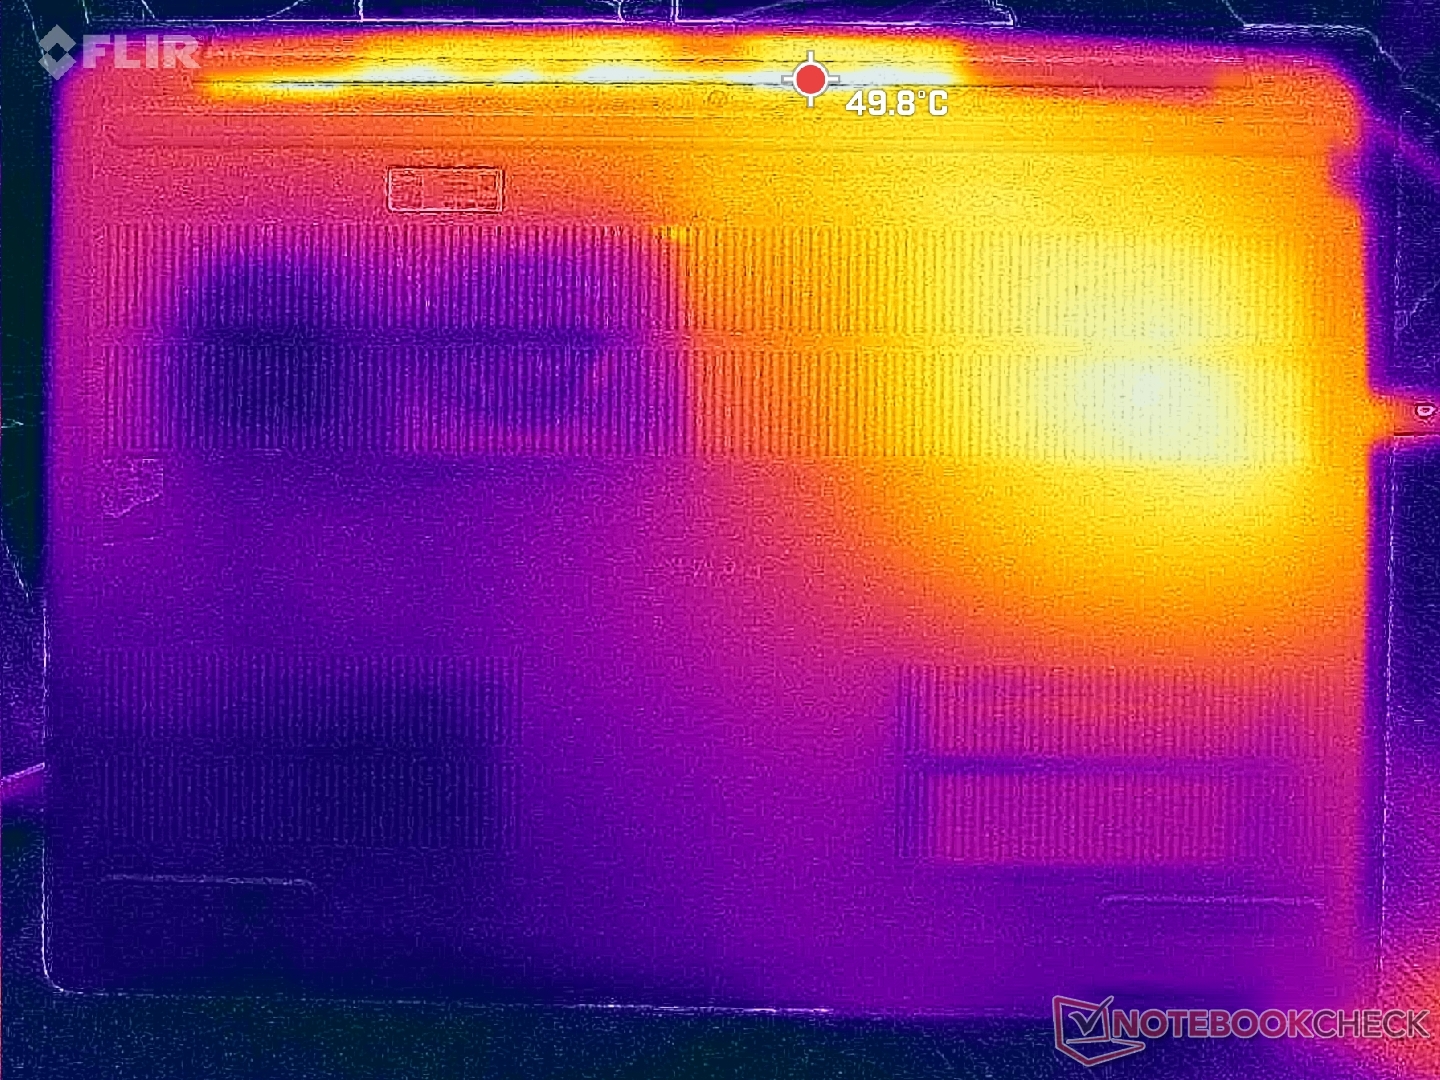
Les températures de surface sont presque toujours chaudes, quelle que soit la charge à l'écran, probablement en raison des ventilateurs léthargiques et des pièces de haute performance. La moitié gauche du châssis devient sensiblement plus chaude que la droite en raison de la solution de refroidissement asymétrique.
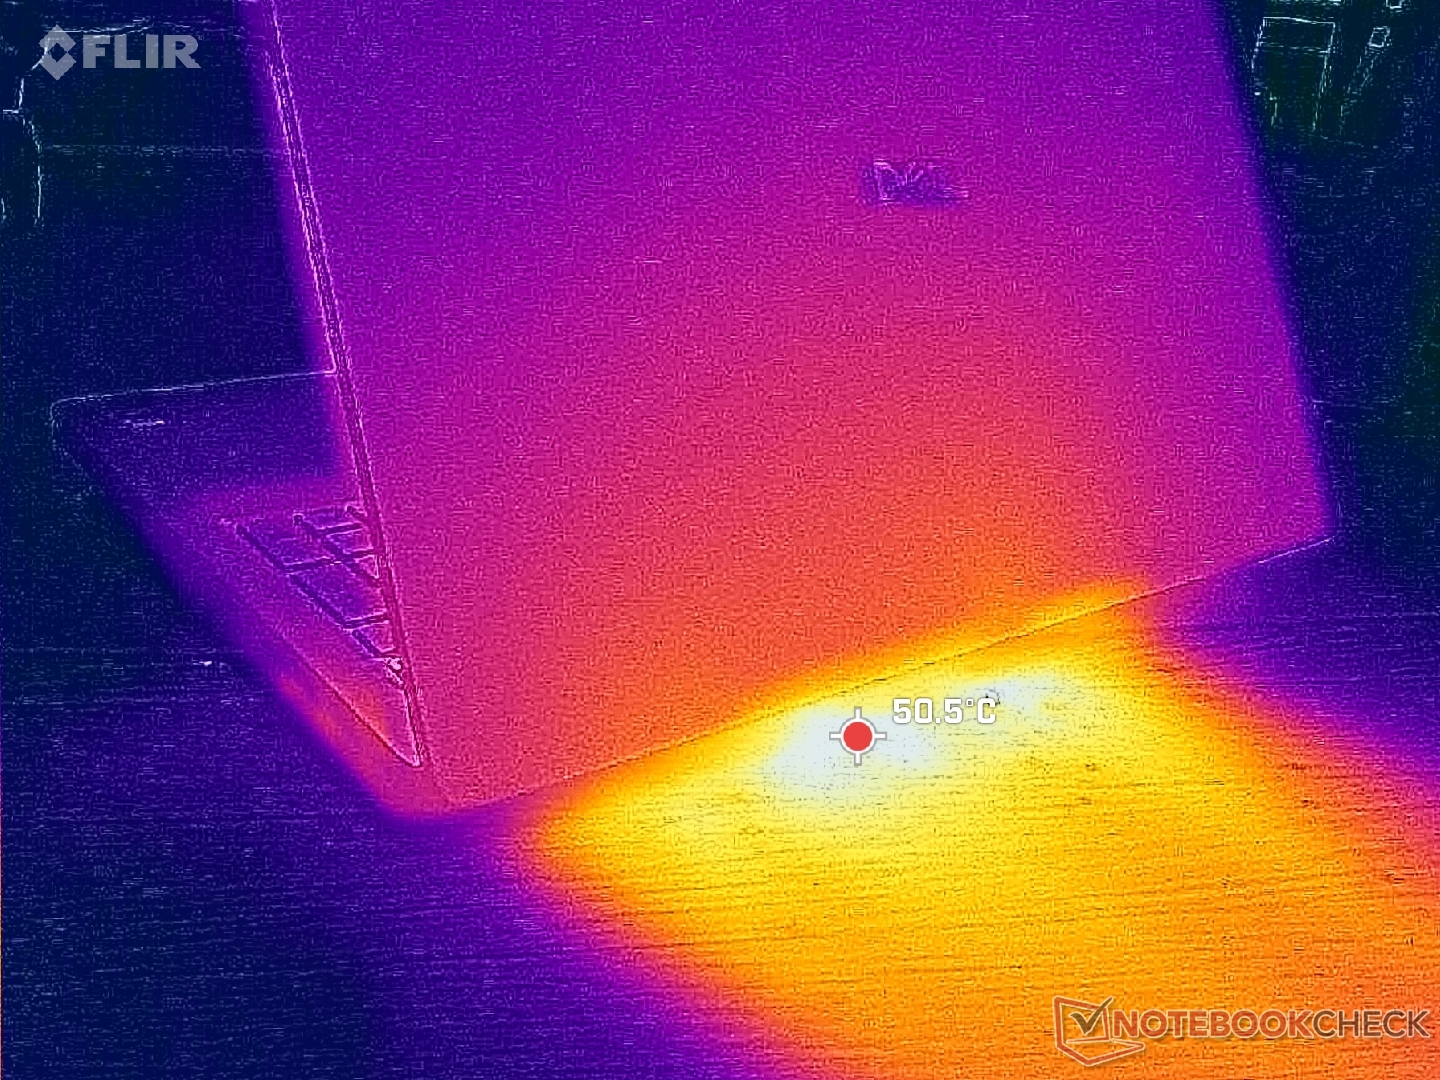
(±) La température maximale du côté supérieur est de 40.4 °C / 105 F, par rapport à la moyenne de 38.2 °C / 101 F, allant de 22.2 à 69.8 °C pour la classe Workstation.
(-) Le fond chauffe jusqu'à un maximum de 45.6 °C / 114 F, contre une moyenne de 41.1 °C / 106 F
(+) En utilisation inactive, la température moyenne du côté supérieur est de 29.5 °C / 85 F, par rapport à la moyenne du dispositif de 32 °C / 90 F.
(±) 3: The average temperature for the upper side is 34.2 °C / 94 F, compared to the average of 32 °C / 90 F for the class Workstation.
(+) Les repose-poignets et le pavé tactile atteignent la température maximale de la peau (33.2 °C / 91.8 F) et ne sont donc pas chauds.
(-) La température moyenne de la zone de l'appui-paume de dispositifs similaires était de 27.8 °C / 82 F (-5.4 °C / #-9.8 F).
| Dell Pro Max 16 Plus Intel Core Ultra 9 285HX, Nvidia RTX PRO 5000 Blackwell Generation Laptop | Dell Precision 5690 Intel Core Ultra 9 185H, Nvidia RTX 5000 Ada Generation Laptop | Dell Precision 5000 5680 Intel Core i9-13900H, Nvidia RTX 5000 Ada Generation Laptop | Lenovo ThinkPad P16 Gen 2 Intel Core i7-14700HX, NVIDIA RTX 4000 Ada Generation Laptop | Lenovo ThinkPad P1 Gen 7 21KV001SGE Intel Core Ultra 7 155H, NVIDIA GeForce RTX 4060 Laptop GPU | HP ZBook Studio 16 G11 Intel Core Ultra 9 185H, NVIDIA RTX 3000 Ada Generation Laptop | MSI CreatorPro Z16P B12UKST Intel Core i7-12700H, NVIDIA RTX A3000 Laptop GPU | |
|---|---|---|---|---|---|---|---|
| Heat | 6% | -1% | 5% | 6% | 0% | -11% | |
| Maximum Upper Side * (°C) | 40.4 | 46.6 -15% | 50.2 -24% | 46.6 -15% | 50.3 -25% | 36.6 9% | 56.3 -39% |
| Maximum Bottom * (°C) | 45.6 | 33 28% | 32 30% | 51 -12% | 38 17% | 47.8 -5% | 68.3 -50% |
| Idle Upper Side * (°C) | 32.8 | 32.4 1% | 37.4 -14% | 24.8 24% | 28.3 14% | 31.4 4% | 25.2 23% |
| Idle Bottom * (°C) | 33 | 29.4 11% | 31.2 5% | 25.6 22% | 27.3 17% | 35.6 -8% | 25.9 22% |
* ... Moindre est la valeur, meilleures sont les performances
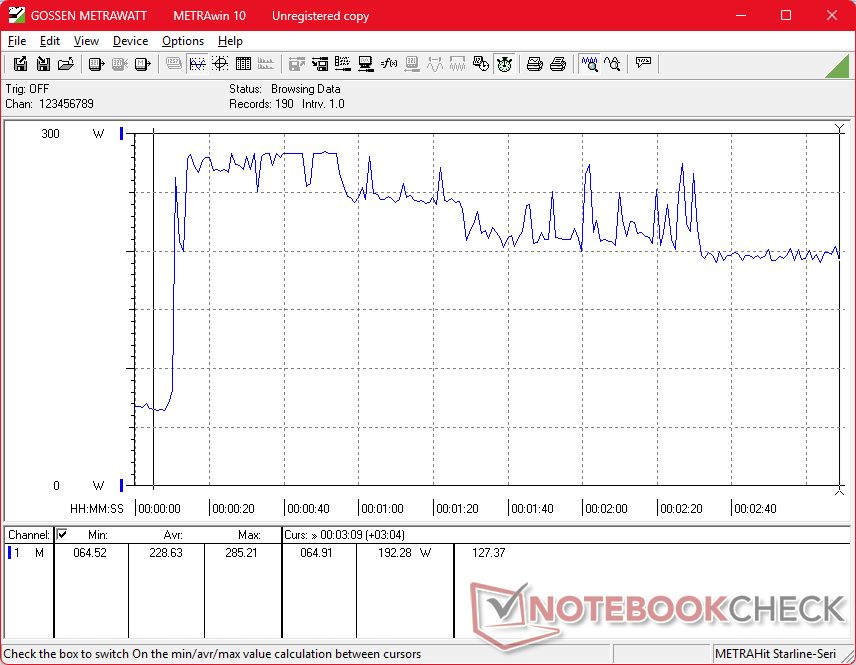
Test de stress
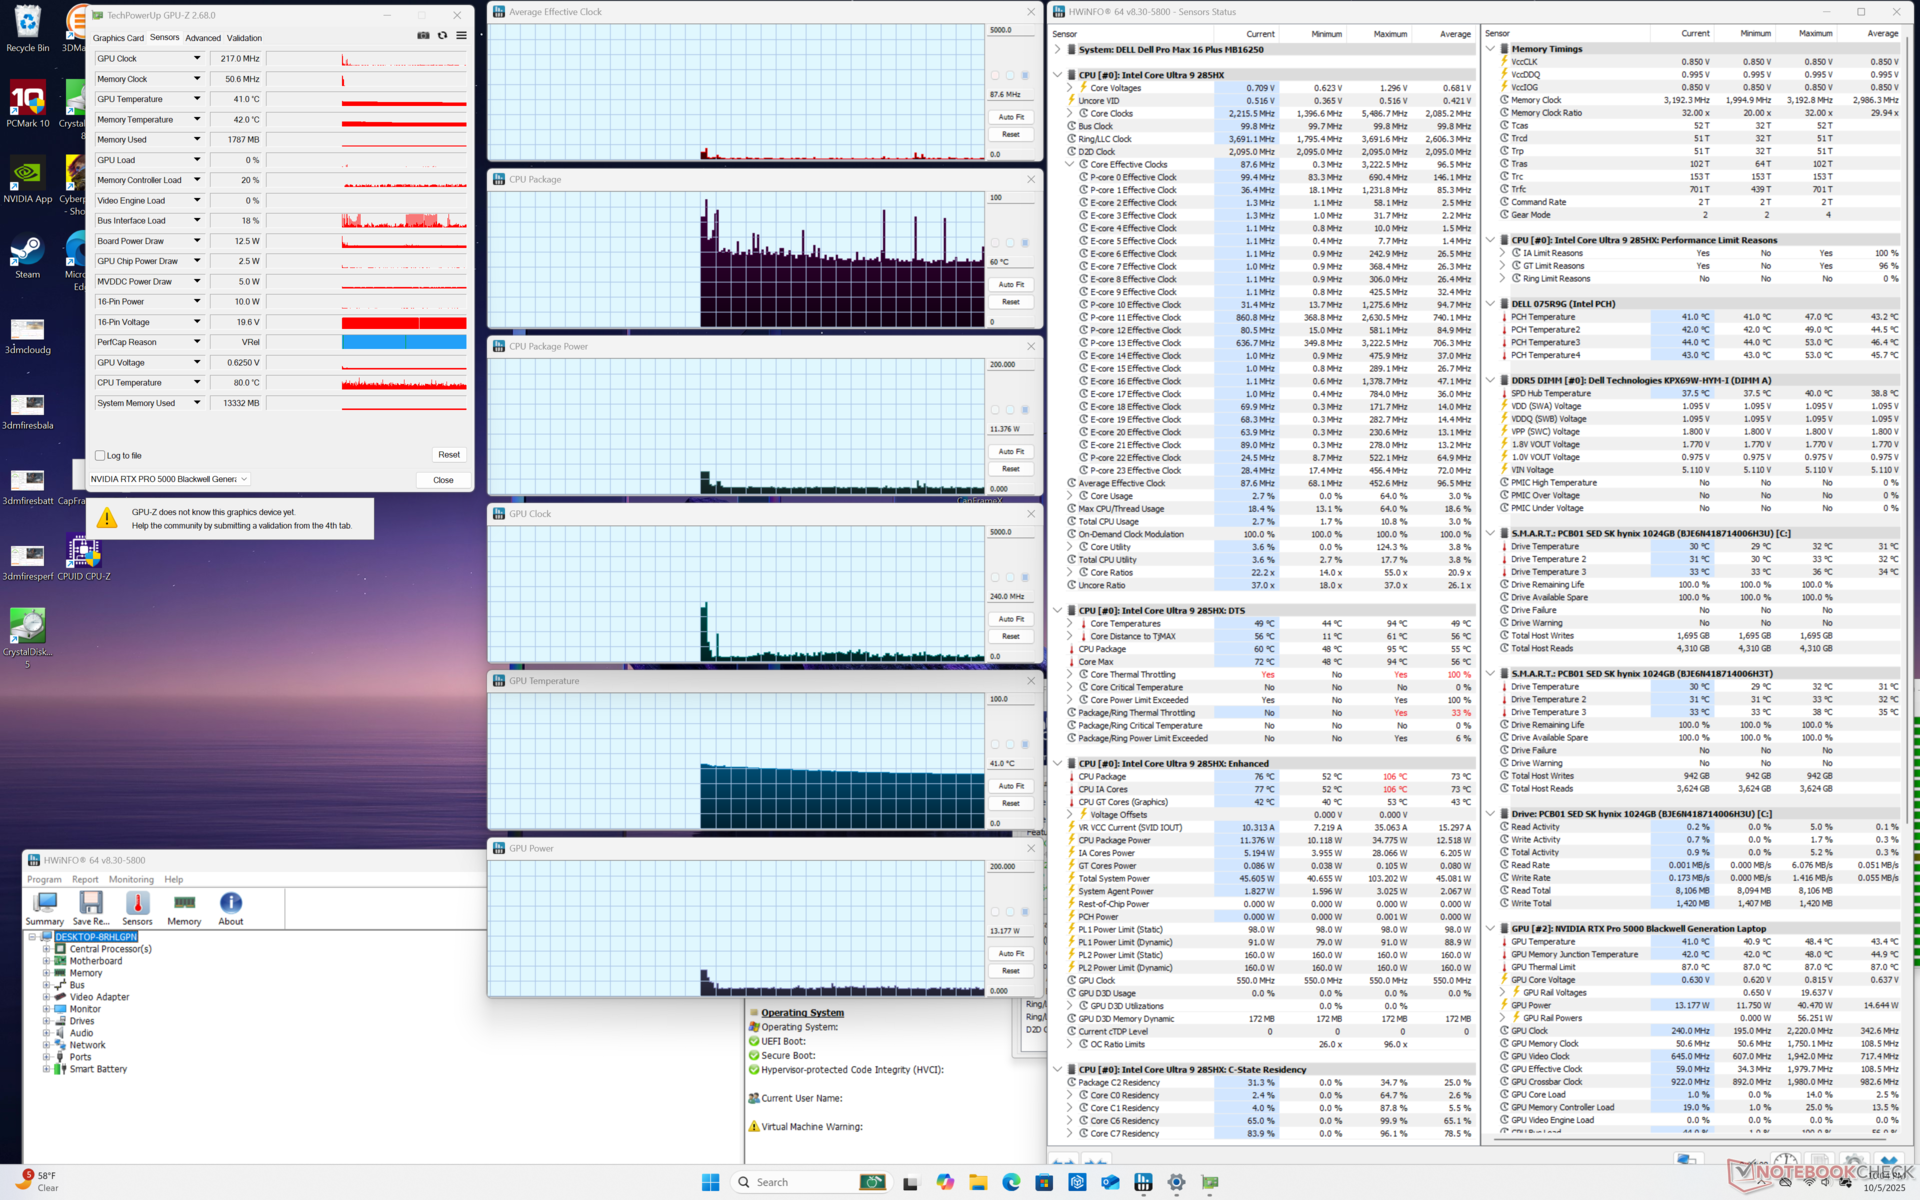
Le CPU monte à 3,8 GHz, 159 W et 105 C lors de l'initialisation du stress Prime95 avant de redescendre rapidement et de se stabiliser à 3,1 GHz, 90 W et 96 C. La température du cœur devient plus chaude que nous le souhaiterions lorsqu'il est complètement stressé.
En exécutant Cyberpunk 2077 en mode Performance pour représenter des conditions de stress plus typiques, le GPU se stabilise à ~121 W. En descendant en mode Équilibré, le plafond de consommation du GPU est ramené à ~108 W.
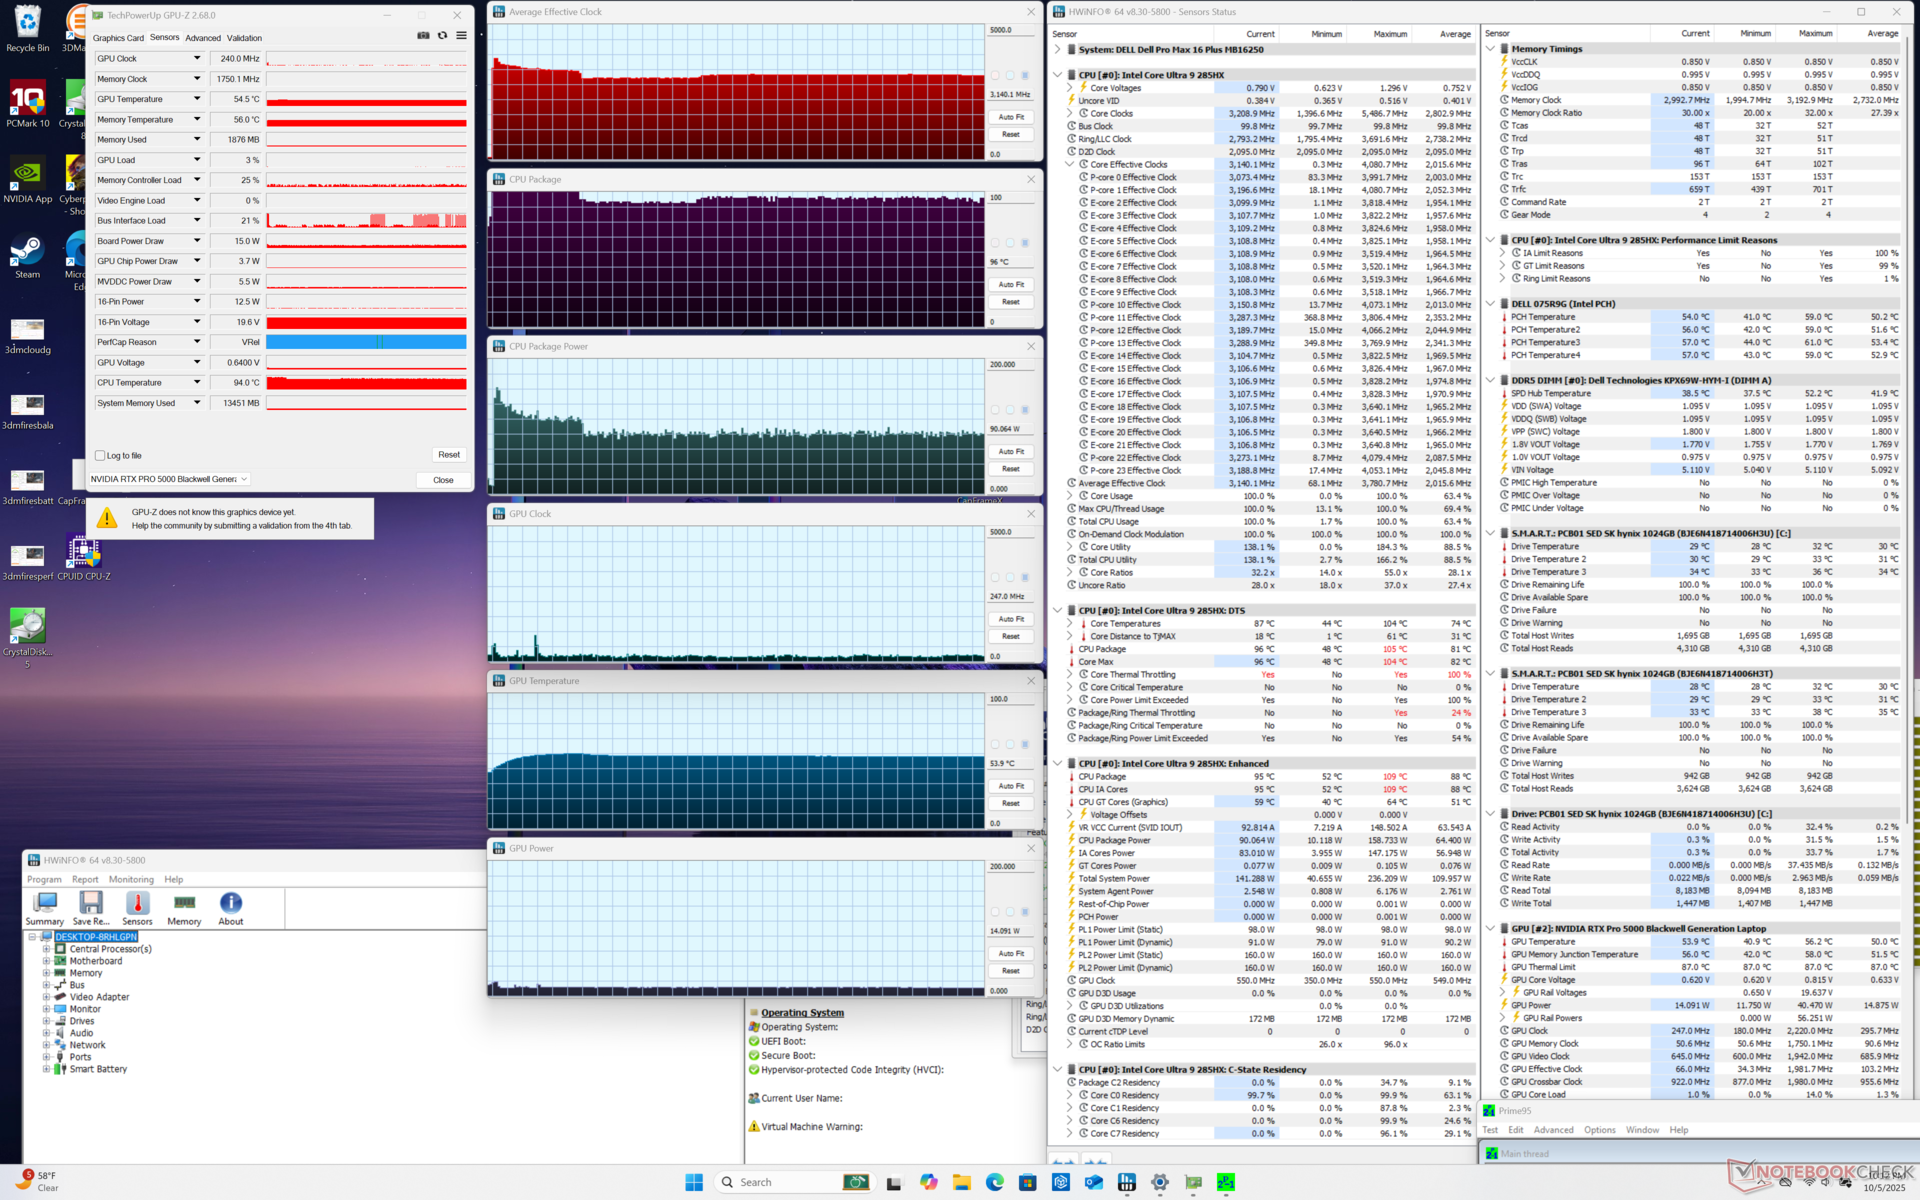
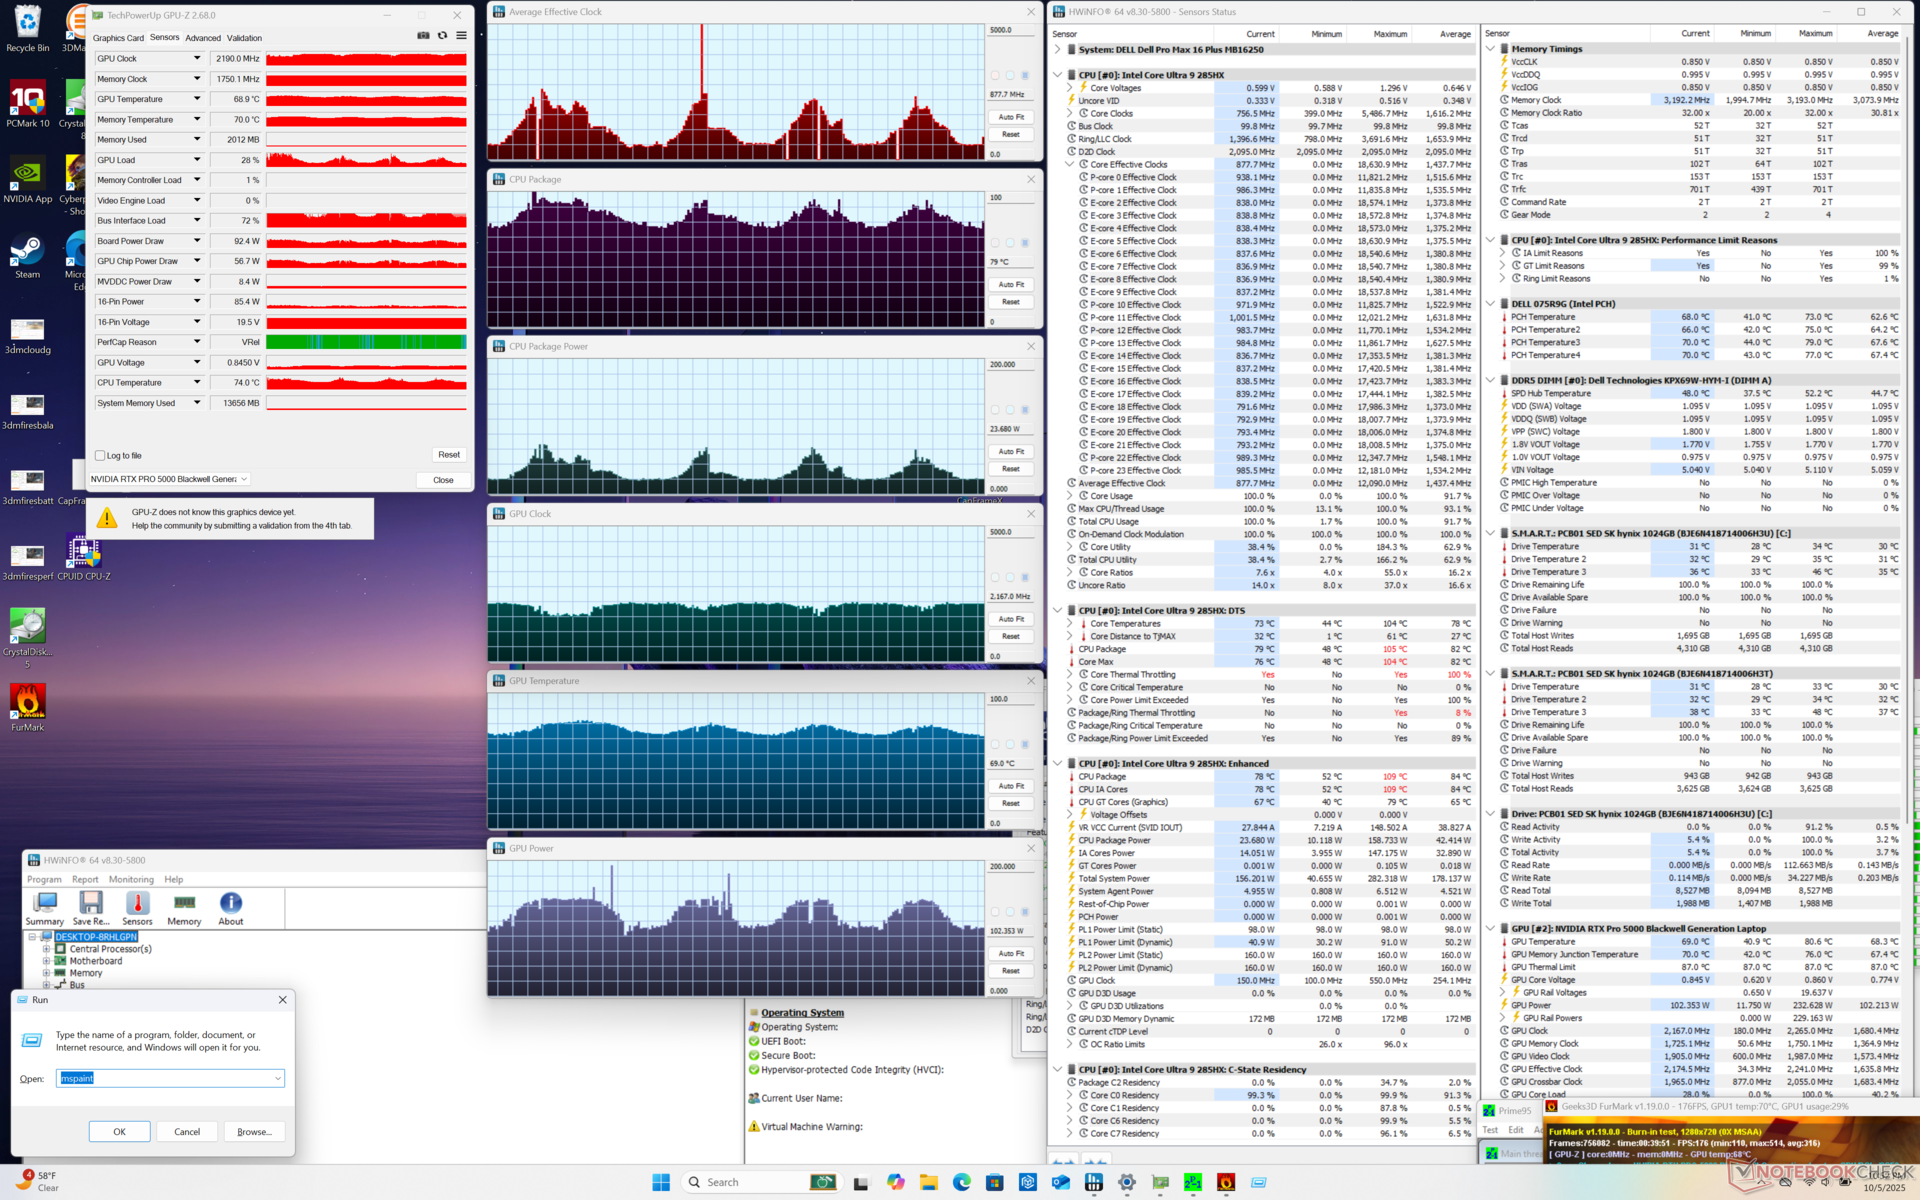
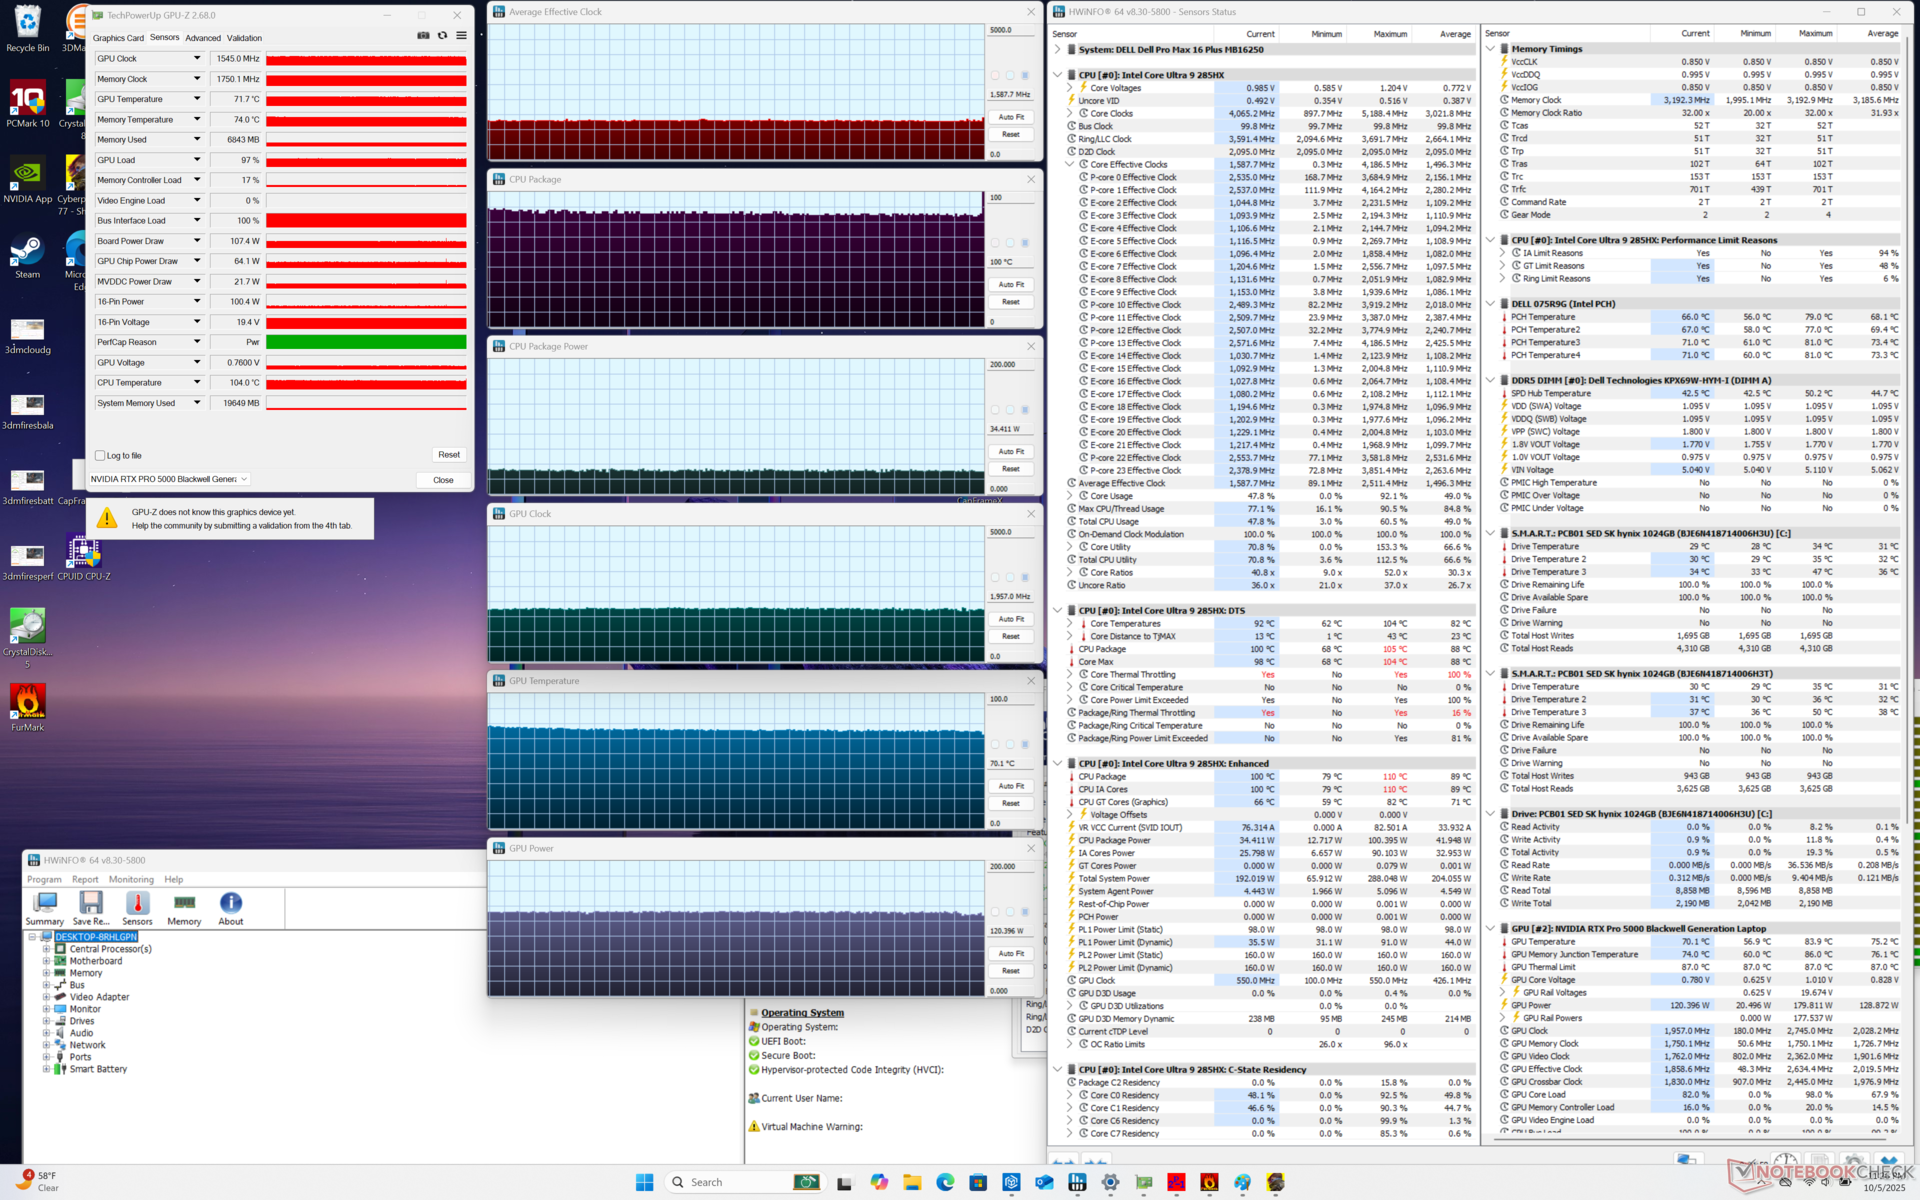
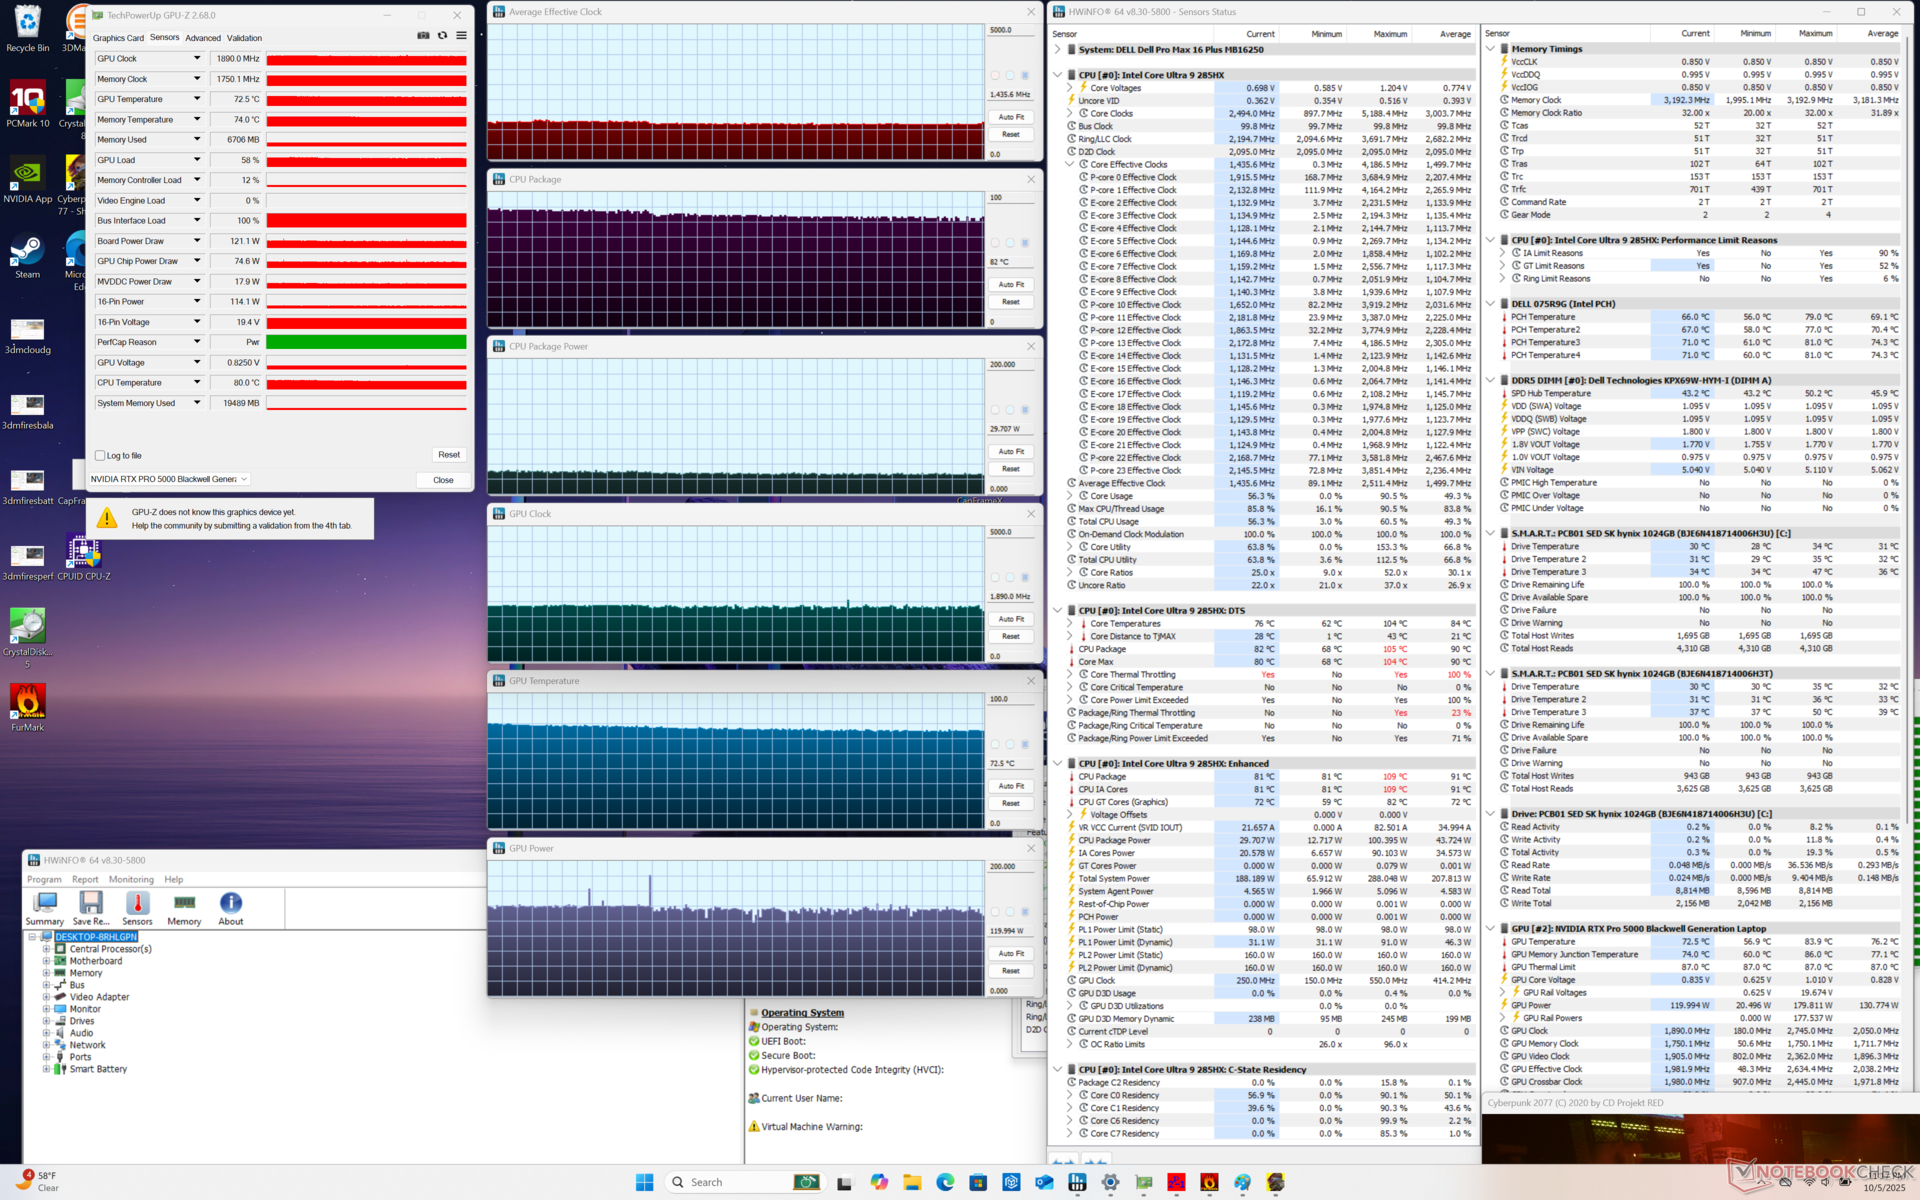
| Horloge moyenne du CPU (GHz) | Horloge du GPU (MHz) | Température moyenne du CPU (°C) | Température moyenne du GPU (°C) | |
| Système en veille | -- | -- | 55 | 41 |
| Prime95 Stress | 3.1 | -- | 96 | 55 |
| Prime95 + FurMark Stress | 0.5 - 2.8 | 1.7 - 2.2 | 75 - 105 | 70 - 78 |
| Cyberpunk 2077 Stress (mode équilibré) | ~1.6 | 1545 | 82 | 71 |
| Cyberpunk 2077 Stress (mode Performance) | ~1.4 | 1890 | 82 | 73 |
Intervenants
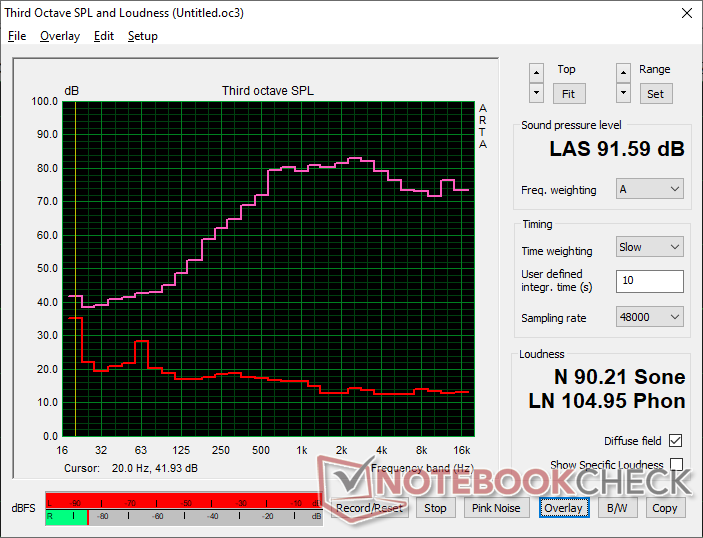
Dell Pro Max 16 Plus analyse audio
(+) | les haut-parleurs peuvent jouer relativement fort (91.6# dB)
Basses 100 - 315 Hz
(-) | presque aucune basse - en moyenne 20.9% plus bas que la médiane
(+) | les basses sont linéaires (5.9% delta à la fréquence précédente)
Médiums 400 - 2000 Hz
(+) | médiane équilibrée - seulement 4.5% de la médiane
(+) | les médiums sont linéaires (4% delta à la fréquence précédente)
Aiguës 2 - 16 kHz
(+) | des sommets équilibrés - à seulement 3.7% de la médiane
(+) | les aigus sont linéaires (2.9% delta à la fréquence précédente)
Globalement 100 - 16 000 Hz
(+) | le son global est linéaire (14.3% différence à la médiane)
Par rapport à la même classe
» 29% de tous les appareils testés de cette catégorie étaient meilleurs, 4% similaires, 68% pires
» Le meilleur avait un delta de 7%, la moyenne était de 17%, le pire était de 35%.
Par rapport à tous les appareils testés
» 17% de tous les appareils testés étaient meilleurs, 4% similaires, 79% pires
» Le meilleur avait un delta de 4%, la moyenne était de 24%, le pire était de 134%.
Apple MacBook Pro 16 2021 M1 Pro analyse audio
(+) | les haut-parleurs peuvent jouer relativement fort (84.7# dB)
Basses 100 - 315 Hz
(+) | bonne basse - seulement 3.8% loin de la médiane
(+) | les basses sont linéaires (5.2% delta à la fréquence précédente)
Médiums 400 - 2000 Hz
(+) | médiane équilibrée - seulement 1.3% de la médiane
(+) | les médiums sont linéaires (2.1% delta à la fréquence précédente)
Aiguës 2 - 16 kHz
(+) | des sommets équilibrés - à seulement 1.9% de la médiane
(+) | les aigus sont linéaires (2.7% delta à la fréquence précédente)
Globalement 100 - 16 000 Hz
(+) | le son global est linéaire (4.6% différence à la médiane)
Par rapport à la même classe
» 0% de tous les appareils testés de cette catégorie étaient meilleurs, 0% similaires, 100% pires
» Le meilleur avait un delta de 5%, la moyenne était de 17%, le pire était de 45%.
Par rapport à tous les appareils testés
» 0% de tous les appareils testés étaient meilleurs, 0% similaires, 100% pires
» Le meilleur avait un delta de 4%, la moyenne était de 24%, le pire était de 134%.
Gestion de l'énergie
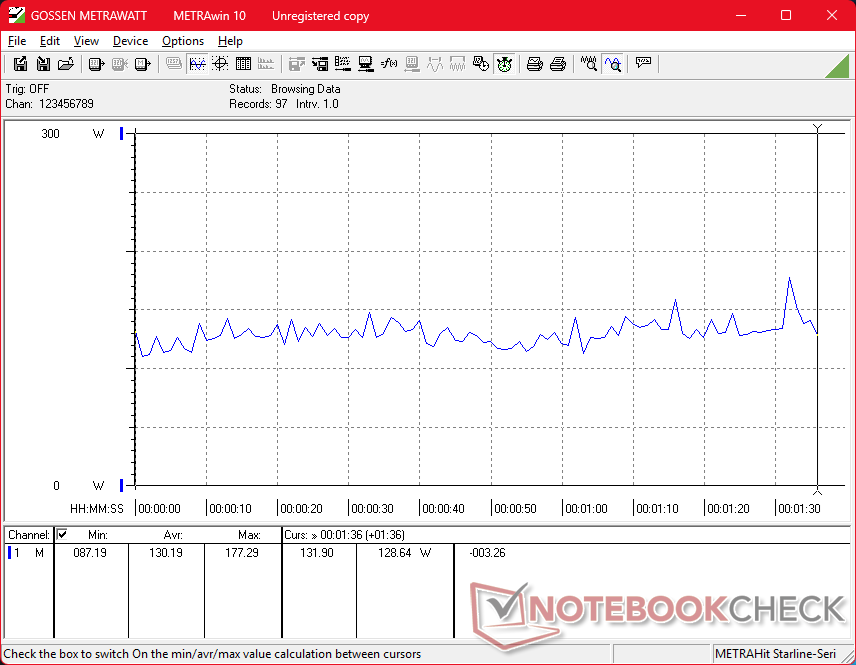
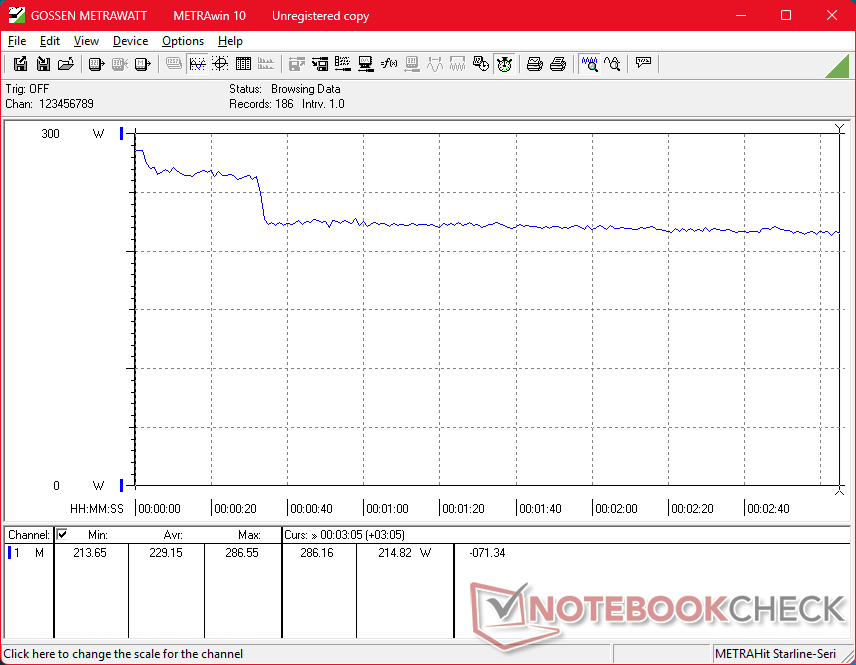
Consommation électrique
Les taux de consommation sont très élevés, même lorsque l'ordinateur est en veille, ce qui contribue à la faible durée de vie de la batterie et aux surfaces toujours chaudes. Le système est nettement plus exigeant que le précédent Precision 5690, mais les performances sont à la fois plus rapides et plus régulières, ce qui constitue un bon compromis.
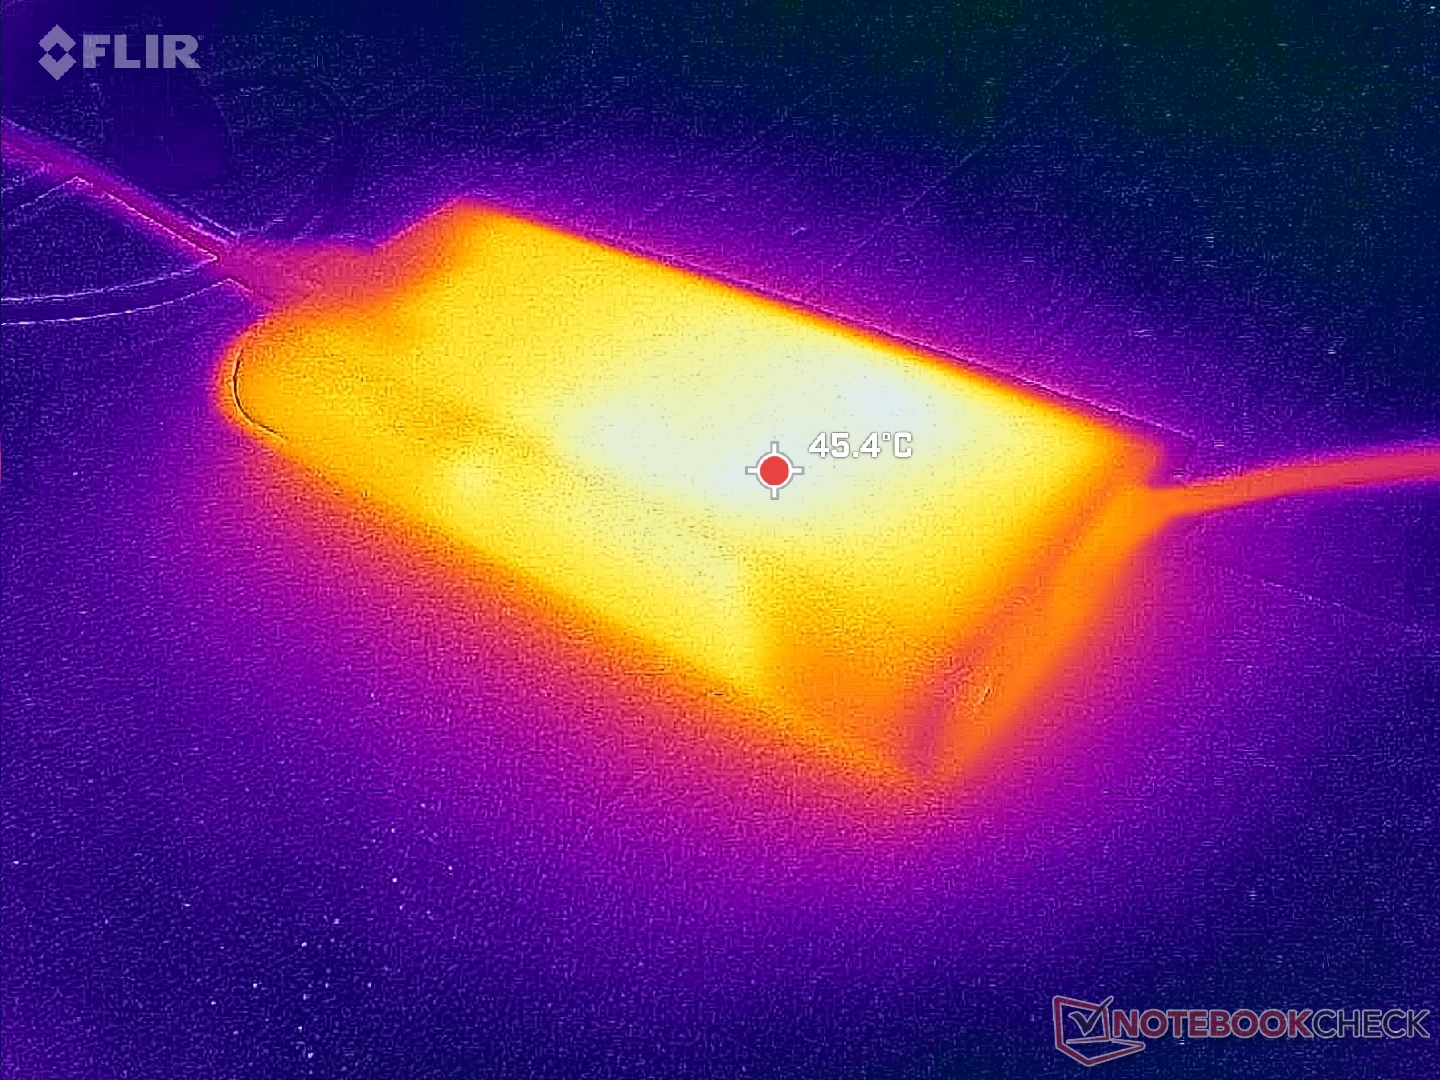
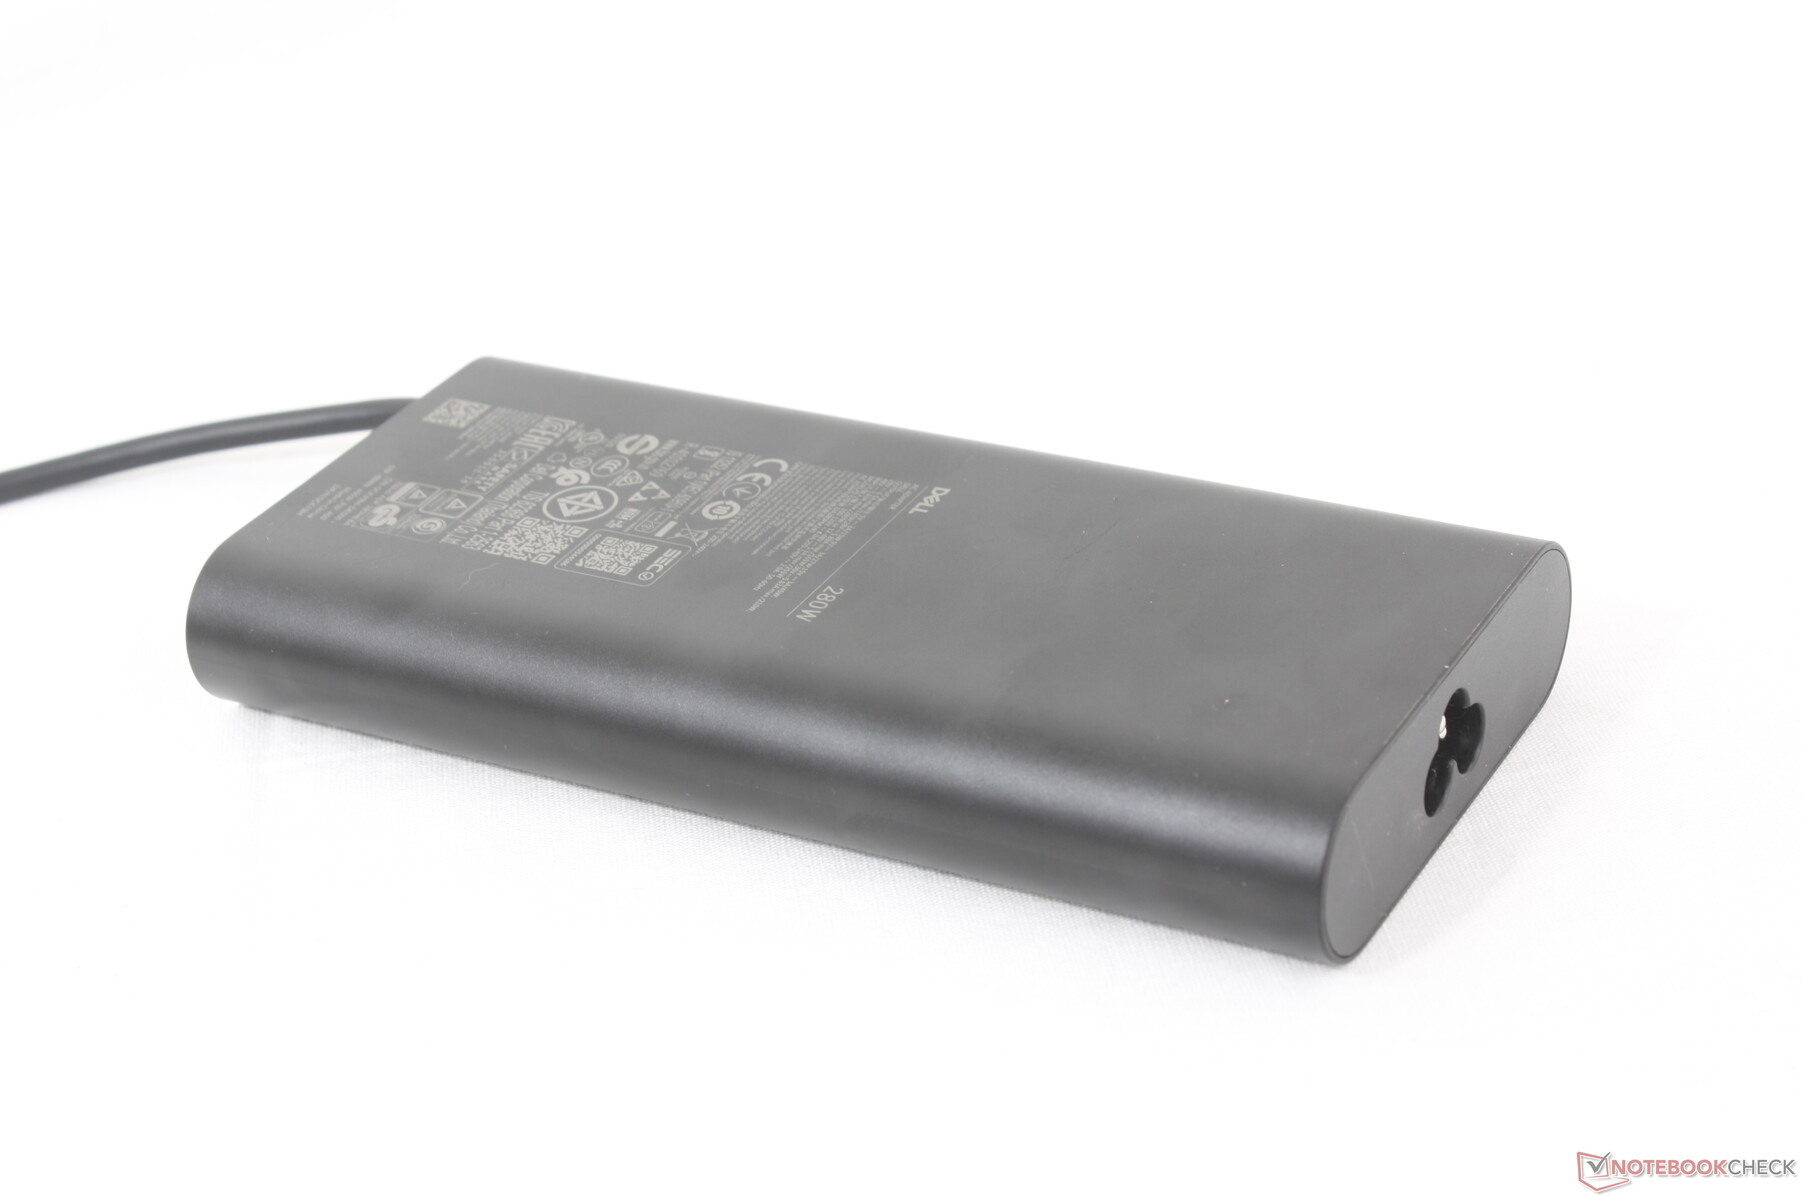
Il convient de noter que c'est l'un des seuls ordinateurs portables à être livré avec un adaptateur secteur USB-C mince (~16 x 7,8 x 2,4 cm) de 280 W, car la plupart des autres adaptateurs USB-C plafonnent entre 150 W et 240 W.
| Éteint/en veille | |
| Au repos | |
| Fortement sollicité |
|
Légende:
min: | |
| Dell Pro Max 16 Plus Ultra 9 285HX, RTX PRO 5000 Blackwell Generation Laptop, SK hynix PCB01 HFS001TFM9X186N, OLED, 3840x2400, 16" | Dell Precision 5690 Ultra 9 185H, RTX 5000 Ada Generation Laptop, 2x Samsung PM9A1 1TB (RAID 0), OLED, 3840x2400, 16" | Dell Precision 5000 5680 i9-13900H, RTX 5000 Ada Generation Laptop, 2x SK hynix PC801 HFS512GEJ9X101N RAID 0, OLED, 3840x2400, 16" | Lenovo ThinkPad P16 Gen 2 i7-14700HX, RTX 4000 Ada Generation Laptop, SK hynix PC801 HFS001TEJ9X162N, IPS, 2560x1600, 16" | Lenovo ThinkPad P1 Gen 7 21KV001SGE Ultra 7 155H, GeForce RTX 4060 Laptop GPU, Kioxia XG8 KXG8AZNV1T02, IPS LED, 2560x1600, 16" | HP ZBook Studio 16 G11 Ultra 9 185H, RTX 3000 Ada Generation Laptop, Kioxia XG8 KXG80ZNV1T02, IPS, 3840x2400, 16" | MSI CreatorPro Z16P B12UKST i7-12700H, RTX A3000 Laptop GPU, Samsung PM9A1 MZVL21T0HCLR, IPS, 2560x1600, 16" | |
|---|---|---|---|---|---|---|---|
| Power Consumption | 52% | 55% | 31% | 55% | 47% | 50% | |
| Idle Minimum * (Watt) | 35.1 | 7.9 77% | 8 77% | 7.9 77% | 7.3 79% | 14 60% | 10.8 69% |
| Idle Average * (Watt) | 39.2 | 12 69% | 10.4 73% | 13.1 67% | 12.3 69% | 22.4 43% | 16.3 58% |
| Idle Maximum * (Watt) | 56 | 28.6 49% | 30.5 46% | 24.2 57% | 17.9 68% | 25.7 54% | 16.9 70% |
| Load Average * (Watt) | 130.2 | 98.8 24% | 75.4 42% | 127.4 2% | 78.2 40% | 90.2 31% | 111.7 14% |
| Cyberpunk 2077 ultra external monitor * (Watt) | 213 | 219 -3% | 117.7 45% | 120.3 44% | |||
| Cyberpunk 2077 ultra * (Watt) | 229 | 225 2% | 123.5 46% | 125.4 45% | |||
| Load Maximum * (Watt) | 285.2 | 174.8 39% | 175 39% | 248.5 13% | 167.5 41% | 142 50% | 177.4 38% |
| Witcher 3 ultra * (Watt) | 144.5 | 134 | 152.1 |
* ... Moindre est la valeur, meilleures sont les performances
Consommation électrique Cyberpunk / Stress Test
Consommation électrique du moniteur externe
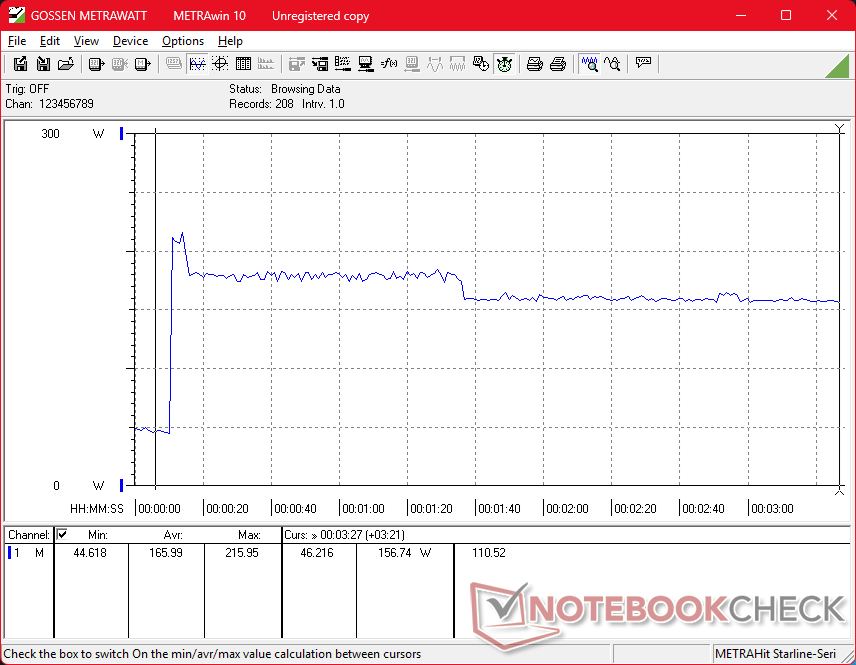
Autonomie de la batterie
L'autonomie du réseau local sans fil n'est que de 3,5 heures malgré la grande capacité de la batterie. Le taux de charge est néanmoins très rapide, en particulier pour un adaptateur secteur USB-C, avec un peu plus d'une heure entre le moment où la batterie est vide et celui où elle est pleine.
| Dell Pro Max 16 Plus Ultra 9 285HX, RTX PRO 5000 Blackwell Generation Laptop, 96 Wh | Dell Precision 5690 Ultra 9 185H, RTX 5000 Ada Generation Laptop, 98 Wh | Dell Precision 5000 5680 i9-13900H, RTX 5000 Ada Generation Laptop, 98 Wh | Lenovo ThinkPad P16 Gen 2 i7-14700HX, RTX 4000 Ada Generation Laptop, 94 Wh | Lenovo ThinkPad P1 Gen 7 21KV001SGE Ultra 7 155H, GeForce RTX 4060 Laptop GPU, 90 Wh | HP ZBook Studio 16 G11 Ultra 9 185H, RTX 3000 Ada Generation Laptop, 86 Wh | MSI CreatorPro Z16P B12UKST i7-12700H, RTX A3000 Laptop GPU, 90 Wh | |
|---|---|---|---|---|---|---|---|
| Autonomie de la batterie | 156% | 175% | -31% | 175% | 33% | 61% | |
| WiFi v1.3 (h) | 3.6 | 9.2 156% | 9.9 175% | 2.5 -31% | 9.9 175% | 4.8 33% | 5.8 61% |
| Reader / Idle (h) | 17.9 | ||||||
| Load (h) | 1.7 | 1.9 |
Notebookcheck Rating
Station de travail Dell phare avec des spécifications uniques, notamment la mémoire CAMM2, l'écran OLED 4K 120 Hz, les processeurs Arrow Lake-HX et les graphiques RTX 5000 Blackwell.
Dell Pro Max 16 Plus
- 10/14/2025 v8
Allen Ngo
 Total Sustainability Score:
 Comparaison avec des concurrents potentiels
Image | Modèle | Prix | Poids | Épaisseur | Écran |
|---|---|---|---|---|---|
1. 88.4%  | Dell Pro Max 16 Plus Intel Core Ultra 9 285HX ⎘ Nvidia RTX PRO 5000 Blackwell Generation Laptop ⎘ 128 Go Mémoire, SSD | Amazon: 1. $1,749.95 Dell Pro 16 Plus PB16250 (Re... 2. $769.00 Dell Pro 16 Plus PB16255 Bus... 3. $1,019.00 Dell 16 Plus Laptop 16" WUXG... Prix de liste: 5000 USD | 2.8 kg | 30.9 mm | 16.00" 3840x2400 283 PPI OLED |
2. 88.3% v7 (old)  | Dell Precision 5690 Intel Core Ultra 9 185H ⎘ Nvidia RTX 5000 Ada Generation Laptop ⎘ 32 Go Mémoire, 2048 Go SSD | Amazon: $1,800.00 Prix de liste: 5900 USD | 2.3 kg | 22.17 mm | 16.00" 3840x2400 283 PPI OLED |
3. 89% v7 (old)  | Dell Precision 5000 5680 Intel Core i9-13900H ⎘ Nvidia RTX 5000 Ada Generation Laptop ⎘ 32 Go Mémoire, 1024 Go SSD | Amazon: 1. $2,955.77 Dell Precision 5000 5680 16"... 2. $1,998.77 Dell Precision 5000 5680 16"... 3. $27.99 UCANUUP 100W USB C Compatibl... Prix de liste: 6500 USD | 2.3 kg | 22.17 mm | 16.00" 3840x2400 283 PPI OLED |
4. 85.9%  | Lenovo ThinkPad P16 Gen 2 Intel Core i7-14700HX ⎘ NVIDIA RTX 4000 Ada Generation Laptop ⎘ 32 Go Mémoire, 1024 Go SSD | Amazon: Prix de liste: 3500 USD | 3.1 kg | 30.23 mm | 16.00" 2560x1600 189 PPI IPS |
5. 83.5%  | Lenovo ThinkPad P1 Gen 7 21KV001SGE Intel Core Ultra 7 155H ⎘ NVIDIA GeForce RTX 4060 Laptop GPU ⎘ 32 Go Mémoire, 1024 Go SSD | Amazon: $2,095.00 Prix de liste: 3239 Euro | 2 kg | 20.5 mm | 16.00" 2560x1600 189 PPI IPS LED |
6. 84.2%  | HP ZBook Studio 16 G11 Intel Core Ultra 9 185H ⎘ NVIDIA RTX 3000 Ada Generation Laptop ⎘ 64 Go Mémoire, 1024 Go SSD | Amazon: Prix de liste: 4300 USD | 1.8 kg | 19 mm | 16.00" 3840x2400 283 PPI IPS |
7. 84.3% v7 (old)  | MSI CreatorPro Z16P B12UKST Intel Core i7-12700H ⎘ NVIDIA RTX A3000 Laptop GPU ⎘ 32 Go Mémoire, 1024 Go SSD | Amazon: 1. $85.99 240W 230W USB Tip Charger Co... 2. $122.50 Factory Original 8GB (1x8GB)... 3. $37.99 240W USB Tip Charger Compati... Prix de liste: 3500€ | 2.4 kg | 19 mm | 16.00" 2560x1600 189 PPI IPS |
Transparency
La sélection des appareils à examiner est effectuée par notre équipe éditoriale. L'échantillon de test a été prêté à l'auteur par le fabricant ou le détaillant pour les besoins de cet examen. Le prêteur n'a pas eu d'influence sur cette évaluation et le fabricant n'a pas reçu de copie de cette évaluation avant sa publication. Il n'y avait aucune obligation de publier cet article. En tant que média indépendant, Notebookcheck n'est pas soumis à l'autorité des fabricants, des détaillants ou des éditeurs.
Voici comment Notebookcheck teste
Chaque année, Notebookcheck examine de manière indépendante des centaines d'ordinateurs portables et de smartphones en utilisant des procédures standardisées afin de garantir que tous les résultats sont comparables. Nous avons continuellement développé nos méthodes de test depuis environ 20 ans et avons établi des normes industrielles dans le processus. Dans nos laboratoires de test, des équipements de mesure de haute qualité sont utilisés par des techniciens et des rédacteurs expérimentés. Ces tests impliquent un processus de validation en plusieurs étapes. Notre système d'évaluation complexe repose sur des centaines de mesures et de points de référence bien fondés, ce qui garantit l'objectivité.
