
Notebookcheck Logo
Teaser

Test du Dell XPS 13 Wildcat Lake : redéfinir la catégorie des ordinateurs Windows d'entrée de gamme

Le luxe à petit prix.

Le XPS 13 est désormais proposé à un prix nettement inférieur afin d’attirer les utilisateurs disposant d’un budget plus serré. Ces inévitables compromis ternissent-ils la réputation de la gamme XPS ou s’agit-il du nouvel ordinateur portable à moins de 1 000 dollars à battre ?
Allen Ngo, 👁 Allen Ngo (traduit par DeepL / Ninh Duy) Publié 🇺🇸 🇳🇱 ...
Laptop / Notebook XPS Wildcat Lake Intel

Verdict — Un look haut de gamme sans le prix qui va avec

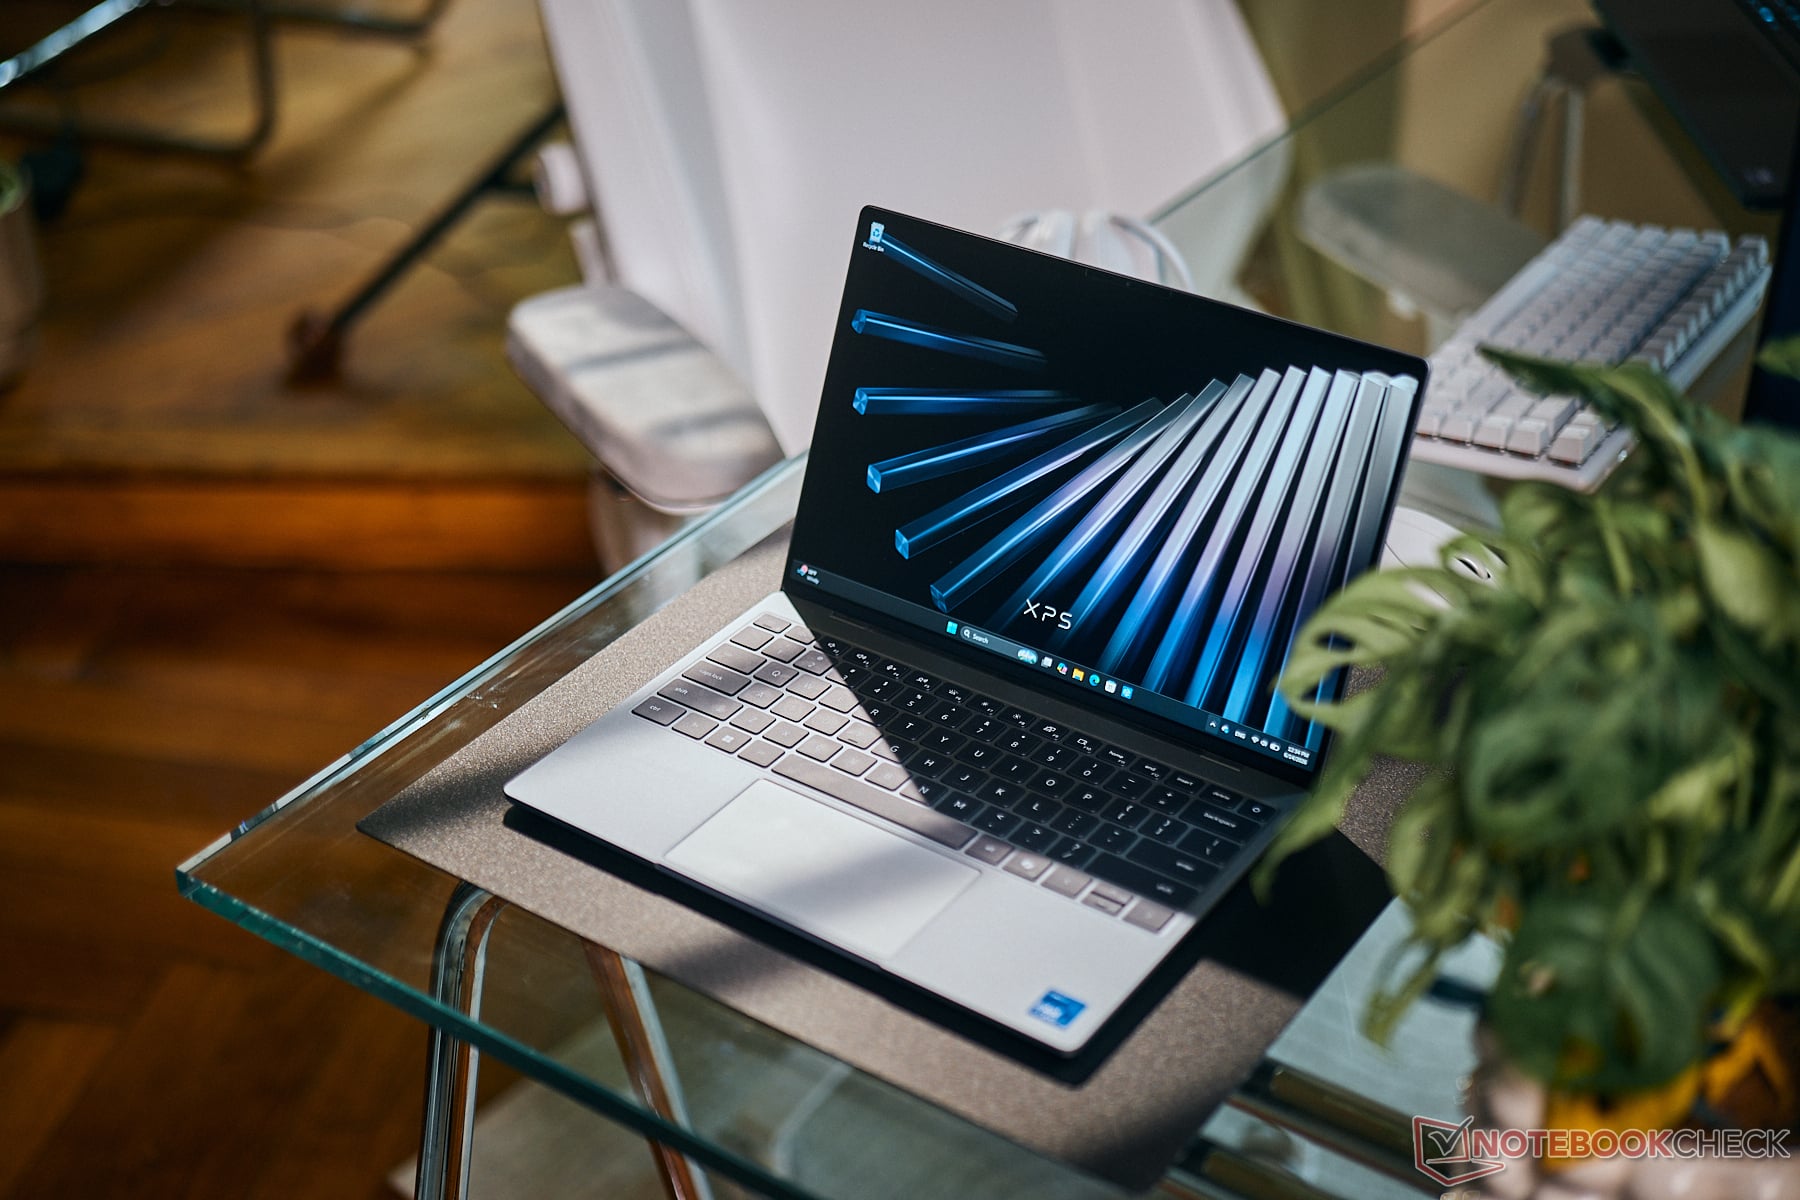
Le choix d’un ordinateur portable Windows bon marché implique souvent des compromis importants, notamment un design peu attrayant et un écran de moindre qualité. Le nouveau XPS 13 répond directement à ces préoccupations et s’impose sans peine comme l’un des plus beaux ordinateurs portables Windows 13 pouces dans la catégorie des moins de 1 000 $. Ce modèle donne l’impression d’être plus cher qu’il ne l’est réellement et surpasse sans peine ses concurrents directs, tels que le HP Pavilion ou le Lenovo IdeaPad 3 ou 5, dont le design peut donner l’impression d’avoir été conçu après coup afin de mettre en valeur leurs modèles plus attrayants et plus onéreux. L'écran du Dell est également une véritable surprise : vous ne trouverez sur aucun autre ordinateur portable à moins de 700 $ un écran tactile 2,5K offrant la gamme complète de couleurs P3 avec une telle qualité.

On peut sans doute considérer que les deux principaux compromis du nouveau XPS 13 concernent les performances et la rigidité du châssis. Le processeur Core 5 320 à faible consommation et les 8 Go de RAM, une capacité limitée, peinent à faire tourner la plupart des applications autres que les navigateurs, les traitements de texte ou les tableurs. Nous vous recommandons d’envisager la configuration à 16 Go pour une plus grande autonomie, ce qui, heureusement, maintient le prix du modèle sous la barre des 1 000 $. Le nouveau design, bien qu’il soit toujours plus léger et de meilleure qualité que la plupart des autres PC Windows dans cette gamme de prix, semble plus fragile que le design traditionnellement solide de l’ancien XPS 13. Malgré tout, le XPS 13 n’a jamais semblé aussi attractif pour répondre aux besoins de base des étudiants et aux exigences multimédias.

Points positifs

+ léger et esthétique, surtout compte tenu de son prix
+ excellent écran tactile à 120 Hz avec gamme de couleurs P3
+ normes Wi-Fi 7 et Bluetooth 6
+ grande autonomie ; faible consommation d'énergie
+ prix abordable, bien en dessous de 1 000 $

Points négatifs

- Les 8 Go de mémoire vive monocanal non extensible limitent la polyvalence
- le châssis est plus fragile que celui des anciens modèles XPS 13
- temps de réponse noir-blanc relativement lents
- performances graphiques très limitées
- la touche Espace peut sembler spongieuse

Prix et disponibilité

Dell commercialise actuellement le XPS 13, tel qu'il est configuré dans cette critique, pour seulement 700 $.

Contrairement aux XPS 14 et XPS 16, le XPS 13 2026 a été entièrement repensé pour offrir un prix de départ nettement inférieur, à seulement 699 $, voire 599 $ avec les remises réservées au secteur de l'éducation. Cette évolution est d’autant plus remarquable que la gamme XPS a toujours proposé des modèles « prosumer » plus onéreux, dont le prix de vente au détail est souvent deux à trois fois plus élevé.

Notre modèle de test correspond à la configuration la plus basique, équipée d’un processeur Intel Wildcat Core 5 320 et de 8 Go de mémoire vive soudée. Doubler la mémoire vive entraîne une augmentation de prix de 200 $, mais toutes les références sont actuellement livrées avec une mémoire monocanal et le même écran tactile IPS de 120 Hz en 2560 x 1600. L’option plus rapide, le Core Ultra 7 355, devrait être disponible sur les futures configurations.

L’Intel Wildcat XPS 13 a été conçu pour être l’alternative Windows au très populaire MacBook Neo. Parmi les autres concurrents, on trouve des modèles économiques tels que la série Lenovo IdeaPad 3, la série HP Pavilion et d’autres ordinateurs portables abordables vendus à moins de 1 000 $.

Autres avis sur Dell :

Spécifications

Dell XPS 13 DX13260
Processeur
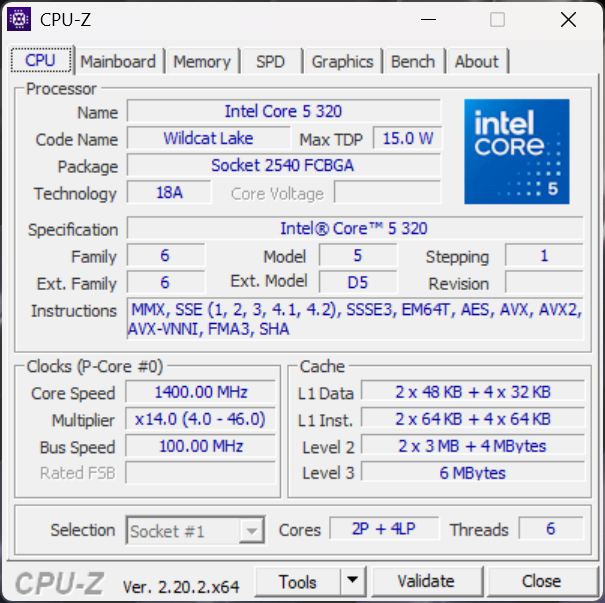
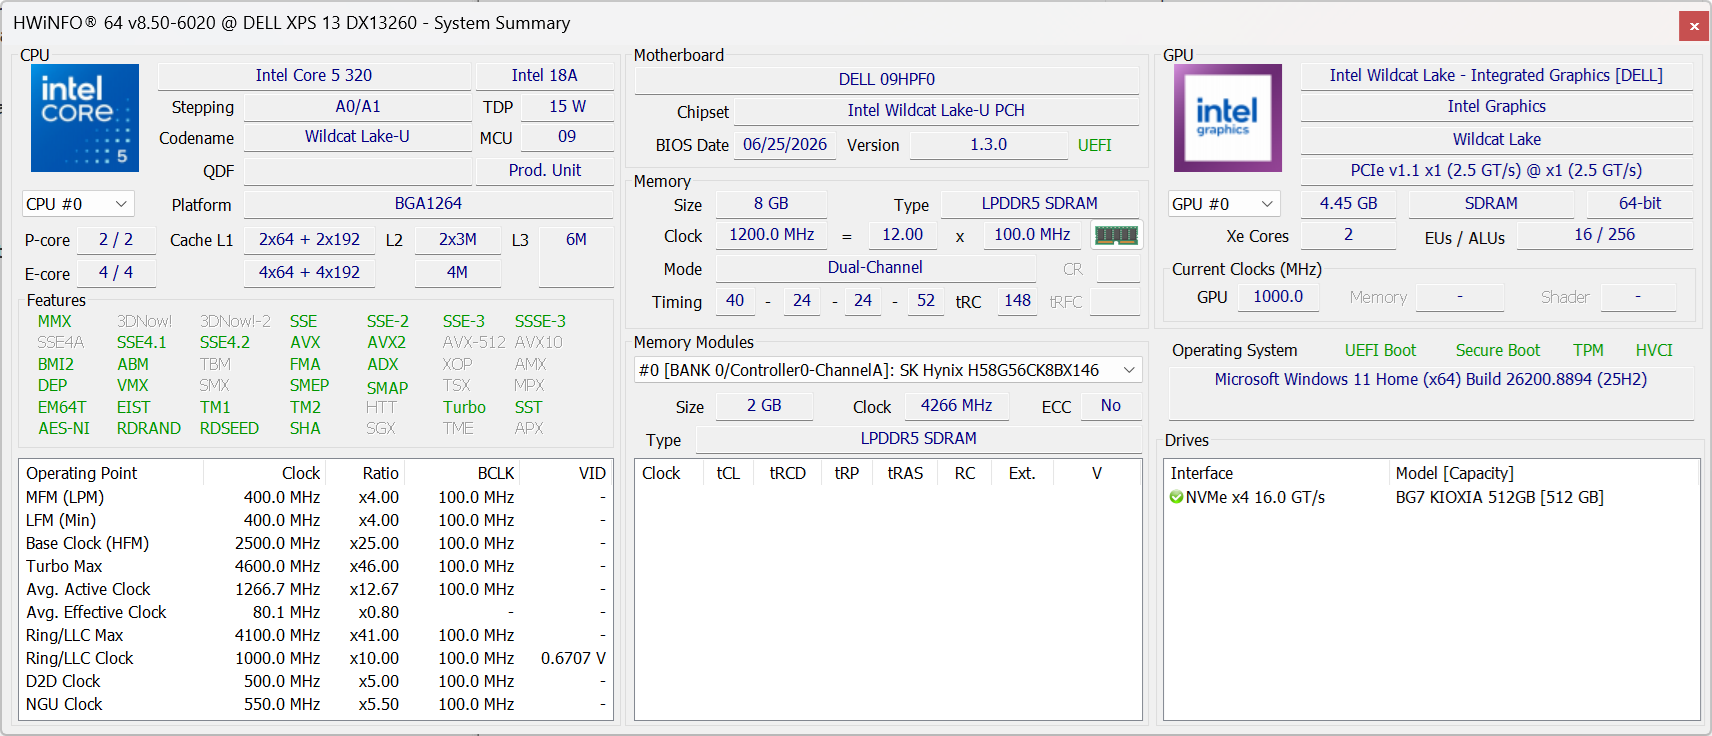
Intel Core 5 320 6c/6t, 2 x 4.6 GHz Intel Cougar Cove P-Core, 4 x 3.4 GHz Intel Darkmont LP E-Core, 37 W PL2 / Short Burst, 18 W PL1 / Sustained, Wildcat Lake
Carte graphique
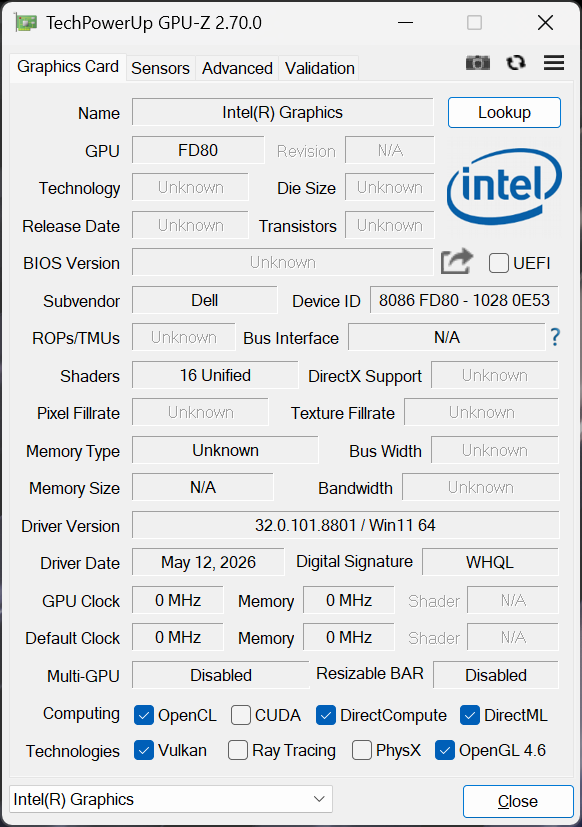
Intel Graphics 2 Xe3 Wildcat Lake iGPU, Processeur: 2500 MHz, LPDDR5x, 32.0.101.8801
Mémoire
8 Go 
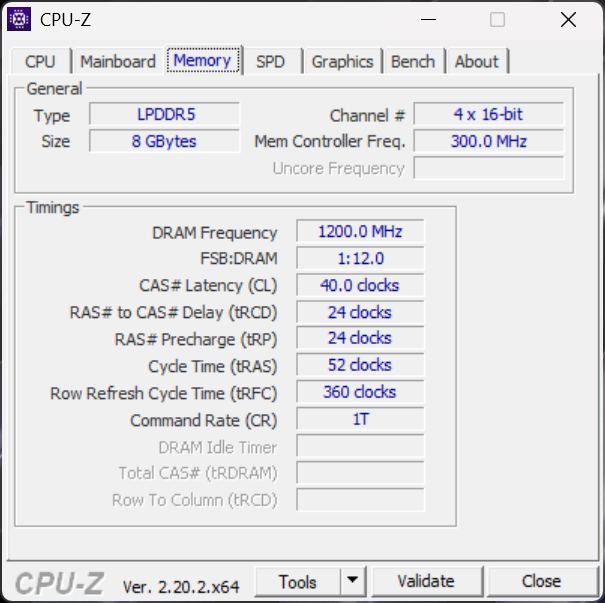
, LPDDR5x-7467, Single-Channel, Soldered
Écran
13.40 pouces 16:10, 2560 x 1600 pixel 225 PPP, 10-point capacitive, LG Philips LP134WQ, IPS, Dell P/N: RNYV4, brillant: non, 120 Hz
Carte mère
Intel Wildcat Lake-U PCH
Carte son
Intel Wildcat Lake-U PCH - High Definition Audio - AVS (Audio, Video, Speech)
Connexions
2 USB 3.1 Gen2, USB-C Power Delivery (PD), 2 DisplayPort, Capteur de luminosité
Réseau
Intel Wi-Fi 7 BE213 160MHz ( be = Wi-Fi 7), Bluetooth 6.0
Taille
Hauteur x Largeur x Profondeur (en mm): 12.7 x 296.9 x 200.66
Batterie
52 Wh Lithium-Polymère
Système d'exploitation
Microsoft Windows 11 Home
Appareil photo
Webcam: 1080p30, IR
Appareil photo primaire: 2 MPix
Fonctionnalités additionnelles
Haut-parleurs: Quad (2x 2 W main + 2x 2 W tweeter), Clavier: Chiclet, Rétroéclairage du clavier: oui, Dell Optimizer, 12 Mois Garantie
Poids
1.062 kg, Alimentation: 166 g
Prix
700 USD
Amazon
Remarque : le fabricant peut utiliser des composants provenant de différents fournisseurs, notamment des panneaux d'affichage, des lecteurs ou des clés USB ayant des spécifications similaires.


Cas

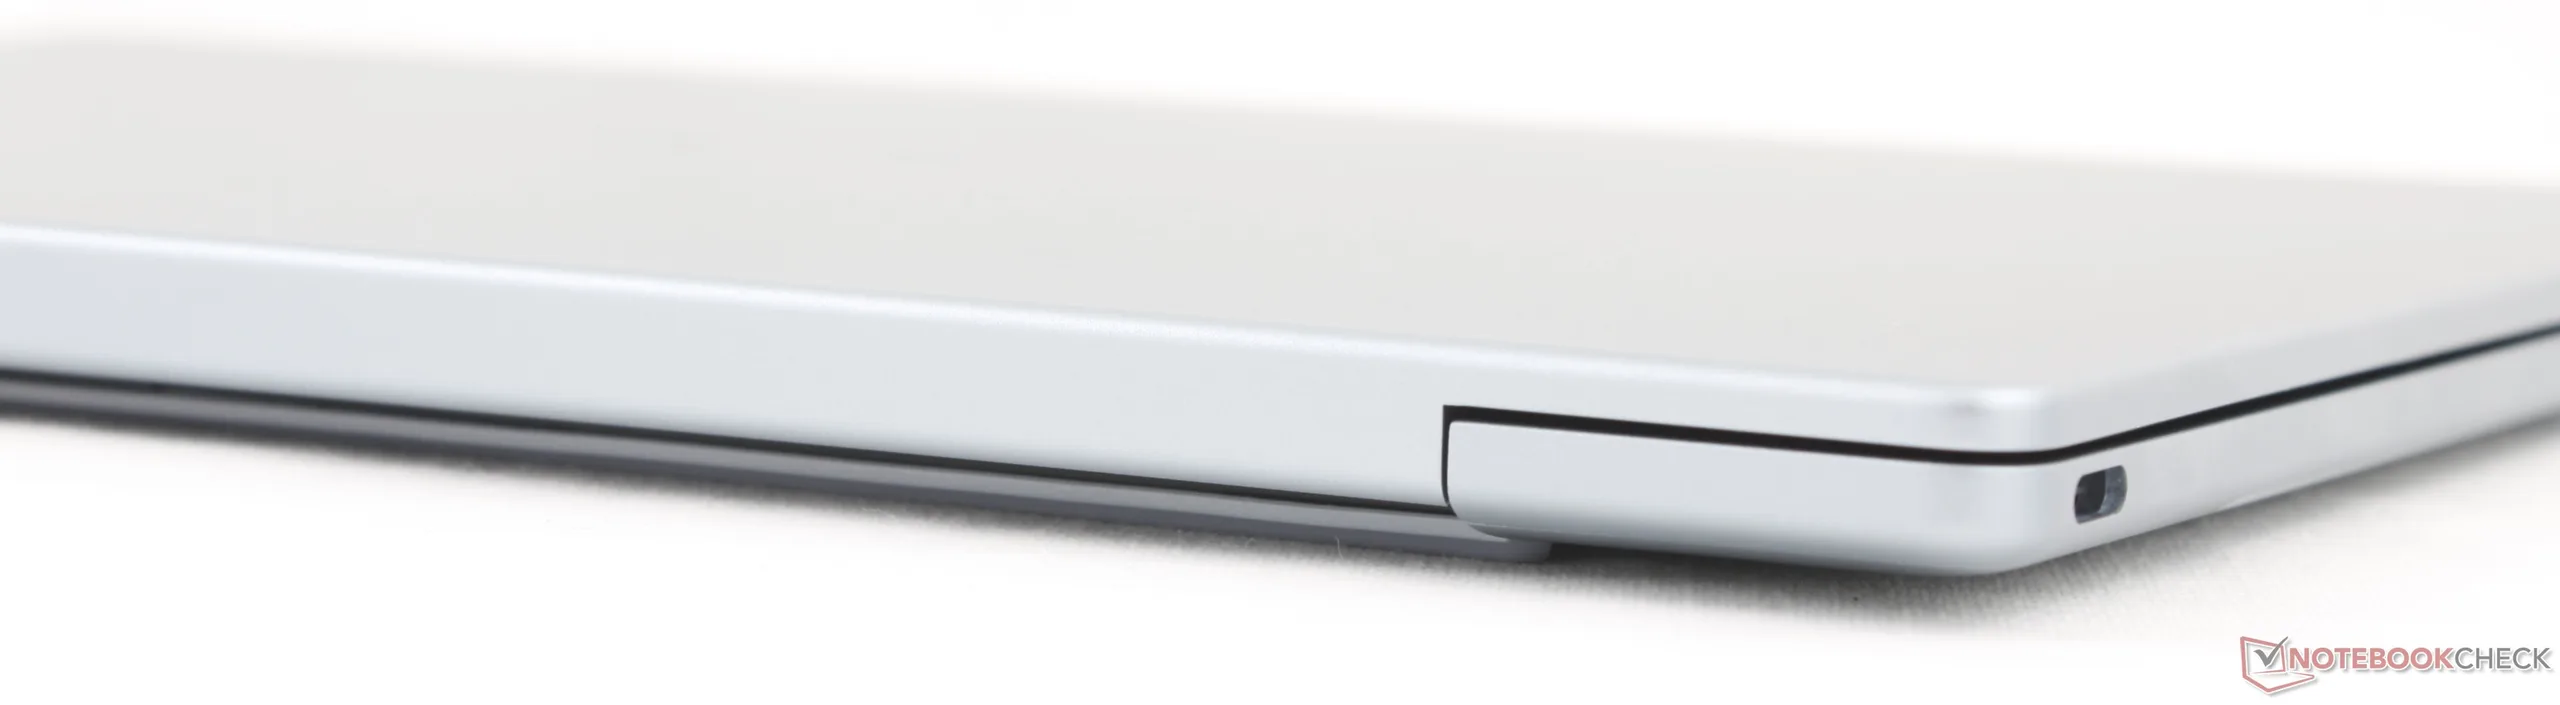
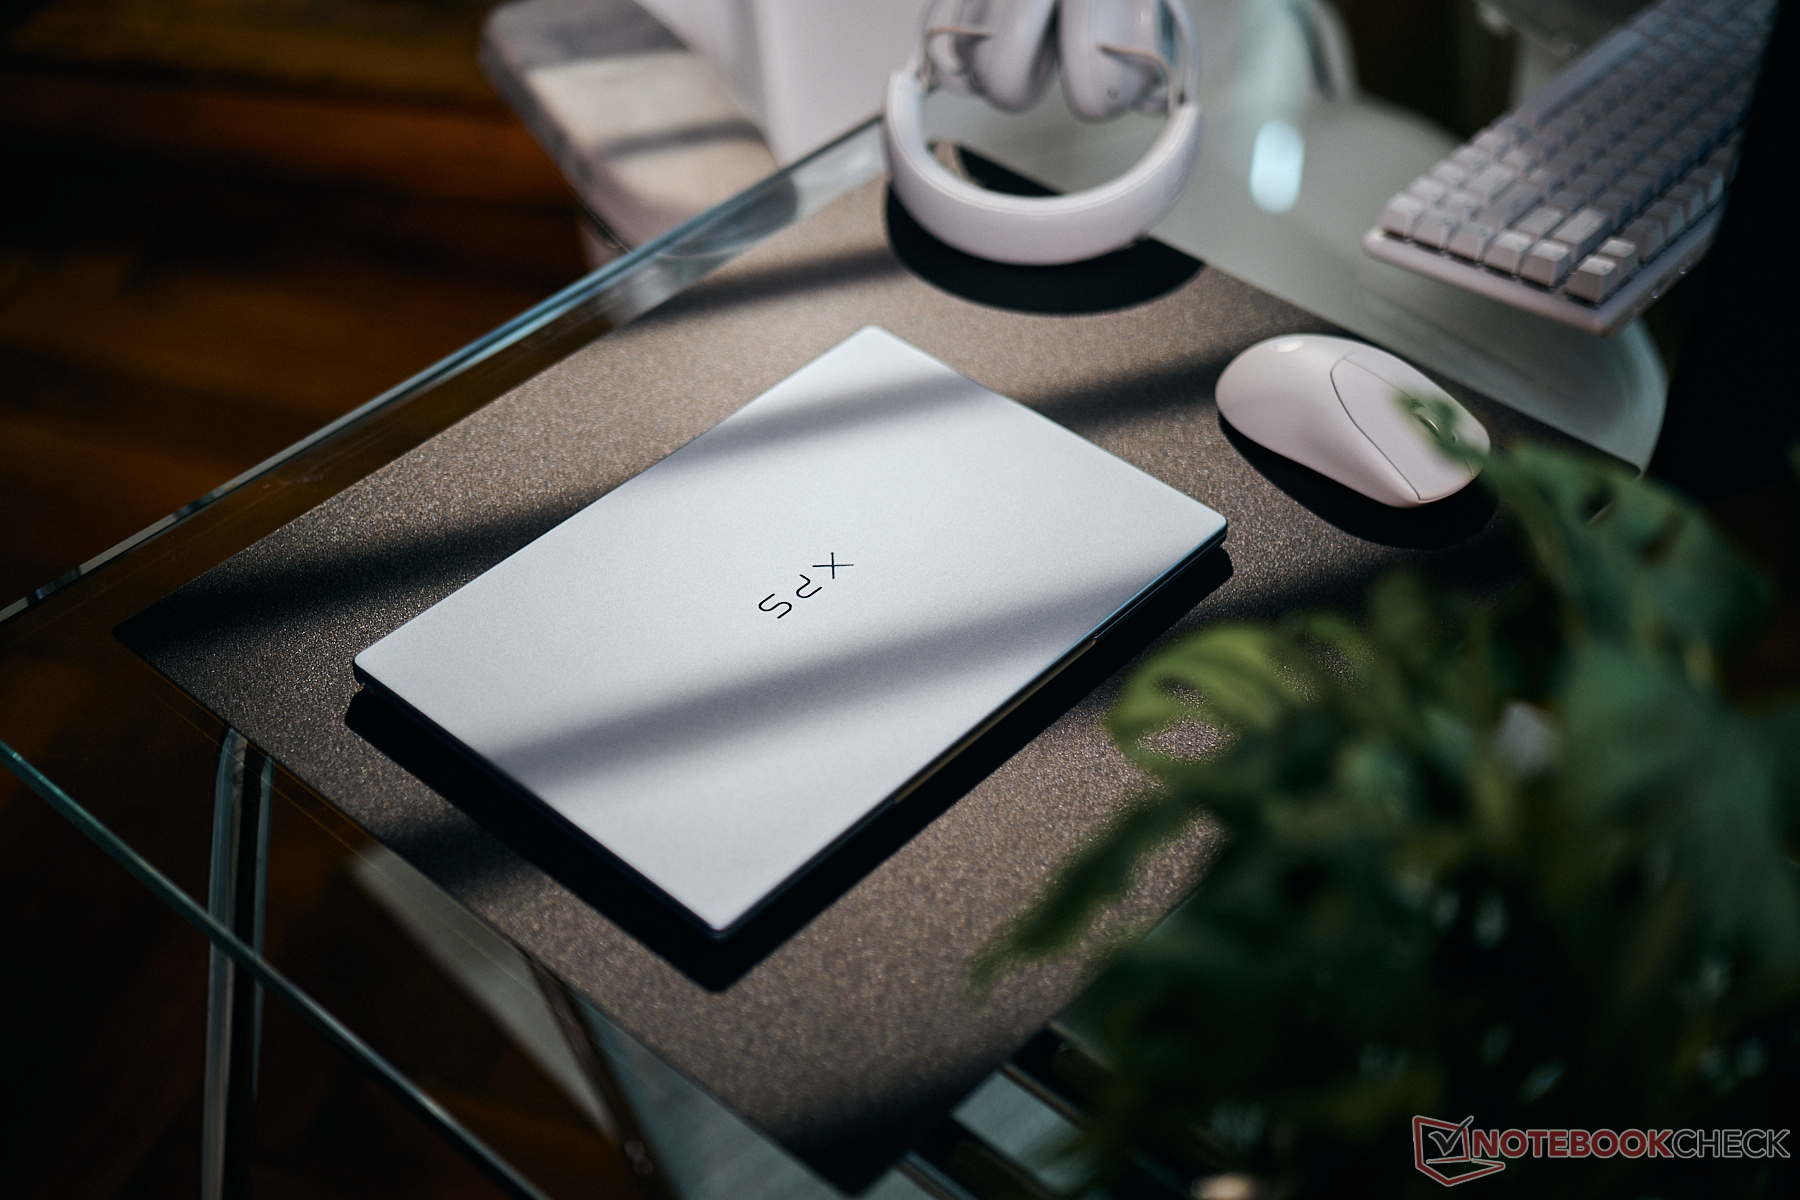
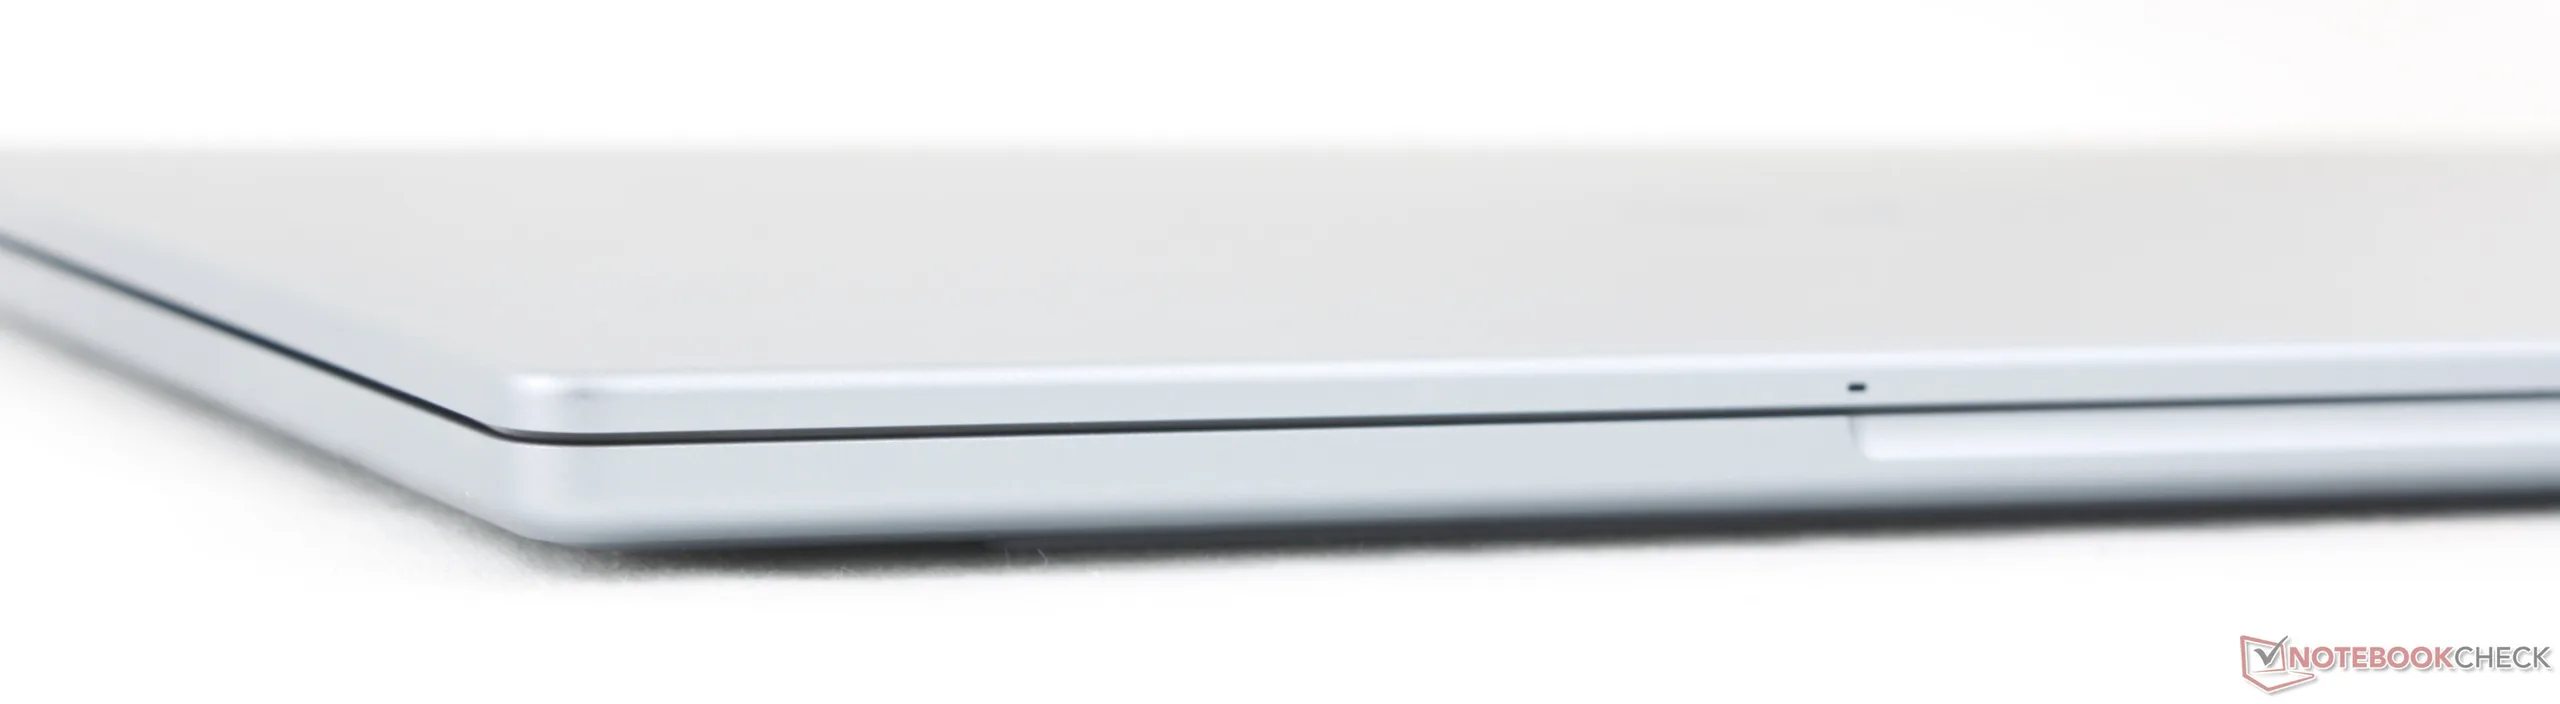
Le XPS 13 2026 est encore plus fin et plus léger que le XPS 13 2024. Lorsqu’il est fermé, il ressemble à une version miniature du XPS 16 récemment repensé. Les anciens modèles du XPS 13, plus lourds, sont néanmoins moins susceptibles de se déformer que cette dernière version ; on peut donc considérer que la réduction de la taille et du poids a eu un impact sur la rigidité.
Comparaison de tailles

313.5 mm 219.3 mm 16.8 mm 1.1 kg309.52 mm 209.71 mm 14.62 mm 1.4 kg297 mm 211 mm 17.6 mm 1 kg295.3 mm 199.1 mm 15.3 mm 1.2 kg297.5 mm 206.4 mm 12.7 mm 1.2 kg296.9 mm 200.66 mm 12.7 mm 1.1 kg297 mm 210 mm 1 mm 5.7 g

Connectivité

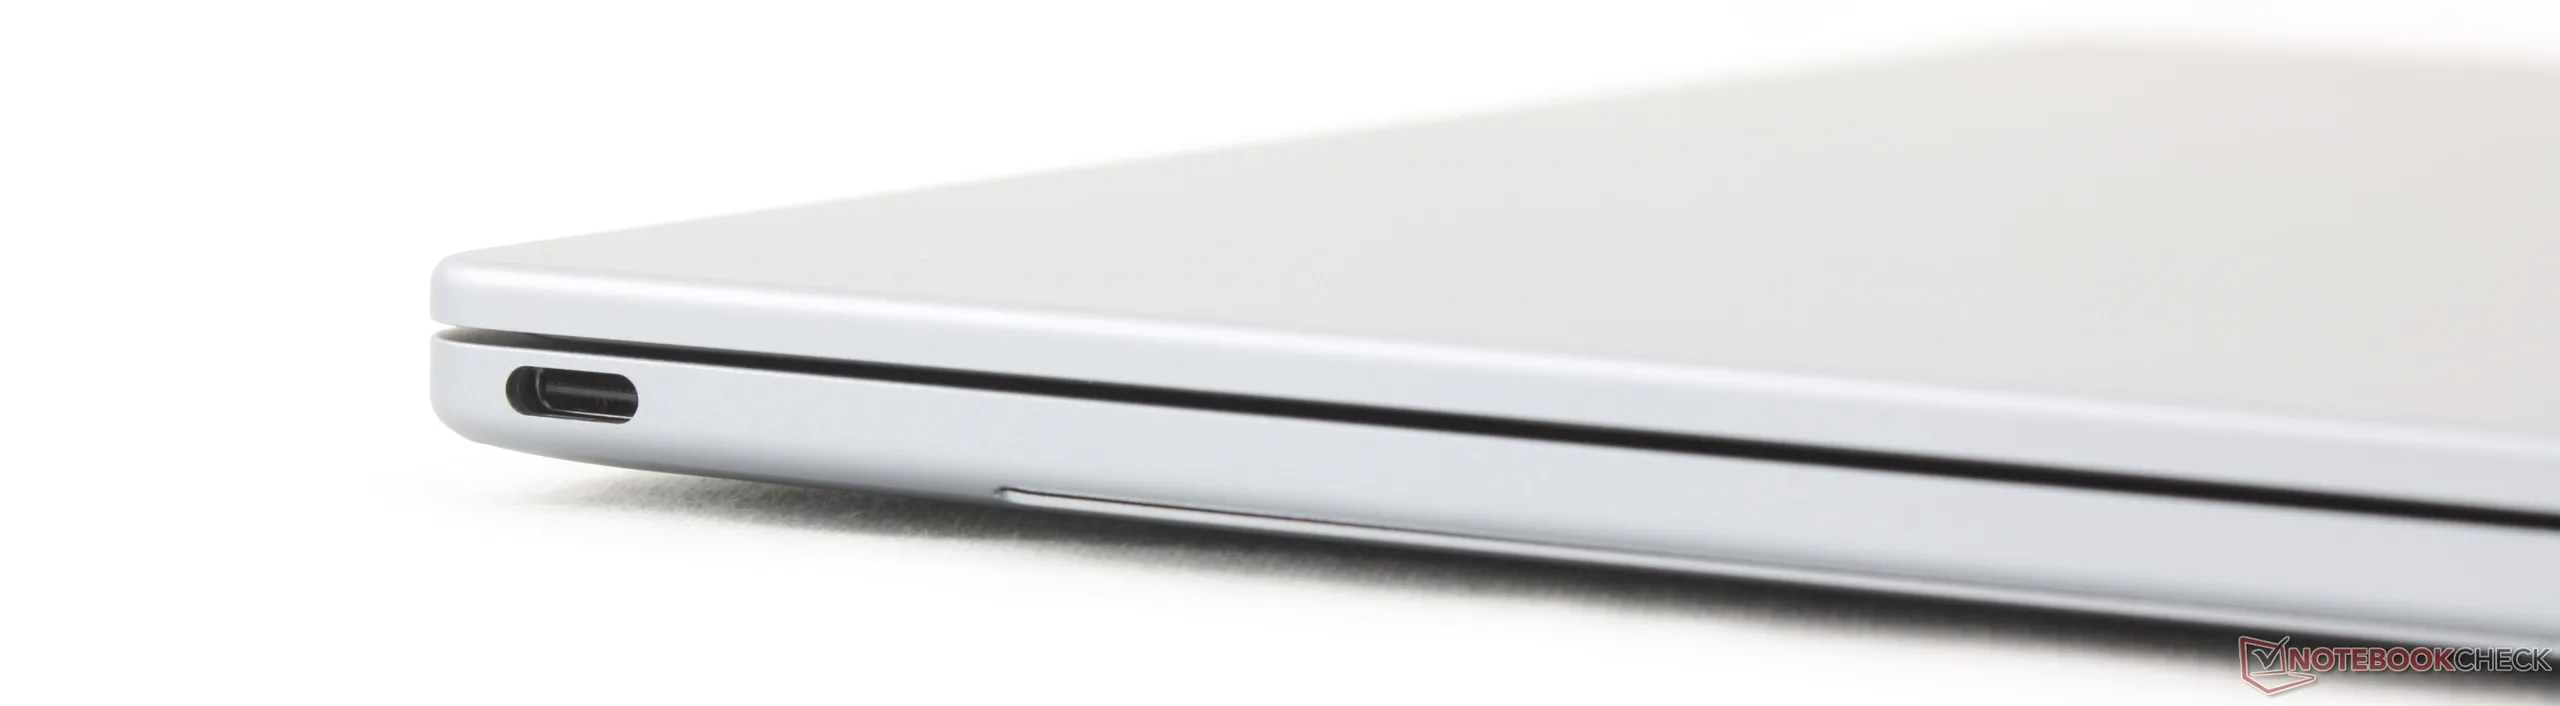
Les références équipées d'un processeur Core Ultra intègrent la technologie Thunderbolt 4 à 40 Gbps, tandis que les références d'entrée de gamme non « Core Ultra » ne disposent que de la norme USB-C 3.2 à 10 Gbps.
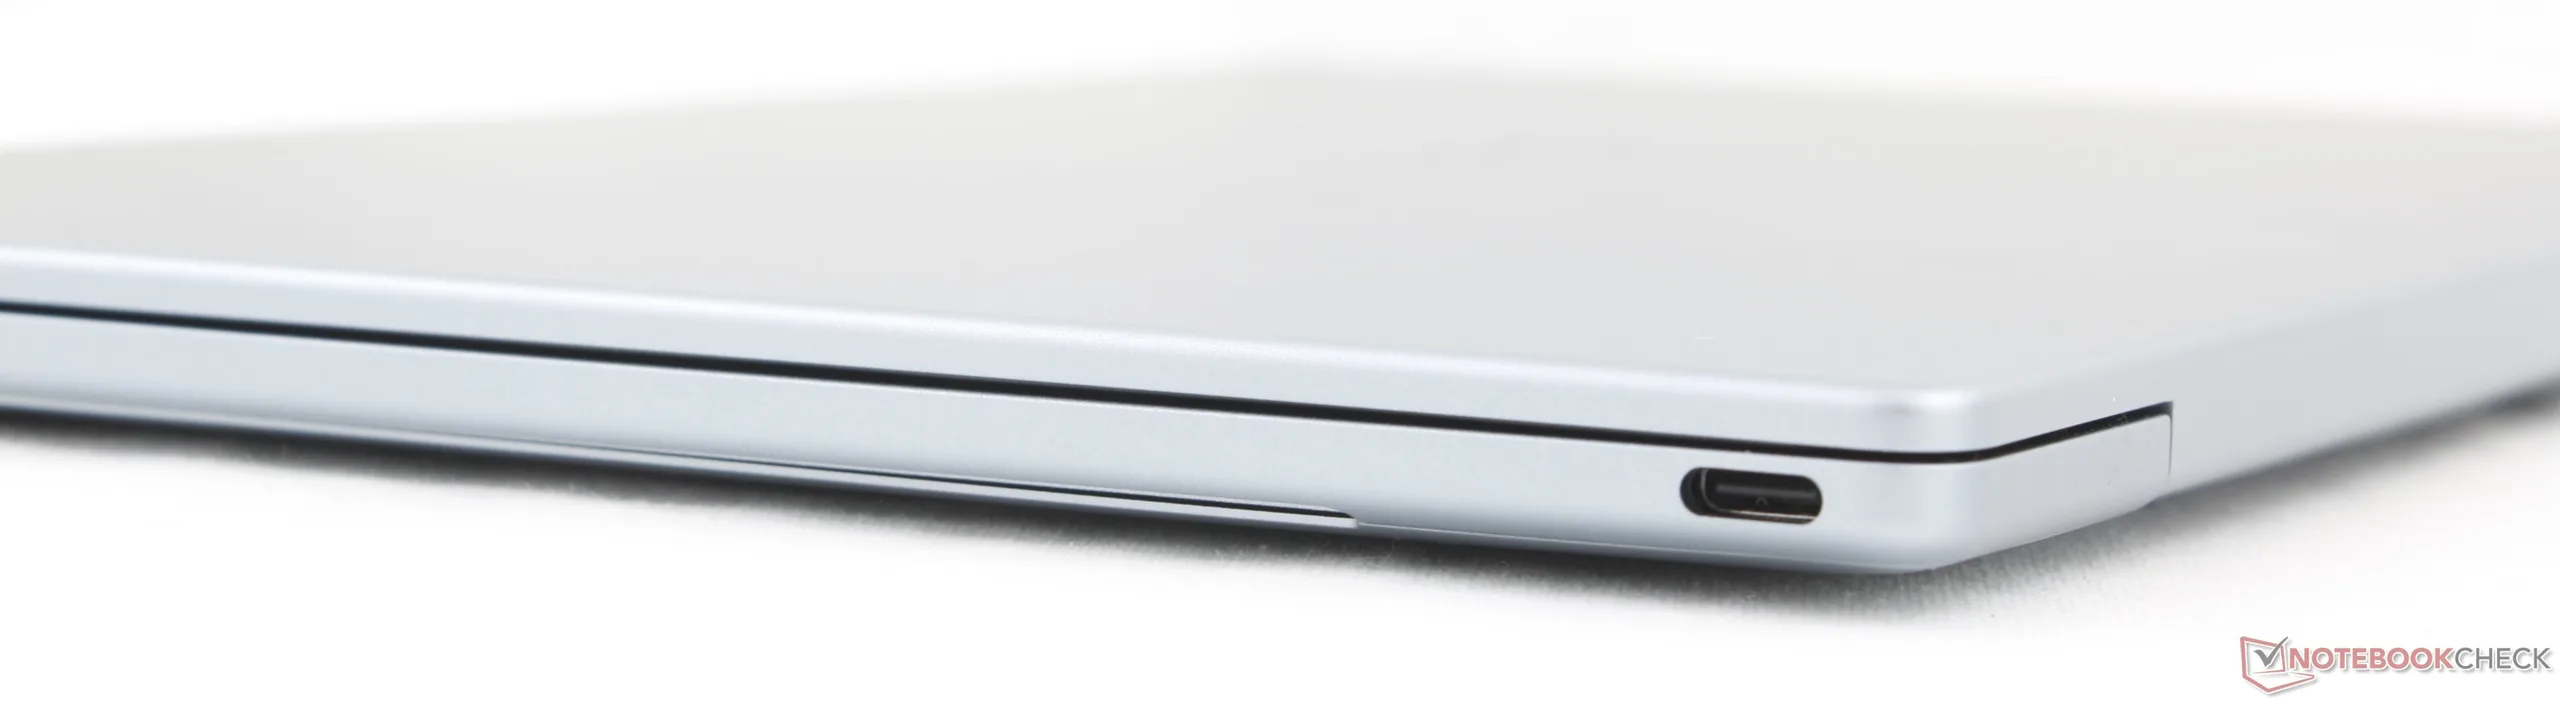
Face avant : aucun port
Exemple correct : USB-C 3.2 Gen. 2 avec DisplayPort 2.1 + Power Delivery
À l'arrière : aucun port
À gauche : USB-C 3.2 Gen. 2 avec DisplayPort 2.1 + Power Delivery

Communication

Networking
iperf3 transmit Wi-Fi6/7 RT-BE96U
Lenovo ThinkPad X1 Carbon Gen 14 21V70075GE
Intel Wi-Fi 7 BE211 320MHz
4557 (4450min - 4688max) MBit/s
iperf3 receive Wi-Fi6/7 RT-BE96U
Lenovo ThinkPad X1 Carbon Gen 14 21V70075GE
Intel Wi-Fi 7 BE211 320MHz
3244 (3047min - 3285max) MBit/s
iperf3 receive AXE11000 6GHz
Dell XPS 14 Core Ultra X7 358H
Intel Wi-Fi 7 BE211 320MHz
1740 (1711min - 1757max) MBit/s +16%
Dell XPS 13 9350
Intel BE201 320MHz
1620 (1578min - 1652max) MBit/s +8%
Dell XPS 13 DX13260
Intel Wi-Fi 7 BE213 160MHz
1498 (1435min - 1602max) MBit/s
iperf3 transmit AXE11000 6GHz
Dell XPS 13 DX13260
Intel Wi-Fi 7 BE213 160MHz
1500 (1399min - 1613max) MBit/s
Dell XPS 14 Core Ultra X7 358H
Intel Wi-Fi 7 BE211 320MHz
1440 (1053min - 1526max) MBit/s -4%
Dell XPS 13 9350
Intel BE201 320MHz
1127 (1037min - 1292max) MBit/s -25%
01002003004005006007008009001000110012001300140015001600Tooltip
Dell XPS 13 DX13260; iperf3 receive AXE11000 6GHz; iperf 3.1.3: Ø1498 (1435-1602) MBit/s
Dell XPS 13 DX13260; iperf3 transmit AXE11000 6GHz; iperf 3.1.3: Ø1500 (1399-1613) MBit/s

Webcam

 Bien que la technologie IR soit intégrée de série pour la prise en charge de Windows Hello, il n'existe toujours pas de cache de confidentialité, qu'il soit physique ou autre.

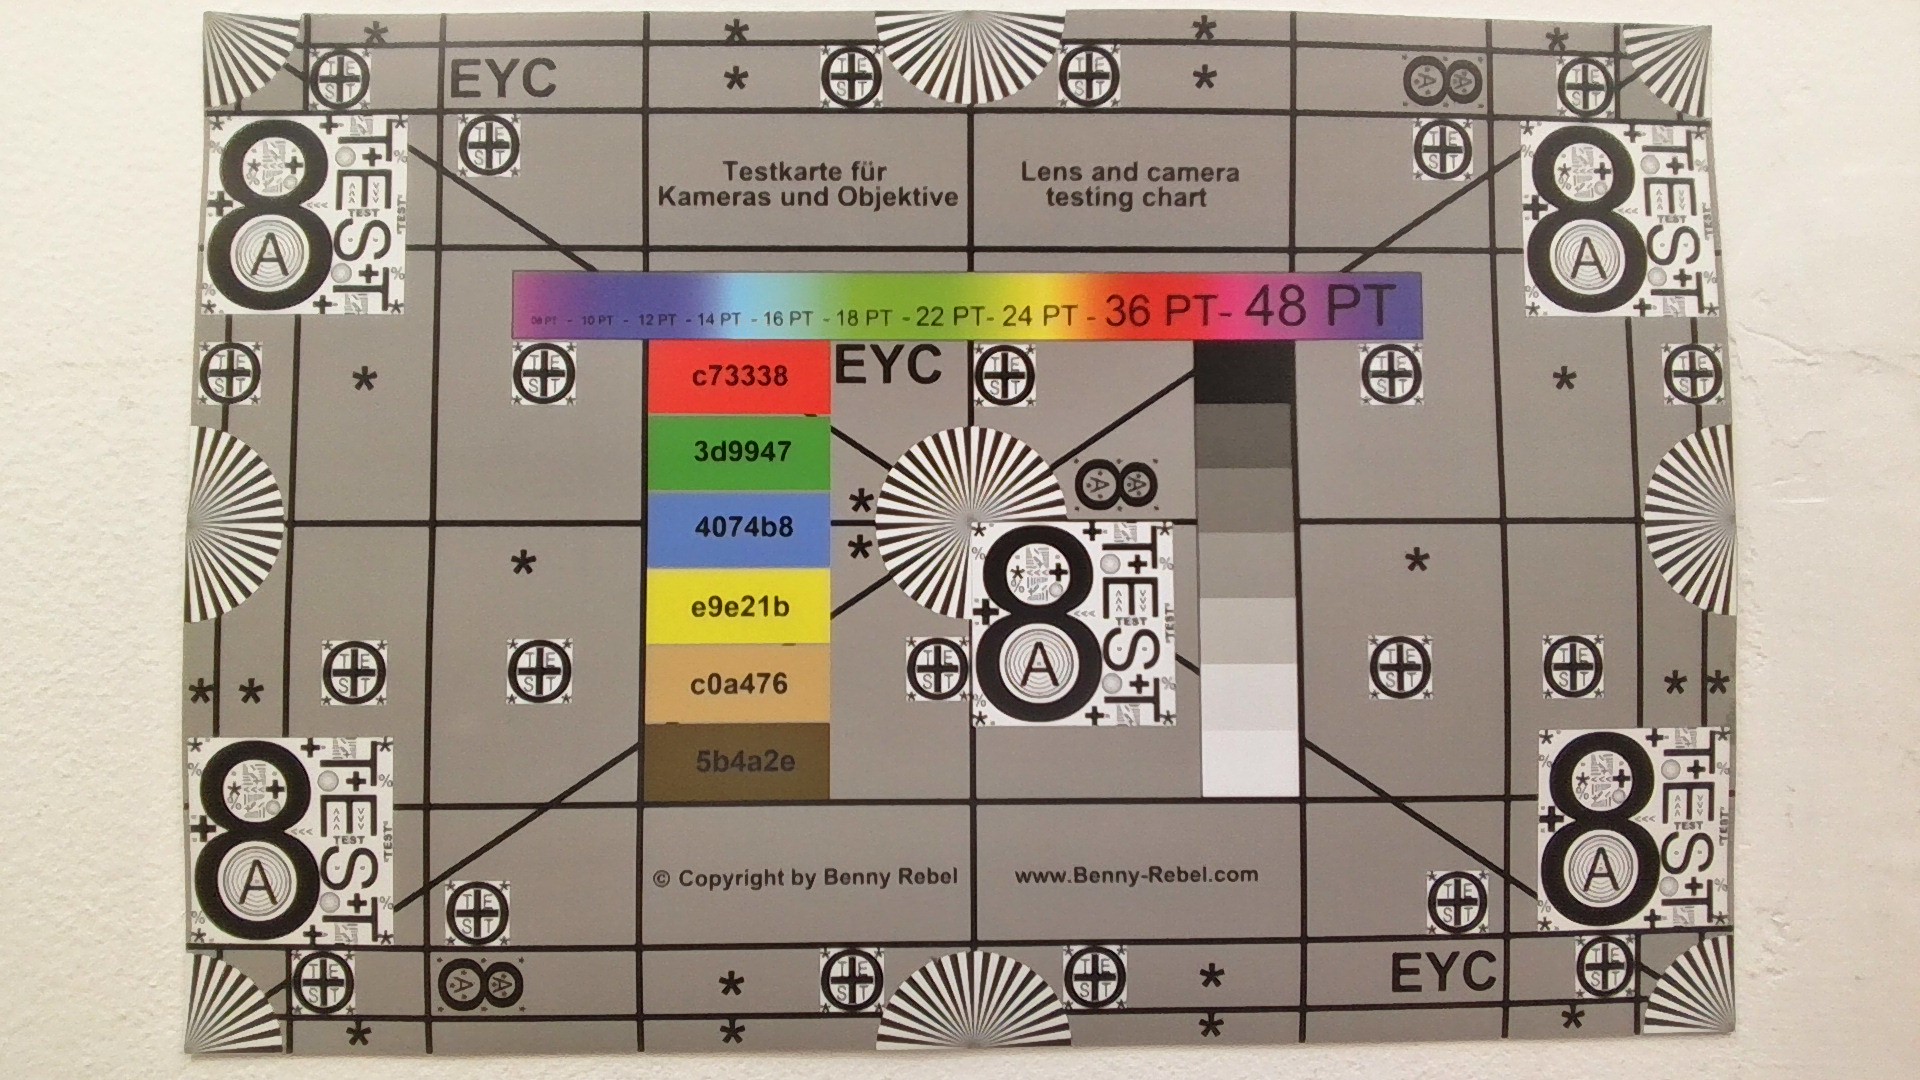
ColorChecker
11 ∆E
13 ∆E
14.1 ∆E
21.3 ∆E
15.8 ∆E
17.9 ∆E
8.1 ∆E
10.2 ∆E
13.9 ∆E
7.6 ∆E
15.3 ∆E
17.7 ∆E
4.6 ∆E
18.5 ∆E
19.8 ∆E
13.1 ∆E
13.8 ∆E
20.3 ∆E
7.8 ∆E
9.9 ∆E
15 ∆E
15 ∆E
12.3 ∆E
3.2 ∆E
ColorChecker Dell XPS 13 DX13260: 13.29 ∆E min: 3.2 - max: 21.3 ∆E

Maintenance

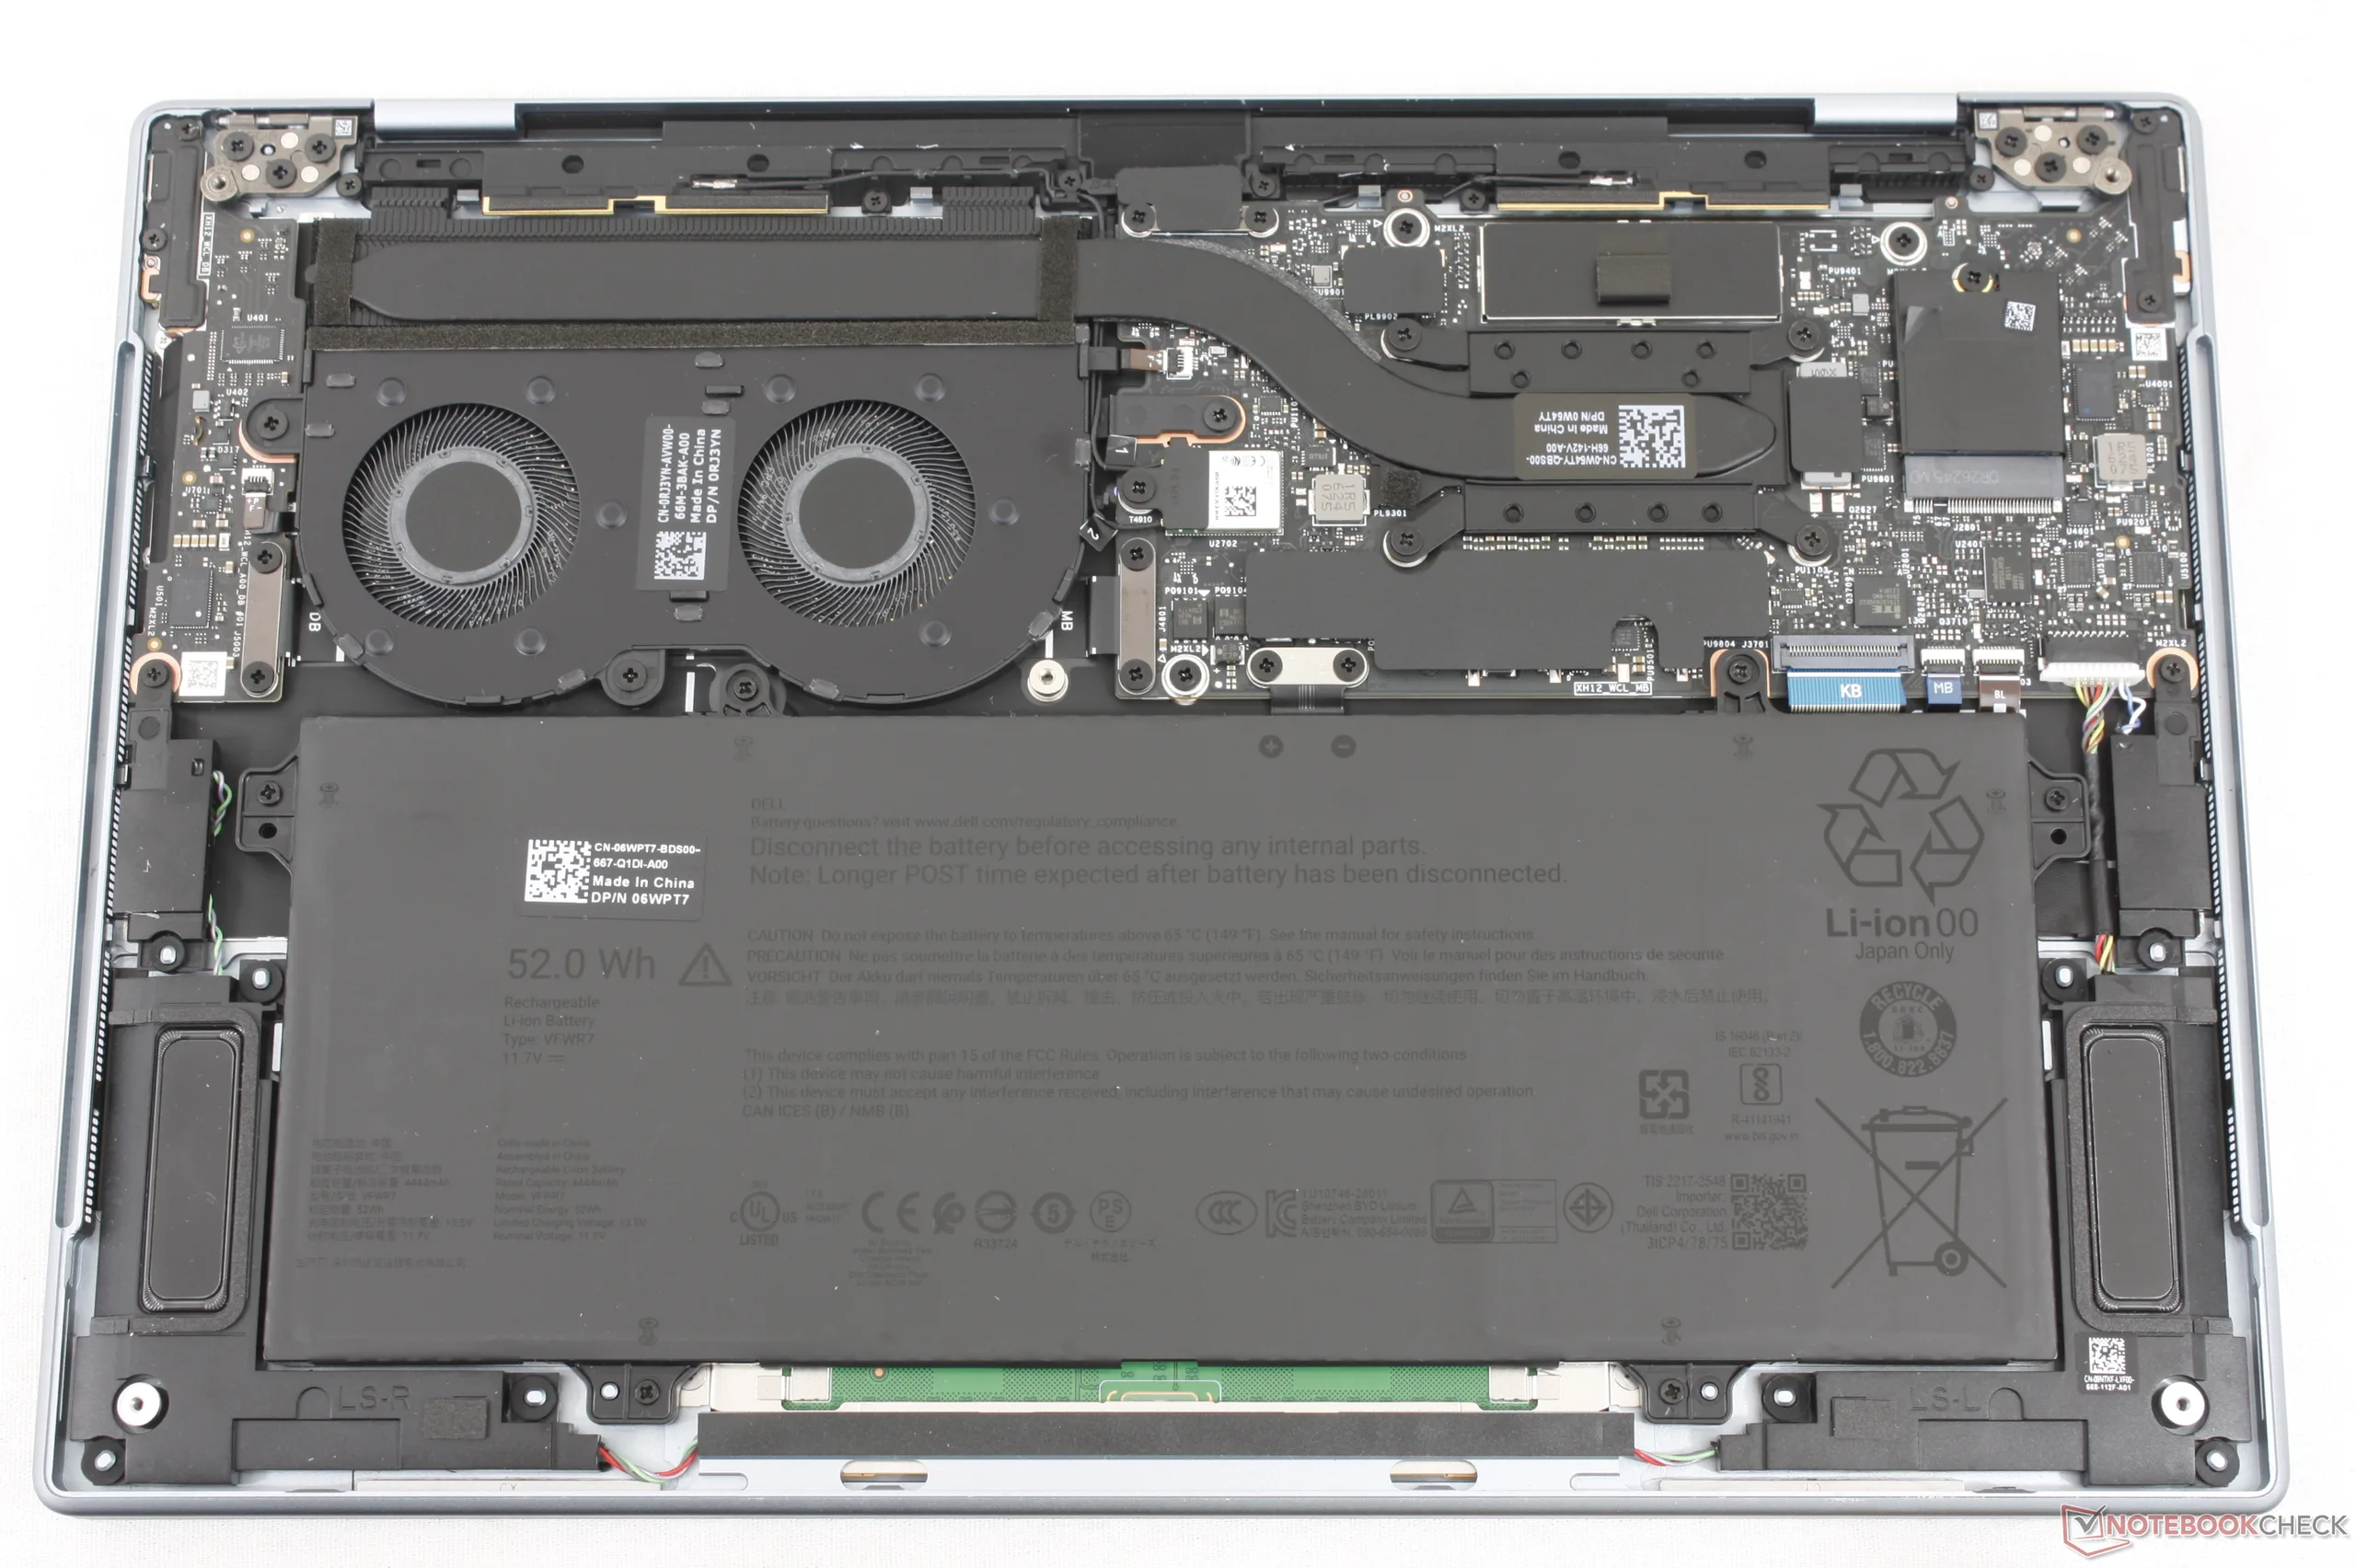
Carte mère du XPS 13 Wildcat. Seules la batterie et le SSD M.2 2242 sont amovibles.

Développement durable

Le châssis est composé jusqu’à 75 % d’aluminium recyclé pour le capot supérieur et les repose-poignets, jusqu’à 50 % de cobalt recyclé pour la batterie et jusqu’à 90 % d’acier recyclé pour les touches. L’emballage est entièrement recyclable et ne contient pas de plastique.

Périphériques d'entrée

Le clavier plus traditionnel est sans doute plus facile à utiliser que le clavier « zero-lattice » du XPS 14, plus grand. Cependant, bien que le retour soit net, la course des touches est très courte, notamment en ce qui concerne la touche Espace.
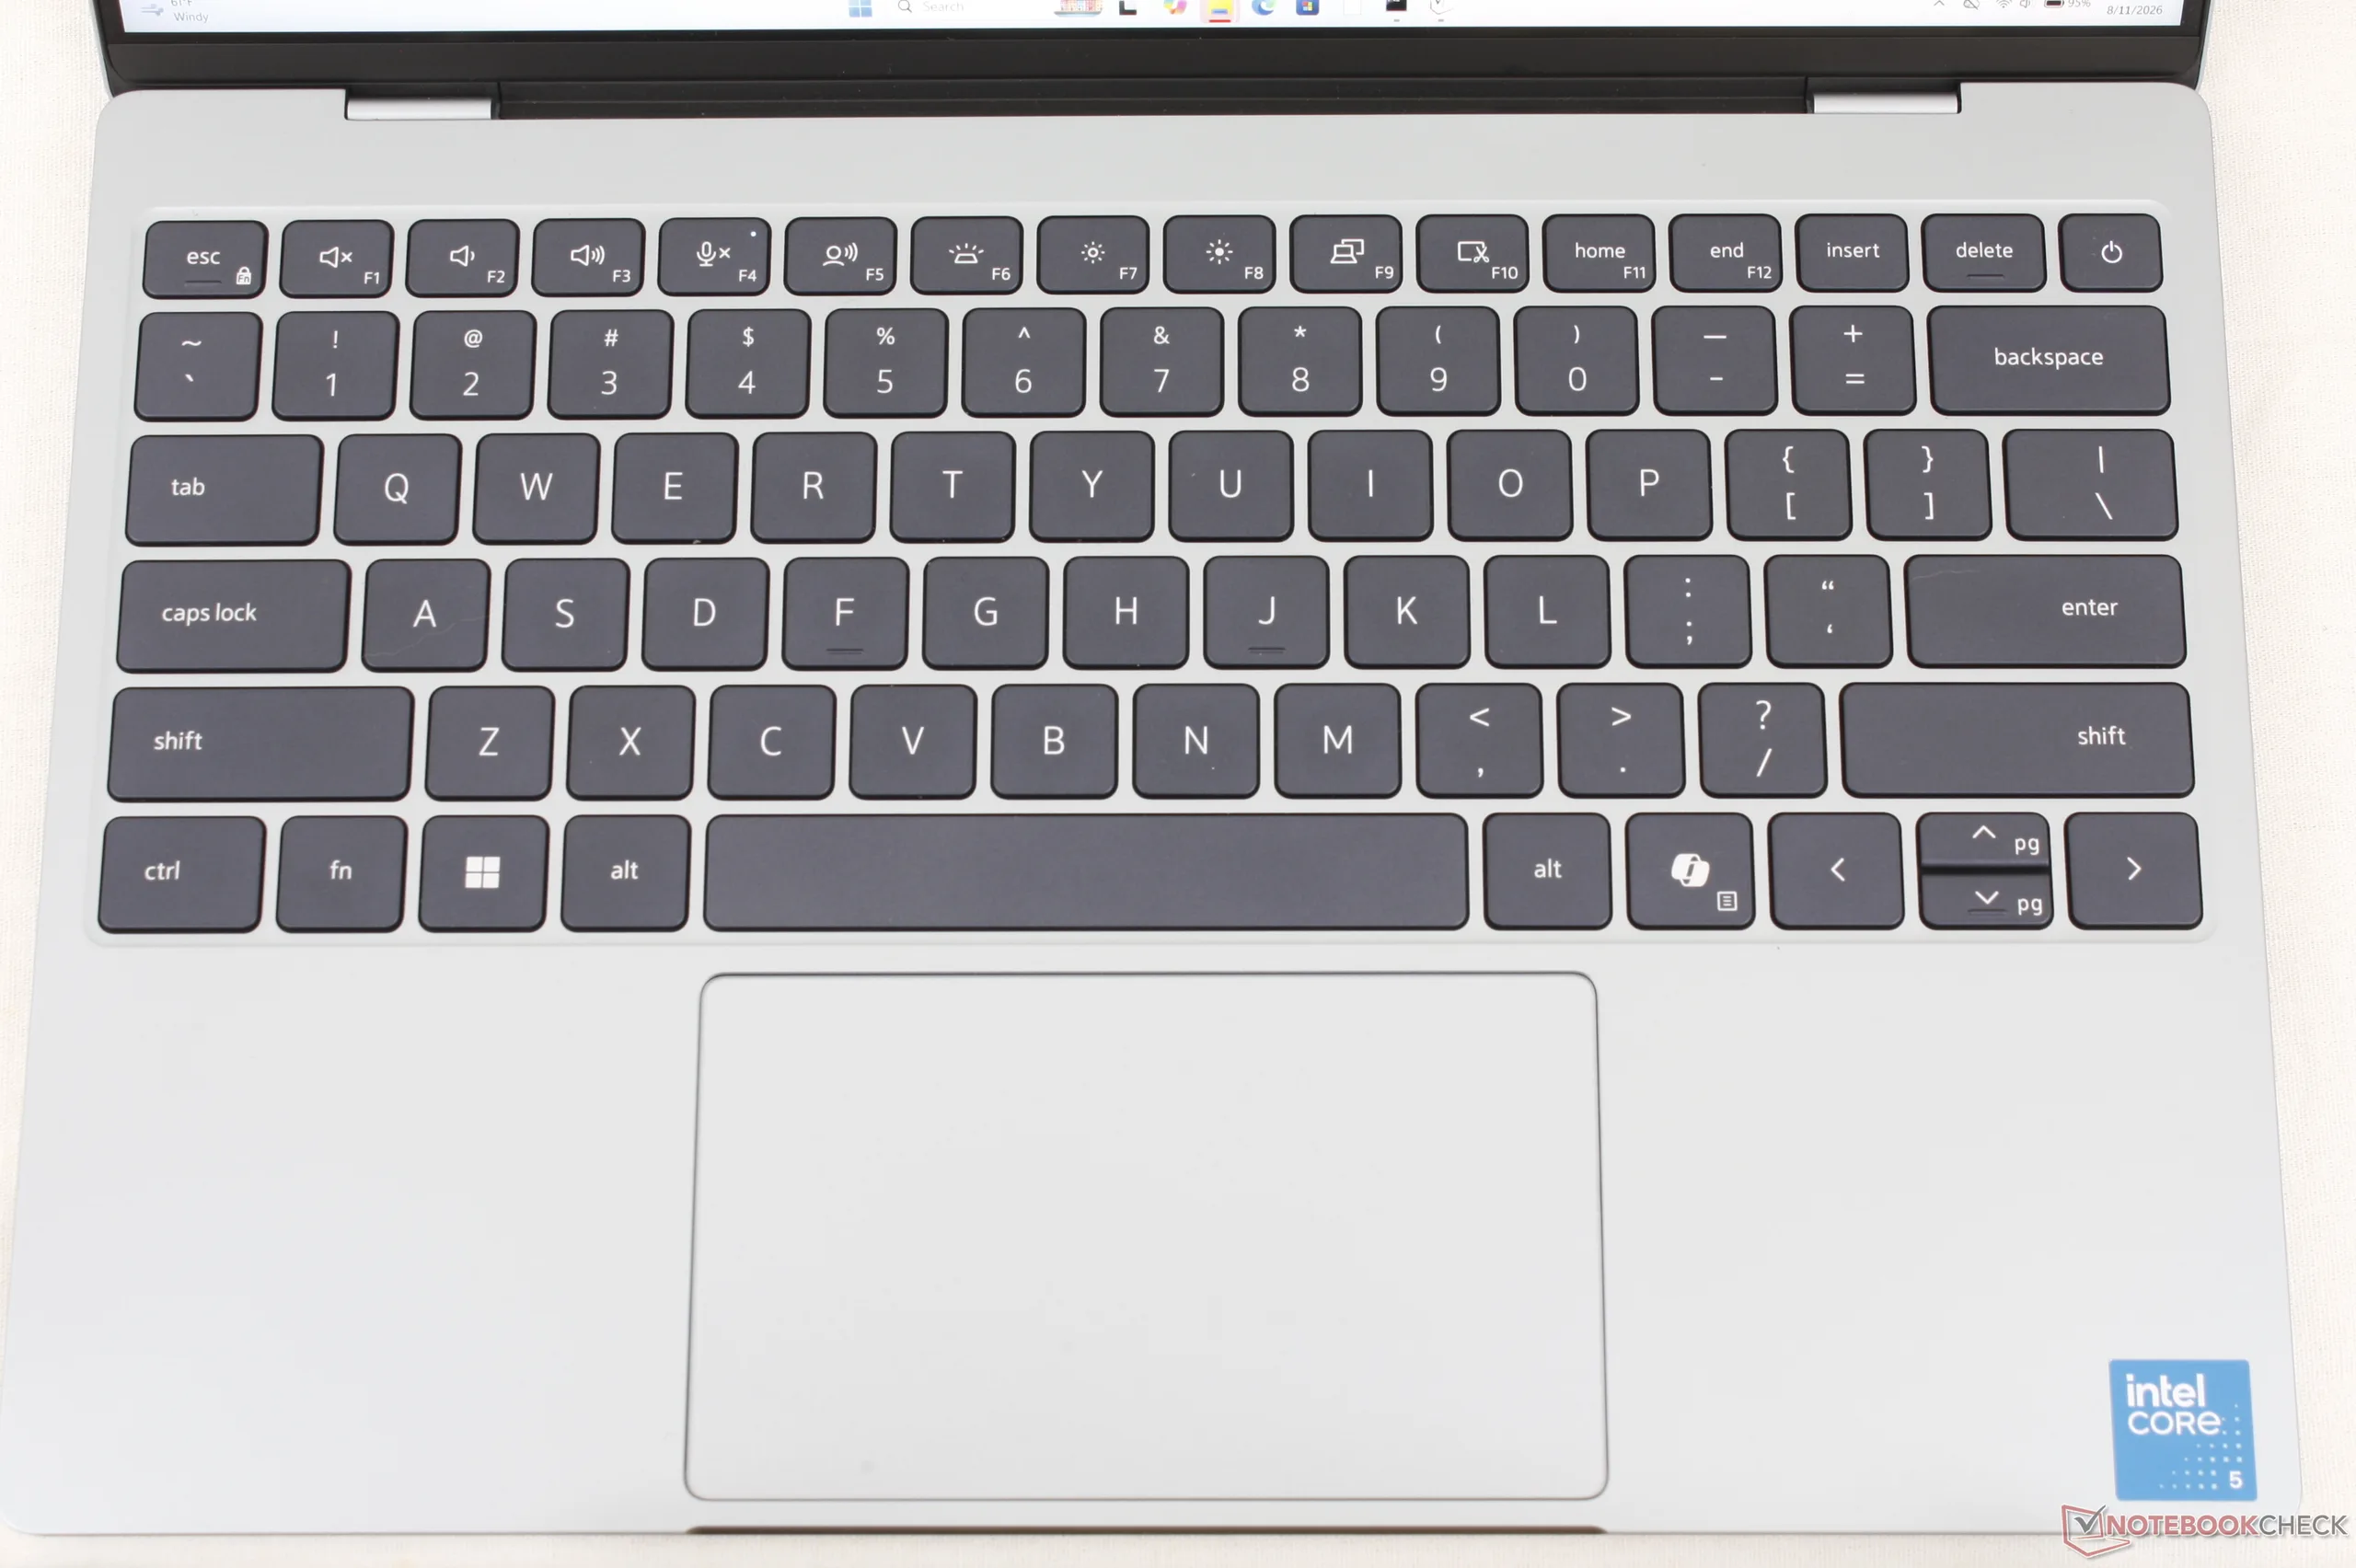
Avec ses dimensions d'environ 12 x 7 cm, le pavé tactile peut sembler un peu étroit, notamment lorsque vous déplacez le curseur verticalement.

Affichage

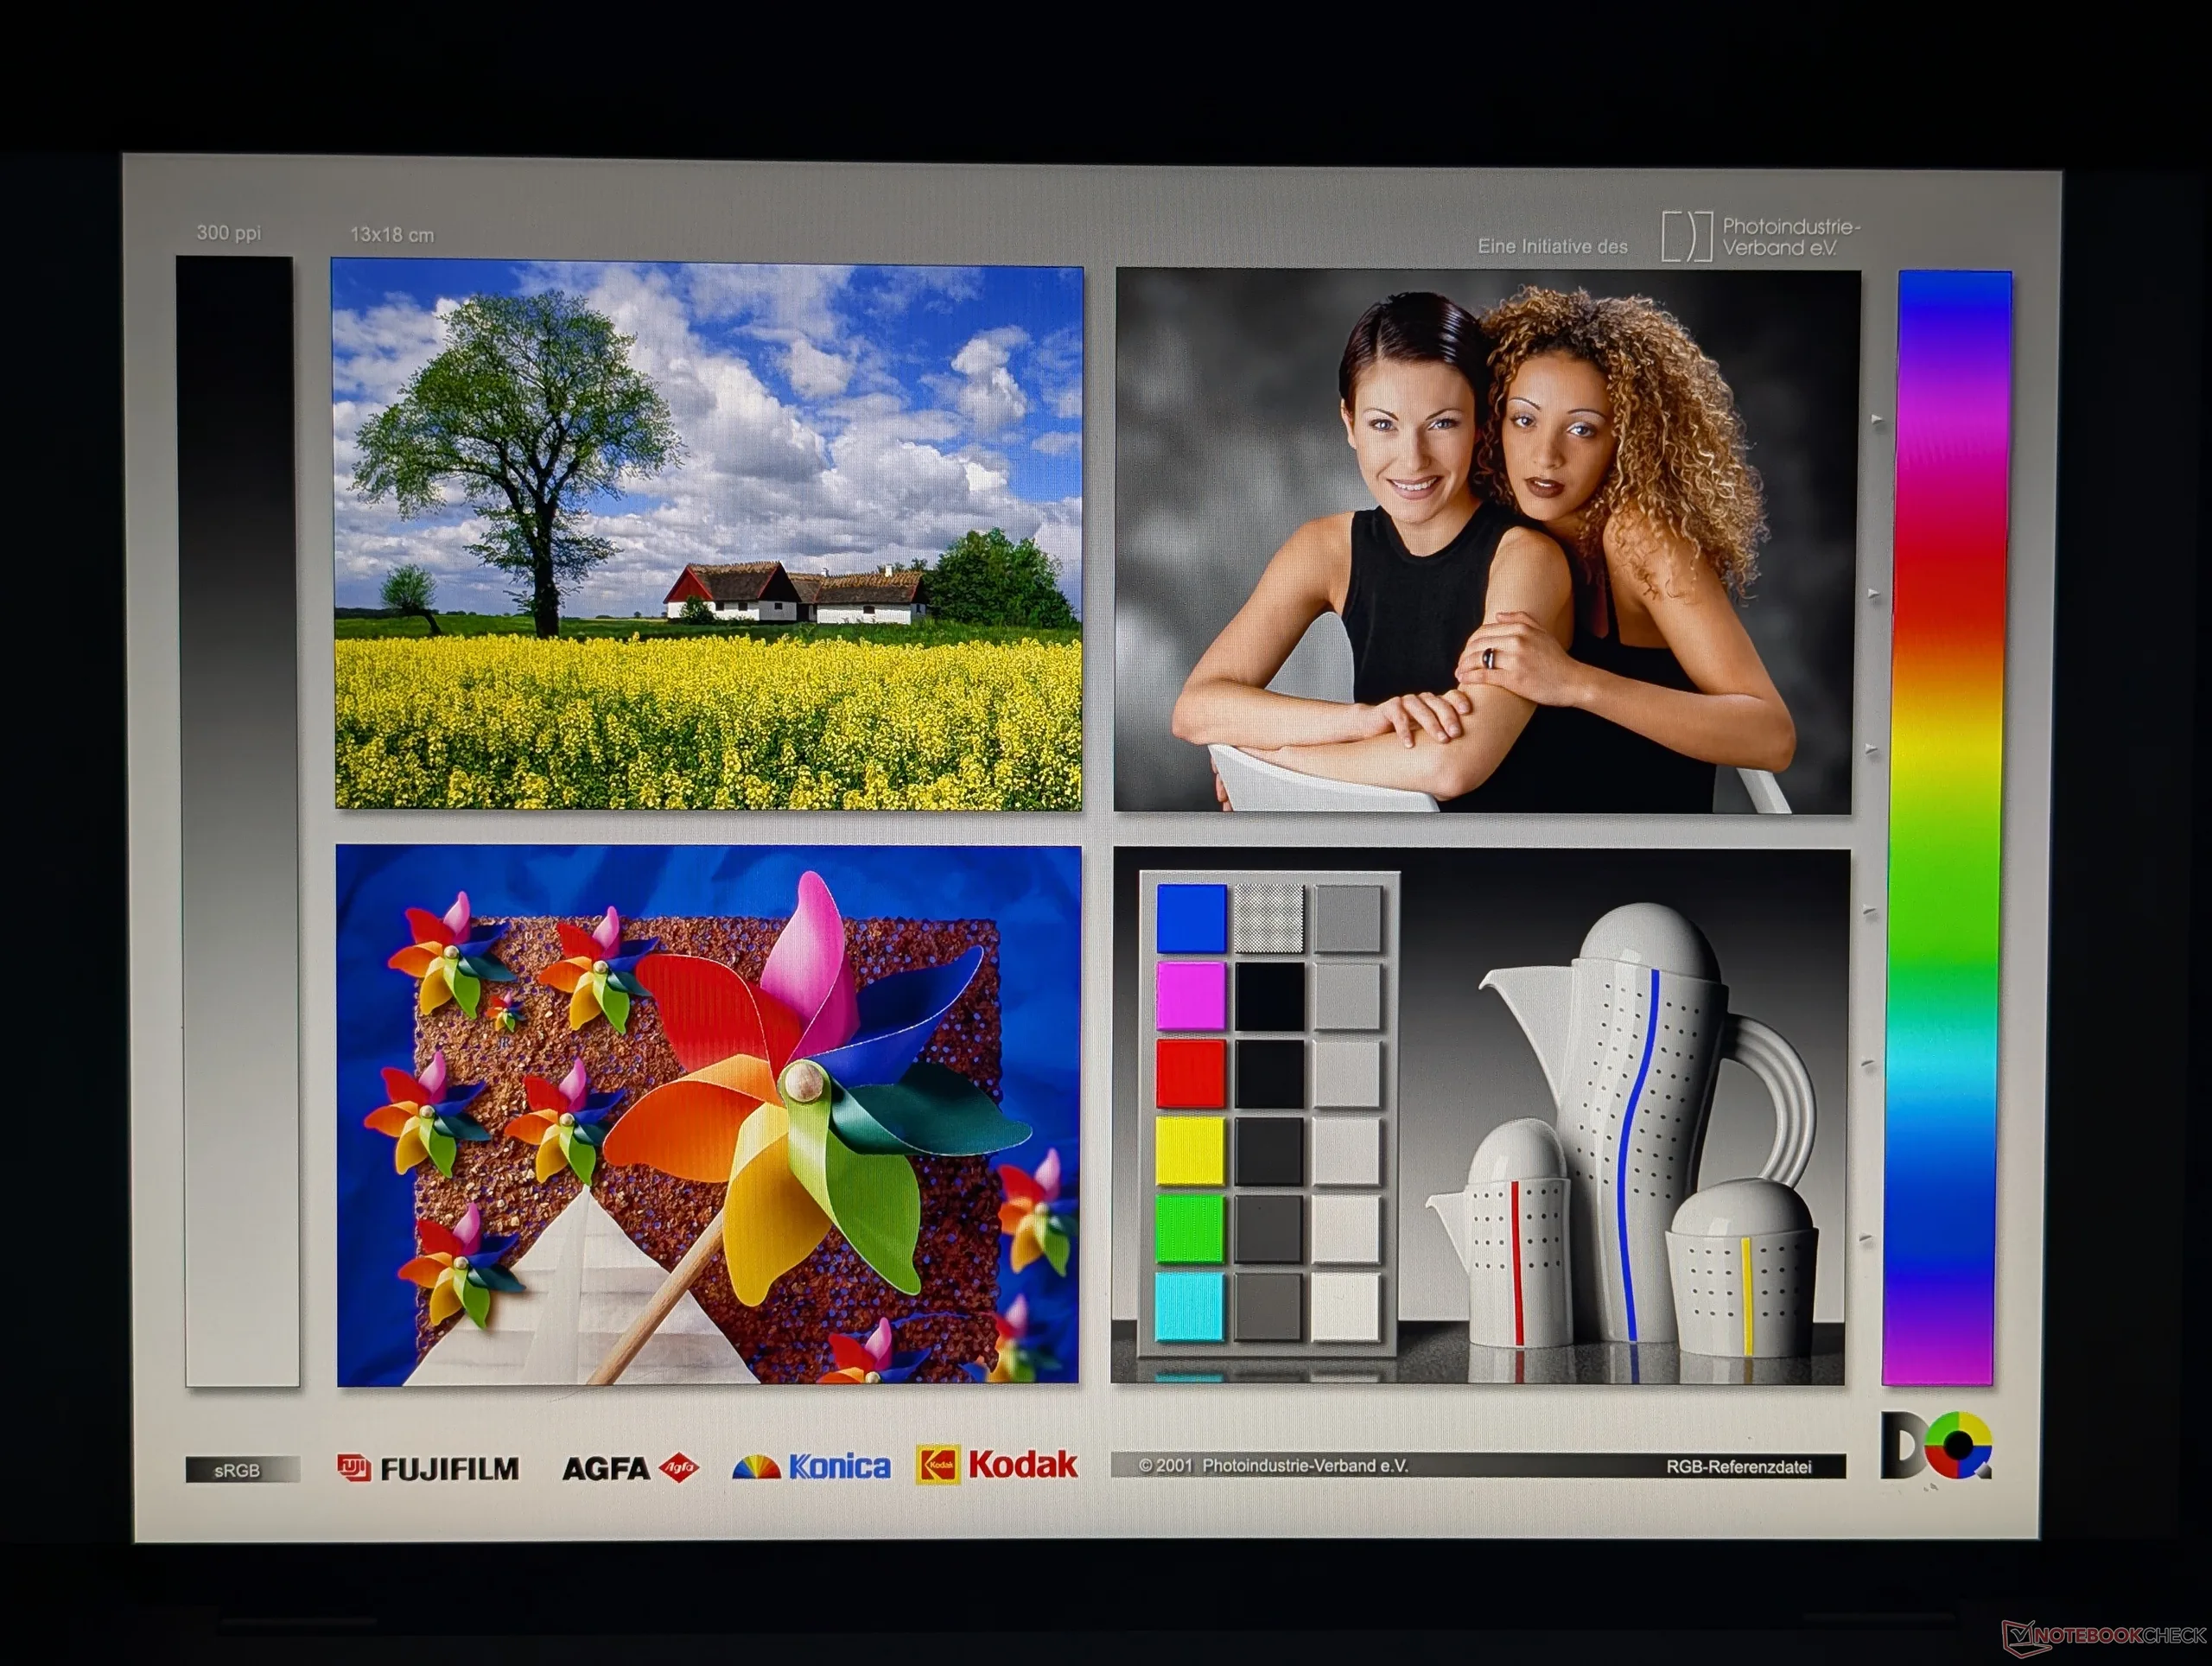
Écran IPS mat présentant un grain minimal
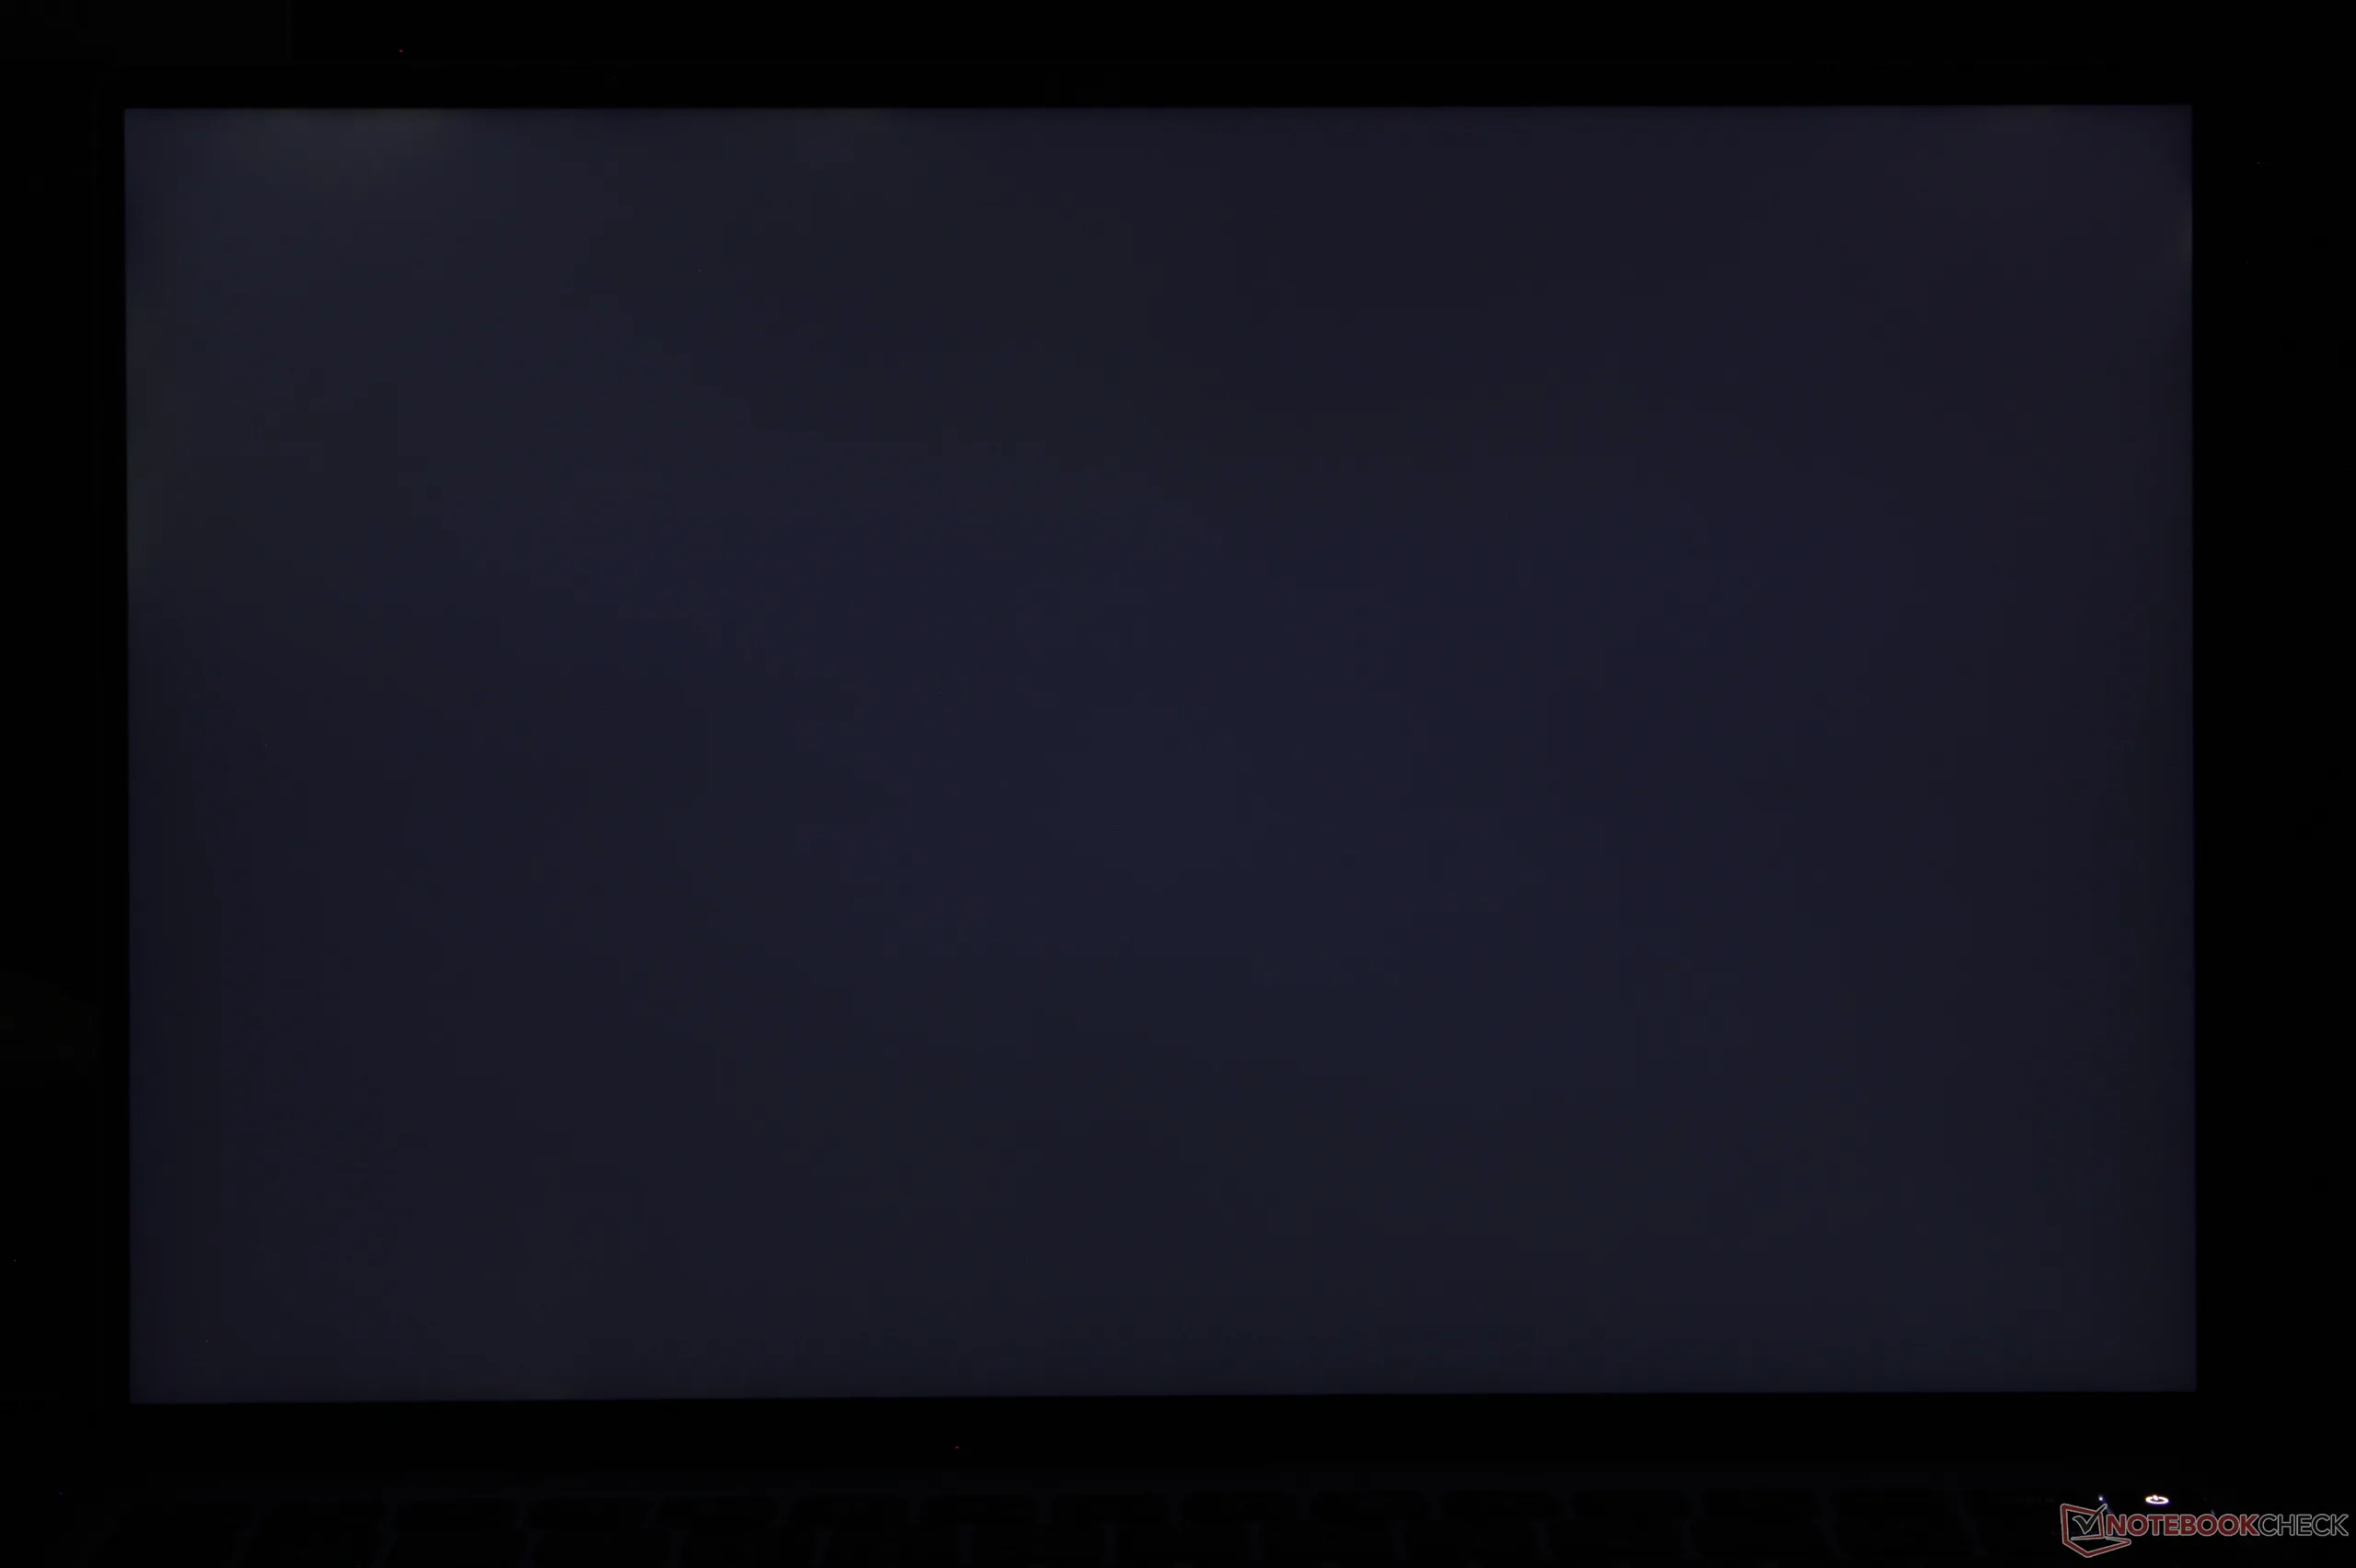
Légère fuite de rétroéclairage irrégulière dans le coin supérieur gauche

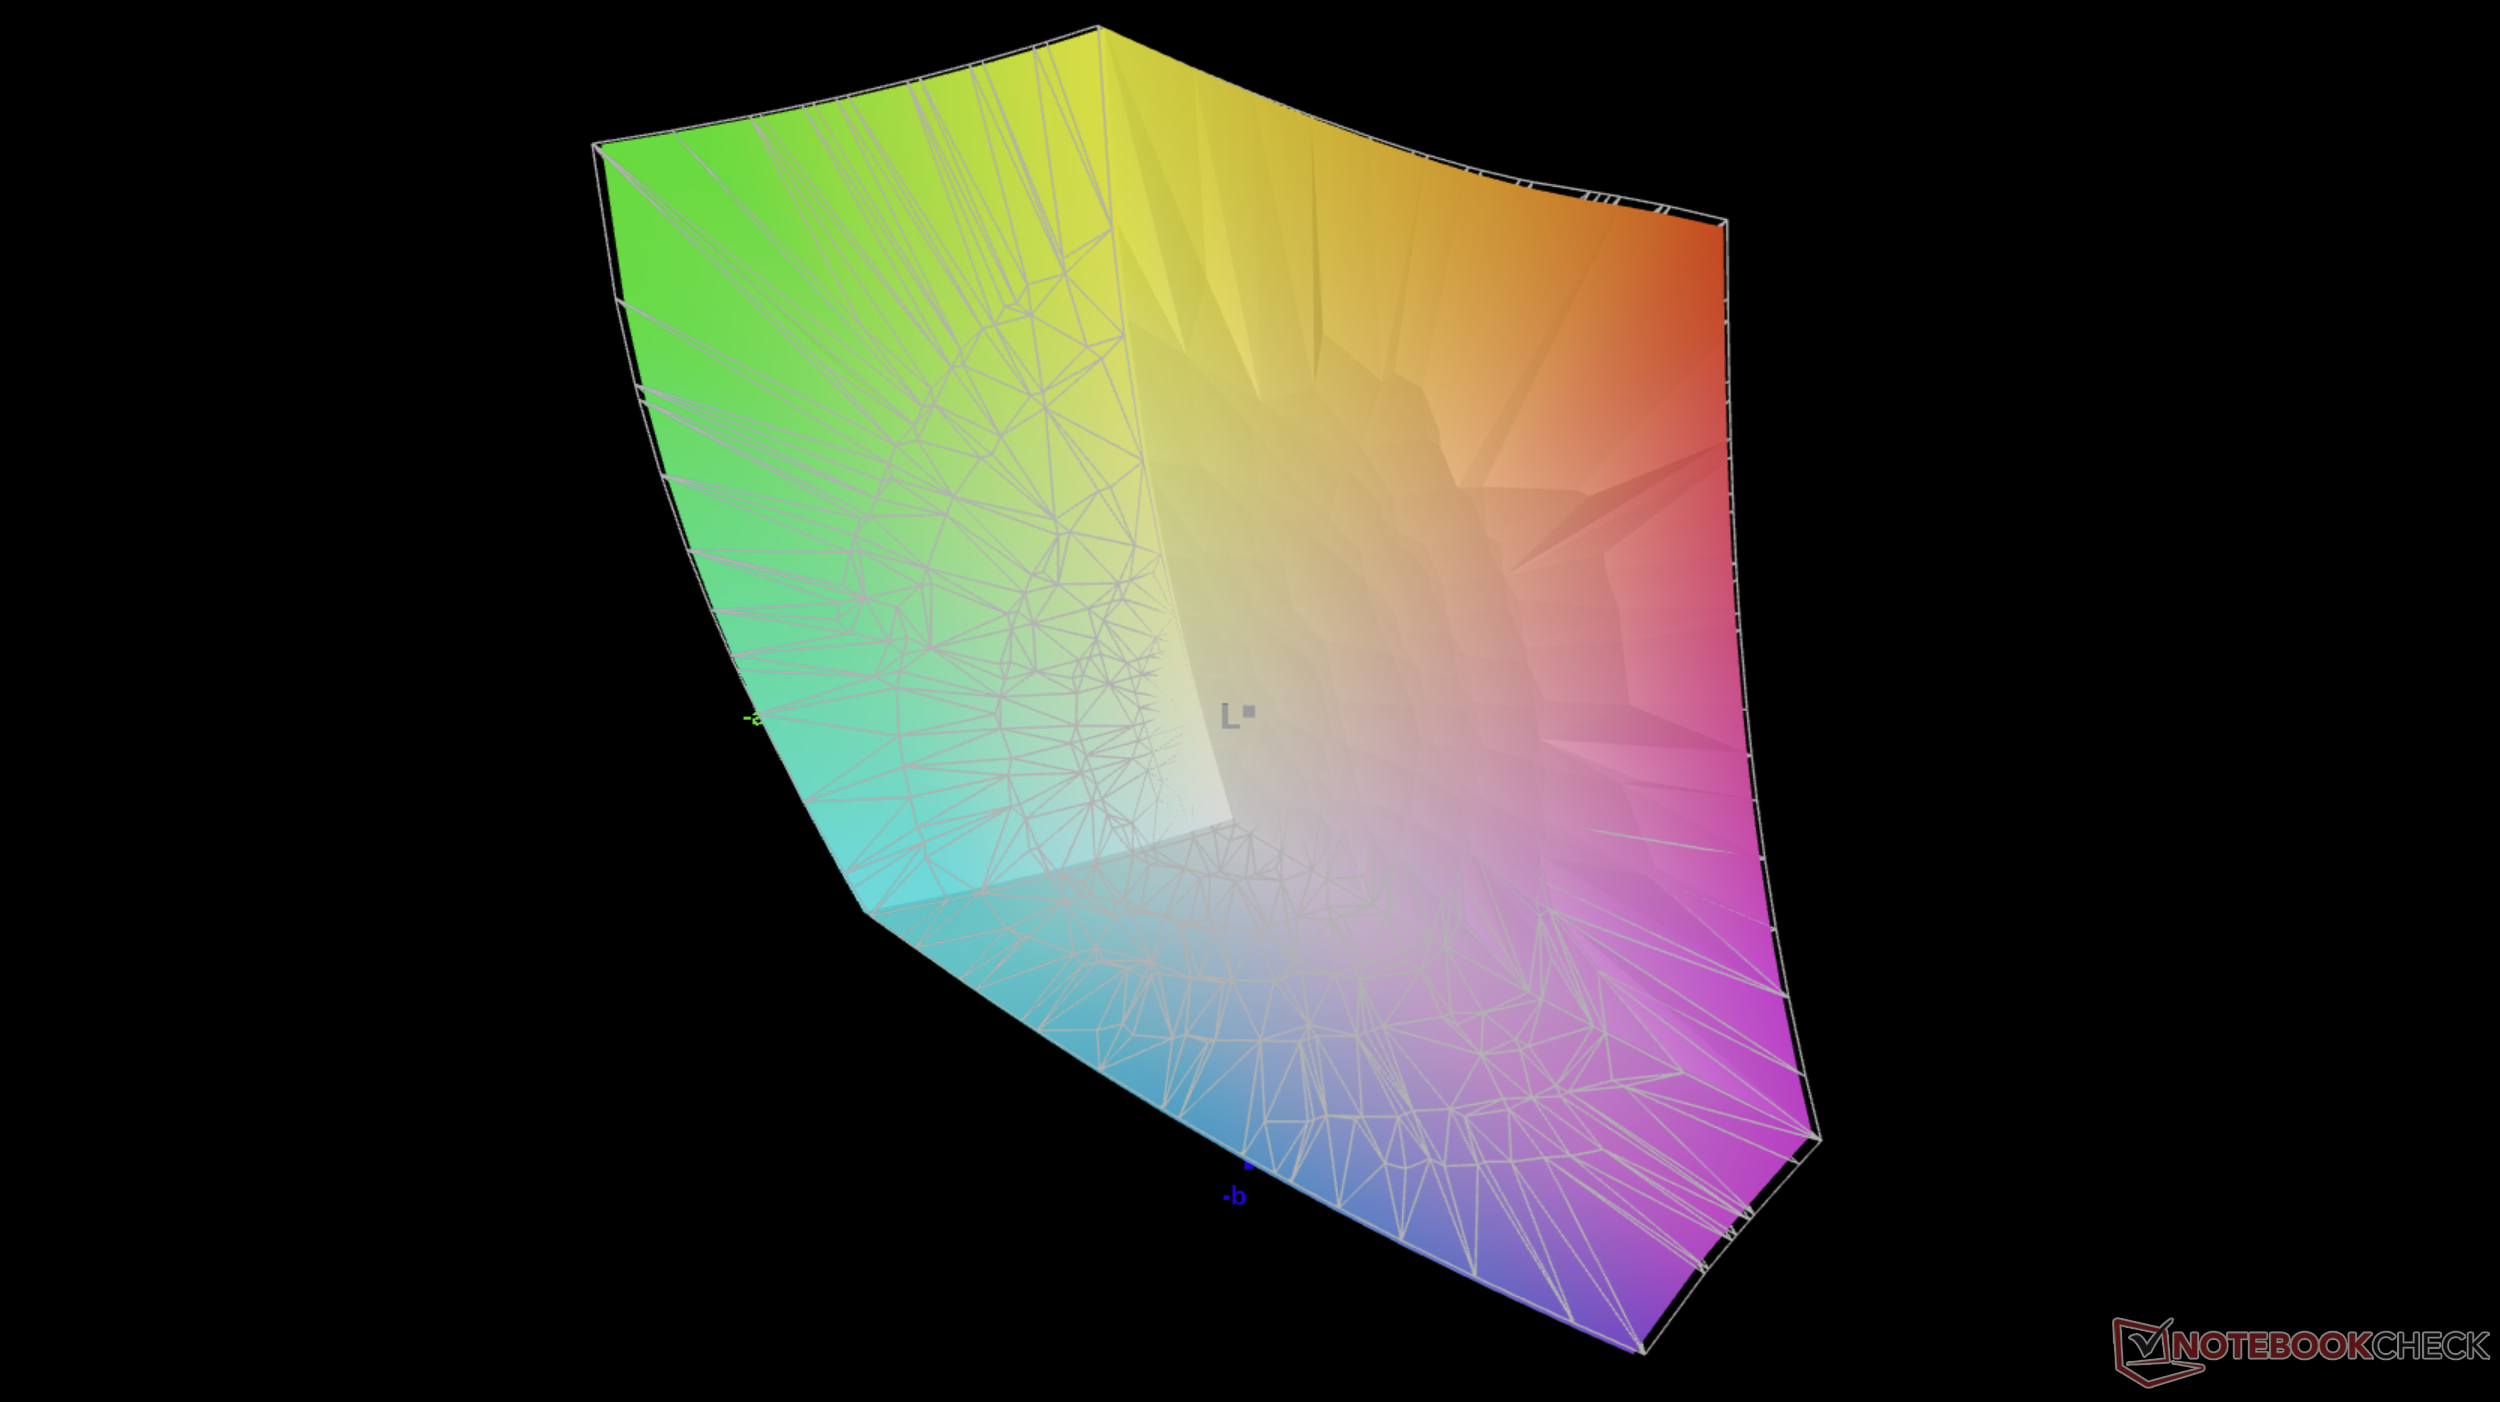
Dell n’a pas lésiné sur l’écran tactile malgré le faible prix global. En effet, il s’agit de l’un des meilleurs écrans disponibles sur un ultraportable de 13 pouces vendu bien en dessous de 1 000 $. Les couleurs sont calibrées et éclatantes avec une couverture de plus de 95 % de l'espace colorimétrique P3, le contraste est élevé pour un écran IPS (environ 2 000:1) et la luminosité est excellente, dépassant les 500 nits. Sa prise en charge limitée du HDR et ses temps de réponse noir-blanc un peu lents ne devraient guère poser de problème au public cible, composé d'utilisateurs professionnels et d'étudiants.

512.7
cd/m²
482.1
cd/m²
508.7
cd/m²
496.8
cd/m²
539.3
cd/m²
491.6
cd/m²
495.9
cd/m²
510.1
cd/m²
487.6
cd/m²
Homogénéité de la luminosité
LG Philips LP134WQ testé avec X-Rite i1Pro 3
Maximum: 539.3 cd/m² (Nits) Moyenne: 502.8 cd/m² Minimum: 0.64 cd/m²
Homogénéité de la luminosité: 89 %
Valeur mesurée au centre, sur batterie: 539.3 cd/m²
Contraste: 2157:1 (Valeurs des noirs: 0.25 cd/m²)
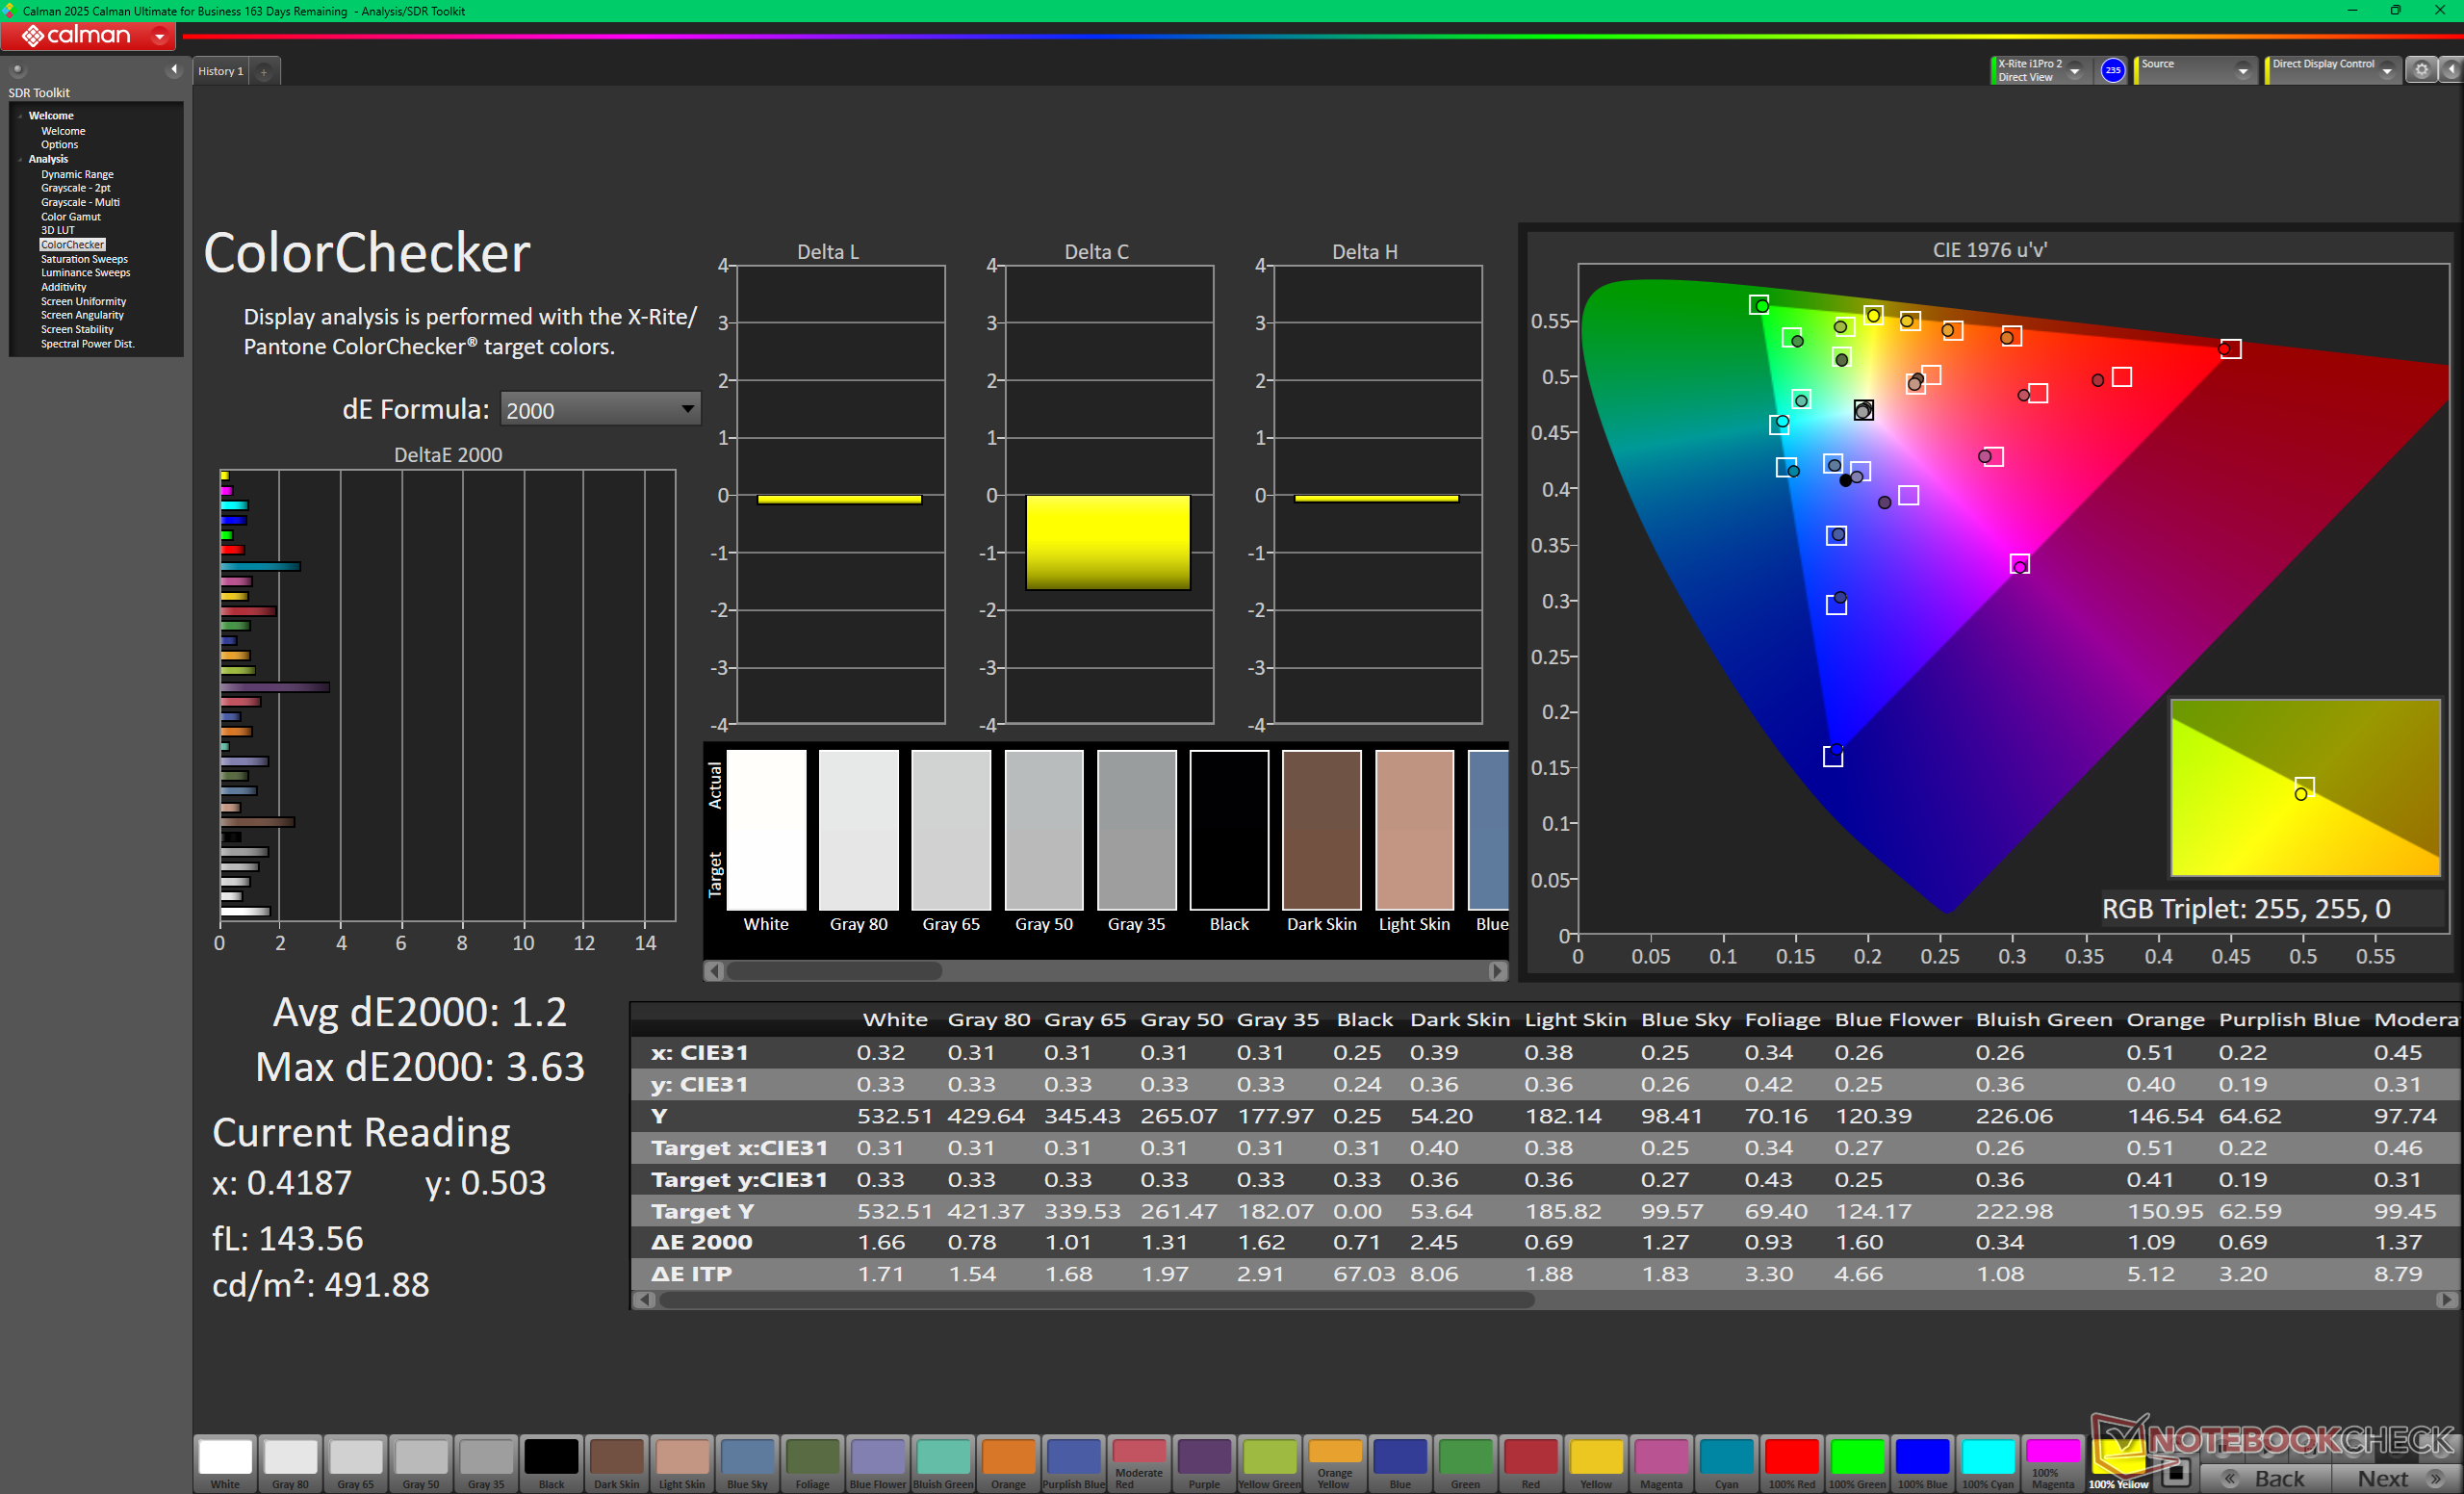
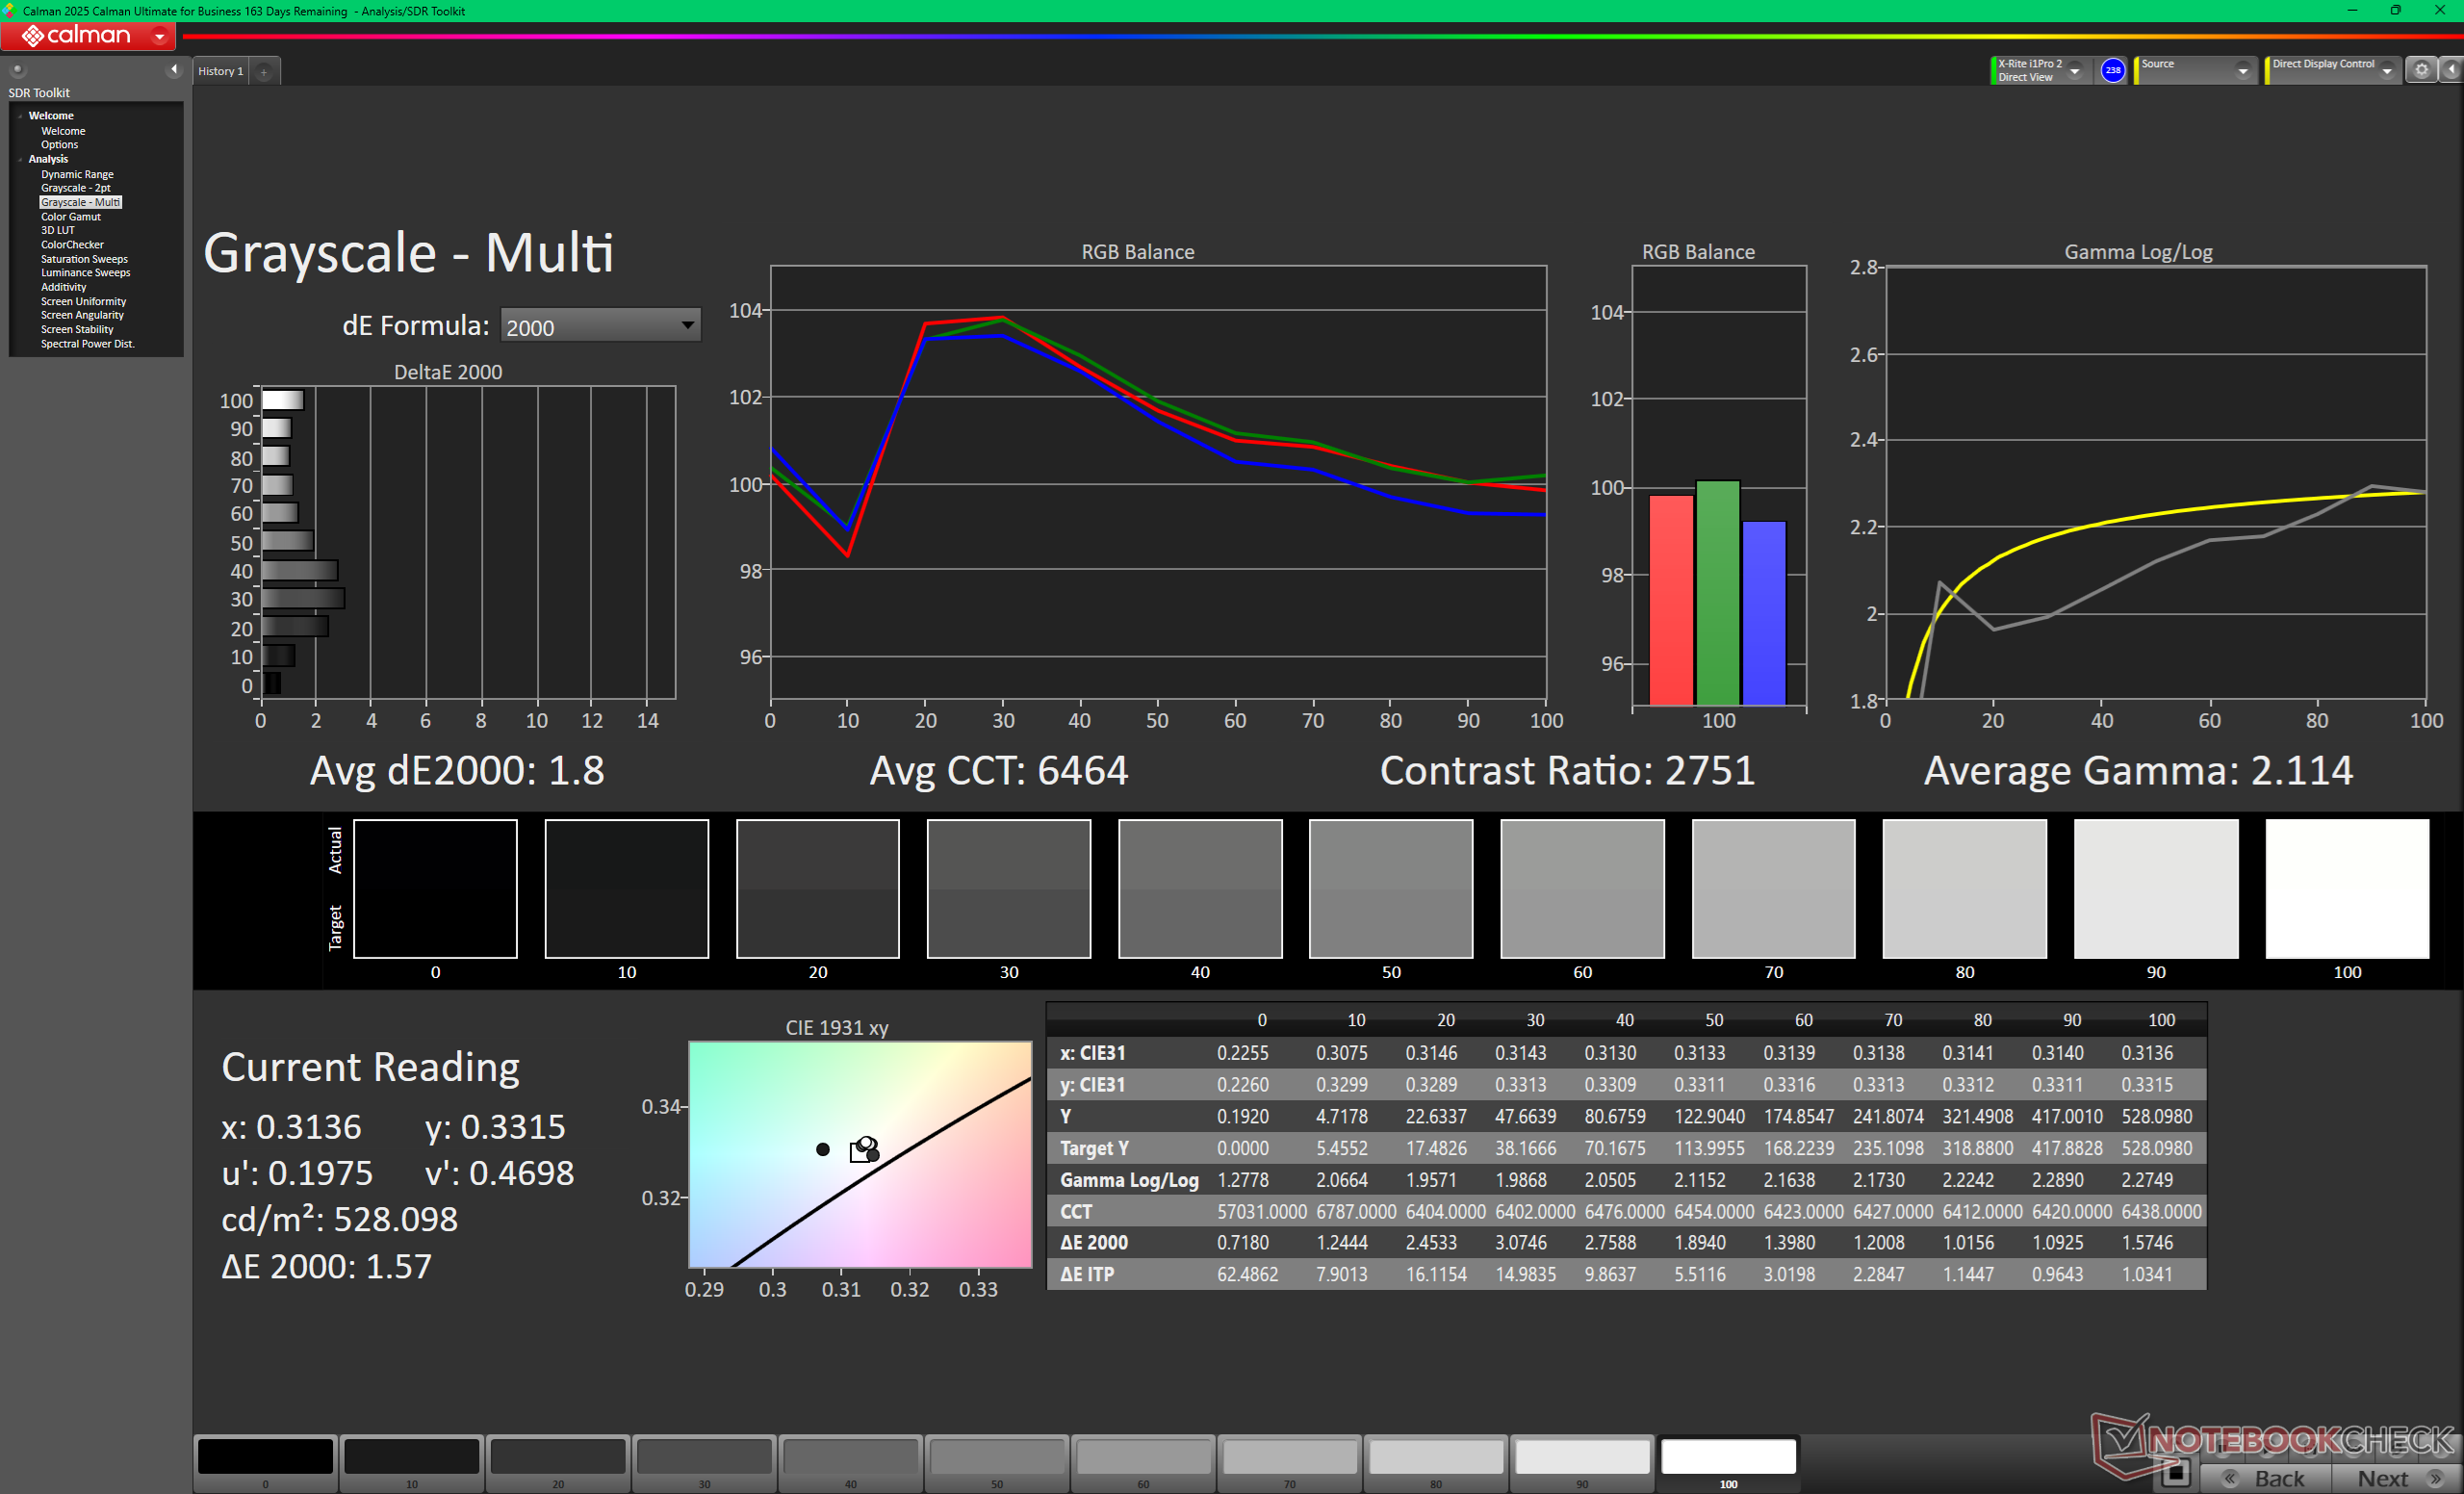
ΔE ColorChecker Calman: 1.2 | ∀{0.5-29.43 Ø4.71}
calibrated: 0.92
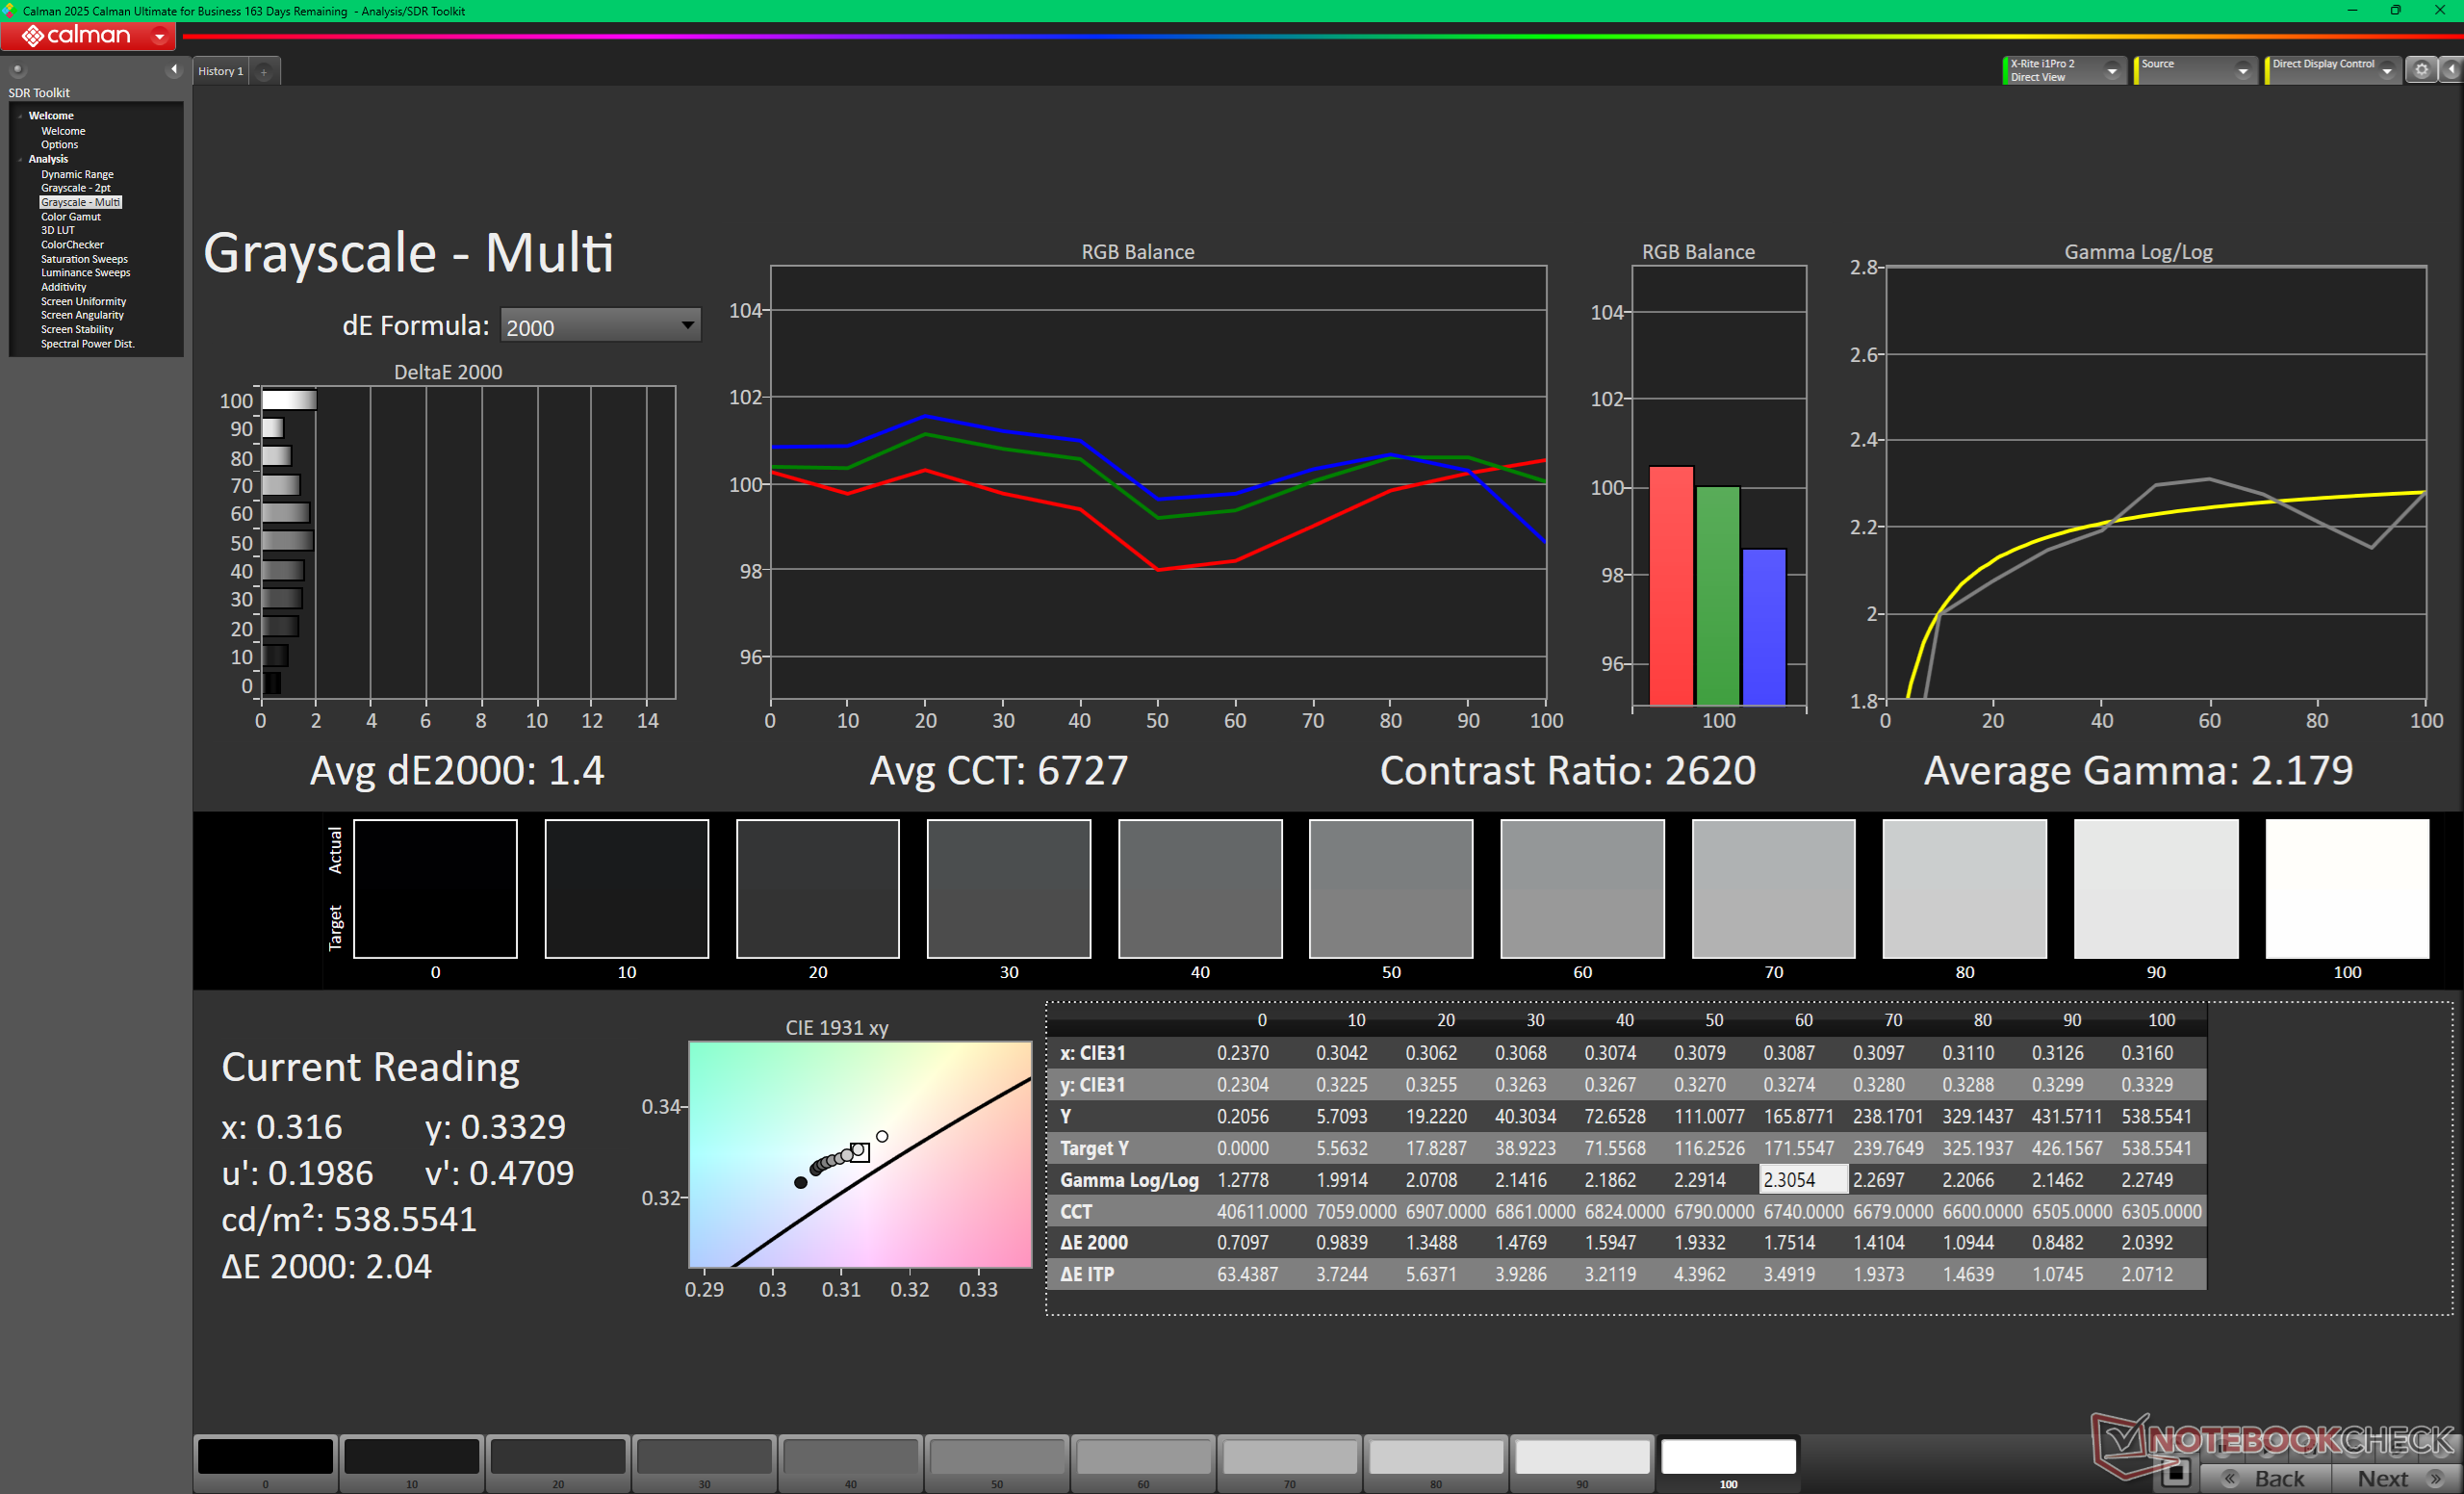
ΔE Greyscale Calman: 1.4 | ∀{0.09-98 Ø4.96}
87.6% AdobeRGB 1998 (Argyll 3D)
99.9% sRGB (Argyll 3D)
98.2% Display P3 (Argyll 3D)
Gamma: 2.2
CCT: 6727 K
Dell XPS 13 DX13260
LG Philips LP134WQ, IPS, 2560x1600, 13.4", 120 Hz
Dell XPS 14 Core Ultra X7 358H
LG Philips 140WT2, OLED, 2880x1800, 14", 120 Hz
Dell XPS 13 9350
LG Philips 134WU2, IPS, 1920x1200, 13.4", 120 Hz
Apple MacBook Neo 256 GB
IPS, 2408x1506, 13", 60 Hz
HP OmniBook 7 Aero 13-bg1077nr
LG Philips LGD0746, IPS, 1920x1200, 13.3", 60 Hz
Lenovo ThinkPad X1 Carbon Gen 14 21V70075GE
B140UAX01.1, IPS, 1920x1200, 14", 60 Hz
Display
5%
-18%
-15%
-19%
-16%
Display P3 Coverage (%)
98.2
99.7
2%
67.3
-31%
72.2
-26%
66.5
-32%
69.8
-29%
sRGB Coverage (%)
99.9
100
0%
99
-1%
97.9
-2%
96.8
-3%
99.1
-1%
AdobeRGB 1998 Coverage (%)
87.6
98.2
12%
68.6
-22%
72.6
-17%
67.3
-23%
72
-18%
Response Times
98%
25%
58%
13%
33%
Response Time Grey 50% / Grey 80% * (ms)
51.2 ?(23.6, 27.6)
0.75 ?(0.43, 0.32)
99%
37.3 ?(17, 20.3)
27%
20.8 ?(9.2, 11.6)
59%
44.7 ?(20.3, 24.4)
13%
42 ?(19.4, 22.6)
18%
Response Time Black / White * (ms)
33.6 ?(14, 19.6)
1.03 ?(0.53, 0.5)
97%
25.9 ?(12.5, 13.4)
23%
14.6 ?(4.3, 10.3)
57%
29.7 ?(14.8, 14.9)
12%
17.7 ?(7.2, 10.5)
47%
PWM Frequency (Hz)
240.62 ?(100)
PWM Amplitude * (%)
29
Screen
-9%
6%
-14%
-94%
-122%
Brightness middle (cd/m²)
539.3
393.8
-27%
462.8
-14%
548
2%
442
-18%
540
0%
Brightness (cd/m²)
503
389
-23%
435
-14%
519
3%
420
-17%
524
4%
Brightness Distribution (%)
89
96
8%
87
-2%
91
2%
88
-1%
93
4%
Black Level * (cd/m²)
0.25
0.19
24%
0.48
-92%
0.3
-20%
0.3
-20%
Contrast (:1)
2157
2436
13%
1142
-47%
1473
-32%
1800
-17%
Colorchecker dE 2000 *
1.2
1.27
-6%
1.92
-60%
1.4
-17%
4.34
-262%
5
-317%
Colorchecker dE 2000 max. *
3.63
3.35
8%
3.45
5%
3.1
15%
9.71
-167%
12.2
-236%
Colorchecker dE 2000 calibrated *
0.92
0.71
23%
0.48
48%
0.4
57%
0.58
37%
1.1
-20%
Greyscale dE 2000 *
1.4
2
-43%
0.6
57%
2.1
-50%
6.5
-364%
8.3
-493%
Gamma
2.2 100%
2.19 100%
2.19 100%
2.24 98%
2.13 103%
2.22 99%
CCT
6727 97%
6379 102%
6539 99%
6870 95%
7466 87%
7068 92%
Moyenne finale (programmes/paramètres)
31% / 13%
4% / 4%
10% / -4%
-33% / -63%
-35% / -77%

* ... Moindre est la valeur, meilleures sont les performances
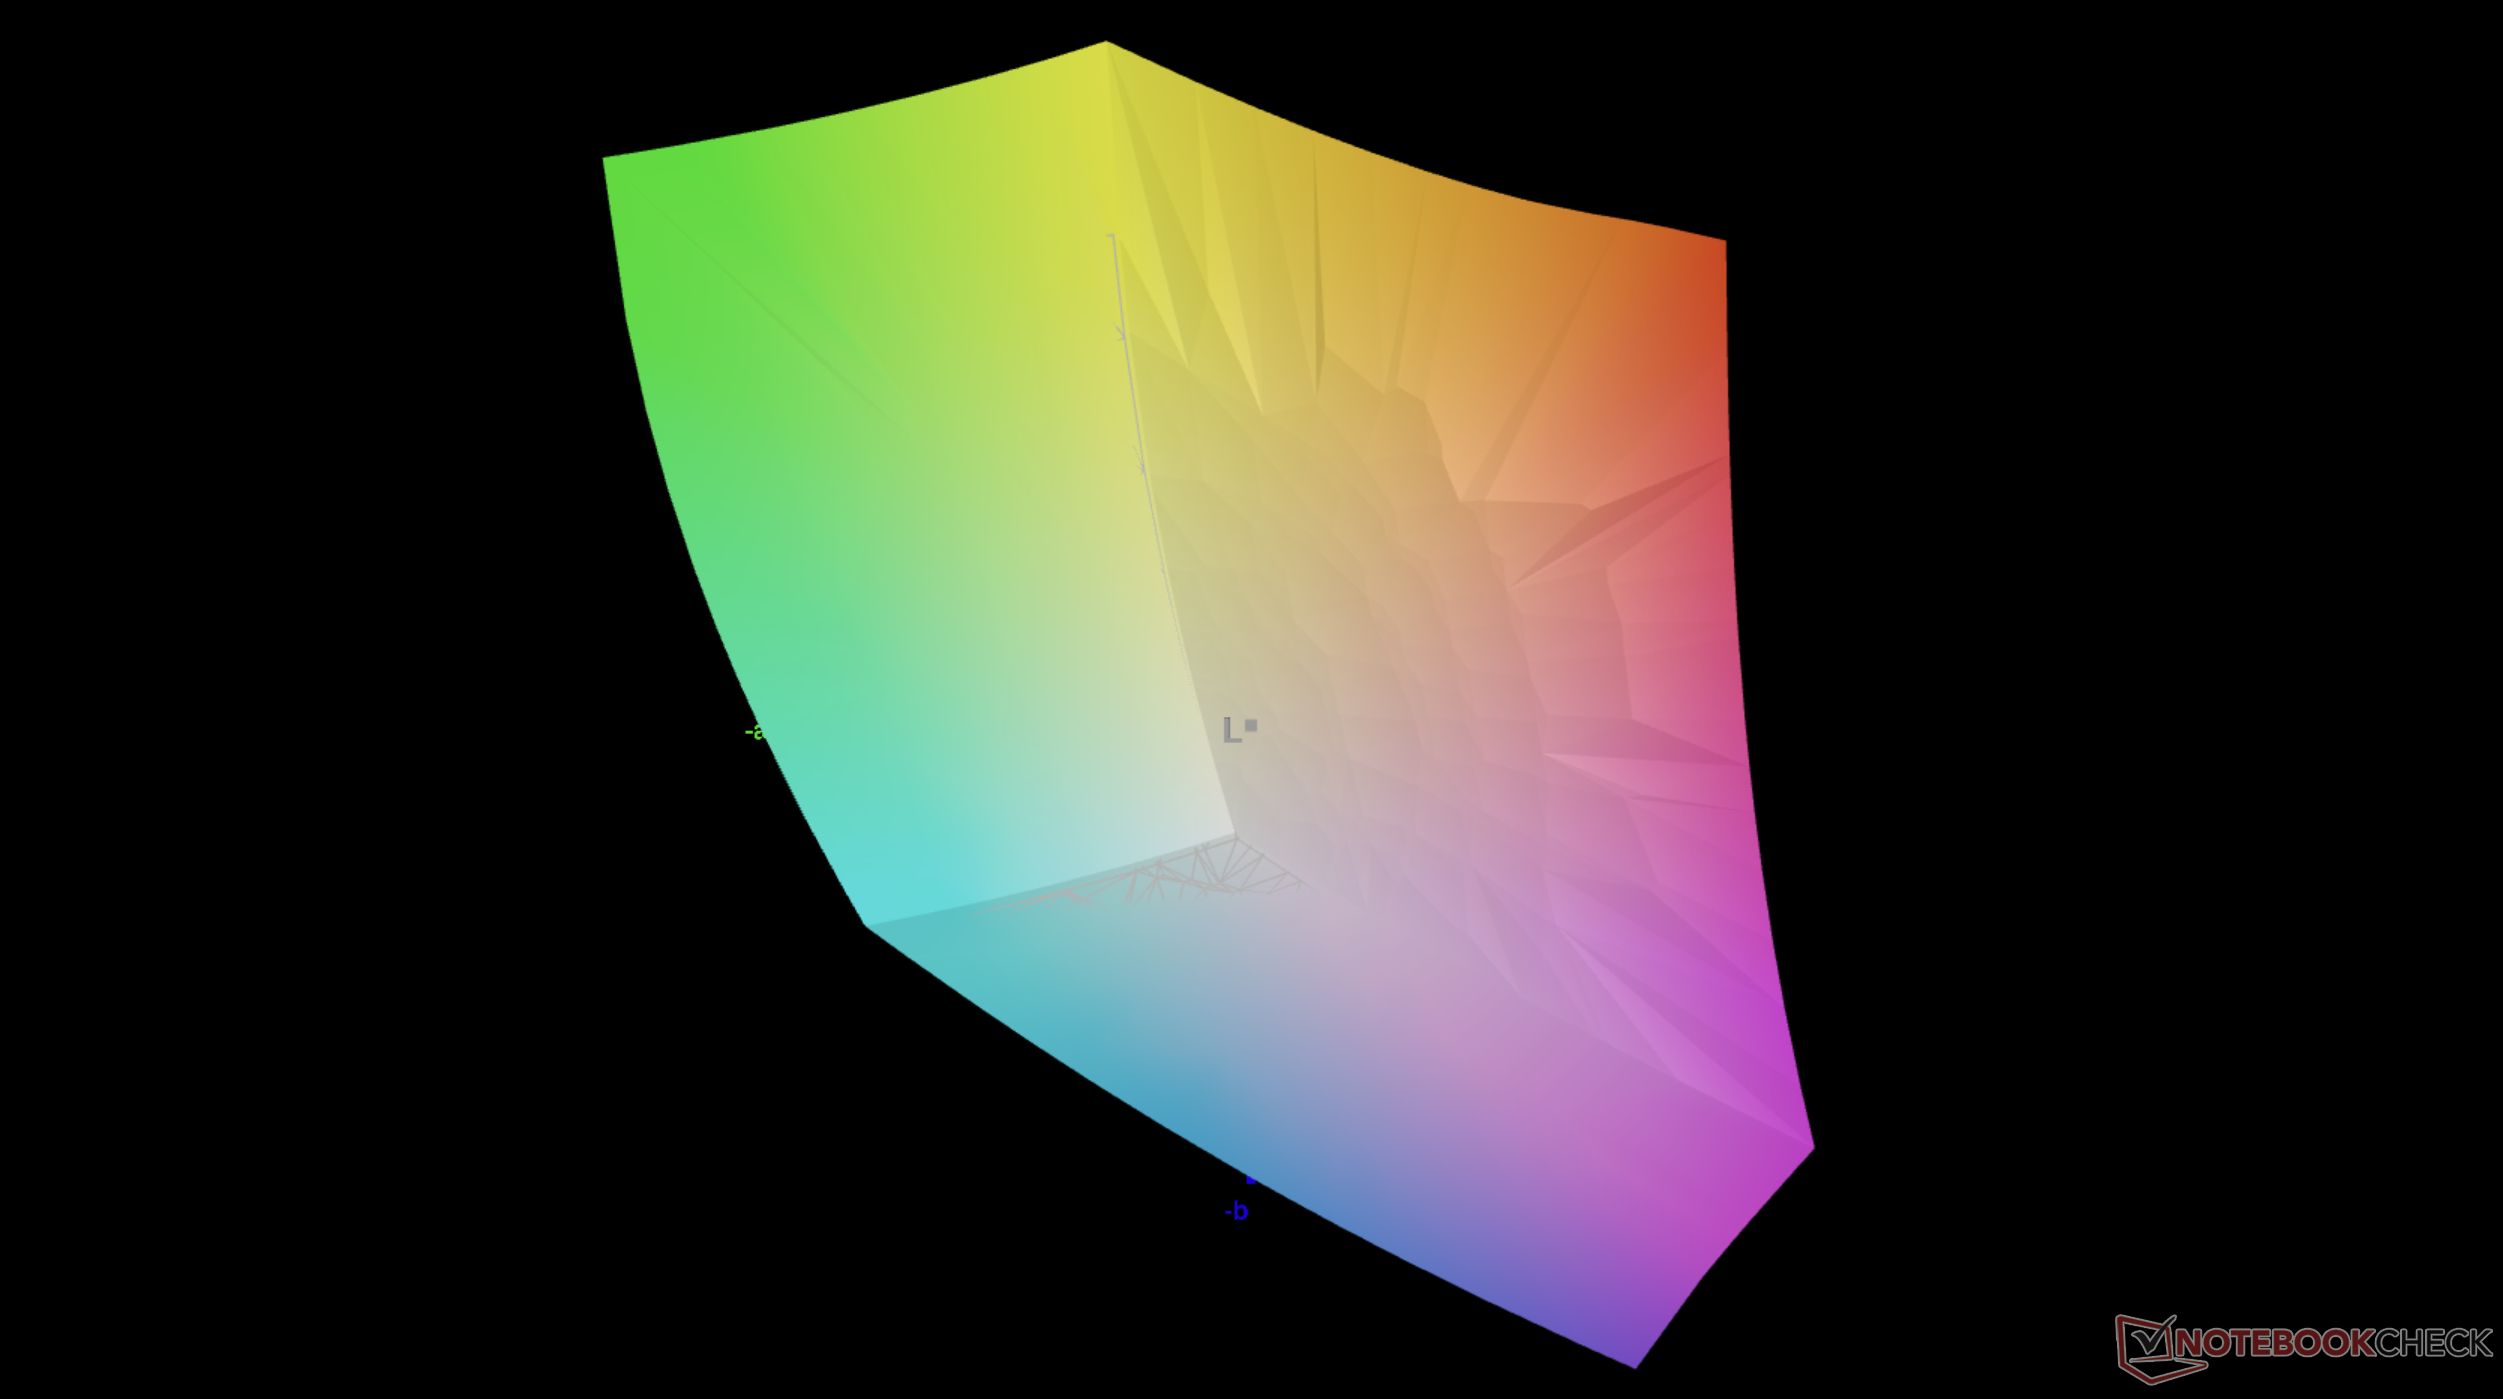
vs. sRGB
vs. sRGB
vs. P3
vs. P3
Échelle de gris avant étalonnage
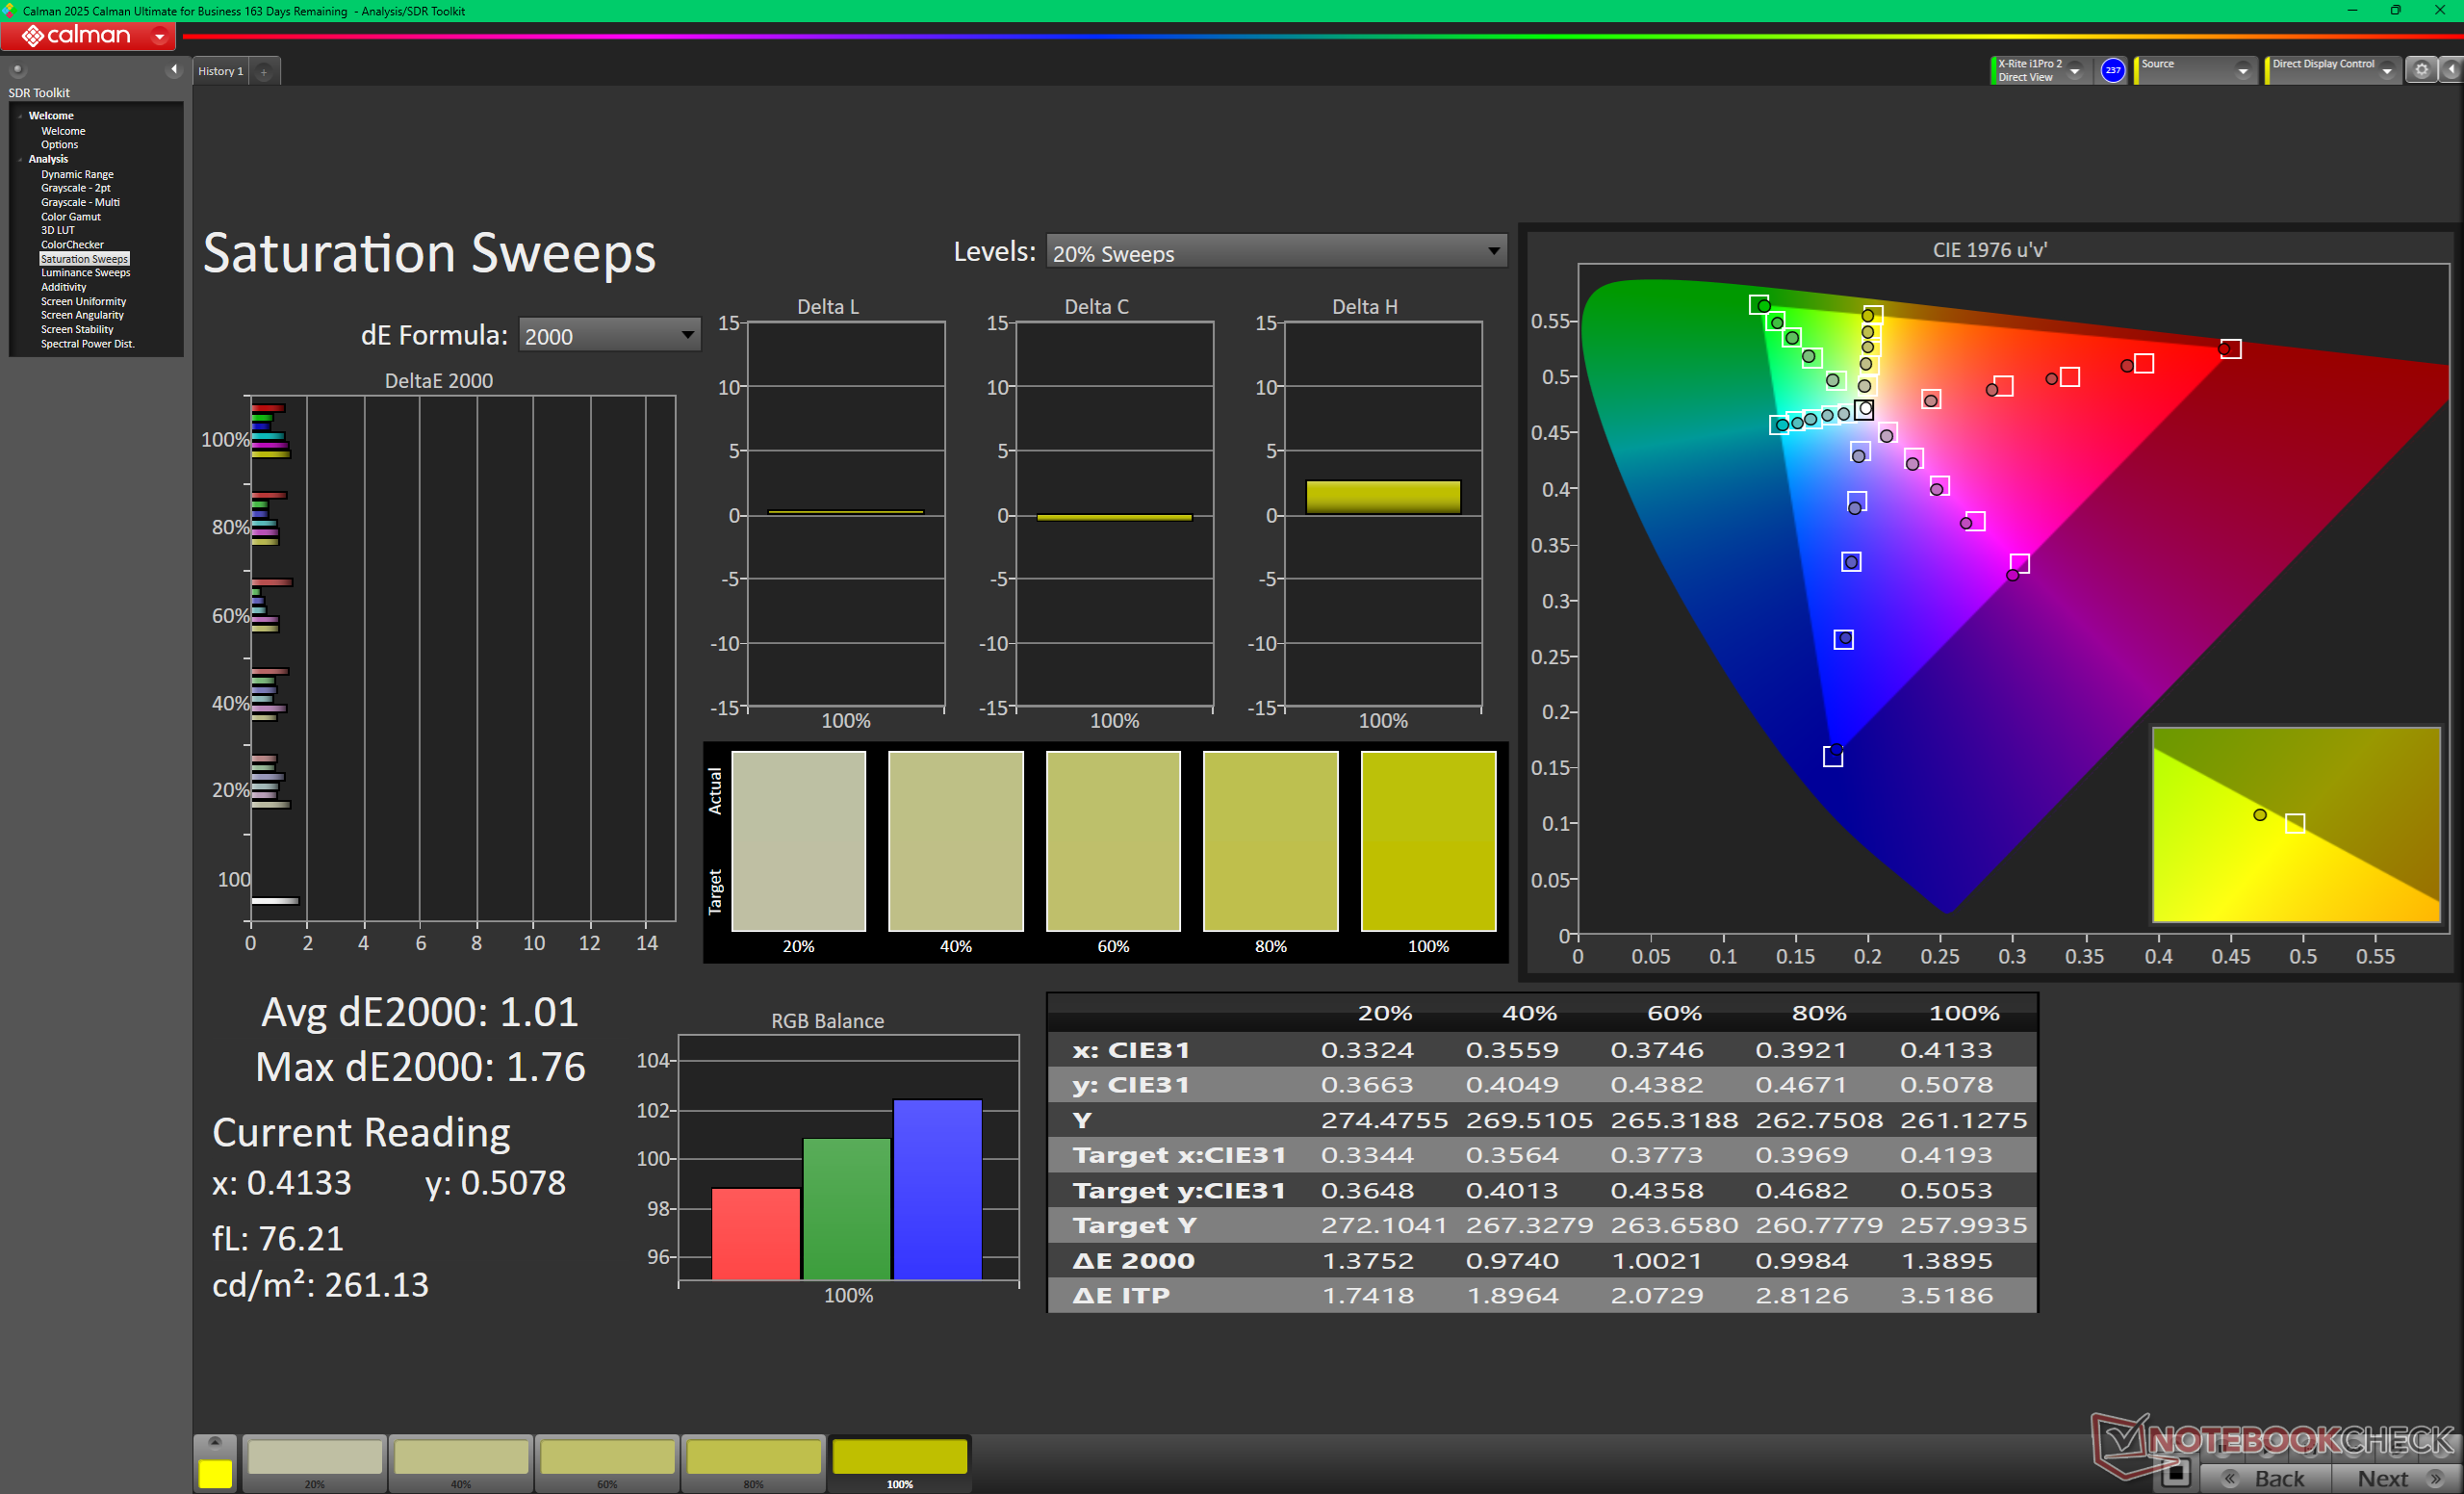
Balayages de saturation avant l'étalonnage
ColorChecker avant l'étalonnage
Niveaux de gris après étalonnage
Balayages de saturation après étalonnage
ColorChecker après étalonnage

Temps de réponse de l'écran

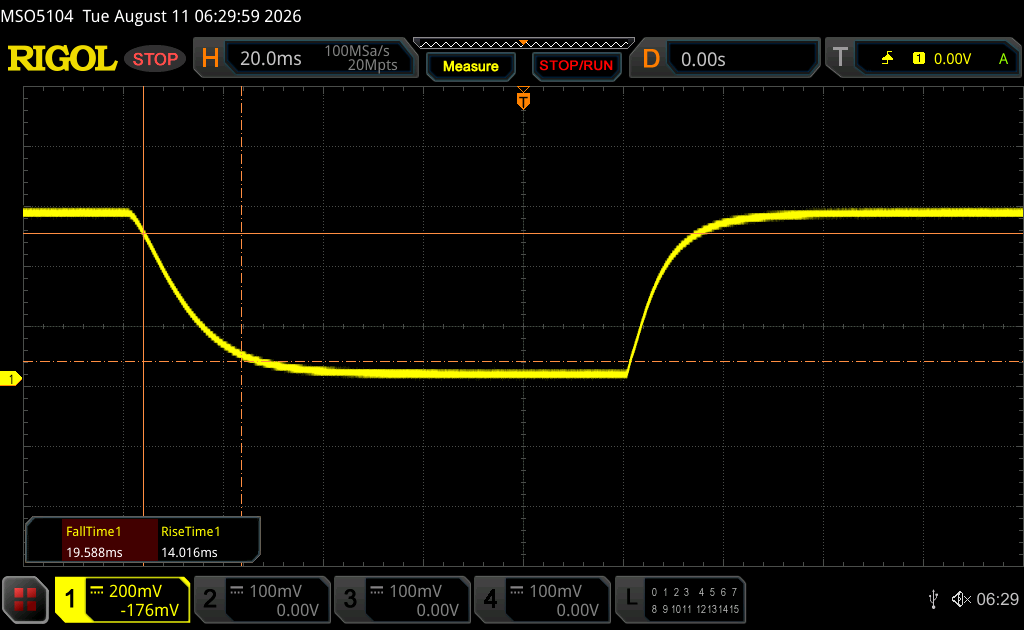
Le temps de réponse d'un écran mesure la rapidité à laquelle l'écran est capable de changer une couleur pour une autre. Un temps de réponse élevé se traduit par une image floutée pour les objets en mouvement. Les joueurs bénéficieront de faibles latences d'affichage en jeu.
       Temps de réponse noir à blanc
33.6 ms ... hausse ↗ et chute ↘ combinées↗ 14 ms hausse
↘ 19.6 ms chute
L'écran souffre de latences très élevées, à éviter pour le jeu.
En comparaison, tous les appareils testés affichent entre 0.1 (minimum) et 240 (maximum) ms. » 90 % des appareils testés affichent de meilleures performances.
Cela signifie que les latences relevées sont moins bonnes que la moyenne (19.8 ms) de tous les appareils testés.
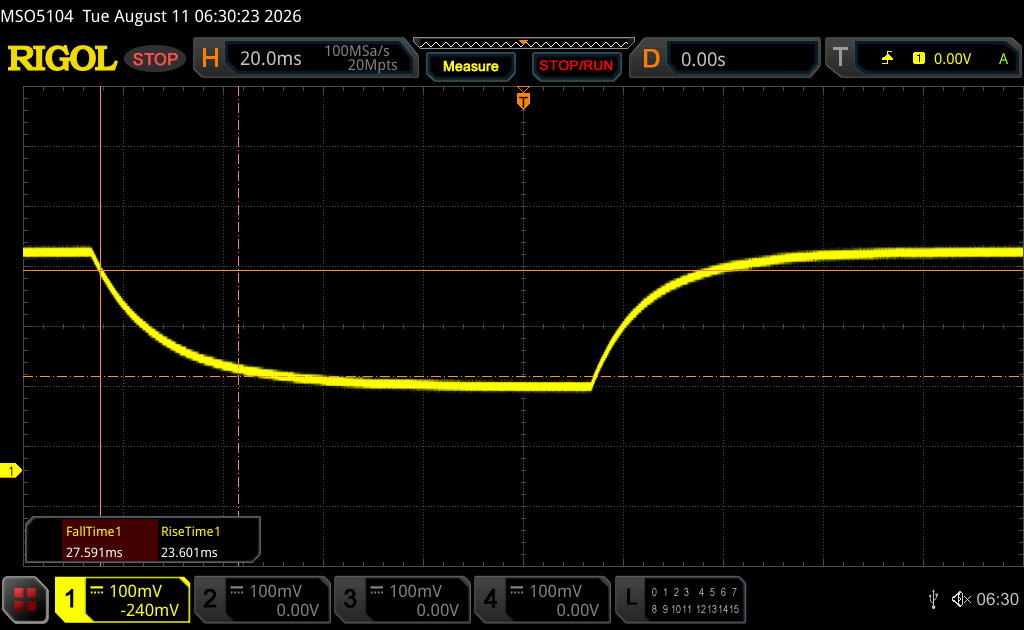
       Temps de réponse gris 50% à gris 80%
51.2 ms ... hausse ↗ et chute ↘ combinées↗ 23.6 ms hausse
↘ 27.6 ms chute
L'écran souffre de latences très élevées, à éviter pour le jeu.
En comparaison, tous les appareils testés affichent entre 0.165 (minimum) et 636 (maximum) ms. » 88 % des appareils testés affichent de meilleures performances.
Cela signifie que les latences relevées sont moins bonnes que la moyenne (30.9 ms) de tous les appareils testés.

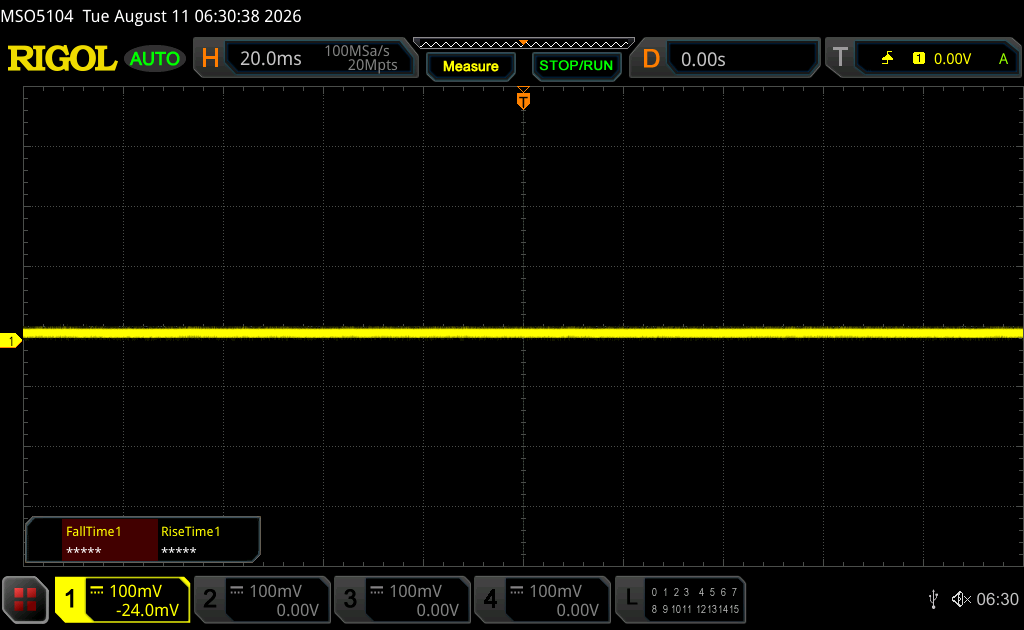
Scintillement / MLI (Modulation de largeur d'impulsion)

Afin d'abaisser la luminosité de l'écran, certains ordinateurs portables font varier très rapidement le rétroéclairage entre éteint et allumé. La fréquence à laquelle le rétroéclairage s'éteint et se rallume est normalement fixée à une valeur qui permet de rendre la variation indétectable à l'œil nu? Si la fréquence est trop basse, certaines personnes peuvent être sujettes à une fatigue oculaire, des maux de tête ou même percevoir les variations.
Scintillement / MLI (Modulation de largeur d'impulsion) non décelé

En comparaison, 52 % des appareils testés n'emploient pas MDI pour assombrir leur écran. Nous avons relevé une moyenne à 7735 (minimum : 5 - maximum : 343500) Hz dans le cas où une MDI était active.

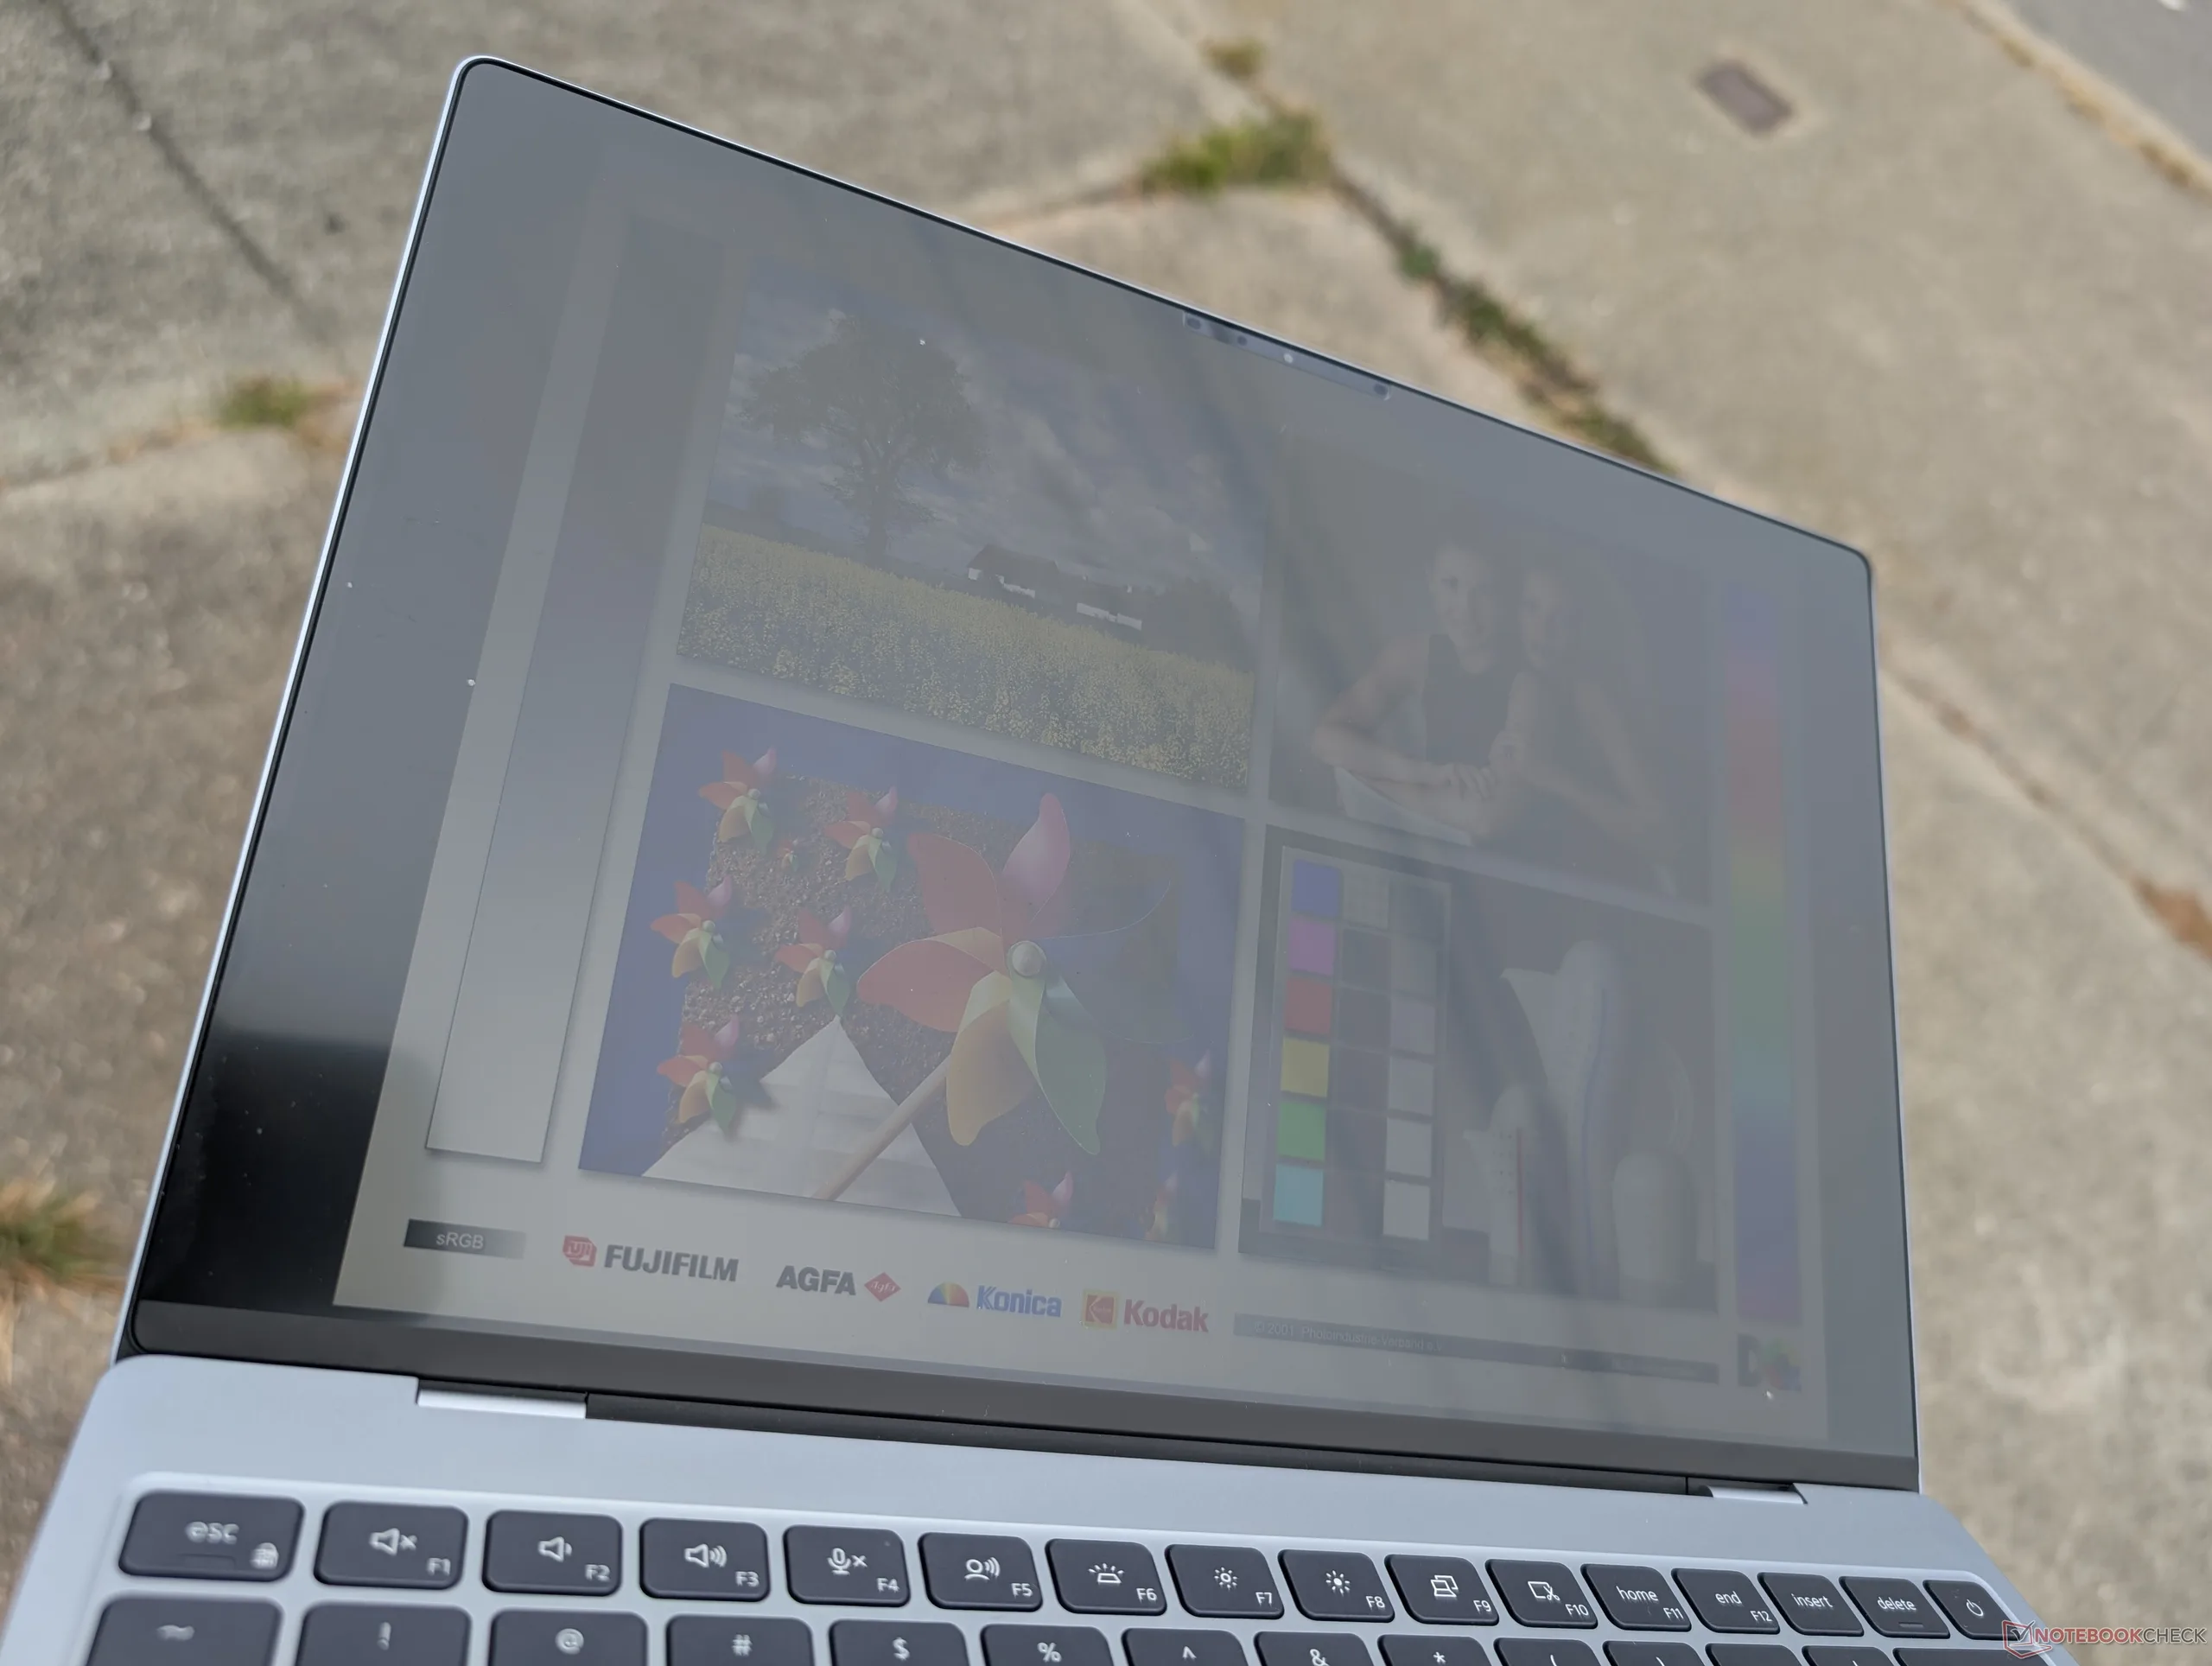
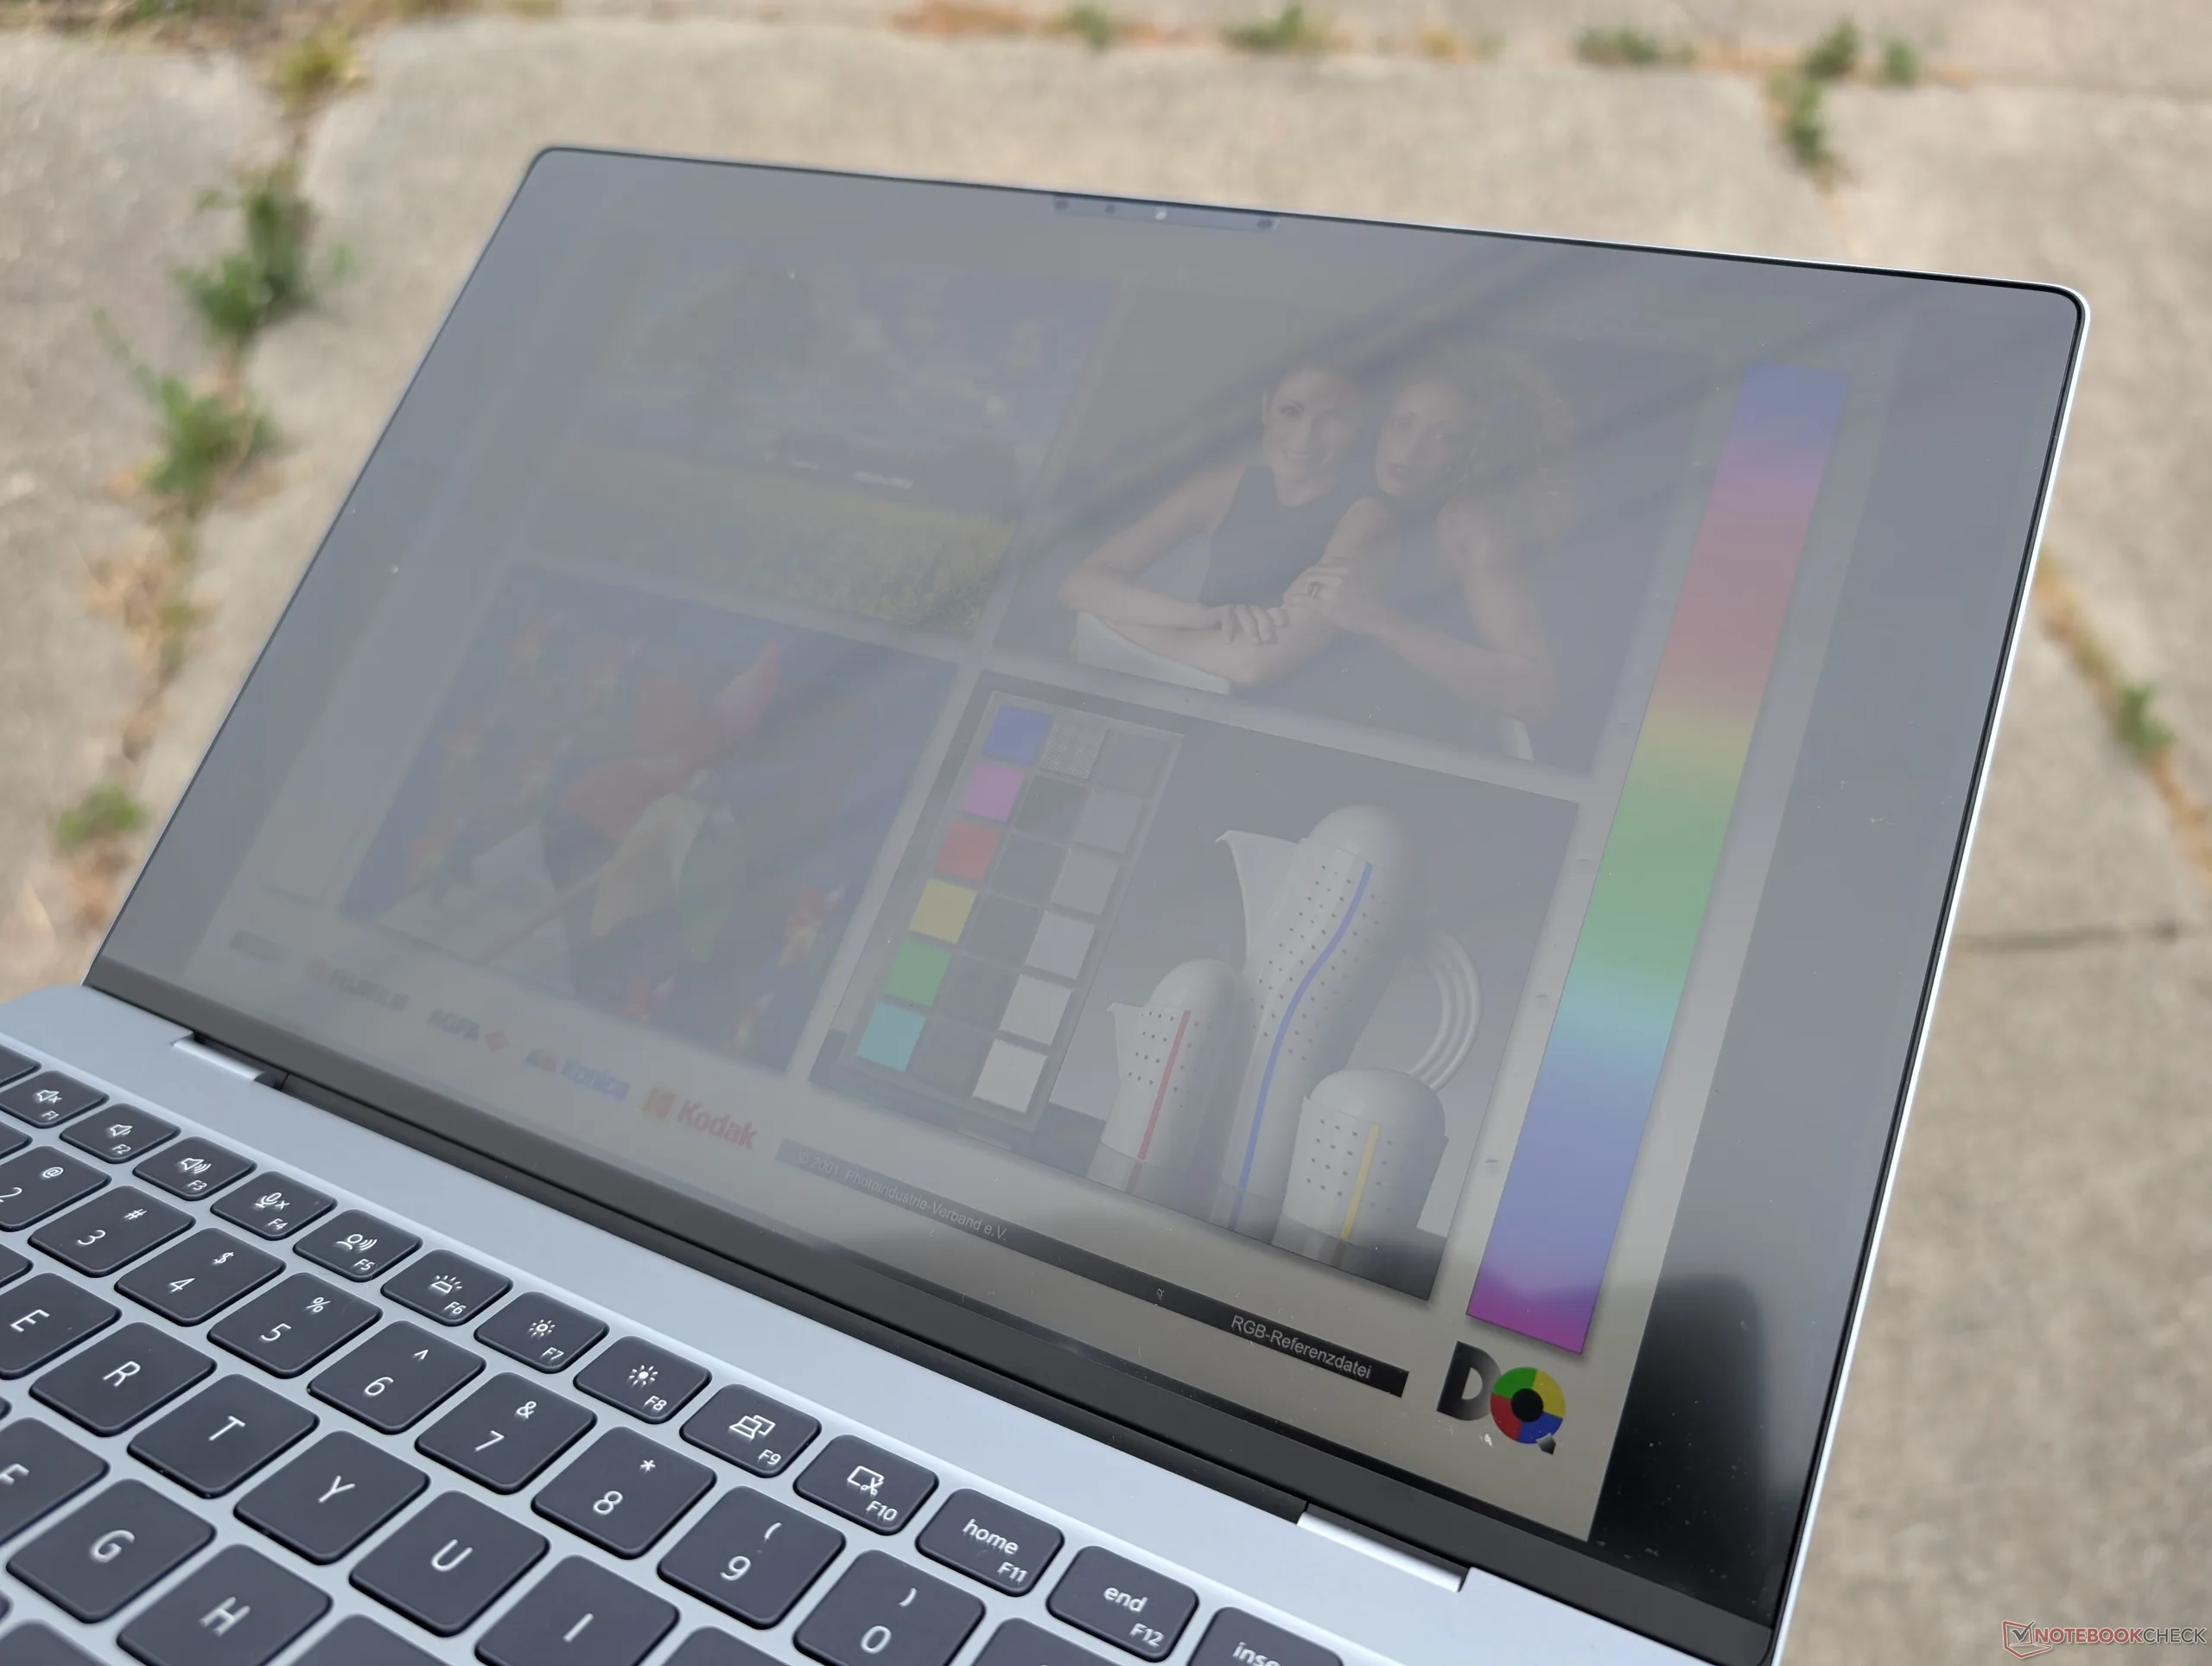
En extérieur, sous un ciel couvert mais lumineux
Bonne lisibilité en extérieur, même à l’ombre
En extérieur, sous un ciel couvert mais lumineux
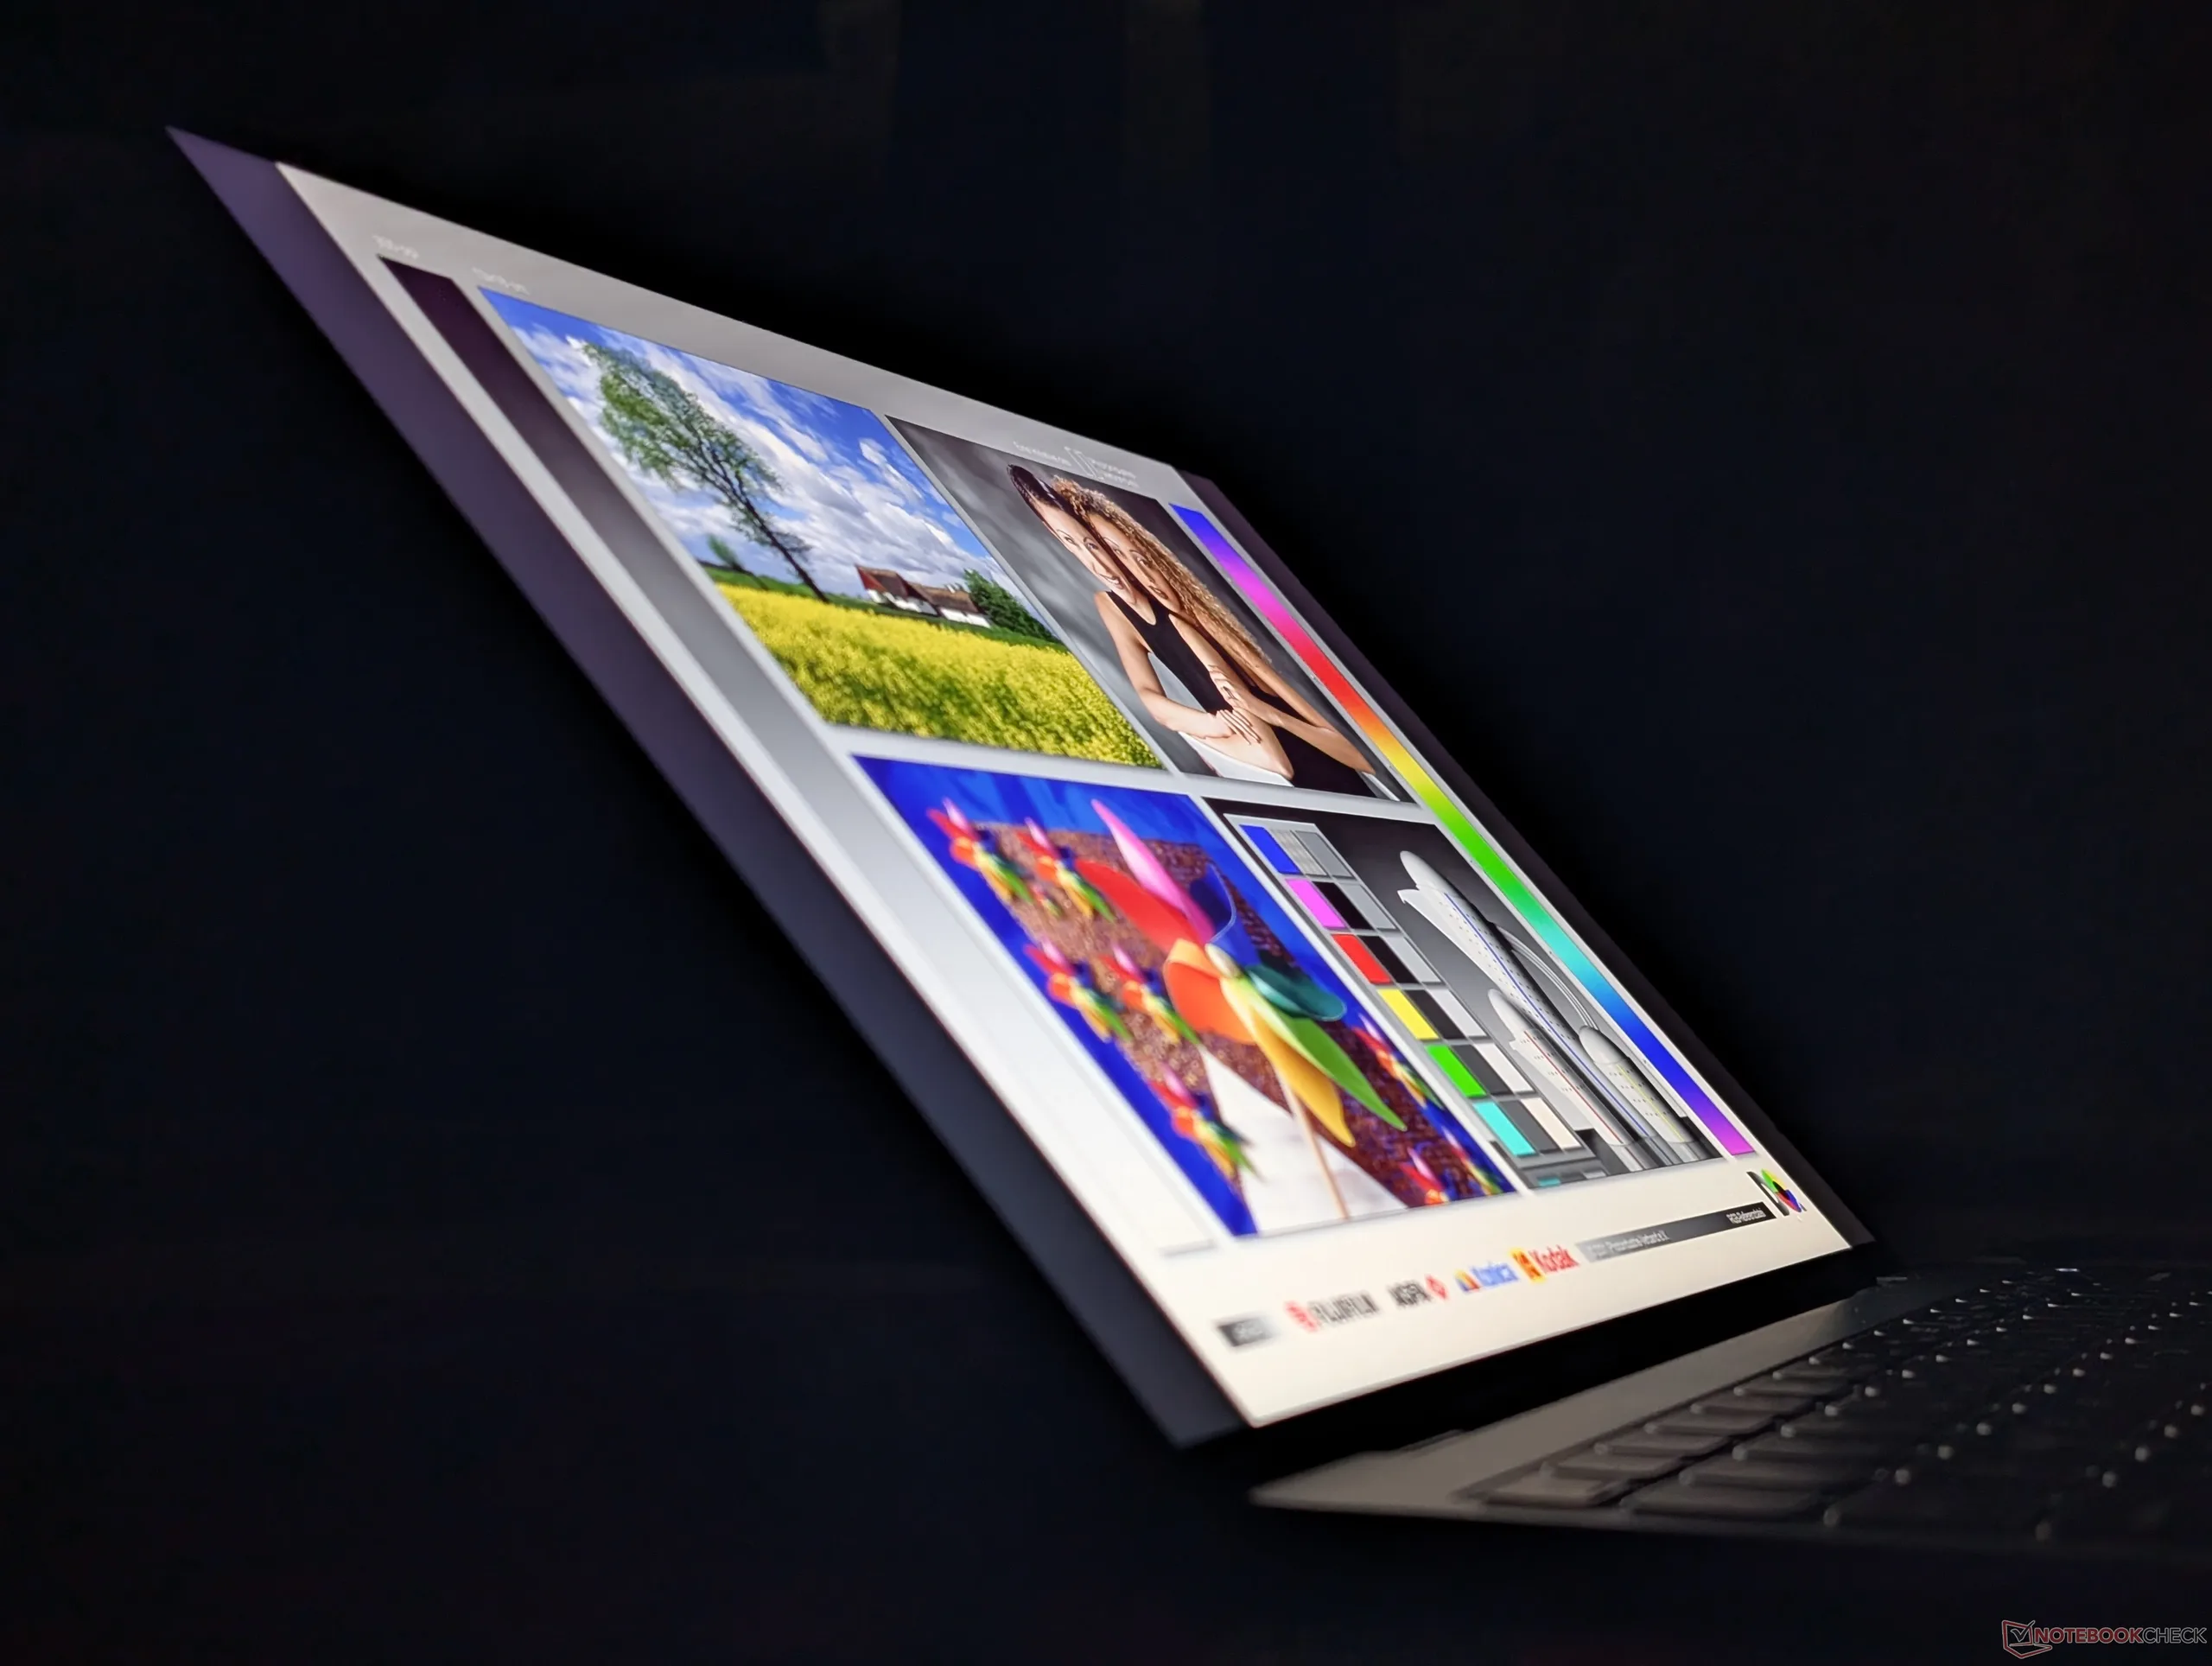
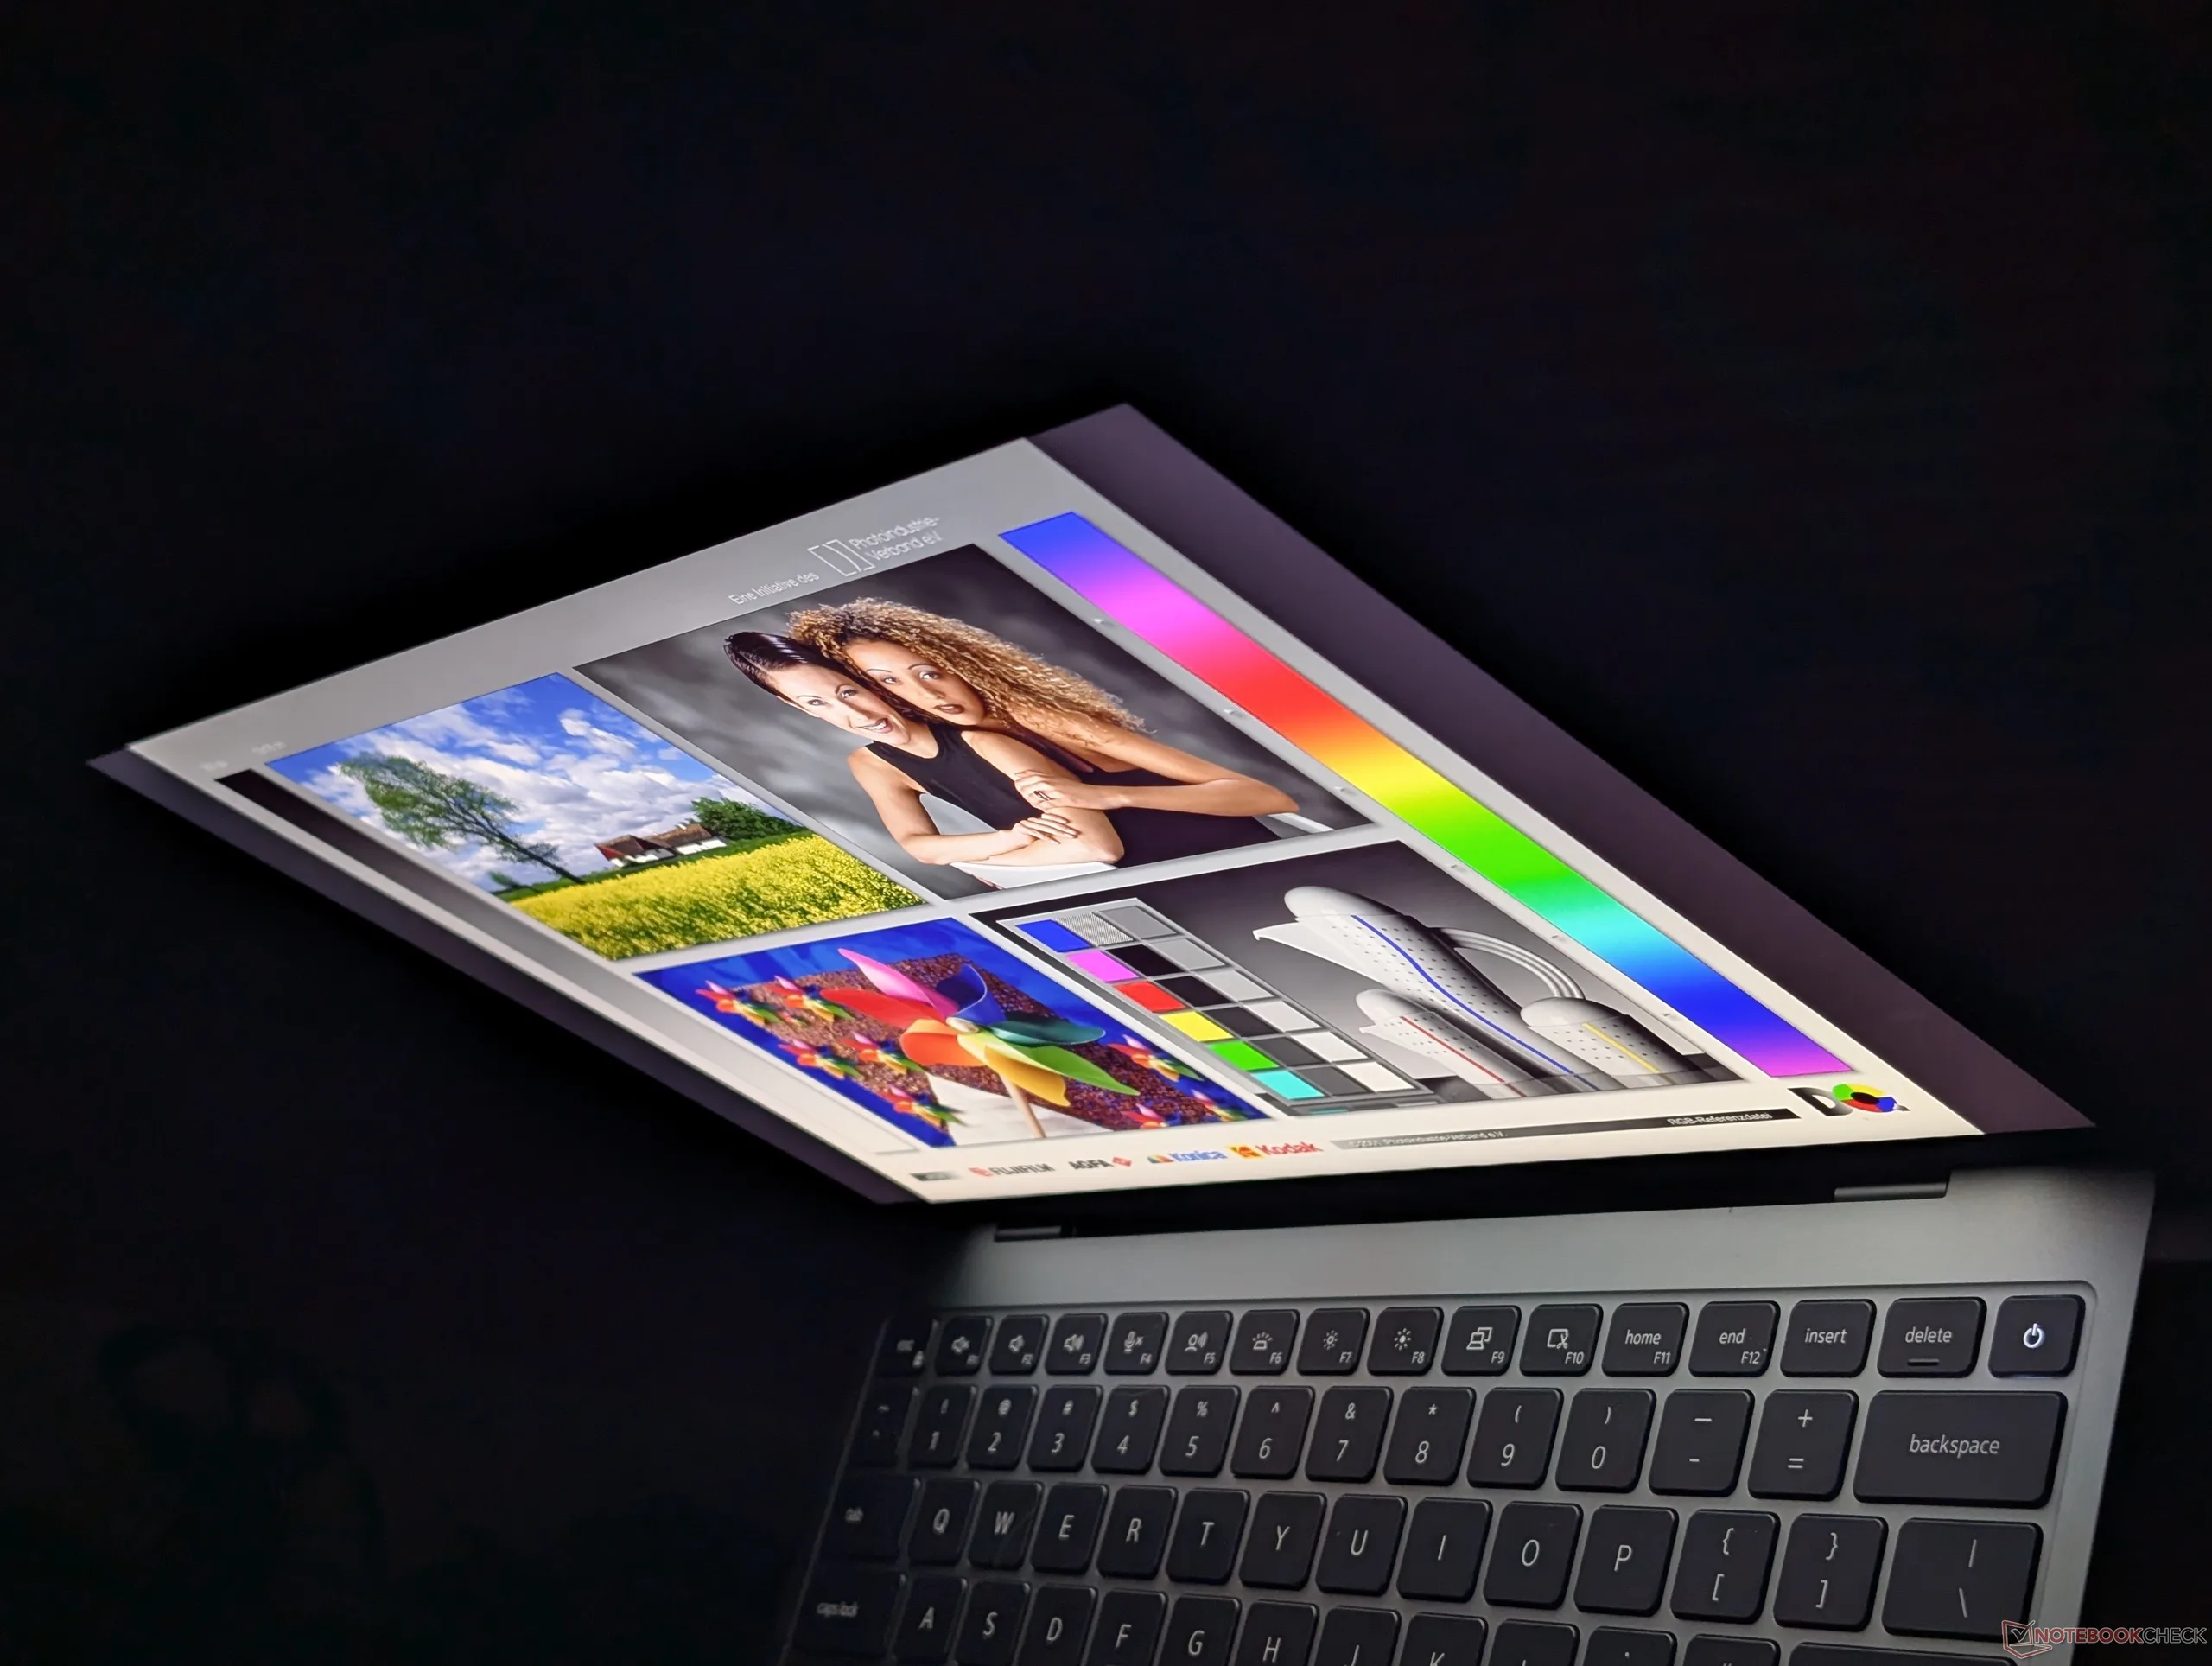
Grands angles de vision IPS

Performances

Conditions d'essai

Nous avons configuré Windows en mode « Équilibré », conformément aux recommandations du fabricant, avant d'exécuter les tests de performance ci-dessous.

Performances du processeur

Les performances multithread brutes du Core 5 320 ne sont que légèrement supérieures à celles du Core i7-1185G7, vieux de cinq ans. Passer au Core Ultra 7 355 peut s’avérer intéressant pour les utilisateurs pratiquant le multitâche intensif, car cela permettrait d’augmenter considérablement les performances multithread de plus de 80 %.

Cinebench R15 Multi Loop

065130195260325390455520585650715780845910975104011051170123513001365143014951560162516901755182018851950201520802145221022752340240524702535260026652730279528602925299030553120Tooltip
Dell XPS 13 DX13260 Intel Core 5 320: Ø940 (856.35-1053.52) Points
Dell XPS 14 Core Ultra X7 358H Intel Core Ultra X7 358H: Ø2340 (2099.85-3134.55) Points
Dell XPS 13 9350 Intel Core Ultra 7 256V: Ø1415 (1369.16-1569.86) Points
HP OmniBook 7 Aero 13-bg1077nr AMD Ryzen AI 7 350: Ø1989 (1917.36-2037.7) Points
Lenovo ThinkPad X1 Carbon Gen 14 21V70075GE Intel Core Ultra 5 325: Ø1617 (1603.78-1670.43) Points
CPU Performance rating: Percent
Cinebench R23: Multi Core | Single Core
Cinebench R20: CPU (Multi Core) | CPU (Single Core)
Cinebench R15: CPU Multi 64Bit | CPU Single 64Bit
Blender: v2.79 BMW27 CPU
7-Zip 18.03: 7z b 4 | 7z b 4 -mmt1
Geekbench 6.7: Multi-Core | Single-Core
Geekbench 5.5: Multi-Core | Single-Core
HWBOT x265 Benchmark v2.2: 4k Preset
LibreOffice : 20 Documents To PDF
R Benchmark 2.5: Overall mean
CPU Performance rating
Dell XPS 14 Core Ultra X7 358H
Intel Core Ultra X7 358H
87.7 pt
Apple MacBook Neo 256 GB -14!
Apple A18 Pro
76.7 pt
HP OmniBook 7 Aero 13-bg1077nr
AMD Ryzen AI 7 350
73 pt
Dell XPS 14 Core Ultra 7 355
Intel Core Ultra 7 355
66.3 pt
Lenovo ThinkPad X1 Carbon Gen 14 21V70075GE
Intel Core Ultra 5 325
64.9 pt
Dell XPS 13 9350
Intel Core Ultra 7 256V
62.8 pt
HP EliteBook 8 Flip G1i 13
Intel Core Ultra 7 265U
59 pt
Dell Latitude 13 7330 -2!
Intel Core i7-1265U
53.4 pt
Lenovo ThinkPad L13 2in1 G5 21LNS4AM00
Intel Core Ultra 5 125U
53.3 pt
Moyenne Intel Core 5 320
 
51.5 pt
Dell XPS 13 DX13260
Intel Core 5 320
51.4 pt
Alldocube iWork GT Ultra -1!
Intel Core Ultra 5 125H
49.4 pt
Microsoft Surface Pro 8, i7-1185G7 -2!
Intel Core i7-1185G7
41.6 pt
Cinebench R23 / Multi Core
Dell XPS 14 Core Ultra X7 358H
Intel Core Ultra X7 358H
18932 (14811.1min - 18932.2max) Points +206%
HP OmniBook 7 Aero 13-bg1077nr
AMD Ryzen AI 7 350
14244 (12235.7min - 14243.7max) Points +130%
Dell XPS 14 Core Ultra 7 355
Intel Core Ultra 7 355
11348 (10188.4min - 11347.5max) Points +83%
Lenovo ThinkPad X1 Carbon Gen 14 21V70075GE
Intel Core Ultra 5 325
10980 Points +77%
HP EliteBook 8 Flip G1i 13
Intel Core Ultra 7 265U
10623 (8296.55min - 10623.2max) Points +71%
Dell XPS 13 9350
Intel Core Ultra 7 256V
10391 (9371.44min - 10390.8max) Points +68%
Lenovo ThinkPad L13 2in1 G5 21LNS4AM00
Intel Core Ultra 5 125U
10372 Points +67%
Alldocube iWork GT Ultra
Intel Core Ultra 5 125H
8419 Points +36%
Dell Latitude 13 7330
Intel Core i7-1265U
8108 (6277.1min - 8107.56max) Points +31%
Dell XPS 13 DX13260
Intel Core 5 320
6197 (6096.49min - 6196.88max) Points
Moyenne Intel Core 5 320
  (n=1)
6197 Points 0%
Microsoft Surface Pro 8, i7-1185G7
Intel Core i7-1185G7
5668 Points -9%
Cinebench R23 / Single Core
Dell XPS 14 Core Ultra X7 358H
Intel Core Ultra X7 358H
2086 Points +8%
HP OmniBook 7 Aero 13-bg1077nr
AMD Ryzen AI 7 350
1979 Points +3%
Dell XPS 14 Core Ultra 7 355
Intel Core Ultra 7 355
1940 Points +1%
Dell XPS 13 DX13260
Intel Core 5 320
1926 Points
Moyenne Intel Core 5 320
  (n=1)
1926 Points 0%
Lenovo ThinkPad X1 Carbon Gen 14 21V70075GE
Intel Core Ultra 5 325
1892 Points -2%
Dell XPS 13 9350
Intel Core Ultra 7 256V
1875 Points -3%
HP EliteBook 8 Flip G1i 13
Intel Core Ultra 7 265U
1749 Points -9%
Dell Latitude 13 7330
Intel Core i7-1265U
1738 Points -10%
Lenovo ThinkPad L13 2in1 G5 21LNS4AM00
Intel Core Ultra 5 125U
1586 Points -18%
Alldocube iWork GT Ultra
Intel Core Ultra 5 125H
1539 Points -20%
Microsoft Surface Pro 8, i7-1185G7
Intel Core i7-1185G7
1512 Points -21%
Cinebench R20 / CPU (Multi Core)
Dell XPS 14 Core Ultra X7 358H
Intel Core Ultra X7 358H
7437 Points +214%
HP OmniBook 7 Aero 13-bg1077nr
AMD Ryzen AI 7 350
5404 Points +128%
Dell XPS 14 Core Ultra 7 355
Intel Core Ultra 7 355
4359 Points +84%
Lenovo ThinkPad X1 Carbon Gen 14 21V70075GE
Intel Core Ultra 5 325
4250 Points +79%
HP EliteBook 8 Flip G1i 13
Intel Core Ultra 7 265U
4061 Points +71%
Dell XPS 13 9350
Intel Core Ultra 7 256V
4038 Points +70%
Lenovo ThinkPad L13 2in1 G5 21LNS4AM00
Intel Core Ultra 5 125U
3984 Points +68%
Alldocube iWork GT Ultra
Intel Core Ultra 5 125H
3203 Points +35%
Dell Latitude 13 7330
Intel Core i7-1265U
3195 Points +35%
Dell XPS 13 DX13260
Intel Core 5 320
2371 Points
Moyenne Intel Core 5 320
  (n=1)
2371 Points 0%
Microsoft Surface Pro 8, i7-1185G7
Intel Core i7-1185G7
2097 Points -12%
Cinebench R20 / CPU (Single Core)
Dell XPS 14 Core Ultra X7 358H
Intel Core Ultra X7 358H
792 Points +10%
HP OmniBook 7 Aero 13-bg1077nr
AMD Ryzen AI 7 350
774 Points +8%
Dell XPS 14 Core Ultra 7 355
Intel Core Ultra 7 355
733 Points +2%
Dell XPS 13 9350
Intel Core Ultra 7 256V
720 Points 0%
Dell XPS 13 DX13260
Intel Core 5 320
717 Points
Moyenne Intel Core 5 320
  (n=1)
717 Points 0%
Lenovo ThinkPad X1 Carbon Gen 14 21V70075GE
Intel Core Ultra 5 325
713 Points -1%
HP EliteBook 8 Flip G1i 13
Intel Core Ultra 7 265U
678 Points -5%
Dell Latitude 13 7330
Intel Core i7-1265U
651 Points -9%
Lenovo ThinkPad L13 2in1 G5 21LNS4AM00
Intel Core Ultra 5 125U
609 Points -15%
Alldocube iWork GT Ultra
Intel Core Ultra 5 125H
592 Points -17%
Microsoft Surface Pro 8, i7-1185G7
Intel Core i7-1185G7
578 Points -19%
Cinebench R15 / CPU Multi 64Bit
Dell XPS 14 Core Ultra X7 358H
Intel Core Ultra X7 358H
3135 (2099.85min - 3134.55max) Points +197%
HP OmniBook 7 Aero 13-bg1077nr
AMD Ryzen AI 7 350
2038 (1917.36min - 2037.7max) Points +93%
HP EliteBook 8 Flip G1i 13
Intel Core Ultra 7 265U
1736 (1258.93min - 1735.81max) Points +65%
Lenovo ThinkPad X1 Carbon Gen 14 21V70075GE
Intel Core Ultra 5 325
1670 (1603.78min - 1670.43max) Points +58%
Dell XPS 14 Core Ultra 7 355
Intel Core Ultra 7 355
1654 (1489.92min - 1654.26max) Points +57%
Lenovo ThinkPad L13 2in1 G5 21LNS4AM00
Intel Core Ultra 5 125U
1614 (1027.83min - 1613.94max) Points +53%
Dell XPS 13 9350
Intel Core Ultra 7 256V
1570 (1369.16min - 1569.86max) Points +49%
Dell Latitude 13 7330
Intel Core i7-1265U
1420 (1010.48min - 1420.35max) Points +35%
Alldocube iWork GT Ultra
Intel Core Ultra 5 125H
1225 Points +16%
Dell XPS 13 DX13260
Intel Core 5 320
1054 (856.35min - 1053.52max) Points
Moyenne Intel Core 5 320
  (n=1)
1054 Points 0%
Microsoft Surface Pro 8, i7-1185G7
Intel Core i7-1185G7
995 (789.61min - 994.68max) Points -6%
Cinebench R15 / CPU Single 64Bit
Dell XPS 14 Core Ultra X7 358H
Intel Core Ultra X7 358H
312 Points +13%
HP OmniBook 7 Aero 13-bg1077nr
AMD Ryzen AI 7 350
297 Points +8%
Dell XPS 14 Core Ultra 7 355
Intel Core Ultra 7 355
288 Points +4%
Dell XPS 13 9350
Intel Core Ultra 7 256V
285 Points +3%
Lenovo ThinkPad X1 Carbon Gen 14 21V70075GE
Intel Core Ultra 5 325
282 Points +2%
Dell XPS 13 DX13260
Intel Core 5 320
276 Points
Moyenne Intel Core 5 320
  (n=1)
276 Points 0%
Dell Latitude 13 7330
Intel Core i7-1265U
250 Points -9%
HP EliteBook 8 Flip G1i 13
Intel Core Ultra 7 265U
244 Points -12%
Lenovo ThinkPad L13 2in1 G5 21LNS4AM00
Intel Core Ultra 5 125U
230 Points -17%
Microsoft Surface Pro 8, i7-1185G7
Intel Core i7-1185G7
224 Points -19%
Alldocube iWork GT Ultra
Intel Core Ultra 5 125H
217 Points -21%
Blender / v2.79 BMW27 CPU
Microsoft Surface Pro 8, i7-1185G7
Intel Core i7-1185G7
569 Seconds * -15%
Dell XPS 13 DX13260
Intel Core 5 320
494 Seconds *
Moyenne Intel Core 5 320
  (n=1)
494 Seconds * -0%
Dell Latitude 13 7330
Intel Core i7-1265U
413 Seconds * +16%
Alldocube iWork GT Ultra
Intel Core Ultra 5 125H
389 Seconds * +21%
Lenovo ThinkPad L13 2in1 G5 21LNS4AM00
Intel Core Ultra 5 125U
380 Seconds * +23%
Dell XPS 13 9350
Intel Core Ultra 7 256V
339 Seconds * +31%
HP EliteBook 8 Flip G1i 13
Intel Core Ultra 7 265U
335 Seconds * +32%
Lenovo ThinkPad X1 Carbon Gen 14 21V70075GE
Intel Core Ultra 5 325
310 Seconds * +37%
Dell XPS 14 Core Ultra 7 355
Intel Core Ultra 7 355
307 Seconds * +38%
HP OmniBook 7 Aero 13-bg1077nr
AMD Ryzen AI 7 350
230 Seconds * +53%
Dell XPS 14 Core Ultra X7 358H
Intel Core Ultra X7 358H
196 Seconds * +60%
7-Zip 18.03 / 7z b 4
Dell XPS 14 Core Ultra X7 358H
Intel Core Ultra X7 358H
64255 MIPS +173%
HP OmniBook 7 Aero 13-bg1077nr
AMD Ryzen AI 7 350
55010 MIPS +134%
Lenovo ThinkPad L13 2in1 G5 21LNS4AM00
Intel Core Ultra 5 125U
39072 MIPS +66%
HP EliteBook 8 Flip G1i 13
Intel Core Ultra 7 265U
38771 MIPS +65%
Dell XPS 14 Core Ultra 7 355
Intel Core Ultra 7 355
37123 MIPS +58%
Lenovo ThinkPad X1 Carbon Gen 14 21V70075GE
Intel Core Ultra 5 325
36228 MIPS +54%
Dell XPS 13 9350
Intel Core Ultra 7 256V
35950 MIPS +53%
Dell Latitude 13 7330
Intel Core i7-1265U
31869 MIPS +35%
Microsoft Surface Pro 8, i7-1185G7
Intel Core i7-1185G7
24679 MIPS +5%
Dell XPS 13 DX13260
Intel Core 5 320
23550 MIPS
Moyenne Intel Core 5 320
  (n=1)
23550 MIPS 0%
7-Zip 18.03 / 7z b 4 -mmt1
Dell XPS 14 Core Ultra X7 358H
Intel Core Ultra X7 358H
6526 MIPS +23%
HP OmniBook 7 Aero 13-bg1077nr
AMD Ryzen AI 7 350
6025 MIPS +13%
Dell XPS 14 Core Ultra 7 355
Intel Core Ultra 7 355
5764 MIPS +8%
Lenovo ThinkPad X1 Carbon Gen 14 21V70075GE
Intel Core Ultra 5 325
5741 MIPS +8%
Dell XPS 13 9350
Intel Core Ultra 7 256V
5727 MIPS +8%
Dell Latitude 13 7330
Intel Core i7-1265U
5615 MIPS +6%
Dell XPS 13 DX13260
Intel Core 5 320
5319 MIPS
Moyenne Intel Core 5 320
  (n=1)
5319 MIPS 0%
Microsoft Surface Pro 8, i7-1185G7
Intel Core i7-1185G7
5168 MIPS -3%
HP EliteBook 8 Flip G1i 13
Intel Core Ultra 7 265U
5088 MIPS -4%
Alldocube iWork GT Ultra
Intel Core Ultra 5 125H
4671 MIPS -12%
Lenovo ThinkPad L13 2in1 G5 21LNS4AM00
Intel Core Ultra 5 125U
4489 MIPS -16%
Geekbench 6.7 / Multi-Core
Dell XPS 14 Core Ultra X7 358H
Intel Core Ultra X7 358H
17121 Points +117%
HP OmniBook 7 Aero 13-bg1077nr
AMD Ryzen AI 7 350
13083 Points +66%
Dell XPS 14 Core Ultra 7 355
Intel Core Ultra 7 355
11394 Points +44%
Lenovo ThinkPad X1 Carbon Gen 14 21V70075GE
Intel Core Ultra 5 325
11038 Points +40%
Dell XPS 13 9350
Intel Core Ultra 7 256V
10972 Points +39%
HP EliteBook 8 Flip G1i 13
Intel Core Ultra 7 265U
10707 Points +36%
Alldocube iWork GT Ultra
Intel Core Ultra 5 125H
10527 Points +33%
Lenovo ThinkPad L13 2in1 G5 21LNS4AM00
Intel Core Ultra 5 125U
9351 Points +19%
Apple MacBook Neo 256 GB
Apple A18 Pro
9140 Points +16%
Moyenne Intel Core 5 320
  (7888 - 8122, n=3)
7974 Points +1%
Dell XPS 13 DX13260
Intel Core 5 320
7888 Points
Geekbench 6.7 / Single-Core
Apple MacBook Neo 256 GB
Apple A18 Pro
3589 Points +39%
Dell XPS 14 Core Ultra X7 358H
Intel Core Ultra X7 358H
2927 Points +14%
HP OmniBook 7 Aero 13-bg1077nr
AMD Ryzen AI 7 350
2886 Points +12%
Dell XPS 13 9350
Intel Core Ultra 7 256V
2778 Points +8%
Dell XPS 14 Core Ultra 7 355
Intel Core Ultra 7 355
2701 Points +5%
Lenovo ThinkPad X1 Carbon Gen 14 21V70075GE
Intel Core Ultra 5 325
2620 Points +2%
Moyenne Intel Core 5 320
  (2564 - 2600, n=3)
2580 Points 0%
Dell XPS 13 DX13260
Intel Core 5 320
2575 Points
HP EliteBook 8 Flip G1i 13
Intel Core Ultra 7 265U
2477 Points -4%
Lenovo ThinkPad L13 2in1 G5 21LNS4AM00
Intel Core Ultra 5 125U
2150 Points -17%
Alldocube iWork GT Ultra
Intel Core Ultra 5 125H
2134 Points -17%
Geekbench 5.5 / Multi-Core
Dell XPS 14 Core Ultra X7 358H
Intel Core Ultra X7 358H
17028 Points +168%
HP OmniBook 7 Aero 13-bg1077nr
AMD Ryzen AI 7 350
11254 Points +77%
Dell XPS 14 Core Ultra 7 355
Intel Core Ultra 7 355
10011 Points +58%
Lenovo ThinkPad X1 Carbon Gen 14 21V70075GE
Intel Core Ultra 5 325
9990 Points +57%
HP EliteBook 8 Flip G1i 13
Intel Core Ultra 7 265U
9683 Points +52%
Dell XPS 13 9350
Intel Core Ultra 7 256V
9302 Points +46%
Alldocube iWork GT Ultra
Intel Core Ultra 5 125H
8717 Points +37%
Lenovo ThinkPad L13 2in1 G5 21LNS4AM00
Intel Core Ultra 5 125U
8457 Points +33%
Dell Latitude 13 7330
Intel Core i7-1265U
6937 Points +9%
Dell XPS 13 DX13260
Intel Core 5 320
6351 Points
Moyenne Intel Core 5 320
  (n=1)
6351 Points 0%
Microsoft Surface Pro 8, i7-1185G7
Intel Core i7-1185G7
5759 Points -9%
Geekbench 5.5 / Single-Core
Dell XPS 14 Core Ultra X7 358H
Intel Core Ultra X7 358H
2142 Points +19%
HP OmniBook 7 Aero 13-bg1077nr
AMD Ryzen AI 7 350
2132 Points +18%
Dell XPS 13 9350
Intel Core Ultra 7 256V
2010 Points +11%
Dell XPS 14 Core Ultra 7 355
Intel Core Ultra 7 355
1999 Points +11%
Lenovo ThinkPad X1 Carbon Gen 14 21V70075GE
Intel Core Ultra 5 325
1959 Points +8%
HP EliteBook 8 Flip G1i 13
Intel Core Ultra 7 265U
1815 Points 0%
Dell XPS 13 DX13260
Intel Core 5 320
1807 Points
Moyenne Intel Core 5 320
  (n=1)
1807 Points 0%
Dell Latitude 13 7330
Intel Core i7-1265U
1778 Points -2%
Alldocube iWork GT Ultra
Intel Core Ultra 5 125H
1615 Points -11%
Lenovo ThinkPad L13 2in1 G5 21LNS4AM00
Intel Core Ultra 5 125U
1577 Points -13%
Microsoft Surface Pro 8, i7-1185G7
Intel Core i7-1185G7
1548 Points -14%
HWBOT x265 Benchmark v2.2 / 4k Preset
Dell XPS 14 Core Ultra X7 358H
Intel Core Ultra X7 358H
20.7 fps +146%
Dell XPS 14 Core Ultra 7 355
Intel Core Ultra 7 355
14.6 fps +73%
Lenovo ThinkPad X1 Carbon Gen 14 21V70075GE
Intel Core Ultra 5 325
14.3 fps +70%
HP OmniBook 7 Aero 13-bg1077nr
AMD Ryzen AI 7 350
14 fps +66%
Dell XPS 13 9350
Intel Core Ultra 7 256V
13.1 fps +56%
Lenovo ThinkPad L13 2in1 G5 21LNS4AM00
Intel Core Ultra 5 125U
11.4 fps +35%
HP EliteBook 8 Flip G1i 13
Intel Core Ultra 7 265U
11.4 fps +35%
Dell Latitude 13 7330
Intel Core i7-1265U
9.37 fps +11%
Alldocube iWork GT Ultra
Intel Core Ultra 5 125H
8.52 fps +1%
Dell XPS 13 DX13260
Intel Core 5 320
8.42 fps
Moyenne Intel Core 5 320
  (n=1)
8.42 fps 0%
Microsoft Surface Pro 8, i7-1185G7
Intel Core i7-1185G7
6.49 fps -23%
LibreOffice / 20 Documents To PDF
Alldocube iWork GT Ultra
Intel Core Ultra 5 125H
63.9 s * -34%
Lenovo ThinkPad L13 2in1 G5 21LNS4AM00
Intel Core Ultra 5 125U
58.5 s * -23%
HP EliteBook 8 Flip G1i 13
Intel Core Ultra 7 265U
58.1 s * -22%
Dell XPS 13 9350
Intel Core Ultra 7 256V
53.2 s * -12%
HP OmniBook 7 Aero 13-bg1077nr
AMD Ryzen AI 7 350
51.2 s * -7%
Microsoft Surface Pro 8, i7-1185G7
Intel Core i7-1185G7
51.1 s * -7%
Dell Latitude 13 7330
Intel Core i7-1265U
49.1 s * -3%
Dell XPS 13 DX13260
Intel Core 5 320
47.7 s *
Moyenne Intel Core 5 320
  (n=1)
47.7 s * -0%
Dell XPS 14 Core Ultra X7 358H
Intel Core Ultra X7 358H
45.9 s * +4%
Lenovo ThinkPad X1 Carbon Gen 14 21V70075GE
Intel Core Ultra 5 325
43.6 s * +9%
Dell XPS 14 Core Ultra 7 355
Intel Core Ultra 7 355
43.1 s * +10%
R Benchmark 2.5 / Overall mean
Microsoft Surface Pro 8, i7-1185G7
Intel Core i7-1185G7
0.568 sec * -20%
Lenovo ThinkPad L13 2in1 G5 21LNS4AM00
Intel Core Ultra 5 125U
0.558 sec * -18%
Alldocube iWork GT Ultra
Intel Core Ultra 5 125H
0.546 sec * -15%
HP EliteBook 8 Flip G1i 13
Intel Core Ultra 7 265U
0.492 sec * -4%
Dell Latitude 13 7330
Intel Core i7-1265U
0.4772 sec * -1%
Dell XPS 13 DX13260
Intel Core 5 320
0.4748 sec *
Moyenne Intel Core 5 320
  (n=1)
0.4748 sec * -0%
Dell XPS 13 9350
Intel Core Ultra 7 256V
0.4578 sec * +4%
HP OmniBook 7 Aero 13-bg1077nr
AMD Ryzen AI 7 350
0.4555 sec * +4%
Lenovo ThinkPad X1 Carbon Gen 14 21V70075GE
Intel Core Ultra 5 325
0.4545 sec * +4%
Dell XPS 14 Core Ultra 7 355
Intel Core Ultra 7 355
0.4435 sec * +7%
Dell XPS 14 Core Ultra X7 358H
Intel Core Ultra X7 358H
0.4127 sec * +13%
CPU Performance rating: Percent
Cinebench R23: Multi Core | Single Core
Cinebench R20: CPU (Multi Core) | CPU (Single Core)
Cinebench R15: CPU Multi 64Bit | CPU Single 64Bit
Blender: v2.79 BMW27 CPU
7-Zip 18.03: 7z b 4 | 7z b 4 -mmt1
Geekbench 6.7: Multi-Core | Single-Core
Geekbench 5.5: Multi-Core | Single-Core
HWBOT x265 Benchmark v2.2: 4k Preset
LibreOffice : 20 Documents To PDF
R Benchmark 2.5: Overall mean

* ... Moindre est la valeur, meilleures sont les performances
Cinebench R15 CPU Multi 64Bit
1054 Points
Cinebench R15 OpenGL 64Bit
102 fps
Cinebench R15 Ref. Match 64Bit
97.8 %
Cinebench R15 CPU Single 64Bit
276 Points
Cinebench R20 CPU (Multi Core)
2371 Points
Cinebench R20 CPU (Single Core)
717 Points
Cinebench R23 Single Core
1926 Points
Cinebench R23 Multi Core
6197 Points
Aide
Performance rating
HP OmniBook 7 Aero 13-bg1077nr -1!
AMD Ryzen AI 7 350, Radeon 860M
90.1 pt
Dell XPS 14 Core Ultra X7 358H
Intel Core Ultra X7 358H, Arc B390 Panther Lake iGPU
85.8 pt
Lenovo ThinkPad X1 Carbon Gen 14 21V70075GE -1!
Intel Core Ultra 5 325, Intel Graphics 4 Xe3 PTL
59.2 pt
Dell XPS 13 9350 -1!
Intel Core Ultra 7 256V, Arc 140V
59 pt
Dell XPS 13 DX13260 -1!
Intel Core 5 320, Intel Graphics 2 Xe3 WCL
12.7 pt
Moyenne Intel Core 5 320 -1!
 
12.7 pt
AIDA64 / FP32 Ray-Trace
HP OmniBook 7 Aero 13-bg1077nr
AMD Ryzen AI 7 350, Radeon 860M (v6.92.6600)
22443 KRay/s +782%
Dell XPS 14 Core Ultra X7 358H
Intel Core Ultra X7 358H, Arc B390 Panther Lake iGPU (v8.20.8100)
14318 KRay/s +463%
Dell XPS 13 9350
Intel Core Ultra 7 256V, Arc 140V (v6.92.6600)
12287 KRay/s +383%
Lenovo ThinkPad X1 Carbon Gen 14 21V70075GE
Intel Core Ultra 5 325, Intel Graphics 4 Xe3 PTL (v8.20.8100)
12020 KRay/s +372%
Dell XPS 13 DX13260
Intel Core 5 320, Intel Graphics 2 Xe3 WCL (v8.20.8100)
2545 KRay/s
Moyenne Intel Core 5 320
  (n=1)
2545 KRay/s 0%
AIDA64 / FPU Julia
HP OmniBook 7 Aero 13-bg1077nr
AMD Ryzen AI 7 350, Radeon 860M (v6.92.6600)
84517 Points +534%
Dell XPS 14 Core Ultra X7 358H
Intel Core Ultra X7 358H, Arc B390 Panther Lake iGPU (v8.20.8100)
77086 Points +479%
Lenovo ThinkPad X1 Carbon Gen 14 21V70075GE
Intel Core Ultra 5 325, Intel Graphics 4 Xe3 PTL (v8.20.8100)
61597 Points +362%
Dell XPS 13 9350
Intel Core Ultra 7 256V, Arc 140V (v6.92.6600)
61131 Points +359%
Dell XPS 13 DX13260
Intel Core 5 320, Intel Graphics 2 Xe3 WCL (v8.20.8100)
13325 Points
Moyenne Intel Core 5 320
  (n=1)
13325 Points 0%
AIDA64 / CPU SHA3
Dell XPS 14 Core Ultra X7 358H
Intel Core Ultra X7 358H, Arc B390 Panther Lake iGPU (v8.20.8100)
4033 MB/s +525%
HP OmniBook 7 Aero 13-bg1077nr
AMD Ryzen AI 7 350, Radeon 860M (v6.92.6600)
3669 MB/s +469%
Dell XPS 13 9350
Intel Core Ultra 7 256V, Arc 140V (v6.92.6600)
2713 MB/s +321%
Lenovo ThinkPad X1 Carbon Gen 14 21V70075GE
Intel Core Ultra 5 325, Intel Graphics 4 Xe3 PTL (v8.20.8100)
2694 MB/s +318%
Dell XPS 13 DX13260
Intel Core 5 320, Intel Graphics 2 Xe3 WCL (v8.20.8100)
645 MB/s
Moyenne Intel Core 5 320
  (n=1)
645 MB/s 0%
AIDA64 / CPU Queen
HP OmniBook 7 Aero 13-bg1077nr
AMD Ryzen AI 7 350, Radeon 860M (v6.92.6600)
72463 Points
Dell XPS 14 Core Ultra X7 358H
Intel Core Ultra X7 358H, Arc B390 Panther Lake iGPU (v6.92.6600)
63827 Points
Dell XPS 13 9350
Intel Core Ultra 7 256V, Arc 140V (v6.92.6600)
49622 Points
AIDA64 / FPU SinJulia
HP OmniBook 7 Aero 13-bg1077nr
AMD Ryzen AI 7 350, Radeon 860M (v6.92.6600)
13051 Points +1334%
Dell XPS 14 Core Ultra X7 358H
Intel Core Ultra X7 358H, Arc B390 Panther Lake iGPU (v8.20.8100)
6919 Points +660%
Dell XPS 13 9350
Intel Core Ultra 7 256V, Arc 140V (v6.92.6600)
4428 Points +387%
Lenovo ThinkPad X1 Carbon Gen 14 21V70075GE
Intel Core Ultra 5 325, Intel Graphics 4 Xe3 PTL (v8.20.8100)
4401 Points +384%
Dell XPS 13 DX13260
Intel Core 5 320, Intel Graphics 2 Xe3 WCL (v8.20.8100)
910 Points
Moyenne Intel Core 5 320
  (n=1)
910 Points 0%
AIDA64 / FPU Mandel
HP OmniBook 7 Aero 13-bg1077nr
AMD Ryzen AI 7 350, Radeon 860M (v6.92.6600)
45043 Points +549%
Dell XPS 14 Core Ultra X7 358H
Intel Core Ultra X7 358H, Arc B390 Panther Lake iGPU (v8.20.8100)
40542 Points +484%
Lenovo ThinkPad X1 Carbon Gen 14 21V70075GE
Intel Core Ultra 5 325, Intel Graphics 4 Xe3 PTL (v8.20.8100)
32568 Points +369%
Dell XPS 13 9350
Intel Core Ultra 7 256V, Arc 140V (v6.92.6600)
32410 Points +367%
Dell XPS 13 DX13260
Intel Core 5 320, Intel Graphics 2 Xe3 WCL (v8.20.8100)
6944 Points
Moyenne Intel Core 5 320
  (n=1)
6944 Points 0%
AIDA64 / CPU AES
HP OmniBook 7 Aero 13-bg1077nr
AMD Ryzen AI 7 350, Radeon 860M (v6.92.6600)
67645 MB/s +716%
Dell XPS 14 Core Ultra X7 358H
Intel Core Ultra X7 358H, Arc B390 Panther Lake iGPU (v8.20.8100)
63775 MB/s +669%
Dell XPS 13 9350
Intel Core Ultra 7 256V, Arc 140V (v6.92.6600)
40828 MB/s +392%
Lenovo ThinkPad X1 Carbon Gen 14 21V70075GE
Intel Core Ultra 5 325, Intel Graphics 4 Xe3 PTL (v8.20.8100)
37722 MB/s +355%
Dell XPS 13 DX13260
Intel Core 5 320, Intel Graphics 2 Xe3 WCL (v8.20.8100)
8293 MB/s
Moyenne Intel Core 5 320
  (n=1)
8293 MB/s 0%
AIDA64 / CPU ZLib
Dell XPS 14 Core Ultra X7 358H
Intel Core Ultra X7 358H, Arc B390 Panther Lake iGPU (v8.20.8100)
1103 MB/s +715%
HP OmniBook 7 Aero 13-bg1077nr
AMD Ryzen AI 7 350, Radeon 860M (v6.92.6600)
663 MB/s +390%
Lenovo ThinkPad X1 Carbon Gen 14 21V70075GE
Intel Core Ultra 5 325, Intel Graphics 4 Xe3 PTL (v8.20.8100)
614 MB/s +354%
Dell XPS 13 9350
Intel Core Ultra 7 256V, Arc 140V (v6.92.6600)
536 MB/s +296%
Dell XPS 13 DX13260
Intel Core 5 320, Intel Graphics 2 Xe3 WCL (v8.20.8100)
135.3 MB/s
Moyenne Intel Core 5 320
  (n=1)
135.3 MB/s 0%
AIDA64 / FP64 Ray-Trace
HP OmniBook 7 Aero 13-bg1077nr
AMD Ryzen AI 7 350, Radeon 860M (v6.92.6600)
12090 KRay/s +832%
Dell XPS 14 Core Ultra X7 358H
Intel Core Ultra X7 358H, Arc B390 Panther Lake iGPU (v8.20.8100)
7603 KRay/s +486%
Dell XPS 13 9350
Intel Core Ultra 7 256V, Arc 140V (v6.92.6600)
6506 KRay/s +402%
Lenovo ThinkPad X1 Carbon Gen 14 21V70075GE
Intel Core Ultra 5 325, Intel Graphics 4 Xe3 PTL (v8.20.8100)
6401 KRay/s +394%
Dell XPS 13 DX13260
Intel Core 5 320, Intel Graphics 2 Xe3 WCL (v8.20.8100)
1297 KRay/s
Moyenne Intel Core 5 320
  (n=1)
1297 KRay/s 0%
AIDA64 / CPU PhotoWorxx
Dell XPS 14 Core Ultra X7 358H
Intel Core Ultra X7 358H, Arc B390 Panther Lake iGPU (v8.20.8100)
88086 MPixel/s +690%
Lenovo ThinkPad X1 Carbon Gen 14 21V70075GE
Intel Core Ultra 5 325, Intel Graphics 4 Xe3 PTL (v8.20.8100)
59824 MPixel/s +437%
Dell XPS 13 9350
Intel Core Ultra 7 256V, Arc 140V (v6.92.6600)
51767 MPixel/s +365%
HP OmniBook 7 Aero 13-bg1077nr
AMD Ryzen AI 7 350, Radeon 860M (v6.92.6600)
43875 MPixel/s +294%
Dell XPS 13 DX13260
Intel Core 5 320, Intel Graphics 2 Xe3 WCL (v8.20.8100)
11144 MPixel/s
Moyenne Intel Core 5 320
  (n=1)
11144 MPixel/s 0%
AIDA64 / CPU CheckMate
Dell XPS 14 Core Ultra X7 358H
Intel Core Ultra X7 358H, Arc B390 Panther Lake iGPU (v8.20.8100)
4475 MP/s +658%
Lenovo ThinkPad X1 Carbon Gen 14 21V70075GE
Intel Core Ultra 5 325, Intel Graphics 4 Xe3 PTL (v8.20.8100)
2716 MP/s +360%
Dell XPS 13 DX13260
Intel Core 5 320, Intel Graphics 2 Xe3 WCL (v8.20.8100)
590 MP/s
Moyenne Intel Core 5 320
  (n=1)
590 MP/s 0%

Performances du système

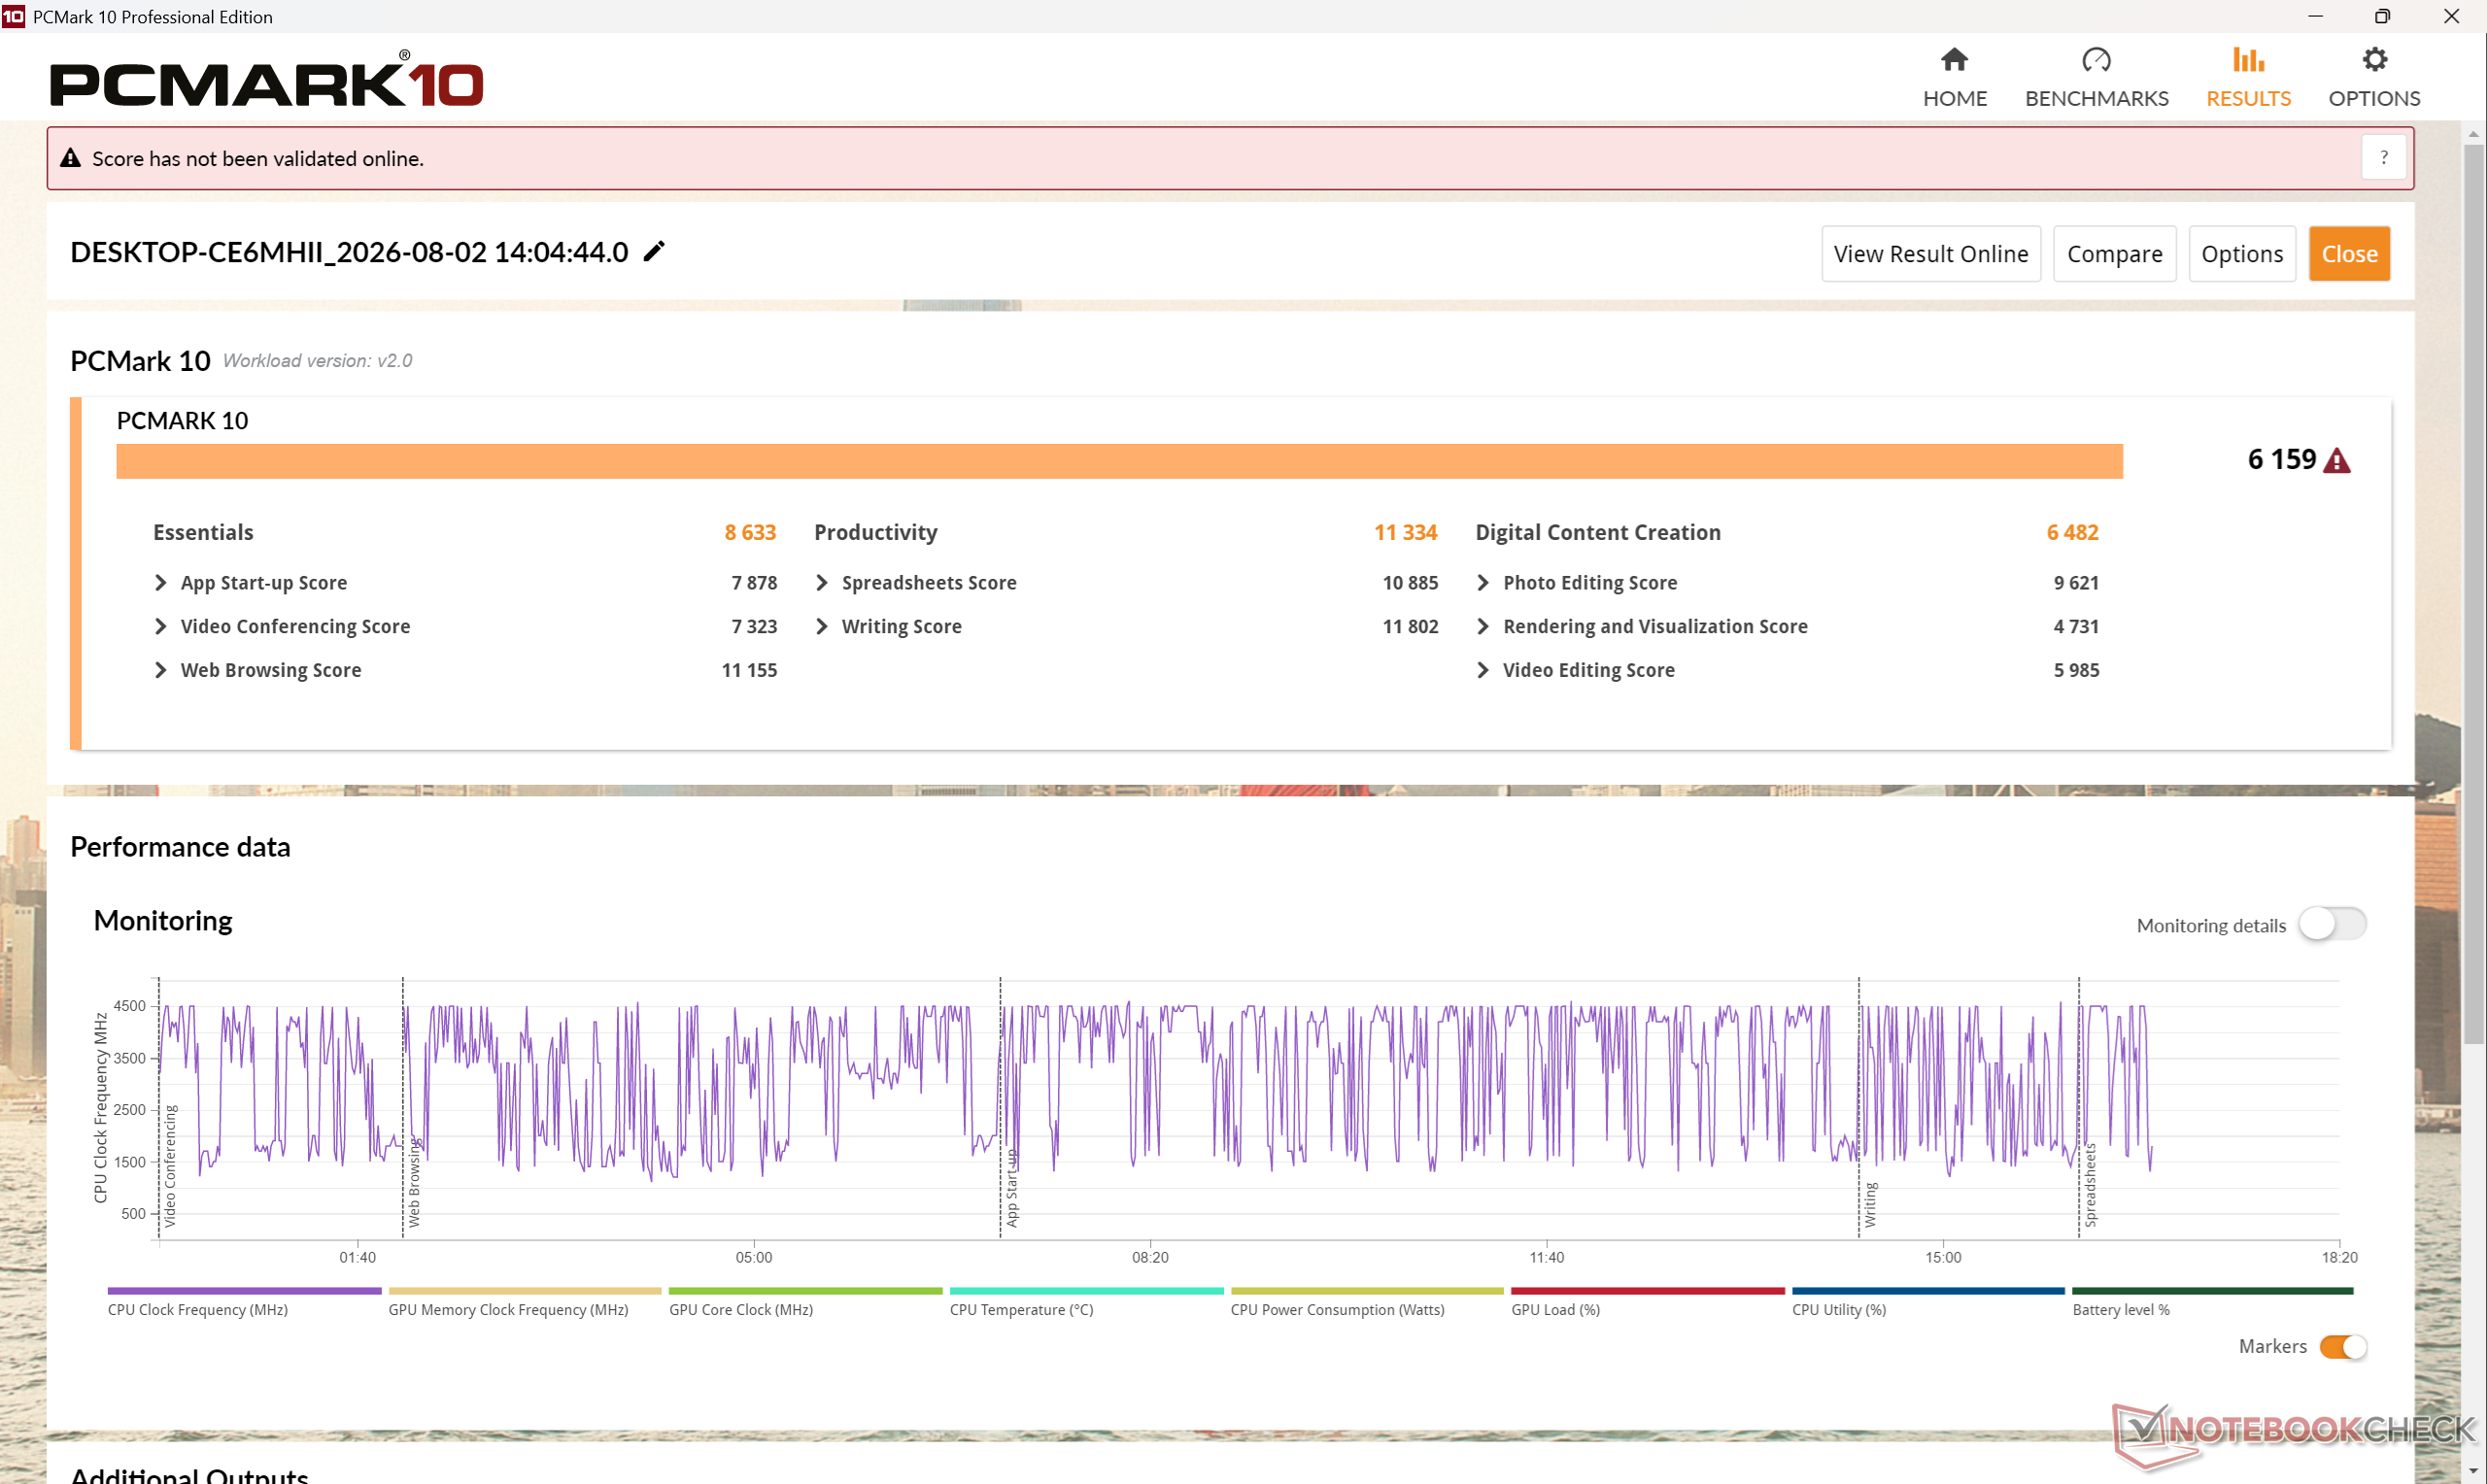
PCMark 10 Standard. Le système excelle dans la navigation sur le Web et le traitement de texte, mais les tâches plus exigeantes, telles que la retouche d'images, sembleront plus lentes.
Performance rating: Percent
PCMark 10: Score | Essentials | Productivity | Digital Content Creation
CrossMark: Overall | Productivity | Creativity | Responsiveness
WebXPRT 3: Overall
WebXPRT 4: Overall
Mozilla Kraken 1.1: Total
Performance rating
Dell XPS 14 Core Ultra X7 358H
Arc B390 Panther Lake iGPU, Ultra X7 358H, Samsung PM9C1b MZVL81T0HFLB-00BH1
90.9 pt
Apple MacBook Neo 256 GB -4!
A18 GPU, A18 Pro, Apple SSD AP0256Z
86.3 pt
Lenovo ThinkPad X1 Carbon Gen 14 21V70075GE
Intel Graphics 4 Xe3 PTL, Ultra 5 325, Samsung PM9C1b MZVL8512HFLU-00BLL
76 pt
Dell XPS 13 9350
Arc 140V, Core Ultra 7 256V, Micron 2550 512GB
74.9 pt
HP OmniBook 7 Aero 13-bg1077nr
Radeon 860M, Ryzen AI 7 350, SK hynix PC801 HFS001TEJ9X101N
69.6 pt
Dell XPS 13 DX13260
Intel Graphics 2 Xe3 WCL, Core 5 320
66.9 pt
Moyenne Intel Core 5 320, Intel Graphics 2 Xe3 Wildcat Lake iGPU
 
66.9 pt
PCMark 10 / Score
Dell XPS 14 Core Ultra X7 358H
Arc B390 Panther Lake iGPU, Ultra X7 358H, Samsung PM9C1b MZVL81T0HFLB-00BH1
9880 Points +60%
HP OmniBook 7 Aero 13-bg1077nr
Radeon 860M, Ryzen AI 7 350, SK hynix PC801 HFS001TEJ9X101N
8424 Points +37%
Lenovo ThinkPad X1 Carbon Gen 14 21V70075GE
Intel Graphics 4 Xe3 PTL, Ultra 5 325, Samsung PM9C1b MZVL8512HFLU-00BLL
7709 Points +25%
Dell XPS 13 9350
Arc 140V, Core Ultra 7 256V, Micron 2550 512GB
6955 Points +13%
Dell XPS 13 DX13260
Intel Graphics 2 Xe3 WCL, Core 5 320
6159 Points
Moyenne Intel Core 5 320, Intel Graphics 2 Xe3 Wildcat Lake iGPU
  (n=1)
6159 Points 0%
PCMark 10 / Essentials
Dell XPS 14 Core Ultra X7 358H
Arc B390 Panther Lake iGPU, Ultra X7 358H, Samsung PM9C1b MZVL81T0HFLB-00BH1
11263 Points +30%
HP OmniBook 7 Aero 13-bg1077nr
Radeon 860M, Ryzen AI 7 350, SK hynix PC801 HFS001TEJ9X101N
10909 Points +26%
Dell XPS 13 9350
Arc 140V, Core Ultra 7 256V, Micron 2550 512GB
10006 Points +16%
Lenovo ThinkPad X1 Carbon Gen 14 21V70075GE
Intel Graphics 4 Xe3 PTL, Ultra 5 325, Samsung PM9C1b MZVL8512HFLU-00BLL
9939 Points +15%
Dell XPS 13 DX13260
Intel Graphics 2 Xe3 WCL, Core 5 320
8633 Points
Moyenne Intel Core 5 320, Intel Graphics 2 Xe3 Wildcat Lake iGPU
  (n=1)
8633 Points 0%
PCMark 10 / Productivity
Dell XPS 14 Core Ultra X7 358H
Arc B390 Panther Lake iGPU, Ultra X7 358H, Samsung PM9C1b MZVL81T0HFLB-00BH1
16780 Points +48%
HP OmniBook 7 Aero 13-bg1077nr
Radeon 860M, Ryzen AI 7 350, SK hynix PC801 HFS001TEJ9X101N
16132 Points +42%
Lenovo ThinkPad X1 Carbon Gen 14 21V70075GE
Intel Graphics 4 Xe3 PTL, Ultra 5 325, Samsung PM9C1b MZVL8512HFLU-00BLL
13901 Points +23%
Dell XPS 13 DX13260
Intel Graphics 2 Xe3 WCL, Core 5 320
11334 Points
Moyenne Intel Core 5 320, Intel Graphics 2 Xe3 Wildcat Lake iGPU
  (n=1)
11334 Points 0%
Dell XPS 13 9350
Arc 140V, Core Ultra 7 256V, Micron 2550 512GB
9219 Points -19%
PCMark 10 / Digital Content Creation
Dell XPS 14 Core Ultra X7 358H
Arc B390 Panther Lake iGPU, Ultra X7 358H, Samsung PM9C1b MZVL81T0HFLB-00BH1
13847 Points +114%
Dell XPS 13 9350
Arc 140V, Core Ultra 7 256V, Micron 2550 512GB
9898 Points +53%
HP OmniBook 7 Aero 13-bg1077nr
Radeon 860M, Ryzen AI 7 350, SK hynix PC801 HFS001TEJ9X101N
9219 Points +42%
Lenovo ThinkPad X1 Carbon Gen 14 21V70075GE
Intel Graphics 4 Xe3 PTL, Ultra 5 325, Samsung PM9C1b MZVL8512HFLU-00BLL
8998 Points +39%
Dell XPS 13 DX13260
Intel Graphics 2 Xe3 WCL, Core 5 320
6482 Points
Moyenne Intel Core 5 320, Intel Graphics 2 Xe3 Wildcat Lake iGPU
  (n=1)
6482 Points 0%
CrossMark / Overall
Dell XPS 14 Core Ultra X7 358H
Arc B390 Panther Lake iGPU, Ultra X7 358H, Samsung PM9C1b MZVL81T0HFLB-00BH1
1955 Points +29%
Dell XPS 13 9350
Arc 140V, Core Ultra 7 256V, Micron 2550 512GB
1736 Points +15%
Apple MacBook Neo 256 GB
A18 GPU, A18 Pro, Apple SSD AP0256Z
1715 Points +14%
Lenovo ThinkPad X1 Carbon Gen 14 21V70075GE
Intel Graphics 4 Xe3 PTL, Ultra 5 325, Samsung PM9C1b MZVL8512HFLU-00BLL
1675 Points +11%
Dell XPS 13 DX13260
Intel Graphics 2 Xe3 WCL, Core 5 320
1511 Points
Moyenne Intel Core 5 320, Intel Graphics 2 Xe3 Wildcat Lake iGPU
  (n=1)
1511 Points 0%
HP OmniBook 7 Aero 13-bg1077nr
Radeon 860M, Ryzen AI 7 350, SK hynix PC801 HFS001TEJ9X101N
1406 Points -7%
CrossMark / Productivity
Apple MacBook Neo 256 GB
A18 GPU, A18 Pro, Apple SSD AP0256Z
1808 Points +15%
Dell XPS 14 Core Ultra X7 358H
Arc B390 Panther Lake iGPU, Ultra X7 358H, Samsung PM9C1b MZVL81T0HFLB-00BH1
1719 Points +9%
Dell XPS 13 9350
Arc 140V, Core Ultra 7 256V, Micron 2550 512GB
1682 Points +7%
Lenovo ThinkPad X1 Carbon Gen 14 21V70075GE
Intel Graphics 4 Xe3 PTL, Ultra 5 325, Samsung PM9C1b MZVL8512HFLU-00BLL
1652 Points +5%
Dell XPS 13 DX13260
Intel Graphics 2 Xe3 WCL, Core 5 320
1570 Points
Moyenne Intel Core 5 320, Intel Graphics 2 Xe3 Wildcat Lake iGPU
  (n=1)
1570 Points 0%
HP OmniBook 7 Aero 13-bg1077nr
Radeon 860M, Ryzen AI 7 350, SK hynix PC801 HFS001TEJ9X101N
1247 Points -21%
CrossMark / Creativity
Dell XPS 14 Core Ultra X7 358H
Arc B390 Panther Lake iGPU, Ultra X7 358H, Samsung PM9C1b MZVL81T0HFLB-00BH1
2398 Points +59%
Dell XPS 13 9350
Arc 140V, Core Ultra 7 256V, Micron 2550 512GB
1953 Points +30%
Apple MacBook Neo 256 GB
A18 GPU, A18 Pro, Apple SSD AP0256Z
1809 Points +20%
Lenovo ThinkPad X1 Carbon Gen 14 21V70075GE
Intel Graphics 4 Xe3 PTL, Ultra 5 325, Samsung PM9C1b MZVL8512HFLU-00BLL
1756 Points +17%
HP OmniBook 7 Aero 13-bg1077nr
Radeon 860M, Ryzen AI 7 350, SK hynix PC801 HFS001TEJ9X101N
1676 Points +11%
Dell XPS 13 DX13260
Intel Graphics 2 Xe3 WCL, Core 5 320
1505 Points
Moyenne Intel Core 5 320, Intel Graphics 2 Xe3 Wildcat Lake iGPU
  (n=1)
1505 Points 0%
CrossMark / Responsiveness
Dell XPS 14 Core Ultra X7 358H
Arc B390 Panther Lake iGPU, Ultra X7 358H, Samsung PM9C1b MZVL81T0HFLB-00BH1
1560 Points +14%
Lenovo ThinkPad X1 Carbon Gen 14 21V70075GE
Intel Graphics 4 Xe3 PTL, Ultra 5 325, Samsung PM9C1b MZVL8512HFLU-00BLL
1511 Points +11%
Dell XPS 13 DX13260
Intel Graphics 2 Xe3 WCL, Core 5 320
1363 Points
Moyenne Intel Core 5 320, Intel Graphics 2 Xe3 Wildcat Lake iGPU
  (n=1)
1363 Points 0%
Dell XPS 13 9350
Arc 140V, Core Ultra 7 256V, Micron 2550 512GB
1343 Points -1%
Apple MacBook Neo 256 GB
A18 GPU, A18 Pro, Apple SSD AP0256Z
1248 Points -8%
HP OmniBook 7 Aero 13-bg1077nr
Radeon 860M, Ryzen AI 7 350, SK hynix PC801 HFS001TEJ9X101N
1191 Points -13%
WebXPRT 3 / Overall
Apple MacBook Neo 256 GB
A18 GPU, A18 Pro, Apple SSD AP0256Z
450 Points +76%
Dell XPS 14 Core Ultra X7 358H
Arc B390 Panther Lake iGPU, Ultra X7 358H, Samsung PM9C1b MZVL81T0HFLB-00BH1
338 Points +33%
Dell XPS 13 9350
Arc 140V, Core Ultra 7 256V, Micron 2550 512GB
310 Points +22%
Lenovo ThinkPad X1 Carbon Gen 14 21V70075GE
Intel Graphics 4 Xe3 PTL, Ultra 5 325, Samsung PM9C1b MZVL8512HFLU-00BLL
295 Points +16%
HP OmniBook 7 Aero 13-bg1077nr
Radeon 860M, Ryzen AI 7 350, SK hynix PC801 HFS001TEJ9X101N
259 Points +2%
Dell XPS 13 DX13260
Intel Graphics 2 Xe3 WCL, Core 5 320
255 Points
Moyenne Intel Core 5 320, Intel Graphics 2 Xe3 Wildcat Lake iGPU
  (n=1)
255 Points 0%
WebXPRT 4 / Overall
Apple MacBook Neo 256 GB
A18 GPU, A18 Pro, Apple SSD AP0256Z
326 Points +21%
Dell XPS 14 Core Ultra X7 358H
Arc B390 Panther Lake iGPU, Ultra X7 358H, Samsung PM9C1b MZVL81T0HFLB-00BH1
305 Points +13%
Dell XPS 13 9350
Arc 140V, Core Ultra 7 256V, Micron 2550 512GB
286 Points +6%
Lenovo ThinkPad X1 Carbon Gen 14 21V70075GE
Intel Graphics 4 Xe3 PTL, Ultra 5 325, Samsung PM9C1b MZVL8512HFLU-00BLL
269 Points 0%
Dell XPS 13 DX13260
Intel Graphics 2 Xe3 WCL, Core 5 320
269 Points
Moyenne Intel Core 5 320, Intel Graphics 2 Xe3 Wildcat Lake iGPU
  (n=1)
269 Points 0%
HP OmniBook 7 Aero 13-bg1077nr
Radeon 860M, Ryzen AI 7 350, SK hynix PC801 HFS001TEJ9X101N
249 Points -7%
Mozilla Kraken 1.1 / Total
HP OmniBook 7 Aero 13-bg1077nr
Radeon 860M, Ryzen AI 7 350, SK hynix PC801 HFS001TEJ9X101N
702 ms * -41%
Lenovo ThinkPad X1 Carbon Gen 14 21V70075GE
Intel Graphics 4 Xe3 PTL, Ultra 5 325, Samsung PM9C1b MZVL8512HFLU-00BLL
517 ms * -4%
Dell XPS 13 DX13260
Intel Graphics 2 Xe3 WCL, Core 5 320
497 ms *
Moyenne Intel Core 5 320, Intel Graphics 2 Xe3 Wildcat Lake iGPU
  (n=1)
497 ms * -0%
Dell XPS 13 9350
Arc 140V, Core Ultra 7 256V, Micron 2550 512GB
472 ms * +5%
Dell XPS 14 Core Ultra X7 358H
Arc B390 Panther Lake iGPU, Ultra X7 358H, Samsung PM9C1b MZVL81T0HFLB-00BH1
445 ms * +10%
Apple MacBook Neo 256 GB
A18 GPU, A18 Pro, Apple SSD AP0256Z
273.4 ms * +45%

* ... Moindre est la valeur, meilleures sont les performances
PCMark 10 Score
6159 points
Aide
AIDA64 / Memory Copy
Dell XPS 14 Core Ultra X7 358H
Intel Core Ultra X7 358H, Arc B390 Panther Lake iGPU
131796 MB/s +709%
Lenovo ThinkPad X1 Carbon Gen 14 21V70075GE
Intel Core Ultra 5 325, Intel Graphics 4 Xe3 PTL
104952 MB/s +544%
Dell XPS 13 9350
Intel Core Ultra 7 256V, Arc 140V
101642 MB/s +524%
HP OmniBook 7 Aero 13-bg1077nr
AMD Ryzen AI 7 350, Radeon 860M
84918 MB/s +421%
Dell XPS 13 DX13260
Intel Core 5 320, Intel Graphics 2 Xe3 WCL
16289 MB/s
Moyenne Intel Core 5 320
  (n=1)
16289 MB/s 0%
AIDA64 / Memory Read
Dell XPS 14 Core Ultra X7 358H
Intel Core Ultra X7 358H, Arc B390 Panther Lake iGPU
114349 MB/s +586%
Dell XPS 13 9350
Intel Core Ultra 7 256V, Arc 140V
88013 MB/s +428%
Lenovo ThinkPad X1 Carbon Gen 14 21V70075GE
Intel Core Ultra 5 325, Intel Graphics 4 Xe3 PTL
83896 MB/s +403%
HP OmniBook 7 Aero 13-bg1077nr
AMD Ryzen AI 7 350, Radeon 860M
63477 MB/s +281%
Dell XPS 13 DX13260
Intel Core 5 320, Intel Graphics 2 Xe3 WCL
16674 MB/s
Moyenne Intel Core 5 320
  (n=1)
16674 MB/s 0%
AIDA64 / Memory Write
Dell XPS 14 Core Ultra X7 358H
Intel Core Ultra X7 358H, Arc B390 Panther Lake iGPU
134916 MB/s +627%
Dell XPS 13 9350
Intel Core Ultra 7 256V, Arc 140V
112340 MB/s +505%
Lenovo ThinkPad X1 Carbon Gen 14 21V70075GE
Intel Core Ultra 5 325, Intel Graphics 4 Xe3 PTL
108023 MB/s +482%
HP OmniBook 7 Aero 13-bg1077nr
AMD Ryzen AI 7 350, Radeon 860M
102762 MB/s +454%
Dell XPS 13 DX13260
Intel Core 5 320, Intel Graphics 2 Xe3 WCL
18564 MB/s
Moyenne Intel Core 5 320
  (n=1)
18564 MB/s 0%
AIDA64 / Memory Latency
Dell XPS 13 DX13260
Intel Core 5 320, Intel Graphics 2 Xe3 WCL
317 ns *
Moyenne Intel Core 5 320
  (n=1)
317 ns * -0%
HP OmniBook 7 Aero 13-bg1077nr
AMD Ryzen AI 7 350, Radeon 860M
104 ns * +67%
Dell XPS 13 9350
Intel Core Ultra 7 256V, Arc 140V
99.6 ns * +69%
Lenovo ThinkPad X1 Carbon Gen 14 21V70075GE
Intel Core Ultra 5 325, Intel Graphics 4 Xe3 PTL
98.5 ns * +69%
Dell XPS 14 Core Ultra X7 358H
Intel Core Ultra X7 358H, Arc B390 Panther Lake iGPU
87.8 ns * +72%

* ... Moindre est la valeur, meilleures sont les performances
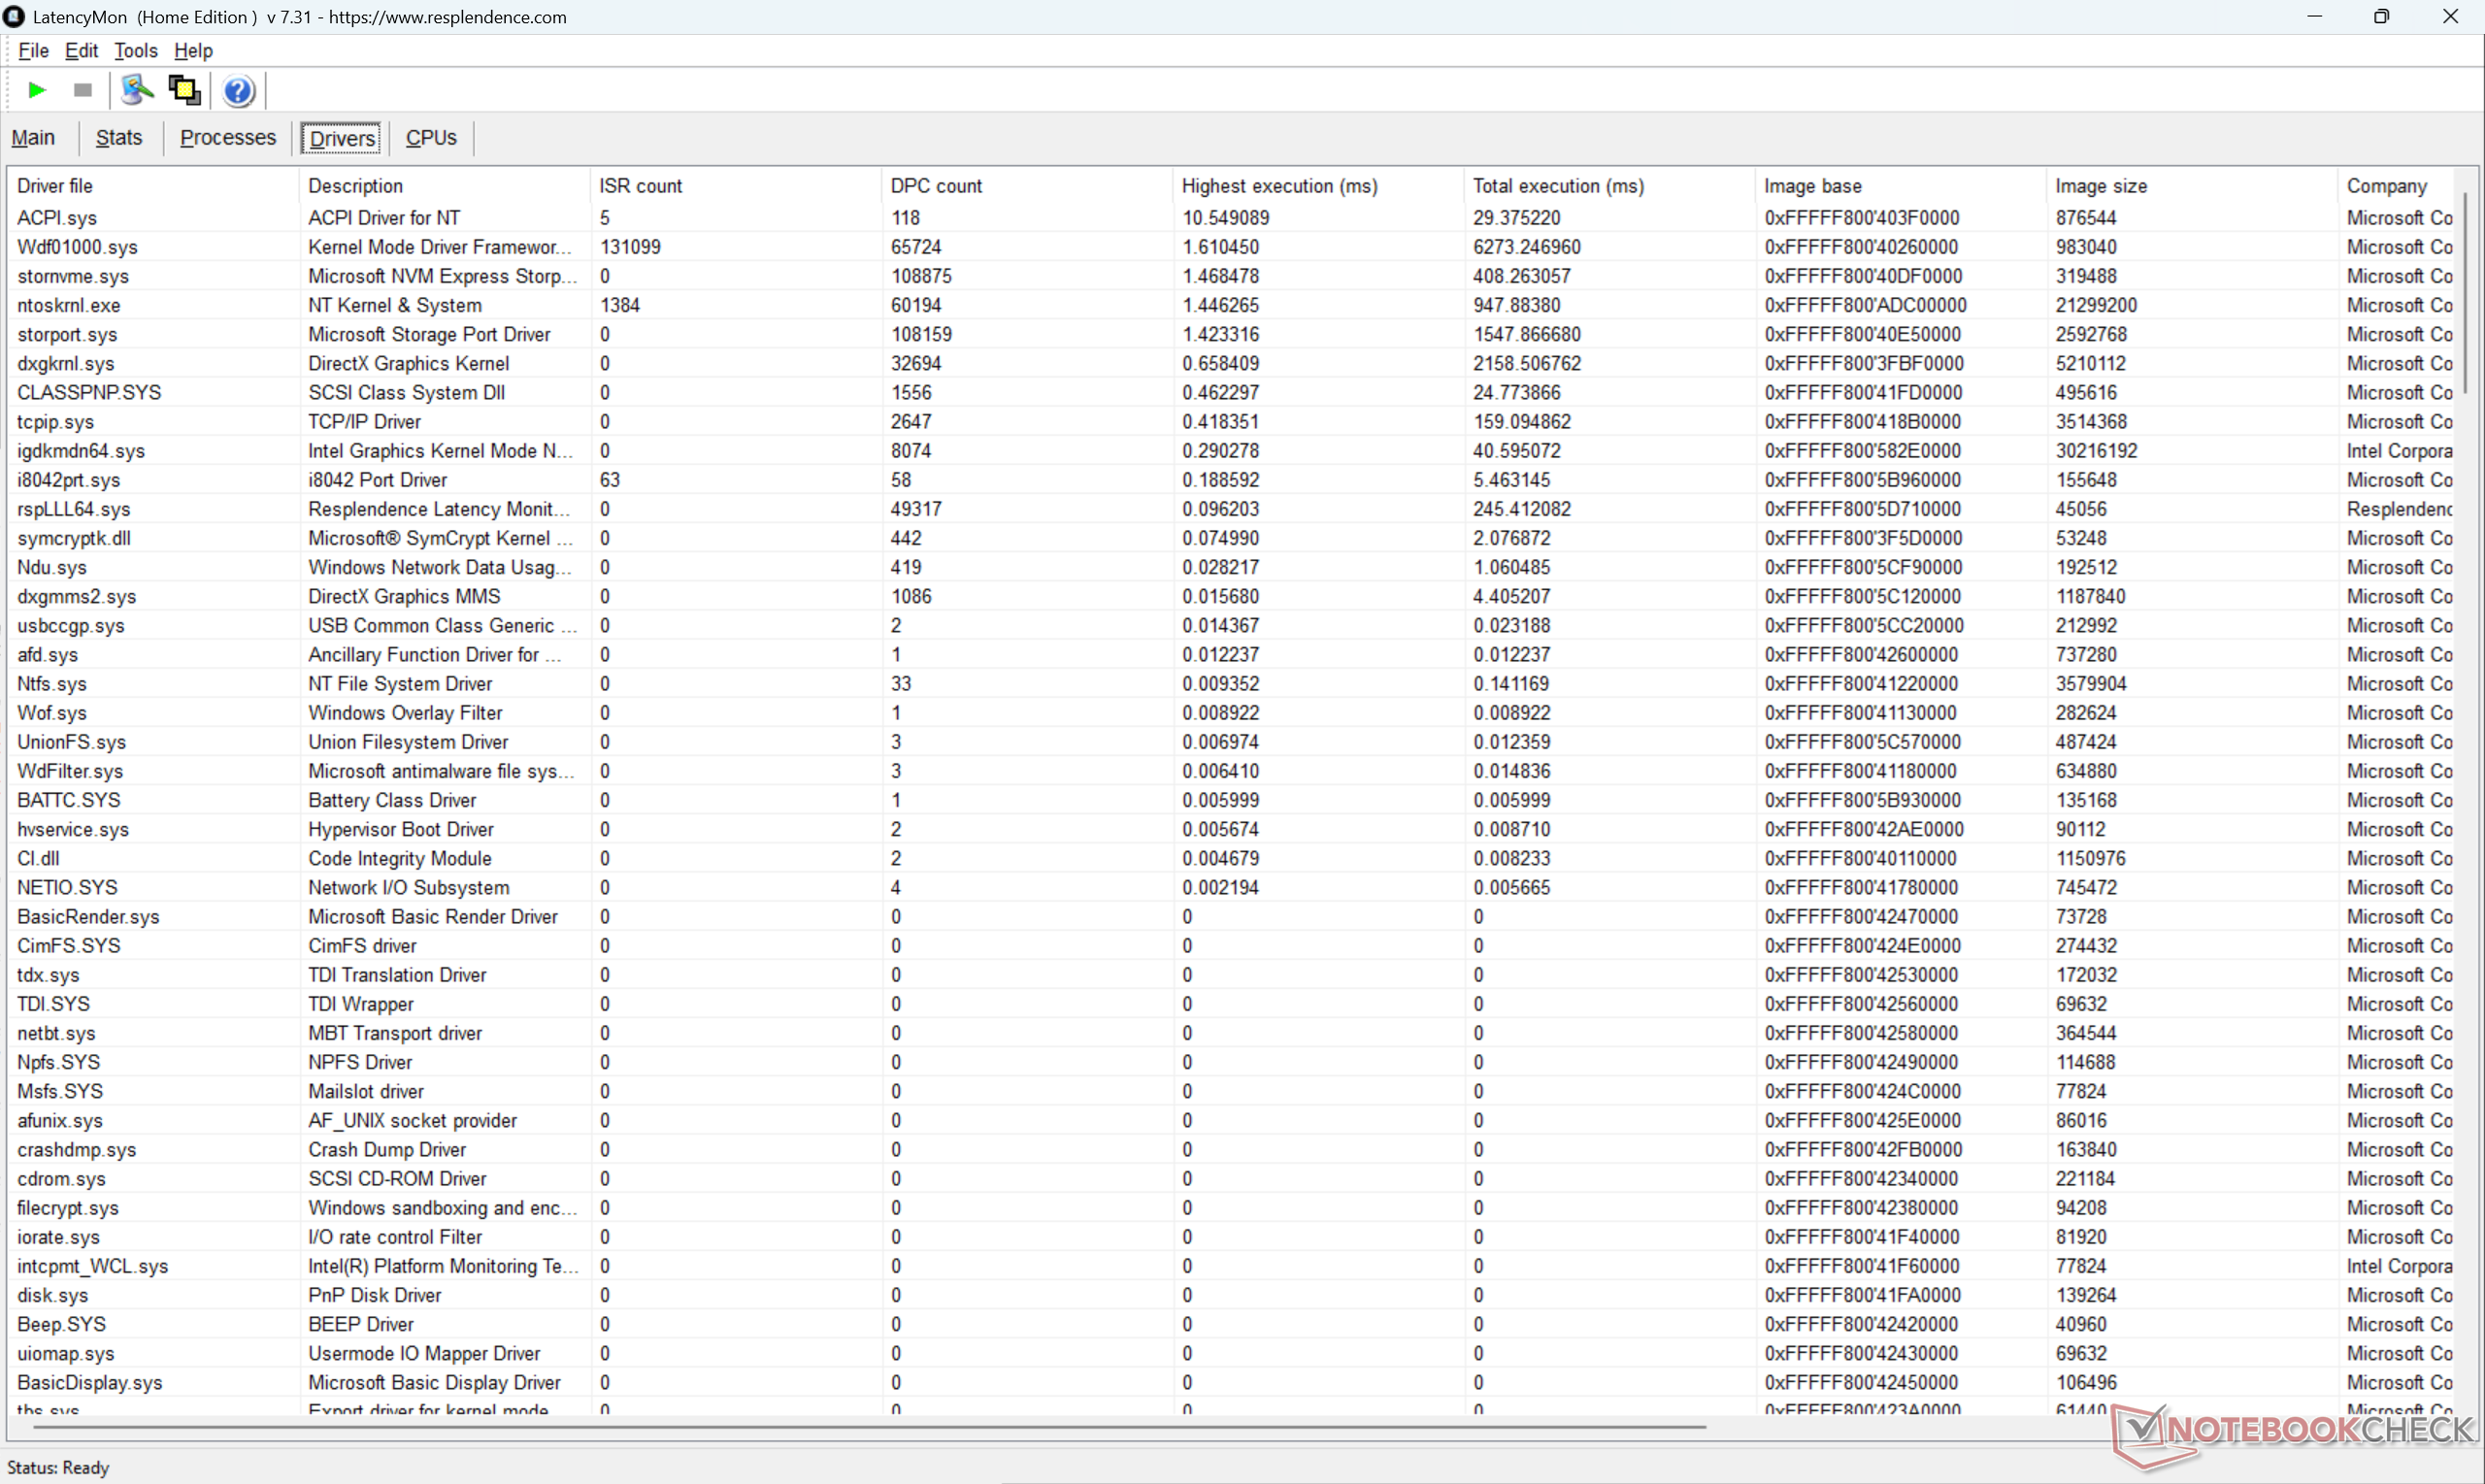
Latence DPC

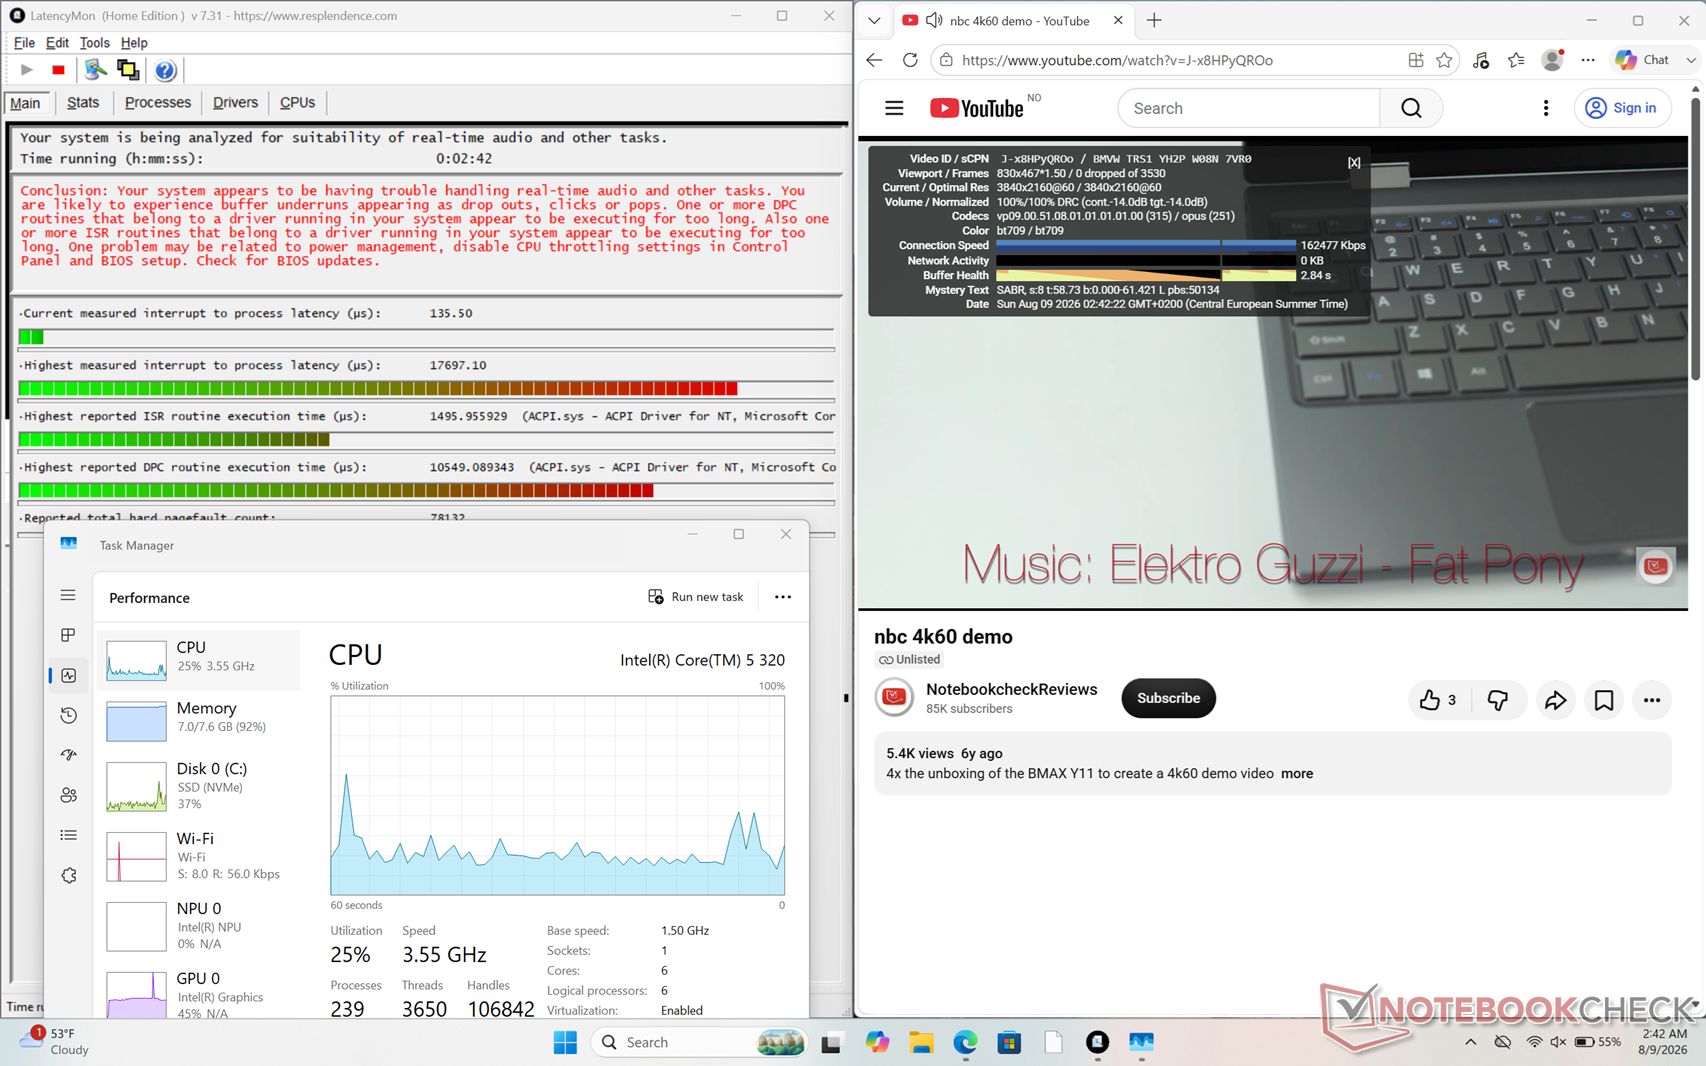
LatencyMon signale des problèmes de DPC, mais aucune image n'est perdue lors de la lecture d'une vidéo en 4K à 60 images par seconde.
Liste des pilotes
Liste des pilotes
DPC Latencies / LatencyMon - interrupt to process latency (max), Web, Youtube, Prime95
Dell XPS 13 DX13260
Intel Graphics 2 Xe3 WCL, Core 5 320
17697.1 μs *
Lenovo ThinkPad X1 Carbon Gen 14 21V70075GE
Intel Graphics 4 Xe3 PTL, Ultra 5 325, Samsung PM9C1b MZVL8512HFLU-00BLL
3000.2 μs * +83%
Dell XPS 14 Core Ultra X7 358H
Arc B390 Panther Lake iGPU, Ultra X7 358H, Samsung PM9C1b MZVL81T0HFLB-00BH1
872.4 μs * +95%
HP OmniBook 7 Aero 13-bg1077nr
Radeon 860M, Ryzen AI 7 350, SK hynix PC801 HFS001TEJ9X101N
719 μs * +96%

* ... Moindre est la valeur, meilleures sont les performances
Périphériques de stockage

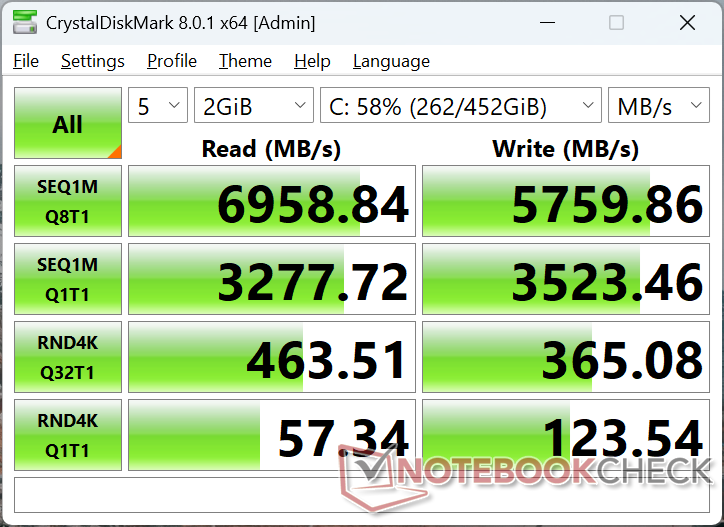
CDM 8
CDM 8
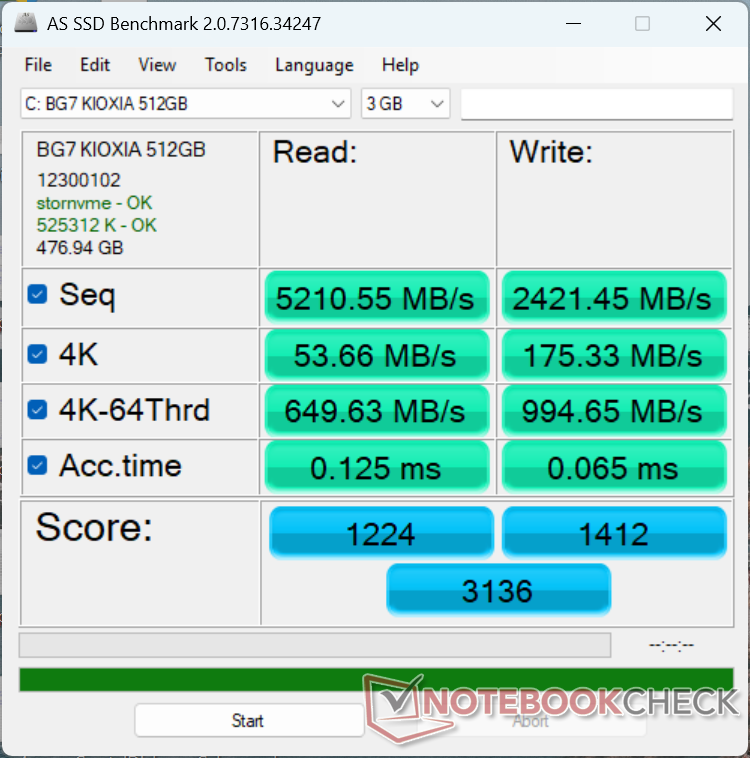
AS SSD
AS SSD
CDM 5/6 Read Seq Q32T1: 7107 MB/s
CDM 5/6 Write Seq Q32T1: 4462 MB/s
CDM 5/6 Read 4K Q32T1: 467.5 MB/s
CDM 5/6 Write 4K Q32T1: 359.6 MB/s
CDM 5 Read Seq: 3262 MB/s
CDM 5 Write Seq: 3536 MB/s
CDM 5/6 Read 4K: 59.62 MB/s
CDM 5/6 Write 4K: 116.7 MB/s
Drive Performance rating - Percent
HP OmniBook 7 Aero 13-bg1077nr
SK hynix PC801 HFS001TEJ9X101N
81.6 pt
Lenovo ThinkPad X1 Carbon Gen 14 21V70075GE
Samsung PM9C1b MZVL8512HFLU-00BLL
79.8 pt
Dell XPS 14 Core Ultra X7 358H
Samsung PM9C1b MZVL81T0HFLB-00BH1
77.7 pt
Dell XPS 13 DX13260
 
66.2 pt
Dell XPS 13 9350
Micron 2550 512GB
60.2 pt
DiskSpd
seq read
HP OmniBook 7 Aero 13-bg1077nr
SK hynix PC801 HFS001TEJ9X101N
4375 (4333.49min - 4375.35max) MB/s +32%
Dell XPS 13 DX13260
 
3317 (3282.04min - 3316.51max) MB/s
Lenovo ThinkPad X1 Carbon Gen 14 21V70075GE
Samsung PM9C1b MZVL8512HFLU-00BLL
3223 (3130.84min - 3223.17max) MB/s -3%
Dell XPS 14 Core Ultra X7 358H
Samsung PM9C1b MZVL81T0HFLB-00BH1
2967 (2659.4min - 2966.9max) MB/s -11%
Dell XPS 13 9350
Micron 2550 512GB
2416 (2299.74min - 2415.91max) MB/s -27%
seq write
HP OmniBook 7 Aero 13-bg1077nr
SK hynix PC801 HFS001TEJ9X101N
3662 (3599.27min - 3661.63max) MB/s +12%
Dell XPS 13 DX13260
 
3272 (3191.03min - 3271.98max) MB/s
Lenovo ThinkPad X1 Carbon Gen 14 21V70075GE
Samsung PM9C1b MZVL8512HFLU-00BLL
3265 (2792.78min - 3265.27max) MB/s 0%
Dell XPS 13 9350
Micron 2550 512GB
2477 (2281.75min - 2476.53max) MB/s -24%
Dell XPS 14 Core Ultra X7 358H
Samsung PM9C1b MZVL81T0HFLB-00BH1
2327 (2217.14min - 2327max) MB/s -29%
seq q8 t1 read
HP OmniBook 7 Aero 13-bg1077nr
SK hynix PC801 HFS001TEJ9X101N
7169 (6417.08min - 7168.69max) MB/s +3%
Dell XPS 14 Core Ultra X7 358H
Samsung PM9C1b MZVL81T0HFLB-00BH1
7037 (5759.83min - 7037.41max) MB/s +1%
Dell XPS 13 DX13260
 
6964 (5869.51min - 6964.43max) MB/s
Lenovo ThinkPad X1 Carbon Gen 14 21V70075GE
Samsung PM9C1b MZVL8512HFLU-00BLL
6949 (5380.03min - 6948.7max) MB/s 0%
Dell XPS 13 9350
Micron 2550 512GB
5057 (4337.25min - 5057.07max) MB/s -27%
seq q8 t1 write
HP OmniBook 7 Aero 13-bg1077nr
SK hynix PC801 HFS001TEJ9X101N
6156 (6136.27min - 6155.83max) MB/s +9%
Lenovo ThinkPad X1 Carbon Gen 14 21V70075GE
Samsung PM9C1b MZVL8512HFLU-00BLL
5863 (5795.9min - 5862.8max) MB/s +4%
Dell XPS 13 DX13260
 
5647 (5306.51min - 5646.79max) MB/s
Dell XPS 14 Core Ultra X7 358H
Samsung PM9C1b MZVL81T0HFLB-00BH1
5595 (5550.94min - 5595.34max) MB/s -1%
Dell XPS 13 9350
Micron 2550 512GB
4062 (3975.8min - 4061.61max) MB/s -28%
4k q1 t1 read
Lenovo ThinkPad X1 Carbon Gen 14 21V70075GE
Samsung PM9C1b MZVL8512HFLU-00BLL
74.6 (69.99min - 74.6max) MB/s +18%
Dell XPS 13 DX13260
 
63.4 (62.65min - 63.44max) MB/s
Dell XPS 14 Core Ultra X7 358H
Samsung PM9C1b MZVL81T0HFLB-00BH1
61.8 (59.95min - 61.82max) MB/s -3%
HP OmniBook 7 Aero 13-bg1077nr
SK hynix PC801 HFS001TEJ9X101N
54.6 (53.89min - 54.55max) MB/s -14%
Dell XPS 13 9350
Micron 2550 512GB
53.2 (50.58min - 53.24max) MB/s -16%
4k q1 t1 write
Lenovo ThinkPad X1 Carbon Gen 14 21V70075GE
Samsung PM9C1b MZVL8512HFLU-00BLL
171.1 (149.61min - 171.12max) MB/s +11%
Dell XPS 13 DX13260
 
154.1 (152.71min - 154.07max) MB/s
Dell XPS 14 Core Ultra X7 358H
Samsung PM9C1b MZVL81T0HFLB-00BH1
139.7 (138.86min - 139.67max) MB/s -9%
Dell XPS 13 9350
Micron 2550 512GB
139.2 (136.33min - 139.15max) MB/s -10%
HP OmniBook 7 Aero 13-bg1077nr
SK hynix PC801 HFS001TEJ9X101N
129.2 (122.07min - 129.16max) MB/s -16%
4k q32 t16 read
HP OmniBook 7 Aero 13-bg1077nr
SK hynix PC801 HFS001TEJ9X101N
970 (862.72min - 969.93max) MB/s +75%
Dell XPS 14 Core Ultra X7 358H
Samsung PM9C1b MZVL81T0HFLB-00BH1
711 (562.02min - 711.38max) MB/s +28%
Lenovo ThinkPad X1 Carbon Gen 14 21V70075GE
Samsung PM9C1b MZVL8512HFLU-00BLL
677 (649.67min - 677.04max) MB/s +22%
Dell XPS 13 9350
Micron 2550 512GB
640 (630.5min - 640.27max) MB/s +16%
Dell XPS 13 DX13260
 
554 (539.77min - 554.36max) MB/s
4k q32 t16 write
HP OmniBook 7 Aero 13-bg1077nr
SK hynix PC801 HFS001TEJ9X101N
545 (535.65min - 545.01max) MB/s +93%
Lenovo ThinkPad X1 Carbon Gen 14 21V70075GE
Samsung PM9C1b MZVL8512HFLU-00BLL
471 (431.88min - 471.05max) MB/s +66%
Dell XPS 14 Core Ultra X7 358H
Samsung PM9C1b MZVL81T0HFLB-00BH1
432 (319.99min - 432.49max) MB/s +53%
Dell XPS 13 9350
Micron 2550 512GB
374 (359.04min - 373.65max) MB/s +32%
Dell XPS 13 DX13260
 
283 (279.07min - 282.59max) MB/s
AS SSD
Score Total
Dell XPS 14 Core Ultra X7 358H
Samsung PM9C1b MZVL81T0HFLB-00BH1
5466 Points +74%
HP OmniBook 7 Aero 13-bg1077nr
SK hynix PC801 HFS001TEJ9X101N
4484 Points +43%
Lenovo ThinkPad X1 Carbon Gen 14 21V70075GE
Samsung PM9C1b MZVL8512HFLU-00BLL
3647 Points +16%
Dell XPS 13 9350
Micron 2550 512GB
3176 Points +1%
Dell XPS 13 DX13260
 
3136 Points
Score Read
HP OmniBook 7 Aero 13-bg1077nr
SK hynix PC801 HFS001TEJ9X101N
1805 Points +47%
Dell XPS 14 Core Ultra X7 358H
Samsung PM9C1b MZVL81T0HFLB-00BH1
1402 Points +15%
Lenovo ThinkPad X1 Carbon Gen 14 21V70075GE
Samsung PM9C1b MZVL8512HFLU-00BLL
1272 Points +4%
Dell XPS 13 DX13260
 
1224 Points
Dell XPS 13 9350
Micron 2550 512GB
1096 Points -10%
Score Write
Dell XPS 14 Core Ultra X7 358H
Samsung PM9C1b MZVL81T0HFLB-00BH1
3375 Points +139%
HP OmniBook 7 Aero 13-bg1077nr
SK hynix PC801 HFS001TEJ9X101N
1856 Points +31%
Lenovo ThinkPad X1 Carbon Gen 14 21V70075GE
Samsung PM9C1b MZVL8512HFLU-00BLL
1798 Points +27%
Dell XPS 13 9350
Micron 2550 512GB
1572 Points +11%
Dell XPS 13 DX13260
 
1412 Points
Seq Read
HP OmniBook 7 Aero 13-bg1077nr
SK hynix PC801 HFS001TEJ9X101N
5217.29 MB/s 0%
Dell XPS 13 DX13260
 
5210.55 MB/s
Lenovo ThinkPad X1 Carbon Gen 14 21V70075GE
Samsung PM9C1b MZVL8512HFLU-00BLL
5129 MB/s -2%
Dell XPS 14 Core Ultra X7 358H
Samsung PM9C1b MZVL81T0HFLB-00BH1
4161.24 MB/s -20%
Dell XPS 13 9350
Micron 2550 512GB
3933.86 MB/s -25%
Seq Write
Dell XPS 14 Core Ultra X7 358H
Samsung PM9C1b MZVL81T0HFLB-00BH1
3356.2 MB/s +39%
Lenovo ThinkPad X1 Carbon Gen 14 21V70075GE
Samsung PM9C1b MZVL8512HFLU-00BLL
3282 MB/s +36%
HP OmniBook 7 Aero 13-bg1077nr
SK hynix PC801 HFS001TEJ9X101N
3126.39 MB/s +29%
Dell XPS 13 9350
Micron 2550 512GB
2608.98 MB/s +8%
Dell XPS 13 DX13260
 
2421.45 MB/s
4K Read
Lenovo ThinkPad X1 Carbon Gen 14 21V70075GE
Samsung PM9C1b MZVL8512HFLU-00BLL
67.7 MB/s +26%
Dell XPS 14 Core Ultra X7 358H
Samsung PM9C1b MZVL81T0HFLB-00BH1
57.94 MB/s +8%
Dell XPS 13 DX13260
 
53.66 MB/s
HP OmniBook 7 Aero 13-bg1077nr
SK hynix PC801 HFS001TEJ9X101N
52.5 MB/s -2%
Dell XPS 13 9350
Micron 2550 512GB
51.9 MB/s -3%
4K Write
Dell XPS 14 Core Ultra X7 358H
Samsung PM9C1b MZVL81T0HFLB-00BH1
183.04 MB/s +4%
Dell XPS 13 DX13260
 
175.33 MB/s
Lenovo ThinkPad X1 Carbon Gen 14 21V70075GE
Samsung PM9C1b MZVL8512HFLU-00BLL
173.8 MB/s -1%
HP OmniBook 7 Aero 13-bg1077nr
SK hynix PC801 HFS001TEJ9X101N
144.39 MB/s -18%
Dell XPS 13 9350
Micron 2550 512GB
138.37 MB/s -21%
4K-64 Read
HP OmniBook 7 Aero 13-bg1077nr
SK hynix PC801 HFS001TEJ9X101N
1230.46 MB/s +89%
Dell XPS 14 Core Ultra X7 358H
Samsung PM9C1b MZVL81T0HFLB-00BH1
927.71 MB/s +43%
Lenovo ThinkPad X1 Carbon Gen 14 21V70075GE
Samsung PM9C1b MZVL8512HFLU-00BLL
691 MB/s +6%
Dell XPS 13 9350
Micron 2550 512GB
650.78 MB/s 0%
Dell XPS 13 DX13260
 
649.63 MB/s
4K-64 Write
Dell XPS 14 Core Ultra X7 358H
Samsung PM9C1b MZVL81T0HFLB-00BH1
2856.06 MB/s +187%
HP OmniBook 7 Aero 13-bg1077nr
SK hynix PC801 HFS001TEJ9X101N
1398.51 MB/s +41%
Lenovo ThinkPad X1 Carbon Gen 14 21V70075GE
Samsung PM9C1b MZVL8512HFLU-00BLL
1295 MB/s +30%
Dell XPS 13 9350
Micron 2550 512GB
1172.49 MB/s +18%
Dell XPS 13 DX13260
 
994.65 MB/s
Access Time Read
Dell XPS 13 DX13260
 
0.125 ms *
Dell XPS 14 Core Ultra X7 358H
Samsung PM9C1b MZVL81T0HFLB-00BH1
0.103 ms * +18%
Dell XPS 13 9350
Micron 2550 512GB
0.091 ms * +27%
Lenovo ThinkPad X1 Carbon Gen 14 21V70075GE
Samsung PM9C1b MZVL8512HFLU-00BLL
0.058 ms * +54%
HP OmniBook 7 Aero 13-bg1077nr
SK hynix PC801 HFS001TEJ9X101N
0.043 ms * +66%
Access Time Write
HP OmniBook 7 Aero 13-bg1077nr
SK hynix PC801 HFS001TEJ9X101N
0.08 ms * -23%
Dell XPS 14 Core Ultra X7 358H
Samsung PM9C1b MZVL81T0HFLB-00BH1
0.077 ms * -18%
Dell XPS 13 9350
Micron 2550 512GB
0.076 ms * -17%
Dell XPS 13 DX13260
 
0.065 ms *
Lenovo ThinkPad X1 Carbon Gen 14 21V70075GE
Samsung PM9C1b MZVL8512HFLU-00BLL
0.026 ms * +60%

* ... Moindre est la valeur, meilleures sont les performances
Limitation du disque : boucle de lecture DiskSpd, profondeur de file d'attente 8

0145290435580725870101511601305145015951740188520302175232024652610275529003045319033353480362537703915406042054350449546404785493050755220536555105655580059456090623563806525667068156960Tooltip
Dell XPS 13 DX13260  ; diskspd 2.0.17 f: Ø6973 (5927.07-7011.62) MB/s
Dell XPS 14 Core Ultra X7 358H Samsung PM9C1b MZVL81T0HFLB-00BH1; diskspd 2.0.17 f: Ø7012 (6080.06-7044.75) MB/s

Performances du GPU

La carte graphique intégrée Graphics 2 Xe3 est légèrement moins performante que l’Iris Xe 96 EU, qui équipait la plupart des Ultrabooks début 2020. Il va sans dire qu’elle est davantage conçue pour la lecture de vidéos en 4K que pour les jeux vidéo ou l’accélération graphique.

Certains titres, notamment F1 24, Strange Brigade et Cyberpunk 2077, ne parvenaient pas à se lancer avec certains paramètres, probablement en raison de limitations strictes en matière de mémoire vive. Par conséquent, ces données ne figurent pas ci-dessous.

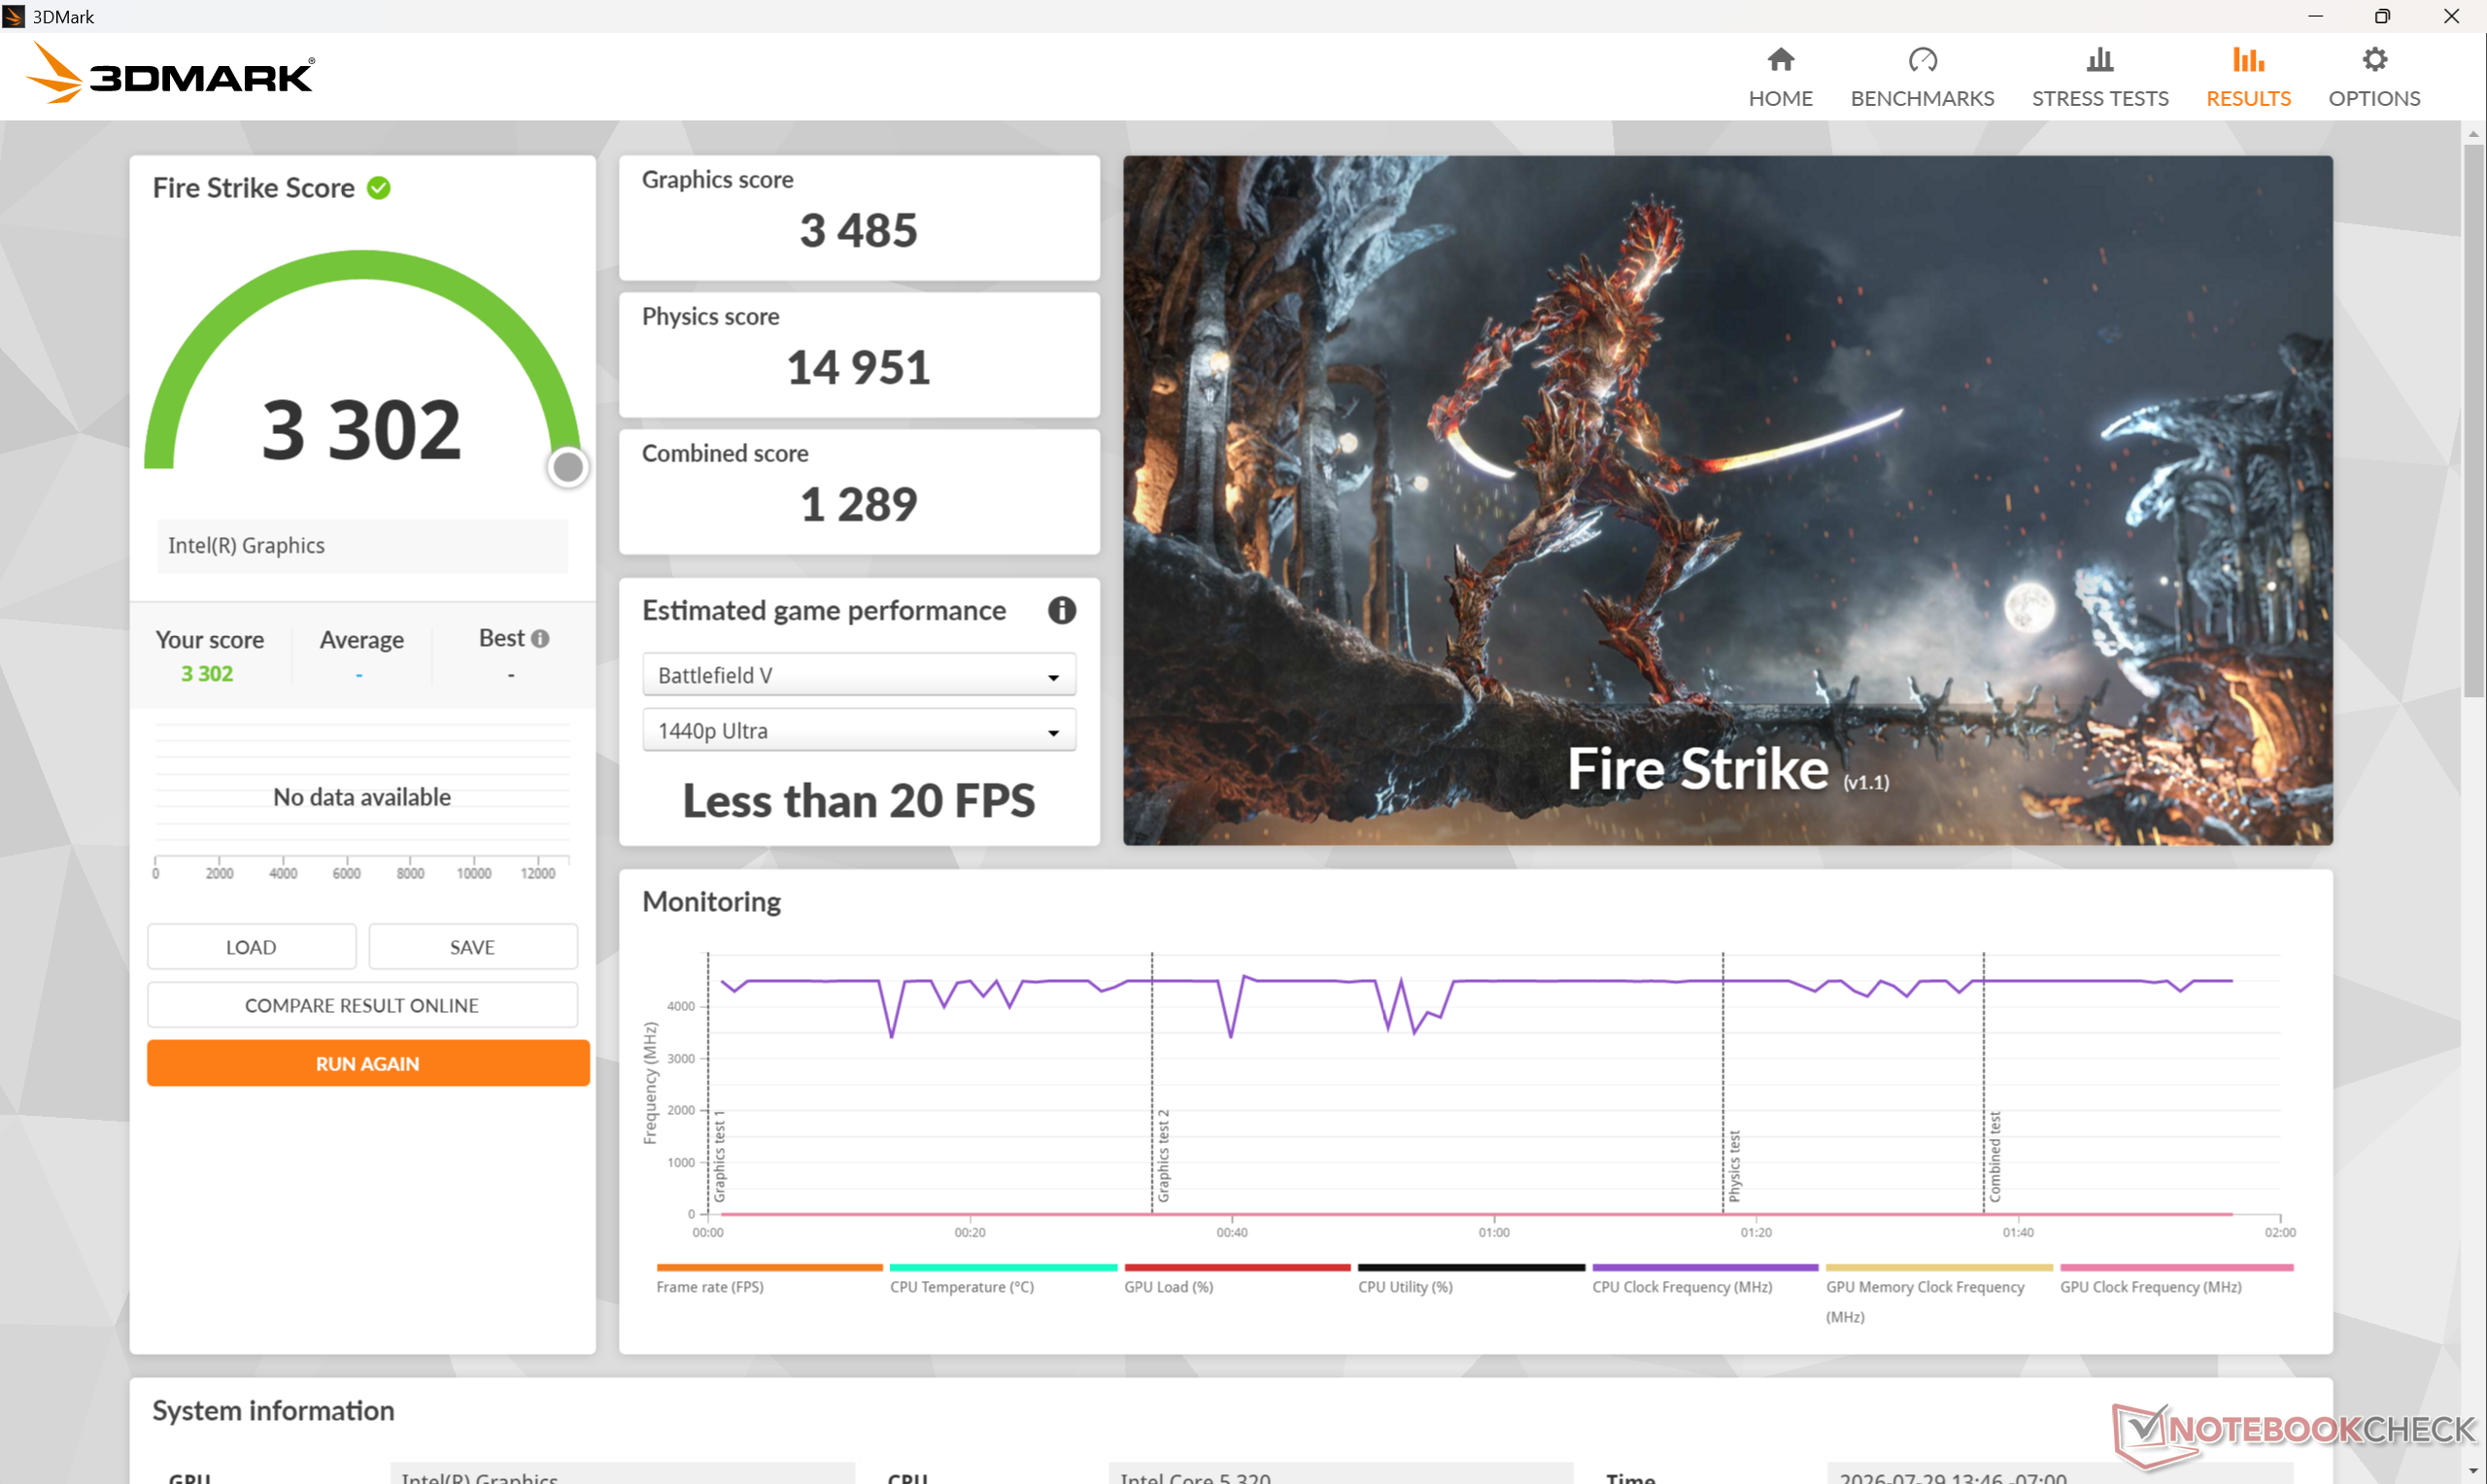
Profil de consommationScore graphiqueScore physiqueScore combiné
Mode Performance3 48514 9511 289
Mode Équilibré3 41015 2261 283
Alimentation par batterie3 38415 1161 270
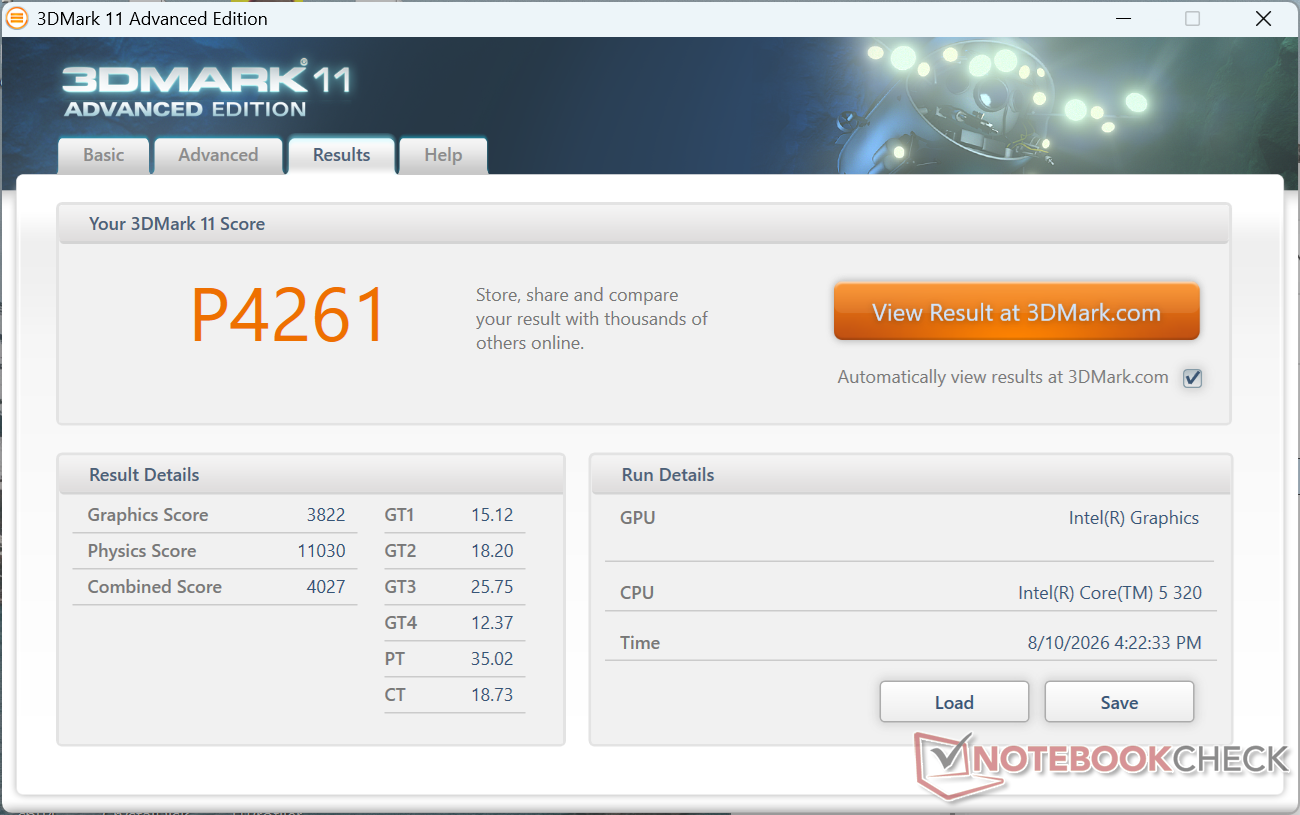
3DMark 11
3DMark 11
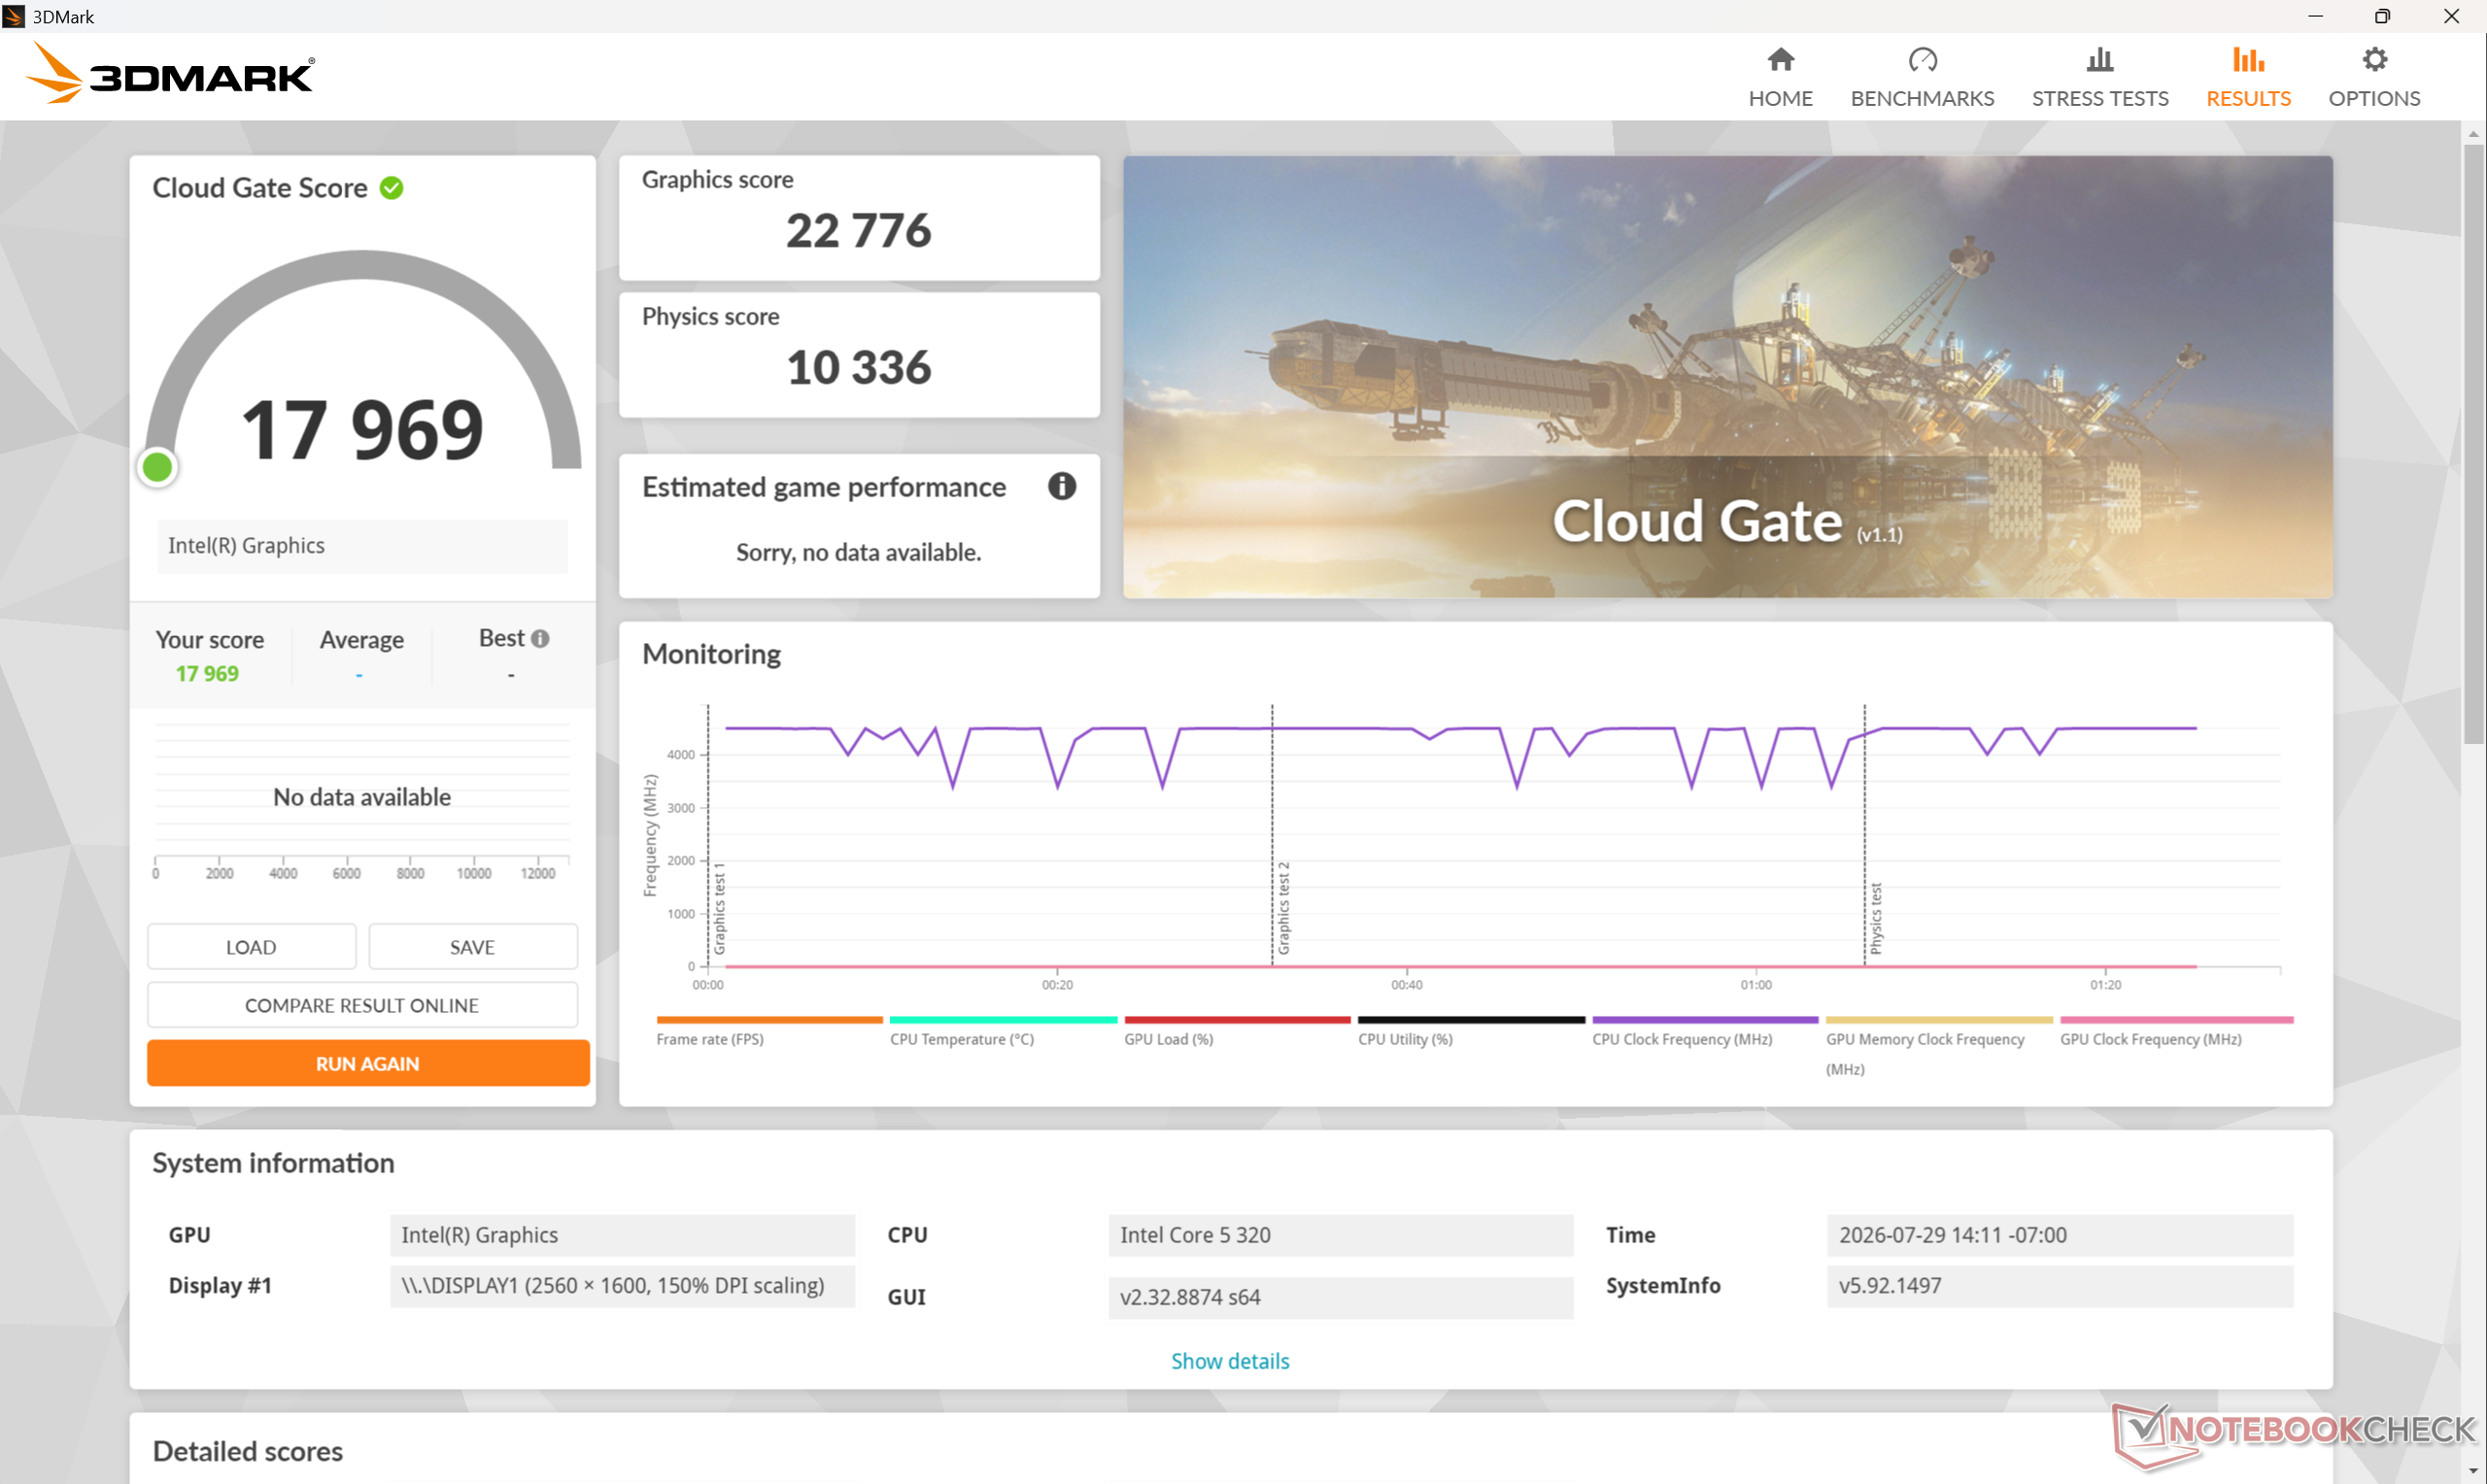
Cloud Gate
Cloud Gate
Fire Strike
Fire Strike
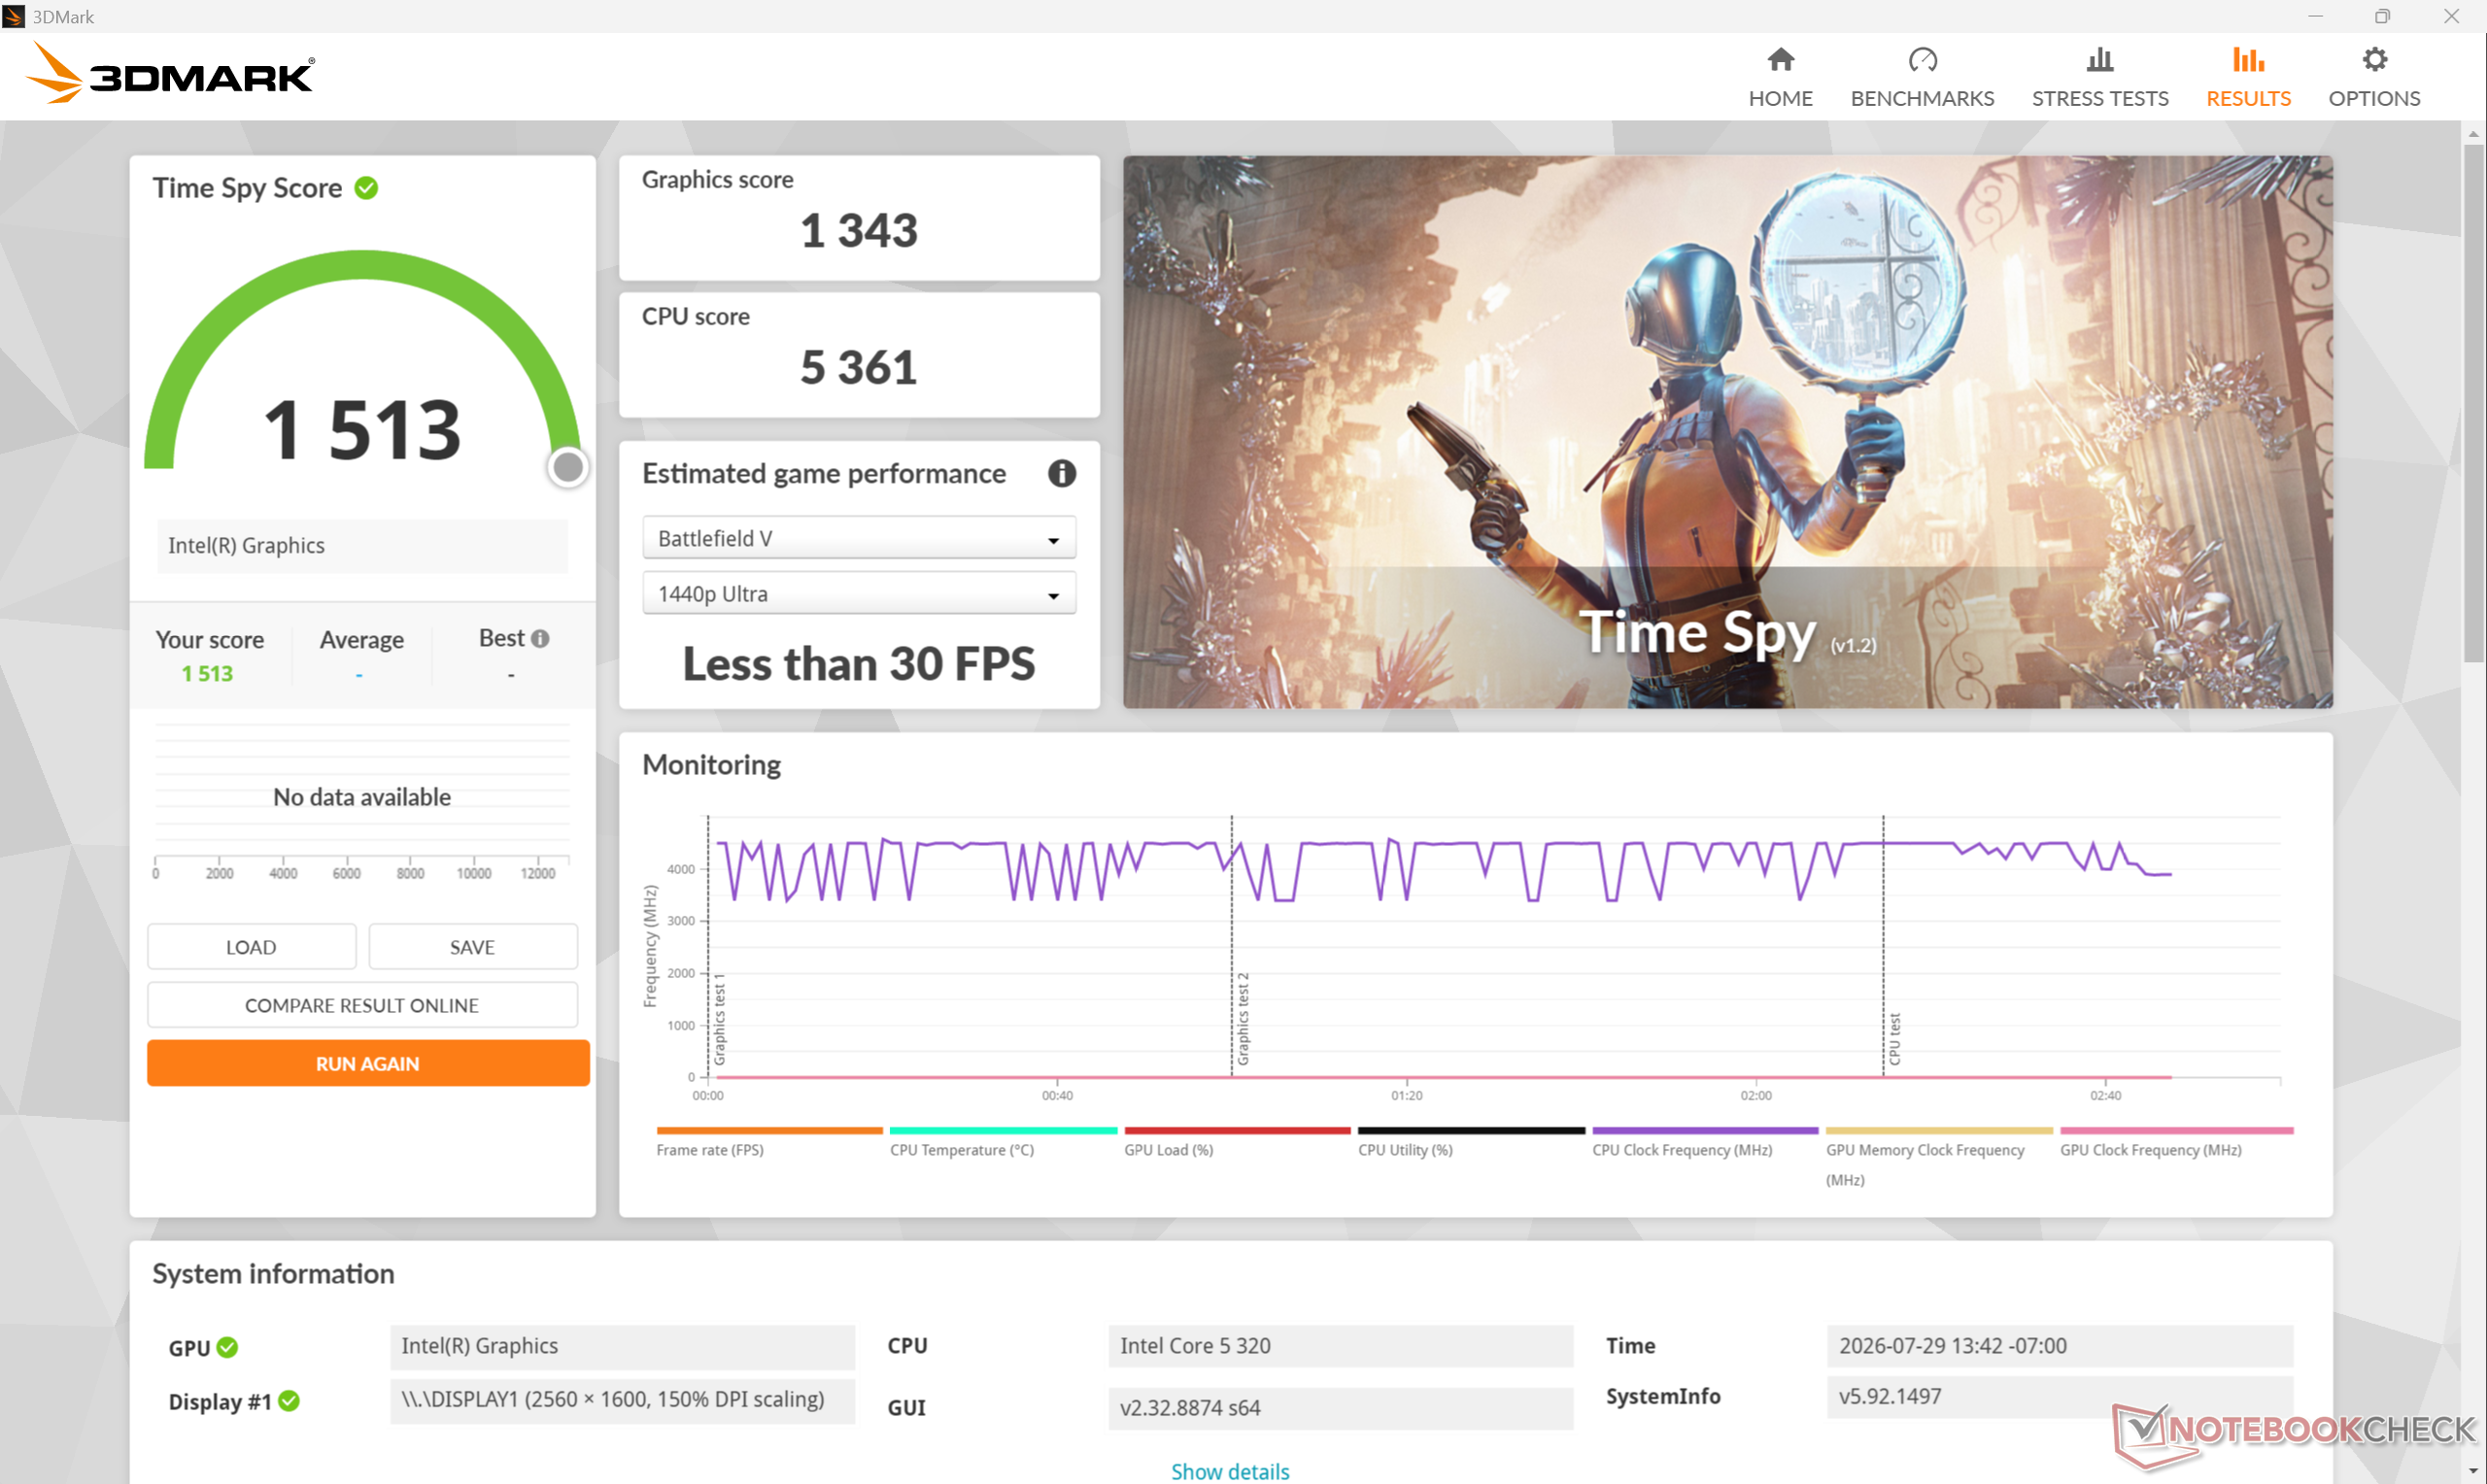
Time Spy
Time Spy
3DMark Performance rating - Percent
Dell XPS 14 Core Ultra X7 358H
Intel Arc B390 12 Xe3 Panther Lake iGPU, Intel Core Ultra X7 358H
100 pt
Dell XPS 13 9350
Intel Arc Graphics 140V, Intel Core Ultra 7 256V
59 pt
Dell XPS 14 Core Ultra 7 355
Intel Graphics 4 Xe3 Panther Lake iGPU, Intel Core Ultra 7 355
42.9 pt
HP OmniBook 7 Aero 13-bg1077nr
AMD Radeon 860M, AMD Ryzen AI 7 350
42.5 pt
Alldocube iWork GT Ultra
Intel Arc 7-Core iGPU, Intel Core Ultra 5 125H
41.7 pt
Lenovo ThinkPad X1 Carbon Gen 14 21V70075GE -1!
Intel Graphics 4 Xe3 Panther Lake iGPU, Intel Core Ultra 5 325
40.4 pt
Microsoft Surface Pro 8, i7-1185G7
Intel Iris Xe Graphics G7 96EUs, Intel Core i7-1185G7
32.2 pt
HP EliteBook 8 Flip G1i 13
Intel Graphics 4-Core iGPU (Meteor / Arrow Lake), Intel Core Ultra 7 265U
31.8 pt
Lenovo ThinkPad L13 2in1 G5 21LNS4AM00 -1!
Intel Graphics 4-Core iGPU (Meteor / Arrow Lake), Intel Core Ultra 5 125U
27.5 pt
Dell Latitude 13 7330
Intel Iris Xe Graphics G7 96EUs, Intel Core i7-1265U
26 pt
Moyenne Intel Graphics 2 Xe3 Wildcat Lake iGPU
 
21.9 pt
Dell XPS 13 DX13260
Intel Graphics 2 Xe3 Wildcat Lake iGPU, Intel Core 5 320
21.8 pt
3DMark 11 - 1280x720 Performance GPU
Dell XPS 14 Core Ultra X7 358H
Intel Arc B390 12 Xe3 Panther Lake iGPU, Intel Core Ultra X7 358H
18743 Points +390%
HP OmniBook 7 Aero 13-bg1077nr
AMD Radeon 860M, AMD Ryzen AI 7 350
11064 Points +189%
Dell XPS 13 9350
Intel Arc Graphics 140V, Intel Core Ultra 7 256V
10651 Points +179%
Alldocube iWork GT Ultra
Intel Arc 7-Core iGPU, Intel Core Ultra 5 125H
7794 Points +104%
Dell XPS 14 Core Ultra 7 355
Intel Graphics 4 Xe3 Panther Lake iGPU, Intel Core Ultra 7 355
7317 Points +91%
Lenovo ThinkPad X1 Carbon Gen 14 21V70075GE
Intel Graphics 4 Xe3 Panther Lake iGPU, Intel Core Ultra 5 325
7301 Points +91%
Microsoft Surface Pro 8, i7-1185G7
Intel Iris Xe Graphics G7 96EUs, Intel Core i7-1185G7
6825 Points +79%
HP EliteBook 8 Flip G1i 13
Intel Graphics 4-Core iGPU (Meteor / Arrow Lake), Intel Core Ultra 7 265U
6090 Points +59%
Dell Latitude 13 7330
Intel Iris Xe Graphics G7 96EUs, Intel Core i7-1265U
5840 Points +53%
Lenovo ThinkPad L13 2in1 G5 21LNS4AM00
Intel Graphics 4-Core iGPU (Meteor / Arrow Lake), Intel Core Ultra 5 125U
5240 Points +37%
Dell XPS 13 DX13260
Intel Graphics 2 Xe3 Wildcat Lake iGPU, Intel Core 5 320
3822 Points
Moyenne Intel Graphics 2 Xe3 Wildcat Lake iGPU
  (3749 - 3822, n=2)
3786 Points -1%
3DMark
1280x720 Cloud Gate Standard Graphics
Dell XPS 14 Core Ultra X7 358H
Intel Arc B390 12 Xe3 Panther Lake iGPU, Intel Core Ultra X7 358H
82808 Points +264%
Dell XPS 13 9350
Intel Arc Graphics 140V, Intel Core Ultra 7 256V
54751 Points +140%
Alldocube iWork GT Ultra
Intel Arc 7-Core iGPU, Intel Core Ultra 5 125H
42086 Points +85%
Dell XPS 14 Core Ultra 7 355
Intel Graphics 4 Xe3 Panther Lake iGPU, Intel Core Ultra 7 355
41422 Points +82%
HP OmniBook 7 Aero 13-bg1077nr
AMD Radeon 860M, AMD Ryzen AI 7 350
34432 Points +51%
HP EliteBook 8 Flip G1i 13
Intel Graphics 4-Core iGPU (Meteor / Arrow Lake), Intel Core Ultra 7 265U
32463 Points +43%
Microsoft Surface Pro 8, i7-1185G7
Intel Iris Xe Graphics G7 96EUs, Intel Core i7-1185G7
30384 Points +33%
Dell Latitude 13 7330
Intel Iris Xe Graphics G7 96EUs, Intel Core i7-1265U
25358 Points +11%
Dell XPS 13 DX13260
Intel Graphics 2 Xe3 Wildcat Lake iGPU, Intel Core 5 320
22776 Points
Moyenne Intel Graphics 2 Xe3 Wildcat Lake iGPU
  (22468 - 22776, n=2)
22622 Points -1%
1920x1080 Fire Strike Graphics
Dell XPS 14 Core Ultra X7 358H
Intel Arc B390 12 Xe3 Panther Lake iGPU, Intel Core Ultra X7 358H
17324 Points +397%
Dell XPS 13 9350
Intel Arc Graphics 140V, Intel Core Ultra 7 256V
9492 Points +172%
Lenovo ThinkPad X1 Carbon Gen 14 21V70075GE
Intel Graphics 4 Xe3 Panther Lake iGPU, Intel Core Ultra 5 325
7090 Points +103%
Dell XPS 14 Core Ultra 7 355
Intel Graphics 4 Xe3 Panther Lake iGPU, Intel Core Ultra 7 355
7025 Points +102%
Alldocube iWork GT Ultra
Intel Arc 7-Core iGPU, Intel Core Ultra 5 125H
6691 Points +92%
HP OmniBook 7 Aero 13-bg1077nr
AMD Radeon 860M, AMD Ryzen AI 7 350
6462 Points +85%
Microsoft Surface Pro 8, i7-1185G7
Intel Iris Xe Graphics G7 96EUs, Intel Core i7-1185G7
5570 Points +60%
HP EliteBook 8 Flip G1i 13
Intel Graphics 4-Core iGPU (Meteor / Arrow Lake), Intel Core Ultra 7 265U
5143 Points +48%
Lenovo ThinkPad L13 2in1 G5 21LNS4AM00
Intel Graphics 4-Core iGPU (Meteor / Arrow Lake), Intel Core Ultra 5 125U
4604 Points +32%
Dell Latitude 13 7330
Intel Iris Xe Graphics G7 96EUs, Intel Core i7-1265U
3978 Points +14%
Moyenne Intel Graphics 2 Xe3 Wildcat Lake iGPU
  (3485 - 3642, n=2)
3564 Points +2%
Dell XPS 13 DX13260
Intel Graphics 2 Xe3 Wildcat Lake iGPU, Intel Core 5 320
3485 Points
2560x1440 Time Spy Graphics
Dell XPS 14 Core Ultra X7 358H
Intel Arc B390 12 Xe3 Panther Lake iGPU, Intel Core Ultra X7 358H
7043 Points +424%
Dell XPS 13 9350
Intel Arc Graphics 140V, Intel Core Ultra 7 256V
4115 Points +206%
Dell XPS 14 Core Ultra 7 355
Intel Graphics 4 Xe3 Panther Lake iGPU, Intel Core Ultra 7 355
2951 Points +120%
Lenovo ThinkPad X1 Carbon Gen 14 21V70075GE
Intel Graphics 4 Xe3 Panther Lake iGPU, Intel Core Ultra 5 325
2905 Points +116%
Alldocube iWork GT Ultra
Intel Arc 7-Core iGPU, Intel Core Ultra 5 125H
2509 Points +87%
HP OmniBook 7 Aero 13-bg1077nr
AMD Radeon 860M, AMD Ryzen AI 7 350
2271 Points +69%
Lenovo ThinkPad L13 2in1 G5 21LNS4AM00
Intel Graphics 4-Core iGPU (Meteor / Arrow Lake), Intel Core Ultra 5 125U
1978 Points +47%
HP EliteBook 8 Flip G1i 13
Intel Graphics 4-Core iGPU (Meteor / Arrow Lake), Intel Core Ultra 7 265U
1808 Points +35%
Microsoft Surface Pro 8, i7-1185G7
Intel Iris Xe Graphics G7 96EUs, Intel Core i7-1185G7
1666 Points +24%
Moyenne Intel Graphics 2 Xe3 Wildcat Lake iGPU
  (1343 - 1401, n=2)
1372 Points +2%
Dell Latitude 13 7330
Intel Iris Xe Graphics G7 96EUs, Intel Core i7-1265U
1355 Points +1%
Dell XPS 13 DX13260
Intel Graphics 2 Xe3 Wildcat Lake iGPU, Intel Core 5 320
1343 Points
3DMark 11 Performance
4261 points
3DMark Cloud Gate Standard Score
17969 points
3DMark Fire Strike Score
3302 points
3DMark Time Spy Score
1513 points
Aide
Blender
v3.3 Classroom METAL
Apple MacBook Neo 256 GB
Apple A18 GPU, Apple A18 Pro
227 Seconds *
v3.3 Classroom CPU
Dell Latitude 13 7330
Intel Iris Xe Graphics G7 96EUs, Intel Core i7-1265U
848 Seconds * -6%
Apple MacBook Neo 256 GB
Apple A18 GPU, Apple A18 Pro
813 Seconds * -2%
Dell XPS 13 DX13260
Intel Graphics 2 Xe3 Wildcat Lake iGPU, Intel Core 5 320
799 Seconds *
Moyenne Intel Graphics 2 Xe3 Wildcat Lake iGPU
  (n=1)
799 Seconds * -0%
Lenovo ThinkPad L13 2in1 G5 21LNS4AM00
Intel Graphics 4-Core iGPU (Meteor / Arrow Lake), Intel Core Ultra 5 125U
719 Seconds * +10%
Alldocube iWork GT Ultra
Intel Arc 7-Core iGPU, Intel Core Ultra 5 125H
705 Seconds * +12%
HP EliteBook 8 Flip G1i 13
Intel Graphics 4-Core iGPU (Meteor / Arrow Lake), Intel Core Ultra 7 265U
667 Seconds * +17%
Dell XPS 13 9350
Intel Arc Graphics 140V, Intel Core Ultra 7 256V
580 Seconds * +27%
Lenovo ThinkPad X1 Carbon Gen 14 21V70075GE
Intel Graphics 4 Xe3 Panther Lake iGPU, Intel Core Ultra 5 325
499 Seconds * +38%
HP OmniBook 7 Aero 13-bg1077nr
AMD Radeon 860M, AMD Ryzen AI 7 350
365 Seconds * +54%
Dell XPS 14 Core Ultra X7 358H
Intel Arc B390 12 Xe3 Panther Lake iGPU, Intel Core Ultra X7 358H
335 Seconds * +58%
v3.3 Classroom oneAPI/Intel
Moyenne Intel Graphics 2 Xe3 Wildcat Lake iGPU
  (n=1)
492 Seconds *
HP EliteBook 8 Flip G1i 13
Intel Graphics 4-Core iGPU (Meteor / Arrow Lake), Intel Core Ultra 7 265U
313 Seconds *
Dell XPS 13 9350
Intel Arc Graphics 140V, Intel Core Ultra 7 256V
211 Seconds *
Dell XPS 14 Core Ultra X7 358H
Intel Arc B390 12 Xe3 Panther Lake iGPU, Intel Core Ultra X7 358H
106 Seconds *
v4.3 Barbershop CPU
Dell XPS 13 DX13260
Intel Graphics 2 Xe3 Wildcat Lake iGPU, Intel Core 5 320
4408 Seconds *
Moyenne Intel Graphics 2 Xe3 Wildcat Lake iGPU
  (3828 - 4408, n=2)
4118 Seconds * +7%
Alldocube iWork GT Ultra
Intel Arc 7-Core iGPU, Intel Core Ultra 5 125H
3693 Seconds * +16%
HP EliteBook 8 Flip G1i 13
Intel Graphics 4-Core iGPU (Meteor / Arrow Lake), Intel Core Ultra 7 265U
3358 Seconds * +24%
HP OmniBook 7 Aero 13-bg1077nr
AMD Radeon 860M, AMD Ryzen AI 7 350
2075 Seconds * +53%
Dell XPS 14 Core Ultra X7 358H
Intel Arc B390 12 Xe3 Panther Lake iGPU, Intel Core Ultra X7 358H
1711 Seconds * +61%
v4.3 Barbershop oneAPI
Moyenne Intel Graphics 2 Xe3 Wildcat Lake iGPU
  (n=1)
2337 Seconds *
HP EliteBook 8 Flip G1i 13
Intel Graphics 4-Core iGPU (Meteor / Arrow Lake), Intel Core Ultra 7 265U
1308 Seconds *
Dell XPS 14 Core Ultra X7 358H
Intel Arc B390 12 Xe3 Panther Lake iGPU, Intel Core Ultra X7 358H
369 Seconds *

* ... Moindre est la valeur, meilleures sont les performances
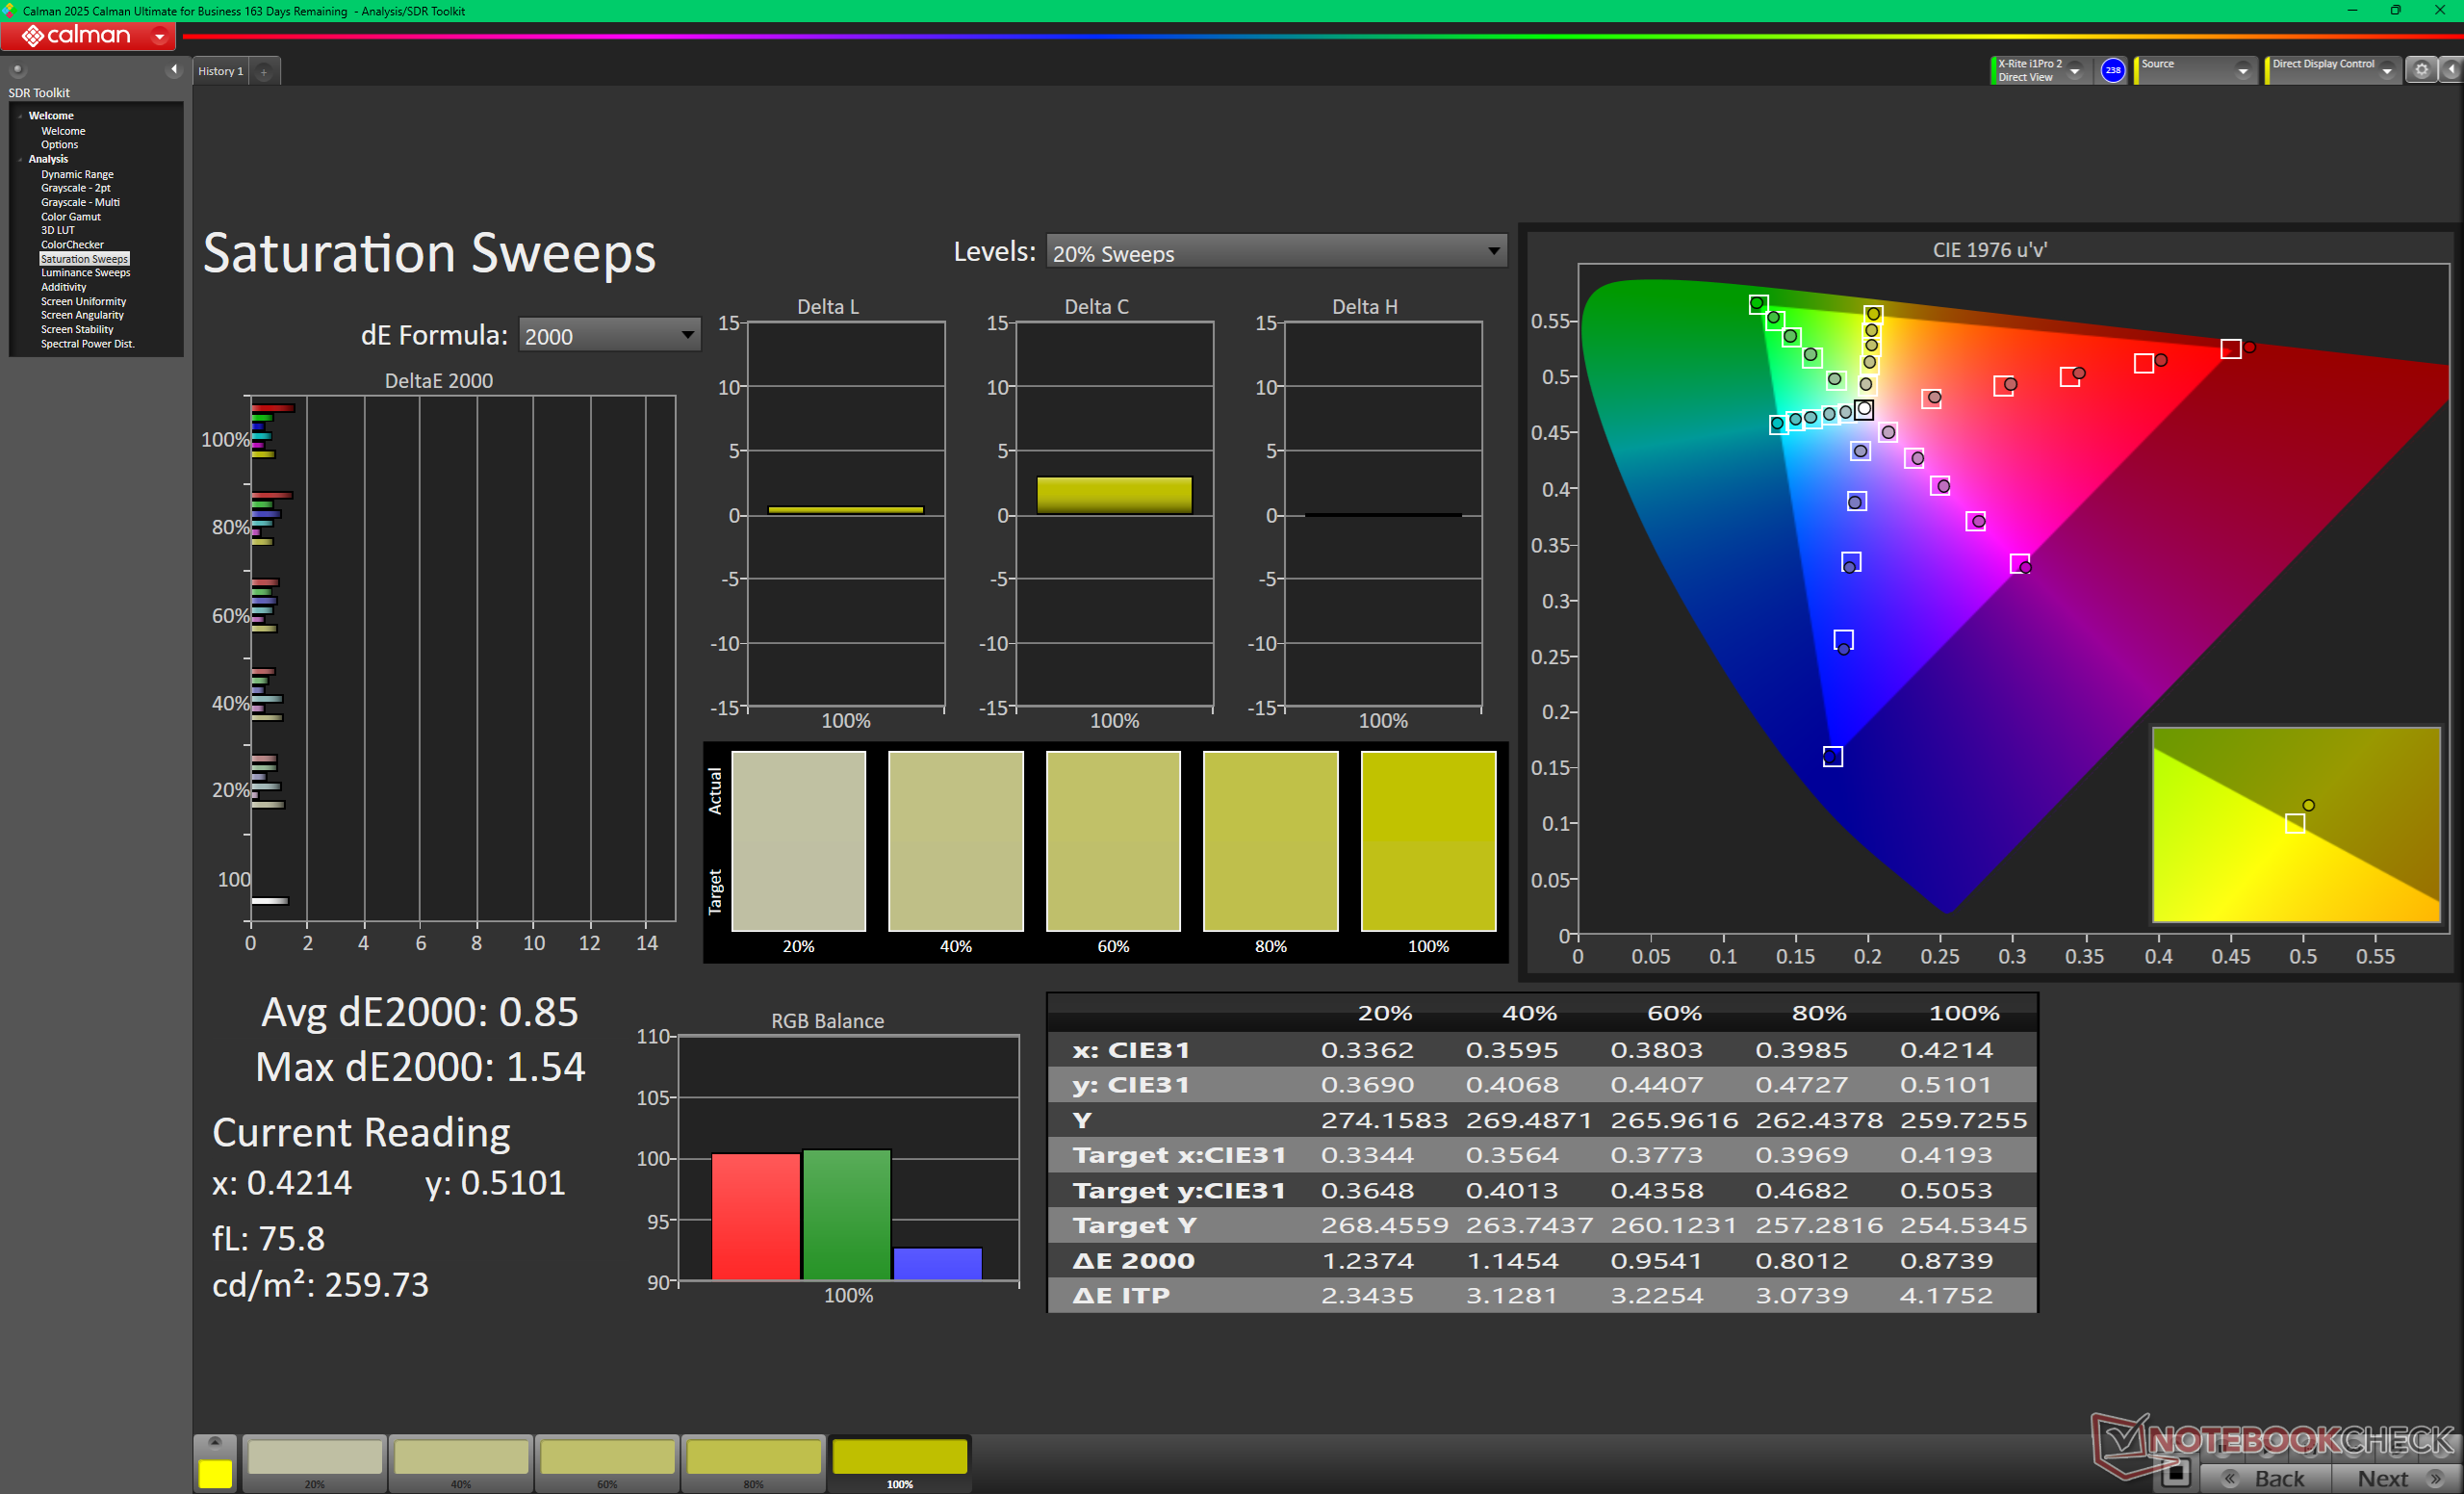
Performance rating - Percent
Dell XPS 14 Core Ultra X7 358H
Intel Core Ultra X7 358H, Intel Arc B390 12 Xe3 Panther Lake iGPU
100 pt
Dell XPS 13 9350
Intel Core Ultra 7 256V, Intel Arc Graphics 140V
64.5 pt
HP OmniBook 7 Aero 13-bg1077nr
AMD Ryzen AI 7 350, AMD Radeon 860M
63.1 pt
Lenovo ThinkPad X1 Carbon Gen 14 21V70075GE
Intel Core Ultra 5 325, Intel Graphics 4 Xe3 Panther Lake iGPU
57.9 pt
Dell XPS 13 DX13260
Intel Core 5 320, Intel Graphics 2 Xe3 Wildcat Lake iGPU
33.9 pt
Apple MacBook Neo 256 GB -4!
Apple A18 Pro, Apple A18 GPU
27.9 pt
Baldur's Gate 3 - 1920x1080 Ultra Preset AA:T
Dell XPS 14 Core Ultra X7 358H
Intel Core Ultra X7 358H, Intel Arc B390 12 Xe3 Panther Lake iGPU
48.7 (43.1min, 44.3P0.1, 45.5P1) fps +347%
Dell XPS 13 9350
Intel Core Ultra 7 256V, Intel Arc Graphics 140V
25.7 fps +136%
Lenovo ThinkPad X1 Carbon Gen 14 21V70075GE
Intel Core Ultra 5 325, Intel Graphics 4 Xe3 Panther Lake iGPU
22.4 (20.3min, 20.4P0.1, 20.6P1) fps +106%
HP OmniBook 7 Aero 13-bg1077nr
AMD Ryzen AI 7 350, AMD Radeon 860M
20.6 (17.1min, 17.1P0.1, 18.4P1) fps +89%
Apple MacBook Neo 256 GB
Apple A18 Pro, Apple A18 GPU
13.6 fps +25%
Dell XPS 13 DX13260
Intel Core 5 320, Intel Graphics 2 Xe3 Wildcat Lake iGPU
10.9 (9.5min, 9.53P0.1, 9.91P1) fps
GTA V - 1920x1080 Highest AA:4xMSAA + FX AF:16x
Dell XPS 14 Core Ultra X7 358H
Intel Core Ultra X7 358H, Intel Arc B390 12 Xe3 Panther Lake iGPU
43.3 (6.46min, 33.3P1) fps +462%
HP OmniBook 7 Aero 13-bg1077nr
AMD Ryzen AI 7 350, AMD Radeon 860M
25.7 (2.43min, 16.9P1) fps +233%
Dell XPS 13 9350
Intel Core Ultra 7 256V, Intel Arc Graphics 140V
25.6 (2.46min, 19.6P1) fps +232%
Lenovo ThinkPad X1 Carbon Gen 14 21V70075GE
Intel Core Ultra 5 325, Intel Graphics 4 Xe3 Panther Lake iGPU
21.9 (6.72min, 17.2P1) fps +184%
Dell XPS 13 DX13260
Intel Core 5 320, Intel Graphics 2 Xe3 Wildcat Lake iGPU
7.71 (1.599min, 5.99P1) fps
Final Fantasy XV Benchmark - 1920x1080 High Quality
Dell XPS 14 Core Ultra X7 358H
Intel Core Ultra X7 358H, Intel Arc B390 12 Xe3 Panther Lake iGPU
52.8 fps +182%
Dell XPS 13 9350
Intel Core Ultra 7 256V, Intel Arc Graphics 140V
31.5 fps +68%
Lenovo ThinkPad X1 Carbon Gen 14 21V70075GE
Intel Core Ultra 5 325, Intel Graphics 4 Xe3 Panther Lake iGPU
26.8 fps +43%
HP OmniBook 7 Aero 13-bg1077nr
AMD Ryzen AI 7 350, AMD Radeon 860M
23.3 fps +25%
Dell XPS 13 DX13260
Intel Core 5 320, Intel Graphics 2 Xe3 Wildcat Lake iGPU
18.7 fps
Dota 2 Reborn - 1920x1080 ultra (3/3) best looking
Dell XPS 14 Core Ultra X7 358H
Intel Core Ultra X7 358H, Intel Arc B390 12 Xe3 Panther Lake iGPU
105.4 (70.1min) fps +131%
Lenovo ThinkPad X1 Carbon Gen 14 21V70075GE
Intel Core Ultra 5 325, Intel Graphics 4 Xe3 Panther Lake iGPU
83.3 (54.4min) fps +82%
Dell XPS 13 9350
Intel Core Ultra 7 256V, Intel Arc Graphics 140V
80.7 (52.1min) fps +77%
HP OmniBook 7 Aero 13-bg1077nr
AMD Ryzen AI 7 350, AMD Radeon 860M
73.3 (66min) fps +60%
Dell XPS 13 DX13260
Intel Core 5 320, Intel Graphics 2 Xe3 Wildcat Lake iGPU
45.7 (22.3min) fps
X-Plane 11.11 - 1920x1080 high (fps_test=3)
HP OmniBook 7 Aero 13-bg1077nr
AMD Ryzen AI 7 350, AMD Radeon 860M
40.4 fps +98%
Dell XPS 14 Core Ultra X7 358H
Intel Core Ultra X7 358H, Intel Arc B390 12 Xe3 Panther Lake iGPU
40.3 fps +98%
Dell XPS 13 9350
Intel Core Ultra 7 256V, Intel Arc Graphics 140V
30.1 fps +48%
Lenovo ThinkPad X1 Carbon Gen 14 21V70075GE
Intel Core Ultra 5 325, Intel Graphics 4 Xe3 Panther Lake iGPU
25.5 fps +25%
Dell XPS 13 DX13260
Intel Core 5 320, Intel Graphics 2 Xe3 Wildcat Lake iGPU
20.4 fps
GTA V
1920x1080 Normal/Off AF:4x
Dell XPS 14 Core Ultra X7 358H
Intel Core Ultra X7 358H, Intel Arc B390 12 Xe3 Panther Lake iGPU
168.2 (4.85min, 111.1P1) fps +116%
Dell XPS 14 Core Ultra 7 355
Intel Core Ultra 7 355, Intel Graphics 4 Xe3 Panther Lake iGPU
145.8 (4.16min, 90.9P1) fps +87%
Dell XPS 13 9350
Intel Core Ultra 7 256V, Intel Arc Graphics 140V
134.2 (5.63min, 83.3P1) fps +72%
HP OmniBook 7 Aero 13-bg1077nr
AMD Ryzen AI 7 350, AMD Radeon 860M
120.3 (16.7min, 83.3P1) fps +55%
Alldocube iWork GT Ultra
Intel Core Ultra 5 125H, Intel Arc 7-Core iGPU
84.5 (27.2min, 55.6P1) fps +9%
Moyenne Intel Graphics 2 Xe3 Wildcat Lake iGPU
  (77.8 - 78.7, n=2)
78.3 fps +1%
Dell XPS 13 DX13260
Intel Core 5 320, Intel Graphics 2 Xe3 Wildcat Lake iGPU
77.8 (7.47min, 47.6P1) fps
HP EliteBook 8 Flip G1i 13
Intel Core Ultra 7 265U, Intel Graphics 4-Core iGPU (Meteor / Arrow Lake)
74.9 (21.5min, 37P1) fps -4%
Dell Latitude 13 7330
Intel Core i7-1265U, Intel Iris Xe Graphics G7 96EUs
46.7 (18.1min, 32.3P1) fps -40%
1920x1080 High/On (Advanced Graphics Off) AA:2xMSAA + FX AF:8x
Dell XPS 14 Core Ultra X7 358H
Intel Core Ultra X7 358H, Intel Arc B390 12 Xe3 Panther Lake iGPU
98.2 (6.53min, 66.7P1) fps +357%
Dell XPS 13 9350
Intel Core Ultra 7 256V, Intel Arc Graphics 140V
60.8 (2.26min, 43.5P1) fps +183%
HP OmniBook 7 Aero 13-bg1077nr
AMD Ryzen AI 7 350, AMD Radeon 860M
60.8 (3.38min, 41.7P1) fps +183%
Dell XPS 14 Core Ultra 7 355
Intel Core Ultra 7 355, Intel Graphics 4 Xe3 Panther Lake iGPU
52.9 (9.17min, 41.7P1) fps +146%
Lenovo ThinkPad X1 Carbon Gen 14 21V70075GE
Intel Core Ultra 5 325, Intel Graphics 4 Xe3 Panther Lake iGPU
52.8 (6.47min, 40P1) fps +146%
Microsoft Surface Pro 8, i7-1185G7
Intel Core i7-1185G7, Intel Iris Xe Graphics G7 96EUs
33.2 (8.69min, 22.7P1) fps +54%
Alldocube iWork GT Ultra
Intel Core Ultra 5 125H, Intel Arc 7-Core iGPU
30.4 (6.49min, 20.8P1) fps +41%
HP EliteBook 8 Flip G1i 13
Intel Core Ultra 7 265U, Intel Graphics 4-Core iGPU (Meteor / Arrow Lake)
24.4 (7.21min, 18.5P1) fps +13%
Moyenne Intel Graphics 2 Xe3 Wildcat Lake iGPU
  (21.5 - 27.2, n=2)
24.4 fps +13%
Lenovo ThinkPad L13 2in1 G5 21LNS4AM00
Intel Core Ultra 5 125U, Intel Graphics 4-Core iGPU (Meteor / Arrow Lake)
23.6 (5.71min, 17.9P1) fps +10%
Dell XPS 13 DX13260
Intel Core 5 320, Intel Graphics 2 Xe3 Wildcat Lake iGPU
21.5 (1.962min, 12.3P1) fps
Dell Latitude 13 7330
Intel Core i7-1265U, Intel Iris Xe Graphics G7 96EUs
13.9 (6.35min, 9.26P1) fps -35%
1920x1080 Highest AA:4xMSAA + FX AF:16x
Dell XPS 14 Core Ultra X7 358H
Intel Core Ultra X7 358H, Intel Arc B390 12 Xe3 Panther Lake iGPU
43.3 (6.46min, 33.3P1) fps +462%
HP OmniBook 7 Aero 13-bg1077nr
AMD Ryzen AI 7 350, AMD Radeon 860M
25.7 (2.43min, 16.9P1) fps +233%
Dell XPS 13 9350
Intel Core Ultra 7 256V, Intel Arc Graphics 140V
25.6 (2.46min, 19.6P1) fps +232%
Lenovo ThinkPad X1 Carbon Gen 14 21V70075GE
Intel Core Ultra 5 325, Intel Graphics 4 Xe3 Panther Lake iGPU
21.9 (6.72min, 17.2P1) fps +184%
Dell XPS 14 Core Ultra 7 355
Intel Core Ultra 7 355, Intel Graphics 4 Xe3 Panther Lake iGPU
20.9 (5.74min, 15.9P1) fps +171%
Alldocube iWork GT Ultra
Intel Core Ultra 5 125H, Intel Arc 7-Core iGPU
13.1 (5.76min, 10.4P1) fps +70%
Microsoft Surface Pro 8, i7-1185G7
Intel Core i7-1185G7, Intel Iris Xe Graphics G7 96EUs
12.8 (4.32min, 9.62P1) fps +66%
HP EliteBook 8 Flip G1i 13
Intel Core Ultra 7 265U, Intel Graphics 4-Core iGPU (Meteor / Arrow Lake)
9.99 (2.84min, 7.46P1) fps +30%
Lenovo ThinkPad L13 2in1 G5 21LNS4AM00
Intel Core Ultra 5 125U, Intel Graphics 4-Core iGPU (Meteor / Arrow Lake)
9.61 (4.73min, 7.41P1) fps +25%
Moyenne Intel Graphics 2 Xe3 Wildcat Lake iGPU
  (7.71 - 10.5, n=2)
9.11 fps +18%
Dell XPS 13 DX13260
Intel Core 5 320, Intel Graphics 2 Xe3 Wildcat Lake iGPU
7.71 (1.599min, 5.99P1) fps
Dell Latitude 13 7330
Intel Core i7-1265U, Intel Iris Xe Graphics G7 96EUs
6.15 (2.67min, 3.83P1) fps -20%
Dota 2 Reborn
1920x1080 high (2/3)
Dell XPS 14 Core Ultra X7 358H
Intel Core Ultra X7 358H, Intel Arc B390 12 Xe3 Panther Lake iGPU
107.6 (68.3min) fps +138%
Dell XPS 13 9350
Intel Core Ultra 7 256V, Intel Arc Graphics 140V
83 (35.8min) fps +83%
HP OmniBook 7 Aero 13-bg1077nr
AMD Ryzen AI 7 350, AMD Radeon 860M
82.7 (74.6min) fps +83%
Lenovo ThinkPad X1 Carbon Gen 14 21V70075GE
Intel Core Ultra 5 325, Intel Graphics 4 Xe3 Panther Lake iGPU
82.1 (35.4min) fps +81%
Alldocube iWork GT Ultra
Intel Core Ultra 5 125H, Intel Arc 7-Core iGPU
74.6 (51min) fps +65%
Dell XPS 14 Core Ultra 7 355
Intel Core Ultra 7 355, Intel Graphics 4 Xe3 Panther Lake iGPU
73.7 (23.2min) fps +63%
Microsoft Surface Pro 8, i7-1185G7
Intel Core i7-1185G7, Intel Iris Xe Graphics G7 96EUs
63.4 (35.7min) fps +40%
Lenovo ThinkPad L13 2in1 G5 21LNS4AM00
Intel Core Ultra 5 125U, Intel Graphics 4-Core iGPU (Meteor / Arrow Lake)
59.9 (30.2min) fps +32%
Dell Latitude 13 7330
Intel Core i7-1265U, Intel Iris Xe Graphics G7 96EUs
50.6 (44.7min) fps +12%
Dell XPS 13 DX13260
Intel Core 5 320, Intel Graphics 2 Xe3 Wildcat Lake iGPU
45.3 (4.2min) fps
HP EliteBook 8 Flip G1i 13
Intel Core Ultra 7 265U, Intel Graphics 4-Core iGPU (Meteor / Arrow Lake)
44.6 (23.8min) fps -2%
Moyenne Intel Graphics 2 Xe3 Wildcat Lake iGPU
  (34.9 - 45.3, n=2)
40.1 fps -11%
1920x1080 ultra (3/3) best looking
Dell XPS 14 Core Ultra X7 358H
Intel Core Ultra X7 358H, Intel Arc B390 12 Xe3 Panther Lake iGPU
105.4 (70.1min) fps +131%
Lenovo ThinkPad X1 Carbon Gen 14 21V70075GE
Intel Core Ultra 5 325, Intel Graphics 4 Xe3 Panther Lake iGPU
83.3 (54.4min) fps +82%
Dell XPS 13 9350
Intel Core Ultra 7 256V, Intel Arc Graphics 140V
80.7 (52.1min) fps +77%
HP OmniBook 7 Aero 13-bg1077nr
AMD Ryzen AI 7 350, AMD Radeon 860M
73.3 (66min) fps +60%
Alldocube iWork GT Ultra
Intel Core Ultra 5 125H, Intel Arc 7-Core iGPU
70.1 (49.9min) fps +53%
Dell XPS 14 Core Ultra 7 355
Intel Core Ultra 7 355, Intel Graphics 4 Xe3 Panther Lake iGPU
69.4 (33.2min) fps +52%
Microsoft Surface Pro 8, i7-1185G7
Intel Core i7-1185G7, Intel Iris Xe Graphics G7 96EUs
56.7 (32.8min) fps +24%
HP EliteBook 8 Flip G1i 13
Intel Core Ultra 7 265U, Intel Graphics 4-Core iGPU (Meteor / Arrow Lake)
52.4 (32.2min) fps +15%
Lenovo ThinkPad L13 2in1 G5 21LNS4AM00
Intel Core Ultra 5 125U, Intel Graphics 4-Core iGPU (Meteor / Arrow Lake)
50.7 (29.1min) fps +11%
Dell XPS 13 DX13260
Intel Core 5 320, Intel Graphics 2 Xe3 Wildcat Lake iGPU
45.7 (22.3min) fps
Dell Latitude 13 7330
Intel Core i7-1265U, Intel Iris Xe Graphics G7 96EUs
44.9 (40.1min) fps -2%
Moyenne Intel Graphics 2 Xe3 Wildcat Lake iGPU
  (32.8 - 45.7, n=2)
39.3 fps -14%
Final Fantasy XV Benchmark
1280x720 Lite Quality
Dell XPS 14 Core Ultra X7 358H
Intel Core Ultra X7 358H, Intel Arc B390 12 Xe3 Panther Lake iGPU
123.5 fps +232%
Dell XPS 13 9350
Intel Core Ultra 7 256V, Intel Arc Graphics 140V
79.4 fps +113%
Lenovo ThinkPad X1 Carbon Gen 14 21V70075GE
Intel Core Ultra 5 325, Intel Graphics 4 Xe3 Panther Lake iGPU
73 fps +96%
Dell XPS 14 Core Ultra 7 355
Intel Core Ultra 7 355, Intel Graphics 4 Xe3 Panther Lake iGPU
67.3 fps +81%
HP OmniBook 7 Aero 13-bg1077nr
AMD Ryzen AI 7 350, AMD Radeon 860M
63.4 fps +70%
Alldocube iWork GT Ultra
Intel Core Ultra 5 125H, Intel Arc 7-Core iGPU
58 fps +56%
Microsoft Surface Pro 8, i7-1185G7
Intel Core i7-1185G7, Intel Iris Xe Graphics G7 96EUs
48.5 fps +30%
Lenovo ThinkPad L13 2in1 G5 21LNS4AM00
Intel Core Ultra 5 125U, Intel Graphics 4-Core iGPU (Meteor / Arrow Lake)
44.9 fps +21%
HP EliteBook 8 Flip G1i 13
Intel Core Ultra 7 265U, Intel Graphics 4-Core iGPU (Meteor / Arrow Lake)
42.6 fps +15%
Moyenne Intel Graphics 2 Xe3 Wildcat Lake iGPU
  (37.2 - 39.4, n=2)
38.3 fps +3%
Dell XPS 13 DX13260
Intel Core 5 320, Intel Graphics 2 Xe3 Wildcat Lake iGPU
37.2 fps
Dell Latitude 13 7330
Intel Core i7-1265U, Intel Iris Xe Graphics G7 96EUs
32.9 fps -12%
1920x1080 Standard Quality
Dell XPS 14 Core Ultra X7 358H
Intel Core Ultra X7 358H, Intel Arc B390 12 Xe3 Panther Lake iGPU
73.7 fps +294%
Dell XPS 13 9350
Intel Core Ultra 7 256V, Intel Arc Graphics 140V
46.1 fps +147%
Lenovo ThinkPad X1 Carbon Gen 14 21V70075GE
Intel Core Ultra 5 325, Intel Graphics 4 Xe3 Panther Lake iGPU
37.5 fps +101%
Dell XPS 14 Core Ultra 7 355
Intel Core Ultra 7 355, Intel Graphics 4 Xe3 Panther Lake iGPU
34.9 fps +87%
Alldocube iWork GT Ultra
Intel Core Ultra 5 125H, Intel Arc 7-Core iGPU
33.2 fps +78%
HP OmniBook 7 Aero 13-bg1077nr
AMD Ryzen AI 7 350, AMD Radeon 860M
32.7 fps +75%
Microsoft Surface Pro 8, i7-1185G7
Intel Core i7-1185G7, Intel Iris Xe Graphics G7 96EUs
26.9 fps +44%
HP EliteBook 8 Flip G1i 13
Intel Core Ultra 7 265U, Intel Graphics 4-Core iGPU (Meteor / Arrow Lake)
24.9 fps +33%
Lenovo ThinkPad L13 2in1 G5 21LNS4AM00
Intel Core Ultra 5 125U, Intel Graphics 4-Core iGPU (Meteor / Arrow Lake)
24.2 fps +29%
Moyenne Intel Graphics 2 Xe3 Wildcat Lake iGPU
  (18.7 - 20.3, n=2)
19.5 fps +4%
Dell XPS 13 DX13260
Intel Core 5 320, Intel Graphics 2 Xe3 Wildcat Lake iGPU
18.7 fps
Dell Latitude 13 7330
Intel Core i7-1265U, Intel Iris Xe Graphics G7 96EUs
17.5 fps -6%
1920x1080 High Quality
Dell XPS 14 Core Ultra X7 358H
Intel Core Ultra X7 358H, Intel Arc B390 12 Xe3 Panther Lake iGPU
52.8 fps +182%
Dell XPS 13 9350
Intel Core Ultra 7 256V, Intel Arc Graphics 140V
31.5 fps +68%
Microsoft Surface Pro 8, i7-1185G7
Intel Core i7-1185G7, Intel Iris Xe Graphics G7 96EUs
26.9 fps +44%
Lenovo ThinkPad X1 Carbon Gen 14 21V70075GE
Intel Core Ultra 5 325, Intel Graphics 4 Xe3 Panther Lake iGPU
26.8 fps +43%
Dell XPS 14 Core Ultra 7 355
Intel Core Ultra 7 355, Intel Graphics 4 Xe3 Panther Lake iGPU
25.4 fps +36%
HP OmniBook 7 Aero 13-bg1077nr
AMD Ryzen AI 7 350, AMD Radeon 860M
23.3 fps +25%
Alldocube iWork GT Ultra
Intel Core Ultra 5 125H, Intel Arc 7-Core iGPU
23.1 fps +24%
Dell XPS 13 DX13260
Intel Core 5 320, Intel Graphics 2 Xe3 Wildcat Lake iGPU
18.7 fps
HP EliteBook 8 Flip G1i 13
Intel Core Ultra 7 265U, Intel Graphics 4-Core iGPU (Meteor / Arrow Lake)
18.2 fps -3%
Moyenne Intel Graphics 2 Xe3 Wildcat Lake iGPU
  (15.2 - 18.7, n=2)
17 fps -9%
Lenovo ThinkPad L13 2in1 G5 21LNS4AM00
Intel Core Ultra 5 125U, Intel Graphics 4-Core iGPU (Meteor / Arrow Lake)
16.9 fps -10%
Dell Latitude 13 7330
Intel Core i7-1265U, Intel Iris Xe Graphics G7 96EUs
12.9 fps -31%
X-Plane 11.11
1280x720 low (fps_test=1)
HP OmniBook 7 Aero 13-bg1077nr
AMD Ryzen AI 7 350, AMD Radeon 860M
60.3 fps +157%
Dell XPS 14 Core Ultra X7 358H
Intel Core Ultra X7 358H, Intel Arc B390 12 Xe3 Panther Lake iGPU
59.7 fps +154%
Dell Latitude 13 7330
Intel Core i7-1265U, Intel Iris Xe Graphics G7 96EUs
47.3 fps +101%
Dell XPS 13 9350
Intel Core Ultra 7 256V, Intel Arc Graphics 140V
47.1 fps +100%
Dell XPS 14 Core Ultra 7 355
Intel Core Ultra 7 355, Intel Graphics 4 Xe3 Panther Lake iGPU
43.6 fps +86%
Alldocube iWork GT Ultra
Intel Core Ultra 5 125H, Intel Arc 7-Core iGPU
42.6 fps +81%
Lenovo ThinkPad X1 Carbon Gen 14 21V70075GE
Intel Core Ultra 5 325, Intel Graphics 4 Xe3 Panther Lake iGPU
36.2 fps +54%
Lenovo ThinkPad L13 2in1 G5 21LNS4AM00
Intel Core Ultra 5 125U, Intel Graphics 4-Core iGPU (Meteor / Arrow Lake)
35.5 fps +51%
HP EliteBook 8 Flip G1i 13
Intel Core Ultra 7 265U, Intel Graphics 4-Core iGPU (Meteor / Arrow Lake)
35.3 fps +50%
Microsoft Surface Pro 8, i7-1185G7
Intel Core i7-1185G7, Intel Iris Xe Graphics G7 96EUs
33.6 fps +43%
Moyenne Intel Graphics 2 Xe3 Wildcat Lake iGPU
  (23.5 - 32.6, n=2)
28.1 fps +20%
Dell XPS 13 DX13260
Intel Core 5 320, Intel Graphics 2 Xe3 Wildcat Lake iGPU
23.5 fps
1920x1080 med (fps_test=2)
HP OmniBook 7 Aero 13-bg1077nr
AMD Ryzen AI 7 350, AMD Radeon 860M
48.9 fps +107%
Dell XPS 14 Core Ultra X7 358H
Intel Core Ultra X7 358H, Intel Arc B390 12 Xe3 Panther Lake iGPU
47.1 fps +100%
Dell XPS 13 9350
Intel Core Ultra 7 256V, Intel Arc Graphics 140V
36.1 fps +53%
Dell Latitude 13 7330
Intel Core i7-1265U, Intel Iris Xe Graphics G7 96EUs
33.8 fps +43%
Alldocube iWork GT Ultra
Intel Core Ultra 5 125H, Intel Arc 7-Core iGPU
32.4 fps +37%
Dell XPS 14 Core Ultra 7 355
Intel Core Ultra 7 355, Intel Graphics 4 Xe3 Panther Lake iGPU
30.9 fps +31%
Lenovo ThinkPad X1 Carbon Gen 14 21V70075GE
Intel Core Ultra 5 325, Intel Graphics 4 Xe3 Panther Lake iGPU
29.4 fps +25%
Microsoft Surface Pro 8, i7-1185G7
Intel Core i7-1185G7, Intel Iris Xe Graphics G7 96EUs
28.8 fps +22%
HP EliteBook 8 Flip G1i 13
Intel Core Ultra 7 265U, Intel Graphics 4-Core iGPU (Meteor / Arrow Lake)
28.1 fps +19%
Lenovo ThinkPad L13 2in1 G5 21LNS4AM00
Intel Core Ultra 5 125U, Intel Graphics 4-Core iGPU (Meteor / Arrow Lake)
28 fps +19%
Moyenne Intel Graphics 2 Xe3 Wildcat Lake iGPU
  (23.6 - 26.2, n=2)
24.9 fps +6%
Dell XPS 13 DX13260
Intel Core 5 320, Intel Graphics 2 Xe3 Wildcat Lake iGPU
23.6 fps
1920x1080 high (fps_test=3)
HP OmniBook 7 Aero 13-bg1077nr
AMD Ryzen AI 7 350, AMD Radeon 860M
40.4 fps +98%
Dell XPS 14 Core Ultra X7 358H
Intel Core Ultra X7 358H, Intel Arc B390 12 Xe3 Panther Lake iGPU
40.3 fps +98%
Dell XPS 14 Core Ultra 7 355
Intel Core Ultra 7 355, Intel Graphics 4 Xe3 Panther Lake iGPU
30.5 fps +50%
Dell Latitude 13 7330
Intel Core i7-1265U, Intel Iris Xe Graphics G7 96EUs
30.3 fps +49%
Microsoft Surface Pro 8, i7-1185G7
Intel Core i7-1185G7, Intel Iris Xe Graphics G7 96EUs
30.2 fps +48%
Dell XPS 13 9350
Intel Core Ultra 7 256V, Intel Arc Graphics 140V
30.1 fps +48%
Alldocube iWork GT Ultra
Intel Core Ultra 5 125H, Intel Arc 7-Core iGPU
29.9 fps +47%
Lenovo ThinkPad X1 Carbon Gen 14 21V70075GE
Intel Core Ultra 5 325, Intel Graphics 4 Xe3 Panther Lake iGPU
25.5 fps +25%
Lenovo ThinkPad L13 2in1 G5 21LNS4AM00
Intel Core Ultra 5 125U, Intel Graphics 4-Core iGPU (Meteor / Arrow Lake)
24.1 fps +18%
HP EliteBook 8 Flip G1i 13
Intel Core Ultra 7 265U, Intel Graphics 4-Core iGPU (Meteor / Arrow Lake)
23.7 fps +16%
Dell XPS 13 DX13260
Intel Core 5 320, Intel Graphics 2 Xe3 Wildcat Lake iGPU
20.4 fps
Moyenne Intel Graphics 2 Xe3 Wildcat Lake iGPU
  (17.8 - 20.4, n=2)
19.1 fps -6%
Baldur's Gate 3
1280x720 Low Preset AA:SM
Dell XPS 14 Core Ultra X7 358H
Intel Core Ultra X7 358H, Intel Arc B390 12 Xe3 Panther Lake iGPU
87 (74.7min, 76P0.1, 78.7P1) fps +254%
Dell XPS 13 9350
Intel Core Ultra 7 256V, Intel Arc Graphics 140V
51.7 fps +110%
HP OmniBook 7 Aero 13-bg1077nr
AMD Ryzen AI 7 350, AMD Radeon 860M
48.9 (32.2min, 36.1P0.1, 45P1) fps +99%
Dell XPS 14 Core Ultra 7 355
Intel Core Ultra 7 355, Intel Graphics 4 Xe3 Panther Lake iGPU
40.6 (34.8min, 34.9P0.1, 37.6P1) fps +65%
Alldocube iWork GT Ultra
Intel Core Ultra 5 125H, Intel Arc 7-Core iGPU
35.5 (20min, 20P0.1, 29.9P1) fps +44%
HP EliteBook 8 Flip G1i 13
Intel Core Ultra 7 265U, Intel Graphics 4-Core iGPU (Meteor / Arrow Lake)
26.3 fps +7%
Moyenne Intel Graphics 2 Xe3 Wildcat Lake iGPU
  (24.6 - 26.9, n=2)
25.8 fps +5%
Dell XPS 13 DX13260
Intel Core 5 320, Intel Graphics 2 Xe3 Wildcat Lake iGPU
24.6 (21.6min, 21.7P0.1, 22P1) fps
1920x1080 Low Preset AA:SM
Dell XPS 14 Core Ultra X7 358H
Intel Core Ultra X7 358H, Intel Arc B390 12 Xe3 Panther Lake iGPU
64.3 (56.2min, 57.5P0.1, 60.1P1) fps +318%
Dell XPS 13 9350
Intel Core Ultra 7 256V, Intel Arc Graphics 140V
36.6 fps +138%
Lenovo ThinkPad X1 Carbon Gen 14 21V70075GE
Intel Core Ultra 5 325, Intel Graphics 4 Xe3 Panther Lake iGPU
34.8 (30.4min, 30.4P0.1, 31P1) fps +126%
HP OmniBook 7 Aero 13-bg1077nr
AMD Ryzen AI 7 350, AMD Radeon 860M
31.8 (23.7min, 23.7P0.1, 27.7P1) fps +106%
Dell XPS 14 Core Ultra 7 355
Intel Core Ultra 7 355, Intel Graphics 4 Xe3 Panther Lake iGPU
28.4 (25.5min, 25.8P0.1, 26.5P1) fps +84%
Alldocube iWork GT Ultra
Intel Core Ultra 5 125H, Intel Arc 7-Core iGPU
25.3 (19.9min, 19.9P0.1, 20P1) fps +64%
Lenovo ThinkPad L13 2in1 G5 21LNS4AM00
Intel Core Ultra 5 125U, Intel Graphics 4-Core iGPU (Meteor / Arrow Lake)
19.4 fps +26%
Apple MacBook Neo 256 GB
Apple A18 Pro, Apple A18 GPU
19.1 fps +24%
HP EliteBook 8 Flip G1i 13
Intel Core Ultra 7 265U, Intel Graphics 4-Core iGPU (Meteor / Arrow Lake)
18.1 fps +18%
Moyenne Intel Graphics 2 Xe3 Wildcat Lake iGPU
  (15.4 - 17.1, n=2)
16.3 fps +6%
Dell XPS 13 DX13260
Intel Core 5 320, Intel Graphics 2 Xe3 Wildcat Lake iGPU
15.4 (7.68min, 9.28P0.1, 13.8P1) fps
1920x1080 Medium Preset AA:T
Dell XPS 14 Core Ultra X7 358H
Intel Core Ultra X7 358H, Intel Arc B390 12 Xe3 Panther Lake iGPU
55.4 (49.6min, 49.9P0.1, 51P1) fps +340%
Dell XPS 13 9350
Intel Core Ultra 7 256V, Intel Arc Graphics 140V
30.5 fps +142%
HP OmniBook 7 Aero 13-bg1077nr
AMD Ryzen AI 7 350, AMD Radeon 860M
26.4 (15.9min, 16.5P0.1, 20.8P1) fps +110%
Lenovo ThinkPad X1 Carbon Gen 14 21V70075GE
Intel Core Ultra 5 325, Intel Graphics 4 Xe3 Panther Lake iGPU
26 (23.5min, 23.6P0.1, 23.9P1) fps +106%
Dell XPS 14 Core Ultra 7 355
Intel Core Ultra 7 355, Intel Graphics 4 Xe3 Panther Lake iGPU
23 (20.8min, 20.8P0.1, 21.1P1) fps +83%
Alldocube iWork GT Ultra
Intel Core Ultra 5 125H, Intel Arc 7-Core iGPU
19.7 (15min, 15P0.1, 15P1) fps +56%
Apple MacBook Neo 256 GB
Apple A18 Pro, Apple A18 GPU
15.5 fps +23%
Lenovo ThinkPad L13 2in1 G5 21LNS4AM00
Intel Core Ultra 5 125U, Intel Graphics 4-Core iGPU (Meteor / Arrow Lake)
15.3 fps +21%
HP EliteBook 8 Flip G1i 13
Intel Core Ultra 7 265U, Intel Graphics 4-Core iGPU (Meteor / Arrow Lake)
14.9 fps +18%
Moyenne Intel Graphics 2 Xe3 Wildcat Lake iGPU
  (12.6 - 13.9, n=2)
13.3 fps +6%
Dell XPS 13 DX13260
Intel Core 5 320, Intel Graphics 2 Xe3 Wildcat Lake iGPU
12.6 (11.6min, 11.6P0.1, 11.8P1) fps
1920x1080 High Preset AA:T
Dell XPS 14 Core Ultra X7 358H
Intel Core Ultra X7 358H, Intel Arc B390 12 Xe3 Panther Lake iGPU
49 (44.2min, 44.5P0.1, 46.3P1) fps +350%
Dell XPS 13 9350
Intel Core Ultra 7 256V, Intel Arc Graphics 140V
25.8 fps +137%
Lenovo ThinkPad X1 Carbon Gen 14 21V70075GE
Intel Core Ultra 5 325, Intel Graphics 4 Xe3 Panther Lake iGPU
22.9 (20.7min, 20.7P0.1, 21P1) fps +110%
HP OmniBook 7 Aero 13-bg1077nr
AMD Ryzen AI 7 350, AMD Radeon 860M
21.1 (16.7min, 17.1P0.1, 18.9P1) fps +94%
Dell XPS 14 Core Ultra 7 355
Intel Core Ultra 7 355, Intel Graphics 4 Xe3 Panther Lake iGPU
19.6 (18.3min, 18.3P0.1, 18.4P1) fps +80%
Alldocube iWork GT Ultra
Intel Core Ultra 5 125H, Intel Arc 7-Core iGPU
17.3 (14.9min, 14.9P0.1, 15P1) fps +59%
Apple MacBook Neo 256 GB
Apple A18 Pro, Apple A18 GPU
13.9 fps +28%
Lenovo ThinkPad L13 2in1 G5 21LNS4AM00
Intel Core Ultra 5 125U, Intel Graphics 4-Core iGPU (Meteor / Arrow Lake)
13.1 fps +20%
HP EliteBook 8 Flip G1i 13
Intel Core Ultra 7 265U, Intel Graphics 4-Core iGPU (Meteor / Arrow Lake)
12.8 fps +17%
Moyenne Intel Graphics 2 Xe3 Wildcat Lake iGPU
  (10.9 - 12, n=2)
11.5 fps +6%
Dell XPS 13 DX13260
Intel Core 5 320, Intel Graphics 2 Xe3 Wildcat Lake iGPU
10.9 (9.83min, 9.85P0.1, 9.97P1) fps
1920x1080 Ultra Preset AA:T
Dell XPS 14 Core Ultra X7 358H
Intel Core Ultra X7 358H, Intel Arc B390 12 Xe3 Panther Lake iGPU
48.7 (43.1min, 44.3P0.1, 45.5P1) fps +347%
Dell XPS 13 9350
Intel Core Ultra 7 256V, Intel Arc Graphics 140V
25.7 fps +136%
Lenovo ThinkPad X1 Carbon Gen 14 21V70075GE
Intel Core Ultra 5 325, Intel Graphics 4 Xe3 Panther Lake iGPU
22.4 (20.3min, 20.4P0.1, 20.6P1) fps +106%
HP OmniBook 7 Aero 13-bg1077nr
AMD Ryzen AI 7 350, AMD Radeon 860M
20.6 (17.1min, 17.1P0.1, 18.4P1) fps +89%
Dell XPS 14 Core Ultra 7 355
Intel Core Ultra 7 355, Intel Graphics 4 Xe3 Panther Lake iGPU
19.5 (18.1min, 18.1P0.1, 18.3P1) fps +79%
Alldocube iWork GT Ultra
Intel Core Ultra 5 125H, Intel Arc 7-Core iGPU
17 (14.9min, 14.9P0.1, 15P1) fps +56%
Apple MacBook Neo 256 GB
Apple A18 Pro, Apple A18 GPU
13.6 fps +25%
Lenovo ThinkPad L13 2in1 G5 21LNS4AM00
Intel Core Ultra 5 125U, Intel Graphics 4-Core iGPU (Meteor / Arrow Lake)
12.8 fps +17%
HP EliteBook 8 Flip G1i 13
Intel Core Ultra 7 265U, Intel Graphics 4-Core iGPU (Meteor / Arrow Lake)
12.7 fps +17%
Moyenne Intel Graphics 2 Xe3 Wildcat Lake iGPU
  (10.9 - 11.8, n=2)
11.4 fps +5%
Dell XPS 13 DX13260
Intel Core 5 320, Intel Graphics 2 Xe3 Wildcat Lake iGPU
10.9 (9.5min, 9.53P0.1, 9.91P1) fps
Cyberpunk 2077
1280x720 Low Preset (FSR off)
Dell XPS 14 Core Ultra X7 358H
Intel Core Ultra X7 358H, Intel Arc B390 12 Xe3 Panther Lake iGPU
94.4 (78.1min, 71P1) fps +178%
Dell XPS 13 9350
Intel Core Ultra 7 256V, Intel Arc Graphics 140V
66.6 (50.2min) fps +96%
Dell XPS 14 Core Ultra 7 355
Intel Core Ultra 7 355, Intel Graphics 4 Xe3 Panther Lake iGPU
59.3 (48.7min, 45.4P1) fps +75%
HP OmniBook 7 Aero 13-bg1077nr
AMD Ryzen AI 7 350, AMD Radeon 860M
49 (39min, 12.1P1) fps +45%
Alldocube iWork GT Ultra
Intel Core Ultra 5 125H, Intel Arc 7-Core iGPU
34.7 (28.8min) fps +2%
Moyenne Intel Graphics 2 Xe3 Wildcat Lake iGPU
  (33.9 - 34.7, n=2)
34.3 fps +1%
Dell XPS 13 DX13260
Intel Core 5 320, Intel Graphics 2 Xe3 Wildcat Lake iGPU
33.9 (28.7min, 26.9P1) fps
HP EliteBook 8 Flip G1i 13
Intel Core Ultra 7 265U, Intel Graphics 4-Core iGPU (Meteor / Arrow Lake)
32.7 (26.5min, 25.4P1) fps -4%
1920x1080 Low Preset (FSR off)
Dell XPS 14 Core Ultra X7 358H
Intel Core Ultra X7 358H, Intel Arc B390 12 Xe3 Panther Lake iGPU
68.6 (57.3min, 52.9P1) fps +267%
Dell XPS 13 9350
Intel Core Ultra 7 256V, Intel Arc Graphics 140V
45.7 (36.4min) fps +144%
Lenovo ThinkPad X1 Carbon Gen 14 21V70075GE
Intel Core Ultra 5 325, Intel Graphics 4 Xe3 Panther Lake iGPU
38.6 (32.4min) fps +106%
Dell XPS 14 Core Ultra 7 355
Intel Core Ultra 7 355, Intel Graphics 4 Xe3 Panther Lake iGPU
32.7 (28.3min, 27P1) fps +75%
HP OmniBook 7 Aero 13-bg1077nr
AMD Ryzen AI 7 350, AMD Radeon 860M
32.5 (27min, 25.2P1) fps +74%
Alldocube iWork GT Ultra
Intel Core Ultra 5 125H, Intel Arc 7-Core iGPU
26.8 (23.2min) fps +43%
HP EliteBook 8 Flip G1i 13
Intel Core Ultra 7 265U, Intel Graphics 4-Core iGPU (Meteor / Arrow Lake)
21.1 (17.8min, 16.2P1) fps +13%
Moyenne Intel Graphics 2 Xe3 Wildcat Lake iGPU
  (18.7 - 20.6, n=2)
19.7 fps +5%
Lenovo ThinkPad L13 2in1 G5 21LNS4AM00
Intel Core Ultra 5 125U, Intel Graphics 4-Core iGPU (Meteor / Arrow Lake)
19.5 (16.5min) fps +4%
Dell XPS 13 DX13260
Intel Core 5 320, Intel Graphics 2 Xe3 Wildcat Lake iGPU
18.7 (15.9min, 13.1P1) fps
Apple MacBook Neo 256 GB
Apple A18 Pro, Apple A18 GPU
12.4 fps -34%
1920x1080 Medium Preset (FSR off)
Dell XPS 14 Core Ultra X7 358H
Intel Core Ultra X7 358H, Intel Arc B390 12 Xe3 Panther Lake iGPU
56.2 (48.2min, 44.5P1) fps +293%
Dell XPS 13 9350
Intel Core Ultra 7 256V, Intel Arc Graphics 140V
37 (30.1min) fps +159%
Lenovo ThinkPad X1 Carbon Gen 14 21V70075GE
Intel Core Ultra 5 325, Intel Graphics 4 Xe3 Panther Lake iGPU
29.1 (25.1min) fps +103%
Dell XPS 14 Core Ultra 7 355
Intel Core Ultra 7 355, Intel Graphics 4 Xe3 Panther Lake iGPU
27.7 (24.2min, 23.3P1) fps +94%
HP OmniBook 7 Aero 13-bg1077nr
AMD Ryzen AI 7 350, AMD Radeon 860M
24.9 (21.2min, 18.5P1) fps +74%
Alldocube iWork GT Ultra
Intel Core Ultra 5 125H, Intel Arc 7-Core iGPU
21.6 (18.7min) fps +51%
HP EliteBook 8 Flip G1i 13
Intel Core Ultra 7 265U, Intel Graphics 4-Core iGPU (Meteor / Arrow Lake)
17.1 (14.8min, 14.3P1) fps +20%
Lenovo ThinkPad L13 2in1 G5 21LNS4AM00
Intel Core Ultra 5 125U, Intel Graphics 4-Core iGPU (Meteor / Arrow Lake)
15.9 (13.9min) fps +11%
Moyenne Intel Graphics 2 Xe3 Wildcat Lake iGPU
  (14.3 - 15.3, n=2)
14.8 fps +3%
Dell XPS 13 DX13260
Intel Core 5 320, Intel Graphics 2 Xe3 Wildcat Lake iGPU
14.3 (12.6min, 12.1P1) fps
Apple MacBook Neo 256 GB
Apple A18 Pro, Apple A18 GPU
9.2 fps -36%
BasMoyenÉlevéUltra
GTA V (2015) 116.8 101 21.5 7.71
Dota 2 Reborn (2015) 79.2 43.7 45.3 45.7
Final Fantasy XV Benchmark (2018) 37.2 18.7 18.7
X-Plane 11.11 (2018) 23.5 23.6 20.4
Strange Brigade (2018) 95.1 38.6 30.5
Baldur's Gate 3 (2023) 15.4 12.6 10.9 10.9
Cyberpunk 2077 (2023) 18.7 14.3

Émissions

Bruit du système

Le système est plus silencieux que les modèles XPS 13 de la génération précédente, ce qui s'explique par les performances globalement plus faibles du processeur Wildcat. Le bruit du ventilateur ne devient perceptible que lors de l'exécution de tâches plus exigeantes que la simple navigation sur Internet ou le streaming vidéo.

Profil de bruit des ventilateurs (Blanc : bruit de fond, Rouge : système au repos, Bleu : 3DMark 11, Orange : Cyberpunk 2077, Vert : test de charge Prime95)

Degré de la nuisance sonore

Au repos
23.3 / 23.3 / 23.3 dB(A)
Fortement sollicité
27.7 / 40.7 dB(A)
  red to green bar
 
 
30 dB
silencieux
40 dB(A)
audible
50 dB(A)
bruyant
 
min: dark, med: mid, max: light   Earthworks M23R, Arta (à 15 cm de distance)   bruit ambiant: 23.3 dB(A)
dB(A) 0102030405060708090Deep BassMiddle BassHigh BassLower RangeMidsHigher MidsLower HighsMid HighsUpper HighsSuper Highs2040.439.840.240.138.22528.62932.628.529.83121.924.224.421.924.64021.721.423.119.921.65024.625.1222223.76325.423.522.725.224.48022.424.725.427.121.91002223232221.812517.718.918.217.221.816015.415.414.916.118.520015.414.414.518.221.525013.913.614.119.823.13151514.41520.624.140012.512.113.220.32550012.111.311.520.825.863010.911.210.919.625.680010.611.110.32126.3100010.410.910.621.726.1125010.1109.923.428.516009.910.31025.229.9200010.210.310.125.530.6250010.410.610.326.331.4315010.811.310.726.731.7400011.311.311.124.730500011.411.711.622.328.2630011.711.711.720.426.8800011.711.711.715.822.41000011.711.811.713.518.51250011.91211.912.415.71600010.911.111.111.312.4SPL23.323.523.335.640.7N0.50.50.52.13.4median 11.7median 11.7median 11.6median 20.6median 25.6Delta1.61.81.73.44.2hearing rangehide median Fan NoiseDell XPS 13 DX13260
Dell XPS 13 DX13260
Core 5 320, Intel Graphics 2 Xe3 WCL
Dell XPS 14 Core Ultra X7 358H
Ultra X7 358H, Arc B390 Panther Lake iGPU
Dell XPS 13 9350
Core Ultra 7 256V, Arc 140V
Apple MacBook Neo 256 GB
A18 Pro, A18 GPU
HP OmniBook 7 Aero 13-bg1077nr
Ryzen AI 7 350, Radeon 860M
Lenovo ThinkPad X1 Carbon Gen 14 21V70075GE
Ultra 5 325, Intel Graphics 4 Xe3 PTL
Noise
-8%
-3%
6%
-10%
arrêt / environnement * (dB)
23.3
22.9
2%
24.1
-3%
23.2
-0%
24.8
-6%
Idle Minimum * (dB)
23.3
23.3
-0%
24.4
-5%
23.3
-0%
24.8
-6%
Idle Average * (dB)
23.3
23.3
-0%
24.4
-5%
23.3
-0%
24.8
-6%
Idle Maximum * (dB)
23.3
23.3
-0%
24.4
-5%
23.3
-0%
24.8
-6%
Load Average * (dB)
27.7
34
-23%
26.2
5%
24.7
11%
38.9
-40%
Cyberpunk 2077 ultra * (dB)
35.6
43.5
-22%
34.2
4%
23.5
34%
38.9
-9%
Load Maximum * (dB)
40.7
45.7
-12%
45.2
-11%
42
-3%
38.9
4%

* ... Moindre est la valeur, meilleures sont les performances
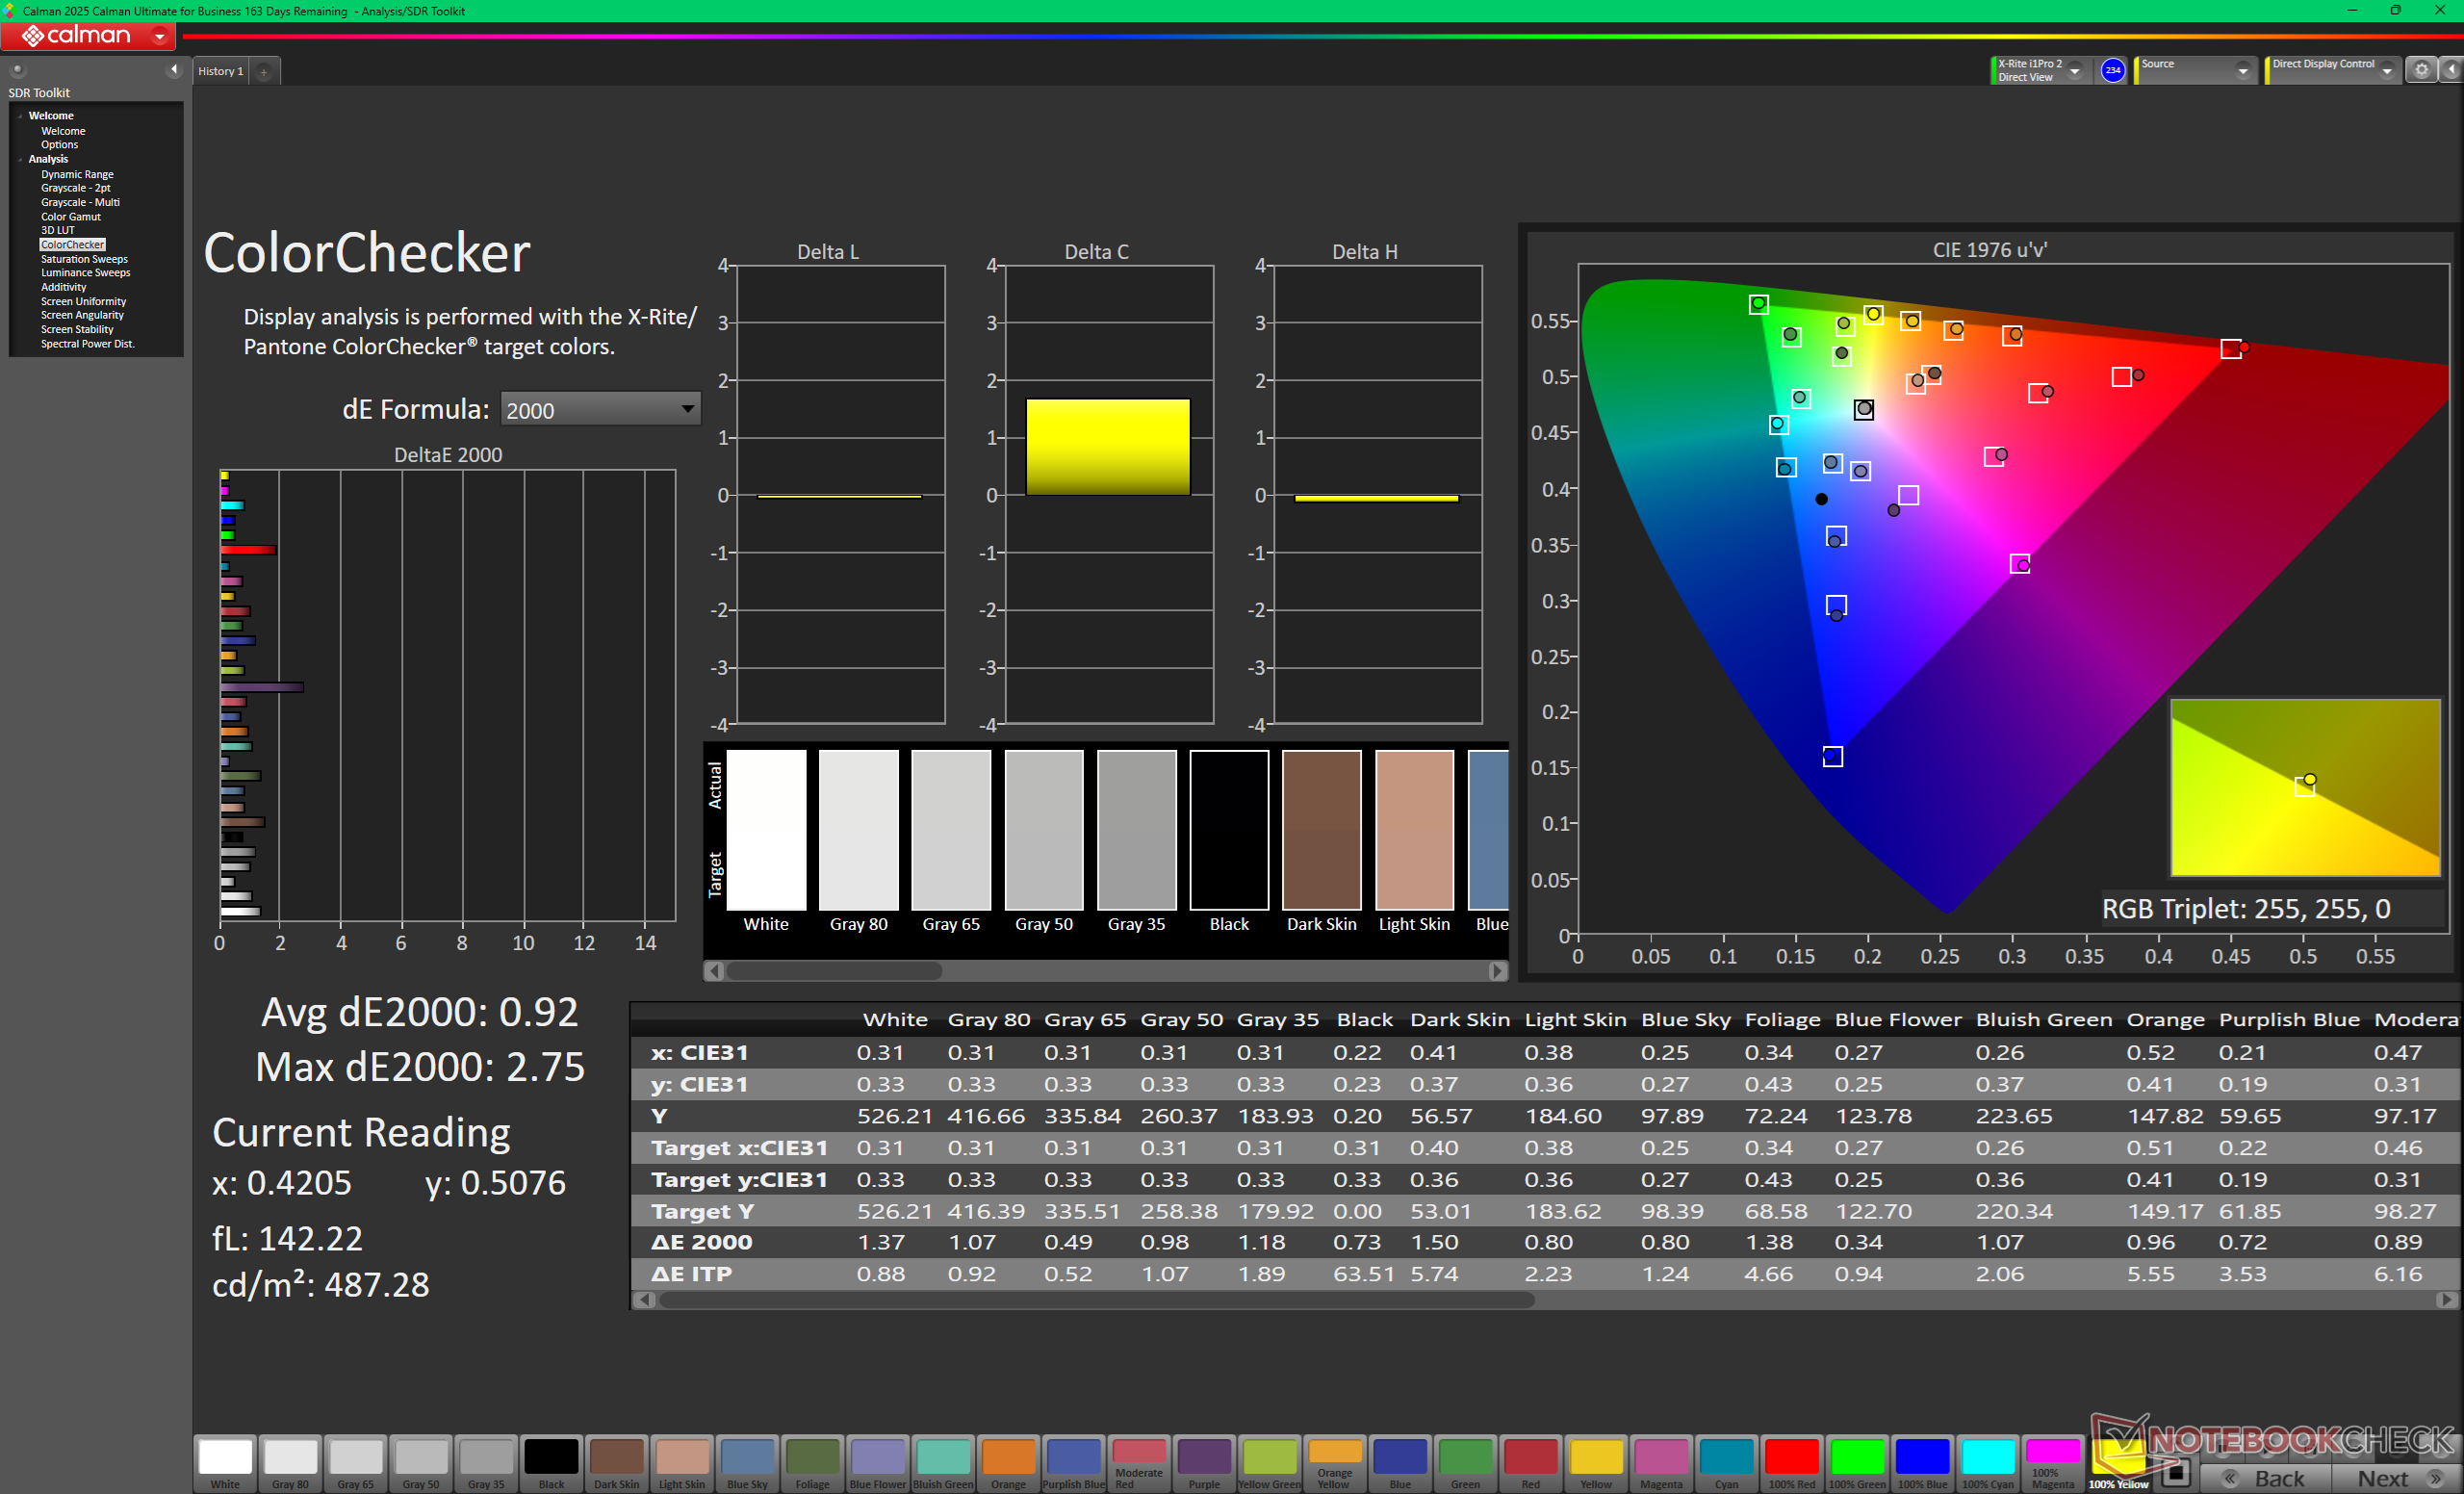
Température
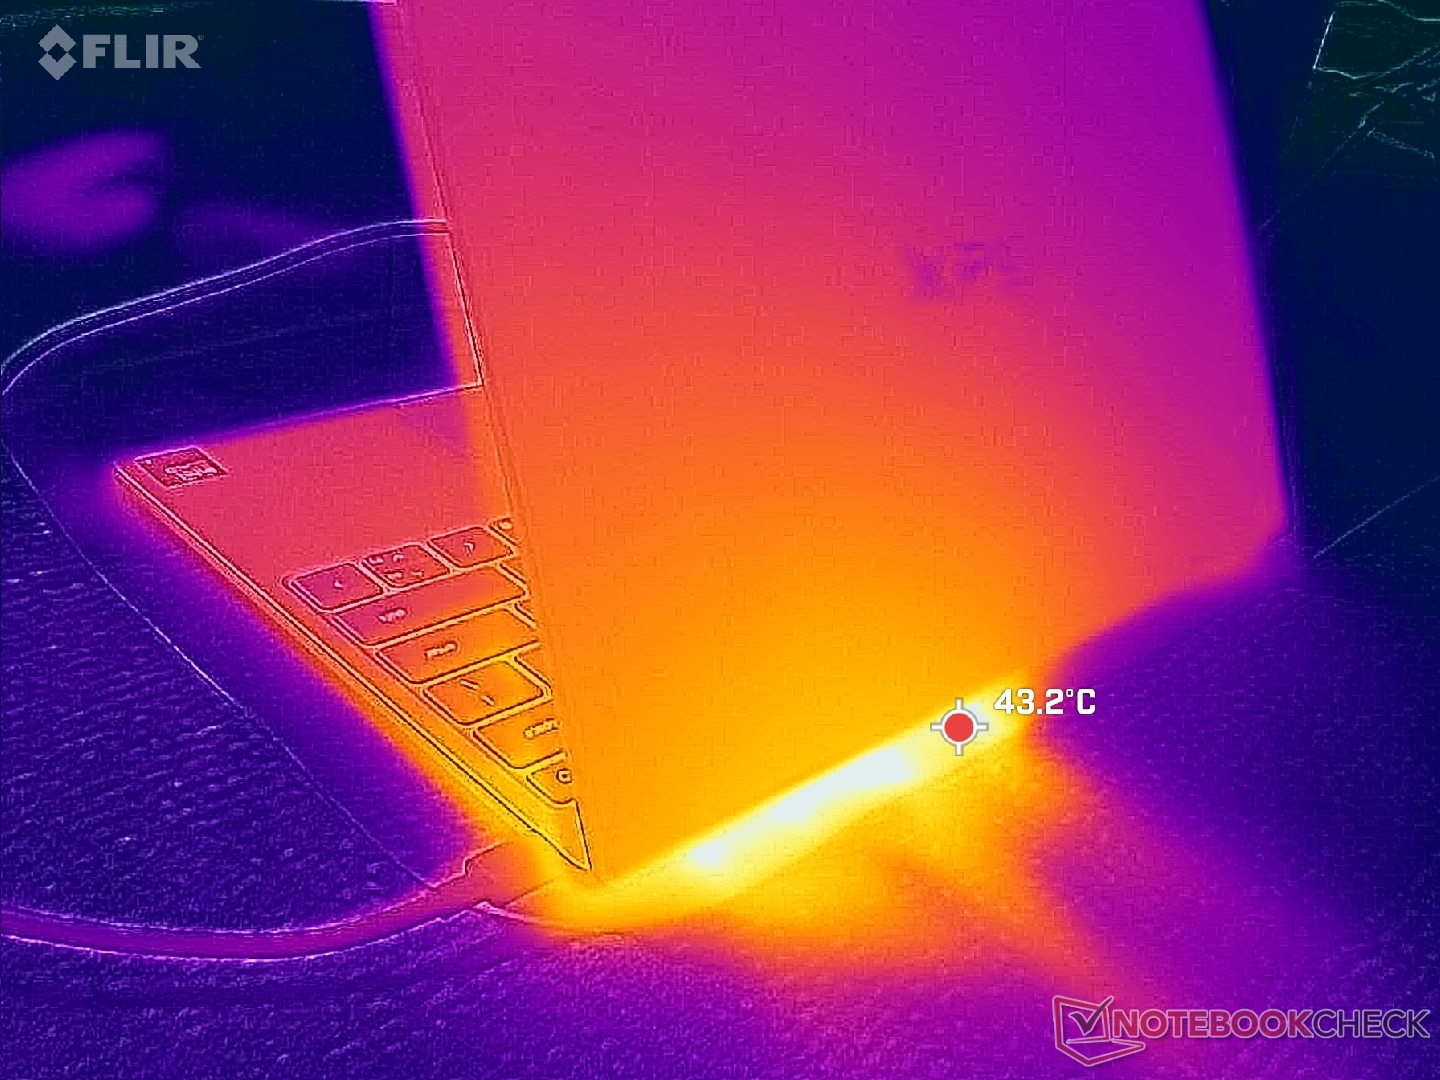
Échappement arrière
Échappement arrière
L'adaptateur secteur atteint plus de 38 °C lorsqu'il est soumis à des charges importantes.
 37.6 °C39 °C38.2 °C 
 34 °C37.6 °C33.4 °C 
 30 °C28.8 °C28.4 °C 
Maximum: 39 °C
Moyenne: 34.1 °C
35.8 °C38.2 °C36.6 °C
31.4 °C36.6 °C34.8 °C
29.4 °C30.8 °C30.6 °C
Maximum: 38.2 °C
Moyenne: 33.8 °C
Alimentation (valeur maximale)  35.6 °C | Température ambiante de la pièce 20 °C | Fluke 62 Mini IR Thermometer
(±) La température moyenne de la face supérieure sous charge maximale est de 34.1 °C / 93 F, par rapport à la moyenne de 30.8 °C / 87 F pour les appareils de la classe Subnotebook.
(+) La température maximale du côté supérieur est de 39 °C / 102 F, par rapport à la moyenne de 35.9 °C / 97 F, allant de 21.4 à 59 °C pour la classe Subnotebook.
(+) Le fond chauffe jusqu'à un maximum de 38.2 °C / 101 F, contre une moyenne de 39.2 °C / 103 F
(+) En utilisation inactive, la température moyenne du côté supérieur est de 25.1 °C / 77 F, par rapport à la moyenne du dispositif de 30.8 °C / 87 F.
(+) Les repose-poignets et le pavé tactile sont plus froids que la température de la peau avec un maximum de 30 °C / 86 F et sont donc froids au toucher.
(±) La température moyenne de la zone de l'appui-paume de dispositifs similaires était de 28.2 °C / 82.8 F (-1.8 °C / #-3.2 F).
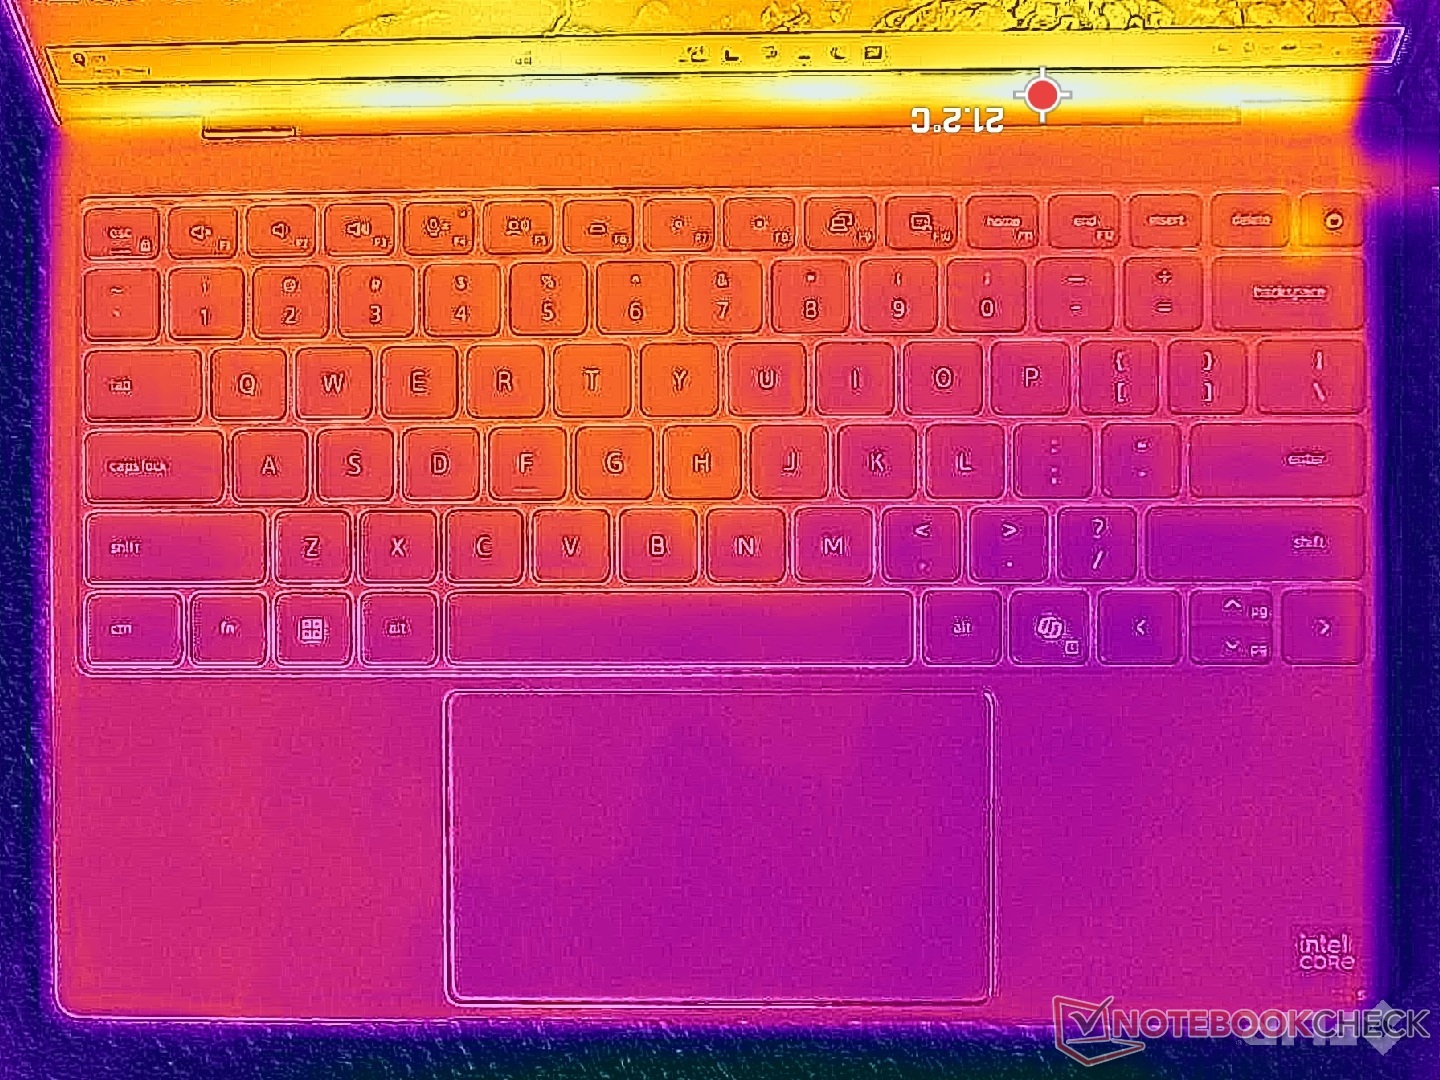
Système inactif (couverture C)
Système inactif (couvercle D)
Test de charge Prime95+FurMark (niveau C)
Test de charge Prime95+FurMark (niveau D)
Dell XPS 13 DX13260
Core 5 320, Intel Graphics 2 Xe3 WCL
Dell XPS 14 Core Ultra X7 358H
Ultra X7 358H, Arc B390 Panther Lake iGPU
Dell XPS 13 9350
Core Ultra 7 256V, Arc 140V
Apple MacBook Neo 256 GB
A18 Pro, A18 GPU
HP OmniBook 7 Aero 13-bg1077nr
Ryzen AI 7 350, Radeon 860M
Lenovo ThinkPad X1 Carbon Gen 14 21V70075GE
Ultra 5 325, Intel Graphics 4 Xe3 PTL
Heat
5%
4%
4%
6%
-2%
Maximum Upper Side * (°C)
39
34
13%
34.8
11%
40.8
-5%
35.8
8%
40.7
-4%
Maximum Bottom * (°C)
38.2
35.8
6%
37.4
2%
38
1%
37.6
2%
42.8
-12%
Idle Upper Side * (°C)
26
25.6
2%
25.4
2%
23.8
8%
24.2
7%
24.9
4%
Idle Bottom * (°C)
26.2
26.4
-1%
26.2
-0%
22.8
13%
24
8%
25
5%

* ... Moindre est la valeur, meilleures sont les performances

Test de résistance

Le processeur passait à 3,6 GHz et 35 W lors du lancement du test de charge Prime95, avant d’atteindre rapidement son maximum à 100 °C. Les performances chutaient alors rapidement à 2,6 GHz et 18 W afin de maintenir une température du cœur plus gérable, à 89 °C. La température du cœur peut être assez élevée, ce qui entraîne des températures de surface sensiblement élevées lors de l’exécution de charges exigeantes.
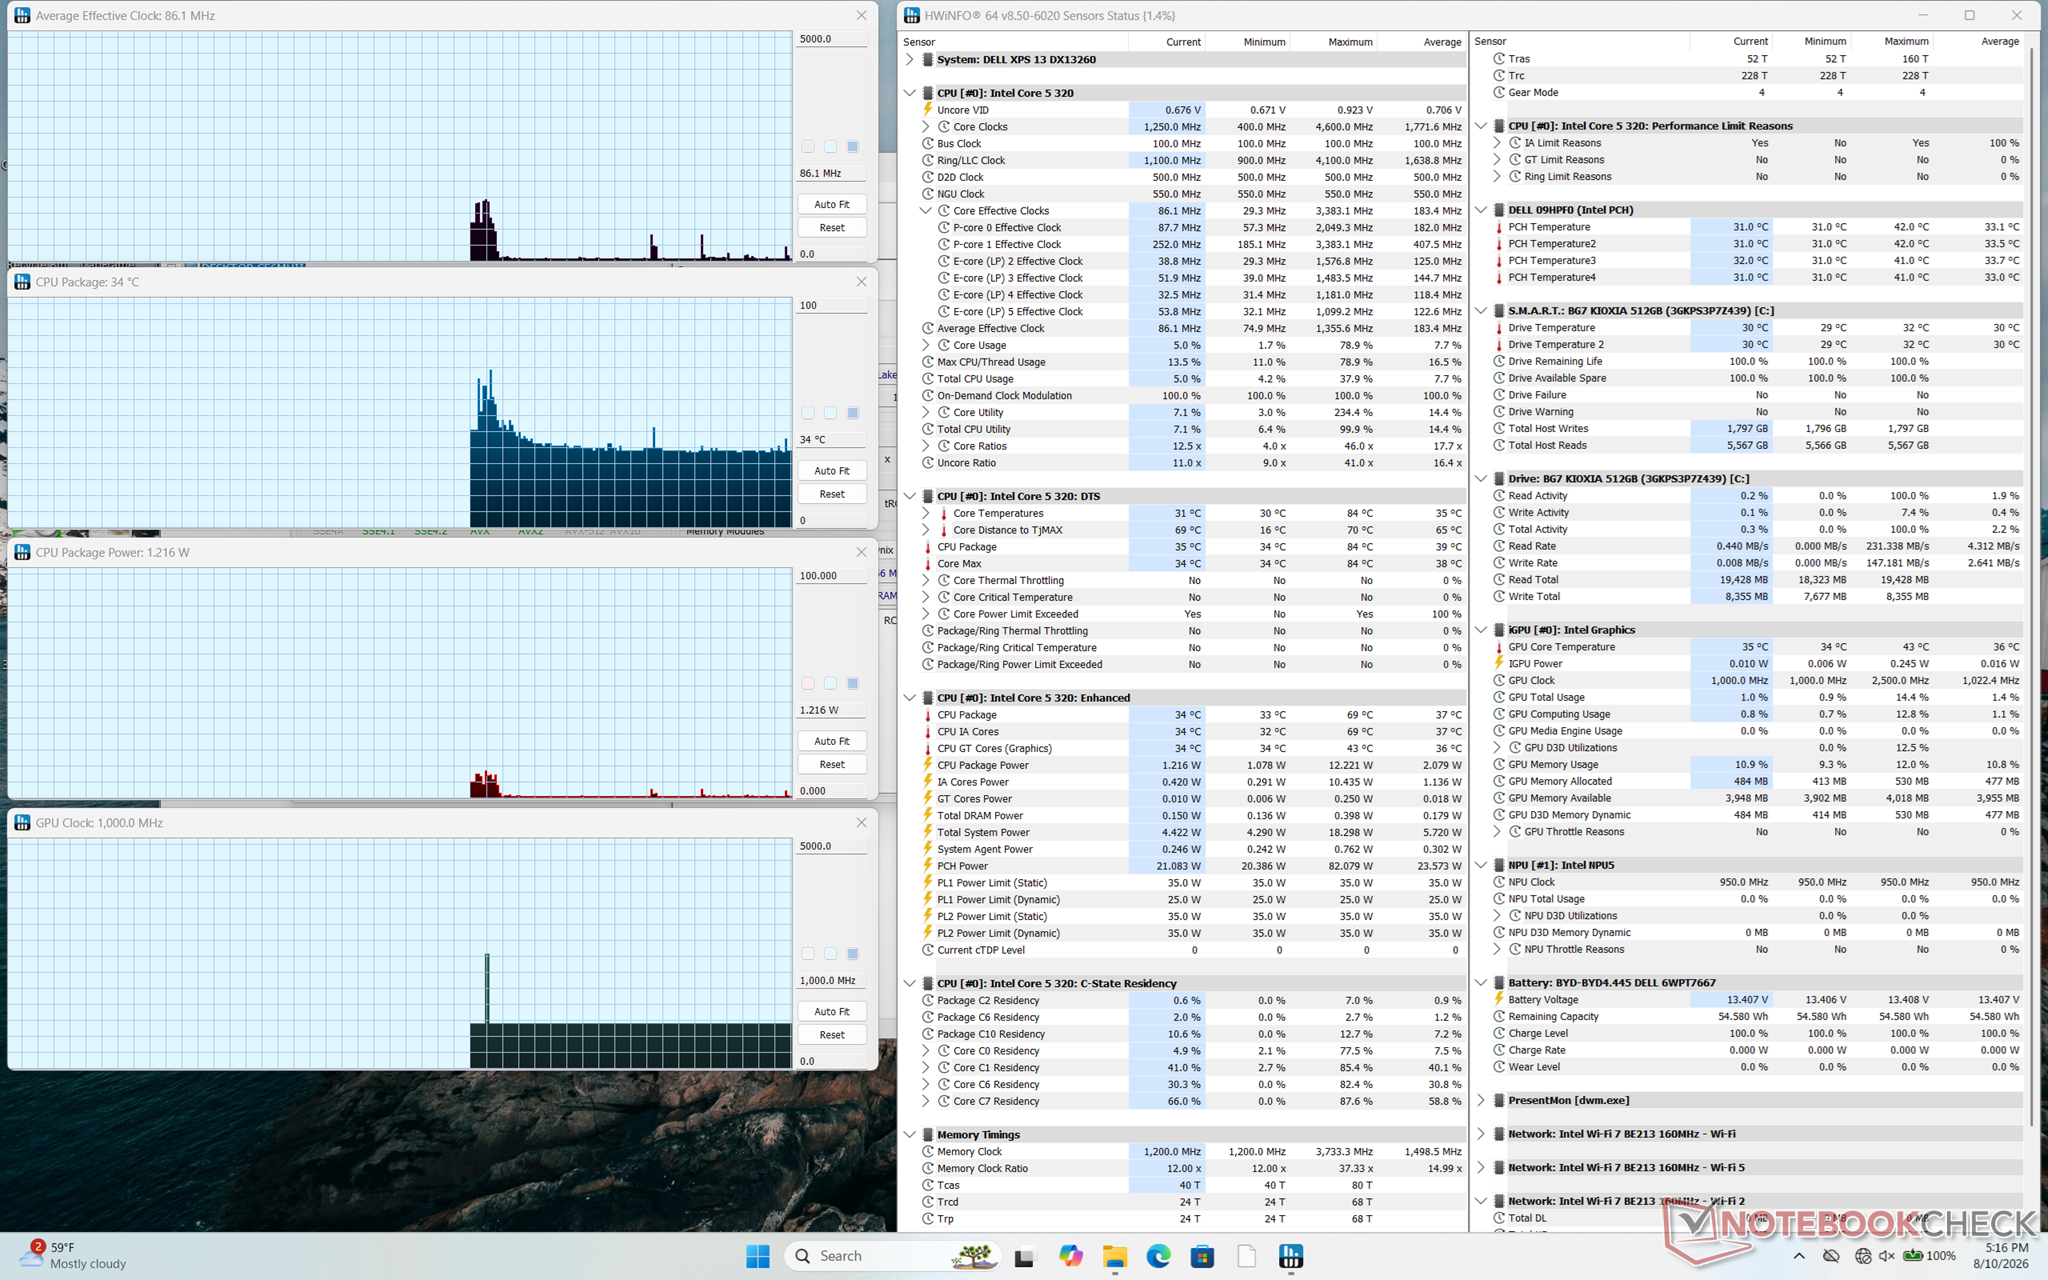
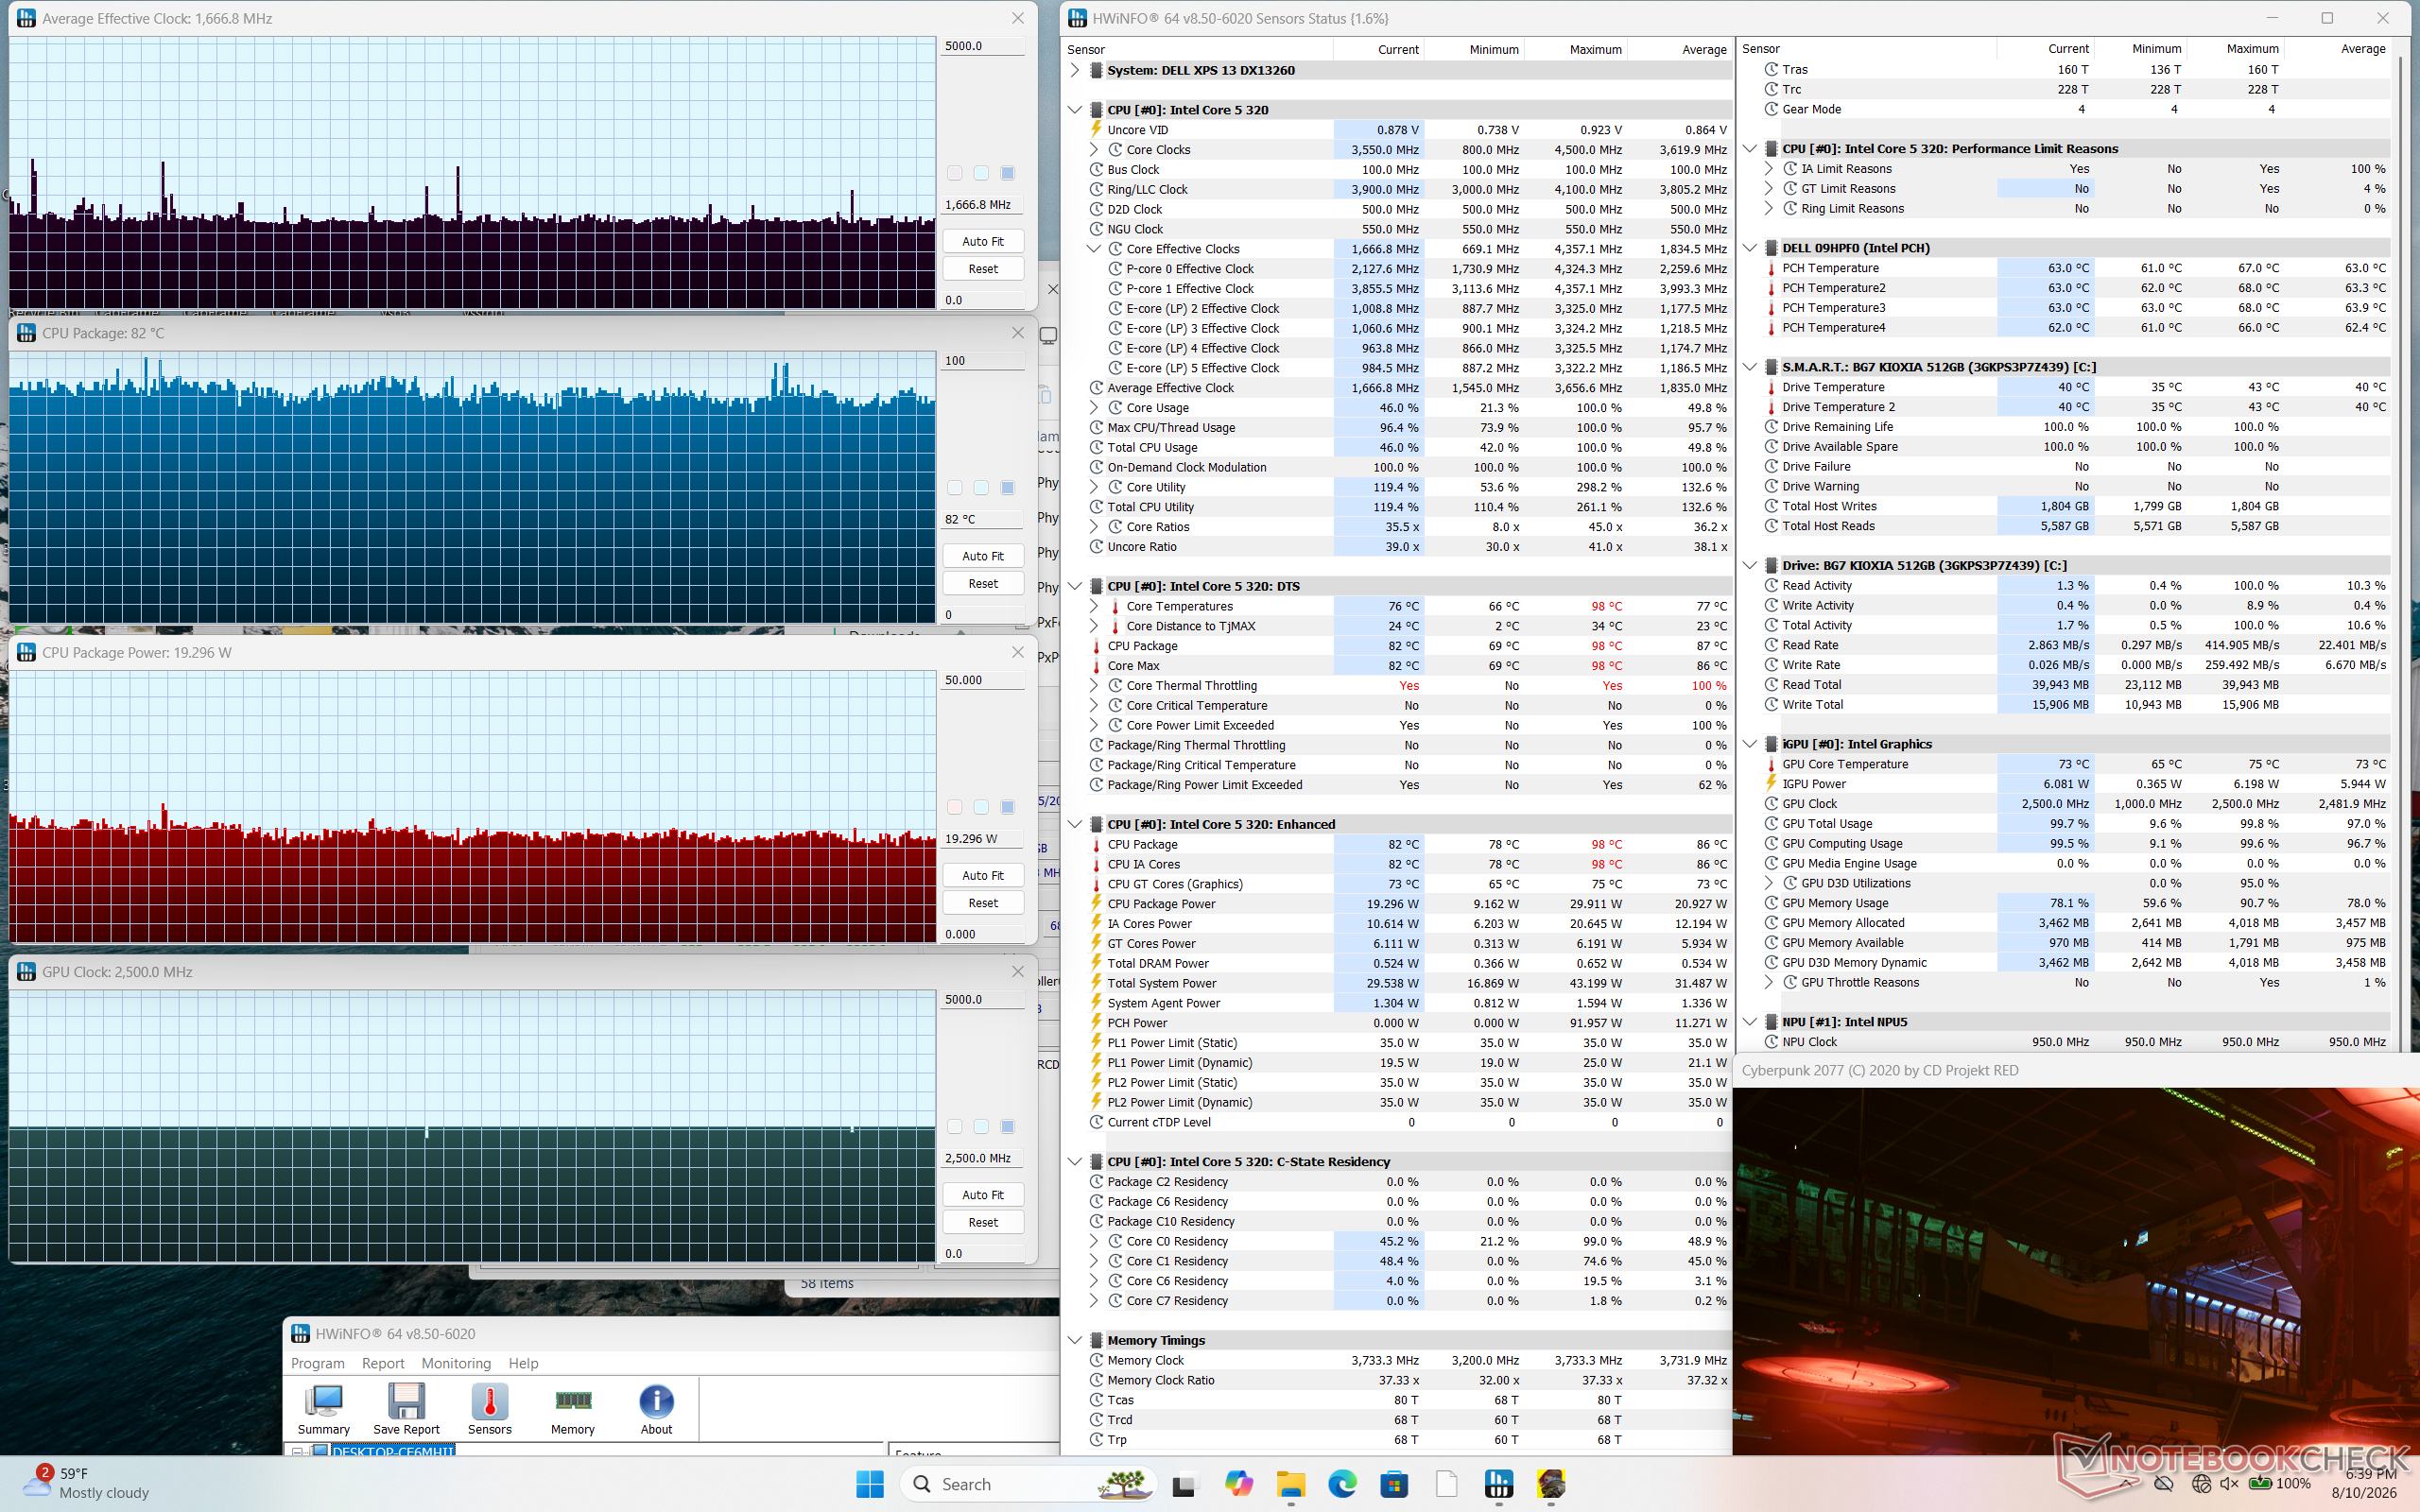
Système inactif
Système inactif
Le stress lié à Cyberpunk 2077
Test de charge Prime95
Test de charge Prime95 + FurMark
Fréquence moyenne du processeur (GHz) Fréquence du processeur graphique (MHz) Température moyenne du processeur (°C) Système au repos
--
1000
34
Test de charge Prime95
2,6
--
89
Test
de charge Prime95 + FurMark
2,4
1 800 - 2 500
79
Test
de charge Cyberpunk 2077
~1,7
2 500
82

Intervenants

Le bruit rose offre un volume maximal élevé avec une plage dynamique supérieure à ce que l'on pourrait attendre compte tenu du prix
dB(A) 0102030405060708090Deep BassMiddle BassHigh BassLower RangeMidsHigher MidsLower HighsMid HighsUpper HighsSuper Highs2039.839.2252929.93124.222.74021.424.15025.131.76323.529.78024.749.61002354.912518.955.116015.458.320014.462.525013.666.231514.470.740012.177.650011.380.463011.276.580011.175100010.979.712501076.9160010.373.7200010.368.8250010.673.1315011.370.3400011.367.3500011.767.4630011.765.8800011.766.11000011.866.5125001265.21600011.157.7SPL23.585.9N0.568.4median 11.7median 68.4Delta1.84.726.325.821.422.12624.925.127.622.532.523.448.72655.818.860.922.167.2267019.372.317.674.217.774.319.575.31571.711.871.311.27410.574.21072.710.17210.67210.97511.374.811.671.71269.71269.612.371.112.669.61270.111.269.824.784.70.666.6median 12median 71.73.42.2hearing rangehide median Pink NoiseDell XPS 13 DX13260Apple MacBook Pro 16 2021 M1 Pro
Diagramme de fréquence (les cases peuvent être cochées et décochées pour comparer les appareils)
Dell XPS 13 DX13260 analyse audio

(+) | les haut-parleurs peuvent jouer relativement fort (85.9# dB)
Basses 100 - 315 Hz
(±) | basse réduite - en moyenne 7.9% inférieure à la médiane
(+) | les basses sont linéaires (6.2% delta à la fréquence précédente)
Médiums 400 - 2000 Hz
(±) | médiane supérieure - en moyenne 7.6% supérieure à la médiane
(+) | les médiums sont linéaires (6.8% delta à la fréquence précédente)
Aiguës 2 - 16 kHz
(+) | des sommets équilibrés - à seulement 2.2% de la médiane
(+) | les aigus sont linéaires (3.1% delta à la fréquence précédente)
Globalement 100 - 16 000 Hz
(+) | le son global est linéaire (11% différence à la médiane)
Par rapport à la même classe
» 10% de tous les appareils testés de cette catégorie étaient meilleurs, 4% similaires, 86% pires
» Le meilleur avait un delta de 5%, la moyenne était de 18%, le pire était de 53%.
Par rapport à tous les appareils testés
» 6% de tous les appareils testés étaient meilleurs, 2% similaires, 92% pires
» Le meilleur avait un delta de 4%, la moyenne était de 23%, le pire était de 134%.

Apple MacBook Pro 16 2021 M1 Pro analyse audio

(+) | les haut-parleurs peuvent jouer relativement fort (84.7# dB)
Basses 100 - 315 Hz
(+) | bonne basse - seulement 3.8% loin de la médiane
(+) | les basses sont linéaires (5.2% delta à la fréquence précédente)
Médiums 400 - 2000 Hz
(+) | médiane équilibrée - seulement 1.3% de la médiane
(+) | les médiums sont linéaires (2.1% delta à la fréquence précédente)
Aiguës 2 - 16 kHz
(+) | des sommets équilibrés - à seulement 1.9% de la médiane
(+) | les aigus sont linéaires (2.7% delta à la fréquence précédente)
Globalement 100 - 16 000 Hz
(+) | le son global est linéaire (4.6% différence à la médiane)
Par rapport à la même classe
» 0% de tous les appareils testés de cette catégorie étaient meilleurs, 0% similaires, 100% pires
» Le meilleur avait un delta de 5%, la moyenne était de 17%, le pire était de 45%.
Par rapport à tous les appareils testés
» 0% de tous les appareils testés étaient meilleurs, 0% similaires, 100% pires
» Le meilleur avait un delta de 4%, la moyenne était de 23%, le pire était de 134%.

Gestion de l'énergie

Consommation électrique

La consommation peut descendre jusqu'à 2 W et 5 W respectivement aux réglages de luminosité le plus bas et le plus élevé, ce qui garantit un niveau d'efficacité énergétique extrêmement élevé. L'autonomie est par conséquent très longue, dépassant les 18 heures de navigation Web en conditions réelles, malgré la taille moyenne de la batterie.
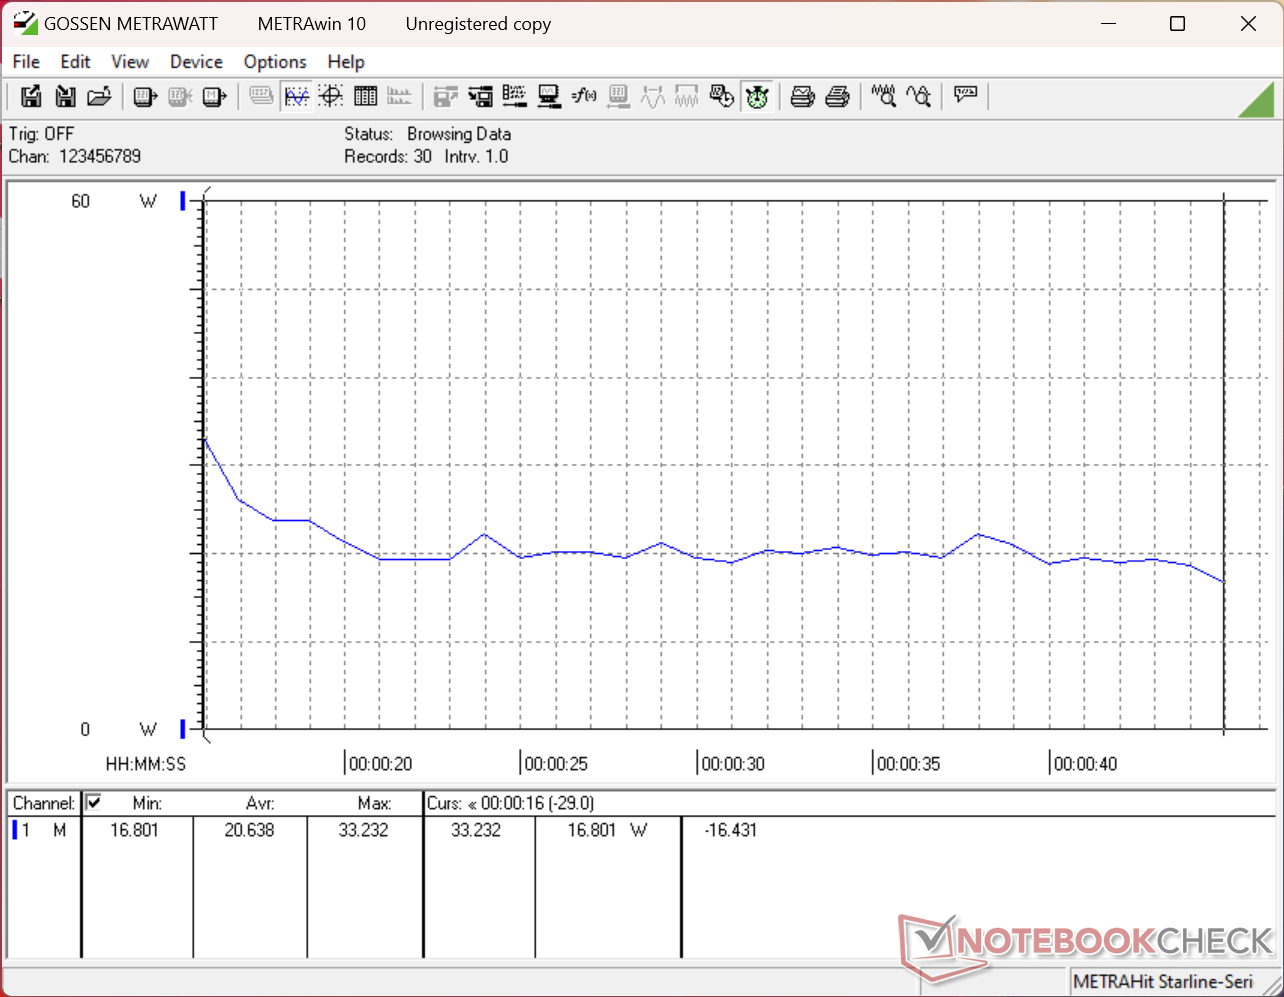
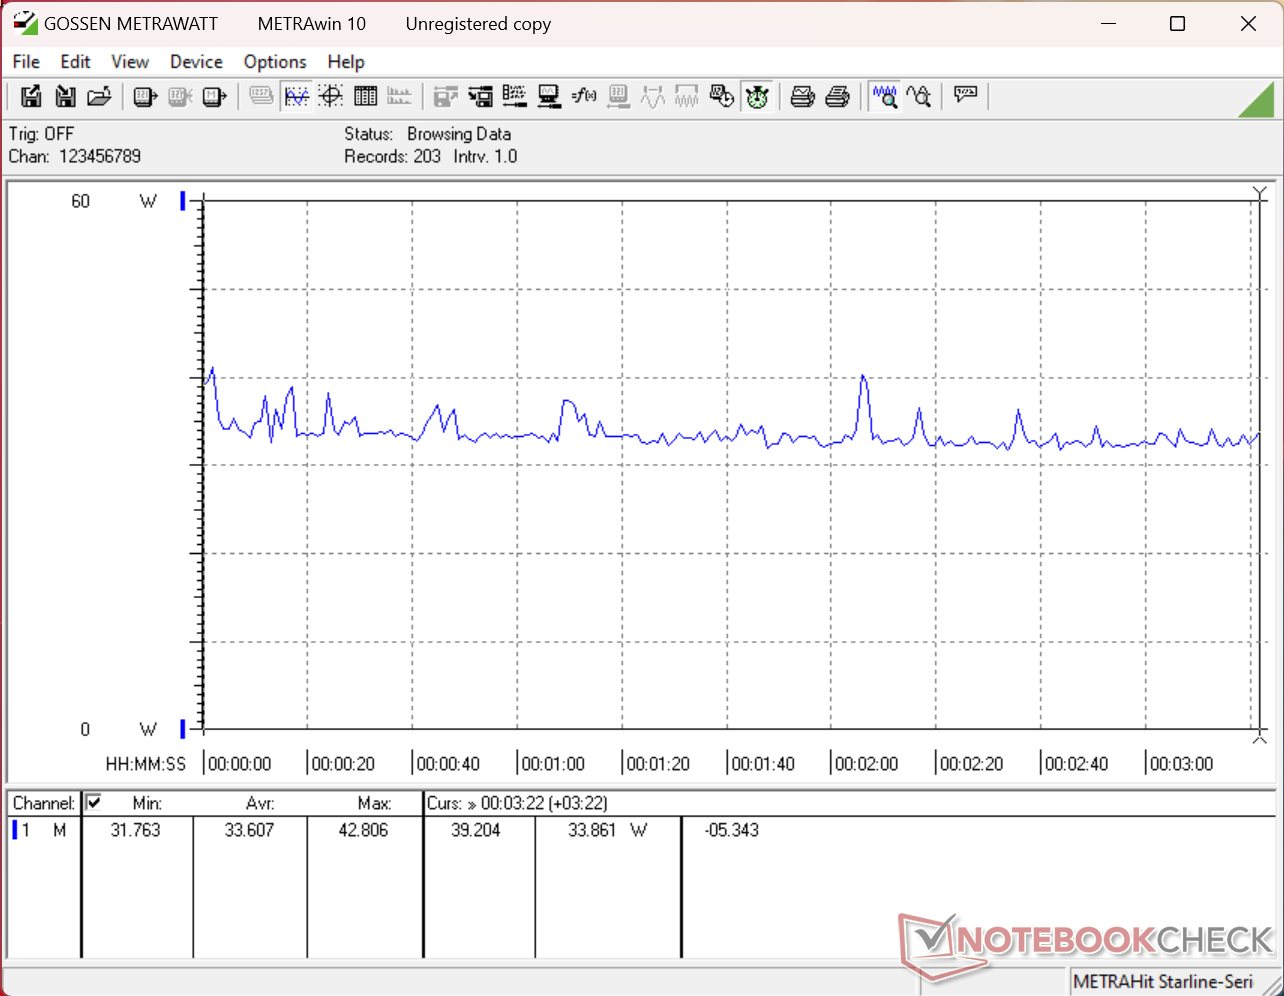
Consommation de 3DMark 11
Cyberpunk 2077 en 1080p, consommation moyenne
La consommation atteindrait un pic de 53 W lors du lancement du test de charge Prime95, avant de redescendre à 36 W environ 30 secondes plus tard, ce qui suggère une autonomie limitée du Turbo Boost.
Test de charge Prime95+FurMark lancé à la 10e seconde
Consommation énergétique
Éteint/en veilledarklight 0.03 / 0.56 Watts
Au reposdarkmidlight 1.9 / 5.4 / 5.8 Watts
Fortement sollicité midlight 20.6 / 52 Watts
 color bar
Légende: min: dark, med: mid, max: light        Metrahit Energy
Dell XPS 13 DX13260
Core 5 320, Intel Graphics 2 Xe3 WCL, , IPS, 2560x1600, 13.4"
Dell XPS 14 Core Ultra X7 358H
Ultra X7 358H, Arc B390 Panther Lake iGPU, Samsung PM9C1b MZVL81T0HFLB-00BH1, OLED, 2880x1800, 14"
Dell XPS 13 9350
Core Ultra 7 256V, Arc 140V, Micron 2550 512GB, IPS, 1920x1200, 13.4"
Apple MacBook Neo 256 GB
A18 Pro, A18 GPU, Apple SSD AP0256Z, IPS, 2408x1506, 13"
HP OmniBook 7 Aero 13-bg1077nr
Ryzen AI 7 350, Radeon 860M, SK hynix PC801 HFS001TEJ9X101N, IPS, 1920x1200, 13.3"
Lenovo ThinkPad X1 Carbon Gen 14 21V70075GE
Ultra 5 325, Intel Graphics 4 Xe3 PTL, Samsung PM9C1b MZVL8512HFLU-00BLL, IPS, 1920x1200, 14"
Power Consumption
-59%
-10%
13%
-53%
-22%
Idle Minimum * (Watt)
1.9
3.1
-63%
1.3
32%
1.5
21%
3.2
-68%
1.6
16%
Idle Average * (Watt)
5.4
3.6
33%
2.5
54%
8.9
-65%
6.8
-26%
4.6
15%
Idle Maximum * (Watt)
5.8
10
-72%
4.1
29%
9
-55%
7
-21%
4.9
16%
Load Average * (Watt)
20.6
39.2
-90%
40.1
-95%
18.9
8%
50.3
-144%
39.7
-93%
Cyberpunk 2077 ultra * (Watt)
33.6
51.4
-53%
46.1
-37%
11.5
66%
52.8
-57%
45.2
-35%
Cyberpunk 2077 ultra external monitor * (Watt)
30.1
51.2
-70%
43.1
-43%
10.3
66%
41.6
-38%
46.1
-53%
Load Maximum * (Watt)
52
101.4
-95%
57.3
-10%
26.3
49%
59.9
-15%
64.2
-23%

* ... Moindre est la valeur, meilleures sont les performances

Consommation électrique Cyberpunk / Test de résistance

05101520253035404550556065707580859095100Tooltip
Dell XPS 13 DX13260 Core 5 320, Intel Graphics 2 Xe3 WCL; 1280x720 Prime95 28.10 and Furmark 1.25: Ø41.5 (36.3-52.6) Watt
Dell XPS 14 Core Ultra X7 358H Ultra X7 358H, Arc B390 Panther Lake iGPU; 1280x720 Prime95 28.10 and Furmark 1.25: Ø57.8 (46.6-101.4) Watt
Dell XPS 13 DX13260 Core 5 320, Intel Graphics 2 Xe3 WCL; Idle 150cd/m2: Ø2.49 (2.36-3.57) Watt
Dell XPS 14 Core Ultra X7 358H Ultra X7 358H, Arc B390 Panther Lake iGPU; Idle 150cd/m2: Ø3.26 (2.28-5.65) Watt
Dell XPS 13 DX13260 Core 5 320, Intel Graphics 2 Xe3 WCL; Cyberpunk 2077 FHD ultra no FSR 150cd: Ø33.6 (31.8-41.2) Watt
Dell XPS 14 Core Ultra X7 358H Ultra X7 358H, Arc B390 Panther Lake iGPU; Cyberpunk 2077 FHD ultra no FSR 150cd: Ø51.4 (48.7-57.4) Watt

Consommation électrique du moniteur externe

05101520253035404550556065707580859095Tooltip
Dell XPS 13 DX13260 Core 5 320, Intel Graphics 2 Xe3 WCL; Prime95 V2810 Stress (external Monitor): Ø38.6 (33.5-48.1) Watt
Dell XPS 14 Core Ultra X7 358H Ultra X7 358H, Arc B390 Panther Lake iGPU; Prime95 V2810 Stress (external Monitor): Ø56.8 (46.6-99.1) Watt
Dell XPS 13 DX13260 Core 5 320, Intel Graphics 2 Xe3 WCL; Cinebench R15 Multi (external Monitor): Ø40 (38.8-42.3) Watt
Dell XPS 14 Core Ultra X7 358H Ultra X7 358H, Arc B390 Panther Lake iGPU; Cinebench R15 Multi (external Monitor): Ø93.9 (89.5-96.9) Watt
Dell XPS 13 DX13260 Core 5 320, Intel Graphics 2 Xe3 WCL; Cinebench R23 Multi (external Monitor): Ø36.8 (34.1-46.4) Watt
Dell XPS 14 Core Ultra X7 358H Ultra X7 358H, Arc B390 Panther Lake iGPU; Cinebench R23 Multi (external Monitor): Ø71 (41.1-94.8) Watt
Dell XPS 13 DX13260 Core 5 320, Intel Graphics 2 Xe3 WCL; 1280x720 FurMark 1.19 GPU Stress Test (external Monitor): Ø16.8 (15.9-17.6) Watt
Dell XPS 14 Core Ultra X7 358H Ultra X7 358H, Arc B390 Panther Lake iGPU; 1280x720 FurMark 1.19 GPU Stress Test (external Monitor): Ø58.2 (42.2-74.1) Watt
Dell XPS 13 DX13260 Core 5 320, Intel Graphics 2 Xe3 WCL; Idle 1min (external Monitor): Ø2.08 (1.816-5.48) Watt
Dell XPS 14 Core Ultra X7 358H Ultra X7 358H, Arc B390 Panther Lake iGPU; Idle 1min (external Monitor): Ø3.43 (1.646-5.16) Watt
Dell XPS 13 DX13260 Core 5 320, Intel Graphics 2 Xe3 WCL; Cyberpunk 2077 FHD ultra no FSR (external Monitor): Ø30.1 (28.8-41.9) Watt
Dell XPS 14 Core Ultra X7 358H Ultra X7 358H, Arc B390 Panther Lake iGPU; Cyberpunk 2077 FHD ultra no FSR (external Monitor): Ø51.2 (30.8-56.9) Watt

Autonomie de la batterie

Autonomie
WiFi Websurfing
18h 26min
Dell XPS 13 DX13260
Core 5 320, Intel Graphics 2 Xe3 WCL, 52 Wh
Dell XPS 14 Core Ultra X7 358H
Ultra X7 358H, Arc B390 Panther Lake iGPU, 70 Wh
Dell XPS 13 9350
Core Ultra 7 256V, Arc 140V, 55 Wh
Apple MacBook Neo 256 GB
A18 Pro, A18 GPU, 36.5 Wh
HP OmniBook 7 Aero 13-bg1077nr
Ryzen AI 7 350, Radeon 860M, 43 Wh
Lenovo ThinkPad X1 Carbon Gen 14 21V70075GE
Ultra 5 325, Intel Graphics 4 Xe3 PTL, 58 Wh
Autonomie de la batterie
-9%
12%
-30%
-43%
26%
WiFi v1.3 (h)
18.4
16.8
-9%
20.6
12%
12.9
-30%
10.4
-43%
23.2
26%
Reader / Idle (h)
56.8
Load (h)
2.4
2.8
H.264 (h)
13.6

Note de Notebookcheck

Le XPS 13 équipé d'Intel Wildcat bouscule les codes de ce que les utilisateurs sont en droit d'attendre d'un ordinateur portable Windows bon marché.

Dell XPS 13 DX13260 - 08/12/2026 v8
Allen Ngo

Châssis
82 / 98 → 84%
Clavier
83%
Dispositif de pointage
85%
Connectivité
57 / 74 → 77%
Poids
74 / 20-77 → 95%
Autonomie
91%
Écran
90%
Performances en jeu
23 / 75 → 31%
Performances dans les applications
79 / 92 → 86%
AI Performance
81%
Chauffe
93%
Nuisance sonore
90%
Audio
82 / 91 → 90%
Appareil photo
35 / 75 → 47%
Moyenne
67%
86%
Subnotebook - Moyenne compensée
CO2 Emissions
No Data
Materials
50%
Packaging
100%
Power Use
93.1%
Repairability
50%
Software Updates
22.3%
Recycle Logo Total Sustainability Score: 52.6%

Comparaison avec les concurrents potentiels

Image
Modèle
Prix
Poids
Épaisseur
Écran
1.
85.7%
Dell XPS 13 DX13260
Dell XPS 13 DX13260
Intel Core 5 320 ⎘
Intel Graphics 2 Xe3 Wildcat Lake iGPU ⎘
8 Go Mémoire
Amazon: Prix de liste: 700 USD1.1 kg12.7 mm13.40"
2560x1600
225 PPI
IPS
2.
87.4%
Dell XPS 14 Core Ultra X7 358H
Intel Core Ultra X7 358H ⎘
Intel Arc B390 12 Xe3 Panther Lake iGPU ⎘
32 Go Mémoire, 1000 Go SSD
Amazon:
1. $1,399.99
Dell XPS 14 Premium Laptop D...
2. $2,049.00
Dell XPS 14 9440 14.5" Noteb...
3. $1,955.00
Dell Pro 14 Plus Business La...
Prix de liste: 2200 USD
1.4 kg14.62 mm14.00"
2880x1800
243 PPI
OLED
3.
85.3%
Dell XPS 13 9350
Dell XPS 13 9350
Intel Core Ultra 7 256V ⎘
Intel Arc Graphics 140V ⎘
16 Go Mémoire, 512 Go SSD
Amazon: Prix de liste: 1400 USD1.2 kg15.3 mm13.40"
1920x1200
169 PPI
IPS
4.
86%
Apple MacBook Neo 256 GB
Apple A18 Pro ⎘
Apple A18 GPU ⎘
8 Go Mémoire, 256 Go SSD
Amazon: Prix de liste: 699€1.2 kg12.7 mm13.00"
2408x1506
218 PPI
IPS
5.
86.9%
HP OmniBook 7 Aero 13-bg1077nr
AMD Ryzen AI 7 350 ⎘
AMD Radeon 860M ⎘
32 Go Mémoire, 1024 Go SSD
Amazon: Prix de liste: 1250 USD1 kg17.6 mm13.30"
1920x1200
170 PPI
IPS
6.
89.9%
Lenovo ThinkPad X1 Carbon Gen 14 21V70075GE
Intel Core Ultra 5 325 ⎘
Intel Graphics 4 Xe3 Panther Lake iGPU ⎘
32 Go Mémoire, 512 Go SSD
Amazon:
1. $1,899.00
Lenovo ThinkPad X1 Carbon Ge...
2. $2,199.99
Lenovo ThinkPad X1 Carbon Bu...
3. $1,929.74
Lenovo ThinkPad X1 Carbon Ge...
Prix de liste: 2469€
1.1 kg16.8 mm14.00"
1920x1200
162 PPI
IPS

Transparency

La sélection des appareils à examiner est effectuée par notre équipe éditoriale. L'échantillon de test a été prêté à l'auteur par le fabricant ou le détaillant pour les besoins de cet examen. Le prêteur n'a pas eu d'influence sur cette évaluation et le fabricant n'a pas reçu de copie de cette évaluation avant sa publication. Il n'y avait aucune obligation de publier cet article. En tant que média indépendant, Notebookcheck n'est pas soumis à l'autorité des fabricants, des détaillants ou des éditeurs.

Voici comment Notebookcheck teste

Chaque année, Notebookcheck examine de manière indépendante des centaines d'ordinateurs portables et de smartphones en utilisant des procédures standardisées afin de garantir que tous les résultats sont comparables. Nous avons continuellement développé nos méthodes de test depuis environ 20 ans et avons établi des normes industrielles dans le processus. Dans nos laboratoires de test, des équipements de mesure de haute qualité sont utilisés par des techniciens et des rédacteurs expérimentés. Ces tests impliquent un processus de validation en plusieurs étapes. Notre système d'évaluation complexe repose sur des centaines de mesures et de points de référence bien fondés, ce qui garantit l'objectivité.
Google LogoAdd as a preferred source on Google
Mail Logo
> Revues et rapports de ordinateurs portatifs et smartphones, ordiphones > Critiques > Test du Dell XPS 13 Wildcat Lake : redéfinir la catégorie des ordinateurs Windows d'entrée de gamme
Allen Ngo, 2026-08-13 (Update: 2026-08-13)